Volume 2: Water Resources - Ministry of Jal Shakti
1317
Report 2020/UCSS09/2 Volume 2: Water Resources December 2020 Evaluation of Centrally Sponsored Schemes in Water Resources, Environment and Forest Sector
-
Upload
khangminh22 -
Category
Documents
-
view
0 -
download
0
Transcript of Volume 2: Water Resources - Ministry of Jal Shakti
Eva
luat
ion
of
Cen
tral
ly S
po
nso
red
Sch
emes
in W
ater
Res
ou
rces
, Env
iro
nm
ent
and
Fo
rest
Sec
tor
Volu
me
2: W
ater
Res
ou
rces
Report 2020/UCSS09/2
Development Monitoring and Evaluation Office
NITI Bhawan, Sansad Marg, New Delhi-110001
[email protected] | https://dmeo.gov.in/
Commentary,Narration and Analysis Survey Partner
Volume 2: Water Resources
December 2020
Evaluation of Centrally Sponsored Schemes inWater Resources, Environment and Forest Sector

Copyright © 2020 Development Monitoring and Evaluation Office (DMEO), NITI Aayog, Government of India
All rights reserved. This report or any portion thereof may not be reproduced or used in any manner whatsoever without the express written permission of DMEO, NITI Aayog, Government of India.
All information, ideas, views, opinions, estimates, advice, suggestions, recommendations (hereinafter 'content') in this publication should neither be understood as professional advice in any manner nor interpreted as policies, objectives, opinions or suggestions of the Development Monitoring and Evaluation Office (DMEO), NITI Aayog. Readers are advised to use their discretion and seek professional advice before taking any action or decision, based on the contents of this publication. The content in this publication has been obtained or derived from sources believed by DMEO to be reliable but DMEO does not represent this information to be accurate or complete. DMEO does not assume any responsibility and disclaim any liability for any loss, damages, caused due to any reason whatsoever, towards any person (natural or legal) who uses this publication. Analysis by KPMG Advisory Services Private Limited Survey Partner Ipsos Research Private Limited www.dmeo.gov.in www.niti.gov.in
Volume 2: Water Resources
Evaluation of Centrally Sponsored Schemes inWater Resources, Environment and Forest Sector

DECEMBER, 2020NEW DELHIINDIA
Dr. Rajiv KumarVice ChairmanNational Institution for Transforming India Government of IndiaNew Delhi, India
MESSAGE
The sustainable use of natural resources is critical for our growing economy and the need is even more pronounced due to the e�ects of climate change. Alongside conservation of the environment, India needs policies and programs that ensure that the people dependent on environmental resources obtain better livelihoods from its conservation. Moreover, this would help in the climate-proo�ng of vulnerable sectors such as water resources, forestry, agriculture, �sheries and infrastructure.
Given that India has only 4% of the world’s renewable water sources but hosts around 18% of the world’s population, the Water Resources sector plays a vital role in ensuring water and food security and achieving our Sustainable Development Goals. Ensuring conjunctive use of surface and groundwater, substantial improvements in water use e�ciencies and equitable supply to all sectors is at the forefront. The spatial and temporal variations need to be addressed by enhancing the country’s water storage capacity by creating decentralized storage structures. A paradigm shift from an asset creation approach to a service-based approach needs to be adopted wherein the maintenance and management of the existing assets must be prioritized. Institutional reforms are warranted to contain the deepening water con�icts among user groups and ensure equitable water distribution and conjunctive use, like setting up state water resources regulatory authority and strengthening the participatory irrigation management practices and water use e�ciency.
From a comprehensive inter-sectoral view, changes in extant policies of crop procurement and subsidized electricity are necessitated. These interventions need to be supplemented by robust data collection and monitoring mechanisms backed by new technological interventions. Given the strained �nancial resources, mobilization of resources through alternative means becomes critically important in funding and ensuring the adequate maintenance of the related infrastructure. Building public-private partnerships by incorporating experiences from related areas like sewage treatment, roads, highways, etc., is needed. Water being a state subject, requires the states to come forward to set up these institutional mechanisms.
In the environment and forest sector, India is among a few countries in the world where forest cover is consistently increasing. The population of tigers, a keystone species, has also doubled, much in advance of the 2022 deadline committed in the St. Petersburg Declaration. The evaluation of changes in biodiversity of forest ecosystems and the development of local forest-dependent communities are critical. But to supplement the government funding, innovative instruments such as domestic carbon o�set markets, payment for ecosystem services, carbon taxes, and impact bond instruments need to be piloted and implemented.
This evaluation report is an important accomplishment in capturing the performance, strengths, and weaknesses of the sixteen di�erent schemes. It makes streamlined suggestions for improvement to support India’s water and food security while maintaining the environmental/ecological balance to become an Atmanirbhar Bharat.
Dr. Rajiv Kumar


Amitabh KantChief Executive O�cerNational Institution for Transforming India Government of IndiaNew Delhi, India
MESSAGE
NITI Aayog’s mandate is to facilitate transformation in India, and through the Development Monitoring and Evaluation Office (DMEO), we are working towards institutionalizing evidence-based policy-making, to strengthen systems of governance in the country. While evaluations have been carried out in India since the 1950s, this evaluation has been different in both its scope and its methods. For the first time, all important sectors under the National Development Agenda covering all the Centrally Sponsored Schemes have been evaluated. Simultaneously conducting such large-scale multiple studies across sectors has allowed for rich cross-learning, standardization, and adoption of leading survey methodologies and data quality processes.
However, evidence generation is not enough – uptake must be ensured too. The findings from this study must now be used to drive reform and future policy initiatives across the Ministries and Departments within its remit. The study provides data-backed recommendations to improve government service delivery, at the scheme, Umbrella scheme, and sector level. The Ministry officials have been closely involved throughout the study, via a thorough consultative process, to optimize the robustness of the study and its recommendations.
It is also important to measure key outcomes so as to understand whether schemes deliver on key objectives or not. The D/o Water Resources, River Development and Ganga Rejuvenation, D/o Agriculture and Farmer’s Welfare, and D/o Land Resources needs to collect regular data on important outcomes to finetune policies and program implementation. Some of these outcome indicators include the actual gap between irrigation potential created and utilized, change in crop yield and ground water level attributable to the projects, income enhancement of farmers, number of person-days of employment generated, among others. Similarly, the Ministry of Environment, Forest and Climate Change needs to measure amount of carbon sequestered, improvement of livelihood opportunities and diversification of income sources as outcomes.
In the larger context of the XVth Finance Commission and devolution of funds from the Centre towards States, these evaluation studies also play an important role in advancing NITI Aayog’s goal of cooperative federalism. The study examines heterogeneous implementation of Centrally Sponsored Schemes and identifies sub-national best practices amenable to national scaling up, facilitating learning among States and with the Centre.
Finally, to make hard evidence the basis of policy decision-making in the country, there is a need at all the levels of the Government to measure outcomes and impacts regularly. This study is a step in that direction.
DECEMBER, 2020NEW DELHIINDIA Amitabh Kant

Preface
The Government of India (GoI) spends close to Rs. 10 lakh Cr. annually on development
activities, through nearly 750 schemes implemented by Union Ministries. Of these 750, a
total of 128 are Centrally Sponsored Schemes (CSS), implying that they are funded jointly by
the Centre and the States, and implemented by the States. Over the years, federalism and
the expectations of government service delivery in India have evolved, and this vast
proliferation of schemes is in sore need of rationalization. The rationalization of schemes is
expected to improve Centre-State relations, the effectiveness and efficiency of public
finance, and the quality of service delivery to citizens.
To this end, all schemes were mandated to undergo third party evaluations, to provide an
evidentiary foundation to the 15th
Finance Commission for scheme continuation from 2021-
22 to 2025-26. The task of conducting these CSS evaluations was granted to NITI Aayog,
specifically to Development Monitoring and Evaluation Office (DMEO). This volume is thus
a part of a historic exercise undertaken between April 2019 and August 2020, to evaluate
128 CSS, under 28 Umbrella CSS, under 10 Packages or Sectors. The studies together cover
close to 30% of the GoI’s development expenditure, amounting to approximately Rs. 3 lakh
Cr. (USD 43 billion) per annum.
In order to fulfill this mandate to the highest standard possible, to optimize both the
robustness and the uptake of the evidence generated, DMEO adopted a nationally
representative mixed-methods evaluation methodology and a consultative review process
for the reports. Altogether, the project incorporates the direct input of approximately 33,000
individuals, through 17,500 household interviews, 7,100 key informant interviews, and 1,400
focus group discussions. The views of Central, State, district, block, ward, and village
administrations, as well as non-governmental experts and civil society organizations, have
been elicited. Through qualitative and quantitative analysis of secondary literature, validated
by this primary data collection, the analysis was done at three levels: the sector, the umbrella
CSS, and the scheme itself. The key parameters for analysis, including relevance,
effectiveness, efficiency, sustainability, impact, and equity (REESIE), have been selected
based on international best practices in evaluation. In addition, across 10 packages, certain
cross-cutting themes have been identified for analysis, including transparency, sustainability,
gender, technology, private sector etc. The reports thus produced then underwent a
consultative review process involving NITI Aayog subject matter divisions, concerned
Ministries and Departments, and external experts. The entire project was implemented
through 10 consultant firm teams selected from the private sector through an open tender
process, managed by my small but fiercely dedicated team at DMEO.
Throughout this project, hundreds of people across the country have pushed themselves
through festivals, monsoon rains, cyclones, and a global pandemic, COVID-19, to present
these volumes. DMEO owes a debt of gratitude to each one of these contributors, but
especially to all the beneficiaries interviewed, for sharing their precious time and experiences
with our teams. Ultimately, this exercise, like all others by the Government of India, is in
service of the sovereign citizens of this country.

Acknowledgment
We would first of all like to express our deepest gratitude to the Ministry of Finance for
recognizing the crucial need for evidence in the deliberations of the 15th
Finance Commission
and entrusting the conduction of these historic evaluations to NITI Aayog. Further, Dr. Rajiv
Kumar, Vice-Chairman NITI Aayog, and Shri Amitabh Kant, Chief Executive Officer, have
played a fundamental role, first in entrusting this weighty responsibility to the Development
Monitoring and Evaluation Office (DMEO) and subsequently as mentors throughout the study,
in providing all necessary support and guidance for the completion of the project.
Our invaluable partners in this exercise have been the Department of Water Resources, River
Development & Ganga Rejuvenation (D/o WR, RD & GR), Department of Agriculture,
Cooperation and Farmer’s Welfare (DAC&FW), Department of Land Resources (DoLR), and
Ministry of Environment, Forest and Climate Change (MoEFCC) and all its officials, without
whose cooperation this evaluation would not have been possible. Sh. Upendra Prasad Singh,
Secretary, Sh. K Guite, and Dr. R Sathish, Economic Advisor from D/o WR, RD & GR, Sh.
Sanjay Agarwal, Secretary and Sh. B V N Rao, Deputy Commissioner from DAC&FW; Sh. Ajay
Tirkey, Secretary and Sh. Umakant, Joint Secretary from DoLR; and various divisions under
the Departments provided invaluable support for the Water Resources sub-package. Sh.
Rameshwar Prasad Gupta, Secretary, , Sh. Yashvir Singh, Economic Advisor, the various
divisions from MoEFCC provided invaluable support for the Environment and Forest
Resources sub-package. We are grateful to them for giving us access to available data, for
patiently sharing their expertise through Key Informant Interviews, and for providing their vital
comments on the draft reports during various stages of the study. A detailed list of Key
Informant Interviews can be found in the annexures to this report.
In the spirit of Centrally Sponsored Schemes in our federal structure, equally important
partners in this endeavor have been the state governments of Assam, Andhra Pradesh, Bihar,
Himachal Pradesh, Jharkhand, Karnataka, Kerala, Maharashtra, Madhya Pradesh, Manipur,
Mizoram, Odisha, Punjab, Rajasthan, Tamil Nadu, Uttar Pradesh, Uttarakhand and West
Bengal and their Chief Secretaries. They provided both ground support and operational
independence to our field partners for the primary study. State Nodal Officers and other
officials also provided invaluable support. We are deeply thankful for their gracious
cooperation in completion of the study.
Next, we must thank our external expert, Dr. Amarjit Singh, ex-Secretary (D/o WR, RD & GR),
and Dr. Deepak Khare, Professor (Department of Water Resources Development and
Management, IIT Roorkee) for helping us refine and rationalize the report through their
insightful comments, corrections and feedback at each stage. From deep fundamentals of the
sector to the latest developments, these experts helped ensure that the report was as
comprehensive, cogent, and technically robust as possible, within the short timeframes
available.
Coming to the implementation teams, it goes without saying that the selected consultant firm,
M/s KPMG Advisory Services Pvt. Ltd. has done a remarkable job, particularly given the
significant challenges of scale, time, and resources presented by this project. Particular
appreciation is due to Mr. Sumouleendra Ghosh, Director, Mr. Manpreet Singh, Partner, and
Mr. Anand Kulkarni, Technical Director and their full team. They conducted hundreds of
interviews across 18 States of India, an extraordinary triumph of operational planning and
logistics, through monsoons, festive seasons, a cyclone, and a pandemic.
At NITI Aayog, this exercise would not have gotten off the ground without the consistent
support of the Procurement Management Committee and Bid Evaluation Committee,
particularly Mr. Sonjoy Saha, Adviser (PPP/PAMD), Sh. Avinash Mishra, Adviser (Water & Land
Resources), Sh. Jitendra Kumar, Adviser (Natural Resources & Environment), and Ms.
Sanchita Shukla, Director, Internal Finance Division. Staff at the NITI Aayog Water & Land
Resources vertical, particularly Sh. Mishra, Ms. Namrata Singh, Young Professional and Sh.
Gopal Sharan, Scientist C, and NRE Adviser Sh. Jitendra Kumar have also been instrumental
in seeing this project to fruition. The Internal Finance Division further merits special mention
here for its extensive efforts.
DMEO team has been at the core of the evaluation studies - in this package specifically, Ms.
Sumitra K, Monitoring and Evaluation Lead, Ms. Fatima Mumtaz, Young Professional and Sh.
Kuldeep Pal, Economic Investigator worked on every last detail of this herculean endeavor,
under the guidance of Deputy Director Generals Sh. Alok Mishra and Ms. Harkiran Sanjeevi.
Across packages, Deputy Director General Sh. Ashutosh Jain also oversaw coordination,
standardization and monitoring of the study design, analysis and implementation processes
across packages. They were supported by the Evaluations Core Team: Dr. Shweta Sharma,
Sh. Anand Trivedi, Ms. Sanjana Manaktala, Ms. Shruti Khanna, Ms. Vatsala Aggarwal, Sh. O.P.
Thakur and Sh. Jayanta Patel. The Primary Data Quality Review team comprising Sh.
Venugopal Mothkoor, Sh. Paresh Dhokad, Sh. Krishn Kant Sharma and Sh. Jayanta Patel
contributed across packages in data quality and analysis. The DMEO administration and
accounts officers, including Sh. D. Bandopadhyay, Sh. Munish Singhal, Sh. D.S. Sajwan, Sh.
Manoj Kumar and others provided vital support on documentation, approvals, payments etc.
Given the massive scope and scale of the exercise, this report owes its successful completion
to the dedicated efforts of a wide variety of stakeholders. The country is deeply grateful to
each one of them.
Page | i
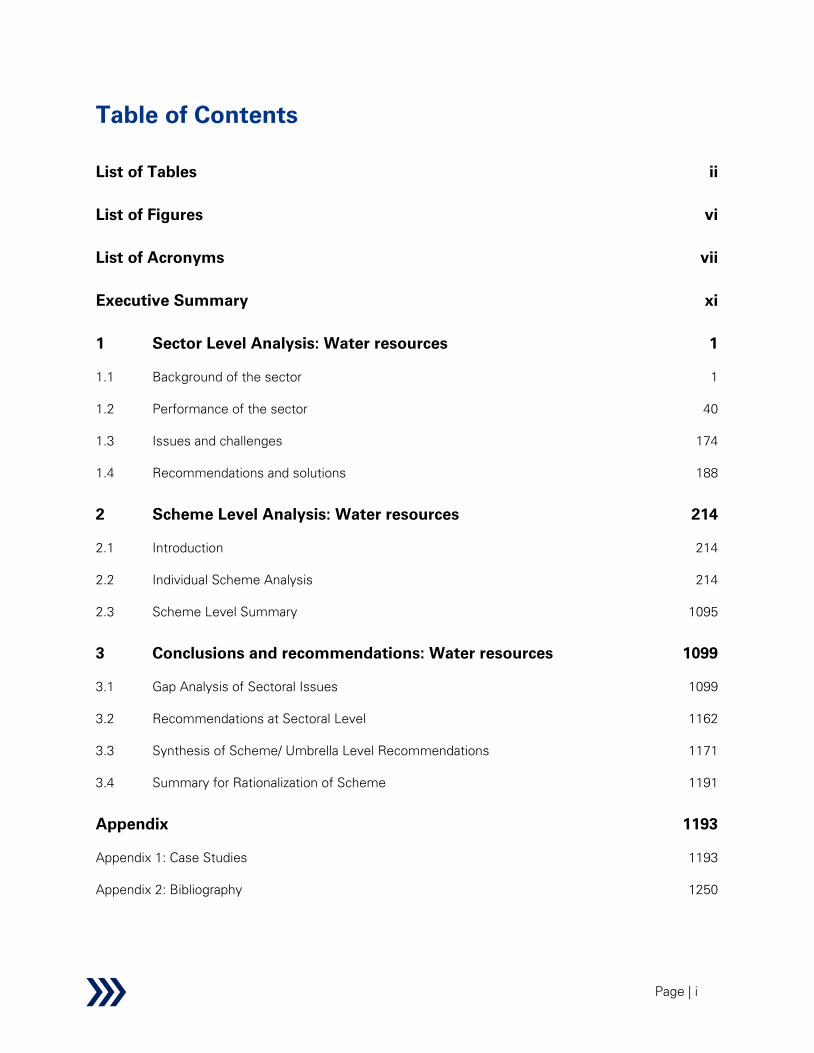
Table of Contents
List of Tables ii
List of Figures vi
List of Acronyms vii
Executive Summary xi
1 Sector Level Analysis: Water resources 1
1.1 Background of the sector 1
1.2 Performance of the sector 40
1.3 Issues and challenges 174
1.4 Recommendations and solutions 188
2 Scheme Level Analysis: Water resources 214
2.1 Introduction 214
2.2 Individual Scheme Analysis 214
2.3 Scheme Level Summary 1095
3 Conclusions and recommendations: Water resources 1099
3.1 Gap Analysis of Sectoral Issues 1099
3.2 Recommendations at Sectoral Level 1162
3.3 Synthesis of Scheme/ Umbrella Level Recommendations 1171
3.4 Summary for Rationalization of Scheme 1191
Appendix 1193
Appendix 1: Case Studies 1193
Appendix 2: Bibliography 1250
Page | ii
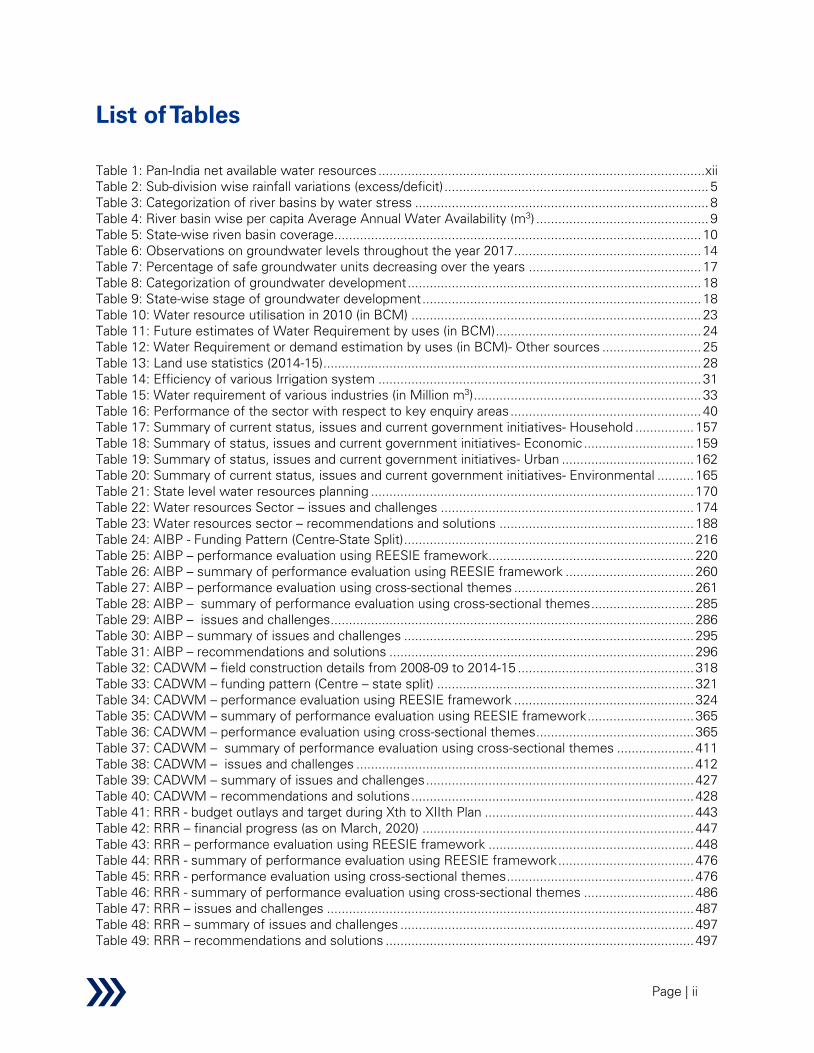
List of Tables
Table 1: Pan-India net available water resources ......................................................................................... xii
Table 2: Sub-division wise rainfall variations (excess/deficit) ........................................................................ 5
Table 3: Categorization of river basins by water stress ................................................................................ 8
Table 4: River basin wise per capita Average Annual Water Availability (m3) ............................................... 9
Table 5: State-wise riven basin coverage .................................................................................................... 10
Table 6: Observations on groundwater levels throughout the year 2017 ................................................... 14
Table 7: Percentage of safe groundwater units decreasing over the years ............................................... 17
Table 8: Categorization of groundwater development ................................................................................ 18
Table 9: State-wise stage of groundwater development ............................................................................ 18
Table 10: Water resource utilisation in 2010 (in BCM) ............................................................................... 23
Table 11: Future estimates of Water Requirement by uses (in BCM) ........................................................ 24
Table 12: Water Requirement or demand estimation by uses (in BCM)- Other sources ........................... 25
Table 13: Land use statistics (2014-15) ....................................................................................................... 28
Table 14: Efficiency of various Irrigation system ........................................................................................ 31
Table 15: Water requirement of various industries (in Million m3) .............................................................. 33
Table 16: Performance of the sector with respect to key enquiry areas .................................................... 40
Table 17: Summary of current status, issues and current government initiatives- Household ................ 157
Table 18: Summary of status, issues and current government initiatives- Economic .............................. 159
Table 19: Summary of status, issues and current government initiatives- Urban .................................... 162
Table 20: Summary of current status, issues and current government initiatives- Environmental .......... 165
Table 21: State level water resources planning ........................................................................................ 170
Table 22: Water resources Sector – issues and challenges ..................................................................... 174
Table 23: Water resources sector – recommendations and solutions ..................................................... 188
Table 24: AIBP - Funding Pattern (Centre-State Split) ............................................................................... 216
Table 25: AIBP – performance evaluation using REESIE framework ........................................................ 220
Table 26: AIBP – summary of performance evaluation using REESIE framework ................................... 260
Table 27: AIBP – performance evaluation using cross-sectional themes ................................................. 261
Table 28: AIBP – summary of performance evaluation using cross-sectional themes ............................ 285
Table 29: AIBP – issues and challenges ................................................................................................... 286
Table 30: AIBP – summary of issues and challenges ............................................................................... 295
Table 31: AIBP – recommendations and solutions ................................................................................... 296
Table 32: CADWM – field construction details from 2008-09 to 2014-15 ................................................ 318
Table 33: CADWM – funding pattern (Centre – state split) ...................................................................... 321
Table 34: CADWM – performance evaluation using REESIE framework ................................................. 324
Table 35: CADWM – summary of performance evaluation using REESIE framework ............................. 365
Table 36: CADWM – performance evaluation using cross-sectional themes ........................................... 365
Table 37: CADWM – summary of performance evaluation using cross-sectional themes ..................... 411
Table 38: CADWM – issues and challenges ............................................................................................ 412
Table 39: CADWM – summary of issues and challenges ......................................................................... 427
Table 40: CADWM – recommendations and solutions ............................................................................. 428
Table 41: RRR - budget outlays and target during Xth to XIIth Plan ......................................................... 443
Table 42: RRR – financial progress (as on March, 2020) .......................................................................... 447
Table 43: RRR – performance evaluation using REESIE framework ........................................................ 448
Table 44: RRR - summary of performance evaluation using REESIE framework ..................................... 476
Table 45: RRR - performance evaluation using cross-sectional themes ................................................... 476
Table 46: RRR - summary of performance evaluation using cross-sectional themes .............................. 486
Table 47: RRR – issues and challenges .................................................................................................... 487
Table 48: RRR – summary of issues and challenges ................................................................................ 497
Table 49: RRR – recommendations and solutions .................................................................................... 497

Page | iii
Table 50: SMI – institutional arrangement ................................................................................................ 505
Table 51: SMI – funding pattern (Centre-state split) ................................................................................. 506
Table 52: SMI - beneficiary states with targets ........................................................................................ 507
Table 53: SMI - performance evaluation using REESIE framework .......................................................... 510
Table 54: SMI - summary of performance evaluation using REESIE framework ..................................... 533
Table 55: SMI - performance evaluation using cross-sectional themes ................................................... 533
Table 56: SMI - summary of performance evaluation using cross-sectional themes .............................. 543
Table 57: SMI – issues and challenges ..................................................................................................... 544
Table 58: SMI– summary of issues and challenges .................................................................................. 554
Table 59: SMI – recommendations and solutions ..................................................................................... 554
Table 60 : GWI – Physical progress of Assam .......................................................................................... 568
Table 61 : GWI – Financial progress of Assam173
..................................................................................... 568
Table 62 : GWI – Physical progress of Arunachal Pradesh173
................................................................... 568
Table 63 : GWI – Financial progress of Arunachal Pradesh173
.................................................................. 569
Table 64: GWI – Performance evaluation based on REESIE framework .................................................. 569
Table 65: GWI – Summary of performance evaluation based on REESIE framework .............................. 582
Table 66: GWI – Performance evaluation based on cross-sectional themes ............................................ 583
Table 67: GWI – Summary of performance evaluation based on cross-sectional themes ....................... 595
Table 68: GWI – Issues and challenges .................................................................................................... 596
Table 69: GWI – Recommendations and solutions ................................................................................... 597
Table 70: SPFM – Physical Progress178
..................................................................................................... 599
Table 71: SPFM – Financial Progress178
.................................................................................................... 600
Table 72: SPFM – Performance evaluation based on REESIE framework ............................................... 600
Table 73: SPFM – Summary of performance evaluation based on REESIE framework ........................... 610
Table 74: SPFM – Performance evaluation based on cross-sectional themes ......................................... 611
Table 75: SPFM – Summary of performance evaluation based on cross-sectional themes..................... 620
Table 76: SPFM – Issues and Challenges ................................................................................................. 621
Table 77: SPFM – Summary of issues and challenges ............................................................................. 628
Table 78: SPFM – Recommendations and solutions ................................................................................ 628
Table 79 : PDMC - Area covered under micro-irrigation (Ha) .................................................................... 632
Table 80 : PDMC – CA release to states (Rs., in Cr.) ................................................................................ 633
Table 81: PDMC – Performance evaluation based on REESIE framework ............................................... 635
Table 82: PDMC – Summary of performance evaluation based on REESIE ............................................. 666
Table 83: PDMC – Performance evaluation based on cross-sectional themes ........................................ 667
Table 84: PDMC - Summary of performance evaluation based on cross-sectional themes .................... 684
Table 85: PDMC – Issues and Challenges ................................................................................................ 684
Table 86: PDMC – Summary of Issues and Challenges ........................................................................... 693
Table 87: PDMC – Recommendations and Solutions ............................................................................... 694
Table 88: State-wise status of WDC projects ........................................................................................... 708
Table 89: State-wise allocation of projects and area covered ................................................................... 709
Table 90: Year-wise Centre and State allocation and expenditure by States from FY 2009-10 (Rs. in Cr.)
.................................................................................................................................................................. 710
Table 91: Financial Progressfrom FY 2015-16 (Rs. in Cr.) ......................................................................... 711
Table 92: Physical Progress ...................................................................................................................... 712
Table 93: State-wise details of Water Harvesting Structures (WHS) created/rejuvenated, additional area
bought under irrigation and farmers benefitted under WDC-PMKSY during 2014- 15 to 2020-21 (as on
30.06.2020) ............................................................................................................................................... 713
Table 94: WDC - performance evaluation using REESIE framework ....................................................... 714
Table 95: WDC - summary of performance evaluation using REESIE framework ................................... 756
Table 96: WDC - performance evaluation using cross-sectional themes ................................................. 757
Table 97: WDC – summary of performance evaluation using cross-sectional themes ........................... 801
Table 98: WDC - issues and challenges .................................................................................................... 802
Table 99: WDC - summary of issues and challenges ............................................................................... 826

Page | iv
Table 100: WDC - recommendations and solutions ................................................................................. 827
Table 101: IC - performance evaluation using REESIE framework ........................................................... 841
Table 102: IC - summary of performance evaluation using REESIE framework ....................................... 862
Table 103: IC - performance evaluation using cross-sectional themes..................................................... 863
Table 104: IC - summary of performance evaluation using cross-sectional themes ................................ 871
Table 105: IC – Issues and challenges ..................................................................................................... 872
Table 106: IC – Area-wise issues and challenges ..................................................................................... 882
Table 107: IC - summary of issues and challenges ................................................................................... 884
Table 108: IC – recommendations and solutions ...................................................................................... 884
Table 109: LTIF – loans sanctioned and released till March 2020 ............................................................ 891
Table 110: LTIF – performance evaluation using REESIE framework....................................................... 892
Table 111: LTIF – summary of performance evaluation using REESIE framework .................................. 899
Table 112: LTIF – performance evaluation using cross-sectional themes ................................................ 900
Table 113: LTIF – summary of performance evaluation using cross-sectional themes ........................... 902
Table 114: LTIF – issues and challenges .................................................................................................. 903
Table 115: LTIF – summary of issues and challenges .............................................................................. 905
Table 116: LTIF – recommendations and solutions .................................................................................. 905
Table 117: Detailed allocation of Budget State-wise & Project-wise ........................................................ 910
Table 118: STP Capacity targeted vs created during FY 2014-15 to 2018-19 under NRCP ...................... 914
Table 119: Financial Progress of the Scheme during FY 2014-15 to 2018-19 .......................................... 914
Table 120: NRCP - performance evaluation using REESIE framework ..................................................... 917
Table 121: NRCP - summary of performance evaluation using REESIE framework ................................ 949
Table 122: NRCP - performance evaluation using cross-sectional themes .............................................. 949
Table 123: NRCP - summary of performance evaluation using cross-sectional themes .......................... 961
Table 124: NRCP – issues and challenges ................................................................................................ 962
Table 125: NRCP - summary of issues and challenges ............................................................................ 974
Table 126: NRCP – recommendations and solutions ................................................................................ 975
Table 127: State-Wise Works Approved, Works Completed and Funds Released under Flood
Management Programme ( FMP ) during XI Plan, XII Plan, 2017-18, 2018-19 & 2019-20 .................... 999
Table 128: State-Wise Grant in Aid Released under RMBA during XII Plan, 2017-18, 2018-19 & 2019-20
.................................................................................................................................................................. 999
Table 129: FMBAP – performance evaluation using REESIE framework ............................................... 1001
Table 130: FMBAP - summary of performance evaluation using REESIE framework ............................ 1031
Table 131: FMBAP - performance evaluation using cross-sectional themes ......................................... 1032
Table 132: FMBAP - summary of performance evaluation using cross-sectional themes ..................... 1060
Table 133: FMBAP – issues and challenges .......................................................................................... 1060
Table 134: FMBAP – area-wise issues and challenges ........................................................................... 1068
Table 135: FMBAP – summary of issues and challenges ....................................................................... 1070
Table 136: FMBAP – recommendations and solutions ........................................................................... 1070
Table 137: IAS – List of completed projects ........................................................................................... 1087
Table 138: IAS: Financial Progress .......................................................................................................... 1087
Table 139: IAS – Performance evaluation based on REESIE framework ................................................ 1087
Table 140: IAS: Summary of performance evaluation based on REESIE ............................................... 1090
Table 141: IAS – Issues and challenges .................................................................................................. 1090
Table 142: IAS – Recommendations and solutions ................................................................................ 1090
Table 143: Performance Summary on REESI+E Framework ................................................................. 1095
Table 144: Performance Summary on Cross-sectional themes .............................................................. 1096
Table 145: Summary of Issues and Challenges ...................................................................................... 1098
Table 146: Interventions gap at Sectoral level ........................................................................................ 1100
Table 147: Gap map synthesis of sector issues and CSS schemes ....................................................... 1116
Table 148: Recommendations – Sectoral level ....................................................................................... 1162
Table 149: AIBP– Recommendations ..................................................................................................... 1171
Table 150: CADWM – Recommendations .............................................................................................. 1173

Page | v
Table 151: RRR– Recommendations ...................................................................................................... 1174
Table 152: SMI– Recommendations ....................................................................................................... 1175
Table 153: PDMC – Recommendations .................................................................................................. 1177
Table 154: WDC – Recommendations .................................................................................................... 1181
Table 155: Irrigation Census- Recommendations ................................................................................... 1183
Table 156: NRCP – Recommendations ................................................................................................... 1185
Table 157: FMBAP- Recommendations .................................................................................................. 1188
Table 158: Summary for Rationalization of Scheme ............................................................................... 1191

Page | vi
List of Figures
Figure 1: Water Resources sector- Value Chain with key issues ................................................................. 1
Figure 2: Per capita water availability (m3/year/capita) .................................................................................. 2
Figure 3: Annual Rainfall pattern over the country ........................................................................................ 4
Figure 4: Departure in annual rainfall in % since 2000 ................................................................................. 5
Figure 5: Water Resources Availability ......................................................................................................... 6
Figure 6: Sources of annual replenishable groundwater ............................................................................... 6
Figure 7: Change in net precipitation patterns .............................................................................................. 7
Figure 8: Storage capacities across major river basins in India (in BCM) ................................................... 13
Figure 9: Average groundwater table levels in metres ............................................................................... 17
Figure 10: Arsenic and Fluorides hotspots in India ..................................................................................... 21
Figure 11: Desalinated Water Generation States in India ........................................................................... 22
Figure 12: Changes in sectoral demand for water from 2010 to 2050 ....................................................... 24
Figure 13: Projections of annual amount of water withdrawn per capita ................................................... 27
Figure 14: Area under irrigation by source .................................................................................................. 30
Figure 15: Irrigation water supply status ..................................................................................................... 31
Figure 16: Source of water supplied to industrial sector ............................................................................ 36
Figure 17: Summary of wastewater treatment and reuse policy across states in India ............................. 40
Figure 18: Water storage capacity comparison ......................................................................................... 151
Figure 19: Country comparison on total water withdrawal per capita ...................................................... 152
Figure 20: Demand supply gap of water resources .................................................................................. 153
Figure 21: Agriculture sector contribution to GDP .................................................................................... 154
Figure 22: Comparison of water use efficiency in the agriculture sector ................................................. 155
Figure 23: Planning in the water resources sector ................................................................................... 169
Figure 24: Major government schemes .................................................................................................... 172
Figure 25: SDGs related to water resources sector ................................................................................. 173
Figure 26: Related ministries and key related programs .......................................................................... 174
Figure 27: AIBP – physical progress during 2016-2020 ............................................................................ 218
Figure 28: AIBP – comparison of physical and financial progress ............................................................. 219
Figure 29: CADWM – India’s irrigation status in 2016 .............................................................................. 319
Figure 30: CADWM – physical progress as on June 2020 since 2016-17 ................................................ 322
Figure 31: CADWM – comparison of physical and financial progresses .................................................. 323
Figure 32: RRR – physical progress (irrigation potential) .......................................................................... 445
Figure 33: RRR – physical progress (storage revival) ............................................................................... 446
Figure 34: RRR – comparison of physical and financial progress ............................................................. 448
Figure 35 SMI-State-wise physical progress (number of schemes) as on March 2019. .......................... 508
Figure 36: SMI-Physical Progress (irrigation potential) as on March 2019 ............................................... 509
Figure 37: Financial Progress (Target versus actual) as on March 2019 ................................................... 509
Figure 38 SMI-state-wise comparison of physical versus financial progress. .......................................... 510
Figure 39: Micro – irrigation journey in India ............................................................................................. 630
Figure 40 Process/Implementation of Watershed Activities by PIAs (Tentative Timeline of 4 years) ...... 704
Figure 41: Project Sanction Mechanism by NRCD ................................................................................... 916

Page | vii
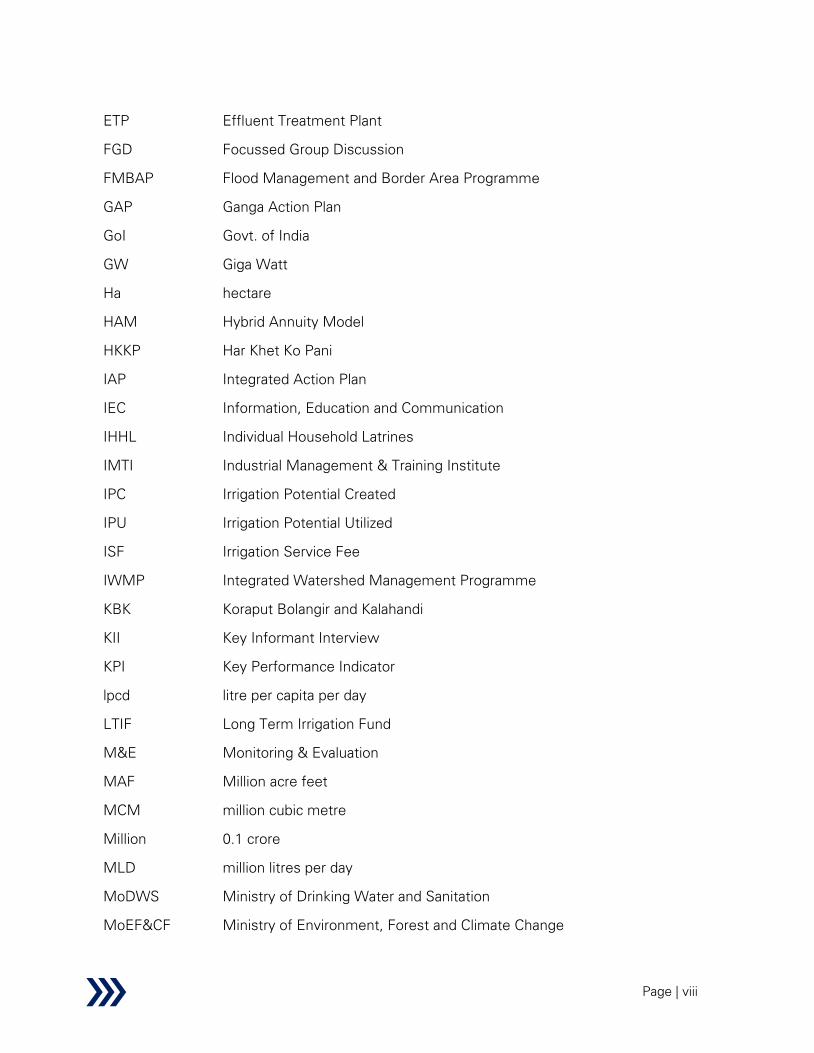
List of Acronyms
AAP Annual Action Plan
AIBP Accelerated Irrigation Benefits Programme
AWDO Asian Water Development Outlook
BCM billion cubic metre
BCR Benefit Cost Ratio
Billion 100 crore
CA Central Assistance
CAD Command Area Development
CADWM Command Area Development and Water Management
CAG Comptroller and Auditor General
CAPI Computer Assisted Personal Interview
CBO Community Based Organization
CCA Cultivable Command Area
CGWA Central Ground Water Authority
CGWB Central Ground Water Board
CPCB Central Pollution Control Board
Cr. Crore
CSR Corporate Social Responsibility
CSS Centrally Sponsored Schemes
CWC Central Water Commission
CWMI Composite Water Management Index
DDP Desert Development Programme
DLIA District Level Implementation Agency
DoLR Department of Land Resources
DPAP Drought Prone Area Programme
DPR Detailed Project Report
EA Enquiry Area
Page | viii
ETP Effluent Treatment Plant
FGD Focussed Group Discussion
FMBAP Flood Management and Border Area Programme
GAP Ganga Action Plan
GoI Govt. of India
GW Giga Watt
Ha hectare
HAM Hybrid Annuity Model
HKKP Har Khet Ko Pani
IAP Integrated Action Plan
IEC Information, Education and Communication
IHHL Individual Household Latrines
IMTI Industrial Management & Training Institute
IPC Irrigation Potential Created
IPU Irrigation Potential Utilized
ISF Irrigation Service Fee
IWMP Integrated Watershed Management Programme
KBK Koraput Bolangir and Kalahandi
KII Key Informant Interview
KPI Key Performance Indicator
lpcd litre per capita per day
LTIF Long Term Irrigation Fund
M&E Monitoring & Evaluation
MAF Million acre feet
MCM million cubic metre
Million 0.1 crore
MLD million litres per day
MoDWS Ministry of Drinking Water and Sanitation
MoEF&CF Ministry of Environment, Forest and Climate Change

Page | ix
MoJS Ministry of Jal Shakti
MoWR Ministry of Water Resources
MoWR, RD &
GR Ministry of Water Resources, River Development and Ganga Rejuvenation
NABARD National Bank for Agriculture and Rural Development
NCIWRD National Commission for Integrated Water Resources Development
NMCG National Mission for Clean Ganga
NMMI National Mission on Micro-irrigation
NMSA National Mission on Sustainable Agriculture
NRAA National Rainfed Area Authority
NRCP National River Conservation Program
NRDWP National Rural Drinking Water Programme
NRSC National Remote Sensing Centre
NRW non-revenue water
NWDA National Water Development Agency
O&M operations and maintenance
ODF Open Defecation Free
OFD On-farm Development
OI Other Interventions
PDMC Per Drop More Crop
PIA Project Implementing Agency
PIM Participatory Irrigation Management
PIRC Project Implementation Review Committee
PMKSY Pradhan Mantri Krishi Sinchai Yojana
REESIE Relevance, Effectiveness, Efficiency, Sustainability, Impact and Equity
RRR Repair, Renovation and Restoration
SCSP Schedule Caste Sub-plan
SDG Sustainable Development Goal
SHG Self Help Group
SLNA State Level Nodal Agency

Page | x
SLSC State Level Sanctioning Committee
SLWM Solid and Liquid Waste Management
SMI Surface Minor Irrigation
SPV Special Purpose Vehicle
STAC State Technical Advisory Committee
STP Sewage Treatment Plant
SWMA Supplementary Water Management Activities
SYL Sutlej Yamuna Link
TSP Tribal Sub-plan
UIP Ultimate Irrigation Potential
ULB urban local body
WALMI Water and Land Management Institute
WC Watershed Committee
WCDC Watershed Cell cum Data Centre
WDC Watershed Development Component
WDT Watershed Development Team
WHS Water Harvesting Structures
WUA Water Users Association
ZLD Zero Liquid Discharge

Page | xi
Executive Summary
The Government of India has mandated NITI Aayog to undertake an independent third-party
evaluation of all Centrally Sponsored Schemes (CSS) with a view to ensure judicious use of public
resources and effect a rationalization of CSS, especially in the context of the 15th Finance
Commission. NITI Aayog has engaged KPMG Advisory Services Private Limited to undertake an
evaluation of CSS in Water Resources, Environment and Forest sectors as part of Package 9.
This is the Executive Summary of the Final Evaluation Report on Water Resources sector and
related CSS. For this evaluation study, a Mixed-Method (MM) approach was adopted by
combining the quantitative methods with qualitative ones and then ‘triangulating’ information
from the two different approaches. The evaluation was undertaken through in-depth review of
secondary literature, and primary research comprising interviews with 567 key informants and
100 focus group discussions as well as survey of 1,284 scheme beneficiaries.
The executive summary here covers the sector analysis for Water Resources sub-sector from
both the demand and supply side perspectives and is followed by scheme-wise analysis and
recommendations. Towards the end, it interlinks sector and scheme-level analysis to build sector-
specific recommendations.
Sector analysis
The report analyses the Sector performance from mainly two perspectives – the supply side and
the demand side.
Supply side
Water resources are critical national assets and are important for sustenance of life, food security,
and maintaining ecological balance. Precipitation is the principal source of water and India
receives a quite significant 3,880 billion cu. m. (BCM) of precipitation, most of it (around 70%)
during the monsoon months of June to September. Of the total precipitation, much is lost to
evapotranspiration and other factors with a net annual utilizable water availability of 1,122 BCM
as summarized in the table below.

Page | xii
Table 1: Pan-India net available water resources
# Water resource (BCM)
1 Total precipitation 3,880
2 Less: Loss to evapotranspiration 1,881
3 Less: non-utilizable water resources 877
4 Net available water resources [1 – (2 + 3)] 1,122 (100%)
4a Groundwater 432 (39%)
4b Surface water 690 (61%)
It is concerning to note that India with a population of around 1.3 billion is classified as water-
stressed with a per capita availability of 1,508 cu. m. in 2015 down from 1,820 cu. m. in 2001,
which is expected to further go down in the coming decades, unless water resources
management is not improved in the country. Groundwater resources are the largest source of
water for agriculture and drinking water purposes. It has been observed that extraction in 37%
of GW assessment units exceeded safe limits in 2017 as compared to 31% in 2013 and the
percentage of safe groundwater units has been decreasing over the years. Due to sustained over-
exploitation of groundwater resources over the years, the groundwater table has fallen in many
places in major states such as Uttar Pradesh, Karnataka, Tamil Nadu, Rajasthan, Punjab, and
Haryana. Further, the quality of groundwater has deteriorated in several districts of India on
account of a combination of anthropogenic (e.g. agricultural run-off) and geogenic reasons (e.g.
presence of naturally occurring minerals in groundwater).
In the case of surface water, except for the Brahmaputra river basin, per capita water availability
in most of the other river basins is either already below 1,000 cu. m. or expected to fall below
1,000 cu. m. by 2050. The total surface water storage capacity in India is 253 BCM (additional 51
BCM is in ongoing works). This translates into a per capita storage capacity of 209 cu. m. which
is much lower than other countries such as Brazil – 3,347 cu. m.; Australia – 3,182 cu. m; USA –
2,268 cu. m.; China – 576 cu. m.). Pollution of rivers is another major cause for concern with 351
river stretches on 275 rivers being polluted, mainly due to untreated discharge of municipal and
industrial wastewater.

Page | xiii
The key issues and related recommendations (in brief) from the study in respect of supply side
challenges are summarized below.
Key Issue Recommendation
Low total water
storage capacity
leads to
inadequate buffer
stock during
periods of
droughts, summer
months as well as
high run-off
• Focus on creation of additional storage capacities at local level
(decentralized).
• De-siltation of all existing major and medium irrigation reservoirs to be
taken up or dredging may be attempted. Extensive catchment area
treatment should also be undertaken for all reservoirs
• Study feasibility of increasing storage capacity of existing reservoirs
through increase in dam height (based on such feasibility study).
• O&M of large dams- a dedicated budget for O&M activities to be kept.
• Integrated operations and monitoring system of dams to maximise
water storage capacity of dams on the same river during monsoons
• Using select groundwater storage aquifers for storage of water
(Mega-scale Artificial Recharge Schemes)
Spatial variance in
surface water
availability leads
to unequal
distribution and
availability
• Evaluate technical and environmental feasibility of river interlinking
projects; wherever feasible, projects may be expedited through
following measures:
o Prioritize intra-state river inter-linking projects as these may be
quick wins due to less political interventions
o Create and empower an independent central agency to act as a
referee in case of inter-state disputes
o Alternatively, river basin authorities may be created as special
bodies with representatives from all participating States.
• Lift Irrigation (LI) projects to be taken up; use of solar power to
reduce O&M cost and improve financial sustainability should be
explored
Unregulated
extraction of
groundwater and
• Focus on decentralised and participatory enforcement of GW related
regulations through WUAs and similar grassroot level organisations.
• Use remote and real-time telemetry-based water sensors to improve
accuracy and frequency of groundwater data.

Page | xiv
Key Issue Recommendation
inadequate
monitoring wells
• Implement real-time telemetry-based meters for GWL measurement
to monitor GW extraction through bore wells
• Encourage participatory groundwater monitoring by involving SHGs,
WUAs or volunteers who may be trained to monitor groundwater at
GP level.
• Additional analysis using satellite data (such as NASA's Gravity
Recovery and Climate Experiment) of groundwater level changes
may also be undertaken at regular intervals to measure seasonal
changes in groundwater levels.
Inadequate micro
level information
of depleted
aquifers
• GP level rainwater and groundwater level recording to be used as an
aid for planning artificial groundwater recharge initiatives
• Water budgeting at GP level by using micro level information to be
undertaken
• Digitize GWL data, integrate the data from all GWL recorders, use
advanced mathematical techniques to check the quality of the data
and use it for planning of GW recharge initiatives. Collaborate with
IITs and NITs to undertake research on the GWL data collected.
Demand side
Overall demand for water resources consists of demand from agriculture (irrigation), municipal,
industrial and other sectors. In addition to this, water resources are also used for maintaining
environmental requirements (such as environmental flows in rivers and evaporation losses). The
total demand for water in 2010 was in the range of 700-800 BCM with agriculture demand
comprising 78 – 85%. By 2050, the demand for water is expected to rise to anywhere between
973 – 1,500 BCM with agriculture’s share expected to reduce to as low as 68% while the share
of industries (including the power sector), municipal and other (comprising environment, inland
navigation and evaporation losses) demands is expected to be around 13%, 9% and 10%
respectively.
Agriculture
Page | xv
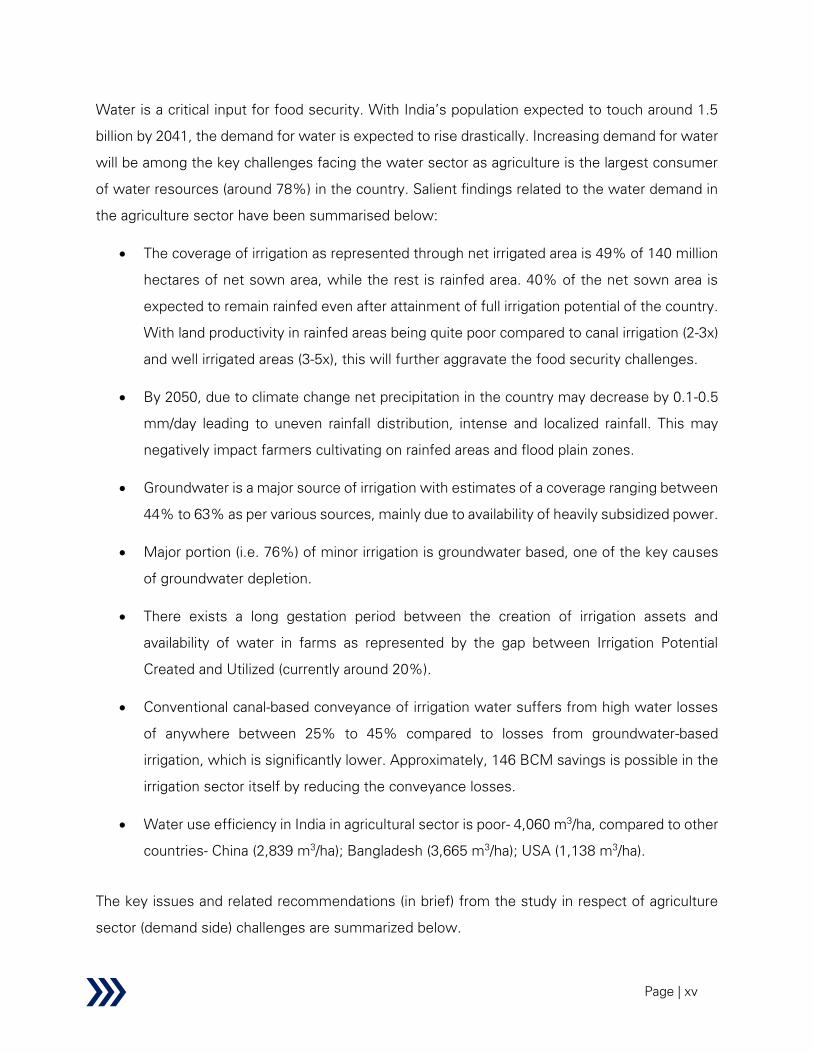
Water is a critical input for food security. With India’s population expected to touch around 1.5
billion by 2041, the demand for water is expected to rise drastically. Increasing demand for water
will be among the key challenges facing the water sector as agriculture is the largest consumer
of water resources (around 78%) in the country. Salient findings related to the water demand in
the agriculture sector have been summarised below:
• The coverage of irrigation as represented through net irrigated area is 49% of 140 million
hectares of net sown area, while the rest is rainfed area. 40% of the net sown area is
expected to remain rainfed even after attainment of full irrigation potential of the country.
With land productivity in rainfed areas being quite poor compared to canal irrigation (2-3x)
and well irrigated areas (3-5x), this will further aggravate the food security challenges.
• By 2050, due to climate change net precipitation in the country may decrease by 0.1-0.5
mm/day leading to uneven rainfall distribution, intense and localized rainfall. This may
negatively impact farmers cultivating on rainfed areas and flood plain zones.
• Groundwater is a major source of irrigation with estimates of a coverage ranging between
44% to 63% as per various sources, mainly due to availability of heavily subsidized power.
• Major portion (i.e. 76%) of minor irrigation is groundwater based, one of the key causes
of groundwater depletion.
• There exists a long gestation period between the creation of irrigation assets and
availability of water in farms as represented by the gap between Irrigation Potential
Created and Utilized (currently around 20%).
• Conventional canal-based conveyance of irrigation water suffers from high water losses
of anywhere between 25% to 45% compared to losses from groundwater-based
irrigation, which is significantly lower. Approximately, 146 BCM savings is possible in the
irrigation sector itself by reducing the conveyance losses.
• Water use efficiency in India in agricultural sector is poor- 4,060 m3/ha, compared to other
countries- China (2,839 m3/ha); Bangladesh (3,665 m
3/ha); USA (1,138 m
3/ha).
The key issues and related recommendations (in brief) from the study in respect of agriculture
sector (demand side) challenges are summarized below.

Page | xvi
Key Issue Recommendation
Large gap
between IPC and
IPU
• Develop standardized methodology for IPC and IPU measurement
• Effective IPU monitoring through remote sensing
• States to be incentivised for reduction of IPC-IPU gap
Unregulated
extraction of
groundwater for
irrigation
• Remove subsidy on electricity supplied for agriculture; implement
direct benefit transfer to farmers in convergence with PM-KISAN
in lieu of power subsidy
• Incentivize micro-irrigation and cultivation of water efficient crops
Low irrigation
efficiency
• Promote piped irrigation networks over open canal irrigation,
wherever feasible
• Launch scheme to complete lining of unlined and old canals to
reduce conveyance loss after cost benefit assessment. A detailed
feasibility study including cost benefit analysis to determine impact
of reduction of seepage on groundwater level may be conducted
before undertaking such projects.
Industrial and municipal
Currently, industries consume about 8% (56 BCM) of the total water resources of the country
with the energy sector being the most water intensive and the demand expected to go up to 70
BCM by 2050 for energy sector alone. Iron, steel and textile industries are the other water
intensive industries. The major issues relevant for industries include growth in water demand
from industries resulting in competing demands from agriculture and industry, inefficient pricing
of water, and unregulated exploitation of groundwater resources.
Municipal or domestic water demand will see higher growth in demand compared to agriculture
or industries and is expected to grow by as much as 158% from 2010 to 2050. Groundwater is
by far the largest source of drinking water. Government of India has launched the Jal Jeevan
Mission to increase coverage of rural households with piped drinking water to 100% (from the
current level of 18%). JJM is expected to create additional demand for water, especially from
groundwater sources. High water losses (un-accounted for water), poor water quality, drying up
Page | xvii
or reduced yields of water sources (especially during summer months) are some of the key areas
of concern in rural areas.
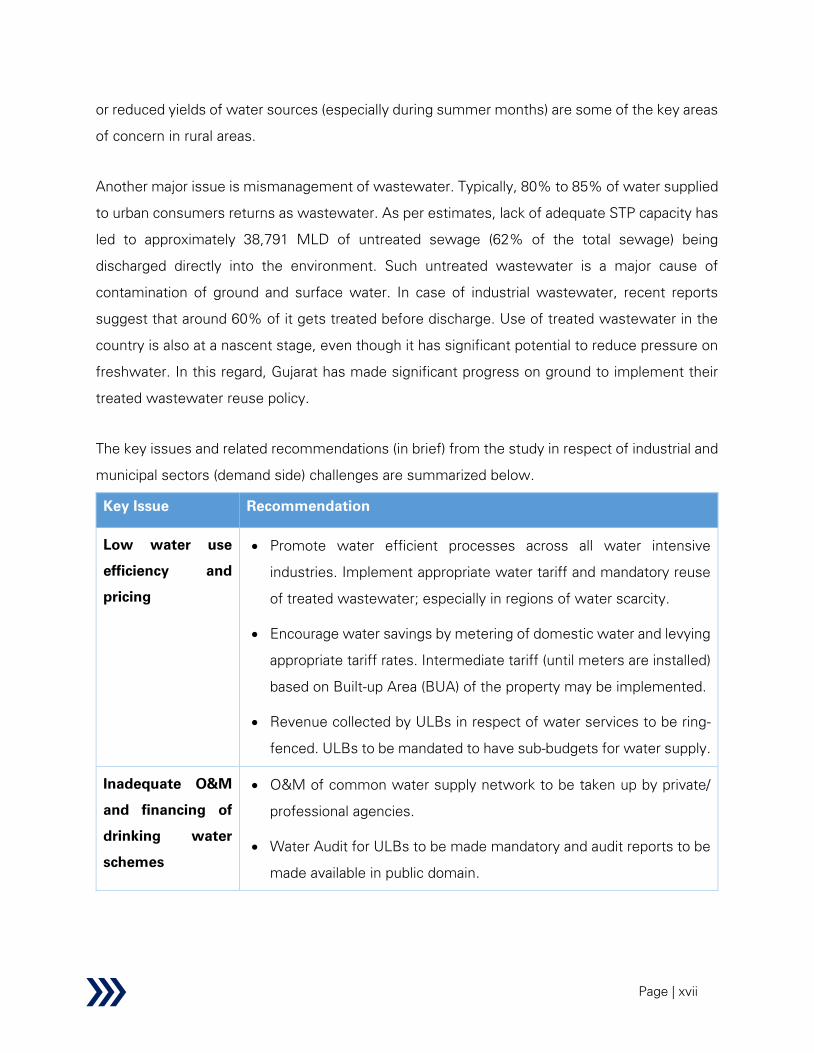
Another major issue is mismanagement of wastewater. Typically, 80% to 85% of water supplied
to urban consumers returns as wastewater. As per estimates, lack of adequate STP capacity has
led to approximately 38,791 MLD of untreated sewage (62% of the total sewage) being
discharged directly into the environment. Such untreated wastewater is a major cause of
contamination of ground and surface water. In case of industrial wastewater, recent reports
suggest that around 60% of it gets treated before discharge. Use of treated wastewater in the
country is also at a nascent stage, even though it has significant potential to reduce pressure on
freshwater. In this regard, Gujarat has made significant progress on ground to implement their
treated wastewater reuse policy.
The key issues and related recommendations (in brief) from the study in respect of industrial and
municipal sectors (demand side) challenges are summarized below.
Key Issue Recommendation
Low water use
efficiency and
pricing
• Promote water efficient processes across all water intensive
industries. Implement appropriate water tariff and mandatory reuse
of treated wastewater; especially in regions of water scarcity.
• Encourage water savings by metering of domestic water and levying
appropriate tariff rates. Intermediate tariff (until meters are installed)
based on Built-up Area (BUA) of the property may be implemented.
• Revenue collected by ULBs in respect of water services to be ring-
fenced. ULBs to be mandated to have sub-budgets for water supply.
Inadequate O&M
and financing of
drinking water
schemes
• O&M of common water supply network to be taken up by private/
professional agencies.
• Water Audit for ULBs to be made mandatory and audit reports to be
made available in public domain.

Page | xviii
Key Issue Recommendation
Wastewater
treatment and
reuse
• State level action plan may be prepared to identify STP requirements
and mapping of the same with the possible demand centers in the
state (industrial clusters, agriculture, etc.).
• In line with NMCG, similar missions for pollution abatement in other
rivers to be taken up
• Wastewater treatment for rural and semi-urban areas through
modular and decentralized wastewater treatment plants to be taken
up
• Reuse of wastewater to be made mandatory as part of NRCP,
NMCG and similar schemes
• Wastewater reuse roadmap may be prepared and extended to
industrial and domestic sectors- gradually mandating reuse targets
for industries as well as for large cities (starting with large
commercial SEZs and housing complexes)
An analysis of the sector level objectives vis-à-vis current interventions reveals that most of the
sectoral issues are being addressed through governmental or other interventions. The key issues
pertaining to broad sectoral objectives and overall responsiveness of the sector are summarised
below:
Key Issue Recommendation
Absence of water
regulator
• There is a need for state level regulatory authority for water. It may
be authorised to set tariffs, evaluate performance of service
providers, arbitrate on water related disputes. Attention should be
given to the organisation structure of the Authority, by drawing
members from all sectors of economy, such as industrial users,
domestic users, agricultural users, groundwater and surface water
management authorities, legal and financial experts, etc.

Page | xix
Financial
sustainability of
the sector
• Mandatory formation of WUAs (or their strengthening where they
exist);
• Stronger outreach, including training and capacity building of the
WUAs may be given necessary importance and taken up
• Strengthening of the Irrigation Act may be undertaken
• Online or local collection of irrigation fees by WUAs should be
encouraged
• Linking of disbursal of agricultural loans/other govt. support to
payment of irrigation fees should be considered
• Promotion of PPP in micro-irrigation projects
o Alternative financing mechanisms like Outcome financing and
“Impact financing” may be explored
Issues related to
planning and data
management in
the sector
• Pooling and collection of existing data related to the water resources
sector through state WRD (like APWRIMS) is required; to include
both water supply and use related data
• In line with the NHP, which aims to improve supply side data
availability, demand side data may also be collected
• A separate scheme may be undertaken dedicated to comprehensive
water resource planning at state level.
• Water entitlement for all category of users should be encouraged
• In Irrigation department at state level, three separate wings to be
created: (1) Construction and Design Wing - focus on technical
designs, asset creation, (2) Operations wing - focus on O&M of
existing assets, and non-structural aspects like community
mobilization and (3) Commercial Wing - focusing on commercial
aspects like service fee collection A fixed percentage of capital
expenses budget for the department may be allocated to O&M

Page | xx
Centrally Sponsored Schemes
This evaluation covers Pradhan Mantri Krishi Sinchayee Yojana (PMKSY), an umbrella scheme
comprising several related schemes, which was launched in the year of 2015-16 with an aim to
enhance physical access of water on farm and expand cultivable area under assured irrigation,
improve water use efficiency at farm level, introduce sustainable water conservation practices,
among other things. In addition to schemes covered under PMKSY, evaluation was also
undertaken for several other CSS as part of this study.
Each scheme was evaluated for Relevance, Effectiveness, Efficiency, Sustainability, Impact and
Equity. The summary of this evaluation is presented in the table below.
Scheme
Name Relevance Effectiveness Efficiency Sustainability Impact Equity
AIBP
CADWM
RRR
SMI
GWI
SPFM
PDMC
WDC
IC
LTIF
NRCP
FMBAP
IAS
REESI+E performance infographics legend
Satisfactory
Average
Needs Improvement
No information

Page | xxi
In addition to the REESI+E framework, the schemes were further evaluated across certain cross-
sectional themes. The summary of evaluation based on cross-sectional themes is presented in
the table below.
Cross
sectional
theme
AIBP CADWM RRR SMI GWI SPFM PDMC WDC IC LTIF NRCP FMBAP
Accountability
&
Transparency
Direct/Indirect
Employment
Generation
Gender
mainstreaming
Building
resilience to
climate
change
(including but
not limited to
developing
water disaster
preparedness)
& ensuring
sustainability
Role of Tribal
Sub-Plan (TSP)
and Scheduled
Caste Sub-
Plan
component of
the scheme in
mainstreaming
of Tribal and
Scheduled
Caste
population
Use of
IT/Technology
in driving
efficiency
Stakeholder
and
Beneficiary
behavioural
change

Page | xxii
Cross
sectional
theme
AIBP CADWM RRR SMI GWI SPFM PDMC WDC IC LTIF NRCP FMBAP
Development,
dissemination
& adoption of
innovative
practices,
technology &
know-how
Research &
Development
Water sharing
treatise /
agreements
and diplomacy
Conjunctive
use of water
Unlocking
Synergies with
other
Government
Program
Reforms,
Regulations
Impact on and
role of private
sector,
community/
collectives/
cooperatives
(e.g. Farmer
cooperatives,
FPOs, Water
User
Associations,
etc.) and civil
society in the
scheme
Cross-sectional themes performance infographics legend
High
Medium
Low
Not relevant
No information
A brief summary of the analysis, issues and challenges, and recommendations for each of the
major scheme evaluated as part of this study, is provided below. A more detailed analyses of
these and other schemes are available in the main report.
Page | xxiii
Accelerated Irrigation Benefits Program (AIBP)
AIBP was launched in 1996-97 to accelerate major and medium irrigation projects that were in
advanced stages of completion and became part of PMKSY in 2015-16. Currently, the scheme
covers 99 projects at a total balance cost of Rs. 73,348 Cr. with balance central assistance of Rs.
16,965 Cr. (as on March 2016). 44 projects have been completed up to March 2020. During
interviews with 255 beneficiaries, around 49% cultivators confirmed increase in crop yield, while
around 40% and 25% confirmed increase in irrigated area and ability to sow multiple crops
respectively. Some of the major issues and corresponding recommendations identified in this
study are indicated below.
# Issue and Recommendation
1.
Issue: Many of the ongoing PMKSY-AIBP projects are marred by delays owing to land
acquisition and R&R issues.
Recommendation: Creation of an inter-departmental task force in every state (with on-
going projects) who should meet on a monthly basis to fast-track clearances and creation
of a separate R&R wing under each state water resources department to expedite
resolutions of R&R issue specific to the projects may be explored
2.
Issue: The economic utility of the capital intensive MMI projects has been called into
question many a times because of their unreliability in delivering the envisaged benefits
to the end beneficiaries. One of the main causes is negligible maintenance of the assets
over the period which stems from lack of accountability of the schem owners to the
beneficiaries.
Recommendation: Adopt a progressive shift from construction based to service-based
approach. This may be attempted by adopting the following approaches:
• Change in funding approach: The eligibility criteria for selection of MMI projects
receiving central grants could be made more favourable for ERM of old projects.
Measures like canal automation (as part of ERM projects) is expected to deliver twin
benefits of higher state regulation of water resources and better service delivery to the
end beneficiaries.
• Improvement in maintenances: The central government may explore introducing a new
scheme through which central grants may be released to states for (non-establishment
component of) maintenance expenditure for the maintenance of select MMI projects.

Page | xxiv
# Issue and Recommendation
Additional incentives may be provided to states that have adopted various water sector
reforms like increase in state budget allocation for maintenances, setting up water
resources regulatory authority,etc.
• Change in organizational structure: The shift towards better service delivery and
operation plan needs to be backed by change in current resource profile of the irrigation
departments; resources from other disciplines like agro-economists,
anthropologists/sociologists could be deployed along with those from engineering
disciplines. Also, in view of the huge spread of irrigation projects, outsourcing of non-
core works (like maintenance, revenue assessment and fees collection) to private
agencies may be explored (as already being initiated by some states like Andhra
Pradesh).
3.
Issue: Existing conveyances losses in irrigation systems in India (40% to 50%) is quite
high compared to other countries like Philippines, Malaysia, Colombia, Egypt and others.
Recommendation: Develop guidelines mandating states to explore feasibility of piped
distribution networks in all branch and distributary networks for all new/ ongoing projects.
4.
Issue: Some of the outcome parameters as defined in the Ministry of Finance’s ‘Output
Outcome Framework’ are not tracked. Also, conduct of impact assessment studies was
observed to be limited.
Recommendation: Ensure transparency by conducting regular third party impact studies
(under the Impact Assessment Studies scheme) along with holistic tracking of indicators
(both output and outcome indicators) in MIS dashboard
Standard guidelines may be developed for assessment of the parameters like IPC-IPU
over the years, which should be followed by adequate dissemination of those guidelines
to the relevant stakeholders and accordingly trainings of state personnel may be
conducted to avoid disparities in methods of calculation across states. Creation of
statistical cells at both central and state levels for reconciliation of project level data and
use of remote sensing technologies (along the lines of Ministry’s recent initiatives of
remote crop assessment) may be explored to ensure timely update of IPC-IPU figures.
Also, as short-term measures, linking the existing MIS dashboard with the CADWM MIS
dashboard for IPU data and reconciliation of groundwater related data with state
Page | xxv
# Issue and Recommendation
dashboards like APWRIMS/ monthly or quarterly reports by State Ground Water Boards
are suggested.
Command Area Development and Water Management (CADWM)
CADWM was introduced in 1974 with the objective of addressing the increasing gap between
irrigation potential created and utilized in major and minor irrigation projects. In 2016-17, after
getting subsumed under Hat Khet Ko Paani (PMKSY), the scope of CADWM was restricted to
pari-passu implementation of CAD works of 99 priority AIBP projects. The scheme involves two
major components – structural interventions (encompassing on-farm development works,
construction of field, intermediate and link drains, correction of system deficiencies and
reclamation of water-logged areas) and non-structural interventions (setting up Water User’s
Association, conducting trainings and demonstrations and engagement of Social Facilitators). At
present, CAD works are being implemented in 88 priority AIBP projects covering culturable
command area (CCA) of 45 lakh ha. with Central Assistance of Rs. 8,300 Cr., CAD works covering
CCA of 14 lakh ha have been completed till June 2020. The scheme has resulted in significant
positive outcomes and facilitated shift from sustenance to commercial crops (in drought prone
areas). During household survey involving 225 beneficiaries, around 60%, 45% and 18%
confirmed increase in crop yield, irrigated land and crop intensity, respectively. Also, as long term
impact, around 45%, 49%, 41% and 43% cultivators confirmed an increase in household income,
access to education, improvement in health standards and employment opportunities,
respectively. Some of the major issues and corresponding recommendations identified in this
study are indicated below.
# Issue and Recommendation
1.
Issue: Limited involvement of WUAs at the time of project inception/ planning stage and
also in stages thereafter, which is further complicated by laxity in implementation of non-
structural components like appointment of social facilitators
Recommendation: Prioritize implementation of non-structural components over
structural ones. To ensure acceptability of the scheme among the cultivators and
Page | xxvi
# Issue and Recommendation
sustenance of the WUAs and scheme, the release of 2nd CA instalment (or some portion
thereof) for structural interventions may be made subject to the completion of the
following: registration of the WUAs, appointment of social facilitator for the project,
conduct of specified trainings by social facilitators and release of the one-time
infrastructural component (in those areas already catered by the 1st instalment). A national
pool of social facilitators may be created by integrating similar agencies working across
related sectors like watershed development, rural drinking water (under Jal Jeevan
Mission), etc.
2.
Issue: Progress under micro-irrigation component has been minimal; major issues being
lack of awareness, cultivator’s unwillingness and unreliable water availability
Recommendation: Explore scheme rationalization by transferring the micro-irrigation
component to the Other Interventions component under the existing Per Drop More Crop
Scheme (of MoA&FW) and ensure assured water supply round the year through
conjunctive use of groundwater measures. Construction of tube well or bore well
structures under the MI component may be explored to ensure water availability in off
seasons (say summer or Rabi season) in areas with adequate groundwater level.
3.
Issue: Inadequacy of prescribed cost norms for the non-structural interventions has been
reported by most of the states.
Recommendation: Revision of the existing cost norms (Rs. 35,000/ ha) for the structural
interventions prescribed in the scheme guidelines (in 2016-17) by linking the norms with
market prices and respective state’s schedule of rates or through annual increment by
indexing the major cost components to relevant inflation indices may be explored.
4.
Issue: Deficiencies in MIS dashboard updates have been noted for some of the non-
structural interventions.
Recommendation: To ensure regular and proper update of MIS dashboard, the following
activities may be attempted:
• Subsequent CA releases to be made contingent on the reflection of the physical
and financial progresses on the MIS dashboard
• CWC regional office to share monthly reports of data upload status, highlighting
areas of deficiencies to the Ministry and state governments.

Page | xxvii
# Issue and Recommendation
• Training plan for the respective state level stakeholders to be developed by
Ministry in consultation with NIC and the state governments
5.
Issue: Staff shortage under CAD department is reported in most of the states
Recommendation: Outsourcing of non-core/ non-technical (particularly seasonal) works
like revenue assessment, billing and collection of water taxes to third party agencies along
with adoption of remote sensing technologies for surveying, monitoring and crop
assessment to cut down on the manual interventions may be explored
Repair, Renovation and Restoration of water bodies (RRR)
Introduced during the XI Plan, Repair, Renovation and Restoration (RRR) of water bodies aims at
increasing storage capacities of existing water bodies (including those of traditional water bodies)
through comprehensive improvement and restoration. As on March 2019, an additional irrigation
potential of 0.99 lakh ha (i.e. 53% of irrigation potential target) and additional storage capacity of
504.85 MCM (i.e. 51% of the target) has been achieved while 48% of the estimated cost has
been incurred. Some of the major issues and corresponding recommendations identified in this
study are indicated below.
# Issue and Recommendation
1.
Issue: Output-outcome framework does not mention separate outcome for each
scheme objective.
Recommendation: There is a need to evolve a standardized methodology to carry out
post project evaluation. Additional indicators (mainly outcome based) corresponding to
scheme objectives like groundwater recharge, agricultural productivity, improvement
of catchment area of tank commands, capacity building, revenue generation from
fisheries, tourism, domestic and industrial water supply may be tracked to understand
holistic benefits accruing from the scheme.
2.
Issue: Erratic rainfall pattern and climatic uncertainities pose a major risk to scheme
sustainability, which is unaddressed under current scheme guidelines.
Recommendation: To address this, power subsidies that favour indiscriminate
abstraction of water resources should be reduced/removed and replaced by direct

Page | xxviii
# Issue and Recommendation
benefit transfer, as initiated by Telangana and Odisha. In addition, scope of work under
RRR may be enhanced to include percolation tanks. Water bodies may be connected
to adjacent canal system so that excess flood waters may be stored in these canals
when water demand for irrigation is comparatively less. This would reduce the
incidences of flooding while additional water stored may be gainfully utilized for
irrigation and other allied purpose during dry season.
3.
Issue: Encroachment of water body limits scheme implementation and further
contributes to adverse impacts like flash floods.
Recommendation: Persistent challenges such as encroachment may be addressed
through active involvement of WUAs since project inception. Encouraging the use of
water body by the villagers for economic benefits like assured income generation
activities may motivate villagers to protect them. Additionally, a certificate may be
issued by the Gram Panchayat before inclusion of water bodies under RRR instead of
waiting till the release of second instalment.
4.
Issue: The current checklist for benefits-cost ratio takes only irrigation potential into
account, despite the scheme having multiple other objectives like groundwater
recharge and provisioning of drinking water.
Recommendation: The checklist for calculation needs to be revised to include other
factors like provisioning of drinking water, groundwater recharge, livelihood generation
activities like pisciculture and other direct-indirect benefits of the scheme, including
socio economic benefits.
Surface Minor Irrigation (SMI)
With the launch of PMKSY in 2015-16, Surface Minor Irrigation Scheme (SMI), which includes
projects with command area less than 2,000 ha were separated from AIBP and introduced under
PMSKY – Har Khet Ko Pani (HKKP) component. As on March 2020, the scheme has achieved
64% of the target irrigation potential i.e. 6.77 lakh ha while 83% of the target expenditure has
been incurred. Some of the major issues and corresponding recommendations identified in this
study are indicated below.
Page | xxix
# Issue and Recommendation
1.
Issue: High seepage and transmission losses in unlined canals constructed under SMI
in few states. Such canals are more prone to siltation, waterlogging and damages.
Recommendation: Replacing earthen canals with lined canals/provisioning of pipe
distribution network may be considered to improve water use efficiency. Canal lining
may lead to increase in velocity and rugosity coefficient. Hence, the discharge carrying
capacity of canal would increase, while seepage losses, water logging and
maintenance cost would reduce. However, water losses from unlined canals and
infiltration surplus of applied water has also been found to increase aquifer recharge.
While canal lining augments the potential for groundwater development in some
geographies; it contributes to issues like waterlogging and soil salinity in others.
Hence, decision of canal lining and selection of lining material may be based on local
aquifer characteristics likes soil permeability, watershed physiograpy and underlying
climatic pattern.
2.
Issue: Temporary and permanent non-usage of the surface water schemes due to low
discharge and drying up of water bodies.
Recommendation: To ensure utility of SMI, the scheme design needs to be sequential
in nature. Provisioning of conveyance system through creation of diversion structures
like weirs should be considered only after there is adequate facility for water storage
in the upstream. In this regard, the scheme could be operated in close coordination
and convergence with RRR/other scheme, which includes component of
creation/restoration of water storage.
3.
Issue: Despite the vast amount of untreated wastewater generated by the country,
which is expected to grow further, there are no provisions for wastewater reuse in SMI
guidelines.
Recommendation: Inclusion of wastewater reuse as a part of scheme guideline would
aid in creation of nutrient rich and reliable water supply for irrigation. Necessary studies
in this regard may be undertaken to develop safety norms for use of treated
wastewater in agriculture and from the perspective of public health.
4.
Issue: Envisaged aim/output/outcome/impact are not mentioned in HKKP -SMI scheme
guidelines.
Page | xxx
# Issue and Recommendation
Recommendation: Other challenges like unclear scheme guidelines; increasing
pressure on groundwater resources and lack of O&M provisioning may be addressed
by making the scheme guidelines more comprehensive with well-defined output,
outcome and impact indicators; provisioning of IEC-BCC activities to create awareness
and financial strengthening of WUAs.
Per Drop More Crop (PDMC)
‘Per Drop More Crop’ was launched in 2015, with a cumulative outlay of Rs. 16,300 Cr. for the
period of 2015-16 to 2019-20, under the Ministry of Agriculture and Farmer’s Welfare. The
scheme aims to enhance water use efficiency in the agriculture sector and encourages farmers
to use water saving and conservation technologies. The scheme mainly focuses on enhancing
water use efficiency at farm level through micro-irrigation viz. Drip and Sprinkler Irrigation.
Besides promoting precision irrigation and better on-farm water management practices to
optimize the use of available water resources, this component also supports micro level water
storage or water conservation/management activities as Other Interventions (OI) to supplement
micro-irrigation. However, the OI activities must be linked with micro-irrigation to make potential
use of the available funds for higher water use efficiency. The scheme has been able to cover
around 48 lakh ha. area under micro-irrigation system during the period FY 15-16 to FY 19-20.
Some of the major issues and corresponding recommendations identified in this study are
indicated below.
# Issue and Recommendation
1.
Issue: In some states, separate departments are responsible for MI and OI components
(e.g. Agriculture/ Horticulture department is responsible for MI and Watershed
department is responsible for OI component). Hence, there is either less focus on
water storage structure creation under OI component or such structures under OI are
not effectively linked to MI systems and it hampers the progress of MI cultivation.
Recommendation: A single department should be accountable for implementing the
entire PDMC scheme (both MI as well as OI components) at state level. This will help
to integrate the water sources created under OI components with MI systems
Page | xxxi
# Issue and Recommendation
effectively, which is currently not happening in effective way across many states due
to presence of two different departments for managing these two components. This
arrangement would help to achieve better progress of MI.
Similar arrangement is observed in some states (e.g. Maharashtra, Tamil Nadu), where
single department (i.e. Horticulture department) manages both the components and
there is no such challenge in linking water sources under OI with MI systems.
2.
Issue: There is huge variance between market prices and cost norms as per guidelines
for the MI and OI components.
Recommendation: Unit cost norms for material cost of MI system (such as drip,
sprinkler, etc.) and material and installation cost of OI components (construction of tube
well/ bore well, water lifting devices, construction of community tanks/ farm ponds,
etc.) specified in the scheme guidelines should be revised so that base prices for all
components reflect current market price. Then, base prices should be escalated
annually using an appropriate index and escalation formula to take care of inflation.
3.
Issue: Many states (such as Bihar, Assam, Manipur etc.) have indicated fragmented
landholding as an issue because more than 80-90% farmers are small and marginal in
these states. The farm holding is as low as 0.1 acre. Since minimum area mentioned in
the MI guideline is 0.4 ha (around 0.99 acre) and subsidy for farm size smaller than that
is calculated on pro-rata basis, it leads to comparatively higher costs for MI systems in
case of such smaller farms.
Recommendation: Farm holding of less than 0.4 ha should be considered and
appropriate cost norms for such farms to be provided in the guidelines. This will help
to increase MI adoption rate among the farmers having fragmented landholdings.
4.
Issue: Subsidy allocation is currently made based on SC/ST population in a state. Some
states are unable to utilize the entire funding allocated for SC/ST farmers since their
landholding in the state is significantly lower compared to their population in the state.
Recommendation: SC/ST fund allocation should be determined based on their
landholding instead of their concentration in the overall population in the state. This will
reduce instances of unutilized funds allocated for SC/ST farmers.
5.
Issue: There is lack of awareness campaign, training sessions, capacity building
programs, which are essential to improve MI adoption rates, across many states (e.g.

Page | xxxii
# Issue and Recommendation
Assam, Manipur, Bihar, Jharkhand, Punjab, etc.). Additionally, some states (e.g.
Maharashtra, Rajasthan, Tamil Nadu, Andhra Pradesh, etc.) have reported that absence
of dedicated allocation for these activities could be possible reason for inadequate
training and capacity building across some states.
Recommendation: A separate allocation of fund for IEC and capacity building may be
made considering their importance in improving awareness and adoption of MI
technology. This fund may be carved out of the 5% funding currently provided for
administrative expenses. The guideline should lay down the specific objectives of IEC
and capacity building activities to be undertaken and how the outputs and outcomes of
such activities will be tracked.
Digital media should be adopted for awareness campaign, training programmes and
capacity building activities. One innovative model could be awareness creation through
social media platforms, such as Facebook, YouTube, etc. Short 5-minute videos (e.g.
video for MI installation, system maintenance, Do’s and Don’ts, crop wise cultivation
using MI, etc.) can be uploaded over such digital platforms. It will increase reach while
reducing cost of awareness programmes and capacity building activities. e.g. Andhra
Pradesh has started such activities through displaying small videos and audio-visual
sessions (e.g. installation, maintenance, benefits of MI, etc.) at village level kiosks of
Rythu Bharosa Kendra (RBK).
Key Performance Indicators (KPI) for the services being offered by the MI companies
can be defined and the MI companies can be incentivized/disincentivized based on KPI
ratings. This may help to improve monitoring of the work undertaken by the MI
companies.
6.
Issue: High initial investment required to be made by farmers, especially small and
marginal farmers, for MI system is one of the factors constraining its wider adoption.
Some states (e.g. Assam, Andhra Pradesh, Himachal Pradesh, Jharkhand, Maharashtra,
Manipur, Punjab, Rajasthan) find difficult to arrange their share of funds including the
additional top-up subsidy in timely manner that leads to project delay.
Recommendation:
Page | xxxiii
# Issue and Recommendation
Short-term solution: The scheme guideline may include provision for drip system with
class I grade of laterals along with class II or class III which are currently mandated in
the guidelines for reducing the cost of drip system.
In drip system, laterals account for around 65-70% cost of the entire drip system. Wall
thickness of class II grade laterals of 16 mm dia. is 0.7 to 0.9 mm. Drip system with
such class II grade laterals with 1.2 m spacing costs around Rs. 50,000 for 1-acre (~ 0.4
ha) land. Class I grade of laterals are also available in the market. It is used by the
farmers who are not taking subsidy through this scheme. These laterals have wall
thickness of 0.4-0.5 mm and rest of the specifications remain same. Drip system with
Class I grade laterals costs around Rs. 28,000 for 1-acre (~0.4 ha) land; thus, around
44% less cost as compared to Class II (grade mandated in the guidelines). Hence, cost
of drip system can be significantly reduced by using lower grade of laterals. Usage of
thin walled lateral (0.4 mm wall thickness) is also observed in developed countries (such
as US). However, there is caveat related to longevity. This Class I grade laterals last for
around 3 years whereas Class II grade laterals last for 5-6 years. However, as per the
key informants of the MI companies (e.g. Jain Irrigation, Netafim, Mahindra EPC, etc.),
there are many instances where farmers have used class I grade laterals for 6-7 years
with proper maintenance.
Similarly, as a short-term measure, cost of sprinkler system can be reduced by using
plastic nozzle instead of metal nozzle.
Long-term solution: R&D on development of low-cost MI technology may be explored
given the focus of the scheme is on small and marginal farmers. Also, a separate
allocation may be considered for such R&D activities.
Govt. can collaborate with MI companies and the research institutes to find out other
ways to reduce the cost of MI systems.
Low-cost technology can be expected to significantly improve the adoption rates since
the target beneficiary group is usually unable to adopt MI technology on account of high
investment required of them.
Page | xxxiv
# Issue and Recommendation
If cost of MI system can be reduced, this will also reduce the subsidy requirement and
thus, the financial burden on states.
7
Issue: Most states provide top-up subsidy over and above the stipulated limit (i.e. 55%
for small and marginal farmers and 45% for others). However, some states (e.g. Assam,
Andhra Pradesh, Himachal Pradesh, Jharkhand, Maharashtra, Manipur, Punjab,
Rajasthan) find it difficult to arrange their share of funds including the additional subsidy
in timely manner that leads to delay.
Recommendation: Central Govt. may increase the central assistance by a certain
percentage for small and marginal farmers and proportionately decrease it for general
farmers considering the fact that the primary target is small and marginal farmers. It
will help to reduce top-up subsidy provided by the states for small & marginal.
State Govt. may reduce the top-up subsidy by a certain percentage for general farmers
considering that they can afford the non-subsidy portion of MI cost. This will also reduce
the overall funding requirements by the states.
8
Issue: PMKSY-PDMC MIS requires district wise and crop wise physical and financial
progress data from the state and thus, the format is very lengthy. Apart from that,
server issues are also there. Hence, many states find it very difficult to upload the data
over the dashboard at regular interval as mandated in the scheme guidelines.
Recommendation: PMKSY-PDMC MIS system at the central level may be integrated
with the MIS system at the state level for the states which currently maintain separate
MIS dashboard. This will help in seamless data flow without any lag. Also, this will
reduce the effort made by the state officials for uploading district wise, crop wise data
over the dashboard.
Watershed Development Component (WDC)
Rainfed agriculture is vital to the country’s economy and food security as it also contributes to
about 40% of the total food grain production. Rainfed regions support two-thirds of livestock and
40% of the human population. Moreover, 80% of small and marginal farmers that are most

Page | xxxv
vulnerable to monsoon failures depend on these areas for livelihoods. Watershed development
aims to develop rainfed regions of net cultivated area, culturable wastelands and degraded lands.
6,382 projects have been taken up under WDC which had a total cost of Rs. 50,739 Cr. with a
central assistance component of Rs. 33,642.24 Cr. Rs. 19185.26 Cr. has been released to states
so far. As on date, 70.31 per cent of the projects have been completed. States such as Rajasthan,
Nagaland, Karnataka, Tamil Nadu, Andhra Pradesh and Madhya Pradesh have performed well.
States like Punjab, Himachal Pradesh and Uttar Pradesh have not performed as expected with
respect to the implementation, utilization of funds and completion of the projects. Since 2014-
15, WDC has led to benefits such as the creation of 0.690 million water harvesting structures,
1.467 million hectares have been brought under irrigation, benefited 3.115 million farmers and
since 2018-19, generated 28.121 million man-days of employment. No new projects under WDC
have been approved after 2014-15. The scheme is extremely relevant given the Sustainable
Development Goals and vision of the government for agriculture productivity and socio-economic
upliftment of farmers in rainfed areas. The scheme has been effective in realising benefits as
shown by various end-line evaluation reports. There is a need to encourage convergence and
effective fund flow and utilisation to garner efficiencies. Sustainability of the scheme needs to
be strengthened by addressing climate change issues, post-project natural resource
management of water and forest and O&M deficiencies. The scheme is based on the ‘principle
of equity’ which has benefited individuals across caste/tribe and gender. Some of the major
issues and corresponding recommendations identified in this study are indicated below.
# Issue and Recommendation
1.
Issue: Proper documentation of Community participation in WDC projects is not there
Recommendation: Extensive community involvement should be there in entry-level
activities and in planning and execution of watershed projects. To ensure adequate
community participation, there should be proper documentation of community
oversight (digitized attendance registers, photo/video uploads of meetings with
timestamps). Further, before and during project implementation, the project benefits
should be properly disseminated, and awareness created. The social audit should be
performed, and beneficiaries and stakeholders should be encouraged to report any
deviation during project implementation.
2.
Issue: Inter-Departmental Coordination needs to be strengthened for better
convergence.
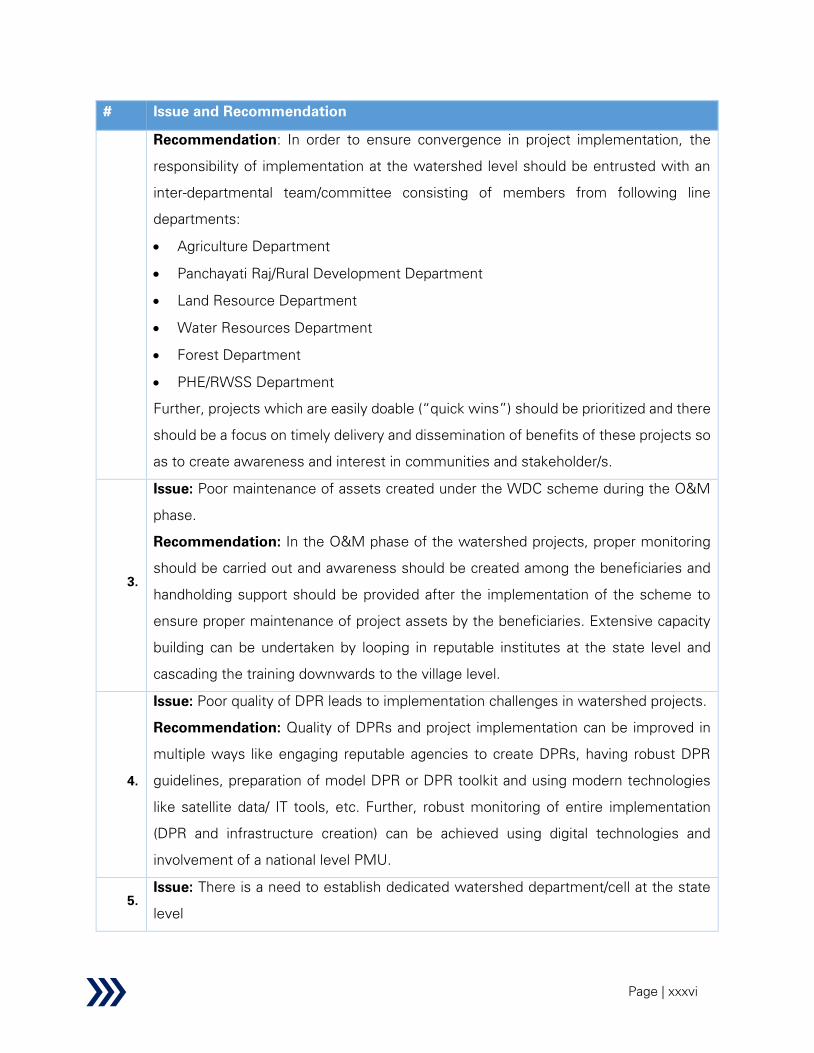
Page | xxxvi
# Issue and Recommendation
Recommendation: In order to ensure convergence in project implementation, the
responsibility of implementation at the watershed level should be entrusted with an
inter-departmental team/committee consisting of members from following line
departments:
• Agriculture Department
• Panchayati Raj/Rural Development Department
• Land Resource Department
• Water Resources Department
• Forest Department
• PHE/RWSS Department
Further, projects which are easily doable (“quick wins”) should be prioritized and there
should be a focus on timely delivery and dissemination of benefits of these projects so
as to create awareness and interest in communities and stakeholder/s.
3.
Issue: Poor maintenance of assets created under the WDC scheme during the O&M
phase.
Recommendation: In the O&M phase of the watershed projects, proper monitoring
should be carried out and awareness should be created among the beneficiaries and
handholding support should be provided after the implementation of the scheme to
ensure proper maintenance of project assets by the beneficiaries. Extensive capacity
building can be undertaken by looping in reputable institutes at the state level and
cascading the training downwards to the village level.
4.
Issue: Poor quality of DPR leads to implementation challenges in watershed projects.
Recommendation: Quality of DPRs and project implementation can be improved in
multiple ways like engaging reputable agencies to create DPRs, having robust DPR
guidelines, preparation of model DPR or DPR toolkit and using modern technologies
like satellite data/ IT tools, etc. Further, robust monitoring of entire implementation
(DPR and infrastructure creation) can be achieved using digital technologies and
involvement of a national level PMU.
5.
Issue: There is a need to establish dedicated watershed department/cell at the state
level

Page | xxxvii
# Issue and Recommendation
Recommendation: It is observed that the states, which have dedicated watershed
development departments have performed better than other states. Therefore, other
states which have a very high percentage of rainfed area may explore setting up of a
dedicated watershed department or watershed cell (under an existing department) to
undertake watershed development activities. States such as Rajasthan, Karnataka,
Nagaland and Odisha have established dedicated cell and have performed better than
other states.
6.
Issue: Lack of guidelines for utilisation of Watershed Development Fund
Recommendation: The scope of work is not clear for the O&M phase; therefore, there
should be clear guidelines to ensure the utilization of Watershed Development Fund
(WDF) for maintenance of assets during the O&M period. DoLR has communicated to
the states on multiple occasions to formulate guidelines for the utilisation of WDF and
this should be further encouraged in all forums. The model template of WDF guidelines
has been circulated by DoLR among all the Sates for customization and adoption as
per States specific conditions. It needs better monitoring from Central as well as from
state levels.
Irrigation Census (IC)
Irrigation Census is an important source of data on minor irrigation assets created. So far five
Minor Irrigation Censuses have been completed with reference years – 1986-87, 1993-94, 2000-
01, 2006-07, 2013-14 while the 6th
Census is currently under progress. The Irrigation Census till
date have been supported through 100% central funding. The 6th
Irrigation Census has added the
component of Census of Water Bodies. The total estimated cost for 6th
Irrigation Census is
around Rs. 258 Cr., of which the cost of conducting the 6th
Irrigation Census is Rs.168 Cr. and
Rs. 90 Cr. is allocated for Census of Water Bodies.
Irrigation Census has evolved over the years and has increased in coverage over the five MI
censuses conducted so far. There are around five schedules that are being canvassed for all
minor irrigation sources and water bodies in rural and urban areas. Some of the states like Andhra
Pradesh and West Bengal have also adopted newer technologies for data collection, validation,

Page | xxxviii
tabulation and analysis. Irrigation Census thus have been a significant source of data for schemes
like Atal Bhujal Yojana and RRR and the key parameters like IPC, IPU, CCA are being used
frequently by water resources department and agriculture departments in the States.
# Issue and Recommendation
1.
Issue: Manual enumeration of Village and Scheme level schedules lead to errors and
increase of time-lag.
Recommendation: The enumeration process may be made “paperless” i.e., the
schedules should be entered on a tab or similar equipment where all the fields will be
entered electronically as practised in states like Andhra Pradesh. The data collection
module should have in-built validation mechanism. This will help in reducing the time
spent for field level validation. Hence, data entry part will be taken care of during
enumeration itself. The validated data will be ready for tabulation, which is currently
done through a software.
2.
Issue: Analysis of MI Census data is restricted to technical aspects of Minor Irrigation
and socio-economic issues are not addressed.
Recommendation: It is necessary to carry out socio-economic survey with basic
indicators pertaining to socio-economic parameters like migration, change in earnings,
spending on education and health, insurance penetration, etc. Along with the MI
census, socio-economic survey should also be conducted, and the report should
include analyses of the parameters to find out correlation with data from minor
irrigation.
3.
Issue: Dissemination of analyses to the agrarian population and MI scheme owners
is not done as dissemination of report results are restricted to policy makers.
Recommendation: The results e.g. major parameters like IPC -IPU gap, groundwater
and surface water consumption and a few others should be communicated back to
the villagers in form of simple messages. Information, Education and Communication
(IEC) strategies should be worked out to effectively communicate and bring out
behavioural change amongst the farmers and MI scheme owners. This will also help
in initiating participatory planning process for MI schemes. In addition, MI census
results may be shared with other departments like Fisheries, Tribal Welfare, MSME,
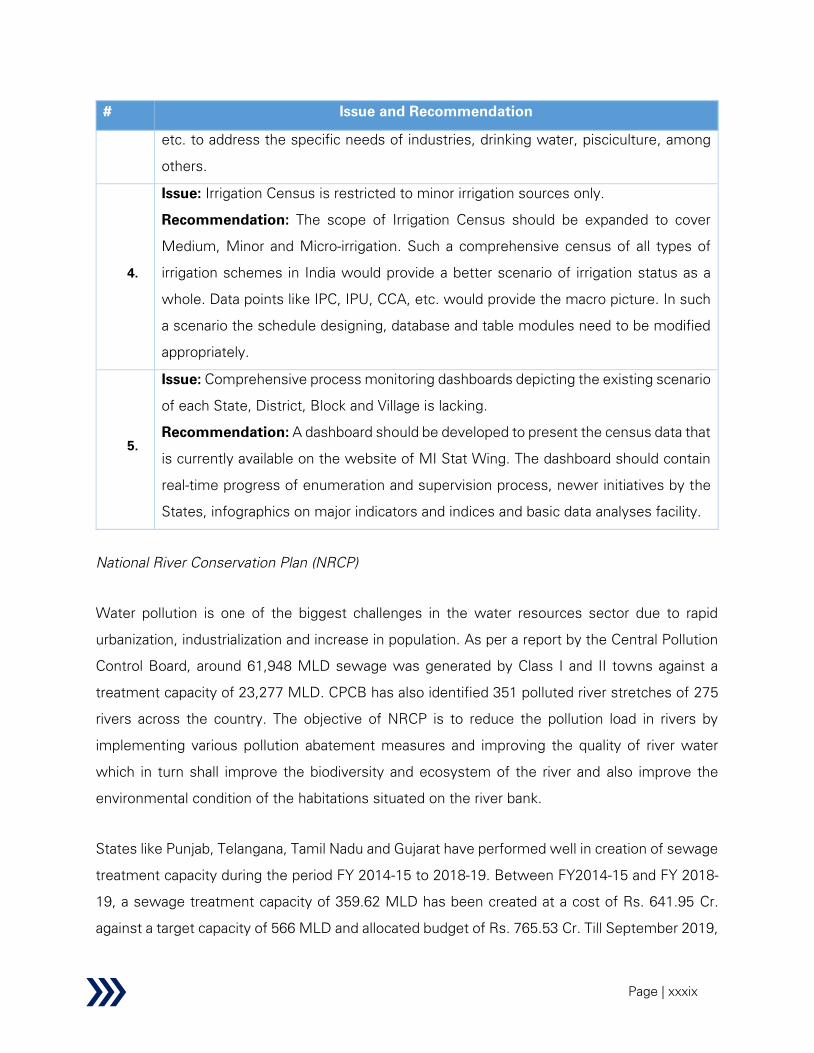
Page | xxxix
# Issue and Recommendation
etc. to address the specific needs of industries, drinking water, pisciculture, among
others.
4.
Issue: Irrigation Census is restricted to minor irrigation sources only.
Recommendation: The scope of Irrigation Census should be expanded to cover
Medium, Minor and Micro-irrigation. Such a comprehensive census of all types of
irrigation schemes in India would provide a better scenario of irrigation status as a
whole. Data points like IPC, IPU, CCA, etc. would provide the macro picture. In such
a scenario the schedule designing, database and table modules need to be modified
appropriately.
5.
Issue: Comprehensive process monitoring dashboards depicting the existing scenario
of each State, District, Block and Village is lacking.
Recommendation: A dashboard should be developed to present the census data that
is currently available on the website of MI Stat Wing. The dashboard should contain
real-time progress of enumeration and supervision process, newer initiatives by the
States, infographics on major indicators and indices and basic data analyses facility.
National River Conservation Plan (NRCP)
Water pollution is one of the biggest challenges in the water resources sector due to rapid
urbanization, industrialization and increase in population. As per a report by the Central Pollution
Control Board, around 61,948 MLD sewage was generated by Class I and II towns against a
treatment capacity of 23,277 MLD. CPCB has also identified 351 polluted river stretches of 275
rivers across the country. The objective of NRCP is to reduce the pollution load in rivers by
implementing various pollution abatement measures and improving the quality of river water
which in turn shall improve the biodiversity and ecosystem of the river and also improve the
environmental condition of the habitations situated on the river bank.
States like Punjab, Telangana, Tamil Nadu and Gujarat have performed well in creation of sewage
treatment capacity during the period FY 2014-15 to 2018-19. Between FY2014-15 and FY 2018-
19, a sewage treatment capacity of 359.62 MLD has been created at a cost of Rs. 641.95 Cr.
against a target capacity of 566 MLD and allocated budget of Rs. 765.53 Cr. Till September 2019,

Page | xl
the National River Conservation Plan has created 85 STPs over 34 polluted river stretches
(excluding Ganga and its tributaries) across 77 towns spread over 16 states . Some of the major
issues and corresponding recommendations identified in this study are indicated below.
# Issue and Recommendation
1.
Issue: Inadequate capacity of sewage treatment infrastructure due to lack of ULB
capacity and unavailability of financial resources with the states
Recommendation: NRCP guidelines should include the following components: -
• Creating city level sewerage master plan with population projection
• Developing phase wise plan for creation of sewer networks, STPs, integrating
existing septage systems
• Exploring alternate funding options for rapid capacity addition – PPP HAM, IFI
funding, philanthropic organizations, CSR funds of private players
• Exploring innovative models such as - One City One Operator
• Creating enabling structure for long term tripartite agreements for PPP
2.
Issue: Lack of measures for holistic river conservation and abatement of other sources
of pollution
Recommendation:
• Maintaining min e-flow in rivers throughout the year
• Non-structural approaches for protecting river basins during floods – floodplain
zoning, catchment area treatment
• Treatment of sewage from all sources – septage treatment plants, organic farming,
afforestation
• Knowledge sharing of best practices available with NMCG
3.
Issue: Lack of capacity utilization of STPs due to lack of backend sewer network
Recommendation:
• Increase in capacity utilization of STPs through construction of I&D network
• Convergence with AMRUT to ensure STPs and I&D structures are created in
conjunction with future planning of sewer networks, household connections
4.
Issue: Lack of O&M in constructed assets due to unavailability of fund and manpower
causing STPs to become defunct
Recommendation:

Page | xli
# Issue and Recommendation
• Exploring private sector participation – HAM or EPC with long term O&M
• Execution of performance-based contracts or technology neutral contracts to
ensure operational efficiency of STP
• Including revenue generation options for contractor – selling of treated wastewater,
treated sludge, agreements with thermal power plants
5.
Issue: Non-compliance with recent revisions in NGT norms and discharge standards of
sewage treatment
Recommendation:
• Inventorisation of STPs by treatment technology, output parameters & compliance
• Earmarking of funds for modernization of STPs for compliance with revised NGT
norms post notification of NGT order by MoEF&CC
6.
Issue: Mixing of industrial effluents with domestic sewage
Recommendation:
• Inventorisation of non-compliant industrial units, notification to CPCB/ SPCB
• Mandatory policies to ensure self-regulation & control by industries
7.
Issue: Lack of holistic river basin pollution monitoring infrastructure
Recommendation:
• Setting up of Real-time Water Quality Monitoring Stations (RTWQMS)
• Monitoring of river health through biodiversity index, assimilative capacities, etc.
• Development of a central dashboard with indicators from RTWQMS and tracking
parameters in planning, works and post–construction phases
Flood Management and Border Area Programme (FMBAP)
Flood Management and Border Area Programme was created through the merger of two
erstwhile schemes: Flood Management Programme (FMP) and River Management Activities &
Works related to Border Areas (RMBA). The objective of the scheme is to assist the State
governments in providing reasonable degree of protection against floods through structural and
non-structural measures. The activities under FMBAP have been implemented during the period
2017-2020. The Flood Management component of FMBAP includes residual works already
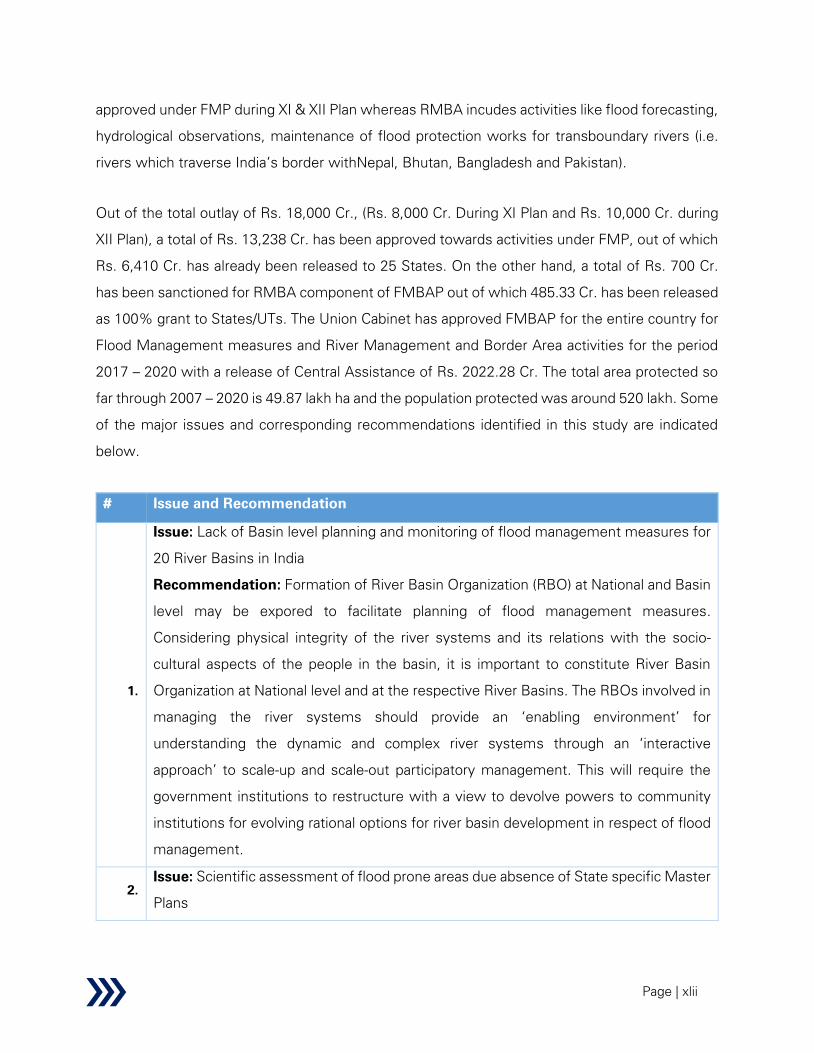
Page | xlii
approved under FMP during XI & XII Plan whereas RMBA incudes activities like flood forecasting,
hydrological observations, maintenance of flood protection works for transboundary rivers (i.e.
rivers which traverse India’s border withNepal, Bhutan, Bangladesh and Pakistan).
Out of the total outlay of Rs. 18,000 Cr., (Rs. 8,000 Cr. During XI Plan and Rs. 10,000 Cr. during
XII Plan), a total of Rs. 13,238 Cr. has been approved towards activities under FMP, out of which
Rs. 6,410 Cr. has already been released to 25 States. On the other hand, a total of Rs. 700 Cr.
has been sanctioned for RMBA component of FMBAP out of which 485.33 Cr. has been released
as 100% grant to States/UTs. The Union Cabinet has approved FMBAP for the entire country for
Flood Management measures and River Management and Border Area activities for the period
2017 – 2020 with a release of Central Assistance of Rs. 2022.28 Cr. The total area protected so
far through 2007 – 2020 is 49.87 lakh ha and the population protected was around 520 lakh. Some
of the major issues and corresponding recommendations identified in this study are indicated
below.
# Issue and Recommendation
1.
Issue: Lack of Basin level planning and monitoring of flood management measures for
20 River Basins in India
Recommendation: Formation of River Basin Organization (RBO) at National and Basin
level may be expored to facilitate planning of flood management measures.
Considering physical integrity of the river systems and its relations with the socio-
cultural aspects of the people in the basin, it is important to constitute River Basin
Organization at National level and at the respective River Basins. The RBOs involved in
managing the river systems should provide an ‘enabling environment’ for
understanding the dynamic and complex river systems through an ‘interactive
approach’ to scale-up and scale-out participatory management. This will require the
government institutions to restructure with a view to devolve powers to community
institutions for evolving rational options for river basin development in respect of flood
management.
2.
Issue: Scientific assessment of flood prone areas due absence of State specific Master
Plans
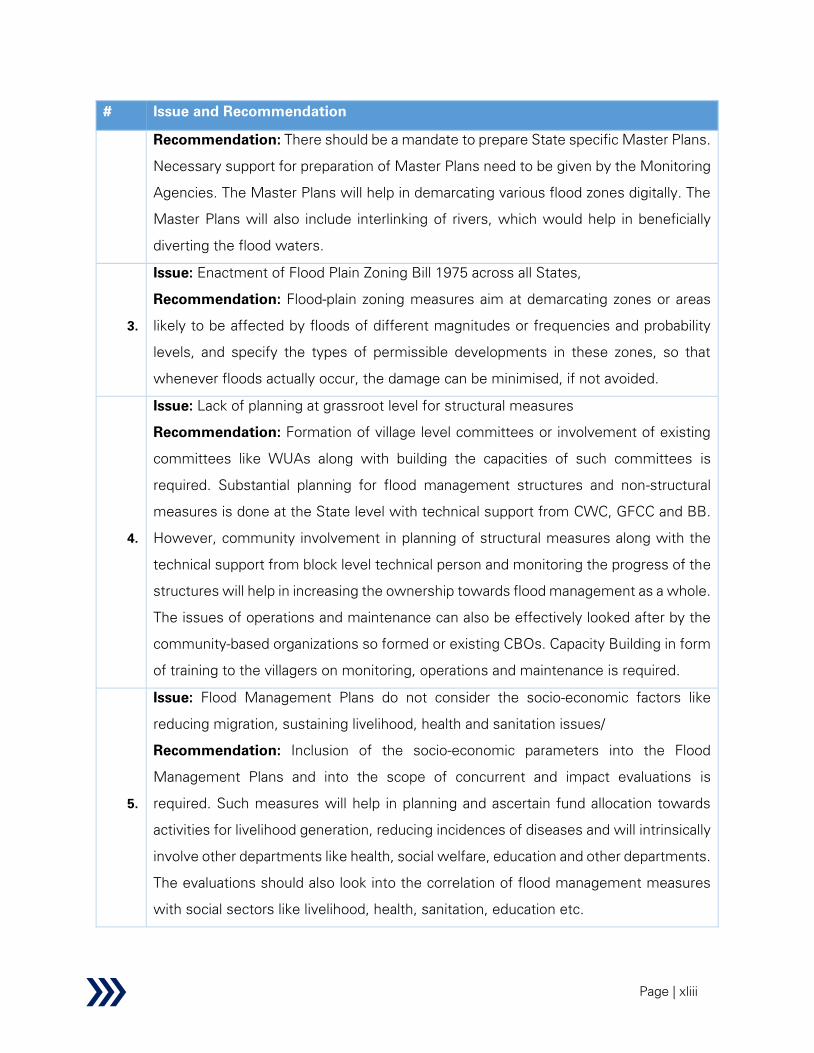
Page | xliii
# Issue and Recommendation
Recommendation: There should be a mandate to prepare State specific Master Plans.
Necessary support for preparation of Master Plans need to be given by the Monitoring
Agencies. The Master Plans will help in demarcating various flood zones digitally. The
Master Plans will also include interlinking of rivers, which would help in beneficially
diverting the flood waters.
3.
Issue: Enactment of Flood Plain Zoning Bill 1975 across all States,
Recommendation: Flood-plain zoning measures aim at demarcating zones or areas
likely to be affected by floods of different magnitudes or frequencies and probability
levels, and specify the types of permissible developments in these zones, so that
whenever floods actually occur, the damage can be minimised, if not avoided.
4.
Issue: Lack of planning at grassroot level for structural measures
Recommendation: Formation of village level committees or involvement of existing
committees like WUAs along with building the capacities of such committees is
required. Substantial planning for flood management structures and non-structural
measures is done at the State level with technical support from CWC, GFCC and BB.
However, community involvement in planning of structural measures along with the
technical support from block level technical person and monitoring the progress of the
structures will help in increasing the ownership towards flood management as a whole.
The issues of operations and maintenance can also be effectively looked after by the
community-based organizations so formed or existing CBOs. Capacity Building in form
of training to the villagers on monitoring, operations and maintenance is required.
5.
Issue: Flood Management Plans do not consider the socio-economic factors like
reducing migration, sustaining livelihood, health and sanitation issues/
Recommendation: Inclusion of the socio-economic parameters into the Flood
Management Plans and into the scope of concurrent and impact evaluations is
required. Such measures will help in planning and ascertain fund allocation towards
activities for livelihood generation, reducing incidences of diseases and will intrinsically
involve other departments like health, social welfare, education and other departments.
The evaluations should also look into the correlation of flood management measures
with social sectors like livelihood, health, sanitation, education etc.
Page | xliv
# Issue and Recommendation
6.
Issue: Lack of a comprehensive database and real-time data analysis on flood
occurrences and flood management measures
Recommendation: Significant quantum of structural and non-structural measures
have already been taken through X, XI, XII plan and for the period 2017 – 20, the
progress and performance of which need to be available in public domain for effective
decision support system. Flood databases in our country are scattered and available
with different department. At present data on different aspects of floods are collected
by various agencies, but mostly these remain confined to official files and sometimes
periodicals and bulletins. There is no unified source of statistics on the hazard and flood
losses at the national/sub-national levels in India. Similarly, data on development
indicators and vulnerability is also not available from any single source. Therefore, there
is a need for development of a comprehensive database on disasters which would
facilitate formulation of area specific disaster risk profile, assessment of long-term
impacts of disasters, development of policies, strategies and frameworks, preparation
of proper plans for disaster preparedness and allocation of adequate funds for the
prevention, mitigation and Disaster Risk Reduction ( DRR) .
7.
Issue: Structural measures like construction of embankments do not sufficiently
reduce the damages caused by floods. Issues like heavy siltation on river beds causes
massive inflow of water from dams to the adjacent low lying areas.
Recommendation: Apart from the structural measures undertaken so far within the
scope of FMBAP, additional activities / interventions like River Dredging and Catchment
Area Treatment should be actively considered.
River Dredging: Silting at places where the rivers emerge from the hills into the plains,
at convex bends and near their outfall into another river or lake or sea, is a natural
phenomenon. Accordingly, rivers exhibit a tendency to braid/meander/form deltas.
Dredging of the river would dig out sediments from the river-bed and will increase the
water retention capacity of the river. Consequently, the pressure on the banks would
be reduced minimizing the chances of flood and erosion. Selective desilting/dredging
at outfalls/confluences or local reaches can, however, can be adopted as a measure to
tackle the problem locally.

Page | xlv
# Issue and Recommendation
Catchment Area Treatment: The rivers bring heavy sediment load from the
catchments. These coupled with inadequate carrying capacity of the rivers are
responsible for causing floods, drainage congestion and erosion of riverbanks.
Inadequate capacity of the rivers to contain within their banks, the high flows brought
down from the upper catchment areas following heavy rainfall, leads to flooding.
The state governments/SDMAs should, therefore, take up appropriate watershed
management measures including afforestation, check dams, detention basins, etc. in
the catchment of rivers to prevent soil erosion, enhance water conservation and
minimize water and sediment runoff.
Sector-scheme linkages and gap map
An analysis of the CSS being evaluated as part of this study and their mapping with the key sector
issues are summarized below:
• Issue of low water storage capacity is being attempted to address through RRR of water
bodies (decentralized storages) and also completion of multi-purpose MMI projects
through the PMKSY-AIBP scheme. However, encroachment of water bodies, dumping of
sewages and poor O&M practices continue to affect the storage capacities.
• A significant portion of the financial outlays of the Ministry has been allotted to enhance
the country’s irrigation coverage through Major and Medium irrigation project and their
command area development (PMKSY-AIBP and CADWM, SPFM) and Minor Irrigation
projects (PMKSY SMI, RRR and GWI). However, the rainfed area water resources
management is currently catered through a single scheme viz PMKSY-WDC scheme;
though a substantial portion of the farmers are perennially dependent on the rains.
• Improving agricultural water efficiency at the farm level is aimed through PDMC scheme
and mandatory coverage of 10% CCA with MI facilities under CADWM scheme. Further,
lining of water courses below outlets through CADWM scheme is expected to enhance
the water utilization and irrigation coverage. However, high conveyance losses as
reported in many major and minor unlined canals continue to undermine the realizable

Page | xlvi
benefits from the scheme. This is further exacerbated by lack of any dedicated O&M
fund.
• In terms of sustainability, schemes like AIBP (through canal seepages), WDC (through
rain water harvesting and groundwater recharging) and RRR (through tanks and water
bodies restoration) have contributed to increase in groundwater level. However, unabated
groundwater extraction, fuelled by subsidized power and increasing shift towards water
intensive crops, poses serious sectoral challenges.
Scope for scheme rationalization
Some potential opportunities for scheme rationalization have been identified based on the study
as listed below.
1. In view of the slow progress under Micro-irrigation (MI) component of CADWM scheme,
it is suggested to transfer and merge this MI component with ‘Other Interventions’
component under PDMC scheme. Noticeably, both these components under the two
schemes have similar objectives and such a rationalization would ensure streamlining of
subsidy flow for the MI equipment and necessary hand-holding support for the cultivators.
2. SMI may be planned in close coordination with RRR since the objective of RRR viz;
improvement and enhancement of storage capacity of water bodies are critical to ensure
utility of SMI during periods of low/no flows. Rationalisation of the two schemes is
suggested to allow for better coordination and accountability.
***

Page | 1
1 Sector Level Analysis: Water resources
In this section, a sectoral analysis of the water resources sector in India has been undertaken
using an end-to-end value chain framework for the sector where areas of enquiry have been
identified and analysed in respect of each element of the value chain. A summary of the value
chain of the water resources sector and key issues in each component is shown in the figure
below. Performance of the water resources sector as well as key issues in both supply and
demand sides of the water resources value chain have been discussed in further detail in this
section of the report.
Figure 1: Water Resources sector- Value Chain with key issues
1.1 Background of the sector
1.1.1 Water resources in India - Supply Side
Water resource is an important national asset and is of foundational importance for sustenance
of life, food security, and maintaining ecological balance. Over the past two decades, the demand
for freshwater in India has increased significantly on account of growing population, rapid
urbanization, industrial development and inefficient agricultural practices. The per capita
availability of water in India has been on a decline – from 1,820 cubic metres in 2001 to 1,508
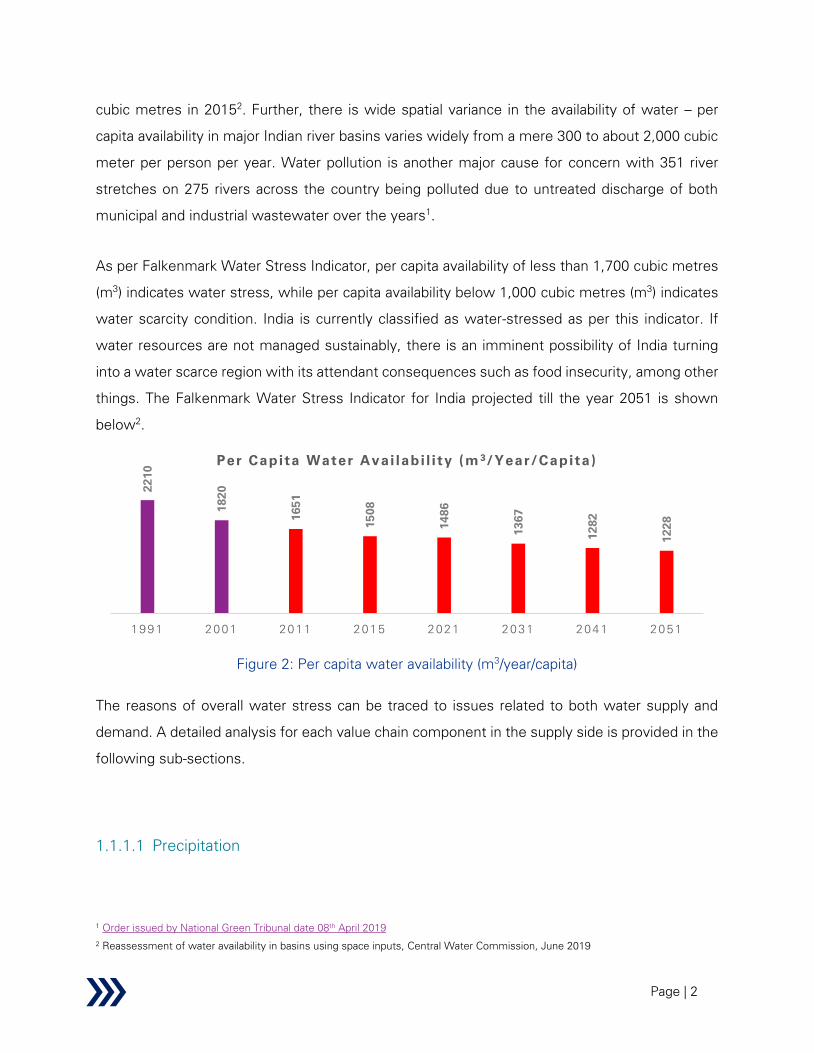
Page | 2
cubic metres in 20152. Further, there is wide spatial variance in the availability of water – per
capita availability in major Indian river basins varies widely from a mere 300 to about 2,000 cubic
meter per person per year. Water pollution is another major cause for concern with 351 river
stretches on 275 rivers across the country being polluted due to untreated discharge of both
municipal and industrial wastewater over the years1.
As per Falkenmark Water Stress Indicator, per capita availability of less than 1,700 cubic metres
(m3) indicates water stress, while per capita availability below 1,000 cubic metres (m
3) indicates
water scarcity condition. India is currently classified as water-stressed as per this indicator. If
water resources are not managed sustainably, there is an imminent possibility of India turning
into a water scarce region with its attendant consequences such as food insecurity, among other
things. The Falkenmark Water Stress Indicator for India projected till the year 2051 is shown
below2.
Figure 2: Per capita water availability (m3/year/capita)
The reasons of overall water stress can be traced to issues related to both water supply and
demand. A detailed analysis for each value chain component in the supply side is provided in the
following sub-sections.
1.1.1.1 Precipitation
1 Order issued by National Green Tribunal date 08
th April 2019
2 Reassessment of water availability in basins using space inputs, Central Water Commission, June 2019
2210
1820
1651
1508
1486
1367
1282
1228
1991 2001 2011 2015 2021 2031 2041 2051
Per Capita Water Avai labi l i ty (m3/Year/Capita)
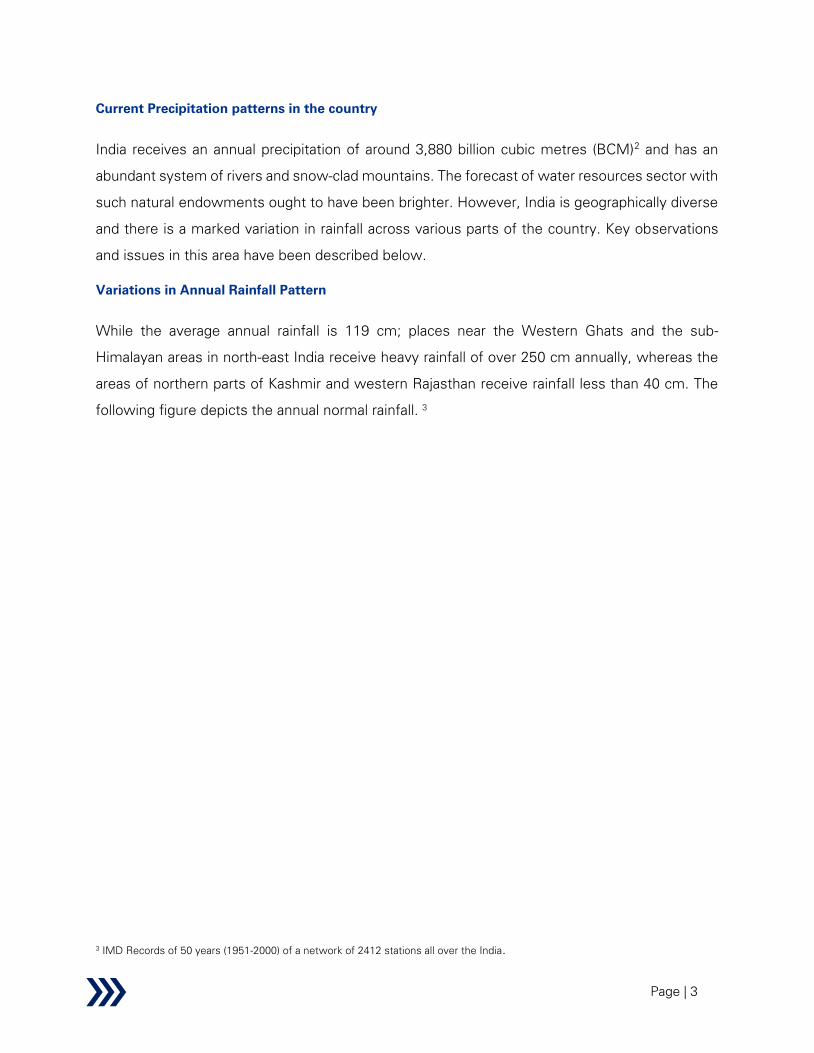
Page | 3
Current Precipitation patterns in the country
India receives an annual precipitation of around 3,880 billion cubic metres (BCM)2 and has an
abundant system of rivers and snow-clad mountains. The forecast of water resources sector with
such natural endowments ought to have been brighter. However, India is geographically diverse
and there is a marked variation in rainfall across various parts of the country. Key observations
and issues in this area have been described below.
Variations in Annual Rainfall Pattern
While the average annual rainfall is 119 cm; places near the Western Ghats and the sub-
Himalayan areas in north-east India receive heavy rainfall of over 250 cm annually, whereas the
areas of northern parts of Kashmir and western Rajasthan receive rainfall less than 40 cm. The
following figure depicts the annual normal rainfall. 3
3 IMD Records of 50 years (1951-2000) of a network of 2412 stations all over the India.
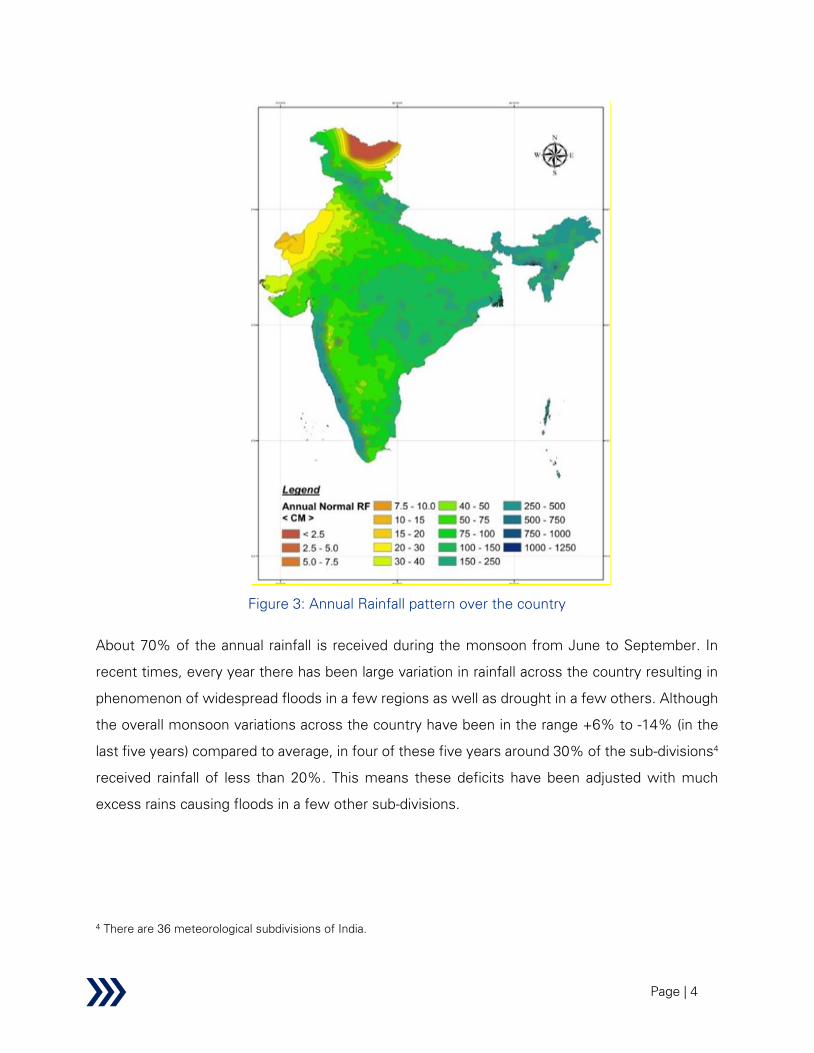
Page | 4
Figure 3: Annual Rainfall pattern over the country
About 70% of the annual rainfall is received during the monsoon from June to September. In
recent times, every year there has been large variation in rainfall across the country resulting in
phenomenon of widespread floods in a few regions as well as drought in a few others. Although
the overall monsoon variations across the country have been in the range +6% to -14% (in the
last five years) compared to average, in four of these five years around 30% of the sub-divisions4
received rainfall of less than 20%. This means these deficits have been adjusted with much
excess rains causing floods in a few other sub-divisions.
4 There are 36 meteorological subdivisions of India.

Page | 5
Table 2: Sub-division wise rainfall variations (excess/deficit)5
Years
Sub-divisions with excess
rains (+20% -+59%)
Sub-division with deficient
rains (-20% - -59%)
2014 0 11
2015 4 12
2016 1 12
2017 3 7
2018 1 12
This fact is also evident from the following statistics of the deviation (%) in annual rainfall from
the normal long-term average. It is observed that rains have been deficient in most years of the
last two decades with only a few exceptions (i.e. 2005, 2010 and 2013)6.
Figure 4: Departure in annual rainfall in % since 2000
Out of the total precipitation in India of 3,880 BCM, around 48.5% is lost to evapotranspiration,
which leaves a balance of 1,999 BCM water in the country. Further, about 43% of the potential
available water cannot be put to beneficial use due to topographical constraints and uneven
distribution of water resources over space and time. This makes the utilizable water potential of
the country around 1,122 BCM consisting of 690 BCM of surface water and 432 BCM of
groundwater (Source for groundwater data: National Compilation on Dynamic Ground Water
Resources of India, Central Ground Water Board, 2017) 2. The figure below depicts the Water
resources availability in India.
5 Indian Meteorological Department-Customized Rainfall Information System
6 EnviStats India 2018 - Supplement on Environmental Accounts, Ministry of Statistics and Programme Implementation,
2018 and Indian Meteorological Department-Customized Rainfall Information System

Page | 6
Figure 5: Water Resources Availability
This deficiency in annual rainfall in recent years is a cause for concern, since in India, monsoon
rainfall is the main source of groundwater recharge, contributing about 58% of the total annual
replenishable resource7. Even regional rainfall variations directly impact water availability. The
annual replenishable groundwater resources is the sum of recharge during monsoon and non-
monsoon seasons and these resources are used mainly for irrigation and domestic uses.
7 Dynamic Groundwater Resources of India, 2017 (Published on July 2019), Central Groundwater Board, Ministry of Water Resources
and Reassessment of water availability in basins using space inputs, Central Water Commission, June 2019
Figure 6: Sources of annual replenishable groundwater

Page | 7
It is evident from the above depiction that any deficiency in monsoon can significantly reduce
annual replenishable groundwater.
Impact of Climate Change
Climate change in the form of changes in temperature and precipitation have come about as a
result of global warming. This has impacted in the form of uneven rainfall distribution and water
related disasters such as floods and droughts. Globally, average water stress8 is 11%. India is
among the 31 countries experiencing water stress in the range of 25-70%. It is forecasted that
India will be among the worst affected countries with respect to change in net precipitation by
2050 vis-à-vis 2010. Net precipitation in significant parts of north, central and west India is
expected to decrease by at least 0.5 mm per day while the rest of the country will witness a
decrease between 0.1 to 0.5 mm per day9.
Figure 7: Change in net precipitation patterns
Growing water stress indicates increasing exploitation of water resources, with adverse impacts
on resource sustainability, and a rising probability for conflicts among users. The overall water
availability is discussed in respect of surface water and groundwater sources.
8 Water stress for purpose of discussion in the above paragraph is defined as the ratio of total freshwater withdrawn annually by all
major sectors, including environmental water requirements, to the total amount of renewable freshwater resources, expressed as a
percentage. Source: UN (2018a, p. 72, based on data from AQUASTAT).
9 Adapted from PBL Netherlands Environmental Assessment Agency (2018, p. 23)
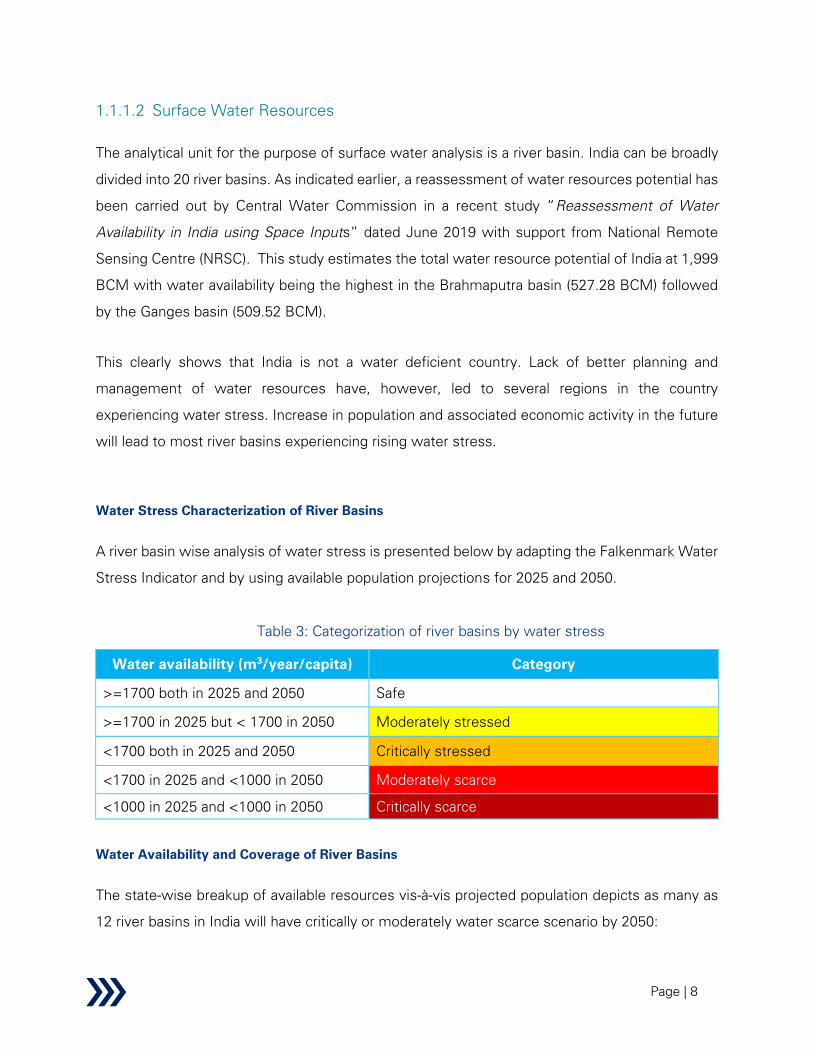
Page | 8
1.1.1.2 Surface Water Resources
The analytical unit for the purpose of surface water analysis is a river basin. India can be broadly
divided into 20 river basins. As indicated earlier, a reassessment of water resources potential has
been carried out by Central Water Commission in a recent study “Reassessment of Water
Availability in India using Space Inputs” dated June 2019 with support from National Remote
Sensing Centre (NRSC). This study estimates the total water resource potential of India at 1,999
BCM with water availability being the highest in the Brahmaputra basin (527.28 BCM) followed
by the Ganges basin (509.52 BCM).
This clearly shows that India is not a water deficient country. Lack of better planning and
management of water resources have, however, led to several regions in the country
experiencing water stress. Increase in population and associated economic activity in the future
will lead to most river basins experiencing rising water stress.
Water Stress Characterization of River Basins
A river basin wise analysis of water stress is presented below by adapting the Falkenmark Water
Stress Indicator and by using available population projections for 2025 and 2050.
Table 3: Categorization of river basins by water stress
Water availability (m3/year/capita) Category
>=1700 both in 2025 and 2050 Safe
>=1700 in 2025 but < 1700 in 2050 Moderately stressed
<1700 both in 2025 and 2050 Critically stressed
<1700 in 2025 and <1000 in 2050 Moderately scarce
<1000 in 2025 and <1000 in 2050 Critically scarce
Water Availability and Coverage of River Basins
The state-wise breakup of available resources vis-à-vis projected population depicts as many as
12 river basins in India will have critically or moderately water scarce scenario by 2050:

Page | 9
Table 4: River basin wise per capita Average Annual Water Availability (m3)10
# River Basin
Avg. annual Water
Resources
Potential
Est. population
(Mn)11
Est. per capita
annual water
availability (m3)
(BCM)
2025 2050 2025 2050
1 Indus (up to Border) 45.53 69.2 81.41 658 559
2 Ganga-Brahmaputra-
Meghna
a Ganga 509.52 593.04 697.69 859 730
b Brahmaputra 527.28 48.06 56.54 10,971 9,326
c Barak & Others 86.67 10.24 12.05 8,464 7,193
3 Godavari 117.74 89.18 104.92 1,320 1,122
4 Krishna 89.04 100.41 118.13 887 754
5 Cauvery 27.67 48.39 56.93 572 486
6 Subernarekha 15.05 15.52 18.26 970 824
7 Brahmani & Baitarani 35.35 16.18 19.04 2,185 1,857
8 Mahanadi 73.00 43.93 51.68 1,662 1,413
9 Pennar 11.02 16.02 18.85 688 585
10 Mahi 14.96 17.34 20.4 863 733
11 Sabarmati 12.96 17.34 20.4 747 635
12 Narmada 58.21 24.28 28.56 2,397 2,038
13 Tapi 26.24 24.44 28.75 1,074 913
14 West Flowing Rivers
from Tapi to Tadri 118.35 42.61 50.13 2,778 2,361
10 Reassessment of water availability in basins using space inputs- Central Water Commission- 2019 Study
11 Report of the Standing Sub-Committee for assessment of availability and requirement of water for diverse uses in the country,
2000

Page | 10
# River Basin
Avg. annual Water
Resources
Potential
Est. population
(Mn)11
Est. per capita
annual water
availability (m3)
(BCM)
2025 2050 2025 2050
15
West Flowing Rivers
from Tadri to
Kanyakumari
119.06 53.84 63.34 2,211 1,880
16
East Flowing Rivers
Between Mahanadi &
Pennar
26.41 38.97 45.85 678 576
17
East Flowing Rivers
Between Pennar And
Kanyakumari
26.74 74.32 87.43 360 306
18
West Flowing Rivers
of Kutch and
Saurashtra including
Luni
26.93 36.5 42.94 738 627
19 Area of Inland drainage
in Rajasthan Negligible 11.73 13.79 NA NA
20
Minor River Draining
into Myanmar (Burma)
& Bangladesh
31.17 2.48 2.91 12,569 10,711
Water scarcity in these 12 basins may lead to around 11 states having critically water scarce
scenario in future as per the above analysis. This is based on the area of coverage of the water
basins in the respective states.
Table 5: State-wise riven basin coverage
State River Basins covered12
Possible future scenario
based on projected
status of predominant
basins12
Punjab Indus Critically Scarce
Rajasthan
Indus, Mahi, Sabarmati, West Flowing
Rivers of Kutch and Saurashtra including
Luni
Critically Scarce
Haryana Indus, Ganga Critically Scarce
12 KPMG Analysis

Page | 11
State River Basins covered12
Possible future scenario
based on projected
status of predominant
basins12
Delhi Ganga Critically Scarce
Himachal Pradesh Indus, Ganga Moderately Scarce
Tamil Nadu
Cauvery, East Flowing Rivers Between
Pennar And Kanyakumari, West Flowing
Rivers from Tadri to Kanyakumari
Critically Scarce
Puducherry East Flowing Rivers Between Pennar And
Kanyakumari Critically Scarce
Uttar Pradesh Ganga Critically Scarce
Karnataka
Godavari, Krishna, Cauvery, Pennar, East
Flowing Rivers Between Mahanadi &
Pennar, East Flowing Rivers Between
Pennar And Kanyakumari, West Flowing
Rivers from Tapi to Tadri
Critically Scarce
Gujarat
Mahi, Sabarmati, Narmada, Tapi, West
Flowing Rivers of Kutch and Saurashtra
including Luni, West Flowing Rivers from
Tapi to Tadri
Moderately scarce
Uttarakhand Ganga Critically Scarce
Madhya Pradesh Ganga, Godavari, Mahanadi, Tapi,
Narmada Critically stressed
Maharashtra Godavari, Krishna, Mahanadi, Narmada,
Tapi Critically stressed
Kerala Cauvery, West Flowing Rivers from Tadri
to Kanyakumari Moderately stressed
Bihar Ganga Critically Scarce
Chhattisgarh Ganga, Godavari, Narmada, Brahmani &
Baitarani Critically Scarce
Andhra Pradesh
East Flowing Rivers Between Mahanadi &
Pennar, East Flowing Rivers Between
Pennar And Kanyakumari
Critically Scarce

Page | 12
State River Basins covered12
Possible future scenario
based on projected
status of predominant
basins12
Odisha
Mahanadi, Godavari, Subarnarekha,
Brahmani & Baitarani, East Flowing Rivers
Mahanadi & Pennar
Moderately Stressed
Goa West Flowing Rivers from Tapi to Tadri Safe
Jharkhand Ganga, Mahanadi, Subarnarekha,
Brahmani & Baitarani Critically Scarce
Assam Brahmaputra, Barak & Others Safe
Tripura Barak & Others, Minor River Draining into
Myanmar (Burma) & Bangladesh Safe
Meghalaya Brahmaputra, Barak & Others Safe
Nagaland Brahmaputra, Barak & Others Safe
Arunachal Pradesh Brahmaputra Safe
Sikkim Brahmaputra Safe
West Bengal Brahmaputra, Ganga, Subarnarekha Moderately scarce
Jammu & Kashmir Indus Moderately scarce
Manipur Minor River Draining into Myanmar
(Burma) & Bangladesh, Barak & Others Safe
Mizoram Minor River Draining into Myanmar
(Burma) & Bangladesh, Barak & Others Safe
Storage Capacities
At present, the storage capacity in basins with large water potential such as the Ganga,
Brahmaputra, Indus, Godavari, Mahanadi, etc. is quite low. As of 2015, the storage capacity

Page | 13
created is only 253.4 BCM under major and medium irrigation projects and an additional capacity
of 51 BCM is likely to be created by the ongoing projects. Hence, 304.4 BCM will be available
storage once the projects are completed which is not even 45% of the total available surface
water resources potential in the country. The storage capacities in major basins vis-à-vis their
respective water resources potential based on the previous estimate of 1,869 BCM of Average
Annual Availability are shown herewith6:
Figure 8: Storage capacities across major river basins in India (in BCM)
A comparison of water storage capacity of India against other countries is provided in the section
below on “Benchmarking of Broad Sectoral Outcomes”. However, it may be mentioned here
that the storage capacity mentioned includes all major and medium irrigation projects while that
from minor structures is not reflected in the above analysis.
1.1.1.3 Groundwater Resources
Groundwater is one resource which is replenishable and dynamic in nature. It is of utmost
importance to periodically assess and monitor groundwater levels to understand availability and
quality of water resources over time and across aquifers. The natural phenomena which impacts
groundwater apart from rainfall include evapotranspiration, runoff, anthropogenic influences like
withdrawal from the aquifer, recharge due to irrigation systems and other practices like water
conservation.
Groundwater Levels in India
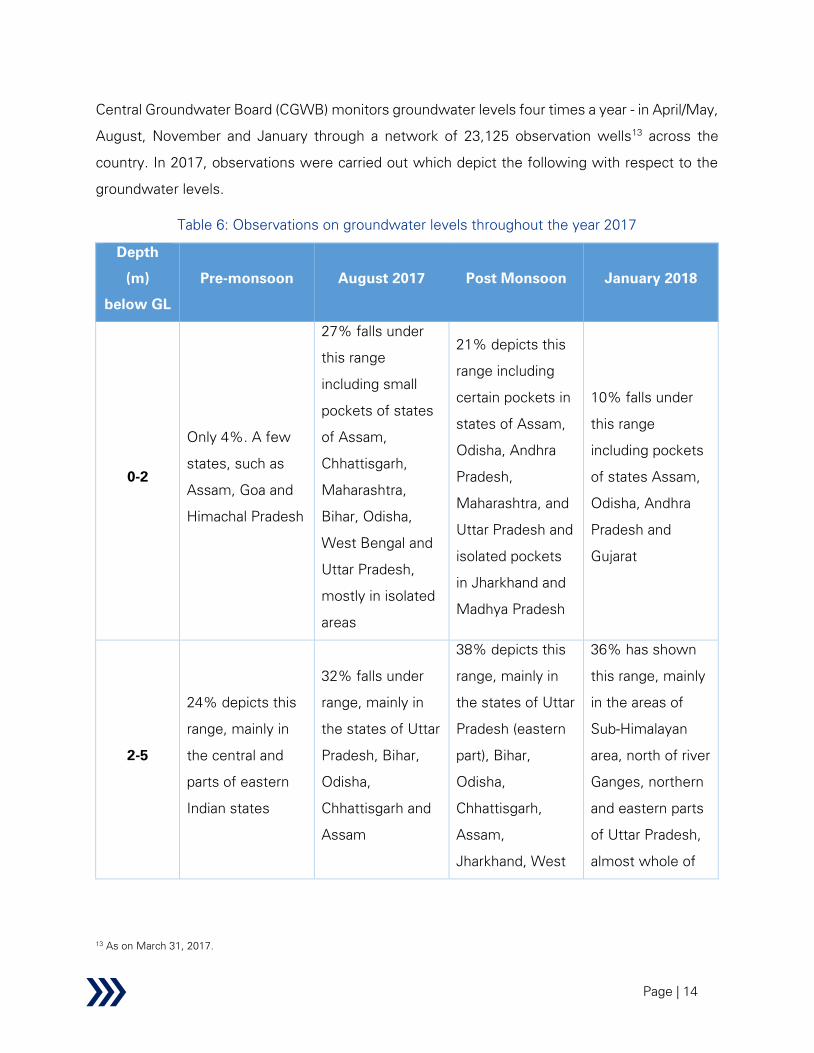
Page | 14
Central Groundwater Board (CGWB) monitors groundwater levels four times a year - in April/May,
August, November and January through a network of 23,125 observation wells13
across the
country. In 2017, observations were carried out which depict the following with respect to the
groundwater levels.
Table 6: Observations on groundwater levels throughout the year 2017
Depth
(m)
below GL
Pre-monsoon August 2017 Post Monsoon January 2018
0-2
Only 4%. A few
states, such as
Assam, Goa and
Himachal Pradesh
27% falls under
this range
including small
pockets of states
of Assam,
Chhattisgarh,
Maharashtra,
Bihar, Odisha,
West Bengal and
Uttar Pradesh,
mostly in isolated
areas
21% depicts this
range including
certain pockets in
states of Assam,
Odisha, Andhra
Pradesh,
Maharashtra, and
Uttar Pradesh and
isolated pockets
in Jharkhand and
Madhya Pradesh
10% falls under
this range
including pockets
of states Assam,
Odisha, Andhra
Pradesh and
Gujarat
2-5
24% depicts this
range, mainly in
the central and
parts of eastern
Indian states
32% falls under
range, mainly in
the states of Uttar
Pradesh, Bihar,
Odisha,
Chhattisgarh and
Assam
38% depicts this
range, mainly in
the states of Uttar
Pradesh (eastern
part), Bihar,
Odisha,
Chhattisgarh,
Assam,
Jharkhand, West
36% has shown
this range, mainly
in the areas of
Sub-Himalayan
area, north of river
Ganges, northern
and eastern parts
of Uttar Pradesh,
almost whole of
13 As on March 31, 2017.

Page | 15
Depth
(m)
below GL
Pre-monsoon August 2017 Post Monsoon January 2018
Bengal, Andhra
Pradesh,
Telangana,
Karnataka and
Maharashtra
Bihar, Andhra
Pradesh, Odisha,
Assam, coastal
parts of
Maharashtra
5-10
43% depicts this
range, mainly in
parts of
peninsular India
24% falls under
this range, mainly
in the states of
Andhra Pradesh,
Maharashtra,
Karnataka,
Telangana, Tamil
Nadu, Kerala,
north western
part of Uttar
Pradesh and West
Bengal
26% depicts this
range, mainly
parts of central
and peninsular
India
35% has shown
this range, mainly
parts of central
India, peninsular
India
10-20
23% falls under
this range,
including few
parts of north-
western and
western states
11% depicts this
range, including
central part of
West Bengal
11% has shown
this range,
including central
part of West
Bengal and
central India
14% falls under
this range,
including
peninsular part of
country
20-40
5% has shown
this range,
including major
parts of north-
western and
western states
3% depicts this
range, including
major parts of
central and
western India
3% has shown
this range,
including major
parts of north-
western states
4% falls under
this range,
including major
parts of north-
western states

Page | 16
Depth
(m)
below GL
Pre-monsoon August 2017 Post Monsoon January 2018
>40
2% falls under
this range,
including parts
Delhi, Chandigarh
and Rajasthan
1% depicts this
range, including in
some parts of
Delhi and
Rajasthan
1% has shown
this range,
including in
Haryana, and
Delhi and almost
major parts of
Rajasthan
1% depicts this
range, including in
some parts of
Haryana, and
Delhi and almost
major parts of
Rajasthan
It is quite evident that the sporadic rainfall patterns impact the groundwater level across various
parts of the country. We observe that even in a few states where average rainfall is much below
country average, certain areas witness shallow water level during monsoon on account of
sporadic heavy rainfall. However, rainfall during monsoon acts as the main source of
replenishment of groundwater, with substantial parts (more than 55%) of the country reporting
groundwater depth of 0-10 mduring monsoon . However, states like Haryana, Rajasthan, Delhi
show consistently higher depths of groundwater levels during entire year showcasing the
obvious water scarcity in these states.
Variance in Groundwater level over years
Over the last couple of decades, there has been gradual depletion of groundwater levels in India
primarily due to unregulated extraction of groundwater. The following figure depicts the
consistent increase in depth of groundwater availability in India.
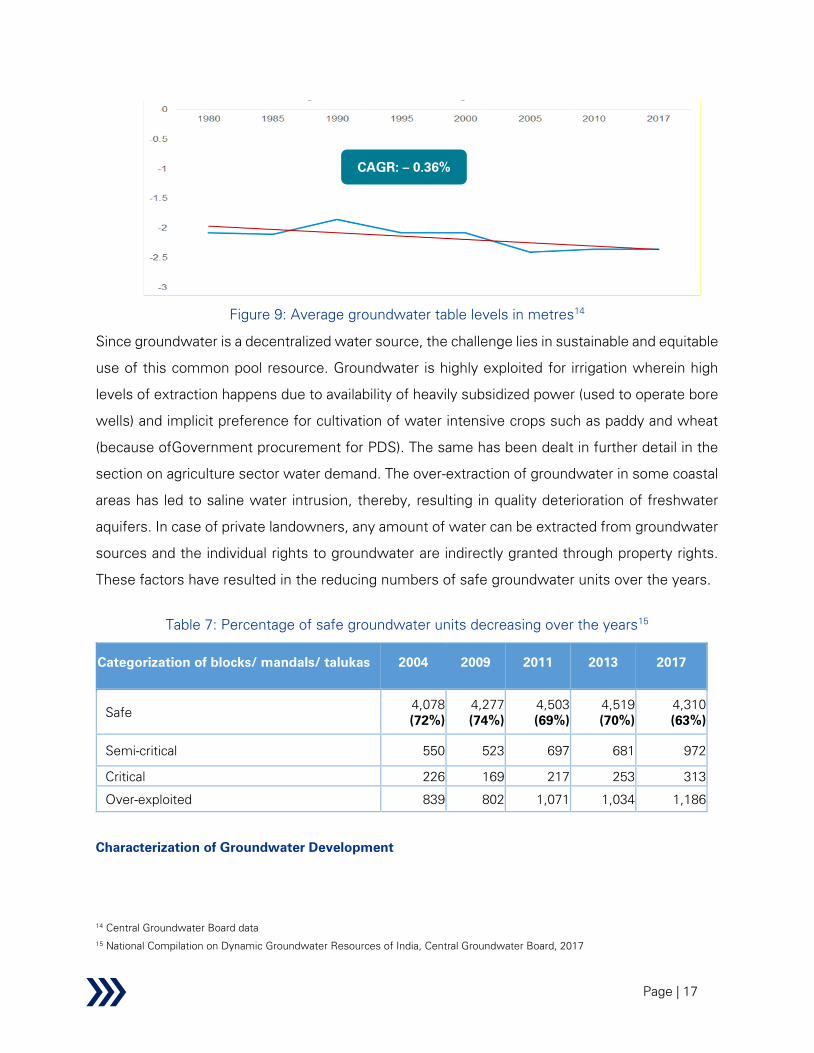
Page | 17
Figure 9: Average groundwater table levels in metres14
Since groundwater is a decentralized water source, the challenge lies in sustainable and equitable
use of this common pool resource. Groundwater is highly exploited for irrigation wherein high
levels of extraction happens due to availability of heavily subsidized power (used to operate bore
wells) and implicit preference for cultivation of water intensive crops such as paddy and wheat
(because ofGovernment procurement for PDS). The same has been dealt in further detail in the
section on agriculture sector water demand. The over-extraction of groundwater in some coastal
areas has led to saline water intrusion, thereby, resulting in quality deterioration of freshwater
aquifers. In case of private landowners, any amount of water can be extracted from groundwater
sources and the individual rights to groundwater are indirectly granted through property rights.
These factors have resulted in the reducing numbers of safe groundwater units over the years.
Table 7: Percentage of safe groundwater units decreasing over the years15
Categorization of blocks/ mandals/ talukas 2004 2009 2011 2013 2017
Safe 4,078
(72%)
4,277
(74%)
4,503
(69%)
4,519
(70%)
4,310
(63%)
Semi-critical 550 523 697 681 972
Critical 226 169 217 253 313
Over-exploited 839 802 1,071 1,034 1,186
Characterization of Groundwater Development
14 Central Groundwater Board data
15 National Compilation on Dynamic Groundwater Resources of India, Central Groundwater Board, 2017
CAGR: – 0.36%
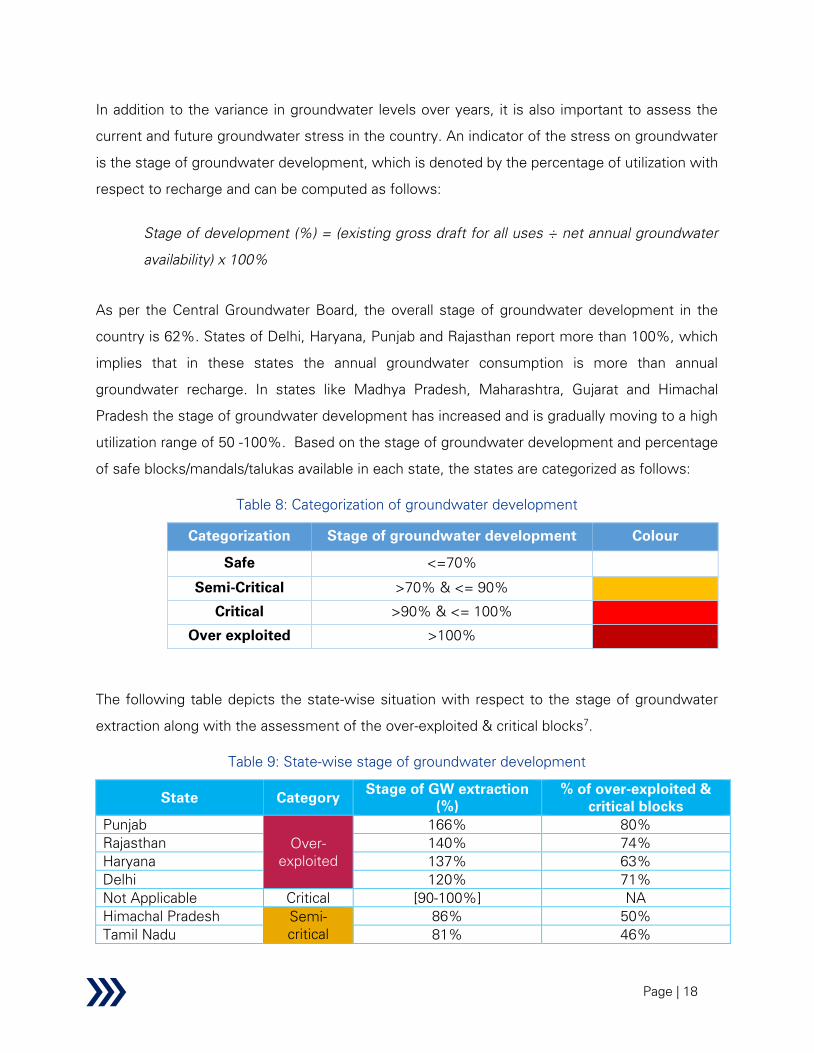
Page | 18
In addition to the variance in groundwater levels over years, it is also important to assess the
current and future groundwater stress in the country. An indicator of the stress on groundwater
is the stage of groundwater development, which is denoted by the percentage of utilization with
respect to recharge and can be computed as follows:
Stage of development (%) = (existing gross draft for all uses ÷ net annual groundwater
availability) x 100%
As per the Central Groundwater Board, the overall stage of groundwater development in the
country is 62%. States of Delhi, Haryana, Punjab and Rajasthan report more than 100%, which
implies that in these states the annual groundwater consumption is more than annual
groundwater recharge. In states like Madhya Pradesh, Maharashtra, Gujarat and Himachal
Pradesh the stage of groundwater development has increased and is gradually moving to a high
utilization range of 50 -100%. Based on the stage of groundwater development and percentage
of safe blocks/mandals/talukas available in each state, the states are categorized as follows:
Table 8: Categorization of groundwater development
Categorization Stage of groundwater development Colour
Safe <=70%
Semi-Critical >70% & <= 90%
Critical >90% & <= 100%
Over exploited >100%
The following table depicts the state-wise situation with respect to the stage of groundwater
extraction along with the assessment of the over-exploited & critical blocks7.
Table 9: State-wise stage of groundwater development
State Category Stage of GW extraction
(%)
% of over-exploited &
critical blocks
Punjab
Over-
exploited
166% 80%
Rajasthan 140% 74%
Haryana 137% 63%
Delhi 120% 71%
Not Applicable Critical [90-100%] NA
Himachal Pradesh Semi-
critical
86% 50%
Tamil Nadu 81% 46%

Page | 19
State Category Stage of GW extraction
(%)
% of over-exploited &
critical blocks
Puducherry 74% 25%
Uttar Pradesh 70% 17%
Karnataka
Safe
70% 30%
Telangana 66% 23%
Gujarat 64% 12%
Uttarakhand 57% 0%
Madhya Pradesh 55% 9%
Maharashtra 55% 6%
Kerala 51% 2%
Bihar 46% 6%
West Bengal 45% NA
Chhattisgarh 44% 1%
Andhra Pradesh 44% 0%
Odisha 42% 0%
Goa 34% 0%
Jammu & Kashmir 29% NA
Jharkhand 28% 2%
Assam 11% 0%
Tripura 8% 0%
Mizoram 4% NA
Meghalaya 2% 0%
Manipur 1% NA
Nagaland 1% 0%
Arunachal Pradesh <1% 0%
Sikkim <1% 0%
Of the 6,584 assessment units (viz. blocks/firkas/valleys/taluks/mandals/districts), as much as
32% are classified as over-exploited, critical or semi critical. The number of over-exploited and
critical administrative units is significantly higher in Delhi, Haryana, Himachal Pradesh, Karnataka,
Punjab, Rajasthan, Tamil Nadu and Uttar Pradesh.
Quality of Groundwater
The natural chemical content of groundwater is dependent on the depth of the soil and sub-
surface geological formations with which groundwater remains in contact. In addition to the
increase in exploitation of groundwater over the years, there have also been occurrences of
quality related issues for groundwater. “Geogenic pollution” of groundwater, which refers to
naturally occurring elevated concentration of certain elements in groundwater having negative

Page | 20
health effects, is more prevalent in India. In India, geogenic contamination by fluoride and arsenic
affecting several parts of the country is a major concern and remains a challenge for safe water
supply in the contaminated areas. High concentrations of parameters like salinity, iron,
manganese, uranium, radon and chromium, in groundwater, may also be of geogenic origin.
High concentration of fluoride in groundwater beyond the permissible limit of 1.5 mg/l poses
health problems. In many districts of India, this permissible limit has been breached. Arsenic as
a contaminant is significant in terms of its toxic nature and dangerous effects on the human body.
As per BIS 2012 (IS 10500:2012), the acceptable limit of arsenic is 0.01 mg/l and the permissible
limit in absence of alternate source is 0.05 mg/l. Large parts of the Ganga-Brahmaputra plains
have breached the permissible limits of arsenic. Other types of groundwater pollutants include
iron and nitrates. High concentration of iron (>1.0 mg/l) in groundwater has been observed in
more than 1.1 lakh habitations in the country. Iron contamination has been reported from the
states of Andhra Pradesh, Assam, Bihar, Chhattisgarh, Goa, Gujarat, Haryana, J&K, Jharkhand,
Karnataka, Kerala, Madhya Pradesh, Maharashtra, Manipur, Meghalaya, Orissa, Punjab,
Rajasthan, Tamil Nadu, Tripura, Uttar Pradesh, West Bengal and the UT of Andaman & Nicobar.
High nitrate concentration in groundwater in India has been found in almost all hydrogeological
formations and is indicative of high use of chemicals in agriculture16
.
The following figures show the arsenic and fluoride hotspots in India.16
16 http://cgwb.gov.in/wqoverview.html
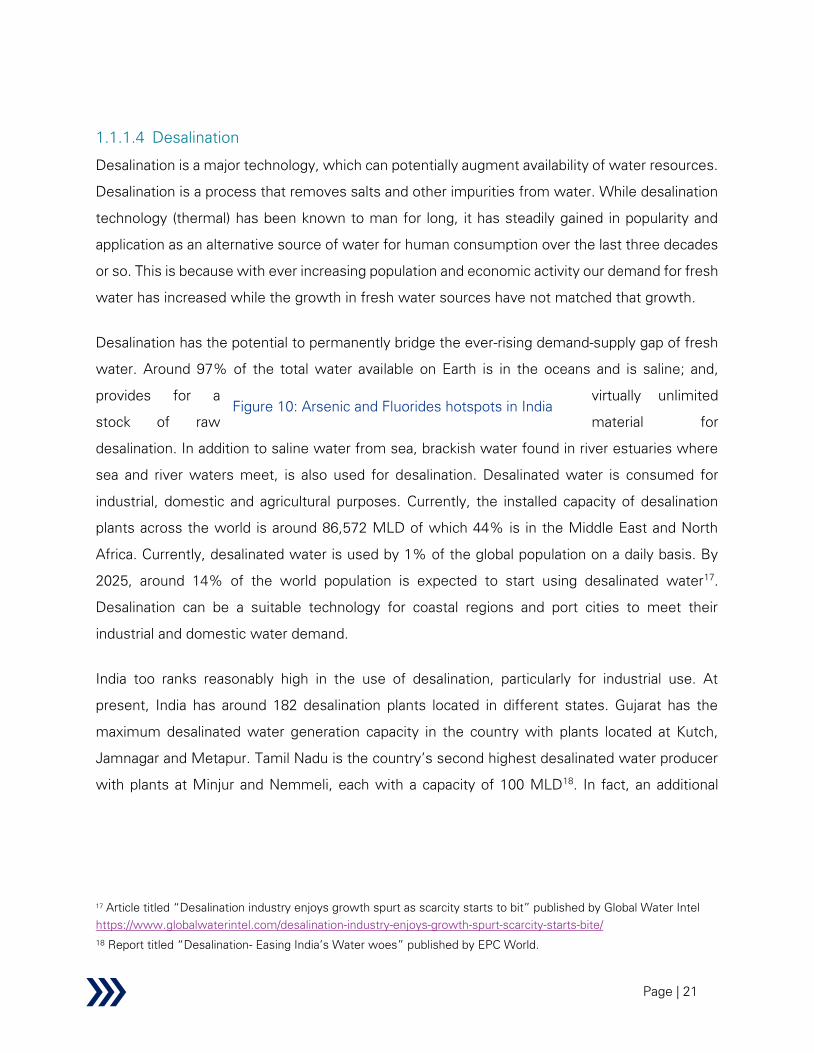
Page | 21
1.1.1.4 Desalination
Desalination is a major technology, which can potentially augment availability of water resources.
Desalination is a process that removes salts and other impurities from water. While desalination
technology (thermal) has been known to man for long, it has steadily gained in popularity and
application as an alternative source of water for human consumption over the last three decades
or so. This is because with ever increasing population and economic activity our demand for fresh
water has increased while the growth in fresh water sources have not matched that growth.
Desalination has the potential to permanently bridge the ever-rising demand-supply gap of fresh
water. Around 97% of the total water available on Earth is in the oceans and is saline; and,
provides for a virtually unlimited
stock of raw material for
desalination. In addition to saline water from sea, brackish water found in river estuaries where
sea and river waters meet, is also used for desalination. Desalinated water is consumed for
industrial, domestic and agricultural purposes. Currently, the installed capacity of desalination
plants across the world is around 86,572 MLD of which 44% is in the Middle East and North
Africa. Currently, desalinated water is used by 1% of the global population on a daily basis. By
2025, around 14% of the world population is expected to start using desalinated water17
.
Desalination can be a suitable technology for coastal regions and port cities to meet their
industrial and domestic water demand.
India too ranks reasonably high in the use of desalination, particularly for industrial use. At
present, India has around 182 desalination plants located in different states. Gujarat has the
maximum desalinated water generation capacity in the country with plants located at Kutch,
Jamnagar and Metapur. Tamil Nadu is the country’s second highest desalinated water producer
with plants at Minjur and Nemmeli, each with a capacity of 100 MLD18
. In fact, an additional
17 Article titled “Desalination industry enjoys growth spurt as scarcity starts to bit” published by Global Water Intel
https://www.globalwaterintel.com/desalination-industry-enjoys-growth-spurt-scarcity-starts-bite/
18 Report titled “Desalination- Easing India’s Water woes” published by EPC World.
Figure 10: Arsenic and Fluorides hotspots in India
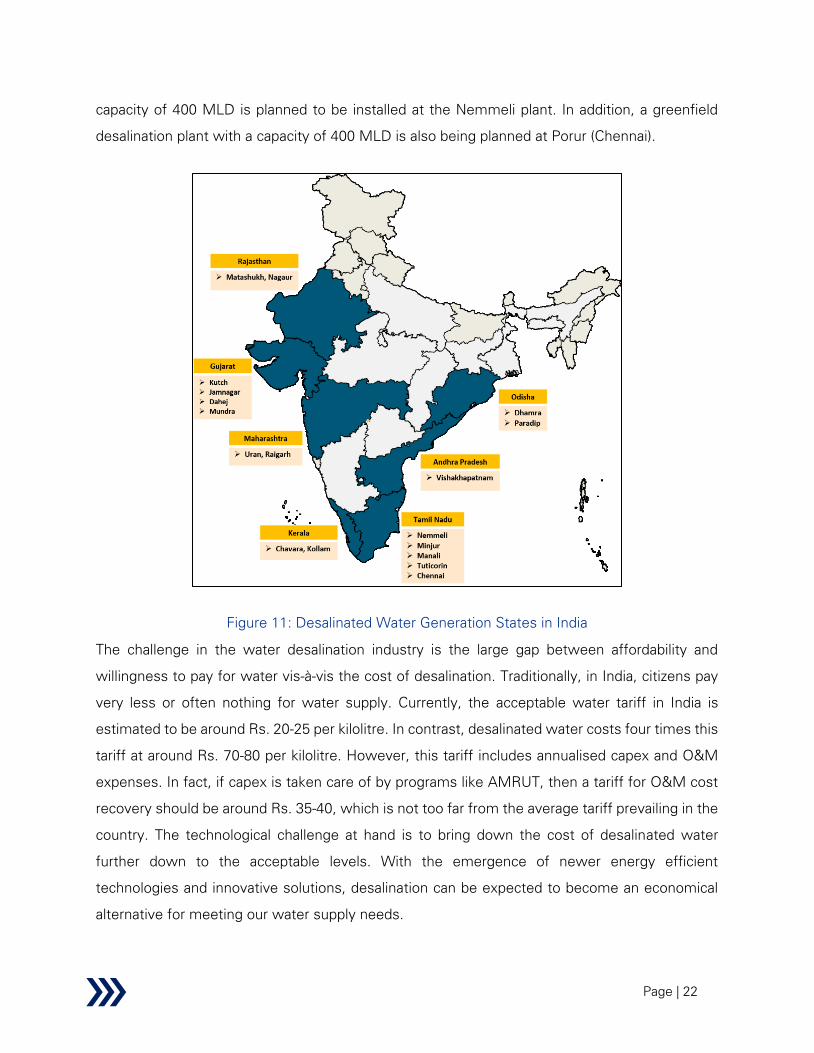
Page | 22
capacity of 400 MLD is planned to be installed at the Nemmeli plant. In addition, a greenfield
desalination plant with a capacity of 400 MLD is also being planned at Porur (Chennai).
Figure 11: Desalinated Water Generation States in India
The challenge in the water desalination industry is the large gap between affordability and
willingness to pay for water vis-à-vis the cost of desalination. Traditionally, in India, citizens pay
very less or often nothing for water supply. Currently, the acceptable water tariff in India is
estimated to be around Rs. 20-25 per kilolitre. In contrast, desalinated water costs four times this
tariff at around Rs. 70-80 per kilolitre. However, this tariff includes annualised capex and O&M
expenses. In fact, if capex is taken care of by programs like AMRUT, then a tariff for O&M cost
recovery should be around Rs. 35-40, which is not too far from the average tariff prevailing in the
country. The technological challenge at hand is to bring down the cost of desalinated water
further down to the acceptable levels. With the emergence of newer energy efficient
technologies and innovative solutions, desalination can be expected to become an economical
alternative for meeting our water supply needs.
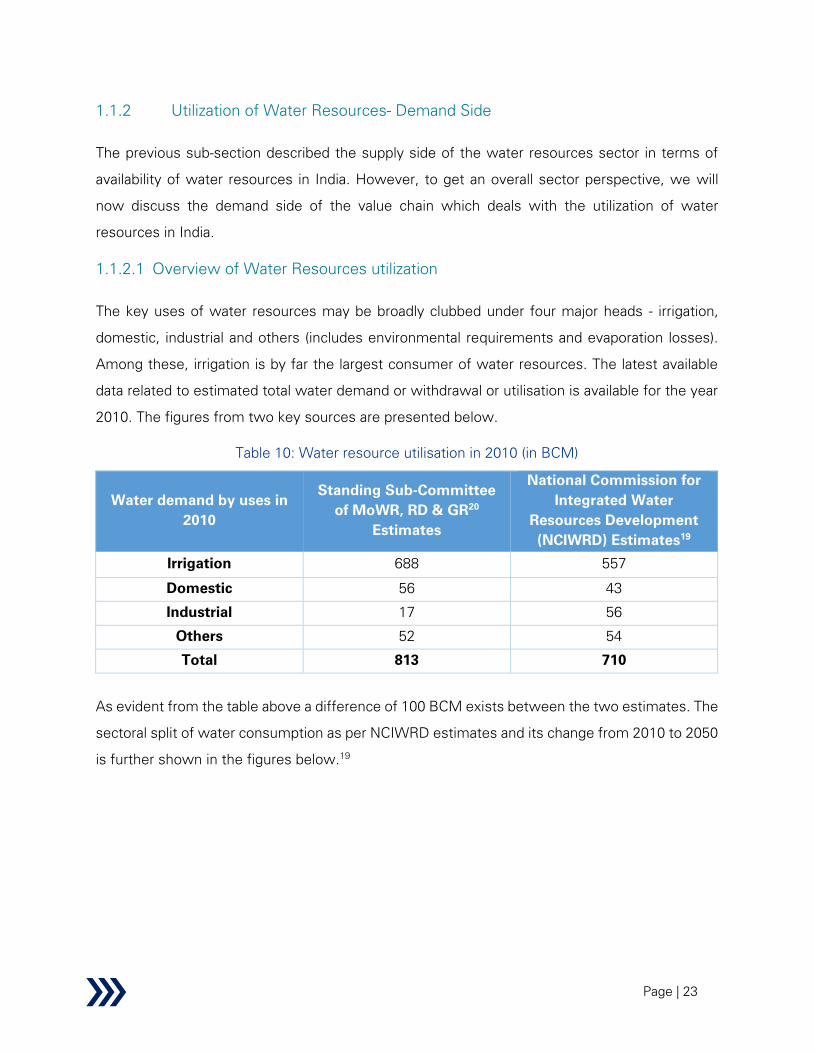
Page | 23
1.1.2 Utilization of Water Resources- Demand Side
The previous sub-section described the supply side of the water resources sector in terms of
availability of water resources in India. However, to get an overall sector perspective, we will
now discuss the demand side of the value chain which deals with the utilization of water
resources in India.
1.1.2.1 Overview of Water Resources utilization
The key uses of water resources may be broadly clubbed under four major heads - irrigation,
domestic, industrial and others (includes environmental requirements and evaporation losses).
Among these, irrigation is by far the largest consumer of water resources. The latest available
data related to estimated total water demand or withdrawal or utilisation is available for the year
2010. The figures from two key sources are presented below.
Table 10: Water resource utilisation in 2010 (in BCM)
Water demand by uses in
2010
Standing Sub-Committee
of MoWR, RD & GR20
Estimates
National Commission for
Integrated Water
Resources Development
(NCIWRD) Estimates19
Irrigation 688 557
Domestic 56 43
Industrial 17 56
Others 52 54
Total 813 710
As evident from the table above a difference of 100 BCM exists between the two estimates. The
sectoral split of water consumption as per NCIWRD estimates and its change from 2010 to 2050
is further shown in the figures below.19

Page | 24
Figure 12: Changes in sectoral demand for water from 2010 to 2050
Further, water resources utilisation or future water demand estimation has been performed by
multiple organisations. The National Commission for Integrated Water Resources Development
(NCIWRD) has projected the demand for water for the various sectors, viz. Irrigation, Domestic,
Industries, Power, Inland Navigation, Flood Control, Environment Afforestation, Environment
Ecology and Evaporation Losses for the year 2025 and 2050. The demand for all the sectors were
projected for both low and high demand scenarios. According to estimates, by the year 2050, the
total demand of water is expected to be 973 BCM for low demand scenario and 1,180 BCM for
high demand scenario. Moreover, the projected demand share is dominated by agriculture (68%)
followed by domestic (9%) and industries (7%) by 2050. The detailed demand breakup is
summarized in the table below19
.
Table 11: Future estimates of Water Requirement by uses (in BCM)
Water Demand (BCM)
# Use
2025 2050
Low High Low High
1. Irrigation 561 611 628 807
2. Domestic 55 62 90 111
19 Report of the National Commission on Integrated Water Resources Development (NCIWRD) - 1999
68%
9%
7%
6%2%
8%
2050
78%
6%
5%
3%1%7%
2010
Irrigation Domestic Industrial
Energy Environment Other

Page | 25
Water Demand (BCM)
# Use
2025 2050
Low High Low High
3. Industries 67 67 81 81
4. Power 31 33 63 70
5.
Inland
Navigation
10 10 15 15
6. Flood Control 0 0 0 0
7.
Environment
Afforestation
0 0 0 0
8.
Environment
ecology
10 10 20 20
9.
Evaporation
Losses
50 50 76 76
Total 784 843 973 1,180
Water demand has also been estimated by multiple other authors or organisations over the
period. These have been summarized below.
Table 12: Water Requirement or demand estimation by uses (in BCM)- Other sources
Projections as per Standing Sub-Committee of MoWR, RD & GR20
Water demand by uses 2025 2050
Irrigation 910 1,072
Domestic 73 102
Industrial 23 63
Power 15 130
Others 72 80
Total 1,093 1,447
Business as usual scenario- Water Demand projections- Paper on “India’s Water
Supply and Demand from 2025-2050”, International Water Management Institute21
20 Standing Sub-committee of MoWR, RD and GR Report- Basin Planning Directorate, CWC, XI Plan Document; Report of the Standing
Sub-Committee on "Assessment of Availability & requirement of Water for Diverse uses-2000
21 India’s Water Supply and Demand from 2025-2050”, International Water Management Institute
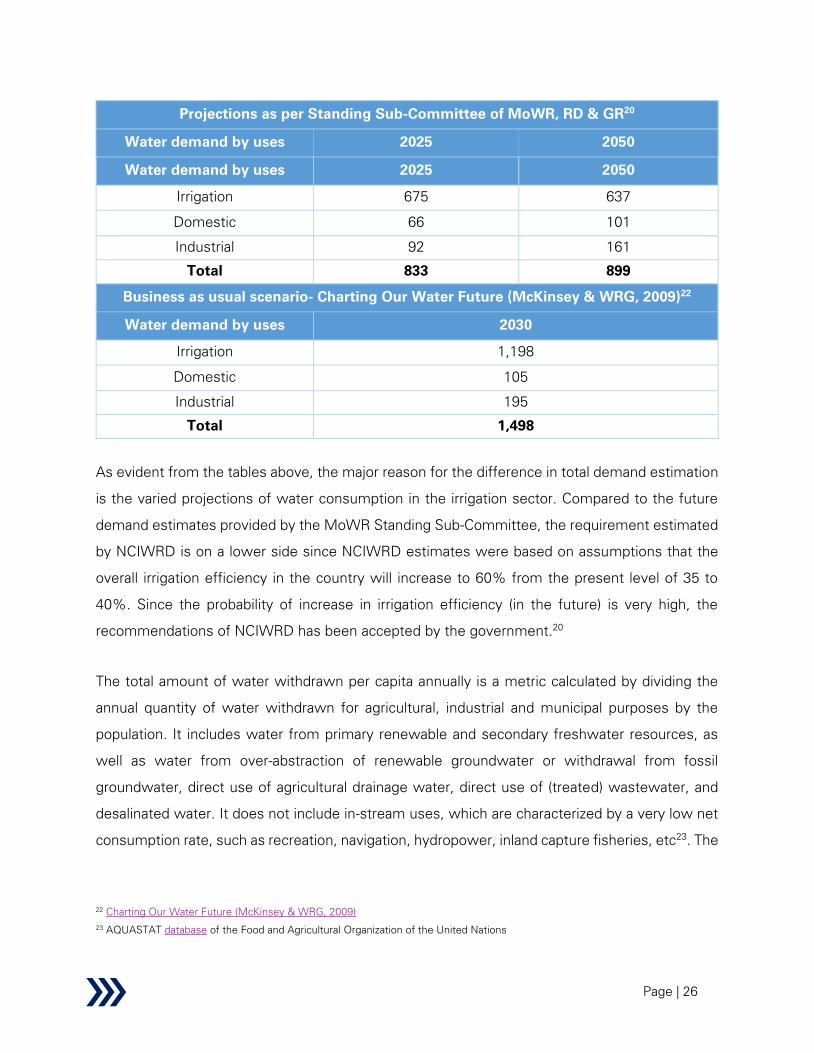
Page | 26
Projections as per Standing Sub-Committee of MoWR, RD & GR20
Water demand by uses 2025 2050
Water demand by uses 2025 2050
Irrigation 675 637
Domestic 66 101
Industrial 92 161
Total 833 899
Business as usual scenario- Charting Our Water Future (McKinsey & WRG, 2009)22
Water demand by uses 2030
Irrigation 1,198
Domestic 105
Industrial 195
Total 1,498
As evident from the tables above, the major reason for the difference in total demand estimation
is the varied projections of water consumption in the irrigation sector. Compared to the future
demand estimates provided by the MoWR Standing Sub-Committee, the requirement estimated
by NCIWRD is on a lower side since NCIWRD estimates were based on assumptions that the
overall irrigation efficiency in the country will increase to 60% from the present level of 35 to
40%. Since the probability of increase in irrigation efficiency (in the future) is very high, the
recommendations of NCIWRD has been accepted by the government.20
The total amount of water withdrawn per capita annually is a metric calculated by dividing the
annual quantity of water withdrawn for agricultural, industrial and municipal purposes by the
population. It includes water from primary renewable and secondary freshwater resources, as
well as water from over-abstraction of renewable groundwater or withdrawal from fossil
groundwater, direct use of agricultural drainage water, direct use of (treated) wastewater, and
desalinated water. It does not include in-stream uses, which are characterized by a very low net
consumption rate, such as recreation, navigation, hydropower, inland capture fisheries, etc23
. The
22 Charting Our Water Future (McKinsey & WRG, 2009)
23 AQUASTAT database of the Food and Agricultural Organization of the United Nations
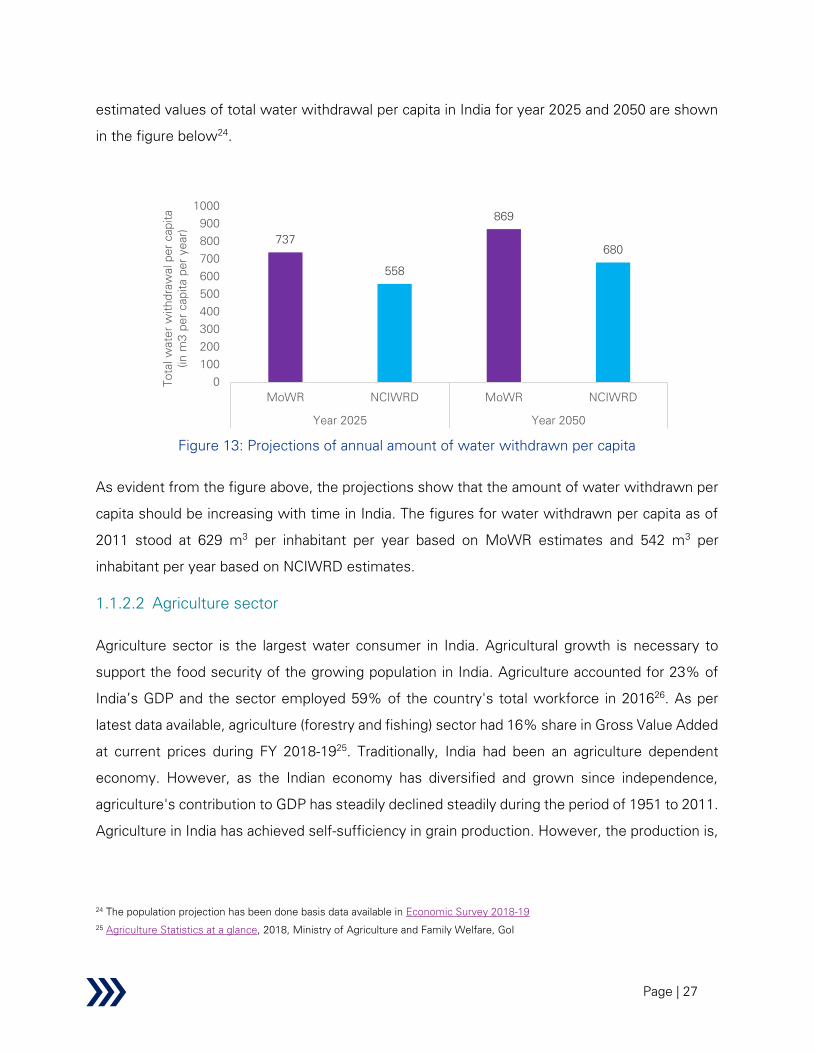
Page | 27
estimated values of total water withdrawal per capita in India for year 2025 and 2050 are shown
in the figure below24
.
Figure 13: Projections of annual amount of water withdrawn per capita
As evident from the figure above, the projections show that the amount of water withdrawn per
capita should be increasing with time in India. The figures for water withdrawn per capita as of
2011 stood at 629 m3 per inhabitant per year based on MoWR estimates and 542 m
3 per
inhabitant per year based on NCIWRD estimates.
1.1.2.2 Agriculture sector
Agriculture sector is the largest water consumer in India. Agricultural growth is necessary to
support the food security of the growing population in India. Agriculture accounted for 23% of
India’s GDP and the sector employed 59% of the country's total workforce in 201626
. As per
latest data available, agriculture (forestry and fishing) sector had 16% share in Gross Value Added
at current prices during FY 2018-1925
. Traditionally, India had been an agriculture dependent
economy. However, as the Indian economy has diversified and grown since independence,
agriculture's contribution to GDP has steadily declined steadily during the period of 1951 to 2011.
Agriculture in India has achieved self-sufficiency in grain production. However, the production is,
24 The population projection has been done basis data available in Economic Survey 2018-19
25 Agriculture Statistics at a glance, 2018, Ministry of Agriculture and Family Welfare, GoI
737
558
869
680
0
100
200
300
400
500
600
700
800
900
1000
MoWR NCIWRD MoWR NCIWRD
Year 2025 Year 2050
Total w
ate
r w
ithd
raw
al p
er cap
ita
(in
m
3 p
er cap
ita p
er ye
ar)

Page | 28
resource intensive, cereal centric and regionally biased. To make future agriculture growth
sustainable, efficient use of water resources will be necessary.26
Irrigation, which is defined as the application of water to soil for supplying the moisture essential
for plant growth, has a major impact on agriculture production and the wider economy. Irrigation
plays a vital role in bringing more area under cultivation, increasing crop yields and stabilizing
production. Depending on multiple factors like soil type, land topography, water availability,
nearby sources of water, size of the area being irrigated, etc., various types of irrigation
technologies/systems are implemented. Irrigation in India broadly includes well water irrigation
system, reservoir water irrigation system, canal irrigation system and water from multipurpose
river valley projects. These systems encompass a network of canals (major and minor),
groundwater, wells, tanks, pool, basin, lake, dams, rainwater harvesting projects, etc. Further,
irrigation involves diverse methodologies like flood irrigation, piped irrigation, manual irrigation,
surface irrigation, drip and sprinkler irrigation among others.27
The overall irrigated area and land use statistics of India is summarised in the table below.
Table 13: Land use statistics (2014-15)
Land use
Area25
(in Million hectares)
Geographical Area 328.73
Agricultural Land/ Cultivable
land/ Culturable land/ Arable
land
181.87
Cultivated Land 155.22
Net Area Sown 140.13
Total cropped Area 198.36
26 India at a glance- FAO, United Nations
27 FAO, United Nations; Review of Accelerated Benefits Programme, 2016-17

Page | 29
Land use
Area25
(in Million hectares)
Area sown more than once 58.23
Net Irrigated Area 68.38
Gross Irrigated Area 96.46
Area Irrigated more than
once
28.07
As evident from the table above, actual cultivated land comprised 85% of the total agricultural
land/cultivable land/culturable land/arable land. Moreover, the net area sown, and the net irrigated
area was 90% and 44% of the cultivated land respectively. Approximately, 49% of the agriculture
land was sown from various irrigation sources whereas the remaining 51% was rainfed.
Irrigation sector water demand
Irrigation water demand from over approximately 100 million hectares (Gross Irrigated Area)
makes it the major consumer of water resources in India. As described in the overview section
above, water consumption for irrigation may reduce from 78% of the total water use to 68% of
the total water consumption by 2050. As per the Mihir Shah Committee report (2016), historically,
for the first two decades after independence, water required for Irrigation across the country was
mainly supplied through large and medium irrigation dams constructed on our major river
systems. However, over the last four decades it is groundwater that has been the main source
of water. 28
The figure below summarises sources of water for irrigation in India and shows how
groundwater (irrigation largely carried out through wells including dug wells, shallow tube wells
and deep tube wells) has become the main source of irrigation at present. As shown in the figure
below, groundwater today provides more than 63% of water for irrigation29
.
28 Mihir Shah Committee Report, 2016
29 Irrigation- Statistical Year Book India 2018

Page | 30
Figure 14: Area under irrigation by source
Irrigation sector water supply
Irrigation projects in India are classified based on culturable command area (CCA) of the project.
A project having CCA of more than 10,000 hectares is termed as major irrigation project while a
project having CCA between 2,000 and 10,000 hectares is called a medium irrigation project. A
project/scheme having CCA up to 2,000 hectares is termed as minor irrigation scheme. The minor
irrigation projects (schemes) are further divided into two categories viz. surface water schemes
and groundwater schemes. Major and medium irrigation projects are generally surface water
projects. The overall irrigation development status as on March 2012 is summarised in the figure
below30
. It depicts the Ultimate Irrigation Potential (UIP), Irrigation Potential Created (IPC) and
Irrigation Potential Utilized (IPU). As evident from the figure below, the IPC in India comprises
56% from surface water sources and the remaining 44% from groundwater sources. Moreover,
groundwater contributes more than 76% of the total irrigation potential created through minor
irrigation projects. The created irrigation potential has also not been fully utilized and there exists
a gap of around 23 million hectares (21%) between the IPC and IPU. The IPC-IPU gap has existed
since 1974-75 as per the Mihir Shah Committee Report and measures are necessary to bring
down this gap.
30 UIP data based on Planning Commission (2009) Report of the Task Force on Irrigation; IPC and IPU data till the end of XI Plan (up
to March 2012)
Canals24%
Tanks2%
Tubewells46%
Other wells17%
Other sources11%
Percentage of Irrigated Area in 2014-15
(Total: 68.38 Million Hectare)
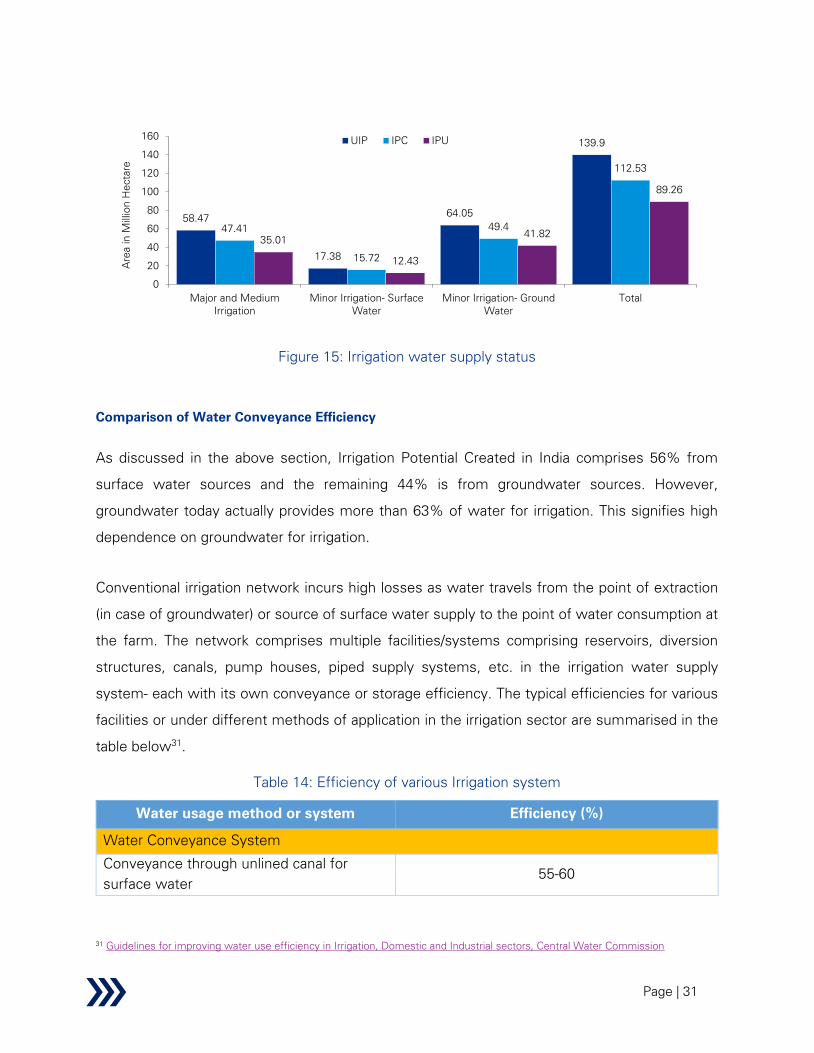
Page | 31
Figure 15: Irrigation water supply status
Comparison of Water Conveyance Efficiency
As discussed in the above section, Irrigation Potential Created in India comprises 56% from
surface water sources and the remaining 44% is from groundwater sources. However,
groundwater today actually provides more than 63% of water for irrigation. This signifies high
dependence on groundwater for irrigation.
Conventional irrigation network incurs high losses as water travels from the point of extraction
(in case of groundwater) or source of surface water supply to the point of water consumption at
the farm. The network comprises multiple facilities/systems comprising reservoirs, diversion
structures, canals, pump houses, piped supply systems, etc. in the irrigation water supply
system- each with its own conveyance or storage efficiency. The typical efficiencies for various
facilities or under different methods of application in the irrigation sector are summarised in the
table below31
.
Table 14: Efficiency of various Irrigation system
Water usage method or system Efficiency (%)
Water Conveyance System
Conveyance through unlined canal for
surface water
55-60
31 Guidelines for improving water use efficiency in Irrigation, Domestic and Industrial sectors, Central Water Commission
58.47
17.38
64.05
139.9
47.41
15.72
49.4
112.53
35.01
12.43
41.82
89.26
0
20
40
60
80
100
120
140
160
Major and Medium
Irrigation
Minor Irrigation- Surface
Water
Minor Irrigation- Ground
Water
Total
Area in
M
illion H
ectare
UIP IPC IPU

Page | 32
Water usage method or system Efficiency (%)
Conveyance through lined canal for surface
water
70-75
Piped Distribution network32
90
Water application System
Flood Irrigation 65
Furrow Irrigation 80
Sprinkler Irrigation 85
Drip Irrigation 90
Overall
Surface Water System 30-65
Groundwater System 65-75
As evident from the table above, irrigation using groundwater system is more efficient compared
to irrigation using surface water system. However, in addition to the above, the existing irrigation
systems in India do not operate at the designed levels of efficiency mainly due to inefficient
operation, poor/deferred maintenance and other factors. Overcoming these issues will result in
significant water savings in the sector. As per a CWC report, approximately 146 BCM31
savings
is possible in the irrigation sector itself.
1.1.2.3 Industrial sector
The Industrial sector in India is the second largest consumer of water resources in the country.
Further, energy sub-sector within the industrial sector is the largest industrial consumer of water.
Industrial water demand has been increasing with the pace of industrial development. In addition
to the energy sector, the growth in some of the other water intensive industries like iron & steel,
paper, textile, etc. has been quite significant, putting further pressure on the available water
resource. As per latest data available, industry (includes mining and quarrying, manufacturing,
electricity and other utility services and construction) sector had 29.80% share in Gross Value
Added at Current Prices during FY 2018-1933
. As described in the overview section above, water
consumption in the industrial sector may increase from 8% to 13% of the total water
32 Guidelines for planning and design of Piped Irrigation Network, MoWR- July 2017
33 Central Statistics Office (As per Press Release dated 28.02.2019)

Page | 33
consumption by 2050. Growing population as well as rising standard of living may further increase
the demand for industrial products, leading to an increase in future industrial water requirement.
At present, industrial sector in India consumes about 2 to 3.5 times more water per unit of
production compared to similar plants operating in developed countries34
.
Shortage of water, in the form of insufficient or erratic water supply is already impacting, and will
continue to impact, the industrial sector. This not only impacts the production processes of the
industry but also its efficiency. The Small-to-Medium Enterprise (SME) and Micro, Small and
Medium Enterprise (MSME) segment will be one of the worst affected due to the shortage and
increased cost of water. The most severely affected industries are likely to include water-
intensive sectors such as food & beverages, textiles, and paper and paper products. Amongst
these, the textiles industry alone contributes 4% towards India’s GDP, 14% to national industrial
production, and accounts for 17% of the country’s foreign exchange earnings35
.
Industrial sector water demand
Water requirements of major water intensive industries (other than power) in India is summarised
in the table below36
.
Table 15: Water requirement of various industries (in Million m3)
Category 2010 2025 2050
Iron & Steel 5,838 6,013 12,035
Smelters 24 32 44
Textiles & Jute 19,019 36,701 46,924
Leather Products 66 93 148
Inorganic
Chemicals
1,600 3,346 615
Pharmaceuticals 209 276 429
34 Socio-economic impact of commercial exploitation of water by industries, Standing Committee Report, MoWR, 2018
35 Composite Water Management Index, 2019, Niti Aayog
36 National Water Mission under National Action Plan for Climate Change- Volume II, 2008

Page | 34
Category 2010 2025 2050
Distillery 66 318 5,204
Paper & Pulp 207 10,240 19,490
Three major water intensive industrial sectors – power, iron & steel, and textile have been
discussed in this section. Power sector is the most water intensive industrial sector in India and
is often estimated and mentioned separately during water demand estimation exercises. As per
NCIWRD estimates cited in the overview section, as on 2010, power sector water demand is
34% of the total water demand for industrial sector. This will further go up to 46% (70 BCM) by
2050. Thermal power generation dominates energy production in India and is the major water
consuming sub-sector. As on March 2019, all India installed capacity of thermal power plants was
226 GW which comprises 64% of the total installed capacity of power stations in India.37
Approximately, 86% of India’s electricity is generated from thermal power plants that rely
significantly on water for cooling. Another 11% of electricity is generated from hydroelectric
plants, which depend on water completely.38
Due to unavailability of water, the operations of
thermal power plants have been severely affected and the power plants may be forced to shut
down or cut down generation in future. While generation from India’s thermal utilities grew by
40% from 2011 to 2016, freshwater consumption in the thermal utilities sector increased by
43%, from 1.5 BCM in 2011 to 2.1 BCM in 2016. However, water consumption in the thermal
power generation sector is estimated to stay below its 2016 level by 2027 if India’s renewable
energy goals are successfully achieved and the notified stringent water regulations are
implemented. 39
In addition to power sector, the iron & steel sector is another large consumer of India’s water
resources. Government has been monitoring the water consumption in the sector and has been
focused on reducing the discharge water and implementation of innovative solutions to recycle
37 Central Electricity Authority report as on 31
st March 2019
38 Central Electricity Authority report, March 2019
39 Luo, Tianyi, Deepak Krishnan, and Shreyan Sen. 2018. “Parched Power: Water Demands, Risks, and Opportunities for India’s
Power Sector.” Working Paper. Washington, DC: World Resources Institute. (http://www.wri.org/publication/parched-power)

Page | 35
and reuse water in the industry. The steel industry has also been planning to pursue strategies
to reduce specific water consumption per tonne of steel produced. According to the National
Steel Policy 2017, by 2030-31, the steel industry is annually estimated to require approximately
1.5 BCM of water40
.
Textile industry in India is another highly water intensive industry. Water is a key input for the
industry as textile production involves large amount of water consumed in the supply chain as
well as during direct operations. Moreover, the textile industry is largely dependent on the
availability of raw material, such as cotton, which itself is a highly water-intensive crop. Study by
the Centre for Science and Environment (CSE) had revealed that the water consumption by the
Indian textile industry alone was about 200-250 m3 of water per tonne cotton cloth in comparison
to the global best of less than 100 m3 per tonne cotton cloth. In addition, it is known that the
textile industry is mainly concentrated in a water-scarce region of India. Therefore, the long-term
viability and sustainability of the Indian textile industry hinges heavily on sustainable water
management practices41
.
Industrial sector water supply
Industrial demand for water is served by both groundwater (open wells, bore/ tube wells, etc.)
and surface water (Rivers, streams, lakes, reservoirs, ponds, etc.). Choice of source of water for
any industry often depends on the availability of adequate and regular supply of water as well as
the cost of water, as per requirement of the specific industry. Groundwater has emerged as an
important/preferred source to meet the water requirements of the industrial sector due to its
availability and private ownership.34
The analysis of water supplied to the Industrial sector in India by source of water is presented in
the figure below. As evident, surface water is the main source of water for the industries (41%)
followed by groundwater (35%). Usage of municipal water (24%) is mainly limited to industries
located in urban and peri-urban areas. In addition to the above, majority of industries use surface
water in conjunction with groundwater to cater to its needs. Groundwater often augments the
40 National Steel Policy, 2017
41 Water governance mapping report: Textile industry water use in India, Stockholm International Water Institute, 2016
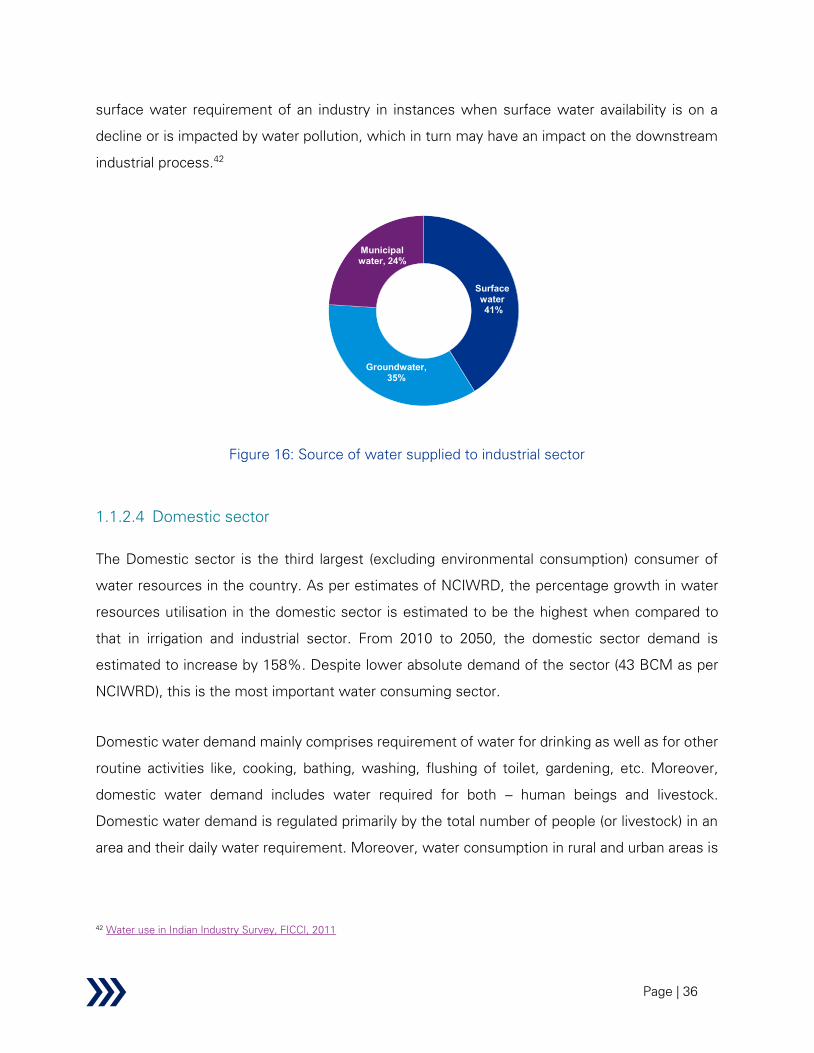
Page | 36
surface water requirement of an industry in instances when surface water availability is on a
decline or is impacted by water pollution, which in turn may have an impact on the downstream
industrial process.42
Figure 16: Source of water supplied to industrial sector
1.1.2.4 Domestic sector
The Domestic sector is the third largest (excluding environmental consumption) consumer of
water resources in the country. As per estimates of NCIWRD, the percentage growth in water
resources utilisation in the domestic sector is estimated to be the highest when compared to
that in irrigation and industrial sector. From 2010 to 2050, the domestic sector demand is
estimated to increase by 158%. Despite lower absolute demand of the sector (43 BCM as per
NCIWRD), this is the most important water consuming sector.
Domestic water demand mainly comprises requirement of water for drinking as well as for other
routine activities like, cooking, bathing, washing, flushing of toilet, gardening, etc. Moreover,
domestic water demand includes water required for both – human beings and livestock.
Domestic water demand is regulated primarily by the total number of people (or livestock) in an
area and their daily water requirement. Moreover, water consumption in rural and urban areas is
42 Water use in Indian Industry Survey, FICCI, 2011
Surfacewater41%
Groundwater, 35%
Municipal water, 24%

Page | 37
different due to the inherent lifestyle of the population. The National Water Policy (2012),
allocates highest priority to ensuring safe water availability for drinking, followed by water
allocated for other domestic uses (including needs of animals)43
.
Domestic sector water demand
As discussed above, drinking water is the primary component within domestic sector demand
and is of utmost priority to the government. Consumption in domestic water currently is and is
expected to be unequally distributed between the urban and rural population of India. While the
urban population’s consumption is at 195 litres per person per day (global average of 135 litres),
the rural population of India consumes as low as 50 litres per person per day44
. However, reports
also suggest that actual quantity of water reaching the consumers is much lower due to high
NRW losses in urban water supply networks across the country. The actual water available for
the users is less than 100 lpcd in the various urban centres.45
As on 2014, no major city in India supplied 24x7 water to its entire urban population and only
35% of urban households in India had piped water in their dwelling as the primary source to
support drinking water needs. The remaining rely on piped water to plot/yard, tube wells, and
public taps, among other sources35
. Increasing urbanisation coupled with rise in the consumption
pattern among the urban population, would mean a new challenge for water resources46
.
About 77%47
of rural households in India do not have individual piped water supply connections;
however physical rural water coverage is estimated to be 79%48
. Enormous progress has been
achieved in the rural drinking water sector due to increase in budget with 39 million people
gaining fully covered status each year. The Jal Jeevan Mission, announced in 2019, targets a
Functional Household Tap Connection (FHTC) for every rural household in the country by 2024,
supplying water at 55 lpcd on a regular basis and of prescribed quality (BIS: 10500 standard).
43 National Water Policy 2012, MoWR
44 Water for the Future- Challenges for India and its industries, 2012, Frost & Sullivan
45 Centre for Science and Environment (2017), Water Efficiency and Conservation in Urban India, Reference link: Link
46 UNICEF, FAO and SaciWATERs. 2013. Water in India: Situation and Prospects
47 Format C36 - No. of Individual households with PWS Connections, IMIS Reports, e-JalShakti website, as accessed on 07
th July,
2020
48 Format 1 - Target & Achievement of Habitation, IMIS Reports, e-JalShakti website, as accessed on 07th July, 2020
Page | 38
Domestic sector water supply
The main sources of water for the Domestic sector are groundwater (open wells, bore wells,
tube wells, etc.) and surface water (rivers, streams, lakes, reservoirs, ponds, etc.). Although
groundwater for domestic use comprised 9% of the total extracted groundwater in India, 50%
of urban domestic water requirements and 85% of rural domestic water requirements are fulfilled
by groundwater.49
1.1.2.5 Wastewater
Wastewater is defined as “used water from any combination of domestic, industrial, commercial
or agricultural activities, surface runoff/stormwater, and any sewer inflow/infiltration”.50
Domestic wastewater may be tapped and treated for reuse. Approximately 80% of the water
supplied for domestic use, comes out as wastewater. In majority of cases, wastewater is
discharged untreated and it either sinks into the ground as a potential pollutant of groundwater
or is discharged into the natural drainage system causing pollution in downstream areas. Sewage
Treatment Plants should be used to treat sewage generated from residential, institutional,
commercial and industrial establishments.51
Wastewater generation
During 2015, the estimated sewage generation in the country was 61,754 MLD (~23 BCM
annually) as against the developed sewage treatment capacity of 22,963 MLD (~8 BCM annually).
Low installed sewage treatment capacity has led to approximately 38,791 MLD of untreated
sewage (62% of the total sewage) being discharged directly into the environment52
. Out of the
total municipal wastewater generation, the sewage generation in metropolitan cities, Class I
cities and Class II towns account for 62% of the total sewage generated in the country. The
treatment capacity developed in the cities is only about 31% of the total wastewater generated
from the cities.51
49 Overview of Ground Water in India, February 2016, PRS
50 Tilley, E., Ulrich, L., Lüthi, C., Reymond, Ph., Schertenleib, R. and Zurbrügg, C., 2014. Compendium of Sanitation Systems and
Technologies. 2nd Revised Edition. Swiss Federal Institute of Aquatic Science and Technology (Eawag). Dübendorf, Switzerland
51 Inventorization of Sewage Treatment Plants, March 2015, CPCB
52 CPCB Bulletin, Volume-1, July 2016

Page | 39
Reports suggest approximately 60% of industrial wastewater generated (mostly from large
industries) in India is treated53
.
Wastewater reuse for circular economy
As India’s per capita water consumption grows rapidly, the quantum of the wastewater
generated will also rise. Untreated wastewater is the prime contributor of surface and
groundwater pollution in the country. The large volume of wastewater offers tremendous
potential for urban local bodies (ULBs) to recycle water within the cities and minimize their
dependency on bulk freshwater sources. While freshwater is required for human consumption,
wastewater can be treated up to the desired quality required for its subsequent utilisation and
can be safely reused for numerous purposes. Water recycling is generally interpreted as
reutilising or reusing treated wastewater for beneficial purposes such as agricultural and
landscaping irrigation, industrial processes, toilet flushing and several similar activities. Water
recycling not only offers additional resource but also leads to financial savings. Wastewater
treatment can also be tailored to meet the water quality requirements for a planned reuse. For
instance, recycled water for landscape irrigation would require less treatment than recycled water
used for cooling tower make-up. Currently, reuse of treated wastewater in the irrigation sector is
mostly prevalent across the world with 32% of reuse application. However, the major challenge
in using recycled water for agriculture is to shift from informal and unplanned use of partially or
untreated wastewater to planned safe uses54
. Additionally, as per orders from the Ministry of
Power, from March 2020, all Thermal Power Plants have been mandated to use treated
wastewater as per the provisions of the Tariff Policy 2016, provided there is an STP within 50 km
radius of the power plant.
Numbers related to wastewater reuse in India are not available. However, many states in India
have formulated wastewater treatment and reuse policy. The figure below summarises the
wastewater reuse policy of various states in India. Once adopted on a massive scale, reuse of
treated wastewater can certainly minimize our dependency on bulk freshwater resources.
53 R Kaur, SP Wani, AK Singh and K Lal, Wastewater production, treatment and use in India.
54 WWAP (United Nations World Water Assessment Programme). 2017. The United Nations World Water Development Report
2017. Wastewater: The Untapped Resource. Paris, UNESCO

Page | 40
Figure 17: Summary of wastewater treatment and reuse policy across states in India
1.2 Performance of the sector
1.2.1 Analysis based on key enquiry areas
The study of the sector background in the preceding section has enabled in identification of
multiple key enquiry areas related to the sector. In this section, we intend to undertake a deeper
analysis of the performance of the sector with respect to enquiry areas identified through
secondary literature and data collected through primary research (viz. key informant interviews
with various stakeholders associated with the sector, focus group discussions and household
surveys). The table below presents a summary of the evaluation objectives, specific areas of
enquiry and findings from secondary literature as well as primary research.
Table 16: Performance of the sector with respect to key enquiry areas
Key Evaluation
sectoral
objective
Area of enquiry Findings from the research
Adequacy Secondary:
Page | 41
Key Evaluation
sectoral
objective
Area of enquiry Findings from the research
Overall water
storage capacity as
well as water
storage capacity per
capita in dams
• Storage capacity is low in large basins (Ganga,
Brahmaputra, Indus, Godavari, Mahanadi)
• Storage of 253 BCM under major and medium
irrigation projects created with additional 51
BCM under works (2015)
• Storage of less than 45% of total available
surface water potential of 690 BCM
Source- EnviStat India 2018, MOSPI
Primary:
Increasing water storage in existing storage
structures
• Siltation of reservoirs is a cause of reduction in
water storage capacity. A national level
stakeholder clarified that de-siltation of
reservoirs is not taken up at the central level
since this comes under the purview of states
• The GoI is however looking at improving dam
management through a World Bank supported
program called Dam Rehabilitation and
Improvement Programme (DRIP). The project
aims at improving the safety and operational
performance of existing dams through repair
and rehabilitation of about 223 dam projects
across seven states, namely, Jharkhand (DVC),
Karnataka, Kerala, Madhya Pradesh, Odisha,
Tamil Nadu, and Uttarakhand (UJVNL). The
program was initiated in April 2012 and
scheduled to complete in June 2020 at a cost of

Page | 42
Key Evaluation
sectoral
objective
Area of enquiry Findings from the research
Rs, 3,466 Cr. 55
However, the existing project
did not have any specific component to increase
the storage capacity of the dams; instead it
focussed on dam safety and O&M aspects.
• Phase 2 and 3 of DRIP is proposed to be
launched soon across 18 states at an estimated
cost of Rs. 10,200 Cr., over a duration of 10
years. The key components should be (a)
Rehabilitation and improvement of dams (b)
Dam safety institutional strengthening (c)
Revenue generation for sustainable O&M (d)
Project Management56
• As per CWC, currently in most states, budgets
for dam O&M are part of the larger budget for
irrigation and canal maintenance which is
decided based on irrigated area. In practice,
irrigation and canal maintenance tend to get
greater priority, with the result that dam O&M
is relatively neglected. Allocations for dam O&M
need to be more in line with need-based
assessments.57
Moreover, an independent
expert also pointed out, all state WRDs should
have scheduled, pre-planned maintenance
budget for dams.
55 Website of DRIP
56 DRIP Phase 2 and 3 project brochure
57 Financial Management Manual- Dam Rehabilitation & Improvement Project, Central Water Commission

Page | 43
Key Evaluation
sectoral
objective
Area of enquiry Findings from the research
Case Study: Efficient O&M by the Bhakra
Beas Management Board (BBMB)
The BBMB was formed in 1966 in the state of
Punjab to undertake administration,
maintenance and operation of Bhakra Nangal
Project. As on date, the BBMB is responsible for
administration, Operations & Maintenance of
large dams- the Bhakra-Nangal Project, Beas
Project Unit-I (Beas Sutlej Link Project) and Beas
Project Unit- II (Pong Dam) in Northern India.
BBMB generates its own revenue (mainly from
power generation), and they have their own
team and dedicated staff to perform the required
O&M activities based on maintenance manual
and a schedule of O&M activities. BBMB was
awarded the most prestigious National Level
Award for 'Bhakra Dam', as "Best Maintained
Project (Functional for more than 50 years)".
Source: BBMB website
• Another common issue which the Expert
pointed is that often multiple organizations are
involved in operations of the dams on a river and
they don’t have enough coordination
mechanism for operations & data sharing. This
often is a major hurdle and the dam owners are
not able to maximise storage utilisation of dams
or reservoirs on the same river basin
Page | 44
Key Evaluation
sectoral
objective
Area of enquiry Findings from the research
Case Study: Resilient Kerala Program- World
Bank
World Bank has sanctioned a loan of USD 90 Mn
in 2019 to the Government of Kerala for the
Resilient Kerala Program. The Program
Development Objective (PDO) is to enhance the
State of Kerala's resilience against the impacts
of natural disasters and climate change. An
integrated river basin planning and management
based on the River Basin Conservation and
Management Act is being undertaken as part of
the program. The major activities include
(i) Developing and operating modern
information and analytical systems to
improve the quality and reliability of data
and information, enhance real-time
monitoring, and improve the scientific
basis for informed decision making in the
water sector;
(ii) Integrating planning across all water-
related sectors on a basin or sub-basin
basis, including developing water
allocation and use strategies;
(iii) Strengthening systems for coordinated
real-time water infrastructure (for
example, dams and irrigation networks),
including rolling out state-wide flood
forecasting and early warning systems
and improving the integrated operation of

Page | 45
Key Evaluation
sectoral
objective
Area of enquiry Findings from the research
reservoirs in the State through updated
cross-sectoral operation guidelines.
Source: Program Document- Resilient Kerala
Program- World Bank
• In the state of Manipur, the height of one of the
major dams has been increased by 1m to
increase the overall storage capacity and results
have been satisfactory. However, no desilting
activities have been undertaken
Construction of new storage structures
• A national level stakeholder suggested that the
priority of the Central Government in recent
years has been to focus on creation of smaller
decentralised storage structures across the
country. An Independent Expert supported the
view of the government
• Multiple national level stakeholders mentioned
that construction of large dams have large
environmental impact and high rehabilitation
costs. Moreover, they take a significant amount
of time for completion. For instance, planning of
additional dams on Ganges and Yamuna may
now pose significant environmental concerns
since it is essential to maintain an optimal inflow
to ensure river health (environmental flow).
Moreover, in the absence of inflow, the
groundwater availability also suffers

Page | 46
Key Evaluation
sectoral
objective
Area of enquiry Findings from the research
Case Study: Catch the Rain- NWM
National Water Mission (NWM) started the
campaign “Catch The Rain” in March 2020 to
nudge the states and the various stakeholders to
create appropriate Rain Water Harvesting
Structures suitable to the climatic conditions and
sub-soil strata before monsoon.
Under this campaign, implementation of check
dams, water harvesting pits, rooftop RWHS etc;
removal of encroachments and de-silting of
tanks to increase their storage capacity; removal
of obstructions in the channels which bring
water to them from the catchment areas etc;
repairs to step-wells and using defunct bore
wells and unused wells to put water back to
aquifers are being taken up with the active
participation of people.
The basic aim is to limit the water to flow out of
the compound and improve soil moisture and
groundwater table. In urban areas it will reduce
water gushing onto roads, damaging them and
will prevent urban flooding.
All District Collectors, heads of institutions like
IIMs, IITs, Central Universities, Private
Universities, Chairmen of Railways, Airport
Authority, PSUs; DGs of Central Armed Police
Force, etc having large tracts of lands with them
Page | 47
Key Evaluation
sectoral
objective
Area of enquiry Findings from the research
have been requested to take steps to “Catch the
Rain”.
Source: NWM website
• The stakeholder also mentioned that going
forward, there is a need to measure the water
storage capacity of smaller storage structures in
addition to large irrigation projects. The 6th
Minor Irrigation Census along with first Census
of Water Bodies being conducted with
Reference Year 2017-18 and scheduled to be
released in FY 2020-21 is an important data
point in this aspect.
• Two national level stakeholders have
mentioned that small barrages, check dams
may continue to be developed (wherever
feasible) since these involve less land
acquisition and are more cost-effective ways of
increasing the existing storage capacity.
• The states of Bihar and Manipur have also
mentioned that the focus is now on creating
smaller decentralized storage structures. This is
mainly since creation of large dams involve high
rehabilitation costs, delays due to land
acquisition issues and environmental concerns.
• In the case of Himachal Pradesh it was
mentioned, that since it is a hilly state, check
dams and gully plugs may be used to capture

Page | 48
Key Evaluation
sectoral
objective
Area of enquiry Findings from the research
rainfall water that otherwise runs off. Additional
storage capacity needs to be created to store
this water.
Inference:
• There are no specific schemes or initiatives
targeted at increasing the storage capacity of
dams. However, states are taking some
initiatives like increasing dam height. Desilting,
catchment area treatment, etc. are yet to be
systematically adopted and has the effect of
reclaiming lost storage capacity.
• DRIP-Dam Rehabilitation and Improvement
Programme (World Bank funded) has been
implemented in select states and aims at
rehabilitation and maintenance of select
existing dams. Phase 2 and 3 of DRIP aims to
bring more dams under its purview.
• The focus is on creating small decentralised
storage structures across the nation. This is
mainly since creation of large dams involve high
rehabilitation costs, suffer from delays due to
land acquisition issues and environmental
concerns.
• Budgets for dam O&M are part of the larger
budget for irrigation and canal maintenance. In
practice, irrigation and canal maintenance tend
to get greater priority, with the result that dam
O&M is relatively neglected.

Page | 49
Key Evaluation
sectoral
objective
Area of enquiry Findings from the research
• Small barrages, check dams may continue to be
developed (wherever feasible) since these
involve less land acquisition and are more cost-
effective ways of increasing the existing
storage capacity
Access IPC-IPU Gap
Secondary:
• IPC-IPU gap of 23 M ha (i.e. 21%)
• Faulty designs, unlined canals, lack of desilting,
poor O&M of distribution channels and
ineffective WUAs key factors
• Shift in cropping pattern towards water
intensive crops at upper end of command area
another major factor.
Source: UIP data based on Planning Commission
(2009) Report of the Task Force on Irrigation; IPC
and IPU data till the end of XI Plan (up to March
2012)
Primary:
Measures to reduce the Gap
• The national level stakeholder shared that the
AIBP and CADWM components of PMKSY with
99 priority projects are the focus projects of GoI.
These intend to address the gaps between UIP-
IPC and IPC-IPU respectively. The delay
between construction of dam and main canal
vis-à-vis field channels and developing the
command area is a key reason for the IPC-IPU
gap. Ensuring that the last mile connectivity of

Page | 50
Key Evaluation
sectoral
objective
Area of enquiry Findings from the research
the canal network to farms is necessary to
reduce this gap.
• The completion of the PMKSY projects and
focus on micro-irrigation by the GoI, will improve
water use efficiency and help in reducing the
IPC and IPU gap
• An Independent Expert shared that often
farmers (especially in head-end of a canal)
switch to water-intensive crops once canal
water is available. This leads to greater quantity
of actual water requirement than the design
requirement. As a result downstream farmer
will not receive the designed water quantity and
lead to increase in the IPC-IPU Gap
• In Manipur, to reduce the gap, piped irrigation
network project is being piloted and micro-
irrigation is being focussed upon.
• However, post construction of canals in
Manipur and Bihar, O&M funds are not available
with the department to undertake regular
maintenance activities. Due to the same, lining
works for old canals have also been pending.
This leads to seepage losses during conveyance
which further increases the IPC-IPU gap.
Assessment related methodology
• Independent Experts shared that due to the
inherent design and conveyance inefficiency of
canal irrigation network, a significant quantity of

Page | 51
Key Evaluation
sectoral
objective
Area of enquiry Findings from the research
groundwater recharge occurs in the command
area. The present calculations of irrigation
potential utilized does not take into
consideration the additional water available for
pumping due to seepage losses of the canal
system.
Case Study: Sina Irrigation system
Maharashtra- IWMI study
A study in Maharashtra by the International
Water Management Institute to assesses the
irrigation performance of Sina Irrigation project
has demonstrated the following
1) The analysis based on satellite data
shows the actual water influence zone
(WIZ) of Sina irrigation system is
substantially larger than the designed
canal command area.
2) Satellite-data based estimate of the ratio
of IPU to IPC is considerably larger than
the official estimate, primarily due to
conjunctive use of groundwater.
3) The existing cropping patterns generate
a substantially higher value of output
Page | 52
Key Evaluation
sectoral
objective
Area of enquiry Findings from the research
than that based on the designed
cropping patterns.
It is evident from the above study that in the
same irrigation command area after the
introduction of canal, farmers started using the
GW in the command area extensively. This is
mainly due to the natural recharge of the
groundwater from the return flow of the canal
irrigation system.
Source: Abstracts- 2nd
International Conference
on Sustainable Water Management, WRD, GoM
• The state of Manipur shared that coordination
and data management issues between
departments often lead to mis-calculations
related to IPC and IPU. It is therefore
undertaking remote sensing studies and aerial
surveys to measure and quantify the IPU on
scientific basis. North East Water Resources
Information Base – a geoportal funded by World
Bank has been created for this purpose. The
actual command area related data should now
be available on a real-time basis.
Inference:
• The IPC-IPU gap can be reduced by focusing on
last mile connectivity and completing the AIBP
and CADWM projects

Page | 53
Key Evaluation
sectoral
objective
Area of enquiry Findings from the research
• Innovative technologies like piped irrigation and
micro-irrigation can help in reducing the gap
further. The switching of head-end farmers to
water -intensive crops also leads to IPC-IPU gap
as tail-end farmers remain deprived of water
(which was theoretical IPC of the project as per
initial designs and planning)
• Due to lack of O&M funds, lining activities and
other maintenance activities remain incomplete
causing water losses
• Coordination and data gaps between
departments at the state level leads to improper
assessment of IPC and IPU; remote sensing and
aerial survey activities can help in this aspect.
• The present calculations of irrigation potential
utilized does not take into consideration the
water made available for additional pumping due
to groundwater recharge from the seepage
losses of the canal system.
Equity
Spatial variance in
surface water
availability and River
interlinking
Secondary:
• Avg. surface water potential – 1,999 BCM (at
75% dependability – 1,750 BCM) from 20 river
basins
• Avg. per capita surface water potential –1,537
cu. m.
• High spatial variance – 7 river basins endowed
with 49% of water resources but with only 14%
of country’s population

Page | 54
Key Evaluation
sectoral
objective
Area of enquiry Findings from the research
Source: Reassessment of water availability in basins
using space inputs- Central Water Commission-
2019 Study
Primary:
• National level stakeholder shared that river-
interlinking projects to reduce the spatial
variance is the focus of GoI. Accordingly, 38
links have been identified in peninsular and
Himalayan rivers
• DPRs and technical work have been completed
for these river interlinking projects and there are
four link projects that are ready to be
implemented
• For instance, the Ken-Betwa link is ready to be
implemented. However, there are unresolved
issues between the state governments of
Madhya Pradesh and Uttar Pradesh. Perception
issues and reservations over water sharing,
have led to delays in implementation. Several
rounds of negotiations are being undertaken to
solve the issues.
• Despite high level of technical preparedness,
the political issues around the interlinking of
river projects are leading to delays.
• Water being a state subject, coordination
among states is required. The central
government has been acting as the mediator
• For every interlinking project, detailed
environmental impact assessments, social
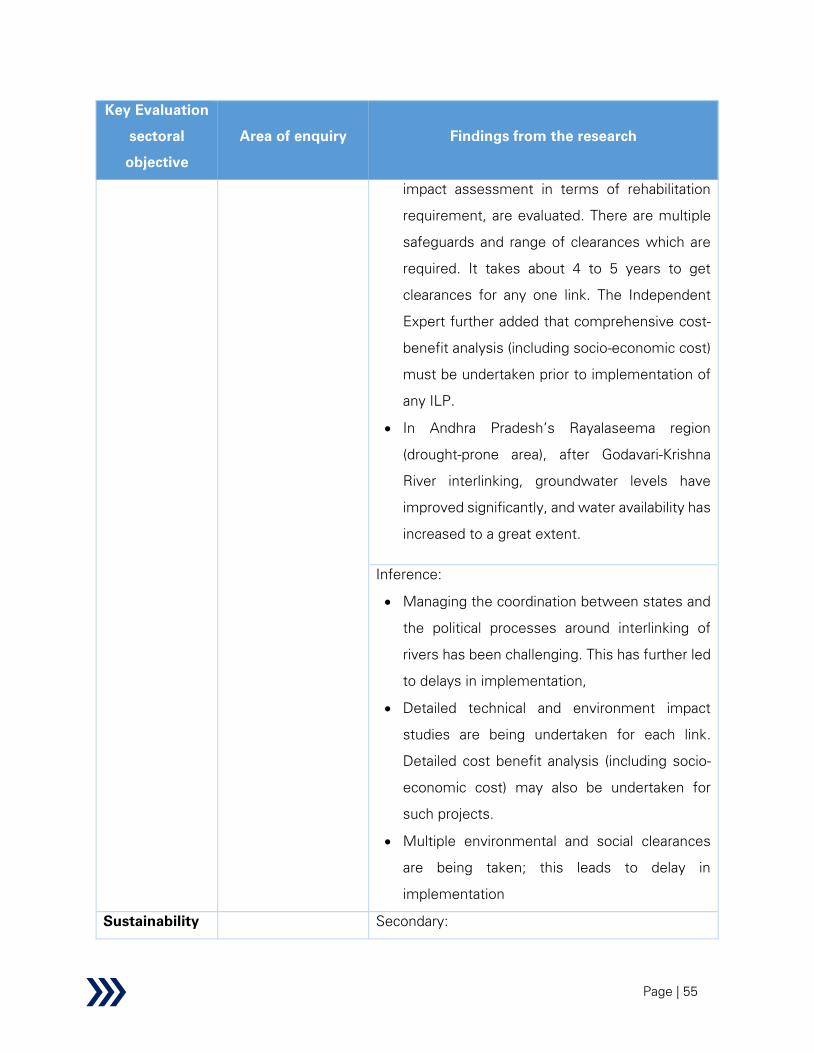
Page | 55
Key Evaluation
sectoral
objective
Area of enquiry Findings from the research
impact assessment in terms of rehabilitation
requirement, are evaluated. There are multiple
safeguards and range of clearances which are
required. It takes about 4 to 5 years to get
clearances for any one link. The Independent
Expert further added that comprehensive cost-
benefit analysis (including socio-economic cost)
must be undertaken prior to implementation of
any ILP.
• In Andhra Pradesh’s Rayalaseema region
(drought-prone area), after Godavari-Krishna
River interlinking, groundwater levels have
improved significantly, and water availability has
increased to a great extent.
Inference:
• Managing the coordination between states and
the political processes around interlinking of
rivers has been challenging. This has further led
to delays in implementation,
• Detailed technical and environment impact
studies are being undertaken for each link.
Detailed cost benefit analysis (including socio-
economic cost) may also be undertaken for
such projects.
• Multiple environmental and social clearances
are being taken; this leads to delay in
implementation
Sustainability Secondary:
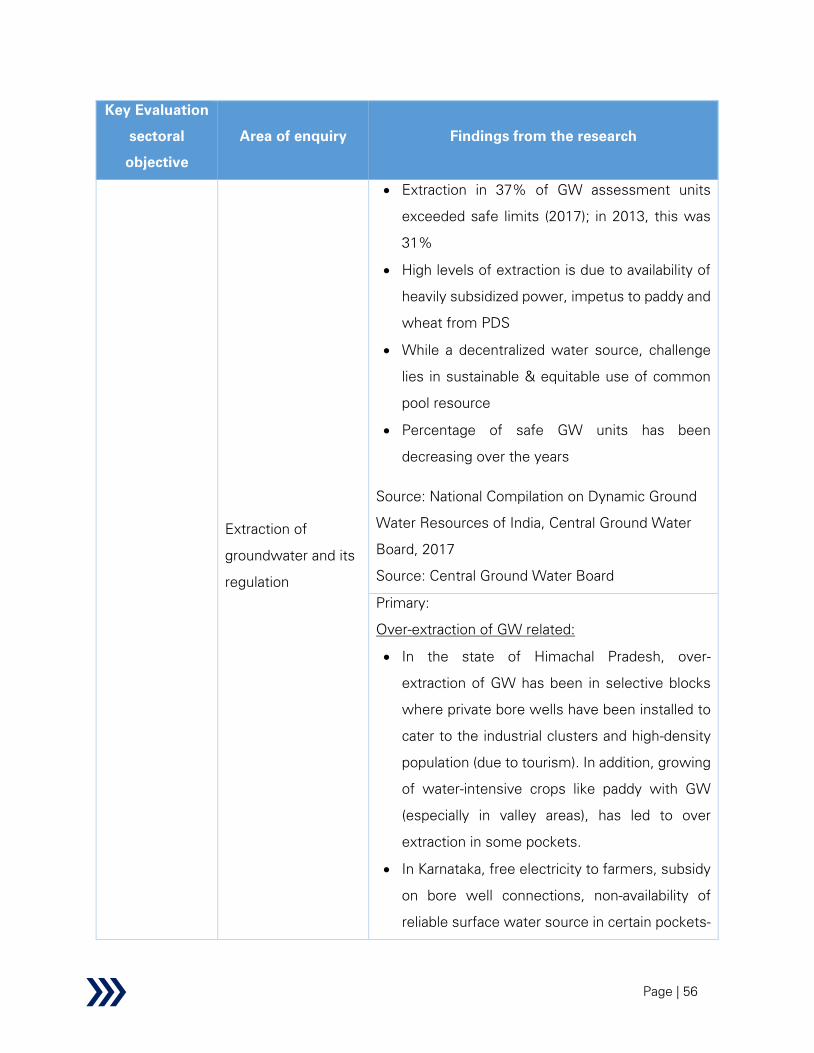
Page | 56
Key Evaluation
sectoral
objective
Area of enquiry Findings from the research
Extraction of
groundwater and its
regulation
• Extraction in 37% of GW assessment units
exceeded safe limits (2017); in 2013, this was
31%
• High levels of extraction is due to availability of
heavily subsidized power, impetus to paddy and
wheat from PDS
• While a decentralized water source, challenge
lies in sustainable & equitable use of common
pool resource
• Percentage of safe GW units has been
decreasing over the years
Source: National Compilation on Dynamic Ground
Water Resources of India, Central Ground Water
Board, 2017
Source: Central Ground Water Board
Primary:
Over-extraction of GW related:
• In the state of Himachal Pradesh, over-
extraction of GW has been in selective blocks
where private bore wells have been installed to
cater to the industrial clusters and high-density
population (due to tourism). In addition, growing
of water-intensive crops like paddy with GW
(especially in valley areas), has led to over
extraction in some pockets.
• In Karnataka, free electricity to farmers, subsidy
on bore well connections, non-availability of
reliable surface water source in certain pockets-

Page | 57
Key Evaluation
sectoral
objective
Area of enquiry Findings from the research
have led to over extraction of GW. Especially for
rainfed areas, insufficient and irregular rainfall
has led to increasing reliance on GW.
• In Andhra Pradesh, increase in agricultural land,
cropping intensity, monsoon failures, reduction
in surface water availability, inequitable
distribution of surface water (especially for tail
end farmers) and easy availability of GW are the
key reasons for over extraction of Groundwater
• In Uttar Pradesh due to subsidised electricity
and poor regulations, GW extraction for
irrigation has been high.
• In Punjab, despite good network of canals, GW
extraction has taken place since it is a very
dense agricultural area. In addition, the
traditional cropping pattern includes paddy and
wheat, which require significant quantity of
water
Case Study- Participatory watershed
management at Ralegan Siddhi in
Ahmednagar, Maharashtra
Ralegan Siddhi village is in a drought-prone and
resource poor area with annual rainfall ranging
between 50-700 mm. In 1975, the GWL in the
village was poor (upto 65 feet) and most of the
wells used to dry up during summer and the
drinking water had to be fetched from the
neighbouring village. The key reason for the

Page | 58
Key Evaluation
sectoral
objective
Area of enquiry Findings from the research
same was poor rainfall and high rate of surface
run off, due to high degree of slope and lack of
vegetative cover. Scarcity of water was a key
distress which limited the prospects of
agriculture in the village.
Post 1975, under the leadership of Mr. Anna
Hazare, a popular figure in the area, the village
promoted and implemented participatory
watershed management initiatives..
Key initiatives undertaken were rainwater
harvesting and management of the four village
watersheds. Every drop of rain was trapped by
developing a drainage system, trenches, check
dams, drainage plugs, percolation tank, etc. and
by developing and designing micro-watershed
specific schemes. These initiatives recharged
the groundwater and now adequate water is
available throughout the year at 21 feet depth.
Improved GWL and water availability improved
the agricultural produce and socio-economic
status of the farmers and the village.
Impact of the project:
• Irrigation potential increased from 0.5 % in
1975 to 70 % in 1985.
• Agriculture production increased by four
times. Overall socio-economic status of the
village has improved- now there is an
intermediate college, post office, bank,
cooperative societies, solar street lights, low-

Page | 59
Key Evaluation
sectoral
objective
Area of enquiry Findings from the research
cost latrines, bio-gas plants, training centre for
watershed management etc. in the village.
Source: A successful case of participatory
watershed management at Ralegan Siddhi
Village in district Ahmednagar, Maharashtra,
India- as published on FAO website
Regulation of GW:
• The national level stakeholder mentioned that
regulation of groundwater is being undertaken
by either Central Ground Water Authority or by
the state groundwater authority (wherever it has
been formed). However, the main aspect of the
regulation is primarily controlling the industrial
water use. Regulation of Irrigation and domestic
use is not the focus, because of various socio-
economic and political reasons. Moreover, the
monitoring agencies do not have adequate
manpower to monitor compliance.
• Only 17 states in India have a dedicated
groundwater department/directorate/agency
and in other states the same is being handled by
other departments like PWD, Irrigation, WRD,
etc.
• In addition, the National Level stakeholder
mentioned that in this regard an order was
released by NGT on 20th July 2020 which has
put curbs on over-exploitation of groundwater.
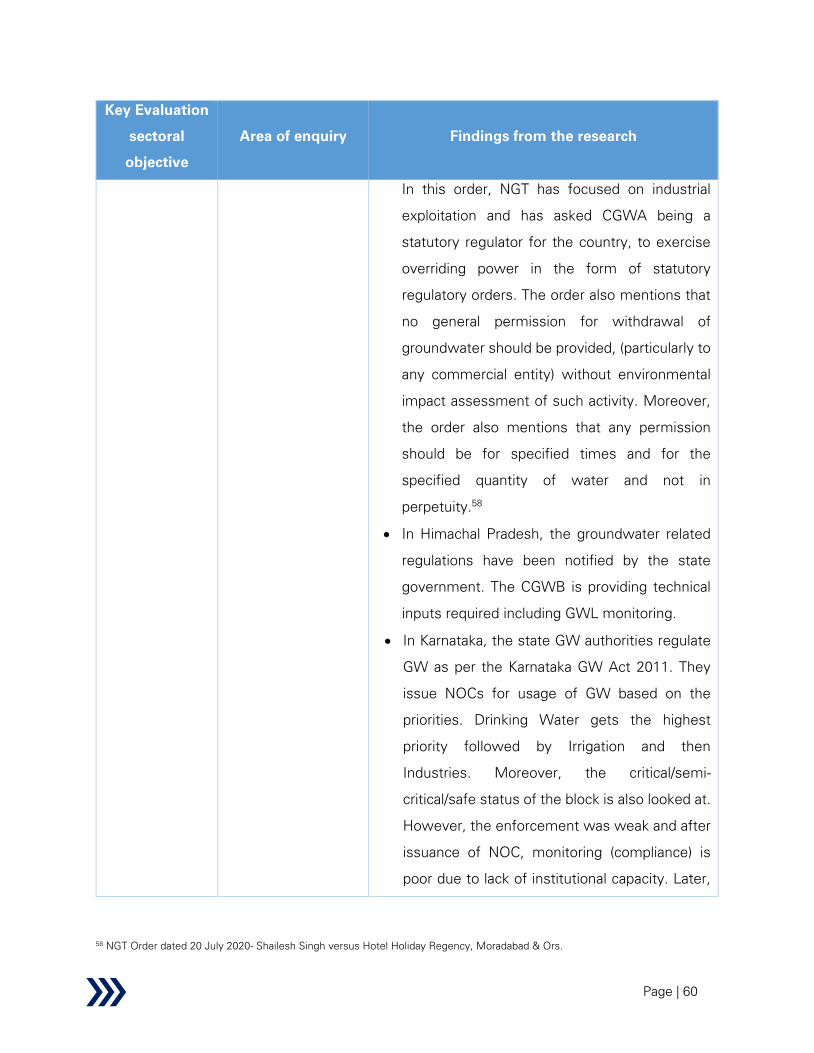
Page | 60
Key Evaluation
sectoral
objective
Area of enquiry Findings from the research
In this order, NGT has focused on industrial
exploitation and has asked CGWA being a
statutory regulator for the country, to exercise
overriding power in the form of statutory
regulatory orders. The order also mentions that
no general permission for withdrawal of
groundwater should be provided, (particularly to
any commercial entity) without environmental
impact assessment of such activity. Moreover,
the order also mentions that any permission
should be for specified times and for the
specified quantity of water and not in
perpetuity.58
• In Himachal Pradesh, the groundwater related
regulations have been notified by the state
government. The CGWB is providing technical
inputs required including GWL monitoring.
• In Karnataka, the state GW authorities regulate
GW as per the Karnataka GW Act 2011. They
issue NOCs for usage of GW based on the
priorities. Drinking Water gets the highest
priority followed by Irrigation and then
Industries. Moreover, the critical/semi-
critical/safe status of the block is also looked at.
However, the enforcement was weak and after
issuance of NOC, monitoring (compliance) is
poor due to lack of institutional capacity. Later,
58 NGT Order dated 20 July 2020- Shailesh Singh versus Hotel Holiday Regency, Moradabad & Ors.
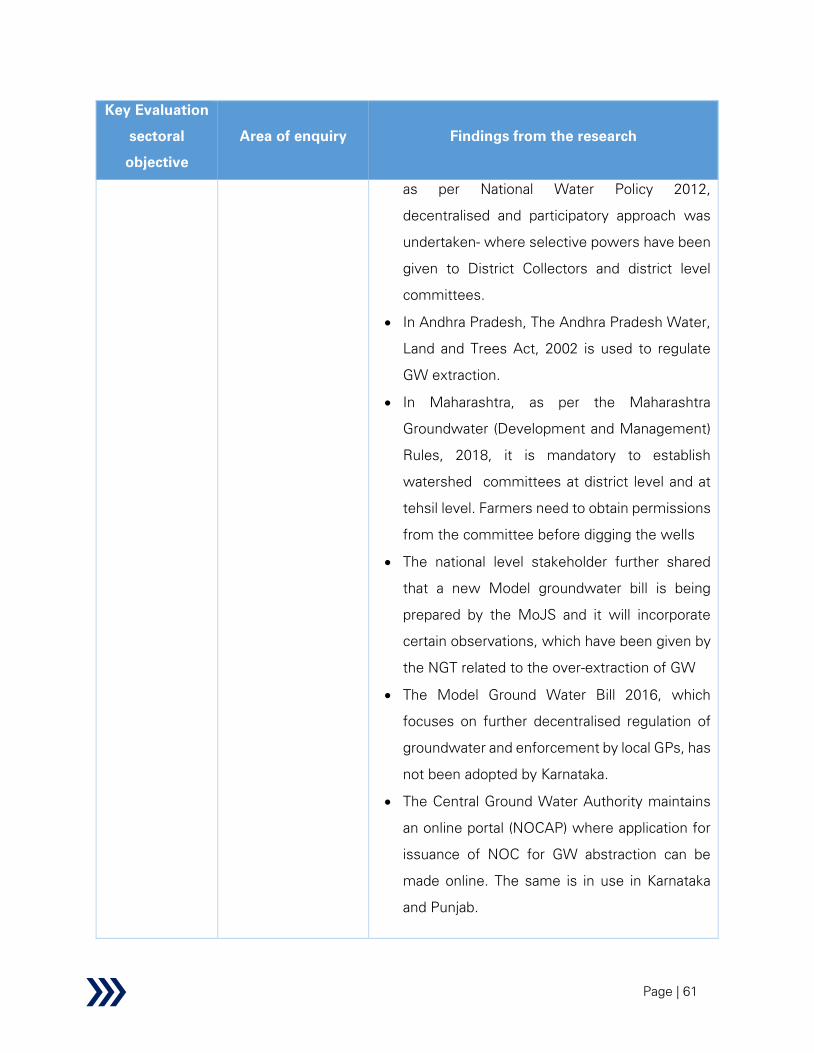
Page | 61
Key Evaluation
sectoral
objective
Area of enquiry Findings from the research
as per National Water Policy 2012,
decentralised and participatory approach was
undertaken- where selective powers have been
given to District Collectors and district level
committees.
• In Andhra Pradesh, The Andhra Pradesh Water,
Land and Trees Act, 2002 is used to regulate
GW extraction.
• In Maharashtra, as per the Maharashtra
Groundwater (Development and Management)
Rules, 2018, it is mandatory to establish
watershed committees at district level and at
tehsil level. Farmers need to obtain permissions
from the committee before digging the wells
• The national level stakeholder further shared
that a new Model groundwater bill is being
prepared by the MoJS and it will incorporate
certain observations, which have been given by
the NGT related to the over-extraction of GW
• The Model Ground Water Bill 2016, which
focuses on further decentralised regulation of
groundwater and enforcement by local GPs, has
not been adopted by Karnataka.
• The Central Ground Water Authority maintains
an online portal (NOCAP) where application for
issuance of NOC for GW abstraction can be
made online. The same is in use in Karnataka
and Punjab.
Page | 62
Key Evaluation
sectoral
objective
Area of enquiry Findings from the research
Inference:
• Over extraction of water by the irrigation sector
across the states of Karnataka, Himachal
Pradesh, Uttar Pradesh, Punjab and Andhra
Pradesh is mainly due to free/subsidised
electricity available to farmers, subsidy on bore
well connections, non-availability of reliable
surface water source, prevalence of cultivation
of water-intensive crops, monsoon failures,
reduction in SW capacity, unequal distribution of
SW (especially for tail end farmers) and easy
availability of GW. Other reasons for over
extraction of GW include its easy accessibility
and availability in many geographical regions,
cheap and easy availability of bore well drilling
and construction technology as well as absence
of GW regulations.
• Although the state groundwater authorities
have GW abstraction related regulations and
acts, the enforcement and adequate monitoring
of the same remains a challenge. Only 17 states
in India have a dedicated groundwater
department/directorate/agency.
• CGWA regulations on industries may also be
further imroved. The quality of data and impact
analysis studies (required to obtain NOC by
industries) conducted by third part agencies,
need to be further improved.

Page | 63
Key Evaluation
sectoral
objective
Area of enquiry Findings from the research
• The Model Ground Water Bill 2016, which
focuses on further decentralised regulation of
groundwater and enforcement by local GPs has
not been adopted by majority states. A new
Model groundwater bill is being prepared by the
MoJS incorporating certain observations which
have been given by the NGT related to the over-
extraction of GW.
Equity
Efficiency of canal
network
Secondary:
• Canal-based irrigation prone to high losses to
evaporation, seepage
• Over-extraction by head-end farmers through
canal breach, unauthorized pumping
• Around 4-5% of command area needs to be
acquired for project – leads to project delays
Source: Guidelines for improving water use
efficiency in Irrigation, Domestic and Industrial
sectors, Central Water Commission
Primary:
• The national level stakeholder shared that the
GoI is currently encouraging all states to go for
piped irrigation networks. This is mainly to avoid
the inefficiency related to the canal network and
high land acquisition costs. Odisha,
Maharashtra, Karnataka, Telangana, Manipur
have been implementing such projects.
Independent experts supported this view and
added that piped irrigation will help in better

Page | 64
Key Evaluation
sectoral
objective
Area of enquiry Findings from the research
accountability and monitoring and control of
water supply (if SCADA and automatic valves
are installed).
Case Study- Telangana Piped Irrigation
Network
A sub-surface piped irrigation network to irrigate
over 800 mn sq. m. (2 lakh acres) is being
implemented in Nizamabad and Jagtial districts
in Telangana. The project is being implemented
as a part of the Kaleshwaram Lift Irrigation
Project (Package 21). The estimated capital cost
of the project is Rs. 2,400 Cr. The project
implementing agency, the Irrigation and CAD
Department, Government of Telangana has
engaged a contractor, selected through a
competitive tender process, to provide its
services under Design-Build-Operate-Transfer
(DBOT) mode and undertake O&M for a period
of 15 years. The contract was awarded in April
2018 and implementation of the same is under
progress.
The project has been designed to reduce losses
and improve water conveyance efficiency and
leverage technology to allow remote monitoring
and control of water supply across their
networks through SCADA based Outlet
Management system.

Page | 65
Key Evaluation
sectoral
objective
Area of enquiry Findings from the research
Technology will allow the project operators to
monitor consumption, manage demand and
match supply to demand to reduce waste and
contribute to additional water savings. Remote
monitoring and control of the networks reduces
the number of personnel required to manage the
networks and thereby reduce O&M cost.
Source: KPMG Analysis
• The GoI also extends necessary support to
increase efficiency of canals and provides
financial support for re-lining, gate maintenance
and better management of select old canals on
a case to case basis and there is no specific
scheme dedicated to this.
• For instance, in 2018 the centre provided
financial assistance for re-lining of Sirhind and
Rajasthan feeder canal (in Punjab) over five
years till 2022-23. They were issues related to
water logging and huge seepage losses
• The centre has also been encouraging states to
laterally assess their canal networks
• In Manipur, piped irrigation network project is
being piloted and micro-irrigation is being
focussed upon.
• However, post construction of canals in
Manipur and Bihar, O&M funds are not available

Page | 66
Key Evaluation
sectoral
objective
Area of enquiry Findings from the research
with the department to undertake regular
maintenance activities. Due to the same, lining
works for old canals have also been pending.
This leads to losses and decrease in efficiency
of the canals in the states
• In Punjab, due to low efficiency of the canal
network, water is not able to reach the tail ends
of canal. Therefore, the state is focusing on
increasing efficiency using underground pipeline
network and micro-irrigation.
Inference:
• Canal-based irrigation is prone to high losses
due to evaporation and seepage
• The central government is assisting the states
and promoting the implementation of piped
irrigation networks and micro-irrigation systems
to improve the irrigation efficiency.
• The GoI is also assisting in re-lining and better
management of select old canals on a case to
case basis. However, there is no specific
scheme dedicated to this.
• Post construction of canals in Manipur and
Bihar, O&M funds are not available with the
department to undertake regular maintenance
activities. Due to the same, lining works for old
canals have also been pending.

Page | 67
Key Evaluation
sectoral
objective
Area of enquiry Findings from the research
• Punjab is focusing on increasing efficiency using
underground pipeline network and micro-
irrigation.
Access
Irrigation coverage
status
Secondary:
• Ultimate Irrigation Potential is approx. 140 M ha
whereas only 68 M ha (i.e. 49%) is net irrigated
area
• Land productivity remains low in rainfed areas
compared to 2 - 3x in canal and 3 – 5x in well
irrigated areas
• Need to close gap in irrigation coverage to
improve food production
Source: Agriculture Statistics at a glance, 2018,
Ministry of Agriculture and Family Welfare, GoI
Primary:
Irrigation coverage
• In the state of Andhra Pradesh, difference in
spatial availability of surface water is one of the
key reasons for inadequate irrigation coverage.
The state government is undertaking large lift
irrigation projects to bring irrigation access to
water deficient regions in the state.
• Moreover, in AP, the rainfall pattern is not
beneficial- very high rainfall concentrated over
fewer days does not benefit the crops.
Additionally, during very heavy rains- runoff is
more and percolation to GW aquifer is less.
Therefore, there is not much of an increase in
Page | 68
Key Evaluation
sectoral
objective
Area of enquiry Findings from the research
GW levels. The state government is focussing
on water conservation and creating small
storage structures under PMKSY/MGNREGA to
increase irrigation coverage.
• In Bihar, floods during monsoon often lead to
crop damage especially in North Bihar; whereas
in South Bihar is often affected by droughts. The
state government is planning the Ganga Water
Lift Project to solve this. Although the initial
focus of the project is on drinking water, the
same is expected to be extended to the
irrigation sector in the future.
• In Punjab, the irrigation coverage is high due to
availability of SW and GW sources. Certain hilly
areas do not have access to irrigation due to the
terrain. The state government has implemented
lift irrigation projects in these regions. However,
O&M costs of such projects are high; farmers
may not be able to bear the Electricity charges
in the long term
• In Jharkhand, small existing ponds in villages are
being desilted and thereafter rainwater
harvesting is being promoted to improve
irrigation coverage.
• In Uttar Pradesh, creation of more command
area is required to increase the irrigation
coverage.
Cropping Intensity
Page | 69
Key Evaluation
sectoral
objective
Area of enquiry Findings from the research
• In Manipur, assured irrigation has started
recently and now the agriculture department is
motivating farmers to take two crops
• In Andhra Pradesh, surface water in canals are
released in the month of August, one month
after the start of monsoon. During the Rabi
season, farmers are mostly dependent on GW
since SW is not available reliably.
• In Punjab, most of the farmers cultivate 2 crops
in a year and aim to cultivate 3 crops going
forward
Household Survey insights
Household Survey conducted across 11 states
revealed 34% of the farmers still undertake mono-
cropping.
Inference:
• Due to unavailability of assured surface water
sources, under-developed command area of
canals and depleting GW levels, the irrigation
coverage needs improvement in the states of
Bihar, Uttar Pradesh and Andhra Pradesh
• The cropping intensity is also expected to
increase after assured irrigation is available in
Manipur
• Development of decentralised storage
structures, desilting of ponds and rainwater
Page | 70
Key Evaluation
sectoral
objective
Area of enquiry Findings from the research
harvesting structures are being undertaken to
increase irrigation coverage in Jharkhand
Sustainability
Dependence on
groundwater for
irrigation
Secondary:
• As per the Mihir Shah Committee the first two
decades after independence, water required for
irrigation was mainly supplied through large and
medium irrigation dams. In last four decades
groundwater (mainly irrigation through wells),
has become the main source of irrigation
• Groundwater today provides more than 63% of
water for irrigation
• Heavy subsidies for agriculture power
consumption encouraged wasteful use
Source: Irrigation- Statistical Year Book India 2018
Primary:
• The National level stakeholder highlighted that
electricity cost subsidy provided by majority
states to farmers is the main reason for
overdependence on draftgroundwater.
• In Himachal Pradesh, farmers depend on GW
for irrigation since it is an assured source of
supply, power for bore wells is available at a
subsidised rate and GW is available in the field
itself. The Independent Experts also highlighted
this as the major reason for dependence on GW
for irrigation. In addition, the experts felt
economic aspirations have led to farmers

Page | 71
Key Evaluation
sectoral
objective
Area of enquiry Findings from the research
making investments in their farms and that has
led to more installation and use of diesel pumps
or electric pumps for irrigation.
• In Karnataka, free electricity, subsidy on bore
wells and non-availability of assured SW has led
to preference of GW by farmers. Moreover, in
some cases, it has been observed that power
subsidy has led to over pumping and over
irrigation. Also, sometimes there are no
switches and the pumps keep on running as
long as power is there; this leads to wastage of
GW. IEC and capacity building activities are
being undertaken for the farmers to avoid such
issues.
• In Andhra Pradesh, approximately 80% of the
GW is being used for agriculture.
Implementation of AIBP and CAD projects as
well as focus on micro-irrigation is helping in
reducing the dependence on GW. Moreover, lift
irrigation projects are being undertaken to bring
assured SW supply to the dry areas of the state.
AP also faces SW shortage in low monsoon
seasons due to the presence of dams in the
Krishna Basin (upstream in Karnataka)
• In Andhra Pradesh, under the NTR Jala Siri
scheme solar powered bore wells have been
installed to pump GW and use for irrigation.
• Punjab is also attempting lift irrigation projects
in hilly areas of the state

Page | 72
Key Evaluation
sectoral
objective
Area of enquiry Findings from the research
• In Maharashtra, lack of access to surface water
has resulted in the over extraction of
groundwater. Tendency to grow sugarcane (due
to the presence of multiple sugar cooperatives)
and assured price (MSP) have further
aggravated the situation. The farmers also lack
awareness in this subject.
Case Study- “Pani Bachao Paisa Kamao”
scheme- Punjab
“Pani Bachao Paise Kamao” scheme has been
launched by Government of Punjab with an aim
to motivate farmers to improve efficiency in the
use of groundwater for agriculture by providing
them monetary incentives.
The State Government had launched the Pilot for
the scheme in June 2018 on 6 Agriculture
feeders in Fatehgarh Sahib, Jalandhar and
Hoshiarpur Districts. After the initial success
during the pilot phase, the same was extended
to 250 additional feeders in June 2019. The
scheme is being implemented by the Punjab
State Power Corporation Limited (PSPCL) and
Agriculture Department and supported by The
World Bank and J-PAL.
The provisions of the scheme are such that
farmers would be given a fixed electricity
entitlement (kWh) for every month of the year
which would vary by season (paddy and non-

Page | 73
Key Evaluation
sectoral
objective
Area of enquiry Findings from the research
paddy) and would depend on sanctioned load of
the consumer. The energy entitlement would be
based on average consumption of the previous
year. Any consumption measured from
individual metres lower than the fixed
settlement will be reimbursed at the rate of Rs.
4 per kWh, while excess consumption above the
fixed entitlement will attract no charge from the
farmers. No bills will be issued, and the farmers
will be intimated through SMS about their saving
bimonthly and electricity consumption
fortnightly and the amount (of saving) will be
transferred directly to the consumer’s bank
account.
Source: PSPCL website
FGD insights
• From the various Focus Group Discussions held
with the farmers, the following points emerged
related to the groundwater usage for irrigation:
o In areas where SW source or assured
irrigation facilities are available, farmers have
reduced dependence on GW. However, they
often use GW conjunctively especially during
low rainfall days/ Rabi season/ days in which
SW is not available, to maintain better crop
productivity
o In some areas of Assam, where the socio-
economic status of the farmers is low,

Page | 74
Key Evaluation
sectoral
objective
Area of enquiry Findings from the research
farmers are largely dependent on rainfall or
SW (if available), as they do not have personal
bore wells.
o In difficult terrains (select districts of MP, AP,
TN and Assam), where GW abstraction using
bore well is not feasible, farmers have no
dependency on GW. Instead they rely on SW
sources (if available) and rainfall for irrigation.
o Dependence on GW (from bore well/dug
wells) as a source of water for MI systems,
was observed in the various states adopting
micro-irrigation (like Karnataka, Uttar Pradesh,
Andhra Pradesh, etc)
Inference:
• Free/subsidised electricity, subsidy on bore
wells and non-availability of assured SW has led
to greater dependence on GW by farmers
• Power subsidy has led to over extraction and
over irrigation and wastage of GW
• Implementation of AIBP and CAD projects as
well as focus on micro-irrigation and Lift
Irrigation projects is helping in reducing the
dependence on GW.
• In addition, economic aspirations have led to
farmers making investments in their farms and
that has led to more installation and use of
diesel pumps or electric pumps for irrigation

Page | 75
Key Evaluation
sectoral
objective
Area of enquiry Findings from the research
Sustainability
Cropping pattern
and crop
diversification
Secondary:
• Preference of farmers to cultivate water
intensive crops such as paddy even in areas of
water stress
• Rice, wheat and sugarcane consume almost
80% of freshwater available for irrigation leading
to inequity in irrigation water availability for other
crops
• Large scale procurement of rice and wheat by
the public distribution system at assured
minimum support prices ensures demand for
such water intensive crops
Source: Agriculture Statistics 2018, Stress category
based on CGWB data
Primary:
Crop diversification
• A national level stakeholder pointed out that
MSPs for a variety of crops exist. However, not
all food grains / crops are procured for
distribution through PDS. In contrast, cultivation
of crops that have assured MSPs and supported
by PDS procurement is high.
• The NWM has started a campaign called "Sahi
Fasal" which is nudging the states to look at
water efficient crops or diversification of crops
and asking/requesting the farmers to cultivate
alternate crops which consume less water
Page | 76
Key Evaluation
sectoral
objective
Area of enquiry Findings from the research
• In Andhra Pradesh, it has been observed that
market of the new crops and buy back
arrangement of the new crop under
diversification by the government are the key
factors affecting crop diversification plans.
Often it has been observed that lack of buy back
makes farmers sceptical and unwilling in
adopting crop diversification. The same logic of
inadequate market linkages being the main
hurdle for crop diversification on a large scale,
and was corroborated by multiple Independent
Experts
• To address these issues, online agriculture
trading platform has been implemented- e-NAM
platform (GoI initiative); also in Andhra Pradesh,
e-Rythu application has been created to
connect- buyers, farmers and agents in the
agricultural value chain. These market
mechanisms provide assured prices to the
farmers for a large variety of crops
Case Study- Ramthal Drip Irrigation Project
Ramthal Drip Irrigation project in Bagalkote
district in Karnataka is the largest drip irrigation
project in Asia. With commencement of water
supply in 2017, the project currently caters to
24,000 ha comprising 15,000 farmers across 30
villages. The project was executed by private
players and their scope also includes O&M for a
Page | 77
Key Evaluation
sectoral
objective
Area of enquiry Findings from the research
period of five years along with the responsibility
of creating WUAs.
The project involves bulk water supply through
fully automated drip irrigation systems. Farmers
are provided water in their respective farmlands
through installed cylinders, which have
provisions for mixing the required fertilizers and
pesticides. The project is expected to alleviate
the water scarcity related issues of farmers in
Ramthal Marola region. It is envisaged that
installation of drip irrigation equipment shall
result in improved water-use efficiency,
reduction in pesticide and fertilizer usages and
increase in crop yields.
The project is further benefitted by the initiative
of Government of Karnataka’s (GoK) Agriculture,
Horticulture and Water Resources departments
in establishing market linkages by signing MoUs
with 14 private sector agri-companies for offtake
of agricultural produce. To facilitate the scaling
of this drip irrigation technology, Drip-to-Market
Agro Corridor (DMAC) has also been established
for promoting market-based mechanisms.
Source: Multiple news articles related to the
project and KPMG Analysis
Page | 78
Case Study- Market linkage support by
FieldFresh Foods, Punjab
Field Fresh Foods Private Limited made its entry
into horticulture in September 2004 in Punjab. A
300-acre Agri Centre of Excellence (ACE)
government-leased model farm was established
at Ludhiana to develop it as an R&D farm. The
agency currently works with over 5,000 farmers
and provides them the required technology
support and offtake supply chain to grow baby
corn, sweet corn and a variety of herbs and
chillies using drip irrigation technique.
The firm also has a joint venture between Bharti
Enterprises & Del Monte Pacific Limited and
exports fresh and processed vegetables like
Baby Corn, Sweet Corn, Chillies etc to UK and
western Europe.
Source: KIIs with stakeholders in Punjab and
website of FieldFresh
• In Punjab, it was observed that farmers are
sticking to the traditional crops mainly due to
the assured prices and procurement.
Procurement of crops by private traders often
suffers from price fluctuations. However,
attempts are being made to grow maize instead
of paddy. The presence of food processing
industry has further supported this.
Page | 79
Key Evaluation
sectoral
objective
Area of enquiry Findings from the research
• Crop diversification attempts are also being
undertaken by the states of Jharkhand (maize
instead of paddy), Assam (maize, pulses,
mustard instead of paddy), Karnataka (pulses,
pigeon peas instead of sugarcane), Maharashtra
(various horticulture crops), Tamil Nadu
(groundnut) and Telangana (soya bean,
groundnut and Bengal gram)
• In the state of Telangana, the state government
is attempting to introduce the “Crop colony
concept”. Under this initiative, the state
government has studied per capita
consumption of all major agricultural produce in
each district of the state and identified the crops
for which surplus production exists currently.
Based on the demand-supply gap, market
demand, price of the crops, and other factors,
the Agriculture Department advises the farmers
(using various channels including social media),
to grow specific remunerative crops only, prior
to the start of the Kharif and Rabi season. The
aim is to grow crops based on demand-supply
gap of crops. The implementation of the
concept is being done in coordination with
Rythu Samanvaya Samithis (Farmers’
Coordination Committee).
Page | 80
Case Study- “Mera Pani Meri Virasat”
scheme, Haryana
The department of Agriculture, Govt of Haryana
started the “Mera Pani Meri Virasat” scheme
from FY19-20 to promote crop diversification in
the state. Under this scheme, farmers who
cultivate alternate crops like maize, bajra, cotton,
pulses, vegetables, etc. (instead of paddy), in
more than 50% of the land parcel available with
them, are eligible to receive subsidy at Rs. 7,000
per acre. The government has also assured
procurement of the produce at reasonable price.
The government is also providing crop insurance
as part of the scheme. The required irrigation
equipment is also being supplied by the
government at subsidised rates.
Source: Mera Pani Meri Virasat web portal
Reduce water consumption of water-intensive
crops
• To reduce the water consumption for paddy
cultivation, Punjab has experimented with direct
seeding technology. It consumes around 20-
30% less water than the traditional methods.
Trials have given good results and the yield
remains almost same (within a range of +/- 5-
10%)
• However, in direct seeding of paddy, farmers
need to use appropriate machines which plant
the seedling directly into soil. The state is
moving towards this technology especially due

Page | 81
Key Evaluation
sectoral
objective
Area of enquiry Findings from the research
to labour shortage. This is easier for larger
farmers to adopt.
• Punjab has also conducted trials for micro-
irrigation of paddy. However, it is cost intensive
and does not increase the yield
FGD insights
• From the various Focus Group Discussions held
with the farmers, the following points emerged
related to crop diversification:
o In areas where SW source or assured
irrigation facilities are available, farmers have
a general tendency to shift to water-intensive
cropping pattern
o In areas where MI has been adopted (such as
states like Karnataka, Uttar Pradesh, Andhra
Pradesh, etc), farmers have started to grow
various fruits and vegetables. In addition,
traditional crops like sugarcane and wheat are
also being cultivated using MI techniques.
Household Survey insights
• Household Survey conducted across 11 states
revealed 49% of the farmers stick to water
intensive crops due to the profitability factor.
• Moreover, 51% of the farmers were growing
paddy as a primary crop across 11 states
• Among the mono-cropping farmers, 72% were
willing to change the cropping pattern

Page | 82
Key Evaluation
sectoral
objective
Area of enquiry Findings from the research
• Among those not willing to change the cropping
pattern, profitability was the main reason cited
for the same.
Inference:
• In order to promote crop diversification, in
addition to declaring an MSP, it is important to
ensure that procurement of such crops happen
and adequate market linkages are established
for offtake of these alternate crops.
• Alternatively, assured price needs to be
ascertained for the alternate crops by adopting
online agriculture trading platform like- e-NAM
platform (GoI initiative). Moreover, e-Rythu
application in AP has been created to connect-
buyers, farmers and agents in the agricultural
value chain. These assure fair prices to the
farmers for a large variety of crops
• Most states have tried to adopt crop
diversification techniques. However, stronger
market linkages and procurement supply chain
can further strengthen such initiatives
• To reduce the water consumption in paddy,
direct seeding of paddy has been tried. It
consumes around 20-30% less water than the
traditional methods. Trials have given good
results and the yield remains almost same (+/-5
to10%)

Page | 83
Key Evaluation
sectoral
objective
Area of enquiry Findings from the research
Water Security
Agriculture water
use efficiency
Secondary:
• The ratio of water consumption and area
cultivated is an important metrics as it signifies
the water use efficiency in the agricultural
sector
• India is one of the highest water consuming
countries
Source: World Resources Institute (AQUEDUCT)
database
Primary:
• A national level stakeholder mentioned that
dedicated “Micro-irrigation fund” has been set
up (Rs. 5,000 Cr. Corpus -NABARD) by the
MoA&FW, GoI under PMKSY. Some of the
states have come forward to take up various
innovative projects with these funds related to
micro-irrigation and water-use efficiency
improvement.
• The NWM is also assisting the state
government and the various stakeholders to
increase water-use efficiency.
• In Punjab, power supply to the agriculture sector
is being provided free of cost. This is the major
impediment to increasing the adoption of micro-
irrigation
Page | 84
Case Study- Gujarat Solar Irrigation
Cooperative to promote water use efficiency
The Dhundi Solar Pump Irrigators' Cooperative
Enterprise (SPICE) provides the proof of
concept for promoting Solar Power as a
Remunerative Crop (SPaRC). Supported by
International Water Management Institute
(IWMI), the model has tried to provide a solution
to western India's groundwater woes as well as
curtailing the carbon footprint of agriculture in
India and aims at creating a risk-free source of
cash income for India's farmers.
The SPICE, which began operating in May 2016,
is the world’s first solar irrigation cooperative
formed in Dhundi village in Gujarat’s Kheda
district, about 90 km from Ahmedabad. Through
this initiative, the farmers not only made a
switch from diesel to solar pumps but also
adopted net metering–selling excess power to
the local electricity utility.
Members now have an incentive to save power
and curtail their groundwater use (thereby
promoting water use efficiency), as any leftover
power is sold to the Madhya Gujarat Vij
Company Limited (MGVCL @ Rs. 4.63/kWh
under 25-year power purchase agreement), the
local power utility, thereby creating a parallel
revenue stream.
Source: “Solar Power as a remunerative Crop”
by Tushar Shah et al. and various news articles

Page | 85
Case Study- Solar powered MI project-
Punjab
The Solar Powered Community Lift Micro-
irrigation Project (SCMIP) was conceptualised in
Punjab, India by the Department of Soil and
Water Conservation (DSWC), Government of
Punjab. The project, situated in the district of
Hoshiarpur, irrigates 6.64 mn sq. m (1,641 acres)
of farmland located on the foothills of Shivalik
mountain range and adjacent to the Kandi canal,
the source of water for the project. The project
was completed and O&M commenced in
August 2017.
The key project components comprise: i)
pumping of water from Kandi canal to the
command area using solar energy, ii) water
distribution network, iii) on-farm micro-irrigation
equipment and iv) SCADA powered automation.
The project was implemented by a contractor
selected through a competitive tender process.
The scope of the contractor includes
construction of the project and operations and
maintenance for a period of seven years.
In order to reduce the cost of operations and to
make the project financially sustainable, the
entire project is designed to exclusively rely on
solar energy.
Source: KII with stakeholders in Punjab and
KPMG Analysis
Page | 86
Key Evaluation
sectoral
objective
Area of enquiry Findings from the research
• In paddy growing areas; Punjab is going for
underground pipelines to increase agricultural
water use efficiency. Direct seeding of paddy
using machinery is also being practiced as it
consumes 20-30% less water
• In Jharkhand, PDMC under PMKSY is being
popularised for adoption among farmers
• In Andhra Pradesh, surface water release and
flows using SCADA control system has led to
efficiency gains
• Across the states of Manipur, Bihar, Assam,
Tamil Nadu, Telangana, Maharashtra, increased
adoption of micro-irrigation among the farmers,
has been reported
• The Independent Expert mentioned that we
need not focus resources on adoption of micro-
irrigation in the Gangetic basin, which has
robust canal network and shallow aquifers.
Inference:
• Free power supply to agriculture sector is a
major impediment for farmers to adopt micro-
irrigation.
• In paddy growing areas: underground piped
irrigation network and direct seeding of paddy
using machines may increase agricultural water
use efficiency.
Page | 87
Key Evaluation
sectoral
objective
Area of enquiry Findings from the research
• Large scale adoption of PDMC (MI) and use of
SCADA system leads to an increase in
agricultural water use efficiency.
• The authorities may prioritise resources and not
focus on adoption of micro-irrigation in the
Gangetic basin, which has robust canal network
and shallow aquifers. However, even in
Gangetic basin, periodic assessment of the
aquifers using suitable technology may be
undertaken before deciding on the adoption of
MI.
Water Security
Agriculture Sector
Contribution
Secondary:
• India is one of the highest water-stressed
country with 18% of the GDP from agriculture
and 52% of the country area under cultivation
• With increase in area under cultivation/ value of
produce/ cropping intensity India can further
increase contribution to GDP from the sector
• However, to avoid facing severe scarcity in the
future; India must focus on water use efficiency
in Irrigation
Source: Food and Agricultural Organization-
AQUASTAT database; World Resources Institute
(AQUEDUCT) database for Water Stress scores
Primary:
• No additional insights gained during primary
research on this enquiry area

Page | 88
Key Evaluation
sectoral
objective
Area of enquiry Findings from the research
Inference:
• India needs to ramp up the land productivity by
growing high value crops, increasing water use
efficiency, area under cultivation and cropping
intensity
Sustainability
Water consumption
in Thermal Power
Plants
Secondary:
• Power sector water demand is 34% of the total
water consumption for industrial sector
• Thermal power plants rely on water for cooling
• Plants failing to adhere water consumption
regulations as per MoEF&CC
• There is less focus on reducing water footprint
since water costs constitute a miniscule portion
of the overall variable costs of a thermal plant
Source: CERC Reports, WRI Working Paper
Primary:
• The Ministry of Power, GoI has made it
mandatory for all the thermal power plants
which are lying within 50 km of any sewage
treatment plant, to take the treated wastewater
from the treatment plant
• In Maharashtra, the regulatory authority
(MWRRA) has set standard water usage norms
by the thermal power plants in terms of their
power generation (water consumption per MW
power generation). The water allocation to
power plants are done in accordance to these
norms. Any additional water consumption by the
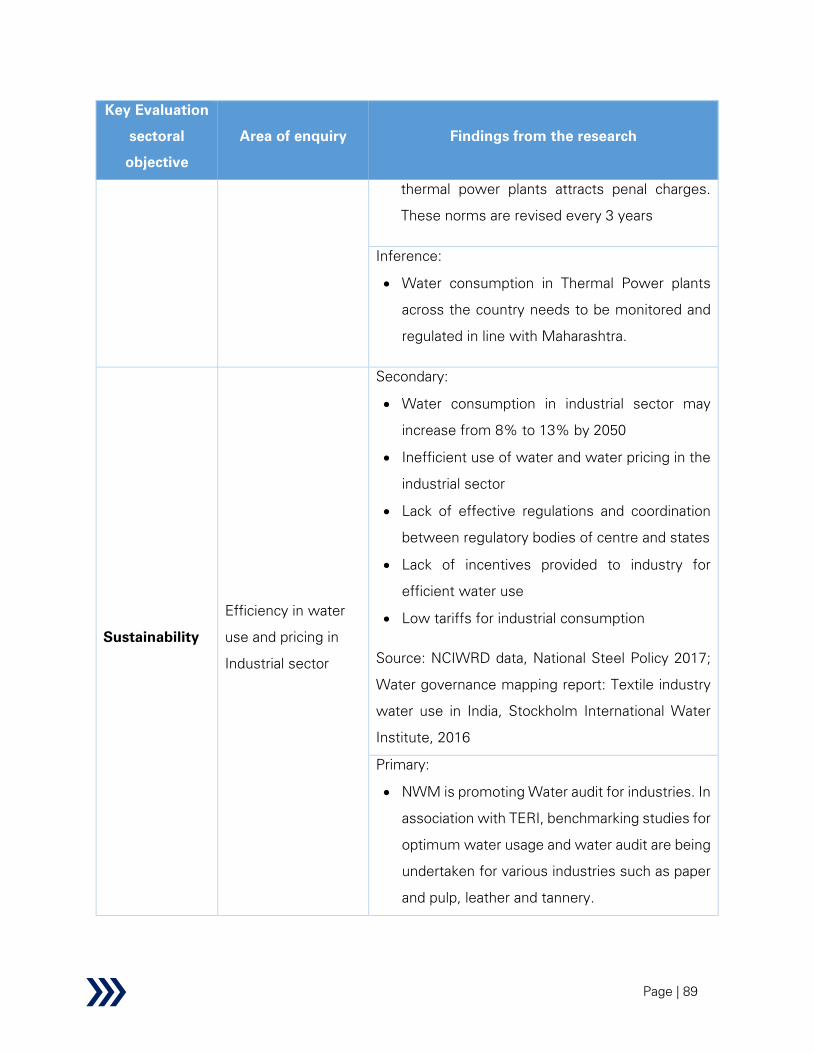
Page | 89
Key Evaluation
sectoral
objective
Area of enquiry Findings from the research
thermal power plants attracts penal charges.
These norms are revised every 3 years
Inference:
• Water consumption in Thermal Power plants
across the country needs to be monitored and
regulated in line with Maharashtra.
Sustainability
Efficiency in water
use and pricing in
Industrial sector
Secondary:
• Water consumption in industrial sector may
increase from 8% to 13% by 2050
• Inefficient use of water and water pricing in the
industrial sector
• Lack of effective regulations and coordination
between regulatory bodies of centre and states
• Lack of incentives provided to industry for
efficient water use
• Low tariffs for industrial consumption
Source: NCIWRD data, National Steel Policy 2017;
Water governance mapping report: Textile industry
water use in India, Stockholm International Water
Institute, 2016
Primary:
• NWM is promoting Water audit for industries. In
association with TERI, benchmarking studies for
optimum water usage and water audit are being
undertaken for various industries such as paper
and pulp, leather and tannery.
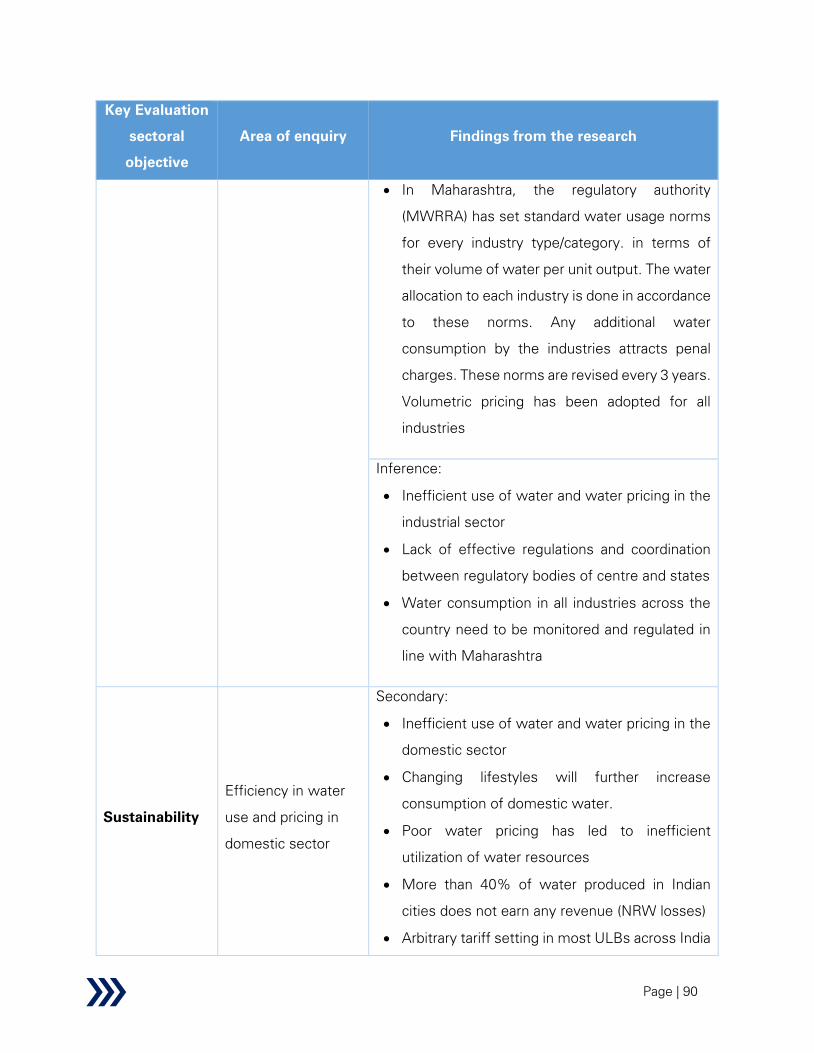
Page | 90
Key Evaluation
sectoral
objective
Area of enquiry Findings from the research
• In Maharashtra, the regulatory authority
(MWRRA) has set standard water usage norms
for every industry type/category. in terms of
their volume of water per unit output. The water
allocation to each industry is done in accordance
to these norms. Any additional water
consumption by the industries attracts penal
charges. These norms are revised every 3 years.
Volumetric pricing has been adopted for all
industries
Inference:
• Inefficient use of water and water pricing in the
industrial sector
• Lack of effective regulations and coordination
between regulatory bodies of centre and states
• Water consumption in all industries across the
country need to be monitored and regulated in
line with Maharashtra
Sustainability
Efficiency in water
use and pricing in
domestic sector
Secondary:
• Inefficient use of water and water pricing in the
domestic sector
• Changing lifestyles will further increase
consumption of domestic water.
• Poor water pricing has led to inefficient
utilization of water resources
• More than 40% of water produced in Indian
cities does not earn any revenue (NRW losses)
• Arbitrary tariff setting in most ULBs across India
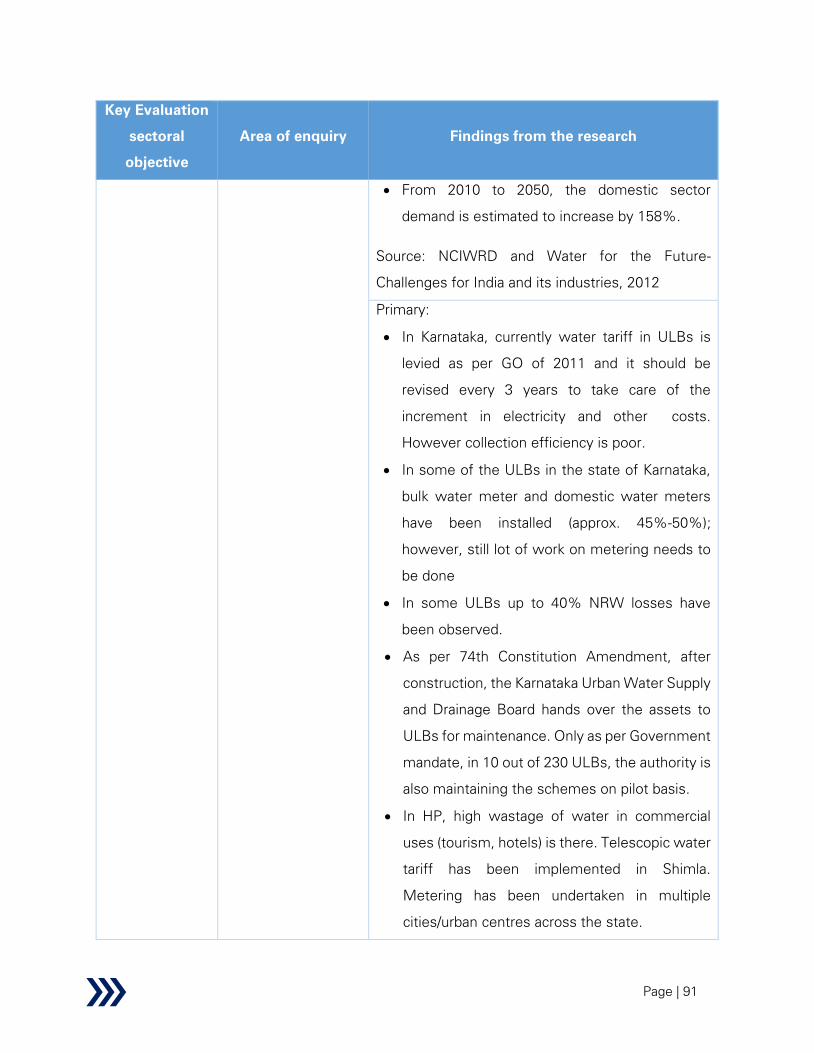
Page | 91
Key Evaluation
sectoral
objective
Area of enquiry Findings from the research
• From 2010 to 2050, the domestic sector
demand is estimated to increase by 158%.
Source: NCIWRD and Water for the Future-
Challenges for India and its industries, 2012
Primary:
• In Karnataka, currently water tariff in ULBs is
levied as per GO of 2011 and it should be
revised every 3 years to take care of the
increment in electricity and other costs.
However collection efficiency is poor.
• In some of the ULBs in the state of Karnataka,
bulk water meter and domestic water meters
have been installed (approx. 45%-50%);
however, still lot of work on metering needs to
be done
• In some ULBs up to 40% NRW losses have
been observed.
• As per 74th Constitution Amendment, after
construction, the Karnataka Urban Water Supply
and Drainage Board hands over the assets to
ULBs for maintenance. Only as per Government
mandate, in 10 out of 230 ULBs, the authority is
also maintaining the schemes on pilot basis.
• In HP, high wastage of water in commercial
uses (tourism, hotels) is there. Telescopic water
tariff has been implemented in Shimla.
Metering has been undertaken in multiple
cities/urban centres across the state.
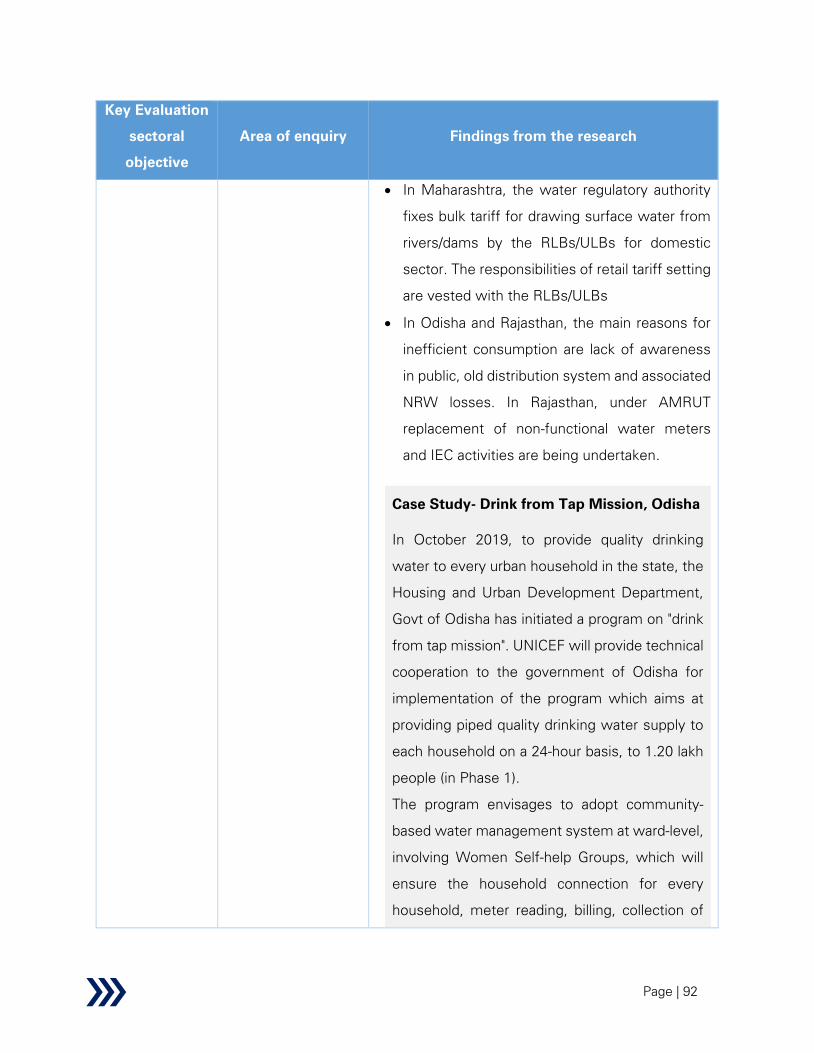
Page | 92
Key Evaluation
sectoral
objective
Area of enquiry Findings from the research
• In Maharashtra, the water regulatory authority
fixes bulk tariff for drawing surface water from
rivers/dams by the RLBs/ULBs for domestic
sector. The responsibilities of retail tariff setting
are vested with the RLBs/ULBs
• In Odisha and Rajasthan, the main reasons for
inefficient consumption are lack of awareness
in public, old distribution system and associated
NRW losses. In Rajasthan, under AMRUT
replacement of non-functional water meters
and IEC activities are being undertaken.
Case Study- Drink from Tap Mission, Odisha
In October 2019, to provide quality drinking
water to every urban household in the state, the
Housing and Urban Development Department,
Govt of Odisha has initiated a program on "drink
from tap mission". UNICEF will provide technical
cooperation to the government of Odisha for
implementation of the program which aims at
providing piped quality drinking water supply to
each household on a 24-hour basis, to 1.20 lakh
people (in Phase 1).
The program envisages to adopt community-
based water management system at ward-level,
involving Women Self-help Groups, which will
ensure the household connection for every
household, meter reading, billing, collection of

Page | 93
Key Evaluation
sectoral
objective
Area of enquiry Findings from the research
water tariff, complaint management and field
quality testing by using standard tools.
Source: Various news articles and KII with
stakeholder in Odisha
• The Independent Expert shared non-metered
connections and low tariff (non-volumetric) are
the major issues related to water use efficiency
in the domestic (urban) sector. Transparency in
meter reading and maintenance of meters
should also be undertaken to ensure
sustainability.
Inference:
• Currently water tariff in ULBs in Karnataka is
levied as per State Government Orders. The
same is required to be revised every 3 years to
take care of the increase in electricity and other
costs. However, collection of tariff is not
adequate.
• Adequate metering, volumetric tariff setting and
awareness generation among consumers need
to be undertaken
Sustainability O&M and financing
Secondary:
• Estimated NRW is between 40-70% of the
water distributed in Urban areas
• As of 2014, no major city in India supplied 24x7
water to its entire urban population

Page | 94
Key Evaluation
sectoral
objective
Area of enquiry Findings from the research
• Urban water O&M cost recovery through tariff
is not more than 30-40%
• 35% of urban households in India have piped
water
Source: Urban Water Supply and Sanitation, The
World Bank
Primary:
O&M related- Domestic Water:
• In some ULBs in Karnataka up to 40% NRW
losses have been observed
• In Karnataka, only in 3 ULBs, 24x7 water supply
has been established on a demo basis.
• As per 74th Constitution Amendment; after
construction, the authority hands over the
assets to ULBs for operations and maintenance.
• The capability of the ULBs (especially ULBs
within 50,000 population range) in undertaking
O&M needs to be ramped up
• Due to poor O&M, after 4-5 years the benefits
are not fully realised and the projects
deteriorates
• In HP, despite tariff collection, lack in O&M
funds exists since tariff is not adequate to meet
the high O&M costs (high power bills due to
terrain)
• In Rajasthan, the authority is working on the
strategy to reduce NRW losses. Study is going

Page | 95
Key Evaluation
sectoral
objective
Area of enquiry Findings from the research
on by forming DMA under pilot project in some
areas.
Case Study- Water Corporation of Odisha
(WATCO)
WATCO is a wholly-owned, not-for-profit
Company of the Government of Odisha,
established in 2015 to provide water supply and
sewerage services in the cities of
Bhubaneswar, Jatni and Khordha on behalf of
the respective municipal bodies.
The corporation manages the overall water
production, treatment, and distribution and
sewerage collection, treatment and disposal
activities. It also levies and collects tariff from
the consumers. WATCO is currently providing
services in 3 cities in Odisha, however it is
planning to expand its services to the entire
state very soon.
Source: WATCO website
O&M related- Irrigation:
• The national level stakeholder mentioned
majority of the states focus on creation of new
infrastructure and neglect O&M. They propose
ERM (Extension/renovation/modernization)
projects and propose the same to be funded by
PMKSY. ERM projects are accorded priority
since these can be completed quickly with

Page | 96
Key Evaluation
sectoral
objective
Area of enquiry Findings from the research
minimum funds. The same view was supported
by an Independent Expert
• In AP, O&M of canals for lining in 19 medium
irrigation projects and one major irrigation
project is being undertaken with JICA funding.
Under Nagarjuna Sagar project, lining is being
done with financial assistance from World Bank
• In Maharashtra, WRD has been able to recover
the entire O&M costs in FY 18-19 due to the
various tariff provisions of MWRRA
Financing- Domestic water
• In Karnataka, cost recovery is very poor- since
the collection of tariff is inadequate.
Additionally, no one is willing to implement and
levy tariff and the issue is highly politicised
• ULBs currently sighs away from their
responsibility especially when it comes to
collection of tariff required for funding the O&M
of the water supply schemes. They ask the
authority or the contractor to collect from the
state government. Therefore, the state
government currently deducts the electricity
cost from GoI’s Finance commission funds.
• Urban Water Supply PPP has been tried but
without significant success as financial
feasibility is poor.

Page | 97
Case Study- PPP in Bulk Water Supply,
Odisha
The Public Health Engineering Organisation
(Urban), Govt of Odisha has engaged a private
player and various stakeholders to implement a
bulk water supply project in Bhubaneshwar at a
cost of Rs. 188 Cr. in public-private partnership
mode. The project started commercial
operations from September 2017 and currently
supplies water to the Indian Institute of
Technology (IIT), National Institute of Science
Education and Research (NISER) and various
industrial establishments, including Infocity-II in
Bhubaneshwar.
This project has benefited a population of more
than two lakh with uninterrupted supply of clean
drinking water at an affordable rate. The project,
financed under the Viability Gap Funding of the
central government, has been provided with Rs.
50 Cr. to be shared jointly by the Centre and the
state government.
Source: Various newspaper reports
Financing- Irrigation
• The Independent Experts shared that strong
and active WUAs can collect irrigation service
fee. However, it is imperative that the canals are
transferred to WUAs in good conditions. It is
however challenging since groundwater
abstraction is free in most of the states
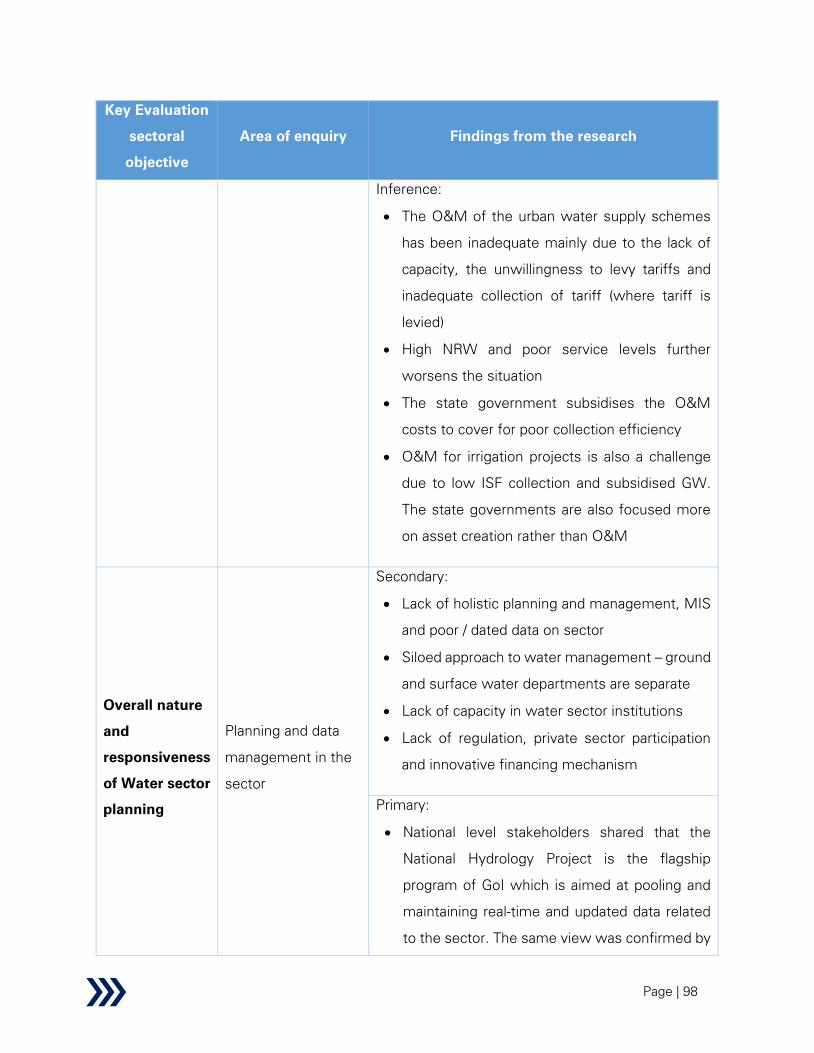
Page | 98
Key Evaluation
sectoral
objective
Area of enquiry Findings from the research
Inference:
• The O&M of the urban water supply schemes
has been inadequate mainly due to the lack of
capacity, the unwillingness to levy tariffs and
inadequate collection of tariff (where tariff is
levied)
• High NRW and poor service levels further
worsens the situation
• The state government subsidises the O&M
costs to cover for poor collection efficiency
• O&M for irrigation projects is also a challenge
due to low ISF collection and subsidised GW.
The state governments are also focused more
on asset creation rather than O&M
Overall nature
and
responsiveness
of Water sector
planning
Planning and data
management in the
sector
Secondary:
• Lack of holistic planning and management, MIS
and poor / dated data on sector
• Siloed approach to water management – ground
and surface water departments are separate
• Lack of capacity in water sector institutions
• Lack of regulation, private sector participation
and innovative financing mechanism
Primary:
• National level stakeholders shared that the
National Hydrology Project is the flagship
program of GoI which is aimed at pooling and
maintaining real-time and updated data related
to the sector. The same view was confirmed by

Page | 99
Key Evaluation
sectoral
objective
Area of enquiry Findings from the research
the Independent experts. Experts additionally
commented that utilization of the data for the
analysis and research is lacking.
• In addition, the National Water Information
Centre (NWIC) has been set up recently and is
being strengthened. The idea is to bring in all
states as stakeholders.
• The NWM has been trying to promote State
specific action plans for water budgeting.
• The Government of Punjab has recently
engaged a leading private sector company to
prepare a comprehensive water sector plan for
the state. It should cover all aspects including
improving water use efficiency, water supply,
water demand, and measures to increase
efficiency in agriculture, industrial, domestic
sectors
• In Punjab, as on date accurate data of water
consumption in various sectors is not available.
Authentic data about the volume of water
consumed by industrial sector, or domestic
sector is also not available because metered
water supply is only in urban area.
• In AP, the GW department has been renamed
as Groundwater and Water Audit department
and they plan to undertake comprehensive
water audit activities
• In Maharashtra, multiple water resources
related departments have been mandated to

Page | 100
Key Evaluation
sectoral
objective
Area of enquiry Findings from the research
maintain and submit data in specific
standardised formats by MWRRA
• For wastewater related data in the Ganga basin,
in addition to the manual stations, special cell
for ganga monitoring under CPCB has been set
up. Online Continuous Emission & Effluent
Monitoring Systems (OCEMS) is being set up
under NMCG and integration of data from the
SCADA system of new STPs is being attempted
Case Study- Maharashtra: Hydro-Economic
Analysis by WRG 2030
The complexity of the interaction between water
resource management and economic indicators
can be demonstrated through integrated
mathematical (hydro-economic) models. The
use of hydro-economic models in water
management helps in defining the physical
behaviour of the system, with a realistic
representation of surface water and
groundwater resources, including their
interaction, and estimating the spatial and
temporal variability of their availability.
In 2015, WRG 2030 conducted a hydro-
economic analysis to prepare a comprehensive
planning by analysis of opportunities to improve
Water Use in Agriculture Sector for
Maharashtra. The hydro-economic analysis

Page | 101
Key Evaluation
sectoral
objective
Area of enquiry Findings from the research
report captures various key elements related to
the sector including diagnosis of water challenge
in Maharashtra’s agriculture, understanding
agriculture growth in Maharashtra, and identifies
the challenges and opportunities for agricultural
growth in rainfed areas. A detailed Water
Balance and Water Demand Forecasting was
undertaken as part of this exercise. Such
detailed studies help in comprehensive planning
for the sector.
Source: 2030 WRG – Hydro-economic Analysis
for Maharashtra – Agriculture sector
Inference:
• The National Hydrology Project is the flagship
program of GoI which is aimed at pooling and
maintaining real-time and updated data related
to the sector
• Accurate and updated data, especially related to
the demand side for Irrigation, Domestic and
Industrial sectors are not available
• Attempts are being made to pool data under the
NWIC and NMCG projects (for wastewater)
Quality
Wastewater reuse &
pollution abatement
measures
Secondary:
• Inadequate capacity of STPs generating
approximately 38,791 MLD of untreated
sewage
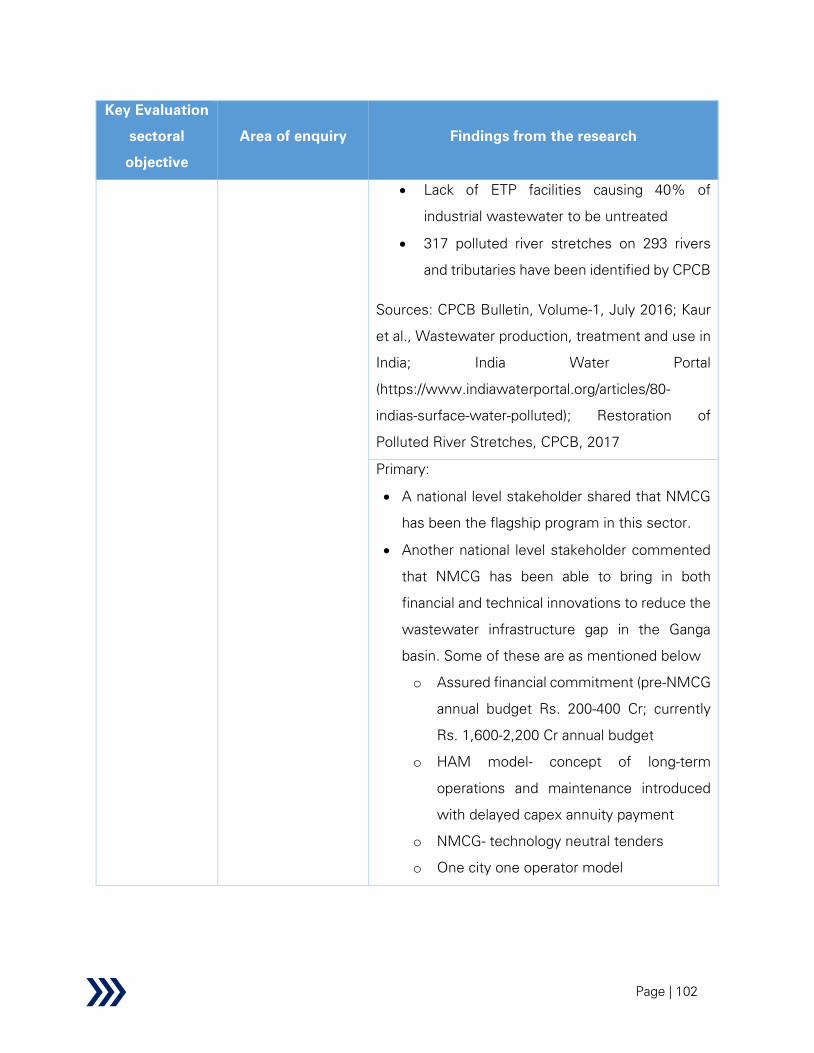
Page | 102
Key Evaluation
sectoral
objective
Area of enquiry Findings from the research
• Lack of ETP facilities causing 40% of
industrial wastewater to be untreated
• 317 polluted river stretches on 293 rivers
and tributaries have been identified by CPCB
Sources: CPCB Bulletin, Volume-1, July 2016; Kaur
et al., Wastewater production, treatment and use in
India; India Water Portal
(https://www.indiawaterportal.org/articles/80-
indias-surface-water-polluted); Restoration of
Polluted River Stretches, CPCB, 2017
Primary:
• A national level stakeholder shared that NMCG
has been the flagship program in this sector.
• Another national level stakeholder commented
that NMCG has been able to bring in both
financial and technical innovations to reduce the
wastewater infrastructure gap in the Ganga
basin. Some of these are as mentioned below
o Assured financial commitment (pre-NMCG
annual budget Rs. 200-400 Cr; currently
Rs. 1,600-2,200 Cr annual budget
o HAM model- concept of long-term
operations and maintenance introduced
with delayed capex annuity payment
o NMCG- technology neutral tenders
o One city one operator model

Page | 103
Key Evaluation
sectoral
objective
Area of enquiry Findings from the research
o Installation of OCEMS – (Online
Continuous Effluent Monitoring systems)
for polluting industries
o Focus on pollution abatement plus Aviral
Dhara, Nirmal Dhara, bio-diversity – lot of
public outreach activities undertaken
o To avoid mixing of effluent from industries,
which is a major challenge for operating
STPs- NMCG conducted inventory of all
industries and undertook CETP projects
o Policies – In recent times NMCG is trying
to improve usage of treated wastewater –
e.g. in Mathura project – 20 MLD treated
wastewater is being purchased by Indian
Oil. Moreover, in Haridwar STP, canals are
being built to carry treated wastewater to
agricultural fields
Case Study- Kanpur CETP set up by NMCG
for tannery
Kanpur’s tanneries are perceived to be the
primary source of industrial pollution in the
Ganga. To solve the pollution issue, National
Mission for Clean Ganga (NMCG) is undertaking
projects worth approx. Rs. 4,000 Cr. which
includes a 20 MLD Common Effluent Treatment
Plant (CETP) for tannery cluster at Jajmau in
Kanpur, Uttar Pradesh.

Page | 104
Key Evaluation
sectoral
objective
Area of enquiry Findings from the research
This 3-phase project at an estimated cost of Rs.
629 Cr. includes pre-treatment unit in 380
individual tannery units, a 20 CETP with physical,
biological and tertiary treatment and installation
of Zero Liquid Discharge (ZLD)-based pilot plant
of 200 KLD capacity among other components.
The central share of this project is Rs. 472 Cr.
This is a major step forward in arresting the
pollution in Ganga emanating from the crucial
industrial town of Kanpur. The project will be
executed by a Special Purpose Vehicle (SPV) –
Jajmau Tannery Effluent Treatment Association.
Source: PIB release dated 22 February 2018
• In Maharashtra, the state government has
planned to treat 100% of domestic and
industrial water and reuse at least 30-40% by
2022
Case Study- Wastewater reuse in Israel
The constraints of water scarcity, combined with
a fast-growing population and the decision to
stop over-exploitation of the aquifers, has made
it imperative for Israel to engage in a massive
program of reuse of treated wastewater.
Gradually, reclaimed wastewater has become a
major source of water for farmers, supplying
more than 40 percent of the country’s needs for

Page | 105
irrigation and more than 87 percent (approx. 500
MCM) of wastewater being reused.
Favourable pricing policies have been put in
place to give farmers a strong incentive to use
treated reclaimed wastewater for irrigation
instead of freshwater. Wastewater is priced at
US$0.3 per cubic meter for unrestricted
irrigation and US$ 0.25 per cubic for restricted
irrigation, less than half the tariff for freshwater
for agriculture which stands at $0.66 per cubic
meter. As an additional incentive for farmers to
use reclaimed wastewater, they were also
initially offered to convert their allocation of fresh
water to reclaimed water using a ratio of 1 : 1.2
(20 percent higher allocated water volume).
Source: Marin, Philippe, Shimon Tal, Joshua
Yeres, and Klas Ringskog. 2017. Water
Management in Israel: Key Innovations and
Lessons Learned for Water-Scarce Countries.
World Bank, Washington, DC.
• In Karnataka, an attempt is being made to reuse
wastewater in 4 ULBs. Focus is on treatment of
wastewater and attempt to supply treated
wastewater for reuse in industries
• In Punjab, STPs are being developed all across
the state. Currently from around 100 sewage
treatment plants around 2000 million litres per
day of treated wastewater is available. However
major part of this treated wastewater is not
being reused

Page | 106
Key Evaluation
sectoral
objective
Area of enquiry Findings from the research
• Currently Punjab is using around 300 MLD
(implemented using state funds) of treated
water in agriculture. Under this project,
underground pipes have been installed in the
areas adjoining the sewage treatment plants
and that water is supplied to agriculture sector
• The same need to be scaled up because Punjab
has a silver lining due to vast urbanization,
adequate amount of water supply to
households, piped water availability in almost
every rural household in Punjab. For organised
use, an action plan has been formed in the state
and the same includes existing plus proposed
STPs
Inference:
• NMCG has been the flagship program in this
sector. Numerous technological and financial
innovations have been implemented by the
Mission. Reuse component is also being
included in some recent projects, wherever
feasible.
• Certain states like Punjab and Maharashtra are
aiming to undertake reuse of treated
wastewater on a larger scale
• Karnataka is also trying to supply treated
wastewater to the industrial sector.
Sustainability Climate Change Secondary:

Page | 107
Key Evaluation
sectoral
objective
Area of enquiry Findings from the research
• Change in temperature and precipitation due to
global warming
• Uneven rainfall distribution, intense & localized
rainfall
• Water related disasters like flood, drought
Source: WWAP (UNESCO World Water
Assessment Programme), 2019. The United Nations
World Water Development Reports 2019: Leaving
No One Behind. Paris, UNESCO
Primary:
• Independent experts mentioned the following
related to climate change impact on the sector:
o Climate change will lead to India requiring
even more storage capacity as even if the
total rainfall remains same, erratic rainfall
patterns (decrease in number of rainfall days)
should require more storage since surplus
days should be lower and the amount of
surplus each day should be high
o Multiple studies in India have been
undertaken related to climate change and
several schemes related to the same are
being administered by MOEF&CC related to
issues such as impact on river basins due to
climate (both the volume and the flow)
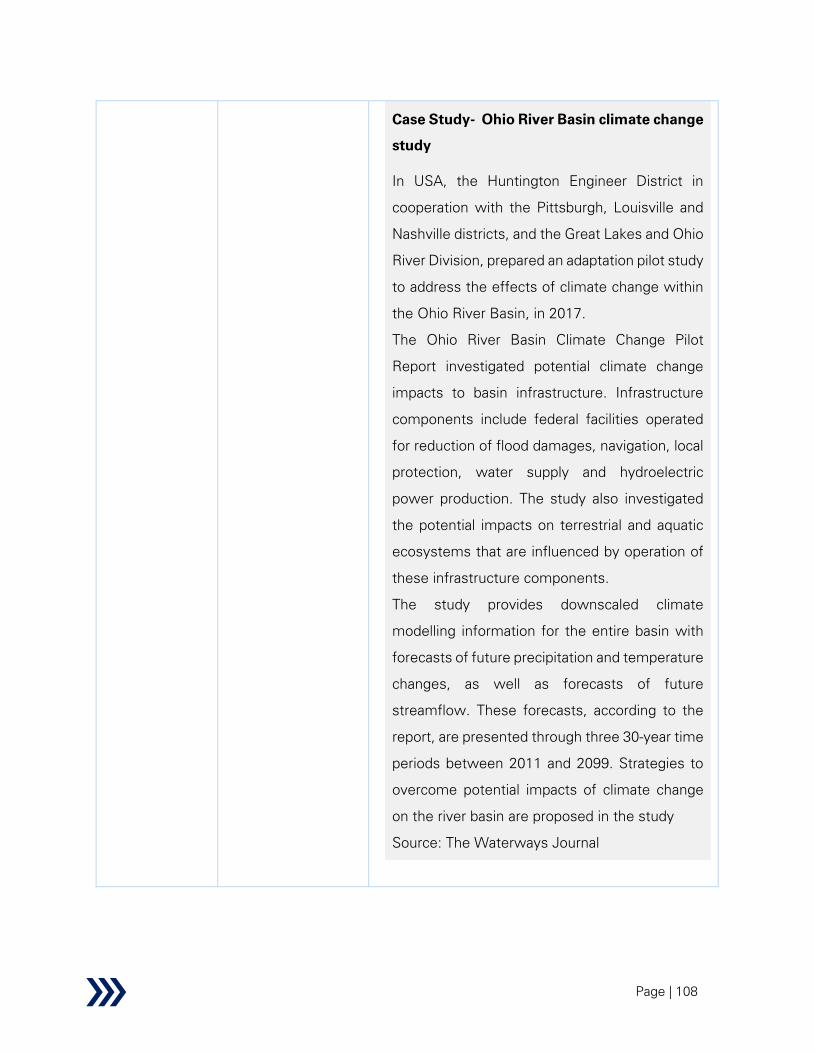
Page | 108
Case Study- Ohio River Basin climate change
study
In USA, the Huntington Engineer District in
cooperation with the Pittsburgh, Louisville and
Nashville districts, and the Great Lakes and Ohio
River Division, prepared an adaptation pilot study
to address the effects of climate change within
the Ohio River Basin, in 2017.
The Ohio River Basin Climate Change Pilot
Report investigated potential climate change
impacts to basin infrastructure. Infrastructure
components include federal facilities operated
for reduction of flood damages, navigation, local
protection, water supply and hydroelectric
power production. The study also investigated
the potential impacts on terrestrial and aquatic
ecosystems that are influenced by operation of
these infrastructure components.
The study provides downscaled climate
modelling information for the entire basin with
forecasts of future precipitation and temperature
changes, as well as forecasts of future
streamflow. These forecasts, according to the
report, are presented through three 30-year time
periods between 2011 and 2099. Strategies to
overcome potential impacts of climate change
on the river basin are proposed in the study
Source: The Waterways Journal
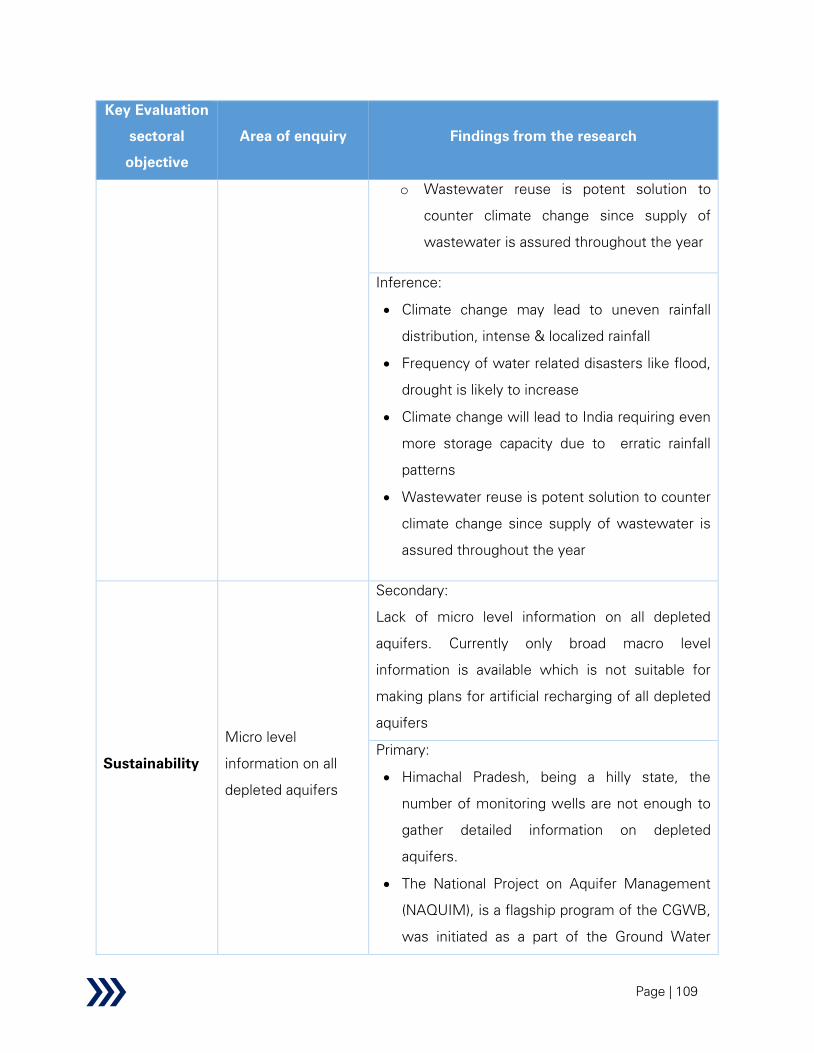
Page | 109
Key Evaluation
sectoral
objective
Area of enquiry Findings from the research
o Wastewater reuse is potent solution to
counter climate change since supply of
wastewater is assured throughout the year
Inference:
• Climate change may lead to uneven rainfall
distribution, intense & localized rainfall
• Frequency of water related disasters like flood,
drought is likely to increase
• Climate change will lead to India requiring even
more storage capacity due to erratic rainfall
patterns
• Wastewater reuse is potent solution to counter
climate change since supply of wastewater is
assured throughout the year
Sustainability
Micro level
information on all
depleted aquifers
Secondary:
Lack of micro level information on all depleted
aquifers. Currently only broad macro level
information is available which is not suitable for
making plans for artificial recharging of all depleted
aquifers
Primary:
• Himachal Pradesh, being a hilly state, the
number of monitoring wells are not enough to
gather detailed information on depleted
aquifers.
• The National Project on Aquifer Management
(NAQUIM), is a flagship program of the CGWB,
was initiated as a part of the Ground Water
Page | 110
Key Evaluation
sectoral
objective
Area of enquiry Findings from the research
Management and Regulation scheme to
delineate and characterize the aquifers to
develop plans for groundwater management
across India. As per data received from CGWB,
out of the total 24.8 lakh km2 area identified for
aquifer mapping under the scheme, an area of
13 lakh km2
(52%) has been covered up to
March 2020. As a part of this programme, region
specific groundwater management plans have
been prepared, which suggest appropriate
demand and supply side management
interventions to improve sustainability of
groundwater resources. However, NAQUIM is
undertaking mapping at 1:50000 scale and may
not provide village level aquifer level data
• In Karnataka, Atal Bhujal Yojana is being
implemented which has a mapping component.
For selected GPs (almost 1,200 GPs) micro
level water security is being planned.
• In Karnataka, artificial recharge is also currently
done at GP level by convergence with
MGNREGA- however more scientific project
preparation is needed
• In Andhra Pradesh, 6 hourly data from 1,254
piezometers are being measured, recorded and
reported through APWRIMS website. However,
there is scope for further analysis using the
available data. The funds for O&M of the
APWRIMS infrastructure including field

Page | 111
Key Evaluation
sectoral
objective
Area of enquiry Findings from the research
equipment is currently being arranged through
World Bank NHP.
• Under National Hydrology Project of the GoI,
real-time GWL monitoring is being implemented
through telemetry system
• The national level stakeholder commented that
the various Groundwater recharge structures
being created across the country (under
MGNREGA and other schemes), are currently
being undertaken by multiple state government
departments or local administration. These
structures are often created without any
coordination, proper planning or technical
knowledge. Guidelines of CGWB need to be
compulsorily followed for the effectiveness of
recharge structures. Moreover, O&M of these
structures have also been lacking. The
independent experts supported these views
and added that recharge structures should not
hamper the downstream water availability
Case Study- Groundwater Recharge
planning and implementation in Madhya
Pradesh
The aquifer mapping program undertaken by
CGWB, has been beneficially utilised by the
state government of Madhya Pradesh to plan
and implement various GW recharge initiatives

Page | 112
across the state. Select such cases provided
below:
• Based on the recommendations of
NAQUIM, state govt. has finalized Water
conservation/ Artificial Recharge sites in
9 blocks in districts of Chattarpur (3),
Tikamgarh (3), Panna (1), Damoh (1) and
Sagar (1)
• 18 successful wells were constructed
and handed over to the State Govt for
water supply based on NAQUIM studies
in parts of Bundelkhand region
• Madhya Pradesh State Employment
Guarantee Council is implementing
water conservation and artificial recharge
interventions as per NAQUIM studies
reports for Ujjain District.
Source: CGWB
• However Independent experts commented that
in addition to improving the quantity we need to
improve the quality, reliability and availability of
data related to depleted aquifers. It is also
important that we analyse the data and prepare
actionable recommendations based on the data.
Case Study- Groundwater Management in
Palla Well Field of Delhi Using Numerical
Modelling Technique
Page | 113
Key Evaluation
sectoral
objective
Area of enquiry Findings from the research
The Palla well field of Delhi is a model of
sustainable groundwater development and
management practices. A battery of ninety tube
wells extract around 25-30 MGD (41-49 million
m3/day) of groundwater to augment drinking
water needs of Delhi. The groundwater
management policy for groundwater abstraction
from the well field is based on a numerical
modelling study.
Source: CGWB
• In Punjab, a master plan for implementation of
artificial recharge structures was prepared in
2013.
Inference:
• The NAQUIM and NHP are flagship programs
aimed at aquifer mapping and real-time GWL
monitoring
• The Atal Bhujal Yojana is being implemented in
seven states across India also has an aquifer
mapping component
• APWRIMS capture 6 hourly data from 1,254
piezometers in Andhra Pradesh
• In addition to improving the quantity we need to
improve the quality, reliability and availability of
data related to depleted aquifers. It is also
important that we analyse the data and prepare
actionable recommendations based on the data.
Page | 114
Key Evaluation
sectoral
objective
Area of enquiry Findings from the research
• The implementation of GW recharge structures
needs to be improved and O&M of the
structures must be mandated.
Quality Groundwater quality
Secondary:
• In addition to the increase in exploitation of
groundwater over the years, there have also
been occurrences of quality related issues for
groundwater. Large parts of the Ganga-
Brahmaputra plains have breached the
permissible limits of arsenic. High concentration
of Iron (>1.0 mg/l) in groundwater has been
observed in more than 1.1 lakh habitations in the
country.
In addition, several Arsenic and fluoride
hotspots have emerged across India.
Source: Central Ground Water Board
Primary:
• The national level stakeholder shared that in
some coastal areas, over extraction has led to
ingress of saline water. Moreover, in some
states in the Ganga basin (10-15 km on either
side of Ganga) like in states UP, Bihar, WB-
arsenic contamination has been observed in
some blocks.

Page | 115
Case Study- Use of deeper aquifers in arsenic
affected areas for community water supply
In India, the problem of arsenic contamination of
groundwater from the state of West Bengal,
initially reported during the 1980’s is widely
known. Subsequently, the contamination was
also reported from several other areas. The
largest contiguous belt of high arsenic in
groundwater in India is reported from the
shallow alluvial aquifers in the Ganga Plain. In
this part arsenic contamination has been
reported from nearly 66 Districts in 6 States
(West Bengal, Uttar Pradesh, Bihar, Jharkhand,
Haryana and Delhi). The problem is compounded
by the fact that the drinking water supply in
these densely populated areas is dependent on
shallow aquifers, which are found to be
contaminated.
In detailed investigations undertaken by CGWB
under the NAQUIM, it has been found that
wherever the deeper aquifers are separated
from the shallow aquifers through a clay barrier,
these are safe from arsenic contamination. A
suitable well design has been developed by
CGWB for tapping the deeper aquifers for
arsenic safe water supply. The wells are
constructed by tapping the arsenic safe deeper
aquifer zones and separating the tapped deeper
aquifer zones in the wells from the overlying
contaminated shallow aquifers through cement
sealing technology.

Page | 116
Key Evaluation
sectoral
objective
Area of enquiry Findings from the research
The States of Uttar Pradesh and West Bengal
are replicating the well design proposed by
CGWB for construction of arsenic safe wells for
public water supply.
Source: CGWB
• In the industrial clusters in Himachal Pradesh,
GW pollution is mainly due to ineffective
handling effluents by the industries
• In Karnataka, over exploitation of GW and no
natural/artificial recharge has led to quality
degradation with time in some blocks. The
quality of groundwater is envisaged to be
controlled by preventing industrial pollution,
wastewater treatment, rainwater harvesting
and artificial recharge
• In Andhra Pradesh, industrial pollution has led to
quality issues in some pockets. In coastal areas,
below 500-600 ft saline ingress is observed
• In some parts of south-west Punjab, salinity
problems have been observed.
Inference:
• The quality of groundwater can be improved by
preventing industrial pollution and undertaking
wastewater treatment, rainwater harvesting
and artificial recharge.

Page | 117
Key Evaluation
sectoral
objective
Area of enquiry Findings from the research
• Salinity problems in coastal areas (due to over-
extraction) and arsenic problems in gangetic
plains exist but some of problems can be
alleviated by adoption of suitable innovative
measures like specially designed wells.
Water Security
Using recycled
water for agriculture
Secondary:
• Reuse of treated wastewater in the irrigation
sector is mostly prevalent across the world with
32% of reuse application. However, the major
challenge in using recycled water for agriculture
is to shift from informal and unplanned use of
partially or untreated wastewater to planned
safe uses
Source: WWAP (United Nations World Water
Assessment Programme). 2017. The United Nations
World Water Development Report 2017.
Wastewater: The Untapped Resource. Paris,
UNESCO
Primary:
• In Andhra Pradesh, not much has been done
especially since wastewater collection in rural
areas is not prevalent
• In Uttar Pradesh, STPs have been installed as a
part of NMCG. However, for reuse of treated
wastewater, awareness should be generated at
the community level
• A national level stakeholder shared that NMCG
has been the flagship program in this sector. . In

Page | 118
Key Evaluation
sectoral
objective
Area of enquiry Findings from the research
recent times NMCG is trying to improve use of
treated wastewater in agriculture – e.g. in
Haridwar STP, canals are being built to carry
treated wastewater to agricultural fields
• The independent experts pointed out that, reuse
in peri-urban areas and areas near STPs may be
easier from implementation perspective.
However initial pricing is required to be low to
encourage adoption. Moreover, treated
wastewater can act as an assured source of
supply for the farmers.
• Currently Punjab is using around 300 MLD
(implemented using state funds) of treated
water in agriculture. In the intervention
underground pipes have been installed in the
areas adjoining the sewage treatment plants
and that water is supplied to agriculture sector
Case Study- Reuse of wastewater in Punjab
The state government of Punjab is using treated
wastewater in agriculture. The treated water
from the STPs goes directly to the farmland via
underground pipelines, from which farmers can
irrigate their agricultural land. Currently the STPs
are located in Mukerian (4MLD), Talwara
(4MLD), and Sham Chaurasi (3 MLD). In
addition, in Shahpur a 30 MLD STP is being
constructed (under AMRUT) and its treated
wastewater is being used for agriculture.

Page | 119
Key Evaluation
sectoral
objective
Area of enquiry Findings from the research
Farmers are happy to use the treated
wastewater because earlier they were using the
untreated water. Treated wastewater is more
nutritious than the groundwater and they are
getting good yield. The treated wastewater
quality is examined through the labs every
quarter. This water is rich in nutrients and
consumption of fertilisers has also decreased.
Source: KII with Punjab stakeholder
• In Maharashtra, wastewater reuse for
agriculture has been attempted from 3 STPs in
Solapur
• However, planned reuse of treated wastewater
in agriculture has not been attempted in large
scale in Assam, Jharkhand, Rajasthan, Tamil
Nadu, Manipur, and Telangana
Household Survey insights
• Household Survey conducted across 11 states
revealed 70% of the farmers are willing to use
recycled wastewater in case the government
mandates the same.
• Among farmers not willing to use treated
wastewater for agriculture, fear of losing crops
was cited as the main reason for the same.

Page | 120
Key Evaluation
sectoral
objective
Area of enquiry Findings from the research
Inference:
• NMCG has been the flagship program in this
sector. In recent times, NMCG is trying to
initiate/incentivize use of treated wastewater in
agriculture.
• Certain states like Punjab and Maharashtra are
aiming to undertake reuse of treated
wastewater in agricultural sector on a larger
scale
• Huge potential of wastewater reuse exists in
Uttar Pradesh due to the NMCG projects
• Reuse in peri-urban areas and areas near STPs
may be easier to be implemented. However
initial pricing is required to be low to encourage
adoption. Treated wastewater can act as an
assured source of supply for the farmers.
Overall nature
and
responsiveness
of Water sector
planning
Coordination
between the various
central government
level organisations
and the state
government
departments
Secondary:
Water is a state subject as per the Constitution of
India. Therefore, the institutional structure and
departments at state level for implementation of
water resources sector related planning, are key to
ensure efficient planning and implementation in the
area. Greater coordination between the various
central government level organisations and the state
government departments is required going forward.
Primary:
• A national level stakeholder has mentioned
that water being a state subject, coordination

Page | 121
Key Evaluation
sectoral
objective
Area of enquiry Findings from the research
among states is required. The central
government has been acting as the mediator in
implementing various river interlinking projects
• In Andhra Pradesh, stakeholder suggested that
role of rural development department should
be reduced in water sector related activities.
The Irrigation and Agriculture department can
take up these activities. Implementation of
SCADA in select projects has led to better
coordination between irrigation and agriculture
departments
• For better coordination, fortnightly meetings
may be undertaken. Currently there exist
coordination issues
• In Karnataka, multiple agencies and
department undertake water conservation and
artificial recharge initiatives. This may lead to
duplication of effort.
• Two different departments operate in Manipur
- WR and CADA. Coordination issues exist
between Water Resources, CADA, Agriculture
and Horticulture departments
• In Punjab, stakeholder mentioned that
irrigation being the pivot of agriculture, there is
need for much more coordination between
water resources department and agriculture
department.
• In Uttar Pradesh, coordination among state
departments is good, however the stakeholder
Page | 122
Key Evaluation
sectoral
objective
Area of enquiry Findings from the research
mentioned that liaison with Central
Government can be further improved
• In Maharashtra, government had formed river
basin organizations and 5 such organisations
(or corporations) exist. These Multi-disciplinary
organizations consisting of agriculture,
groundwater, surface water and all other
related departments working together.
However, the integration expected in the river
basin organizations did not materialise.
Case Study- Tennessee Valley Authority – a
River Basin Organisation
The Tennessee Valley Authority (TVA) is a
federally owned corporation in the United States
created in the year 1933 to provide navigation,
flood control, and land management for the
Tennessee river system as well as undertake
electricity generation, fertilizer manufacturing,
environmental and economic development of
the Tennessee Valley region.
TVA was envisioned not only as a provider, but
also as a regional economic development
agency that would use federal experts and rural
electrification to help modernize the rural
region's economy and society. Since 1933, TVA
has worked to make life better for the people of
the Tennessee Valley region, which spans

Page | 123
Key Evaluation
sectoral
objective
Area of enquiry Findings from the research
80,000 square miles across parts of seven
states in the Southeast USA.
Source: TVA website
Case Study- Damodar Valley Corporation – a
River Basin Organisation in India
The Damodar Valley Corporation (DVC),
established in the year 1948, came into
existence as the first multi-purpose river valley
project of independent India. As on date, DVC
functions as a river basin authority, of the
Damodar valley area spanning across the states
of West Bengal and Jharkhand. DVC undertakes
the following key activities with the ultimate
objective of socio-economic development of the
Damodar Valley area:
• Power supply including hydro-power
generation in the area
• Flood control activities
• Irrigation and water supply related
activities
• Soil conservation in the valley
Source: DVC website
Inference:
• Overall, most states stated that greater
coordination between irrigation and agriculture
department is required

Page | 124
Key Evaluation
sectoral
objective
Area of enquiry Findings from the research
• Water being a state subject, in case of inter-
state river disputes and river interlinking
projects, better coordination is necessary
Sustainability
Gap between
demand and supply
of water
Secondary:
• A WRG 2030 study states India may be facing a
supply deficit of 50% vis-à-vis actual demand by
2030, driven by rapid growth in agricultural,
municipal and domestic sector demand
• India should face the worst scarcity in terms of
percentage of demand when compared to the
other countries
• 6% loss in the country's GDP anticipated by
2050 due to water scarcity (CWMI, 2018)
Source: 2030 WRG
Primary:
• National level stakeholders and independent
experts suggested the following to decrease
the demand supply gap
o Improved GW management
o Better regulatory system
o Improve water use efficiency in
agriculture
o Strengthening micro-irrigation
o Working on crop diversification
o Reuse of treated wastewater in
agriculture/industry
o Recharge and conservation of water
o River rejuvenation

Page | 125
Key Evaluation
sectoral
objective
Area of enquiry Findings from the research
o Design, management and O&M of
irrigation infrastructure keeping in
view various climate change aspects
• The stakeholder from Punjab also agreed that
the gap between demand and supply of water
needs to be addressed by the following:
o Reduce area under water intensive
crops like paddy
o Promoting micro-irrigation of
alternate crops like cotton and
horticulture
o Reuse of treated wastewater
Inference:
• The gap between demand and supply of water
needs to be reduced through interventions
related to both supply and demand side of water
Gaps in broad
sectoral
outcomes
Efficient
groundwater
management and
technologies
Secondary:
• India is one of the world’s
largest groundwater users, accounting for more
than 25% of the global total.
As per the estimates of the Central Groundwater
Board, share of bore well irrigation went up from just
1% (1960-1961) to 60% (2006-2007).
Primary:
• Stakeholder from Himachal Pradesh suggested
that better technology and more scientific
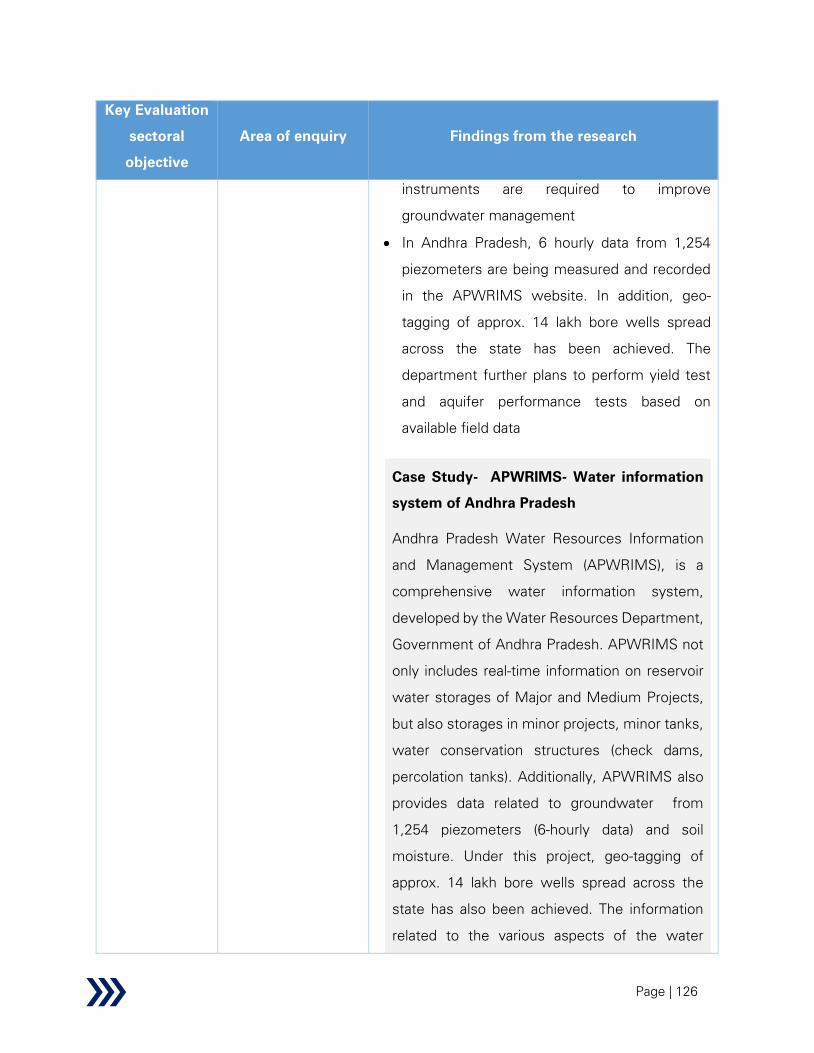
Page | 126
Key Evaluation
sectoral
objective
Area of enquiry Findings from the research
instruments are required to improve
groundwater management
• In Andhra Pradesh, 6 hourly data from 1,254
piezometers are being measured and recorded
in the APWRIMS website. In addition, geo-
tagging of approx. 14 lakh bore wells spread
across the state has been achieved. The
department further plans to perform yield test
and aquifer performance tests based on
available field data
Case Study- APWRIMS- Water information
system of Andhra Pradesh
Andhra Pradesh Water Resources Information
and Management System (APWRIMS), is a
comprehensive water information system,
developed by the Water Resources Department,
Government of Andhra Pradesh. APWRIMS not
only includes real-time information on reservoir
water storages of Major and Medium Projects,
but also storages in minor projects, minor tanks,
water conservation structures (check dams,
percolation tanks). Additionally, APWRIMS also
provides data related to groundwater from
1,254 piezometers (6-hourly data) and soil
moisture. Under this project, geo-tagging of
approx. 14 lakh bore wells spread across the
state has also been achieved. The information
related to the various aspects of the water
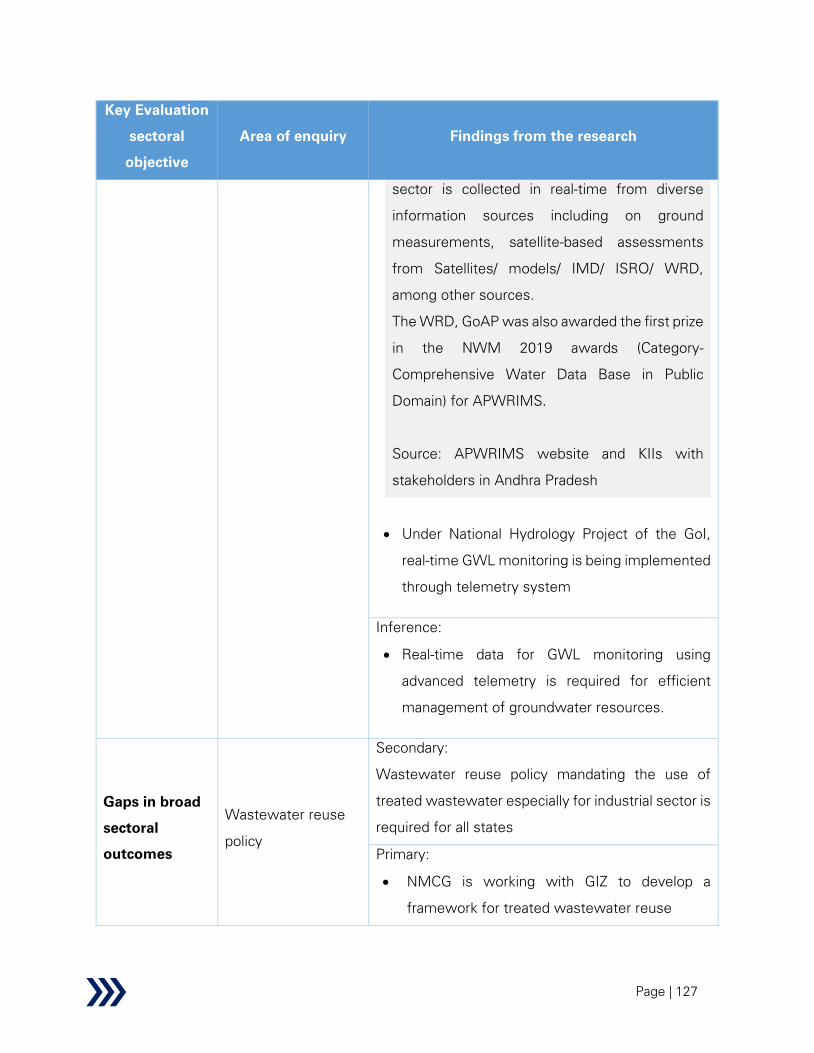
Page | 127
Key Evaluation
sectoral
objective
Area of enquiry Findings from the research
sector is collected in real-time from diverse
information sources including on ground
measurements, satellite-based assessments
from Satellites/ models/ IMD/ ISRO/ WRD,
among other sources.
The WRD, GoAP was also awarded the first prize
in the NWM 2019 awards (Category-
Comprehensive Water Data Base in Public
Domain) for APWRIMS.
Source: APWRIMS website and KIIs with
stakeholders in Andhra Pradesh
• Under National Hydrology Project of the GoI,
real-time GWL monitoring is being implemented
through telemetry system
Inference:
• Real-time data for GWL monitoring using
advanced telemetry is required for efficient
management of groundwater resources.
Gaps in broad
sectoral
outcomes
Wastewater reuse
policy
Secondary:
Wastewater reuse policy mandating the use of
treated wastewater especially for industrial sector is
required for all states
Primary:
• NMCG is working with GIZ to develop a
framework for treated wastewater reuse

Page | 128
Key Evaluation
sectoral
objective
Area of enquiry Findings from the research
• Wastewater reuse policy exists for the states
of Karnataka, Jharkhand and Punjab-
implementation needs to be further
strengthened
• HP is planning to introduce wastewater reuse
policy
Inference:
Wastewater reuse policy exists in a few states and
the implementation of the reuse initiatives needs to
be strengthened. More states need to adopt
wastewater reuse policy.
Gaps in broad
sectoral
outcomes
Need for water
regulator for all
states and /or central
Secondary:
The national water policy 2012 talks about setting up
a water regulator to manage various issues around
water. Considering the enormous challenges in
water sector, lack of a water regulatory authority is
hampering the growth of this sector. With multiple
disputes around water resources, supplies etc.,
there is an urgent need of a regulator to create
proper legislation, regulations for private sector
participation and innovative financing mechanism
Primary:
• National level stakeholder and Independent
Experts suggested that there is scope and need
for a regulator to issue such as competing uses
of water and allocating water resources across
drinking, industrial and irrigation sectors
• Karnataka suggested that a state level regulator
is required to levy tariff

Page | 129
Key Evaluation
sectoral
objective
Area of enquiry Findings from the research
• Independent water regulator is required to look
into various issues like tariff setting, water
quota allocation, equitable distribution, dispute
resolution, water use efficiency promotion, etc.
The regulator being third party (neither part of
government nor from other stakeholders) can
perform effectively without bias.
Case Study- Maharashtra Water Resources
Regulatory Authority (MWRRA)
The Maharashtra Water Resources Regulatory
Authority formed in the year 2005 is the first
independent water regulatory body in India. The
Established under the MWRRA Act, the
authority establishes a regulatory mechanism for
overseeing the relationship between the service
provider and water user entities as well as
among the various water user entities, in terms
of determination, enforcement and dispute
resolution of entitlements and fixing of water
charges, in the state of Maharashtra.
The regulator regulates activities across the
water sector in Maharashtra- starting from
supply side- surface water and groundwater as
well as the demand side- industrial sector,
domestic sector, agricultural sector and
commercial sector. MWRRA also regulates

Page | 130
Key Evaluation
sectoral
objective
Area of enquiry Findings from the research
wastewater treatment and wastewater reuse
related activities.
Challenge: MWRRA currently does not have any
field agencies to monitor the implementation of
the various initiatives and check compliance of
the same.
Source: MWRRA website; KII with stakeholder
Inference:
Independent Water regulator is necessary to
address issues such as competing uses of water
and allocating water across drinking, industrial and
irrigation sectors
Gaps in broad
sectoral
outcomes
Capacity building of
the
organisations/utilities
creating and
managing Water
Resources
infrastructure and
providing service
Secondary:
Lack of capacity of the departments / utilities
managing water resources and the service delivery
is leading to poor water management. There is a
serious need of involving the community (end
beneficiary) in the process of management of these
infrastructures for optimum use. Similarly, the
capacity available in the private also should be
tapped for bringing in efficiency in the management
systems.
Primary:
• The national level stakeholder mentioned that
Krishi Vikas Kendras situated across the country
impart training to the farmers and the
government officials at the state/district level

Page | 131
Key Evaluation
sectoral
objective
Area of enquiry Findings from the research
• Independent Expert shared that knowledge or
capacity needs to be built in areas related to
climate modelling, hydrological modelling and
similar advanced aspects
• In Bihar, more capacity building activities are
required for micro-irrigation and crop
diversification aspects. WALMI is currently
providing trainings in Bihar
• In Karnataka, capacity building to undertake
O&M of water supply and sewerage assets of
ULBs is necessary
• In Manipur, capacity building in latest
technologies and new instruments being
installed as a part of NHP is required
• In Punjab, local awareness generation programs
are regularly held by Punjab Agricultural
University
• In HP, engineers in the PHE or other engineering
departments need capacity building in social
skills.
Case Study- Odisha – AMRUT Orientation
Program
The Government of Odisha in association with
MoHUA (GoI) organises structured capacity
building at regular intervals, for the various
Municipal functionaries across the state who
oversee implementation of the various AMRUT
projects in the state. The various agencies who
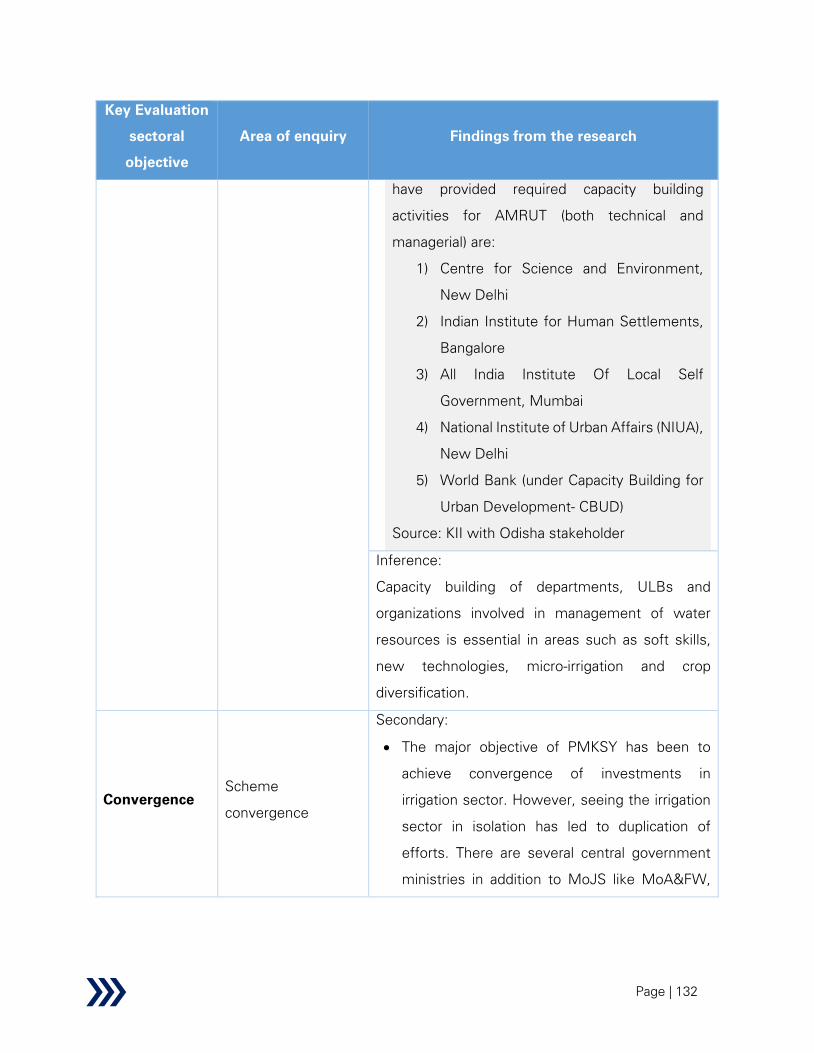
Page | 132
Key Evaluation
sectoral
objective
Area of enquiry Findings from the research
have provided required capacity building
activities for AMRUT (both technical and
managerial) are:
1) Centre for Science and Environment,
New Delhi
2) Indian Institute for Human Settlements,
Bangalore
3) All India Institute Of Local Self
Government, Mumbai
4) National Institute of Urban Affairs (NIUA),
New Delhi
5) World Bank (under Capacity Building for
Urban Development- CBUD)
Source: KII with Odisha stakeholder
Inference:
Capacity building of departments, ULBs and
organizations involved in management of water
resources is essential in areas such as soft skills,
new technologies, micro-irrigation and crop
diversification.
Convergence
Scheme
convergence
Secondary:
• The major objective of PMKSY has been to
achieve convergence of investments in
irrigation sector. However, seeing the irrigation
sector in isolation has led to duplication of
efforts. There are several central government
ministries in addition to MoJS like MoA&FW,

Page | 133
Key Evaluation
sectoral
objective
Area of enquiry Findings from the research
MoHUA, MoRD, etc implementing programs
related to water sector.
Source: Refer to Fig 22,23 and 24 of Inception report
for further details
Primary:
• The national level stakeholder mentioned that
the GoI is striving to achieve greater
convergence among schemes. Creation of new
small storage structures and water bodies in
convergence with MGNREGA is being
attempted
• Greater convergence is being attempted
between Jal Jeevan Mission and Atal Bhujal
Yojana
• Greater convergence is being attempted with
MNRE for solar interventions in the sector
• The NWM is trying to promote and implement
“Catch the Rain” initiative (decentralised
rainwater harvesting structures) in convergence
with MGNREGA
• In Punjab, Uttar Pradesh and Andhra Pradesh,
convergence is being tried with MGNREGA
Case Study- NMCG Convergence
The National Mission for Clean Ganga (NMCG),
is trying to converge various available fund

Page | 134
Key Evaluation
sectoral
objective
Area of enquiry Findings from the research
sources to achieve its objective of clean Ganga.
Some key initiatives are:
1) Programme for promotion of afforestation in
convergence with MoEF&CC (with CAMPA
funds) to attend to the issue related to
agricultural runoff and pollution
2) Program for Organic farming all along ganga
river in convergence with Ministry of Agriculture
and Farmer Welfare. Under the initiative, there
are plans to undertake organic riverbed farming
in 5-7 km belt along the river Ganga.
Source: KII with stakeholder
Inference:
• There is increasing focus on convergence both
at National and state levels. Creation of new
small storage structures and water bodies in
convergence with MGNREGA is being
attempted. Other areas are use of solar power
and agriculture, which are also being tried.
Gaps in broad
sectoral
outcomes
Staffing levels
Secondary:
• Present staffing levels are ten times that of
international norms, and most public funds are
now spent feeding the administrative
machinery, not maintaining the stock of
infrastructure or providing services.

Page | 135
Key Evaluation
sectoral
objective
Area of enquiry Findings from the research
Source: India's Water Economy: Bracing for a
Turbulent Future – WBG
Primary:
• In Bihar, there was no regular recruitment after
1994. So the WRD department is under staffed
• In Karnataka, the stakeholder mentioned that in
terms of permanent staff, the authority was
under staffed
• In Manipur, the stakeholder informed that staff
numbers at lower levels were less
• A national level stakeholder shared that CWC
and its regional offices are understaffed
• Another national level stakeholder mentioned
that state groundwater departments are
understaffed and have a very skeletal structure.
AP state GWD stakeholder confirmed the same.
• HP stakeholder shared that field staff were less
in number.
Case Study- Telangana agriculture staffing
The Department of Agriculture, Government of
Telangana had envisaged to increase the staff
strength in its department including extension
and district offices. Therefore, from 2017
onwards, for every 5,000 farmers, one
agricultural extension officer was recruited.
For instance, the state has 77 agricultural
extension officers working in one district
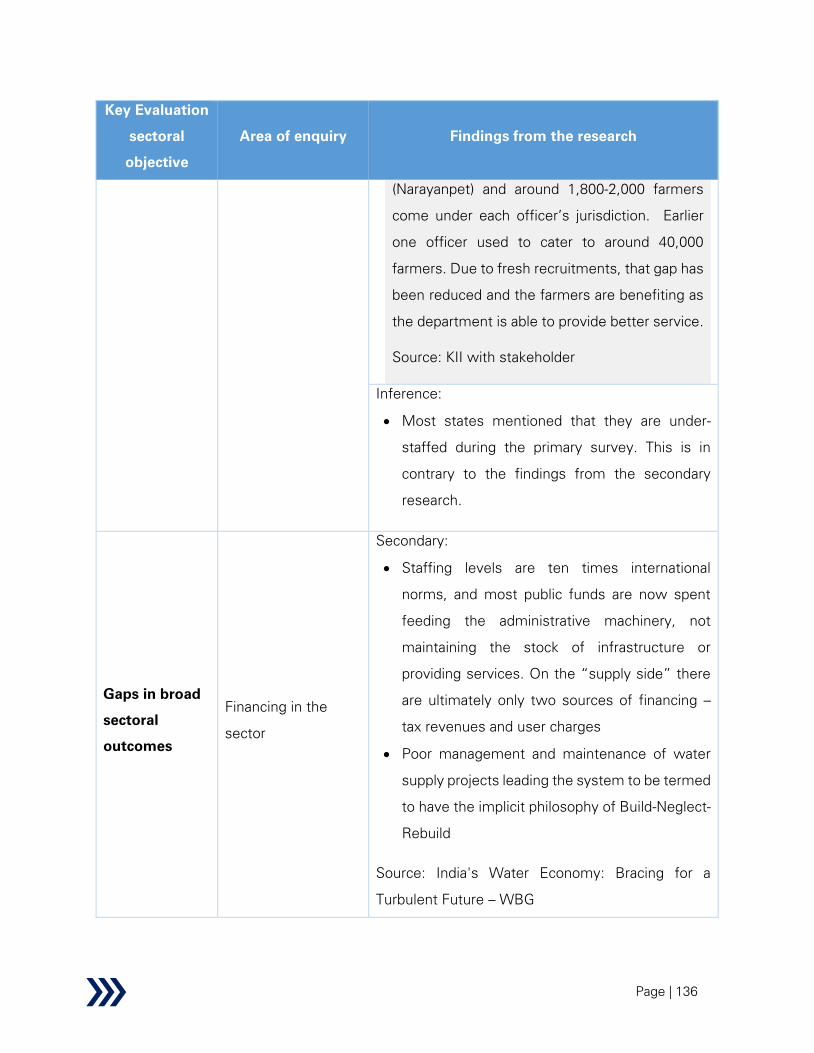
Page | 136
Key Evaluation
sectoral
objective
Area of enquiry Findings from the research
(Narayanpet) and around 1,800-2,000 farmers
come under each officer’s jurisdiction. Earlier
one officer used to cater to around 40,000
farmers. Due to fresh recruitments, that gap has
been reduced and the farmers are benefiting as
the department is able to provide better service.
Source: KII with stakeholder
Inference:
• Most states mentioned that they are under-
staffed during the primary survey. This is in
contrary to the findings from the secondary
research.
Gaps in broad
sectoral
outcomes
Financing in the
sector
Secondary:
• Staffing levels are ten times international
norms, and most public funds are now spent
feeding the administrative machinery, not
maintaining the stock of infrastructure or
providing services. On the “supply side” there
are ultimately only two sources of financing –
tax revenues and user charges
• Poor management and maintenance of water
supply projects leading the system to be termed
to have the implicit philosophy of Build-Neglect-
Rebuild
Source: India's Water Economy: Bracing for a
Turbulent Future – WBG
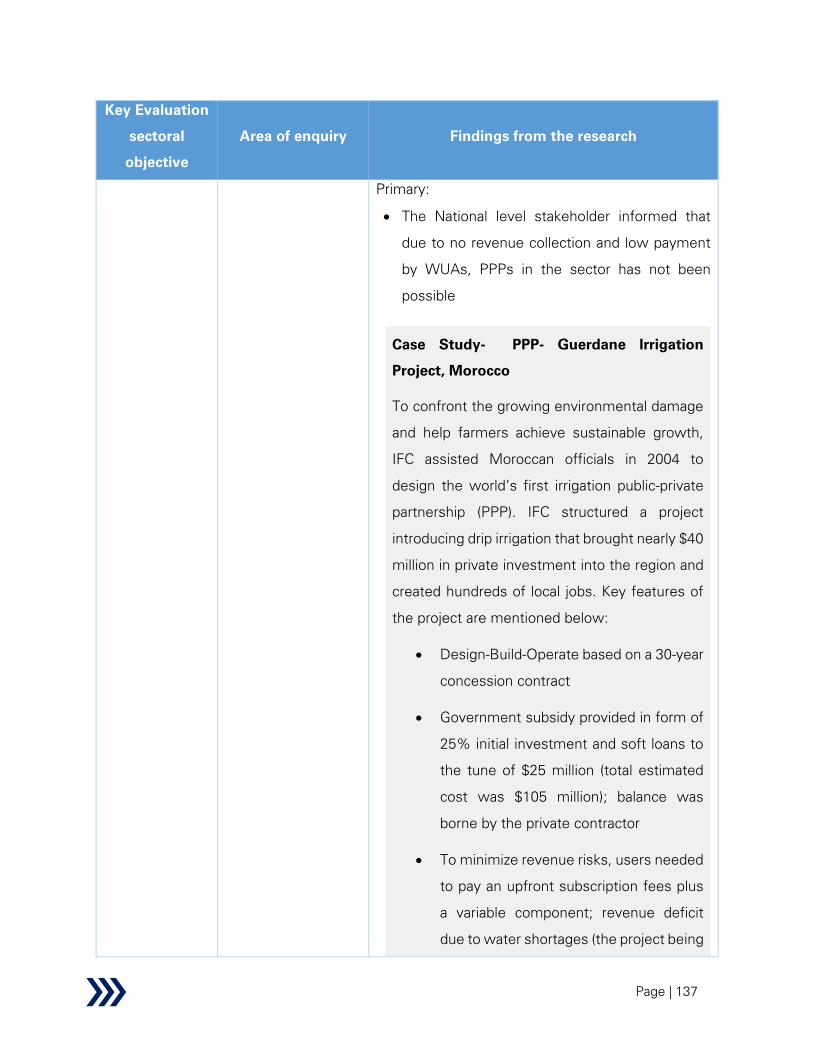
Page | 137
Key Evaluation
sectoral
objective
Area of enquiry Findings from the research
Primary:
• The National level stakeholder informed that
due to no revenue collection and low payment
by WUAs, PPPs in the sector has not been
possible
Case Study- PPP- Guerdane Irrigation
Project, Morocco
To confront the growing environmental damage
and help farmers achieve sustainable growth,
IFC assisted Moroccan officials in 2004 to
design the world’s first irrigation public-private
partnership (PPP). IFC structured a project
introducing drip irrigation that brought nearly $40
million in private investment into the region and
created hundreds of local jobs. Key features of
the project are mentioned below:
• Design-Build-Operate based on a 30-year
concession contract
• Government subsidy provided in form of
25% initial investment and soft loans to
the tune of $25 million (total estimated
cost was $105 million); balance was
borne by the private contractor
• To minimize revenue risks, users needed
to pay an upfront subscription fees plus
a variable component; revenue deficit
due to water shortages (the project being

Page | 138
in a drought prone area) to be shared
between the parties with private
concessionaire’s loss capped to 15%
while users need to partly bear the loss
through increase in water charges
• Concessionaire agreement was signed in
2006 and the project achieved a 100
percent connection rate by 2009
Source: Public-Private Partnership Impact
Stories- Morocco: Guerdane Irrigation- IFC
• Independent Expert shared that for dams
revenue generation from tourism is a possibility
• In Bihar, Revenue collection has not been
adequate due to less manpower and farmers
often don’t come to the office to pay since it is
far away and they will incur costs.
• In Bihar, under Participatory Irrigation
Management (PIM); the department is handing
over certain canals to the empanelled agencies
after construction for O&M only. They are
mandated to collect the required revenue. 30%
of the fees is to be shared with Govt and the
remaining 70% is to be used for O&M.
However, collection has been inadequate and
the contractor has defaulted in payments
• In Karnataka, urban water supply related
schemes have received capex funding from
various Central government and state
government schemes like AMRUT. The O&M
funds are however to be met only from tariff
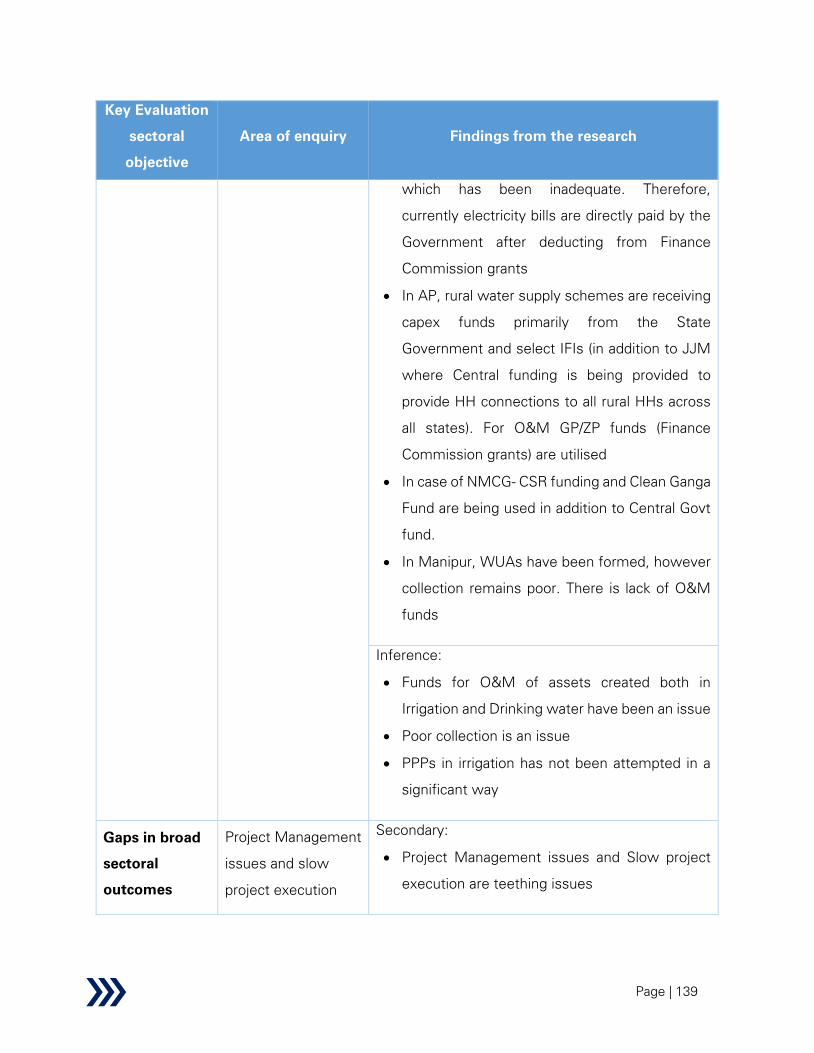
Page | 139
Key Evaluation
sectoral
objective
Area of enquiry Findings from the research
which has been inadequate. Therefore,
currently electricity bills are directly paid by the
Government after deducting from Finance
Commission grants
• In AP, rural water supply schemes are receiving
capex funds primarily from the State
Government and select IFIs (in addition to JJM
where Central funding is being provided to
provide HH connections to all rural HHs across
all states). For O&M GP/ZP funds (Finance
Commission grants) are utilised
• In case of NMCG- CSR funding and Clean Ganga
Fund are being used in addition to Central Govt
fund.
• In Manipur, WUAs have been formed, however
collection remains poor. There is lack of O&M
funds
Inference:
• Funds for O&M of assets created both in
Irrigation and Drinking water have been an issue
• Poor collection is an issue
• PPPs in irrigation has not been attempted in a
significant way
Gaps in broad
sectoral
outcomes
Project Management
issues and slow
project execution
Secondary:
• Project Management issues and Slow project
execution are teething issues
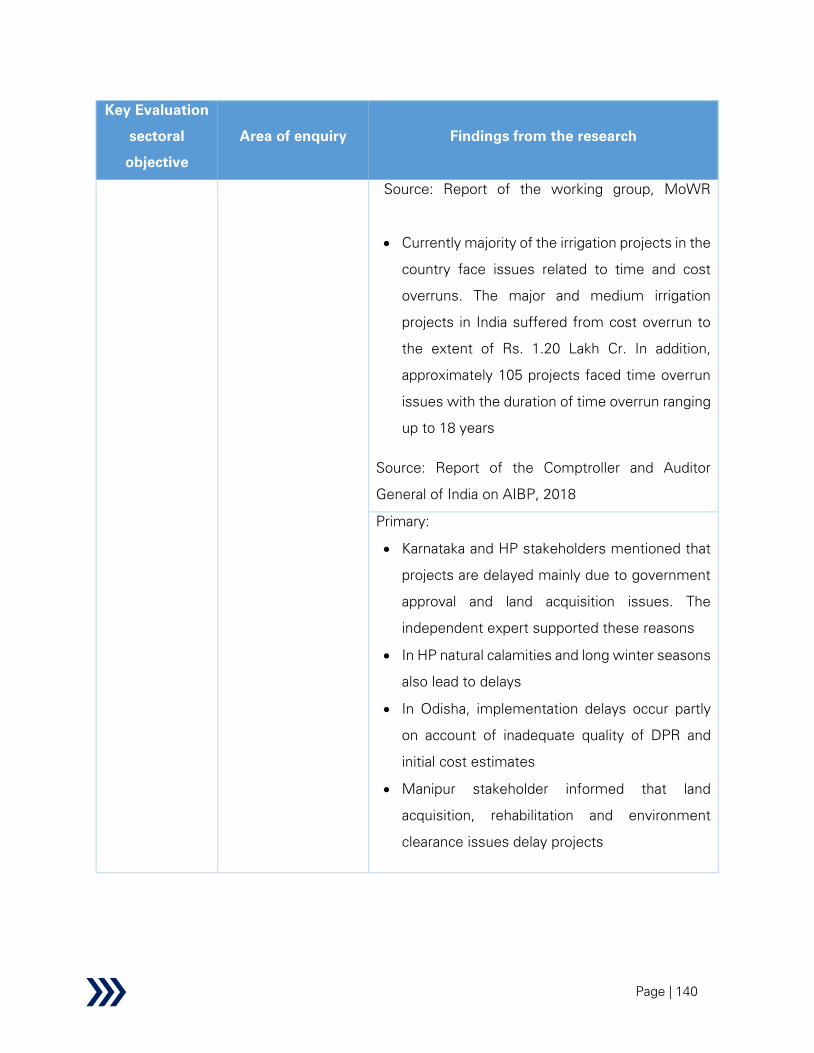
Page | 140
Key Evaluation
sectoral
objective
Area of enquiry Findings from the research
Source: Report of the working group, MoWR
• Currently majority of the irrigation projects in the
country face issues related to time and cost
overruns. The major and medium irrigation
projects in India suffered from cost overrun to
the extent of Rs. 1.20 Lakh Cr. In addition,
approximately 105 projects faced time overrun
issues with the duration of time overrun ranging
up to 18 years
Source: Report of the Comptroller and Auditor
General of India on AIBP, 2018
Primary:
• Karnataka and HP stakeholders mentioned that
projects are delayed mainly due to government
approval and land acquisition issues. The
independent expert supported these reasons
• In HP natural calamities and long winter seasons
also lead to delays
• In Odisha, implementation delays occur partly
on account of inadequate quality of DPR and
initial cost estimates
• Manipur stakeholder informed that land
acquisition, rehabilitation and environment
clearance issues delay projects
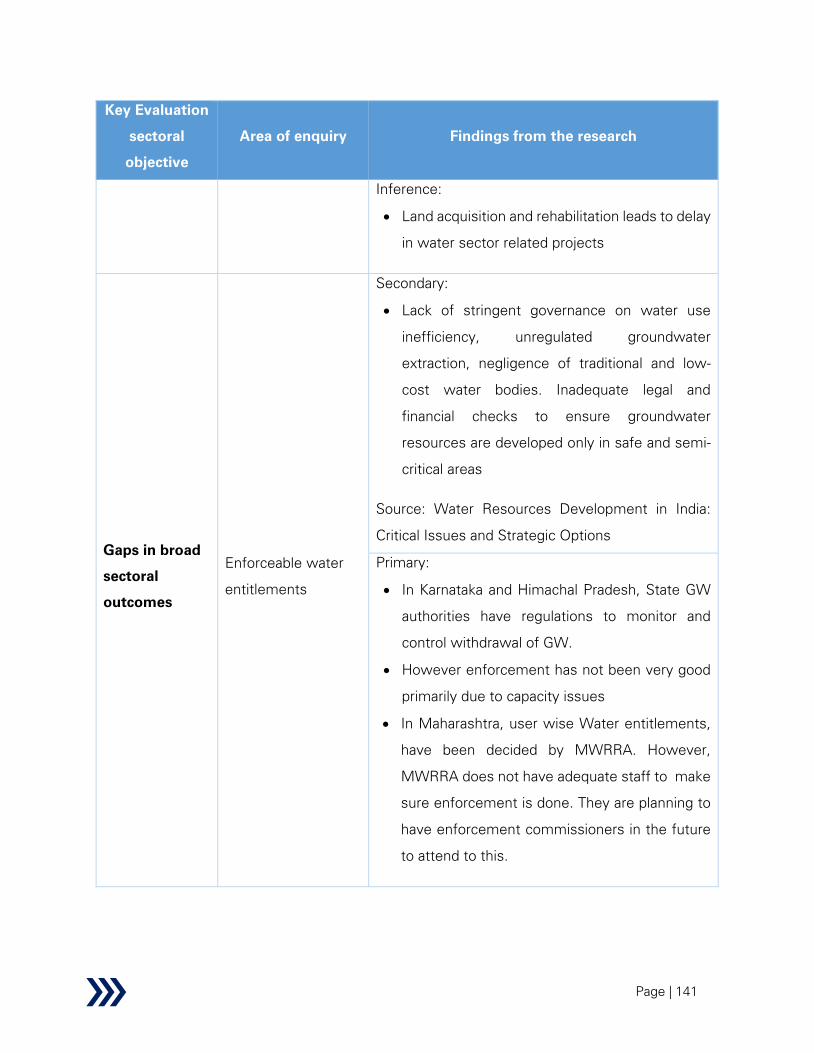
Page | 141
Key Evaluation
sectoral
objective
Area of enquiry Findings from the research
Inference:
• Land acquisition and rehabilitation leads to delay
in water sector related projects
Gaps in broad
sectoral
outcomes
Enforceable water
entitlements
Secondary:
• Lack of stringent governance on water use
inefficiency, unregulated groundwater
extraction, negligence of traditional and low-
cost water bodies. Inadequate legal and
financial checks to ensure groundwater
resources are developed only in safe and semi-
critical areas
Source: Water Resources Development in India:
Critical Issues and Strategic Options
Primary:
• In Karnataka and Himachal Pradesh, State GW
authorities have regulations to monitor and
control withdrawal of GW.
• However enforcement has not been very good
primarily due to capacity issues
• In Maharashtra, user wise Water entitlements,
have been decided by MWRRA. However,
MWRRA does not have adequate staff to make
sure enforcement is done. They are planning to
have enforcement commissioners in the future
to attend to this.

Page | 142
Case Study- Water entitlement and trading
in Murray Darling Basin, Australia
The Murray–Darling Basin Authority operates
the River Murray on behalf of New South Wales,
Victoria and South Australia. Under the Murray–
Darling Basin Agreement, the Murray–Darling
Basin Authority determines the amount of water
available to each state each year. The various
state governments work with the Authority to
provide an allocation of water to their
entitlement holders. To access water in the
River Murray, an entitlement holder places a
water order directly with their state water
agency.
Water in the Murray–Darling Basin can be
bought and sold. This water is traded on markets
– within catchments, between catchments
(where possible) or along river systems. This
form of trading allows water users to buy and
sell water in response to their individual needs
(mainly surface water and some groundwater).
Water trading (from the entitlement) helps
Murray–Darling Basin farmers to make more
productive use of water and contributes to
sustainable water management. Water trading
in the Basin is worth about $2 billion annually.
Source: Website of Murray–Darling Basin
Authority
Inference:
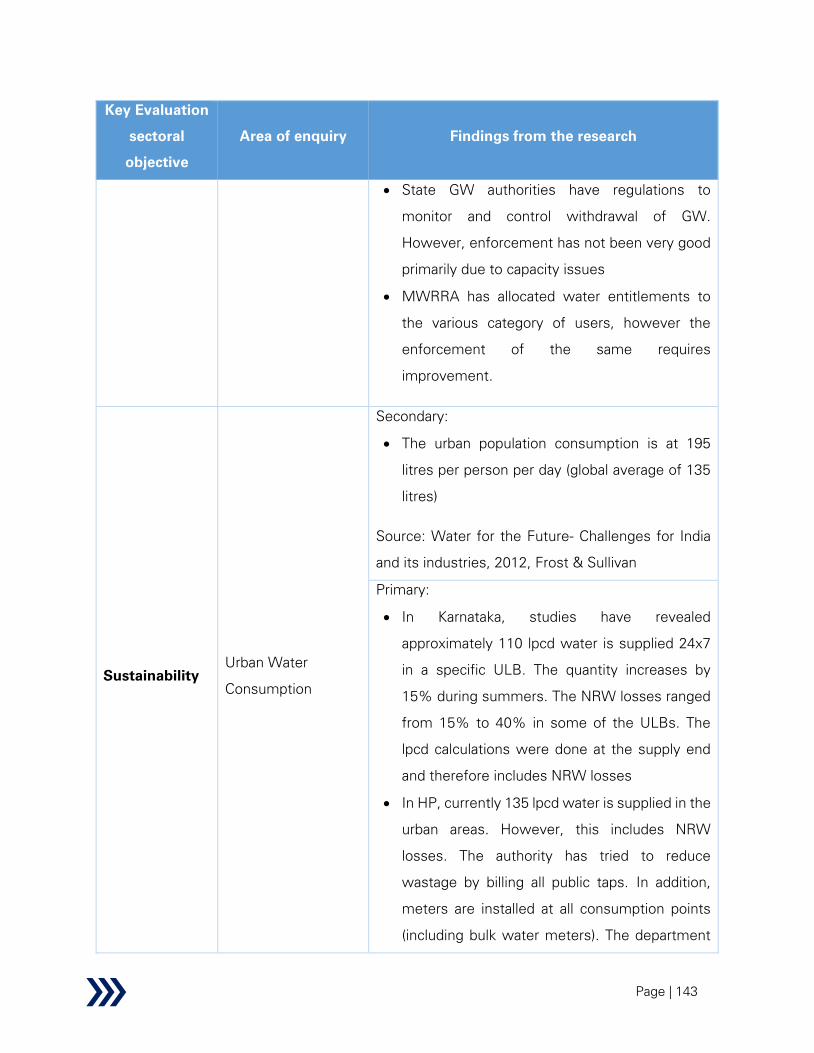
Page | 143
Key Evaluation
sectoral
objective
Area of enquiry Findings from the research
• State GW authorities have regulations to
monitor and control withdrawal of GW.
However, enforcement has not been very good
primarily due to capacity issues
• MWRRA has allocated water entitlements to
the various category of users, however the
enforcement of the same requires
improvement.
Sustainability
Urban Water
Consumption
Secondary:
• The urban population consumption is at 195
litres per person per day (global average of 135
litres)
Source: Water for the Future- Challenges for India
and its industries, 2012, Frost & Sullivan
Primary:
• In Karnataka, studies have revealed
approximately 110 lpcd water is supplied 24x7
in a specific ULB. The quantity increases by
15% during summers. The NRW losses ranged
from 15% to 40% in some of the ULBs. The
lpcd calculations were done at the supply end
and therefore includes NRW losses
• In HP, currently 135 lpcd water is supplied in the
urban areas. However, this includes NRW
losses. The authority has tried to reduce
wastage by billing all public taps. In addition,
meters are installed at all consumption points
(including bulk water meters). The department

Page | 144
Key Evaluation
sectoral
objective
Area of enquiry Findings from the research
gets to know the leakages in the main line due
to this. So, leakage detection in the primary grid
is being done. However leakage detection in
distribution network is yet to be undertaken
• In Rajasthan urban water supply goes up to 275
lpcd
• In Odisha, urban water supply is around 275
lpcd and includes high NRW losses
Inference:
• High NRW losses inflate the per capita
consumption by urban water users. Consumer-
end metering would indicate actual
consumption.
Sustainability
O&M and lack of
financing- rural water
supply
Secondary:
• Estimated NRW is between 40-70% of the
water distributed. About 82% of rural
households in India do not have individual piped
water supply; however physical rural water
coverage is estimated to be 81%. Government
of India has recently launched Jal Jeevan
Mission (JJM) which targets to provide piped
water supply connections to 100% of the
households by 2024
Source: Urban Water Supply and Sanitation, The
World Bank
Primary:

Page | 145
Key Evaluation
sectoral
objective
Area of enquiry Findings from the research
• In AP, O&M of rural water supply schemes are
primarily done using Finance commission funds
(received by GPs/ZPs). Improvement in
metering and tariff collection can further
augment the existing O&M funding sources
• Currently in AP, metering is being done only in a
few pilot projects
• For O&M financing- NABARD and in some
cases CSR funds are being utilised. In most
cases GP/ZP funds (Finance Commission) funds
are being used
Case Study- Efficient rural water supply
O&M in Maharashtra
Maharashtra Water Supply and Sewerage Board
(MWSSB) was established as per MWSSB Act
1976 for rapid development and proper
regularization of water supply and sewerage
services in the state. MWSSB was subsequently
named as Maharashtra Jeevan Pradhikaran
(MJP) in 1997.
The authority is responsible for implementing
the rural water supply schemes and undertakes
O&M of multiple rural water schemes. It hands
over some rural water schemes to GPs but many
schemes are being managed by them.
The authority also collects tariff from the users
in case it undertakes the O&M itself. In case
O&M is undertaken by the GP/ZP, they collect

Page | 146
Key Evaluation
sectoral
objective
Area of enquiry Findings from the research
the appropriate tariff charge from the GP/ZP,
who in turn recovers it from the consumers.
Source: MJP website and KII with stakeholder
Inference:
• The JJM will aim to provide household
connection to all rural households by 2024
• Sustainable O&M of RWS schemes is currently
a major issue
Overall nature
and
responsiveness
of Water sector
planning
Groundwater Level
Monitoring
Secondary:
• Currently, CGWB monitors groundwater levels
four times a year through a network of 23,125
observation wells as on 31.03.2017, which are
spread throughout the country. Moreover, the
CGWB undertakes detailed groundwater
assessment studies across 6,881 assessment
units (Blocks/Mandals/Talukas/Firkas) in the
country (2017)
Source: Dynamic Ground Water Resources of
India, 2017 (Published on July 2019), Central
Ground Water Board, Ministry of Water Resources
and Reassessment of water availability in basins
using space inputs, Central Water Commission,
June 2019
Primary:
• As per data received from CGWB, as on March
2020, CGWB has a total of 22,730 monitoring

Page | 147
Key Evaluation
sectoral
objective
Area of enquiry Findings from the research
wells throughout India which includes 16,375
Dug Wells and 6,355 Piezometers for
monitoring GWL. The national level stakeholder
mentioned that in addition to the above, approx.
50,000+ monitoring wells have been installed by
various state level monitoring agencies. The
density of monitoring wells may be further
improved. However, it depends upon the aim of
monitoring
• Both the states of Himachal Pradesh and
Karnataka have suggested that number of
monitoring points need to be increased
• Automatic GWL recorders based on telemetry
are required
• In hilly areas, separate study needs to be done
to determine the adequate number of
piezometers
• In Punjab, both manual and automatic
monitoring systems for recording GWL are in
place. Participatory monitoring is also
undertaken. NHP is further strengthening the
monitoring ecosystem
Case Study- National Hydrology project for
innovative GWL monitoring
In order to strengthen the monitoring program,
under National Hydrology Project (a World Bank
aided project), all the State agencies and central
agency (CGWB) are installing DWLRs

Page | 148
(Automatic Digital Water Level Recorder) and
data is being acquired through telemetry. In
CGWB, bids have already been floated for 3,400
DWLRs with telemetry for acquiring data
through telemetry two times a day (0600 Hrs &
1800 Hrs) and bids for 60 DWLRs with water
quality probes are to be floated. Similarly, in
other States, the bidding processes are in
various stages and in total about 6,000 DWLRs
are proposed to be procured by various States
under NHP.
The water level monitored by DWLRs would be
transmitted to various data centers of State and
CGWB and thereafter transmitted to Water
Resources Information System (WIMS), a
common database being maintained by NPMU
and thereafter sent to India- Water Resources
Information System (India-WRIS) for data
dissemination. The manual data collection will
continue till the automatic measurement is
strengthened with higher requisite numbers to
make the monitoring more robust.
Source: CGWB
• In Karnataka- State GWB and CGWB together
have monitoring stations. However, based on
analysis, additional 50 stations are required
• In Karnataka technology used for GWL
monitoring are
o Manual monitoring by officials

Page | 149
Key Evaluation
sectoral
objective
Area of enquiry Findings from the research
o Participatory monitoring involving SHGs
and volunteers who have been trained to
monitor- GP etc- based on nominal
payment; the same is being recorded
locally and shared by phone, postcard etc.
Numbers are being ramped up
o Automatic recording using telemetry-
there are a few, more is being procured;
given the higher cost, there is a need to
optimize.
Inference:
• The number of GWL monitoring wells need to
be increased based on the terrain and specific
requirements
• Automatic GWL recorders may be installed and
optimised
Overall nature
and
responsiveness
of Water sector
planning
Conjunctive use of
surface and
groundwater
Secondary:
• Conjunctive use of surface and groundwater
consists of harmoniously combining the use of
both sources of water in order to minimize the
undesirable physical, environmental and
economic effects of each solution and to
optimize the water demand/supply balance.
Usually conjunctive use of surface and
groundwater is considered within a river basin
management programme
Source: FAO
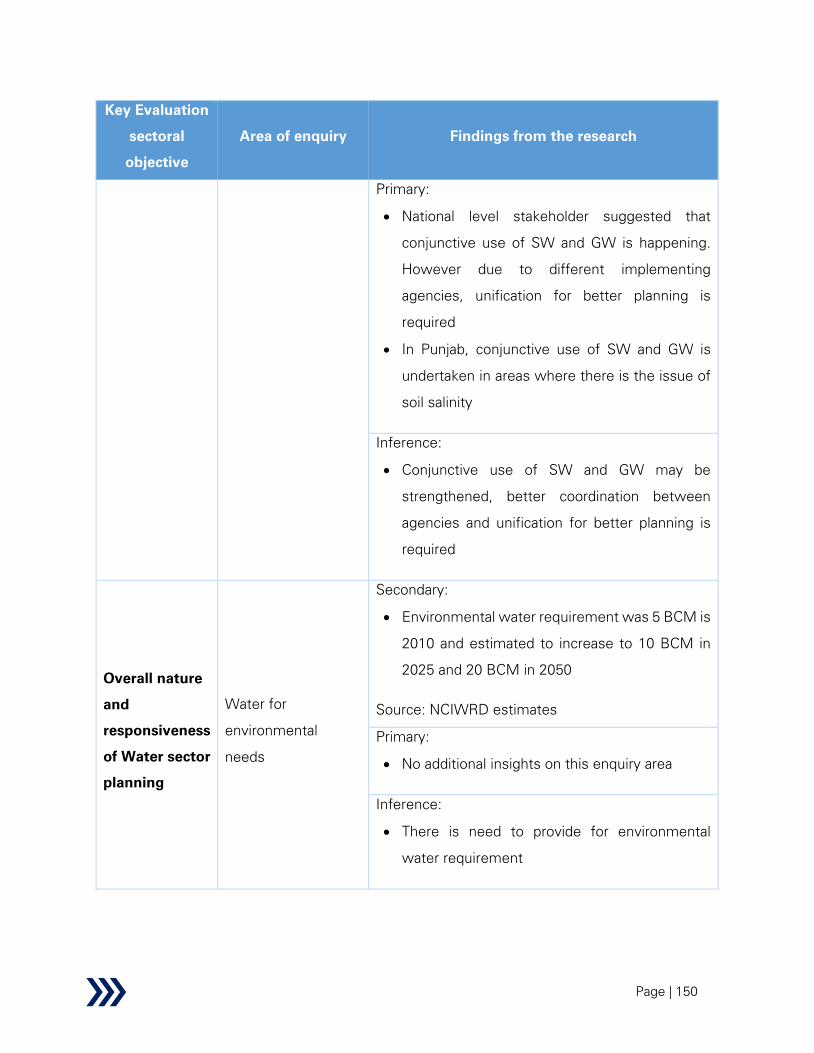
Page | 150
Key Evaluation
sectoral
objective
Area of enquiry Findings from the research
Primary:
• National level stakeholder suggested that
conjunctive use of SW and GW is happening.
However due to different implementing
agencies, unification for better planning is
required
• In Punjab, conjunctive use of SW and GW is
undertaken in areas where there is the issue of
soil salinity
Inference:
• Conjunctive use of SW and GW may be
strengthened, better coordination between
agencies and unification for better planning is
required
Overall nature
and
responsiveness
of Water sector
planning
Water for
environmental
needs
Secondary:
• Environmental water requirement was 5 BCM is
2010 and estimated to increase to 10 BCM in
2025 and 20 BCM in 2050
Source: NCIWRD estimates
Primary:
• No additional insights on this enquiry area
Inference:
• There is need to provide for environmental
water requirement
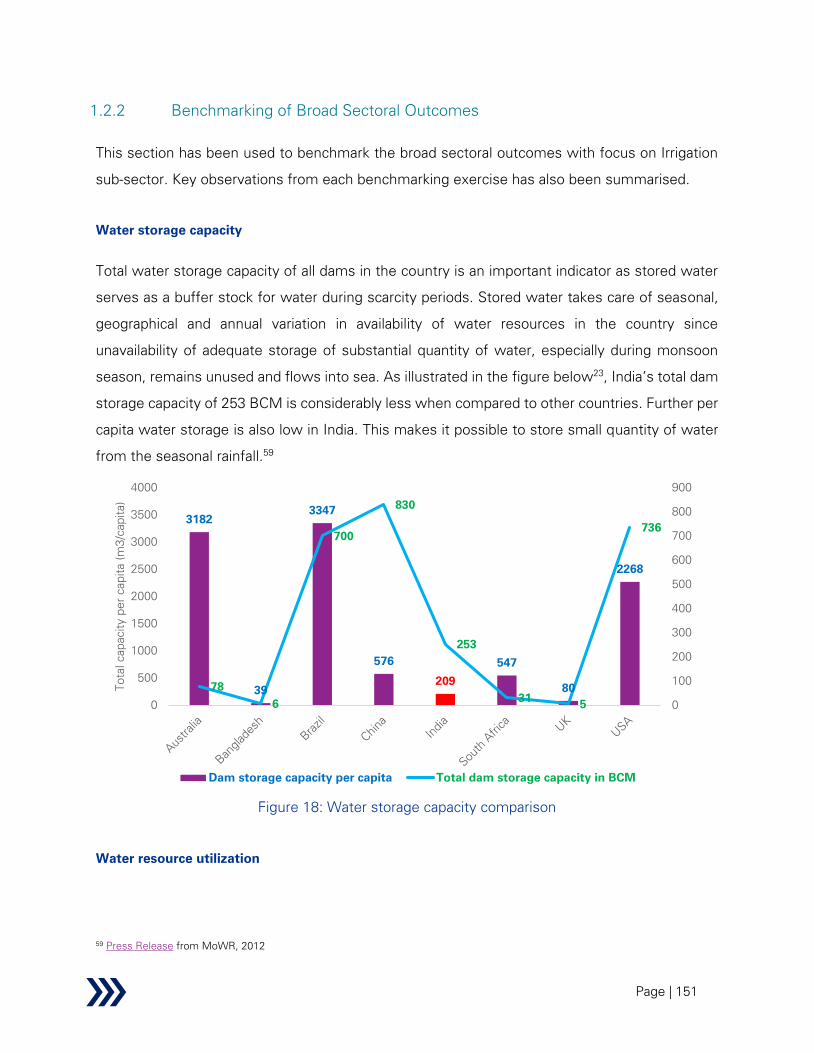
Page | 151
1.2.2 Benchmarking of Broad Sectoral Outcomes
This section has been used to benchmark the broad sectoral outcomes with focus on Irrigation
sub-sector. Key observations from each benchmarking exercise has also been summarised.
Water storage capacity
Total water storage capacity of all dams in the country is an important indicator as stored water
serves as a buffer stock for water during scarcity periods. Stored water takes care of seasonal,
geographical and annual variation in availability of water resources in the country since
unavailability of adequate storage of substantial quantity of water, especially during monsoon
season, remains unused and flows into sea. As illustrated in the figure below23
, India’s total dam
storage capacity of 253 BCM is considerably less when compared to other countries. Further per
capita water storage is also low in India. This makes it possible to store small quantity of water
from the seasonal rainfall.59
Figure 18: Water storage capacity comparison
Water resource utilization
59 Press Release from MoWR, 2012
3182
39
3347
576
209
547
80
2268
78
6
700
830
253
315
736
0
100
200
300
400
500
600
700
800
900
0
500
1000
1500
2000
2500
3000
3500
4000
Total capacity per capita (m
3/capita)
Dam storage capacity per capita Total dam storage capacity in BCM
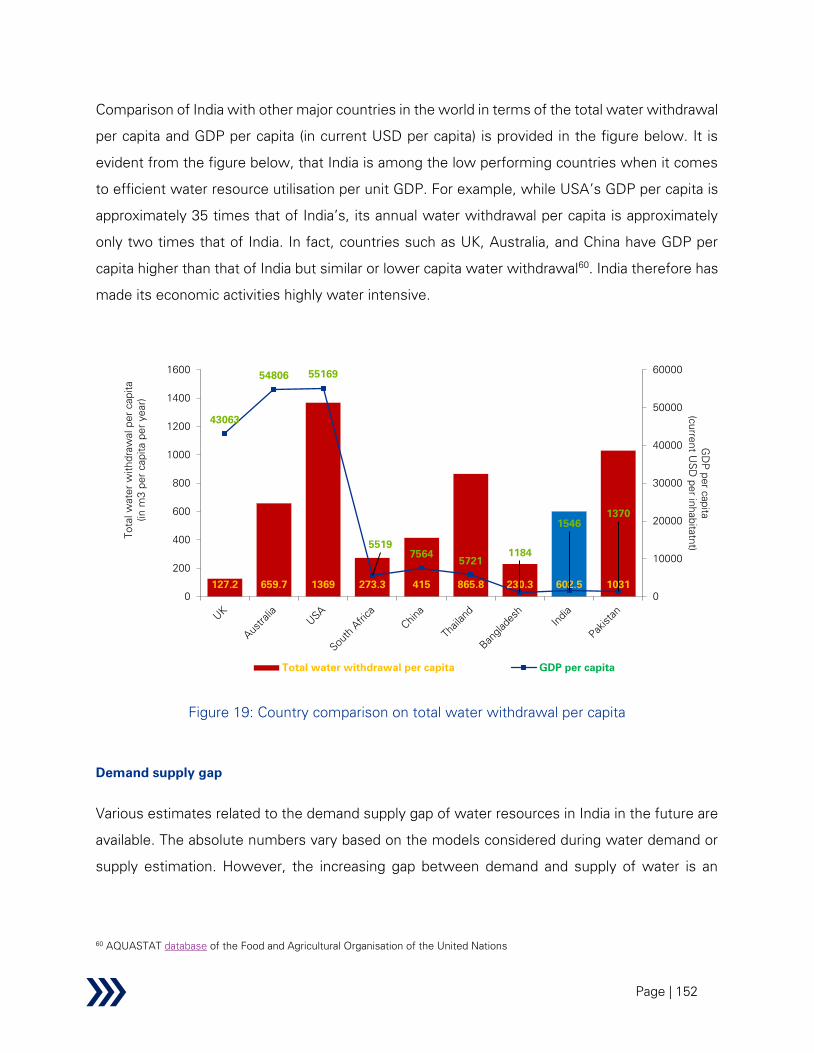
Page | 152
Comparison of India with other major countries in the world in terms of the total water withdrawal
per capita and GDP per capita (in current USD per capita) is provided in the figure below. It is
evident from the figure below, that India is among the low performing countries when it comes
to efficient water resource utilisation per unit GDP. For example, while USA’s GDP per capita is
approximately 35 times that of India’s, its annual water withdrawal per capita is approximately
only two times that of India. In fact, countries such as UK, Australia, and China have GDP per
capita higher than that of India but similar or lower capita water withdrawal60
. India therefore has
made its economic activities highly water intensive.
Figure 19: Country comparison on total water withdrawal per capita
Demand supply gap
Various estimates related to the demand supply gap of water resources in India in the future are
available. The absolute numbers vary based on the models considered during water demand or
supply estimation. However, the increasing gap between demand and supply of water is an
60 AQUASTAT database of the Food and Agricultural Organisation of the United Nations
127.2 659.7 1369 273.3 415 865.8 230.3 602.5 1031
43063
54806 55169
5519
7564
5721
1184
1546
1370
0
10000
20000
30000
40000
50000
60000
0
200
400
600
800
1000
1200
1400
1600
GD
P per capit
a
(current U
SD
per in
habitatnt)
Total w
ater w
ithdraw
al per capit
a
(in
m
3 per capit
a per year)
Total water withdrawal per capita GDP per capita

Page | 153
established fact, not only for India but also for other countries. The figure below compares the
demand supply gap for four countries. The model calculated the gap between projected 2030
demand and existing supply based on commonly accepted projections of economic and
population growth. As estimated by the author, India may be facing an aggregate gap of 50% of
the actual demand by 2030, mainly driven by rapid growth in agricultural, municipal & domestic
sector demand. India faces a large gap between current supply and projected. Climate change
effects can further worsen the situation for India. The gap as projected by the author, shows that
India should face the worst scarcity in terms of percentage of demand when compared to the
other countries22
.
Figure 20: Demand supply gap of water resources
Agriculture sector contribution to GDP
The World Resources Institute has modelled water stress for various countries and assigned
water stress scores (out of 5) to all the countries61
. India is one of the most stressed country in
terms of water availability with 18% of the GDP from agriculture and 52% of the country area
under cultivation23
. With increase in area under cultivation or value of produce or cropping
61 World Resources Institute (AQUEDUCT) database

Page | 154
intensity, India can further increase contribution to GDP from the sector. However, to avoid facing
severe scarcity in the future; India must focus on water use efficiency in irrigation sector.
Figure 21: Agriculture sector contribution to GDP
Agriculture sector Water Use Efficiency
As per Food and Agricultural Organisation of the United Nations, the total water consumption in
the agricultural sector is defined as the “Annual quantity of self-supplied water withdrawn for
irrigation, livestock and aquaculture purposes. It can include water from primary renewable and
secondary freshwater resources, as well as water from over-abstraction of renewable
groundwater or withdrawal from fossil groundwater, direct use of agricultural drainage water,
direct use of (treated) wastewater, and desalinated water”. The total cultivated land is defined
as the “The sum of the arable land area and the area under permanent crop”. The ratio of water
consumption and area cultivated is an important metrics as it signifies the water use efficiency
in the agricultural sector. As evident in the figure below, India is one of the highest water
consuming countries23
.
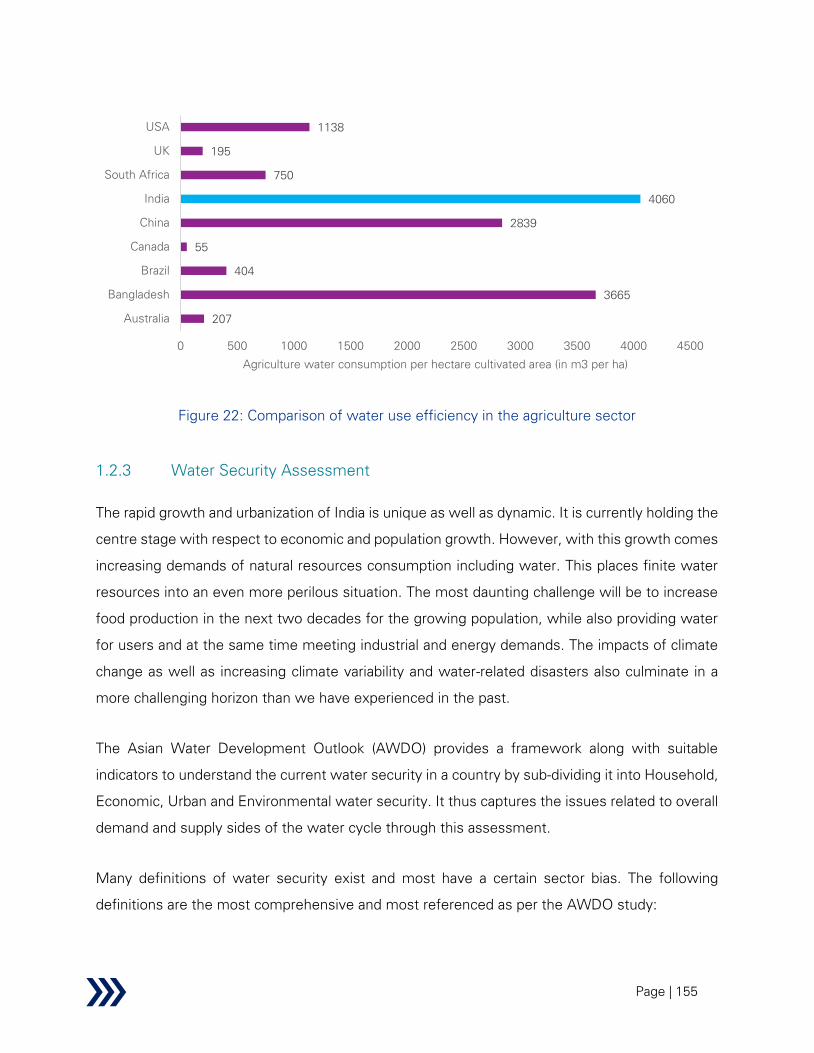
Page | 155
Figure 22: Comparison of water use efficiency in the agriculture sector
1.2.3 Water Security Assessment
The rapid growth and urbanization of India is unique as well as dynamic. It is currently holding the
centre stage with respect to economic and population growth. However, with this growth comes
increasing demands of natural resources consumption including water. This places finite water
resources into an even more perilous situation. The most daunting challenge will be to increase
food production in the next two decades for the growing population, while also providing water
for users and at the same time meeting industrial and energy demands. The impacts of climate
change as well as increasing climate variability and water-related disasters also culminate in a
more challenging horizon than we have experienced in the past.
The Asian Water Development Outlook (AWDO) provides a framework along with suitable
indicators to understand the current water security in a country by sub-dividing it into Household,
Economic, Urban and Environmental water security. It thus captures the issues related to overall
demand and supply sides of the water cycle through this assessment.
Many definitions of water security exist and most have a certain sector bias. The following
definitions are the most comprehensive and most referenced as per the AWDO study:
207
3665
404
55
2839
4060
750
195
1138
0 500 1000 1500 2000 2500 3000 3500 4000 4500
Australia
Bangladesh
Brazil
Canada
China
India
South Africa
UK
USA
Agriculture water consumption per hectare cultivated area (in m3 per ha)

Page | 156
“The reliable availability of an acceptable quantity and quality of water for production,
livelihoods and health, coupled with an acceptable level of risk to society of unpredictable
water-related impacts.”
“The capacity of a population to safeguard sustainable access to adequate quantities of
acceptable quality water for sustaining livelihoods, human well-being, and socioeconomic
development, for ensuring protection against water-borne pollution and water-related
disasters, and for preserving ecosystems in a climate of peace and political stability.”
As per the AWDO 2013 study, the following shared vision of water security was formulated:
Societies can enjoy water security when they successfully manage their water resources
and services to
• satisfy household water and sanitation needs in all communities;
• support productive economies in agriculture, industry, and energy;
• develop vibrant, liveable cities and towns;
• restore healthy rivers and ecosystems
From this shared vision different dimensions under the Household, Economic, Urban and
Environmental water security have been examined with respect to their current status, issues
and government interventions.
1.2.3.1 Household Water Security
The foundation of water security happens at the household level. Providing the entire population
with reliable, safe water, and sanitation services should be the top priority of any country. From
the perspective of poverty eradication and economic development, household water security is
an essential foundation.
Accordingly, the key indicators of Household Water Security are:
• Access to piped water
• Access to improved sanitation

Page | 157
On both these fronts, India has been making progress, however with varying degree of outcomes
and successes. Let us look at the current situation in the country and upcoming government
initiatives.
Table 17: Summary of current status, issues and current government initiatives- Household
Current Status Key issues
Current government
initiatives
▪ In rural India only
18% of
households are
provided with
piped water
supply
connections62
▪ In rural areas issues are manifold;
few key issues include:
o Limited co-ordination
between the water resources
department and the rural
drinking water supply
department during planning of
water supply schemes
o Lack of capacity of Panchayati
Raj Institutions for
management for asset
ownership and long-term
maintenance
o Lack of innovative financing
structures attracting private
sector involvement in
development and long-term
O&M of the assets
▪ National Rural
Development
Programme was focused
towards providing piped
water supply connections
to rural households. This
programme is likely to be
subsumed by Jal Jeevan
Mission which targets to
provide piped water
supply connections to
100% of the households
by 2024
▪ 100% of
households had
access to
toilets63
▪ Possible slip backs due to lack of
maintenance or falling back to old
habits
Swachh Bharat’s future
focus areas include
62 National Rural Drinking Water Programme database accessed on 7 November 2019
63 Swachh Bharat Mission-Gramin Dashboard, Department of Drinking Water and Sanitation, Ministry of Jal Shakti, Government of
India, accessed October 11, 2019, https://sbm.gov.in/sbmdashboard/IHHL.aspx

Page | 158
Current Status Key issues
Current government
initiatives
▪ 96.5% of the
people with
access to toilets
used them
▪ 90.7% of villages
which were
previously
declared and
verified as ODF
were confirmed
to be ODF. The
remaining
villages had
sanitation
coverage of
about 93%
▪ 97.5%
households did
not report to
have visible
garbage or litter
within the
premises
▪ Ensuring availability of water in rural
areas is critical in sustaining the
usage of toilets
▪ Solid and Liquid Waste
Management – The scheme’s focus
on emptying and transportation, and
treatment and disposal, and SLWM
was relatively limited.
o 63.3% of villages in India
practice Solid & Liquid Waste
Management (SLWM) which
was far below the figures for
ODF outcomes.
▪ Sustained usage of
Individual Household
Latrines (IHHL)
▪ Sanitation coverage
of public spaces
(through public and
community toilets)
▪ Enhanced focus on
Solid and Liquid
waste management
(SLWM)
1.2.3.2 Economic Water Security
Water can be treated as one of main fuel which powers any economy. The use of water in all
sectors like Agriculture, Industry and Domestic is critical in enabling value addition to our GDP.

Page | 159
The use of water in these sectors should no longer be seen in isolation from each other. Debate
about the water–food–energy nexus has begun to raise general awareness about the critical
interface among water uses to support the various economic activities.
Accordingly, the key indicators of Economic Water Security are:
• Agricultural Water Productivity
• Energy and Industrial Water Productivity
Table 18: Summary of status, issues and current government initiatives- Economic
Current Status Key issues
Current government
initiatives
▪ Water productivity of main
water guzzling crops like
rice, wheat & sugarcane.64
o Rice- Irrigation
Water Productivity-
0.22-0.48 kg/m3
o Wheat- Irrigation
Water Productivity-
0.84 kg/m3
o Sugarcane-
Irrigation Water
Productivity- 4.38
kg/m3
▪ Rice, wheat and sugarcane
consume almost 80% of
freshwater available for
irrigation leading to inequity
in irrigation water availability
for other crops
▪ In addition to this inequity, it
is worth noting that these
water guzzler crops are
concentrated in some of the
most water scarce regions
of the country like Punjab
and Haryana which is
leading to massive
depletion of groundwater in
these states
o The irrigation water
productivity of rice,
▪ With schemes like “Per
Drop More Crop”, and
related policies the
government is looking
towards
o Shifting towards
production of less
water guzzling
crops like pulses,
oil seeds
o Improving water
use efficiency
through
encouraging
micro-irrigation,
sprinklers, drip
irrigation
64 NABARD- WATER PRODUCTIVITY MAPPIN of MAJOR INDIAN CROPS Bharat R. Sharma, Ashok Gulati, Gayathri Mohan, Stuti
Manchanda, Indro Ray, and Upali Amarasinghe

Page | 160
Current Status Key issues
Current government
initiatives
wheat and sugarcane
with their
corresponding land
productivity across
major states, are
nonaligned with
respect to cropping
patterns and available
water resource
o Increasing usage
of solar power in
irrigation
▪ Current specific water
consumption in power
sector is 5-7 m3/MWh as
per NITI Aayog
estimates65
▪ More than 80% of the
water consumption in
industries is on account of
thermal power plants
▪ Thermal Power Plant are
failing to adhere to the
regulations of the limits of
water consumption as set
by the Ministry of
Environment, Forest &
Climate Change
(MoEF&CC)
o There is less focus on
reducing water
footprint since water
costs constitute a
miniscule portion of
the overall variable
▪ MoEF&CC has regulated
the water consumption
limit of thermal power
plant to be 3.5 m3/MWh-
However despite this
regulation, multiple
power plants are failing
to adhere to these
norms
▪ The government has
mandated the power
plants which are within
50 Kms radius of a
Sewage Treatment Plant
(STP) to use treated
wastewater from those
STPs
▪ Current focus on
increasing the share of
65 Study on Assessment of Water Foot Prints of India's Long-Term Energy Scenarios by TERI sponsored by Niti Aayog
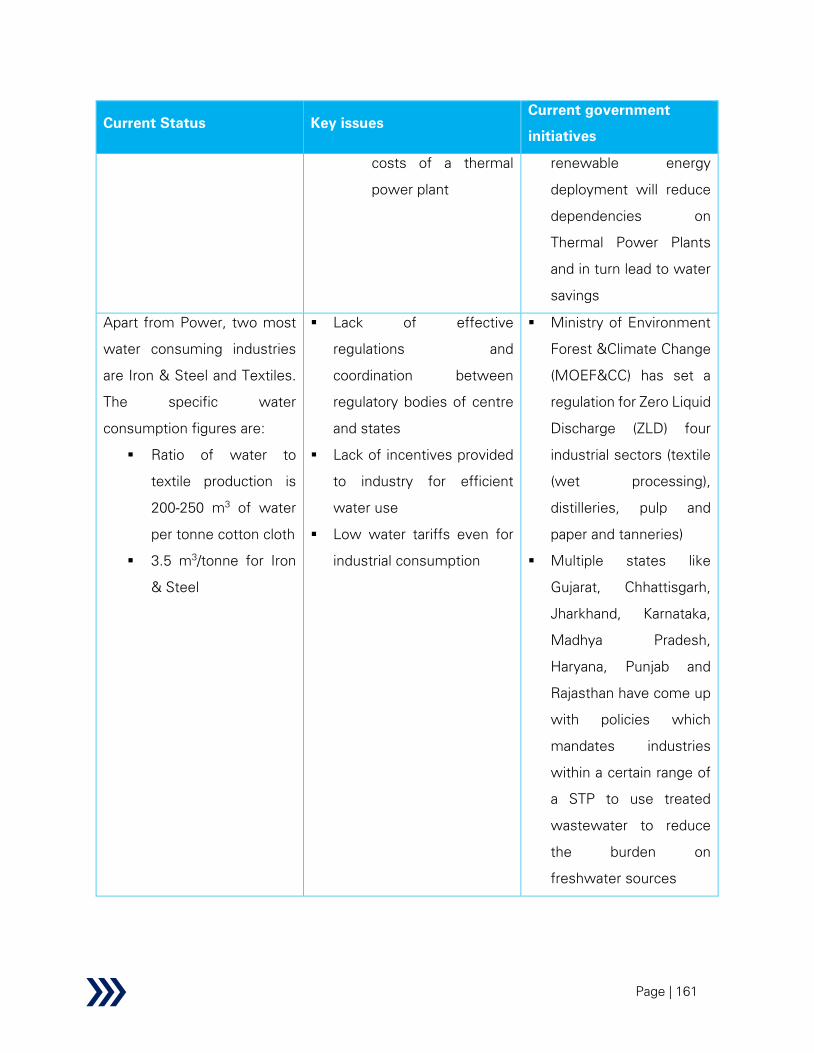
Page | 161
Current Status Key issues
Current government
initiatives
costs of a thermal
power plant
renewable energy
deployment will reduce
dependencies on
Thermal Power Plants
and in turn lead to water
savings
Apart from Power, two most
water consuming industries
are Iron & Steel and Textiles.
The specific water
consumption figures are:
▪ Ratio of water to
textile production is
200-250 m3 of water
per tonne cotton cloth
▪ 3.5 m3/tonne for Iron
& Steel
▪ Lack of effective
regulations and
coordination between
regulatory bodies of centre
and states
▪ Lack of incentives provided
to industry for efficient
water use
▪ Low water tariffs even for
industrial consumption
▪ Ministry of Environment
Forest &Climate Change
(MOEF&CC) has set a
regulation for Zero Liquid
Discharge (ZLD) four
industrial sectors (textile
(wet processing),
distilleries, pulp and
paper and tanneries)
▪ Multiple states like
Gujarat, Chhattisgarh,
Jharkhand, Karnataka,
Madhya Pradesh,
Haryana, Punjab and
Rajasthan have come up
with policies which
mandates industries
within a certain range of
a STP to use treated
wastewater to reduce
the burden on
freshwater sources
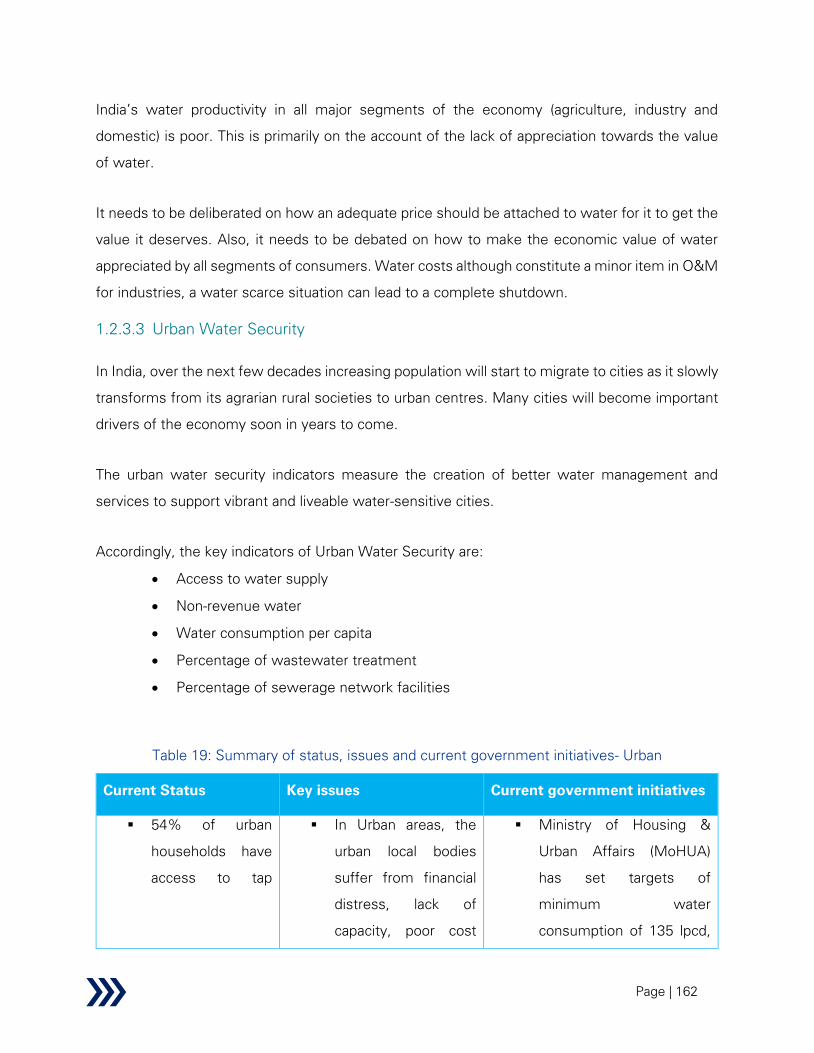
Page | 162
India’s water productivity in all major segments of the economy (agriculture, industry and
domestic) is poor. This is primarily on the account of the lack of appreciation towards the value
of water.
It needs to be deliberated on how an adequate price should be attached to water for it to get the
value it deserves. Also, it needs to be debated on how to make the economic value of water
appreciated by all segments of consumers. Water costs although constitute a minor item in O&M
for industries, a water scarce situation can lead to a complete shutdown.
1.2.3.3 Urban Water Security
In India, over the next few decades increasing population will start to migrate to cities as it slowly
transforms from its agrarian rural societies to urban centres. Many cities will become important
drivers of the economy soon in years to come.
The urban water security indicators measure the creation of better water management and
services to support vibrant and liveable water-sensitive cities.
Accordingly, the key indicators of Urban Water Security are:
• Access to water supply
• Non-revenue water
• Water consumption per capita
• Percentage of wastewater treatment
• Percentage of sewerage network facilities
Table 19: Summary of status, issues and current government initiatives- Urban
Current Status Key issues Current government initiatives
▪ 54% of urban
households have
access to tap
▪ In Urban areas, the
urban local bodies
suffer from financial
distress, lack of
capacity, poor cost
▪ Ministry of Housing &
Urban Affairs (MoHUA)
has set targets of
minimum water
consumption of 135 lpcd,
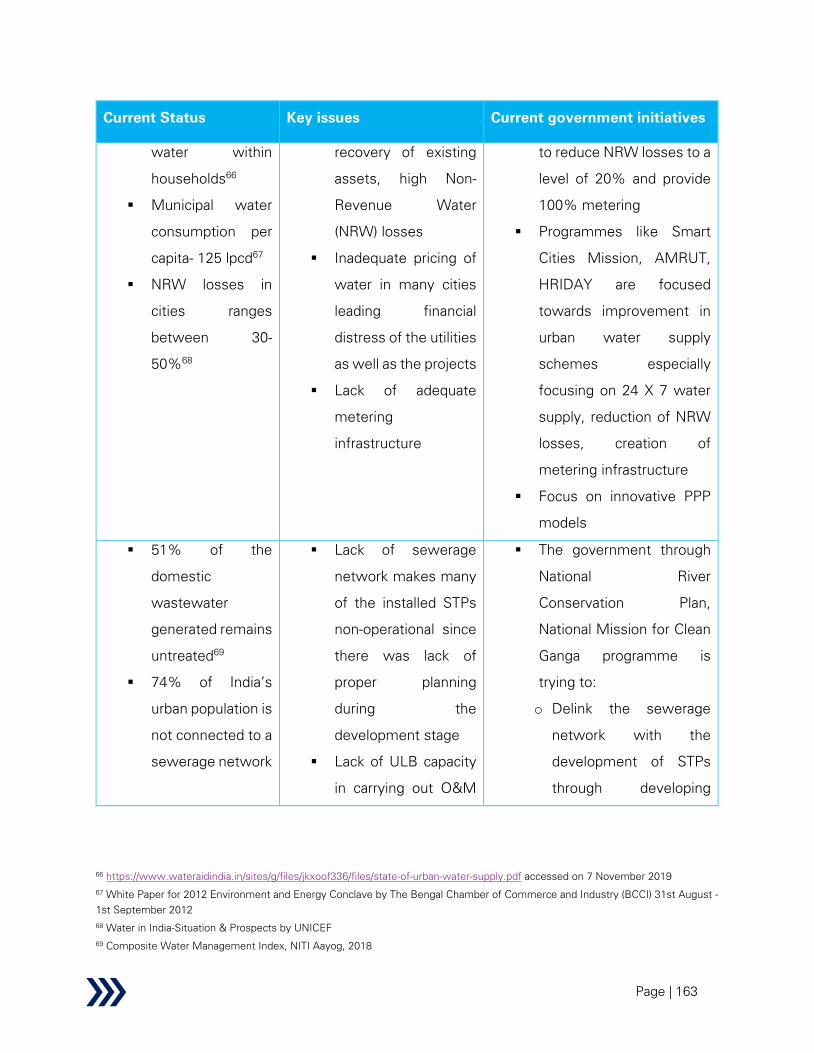
Page | 163
Current Status Key issues Current government initiatives
water within
households66
▪ Municipal water
consumption per
capita- 125 lpcd67
▪ NRW losses in
cities ranges
between 30-
50%68
recovery of existing
assets, high Non-
Revenue Water
(NRW) losses
▪ Inadequate pricing of
water in many cities
leading financial
distress of the utilities
as well as the projects
▪ Lack of adequate
metering
infrastructure
to reduce NRW losses to a
level of 20% and provide
100% metering
▪ Programmes like Smart
Cities Mission, AMRUT,
HRIDAY are focused
towards improvement in
urban water supply
schemes especially
focusing on 24 X 7 water
supply, reduction of NRW
losses, creation of
metering infrastructure
▪ Focus on innovative PPP
models
▪ 51% of the
domestic
wastewater
generated remains
untreated69
▪ 74% of India’s
urban population is
not connected to a
sewerage network
▪ Lack of sewerage
network makes many
of the installed STPs
non-operational since
there was lack of
proper planning
during the
development stage
▪ Lack of ULB capacity
in carrying out O&M
▪ The government through
National River
Conservation Plan,
National Mission for Clean
Ganga programme is
trying to:
o Delink the sewerage
network with the
development of STPs
through developing
66 https://www.wateraidindia.in/sites/g/files/jkxoof336/files/state-of-urban-water-supply.pdf accessed on 7 November 2019
67 White Paper for 2012 Environment and Energy Conclave by The Bengal Chamber of Commerce and Industry (BCCI) 31st August -
1st September 2012
68 Water in India-Situation & Prospects by UNICEF
69 Composite Water Management Index, NITI Aayog, 2018
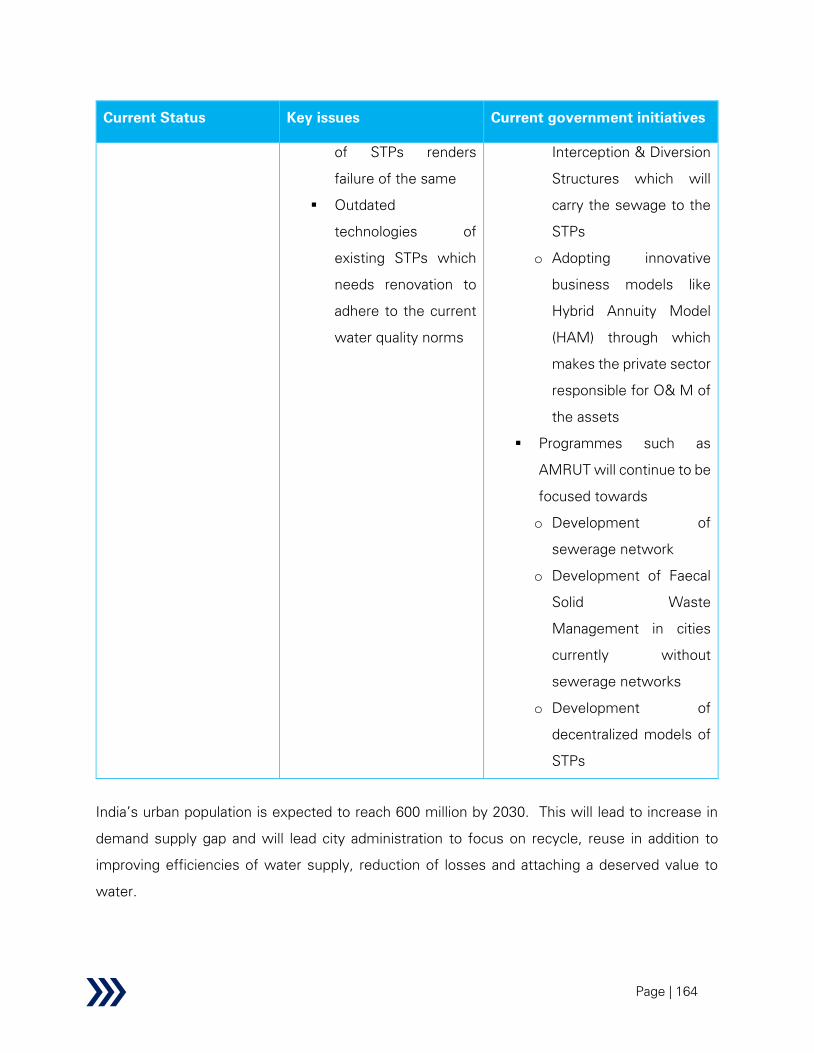
Page | 164
Current Status Key issues Current government initiatives
of STPs renders
failure of the same
▪ Outdated
technologies of
existing STPs which
needs renovation to
adhere to the current
water quality norms
Interception & Diversion
Structures which will
carry the sewage to the
STPs
o Adopting innovative
business models like
Hybrid Annuity Model
(HAM) through which
makes the private sector
responsible for O& M of
the assets
▪ Programmes such as
AMRUT will continue to be
focused towards
o Development of
sewerage network
o Development of Faecal
Solid Waste
Management in cities
currently without
sewerage networks
o Development of
decentralized models of
STPs
India’s urban population is expected to reach 600 million by 2030. This will lead to increase in
demand supply gap and will lead city administration to focus on recycle, reuse in addition to
improving efficiencies of water supply, reduction of losses and attaching a deserved value to
water.
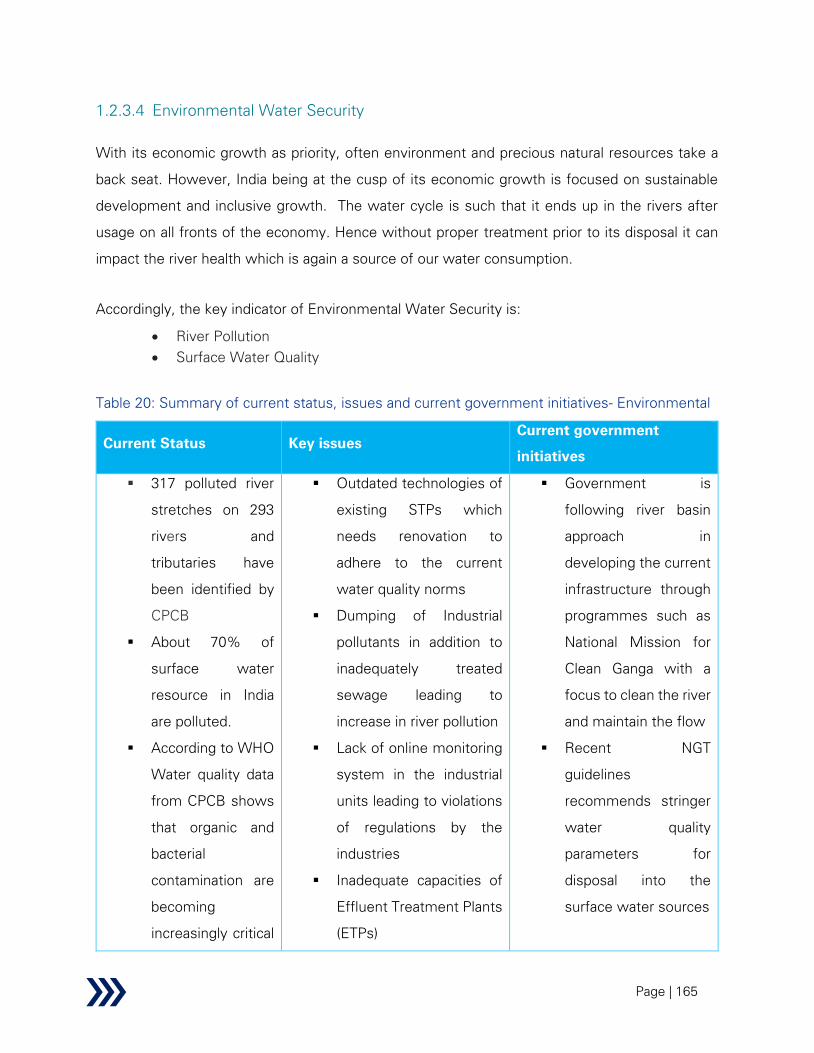
Page | 165
1.2.3.4 Environmental Water Security
With its economic growth as priority, often environment and precious natural resources take a
back seat. However, India being at the cusp of its economic growth is focused on sustainable
development and inclusive growth. The water cycle is such that it ends up in the rivers after
usage on all fronts of the economy. Hence without proper treatment prior to its disposal it can
impact the river health which is again a source of our water consumption.
Accordingly, the key indicator of Environmental Water Security is:
• River Pollution
• Surface Water Quality
Table 20: Summary of current status, issues and current government initiatives- Environmental
Current Status Key issues
Current government
initiatives
▪ 317 polluted river
stretches on 293
rivers and
tributaries have
been identified by
CPCB
▪ About 70% of
surface water
resource in India
are polluted.
▪ According to WHO
Water quality data
from CPCB shows
that organic and
bacterial
contamination are
becoming
increasingly critical
▪ Outdated technologies of
existing STPs which
needs renovation to
adhere to the current
water quality norms
▪ Dumping of Industrial
pollutants in addition to
inadequately treated
sewage leading to
increase in river pollution
▪ Lack of online monitoring
system in the industrial
units leading to violations
of regulations by the
industries
▪ Inadequate capacities of
Effluent Treatment Plants
(ETPs)
▪ Government is
following river basin
approach in
developing the current
infrastructure through
programmes such as
National Mission for
Clean Ganga with a
focus to clean the river
and maintain the flow
▪ Recent NGT
guidelines
recommends stringer
water quality
parameters for
disposal into the
surface water sources
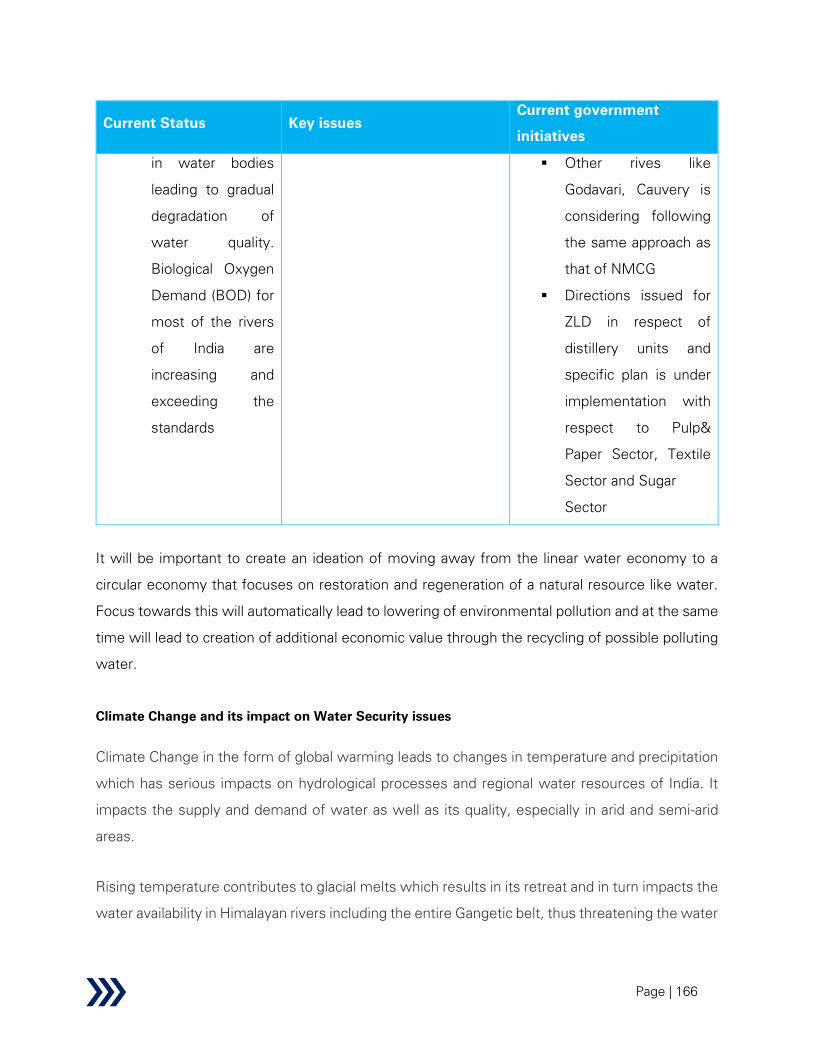
Page | 166
Current Status Key issues
Current government
initiatives
in water bodies
leading to gradual
degradation of
water quality.
Biological Oxygen
Demand (BOD) for
most of the rivers
of India are
increasing and
exceeding the
standards
▪ Other rives like
Godavari, Cauvery is
considering following
the same approach as
that of NMCG
▪ Directions issued for
ZLD in respect of
distillery units and
specific plan is under
implementation with
respect to Pulp&
Paper Sector, Textile
Sector and Sugar
Sector
It will be important to create an ideation of moving away from the linear water economy to a
circular economy that focuses on restoration and regeneration of a natural resource like water.
Focus towards this will automatically lead to lowering of environmental pollution and at the same
time will lead to creation of additional economic value through the recycling of possible polluting
water.
Climate Change and its impact on Water Security issues
Climate Change in the form of global warming leads to changes in temperature and precipitation
which has serious impacts on hydrological processes and regional water resources of India. It
impacts the supply and demand of water as well as its quality, especially in arid and semi-arid
areas.
Rising temperature contributes to glacial melts which results in its retreat and in turn impacts the
water availability in Himalayan rivers including the entire Gangetic belt, thus threatening the water

Page | 167
supplies on which hundreds of millions of people depend. In the last few decades, nearly 67%
of the Himalayan glaciers have retreated due to global warming.
Another profound impact of climate change in the increase in the frequency of heavy precipitation
events. Increase in precipitation intensity within a short period leads to increasing flood events
per year over the last decade. It is predicted extreme rainfall events are very likely in three major
river basins viz. Krishna, Godavari and Ganga by 2100 with dry season becoming drier and wet
wetter. Over the last five decades there has been increasing events of natural disasters in the
country which is testimony to the fact that climate change is a reality and it can have profound
impact to our country’s economy.
India70
has faced 649 disasters in last 100 years out of which 302 were caused by flood with an
average of 3 floods per year. This accounted approximately 47% of total disasters took place in
India in last 100 years. The average annual flood damage during the period 1996-2005 was Rs.
4,745 Cr. as compared to Rs. 1,805 Cr., the corresponding average for the previous 53 years
which shows the trend of increasing events of floods in the recent years.
As per the assessments carried out by INCCA: Indian Network For Climate Change Assessment
in 201071
, which deliberated on the possible impacts of climate on Indian Water Resources in
2030, the following were the key observations:
• Due to increase in precipitation, the water yield in the Himalayan region, mainly
covered by river Indus, is likely to increase by 5%–20% in most of the areas, with
some areas of Jammu and Kashmir and Uttarakhand showing an increase of up to
50% with respect to the 1970s
• The Western Ghats region exhibit wide variability in water yield in the 2030s. The
northern portion of the Western Ghats shows a decrease in the water yield, ranging
from 10%– 50% in the 2030s with respect to the 1970s
• North-Eastern region except for Mizoram, Tripura, Manipur and Assam shows an
increase in the evapotranspiration in the 2030s. As a result, a reduction in water yield
70 https://www.adriindia.org/adri/india_water_facts
71 Reference Link

Page | 168
by up to 20% is projected for Arunachal Pradesh. The increase in the water yield in
Assam and Manipur is projected to increase by 40%
• The reduction in water yield in coastal areas of West Bengal & Orissa in the 2030s
is as less as 40%. However, in the southern parts of Andhra Pradesh and northern
parts of Tamil Nadu, the water yield is projected to rise by 10%–40%
• Moderate to extreme drought severity has been pronounced for the Himalayan
region where the increase is more than 20% in many areas despite the overall
increase in precipitation.
• Flooding may vary from 10% to over 30% of the existing magnitudes in most of the
regions. This will have a very severe implication for existing infrastructures such as
dams, bridges, roads, etc., in the areas and will require appropriate adaptation
measures to be taken up
Summing up it is quite evident that climate change considerations will need to be a part of
mainstream water resources planning in this country. Few possible actions could involve:
• Spatial development of existing models to allow greater precision in climate change
predictions.
• Agricultural policy will require more flexible food policies that can anticipate the
selection of crops for the planting season.
• Forest policy will need to account for erosion mitigation measures in areas where
precipitation is predicted to be high.
• Wastewater treatment and sewerage planning will need to address overflow and
capacity issues related to intense precipitation
• Development of water-intensive industries will need to take account of siting issues
related to changes in precipitation
1.2.4 Government interventions in the sector
1.2.4.1 Overall nature and responsiveness of water resources planning in the country
The water resources planning has been receiving increased policy attention over the past few
years. In this decade the Indian government has been taking several key steps to revitalise water
resources planning in the country. The major initiatives related to the water resources are
highlighted in the figure below.

Page | 169
Figure 23: Planning in the water resources sector
In the present scenario, water resources planning is of utmost importance. At institutional level,
the major water resources sector related planning in the country is undertaken at both the central
government as well as state government level. Since water is a state subject, planning at state
level is equally (if not more) important. The key central government departments or organisations
and their responsibilities with respect to planning for the water resources sector are mentioned
below.
Central Water Commission- The Central Water Commission is a technical organization in the
field of Water Resources development and planning in India. It is currently functioning as an
attached office of the Ministry of Jal Shakti, Department of Water Resources, River Development
and Ganga Rejuvenation, Government of India. Key responsibilities of the commission include
initiating, coordinating and furthering in consultation of the State Governments concerned,
schemes for control, conservation and utilization of water resources in areas related to Flood
Control, Irrigation, Navigation, Drinking Water Supply and Hydro Power Development72
.
72 Website of the Central Water Commission
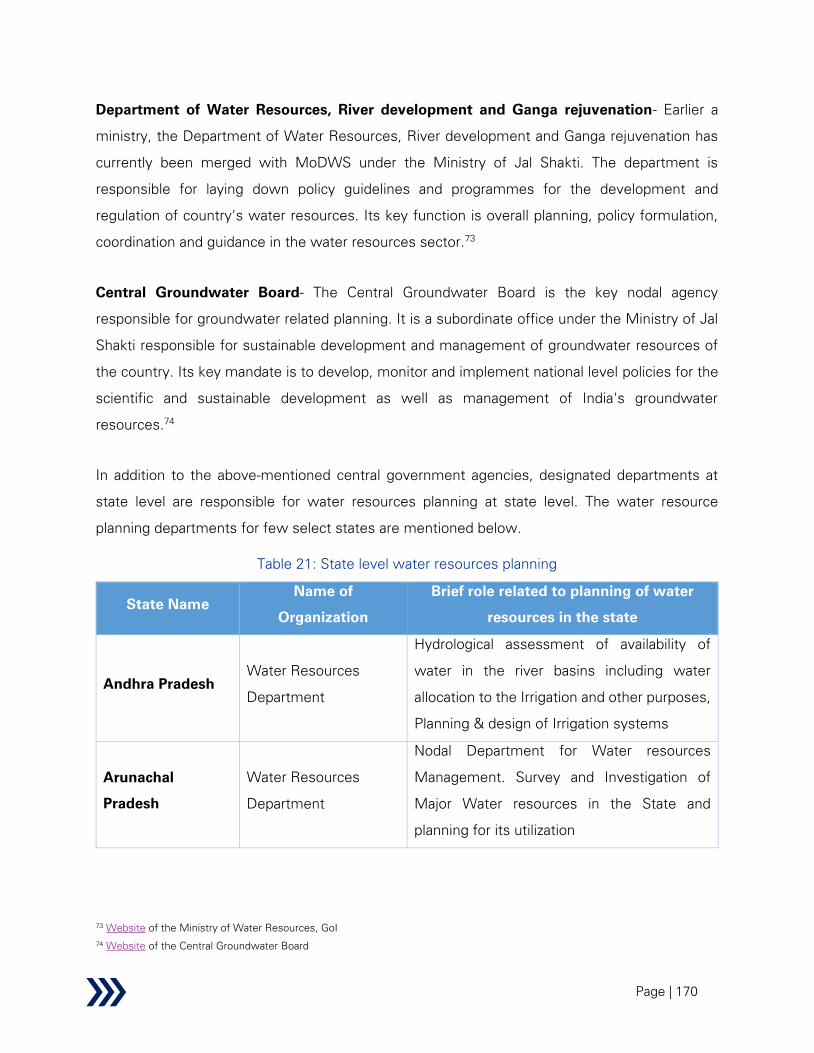
Page | 170
Department of Water Resources, River development and Ganga rejuvenation- Earlier a
ministry, the Department of Water Resources, River development and Ganga rejuvenation has
currently been merged with MoDWS under the Ministry of Jal Shakti. The department is
responsible for laying down policy guidelines and programmes for the development and
regulation of country's water resources. Its key function is overall planning, policy formulation,
coordination and guidance in the water resources sector.73
Central Groundwater Board- The Central Groundwater Board is the key nodal agency
responsible for groundwater related planning. It is a subordinate office under the Ministry of Jal
Shakti responsible for sustainable development and management of groundwater resources of
the country. Its key mandate is to develop, monitor and implement national level policies for the
scientific and sustainable development as well as management of India's groundwater
resources.74
In addition to the above-mentioned central government agencies, designated departments at
state level are responsible for water resources planning at state level. The water resource
planning departments for few select states are mentioned below.
Table 21: State level water resources planning
State Name
Name of
Organization
Brief role related to planning of water
resources in the state
Andhra Pradesh
Water Resources
Department
Hydrological assessment of availability of
water in the river basins including water
allocation to the Irrigation and other purposes,
Planning & design of Irrigation systems
Arunachal
Pradesh
Water Resources
Department
Nodal Department for Water resources
Management. Survey and Investigation of
Major Water resources in the State and
planning for its utilization
73 Website of the Ministry of Water Resources, GoI
74 Website of the Central Groundwater Board
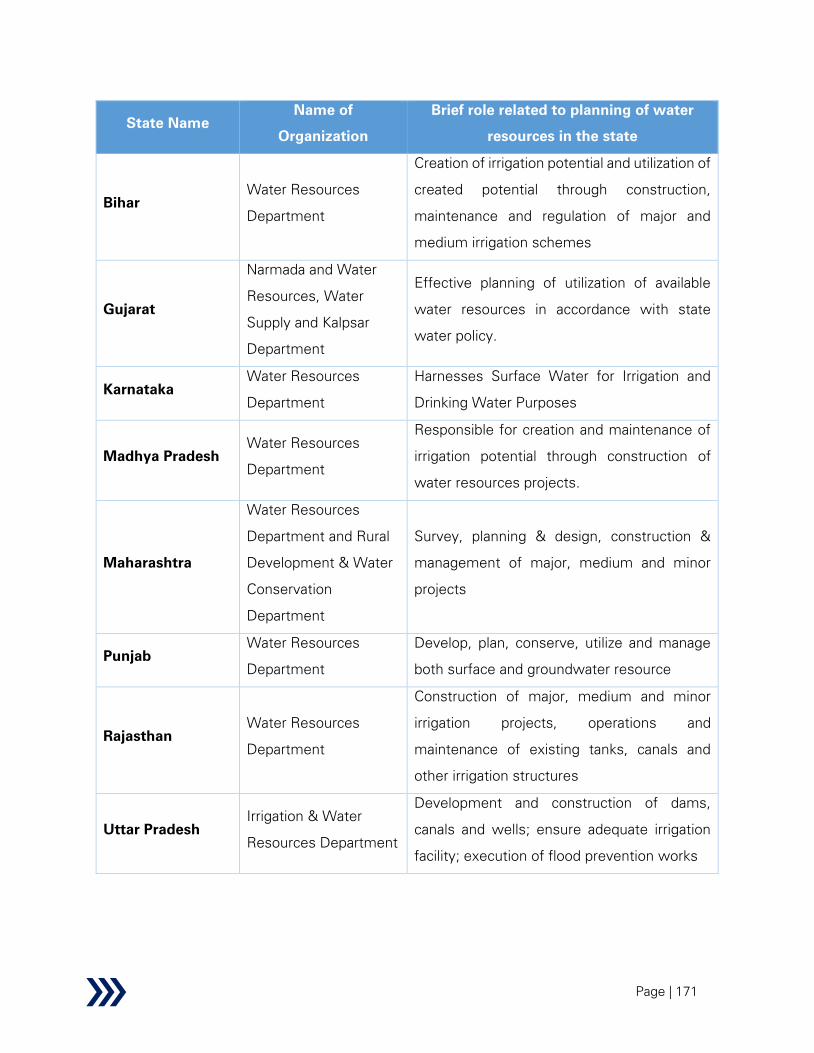
Page | 171
State Name
Name of
Organization
Brief role related to planning of water
resources in the state
Bihar
Water Resources
Department
Creation of irrigation potential and utilization of
created potential through construction,
maintenance and regulation of major and
medium irrigation schemes
Gujarat
Narmada and Water
Resources, Water
Supply and Kalpsar
Department
Effective planning of utilization of available
water resources in accordance with state
water policy.
Karnataka
Water Resources
Department
Harnesses Surface Water for Irrigation and
Drinking Water Purposes
Madhya Pradesh
Water Resources
Department
Responsible for creation and maintenance of
irrigation potential through construction of
water resources projects.
Maharashtra
Water Resources
Department and Rural
Development & Water
Conservation
Department
Survey, planning & design, construction &
management of major, medium and minor
projects
Punjab
Water Resources
Department
Develop, plan, conserve, utilize and manage
both surface and groundwater resource
Rajasthan
Water Resources
Department
Construction of major, medium and minor
irrigation projects, operations and
maintenance of existing tanks, canals and
other irrigation structures
Uttar Pradesh
Irrigation & Water
Resources Department
Development and construction of dams,
canals and wells; ensure adequate irrigation
facility; execution of flood prevention works

Page | 172
1.2.4.2 Major central government schemes in the water resources sector
Water resources is a vast sector composed of multiple vital sub-components. The key sub-
sectors or sub-components within the larger sector are- Groundwater, Surface Water, Reservoirs,
Micro-irrigation Tanks, Water consumption and wastewater. Various central government
ministries are responsible for implementation of multiple schemes under each sub-sector or
component as listed above. A brief overview of major central government schemes in the water
resources sector is shown in the figure below. The list is indicative in nature and not exhaustive.
Figure 24: Major government schemes
As shown in the figure above, there are multiple central government ministries related to various
sub-components of the water resources sub sector. Ministry of Jal Shakti is the major ministry
within the central government and is responsible for laying down policy guidelines and planning
as well as implementing programmes for the development and regulation of country's water
resources.

Page | 173
1.2.4.3 Externalities and relation to other sectors
The Sustainable Development Goals (SDGs) have been pledged to be implemented by all United
Nations Member states in 2015 as a universal call to action to end poverty. The SDGs once
implemented should protect the planet and ensure that all people enjoy peace and prosperity by
2030. Total 17 SDGs are integrated and improvement in one area is bound to impact outcomes
in others75
. A deep dive into the multiple SDGs including the sub goals within each SDG is useful
in discovering externalities for the water resources sector. Among the 17 SDGs, the 6th
SDG
pertains to Clean Water and Sanitation and is directly related to water resources sector. However,
as explained in the figure below, multiple goals within other SDGs are dependent or related to
the water resources sector.
Figure 25: SDGs related to water resources sector
As mentioned in the figure above, directly and indirectly related thematic areas with the water
resources sector, makes it an important focus area for development. The related ministries in
India implementing programs in the identified related sectors have been further derived in the
figure below. Key programs with respect to each ministry which can directly impact the water
resources sector are mentioned below.
75 United Nations Development Programme, Sustainable Development Goals web page

Page | 174
Figure 26: Related ministries and key related programs
The related programs listed above are not only linked with the water resources sector, but also
share certain commonalities with the Pradhan Mantri Krishi Sinchayee Yojana.
1.3 Issues and challenges
Table 22: Water resources Sector – issues and challenges
Sl.no Area Issues & Challenges
Secondary KII HH/
FGD
Supply Side
WR-
F1
Water
Storage
Capacity
• Low total water storage capacity as
well as water storage capacity per
capita in dams is one of the key issues.
This leads to inadequate buffer stock
during periods of droughts, summer
months and seasonal, geographical
and annual variation as well as high
run-off of surface water into sea in the
absence of adequate storage
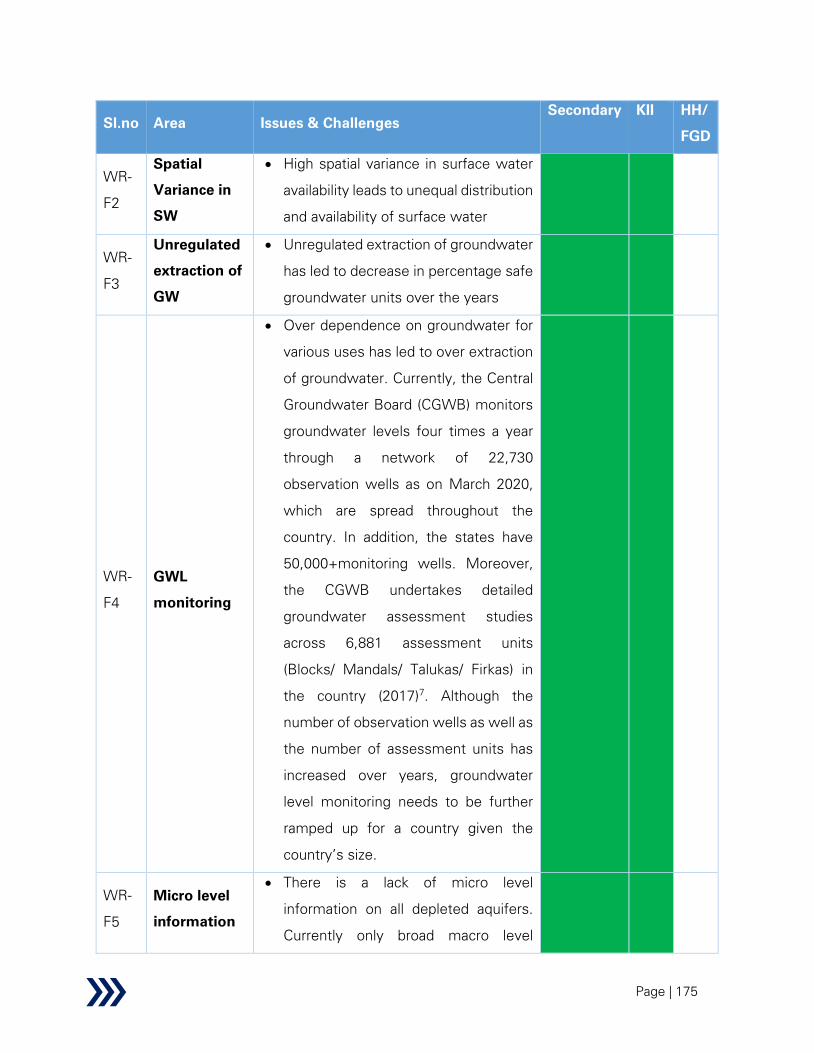
Page | 175
Sl.no Area Issues & Challenges
Secondary KII HH/
FGD
WR-
F2
Spatial
Variance in
SW
• High spatial variance in surface water
availability leads to unequal distribution
and availability of surface water
WR-
F3
Unregulated
extraction of
GW
• Unregulated extraction of groundwater
has led to decrease in percentage safe
groundwater units over the years
WR-
F4
GWL
monitoring
• Over dependence on groundwater for
various uses has led to over extraction
of groundwater. Currently, the Central
Groundwater Board (CGWB) monitors
groundwater levels four times a year
through a network of 22,730
observation wells as on March 2020,
which are spread throughout the
country. In addition, the states have
50,000+monitoring wells. Moreover,
the CGWB undertakes detailed
groundwater assessment studies
across 6,881 assessment units
(Blocks/ Mandals/ Talukas/ Firkas) in
the country (2017)7. Although the
number of observation wells as well as
the number of assessment units has
increased over years, groundwater
level monitoring needs to be further
ramped up for a country given the
country’s size.
WR-
F5
Micro level
information
• There is a lack of micro level
information on all depleted aquifers.
Currently only broad macro level

Page | 176
Sl.no Area Issues & Challenges
Secondary KII HH/
FGD
of depleted
aquifers
information is available which is not
suitable for making plans for artificial
recharging of depleted aquifers. The
analysis of data to plan GW recharge
initiatives and formulate other
actionable recommendations, is
lacking
Demand Side- Irrigation
WR-
F6
IPC IPU Gap
• There is a large gap between IPC and
IPU leads to low utilization of
expensive irrigation assets (viz. major
and medium irrigation projects) and
impedes irrigation coverage. There are
several reasons for the large gap
between IPC and IPU such as non-
completion of command area works,
high water loss during conveyance
through open canal networks,
switching to water-intensive cropping
pattern on project completion (esp.
head end farmers), faulty designs,
unlined canals, lack of desilting, poor
O&M of distribution channels and
ineffective WUAs. Closing the gap can
substantially improve irrigation
coverage at low incremental cost
WR-
F7
Irrigation
Coverage
• India’s Ultimate Irrigation Potential is
estimated at approximately 140 million
hectares as evident from Land-use
statistics. However, with only 68
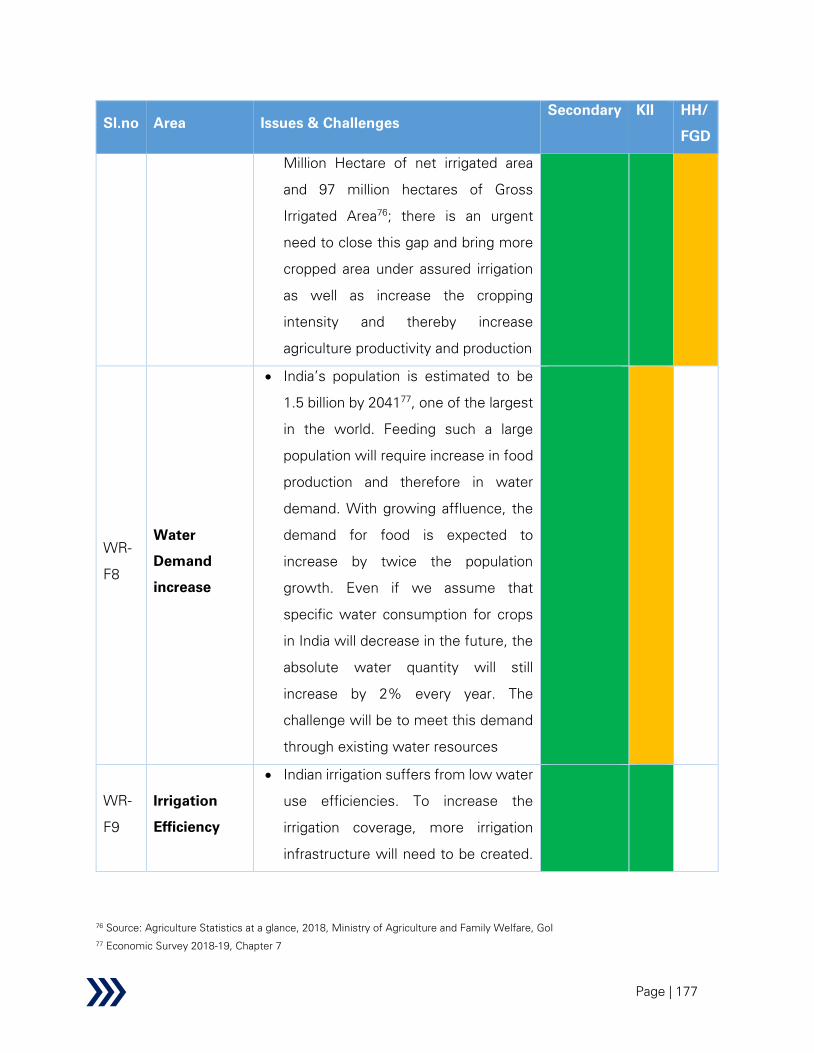
Page | 177
Sl.no Area Issues & Challenges
Secondary KII HH/
FGD
Million Hectare of net irrigated area
and 97 million hectares of Gross
Irrigated Area76
; there is an urgent
need to close this gap and bring more
cropped area under assured irrigation
as well as increase the cropping
intensity and thereby increase
agriculture productivity and production
WR-
F8
Water
Demand
increase
• India’s population is estimated to be
1.5 billion by 204177
, one of the largest
in the world. Feeding such a large
population will require increase in food
production and therefore in water
demand. With growing affluence, the
demand for food is expected to
increase by twice the population
growth. Even if we assume that
specific water consumption for crops
in India will decrease in the future, the
absolute water quantity will still
increase by 2% every year. The
challenge will be to meet this demand
through existing water resources
WR-
F9
Irrigation
Efficiency
• Indian irrigation suffers from low water
use efficiencies. To increase the
irrigation coverage, more irrigation
infrastructure will need to be created.
76 Source: Agriculture Statistics at a glance, 2018, Ministry of Agriculture and Family Welfare, GoI
77 Economic Survey 2018-19, Chapter 7
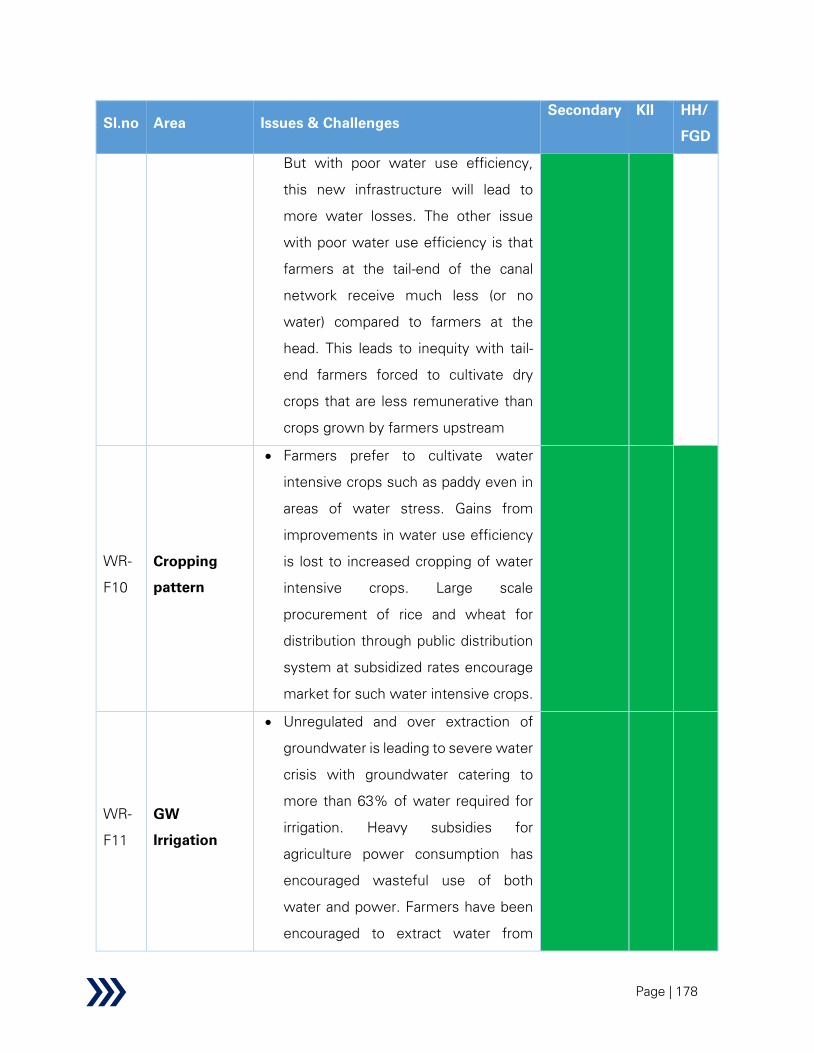
Page | 178
Sl.no Area Issues & Challenges
Secondary KII HH/
FGD
But with poor water use efficiency,
this new infrastructure will lead to
more water losses. The other issue
with poor water use efficiency is that
farmers at the tail-end of the canal
network receive much less (or no
water) compared to farmers at the
head. This leads to inequity with tail-
end farmers forced to cultivate dry
crops that are less remunerative than
crops grown by farmers upstream
WR-
F10
Cropping
pattern
• Farmers prefer to cultivate water
intensive crops such as paddy even in
areas of water stress. Gains from
improvements in water use efficiency
is lost to increased cropping of water
intensive crops. Large scale
procurement of rice and wheat for
distribution through public distribution
system at subsidized rates encourage
market for such water intensive crops.
WR-
F11
GW
Irrigation
• Unregulated and over extraction of
groundwater is leading to severe water
crisis with groundwater catering to
more than 63% of water required for
irrigation. Heavy subsidies for
agriculture power consumption has
encouraged wasteful use of both
water and power. Farmers have been
encouraged to extract water from
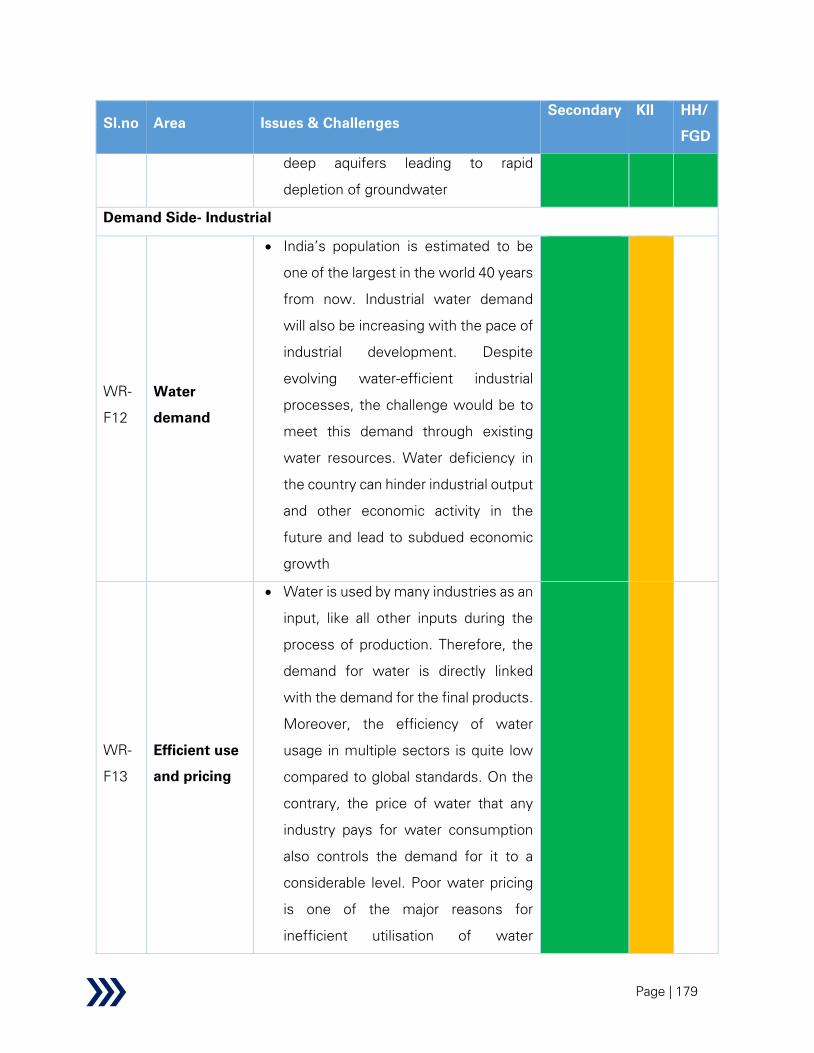
Page | 179
Sl.no Area Issues & Challenges
Secondary KII HH/
FGD
deep aquifers leading to rapid
depletion of groundwater
Demand Side- Industrial
WR-
F12
Water
demand
• India’s population is estimated to be
one of the largest in the world 40 years
from now. Industrial water demand
will also be increasing with the pace of
industrial development. Despite
evolving water-efficient industrial
processes, the challenge would be to
meet this demand through existing
water resources. Water deficiency in
the country can hinder industrial output
and other economic activity in the
future and lead to subdued economic
growth
WR-
F13
Efficient use
and pricing
• Water is used by many industries as an
input, like all other inputs during the
process of production. Therefore, the
demand for water is directly linked
with the demand for the final products.
Moreover, the efficiency of water
usage in multiple sectors is quite low
compared to global standards. On the
contrary, the price of water that any
industry pays for water consumption
also controls the demand for it to a
considerable level. Poor water pricing
is one of the major reasons for
inefficient utilisation of water
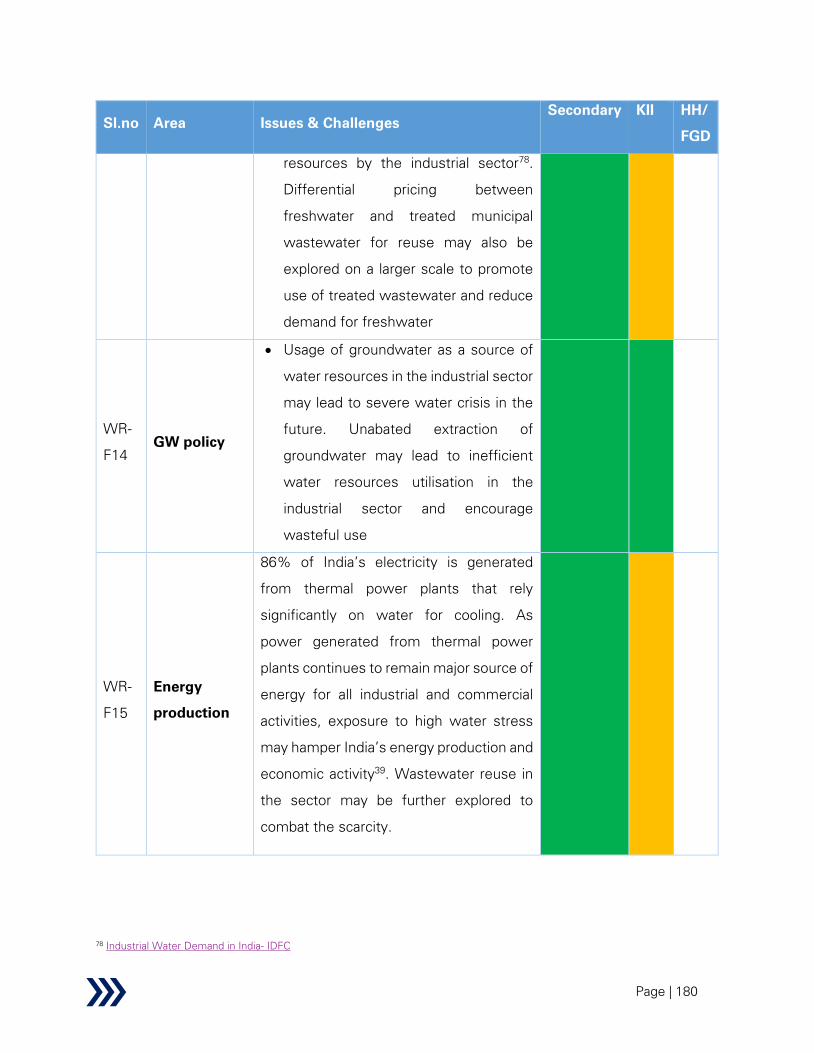
Page | 180
Sl.no Area Issues & Challenges
Secondary KII HH/
FGD
resources by the industrial sector78
.
Differential pricing between
freshwater and treated municipal
wastewater for reuse may also be
explored on a larger scale to promote
use of treated wastewater and reduce
demand for freshwater
WR-
F14
GW policy
• Usage of groundwater as a source of
water resources in the industrial sector
may lead to severe water crisis in the
future. Unabated extraction of
groundwater may lead to inefficient
water resources utilisation in the
industrial sector and encourage
wasteful use
WR-
F15
Energy
production
86% of India’s electricity is generated
from thermal power plants that rely
significantly on water for cooling. As
power generated from thermal power
plants continues to remain major source of
energy for all industrial and commercial
activities, exposure to high water stress
may hamper India’s energy production and
economic activity39
. Wastewater reuse in
the sector may be further explored to
combat the scarcity.
78 Industrial Water Demand in India- IDFC

Page | 181
Sl.no Area Issues & Challenges
Secondary KII HH/
FGD
WR-
F16
Impact on
Banking
sector
Water scarcity may pose significant
impact on the Indian economy through the
banking sector as the portfolio of banks is
exposed to the Industrial sector, which
may be facing operational risks
(production as well as regulatory risks) due
to water scarcity35
.
Demand Side- Domestic
WR-
F17
Water
Demand
India’s population is estimated to be one
of the largest in the world 40 years from
now. Domestic water demand will also be
increasing with the increase in population,
changing lifestyle and urbanisation. Supply
of adequate (or 24x7) safe treated drinking
water at household level (using piped
water supply) to the increasing population
of India is therefore a challenge.
WR-
F18
Water
quality
• In addition to the increase in
exploitation of groundwater over the
years, there have also been
occurrences of quality related issues
for groundwater. Therefore, quality of
water for domestic use must be
monitored strictly.
WR-
F19
Efficient use
and pricing
• There exists a difference in the amount
of water consumed by rural and urban
population in India. Changing lifestyles
will further increase consumption of
domestic water. Poor water pricing

Page | 182
Sl.no Area Issues & Challenges
Secondary KII HH/
FGD
may lead to inefficient utilisation of
water resources. Differential pricing
between freshwater and treated
municipal wastewater for reuse may
be explored for domestic sector to
promote reuse of treated wastewater
for non-potable domestic purposes.
WR-
F20
Water
Scarcity
• The urban population across the
various urban hubs in India is expected
to increase to 600 million in the year
2030 and 877 million by the year
205079
. With the increase in
population, pressure on water
resources will substantially increase.
Water supply infrastructure in the
major urban centres of the country
should be facing this stress as these
were never designed to cater to such
large population sizes and may not be
well equipped to handle such demand.
As of 2014, none of the major cities in
India have been able to supply 24x7
water to its entire urban population35
.
WR-
F21
O&M and
NRW
Water supply system especially in urban
areas, suffer high non-revenue water due
to leakages, unauthorized connections,
billing and collection inefficiencies.
79 United Nations, Department of Economic and Social Affairs, Population Division (2018). World Urbanization Prospects: The 2018
Revision, Online Edition
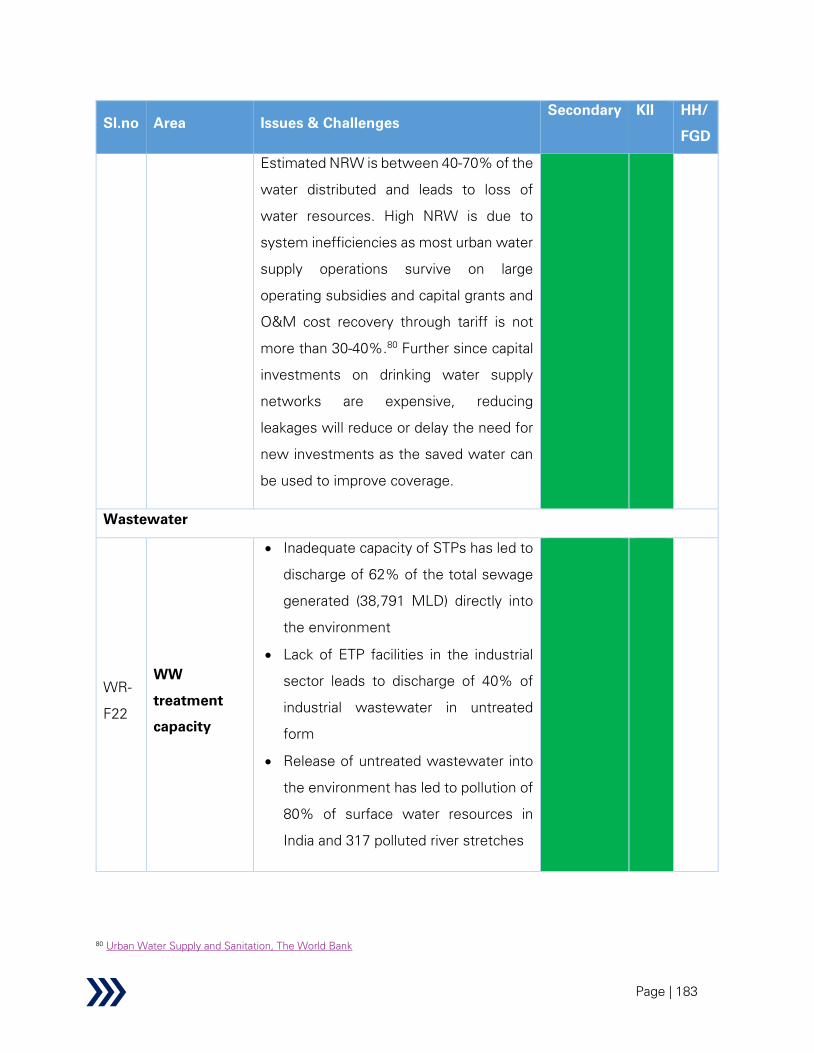
Page | 183
Sl.no Area Issues & Challenges
Secondary KII HH/
FGD
Estimated NRW is between 40-70% of the
water distributed and leads to loss of
water resources. High NRW is due to
system inefficiencies as most urban water
supply operations survive on large
operating subsidies and capital grants and
O&M cost recovery through tariff is not
more than 30-40%.80
Further since capital
investments on drinking water supply
networks are expensive, reducing
leakages will reduce or delay the need for
new investments as the saved water can
be used to improve coverage.
Wastewater
WR-
F22
WW
treatment
capacity
• Inadequate capacity of STPs has led to
discharge of 62% of the total sewage
generated (38,791 MLD) directly into
the environment
• Lack of ETP facilities in the industrial
sector leads to discharge of 40% of
industrial wastewater in untreated
form
• Release of untreated wastewater into
the environment has led to pollution of
80% of surface water resources in
India and 317 polluted river stretches
80 Urban Water Supply and Sanitation, The World Bank
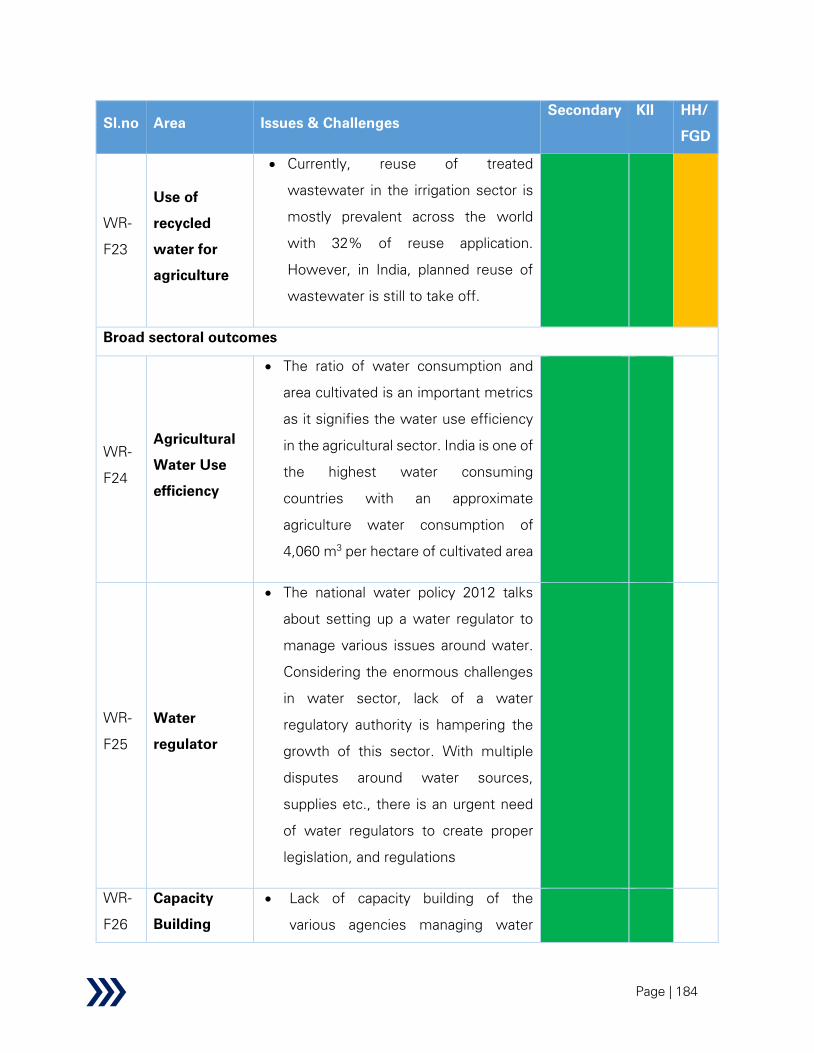
Page | 184
Sl.no Area Issues & Challenges
Secondary KII HH/
FGD
WR-
F23
Use of
recycled
water for
agriculture
• Currently, reuse of treated
wastewater in the irrigation sector is
mostly prevalent across the world
with 32% of reuse application.
However, in India, planned reuse of
wastewater is still to take off.
Broad sectoral outcomes
WR-
F24
Agricultural
Water Use
efficiency
• The ratio of water consumption and
area cultivated is an important metrics
as it signifies the water use efficiency
in the agricultural sector. India is one of
the highest water consuming
countries with an approximate
agriculture water consumption of
4,060 m3 per hectare of cultivated area
WR-
F25
Water
regulator
• The national water policy 2012 talks
about setting up a water regulator to
manage various issues around water.
Considering the enormous challenges
in water sector, lack of a water
regulatory authority is hampering the
growth of this sector. With multiple
disputes around water sources,
supplies etc., there is an urgent need
of water regulators to create proper
legislation, and regulations
WR-
F26
Capacity
Building
• Lack of capacity building of the
various agencies managing water

Page | 185
Sl.no Area Issues & Challenges
Secondary KII HH/
FGD
resources infrastructure and the
service delivery is leading to poor
water resources management.
WR-
F27
Convergence
• Multiple central government
ministries have been implementing
programs related to water sector with
scope to reduce duplication in effort
and fund utilization. Greater
convergence across scheme is
necessary
WR-
F28
Staffing
levels
• Staffing levels are ten times
international norms, and most public
funds are now spent feeding the
administrative machinery, not
maintaining the stock of infrastructure
or providing services.
WR-
F29
Financing
• There is an ever-increasing funding gap
in the sector due to poor tariff
collection and absence of alternative
financing mechanisms
WR-
F30
Project
Management
• Currently majority of the irrigation
projects in the country face issues
related to time and cost overruns. The
major and medium irrigation projects in
India suffered from cost overrun to the
extent of Rs. 1.20 Lakh Cr. In addition,
approximately 105 projects faced time
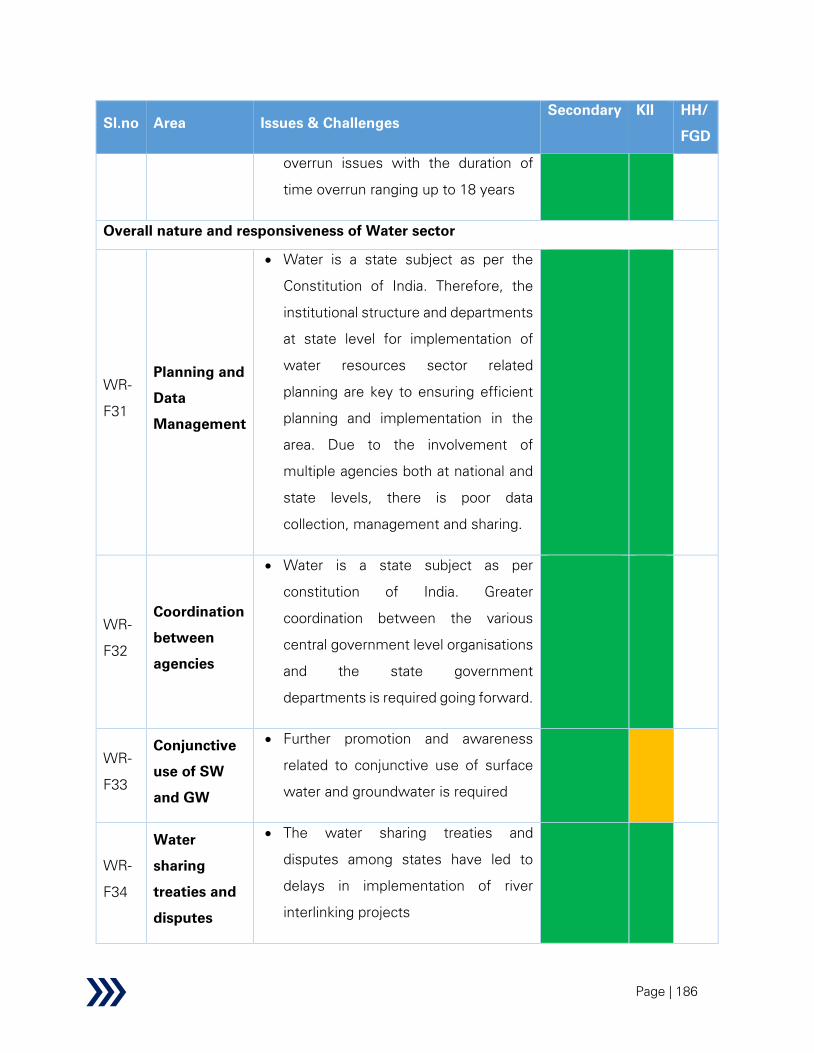
Page | 186
Sl.no Area Issues & Challenges
Secondary KII HH/
FGD
overrun issues with the duration of
time overrun ranging up to 18 years
Overall nature and responsiveness of Water sector
WR-
F31
Planning and
Data
Management
• Water is a state subject as per the
Constitution of India. Therefore, the
institutional structure and departments
at state level for implementation of
water resources sector related
planning are key to ensuring efficient
planning and implementation in the
area. Due to the involvement of
multiple agencies both at national and
state levels, there is poor data
collection, management and sharing.
WR-
F32
Coordination
between
agencies
• Water is a state subject as per
constitution of India. Greater
coordination between the various
central government level organisations
and the state government
departments is required going forward.
WR-
F33
Conjunctive
use of SW
and GW
• Further promotion and awareness
related to conjunctive use of surface
water and groundwater is required
WR-
F34
Water
sharing
treaties and
disputes
• The water sharing treaties and
disputes among states have led to
delays in implementation of river
interlinking projects

Page | 187
Issue relevance legend
Supported Partially
supported Not supported
Not applicable
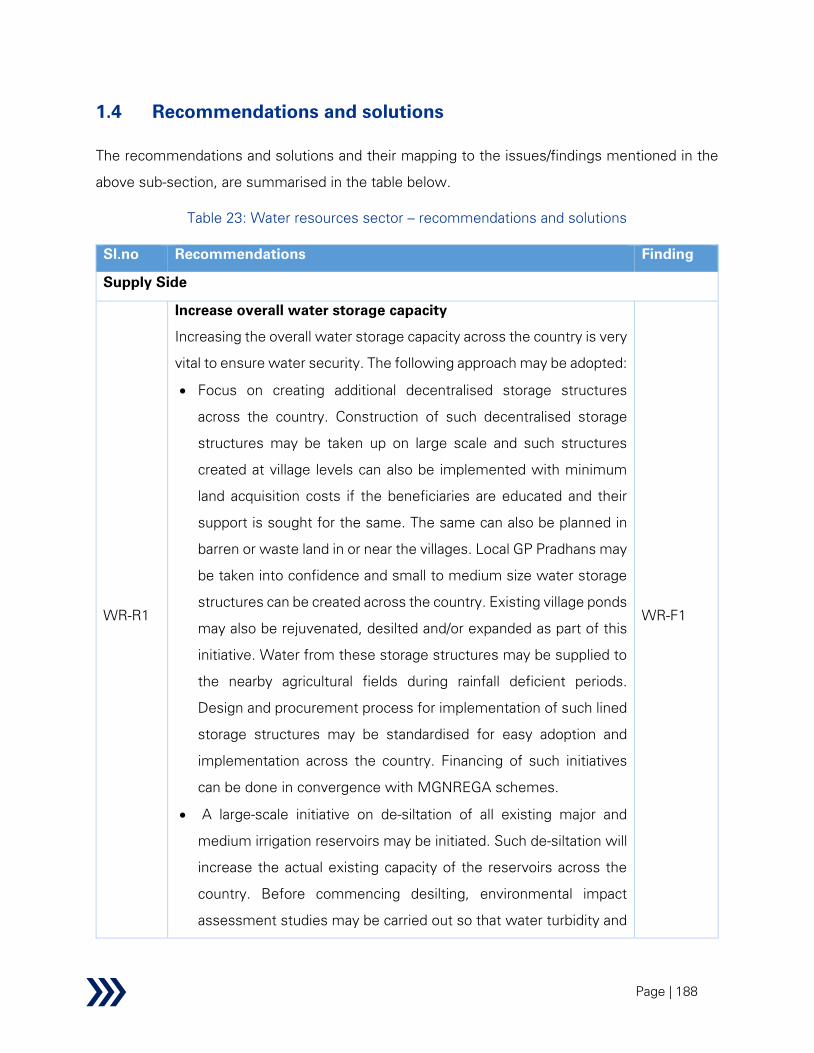
Page | 188
1.4 Recommendations and solutions
The recommendations and solutions and their mapping to the issues/findings mentioned in the
above sub-section, are summarised in the table below.
Table 23: Water resources sector – recommendations and solutions
Sl.no Recommendations Finding
Supply Side
WR-R1
Increase overall water storage capacity
Increasing the overall water storage capacity across the country is very
vital to ensure water security. The following approach may be adopted:
• Focus on creating additional decentralised storage structures
across the country. Construction of such decentralised storage
structures may be taken up on large scale and such structures
created at village levels can also be implemented with minimum
land acquisition costs if the beneficiaries are educated and their
support is sought for the same. The same can also be planned in
barren or waste land in or near the villages. Local GP Pradhans may
be taken into confidence and small to medium size water storage
structures can be created across the country. Existing village ponds
may also be rejuvenated, desilted and/or expanded as part of this
initiative. Water from these storage structures may be supplied to
the nearby agricultural fields during rainfall deficient periods.
Design and procurement process for implementation of such lined
storage structures may be standardised for easy adoption and
implementation across the country. Financing of such initiatives
can be done in convergence with MGNREGA schemes.
• A large-scale initiative on de-siltation of all existing major and
medium irrigation reservoirs may be initiated. Such de-siltation will
increase the actual existing capacity of the reservoirs across the
country. Before commencing desilting, environmental impact
assessment studies may be carried out so that water turbidity and
WR-F1

Page | 189
Sl.no Recommendations Finding
erosion of the reservoir banks are avoided. Further, the silt
recovered from these bodies (after separation of sand) may be
provided to farmers/WUAs in the nearby areas for improving
fertility of their agricultural fields. Processing of desilted soil would
provide a huge quantity of sand which can further be used for
construction works. The inclusion of de-siltation component in the
upcoming DRIP Phase 2 and Phase 3 projects may be explored.
Similar large-scale de-siltation initiatives have been taken up by the
Government of Maharashtra in the year 2017.
• Alternatively, dredging of accumulated silt may also be attempted
for very large dams. Extensive catchment area treatment should
also be undertaken for all reservoirs to avoid silt deposition
• A feasibility study to increase the existing height of the reservoirs
of all existing major and medium irrigation projects in India may be
taken up in a systematic manner. If feasible the height of the
reservoirs may be increased based on recommendations by the
technical panel. Through such initiatives, the storage capacity of
reservoirs can be increased without incurring large investments.
Similar attempts have been successful in Manipur where the state
has increased the height of an existing dam by 1m to increase the
storage capacity of the reservoir.
• Since the focus should remain on small decentralised storage
structures, in future we may have to measure the water storage
capacity of dams plus other small storage structures on a regular
basis. The storage capacity of Major and Medium irrigation projects
is monitored by the CWC. However, a robust census of Minor
Irrigation and other such small storage structures created across
the country needs to be parallelly strengthened. The 6th
Minor
Irrigation Census along with first Census of Water Bodies is being
conducted with Reference Year 2017-18 and scheduled to be
published in FY 2020-21, may provide essential data in this aspect.

Page | 190
Sl.no Recommendations Finding
• O&M of large dams across the country should also be focused
upon. Currently, majority of the dams do not have a separate
operations and maintenance budget. Moreover, state WRDs don’t
have scheduled and pre-planned maintenance budget. A dedicated
budget for operations and maintenance of the dams to address the
existing O&M issues, is required.
• Going forward, Integrated operations and monitoring system of
dams may be introduced, Such systems can help optimize water
storage capacity of dams on the same river and will help the dam
operators maximize storage, especially during the monsoon
season through integrated operations.
• In addition to the above initiatives, using select groundwater
storage aquifers for storage of water may also be explored. With
increased knowledge on aquifers and improved recharge
techniques, Mega-scale Artificial Recharge Schemes may be
implemented after conducting detailed feasibility study for the
same. Such schemes can create large underground storage in
suitable geological areas, without acquiring land as well as with no
threat of loss due to evaporation (as in surface water reservoirs).
WR-R2
Reduce spatial variance in surface water
• The GoI has been planning and undertaking multiple river
interlinking projects to reduce the spatial variance in surface water.
However, the on-ground implementation has been rather slow. The
following aspects may be explored to implement these projects on
a faster pace:
o Prioritize intra-state river inter-linking projects as these may be
quick wins due to less political interventions
o River Interlinking projects may be further promoted, and their
environmental sustainability may be publicised (through
WR-F2
WR-F34
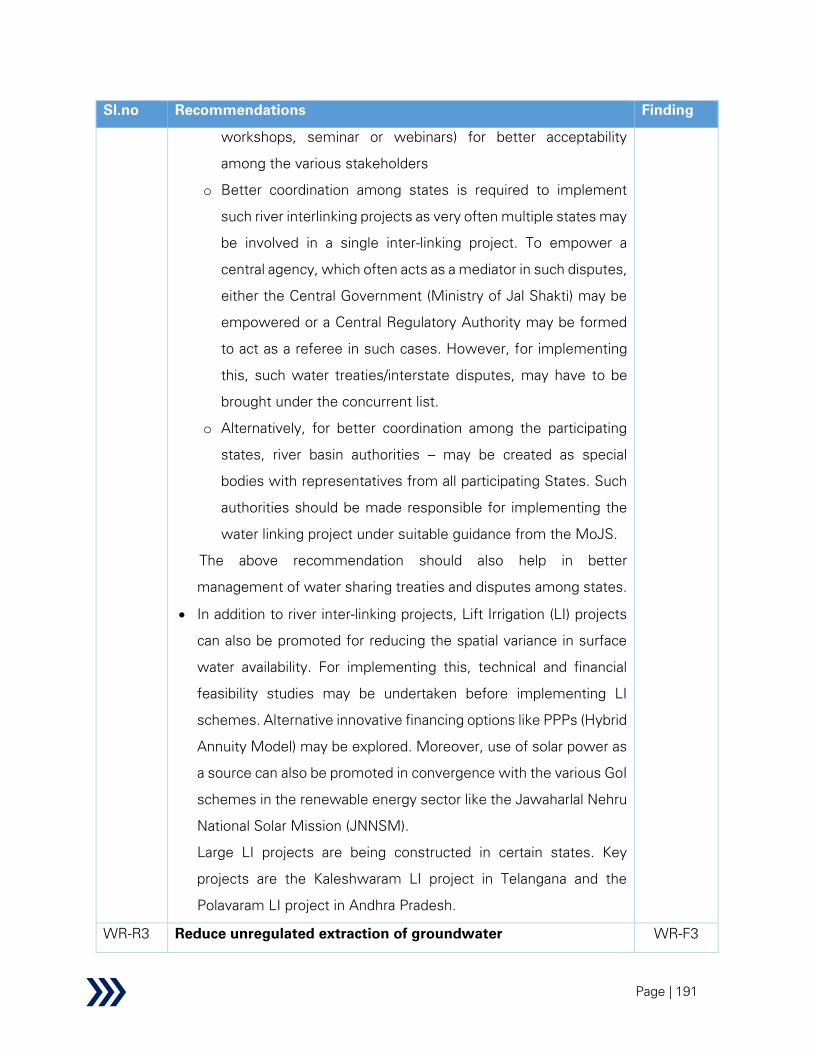
Page | 191
Sl.no Recommendations Finding
workshops, seminar or webinars) for better acceptability
among the various stakeholders
o Better coordination among states is required to implement
such river interlinking projects as very often multiple states may
be involved in a single inter-linking project. To empower a
central agency, which often acts as a mediator in such disputes,
either the Central Government (Ministry of Jal Shakti) may be
empowered or a Central Regulatory Authority may be formed
to act as a referee in such cases. However, for implementing
this, such water treaties/interstate disputes, may have to be
brought under the concurrent list.
o Alternatively, for better coordination among the participating
states, river basin authorities – may be created as special
bodies with representatives from all participating States. Such
authorities should be made responsible for implementing the
water linking project under suitable guidance from the MoJS.
The above recommendation should also help in better
management of water sharing treaties and disputes among states.
• In addition to river inter-linking projects, Lift Irrigation (LI) projects
can also be promoted for reducing the spatial variance in surface
water availability. For implementing this, technical and financial
feasibility studies may be undertaken before implementing LI
schemes. Alternative innovative financing options like PPPs (Hybrid
Annuity Model) may be explored. Moreover, use of solar power as
a source can also be promoted in convergence with the various GoI
schemes in the renewable energy sector like the Jawaharlal Nehru
National Solar Mission (JNNSM).
Large LI projects are being constructed in certain states. Key
projects are the Kaleshwaram LI project in Telangana and the
Polavaram LI project in Andhra Pradesh.
WR-R3 Reduce unregulated extraction of groundwater WR-F3

Page | 192
Sl.no Recommendations Finding
• The Groundwater (Sustainable Management) Bill, 2017 drafted by
the MoJS, GoI has been a welcome step towards decentralised
groundwater regulation enforcement and may assist in regulation
of unregulated extraction of GW. States should be encouraged to
adopt the salient features of the Bill, after suitable customization to
suit local conditions, institutional, legal, governance as well as
aquifer related differences. Decentralised monitoring and
enforcement of GW related regulations are key to the success of
GW acts. Public participation and awareness campaigns may be
conducted in large scale, and participatory enforcement through
WUAs and similar grassroot level organisations may also be
explored. Latest NGT guidelines should also be accommodated to
reduce unregulated extraction of GW.
• In the long term, remote and real-time telemetry-based water
sensors may be installed across states for accurate and updated
data. Rain gauges may also be installed for accurate data on rainfall.
Modelling and analysis of real-time GWL and rainfall data may be
conducted to track extraction of GW. The state of Andhra Pradesh
is attempting the same, with the help of piezometers located
across the state. The APWRIMS portal provides updated
information related to crucial aspects of GW.
• Implement real-time telemetry-based meters for GWL
measurement to monitor GW extraction through bore wells
• Additional analysis using satellite data (such as NASA's Gravity
Recovery and Climate Experiment) of groundwater level changes
may also be undertaken at regular intervals to measure seasonal
changes in groundwater levels. Such analysis shall help in
understanding the multi-tier aquifers of the Indo-Gangetic plains.
WR-R4 Upgrade Groundwater level monitoring WR-F4

Page | 193
Sl.no Recommendations Finding
• As highlighted in the above recommendation, in the long term,
remote and real-time telemetry-based water sensors may be
installed across states for accurate and updated data on GW level.
The implementation of the same can be converged with the
National Hydrology Project on a larger scale. The data can also be
used to prioritise investments in GW recharge structures and other
GW conservation initiatives.
• As an alternative in the medium term, participatory GWL
Monitoring may be undertaken. For implementing such initiatives,
SHGs and volunteers may be involved who may be formally trained
by CGWB or Stater Ground Water Board officials, to monitor GWL
at GP level. Once the GWL is found out at the local level, the same
may be shared with the State level GW authorities by phone or
through an application on a regular basis. Utilisation of WUAs may
also be done for this purpose.
Similar initiatives are being undertaken in Karnataka where select
SHGs and volunteers have been trained to record GWL at GP level
based on nominal payment. The same is being shared by phone,
postcard, etc.
WR-R5
Micro level information of depleted aquifers
National Aquifer Mapping programme (NAQUIM) is being
implemented across the country which involves mapping of aquifers
to some extent. Moreover, Atal Bhujal Yojana also has an aquifer
mapping component. However, the same can be undertaken in further
detail going forward. In addition to this, the data generated from the
aquifer level mapping needs to be used for actionable insights
generation. A few such probable initiatives are:
• Water budgeting at GP level may be carried out by using micro level
(at least GP) information. Such water budgeting document can be
WR-F5

Page | 194
Sl.no Recommendations Finding
used to prepare a GP-wise water security plan, especially for those
GPs which fall in the unsafe category.
• GP level rainwater and GWL recording can be used to understand
the extent of natural recharge of the aquifers and therefore plan for
artificial GW recharge initiatives by prioritising investments
• Attempts may be made to digitize GWL data and integration of data
from all GWL recorders (under the NHP or NWIC) and use
advanced mathematical techniques like artificial algorithms to
check the quality of the data sets. Thereafter, the existing data may
be used for analysis and planning of GW recharge initiatives.
Collaborations and MoUs may be executed with various national
level institutes like IITs, NITs, IISc and International institutes like
Delft Institute (Netherlands) to undertake research on the GWL
data collected, and formulation of recommendations based on the
findings for implementation by the stakeholders.
Demand Side- Irrigation
WR-R6
Reduction of IPC IPU Gap
• Standard guidelines and methodology should be developed for
assessing the IPC and IPU of the various irrigation projects across
India. This will enable to correctly ascertain the true potential of the
irrigation systems and to promote more transparency in reporting
by various organizations. Details related to the same are provided
in the recommendations for AIBP scheme.
• For monitoring IPU more effectively, remote sensing may be used
for real-time data on cropping. A similar initiative has been taken up
by the state of Manipur where remote sensing studies and aerial
surveys are being undertaken to measure and quantify the IPU on
WR-F6
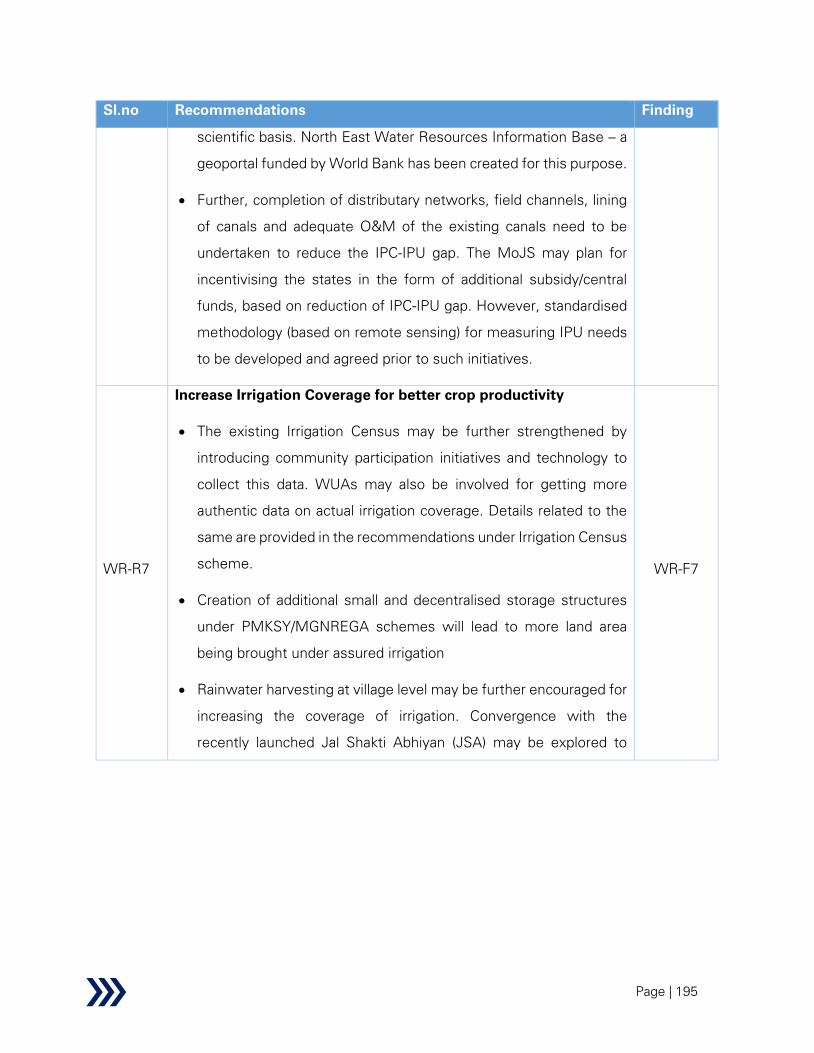
Page | 195
Sl.no Recommendations Finding
scientific basis. North East Water Resources Information Base – a
geoportal funded by World Bank has been created for this purpose.
• Further, completion of distributary networks, field channels, lining
of canals and adequate O&M of the existing canals need to be
undertaken to reduce the IPC-IPU gap. The MoJS may plan for
incentivising the states in the form of additional subsidy/central
funds, based on reduction of IPC-IPU gap. However, standardised
methodology (based on remote sensing) for measuring IPU needs
to be developed and agreed prior to such initiatives.
WR-R7
Increase Irrigation Coverage for better crop productivity
• The existing Irrigation Census may be further strengthened by
introducing community participation initiatives and technology to
collect this data. WUAs may also be involved for getting more
authentic data on actual irrigation coverage. Details related to the
same are provided in the recommendations under Irrigation Census
scheme.
• Creation of additional small and decentralised storage structures
under PMKSY/MGNREGA schemes will lead to more land area
being brought under assured irrigation
• Rainwater harvesting at village level may be further encouraged for
increasing the coverage of irrigation. Convergence with the
recently launched Jal Shakti Abhiyan (JSA) may be explored to
WR-F7

Page | 196
Sl.no Recommendations Finding
create an intensive water conservation campaign built on citizen
participation across the country.
• Artificial GW recharge initiatives in select water scarce zones based
on recommendations suggested earlier will also increase the
access to assured irrigation
• In addition, based on the recommendations suggested earlier,
River Interlinking projects and Lift Irrigation projects will also
increase irrigation coverage.
• In areas where groundwater is in abundance and surface water
availability is unreliable, farmers sometimes do not have money to
invest in pumps to extract groundwater. Erratic electricity supply or
high price of diesel further affects the usage of groundwater for
agriculture in such regions. A suitable service delivery model may
be explored in such areas where a mobile solar pump may be
rented to farmers (at fixed hourly rates). Claro Energy has
implemented a similar service delivery model in Bihar where a
portable trolley-mounted solar pump is offered on a fixed hourly
rent to small farmers within a local area.
WR-R8
Reduce dependency on GW for irrigation
Input subsidy to farmers in the form of free/subsidised power for
irrigation and subsidy on bore wells may be removed to minimise over
extraction of groundwater for irrigation. The following options may be
explored, alternatively:
• Regulating the supply of electricity supplied for groundwater
pumping and limiting it to a few hours
• Fixing ceilings for water or power used per hectare and thereafter
providing cash incentives to farmers in the form of DBT
corresponding to the quota allocated to the farmer based on his
WR-F11

Page | 197
Sl.no Recommendations Finding
land ownership. The same can be converged with PM-KISAN
scheme
• Provide power subsidy in the form of DBT only to targeted farmers;
for instance, subsidy may be provided to farmers practicing micro-
irrigation or to farmers cultivating water efficient crops (in
convergence with PM-KISAN scheme).
• Measure the quantum of power and water for each connection;
this may have an impact on the farmers psychology who in turn
may reduce water abstraction and wastage
WR-R9
Increase Irrigation Efficiency
• Incentivize introduction of piped irrigation networks (PIN) for new
irrigation projects or for all ongoing branch, distribution and minor
canals should lead to increase in irrigation efficiency. However,
detailed feasibility study (including cost benefit analysis covering
social and environmental costs and benefits) may be undertaken
before implementing PIN projects. Some facts on PIN are as
follows:
o Recent successful implementation of PIN projects in various
states like Maharashtra, Odisha, Gujarat and Rajasthan
o Countries like Israel have migrated from open water canals to
piped supplies and drip irrigation; currently Israel has the
world’s highest crop yield/ m3 of water consumed. Successful
case studies in China showed 30% savings in water delivered
(equivalent to 15% of the total irrigated area) and 25% in
labour input using PIN in place of canal-based irrigation.
o However, it may be noted that PIN is needed to be fitted with
proper de-silting arrangements, including de-silting chambers
and flushing arrangement, where irrigation water contains
WR-F8
WR-F9
Page | 198
Sl.no Recommendations Finding
large quantity of sediments particularly in case the source of
water is any of the Himalayan rivers.
o Adequate provisions should be made for electricity
connections through DISCOMS/solar power for operation of
the pumps. Use of solar power as a source can also be
promoted in convergence with the various GoI schemes in the
renewable energy sector like the Jawaharlal Nehru National
Solar Mission (JNNSM)
o Further details related to PIN are mentioned in the
recommendations for AIBP scheme.
• Lining of old canals based on detailed condition assessment
studies may also be taken up on a large scale to increase the
irrigation efficiency. A detailed feasibility study including cost
benefit analysis to determine impact of reduction of seepage on
groundwater level, may be conducted before undertaking such
projects. The same may be taken up in convergence with AIBP
component (at least lining of the main canals); the funding
modalities for the same needs to be finalized.
WR-R10
Crop Diversification
Crop diversification initiatives of the government may be further
strengthened by adopting the following:
• In the long term, alternative and less water intensive crops (like
ragi, jowar, bajra) may be promoted over traditional water intensive
crops like paddy and wheat. Nutritional security may be promoted
among the population and thus crop diversification may be
achieved through change in mindset and food habits. The same can
WR-F10
Page | 199
be undertaken in convergence with existing schemes like Poshan
Abhiyaan
• Promotion and strengthening of E- platforms may be undertaken
for wider awareness and acceptance among the farmer
community. Specific IEC and Capacity building activities may be
undertaken with WUAs to promote online agriculture trading
platform like the e-NAM platform (GoI initiative). Increase in
popularisation and adoption of such platforms will further bolster
crop diversification as it will attract more buyers, farmers and
agents and provide an assured market and price for a variety of
crops through the portal.
Similar initiative taken by the Government of Andhra Pradesh is the
e-Rythu application. The initiative is designed to digitise agriculture
marketplace by connecting buyers, farmers and agents in the
agricultural value chain. This assures fair prices to the farmers for a
large variety of crops and the application is easy to use and can be
accessed from feature phones.
• The Government can also promote crop diversification by
introducing MSP for less water intensive crops and undertake
actual procurement of such crops.
• Additionally, strong market integration for offtake of agricultural
produce and remunerative crop price must be ensured to promote
MI adoption and avoid slip backs. Implementing agencies may sign
MoUs with NGOs, private players and other similar marketing/food
processing supply chains to promote such initiatives.
• Crop diversification may also be promoted by adopting the concept
of crop colonies as part of the regulated farming. Agriculture
experts may be consulted to design and plan the specific crops to
be grown in a particular state in a given area based on various
factors like forecasted rainfall and water availability during the
Page | 200
Sl.no Recommendations Finding
season, soil conditions, demand of the produce, etc. The state of
Telangana is planning to introduce this crop colony concept.
• Alternatively, in addition to individual farmer-based beneficiary
model, basin-centric approach for widespread implementation of
MI initiatives with a specific area may be undertaken in a time
bound manner. Karnataka’s Ramthal MI project is one such
example.
• Additionally, by using water quota as a tool, crop planning, water
budgeting and crop rotation policy may be implemented at WUA
level. A specific water quantity may be allocated at WUA level and
the individual crop planning responsibility (like cash crop rotation
among farmers) may be left to the WUA for deciding on.
Agriculture department may provide necessary capacity building
and support to WUAs.
Similar initiatives have been successful in Maharashtra on a small
scale where WUAs are deciding who will take normal crop and who
will take the crash crop during any given year. Crop rotation is being
practiced to promote crop diversification among the members of
the WUA.
Demand Side- Industrial
WR-R11
Reduce Water consumption in Thermal Power Plants and other
water intensive industries
• Thermal power plants are one of the major consumers of water in
the industrial sector. It is necessary that India moves on to produce
power from sources which have lesser water footprint. Diversifying
to solar and wind power, will not only enable India to save on its
precious water resources, but also reduce pollution and combat
climate change. As per the Paris Accord on Climate Change, India
has promised installation of 175 GW of renewable energy capacity
by 2022. This includes 100 GW from solar power projects, 60 GW
WR-F12
WR-F13
WR-F14
WR-F15
WR-F16

Page | 201
Sl.no Recommendations Finding
from wind power, 10 GW from bio-power and 5 GW from small
hydro power projects81
• To further promote water use efficiency among industries and
optimise water consumption in the water sector, fixed water
allocation (quotas) for each industrial sector may be explored.
Tradable water use permits in the industrial sector may further
improve water use efficiency.
WR-R12
Increase efficiency in water use and pricing in Industrial sector
• It has become extremely essential to promote water efficient
processes across all industries, especially in the major water
intensive industries such as, power, textile, iron & steel. These
industrial sectors may be incentivised further to innovate and use
water efficient processes, thereby reducing the pressure on water
resources. In addition, appropriate tariff for the industrial
consumers may be levied. Reuse of treated wastewater may also
be promoted in the industrial sector; especially in regions of water
scarcity.
In Karnataka, the urban water supply authority is currently
supplying treated wastewater to the industrial clusters (mining and
sponge iron industries) in the water scarce areas.
WR-F12
WR-F13
WR-F14
WR-F15
WR-F16
Demand Side- Domestic
WR-R13
Increase efficiency in water use and pricing in Domestic sector
• It has become extremely essential to encourage water savings
and thereby prevent wasteful consumption of water resources.
Metering of water supply and appropriate tariff rates will
encourage water conservation. Intermediate tariff (until meters
are installed) may be set based on Built Up Area (BUA) of the
property. The same may be collected as a part of Property Tax.
WR-F17
WR-F19
WR-F20
WR-F21
81 Press Information issued by Ministry of New and Renewable Energy, GoI, December 2018
Page | 202
Sl.no Recommendations Finding
However, ring fencing of water revenues collected by ULBs or
Authorities should be made mandatory to ensure financial
sustainability of the various water supply schemes. Moreover,
ULBs may be mandated to have sub-budgets for specific
components like water supply, distribution, sanitation, etc.
WR-R14
Enhance O&M and Financing of drinking water schemes
• To achieve O&M efficiency- O&M of common infrastructure of the
water supply scheme may be handed over to a private or
professional agency. However, inside ULB area, ULBs themselves
need to take responsibility for O&M of distribution network and
other assets. A dedicated water supply cell with dedicated
manpower may be allocated for this purpose.
• Water Audit for ULBs may be made mandatory. Such audit reports
should also be put on the public domain.
Similar initiatives have been implemented in Nagpur. The audit
report includes key water supply related parameters like quantity
of water withdrawal, water treated, water supplied, wastage and
losses, cost recovery from users, etc., and is available in the public
domain. Such data can be expected to motivate the people to put
pressure on the authority to reduce the loss to make it more
efficient. Additionally, collection efficiency may also increase due
to such initiatives.
• Extensive capacity building activities may be undertaken for ULB
officials to enable them to undertake efficient O&M of assets
• To enhance the financial sustainability of drinking water schemes,
metering and tariff collection are extremely essential. The
recommendations mentioned above may be implemented
WR-F17
WR-F19
WR-F21
WR-R15 Water quality WR-F18
Page | 203
Sl.no Recommendations Finding
• Water quality of drinking water supply projects may be
maintained by proper O&M and monitoring. Additionally, water
quality tests may be undertaken at regular intervals and as per
CPHEEO guidelines to ensure adherence to drinking water
quality standards
• In addition, ETP for industries must be made mandatory and
PCBs should monitor any pollution sources to maintain the
water quality
Wastewater
WR-R16
Wastewater reuse & pollution abatement measures
• State level action plan may be prepared to identify STP
requirements. The mapping of the same should be done with the
possible demand centers in the state (industrial clusters,
agricultural zones, etc.). Projects in nearby demand centers and in
water scarce areas may be taken up on priority. Financial feasibility
of such projects will also be high due to possible revenue sources.
• In line with NMCG, similar missions for creation of STPs in other
states and for important rivers like Mahanadi, Godavari, Krishna,
Kaveri, etc. may be undertaken. PPP (HAM model) similar to NMCG
projects may be adopted for financing of such projects.
• Wastewater treatment for rural and peri-urban areas may also be
planned, going forward as JJM is being implemented which will
bring household drinking water supply to rural areas. Modular and
decentralized wastewater treatment plants may be explored for
such rural and peri-urban areas
• Reuse of wastewater in Agriculture and/or Industrial sector is
currently being included as a component in the new NRCP projects.
However, options for wastewater reuse in agriculture and industrial
WR-F18
WR-F22
Page | 204
Sl.no Recommendations Finding
sector as a revenue generation mechanism may be explored for
the previously commissioned projects under NRCP. This will also
help boost the financial sustainability of those projects. The same
may also be extended to the implemented NMCG projects,
wherever possible.
• For quicker adoption, areas where there is scarcity of water may
be taken up on priority
• Wastewater reuse policy should be framed by all state
governments
• Wastewater reuse roadmap may be prepared and extended to
industrial and domestic sectors, gradually mandating reuse targets
for industries as well as for large cities (starting with large
commercial SEZs and housing complexes)
WR-R17
Formalise and increase use of recycled water for agriculture
• Further formalization and promotion of use of recycled water for
agriculture may be undertaken in a large scale. Initially, water
scarce areas may be the focus. Capacity building and IEC activities
are required for farmers to educate them about the use of recycled
wastewater and these should be undertaken.
WR-F23
Broad Sectoral outcomes
WR-R18
Improve Agriculture Water Use Efficiency
• To improve agriculture water use efficiency, micro-irrigation needs
to be adopted at an even larger scale. Further details related to
adoption and improvement of micro-irrigation are mentioned in the
recommendations for PDMC scheme.
• Broadly, micro-irrigation guidelines need to be crop specific and
also tailored to the climatic or soil conditions. Such initiatives will
WR-F24

Page | 205
Sl.no Recommendations Finding
allow the farmers to get better subsidy and also maintain better
land productivity
• Additionally, to increase micro-irrigation adoption, subsidised
power is a major impediment. Therefore, blanket subsidy on
power may be avoided.
WR-R19
Bridge increasing gap between demand and supply of water
Supply Side- Key interventions in the supply side are:
• Improved Groundwater Management through community
participation
• Better regulatory system
• Assured SW supply through LI, River interlinking and PDN projects
• Reuse of treated wastewater in agricultural sector
• GW recharge and water conservation promotion
• River rejuvenation
Demand Side- Key Interventions in the demand side are:
• Improving water use efficiency in agriculture by strengthening
micro-irrigation
• Reducing conveyance losses in canals
• Working on crop diversification
• Implementing climate smart agriculture (CSA) and the climate
smart water management practices. CSA aims to tackle three
primary objectives- (1) Sustainably increasing agricultural
productivity and incomes (2) Adapting and building resilience to
climate change; and (3) Reducing and/or removing greenhouse gas
emissions, where possible.
Climate smart water management practices involve safeguarding
of critical water resources for sustainable use through adaptive
measures for effective water management, particularly in drought-
prone regions. An integrated approach needs to be implemented
in agricultural water management through adoption of innovative
WR-F8
WR-F12
WR-F20
WR-F24

Page | 206
Sl.no Recommendations Finding
practices such as rainwater harvesting, micro-irrigation and
resource conservation farming to increase water-use efficiency in
agriculture.
WR-R20
Efficient groundwater management and technologies
• In addition to the earlier mentioned GW related initiatives, crowd
sourcing GW related data may be attempted. For instance, it may
be made mandatory by state GW authorities, to disclose GW
related data when a user receives a NOC from the authority for
extracting groundwater. The detailed level by level drilling data of
soil strata should be shared with the authority. Such information
regarding depth of individual strata will be beneficial to create a
profile of the area. Moreover, information on GWL in the area can
also be shared. Such information may be digitized and used
judiciously for planning GW recharge related initiatives. However,
in addition to GWL, monitoring of flow regime dynamics and GW
quality shall also be taken up on regular basis.
WR-F3
WR-F11
WR-R21
Water regulator
• Like the transformation in Telecom and Power sector has been
achieved with a regulator in place, there should be a state level
regulatory authority for water. The authority should monitor the
progress of goals set in the state water policy and regulate the
quantity of water for different category for users- agricultural,
industrial and domestic. The regulator will also be an independent
body which will be authorised to arbitrate on water related
disputes. Such regulatory authority may also take up the mandate
for streamlining and improving the data collected and maintained
by various stakeholders. A careful attention should also be given to
the organisation structure of the Authority, by drawing members
from all all sectors of economy and water value chain, such as
industrial users, domestic users, agricultural users, groundwater
WR-F25

Page | 207
Sl.no Recommendations Finding
and surface water management authorities, legal and financial
experts while constituting the Authority.
• Various incentives may be provided by the GoI to the states to form
an independent water regulator (similar to Maharashtra Water
Resources Regulatory Authority. Specific measures may be:
o Providing more subsidy on certain schemes (e.g. micro-
irrigation / PDMC) to states where independent regulatory
authority has been formed. Such a move can initiate
people’s movement and create pressure on the state
governments
o Another option could be to provide a one-time grant to the
states whereby initiation fund may be provided for setting
up an independent water regulatory authority in the state.
Specific guidelines and suggested organisation structure
may also be suggested by the Central government for
adoption by the states.
WR-R22
Capacity building of organizations
• Renowned organizations working in the irrigation and agricultural
sectors like Water and Land Management Institute (WALMI) and
Punjab Agricultural University (PAU) may be empaneled for
providing capacity building on latest technologies
• The key topics which may be focused upon initially are Micro-
irrigation, National Hydrology Project monitoring, Piped
Distribution Network, reuse of treated wastewater and other such
novel initiatives. In addition, certain special skillsets/capabilities
may be developed among selected state officials in advanced
areas related to climate modelling, hydrological modelling, etc.
WR-F26
WR-R23 Scheme convergence WR-F27
Page | 208
Sl.no Recommendations Finding
• The primary schemes with which attempts may be made to
achieve convergence are MGNREGA, IWMP, SBM(G), MPLAD,
MLALAD, DMDF
• A cross-sectoral task force may be formed especially involving
irrigation, agriculture, horticulture and rural development
departments to facilitate scheme convergence
WR-R24
Staffing levels
• A thorough organisational and institutional study needs to be
conducted to identify the gaps in staffing. Organisation
restructuring, reskilling and job role review may be undertaken
based on this comprehensive assessment. In case of inadequate
staff strength, or poor ratio of field to office staff, recruitment or
departmental transfer initiatives need to be undertaken
WR-F28
WR-R25 Financing in the sector WR-F29

Page | 209
To improve revenue collection in the irrigation sector, the following
initiatives are suggested:
• Mandatory formation of WUAs (or strengthening where it
exists)
• Stronger outreach, including training and capacity building of
the WUAs may be focused upon
• Strengthening of the Irrigation Act
• Assured service levels to customers / beneficiaries
• Online collection or local payment collection of irrigation fees
through agents or WUAs
• Linking of disbursal and approval of agricultural loans and other
government support to payment of irrigation fees
• In case of Micro-irrigation projects – PPP initiatives may be
explored where capex is borne by Private sector. During O&M
period, the irrigation service fee is collected through WUA.
Such targeted programs may be carried out in water scarcity
areas
• Alternative financing mechanisms like Outcome financing and
Impact financing may be explored for financing of water sector
related projects. In these innovative financing mechanisms
(mostly used to fund social sector projects), investors provide
up-front capital to service providers, with the potential for a
return if selected outcomes are achieved. Such innovative
funding mechanisms have enabled successful achievement of
outcomes across a variety of sectors like improved learning
outcomes among primary school-aged girls in rural India, family
reunification of children in out-of-home care in Australia, and
sustained employment among vulnerable youth in Colombia,
etc.

Page | 210
Sl.no Recommendations Finding
WR-R26
Improve Project Management
• Develop a national contractor management tool/ software- Since
most large irrigation projects involve engagement of a host of
contractors over a long period of time, an online contractor
management tool should be developed by the Central government
and source code should be shared to each of the states to avoid
individual state investments in such tools.
• Systematic progress tracking of contractors will help to identify
critical paths and ensure timely actions and escalations are
undertaken.
WR-F30
Overall nature and responsiveness of Water sector
WR-R27
Improve Planning and data management in the sector
Creation of reliable and dedicated data sources for the Water
Resources sector focusing on supply as well as demand side
(irrigation, industrial - consumption by sector, domestic and
wastewater) is of utmost necessity. For this, the following may be
adopted:
• Since water is a state subject, data is collected and maintained by
various state government agencies operating in the sector.
Pooling and collection of existing data related to the water
resources sector through state WRD (like APWRIMS). This should
include both water supply and use related data.
• In line with the National Hydrology Project which aims to improve
Supply side data availability, demand side data may also be
collected from the various responsible agencies by designing a
similar scheme going forward. Moreover, when coverage of
metering and monitoring infrastructure becomes more
widespread, decentralized data collection from all demand centers
WR-F31

Page | 211
(irrigation, domestic and industrial) may be attempted.
Involvement and support from various associations like WUAs,
civil societies, industry associations, etc. may be sought for this.
Planning in the water resources sector may also be improved by
adopting the following:
• A separate scheme may be undertaken dedicated to water
resource planning at state level. Such exhaustive exercise is
required to be conducted individually for all states. A
comprehensive sector plan covering all facets of the sector- water
supply and demand for irrigation, industrial and domestic sector,
water use efficiency, etc. is required to be undertaken. A deeper
and exhaustive study through a well-designed scheme will
strengthen the state sector planning. The existing State Specific
Action Plan which primarily focuses on climate change and water
conservation initiatives, may be subsumed and merged with the
proposed initiative. Such initiatives will also address data gaps
pertaining to the sector
Similar initiatives have been taken by the Government of Punjab
which has recently engaged a leading private sector company to
prepare a comprehensive water sector plan for the state. It should
cover all aspects including improving water use efficiency, water
supply, water demand, and measures to increase efficiency in
agriculture, industrial and` domestic sectors.
• In Irrigation department at state level, three wings may be created
based on the distinct skillsets required for the exhaustive list of
activities conducted by the department. (1) Construction and
Design Wing- The same to continue to focus on technical designs,
asset creation and other technical activities; (2) Operations wing-
The same may focus on O&M of existing assets, and other softer
aspects like Community mobilization, and (3) Commercial Wing -
Page | 212
Sl.no Recommendations Finding
focusing on commercial aspects like service fee collection, etc.
These separate wings may operate under a common Engineer in
Chief and Secretary. A fixed percentage of the capital expenses
budget for the department should be allocated for O&M
• Water entitlement for all category of users - domestic (bulk),
industrial and irrigation may be fixed to promote water use
efficiency. Regulatory authorities should be mandated to
implement such initiatives.
• In drinking water supply, for better planning, implementation and
efficient O&M it is suggested that due to the inherent difference
skillset required for undertaking these activities, bulk water
production and transmission may be undertaken by a single entity
(preferably Water Supply Authorities in case of Urban areas and
ZPs in case of rural areas), whereas drinking water distribution
related activities are conducted by a separate entity (preferably
ULBs in case of Urban areas and GPs via VWSCs in case of rural
areas).
WR-R28
Improve coordination between various agencies
• Design of irrigation sector related schemes and implementation of
the same would require better cooperation between the Jal Shakti
ministry, Agricultural Ministry and the Irrigation, Agriculture,
Horticulture, Rural development and Groundwater authorities or
departments at the state level. To promote this, task force or
similar coordination mechanisms may be formalized both at State
as well as District levels between the above-mentioned
departments or agencies.
The state of Gujarat has attempted such initiatives while
implementing micro-irrigation programs. They have undertaken
micro-irrigation programs in mission mode wherein they have
created a task force and engaged experts from agriculture, water
WR-F32
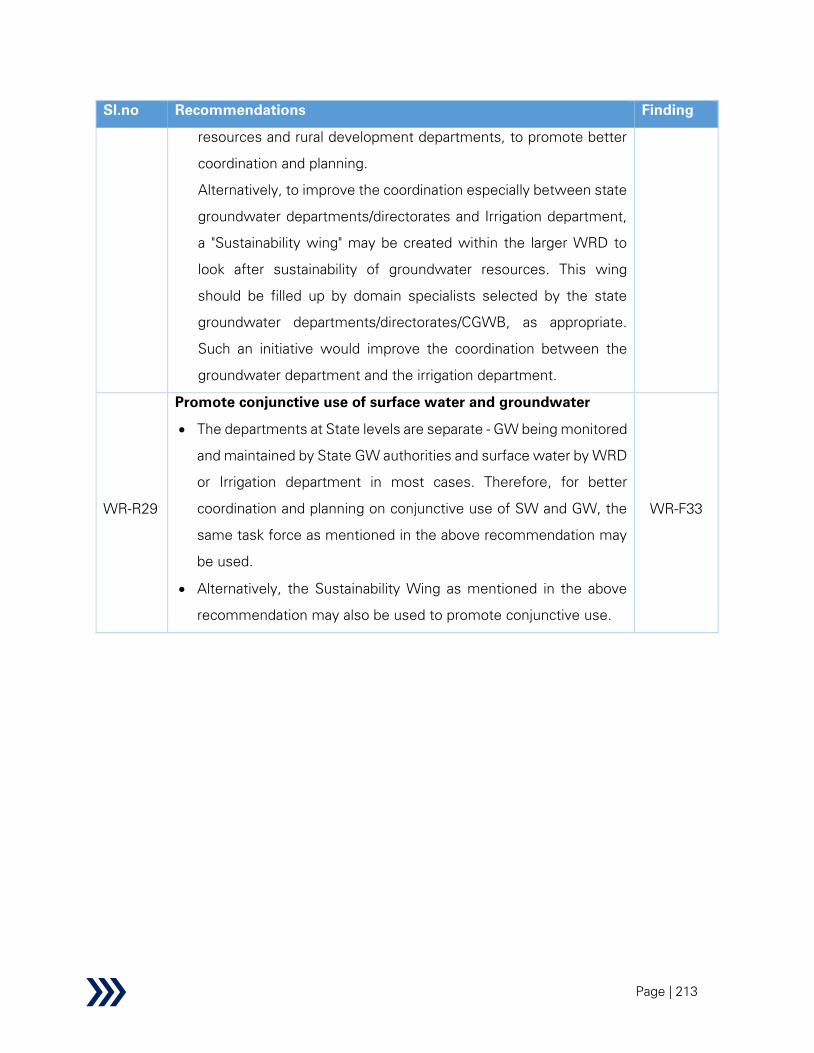
Page | 213
Sl.no Recommendations Finding
resources and rural development departments, to promote better
coordination and planning.
Alternatively, to improve the coordination especially between state
groundwater departments/directorates and Irrigation department,
a "Sustainability wing" may be created within the larger WRD to
look after sustainability of groundwater resources. This wing
should be filled up by domain specialists selected by the state
groundwater departments/directorates/CGWB, as appropriate.
Such an initiative would improve the coordination between the
groundwater department and the irrigation department.
WR-R29
Promote conjunctive use of surface water and groundwater
• The departments at State levels are separate - GW being monitored
and maintained by State GW authorities and surface water by WRD
or Irrigation department in most cases. Therefore, for better
coordination and planning on conjunctive use of SW and GW, the
same task force as mentioned in the above recommendation may
be used.
• Alternatively, the Sustainability Wing as mentioned in the above
recommendation may also be used to promote conjunctive use.
WR-F33
Page | 214
2 Scheme Level Analysis: Water resources
2.1 Introduction
Analysis of Centrally Sponsored Schemes to be covered under the Water Resources sector is
presented here. For each CSS, the analysis presents a background of the scheme including
historical context, physical and financial performances, performance evaluation using REESIE
framework and cross-sectional themes, issues and challenges, recommendations and solutions
mapped to the issues. A brief summary of those CSS for whose implementation has not started
at the time of preparation of this report has also been included.
2.2 Individual Scheme Analysis
2.2.1 Accelerated Irrigation Benefits Program
Accelerated Irrigation Benefit Programme (AIBP) was launched by the central government in
1996-97 for providing Central Assistance to major/ medium irrigation projects to facilitate
accelerated implementation of projects that were in advanced stage of completion or beyond the
resource capacity of states with the objective of reducing the gap between Ultimate Irrigation
Potential (UIP) and Irrigation Potential Created (IPC). Projects that were started in pre-5th and 5th
plan period were prioritized under this scheme along with those projects which were catering to
tribal and drought prone areas. Total 297 irrigation/ multi-purpose projects have been included
under AIBP since its inception. 143 projects out of 297 have been completed, which have created
an irrigation potential of 24 lakh ha under AIBP up to March 2014. Further, overall potential
creation through all AIBP schemes up to March 2014 is 81 Lakh Ha.82
AIBP became a part of
PMKSY after its launch in 2015-16.
Under PMKSY-AIBP, 99 on-going major/medium irrigation projects were prioritized
during 2016-17. These projects have an ultimate irrigation potential of 76.03 lakh
ha. and up to March 2016, an irrigation potential of 41.39 lakh Ha was created through these
82 AIBP-PMKSY website (http://pmksy-mowr.nic.in/aibp-mis/), Data shared by SPR wing (DoWR)

Page | 215
projects. The balance irrigation potential of 34.63 lakh Ha was targeted to be created under
PMKSY-AIBP.
Further to expedite the completion of these projects, in 2016-17 a Long-Term Irrigation Fund
(LTIF) was created under National Bank for Agriculture and Rural Development (NABARD) for
providing funds to both Central and State Governments to meet the financial requirements for
completion of the prioritized irrigation projects including CAD works. Initial corpus of LTIF was
Rs. 20,000 Cr.83
2.2.1.1 Background
Irrigation is a state subject and the projects are implemented by the state governments from their
own resources. Irrigation projects require huge capital investments and most of the projects
suffer from fund crisis because the states have very limited funds, it was found that some of
these projects were in an advanced stage of construction and if completed, they could benefit
many farmers by bringing irrigation in their respective command areas.
In view of the above, the Central Government launched Accelerated Irrigation Benefits
Programme in the year 1996-97 to provide Central Assistance to expedite the progress of ongoing
major and medium irrigation projects.
The AIBP guidelines were amended from time to time for inclusion of more projects within its
ambit including the projects of KBK (Koraput, Balangir and Kalahandi) districts of Odisha and from
drought prone areas which were performing below national level. The Central Loan Assistant was
also extended to Minor Surface Irrigation Projects of special category states: North-Eastern &
Hilly states and KBK districts of Odisha. From October 2013 onwards, additional emphasis was
placed on pari-passu implementation of command area development works for increasing
utilization of created irrigation potential.
83 National Water Development Agency website (http://nwda.gov.in/content/innerpage/pmksy-aibp.php)
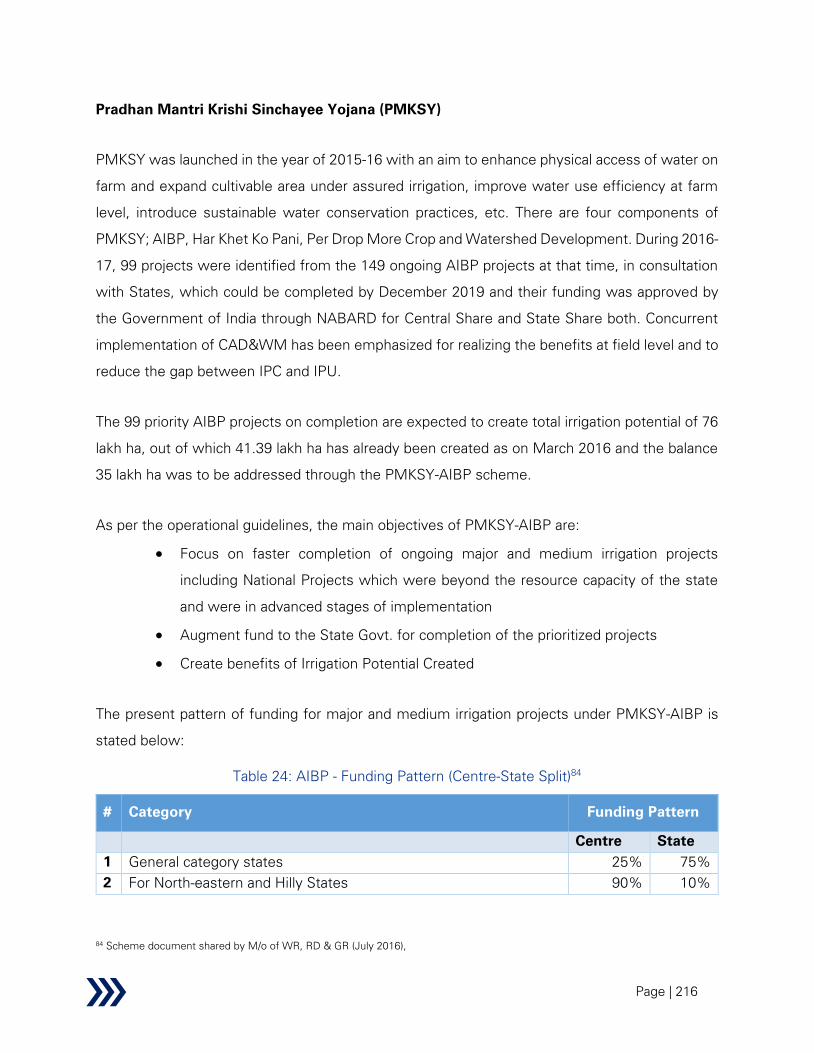
Page | 216
Pradhan Mantri Krishi Sinchayee Yojana (PMKSY)
PMKSY was launched in the year of 2015-16 with an aim to enhance physical access of water on
farm and expand cultivable area under assured irrigation, improve water use efficiency at farm
level, introduce sustainable water conservation practices, etc. There are four components of
PMKSY; AIBP, Har Khet Ko Pani, Per Drop More Crop and Watershed Development. During 2016-
17, 99 projects were identified from the 149 ongoing AIBP projects at that time, in consultation
with States, which could be completed by December 2019 and their funding was approved by
the Government of India through NABARD for Central Share and State Share both. Concurrent
implementation of CAD&WM has been emphasized for realizing the benefits at field level and to
reduce the gap between IPC and IPU.
The 99 priority AIBP projects on completion are expected to create total irrigation potential of 76
lakh ha, out of which 41.39 lakh ha has already been created as on March 2016 and the balance
35 lakh ha was to be addressed through the PMKSY-AIBP scheme.
As per the operational guidelines, the main objectives of PMKSY-AIBP are:
• Focus on faster completion of ongoing major and medium irrigation projects
including National Projects which were beyond the resource capacity of the state
and were in advanced stages of implementation
• Augment fund to the State Govt. for completion of the prioritized projects
• Create benefits of Irrigation Potential Created
The present pattern of funding for major and medium irrigation projects under PMKSY-AIBP is
stated below:
Table 24: AIBP - Funding Pattern (Centre-State Split)84
# Category Funding Pattern
Centre State
1 General category states 25% 75%
2 For North-eastern and Hilly States 90% 10%
84 Scheme document shared by M/o of WR, RD & GR (July 2016),
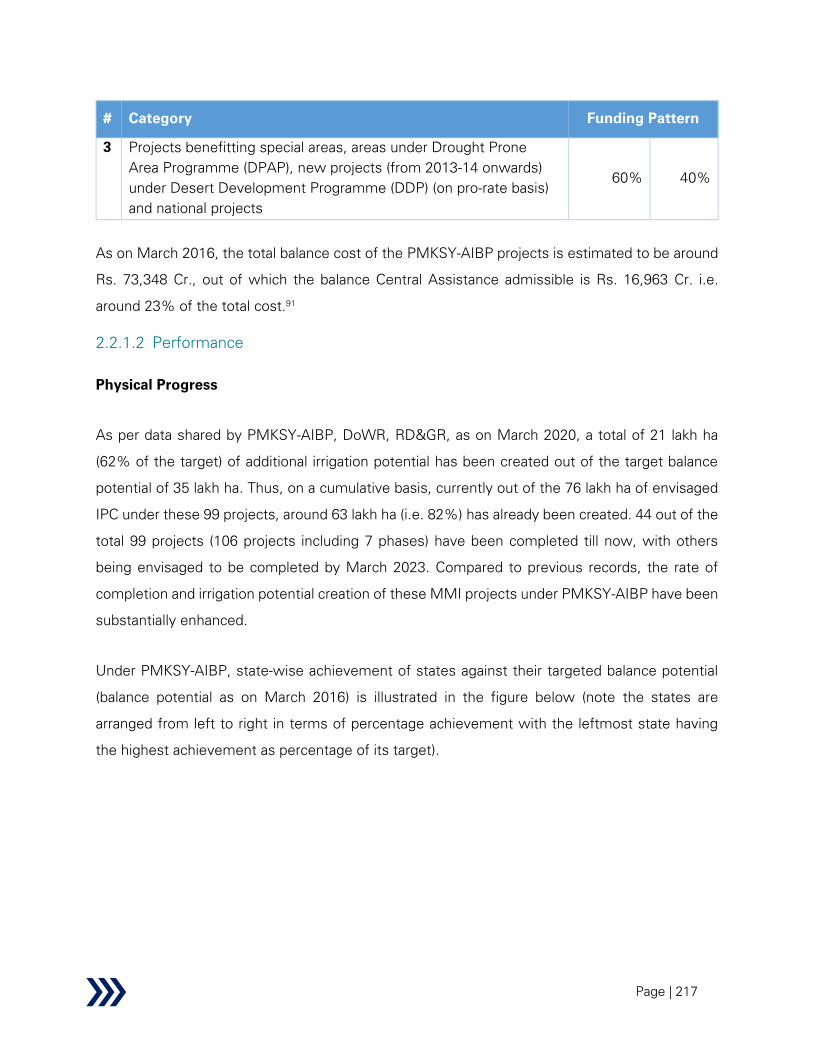
Page | 217
# Category Funding Pattern
3 Projects benefitting special areas, areas under Drought Prone
Area Programme (DPAP), new projects (from 2013-14 onwards)
under Desert Development Programme (DDP) (on pro-rate basis)
and national projects
60% 40%
As on March 2016, the total balance cost of the PMKSY-AIBP projects is estimated to be around
Rs. 73,348 Cr., out of which the balance Central Assistance admissible is Rs. 16,963 Cr. i.e.
around 23% of the total cost.91
2.2.1.2 Performance
Physical Progress
As per data shared by PMKSY-AIBP, DoWR, RD&GR, as on March 2020, a total of 21 lakh ha
(62% of the target) of additional irrigation potential has been created out of the target balance
potential of 35 lakh ha. Thus, on a cumulative basis, currently out of the 76 lakh ha of envisaged
IPC under these 99 projects, around 63 lakh ha (i.e. 82%) has already been created. 44 out of the
total 99 projects (106 projects including 7 phases) have been completed till now, with others
being envisaged to be completed by March 2023. Compared to previous records, the rate of
completion and irrigation potential creation of these MMI projects under PMKSY-AIBP have been
substantially enhanced.
Under PMKSY-AIBP, state-wise achievement of states against their targeted balance potential
(balance potential as on March 2016) is illustrated in the figure below (note the states are
arranged from left to right in terms of percentage achievement with the leftmost state having
the highest achievement as percentage of its target).
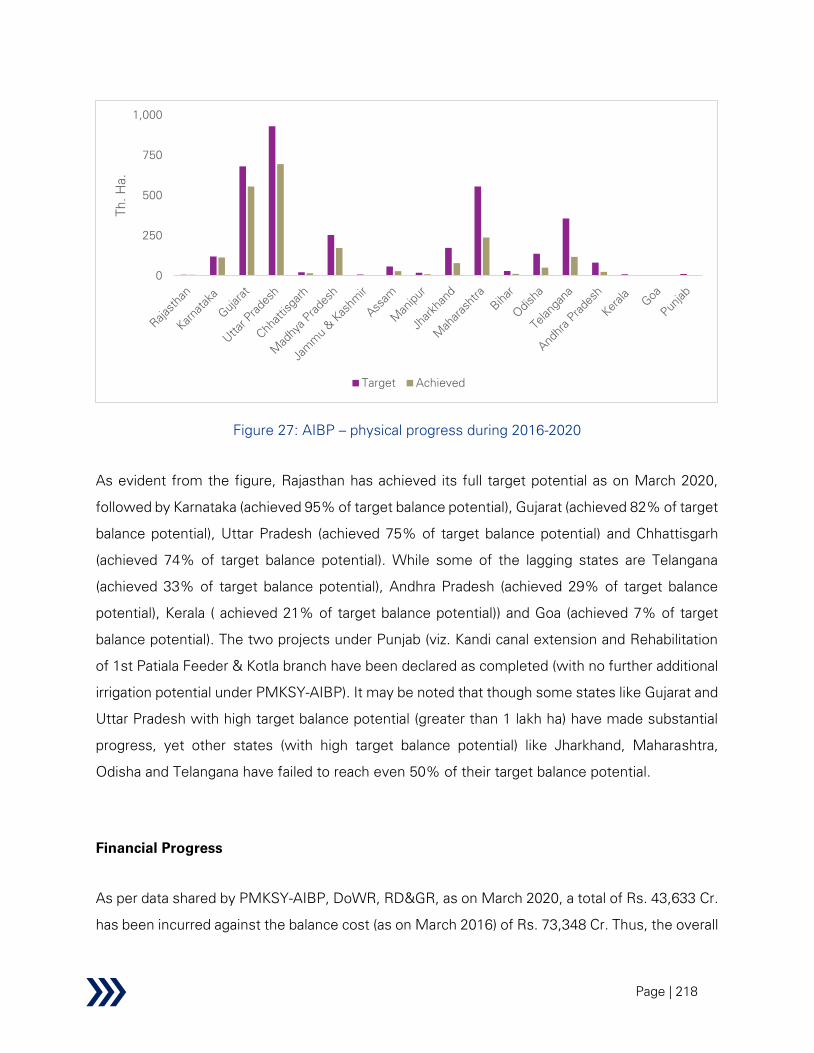
Page | 218
Figure 27: AIBP – physical progress during 2016-2020
As evident from the figure, Rajasthan has achieved its full target potential as on March 2020,
followed by Karnataka (achieved 95% of target balance potential), Gujarat (achieved 82% of target
balance potential), Uttar Pradesh (achieved 75% of target balance potential) and Chhattisgarh
(achieved 74% of target balance potential). While some of the lagging states are Telangana
(achieved 33% of target balance potential), Andhra Pradesh (achieved 29% of target balance
potential), Kerala ( achieved 21% of target balance potential)) and Goa (achieved 7% of target
balance potential). The two projects under Punjab (viz. Kandi canal extension and Rehabilitation
of 1st Patiala Feeder & Kotla branch have been declared as completed (with no further additional
irrigation potential under PMKSY-AIBP). It may be noted that though some states like Gujarat and
Uttar Pradesh with high target balance potential (greater than 1 lakh ha) have made substantial
progress, yet other states (with high target balance potential) like Jharkhand, Maharashtra,
Odisha and Telangana have failed to reach even 50% of their target balance potential.
Financial Progress
As per data shared by PMKSY-AIBP, DoWR, RD&GR, as on March 2020, a total of Rs. 43,633 Cr.
has been incurred against the balance cost (as on March 2016) of Rs. 73,348 Cr. Thus, the overall
0
250
500
750
1,000T
h. H
a.
Target Achieved

Page | 219
financial progress of 59% is commensurate with the overall physical progress of 62% during this
period. State-wise performance in terms of physical progress compared to their financial progress
is illustrated below (states are arranged in descending order with the topmost state with the
highest margin between its physical and financial progress).
As evident in the figure below, states Karnataka, Rajasthan and Chhattisgarh have achieved
considerable progress at lower expenses while states like Jammu & Kashmir, Telangana and
Odisha have incurred higher expenses compared to their physical progress.
Figure 28: AIBP – comparison of physical and financial progress
Performance on REESI+E framework
0% 20% 40% 60% 80% 100% 120% 140%
Karnataka
Rajasthan
Chhattisgarh
Assam
Jharkhand
Madhya Pradesh
Gujarat
Uttar Pradesh
Bihar
Andhra Pradesh
Maharashtra
Manipur
Kerala
Odisha
Telangana
Punjab
Jammu & Kashmir
Physical progress Financial progress

Page | 220
Table 25: AIBP – performance evaluation using REESIE framework
Parameter Findings from research
Relevance
Secondary:
• The scheme’s intended outcomes aim to address the following
Sustainable Development Goals:
o SDG Goal 2 – hunger
o SDG Goal 6 – clean water and sanitation
o SDG Goal 10 – reduced inequalities
• The scheme’s objective of focusing on faster completion of ongoing
MMI projects, funding of prioritized projects and creation of irrigation
potential shall invariably address the following:
o Food security challenges – food grain production in 2016
stood at 255 MMT against estimated requirement of 291
MMT in 2025 and 450 MMT in 2050
o Inaccessibility to assured irrigation: in 2016, Ultimate
Irrigation Potential (UIP) was 140 mha while Irrigation
Potential Created (IPC) is 113 mha85
. The 99 Priority AIBP
projects on completion shall help in creating 76.03 lakh ha of
irrigation potential
o Doubling of farmer’s income by 2022 in line with the Central
government target
• In terms of PMKSY-AIBP scheme coverage, the eligibility criteria
accord special consideration for states lagging in development,
drought prone and tribal areas, states with lower irrigation
development and districts identified under PM package for agrarian
distress. However, out of the 18 states selected for PMKSY-AIBP,
almost 86% of the total CA funding is accounted by only 6 states viz
Gujarat (28%), Maharashtra (18%), Uttar Pradesh (9%), Jharkhand
(8%), Karnataka (7%) and Madhya Pradesh (7%).
85 Data shared by DoWR,RD&GR

Page | 221
Parameter Findings from research
• A number of recent studies (like IMMI-Tata policy paper ‘Rethinking
PMKSY, July 2016’), pointed that investments in Type I irrigation (i.e.
large publicly funded irrigation projects) since 1990 resulted in 'little
or no benefits' to Indian agriculture as utilization of assets failed to
keep up with the assets creation. Farmers are found to prefer Type
II irrigation (private wells/ tubewells and lift irrigation structures)
owing to their cost effectiveness, quick completion and reliability.
Several such studies advocated states to expand affordable and
decentralized Type II irrigation on priority basis before investing in
watershed treatment and surface water from tanks and canals.
Again a study by IIM Ahmedabad in 2008 (‘Study Gap between
Irrigation Potential Created and Utilized in India’) pointed out that
though the government controlled and centralized MMI projects
suffer from lower effectiveness due higher agency problem, yet they
have much longer life compared due to minor-irrigation structures
which have higher effectiveness (especially in the initial designed
years) and shorter life-span.
• A host of studies including Dr. Mihir Shah’s article ‘Water: Towards
a Paradigm Shift in the Twelfth Plan’ point to the importance of
planning from ‘reservoir to farm gate’ and urgent need for
development of command area development (CAD works).
Primary:
Discussions with the key stakeholders like Directors (Monitoring &
Appraisal) CWC regional offices, Chief Engineers, Superintending Engineers
and equivalents from State Government departments provided the following
insights in relation to relevance:
• In terms of scheme coverage, since only a handful of states account
for majority of the CA funding, it was suggested by some
stakeholders to revisit the selection criteria to ensure more equitable
coverage across other states. It was suggested that a more
accommodative stance may be adopted, where after a specified
Page | 222
Parameter Findings from research
time interval (say yearly, bi-yearly) new projects meeting the
eligibility criteria may be allowed to be onboarded.
• Both major and decentralized minor irrigation projects have equal
potential in water resources exploitation and comparative merits and
de-merits; comparison and substitution of one with the other may
not be the right approach. Category of projects planned should
depend on the site location (availability of command area),
topography, quantum of water availability and other factors; while
minor projects benefit from low gestation period and quick
realization of benefits, major projects cater to larger population and
other needs like drinking water, industrial water supply, hydel power
generation, storages for essential use during drought years and also
have better capital investment per ha ratio. According to many
stakeholders, major projects are better planned and easier to monitor
and also incur less resources (in terms of total maintenance cost over
subsequent years).
• Stakeholders in some states like Punjab, Andhra Pradesh and
Karnataka pointed to the increasing demand for canal water in view
of the dwindling groundwater level.
• All the stakeholders unanimously validated the immense positive
impact of the AIBP projects on the farming communities both in
desert and drought prone states like Punjab and Maharashtra and
water abundant states like Assam and Jharkhand.
Inference:
• The major and medium irrigation projects (including the AIBP
projects) have immense potential in addressing the SDG goals and
related national priorities; however, there is an imminent need to
focus on some scheme components like command area
development and maintenance to realize full potential of projects. In
this aspect, the 99 Priority AIBP projects with provisions for pari-
passu implementation of CAD works is a well-conceived scheme in

Page | 223
Parameter Findings from research
achieving the goals. Hovever, as suggested by some stakeholders,
scheme coverage may be made more accommodative by allowing
onboarding of new projects meeting the eligibility criteria after
specified periods of scheme launch.
Thus, it may be concluded that the PMKSY-AIBP scheme is extremely
relevant for achieving the SGD goals and the national priority.
Effectiveness
Secondary:
Scheme design
• Review mechanism: At national level, PMKSY Mission has been set
up for overall coordination and outcome focused monitoring while
Council is responsible for overall supervision and course correction
and high level empowered committee (HLEC) responsible for policy
guidance and midterm policy correction.
• Institutional structure: Various studies (like ADB Study 2013) pointed
out that with progressive shift towards service oriented approach
from construction based approach and Participatory Irrigation
Management, staffing pattern of Irrigation Departments needs to be
broadened to include social mobilizers like social workers, agro-
economists, anthropologists along with the engineers
Scheme implementation
• Out of the Ultimate Irrigation Potential (UIP) of 76 lakh ha of the 99
Priority AIBP projects, 41 lakh ha was created as on March 2016;
while out of the balance 35 lakh ha, around 21 lakh ha (i.e. 62% of
the balance) have been created during 2016-202091.Since its
inception under PMKSY-AIBP in 2016-17, the pace of project
completion and irrigation potential creation have significantly
increased. Since 2016-17, annually, the AIBP works of 11 projects
have been completed under PMKSY-AIBP against the average of 7
projects per year earlier. Similarly, annual rate of creation of irrigation
potential now is 5.3 lakh hectares (ha) against the 4.5 lakh hectare
Page | 224
Parameter Findings from research
per annum earlier. This is facilitated by various innovative provisions
introduced under the PMKSY-AIBP schemes like Fast Track
Proforma Clearance for faster clearance of projects with escalated
cost and Long Term Irrigation Fund (under NABARD) through which
the government extended loan assistance for both centre and state
shares at subsidized interest rate of 6%. As on date, the Central
Government has already released Rs. 11,489 Cr. as Central
Assistance and Rs. 22,710 Cr. as State Share through NABARD
during 2016-20 for the 99 Priority AIBP projects.85
However, inspite of this accelerated pace, the initial target of
completion of all the 99 projects by December 2019 could not be
met, which is now expected to be completed by 2023 only.
Some of the teething problems still plaguing the project
implementation are highlighted below:
o Land acquisition: Delays in MMI due to land acquisition has
been well documented in various past studies and literature.
In accordance with the suggestion of the Public Accounts
Committee (2012-13), the Ministry has invariably linked the
release of funds in each financial year subject to state
government’s possession of adequate land for that particular
financial year’s work. However, land acquisition continues to
scuttle many of the ongoing Priority Projects. Many of the
delays may be attributed to externalities (outside the purview
of the state implementing authorities) like the clearances
required from other departments like, railways, roads and the
environment departments.
o Rehabilitation & Resettlement: Another significant
contribution to delay in project implementation are stalling of
projects (particularly those involving construction of reservoir
structures) owing to protests related to R&R and demand for
higher compensations. C&AG report on AIBP (Report No 22
Page | 225
Parameter Findings from research
of 2018) points to several deficiencies in terms of R&R like
administrative laxities, incomplete coverage of all project
affected people, lack of basic infrastructure and amenities,
delays in release of funds which led to project delays.(note
the C&AG report observations pertain to the period of study
between 2008 and 2017 and hence some of the observations
may not be relevant for the current PMKSY-AIBP schemes
which were initiated only in 2016-17. Issues relevant for
PMKSY-AIBP, observed during the primary study, are
highlighted in the next row under ‘Primary’ observations).
E.g. in case of Durgawati and Punpun projects in Bihar, it is
reported that even though in possession of 96% and 86% of
land for the respective projects, the state government
released compensation for only 72% and 42% respectively86
.
This is also validated by the PMKSY-AIBP MIS dashboard
where out of the 43 projects reported to be facing ‘issues
and constraints’, land acquisition, R&R and legal/ court cases
are reported to affect 26 of the projects (i.e. 60% of the 43
projects) while 4 of the remaining projects are facing issues
owing to clearances from other departments.
o Other issues: Issues like political or local interferences
leading to deviation from optimal design (like change in
location, size/length) hamper scheme implementation.
• Negative factors affecting scheme benefits:
o Operational losses: Conventional open canal systems are
prone to severe water losses owing to percolation losses and
poor conveyance capacity owing to inadequate maintenance,
heavy siltation and weeding, the fallout of which is
86 https://www.nationalheraldindia.comhttps://www.nationalheraldindia.com

Page | 226
Parameter Findings from research
inadequate water availability at branch canals and tail-end
regions. Also, the traditional water delivery systems in India
(like warabandi, shejpali, satta, etc.) suffer from inherent
weaknesses like discrepancies between forecast and actual
delivery flows, inaccuracies in checking water flow, etc.
• A study by Rubicon Water India ‘Global experience of
automation of irrigation systems’ states that the current
conveyance efficiency is 40% and out of the 510 km3
of
water per annum for irrigation, only 204 km3 translates into
beneficial use. A report by IIM Calcutta (2008) “IPC-IPU Gap
Analysis in West Bengal and the North-east” pointed how
lack of maintenance, unlined channels and seepages are
reported to cause ‘more than 30% water loss’. Water loss87
across different components in open conventional canals is
summarized below:
Component
water loss
%
cumulative
loss %
Main canals 6% 6%
Branch canals 8% 14%
Distributaries 10% 24%
Water courses 20% 44%
Evaporation losses 15% 59%
Thus, various studies have suggested adoption of piped
irrigation network (PIN) to contain the conveyance losses.
CWC's 'Guidelines for Planning and Design of PIN',
estimates overall efficiency for PDN is 70-80% compared to
87 As per document shared by Jain Irrigation Systems Ltd
Page | 227
Parameter Findings from research
35-60% conveyance efficiency of Canal Distribution
Network.
• In order to address land acquisition, conveyance and other
issues associated with open conventional canals, the
Ministry has been promoting use of underground pipelines,
wherever feasible. Detailed guidelines related to ‘planning
and design of piped irrigation network’ have been released
by the CWC on July 2017. As on date, 26 of the priority
projects have planned/ implemented use of piped distribution
network to the extent feasible, covering a total length of
64,137 km88
and which helped to avoid land acquisition to the
tune of 12.8 thousand ha and resulted in direct cost saving of
Rs. 2,386 Cr.
o Societal factors: Traditional irrigation methods (flood
irrigation) and shift in cropping pattern towards water-
intensive crops, particularly in the head reaches, (which is the
fallout of skewed public procurement policies and MSP
implementation, climatic pattern, market accessibility, food
habits, climatic and soil conditions, etc.) have resulted in huge
water demand and rampant pilferages in command areas.
Farmers at reservoir rim and idle reaches/higher elevation to
the canal lift water using submerged pumps, thus affecting
the water availability and flow in the canals89
.
Monitoring and evaluation
• A dedicated PMU and web portal with MIS has been established
which tracks the various output indicators like status of completion
of AIBP projects; however except for ‘total irrigation potential
created through PMKSY-AIBP’ there are no provisions for tracking
88 K Vohra and M L Franklin, “Reforms in the irrigation sector of India”
89 Planning Commission, GOI (November 2010), Evaluation Study on Accelerated Irrigation Benefits Programme (AIBP)
Page | 228
Parameter Findings from research
the outcome indicators like ‘% of irrigation potential utilized (in lakh
ha) through infrastructure created through PMKSY-AIBP, increase in
crop yield attributable to increased irrigation from PMKSY-AIBP,
increase in groundwater levels attributable to PMKSY-AIBP’ as
mentioned in the Output-Outcome Framework guidelines by
Ministry of Finance, Govt. of India (it may be noted that the utilization
of irrigation potential is tracked under CADWM-MIS in separate
dashboard)
• Scheme guidelines suggest submission of Independent Evaluation
Report of AIBP and CADWM components by state govt (report to be
submitted to CWC/ DoWR at end of each financial years) and
minimum of two visits per year by the CWC officials. As per the
guidelines, there is a provision of mandated budget for monitoring
purposes like 3% of CA (estimated Rs. 940 Cr.) for concurrent
evaluation, social audit (10% of projects in each state), third party
monitoring, IEC, etc. As reported by the SPR wing, PMKSY-AIBP,
DoWR, RD & GR, third party monitoring through PMU-WAPCOS is
being conducted regularly for PMKSY-AIBP projects.
• C&AG report on AIBP (Report No 22 of 2018) points out that
according to 2013 guidelines, the State Level Monitoring
Committees (SLMC) are to be formed immediately for MMI projects
under AIBP for implementation of environmental safeguards;
however only 4 of the 19 states formed SLMC. Since the C&AG
observations pertains to the period 2008-2017, current status of
SLMC formation needs to be validated.
• Various past studies including the IIM Ahmedabad report in 2008
titled ‘Studying Gap between Irrigation Potential Created and Utilized
in India’ have highlighted the discrepancies in assessment of IPC and
IPU by various organizations. Currently most of the organizations
calculate IPC by aggregating all areas at the outlets/ end of the
watercourses that can be catered by the hydraulic structures.
Page | 229
Parameter Findings from research
However, the delivery capability of an irrigation system keeps on
changing depending on various factors like design, wear and tear,
source reliability and other factors, which are dynamic in nature.
Primary:
Scheme design
• Institutional structure: Most of the evaluated states (barring some
exceptions like Andhra Pradesh and Bihar) like Assam, Karnataka,
Madhya Pradesh, Maharashtra and Manipur reported staff shortages
at the field offices. This has significantly hampered survey work (as
reported in Karnataka), execution of construction work (as reported
in Assam and Maharashtra),water management and fees collection.
Some of the reported issues contributing to staff shortages include
no new recruitment for vacant positions left by retiring personnel,
attachment of the engineers in land acquisition and R&R related
issues and during water rotational periods, which collectively hamper
the planning and construction works. Also, some of the project
authorities in states like Maharashtra and Rajasthan pointed to
inadequate resources like drivers and vehicles.
Scheme implementation
• Project implementation status and bottleneck: The most pressing
problems contributing to delay in project implementation are listed
(based on priority):
o Land acquisition: Since most of the projects involve obtaining
clearances from a number of departments like roads, railway,
environment, land resources and others, considerable time is
consumed in the process. Though the Ministry has adopted
a policy of releasing funds in a year only when the state
government is in possession of the required land; yet
geological surprises encountered during implementation (say
minor changes in canal alignments) or requirement to cater
Page | 230
Parameter Findings from research
to additional area (based on local demand) has resulted the
need for additional land requirements. Often, though the
quantum of land requirement may be small yet resistance of
land holders and legal cases lead to delay in completing the
hydraulic connectivity.
o Rehabilitation and Resettlement: Some of the significant
contributors to R&R issues are delay in administrative
approvals (like getting clearances from respective land
resources departments), non-involvement of the local
stakeholders at the project inception stages and differences
in relation to compensation amount. Owing to R&R issues,
various proposals of increasing dam/ reservoir heights (and
consequent IPC creation) in states like Bihar, Jharkhand,
Uttar Pradesh and Manipur have been stalled.
Delays due to land acquisition and R&R issues have been
cited as the major factor hampering implementation of
PMKSY-AIBP; some of the project authorities reporting such
ongoing issues include Tadipudi LIS, Thotapally and
Tarakaram Teerta Sagaram projects in Andhra Pradesh,
Punpun barrage and Durgawati projects in Bihar, Upper
Tunga project in Karnataka and Dhom Balkaawadi and
Bembala projects in Maharashtra. Some of the common
factors cited by stakeholders include revised higher
compensation demands from some land-owners/ PAP on the
basis of escalated price as per ‘The Right to Fair
Compensation and Transparency in Land Acquisition,
Rehabilitation and Resettlement Act, 2013’, increased steps
for soliciting approval as per the 2013 act, delay in
disbursement of compensation to the PAP owing to
administrative delays like vacancy in positions for related
revenue/ land acquisition officials and inadequate provisions

Page | 231
Parameter Findings from research
for LA compensation in the initial proposal stage. During FGD
in a tail reach village of Sri Rameswara project (Babujikoappa
village, Belgaum district, Karnataka), the cultivators
complained of not receiving any compensation for land
acquired for canal construction. This finding is also validated
by some of the stakeholders (mainly project implementing
agencies) who confirmed how delay in payment of
compensation by the state government is affecting the CAD
field works owing to farmer protests.
o Fund shortages: Though funding mechanisms have been
streamlined under PMKSY-AIBP particularly in relation to
release of CA and loan assistance to states from NABARD
(LTIF), yet the following issues still persist in some states:
▪ Inability of the state governments to match central
contribution. E.g. the projects authorities in Dhansiri
major irrigation project in Assam reported stalling of
project works during 2017-18 in want of approval
from State Finance and pending MOA with
NABARD90
▪ Delay in transfer of Central releases by states to
implementing authorities. Instances of delay range
from 1 months to 18 months in some projects. The
delay in transfer of funds has significantly affected
execution of works particularly contractor
management.
Also, as pointed by some of the stakeholders, though the
Centre:State fund sharing split is higher for north-eastern
and hilly states and special category states yet it is only
25:75 in general category states (which generally have
90 Monitoring & Appraisal Directorate (March 2018), Monitoring Report of Dhansiri Major Irrigation Project Assam

Page | 232
Parameter Findings from research
higher irrigation potential than the above two category of
states). Thus, the overall CA admissible was only 23% of the
total balance cost of Rs. 73,348 Cr.91
Thus, such a lower
central grant leaves the Centre with little leverage to push
the state governments to adopt various water sector
reforms (like increasing maintenance budget, creation of
water regulatory authority, wastewater reuse, etc.)
o Contractor deficiencies like inability to simultaneously
mobilize resource (particularly for critical paths), working
capital management issues, delay in receipt of funds from
project implementing authorities have significantly affected
project implementation in some states like Andhra Pradesh,
Assam, Punjab and Karnataka.
o Other issues:
▪ lack of co-ordination among other departments like
delay in Narmada Canal project in Rajasthan owing to
laxity from state electricity DISCOM/ Jodhpur Vidyut
Vitaran Nigam (JVVN) which has delayed the
electrification works of all diggies in the command
area.
▪ difficulty in resource mobilization (both machine and
labour forces) in remote areas. E.g. Musurumulli
project in Andhra Pradesh which covers a large chunk
of remote tribal areas witnessed some delays owing
to mobilization of machineries in such remote areas
and labour shortages due to frequent outbreak of
diseases in that tribal belt; same phenomenon has
been witnessed in other projects (particularly north-
eastern states).

Page | 233
Parameter Findings from research
▪ delay in procurement of sand for construction
activities owing to delays in auction by state
government has been reported by some of the
projects in Maharashtra like Khadakpurna project
▪ environmental issues like floods have hampered
project implementation in some states. E.g. various
components (including motors and panel of the
pumping stations) of the Narmada Canal project in
Rajasthan suffered significant damages due to
unexpected floods in 2015 and 2017; portion of the
Borolia canal in Assam was breached by the villages
at times of flood to divert water
• Most of the states like Assam, Punjab, Maharashtra, Manipur and
others, facing water availability issues in main canal and distributary
canals attributed low conveyance efficiency of open canals as the
main culprit for this IPC-IPU gap
o The average open canal losses as estimates of states vary
from 40% to 60%
o A substantial portion of the water losses is contributed by
operational losses like spillage during manual gate operation,
high head losses owing to inaccurate operations of gates and
co-ordination with peer gates, etc. Such inaccurate gate
operation and water wastages were confirmed by the
beneficiary cultivators in the command region of Sri
Rameswara project in Karnataka.
o Other significant contributors are high seepages and
percolation losses, coupled with inadequate maintenance in
some states. Notably, CWC’s monitoring report for one of
the projects in Assam pointed to the imminent need for
maintaining the main canal for FSL condition from the state
Page | 234
Parameter Findings from research
fund (tasks like de-siltation/ cleaning of operative canals and
greasing of regulators were suggested to maintain FSL) to
ensure adequate water availability in the branch canals and
distributaries. Again, in Champamati major irrigation project
in Assam, during FGDs with cultivators, it was reported that
de-siltation and cleaning of canals needed to be done in
certain stretches by the cultivators themselves, in the
backdrop of poor maintenance by irrigation officials due to
lack of funds. Similarly, during FGD in tail region of Sri
Rameswara project (Hulkund village, Belgaum district,
Karnataka), the beneficiaries complained about huge weed
growth and siltation in the canal which hindered normal water
flow. Again, cultivators in another tail reach village of Sri
Rameswara project (Babujikoappa village, Belgaum district,
Karnataka) reported canal damages and high seepages in
several places and associated water-logging (and damages to
crops) in the surrounding areas.
o Other issues are unauthorized water lifting or canal breaches
by cultivators in upper and idle reaches. During FGD in the
command area of Dhom Balkaawadi project (Wakhari village,
Satara district, Maharashtra), the cultivators pointed how
huge seepages in the network and unabated water
withdrawal at the upper reaches delay and also reduce the
water flow in the tail reaches (particularly during summer
months when wells also dry up).
o Above issues are further complicated by diversion of water
for drinking, hydro-power and other industrial issues in multi-
purpose projects. A case in point is the Champamati irrigation
project in Assam, where the beneficiaries attributed diversion
of water for hydro-electric power and maintenance issues for
severe water shortages in the Rabi season. As per data
Page | 235
Parameter Findings from research
provided by the Champamati major irrigation authorities, total
observed area under crop is only 13,262 ha against the
envisaged 24,994 ha (i.e. only 53%), with observed area
under crop during Rabi season recorded to be nil against the
designed value of 8,816 ha, though the observed discharge
of water was same as the designed value of 33.30 cumecs.
Similarly, in Bawanthadi project (in Maharashtra), water
shortage is reported in Rabi season owning to diversion for
drinking water purposes and inter-state water sharing with
Madhya Pradesh.
Monitoring and evaluation
• The stakeholders from all the evaluated states viz Andhra Pradesh,
Assam, Jharkhand, Karnataka, Maharashtra, Manipur, Punjab and
Rajasthan confirmed the positive impact of the AIBP projects on
agricultural productivity, socio-economic conditions and overall
groundwater level in the command area. But in most states, in
absence of any survey done by the Irrigation departments in this
aspect (as the outcome indicators come under the purview of other
departments like agriculture and groundwater departments), exact
estimates of quantum of benefits could not be ascertained.
• Many of the states were observed to adopt different local methods
for assessment of IPC and IPU figures. The awareness of any
standard guidelines on the same among the implementing staff was
found to be minimal.
• Almost all the stakeholders (including respondents from both CWC
regional offices and state departments) validated that officials from
CWC pay adequate visits (more than two times/ year) to the project
sites; however, considering the huge quantum of ongoing project
works in some states and their remote location, visits are limited to
critical project locations and/ or bottlenecks.

Page | 236
Parameter Findings from research
• Though all the stakeholders (project implementing authorities) are
aware of the remote sensing technology (using satellites images
through NRSC Hyderabad), yet none of the evaluated states are
currently using them; reasons being low technical know-how, limited
use owing to low imagery resolutions, high cost of procuring images
from ISRO and low frequency of image capture (can be done
quarterly/ yearly). However all the stakeholders asserted that some
sort of remote sensing technologies (like drone survey, etc.) would
greatly facilitate the monitoring of projects and identification of
system deficiencies, which are often neglected owing to limited
resources of the departments and huge spread of the command
areas. In relation to remote sensing technologies, some recent
initiatives have been undertaken at the national level by the Ministry.
Cropped area mapping studies using remote sensing technologies
are being initiated along with project monitoring through
Bhaskaracharya Institute of Space Applications and Geo-informatics
(BISAG) (note that the quality of assessment and monitoring studies
has not been validated under this study). Also, a mobile application
for geo-tagging project components has been developed along with
a GIS-based web portal for monitoring progress.
Inference:
Scheme design
• Institutional structure: In light of the staff shortages and increasing
need for water management, a re-look at the current resource profile
of irrigation departments and outsourcing of non-core works (as
initiated in Andhra Pradesh) is warranted.
Scheme implementation
• Under PMKSY-AIBP, considerable progress has been achieved vis-a-
vis previous years in terms of project completion and irrigation
potential creation. Some noticeable steps taken by Ministry in
Page | 237
Parameter Findings from research
ensuring this includes faster clearance of escalated project costs
through Fast track Proforma Clearance (FTPC), extension of financial
support to states through NABARD (under Long Term Irrigation
Fund) and extensive review mechanism set at the level of Secretary
(WR,RD&GR), Hon’ble Minister (Jal Shakti) and PMKSY Council
under Chairmanship of CEO, NITI Aayog.
However, even at this accelerated pace under PMKSY-AIBP, the
initial target of completion of 99 projects by December 2019 could
not be achieved. Some of the teething problems like delays due to
land acquisition, R&R, fund issues, contractor problems and lack of
co-ordination among state departments still persist. While many of
the problems may not be attributed solely to the project authorities,
however considerable scope is there for executing the projects in
‘mission mode’, particularly those hindered due to administrative
laxities.
Thus, though the PMKSY-AIBP scheme is observed to be a well-
conceived scheme in terms of planning (funding, institutional
mechanisms and governance), yet some of the chronic execution
issues (at state level) also experienced in earlier AIBP and MMI
projects, still persist.
• There is a significant scope to increase the conveyance efficiency of
open canals systems in India through lining of canals, proper
maintenance (de-silting, removal of weeds, etc.) which are often
neglected for want of funds and through adoption of canal
automation to mitigate water wastages associated with manual gate
operations and management.
• Recent promotion and adoption of underground piped distribution
network by states are welcome steps in addressing some of the
chronic issues like delays due to land acquisition and R&R,
conveyance losses, unauthorized water withdrawals and escalated
land acquisition costs.

Page | 238
Parameter Findings from research
Monitoring and evaluation
• There is a scope for improvement in terms of monitoring and
evaluation, particularly the imminent need for deployment of more
resources in states with larger share of ongoing projects. Monitoring
of outcome parameters (which are currently being not tracked by
most of the implementing agencies) in addition to output parameters
is necessary to get a holistic view of the project impact. Also, it is
imperative to develop and follow standard guidelines for assessment
of the output-outcome figures to avoid disparities in measurements
across states.
• Recent initiatives have been undertaken by the Ministry in relation to
adoption of remote sensing technologies like crop assessment and
project monitoring through BISAG. However, the extent of adoption
of remote sensing technologies in overall project management and
M&E was found to be in nascent stage in almost all the states barring
some particular projects.
Based on the above inferences, the performance of the scheme in terms of
effectiveness is termed as ‘average’.
Efficiency
Secondary:
Cost
• Total balance cost for the 99 Priority AIBP projects as on Apr'16 is
Rs. 73,348 Cr., while total expenditure incurred during 2016-20 is Rs.
43,633 Cr.91
• The Central Government has already released Rs. 11,489 Cr. as
Central Assistance and Rs. 22,710 Cr. as State Share through
NABARD during 2016-20 for the 99 Priority AIBP projects.91
91 Data provided by DoWR,RD&GR

Page | 239
Parameter Findings from research
• Many of the 99 priority PMKSY-AIBP projects witnessed
considerable cost-over runs, mainly due to delays due to LA and R&R
issues, increased compensation costs under ‘Right to Fair
Compensation and Transparency in Land Acquisition, Rehabilitation
and Resettlement, Act, 2013’ and increase in scheduled rates. e.g.
as reported in Khadakpurna project in Maharashtra, increase in land
acquisition costs and schedule rates account for 44% and 45% of
the total cost escalation estimate of Rs. 278 Cr. respectively.
• As per data shared by the SPR wing, PMKSY-AIBP, DoWR, RD &
GR, at the time of inclusion of the prioritized projects under PMKSY-
AIBP, total cost of the projects was Rs. 1,39,529 Cr. while the latest
cost as on date is Rs. 1,65,449 Cr. thus indicating a cost escalation
of around 18.6%. Details of the 25 projects witnessing significant
cost escalations (i.e. cost escalations exceeding 20% of estimated
cost as per cabinet note at the time of inception under PMKSY) along
with time escalations are illustrated in the table below85
.
Project Name % cost
escalation
Time
escalation92
(in
years)
Thotapally (Andhra Pradesh) 32.05% 1.25 years
Borolia (Assam) 63.13% 1.25 years
Sardar Sarovar (Gujarat) 52.15% 2 years
Subarnarekha Multipurpose
(Jharkhand)
124.68% 3.25 years
Upper Tunga (Karnataka) 98.88% 1.25 years
NLBC (Karnataka) 44.86% 1.25 years
Dongargaon (Maharashtra) 39.23% Nil (completed)
Waghur (Maharashtra) 42.62% 1.5 years
Lower Wardha (Maharashtra) 52.45% 1 year
92 Note time escalations are calculated as differences between envisaged target date of completion viz Dec 2019 and current
expected completion date

Page | 240
Parameter Findings from research
Aruna (Maharashtra) 150.45% 2.25 years
Morna (Maharashtra) 20.26% 1 year
Lower Pedhi 38.16% 2.5 years
Nardave (Maharashtra) 208.12% 1.5 years
RET irrigation (Odisha) 76.98% Nil (completed)
Telengiri (Odisha) 97.92% Nil (completed)
Lower Indra KBK (Odisha) 33.54% Nil (completed)
Subarnarekha (Odisha) 22.41% 2.25 years
Annadpur barrage (Odisha) 55.81% 2.5 years
Kanupur (Odisha) 36.98% 3.25 years
Kandi canal extension II (Punjab) 21.73% Nil (completed)
Peddavagu – Neelwai (Telangana) 44.21% 1.25 years
Rajiv Bheema LIS (Telangana) 41.08% 1.25 years
J Chokha Rao LIS (Telangana) 44.38% 1.25 years
Arjun Sahayak (Uttar Pradesh) 74.70% 1.25 years
Madhya Ganga canal Ph-II 64.22% 1.25 years
• The C&AG report on AIBP (Report No 22 of 2018) pointed to
inaccurate splitting of works, sub-standard execution of works and
irregularities, deficiencies in award of work, deficiencies in work
expenditure and undue benefits to the contractor. A sample
illustration of the project-wise deficiencies (as stated in the Audit
Report) is stated below:
o Inaccurate splitting of works: Tillari and Dhom Balkaawadi
projects in Maharashtra, Bansagar and Madhya Ganga canal
projects in Uttar Pradesh and SRSP-II project in Telangana
o Sub-standard execution of works: Durgawati project in Bihar,
Sindh Project Phase II in Madhya Pradesh, Warna, Wand and
Tarali projects in Maharashtra
It may be noted that since the C&AG report pertains to the period 2008 to
2017; hence some of the observations stated above may no longer be
relevant for the PMKSY-AIBP projects.

Page | 241
Parameter Findings from research
Benefit
• As stated earlier, since 2016-17, the 99 Priority AIBP projects
contributed to an additional 21 lakh ha of IPC. Though the actual
utilization of the potential created viz IPU needs to be ascertained;
yet the benefits of the irrigation projects in terms of agricultural
outputs and groundwater level have been well-documented in many
evaluation reports. Also, many of the multi-purpose projects have
significantly contributed to addressing drinking water needs,
industrial water supply and hydel power generation in many areas.
• In addition to these, these MMI projects are expected to provide
large employment opportunities for both skilled and un-skilled labour
in the project areas. As per MoWR sources, these 99 Priority AIBP
projects are expected to generate 1700 lakh man-days, 850 lakh
man-days and 425 lakh man-days of additional unskilled, semi-skilled
and skilled employment respectively.
Primary:
Cost
• Many of the projects have undergone significant cost overruns
owing to delay in implementation, thus leading to additional financial
burden on the state government. However, the issue of various
execution deficiencies (like inaccurate splitting of works, sub-
standard execution) as pointed by C&AG report, in reference to some
of the projects during 2008 to 2017, have not been validated in this
study.
• The Central Government’s policy of Fast Track Proforma Clearance
(FTPC) policy of clearance/ TAC clearance/ Investment Clearance for
projects with cost escalation has greatly benefitted many of the
projects.

Page | 242
Parameter Findings from research
• Private sector investment: Across states, private sector investment
remains tepid in this sector except in some cases of involvement in
micro-irrigation structures, owing to lack of returns in this sector. In
view of the financial burden on state exchequer, some states like
Maharashtra are exploring options to involve private parties through
innovative PPP models like Hybrid Annuity Model (HAM model has
already been successfully implemented in financing road and
sewage treatment infrastructure in India).
Benefit
• All the stakeholders validated the immense agricultural benefits
resulting from the AIBP projects (particularly in barren/ drought
prone/remote tribal areas) along with positive impact on
groundwater level in the command area in places with open canal
systems.
• During Focus Group Discussions (FGD) among beneficiary farmers
in the tail region of the Pushkara project (Jaggampeta village, East
Godavari, Andhra Pradesh), it was confirmed that assured irrigation
ensured cultivation of paddy, sugarcane and chilli, which would not
have been possible/guaranteed earlier (before project
implementation). Also, storage in nearby ponds ensures water
access to cattle in dry season and also support to vegetable and
other crops like black-gram. Growth in agricultural activities ensured
sufficient employment in the villages all throughout the year. The
beneficiaries also confirmed receiving adequate training through the
year. Similarly, benefits in agricultural output were confirmed during
FGD in villages in the head region of Champamati major irrigation
project (Dakshin Karigaon, Kokrajhar, Assam) and tail region of Sri
Rameswara project (Hulkund, Belgaum, Karnataka). The
beneficiaries in the Sri Rameswara project confirmed increase in
income from Rs. 6,000 – Rs. 10,000 per acre (earlier) to Rs. 70,000
– Rs. 80,000 per acre (post project implementation). Also, during

Page | 243
Parameter Findings from research
FGD (for CADWM scheme) in command area of Dhom Balkwaadi
project (Wakhari village, Satara district, Maharashtra), the cultivators
confirmed how assured irrigation from the dam ensured sufficient
green fodder for the livestock which led to substantial growth in dairy
farming in the village.
During the household survey interviews with 255 cultivators in
Andhra Pradesh (command areas of Musurumulli and Pushkara
projects), Assam (Champamati major irrigation project), Karnataka
(Sri Rameswara), Maharashtra (Dhom Balkaawadi and Tarali
projects), Manipur (Dolaithabi barrage), Punjab (mod. of Kotla canal)
and Rajasthan (Narmada Canal Project), 40% of the respondents
confirmed increase in irrigated land, while 49% and 25% confirmed
increase in crop yield and adoption of multi-cropping owing to
assured water supply post completion of the canals.
• Since, many of these projects are ongoing ones, the actual impact
on groundwater level will take some time to get reflected; e.g.
analysis of groundwater level in the command area of three of the
projects in Andhra Pradesh viz Gundlakamma (Naguppalapadu and
Maddipadu mandals in Prakasam districts), Musurumulli
(Rampachodavaram and Devipatnam mandals in East Godavari
districts) and Pushkara (Gandepalli and Jaggampeta mandals in
Pushkara) revealed no significant trends during the period 2017-2020
(as per data reported in APWRIMS)
However, noticeable growth in private tubewells/ bore wells as
reported in some of the command areas indirectly validated the
improvement in groundwater level. Also, during primary survey with
255 cultivators in Andhra Pradesh (command areas of Musurumulli
and Pushkara projects), Assam (Champamati major irrigation
project), Karnataka (Sri Rameswara), Maharashtra (Dhom Balkaawadi
and Tarali projects), Manipur (Dolaithabi barrage), Punjab (mod. of
Kotla canal) and Rajasthan (Narmada Canal Project), around 41% of
Page | 244
Parameter Findings from research
the respondents confirmed increase in groundwater due to AIBP
projects; in some of the states like Andhra Pradesh (n=94), Karnataka
(n=26) and Rajasthan (n=18), around 63%, 42% and 67% of the
respondents confirmed increase in groundwater level respectively,
after implementation of AIBP projects. In command areas of
Musurumulli and Pushkara projects, recharge of groundwater
through canal seepages has facilitated around 10%-20% of the
cultivators to go for second crop through lifting of water using bore
wells.
• Moreover, many of the multi-purpose projects cater to drinking
water needs (particularly in dry and summer seasons) and electricity
generation in far-off remote places. During the household interviews,
46% of the 255 respondents confirmed usage of canal water for
livestock while 36%, 28% and 15% of the respondents confirmed
usage for domestic (washing/ cleaning), sanitation (bathing and
handwashing) and drinking water purposes.
• Notable examples:
o In the desert and drought-prone areas of Jalore and Barmer
districts in Rajasthan, the Narmada canal has benefitted 233
villages in terms of access to assured irrigation (2.46 lakh ha),
1,541 village and 3 towns in terms of drinking water supply93
.
Income from food production increased by 177% from Rs.
534 Cr. (base year 2013-14) to Rs. 1,480 cr88
. The concurrent
evaluation study by Department of Civil Engineering, MBM
Engineering College, Jodhpur has stated the achievements
and results under the project as ‘overwhelming and
encouraging’.
93 Data shared by Office of the Chief Engineer Narmada Canal, Sanchore
Page | 245
Parameter Findings from research
o In Assam, the Champamati major irrigation project has
resulted in increase in irrigation intensity over net irrigated
area (N.I.A.) from 18.88% in 2007-08 to 87.86% in 2012-13,
change in cropping pattern in pre-Kharif season from early
paddy to early paddy, mustard, potato and other
vegetables94
.
o These projects also created huge employment opportunities
in the command area (particularly significant in remote tribal
areas). E.g. the Champamati major irrigation project in Assam
generated around 26.76 lakh95
of man-days of employment.
The Subarnarekha Multipurpose Irrigation project is expected
to create 112 lakh man days of work during 2020-21.96
During
household survey, 17% of the 132 respondents confirmed
participation in the construction activities under AIBP, with
the corresponding figure recorded is as high as 50% in
Manipur (n=24). Noticeably, the construction activities
benefitted the small and marginal farmers (land-holding less
than 2 ha) more – 10% of the 192 small and marginal farmers
confirmed involvement in AIBP construction activities
compared to only 5% of 44 large farmers (land-holding more
than 2 ha).
Inference:
• Many of the projects have witnessed considerable cost overrun
owing mainly to delays, escalated land acquisition costs and
schedule of rates and possible issues of execution deficiencies (like
sub-standard works, inadequate splitting of works), thus
undermining the envisaged benefits. Though some of the issues like
94 NERIWALM, Tezpur (2014), Report on Concurrent Evaluation of Champamati Major Irrigation Project in BTC area in Assam
95 As per reports provided by project authorities, Champamati Major Irrigation Project in BTC area in Assam
96 As per reports provided by project authorities, Subarnarekha Multipurpose Irrigation Project, Jharkhand

Page | 246
Parameter Findings from research
delays due to R&R issues may not be directly under the purview of
the implementing agencies, yet there is significant scope of
improving the efficacy of execution by eliminating the administrative
delays.
The Central Government’s policy of Fast Track Proforma Clearance
(FTPC) is a welcome step in expediting the completion of the
projects with escalated costs.
Thus, it may be observed, that inspite of the time overruns and
associated cost overruns, inception of the PMKSY-AIBP (since 2016-
17) has significantly helped to rein in both the metrics vis-a-vis
previous years.
• The 99 AIBP projects have invariably led to increased agricultural
outcomes while also catering to other needs like domestic and
industrial water supply, electricity generation (with substantial
benefits accruing to drought prone and tribal areas) and other allied
livelihood activities like pisciculture, horticulture, etc. Construction
activities in PMKSY-AIBP projects provided direct employment
opportunities to a substantial local population particularly the small
and marginal farmers.
Thus, the performance of the scheme in terms of efficiency is termed as
‘satisfactory’.
Sustainability
Secondary:
Since many of the AIBP projects are either ongoing or recently completed,
sustainability of the schemes has been studied based on both performance
of similar projects and insights from the PMKSY-AIBP projects. Also,
sustainability has been assessed from the standpoint of three key
parameters: financial, social and environmental sustainability; some of the
aspects/ insights developed will be overlapping with the CADWM scheme.
• Financial factors: Various studies like the article “Reforms in the
Irrigation Sector of India” by K. Vohra and M.L. Franklin, have pointed
Page | 247
Parameter Findings from research
to the capital intensive nature of irrigation projects along with their
high maintenance expenditure. This is further complicated by the
poor private participation in this sector owing to low investment
returns along with extant social practices of low water rates which
prevent recovery of not only the capital but also maintenance costs.
CWC’s report (2010) “Financial Aspects of Irrigation Projects in
India” noted that the sub-optimal performance of many of the MMI
projects may be attributed lack of proper maintenance and
management, due to inadequate funding from State. It also noted
that major portion of the available funds for maintenance and
management of the system are incurred on establishment
expenses. Similar views were also repeated by subsequent CWC
reports like “Financial Aspects of Irrigation Projects in India (2015)”.
The CWC report (2015) further highlighted that the gross receipts
from the MMI projects, on account of water charges and other
economic activities, varied from 5% to 12% of capital expenditures
during 1992-93 to 2013-14. This conundrum was also highlighted by
Tushar Shah in IWMI paper “Past, Present and Future of Canal
Irrigation in India”, where he observed that in states where irrigation
departments are expanding, with increasing salary costs and
stagnant water tax collection, establishment cost will come to
occupy a substantial portion of the working expenses pie which will
leave little for repair and maintenance of systems. Thus,
maintenance of the projects and thus realization of benefits over long
term becomes challenging in light of poor financial commitment for
the same by the government. The CWC report (2010) advocated
levying water charges on the users to generate requisite finances for
an effective operation, maintenance and management of the
irrigation system.
The erstwhile Planning Commission in the report ‘Evaluation Study
on AIBP, November 2010’ noted that most of the farmers in

Page | 248
Parameter Findings from research
command areas of major irrigation projects in Assam, Karnataka and
Uttar Pradesh do not pay any fees. However, the same report
pointed that 50% of the farmers in major projects are willing to pay
more in case of assured water supply. Along similar lines, in the
article ‘Water: Towards a Paradigm Shift in the Twelfth Plan, 2013’,
Dr. Mihir Shah proposed that there is a close link between service
provided and fees collected – “wherever ISF gets regularly collected,
irrigation staff shows greater accountability and responsiveness to
farmers”. The report opines that abolition of irrigation fees (or
inadequate collection like 2% to 8% of dues) has broken the
accountability link between irrigation officials and farmers. A similar
hypothesis has been put forth by the IWMI working paper “Malik, R.
P. S.; Prathapar, S. A.; Marwah, M. (2014), Revitalizing canal
irrigation: towards improving cost recovery” which points that “the
cost recovery is also influenced positively by the status of
maintenance of irrigation infrastructure”. These underscore the need
for proper maintenance, particularly in the initial years, to ensure
better farmer participation, fees recovery and sustainability of the
projects. This hypothesis is also validated during primary household
survey, where 61% of the 255 cultivators interviewed in seven
states, confirmed that they are willing to pay ‘additional fees’ in case
reliable water supply is ensured.
Case study: Main system irrigation management by Madhya
Pradesh state government
From 2009-10, Madhya Pradesh government undertook host of
initiatives to ensure improved management of existing schemes
along with faster completion of ongoing projects and adoption of
pipe based distribution system. During 2009-10 to 2015-16, the
state succeeded in creating 2.06 mha of which around 64% was
achieved through improved management of existing schemes and
the remaining through construction of new schemes; average

Page | 249
Parameter Findings from research
utilization efficiency increased from 32% in 2009-10 to 85% in
2015-16.
Key initiatives:
• To bridge the gap between IPC and IPU, emphasis on pre-
irrigation maintenance, rehabilitation of old irrigation
projects and improved management using target setting
and monitoring through conventional and web-based tools
were adopted
• Timely pre-emptive maintenance was given utmost priority
to improve system performance
o Pre-Rabi inspections were made mandatory for
WRD staff to ensure FSL at main canal. This was
complimented by additional delegation of authority
to divisional offices to conduct small maintenance
work during the month-long maintenance
timeframe between mid-September to mid-
October
o The above initiatives were supported by adequate
and timely budget support from the state
government; annual expenditure per unit area
increased from Rs. 112/ ha in 2009-10 to Rs. 820/
ha in 2015-16
o Also, participation of WUAs was ensured through
delegation of civil works of less than Rs. 50 lakh
each to 50 WUAs under Madhya Pradesh Water
Sector Restructuring Project
(Reference: RS Julaniya et al., A Management Approach to
Increase Irrigated Area and Production in Madhya Pradesh, India)
MP’s irrigation management reform was also highlighted by Dr
Tushar Shah (2016) in the article “Har Khet ko Pani?: Madhya
Page | 250
Parameter Findings from research
Pradesh’s irrigation reform as a model”, which highlighted the
following success factors:
• Ensuring effective canal system operation: it
encompassed revision of obsolete irrigation schedules,
strict enforcement of osarabandi and ‘tail to head’ irrigation
schedule
• Expediting completion of last mile connectives:
competition of last-mile projects, rehabilitation of 4,000
minor irrigation schemes, lining of old earthen canals which
led to a jump in area served from 0.37 mha to 0.76 mha in
just 2 years
• Reduction of deferred maintenance: additional financial
resources provided to the departments to carry out de-
siltation and fixation of canal breeches two months ahead
of every irrigation season
• Setting up rigorous monitoring practices: regular
monitoring by higher management using ICT and video-
conferences set up, water access at tail-end villages was
fixed as one of the key performance metrics
• Revival of the irrigation bureaucracy: irrigation
bureaucracy was empowered and political interferences
were curtailed
• Strengthening of the WUAs
All these concerted efforts resulted in increase in irrigated area
from 2.53 mha in 2013-14 to 2.69 mha in 2014-15 and 2.81 mha in
2015-16 and increase in food grain production from 30.07 MT in
2013-14 to 34.09 MT in 2014-15 and 37 MT (expected) in 2015-16.
• Societal Factors: In an IWMI paper “Past, Present and Future of
Canal Irrigation in India”, Tushar Shah attributed ‘the gap between

Page | 251
Parameter Findings from research
the area designed to be served by gravity irrigation and area actually
served after the irrigation system begins operation’ to the repeated
overlooking of the aspect of ‘head-reach farmers irrigating water-
intensive crops and the shrinking of the command area that actually
gets served’ during the design stage; it estimated that adoption of
water-intensive crops in the head region leads to a shrinking of
almost one-third to half of the designed command area.
• Environmental Factors: Various reports have pointed how increase
in groundwater level in the command areas of the canals led to
proliferation of groundwater based private tubewells/bore wells.
While such conjunctive use of surface and groundwater contributed
to better yield, yet at the same it led to severe groundwater
extraction in some areas along with shift towards water intensive
crops like paddy (particularly in the head regions). In the paper titled
“Past, Present and the Future of Canal Irrigation”, Tushar Shah
pointed that “proliferation of irrigation wells in many canal
commands has turned what were irrigation canals into recharge
canals”.
It may be noted that the above insights are drawn from literature available
for MMI projects in India in general; the relevance of these insights with
respect to PMKSY-AIBP projects is elaborated in the next row under
‘Primary’ observations.
Primary:
• Financial factors: Collection of irrigation fees or cess is found to be
either inadequate or absent in most of the states barring some
exceptions in Maharashtra and few other states. e.g.
o in Punjab the practice of collection of irrigation fees (abiana)
has been stopped few years back
o inadequate collection reported in Assam (in Champamati
irrigation project, canal maintenances are done by the
cultivators only; hence they are reluctant to pay any additional

Page | 252
Parameter Findings from research
fees). An earlier report of CWC in May 2010 “Financial
Aspects of Irrigation Projects in India” mentioned that the
gross receipt on account of water charges levy in Assam
amounts to only 0.1% to 1.8% of capital expenditure during
1990-91 to 2006-07.
o in Andhra Pradesh, fees collection has not started in the
ongoing projects owing to absences of required assessment
mechanisms and operational WUAs (like Musurumulli,
Pushkara LIS, Gundlakamma projects)
o In Bihar, all the stakeholders interviewed confirmed low fees
recovery in the range of 10-20%, which is however expected
to increase once WUAs are delegated the authority to collect
fees. Also, low fees payment by tail end farmers reported
due to inadequate access to water. This is further
exacerbated by political issues like waive-off of irrigation fees
promised by certain political parties. The CWC (2010) report
puts the water charges levy collection in Bihar at 2.5% to
18% of capital expenditure during 1990-91 to 2006-07.
o Similarly, in Jharkhand, fees collection has not commenced
as hydraulic connectivity or adequate water supply is yet to
be established in many of the areas
o In Sri Rameswara project in Karnataka, fees collection is
reported to be waived off for the initial three years after
which the WUAs will be responsible for collection
o In Bariyarpur and Singpur projects in Madhya Pradesh, only
10% fees collection is reported owing to unavailability of
adequate irrigation staff for collecting the same
o In Maharashtra, a mixed response has been recorded – in
some projects like Warna and Waghur regular fees collection
has been reported, while it was reported to be almost nil in

Page | 253
Parameter Findings from research
other projects like Dhom Balkaawadi, Khadakpurna and Tillari
mainly due to farmers’ unwillingness to pay any fees.
• During the household survey with 255 cultivators in Andhra Pradesh
(command areas of Musurumulli and Pushkara projects), Assam
(Champamati major irrigation project), Karnataka (Sri Rameswara),
Maharashtra (Dhom Balkaawadi and Tarali projects), Manipur
(Dolaithabi barrage), Punjab (mod. of Kotla canal) and Rajasthan
(Narmada Canal Project), only 15% confirmed paying of water taxes
with none in Manipur and Rajasthan confirming any payment. Some
of the major contributing issues being political apathy, farmers’
unwillingness, inadequate irrigation staff for fees collection, non-
establishment of hydraulic connectivity/ adequate water supply in
some of the ongoing projects. As highlighted by a number of studies,
fees collection is expected to improve with increase in water access
and service reliability.
During the household survey interviews with 255 farmers in seven
states of Andhra Pradesh, Assam, Karnataka, Manipur Maharashtra,
Punjab and Rajasthan, around 41% confirmed increased access to
water owing to AIBP; however sub-par performance was reported in
some of the states like Assam (only 22% of 23 respondents), Punjab
(only 18% of 17 respondents) and Manipur (only 20% of 46
respondents) where less than a quarter of the respondents
confirmed increased water access due to AIBP. It is interesting to
note here that around 60% of the 62 respondents, who reported
increased access to water after AIBP, expressed willingness to pay
additional fees if reliable water supply is ensured.
• Societal factors: With increased access to assured irrigation and
improved level of groundwater in the command area, many farmers
(particularly in states like Andhra Pradesh, Punjab and Karnataka)
have shifted to water intensive crops like paddy and sugarcane,
though in many cases the canals are designed for dry crops. This
Page | 254
Parameter Findings from research
comes in the backdrop of subsidized electricity and subsidies for
tubewells, bore wells and assured procurement for these crops in
many of the states. Some examples of the projects where cultivators
have shifted their cropping pattern after implementation of AIBP
projects are stated below:
o NLBC project (Karnataka): cultivators have shifted from
sowing toor dal to paddy, vegetables and sunflower
o Bhima and Karanja projects (Karnataka): though the systems
are designed for semi-dry crops, the cultivators are shifting
to paddy and sugarcane with assured water supply
(particularly with almost perennial water supply in the upper
reaches); market dynamics coupled with low labour
requirements for sugarcane motivate the cultivators to adopt
these two crops
o Gundlakamma project (Andhra Pradesh): cultivators have
started sowing water intensive crops like paddy and tobacco
with assured water supply
o Musurumulli and Pushkara projects (Andhra Pradesh): it is
reported that though the systems were designed for dry
crops, cultivators are going for paddy
o Dhom Balkaawadi project (Maharashtra): with access to
water in the drought-prone areas, cultivators have started
sugarcane plantation, further fueled by the presence of sugar
mills in near-by locations
• During household survey interviews with 255 cultivators in Andhra
Pradesh (command areas of Musurumulli and Pushkara projects),
Assam (Champamati major irrigation project), Karnataka (Sri
Rameswara), Maharashtra (Dhom Balkaawadi and Tarali projects),
Manipur (Dolaithabi barrage), Punjab (mod. of Kotla canal) and

Page | 255
Parameter Findings from research
Rajasthan (Narmada Canal Project), 63% of the cultivators confirmed
‘paddy’ as the primary crop followed by grams, vegetables, bajra,
wheat and maize. While paddy is the dominant primary crop in both
the head and tail reaches of Musurumulli and Pushkara projects in
Andhra Pradesh, tail reaches of Kotla branch canal in Punjab,
Champamati irrigation project in Assam and Doliathabi barrage in
Manipur, grams and bajra have been the dominant crops in both
Tarali and Dhom Balkawadi projects which cater to drought prone
areas in Maharashtra, while wheat and mustard were found to be
popular in some of the water scarce western states like Narmada
canal project in Rajasthan and Kolta branch canal in Punjab.
• Environmental factors: With assured irrigation and increase in
groundwater level in the command area, increase in private
groundwater based tubewells, bore wells and open wells have been
reported in command area of some of the projects like Karanja in
Karnataka, Dhom Balkaawadi and Tarali irrigation projects in
Maharashtra. Though, it is understood that such structures
contribute to drinking water and irrigation purposes (particularly
during dry seasons), yet over-extraction of groundwater in certain
cases becomes a concern considering that some talukas in
command areas of Karanja (viz Bhalki taluka in Bidar district), Dhom
Balkaawadi (viz Phaltan taluka in Satara district) and Tarali (viz Khatav
taluka in Satara district) fall under ‘semi-critical’ category as per
Central Ground Water Board’s ‘Dynamic Ground Water Resources
of India, 2017’.
Inference:
• The current irrigation fees collection is inadequate in most of the
states and does not bode well for maintenance and long-term
sustainability of the projects. The irrigation fees collection is
expected to improve with increase in service reliability and greater
involvement of the WUAs after completion of CADWM works.
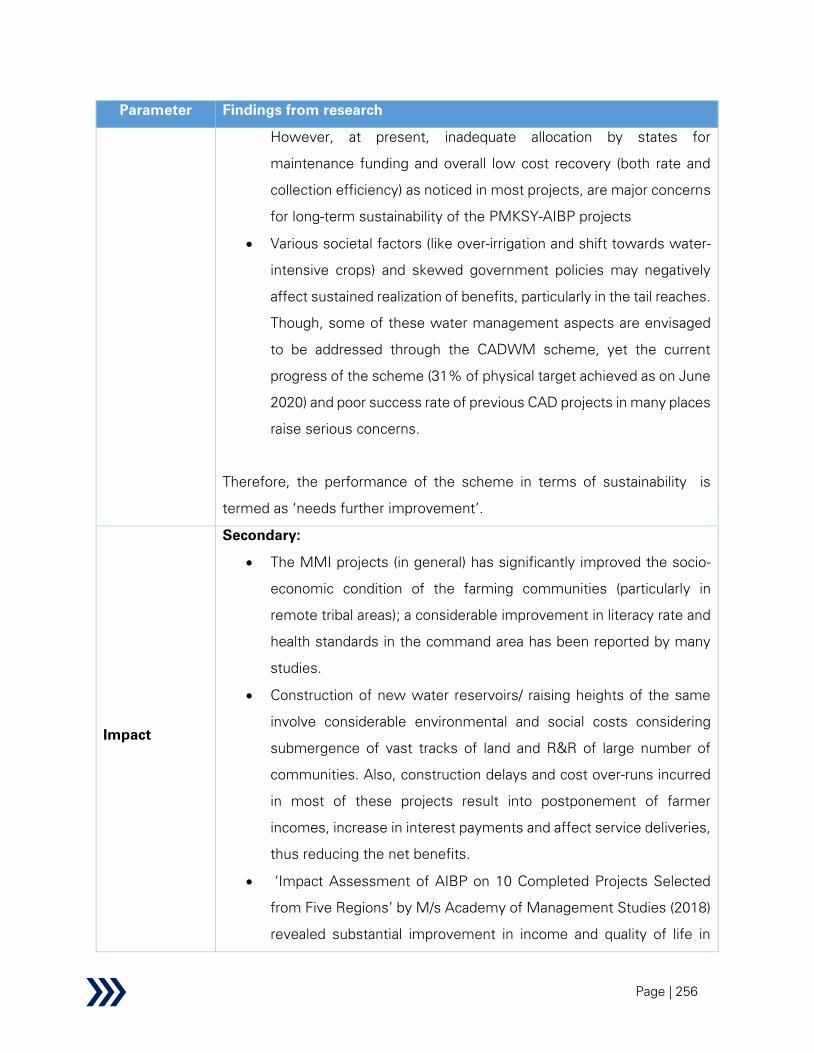
Page | 256
Parameter Findings from research
However, at present, inadequate allocation by states for
maintenance funding and overall low cost recovery (both rate and
collection efficiency) as noticed in most projects, are major concerns
for long-term sustainability of the PMKSY-AIBP projects
• Various societal factors (like over-irrigation and shift towards water-
intensive crops) and skewed government policies may negatively
affect sustained realization of benefits, particularly in the tail reaches.
Though, some of these water management aspects are envisaged
to be addressed through the CADWM scheme, yet the current
progress of the scheme (31% of physical target achieved as on June
2020) and poor success rate of previous CAD projects in many places
raise serious concerns.
Therefore, the performance of the scheme in terms of sustainability is
termed as ‘needs further improvement’.
Impact
Secondary:
• The MMI projects (in general) has significantly improved the socio-
economic condition of the farming communities (particularly in
remote tribal areas); a considerable improvement in literacy rate and
health standards in the command area has been reported by many
studies.
• Construction of new water reservoirs/ raising heights of the same
involve considerable environmental and social costs considering
submergence of vast tracks of land and R&R of large number of
communities. Also, construction delays and cost over-runs incurred
in most of these projects result into postponement of farmer
incomes, increase in interest payments and affect service deliveries,
thus reducing the net benefits.
• ‘Impact Assessment of AIBP on 10 Completed Projects Selected
from Five Regions’ by M/s Academy of Management Studies (2018)
revealed substantial improvement in income and quality of life in

Page | 257
Parameter Findings from research
some of the projects viz. HK Doab, Upper Kolab Irrigation project,
Priyadarshini Jurala project and Sindh Phase I.
It may be noted that the above insights are drawn from literature available
for MMI projects in India in general; the relevance of these insights with
respect to PMKSY-AIBP projects is elaborated in the next row under
‘Primary’ observations.
Primary:
• All the stakeholders validated the large positive socio-economic
impact on communities in command areas; considering many of
these areas being in barren terrains, the communities were earlier
dependent on subsistence farming but with assured irrigation, many
of them have adopted multi-crop farming.
• During FGD in the tail region of the Sri Rameswara project (Hulkund,
Belgaum, Karnataka), the beneficiary cultivators confirmed increase
in income from agricultural activities, access to better farm
machineries, tractors, owning of private vehicles, inward migration
of agricultural labourers from nearby villages and districts during
cropping season as impact of the project. Similar benefits like
increased access to reliable water supply (however, inadequate
drinking water issues during summers were mentioned by some),
considerable growth in agricultural output (substantial growth in
sugarcane production) and activities (noticeable shift of workers
from manual labour to farming activities), increase in overall income
and education and decrease in outward migration were reported by
beneficiary cultivators during FGD in the command area of Tarali
irrigation project in Maharashtra (Katarkhatav village, Satara district).
• During household survey interviews with 255 cultivators in Andhra
Pradesh (command areas of Musurumulli and Pushkara projects),
Assam (Champamati major irrigation project), Karnataka (Sri
Rameswara), Maharashtra (Dhom Balkaawadi and Tarali projects),
Manipur (Dolaithabi barrage), Punjab (mod. of Kotla canal) and

Page | 258
Parameter Findings from research
Rajasthan (Narmada Canal Project), 45% confirmed improvement in
overall household income level post completion of AIBP works,
while the corresponding cultivator percentages confirming increase
in education level, employment opportunities, access to credit
facilities and decrease in livelihood related migration are 48%, 44%,
34% and 23% respectively. Also, during FGDs in the command areas
of Champamati, Sri Rameswara and Dhom Balkaawadi, the
cultivators confirmed how increase in agricultural income facilitated
the villagers in buying private two-wheelers, ensuring education of
children and accessing better health facilities. Also, around 29% of
the 255 cultivators confirmed decrease in incidences of water-borne
diseases in the villages post completion of canal works.
Inference:
• The implementation of the PMKSY-AIBP projects have resulted in
considerable improvement in socio-economic conditions of the
communities (like increase in job opportunities, income, education
and health standards and decrease in migration level) in the
command area as reported during primary survey. However, in the
absence of adequate impact studies of these 99 Priority AIBP
projects (considering many of these are ongoing/recently completed
projects), an accurate assessment of the impact of these schemes
after accounting for the environmental and social costs cannot be
done.
Based on the reported socio-economic impacts of the PMKSY-AIBP projects
at this stage, the performance of the scheme in terms of impact is termed
as satisfactory.
Equity
Secondary:
• 59 projects in 11 states (out of the 99 Priority AIBP projects) cater to
the drought-prone areas
Primary:

Page | 259
Parameter Findings from research
• The completion of AIBP projects in many drought prone and remote
tribal areas facilitated in providing assured irrigation to the
communities resulting in significant socio-economic benefits.
• The projects have significantly benefitted the small and marginal
farmers. E.g. 50% of the farmers catered by the Champamati major
irrigation project in Assam have small land holding (1 to 2 ha) while
33% of them have marginal land holdings.
• The issue of water inadequacy at tail ends (particularly during dry
seasons) still continues to persist in many projects (mainly those
with open conventional canals) in Assam, Andhra Pradesh,
Karnataka, Punjab, Maharashtra, Uttar Pradesh and others as
reported by various stakeholders. E.g. during FGD in command area
of Dhom Balkaawadi (Wakhari village, Satara district, Maharashtra),
the cultivators reported water scarcity in the dry months owing to
high seepages and unabated water withdrawal (/ pilferages) at the
head reaches. Similar observations in relation to water inadequacy at
distant agricultural fields were reported during FGD in the command
area of Champamati irrigation project (Assam).
• A comparative analysis of ‘increased access to water owing to
implementation of AIBP’ between head and tail reaches villages in
Musurumulli project in Andhra Pradesh revealed a difference of 27%
(while 91% of 23 farmers in head reaches confirmed increased water
access, the same for tail region stands at 64% of 25 farmer). As
reported during KIIs, the disparities between head and tail reaches
are expected to decrease with completion of field channel works and
establishment of WUAs. Recent initiatives like ERM (extension/
renovation/ modernisation) canals including adoption of piped
distribution and canal automation network in some projects (NCP
project in Rajasthan, NLBC in Karnataka) have helped to contain the
issue of water inadequacy at tail ends to some extent. It is
interesting to note at this stage though disparities in water access
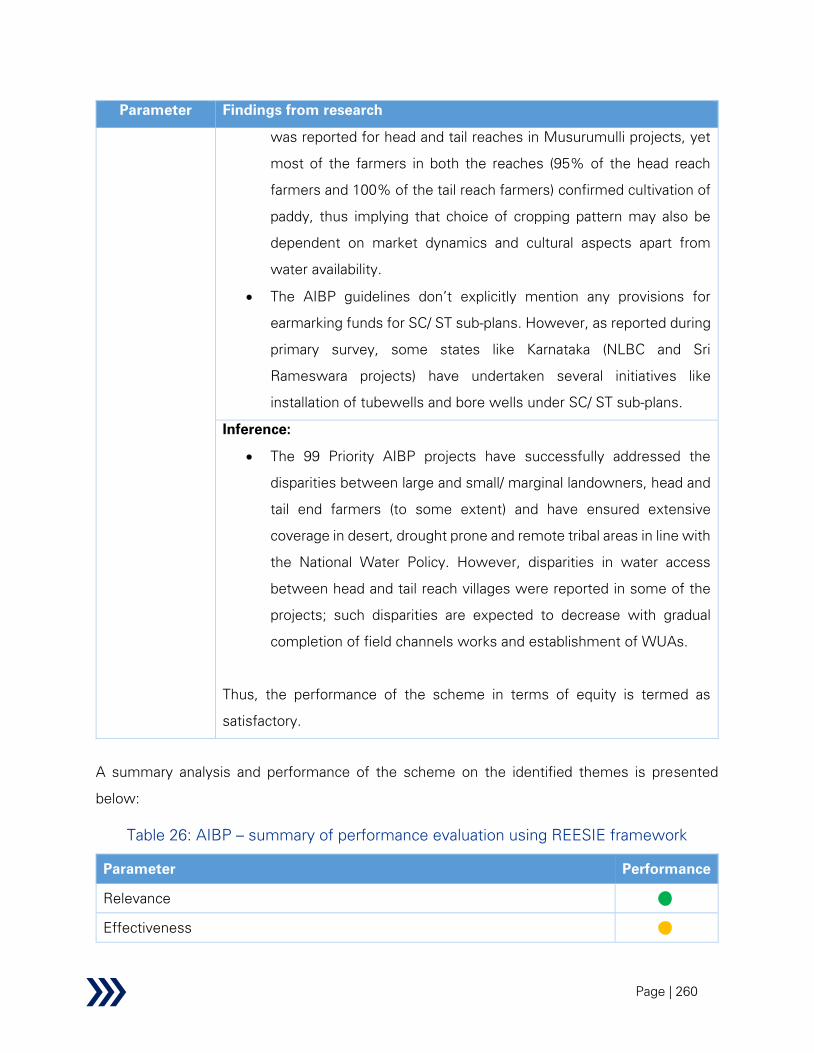
Page | 260
Parameter Findings from research
was reported for head and tail reaches in Musurumulli projects, yet
most of the farmers in both the reaches (95% of the head reach
farmers and 100% of the tail reach farmers) confirmed cultivation of
paddy, thus implying that choice of cropping pattern may also be
dependent on market dynamics and cultural aspects apart from
water availability.
• The AIBP guidelines don’t explicitly mention any provisions for
earmarking funds for SC/ ST sub-plans. However, as reported during
primary survey, some states like Karnataka (NLBC and Sri
Rameswara projects) have undertaken several initiatives like
installation of tubewells and bore wells under SC/ ST sub-plans.
Inference:
• The 99 Priority AIBP projects have successfully addressed the
disparities between large and small/ marginal landowners, head and
tail end farmers (to some extent) and have ensured extensive
coverage in desert, drought prone and remote tribal areas in line with
the National Water Policy. However, disparities in water access
between head and tail reach villages were reported in some of the
projects; such disparities are expected to decrease with gradual
completion of field channels works and establishment of WUAs.
Thus, the performance of the scheme in terms of equity is termed as
satisfactory.
A summary analysis and performance of the scheme on the identified themes is presented
below:
Table 26: AIBP – summary of performance evaluation using REESIE framework
Parameter Performance
Relevance
Effectiveness
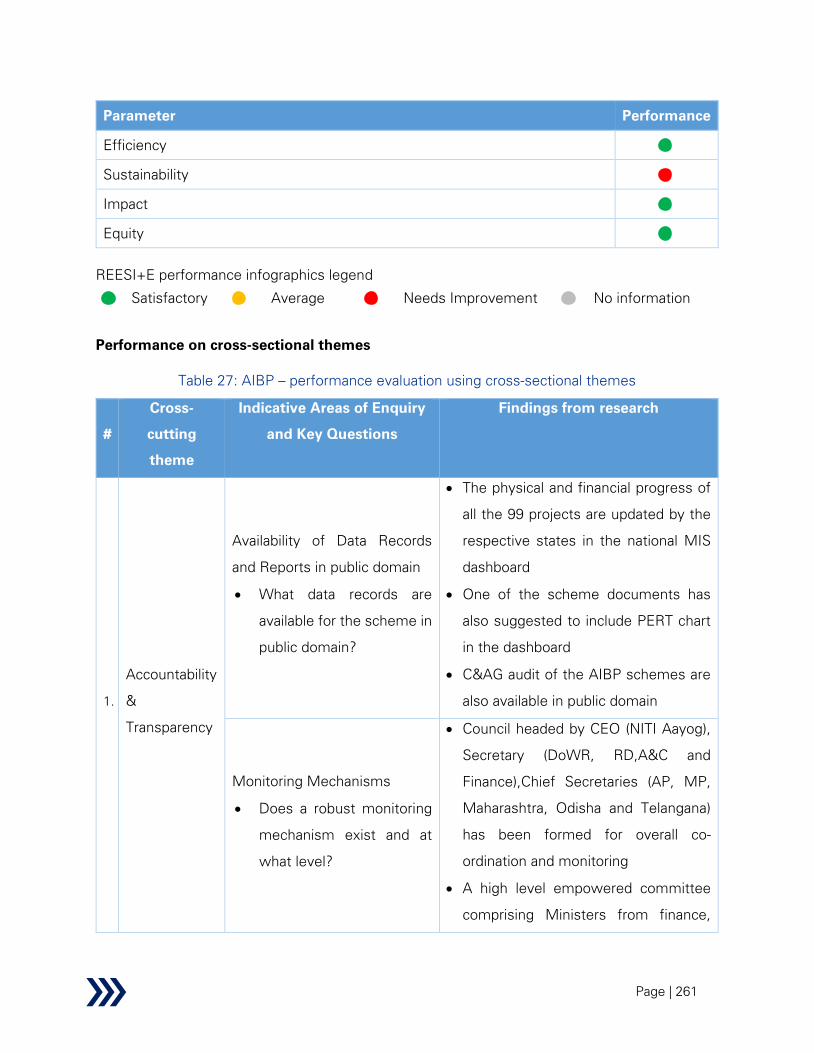
Page | 261
Parameter Performance
Efficiency
Sustainability
Impact
Equity
REESI+E performance infographics legend
Satisfactory
Average
Needs Improvement
No information
Performance on cross-sectional themes
Table 27: AIBP – performance evaluation using cross-sectional themes
#
Cross-
cutting
theme
Indicative Areas of Enquiry
and Key Questions
Findings from research
1.
Accountability
&
Transparency
Availability of Data Records
and Reports in public domain
• What data records are
available for the scheme in
public domain?
• The physical and financial progress of
all the 99 projects are updated by the
respective states in the national MIS
dashboard
• One of the scheme documents has
also suggested to include PERT chart
in the dashboard
• C&AG audit of the AIBP schemes are
also available in public domain
Monitoring Mechanisms
• Does a robust monitoring
mechanism exist and at
what level?
• Council headed by CEO (NITI Aayog),
Secretary (DoWR, RD,A&C and
Finance),Chief Secretaries (AP, MP,
Maharashtra, Odisha and Telangana)
has been formed for overall co-
ordination and monitoring
• A high level empowered committee
comprising Ministers from finance,
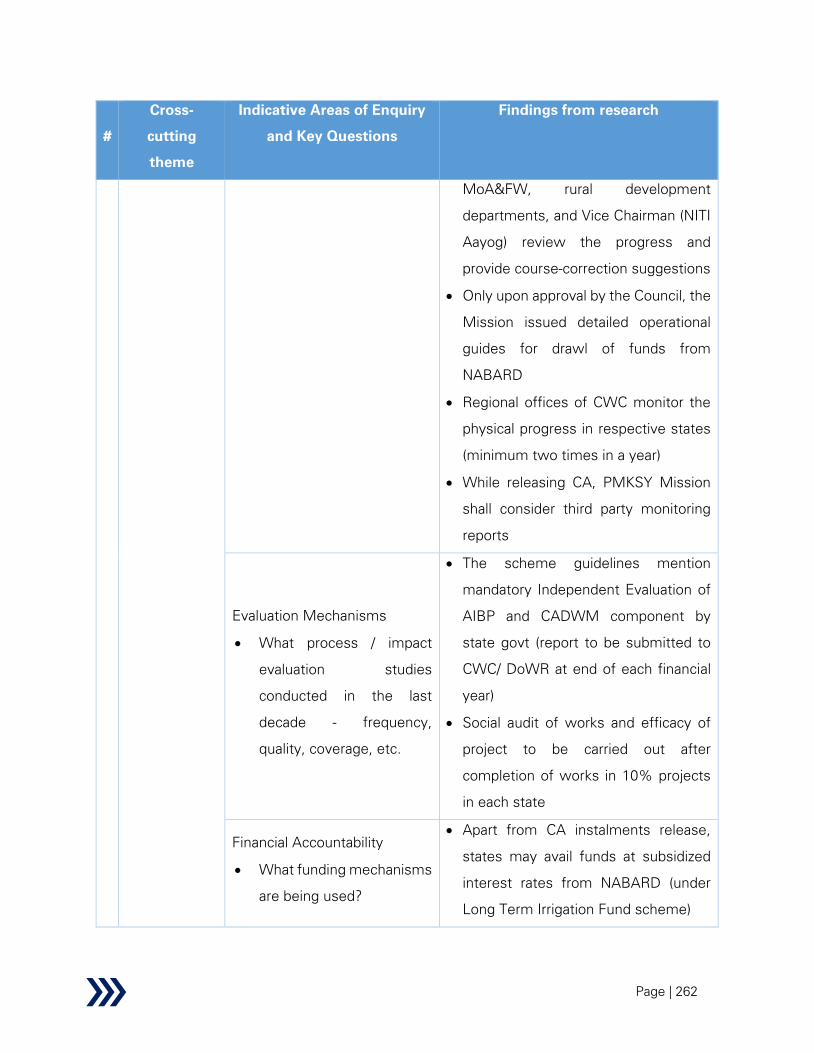
Page | 262
#
Cross-
cutting
theme
Indicative Areas of Enquiry
and Key Questions
Findings from research
MoA&FW, rural development
departments, and Vice Chairman (NITI
Aayog) review the progress and
provide course-correction suggestions
• Only upon approval by the Council, the
Mission issued detailed operational
guides for drawl of funds from
NABARD
• Regional offices of CWC monitor the
physical progress in respective states
(minimum two times in a year)
• While releasing CA, PMKSY Mission
shall consider third party monitoring
reports
Evaluation Mechanisms
• What process / impact
evaluation studies
conducted in the last
decade - frequency,
quality, coverage, etc.
• The scheme guidelines mention
mandatory Independent Evaluation of
AIBP and CADWM component by
state govt (report to be submitted to
CWC/ DoWR at end of each financial
year)
• Social audit of works and efficacy of
project to be carried out after
completion of works in 10% projects
in each state
Financial Accountability
• What funding mechanisms
are being used?
• Apart from CA instalments release,
states may avail funds at subsidized
interest rates from NABARD (under
Long Term Irrigation Fund scheme)

Page | 263
#
Cross-
cutting
theme
Indicative Areas of Enquiry
and Key Questions
Findings from research
• The Ministry also introduced Fast
Track Proforma Clearance for fast
track clearances of projects with
escalated revised cost
Citizen Accountability
• Are there functional
grievance redressal
mechanisms that
successfully incorporate
beneficiaries' and non-
beneficiaries' concerns?
• Some of the projects involve creation
of reservoir structures and thus
involve R&R; the functional grievance
redressal mechanisms in place at
various states have not been yet
studied at this stage of study
Beneficiary involvement
• What is the involvement of
beneficiaries across the
project lifecycle? Is the
level of involvement
adequate?
• The ambit of the AIBP project is limited
to the creation of IPC; while last mile
connectivity is implemented pari-
passu through CADWM scheme.
Thus, as per the scope, the direct
involvement of beneficiaries is limited.
• The government is itself responsible
for maintenance of all the assets
above the outlets in lieu of irrigation
service fees.
Community institutions
• Are community
institutions (e.g. WUAs)
truly representative? Do
they have adequate
powers to take decisions?
• Formation and engagement of
community institutions and WUAs
come under the scope of the CADWM
scheme.

Page | 264
#
Cross-
cutting
theme
Indicative Areas of Enquiry
and Key Questions
Findings from research
Summary Analysis:
• The MIS dashboard is a positive step in monitoring of the 99 projects. The release of the
C&AG reports further helps to bring transparency and accountability to the system.
• Also, considering that many of the projects are ongoing/ recently completed, any impact
evaluation study (other than the concurrent evaluation reports) encompassing socio-
economic and environmental impacts on all the benefitted and affected stakeholders of the
PMKSY-AIBP projects is yet to be undertaken.
• The conduct of social audit in the command areas of the projects, was reported to be
limited.
2.
Direct/Indirect
Employment
Generation
Employment generation
• What is the level of
employment generation
through schemes in the
sector and overall sectoral
contribution in National
employment generation?
• What is the improvement
in income levels?
• What is the women
participation (%) in the
Sector/Program?
• Currently, there is no aggregated
record of actual man-days generated
through these 99 projects in public
domain, though one of the scheme
documents has acknowledged
employment generation as one of the
envisaged benefits.
• However, during the primary survey all
the stakeholders confirmed creation of
huge employment opportunities
particularly in tribal areas owing to
huge labour needed for the civil works.
E.g. the Champamati major irrigation
project in Assam generated around
26.76 lakh97
of man-days of
employment. The Subarnarekha
Multipurpose Irrigation project is
97 As per reports provided by project authorities, Champamati Major Irrigation Project in BTC area in Assam

Page | 265
#
Cross-
cutting
theme
Indicative Areas of Enquiry
and Key Questions
Findings from research
expected to create 112 lakh man days
of work during 2020-21.98
• During household survey interviews
with 255 cultivators in Andhra
Pradesh (command areas of
Musurumulli and Pushkara projects),
Assam (Champamati major irrigation
project), Karnataka (Sri Rameswara),
Maharashtra (Dhom Balkaawadi and
Tarali projects), Manipur (Dolaithabi
barrage), Punjab (mod. of Kotla canal)
and Rajasthan (Narmada Canal
Project), around 44% and 34% of the
respondents confirmed increases in
employment opportunities and access
to credit facilities respectively while
around 23% confirmed decrease in
livelihood related migration. During
FGD in Hulkund village in Belgaum,
Karnataka (command area of Sri
Rameswara project), the farmers
informed increase in income from Rs.
6,000/ acre (pre project) to as high as
Rs. 70,000 – Rs. 80,000/ acre (post
project). Increased income is reported
to have resulted increase in private
ownership of vehicles with number of
98 As per reports provided by project authorities, Subarnarekha Multipurpose Irrigation Project, Jharkhand
Page | 266
#
Cross-
cutting
theme
Indicative Areas of Enquiry
and Key Questions
Findings from research
tractors surging from 100 to 300 post
implementation of AIBP. During
cropping season, 20% of the labourers
are reported to come from
neighbouring districts to support
cultivation work.
• As also highlighted under the
‘Efficiency’ section in REESIE
framework, around 17% of the 132
respondents during household survey
confirmed participation in the
construction activities under AIBP,
with the corresponding figure
recorded as high as 50% (n=24) in
north-eastern states like Manipur.
Noticeably, it was observed the
construction activities benefitted the
small and marginal farmers (land-
holding less than 2 ha) more than the
large farmers (with land-holding
greater than 2 ha).
Institutional barriers
• Are there institutional
barriers to employment
generation (e.g. access to
markets)?
• Institutional barriers like limited access
to market, absence of other agro-
processing industries and other
infrastructural constraints like poor
roads in the command areas of many
projects have been reported which
invariable led some of the cultivators
to shift towards water-intensive crops

Page | 267
#
Cross-
cutting
theme
Indicative Areas of Enquiry
and Key Questions
Findings from research
like paddy and sugarcane which have
higher market demands.
Summary Analysis:
• The 99 Priority AIBP projects, with their huge scope of labour intensive works, have
invariably led to generation of huge man-days of employment (both direct like in
construction activities and in-direct like in agriculture and allied activities) in all the command
areas particularly in remote tribal hinterlands as confirmed during primary survey at various
projects like the Champamati irrigation project in Assam, Subarnarekha multipurpose
project in Jharkhand, Sri Rameswara project in Karnataka and others. However, currently,
almost none of the project implementing authorities were observed to maintain any
aggregate data record of the exact quantum of man-days of employment generated.
3.
Climate
change &
sustainability
including
adoption of
climate-
change
resilient
practices &
diversifications
Climate resilience
• Are there appropriate
climate resilient policies
for mitigation and/or
adaptation (or included as
part of scheme objectives
and design)?
• The scheme guidelines don’t have any
explicit provisions for adoption of
climate resilient practices. While in
eligibility criteria for inclusion of ERM
projects, criteria related to various
water sector reforms like adoption of
MI practices, PIM, initiation of CAD
works were mentioned; however no
specific guidelines related to climate
resilient practices were noted.
Climate impact
• What are the main impacts
of climate change on the
sector and scheme
beneficiaries?
• It may be noted that MMI projects,
which involve creation of storage
reservoirs, inherently support climate
change resilent practices by acting as
water abosrbers during periods of
excess rainfall and using the excess
water during periods of drought.
However, in view of the drastic

Page | 268
#
Cross-
cutting
theme
Indicative Areas of Enquiry
and Key Questions
Findings from research
changes in climatic patterns in recent
years and considering the long life-
span of MMI projects, it is imperative
to incorporate additional climate
resilient practices (say use of
advanced rainfall and flood forecasting
models, provisions for small-scale
water harvesting structures,
provisions for adequate diversions and
intakes in areas prone to flash floods,
etc.) at the design stage to avoid
incidences of water inundation or
water shortages at later stages as
already observed in some command
areas during the primary study. In this
respect, inter-departmetal co-
ordination may be explored at the
design stage (like with the flood wing
to incorporate aspects of recent
developments in flood modelling).
• Incidences of flood/ excess rainfall
were reported to have severely
affected some projects; some of the
notable examples are summarized
below:
o Progress in Narmada canal
(Rajasthan) was hampered by the
floods in year 2017, when motors
and panels of the pumping stations
Page | 269
#
Cross-
cutting
theme
Indicative Areas of Enquiry
and Key Questions
Findings from research
were severely damaged and some
canal breaches were reported.
Subsequently, the existing
syphone of the Lunui and Sukri
rivers were extended.
o Incidences of severe breaches of
canal during monsoons were
reported during FGDs at villages in
command area of Champamati
Major Irrigation Project in Assam,
where extensive damages to
agricultural lands and households
were reported. In absence of any
assistance from the government,
the villagers reported to have
formed a flood committee
themselves which is entrusted to
collect fees, mobilize resources
and conduct canal repair works
post-monsoon every year.
• Lower storage capacities and erratic
rainfall pattern are endemic concerns
for irrigation and drainage (I&D) sector
in India. Low water storage levels in
dams, during droughts, severely affect
water access in the tail end villages.
This issue gets further exacerbated in
projects, which have provisions for
inter-state water sharing, like
Page | 270
#
Cross-
cutting
theme
Indicative Areas of Enquiry
and Key Questions
Findings from research
Bawanthadi project in Maharashtra
(which has water-sharing pact with
Madhya Pradesh) and multi-purpose
projects which need to cater to
essential requirements like drinking
water before catering to irrigation
needs. In order to tackle the issues
related to low dam storage capacities,
convergence with other water
resources sector schemes may be
explored for enabling activities like de-
siltatiion, allocating O&M budget for
dam maintenances, etc. as already
discussed in detail under the ‘Sector
Level Analysis’ section. Also, as
pointed by various research studies, to
combat climate change induced water
resources challenges, it is important to
strengthen existing data collection
networks and promote inter-
disciplinary research centres.
Summary Analysis:
• The AIBP scheme guidelines don’t have any explicit provisions for adoption of climate
resilience practices. During primary survey, certain incidences of droughts and excess
rainfall/ floods affecting the projects were reported.
• In view of the drastic changes in climatic patterns in recent years, it is imperative to
incorporate the aspects of recent climate changes at the time of design to mitigate
instances of inundation or shortages.

Page | 271
#
Cross-
cutting
theme
Indicative Areas of Enquiry
and Key Questions
Findings from research
4.
Role of Tribal
Sub-Plan (TSP)
and Scheduled
Caste Sub-Plan
component of
the scheme in
mainstreaming
of Tribal and
Scheduled
Caste
population
Inclusion of vulnerable groups
in scheme as well as sector
• What are the interventions
implemented for specific
vulnerable groups?
• 59 projects in 11 states (out of the 99
Priority AIBP projects) cater to the
drought-prone areas
• The projects have significantly
benefitted the small and marginal
farmers. E.g. 50% of the farmers
catered by the Champamati major
irrigation project in Assam have small
land holding (1 to 2 ha) while 33% of
them have marginal land holdings.
• The AIBP guidelines don’t explicitly
mention any provisions for earmarking
funds for SC/ ST sub-plans. However,
as reported during primary survey,
some states like Karnataka (NLBC and
Sri Rameswara projects) have
undertaken several initiatives like
installation of tubewells and bore wells
under SC/ ST sub-plans.
Summary Analysis:
• The AIBP scheme guidelines don’t have any explicit provisions for separate budget
allocation under SC/ ST sub-plans. However, it may be noted that the completion of
AIBP projects in many drought prone and remote tribal areas (with substantial presence
of small and marginal farmers) facilitated in providing assured irrigation to the
communities resulting in significant socio-economic benefits, as also confirmed during
the HH survey and FGDs. Addition of separate provisions for earmarking funds for
SC/ST sub-plans may be explored, as reported in Karnataka.

Page | 272
#
Cross-
cutting
theme
Indicative Areas of Enquiry
and Key Questions
Findings from research
5.
Use of
IT/Technology
in driving
efficiency
Deployment of IT enabled
mechanisms for monitoring of
the Schemes
• In case of a scheme to
create physical assets, is
geotagging and use of
geotagged photographs
being done?
• How is technology being
used for on-ground data
collection?
• There are no explicit provisions in the
guidelines for geo-tagging of assets.
Yet, most of the states are geo-
tagging the critical assets.
Use of latest technology to
improve efficiency and
effectiveness of scheme
implementation
• What are the technologies
being used in project
implementation, service
delivery?
• Which states are using the
latest technologies?
• Remote sensing technologies like
satellite images (procured from NRSC
– Hyderabad) for monitoring of
projects have already been tried by the
Ministry with limited success due to
limited resolution of the images, high
cost of procurement and limited
frequencies owing to satellite
positions, cloud cover. Recently the
Ministry has undertaken new
initiatives at national level like cropped
area mapping studies (to assess IPU)
using remote sensing technologies
and project monitoring through
Bhaskaracharya Institute of Space
Applications and Geo-informatics
(BISAG) (note that the quality of
assessment and monitoring studies

Page | 273
#
Cross-
cutting
theme
Indicative Areas of Enquiry
and Key Questions
Findings from research
has not been validated under this
study). Also, a mobile application for
geo-tagging project components has
been developed along with a GIS-
based web portal for monitoring the
progress.
• Monitoring of construction works
using drones has been successfully
demonstrated in some place like
Polavaram project in Andhra Pradesh.
Similarly, some projects in A.P. are
using drone surveying for contour
generation for preparing proposals for
the CADWM projects. The Ministry
has also undertaken a similar initiative
(pilot study) of drone surveying in
Bawanthadi irrigation project in
Maharashtra.
• Also, the project authorities in
Narmada Canal project in Rajasthan
has recently submitted proposal for
crop assessment using satellite
images
Technology to address key
challenges
• What technologies are
available to address key
challenges facing the
scheme? Are there
• In view of the land acquisition issues,
high conveyance losses, increasing
incidence of un-authorized water
withdrawal, high maintenance losses,
many states like Assam, Gujarat,
Rajasthan and Maharashtra are

Page | 274
#
Cross-
cutting
theme
Indicative Areas of Enquiry
and Key Questions
Findings from research
constraints in their
adoption?
adopting underground piped
distribution networks (for branch
canals, distributaries, minors, sub-
minors) in place of conventional open
canals.
• The Ministry has been promoting use
of underground pipelines, wherever
feasible. Detailed guidelines related to
‘planning and design of piped irrigation
network’ have been released by the
CWC on July 2017. As on date, 26 of
the priority projects have
planned/implemented use of piped
distribution network to the extent
feasible, covering a total length of
64,137 km99
and which helped to avoid
land acquisition to the tune of 12.8
thousand ha and resulted in direct cost
saving of Rs. 2,386 Cr.
• Other technologies like canal
automation and SCADA, as already
implemented successfully in NLBC
project in Karnataka, may be adopted
to contain the ineffeiciencies related to
manual operations (like gate
operations).
99 K Vohra and M L Franklin, “Reforms in the irrigation sector of India”

Page | 275
#
Cross-
cutting
theme
Indicative Areas of Enquiry
and Key Questions
Findings from research
Any best practices • Countries like Israel has migrated from
open water canals to piped supplies
and drip irrigation; currently Israel has
the world’s highest crop yield/ m3 of
water consumed. Successful case
studies in China showed 30% savings
in water delivered (equivalent to 15%
of the total irrigated area) and 25% in
labour input using PIN in place of CDN
• Among the 99 Priority AIBP projects,
piped distribution network has already
been implemented in Narmada Canal
project in Rajasthan and Sardar
Sarovar project in Gujarat and is under
implementation in several projects in
Maharashtra like Waghur.
Summary Analysis:
• Successful implementation of piped irrigation network in place of conventional open canals
by some states marks a watershed in the history of canal irrigation in India and may
significantly influence future policy decisions as irrigation departments move from
construction based to utility-based approach. Piped network will greatly facilitate
implementation of canal automation, volumetric supply and differential pricing and with low
operations and maintenance costs, it will also reduce the huge burden on the state
exchequer. Adoption of canal automation and SCADA is expeted to down on the wastages
due to manual interventions. At present, overall adoption of such projects are obsesrved to
be in nascent stages with implementation being initiated in a few projects in Gujarat
(SSNNL), Rajasthan (NCP), Maharashtra (Waghur), Karnataka (NLBC), etc..
• Adoption of remote sensing techniques (like drone surveys) for monitoring purposes, as
already being initiated by the Ministry and some states, becomes necessary in light of the
Page | 276
#
Cross-
cutting
theme
Indicative Areas of Enquiry
and Key Questions
Findings from research
huge spread of the command area and limited resources of the state departments. Overall,
the extent of adoption of remote sensing technologies across states was observed to be
in nascent stage.
6.
Research &
Development
What percentage of total
allocation (Sector as well as
Scheme specific) is directed
towards R&D? How much of
that percent is being utilized?
• The scheme guidelines have no
separate provisions for fund allocation
towards research and development.
Institutes and departments
dedicated for R&D
• It may be noted that the
DoWR,RD&GR has a separate
programme titled ‘Research and
Development Programme in Water Sector
and Implementation of National Water
Mission’100
. Research activities are
conducted primarily through 4 premier
institutes viz Central Water and Power
Research Station – Pune, Central Soil
and Material Research Station – New
Delhi, National Institute of Hydrology –
Roorkee and Central Water
Commission – Delhi. Also, various
studies related to water use efficiency,
post project performance evaluation
and environmental impact assessment
are taken up in co-ordination with IITs,
Indian National Committees, regional
WALMIs, etc. During primary survey,
100 http://mowr.gov.in/schemes-projects-programmes/programmes/r-and-d-programme-water-sector

Page | 277
#
Cross-
cutting
theme
Indicative Areas of Enquiry
and Key Questions
Findings from research
several state implementing agencies
confirmed conducting studies for MMI
projects through regional WALMIs like
NERIWALM in Assam, WALMI
Aurangabad; however the PMKSY
projects being recent initiatives, no
R&D studies have been initiated in
relation to these.
Private Sector participation in R
& D
• Several notable initiatives have been
taken up by private sector agencies
like Jain Irrigation Systems Pvt Lt. in
relation to piped distribution network
and canal automation; some of the
notable PMKSY projects are already
being highlighted in above sections.
Summary Analysis:
• Currently, the scheme does not have any separate provision for allocation of funds towards
R&D. DoWR, RD & GR has a separate R&D programme for conducting studies through
reputed institutes for overall irrigation sector. Since the PMKSY projects are recent
initiatives, not much R&D studies have been conducted by the project authorities and
detailed information regarding private sector participation (except in piped distribution
network) are not available. In light of the same, the performance of the scheme against this
parameter has been marked as ‘no information’.
7.
Unlocking
Synergies
with other
Government
Program
Convergence (Inter-
Ministerial/Inter-
Departmental/Financial/Human
Resources/ Administrative/
Institutions/ Schemes
• Under PMKSY, the CADWM scheme
is being implemented pari-passu with
the 99 Priority AIBP projects. Thus,
while the AIBP projects helps to create
the irrigation potential, the CADWM
ensures effective utilization of this
Page | 278
#
Cross-
cutting
theme
Indicative Areas of Enquiry
and Key Questions
Findings from research
• What activities are
undertaken to ensure
convergence at
community level? Are
there any Action Plans
prepared at
State/District/Block level
to ensure the same?
• What are the challenges
hindering effective
convergence?
potential created by providing last mile
connectivity. Incorporation of ‘pari-
passu’ implementation of CAD
projects in the AIBP guidelines (2013)
itself is a significant progressive step
over previous guidleines when they
were implemented separately.
• However, one of the major challenges
includes delay in planning of execution
of CADWM works as execution in a
particular command area may start
only when hydraulic connectivity to
the outlets are established (since
farmers are unwilling to part with their
lands without being completely
assured of water reaching the outlets).
Potential areas for synergy
• What are the areas for
potential convergence /
synergy across govt.
programs?
• To ensure conjunctive use of surface
and groundwater, for command areas
catered by single season canals,
provisions for setting up tanks/
groundwater based irrigation
structures like bore wells, tubewells
(in command areas where
groundwater level is reported to be
‘safe’) may be explored through
convergence with other government
schemes and/or various agricultural
schemes (like in Assam, where with
Rural Infrastructure Development

Page | 279
#
Cross-
cutting
theme
Indicative Areas of Enquiry
and Key Questions
Findings from research
Fund from NABARD, state agriculture
department is facilitating installation
of ‘1 lakh shallow tube well and
‘1,000 solar powered shallow tube
wells’ from 2016-17 to ensure
assured irrigation during Rabi when
there is scarcity of canal water).
Other notable examples are the
Narayanpur Left Bank Canal and Sri
Rameswara projects in Karnataka,
where the irrigation officials facilitate
storage of water in numerous tanks
in the command area for usage during
off-seasons, which also indirectly
contributes to increase in
groundwater level.
• Convergence with MGNREGA may
be explored for the following type of
works as permitted under
MGNREGA Operational Guidelines
2013:
o Irrigation canals including
micro and minor irrigation
o Masonry works in Lift
Irrigation projects
o One-time rehabilitation of
minors, sub-minors and field
channels, including repair of
minor cracks, earth levelling,

Page | 280
#
Cross-
cutting
theme
Indicative Areas of Enquiry
and Key Questions
Findings from research
repair of earthern
embankments, bank raising,
etc. However, it may be noted
that regular O&M works are
not permitted.
During primary survey, most of the
project authoriries could not
ascertain the extent of convergence
with MGNREGA for the PMKSY-
AIBP projects, mostly due to non-
maintenance of any such
employment records.
Summary Analysis:
• Currently, CADWM works are being executed pari-passu with the 99 Priority AIBP projects
to establish last mile connectivities; however the physical progress achieved under
CADWM structural interventions has been limited compared to that under AIBP owing to
various issues; one of the issues being non-establishment of any hydraulic connectivity to
outlets (owing to non-completion of minor canals under ongoing AIBP projects).
• Conjunctive use of surface and groundwater in the command area may be promoted
through convergence with groundwater related schemes and/or agricultural scheme
(particularly in command areas with ‘safe’ groundwater level and inadequate surface water
availability in certain seasons).
8.
Reforms,
Regulations
Adoption of models acts and
reforms at governance,
institutional and administrative
level
• What measures are being
taken to ensure effective
implementation and
• The National Water Framework Bill
(2016) proposed differential pricing of
water on volumetric basis and
establishment of an independent
Water Regulatory Authority for
ensuring the same and determination
of tariff. This is similar in lines with

Page | 281
#
Cross-
cutting
theme
Indicative Areas of Enquiry
and Key Questions
Findings from research
compliance of adopted
acts/rule/regulations? (like
in areas of safety,
accountability,
transparency etc.)
National Water Policy (2012) which
advocated for differential pricing and
higher priority allocation for water use
for ensuring food security and
supporting livelihood for the poor. The
14th
Finance Commission even
incentivized the states to set up
regulatory authorities to facilitate
pricing and management – a grant in-
aid of Rs. 5,000 Cr. to states were
recommended for maintenance of
irrigation assets with the grant release
being subject to certain conditions met
by the states like setting up of Water
Regulatory Authority by 2011-12 and
achievement of state specific recovery
rates. Similarly, the Working Group on
Major & Medium Irrigation and CAD
for the XII Five Year Plan (2012-2017),
suggested that the release of central
assistances should be made subject to
adoption of better management
practices by states which includes
maximization of collection of ISFs from
users through WUAs and allowing the
WUAs to retain at least 50% of ISF
collected for maintenance of
distribution system.
Page | 282
#
Cross-
cutting
theme
Indicative Areas of Enquiry
and Key Questions
Findings from research
• However, barring the exception of
Maharashtra Water Resources
Regulatory Authority and newly
constituted Punjab Regulation and
Development Authority (PWRDA),
most of the states have adopted a
lackadaisical approach towards setting
up any WRA. Many of the states like
Andhra Pradesh, Arunachal Pradesh
Jharkhand and Jammu and Kashmir
have enacted statutes for creation of
water regulators but they are yet to be
implemented. Similarly, Uttar Pradesh
enacted a statute in 2008 while Kerala
introduced a bill in 2012 to create
water regulators; but none are
functional yet. Recently, the Haryana
state cabinet has decided to set up an
authority for conservation,
management and regulation of water
resources in the state.
Summary Analysis:
• Though the National Water Policies and other successive government policies suggested
differential pricing of water and establishment of independent water regulatory authority at
state level, yet only a few states (like Maharashtra) have taken any concrete steps to
facilitate the same. It is understood that differential water pricing forms an important step
in ensuring sufficient revenue streams for attracting investors and enabling adequate O&M
of the systems.

Page | 283
#
Cross-
cutting
theme
Indicative Areas of Enquiry
and Key Questions
Findings from research
9.
Impact on and
role of private
sector,
community/
collectives/
cooperatives
(e.g. Farmer
cooperatives,
FPOs, Water
User
Associations,
etc.) and civil
society in the
scheme
Public-Private Partnership
• How well have PPP
functions in the Sector?
What are the challenges
faced?
• Private sector participation in irrigation
and drainage sector (I&D) in India
remains tepid till now. Some of the
reasons being low cost recovery from
water (water being perceived as a
social good/ right rather than an
economic commodity), land
acquisition, R&R and other legal and
administrative issues endemic in this
sector, non-availability of alternative
revenue streams. However, as
adoption of piped distribution network
gain traction, instances of private
sector involvement in construction and
O&M of the systems are expected to
increase. At present, such
involvements are mostly restricted to
certain components of multi-purpose
projects like hydel power generation
and projects involving piped
distribution network. A recent
example being the Ramthal Integrated
Drip Irrigation Project in Karnataka,
which is a joint venture between
Netafim India Pvt. Ltd. and Jain
Irrigation, which is being developed
under the Build, Own, Operate and
Transfer (BOOT) Model and the private
parties will be responsible for O&M of

Page | 284
#
Cross-
cutting
theme
Indicative Areas of Enquiry
and Key Questions
Findings from research
the system for 5 years. Also, as part of
the Karnataka government’s Drip-to-
Market Agro Corridor (DMAC), eight
private agricultural firms signed MOUs
with the government to procure the
farm produce.
• Few states like Andhra Pradesh and
Maharashtra explored certain pilot PPP
projects in the past; however the
projects did not materialize due to
want of adequate revenue streams for
the private party (ADB 2013,
“Exploring Public Private Partnership
in the Irrigation and Drainage Sector in
India”).
Any best practices • There are numerous international case
studies like West Delta and New
Zealand where private parties have
successfully invested in the I&D
sector and recouped the costs
(including capital costs) through water
user charges.
• Other notable examples are: Megech
Seraba Irrigation and Drainage
scheme, Ethiopia (management
service contract) and Guerdane
Irrigation Project, Morocco (design-
build-operate for 30 year
concessionaire period)

Page | 285
#
Cross-
cutting
theme
Indicative Areas of Enquiry
and Key Questions
Findings from research
Summary Analysis:
• Private sector participation in irrigation and drainage (I&D) has been lukewarm till now
owing to various issues, two of the major issues being low cost recovery and delays due
to land acquisition and R&R issues.
• However, with gradual shift towards volumetric pricing and also increasing adoption of
piped distribution network, the potential of private sector participation has greatly improved
and options like EPC contract with built-in O&M clauses may be explored initially.
In addition, to the above themes, other related themes for MMI projects under PMKSY like
‘gender mainstreaming/ inclusiveness’, ‘stakeholder and beneficiary behavioural change’ and
‘Conjunctive use of water - surface versus groundwater usage optimizations’ have been
evaluated under the CADWM scheme; hence they have not been separately evaluated under this
section and rated as ‘not relevant’ in the table below. Similarly, the ‘water sharing treaties/
agreements & diplomacy’ theme has been evaluated in detail under the ‘Sector Level Analysis’
section and hence not covered separately under PMKSY-AIBP while in absence of adequate
information for the themes ‘developlment, dissemination and adoption’ and ‘Research &
Development’, they have been marked as ‘no information’.
A summary analysis and performance of the scheme on the identified themes is presented
below:
Table 28: AIBP – summary of performance evaluation using cross-sectional themes
Parameter Performance
Accountability & Transparency
Direct/Indirect Employment Generation
Gender mainstreaming/Inclusiveness

Page | 286
Parameter Performance
Building resilience to climate change (including but not limited to developing
water disaster preparedness) & ensuring sustainability
Role of Tribal Sub-Plan (TSP) and Scheduled Caste Sub-Plan component of
the scheme in mainstreaming of Tribal and Scheduled Caste population
Use of IT/Technology in driving efficiency
Stakeholder and Beneficiary behavioural change
Development, dissemination & adoption
Research & Development
Water sharing treaties/agreements & diplomacy
Conjunctive use of water - surface versus groundwater usage optimizations
Unlocking Synergies with other Government Program
Reforms, Regulations
Impact on and role of private sector, community and civil society in the
scheme
Cross-sectional themes performance infographics legend
High
Medium
Low
Not relevant
No information
2.2.1.3 Issues and challenges
This sub-section describes the scheme issues and challenges and their mapping with the source
of information viz. primary source, secondary source and household survey (if applicable).
Table 29: AIBP – issues and challenges
Sl.no Area Issues & Challenges
Secondary KII FGD/
HH
Scheme design
AIBP-
F1
IPC
assessment
• A study by IIMs initiated by the MoWR
noted that initial IPC, without further
updates to account for lack of
maintenance, change in cropping and

Page | 287
Sl.no Area Issues & Challenges
Secondary KII FGD/
HH
climatic patterns, may lead to
miscalculation, lack of transparency and
misguided policy decisions.
• Also, the irrigation potential created under
a large number of major and minor
irrigation projects could have decreased
over the years, owing to diversion of water
for other purposes like drinking water,
industrial use and other interceptions; but
these are not reflected, thus leading to
over-estimation of the IPC when
aggregated at the national level.
• During primary survey, it was observed
currently none of the states have any
reporting mechanisms for updating the
IPC-IPU data over time. Also, some of the
states were reported to adopt different
conventions for assessment of IPC and
IPU figures.
AIBP-
F2
Fund transfer
mechanism
• The AIBP guidelines mandates the states
to release the Central Assistance and the
state’s matching share to the project
implementing authorities within 15 days of
receipt of the Central releases.
• However, delay in the range of 1 to 18
months was confirmed by the
stakeholders during the primary survey in
some states like Assam.
Scheme implementation
Page | 288
Sl.no Area Issues & Challenges
Secondary KII FGD/
HH
AIBP-
F3
Land
acquisition
and R&R
issues
• Under PMKSY-AIBP, the 99 Priority AIBP
projects (106 projects including phases)
were planned to be completed by
December 2019. However as on March
2020, only 44 projects have been
completed, while the balance is targeted
to be completed over March 2020-23.
• Land acquisition and R&R issues still
continue to scuttle the progress of almost
all the AIBP projects.
• Many of the factors though may be
attributed to externalities outside the
control of the implementing authorities like
revision in Land Acquisition and R&R acts,
changes in design (say canal alignment)
due to geological surprises. However, part
of the delay may be attributed to various
administrative deficiencies (shortage of
revenue/land acquisition officials as
reported in states like Karnataka) , lack of
project stakeholder engagement and non-
payment of compensation fees (as
reported in Karnataka and Bihar).
AIBP-
F4
Fund crunch
• With the increase in land prices and
escalation in projects costs (plagued by
inordinate time delays), many states are
witnessing limited fiscal space to
accommodate the new construction
projects. Though the Centre’s loan
arrangement from NABARD (Long Term
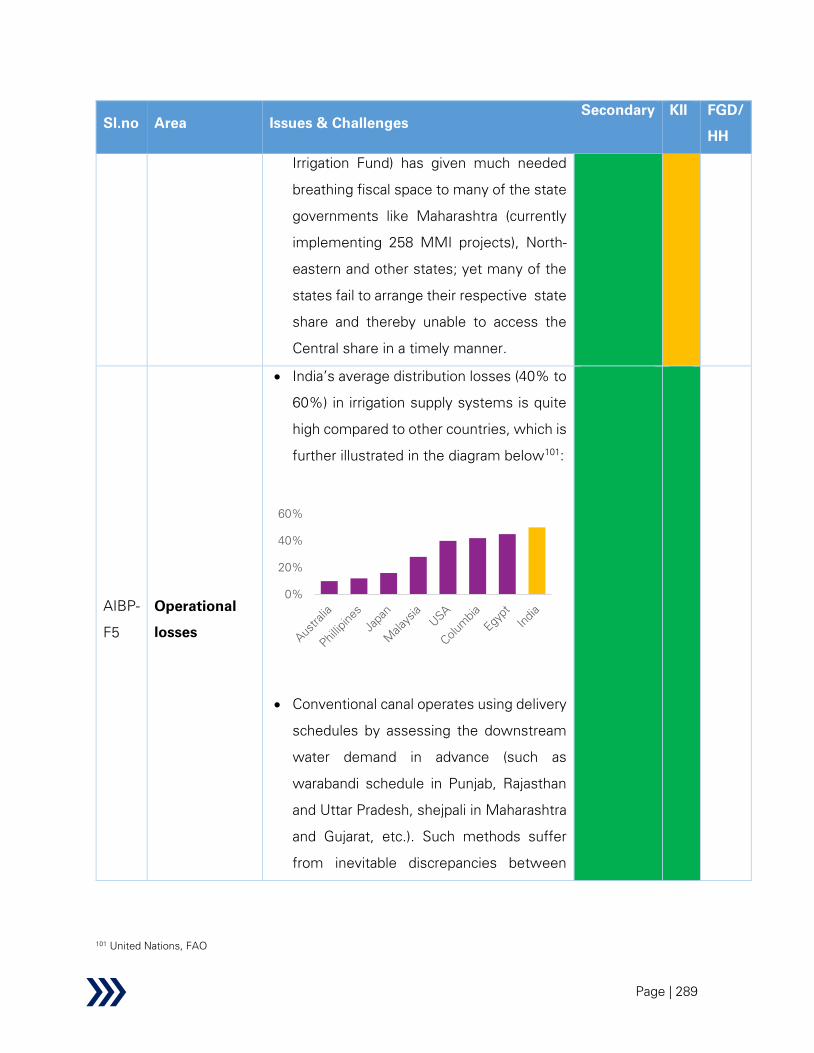
Page | 289
Sl.no Area Issues & Challenges
Secondary KII FGD/
HH
Irrigation Fund) has given much needed
breathing fiscal space to many of the state
governments like Maharashtra (currently
implementing 258 MMI projects), North-
eastern and other states; yet many of the
states fail to arrange their respective state
share and thereby unable to access the
Central share in a timely manner.
AIBP-
F5
Operational
losses
• India’s average distribution losses (40% to
60%) in irrigation supply systems is quite
high compared to other countries, which is
further illustrated in the diagram below101
:
• Conventional canal operates using delivery
schedules by assessing the downstream
water demand in advance (such as
warabandi schedule in Punjab, Rajasthan
and Uttar Pradesh, shejpali in Maharashtra
and Gujarat, etc.). Such methods suffer
from inevitable discrepancies between
101 United Nations, FAO
0%
20%
40%
60%
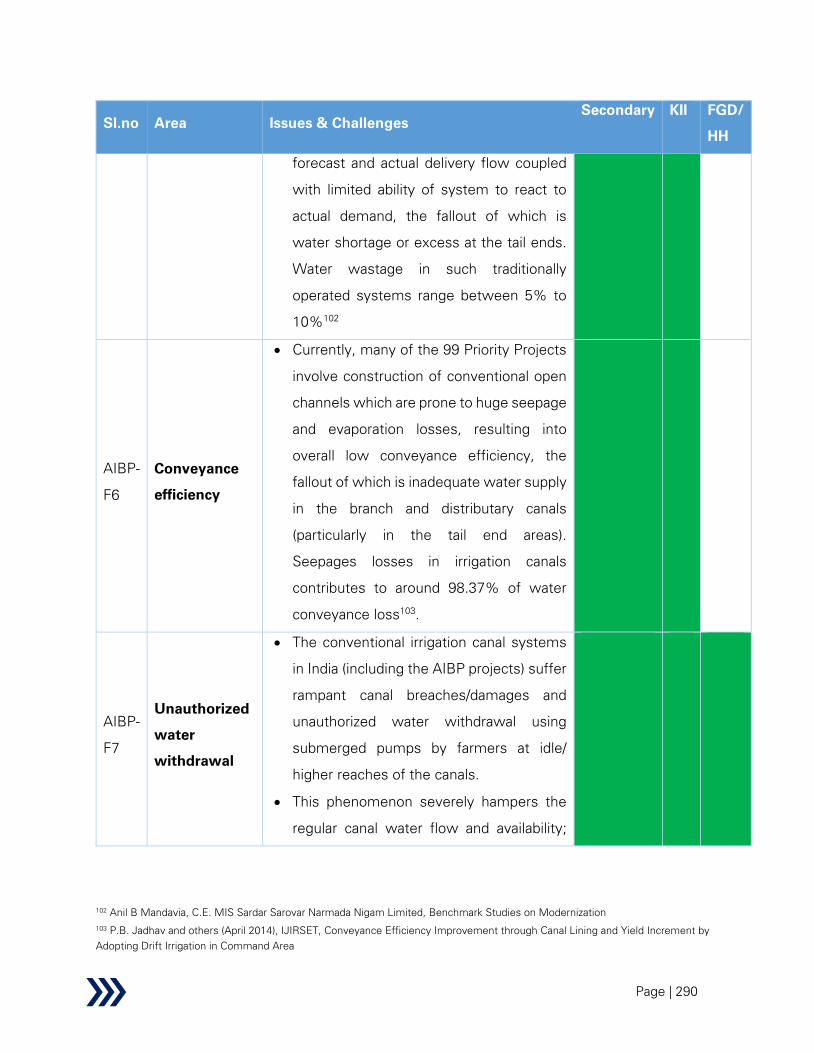
Page | 290
Sl.no Area Issues & Challenges
Secondary KII FGD/
HH
forecast and actual delivery flow coupled
with limited ability of system to react to
actual demand, the fallout of which is
water shortage or excess at the tail ends.
Water wastage in such traditionally
operated systems range between 5% to
10%102
AIBP-
F6
Conveyance
efficiency
• Currently, many of the 99 Priority Projects
involve construction of conventional open
channels which are prone to huge seepage
and evaporation losses, resulting into
overall low conveyance efficiency, the
fallout of which is inadequate water supply
in the branch and distributary canals
(particularly in the tail end areas).
Seepages losses in irrigation canals
contributes to around 98.37% of water
conveyance loss103
.
AIBP-
F7
Unauthorized
water
withdrawal
• The conventional irrigation canal systems
in India (including the AIBP projects) suffer
rampant canal breaches/damages and
unauthorized water withdrawal using
submerged pumps by farmers at idle/
higher reaches of the canals.
• This phenomenon severely hampers the
regular canal water flow and availability;
102 Anil B Mandavia, C.E. MIS Sardar Sarovar Narmada Nigam Limited, Benchmark Studies on Modernization
103 P.B. Jadhav and others (April 2014), IJIRSET, Conveyance Efficiency Improvement through Canal Lining and Yield Increment by
Adopting Drift Irrigation in Command Area
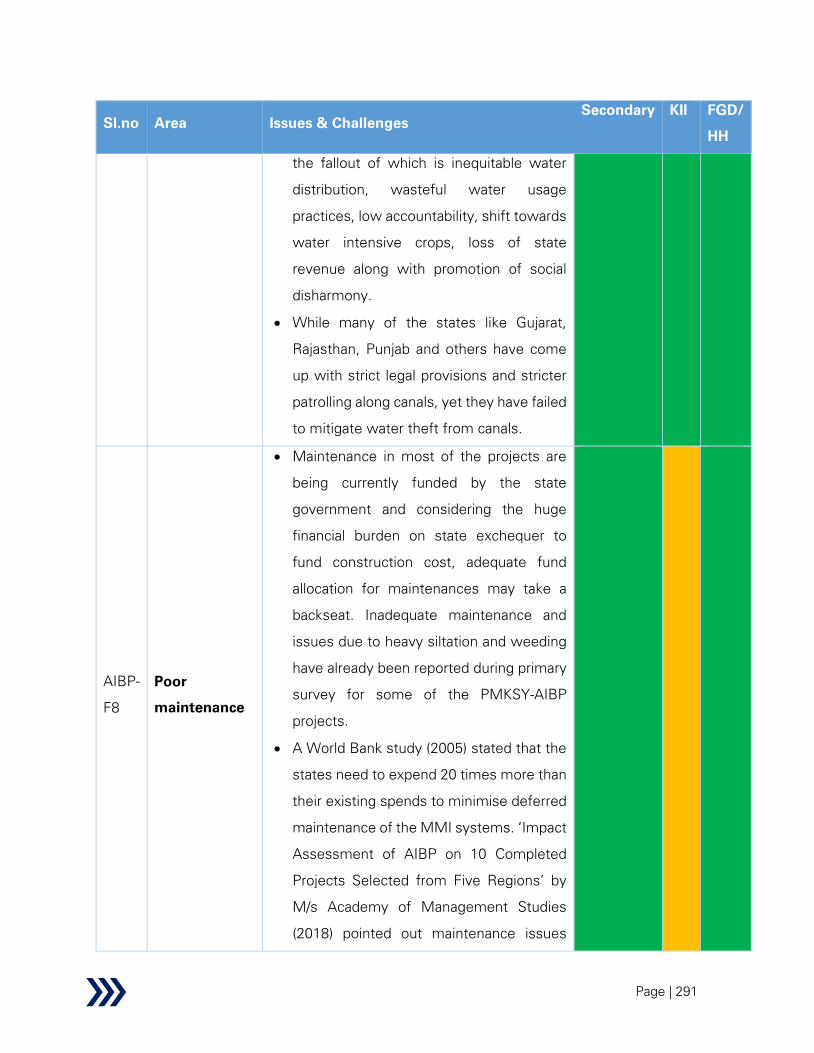
Page | 291
Sl.no Area Issues & Challenges
Secondary KII FGD/
HH
the fallout of which is inequitable water
distribution, wasteful water usage
practices, low accountability, shift towards
water intensive crops, loss of state
revenue along with promotion of social
disharmony.
• While many of the states like Gujarat,
Rajasthan, Punjab and others have come
up with strict legal provisions and stricter
patrolling along canals, yet they have failed
to mitigate water theft from canals.
AIBP-
F8
Poor
maintenance
• Maintenance in most of the projects are
being currently funded by the state
government and considering the huge
financial burden on state exchequer to
fund construction cost, adequate fund
allocation for maintenances may take a
backseat. Inadequate maintenance and
issues due to heavy siltation and weeding
have already been reported during primary
survey for some of the PMKSY-AIBP
projects.
• A World Bank study (2005) stated that the
states need to expend 20 times more than
their existing spends to minimise deferred
maintenance of the MMI systems. ‘Impact
Assessment of AIBP on 10 Completed
Projects Selected from Five Regions’ by
M/s Academy of Management Studies
(2018) pointed out maintenance issues
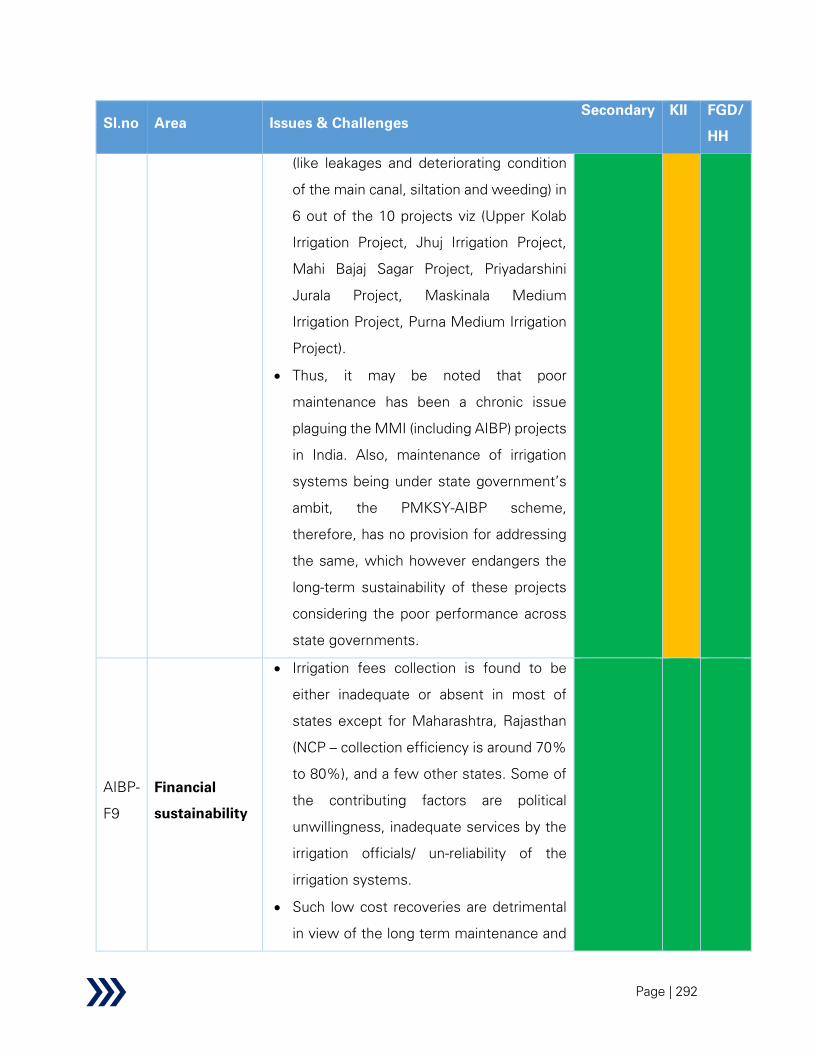
Page | 292
Sl.no Area Issues & Challenges
Secondary KII FGD/
HH
(like leakages and deteriorating condition
of the main canal, siltation and weeding) in
6 out of the 10 projects viz (Upper Kolab
Irrigation Project, Jhuj Irrigation Project,
Mahi Bajaj Sagar Project, Priyadarshini
Jurala Project, Maskinala Medium
Irrigation Project, Purna Medium Irrigation
Project).
• Thus, it may be noted that poor
maintenance has been a chronic issue
plaguing the MMI (including AIBP) projects
in India. Also, maintenance of irrigation
systems being under state government’s
ambit, the PMKSY-AIBP scheme,
therefore, has no provision for addressing
the same, which however endangers the
long-term sustainability of these projects
considering the poor performance across
state governments.
AIBP-
F9
Financial
sustainability
• Irrigation fees collection is found to be
either inadequate or absent in most of
states except for Maharashtra, Rajasthan
(NCP – collection efficiency is around 70%
to 80%), and a few other states. Some of
the contributing factors are political
unwillingness, inadequate services by the
irrigation officials/ un-reliability of the
irrigation systems.
• Such low cost recoveries are detrimental
in view of the long term maintenance and

Page | 293
Sl.no Area Issues & Challenges
Secondary KII FGD/
HH
sustainability of the projects and deterrent
to any future investments by private
sector.
AIBP-
F10
Private sector
participation
• Though some states like Maharashtra,
Andhra Pradesh have taken some steps in
attracting private sector participation in
irrigation and drainage sector (I&D), yet the
overall participation across India remains
tepid still now. Some of the reasons being
low cost recovery from water (water being
perceived as a social good/ right rather
than an economic commodity), land
acquisition, R&R and other legal and
administrative issues endemic in this
sector, and non-availability of alternative
revenue streams.
Monitoring and evaluation
AIBP-
F11
Monitoring
visits
• AIBP scheme guidelines mandate
minimum two site visits per year by CWC
officials to the project sites in all states,
which was also validated during the
primary survey.
• However, considering the large number of
on-going projects (in states like
Maharashtra, Assam and Manipur, Andhra
Pradesh and Telangana) and huge span of
the project area, two/three visits to the
project sites may not be sufficient for the
purpose, as also reported by some of the
regional offices.
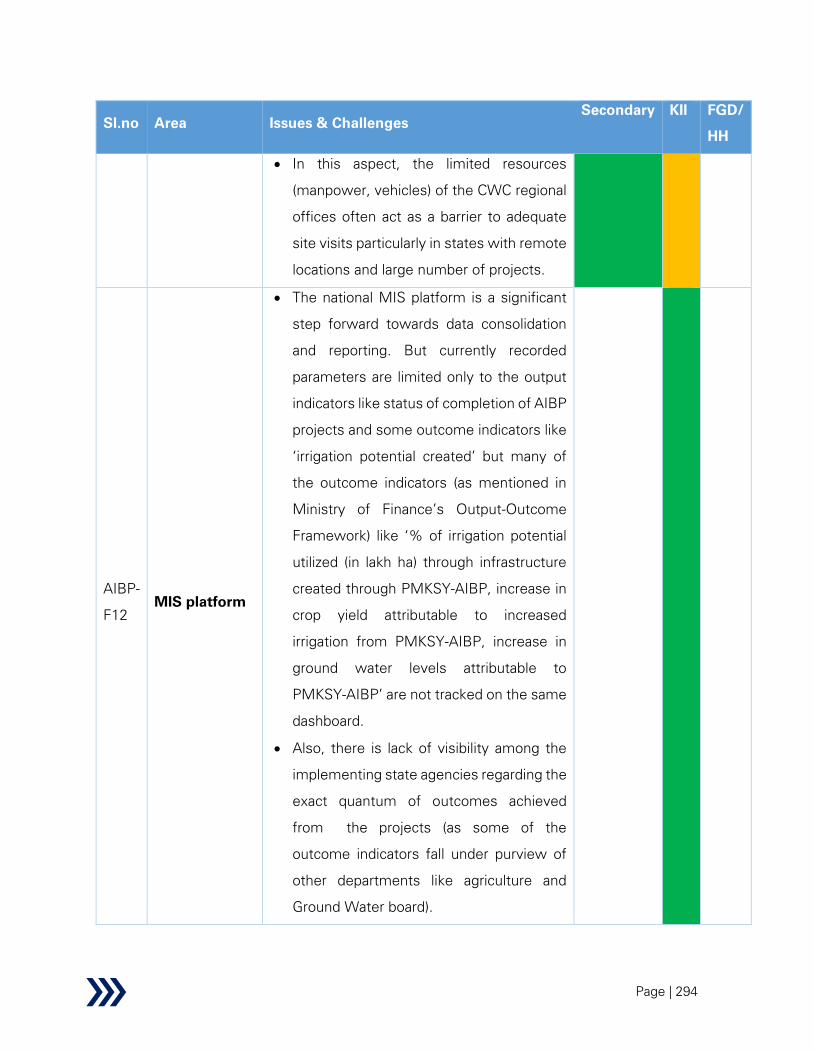
Page | 294
Sl.no Area Issues & Challenges
Secondary KII FGD/
HH
• In this aspect, the limited resources
(manpower, vehicles) of the CWC regional
offices often act as a barrier to adequate
site visits particularly in states with remote
locations and large number of projects.
AIBP-
F12
MIS platform
• The national MIS platform is a significant
step forward towards data consolidation
and reporting. But currently recorded
parameters are limited only to the output
indicators like status of completion of AIBP
projects and some outcome indicators like
‘irrigation potential created’ but many of
the outcome indicators (as mentioned in
Ministry of Finance’s Output-Outcome
Framework) like ‘% of irrigation potential
utilized (in lakh ha) through infrastructure
created through PMKSY-AIBP, increase in
crop yield attributable to increased
irrigation from PMKSY-AIBP, increase in
ground water levels attributable to
PMKSY-AIBP’ are not tracked on the same
dashboard.
• Also, there is lack of visibility among the
implementing state agencies regarding the
exact quantum of outcomes achieved
from the projects (as some of the
outcome indicators fall under purview of
other departments like agriculture and
Ground Water board).

Page | 295
Sl.no Area Issues & Challenges
Secondary KII FGD/
HH
AIBP-
F13
Accountability
and
transparency
• The scheme guidelines mandates
allotment of 3% of CA (estimated Rs. 940
Cr.) for concurrent evaluation, social audit,
third party monitoring, IEC, etc.; social
audit of works and efficacy of project has
to be carried out after completion of works
in 10% of projects in each state
• During primary survey, the following
observations are made:
o Social audit has not been carried out/
not initiated by the irrigation
department as conducting such
audits comes under the purview of
land resources/ revenue department
o In some cases, the stakeholders
were not aware of any such audit
provisions
Issue relevance legend
Supported Partially
supported Not supported
Not applicable
A summary analysis of issues & challenges for the scheme is presented below:
Table 30: AIBP – summary of issues and challenges
Parameter Performance
Institutional Mechanism and governance
Fund flow efficiency and utilization
Unavailability of resources (fund, manpower and others)
Monitoring and evaluation
Capacity building

Page | 296
Parameter Performance
Operational efficiency
Performance infographics legend
Satisfactory
Average
Needs Improvement
2.2.1.4 Recommendations and solutions
This sub-section describes the scheme recommendation and solutions from the perspective of
scheme design, scheme implementation and monitoring & evaluation, along with their mapping
with the issues and challenges described in the preceding sub-section.
Table 31: AIBP – recommendations and solutions
Sl.no Recommendations Finding
Scheme design
AIBP-R1
Standard guidelines for IPC assessment
• Standard guidelines should be developed by DoWR,RD&GR, in
consultation with CWC and other research institutes, for assessing
the IPC over the years to correctly ascertain the true potential of
the irrigation systems (after discounting for natural wear and tear
of the irrigation system, siltation of the reservoirs, diversion of
water due to command area interceptions, overlapping with other
minor irrigation systems in the same command area) and to
promote more transparency in reporting by various organizations.
Several such guidelines in relation to IPC measurement have
already been prepared some IIMs in 2008, in consultation with
MoWR.
• The CWC should prepare standard guidelines for IPC-IPU
assessment (in the line with similar guidelines like ‘Guideline for
Computing the Water Use Efficiency of the Irrigation Projects
(February 2014)’ and adequate dissemination of the prepared
guidelines to all state project implementing agencies should to be
AIBP-F1

Page | 297
Sl.no Recommendations Finding
ensured. Special statistical cells may be created under the state
irrigation/ water resources department to compute the dynamic
figures for IPC over specified time periods, which is to be
monitored and assimilated by any designated statistical cell/
empowered committee at the national level. The computed data
may be linked with the MIS dashboard to bring in greater
transparency on the status of the irrigation projects.
• The above recommendations will facilitate in executing the
suggestions provided by the Standing Committee on Water
Resources (2017-18) in its 21st Report where the Ministry was
requested ‘to reconcile the data with respect to IPC and IPU since
the inception of projects state-wise, year-wise and project-wise’.
AIBP-R2
Change in guidelines for monitoring visits
• For monitoring of ongoing projects by CWC officials, a ‘one-size-
fits-all’ approach viz minimum of 2 site visits may not suffice the
purposes of visits, considering that the number and scope of
ongoing projects, project locations and criticalities varies across
states. In this aspect, the guidelines for site visits may be
dynamically set for each of the projects based on:
o project criticality (stage of completion, number of
implementation bottlenecks reported in last 6 months,
etc.)
o project location (remoteness, terrain say hilly areas,
etc.)
• Based on the above guidelines, re-deployment of resources (mainly
manpower) across CWC regional offices or hiring of third party
agencies for the same purpose could be explored.
AIBP-F11
AIBP-R3
Develop guidelines mandating states to explore feasibility of
piped distribution networks in all branch and distributary
networks for all new/ ongoing projects
AIBP-F3
AIBP-F5
AIBP-F6
AIBP-F7
Page | 298
Sl.no Recommendations Finding
• In view of the endemic issues of delays due to land acquisition and
R&R in many of the ongoing AIBP projects coupled with poor
conveyance efficiency of open canal systems, adoption of piped
irrigation network (PIN) becomes imperative.
• Particularly in light of the recent successful implementation of PIN
projects in various states of India like Maharashtra, Odisha, Gujarat
and Rajasthan (Narmada Canal project, one of the 99 AIBP projects
has successfully implemented pressured irrigation network), a re-
look at exploring the feasibility of roll out of underground
pressurized piped irrigation network in ongoing secondary
and tertiary canal projects is warranted. (including cost benefit
analysis covering social and environmental costs and benefits).
• Some benefits of the Piped Irrigation Network over open canal
systems is demonstrated below:
o Lesser land requirement - as per MoWR sources
adoption of PIN assisted in avoiding land acquisition to
the tune of 6,200 ha and 4,920 ha in Odisha and
Maharashtra respectively leading to approximate cost
saving of Rs. 1,500 Cr.
o Avoidance of unauthorized water withdrawal
o Higher conveyance efficiency- as per CWC’s
‘Guidelines for Planning and Design of Piped Irrigation
Network’, PIN has a conveyance efficiency of 70% to
80% compared to 35% to 60% efficiency of
conventional canals
o Lower cost – as per CWC estimates, cost of canal
distribution network (CDN) is around 3.24 times that of
PIN, as the high cost of land acquisition (particularly in
view of recent escalation of land prices) and CD
structures in CDN offset the cost of piping material in
PIN by a large margin (while major components of canal
AIBP-F8
Page | 299
Sl.no Recommendations Finding
cost are land acquisition & CD structures, that of PIN is
cost of pipe material)
• Countries like Israel has migrated from open water canals to piped
supplies and drip irrigation; currently Israel has the world’s highest
crop yield/ m3 of water consumed. Successful case studies in
China showed 30% savings in water delivered (equivalent to 15%
of the total irrigated area) and 25% in labour input using PIN in place
of CDN
• However, it may be noted that PIN needs to be fitted with proper
de-silting arrangements where irrigation water contain large
quantity of sediments particularly in the canals fed by Himalayan
rivers. A notable example in this respect is Balh Valley Project in
Himachal Pradesh where proper de-siltation arrangements have
been put in place before water is conveyed to the Main
Conveyance Line. Also, adequate provisions need to be put in place
for electricity connections through DISCOMS/ solar power for
operation of the pumps. Also, while checking feasibility of PIN
projects, aspects like loss in groundwater recharges owing to
elimantion of canal seepages, should be taken into account.
AIBP-R4
Introduce provisions for expanding command area using
alternate systems like Lift Irrigation Schemes in new proposals
• Cultivators at higher elevation or rim of the storage reservoirs
deploy lift irrigation using their own means (like Kachnari diversion
scheme in Madhya Pradesh, Warna project in Maharashtra, etc.) to
irrigate their fields.
• There are numerous incidences where the project implementing
agencies have to incorporate lift irrigation schemes by revising their
initial proposals (e.g. introduction of Lift irrigation system in
Narmada canal, inclusion four lift irrigation schemes to Lower
Dudhna project in the latest proposal, one lift irrigation in Sangola
branch canal project; talks are going on to include lift irrigation
AIBP-F7

Page | 300
Sl.no Recommendations Finding
project on both side of the carrier canal in Punpun barrage project
in Bihar) which led to unnecessary time delays and cost overruns.
• In view of the same, it is suggested that the implementing
agencies critically explore the possibility of inclusion of lift
irrigation proposals (particularly in project areas with high
incidences of lifting) in the main irrigation system in their
initial proposal. A national guideline in this aspect may be
prepared by the Ministry to specify the eligibility criteria and
other norms. A 2010 Planning Commission study (“Evaluation
Study on AIBP”) also suggested to install/ legalize the lift irrigation
schemes on main canal so as to increase the command area in lieu
of service fees from the benefitting cultivators.
Some of the notable examples where state governments
undertook lift irrigation schemes in main irrigation system with
considerable success are listed below:
• Upper Krishna Basin in Maharashtra
o Context: in 1976, Maharashtra was awarded 560 TMC
by Bachhawat Award; however, by 1996 the state could
only manage to 385 TMC of storage and associated
canal networks. This led to proliferation of small-scale
private lifting schemes along Krishna.
o Key features: subsequently government legalized lifting
of water and facilitated operational irrigation co-
operative societies with capital cost subsidies and
additional finances from national and co-operative
banks to develop lift irrigation schemes (LIS). This is
complimented by the irrigation department’s initiative
to construct a series of Kolhapur Type (KT) weirs across
tributaries to act as storages for the LIS. Each LIS has
to get an approval from irrigation department and state
electricity board (for electricity connection).

Page | 301
Sl.no Recommendations Finding
o Another similar example is the Radhanagari project in
Kolhapur district where exceptional performance was
recorded compared to surface irrigation systems;
average irrigated area was 30,341 ha compared to
design value of 26,560 ha and irrigation fees were
collected to the tune of Rs. 179 lakh against O&M
expenses of Rs. 79 lakh
• Solar powered lift irrigation project, Hoshiarpur, Punjab
o Key features: the project lifts water from Kandi canal to
irrigate 1,641 acres (at higher elevation) across 14
villages and encapsulates innovative technologies like
SCADA, solar powered pumps and micro-irrigation
equipment
o Project benefit cost ratio is around 3; it resulted
incremental benefits to the cultivators to the tune of Rs.
180 Cr.104
However, since the LIS demands a recurring expense on account of
electricity costs, feasibility of long-term operations and maintenance
of such projects needs to be thoroughly studied before inclusion.
There are ample examples of such LIS like Hawaipur LIS, Assam which
ultimately became defunct due to electricity cost issue despite huge
investments.
AIBP-R5
Introduce provisions for lining of main canals
• Mandatory provisions may be included in the guidelines for lining
of at least the main canals (on the side slopes and canal bed
depending on the soil characteristics) under this scheme in places
as feasible after cost benefit assessment. The funding modalities
for the same needs to be chalked out by the Ministry.
AIBP-F6
104 KPMG Analysis
Page | 302
Sl.no Recommendations Finding
• As illustrated by numerous studies, canal lining not only minimizes
the seepage losses but also help to retain the flow characteristics
and shape of the canal. The overall irrigation efficiency is 65% to
75% in case of lined canals compared to 50% to 60% for unlined
canals105
. During primary survey, various stakeholders like irrigation
officials from Assam (Dhansiri project), Andhra Pradesh (Musrumilli
and Pushkara projects) and Bihar (Durgawati project) advocated for
lining of canals to address seepage and tail end water unavailability
issues. However, at the same time, it may be noted that the
deacrese in seepages due to lining may also cut down on the
amount of groundwater recharges in the surrounding areas (a
research study by Anna University, Tamil Nadu, highlights that
unlined canal assists in groundwater recharging 20% more than
the lined canal106
). Thus, a detailed feasibility study including cost
benefit analysis to determine impact of reduction of seepage on
groundwater level may be conducted before undertaking such
projects.
• Case study: Panchanadi minor irrigation project, Ratnagiri,
Maharashtra103
o Features: Project encapsulates earthen dam with
masonry spillway with total storage capacity of 1.783
Mm3, 1.33 km of lined and 0.67 km of unlined main
canal
o Findings: Conversion of unlined canal network sections
into lined ones resulted in increase in conveyance
efficiency up to 75% and in saving of 0.376 Mm3 of
water leading to scope of irrigating additional 43 ha.
105 ADB Scoping Study (2013), ‘Exploring PPP in the Irrigation and Drainage Sector in India’
106 Mirudhula K, Anna University (Sepetember 2014), Internationa Journal of Engineering Research and Technology, “Impact of
lined/ unlined canal on groundwater recharge in the Lower Bhavani Basin”

Page | 303
Sl.no Recommendations Finding
A brief comparison of the overall efficiency and
conveyance losses across different sections of the
canal is illustrated below.
AIBP-R6
Change in funding norms/ eligibility criteria to facilitate more
focus on ERM projects and release of additional grants for
maintenance
• Various studies in the recent past has advocated for imminent need
to invest more in maintenance and utilization of the existing
irrigation assets rather than investing in new investment projects
in the I&D sector. Scholars (like Ackerman 2011) and World Bank
Study (Briscoe and Malik, 2006) state that most of the water
storage projects in India (particularly in Peninsular India) has
reached the limits of any economically viable additional water
storage. An ADB study (Blackmore 2010) pointed to the low
economic value addition by surface irrigation projects in Ganga
basin because of existing high water table. Burton (2010) pointed
that though construction of new irrigation schemes helped to
expand irrigated area, yet much more benefits could be obtained
through ‘better management’. Past experiences in Madhya Pradya
also confirm such findings as already highlighted in one of the case
studies.
AIBP-F4
0%
20%
40%
60%
80%
0
0.2
0.4
0.6
0.8
Lined canal
sections
Unlined canal
sections
Unlined field
channel
conveyance loss (Mm3) overall efficiency (%)
Page | 304
Sl.no Recommendations Finding
• In view of these findings and existing low utilization/ below par
utilization of many of the MMI projects (widening IPC-IPU gap), it
is proposed that government brings in a paradigm shift in its
priority selection; more focus on Extension, Renovation and
Modernization (ERM) and maintenance of existing projects is
suggested. Similar suggestions were put forth by the Working
Group on Major & Medium Irrigation and CAD for the XII Five Year
Plan (2012-2017), where it was recommended that ‘liberalized
central funding at enhanced rate’ should be considered for central
assistance in respect of CADWM and ERM projects.
• Since its inception in 1996-97, around 42 ERM projects have been
included under AIBP for which around Rs. 2845.27 Cr. have been
released till December 2016107
. A proactive approach in bringing
more such projects under the scheme coverage by relaxing/
incentivizing the eligibility criteria for inclusion of ERM projects is
necessary.
• Change in funding forms for MMI projects is suggested with higher
percentage of earmarked funds for O&M of headworks.
• The ministry could also explore introducing a separate scheme for
non-establishment component of maintenance expenditure for the
MMI projects. Additional incentives may be provided to states that
have adopted various water sector reforms like increase in state
maintenance budget, setting up water resources regulatory
authority, etc.
AIBP-R7
Bring in institutional changes to support recent developments
and transition towards service oriented approach
• Capacity building: In line with recent developments in the sector
like emergence of various remote sensing technologies, shift from
107 Lok Sabha reply by Water Resources Minister, Smt. Uma Bharti (https://economictimes.indiatimes.com)

Page | 305
Sl.no Recommendations Finding
open canals to piped irrigation, etc. it becomes imperative to chalk
out a national training plan for training state irrigation officials,
backed by budgetary provisions.
• Change in staffing pattern: With paradigm shift towards water
management, it becomes imperative to adopt a multi-disciplinary
profile of the irrigation staff. An illustrative list is suggested below:
Staff discipline Area Task details
Engineer (civil,
electrical,
mechanical, IT,
E&TC)
Irrigation
and
drainage
system
• Civil construction
• Infrastructure O&M
• System automation
• Maintenance of water
delivery
Agronomist Agriculture
economy
• Understanding economic and
financial value of crops, water
requirement and farm budget
• Determination of water tariff
Anthropologist/
sociologist
Socio-
economy
• Community engagement
• IEC and capacity building
• Outsourcing of services: In view of the vast span of the MMI
projects and limited resources of the irrigation department;
outsourcing of maintenance activities to private organizations may
be explored. As reported, such initiatives have already been
adopted by the Andhra Pradesh government.
Also, outsourcing of other non-core seasonal works like monitoring
of outlets, crop assessment, billing and revenue collection to
private agencies/ retired personnel (on contract basis) may be
explored.

Page | 306
Sl.no Recommendations Finding
• Inter-departmental co-ordination: Though the AIBP guidelines
mandates pari-passu implementation of CADWM; yet works under
CADWM has significantly lagged in many of the projects, in spite
of the hydraulic activities being completed (particularly in states like
Andhra Pradesh, Manipur, Punjab, Jharkhand and Uttar Pradesh).
One of the reasons being lack of co-ordination among the
implementing authorities of the two schemes (e.g. in Manipur
there are two separate departments for water resources and CAD
which puts administrative limits on the extent of co-operation). To
mitigate such issues, standardized institutional guidelines for
smooth co-operation of the two implementing agencies/ merging
into a single implementing agency could be chalked out to bring
more accountability.
AIBP-R8
Ensuring release of funds/ central grants by states to project
implementing agencies within stipulated time
• To expedite the release of the central grants by the states, options
like transfer of funds by the Centre directly to the project
implementing agencies may be explored. Considering such modus
operandi may be an interference in the federal power of the states,
such mechanisms may be adopted for only those projects/ states
which have witnessed significant delays in the past.
AIBP-F2
Scheme implementation
AIBP-R9
Create a task force for inter-departmental clearances and a
separate R&R wing under Water Resources department
• To expedite the inter-departmental clearances for land acquisition
(like clearances from roads, railways and environment), a separate
inter-departmental task force could be created comprising
Secretaries/ senior officials of the relevant departments who may
meet regularly (say monthly) to expedite the approvals.
AIBP-F3

Page | 307
Sl.no Recommendations Finding
• Currently, the irrigation officials have to make multiple visits to
various divisions of the Land Resources department to sort out the
R&R issues. This often leads to inordinate delays considering that
Land Resources department officials being not dedicated to a
particular sector have to address R&R issues pertaining to other
sectors also. Thus, creation of a separate Rehabilitation and
Resettlement wing is proposed under the Water Resources
department for better co-ordination and expeditious clearances.
E.g. in Polavaram project, a separate Relief and Rehabilitation
Commissioner has been appointed by the Andhra Pradesh
government. The AP government has also set up a separate wing
called Commissioner of Rehabilitation and Resettlement under the
Water Resources department to facilitate R&R of the MMI projects
(including projects under 99 Priority AIBP projects like Musurumulli
and Tharakarama Thirtha Sagaram Project.
AIBP-
R10
Develop a national contractor management tool/ software
• Since most of the MMI projects involve engagement of a host of
contractors over a long period of time, an online contractor
management tool may be developed by the Central government
and source code can be shared with each of the states to avoid
individual state investments in such tools.
• Systematic progress tracking of contractors will help to identify
critical paths and ensure timely actions and escalations are done.
AIBP-
R11
Implement SCADA/ telemetry techniques and canal automation
• Overall efficiency of manually operated canals is around 40%,
which may be increased by at least 10% with some level of
automation102
• With progressive transition to Participatory Irrigation Management
and shift from construction to service oriented approach, canal
automation becomes inevitable. DoWR, RD & GR, in association
AIBP-F5
AIBP-F9
Page | 308
Sl.no Recommendations Finding
with CWC and state governments, should conduct studies to
identify MMI projects that could be taken up for canal
automation either under current ERM projects (PMKSY-AIBP)
or through any new schemes. Since, such initiatives entail less
investments and no risks of delays due to land acquisition and R&R
issues, this is expected to result in considerable benefits in a
shorter period of time compared to new construction.
• Some of the envisaged benefits of SCADA implementation and
canal automation are:
o Remote device monitoring and operations of components
(particularly significant for projects in India with huge canal
network and thousands of cross and head regulators)
o Maintenance of water level at Full Supply Level (FSL) in every
pool; alleviated the risk of water logging and salination at head
reaches and scarcity at tail reaches
o Volumetric water measurement and automated invoicing
o Optimization of scheduling of water deliveries based on
WUA’s requirements and water availability in canal network
• However, canal automation calls for a multi-pronged approach with
close co-ordination between various engineering disciplines like
Civil, Mechanical, Electrical, Electronics & Telecommunication and
IT
• While canal automation is still an evolving technology, it has already
been implemented successfully in many parts of world including
India, some of which are listed below:
• Case Study 1: Narayanpur Left Bank Canal (NLBC), Karnataka (1 of
the 99 Priority AIBP project)
o Key features: SCADA based solar power operated
‘Integrated Automated Gates’ at all distributaries of NLBC
and entire command network of Hunasgi Branch Canal; GIS
based Irrigation Network Management Information System

Page | 309
Sl.no Recommendations Finding
(INMIS) for better crop yield and water management
(dynamic planning of water demands and availability based
on soil moisture, cropping pattern, soil health, weather
conditions), 210 Information Kiosks for water allocation,
information collection and dissemination to WUAs; wireless
data connection network and control centres at Narayanpur
(master) and 10 other remote monitoring stations
o Status: 1st phase of the project has already been completed
while 2nd phase is expected to be completed by December
2021
o Envisaged benefits: to increase system water use efficiency
from 31.5% to designed 51%; supply water to 1.05 lakh ha
of tail end farmers and mitigate water logging issues in
37,000 ha; reduce resources for canal operations and
maintenance; improve responsiveness of the system;
demand aggregation and volumetric water supply;
dissemination of water allotment and invoice details to the
farmers; GIS based information on soil health, soil moisture,
crop pattern and weather conditions
• Case Study 2: Ramthal Integrated Drip Irrigation Project, Karnataka
o Key features: water lifted from Narayanpur reservoir
and distributed to fields using HDPE/ PVC pipes; online
self-cleaning automatic filters used to ensure clean
water for drip systems; each field outlet is fitted with
automated valves controlled by a wireless remote
monitoring station – automated alerts through SMS are
sent to farmers regarding on/ off schedules, crop alerts
and other agronomical practices; entire systems like
pressure regulation, opening and controlling of pumps
are automated based on pre-defined and pre-set water
Page | 310
Sl.no Recommendations Finding
level in the system - all data are secured on cloud
servers which thus allows remote monitoring
o Envisaged benefits – the overall project efficiency is
expected to be 90%108
(water conveyance efficiency –
99% and field application efficiency – 95%), envisaged
net income is Rs. 29,259/ acre while water productivity
is expected to be 1.41 kg/ m3 (which is much higher
compared to 0.28 kg/ m3 from comparable conventional
canal system)
• While ‘one-size-fits-all’ automation may not be the right approach
and the extent of automation may vary project-wise, it is suggested
to carry out renovation of the existing control structures, canal
lining and sizing and CAD works before any sort of automation is
adopted.
AIBP-
R12
Attracting private investments in MMI projects
• Involvement of private parties in irrigation and drainage (I&D) sector
may be explored to mitigate the current resource crunch
(manpower, funds, technical knowhow) plaguing this sector.
• In line with the recommendations of previous committees/ studies
(like MoWR committee in 2003, ADB study in 2013), private party
investments could initially be encouraged in management service
contracts with gradual transition to BOT- annuity and other
innovative PPP models like Hybrid Annuity model, which is further
illustrated below:
o Management service contract: the private concessionaire to
maintain O&M of the infrastructure for specified years in
accordance with prescribe service levels in lieu of specified
AIBP-9
AIBP-F10
108 Document share by Jain Irrigation Systems Ltd. (one of the implementing contractors for this project)
Page | 311
Sl.no Recommendations Finding
fees (to be shared between the government and the water
users
i. Case study – Megech Seraba Irrigation and Drainage
scheme, Ethiopia
▪ Maintenance of the primary and secondary irrigation
infrastructure in lieu of service fee paid by the
government with farmers to share a part of the fees
o EPC contract with built in O&M clause for 5-10 years: To attract
private parties and ensure expeditious completion, EPC
contracts with built-in O&M clauses for specified years (say 2
years for gravity canals and 5-10 years for LIS) may be explored.
Such model is particularly relevant in the backdrop of recent
demand for piped irrigation, canal automation and LIS projects.
ii. The I&CAD department, Andhra Pradesh has proposed to
build a 320 MW hydropower based project under BOT
annuity based model with a provision for EPC contract with
O&M contract for 15 years for the LIS component
o BOT Annuity/ other PPP Models like Hybrid Annuity Model
(HAM): HAM model has been successfully implemented in
construction of road and sewage treatment plant projects in
India. Under HAM the government invests 40%-60% of the
initial construction cost (balance being borne by the private
concessionaire) and pays the rest through annuity payments
over 15-30 years. With increased options for other revenue
streams (like sale of water to industries, drinking water to bulk
consumers, hydro-power generation), such innovative models
may be explored
iii. Case study – Guerdane Irrigation Project, Morocco
▪ Design-Build-Operate based on a 30 year concession
contract

Page | 312
Sl.no Recommendations Finding
▪ Government subsidy provided in form of 25% initial
investment and soft loans to the tune of $25 million (total
estimated cost was $105 million); balance was borne by
the private contractor
▪ To minimize revenue risks, users need to pay an upfront
subscription fees plus a variable component; revenue
deficit due to water shortages (the project being in a
drought prone area) to be shared between the parties
with private concessionaire’s loss capped to 15% while
users need to partly bear the loss through increase in
water charges
▪ Concessionaire agreement was signed in 2006 and 95%
of the farmers subscribed by 2007
• Financial sustainability: There are numerous other international
case studies like West Delta and New Zealand where private
parties have successfully invested in the I&D sector and recouped
the costs (including capital costs) through water user charges.
• In the back drop of the poor fiscal position of many of the state
governments and gradual shift from open canal to piped irrigation
systems and adoption of canal automation, exploration of PPP
models is suggested.
Monitoring and evaluation
AIBP-
R13
Tracking of outcome indicators on MIS platform
• For holistic view of the scheme implementation and impact, it is
suggested to track all the outcome indicators suggested in the
Ministry of Finance’s Output-Outcome be tracked viz ‘% of
irrigation potential utilized (in lakh ha) through infrastructure created
through PMKSY-AIBP, increase in crop yield attributable to
increased irrigation from PMKSY-AIBP, increase in groundwater
levels attributable to PMKSY-AIBP’ in addition to the already
AIBP-F12
Page | 313
Sl.no Recommendations Finding
tracked indicator ‘total additional irrigation potential created
through PMKSY-AIBP’.
• Considering that many of these indicators may be tracked/ needs
to be tracked by other departments/ ministries/ schemes like
PMKSY-HKKP, Groundwater board, Agriculture Ministry, a
coordinated approach needs to be adopted for better visualization
and tracking of the project impacts. E.g. irrigation potential utilized
is currently tracked by the CADWM dashboard. Similarly, some of
states maintain dashboards for groundwater level monitoring
APWRIMs/ release monthly or quarterly groundwater level data.
Thus, the feasibility of integration with the existing dashboards/
data records should be initiated on a priority basis.
• Also, in line with the suggestions by the one of the scheme
documents (July 2016), inclusion of detailed PERT chart for project
management of the 99 projects is suggested.
AIBP-
R14
Mandatory implementation of social audit provisions
• The states need to be encouraged (either by incentivization or
penal provisions) to undertake mandatory implementation of social
audit where 10% of the project works have been completed. A
participatory approach involving the ground-level stakeholders and
beneficiaries needs to be adopted; this becomes particularly
relevant in view of the various execution deficiencies (like
unnecessary splitting of works, sub-standard works, etc.) pointed
by the C&AG report in reference to previous AIBP projects.
AIBP-F13
AIBP-
R15
Adoption of remote sensing technologies
• Considering the huge span and difficult terrains of project areas,
adoption of remote sensing technologies for project monitoring
(both for on-going and completed) projects is imperative.
• Survey of ongoing construction works and monitoring of
projects (to detect canal breaches, unauthorized water
withdrawals) using drones could be explored. In this aspect the
AIBP-F13

Page | 314
Sl.no Recommendations Finding
extensive use of drones during construction of Polavaram project
(in Andhra Pradesh) is well documented. Recent MOU between
Andhra Pradesh Drones Corporation Private Limited (APDC) and
Andhra Pradesh Licensed Service Area (APLSA) may be leveraged
to monitor the progress of ongoing seven AIBP projects in Andhra
Pradesh, particularly for assessing the irrigation fees/revenue
collections (based on land mapping) once the projects are
completed.
• With the progressive implementation of Participatory Irrigation
Management, drone surveying could be a prominent tool in
facilitating the Irrigation/ Revenue/ Agriculture departments in
assessing the irrigation fees, revenue collection and crop planning.
Recent initiatives by Water Resources Department of the
Maharashtra Krishna Valley Development Corporation (MKDVC) in
association with Terra Drone India helped in assessing the 4,200
sq. km109
of agricultural land. In this aspect, even other alternative
Remote Sensing and GIS technologies may be explored. A notable
example is the recent proposal of mapping the Rabi season Land
Use and Land Cover (LULC) in Narmada Canal (one of the 99
Priority AIBP projects) command area, Rajasthan, where satellite
data procured from ISRO’s NRSC Data Centre would be used110
.
Also, notable are the recent initiatives being undertaken at the
national level by the Ministry like cropped area mapping studies (to
assess IPU) using remote sensing technologies and project
monitoring through Bhaskaracharya Institute of Space Applications
and Geo-informatics (BISAG) (note that the quality of assessment
and monitoring studies have not been validated under this study).
Also, a mobile application for geo-tagging project components has
109 https://www.geospatialworld.net
110 Document shared by A.C.E, Narmada Canal Project, Rajasthan

Page | 315
Sl.no Recommendations Finding
been developed by the Ministry along with a GIS-based web portal
for monitoring the progress.

Page | 316
2.2.2 Har Khet Ko Pani
2.2.2.1 Command Area Development & Water Management
The CADWM programme component under Har Khet Ko Pani (PMKSY) involves creation of field
channels, intermediate and link drains, reclamation of water-logged areas along with Participatory
Irrigation Management. Its main objective is to reduce the yawning gap between Irrigation
Potential Created (IPC) and Irrigation Potential Utilized (IPU) for the major and minor irrigation
projects through more involvement of farmers.
Introduced in 1974 as ‘Command Area Development Programme (CADP), the scheme was
restructured a number of times and scope got extended with the new guidelines focussing more
and more on involvement of the farmers for sustaining the scheme. Currently, the scheme is
being implemented as a component of Har Khet Ko Pani with the main focus of developing pari-
passu CAD works for 99 priority AIBP projects.
CAD works may be broadly categorized into the following two parts:
• Structural Interventions which involve survey, planning, design and execution of
the following:
o On-farm Development (OFD) works
o Construction of field, intermediate and link drains
o Correction of system deficiencies
o Reclamation of water-logged areas
• Non-structural Interventions which involve strengthening of Participatory
Irrigation Management (PIM) through activities like:
o Providing one-time Functional Grant to the registered Water User’s
Association (WUAs)
o Providing one-time Infrastructure Grant to the registered WUAs
o Conducting trainings, demonstrations and adaptive trials in relation to
water use efficiency and sustainable irrigation in participatory environment
(trainings, demonstrations, etc shall be conducted by WALMIs/ IMTIs)

Page | 317
The institutional arrangement for CADWM programmes as suggested in the scheme guidelines
is as follows:
• Implementation Support: All CAD works starting from planning, designing, tendering to
execution are responsibility of the State Government. Since CAD works are implemented in
pari-passu with AIBP, they shall be preferably executed by the same department
• Overall Monitoring and Co-ordination Support: Central Water Commission through its CAD
cells in the Regional Office and Project Monitoring Organization at headquarters shall monitor
and provide co-ordination support.
• Hand-holding Support: Empanelled Social Facilitators (like NGOs/ entities having substantial
influence in village level reforms) shall provide hand-holding support for strengthening
Participatory Irrigation Management. Activities of Social Facilitators shall be monitored by
special institutes (experienced in social sciences) as engaged by MoWR.
Background
After independence, construction of a large number of irrigation projects were taken up to
enhance agricultural production in the country. However, the increase in irrigation potential
utilized fell far short of the increase in irrigation potential created. In 1972, the Irrigation
Commission recommended development of command area to address this issue. In 1974, the
Government introduced the Centrally Sponsored scheme of Command Area Development
Programme (CADP) with an objective of increasing irrigation potential utilization and enhance
food grain productions through efficient water management efforts. In 1996, scope of the
programme was further extended to include farmer’s participation and reclamation of water-
logged areas. A review of the programme implementation during VIIIth and IXth Plan pointed to
a number of other system constraints viz. system deficiency before the outlet leading to
unreliability of outlet water supply, absence of link and intermediate drains to channelize the
surplus water to the main drains, non-inclusion of minor irrigation projects in non-hilly areas, low
priority of state governments in investing in training and hand-holding support to the farmers and
non-revision of cost norms since VIIIth plan. Thus, during Xth plan, the programme was
restructured to ‘Command Area Development and Water Management Programme’ and the
scope was further expanded. However, the Working Group on Major & Medium Irrigation and
Command Area Development for the XIIth Year Plan pointed to aggravating water logging
problems. The target achievement in field drains was noticed to be one-tenth of that in field

Page | 318
channels (as on 2011 only 0.52 lakh ha was reclaimed out of the target of 0.79 lakh ha111
waterlogged area). The Working Group also noted that a number of irrigation projects have failed
to operate at their target level owing to fund shortage for O&M. Thus, a provision of Correction
of System Deficiencies was added to the scope of CADWM programme to address such
deficiencies above the outlet (on canal system of capacity up to 4.2 cusec). During the XIth Plan,
the Ministry also introduced a model act for facilitating Participatory Irrigation Management. It
was proposed to transfer responsibility for O&M to WUAs along with the authority of collecting
Irrigation Service Fees (ISF) in their respective jurisdiction.
At the time of inception, CAD works for 60 major and medium irrigation projects with CCA of 150
lakh ha were taken up. As on December 2015, there were 145 active projects with CAD works
covering 221.6 lakh ha112
over 23 states and 2 UTs. Details of field constructions done during the
XIth Plan and XIIth Plan under CADWM are given in the table below:
Table 32: CADWM – field construction details from 2008-09 to 2014-15
Year Target Achievement
(in lakh ha) (in lakh ha)
2008-09 to 2011-12 13.2 16.9
2012-13 3.5 3.6
2013-14 5.0 3.1
2014-15 5.0 0.3*
*as on December, 2014
Data Source: Standing Committee on Water Resources (2016-17), Review of Accelerated Irrigation Benefit
Programme (AIBP)
However, in spite of the above efforts, the issue of IPC-IPU gap cannot be fully resolved as
highlighted in the figure below. According to a study, as on 2016, the IPC-IPU gap for 43 AIBP
projects (out of the completed 143 projects) was around 7.87 lakh ha.
111 MoWR (November 2011), Report of the Working Group on Major & Medium Irrigation and Command Area Development for the
XII Five Year Plan (2012-2017)
112 NITI Aayog (December 2015), Evaluation Study on Command Area Development & Water Management Programme

Page | 319
Figure 29: CADWM – India’s irrigation status in 2016
This gap between creation and utilization may be attributed to lack of CAD works, poor
maintenance of structures and canal networks, system deficiencies, poor planning, siltation in
minor networks, change in cropping pattern, etc. Dr. Mihir Shah Report states “Our huge
investments in irrigation have yielded much less than what they should have mainly because
command area development (CAD) has been consistently neglected and divorced from building
of irrigation capacities”. Thus, the XIIth Plan stipulated pari-passu implementation of CAD works
with AIBP projects to address the issue of IPC-IPU gap. Accordingly, the guidelines of AIBP were
modified in October 2013.
In the beginning of FY 2016-17, CADWM works were ongoing in 152 projects targeting a CCA of
about 70 Lakh ha. However, in July 2016, with the launch of 99 priority AIBP projects CAD works
were made restricted to only these 99 priority projects from 2016-17 onwards. It was proposed
to fund the scheme through budgetary support and loans from NABARD. (Note: for projects other
than the 99 priority AIBP projects, it was proposed to fund the CADWM works through a new
‘scheme of incentivization for bridging the IPC-IPU gap’). The implementation of 99 priority AIBP
projects is envisaged to create an irrigation potential of 76.03 lakh ha.
As stated in MoWR’s ‘Guidelines for Central Assistance for Command Area Development Works
in prioritized AIBP funded irrigation projects’, aim of implementing the CAD works shall be to
enhance food grain production to meet the needs of the rising population. The key objectives of
the scheme are:
1400
1130
890
240
0
200
400
600
800
1000
1200
1400
1600
Ultimate Irrigation
Potential
Irrigation Potential
Created
Irrigation Potential
Utilized
Gap
Irrigation status as on July 2016 (in lakh ha)
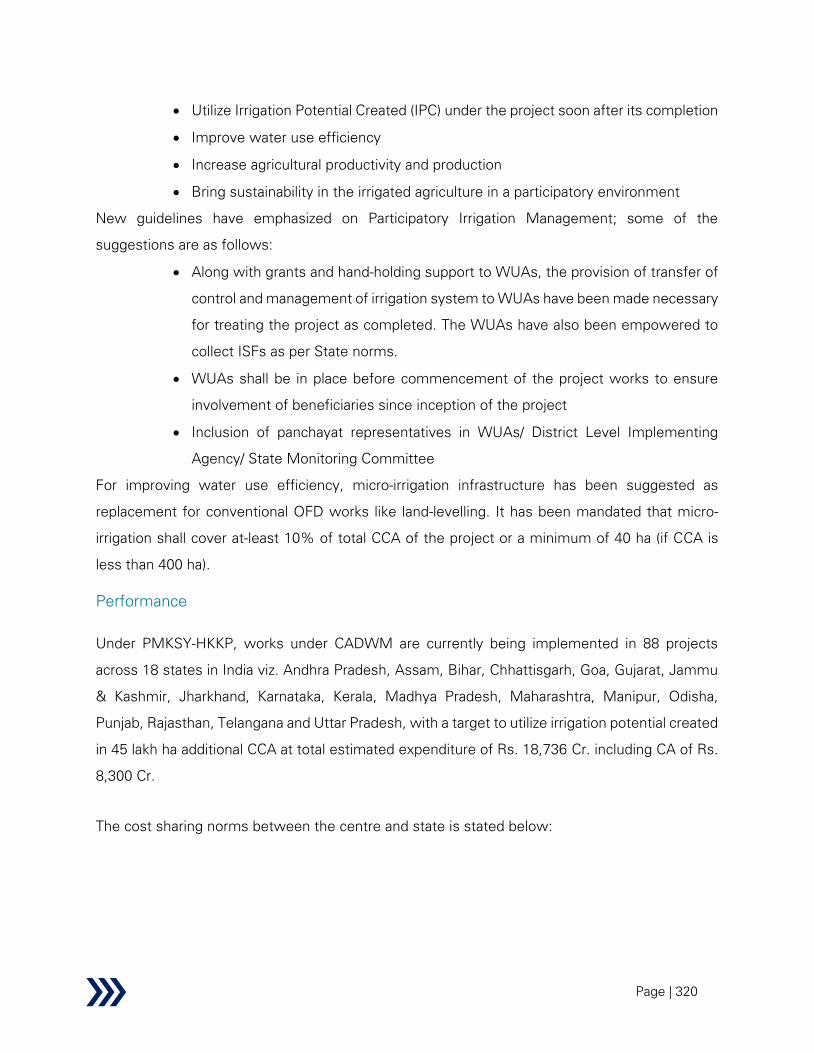
Page | 320
• Utilize Irrigation Potential Created (IPC) under the project soon after its completion
• Improve water use efficiency
• Increase agricultural productivity and production
• Bring sustainability in the irrigated agriculture in a participatory environment
New guidelines have emphasized on Participatory Irrigation Management; some of the
suggestions are as follows:
• Along with grants and hand-holding support to WUAs, the provision of transfer of
control and management of irrigation system to WUAs have been made necessary
for treating the project as completed. The WUAs have also been empowered to
collect ISFs as per State norms.
• WUAs shall be in place before commencement of the project works to ensure
involvement of beneficiaries since inception of the project
• Inclusion of panchayat representatives in WUAs/ District Level Implementing
Agency/ State Monitoring Committee
For improving water use efficiency, micro-irrigation infrastructure has been suggested as
replacement for conventional OFD works like land-levelling. It has been mandated that micro-
irrigation shall cover at-least 10% of total CCA of the project or a minimum of 40 ha (if CCA is
less than 400 ha).
Performance
Under PMKSY-HKKP, works under CADWM are currently being implemented in 88 projects
across 18 states in India viz. Andhra Pradesh, Assam, Bihar, Chhattisgarh, Goa, Gujarat, Jammu
& Kashmir, Jharkhand, Karnataka, Kerala, Madhya Pradesh, Maharashtra, Manipur, Odisha,
Punjab, Rajasthan, Telangana and Uttar Pradesh, with a target to utilize irrigation potential created
in 45 lakh ha additional CCA at total estimated expenditure of Rs. 18,736 Cr. including CA of Rs.
8,300 Cr.
The cost sharing norms between the centre and state is stated below:
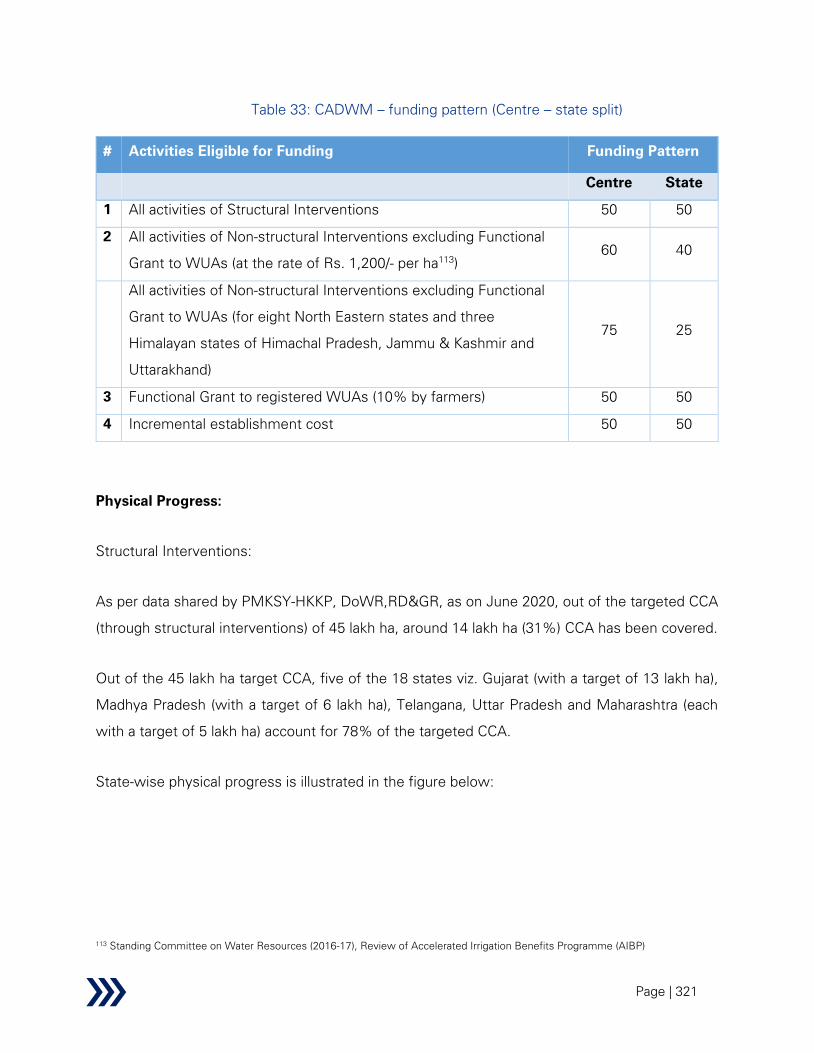
Page | 321
Table 33: CADWM – funding pattern (Centre – state split)
# Activities Eligible for Funding Funding Pattern
Centre State
1 All activities of Structural Interventions 50 50
2 All activities of Non-structural Interventions excluding Functional
Grant to WUAs (at the rate of Rs. 1,200/- per ha113
)
60 40
All activities of Non-structural Interventions excluding Functional
Grant to WUAs (for eight North Eastern states and three
Himalayan states of Himachal Pradesh, Jammu & Kashmir and
Uttarakhand)
75 25
3 Functional Grant to registered WUAs (10% by farmers) 50 50
4 Incremental establishment cost 50 50
Physical Progress:
Structural Interventions:
As per data shared by PMKSY-HKKP, DoWR,RD&GR, as on June 2020, out of the targeted CCA
(through structural interventions) of 45 lakh ha, around 14 lakh ha (31%) CCA has been covered.
Out of the 45 lakh ha target CCA, five of the 18 states viz. Gujarat (with a target of 13 lakh ha),
Madhya Pradesh (with a target of 6 lakh ha), Telangana, Uttar Pradesh and Maharashtra (each
with a target of 5 lakh ha) account for 78% of the targeted CCA.
State-wise physical progress is illustrated in the figure below:
113 Standing Committee on Water Resources (2016-17), Review of Accelerated Irrigation Benefits Programme (AIBP)
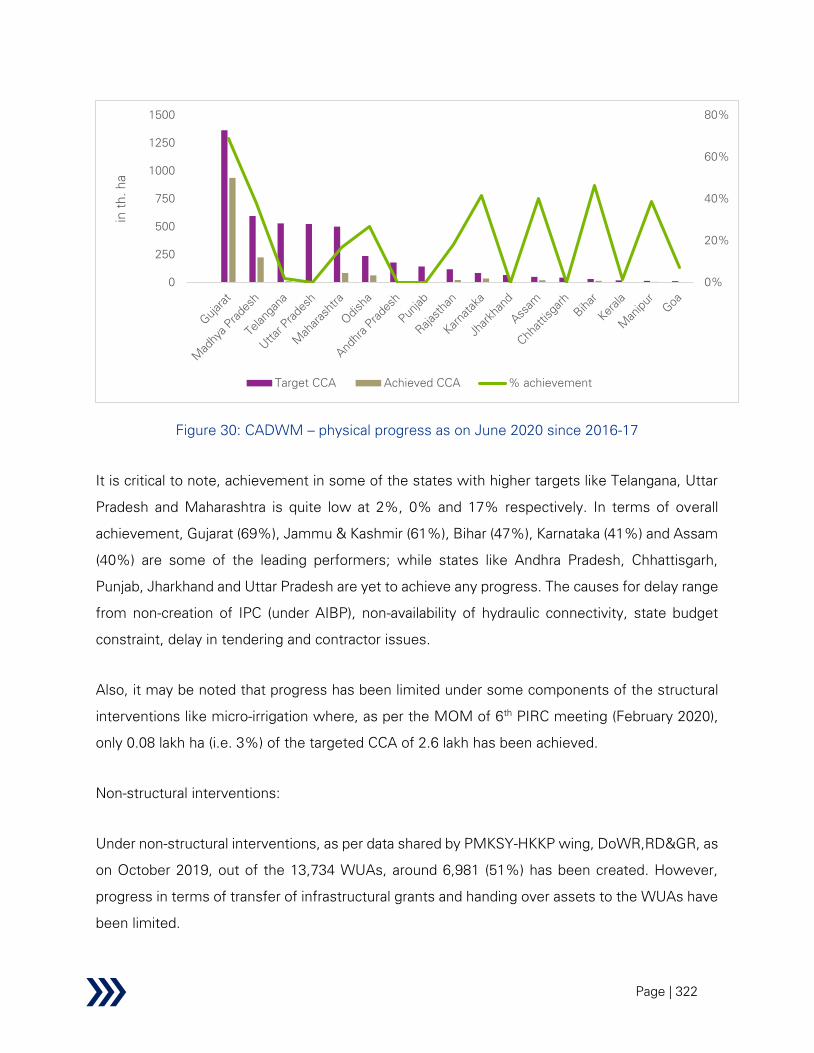
Page | 322
Figure 30: CADWM – physical progress as on June 2020 since 2016-17
It is critical to note, achievement in some of the states with higher targets like Telangana, Uttar
Pradesh and Maharashtra is quite low at 2%, 0% and 17% respectively. In terms of overall
achievement, Gujarat (69%), Jammu & Kashmir (61%), Bihar (47%), Karnataka (41%) and Assam
(40%) are some of the leading performers; while states like Andhra Pradesh, Chhattisgarh,
Punjab, Jharkhand and Uttar Pradesh are yet to achieve any progress. The causes for delay range
from non-creation of IPC (under AIBP), non-availability of hydraulic connectivity, state budget
constraint, delay in tendering and contractor issues.
Also, it may be noted that progress has been limited under some components of the structural
interventions like micro-irrigation where, as per the MOM of 6th
PIRC meeting (February 2020),
only 0.08 lakh ha (i.e. 3%) of the targeted CCA of 2.6 lakh has been achieved.
Non-structural interventions:
Under non-structural interventions, as per data shared by PMKSY-HKKP wing, DoWR,RD&GR, as
on October 2019, out of the 13,734 WUAs, around 6,981 (51%) has been created. However,
progress in terms of transfer of infrastructural grants and handing over assets to the WUAs have
been limited.
0%
20%
40%
60%
80%
0
250
500
750
1000
1250
1500in
th
. h
a
Target CCA Achieved CCA % achievement
Page | 323
Financial Progress:
As per data shared by PMKSY-HKKP wing, DoWR, RD&GR, as on June 2020, out of the targeted
expenditure of Rs. 18,736 Cr., around Rs. 5,064 (i.e. 27% of target) has been incurred. While out
of the targeted CA of Rs. 8,301 Cr., the centre has released around Rs. 2,653 Cr. (i.e. 32% of
target). Thus, the overall financial progress of 27% is commensurate with the overall physical
progress (under structural interventions) of 31%.
A state-wise comparison of the physical and financial progresses is illustrated in the figure below:
Figure 31: CADWM – comparison of physical and financial progresses
As evident from the above figure, states like Jammu & Kashmir, Karnataka and Assam has
achieved higher physical progresses compared to the expenses incurred; while states like Goa
have incurred higher expenses compared to their physical progresses.
0% 10% 20% 30% 40% 50% 60% 70% 80%
Jammu & Kashmir
Karnataka
Assam
Manipur
Madhya Pradesh
Bihar
Maharashtra
Rajasthan
Telangana
Odisha
Kerala
Gujarat
Goa
Physical Progress Financial Progress
Page | 324
Performance on REESI+E framework
Table 34: CADWM – performance evaluation using REESIE framework
Parameter Findings from research
Relevance Secondary:
• The main objectives of the CADWM scheme under PMKSY-HKKP
are:
o utilization of IPC soon after its creation
o improve water use efficiency
o increase in agriculture production and productivity
o ensure sustainability in the irrigated agriculture through
Participatory Irrigation Management
• Thus, the implementation of the scheme is envisaged to address the
following sustainable development goals and national priorities:
o SDG Goal 2 – hunger
o SDG Goal 6 – clean water and sanitation
o SDG Goal 10 – reduced inequalities
o The national priority of doubling farmers’ income by 2022
• The successful implementation of the scheme would help to mitigate
the issue of widening IPC-IPU gap in India: as per reported statistics
(in 2012), out of the Ultimate Irrigation Potential (UIP) of 140 mha in
India, around 113 mha of irrigation potential has already been created
(IPC); however only 89 mha of this IPU can be utilized.
• Some of the major causes contributing to this IPC-IPU gap, as pointed
by various previous studies, are listed below:
o Non-completion and poor maintenance of distributary
networks
o Inadequate maintenance of irrigation structures leading to
high conveyance losses
o Poor-efficiency of on-farm applications including traditional
methods of farming
o Crop pattern i.e. increasing shift to water-intensive crops
Page | 325
Parameter Findings from research
• The completion of CADWM works (to be implemented in pari-passu
with 99 Priority AIBP projects) is expected to address some of these
challenges by building last-mile connectivity, increasing field
conveyance efficiency, proper water management and capacity
building of cultivators. This is underlined by a host of studies including
Dr. Mihir Shah’s article ‘Water: Towards a Paradigm Shift in the
Twelfth Plan’ which points to the importance of planning from
‘reservoir to farm gate’ and urgent need for development of
command area development (CAD works).
Primary:
• Discussions with the key informants like Secretary (DoWR,RD&GR),
Directors (Monitoring & Appraisal) CWC regional offices, Chief
Engineers, Superintending Engineers and equivalents from State
Government departments provided the following insights in relation
to relevance:
o The completion of CADWM works is extremely pertinent in
establishing the last mile connectivity for major and medium
irrigation projects
o Lining of field channels, correction of system deficiencies and
reclamation of water-logged areas hold the key to improving
on-farm efficiency
o Formation of WUAs and hand-holding the cultivators through
specialized agencies are necessary steps to bring change in
cropping pattern and restoring equity in water distribution
o Adoption of micro-irrigation will assist in extending the
command area coverage
o As forward looking measures, several reforms similar in the
lines of Incentivization Scheme for bridging Irrigation Gap
(ISBIG) scheme were suggested to expand the scheme
scope; some of which are listed below:

Page | 326
Parameter Findings from research
▪ Increased convergence with the extant micro-
irrigation scheme of Ministry of Agriculture and
Farmer’s Welfare to facilitate procurement and
installation of micro-irrigation equipment at farmer’s
end
▪ Provision enabling Installation of solar power system
for micro-irrigation to cut down on the running
expenses
▪ Provision for taking wastewater re-use projects on
pilot basis
▪ Incorporation of conjunctive use of groundwater like
components of groundwater development (dug wells/
tube wells/ farm ponds) to ensure assured water
supply in lean monsoon periods
▪ Provision for implementation of canal automation
system from the farm end and upward up to the
distributaries or branch canals
▪ Provisions for strengthening capacities of existing
WALMIs and establishment of WALMIs in states
(where WALMIs are not existing)
Inference:
• The implementation of CADWM works pari-passu with the 99 AIBP
Priority projects should definitely contribute to improvement of IPC-
IPU gap for these projects. It should also help to facilitate gradual shift
towards Participatory Irrigation Management. As forward looking
measures, several of the additional intervention areas suggested
under the ISBIG may be incorporated in the CADWM scheme.
The CADWM scheme under PMKSY-HKKP is thus found to be quite relevant
in containing the IPC-IPU gap and addressing the SDG goals and national
priorities.

Page | 327
Parameter Findings from research
Effectiveness Secondary:
Scheme design
• Institutional structure: Under the non-structural interventions, the
CADWM guidelines suggest selection of social facilitators (from an
empanelled list of suitable agencies/ institutes/ consultant) for each
of the 99 projects for providing support to the WUAs, while the
structural interventions are to be implemented by the respective CAD
department of each state. A Project Implementation Review
Committee shall review the implementation of both the interventions
on zonal basis two times in a year.
Scheme implementation
• Physical Progress (structural interventions):
o As on June 2020, 14 lakh ha (31%) CCA was achieved against
a target CCA of 45 lakh ha (structural interventions) under
PMKSY-CADWM. Out of these, physical progress in 8 states
(out of 18 selected states for implementation) viz. Andhra
Pradesh, Chhattisgarh, Goa, Jharkhand, Kerala, Punjab,
Telangana and Uttar Pradesh is almost nil or below 10%. As
per the CADWM-MIS dashboard, accessed on 8th July 2020,
physical progress for 55 out of 88 projects is between 0-10%
of the targeted CCA.
o Though many of the contributing issues for poor performance
vary across states, some of the common issues are
summarized below. This is based on the 6th
PIRC (February
2020) Progress Review Presentations MOM:
# Contributing issues
No of states
reporting issue
Examples
1. Absence of hydraulic
connectivity up to outlet 9
AP, Gujarat,
Jharkhand,
Kerala
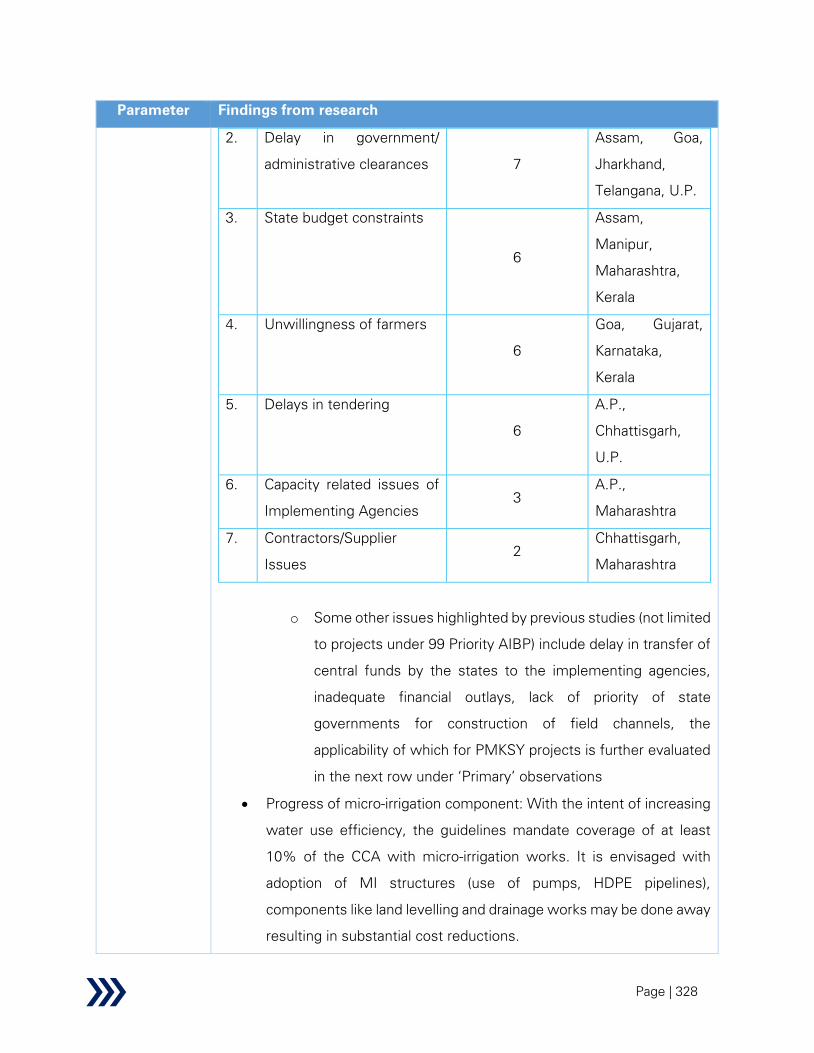
Page | 328
Parameter Findings from research
2. Delay in government/
administrative clearances 7
Assam, Goa,
Jharkhand,
Telangana, U.P.
3. State budget constraints
6
Assam,
Manipur,
Maharashtra,
Kerala
4. Unwillingness of farmers
6
Goa, Gujarat,
Karnataka,
Kerala
5. Delays in tendering
6
A.P.,
Chhattisgarh,
U.P.
6. Capacity related issues of
Implementing Agencies
3
A.P.,
Maharashtra
7. Contractors/Supplier
Issues
2
Chhattisgarh,
Maharashtra
o Some other issues highlighted by previous studies (not limited
to projects under 99 Priority AIBP) include delay in transfer of
central funds by the states to the implementing agencies,
inadequate financial outlays, lack of priority of state
governments for construction of field channels, the
applicability of which for PMKSY projects is further evaluated
in the next row under ‘Primary’ observations
• Progress of micro-irrigation component: With the intent of increasing
water use efficiency, the guidelines mandate coverage of at least
10% of the CCA with micro-irrigation works. It is envisaged with
adoption of MI structures (use of pumps, HDPE pipelines),
components like land levelling and drainage works may be done away
resulting in substantial cost reductions.

Page | 329
Parameter Findings from research
As per the 6th
PIRC (February 2020) Progress Review Presentation,
the progress in all states under micro-irrigation component is nil or
almost nil (i.e. below 2% of target) except Assam (38.5% of target),
J&K (50.25%), Maharashtra (9.24%) and Bihar (6.16%). The overall
progress under micro-irrigation is only 3.1% of the total target.
• Holistic implementation of CADWM scheme: In reference to previous
CAD schemes, the Report of the Working Group on MMI and
CADWM for the XII Five Year Plan (2012-2017) pointed to ‘lack of
holistic implementation of Programme’ adding that ‘programme is
implemented by constructing only the field channels so much so that
the construction of field channel only is construed as CADWM
programme’. However, whether validity of such statement in relation
to PMKSY-CADWM still holds is further tested in the next row under
‘Primary’ observations.
• Physical Progress (non-structural interventions):
o As on October 2019, 6,981 WUAs i.e. 51% of the targeted
13,734115
WUAs have been created under the CADWM
scheme. Though most of the states have made notable
progresses in terms of creation of WUA compared to their
physical progress, yet as per the MOM of 6th
PIRC
Presentation (February 2020), only 17% of the WUAs have
been handed over infrastructural grants while only 34% of
them have been handed over the assets. It may be noted that
in Assam and Rajasthan, despite considerable progress in
WUA creation, neither the infrastructural grants nor the
handing over assets have taken place.
o In the past, various organizations/ committee like DMEO NITI
Aayog (2015) and the Working Group on Major & Medium
Irrigation and CAD (2011) have pointed to the ineffectiveness
of many of the WUAs, terming them as ‘paper WUAs’. The
same has been the echoed by the NITI Aayog CWMI Index

Page | 330
Parameter Findings from research
2019, which states that despite enactment of PIM laws by
most of the states, the overall level of involvement has
decreased.
o Some of the other issues highlighted by various studies like
DMEO NITI Aayog’s ‘Evaluation Study’s ‘Evaluation Study on
CADWM’ in 2015 include lack of capacity building initiatives
for WUAs and non-involvement of farmers in the planning
stage (note observations made in these past studies pertain
to pre-PMKSY projects).
Case Study: Effective function of WUAs ensured through
strategic community mobilization plan (Satak Tank, Khargone
district, Madhya Pradesh)
Action for Social Advancement (ASA), an NGO, was appointed to
facilitate capacity building of the WUAs for the Satak minor irrigation
scheme in Khargone district. The key objective was to ensure
effective functioning of the Satak WUAs and generate adequate funds
for the canal restoration process through community collection drive.
Some of the steps taken by ASA to ensure the same are summarized
below:
a. Community mobilization through awareness campaigns:
• ASA held series of awareness campaigns using village
wise quiz competitions, local folk media (Kalki-turra)
and wall paintings. 36 community volunteers were
trained as Jal Praharis, who also helped later in the
water distribution process. Baseline surveys were
conducted to understand the needs of the farmers and
also agriculture support services were provided.
b. Capacity building initiatives:
• A training module was prepared by ASA – in the 1st
phase emphasis was put on communicating the rights,

Page | 331
Parameter Findings from research
role and responsibilities of the WUA and its members
while in the 2nd
phase, attention was focussed on
developing the institutional capacity of both the WUA
and WRD through training programmes on water
distribution management, gender sensitization and
dispute resolution. Training were conducted on social
audit.
• Exposure visits were conducted to neighbouring states
c. Community contribution collection drive:
• To ensure a transparent collection process, a
formalized instrument of agreement ‘anshdaan
anuband’ was introduced between the WUA and the
users. Contribution receipts were given to the payees
and collected fund was deposited in the common bank
account
• To encourage more collection, letters of appreciation
were issued to the payees and printed posters were
pasted at the gram choupal
d. Gender mainstreaming
• WUA voting rights were extended to spouses of the
existing WUA members through necessary
amendment in the PIM act.
• Extensive awareness campaigns were conducted to
sensitize the villages about women participation and
franchise rights
• Self-help groups were set up to ensure women
empowerment
Outcome:
• Community contribution by farmers touched 20% of the cost
of physical works which exceed the 10% target set by the

Page | 332
Parameter Findings from research
authority (ICEF). Such contributions for canal restoration also
helped to create a sense of ownership among farmers.
• Increase in irrigation rotation frequencies resulted in 20-30%
improvement in wheat production (in Balkhar village), increase
in jobs for agricultural laborers with greater adoption of labour
intensive commercial crops like cotton and chilli which greatly
helped the landless labourers
• Around 73% of spouses of landowners casted vote in the last
reported WUA elections
• Social audits were conducted in every 6 months
(Reference: Action for Social Advancement, “ICEF-M.P. WRD Project
on Participatory Restoration and Management of Irrigation Systems by
Water Users Associations in M.P.”)
Case Study: Ensuring involvement of WUAs through local
leadership and assets handover, (Ozhar Water User Societies,
Nashik, Maharashtra in command area of Waghad medium
irrigation project)
Some of the key features are summarized below:
• Initial handholding by local leadership: 3 WUAs set up by
Samaj Parivartan Kendra with support from SOPPECOM in
1990s: Banganga, Mahatma Phule and Jay Yogeshwar.
• Asset handover: One of the few earlier WUAs, where
complete project has been handed over to the WUAs
• Provision for conjunctive water use: Constructed water
harvesting structures like check dams on the nullas and
streams flowing nearby and stored unused quota of canal
water which helped in recharging wells
• To ensure conjunctive use of surface water and groundwater,
water charges were imposed on the farmers for using well

Page | 333
Parameter Findings from research
water and a simple assessment mechanism for estimating
well water level and charge was adopted
All these concerted efforts resulted in substantial increase in irrigation
efficiency, irrigated area and fees collection efficiency
(reference: IWMI TATA Water Policy Research, “Situational Analysis
of WUAs in Maharashtra”)
Case Study: Enhancing community involvement to ensure
effective functioning of the WUAs (Chappi Tank, Rajgarh)
In order to address the deteriorating maintenances and acute water
shortages in the Chappi medium irrigation scheme, the MP-WRD
appointed an NGO Bhartiya Agro Industries Foundation (BAIF) to
operationalize the PIM. Implementation strategies adopted by BAIF
are summarized below:
Community mobilization process: To gain credibility among the
community, initially BAIF assisted the community with livestock
development and other food security related government programs.
Setting up a transparent mechanism for fund collection: To lend
more legitimacy and acceptance of the collection drive, irrigation
officials were roped in the collection process. Community contribution
were directly transferred to the account of the executive engineer and
receipts were provided to the payees. A separate sub-committee viz
Nirman Samiti was set up to channelize all the funds and supervise
the physical work.
Setting up a water distribution system: WUA took decision to give
priority to tail ends villages and release 2 rotations of water. An
equitable water distribution system was worked out by the WUA to
ensure optimum water utilization and reduce community conflicts.

Page | 334
Parameter Findings from research
Outcome
• Increase in irrigated area and agricultural productivity was
reported – farmers have shifted from crops like maize, jowar
and local cotton to other diversified crops like gram, coriander,
mustard and soya bean.
• Effective functioning of the WUAs imparted a sense of
ownership among farmers and faster resolution of grievances.
• Community sensitization about water conservation and
management led to reduction in water loss to 5-10% from
40%
• Some tail end villages were reported to get access to canal
water for the first time
(Reference: Action for Social Advancement, “ICEF-M.P. WRD Project
on Participatory Restoration and Management of Irrigation Systems by
Water Users Associations in M.P.”)
Monitoring and evaluation
• IPC-IPU assessment: Various studies including an IIM Ahmedabad
Study initiated by the MoWR (Samar K Dutta et al., 2008) pointed that
both IPC and IPU are dynamic figures dependant on a number of
factors like resource reliability, wear and tear of the infrastructure,
cropping pattern, etc.; thus simply aggregating the same without
normalization (e.g. without allowing for discounting factors) is
methodologically not sound. The study recommends a number of
steps like reconciliation of IPC and IPU data by standing committees
starting from district level, inter-departmental co-ordination for data
collection and re-defining the concepts of IPC and IPU.
This was again echoed by a NITI Aayog Study (in 2015), asserting the
imminent need for ‘more reliable and accurate’ system for
Page | 335
Parameter Findings from research
assessment of IPC-IPU with active co-ordination of statistical
organization in each state.
• The Output Outcome Framework prepared by the Ministry of Finance
has suggested the following outcome indicators:
o Utilization of irrigation potential in an additional culturable
command area
o Command area covered for PIM through WUA formation
o Additional irrigation potential created
• However, the CADWM-MIS tracker currently does not record any
figure for ‘additional irrigation potential created’; the tracker currently
provides figures in respect of physical progress (in terms of CCA
covered), financial progress and other non-structural interventions.
• The CADWM MIS dashboard has been a significant step in ensuring
accountability and data transparency. Though the updates in relation
to structural interventions are observed to be regular, yet some
deficiencies in update of non-structural interventions have been
noted which are further detailed out in the issues section.
• Under the CAD implementation support and review process, the
guideline has suggested the following:
o Periodic review of the structural components by the regional
CWC cells
o Under non-structural interventions, social facilitators shall
submit monthly progress report to the social agencies/
institute and PIRC
o PIRC to review both the structural and non-structural
interventions on a yearly basis.
Primary:
Scheme design
• Though the CAD guidelines suggested ‘continuous support’ of the
Social Facilitators, yet during primary survey the following
deficiencies were observed:
Page | 336
Parameter Findings from research
o In almost all states (viz Assam, Bihar, Karnataka, Madhya
Pradesh, Maharashtra barring some exceptions like Lower
Panzara and Dhom Balkaawadi projects, Manipur and
Rajasthan), the involvement of social facilitators under
CADWM scheme was reported to be either limited or non-
existent owing to want of funds. Majority of the informants
across the states were found to be not much familiar with the
provision and concept of ‘social facilitator’. However, some of
the states like Assam, Bihar, Karnataka and Madhya Pradesh
confirmed periodic training of cultivators at regional WALMIs/
agricultural institutes. Among the four afore-mentioned
states, Karnataka was observed to be most effective in
conducting regular training through irrigation officials, WALMI
and Krishi Vigyan Kendra (KVKs) in relation to functionality of
WUAs, maintenance of water courses and micro-irrigation
structures (though inadequacy of training reported in some
projects like Upper Tunga); while in Madhya Pradesh the WUA
chairmen were reported to undergo training at regional
WALMIs after election while exposure visits are arranged for
farmers to other states like Maharashtra and Gujarat (it may
be noted here that though conduct of WUA chairmen training
was confirmed by the beneficiaries yet conduct of exposure
visits for farmers has not been validated by them). However,
baring these exceptions, in most of the other states trainings
were observed to be sporadic, non-institutional and limited to
only agricultural aspects like cropping pattern, seeds
selection, thus underlying the imminent need for a structured
institutional training programmes mandated in the CADWM
guidelines.
It is to be noted that in the 4th
PIRC meeting (February 2019)
all states have been suggested to involve the empanelled

Page | 337
Parameter Findings from research
NGOs under MoWR’s National Water Mission. The delay in
onboarding of agencies/ NGOs as ‘social facilitators’ has been
attributed to the following causes:
▪ in many of the projects, either WUA formation has not
commenced or been recently undertaken; hence
social facilitators have not been appointed
▪ registered WUAs are not functional/ effective
handover of assets have not taken place
▪ non-receipt of central funds for conducting trainings
(as reported in Champamati and Dhansiri projects in
Assam), inadequate grants (as reported in Durgawati
project in Bihar and Upper Tunga project in Karnataka)
▪ non-availability of any local competent agency/ NGO
Scheme implementation
• Structural interventions: In line with the issues highlighted by the 6th
PIRC meeting MOM, some of the major issues pointed by the
informants during primary survey are summarized below (without any
order of priority):
o Delay in IPC creation: Though the AIBP guidelines mandate
pari-passu implementation of CADWM provisions, yet various
constraints (like land acquisition, R&R issues, etc.) delayed
the completion of some of the main/ branch/ distributaries
canals and without any hydraulic connectivity to the outlets,
the CAD officials were either unable to plan/ conduct the
survey for field courses (as in Andhra Pradesh) or cultivators
were un-willing to part with their lands (as in Assam, Manipur
and Karnataka) without visibility of any realizable benefits
o State budget constraints: In many states like Assam and
Manipur, states failed to match their share for central
releases; however the same has been resolved last year
through loans from NABARD (under LTIF).

Page | 338
Parameter Findings from research
o Small window for execution of works: Owing to standing
crops during cropping season or field preparation during pre-
harvesting months, the actual working period available for
execution of works is limited to only 3-4 months in a year as
pointed by informants in many states like Bihar, Maharashtra
and Manipur. Thus, simultaneous mobilization of resources by
contractors (considering the huge span of command area),
timely release of funds by the government become critical in
execution of the field works.
o Delay in transfer of central grants (in Assam) and transfer of
grants by state government to implementing agencies (in
Assam, in Bihar owing to technical issues related to
Comprehensive Financial Management System and in
Rajasthan) to the tune of 2-3 months to 12-18 months resulted
in delay in mobilizing contractors/ resources during the limited
execution period (which is of 3-4 months duration in a year
owing to standing crops in cultivator’s field)
• Progress under micro-irrigation (MI) target has been remarkably low
almost across all the states. The reason being un-willingness of the
farmers to adopt such techniques, the causes of which are stated
below:
o Lack of awareness among cultivators regarding micro-
irrigation (as reported in Bihar, Maharashtra, Madya Pradesh
and Rajasthan). During focus group discussions (FGD),
cultivators in command area of Champamati irrigation project
(Khargaon village, Kokrajhar district, Assam) confirmed not a
single training being conducted by government in relation to
micro-irrigation techniques; cultivators expressed reluctance
to adopt drips and sprinkler without proper trainings.
o MI is not conducive to water-intensive crops like paddy and
its usage is restricted to mostly horticulture crops and

Page | 339
Parameter Findings from research
vegetables. With access to assured irrigation, the cultivators,
particularly those in the head region, are shifting to either
water-intensive crops (in states like Karnataka and Rajasthan)
or already cultivating paddy and/ sugarcane (as in Assam,
Bihar, Rajasthan and Punjab) and are unwilling to change their
cropping patterns. Also, in states like Assam and Uttar
Pradesh, with low land-holdings and adequate water supply
(unlike some western states), cultivators are reluctant to shift
from their traditional crop (like paddy) and adopt expensive
water-efficient technologies.
During household survey interviews with 225 cultivators in
five states of Assam, Karnataka, Maharashtra, Rajasthan and
Manipur, top three reasons cited by the farmers for cultivating
water-intensive crops like paddy, cotton, sugarcane, wheat
and soya are ‘demand in more’ (selected by 40% of the
respondents), ‘this is a traditional practice’ (selected by 27%)
and ‘there is no scarcity of water’ (selected by 23%). Thus,
without adequate economic incentives and awareness
trainings, farmers may be reluctant to shift away from their
traditional practices and adopt water-efficient practices in
water abundant regions particularly when such crops like
paddy are in higher demand. It may be noted here that in NITI
Aayog’s Working Group Report (2018) “Demand and Supply
Projections Towards 2033: Crops, Livestock, Fisheries and
Agricultural Inputs”, it was pointed that 94% of the total
coverage under micro-irrigation is accounted by only 9 states
viz Andhra Pradesh, Chhattisgarh, Gujarat, Haryana,
Karnataka, Maharashtra, Madhya Pradesh, Rajasthan and
Tamil Nadu, which notably are some of the states facing high
water scarcity. These was also validated during household
interviews with 255 cultivators in Andhra Pradesh

Page | 340
Parameter Findings from research
(Musurumulli and Pushkara projects), Assam (Champamati
major irrigation project), Karnataka (Sri Rameswara),
Maharashtra (Dhom Balkaawadi and Tarali projects), Manipur
(Dolaithabi barrage), Punjab (mod. of Kotla canal) and
Rajasthan (Narmada Canal Project) under AIBP scheme,
where it was observed that MI adoption was much higher in
some of the aforementioned 9 states compared to water
abundant states – MI adoption rates in Andhra Pradesh (40%
of 94 respondents), Karnataka (12% of 26 respondents),
Rajasthan (67% of 18 respondents) was much higher
compared to water abundant states like Assam (9% of 23
respondents) and Manipur (0% of 46 respondents). Such
patterns were also observed during the household interviews
in head and tail reaches of some of the projects in Andhra
Pradesh and Karnataka; adoption of MI was found to be
indirectly related to water abundance as highlighted in the
table below:
% cultivators
reporting increase
in water access
after AIBP
% cultivators
using any MI
equipment
Musurumulli project (Andhra Pradesh)
Head reaches 91% (n=23) 22% (n=23)
Tail reaches 64% (n=25) 40% (n=25)
Sri Rameswara project (Karnataka)
Head reaches 40% (n=13) 0% (n=13)
Tail reaches 38% (n=13) 23% (n=13)
The above insights imply that though willingness of farmers
to adopt such techniques may be lower in areas with
traditional cropping practices and having adequate access to
water, yet it may be easily promoted in areas suffering from

Page | 341
Parameter Findings from research
water shortages (like tail/ idle reaches) which have shown a
higher adoption rate for such water-efficient techniques. E.g.
in Bansagar project in Madhya Pradesh, MI adoption is being
encouraged in areas at higher elevation or outside direct canal
reaches.
o Fragmented land and advanced stage of project led the
irrigation officials to scrap the MI proposal; since adoption of
MI structures at such advanced stages would led to
significant cost escalations (as reported in Sri Rameswara LIS,
Bhima and Karanja projects in Karnataka) thus exceeding the
prescribed cost norms under the scheme guidelines
o Creation of MI structures encapsulates construction of small
diggies/ sumps/ tanks which occupy land; thus, cultivators
with small land holding are unwilling to adopt such techniques
o Unless the cultivators procure drips and sprinklers (via
government assistance/ under subsidies provided by the
extant Per Drop More Crop scheme of MoA&FW), the sumps/
pumps remain un-utilized which further de-motivates them
o Cultivators are un-willing to commit the initial capex cost and
the recurring cost (for electricity, etc.) (as reported in Bihar,
Madhya Pradesh and Maharashtra)
o Non-availability of canal water in other seasons (say summer
and Rabi) dissuades the farmer to adopt such expensive
mechanisms (as reported in Bihar and Madhya Pradesh). E.g.
in Durgawati project in Bihar, it was reported that farmers are
unwilling to adopt any water-efficient technologies during
Kharif season when adequate rain and canal water are
available; again in the absence of any water sources during
Rabi season and with no prospect for cultivation, farmers are
apprehensive of investing in any new farming technologies.
Thus, it was suggested that access to alternate water sources
Page | 342
Parameter Findings from research
in off/ dry/ Rabi seasons may persuade the farmers to explore
adoption of such technologies.
o In places with sandy and loamy soil, there are instances of MI
structures getting choked, which further dissuaded the
cultivators (as reported in Gang canal in Rajasthan)
o Lack of awareness among the irrigation officials regarding
micro-irrigation techniques, which is further complicated by
staff shortage at field offices thus leading to low priority to
execution of such components
o Non-receipt of funds under such component (as reported in
Assam)
• The convergence with other schemes like MGNREGA was found to
be minimal. Almost all states attributed the low convergence with
MGNREGA to the extant 40:60 material-labour shares in MGNREGA
which precludes taking up CADWM works as CAD works require
around 70-80% material component. Also, it is reported that CADWM
works require skilled manpower which are generally provided by the
contractors engaged, which thus obviates the need to seek services
under MGNREGA which generally offers services of un-skilled
labourers.
• Except micro-irrigation component, more or less holistic
implementation of all components of structural interventions have
been observed, with some scope for improvement in some of the
components like ‘reclamation of water-logged areas.” Type of
activities undertaken (along with percentages of cultivators
confirming the same in their fields) as reported during primary survey
with 225 cultivators in Assam, Karnataka, Manipur, Maharashtra and
Rajasthan are stated below:
o Construction of field channels – 40%
o Construction of intermediate and link drains – 33%
Page | 343
Parameter Findings from research
o Reclamation of water-logged areas/ drainage – 16% (note a
relatively lower progress percentage may be attributed to the
fact that water-logging being not significant in some projects,
this component has not been kept in the proposals submitted
by the states as they don’t face any such issues). However,
there is a scope of further improving the implementation of
the water-logging initiatives and revisiting the proposals
(where this component has not been initially considered),
considering that during the household interviews with 225
cultivators in five states, around 40% of the respondents still
complained about water-logging issues in their fields.Land
levelling and shaping – 15%
o Re-alignment of field boundaries/ consolidation of holdings –
6%. Among the evaluated states, Karnataka reported
substantial progress under this component with a number of
initiatives being undertaken in relation to reclamation of land
facing surface and sub-surface damages.
o Correction of system deficiencies – 7% (lower percentage
may be attributed to the recent establishment of hydraulic
connections)
• Non-structural interventions: Though WUA formation and handing
over assets are still going on in many of the projects, yet even in
projects where substantial number of WUAs have been registered,
actual functioning of the WUAs are noted to be limited barring some
exceptions in the states like Karnataka, Maharashtra and Madhya
Pradesh (notably, in these later two states, many of the projects have
successful history of functional WUAs prior to inception of PMKSY
schemes). This is in line with the apprehensions expressed by many
of the previous studies regarding non-functional or ‘paper WUAs’.
Some of the contributing issues are listed below:
Page | 344
Parameter Findings from research
o Owing to non-completion of CAD works, WUA’s involvement
remained mostly mutant (as reported in Borolia and
Champamati projects in Assam)
o Poor competency level of cultivators coupled with lack of
training have rendered most of the WUA non-effective. This
is further complicated by lack of any other financial incentives
along with lack of motivation in areas with adequate access
to canal water (as reported in Bhima and Karanja projects in
Karnataka)
o Non-delegation of any financial powers (say collection of fees)
to the WUAs (as reported in Durgawati project Bihar). At
present, the onus of fees collection still lies with the irrigation/
revenue officials in most of the evaluated projects (viz
irrigation officials in Dhansiri project in Assam, Durgawati
project in Bihar, Bariyarpur and Singpur projects in Madhya
Pradesh, Bawanthadi project in Maharashtra, revenue officials
in Bhima and Karanja projects in Karnataka, etc.).
o Non-transfer of infrastructure and/ or functional grants (as
reported in Durgawati project in Bihar)
o Lack of local leadership (as reported in Tarali and Dhom
Balkaawadi projects in Maharashtra); often competent local
organizations are disinterested to participate owing to low
financial returns. It may be noted that during KIIs, various
stakeholders stressed the importance of local level leadership
for ensuring success of the WUAs. Such observations are also
validated by secondary findings – notable examples are the
prominent role taken by Bapu Upadhye and Bharat Khawale
and their NGO ‘Samaj Pragati Kendra’ along with senior
researchers of SOPPEKOM in setting up Ozhar WUAs in
Nashik; initiatives taken by Aga Khan Rural Support Program
and Development Support Centre to catalyse WUAs in Gujarat

Page | 345
Parameter Findings from research
(Tushar Shah, IWMI, “Past, Present and the Future of Canal
Irrigation in India”).
o Non-willingness of cultivators to take over the maintenance of
the assets (as reported in Manipur)
o Non-willing of cultivators to take ownership of the assets
owing to unreliability of water supply at the outlets (as
reported in Maharashtra). Also, during household interviews
with 225 cultivators in Assam (Champamati major irrigation
project), Karnataka (Sri Rameswara irrigation project), Manipur
(Dolaithabi barrage), Maharashtra (Dhom Balkaawadi project)
and Rajasthan (Gang canal), around 56% of the cultivators
confirmed non-availability of adequate water at the supply
outlets throughout the year (barring Sri Rameswara project
where the figure is 2%, other projects recorded more than
65%)
o Other issues include lack of involvement of the agriculture
department. E.g. in some states like Maharashtra, the
agricultural department was reported to be unaware of even
presence of WUAs in some of the projects. Significant scope
lies in involving the WUAs in other agriculture schemes,
ensuring timely receipt of fertilizers, seeds and subsidy for
farm machineries.
• During household interviews with 225 cultivators in Assam
(Champamati major irrigation project), Karnataka (Sri Rameswara
irrigation project), Manipur (Dolaithabi barrage), Maharashtra (Dhom
Balkaawadi project) and Rajasthan (Gang canal), only 25%
respondents confirmed existence of WUAs in the command areas
This is particularly concerning considering that as per CADWM MIS
dashboard, some of the above-mentioned projects reported
existence of a substantial number of WUAs – 25 WUAs in
Page | 346
Parameter Findings from research
Champamati (Assam), 19 in Sri Rameswara (Karnataka), 54114
in
Dhom Balkaawadi (Maharashtra) and 36 in Gang canal (mod of Gang
Canal);
• Some of the states (like Bihar, Karnataka and Madhya Pradesh)
confirmed regular trainings of cultivators, yet the awareness of ‘social
facilitator’ as a concept was found to be extremely poor among all the
state implementing agencies. Though some projects like Dhom
Balkaawadi in Maharashtra confirmed presence of specialized
agencies like Suprabha Pratishtan, Pune and G.P. Gahanekar, Pune,
yet the fact that none of the sampled cultivators in the command area
confirmed receiving any training, raise question on the actual
performance of the social facilitators. Also, states like Assam cited
non-receipt of adequate funds (as on date) for conducting trainings.
During household interviews with 225 cultivators in Assam
(Champamati major irrigation project), Karnataka (Sri Rameswara
irrigation project), Manipur (Dolaithabi barrage), Maharashtra (Dhom
Balkaawadi project) and Rajasthan (Gang canal), only 10% of the
respondents confirmed attending any trainings in last three years
with Karnataka alone contributing to 70% of the total trainings held.
Topics of the training included mainly water management, crop
management and maintenance of irrigation systems. It is concerning
to note that majority of the trainings were conducted by the irrigation
officials themselves, with only a few being undertaken by specialized
agencies/ WALMIs/ regional agricultural institutes. Also, around 48%
of the trainees reported receiving training more than 2 years ago and
around 70% of the trainees confirmed attending less than 2 trainings
in last 3 years. This points to the imminent need to have a structured
institutional setup for conducting trainings to ensure both quality and
periodicity of the trainings.
114 As reported by state project authorities

Page | 347
Parameter Findings from research
• Barring some exceptions (like Durgawati project in Bihar), almost all
informants across states pointed to staff crunch as the major
contributor to delay in execution (since no land acquisition is done
under this scheme, one-to-one relationship with the cultivators need
to be established to get consent for construction of water courses in
their field), deficiency in water management (particularly in tail ends)
and poor billing and collection efficiencies. During KIIs, staff
shortages were reported in the following projects by the
implementing departments:
o Dhansiri (Assam): shortage of field staff
o WALMI (Bihar): current strength is only 20% of that of the
sanctioned staff
o Bhima, Karanja, Upper Tunga (Karnataka): shortage of staff
reported to affect land reclamation survey works, co-
ordination with water user co-operatives
o Bansagar (Madhya Pradesh): current strength is only 25% of
that of the sanctioned staff, staff shortage affecting patrolling
o Tarali and Dhom Balkaawadi (Maharashtra): staff shortages
hampering water management and revenue assessment and
fees collection, current strength reported to be only 25% of
that of the sanctioned staff in Tarali
o Upper Penganga (Maharashtra): current strength is only 20%
of that of the sanctioned staff
o Nandur Madhmeshwar (Maharashtra): current strength is only
40% of that of the sanctioned staff
o Lower Panzara: staff shortages affecting measurement of
water discharges, revenue collection and billing
o Thoubal and Dolaithabi: staff shortages affecting execution of
CADWM works

Page | 348
Parameter Findings from research
o Gang canal (Rajasthan); vacancy reported for all assistant and
junior engineer posts; shortage of drivers and vehicles also
reported
• Though all the informants confirmed that completion of CADWM
works resulted in greater access to canal water particularly in tail end
areas, however the true potential benefits of the scheme get
somewhat offset by poor irrigation practices like flood irrigation and
shift toward water-intensive crops in the head reaches of the canals,
details for a few of the projects are summarized below:
o Shift towards water intensive crops like sugarcane and paddy
in the upper reaches of the projects like (Bhima, Karanja and
Upper Tunga projects in Karnataka) though most of these
projects are being designed for semi-dry crops
o Diversion of water for drinking water purposes in Upper Tunga
project in Karnataka
o Shortages due to water sharing with other states, e.g. water
from Karanja project in Karnataka is shared with Maharashtra
and Andhra Pradesh,
o Obstruction of water flow by head reaches farmers as
reported in Bariyarpur and Singpur projects in Madhya
Pradesh
o System deficiencies and inadequate maintenance as reported
in Dhansiri project in Assam
Monitoring and evaluation
• During interactions with informants, it is understood currently there
is no defined/ standard guidelines for tracking of IPU. Stakeholders
calculate physical progress based on coverage of field channels/
structural interventions, which is then aggregated at project levels.
Inference:
Scheme design
Page | 349
Parameter Findings from research
• Many of the states have made considerable progress in terms of
WUA creation, however there is an unmet need for proper hand-
holding of the WUAs. Particularly notable is the absence of any
dedicated social facilitator in most of the states (reasons being lack
of awareness, want of funds, etc.)
Scheme implementation
• The scheme has made considerable progress in spite of various
delays (not directly attributable to the implementing agencies) like
non-establishment of hydraulic connectivity to outlets, delay in
release of state grants and contractor issues. However, at the current
progress rate (with achievement of only 31% of structural
interventions target as on June 2020), the desired CCA coverage
would take several years to be achieved. There is a scope to expedite
the execution rate by addressing the administrative issues through
timely transfer of funds to implementing agencies and deployment of
adequate staff and resources.
• Also, it may be noted that progress under components like micro-
irrigation has been extremely poor across all states even after 3-4
years of scheme inception.
• Apart from the MI component and ‘reclamation of water logged
areas’ components, more or less a holistic implementation of other
structural interventions has been observed.
• There is a considerable scope for improvement in the non-structural
interventions like ensuring proper functioning of the WUAs through
proper delegation of powers and capacity building initiatives, which
are critical for the success and sustainability of the scheme.
Monitoring and evaluation
• As advocated by various past studies, correct assessment of IPC and
IPU forms an integral part of measuring the impact of the scheme.
Simply, aggregation of physical coverage under field works may not

Page | 350
Parameter Findings from research
truly reflect the actual IPC and IPU figures which are dependent on
various factors like resource availability, wear and tear of the
structures, maintenance, cropping pattern, climatic conditions, etc.
• Online update of both physical and financial progresses in the MIS
dashboard is a significant positive step by the Ministry in ensuring
accountability and transparency. However there is a significant scope
to improve the MIS further through tracking of all the outcome
indicators mentioned in the Output-Outcome Framework and also
ensuring regular update of the implementation progresses
(particularly non-structural interventions).
Thus, the performance of the scheme in terms of effectiveness is termed as
‘average’.
Efficiency Secondary:
Cost
• The total targeted expenditure for CADWM works in 45.08 lakh ha
CCA is Rs. 18,736 Cr. out of which Rs. 5,064 Cr. (27%) has been
incurred as on June 2020. Of this the targeted CA is Rs. 8,301 Cr. out
of which Rs. 2,653 Cr. (32%) has been disbursed as on June 2020115
.
• As per cost norms in the CADWM guidelines, the total cost for
structural components is capped at Rs. 35,000 per ha., while that for
non-structural interventions is Rs. 5,000 per ha. Also, for calculation
of CA, the guideline has set the ceiling cost for lined channel as Rs.
25,050 per ha.
• In context of lowering costs and better contractor management, the
1st PIRC meeting (2017) suggested to go for large contract packages
(with prior consultation with cultivators) to avoid issues related to
execution limitations of WUAs like attracting large contractors in
115 Date shared by PMKSY-HKKP, DoWR,RD&GR
Page | 351
Parameter Findings from research
WUA’s elected bodies, slow progress in case of small packages, lack
of competitive pricing and absence of mechanization and inferior
quality to that offered by large contractors.
Benefit
• The benefits of the implementation of CAD works have been well-
documented by various past studies, some of which are:
o Improvement in field conveyance efficiency due to
construction and lining of water courses ensured access to
water at tail ends of the command area (particularly during the
drought seasons)
o Establishment of WUAs and water regulation has led to better
water management among the cultivators
o Around 10% to 15% improvement in utilization of irrigation
potential owing to CAD works
o All the above have ultimately contributed to increase in
agricultural productivity and subsequent income level of the
famers
Primary:
Cost
• Inadequate cost norms: the current cost norms (Rs. 25,050 for
construction of lined field channels, laying of underground pipelines,
etc. and Rs. 35,000/ ha overall for structural interventions) specified
in the CADWM guidelines were termed inadequate by the key
stakeholders in Assam, Bihar, Maharashtra, Manipur and Karnataka in
light of the escalation of market rates in the last 3-4 years and higher
schedule of rates in some states compared to others. One of the
fallouts of this constrained budget has been restriction of lining/
concretization of field channels to limited portions of water courses
(say 30% of the total length), which becomes particularly concerning
in the wake of limited durability of ‘kutcha’ field channels. Informants
Page | 352
Parameter Findings from research
in states like Bihar, Madhya Pradesh, Maharashtra and Manipur
pointed to the high propensity of ‘kutcha’ channels of getting easily
damaged owing to movement of tractors and heavy machineries or
flattened by the cultivators during dry seasons or easily dilapidated
due to poor maintenance. However, in some projects in Madhya
Pradesh and Rajasthan (particularly older ones), where old water
courses are already existing, substantial portion of the water courses
have been concretized and both the stakeholders and beneficiaries
from these command areas also vouched for the high durability of
such ‘pucca’ channels.
• In the context of adoption of cost reduction initiatives, use of cheaper
alternatives plastic pipes in place of lined field channels was termed
unadvisable by some of the stakeholders considering the low
durability of such alternatives.
• The informants across states expressed mixed opinions regarding
award of projects to large contractors (through clusters) in place of
small contractors.
Clustering a number of small projects into a large one and awarding
to one large contractor are expected to result in lower costs (achieved
through economics of scale and higher mechanization) and greater
negotiation power for dealing with the recalcitrant land owners
(cultivators). However, blanket adoption of such an approach suffers
from the following pitfalls:
o The large contractors generally outsource their scope of work
to a number of small contractors who have low accountability;
sometimes these small contractors do not have adequate
capacities to execute the works
o Local small contractors have closer relations with the
cultivators and are thus more accountable; also in cases of
recalcitrant cultivators (unwilling to part with their land), local

Page | 353
Parameter Findings from research
contractors leverage their personal relationships to resolve
the same
Benefit
• The positive impact to farmers owing to construction of ‘pucca’ water
channels like improvement in water efficiency, extension in
command reach has been validated by all the key stakeholders.
Particularly noticeable is that in some areas of Assam, Madhya
Pradesh, Maharashtra and Rajasthan, the cultivators themselves
have come forward for construction of water courses after seeing the
benefits in adjacent command areas.
• Some of the reported benefits by the informants are listed below:
o Durgawati project in Bihar and Upper Tunga Project in
Karnataka: horticulture crops and vegetables sown along with
traditional crops like paddy and wheat, increase in
groundwater level resulting greater access to drinking water
through tube wells, increase in livestock feeding
o Bhima and Karanja projects in Karnataka: increase in crop
yields by 35% to 40%, tail end farmers sowing crops for 2
seasons (initially it used to be single season), growth in
agricultural jobs
o Tarali and Dhom Balkaawadi projects in Maharashtra:
considerable increase in IPU, shift from sustenance crops to
commercial crops, increase in agricultural jobs coupled with
decrease in migration, increase in dairy activities due to
availability of green fodder
o Nandur Madhmeshwar project in Maharashtra: shift from rain-
fed crops like jowar, bajra and cotton to cash crops like
sugarcane along with vegetable and other horticulture crops,
CAD works obviated the requirement for lifting of canal water
(and hence the associated electricity/ diesel cost), increase in

Page | 354
Parameter Findings from research
groundwater level ensured well recharging and adequate
drinking water provisions
• During household interviews with 225 cultivators in Assam
(Champamati major irrigation project), Karnataka (Sri Rameswara
irrigation project), Manipur (Dolaithabi barrage), Maharashtra (Dhom
Balkaawadi project) and Rajasthan (Gang canal), around 45% of the
cultivators confirmed increase in irrigated area, while 60% confirmed
increase in crop yield while 14% validated increase in water efficiency
post completion of CADWM works. Also, around 45% of the
respondents confirmed increase in groundwater level (with around
78% and 47% respondents in water scarce states like Karnataka and
Rajasthan respectively confirming such increase).
Inference:
• Revision of the existing cost norms as suggested by many states
need to be further explored in view of the cost escalations in the last
3-4 years and higher schedule of rates in some of the states.
• As expected and documented by the primary and secondary
research, the implementation of CADWM works have immensely
benefited most of the cultivators in terms of agricultural benefits and
other livelihood opportunities.
Thus, the performance of the scheme in terms of efficiency is termed as
‘satisfactory’.
Sustainability Secondary:
• As per the CADWM guidelines, all the assets created below outlets
are not accounted as government assets (the assets are created on
cultivators’ land) and thus the routine maintenance of such assets
shall be the onus of the cultivators/ WUAs; for which the WUAs may
collect fees from the individual collectors. Central/ state government
grants for such purposes are not desired.
• Various studies have pointed out to the existing low fees collection
efficiencies in most of the states. As highlighted in the article by Dr

Page | 355
Parameter Findings from research
Mihir Shah (2013), “Water: Towards a Paradigm Shift in the Twelfth
Plan” the current Irrigation Service Fee (ISF) collection is as low as 2-
8% of the dues.
Regarding fees collection, the IWMI working paper “Malik, R. P. S.;
Prathapar, S. A.; Marwah, M. (2014), Revitalizing canal irrigation:
towards improving cost recovery, Colombo, Sri Lanka: International
Water Management Institute (IWMI)” put forward and validated the
following hypothesis: “cost recovery is likely to be much higher in
areas where WUAs manage the affairs of water allocations, setting
of water tariffs, collection of bills and maintenance of local supply
infrastructure in comparison to those projects/areas where these
roles are being performed by other institutions such as Irrigation
Departments”.
Case Study: Capacity building and handholding by
specialized agencies resulting in high cost recovery (Paliganj
Viratni Krishak Samiti, Bihar)
Key features:
• Handholding in initial stages: Continuous dialogues with
cultivators in the command area of Paliganj distributary
and subsequent hand-holding in the initial few months by
specialized organizations like WALMI, supported by
USAID team, led to the formation of Paliganj Distributary
Famers Committee and Village Level Committees
• Delegation of power: Decisions regarding water
distribution, agricultural activities (like choice of crops) and
collection of fees delegated to the committees
• Increase in recovery: The above two features resulted in
substantial improvement in canal condition, conveyance
efficiency, water availability at canal ends while collection
efficiency improved to 30%- 50%. This is further helped
Page | 356
Parameter Findings from research
by the PIM act in Bihar which allows sharing 70% of the
collected fees with the WUAs. In case of additional
monetary requirements, farmers pay through additional
payment or labour contribution (“Shramadan”).
Case Study: Ensuring proper maintenance through non-
monetary contributions (Khairani WUA—Jopadong Pagladia
No. 2 Group Bund Dong Committee, Baksa, Assam)
Key features:
• The WUA’s working rules have no provision for monetary
collection of water taxes. All the taxes are collected in the
form of labour and activities undertaken by WUA.
Participation and contribution of labour for WUA’s
activities are mandatory for each member failing which
stiff monetary penalties (‘kuruk’) are imposed. Also, fines
are imposed in case of withdrawal more water compared
to the allotted one. The penalty fees form an important
source for conducting repair and maintenance
organization. Also, the WUA, which was initially working a
voluntary organization of farmers, got officially registered
to avail the government grants which compliments the
penalty fees in financing R&M works.
(reference: Vasant P. Gandhi et al., November 2019, Institutional
Structure, Participation, and Devolution in Water Institutions of
Eastern India)
Case Study: Fess collection based on time-based assessment
(Ozhar Water User Societies, Nashik, Maharashtra
(command area of Waghad medium irrigation project)
Key feature:
Page | 357
Parameter Findings from research
• Instead of internal assessment of water charges based on
area and crop, time based charging was adopted as a
better metric of the actual volume of water consumed.
Individual cultivators are charged based on the time
duration of water receipt. This mechanism simplified the
assessment of water charges and ensured greater
transparency to the farmers.
(reference: Subhas Paranjape et al., SOPPECOM, “The Ozhar
Water User Societies: Impact of Society Formation )
• As per the MOM of 1st PIRC meeting (2017), rampant variations in
crop pattern, contrary to that envisaged at planning stage,
undermines the equitable distribution of water. Proposed awareness
programmes, empowerment of WUAs and control of water at
government outlets are mitigating measures in this respect.
Primary:
• Financial factors: Adequate maintenance of the water courses along
with minor distributaries in the absence of government grants is the
biggest challenge to the upkeep of the assets created under this
scheme, considering the current trend of fees collection.
o Collection of irrigation fees (/ cess) by states is found to be
either inadequate or absent in most of states except a few –
Maharashtra, Rajasthan (NCP – collection efficiency is around
70% to 80%),and few other states. The poor cost of recovery
may be broadly attributed to the following factors:
▪ Unwillingness to pay owing to non-reliability of water
supply
▪ Lack of motivation to pay due to absence of any
sharing mechanism for the collected fees with the
WUAs as reported in Assam (however some states
like Bihar, Maharashtra and Karnataka have put in

Page | 358
Parameter Findings from research
place mechanisms where a substantial portion of the
collected fees are shared with the WUAs)
▪ Poor economic position of the small and marginal
cultivators
▪ Absence of dedicated irrigation staff for fees collection
o Some of stakeholders (in Assam, Andhra Pradesh, Manipur,
Maharashtra and Karnataka) however opined that with
establishment of sufficient hydraulic connectivity to outlets
and establishment of WUAs (of which the farmers
themselves shall be members), the fees collection/
willingness of farmers to bear at least the O&M costs may
increase.
However, in many of the existing (/old) projects or projects in
advanced stages i.e. projects where hydraulic connectivity to
the field has already been established, collection of O&M fees
may become a challenge without sufficient legal provisions
and capacity building/ awareness of the cultivators. For. e.g.
in states like Assam, Manipur and Uttar Pradesh with
adequate rainfall/ access to water sources, the paddy
cultivators have been practicing flood irrigation for decades;
convincing the cultivators to resort to volumetric supply and
fees payment is expected to be challenging without adequate
legal provisions/ capacity building programmes and
involvement of the WUAs. This is corroborated by the IWMI
working paper “Malik, R. P. S.; Prathapar, S. A.; Marwah, M.
2014. Revitalizing canal irrigation: towards improving cost
recovery. Colombo, Sri Lanka: International Water
Management Institute (IWMI)” which validated the following
hypothesis: “The collection of water charges is likely to be
greater in projects/regions which are dependent exclusively
on availability of canal water in comparison to areas where
Page | 359
Parameter Findings from research
farmers have access to both surface water and groundwater”.
Such a trend was also observed (though it would be
premature to draw any conclusion at this stage considering
the limitation of the survey to five states) during primary
survey with 225 cultivators in five states viz Assam,
Karnataka, Manipur, Maharashtra and Rajasthan, where it was
found that fees payment is quite high (60%) in Rajasthan
(n=43) where the cultivators are primarily dependant on canal
water for irrigation (77% dependent on canal water, 9% on
rain water and only 2% on groundwater) compared to
Karnataka (n=55) where fees payment is quite low (5%) and
cultivators are almost equally dependent on canal water (40%)
and groundwater (36%). Similarly, Assam (n=31) with low
fees payment (26%) has equal dependence on canal water
(48%) and rain water (45%).
o During household interviews with 225 cultivators in Assam
(Champamati major irrigation project), Karnataka (Sri
Rameswara irrigation project), Manipur (Dolaithabi barrage),
Maharashtra (Dhom Balkaawadi project) and Rajasthan (Gang
canal), only 26% confirmed any payment of fees/ water taxes
with the figure as low as 5% in Karnataka (n=55). Another
interesting observation is the significant difference in
propensity to pay fees between the head and tail end
cultivators – e.g. while only 24% of the tail reach cultivators
(n=17) in Gang canal (Rajasthan) confirmed fees payment, the
same figure stands at 85% for head reach cultivators (n=17.
Such disparity in payments between tail and head reaches
farmers have also been highlighted during interactions with
stakeholders in other projects like Upper Tunga in Karnataka,
where it was reported that tail reaches farmers are unwilling
to pay water owing to unreliable water supply. This is in line

Page | 360
Parameter Findings from research
with the findings put forth by various studies that water fees
payment is directly related to water service availability; areas
which have better water access and where irrigation staff
show better accountability, generally recorded higher fees
collection. It may be noted here that the IWMI working paper
(2014) has also put forth another hypothesis that “the cost
recovery is also influenced positively by the status of
maintenance of irrigation infrastructure”. This is also validated
during the primary survey where around 60% of the 225
respondents confirmed that they are willing to pay fees (/
additional fees) provided reliable water supply is assured.
o Also, with proper capacity building programmes, increasing
involvement of the WUAs, completion of the structural
intervention works and gradual trickling of the benefits
(achieved through better access to water and higher
conveyance efficiency) to the individual cultivators, the sense
of ownership among them is expected to increase, as also
highlighted in various projects like Sri Rameswara LIS in
Karnataka, Waghad, Nashik (non-AIBP project) in Maharashtra
where initial reluctance of the farmers gradually gave way to
co-operation as the benefits started being realized.
• Social factors: With increased access to assured irrigation (under
AIBP) many cultivators in the upper reaches of the canal in some
states (like Andhra Pradesh, Karnataka) have been shifting to water-
intensive crops like paddy and sugarcane. With many of these
irrigation systems being designed for dry or semi-dry crops like maize,
chilli, etc, water availability at the branch canals and minors
particularly in the tail ends may pose to be a serious challenge. This
is also validated during primary household interviews conducted in
five states in Assam, Karnataka, Manipur, Maharashtra and
Rajasthan, where around 71% of the 73 beneficiary cultivators

Page | 361
Parameter Findings from research
responded that they are planning to shift towards crops like paddy
and sugarcane with increase in assured water supply.
• Other factors: As highlighted in the above section under ‘Efficiency’,
the current cap on cost norms have restricted lining/ concretization to
certain sections of the water courses, which exposes the un-lined/
‘kuccha’ part to various climatic vagaries – many of the stakeholders
(from Bihar, Maharashtra and Manipur) confirmed the vulnerability of
the ‘kuchha’ channels during rainy season run-off or during droughts
when cultivators demolish these temporary redundant structures.
However, places where lining of substantial portion of water courses
has been done, the stakeholder (both the implementing agencies and
WUAs) vouched for the high durability of the ‘pucca’ structures.
Inference:
• Proper maintenance and up-keep of the assets (like field channels) in
absence of any government grant may pose to be a challenge in the
future. However with gradual involvement of the WUAs and
increasing realization of the benefits of the scheme, a sense of
ownership is expected to prevail among the cultivators.
• Increase in ownership and adoption of transparent fees assessment
is expected to result in increasing cost recovery. However, collection
of fees may still be a challenge in water abundant states like Assam,
Manipur and Uttar Pradesh, where adequate access to other water
sources are available.
• Social factors (in spite of efforts to implement better water
management practices through CADWM) like poor irrigation
practices and increasing shift towards water-intensive crops like
wheat, sugarcane (propelled by skewed government policies, market
dynamics, infrastructure gaps, food habits, etc.) may lead to higher
incidences of water unavailability at tail ends. With fading of the
benefits, it would be a challenge to keep the farmers motivated to
maintain and upkeep the field channels and other assets.
Page | 362
Parameter Findings from research
• The durability of the ‘kutcha’ channels is undermined by their
vulnerabilities during rainy season run-offs and droughts.
Thus, the performance of the scheme in terms of sustainability is termed as
‘average’.
Impact Secondary:
• Improvement in agricultural outputs has resulted in significant
improvement in socio-economic conditions of the farming
communities including literacy rate, health and sanitation conditions.
Primary:
• The increase in socio-economic conditions of the farming
communities have also been validated by all the informants.
However, many pointed to the further scope for improvement in
terms of awareness generation among farmers in terms of crop
planning and capacity building in relation to water management and
maintenance of irrigation structures.
• During household interviews with 225 cultivators in Assam
(Champamati major irrigation project), Karnataka (Sri Rameswara
irrigation project), Manipur (Dolaithabi barrage), Maharashtra (Dhom
Balkaawadi project) and Rajasthan (Gang canal), percentages of
cultivators confirming various benefits owing to implementation of
CAD activities are listed below:
o increase in household income – 45%
o increase in education – 49%
o increase in overall health conditions – 41%
o new employment opportunities in the village – 43%
o decrease in migration to other places for livelihood options –
24%
Inference:
• Implementation of CADWM works has increased the socio-economic
conditions of the farming communities in the command areas in
Page | 363
Parameter Findings from research
terms of overall household income, education, health standards and
employment opportunities.
Thus, the performance of the scheme in terms of impact is termed as
satisfactory.
Equity Secondary:
• CADWM works are being implemented pari-passu in the command
area of the 99 Priority AIBP projects, out which 59 projects in 11
states cater to the drought-prone areas.
• One of the main objectives of the CADWM scheme has been
equitable distribution of water (among cultivators across head and tail
reaches) through proper water management
• A recent survey by Vidarbha Irrigation Development Corporation
(January 2019) at command area of Gosikhurd National Project (one
of the 99 AIBP projects) in Maharashtra mentioned that in spite of the
appreciable increase in command area and crop yield, the disparities
between the head and tail end farmers in terms of apportion of the
benefits still remain. The validity of such statement in relation to
PMKSY-CADWM projects is tested below under ‘Primary’
observations.
Primary:
• The completion of AIBP projects and CADWM works in many drought
prone and remote tribal areas facilitated in providing assured irrigation
to the communities resulting in significant socio-economic benefits.
• The projects have significantly benefitted the small and marginal
farmers. E.g. 50% of the farmers catered by the Champamati major
irrigation project in Assam have small land holding (1 to 2 ha) while
33% of them have marginal land holdings.
• During KIIs, the stakeholder also confirmed that significant benefits
accrued to the tail end farmers owing to the CADWM scheme. During
primary survey among 55 cultivators in Karnataka (Sri Rameswara
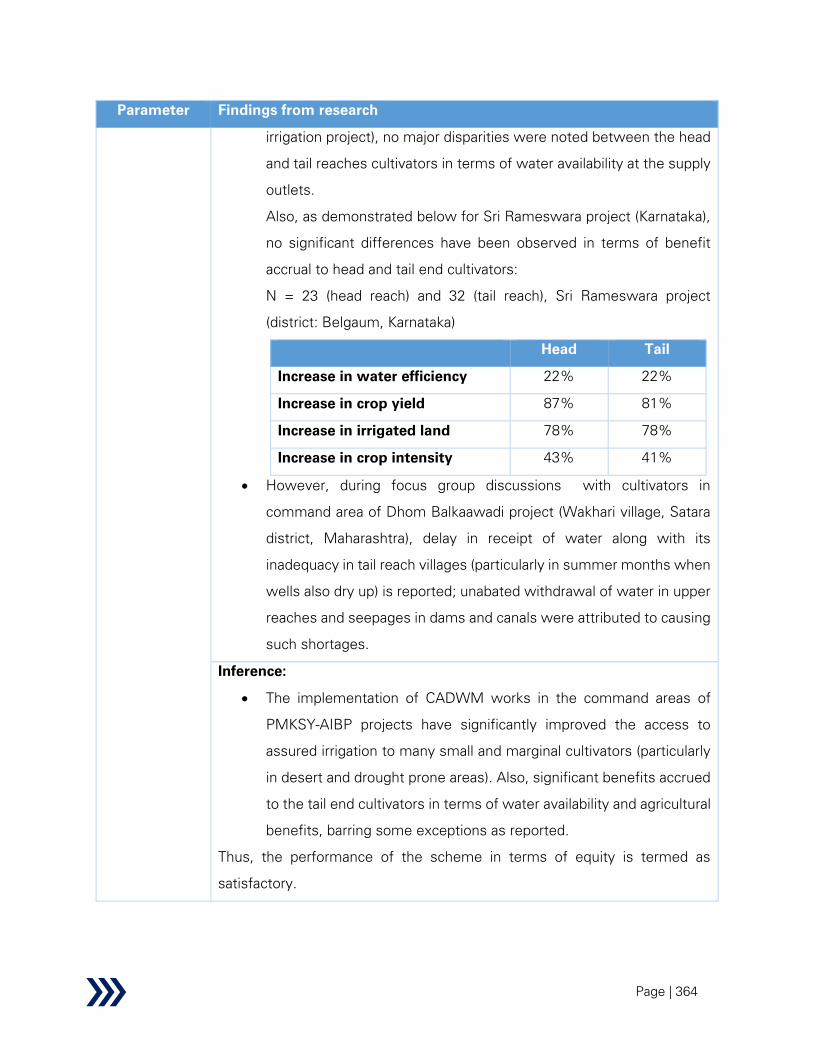
Page | 364
Parameter Findings from research
irrigation project), no major disparities were noted between the head
and tail reaches cultivators in terms of water availability at the supply
outlets.
Also, as demonstrated below for Sri Rameswara project (Karnataka),
no significant differences have been observed in terms of benefit
accrual to head and tail end cultivators:
N = 23 (head reach) and 32 (tail reach), Sri Rameswara project
(district: Belgaum, Karnataka)
Head Tail
Increase in water efficiency 22% 22%
Increase in crop yield 87% 81%
Increase in irrigated land 78% 78%
Increase in crop intensity 43% 41%
• However, during focus group discussions with cultivators in
command area of Dhom Balkaawadi project (Wakhari village, Satara
district, Maharashtra), delay in receipt of water along with its
inadequacy in tail reach villages (particularly in summer months when
wells also dry up) is reported; unabated withdrawal of water in upper
reaches and seepages in dams and canals were attributed to causing
such shortages.
Inference:
• The implementation of CADWM works in the command areas of
PMKSY-AIBP projects have significantly improved the access to
assured irrigation to many small and marginal cultivators (particularly
in desert and drought prone areas). Also, significant benefits accrued
to the tail end cultivators in terms of water availability and agricultural
benefits, barring some exceptions as reported.
Thus, the performance of the scheme in terms of equity is termed as
satisfactory.

Page | 365
Table 35: CADWM – summary of performance evaluation using REESIE framework
Parameter Performance
Relevance
Effectiveness
Efficiency
Sustainability
Impact
Equity
REESI+E performance infographics legend
Satisfactory
Average
Needs Improvement
No information
Performance on cross-sectional themes
Table 36: CADWM – performance evaluation using cross-sectional themes
#
Cross-cutting
theme
Indicative Areas of Enquiry and Key
Questions
Findings from research
1.
Accountability
&
Transparency
Availability of Data Records and Reports
in public domain
• What data records are available for
the scheme in public domain?
• The physical and financial
progress of both the
structural and non-
structural interventions
for each project are
updated by the respective
states in the national MIS
dashboard. However,
some discrepancies were
observed in terms of MIS
updates for non-structural
interventions which have
been highlighted in detail
Page | 366
#
Cross-cutting
theme
Indicative Areas of Enquiry and Key
Questions
Findings from research
in a later section “Issues
and Challenges”.
• The PIRC conducts half-
yearly review of the
projects, details of which
are released publicly.
Monitoring Mechanisms
• Does a robust monitoring
mechanism exist and at what level?
• For structural
interventions, the regional
CWC offices monitor the
progress, while at the
national level it is
monitored and reviewed
by the PIRC half-yearly.
• For the non-structural
interventions, an agency
empanelled by the MoJS
shall monitor the
performance of the Social
Facilitator, while at the
national level it is
monitored and reviewed
by the PIRC half-yearly.
However, during primary
survey, existence of
‘social facilitators’ was
found to be limited. Also,
no such evaluation
mechanism by
empanelled agencies was
observed to be operative.
Page | 367
#
Cross-cutting
theme
Indicative Areas of Enquiry and Key
Questions
Findings from research
Evaluation Mechanisms
• What process / impact evaluation
studies conducted in the last
decade - frequency, quality,
coverage, etc.
• PIRC conducts half-yearly
review of the progresses.
• The states need to submit
concurrent evaluation
report by a 3rd
party
agency; however the
quality and independence
of such evaluations have
not been validated in this
study.
• Currently, there is a
provision under Impact
Assessment Studies for
evaluation of AIBP (and
CADWM) projects;
however no such study
has been initiated for
these 99 priority projects
till date
Financial Accountability
• What funding mechanisms are
being used?
• The cost norms along
with the Centre – State
cost sharing ratio has
been specified in the
scheme guidelines.
• The CA is capped at Rs.
35,000/ ha for structural
interventions and Rs.
5,000/ ha for the non-
structural norms.

Page | 368
#
Cross-cutting
theme
Indicative Areas of Enquiry and Key
Questions
Findings from research
• Various states however
raised questions
regarding the adequacy of
the cost norms (as on
date) which were set in
2016-17 and not revised
hence after.
Beneficiary involvement
• What is the involvement of
beneficiaries across the project
lifecycle? Is the level of involvement
adequate?
• The non-structural
component of the
scheme entails provisions
for creations of WUAs
and their proper hand-
holding along with
organizing trials/
demonstrations through
local WALMIs.
• The structures are built on
the cultivator’s land and in
subsequent stages the
structures are handed
over to the cultivators for
O&M; thus, involvement
of the cultivators at the
project planning stage is a
critical determinant of the
success and sustainability
of the scheme.
• A considerable progress
has been achieved in
creation of WUAs,

Page | 369
#
Cross-cutting
theme
Indicative Areas of Enquiry and Key
Questions
Findings from research
however most of the
WUAs are yet to be
functional; issues for the
same have been
discussed in detail under
‘Effectiveness’ in the
above section.
Community institutions
• Are community institutions (e.g.
WUAs) truly representative? Do
they have adequate powers to take
decisions?
• Almost all the states have
enacted PIM laws for
empowering the WUAs,
with the extent of
delegation of power
varying from states to
states.
• Delegation of actual
power like financial power
to collect fees was found
to be lacking in some
states, as discussed in
detail under
‘Effectiveness’ in the
above section.
• Also, as discussed in
detail under the ‘gender
mainstreaming’ theme,
the involvement of
women in WUAs and
their decision making
power in WUA activities
Page | 370
#
Cross-cutting
theme
Indicative Areas of Enquiry and Key
Questions
Findings from research
were observed to be
limited.
Summary Analysis:
• The national MIS dashboard is effective in tracking the overall physical and financial
progress of the scheme; however some deficiencies like non-regular update,
inconsistencies with other databases in relation to non-structural interventions are
observed. It may be noted that release of MOMs of half-yearly progress review by PIRC is
a significant step towards increasing accountability and transparency.
• Though the scheme guidelines entail a robust monitoring mechanism, yet actual
implementation of the same, particularly the non-structural interventions, is observed to be
inadequate.
• A considerable number of WUAs have been registered under the CADWM provision;
however the many of them were reported to be non-functional as on date owing to non-
delegation of adequate authority to WUAs, inadequate financial resources and lack of
technical competency of the members. Also, decision making authority of women on WUA
activities was noted to be limited.
2.
Direct/Indirect
Employment
Generation
Employment generation
• What is the level of employment
generation through schemes in the
sector and overall sectoral
contribution in National
employment generation?
• What is the improvement in income
levels?
• The scheme guidelines do
not explicitly provide any
estimate for employment
generation target.
However, one the
provisions highlighted the
need for convergence
with PMKSY (watershed)
and MGNREGA,
wherever feasible, for
activities involving earth
works like construction of
unlined channels,

Page | 371
#
Cross-cutting
theme
Indicative Areas of Enquiry and Key
Questions
Findings from research
intermediate and link
drains, etc.
• During primary survey, it
was observed that the
implementation of the
scheme has resulted in
substantial increase in
agricultural productivity,
increase in income of the
farmers, creation of
agricultural jobs and
decrease in migration;
details of which are
elaborated under ‘Impact’
in previous section.
Institutional barriers
• Are there institutional barriers to
employment generation (e.g.
access to markets)?
• Limited access to market
mechanism and absence
of other-agro processing
industries in the
command areas (as
reported in some states
like Karnataka) are some
of the factors leading to
shift towards water-
intensive crops like paddy
by many of the cultivators
with increased access to
assured irrigation.
Summary Analysis:

Page | 372
#
Cross-cutting
theme
Indicative Areas of Enquiry and Key
Questions
Findings from research
• Implementation of the CAD works has significantly benefitted the cultivators in the
command area in terms of creation of employment opportunities and decreasing the
migration rate, as confirmed during primary survey.
• Institutional barriers like absence of local agro-based industries and market for different
crops along with poor infrastructure like roads have negatively impacted crop planning and
water management in some command areas.
3.
Climate
change &
sustainability
including
adoption of
climate-
change
resilient
practices &
diversifications
Climate resilience
• Are there appropriate climate
resilient policies for mitigation
and/or adaptation (or included as
part of scheme objectives and
design)?
• The scheme has no
specific guideline for
adopting climate resilient
practices. However, it is
understood that increase
in participatory irrigation
management and
awareness generation
through specialized
agencies would lead to
adoption of sustainable
water management
practices and cropping
pattern.
Sustainable practices
• Is there an effective waste
management/end-of-life system in
place for resources used in the
sector/schemes?
• Currently, the CADWM
scheme has no specific
provision for waste
management. However, it
may be noted in a similar
recent CSS scheme viz.
ISBIG, provisions for
wastewater reuse and
solar power based micro-

Page | 373
#
Cross-cutting
theme
Indicative Areas of Enquiry and Key
Questions
Findings from research
irrigation system has
been introduced.
Awareness and capacity building
• Are there any training sessions held
regularly for reducing pollution,
adopting green practices, using local
materials etc.?
• As noted earlier, in overall
conduct of training and
capacity building
initiatives, the scheme
performance has been
poor.
• During household
interviews with 225
cultivators in Assam,
Karnataka, Manipur,
Maharashtra and
Rajasthan, only 10% of
the respondents
confirmed attending any
trainings in last three
years with Karnataka
alone contributing to 70%
of the total trainings held.
Topics of the training
included mainly water
management, crop
management and
maintenance of irrigation
systems.. Also, it is
concerning to note that
around 48% of the
trainees reported
receiving training more

Page | 374
#
Cross-cutting
theme
Indicative Areas of Enquiry and Key
Questions
Findings from research
than 2 years ago and
around 70% of the
trainees confirmed
attending less than 2
trainings in last 3 years.
Climate impact
• What are the main impacts of
climate change on the sector and
scheme beneficiaries?
• As reported by many
states, the existing
prescribed norms limit the
extent to which lining of
field channels may be
done. It may become a
serious issue in terms of
climate change and
unsustainability, as
unlined or ‘kutcha’ portion
of water courses are
vulnerable to incidences
of excess water run-off
(as reported during
monsoons in Bihar) and
also deteriorate quickly
after 2-3 seasons of
drying and wetting of the
fields.
Summary Analysis:
• There are no specific provisions in the scheme guidelines in relation to adoption of climate
resilient practices. However, some of the scheme provisions in relation to participatory
irrigation management, once properly implemented, would contribute to sustainable water
management practices.
Page | 375
#
Cross-cutting
theme
Indicative Areas of Enquiry and Key
Questions
Findings from research
• Provisions related to wastewater reuse may be incorporated in line with provisions in similar
CSS schemes like ISBIG.
• Considering that ‘kutcha’ portion of the water courses are more susceptible to climate
change, revisiting the prescribed cost norms is warranted to ensure maximum lining of the
field channels.
4.
Gender
mainstreaming
Inclusiveness in scheme design/
planning
• Is there a specific mention of
gender equality and equity
considerations in the scheme
guidelines/objectives, i.e. has the
scheme been designed keeping
gender considerations in mind?
• There is no specified
guideline in the scheme
for ensuring gender
equality.
• However, some states
have enacted provisions
for ensuring increased
participation of women in
the WUAs. E.g. MMISFA
(Maharashtra) mandates
quota of 3 women
members in the
management
committees. In Bihar, also
the general policy of
appointing at least 1
woman in each WUA is
followed. Similarly in
Karnataka, in some
projects, reservation of
two seats for women in
each WUA has been
adopted. The M.P.
government has
introduced a provision of
Page | 376
#
Cross-cutting
theme
Indicative Areas of Enquiry and Key
Questions
Findings from research
electing/ nominating at
least 1 woman member in
the WUA.
• However, even in WUAs
with women members,
the extent of women
participation was reported
to be limited. During
household survey
interviews in seven states
(under AIBP scheme), in
places with WUAs, only
35% of the 46 cultivators
confirmed presence of
any women members in
the WUAs. Also, in most
cases, women members’
participation was reported
to be limited to only
attending meetings while
a small percentage also
participated in trainings.
Such findings are also lent
credence by various
research articles like a
primary study in WUAs in
Assam and Bihar by
Varsha Khander et al.

Page | 377
#
Cross-cutting
theme
Indicative Areas of Enquiry and Key
Questions
Findings from research
(2020)116
which also
observed that barring
some few instances of
joint-decision making,
most of the decisions are
taken by men only though
in Bihar, presence of
women membership was
found to be substantial
(because of mandatory
provisions). The study
attributed the following
factors as the major
deterrents to women
participation: the
participants in meetings
are mainly men and
women lack knowledge
about water management
issues, cultures issues
and family tradition
prevent women from
attending and
participating such issues,
women more engaged in
household tasks. During
KII with stakeholders in
116 Varsha Khander et al. (2020), “Gender Perspective in Water Management: The Involvement of Women in Participatory Water
Institutions of Eastern India”

Page | 378
#
Cross-cutting
theme
Indicative Areas of Enquiry and Key
Questions
Findings from research
Assam, low women
membership in WUAs
was attributed to gender
gap in property rights –
since WUA memberships
and water rights are
allocated to land-holders,
women without any
formal property rights are
thus excluded from such
organizations. An IWMI
study (2012)117
in Tamil
Nadu found the following
factors to be mainly
responsible for ‘fencing’
of women in WUA
governance: gender
discrimination in land
ownership limits women
membership in the
WUAs, male domination
in activities of WUA
alienate women’s
participation, lack of land-
ownership by women
restricts their
membership while
inclusion of non-
117 K.Gulam Dasthagir (2012) “Fencing Women in Water User Associations”
Page | 379
#
Cross-cutting
theme
Indicative Areas of Enquiry and Key
Questions
Findings from research
cultivating women land-
owners leads to only
nominal participation of
women.
• As part of project planning
and implementation, the
National Water Policy
(2012) has urged that
“unique needs and
aspirations of the
Scheduled caste and
Scheduled Tribes, women
and other weaker
sections of the society
should be given due
consideration”. The draft
National Policy for
Women (2016) also
advocated that “unique
needs and aspirations of
the Scheduled caste and
Scheduled Tribes, women
and other weaker
sections of the society
should be given due
consideration”. However,
the PMKSY-CADWM
scheme guidelines do not
have any gender specific
provisions as part of the

Page | 380
#
Cross-cutting
theme
Indicative Areas of Enquiry and Key
Questions
Findings from research
participatory irrigation
management approach.
Any best practices Case study 1: Chhattisgarh
Irrigation Development
Project118
Some of the key features of
the project is mentioned
below:
• Institutional structure:
membership of WUA on
household basis so that
both men and women
(irrespective of who is the
land title owner) can
participate; WUA
management committee
to have at least two
women member, 33%
women membership
mandated in all sub-
committees and each
WUA to have a gender
sub-committee
• Capacity building: 50% of
training slots for WUAs
reserved for women;
women were also given
118 Asian Development Bank, Gender Mainstreaming Case Study: Chhattisgarh Irrigation Development Project
Page | 381
#
Cross-cutting
theme
Indicative Areas of Enquiry and Key
Questions
Findings from research
training on other
livelihood options
• Others: women to receive
equal pay as men
Case study 2: Dhom
Balkaawadi Project in
Maharashtra (one of the 99
Priority AIBP projects)119
Some of the key features of
the project are:
• Institutional structure:
33% of total seats of
directors of WUAs are
reserved for women
• Capacity building: Five
trainings are conducted
before and after formation
of each WUA to increase
awareness and promote
more livelihood
opportunities for women
Case Study 3: Satak Tank
Minor Irrigation Scheme,
Madhya Pradesh
As detailed in the ‘REESIE’
section, in Satak, the
appointed NGO, Action for
119 Data shared by relevant state implementing agencies

Page | 382
#
Cross-cutting
theme
Indicative Areas of Enquiry and Key
Questions
Findings from research
Social Advancement (ASA),
adopted the following steps
to ensure women
participation:
• Franchise rights: Voting
rights for WUA elections
were also extended to the
spouses of the
landholders and the WUA
members, through
appropriate amendment
in the PIM Act. This was
followed by extensive
awareness campaigns to
sensitize the villagers
regarding roles of women
and their rights
• Women empowerment:
Enabling participation in
WUA was also
supplemented by
facilitating the women
volunteers to establish
self-help groups
Summary Analysis:
• There are no specific gender specific provisions in the scheme guidelines. However, some
projects have taken individual steps to ensure participation of women and promotion of
livelihood opportunities.
• Though many of the states like M.P and Bihar introduced provisions for electing women in
the WUAs, yet their participation in WUA governance remain mostly nominal without any
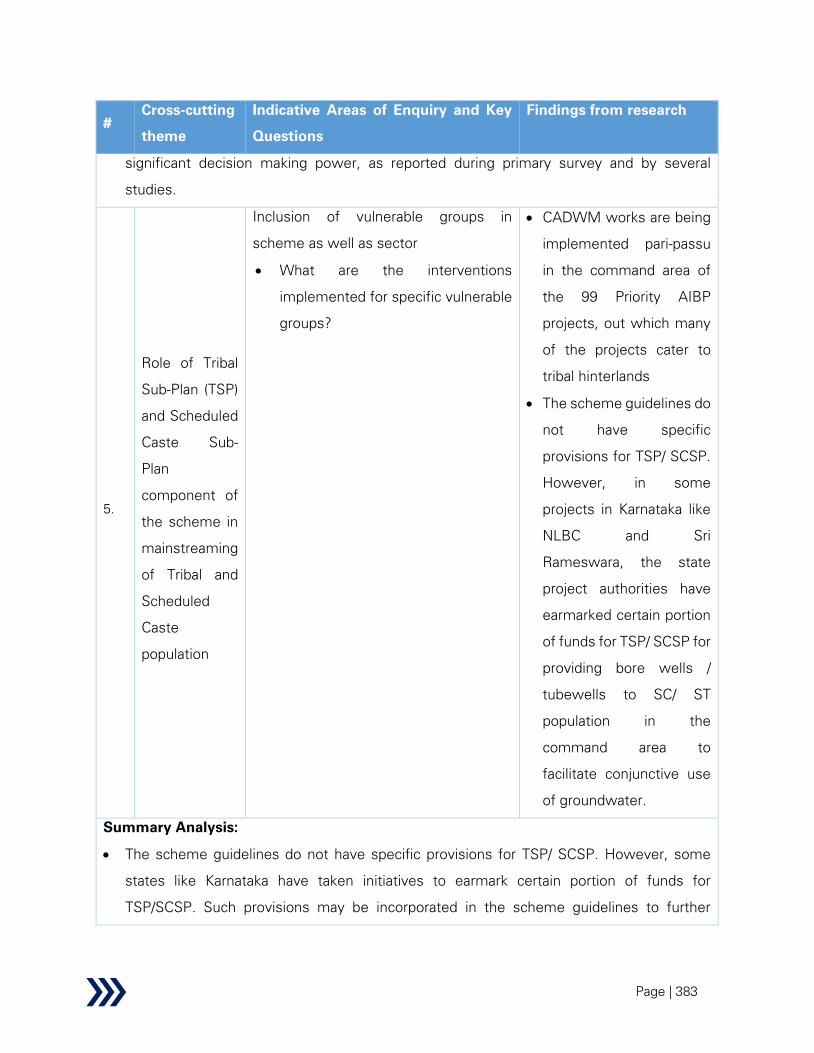
Page | 383
#
Cross-cutting
theme
Indicative Areas of Enquiry and Key
Questions
Findings from research
significant decision making power, as reported during primary survey and by several
studies.
5.
Role of Tribal
Sub-Plan (TSP)
and Scheduled
Caste Sub-
Plan
component of
the scheme in
mainstreaming
of Tribal and
Scheduled
Caste
population
Inclusion of vulnerable groups in
scheme as well as sector
• What are the interventions
implemented for specific vulnerable
groups?
• CADWM works are being
implemented pari-passu
in the command area of
the 99 Priority AIBP
projects, out which many
of the projects cater to
tribal hinterlands
• The scheme guidelines do
not have specific
provisions for TSP/ SCSP.
However, in some
projects in Karnataka like
NLBC and Sri
Rameswara, the state
project authorities have
earmarked certain portion
of funds for TSP/ SCSP for
providing bore wells /
tubewells to SC/ ST
population in the
command area to
facilitate conjunctive use
of groundwater.
Summary Analysis:
• The scheme guidelines do not have specific provisions for TSP/ SCSP. However, some
states like Karnataka have taken initiatives to earmark certain portion of funds for
TSP/SCSP. Such provisions may be incorporated in the scheme guidelines to further
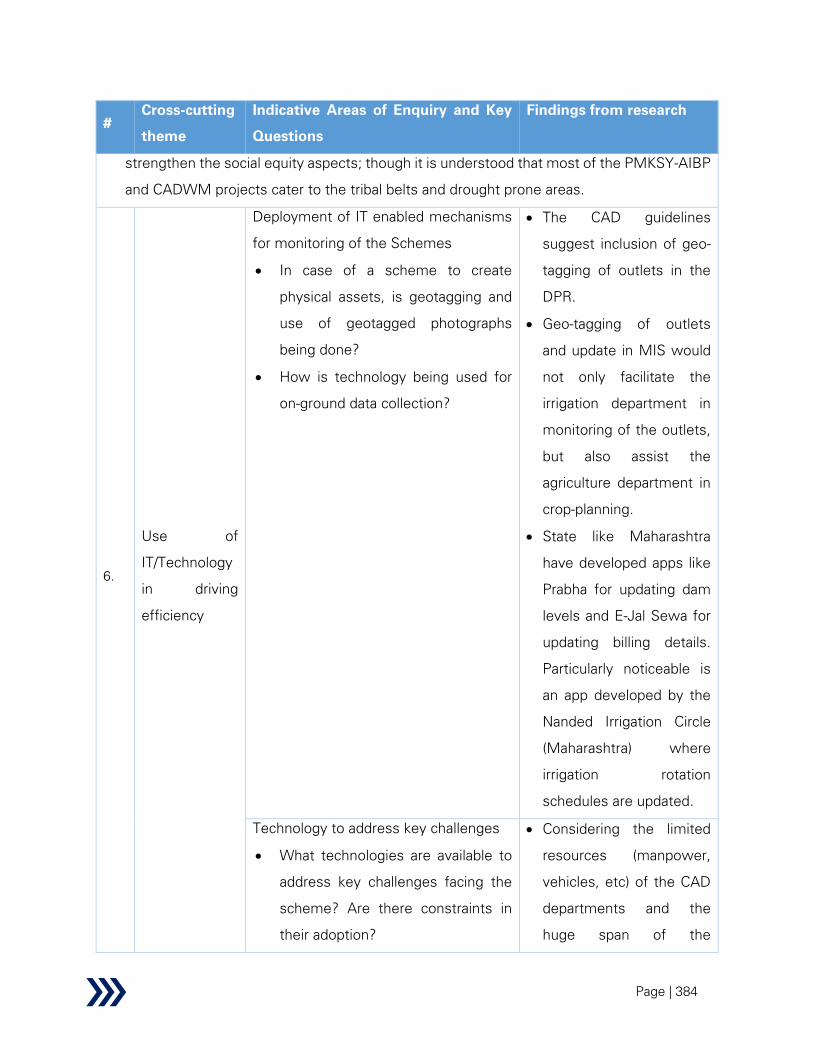
Page | 384
#
Cross-cutting
theme
Indicative Areas of Enquiry and Key
Questions
Findings from research
strengthen the social equity aspects; though it is understood that most of the PMKSY-AIBP
and CADWM projects cater to the tribal belts and drought prone areas.
6.
Use of
IT/Technology
in driving
efficiency
Deployment of IT enabled mechanisms
for monitoring of the Schemes
• In case of a scheme to create
physical assets, is geotagging and
use of geotagged photographs
being done?
• How is technology being used for
on-ground data collection?
• The CAD guidelines
suggest inclusion of geo-
tagging of outlets in the
DPR.
• Geo-tagging of outlets
and update in MIS would
not only facilitate the
irrigation department in
monitoring of the outlets,
but also assist the
agriculture department in
crop-planning.
• State like Maharashtra
have developed apps like
Prabha for updating dam
levels and E-Jal Sewa for
updating billing details.
Particularly noticeable is
an app developed by the
Nanded Irrigation Circle
(Maharashtra) where
irrigation rotation
schedules are updated.
Technology to address key challenges
• What technologies are available to
address key challenges facing the
scheme? Are there constraints in
their adoption?
• Considering the limited
resources (manpower,
vehicles, etc) of the CAD
departments and the
huge span of the

Page | 385
#
Cross-cutting
theme
Indicative Areas of Enquiry and Key
Questions
Findings from research
command areas, the use
of remote sensing
technologies to monitor
the physical progress
becomes imperative. Use
of satellite images
(current utility is limited
due to low resolution,
high cost of procurement
and low frequency of
image availability) and 3D
images using drones may
be explored, particularly in
relation to monitoring of
field channels progress,
identification of system
deficiencies and water-
logged areas.
• The recent initiative taken
by the Ministry to map
crop assessment and
project monitoring
through BISAG is
noteworthy.
Any best practices • Use of drones has been
successfully
demonstrated at various
parts in in India like
monitoring of
construction works in
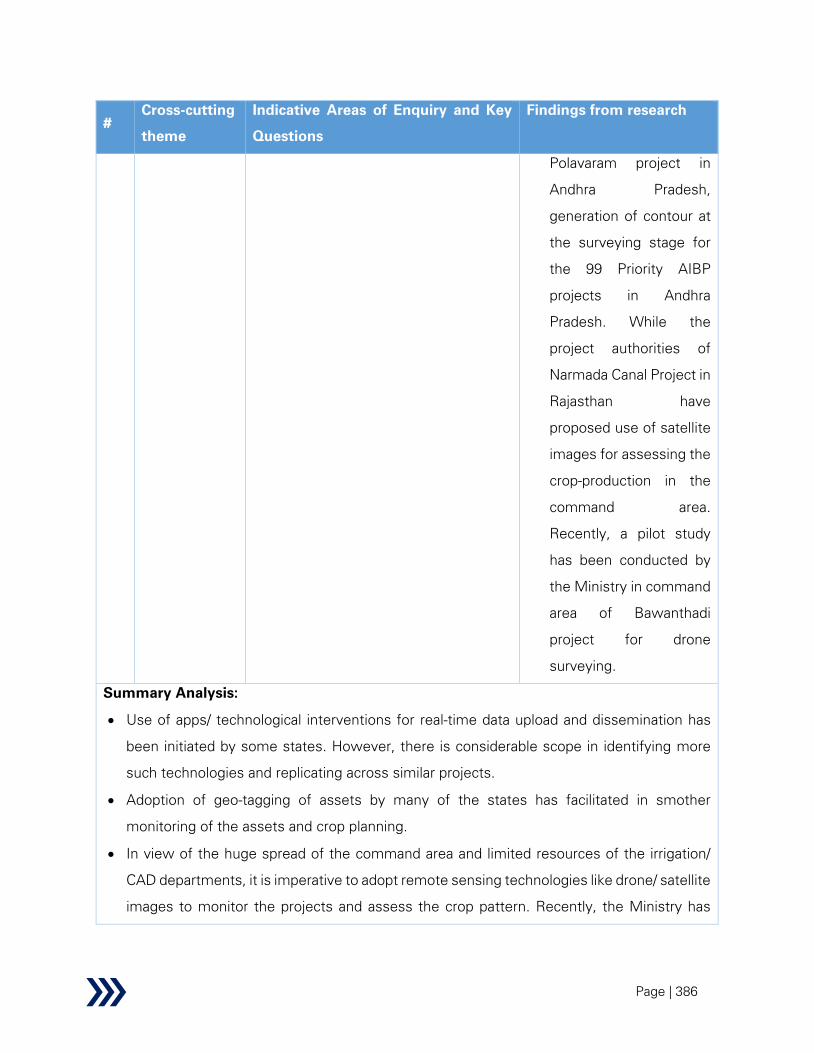
Page | 386
#
Cross-cutting
theme
Indicative Areas of Enquiry and Key
Questions
Findings from research
Polavaram project in
Andhra Pradesh,
generation of contour at
the surveying stage for
the 99 Priority AIBP
projects in Andhra
Pradesh. While the
project authorities of
Narmada Canal Project in
Rajasthan have
proposed use of satellite
images for assessing the
crop-production in the
command area.
Recently, a pilot study
has been conducted by
the Ministry in command
area of Bawanthadi
project for drone
surveying.
Summary Analysis:
• Use of apps/ technological interventions for real-time data upload and dissemination has
been initiated by some states. However, there is considerable scope in identifying more
such technologies and replicating across similar projects.
• Adoption of geo-tagging of assets by many of the states has facilitated in smother
monitoring of the assets and crop planning.
• In view of the huge spread of the command area and limited resources of the irrigation/
CAD departments, it is imperative to adopt remote sensing technologies like drone/ satellite
images to monitor the projects and assess the crop pattern. Recently, the Ministry has
Page | 387
#
Cross-cutting
theme
Indicative Areas of Enquiry and Key
Questions
Findings from research
initiated some steps in this regard. Overall, the extent of adoption of remote sensing
technologies across states was observed to be in nascent stage.
7.
Development,
dissemination
& adoption of
innovative
practices,
technology &
know-how
Fund allocation towards promotion of
innovation
• What percent of total allocation is
directed towards development,
dissemination and adoption of
innovative practices and
technology? How much of it is
utilized?
• There is no separate fund
allocation for promotion of
innovative practices.
However, certain
provisions under non-
structural interventions
like ‘trainings,
demonstrations and
adaptive trials with
respect to water use
efficiency, increased
productivity and
sustainable irrigation’
promote such practices.
Also, the half-yearly PIRC
meetings highlight some
of the innovative practices
adopted by some states
in terms of micro-
irrigation, conjunctive
water use and lining of
water courses.
Contribution of improved practices in
increasing outcomes
• What is the impact of innovative
technologies and practices on
scheme and sectoral outcomes?
• Adoption of pressured
piped distribution
networks instead of open
field channels has
resulted in avoiding land
acquisition issues,

Page | 388
#
Cross-cutting
theme
Indicative Areas of Enquiry and Key
Questions
Findings from research
conveyance losses,
reduction in operations
and maintenance cost.
• Successful case studies
in China showed 30%
savings in water delivered
(equivalent to 15% of the
total irrigated area) and
25% in labour input using
PIN in place of CDN
Any best practices • Piped distribution has
successfully been
implemented in
command areas of a
number of projects in
India like Sardar Sarovar
project in Gujarat and
Narmada canal project in
Rajasthan (both are part of
the 99 Priority AIBP
projects).
• Another successful
demonstration of piped
distribution network in a
non-PMKSY project is
Integrated Drip Irrigation
project in Ramthal,
Karnataka, where water is
being conveyed to the
individual fields using

Page | 389
#
Cross-cutting
theme
Indicative Areas of Enquiry and Key
Questions
Findings from research
HDPE/ PVC pipe. Every
field outlet is being fitted
with an automatic valve
operated through a
wirelessly controlled RTU
(remote terminal unit) to
regulate the water flow.
The automated system
monitors and controls
through a series of field
sensors and the data is
stored in a central server
which allows flexible
control and data access to
multiple users like project
engineers, field
technicians, and farmers.
The farmers are apprised
beforehand of on-off
schedules, crop alerts and
other agronomical
services through
automated SMS alerts.
This integrated project
has recorded as high as
90% overall efficiency
with water conveyance
efficiency at 99% and

Page | 390
#
Cross-cutting
theme
Indicative Areas of Enquiry and Key
Questions
Findings from research
field application efficiency
up to 95%120
.
Summary Analysis:
• Though there is no separate fund allocation for dissemination of innovative practices, yet
certain provisions under non-structural interventions and half-yearly PIRC review meetings
ensure sharing of innovative practices among states mainly in relation to adequate norms
for water course linings, adoption of MI practices, conjunctive use of groundwater, etc.
• Successful adoption of piped distribution networks in various parts of India like Gujarat,
Maharashtra, Rajasthan and Karnataka has led to similar proposals from project authorities
of ongoing projects in Assam, Maharashtra and Manipur. However, feasibility of such
projects (in the wake of huge initial capex, recurring electricity costs, acceptability among
cultivators) needs to be studied more; generally new lift irrigation schemes may be
encouraged to adopt such mechanisms (as successfully demonstrated in Ramthal in
Karnataka).
• Currently, adoption of various innovative technologies like piped distribution network and
conjunctive use of groundwater was found to be sporadic across certain states. It is
however expected to be successfully replicated across other states, once considerable
progress in the scheme implementation is attained.
8.
Stakeholder
and
Beneficiary
behavioural
change
Fund Allocation
• What percent of total allocation is
directed towards Awareness
generation or sensitization? What is
the utilization rate? and How much
impact has it been able to generate
in terms of behaviour change?
• Under the non-structural
interventions, there are
components for
trainings, demonstration,
and adaptive trials
(including on micro-
irrigation, water use
efficiency, increased
productivity and
120 Source: Jain Irrigation Systems Ltd., “Resource to Root: Integrated Irrigation Solution”

Page | 391
#
Cross-cutting
theme
Indicative Areas of Enquiry and Key
Questions
Findings from research
sustainable irrigation) to
be conducted through
regional WALMIs or
agricultural training
institutes. The scheme
guidelines also mandate
construction of mico-
irrigation (MI) facilities in
10% CCA.
• As mentioned in earlier
sections, the adoption of
MI facilities was found to
be limited – around 3%
of the target was
achieved. Similarly
adoption of suitable
cropping pattern and
efficient water practices
was reported to be
limited.
Mechanisms to promote and ensure
behaviour change
• What activities are undertaken at
District/Block level to promote
adoption of good practices?
• Trial and demonstrations
are held in the command
area by the regional
agriculture institutes in
many of the states like
Karnataka, Madhya
Pradesh to promote
efficient on-farm water
management.
Page | 392
#
Cross-cutting
theme
Indicative Areas of Enquiry and Key
Questions
Findings from research
• The scheme guidelines
also manadate
engagement of ‘social
facilitators’ / specialized
agencies for conducting
trainings and hand-holding
the WUA members.
However the
implementation of the
same was observed to be
limited.
Challenges faced
• What are the major challenges? Are
there any areas which needs more
attention in terms of bringing
behaviour change?
• Societal factors like
cultural and food habits,
skewed government
policies (like free
electricity, distorted MSP
setting and procurement
policy), institutional
barriers (like barrier to
market access, lack of
agro-processing
industries), climatic
patterns has led many
cultivators to shift
towards water intensive
crops like paddy.
• In terms of adoption of MI
facilities, the key issues
reported were extant
traditional flood irrigation

Page | 393
#
Cross-cutting
theme
Indicative Areas of Enquiry and Key
Questions
Findings from research
practices which are
conducive to water
intensive crops like paddy
and are further facilitated
by adequate water
availability during Kharif
seasons, low awareness
among farmers regarding
such technologies,
unwillingness to incur any
capex and opex for the MI
equipment (like drips and
sprinklers)
Cropping pattern
• What are the key constraints in crop
planning based on local water
availability with a view to reduce
water intensive crops?
• Increased access to
surface water (owing to
completion of canals) has
promoted many farmers
even in drought prone
areas to shift towards
water intensive crops,
further supplemented by
proliferation of
groundwater based
structures like tubewells
and bore wells (which are
supported by the increase
in groundwater level in
the command area). Such
a tendency is also
validated during

Page | 394
#
Cross-cutting
theme
Indicative Areas of Enquiry and Key
Questions
Findings from research
household interviews in
five states of Assam,
Karnataka, Maharashtra,
Manipur and Rajasthan,
where 71% of the 73
cultivators confirmed that
given increased access to
water, they would like to
switch to water-intensive
crops like paddy and
sugarcane.
Summary Analysis:
• There is a huge scope for further intensifying the IEC activities, awareness among the
farmers through proper implementation of the non-structural components as mandated in
the guidelines.
• Currently, the performance of the scheme has been found poor in relation to awareness
generation and trainings conducted to bring in any noticeable stakeholder and behavioural
change. With increased access to assured irrigation, cultivators in many areas have shifted
to water-intensive crops like paddy and sugarcane which is further complicated by skewed
government policies, societal factors and others. Also, in absence of adequate trainings and
other issues, the adoption of micro-irrigation facilities was also found to be limited.
9.
Conjunctive
use of water -
surface versus
groundwater
usage
optimizations
What are the main challenges to
conjunctive use of ground and surface
water?
• The existing scheme
guidelines have no
provisions for promoting
conjunctive use of
groundwater. However,
the 4th
PIRC and
subsequent PIRCs
encouraged states to
adopt conjunctive use of
Page | 395
#
Cross-cutting
theme
Indicative Areas of Enquiry and Key
Questions
Findings from research
groundwater. However, in
absence of any definite
guidelines and fund
allocation for the same,
adoption of such practices
has been minimal.
• It may be noted here that
the recently conceived
CSS scheme ISBIG has
included certain
provisions for
implementation of
groundwater
management activities
(through bore wells and
tubewells) to ensure
assured water supply in
lean monsoon periods.
Any best practice • In some projects in
Karnataka like NLBC and
Sri Rameswara, the state
implementing authorities
have provided bore wells
and tubewells under
SC/ST sub-plan to
facilitate conjunctive use
of groundwater.
• In Assam, solar powered
shallow tubewells have
been provided to the

Page | 396
#
Cross-cutting
theme
Indicative Areas of Enquiry and Key
Questions
Findings from research
farmers using the MI
fund, to ensure adequate
water access during dry
Rabi seasons.
• As highlighted earlier
in Ozhar case study
(non-PMKSY), the
WUAs have evolved
a mechanism where
certain water
charges are imposed
on the farmers for
using well water and
a simple assessment
mechanism for
estimating well
water level and
charge has been
developed. Such
practices help to
mitigate the issue of
over-extraction of
groundwater and at
the same time
ensure conjunctive
use of surface and
groundwater.
Summary Analysis:
• The existing scheme guidelines have no provisions for promoting conjunctive use of
groundwater; however conjuctive use of groundwater has been promoted during PIRC
Page | 397
#
Cross-cutting
theme
Indicative Areas of Enquiry and Key
Questions
Findings from research
review meetings. In absence of any specified guideline and fund allocation for the same,
adoption of such practices was reported to be limited barring some exceptions like Assam.
10.
Unlocking
Synergies with
other
Government
Program
Convergence (Inter-Ministerial/Inter-
Departmental/Financial/Human
Resources/ Administrative/ Institutions/
Schemes
• What activities are undertaken to
ensure convergence at community
level? Are there any Action Plans
prepared at State/District/Block
level to ensure the same?
• What are the challenges hindering
effective convergence?
• CADWM under PMKSY is
implemented pari-passu
with the 99 Priority AIBP
projects
• CADWM guidelines
mandate implementation
of micro-irrigation
structures (like laying of
pipelines, creation of
sumps/ tanks, etc.) at
10% of the CCA;
convergence with extant
PMKSY-PDMC is
suggested for
procurement of the MI
equipment like drips and
sprinklers
• Guidelines suggest
convergence with PMKSY
(WDC) and MGNREGA
works for activities
involving earth works like
construction of unlined
field works, land levelling
works, creation of surface
drainage, etc. However,
the convergence with
other schemes like

Page | 398
#
Cross-cutting
theme
Indicative Areas of Enquiry and Key
Questions
Findings from research
MGNREGA was found to
be minimal. Almost all
states attributed the low
convergence with
MGNREGA to the extant
40:60 material-labour
share convention in
MGNREGA which
precludes taking up
CADWM works as CAD
works require around 70-
80% material component.
Also, it is reported that
CADWM works require
skilled labour while
MGNREGA generally
offers services of un-
skilled labourers.
Potential areas for synergy
• What are the areas for potential
convergence / synergy across govt.
programs?
• Conjunctive use of
surface and groundwater
need to be explored for
installation of
groundwater based
minor irrigation
structures like tube
wells, bore wells in
command areas catered
by projects designed for
single season use
(notably, the
Page | 399
#
Cross-cutting
theme
Indicative Areas of Enquiry and Key
Questions
Findings from research
Groundwater Irrigation
scheme under PMKSY-
HKKP caters to only
areas not catered by
surface water schemes).
Some states like Assam
has reported utilization of
portion of MI fund to
facilitate installation of
solar powered shallow
tube wells, thus ensuring
water availability during
dry Rabi season.
Any Best Practices
Case Study: Effective
convergence with
MNREGS (Dhar district,
Madhya Pradesh)
In 2008, the MP Panchayat
and Rural Development
department formulated two
schemes for facilitating
development and
management of irrigation
infrastructure using
MNREGS funds. Some of
the key features of the
implementation strategy is
highlighted below:
Enabling policies: MNREGS
funds used for canal

Page | 400
#
Cross-cutting
theme
Indicative Areas of Enquiry and Key
Questions
Findings from research
rehabilitation and
construction of field
channels under
Sahastradhara scheme.
Joint planning: Joint walk-
throughs conducted with
farmers by NVDA to prepare
detailed estimates of minor
canal repairs followed by
submission of technical
sanction plan by Executive
Engineer to the Panchayat.
Faster fund disbursal:
Funds were directly
transferred to the WUA’s
account by the Jilla
Panchayat (thus bypassing
the Gram Panchayat)
Hand-holding by
specialized agencies:
NVDA together with the
appointed NGO
Development Support
Centre (DSC) provided
technical support to the
WUAs in relation to technical
planning and estimation,
MNREGS labour orientation,
training of supervisors (/
mate), preparation of job
cards, bookkeeping and
accounting. Exposure visits
for WUA members were

Page | 401
#
Cross-cutting
theme
Indicative Areas of Enquiry and Key
Questions
Findings from research
arranged by DCS to
successful projects in
Madhya Pradesh, Gujarat
and Maharashtra. 20 local
youths were trained as
Kolaba Sahayaks/ mate of
MNREGS works. IEC and
awareness campaigns
involving graphic and visual
shows were arranged to
sensitize the villagers.
Implementation by WUAs:
The WUAs got the
opportunity to carry out the
R&M under the MNREGS
assisted canal repairing
works themselves, thus
obviating the need for
appointment of
departmental/ private
contractors.
Outcome
• 147 km of canal network
repaired and 93 km of
earther field channels
created in Maan and
Jobat projects. New field
channels facilitated water
access to tail end users in
Kukshi block.
• Direct transfer of
MNREGS funds to WUAs

Page | 402
#
Cross-cutting
theme
Indicative Areas of Enquiry and Key
Questions
Findings from research
instilled a sense of
ownership and
accountability among the
members.
• 6,500 ha of additional
area was brought under
irrigation. Irrigated area in
Maan and Jobat projects
increased from 7000 ha
and 5000 ha in 2007-08 to
11,400 ha and 7,700 ha in
2009-10 respectively.
• The farmers reported
increase in net income by
Rs. 10,000/ ha. Majority
of the farmers were able
to irrigate more than 50%
of their land and sow two
crops in a season by
adoption of new crops
like wheat, cotton, chilly,
pulses, etc.
• Substantial increase in
groundwater reported in
areas where field
channels have been
constructed.
(Reference: Tapan Patel et.
al. (2010), “Best Practices on
MNREGS Assisted Canal
Rehabilitation under
Participatory Irrigation
Page | 403
#
Cross-cutting
theme
Indicative Areas of Enquiry and Key
Questions
Findings from research
Management in Dhar,
Madhya Pradesh).
.
Summary Analysis:
• Though convergence with various schemes like PDMC, WDC and MGNREGA is suggested,
but actual convergence has been observed to be limited till now; some of the causes are
as follows: low acceptability of the MI structures by the farmers (particularly in light of the
increasing shift towards water-intensive crops like paddy which are conducive to flood
irrigation and abundant water availability during Kharif season) while the 40:60 material -
labour ratio mandated for MGNREGA works limit the mobilization of resources for CADWM
which demands material intensive services, etc.
11. Reforms,
Regulations
Adoption of models acts and reforms at
governance, institutional and
administrative level
• What measures are being taken to
ensure effective implementation
and compliance of adopted
acts/rule/regulations? (like in areas
of safety, accountability,
transparency etc.)
• In line with the
suggestions of National
Water Policy 2002, 20
out of 25 states (except
Haryana, Meghalaya,
Uttarakhand, Tripura and
Puducherry) have
instituted some
framework with respect
to PIM (as per NITI
Aayog CWMI 2019). A
brief comparison of the
important provisions in
the PIM acts across
various states is
summarized below:
o Capacity building:
Detailed provisions for
capacity building of

Page | 404
#
Cross-cutting
theme
Indicative Areas of Enquiry and Key
Questions
Findings from research
WUA members and
government field staffs
are absent in most of
the states except for
Gujarat, Jharkhand,
Karnataka, Kerala,
Maharashtra and Uttar
Pradesh (on payment
basis) and Goa.
o Gender
mainstreaming: Only 5
states viz A.P.,
Jharkhand,
Maharashtra, M.P. and
Chhattisgarh have
provisions for certain
reservation of women in
WUAs. During primary
survey, it was observed
that in some projects in
states like Bihar and
Karnataka, certain
women reservation
conventions are
followed.
o Social inclusion:
apart from Chhattisgarh
and West Bengal, none
of the states’ PIM acts

Page | 405
#
Cross-cutting
theme
Indicative Areas of Enquiry and Key
Questions
Findings from research
have any special
provisions for SC/ ST.
o Water management:
Provisions for
measuring devices and
monitoring are stated in
acts for states like
Gujarat, Maharashtra,
Goa and Uttar Pradesh.
o In states like Goa,
Uttar Pradesh,
Maharashtra and Bihar,
there are provisions for
conjunctive use of
groundwater
• However, during primary
survey in the command
areas of some of the
PMKSY-CADWM
projects, it was observed
that many of the WUAs
are non-functional;
detailed reasons for the
same are being
highlighted in the
REESIE section. In the
NITI Aayog CWMI 2019,
it is reported that during
FY 16 to FY 18, overall
states have ‘not shown
Page | 406
#
Cross-cutting
theme
Indicative Areas of Enquiry and Key
Questions
Findings from research
any significant progress
on the existing low WUA
participation in O&M and
irrigation facilities’; while
no states reported WUA
participation greater than
50%, the figures are
abysmally low for north-
eastern and Himalayan
states. The NITI Aayog
report attributed this
poor participation rate to
low technical
competency and poor
financial resources of the
WUAs.
• As reported during the
primary survey in some
states, the WUAs are
further financially
crippled by the lack of
any provision in state
PIM act to retain fees
collected. This is
highlighted in the NITI
Aayog CWMI 2019,
where it was observed
that ’18 of the 25
reporting states and UT’
do not share any

Page | 407
#
Cross-cutting
theme
Indicative Areas of Enquiry and Key
Questions
Findings from research
percentage of the
Irrigation Service
collection. Only 4 non-
Himalayan states viz.
Andhra Pradesh, Bihar,
Gujarat and Rajasthan
allow WUAs to retain
50% or more share. It
may be noted here that
the National Water Policy
(2012) proposed giving
statutory powers to
WUAs ‘to collect and
retain a portion of water
charges, manage the
volumetric quantum of
water allotted to them
and maintain the
distribution system in
their jurisdiction’.
Summary Analysis:
• Most of the states have instituted some mechanisms to ensure involvement of WUA;
however during the primary research, it was observed that many of the WUAs are non-
functional.
• Though National Water Policy (2012) suggested statutory powers to WUAs to collect and
retain portion of the water taxes, yet most states, barring some exceptions, are yet to
implement the same provision. Currently, most of the states PIM Acts have no provisions
for allowing the WUAs to retain 50% or more of the water fess collected.
12. Impact on and
role of private
Public-Private Partnership • Though some states like
Maharashtra, Andhra

Page | 408
#
Cross-cutting
theme
Indicative Areas of Enquiry and Key
Questions
Findings from research
sector,
community/
collectives/
cooperatives
(e.g. Farmer
cooperatives,
FPOs, Water
User
Associations,
etc.) and civil
society in the
scheme
• How well have PPP functions in the
Sector? What are the challenges
faced?
Pradesh have taken some
steps in attracting private
sector participation in
irrigation and drainage
sector (I&D) particularly in
building the large assets,
yet the overall
participation across India
remains tepid till now.
• Some of the reasons
being low cost recovery
from water (water being
perceived as a social
good/ right rather than an
economic commodity),
land acquisition, R&R and
other legal and
administrative issues
endemic in this sector,
non-availability of
alternative revenue
streams.
• However, with adoption
of piped distribution
network gaining traction,
there is a potential for
engaging private
contractors for both
construction and O&M of
these networks through

Page | 409
#
Cross-cutting
theme
Indicative Areas of Enquiry and Key
Questions
Findings from research
some cost and revenue
sharing models.
Any best practices International Case Studies
• Megech Seraba Irrigation
and Drainage scheme,
Ethiopia : maintenance of
the primary and
secondary irrigation
infrastructure by a private
entity in lieu of service fee
paid by the government
with farmers to share a
part of the fees
• Also, a number of
irrigation command areas
in China have engaged
private contractors for
maintenance and service
of the field distribution
networks.
• In terms of private sector
participation to reduce the
market barriers for agri-
produces, the Ramthal
Integrated Drip Irrigation
Project in Karanataka is a
notable project, where
the state government
signed MoUs with eight
private agricultural firms

Page | 410
#
Cross-cutting
theme
Indicative Areas of Enquiry and Key
Questions
Findings from research
for procuring farm
produces from this
project command area.
FPOs/SHGs/Cooperative's Participation
• How many private sector,
community/collectives/cooperatives
and civil society have availed the
benefits under any Scheme?
• Under non-structural
interventions of the
scheme, trials and
demonstrations are
provided by the WALMIs/
regional agriculture
universities to the WUAs.
The scheme guidelines
also mandate
appointment of ‘social
facilitators’ for each
project to hand-hold the
WUAs. However, as
mentioned in previous
sections, barring some
exceptions (in Maharshtra
and Karnataka where in
some cases specialized
agencies and/ or irrigation
department conducted
regular trainings for WUA
members), the
performance of the
scheme has been sub-par
in terms of non-structural
interventions.
Summary Analysis:
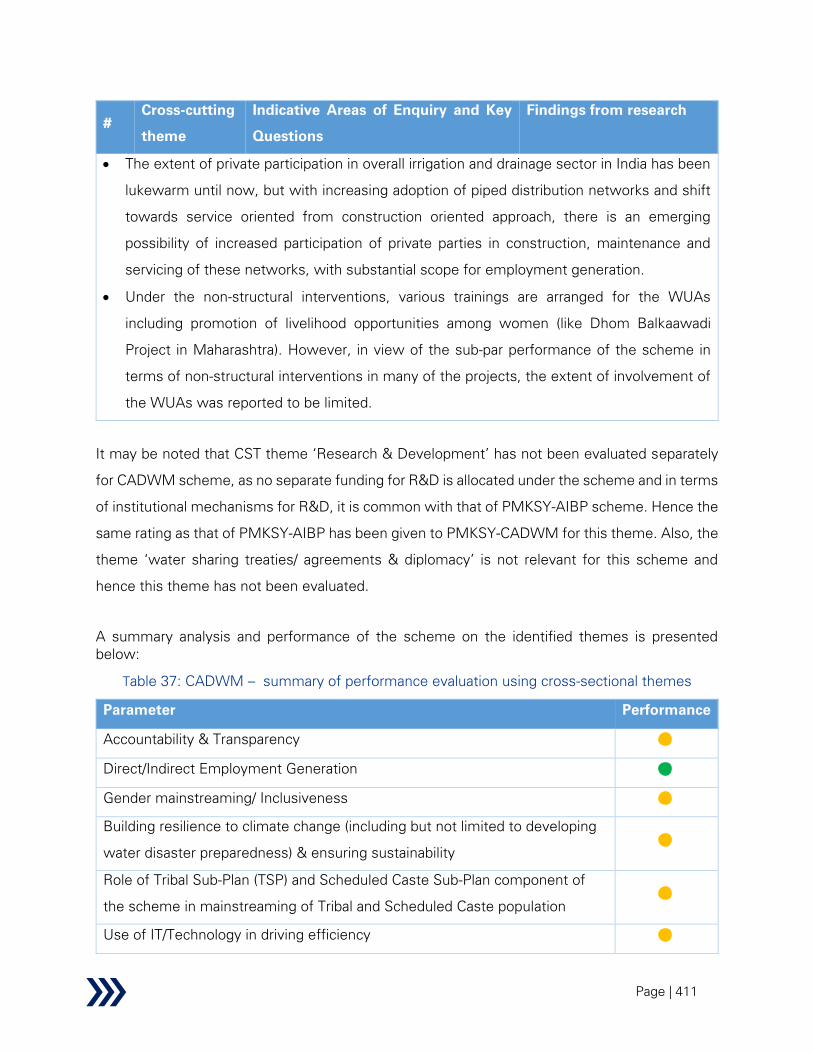
Page | 411
#
Cross-cutting
theme
Indicative Areas of Enquiry and Key
Questions
Findings from research
• The extent of private participation in overall irrigation and drainage sector in India has been
lukewarm until now, but with increasing adoption of piped distribution networks and shift
towards service oriented from construction oriented approach, there is an emerging
possibility of increased participation of private parties in construction, maintenance and
servicing of these networks, with substantial scope for employment generation.
• Under the non-structural interventions, various trainings are arranged for the WUAs
including promotion of livelihood opportunities among women (like Dhom Balkaawadi
Project in Maharashtra). However, in view of the sub-par performance of the scheme in
terms of non-structural interventions in many of the projects, the extent of involvement of
the WUAs was reported to be limited.
It may be noted that CST theme ‘Research & Development’ has not been evaluated separately
for CADWM scheme, as no separate funding for R&D is allocated under the scheme and in terms
of institutional mechanisms for R&D, it is common with that of PMKSY-AIBP scheme. Hence the
same rating as that of PMKSY-AIBP has been given to PMKSY-CADWM for this theme. Also, the
theme ‘water sharing treaties/ agreements & diplomacy’ is not relevant for this scheme and
hence this theme has not been evaluated.
A summary analysis and performance of the scheme on the identified themes is presented
below:
Table 37: CADWM – summary of performance evaluation using cross-sectional themes
Parameter Performance
Accountability & Transparency
Direct/Indirect Employment Generation
Gender mainstreaming/ Inclusiveness
Building resilience to climate change (including but not limited to developing
water disaster preparedness) & ensuring sustainability
Role of Tribal Sub-Plan (TSP) and Scheduled Caste Sub-Plan component of
the scheme in mainstreaming of Tribal and Scheduled Caste population
Use of IT/Technology in driving efficiency
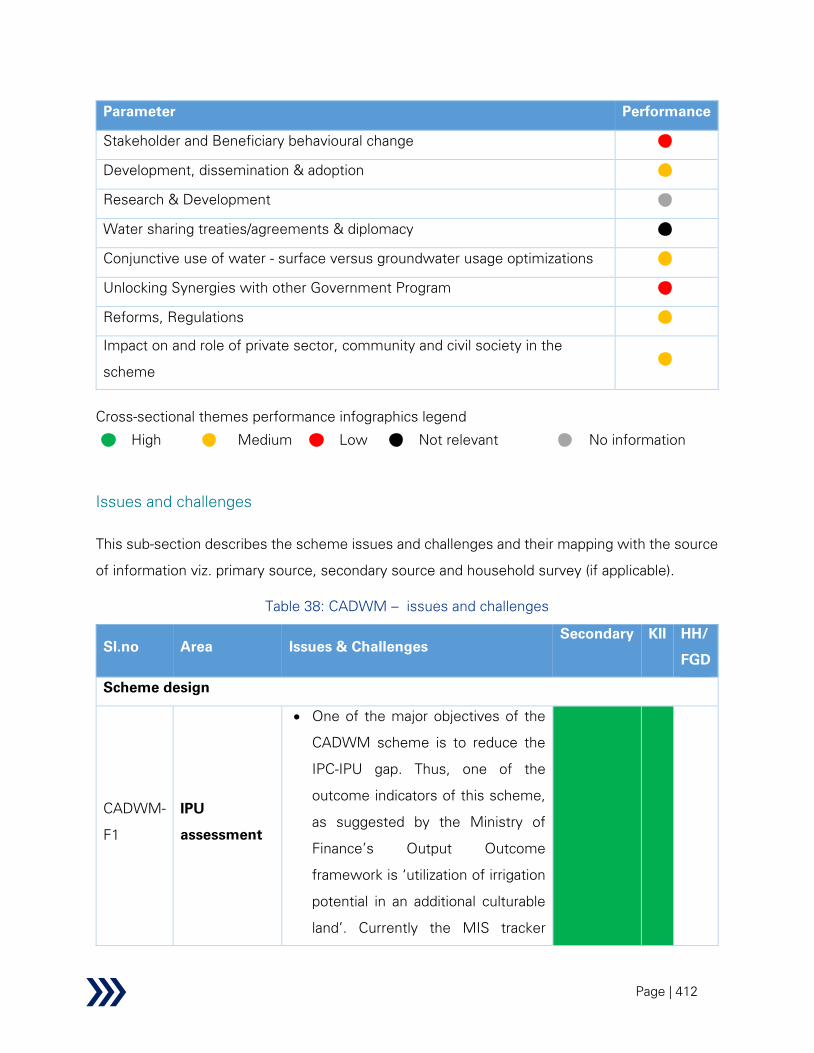
Page | 412
Parameter Performance
Stakeholder and Beneficiary behavioural change
Development, dissemination & adoption
Research & Development
Water sharing treaties/agreements & diplomacy
Conjunctive use of water - surface versus groundwater usage optimizations
Unlocking Synergies with other Government Program
Reforms, Regulations
Impact on and role of private sector, community and civil society in the
scheme
Cross-sectional themes performance infographics legend
High
Medium
Low
Not relevant
No information
Issues and challenges
This sub-section describes the scheme issues and challenges and their mapping with the source
of information viz. primary source, secondary source and household survey (if applicable).
Table 38: CADWM – issues and challenges
Sl.no Area Issues & Challenges
Secondary KII HH/
FGD
Scheme design
CADWM-
F1
IPU
assessment
• One of the major objectives of the
CADWM scheme is to reduce the
IPC-IPU gap. Thus, one of the
outcome indicators of this scheme,
as suggested by the Ministry of
Finance’s Output Outcome
framework is ‘utilization of irrigation
potential in an additional culturable
land’. Currently the MIS tracker

Page | 413
Sl.no Area Issues & Challenges
Secondary KII HH/
FGD
records the physical progress in
terms of coverage under structural
interventions as IPU.
• However, currently there is no
standard guidelines for calculation of
IPU, resulting in significant
disparities between studies
conducted by various organizations.
E.g. the report by IIM Calcutta in
2008 “IPC-IPU Analysis in West
Bengal and the North-east” pointed
that ‘none of the states satisfied the
team about actual process of
reporting the IPU’.
• In 2007, a similar study conducted
by IIM Ahmedabad under the
guidance of MoWR for the purpose
of assessment IPC-IPU gap, also
pointed that both IPC and IPU are
dynamic figures dependant on a
number of factors like resource
reliability, wear and tear of the
infrastructure, cropping pattern,
etc.; thus simply aggregating the
same without further updates (/
without accounting for the
discounting factors) is not
methodologically sound. The same
has been echoed by various other

Page | 414
Sl.no Area Issues & Challenges
Secondary KII HH/
FGD
studies in the last decade like NITI
Aayog study (in 2015).
CADWM
-F2
Cost norms
• The cost norms for calculation of CA
set in 2016-17 has not been revised
thereafter, resulting in differences
with the existing market rates
• It has also been reported inadequate
for some states particularly those
which have moved to a higher
schedule of rates like Assam and
Manipur.
• This may compromise the extent of
lining of water courses (for want of
additional funds from the state for
the same) thus contributing to
inefficiency in conveyance, the
fallout of which is abandonment of
the water courses by farmers during
periods of drought. Also unlined
channels have higher chances of
getting damaged during period of
alternate drying and wetting of the
fields further aggravated by the
movement of heavy equipment by
the cultivators.
Scheme implementation
CADWM
-F3
Institutional
structure
• Under the non-structural
interventions, the CADWM
guidelines has identified the Social
Facilitators as the main organization
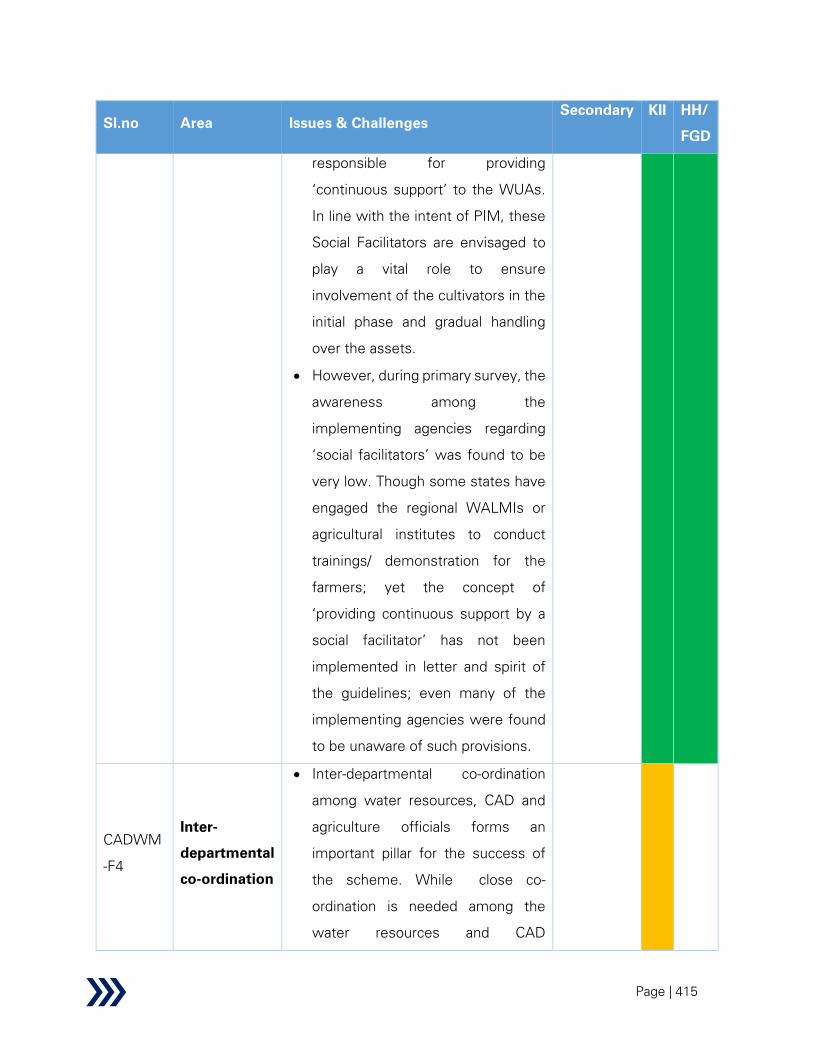
Page | 415
Sl.no Area Issues & Challenges
Secondary KII HH/
FGD
responsible for providing
‘continuous support’ to the WUAs.
In line with the intent of PIM, these
Social Facilitators are envisaged to
play a vital role to ensure
involvement of the cultivators in the
initial phase and gradual handling
over the assets.
• However, during primary survey, the
awareness among the
implementing agencies regarding
‘social facilitators’ was found to be
very low. Though some states have
engaged the regional WALMIs or
agricultural institutes to conduct
trainings/ demonstration for the
farmers; yet the concept of
‘providing continuous support by a
social facilitator’ has not been
implemented in letter and spirit of
the guidelines; even many of the
implementing agencies were found
to be unaware of such provisions.
CADWM
-F4
Inter-
departmental
co-ordination
• Inter-departmental co-ordination
among water resources, CAD and
agriculture officials forms an
important pillar for the success of
the scheme. While close co-
ordination is needed among the
water resources and CAD

Page | 416
Sl.no Area Issues & Challenges
Secondary KII HH/
FGD
departments for ensuring adequate
water availability at the outlets,
correct requisition of demands from
WUA and successful operation of
the warabandi schedule while
engagement with the agriculture
department becomes vital in
ensuring crop planning, estimating
demand for water, hand-holding the
cultivators, etc.
• The following deficiencies in relation
to co-ordination was observed:
o In some states like Uttar
Pradesh, inadequate co-
ordination between water
resources and CAD
departments (in terms of staff
deployment, identification of
scope) were stated
o In states like Manipur, CAD and
water resources have been
bifurcated into separate
department resulting in
administrative hurdles and staff
shortages
o One of the causes attributed to
the poor performance of micro-
irrigation schemes is non-
utilization of the sumps/ tanks
(created under MI component

Page | 417
Sl.no Area Issues & Challenges
Secondary KII HH/
FGD
in CADWM) due to non-
availability of drips and
sprinklers from the agriculture
department, thus leading to
lesser motivation for this
component among the
cultivators. This is also
complicated by the lack of
awareness among farmers
regarding micro-irrigation as
reported in states like Bihar,
Madhya Pradesh and
Maharashtra.
CADWM
-F5
Staff
shortage
• Almost all the informants across
evaluated states, barring exceptions
like Bihar, confirmed severe staff
shortages under the CAD
department. The high number of
vacancies across different posts has
hampered the survey, execution,
monitoring and water taxes
assessment and collection in many
of projects (like Dhansiri in Assam,
Durgawati in Bihar, Bhima and
Karanja in Karnataka, Baryiarpur and
Singpur in Madhya Pradesh, Tarali,
Dhom Balkaawadi, Upper
Penganga, Lower Panzara and
Nandur Madhmeshwar in
Maharashtra, Thoubal and Dolaithabi
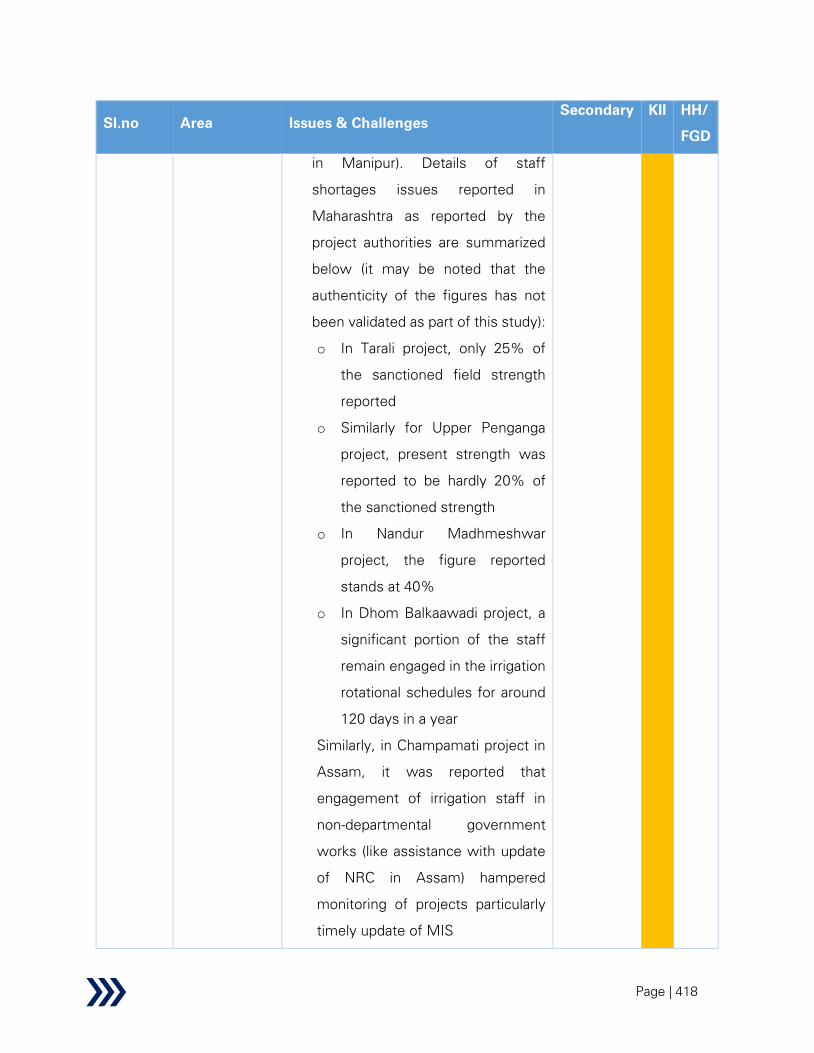
Page | 418
Sl.no Area Issues & Challenges
Secondary KII HH/
FGD
in Manipur). Details of staff
shortages issues reported in
Maharashtra as reported by the
project authorities are summarized
below (it may be noted that the
authenticity of the figures has not
been validated as part of this study):
o In Tarali project, only 25% of
the sanctioned field strength
reported
o Similarly for Upper Penganga
project, present strength was
reported to be hardly 20% of
the sanctioned strength
o In Nandur Madhmeshwar
project, the figure reported
stands at 40%
o In Dhom Balkaawadi project, a
significant portion of the staff
remain engaged in the irrigation
rotational schedules for around
120 days in a year
Similarly, in Champamati project in
Assam, it was reported that
engagement of irrigation staff in
non-departmental government
works (like assistance with update
of NRC in Assam) hampered
monitoring of projects particularly
timely update of MIS
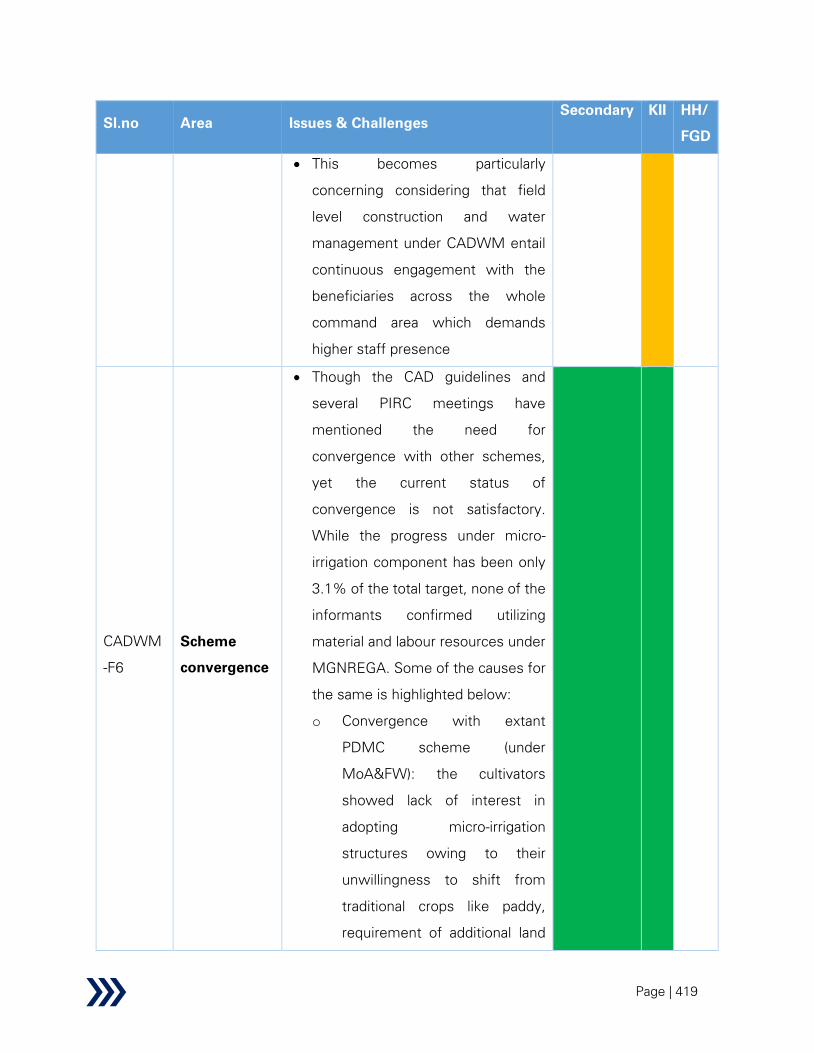
Page | 419
Sl.no Area Issues & Challenges
Secondary KII HH/
FGD
• This becomes particularly
concerning considering that field
level construction and water
management under CADWM entail
continuous engagement with the
beneficiaries across the whole
command area which demands
higher staff presence
CADWM
-F6
Scheme
convergence
• Though the CAD guidelines and
several PIRC meetings have
mentioned the need for
convergence with other schemes,
yet the current status of
convergence is not satisfactory.
While the progress under micro-
irrigation component has been only
3.1% of the total target, none of the
informants confirmed utilizing
material and labour resources under
MGNREGA. Some of the causes for
the same is highlighted below:
o Convergence with extant
PDMC scheme (under
MoA&FW): the cultivators
showed lack of interest in
adopting micro-irrigation
structures owing to their
unwillingness to shift from
traditional crops like paddy,
requirement of additional land
Page | 420
Sl.no Area Issues & Challenges
Secondary KII HH/
FGD
occupying structures like
sumps/ tanks for using MI
equipment like drips/ sprinklers,
choking of some of the MI
equipment in sandy and loamy
soil and additional capex and
recurrent expenses (like
electricity costs) requirement.
This is further complicated by
lack of co-ordination with
horticulture/ agriculture
resulting into delay in obtaining
subsidy for the MI equipment
and lack of awareness among
farmers regarding MI
equipment.
o Convergence with MGNREGA:
None of the informants across
sampled states confirmed
taking either material and
labour support under
MGNREGA. The reasons cited
is the mandatory 40:60 ratio of
material and labour component
under MGNREGA prevents
using the services under
CADWM as this is more
material intensive scheme
(with ratios of material to
labour).

Page | 421
Sl.no Area Issues & Challenges
Secondary KII HH/
FGD
CADWM
-F7
Fund transfer
• In view of the limited working period
available for execution of field works
(3-4 months in many states) owing
to standing crops and field
preparation during pre-harvesting
period, the need for proper resource
planning (both financial, manpower
and other material resources)
becomes critical.
• However, implementing agencies in
some states pointed to delay in
receipt of funds: delay in receipt of
both Centre and State share in
Assam, stalling in transfer of grants
from state treasuries due to
technical issues in Comprehensive
Financial Management System in
Bihar and delay in transfer of grants
by state departments in Rajasthan
were reported. Such delays are
understood to have hampered the
contractor mobilization process
before start of field work and setting
up of WUAs.
• This phenomenon has also been
pointed by past studies like NITI
Aayog (2015) which stated that
modus operandi of transfer of CA
grants to state finance department
(state common pool) is not

Page | 422
Sl.no Area Issues & Challenges
Secondary KII HH/
FGD
conducive to timely release of funds
to the implementing agencies.
CADWM
-F8
Maintenance
issue
• Adequate maintenance of the water
courses, WUAs and other assets is
the main determinant of the
success of the scheme in long run.
As per the guidelines, since the
assets are created on the individual
cultivator’s field, the onus of
maintenance and up-keep of the
same falls on the cultivators and the
WUAs. The guidelines mandate
gradual hand-holding of the WUAs
and transfer of the management and
maintenance of all the assets (below
outlets) to the WUAs.
• However, at a national level, the
NITI Aayog CWMI 2019 points to
the low level of participation (around
24% only of irrigated command
areas) of the WUAs in the O&M and
the irrigation facilities; particularly
concerning is the poor performance
of some of the bigger states like
Bihar (3%), Gujarat (35%) and U.P.
(2%).
• In the backdrop of the existing trend
of poor collection of water fees,
generating enough cash for smooth
operation of the WUAs may turn out
Page | 423
Sl.no Area Issues & Challenges
Secondary KII HH/
FGD
to be challenging in the future. Also,
as per the NITI Aayog’s CWMI 2019,
18 of the 25 reporting states and
UTs do not share any portion of the
irrigation fees collected with the
WUAs for O&M. Only 4 non-
Himalayan states viz Andhra
Pradesh, Bihar, Gujarat and
Rajasthan allow the WUAs to retain
50% or more of the fees collected.
Thus, defunct WUAs and low fees
collection are major concerns in
ensuring proper maintenance of the
water courses.
• Though it is understood that interest
earned from the infrastructure/
functional grants may be utilized to
fund the operations and repair and
maintenance works, yet as per the
6th
PIRC MOM, only 17% of the
registered 8,332 WUAs have been
handed over the infrastructure
grant.
CADWM
-F9
Private
participation
• Though some states like
Maharashtra, Andhra Pradesh have
taken some steps in attracting
private sector participation in
irrigation and drainage sector (I&D)
particularly in building of large

Page | 424
Sl.no Area Issues & Challenges
Secondary KII HH/
FGD
assets, yet the overall participation
across India remains tepid till now.
• Some of the reasons being low cost
recovery from water (water being
perceived as a social good/ right
rather than an economic
commodity), land acquisition, R&R
and other legal and administrative
issues endemic in this sector, non-
availability of alternative revenue
streams.
Monitoring and evaluation
CADWM
-F10
Non-
structural
intervention
evaluation
criteria
• The CAD guidelines mandate
engagement of one Social Facilitator
for each of the projects and the
monitoring of the performance of
the Social Facilitator by some
specialized agency/ institute/
consultant engaged by the MoWR.
• However during primary survey, it
was found the level of awareness
about ‘social facilitators’ is almost nil
among all states (barring some
exceptions like Lower Panzara
project in Maharashtra). Some of the
project implementing authorities
have engaged the local WALMIs/
agricultural institutes for training and
demonstration to the farmers, but
the mechanism of engagement of
Page | 425
Sl.no Area Issues & Challenges
Secondary KII HH/
FGD
social facilitators for continuous
hand-holding and submission of
evaluation reports was found to be
totally absent.
CADWM
-F11
MIS update
• The CADWM MIS dashboard has
been a significant step in ensuring
accountability and data
transparency. Though the updates in
relation to structural interventions
are observed to be regular, yet
some deficiencies in update of non-
structural interventions have been
noted (dashboard accessed on 9th
July 2020), some of which are listed
below:
o Data inconsistencies:
▪ Under Dhansiri Irrigation
Project in Assam, though
the ‘number of WUA
created’ has been stated as
44, yet the ‘total number of
farms’ has been stated as 1.
o Incomplete data update:
▪ Under Durgawati project in
Bihar, though the ‘number
of WUA created’ is stated
as 14, yet no corresponding
figure has been updated for
‘CCA covered’ and ‘total
number of farms’
Page | 426
Sl.no Area Issues & Challenges
Secondary KII HH/
FGD
o Inconsistencies among different
databases
▪ Under Sardar Sarovar
project in Gujarat, as per
MOM of 6th
PIRC meeting
(February 2020), the nos. of
WUA created is stated as
3,624; while the
corresponding figure in MIS
dashboard (as on July 2020)
reads as 2,140
▪ Similarly as per MOM of 6th
PIRC meeting (February
2020), the nos. of WUA
created in Jharkhand is 48;
while the same head under
MIS dashboard is found to
be blank.
▪ Again, the number of WUAs
created in Manipur reads as
34 in 6th
PIRC MOM and 2
in MIS dashboard (1 for
Thoubal and Dolaithabi
project each).
▪ Similarly, as per data shared
by project authorities of
Dhom Balkaawadi project in
Maharashtra, 54 WUAs
have been formed out of
the targeted 85 WUAs

Page | 427
Sl.no Area Issues & Challenges
Secondary KII HH/
FGD
while infrastructural grants
have been handed over to
30 of the WUAs during
2018-20. But as per MIS
dashboard (as accessed on
8th
June 2020), only 1 out of
the targeted 85 WUAs have
been created and
infrastructural grants have
been handed to over none.
• Deficiencies in data upload in MIS
and inconsistencies in data reporting
across various databases severely
undermine the transparency and
accountability with negative
implications on policy design.
• Also, one of the outcome indicators
viz. ‘additional irrigation potential
created’ as mandated in the Output
Outcome framework by Ministry of
Finance, is not being tracked in the
dashboard.
Issue relevance legend
Supported Partially
supported Not supported
Not applicable
A summary analysis of issues & challenges for the scheme is presented below:
Table 39: CADWM – summary of issues and challenges
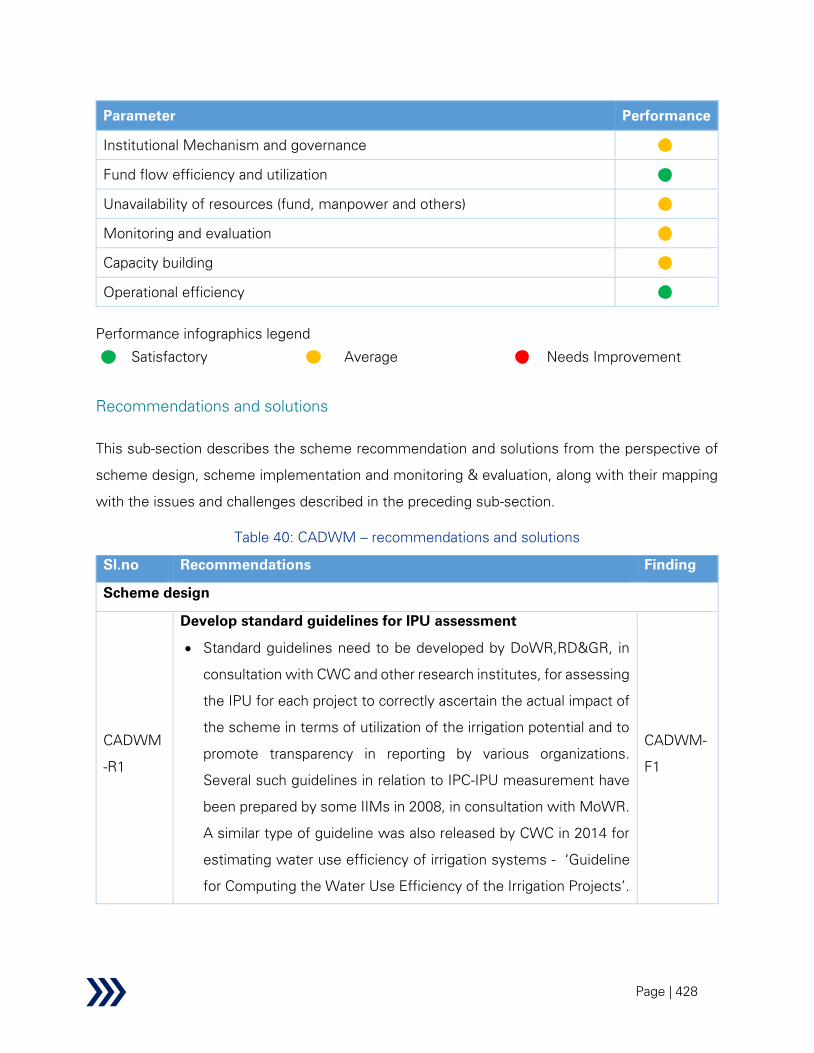
Page | 428
Parameter Performance
Institutional Mechanism and governance
Fund flow efficiency and utilization
Unavailability of resources (fund, manpower and others)
Monitoring and evaluation
Capacity building
Operational efficiency
Performance infographics legend
Satisfactory
Average
Needs Improvement
Recommendations and solutions
This sub-section describes the scheme recommendation and solutions from the perspective of
scheme design, scheme implementation and monitoring & evaluation, along with their mapping
with the issues and challenges described in the preceding sub-section.
Table 40: CADWM – recommendations and solutions
Sl.no Recommendations Finding
Scheme design
CADWM
-R1
Develop standard guidelines for IPU assessment
• Standard guidelines need to be developed by DoWR,RD&GR, in
consultation with CWC and other research institutes, for assessing
the IPU for each project to correctly ascertain the actual impact of
the scheme in terms of utilization of the irrigation potential and to
promote transparency in reporting by various organizations.
Several such guidelines in relation to IPC-IPU measurement have
been prepared by some IIMs in 2008, in consultation with MoWR.
A similar type of guideline was also released by CWC in 2014 for
estimating water use efficiency of irrigation systems - ‘Guideline
for Computing the Water Use Efficiency of the Irrigation Projects’.
CADWM-
F1

Page | 429
Sl.no Recommendations Finding
• IPU being a dynamic figure which substantially depends on the
existing cropping pattern, climatic conditions, etc., it is suggested
to create special statistical cells under the state irrigation/ water
resources department to compute the dynamic figures for IPU
over specified time periods, which should be monitored and
assimilated at national level by any designated statistical cell/
empowered committee.
• As an interim measure, remote sensing technologies like satellite
image mapping (as already initiated by Ministry in co-ordination
with BISAG) for crop assessment may be explored. Another
noticeable example is the Narmada Canal Project, Rajasthan,
where the project authorities are leveraging satellites ordered
through ISRO’s NRSC Data Centre (NDC) – UOPS Portal to carry
out mapping of the Rabi season Land Use and Land Cover (LUCL)
in the command area. It is suggested to link such crop assessment
data with the ‘CCA covered through CADWM interventions’ in the
MIS dashboard to bring more transparency in assessing the
scheme outcomes.
CADWM
-R2
Prioritize implementation of non-structural components
• As per the Fourteenth Report to Lok Sabha by Standing
Committee on Water Resources (2016-17), it is mandatory to have
the WUAs in position before project components are taken up so
as to ensure participation of the beneficiaries in the planning stage.
Also, as highlighted by many past studies like DMEO NITI Aayog
(2015), there are many instances where project implementation of
various components starts without the formation of WUAs.
• Also, mere formation of WUAs without proper capacity building/
awareness programmes by Social Facilitators may not help in the
cause of their active involvement and later sustainability of the
projects. Thus, taking the cultivators to confidence before scheme
implementation forms a major step in initial acceptance of the
CADWM
-F10

Page | 430
Sl.no Recommendations Finding
scheme. This is reflected in various projects like Waghad in Nashik,
Maharashtra and Paliganj project in Bihar (non-AIBP projects), Sri
Rameswara LIS in Karnataka where handholding by specialized
training institutes and gradual realization of benefits helped to
overcome the initial resistance of the farmers. Also, in case of
ongoing projects with inadequate hydraulic connectivity to outlets,
release of infrastructure grants to the WUAs (for setting up
establishments, etc) at the project onset would help to secure the
confidence of cultivators.
• Thus, the release of 2nd CA instalment (or some portion thereof)
for structural interventions (in a particular project) may be linked
subject to the completion of the following steps by states:
o Online registration of the WUAs
o Appointment of social facilitator for the project
(notification/ proofs for the same to be submitted at the
time of application for 2nd
instalment and uploaded in
MIS dashboard)
o A minimum number of trainings (to be specified) to be
conducted by the social facilitators (conduct of
trainings to be validated by the WUA chairman and
submitted by state at the time of application for 2nd
instalment)
o Transfer of the CA grant under the one-time
infrastructural component (which should be
immediately released by the Centre at the project
onset) to the WUAs (such a lump sum amount at
project onset would help to garner more involvement
from the cultivators and also interest generated on the
same shall help to ensure R&M of the assets in the
subsequent years)
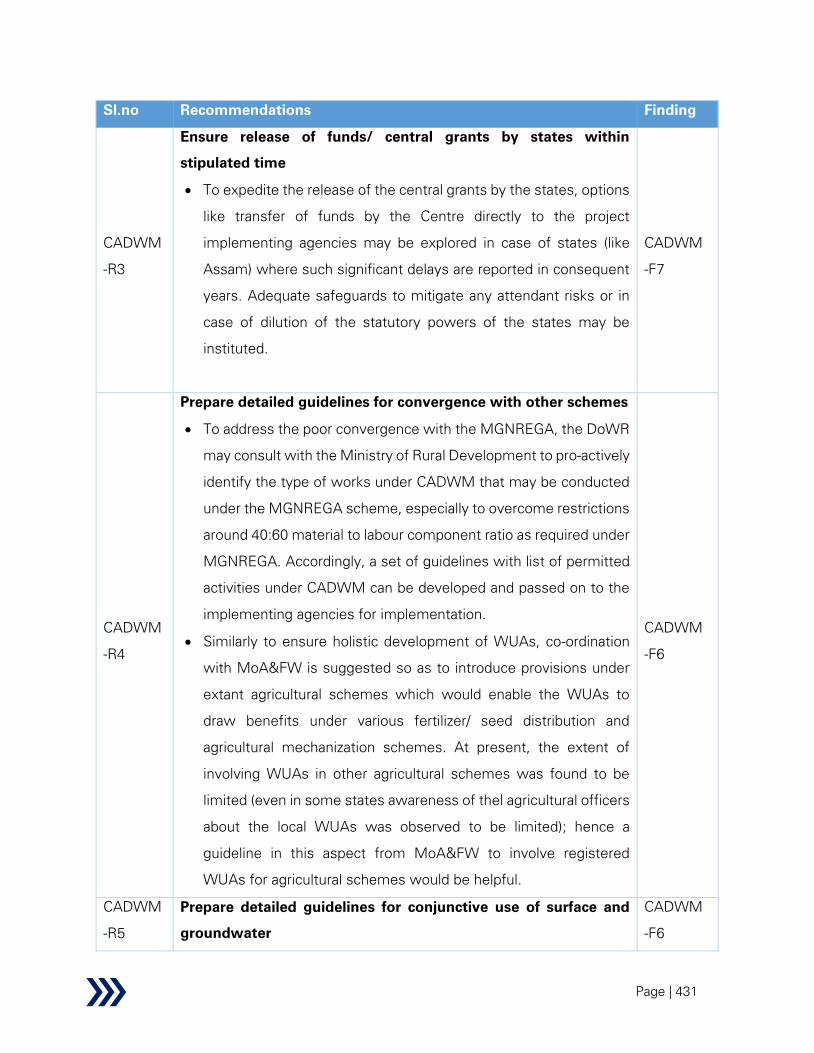
Page | 431
Sl.no Recommendations Finding
CADWM
-R3
Ensure release of funds/ central grants by states within
stipulated time
• To expedite the release of the central grants by the states, options
like transfer of funds by the Centre directly to the project
implementing agencies may be explored in case of states (like
Assam) where such significant delays are reported in consequent
years. Adequate safeguards to mitigate any attendant risks or in
case of dilution of the statutory powers of the states may be
instituted.
CADWM
-F7
CADWM
-R4
Prepare detailed guidelines for convergence with other schemes
• To address the poor convergence with the MGNREGA, the DoWR
may consult with the Ministry of Rural Development to pro-actively
identify the type of works under CADWM that may be conducted
under the MGNREGA scheme, especially to overcome restrictions
around 40:60 material to labour component ratio as required under
MGNREGA. Accordingly, a set of guidelines with list of permitted
activities under CADWM can be developed and passed on to the
implementing agencies for implementation.
• Similarly to ensure holistic development of WUAs, co-ordination
with MoA&FW is suggested so as to introduce provisions under
extant agricultural schemes which would enable the WUAs to
draw benefits under various fertilizer/ seed distribution and
agricultural mechanization schemes. At present, the extent of
involving WUAs in other agricultural schemes was found to be
limited (even in some states awareness of thel agricultural officers
about the local WUAs was observed to be limited); hence a
guideline in this aspect from MoA&FW to involve registered
WUAs for agricultural schemes would be helpful.
CADWM
-F6
CADWM
-R5
Prepare detailed guidelines for conjunctive use of surface and
groundwater
CADWM
-F6
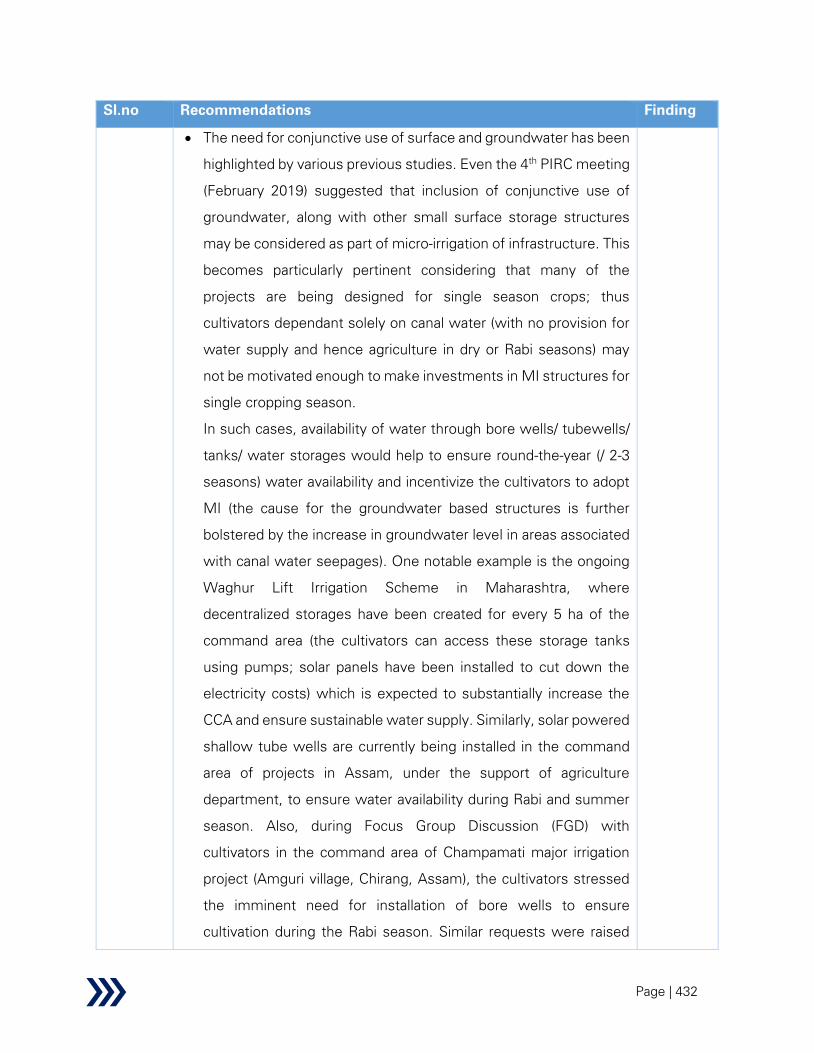
Page | 432
Sl.no Recommendations Finding
• The need for conjunctive use of surface and groundwater has been
highlighted by various previous studies. Even the 4th
PIRC meeting
(February 2019) suggested that inclusion of conjunctive use of
groundwater, along with other small surface storage structures
may be considered as part of micro-irrigation of infrastructure. This
becomes particularly pertinent considering that many of the
projects are being designed for single season crops; thus
cultivators dependant solely on canal water (with no provision for
water supply and hence agriculture in dry or Rabi seasons) may
not be motivated enough to make investments in MI structures for
single cropping season.
In such cases, availability of water through bore wells/ tubewells/
tanks/ water storages would help to ensure round-the-year (/ 2-3
seasons) water availability and incentivize the cultivators to adopt
MI (the cause for the groundwater based structures is further
bolstered by the increase in groundwater level in areas associated
with canal water seepages). One notable example is the ongoing
Waghur Lift Irrigation Scheme in Maharashtra, where
decentralized storages have been created for every 5 ha of the
command area (the cultivators can access these storage tanks
using pumps; solar panels have been installed to cut down the
electricity costs) which is expected to substantially increase the
CCA and ensure sustainable water supply. Similarly, solar powered
shallow tube wells are currently being installed in the command
area of projects in Assam, under the support of agriculture
department, to ensure water availability during Rabi and summer
season. Also, during Focus Group Discussion (FGD) with
cultivators in the command area of Champamati major irrigation
project (Amguri village, Chirang, Assam), the cultivators stressed
the imminent need for installation of bore wells to ensure
cultivation during the Rabi season. Similar requests were raised

Page | 433
Sl.no Recommendations Finding
during FGD in the command area of Dhom Balkaawadi project
(Wakhari village, Satara district, Maharashtra), where the
cultivators asserted the need for filling up tanks, particularly in the
tail reaches, to reduce the dependency on rain water.
• The absence of any specific guidelines for conjuctive water use
and poor progress under micro-irrigation component (only 3.1% of
the target) have brought to fore the imminent need of detailing the
guidelines for successful implementation of such component like
installation of bore wells/ tubewells in areas with ‘safe’
groundwater levels and creation of small tanks (as required) which
can be undertaken using the fund earmarked under micro-irrigation
component. The Ministry should clearly specify the activities to be
counted under conjunctive use of groundwater and the relevant
cost norms.
CADWM-
R6
Explore scheme rationalization by merging the micro-irrigation
component with OI component of PDMC scheme
• In view of the continuing poor progress under the micro-irrigation
component, transfer of this component to the Other Interventions
component of the extant Per Drop more Crop scheme (under
MoA&FW) may be explored.
• In consultation with the MoA&FW, provisions may be added under
the OI component of Per Drop More Crop (PDMC) scheme for
mandatory coverage of 10% of the command area (or more in case
of lift irrigation schemes) of the 99 AIBP projects along with
flexibilities to compensate the shortfall in coverage in one
command area through higher target coverage in another
command area (in the same state).
• This would enable the beneficiaries to directly apply for the
subsidies for drips/ sprinklers to the MoA&FW.
• Transfer of the micro-irrigation component to OI component under
PDMC scheme is also expected to increase the acceptance of MI
CADWM
-F6

Page | 434
Sl.no Recommendations Finding
techniques among the cultivators with the hand-holding and
awareness sessions already being conducted by the agriculture/
horticulture department in this aspect. At present, low awareness
among the cultivators regarding MI techniques was found to be a
stumbling block for adopting such techniques – this can be
addressed using the 5% ‘Admin Expenses’ earmarked under
PDMC schemes and also can be supported by the awareness
trainings organized by the various MI manufacturers.
CADWM
-R7
Incentivize states for adopting piped distribution network,
wherever feasible
• In view of the increasing shift towards volumetric water supply
and differential pricing and reluctance of farmers in some areas to
part with their land (particularly in light of the fragmented land-
holding pattern in many states and recent escalation in land prices),
use of piped distribution network, wherever feasible, can be
explored.
• The success of piped distribution network has already been
demonstrated across several projects in India like Sardar Sarovar
in Gujarat, Narmada Canal Project in Rajasthan and currently being
implemented in Waghur command area in Maharashtra. Some of
the benefits of piped irrigation network include less requirement
of land, low conveyance loss, higher durability and lower O&M
cost, thus assisting in avoiding the impending issue of high
maintenance burden to be borne by the WUAs. Also, such
networks with provisions for water regulation and measurement
would greatly enable the shift towards volumetric supply and
differential pricing.
• For all new proposals, the state governments may be incentivized
to adopt pressurized piped irrigation distribution network
(wherever feasible). The Ministry should pro-actively develop a list
of the ongoing projects where implementation of such distribution
CADWM
-F8
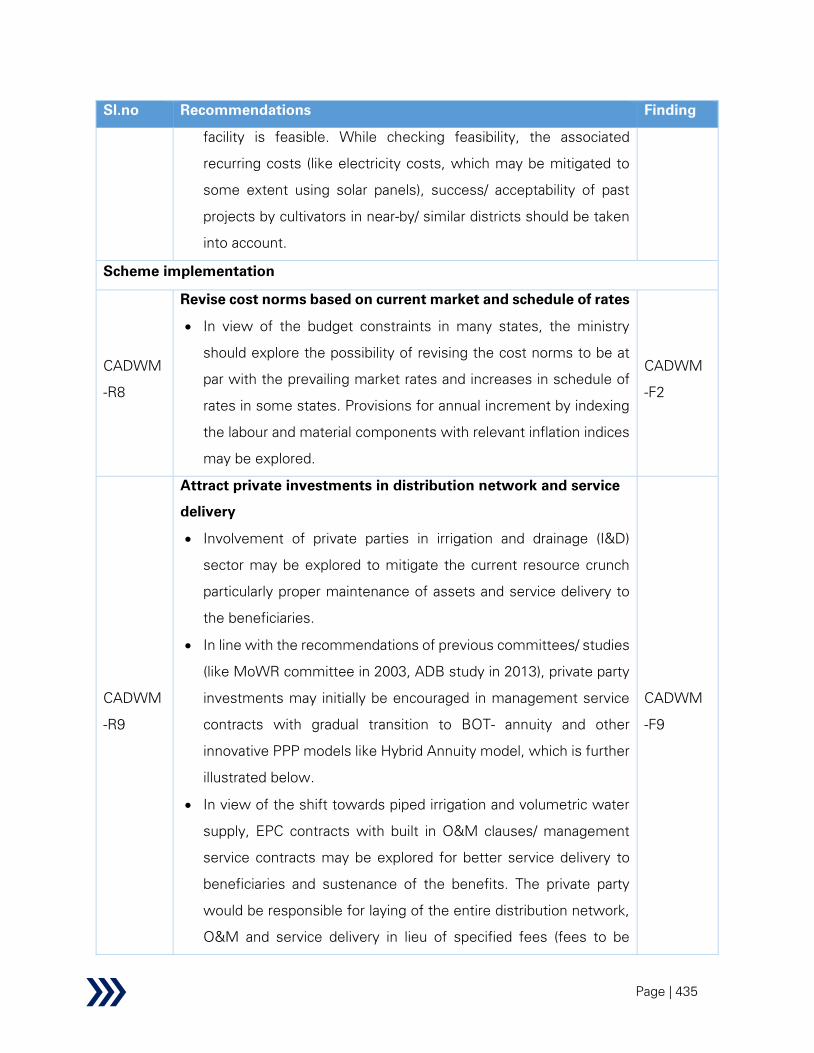
Page | 435
Sl.no Recommendations Finding
facility is feasible. While checking feasibility, the associated
recurring costs (like electricity costs, which may be mitigated to
some extent using solar panels), success/ acceptability of past
projects by cultivators in near-by/ similar districts should be taken
into account.
Scheme implementation
CADWM
-R8
Revise cost norms based on current market and schedule of rates
• In view of the budget constraints in many states, the ministry
should explore the possibility of revising the cost norms to be at
par with the prevailing market rates and increases in schedule of
rates in some states. Provisions for annual increment by indexing
the labour and material components with relevant inflation indices
may be explored.
CADWM
-F2
CADWM
-R9
Attract private investments in distribution network and service
delivery
• Involvement of private parties in irrigation and drainage (I&D)
sector may be explored to mitigate the current resource crunch
particularly proper maintenance of assets and service delivery to
the beneficiaries.
• In line with the recommendations of previous committees/ studies
(like MoWR committee in 2003, ADB study in 2013), private party
investments may initially be encouraged in management service
contracts with gradual transition to BOT- annuity and other
innovative PPP models like Hybrid Annuity model, which is further
illustrated below.
• In view of the shift towards piped irrigation and volumetric water
supply, EPC contracts with built in O&M clauses/ management
service contracts may be explored for better service delivery to
beneficiaries and sustenance of the benefits. The private party
would be responsible for laying of the entire distribution network,
O&M and service delivery in lieu of specified fees (fees to be
CADWM
-F9

Page | 436
Sl.no Recommendations Finding
regulated by the government; subsidy may be provided in the initial
stages to attract more players) paid by the beneficiaries.
• In relation to such modus operandi (where O&M and service of
distribution network has been outsourced to individual managers)
in some irrigation projects in China, a study by Tushar Shah et al.
(July 2004), "Irrigation Institutions in a Dynamic Economy: What is
China Doing Differently from India” stated the following:
o contracting to individual managers (instead of collective
management by WUAs) was found to be more popular among
the cultivators
o water use per ha reduced in systems maintained by private
managers
• Case Study:
o Megech Seraba Irrigation and Drainage scheme, Ethiopia
▪ Maintenance of the primary and secondary irrigation
infrastructure in lieu of service fee paid by the
government where farmers contribute a part of the fees
• In the backdrop of the poor fiscal position of many of the state
governments and gradual shift from open canal to piped irrigation
systems and adoption of canal automation, exploration of PPP
models is surely called for.
Monitoring and evaluation
CADWM
-R10
Prepare guidelines to ensure regular update of MIS
• Despite suggestions from PIRC to states (as noted in MOMs of 4th
PIRC February 2019 and 5th
PIRC July 2019) for regular update of
MIS portal, discrepancies (in terms of update, inconsistencies
among data, mismatch across databases) in case of non-structural
interventions still persist. This undermines the transparency and
accountability of the data dissemination process. To mitigate the
issue, following steps are recommended:
CADWM
-F11

Page | 437
Sl.no Recommendations Finding
o Linking of subsequent CA instalments releases to the
physical and financial progress as reflected on the
dashboard
o The Ministry in association with the NIC should chalk
out a training plan for all the state-level responsible for
MIS updates
o The CWC regional office should share monthly reports
of data upload status, highlighting areas of deficiencies,
to the Ministry and state governments.
CADWM
-R11
Prepare detailed guidelines for engagement and monitoring of
social facilitator
• The ministry should prepare detailed guidelines for engagement of
the social facilitators and their monitoring KPIs to avoid non-
standardization and dilution of engagement mechanisms across
states. The current guidelines fall short of detailing out any
measurable KPIs for evaluation of the social facilitators. Also, with
no detailed provisions for engagement of the social facilitators, the
implementation of the same has been found poor invariably across
all states. Though the ministry has provided some suggestions
from time to time like involvement of NGOs empanelled under the
National Water Mission and others, yet without any detailed
provisions for implementation of the same has led to laxity in
implementation.
• It is suggested that the Ministry clearly defines the following in
respect to social facilitators and ensure strict implementation:
o Define eligibility criteria for selection of social
facilitators (like defining minimum experience in
relevant fields, experience in water management, etc.).
In this aspect, the states may choose from the already
empanelled NGOs under National Water Mission at
national level or competent local NGOs operating in the
CADWM
-F10

Page | 438
Sl.no Recommendations Finding
respective state in the same sector for a specified
period of time (as in Maharashtra). The Ministry may
also explore creating a common national pool of
empanelled NGOs/ specialized agencies across
relevant schemes for irrigation water management,
watershed development, drinking water supply, etc.
o Prepare details of the KPI for evaluation of their
performance (indicative list: success in opening of
separate bank accounts for WUAs, performance in
mobilization of community contribution for O&M,
campaigns and awareness drives conducted in relation
to water management and maintenance of water
courses, number of inter-departmental meetings held
involving irrigation, agriculture departments and WUAs,
etc.). As mandated in the existing scheme guidelines,
the Ministry needs to appoint the social science
agency/ institute/ consultant to review the
performance of the social facilitators
o Mandatory submission of monthly progress report by
social facilitators to social agencies/ consultant and
PIRC (in line with the provisions already set out in the
existing CADWM guidelines)
Similar guidelines covering some of the above aspects
have already been developed by Department of Drinking
Water and Sanitation in respect to engagement of
Implementation Support Agencies (ISAs) for
implementation of Jal Jeevan Mission (implementation of
piped drinking water connections to each rural household).
CADWM
-R12
Explore use of remote sensing techniques for monitoring and IPU
assessment
CADWM
-F5

Page | 439
Sl.no Recommendations Finding
• Considering the limited resources (manpower, vehicles, etc as
already) of the CAD departments and the huge span of the
command areas, the use of remote sensing technologies to
monitor the physical progress becomes imperative. Use of
satellite images and 3D images using drones may be explored,
particularly in relation to monitoring of field channels progress,
identification of system deficiencies and water-logged areas and
crop assessment.
• Use of drones has been successfully demonstrated at various
parts in in India like monitoring of construction works in Polavaram
project in Andhra Pradesh, generation of contour at the surveying
stage for the respective 99 Priority AIBP projects in Andhra
Pradesh. Other notable examples include extensive use of drone
in agricultural insurance and assessment sector – agencies like
Skymet are already leveraging drones to provide agricultural
survey services to insurance companies and various state
governments like Gujarat, Madhya Pradesh, Maharashtra and
Rajasthan. In another recent successful example, the Maharashtra
Krishna Valley Development Corporation (MKDVC) in association
with Terra Drones mapped 4200 sq.km of agricultural land.
Also once drone survey is conducted for a specific project and a
database of the orthomossaic image, area, crop and other details
for a particular village is created, next time the survey may be
updated using just a mobile app and capturing geo-time stamped
photo of the crop. (Source Reference: Pravin Kohle and T N
Munde, “Use of Drone for Efficient Water Management – A Case
Study”).
• Along with drones, many states are also leveraging satellite
imaging for crop assessment. One such notable example is the
Narmada Canal Project in Rajasthan (one of the PMKSY-AIBP
projects) who are procuring satellite data using ISRO’s NRSC Data

Page | 440
Sl.no Recommendations Finding
Centre (NDC) – UOPS portal for mapping of the Rabi season Land
Use and Land Cover (LULC). Similarly, Vassar Labs helped the
state government of Andhra Pradesh in developing agro-climatic
zone mapping to optimize the cropping pattern along crop
moisture, crop pest advisories and crop acreage estimation.
Noteworthy examples in other sectors include Crop Cutting
Experiments (CCE) conducted under Pradhan Mantri Fasal Bima
Yojana by government of India in some states like Haryana,
Karnataka, Madhya Pradesh and Maharashtra where multidate
satellite remote sensing data was used to map particular crop area
with ground truthing support. NRSC-ISRO also developed an
Android app ‘Bhuvan crop yield’ for collecting CCE data with
geographic location and field photographs. Such platforms may be
leveraged for IPU assessment and data generated may be linked
with the CADWM MIS dashboard, side by side with the ‘CCA
covered by field works’ so as to reflect both the output and
outcome of the scheme in the same portal.
• It may be noted here that the Ministry has already initiated crop
assessment studies using satellite images, in co-ordination with
Bhaskaracharya Institute for Space Applications and
Geoinformatics (BISAG) and drone pilot surveys in Bawanthadi
project in Maharashtra. Once such assessment is completed,
update of data in the MIS is suggested so as to bring more
transparency regarding IPC-IPU gap data for the PMKSY-AIBP
projects. It may be noted here that in the 21st Report of Standing
Committee on Water Resources (2017-18) on ‘Review of
Accelerated Irrigation Benefits Programme’, the committee urged
the Ministry to reconcile the IPC and IPU data ‘state-wise, year-
wise and project-wise and maintain them at one place so as to
have a holistic picture of the progress, actual gap between
Irrigation Potential targeted, created and utilized’.
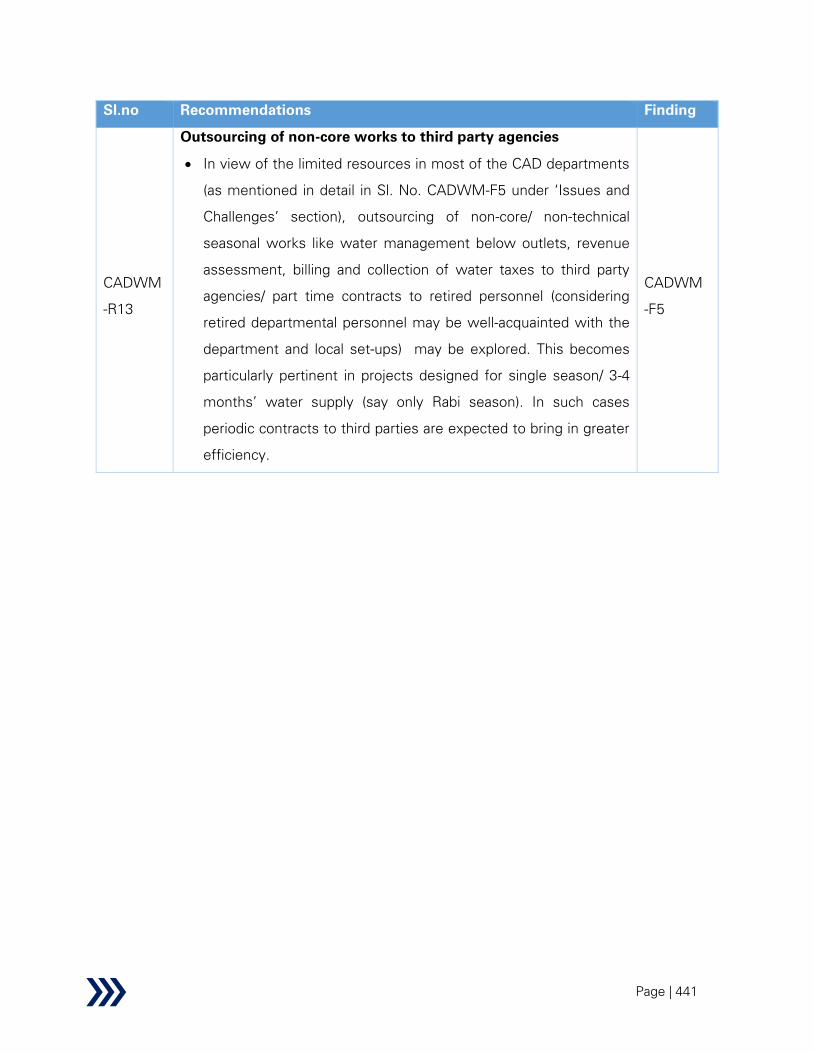
Page | 441
Sl.no Recommendations Finding
CADWM
-R13
Outsourcing of non-core works to third party agencies
• In view of the limited resources in most of the CAD departments
(as mentioned in detail in Sl. No. CADWM-F5 under ‘Issues and
Challenges’ section), outsourcing of non-core/ non-technical
seasonal works like water management below outlets, revenue
assessment, billing and collection of water taxes to third party
agencies/ part time contracts to retired personnel (considering
retired departmental personnel may be well-acquainted with the
department and local set-ups) may be explored. This becomes
particularly pertinent in projects designed for single season/ 3-4
months’ water supply (say only Rabi season). In such cases
periodic contracts to third parties are expected to bring in greater
efficiency.
CADWM
-F5

Page | 442
2.2.2.2 Repair, Renovation & Restoration of Water Bodies
Repair, Renovation and Restoration (RRR) of water bodies, a sub-component of the programme
‘Har Khet Ko Pane’, was conceived during the XIth Plan to check the irrigation potential lost every
year owing to non-use and/ or sub-optimal use of existing water bodies and irrigation tanks/ water
storage systems. The scheme aims at increasing storage capacities of existing water bodies
through comprehensive improvement and restoration. The scheme also encompasses
rejuvenating traditional water storage systems like Jal Mandir in Gujarat, Khatri and Khul in
Himachal Pradesh, Katas and Bandhas in Odisha and Madhya Pradesh, Dongs in Assam, Eri and
Ooranis in Tamil Nadu, etc. As per the scheme guidelines, the scheme shall emphasize on
development of catchment, de-siltation of tanks and command area development. The RRR of
water bodies has been set a target of creation of irrigation potential and utilization of 1.5 lakh ha/
year during 2015-16 to 2019-20. In order to sustain the benefits accrued, the scheme also
envisages building capacities of local communities and financially empowering the local water
user groups to maintain the water bodies.
As stated in the scheme guidelines, RRR shall be accorded high priority in drought-prone areas.
The scheme envisages developing an inventory of water bodies in villages and geo-map them to
ensure that all the water bodies are put to maximum storage. This shall facilitate in meeting water
demand for drinking, irrigation and other purposes during the off-rainy season along with recharge
of groundwater. Additionally, during the monsoons they may act as a natural sink for storage of
excess water thus mitigating surface run-off and incidence of flood.
Background
In India, traditionally water bodies like tanks, ponds and lakes have always played a significant
role in conserving water to meet various needs of the communities particularly in monsoon
dependant areas. In addition to sustaining agriculture, some of the water bodies also have
significant religious influence. While the small water bodies/ tanks locally known as ‘bundhis’ are
community owned, the large ones with command areas between 20 to 2,000 hectares are
constructed by government bodies. As per the 3rd Minor Irrigation Census 2000-2001, 5.56 lakh
tanks and storages act as minor irrigation sources with an estimated irrigation potential of 6.27
million ha. However, around 15% of these tanks become dysfunctional owing to inadequate

Page | 443
maintenance, encroachments, diversion of land, etc. thus leading to loss of irrigation potential to
the tune of 1 million ha.
In order to restrict this reduction in irrigation potential, the GoI launched a pilot scheme of ‘Repair,
Restoration and Renovation of water bodies directly linked to agriculture’ in January 2005 to be
implemented during the remaining of Xth Plan with a total budget outlay of Rs. 300 Cr. (75% as
Central Assistance and 25% by State Government). The scheme was sanctioned in 26 districts
of 15 states covering 1,098 water bodies with an estimated additional irrigation potential 0.78
lakh ha121
(thus roughly translating into budget outlay of Rs. 3,845/ ha of additional irrigation
potential). Till 2008, 1085 of the water bodies were completed while the remaining 13 were
dropped by the respective state governments. However, the total target irrigation potential of
0.78 lakh ha122
was achieved by the scheme.
Table 41: RRR - budget outlays and target during Xth to XIIth Plan
# Xth Plan XIth Plan XIIth Plan
External
Assistance
Domestic
Budgetary
Support
1 Budget
a Outlay (in Rs. Cr.) 300 3,700 1,309 10,000
b
Centre: State split 75:25 NA NA
90:10 (seven north
eastern states and
three hilly states)
60:40 (project
benefitting special
areas)
25:75 (non-special
category)109
2 Target
121 http://pmksy-mowr.nic.in/rrr.html
122 India Water Portal (2019), Background Note on Repair, Renovation and Restoration (RRR) of Water Bodies

Page | 444
# Xth Plan XIth Plan XIIth Plan
a No of water bodies
1,098 10,887 3,341
9,000 (rural)
1,000 (urban)
b Irrigation potential (in
lakh ha)
0.78 8.25 3.09 6.24
3 Budget/
additional
potential*
1 (a)
Cr.
300 3700 1309 10000
2 (b) L
Ha
0.78 8.25 3.09 6.24
1 (a) x
100 /
2(b)
Rs./Ha
38462 44848 42362 160256
*Data shared by Ministry of Water Resources, Rural Development and Ganga Rejuvenation
In view of the success of the pilot scheme, the Ministry of Water Resources launched a State
Sector scheme of Repair, Renovation and Restoration of water bodies with two components viz.
one with external assistance and another with domestic budgetary support, during the XIth Plan.
During the XIIth plan, the external and domestic components were merged into one and an
additional Rs. 10,000 Cr. was allotted to the scheme. It may be noted that the Working Group of
Minor Irrigation and Watershed Management recommended an outlay of Rs. 30,000 Cr. during
the XIIth Plan; however, due to financial constraints, the budget outlay was restricted to Rs.
10,000 Cr. A comparison of budget outlays and targets for the RRR of water bodies during Xth
to XIIth Plans is illustrated in the above table. As can be noted from the table, the budget allotted
per additional ha of irrigation potential created substantially increased from Xth Plan to XIIth plan,
thus pointing to government’s priority for this scheme.
In 2013 the Adviser, Planning Commission has pointed to the need for achieving convergence
with other schemes like IWMP, CAD & Ground Water Management while selecting water bodies
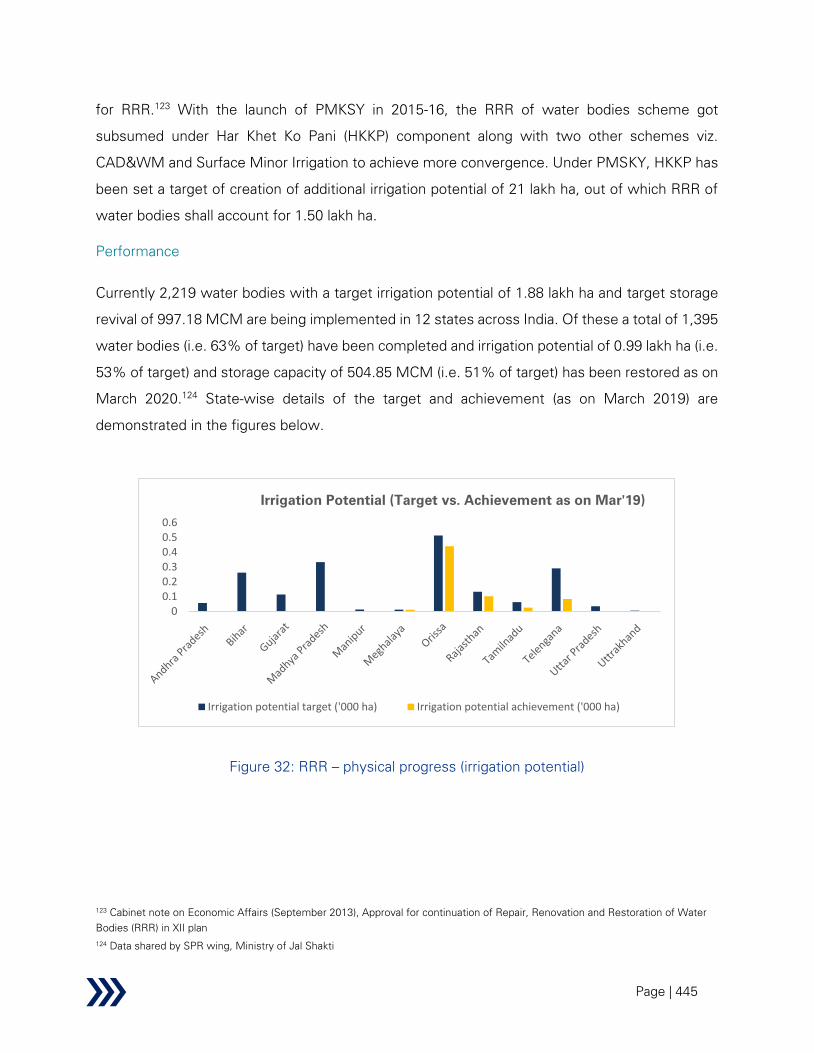
Page | 445
for RRR.123
With the launch of PMKSY in 2015-16, the RRR of water bodies scheme got
subsumed under Har Khet Ko Pani (HKKP) component along with two other schemes viz.
CAD&WM and Surface Minor Irrigation to achieve more convergence. Under PMSKY, HKKP has
been set a target of creation of additional irrigation potential of 21 lakh ha, out of which RRR of
water bodies shall account for 1.50 lakh ha.
Performance
Currently 2,219 water bodies with a target irrigation potential of 1.88 lakh ha and target storage
revival of 997.18 MCM are being implemented in 12 states across India. Of these a total of 1,395
water bodies (i.e. 63% of target) have been completed and irrigation potential of 0.99 lakh ha (i.e.
53% of target) and storage capacity of 504.85 MCM (i.e. 51% of target) has been restored as on
March 2020.124
State-wise details of the target and achievement (as on March 2019) are
demonstrated in the figures below.
Figure 32: RRR – physical progress (irrigation potential)
123 Cabinet note on Economic Affairs (September 2013), Approval for continuation of Repair, Renovation and Restoration of Water
Bodies (RRR) in XII plan
124 Data shared by SPR wing, Ministry of Jal Shakti
00.10.20.30.40.50.6
Irrigation Potential (Target vs. Achievement as on Mar'19)
Irrigation potential target ('000 ha) Irrigation potential achievement ('000 ha)

Page | 446
Figure 33: RRR – physical progress (storage revival)
From the above two figures it may be noted that among states with projects sanctioned prior to
2017-18, 3 states viz. Madhya Pradesh, Meghalaya and Rajasthan have achieved considerable
progress (i.e. over 75%). None of the states for which projects were sanctioned last year (2018-
19) viz. Andhra Pradesh, Bihar, Odisha and Tamil Nadu have made much progress. It may be
noted that the scheme guidelines specify “the works shall be completed within 2 financial years
excluding the year of inclusion of water bodies under RRR”. However, 791 water bodies still to
be completed stretches back to 2014-15 and 2015-16.
As on March 2020, around Rs. 925 Cr. has been incurred on works related to 2,219 water bodies
with a total estimated cost of Rs. 1,911 Cr. The corresponding Central Allocation (as on March
2020) of Rs. 433.8 Cr. against the planned Rs. 1,120 Cr. has been released. Detailed state-wise
figures are listed in the table below.
0
50
100
150
200
250
300
350
400
450
500
Storage revival (Target vs Achievement as on Mar'19)
Storage revival target (MCM) Storage revival achieved (MCM)
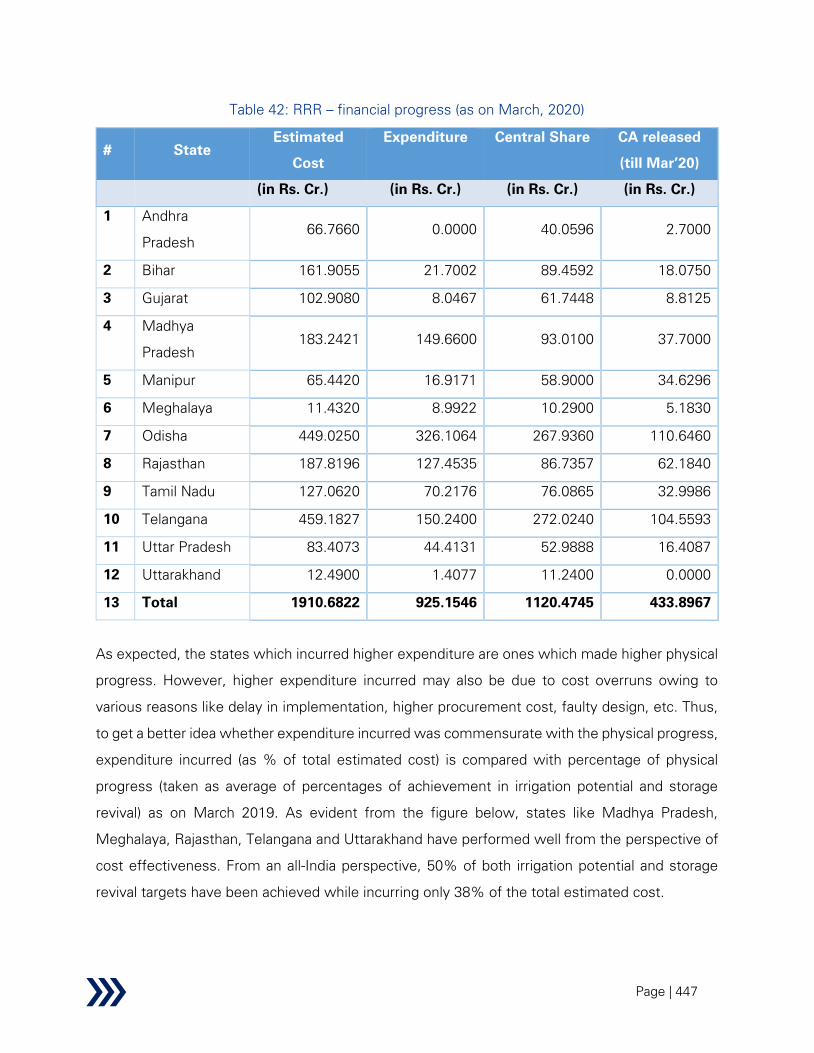
Page | 447
Table 42: RRR – financial progress (as on March, 2020)
# State
Estimated
Cost
Expenditure Central Share CA released
(till Mar’20)
(in Rs. Cr.) (in Rs. Cr.) (in Rs. Cr.) (in Rs. Cr.)
1 Andhra
Pradesh
66.7660 0.0000 40.0596 2.7000
2 Bihar 161.9055 21.7002 89.4592 18.0750
3 Gujarat 102.9080 8.0467 61.7448 8.8125
4 Madhya
Pradesh
183.2421 149.6600 93.0100 37.7000
5 Manipur 65.4420 16.9171 58.9000 34.6296
6 Meghalaya 11.4320 8.9922 10.2900 5.1830
7 Odisha 449.0250 326.1064 267.9360 110.6460
8 Rajasthan 187.8196 127.4535 86.7357 62.1840
9 Tamil Nadu 127.0620 70.2176 76.0865 32.9986
10 Telangana 459.1827 150.2400 272.0240 104.5593
11 Uttar Pradesh 83.4073 44.4131 52.9888 16.4087
12 Uttarakhand 12.4900 1.4077 11.2400 0.0000
13 Total 1910.6822 925.1546 1120.4745 433.8967
As expected, the states which incurred higher expenditure are ones which made higher physical
progress. However, higher expenditure incurred may also be due to cost overruns owing to
various reasons like delay in implementation, higher procurement cost, faulty design, etc. Thus,
to get a better idea whether expenditure incurred was commensurate with the physical progress,
expenditure incurred (as % of total estimated cost) is compared with percentage of physical
progress (taken as average of percentages of achievement in irrigation potential and storage
revival) as on March 2019. As evident from the figure below, states like Madhya Pradesh,
Meghalaya, Rajasthan, Telangana and Uttarakhand have performed well from the perspective of
cost effectiveness. From an all-India perspective, 50% of both irrigation potential and storage
revival targets have been achieved while incurring only 38% of the total estimated cost.

Page | 448
Figure 34: RRR – comparison of physical and financial progress
However, in spite of the physical and financial progresses, it is worth noting the comment by the
Standing Committee on Water Resources in its Twentieth Report of Demands for Grants (2018-
19) in relation to fund utilization: “It is further seen that in all the Central Schemes and Centrally
Sponsored Schemes, the utilization of funds has been lower as compared to Revised Estimate
during 2017-18.” Also, the ‘Note for Cabinet Committee on Economic Affairs (2013) - Approval
for Continuation of Repair, Renovation and Restoration (RRR) of Water Bodies in XIIth Plan’
further stated that “there is general reluctance on the part of the States to seek external
assistance for RRR of water bodies… the reluctance of the states need to be ascertained”
Performance on REESI+E framework
Table 43: RRR – performance evaluation using REESIE framework
Parameter Findings from research
Relevance
Secondary:
• The system of water tanks has traditionally been critical for
meeting the irrigation demands and overall management of water
resources in India. Apart from aiding in sustaining agricultural and
0%
20%
40%
60%
80%
100%
Physical vs Financial Progresses (as on Mar'19)
Physical Progress % Financial Progress %
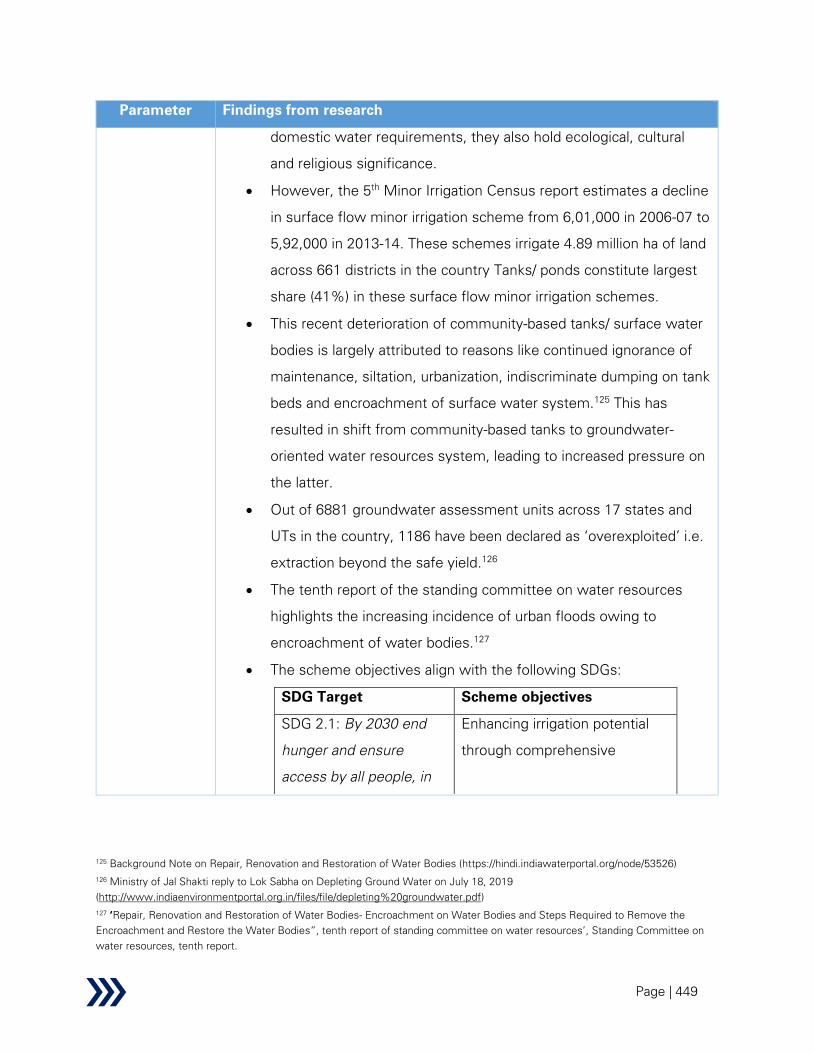
Page | 449
Parameter Findings from research
domestic water requirements, they also hold ecological, cultural
and religious significance.
• However, the 5th
Minor Irrigation Census report estimates a decline
in surface flow minor irrigation scheme from 6,01,000 in 2006-07 to
5,92,000 in 2013-14. These schemes irrigate 4.89 million ha of land
across 661 districts in the country Tanks/ ponds constitute largest
share (41%) in these surface flow minor irrigation schemes.
• This recent deterioration of community-based tanks/ surface water
bodies is largely attributed to reasons like continued ignorance of
maintenance, siltation, urbanization, indiscriminate dumping on tank
beds and encroachment of surface water system.125
This has
resulted in shift from community-based tanks to groundwater-
oriented water resources system, leading to increased pressure on
the latter.
• Out of 6881 groundwater assessment units across 17 states and
UTs in the country, 1186 have been declared as ‘overexploited’ i.e.
extraction beyond the safe yield.126
• The tenth report of the standing committee on water resources
highlights the increasing incidence of urban floods owing to
encroachment of water bodies.127
• The scheme objectives align with the following SDGs:
SDG Target Scheme objectives
SDG 2.1: By 2030 end
hunger and ensure
access by all people, in
Enhancing irrigation potential
through comprehensive
125 Background Note on Repair, Renovation and Restoration of Water Bodies (https://hindi.indiawaterportal.org/node/53526)
126 Ministry of Jal Shakti reply to Lok Sabha on Depleting Ground Water on July 18, 2019
(http://www.indiaenvironmentportal.org.in/files/file/depleting%20groundwater.pdf)
127 ‘Repair, Renovation and Restoration of Water Bodies- Encroachment on Water Bodies and Steps Required to Remove the
Encroachment and Restore the Water Bodies”, tenth report of standing committee on water resources’, Standing Committee on
water resources, tenth report.
Page | 450
Parameter Findings from research
particular the poor and
people in vulnerable
situations including
infants, to safe,
nutritious and sufficient
food all year round
improvement and restoration of
water bodies
SDG 6.1: By 2030,
achieve universal and
equitable access to safe
and affordable drinking
water for all.
Increasing availability of
drinking water through
restoration of water bodies
SDG 6.5: By 2030,
implement integrated
water resources
management at all
levels, including through
transboundary
cooperation as
appropriate.
Community participation and
self-supporting system for
sustainable management of
water bodies
SDG 6.6: By 2030,
protect and restore
water-related
ecosystems, including
mountains, forests,
wetlands, rivers, aquifers
and lakes.
Comprehensive improvement
and restoration of water bodies.
Primary:
• The Key Informant Interviews with national, state and district level
stakeholder across eight states: Andhra Pradesh, Bihar, Madhya
Pradesh, Manipur, Meghalaya, Rajasthan, Tamil Nadu and Telangana

Page | 451
Parameter Findings from research
highlight the reducing storage capacity of traditional water systems
due to lack of maintenance and the importance of RRR for continued
provision of water for irrigation and domestic needs.
• In the drought prone areas of Rajasthan and rain-shadow regions of
Andhra Pradesh, tanks are primary source for domestic and
agricultural water needs.
• Tanks have been traditionally serving as lifeline for the state of
Telangana due to its geographical positioning, topography and rainfall
pattern. Considering its significance for employment generation,
agriculture and poverty reduction; RRR works are pertinent for the
state.
• While 19 tanks have already been taken under RRR in Betul district,
Madhya Pradesh; there are 50 more tanks in the district which are
more than 15 years old and require immediate inclusion under RRR
to arrest further damage.
• In hilly areas like Manipur and Meghalaya, tanks act as natural sinks
for storage of excess water during rainy season, thereby reducing
runoff and incidences of flooding. These states are prone to flash
floods, which makes the infrastructure highly vulnerable, requiring
frequent operations and maintenance.
• Farmers in Tamil Nadu primarily depend on north-east monsoon for
cultivation, which brings erratic, unpredictable and usually deficit
rainfall. State highlights rehabilitation of minor irrigation tank as an
absolute necessity to improve water use efficiency, particularly in
drought prone regions.
• Expedited scheme implementation is critical to ensure sustainable
irrigation, particularly in groundwater overexploited regions.
o Agriculture is the primary source of livelihood in Patna district
of Bihar. The Son canal system serves the water needs of a
limited area while most of the regions are dependent on
rainfed agriculture. Hence, enhancement of storage capacity

Page | 452
Parameter Findings from research
in traditional water bodies like Ahar Pynes and its optimum
management becomes important to continue cropping after
Kharif season and reduce dependence on groundwater-
based agriculture.
o Out of 313 blocks in Madhya Pradesh, 105 are in grey/ black
zone due to overexploitation of groundwater128
.
o In Vellore district, Tamil Nadu, 29% of the total 5,92,018 ha
area is under cultivation: 52% rainfed and 48% irrigated. Out
of 20 blocks; 14 are estimated as overexploited, 3 as critical
while one is under semi-critical category with regards to
groundwater.129
Likewise, in drought-prone Virudhunagar
district, though the cultivation is primarily dependent on
north-east monsoon; water scarcity due to scanty rainfall and
indiscriminate abstraction of groundwater, necessitates
improvement of existing tank storage capacity to reduce
agricultural susceptibility.
• KIIs suggest scale up and further acceleration of RRR across all
states. However, in Meghalaya the scope for expansion under RRR
is limited as most of the water bodies are less than 5 ha in size and
hence do not fulfil the scheme eligibility criteria. Therefore, the state
is planning alternate ‘Multipurpose Reservoir Project’ with an
objective to meet the irrigation needs, promote pisciculture and
recreational activities; without any size constraint.
Inference:
• RRR scheme is appropriate to increase the storage capacity of
existing surface water structures, thereby meet the agricultural and
domestic water needs, particularly in drought prone and rainfed
128 Agriculture Department, Government of Madhya Pradesh
129 Data shared by district agriculture department, Vellore, Tamil Nadu
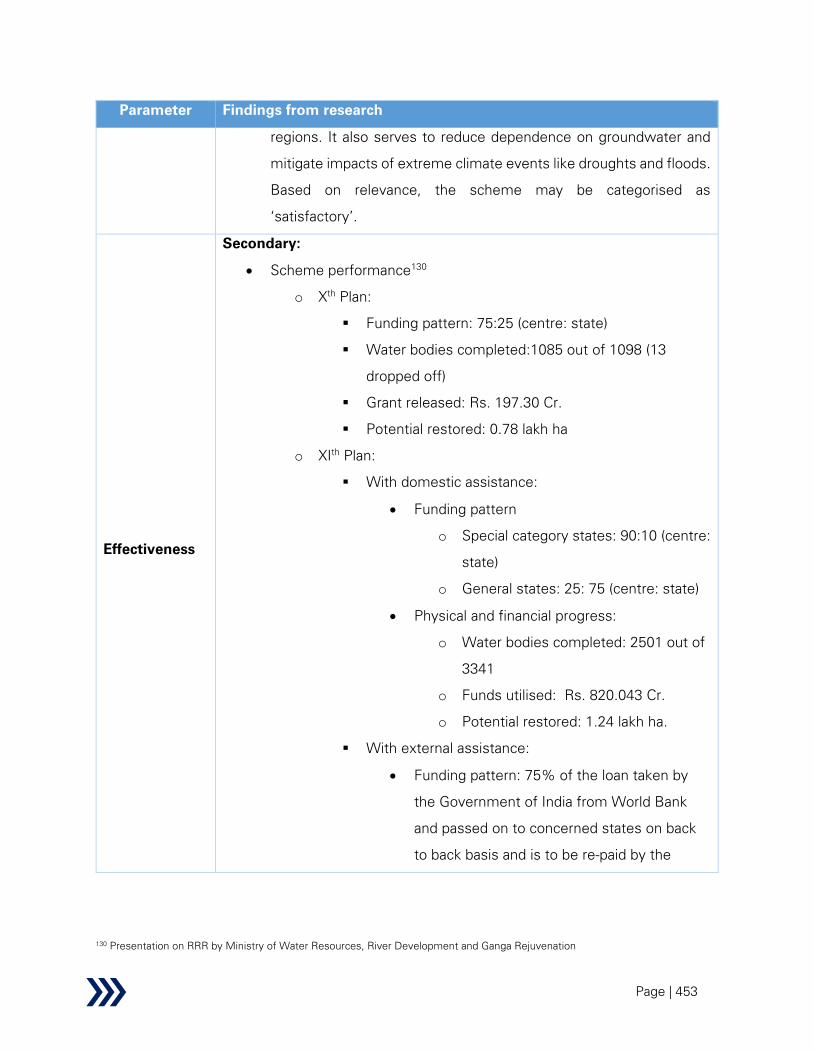
Page | 453
Parameter Findings from research
regions. It also serves to reduce dependence on groundwater and
mitigate impacts of extreme climate events like droughts and floods.
Based on relevance, the scheme may be categorised as
‘satisfactory’.
Effectiveness
Secondary:
• Scheme performance130
o Xth
Plan:
▪ Funding pattern: 75:25 (centre: state)
▪ Water bodies completed:1085 out of 1098 (13
dropped off)
▪ Grant released: Rs. 197.30 Cr.
▪ Potential restored: 0.78 lakh ha
o XIth
Plan:
▪ With domestic assistance:
• Funding pattern
o Special category states: 90:10 (centre:
state)
o General states: 25: 75 (centre: state)
• Physical and financial progress:
o Water bodies completed: 2501 out of
3341
o Funds utilised: Rs. 820.043 Cr.
o Potential restored: 1.24 lakh ha.
▪ With external assistance:
• Funding pattern: 75% of the loan taken by
the Government of India from World Bank
and passed on to concerned states on back
to back basis and is to be re-paid by the
130 Presentation on RRR by Ministry of Water Resources, River Development and Ganga Rejuvenation

Page | 454
Parameter Findings from research
State. The balance 25% of the cost of the
project as loan is taken as liability by
Government of India and passed on to the
states as 100% grant for the projects.
o RRR under PMKSY:
▪ Funding pattern:
• Special category states: 90:10 (centre: state)
• General states: 25: 75 (centre: state)
▪ As on March, 2020:
• Water bodies completed: 1350 out of 2219
(61%).
• CA released: Rs. 433.89 Cr. against planned
Rs. 1120.47 Cr. (39%).
• Expenditure incurred: Rs. 925.15 Cr. against
estimated 1910.68 (48%).
• Potential restored: 0.99 lakh ha out of 1.88
lakh ha. (53%)
• Independent evaluation of completed pilot scheme by Water &
Land Management and Training and Research Institute
(WALAMTARI), Hyderabad; National Remote Sensing Centre
(NRSC), Hyderabad; Water Technology Centre (WTC),
Bhubaneshwar; Centre for Water Resources Development and
Management (CWRDM), Kerala confirms multiple positive
outcomes of RRR like enhanced storage capacity and increased
utilisation of water for irrigation.131
• Other outcomes include expansion of area under irrigation,
improvement in agricultural productivity, command area
development, improvement in socio-economic conditions of
131 Background Note on Repair Renovation and Restoration (RRR) of water bodies.

Page | 455
Parameter Findings from research
community, sustainable system for water body management
through community participation and capacity building of WUAs
and government agencies.
• Though the scheme guidelines mandate completion within 2 years
except the year of inception, 791 water bodies still to be
restored/completed stretch back to 2014-15 and 2015-16.132
• Positive factors impacting scheme performance:
o Convergence with other complementary schemes:
Implementation of RRR in Chittoor, Andhra Pradesh in a
chain of tanks via training of 1383 CBOs and 610 WUAs in
convergence with other complementary schemes likes
“Neeru Pragati” and MGNREGA resulted in an increase in
irrigation potential by 5,023 ha.133
o Community participation: “Mission Kakatiya” was
launched by the Government of Telangana in 2014 with an
objective to enhance development of minor irrigation
structures and promote community-based irrigation
management. By March 2018, it was successful in
restoration of 22,500 tanks, leading to outcomes like
increased water storage capacity and enhanced on-farm
moisture retention.134
Through active community involvement in planning and
motivating farmers to deposit silt in agricultural field; the
project resulted in reduction of gap ayacut by 63%,
agricultural diversification, reduced use of chemical
fertilisers, enhanced on-farm water retention, improved soil
132 Data received from Ministry of Water Resources, River Development and Ganga Rejuvenation
133 Selected best practices in water management, August 2017, prepared by NITI Aayog with the support of Teri University
134 Composite Water Management Index by NITI Aayog, August 2019 (https://niti.gov.in/sites/default/files/2019-08/CWMI-2.0-
latest.pdf)

Page | 456
Parameter Findings from research
nutritive value and water accessibility to small and medium
farmers. Additionally, it also led to development of fisheries
and livestock, increase in groundwater levels and income
augmentation of farmers.135
o Involvement of CSR/community and usage of mobile
app for monitoring: ‘Gaalmukt Dharan Gaalyukt Shivar
Yojana’136
(silt free water reservoirs and silt applied farms) is
an initiative by Maharashtra Government towards making it
water secure and boosting agricultural income through
activities like community-based tank desiltation under RRR
and WDC, along with awareness generation for efficient
water utilisation. While the state government provided fuel
subsidy; machine rent cost was contributed by community/
pooled through CSR/ NGO funds. Desiltation resulted in
increased water storage capacity in the tank, which lead to
drought resilience, improved incomes and reduced water
scarcity. At the same time, farmers could use the silt for
free as organic manure, which improved soil quality,
productivity and regional hydrology.
• Negative factors that reduce scheme performance:
o Encroachment: Standing Committee on Water Resources
(2015-16) points out encroachment of water bodies as a
major challenge, resulting in depletion of surface and
groundwater resources. Encroachment has been further
found to cause adverse impacts like flash floods (as in
135 Selected best practices in Water Management, prepared by NITI Aayog with the support of Teri University, August 2017.
136 Soil and water conservation Department, Government of Maharashtra ‘Jalyukt Shivar Abhiyan’(http://cgwb.gov.in/Bhujal-
manthan/bm3-file3.pdf)

Page | 457
Parameter Findings from research
Maharashtra & Uttarakhand) and drainage congestion
leading to urban floods/ inundation.
o Budget constraints: Commensurate CA could not be
released for RRR projects in 2017-18 due to budget
constraints.137
• Institutional arrangement: at water body level - DPR preparation
and monitoring is done by WUA/ local community; at the district
level - proposal scrutiny and monitoring is done by DLIA at district
and SLNA at the state level; proposal approval is done by STAC,
SLSC and monitoring is undertaken by CWC (field office); at the
centre: approval and monitoring is the responsibility of M/o JS and
CWC.
• As per CWMI 2019, most of the states don’t maintain individual
project level data and only maintain cluster/ state level data.
• Scheme guidelines specify engagement of community members
and capacity building objectives; but no indicators are tracked in
this regard.
Primary:
• Scheme performance:
o Out of eight states assessed under primary study, five have
performed well under PMKSY-RRR: Madhya Pradesh,
Meghalaya, Rajasthan, Tamil Nadu and Telangana. However,
projects are yet to be completed in Andhra Pradesh, Bihar
and Manipur.
o Completion of RRR projects in Bhilwara district, Rajasthan
have extended irrigation to the tail-end, unlike earlier years.
The irrigation command area has increased from 40% to 65-
137 Standing committee on Water Resources (2017-18), Sixteenth Lok Sabha, Ministry of Water Resources, River Development and
Ganga Rejuvenation, Demands for Grants (2018-19)
(http://164.100.47.193/lsscommittee/Water%20Resources/16_Water_Resources_20.pdf)
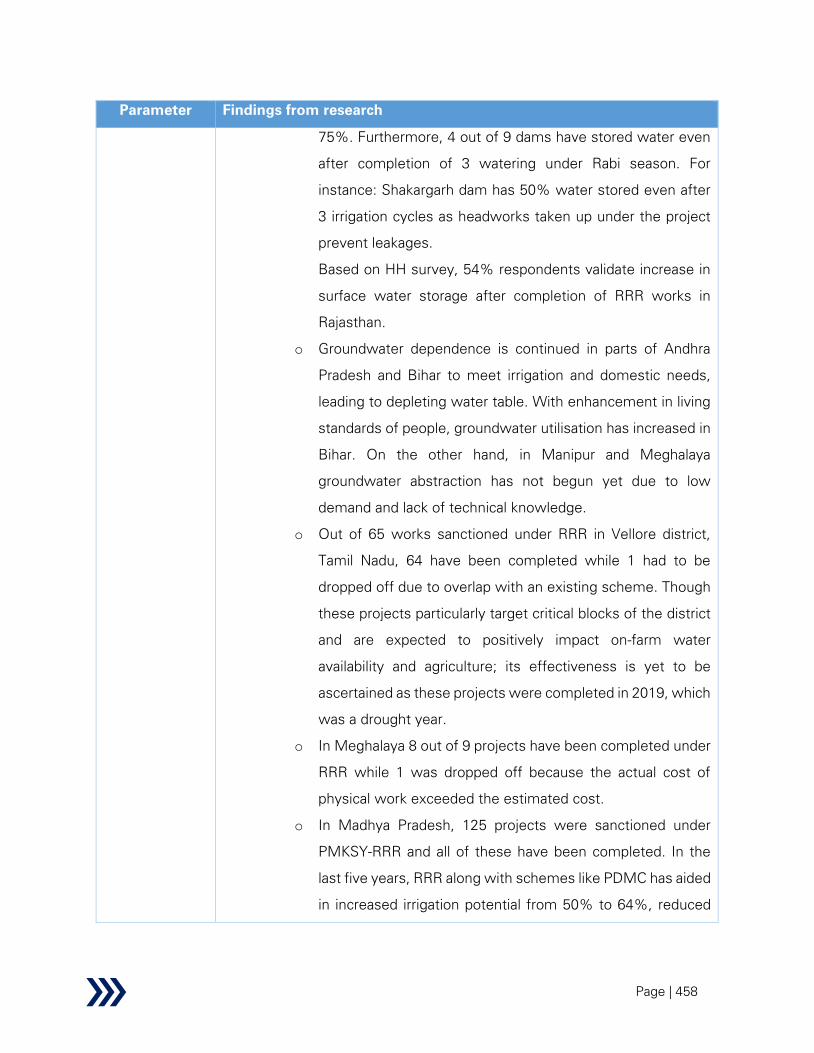
Page | 458
Parameter Findings from research
75%. Furthermore, 4 out of 9 dams have stored water even
after completion of 3 watering under Rabi season. For
instance: Shakargarh dam has 50% water stored even after
3 irrigation cycles as headworks taken up under the project
prevent leakages.
Based on HH survey, 54% respondents validate increase in
surface water storage after completion of RRR works in
Rajasthan.
o Groundwater dependence is continued in parts of Andhra
Pradesh and Bihar to meet irrigation and domestic needs,
leading to depleting water table. With enhancement in living
standards of people, groundwater utilisation has increased in
Bihar. On the other hand, in Manipur and Meghalaya
groundwater abstraction has not begun yet due to low
demand and lack of technical knowledge.
o Out of 65 works sanctioned under RRR in Vellore district,
Tamil Nadu, 64 have been completed while 1 had to be
dropped off due to overlap with an existing scheme. Though
these projects particularly target critical blocks of the district
and are expected to positively impact on-farm water
availability and agriculture; its effectiveness is yet to be
ascertained as these projects were completed in 2019, which
was a drought year.
o In Meghalaya 8 out of 9 projects have been completed under
RRR while 1 was dropped off because the actual cost of
physical work exceeded the estimated cost.
o In Madhya Pradesh, 125 projects were sanctioned under
PMKSY-RRR and all of these have been completed. In the
last five years, RRR along with schemes like PDMC has aided
in increased irrigation potential from 50% to 64%, reduced

Page | 459
Parameter Findings from research
power consumption towards irrigation and aided in
groundwater recharge in critical blocks.
o As per district authorities in Betul district, Madhya Pradesh;
completion of 19 works under RRR have led to reduction in
evaporation and transmission losses by 20%. Additionally,
lining of canal has also reduced its susceptibility to damages.
However, KII with Chairman, WUA indicates that lining works
are incomplete and have not been sanctioned despite
sending proposals.
In Damoh district, Madhya Pradesh completion of RRR works
has increased the irrigation potential utilisation by 2-8 times.
o Out of 575 water bodies included under RRR in Telangana
with an estimated cost of Rs. 459.7 Cr., 371 have been
completed at an expenditure of Rs. 163.07 Cr. Works are
under progress in 173 water bodies while they have not
started yet in 27 due to delays in administrative/ tendering
process. Most of these water bodies are included in drought
prone and Naxal affected areas. State, district and village
level stakeholders unanimously agree on the effectiveness of
RRR in agricultural diversification and groundwater recharge.
Though these tanks have been designed to serve crop-water
needs during Kharif season, some of these were able to
sustain water for Rabi season too.
• Based on HH survey, it may be inferred that RRR is successful
increasing groundwater level, irrigated land, crop yield, crop
intensity and land productivity in Rajasthan and Madhya Pradesh.
• In states like Andhra Pradesh, Bihar, Rajasthan, Tamil Nadu and
Telangana, priority is given to special category areas, which
includes drought prone/ tribal/ flood prone and/or under desert
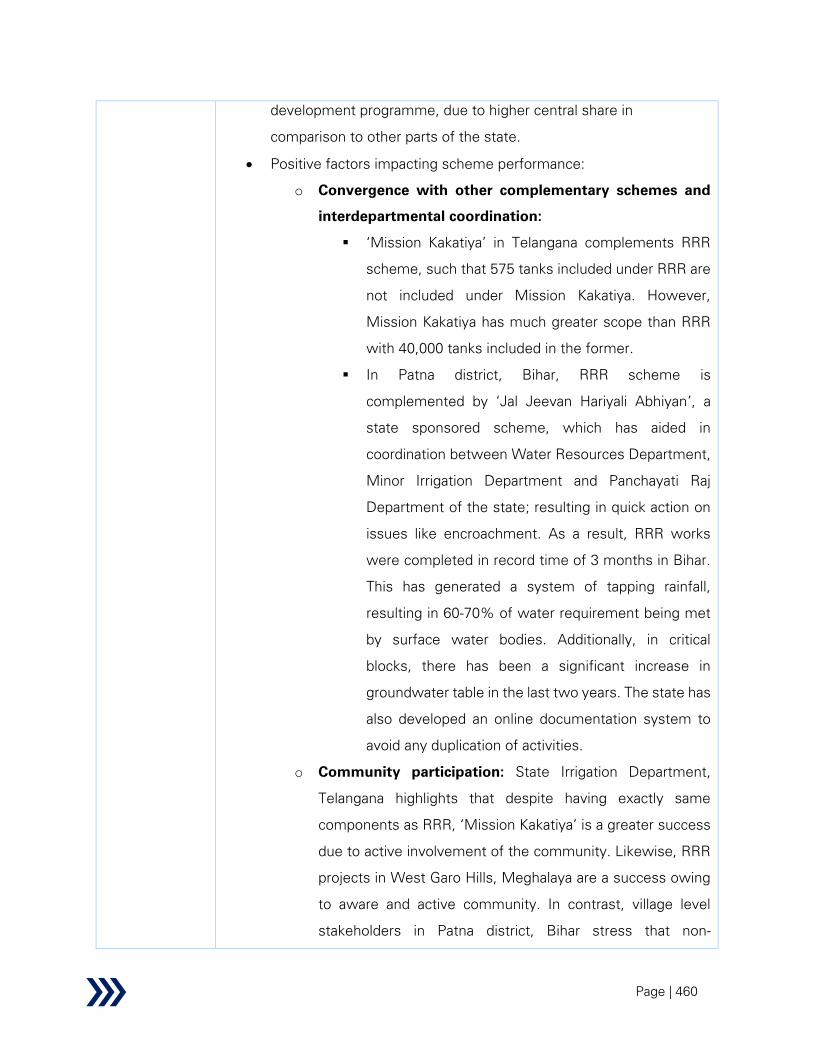
Page | 460
development programme, due to higher central share in
comparison to other parts of the state.
• Positive factors impacting scheme performance:
o Convergence with other complementary schemes and
interdepartmental coordination:
▪ ‘Mission Kakatiya’ in Telangana complements RRR
scheme, such that 575 tanks included under RRR are
not included under Mission Kakatiya. However,
Mission Kakatiya has much greater scope than RRR
with 40,000 tanks included in the former.
▪ In Patna district, Bihar, RRR scheme is
complemented by ‘Jal Jeevan Hariyali Abhiyan’, a
state sponsored scheme, which has aided in
coordination between Water Resources Department,
Minor Irrigation Department and Panchayati Raj
Department of the state; resulting in quick action on
issues like encroachment. As a result, RRR works
were completed in record time of 3 months in Bihar.
This has generated a system of tapping rainfall,
resulting in 60-70% of water requirement being met
by surface water bodies. Additionally, in critical
blocks, there has been a significant increase in
groundwater table in the last two years. The state has
also developed an online documentation system to
avoid any duplication of activities.
o Community participation: State Irrigation Department,
Telangana highlights that despite having exactly same
components as RRR, ‘Mission Kakatiya’ is a greater success
due to active involvement of the community. Likewise, RRR
projects in West Garo Hills, Meghalaya are a success owing
to aware and active community. In contrast, village level
stakeholders in Patna district, Bihar stress that non-

Page | 461
Parameter Findings from research
involvement of local community during DPR preparation has
led to technical issues in scheme design, which limits it from
realizing its true potential.
o Participatory planning: Participatory planning is done in
Bhilwara district, Rajasthan after the water is available
through RRR. People of the command area and WUAs get
together on the notified date and take decision on
prioritising water distribution, considering the water
available.
• Negative factors that reduce scheme performance:
o Waste discharge by municipalities: Works in Nagdi canal,
Bhilwara district, Rajasthan got delayed as it passes through
the middle of a town and is prone to encroachment and
waste discharge by municipalities. However, the state has
taken it up and plans to complete work by September end.
o Encroachment: Whilst Ministry of WR, RD and GR in its
response to Standing Committee of Water Resources (2017-
18) stated “water bodies are considered under RRR
programme after State Government gives certificate that
they are encroachment free”; as per the current scheme
guidelines such certificate is issued during the release of
second instalment. Hence encroachment continues to be a
major issue delaying project implementation across Andhra
Pradesh, Bihar, Madhya Pradesh, Manipur and Meghalaya.
In Manipur, encroachment by fishing society resulted in a 4-
year delay. Likewise, in Bihar, 11 projects are still on hold
because of the encroachment issue. In parts of Betul district,
Madhya Pradesh; farmers have encroached canal area for
agricultural and domestic purposes.

Page | 462
Parameter Findings from research
However, in rural Rajasthan, ‘Nadi’ and ‘Talab’ are given
special treatment. Since these are very small water bodies
and hold cultural and religious significance, state claims there
are no issues of encroachment/ discharge of waste.
o Cumbersome administrative procedures and delays in
budget provisioning: Central share was released timely in
Madhya Pradesh, Meghalaya, Rajasthan and Telangana while
delayed fund allocation was observed in Andhra Pradesh,
Bihar, Madhya Pradesh, Manipur and Tamil Nadu due to
cumbersome administrative process; which deters scheme
performance.
For instance: Second instalment for 125 water bodies
sanctioned under RRR in Madhya Pradesh was requested by
the state in 2016 but the completion of administrative
procedures, including submission of non-encroachment
certificate and audit of the expenditure incurred took until
February 2017. However, scheme guidelines had been
revised by then and central: state share changed from 90:10
to 60:40 for special category areas. Since state had already
completed works in 119 water bodies by then, central share
was released for 6 remaining projects only while state had to
bear 100% cost for the rest.
Similarly, while first instalment of central assistance (Rs.
512.79 and Rs. 409.56) was received by Tamil Nadu in March
2016; the state has not received second instalment till date.
In this regard, centre has informed the state that expenditure
incurred cannot be reimbursed.
For tanks included under Phase III in the state, release of
second instalment got delayed by 11 months (i.e., proposal
sent on March, 2019 but CA released on February, 2020)
Page | 463
Parameter Findings from research
o Preference of private irrigation system over community-
based irrigation: CWC regional officials in Telangana
highlight preference of farmers to dig wells near their
command area due to provision of free electricity in the state.
Likewise, in Madhya Pradesh, electricity is easily available
and there is a shift towards micro-irrigation. Hence, farmers
prefer private irrigation despite higher cost.
o Non linkage with Micro-irrigation: Efficient utilization of
irrigation potential created under RRR is limited by non-
linkage of RRR to micro-irrigation.138
In Bhilwara district, Rajasthan, 10% of command area is
mandatorily under micro-irrigation through drip/sprinkler
under state specific restoration scheme funded by World
Bank and JICA. However, RRR doesn’t have any similar
provisions to improve water use efficiency.
o Lack of coordination between agriculture and irrigation
department during scheme implementation: The
participation of agriculture department under RRR is limited
to conducting SLSC meetings and calculation of B-C ratio.
Agriculture and Horticulture department, Madhya Pradesh
point out non-involvement of agriculture department during
scheme implementation to limit realization of holistic
outcomes.
o Limiting scheme design:
▪ States like Andhra Pradesh, Manipur, Meghalaya,
Rajasthan and Telangana face difficulty in
undertaking more relevant projects under RRR due
to cost capping at Rs. 2.5 lakh/ha. Particularly for
hilly areas like Manipur and Meghalaya, water bodies
138 Agriculture and Horticulture department, Madhya Pradesh

Page | 464
are small and sites are often inaccessible through
roads. This increases the expenditure under
transportation/ labour but proposals with higher
estimates get rejected by the centre.
▪ Though scheme guidelines mandate completion of
work in two years (excluding the year of inclusion),
states in hilly areas often need to seek extension
since working period is limited to 4-5 months only
due to rains. State level stakeholders in Madhya
Pradesh also highlight the difficultly in completing
scheme on time as the effective working period is
limited to 3 months between April to June i.e. post-
irrigation period.
▪ Detailed hydrological information mandatorily needed
during DPR preparation is seen as a hindrance as it is
often unavailable/ difficult to obtain for small water
bodies in Andhra Pradesh.
▪ Several levels of approvals are needed before
scheme sanctioning: State Level Nodal Agency
(SLNA) followed by Technical Advisory Committee
(TAC) and State Level Sanctioning Committee (SLSC).
This often leads to delays in states like Meghalaya and
Rajasthan.
▪ The criterion for inclusion of water bodies with
minimum water spread area of 5 ha in rural areas and
2-10 ha in urban areas is seen as a major challenge by
state and district level stakeholders in Meghalaya and
Telangana. Smaller size of most water bodies limits
Meghalaya from including water bodies in regions of
water scarcity where RRR works are of utmost
importance.

Page | 465
▪ The constitution and roles of District Level
Implementation Agency (DLIA) is not clear in the
scheme guidelines. However, it is headed by District
Magistrate and formed in all states except
Meghalaya. Stakeholders in Rajasthan pointed out
the challenges faced while convincing DLIA towards
inclusion of water bodies in DIP, often leading to
delays. It has also been highlighted that RRR is a
continuous process and it is difficult for the states to
propose all works to be included in the next 5 years
under DIP.
▪ Owing to torrential rains in Meghalaya, upstream
lands often get submerged after implementation of
RRR. Since there is no mechanism for compensation
under the scheme guidelines, local communities are
reluctant towards RRR works.
▪ The storage capacity of Arvad dam, Bhilwara district,
Rajasthan has been estimated to reduce from 47.79
MCM to 12.26 MCM due to establishment of
Rampura Agucha mines in 1984. Since 29 villages are
dependent upon the dam for fulfilling their agricultural
and domestic needs; restoration works have been
proposed under multiple schemes including RRR,
NABARD and RWSLIT. However, they have been
rejected each time on grounds of hydrological
dependability criteria. District estimates that even at
less than 50% dependability, the dam sustains
agricultural yield worth 7.5 Cr. each year. They further
emphasize the dire need to restore the tank,
considering the water scarcity in the region, which is
so severe that army has to be called in each time
there is water in the tank.

Page | 466
Parameter Findings from research
▪ CWC Regional office is involved during techno-
economical appraisal of DPR, monitoring and
forwarding financial proposal to Ministry of Jal Shakti.
However, presence of only one regional office for all
north eastern states poses a challenge, considering
difficulties involved in travel, thereby delaying
scheme implementation as pointed out by
stakeholders in Manipur.
▪ CWC officials in Telangana highlight that unlike
medium and major projects, specific guidelines on
DPR preparation are not available for RRR projects.
• Monitoring is done at three levels across all states: by
Panchayats/WUAs, state government and CWC field office. States
face no challenge in this regard.
• As per HH survey, an increase in surface water storage was
confirmed by 31% farmers while 27% indicated an increase in
engagement in agricultural activities as a result of RRR works.
Though 57% farmers farmer are dependent on surface water for
irrigation after completion of RRR, 29% continue to be dependent
on groundwater (n= 172).
Inference:
• Both secondary literature and KIIs across national, state and district
level emphasize the effectiveness of RRR in meeting its objective.
This is further validated by HH survey, indicating an increase in
irrigated land, crop yield, crop intensity, land productivity, drinking
water availability and groundwater storage after completion of RRR.
However, most of the general category states are unable to take
relevant projects under RRR due to fund constraints and much higher
proportion of state share.
• While community participation and convergence with complimentary
schemes positively impacts scheme effectiveness; it is deterred by

Page | 467
Parameter Findings from research
factors like delayed/ inadequate fund release, encroachments, waste
discharge by municipalities, cumbersome administrative process,
farmer’s preference for private irrigation and lack of
interdepartmental coordination.
Hence, the scheme effectiveness has been categorised as
‘average’.
Efficiency
Secondary:
• Proposals sent under RRR need to specify Benefit-Cost ratio of 1:1
for special category states and more than 1 for non-special category
states.
• Guidelines mandate convergence with Integrated Watershed
Management Program (IWMP) through selection of water bodies
with overlapping catchment area. However, there are no details on
the implementation structure.
Primary
• The Benefit-Cost (B-C) ratio, which is mandatorily included in DPR
considers only irrigation potential created, based on inputs received
from agriculture department. It does not take other benefits from
the scheme like provisioning of drinking water through PHED,
groundwater recharge and socio-economic benefits into account.
However, improved availability of drinking water after RRR has been
highlighted by 37% respondents during HH survey in Rajasthan.
o Non-inclusions in B-C ratio makes it difficult for districts like
Jaisalmer to take water bodies under RRR because no
irrigation potential is created but revival of water bodies is of
Page | 468
tremendous importance, particularly for domestic purposes
and groundwater recharge.
o In Rajasthan, the revenue generation after RRR activities is
more substantial through domestic and industrial water
supply than irrigation.
For instance: In Bhilwara district, Rajasthan, Fisheries
Department generates a revenue of Rs. 30-40 lakh per tank
per annum.
Likewise, in Andhra Pradesh, the constraint of B-C ratio >1
makes it difficult for the state to undertake small waterbodies
under RRR due to creation of limited irrigation potential.
However, the state points out the significance of including
these water bodies under RRR owing to several other
purposes being fulfilled by these water bodies like
groundwater recharge, which are included under scheme
objectives too.
• Whilst scheme guidelines mention prioritisation of ODF towns/
villages and areas covered under Saansad Adarsh Gram Yojana; this
parameter is not considered by the states during site selection.
• Strict convergence with IWMP is considered by all states except
Meghalaya and Madhya Pradesh, where RRR projects have been
completed but watershed component has not been implemented
yet since these projects were initiated before 2015.
In Rajasthan, this restriction limits the scope of work under RRR as
no work has been undertaken under IWMP since 2015-16.
For instance: In Sirohi district, Rajasthan, a project had to be pulled
back at the state level despite high significance because the water
body exists in middle of a forest, where implementation of IWMP is
not possible.
• After provisioning of assured irrigation under RRR, farmers in
Madhya Pradesh have shifted from monsoon dependent soybean to
water intensive paddy, considering 5-7 times higher productivity in

Page | 469
Parameter Findings from research
the latter. HH survey further confirms that majority of farmers
continue to grow water intensive crops like paddy since it is
profitable and has higher demand. However, it has been pointed out
during KIIs that after 2-3 cropping seasons of continuous water
availability, farmers become aware and start using water more
judiciously.
• Though dependency on flood irrigation continues after completion of
RRR works, controlled irrigation though direct outlets has replaced
uncontrolled irrigation in parts of Madhya Pradesh. State agriculture
department further highlights growing awareness amongst farmers
and shift towards water efficient agriculture like micro-irrigation,
particularly in medium irrigation schemes.
• As per HH survey, an increase in incidences of waterlogging as a
result of RRR works has been indicated by 47% respondents in
Rajasthan (n= 113) and 16% in Madhya Pradesh (n=59).
Inference:
• The scheme efficiency is impacted by selection criterion of
mandatory IWMP implementation and prevalence of traditional
practices like flood irrigation to grow water intensive crops like
paddy.
• Many proposed water bodies are unable to fulfil the B-C ratio > 1
criterion because the calculations are largely based on creation of
irrigation potential. The numerous other functions fulfilled by the
water bodies, particularly in desert prone areas are not considered
while determining the B-C ratio.
• Whilst HH survey indicates an increase in surface water storage as
a result of RRR works; it also indicates an increase in waterlogging
incidences.
Hence, under efficiency, the scheme may be rated as ‘average’.
Sustainability Secondary:
Page | 470
Parameter Findings from research
• Scheme guidelines mention WUAs to earn revenues by charging its
members, but no detailed provisions/ mechanism for financial
sustainability are stated.
• As per 5th
Minor Irrigation census, surface flow schemes have
highest percentage of temporarily not in use (9.4%) and permanently
not in use (2.9%) water bodies.
o The primary reasons behind temporary non-usage of surface
water scheme includes ‘less discharge of water’ (32.9%),
‘storage not filled up fully’ (23.2%) and ‘channel break down’
(9.2%).
o Permanent non-usage of surface water schemes is attributed
to ‘dried up’ (35.1%) and ‘destroyed beyond repair’ (5.1%)
water bodies.
• The increasing incidences of drying up of water bodies may be
attributed to an increase in average annual temperature (0.48
degrees) and decline in average rainfall (26mm) between 1970 and
2016.139
• Factors like rapid urbanisation, encroachment and discharge of
sewage/ waste into the drains are also detrimental to scheme
sustainability.
Primary:
• Rainfall is regarded as critical to scheme sustainability across,
Andhra Pradesh, Bihar, Manipur, Madhya Pradesh and Rajasthan.
• Repercussions of climate change have been observed across all
states. For instance: In Madhya Pradesh, there has been an increase
139 The Economic Survey (2017-18)

Page | 471
in periods of dry spells, which requires supplementary irrigation even
during monsoon period while in Manipur.
• No provision for O&M poses a major threat to scheme across all
states, particularly in hilly areas, where siltation is a continuous
phenomenon. Though water is a state subject; Andhra Pradesh,
Manipur, Meghalaya, Rajasthan and Telangana have pointed to non-
availability of adequate funds under O&M as the major reason for
having to include these water bodies under RRR at the first place.
• Though the scheme guidelines mention WUAs to charge for its
services and build up corpus for maintenance and management of
water bodies; there are no details on its implementation structure.
o The KIIs in Rajasthan highlight WUAs to be functioning well
near perennial water source in Rajasthan. However, they are
working as per the state specified guidelines: 50% of the
collected revenue is returned to WUAs for undertaking their
works. Revenue directly generated through irrigation under
RRR schemes is low due to water bodies being small in
scale. State specific provisions on the functioning of WUAs
are as per Rajasthan Farmers Participation Act, 2018. In
practice, WUA is unable to charge for livelihood generating
services like fisheries due to lack of interdepartmental
coordination.
o In Bhilwara district, Rajasthan, WUAs could not be created
for 3 tanks as they are 250-300 year old structures and it is
difficult to obtain revenue map of the command area.
o While O&M works are undertaken by Madhya Pradesh state
government, tax is recovered from the farmers based on
number of watering per season. However, farmers are
reluctant to contribute and there are large pending dues in
this regard. WUA is incentivized at Rs. 120/ha by the state
government but this is regarded as inadequate for annual
maintenance works by both district irrigation authorities and
Page | 472
Parameter Findings from research
WUAs. The chairman of WUA, Madhya Pradesh further
highlights that the area is inhabited by marginal farmers who
are not capable for undertaking O&M works on their own.
o In Meghalaya, WUAs are formed for all completed projects
under RRR. Though they are involved in water distribution
and management; they lack in financial capability towards
O&M and instead contribute via labour for minor
maintenance works while major works continue to be funded
by the state government.
o In Tamil Nadu, WUAs are formed but currently non-active
since their 5-year tenure is over and the state is unable to
conduct elections due to Covid situation.
• HH survey in Rajasthan and Madhya Pradesh indicates only 17%
respondents are aware of the presence of registered WUA in the
command area (n= 172).
Inference:
• Scheme sustainability is dependent on climatic factors: rainfall and
temperature, which directly affects discharge in the water bodies.
• Scheme design ensures presence of WUAs for operations and
maintenance of water bodies refurbished under RRR works.
However, the secondary data, KIIs and HH survey indicates that
WUAs are non-existent/ exist at conceptual level only, with no details
on its framework, management and financial sustainability.
Therefore, under sustainability, RRR may be categorised as
‘average’.
Impact
Secondary:
• The anticipated impact of the scheme includes increase in
employment, improvement in socio-economic conditions like
increase in health levels, literacy level, women empowerment,
social harmony and decrease in distress migration.

Page | 473
Parameter Findings from research
• Community based tank management in Karnataka led to increase in
income by Rs. 8,015/ year for an average land holding of 0.75 ha.
Improvement and increase in irrigation coverage led to
intensification and diversification of irrigated agriculture, generating
additional farm employment of 8,050 persons per year. This has
helped in poverty alleviation for 17% of the population. Additionally,
irrigated area and water volume increased by 20% and 44%
respectively. Though there was some rise in groundwater levels,
groundwater abstraction also increased by 42%.140
Primary:
• Out of 8 states assessed, RRR works under PMKSY has been
completed in Rajasthan, Bihar, Madhya Pradesh, Meghalaya, Tamil
Nadu and Telangana. Though the guidelines mention post
implementation evaluation and impact assessment studies to be
done by MoWR/CWC, no such studies have been done under
HKKP-RRR.
KIIs across all states confirm creation of irrigation potential,
generation of employment, reduction in power consumption and
enhanced agricultural productivity as a result of RRR.
• The district irrigation officials of Betul district, Madhya Pradesh
confirm increase in food grain production by 1.5 times as a result of
improved irrigation through RRR and other schemes. Furthermore,
it has also led to income augmentation, agricultural diversification,
improvement in education and overall socioeconomic development
of the community. The KII with Chairman, WUA further validates
this.
• In Deora Gram Panchayat, Patna district, Bihar, restoration of Ahar-
Pyne system has not only reduced soil erosion; but also replaced
140 Background note on Repair Renovation and Restoration (RRR) of Water Bodies

Page | 474
Parameter Findings from research
groundwater dependence of the farmers, leading to increase in
groundwater level from 35 ft to 15 ft below ground.
• The HH survey further validates an increase in groundwater level,
income, education and employment, as a result of RRR works.
Inference:
• Though the guidelines mention post implementation evaluation and
impact assessment studies to be done by MoWR/CWC, no such
studies have been done under HKKP-RRR.
• The secondary data indicates multiple positive impacts of the
scheme, including increase in income, generation of employment,
women empowerment and increase in groundwater table.
• The KIIs and HH data further validates this change.
Hence, under impact, the scheme may be categorised as
satisfactory.
Equity
Secondary:
• Scheme guidelines propose higher percentage of Central Grant for
north-eastern, hilly states, KBK states, tribal and flood prone areas.
Project proposals are required to provide details of SC/ST people
benefitted.
• Independent studies by WALAMATRI, Water Technology Centre for
Eastern Region confirmed increased water utilization and benefits to
farmers & SC/ST families.
• Cabinet note recommends not to affect the rights of the existing
users/ communities during repair, renovation and restoration stage.
Primary:
• KIIs across all states indicate equitable distribution of water
resources under RRR.
• In parts of Sirohi district, Rajasthan, influential beneficiaries in the
head region of the tank have monopoly over water usage during
scarcity. However, in other areas like Bhilwara, 60-70% beneficiaries
in the command area belong to SC/ST/OBC communities and there

Page | 475
Parameter Findings from research
are no concerns relating to equity. Few issues which arise are
resolved by WUAs.
• Instances of SC, ST and other weaker sections of the society not
getting equal access to water were earlier prevalent in Bihar.
However, with handing over of water bodies to Gram Panchayats,
such problems have been completely resolved. In Madhya Pradesh,
KII with chairman, WUA, Betul district validates equitable access to
water after completion of RRR works.
• With the introduction of Rajasthan Farmer Participation in
Management of Irrigation Systems Act, 2018, women participation
in WUA needs to be ensured at 50%. However, this is yet to be
implemented on ground. Absence of women in WUAs was further
highlighted by 97% respondents during HH survey across Rajasthan
and Madhya Pradesh (n= 30).
Inference:
• The scheme has provisions favouring equity like higher central grant
for north-eastern, hilly and flood prone states.
• Most of the states further confirm equitable distribution of resources
post scheme implementation. However, there have been occasional
instances of few influential individuals having monopoly in water
scarce region of Rajasthan.
• There are no provisions favouring gender equity in scheme
guidelines. The HH data and KIIs indicates absence of women in
WUAs.
Considering all these factors, the scheme may be categorised as
‘average’ under equity.
A summary analysis and performance of the scheme on the identified themes is presented
below:

Page | 476
Table 44: RRR - summary of performance evaluation using REESIE framework
Parameter Performance
Relevance
Effectiveness
Efficiency
Sustainability
Impact
Equity
REESI+E performance infographics legend
Satisfactory
Average
Needs Improvement
No information
Performance on cross-sectional themes
Table 45: RRR - performance evaluation using cross-sectional themes
#
Cross-cutting
theme
Indicative Areas
of Enquiry and
Key Questions
Findings from research
1.
Accountability
& Transparency
Monitoring
Mechanisms
Citizen
Accountability
• Scheme parameters like number of water
bodies created/ restored, CCA covered,
MCM storage restored and financial
progress are tracked on PMKSY-RRR
dashboard, which in available in public
domain.
• Institutional arrangement - DPR preparation
and monitoring is done by WUA/ local
community; proposal scrutiny and
monitoring is done by DLIA at district and
SLNA at state level; proposal approval is
done by STAC, SLSC and monitoring is
undertaken by CWC (field office), at the
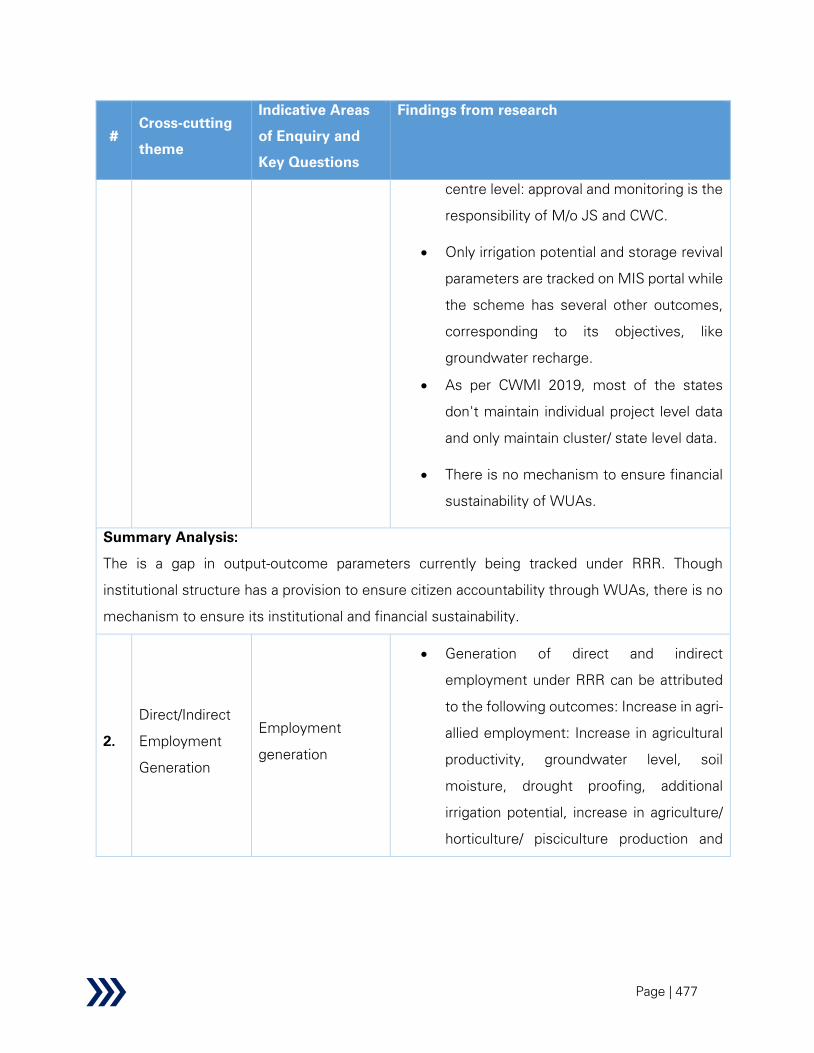
Page | 477
#
Cross-cutting
theme
Indicative Areas
of Enquiry and
Key Questions
Findings from research
centre level: approval and monitoring is the
responsibility of M/o JS and CWC.
• Only irrigation potential and storage revival
parameters are tracked on MIS portal while
the scheme has several other outcomes,
corresponding to its objectives, like
groundwater recharge.
• As per CWMI 2019, most of the states
don't maintain individual project level data
and only maintain cluster/ state level data.
• There is no mechanism to ensure financial
sustainability of WUAs.
Summary Analysis:
The is a gap in output-outcome parameters currently being tracked under RRR. Though
institutional structure has a provision to ensure citizen accountability through WUAs, there is no
mechanism to ensure its institutional and financial sustainability.
2.
Direct/Indirect
Employment
Generation
Employment
generation
• Generation of direct and indirect
employment under RRR can be attributed
to the following outcomes: Increase in agri-
allied employment: Increase in agricultural
productivity, groundwater level, soil
moisture, drought proofing, additional
irrigation potential, increase in agriculture/
horticulture/ pisciculture production and

Page | 478
#
Cross-cutting
theme
Indicative Areas
of Enquiry and
Key Questions
Findings from research
productivity, removal of weed growth and
promotion of tourism.
• To ensure financial sustainability, other
commercial activities like selling of silt as
organic manure and tourism activities may
be promoted.
• Community based tank management in
Karnataka has helped in generating
additional farm employment of Rs. 8,050
per person per year.141
• The KIIs across all states further confirm
generation of employment as a result of
scheme implementation.
Summary Analysis:
The primary and secondary data indicates generation of direct and indirect employment as a
result of scheme implementation.
3.
Gender
mainstreaming
Inclusiveness in
scheme
design/planning
• There are no provisions favouring gender
mainstreaming in the scheme guideline
document.
• The KIIs indicate non-involvement of
women in WUAs across all states. The
household survey further validates
absence of women in WUAs in Rajasthan
and Madhya Pradesh. However, in hilly
states (e.g. Meghalaya, Uttarakhand),
141 Background note on Repair Renovation and Restoration (RRR) of Water Bodies.

Page | 479
#
Cross-cutting
theme
Indicative Areas
of Enquiry and
Key Questions
Findings from research
women are actively involved in agriculture
and allied activities.
Summary Analysis:
A gap in scheme design, considering inclusiveness can be seen, which limits gender
mainstreaming.
4.
Climate change
& sustainability
including
adoption of
climate-change
resilient
practices &
diversification
Climate resilience
Climate impact
• Creation of additional storage through RRR
aids in building resilience against extreme
climate events like droughts and floods.
• However, erratic rainfall pattern (excess
rainfall, less than normal rainfall, abrupt
interval) poses a major risk to scheme
sustainability, which is unaddressed under
current scheme guidelines. It directly
affects discharge which leads to
temporary/permanent non-usage of water
bodies.
• Repercussions of climate change have
been observed across all states. For
instance: In Madhya Pradesh, there has
been an increase in periods of dry spells,
which requires supplementary irrigation
even during monsoon period.
Summary Analysis:
Though climate change factor is critical to scheme sustainability, it is unaddressed under the
current scheme guidelines. RRR also aids in building climate resilience to some extent by
creating additional storage.
5.
Use of
IT/Technology
Deployment of IT
enabled
mechanisms for
• In Maharashtra, project progress under
‘Gaalmukt Dharan Gaalyukt Shivar Yojana’,
was monitored using mobile app.

Page | 480
#
Cross-cutting
theme
Indicative Areas
of Enquiry and
Key Questions
Findings from research
in driving
efficiency
monitoring of the
Schemes
Use of latest
technology to
improve efficiency
and effectiveness
of scheme
implementation
• Usage of GIS has aided in effective scheme
implementation in states like Telangana
and Manipur.
For instance: Manipur is utilising GIS
technology, which has aided in mitigating
overlap with similar schemes.
• While geotagging of photograph is done in
Rajasthan, gap with regards to usage of
latest technologies like Remote Sensing
and GIS has been observed in the state.
Likewise, usage of GIS is yet to be initiated
in multiple states like Meghalaya.
Summary Analysis:
Use of latest technology is pertinent for efficient scheme implementation. However, under RRR
its current utilisation is limited to few states only.
6.
Research &
Development
Fund Allocation,
challenges in
undertaking R&D
efforts, any Best
Practices
• No specific funds are earmarked for R&D
as per the scheme guidelines.
• Previous research has shown lining
material to significantly affect storage,
water losses and benefit-cost ratio. For
instance: lining with LDPE agrifilm reduced
seepage losses by 94.7%, lining with 200
GSM UV resistant polyethylene film
commonly known as Silpaulin was found to
hinder storage and percolation losses.142
142 Smuel and Mathew, 2008, Rejuvenation of Water Bodies by Adopting Rainwater Harvesting and Groundwater Recharging
Practices in Catchment Area-A Case Study
(https://www.researchgate.net/publication/229045738_Rejuvenation_of_Water_Bodies_by_Adopting_Rainwater_Harvesting_and_Gr
oundwater_Recharging_Practices_in_Catchment_Area-A_Case_Study)

Page | 481
#
Cross-cutting
theme
Indicative Areas
of Enquiry and
Key Questions
Findings from research
• More research on localised low-cost
technologies for lining could aid in
enhancing scheme effectiveness by
increasing benefit-cost ratio.
• Research institutes like IITs/ IISc, Indian
Council for Agricultural research, National
Academy of Agricultural Research
Management and state agriculture
universities could be involved in such
studies.
Summary Analysis:
Though no funds are earmarked for R&D under the scheme, research on localised low-cost
technologies for canal lining under RRR through involvement of national and regional research
organisations could aid increasing scheme effectiveness.
7.
Stakeholder and
Beneficiary
behavioural
change
Fund Allocation
Mechanisms to
promote and
ensure behaviour
change
Challenges faced
• The scheme envisages capacity building of
implementing agencies such as Ministry of
Water Resources, River Development &
Ganga Rejuvenation (MoWR, RD & GR) and
its attached and subordinate offices, State
Governments, District Implementing
agencies, Water Users’ Associations
(WUAs) and Panchayats.
Accordingly, a capacity building
programme aimed at sensitization of
stakeholders, identification and selection of
water bodies, monitoring and evaluation is
to be prepared and included in the DPRs.

Page | 482
#
Cross-cutting
theme
Indicative Areas
of Enquiry and
Key Questions
Findings from research
However, there are no indicators to track
the same.
• Poor maintenance of water bodies often
leads to siltation and encroachment issues.
Primary research found that encroachment
is a major issue across Andhra Pradesh,
Bihar, Manipur and Meghalaya. RRR works
got delayed by 4 years due to
encroachment by fishing society in
Manipur.
• Though few states like Telangana and
Madhya Pradesh conduct capacity building
and awareness generation activities, KIIs
and HH survey indicates the scheme has
not been able to bring significant
behavioural change amongst beneficiaries
as the farmers continue to be primarily
dependent on groundwater for irrigation,
while majority of farmers continue to
cultivate water intensive crops like Paddy.
Summary Analysis:
The primary and secondary data indicates the scheme has been unable to bring stakeholder and
beneficiary behavioural change.
8.
Conjunctive use
of water
Challenges and
awareness
• Though scheme objectives include
conjunctive use of surface and
groundwater, no indicators are tracked in
this regard.
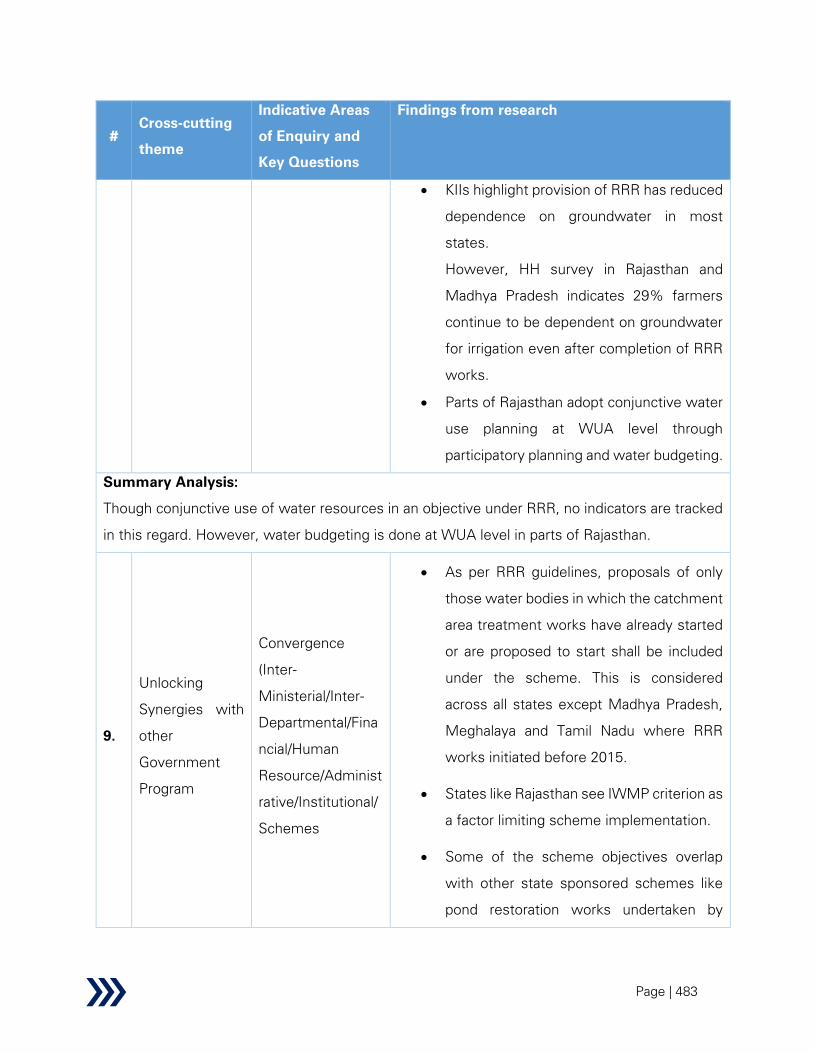
Page | 483
#
Cross-cutting
theme
Indicative Areas
of Enquiry and
Key Questions
Findings from research
• KIIs highlight provision of RRR has reduced
dependence on groundwater in most
states.
However, HH survey in Rajasthan and
Madhya Pradesh indicates 29% farmers
continue to be dependent on groundwater
for irrigation even after completion of RRR
works.
• Parts of Rajasthan adopt conjunctive water
use planning at WUA level through
participatory planning and water budgeting.
Summary Analysis:
Though conjunctive use of water resources in an objective under RRR, no indicators are tracked
in this regard. However, water budgeting is done at WUA level in parts of Rajasthan.
9.
Unlocking
Synergies with
other
Government
Program
Convergence
(Inter-
Ministerial/Inter-
Departmental/Fina
ncial/Human
Resource/Administ
rative/Institutional/
Schemes
• As per RRR guidelines, proposals of only
those water bodies in which the catchment
area treatment works have already started
or are proposed to start shall be included
under the scheme. This is considered
across all states except Madhya Pradesh,
Meghalaya and Tamil Nadu where RRR
works initiated before 2015.
• States like Rajasthan see IWMP criterion as
a factor limiting scheme implementation.
• Some of the scheme objectives overlap
with other state sponsored schemes like
pond restoration works undertaken by

Page | 484
#
Cross-cutting
theme
Indicative Areas
of Enquiry and
Key Questions
Findings from research
Urban & Rural development departments,
AMRUT and JNNURM.
• The scheme guideline highlights
preference to be given to water bodies in
villages or towns covered under ‘Saansad
Aadarsh Gram Yojana’ or those that are
declared as ODF. However, KIIs indicate
that this criterion is not considered while
project prioritisation.
• Lack of coordination between agriculture,
irrigation and fishery department was
observed in Rajasthan, which reduces
scheme efficiency.
• Limited coordination between agriculture
and irrigation department during scheme
implementation limits realization of holistic
benefits.
Summary Analysis:
While the scheme design adequately addresses convergence across departments, states see
this as a challenge limiting scheme implementation. Lack of coordination between agriculture,
irrigation and fishery department further minimises scheme effectiveness.
10.
Impact on and
role of private
sector,
community/
collectives/
cooperatives
(e.g. Farmer
What is the
percentage of
private investment
in the
clusters/programs
run by the
government?
• The scheme guidelines point out that
NGOs could play a role in implementation,
planning and execution of the scheme,
subject to state government's decision.

Page | 485
#
Cross-cutting
theme
Indicative Areas
of Enquiry and
Key Questions
Findings from research
cooperatives,
FPOs, Water
User
Associations,
etc.) and civil
society in the
scheme
How many private
sector,
community/collecti
ves/cooperatives
and civil society
have availed the
benefits under any
Scheme?
However, as per KIIs, no such activities are
being carried out.
• The onus of scheme operations and
maintenance lies with the WUAs but there
is no defined mechanism to ensure the
same.
• Though WUAs are active in parts of
Rajasthan, there is a reluctance to start off
unless they see water continuously for few
seasons.
• Alternate model case study: Maharashtra’s
‘Gaalmukt Dharan Gaalyukt Shivar Yojana’
is an initiative by Maharashtra Government
towards making it water secure and boost
agricultural income through community-
based tank desiltation. While the state
government provided fuel subsidy,
machine rent cost was contributed by
community/ pooled through CSR. Farmers
could use the silt for free as organic
manure, which improved soil quality,
productivity and regional hydrology.
Desiltation resulted in increased water
storage capacity in the tank, which lead to
drought resilience, improved incomes and
reduction in water scarcity.
Summary Analysis:

Page | 486
#
Cross-cutting
theme
Indicative Areas
of Enquiry and
Key Questions
Findings from research
Secondary data indicates success stories with respect to involvement of community/ collectives.
KIIs highlight while limited involvement of community in operations and maintenance through
WUAs.
In addition to the above themes, no information was found for ‘Development, dissemination &
adoption’, ‘Research & Development’ and ‘Reform, Regulation’ while ‘Role of Tribal Sub-Plan
(TSP) and Scheduled Caste Sub-Plan component of the scheme in mainstreaming of Tribal and
Scheduled Caste population’ and ‘Water sharing treaties/agreements & diplomacy’ are not
relevant for the scheme.
A summary analysis and performance of the scheme on the identified themes is presented
below:
Table 46: RRR - summary of performance evaluation using cross-sectional themes
Parameter Performance
Accountability & Transparency
Direct/Indirect Employment Generation
Gender mainstreaming/Inclusiveness
Building resilience to climate change (including but not limited to developing
water disaster preparedness) & ensuring sustainability
Role of Tribal Sub-Plan (TSP) and Scheduled Caste Sub-Plan component of
the scheme in mainstreaming of Tribal and Scheduled Caste population
Use of IT/Technology in driving efficiency
Stakeholder and Beneficiary behavioural change
Development, dissemination & adoption
Research & Development
Water sharing treaties/agreements & diplomacy
Conjunctive use of water - surface versus groundwater usage optimizations
Unlocking Synergies with other Government Program
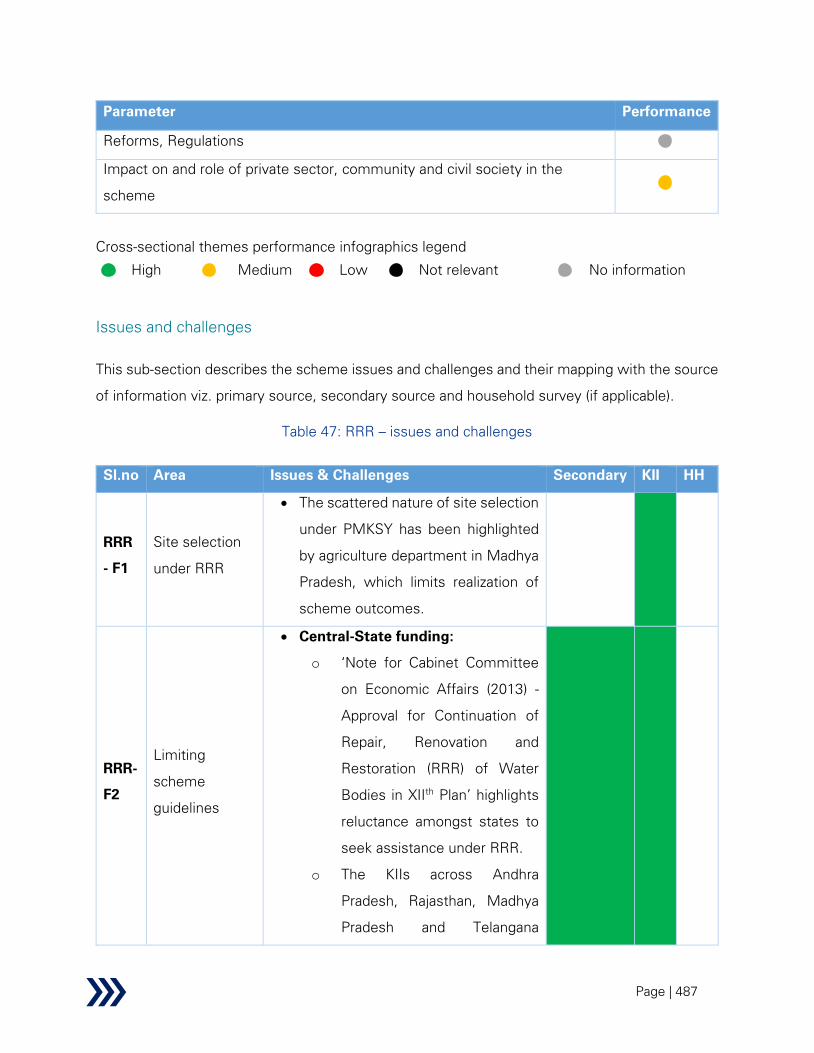
Page | 487
Parameter Performance
Reforms, Regulations
Impact on and role of private sector, community and civil society in the
scheme
Cross-sectional themes performance infographics legend
High
Medium
Low
Not relevant
No information
Issues and challenges
This sub-section describes the scheme issues and challenges and their mapping with the source
of information viz. primary source, secondary source and household survey (if applicable).
Table 47: RRR – issues and challenges
Sl.no Area Issues & Challenges Secondary KII HH
RRR
- F1
Site selection
under RRR
• The scattered nature of site selection
under PMKSY has been highlighted
by agriculture department in Madhya
Pradesh, which limits realization of
scheme outcomes.
RRR-
F2
Limiting
scheme
guidelines
• Central-State funding:
o ‘Note for Cabinet Committee
on Economic Affairs (2013) -
Approval for Continuation of
Repair, Renovation and
Restoration (RRR) of Water
Bodies in XIIth
Plan’ highlights
reluctance amongst states to
seek assistance under RRR.
o The KIIs across Andhra
Pradesh, Rajasthan, Madhya
Pradesh and Telangana
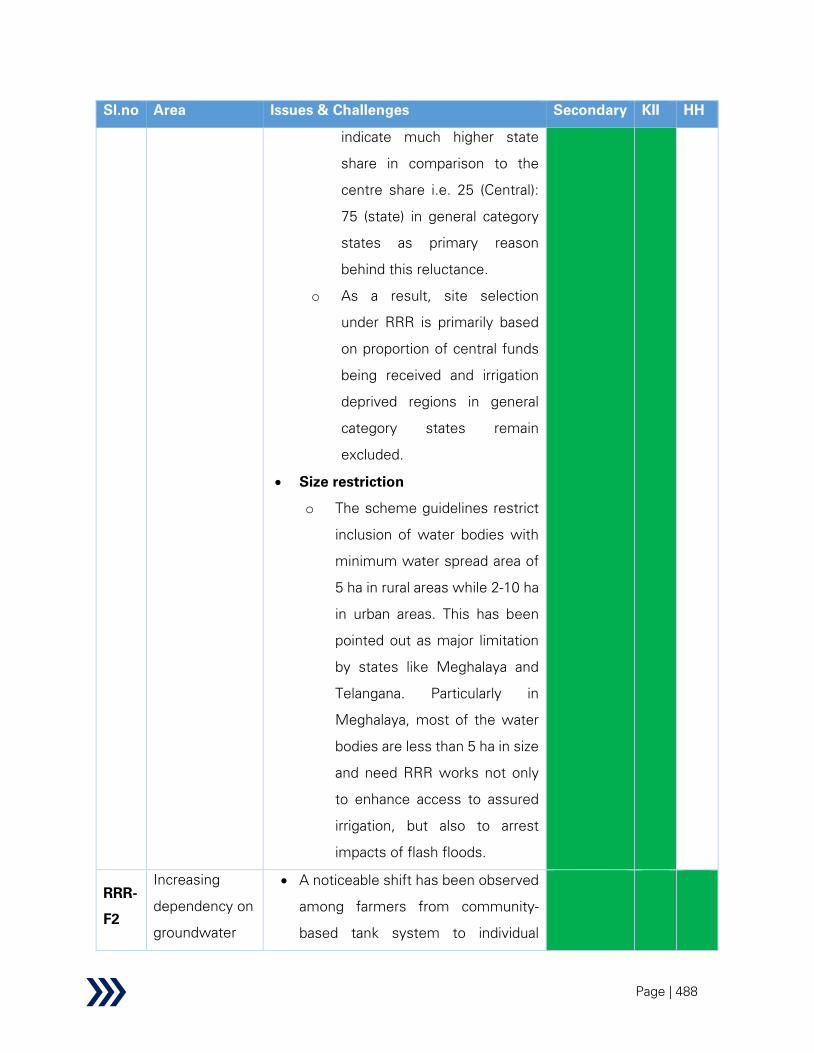
Page | 488
Sl.no Area Issues & Challenges Secondary KII HH
indicate much higher state
share in comparison to the
centre share i.e. 25 (Central):
75 (state) in general category
states as primary reason
behind this reluctance.
o As a result, site selection
under RRR is primarily based
on proportion of central funds
being received and irrigation
deprived regions in general
category states remain
excluded.
• Size restriction
o The scheme guidelines restrict
inclusion of water bodies with
minimum water spread area of
5 ha in rural areas while 2-10 ha
in urban areas. This has been
pointed out as major limitation
by states like Meghalaya and
Telangana. Particularly in
Meghalaya, most of the water
bodies are less than 5 ha in size
and need RRR works not only
to enhance access to assured
irrigation, but also to arrest
impacts of flash floods.
RRR-
F2
Increasing
dependency on
groundwater
• A noticeable shift has been observed
among farmers from community-
based tank system to individual
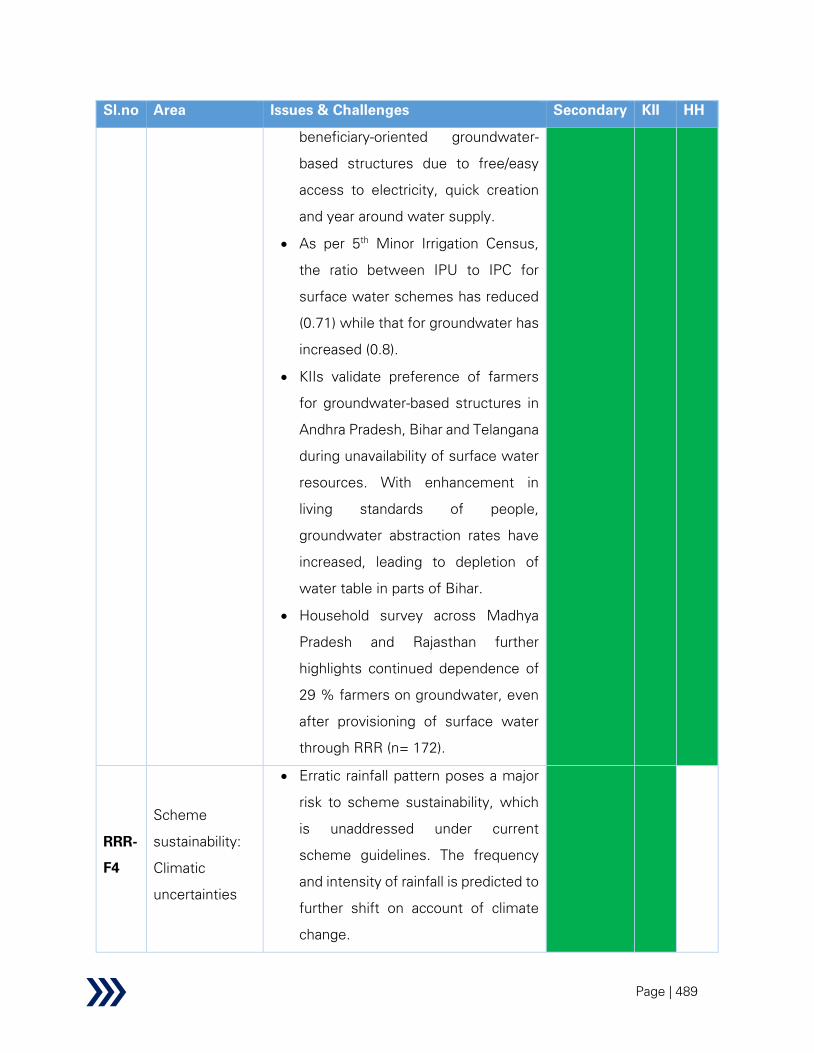
Page | 489
Sl.no Area Issues & Challenges Secondary KII HH
beneficiary-oriented groundwater-
based structures due to free/easy
access to electricity, quick creation
and year around water supply.
• As per 5th
Minor Irrigation Census,
the ratio between IPU to IPC for
surface water schemes has reduced
(0.71) while that for groundwater has
increased (0.8).
• KIIs validate preference of farmers
for groundwater-based structures in
Andhra Pradesh, Bihar and Telangana
during unavailability of surface water
resources. With enhancement in
living standards of people,
groundwater abstraction rates have
increased, leading to depletion of
water table in parts of Bihar.
• Household survey across Madhya
Pradesh and Rajasthan further
highlights continued dependence of
29 % farmers on groundwater, even
after provisioning of surface water
through RRR (n= 172).
RRR-
F4
Scheme
sustainability:
Climatic
uncertainties
• Erratic rainfall pattern poses a major
risk to scheme sustainability, which
is unaddressed under current
scheme guidelines. The frequency
and intensity of rainfall is predicted to
further shift on account of climate
change.
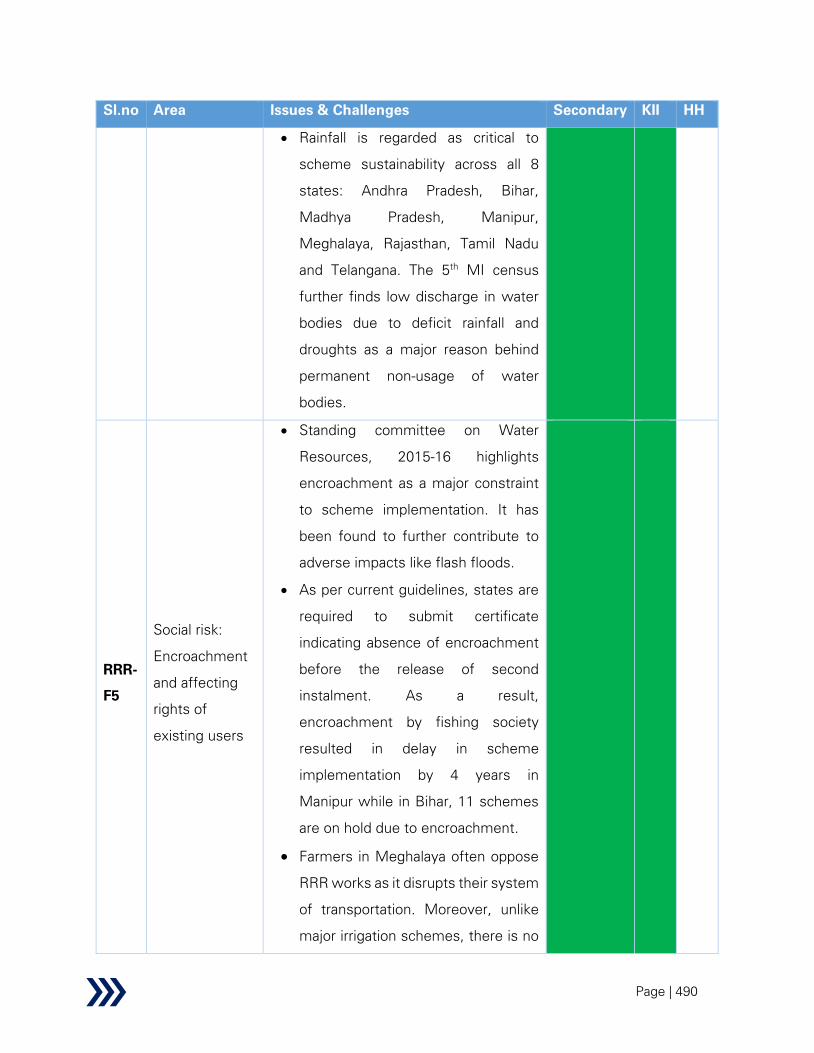
Page | 490
Sl.no Area Issues & Challenges Secondary KII HH
• Rainfall is regarded as critical to
scheme sustainability across all 8
states: Andhra Pradesh, Bihar,
Madhya Pradesh, Manipur,
Meghalaya, Rajasthan, Tamil Nadu
and Telangana. The 5th
MI census
further finds low discharge in water
bodies due to deficit rainfall and
droughts as a major reason behind
permanent non-usage of water
bodies.
RRR-
F5
Social risk:
Encroachment
and affecting
rights of
existing users
• Standing committee on Water
Resources, 2015-16 highlights
encroachment as a major constraint
to scheme implementation. It has
been found to further contribute to
adverse impacts like flash floods.
• As per current guidelines, states are
required to submit certificate
indicating absence of encroachment
before the release of second
instalment. As a result,
encroachment by fishing society
resulted in delay in scheme
implementation by 4 years in
Manipur while in Bihar, 11 schemes
are on hold due to encroachment.
• Farmers in Meghalaya often oppose
RRR works as it disrupts their system
of transportation. Moreover, unlike
major irrigation schemes, there is no

Page | 491
Sl.no Area Issues & Challenges Secondary KII HH
mechanism for compensation under
RRR. Though the cabinet note
recommends not to affect the rights
of existing users during scheme
implementation, there is no
mechanism to ensure the same.
RRR
F6
Poor Water
Use Efficiency
• One of the objectives of RRR is
introduction of sustainable water
conservation practices. However,
states usually carry out conventional
irrigation practices like flood irrigation
after water is provisioned under RRR.
• States like Bihar, which are
dependent on agriculture as primary
source for livelihood opt for
traditional water intensive crops like
paddy even in water scarce areas.
• Household data depicts majority of
farmers continue to grow water
intensive crop like Paddy due to
greater profit and higher demand
after completion of RRR works. An
increase in incidences of
waterlogging has also been
highlighted by 47% and 16%
respondents in Rajasthan (n= 59) and
Madhya Pradesh (n= 113)
respectively.
RRR-
F7
Delays in fund
release and
• Delayed/inadequate fund release
was observed in Andhra Pradesh,
Manipur, Madhya Pradesh, and Tamil

Page | 492
Sl.no Area Issues & Challenges Secondary KII HH
cost capping
criterion
Nadu, thereby significantly slowing
the scheme progress.
• For instance: While first instalment
of central assistance was received by
Tamil Nadu in March 2016; the state
has not received second instalment
till date. In this regard, centre has
informed the state that expenditure
incurred cannot be reimbursed.
Similarly, for tanks included under
Phase III, release of second
instalment got delayed by 11
months.
• States like Andhra Pradesh, Manipur,
Meghalaya and Rajasthan face
difficulty in undertaking more
relevant projects under RRR due to
cost capping at Rs. 2.5 lakh/hectare.
RRR-
F8
Cumbersome
administrative
processes
• DPR preparation is a cumbersome
exercise requiring hydrological data,
benefit-cost ratio and several levels
of approvals, including appraisal from
CWC regional office.
• Project sanctioning has taken as long
as 4-5 years in Rajasthan. Relevant
projects have been rejected multiple
times due to non-fulfilment of
hydrological dependability criteria.
• Due to delays in release of second
instalment for administrative reasons
and changes in scheme guidelines

Page | 493
Sl.no Area Issues & Challenges Secondary KII HH
midway, Madhya Pradesh had to
bear 100% cost of 119 works under
RRR.
• Considering the hilly terrain and
difficulties involved in travel, a single
CWC regional office catering to all
north-eastern states is inadequate.
RRR-
F9
Non- Inclusions
in Benefit-Cost
ratio
• Revenue generation from domestic
and industrial water supply after
completion of RRR projects is much
higher compared to irrigation.
However, the current checklist for B-
C ratio, included in DPR, takes only
irrigation potential into account,
despite the scheme having multiple
other benefits like groundwater
recharge and provisioning of drinking
water. Since the B-C ratio does not
fully account for all the benefits that
flow from the scheme, it limits taking
up projects under RRR (e.g. Andhra
Pradesh, Rajasthan, Telangana).
• Districts like Jaisalmer are unable to
implement RRR because creation of
irrigation potential is not possible in
such areas, though revival of water
bodies is of tremendous importance,
particularly for drinking water and
groundwater recharge.
RRR-
F10
Lack of funds
for O&M
• States like Andhra Pradesh, Manipur,
Meghalaya, Madhya Pradesh and
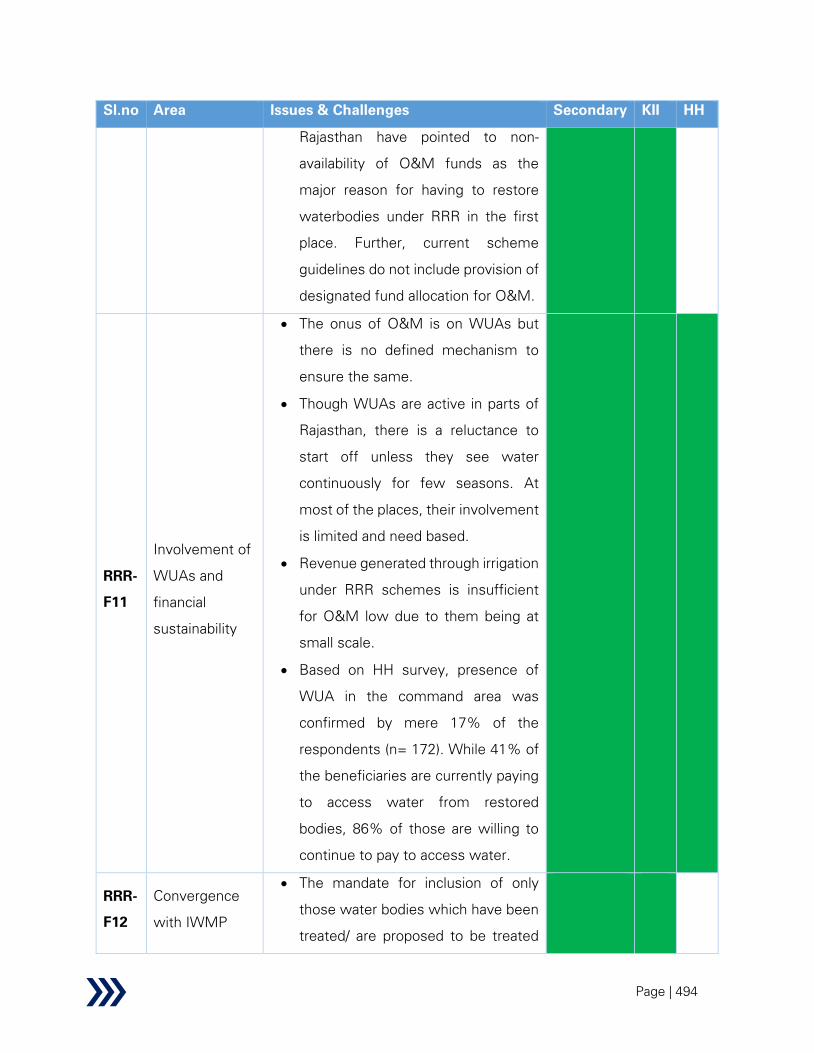
Page | 494
Sl.no Area Issues & Challenges Secondary KII HH
Rajasthan have pointed to non-
availability of O&M funds as the
major reason for having to restore
waterbodies under RRR in the first
place. Further, current scheme
guidelines do not include provision of
designated fund allocation for O&M.
RRR-
F11
Involvement of
WUAs and
financial
sustainability
• The onus of O&M is on WUAs but
there is no defined mechanism to
ensure the same.
• Though WUAs are active in parts of
Rajasthan, there is a reluctance to
start off unless they see water
continuously for few seasons. At
most of the places, their involvement
is limited and need based.
• Revenue generated through irrigation
under RRR schemes is insufficient
for O&M low due to them being at
small scale.
• Based on HH survey, presence of
WUA in the command area was
confirmed by mere 17% of the
respondents (n= 172). While 41% of
the beneficiaries are currently paying
to access water from restored
bodies, 86% of those are willing to
continue to pay to access water.
RRR-
F12
Convergence
with IWMP
• The mandate for inclusion of only
those water bodies which have been
treated/ are proposed to be treated

Page | 495
Sl.no Area Issues & Challenges Secondary KII HH
under Integrated Watershed
Management Program, poses a
hurdle in taking relevant projects in
Andhra Pradesh and Rajasthan.
• At several instances, projects were
sent back (e.g. Rajasthan) owing to
non-fulfilment of this criterion. The
state claims it to be an unnecessary
constraint reducing the scope of the
scheme as no projects have been
taken in parts of Rajasthan under
IWMP since 2015-16.
RRR-
F13
Project
Implementation
structure and
limited working
period
• The constitution and role of District
level Implementation Agency is not
described in the scheme guidelines.
Its current role is limited to including
work under DIP in Rajasthan.
• Limited working period, particularly in
hilly states like Manipur and
Meghalaya, prevents completion of
project in two years (excluding the
year of inclusion), as mandated by
the scheme guidelines.
RRR-
F14 Need for
project
inclusion under
DIP
• Approval under RRR requires project
to be included in the District Irrigation
Plan (DIP). However, DIP is prepared
for a 5-year period while restoration
of waterbodies under RRR is a
continuous process. Therefore, it is

Page | 496
Sl.no Area Issues & Challenges Secondary KII HH
not feasible for states to anticipate
and include all works under DIP.
• Furthermore, there is no provision to
include emergency maintenance
works (say, from droughts/floods)
under RRR.
RRR-
F15
Database
maintenance
and monitoring
• There is a lack of transparent
database on the status of water
bodies and zones/ areas with critical
water bodies.
• Only irrigation potential and storage
revival parameters are tracked on
MIS portal while the scheme has
several other outcomes,
corresponding to its objectives like
groundwater recharge.
RRR-
F16
Output-
Outcome
Framework
• Output-outcome framework
mentions no separate outcome for
each objective. Additionally, outcome
targets like IPU, additional IPC and
WUA formation are not tracked at
RRR scheme level.
• Though guidelines mention
evaluation and impact assessment of
the schemes to be done by
independent agencies identified by
CWC/ MoWR; no activities have
been carried out by the centre in this
regard.
Issue relevance legend

Page | 497
Supported
Partially
supported
Not supported
Not applicable
A summary analysis of issues & challenges for the scheme is presented below:
Table 48: RRR – summary of issues and challenges
Parameter Performance
Institutional Mechanism and governance
Fund flow efficiency and utilization
Unavailability of resource persons
Capacity building
Monitoring and evaluation
Encroachment of surface water bodies
Performance infographics legend
Satisfactory
Average
Needs Improvement
Recommendations and solutions
This sub-section describes the scheme recommendation and solutions from the perspective of
scheme design, scheme implementation and monitoring & evaluation, along with their mapping
with the issues and challenges described in the preceding sub-section.
Table 49: RRR – recommendations and solutions
Sl.no Recommendation Finding
Scheme design
RRR -
R1
Phase-wise site selection
• Considering the scattered nature of scheme implementation
under RRR; area-wise phased planning, with due
consideration to existing schemes in the catchment area
is suggested for it to realize maximum benefits.
RRR-F1
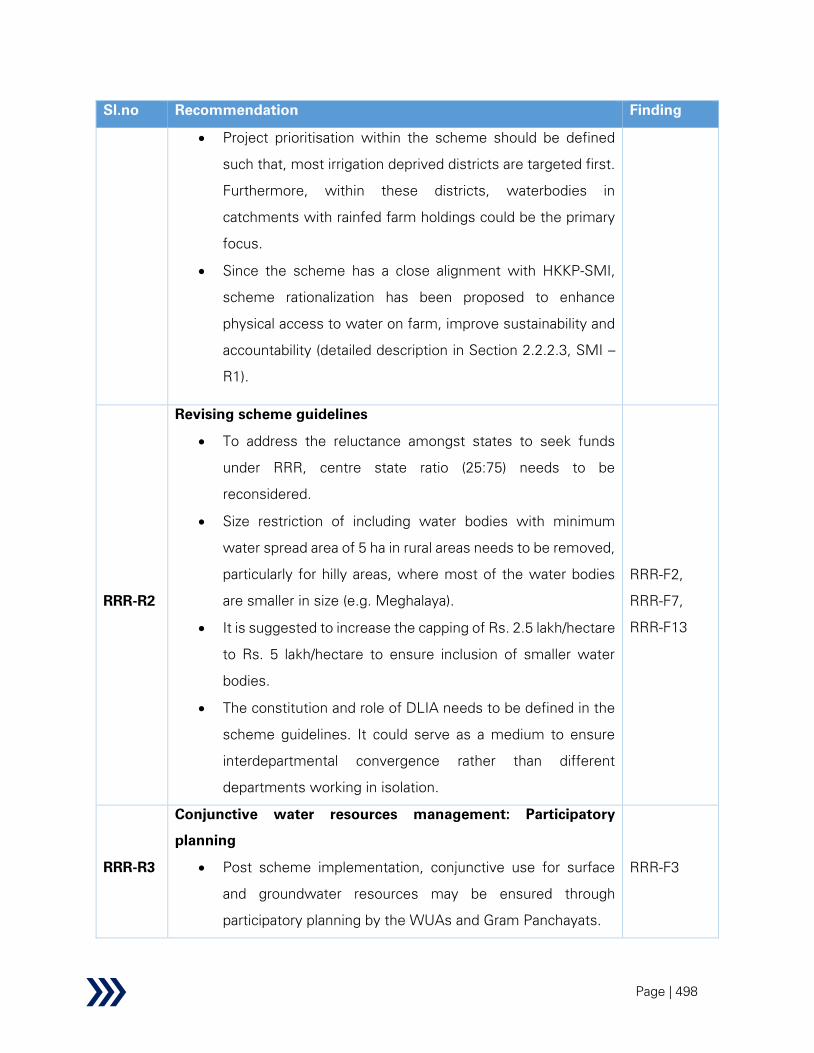
Page | 498
Sl.no Recommendation Finding
• Project prioritisation within the scheme should be defined
such that, most irrigation deprived districts are targeted first.
Furthermore, within these districts, waterbodies in
catchments with rainfed farm holdings could be the primary
focus.
• Since the scheme has a close alignment with HKKP-SMI,
scheme rationalization has been proposed to enhance
physical access to water on farm, improve sustainability and
accountability (detailed description in Section 2.2.2.3, SMI –
R1).
RRR-R2
Revising scheme guidelines
• To address the reluctance amongst states to seek funds
under RRR, centre state ratio (25:75) needs to be
reconsidered.
• Size restriction of including water bodies with minimum
water spread area of 5 ha in rural areas needs to be removed,
particularly for hilly areas, where most of the water bodies
are smaller in size (e.g. Meghalaya).
• It is suggested to increase the capping of Rs. 2.5 lakh/hectare
to Rs. 5 lakh/hectare to ensure inclusion of smaller water
bodies.
• The constitution and role of DLIA needs to be defined in the
scheme guidelines. It could serve as a medium to ensure
interdepartmental convergence rather than different
departments working in isolation.
RRR-F2,
RRR-F7,
RRR-F13
RRR-R3
Conjunctive water resources management: Participatory
planning
• Post scheme implementation, conjunctive use for surface
and groundwater resources may be ensured through
participatory planning by the WUAs and Gram Panchayats.
RRR-F3
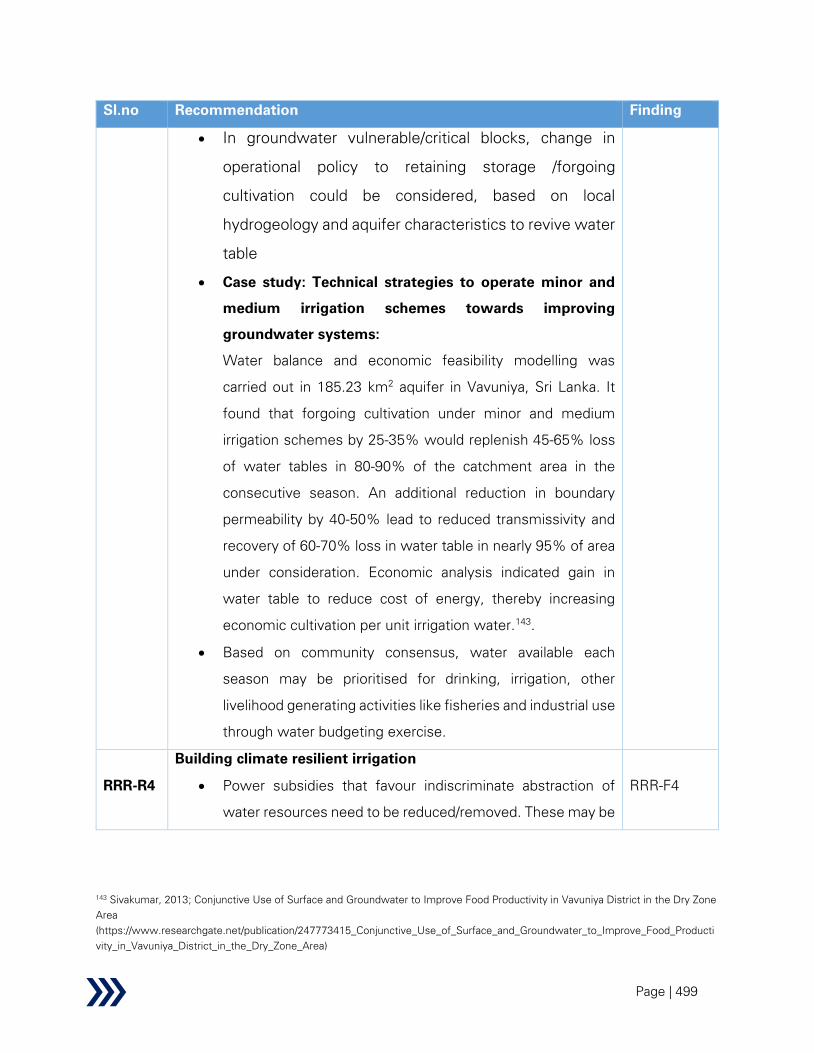
Page | 499
Sl.no Recommendation Finding
• In groundwater vulnerable/critical blocks, change in
operational policy to retaining storage /forgoing
cultivation could be considered, based on local
hydrogeology and aquifer characteristics to revive water
table
• Case study: Technical strategies to operate minor and
medium irrigation schemes towards improving
groundwater systems:
Water balance and economic feasibility modelling was
carried out in 185.23 km2 aquifer in Vavuniya, Sri Lanka. It
found that forgoing cultivation under minor and medium
irrigation schemes by 25-35% would replenish 45-65% loss
of water tables in 80-90% of the catchment area in the
consecutive season. An additional reduction in boundary
permeability by 40-50% lead to reduced transmissivity and
recovery of 60-70% loss in water table in nearly 95% of area
under consideration. Economic analysis indicated gain in
water table to reduce cost of energy, thereby increasing
economic cultivation per unit irrigation water.143
.
• Based on community consensus, water available each
season may be prioritised for drinking, irrigation, other
livelihood generating activities like fisheries and industrial use
through water budgeting exercise.
RRR-R4
Building climate resilient irrigation
• Power subsidies that favour indiscriminate abstraction of
water resources need to be reduced/removed. These may be
RRR-F4
143 Sivakumar, 2013; Conjunctive Use of Surface and Groundwater to Improve Food Productivity in Vavuniya District in the Dry Zone
Area
(https://www.researchgate.net/publication/247773415_Conjunctive_Use_of_Surface_and_Groundwater_to_Improve_Food_Producti
vity_in_Vavuniya_District_in_the_Dry_Zone_Area)

Page | 500
Sl.no Recommendation Finding
replaced by direct benefit transfer, as initiated by Telangana
and Odisha.
• Towards achieving the objective of groundwater recharge
and increased availability of drinking water along with building
climate resilience; scope of work under RRR may be
enhanced further to include percolation tank and waterbodies
used for drinking water/ other community purposes.
• Water bodies may be connected to adjacent canal system so
that excess flood waters may be stored in these canals when
water demand for irrigation is comparatively less. This would
reduce the incidences of flooding while additional water
stored may be gainfully utilized for irrigation and other allied
purpose during dry season.
RRR-R5
Ascertaining extent of encroachment and ensuring its removal
before commencement of RRR
• As recommended by Standing Committee in its tenth report
(16th
Lok Sabha), survey of water bodies to assess their size,
condition and status of encroachment needs to be carried
out.
• To ensure there is no encroachment, domestic/industrial
discharge in proposed water bodies, a certificate may be
issued by the Gram Panchayat before inclusion of water
bodies under RRR instead of waiting till the release of second
instalment. It may also be checked through active
involvement of stakeholders at grassroot level since planning
stage.
RRR-F5
RRR-R6
Mandating micro-irrigation to improve water use efficiency
• Towards realisation of the scheme objective: introduction of
sustainable water conservation, water efficient irrigation
techniques like micro-irrigation should be mandatory in 10-
20% of irrigation potential created through RRR.
RRR-F6

Page | 501
Sl.no Recommendation Finding
• This is critical not only to improve water-use efficiency, but
also to reduce expense on fertilizers and enhance agricultural
productivity.
RRR-R7
Revising phased process of DPR approval
• Given the volume and spatial spread of RRR works, preparing
tank-wise DPR is time consuming and particularly challenging
for areas where working season is limited. If the repair is not
attended on time, the damage and thereby cost increases
and agriculture gets affected.
• An estimate duly explaining the necessity of RRR works in
respective water bodies, as had served the purpose in RRR
Phase-II could be considered to speed up the process. Since
these are not new works, the whole process of study
stipulated for DPR preparation and phased approval might not
be necessary.
RRR-F8
Scheme implementation
RRR-R8
Revision in B-C ratio checklist
• Given that the scheme objectives are not limited to creation
of irrigation potential; other factors like provisioning of
drinking water, groundwater recharge, livelihood generation
activities like pisciculture and other direct-indirect benefits of
the scheme should also be considered while calculating B-C
ratio. The checklist for calculation needs to be revised
accordingly.
RRR-F9
RRR-R9
Mechanism for O&M by WUAs
• WUAs and local people should be involved in the project
since inception, to inculcate feeling of ownership within the
community. Their understanding of local topographical
condition needs to be appreciated and considered during
project planning.
RRR-F10,
RRR-F11
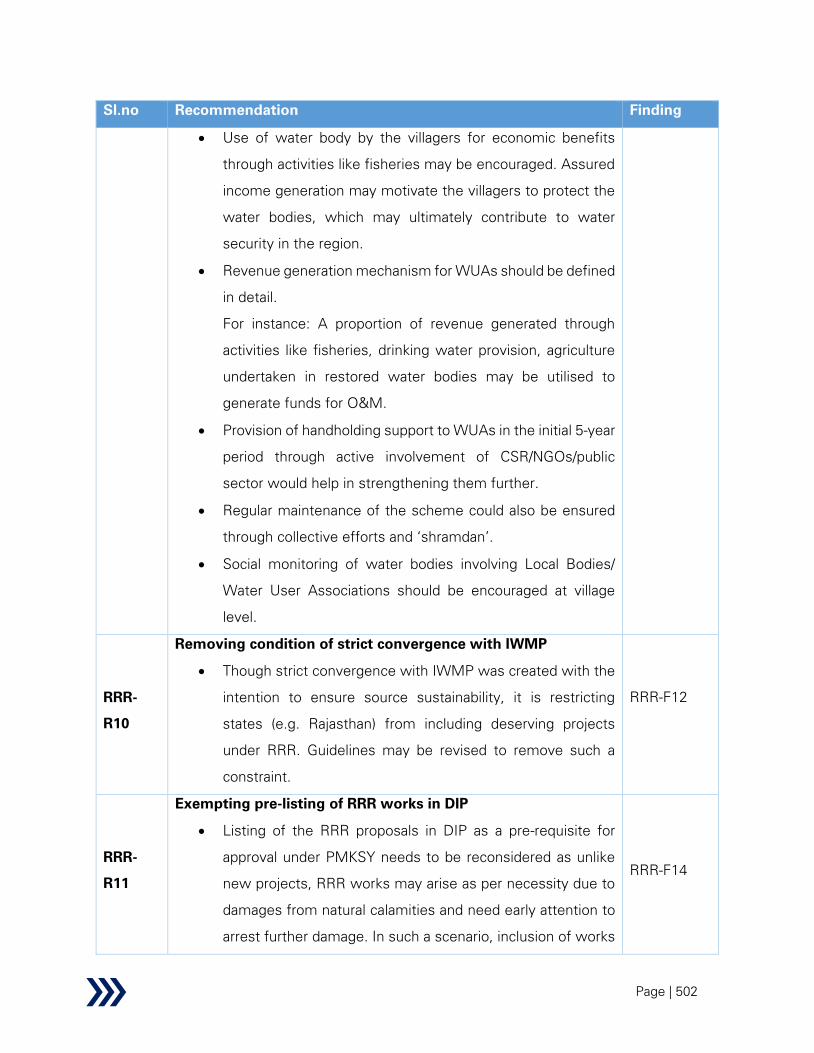
Page | 502
Sl.no Recommendation Finding
• Use of water body by the villagers for economic benefits
through activities like fisheries may be encouraged. Assured
income generation may motivate the villagers to protect the
water bodies, which may ultimately contribute to water
security in the region.
• Revenue generation mechanism for WUAs should be defined
in detail.
For instance: A proportion of revenue generated through
activities like fisheries, drinking water provision, agriculture
undertaken in restored water bodies may be utilised to
generate funds for O&M.
• Provision of handholding support to WUAs in the initial 5-year
period through active involvement of CSR/NGOs/public
sector would help in strengthening them further.
• Regular maintenance of the scheme could also be ensured
through collective efforts and ‘shramdan’.
• Social monitoring of water bodies involving Local Bodies/
Water User Associations should be encouraged at village
level.
RRR-
R10
Removing condition of strict convergence with IWMP
• Though strict convergence with IWMP was created with the
intention to ensure source sustainability, it is restricting
states (e.g. Rajasthan) from including deserving projects
under RRR. Guidelines may be revised to remove such a
constraint.
RRR-F12
RRR-
R11
Exempting pre-listing of RRR works in DIP
• Listing of the RRR proposals in DIP as a pre-requisite for
approval under PMKSY needs to be reconsidered as unlike
new projects, RRR works may arise as per necessity due to
damages from natural calamities and need early attention to
arrest further damage. In such a scenario, inclusion of works
RRR-F14
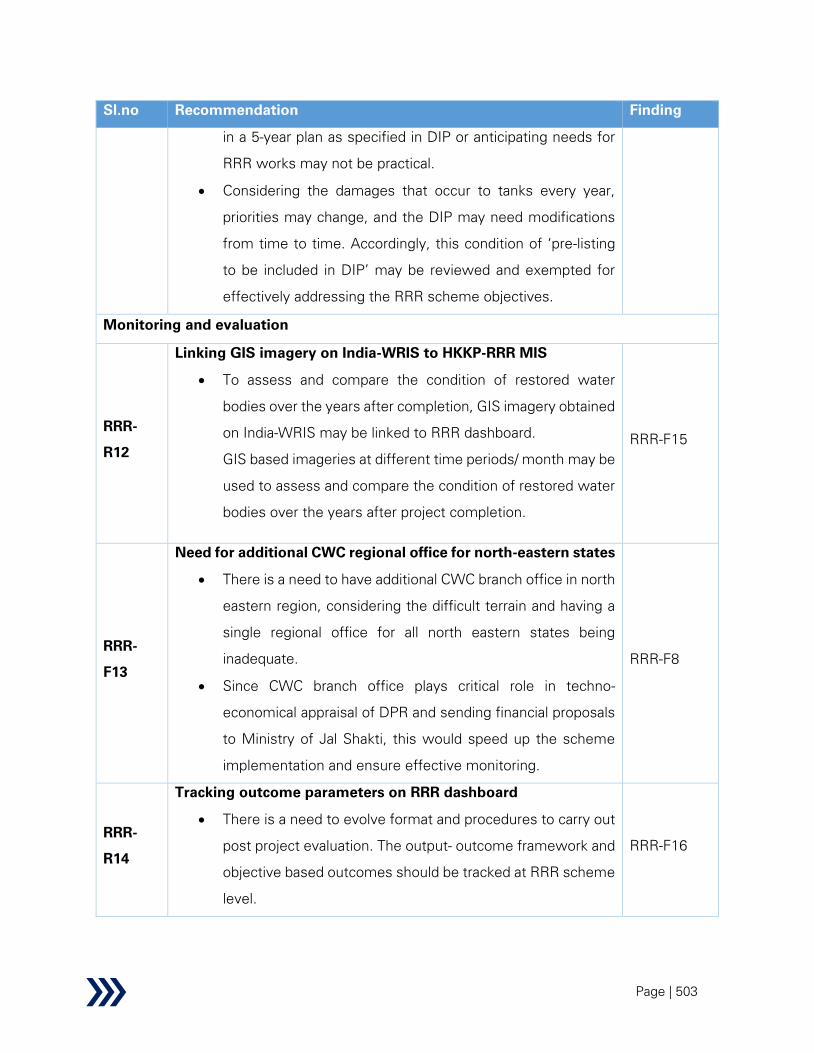
Page | 503
Sl.no Recommendation Finding
in a 5-year plan as specified in DIP or anticipating needs for
RRR works may not be practical.
• Considering the damages that occur to tanks every year,
priorities may change, and the DIP may need modifications
from time to time. Accordingly, this condition of ‘pre-listing
to be included in DIP’ may be reviewed and exempted for
effectively addressing the RRR scheme objectives.
Monitoring and evaluation
RRR-
R12
Linking GIS imagery on India-WRIS to HKKP-RRR MIS
• To assess and compare the condition of restored water
bodies over the years after completion, GIS imagery obtained
on India-WRIS may be linked to RRR dashboard.
GIS based imageries at different time periods/ month may be
used to assess and compare the condition of restored water
bodies over the years after project completion.
RRR-F15
RRR-
F13
Need for additional CWC regional office for north-eastern states
• There is a need to have additional CWC branch office in north
eastern region, considering the difficult terrain and having a
single regional office for all north eastern states being
inadequate.
• Since CWC branch office plays critical role in techno-
economical appraisal of DPR and sending financial proposals
to Ministry of Jal Shakti, this would speed up the scheme
implementation and ensure effective monitoring.
RRR-F8
RRR-
R14
Tracking outcome parameters on RRR dashboard
• There is a need to evolve format and procedures to carry out
post project evaluation. The output- outcome framework and
objective based outcomes should be tracked at RRR scheme
level.
RRR-F16

Page | 504
Sl.no Recommendation Finding
• Apart from currently tracked irrigation potential created and
storage revived; additional indicators (mainly outcome based)
corresponding to scheme objectives like groundwater level,
agricultural productivity, capacity building, water use
efficiency, revenue generated through allied activities like
fisheries, domestic and industrial water supply obtained
could also be tracked to understand holistic benefits accruing
from the scheme.
The parameters currently tracked by other departments in
few states (e.g. groundwater recharge is monitored by
regional groundwater board/ state groundwater board) may
be directly integrated to the existing dashboard.
2.2.2.3 Surface Minor Irrigation
Surface Minor Irrigation (SMI) was initiated in 1999-2000 as a part of AIBP package to cover
projects with irrigation potential less than 2000 ha in Special Category states. The scheme was
later extended to areas under DPAP, tribal, desert prone, flood prone, naxal afflicted and Koraput,
Bolangir and Kalahandi (KBK) districts of Odisha. With the launch of PMKSY in 2015-16, SMI got
subsumed under the Har Khet Ko Pani programme. The programme covers individual schemes
with CCA more than or equal to 20 ha. (10 ha for Special Category states) or a cluster of Minor
Irrigation schemes within a radius of 5 km covering CCA of 50 ha. (20 ha for Special Category
states) or more.
Background
The water-stressed situation has been found to create gaps in irrigation coverage, resulting in a
difference of 20% (23 million ha) between IPC and IPU. This, in addition to water loss throughout
irrigation value chain, critically impacts food production. Since XIIth
Plan, 6213 SMI projects were
taken up; out of which 3386 were completed (i.e. 54%) till March 2020. A total CA of Rs. 7299
Cr. has been released since XIIth
Plan, which includes CA release of Rs. 665 Cr. during 2017-
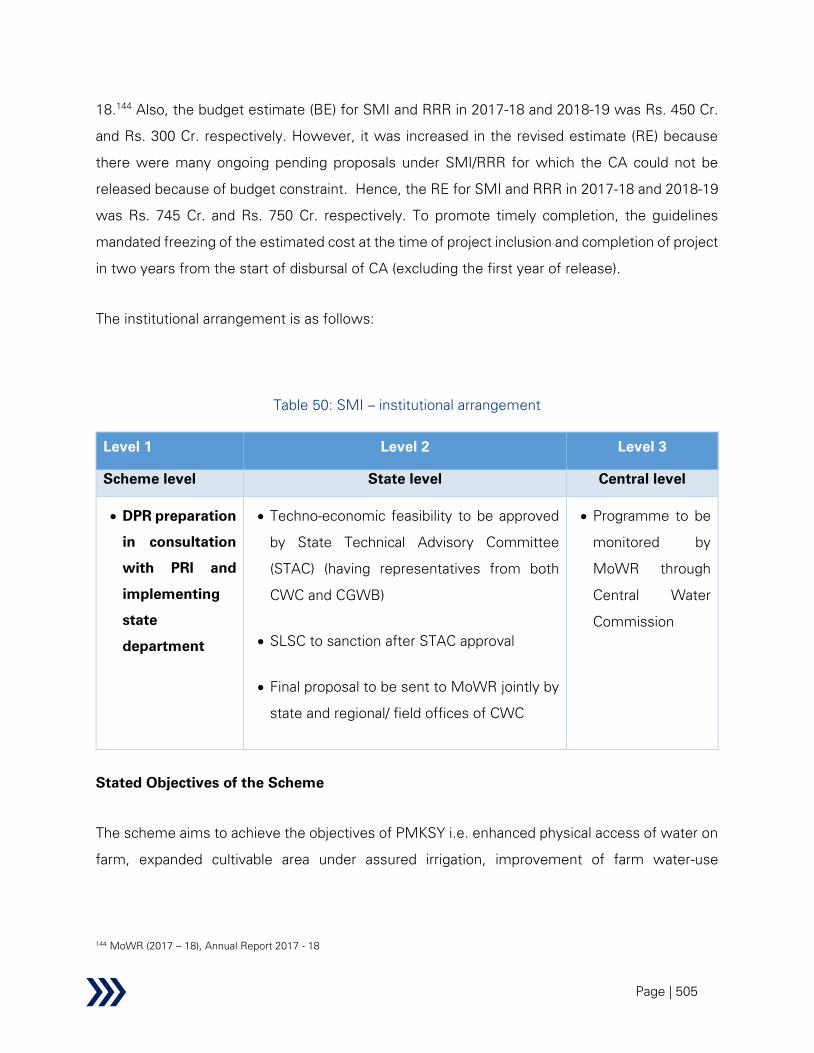
Page | 505
18.144
Also, the budget estimate (BE) for SMI and RRR in 2017-18 and 2018-19 was Rs. 450 Cr.
and Rs. 300 Cr. respectively. However, it was increased in the revised estimate (RE) because
there were many ongoing pending proposals under SMI/RRR for which the CA could not be
released because of budget constraint. Hence, the RE for SMI and RRR in 2017-18 and 2018-19
was Rs. 745 Cr. and Rs. 750 Cr. respectively. To promote timely completion, the guidelines
mandated freezing of the estimated cost at the time of project inclusion and completion of project
in two years from the start of disbursal of CA (excluding the first year of release).
The institutional arrangement is as follows:
Table 50: SMI – institutional arrangement
Level 1 Level 2 Level 3
Scheme level State level Central level
• DPR preparation
in consultation
with PRI and
implementing
state
department
• Techno-economic feasibility to be approved
by State Technical Advisory Committee
(STAC) (having representatives from both
CWC and CGWB)
• SLSC to sanction after STAC approval
• Final proposal to be sent to MoWR jointly by
state and regional/ field offices of CWC
• Programme to be
monitored by
MoWR through
Central Water
Commission
Stated Objectives of the Scheme
The scheme aims to achieve the objectives of PMKSY i.e. enhanced physical access of water on
farm, expanded cultivable area under assured irrigation, improvement of farm water-use
144 MoWR (2017 – 18), Annual Report 2017 - 18

Page | 506
efficiency and introduction of sustainable water conservation practices, through surface minor
irrigation.
Funding details of the Scheme-Budget Amount-Centre-State split
The funding pattern of the scheme is listed in the table below:
Table 51: SMI – funding pattern (Centre-state split)
# Category Funding Pattern
Centre State
1
Seven North-Eastern states including Sikkim and, three Hilly states
(Himachal Pradesh, Jammu and Kashmir and Uttarakhand) 90 10
2
Project benefitting special areas i.e., undivided Koraput, Bolangir
and Kalahandi (KBK) districts of Odisha, Bundelkhand region of UP
and MP, Marathwada and Vidharbha region of Maharashtra, Naxal
affected areas, DPAP areas, Tribal areas, Flood prone area, Desert
Development Programme (DDP) areas
60 40
The scheme guidelines not only include favourable funding pattern for Special category states
but has also incorporated several other provisions to ensure inclusiveness. The guidelines
mandate consultation with Panchayat Raj Institutions at the time of proposal submission.
Broad list of Projects and Beneficiary States
A total of 5,801 SMI schemes across 16 states are ongoing. Out of these, 2804 (i.e. 48%),
schemes have already been completed. Details of beneficiary states is presented in the table
below.

Page | 507
Table 52: SMI - beneficiary states with targets
States Targeted Schemes Targeted Irrigation Potential
Estimated
cost
Targeted
Central
Share
Nos. (in ‘000 ha)
(in Rs.
Cr.)
(in Rs.
Cr.)
Arunachal Pradesh 919 42 716 645
Assam 1,010 423 4,975 4,478
Bihar 176 76 352 274
Chhattisgarh 147 51 722 433
Himachal Pradesh 154 26 499 449
Jammu and Kashmir 417 112 1,278 1,150
Jharkhand 82 9 75 56
Karnataka 465 39 595 456
Madhya Pradesh 276 111 1,817 1,192
Manipur 102 13 170 153
Meghalaya 260 41 703 632
Mizoram 36 2 42 38
Nagaland 704 29 520 468
Sikkim 381 12 115 104
Tripura 21 4 47 43
Uttarakhand 651 42 521 469
Total 5,801 1,033 13,148 11,040
Performance
Physical progress
Under the SMI – HKKP (PMKSY) scheme, 5838 SMI schemes with total irrigation potential of
10.5 lakh ha. have been taken up. Till March 2020, 3386 schemes have been completed and an
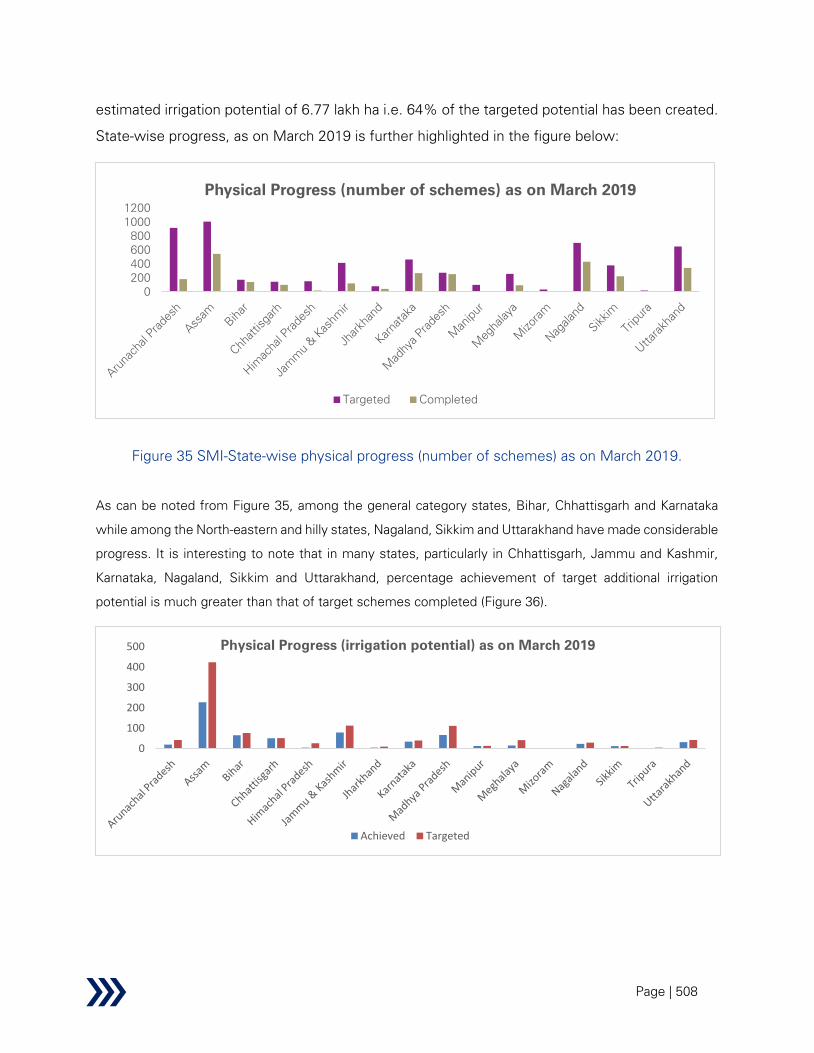
Page | 508
estimated irrigation potential of 6.77 lakh ha i.e. 64% of the targeted potential has been created.
State-wise progress, as on March 2019 is further highlighted in the figure below:
Figure 35 SMI-State-wise physical progress (number of schemes) as on March 2019.
As can be noted from Figure 35, among the general category states, Bihar, Chhattisgarh and Karnataka
while among the North-eastern and hilly states, Nagaland, Sikkim and Uttarakhand have made considerable
progress. It is interesting to note that in many states, particularly in Chhattisgarh, Jammu and Kashmir,
Karnataka, Nagaland, Sikkim and Uttarakhand, percentage achievement of target additional irrigation
potential is much greater than that of target schemes completed (Figure 36).
0
200
400
600
800
1000
1200
Physical Progress (number of schemes) as on March 2019
Targeted Completed
0
100
200
300
400
500 Physical Progress (irrigation potential) as on March 2019
Achieved Targeted

Page | 509
Figure 36: SMI-Physical Progress (irrigation potential) as on March 2019
This may be due to underestimation of the target irrigation potential or prioritisation of SMI
schemes with larger CCA by states.
Financial Progress
The expected targeted expenditure is Rs. 13,449 Cr., with central share of Rs. 11,310 Cr. Till
March 2020, an expenditure of Rs. 9236 Cr. has been incurred, which is 69% of the total targeted
expenditure. Total CA of Rs. 7299 Cr. has already been released till March 2020. The state-wise
financial progress, till March2019 is further highlighted in Figure 37.
Figure 37: Financial Progress (Target versus actual) as on March 2019
It can be concluded that the physical progress of 62% of targeted irrigation potential is in
commensurate with the actual expenditure incurred. A state-wise comparison of physical and
financial progress reveals efficiency of the states. This is further illustrated using the figure below.
0
1000
2000
3000
4000
5000
6000
Financial Progress as on March 2019
Target Actual

Page | 510
Figure 38 SMI-state-wise comparison of physical versus financial progress.
Clearly, many of the states like Arunachal Pradesh, Bihar, Chhattisgarh, Jammu and Kashmir,
Karnataka, Manipur, Nagaland and Sikkim (i.e. 50% out of 16 states) have performed well with
regards to cost effectiveness.
Performance on REESI+E framework
Table 53: SMI - performance evaluation using REESIE framework
Parameter Findings from research
Relevance
Secondary:
• Gaps in irrigation coverage due to water stressed situation and huge
water loss throughout the irrigation value chain impacts food
production.
• While the number of groundwater schemes in the country have
increased from 19.75 million to 20.52 million; surface water schemes
have reduced from 1.24 million to 1.19 million between 2006-07 to
2013-14.145
Furthermore, the ratio between IPU to IPC for surface
145 5
th Minor Irrigation Census Report (Pg. xvi)
0%
20%
40%
60%
80%
100%
120%
Physical versus Financial Progress as on March 2019
% physical progress achieved % financial progress achieved
Page | 511
Parameter Findings from research
water schemes has reduced (0.71) while that for groundwater has
increased (0.8).146
• Only in a relatively small proportion of cases have water resources
been developed in the irrigation deprived regions, which leaves
significant scope for development of irrigation potential and
augmentation of groundwater through recharge in these areas.147
• Most of the minor irrigation schemes (96.7%) are under private
ownership i.e. owned and maintained by individual/ group of
individuals.148
• The scheme objective of ‘Expanding cultivable area under assured
irrigation’ contribute towards SDG 2.1: By 2030, end hunger and
ensure access by all people, in particular the poor and people in
vulnerable situations.
Primary:
• The CWC highlights, most of the accessible and economical sites for
major irrigation projects have been exhausted in the country, leaving
limited possibility for construction of major projects.
Since SMI is designed to utilise local water resources to irrigate
nearby fields; there are fewer land acquisition issues and adverse
environmental impacts compared to major irrigation projects. Hence,
SMI is becoming more important, not only for hilly regions, but also
for the plain areas.
• Primary study across all states emphasizes the relevance of SMI
towards provision of assured irrigation.
o In hilly states like Assam, Meghalaya, Manipur, Himachal
Pradesh, Jammu & Kashmir and Uttarakhand, it is not possible
146 5
th Minor Irrigation Census Report (Pg. xvii)
147 IWMI-TATA Policy Paper: Har Khet Ko Pani: Rethinking Pradhan Mantri Krishi Sinchai Yojana (PMSY), June 2016
148 5
th Census of Minor Irrigation scheme report (Pg 12)

Page | 512
to construct major and medium dams/canal system due to
topographical constraints and scattered command area.
o Out of 1.40 Cr. hectares in Karnataka, irrigable area is around
70 lakh hectares, and the minor irrigation department has a
mandate of bringing 10 lakh hectares under irrigation. Though
works undertaken by the minor irrigation department are small
in nature, they provide big relief and have very low gestation
period i.e. irrigation benefits start flowing almost immediately.
o The scheme is also relevant to check the dependence on
groundwater in states like Himachal Pradesh, Karnataka and
Madhya Pradesh.
o SMI serves as lifeline for irrigation network in the UT of J&K,
particularly in context of Kashmir division, where the existence
of major/ medium/ groundwater-based schemes is negligible.
Out of 861 schemes approved under DIP, merely 170 could be
taken up by the division. Hence, huge potential for
development of SMI is yet to be tapped.
o In Uttarakhand, 11 out of 13 districts are in hilly areas and 60-
70% of irrigation is through SMI. While 70% of the total area
is irrigated, merely 15% of the hilly area comes under irrigated
category; leaving huge scope for development of irrigation
through SMI in these areas. The scheme is critical not only for
provision of assured irrigation but also for generation of local
employment and reducing migration.
• All states except Madhya Pradesh demand further scaling up of the
scheme. While state irrigation department in Madhya Pradesh claims
there is no scope for expansion as sites for minor irrigation projects
have already exhausted; district irrigation and agriculture department
highlight the significant importance of these projects and demand
further expansion and acceleration of SMI.
Page | 513
Parameter Findings from research
Inference:
• The relevance of SMI is attributed to its quick construction, lower
losses / high water-use efficiency, lower environmental impacts, easy
management and more involvement of local stakeholders. However,
the scheme is limited to public water bodies only while most of the
minor irrigation structures in India are privately owned.
• Considering the reducing number of surface water schemes and
increasing pressure on groundwater resources, there is a need to
prioritise SMI.
Therefore, the scheme may be rated as ‘satisfactory’ under relevance.
Effectiveness
Secondary:
• The envisaged output, outcome and impacts of the scheme are not
clear from the scheme guidelines document. However, the 5th
Minor
Irrigation census report covers some information on the type,
ownership, culturable command area (CCA), season wise irrigation
potential created (IPC) and irrigation potential utilised (IPU) from SMI.
• Underutilization of Minor Irrigation schemes has been observed due
to reasons like mechanical breakdown, less discharge of water and
non-availability of power supply.149
• The SMI structures have low water losses (i.e. high irrigation
efficiency) as unlike major irrigation projects, these do not involve long
conveyance and distribution system.
• The percentage of open channels used for conveying water to field
has reduced from 65% during 4th
Minor Irrigation census to 53% as
per 5th
Minor Irrigation census, with a corresponding increase in the
share of piped irrigation, drips and sprinklers. However, despite high
evaporation and seepage losses in open channels, viz. 42.6% in open
149 Report on 5
th MI Census (Page 43)

Page | 514
unlined channels while 10.4% in open lined channels150
; they remain
primary mechanism for water distribution.
• Previous 3rd party evaluation report on the Minor Irrigation schemes
in Jammu and Kashmir (2014-15) stated that the approved technical
norms, design and quality standards were observed at the site.
However, it recommended regular supervision of works during
execution to improve the overall quality. Proper tendering procedure
was followed while awarding work to the contractor and the
implementation process was transparent. It further mentioned about
close involvement of local stakeholders, users as well as NGOs.
However, formation of WUAs for maintenance of the completed
asset, was under progress at that time.
• Previous evaluation study on minor irrigation projects (2013-14/2014-
15) in Nagaland did not find any issues regarding land acquisition,
litigation, community protest etc. It found delay in project progress
due to inadequate and delayed fund release.
• 5th census of Minor Irrigation schemes shows a decline in the
dependence on surface irrigation schemes while a corresponding
increase in groundwater usage for irrigation.
• Farmer participation: Case study from South India:
Evaluation of minor irrigation in Kozhikode district, Kerala found level
of farmers participation as a key indicator of scheme performance.
Most of the farmers (83-100%) were found to discuss problems in
cultivation and ways to improve productivity. Further, marketing of the
produce was done through farmers association, which motivated
them to be more involved in the scheme.151
• Provision of wastewater reuse for SMI is not addressed in the current
scheme design.
• State Irrigation/Water Resources Department and regional offices of
CWC are responsible for periodic monitoring of the schemes on
sample basis (at least 20% of the Minor Irrigation schemes) and

Page | 515
Parameter Findings from research
performance of the schemes are to be assessed against the pre-
determined targets set by MoWR.
Primary:
• Target for creation of irrigation potential are set by the implementing
department of the state government, with the support from revenue
department.
For instance: In Himachal Pradesh, targets are set by the Department
of Jal Shakti (erstwhile Department of Irrigation and Public Health)
based on their experience and fund availability while in Uttarakhand,
they are set by the Minor Irrigation department, based on the inputs
from PRIs.
• All states confirm three levels of monitoring under the scheme: by
state implementing agency (Minor Irrigation/Water Resources
Department), CWC regional office and independent third-party
monitoring. However, no third-party independent evaluation has been
undertaken for completed Minor Irrigation schemes in any state.
o Most of the projects are in construction phase in Himachal
Pradesh and concurrent evaluation studies are being done by
NIT, Hamirpur to check the quality of construction.
o In Uttarakhand, state minor irrigation department and
independent district level task force is involved in monitoring.
Targets achieved are reported to the statistics department.
150 5
th MI Census Report (Pg. xviii)
151 Evaluation of minor irrigation schemes using performance indicators: case studies from south India
(https://link.springer.com/content/pdf/10.1007/s40899-016-0074-3.pdf)
Page | 516
Concurrent evaluation studies during implementation are
carried out by WAPCOS.
• The effectiveness of SMI has been emphasized by all states.
However, works under PMKSY-SMI have not been initiated in
Jharkhand and Karnataka.
o Out of 1010 schemes sanctioned for Assam, 595 have been
completed. The target for creation of irrigation potential was
53,724 ha and 11,529 ha for 2018-19 and 2019-20 respectively,
against which 52,255 ha and 13,000 ha was achieved.
o In Madhya Pradesh, no projects have been proposed in the last
5 years. Against 276 schemes proposed before 2015 (68 in
2012-13, 89 in 2012-13, 111 in 2013-14 and 8 in 2014-15), 18
had to be dropped due to opposition by the community/ non
feasibility of site. Finally, 258 schemes were included under
PMKSY, out of which 257 have been completed while 1 is
ongoing. The state has been successful in creating irrigation
potential of 67,957 ha against the target of 79,163 ha.
o In Himachal Pradesh, 8 out of 115 sanctioned projects have
been completed under SMI. Remaining are expected to be
completed by March 2020-21. Though 2 SMI projects have
been completed in Solan district around March 2020, their
effectiveness is yet to be ascertained as they could not be
utilised due to lockdown imposed in the state. However, the
district anticipates a change in cropping pattern from traditional
to cash crops and up to 1.5% increase in production, based on
previous experience.
o In Uttarakhand, 651 schemes, with target irrigation potential of
42,755 ha were sanctioned in 2013-14 and later included under
PMKSY. Till June 2020, the state has been successful in
creating irrigation potential of 35,948 ha at the expense of 459
Cr. However, 60 projects had to be dropped off due to reasons
like drying of source and overlap with other ongoing schemes.
Page | 517
Further, 422 projects have been included in DIP and proposed
under PMKSY, which are expected to be sanctioned this year.
o Out of 175 projects ongoing in J&K, 50 have been completed,
14 had to be dropped off and 57 are scheduled to complete
this year.
o In Meghalaya, SMI projects were proposed under AIBP in
2012-13 and 2013-14 while 44 projects were sanctioned under
PMKSY in 2015-16 and 68 in 2018-19.
• The effectiveness of the scheme in meeting the objectives of HKKP
has been highlighted by most states:
o Before the introduction of SMI, temporary bunds had to be
created by farmers each year as they used to get washed away
during floods. However, now farmers in parts of Assam and
Manipur are getting assured irrigation.
o Irrigation reliability has improved in Kamrup district, Assam due
to SMI. However, in Baska district, SMI structures are unable
to fulfil the irrigation needs during Rabi season. Farmers largely
rely on rainfall since there is no mechanism for water storage.
There is a difference in opinion regarding effectiveness of SMI
amongst district irrigation and agriculture department. While
the former regard SMI to be effective in providing assured
irrigation; the latter point out its inability in meeting irrigation
water needs during peak season. FGD with farmers in this area
validates limited utility of Tihunadi FIS constructed under SMI.
Despite high water scarcity in the region, farmers grow water
intensive crops like paddy.
o In Bihar, minor irrigation is primarily being undertaken through
state sponsored schemes. PMKSY-SMI has been
implemented only in drought prone and flood affected areas
and has resulted in provision of assured irrigation and
groundwater recharge.
Page | 518
o In Manipur, SMI has resulted in enhancement of agricultural
productivity and income of farmers. However, there has not
been much impact on the groundwater levels as the water
table is already high in the state. Given an increase in drought
like situation over the past few years, the scheme has aided in
providing resilience to climate change and access to water
during droughts.
o Most SMI projects in Himachal Pradesh are under
implementation phase. Though the exact outcomes of the
scheme are not known yet, the state anticipates immense
positive effects like reduction in IPC-IPU gap and upliftment in
economic status of farmers based on its experience with
similar projects under NABARD.
o SMI has been effective in enhancing agricultural productivity,
reducing soil erosion, augmenting income, generating
employment and increasing groundwater levels in Madhya
Pradesh. While state irrigation authorities infer their utility is
limited due to its limited scale; district level stakeholders
highlight their immense significance in providing assured
irrigation.
Participants in FGD at Rajgarh district, Madhya Pradesh
highlight limited effectiveness of SMI: while it has reduced
dependence on groundwater, its utility is limited by damages/
leakages in the canal. This has further increased incidences of
water logging in the village, which leads to decline in soil
structure and crop losses.
o In Uttarakhand, implementation of SMI has resulted in
increased agricultural productivity, reduction in soil erosion and
local employment generation. Due to small and scattered farm
holdings, farmers are engaged in subsistence agriculture in
Chamoli district. In contrast, transition from traditional crops to
cash crops like vegetables can be seen after completion of
Page | 519
SMI in Nainital district. In plain areas of the state, the scheme
has also led to reduced dependence on groundwater. For
instance: In parts of Udham Singh Nagar district, the
groundwater levels have increased by 2-3 meters after
implementation of SMI and groundwater irrigation.
o HH survey across Assam and Madhya Pradesh validates
effectiveness of SMI in increasing area under irrigation,
enhancing crop yield and improving land productivity. Increase
in groundwater levels after completion of SMI works is also
highlighted by 88%, 14% and 36% respondents in Madhya
Pradesh (n= 118), Assam (n= 50) and Manipur (n=25)
respectively.
• Positive factors affecting scheme implementation:
o Utilisation of latest technology like GIS and Remote
Sensing: Though the scheme guidelines mandate utilisation
of GIS maps for monitoring, its current utilisation is limited to
few states only.
▪ With the advent of digital mapping, issues of
duplication do not exist in Manipur. However,
digitisation of existing cadastral maps is time taking
due to changes in topography.
▪ GIS technology is being utilized by J&K with support
from ‘The Ecology and Remote Sensing department’.
▪ Digitisation for planning and monitoring is very relevant
for Jharkhand to aid in targeting the irrigation deprived
areas first, but it is currently in nascent stage.
▪ Karnataka State Remote Sensing Application Centre
provides land data at regular intervals, which is further
validated by the state before planning for irrigation.
▪ The ongoing schemes are not geotagged in
Uttarakhand. However, creation of GIS portal is under
progress in the state and once the proposal for 421

Page | 520
Parameter Findings from research
schemes is sanctioned, the state plans to geotag the
assets created.
▪ Currently monitoring through GIS is not done in Assam,
Himachal Pradesh and Madhya Pradesh. Fund
constraint may be a limiting factor for few states in this
regard like in Assam.
o Lining of canals:
▪ Lining of canal in states like Uttarakhand has aided in
reducing seepage and transmission losses and
minimising IPC-IPU gap. Furthermore, O&M cost and
instances of waterlogging have also reduced after
lining.
▪ In contrast, open channels constructed under SMI are
earthen canals in states like Assam and Madhya
Pradesh. Such structures are prone to damages and
have high seepage losses, thereby reducing water use
efficiency. An increase in waterlogging instances after
completion of SMI works has been highlighted during
HH survey by 23% respondents in Assam, 88% in
Madhya Pradesh and 32% in Manipur.
▪ In parts of Assam, pigs damage the earthen canal,
leading to leakage, which drains away the entire water
supply. Additionally, there have been instances of
farmers digging and diverting Minor Irrigation canals
towards their fields, in fear of not getting enough
water. This results in water losses, thereby reducing
efficiency of the system.
o Use of treated sewage for irrigation:
In Karnataka, none of the SMI projects under PMKSY were
approved by the Ministry in the last 5 years. However, the

Page | 521
Parameter Findings from research
state sponsored scheme (equivalent to SMI) is being
implemented in the state. Secondary treated sewage from
Koramangala and Challaghatta valley is send to the
surrounding drought prone districts – Chikkaballapur, Kolara
and Bengaluru rural. Despite achieving excellent results and
high demand from farmers, the state is unable to scale it up
due to fund constraints.
• Negative factors affecting scheme:
o Restriction of cost per hectare: The restriction of
development cost norm at Rs. 2.5 lakh/hectare, as mentioned
in the scheme guideline limits scheme implementation in
remote areas of Himachal Pradesh, J&K, Manipur and
Meghalaya owing to increased project cost due to reasons like
higher labour charges. Despite meeting the B-C ratio criterion,
such proposals are sent back by CWC regional office during
technical examination.
For instance: In Manipur, the construction phase during SMI
requires around 120 km to be covered on foot instead of
vehicle, owing to the difficult terrain, which increases project
cost in comparison to other general category states.
o Increasing dependence on groundwater/ private
irrigation: Most of the farmers prefer groundwater based/
private irrigation over SMI.
For instance: Majority of farmers in Himachal Pradesh have
installed tube wells in their fields while in Madhya Pradesh
Page | 522
private source of irrigation is preferred over SMI despite higher
cost due to easy access to electricity.
HH survey further highlights groundwater as preferred mode
of irrigation amongst 57% farmers even after completion of
SMI works (n= 193).
o Drying up of sources:
▪ Projects had to be dropped in Madhya Pradesh and
Uttarakhand due to drying up of sources as a result of
natural calamities like landslides/ other climatic factors.
Despite being critical for irrigation, canal created on
Ranipur dam under SMI in Betul district, Madhya
Pradesh is often dry, limiting its utilisation. The village
level stakeholders claim that the dam has barely filled
5-6 times since 1996.
▪ Likewise, unavailability of water storage structure in
the head region, makes SMI ineffective during the
drought season in parts of Baska district, Assam. The
river often dries up and the scheme is unable to provide
water during Rabi season, when farmers need it the
most.
▪ In Manipur, SMI has been successful in increasing
water use efficiency and farmers are using it both for
agricultural and domestic purposes. However, parts of
Kampokpi district were unable to access water through
SMI structures due to ‘no flow’ condition. It is also
affected by the mining activities nearby.
▪ Year- round water unavailability after completion of
SMI works has been validated by 83%, 46% and 80%
farmers in Assam, Madhya Pradesh and Manipur
respectively.
o Delay in project sanction: Often states face long delays in
project sanctioning.
Page | 523
For instance: 443 projects submitted by Manipur in 2018-19
have not been sanctioned yet. The lack of clarity on
implementation structure, particularly regarding inclusion of
projects in District Irrigation Plan (DIP) has been highlighted by
the state. The DIP had to be revised due to non-inclusion of
SMI projects in it, leading to delay of one year.
o Inadequate and delayed fund release: Delays in fund release
by centre hampers timely execution of schemes.
▪ In 2019-20 funds were requested under two clusters
by J&K but merely balance amount from 2018-19 was
received in the first cluster.
▪ A proposal requesting funds for 68 projects was sent
by Meghalaya in 2019-20 but it has not been released
yet.
▪ As per the implementation schedule proposed in the
DPR, 651 projects were planned to be completed till
2016 in Uttarakhand but many of them are still pending
due to delays in fund release.
o Limited working season: Despite variable terrain and size of
different minor irrigation projects, the timeline for completion
is uniform i.e. two years only. This is particularly challenging
for hilly states like Himachal Pradesh, J&K, Manipur,
Meghalaya and Uttarakhand, where working season is limited
to 3-6 months only.
o Labour unavailability: In J&K labour mobilisation is time
taking as the availability of local labour is limited and the UT
relies on migrant labour. The challenge of labour unavailability
has also been highlighted in Assam.
o Delayed land acquisition: Issues in land acquisition have
been highlighted by stakeholders across Assam, Madhya
Pradesh, Meghalaya and Uttarakhand; leading to delays in
scheme implementation. Often states have to be drop projects

Page | 524
(e.g. Uttarakhand) as unlike major irrigation schemes, there is
no mechanism for compensation under SMI.
o Reluctance to adopt modern agricultural practices:
Farmers are unwilling to adopt modern agricultural practices
like multi-cropping, which reduces water use efficiency in
Assam, Himachal Pradesh and Meghalaya. Furthermore, most
of the farmers in Himachal Pradesh are ‘absentee farmers’ i.e.
those who migrate elsewhere/abstain from farming. This
contributes to the widening IPC-IPU gap.
o Inadequate monitoring by CWC: Though guideline mandate
progress monitoring by CWC regional office through field visits
(minimum 20% of schemes), it becomes challenging in north-
eastern states.
▪ Though more than 1000 SMI projects are ongoing in
Assam, CWC was able to visit merely 40 projects in
2019-20 against the target of 200.
▪ Since CWC regional office plays a critical role in
technically examining the proposal and forwarding to
Ministry of Jal Shakti, presence of single regional office
for 7 north eastern state leads to delays in scheme
implementation. This is further exacerbated by difficult
terrain and inconvenient travel in states like Manipur
and Meghalaya.
• Reducing command area under major irrigation projects: Existing
major irrigation schemes are unable to meet the requirements of
farmers and need supporting minor irrigation. However, such
proposals are beyond the purview of SMI due to overlap with other
major irrigation schemes.
For instance: Loktak lift irrigation project, Manipur which was
designed in 1980 to cater to 40,000 ha is currently able to irrigate a
mere 2,800 ha. Khuga irrigation project, which was designed in 1980s

Page | 525
Parameter Findings from research
and inaugurated in 2012 is unable to serve the designated command
area due to reduction in flow.
However, district agricultural authorities in Uttarakhand describe
subsidiary irrigation channels being created to support major irrigation
projects.
Inference:
• Secondary data, KII and HH survey validates scheme effectiveness in
increasing area under irrigation, enhancing crop yield and improving
land productivity. Increase in groundwater levels after completion of
SMI works is also highlighted by states.
• However, the outcomes are limited by level of farmer’s participation,
lining of canals, restriction cost per hectare, groundwater
dependence, drying up of sources, delays in project sanctioning,
reluctance to adopt modern agricultural practices, limited working
season, budget constraints, labour unavailability and issues in land
acquisition.
Therefore, scheme efficiency may be rated as ‘average’.
Efficiency
Secondary:
• Previous evaluation report on minor irrigation projects (2013-14/2014-
15) in Nagaland stated that BCR was not assessed. The proposed
cropping pattern was considered as critical for determination of
incremental benefits but state Agriculture Department was not
consulted in this regard.
• This scheme complements MGNREGA in terms of water source
creation. While scheme creates 2-10 ha water spread area in urban
and more than 5 ha in rural area; MGNREGA creates water spread
area of smaller coverage.
Primary:
• As mentioned in scheme guidelines, B-C ratio is mandatorily
calculated at DPR stage across all 7 states surveyed: Assam, Bihar,
Himachal Pradesh, Jammu & Kashmir, Madhya Pradesh, Manipur and
Page | 526
Parameter Findings from research
Meghalaya. Agriculture department is involved in calculating benefit
component based on proposed cropping pattern, hydrological
dependability, anticipated crop yield and market value of the proposed
crop. States don’t face any challenge in this regard.
• While several projects are being implemented in Assam with
assistance from NABARD; the state is reluctant to seek financial
assistance from private agencies. Complimentary schemes (e.g.
MGNREGA) are being utilized by states like Uttarakhand. However, its
utility is limited since it covers only labour component and not the
material component. Furthermore, the Panchayati Raj Institutions
accords lower priority to irrigation under MGNREGA.
• Minor irrigation department, J&K highlights that while agriculture
department is the nodal department; the scheme is implemented by
minor irrigation department, which comes under Department of Jal
Shakti (erstwhile irrigation and flood control department). This creates
gaps in coordination and overall scheme harmonization.
• The State Agriculture and Horticulture Department, Madhya Pradesh
mentions that their involvement in the scheme is limited to STAC
meetings and calculation of B-C ratio. They further add that taking
inputs from agriculture department while site selection and scheme
implementation could aid in more holistic planning.
Inference:
• Benefit – Cost ratio is mandatorily calculated by all states based on
inputs from the agriculture department. However, non-involvement of
agriculture department during site selection and scheme
implementation limits holistic planning.
• While coordination between agriculture and irrigation department is
satisfactory in most states; gaps in synergy have been highlighted in
J&K, which limits scheme harmonisation.
Scheme effectiveness may be rated as ‘satisfactory’.
Sustainability Secondary:
Page | 527
• The 5th
Minor Irrigation census points out low discharge of water due
to continuous droughts and deficit rainfall as the primary reason
behind waterbodies ‘permanently not in use’. The reasons behind
‘temporary non-usage’ of water bodies are less discharge, low storage
and channel breakdown.
• The increasing incidences of drying up of water bodies may be
attributed to an increase in average annual temperature (0.48 degrees)
and decline in average rainfall (26mm) between 1970 and 2016.152
• Climate change is an important factor threatening scheme
sustainability as SMI is directly dependent on rainfall.
• Previous 3rd party evaluation study of Minor Irrigation schemes in
Jammu and Kashmir (2014-15) found the projects to be economically
viable and sustainable. The study also stated the need to improve
awareness about benefits from the scheme, so that beneficiaries
develop feeling of ownership for the project which is important for
proper maintenance of the assets.
• Previous evaluation study on minor irrigation projects (2013-14/2014-
15) in Nagaland found that maintenance of the created assets was not
given required priority. Arrangement for handing over the completed
projects to the WUAs had not been operationalized in most of the
cases.
• Minor Irrigation through community management: Case study
from West Bengal:
Minor irrigation schemes constructed/rejuvenated under West Bengal
Accelerated Development of Minor Irrigation (WBADMI) have been
handed over to the WUAs. A significant increase in cropping intensity,
agricultural diversity and yield was observed in comparison to the
schemes without WUAs. The study concludes that created
infrastructure is of minimal use if not managed well and WUAs could
be effective institution for management of SMI. Sustainability of
WUAs in the long run can be ensured by convergence with other
schemes and centralizing scheme operation under WUAs.153

Page | 528
Parameter Findings from research
Primary:
• Minor Irrigation infrastructure in hilly states like Assam, Jammu and
Kashmir, Manipur, Meghalaya and Uttarakhand are vulnerable. The
states are prone to natural disasters like landslides, siltation, leading
to drying up/ temporary/ permanent non-usage of sources. This further
exacerbates the need for continuous maintenance and in the absence
of adequate mechanism for O&M, states are often forced to spend
more later.
• Lining of canal is critical to ensure scheme sustainability. For instance:
Mundala canal created under SMI in Rajgarh district, Madhya Pradesh
is partly earthen/katchha. Hence, it has collapsed at multiple places,
leading to leakages and waterlogging.
• Though the guidelines mention O&M to be done by WUAs, states
face challenges in this regard. In few states, department has to
intervene since WUAs are technically and financially unequipped to
take care of the maintenance work.
o All funds collected by WUA in Assam goes to the government
exchequer. In parts of the state, WUAs are utilising the
collected levy unofficially for operations and maintenance.
o In Bihar, the concept of WUAs is not successful due to limited
financial capability of WUAs and internal social issues within
villages. Therefore, O&M of SMI structures is done by the
state. In some cases, where Gram Panchayat is active,
schemes have been handed over to them.
o In J&K, WUAs are non-existent. The irrigation department of
the UT claims that since Panchayats and BDCs have been
constituted recently, the creation of WUAs shall now be
152 The Economic Survey (2017-18)
153 2
nd International conference on sustainable water management Pg 23 (http://nhp.mowr.gov.in/Conference-
2/Proceeding.pdf.)
Page | 529
Parameter Findings from research
prioritised. Hence, the department takes care of current O&M.
However, funds allocated for O&M are insufficient.
o The state and district authorities in Madhya Pradesh claim that
WUAs exist at every 1000 ha and are involved in project
operations and maintenance. Though funds are allocated by
the state to WUAs at INR120/ha for canal and Rs. 40/ha for
annual maintenance; these are inadequate to cater to major
damages. Therefore, funds need to be sanctioned under
special repair in this regard. Farmers are reluctant to pay for
irrigation and revenue recovery is a major challenge for the
department.
Respondents during FGD in Rajgarh district, Madhya Pradesh
highlight that despite giving tariff to the irrigation department,
canal repair works are not undertaken by the state, which
limits utility of SMI.
o Though WUAs are formed across all schemes in Meghalaya,
no revenue is generated by them for O&M. Since all
beneficiaries are marginal farmers, they contribute through
labour only. Hence, major repair works are undertaken by the
state.
o Since there is no scarcity of water, district authorities in
Uttarakhand have highlighted unwillingness of farmers to pay
for it. Schemes are handed over to Gram Panchayats for O&M
and water management but fund inadequacy in this regard has
been stressed by stakeholders across all levels. For instance:
In 2019, the budget for O&M was 5 Cr. but since the number
of schemes have increased significantly, O&M works could be
undertaken for prioritised projects only. Hence, maintenance
of the created irrigation potential is a major challenge for the
state.
Page | 530
Parameter Findings from research
o Though none of the schemes under PMKSY-SMI have been
sanctioned in Jharkhand, the state has pointed out challenges
relating to operations and maintenance of existing SMI
projects. Since such structures are present in areas with
limited habitation, they are in a state of neglect. Additionally,
there are issues related to siltation, theft, physical and
mechanical damage.
o Based on HH survey across Assam and Madhya Pradesh 40%
respondents highlight inability of WUAs to undertake effective
O&M (n= 35) while WUAs were found to be non-existent in
Manipur.
• The implications of climate change factor on scheme sustainability has
been stressed by most of the states.
o Since the last few years, Assam has witnessed a depletion in
rainfall, leading to lower discharge in rivers. This poses a
hindrance towards utilisation of SMI.
o There have been few instances of drying up of water bodies in
parts of Bihar. However, the state sponsored ‘Jal Jeevan
Hariyali Abhiyan’ is addressing the issues of groundwater
overdraft, waterlogging, and aiding in awareness generation
regarding crop-water use efficiency.
o In J&K, the recent years have witnessed water scarcity as
snowfall during winters is not complemented by rains.
For instance: In year 2020, rainfall was 70% less than normal
while snow was 60% above normal. This disturbing trend
threatens sustainability of irrigation.
o In Uttarakhand, there has been a change in frequency and
distribution of rainfall in the last 20 years. Flash floods caused
by cloudburst cause irreparable damage to agriculture.
Page | 531
Parameter Findings from research
o The shifting rainfall pattern, as a result of climate change in
Himachal Pradesh has been highlighted by the agriculture
department.
Inference:
• Current institutional structure for O&M by WUAs is not sustainable as
there is no mechanism to ensure their financial independence.
• Last few years have witnessed spatial and temporal shift in rainfall
pattern. The change in discharge due to climate change threatens
scheme sustainability.
The scheme may be rated as ‘average’ under sustainability.
Impact
Secondary:
• The intended scheme specific impacts are not mentioned in
guidelines of SMI.
• Scheme guidelines propose evaluation of completed SMI projects to
be carried out through independent agency.
• Previous 3rd party evaluation report on the MI schemes in Jammu and
Kashmir (2014-15) was certain about economic upliftment of the
beneficiary communities upon the completion of the project, which
would influence their literacy, health, communication and help them
to market their produce.
Primary:
• Though scheme guidelines mention states to carry out evaluation of
completed SMI projects by independent agency, no such studies have
been conducted yet. However, states anticipate assured irrigation
after completion of SMI to reduce migration and boost economic
status of beneficiaries.
For instance: In Rajgarh district, Madhya Pradesh, creation of 3980 ha
irrigation potential after completion of Bankpura and Mundala Tank
project under SMI has led to reduction in migration.

Page | 532
Parameter Findings from research
• The impact of SMI in increasing education and employment has been
highlighted by 57% and 41% respondents respectively. Though
enhanced income has been mentioned by 40%, increased
expenditure on agriculture has also been highlighted by 79%
respondents (n= 193).
Inference:
• There is a gap in scheme guidelines with respect to envisaged impact.
• Though secondary data indicates economic upliftment of beneficiaries
after completion of SMI project, no primary impact assessment
studies have been done by states/ CWC/ MoJ/S in this regard.
• Based on HH survey, it may be concluded that the scheme is
successful in increasing employment, education and income of
farmers.
Hence, under impact the scheme may be rated as ‘satisfactory’.
Equity
Secondary:
• The scheme targets special category states: North Eastern, hilly and
specific areas of general category states/UTs: KBK districts of Odisha,
Bundelkhand region of UP and MP, Marathwada and Vidarbha region
of Maharashtra, DPAP, DDP, tribal, naxal affected and flood prone
areas.
• There is favourable funding pattern [90(central):10(state)] for north
eastern and hilly states.
Primary:
• KIIs across all states indicate equitable distribution of resources across
all section of society through structures created under SMI. FGDs in
Assam and Madhya Pradesh further validate this.
• Women are actively involved in the scheme, particularly in hilly states
like Assam, Meghalaya and Uttarakhand.
• In Bihar, areas with higher population of SC/ST/OBC and other weaker
section of the society are given priority for inclusion under SMI.

Page | 533
Parameter Findings from research
Inference:
• Scheme guidelines mention favourable funding pattern for weaker
sections of society. The primary survey further indicates equitable
access to assets created under SMI.
Therefore, under equity, the scheme may be categorised as
‘satisfactory’.
Table 54: SMI - summary of performance evaluation using REESIE framework
Parameter Performance
Relevance
Effectiveness
Efficiency
Sustainability
Impact
Equity
REESI+E performance infographics legend
Satisfactory
Average
Needs Improvement
No information
Performance on cross-sectional themes
Table 55: SMI - performance evaluation using cross-sectional themes
#
Cross-
cutting
theme
Indicative Areas of
Enquiry and Key
Questions
Findings from research
1.
Accountability
&
Transparency
Monitoring Mechanisms
Citizen Accountability
• The envisaged output, outcome and
impact are not mentioned under SMI
scheme guidelines.
• Only irrigation potential created (IPC)
is tracked on MIS portal.
Page | 534
#
Cross-
cutting
theme
Indicative Areas of
Enquiry and Key
Questions
Findings from research
• Guidelines mandate evaluation for
completed Minor Irrigation schemes
to be carried out by the state
government through independent
agency. However, no such studies
have been done conducted under
HKKP-SMI. Concurrent evaluation
during implementation phase is
ongoing in Himachal Pradesh through
NIT, Hamirpur.
• Guidelines mandate submission of
Utilization Certificate, containing
physical achievement of irrigation
potential and financial
progress/expenditure under SMI –
HKKP. States confirm the submission
of UC post project completion.
• Though the guidelines mention
handing over of assets created under
SMI to WUA, there is no mechanism
to ensure institutional and financial
sustainability of WUAs.
Summary Analysis:
The scheme guidelines do not have defined output, outcomes and impact parameters, which
limits adequate monitoring and evaluation. By design, citizen accountability is ensured through
WUAs. However, there is no mechanism to ensure its sustainability.
2.
Direct/Indirect
Employment
Generation
Employment generation
• Previous 3rd party evaluation report
on the MI schemes in Jammu &
Kashmir (2014-15) indicated

Page | 535
#
Cross-
cutting
theme
Indicative Areas of
Enquiry and Key
Questions
Findings from research
economic upliftment of the
beneficiary communities upon the
completion SMI projects.
• The KIIs across all states indicate
generation of employment as a result
of scheme implementation.
However, states do not maintain
quantitative data on the subject.
Summary Analysis:
The secondary and primary data indicates employment generation as a result of SMI but
absence of any data on the subject limits validation.
3.
Gender
mainstreamin
g
Inclusiveness in scheme
design/planning
• There are no provisions favouring
gender mainstreaming under
scheme guidelines.
• The KIIs indicate involvement of
women during scheme
implementation, particularly in hilly
states.
• The absence of women in WUAs
was highlighted during KIIs. This was
further validated during HH survey by
75% respondents in Assam and
100% in Madhya Pradesh (n= 10).
Summary Analysis:
Though KIIs indicate active involvement of women during scheme implementation, there is a
need to have provisions favouring gender inclusiveness as a part of scheme guidelines.
4.
Climate
change &
sustainability
Climate resilience
Climate impact
• The scheme is completely
dependent on rainfall but there is no

Page | 536
#
Cross-
cutting
theme
Indicative Areas of
Enquiry and Key
Questions
Findings from research
including
adoption of
climate-
change
resilient
practices &
diversification
mechanism under current guidelines
to address the climate change factor.
• The negative implications of climate
change in recent years, often leading
to ‘no flow’ conditions have been
highlighted by Assam, Bihar, J&K,
Uttarakhand and Himachal Pradesh.
Summary Analysis:
Climate change factor is critical to scheme sustainability, but it is unaddressed under the current
scheme guidelines.
5.
Role of Tribal
Sub-Plan
(TSP) and
Scheduled
Caste Sub-
Plan
component of
the scheme in
mainstreamin
g of Tribal and
Scheduled
Caste
population
Funds allocated under
TSP/ SCSP and other
provisions for vulnerable
communities
Inclusion of vulnerable
groups in scheme as
well as sector
• States like Assam are utilising funds
allocated under TSP/SCSP towards
inclusion of vulnerable communities
under SMI.
Summary Analysis:
Inclusion of vulnerable communities is ensured under SMI through utilisation of funds
allocated under TSP/SCSP in few states like Assam.
6.
Use of
IT/Technology
Deployment of IT
enabled mechanisms for
• The scheme guidelines mandate
utilization of Geographic Information
System (GIS) for monitoring. Further,

Page | 537
#
Cross-
cutting
theme
Indicative Areas of
Enquiry and Key
Questions
Findings from research
in driving
efficiency
monitoring of the
Schemes
Use of latest technology
to improve efficiency and
effectiveness of scheme
implementation
each minor irrigation project must be
given a Unique Identification Code
(U.I.C). However, GIS is currently not
being utilised by states like Madhya
Pradesh, Uttarakhand and Himachal
Pradesh.
• Manipur and J&K are utilising GIS
technology for effective scheme
implementation, which has aided in
mitigating issues like overlap with
similar schemes. The Ecology and
Remote Sensing department, J&K
aids in providing GIS maps in this
regard.
• The ongoing schemes are not
geotagged in Uttarakhand. However,
GIS portal creation in under progress
in the state and once the proposal for
421 schemes is sanctioned, the state
plans to geotag the assets created.
• Though needed for more effective
monitoring, fund constraints limit the
use of GIS in Assam.
Summary Analysis:
The use of technologies like GIS is felt by the state, not only during implementation, but also
during monitoring. Though scheme guidelines mandate its usage for monitoring, fund
constraints limit its utilisation in some states.
7.
Stakeholder
and
Fund Allocation
• Previous 3rd party evaluation study
on Minor Irrigation schemes in

Page | 538
#
Cross-
cutting
theme
Indicative Areas of
Enquiry and Key
Questions
Findings from research
Beneficiary
behavioural
change
Mechanisms to promote
and ensure behaviour
change
Challenges faced
Jammu & Kashmir (2014-15) stated
the need for awareness generation
about benefits of the project so that
beneficiaries would be motivated to
provide their assistance for
maintaining the assets.
• Previous evaluation report on minor
irrigation projects (2013-14/2014-15)
in Nagaland stated the proposed
cropping pattern to be critical for
determination of incremental
scheme benefits.
• In Uttarakhand, awareness
generation activities are done by the
agriculture department at block level
through BDC meetings every 2-3
months. However, with growing
water scarcity, the irrigation
department highlights the need to
include ‘Jal Sanrakshan –
Samwardhan’ component to ensure
sustainable irrigation. Village level
stakeholders further validate that
though trainings are conducted by
the agriculture department; they lack
water use efficiency/ water
conservation component.
• Agriculture department in Himachal
Pradesh undertakes awareness
Page | 539
#
Cross-
cutting
theme
Indicative Areas of
Enquiry and Key
Questions
Findings from research
generation activities through
trainings and door to door IEC
activities towards encouraging crop
water-use efficiency. Additionally,
exposure visits are also organised in
this regard to shift mindset of
farmers from traditional practices.
• 5th census of MI schemes shows
declining dependency of farmers on
surface minor irrigation and
increasing dependency on
groundwater for fulfilling their minor
irrigation requirement. KIIs and HH
survey indicates that farmers
continue to adopt traditional
agricultural practices like
monocropping and flood irrigation.
Summary Analysis:
The primary and secondary data indicates the need to include awareness generation component
as part of the scheme guideline. Though these activities are being undertaken by few states,
they lack crop water use efficiency component.
8.
Research &
Development
Fund Allocation,
challenges in
undertaking R&D efforts,
any Best Practices
• No funds are allocated for R&D as per
scheme guidelines.
• Considering that flood irrigation is
currently practiced across most
states after provisioning of SMI,
research on water conveyance,
application and distribution efficiency
is needed to evaluate irrigation

Page | 540
#
Cross-
cutting
theme
Indicative Areas of
Enquiry and Key
Questions
Findings from research
system performance and transition
towards more effective irrigation
technique.
• Research institutes like ICAR and
state agriculture universities could be
involved in such studies.
Summary Analysis:
R&D efforts through involvement of ICAR/ state agricultural universities are needed to aid in
transition to water efficient minor irrigation.
9.
Conjunctive
use of water
Challenges and
awareness
• Though SMI has reduced
dependence on groundwater, the
conjunctive use of water doesn’t
form a part of the scheme design.
• North eastern states and hilly areas
which are well endowed with rainfall,
continue to use surface water
resources for irrigation. On the other
hand, there have been instances of
groundwater overexploitation (e.g.:
Bihar, Madhya Pradesh). This is being
addressed through state sponsored,
‘Jal Jeevan Hariyali Mission’ in Bihar.
Summary Analysis:
Though pressure on groundwater resources has reduced to some extent after provisioning of
SMI, there exists a gap conjunctive planning for water resources management.
10.
Unlocking
Synergies
with other
Convergence (Inter-
Ministerial/Inter-
Departmental/Financial/
Human
• This scheme complements
MGNREGA in terms of water source
creation. While SMI creates 2-10 ha
water spread area in urban and more
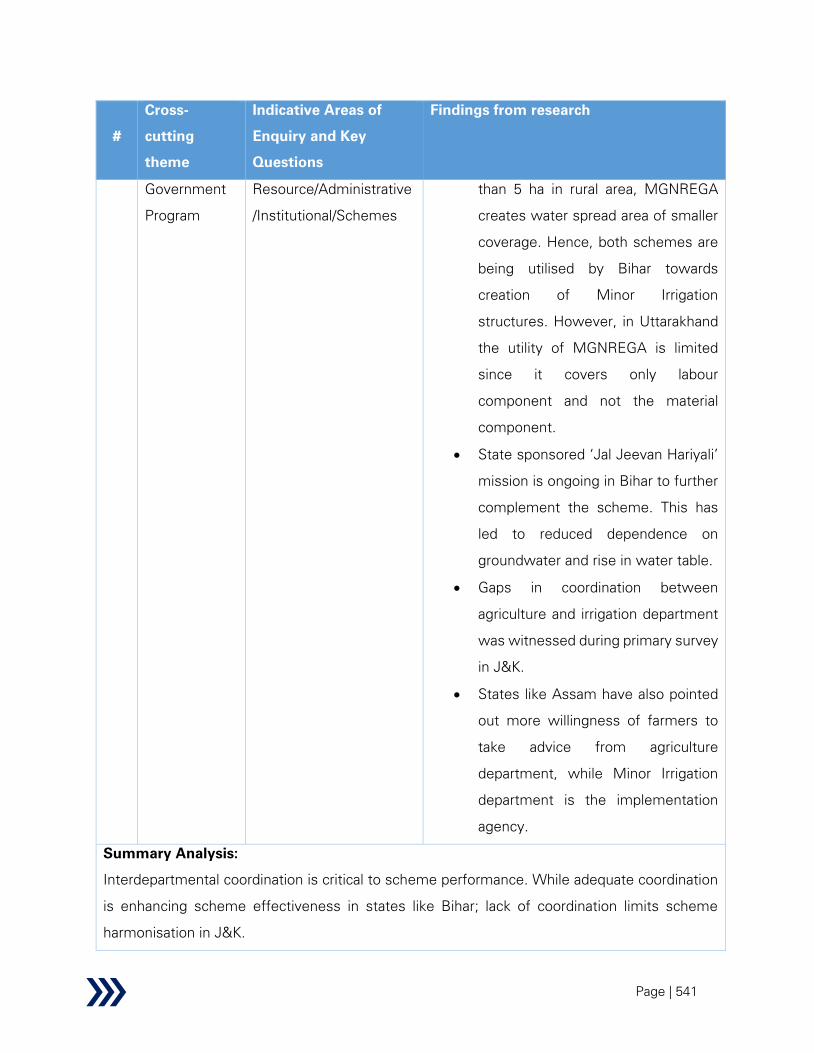
Page | 541
#
Cross-
cutting
theme
Indicative Areas of
Enquiry and Key
Questions
Findings from research
Government
Program
Resource/Administrative
/Institutional/Schemes
than 5 ha in rural area, MGNREGA
creates water spread area of smaller
coverage. Hence, both schemes are
being utilised by Bihar towards
creation of Minor Irrigation
structures. However, in Uttarakhand
the utility of MGNREGA is limited
since it covers only labour
component and not the material
component.
• State sponsored ‘Jal Jeevan Hariyali’
mission is ongoing in Bihar to further
complement the scheme. This has
led to reduced dependence on
groundwater and rise in water table.
• Gaps in coordination between
agriculture and irrigation department
was witnessed during primary survey
in J&K.
• States like Assam have also pointed
out more willingness of farmers to
take advice from agriculture
department, while Minor Irrigation
department is the implementation
agency.
Summary Analysis:
Interdepartmental coordination is critical to scheme performance. While adequate coordination
is enhancing scheme effectiveness in states like Bihar; lack of coordination limits scheme
harmonisation in J&K.
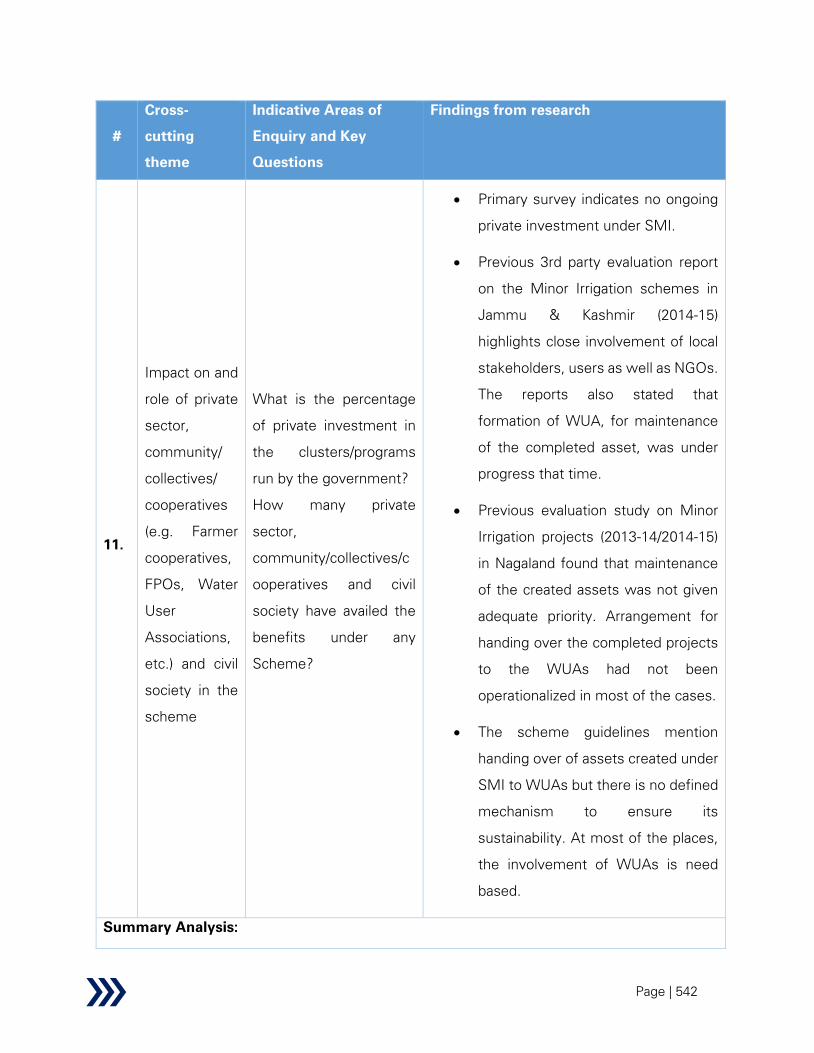
Page | 542
#
Cross-
cutting
theme
Indicative Areas of
Enquiry and Key
Questions
Findings from research
11.
Impact on and
role of private
sector,
community/
collectives/
cooperatives
(e.g. Farmer
cooperatives,
FPOs, Water
User
Associations,
etc.) and civil
society in the
scheme
What is the percentage
of private investment in
the clusters/programs
run by the government?
How many private
sector,
community/collectives/c
ooperatives and civil
society have availed the
benefits under any
Scheme?
• Primary survey indicates no ongoing
private investment under SMI.
• Previous 3rd party evaluation report
on the Minor Irrigation schemes in
Jammu & Kashmir (2014-15)
highlights close involvement of local
stakeholders, users as well as NGOs.
The reports also stated that
formation of WUA, for maintenance
of the completed asset, was under
progress that time.
• Previous evaluation study on Minor
Irrigation projects (2013-14/2014-15)
in Nagaland found that maintenance
of the created assets was not given
adequate priority. Arrangement for
handing over the completed projects
to the WUAs had not been
operationalized in most of the cases.
• The scheme guidelines mention
handing over of assets created under
SMI to WUAs but there is no defined
mechanism to ensure its
sustainability. At most of the places,
the involvement of WUAs is need
based.
Summary Analysis:

Page | 543
#
Cross-
cutting
theme
Indicative Areas of
Enquiry and Key
Questions
Findings from research
Based on the primary survey, no private investment is ongoing under SMI. The scheme
sustainability relies on WUAs by design, but its implementation mechanism is unclear.
In addition to the above themes, no information was found for ‘Development, dissemination &
adoption’, ‘Research & Development’ and ‘Reform, Regulation’ while ‘Water sharing
treaties/agreements & diplomacy’ is not relevant for the scheme.
A summary analysis and performance of the scheme on the identified themes is presented
below:
Table 56: SMI - summary of performance evaluation using cross-sectional themes
Parameter Performance
Accountability and Transparency
Direct/Indirect Employment Generation
Gender mainstreaming/Inclusiveness
Building resilience to climate change (including but not limited to developing
water disaster preparedness) and ensuring sustainability
Role of Tribal Sub-Plan (TSP) and Scheduled Caste Sub-Plan component of
the scheme in mainstreaming of Tribal and Scheduled Caste population
Use of IT/Technology in driving efficiency
Stakeholder and Beneficiary behavioural change
Development, dissemination & adoption
Research and Development
Water sharing treaties/agreements and diplomacy
Conjunctive use of water - surface versus groundwater usage optimizations
Unlocking Synergies with other Government Program
Reforms, Regulations
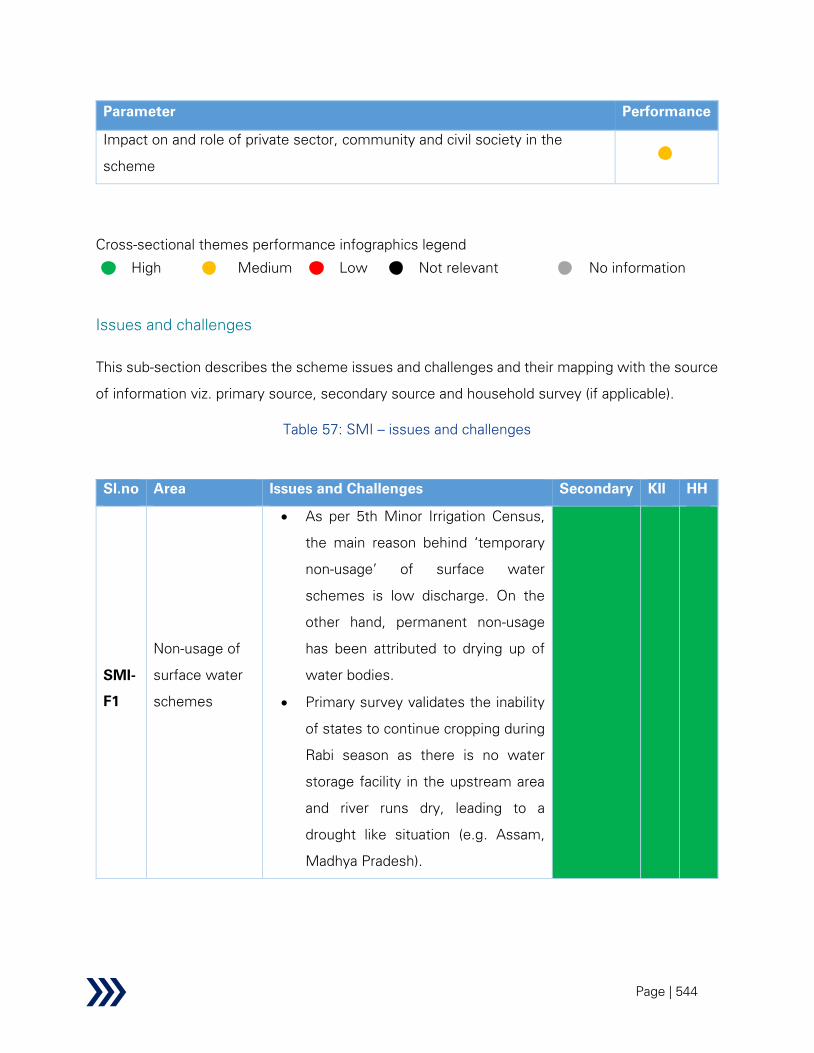
Page | 544
Parameter Performance
Impact on and role of private sector, community and civil society in the
scheme
Cross-sectional themes performance infographics legend
High
Medium
Low
Not relevant
No information
Issues and challenges
This sub-section describes the scheme issues and challenges and their mapping with the source
of information viz. primary source, secondary source and household survey (if applicable).
Table 57: SMI – issues and challenges
Sl.no Area Issues and Challenges Secondary KII HH
SMI-
F1
Non-usage of
surface water
schemes
• As per 5th Minor Irrigation Census,
the main reason behind ‘temporary
non-usage’ of surface water
schemes is low discharge. On the
other hand, permanent non-usage
has been attributed to drying up of
water bodies.
• Primary survey validates the inability
of states to continue cropping during
Rabi season as there is no water
storage facility in the upstream area
and river runs dry, leading to a
drought like situation (e.g. Assam,
Madhya Pradesh).

Page | 545
Sl.no Area Issues and Challenges Secondary KII HH
Hence, presence of SMI has not
changed the traditional rain
dependence in these areas.
• As per HH survey, unavailability of
year-round water supply after
completion of SMI works has been
indicated by 73% respondents (n=
193).
SMI
– F2
Delays in
project
sanction and
budget
constraints
• Long delays in project sanctioning
have been highlighted by the states.
For instance: 443 projects submitted
by Manipur in 2018-19 have not been
sanctioned yet.
• Though MoWR claims 100%
utilization of the available budget,
delayed and insufficient fund release
by centre has been pointed out by
states which hampers timely
execution of schemes.
For instance: In 2019-20 funds were
requested under two clusters by J&K
but merely balance amount from
2018-19 was received in the first
cluster. Likewise, proposal
requesting funds for 68 projects was
sent by Meghalaya in 2019-20 but it
has not been released yet.
SMI-
F3
Increasing
pressure on
groundwater
resources
• While hilly areas like Assam, J&K,
Manipur, Meghalaya and
Uttarakhand are primarily dependent
on surface water for irrigation; there

Page | 546
Sl.no Area Issues and Challenges Secondary KII HH
is an increasing dependence on
groundwater-based irrigation;
particularly in parts of Bihar,
Himachal Pradesh, Karnataka and
Madhya Pradesh due to easy access
to electricity and its advantage of
being demand driven instead of
supply driven.
• HH survey further validates
groundwater as preferred mode of
irrigation amongst 56% and 50%
respondents in Assam and Madhya
Pradesh respectively (n= 168). While
current irrigation needs are entirely
met by rainwater and SMI in
Manipur; groundwater is preferred
mode of irrigation amongst 76%
respondents (n= 25).
• As per CGWB estimates of 2017, out
of 6881 assessment units, 1186
blocks are ‘over exploited’, 313
‘critical’ and 972 under ‘semi critical’
category.154
• More than one fourth of these
overexploited and critical blocks are
limited to Delhi, Haryana, Himachal
Pradesh, Karnataka, Punjab,
Rajasthan, Tamil Nadu and
154 National Compilation on Dynamic Ground Water Resources of India, 2017 (http://cgwb.gov.in/GW-Assessment/GWRA-2017-
National-Compilation.pdf)

Page | 547
Sl.no Area Issues and Challenges Secondary KII HH
Puducherry. However, the current
scope of SMI is restricted to north
eastern states, DPAP, tribal, flood
prone and special category areas in
general states/UTs. It is not aligned
to address regions facing
overexploitation of groundwater.
SMI-
F4
Unclear/
Limiting
scheme
guidelines
• The scheme guidelines of SMI
mention aim of PMKSY i.e. ‘enhance
physical access of water on farm and
expand cultivable area under assured
irrigation, improve on farm water use
efficiency, introduce sustainable
water conservation practices’, with
no reference to envisaged aim/
output/ outcome/ impact of HKKP -
SMI.
• The restriction of development cost
norm of Rs. 2.5 lakh/hectare poses
challenge for scheme
implementation in Himachal Pradesh,
J&K, Manipur, Meghalaya and
Uttarakhand due to topographical
constraints and high labour cost. For
instance:
o The construction phase
under SMI in Manipur
requires around 120
kilometres to be covered on
foot instead of vehicle,

Page | 548
Sl.no Area Issues and Challenges Secondary KII HH
owing to the difficult terrain,
which increases the labour
cost significantly.
o Due to unavailability of local
labour in J&K, it relies on
migrant labour during
construction phase.
• Despite variable site topography,
working period and size of different
Minor Irrigation projects, the timeline
for completion is restricted to two
years only.
This is particularly challenging for hilly
states like Himachal Pradesh, J&K,
Manipur, Meghalaya and
Uttarakhand, where working season
is limited to 3-6 months only.
SMI-
F5
Water losses in
open channels
• High seepage losses in unlined
channels have been found to
increase water table, leading to
waterlogging in the vicinity.155
• Though the primary objective of SMI
is enhancing water use efficiency,
some of the channels constructed
under SMI are unlined/ earthen (e.g.:
in Assam, Madhya Pradesh). These
have high seepage losses and are
155 Assessing the impact of canal network on surface waterlogging using remote sensing datasets in Rohtak, Haryana
(https://www.researchgate.net/publication/329043645_ASSESSING_THE_IMPACT_OF_CANAL_NETWORK_ON_SURFACE_WATE
RLOGGING_USING_REMOTE_SENSING_DATASETS_IN_ROHTAK_DISTRICT_HARYANA)

Page | 549
Sl.no Area Issues and Challenges Secondary KII HH
more prone to siltation, waterlogging
and damages.
• Increase in instances of waterlogging
after completion of SMI works has
been confirmed by 23% respondents
in Assam, 86% in Madhya Pradesh
and 32% in Manipur.
SMI-
F6
Reducing
command area
under major
irrigation
projects
• Existing major irrigation projects are
often unable to suffice the needs of
farmers till the tail end, due to change
in flow or topographical constraints.
However, such areas cannot be
supported by SMI as per the current
scheme design due to overlap with
major irrigation projects.
• For instance: The Loktak and Khuga
irrigation projects in Manipur are
unable to irrigate the command area
that they were designed for due to
reduction in flow.
However, supporting SMI schemes
in these areas were rejected by the
centre on grounds of overlap.
SMI-
F7
Climatic
uncertainties
• Though the scheme is completely
dependent on rainfall, there is no
mechanism under current guidelines
to address the climate change factor.
• Considering IPCC prediction of rise in
temperature by 3-4 degree Celsius
by the end of 21st century and
estimated change in rainfall pattern;
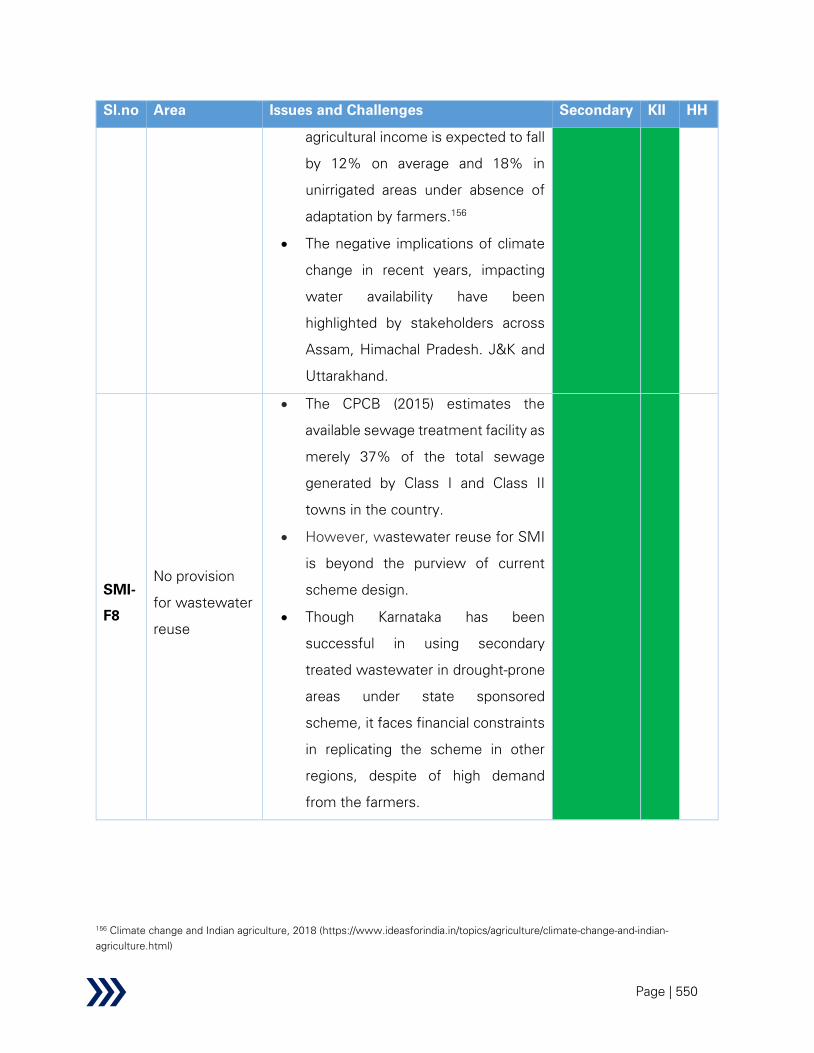
Page | 550
Sl.no Area Issues and Challenges Secondary KII HH
agricultural income is expected to fall
by 12% on average and 18% in
unirrigated areas under absence of
adaptation by farmers.156
• The negative implications of climate
change in recent years, impacting
water availability have been
highlighted by stakeholders across
Assam, Himachal Pradesh. J&K and
Uttarakhand.
SMI-
F8
No provision
for wastewater
reuse
• The CPCB (2015) estimates the
available sewage treatment facility as
merely 37% of the total sewage
generated by Class I and Class II
towns in the country.
• However, wastewater reuse for SMI
is beyond the purview of current
scheme design.
• Though Karnataka has been
successful in using secondary
treated wastewater in drought-prone
areas under state sponsored
scheme, it faces financial constraints
in replicating the scheme in other
regions, despite of high demand
from the farmers.
156 Climate change and Indian agriculture, 2018 (https://www.ideasforindia.in/topics/agriculture/climate-change-and-indian-
agriculture.html)
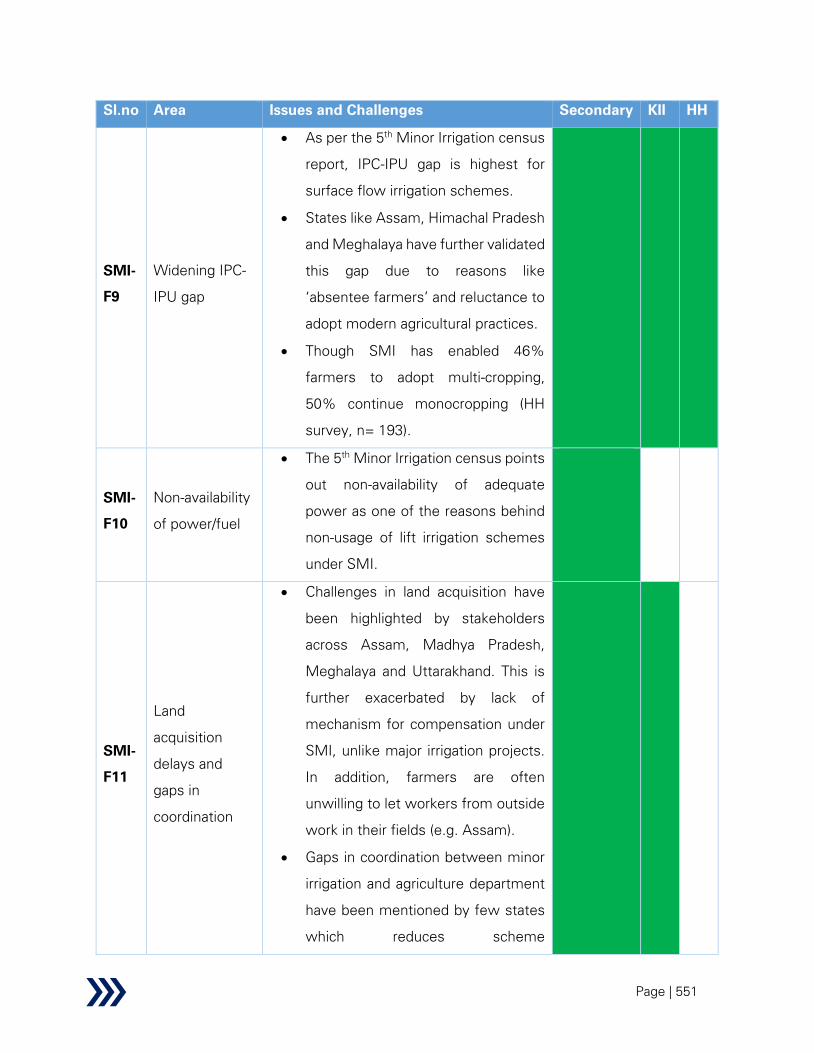
Page | 551
Sl.no Area Issues and Challenges Secondary KII HH
SMI-
F9
Widening IPC-
IPU gap
• As per the 5th
Minor Irrigation census
report, IPC-IPU gap is highest for
surface flow irrigation schemes.
• States like Assam, Himachal Pradesh
and Meghalaya have further validated
this gap due to reasons like
‘absentee farmers’ and reluctance to
adopt modern agricultural practices.
• Though SMI has enabled 46%
farmers to adopt multi-cropping,
50% continue monocropping (HH
survey, n= 193).
SMI-
F10
Non-availability
of power/fuel
• The 5th
Minor Irrigation census points
out non-availability of adequate
power as one of the reasons behind
non-usage of lift irrigation schemes
under SMI.
SMI-
F11
Land
acquisition
delays and
gaps in
coordination
• Challenges in land acquisition have
been highlighted by stakeholders
across Assam, Madhya Pradesh,
Meghalaya and Uttarakhand. This is
further exacerbated by lack of
mechanism for compensation under
SMI, unlike major irrigation projects.
In addition, farmers are often
unwilling to let workers from outside
work in their fields (e.g. Assam).
• Gaps in coordination between minor
irrigation and agriculture department
have been mentioned by few states
which reduces scheme

Page | 552
Sl.no Area Issues and Challenges Secondary KII HH
effectiveness. For instance: Madhya
Pradesh state agriculture department
mentions their role being limited to
STAC meetings only while their
involvement during site selection
could aid in more holistic
implementation.
SMI-
F12
Lack of
mechanism for
O&M: Role of
WUAs
• SMI structures (particularly unlined
canals) are prone to damages from
flooding, requiring frequent
maintenance. Currently, there are no
allocations by the centre for O&M
works. Few states carry out such
activities on need basis/ request from
WUAs.
• Though water is a state subject, all
states have pointed out inadequacy
of funds for O&M. Challenges in
O&M have also been highlighted by
32%, 66% and 68% respondents
during HH survey across Assam,
Madhya Pradesh and Manipur
respectively.
• The scheme guidelines mention
handing over of Minor Irrigation
assets to WUAs for future operations
and maintenance. However, it
doesn’t provide any details on
mechanism for sustainability/
revenue generation by WUAs. The
inability of WUA to undertake O&M

Page | 553
Sl.no Area Issues and Challenges Secondary KII HH
has been highlighted during KIIs and
further validated during HH survey
40% respondents (n= 35).
• In Assam, as per the state irrigation
act, all the funds collected by WUA
goes to the government exchequer.
In parts of the state, WUAs are
utilising the collected levy unofficially
for operations and maintenance.
SMI-
F13
Inadequate
monitoring by
CWC
• Regular monitoring and visits by
CWC regional office is challenging,
particularly in north eastern states.
• Though they are mandated to visit a
minimum of 20% sites annually, it
becomes difficult to do so in areas
like Assam, which have more than
1000 schemes ongoing under SMI.
Hence, CWC was able to visit 40
schemes in 2019-20, against the
target of 200.
• Since CWC regional office plays a
critical role in technically examining
proposal and forwarding to Ministry
of Jal Shakti; presence of single
regional office for 7 north eastern
states leads to delays.
The issue is further exacerbated by
difficult terrain and inconvenient
travel in states like Manipur and
Meghalaya.
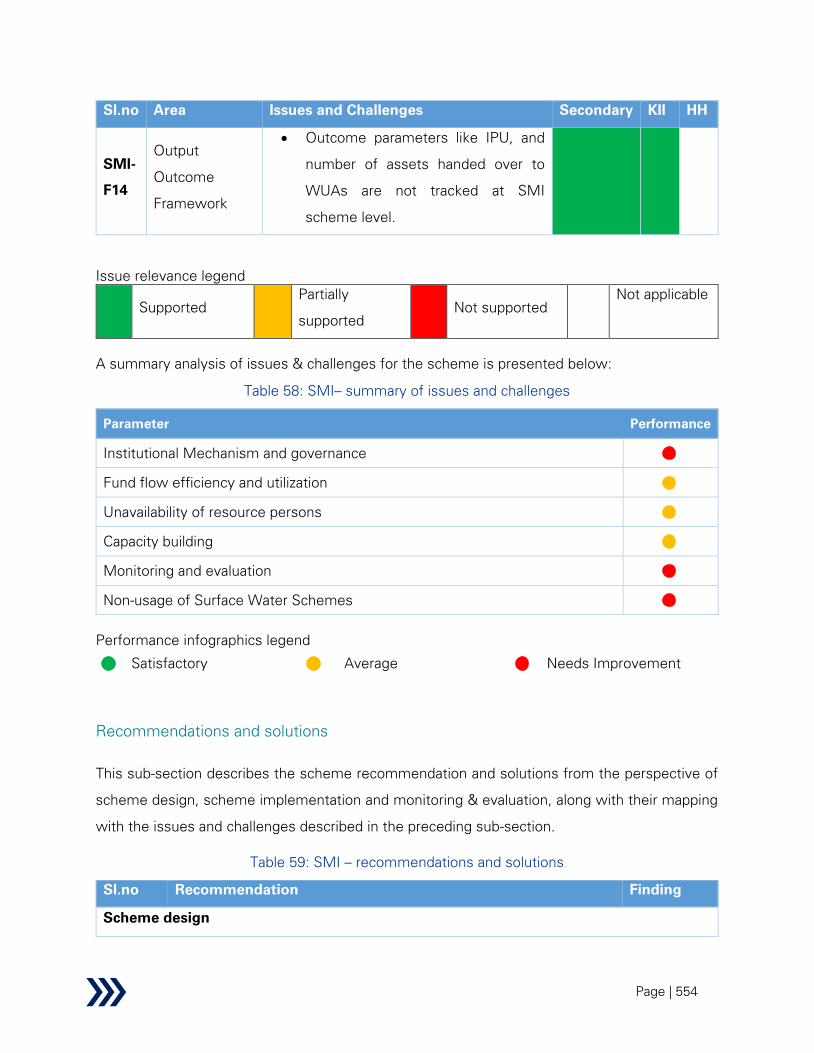
Page | 554
Sl.no Area Issues and Challenges Secondary KII HH
SMI-
F14
Output
Outcome
Framework
• Outcome parameters like IPU, and
number of assets handed over to
WUAs are not tracked at SMI
scheme level.
Issue relevance legend
Supported
Partially
supported
Not supported
Not applicable
A summary analysis of issues & challenges for the scheme is presented below:
Table 58: SMI– summary of issues and challenges
Parameter Performance
Institutional Mechanism and governance
Fund flow efficiency and utilization
Unavailability of resource persons
Capacity building
Monitoring and evaluation
Non-usage of Surface Water Schemes
Performance infographics legend
Satisfactory
Average
Needs Improvement
Recommendations and solutions
This sub-section describes the scheme recommendation and solutions from the perspective of
scheme design, scheme implementation and monitoring & evaluation, along with their mapping
with the issues and challenges described in the preceding sub-section.
Table 59: SMI – recommendations and solutions
Sl.no Recommendation Finding
Scheme design

Page | 555
Sl.no Recommendation Finding
SMI-R1
Ensure adequate upstream storage while planning SMI
• To address the current non-utility of SMI in parts of Assam
and Madhya Pradesh due to drying up/low discharge;
sequential scheme design needs to be ensured. Provisioning
of conveyance system through creation of diversion
structures like weirs should be considered only after there is
adequate facility for water storage in the upstream.
• To implement this, SMI could be planned in close
coordination with RRR/ MGNREGA/ WDC/ other state
sponsored scheme which includes component of creating/
renovating surface storage structure.
• Rationalisation with RRR:
o Rationale: Whilst scope of work under HKKP-SMI is
limited to construction of small diversion structures
like weir/ check dams; HKKP-RRR is focused on
restoration of pre-existing tanks/ponds. Since the
objective of RRR, viz. comprehensive improvement
and restoration of water bodies could ensure proper
operation of SMI projects, scheme rationalization may
be considered.
o Renovation works in the upstream storage structures
could aid in supplementing discharge for SMI during
periods of low/no flow. The minimization of water
losses would also help in addressing the widening
IPC-IPU gap.
o Implementation and sustainability: Since both SMI
and RRR are implemented by the Minor Irrigation
department and involve handing over of renovated/
created assets to WUAs, the institutional structure for
scheme implementation and sustainability may
remain the same. Moreover, capacity building of the
SMI-F1,
SMI-F9,
SMI-F12

Page | 556
Sl.no Recommendation Finding
communities towards water resources management,
which is an objective under RRR could help in
improving the sustainability of SMI upon
rationalization.
SMI-R2
Change in operational policy of SMI to address depleting water
table
• Given the growing dependence on groundwater and most of
the overexploited and critical blocks being situated in 8
states, there is a need to expand the scope of SMI in these
areas.
• Change in operational policy of minor irrigation schemes like
forgoing one third cultivation/retaining one fourth storage
could be considered to revive water table in these areas, as
illustrated in Vavuniya district, Sri Lanka.
• Case study: Technical strategies to operate minor and
medium irrigation schemes towards improving
groundwater systems:
Water balance and economic feasibility modelling was
carried out in 185.23 km2 aquifer in Vavuniya, Sri Lanka. It
found that forgoing cultivation under minor and medium
irrigation schemes by 25-35% would replenish 45-65% loss
of water tables in 80-90% of the catchment area in the
consecutive season. An additional reduction in boundary
permeability by 40-50% lead to reduced transmissivity and
recovery of 60-70% loss in water table in nearly 95% of area
under consideration. Economic analysis indicated gain in
SMI-F3

Page | 557
Sl.no Recommendation Finding
water table to reduce cost of energy, thereby increasing
economic cultivation per unit irrigation water.157
SMI-R3
Need for more comprehensive scheme guidelines
• The existing scheme guidelines need to be revised and made
more comprehensive, with clearly defined objective, output,
outcome and impact. The suggested output-outcome
parameters and monitoring mechanism in this regard is
described in SMI-R13.
• The current ‘one size fits all’ approach mentioned in the
scheme guidelines; which restrict development cost at Rs.
2.5 lakh/hectare and timeline for project completion to two
year needs to be revised to allow flexibility considering
project size, working period, prevailing topography and labour
availability; particularly for north eastern and hilly states.
SMI-F4
SMI-R4
Lining of canals/ pipe distribution network to improve water
use efficiency
• The scheme objective of enhancing water use efficiency can
be achieved by minimising high water losses in canals
through canal lining/ pipe distribution network.
• Replacing earthen canals with lined canals could lead to
increase in velocity and rugosity coefficient. Hence, the
discharge carrying capacity of the existing canals would
increase, while seepage losses, water logging and
maintenance cost of the canal would reduce.158
However,
SMI-F5,
SMI-F1,
SMI-F9
157 Sivakumar, 2013; Conjunctive Use of Surface and Groundwater to Improve Food Productivity in Vavuniya District in the Dry Zone
Area
(https://www.researchgate.net/publication/247773415_Conjunctive_Use_of_Surface_and_Groundwater_to_Improve_Food_Producti
vity_in_Vavuniya_District_in_the_Dry_Zone_Area)
158 Seepage losses through lined and unlined canals (http://www.ijaamm.com/uploads/2/1/4/8/21481830/v2n2p9.pdf
http://www.ijaamm.com/uploads/2/1/4/8/21481830/v2n2p9.pdf)
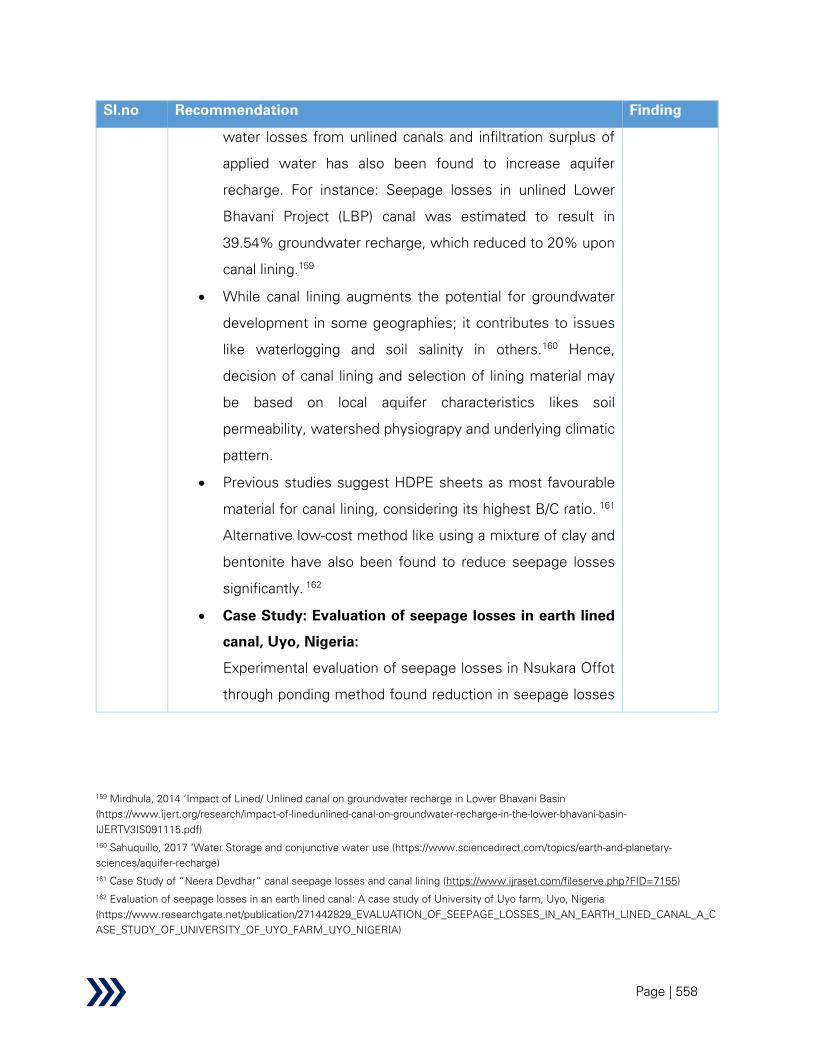
Page | 558
Sl.no Recommendation Finding
water losses from unlined canals and infiltration surplus of
applied water has also been found to increase aquifer
recharge. For instance: Seepage losses in unlined Lower
Bhavani Project (LBP) canal was estimated to result in
39.54% groundwater recharge, which reduced to 20% upon
canal lining.159
• While canal lining augments the potential for groundwater
development in some geographies; it contributes to issues
like waterlogging and soil salinity in others.160
Hence,
decision of canal lining and selection of lining material may
be based on local aquifer characteristics likes soil
permeability, watershed physiograpy and underlying climatic
pattern.
• Previous studies suggest HDPE sheets as most favourable
material for canal lining, considering its highest B/C ratio. 161
Alternative low-cost method like using a mixture of clay and
bentonite have also been found to reduce seepage losses
significantly. 162
• Case Study: Evaluation of seepage losses in earth lined
canal, Uyo, Nigeria:
Experimental evaluation of seepage losses in Nsukara Offot
through ponding method found reduction in seepage losses
159 Mirdhula, 2014 ‘Impact of Lined/ Unlined canal on groundwater recharge in Lower Bhavani Basin
(https://www.ijert.org/research/impact-of-linedunlined-canal-on-groundwater-recharge-in-the-lower-bhavani-basin-
IJERTV3IS091115.pdf)
160 Sahuquillo, 2017 ‘Water Storage and conjunctive water use (https://www.sciencedirect.com/topics/earth-and-planetary-
sciences/aquifer-recharge)
161 Case Study of “Neera Devdhar” canal seepage losses and canal lining (https://www.ijraset.com/fileserve.php?FID=7155)
162 Evaluation of seepage losses in an earth lined canal: A case study of University of Uyo farm, Uyo, Nigeria
(https://www.researchgate.net/publication/271442829_EVALUATION_OF_SEEPAGE_LOSSES_IN_AN_EARTH_LINED_CANAL_A_C
ASE_STUDY_OF_UNIVERSITY_OF_UYO_FARM_UYO_NIGERIA)
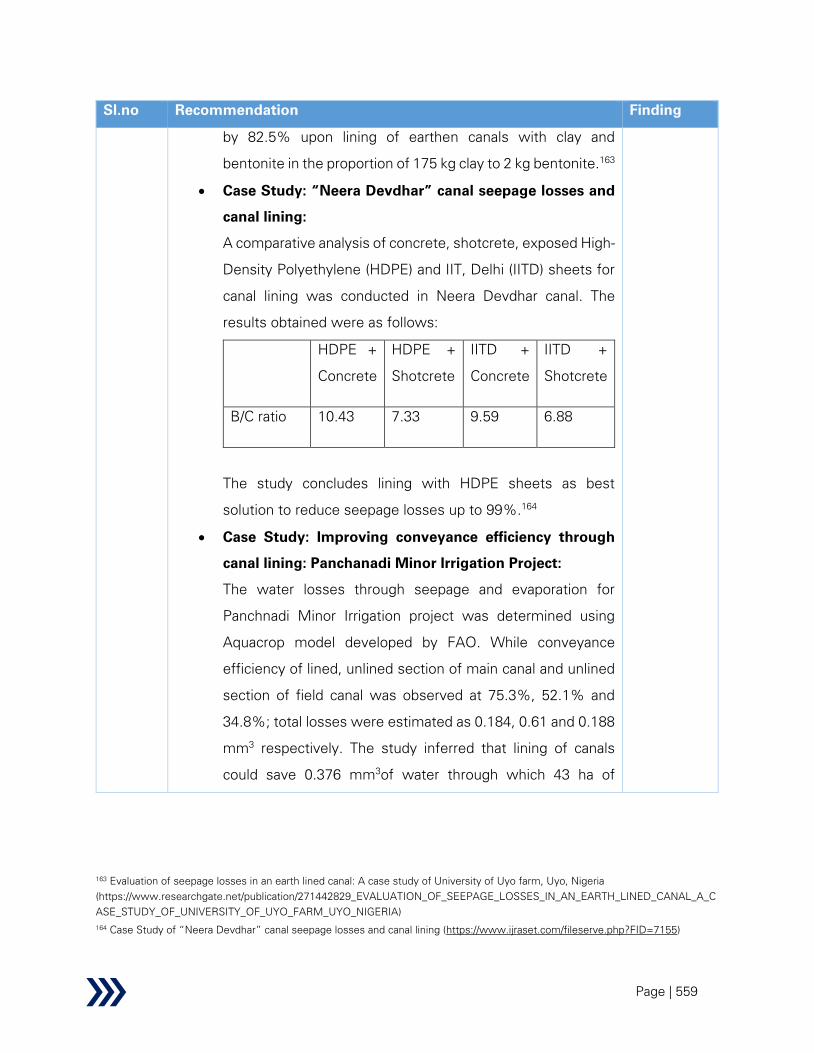
Page | 559
Sl.no Recommendation Finding
by 82.5% upon lining of earthen canals with clay and
bentonite in the proportion of 175 kg clay to 2 kg bentonite.163
• Case Study: “Neera Devdhar” canal seepage losses and
canal lining:
A comparative analysis of concrete, shotcrete, exposed High-
Density Polyethylene (HDPE) and IIT, Delhi (IITD) sheets for
canal lining was conducted in Neera Devdhar canal. The
results obtained were as follows:
HDPE +
Concrete
HDPE +
Shotcrete
IITD +
Concrete
IITD +
Shotcrete
B/C ratio 10.43 7.33 9.59 6.88
The study concludes lining with HDPE sheets as best
solution to reduce seepage losses up to 99%.164
• Case Study: Improving conveyance efficiency through
canal lining: Panchanadi Minor Irrigation Project:
The water losses through seepage and evaporation for
Panchnadi Minor Irrigation project was determined using
Aquacrop model developed by FAO. While conveyance
efficiency of lined, unlined section of main canal and unlined
section of field canal was observed at 75.3%, 52.1% and
34.8%; total losses were estimated as 0.184, 0.61 and 0.188
mm3 respectively. The study inferred that lining of canals
could save 0.376 mm3of water through which 43 ha of
163 Evaluation of seepage losses in an earth lined canal: A case study of University of Uyo farm, Uyo, Nigeria
(https://www.researchgate.net/publication/271442829_EVALUATION_OF_SEEPAGE_LOSSES_IN_AN_EARTH_LINED_CANAL_A_C
ASE_STUDY_OF_UNIVERSITY_OF_UYO_FARM_UYO_NIGERIA)
164 Case Study of “Neera Devdhar” canal seepage losses and canal lining (https://www.ijraset.com/fileserve.php?FID=7155)
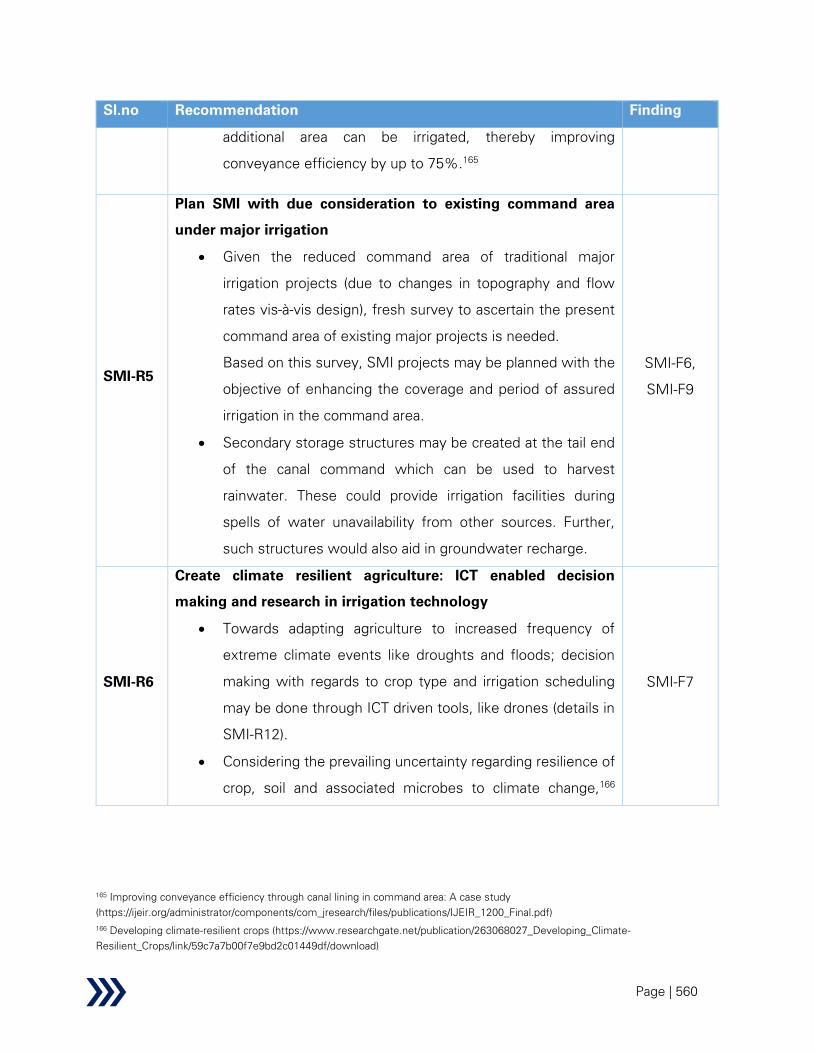
Page | 560
Sl.no Recommendation Finding
additional area can be irrigated, thereby improving
conveyance efficiency by up to 75%.165
SMI-R5
Plan SMI with due consideration to existing command area
under major irrigation
• Given the reduced command area of traditional major
irrigation projects (due to changes in topography and flow
rates vis-à-vis design), fresh survey to ascertain the present
command area of existing major projects is needed.
Based on this survey, SMI projects may be planned with the
objective of enhancing the coverage and period of assured
irrigation in the command area.
• Secondary storage structures may be created at the tail end
of the canal command which can be used to harvest
rainwater. These could provide irrigation facilities during
spells of water unavailability from other sources. Further,
such structures would also aid in groundwater recharge.
SMI-F6,
SMI-F9
SMI-R6
Create climate resilient agriculture: ICT enabled decision
making and research in irrigation technology
• Towards adapting agriculture to increased frequency of
extreme climate events like droughts and floods; decision
making with regards to crop type and irrigation scheduling
may be done through ICT driven tools, like drones (details in
SMI-R12).
• Considering the prevailing uncertainty regarding resilience of
crop, soil and associated microbes to climate change,166
SMI-F7
165 Improving conveyance efficiency through canal lining in command area: A case study
(https://ijeir.org/administrator/components/com_jresearch/files/publications/IJEIR_1200_Final.pdf)
166 Developing climate-resilient crops (https://www.researchgate.net/publication/263068027_Developing_Climate-
Resilient_Crops/link/59c7a7b00f7e9bd2c01449df/download)

Page | 561
Sl.no Recommendation Finding
funding towards research in irrigation technology is needed
to develop climate resilient agriculture.
SMI-R8
Include provision of wastewater reuse under SMI
• Given the vast amount of wastewater generated by the
country, which is expected to grow further, reuse of
secondary treated wastewater for irrigation could be an
efficient mechanism for water resources management.
Public acceptance in this regard is highlighted by the HH
survey: 74% respondents are willing to use treated
wastewater for irrigation if government makes it mandatory.
• Investment in such infrastructure could aid in creation of
nutrient rich and reliable water supply for irrigation.
Furthermore, it could also help in coping up with seasonal
water shortages and irregularities due to variability and
climate change.
• Its inclusion as a part of scheme guidelines, would encourage
the states to invest in such infrastructure. Necessary studies
in this regard may be undertaken to develop safety norms for
use of treated wastewater in agriculture from the perspective
of public health.
• Case Study: Use of secondary treated for irrigation,
Karnataka
Secondary treated sewage from Koramangala and
Challaghatta valley is send to the surrounding drought prone
districts – Chikkaballapur, Kolara and Bengaluru rural. The
farmers in the region demand further scale up of the project.
SMI-F8
Scheme implementation
SMI-R7
Partial desiltation of canals to reduce water losses
• Periodic and frequent partial desiltation of minor canals may
be adopted as a low-cost alternative to complete desiltation.
SMI-F12,
SMI-F9

Page | 562
Sl.no Recommendation Finding
• Case Study: Physical restoration of minor irrigation
system through partial desilting, Kapiriggama village
tank cascade system
Based on hydrological and sedimentation research, it has
been inferred that the amount of sediment deposited in
minor tanks is 20-35% and half of this sediment is found
within one third of tank bed close to bund. Therefore, tank
capacity may be maintained by removing sediment in this
area. Though primary objective of partial desilting is to
minimise water losses, it has also been found to improve
agricultural productivity, cropping intensity and extent of
cultivation.167
SMI-R8
Awareness generation through IEC-BCC and interdepartmental
coordination
• To overcome resistance to change from traditional agriculture
and encourage modern agricultural practices like multi-
cropping, IEC-BCC activities could be undertaken.
• Moving to a cropping pattern that is appropriate in view of
water resources available in an area is important to ensure
benefits from the scheme are optimized and water resources
are used in a sustainable manner.
• In this regard, it is observed that farmers are more willing to
take advice from agriculture department. Therefore,
interdepartmental coordination and convergence to motivate
/ incentivize farmers is necessary. Well defined roles and
responsibilities for both Minor Irrigation (or equivalent) and
SMI-F9
167 Physical restoration of irrigation system
(https://www.iucn.org/sites/dev/files/content/documents/brief_5_january_28_2016_physical_restoration_1.pdf)
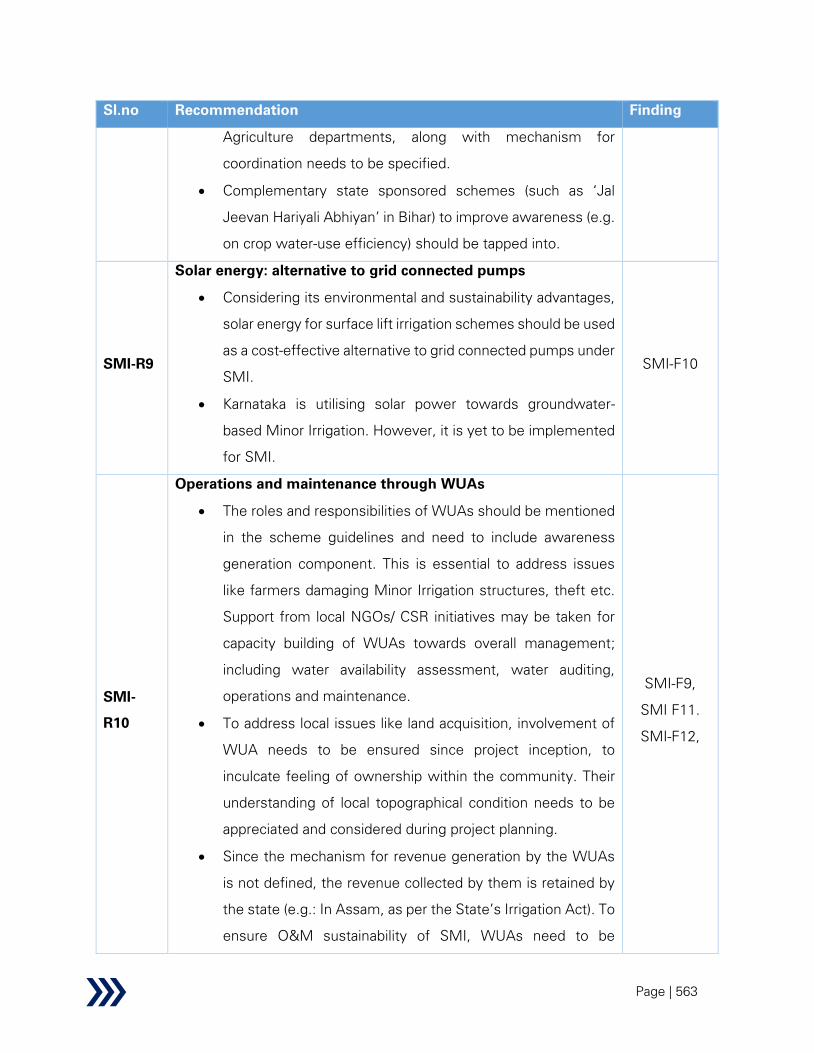
Page | 563
Sl.no Recommendation Finding
Agriculture departments, along with mechanism for
coordination needs to be specified.
• Complementary state sponsored schemes (such as ‘Jal
Jeevan Hariyali Abhiyan’ in Bihar) to improve awareness (e.g.
on crop water-use efficiency) should be tapped into.
SMI-R9
Solar energy: alternative to grid connected pumps
• Considering its environmental and sustainability advantages,
solar energy for surface lift irrigation schemes should be used
as a cost-effective alternative to grid connected pumps under
SMI.
• Karnataka is utilising solar power towards groundwater-
based Minor Irrigation. However, it is yet to be implemented
for SMI.
SMI-F10
SMI-
R10
Operations and maintenance through WUAs
• The roles and responsibilities of WUAs should be mentioned
in the scheme guidelines and need to include awareness
generation component. This is essential to address issues
like farmers damaging Minor Irrigation structures, theft etc.
Support from local NGOs/ CSR initiatives may be taken for
capacity building of WUAs towards overall management;
including water availability assessment, water auditing,
operations and maintenance.
• To address local issues like land acquisition, involvement of
WUA needs to be ensured since project inception, to
inculcate feeling of ownership within the community. Their
understanding of local topographical condition needs to be
appreciated and considered during project planning.
• Since the mechanism for revenue generation by the WUAs
is not defined, the revenue collected by them is retained by
the state (e.g.: In Assam, as per the State’s Irrigation Act). To
ensure O&M sustainability of SMI, WUAs need to be
SMI-F9,
SMI F11.
SMI-F12,

Page | 564
Sl.no Recommendation Finding
financially independent. A proportion of the revenue should
be retained by the WUAs. For example, 30% could be
retained by WUAs while the rest can be with the government
exchequer.
• Case Study: Minor Irrigation through community
management, West Bengal
Handing over of Minor Irrigation schemes
constructed/rejuvenated under West Bengal Accelerated
Development of Minor Irrigation (WBADMI) to WUAs
resulted in significant increase in cropping intensity,
agricultural diversity and yield in comparison to the schemes
without WUAs. The study concluded that created
infrastructure is of minimal use if not managed well and
WUAs could be effective institution for management of SMI.
Sustainability of WUAs in the long run can be ensured by
convergence with other schemes and centralizing scheme
operation under WUAs.168
Monitoring and evaluation
SMI-
R11
Need for additional CWC branch office and ICT based
monitoring
• Given the presence of single CWC regional office for seven
north eastern states and its inability in meeting mandate of
20% annual monitoring; there is need to have an additional
branch office. This would also ensure more efficient scheme
implementation, considering the critical role of regional office
in preparing, examining and forwarding proposals to MoWR,
RD and GR
SMI-F13
168 2
nd International conference on sustainable water management Pg 23 (http://nhp.mowr.gov.in/Conference-2/Proceeding.pdf.)

Page | 565
Sl.no Recommendation Finding
• ICT driven tools and technologies for monitoring: (e.g.
through drones) should be explored, owing to following
advantages:
o Transparent, fast, evidence based, verification
enabled accurate measurement, with minimum
manpower requirement.
o Cost effective: Rs. 156/ha169
o Capability to collect high resolution imagery below
cloud level, with more detail than satellite imagery.170
This could ensure frequent (say monthly) monitoring of
scheme during the implementation phase.
It may also be utilised by the state irrigation department for
revenue recovery by estimating accurate area under
irrigation, as being done in Maharashtra. Drones with
hyperspectral, multispectral and thermal sensors could aid
in identifying the dry areas of field and aid in more effective
planning.171
However, existing drone laws in India need to be considered
in this regard.
• Case study: Use of drone for mapping command area of
irrigation project, Maharashtra
Unnamed Aerial Vehicles (UAVs) are being used in 500,000
ha area in Pune region of Maharashtra. Crop wise area
determined is used to estimate water charges. The
intervention has been successful in accurate estimation of
169 Use of drone for efficient water management: A case study (https://www.icid.org/wif3_bali_2019/wif3_3-1_26-min.pdf)
170 E-Agriculture in action: Drone for agriculture (http://www.fao.org/3/I8494EN/i8494en.pdf)
171 Application of drone in agriculture (https://www.ijcmas.com/8-1-2019/S.%20Ahirwar,%20et%20al.pdf)

Page | 566
Sl.no Recommendation Finding
irrigated area, which has aided in bringing transparency,
increasing revenue and saving time.172
SMI-
R12
Tracking additional outcome parameters
• Apart from currently tracked IPC; other structural and non-
structural outcome indicators need to be included.
For instance: Outcome parameters like water use efficiency,
agricultural productivity and groundwater levels, which are
currently monitored by state agriculture/ minor irrigation
department/ CGWB regional office may be linked to SMI
dashboard.
• In addition, parameters like number of assets handed over to
WUAs, training/ capacity building activities conducted may be
tracked a) at water body level by WUAs b) at state level by
MI department and CWC.
SMI-F14
2.2.2.4 Groundwater Irrigation
This scheme is one of the CSS schemes under Umbrella CSS – PMKSY. This scheme aims to
create irrigation potential through groundwater based minor irrigation. The beneficiary under this
scheme shall be small and marginal farmers only, with priority to be given to SC/ST and Women
farmers.
Some salient features of this scheme:
• Groundwater irrigation facility through dug wells, dug cum bore wells, tube wells
and bore wells etc. can be funded for schemes in areas other than Over- Exploited
(OE), Critical or Semi-Critical meeting the following criteria:
172 Use of drone for efficient water management: A case study https://www.icid.org/wif3_bali_2019/wif3_3-1_26-min.pdf

Page | 567
- Less than 60% of the annual replenishable groundwater resources have been
developed
- Average annual rainfall of 750 mm or more to have availability of enough water
for recharge
- Shallow groundwater levels within range of 15m below ground level or less
during pre-Monsoon period
• Groundwater development for irrigation must be planned in such a way that after
implementation of the project, Stage of Groundwater Development (SOD) in an area
should not exceed 70% at any time.
• This scheme is applicable to individual farmer, group of farmers/ cooperatives, Govt.
Scheme utilizing Govt. land etc.
• Each well to be provided with electric/solar pumps for water lifting. Provision of 75%
electric and 25% solar pumps may be considered for a cluster/proposal. The ratio of
solar pump may be relaxed in Tribal/LWE/infested/difficult areas.
• There is scope of convergence with MGNREGA as well as PMKSY-Watershed
component for supporting water harvesting and groundwater recharge interventions
to ensure the long-term groundwater sustainability.
• There is scope of convergence with Micro-Irrigation Fund to utilize the corpus for
adoption of micro-irrigation facilities in area proposed to be covered under this
scheme, to the extent possible.
Background
This scheme was approved under PMKSY along with other CSS schemes – AIBP, CAD, SMI and
RRR during July 2015 for a period from 2015-16 to 2019-20. Operational guidelines for
Groundwater component were issued by the Ministry of Water Resources, RD & GR in July 2016.
However, keeping in view of various requirements to implement the same, guidelines have been
revised during May 2019. Post that, the scheme became operational and it is currently in progress
in two states – Assam and Arunachal Pradesh.
Performance
The scheme is currently operational in two states: Assam and Arunachal Pradesh. Physical and
financial progress for 2019-20 are demonstrated below:

Page | 568
Assam
Table 60 : GWI – Physical progress of Assam173
# Item
Achievement/Target (as on 15th
June
2020)
1 Site selection investigations completed 4,779 / 4,779
2 Wells constructed 4,065 / 4,779
3 Installation of Electric Pumps 529 / 2,435
4 Installation of Solar Pumps 402 / 2,344
5 Distribution pipe (in Rm) Nil / 955,800
6 Command area irrigated (in ha) 3,000174
/ 19,116
Table 61 : GWI – Financial progress of Assam173
# Item
Amount (Rs., in Cr.) (as on 12th
June
2020)
1 Total fund release (Central Assistance) 133
2 Total fund release (State share) 8
Total fund release 141
1 Total fund utilization (Central Assistance) 73
2 Total fund utilization (State share) 8
Total fund utilization 81
Arunachal Pradesh
Table 62 : GWI – Physical progress of Arunachal Pradesh173
# Item Area (in ha)
1 Irrigation potential planned 1,786
173 Data shared by Ground Water (HKKP), Mo WR, RD & GR on 9
th July 2020
174 Data shared by CGWB, HQ, Faridabad on 8
th October 2020
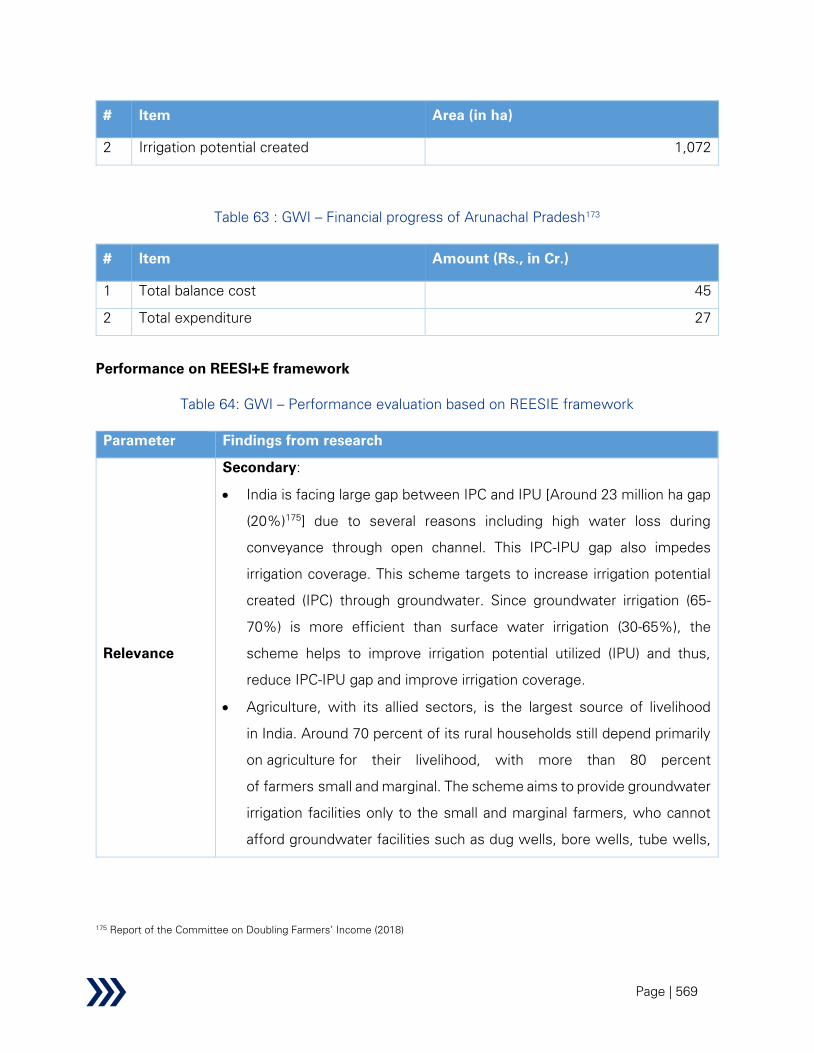
Page | 569
# Item Area (in ha)
2 Irrigation potential created 1,072
Table 63 : GWI – Financial progress of Arunachal Pradesh173
# Item Amount (Rs., in Cr.)
1 Total balance cost 45
2 Total expenditure 27
Performance on REESI+E framework
Table 64: GWI – Performance evaluation based on REESIE framework
Parameter Findings from research
Relevance
Secondary:
• India is facing large gap between IPC and IPU [Around 23 million ha gap
(20%)175
] due to several reasons including high water loss during
conveyance through open channel. This IPC-IPU gap also impedes
irrigation coverage. This scheme targets to increase irrigation potential
created (IPC) through groundwater. Since groundwater irrigation (65-
70%) is more efficient than surface water irrigation (30-65%), the
scheme helps to improve irrigation potential utilized (IPU) and thus,
reduce IPC-IPU gap and improve irrigation coverage.
• Agriculture, with its allied sectors, is the largest source of livelihood
in India. Around 70 percent of its rural households still depend primarily
on agriculture for their livelihood, with more than 80 percent
of farmers small and marginal. The scheme aims to provide groundwater
irrigation facilities only to the small and marginal farmers, who cannot
afford groundwater facilities such as dug wells, bore wells, tube wells,
175 Report of the Committee on Doubling Farmers’ Income (2018)
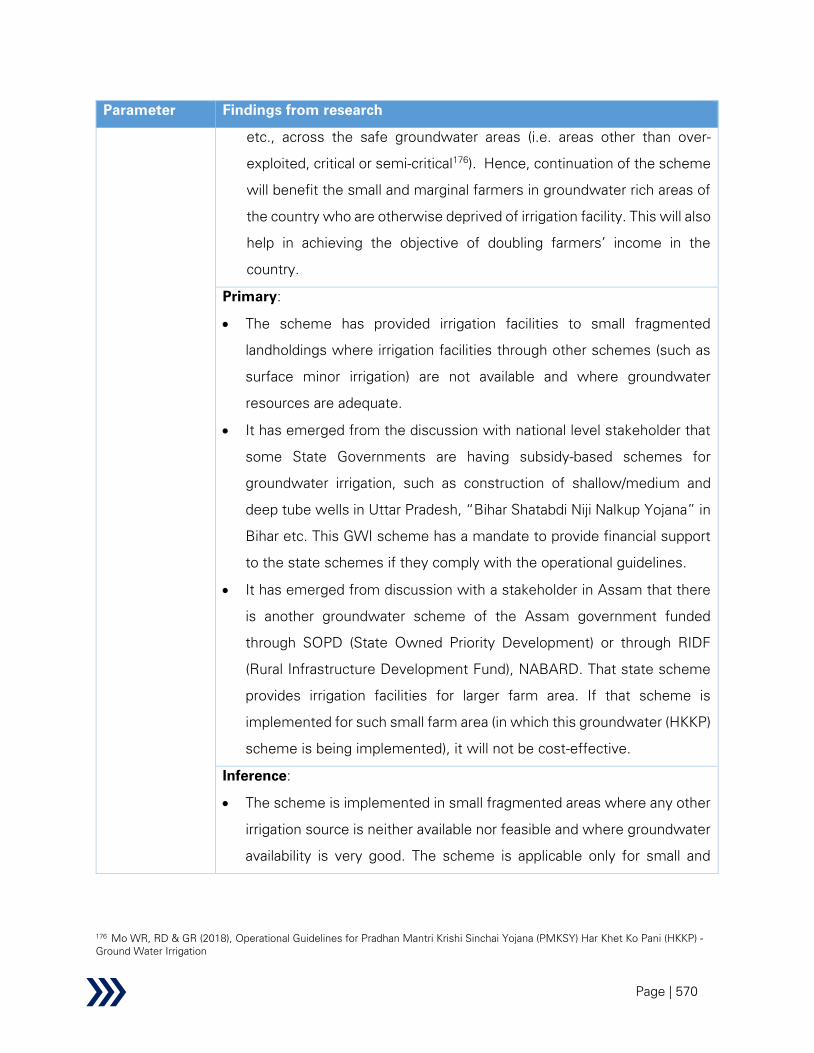
Page | 570
Parameter Findings from research
etc., across the safe groundwater areas (i.e. areas other than over-
exploited, critical or semi-critical176
). Hence, continuation of the scheme
will benefit the small and marginal farmers in groundwater rich areas of
the country who are otherwise deprived of irrigation facility. This will also
help in achieving the objective of doubling farmers’ income in the
country.
Primary:
• The scheme has provided irrigation facilities to small fragmented
landholdings where irrigation facilities through other schemes (such as
surface minor irrigation) are not available and where groundwater
resources are adequate.
• It has emerged from the discussion with national level stakeholder that
some State Governments are having subsidy-based schemes for
groundwater irrigation, such as construction of shallow/medium and
deep tube wells in Uttar Pradesh, “Bihar Shatabdi Niji Nalkup Yojana” in
Bihar etc. This GWI scheme has a mandate to provide financial support
to the state schemes if they comply with the operational guidelines.
• It has emerged from discussion with a stakeholder in Assam that there
is another groundwater scheme of the Assam government funded
through SOPD (State Owned Priority Development) or through RIDF
(Rural Infrastructure Development Fund), NABARD. That state scheme
provides irrigation facilities for larger farm area. If that scheme is
implemented for such small farm area (in which this groundwater (HKKP)
scheme is being implemented), it will not be cost-effective.
Inference:
• The scheme is implemented in small fragmented areas where any other
irrigation source is neither available nor feasible and where groundwater
availability is very good. The scheme is applicable only for small and
176 Mo WR, RD & GR (2018), Operational Guidelines for Pradhan Mantri Krishi Sinchai Yojana (PMKSY) Har Khet Ko Pani (HKKP) -
Ground Water Irrigation
Page | 571
Parameter Findings from research
marginal farmers who cannot bear cost of groundwater irrigation
facilities.
Therefore, the scheme is rated ‘Satisfactory’ in respect of relevance.
Effectiveness
Secondary:
• Although the output, outcome and impact parameters are not specified
in the scheme guidelines document, it can be logically inferred that the
scheme is expected to increase irrigation potential (output); enhance
crop productivity, improve income of farmers, reduce IPC-IPU gap
(outcome); improve socio-economic condition of the beneficiaries
(impact).
• As per the scheme guidelines, the criteria for an area to be eligible for
this scheme:
- The area should not be classified as over-exploited, critical or semi-
critical in respect of groundwater resources
- Less than 60% of the annual replenishable groundwater resources
have been developed
- Average annual rainfall should be 750 mm or more to ensure scope
for groundwater recharge
- Shallow groundwater levels within a range of 15 m below ground level
or less during pre-monsoon period
• Groundwater development will be carried out preferably through dug
wells, dug cum bore wells in hard rock area tapping shallow aquifers and
shallow/deep tube wells in alluvium areas tapping prolific aquifers. Bore
wells are to be taken up in areas where hydro-geological setup and
groundwater aquifers justifies their suitability176
• The scheme has dedicated budget allocation, institutional arrangements,
guidelines and monitoring mechanism
• Scheme guidelines mandate the following mechanism for effective
implementation:

Page | 572
Parameter Findings from research
- State govt. should identify areas for scheme implementation in
consultation with CGWB and the State Ground Water Department
- Awareness about this scheme is to be created at state/ district/ block/
panchayat level and application from beneficiaries (individual/ WUA)
shall be obtained at panchayat/ block level
- The state govt. shall prepare feasibility report/ DPR including cost
estimates and technical details in consultation with CGWB
- It is to be ensured that the areas proposed under this scheme are not
irrigated through any other scheme
- State govt. will execute the work under this project/ scheme and
institute suitable mechanism to supervise the work in efficient and
transparent manner
• Scheme guidelines mandate the following mechanism for effective
monitoring:
- CGWB shall monitor the projects at least twice a year
- Ministry may conduct 3rd
party monitoring and utilize up to 1.5% CA
component for 3rd
party monitoring, evaluation and IEC activities
- State govt. shall provide necessary assistance to CGWB or 3rd
party
for monitoring
Primary:
• The scheme is designed considering several factors including
groundwater resources, groundwater level, rainfall pattern, demography
of farmers, extent of groundwater withdrawal permissible for irrigation
without impacting groundwater conditions, technical designs of wells/
pumps etc.
• Scheme targets are proposed by the State Governments within the
eligible blocks identified based on the operational guidelines.

Page | 573
Parameter Findings from research
• Administrative approval of 13 projects has been issued amounting Rs.
1,656.27 Cr. in 11 States177
.
• The projects in Assam and Arunachal have been delayed because supply
of construction materials has been disrupted due to heavy rain, flood and
COVID-19 pandemic situation.
• Assam has utilized a fund of Rs. 81 Cr. (central + state) out of total Rs.
141 Cr. (central + state) fund released during 2019-20. All site selection
investigations targeted for 2019-20 have been completed. A total of
4,065 numbers of wells (out of 4,779) have been constructed as on 15th
June 2020. An irrigation potential of 3,000 ha has been created. It is
planned to complete construction of the remaining wells and achieve the
IPC target by September 2020.
• Arunachal Pradesh has utilized an amount of Rs. 27 Cr. out of total Rs.
45 Cr. fund released during 2019-20 for creating an irrigation potential of
1,072 ha.
• The stakeholder from north eastern region (NER) has described the
entire process as below:
- Identification of beneficiary: Applications are invited from the small
and marginal farmers along with agreement documents at Panchayat
level and included in the Block Irrigation Plan/DIP after geo-physical
survey following the operational guidelines
- Preparation of DPR/proposal by State Implementing Agency in
consultation with CGWB, NER
- Review of the proposal (DPR), by CGWB, NER, including
component-wise cost estimate of admissible items (viz. site
selection, well construction, pump installation, electric connection,
distribution pipe) as per the operational guidelines
- Administrative approval for CA is accorded by MoWR
177 Information/ comment received from CGWB on 17 Dec 2020 (since the scheme is new, started post May 2019, we have
incorporated recent information)

Page | 574
Parameter Findings from research
- Release of funds from State Govt to Implementing Agency: After
achieving satisfactory progress, the Implementing Agency submits
demand for release of fund and accordingly, fund gets released from
the State govt. to Implementing Agency as per demand
- Tenders for each admissible item are separately done on Turnkey
basis
- Execution of works on ground is done through the successful
bidders under close supervision of the field officers/Executive
Engineers and other higher officials of the department
• The stakeholder from Assam has stated the below issues, faced during
implementation of this scheme:
- Requirement of drilling rigs were so high that it could not be fulfilled
within the state. Hence, the vendors had to bring many drilling rigs
from other states which resulted in delay in progress.
- Some projects were in remote areas and road connectivity was not
good across those areas. Hence, it was challenging to transport
drilling rigs and other facilities to those areas.
• Since central level MIS is under development, the physical and financial
progress are not currently tracked by any central MIS system. However,
it is managed through in-house software application in Assam and state
level MIS system in Arunachal Pradesh.
• CGWB officials conduct in-person visits to monitor several parameters
including number of bore wells dug, number of bore wells developed,
level of electric connection, installation of solar panel, additional
command created, number of beneficiaries, etc. They conduct review
meetings with successful bidder along with Executive Engineer and
higher officials of the implementing agency. These meetings are held
quarterly for monitoring of the scheme implementation and submit
report to the Regional Directorate office, CGWB, NER, Guwahati.
Financial progress is also reported to Regional Directorate office, CGWB,
NER, Guwahati.

Page | 575
Parameter Findings from research
• The CGWB officials do not use technolgical interventions like remote
sensing, GIS, etc. for project monitoring activities considering the fact
that it would not be cost effective because the scheme covers small
farmlands. The stakeholder from Assam has agreed to this fact.
However, the officials adopt the below interventions:
- Geophysical feasibility Survey (Vertical electrical sounding/ resistivity
survey) to study existence of groundwater, identify potential site location
for implementation of groundwater irrigation infrastructure, groundwater
contamination etc.
- Hydrogeological survey to determine the groundwater level, quantity of
groundwater available at a location
Also, there is a scope for technological interventions like sensor-based
water meter, piezometer, etc. for groundwater level measurement to
monitor groundwater extraction. As an example, Andhra Pradesh is
monitoring extraction of groundwater with the help of piezometers
located across the state and groundwater related information is
maintained over their APWRIMS portal.
For these activities, existing infrastructure of various organizations like
CGWB, ISRO, etc. can be leveraged. Also, funding for the monitoring
activities can be utilized from the allocation (1.5% of CA component)
mandated for 3rd party monitoring, evaluation and IEC activities in the
scheme guidelines.
• WUAs have been formed during preparation of DPR/proposal for this
scheme. They will be involved to operate and maintain the irrigation
assets created under this scheme.
• It has emerged from the discussions with the stakeholders that CGWB,
Groundwater Research Institutes, State Departments are working
towards creating awareness among the beneficiaries about importance
of extraction of groundwater only up to a certain level, utilization of the
infrastructure, cropping pattern, water conservation practices, etc. The
department officials involve the beneficiaries for different stages of

Page | 576
Parameter Findings from research
project execution (e.g. well construction, installation of pumps etc.) and
thus, the beneficiaries are indirectly getting on-field training.
Inference:
• Physical progress in Arunachal is around 60%. In Assam, although 85%
wells are constructed, IPC creation is only around 16%. The projects are
delayed mainly because the supply of construction materials got
disrupted due to heavy rain, flood and COVID pandemic situation.
• Although WUAs were formed during proposal stage, managing irrigation
assets by them have not yet started.
• The officers are involving the beneficiaries in project execution for
providing them on-field training opportunity. However, there are no such
regular training activities currently being conducted for the beneficiaries.
Therefore, the scheme is rated ‘average’ in respect of effectiveness.
Efficiency
Secondary:
• Cost of this scheme comprises four components:
- Investigation cost for site selection
- Construction of groundwater abstraction structure (such as bore
well, tube well, dug well etc.)
- Cost of pump (electric/ solar)
- Water supply pipe
• The scheme aims to increase irrigation potential creation in safe areas
for small and marginal farmers. It is expected to increase productivity,
irrigation coverage and income of farmers.
• There is scope of convergence with MGNREGA as well as PMKSY-
Watershed component with respect to water harvesting and
groundwater recharge interventions to ensure the long-term
groundwater sustainability. There is scope of convergence with Micro-
Irrigation Fund as well to utilize the corpus for adoption of micro-irrigation
facilities in areas proposed to be covered under this scheme.176
• Convergence with these govt. schemes will help to reduce project cost.

Page | 577
Parameter Findings from research
Primary:
• It has emerged from the discussions with the stakeholders that creation
of additional assured irrigation by surface water through major, medium
and minor irrigation projects are much costlier than that by groundwater.
Cost of surface water irrigation ranges from Rs. 2.5 lakh per ha to Rs. 4
lakh per ha in SMI projects; whereas MMI irrigation projects cost around
Rs. 3.5 to more than 5 lakh per ha. depending upon how fast the project
gets completed. Therefore, groundwater irrigation can be considered
most economical since it costs in the range of Rs. 1.5 to 2.05 lakh per
ha depending upon the yields of wells and type of aquifers.
• The stakeholders have also stated that convergence with PMKSY-
Watershed Component, MGNREGA, PMKSY-Per Drop More Crop, etc.
is envisaged. Further, the State Governments are asked to extend
extension services and convergence with other schemes, such as RKVY-
RAFTAAR, Bringing Green Revolution to Eastern India (BGREI), Soil
Health Card Scheme, Paramparagat Krishi Vikas Yojana (PKVY), National
Agriculture Market (e-NAM), Pradhan Mantri Fasal Bima Yojana
(PMFBY), etc., including linkages with Krishi Vigyan Kendras (KVKs) in
the districts. These schemes will provide support for pre - & post-harvest
agri-infrastructure including access to quality inputs, storage, markets,
etc. Some of the states are also operating subsidy-based scheme for
construction of groundwater wells for irrigation and pump installation like
UP and Bihar. Administrative approval has been accorded to Uttar
Pradesh Government proposal under PMKSY-HKKP-GWI,
complementing one of the schemes of Uttar Pradesh Government in
2019-20. These convergence activities are expected to reduce project
cost and thus, enhance efficiency of this scheme. However,
convergence activities are in planning stage since the scheme is new.
• Stakeholder from NER has reported that they are planning to integrate
30% projects under the scheme with micro-irrigation system for
enhancing on-farm water use efficiency.

Page | 578
Parameter Findings from research
• The stakeholders from north eastern states have stated that maximum
cost norms for groundwater structures and their ancillaries are less
attractive to the vendor companies which supply the construction
materials. Due to logistical challenges and less availability of
construction materials, vendor companies have incurred more cost than
estimated and executed the project works at low margin. Therefore, if
the volume of projects is not high in upcoming years, the companies
might not come forward. However, the national level stakeholder has
not heard about any such challenges from the north eastern states so
far.
Inference:
• According to MI Census data and other reports on irrigation from surface
water as well as groundwater from World Bank, NITI Aayog, Planning
Commission, etc., it is well established that IPC and IPU gap in case of
groundwater is minimal. Whereas, it is higher in surface water irrigation
due to conveyance losses, distance between availability of water source
and place of its utilization. Hence, the scheme can generate many
benefits since groundwater irrigation facilities can more efficiently fulfil
irrigation need than that of surface water irrigation.
• It has emerged from the discussion with the stakeholders from national,
state and region level that cost of providing irrigation facilities through
this scheme is very less as compared to surface water irrigation
schemes and other state sponsored groundwater irrigation schemes.
However, there is scope for reducing project cost through effective
convergence activities across various govt. schemes as discussed
above, which are currently in planning stage since the scheme is new.
• Considering the scheme being operational from post May 2019, it would
be premature to rate the scheme with respect to efficiency.
Sustainability Secondary:
Page | 579
Parameter Findings from research
• The scheme guidelines mandate the following measures to ensure
sustainability of this scheme in the context of current water stressed
situation in India:
- The scheme should be planned in safe areas, cannot be planned in
areas classified as over-exploited, critical or semi-critical
- Project authorities or state government departments should monitor
groundwater levels in the project areas to ensure that groundwater
development level do not exceed 70% at any time, in any of the
areas, after implementation of the project
- Farmers will be encouraged for adopting activities through
combination of rainwater harvesting and groundwater extraction
- Farmers should be educated to adopt water use efficiency and
conservations practices, such as micro-irrigation system,
diversification to low water demand crops, promoting on-farm
rainwater harvesting etc. Awareness campaign should be conducted
for promoting such practices.
- Suitable recharge measures are to be taken up under NRM
component of MGNREGA or any other recharge scheme in the
project area.
Primary:
• National level stakeholders have stated the below procedure to maintain
sustainable groundwater resources:
- Potential assessment unit is identified considering several factors
including nature of the aquifer system in the area, spatio-temporal
behaviour of water level, groundwater resources availability, artificial
recharge structures suitable for that area and sites for their
construction, etc.
- Limiting the number of wells in any potential assessment unit
through the method below:
Page | 580
Parameter Findings from research
1) Identify the maximum probable wells that can be drilled which
can lead to the Stage of Groundwater Development (SOD) being
beyond 70%
2) The limit of admissible number of wells in each assessment unit
is kept 20% less than the wells required to lead SOD to 70%
(calculated in step1)
3) Number of wells proposed in State Government proposals are
significantly less than the admissible wells (calculated in step 2)
in each unit which comfortably covers the wells drilled other than
this groundwater (HKKP) scheme
- Convergence with other schemes, such as PMKSY-Watershed
Component, MGNREGA, PMKSY-Per Drop More Crop, etc., for
supporting water harvesting and groundwater recharge
interventions/demand side interventions will influence long-term
sustainability of groundwater resources.
• However, marginal risk of failure of bore wells, especially in hard rock
areas do exist for which provision of site selection through
hydrogeological and geophysical investigation is mandated in the
scheme guidelines.
• Discussions with the stakeholders from Assam and Arunachal Pradesh
have indicated that existing groundwater resources is abundant in these
states. Hence, it will take long time to reach groundwater development
level beyond 70%. Still, they are planning to have convergence with
some groundwater recharge schemes for replenishment of groundwater
resources.
• The stakeholders have stated that since the project envisages
withdrawal of maximum 70% of replenishable dynamic groundwater
resources, possibility of deterioration of groundwater quality is very less.
However, State Technical Advisory Committee has also recommended
the study of the groundwater quality and its regular monitoring by CGWB
and PHED in all these areas through their network of observation wells.
Page | 581
Parameter Findings from research
Tapping of aquifer zone beyond 50 m is suggested in arsenic prone
districts/areas.
• The stakeholders have stated that general life span of tube well is 10-15
years; thus, no such maintenance is required for the tube wells.
However, the farmers should be provided with extensive training for
operations and maintenance of pumps and other electrical components
(switch gear, LT panel, etc.) associated with the water abstraction setup.
Inference:
• The states are following the eligibility criteria for site selection to ensure
groundwater development does not go beyond safe limit.
• The states are planning for convergence with groundwater recharge as
well as water conservation schemes for ensuring long-term
sustainability of groundwater resources.
• Considering the scheme being operational from post May 2019, it would
be premature to rate the scheme with respect to sustainability.
Impact
Secondary:
• The scheme aims to improve the socio-economic condition of the small
and marginal farmers in safe areas by providing groundwater irrigation
facilities.
Primary:
Since this is a recently launched scheme, impact of the scheme cannot be
assessed at this stage.
Inference:
• Since the scheme has been operational post May 2019, it would be
premature to evaluate impact of the scheme.
Equity
Secondary:
• The scheme is targeted only at small and marginal farmers
• The scheme guidelines mandate to provide priority to the SC/ST and
women farmers
Primary:
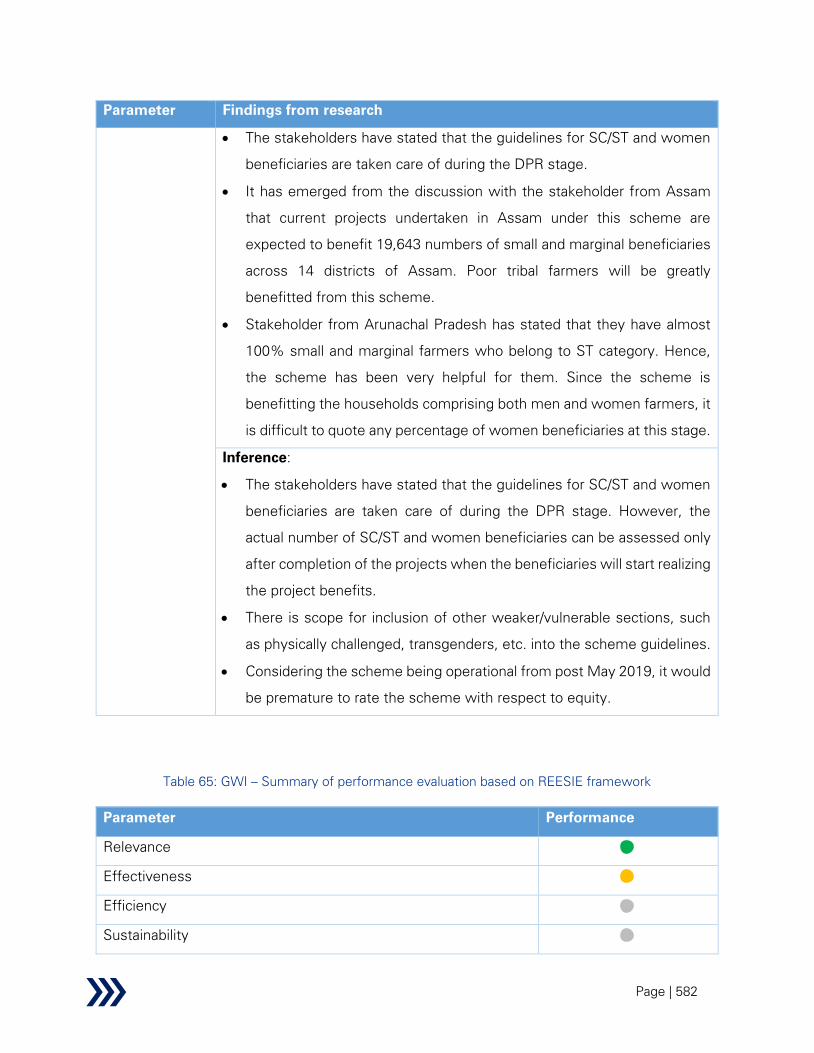
Page | 582
Parameter Findings from research
• The stakeholders have stated that the guidelines for SC/ST and women
beneficiaries are taken care of during the DPR stage.
• It has emerged from the discussion with the stakeholder from Assam
that current projects undertaken in Assam under this scheme are
expected to benefit 19,643 numbers of small and marginal beneficiaries
across 14 districts of Assam. Poor tribal farmers will be greatly
benefitted from this scheme.
• Stakeholder from Arunachal Pradesh has stated that they have almost
100% small and marginal farmers who belong to ST category. Hence,
the scheme has been very helpful for them. Since the scheme is
benefitting the households comprising both men and women farmers, it
is difficult to quote any percentage of women beneficiaries at this stage.
Inference:
• The stakeholders have stated that the guidelines for SC/ST and women
beneficiaries are taken care of during the DPR stage. However, the
actual number of SC/ST and women beneficiaries can be assessed only
after completion of the projects when the beneficiaries will start realizing
the project benefits.
• There is scope for inclusion of other weaker/vulnerable sections, such
as physically challenged, transgenders, etc. into the scheme guidelines.
• Considering the scheme being operational from post May 2019, it would
be premature to rate the scheme with respect to equity.
Table 65: GWI – Summary of performance evaluation based on REESIE framework
Parameter Performance
Relevance
Effectiveness
Efficiency
Sustainability
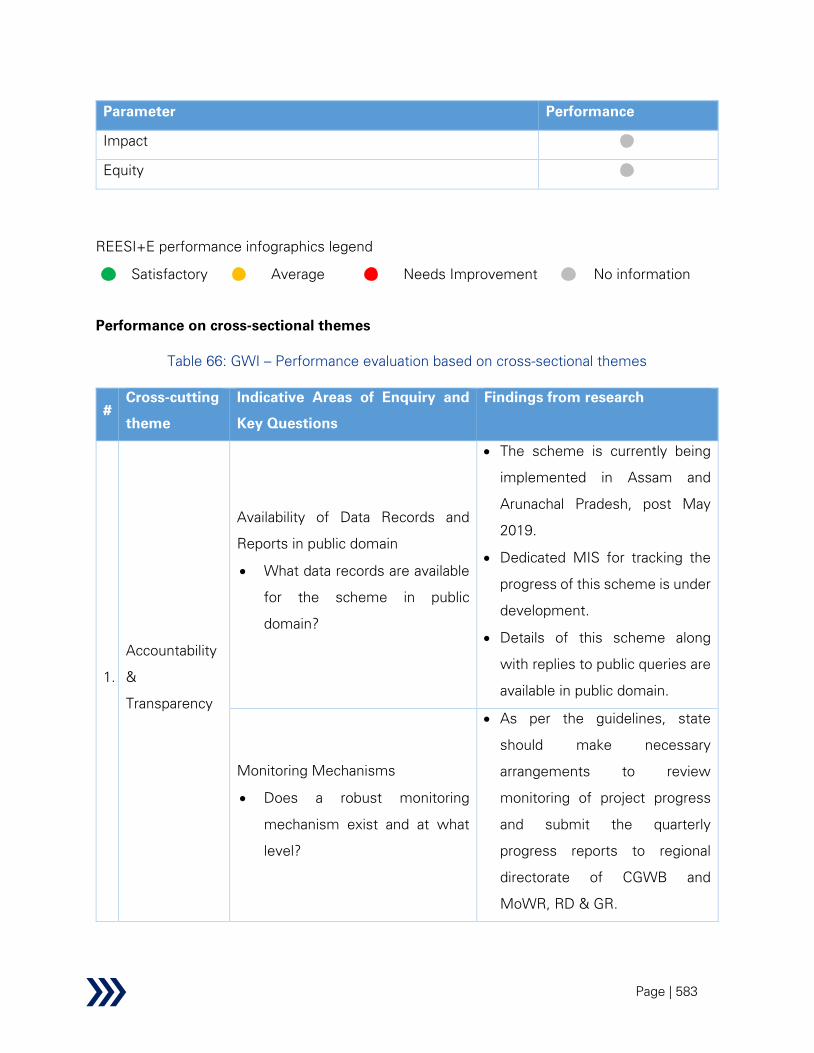
Page | 583
Parameter Performance
Impact
Equity
REESI+E performance infographics legend
Satisfactory
Average
Needs Improvement
No information
Performance on cross-sectional themes
Table 66: GWI – Performance evaluation based on cross-sectional themes
#
Cross-cutting
theme
Indicative Areas of Enquiry and
Key Questions
Findings from research
1.
Accountability
&
Transparency
Availability of Data Records and
Reports in public domain
• What data records are available
for the scheme in public
domain?
• The scheme is currently being
implemented in Assam and
Arunachal Pradesh, post May
2019.
• Dedicated MIS for tracking the
progress of this scheme is under
development.
• Details of this scheme along
with replies to public queries are
available in public domain.
Monitoring Mechanisms
• Does a robust monitoring
mechanism exist and at what
level?
• As per the guidelines, state
should make necessary
arrangements to review
monitoring of project progress
and submit the quarterly
progress reports to regional
directorate of CGWB and
MoWR, RD & GR.
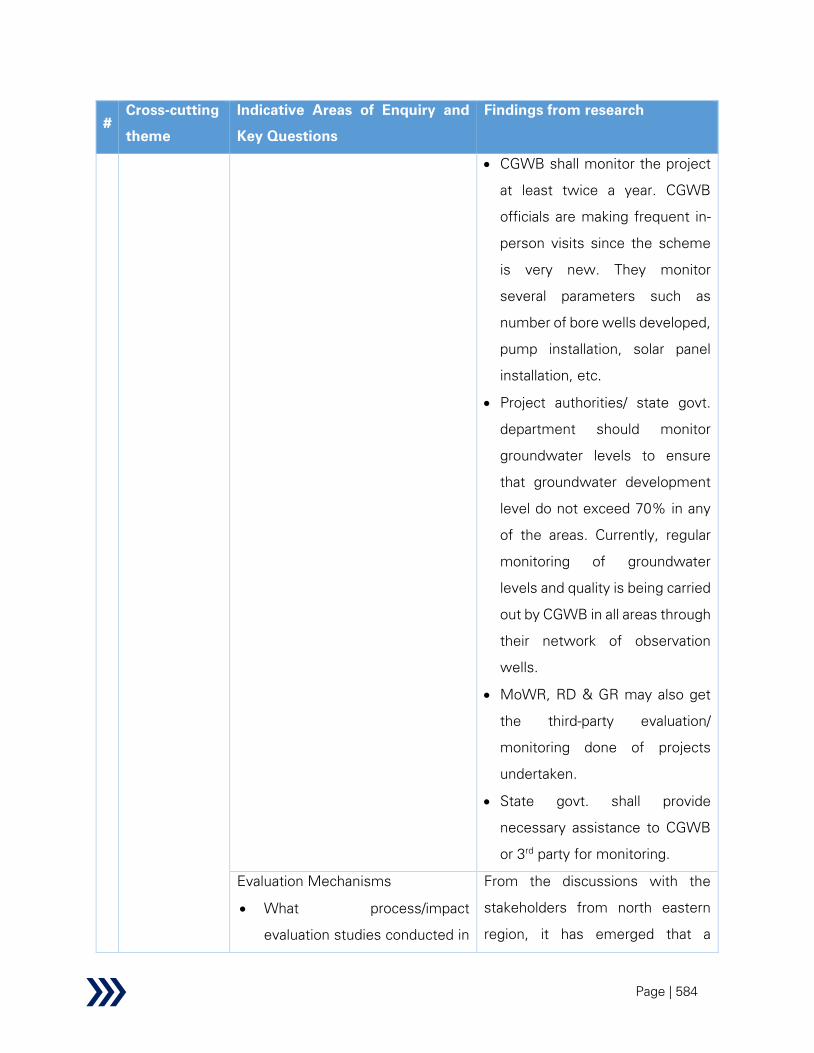
Page | 584
#
Cross-cutting
theme
Indicative Areas of Enquiry and
Key Questions
Findings from research
• CGWB shall monitor the project
at least twice a year. CGWB
officials are making frequent in-
person visits since the scheme
is very new. They monitor
several parameters such as
number of bore wells developed,
pump installation, solar panel
installation, etc.
• Project authorities/ state govt.
department should monitor
groundwater levels to ensure
that groundwater development
level do not exceed 70% in any
of the areas. Currently, regular
monitoring of groundwater
levels and quality is being carried
out by CGWB in all areas through
their network of observation
wells.
• MoWR, RD & GR may also get
the third-party evaluation/
monitoring done of projects
undertaken.
• State govt. shall provide
necessary assistance to CGWB
or 3rd
party for monitoring.
Evaluation Mechanisms
• What process/impact
evaluation studies conducted in
From the discussions with the
stakeholders from north eastern
region, it has emerged that a
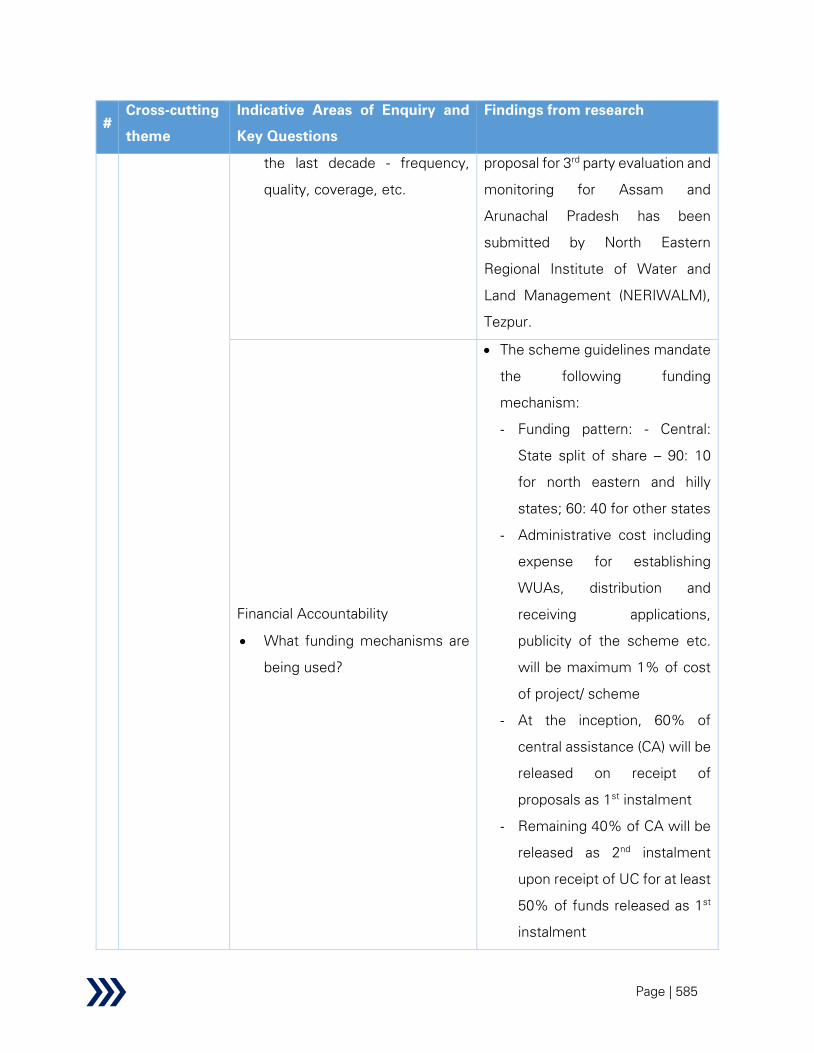
Page | 585
#
Cross-cutting
theme
Indicative Areas of Enquiry and
Key Questions
Findings from research
the last decade - frequency,
quality, coverage, etc.
proposal for 3rd
party evaluation and
monitoring for Assam and
Arunachal Pradesh has been
submitted by North Eastern
Regional Institute of Water and
Land Management (NERIWALM),
Tezpur.
Financial Accountability
• What funding mechanisms are
being used?
• The scheme guidelines mandate
the following funding
mechanism:
- Funding pattern: - Central:
State split of share – 90: 10
for north eastern and hilly
states; 60: 40 for other states
- Administrative cost including
expense for establishing
WUAs, distribution and
receiving applications,
publicity of the scheme etc.
will be maximum 1% of cost
of project/ scheme
- At the inception, 60% of
central assistance (CA) will be
released on receipt of
proposals as 1st instalment
- Remaining 40% of CA will be
released as 2nd
instalment
upon receipt of UC for at least
50% of funds released as 1st
instalment
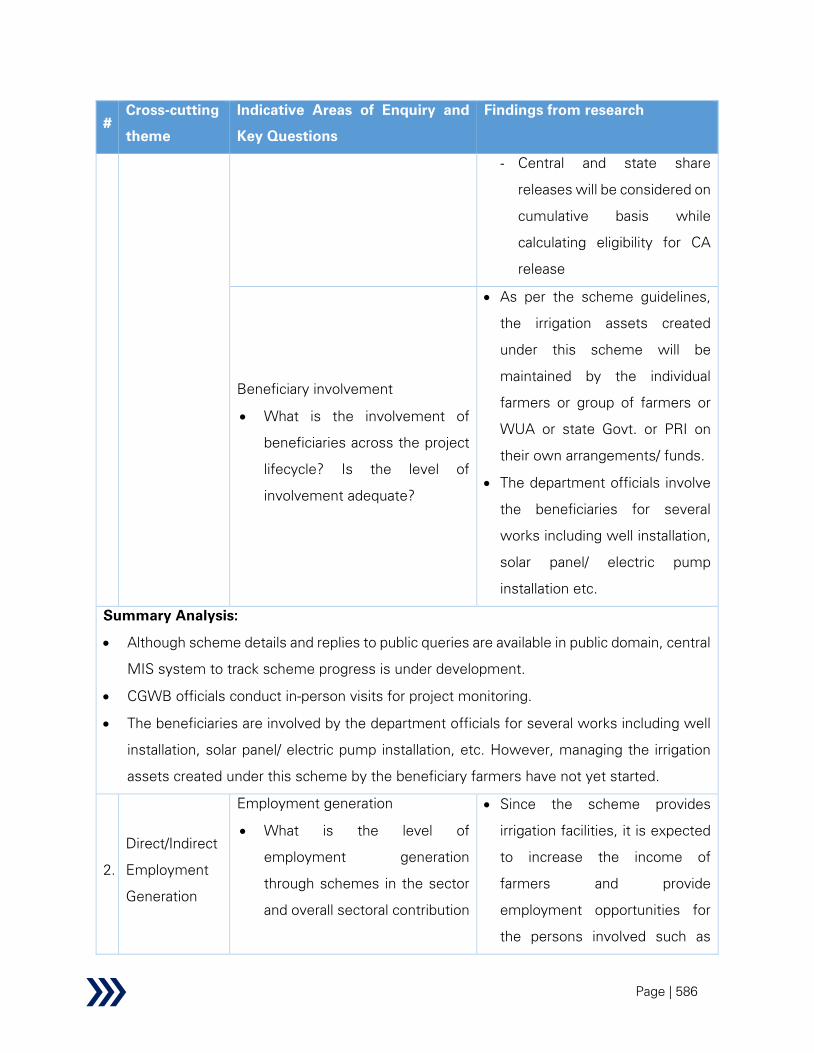
Page | 586
#
Cross-cutting
theme
Indicative Areas of Enquiry and
Key Questions
Findings from research
- Central and state share
releases will be considered on
cumulative basis while
calculating eligibility for CA
release
Beneficiary involvement
• What is the involvement of
beneficiaries across the project
lifecycle? Is the level of
involvement adequate?
• As per the scheme guidelines,
the irrigation assets created
under this scheme will be
maintained by the individual
farmers or group of farmers or
WUA or state Govt. or PRI on
their own arrangements/ funds.
• The department officials involve
the beneficiaries for several
works including well installation,
solar panel/ electric pump
installation etc.
Summary Analysis:
• Although scheme details and replies to public queries are available in public domain, central
MIS system to track scheme progress is under development.
• CGWB officials conduct in-person visits for project monitoring.
• The beneficiaries are involved by the department officials for several works including well
installation, solar panel/ electric pump installation, etc. However, managing the irrigation
assets created under this scheme by the beneficiary farmers have not yet started.
2.
Direct/Indirect
Employment
Generation
Employment generation
• What is the level of
employment generation
through schemes in the sector
and overall sectoral contribution
• Since the scheme provides
irrigation facilities, it is expected
to increase the income of
farmers and provide
employment opportunities for
the persons involved such as

Page | 587
#
Cross-cutting
theme
Indicative Areas of Enquiry and
Key Questions
Findings from research
in National employment
generation?
• What is the improvement in
income levels?
• What is the women
participation (%) in the
Sector/Program?
mechanics, drillers, pump
manufacturers, electricians, etc.
• The scheme is very new
(operational post May 2019);
hence, it would be pre-mature to
estimate actual employment
generation and increase in
income.
Summary Analysis:
• It is expected to increase income of farmers and provide employment opportunities for
persons involved such as mechanics, drillers, pump manufacturers, electricians, etc.
• The scheme is very new (operational post May 2019); hence, it would be pre-mature to
estimate actual employment generation and increase in income at this stage.
3.
Gender
mainstreaming
Inclusiveness in scheme design/
planning
• Is there a specific mention of
gender equality and equity
considerations in the scheme
guidelines/objectives, i.e. has
the scheme been designed
keeping gender considerations
in mind?
• As per the guidelines, the
beneficiary under this scheme
shall be small and marginal
farmers only with priority to be
given to SC/ST and Women
farmers.
• The key informants from Assam
and Arunachal Pradesh have
stated that they have followed
the mandate during the
DPR/proposal stage. However,
actual women beneficiary data is
not available at this stage.
Gender-friendly infrastructure and
policies
• How has empowerment of
women improved?
• According to the primary
stakeholders, no exclusive
training programs for women are
proposed under the scheme but
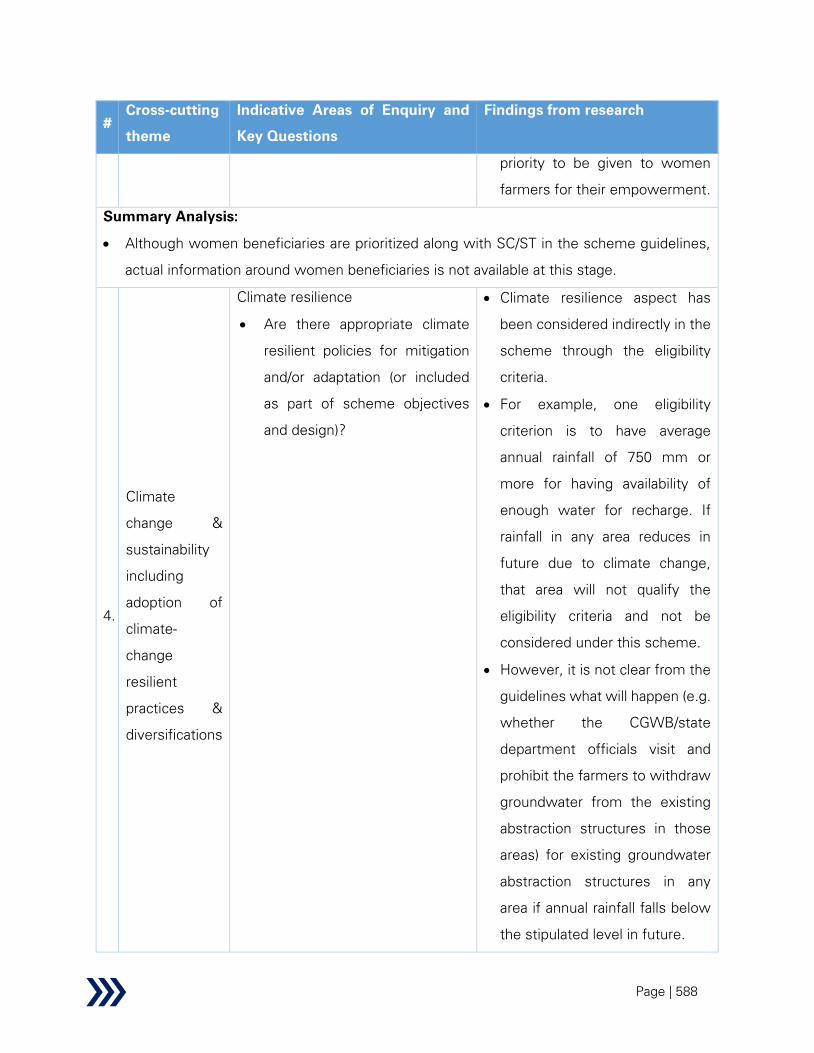
Page | 588
#
Cross-cutting
theme
Indicative Areas of Enquiry and
Key Questions
Findings from research
priority to be given to women
farmers for their empowerment.
Summary Analysis:
• Although women beneficiaries are prioritized along with SC/ST in the scheme guidelines,
actual information around women beneficiaries is not available at this stage.
4.
Climate
change &
sustainability
including
adoption of
climate-
change
resilient
practices &
diversifications
Climate resilience
• Are there appropriate climate
resilient policies for mitigation
and/or adaptation (or included
as part of scheme objectives
and design)?
• Climate resilience aspect has
been considered indirectly in the
scheme through the eligibility
criteria.
• For example, one eligibility
criterion is to have average
annual rainfall of 750 mm or
more for having availability of
enough water for recharge. If
rainfall in any area reduces in
future due to climate change,
that area will not qualify the
eligibility criteria and not be
considered under this scheme.
• However, it is not clear from the
guidelines what will happen (e.g.
whether the CGWB/state
department officials visit and
prohibit the farmers to withdraw
groundwater from the existing
abstraction structures in those
areas) for existing groundwater
abstraction structures in any
area if annual rainfall falls below
the stipulated level in future.
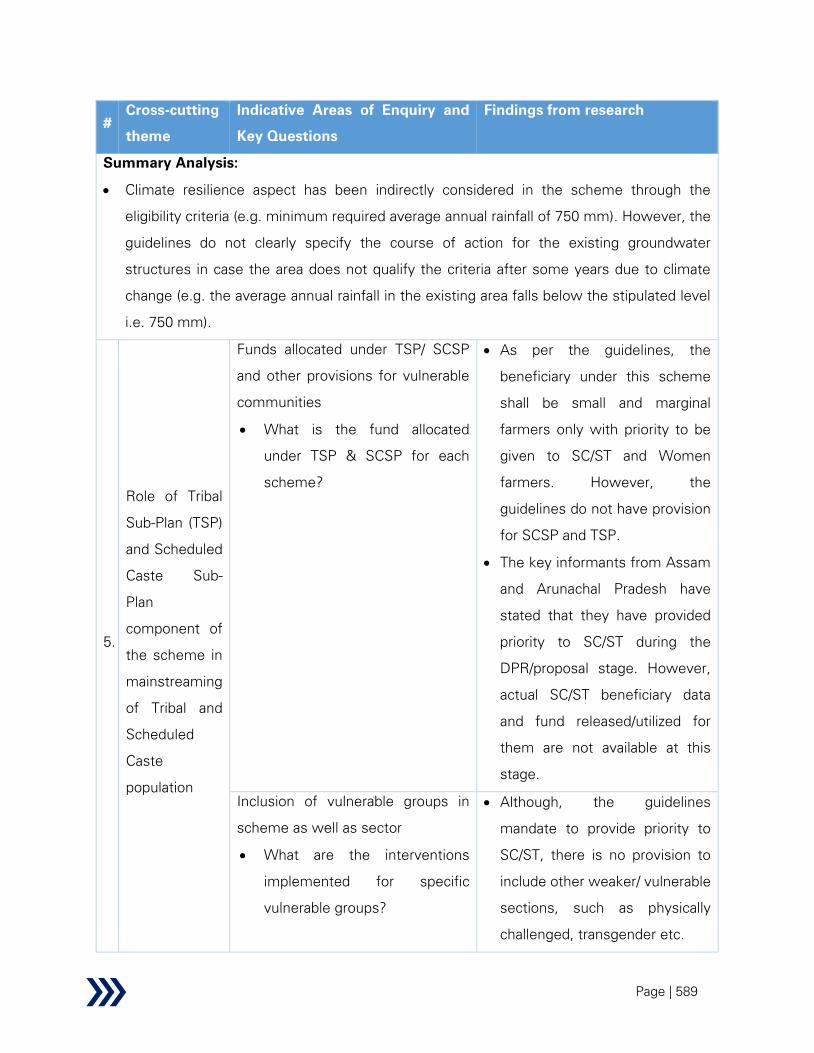
Page | 589
#
Cross-cutting
theme
Indicative Areas of Enquiry and
Key Questions
Findings from research
Summary Analysis:
• Climate resilience aspect has been indirectly considered in the scheme through the
eligibility criteria (e.g. minimum required average annual rainfall of 750 mm). However, the
guidelines do not clearly specify the course of action for the existing groundwater
structures in case the area does not qualify the criteria after some years due to climate
change (e.g. the average annual rainfall in the existing area falls below the stipulated level
i.e. 750 mm).
5.
Role of Tribal
Sub-Plan (TSP)
and Scheduled
Caste Sub-
Plan
component of
the scheme in
mainstreaming
of Tribal and
Scheduled
Caste
population
Funds allocated under TSP/ SCSP
and other provisions for vulnerable
communities
• What is the fund allocated
under TSP & SCSP for each
scheme?
• As per the guidelines, the
beneficiary under this scheme
shall be small and marginal
farmers only with priority to be
given to SC/ST and Women
farmers. However, the
guidelines do not have provision
for SCSP and TSP.
• The key informants from Assam
and Arunachal Pradesh have
stated that they have provided
priority to SC/ST during the
DPR/proposal stage. However,
actual SC/ST beneficiary data
and fund released/utilized for
them are not available at this
stage.
Inclusion of vulnerable groups in
scheme as well as sector
• What are the interventions
implemented for specific
vulnerable groups?
• Although, the guidelines
mandate to provide priority to
SC/ST, there is no provision to
include other weaker/ vulnerable
sections, such as physically
challenged, transgender etc.

Page | 590
#
Cross-cutting
theme
Indicative Areas of Enquiry and
Key Questions
Findings from research
Summary Analysis:
• There is no provision for TSP and SCSP in the scheme guidelines.
• Although the scheme guidelines provide more focus on SC/ST, actual information on SC/ST
beneficiaries, funds released/ utilized for them are not available.
6.
Use of
IT/Technology
in driving
efficiency
Deployment of IT enabled
mechanisms for monitoring of the
Schemes
• In case of a scheme to create
physical assets, is geotagging
and use of geotagged
photographs being done?
• How is technology being used
for on-ground data collection?
• The scheme guidelines suggest
utilizing appropriate technology
including remote sensing to
investigate the areas where
recharge interventions can be
constructed. No such
interventions have been adopted
so far.
• Geo-tagging of irrigation assets
has been done to identify them
and maintain transparency in
scheme implementation. It is
also helpful for future planning.
• Technologies used for on-
ground data collections are:
- Geophysical feasibility
Survey (Vertical electrical
sounding/ resistivity survey)
to study existence of
groundwater, identify
potential site location for
implementation of
groundwater irrigation
infrastructure, groundwater
contamination etc.

Page | 591
#
Cross-cutting
theme
Indicative Areas of Enquiry and
Key Questions
Findings from research
- Hydrogeological survey to
determine the groundwater
level, quality and quantity of
groundwater available at a
particular location.
• Technological interventions have
not been adopted for project
monitoring yet considering that it
would not be cost-effective for
such small scale of the projects.
• Arunachal Pradesh has state
level MIS system to track project
progress. In-house software
application and WhatsApp group
fulfil the purpose in Assam.
Summary Analysis:
• The states geo-tag the physical assets, use geo-tagged photographs.
• Geo-physical feasibility and hydro-geological survey are carried out to identify potential site
location, groundwater availability and level of groundwater contamination.
• The scheme guidelines suggest utilizing appropriate technology including remote sensing
to investigate the areas where recharge interventions can be constructed. However, no
such interventions have been adopted so far.
7.
Stakeholder
and
Beneficiary
behavioural
change
Fund Allocation
• What percent of total allocation
is directed towards Awareness
generation or sensitization?
What is the utilization rate? and
How much impact has it been
able to generate in terms of
behaviour change?
• Scheme guidelines mandate that
the Ministry may utilize up to
1.5% of central assistance (CA)
for IEC activities, evaluation and
3rd
party monitoring. However,
stakeholder from Assam has
suggested to increase this
allocation to at least 5%.

Page | 592
#
Cross-cutting
theme
Indicative Areas of Enquiry and
Key Questions
Findings from research
Cropping pattern
• How has this scheme impacted
cropping pattern?
• Scheme guidelines suggest for
promotion and adoption of low
water demand cropping pattern
for efficient use and
conservation of water.
• According to the stakeholder
from north east region, this
scheme will help the farmers to
get assured irrigation water for
cultivating cereals, vegetables,
horticulture crops, etc.
throughout the years.
Summary Analysis:
• Although the scheme guideline mandates a provision to utilize funding for generating
awareness about this scheme, information around actual utilization of this fund is not
available.
• This scheme is expected to get assured irrigation water for cultivating cereals, vegetables,
horticulture crops, etc. throughout the years. However, actual realization is yet to happen.
8.
Research &
Development
Fund Allocation
• What percentage of total
allocation (Sector as well as
Scheme specific) is directed
towards R&D? How much of
that percent is being utilized?
• The scheme guidelines do not
have any provision for R&D.
Also, no fund is earmarked for
such activities.
• However, there is scope of R&D
in the following areas:
- Aquifer vulnerability
assessment to reduce the
risk of failure of bore wells
and demarcate aquifer zone
vulnerable to
contaminations

Page | 593
#
Cross-cutting
theme
Indicative Areas of Enquiry and
Key Questions
Findings from research
- Cleaning up of
contaminated aquifer
- Regulated use of
groundwater so that
groundwater extraction
under this scheme does not
exceed the Stage of
Groundwater Development
(SOD) beyond 70% in any
area
- Improvement of accuracy
and frequency of
groundwater data
- Micro level information of
depleted aquifers
Summary Analysis:
• The scheme guidelines do not have any provision for R&D and no funds earmarked for such
activities. However, there is scope for R&D activities in this groundwater irrigation area.
9.
Unlocking
Synergies with
other
Government
Program
Convergence (Inter-
Ministerial/Inter-
Departmental/Financial/Human
Resources/ Administrative/
Institutions/ Schemes
• What activities are undertaken
to ensure convergence at
community level? Are there any
Action Plans prepared at
State/District/Block level to
ensure the same?
• Since the project is new,
convergence activities are not
undertaken yet across states.
However, the state department
realizes the importance of
convergence and is currently
planning for that.

Page | 594
#
Cross-cutting
theme
Indicative Areas of Enquiry and
Key Questions
Findings from research
Potential areas for synergy
• What are the areas for potential
convergence / synergy across
govt. programs?
• There is scope for convergence
with PMKSY-Watershed
Component, MGNREGA,
PMKSY-Per Drop More Crop,
etc. for supporting water
harvesting, groundwater
recharge and water use efficient
interventions for sustaining long
term groundwater management.
Summary Analysis:
• There is scope for convergence with MGNREGA, PMKSY- WDC and PMKSY-PDMC for
activities including water harvesting, groundwater recharge and efficient use of water.
However, convergence activities are in planning stage since the scheme is new.
10.
Impact on and
role of private
sector,
community/
collectives/
cooperatives
(e.g. Farmer
cooperatives,
FPOs, Water
User
Associations,
etc.) and civil
society in the
scheme
Private Sector Participation
What is the percentage of private
investment in the clusters/programs
run by the government?
Apart from material supply (pumps,
electrical components, pipes, etc.)
and EPC contract, private sector
involvement is limited.
FPOs/SHGs/Cooperative's
Participation
How many private sector,
community/collectives/cooperatives
and civil society have availed the
benefits under any Scheme?
WUAs are supposed to be involved
in operations and management of
irrigation assets. However, there is
absence of adequate data for
WUAs. Also, information related to
FPOs, SHGs, Cooperative’s
participation is not available.
Summary Analysis:
• Apart from material supply and EPC contract, private sector involvement is limited.
• There is absence of adequate data for WUAs, FPOs, SHGs etc.
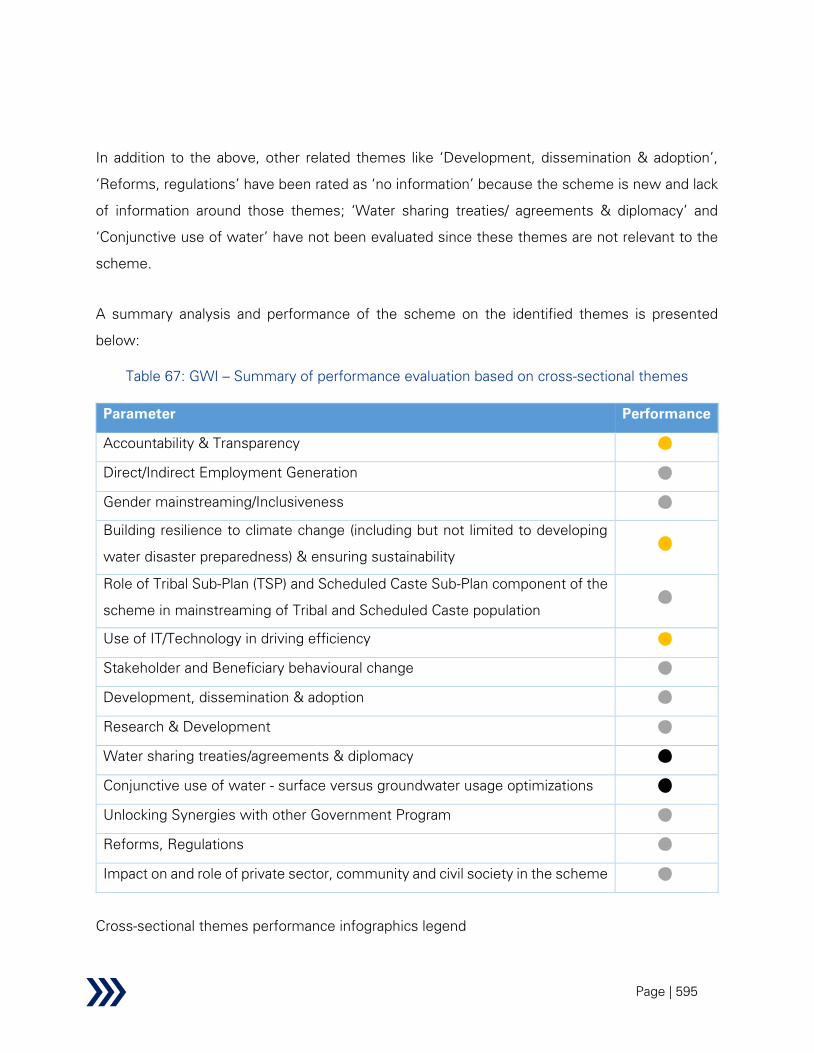
Page | 595
In addition to the above, other related themes like ‘Development, dissemination & adoption’,
‘Reforms, regulations’ have been rated as ‘no information’ because the scheme is new and lack
of information around those themes; ‘Water sharing treaties/ agreements & diplomacy’ and
‘Conjunctive use of water’ have not been evaluated since these themes are not relevant to the
scheme.
A summary analysis and performance of the scheme on the identified themes is presented
below:
Table 67: GWI – Summary of performance evaluation based on cross-sectional themes
Parameter Performance
Accountability & Transparency
Direct/Indirect Employment Generation
Gender mainstreaming/Inclusiveness
Building resilience to climate change (including but not limited to developing
water disaster preparedness) & ensuring sustainability
Role of Tribal Sub-Plan (TSP) and Scheduled Caste Sub-Plan component of the
scheme in mainstreaming of Tribal and Scheduled Caste population
Use of IT/Technology in driving efficiency
Stakeholder and Beneficiary behavioural change
Development, dissemination & adoption
Research & Development
Water sharing treaties/agreements & diplomacy
Conjunctive use of water - surface versus groundwater usage optimizations
Unlocking Synergies with other Government Program
Reforms, Regulations
Impact on and role of private sector, community and civil society in the scheme
Cross-sectional themes performance infographics legend

Page | 596
High
Medium
Low
Not relevant
No information
Issues and challenges
This scheme is operational post May 2019 in Assam and Arunachal Pradesh. Progress is also
good so far. Stakeholder from Assam has indicated very few issues and challenges faced during
scheme implementation.
Table 68: GWI – Issues and challenges
Sl.no Issues & Challenges
GWI - F1
Requirement of drilling rigs were so high that it could not be fulfilled from within
the state (Assam). Hence, the vendors had to bring many drilling rigs from other
states which resulted in cost escalation as well as delays.
GWI – F2
Some projects were in remote areas and road connectivity is not good across those
areas. Hence, it was challenging to transport drilling rigs and other facilities to
those areas.
GWI – F3
From the discussions with state level stakeholders, it has emerged that maximum
cost norms for groundwater structures and their ancillaries are less attractive to
the vendor companies across the north eastern states which supply the
construction materials. Due to logistical challenges and less availability of
construction materials, vendor companies have incurred more cost than estimated
and executed the project works at low margin. Therefore, if the volume of projects
is not high in upcoming years, the companies might not come forward for
construction of such projects. However, the national level stakeholder has
informed that they have not heard about any such challenges from the north
eastern states.
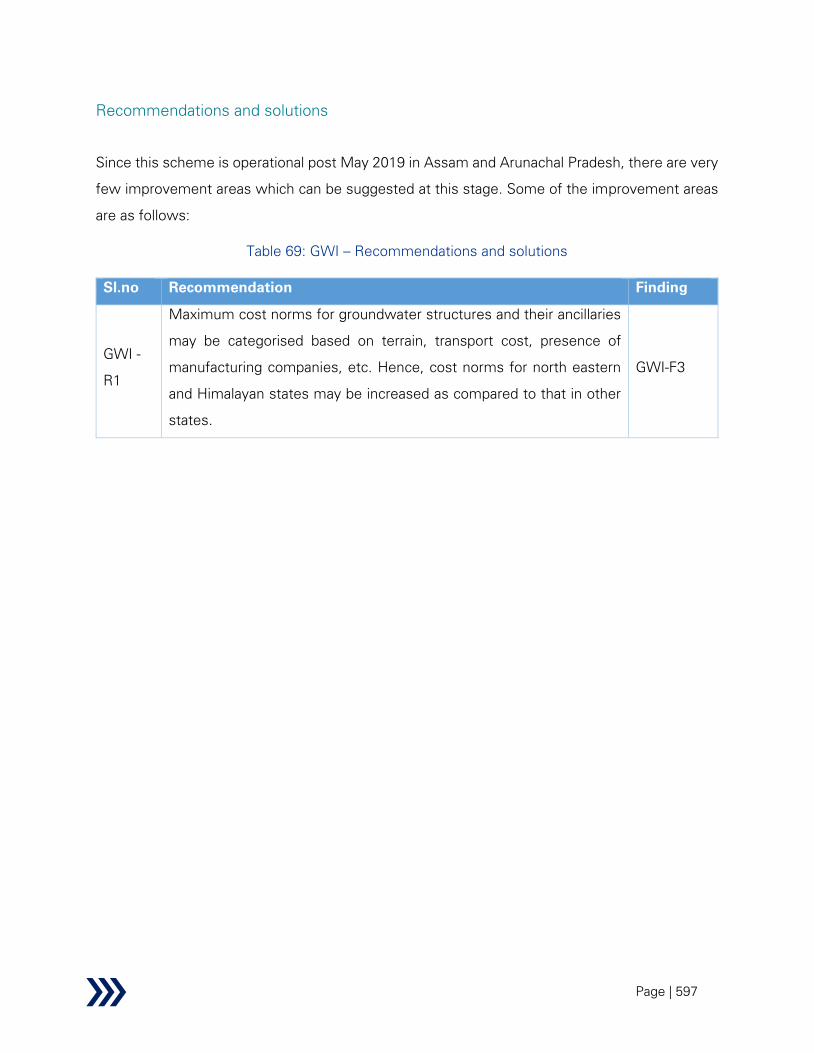
Page | 597
Recommendations and solutions
Since this scheme is operational post May 2019 in Assam and Arunachal Pradesh, there are very
few improvement areas which can be suggested at this stage. Some of the improvement areas
are as follows:
Table 69: GWI – Recommendations and solutions
Sl.no Recommendation Finding
GWI -
R1
Maximum cost norms for groundwater structures and their ancillaries
may be categorised based on terrain, transport cost, presence of
manufacturing companies, etc. Hence, cost norms for north eastern
and Himalayan states may be increased as compared to that in other
states.
GWI-F3
Page | 598
2.2.3 Special Package for Irrigation Projects in agrarian districts of Maharashtra
In July 2018, Government of India approved the Centrally Sponsored Scheme - ‘Special Package
for completion of Irrigation Projects in suicide prone districts in Vidarbha and Marathwada and
other chronically drought prone areas of Rest of Maharashtra’ with Central Assistance of Rs.3,831
Cr. The intent was to complete 83 Surface Minor Irrigation (SMI) projects and 8 Major / Medium
Irrigation Projects. It was envisaged that the completion of proposed projects would help in the
creation of additional 3.77 lakh ha of irrigation potential.
The projects proposed under the special package are over and above the prioritized projects
currently being funded under PMKSY and will receive Central Assistance of 25%. If required, the
State share can be arranged by borrowing, from NABARD. The monitoring of these projects is
on the lines of PMKSY.
2.2.3.1 Background
Maharashtra having a total cultivable area of around 225 lakh ha. has a typical geographical pattern
with skewed distribution of rainfall resulting in droughts, impacting many districts of the State,
as a recurrent phenomenon. Maharashtra experienced hydrological and agricultural drought
during the years 2012 to 2016. The situation was worst in Vidarbha and Marathwada regions.
Unfortunate incidences of suicides by farmers occurred in 6 districts of Vidarbha region and 8
districts of Marathwada region. Also, Drought Prone Areas (DPA) in rest of Maharashtra were
experiencing distress in the recent years.
The Govt. of Maharashtra reported that irrigation potential created in 14 districts in Marathwada
and Vidarbha was around 18%. Only 6.4% of the area was irrigated while the balance 93.6%
area was rainfed. Therefore, providing adequate irrigation facilities for sustainable agriculture was
the need of the hour. The State Government took various measures to overcome the farmers’
distress in these areas. One of the steps was to complete ongoing irrigation projects benefiting
such areas.
On 15-5-2017 Govt. of Maharashtra submitted a proposal containing 115 Surface Minor Irrigation
(SMI) and Major/medium Irrigation (MMI) projects in Vidarbha, Marathwada and drought prone
areas in the rest of Maharashtra for special package. Later in December 2017, it was informed

Page | 599
by the State Govt. that out of 115 projects, 3 projects were completed. Out of balance 112
projects, (83 SMI and 29 MMI), 83 SMI and 7 MMI projects had requisite TAC clearances from
State/Ministry of WR, RD & GR as required. Later, one more MMI project (Warkhed Londhe)
obtained TAC clearance. The special package was proposed for these 91 projects (83 SMI and 8
MMI). The total estimated balance cost of these projects was Rs. 13,651.61 Cr. as on 01.04.2018.
These projects were ongoing and Rs.11,552.15 Cr. had already been spent by the State
Government on these projects as on 31.3.2018. The completion of balance works of these
projects would help in creation of additional 3.77 lakh ha of potential and reduce distress
conditions in 12 districts of Vidarbha and Marathwada regions of Maharashtra and certain other
drought prone areas of rest of Maharashtra.
2.2.3.2 Performance
There are total 91 projects considered under this scheme across 16 districts in Vidarbha and
Marathwada regions.
Physical Progress178
Ultimate irrigation potential of these 91 projects is 406,440 ha. As on 1st April 2018, balance
irrigation potential to be created was 372,938 ha. From 2018-19 to 2019-20, irrigation potential
creation was 90,410 ha.
Table 70: SPFM – Physical Progress178
# Projects
Balance Irrigation
Potential as on
01.04.2018 (Ha)
Irrigation Potential
Created (2018-19
to 2019-20) (Ha)
Progress
83 Surface Minor Irrigation (SMI) Projects
1 Vidarbha 53,826 12,121 23%
2 Marathwada 11,762 1,018 9%
SMI Total 65,588 13,139 20%
8 Major/Medium
Irrigation (MMI) Projects
307,350 77,271 25%
Total Maharashtra State 372,938 90,410 24%
178 Data shared by SPR wing under MoWR, RD & GR on 27 Aug and 1 Sep 2020

Page | 600
Financial Progress178
As on 1st April 2018, total approved balance cost of these 91 projects was Rs. 11,969 Cr. From
2018-19 to 2019-20, an amount of Rs. 800 Cr. was released as central assistance (CA).
Table 71: SPFM – Financial Progress178
# Projects
Balance Cost as on
01.04.2018
(Rs. in Cr.)
CA Release (2018-19 to
2019-20)
(Rs. in Cr.)
1 Vidarbha 2,525 294
2 Marathwada 352 43
SMI Total 2,877 337
8 Major/Medium Irrigation
(MMI) Projects
9,092 463
Total Maharashtra State 11,969 800
Performance on REESI+E framework
Table 72: SPFM – Performance evaluation based on REESIE framework
Parameter Findings from research
Relevance
Secondary:
• Maharashtra experienced hydrological and agricultural drought during
the years 2012 to 2016 and the situation was worst in Vidarbha and
Marathwada regions179
• Unfortunate incidence of suicides by famers occurred in 6 districts of
Vidarbha region and 8 districts of Marathwada region179
• Irrigation potential created across 14 districts of Vidarbha and
Marathwada regions was only around 18%179
• Therefore, the scheme was incorporated for providing adequate
irrigation facilities for sustainable agriculture, water for domestic use in
these suicide prone districts and drought prone areas. The scheme is
expected to improve the socio-economic condition of the farmers of
179 Scheme guidelines, Special Package for Maharashtra, MoWR, RD & GR (June 2018)
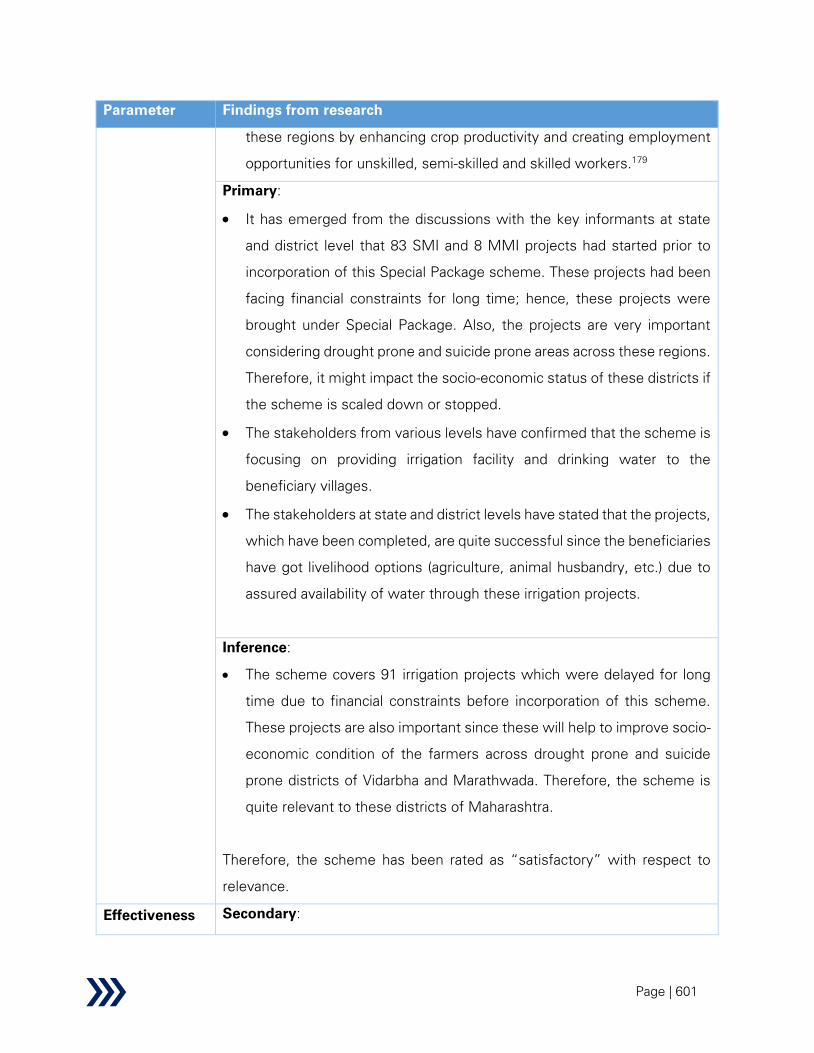
Page | 601
Parameter Findings from research
these regions by enhancing crop productivity and creating employment
opportunities for unskilled, semi-skilled and skilled workers.179
Primary:
• It has emerged from the discussions with the key informants at state
and district level that 83 SMI and 8 MMI projects had started prior to
incorporation of this Special Package scheme. These projects had been
facing financial constraints for long time; hence, these projects were
brought under Special Package. Also, the projects are very important
considering drought prone and suicide prone areas across these regions.
Therefore, it might impact the socio-economic status of these districts if
the scheme is scaled down or stopped.
• The stakeholders from various levels have confirmed that the scheme is
focusing on providing irrigation facility and drinking water to the
beneficiary villages.
• The stakeholders at state and district levels have stated that the projects,
which have been completed, are quite successful since the beneficiaries
have got livelihood options (agriculture, animal husbandry, etc.) due to
assured availability of water through these irrigation projects.
Inference:
• The scheme covers 91 irrigation projects which were delayed for long
time due to financial constraints before incorporation of this scheme.
These projects are also important since these will help to improve socio-
economic condition of the farmers across drought prone and suicide
prone districts of Vidarbha and Marathwada. Therefore, the scheme is
quite relevant to these districts of Maharashtra.
Therefore, the scheme has been rated as “satisfactory” with respect to
relevance.
Effectiveness Secondary:

Page | 602
Parameter Findings from research
• The scheme is expected to increase irrigation potential creation (output).
It is expected to enhance productivity and generate employment
opportunities (outcome).
• This irrigation facility will provide an opportunity to boost the socio-
economic condition of the farmers of these suicide prone districts of
Vidarbha and Marathwada and draught prone areas (impact).
• Although output, outcome, impact parameters can be assumed (as
mentioned above) from scheme objectives, these parameters are not
specified in the scheme guidelines.
• The scheme is operational from 2018-19 to 2022-23. The scheme has
created an irrigation potential of 90,410 ha (as on 31st March 2020) out
of targeted potential of 3.73 lakh ha178
.
• There is a dedicated MIS for tracking the progress of this scheme where
the physical progress, financial progress and project related issues and
constraints are being tracked. There is a scope for tracking the outcome
parameters in the MIS as well.
• Scheme guidelines mandate that the major and medium projects under
the proposal shall be monitored by field offices of CWC twice a year.
SMI schemes shall be monitored periodically by field offices of CWC on
sample basis (25%) twice a year179
.
• The scheme guidelines have specified the following milestones for
implementation of this scheme:
- Completion of 13 SMI projects by June 2019
- Completion of 56 SMI and 2 MMI projects by June 2020
- Completion of 14 SMI and 2 MMI projects by June 2021
- Completion of 2 MMI by June 2022
- Completion of 2 MMI by June 2023
Primary:
• State Water Resources Department is accountable for planning and
execution of the projects on ground; whereas CWC looks after
monitoring of the projects.
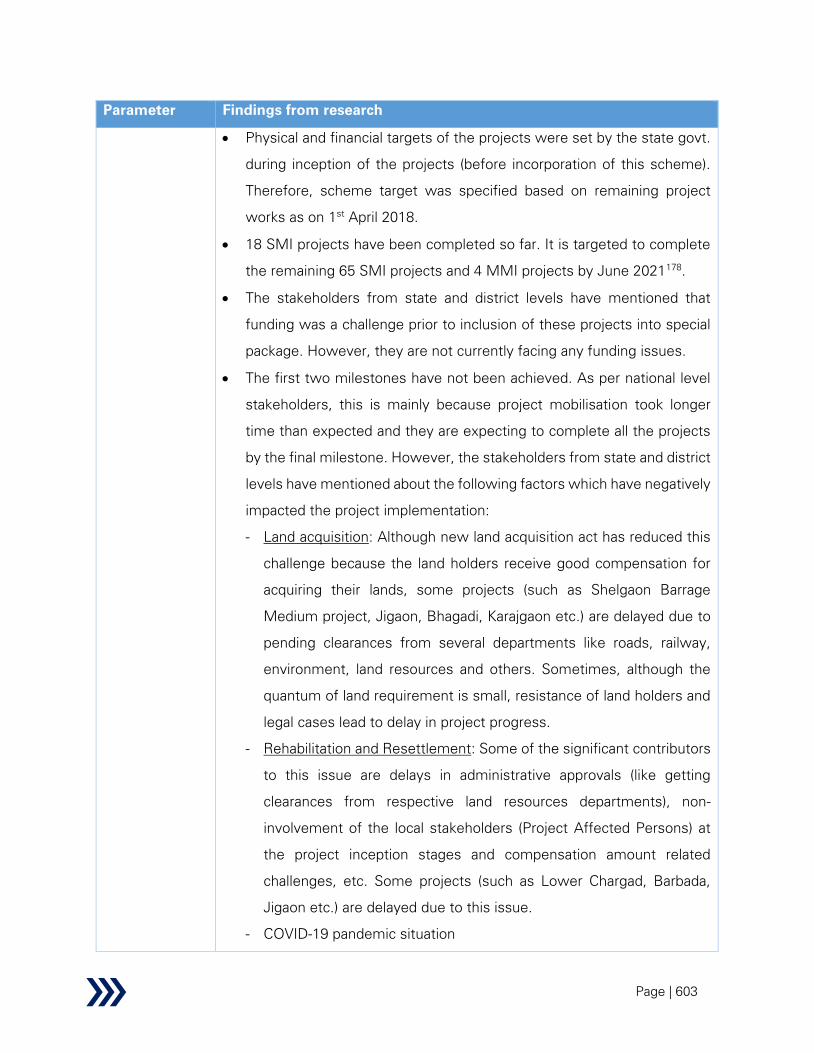
Page | 603
Parameter Findings from research
• Physical and financial targets of the projects were set by the state govt.
during inception of the projects (before incorporation of this scheme).
Therefore, scheme target was specified based on remaining project
works as on 1st April 2018.
• 18 SMI projects have been completed so far. It is targeted to complete
the remaining 65 SMI projects and 4 MMI projects by June 2021178
.
• The stakeholders from state and district levels have mentioned that
funding was a challenge prior to inclusion of these projects into special
package. However, they are not currently facing any funding issues.
• The first two milestones have not been achieved. As per national level
stakeholders, this is mainly because project mobilisation took longer
time than expected and they are expecting to complete all the projects
by the final milestone. However, the stakeholders from state and district
levels have mentioned about the following factors which have negatively
impacted the project implementation:
- Land acquisition: Although new land acquisition act has reduced this
challenge because the land holders receive good compensation for
acquiring their lands, some projects (such as Shelgaon Barrage
Medium project, Jigaon, Bhagadi, Karajgaon etc.) are delayed due to
pending clearances from several departments like roads, railway,
environment, land resources and others. Sometimes, although the
quantum of land requirement is small, resistance of land holders and
legal cases lead to delay in project progress.
- Rehabilitation and Resettlement: Some of the significant contributors
to this issue are delays in administrative approvals (like getting
clearances from respective land resources departments), non-
involvement of the local stakeholders (Project Affected Persons) at
the project inception stages and compensation amount related
challenges, etc. Some projects (such as Lower Chargad, Barbada,
Jigaon etc.) are delayed due to this issue.
- COVID-19 pandemic situation
Page | 604
Parameter Findings from research
• Prior to this scheme, it was mandated to monitor the irrigation projects
(MMI and SMI) only once in a year. This scheme has increased the
frequency to twice in a year for better project monitoring. Most of the
stakeholders from state and district levels have stated that CWC
conducts in-person monitoring of the MMI as well as minor irrigation
projects following the guidelines. However, the stakeholder from
Amravati Irrigation Project circle has stated that CWC conducts holistic
monitoring for medium projects; but monitoring has not been
satisfactory for the minor projects. The state level stakeholder has also
suggested that innovative technologies (such as drone survey, remote
sensing etc.) can be adopted along with in-person monitoring for further
improving project monitoring. For example:
- Remote sensing technologies can be helpful on account of the huge
span and difficult terrains of project areas
- Survey of ongoing construction works and monitoring of projects (to
detect canal breeches, unauthorized water withdrawals) can be
explored using drones
• National level stakeholder has stated that project monitoring through
remote sensing has already been arranged through Bhaskaracharya
Institute of Space Applications and Geo-informatics (BISAG). A mobile
application for geo-tagging project components has been developed
along with a GIS based web portal for monitoring the progress of canal
works. Drone monitoring of the projects is under consideration by the
Ministry. A pilot study has been done by Government of Maharashtra for
one irrigation project in the State on the use of Drone Technology. The
technology would be promoted in the future for the purpose of progress
monitoring, as required. However, the stakeholders from state and
district levels do not have information of such technological interventions
(e.g. remote sensing, drone survey, etc.) in the projects under SPFM
scheme.

Page | 605
Parameter Findings from research
• Discussion with national level stakeholder has indicated that Govt. has
taken the following major initiatives to improve implementation of these
projects:
- Extensive Review: The progress of the projects is being reviewed
extensively at the level of Secretary (WR, RD&GR), Hon’ble Minister
(Jal Shakti).
- MIS: Online Management Information System (MIS) has been
developed for monitoring of the projects. Physical and financial
progress of the projects is regularly updated in the MIS by the State
Government of Maharashtra.
- UGPL: Use of Underground Pipeline (UGPL) has been actively
promoted to resolve the issue of Land Acquisition (LA) and increase
water conveyance efficiency. Guidelines for Planning and Design of
Piped Irrigation Network were released by this Ministry in July’2017.
- Extensive Monitoring: The progress of the projects in terms of
physical as well as financial is monitored through the field units of
Central Water Commission.
Inference:
• Incorporation of this scheme is very relevant in the existing context.
Govt. has taken several measures, including extensive review by senior
officials of MoWR, RD&GR, progress tracking through online MIS;
extensive monitoring by CWC; use of Underground Pipeline (UGPL) to
resolve the issue of Land Acquisition (LA) and increase water
conveyance efficiency, etc. for improving implementation of this
scheme.
• However, the scheme has not achieved first two milestones (as
envisaged in the scheme guidelines) because of issues related to land
acquisition, rehabilitation, longer mobilization period etc.
Therefore, the scheme has been rated as “average” with respect to
effectiveness.

Page | 606
Parameter Findings from research
Efficiency
Secondary:
• Total balance cost for the 91projects under SPFM as on 1st April 2018 is
Rs. 11,969 Cr. Total central assistance (CA) released from 2018-19 to
2019-20 is Rs. 800 Cr. 178
• Direct benefit of the scheme is to increase irrigation potential. Indirect
benefits are productivity increase, employment generation and
improvement in socio-economic scenario etc.
• The projects are expected to generate immediate wage and other
employment opportunities during construction phase. It is expected to
generate 341 lakh man-days for unskilled, semi-skilled, and skilled
workers.179
• There is scope of convergence with MGNREGA and other state/central
level schemes. 179
Primary:
• At the time of inclusion in the SPFM scheme, the total cost of the
projects considered in the scheme guidelines was Rs. 25,203.76 Cr.178
The approved cost of works of the projects under SPFM was Rs.
22,836.01 Cr.178
However, the latest cost of the projects under SPFM is
Rs. 24,331.11 Cr.178
; thus, there is a cost over-run of 6.55%, which is
not that significant. Hence, it can be concluded that the financial burden
on the State in respect of these projects has effectively reduced with
the help of Central Assistance under the scheme.
• This cost over-run depends upon variety of factors and many of these
factors may not be entirely under control of implementing authorities
such as inter-state issues, revision in Land Acquisition Act, R&R issue,
change in design due to geological surprises encountered while
execution, lack of financial resources, State Government’s priority, delay
in getting statutory clearances, time taken in the public hearing process
and limited working season in hilly and troubled areas, etc. However,
Page | 607
Parameter Findings from research
there should be a systematic and time-bound response to these issues
to improve efficiency of the projects.
• There is a provision for state department to utilize NABARD loan. As per
agreement between Govt. of Maharashtra and NABARD, there are two
instruments available:
- Rural Infrastructure Development Fund (RIDF): loan at lesser interest
rate than market
- NABARD Infrastructure Development Assistance (NIDA): loan at
market rate
• State department also utilizes another source of fund, i.e. state
borrowing from the market. However, other sources of fund have 2-3%
higher rate of interest than that of NABARD loan.
• Private sector companies are not coming forward to invest owing to lack
of returns in this sector. In view of the financial burden on state
exchequer, state govt. is exploring options to involve private parties
through innovative PPP models like Hybrid Annuity Model (HAM model
has already been successfully implemented in financing road and
sewage treatment infrastructure in India) mainly in O&M of the irrigation
assets.
• There is further scope of reducing project cost through achieving
convergence with other state/central schemes. However, discussions
with the stakeholders at the district level have indicated mixed feedback
about convergence activities. The stakeholder from Upper Wardha
Irrigation circle has reported that convergence activities with MGNREGA
is effectively going on. However, the stakeholder from Amravati
Irrigation Project circle has not mentioned about any such convergence
activities.
• The stakeholders at state and district levels have validated the immense
benefit of these irrigation projects to improve socio-economic condition
of the beneficiary farmers. They have mentioned that benefit is realized
in terms of employment generation during the construction phase and
Page | 608
Parameter Findings from research
improvement in agricultural activities, cropping pattern, etc. during post
construction phase.
Inference:
• After inclusion of these 91 projects in the SPFM scheme, there has been
no significant cost over-run in these projects.
• The cost of the projects depends upon variety of factors and many of
these factors may not be entirely under control of implementing
authorities such as inter-state issues, revision in Land Acquisition Act,
R&R issue, change in design due to geological surprises encountered
while execution, lack of financial resources, State Government’s priority,
delay in getting statutory clearances, time taken in public hearing
process and limited working season in hilly and troubled areas etc. There
is scope to make the projects more cost efficient by providing systematic
and time-bound response to these issues.
• There is a scope to make the projects more cost efficient with several
measures including private sector involvement, convergence with other
state/ central schemes, etc.
Therefore, the scheme has been rated as “average” with respect to
efficiency.
Sustainability
Secondary: Since the scheme is relatively new (operational since April
2018), there is a lack of information across secondary sources to evaluate
its sustainability.
Primary:
• Considering water-scarce situation and popularity of water intensive crop
(such as cotton, sugarcane etc.) cultivation in Vidarbha and Marathwada
regions, the state department. has undertaken the below measures to
maintain sustainable water sources management:
- Volumetric Supply of Water: Farmers are informed the amount of
water they will receive in a period so that they can plan cropping
pattern based on availability of water. Also, they are educated to save
water during Rabi season in order to compensate the water
Page | 609
Parameter Findings from research
requirement during summer months. In this way, sustainability of
water resources is managed without curbing their freedom of
cropping.
- Participatory Irrigation Management: Water Users Association
(WUA) is formed for monitoring water use by different farmers.
• It has emerged from the discussions with the stakeholders at district
level that integration of irrigation projects (major, medium and minor)
with micro-irrigation system (e.g. drip, sprinkler etc.) can be
implemented to improve on-farm water use efficiency, resulting in
sustainable water resources management.
• User’s participation into management of the assets can be mandated for
maintaining sustainability because it would be difficult and not cost
effective for the Govt. to manage the assets over entire life.
• States organize training sessions and capacity building activities for the
Water Users Associations (WUA) so that they can manage the irrigation
assets after certain years (e.g. 3-5 years) of O&M by the Govt. or any
NGO or any private body appointed by the Govt. However, the district
level stakeholders have stated that training and capacity building
activities are not adequately organized at present; thus, there is huge
scope of extensive training and capacity building activities.
Inference:
• State department has taken several measures such as volumetric water
supply, participatory irrigation management, etc. for sustainable water
resources management. There is a scope of further improvement of
water resources management through integration of irrigation projects
with micro-irrigation systems.
• Since WUAs are accountable for O&M of irrigation assets, there is a
need of extensive training and capacity building activities.

Page | 610
Parameter Findings from research
• However, it would be premature to rate the scheme in terms of
sustainability since the scheme is relatively new (operational since April
2018).
Impact
Since the scheme is relatively new (operational since April 2018), it would
be premature to evaluate impact of the scheme
Equity
Secondary:
• As per the scheme guidelines, the implementation of the Scheme would
help all categories of farmers including marginal farmers in the command
of the projects proposed to be completed, spread across Marathwada,
Vidarbha and rest of the drought prone areas of Maharashtra.
Primary:
• Equity aspects (gender, weaker section) were taken into consideration
during the DPR preparation
• Women participation is ranging from 25% to 33% across projects.
Inference: Since the scheme is relatively new (operational since April 2018),
it would be premature to evaluate the scheme with respect to equity aspect.
A summary analysis and performance of the scheme on the identified themes is presented
below:
Table 73: SPFM – Summary of performance evaluation based on REESIE framework
Parameter Performance
Relevance
Effectiveness
Efficiency
Sustainability
Impact
Equity
REESI+E performance infographics legend
Satisfactory
Average
Needs Improvement
No information

Page | 611
Performance on cross-sectional themes
Table 74: SPFM – Performance evaluation based on cross-sectional themes
#
Cross-
cutting
theme
Indicative Areas of
Enquiry and Key
Questions
Findings from research
1.
Accountab
ility &
Transpare
ncy
Availability of Data
Records and Reports in
public domain
• What data records are
available for the
scheme in public
domain?
• There is a dedicated online Management
Information System (MIS) for tracking the
progress of this scheme where output
parameters (such as physical progress,
financial progress) along with project
related issues and constraints are being
tracked. This progress data is regularly
updated in the MIS by the State
Government of Maharashtra. The progress
of the projects is being reviewed
extensively at the level of Secretary (WR,
RD&GR), Hon’ble Minister (Jal Shakti).
• Tracking of outcome (such as enhance
productivity, generate employment
opportunities etc.) and impact (such as
improve socio-economic status of farmers
etc.) parameters can be explored in future.
Monitoring Mechanisms
• Does a robust
monitoring
mechanism exist and
at what level?
• As per the scheme guidelines, monitoring
for environment safeguards stipulated by
MoEF&CC, if any, to be activated
immediately by the state Govt. for these
projects. Dedicated Land Acquisition &
Rehabilitation and Resettlement
arrangements for these projects shall be
established by the state to ensure that

Page | 612
#
Cross-
cutting
theme
Indicative Areas of
Enquiry and Key
Questions
Findings from research
there is no delay on account of these
activities.
• As per the scheme guidelines, monitoring
of each of the minor irrigation scheme has
to be done by the State Government
physically and they would be geo-tagged,
and each Minor Irrigation project would be
given a Unique Identification Code (U.l.C)
• The major and medium projects under the
proposal shall be monitored by field offices
of CWC twice a year. SMI schemes would
also be monitored periodically by field
offices of CWC on sample basis (25%)
twice a year.
• Most of the stakeholders from state level
have stated that CWC conducts in-person
monitoring of the MMI as well as minor
irrigation projects following the guidelines.
However, stakeholder from Amravati
Irrigation Project circle has stated that
CWC conducts holistic monitoring for
medium projects; however, monitoring
has not been satisfactory for the minor
projects.
• Stakeholders from state and district levels
have suggested to improve monitoring
mechanism by adopting technological
interventions (such as remote sensing,
drone survey etc.).
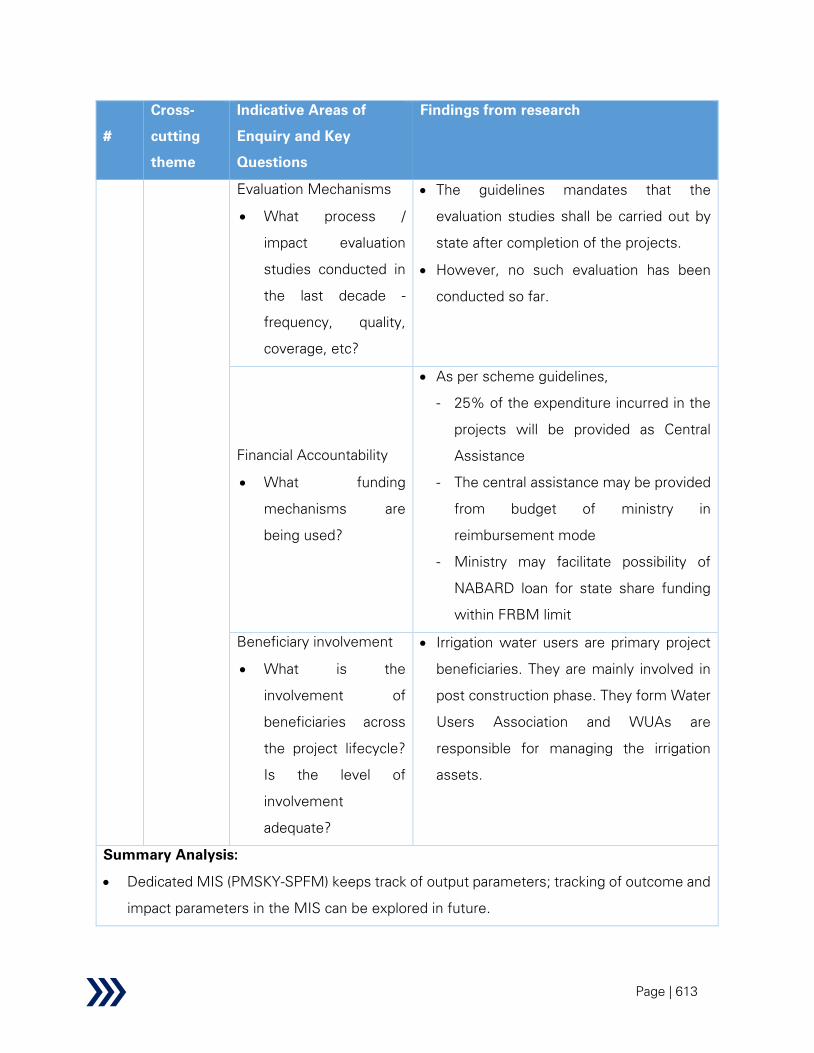
Page | 613
#
Cross-
cutting
theme
Indicative Areas of
Enquiry and Key
Questions
Findings from research
Evaluation Mechanisms
• What process /
impact evaluation
studies conducted in
the last decade -
frequency, quality,
coverage, etc?
• The guidelines mandates that the
evaluation studies shall be carried out by
state after completion of the projects.
• However, no such evaluation has been
conducted so far.
Financial Accountability
• What funding
mechanisms are
being used?
• As per scheme guidelines,
- 25% of the expenditure incurred in the
projects will be provided as Central
Assistance
- The central assistance may be provided
from budget of ministry in
reimbursement mode
- Ministry may facilitate possibility of
NABARD loan for state share funding
within FRBM limit
Beneficiary involvement
• What is the
involvement of
beneficiaries across
the project lifecycle?
Is the level of
involvement
adequate?
• Irrigation water users are primary project
beneficiaries. They are mainly involved in
post construction phase. They form Water
Users Association and WUAs are
responsible for managing the irrigation
assets.
Summary Analysis:
• Dedicated MIS (PMSKY-SPFM) keeps track of output parameters; tracking of outcome and
impact parameters in the MIS can be explored in future.
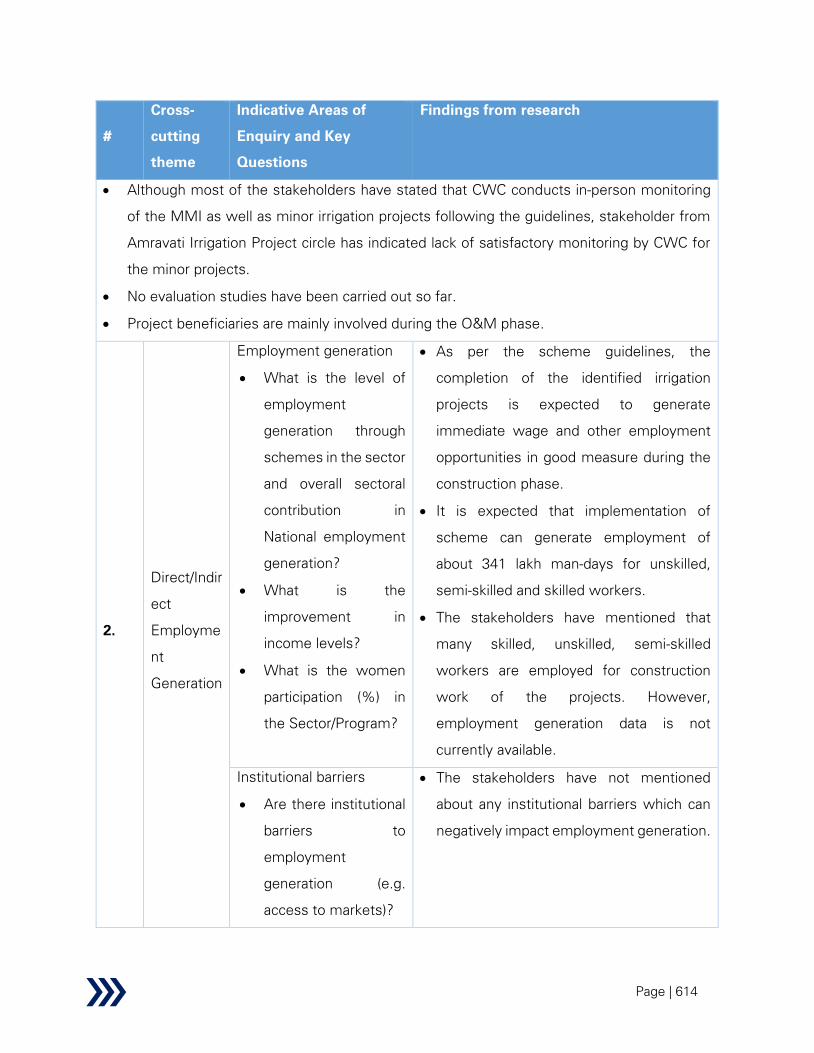
Page | 614
#
Cross-
cutting
theme
Indicative Areas of
Enquiry and Key
Questions
Findings from research
• Although most of the stakeholders have stated that CWC conducts in-person monitoring
of the MMI as well as minor irrigation projects following the guidelines, stakeholder from
Amravati Irrigation Project circle has indicated lack of satisfactory monitoring by CWC for
the minor projects.
• No evaluation studies have been carried out so far.
• Project beneficiaries are mainly involved during the O&M phase.
2.
Direct/Indir
ect
Employme
nt
Generation
Employment generation
• What is the level of
employment
generation through
schemes in the sector
and overall sectoral
contribution in
National employment
generation?
• What is the
improvement in
income levels?
• What is the women
participation (%) in
the Sector/Program?
• As per the scheme guidelines, the
completion of the identified irrigation
projects is expected to generate
immediate wage and other employment
opportunities in good measure during the
construction phase.
• It is expected that implementation of
scheme can generate employment of
about 341 lakh man-days for unskilled,
semi-skilled and skilled workers.
• The stakeholders have mentioned that
many skilled, unskilled, semi-skilled
workers are employed for construction
work of the projects. However,
employment generation data is not
currently available.
Institutional barriers
• Are there institutional
barriers to
employment
generation (e.g.
access to markets)?
• The stakeholders have not mentioned
about any institutional barriers which can
negatively impact employment generation.
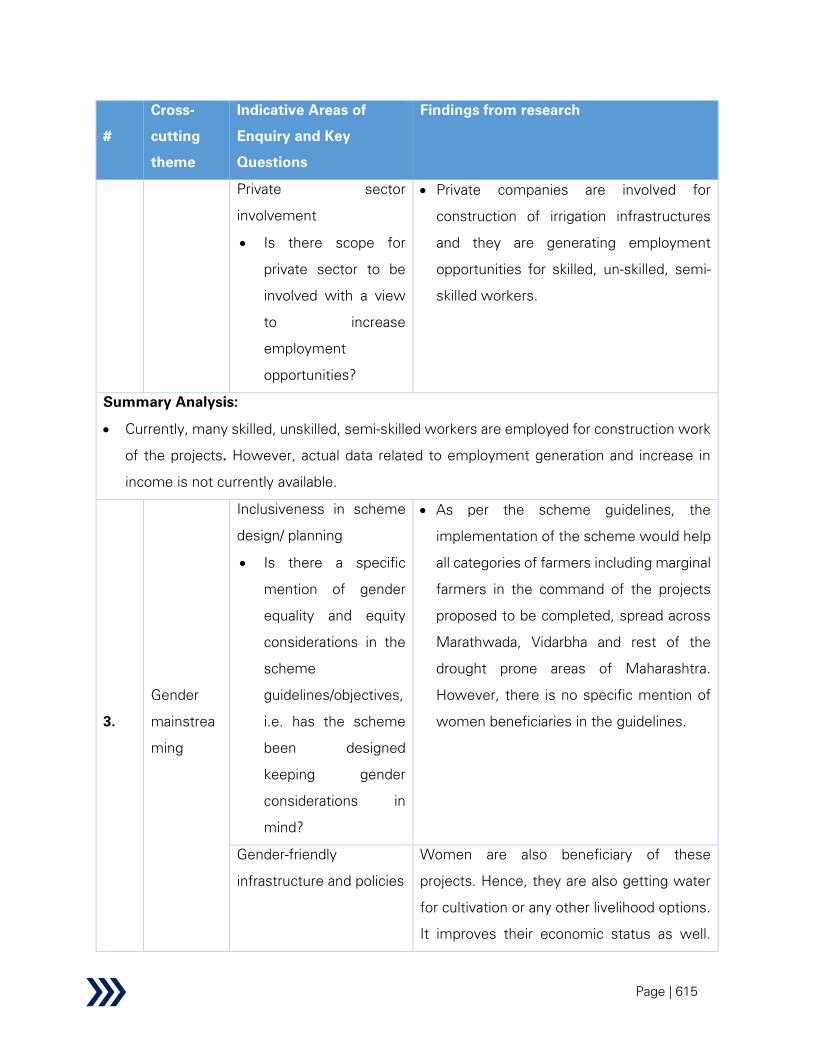
Page | 615
#
Cross-
cutting
theme
Indicative Areas of
Enquiry and Key
Questions
Findings from research
Private sector
involvement
• Is there scope for
private sector to be
involved with a view
to increase
employment
opportunities?
• Private companies are involved for
construction of irrigation infrastructures
and they are generating employment
opportunities for skilled, un-skilled, semi-
skilled workers.
Summary Analysis:
• Currently, many skilled, unskilled, semi-skilled workers are employed for construction work
of the projects. However, actual data related to employment generation and increase in
income is not currently available.
3.
Gender
mainstrea
ming
Inclusiveness in scheme
design/ planning
• Is there a specific
mention of gender
equality and equity
considerations in the
scheme
guidelines/objectives,
i.e. has the scheme
been designed
keeping gender
considerations in
mind?
• As per the scheme guidelines, the
implementation of the scheme would help
all categories of farmers including marginal
farmers in the command of the projects
proposed to be completed, spread across
Marathwada, Vidarbha and rest of the
drought prone areas of Maharashtra.
However, there is no specific mention of
women beneficiaries in the guidelines.
Gender-friendly
infrastructure and policies
Women are also beneficiary of these
projects. Hence, they are also getting water
for cultivation or any other livelihood options.
It improves their economic status as well.

Page | 616
#
Cross-
cutting
theme
Indicative Areas of
Enquiry and Key
Questions
Findings from research
• How has
empowerment of
women improved?
However, information specific to women
empowerment, is not available.
Summary Analysis:
• There is no specific mention of gender mainstreaming in the scheme guidelines.
• Although women are involved as beneficiaries of these projects, actual data related to
women beneficiaries, activities undertaken to empower them is not available.
4.
Role of
Tribal Sub-
Plan (TSP)
and
Scheduled
Caste Sub-
Plan
componen
t of the
scheme in
mainstrea
ming of
Tribal and
Scheduled
Caste
population
Funds allocated under
TSP/ SCSP and other
provisions for vulnerable
communities
• What is the fund
allocated under TSP &
SCSP for each
scheme?
There is no specific mention of TSP and
SCSP in the scheme guidelines
Inclusion of vulnerable
groups in scheme as well
as sector
• What are the
interventions
implemented for
specific vulnerable
groups?
As per the scheme guidelines, the
implementation of the scheme would help all
categories of farmers including marginal
farmers in the command of the projects
proposed to be completed, spread across
Marathwada, Vidarbha and rest of the
drought prone areas of Maharashtra.
Summary Analysis:
• There is no specific mention of TSP and SCSP in the scheme guidelines.
• Although the scheme guidelines mandate to include all categories of farmers, actual data
of SC/ST is not currently available.
5.
Use of
IT/Technol
Deployment of IT enabled
mechanisms for
• As per the scheme guidelines, the minor
irrigation assets would be geo-tagged, and
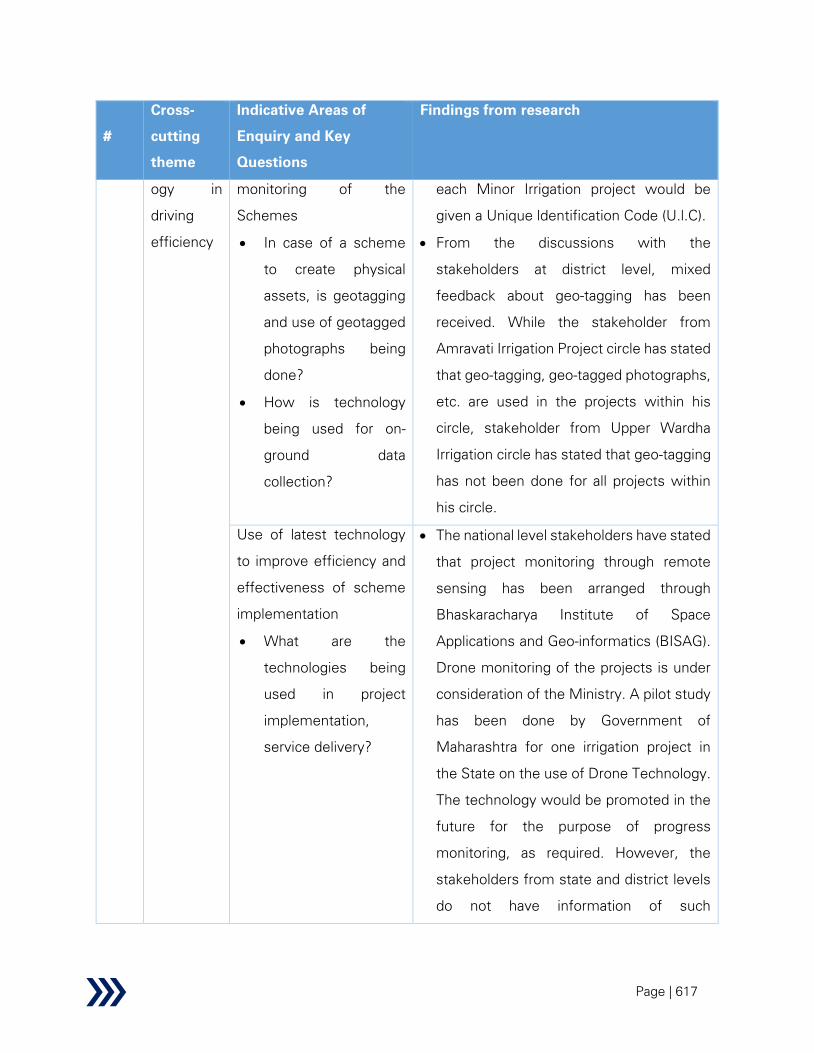
Page | 617
#
Cross-
cutting
theme
Indicative Areas of
Enquiry and Key
Questions
Findings from research
ogy in
driving
efficiency
monitoring of the
Schemes
• In case of a scheme
to create physical
assets, is geotagging
and use of geotagged
photographs being
done?
• How is technology
being used for on-
ground data
collection?
each Minor Irrigation project would be
given a Unique ldentification Code (U.l.C).
• From the discussions with the
stakeholders at district level, mixed
feedback about geo-tagging has been
received. While the stakeholder from
Amravati Irrigation Project circle has stated
that geo-tagging, geo-tagged photographs,
etc. are used in the projects within his
circle, stakeholder from Upper Wardha
Irrigation circle has stated that geo-tagging
has not been done for all projects within
his circle.
Use of latest technology
to improve efficiency and
effectiveness of scheme
implementation
• What are the
technologies being
used in project
implementation,
service delivery?
• The national level stakeholders have stated
that project monitoring through remote
sensing has been arranged through
Bhaskaracharya Institute of Space
Applications and Geo-informatics (BISAG).
Drone monitoring of the projects is under
consideration of the Ministry. A pilot study
has been done by Government of
Maharashtra for one irrigation project in
the State on the use of Drone Technology.
The technology would be promoted in the
future for the purpose of progress
monitoring, as required. However, the
stakeholders from state and district levels
do not have information of such
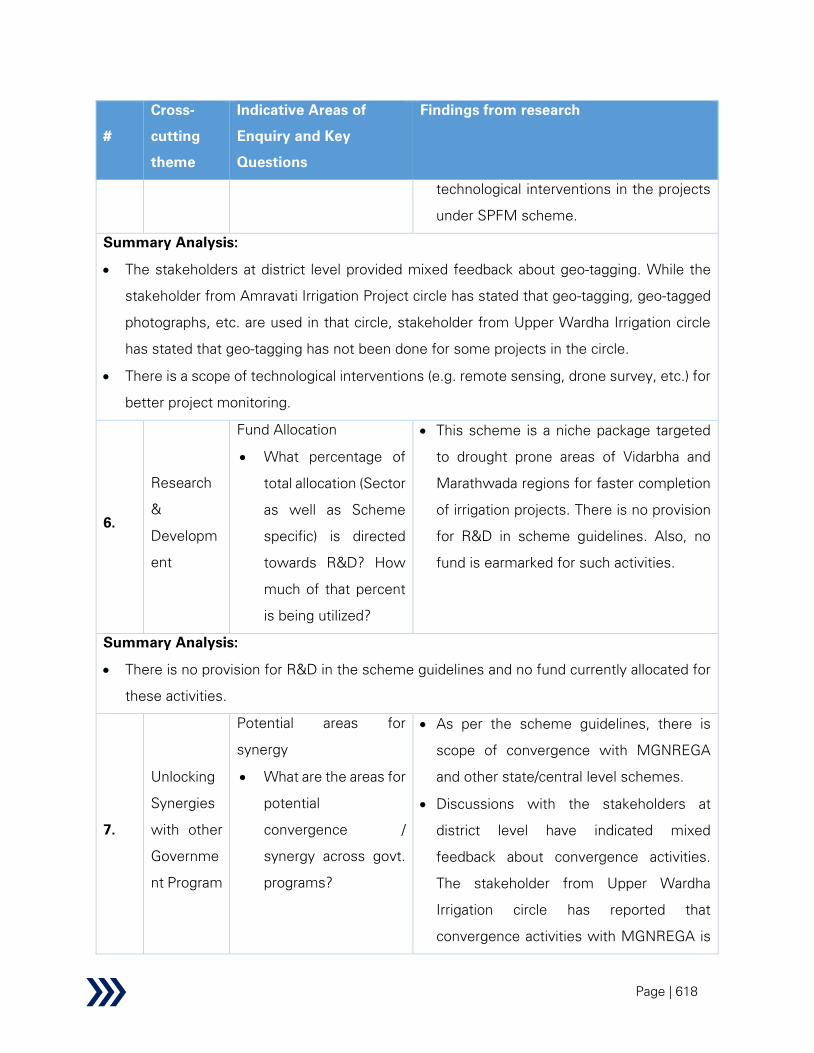
Page | 618
#
Cross-
cutting
theme
Indicative Areas of
Enquiry and Key
Questions
Findings from research
technological interventions in the projects
under SPFM scheme.
Summary Analysis:
• The stakeholders at district level provided mixed feedback about geo-tagging. While the
stakeholder from Amravati Irrigation Project circle has stated that geo-tagging, geo-tagged
photographs, etc. are used in that circle, stakeholder from Upper Wardha Irrigation circle
has stated that geo-tagging has not been done for some projects in the circle.
• There is a scope of technological interventions (e.g. remote sensing, drone survey, etc.) for
better project monitoring.
6.
Research
&
Developm
ent
Fund Allocation
• What percentage of
total allocation (Sector
as well as Scheme
specific) is directed
towards R&D? How
much of that percent
is being utilized?
• This scheme is a niche package targeted
to drought prone areas of Vidarbha and
Marathwada regions for faster completion
of irrigation projects. There is no provision
for R&D in scheme guidelines. Also, no
fund is earmarked for such activities.
Summary Analysis:
• There is no provision for R&D in the scheme guidelines and no fund currently allocated for
these activities.
7.
Unlocking
Synergies
with other
Governme
nt Program
Potential areas for
synergy
• What are the areas for
potential
convergence /
synergy across govt.
programs?
• As per the scheme guidelines, there is
scope of convergence with MGNREGA
and other state/central level schemes.
• Discussions with the stakeholders at
district level have indicated mixed
feedback about convergence activities.
The stakeholder from Upper Wardha
Irrigation circle has reported that
convergence activities with MGNREGA is

Page | 619
#
Cross-
cutting
theme
Indicative Areas of
Enquiry and Key
Questions
Findings from research
effectively going on. However, the
stakeholder from Amravati Irrigation
Project circle has indicated lack of
convergence activities
Summary Analysis:
• Convergence with MGNREGA is happening effectively across some projects (e.g. Upper
Wardha Irrigation Circle); however, stakeholder from Amravati Irrigation Project circle has
indicated lack of convergence activities in that circle.
8.
Impact on
and role of
private
sector,
communit
y/
collectives
/
cooperativ
es (e.g.
Farmer
cooperativ
es, FPOs,
Water
User
Associatio
ns, etc.)
and civil
society in
the
scheme
Public-Private Partnership
• How well have PPP
functions in the
Sector? What are the
challenges faced?
• Although private companies are involved
for construction of irrigation
infrastructures, no project is currently
being undertaken in PPP mode.
Private Sector
Participation
• What is the
percentage of private
investment in the
clusters/programs run
by the government?
• Private sector companies are not coming
forward to invest due to lack of returns in
this sector. However, the govt. is very
keen to involve private companies.
Currently, the state govt. is exploring
options to involve private parties through
innovative PPP models like Hybrid Annuity
Model (HAM model has already been
successfully implemented in financing
road and sewage treatment infrastructure
in India) mainly in O&M of the irrigation
assets.
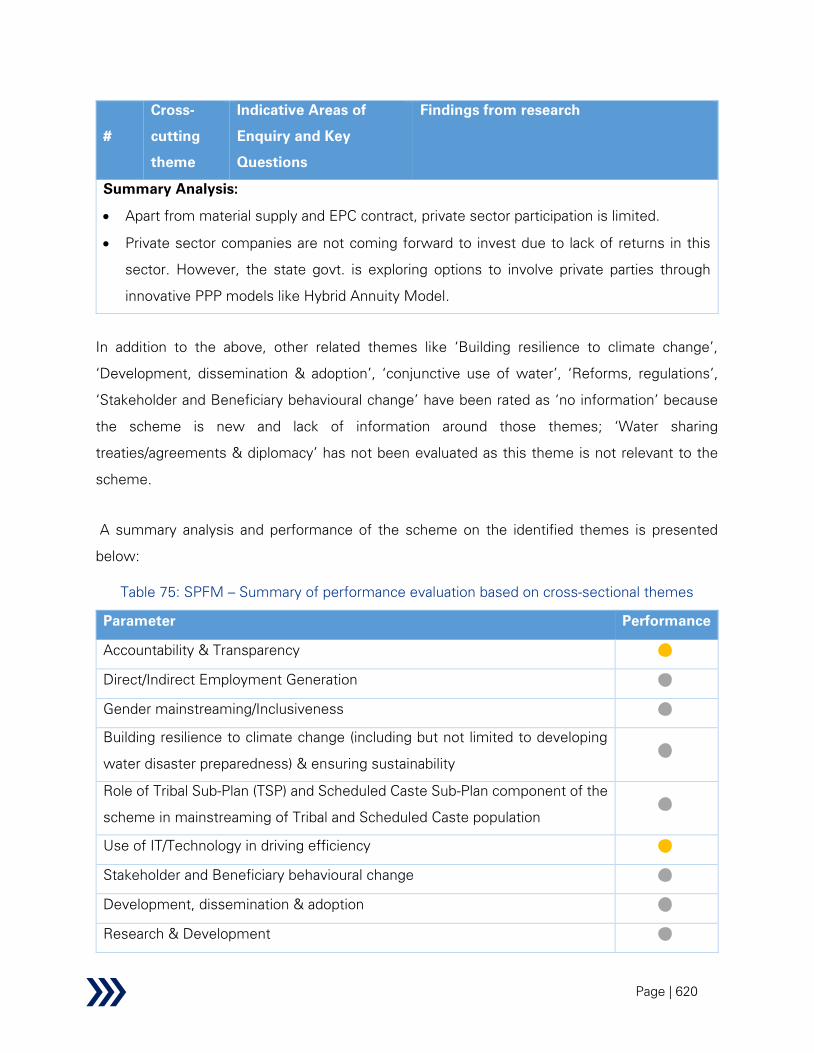
Page | 620
#
Cross-
cutting
theme
Indicative Areas of
Enquiry and Key
Questions
Findings from research
Summary Analysis:
• Apart from material supply and EPC contract, private sector participation is limited.
• Private sector companies are not coming forward to invest due to lack of returns in this
sector. However, the state govt. is exploring options to involve private parties through
innovative PPP models like Hybrid Annuity Model.
In addition to the above, other related themes like ‘Building resilience to climate change’,
‘Development, dissemination & adoption’, ‘conjunctive use of water’, ‘Reforms, regulations’,
‘Stakeholder and Beneficiary behavioural change’ have been rated as ‘no information’ because
the scheme is new and lack of information around those themes; ‘Water sharing
treaties/agreements & diplomacy’ has not been evaluated as this theme is not relevant to the
scheme.
A summary analysis and performance of the scheme on the identified themes is presented
below:
Table 75: SPFM – Summary of performance evaluation based on cross-sectional themes
Parameter Performance
Accountability & Transparency
Direct/Indirect Employment Generation
Gender mainstreaming/Inclusiveness
Building resilience to climate change (including but not limited to developing
water disaster preparedness) & ensuring sustainability
Role of Tribal Sub-Plan (TSP) and Scheduled Caste Sub-Plan component of the
scheme in mainstreaming of Tribal and Scheduled Caste population
Use of IT/Technology in driving efficiency
Stakeholder and Beneficiary behavioural change
Development, dissemination & adoption
Research & Development
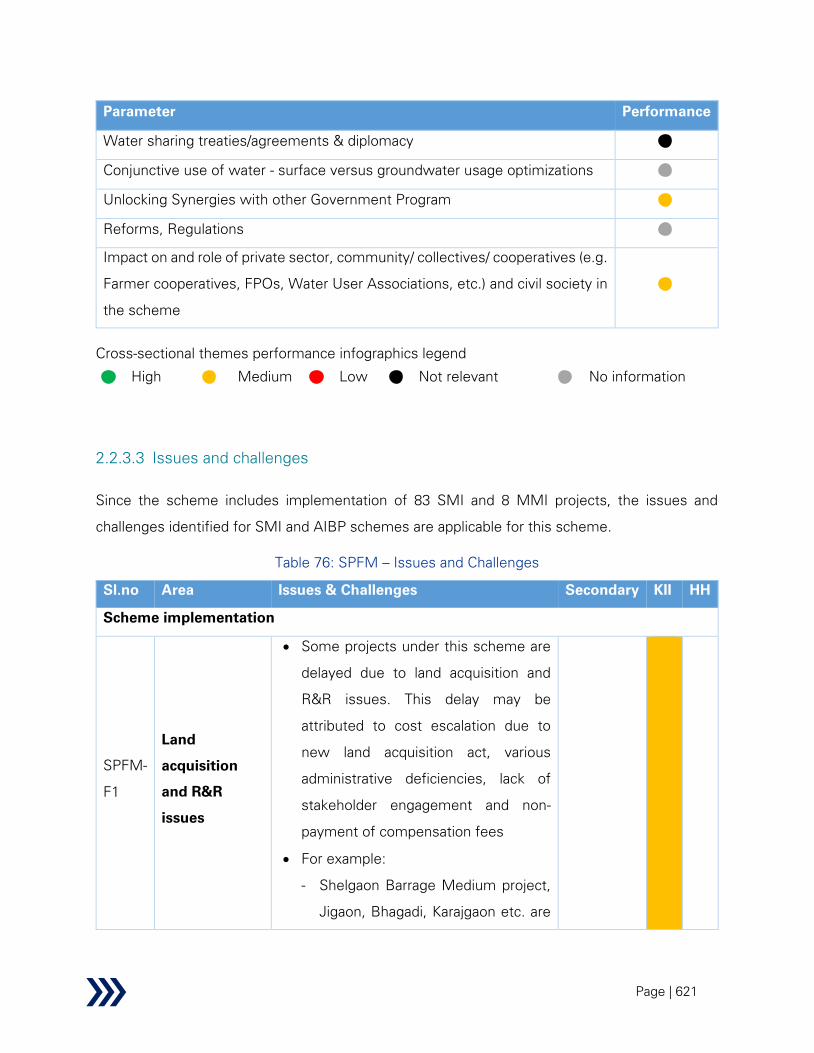
Page | 621
Parameter Performance
Water sharing treaties/agreements & diplomacy
Conjunctive use of water - surface versus groundwater usage optimizations
Unlocking Synergies with other Government Program
Reforms, Regulations
Impact on and role of private sector, community/ collectives/ cooperatives (e.g.
Farmer cooperatives, FPOs, Water User Associations, etc.) and civil society in
the scheme
Cross-sectional themes performance infographics legend
High
Medium
Low
Not relevant
No information
2.2.3.3 Issues and challenges
Since the scheme includes implementation of 83 SMI and 8 MMI projects, the issues and
challenges identified for SMI and AIBP schemes are applicable for this scheme.
Table 76: SPFM – Issues and Challenges
Sl.no Area Issues & Challenges Secondary KII HH
Scheme implementation
SPFM-
F1
Land
acquisition
and R&R
issues
• Some projects under this scheme are
delayed due to land acquisition and
R&R issues. This delay may be
attributed to cost escalation due to
new land acquisition act, various
administrative deficiencies, lack of
stakeholder engagement and non-
payment of compensation fees
• For example:
- Shelgaon Barrage Medium project,
Jigaon, Bhagadi, Karajgaon etc. are

Page | 622
Sl.no Area Issues & Challenges Secondary KII HH
delayed due to land acquisition
issues
- Lower Chargad, Barbada, Jigaon
etc. are facing rehabilitation issues
SPFM-
F2
Environmental
clearance
issue
• Some projects were delayed because
of not getting environment clearances
in time bound manner. e.g. there is
forest area in Vidarbha. A few projects
in Vidarbha were delayed by 3-4 years.
However, there is no such issue after
bringing those projects under this
scheme. The projects have been
included in the SPFM only after they
have got requisite statutory
clearances.
SPFM-
F3
Lack of
coordination
• There are railway crossing or highway
crossing over the span of some
projects. Some projects were delayed
due to lack of coordination with these
concerned departments. However,
there is no such issue after
incorporation of this scheme. Those
projects were included under this
scheme only after getting required
clearances from various departments.
SPFM-
F4
Project design
issue
• It has emerged from the discussions
with stakeholders from state and
district levels that some projects are
spanned through soft soil strata, which
makes the project design and
drawings more complicated. CDO,
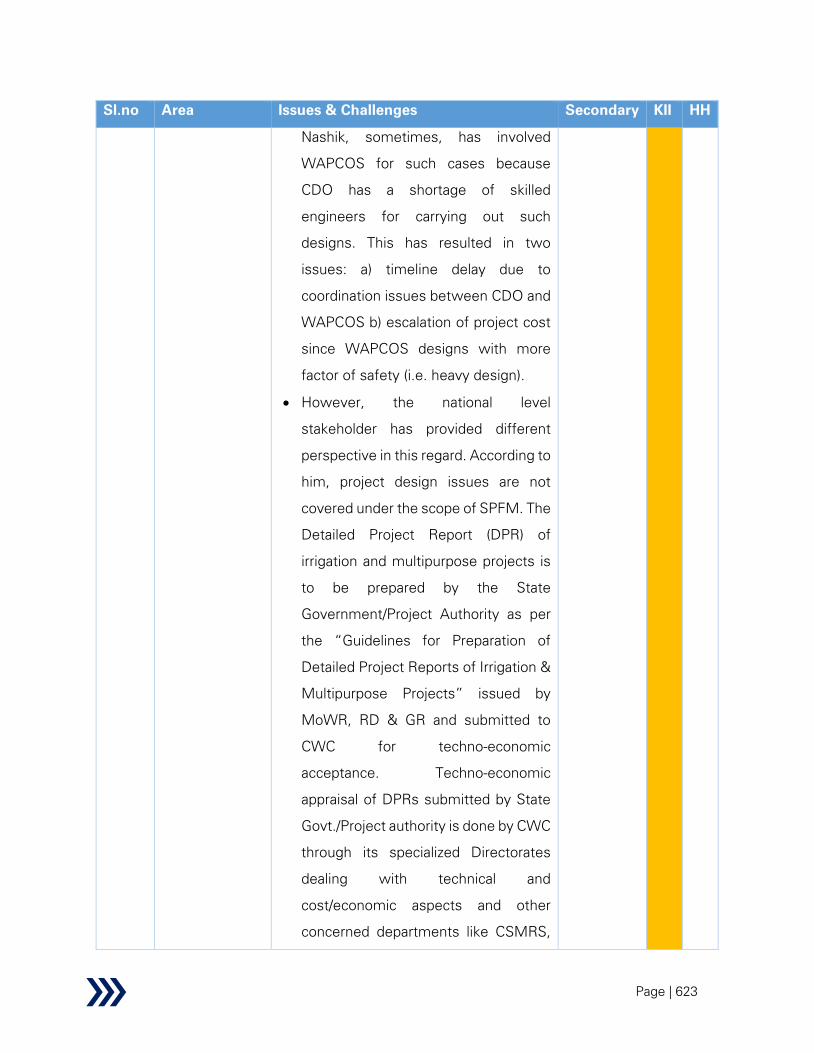
Page | 623
Sl.no Area Issues & Challenges Secondary KII HH
Nashik, sometimes, has involved
WAPCOS for such cases because
CDO has a shortage of skilled
engineers for carrying out such
designs. This has resulted in two
issues: a) timeline delay due to
coordination issues between CDO and
WAPCOS b) escalation of project cost
since WAPCOS designs with more
factor of safety (i.e. heavy design).
• However, the national level
stakeholder has provided different
perspective in this regard. According to
him, project design issues are not
covered under the scope of SPFM. The
Detailed Project Report (DPR) of
irrigation and multipurpose projects is
to be prepared by the State
Government/Project Authority as per
the “Guidelines for Preparation of
Detailed Project Reports of Irrigation &
Multipurpose Projects” issued by
MoWR, RD & GR and submitted to
CWC for techno-economic
acceptance. Techno-economic
appraisal of DPRs submitted by State
Govt./Project authority is done by CWC
through its specialized Directorates
dealing with technical and
cost/economic aspects and other
concerned departments like CSMRS,

Page | 624
Sl.no Area Issues & Challenges Secondary KII HH
CGWB, CEA, Do WR, RD& WR, etc. If
deficiencies are found during the
process of examination of DPR, the
same are conveyed to the project
authority/state govt. for needful
compliance. The studies, surveys and
investigations carried out at the DPR
preparation stage are required to be
supplemented/ firmed-up by
undertaking additional studies/ surveys
during pre-construction stage when
the project is taken-up for
implementation.
SPFM-
F5
Low
conveyance
efficiency
• The major and medium irrigation (MMI)
projects involve construction of
conventional open channels which are
prone to huge seepage and
evaporation losses, resulting into
overall low conveyance efficiency.
Hence, inadequate water is supplied in
the branch and distributary canals
(particularly in the tail end areas).
Seepages losses in irrigation canals
contributes to around 98.37% of water
conveyance loss180
.
• The national level stakeholder has
stated that the use of underground
pipelines (UGPL) in the projects
180 P.B. Jadhav and others (April 2014), IJIRSET, Conveyance Efficiency Improvement through Canal Lining and Yield Increment by
Adopting Drift Irrigation in Command Area
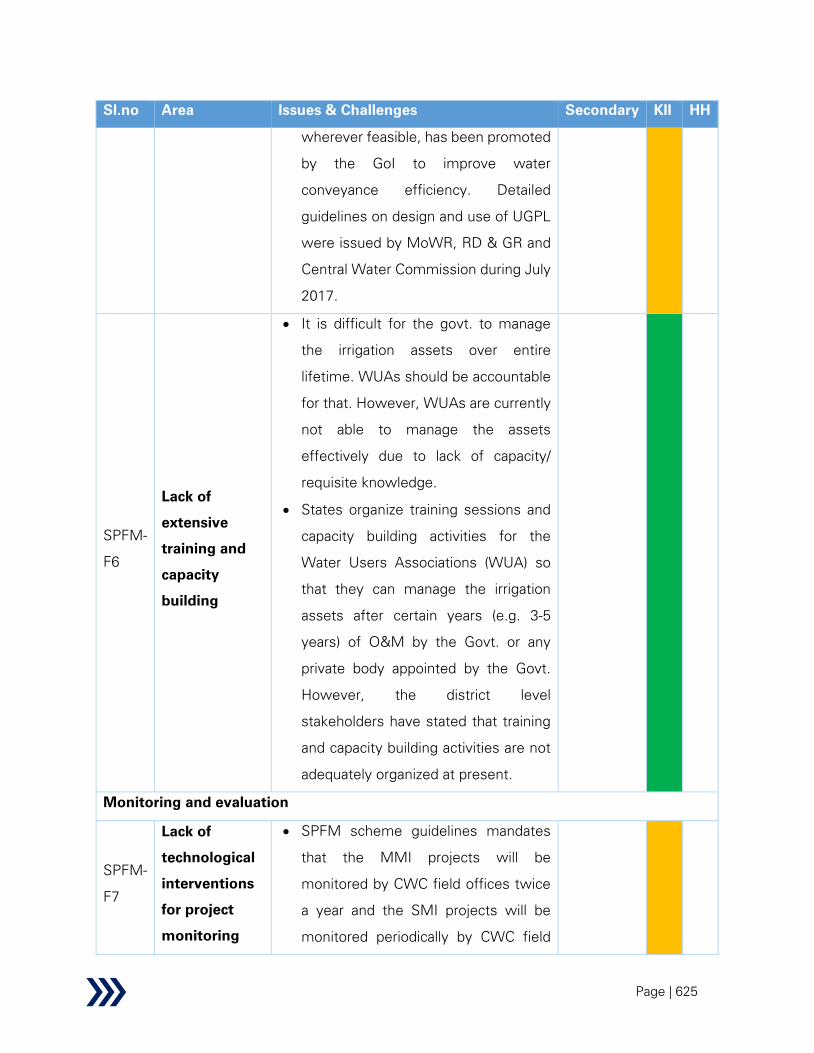
Page | 625
Sl.no Area Issues & Challenges Secondary KII HH
wherever feasible, has been promoted
by the GoI to improve water
conveyance efficiency. Detailed
guidelines on design and use of UGPL
were issued by MoWR, RD & GR and
Central Water Commission during July
2017.
SPFM-
F6
Lack of
extensive
training and
capacity
building
• It is difficult for the govt. to manage
the irrigation assets over entire
lifetime. WUAs should be accountable
for that. However, WUAs are currently
not able to manage the assets
effectively due to lack of capacity/
requisite knowledge.
• States organize training sessions and
capacity building activities for the
Water Users Associations (WUA) so
that they can manage the irrigation
assets after certain years (e.g. 3-5
years) of O&M by the Govt. or any
private body appointed by the Govt.
However, the district level
stakeholders have stated that training
and capacity building activities are not
adequately organized at present.
Monitoring and evaluation
SPFM-
F7
Lack of
technological
interventions
for project
monitoring
• SPFM scheme guidelines mandates
that the MMI projects will be
monitored by CWC field offices twice
a year and the SMI projects will be
monitored periodically by CWC field

Page | 626
Sl.no Area Issues & Challenges Secondary KII HH
offices in sample basis (25%) twice a
year. The projects are located
throughout the entire states. CWC
field officials comply with the
mandate.
• Discussions with the stakeholders at
state and district levels have indicated
that projects are not effectively
monitored because they conduct
physical monitoring and it is difficult to
monitor all areas physically, especially
the remote locations. Therefore, there
is a scope of technological
interventions such as remote sensing,
drone survey etc.
• However, stakeholder at national level
has stated that project monitoring
through remote sensing is already
arranged through Bhaskaracharya
Institute of Space Applications and
Geo-informatics (BISAG).
Drone monitoring of the projects is
under consideration of the Ministry. A
pilot study has been done by
Government of Maharashtra for one
irrigation project in the State on the
use of Drone Technology. The
technology would be promoted in the
future for the purpose of progress
monitoring, as required. The state and
district level officers do not have

Page | 627
Sl.no Area Issues & Challenges Secondary KII HH
information of such technological
intervention.
SPFM-
F8
MIS platform
• The national MIS platform is a
significant step forward towards data
consolidation and reporting. But
currently recorded parameters are
limited only to the output indicators
like status of completion of SPFM
projects, irrigation potential created,
but the outcome indicators like
irrigation potential utilized, increase in
crop yield, employment generation
etc. are not tracked in the same
dashboard. National level stakeholder
has stated that the indicators
mentioned such as increase in crop
yield through works of projects are not
realized immediately and may take
some time to be realized. The irrigation
potential utilized depends upon the
completion of CADWM Works. In case
of projects under SPFM, the CADWM
works are not covered and these are to
be completed by the State
Government from their own funds.
Hence, tracking outcome parameters
might be difficult at this stage.
• However, these is a scope for tracking
outcome parameters in future, and it
will be helpful to realize benefits of the

Page | 628
Sl.no Area Issues & Challenges Secondary KII HH
irrigation projects from same online
platform.
Issue relevance legend
Supported Partially
supported Not supported
Not applicable
A summary analysis of issues & challenges for the scheme is presented below:
Table 77: SPFM – Summary of issues and challenges
Parameter Performance
Institutional Mechanism and governance
Fund flow efficiency and utilization
Unavailability of resources (fund, manpower and others)
Monitoring and evaluation
Capacity building
Any other issues (scheme specific issue can be added) Not applicable
Performance infographics legend
Satisfactory
Average
Needs Improvement
2.2.3.4 Recommendations and solutions
Since the scheme includes implementation of 83 SMI and 8 MMI projects, the recommendations
and solutions proposed for SMI and AIBP schemes are applicable for this scheme.
Table 78: SPFM – Recommendations and solutions
Sl.no Recommendations Finding
SPFM-R1
To minimize the delay due to land acquisition, rehabilitation and
resettlement, the below measures can be considered:
SPFM-F1

Page | 629
Sl.no Recommendations Finding
• Periodic review meeting among high level officials (e.g. secretary):
This will expedite the administrative process required for obtaining
clearance
• Separate agency for managing rehabilitation and resettlement
related activities: Such activities are currently looked after by
several officials such as water resources/irrigation officials,
collector, land resource officials etc. These officials have other
priority works. Hence, the rehabilitation and resettlement work get
delayed. Therefore, creation of a dedicated agency can be
explored for better coordination and accelerated clearances
• Local NGOs to be involved to educate PAPs about project benefits:
Besides Govt. officers, PAPs trust their local people. Hence, if
NGOs (involving local people) can be engaged for building trust
among the PAPs about project benefits, requirement for
rehabilitation and resettlement, assurance of compensation etc.,
the land acquisition, rehabilitation and resettlement process can
be expedited
SPFM-R2
• There is a need of extensive training and capacity building
activities for the WUAs to enable them for managing the irrigation
assets after certain years (e.g. 3-5 years) of O&M by the Govt. or
any private body appointed by the Govt.
• In view of this, involvement of local NGO can be explored for
educating the beneficiaries about how to operate and maintain the
irrigation assets for their better life and larger benefits.
SPFM –
F6
2.2.4 Per Drop More Crop
The Centrally Sponsored Scheme – ‘Per Drop More Crop’ was launched on 1st July 2015 under
Department of Agriculture, Cooperation and Farmers Welfare (DAC&FW). The primary objective
of this scheme is to enhance water use efficiency in the agriculture sector by promoting

Page | 630
precision/micro-irrigation such as drip and sprinkler irrigation technologies and encourage the
farmers to use water saving and conservation technologies.
The PMKSY- Per Drop More Crop mainly focuses on enhancing water use efficiency at farm level
through micro-irrigation viz. Drip and Sprinkler Irrigation. Besides promoting precision irrigation
and better on-farm water management practices to optimize the use of available water resources,
this component also supports micro level water storage or water conservation/management
activities as Other Interventions (OI) to supplement Micro-irrigation. However, the OI activities
must be linked with Micro-irrigation to make potential use of the available funds for higher water
use efficiency.
Background
The government has implemented various schemes over time for promoting micro-irrigation.
Some notable schemes launched to promote micro-irrigation are mentioned in this section.
Figure 39: Micro – irrigation journey in India
Source: Strategy paper by Irrigation Association of India and FICCI, 2016
National Mission on Micro-irrigation (NMMI) (2010)181
181 Vaibhav Bhamoriya et al (2014), An Analysis of Resource Conservation Technology: A Case of Micro-Irrigation System (Drip
Irrigation), IIM Ahmedabad

Page | 631
The Centrally Sponsored Scheme on micro–irrigation being implemented by the Ministry of
Agriculture since 2005–06 for promoting the use of drip / sprinkler irrigation was reintroduced as
a national mission during the XIth
Plan period (2010). Under this scheme, the central subsidy was
revised to 60% of the total cost of the system for small and marginal farmers and 50% for general
farmers, including 10% of state share. Some of the states increased their share of subsidy to
20–50% instead of 10%, to incentivise more to the farmers. About 3 million ha were brought
under micro-Irrigation. The ministry of agriculture had set a target of covering 0.7 million ha under
the scheme in 2010 – 11 (MoA, 2010).
The NMMI promoted cultivation of vegetables with close spacing of laterals and use of micro
and mini sprinklers in the field resulting in saving of water and enhanced productivity within a
short period so that the farmers could get more income from the same land. NMMI promoted
latest technologies like valves, filters and fertigation etc. to increase water use efficiency,
productivity of crops and savings in use of fertilizers, water and electricity.
The Govt. of India Task Force on Micro-irrigation under N. Chandrababu Naidu had recommended
increasing the area under micro-irrigation by 3 million ha in the Tenth Plan and 14 million ha in the
Eleventh Plan with investments of Rs.10,500 Cr. and Rs.51,000 Cr. respectively182
.
National Mission on Sustainable Agriculture (NMSA) (2014)181
NMSA was formulated in 2014 to enhance agricultural productivity (mainly in rain fed areas)
focusing on integrated farming, water use efficiency, soil health management and resource
conservation. It was devised based on the basic premise that sustaining agricultural productivity
depends on quality and availability of natural resources such as soil and water. NMSA derived its
mandate from Sustainable Agriculture Mission, one of the eight missions outlined under the
National Action Plan on Climate Change (NAPCC).
NMSA has four components – Rainfed Area Development, On Farm Water Management
(OFWM), Soil Health Management and Climate Change & Sustainable Agriculture. The ongoing
182 Department of Agriculture & Cooperation (2004), Report of Task Force on Micro-irrigation

Page | 632
NMMI (since 2010) was subsumed under NMSA and implemented as ‘On Farm Water
Management (OFWM)’ during 2014-15.
Pradhan Mantri Krishi Sinchayee Yojana (PMKSY) (2015)181
Pradhan Mantri Krishi Sinchayee Yojana (PMKSY) was launched in 2015. This is an umbrella
scheme conceived by the Central Government to ensure access to some means of protective
irrigation for all agricultural farms in the country, to increase productivity, thus bringing much
desired rural prosperity, and, to achieve convergence of investments in irrigation at the field level.
The micro-irrigation component of OFWM was subsumed under PMKSY and implemented as
Per Drop More Crop. In addition to that, other main components of PMKSY – Accelerated
Irrigation Benefit Programme (AIBP), Har Khet Ko Pani (Command Area Development & Water
Management; Surface Minor Irrigation; Repair, Renovation & Restoration) and Watershed
Development Component.
Performance
From 2015-16 to 2019-20, this scheme has covered 4.8 mha area under micro-irrigation. State-
wise physical progress is tabulated below:
Table 79 : PDMC - Area covered under micro-irrigation (Ha)
# State 2015-16 2016-17 2017-18 2018-19 2019-20 Total
1 Karnataka 64,220 139,405 236,107 234,853 250,591 925,176
2 Andhra Pradesh 94,104 141,098 186,441 200,269 122,080 743,992
3 Gujarat 142,681 165,948 143,134 140,778 107,649 700,190
4 Tamil Nadu 32,288 44,778 105,695 172,445 263,494 618,700
5 Maharashtra 35,242 106,172 132,829 159,959 171,098 605,300
6 Rajasthan 56,346 47,650 48,205 53,982 58,573 264,756
7 Telangana 39,864 61,980 89,474 40,381 4,548 236,247
8 Madhya Pradesh 75,224 54,323 39,761 35,195 14,270 218,773
9 Uttar Pradesh 1,598 32,511 28,235 55,086 56,953 174,383
10 Chhattisgarh 8,056 19,227 13,087 18,929 27,688 86,987
11 Haryana 3,117 5,701 10,751 10,469 22,652 52,690
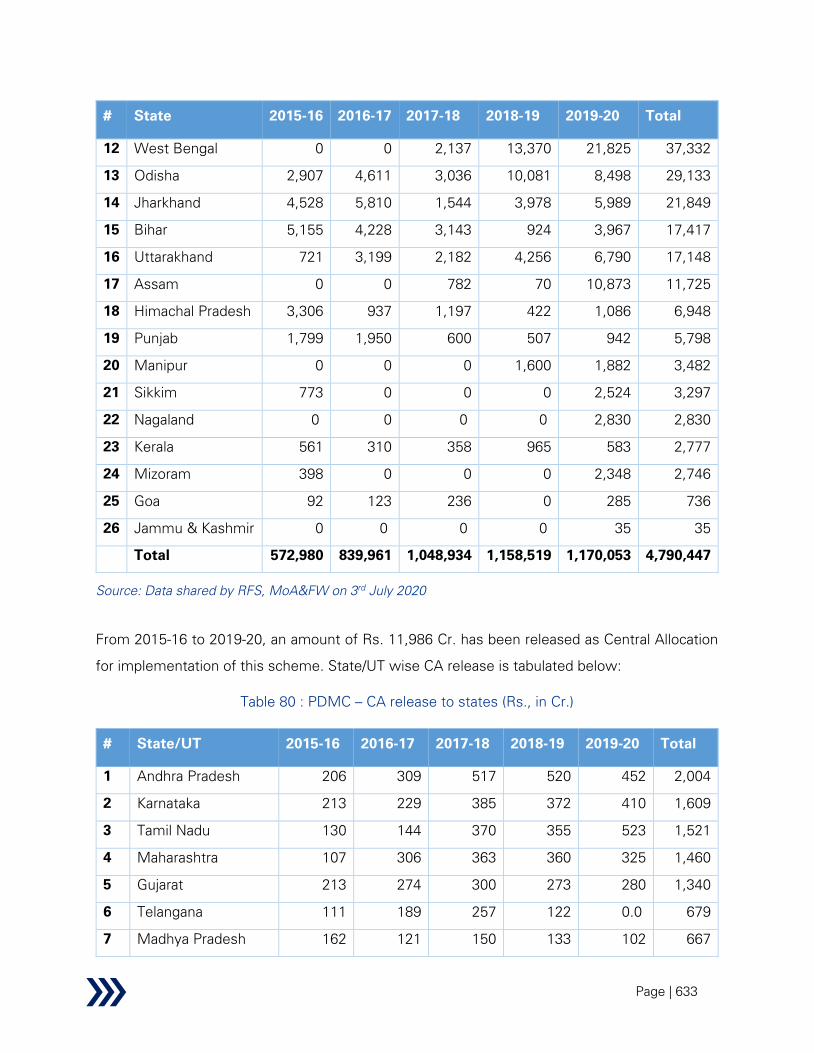
Page | 633
# State 2015-16 2016-17 2017-18 2018-19 2019-20 Total
12 West Bengal 0 0 2,137 13,370 21,825 37,332
13 Odisha 2,907 4,611 3,036 10,081 8,498 29,133
14 Jharkhand 4,528 5,810 1,544 3,978 5,989 21,849
15 Bihar 5,155 4,228 3,143 924 3,967 17,417
16 Uttarakhand 721 3,199 2,182 4,256 6,790 17,148
17 Assam 0 0 782 70 10,873 11,725
18 Himachal Pradesh 3,306 937 1,197 422 1,086 6,948
19 Punjab 1,799 1,950 600 507 942 5,798
20 Manipur 0 0 0 1,600 1,882 3,482
21 Sikkim 773 0 0 0 2,524 3,297
22 Nagaland 0 0 0 0 2,830 2,830
23 Kerala 561 310 358 965 583 2,777
24 Mizoram 398 0 0 0 2,348 2,746
25 Goa 92 123 236 0 285 736
26 Jammu & Kashmir 0 0 0 0 35 35
Total 572,980 839,961 1,048,934 1,158,519 1,170,053 4,790,447
Source: Data shared by RFS, MoA&FW on 3rd
July 2020
From 2015-16 to 2019-20, an amount of Rs. 11,986 Cr. has been released as Central Allocation
for implementation of this scheme. State/UT wise CA release is tabulated below:
Table 80 : PDMC – CA release to states (Rs., in Cr.)
# State/UT 2015-16 2016-17 2017-18 2018-19 2019-20 Total
1 Andhra Pradesh 206 309 517 520 452 2,004
2 Karnataka 213 229 385 372 410 1,609
3 Tamil Nadu 130 144 370 355 523 1,521
4 Maharashtra 107 306 363 360 325 1,460
5 Gujarat 213 274 300 273 280 1,340
6 Telangana 111 189 257 122 0.0 679
7 Madhya Pradesh 162 121 150 133 102 667
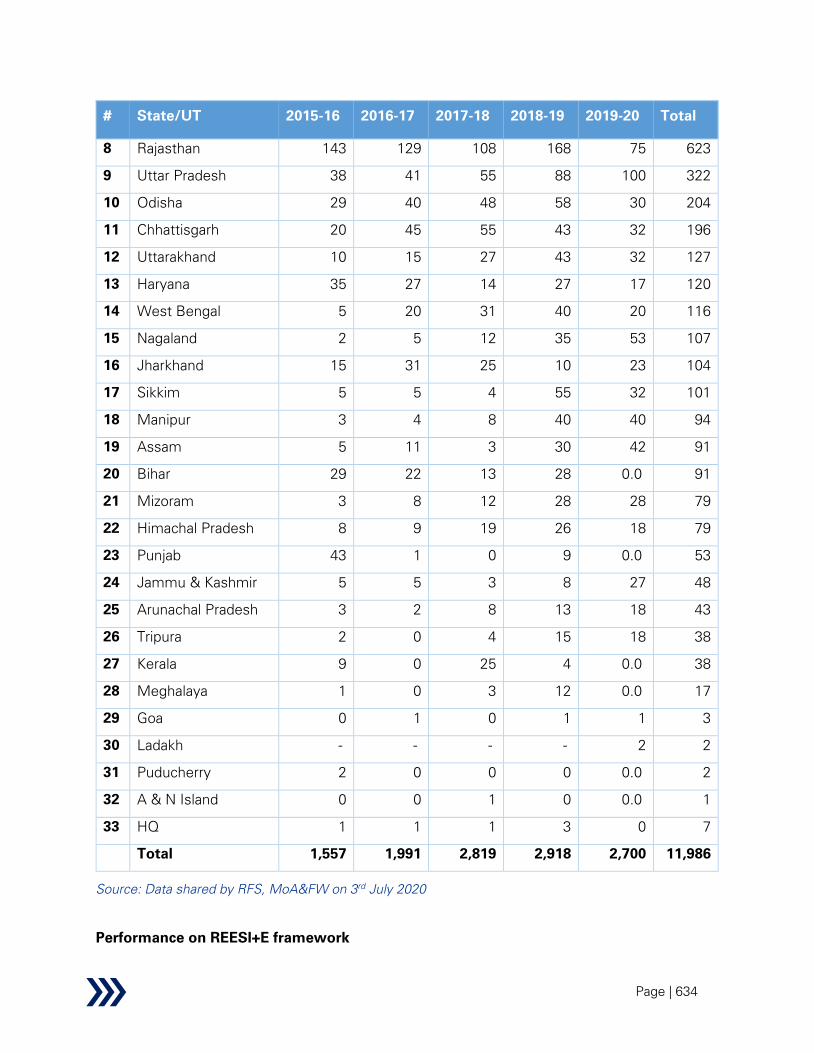
Page | 634
# State/UT 2015-16 2016-17 2017-18 2018-19 2019-20 Total
8 Rajasthan 143 129 108 168 75 623
9 Uttar Pradesh 38 41 55 88 100 322
10 Odisha 29 40 48 58 30 204
11 Chhattisgarh 20 45 55 43 32 196
12 Uttarakhand 10 15 27 43 32 127
13 Haryana 35 27 14 27 17 120
14 West Bengal 5 20 31 40 20 116
15 Nagaland 2 5 12 35 53 107
16 Jharkhand 15 31 25 10 23 104
17 Sikkim 5 5 4 55 32 101
18 Manipur 3 4 8 40 40 94
19 Assam 5 11 3 30 42 91
20 Bihar 29 22 13 28 0.0 91
21 Mizoram 3 8 12 28 28 79
22 Himachal Pradesh 8 9 19 26 18 79
23 Punjab 43 1 0 9 0.0 53
24 Jammu & Kashmir 5 5 3 8 27 48
25 Arunachal Pradesh 3 2 8 13 18 43
26 Tripura 2 0 4 15 18 38
27 Kerala 9 0 25 4 0.0 38
28 Meghalaya 1 0 3 12 0.0 17
29 Goa 0 1 0 1 1 3
30 Ladakh - - - - 2 2
31 Puducherry 2 0 0 0 0.0 2
32 A & N Island 0 0 1 0 0.0 1
33 HQ 1 1 1 3 0 7
Total 1,557 1,991 2,819 2,918 2,700 11,986
Source: Data shared by RFS, MoA&FW on 3rd
July 2020
Performance on REESI+E framework

Page | 635
Table 81: PDMC – Performance evaluation based on REESIE framework
Parameter Findings from research
Relevance
Secondary:
• India is expected to face a water demand-supply gap of 50% by 2030183
.
On account of inefficient water use across the irrigation value chain,
irrigation coverage184
is lower. PDMC targets to improve on-farm water
use efficiency to address the widening demand-supply gap and improve
irrigation coverage. Micro-irrigation has high water use efficiency (85-
90%) compared to flood irrigation (60-75%).185
• Water source creation under the ‘other interventions’ (OI) component of
the scheme has improved availability of surface water, and thereby
reduced dependency on groundwater (as source for micro-irrigation) and
improved soil-moisture content.
• The scheme guidelines clearly specify the scheme objectives and the
guidelines are aligned to deliver the same. The scheme objectives are
clear and can be easily represented in terms of outputs and outcomes.
Primary:
• Scheme is designed to address several national priorities such as
improving on-farm water use efficiency, enhancing crop productivity,
generating employment etc.
• In the beneficiary survey, around
54% of farmers have indicated
improvement of water use efficiency
after adoption of MI for cultivation.
Around 78% of farmers have
reported increase in crop productivity
after use of MI.
183 2030 Water Resources Group
184 Agriculture Statistics at a glance, 2018, Ministry of Agriculture and Family Welfare, GoI
185 Guidelines for improving water use efficiency in Irrigation, Domestic and Industrial sectors, Central Water Commission
Yes No
54%46%
Did water use efficiency improve
after MI adoption? (N=193)
(n=149)

Page | 636
Parameter Findings from research
• One of the key outcomes expected
of the scheme is to increase
irrigation coverage through
improved water use efficiency.
Discussions with the key informants
across all states have also
supported this aspect of scheme
design.
• Under National Mission on Micro-irrigation (i.e. predecessor to PDMC),
only those farmers who already had access to an irrigation water source
were eligible. PDMC has bridged this gap and provides support for water
source creation (under the Other Interventions (OI) component) in
addition to Micro-irrigation (MI) system. This component has increased
the coverage of eligible farmers under the scheme. Other schemes like
MGNREGA also allow for water source creation (e.g. ponds). However,
generally, the primary purpose of such sources is not for irrigation. On
the other hand, OI component of the scheme allows for creation of water
sources exclusively for MI. In this way, PDMC fills-in an important
interventional gap.
• The scheme has also started intervening another sectoral area i.e. water
security by using treated wastewater for agriculture. Government of
India promotes the use of treated wastewater for MI through Micro-
irrigation Fund (MIF). This fund (a corpus of Rs. 5,000 Cr.) was created
with NABARD during 2017-18. The major objective of the fund is to
facilitate the States in mobilizing the resources for expanding coverage
of Micro-irrigation by taking up special and innovative projects and for
incentivizing micro-irrigation beyond the provisions available under
PMKSY-PDMC to encourage farmers to install micro-irrigation systems.
As per guidelines of the MIF, a Tripartite Memorandum of Agreement
(MoA) must be signed between State, NABARD and Govt. of India for
availing the fund. Tripartite MoA has been signed by States of Andhra
Yes No 78% 22%
Did crop productivity increase
after MI adoption? (N=193)
(n=149)
Page | 637
Parameter Findings from research
Pradesh, Gujarat, Tamil Nadu, Haryana, Uttarakhand and West Bengal.
Steering Committee of MIF and PSC of NABARD has approved projects
for Tamil Nadu, Andhra Pradesh, West Bengal and Haryana. One of the
proposal for availing MIF is use of treated wastewater for Micro-
irrigation. In Karnataka, recycled wastewater is being used for vegetable
cultivation at Kolar district. There are a few pilot projects underway in
Tamil Nadu as well. While several countries (e.g. Israel, USA) are
successfully using treated wastewater for agriculture, there is a need to
conduct research for the Indian context and formulate necessary
guidelines for using treated wastewater in agriculture, horticulture and
fodder crops as was pointed out by a key informant from Andhra
Pradesh. In the absence of safety regulations and ensuring that
wastewater is adequately treated, there exists health risks including
introduction of harmful elements / metals into the food chain.
• Certain technological, regulatory and institutional modifications are
necessary to enhance the adoption of MI. For example:
- Discussion with the national stakeholders has revealed that while
the scheme remains popular in areas with bore well prevalence or
other perennial water sources, adoption rates are significantly
lower in areas served through canal irrigation. This is due to the
fact that MI requires pressurized water supply while canal irrigation
relies on gravity flows. Technological innovation in outlet design
that allow for pressurized supply from existing canal network may
help to address the above issue.
- New Major and Medium Irrigation (MMI) projects being planned or
implemented should have provision for integration with MI system
at the farm level. Since new MMI projects are generally undertaken
by the states, necessary directions / guidelines at the state level
for MI integration need to be adopted and implemented. In fact,
Page | 638
Parameter Findings from research
present guideline186
requires that for existing MMI projects at least
10% of the projects are to be linked to MI system. However,
compliance in regard has not been satisfactory.
- Key informants from Andhra Pradesh, Rajasthan emphasised the
necessity of integrating MMI projects to MI systems to enable
multiple cropping and water saving across the cultivable area
served by the MMI projects.
Inference:
The scheme is relevant in achieving national priorities such as substantially
improving on-farm water use efficiency, enhancing crop productivity,
generating employment opportunities etc. Also, the scheme fills in
interventional gap by allowing water source creation exclusively for MI
through its Other Intervention component.
Therefore, the scheme is rated as ‘satisfactory’ with respect to relevance.
Effectiveness
Secondary:
• The scheme has resulted in increase in MI coverage, creation of micro-
water harvesting structures, etc. (outputs). The scheme has enhanced
productivity; reduced the consumption of water, fertilizer, power etc.
(outcomes). The scheme has also created employment opportunities,
increased incomes of farmers and helped in ensuring food security etc.
(impact).
• Impact Evaluation Study (2014) shows, on average, reduction in irrigation
cost of 32%; saving in electricity consumption of 31%, fertilizer saving
of 7% to 42%; productivity increases in yields of fruits and vegetables
of about 42% and 53% respectively; increase in farmers’ income of
48.5%.
186 Mo WR, RD & GR, Guidelines for Central Assistance for Command Area Development Works in Prioritized AIBP funded
Irrigation Projects (section 2.4)

Page | 639
Parameter Findings from research
• Recent field study (in Himachal Pradesh) by TERI shows increase in crop
productivity of 35% to 86%; increase in farmers’ income of 230%; water
saving of 50% to 90%. However, this study did not show any reduction
in fertilizer consumption.
• Karnataka, Andhra Pradesh, Gujarat, Tamil Nadu, Maharashtra,
Rajasthan, Telangana, Madhya Pradesh, Uttar Pradesh have performed
well from 2015-16 to 2019-20. Goa, Mizoram, Kerala, Nagaland, Sikkim,
Manipur, Punjab, Himachal Pradesh, Assam have performed poorly from
2015-16 to 2019-20. Arunachal Pradesh, Meghalaya, Tripura, A&N and
Puducherry have not reported any progress.
• The physical- financial targets and its progress are uploaded by the
states on the PMKSY- PDMC portal. Physical targets are finalized from
the approved Annual Action Plan of the States which is approved by the
State Level Sanctioning Committee (SLSC) of the states headed by Chief
Secretary of the states.
• Higher capital investment for MI system discourages small and marginal
farmers from adopting it187
. In contrast, another study has pointed out
that the upper cap of 5 ha for a beneficiary farmer excludes large farms
and therefore reduces the adoption rate190
.
• Previous studies have identified delay in fund release as a cause for
delays in project progress188
.
• A previous study189
has shown that increase in subsidy beyond a certain
limit has little or no impact on increasing MI coverage. Previously,
Rajasthan, Tamil Nadu and Bihar provided 90%, 75% and 90% subsidy
respectively; however, MI penetration was 7.3%, 4.5%, and 3.1%
respectively.
187 IAI, FICCI, Grant Thornton (2016), Accelerating growth of Indian agriculture: Micro-irrigation an efficient solution
188 Department of Agriculture Cooperation & Farmers Welfare (2017), Presentation on Pradhan Mantri Krishi Sinchai Yojana
(PMKSY)- “Per Drop More Crop”-Micro-irrigation
189 Ministry of Agriculture (2014), National Mission on Micro-irrigation (NMMI) – Impact Evaluation Study

Page | 640
Parameter Findings from research
• A previous study189
has recommended more subsidy on drip irrigation as
compared to sprinkler irrigation as drip irrigation is more expensive
• The scheme has dedicated budget allocation, institutional arrangements,
guidelines and IT infrastructure for progress monitoring. State
Agriculture Department is responsible for reporting the progress data
and National Committee on Plasticulture Applications in Horticulture
(NCPAH) is involved in monitoring & reviewing the progress of the
scheme
• National Rainfed Area Authority (NRAA) is involved in mid-term/end-term
evaluation of the programme. State Govts are free to appoint any
reputed agencies for monitoring and evaluation of the scheme in their
states. There is a requirement that 25% of the projects sanctioned by
the state should be considered for third party monitoring and evaluation
by the implementing state.
• Scheme guidelines does not provide for a separate allocation for IEC and
capacity building activities but are to be incurred under the head of admin
expense (i.e. 5% of central allocation)
• Absence of a single department/body for implementation of the scheme
at state level adversely impacts scheme performance190
.
Primary:
• There is a two-pronged approach to improve MI penetration – i) demand
driven (i.e. farmer) and ii) supply driven (i.e. integrating MI to major and
medium irrigation projects). The target for the demand driven approach
is based on available budget and demand (during 2015-16 to 2019-20,
average ~1 mha per year) during a year. There is an established process
(e.g. educating farmers, demonstrating benefits of MI, etc.) to achieve
this target which is working well. However, in respect of supply driven
MI adoption, the progress has not been significant. It is noteworthy that
190 Planning Commission, GoI (2014), Evaluation Study on Integrated Scheme of Micro-irrigation
Page | 641
Parameter Findings from research
supply driven target flows from the CADWM scheme guideline186
(viz.
for 10% of MMI projects to be integrated with micro-irrigation).
• Out of 12 states selected for primary research under the present study,
Karnataka, Andhra Pradesh, Tamil Nadu, Maharashtra, Rajasthan, Uttar
Pradesh have performed well. The factors that have positively
contributed for their performance include:
- Dedicated agency responsible for MI implementation in Andhra
Pradesh (Andhra Pradesh Micro-irrigation Project) and Tamil Nadu
(Tamil Nadu Horticulture Development Agency)
- Arid or semi-arid or drought prone region where assured irrigation
facility is low, such as Rajasthan (e.g. Jalore, Sri Ganganagar district),
Karnataka (e.g. Koppal district), Maharashtra (e.g. Buldhana district),
Andhra Pradesh (e.g. Kurnool district)
- Prevalence of perennial water sources such as dug well, bore well in
Maharashtra (e.g. Jalgaon district), Karnataka, Uttar Pradesh, Andhra
Pradesh, Tamil Nadu (e.g. Krishnagiri district)
- Continuous monitoring of progress and quality (e.g. 3rd
party
monitoring in Andhra Pradesh, Tamil Nadu etc. by NABCONS,
educational institutes etc.)
- Extensive awareness campaign and training programs in these
states
- Single agency / department responsible for implementation of both
MI and OI components of the scheme in Tamil Nadu, Maharashtra
- Predominance of horticulture (vegetables, fruits etc.) and high value
crops (sugarcane, cotton, banana etc.) in the cropping pattern of the
states
- Financing facilities available for farmers (e.g. Kisan Credit Card in
Andhra Pradesh, post-dated cheque in Uttar Pradesh etc.)
- Presence of many MI system manufacturing companies (e.g. around
37 empanelled companies in Andhra Pradesh, around 120 in
Maharashtra, around 68 in Uttar Pradesh)

Page | 642
Parameter Findings from research
- Measures such as in Rajasthan that requires farmer who desires to
install solar pump to necessarily implement MI system in his farm
- Mandatory fertigation along with drip irrigation in Rajasthan
- Innovative arrangements such as mulching along with drip, auto-
irrigation schedule with drip, weed control etc.
- A few district specific favourable factors: Tamil Nadu provides free
electricity and 100% subsidy to the small and marginal farmers.
Hence, these farmers get both drip system as well as water at free
of cost. In Krishnagiri district, there is lack of adequate water to
cultivate crops during the period from December to first week of
June. However, since the district is located close to Bangalore, the
farmers are motivated to use drip irrigation during these 6 months
period for growing vegetables and increase their income. Krishnagiri
is one of the well-performing districts in Tamil Nadu with respect to
MI coverage.
• The performances of Jharkhand, Bihar, Assam, Himachal Pradesh,
Punjab, Manipur in respect of MI implementation have been below par.
The factors that have contributed to this are:
- Assured canal-based irrigation facilities and free electricity in Punjab
- High rainfall in Assam, Manipur
- Lack of perennial source of water in Assam (e.g. Goalpara, Golaghat
districts), Bihar, Manipur (e.g. Chandel district)
- Inadequate awareness campaign and training programs especially in
north eastern states (e.g. Assam, Manipur)
- Hilly terrain in Jharkhand, which is difficult for boring
- More than 90% landholdings are fragmented in Bihar, Jharkhand,
Assam, Manipur
- High transportation cost for Assam, Manipur resulting in higher cost
of MI systems
• Key informants from states, districts, villages have mentioned about
several benefits of MI including productivity increase, fertilizer saving,
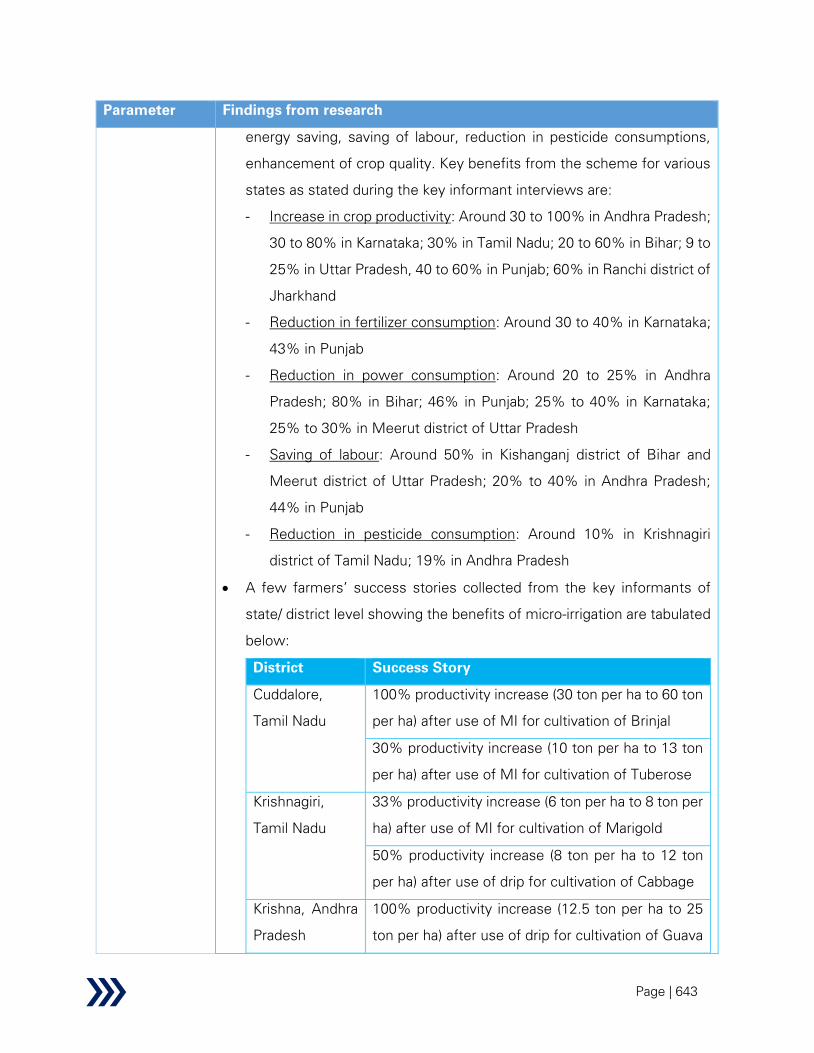
Page | 643
Parameter Findings from research
energy saving, saving of labour, reduction in pesticide consumptions,
enhancement of crop quality. Key benefits from the scheme for various
states as stated during the key informant interviews are:
- Increase in crop productivity: Around 30 to 100% in Andhra Pradesh;
30 to 80% in Karnataka; 30% in Tamil Nadu; 20 to 60% in Bihar; 9 to
25% in Uttar Pradesh, 40 to 60% in Punjab; 60% in Ranchi district of
Jharkhand
- Reduction in fertilizer consumption: Around 30 to 40% in Karnataka;
43% in Punjab
- Reduction in power consumption: Around 20 to 25% in Andhra
Pradesh; 80% in Bihar; 46% in Punjab; 25% to 40% in Karnataka;
25% to 30% in Meerut district of Uttar Pradesh
- Saving of labour: Around 50% in Kishanganj district of Bihar and
Meerut district of Uttar Pradesh; 20% to 40% in Andhra Pradesh;
44% in Punjab
- Reduction in pesticide consumption: Around 10% in Krishnagiri
district of Tamil Nadu; 19% in Andhra Pradesh
• A few farmers’ success stories collected from the key informants of
state/ district level showing the benefits of micro-irrigation are tabulated
below:
District Success Story
Cuddalore,
Tamil Nadu
100% productivity increase (30 ton per ha to 60 ton
per ha) after use of MI for cultivation of Brinjal
30% productivity increase (10 ton per ha to 13 ton
per ha) after use of MI for cultivation of Tuberose
Krishnagiri,
Tamil Nadu
33% productivity increase (6 ton per ha to 8 ton per
ha) after use of MI for cultivation of Marigold
50% productivity increase (8 ton per ha to 12 ton
per ha) after use of drip for cultivation of Cabbage
Krishna, Andhra
Pradesh
100% productivity increase (12.5 ton per ha to 25
ton per ha) after use of drip for cultivation of Guava
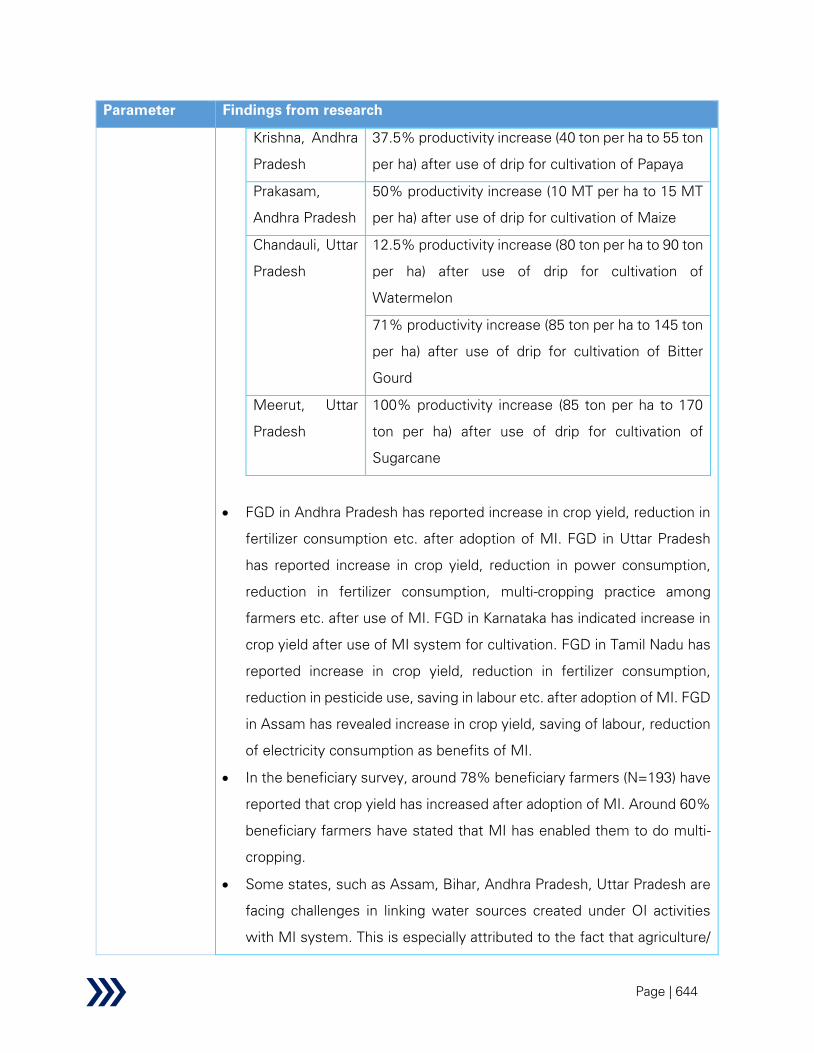
Page | 644
Parameter Findings from research
Krishna, Andhra
Pradesh
37.5% productivity increase (40 ton per ha to 55 ton
per ha) after use of drip for cultivation of Papaya
Prakasam,
Andhra Pradesh
50% productivity increase (10 MT per ha to 15 MT
per ha) after use of drip for cultivation of Maize
Chandauli, Uttar
Pradesh
12.5% productivity increase (80 ton per ha to 90 ton
per ha) after use of drip for cultivation of
Watermelon
71% productivity increase (85 ton per ha to 145 ton
per ha) after use of drip for cultivation of Bitter
Gourd
Meerut, Uttar
Pradesh
100% productivity increase (85 ton per ha to 170
ton per ha) after use of drip for cultivation of
Sugarcane
• FGD in Andhra Pradesh has reported increase in crop yield, reduction in
fertilizer consumption etc. after adoption of MI. FGD in Uttar Pradesh
has reported increase in crop yield, reduction in power consumption,
reduction in fertilizer consumption, multi-cropping practice among
farmers etc. after use of MI. FGD in Karnataka has indicated increase in
crop yield after use of MI system for cultivation. FGD in Tamil Nadu has
reported increase in crop yield, reduction in fertilizer consumption,
reduction in pesticide use, saving in labour etc. after adoption of MI. FGD
in Assam has revealed increase in crop yield, saving of labour, reduction
of electricity consumption as benefits of MI.
• In the beneficiary survey, around 78% beneficiary farmers (N=193) have
reported that crop yield has increased after adoption of MI. Around 60%
beneficiary farmers have stated that MI has enabled them to do multi-
cropping.
• Some states, such as Assam, Bihar, Andhra Pradesh, Uttar Pradesh are
facing challenges in linking water sources created under OI activities
with MI system. This is especially attributed to the fact that agriculture/
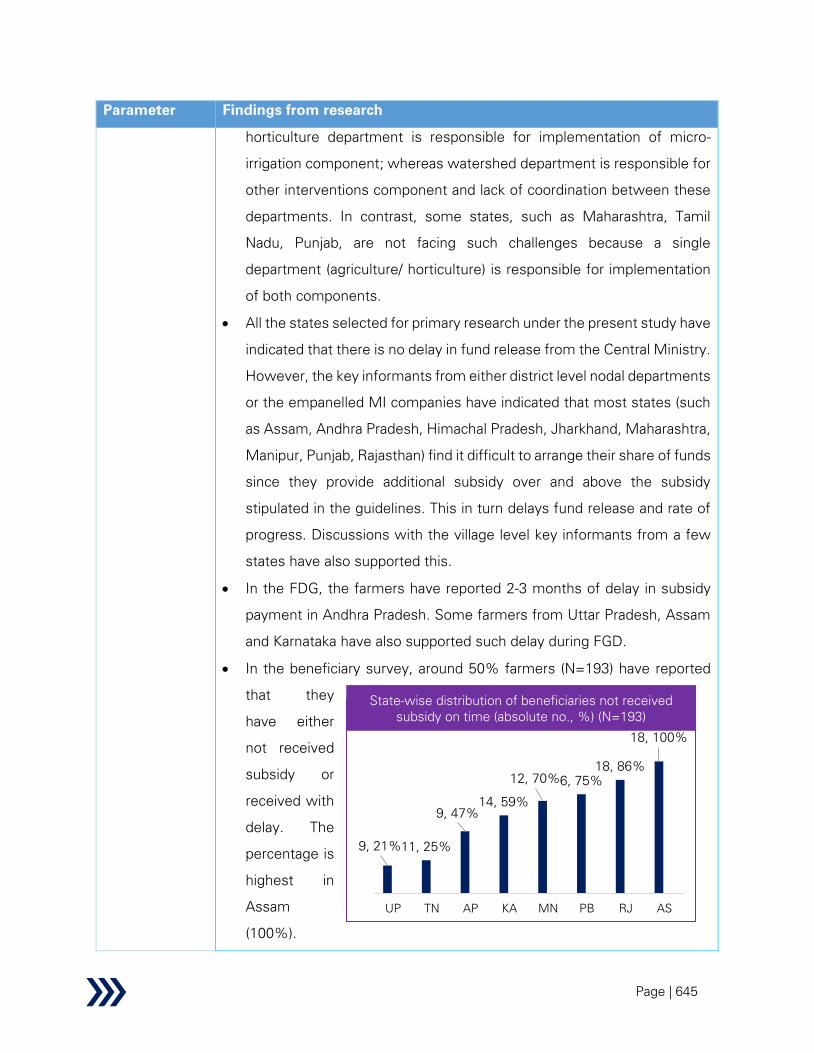
Page | 645
Parameter Findings from research
horticulture department is responsible for implementation of micro-
irrigation component; whereas watershed department is responsible for
other interventions component and lack of coordination between these
departments. In contrast, some states, such as Maharashtra, Tamil
Nadu, Punjab, are not facing such challenges because a single
department (agriculture/ horticulture) is responsible for implementation
of both components.
• All the states selected for primary research under the present study have
indicated that there is no delay in fund release from the Central Ministry.
However, the key informants from either district level nodal departments
or the empanelled MI companies have indicated that most states (such
as Assam, Andhra Pradesh, Himachal Pradesh, Jharkhand, Maharashtra,
Manipur, Punjab, Rajasthan) find it difficult to arrange their share of funds
since they provide additional subsidy over and above the subsidy
stipulated in the guidelines. This in turn delays fund release and rate of
progress. Discussions with the village level key informants from a few
states have also supported this.
• In the FDG, the farmers have reported 2-3 months of delay in subsidy
payment in Andhra Pradesh. Some farmers from Uttar Pradesh, Assam
and Karnataka have also supported such delay during FGD.
• In the beneficiary survey, around 50% farmers (N=193) have reported
that they
have either
not received
subsidy or
received with
delay. The
percentage is
highest in
Assam
(100%).
9, 21%11, 25%
9, 47%
14, 59%
12, 70%6, 75%
18, 86%
18, 100%
UP TN AP KA MN PB RJ AS
State-wise distribution of beneficiaries not received
subsidy on time (absolute no., %) (N=193)

Page | 646
Parameter Findings from research
• In the beneficiary survey, around 42% farmers (N=193) have stated that
they have not received any support (like technical, financial) from the
Government.
• Favourable
periods for
cultivation
using MI
system are pre-
monsoon (April
to June) and
Rabi (October
to March)
seasons. Discussions with the key informants from a few states (e.g.
Jharkhand, Maharashtra etc.) and a few empanelled MI companies have
indicated that currently, the farmers, in most of states, are able to avail
MI in the Rabi window for cultivation due to the existing administrative
process (communication of tentative allocation by ministry to states,
approval of action plan at state and central level etc.). Although GOI
approves GOI share or guideline, the work orders are not in place across
many states due to several reasons such as:
- States do not have action plan ready
- States cannot arrange for their matching share of fund
- Approval is pending from State Level Sanctioning committee (SLSC)
Hence, the overall funding gets delayed to July, August; however, it is
difficult to start the work because MI installation is difficult during the
monsoon. As a result, it is postponed to September, October.
If the timelines for administrative processing can be modified to enable
the fund release (both central and state’s share) in the 1st week of April,
the work can be started from mid-April and the farmers will be able to
utilize the pre-monsoon window for cultivation using MI. Such
adjustment to timelines will further enhance the productivity utilizing
2, 5%
7, 17%
8, 42%
13, 54%
6, 75%
13, 76%
14, 78%
18, 86%
TN UP AP KA PB MN AS RJ
State wise distribution of beneficiaries not received any
Govt. support (absolute no., %) (N=193)
Page | 647
Parameter Findings from research
same quantity of fund. A few states (e.g. Tamil Nadu, Gujarat etc.) have
already made such changes to timelines. There is opportunity for other
states to make similar adjustments to their timelines.
• A few states, such as Punjab, Tamil Nadu, have pointed out that the
exclusion of farms with acreage in excess of 5 ha negatively impacts MI
adoption. Farmers with large farms do not implement MI on account of
not being eligible for subsidy. However, the Ministry clarified that the
scheme is targeted at small and marginal farmers who are unable to bear
the full cost of MI systems. Further, it was pointed out that recovery of
investment for small and marginal farmers happens within 8-18 months.
It was also pointed out that based on interactions with some of large
farmers, that the exclusion of large farms from the scheme was not a
hindrance and in fact such farmers have implemented MI at their own
cost.
• The progress/ achievement of the scheme is being regularly monitored
through online Monitoring Information System (MIS), desk reviews, filed
visits. Some of the success stories of farmers from PDMC adoption have
been documented for various states. However, the outcome may be
assessed through third party evaluation of the scheme. Further,
outcome/ impact parameters should be reported through PMKSY-PDMC
dashboard.
• The present study is the first post-2014 to independently evaluate the
scheme at a national level. Apart from this, a few states (e.g. Andhra
Pradesh, Jharkhand, Uttar Pradesh, Tamil Nadu) have either conducted
or are currently conducting (e.g. Karnataka) independent third-party
evaluation to verify the progress as well as assess the impact of the
scheme in their states.
• Discussions with the key informants of state, district level have indicated
that many states (e.g. Andhra Pradesh, Tamil Nadu, Bihar, Karnataka,
Jharkhand, Maharashtra etc.) have their own exclusive, transparent MIS
system (e.g. Andhra Pradesh Micro-irrigation Project [APMIP] in Andhra
Page | 648
Parameter Findings from research
Pradesh, Micro-irrigation Management Information System [MIMIS] in
Tamil Nadu, Horticultural Application for Scheme Intervention and
Regulating Utilization of Funds [HASIRUF] in Karnataka) for managing
data and monitoring progress. The end-to-end process starting from
beneficiary selection to subsidy disbursement are tracked through these
online systems. The key informants have also indicated several
challenges (e.g. delay due to troubleshooting) of using Bhuvan app for
data capture and PMKSY-PDMC MIS for data upload. Therefore,
integration of respective state level MIS with the PMKSY-PDMC MIS
can be explored, which will reduce the effort currently being made by
the state or district level officers to upload the data and enable real-time
data transfer to the central dashboard (i.e. PMKSY-PDMC).
• Some best practices or innovative initiatives taken across states are
discussed below:
- Cultivation of Musk Melon, Watermelon using drip along with plastic
mulching sheet and solar system in Ananthapur, Nellore districts of
Andhra Pradesh. Plastic Mulching sheet with Drip in farmland is more
effective in the aspects of water conservation and weed control
when compared without mulching sheet plots
- Cultivation of paddy with drip in Vishakhapatnam, Andhra Pradesh
- Cultivation of vegetables using drip along with plastic mulching in
Dharwad, Karnataka
- Cultivation of Banana using drip along with mulching and solar
system in Goalpara, Assam
- Cultivation of vegetables using drip along with mulching in Chandauli,
Uttar Pradesh
- Drip irrigation in combination with mulching and weed removing
technology in Krishnagiri, Dharmapuri districts of Tamil Nadu
- In Bihar, Agricultural Technology Management Agency (ATMA)
broadcasts the success stories of farmers, who have been

Page | 649
Parameter Findings from research
benefitted using MI system for cultivation, in Doordarshan and other
channels over TV. It has been quite effective for awareness creation.
- Awareness campaign through displaying small videos, audio-visual
sessions (e.g. MI system installation, MI system maintenance,
benefit of MI etc.) at village level kiosks of Rythu Bharosa Kendra
(RBK) in Andhra Pradesh. This is cost effective as compared to in-
person demo or workshop for extension programs.
- Direct involvement of sugar mill owners in case of providing
financing assistance to the farmers, coordination with the
empanelled MI companies for creating awareness among farmers
about benefit of MI, importance of water conservation practices,
installation and maintenance of equipment etc. in West Champaran
district of Bihar. This has reduced financial burden on the beneficiary
farmers, enhanced sugarcane production and income of the
beneficiary farmers in the district.
Inference:
• The scheme is effective in achieving its demand side targets; however,
there is a need to take remedial measures to improve supply driven MI
implementation.
• Secondary reports as well as key informants from state, district, village
level have confirmed that the scheme has been quite effective in terms
of showing benefits (e.g. increase in productivity; reduction in fertilizer
consumption, water consumption, power consumption etc.).
• Primary survey across 12 states has shown that the scheme is effective
in southern India, and there is significant scope for improvement in
north-eastern as well as Himalayan states.
• The scheme progress is uneven across the country. Around 81%
scheme coverage is limited to only top 6 countries (i.e. Karnataka,
Andhra Pradesh, Tamil Nadu, Maharashtra, Rajasthan, Gujarat).

Page | 650
Parameter Findings from research
• Coverage across the remaining states is less mainly because of several
issues such as lack of coordination among various departments, high
logistics cost in hilly areas, delayed fund flow due to unavailability of
states’ share of fund, lack of awareness campaign and capacity building
activities etc.
Therefore, the scheme is rated as ‘average’ with respect to effectiveness.
Efficiency
Secondary:
• Previous evaluation study showed that overall expenditure on MI system
were higher because of fragmented landholding by farmers across
states, resulting in separate MI installation in each farm. This factor is a
risk in improving the adoption rates of MI systems
• The scheme is helpful in providing many social and economic benefits,
like productivity increase, energy saving, water saving, off-farm
employment generation, increase in farmer’s income etc.
• Different components of cost are – cost of subsidy to the Govt.; forced
investment on well for drip191
; cost of inputs like water, fertilizer,
manure, seeds; labour cost, cost of maintenance of MI system, etc.
• According to the previous studies, many farmers could not opt for MI
because of the high upfront investment. For such cases, alternate
business model needs to be evaluated.
• This scheme complements MGNREGA and PMKSY-WDC in terms of
source creation and efficient water resources management
Primary:
• All key informants at state, district, village levels have indicated that
benefit cost ratio (BCR) for MI system is more than that of conventional
irrigation system. However, most states do not maintain such data viz.
191 Economic Affairs (2018), Social Costs and Benefits Analysis of Drip Irrigation System in Northern Maharashtra
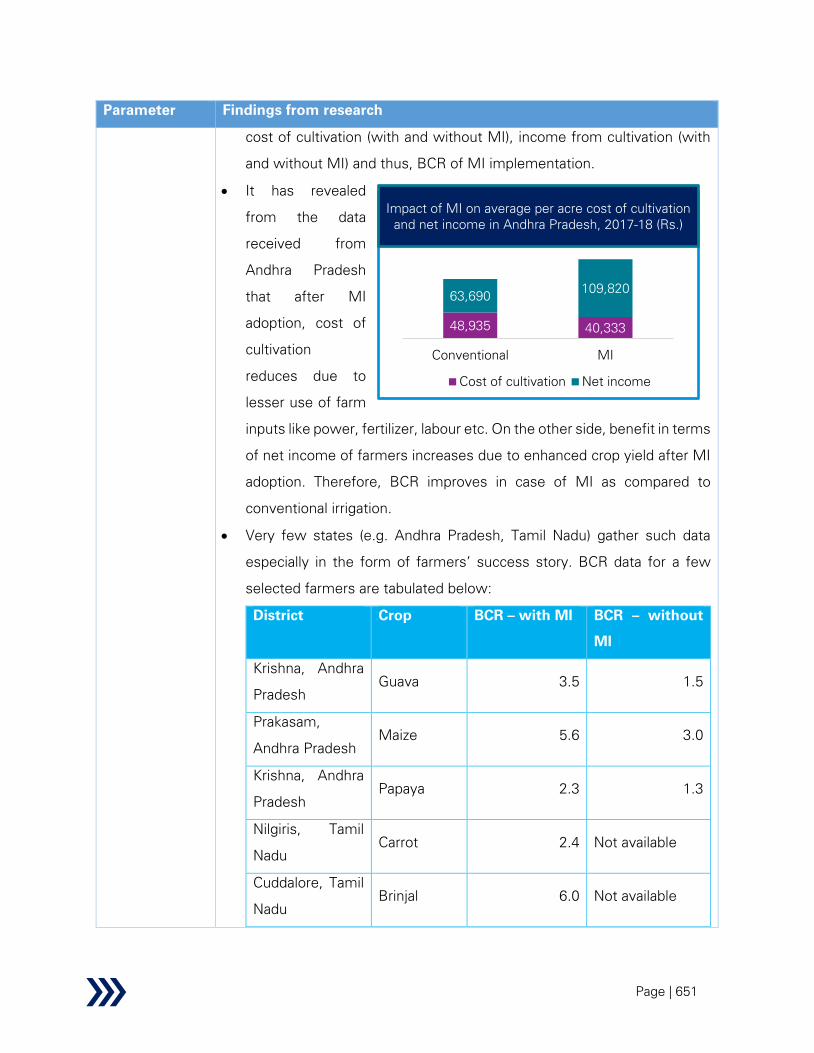
Page | 651
Parameter Findings from research
cost of cultivation (with and without MI), income from cultivation (with
and without MI) and thus, BCR of MI implementation.
• It has revealed
from the data
received from
Andhra Pradesh
that after MI
adoption, cost of
cultivation
reduces due to
lesser use of farm
inputs like power, fertilizer, labour etc. On the other side, benefit in terms
of net income of farmers increases due to enhanced crop yield after MI
adoption. Therefore, BCR improves in case of MI as compared to
conventional irrigation.
• Very few states (e.g. Andhra Pradesh, Tamil Nadu) gather such data
especially in the form of farmers’ success story. BCR data for a few
selected farmers are tabulated below:
District Crop BCR – with MI BCR – without
MI
Krishna, Andhra
Pradesh
Guava 3.5 1.5
Prakasam,
Andhra Pradesh
Maize 5.6 3.0
Krishna, Andhra
Pradesh
Papaya 2.3 1.3
Nilgiris, Tamil
Nadu
Carrot 2.4 Not available
Cuddalore, Tamil
Nadu
Brinjal 6.0 Not available
48,935 40,333
63,690109,820
Conventional MI
Cost of cultivation Net income
Impact of MI on average per acre cost of cultivation
and net income in Andhra Pradesh, 2017-18 (Rs.)

Page | 652
Parameter Findings from research
Cuddalore, Tamil
Nadu
Tuberose 5.0 Not available
Krishnagiri, Tamil
Nadu
Turmeric 1.7 Not available
Krishnagiri, Tamil
Nadu
Marigold 1.0 Not available
• Fragmented landholding is an issue across many states (such as Bihar,
Assam, Manipur etc.) because more than 80-90% farmers are small and
marginal in these states. The farm holding is as low as 0.1 acre. Since
minimum area mentioned in the MI guideline is 0.4 ha (around 0.99 acre)
and subsidy for farm size smaller than that is calculated on pro-rata basis,
it leads to comparatively higher costs for MI systems in case of such
smaller farms. For example, let us consider two farms - 0.4 acre and 0.2
acre. If all other factors remain same, the subsidy calculated for 0.2 acre
will be half of that for 0.4 acre. However, the actual cost of MI
implementation for 0.2 acre will not be half of that for 0.4 acre, instead
it will be more than that because there are a few fixed cost components
(e.g. filter, venturi fertilizer injector assembly etc.) and costs of those
components do not vary with the farm size (in case of such smaller
farms).
• The adoption of the scheme is higher in those states that offer a higher
(top-up) subsidy. The states are, on occasions, unable to arrange funds
for the top-up subsidy, which then negatively impacts scheme progress.
In view of the above, states have proposed certain measures to reduce
overall cost without compromising on the scheme objectives:
- Skill upgradation of farmers is necessary so that farmers can install
MI systems by themselves. This will help farmers avoid the
installation charges. The village level key informants from Uttar
Pradesh have supported this view.

Page | 653
Parameter Findings from research
- Low cost MI solutions can be helpful to improve affordability among
small and marginal farmers.
- Drip along with fertigation is more effective than drip without
fertigation because fertigation reduces fertilizer consumption,
resulting in overall cost reduction and enhances quality of crops.
However, water soluble fertilizer is comparatively expensive and
thus, many farmers cannot afford fertigation, even if they use drip
system for cultivation. Therefore, most states, district and village
level key informants have stated that water soluble fertilizer can be
made available in the market at subsidized rate (under this scheme).
This will encourage many farmers (especially small and marginal) to
adopt fertigation.
- For some states (e.g. Assam, Manipur, Udupi district in Karnataka),
the cost associated with transportation and logistics of MI systems
is significant. Accordingly, factories for manufacturing MI
components can be set-up in such states which will reduce the
logistics cost and therefore the overall cost of the MI system.
- Discussions with the key informants at state, district levels (such as:
Goalpara, Golaghat districts of Assam, Andhra Pradesh, Kishanganj
district of Bihar, Manipur, Rajasthan, Meerut district of Uttar
Pradesh, Tamil Nadu etc.) has revealed that convergence with other
schemes, such as MGNREGA, PMKSY-WDC, is not happening
effectively in the above-mentioned states. It is mainly attributed to
coordination issues between departments responsible for
implementing various schemes. However, a few states and districts
(such as Punjab, Maharashtra, Jharkhand, Himachal Pradesh,
Kurnool, Udupi district of Karnataka) have reported no issue with
respect to convergence.
- Therefore, convergence with other schemes, such as MGNREGA,
PMKSY-WDC needs to be strengthened. The guidelines should

Page | 654
Parameter Findings from research
allow the water sources created under such schemes to be linked to
MI system. This will help in saving funds spent on OI component.
- Discussions with a few state (e.g. Uttar Pradesh) level key
informants have indicated that MI manufacturing companies have
different price structures. MNC companies’ prices of MI system are
higher (e.g. while cost of drip for 1.2 m x 0.6 m from a local company
is around Rs. 1.3 lakh per acre; MNC like Netafim charges Rs. 1.6
lakh per acre).
Inference:
• The scheme has effectively resulted in many benefits across the states.
The benefit cost ratio is found to be more than that of conventional
irrigation as per a few selected success stories and the key informants
from various levels. However, it appears, based on responses of state,
district level stakeholders that there is scope to reduce project cost
without compromising on scheme objectives (e.g. low-cost MI solutions,
training of farmers for skill upgradation, etc.), thus improving efficiency.
• There is a need for improved coordination mechanisms across ministries
and state department to be able to secure the benefits of convergence
with other central as well as state schemes (e.g. MGNREGA, PMKSY-
WDC, etc.) in terms of water source creation. If water sources created
under those schemes can be utilized for MI based cultivation, this will
help in saving fund spent on other intervention component of this
scheme.
Therefore, the scheme is rated as ‘average’ with respect to efficiency.
Sustainability
Secondary:
• As per the guidelines, in order to ensure sustainability of benefits from
the schemes, manufacturers are required to provide training to farmers
for O&M, detailed O&M manual in vernacular language at the time of
installation and provide after sales services for a period of 3 years post
installation of MI assets. Also, the manufacturers are supposed to
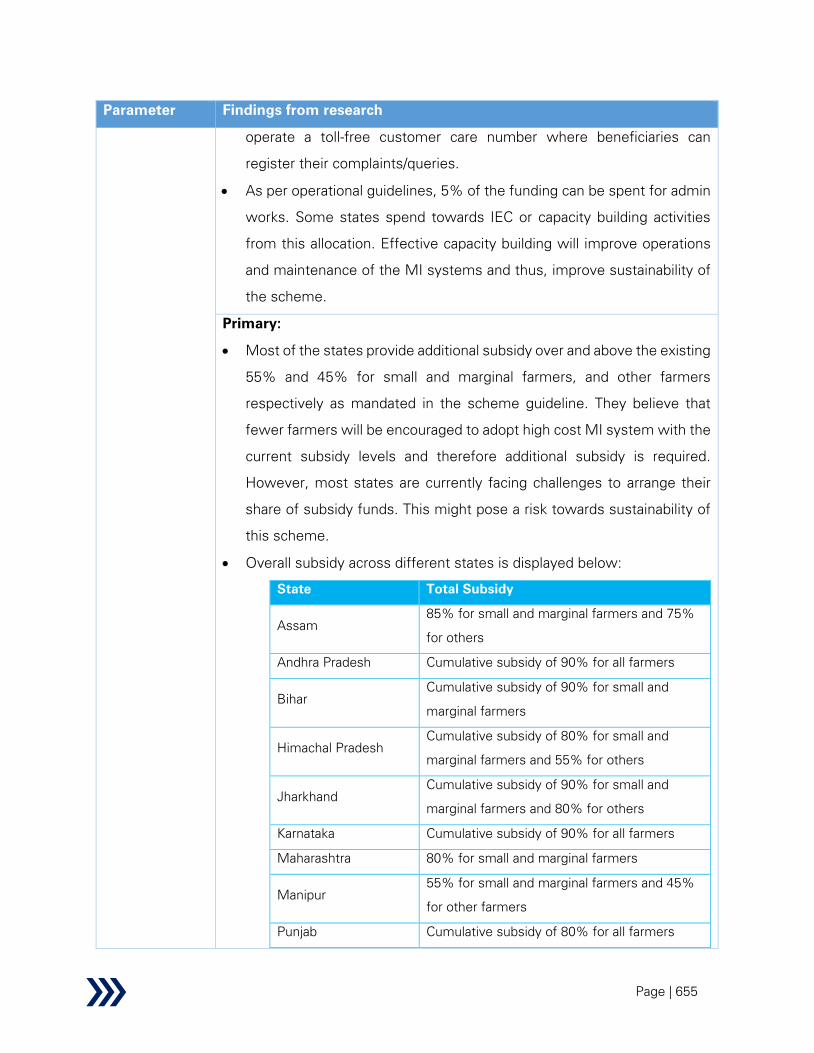
Page | 655
Parameter Findings from research
operate a toll-free customer care number where beneficiaries can
register their complaints/queries.
• As per operational guidelines, 5% of the funding can be spent for admin
works. Some states spend towards IEC or capacity building activities
from this allocation. Effective capacity building will improve operations
and maintenance of the MI systems and thus, improve sustainability of
the scheme.
Primary:
• Most of the states provide additional subsidy over and above the existing
55% and 45% for small and marginal farmers, and other farmers
respectively as mandated in the scheme guideline. They believe that
fewer farmers will be encouraged to adopt high cost MI system with the
current subsidy levels and therefore additional subsidy is required.
However, most states are currently facing challenges to arrange their
share of subsidy funds. This might pose a risk towards sustainability of
this scheme.
• Overall subsidy across different states is displayed below:
State Total Subsidy
Assam
85% for small and marginal farmers and 75%
for others
Andhra Pradesh Cumulative subsidy of 90% for all farmers
Bihar
Cumulative subsidy of 90% for small and
marginal farmers
Himachal Pradesh
Cumulative subsidy of 80% for small and
marginal farmers and 55% for others
Jharkhand
Cumulative subsidy of 90% for small and
marginal farmers and 80% for others
Karnataka Cumulative subsidy of 90% for all farmers
Maharashtra 80% for small and marginal farmers
Manipur
55% for small and marginal farmers and 45%
for other farmers
Punjab Cumulative subsidy of 80% for all farmers
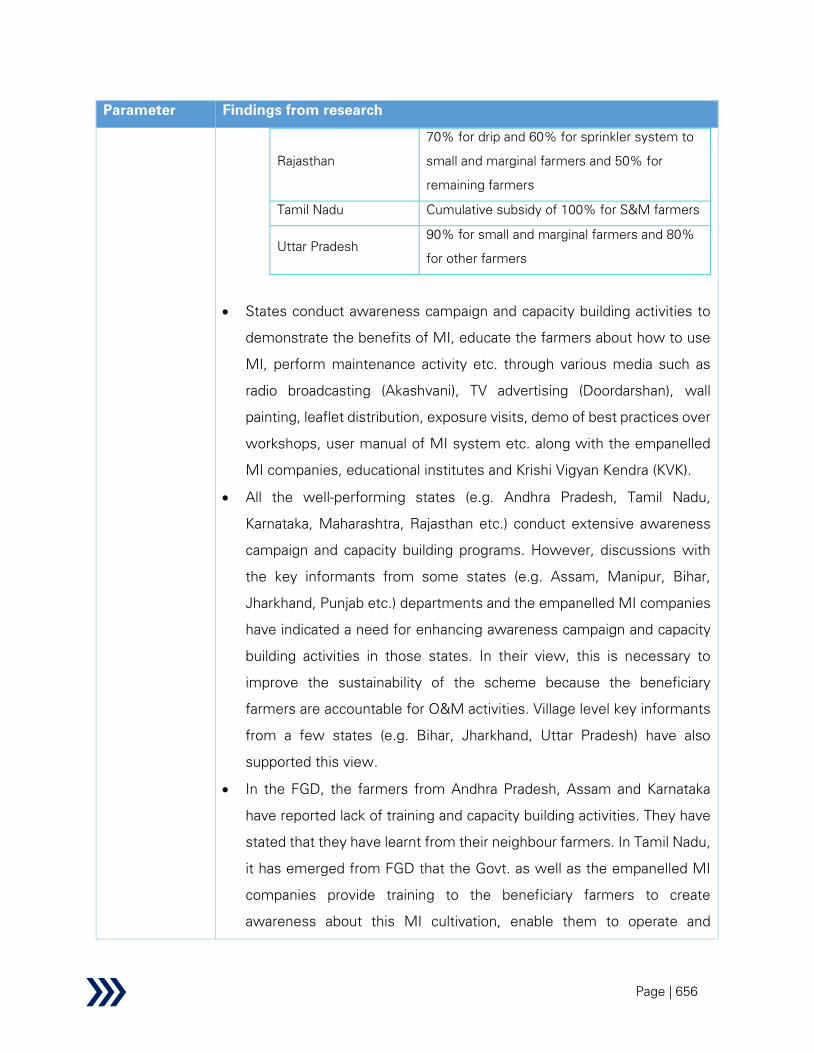
Page | 656
Parameter Findings from research
Rajasthan
70% for drip and 60% for sprinkler system to
small and marginal farmers and 50% for
remaining farmers
Tamil Nadu Cumulative subsidy of 100% for S&M farmers
Uttar Pradesh
90% for small and marginal farmers and 80%
for other farmers
• States conduct awareness campaign and capacity building activities to
demonstrate the benefits of MI, educate the farmers about how to use
MI, perform maintenance activity etc. through various media such as
radio broadcasting (Akashvani), TV advertising (Doordarshan), wall
painting, leaflet distribution, exposure visits, demo of best practices over
workshops, user manual of MI system etc. along with the empanelled
MI companies, educational institutes and Krishi Vigyan Kendra (KVK).
• All the well-performing states (e.g. Andhra Pradesh, Tamil Nadu,
Karnataka, Maharashtra, Rajasthan etc.) conduct extensive awareness
campaign and capacity building programs. However, discussions with
the key informants from some states (e.g. Assam, Manipur, Bihar,
Jharkhand, Punjab etc.) departments and the empanelled MI companies
have indicated a need for enhancing awareness campaign and capacity
building activities in those states. In their view, this is necessary to
improve the sustainability of the scheme because the beneficiary
farmers are accountable for O&M activities. Village level key informants
from a few states (e.g. Bihar, Jharkhand, Uttar Pradesh) have also
supported this view.
• In the FGD, the farmers from Andhra Pradesh, Assam and Karnataka
have reported lack of training and capacity building activities. They have
stated that they have learnt from their neighbour farmers. In Tamil Nadu,
it has emerged from FGD that the Govt. as well as the empanelled MI
companies provide training to the beneficiary farmers to create
awareness about this MI cultivation, enable them to operate and

Page | 657
Parameter Findings from research
maintain the MI systems. However, they have reported lack of after
sales support from the MI companies during the O&M period.
• In the
beneficiary
survey, it has
been reported
that only
around 28%
beneficiary
farmers
(N=193) have
attended
training
sessions.
Hence, it also
supports the
need of
extensive
extension
programs.
• In addition to
that, around
49% and 74%
beneficiary
farmers have
reported not
receiving any
technical
support from
the Govt. and
the MI
18, 43%
26, 59%
13, 68%
15, 88%7, 88%
16, 89%
20, 95%23, 96%
UP TN AP MN PB AS RJ KA
State-wise distribution of beneficiaries not received any
training (absolute no., %) (N = 193)
6, 14%
11, 26%
10, 53%
13, 54%
14, 82%15, 83% 7, 88%
19, 90%
TN UP AP KA MN AS PB RJ
State-wise distribution of beneficiaries not received
technical support from Govt. (absolute no., %) (N = 193)
14, 33%
5, 63%
14, 74%
33, 75%
17, 94% 20, 95%
23, 96%
17, 100%
UP PB AP TN AS RJ KA MN
State-wise distribution of beneficiaries not received
technical support from companies (absolute no., %)
(N = 193)

Page | 658
Parameter Findings from research
companies respectively, which also supports the requirement of
adequate capacity building program.
• No separate funding is available for the awareness campaign and
capacity building activities. States spend for those activities from the 5%
funding allocated for admin expenses or other extension schemes. A
few states, districts (viz. Rajasthan, Tamil Nadu, Punjab, Maharashtra,
Manipur, Goalpara, Golaghat districts of Assam, Kurnool district of
Andhra Pradesh) have expressed the need for a separate fund to conduct
such activities. However, Ministry has clarified that 5% of the funding
set aside for administration expenses is on the higher side and it is
expected to be enough to cover the said expenses. Some states and
district level officers (such as Uttar Pradesh, Bihar, Karnataka, Himachal
Pradesh, Ranchi district of Jharkhand) have agreed to this view.
• Discussions with most state, district level officers have indicated that
the empanelled MI companies/ manufacturers are following the
guideline in most states and providing after sales services to the
beneficiary farmers and respond to their questions/issues in timely
manner. However, the village level key informants across a few states
(e.g. Jharkhand, Bihar) have provided negative feedback about them
because of not getting timely after sales support from them, poor quality
of products etc.
• In the beneficiary survey, around 73% beneficiary farmers (N=193) have
reported that they have not received any support from the MI
companies. Out of the remaining beneficiaries, who have received
support from the MI companies, around 94% have reported of receiving
technical support (such as installation, maintenance etc.) and 83% have
reported of receiving support related to benefit of MI, importance of
water conservation etc. Also, around 78% beneficiary farmers have
reported that there is either not any toll-free customer care number
provided by the empanelled companies to resolve queries or they do not
know about such number. Out of 22%, who are aware of toll-free
Page | 659
Parameter Findings from research
number, around 46% beneficiaries have used that for raising queries and
around 42% have reported receiving satisfactory responses from the
empanelled companies towards the raised queries.
• Ministry indicated that a period of 7 years, has been set in the guideline
as the period before which a beneficiary is not eligible for a second round
of subsidy for replacing the MI system on his farm, is not based on the
economic life of the assets which is generally more than this period if
the MI system is handled properly. Maharashtra, Bihar indicated their
agreement to this gap of 7 years between consecutive subsidies.
However, some states have expressed different opinions in this regard:
- Andhra Pradesh, Uttar Pradesh, Rajasthan: have suggested that this
period can be reduced to 5 years considering all practical views,
feedback from farmers and longevity
- Karnataka: has indicated 7 years is appropriate for some
components, such as lateral, filter, venturi manifold etc. However, it
may be extended to 15 years for PVC pipes.
- Punjab, Jharkhand: have illustrated the scenario that if any farmer
implement MI on a small portion of his farm on a pilot basis, he will
have to wait until the expiry of the 7-year period before he can
implement the system in the entire farm even if he is convinced of
its efficacy. Hence, there is a need to offer some flexibility in the
guideline for such situation.
• Ministry indicated that demand driven (i.e. farmers) target can be
sustainably achieved by following the established process (e.g.
educating farmers, demonstrating benefits of MI, etc.). However, states
should strengthen their institutional arrangement and mandate
necessary guidelines/ directions to manage supply driven ((i.e.
integrating MI to major and medium irrigation projects) target.
Inference:
• Since many states have started providing significant top-up subsidy over
and above what is provided under the scheme guidelines and they are

Page | 660
Parameter Findings from research
facing challenges to arrange for that additional fund, it is currently not
clear if scheme will be sustainable in the present form.
• Lack of capacity building programs across some states (e.g. Assam,
Manipur, Bihar, Jharkhand, Punjab etc.) lead to ineffective operations
and maintenance of MI assets which hampers proper utilization of the
assets.
• During KII and FGD, the village level key informants across a few states
(e.g. Jharkhand, Bihar) have provided negative feedback about the MI
companies because of not getting timely after sales support from them,
poor quality of products etc. In the beneficiary survey, around 73%
beneficiary farmers have reported not receiving any support from the MI
companies during the O&M period.
Therefore, the scheme is rated as ‘needs improvement’ with respect to
sustainability.
Impact
Secondary:
• Previous study189
showed that micro-irrigation had increased income of
farmers in the range of 20% to 68%; generated employment opportunity
in the range of 21% to 50%.
• It is evident that more area can be irrigated with the same amount of
water as compared to conventional method of irrigation, thus improving
water use efficiency.
Primary:
• All the key informants from state, district and village level have stated
that MI has increased income of farmers. Increase in income of farmers
as intimated by the key informants during interviews:
- Andhra Pradesh: approx. 10 to 60%
- Karnataka: approx. 30 to 40%
- Bihar: approx.60% for vegetables, 40%for fruits, 20% for cereal
crops, 30-40% for sugarcane, 20-25% for wheat
- Uttar Pradesh: approx. 14% to 32% cole crops, onion, cucumber &
other vegetables

Page | 661
Parameter Findings from research
- Punjab: approx. 31% to 69%
- Krishnagiri, Tamil Nadu: approx. 20% to 40%
• A few farmers’ success stories showing the increase in income after use
of micro-irrigation are tabulated below:
District Success Story
Nilgiris, Tamil
Nadu
29% increase in income after use of sprinkler for
cultivation of Carrot
Cuddalore, Tamil
Nadu
100% increase in income after use of MI for cultivation
of Brinjal
Cuddalore, Tamil
Nadu
50% increase in income after use of MI for cultivation of
Tuberose
Krishnagiri, Tamil
Nadu
50% increase in income after use of MI for cultivation of
Turmeric
Krishnagiri, Tamil
Nadu
100% increase in income after use of drip for cultivation
of Marigold
Krishnagiri, Tamil
Nadu
134% increase in income after use of drip for cultivation
of Cabbage
Krishna, Andhra
Pradesh
100% increase in income after use of drip for cultivation
of Guava
Prakasam,
Andhra Pradesh
50% increase in income after use of drip for cultivation
of Maize
Krishna, Andhra
Pradesh
37.5% increase in income after use of drip for cultivation
of Papaya
• FGDs in Andhra Pradesh, Karnataka, Uttar Pradesh, Tamil Nadu, Assam
have reported increase in income after adoption of MI.

Page | 662
Parameter Findings from research
• In the beneficiary survey, around 70% beneficiary farmers (N=193) have
reported that
adoption of
MI has
increased
their income.
The
percentages
are high in
Uttar Pradesh
(86%),
Andhra Pradesh (79%), Tamil Nadu (77%). However, only around 38%
beneficiaries have supported the fact in Punjab, while around 38% have
not answered there.
• Most states have realized the benefit of employment generation out of
MI cultivation. The key informants from Andhra Pradesh and
Maharashtra have mentioned that around 10,000 and 16,000 people
(respectively) are directly and indirectly working with MI cultivation.
• Discussion with the key informant of Kurnool district of Andhra Pradesh
has revealed that many unemployed youths from local villages are
working as fitters for MI installation and getting income out of it. The
empanelled MI companies are also employing local people as field
coordinators, district coordinators. Also, educated people are employed
as MI engineers by the companies.
• Discussion with the key informants of Ranchi district of Jharkhand has
revealed that local people are employed for maintenance of MI systems,
running shops as dealer or sub-dealers in remote areas to provide
convenience to the farmers and getting income out of it.
• Discussion with the key informants of Meerut district of Uttar Pradesh
has revealed that local people are involved for drip trenching.
3, 38%
8, 38%
11, 61%
12, 71%17, 71%
34, 77%
15, 79%
36, 86%
PB RJ AS MN KA TN AP UP
State-wise distribution of beneficiaries realizing increase in
income after MI adoption (absolute no., %) (N = 193)
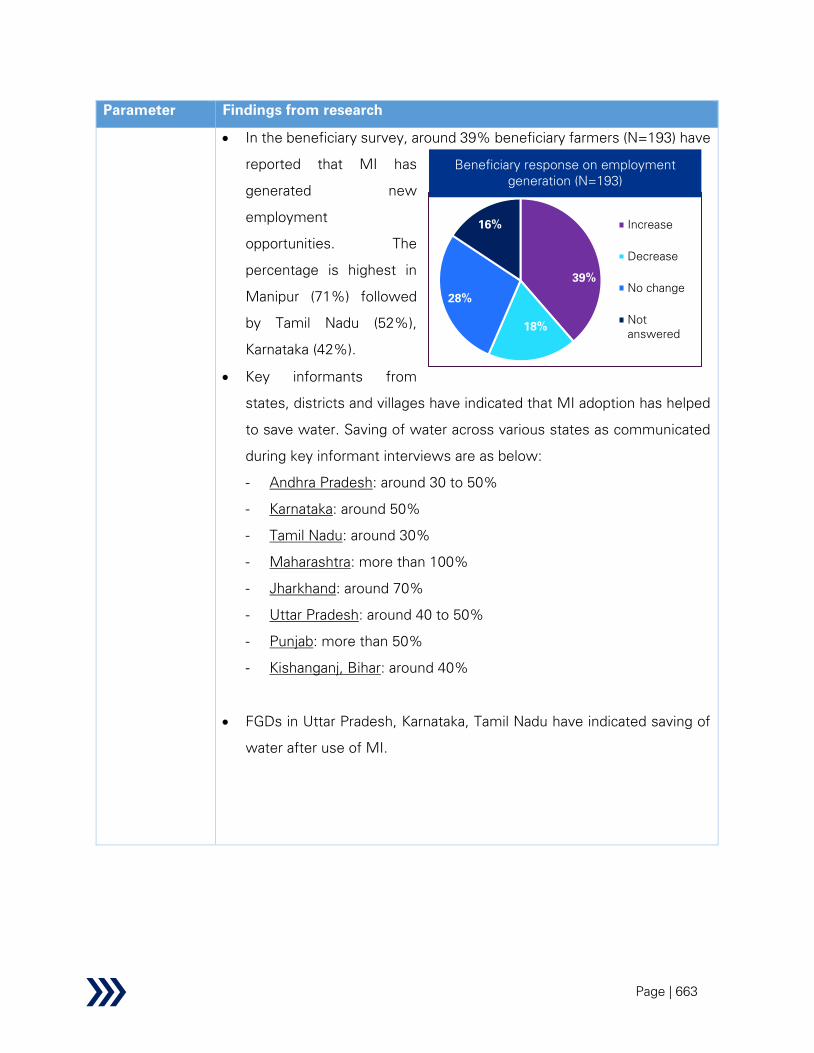
Page | 663
Parameter Findings from research
• In the beneficiary survey, around 39% beneficiary farmers (N=193) have
reported that MI has
generated new
employment
opportunities. The
percentage is highest in
Manipur (71%) followed
by Tamil Nadu (52%),
Karnataka (42%).
• Key informants from
states, districts and villages have indicated that MI adoption has helped
to save water. Saving of water across various states as communicated
during key informant interviews are as below:
- Andhra Pradesh: around 30 to 50%
- Karnataka: around 50%
- Tamil Nadu: around 30%
- Maharashtra: more than 100%
- Jharkhand: around 70%
- Uttar Pradesh: around 40 to 50%
- Punjab: more than 50%
- Kishanganj, Bihar: around 40%
• FGDs in Uttar Pradesh, Karnataka, Tamil Nadu have indicated saving of
water after use of MI.
39%
18%
28%
16% Increase
Decrease
No change
Not
answered
Beneficiary response on employment
generation (N=193)
(n=149)

Page | 664
Parameter Findings from research
• In the beneficiary survey, around 54% beneficiary farmers have reported
that
adoption
of MI has
improved
water use
efficiency.
Inference:
• Impact of this scheme has been realized in terms of increase in farmer’s
income, employment generation and water savings.
• Income of farmers has increased in the range of 10% to 69%
• Water use efficiency has improved around 30% to 70%
• The scheme has created direct and indirect employment opportunities
as field contractors, dealers, sub-dealers, field workers for installation,
drip trenching etc.
Therefore, the scheme is rated as ‘satisfactory’ with respect to impact.
Equity
Secondary:
• As per the guidelines, available financial assistance is 55% for small and
marginal farmers; while it is 45% for other farmers
• At least 50% of the allocation to state is to be utilized for small and
marginal farmers, of which, at least 30% must be for women
beneficiaries/ farmers
• Further, 16% and 8% of the total allocation or in proportion of Scheduled
Cast (SC)/Scheduled Tribe (ST) population is to be utilized for Special
Component Sub-Plan (SCSP) and Tribal Sub-Plan (TSP) respectively
1, 6%
3, 16%
3, 38%8, 38%
30, 68%
35, 83%24, 100%
AS AP PB RJ TN UP KA
State-wise distribution of beneficiaries realizing improvement
in water use efficiency after MI adoption (absolute no., %)
(N = 193)
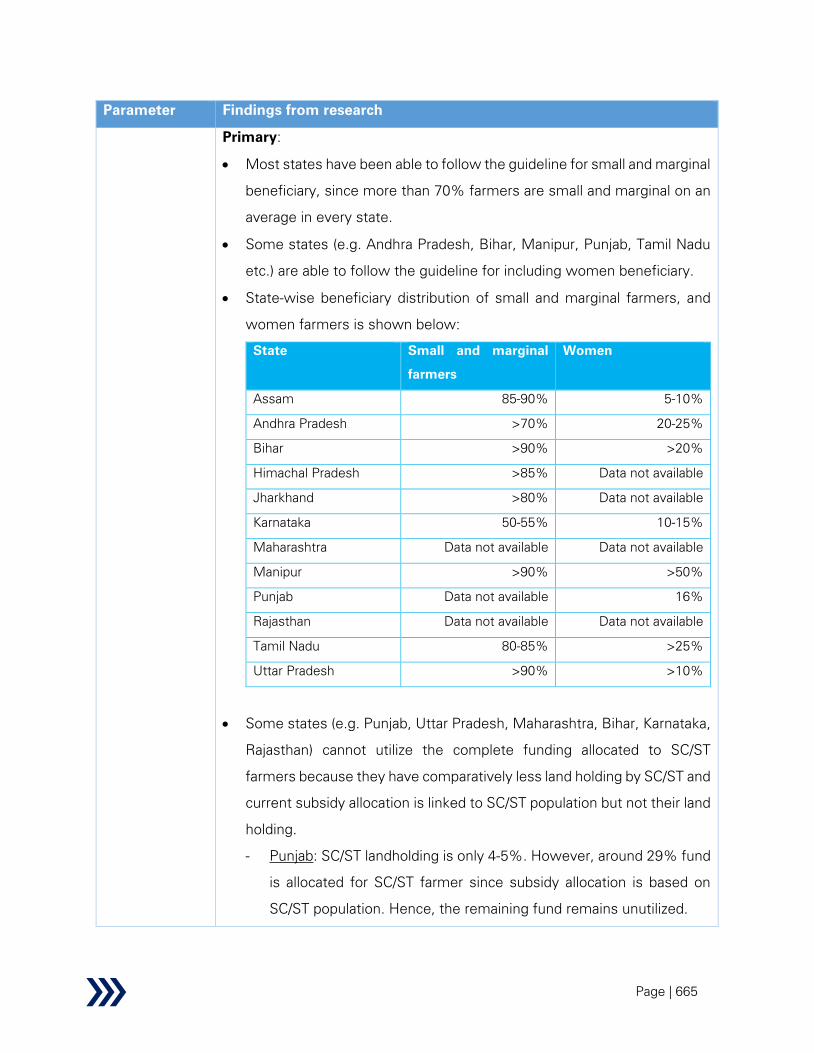
Page | 665
Parameter Findings from research
Primary:
• Most states have been able to follow the guideline for small and marginal
beneficiary, since more than 70% farmers are small and marginal on an
average in every state.
• Some states (e.g. Andhra Pradesh, Bihar, Manipur, Punjab, Tamil Nadu
etc.) are able to follow the guideline for including women beneficiary.
• State-wise beneficiary distribution of small and marginal farmers, and
women farmers is shown below:
State Small and marginal
farmers
Women
Assam 85-90% 5-10%
Andhra Pradesh >70% 20-25%
Bihar >90% >20%
Himachal Pradesh >85% Data not available
Jharkhand >80% Data not available
Karnataka 50-55% 10-15%
Maharashtra Data not available Data not available
Manipur >90% >50%
Punjab Data not available 16%
Rajasthan Data not available Data not available
Tamil Nadu 80-85% >25%
Uttar Pradesh >90% >10%
• Some states (e.g. Punjab, Uttar Pradesh, Maharashtra, Bihar, Karnataka,
Rajasthan) cannot utilize the complete funding allocated to SC/ST
farmers because they have comparatively less land holding by SC/ST and
current subsidy allocation is linked to SC/ST population but not their land
holding.
- Punjab: SC/ST landholding is only 4-5%. However, around 29% fund
is allocated for SC/ST farmer since subsidy allocation is based on
SC/ST population. Hence, the remaining fund remains unutilized.

Page | 666
Parameter Findings from research
• Tamil Nadu has given special focus to transgender and physically
challenged beneficiaries along with SC/ST and women farmers. They
have created Self Help Group (SHG) for women farmers. They have
asked the MI companies to enrol transgender, physically challenged
people, women as dealer or sub-dealer across various districts.
Inference:
• Although most states follow the principle of equity for small and marginal
farmers viz. minimum 50% fund to be utilized for them, some states
(e.g. Assam, Uttar Pradesh etc.) do not follow the principle of equity for
women beneficiaries viz. minimum 15% to be utilized for them.
• SC/ST allocation is based on their population. Some states (e.g. Punjab,
Uttar Pradesh, Maharashtra, Bihar, Karnataka, Rajasthan) cannot utilize
the complete funding allocated to SC/ST farmers because they have
comparatively less land holding by SC/ST and hence, a portion of this
fund remains unutilized in those states.
Therefore, the scheme is rated as ‘average’ with respect to equity.
A summary analysis and performance of the scheme on the identified themes is presented
below:
Table 82: PDMC – Summary of performance evaluation based on REESIE
Parameter Performance
Relevance
Effectiveness
Efficiency
Sustainability
Impact
Equity
REESI+E performance infographics legend

Page | 667
Satisfactory
Average
Needs Improvement
No information
Performance on cross-sectional themes
Table 83: PDMC – Performance evaluation based on cross-sectional themes
#
Cross-cutting
theme
Indicative Areas of Enquiry
and Key Questions
Findings from research
1.
Accountability
&
Transparency
Availability of Data Records
and Reports in public domain
• What data records are
available for the scheme
in public domain?
• Physical and financial progress at state
and district level for scheme output
parameters are reported on PDMC
website.
• Scheme guideline has provision to
track/ assess outcomes (such as
increase in crop yield) and impacts (such
as increase in income) of the scheme
through 3rd
party evaluation. That data
can be made available over public
domain (e.g. PDMC portal).
Monitoring Mechanisms
• Does a robust
monitoring mechanism
exist and at what level?
• As per scheme guideline, National
Rainfed Area Authority is involved in
mid-term/end-term evaluation of the
programme. State Govts are free to
appoint any reputed agencies for M&E
of the scheme in their states. An Impact
Evaluation Study on Micro-irrigation at
the National level is to be undertaken
through an independent Agency with
involvement of NCPAH once every
three years to assess the impact of the
scheme in increasing water use
efficiency, productivity, enhancement
of farmers’ income, technology

Page | 668
#
Cross-cutting
theme
Indicative Areas of Enquiry
and Key Questions
Findings from research
adoption and other parameters. There is
a provision that 25% of the projects
sanctioned by the state should be
considered for 3rd party M&E by the
implementing state.
• Well-performing states, such as Andhra
Pradesh, Tamil Nadu, Karnataka
conduct quality monitoring of the
project progress through 3rd
party (e.g.
NABCONS), empanelled MI companies,
research institutes and govt. officers.
Evaluation Mechanisms
• What process / impact
evaluation studies
conducted in the last
decade - frequency,
quality, coverage, etc.
• Previously, an impact evaluation study
was conducted on NMMI (predecessor
of PDMC) in 2014.
• A few states (e.g. Uttar Pradesh, Tamil
Nadu, Karnataka) have conducted
independent 3rd party evaluation to
verify progress of the scheme in their
states.
Financial Accountability
• What funding
mechanisms are being
used?
• Fund allocation mechanism, eligibility
etc. are covered in the scheme
operations guidelines. Some points:
- Subsidy: - 55% and 45% for small
and marginal farmers and other
farmers respectively
- Funding pattern: - Central: State split
= 90: 10 for North Eastern and
Himalayan states; 60: 40 for other
states
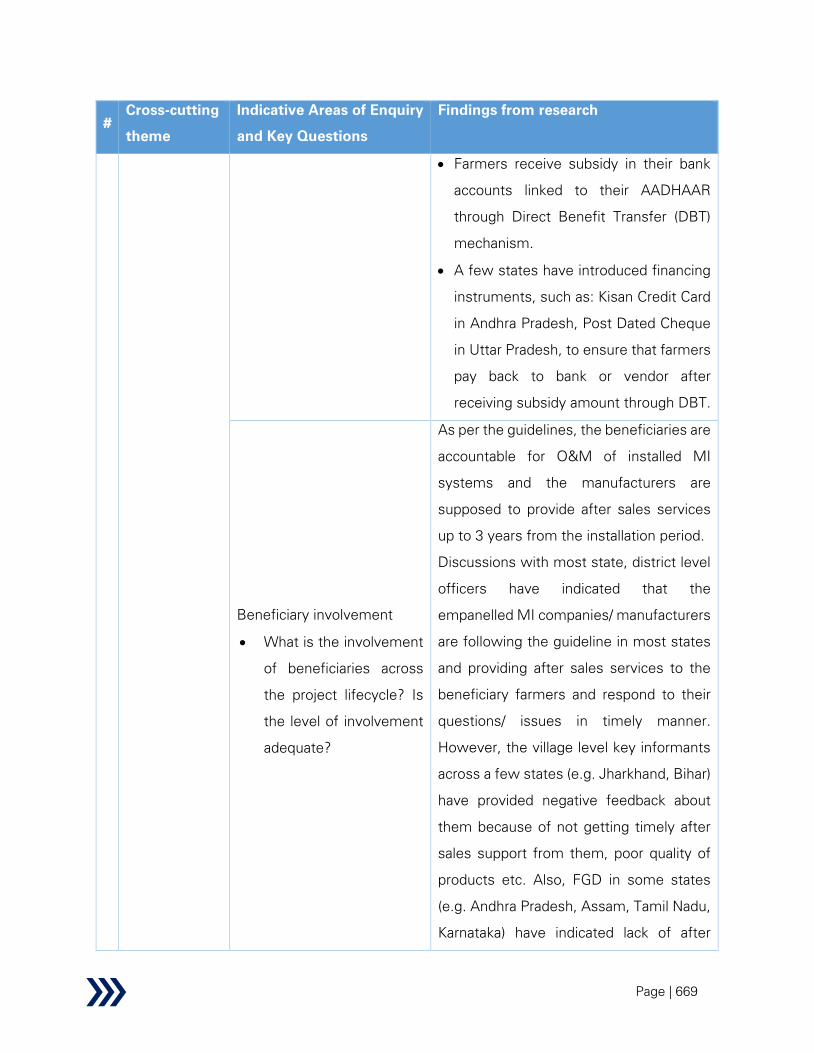
Page | 669
#
Cross-cutting
theme
Indicative Areas of Enquiry
and Key Questions
Findings from research
• Farmers receive subsidy in their bank
accounts linked to their AADHAAR
through Direct Benefit Transfer (DBT)
mechanism.
• A few states have introduced financing
instruments, such as: Kisan Credit Card
in Andhra Pradesh, Post Dated Cheque
in Uttar Pradesh, to ensure that farmers
pay back to bank or vendor after
receiving subsidy amount through DBT.
Beneficiary involvement
• What is the involvement
of beneficiaries across
the project lifecycle? Is
the level of involvement
adequate?
As per the guidelines, the beneficiaries are
accountable for O&M of installed MI
systems and the manufacturers are
supposed to provide after sales services
up to 3 years from the installation period.
Discussions with most state, district level
officers have indicated that the
empanelled MI companies/ manufacturers
are following the guideline in most states
and providing after sales services to the
beneficiary farmers and respond to their
questions/ issues in timely manner.
However, the village level key informants
across a few states (e.g. Jharkhand, Bihar)
have provided negative feedback about
them because of not getting timely after
sales support from them, poor quality of
products etc. Also, FGD in some states
(e.g. Andhra Pradesh, Assam, Tamil Nadu,
Karnataka) have indicated lack of after
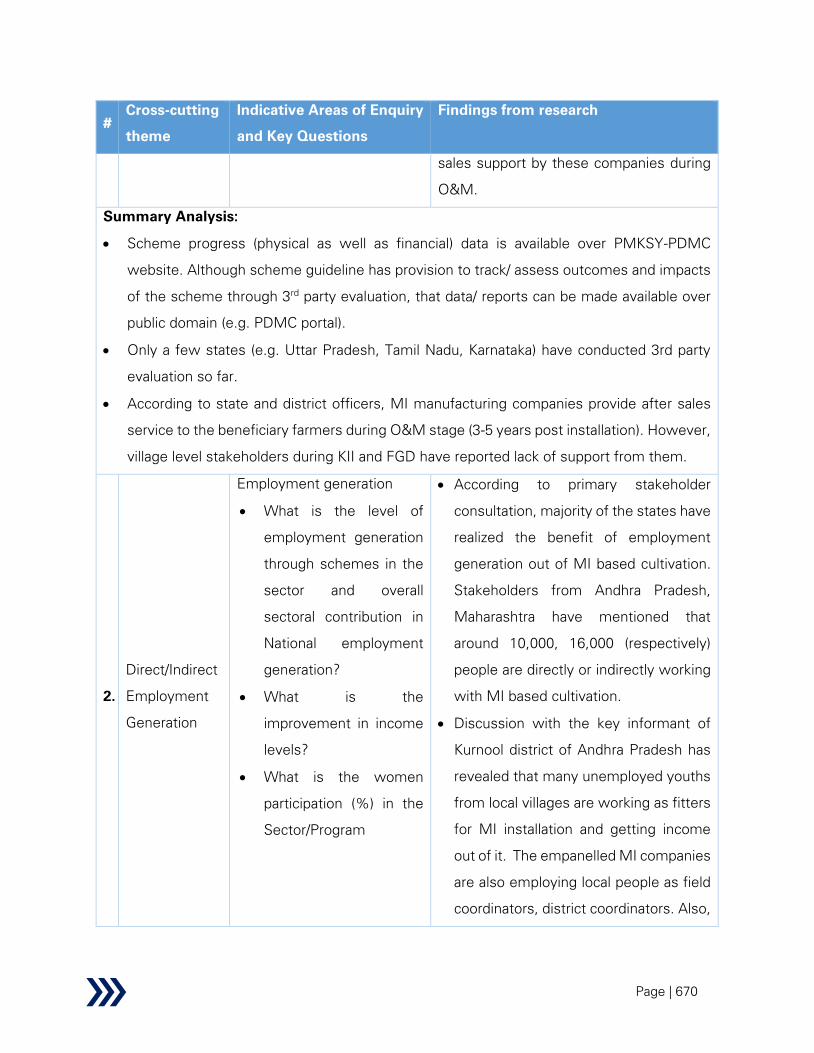
Page | 670
#
Cross-cutting
theme
Indicative Areas of Enquiry
and Key Questions
Findings from research
sales support by these companies during
O&M.
Summary Analysis:
• Scheme progress (physical as well as financial) data is available over PMKSY-PDMC
website. Although scheme guideline has provision to track/ assess outcomes and impacts
of the scheme through 3rd
party evaluation, that data/ reports can be made available over
public domain (e.g. PDMC portal).
• Only a few states (e.g. Uttar Pradesh, Tamil Nadu, Karnataka) have conducted 3rd party
evaluation so far.
• According to state and district officers, MI manufacturing companies provide after sales
service to the beneficiary farmers during O&M stage (3-5 years post installation). However,
village level stakeholders during KII and FGD have reported lack of support from them.
2.
Direct/Indirect
Employment
Generation
Employment generation
• What is the level of
employment generation
through schemes in the
sector and overall
sectoral contribution in
National employment
generation?
• What is the
improvement in income
levels?
• What is the women
participation (%) in the
Sector/Program
• According to primary stakeholder
consultation, majority of the states have
realized the benefit of employment
generation out of MI based cultivation.
Stakeholders from Andhra Pradesh,
Maharashtra have mentioned that
around 10,000, 16,000 (respectively)
people are directly or indirectly working
with MI based cultivation.
• Discussion with the key informant of
Kurnool district of Andhra Pradesh has
revealed that many unemployed youths
from local villages are working as fitters
for MI installation and getting income
out of it. The empanelled MI companies
are also employing local people as field
coordinators, district coordinators. Also,

Page | 671
#
Cross-cutting
theme
Indicative Areas of Enquiry
and Key Questions
Findings from research
educated people are employed as MI
engineers by the companies.
• Discussion with the key informants of
Ranchi district of Jharkhand has
revealed that local people are employed
for maintenance of MI systems, running
shops as dealer or sub-dealers in
remote areas to provide convenience to
the farmers and getting income out of
it.
• Discussion with the key informants of
Meerut district of Uttar Pradesh has
revealed that local people are involved
for drip trenching.
• In the beneficiary survey, around 40%
beneficiary farmers have reported that
MI has generated new employment
opportunities. The percentage is
highest in Manipur (72%) followed by
Karnataka (45%). However, around
34% beneficiaries have not noticed any
change in employment due to MI
adoption.
• Many states are following guidelines for
women beneficiaries. Women
participation across a few states are as
below:
- Andhra Pradesh: 20 to 25%
- Karnataka: 10 to 15%
- Uttar Pradesh: around 10%
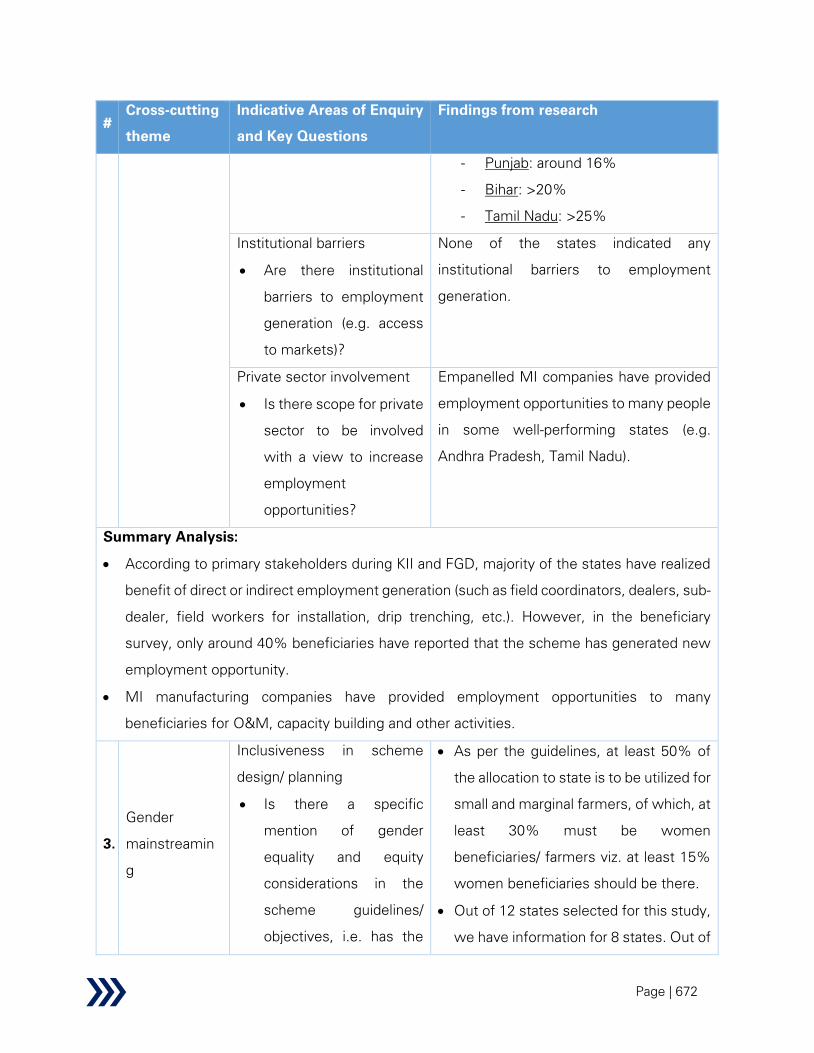
Page | 672
#
Cross-cutting
theme
Indicative Areas of Enquiry
and Key Questions
Findings from research
- Punjab: around 16%
- Bihar: >20%
- Tamil Nadu: >25%
Institutional barriers
• Are there institutional
barriers to employment
generation (e.g. access
to markets)?
None of the states indicated any
institutional barriers to employment
generation.
Private sector involvement
• Is there scope for private
sector to be involved
with a view to increase
employment
opportunities?
Empanelled MI companies have provided
employment opportunities to many people
in some well-performing states (e.g.
Andhra Pradesh, Tamil Nadu).
Summary Analysis:
• According to primary stakeholders during KII and FGD, majority of the states have realized
benefit of direct or indirect employment generation (such as field coordinators, dealers, sub-
dealer, field workers for installation, drip trenching, etc.). However, in the beneficiary
survey, only around 40% beneficiaries have reported that the scheme has generated new
employment opportunity.
• MI manufacturing companies have provided employment opportunities to many
beneficiaries for O&M, capacity building and other activities.
3.
Gender
mainstreamin
g
Inclusiveness in scheme
design/ planning
• Is there a specific
mention of gender
equality and equity
considerations in the
scheme guidelines/
objectives, i.e. has the
• As per the guidelines, at least 50% of
the allocation to state is to be utilized for
small and marginal farmers, of which, at
least 30% must be women
beneficiaries/ farmers viz. at least 15%
women beneficiaries should be there.
• Out of 12 states selected for this study,
we have information for 8 states. Out of
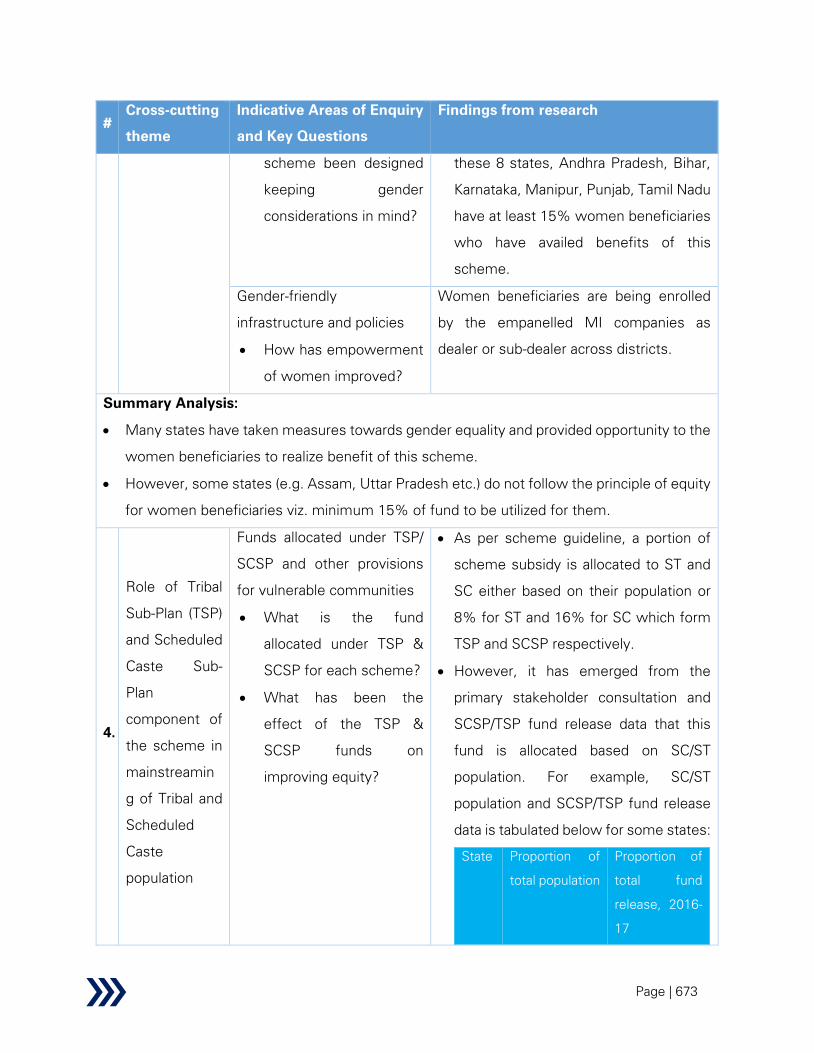
Page | 673
#
Cross-cutting
theme
Indicative Areas of Enquiry
and Key Questions
Findings from research
scheme been designed
keeping gender
considerations in mind?
these 8 states, Andhra Pradesh, Bihar,
Karnataka, Manipur, Punjab, Tamil Nadu
have at least 15% women beneficiaries
who have availed benefits of this
scheme.
Gender-friendly
infrastructure and policies
• How has empowerment
of women improved?
Women beneficiaries are being enrolled
by the empanelled MI companies as
dealer or sub-dealer across districts.
Summary Analysis:
• Many states have taken measures towards gender equality and provided opportunity to the
women beneficiaries to realize benefit of this scheme.
• However, some states (e.g. Assam, Uttar Pradesh etc.) do not follow the principle of equity
for women beneficiaries viz. minimum 15% of fund to be utilized for them.
4.
Role of Tribal
Sub-Plan (TSP)
and Scheduled
Caste Sub-
Plan
component of
the scheme in
mainstreamin
g of Tribal and
Scheduled
Caste
population
Funds allocated under TSP/
SCSP and other provisions
for vulnerable communities
• What is the fund
allocated under TSP &
SCSP for each scheme?
• What has been the
effect of the TSP &
SCSP funds on
improving equity?
• As per scheme guideline, a portion of
scheme subsidy is allocated to ST and
SC either based on their population or
8% for ST and 16% for SC which form
TSP and SCSP respectively.
• However, it has emerged from the
primary stakeholder consultation and
SCSP/TSP fund release data that this
fund is allocated based on SC/ST
population. For example, SC/ST
population and SCSP/TSP fund release
data is tabulated below for some states:
State Proportion of
total population
Proportion of
total fund
release, 2016-
17

Page | 674
#
Cross-cutting
theme
Indicative Areas of Enquiry
and Key Questions
Findings from research
(2011 census
data)192
(Rs. in lakh)193
SC ST SCSP TSP
AP 16% 7% 17% 7%
HP 25% 4% 26% 6%
JH 12% 26% 12% 26%
MH 10% 9% 12% 6%
PB 29% 0% 33% 0%
KA 16% 7% 18% 7%
RJ 17% 13% 18% 13%
UP 21% 0% 21% 1%
• Some states (e.g. Punjab, Uttar
Pradesh, Maharashtra, Bihar, Karnataka,
Rajasthan) were unable to use the
entire funding allocated to SC/ST
farmers because they have
comparatively less landholding by
SC/ST farmers
- Punjab: SC/ST landholding is only 4-
5%. However, around 29-33% fund
is allocated for SC/ST farmers.
Hence, the remaining fund remains
unutilized
192 https://censusindia.gov.in/tables_published/a-series/a-series_links/t_00_005.aspx
193 https://pmksy.gov.in/microirrigation/Archive/MI_Release20162017.pdf
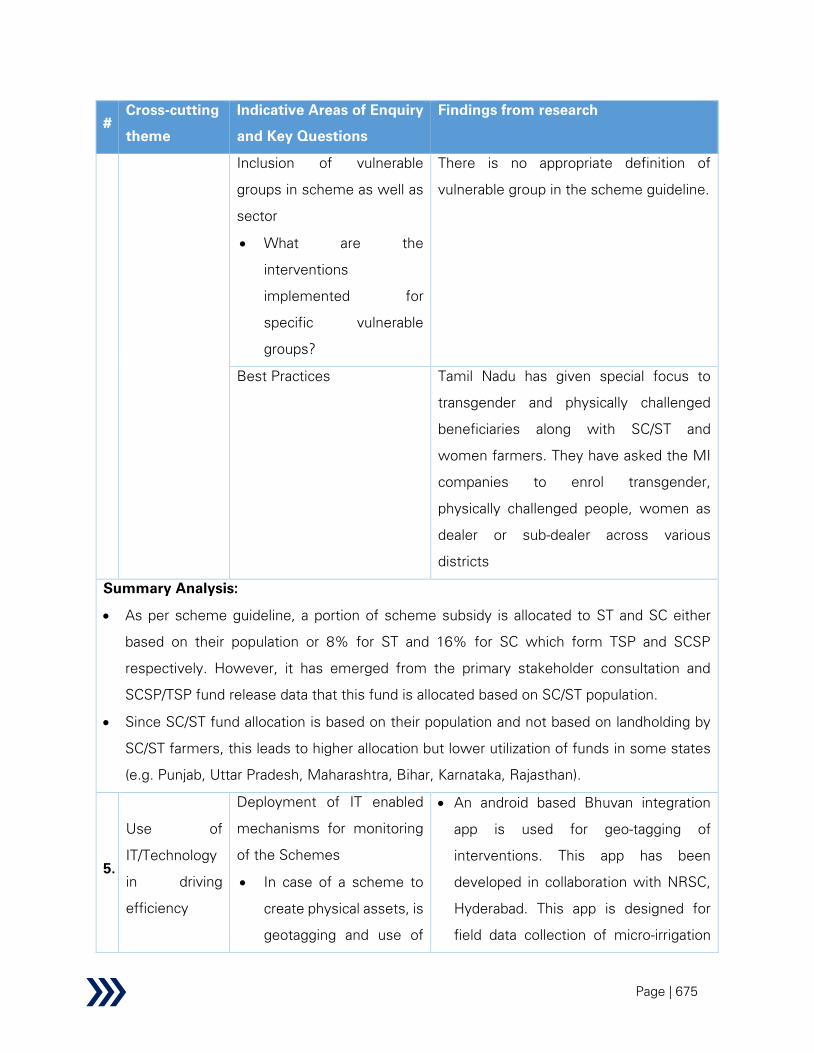
Page | 675
#
Cross-cutting
theme
Indicative Areas of Enquiry
and Key Questions
Findings from research
Inclusion of vulnerable
groups in scheme as well as
sector
• What are the
interventions
implemented for
specific vulnerable
groups?
There is no appropriate definition of
vulnerable group in the scheme guideline.
Best Practices Tamil Nadu has given special focus to
transgender and physically challenged
beneficiaries along with SC/ST and
women farmers. They have asked the MI
companies to enrol transgender,
physically challenged people, women as
dealer or sub-dealer across various
districts
Summary Analysis:
• As per scheme guideline, a portion of scheme subsidy is allocated to ST and SC either
based on their population or 8% for ST and 16% for SC which form TSP and SCSP
respectively. However, it has emerged from the primary stakeholder consultation and
SCSP/TSP fund release data that this fund is allocated based on SC/ST population.
• Since SC/ST fund allocation is based on their population and not based on landholding by
SC/ST farmers, this leads to higher allocation but lower utilization of funds in some states
(e.g. Punjab, Uttar Pradesh, Maharashtra, Bihar, Karnataka, Rajasthan).
5.
Use of
IT/Technology
in driving
efficiency
Deployment of IT enabled
mechanisms for monitoring
of the Schemes
• In case of a scheme to
create physical assets, is
geotagging and use of
• An android based Bhuvan integration
app is used for geo-tagging of
interventions. This app has been
developed in collaboration with NRSC,
Hyderabad. This app is designed for
field data collection of micro-irrigation

Page | 676
#
Cross-cutting
theme
Indicative Areas of Enquiry
and Key Questions
Findings from research
geotagged photographs
being done?
• How is technology being
used for on-ground data
collection?
projects. This app also includes a facility
to upload photos on to the Bhuvan
PDMC Web Portal.
• Most states indicated that they use
geotagging (including geotagged
photographs).
• Geo-tagging has helped the states in
the below aspects:
- Maintain transparency and check
irregularities in implementation of
the scheme
- Identify location of land and other
non-movable assets
- Strictly monitor utilization of MI
assets
- Monitor if there is any misuse of
subsidy
• Actual MI coverage in a district/state
can be easily evaluated with the help of
geo-tagging. Hence, it is helpful to
estimate future requirement of MI
assets in that district/state. In this way,
it has played an important role in
planning and targeting phase of the
scheme implementation.
• Some states, like Andhra Pradesh,
Bihar, Karnataka, Tamil Nadu, are
leading in the use of technology. They
have their own online system for

Page | 677
#
Cross-cutting
theme
Indicative Areas of Enquiry
and Key Questions
Findings from research
beneficiary application to subsidy
disbursement
- Karnataka: HASIRUF (Horticultural
Application for Scheme
Intervention and Regulating
Utilization of funds)
- Andhra Pradesh: APMIP (Andhra
Pradesh Micro-irrigation Project)
- Tamil Nadu: MIMIS (Micro-irrigation
Management Information Service)
Summary Analysis:
• Most states use geotagging and geotagged photographs
• Many states use an android based Bhuvan app for on-ground data collection of micro-
irrigation projects. This app also includes a facility to upload photos on to the Bhuvan PDMC
Web Portal.
• A few states (e.g. Andhra Pradesh, Bihar, Karnataka, Tamil Nadu) are leading with respect
to use of technology; they use their own state level MIS. The entire process starting from
beneficiary selection to subsidy disbursement are tracked through these online MIS
systems.
6.
Stakeholder
and
Beneficiary
behavioural
change
Fund Allocation
• What percent of total
allocation is directed
towards Awareness
generation or
sensitization? What is
the utilization rate? and
How much impact has it
been able to generate in
terms of behaviour
change?
• Scheme guidelines has not specified
any separate allocation for awareness
campaign and capacity building
activities. It is to be incurred from admin
expense (5% of CA allocation).
• Ministry indicated that 5% of the
funding for admin expense is quite high.
States can use fund for IEC activities
from this allocation. There is no need for
separate funding. Some states like –
Uttar Pradesh, Bihar, Maharashtra
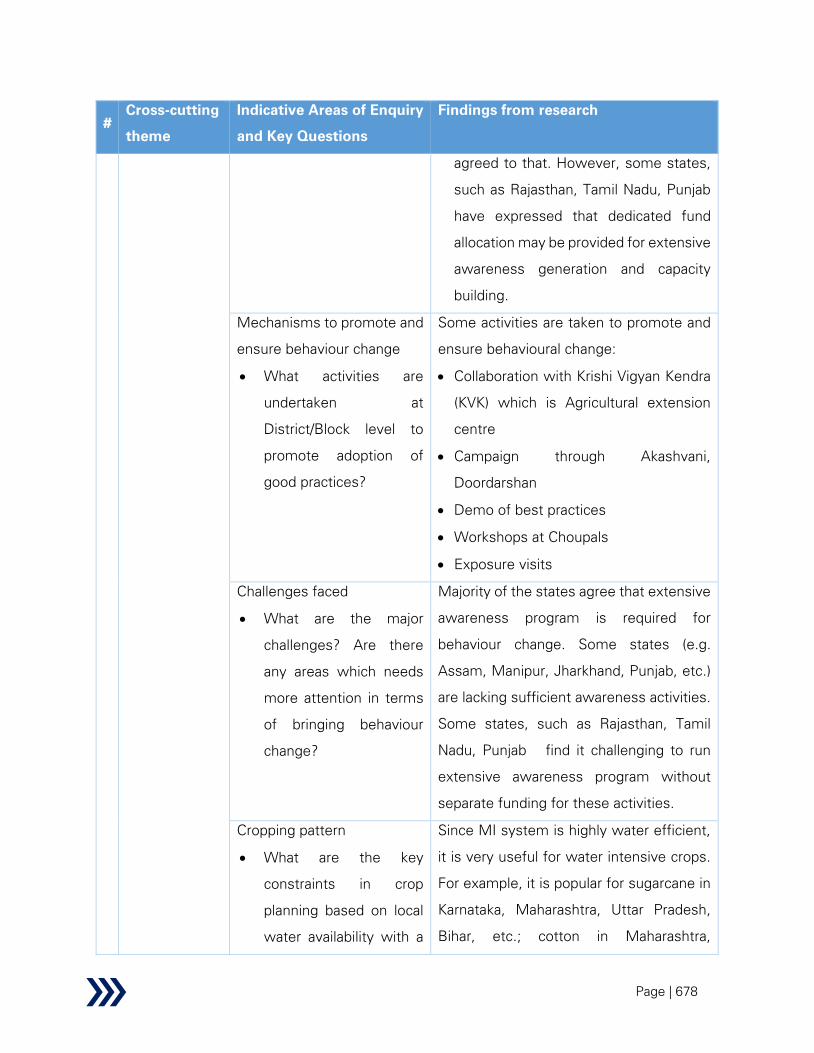
Page | 678
#
Cross-cutting
theme
Indicative Areas of Enquiry
and Key Questions
Findings from research
agreed to that. However, some states,
such as Rajasthan, Tamil Nadu, Punjab
have expressed that dedicated fund
allocation may be provided for extensive
awareness generation and capacity
building.
Mechanisms to promote and
ensure behaviour change
• What activities are
undertaken at
District/Block level to
promote adoption of
good practices?
Some activities are taken to promote and
ensure behavioural change:
• Collaboration with Krishi Vigyan Kendra
(KVK) which is Agricultural extension
centre
• Campaign through Akashvani,
Doordarshan
• Demo of best practices
• Workshops at Choupals
• Exposure visits
Challenges faced
• What are the major
challenges? Are there
any areas which needs
more attention in terms
of bringing behaviour
change?
Majority of the states agree that extensive
awareness program is required for
behaviour change. Some states (e.g.
Assam, Manipur, Jharkhand, Punjab, etc.)
are lacking sufficient awareness activities.
Some states, such as Rajasthan, Tamil
Nadu, Punjab find it challenging to run
extensive awareness program without
separate funding for these activities.
Cropping pattern
• What are the key
constraints in crop
planning based on local
water availability with a
Since MI system is highly water efficient,
it is very useful for water intensive crops.
For example, it is popular for sugarcane in
Karnataka, Maharashtra, Uttar Pradesh,
Bihar, etc.; cotton in Maharashtra,

Page | 679
#
Cross-cutting
theme
Indicative Areas of Enquiry
and Key Questions
Findings from research
view to reduce water
intensive crops?
Karnataka, etc.; Banana in Uttar Pradesh,
Maharashtra, Bihar, etc.
Summary Analysis:
• Majority of the states agree that extensive awareness program is required for behaviour
change. Many states (e.g. Andhra Pradesh, Tamil Nadu, Karnataka, Maharashtra, Rajasthan,
etc.) conduct several activities such as campaign through TV/ radio, demo of best practices,
exposure visits, workshops at Choupals etc. under awareness program.
• However, some states (e.g. Assam, Manipur, Bihar, Jharkhand, etc.) are lacking in terms
of required awareness campaign and capacity building activities and some states (e.g.
Rajasthan, Tamil Nadu, Punjab) find it challenging to run extensive awareness program
without separate funding for these activities.
7.
Research &
Development
Fund Allocation
• What percentage of total
allocation (Sector as well
as Scheme specific) is
directed towards R&D?
How much of that
percent is being utilized?
• There is no provision for R&D in the
scheme guidelines. Also, no fund is
earmarked for R&D activities.
• States have suggested for R&D work
for the following activities:
- Develop low cost MI system
considering high set up cost of
existing system is a challenge for
many small and marginal farmers
(e.g. an NGO, International
Development Enterprises (lDE),
worked in Maharashtra and Gujarat
to innovate low cost systems)
- Effective use of MI system for high
density crops like paddy, wheat etc.
(for example, field trials were
conducted for paddy cultivation in
2012 and 2013 by Tamil Nadu
Agricultural University, Coimbatore

Page | 680
#
Cross-cutting
theme
Indicative Areas of Enquiry
and Key Questions
Findings from research
and successful paddy cultivation
using drip system in Tirupur district
of Tamil Nadu; paddy cultivation in
Kota district of Rajasthan in
collaboration with Jain Irrigation;
Netafim is promoting rice cultivation
using MI systems; on-farm trial
conducted in Kurukshetra district of
Haryana for paddy cultivation, APMIP
has started promoting paddy
cultivation using MI system in
Andhra Pradesh; Punjab Agricultural
University successfully conducted
filed trials on wheat cultivation using
drip system, etc.)
- Cost-effective and durable
underground piping system for
sugarcane because pipelines are
penetrated by sugarcane roots in
existing set-up and, sometimes
pipelines are damaged by rats
• However, according to primary
stakeholders, there is limited evidence
of R&D activities being undertaken
with respect to this scheme.
Summary Analysis:
• There is no provision for R&D in the scheme guidelines. Also, no fund is earmarked for R&D
activities.
• There is scope of R&D activities in several areas like developing low cost MI system,
suitable MI system for high density crops like paddy, etc. On these areas, there have been

Page | 681
#
Cross-cutting
theme
Indicative Areas of Enquiry
and Key Questions
Findings from research
limited research activities, field trials and thereafter successful implementation across a
few areas in the country. However, there is scope for further R&D activities to
commercialize low cost MI system, use of MI system for high density crops like paddy,
etc. across the country.
8.
Unlocking
Synergies with
other
Government
Program
Convergence (Inter-
Ministerial/Inter-
Departmental/Financial/Hum
an Resources/
Administrative/ Institutions/
Schemes
• What activities are
undertaken to ensure
convergence at
community level? Are
there any Action Plans
prepared at
State/District/Block level
to ensure the same?
• What are the challenges
hindering effective
convergence?
• This scheme complements MGNREGA
and PMKSY-WDC in terms of source
creation and efficient water resources
management. Main activity undertaken
to ensure convergence is to create
water sources for MI.
• Discussions with the key informants at
state, district levels (such as: Goalpara,
Golaghat districts of Assam, Andhra
Pradesh, Kishanganj district of Bihar,
Manipur, Rajasthan, Meerut district of
Uttar Pradesh, Tamil Nadu etc.) have
indicated that convergence with other
schemes, such as MGNREGA, PMKSY-
WDC, is not happening effectively. It is
mainly due to coordination issues
between departments responsible for
implementing various schemes.
However, a few states and districts
(such as Punjab, Maharashtra,
Jharkhand, Himachal Pradesh, Kurnool,
Vishakhapatnam districts of Andhra
Pradesh, Udupi district of Karnataka)
have reported no issue with respect to
convergence.
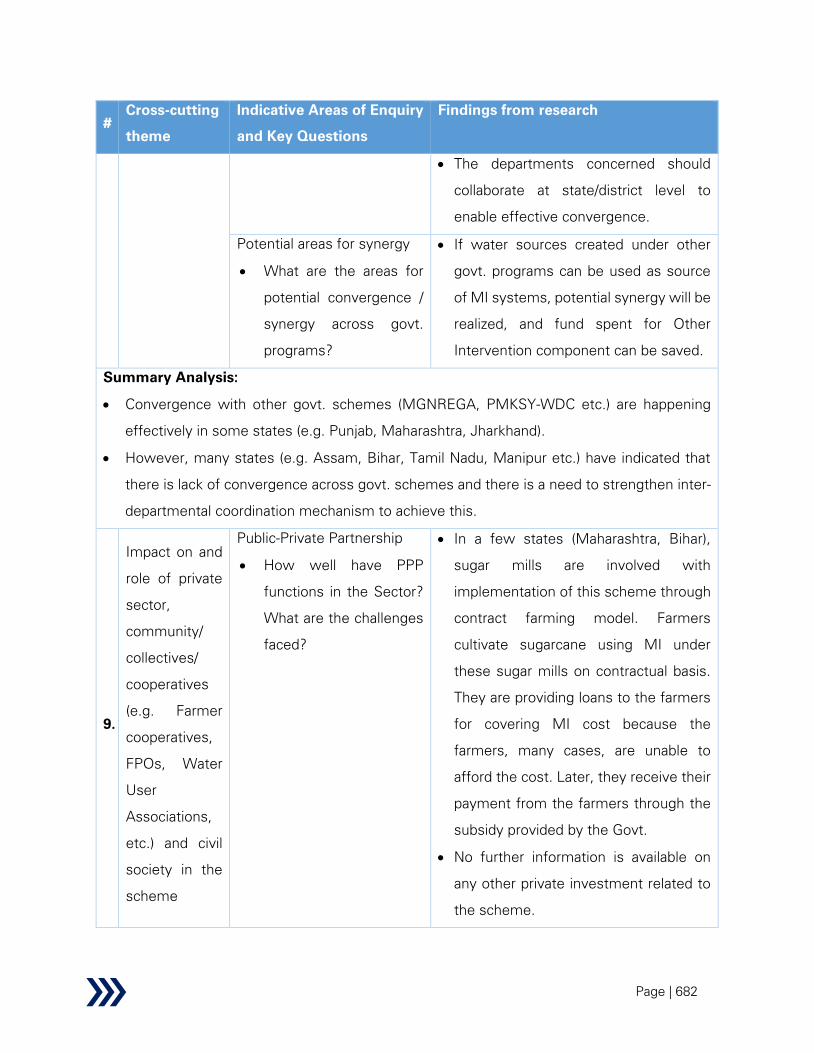
Page | 682
#
Cross-cutting
theme
Indicative Areas of Enquiry
and Key Questions
Findings from research
• The departments concerned should
collaborate at state/district level to
enable effective convergence.
Potential areas for synergy
• What are the areas for
potential convergence /
synergy across govt.
programs?
• If water sources created under other
govt. programs can be used as source
of MI systems, potential synergy will be
realized, and fund spent for Other
Intervention component can be saved.
Summary Analysis:
• Convergence with other govt. schemes (MGNREGA, PMKSY-WDC etc.) are happening
effectively in some states (e.g. Punjab, Maharashtra, Jharkhand).
• However, many states (e.g. Assam, Bihar, Tamil Nadu, Manipur etc.) have indicated that
there is lack of convergence across govt. schemes and there is a need to strengthen inter-
departmental coordination mechanism to achieve this.
9.
Impact on and
role of private
sector,
community/
collectives/
cooperatives
(e.g. Farmer
cooperatives,
FPOs, Water
User
Associations,
etc.) and civil
society in the
scheme
Public-Private Partnership
• How well have PPP
functions in the Sector?
What are the challenges
faced?
• In a few states (Maharashtra, Bihar),
sugar mills are involved with
implementation of this scheme through
contract farming model. Farmers
cultivate sugarcane using MI under
these sugar mills on contractual basis.
They are providing loans to the farmers
for covering MI cost because the
farmers, many cases, are unable to
afford the cost. Later, they receive their
payment from the farmers through the
subsidy provided by the Govt.
• No further information is available on
any other private investment related to
the scheme.
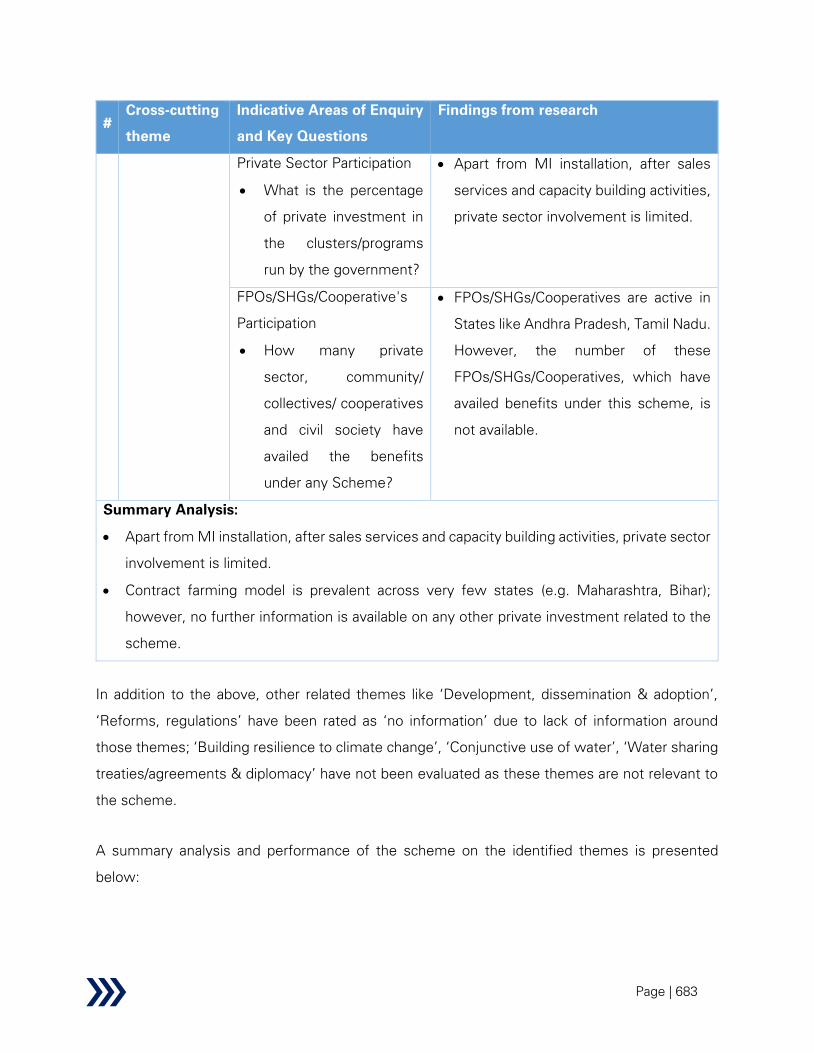
Page | 683
#
Cross-cutting
theme
Indicative Areas of Enquiry
and Key Questions
Findings from research
Private Sector Participation
• What is the percentage
of private investment in
the clusters/programs
run by the government?
• Apart from MI installation, after sales
services and capacity building activities,
private sector involvement is limited.
FPOs/SHGs/Cooperative's
Participation
• How many private
sector, community/
collectives/ cooperatives
and civil society have
availed the benefits
under any Scheme?
• FPOs/SHGs/Cooperatives are active in
States like Andhra Pradesh, Tamil Nadu.
However, the number of these
FPOs/SHGs/Cooperatives, which have
availed benefits under this scheme, is
not available.
Summary Analysis:
• Apart from MI installation, after sales services and capacity building activities, private sector
involvement is limited.
• Contract farming model is prevalent across very few states (e.g. Maharashtra, Bihar);
however, no further information is available on any other private investment related to the
scheme.
In addition to the above, other related themes like ‘Development, dissemination & adoption’,
‘Reforms, regulations’ have been rated as ‘no information’ due to lack of information around
those themes; ‘Building resilience to climate change’, ‘Conjunctive use of water’, ‘Water sharing
treaties/agreements & diplomacy’ have not been evaluated as these themes are not relevant to
the scheme.
A summary analysis and performance of the scheme on the identified themes is presented
below:

Page | 684
Table 84: PDMC - Summary of performance evaluation based on cross-sectional themes
Parameter Performance
Accountability & Transparency
Direct/Indirect Employment Generation
Gender mainstreaming/Inclusiveness
Building resilience to climate change (including but not limited to developing
water disaster preparedness) & ensuring sustainability
Role of Tribal Sub-Plan (TSP) and Scheduled Caste Sub-Plan component of the
scheme in mainstreaming of Tribal and Scheduled Caste population
Use of IT/Technology in driving efficiency
Stakeholder and Beneficiary behavioural change
Development, dissemination & adoption
Research & Development
Water sharing treaties/agreements & diplomacy
Conjunctive use of water - surface versus groundwater usage optimizations
Unlocking Synergies with other Government Program
Reforms, Regulations
Impact on and role of private sector, community and civil society in the scheme
Cross-sectional themes performance infographics legend
High
Medium
Low
Not relevant
No information
Issues and challenges
This sub-section describes the scheme issues and challenges and their mapping with the source
of information viz. primary source, secondary source and household survey (if applicable).
Table 85: PDMC – Issues and Challenges
Sl.no Area Issues & Challenges Secondary KII HH
Scheme Design
PDMC
– F1
Cost norms
not suitable
In most cases, farmers' landholdings are
divided into many smaller fragments

Page | 685
Sl.no Area Issues & Challenges Secondary KII HH
for small
land holding
which are not adjoining to each other. So,
beneficiary farmers need to install
separate MI units for each fragment of
land resulting in escalation of the overall
cost of the system. This cost escalation
acts as a deterrent for adoption of such
systems by the farmers.190
Many states (such as Bihar, Assam,
Manipur etc.) have indicated fragmented
landholding as an issue because more
than 80-90% farmers are small and
marginal in these states. The farm holding
is as low as 0.1 acre. Since minimum area
mentioned in the MI guideline is 0.4 ha
(around 0.99 acre) and subsidy for farm
size smaller than that is calculated on pro-
rata basis, it leads to comparatively higher
costs for MI systems in case of such
smaller farms. For example, let’s consider
two farms - 0.4 acre and 0.2 acre. If all
other factors remain same, the subsidy
calculated for 0.2 acre will be half of that
for 0.4 acre. However, the actual cost of
MI implementation for 0.2 acre will not be
half of that for 0.4 acre, instead it will be
more than that because there are a few
fixed components (e.g. filter, venturi
fertilizer injector assembly etc.) and costs
of those components do not vary with the
farm size (in case of such smaller farms).

Page | 686
Sl.no Area Issues & Challenges Secondary KII HH
PDMC
– F2
Additional
costs
The additional cost towards 12% GST
levied on MI equipment is not covered
through subsidy under the scheme and is
borne entirely by the farmer. This increase
the total cost of ownership for farmers.
This issue has been stated by the state,
district, village level key informants.
PDMC
– F3
Variance
between
market
prices and
cost norms
per guideline
It has emerged from the discussions with
the key informants at state, district, village
level that unit cost norms of the MI
components as per the guideline has not
been revised since 2017. Current market
rates are significantly higher than the unit
costs (material cost). Hence, farmers end
up bearing additional cost in this respect.
Similarly, unit cost norms (material cost,
installation cost etc.) for OI activities in the
guideline are lower than the market rates.
Hence, it is very difficult to undertake OI
activities (i.e. water source creation) and
very few farmers are willing to undertake
such activities.
PDMC
– F4
Fund
allocated for
SC/ST
unutilized
Subsidy allocation is made based on
SC/ST population in a state. Some states
(e.g. Punjab, Uttar Pradesh, Maharashtra,
Bihar, Karnataka, Rajasthan) are unable to
utilize the entire funding allocated for
SC/ST farmers since their landholding is
significantly lower compared to their
population.

Page | 687
Sl.no Area Issues & Challenges Secondary KII HH
Punjab: SC/ST landholding is only 4-5%.
However, around 29% fund is allocated
for SC/ST farmers. Hence, the remaining
fund remains unutilized.
PDMC
– F5
Upper cap on
landholding
Some states, such as Punjab, Tamil Nadu,
have indicated that the upper limit of 5 ha
for the provision of subsidy restricts
adoption of MI by farmers having large
landholding.190
However, it needs to be
noted that subsidy provided under this
scheme is mainly targeted at small and
marginal farmers.
PDMC
– F6
Low
awareness
on OI
guidelines
As per the Ministry, the states are
expected to follow the operational
guidelines of National Mission for
Sustainable Agriculture (NMSA), 2014 for
OI activities.
Discussions with the key informants from
some states, districts (e.g. Tamil Nadu,
Maharashtra, Goalpara district of Assam)
have revealed that there is lack of
knowledge about all components included
in the OI guidelines. For example:
- State level key informant from
Tamil Nadu has stated that OI
guidelines restrict creation of
water source on a sharing basis or
for a group of farmers.
- State level key informant of
Maharashtra has stated that there

Page | 688
Sl.no Area Issues & Challenges Secondary KII HH
is no provision to cover farm pond
under OI component.
- State level key informant of Bihar
and district level key informant
from Assam have stated that
shallow tube well, bore well is not
included under OI components.
However, all these components are
already covered in NMSA guidelines (thus
OI guidelines).
Although OI component is part of PMKSY-
PDMC scheme, its implementation is
governed by NMSA (2014) guidelines.
Based on primary survey, it was observed
that there is lack of awareness or
complete knowledge about OI guidelines
among stakeholders.
Scheme Implementation
PDMC
– F7
Lack of
coordination
It is observed that multiple departments
are responsible for implementation of this
scheme in most states190
(e.g. Assam,
Bihar, Uttar Pradesh, Jharkhand, Andhra
Pradesh, Manipur, Karnataka, Rajasthan).
In some states (e.g. Assam, Bihar,
Jharkhand, Uttar Pradesh), separate
departments are responsible for MI and
OI components (e.g. Agriculture/
Horticulture department is responsible for
MI and Watershed department is

Page | 689
Sl.no Area Issues & Challenges Secondary KII HH
responsible for OI component). Hence,
there is either less focus on water storage
structure creation under OI component or
such structures under OI are not
effectively linked to MI systems and it
hampers the progress of MI cultivation.
Convergence with other schemes, such
as MGNREGA, PMKSY-WDC, is not
happening effectively across most states,
districts (e.g. Goalpara, Golaghat districts
of Assam, Andhra Pradesh, Kishanganj
district of Bihar, Manipur, Rajasthan,
Meerut district of Uttar Pradesh,
Karnataka etc.). State level stakeholders
have mentioned that it is mainly due to
coordination issues between departments
responsible for implementing various
schemes.
PDMC
– F8
Non-uniform
pricing
There is variance in the pricing of MI
system across manufacturers. For
example, prices of MI system provided by
MNCs are significantly higher compared
to local manufacturers. Prices and quality
are not regulated.
PDMC
– F9
High
logistics cost
There is absence or very low presence of
MI manufacturing companies across a
few states/districts (e.g. Assam, Manipur,
Udupi district in Karnataka). Due to
logistics/ transportation cost, the cost of

Page | 690
Sl.no Area Issues & Challenges Secondary KII HH
MI system is higher in such
states/districts.
PDMC
– F10
MMI projects
not
integrated
with MI
While the scheme remains popular in
areas with bore well prevalence or other
perennial water sources, adoption rates
are significantly lower in areas served
through canal irrigation. This is due to the
fact that MI requires pressurized water
supply while canal irrigation relies on
gravity flows. Hence, Major and Medium
Irrigation (MMI) projects should be linked
to MI system186
by adopting technological
innovation in outlet design that will allow
for pressurized supply from existing canal
network. However, MMI projects are
currently not planned to be integrated
with MI system. Hence, farmers, who
draw water from MMI projects, prefer
flood irrigation over MI due to abundance
of water. This negatively impacts efficient
water resources management and
defeats the objectives of the scheme.
PDMC
- F11
High initial
investment
by farmer
High initial investment required to be
made by farmers, especially small and
marginal farmers, for MI system is one of
the factors constraining its wider
adoption.190
In the beneficiary survey,
around 54% farmers (N=193) have stated
that the subsidy amount is not adequate
considering high set-up cost of MI
system.
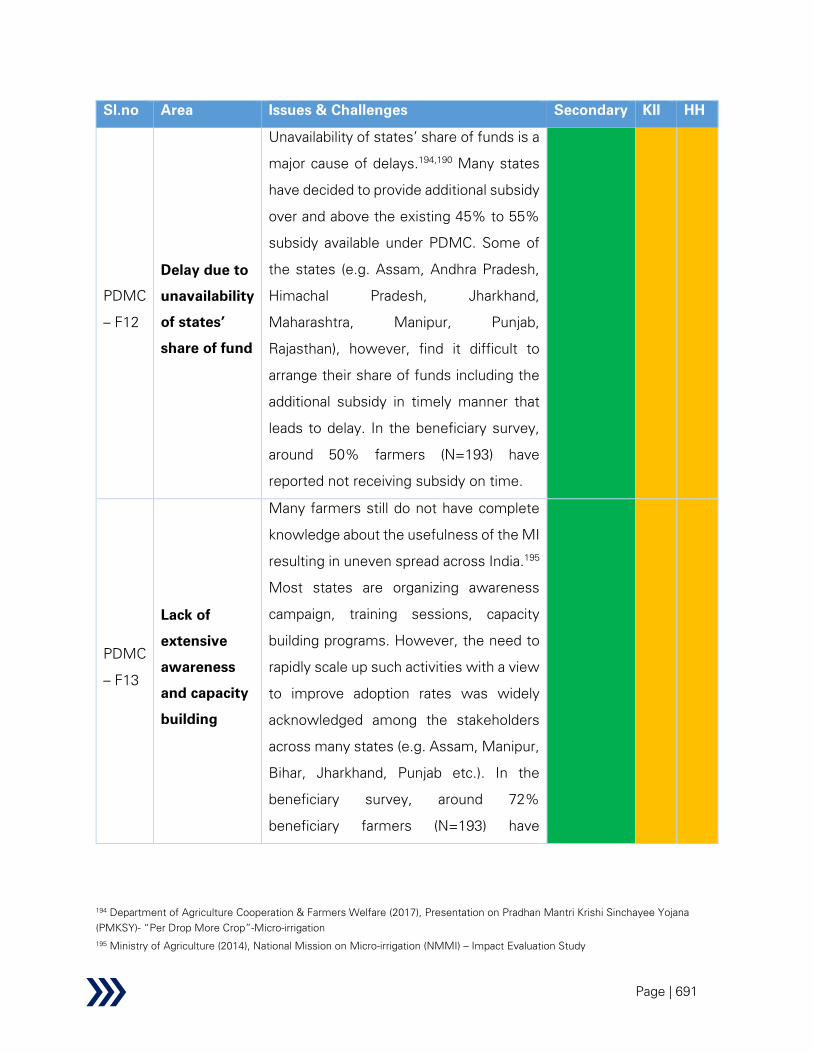
Page | 691
Sl.no Area Issues & Challenges Secondary KII HH
PDMC
– F12
Delay due to
unavailability
of states’
share of fund
Unavailability of states’ share of funds is a
major cause of delays.194,190
Many states
have decided to provide additional subsidy
over and above the existing 45% to 55%
subsidy available under PDMC. Some of
the states (e.g. Assam, Andhra Pradesh,
Himachal Pradesh, Jharkhand,
Maharashtra, Manipur, Punjab,
Rajasthan), however, find it difficult to
arrange their share of funds including the
additional subsidy in timely manner that
leads to delay. In the beneficiary survey,
around 50% farmers (N=193) have
reported not receiving subsidy on time.
PDMC
– F13
Lack of
extensive
awareness
and capacity
building
Many farmers still do not have complete
knowledge about the usefulness of the MI
resulting in uneven spread across India.195
Most states are organizing awareness
campaign, training sessions, capacity
building programs. However, the need to
rapidly scale up such activities with a view
to improve adoption rates was widely
acknowledged among the stakeholders
across many states (e.g. Assam, Manipur,
Bihar, Jharkhand, Punjab etc.). In the
beneficiary survey, around 72%
beneficiary farmers (N=193) have
194 Department of Agriculture Cooperation & Farmers Welfare (2017), Presentation on Pradhan Mantri Krishi Sinchayee Yojana
(PMKSY)- “Per Drop More Crop”-Micro-irrigation
195 Ministry of Agriculture (2014), National Mission on Micro-irrigation (NMMI) – Impact Evaluation Study

Page | 692
Sl.no Area Issues & Challenges Secondary KII HH
reported not receiving any training
sessions under the scheme and around
49% farmers have mentioned about not
having any technical support from the
Govt.
Also, some states (e.g. Maharashtra,
Rajasthan, Tamil Nadu, Andhra Pradesh
etc.) have reported that absence of
dedicated allocation could be possible
reason for inadequate training and
capacity building in some states. Another
possible reasons could be inadequate
support provided by the MI companies. In
the beneficiary survey as well, around
74% farmers have reported not having
technical support from the MI companies.
PDMC
– F14
Lack of easy
financing
Farmers face a major challenge in
securing financing for purchasing MI
systems. Even if they can find financing,
they are required to provide a high value
collateral for securing this financing. This
prevents wider adoption of MI.
PDMC
– F15
High-cost
technology
According to some states (e.g. Andhra
Pradesh, Karnataka, Tamil Nadu, Punjab,
Uttar Pradesh, Maharashtra, Jharkhand),
there is an absence of low-cost
technology solution for MI system. Since
the scheme targets small and marginal

Page | 693
Sl.no Area Issues & Challenges Secondary KII HH
farmers, high cost equipment makes it
unaffordable for them. There is a need to
lower the cost of MI systems to allow for
wider adoption.
Monitoring and Evaluation
PDMC
– F16
Outcomes
and impact
not
monitored
The PMKSY MIS or any other system
does not monitor outcomes (productivity
increase, reduction in fertilizer
consumption etc.) and impact (increase in
income of farmers, employment
opportunity etc.) of the scheme.
PDMC
– F17
Cumbersome
progress
reporting
PMKSY-PDMC MIS requires district wise
and crop wise physical and financial
progress data from the state and thus, the
format is very lengthy. States are required
to fill around 50-60 columns for reporting
financial progress and 50-60 for physical
progress reporting. Apart from that, server
issues are also there. Hence, many states
find it very difficult to upload the data over
the dashboard at regular interval as
mandated in the scheme guidelines.
Issue relevance legend
Supported Partially
supported
Not
supported
Not
applicable
A summary analysis of issues & challenges for the scheme is presented below:
Table 86: PDMC – Summary of Issues and Challenges
Parameter Performance
Institutional Mechanism and governance

Page | 694
Parameter Performance
Fund flow efficiency and utilization
Unavailability of resource persons
Capacity building
Monitoring and evaluation
Performance infographics legend
Satisfactory
Average
Needs Improvement
Recommendations and solutions
This sub-section describes the scheme recommendation and solutions from the perspective of
scheme design, scheme implementation and monitoring & evaluation, along with their mapping
with the issues and challenges described in the preceding sub-section.
Table 87: PDMC – Recommendations and Solutions
Sl.no Recommendation Finding
Scheme design
PDMC -
R1
Short-term solution: The scheme guideline may include provision for
drip system with class I grade of laterals along with class II or class
III which are currently mandated in the guideline for reducing the
cost of drip system.
In drip system, laterals account for around 65-70% cost of the entire
drip system. Wall thickness of class II grade laterals of 16 mm dia. is
0.7 to 0.9 mm. Drip system with such class II grade laterals with 1.2
m spacing costs around Rs. 50,000 for 1-acre (~ 0.4 ha) land. Class I
grade of laterals are also available in the market. It is used by the
farmers who are not taking subsidy through this scheme. These
laterals have wall thickness of 0.4-0.5 mm and rest of the
specifications remain same. Drip system with class I grade laterals
costs around Rs. 28,000 for 1-acre (~0.4 ha) land; thus, around 44%
less cost as compared to class II (grade mandated in the guidelines).
PDMC-F11,
PDMC-F12
& PDMC-
F15

Page | 695
Sl.no Recommendation Finding
Hence, cost of drip system can be significantly reduced by using
lower grade of laterals. Usage of thin walled lateral (0.4 mm wall
thickness) is also observed in developed countries (such as US).
However, there is caveat related to longevity. This class I grade
laterals last for around 3 years whereas class II grade laterals last for
5-6 years. However, as per the key informants of the MI companies
(e.g. Jain Irrigation, Netafim, Mahindra EPC etc.), there are many
instances where farmers have used class I grade laterals for 6-7
years with proper maintenance.
Similarly, as a short-term measure, cost of sprinkler system can be
reduced by using plastic nozzle instead of metal nozzle.
Long-term solution: R&D on development of low-cost MI technology
may be explored given the focus of the scheme is on small and
marginal farmers. Also, a separate allocation may be considered for
such R&D activities.
Govt. can collaborate with MI companies and the research institutes
to find out other ways to reduce the cost of MI systems.
Low-cost technology can be expected to significantly improve the
adoption rates since the target beneficiary group may be unable to
adopt MI technology on account of high investment required of
them.
If cost of MI system can be reduced, this will also reduce the subsidy
requirement and thus, the financial burden on states.
PDMC-
R2
Central Govt. may increase the central assistance by a certain
percentage for small and marginal farmers and proportionately
decrease it for general farmers considering the fact that the primary
target is small and marginal farmers. It will help to reduce top-up
subsidy provided by the states for small & marginal.
PDMC –
F12

Page | 696
Sl.no Recommendation Finding
State Govt. may reduce the top-up subsidy by a certain percentage
for general farmers considering that they can afford the non-subsidy
portion of MI cost. This will also reduce the overall funding
requirements by the states.
PDMC –
R3
A separate allocation of fund for IEC and capacity building may be
made considering their importance in improving awareness and
adoption of MI technology. This fund may be carved out of the 5%
funding currently provided for administrative expenses. The
guideline should lay down the specific objectives of IEC and capacity
building, activities to be undertaken, how the outputs and outcomes
of such activities will be tracked.
PDMC-F13
PDMC-
R4
The scheme guideline has already mandated for a satisfaction
certificate towards successful installation of the system from the
beneficiaries. Based on which payment towards MI companies is
processed. It may also include provision for mid-term assessment
certificate after certain years (say, 3 years) of O&M. This will help to
monitor after sales services provided by the MI companies during
O&M period.
PDMC-F13
PDMC –
R5
Unit cost norms in the scheme guideline for subsidy calculation are
exclusive of GST and other taxes (if any). The farmers bear these
taxes at their end. Hence, if rate of GST or other taxes can be
reduced for the MI components, this will reduce the cost burden on
farmers.
PDMC-F2
PDMC –
R6
Unit cost norms for material cost of MI system (such as drip,
sprinkler etc.) and material and installation cost of OI components
(construction of tube well/ bore well, water lifting devices,
construction of community tanks/ farm ponds etc.) specified in the
scheme guidelines should be revised so that base prices for all
components reflect current market price. Then, base prices should
PDMC-F3

Page | 697
Sl.no Recommendation Finding
be escalated annually using an appropriate index and escalation
formula to take care of inflation.
PDMC –
R7
Farm holding of less than 0.4 ha and appropriate cost norms for such
farms to be provided in the guidelines. This will help to increase MI
adoption rate among the farmers having fragmented landholdings.
PDMC-F1
PDMC –
R8
SC/ST fund allocation at a state should be determined based on their
landholding instead of their concentration in the overall population in
the state. This will reduce instances of unutilized funds allocated for
SC/ST farmers on account of mismatch between population and
their landholding.
PDMC-F4
PDMC –
R9
Separate OI guidelines should be published under PMKSY-PDMC
which are currently available under NMSA (2014). This will improve
awareness around OI activities and help the states to get subsidy
benefit for various components (e.g. bore well, farm ponds etc.)
which are currently not being used in some states due to lack of
knowledge.
PDMC-F6
Scheme implementation
PDMC-
R10
Govt. may mandate release of subsidy in phased manner for general
farmers. It may reduce upfront fund requirement by the states and
smoothen the fund flow.
PDMC-F12
PDMC –
R11
Single department should be accountable for implementing the
entire PDMC scheme (both MI as well as OI components) at state
level. This will help to integrate the water sources created under OI
components with MI systems effectively, which is currently not
happening across many states due to presence of two different
departments for managing these two components. This
arrangement would help to achieve better progress of MI.
Such arrangement is observed in some states (e.g. Maharashtra,
Tamil Nadu); where single department (i.e. Horticulture department)
PDMC-F7
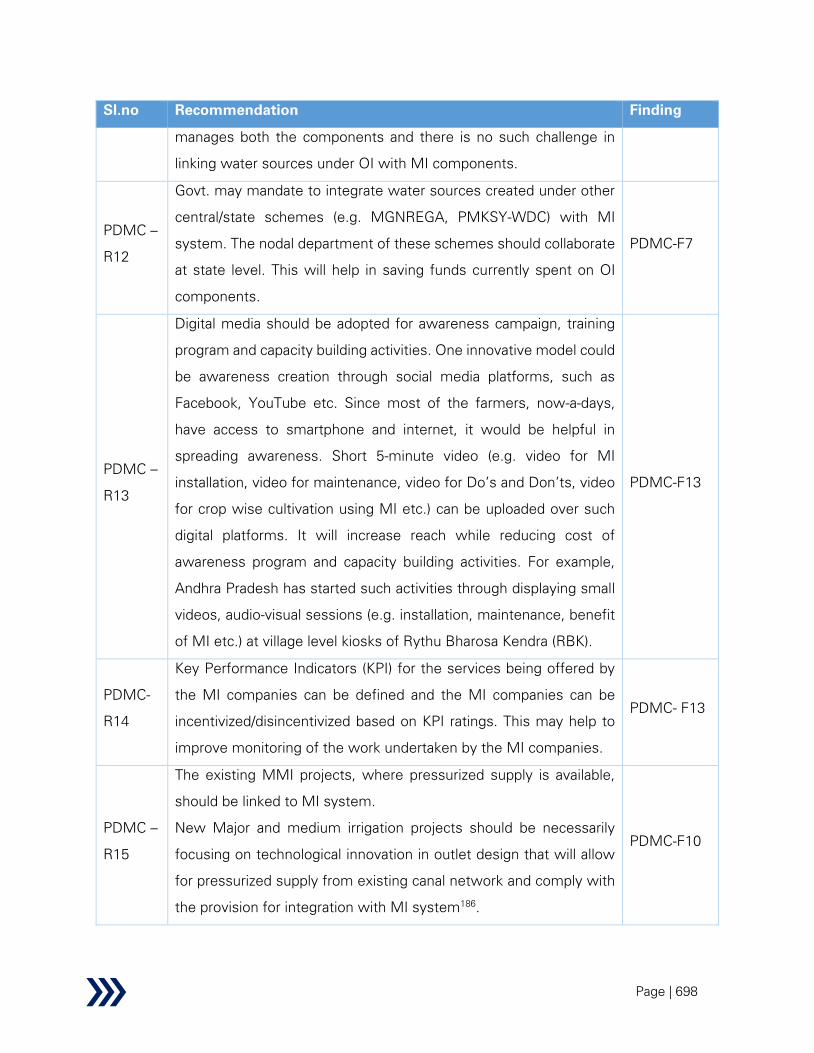
Page | 698
Sl.no Recommendation Finding
manages both the components and there is no such challenge in
linking water sources under OI with MI components.
PDMC –
R12
Govt. may mandate to integrate water sources created under other
central/state schemes (e.g. MGNREGA, PMKSY-WDC) with MI
system. The nodal department of these schemes should collaborate
at state level. This will help in saving funds currently spent on OI
components.
PDMC-F7
PDMC –
R13
Digital media should be adopted for awareness campaign, training
program and capacity building activities. One innovative model could
be awareness creation through social media platforms, such as
Facebook, YouTube etc. Since most of the farmers, now-a-days,
have access to smartphone and internet, it would be helpful in
spreading awareness. Short 5-minute video (e.g. video for MI
installation, video for maintenance, video for Do’s and Don’ts, video
for crop wise cultivation using MI etc.) can be uploaded over such
digital platforms. It will increase reach while reducing cost of
awareness program and capacity building activities. For example,
Andhra Pradesh has started such activities through displaying small
videos, audio-visual sessions (e.g. installation, maintenance, benefit
of MI etc.) at village level kiosks of Rythu Bharosa Kendra (RBK).
PDMC-F13
PDMC-
R14
Key Performance Indicators (KPI) for the services being offered by
the MI companies can be defined and the MI companies can be
incentivized/disincentivized based on KPI ratings. This may help to
improve monitoring of the work undertaken by the MI companies.
PDMC- F13
PDMC –
R15
The existing MMI projects, where pressurized supply is available,
should be linked to MI system.
New Major and medium irrigation projects should be necessarily
focusing on technological innovation in outlet design that will allow
for pressurized supply from existing canal network and comply with
the provision for integration with MI system186
.
PDMC-F10
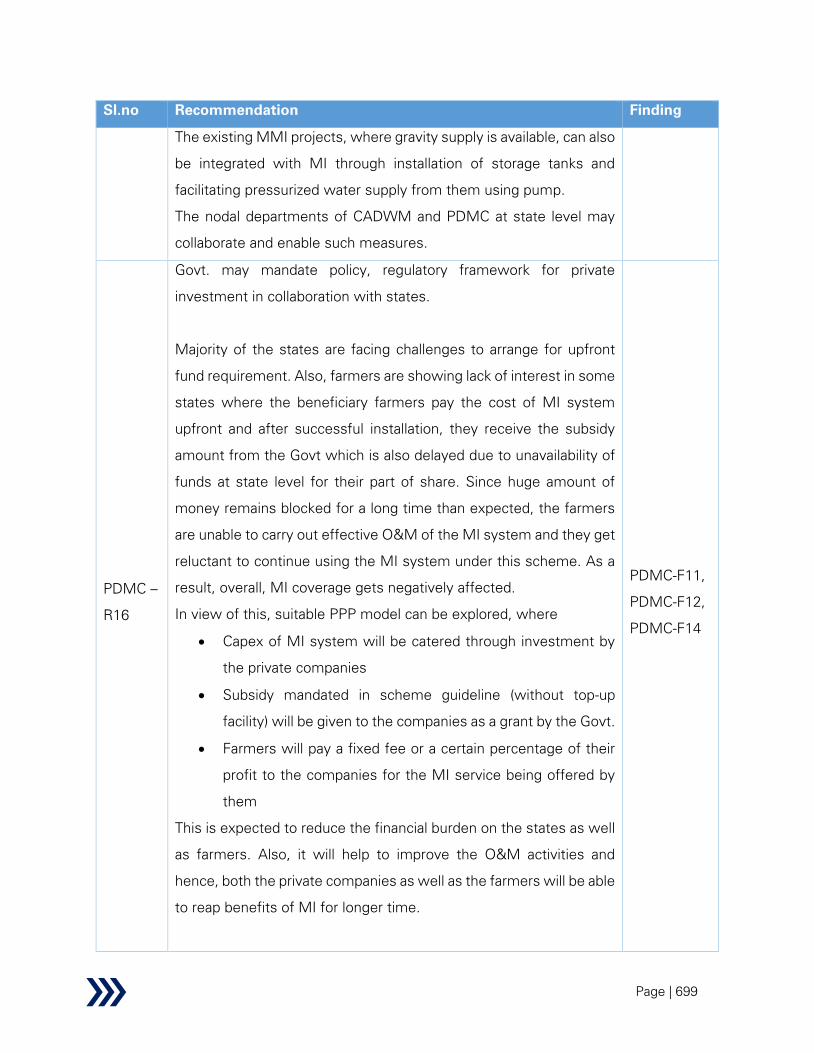
Page | 699
Sl.no Recommendation Finding
The existing MMI projects, where gravity supply is available, can also
be integrated with MI through installation of storage tanks and
facilitating pressurized water supply from them using pump.
The nodal departments of CADWM and PDMC at state level may
collaborate and enable such measures.
PDMC –
R16
Govt. may mandate policy, regulatory framework for private
investment in collaboration with states.
Majority of the states are facing challenges to arrange for upfront
fund requirement. Also, farmers are showing lack of interest in some
states where the beneficiary farmers pay the cost of MI system
upfront and after successful installation, they receive the subsidy
amount from the Govt which is also delayed due to unavailability of
funds at state level for their part of share. Since huge amount of
money remains blocked for a long time than expected, the farmers
are unable to carry out effective O&M of the MI system and they get
reluctant to continue using the MI system under this scheme. As a
result, overall, MI coverage gets negatively affected.
In view of this, suitable PPP model can be explored, where
• Capex of MI system will be catered through investment by
the private companies
• Subsidy mandated in scheme guideline (without top-up
facility) will be given to the companies as a grant by the Govt.
• Farmers will pay a fixed fee or a certain percentage of their
profit to the companies for the MI service being offered by
them
This is expected to reduce the financial burden on the states as well
as farmers. Also, it will help to improve the O&M activities and
hence, both the private companies as well as the farmers will be able
to reap benefits of MI for longer time.
PDMC-F11,
PDMC-F12,
PDMC-F14
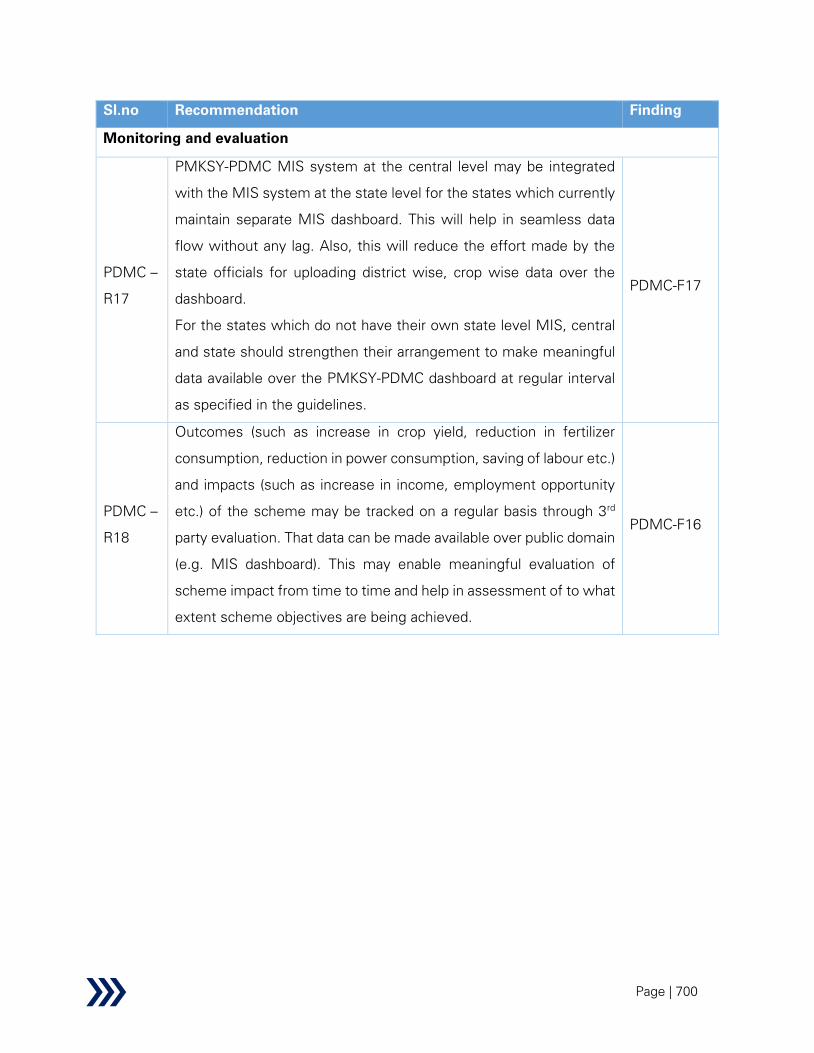
Page | 700
Sl.no Recommendation Finding
Monitoring and evaluation
PDMC –
R17
PMKSY-PDMC MIS system at the central level may be integrated
with the MIS system at the state level for the states which currently
maintain separate MIS dashboard. This will help in seamless data
flow without any lag. Also, this will reduce the effort made by the
state officials for uploading district wise, crop wise data over the
dashboard.
For the states which do not have their own state level MIS, central
and state should strengthen their arrangement to make meaningful
data available over the PMKSY-PDMC dashboard at regular interval
as specified in the guidelines.
PDMC-F17
PDMC –
R18
Outcomes (such as increase in crop yield, reduction in fertilizer
consumption, reduction in power consumption, saving of labour etc.)
and impacts (such as increase in income, employment opportunity
etc.) of the scheme may be tracked on a regular basis through 3rd
party evaluation. That data can be made available over public domain
(e.g. MIS dashboard). This may enable meaningful evaluation of
scheme impact from time to time and help in assessment of to what
extent scheme objectives are being achieved.
PDMC-F16

Page | 701
2.2.5 Watershed Development Component
India is primarily a rural economy and agriculture development forms the backbone of the
governments' efforts to tackle poverty and enhance food security. The rainfed areas are the hot
spots of poverty, undernourishment, water and food insecurity, prone to severe land degradation,
and poor institutional and social infrastructure. A balanced approach is thus required to meet
demands for food on one hand and to preserve natural resources and tackle climate change on
the other.
Out of India’s total geographical area of 329 million hectares, only 140 million hectares can be
categorized as net sown area. Of this, 47 per cent is irrigated and the remaining 53 per cent is
rainfed. Even if we can achieve full irrigation potential in the country, still around 40 per cent of
the net cultivated area will remain rainfed.196
Therefore, rainfed agriculture is vital to the country’s
economy and food security as it also contributes to about 40 per cent of the total food grain
production.197
Rainfed regions also support two-thirds of livestock and 40 per cent of the human
population. Moreover, 80 per cent of small and marginal farmers that are most vulnerable to
monsoon failures depend on these areas for livelihoods.198
Given that the rainfed areas are the most backward, there is a need to ensure profitability,
economic and social equity in these areas at an accelerated pace.199
The main challenge of rainfed
agriculture in future will be sustaining the livelihoods of small and marginal farmers, who will still
depend on farming despite increased climate variability and dwindling landholding size. Hence it
becomes imperative that agriculture productivity must be duly taken care of and efforts need to
be taken to address concerns of irrigation and enhance productivity in rainfed areas. Watershed
development programmes are considered as a valuable instrument for addressing many of these
problems in fragile soil areas, in intensively cultivated lands and marginal rainfed areas.
196 Potential and Challenges of Rainfed Farming in India, Srinivasrao Ch, et al., Advances in Agronomy 133:115-181 · July 2015
197 farmer.gov.in
198 Report of the Committee on Doubling Farmers’ Income, Volume VI, November 2017, “Strategies for Sustainability in
Agriculture”, Department of Agriculture, Cooperation and Farmers’ Welfare, Ministry of Agriculture & Farmers’ Welfare.
199 Sustainable Agriculture, FAO and the post- 2015 development agenda issue papers, Post 2015 and SDGs. Nourishing people,
Nourishing the planet. Available at http://www.fao.org/fileadmin/ user_upload/mdg/doc/SustAg-12.pdf, last accessed on 25
October 2019.

Page | 702
Watershed management leads to scientific conservation of soil and water, thereby increasing
agriculture and biomass production. It helps in increasing the income of the people living in the
watershed community and lessens the occurrence of drought and flood leading to an increase in
the life of the downstream dam and reservoirs. Therefore, Watershed Development Component
of Pradhan Mantri Krishi Sinchayee Yojana (WDC-PMKSY erstwhile IWMP) is a necessary step
in the direction of achieving the larger goal of PMKSY which is to provide economic and social
sustainability to agriculture in rainfed regions of India.
Moreover, WDC-PMKSY is extremely relevant to SDG 15.3, which specifically deals with Land
Degradation Neutrality. India has committed to improving degraded land of 26 million hectares
by 2030 which includes 13 million hectares committed as part of Bonn Challenge 2020, 8 million
hectares committed by 2030 as GoI is a signatory to UNCCD and additionally, Prime Minister has
committed to improving an additional 5 million hectares.
2.2.5.1 Background
Under the umbrella of the former Planning Commission, the National Rainfed Area Authority
(NRAA) framed the Common Guidelines (2008) for watershed programmes for all Ministries and
Departments.200
The provisions in the Common Guidelines and the observations of the
Parthasarathy Committee necessitated modifications in the Watershed Schemes of the
Department of Land Resources (DoLR). Accordingly, during 2009-10, the Schemes of Integrated
Wasteland Development Programme (IWDP), Desert Development Programme (DDP) and
Drought Prone Areas Programme (DPAP) of the DoLR were integrated and consolidated into a
single tailored programme called the Integrated Watershed Management Programme (IWMP).
This programme is being implemented with effect from 26.02.2009 as per the Common
Guidelines for Watershed Development Projects, 2008 (revised in 2011). The IWMP programme
has been continued as one of the four components of Pradhan Mantri Krishi Sinchayee Yojana
(PMKSY) under the 14th Finance Commission period (starting in 2015-16).
WDC-PMKSY is principally for development of rainfed part of net cultivated area and culturable
wastelands/degraded lands. The activities being undertaken include ridge area treatment,
200 www.dolr.gov.in

Page | 703
drainage line treatment, soil and moisture conservation, rainwater harvesting, nursery raising,
afforestation, horticulture, pasture development, livelihoods for asset-less individuals, etc.
Watershed development activities are not only limited to engineering and vegetative measures
but also ensure sustainability in food production, eco-development and soil health care through
social mobilization, community organisation and capacity building of the affected community.
Stated Objective of the Scheme
The primary objectives of the Watershed Development Component of PMKSY are201
:
i. harnessing, conserving and developing degraded natural resources
ii. prevention of soil run-off;
iii. rainwater harvesting and recharging of groundwater table;
iv. increasing the productivity of crops;
v. introduction of multi-cropping and diverse agro-based activities;
vi. promoting sustainable livelihoods; and
vii. increasing household incomes.
Key features of the Scheme
The main features of WDC-PMKSY are as below202
:
• As per the Common Guidelines for Watershed Development Projects-2008 (thereafter
revised in 2011), the period for completing projects is between 4-7 years (Figure 40).
201 Report of Standing Committee on Rural Development, Sixteenth Lok Sabha (2016-2017) on Watershed development component
(WDC-PMKSY), 39th
Report
202 www.dolr.gov.in
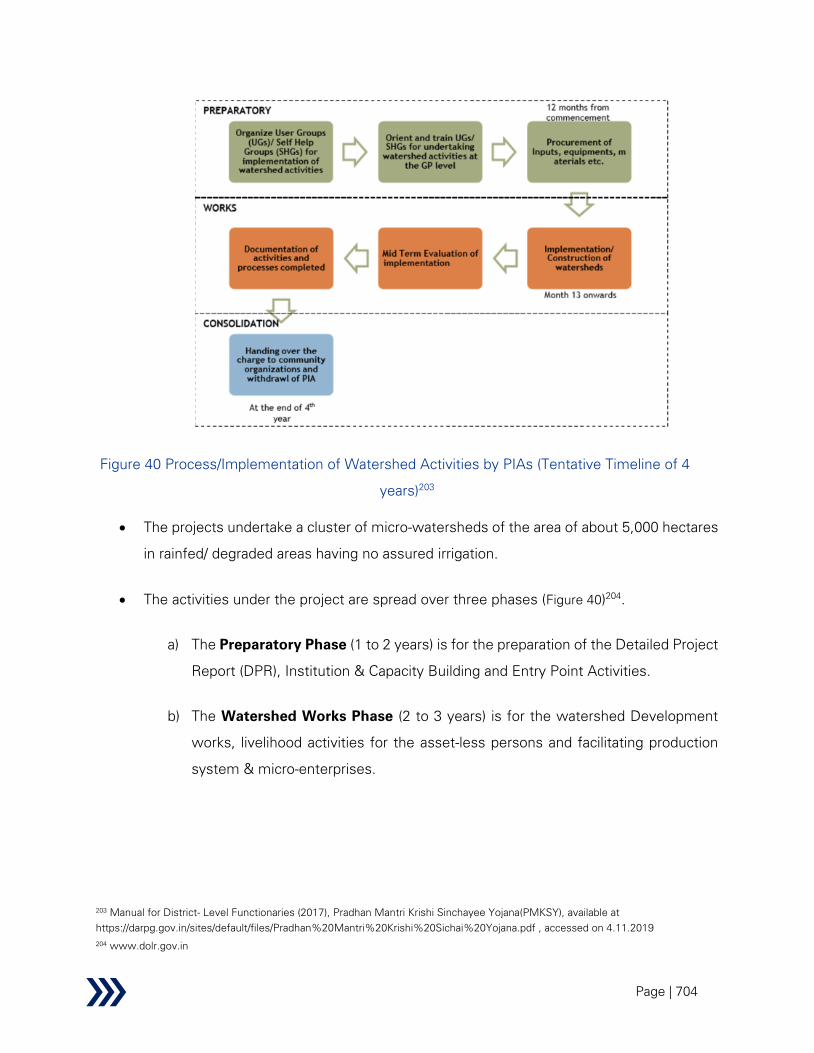
Page | 704
Figure 40 Process/Implementation of Watershed Activities by PIAs (Tentative Timeline of 4
years)203
• The projects undertake a cluster of micro-watersheds of the area of about 5,000 hectares
in rainfed/ degraded areas having no assured irrigation.
• The activities under the project are spread over three phases (Figure 40)204
.
a) The Preparatory Phase (1 to 2 years) is for the preparation of the Detailed Project
Report (DPR), Institution & Capacity Building and Entry Point Activities.
b) The Watershed Works Phase (2 to 3 years) is for the watershed Development
works, livelihood activities for the asset-less persons and facilitating production
system & micro-enterprises.
203 Manual for District- Level Functionaries (2017), Pradhan Mantri Krishi Sinchayee Yojana(PMKSY), available at
https://darpg.gov.in/sites/default/files/Pradhan%20Mantri%20Krishi%20Sichai%20Yojana.pdf , accessed on 4.11.2019
204 www.dolr.gov.in
Page | 705
c) The Consolidation and Withdrawal Phase (1 to 2 years) involves the
consolidation and completion of various works and handing over to community
concerned.
• The funding pattern under the Watershed Development Component of PMKSY is 60:40.
However, for the North-Eastern States and Hill States (J&K, H.P & Uttarakhand) the
funding pattern between the Centre and the States continues to be 90:10.
• The cost norm is Rs. 15,000 per hectare for hilly & difficult area, Rs. 12,000 per hectare
for other areas and up to Rs. 15,000 per hectare for WDC projects in the Integrated Action
Plan (IAP) Districts.
• The programme emphasizes careful planning and capacity building, by providing a special
provision of 1 per cent for preparation of Detailed Project Report (DPR) and 5 per cent for
Institution and Capacity Building.
• Dedicated institutions are also provided at Centre, State and District levels for
decentralised management of the scheme205
:
1. Ministry Level: The Department of Land Resources has the necessary
institutional mechanism in the form of a Steering Committee chaired by the
Secretary, DoLR.206
This Committee inter alia appraises and clears the project
proposals of the States.
205 www.dolr.gov.in
206 The Steering Committee consists of members from Department of Land Resources, the National Institution for Transforming
India (NITI) Aayog, Ministry of Science and Technology, Department of Drinking Water Supply, Department of Agriculture,
Cooperation & Farmers Welfare, Department of Rural Development, Ministry of Water Resources, River Development & Ganga
Rejuvenation, Ministry of Environment, Forest and Climate Change, National Rural Livelihoods Mission, (Ministry of Rural
Development), Department of Animal Husbandry, Dairying & Fisheries, Department of Agricultural Research & Education, Ministry
of Skill Development & Entrepreneurship, Central Ground Water Board, Indira Gandhi National open University (IGNOU), National
Bank for Agriculture and Rural Development (NABARD), organizations in Space Technology (NRSA,ISRO,FSI), three organizations in
the field of watershed management (ICRISAT, CRIDA, MANAGE etc.), National Informatics Centre (NIC) , representative from
NRAA as a Special Invitee for policy matters, three to five experts in the field of watershed management and three reputed NGOs.

Page | 706
2. State Level: A State Level Nodal Agency (SLNA) has been constituted with
professional support. SLNA is a dedicated institution for the implementation of
projects in a State.
3. District Level: Watershed Cell-cum-Data Centre (WCDC) is the District level
institution to supervise and coordinate the projects in the District. WCDC is set
up in DRDA/ Zilla Parishad/ District Level Implementing Agency/ Department in
all programme districts as per the convenience of the State Governments.
4. Project Level: Supervision of project implementation is under the Project
Implementing Agency (PIA). As per the Common Guidelines for Watershed
Projects, 2008 (Revised in 2011), Panchayats, Government and Non-Government
agencies may function as PIAs. A Watershed Development Team (WDT)
comprising 3 to 4 technical experts will assist each PIA.
5. Village Level: Watershed Committee (WC) is constituted by the Gram Sabha
for the execution of the projects at ground level. It comprises at least 10 members,
half of which are representatives of Self Help Groups and User Groups (UGs),
SC/STs, women and landless. One member from WDT is also represented in WC.
• As a systemic improvement, a protocol on formal completion and closure of WDC-PMKSY
projects has been formulated by the DoLR in consultation with the then Ministry of Water
Resources, River Development & Ganga Rejuvenation and NITI Aayog. The protocol inter
alia envisages ensuring (i) the due completion of unfinished works (if any), (ii)
maintenance, (iii) security and (iv) sustainability of the watershed development projects.
It also includes (v) an apt, quick and low-cost/cost-effective end-line evaluation of the
project or a group of projects within the approved cost norm for M&E component207
.
• Before the projects are formally treated as closed by the DoLR, the completion and
closure protocol have to be duly adopted by the States in respect of the projects
administratively reported to have been completed. All States have been accordingly
207 www.dolr.gov.in

Page | 707
requested on 12th July 2017. States have reported that the end-line evaluation of 2052
completed projects has been undertaken.
• A geospatial portal SRISHTI is being implemented from 2015 with the assistance of
National Remote Sensing Centre (NRSC) for near real-time monitoring. It has been
extended to all 28 States by 2016. Geo-coded and time-stamped photographs on a near
real-time basis are uploaded on SRISHTI portal using a mobile application DRISHTI
specifically developed for the purpose. A total of 13.75 lakh photographs have been
uploaded by the States on the portal as on 20.09.2020208
.
Progress and Achievements
About 8,214209
number of watershed development projects were sanctioned between the period
of 2009-10 to 2014-15 in 28 states (except Goa) involving an area of about 39.07 million hectares
(Table 89).210
The normative period for completion of a project is 4 to 7 years, WDC-PMKSY was
getting over by March 2020. However, GoI has extended the same for one year viz. up to March
2021. Project life of Batch-VI projects (total 118) spans up to March 2022. State-wise projects
have been displayed in the table below (Table 88) according to the stage of completion. The
evaluation report has been submitted for 2052 projects. 1487 projects are in the Preparatory
Phase and have been transferred to the states.
208 https://bhuvan-app1.nrsc.gov.in/iwmp/
209 For the discussion with DoLR it was learnt that there were 8,214 projects under the scheme – out of these 1,832 projects were
handed back to the state government due to various reasons, mainly due to lack of preparedness on these projects. Thus,
currently, there are 6,382 projects under the scheme.
210 Report of the Committee on Doubling Farmers’ Income, Volume VI, November 2017, Ministry of Agriculture & Farmers’ Welfare.
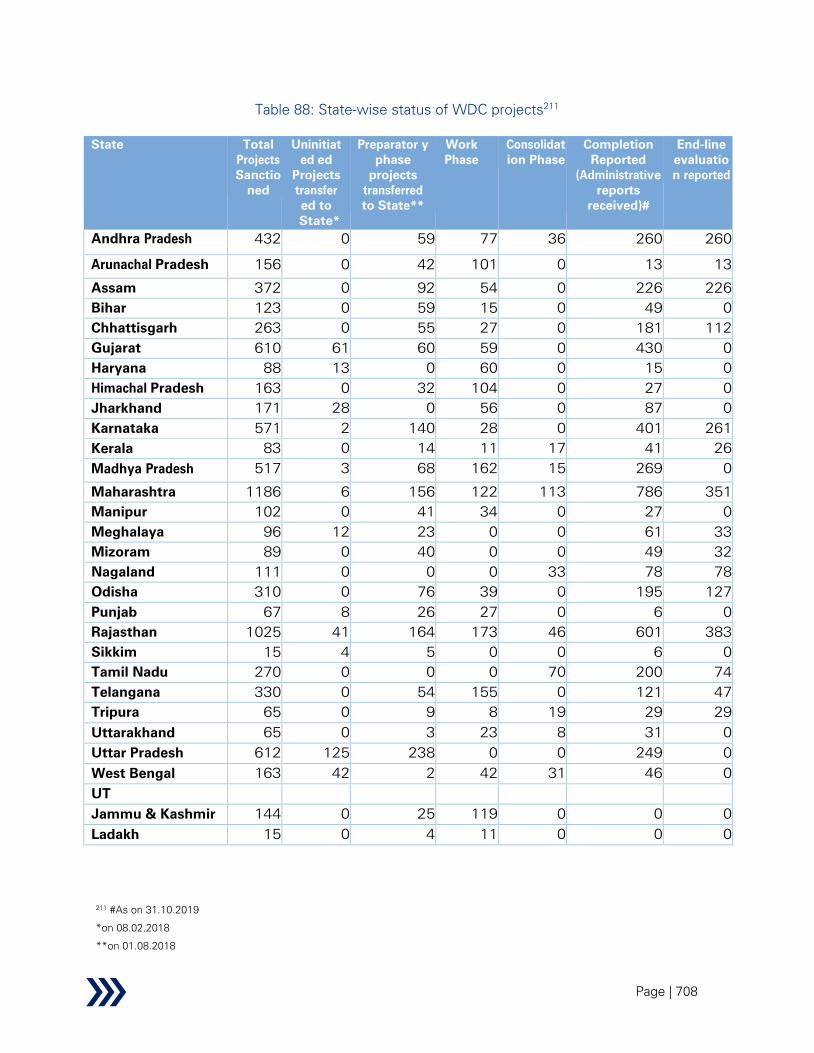
Page | 708
Table 88: State-wise status of WDC projects211
State Total
Projects
Sanctio
ned
Uninitiat
ed ed
Projects
transfer
ed to
State*
Preparator y
phase
projects
transferred
to State**
Work
Phase
Consolidat
ion Phase
Completion
Reported
(Administrative
reports
received)#
End-line
evaluatio
n reported
Andhra Pradesh 432 0 59 77 36 260 260
Arunachal Pradesh 156 0 42 101 0 13 13
Assam 372 0 92 54 0 226 226
Bihar 123 0 59 15 0 49 0
Chhattisgarh 263 0 55 27 0 181 112
Gujarat 610 61 60 59 0 430 0
Haryana 88 13 0 60 0 15 0
Himachal Pradesh 163 0 32 104 0 27 0
Jharkhand 171 28 0 56 0 87 0
Karnataka 571 2 140 28 0 401 261
Kerala 83 0 14 11 17 41 26
Madhya Pradesh 517 3 68 162 15 269 0
Maharashtra 1186 6 156 122 113 786 351
Manipur 102 0 41 34 0 27 0
Meghalaya 96 12 23 0 0 61 33
Mizoram 89 0 40 0 0 49 32
Nagaland 111 0 0 0 33 78 78
Odisha 310 0 76 39 0 195 127
Punjab 67 8 26 27 0 6 0
Rajasthan 1025 41 164 173 46 601 383
Sikkim 15 4 5 0 0 6 0
Tamil Nadu 270 0 0 0 70 200 74
Telangana 330 0 54 155 0 121 47
Tripura 65 0 9 8 19 29 29
Uttarakhand 65 0 3 23 8 31 0
Uttar Pradesh 612 125 238 0 0 249 0
West Bengal 163 42 2 42 31 46 0
UT
Jammu & Kashmir 144 0 25 119 0 0 0
Ladakh 15 0 4 11 0 0 0
211 #As on 31.10.2019
*on 08.02.2018
**on 01.08.2018

Page | 709
State Total
Projects
Sanctio
ned
Uninitiat
ed ed
Projects
transfer
ed to
State*
Preparator y
phase
projects
transferred
to State**
Work
Phase
Consolidat
ion Phase
Completion
Reported
(Administrative
reports
received)#
End-line
evaluatio
n reported
Total 8,214 345 1,487 1,507 388 4,487 2,052
Out of 8,214 sanctioned projects, 345 uninitiated projects and 1,487 projects in Preparatory
Phase (Total 1,832) had been transferred to States to be taken up under their respective States’
budget. Out of balance 6,382 projects being funded by DoLR, as on 22.09.2020, 4,487 (70.31%)
have been reported completed, 388 (6.08%) projects are in Consolidation Phase and 1,507
(23.61%) are in Works Phase. A total of approx. 14.67 lakh hectare has been brought under
protective irrigation benefitting 31.15 lakh farmers.212
The central share is Rs. 33,642.24 Cr.213
out of the total project cost of Rs. 50,739.58 Cr. So far,
Rs. 19,185.26 Cr. of Central Share has been released to States.
The following table (Table 89) shows the state-wise allocation of the projects and the aggregate
area of the projects sanctioned. Both Rajasthan (1,025) and Maharashtra (1,186) have been
allocated the maximum share of the projects (above 1,000 project). The maximum area has been
covered in four states i.e. Maharashtra, Rajasthan, Uttar Pradesh and Gujarat with 5.128, 5.764,
3.045 and 3.013 Million Hectares respectively.
Table 89: State-wise allocation of projects and area covered
Sr.
No.
State Sanctioned
(from 2009-10 to 2014-15)@
Central share
released$ (up
to 31.10.2019)
(in Cr.)
No. of sanctioned
projects
Area covered
(m ha)
Total
project cost
(in Cr.)
1 Andhra Pradesh 432 1.810 2290.00 1148.68
2 Arunachal Pradesh 156 0.467 701.48 300.04
3 Assam 372 1.577 1946.11 522.99
4 Bihar 123 0.612 841.53 239.68
212 WDC-PMKSY Booklet provided by DoLR
213 DoLR dashboard for WDC-PMKSY
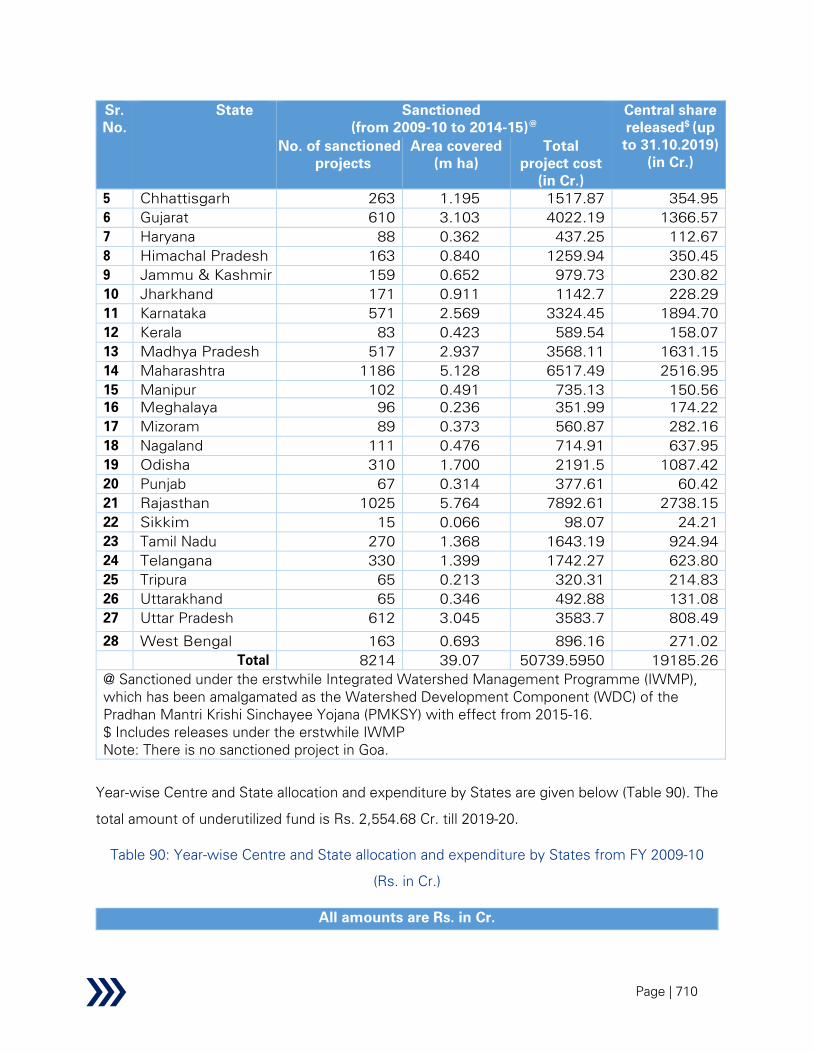
Page | 710
Sr.
No.
State Sanctioned
(from 2009-10 to 2014-15)@
Central share
released$ (up
to 31.10.2019)
(in Cr.)
No. of sanctioned
projects
Area covered
(m ha)
Total
project cost
(in Cr.)
5 Chhattisgarh 263 1.195 1517.87 354.95
6 Gujarat 610 3.103 4022.19 1366.57
7 Haryana 88 0.362 437.25 112.67
8 Himachal Pradesh 163 0.840 1259.94 350.45
9 Jammu & Kashmir 159 0.652 979.73 230.82
10 Jharkhand 171 0.911 1142.7 228.29
11 Karnataka 571 2.569 3324.45 1894.70
12 Kerala 83 0.423 589.54 158.07
13 Madhya Pradesh 517 2.937 3568.11 1631.15
14 Maharashtra 1186 5.128 6517.49 2516.95
15 Manipur 102 0.491 735.13 150.56
16 Meghalaya 96 0.236 351.99 174.22
17 Mizoram 89 0.373 560.87 282.16
18 Nagaland 111 0.476 714.91 637.95
19 Odisha 310 1.700 2191.5 1087.42
20 Punjab 67 0.314 377.61 60.42
21 Rajasthan 1025 5.764 7892.61 2738.15
22 Sikkim 15 0.066 98.07 24.21
23 Tamil Nadu 270 1.368 1643.19 924.94
24 Telangana 330 1.399 1742.27 623.80
25 Tripura 65 0.213 320.31 214.83
26 Uttarakhand 65 0.346 492.88 131.08
27 Uttar Pradesh 612 3.045 3583.7 808.49
28 West Bengal 163 0.693 896.16 271.02
Total 8214 39.07 50739.5950
7 19185.26
@ Sanctioned under the erstwhile Integrated Watershed Management Programme (IWMP),
which has been amalgamated as the Watershed Development Component (WDC) of the
Pradhan Mantri Krishi Sinchayee Yojana (PMKSY) with effect from 2015-16.
$ Includes releases under the erstwhile IWMP
Note: There is no sanctioned project in Goa.
Year-wise Centre and State allocation and expenditure by States are given below (Table 90). The
total amount of underutilized fund is Rs. 2,554.68 Cr. till 2019-20.
Table 90: Year-wise Centre and State allocation and expenditure by States from FY 2009-10
(Rs. in Cr.)
All amounts are Rs. in Cr.

Page | 711
Financial Year Central Share
Released
State Share
Released
Expenditure by State
2009-10 501.47 26.45 27.66
2010-11 1496.86 167.17 276.77
2011-12 1865.92 203.12 841.37
2012-13 2720.52 257.92 1962.55
2013-14 2162.81 255.32 3436.23
2014-15 2284.64 186.01 3413.49
2015-16 1487.83 1107.28 2400.35
2016-17 1471.72 658.62 2603.51
2017-18 1691.81 461.42 1947.46
2018-19 1780.55 349.91 1522.79
2019-20 1472.33 608.64 2385.03
2020-21 248.807 27.27 -
Total 19,185.26 4,309.13 20,817.21
Financial progress of the scheme from 2015-16 to 2019-20 is given in the table (Table 91) below.
The percentage release (of Revised Estimate) is almost above 99 per cent for most years.
Table 91: Financial Progressfrom FY 2015-16 (Rs. in Cr.)
Year RE Release % Release Expenditure
2015-16 1530.00 1527.39 99.83 2580.80
2016-17 1495.00 1494.92 99.99 2818.97
2017-18 1700.00 1699.40 99.96 2897.12
2018-19 1826.00 1791.49 98.11 2665.21
2019-20 1732.64 1478.83 85.33 2385.03
Physical progress has been shown in the table below (Table 92). Since 2015-16 around 0.581
million water harvesting structures have been created and additional area brought under irrigation
is 1.28 million hectares. Numbers of farmers benefitting from the aforementioned initiatives is
2.674 million. Since 2018-19, 28.121 million man-days have been generated and total area
brought under plantation (Afforestation / Horticulture) etc. is 0.137 million hectares and area of
culturable wastelands treated in completed watershed development projects are 0.263 million
hectares.

Page | 712
Table 92: Physical Progress
Indicators /
Parameters
2015-
16
2016-
17
2017-
18
2018-
19
2019-
20
2020-
21*
Total
No. of Water
Harvesting
Structures (in
million)
0.105 0.155 0.137 0.081 0.090 0.013 0.581
Additional Area
brought under
Irrigation
(in million hectare)
0.247 0.307 0.287 0.257 0.152 0.030 1.28
No. of Farmers
Benefited (in
million)
0.507 0.52 0.473 0.652 0.424 0.098 2.674
Area brought under
plantation
[Afforestation /
Horticulture etc.]
(in million hectare)
- - - 0.07 0.057 0.01 0.137
Area of culturable
wastelands treated
in completed /
closed watershed
development
projects (in million
hectare)
- - - 0.178 0.078 0.007 0.263
No. of man-days
generated (in
million)
- - - 16.896 8.667 2.558 28.121
Table 93 shows the Water Harvesting Structures (WHS) created/rejuvenated in 28 states is about
6.90 lakh. Andhra Pradesh by far has the maximum share in this with 1,94,308 structures with
Rajasthan as second with 1,23,993 structures. The additional area brought under irrigation is
14.67 lakh hectares. The number of farmers benefitted is 31,15,453 during the said period.

Page | 713
Table 93: State-wise details of Water Harvesting Structures (WHS) created/rejuvenated,
additional area bought under irrigation and farmers benefitted under WDC-PMKSY during 2014-
15 to 2020-21 (as on 30.06.2020)
State WHS created/
Rejuvenated (in
Nos.)
Additional area
brought
under irrigation
(Ha)
Farmers
benefitted (in
Nos.)
Andhra
Pradesh**
194308 298405 275670
Arunachal
Pradesh
654 3955 25434
Assam 7034 111254 260529
Bihar 6226 23945 72599
Chhattisgarh 9258 27149 51067
Gujarat 44627 46416 73373
Haryana 3423 44751 34870
Himachal
Pradesh
9329 11900 65649
Jammu &
Kashmir
4826 17211 88241
Jharkhand 3718 3746 73475
Karnataka 29651 74040 185968
Kerala 28660 29049 166534
Madhya
Pradesh
29495 127415 139303
Maharashtra 11880 125107 181258
Manipur 11659 3343 167077
Meghalaya 2521 4075 15956
Mizoram 9909 51061 55646
Nagaland 3603 4534 16267
Odisha 24592 53436 88370
Punjab 365 6943 5151
Rajasthan 123993 78273 280786
Sikkim 169 33 1005
Tamil Nadu 51612 140718 285034
Telangana 21637 47011 63995
Tripura 3153 5891 9984
Uttar Pradesh 22696 109480 314110
Uttarakhand 17186 2334 53695
West Bengal 14018 15655 64407
Total 690202 1467130 3115453
Note: Provisional and subject to change (As per information received from states)
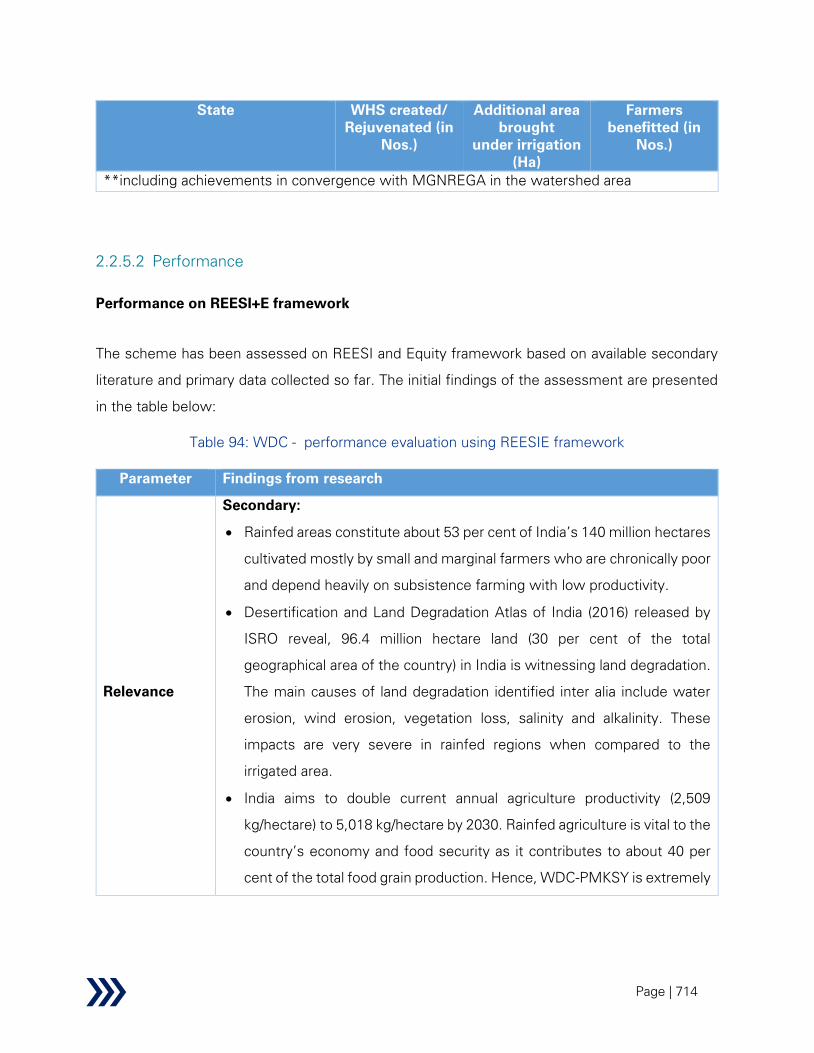
Page | 714
State WHS created/
Rejuvenated (in
Nos.)
Additional area
brought
under irrigation
(Ha)
Farmers
benefitted (in
Nos.)
**including achievements in convergence with MGNREGA in the watershed area
2.2.5.2 Performance
Performance on REESI+E framework
The scheme has been assessed on REESI and Equity framework based on available secondary
literature and primary data collected so far. The initial findings of the assessment are presented
in the table below:
Table 94: WDC - performance evaluation using REESIE framework
Parameter Findings from research
Relevance
Secondary:
• Rainfed areas constitute about 53 per cent of India’s 140 million hectares
cultivated mostly by small and marginal farmers who are chronically poor
and depend heavily on subsistence farming with low productivity.
• Desertification and Land Degradation Atlas of India (2016) released by
ISRO reveal, 96.4 million hectare land (30 per cent of the total
geographical area of the country) in India is witnessing land degradation.
The main causes of land degradation identified inter alia include water
erosion, wind erosion, vegetation loss, salinity and alkalinity. These
impacts are very severe in rainfed regions when compared to the
irrigated area.
• India aims to double current annual agriculture productivity (2,509
kg/hectare) to 5,018 kg/hectare by 2030. Rainfed agriculture is vital to the
country’s economy and food security as it contributes to about 40 per
cent of the total food grain production. Hence, WDC-PMKSY is extremely
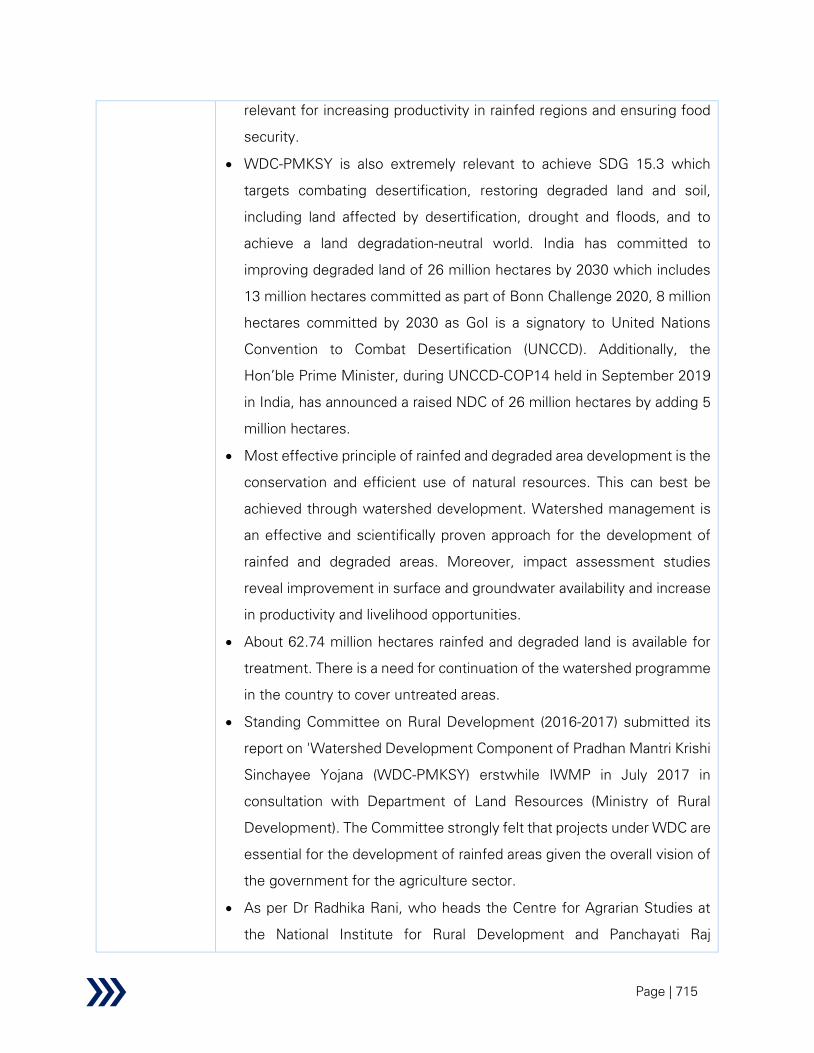
Page | 715
relevant for increasing productivity in rainfed regions and ensuring food
security.
• WDC-PMKSY is also extremely relevant to achieve SDG 15.3 which
targets combating desertification, restoring degraded land and soil,
including land affected by desertification, drought and floods, and to
achieve a land degradation-neutral world. India has committed to
improving degraded land of 26 million hectares by 2030 which includes
13 million hectares committed as part of Bonn Challenge 2020, 8 million
hectares committed by 2030 as GoI is a signatory to United Nations
Convention to Combat Desertification (UNCCD). Additionally, the
Hon’ble Prime Minister, during UNCCD-COP14 held in September 2019
in India, has announced a raised NDC of 26 million hectares by adding 5
million hectares.
• Most effective principle of rainfed and degraded area development is the
conservation and efficient use of natural resources. This can best be
achieved through watershed development. Watershed management is
an effective and scientifically proven approach for the development of
rainfed and degraded areas. Moreover, impact assessment studies
reveal improvement in surface and groundwater availability and increase
in productivity and livelihood opportunities.
• About 62.74 million hectares rainfed and degraded land is available for
treatment. There is a need for continuation of the watershed programme
in the country to cover untreated areas.
• Standing Committee on Rural Development (2016-2017) submitted its
report on 'Watershed Development Component of Pradhan Mantri Krishi
Sinchayee Yojana (WDC-PMKSY) erstwhile IWMP in July 2017 in
consultation with Department of Land Resources (Ministry of Rural
Development). The Committee strongly felt that projects under WDC are
essential for the development of rainfed areas given the overall vision of
the government for the agriculture sector.
• As per Dr Radhika Rani, who heads the Centre for Agrarian Studies at
the National Institute for Rural Development and Panchayati Raj

Page | 716
Parameter Findings from research
(NIRD&PR), the watershed development project is the only option for
rainfed areas, contributing to water conservation and recharge, and
preventing soil degradation.
Primary:
• The interviews conducted amongst scheme implementers, National
Rainfed Area Authority and interviews conducted with stakeholders in
SLNA clearly emphasise the importance of Watershed Development
projects in rainfed areas to reclaim degraded land, improving productivity
and availability of surface water and groundwater recharge and livelihood
opportunities.
• Stakeholders also cited numerous impact assessment/end-line
evaluation studies which reveal that watershed development
programmes are well placed to tackle the major sectoral challenges in
rainfed areas.
• As per the stakeholders, the scheme is not overlooking/bypassing any
sectoral challenge. The scheme has provision to include all interventions
that are required to holistically enhance the welfare and economic status
of the beneficiary. The scheme design is meant for developing the
intervention area which includes all-natural resources on a sustained
basis by transforming resource users into managers.
Inference:
• Watershed development projects undertaken under WDC-PMKSY are
one of the prime strategies to deal with key sectoral challenges in rainfed
and degraded areas. The benefits include reclamation of degraded land,
improving the availability of surface and groundwater, checking soil
erosion and enhancing livelihood opportunities.
• The WDC scheme mainly addresses SDG-15.3 (By 2030, combat
desertification, restore degraded land and soil, including land affected by
desertification, drought and floods and strive to achieve land degradation
– neutral world). Besides, the scheme addresses Sustainable
Development Goal-1 (SDG-1, No poverty), SDG -2 (Zero hunger), SDG -3
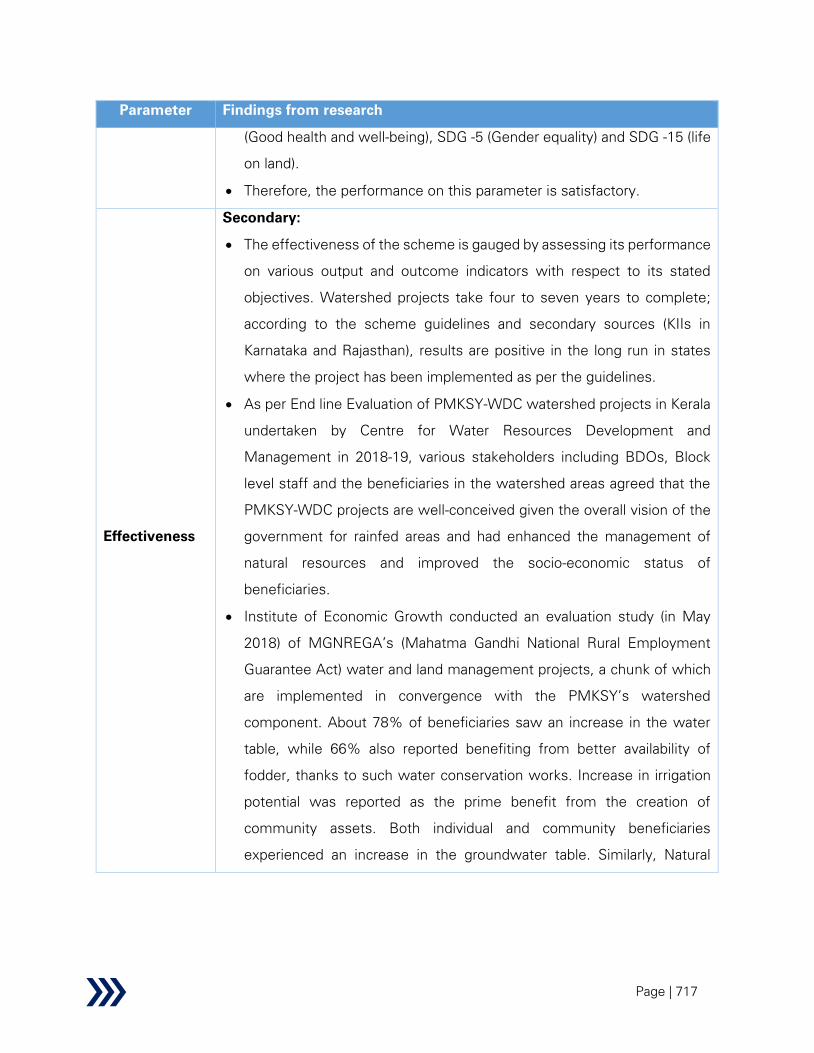
Page | 717
Parameter Findings from research
(Good health and well-being), SDG -5 (Gender equality) and SDG -15 (life
on land).
• Therefore, the performance on this parameter is satisfactory.
Effectiveness
Secondary:
• The effectiveness of the scheme is gauged by assessing its performance
on various output and outcome indicators with respect to its stated
objectives. Watershed projects take four to seven years to complete;
according to the scheme guidelines and secondary sources (KIIs in
Karnataka and Rajasthan), results are positive in the long run in states
where the project has been implemented as per the guidelines.
• As per End line Evaluation of PMKSY-WDC watershed projects in Kerala
undertaken by Centre for Water Resources Development and
Management in 2018-19, various stakeholders including BDOs, Block
level staff and the beneficiaries in the watershed areas agreed that the
PMKSY-WDC projects are well-conceived given the overall vision of the
government for rainfed areas and had enhanced the management of
natural resources and improved the socio-economic status of
beneficiaries.
• Institute of Economic Growth conducted an evaluation study (in May
2018) of MGNREGA’s (Mahatma Gandhi National Rural Employment
Guarantee Act) water and land management projects, a chunk of which
are implemented in convergence with the PMKSY’s watershed
component. About 78% of beneficiaries saw an increase in the water
table, while 66% also reported benefiting from better availability of
fodder, thanks to such water conservation works. Increase in irrigation
potential was reported as the prime benefit from the creation of
community assets. Both individual and community beneficiaries
experienced an increase in the groundwater table. Similarly, Natural
Page | 718
Parameter Findings from research
Resource Management (NRM) assets have helped small and marginal
farmers to improve livelihood opportunities.214
• When the groundwater table increases as a result of watershed
management projects, farmers in the area go for water-intensive crops
like paddy and sugarcane causing over-extraction. After execution,
proper post-implementation management is critical. Otherwise, even
after the achievement of planned outputs, desired outcomes may not be
realized. If Panchayati Raj leadership and water user associations are not
strengthened and empowered, benefits from the scheme will be short-
lived.215
• Case study of Jangalahalli village of Kapalamadagu GP in Kolar
(Karnataka)216
: By overall upliftment of farmers’ economic condition
along with sustainable management and conservation of soil and water
the watershed project in Jangalahalli village has contributed substantially
towards the sectoral challenge, national priority and Sustainable
Development Goals (SDG). Under Batch-4 PMKSY-WDC programme
implemented in Mulbagal taluk, Schedule Caste (SC) farmers having
aggregate landholdings of up to 10 hectares in Jangalahalli village of
Kapalamadagu GP were migrating to towns in search of jobs. Their lands
were unproductive and were left barren/fallow. But after project
intervention due to land treatment from upper reach to lower reach and
via various watershed activities such as bunding, construction of
Nalabund and check dams, agroforestry, dry land horticulture, boulder
checks and diversion channels have converted uncultivable land into
productive cultivable lands. Water stored in the water harvesting
structure has helped the farmers to undertake intensive cultivation of
commercial crops. In Jangalahalli village, watershed development
programme has not only raised the income level of SC farmers but also
facilitated them to sustainably settle down in their farm, thereby reducing
migration and poverty.

Page | 719
Parameter Findings from research
Primary:
• Poor water harvesting system, land degradation, poor water quality,
environmental protection, poverty alleviation are the major criteria
considered during selection of watershed projects. Therefore, WDC
aligns with sectoral challenges. Watershed Development programme is
most ideal for achieving desired objectives and conforms to many of the
core objectives of SDG. The scheme aligns to SDG-15 which focuses on
“Sustainably manage forests, combat desertification and halt and
reverse land degradation and halt biodiversity loss”. Moreover, since the
scheme also emphasises on the livelihood of
marginalised/women/landless in rainfed areas, it also tackles SDG-1 (No
poverty), SDG -2 (Zero hunger), SDG -3 (Good health and well-being),
SDG -5 (Gender equality).
• As per DoLR, there is no duplication of objectives with any other
schemes/sub-schemes. Watershed development projects are
implemented with an objective of holistic development of project area
by taking up all possible measures. Before sanctioning any watershed
projects, the Department of Land Resources (DoLR) obtains a certificate
from the State concerned that the area taken up under the watershed
project is not being funded by a similar scheme of any other Ministry of
either the State or Central Government. Each state has to prepare a
perspective plan indicating details of the area already taken up, balance
area required to be developed and are to be taken up in the next 5 years.
• Meeting the output targets are subject to the availability of required
funds. Some states like Jharkhand, Punjab, Andhra Pradesh (Srikakulam
district), Assam (Barpeta district), Bihar (Kaimur district), Karnataka (Kolar
and Devanagere district) and UP reflect that at times there is a delay by
214 www.zuccess.in
215 Watershed development projects lagging behind Badly by Priscilla Jebaraj published in The Hindu on Oct 28, 2019 11:08:02 AM
216 As reported by WCDC of Kolar in the written response to the questionnaire

Page | 720
the Centre or State in the release of funds. In case of absence of proper
documentation by the states or deficiencies in the proposals submitted
by the states, such delays are caused. Moreover, there are cases where
delay in the release of funds from States’ finance departments to SLNAs
has been reported. DoLR, moreover, invariably takes up such issues with
appropriate levels from time to time.By the time it was released at the
district level, it is already the end of the year and it is very difficult to
complete the project in time. Therefore, there are concerning issues with
respect to the delayed release of funds.
• As per the information provided by Department of Land Resources
(DoLR), in the cabinet note WDC target was set at 11.50 lakh Hectares
for 'Area to be bought under assured irrigation’ during the period 2015-
16 to 2020-21 and against this the achievement is 13 lakh Hectares.
Similarly, the cabinet note stipulated ‘70 per cent projects to be
completed’ in the period and against that 70.31% has been achieved.
This is the information on physical progress.
• In terms of Financial Progress, Table 91 highlights the present situation.
The Revised Estimate (RE) is the target amount and against that the
Central Assistance released has been over 98% in most of the years
under evaluation as per the information provided by Department of Land
Resources.
• One of the key problems cited by the states was with regards to the
inadequate staff to carry out the implementation work. Some states like
UP, Bihar, Andhra Pradesh (Chittoor and Srikakulam district) and
Jharkhand (Koderma district) have mentioned that they are working
below the desired manpower requirement. Another issue that was
highlighted by DoLR was that problems have been faced at the State and
District level to retain trained manpower and there is high attrition of
contractual manpower. These issues have a detrimental impact on
scheme performance and effectiveness.
• There have been cases of unregulated extraction of groundwater in
watershed areas post groundwater recharge as was suggested by the
Page | 721
state of Rajasthan, Odisha and Bihar. It was also highlighted that SLNA
does not monitor this aspectbut this phenomenon is happening
wherever there is groundwater based irrigation. It is very difficult to
change the behaviour of farmer unless there is an exclusive capacity
building component in the scheme for it, although this is not covered in
WDC-PMKSY.
• Following findings are drawn from the household survey:
o As per the Household Survey in 72 per cent of the cases, water is
fetched by adult women for household needs. Besides, about 41 per
cent of respondents reported that the water source is more than 100
meters away from their house. Additionally, 26.80 per cent of the
respondents reported that there was an increase in the availability of
surface water in the summer months. On the other hand, 32.10 per
cent of respondents reported an improvement in groundwater table
owing to watershed activities. Therefore, women are one of the key
segments which has benefitted by reducing drudgery. This finding
was also reiterated in the KIIs with women members of Watershed
Committees (WC) and Watershed Development Team (WDT).
o Out of the respondents, 35.80 per cent reported that the source of
irrigation was groundwater and 37.40 per cent reported rainwater as
a source of irrigation. Around 8.90 per cent reported Surface-water
[River/stream] as the source of irrigation and 13 per cent reported
Surface-water [Farm Pond] as their source of primary irrigation.
Therefore, the majority of the farmers are dependent on rainwater
for irrigation and are dependent on the watershed scheme to bring
about change in their lives. Besides, 35.80 of the farmers use
groundwater emphasising the need to build capacity at the local level
for sustainable use of groundwater sources.
o About 86.40 per cent of the respondents who reported that they
practice mono-cropping (N=81) are willing to switch to cropping
pattern. Around 13.60 per cent were unwilling to change the

Page | 722
Parameter Findings from research
cropping pattern. Out of respondents that are not willing to change
(N=11) the primary reasons are; profitability (27.30%), water scarcity
(63.60%) and lack of know-how (18.20%). Hence with proper
handholding and capacity building, farmers can be induced to grow
more sustainable cropping patterns.
o Out of 25 respondents (9.80% of total respondents) who have
received training under the watershed project, 20 received training
in intercropping, 22 for crop varieties, 14 for contour cultivation and
21 received training for crop management. Respondents from
Karnataka were the main contributors to these responses. However,
a very limited number (N=25) of stakeholders have received training
in alternate cropping strategies and crop management practices.
Therefore, there is a scope to further encourage these training
practices thereby inducing a sustainable change.
o Concerning training on common property in the villages (N=246),
merely 4.10 per cent reported they were trained to maintain
Nursery, 6.90 per cent reported Soil and moisture conservation, 6.10
per cent for Livestock development activities, and low percentage
reported for Fisheries (4.90%), Crop demonstration (5.30%) and Bio-
fuel plantations (4.50%).
o Concerning training on farmers’ land, 2.80 per cent respondents
reported they were trained to maintain Nursery, 5.70 per cent
reported Soil and moisture conservation, 4.10 per cent for Livestock
development activities, 4.10 per cent for Fisheries, 4.90 per cent for
Crop demonstration, 4.10 per cent for Bio-fuel plantations, 11 per
cent for Fodder cultivation, and 5.30 per cent were trained for
Establishment of milk cooperatives. Hence there is enough scope to
encourage alternate income sources amongst the community and at
present very limited effort is being put in this regard.
Inference:
Page | 723
Parameter Findings from research
• Various reports show that the scheme has led to some positive
outcomes as planned under the objectives.
• Moreover, KIIs with state functionaries also reiterate that watershed
projects have led to benefits as envisaged in the scheme objectives.
•
• The scheme progress (both physical and financial) has been satisfactory
and targets have been achieved to a significant extent (as per the
information provided by Department of Land Resources)
• Effectiveness or attainment of desired objectives also depends on many
factors exogenous to the scheme, such as lack of market connectivity,
weak post-harvest management, lack of transport facility, etc.
• State-level implementing agencies should focus on capacity building of
farmers in alternate income sources and crop management practices as
shown by survey data.
• The scheme design is appropriate to achieve the stated objectives and
states like Rajasthan and Karnataka that have implemented the scheme
as per the guidelines have reaped desired benefits.
• Therefore the performance on this parameter is satisfactory.
Efficiency
Secondary:
• A meta-analysis of the benefit-cost (BC) ratio of WDC-PMKSY project is
yet to be done. However, the BC ratio in respect of pre-IWMP projects
was analysed by a third party i.e. ICRISAT. The meta-analysis shows that
the mean benefit to cost ratio of Watershed program was at 2.14
indicating that investment in watershed programs that are situated in
fragile and uncertain rainfed environments yielded more than double the
initial investment. The analysis also reveals that carefully planned and
executed watershed activities yielded returns of at least 2.1 times more
than the initial investment. Also, other factors determine the efficiency
of watershed programs. These include geographical location, rainfall
pattern, the focus of the watershed program, implementing agency, the

Page | 724
Parameter Findings from research
status of the target population, people’s participation, activities
performed under the program and the soil types in the area.
• Case study of Tamil Nadu217
: SLNA of Tamil Nadu reported that they
have adopted the construction of Recharge Shafts to improve
groundwater table as a cost-effective and innovative intervention. It was
reported by the SLNA that Recharge Shafts are the most efficient and
cost-effective structure to recharge the shallow aquifers. Recharge
Shafts of 0.5 to 1 metre diameter and 10 to 15 metres deep were
constructed across the state watersheds. The impact reported was the
rise in groundwater level from 0.33 meter to 3.28 meter in the watershed
areas of Tamil Nadu. Given the success and cost-effectiveness, so far
17,879 Recharge Shafts have been created with an expenditure of Rs.
68.10 Cr..
Primary:
• In the KIIs in the states it was suggested that for the selection of new
projects, it will be better to focus on micro-watersheds rather than the
whole watershed to bring in efficiencies. A watershed has about 4 to 5
micro watersheds. It is not hydrologically feasible to work on the entire
watershed at once. An alternate could be to give preference to micro-
watersheds in sequence and then move to complete watershed.
• As far as the guidelines are concerned, per hectare cost of Rs. 12,000
for development works is very low. This cost norm has been used since
2008-09. There should be a mechanism for revision in the cost every 3
or 4 years based on inflation and other relevant factors. Due to highly
constraining cost norms, the work in the watershed is impacted thereby
reducing project effectiveness. Cost norms should be developed using
an expert committee by arriving at estimates of key components like
man-day cost, materials and consumables, etc. A method should be
217 Based on written response against queationnair submitted by the SLNA of Tamil Nadu

Page | 725
devised for year-on-year escalation or period escalation or one round of
escalation every 3rd year.
• As per DoLR, taking the rate of inflation during last 11 years into
consideration, the department intends to increase the unit cost to Rs.
22,000 per hectare for plain areas and Rs. 28,000 per hectare for hilly &
difficult areas for new generation watershed projects proposed to be
taken up with effect from 2021. However, DoLR also accepts that the
proposed enhancement in the cost norm is not sufficient for the
development of watershed projects on a saturation basis. Keeping this
in mind, the department has been emphasizing with States to improve
convergence with other schemes of the Central and State Governments
towards addressing the gaps in fund requirement for achieving the
desired impact in the watershed areas.
• All States are making efforts to use the latest technology like IT (for
example MJSA app in Rajasthan), Remote Sensing and Geographic
Information System (GIS). However, NE and some Eastern States are
lagging due to internet connectivity issues. The States like Karnataka,
Andhra Pradesh, Telangana, Gujarat, Maharashtra, Madhya Pradesh,
Rajasthan are leading in the use of technology to improve efficiency.
• It was reported by states like UP, Punjab and Bihar that inter-
departmental coordination is lacking in terms of information and data
sharing concerning respective schemes and programmes. It was
informed that in these states departments work in silos. This has a
negative impact on the convergence between departments leading to
inefficiencies. Moreover, states like UP pointed out this also leads to
duplication of work by different departments under different schemes.
• Central Funds are released based on the Annual Action Plans submitted
by the States and Annual Budget allocated for the scheme by the
Government of India. In a financial year, funds are released in two
instalments (the first instalment of 60 per cent after deducting unspent
balance & second instalment of 40 per cent). As per Jharkhand, Punjab,
Andhra Pradesh (Srikakulam district), Assam (Barpeta district), Bihar

Page | 726
(Kaimur district), Karnataka (Kolar and Devanagere district) and UP, it has
been observed that there is a delay in the release of funds from the
Central and State Government. In case of absence of proper
documentation by the states or deficiencies in the proposals submitted
by the states, such delays are caused. Moreover, there are cases where
delay in the release of funds from States’ finance departments to SLNAs
has been reported. This negatively impacts work on the ground affecting
efficiency (e.g. cost and time over-runs).
• Further, in some districts, Watershed Committees are unable to
complete the works in time and hence unable to utilize the available
funds as per the schedule. Consequently, the State is unable to claim
instalment from the Central Government in a timely manner. WC should
submit the utilization certificate on time to enable State nodal agency to
furnish consolidated UC to DoLR to avoid any delay on the release of
funds from central government.
• As per the household survey:
o Only 28.90 per cent of the respondents were satisfied with
the quality of works executed through watershed
development activities. About 31.30 per cent were
dissatisfied with works and 20.70 were neutral. Around 81.50
per cent of respondents in Karnataka stated that they were
satisfied. Around 92.30 per cent of respondents in
Maharashtra and 61.10 per cent in Assam were dissatisfied
with the quality of watershed activities executed in their
villages.
o Around 32.50 per cent of respondents were satisfied with
the equipment provided by the government. 35 per cent
were dissatisfied and remaining were neutral or had no
information. 77.80 per cent of the respondents were satisfied
in UP followed by 55.60 per cent in Karnataka and 51.10 per
cent in Andhra Pradesh. Around 92.30 per cent of
Page | 727
Parameter Findings from research
respondents in Maharashtra reported that they were
dissatisfied.
o About 26.40 per cent of the respondents were satisfied with
the financial support provided by the government and 42.30
per cent were dissatisfied. Remaining were neither satisfied
nor dissatisfied. 55.60 per cent in UP, 44.40 per cent in
Karnataka, 46.20 per cent in Maharashtra reported that they
are satisfied with the financial support. 66.20 per cent in
Rajasthan, 66.70 per cent in Himachal Pradesh and 66.70 per
cent in Assam reported that they were dissatisfied.
o Majority of the respondents (40.20 per cent) were
dissatisfied with the information provided about the scheme.
100 per cent in Maharashtra and 77.80 per cent in UP were
the main contributors in the dissatisfied respondents. About
28.90 per cent of respondents reported that they were
satisfied. The remainder were neutral or had no opinion.
Around 66.70 per cent of respondents in Karnataka reported
that they were satisfied.
Inference:
• Given that the cost norms have not been modified since 2009, it was
reported by all states that they are undertaking the development work at
full efficiency, that is, at a lower cost or at par when compared to actual
market prices.
• DoLR has been urging states to maximize the convergence of the
relevant schemes of Central and State Governments for the fulfilment of
the fund gaps for achieving the desired impact in the watershed areas.
DoLR also issued advisories to States from time to time for maximization
of convergence for increasing the rainwater harvesting, conservation and
also improving water use efficiency through micro-irrigation etc.
However, some states like UP, Punjab and Himachal Pradesh are lagging

Page | 728
Parameter Findings from research
and have not created a viable institutional structure say in the form of the
committee under the chairmanship of Chief Secretaries to facilitate
convergence.
• It was also reported by WCDCs at the district level that due to shortage
of funds and delay in the release of funds, many of the works required
in the watershed are left incomplete causing inefficiencies.
• Many of the respondents reported that they are dissatisfied with
technical and financial support provided by the implementing agencies,
therefore there is room for further improvement.
• Moreover, the majority of respondents were dissatisfied with the
information provided about the scheme. This point was further
emphasised in the Focus Group Discussions held at Maharashtra.
• There is much scope to improve efficiency by optimal utilisation of funds
and by ensuring effective convergence. Therefore, the performance of
this parameter is average.
Sustainability
Secondary:
• In the End line Evaluation of PMKSY-WDC watershed projects in Kerala
undertaken by Centre for Water Resources Development and
Management in 2018-19, it was observed that many of the interventions/
structures implemented under the scheme were under poor condition
due to the lack of maintenance from the end-user. Minor repairs and
maintenance of assets created should be done by the beneficiaries for
getting sustainable results. Awareness regarding the various aspects of
the project and its advantages/benefits should be created among the
stakeholder to ensure their participation and they should be encouraged
to take ownership of the project.
• Given the funding pattern under Watershed Development Component
has been revamped to 60:40 between Centre and states, the Standing
Committee on Rural Development (2016-2017), while examining the
physical progress of the projects felt that given the change in the funding
pattern, the role of the states holds, even more, importance vis-à-vis fund
Page | 729
release and proper fund management for scheme implementation.
However, KIIs reflect that the states have been lagging in releasing
payments to SLNA which is negatively impacting work at the ground
level.
• Environment Sustainability: A Case study of Salulamang village in
Mokokchung district of Nagaland218
: Salulamang is one of the few
villages in Mokokchung district where public transportation is not
available. The main occupation of the villagers was Jhum cultivation and
Jhum cultivation was practised extensively before the intervention of
PMKSY-WDC. Around 60 households were engaged in Jhum cultivation
over a total area of around 90 Hectares in 2012. However, after the
intervention of WDC, Jhum cultivation has gradually decreased and the
villagers have taken up rubber plantation. During the study and
monitoring visits by the evaluating agency, it was noted by the agency
that the Land Resources Department has been performing
commendably in reaching out to villages through PMKSY-WDC. In the
initial 2-3 years, mixed cropping was done in the rubber plantation area.
About 27 units of piggery have been initiated under livelihood activities,
rubber plantation has been encouraged on a large scale and setting up of
micro-enterprise unit has provided a source of income for the villagers.
Technical inputs on land use and construction of engineering structures,
viz. water harvesting structures and gully plugs have made water
available for use in fields and other plantation areas. The technical
assistance provided through the programme for management of orange
plantation has been beneficial to the farmers and contributed to the
success of the activity, eventually increasing production and generating
more income for the farmers. The average land under Jhum per
household has exhibited a decreasing trend, i.e. 1.5 Hectare per
household in 2012 to 0.75 Hectare per household in 2016, resulting in a
reduction of the total area under Jhum to 22.5 Hectares (2016) from 90
Hectares (2012). Green coverage created by plantation crops over
Page | 730
Parameter Findings from research
abandoned Jhum land provides safe shelter for wildlife, birds, insects
and microbes. Thereby, through watershed intervention and promotion
of economic activities in the villages under PMKSY-WDC, there has been
a significant reduction in Jhum practice in the state which has a
favourable impact on the environment.
Primary:
• Scheme design is appropriate for meeting the stated objectives.
However, ensuring people’s participation at all levels of project
implementation and post-project management issues are required to be
taken care of at the community level for sustained benefits.
• One of the key aspects for post-project sustainability is to formulate a
proper guideline for the utilization of Watershed Development Fund
(WDF) for maintaining assets during the post-project period. It was found
that on completion of projects, the remaining WDF under the project lies
unutilized in their respective WDF accounts. DoLR has communicated to
the states on multiple occasions to formulate guidelines for the utilisation
of WDF. The model template of WDF guidelines has been circulated by
DoLR among all the States for customization and adoption as per States
specific conditions. It needs better monitoring from Central as well as
from state levels.
• There is need for sensitization of local institutes and handholding the
community for proper maintenance of assets during the O&M phase. In
places where the community is not involved (such as UP, Odisha, Punjab
and Himachal Pradesh), ensuring sustainability becomes difficult219220
.
• As per DoLR, it is felt that (a) long gestation period of projects has led to
loss of focus etc.; (b) some states such as Punjab, UP and Himachal
218 Various social impacts of PMKSY-WC with special focus on reduction of Jhum cultivation, 2016, MELD in Nagaland-NABARD
Consultancy Services Pvt. Ltd.
219 Final/End Term Impact Evaluation Consolidated Report, IWMP Batch-II (2010-11) Projects, Odisha, Year-2017-18
220 AFC INDIA LIMITED MUMBAI & GVT, NOIDA, Odisha-END TERM/FINAL IMPACT EVALUATION REPORT OF BATCH- I/2009-
10
Page | 731
Pradesh took up schemes despite no contribution from the community,
which led to a reluctance to take up WDC-PMKSY activities whole-
heartedly, (c) frequent transfer of officials at SLNA / district level and
operating with temporary officers has hampered work progress.
• There is a growing need for convergence with MGNREGA for
maintenance of the structures during the O&M phase.
• Designing proper usufructs rights especially for assets created on
common property resources.
• Natural Resource Governance is one of the key issues after the project
is completed and assets/infrastructures are handed over to the
community. There is a need for efficient management of natural
resources. When the groundwater table increases as a result of
watershed management projects, farmers in the area go for water-
intensive crops like paddy and sugarcane causing over-extraction. Post-
project management of natural resources like water, soil, etc. has not
been given priority in the ongoing watershed programs.
• On account of frequent extreme weather events because of climate
change, disaster resilience needs to be brought into the watershed
design. There is a need to bring in better resilience strategies to the
production system with climate change mitigation and
adaptationpractices in rainfed areas to the core of the watershed
programme design.
• Although infrastructure and resources have been developed there is a
need to focus on how to translate those into economic terms. Though
productivity has been increased, potential economic gains have not been
achieved by the farmers because of lack of market connectivity, weak
post-harvest management, lack of transport facility etc. Therefore there
is a need to accommodate these things in the watershed programme
design.
• During the KIIs (UP, Bihar, Andhra Pradesh (Chittoor and Srikakulam
district) and Jharkhand (Koderma district) it was generally highlighted
Page | 732
that there is a shortage of manpower at the state and district level to
efficiently implement the project.
• Key aspects of institutional and financial sustainability that are brought
out from the household survey are as follows:
o Around 60.60 per cent reported that no consultation meeting
was organized with the farmers for planning activities under
the WDC scheme against 22.40 per cent who reported that
such meetings were organized. A total of 17.10 per cent
reported ‘Don’t Know’ in their responses. Out of respondents
who reported that consultation meetings were organized,
81.80 per cent of respondents reported that they have
attended the meetings for planning Watershed Development
works. Around 55.60 per cent of the respondents in
Karnataka reported that consultation meetings were
organised indicating relatively better community
participation.
o 64.20 per cent of the respondents reported that they have
not attended any training for O&M under the scheme.
Around 25.60 per cent reported that no such training was
organized and 10.20 per cent attended training for operations
and maintenance. 37 per cent of the respondents in
Karnataka reported that they have attended the training.
While Maharashtra, Tamil Nadu and Punjab reported that
none of the respondents have attended the training.
o In case of any breakdown in the infrastructure created under
WDC scheme, 11% reported that implementing agency is
responsible for maintenance. About 19.50 (N=67) reported
that user associations are responsible for maintenance and
21.50 per cent reported that contractor is responsible. There

Page | 733
Parameter Findings from research
is a need to raise awareness about O&M responsibilities at
the ground level.
o Out of the respondents that stated that user associations are
responsible for the maintenance (N=67), 23.90 per cent of
respondents reported that they were members of an
association to carry out repair and maintenance. About 76.10
per cent reported that they were not a member of any
association.
o Around 18.70 per cent reported that there is a WDF for repair
and maintenance and on the other hand 55.30 per cent
reported that there is no such fund. Around 26 per cent
reported that they don’t know about such fund.
o Around 56.10 per cent stated that Government is the
contributor in the watershed fund, 21.50 per cent stated that
villagers contribute and the remainder (36.60 per cent)
responded that they don’t know.
o Amongst those who know watershed development fund
(N=46), 47.80 per cent opined that the fund is sufficient for
repair and maintenance and 39.10 per cent were of the view
that the fund is insufficient. About 13 per cent of the
respondents reported that they don’t have an opinion on this.
o Amongst those who know the WDF (N=46), 26.10 per cent
of the respondents give user fees into the fund and 73.90 per
cent do not contribute any fees.
o Amongst those who contribute fees in the watershed
development fund (N=12), 25 per cent feel that the fees are
appropriate and 25 per cent feel it is high and the remainder
feel that it is low.

Page | 734
Parameter Findings from research
Inference:
• It was reported by 39.10 (N=46) per cent of the respondents in the HHS
that watershed development fund was not adequate to sustain all the
repair and maintenance in the post-project period. Secondary
sources221222
and KIIs in states like Rajasthan and Jharkhand (Latehar
district) also reiterate the same point.
• Majority of respondents in the HHS stated that no formal training was
given for operations and maintenance and many didn’t know who was
responsible for operations and maintenance.
• Climate change resilience, mitigation and adaptation have not been
brought into the watershed design. Moreover, post-project management
of natural resources like water and forest has not taken much focus in
the ongoing generation of Watershed Programs.
• Therefore, the projects lack environmental, financial and institutional
sustainability and therefore the performance on this parameter “needs
improvement”.
Impact
Secondary:
• In Kerala, as on date, 83 watershed development projects are being
implemented under WDC-PMKSY in different districts. The
Commissionerate of Rural Development (SNLA) Govt. of Kerala had
delegated to Centre for Water Resources Development and
Management (CWRDM) the conduct of end-line evaluation of 26 Batch-
II watershed projects in 14 Districts in the State completed in March
2018. The key findings of the report show that groundwater recharge
has taken place and the water table in the wells and bore wells have
gone up in all the watersheds, there is prolonged stream-flow in summer
months after the execution of various interventions, the soil erosion has
221 Final/End Term Impact Evaluation Consolidated Report, IWMP Batch-II (2010-11) Projects, Odisha, Year-2017-18
222 AFC INDIA LIMITED MUMBAI & GVT, NOIDA, Odisha-END TERM/FINAL IMPACT EVALUATION REPORT OF BATCH- I/2009-
10

Page | 735
reduced and positive changes in soil moisture content, crop growth,
greenery/biodiversity was also observed.
• Impact evaluation of IWMP projects in Rajasthan, Meghalaya and Assam
were undertaken by WAPCOS Ltd. (July 2019). State-wise project impact
summary is given below:
o Rajasthan (Alwar, Bikaner, Kota and Udaipur): Impact
evaluations of all the four districts show some common
features. The expected post-project target of an increase in
the groundwater table, total irrigated area, the area under
agriculture crops, the area under horticulture crops,
wasteland development was not achieved as planned in the
DPR. However, there is an increase when compared to the
pre-project level. The water table has not increased up to the
expected post-project stage because the planned target of
water harvesting structures was not achieved in the area. A
positive impact was observed in terms of crop productivity,
annual income and reduction in migration. The productivity of
certain crops like Maize, Bajra, Mustard, Wheat and Gram
was better than the target due to adoption of High Yield
Variety (HYV) seeds, adoption of crop technologies and due
to hired irrigation water from private tube wells in Rabi
season. There was a limited impact on horticulture crops due
to the lack of farmers interest and shortage of irrigation
water. Similarly, the partial achievement was seen in Self
Help Groups (SHG) to implement the livelihood action plan
and increase in members’ income. The household income
on general had seen an increase across districts over the pre-
project level mainly due to increase in crop productivity,
increase in the price of agriculture produces, higher wage
rate and adoption of livelihood programme in the project area.
Page | 736
o Meghalaya (East Khasi Hills): The anticipated (as per DPR)
increase in groundwater table has not been achieved against
the target; however, significant increase has been seen
when compared to pre-project levels in almost all blocks
surveyed. The progress was limited since the Water
Harvesting Structure was not constructed as per plan. The
area under agriculture crop did not increase as expected due
to less progress in the conversion of wasteland into
agricultural land. The expected post-project target of an
increase in the water table, irrigated area, area under
agriculture crops, the area under horticulture crops,
wasteland development was not achieved. However, better
results were observed on almost all fronts when compared
to the pre-project level. The impact observed in respect of
crop productivity, annual income and reduction in out-
migration were positive. The expected outcome of the area
under horticulture crops was not achieved as farmers did not
show interest owing to lack of marketing facilities for
horticulture /vegetable crops. The productivity of Maize,
three seasons (rice autumn, summer and winter) of rice and
potato crops have been more than the target due to adoption
of HYV/ Hybrid crop variety, adopting crop management
practices and judicial use of limited irrigation water in crops.
Reduction in migration is observed mainly due to availability
of work under MGNREGA and adoption of livelihood
programme.
o Assam (Goalpara, Jorhat, Nagaon): Cropping intensity
remained short of DPR targets even though showing
improvement over pre-project level. The area under
horticulture crops did not rise as expected due to lack of
marketing facilities for horticulture crops. The expected
Page | 737
outcome of SHG has been achieved to implement the
livelihood action plan to increase their income. The household
income increased due to an increase in crop productivity, the
higher price of agriculture produce, higher wage rate and
adoption of livelihood programme in the project area. The
anticipated (as per DPR) increase in groundwater table has
been not achieved against the above target; however, a
significant increase has been seen when compared to pre-
project levels in almost all blocks surveyed. Reduction in
migration is observed against the expected post-project
outcome mainly due to availability of work under MGNREGA
and adoption of livelihood activities. The area under
agriculture did not increase as expected due to less progress
on the conversion of wasteland into agricultural land.
o Tripura (Gomati and North Tripura): Expected post-project
target of an increase in water table, irrigated area, area under
agriculture crops, the area under horticulture crops,
wasteland development was not achieved as planned due to
under-construction of Water Harvesting Structure (WHS).
The impact on crop productivity, annual income and reduction
in migration were observed positively.
• Key findings from the final evaluation report for the project (IWMP-
II) in Koijhar Nala, Dharamjaigarh block, Raigarh district, Chhatisgarh
are as follows:
o It has been observed that the assets created under the said
project in some of the cases need maintenance.
o It is observed that farmers are adopting new agricultural
practices like line-sowing, intercropping, etc. after project
intervention.

Page | 738
o The participation of landless, destitute, women-headed
households in the watershed activity is not as encouraging as
desired.
o There has been a significant shift to water-efficient crop in
some of the treated areas.
o Most of the fallow lands have been diverted to crop coverage
after treatment with different soil and moisture conservation
measures.
o Community mobilization needs to be strengthened to make
the exit strategy more effective.
o The availability of drinking water facility increased after
treatment of watersheds.
o There has been a marginal change in the land use pattern in
the watershed villages after treatment of watersheds.
o The labour migration has reduced by around 25-35 per cent
after the implementation of the watershed programme.
o The wage of the labourers increased at least by 10 to 20 per
cent in comparison to the pre-watershed development
programme. The labourers are getting minimum wage
declared by the state in the area.
o Some of the SHGs especially by women have been actively
engaged in production and marketing activities along with
credit and thrift activities.
o The water level increased in different watersheds after
implementation of watershed development works as is
evident from the interview of the farmers.
• Case Study of Gokak Taluk of Belagavi district:223
Karnataka
Watershed Development Department is implementing PMKSY-

Page | 739
223 'Rejuvenation of defunct Dug wells due toss watershed development activities', 2020, Watershed Development Department,
Government of Karnataka.

Page | 740
WDC (formerly IWMP) in a phased manner all over the State. As per
the department, the watershed development activities have helped
in water conservation, groundwater recharge, reduction in soil
erosion, increased productivity etc. The project (IWMP-20/11-12)
was sanctioned in the year 2011-12 to treat an area of 2,080 hectare
in Gokak Taluk of Belagavi district at an estimated cost of Rs. 312
lakh under Batch-Ill. In an area of about 548 hectares bunding was
done and 127 Water Harvesting Structures (WHS) was constructed
by spending Rs. 265.77 lakh. The interventions made through
watershed development activities in the form of rainwater
harvesting structures have led to a spurt in recharge of the aquifers
in the area. Thus, cumulatively 20,310 cubic metres of rainwater is
made available for recharge to groundwater body in the area
annually. The latest Assessment of Dynamic Groundwater
Resources of the State 2017 is made jointly by the Central Ground
Water Board and the State Ground Water Department. As per the
last report, Gokak taluk was categorised as "Semi Critical" based on
the stage of groundwater development ('Semi Critical' is where
Groundwater extraction is between 70 to 90%). However, the
watershed development activities have helped in augmenting the
water resources in the taluk and has restored the taluk to "Safe"
category. The permeable topsoil and weathered and fractured rocks
underneath are the factors that lead to good recharge. Such recharge
has rejuvenated the defunct wells, can sustain additional wells in the
area, and also can sustain the water yield from wells over an
extended period. The farmers were favourably impacted as their
wells were getting groundwater inflows as before. The effect of
watershed activities observed in the rejuvenation of defunct wells is
demonstrated as the irrigated area increased from 0 to 37 acres in
Kharif and 0 to 25 acres in Rabi.

Page | 741
Parameter Findings from research
• Despite very meagre support (the cost norm is based on 2008-09 price
base), the scheme has been able to bring about notable changes in the
outcome parameters in the project areas.
Primary:
• At present, the end line impact evaluations referred above (except
WAPCOS studies) are sanctioned by the SLNA for the projects
undertaken in their respective states. SLNA themselves commission
the evaluation studies to a suitable agency. This leaves the issue of
transparency and objectivity in question. There should be an arms-
length distance between the implementing agency and evaluating
agency so that unbiased assessment could be made.
• As per the DoLR, states that have performed well in terms of
implementation and impact are Nagaland, Karnataka, Andhra
Pradesh, Rajasthan and Madhya Pradesh. These States have
dedicated State Level Nodal Agencies with requisite professional
support. Some of the States like Punjab, Himachal Pradesh and Uttar
Pradesh have not performed as expected concerning the
implementation, utilization of funds and completion of the projects.
The main reasons being administrative constraints at the State level.
• As per DoLR, about 60 per cent of the expenditure incurred on
Natural Resource Management Activities under the Watershed
Project goes as wages to labour and generate employment. The
‘Meta-Analysis to Assess Impact of Watershed Program and
People's Participation’ by ICRISAT reported that watershed projects
have a positive impact of alleviating rural poverty and reducing
income disparities among households. As per the study, the mean
additional annual employment generation in the watershed area on
various activities and operations was 181 person-days/ha/year. In
those watershed projects that included multiple activities,
employment generation increased to 900 person-days/ha/year. The
generation of employment opportunities within these rural

Page | 742
communities will invariably increase their purchasing power with a
corresponding decline in rural poverty. Based on these observations,
the watershed investments could be viewed as a poverty alleviation
program in fragile areas.
• Third-party end-line evaluation reports of completed projects
furnished by DoLR (submitted by states to DoLR) reveal that there is
an improvement in the availability of surface and groundwater,
increase in productivity and vegetative cover, enhanced livelihood
opportunities and household income in project areas. The
environmental impact is a very important aspect of the benefits.
Various soil & water conservation activities of watershed projects
help in increasing the moisture content of the soil, increase in the
availability of surface & groundwater, enhance the microbial activity,
building organic matter content in the soil and increase the greenery
of the surroundings. The conserved water is used for domestic and
wild animals as well. As reported by DoLR following benefits has
been observed in the select states as per end-line evaluation report
available with DoLR:
o In Maharashtra, the groundwater table has risen by 0.2 to 2
meters. The cultivated area has increased by 2.29 per cent.
Crop productivity has seen an upward rise by 2-3 Quintals per
Hectare. Apart from these, cropping intensity has seen a
favourable rise by 18.3 per cent. Annual income has risen by
70.3 per cent and outmigration has fallen by 32 per cent.
o In Andhra Pradesh groundwater table has risen by 15 per
cent. The cultivated area has increased by 30 per cent. Crop
productivity has seen an upward rise of 30 per cent. Apart
from this vegetation cover has seen a favourable rise by 50
per cent. Crop production has risen by 20 per cent and milk
production by 40 per cent. The area under water bodies has
risen by 8 per cent.

Page | 743
o In Karnataka, the water table has gone up by 2 to 30 meters.
Irrigated area has gone up by 6 per cent. Gross cropped area
has gone up by 6.82 per cent. Cropping intensity has gone up
by 6 per cent. Crop productivity has gone up by 41.5 to 61.5
per cent. Milk production has gone up by 14 to 29 per cent.
Per capita income has risen by 21 per cent to 254 per cent.
And lastly, vegetation density has gone up by 3 to 24 times
(Forestry).
o In Rajasthan, the groundwater table has risen by 0.41 to 1.32
meters. Irrigated area has gone up by 26.29 per cent. Gross
cropped area has gone up by 26.28 per cent. Cropping
intensity has gone up by 3.23 per cent. Crop productivity has
gone up by 7.03 to 97.62 per cent. Average annual income
has risen by 8.28 to 18.72 per cent and milk production by
18.60 to 37.86 per cent. Out-migration has fallen by 1.34 per
cent.
• WDC-PMKSY projects are being implemented by the respective
SLNAs following the Common Guidelines for Watershed
Development Projects. These Guidelines inter alia provide for the
distribution of budget for specific watershed projects for the various
components which includes allocation of 9% and 10% of the budget
for ‘livelihood activities’ for the asset fewer persons and ‘production
system and micro-enterprises’ respectively. Livelihood activities
taken up, by constituting Self Help Groups (SHGs), vary from project
to project and inter alia include goat rearing, poultry, dairy, vegetable
production, fishery, bamboo art, small grocery shop, tailoring,
vermicompost, nursery raising, making of pickle, papad, paper/leaf
plates, soft toys, artificial jewellery etc. It was reported by states
(Karnataka, Rajasthan, Nagaland and Assam) that the livelihood
component has been successful in the upliftment of the
marginalised.
• Findings of the Household survey are as follows:

Page | 744
o Around 28.90 per cent of the respondents reported that
there is an increase in the quality of drinking water and 10.20
per cent reported that there is a decline in the quality after
the implementation of the project. Approximately 48.80 per
cent noted that there was no change in the quality and 12.20
per cent reported that they don’t know.
o Around 33.30 per cent of respondents opined that there has
been an increase in their personal household income due to
the watershed development project. 43.90 per cent
responded that there has been a decrease. Approximately
10.60 per cent reported that there has been no change and
12.20 per cent reported that they don’t know. 77.80 per cent
of respondents in Karnataka stated that there was a positive
impact. Also, 46.70 per cent of respondents in Andhra
Pradesh reported that there was a rise in household income.
Surprisingly, 73.90 per cent of the respondents in the Tonk
district of Rajasthan and 84.60 per cent in Solapur in
Maharashtra stated that there has been a decrease in
household income due to watershed development activity.
o Around 35.40 per cent of respondents opined that there has
been an increase in community income due to the watershed
development project. Approximately 43.10 per cent reported
that there has been no change and 8.90 per cent reported
that they don’t know.
o Around 38.60 per cent of the respondents reported that they
observed an increase in agriculture land owing to the
watershed development project. Respondents in UP (100%),
Karnataka (66.70%), Andhra Pradesh (64.40%) has registered
the maximum increase.

Page | 745
o 14.60 per cent reported that there was an increase in
horticulture land post project completion. 51.90% of
respondents in Karnataka registered the increase in land
under horticulture other states were below 33.30 per cent.
o 9.80 per cent reported that there was an increase in area
under plantation and forest. The maximum percentage of
respondents (37%) in Karnataka reported an increase in the
forest and plantation.
o Only 14.20 per cent of respondents reported that there was
an increase in irrigated area. Karnataka again was the best
performer with 70.40 respondents reported an increase in
irrigated area.
o 22.80 per cent reported that there was an increase in crop
yield. Manipur and Karnataka performed better than other
states in crop yield with 62.50 per cent and 59.30 per cent
respondents reported a favourable response respectively.
None of the respondents in Tamil Nadu, Himachal Pradesh
and Assam reported an increase in crop yield.
o Only 11.80 per cent reported an increase in the number of
crops cultivated. About 44.40 per cent of the respondents in
Karnataka reported that they were able to do multiple
cropping. None of the respondents in Assam, Tamil Nadu,
Himachal Pradesh, Maharashtra, Manipur and Punjab
reported a shift to multiple cropping.
o Only 5.30 per cent reported an improvement in land
productivity, 22.80 per cent reported improved crop yield and
6.10 reported improved cropping intensity.
o 32.10 per cent of respondents reported an improvement in
groundwater table owing to watershed activities. 17.10 per
cent responded no change and 13.40 per cent responded
Page | 746
‘don’t know’. About 37.40 per cent reported a decline.
Maximum respondents in Karnataka (70.40%) and UP
(88.90%) stated an improvement in the water table.
o About 24.40 per cent of the respondents reported that there
has been an increase in the grazing land for the livestock. On
the other hand, 15.9 per cent of respondents reported a
decline. Remaining respondents either found no change or
were unaware. The best performer was Karnataka with 70.40
per cent respondents in Karnataka reported an increase in
grazing land.
o Around 30.10 per cent of the respondents opined that the soil
fertility has improved due to watershed development project.
About 43.50 per cent reported no change. A minority of 17.50
per cent reported that soil fertility has gone down after the
project. Karnataka was the good performer with 70.40 per
cent of respondents reporting an increase in soil fertility.
o About 25.20 per cent have reported that soil erosion has
fallen due to the watershed project. However, at the same
time, 18.30 per cent reported that it has increased when
compared to the pre-project level. 66.70 per cent of
respondents in Karnataka reported a decline in soil erosion.
o About 26.80 per cent of the respondents reported that there
was an increase in the availability of surface water in the
summer months. Around 35.40 per cent reported that there
was no change. Karnataka (70.4%) and Uttar Pradesh
(66.70%) were the best performers.
o Around 28.50 per cent reported that they observed
improvement in the water table in the tube well and dug well.
Respondents in UP (88.90%), Karnataka (55.60%) and
Page | 747
Assam (13.30%) reported maximum benefits in water
recharge in tube wells and dug wells.
o 17.90 per cent reported that they observed wasteland
converted to cultivable land on their farmland. Around 55.60
per cent respondents in Karnataka and 55.60 per cent in UP
reported positively. Whereas 17.10 per cent reported
wasteland converted to cultivable land on common property.
Here again, as per the responses, Karnataka (63%) and UP
(66.70%) performed better than other states.
o About 19.90 per cent of respondents reported an increase in
revenue from forest land as a result of watershed
development. On the other hand, 40.70 per cent reported
that there has been no change. UP (77.80%), Karnataka
(37%) and Andhra Pradesh (46.70%) had maximum
respondents giving a positive response.
o Around 9.30 per cent of respondent reported that there was
a positive impact on migration owing to watershed activities
in villages. Around 50 per cent of respondents in HP reported
that the migration has gone down.
o 28.90 per cent of the respondents reported that there is an
increase in employment opportunities owing to watershed
development activity. Maharashtra (69.20%) and Karnataka
(74.10%) were the top states giving a favourable response.
Around 21.50 per cent reported a fall in employment
opportunities and 39.40 per cent reported no change. 44.40
per cent respondents in Assam and 55.60 per cent
respondents in Himachal Pradesh reported a fall in
employment.
o 23.60 of the respondents reported that there has been an
increase in migratory bird population in the intervention
Page | 748
Parameter Findings from research
areas. Major contributors were UP (88.90%), Himachal
Pradesh (38.90%) and Andhra Pradesh (40%).
Inference:
• Looking at the data reported in the Household Survey (HHS), the impact
has been limited to a few states with other states lagging behind.
• Karnataka stands out as one of the better performing states. Good
performance of Karnataka in impacts show that positive outcomes can
be ensured if the proper implementation is done with the complete
involvement of the local community. Karnataka model is worth
replicating in other states and other states have much to learn from
Karnataka.
• Various reports, KIIs at the state and district level show, that the scheme
has led to positive impacts in the intervention watersheds. However,
given that at present, the end-line impact evaluations sanctioned by the
SLNA leaves the issue of transparency and objectivity in question. There
should be an arms-length distance between the implementing agency
and evaluating agency.
• However, it takes time for outcome/impact to show on the ground
considering the gradual flow of benefits from natural resources like
afforestation and slow acceptance of new technology by the farmers.
Therefore, the time of evaluation is a crucial criterion for impact
assessment and assessment should be done after 2 to 3 years post-
completion of the project. Also, other factors determine the efficiency of
watershed programs. These include geographical location, rainfall
pattern, the focus of the watershed program, implementing agency, the
status of the target population, people’s participation, activities
performed under the program and the soil types in the area.
• Moreover, a few impact studies highlight that the benefits are not up to
the level that was envisaged in the DPRs. However, it is evidenced that
despite very meagre support (the cost norm is based on 2008-09 price
Page | 749
Parameter Findings from research
base), the scheme has been able to bring about notable changes in the
outcome parameters in the project areas vis-à-vis pre-project level.
• In light of the mixed evidence from secondary and primary sources, the
performance on this parameter is” Average”.
Equity
Secondary:
• The common guidelines for watershed development projects are
based on the principle of Equity and Gender Sensitivity. As per the
guidelines Project Implementing Agencies (PIAs), must facilitate the
equity processes such as a) enhanced livelihood opportunities for the
poor through investment in their assets and improvements in
productivity and income, b) improving access of the poor, especially
women to the benefits, c) enhancing the role of women in decision
making processes and their representation in the institutional
arrangements, and d) ensuring access to usufruct rights from the
common property resources for the resource-poor.
• The Gram Sabha will constitute the Watershed Committee (WC) to
implement the Watershed project with the technical support of the
WDT in the village. The Watershed Committee (WC) will comprise
at least 10 members, half of the members shall be representatives
of SHGs and User Groups, SC/ST community, women and landless
persons in the village.
• The WDT will involve WC in the formulation of the watershed action
plan by also mobilising women to ensure that the perspectives and
interests of women are adequately reflected in the watershed action
plan.
• The WC shall constitute SHGs in the watershed area with the help
of WDT from amongst poor, small and marginal farmer households,
landless/asset-less poor agricultural labourers, women, shepherds

Page | 750
Parameter Findings from research
and SC/ST persons. Each Self Help Group will be provided with a
revolving fund of Rs. 25,000.
• As per the guidelines, the DPR should include, among other things,
Expected Outcomes and Benefits, especially concerning livelihoods
for different segments, benefits to women.
• Case Study of Yeiikha and Yow Miijaiim Self-Help Groups
(SHGs) in Phek district of Nagaland224
: Land Resource
Department of Phek District facilitated the formation of two SHGs,
namely; Yeiikha SHG & Yow Miijaiim SHG in the year 2017 with ten
women members in each group. The primary purpose of
collectivizing and forming the groups was to improve the socio-
economic status of poor rural women, especially to enhance their
income. Seed money amounting to Rs. 10,000 each was given to
both the groups. Each SHG has been earning Rs. 40,000-50,000
annually from the sale of Parkia. The Self-Help groups collect the
entire produce of their village and transport it to the nearest market
which is 114 km away from their village and sells it. Tree beans
(Parkia), a very important multipurpose tree species, having many
utilities such as rich nutritional value as it is abundant in minerals and
vitamins, medicinal value, use as insecticides and pesticides,
enriching the soil by fixing atmospheric nitrogen, etc. Besides, tree
bean (Parkia) the SHG members are also engaged in weaving and
kitchen gardening. The group maintains cash book, savings book,
meeting minutes register and all other relevant registers. The
livelihood component of the programme has helped the women in
the SHGs to earn a sustainable livelihood thereby contributing to
equity.
Primary:
224 Success stories: Bringing visible changes in the economy of the rural community, Booklet provided by SLNA of Nagaland
Page | 751
• State of Karnataka informed that the watershed selection is based
on the guidelines given by the National Rainfed Area Authority
(NRAA) which are based on the principle of equity. NRAA brought
out the guidelines in 2008 (revised in 2011) for the watershed
selection. There are 12 sets of indicators such as poverty,
percentage of SC/ST population, the percentage of the small and
marginal farmers, the groundwater status, the area under rainfed
agriculture, the drinking water status, etc. Weightage is given to
each of them and based on those weightage selections of the
watershed is done under this program.
• Each Project Implementing Agency (PIA) is having a Watershed
Development Team (WDT) for implementation of the projects.225
As
per the Watershed Guidelines, at least one of the WDT members is
a woman. This guideline is being followed in sprit on the field as
reported by the state and district level KIIs and women members of
the Watershed Committee and Watershed Development Team.
• As per states, the WDT has also the responsibility of mobilising
women to ensure that the perspectives and interests of women are
adequately reflected in the watershed action plan.
• States informed that most of the SHGs formulated in the projects
are women-oriented and supported under the livelihood component
of the project. A total of 9 per cent funds are kept for the livelihood
activities and they are basically for the people (mostly women) who
do not have land or other assets.
• Women participation in the scheme has been reported from 33 per
cent to 60 per cent depending on the state.
• It was also reported that this scheme holds special importance when
it comes to women empowerment because many of the farmers are
women. If one is supplying water to the farmer, benefits will go to
women, because they are the ones who carry drinking water from
far off to fulfil the requirement of their family. As per the household
survey, 67 per cent of the cases, water is fetched by adult women

Page | 752
225 The WDT consists of at least four members, broadly with knowledge and experience in agriculture, soil science, water
management, social mobilisation and institutional building.

Page | 753
for household needs. They are the ones who go to the field and carry
the fodder for their livestock. Therefore, converting wasteland for
pasture development benefits those women who rear the livestock.
Scheme guidelines reflect that equity and women empowerment
are two things which are addressed by this program.
• As reported by the states, landless people are also the beneficiaries
of the scheme and special weightage is given for SC/ST population,
small and marginal farmers.
• The formation of women and marginalized SHGs paved the way for
the improvement of the general awareness level, provided
opportunities to have access to credit systems, banks and other
financial institutions, savings, internal lending, initiating income
generation activities and achieving sustainable development.
Women development activities like providing of the sewing
machine, backyard poultry, beehives, Azolla cultivation,
vermicomposting, and goat rearing were the major income
generation activities taken up by the women SHG members and the
landless families. The additional income realized by the women
members increased the total family income and facilitated the rise of
the status in the family and village. This has also reduced the level
of migration of the male and female members of the family. The
members of the SHGs have developed a rapport with the bank,
financial institutions, villager panchayat, and other government
departments. The various training programmes, capacity building
programmes and the Revolving Fund (RF) provided them with
opportunities to get employment and achieve economic freedom.
The following are the benefits realised by the women members with
the result of the revolving fund provided by the watershed project;
(a) Families of underprivileged of the watershed are released from
the clutches of the high-interest money lenders; (b) Initially the RF
helped them to clear their old debts; (c) With the result of the micro-
Page | 754
enterprises they ventured into with the support of the RF, the basic
livelihood needs are met.
• The following findings are drawn from the household survey:
o Around 30.10 per cent reported that scheme benefits are
accessible to all farmers, 25.60 per cent reported that
benefits are accessible to some farmers and 19.10 per cent
reported that benefits are accessible to a few farmers.
Majority of respondents in Andhra Pradesh (60%), Uttar
Pradesh (44.40%) and Himachal Pradesh (50%) reported that
the benefits are available to all farmers. 84.60 per cent of
farmers in Maharashtra reported that benefits are available to
a few farmers.
o About 39.80 per cent reported that there is equitable
distribution of water to all farmers however 60.20 responded
that there is inequity in the distribution of water. Majority of
respondents in Andhra Pradesh (60%) and Himachal Pradesh
(66.70%) have reported equitable distribution.
o Only 13 per cent of respondents reported that they faced
hurdles in accessing benefits under the scheme. 87 per cent
reported that they faced no hurdles in accessing benefits.
o Around 40.20 per cent reported that they have been involved
in income generation activities carried out in the village
through wage-earning through community asset creation
such as community building and village road. Majority of
respondents in Andhra Pradesh (84.40%), Assam (72.20%)
and UP (77.80%) gave a favourable response.
o Around 14.60 per cent reported that they have been involved
in income generation activities carried out in the village
through the cottage industry (Bamboo, cane, woodcraft etc).

Page | 755
Parameter Findings from research
77.80 per cent of respondents in UP and 38.90 per cent in
Assam gave a favourable response.
o As per the Household Survey in 72 per cent of the cases,
water is fetched by adult women for household needs.
Besides, about 41 per cent of respondents reported that the
water source is more than 100 meters away from their
house. Additionally, 26.80 per cent of the respondents
reported that there was an increase in the availability of
surface water in the summer months. On the other hand,
32.10 per cent of respondents reported an improvement in
groundwater table owing to watershed activities. About
24.40 per cent of the respondents reported that there has
been an increase in the grazing land for the livestock.
Therefore, women are one of the key segments which has
benefitted by reducing cost and drudgery in the collection of
water and fodder. This finding was also reiterated in the KIIs
with women members of Watershed Committees (WC) and
Watershed Development Team (WDT).
Inference:
• Scheme guidelines have ensured that the watershed projects follow
the principle of equity which keeps women, SC/ST, landless/asset
less in mind from the DPR phase onwards to the consolidation
phase.
• From KIIs at the state level and district level, we can infer that the
guidelines are being followed in spirit.
• While selecting the project area, due weightage is given for SC/ST
population, poverty index and percentage of the small and marginal
farmer. Scheme guidelines also provide for inclusion of women,
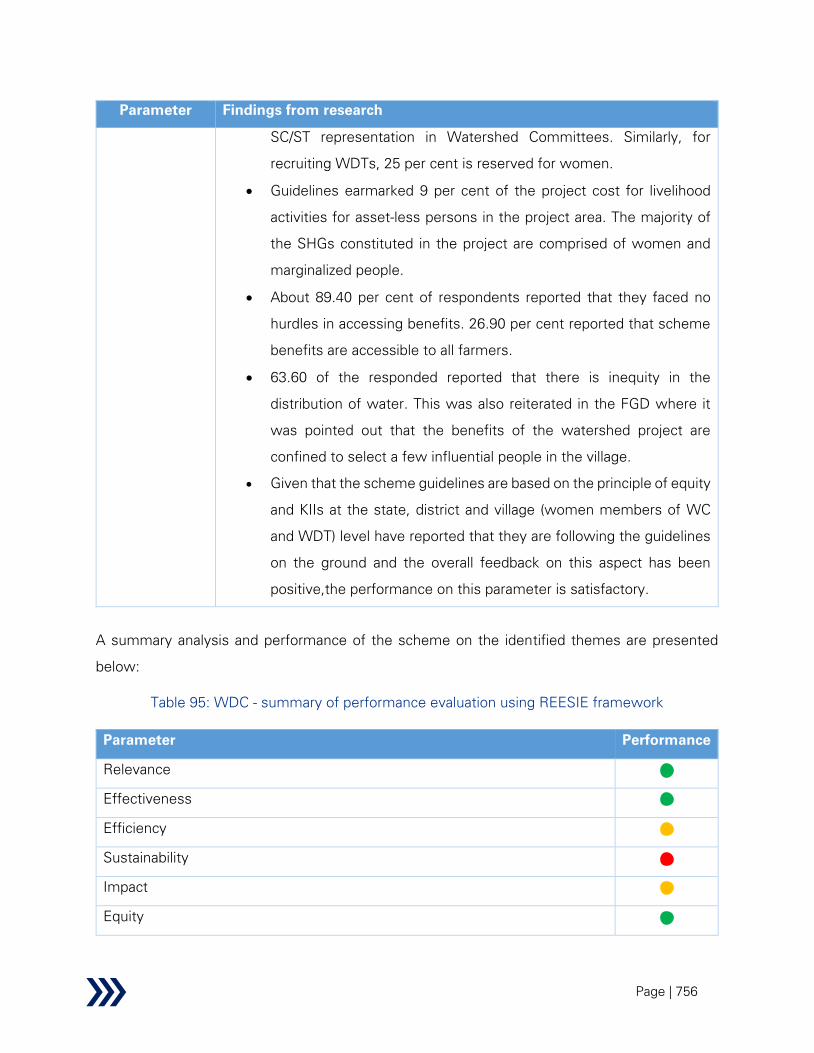
Page | 756
Parameter Findings from research
SC/ST representation in Watershed Committees. Similarly, for
recruiting WDTs, 25 per cent is reserved for women.
• Guidelines earmarked 9 per cent of the project cost for livelihood
activities for asset-less persons in the project area. The majority of
the SHGs constituted in the project are comprised of women and
marginalized people.
• About 89.40 per cent of respondents reported that they faced no
hurdles in accessing benefits. 26.90 per cent reported that scheme
benefits are accessible to all farmers.
• 63.60 of the responded reported that there is inequity in the
distribution of water. This was also reiterated in the FGD where it
was pointed out that the benefits of the watershed project are
confined to select a few influential people in the village.
• Given that the scheme guidelines are based on the principle of equity
and KIIs at the state, district and village (women members of WC
and WDT) level have reported that they are following the guidelines
on the ground and the overall feedback on this aspect has been
positive,the performance on this parameter is satisfactory.
A summary analysis and performance of the scheme on the identified themes are presented
below:
Table 95: WDC - summary of performance evaluation using REESIE framework
Parameter Performance
Relevance
Effectiveness
Efficiency
Sustainability
Impact
Equity
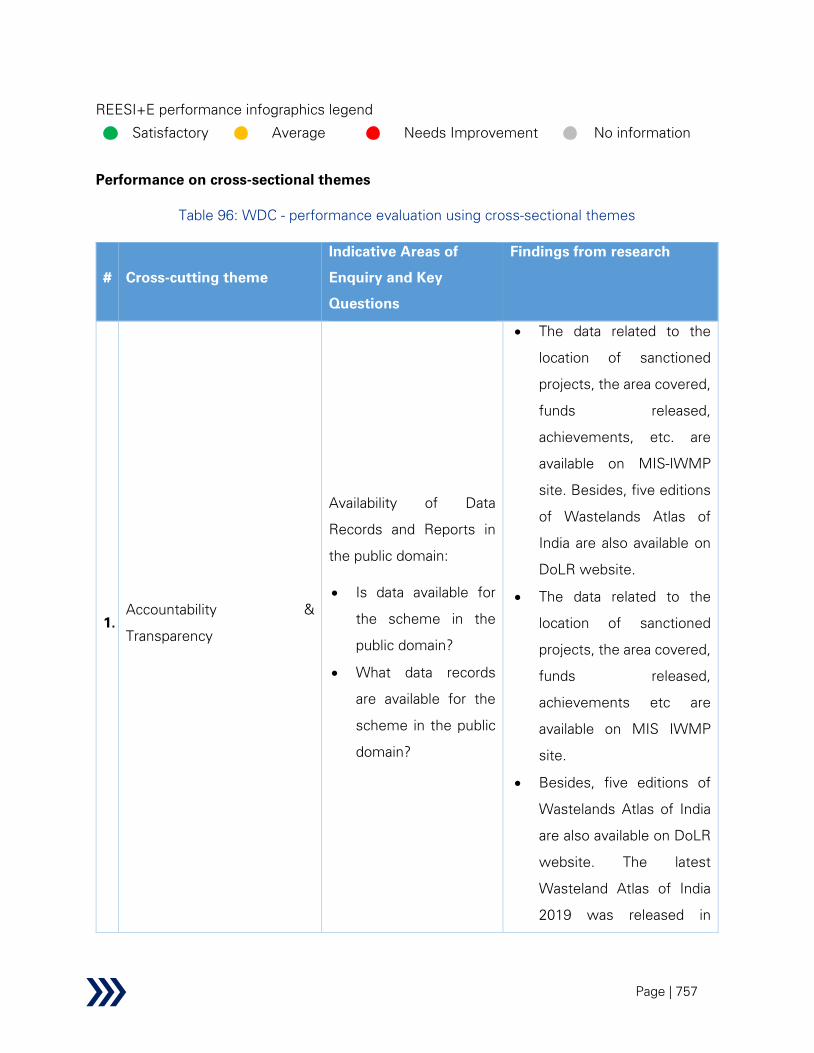
Page | 757
REESI+E performance infographics legend
Satisfactory
Average
Needs Improvement
No information
Performance on cross-sectional themes
Table 96: WDC - performance evaluation using cross-sectional themes
# Cross-cutting theme
Indicative Areas of
Enquiry and Key
Questions
Findings from research
1.
Accountability &
Transparency
Availability of Data
Records and Reports in
the public domain:
• Is data available for
the scheme in the
public domain?
• What data records
are available for the
scheme in the public
domain?
• The data related to the
location of sanctioned
projects, the area covered,
funds released,
achievements, etc. are
available on MIS-IWMP
site. Besides, five editions
of Wastelands Atlas of
India are also available on
DoLR website.
• The data related to the
location of sanctioned
projects, the area covered,
funds released,
achievements etc are
available on MIS IWMP
site.
• Besides, five editions of
Wastelands Atlas of India
are also available on DoLR
website. The latest
Wasteland Atlas of India
2019 was released in
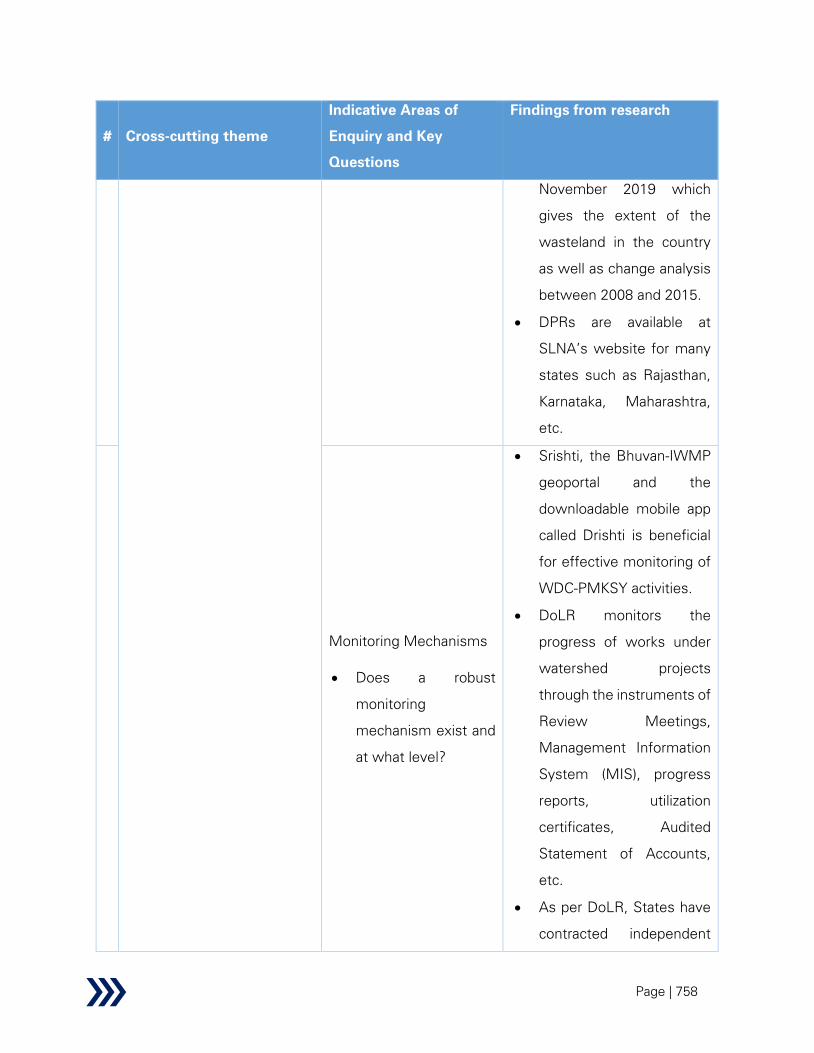
Page | 758
# Cross-cutting theme
Indicative Areas of
Enquiry and Key
Questions
Findings from research
November 2019 which
gives the extent of the
wasteland in the country
as well as change analysis
between 2008 and 2015.
• DPRs are available at
SLNA’s website for many
states such as Rajasthan,
Karnataka, Maharashtra,
etc.
Monitoring Mechanisms
• Does a robust
monitoring
mechanism exist and
at what level?
• Srishti, the Bhuvan-IWMP
geoportal and the
downloadable mobile app
called Drishti is beneficial
for effective monitoring of
WDC-PMKSY activities.
• DoLR monitors the
progress of works under
watershed projects
through the instruments of
Review Meetings,
Management Information
System (MIS), progress
reports, utilization
certificates, Audited
Statement of Accounts,
etc.
• As per DoLR, States have
contracted independent

Page | 759
# Cross-cutting theme
Indicative Areas of
Enquiry and Key
Questions
Findings from research
agencies that would
monitor the
implementation of the
projects which includes
process and input-output
monitoring.
• To monitor the quality in
the implementation of
programmes of the
Ministry including
watershed programme,
the Vigilance & Monitoring
Committees are
constituted with Members
of Parliament and elected
representatives of the
people in State
Legislatures and
Panchayati Raj
Institutions.
• The DoLR holds Steering
Committee Meetings &
Regional Review
Meetings under the
Chairpersonship of

Page | 760
Secretary (LR) to monitor
the Programme.
• Officers, dealing with the
implementation of the
programmes at State
Headquarters & districts,
visit project areas to
ensure that the
programmes are being
implemented
satisfactorily.
• At the State-level, the
SLNAs have been made
responsible for monitoring
the State-level Watershed
Programme.
• Public Financial
Management System
(PFMS) is utilised for
financial monitoring.
• Officers, dealing with the
implementation of the
programmes at State
headquarters and districts,
visit project areas to
ensure that the
programmes are being
implemented
satisfactorily.

Page | 761
• At the state level following
information is shared with
DoLR; (a) Detailed Project
Report (DPR); (b) MIS on
monthly basis; (c) Output-
outcome indicators on
monthly basis; (d) PFMS
on transaction basis; (e)
Audited Statement of
Accounts (ASA) on annual
basis; (f) Monitoring
Evaluation Learning and
Documentation (MELD)
reports; and (g) Phase
wise evaluation reports
• Under PMKSY-WDC
program there is a
provision of Monitoring
Evaluation Learning and
Documentation (MELD)
agency which have their
people on the field and
they keep on monitoring
whether the works are
happening as per plan, the
quality is satisfactory, are
records being maintained.
MELD agency collects the
records and gives
feedback at the district
level and the district level

Page | 762
# Cross-cutting theme
Indicative Areas of
Enquiry and Key
Questions
Findings from research
feedbacks are given at
SLNA level every month.
Follow-up is done with the
districts regarding certain
observation if there are
certain quality issues or
the meetings not
happening regularly, etc.
Evaluation Mechanisms
• Process/Impact
evaluation studies
conducted in the last
decade - frequency,
quality, coverage,
etc.
• For evaluation of IWMP
projects by the
independent evaluating
agencies, specific financial
provision of 1% of project
fund has been provided in
the Guidelines.
• As per DoLR, evaluation
studies are also
undertaken through
reputed and independent
Research
Institutions/Organizations
from time to time to
evaluate the performance
of watershed projects at
the field level, to assess
the impact of the
programmes.

Page | 763
# Cross-cutting theme
Indicative Areas of
Enquiry and Key
Questions
Findings from research
• As per data provided by
DoLR, as on 20.09.2020
only 2052 end line
evaluation reports have
been submitted to the
department against 4487
projects reported as
completed.
• At present, key outcomes
indicators being monitored
are: (a)
creation/rejuvenation of
Water Harvesting
Structures, (b) farmers
benefited, (c) additional
area brought under
protective irrigation, (d)
afforestation including
horticultural plantation, (e)
wastelands brought into
productive use and (f)
man-days of employment
generated.
Citizen Accountability
• Are there functional
grievance redressal
mechanisms that
successfully
• All states have reported
that there is not a
dedicated grievance
redressal mechanism.
• Some states like
Karnataka, Andhra

Page | 764
# Cross-cutting theme
Indicative Areas of
Enquiry and Key
Questions
Findings from research
incorporate
beneficiaries and
non-beneficiaries’
concerns?
• Is the RTI mechanism
functioning
effectively?
Pradesh and Bihar
reported that the regular
Grama Sabha and
Executive committee
meetings act as
beneficiaries and Non-
beneficiaries functional
grievance redressal forum.
• RTI applies to the scheme.
Financial Accountability
• What funding
mechanisms are
being used?
• Central Funds are released
based on the Annual
Action Plans submitted by
the States and Annual
Budget allocated for the
scheme by the
Government.
• The Department is
implementing the Public
Finance Management
System (PFMS) developed
by the Office of Controller
General of Accounts in
IWMP. The system is
being used to make
payments, execute
expenditure filing and
track expenditure of funds
in near real-time during the
implementation of

Page | 765
# Cross-cutting theme
Indicative Areas of
Enquiry and Key
Questions
Findings from research
watershed projects. PFMS
is adopted to bring in
transparency in the
financial transactions.
• MIS is utilized per month
for monitoring physical &
financial achievements.
Summary Analysis:
• In terms of accountability and transparency, DPRs are available in the public domain for
many states such as Rajasthan, Karnataka, Maharashtra, etc.
• The data related to the location of sanctioned projects, the area covered, funds released,
physical and financial plan, physical and financial achievements, etc are available on MIS
IWMP site.
• Evaluation reports are not readily available in the public domain.
• In terms of citizen accountability, a separate grievance redressal mechanism has not been
established.
• RTI applies to the scheme.
2.
Direct/Indirect Employment
Generation
Employment generation
• What is the level of
employment
generation through
schemes in the
sector and overall
sectoral contribution
in national
employment
generation?
• As per DoLR about 60 per
cent of the expenditure
incurred on Natural
Resource Management
Activities under the
Watershed Project goes
as wages to labour and
generate employment.
• The ‘Meta-Analysis to
Assess Impact of
Watershed Program and
People's Participation’ by

Page | 766
# Cross-cutting theme
Indicative Areas of
Enquiry and Key
Questions
Findings from research
• How has the scheme
contributed to an
improvement in
income levels?
• What is the
improvement in the
availability of
employment
opportunities?
ICRISAT reported that
watershed projects have a
positive impact of
alleviating rural poverty
and reducing income
disparities among
households.
• As per the same report,
the mean additional annual
employment generation in
the watershed area on
various activities and
operations was 181
person-days/ha/year. In
those watershed projects
that included multiple
activities, employment
generation increased to
900 person-days/ha/year.
• The generation of
employment opportunities
within these rural
communities invariably
increases their purchasing
power with a
corresponding decline in
rural poverty. Based on
these observations, the
watershed investments

Page | 767
# Cross-cutting theme
Indicative Areas of
Enquiry and Key
Questions
Findings from research
may be viewed as a
poverty alleviation
program in fragile areas.
Summary Analysis:
• The project plays a role in facilitating employment in rainfed areas.
• Support is provided for self- employment opportunities under the livelihood component.
3.
Gender
mainstreaming/Inclusiveness
Inclusiveness in scheme
design/planning
• Is there a specific
mention of gender
equality and equity
considerations in the
scheme
guidelines/objectives,
i.e. has the scheme
been designed
keeping gender
considerations in
mind?
• What is the women
participation (per
cent) in the
sector/program?
• As per guidelines, each
Project Implementing
Agency (PIA) is having a
Watershed Development
Team (WDT) for
implementation of the
projects. At least one of
the WDT members should
be a woman. This
guideline is being followed
in sprit on the field as
reported in the KIIs at the
state, district and village
(women members of WC
and WDT) level.
• The WDT has also the
responsibility of mobilising
women to ensure that the
perspectives and interests
of women are adequately
reflected in the watershed
action plan.

Page | 768
# Cross-cutting theme
Indicative Areas of
Enquiry and Key
Questions
Findings from research
• Similarly, half of the
members of the
Watershed Committees
constituted to implement
the Watershed project
should be the
representatives of SHGs
and User Groups, SC/ST
community, women and
landless persons in the
village.
• Most of the SHGs
formulated in the projects
are women-oriented and
supported under the
livelihood component of
the project. A total of 9 per
cent funds are kept for the
livelihood activities and
they are basically for the
people (mostly women)
who do not have land or
other assets.
• Women participation in
the scheme has been
reported from 33 per cent
to 60 per cent depending
on the state. Also, the SC,
ST representation has to
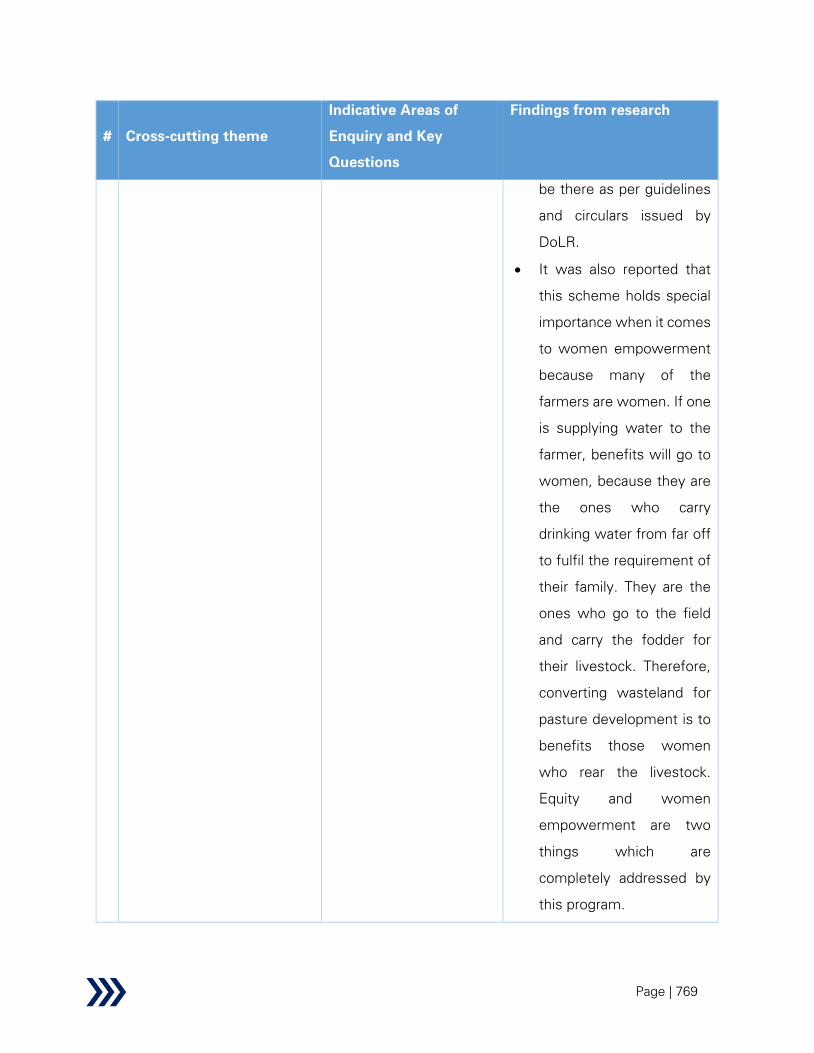
Page | 769
# Cross-cutting theme
Indicative Areas of
Enquiry and Key
Questions
Findings from research
be there as per guidelines
and circulars issued by
DoLR.
• It was also reported that
this scheme holds special
importance when it comes
to women empowerment
because many of the
farmers are women. If one
is supplying water to the
farmer, benefits will go to
women, because they are
the ones who carry
drinking water from far off
to fulfil the requirement of
their family. They are the
ones who go to the field
and carry the fodder for
their livestock. Therefore,
converting wasteland for
pasture development is to
benefits those women
who rear the livestock.
Equity and women
empowerment are two
things which are
completely addressed by
this program.

Page | 770
# Cross-cutting theme
Indicative Areas of
Enquiry and Key
Questions
Findings from research
• The formation of SHGs
comprised of women and
marginalized sections of
society paved the way for
the improvement of the
general awareness level,
provided opportunities to
have access to credit
systems, banks and other
financial institutions,
savings, internal lending,
initiating income
generation activities and
achieving sustainable
development. Women
development activities like
providing of the sewing
machine, backyard poultry,
beehives, Azolla
cultivation,
vermicomposting, goat
rearing, etc. are the major
income generation
activities taken up by the
women SHG members
and the landless families.
The additional income
realised by the woman
members increased the
Page | 771
# Cross-cutting theme
Indicative Areas of
Enquiry and Key
Questions
Findings from research
total family income and
facilitated in the rise of the
status in the family and
village. This has reduced
the level of migration of
the male and female
members of the family.
The members of the SHGs
have developed a rapport
with the bank, financial
institutions, villager
panchayat, and other
government departments.
The various training
programmes, capacity
building programmes and
the Revolving Fund (RF)
provided them with
opportunities to get
employment and achieve
economic freedom. The
following are the benefits
realised by the women
members with the result
of the RF provided by the
watershed project: (a)
Families of
underprivileged of the
watershed are relieved out

Page | 772
# Cross-cutting theme
Indicative Areas of
Enquiry and Key
Questions
Findings from research
from the clutches of the
high-interest money
lenders; (b) Initially the RF
helped them to clear their
old debts; (c) With the
result of the micro-
enterprises they ventured
into with the support of
the RF, the basic livelihood
needs were met.
Summary Analysis:
• Scheme guidelines have ensured that the watershed projects follows the principle of
equity which keeps women in mind from the DPR phase onwards to the consolidation
phase.
• From KIIs at the state level and district level, we can infer that the guidelines are being
followed in spirit.
4.
Building resilience to climate
change (including but not
limited to developing water
disaster preparedness) &
ensuring sustainability
• Are there appropriate
climate-resilient
policies for mitigation
and/or adaptation (or
included as part of
scheme objectives
and design)?
• Are there any training
sessions held
regularly for reducing
pollution, adopting
green practices,
• Climate change issue is
very pertinent when
talking about rainfed areas
as rainfed agriculture is
highly vulnerable to
climate change.
• The GoI included
agriculture as a priority
sector for climate change
adaptation in its Nationally
Determined Contribution
(NDC) to the UNFCCC
Page | 773
# Cross-cutting theme
Indicative Areas of
Enquiry and Key
Questions
Findings from research
using local materials
etc.?
• What are the main
impacts of climate
change on the sector
and scheme
beneficiaries?
under the Paris
Agreement. The National
Rainfed Area Authority
(NRAA) prioritized 168
rainfed districts in India
based on the climate
vulnerability
characteristics and risks.
• Increased investment in
climate-smart agriculture
measures to reduce
vulnerability is essential to
sustain productivity in
rainfed areas.
• The scheme guidelines do
not focus on the topic of
climate change resilience
in rainfed areas. Far and
few efforts are being
made on the ground from
the states.
• As per NRAA, many
extreme climatic events
are being observed
because of climate
change, resilience has not
been brought into the
watershed design. There
is a need to bring better

Page | 774
# Cross-cutting theme
Indicative Areas of
Enquiry and Key
Questions
Findings from research
resilience strategies to the
production system with
climate change mitigation
and adaptation practices in
rainfed areas.
• Post-project management
of natural resources like
water has not taken much
focus in the ongoing
generation of Watershed
Programs. Besides, it is
observed in states like
Rajasthan, although rarely,
that farmers over-extract
groundwater owing to
water-intensive crops.
Hence, the scheme lags in
environmental
sustainability.
• The climate change
concept has not made way
at the village level. There is
a strong lack of awareness
for climate change in the
implementation of
programs and there is a
need to educate the
people at the grass-root
level.
Page | 775
# Cross-cutting theme
Indicative Areas of
Enquiry and Key
Questions
Findings from research
• The drought-proofing
activities like Trench Cum
Bunding and farm ponds
to harvest the running
water of the field have
helped the farmer to
mitigate the drought to a
greater extent by providing
protective irrigation under
rainfed condition during
the critical growth period
of the crop.
• Crop diversification and
movement of farmer
towards allied activities
empowered the farmer to
economically sustain crop
failure under drought
condition.
• The National Rainfed Area
Authority has given ample
consideration to
understand the impact of
climate change in the new
guidelines.
Summary Analysis:
Page | 776
# Cross-cutting theme
Indicative Areas of
Enquiry and Key
Questions
Findings from research
• Climate change resilience strategies have not been brought into the watershed design
and new guidelines should focus on this.
• Post-project management of natural resources like water has not taken much focus in
the ongoing generation of Watershed Programs.
• On the ground, some states like Rajasthan, Andhra Pradesh (Chittoor district) and
Karnataka are giving exclusive training concerning water-saving technologies and
climate-resilient crops. However, this is confined to only a few states.
• There is a strong lack of awareness for climate change in the implementation of
programs and there is a need to educate the people at the grass-root level.
5.
Role of Tribal Sub-Plan (TSP)
and Scheduled Caste Sub-
Plan component of the
scheme in mainstreaming of
Tribal and Scheduled Caste
population
Funds allocated under
TSP/ SCSP and other
provisions for vulnerable
communities
• What is the fund
allocated under TSP
(Tribal Sub Plan) &
SCSP (Scheduled
Caste Sub Plan) for
each scheme?
• What has been the
effect of the TSP &
SCSP funds on
improving equity?
• Around 16.6 per cent of
the budget is released for
Schedule Caste sub-plan
and 10 per cent is released
for Tribal sub-plan. In
north-eastern states, only
10 per cent for Tribal sub-
plan is released in the
budget.
• One of the selection
criteria of the watershed at
the national level is the per
cent of SC/ST population.
• The involvement of SC/ST
population is ensured
amongst the beneficiaries.
• SC/ST farmers with the
land of their own are
Page | 777
# Cross-cutting theme
Indicative Areas of
Enquiry and Key
Questions
Findings from research
covered under the
watershed activities.
Those who are landless or
asset-less, it is ensured
that they are covered
under the livelihood
activities for which 9 per
cent is earmarked.
• While forming SHGs
adequate representation
of SC/ST population is
ensured by giving them a
priority.
• Participation of SC/ST is
also ensured in the
Watershed Committee.
Summary Analysis:
• Around 16.6 per cent of the budget is released for Schedule Caste sub-plan and 10 per
cent is released for Tribal sub-plan.
• Involvement of SC/ST population is ensured as one of the selection criteria of the
watershed at the national level is the per cent of SC/ST population.
• SC/ST population who are landless or asset-less, it is ensured that they are covered
under the livelihood activities for which 9 per cent is earmarked.
• While forming SHGs adequate representation of SC/ST population is ensured.
6.
Use of IT/Technology in
driving efficiency
Deployment of IT-enabled
mechanisms for
• Srishti & Drishti ‘Bhuvan
Portal’ developed by
ISRO/NRSC has been
Page | 778
# Cross-cutting theme
Indicative Areas of
Enquiry and Key
Questions
Findings from research
monitoring of the
Schemes
• In case of a scheme
to create physical
assets, is geotagging
and use of geotagged
photographs being
done?
• How is technology
being used for on-
ground data
collection?
• Is there an online
scheme MIS to
ensure regular
update of progress
and effective
supervision?
• What is the
granularity of data
available in MIS?
• What is the
frequency at which
the information is
being
updated/reported on
the MIS/Dashboard?
launched on 19.02.2015
for planning and
monitoring of projects.
• Srishti is a GIS-based Geo-
portal developed to assist
in monitoring, evaluation,
change assessment and
provide inputs in planning
for watershed
management and
preparation of Detailed
Project Reports (DPR).
• Drishti is the Mobile
Application tool to capture
data including visuals from
the field for real-time
monitoring of IWMP
projects. The tool can also
be used for community
monitoring of IWMP
works.
• As on 20.09.2020, about
13.75 lakh photos of
activities undertaken
during the implementation
of PMKSY-WDC of 27
States and 2 UTs have
been uploaded on Shristi
portal. These tools aid in
Page | 779
# Cross-cutting theme
Indicative Areas of
Enquiry and Key
Questions
Findings from research
the physical and qualitative
assessment of the works
undertaken. Any
shortcomings as
evidenced through Shristi
portal are appropriately
taken up on a continuous
basis by the project
implementers at the
various levels.
• The Department is
implementing the Public
Finance Management
System (PFMS) developed
by the Office of Controller
General of Accounts in
IWMP. The system is
being used to make
payments, execute
expenditure filing and
track expenditure of funds
in near real-time during the
implementation of IWMP.
• The States like Karnataka,
Andhra Pradesh,
Telangana, Gujarat,
Maharashtra, Madhya
Pradesh, Rajasthan are
leading in the use of

Page | 780
# Cross-cutting theme
Indicative Areas of
Enquiry and Key
Questions
Findings from research
technology in bringing in
efficiency.
• All States are making
efforts for the use of the
latest technology.
However, North-East and
some Eastern States are
lagging due to internet
connectivity and other
issues.
• Case study of Andhra
Pradesh226
: Within a year
of the launch, the Andhra
Pradesh government
realised that due to the
absence of
comprehensive
information
communication
technology (ICT) solution,
planning, execution and
monitoring of many
watershed projects will
turn out to be a
complicated task. The
manual system led to a
226 Watershed scheme gets a digital push in Andhra Pradesh, Viswanath Pilla , 23 Feb 2015, The Mint

Page | 781
slow pace of
implementation, funds
getting parked at various
levels unutilised and lack
of standardisation of
works leading to reduced
accuracy in terms of
budgeting. The Andhra
Pradesh government tied
up with software services
firm Tata Consultancy
Services Ltd (TCS) to build
an end-to-end application
that works on a basic
Internet connection. TCS
also runs the data centre
for the project. There are
three levels of users of the
application. One is the
state-level nodal agency
that oversees
implementation, financial,
analytical and performance
of the project; the second
is the district-level agency
which monitors physical
and financial progress and
the field level agency,
which is called the project
implementing agency,
enters details for project
sanction, generates fund
Page | 782
transfer orders and work
status reports. The project
implementing agency
works closely with village
panchayats and women’s
self-help groups in
training, enlisting workers,
execution and
maintenance of projects.
Technology allowed the
government to automate
all critical functions of
IWMP which include
detailed project reports,
basic and specific details
of work, generation of
estimates, technical and
administrative sanctions,
execution of work, entry of
muster details, and
payments227
.
• In Rajasthan, there is a
single mobile app and a
single portal where all the
line departments update
the progress, plan and
generate the completion
certificate. All the
departments are
supposed to use the
MJSA app for planning in
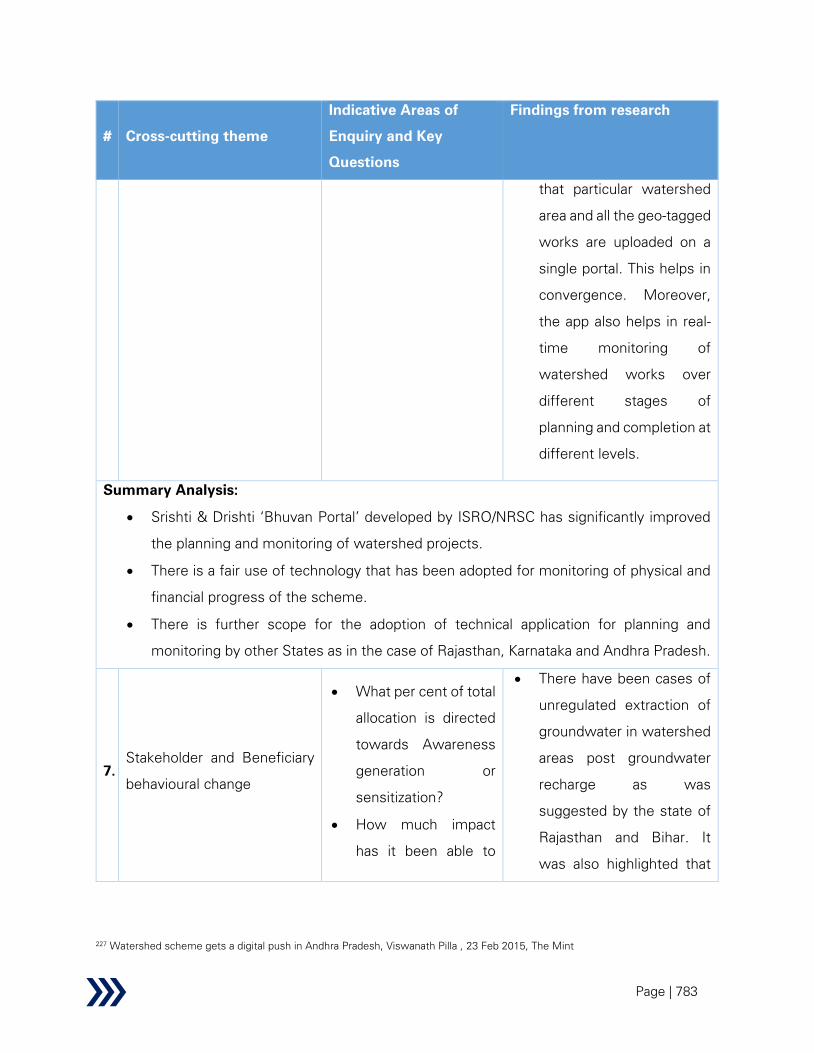
Page | 783
# Cross-cutting theme
Indicative Areas of
Enquiry and Key
Questions
Findings from research
that particular watershed
area and all the geo-tagged
works are uploaded on a
single portal. This helps in
convergence. Moreover,
the app also helps in real-
time monitoring of
watershed works over
different stages of
planning and completion at
different levels.
Summary Analysis:
• Srishti & Drishti ‘Bhuvan Portal’ developed by ISRO/NRSC has significantly improved
the planning and monitoring of watershed projects.
• There is a fair use of technology that has been adopted for monitoring of physical and
financial progress of the scheme.
• There is further scope for the adoption of technical application for planning and
monitoring by other States as in the case of Rajasthan, Karnataka and Andhra Pradesh.
7.
Stakeholder and Beneficiary
behavioural change
• What per cent of total
allocation is directed
towards Awareness
generation or
sensitization?
• How much impact
has it been able to
• There have been cases of
unregulated extraction of
groundwater in watershed
areas post groundwater
recharge as was
suggested by the state of
Rajasthan and Bihar. It
was also highlighted that
227 Watershed scheme gets a digital push in Andhra Pradesh, Viswanath Pilla , 23 Feb 2015, The Mint

Page | 784
# Cross-cutting theme
Indicative Areas of
Enquiry and Key
Questions
Findings from research
generate in terms of
behaviour change?
• What are the existing
mechanisms at the
State/District/Block
level to promote
beneficiary
awareness and
sensitization?
• What activities are
undertaken at the
District/Block level to
promote the adoption
of good practices?
SLNA does not monitor
the same but such cases
have been observed. A
behavioural change
towards sustainable
practices is required on
behalf of farmers. There is
a need for an exclusive
and robust planning
system for it, although this
component is not covered
under WDC-PMKSY.
• As per the National
Rainfed Area Authority,
Natural Resource
Governance is one of the
key issues after the
project is completed and
assets/infrastructures are
handed over to the
community. There is a
need for efficient
management of natural
resources in the post-
project period. When the
groundwater table
increases as a result of
watershed management
projects, farmers in the

Page | 785
# Cross-cutting theme
Indicative Areas of
Enquiry and Key
Questions
Findings from research
area go for water-intensive
crops like paddy and
sugarcane and drain it
again. This post-project
management of natural
resources which also
includes behaviour change
of the beneficiary has not
taken much focus in the
scheme guidelines.
• On the ground, some
states like Rajasthan,
Andhra Pradesh (Chittoor
district) and Karnataka are
giving exclusive training
concerning water-saving
technologies and climate-
resilient crops. However,
this is confined to only a
few states.
• Convergence is being
promoted with the
scheme Per Drop More
Crop.
• There is a need to develop
and impart knowledge
concerning cropping
system in sync with the
natural resources. The
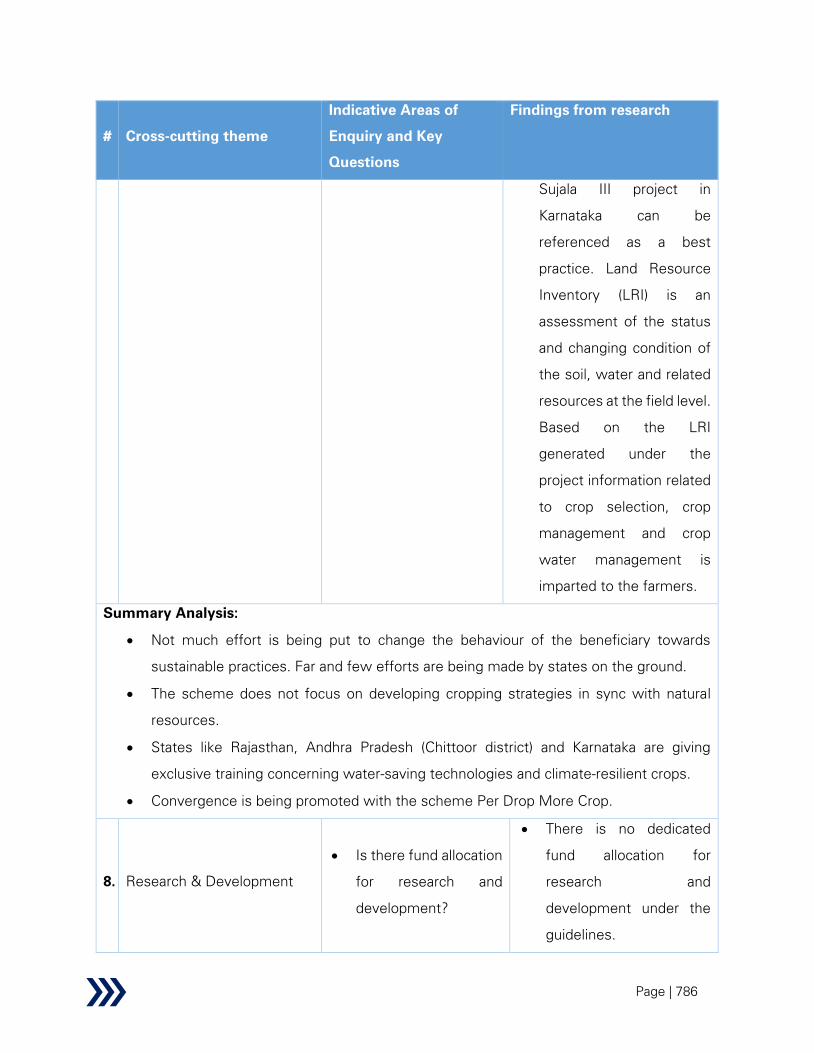
Page | 786
# Cross-cutting theme
Indicative Areas of
Enquiry and Key
Questions
Findings from research
Sujala III project in
Karnataka can be
referenced as a best
practice. Land Resource
Inventory (LRI) is an
assessment of the status
and changing condition of
the soil, water and related
resources at the field level.
Based on the LRI
generated under the
project information related
to crop selection, crop
management and crop
water management is
imparted to the farmers.
Summary Analysis:
• Not much effort is being put to change the behaviour of the beneficiary towards
sustainable practices. Far and few efforts are being made by states on the ground.
• The scheme does not focus on developing cropping strategies in sync with natural
resources.
• States like Rajasthan, Andhra Pradesh (Chittoor district) and Karnataka are giving
exclusive training concerning water-saving technologies and climate-resilient crops.
• Convergence is being promoted with the scheme Per Drop More Crop.
8. Research & Development
• Is there fund allocation
for research and
development?
• There is no dedicated
fund allocation for
research and
development under the
guidelines.

Page | 787
# Cross-cutting theme
Indicative Areas of
Enquiry and Key
Questions
Findings from research
• What activities are
being carried out
under this fund?
• Government of India has
come out with a flexi-
fund scheme to carry out
state-specific innovations
w.r.t watershed
development. The
guidelines for the same
have been issued by the
Finance Ministry.
• Earlier the amount
earmarked for innovation
was 10 per cent of the
budget. Recently it has
been revised up to 25 per
cent.
Summary Analysis:
• There is no dedicated fund allocation for research and development under the
guidelines.
• Government of India has come out with a flexi-fund scheme to carry out state-specific
innovations w.r.t watershed development.
• Earlier the amount earmarked for innovation was 10 per cent of the budget. Recently it
has been revised up to 25 per cent.
9.
Acts/regulations, regulatory
bodies and reforms
• What are the key
Acts/regulations,
regulatory bodies and
reforms governing the
scheme?
• The guidelines are the
primary guiding
document for
implementing the
scheme.
• Since the implementation
is done at the state level,

Page | 788
# Cross-cutting theme
Indicative Areas of
Enquiry and Key
Questions
Findings from research
the state-level financial
rules, vigilance and anti-
corruption laws are
applicable.
• Right to Information
applies to the scheme.
• This scheme also comes
under the DISHA
committee which
monitors all rural
development schemes.
Summary Analysis:
• The guidelines are the primary guiding document for implementing the scheme.
• The state-level financial rules, vigilance and anti-corruption laws are applicable.
• Right to Information applies to the scheme.
10.
Conjunctive use of water -
surface versus groundwater
usage optimizations
• How has conjunctive
use of water lead to
efficiencies?
• Surface versus
groundwater usage
optimizations
• What is the impact on
water use efficiency?
• As per stakeholders
given the prolonged
availability of surface
water in the monsoon,
pressure on groundwater
extraction has come
down during this period.
• Groundwater is used
mainly in the rabi season
when surface water is
scantly available.
• Unregulated extraction of
groundwater in certain
pockets in Rajasthan and

Page | 789
# Cross-cutting theme
Indicative Areas of
Enquiry and Key
Questions
Findings from research
Karnataka have been
observed leading to
groundwater depletion.
• DoLR has issued
advisories to the States,
SLNA and Agriculture
Ministry to ensure
convergence with the
scheme Per Drop More
Crop (PDMC) to enhance
water use efficiency.
• The department has been
promoting the use of drip
and sprinkler irrigation
with water-saving crops
for optimisation of water
use.
Summary Analysis:
• Given the prolonged availability of surface water in the monsoon, pressure on
groundwater extraction has come down during this period.
• Groundwater is used mainly in the rabi season when surface water is scantly available.
• DoLR has issued advisories to the States, SLNA and Agriculture Ministry to ensure
convergence with the scheme Per Drop More Crop (PDMC) to enhance water use
efficiency.
11. Unlocking Synergies with
other Government Program
• What are the
challenges hindering
effective
convergence?
• It was reported by states
like Uttar Pradesh,
Nagaland and Punjab that
inter-departmental
coordination is lagging

Page | 790
# Cross-cutting theme
Indicative Areas of
Enquiry and Key
Questions
Findings from research
• What are the areas for
potential
convergence/synergy
across govt.
programs?
which adversely affects
the convergence
between state
departments.
• Moreover, states like
Uttar Pradesh and
Nagaland highlighted that
due to lack of
convergence there has
been duplication of work
between efforts under
various schemes such as
Jal Sanchay Yojna,
MGNREGA and funds
under Gram Panchayat,
Fourteenth Finance
Commission and State
Finance Commission. All
doing the same work,
therefore, there is scope
for better convergence.
In UP, sometimes the
work done by one
department is shown by
the other department as
its own and the funds for
that work are dishonestly
claimed.
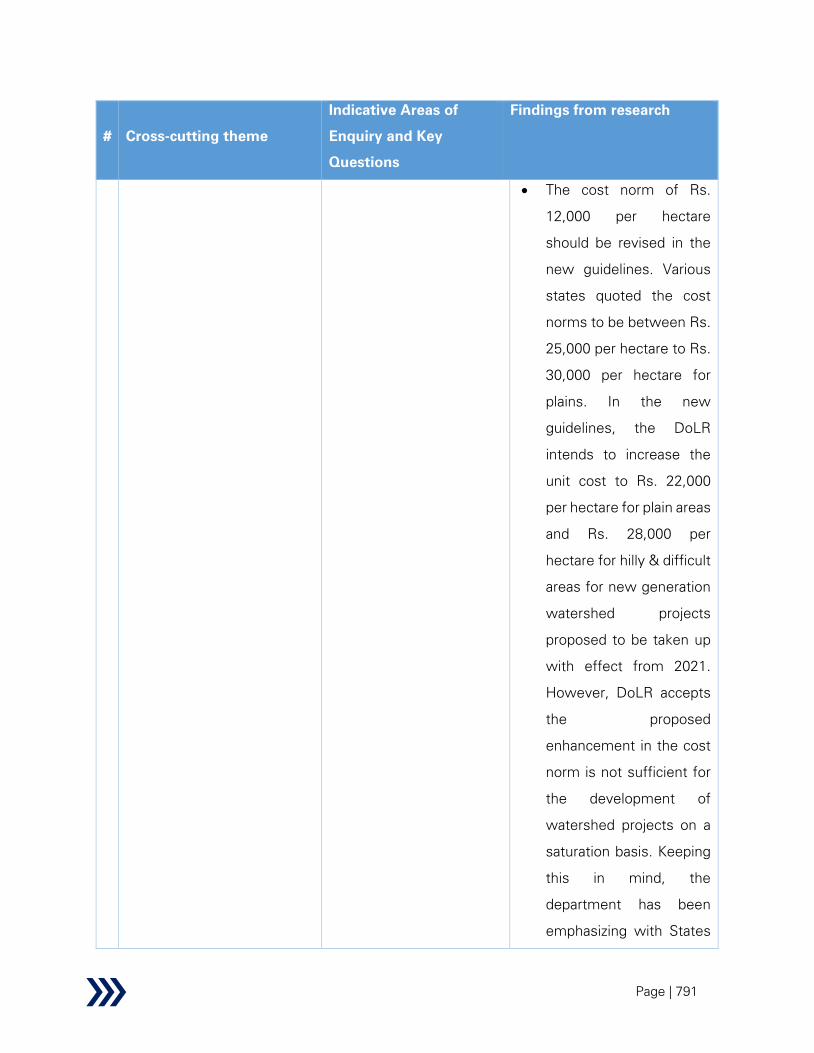
Page | 791
# Cross-cutting theme
Indicative Areas of
Enquiry and Key
Questions
Findings from research
• The cost norm of Rs.
12,000 per hectare
should be revised in the
new guidelines. Various
states quoted the cost
norms to be between Rs.
25,000 per hectare to Rs.
30,000 per hectare for
plains. In the new
guidelines, the DoLR
intends to increase the
unit cost to Rs. 22,000
per hectare for plain areas
and Rs. 28,000 per
hectare for hilly & difficult
areas for new generation
watershed projects
proposed to be taken up
with effect from 2021.
However, DoLR accepts
the proposed
enhancement in the cost
norm is not sufficient for
the development of
watershed projects on a
saturation basis. Keeping
this in mind, the
department has been
emphasizing with States

Page | 792
# Cross-cutting theme
Indicative Areas of
Enquiry and Key
Questions
Findings from research
to maximize the
convergence of the
relevant schemes of
Central and State
Governments for the
fulfilment of the gaps for
achieving the desired
impact in the watershed
areas.
• It is pertinent to mention
here that, as per the
available information with
DoLR, about 19% of the
expenditure in the
watershed project areas
has been mobilized
through convergence
with the other relevant
schemes.
• As per DoLR, the States
should expedite the
implementation and
completion of projects on
priority by optimal
utilization of available
funds and mobilizing
funds through
convergence with
schemes of similar

Page | 793
# Cross-cutting theme
Indicative Areas of
Enquiry and Key
Questions
Findings from research
nature like MGNREGA
etc. There is also a need
to ensure convergence
with MGNREGA for the
maintenance of the built
structures.
• DoLR has been taking
measures to guide states
to effective convergence
however some states like
UP, Punjab and Himachal
Pradesh have been found
wanting in this respect.
Secretaries of D/o
Drinking Water and
Sanitation, D/o Water
Resources, River
Development and Ganga
Rejuvenation, Ministry of
Jal Shakti, D/o Rural
Development & D/o
Land Resources, Ministry
of Rural Development,
GOI wrote a joint D.O
letter No.J-11060/4/2019-
RE-VI dated 24.04.2020
addressed to Chief
Secretaries of all States /
UTs, emphasizing on the

Page | 794
# Cross-cutting theme
Indicative Areas of
Enquiry and Key
Questions
Findings from research
utilization of all the
available resources of
Central schemes for
effective rainwater
harvesting and water
conservation. Besides,
DoLR also issued
advisories to States from
time to time for
maximization of
convergence for
increasing the rainwater
harvesting, conservation
and also improving water
use efficiency through
micro-irrigation etc.
Some states like Uttar
Pradesh and Punjab have
not yet created an
institutional arrangement
at the field level for
effective convergence.
Few states, namely
Andhra Pradesh,
Karnataka, Telangana,
Tamil Nadu and Bihar
have shown good
progress but states like
Uttar Pradesh and Punjab
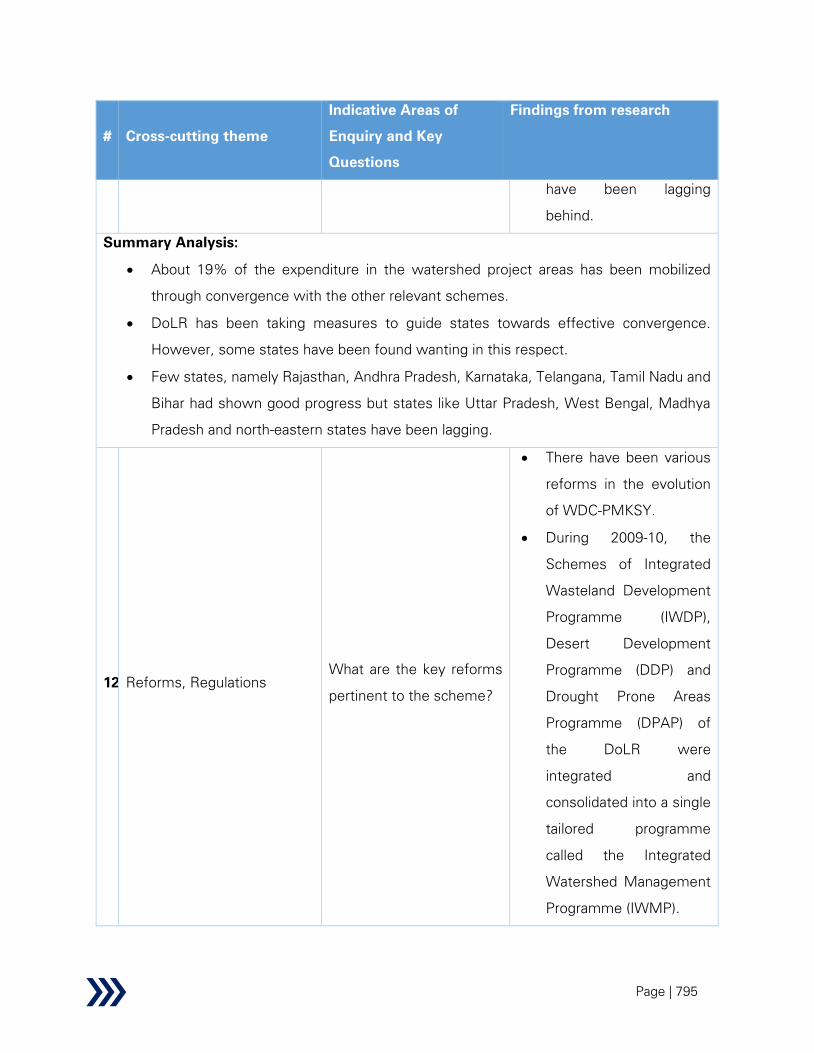
Page | 795
# Cross-cutting theme
Indicative Areas of
Enquiry and Key
Questions
Findings from research
have been lagging
behind.
Summary Analysis:
• About 19% of the expenditure in the watershed project areas has been mobilized
through convergence with the other relevant schemes.
• DoLR has been taking measures to guide states towards effective convergence.
However, some states have been found wanting in this respect.
• Few states, namely Rajasthan, Andhra Pradesh, Karnataka, Telangana, Tamil Nadu and
Bihar had shown good progress but states like Uttar Pradesh, West Bengal, Madhya
Pradesh and north-eastern states have been lagging.
12. Reforms, Regulations
What are the key reforms
pertinent to the scheme?
• There have been various
reforms in the evolution
of WDC-PMKSY.
• During 2009-10, the
Schemes of Integrated
Wasteland Development
Programme (IWDP),
Desert Development
Programme (DDP) and
Drought Prone Areas
Programme (DPAP) of
the DoLR were
integrated and
consolidated into a single
tailored programme
called the Integrated
Watershed Management
Programme (IWMP).

Page | 796
# Cross-cutting theme
Indicative Areas of
Enquiry and Key
Questions
Findings from research
• Initially, the scheme had a
sectoral focal point
primarily focusing on soil
and water conservation.
• Gradually the scope of
the scheme has widened
incorporating crop
production, horticulture
and plantation.
• Before IWMP there was
no component of
livelihood and separate
component for asset-less
people.
• Dedicated institutions
with appropriate
expertise such as SLNAs
and WCDCs were
created under IWMP.
• The mechanism of fund
release has been
changed in 2014-15
where the funds are
channelized via State
government.
• Initially, the funding
pattern was 90:10 for all
states 90 being the
Centre’s contribution.

Page | 797
# Cross-cutting theme
Indicative Areas of
Enquiry and Key
Questions
Findings from research
Later it was changed to
60:40 with north-east
continuing with 90:10.
• Initially, projects were
sanctioned in the SLNA
committee meeting, but
now State Leve
Sanctioning Committee
has been formed under
the chairmanship of the
Chief Secretary for
approving the projects.
• Under WDC funds have
been allocated for
monitoring and
evaluation with 1 per cent
each respectively.
• Earlier there was no
allotment for DPR
preparation. Now 1 per
cent has been earmarked
for the same.
• Under WDC 4 per cent
has been earmarked for
entry point activities for
capacity building and
raising awareness.
Summary Analysis:
• There have been various reforms in the evolution of WDC-PMKSY.
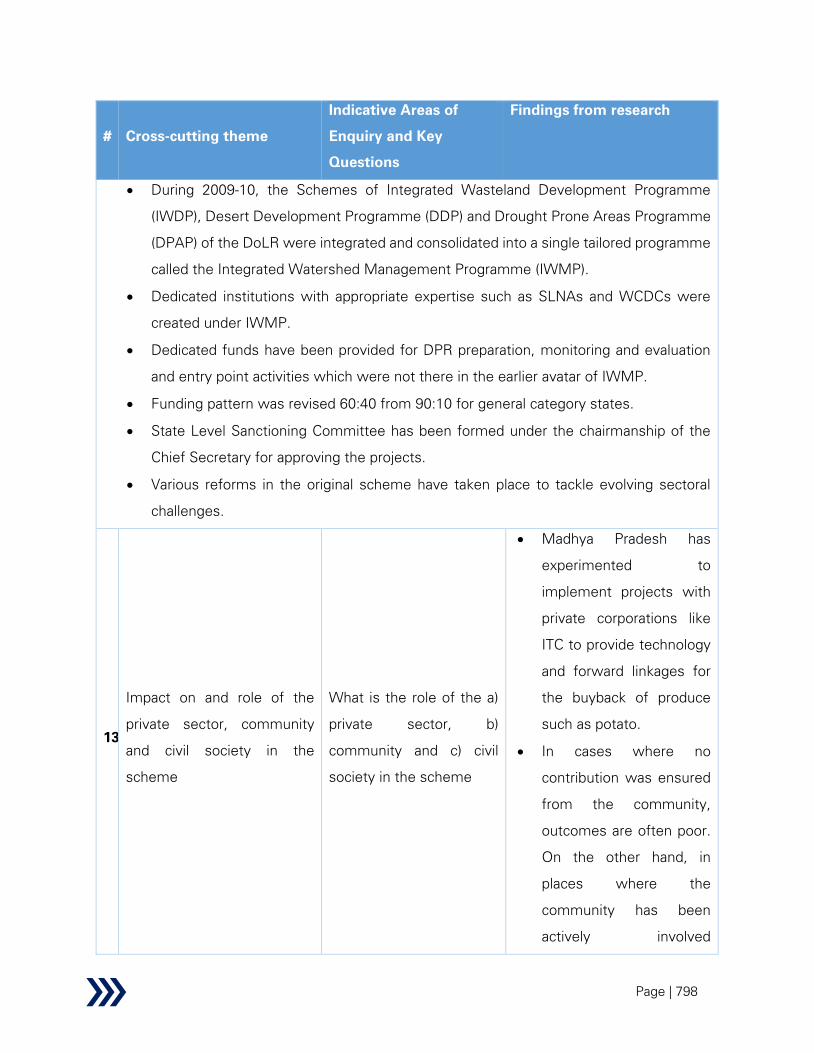
Page | 798
# Cross-cutting theme
Indicative Areas of
Enquiry and Key
Questions
Findings from research
• During 2009-10, the Schemes of Integrated Wasteland Development Programme
(IWDP), Desert Development Programme (DDP) and Drought Prone Areas Programme
(DPAP) of the DoLR were integrated and consolidated into a single tailored programme
called the Integrated Watershed Management Programme (IWMP).
• Dedicated institutions with appropriate expertise such as SLNAs and WCDCs were
created under IWMP.
• Dedicated funds have been provided for DPR preparation, monitoring and evaluation
and entry point activities which were not there in the earlier avatar of IWMP.
• Funding pattern was revised 60:40 from 90:10 for general category states.
• State Level Sanctioning Committee has been formed under the chairmanship of the
Chief Secretary for approving the projects.
• Various reforms in the original scheme have taken place to tackle evolving sectoral
challenges.
13.
Impact on and role of the
private sector, community
and civil society in the
scheme
What is the role of the a)
private sector, b)
community and c) civil
society in the scheme
• Madhya Pradesh has
experimented to
implement projects with
private corporations like
ITC to provide technology
and forward linkages for
the buyback of produce
such as potato.
• In cases where no
contribution was ensured
from the community,
outcomes are often poor.
On the other hand, in
places where the
community has been
actively involved

Page | 799
# Cross-cutting theme
Indicative Areas of
Enquiry and Key
Questions
Findings from research
throughout the project,
the success rate has been
observed to be higher.
• WDC is the only scheme
where the involvement of
the community is
absolutely necessary for
the success of the
projects.
• There is need for
sensitization of the local
community with proper
handholding for
appropriate maintenance
of assets during the O&M
phase.
• As per stakeholders Civil
society and NGOs play a
very crucial role in the
WDC project. In many
states, like Gujarat,
Karnataka, Maharashtra,
NGOs have been fully
involved in DPR
preparation, capacity
building and raising
awareness.
• Some states like Andhra
Pradesh, Madhya

Page | 800
# Cross-cutting theme
Indicative Areas of
Enquiry and Key
Questions
Findings from research
Pradesh, Maharashtra,
Uttarakhand, Telangana
have allowed NGOs to act
as Project Implementing
Agency (PIA).
• NGOs have also been
used for evaluation of
WDC projects.
Summary Analysis:
• Madhya Pradesh has experimented to implement projects with private corporations like
ITC to provide technology and forward linkages for the buyback produce such as potato.
• WDC is a scheme where the involvement of the community is absolutely necessary
for the success of the projects.
• In places where the community has been actively involved throughout the project, the
success rate has been observed to be higher.
• There is need for sensitization of the local community with proper handholding for
appropriate maintenance of assets during the O&M phase.
• Civil society and NGOs play a very crucial role in the WDC project. NGOs have been
fully involved in DPR preparation, capacity building and raising awareness. NGOs have
also been used for evaluation of WDC projects.
• Some states like Andhra Pradesh, Madhya Pradesh, Maharashtra, Uttarakhand,
Telangana have allowed NGOs to act as Project Implementing Agency (PIA).
The CST theme ‘Water sharing treaties/agreements & diplomacy’ is noted to be ‘not relevant’ for
the WDC scheme and hence it has not been evaluated.
A summary analysis and performance of the scheme on the identified themes are presented
below:
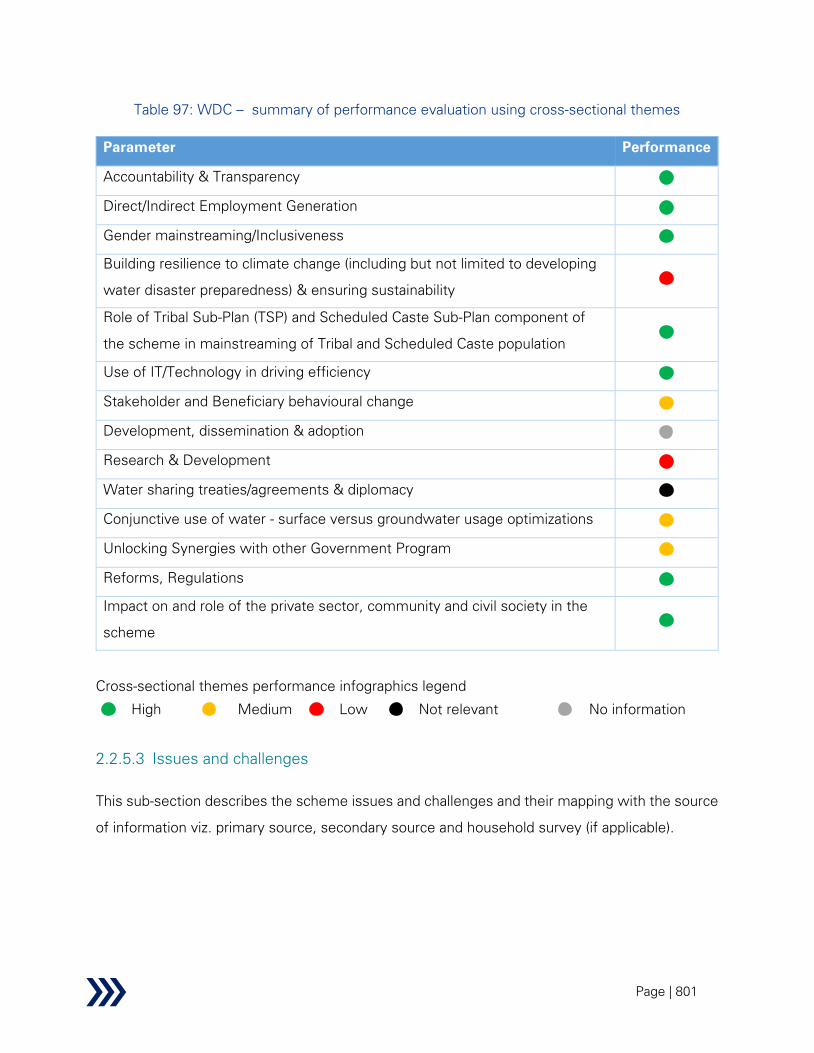
Page | 801
Table 97: WDC – summary of performance evaluation using cross-sectional themes
Parameter Performance
Accountability & Transparency
Direct/Indirect Employment Generation
Gender mainstreaming/Inclusiveness
Building resilience to climate change (including but not limited to developing
water disaster preparedness) & ensuring sustainability
Role of Tribal Sub-Plan (TSP) and Scheduled Caste Sub-Plan component of
the scheme in mainstreaming of Tribal and Scheduled Caste population
Use of IT/Technology in driving efficiency
Stakeholder and Beneficiary behavioural change
Development, dissemination & adoption
Research & Development
Water sharing treaties/agreements & diplomacy
Conjunctive use of water - surface versus groundwater usage optimizations
Unlocking Synergies with other Government Program
Reforms, Regulations
Impact on and role of the private sector, community and civil society in the
scheme
Cross-sectional themes performance infographics legend
High
Medium
Low
Not relevant
No information
2.2.5.3 Issues and challenges
This sub-section describes the scheme issues and challenges and their mapping with the source
of information viz. primary source, secondary source and household survey (if applicable).
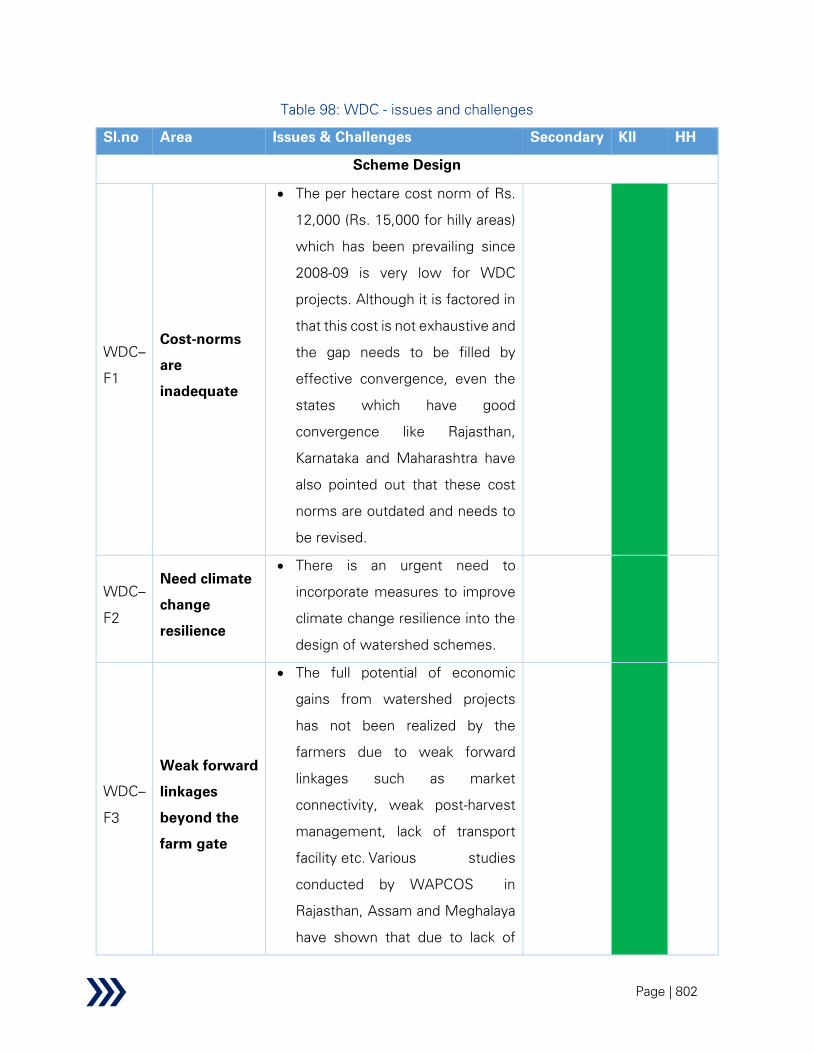
Page | 802
Table 98: WDC - issues and challenges
Sl.no Area Issues & Challenges Secondary KII HH
Scheme Design
WDC–
F1
Cost-norms
are
inadequate
• The per hectare cost norm of Rs.
12,000 (Rs. 15,000 for hilly areas)
which has been prevailing since
2008-09 is very low for WDC
projects. Although it is factored in
that this cost is not exhaustive and
the gap needs to be filled by
effective convergence, even the
states which have good
convergence like Rajasthan,
Karnataka and Maharashtra have
also pointed out that these cost
norms are outdated and needs to
be revised.
WDC–
F2
Need climate
change
resilience
• There is an urgent need to
incorporate measures to improve
climate change resilience into the
design of watershed schemes.
WDC–
F3
Weak forward
linkages
beyond the
farm gate
• The full potential of economic
gains from watershed projects
has not been realized by the
farmers due to weak forward
linkages such as market
connectivity, weak post-harvest
management, lack of transport
facility etc. Various studies
conducted by WAPCOS in
Rajasthan, Assam and Meghalaya
have shown that due to lack of

Page | 803
Sl.no Area Issues & Challenges Secondary KII HH
market facility farmers are not
taking up income-generating
activities like horticulture, raising
nursery, etc.
WDC–
F4
Role of
National
Rainfed Area
Authority
• At present National Rainfed Area
Authority is only involved in
drafting the guidelines for
watershed scheme. Besides
NRAA is also playing a very limited
role in facilitating convergence.
However, a much greater role
was envisaged for NRAA in the
2009 guidelines (revised in 2011)
where many other tasks were
assigned to it. The primary reason
cited for the diminished role is that
earlier various ministries were
involved in the watershed projects
but now only one scheme is there
and is being administered by a
single nodal department that is
the Department of Land
Resources. In 2015-16,
recognising that watershed
development is the best strategy
for the development of rainfed
areas, NRAA was entrusted to
undertake a study to prioritise the
most vulnerable districts in India.
This composite index ranked the
districts of the country based on
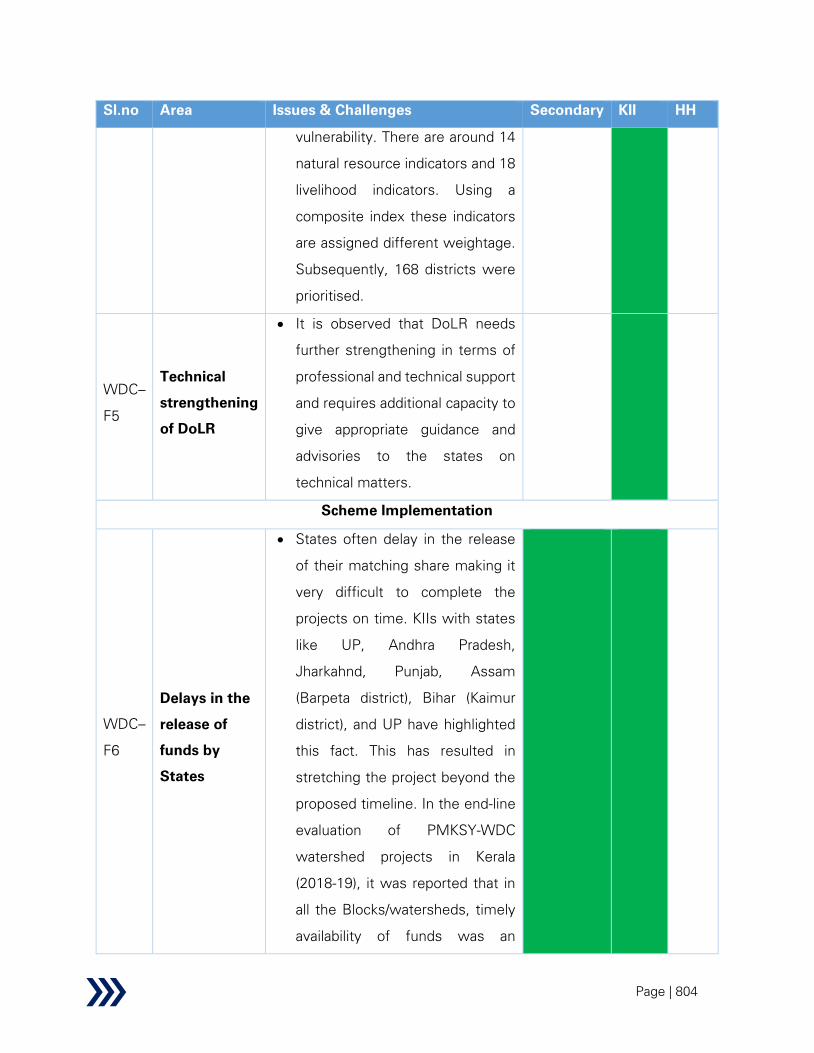
Page | 804
Sl.no Area Issues & Challenges Secondary KII HH
vulnerability. There are around 14
natural resource indicators and 18
livelihood indicators. Using a
composite index these indicators
are assigned different weightage.
Subsequently, 168 districts were
prioritised.
WDC–
F5
Technical
strengthening
of DoLR
• It is observed that DoLR needs
further strengthening in terms of
professional and technical support
and requires additional capacity to
give appropriate guidance and
advisories to the states on
technical matters.
Scheme Implementation
WDC–
F6
Delays in the
release of
funds by
States
• States often delay in the release
of their matching share making it
very difficult to complete the
projects on time. KIIs with states
like UP, Andhra Pradesh,
Jharkahnd, Punjab, Assam
(Barpeta district), Bihar (Kaimur
district), and UP have highlighted
this fact. This has resulted in
stretching the project beyond the
proposed timeline. In the end-line
evaluation of PMKSY-WDC
watershed projects in Kerala
(2018-19), it was reported that in
all the Blocks/watersheds, timely
availability of funds was an
Page | 805
Sl.no Area Issues & Challenges Secondary KII HH
important constraint leading to
undue delay in payment for the
completed works. As a result,
some works planned could not be
taken up which has unfavourably
affected the reliability and
effectiveness of implementation.
Earlier funds were directly
transferred to SLNA but now it is
channelized via state government.
It has been informed by the
SLNAs and WCDC that it can take
as much as 4 to 6 months to
release the payment and delay is
on behalf of slow processing and
tedious financial approvals. It was
also reported that delay is also
caused as a result of state utilising
the released fund for some other
work.
WDC–
F7
Delay in fund
release by
GoI
Delayed, staggered and
inadequate release of funds by
GOI stated by Jharkhand, Punjab,
Andhra Pradesh (Srikakulam
district), Assam (Barpeta district),
Bihar (Kaimur district), Karnataka
(Kolar and Devanagere district)
and UP has resulted in stretching
the project beyond the proposed
timeline. In case of absence of
proper documentation by the

Page | 806
Sl.no Area Issues & Challenges Secondary KII HH
states or deficiencies in the
proposals submitted by the states,
such delays are caused. As per
DoLR it releases the funds to
States as soon as the SLNA
submits proposals and fulfil all
criteria as per scheme guidelines.
Therefore, proper capacity
building should be done at the
state level to ensure proper
documentation and submission of
complete proposals in all respect.
Further, it must be noted that
whatever funds released to date
have not been fully utilized by the
States and every State is having
unspent balance.
WDC–
F8
Delays by
Watershed
Committees
• Watershed Committees within
the district do not complete the
works in time and therefore are
unable to utilize the available
funds as per the schedule leading
to delay in receipt of share from
the Central Government. The key
reasons for this delay are a
collection of watershed
development fund taking more
time than planned, bad weather
impeding the completion of work
and contractors not completing
the work on time.

Page | 807
Sl.no Area Issues & Challenges Secondary KII HH
WDC–
F9
Inadequate
staffing
• States like UP, Bihar, Andhra
Pradesh (Chittoor and Srikakulam
district), Karnataka (Devanagere
district) and Jharkhand (Koderma
and Latehar district) have
mentioned that they are working
with significantly lower
manpower than what is required.
This adversely impacts project
execution. This shortage is due to
both organisational structural
issues and vacancy of sanctioned
posts.
WDC–
F10
High attrition
of trained
manpower
Problems are being faced at the
state and district level to retain
trained manpower. There is high
attrition of contractual manpower
having a detrimental impact on
project success. The Watershed
Development Team (WDT)
comprises four members. One
each from social, engineering,
micro-enterprise and livelihood
background. The WDT member
receives Rs. 10,000 to 15,000. As
the budget is increasing for
everything on a day-to-day basis,
their salaries also should be
increased. It has been observed
that in some cases like in South
Bihar Districts, the salaries of
Page | 808
Sl.no Area Issues & Challenges Secondary KII HH
manpower or WDT have not been
increased for the last 5 to 10
years. It was mentioned that
hiring competent professionals
with the requisite background is
difficult at these salary levels.
Even if such professionals are
hired retaining them is difficult. As
per the guidelines, only 10 per
cent of the project cost can be
sanctioned under administration
head, therefore, the onus is on
states to ensure that proper
remuneration is given to the
employees to retain the trained
manpower. Another issue is the
inability to pay salaries on time
which is because of delay in the
release of funds.
WDC–
F11
Quality of
DPR
• The DPR, the most important
planning document, is found to be
below the desired quality in states
like Odisha, Punjab, Bihar (Kaimur
district), Jharkhand (Koderma and
Latehar district) and UP. The
DoLR informed the Standing
Committee on Rural Development
that more often than not, the
major obstacle in the delay/non-
starting of the projects was due to
the low quality of DPR which

Page | 809
Sl.no Area Issues & Challenges Secondary KII HH
failed to take into its ambit all the
issues and peculiarities of the
geographical location, its
challenges and ways for the
successful completion of the
project efficiently. There is scope
for significant improvement. A
total of 1 per cent of the fund has
been earmarked for DPR
preparation that is sufficient to
hire a reputed organisation and
procurement of scientific data. It
was reported that most technical
consultants engaged in DPR
preparation copy paste from
existing DPRs and local risk
factors are overlooked. It is also
suggested that local beneficiaries,
SHGs be more involved in the
DPR preparation phase.
WDC–
F12
Ensuring
community
participation
• In cases where no contribution
was ensured from the community
(for example Chittoor district in
Andhra Pradesh, Devanagree
district in Karnataka and Latehar
district in Jharkhand), outcomes
are poor. On the other hand, in
places where the community has
been actively involved throughout
the project, the success rate has
been observed to be higher.

Page | 810
Sl.no Area Issues & Challenges Secondary KII HH
Funds earmarked for capacity
building, raising awareness and
institution building is 5 per cent
and besides 4 per cent is kept for
Entry Point Activities which
include confidence-building of the
local community. It was found
that these funds are not fully
utilised in some cases owing to
loss of focus and laid back
approach.
WDC–
F13
Behaviour
change for
sustainable
practices
• There have been cases of
unregulated extraction of
groundwater after
implementation of watershed
projects. It was also pointed out
that it is very difficult to change
the behaviour of the farmers
unless there is an exclusive
planning system inbuilt in the
scheme in coordination with
Agriculture Department, State
Groundwater Board and Electricity
Distribution Utilities. As per
guidelines, once the project is
handed over to the community all
manpower is withdrawn and no
effort is made to ensure long term
sustainability of the natural
resources. The scheme guidelines

Page | 811
Sl.no Area Issues & Challenges Secondary KII HH
are silent on long term
environmental sustainability.
WDC–
F14
Need for
effective
convergence
• Inter-departmental coordination is
lacking in terms of information
and data sharing in some states
like Uttar Pradesh, Punjab and
Himachal Pradesh. This affects
the convergence between
departments leading to
inefficiencies. DoLR has been
taking measured to guide states
to effective convergence however
states have been found wanting in
this respect. Secretaries of D/o
Drinking Water and Sanitation,
D/o Water Resources, River
Development and Ganga
Rejuvenation, Ministry of Jal
Shakti, D/o Rural Development &
D/o Land Resources, Ministry of
Rural Development, GOI wrote a
joint D.O letter No.J-
11060/4/2019-RE-VI dated
24.04.2020 addressed to Chief
Secretaries of all States / UTs,
emphasizing on the utilization of
all the available resources of
Central schemes for effective
rainwater harvesting and water
conservation. Besides, DoLR also
issued advisories to States from

Page | 812
Sl.no Area Issues & Challenges Secondary KII HH
time to time for maximization of
convergence for increasing the
rainwater harvesting,
conservation and also improving
water use efficiency through
micro-irrigation etc.
• States like Karnataka,
Maharashtra, Rajasthan, Andhra
Pradesh, Odisha and Chhattisgarh
have done well in convergence.
On the other hand, states like
Uttar Pradesh, Madhya Pradesh,
West Bengal and the North-
Eastern states are lagging.
• As recommended by the
Parliamentary Standing
Committee on Rural
Development, a dedicated
institutional mechanism has not
been created to facilitate
convergence in some states Uttar
Pradesh, Madhya Pradesh, West
Bengal and the North-Eastern
states are lagging.
• Also, convergence is not brought
in at the planning phase of the
project.
• Convergence fails because the
departments work in silos and do
not cooperate.

Page | 813
Sl.no Area Issues & Challenges Secondary KII HH
• Rajasthan launched
Mukhyamantri Jal Swavlamban
Abhiyaan (MJSA) in 2016. 10 line
departments that are related to
water like watershed department,
the irrigation department, the
public health engineering
department, the forest
department, the groundwater
department, the NREGA
implementing agencies and the
agriculture department, the
horticulture department, etc.
came together and planned and
implemented the scheme. The
results of the scheme were very
positive as was found in the
impact evaluation done after the
first phase. Analysis conducted by
the expert committee found that
our of 21 desert districts, 16
districts showed an average
groundwater rise of 4.66 feet.
Remaining 5 districts showed a
decline in the rate of depletion.
• In addition, involvement at the
level of Chief Secretary is lacking
and regular meetings are not held
in lagging states.
• As per DoLR, coordination with
programme officers at block and
Page | 814
Sl.no Area Issues & Challenges Secondary KII HH
field level is one of the main
challenges in relation to effective
convergence. Initiatives should
also be taken at the level below
the District/Block, at the
watershed cluster level, where
actual implementation is
envisaged to address common
concerns and realize mutual
benefits. The roles of the
Panchayati Raj Institutions (PRIs)
are particularly important in this
respect and an effort needs to be
made to make them involved at all
stages of the project.228
WDC–
F15
O&M phase
sustainability
• Watershed Development Fund
that is being generated through
the Watershed Programs is on
occasions not sufficiently utilised
to manage, repair and maintain
assets being created under the
project. In places where the
community is not concerned or
actively participating, ensuring
post-project sustainability by full
utilization of WDF becomes
difficult. There is no handholding
from the Department after the
228 Evaluation Report of Bellampalli Sub Watershed, PMKSY-WD Batch-II, Block Name- Bagepalli, District Name- Chickballapur,
Karnataka

Page | 815
Sl.no Area Issues & Challenges Secondary KII HH
exit protocol which leads to lack of
motivation to ensure the
sustainability of the structures
using WDF. Moreover, utilisation
of WDF is low as once the
sarpanch of Gram Sabha is
changed focus is lost and he/she
is not interested in the utilisation
of WDF to maintain the created
structures.
WDC–
F16
Post project
sustainability
• There is need for mobilisation of
the local community from DPR
preparation to maintenance of
assets during the O&M phase.
There is no handholding after the
exit protocol which leads to lack of
motivation to ensure O&M is
carried out in a systematic
manner. Moreover, the focus on
O&M is also lost once the
sarpanch of members of Gram
Sabha is changed. Also, the HH
survey shows that lack of
awareness also contributes to the
poor condition of assets. Scheme
guidelines do not cover post-
project environmental
sustainability.
WDC–
F17
Frequent
transfers
• Frequent transfer of officials at
SLNA / district level and operating
with in-charge officers has proved

Page | 816
Sl.no Area Issues & Challenges Secondary KII HH
to be a significant bottleneck in
the implementation of the
scheme as the new staff are not
familiar with the area. Moreover,
these transfers lead to a loss of
focus in the project.
WDC–
F18
Proper
maintenance
of assets
• Impact evaluation studies
conducted earlier show that many
of the interventions/structures
implemented under the scheme
were under poor condition due to
the lack of maintenance from the
end-user. There is no support
after the exit protocol which leads
to lack of impetus to guarantee
O&M is carried out efficiently. As
reported, the scope of work is not
clear during the O&M phase,
therefore there should be clear
guidelines for O&M in WDC
scheme. Moreover, once the
gram sabha functionaries change
the whole focus is lost and WDF
is not fully utilised.
WDC–
F19
Long
gestation
period
• The long gestation period of the
projects leads to loss of focus.
Project duration was kept at 4 to 7
years to give some flexibility to
the states in the completion of the
projects. However, as per DoLR,
most of the states are completing

Page | 817
Sl.no Area Issues & Challenges Secondary KII HH
projects in 7 years which has led
to weak monitoring of the projects
and loss of focus. Also, due to a
long gestation period, many
project staff are changed or
transferred which also further
leads to loss of focus.
WDC–
F20
Post-project
management
of natural
resources
• As per the National Rainfed Area
Authority, Natural Resource
Governance is one of the key
issues after the project is
completed and
assets/infrastructures are handed
over to the community. There is a
need for efficient management of
natural resources once the
structures are handed over to the
community and Gram Sabha.
Once the project is over the
implementors hand over the
assets and moves to another
project site. Post-implementation
no handholding support is
provided to the community on
how to manage natural resources.
This post-project management of
natural resources has not been
given much focus in the ongoing
Watershed Programs.
WDC–
F21
Political
interference
• Many states (Karnataka
(Devanagere district), Assam
Page | 818
Sl.no Area Issues & Challenges Secondary KII HH
(Barpeta and Cachar District),
Andhra Pradesh (Chittoor and
Srikakulam district) and Bihar
(Kaimur and Banka district)
indicated that they face political
interference during the
implementation of the scheme.
Elected members put pressure on
the implementers to build
structures on the land of their
choice. Moreover, some
politicians at the district level
concentrate only on certain
pockets of the district and this is
influenced by personal or political
parties’ agenda rather than the
importance of the scientific
rationale for watershed
management.
WDC–
F22
Unutilised
Watershed
Development
Fund
• It was found that on completion of
projects, the remaining WDF
under the project lies unutilized in
their respective WDF accounts.
DoLR has communicated to the
states on multiple occasions to
formulate guidelines for the
utilisation of WDF. However, not
much progress has been made on
this front. The model template of
WDF guidelines has been
circulated by DoLR among all the

Page | 819
Sl.no Area Issues & Challenges Secondary KII HH
States for customization and
adoption as per States specific
conditions. It needs better
monitoring from Central as well as
from state levels. It must be noted
that for most states completion
has started in the last 2-3 years.
Watershed development fund
utilization shall only take place
after completion of the project,
not during implementation.
WDC–
F23
PSME vs
Livelihood
Component
• Under the PSME (Production
System and Micro Enterprise)
assistance is provided to farmers
who have land and this amount is
sanctioned as one time grant.
However, the grant under the
livelihood component is given to
landless and women as a
revolving fund which needs to be
returned in one year. It was
reported that this anomaly leads
to difficulty in implementation.
WDC–
F24
Dedicated
watershed
development
department
at the state
level
• It is observed that the states
which have a dedicated
watershed development
department have performed
better than other states. Such
states are Rajasthan, Karnataka,
Nagaland and Odisha. It is felt that
it is an added advantage to have

Page | 820
Sl.no Area Issues & Challenges Secondary KII HH
professionals from a
multidisciplinary background on a
full-time basis and therefore, good
results are observed on the
ground.
WDC–
F25
Systemic
delays in
project
completion
• It has been observed that there
have been systemic delays in the
completion of the projects despite
a generous 5-7 years which have
been given for project completion.
In some states, very few projects
out of the total sanctioned
projects have reached the
consolidation and completion
phase as in the case of Punjab,
Himachal Pradesh and UP. For
other states, completion has been
reported in the last 2-3 years only.
WDC–
F26
The slow
progress of
the scheme in
some states
• From the KIIs, it is learnt that the
primary reasons impeding the
progress of sanctioned projects
are; (a) strength of officials at
State Level has been reduced
over a period as the number of
ongoing projects is decreasing
year after year and no new
projects are being sanctioned with
effect from 2015; (b) Frequent
transfers of key officials at the
State Government level; and (c) In
many States, the key positions

Page | 821
Sl.no Area Issues & Challenges Secondary KII HH
related to implementation are held
only as an additional
responsibility.
WDC–
F27
Training and
capacity
building
• One of the key areas that need to
be addressed is training at the
state, district and village level on
new innovations, climate change,
crop management practices, etc.
Although currently a few steps
have been taken to impart training
on various issues of watershed
management, yet there is a need
to enhance them in terms of
quality and quantity. DoLR and
NRAA should play a greater role in
this respect.
WDC–
F28
Delay in the
release of the
instalments
• At present, GOI releases the
funds in two instalments every
year. The first instalment is
released after submitting the
Utilisation Certificate (UC) of the
previous year. The second
instalment is released after
utilizing 60 per cent of the first
instalment. Assuming that GoI
releases the first instalment in
June, the G.O for this release will
be issued in October. 60 per cent
of this amount will be utilized by
January and after submitting the
UC, the second instalment will be
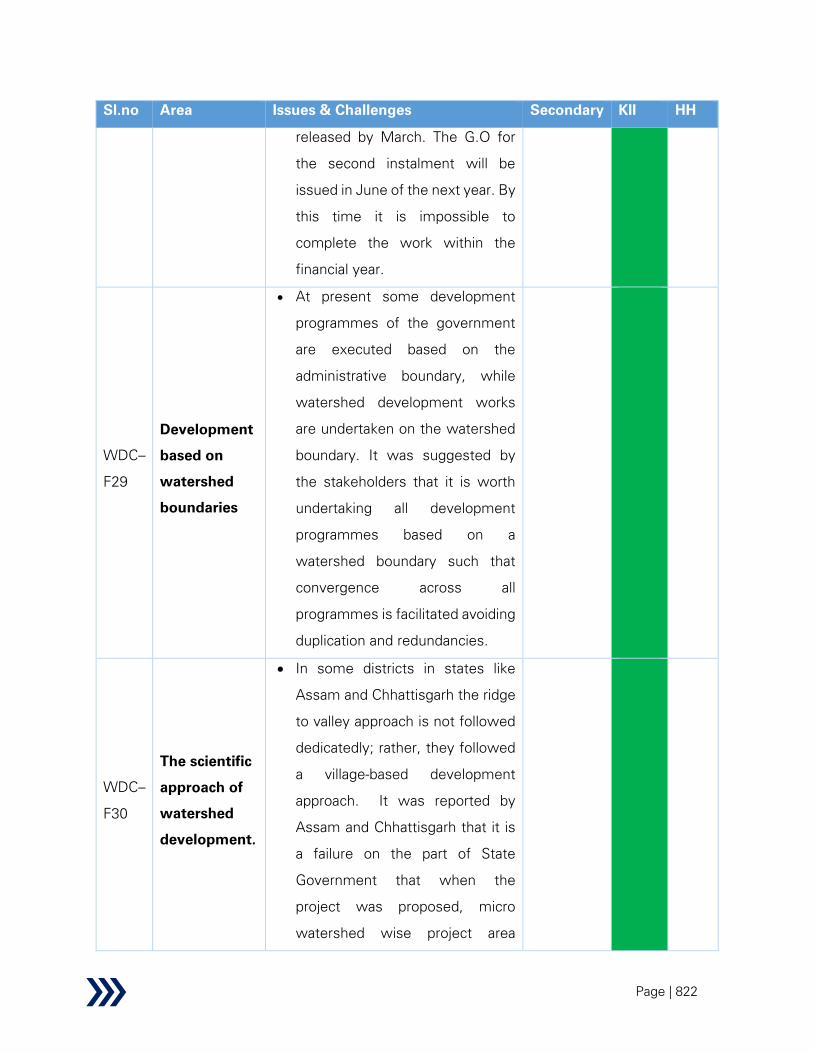
Page | 822
Sl.no Area Issues & Challenges Secondary KII HH
released by March. The G.O for
the second instalment will be
issued in June of the next year. By
this time it is impossible to
complete the work within the
financial year.
WDC–
F29
Development
based on
watershed
boundaries
• At present some development
programmes of the government
are executed based on the
administrative boundary, while
watershed development works
are undertaken on the watershed
boundary. It was suggested by
the stakeholders that it is worth
undertaking all development
programmes based on a
watershed boundary such that
convergence across all
programmes is facilitated avoiding
duplication and redundancies.
WDC–
F30
The scientific
approach of
watershed
development.
• In some districts in states like
Assam and Chhattisgarh the ridge
to valley approach is not followed
dedicatedly; rather, they followed
a village-based development
approach. It was reported by
Assam and Chhattisgarh that it is
a failure on the part of State
Government that when the
project was proposed, micro
watershed wise project area

Page | 823
Sl.no Area Issues & Challenges Secondary KII HH
selection was not done. They had
done the selection village wise. In
the preliminary project report, the
development plan was village
oriented instead of the micro
watershed-based. It is important
that the scientific approach of
watershed development is
adopted.
WDC–
F31
Scientific
preparation
of DPRs
• In some states Odisha, Punjab,
Bihar (Kaimur district), Jharkhand
(Koderma and Latehar district) and
UP, DPRs lack scientific rigour.
DPRs should be based on the
state-of-the-art scientific
approaches with the latest GIS
maps, land resource inventory
approaches, remote sensing
technology and they should be
based on scientific inputs from
various databases.
WDC–
F32
Equitable
distribution
of benefits to
beneficiaries
residing in
the Ridge vis
a vis
Valley
• One of the challenges in
watershed implementation is to
equitably distribute the benefits to
beneficiaries residing in the upper
(Ridge) and lower reaches (Valley).
Generally, the upper reaches are
defined by poor farmers with less
water availability, less
accessibility, not so good quality
of the land or landless, who are

Page | 824
Sl.no Area Issues & Challenges Secondary KII HH
the most marginalized in the area.
Whereas in the lower reaches,
people have fertile land, good
water availability, and most of the
harvesting structures are
constructed in the valley. Hence
equity issues are there and there
is a need to plan how to ensure
that small and marginal farmers,
landless families and artisans can
also be part of the development
plan during the planning stage.
WDC–
F33
Adequacy of
Watershed
Development
Fund (WDF)
• It was reported by 39.10 per cent
of the respondents in the HHS
that watershed development fund
was not adequate to sustain all
the repair and maintenance in the
post-project period. Secondary
sources229230
and KIIs in states like
Rajasthan and Jharkhand (Latehar
district) also reiterate the same
point. The mechanism at present
is that 10 per cent of the individual
investment goes to the WDF fund
(in case of SC/ST only 5 per cent).
However, poorest of the poor
cannot contribute. This leaves the
229 Final/End Term Impact Evaluation Consolidated Report, IWMP Batch-II (2010-11) Projects, Odisha, Year-2017-18
230 AFC INDIA LIMITED MUMBAI & GVT, NOIDA, Odisha-END TERM/FINAL IMPACT EVALUATION REPORT OF BATCH- I/2009-
10

Page | 825
Sl.no Area Issues & Challenges Secondary KII HH
sustainability of assets/structures
in question.
WDC–
F34
Cropping
system in a
sink with the
natural
resources
• As per NRAA, though water
conservation has been the focus
in ongoing watershed projects,
the crop production aspect is
missing. There is a need to
develop and impart knowledge
concerning cropping system in
sync with the natural resources.
Monitoring and Evaluation
WDC–
F35
Use of
technology
for
monitoring
• All States are making good efforts
for the use of the latest
technology for monitoring.
However, NE and some Eastern
States are lagging due to internet
connectivity and other issues.
WDC–
F36
Accuracy of
SRISHTI-
DRISHTI
platform
• Geospatial portal SRISHTI is being
implemented from the year 2015.
Geo-coded and time-stamped
photographs on a near real-time
basis are uploaded on SRISHTI
portal using a mobile application
DRISHTI. However, accuracy is an
issue with the app. The accuracy
level varies by as much as 30 to
40 meters. As per DoLR required
modifications are being made in
the design of the portal to mitigate
inaccuracies. Besides, there is no

Page | 826
Sl.no Area Issues & Challenges Secondary KII HH
facility for approval at the District
level. All approvals have to be
made at the State level. So, the
officials in District face problems
as they need to come again and
again to the State Head Office.
WDC–
F37
The
objectivity of
end-line
evaluation
reports
• At present, the end line impact
evaluations are sanctioned by the
SLNA for the projects undertaken
in their respective states. This
leaves the issue of transparency
and objectivity in question. It is
observed that multiple reports for
the same state but different
watersheds have the same set of
recommendations. Moreover,
there should be an arms-length
distance between the
implementing agency and
evaluating agency.
Issue relevance legend
Supported Partially
supported Not supported Not applicable
A summary analysis of issues & challenges for the scheme is presented below:
Table 99: WDC - summary of issues and challenges
Parameter Performance
Institutional Mechanism and governance
Fund flow efficiency and utilization
Unavailability of resource persons
Capacity building

Page | 827
Parameter Performance
Monitoring and evaluation
Performance infographics legend
Satisfactory Average Needs Improvement
2.2.5.4 Recommendations and solutions
This sub-section describes the scheme recommendations and solutions from the perspective of
scheme design, scheme implementation and monitoring & evaluation, along with their mapping
with the issues and challenges described in the preceding sub-section.
Table 100: WDC - recommendations and solutions
Sl.no Recommendation Finding
Scheme design
WDC – R1
The cost norms for the scheme should be revised to reflect the
current market conditions. During the interaction with
stakeholders from various states, it has emerged that the cost
norms should be between Rs. 25,000 to 30,000 per hectare for
the plains. Instead of adopting an ad hoc measure, it is proposed
that the cost norms should be rationalized by a committee of
experts who will frame a base value for major cost heads (based
on current market price). Further, an escalation formula should
be devised for year-on-year escalation or period escalation or one
round of escalation every 3rd year, which will be linked to
appropriate inflation indices (e.g. WPI).
WDC – F1
WDC – R2
While framing new guidelines, the focus should be there on
climate resilience (as it affects the rainfed areas the most). The
following areas should accommodate components pertaining to
climate change and its mitigation:
• Project planning and prioritization
• Preparation of DPR
WDC – F2
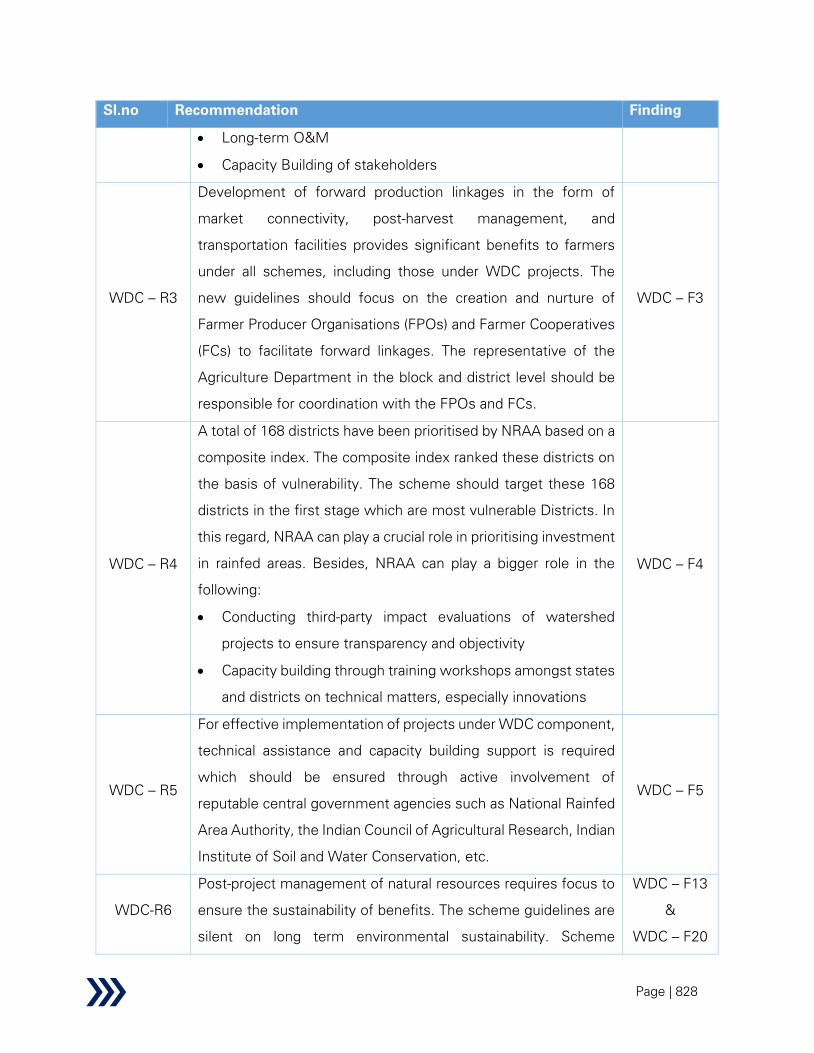
Page | 828
Sl.no Recommendation Finding
• Long-term O&M
• Capacity Building of stakeholders
WDC – R3
Development of forward production linkages in the form of
market connectivity, post-harvest management, and
transportation facilities provides significant benefits to farmers
under all schemes, including those under WDC projects. The
new guidelines should focus on the creation and nurture of
Farmer Producer Organisations (FPOs) and Farmer Cooperatives
(FCs) to facilitate forward linkages. The representative of the
Agriculture Department in the block and district level should be
responsible for coordination with the FPOs and FCs.
WDC – F3
WDC – R4
A total of 168 districts have been prioritised by NRAA based on a
composite index. The composite index ranked these districts on
the basis of vulnerability. The scheme should target these 168
districts in the first stage which are most vulnerable Districts. In
this regard, NRAA can play a crucial role in prioritising investment
in rainfed areas. Besides, NRAA can play a bigger role in the
following:
• Conducting third-party impact evaluations of watershed
projects to ensure transparency and objectivity
• Capacity building through training workshops amongst states
and districts on technical matters, especially innovations
WDC – F4
WDC – R5
For effective implementation of projects under WDC component,
technical assistance and capacity building support is required
which should be ensured through active involvement of
reputable central government agencies such as National Rainfed
Area Authority, the Indian Council of Agricultural Research, Indian
Institute of Soil and Water Conservation, etc.
WDC – F5
WDC-R6
Post-project management of natural resources requires focus to
ensure the sustainability of benefits. The scheme guidelines are
silent on long term environmental sustainability. Scheme
WDC – F13
&
WDC – F20

Page | 829
Sl.no Recommendation Finding
guidelines should specify objectives and strategies in this regard.
This will require a holistic approach with support from the state
agriculture department, animal husbandry, state groundwater
board, regulatory bodies, electricity distribution utilities, etc. As
per guidelines, once the project is handed over to the community
all manpower is withdrawn and no effort is done to ensure long
term sustainability of the natural resources. Therefore, this
aspect of post-project handholding support should be
incorporated.
Scheme implementation
WDC – R7
• To incentivize Centre and State to work together in
completion of these projects, and to ensure that funds are
released without delay, an annual or biennial ranking of the
states could be carried out based on their performance in
WDC projects. NITI Aayog could assist in the creation of the
ranking methodology. States with better ranking may be
given fiscal incentives/priority while sanctioning new projects
under WDC.
• A suitable financial system should be set up/devised to
ensure a faster flow of information between PFMS EAT
module at Centre and similar finance modules at State level.
WDC – F6
&
WDC – F7
WDC – R8
Progress on works being undertaken by Watershed Committees
(WC) needs to be monitored closely to ensure they adhere to the
agreed schedule.
To this end, IT tools and technologies (for project-specific MIS)
may be employed including:
• Satellite Data
• Geo-tagging of assets
• Mobile apps to report progress through timestamping and
photo/video upload of project progress
WDC – F8
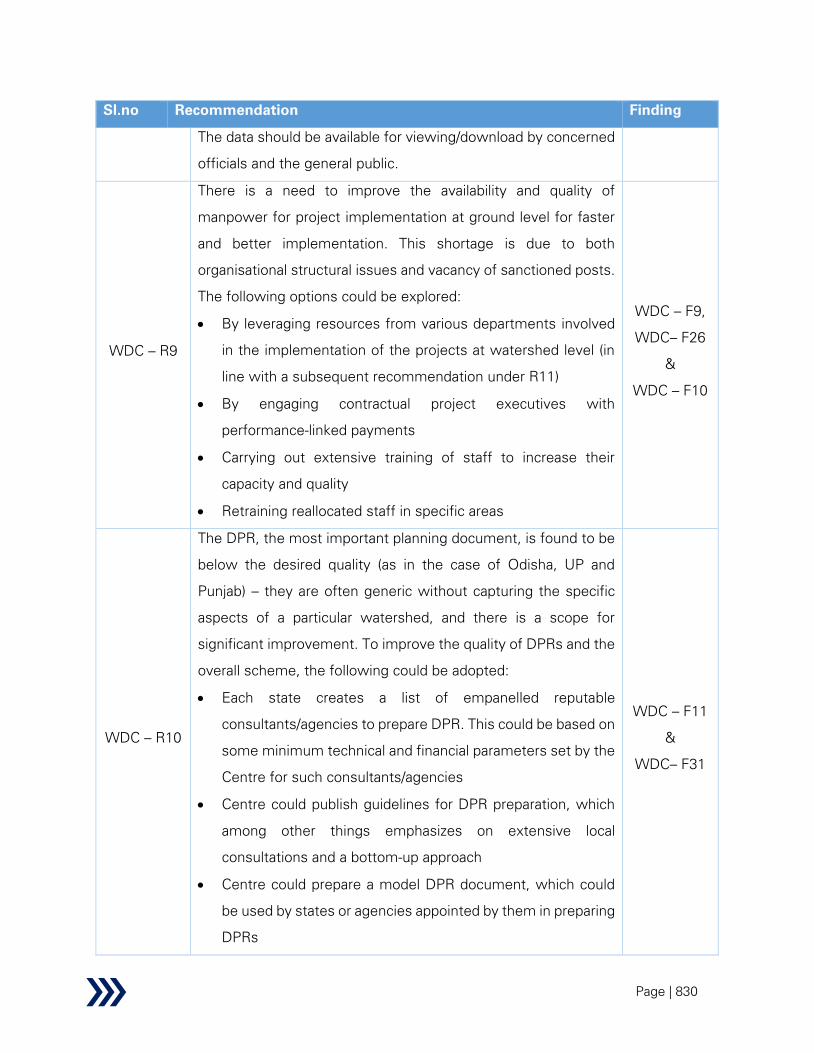
Page | 830
Sl.no Recommendation Finding
The data should be available for viewing/download by concerned
officials and the general public.
WDC – R9
There is a need to improve the availability and quality of
manpower for project implementation at ground level for faster
and better implementation. This shortage is due to both
organisational structural issues and vacancy of sanctioned posts.
The following options could be explored:
• By leveraging resources from various departments involved
in the implementation of the projects at watershed level (in
line with a subsequent recommendation under R11)
• By engaging contractual project executives with
performance-linked payments
• Carrying out extensive training of staff to increase their
capacity and quality
• Retraining reallocated staff in specific areas
WDC – F9,
WDC– F26
&
WDC – F10
WDC – R10
The DPR, the most important planning document, is found to be
below the desired quality (as in the case of Odisha, UP and
Punjab) – they are often generic without capturing the specific
aspects of a particular watershed, and there is a scope for
significant improvement. To improve the quality of DPRs and the
overall scheme, the following could be adopted:
• Each state creates a list of empanelled reputable
consultants/agencies to prepare DPR. This could be based on
some minimum technical and financial parameters set by the
Centre for such consultants/agencies
• Centre could publish guidelines for DPR preparation, which
among other things emphasizes on extensive local
consultations and a bottom-up approach
• Centre could prepare a model DPR document, which could
be used by states or agencies appointed by them in preparing
DPRs
WDC – F11
&
WDC– F31

Page | 831
Sl.no Recommendation Finding
• An automated IT based system for preparing DPRs could be
created, which generates a DPR on the input of technical
information. However, such standardisation should be done
keeping in mind the large diversity of Watershed projects and
significant customisation that may be required considering
project location, topography, climatic conditions, rainfall
pattern, hydrology, etc. Further, it is important to involve local
stakeholders in the formulation of DPR – since significant
local knowledge lies with them. So, the standard templates
should be flexible enough to incorporate such customizations
that may be required.
• A national-level PMU is formed for vetting and approving all
DPRs for the scheme.
WDC – R11
Community participation in some projects (for example Chittoor
district in Andhra Pradesh, Devanagree district in Karnataka and
Latehar district in Jharkhand) is low and this can be increased by
undertaking entry point activities and capacity building (for which
9% of funds are allocated under the scheme guidelines). To
ensure adequate community participation, there should be
proper documentation of community oversight (digitized
attendance registers, photo/video uploads of meetings with
timestamps). Further, before and during project implementation,
the project benefits should be properly disseminated, and
awareness created. A social audit should be performed, and
beneficiaries and stakeholders should be encouraged to report
any deviation during project implementation.
WDC – F12
&
WDC – F16
WDC – R12
The States should expedite the implementation and completion
of projects on priority by mobilizing funds through convergence
with schemes of similar nature. Similar to what has been
suggested by the Parliamentary Standing Committee on Rural
Development a dedicated institutional mechanism may be
WDC – F14
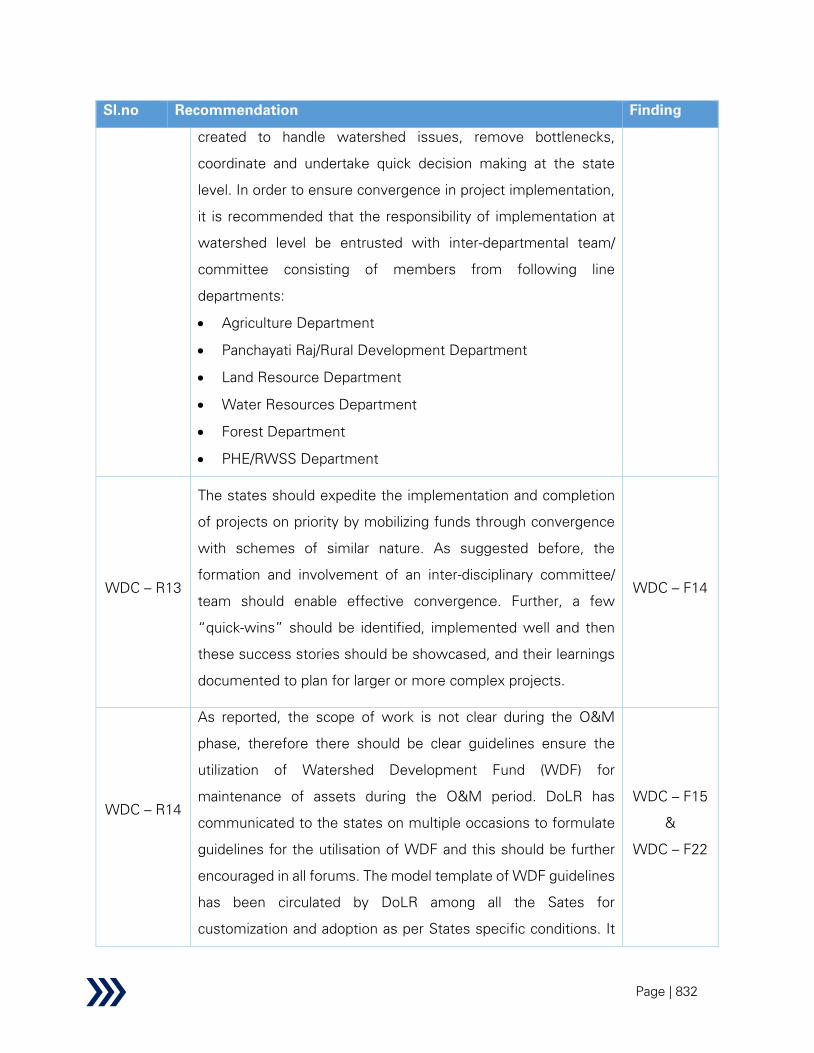
Page | 832
Sl.no Recommendation Finding
created to handle watershed issues, remove bottlenecks,
coordinate and undertake quick decision making at the state
level. In order to ensure convergence in project implementation,
it is recommended that the responsibility of implementation at
watershed level be entrusted with inter-departmental team/
committee consisting of members from following line
departments:
• Agriculture Department
• Panchayati Raj/Rural Development Department
• Land Resource Department
• Water Resources Department
• Forest Department
• PHE/RWSS Department
WDC – R13
The states should expedite the implementation and completion
of projects on priority by mobilizing funds through convergence
with schemes of similar nature. As suggested before, the
formation and involvement of an inter-disciplinary committee/
team should enable effective convergence. Further, a few
“quick-wins” should be identified, implemented well and then
these success stories should be showcased, and their learnings
documented to plan for larger or more complex projects.
WDC – F14
WDC – R14
As reported, the scope of work is not clear during the O&M
phase, therefore there should be clear guidelines ensure the
utilization of Watershed Development Fund (WDF) for
maintenance of assets during the O&M period. DoLR has
communicated to the states on multiple occasions to formulate
guidelines for the utilisation of WDF and this should be further
encouraged in all forums. The model template of WDF guidelines
has been circulated by DoLR among all the Sates for
customization and adoption as per States specific conditions. It
WDC – F15
&
WDC – F22

Page | 833
Sl.no Recommendation Finding
needs better monitoring from Central as well as from state
levels. Guidelines issued by Karnataka can be treated as model
guidelines and can be modified by states as per their
requirement. Alternatively, guidelines to manage WDF can be
formulated and incorporated in the new scheme guidelines by
the ministry. This is essential for the sustainability of watershed
projects. Capacity building of new functionaries at the gram
sabha should be done in the post-project period to ensure
continued support for O&M. Transparency in the WDF fund
utilization and its social scrutiny is a must for all watersheds.231
WDC – R15
In the O&M phase of watershed projects, proper monitoring
should be carried out and awareness should be created among
the beneficiaries and handholding support should be provided
after the implementation of the scheme to ensure proper
maintenance of project assets by the beneficiaries. To enable
capacity building at the village level, a multi-level programme
could be adopted:
• State-level officials to be trained by Central organizations (like
NRAA) as Trainers
• District-level officials to be trained by trainers in State Level
as grassroot trainers
• Block and Village level stakeholders to be trained by the
grassroot trainers
Further, a booklet or guidebook could be created in multiple
languages for knowledge dissemination and training of village
level stakeholders.
All training materials for the above training programs should also
be made available through a portal to be created for the program.
WDC – F18
231 Final Evaluation Report, Project name: IWMP-II, Koijhar nala, BLOCK–Dharamjaigarh, DISTRICT-Raigarh, CHHATTISGARH

Page | 834
Sl.no Recommendation Finding
The same portal may also be utilized for disseminating best
practices, sharing success stories between states, rolling out e-
learning courses, etc.
WDC – R16
To reduce subjectivity and undue influence on the projection
selection and planning process, it is recommended that all
activities should be planned based on scientific principles using
satellite and other reliable/authentic data and properly
documented guidelines. The DPR documents should be very
specific and identify the area where structures should come up.
Once, this is frozen, with proper monitoring using IT-based tools
it should be ensured that there is no deviation. Further, the work
and the locations where the structures should come up should
be communicated to all stakeholders through signages and the
beneficiaries should be encouraged to report any deviation.
WDC – F31
&
WDC – F11
WDC – R17
There are equity issues between upper reaches (Ridge) and
lower reaches (Valley), which are inhabited by poor farmers and
rich farmers respectively. Most of the harvesting structures are
constructed in the valley. This can be mitigated to an extent by
the involvement of multiple departments as recommended.
In addition to this, the scheme planning, and design should also
ensure social equity – by ensuring the involvement of and
benefits to weaker sections including SC/ST, women, landless
farmers, etc. This may be ensured by putting weightage on
social equity at the time of selection of SHGs as well as selection
and prioritization of projects.
There should be an added emphasis on livelihood component,
which supports the poorer farmers/stakeholders in a watershed.
Two possible options based could be:
• Reallocation of the one-time grant currently provided to the
PSME to the livelihood component
• Ensuring the livelihood component is covered under NRLM
WDC– F23
&
WDC– F32
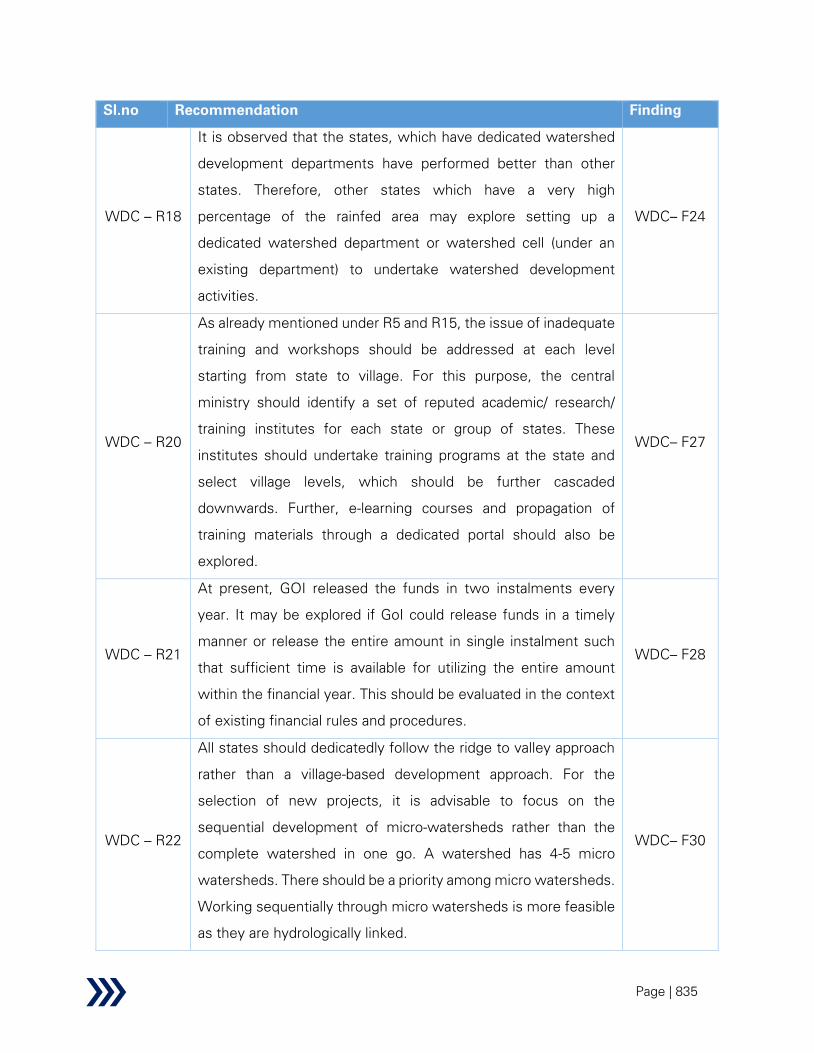
Page | 835
Sl.no Recommendation Finding
WDC – R18
It is observed that the states, which have dedicated watershed
development departments have performed better than other
states. Therefore, other states which have a very high
percentage of the rainfed area may explore setting up a
dedicated watershed department or watershed cell (under an
existing department) to undertake watershed development
activities.
WDC– F24
WDC – R20
As already mentioned under R5 and R15, the issue of inadequate
training and workshops should be addressed at each level
starting from state to village. For this purpose, the central
ministry should identify a set of reputed academic/ research/
training institutes for each state or group of states. These
institutes should undertake training programs at the state and
select village levels, which should be further cascaded
downwards. Further, e-learning courses and propagation of
training materials through a dedicated portal should also be
explored.
WDC– F27
WDC – R21
At present, GOI released the funds in two instalments every
year. It may be explored if GoI could release funds in a timely
manner or release the entire amount in single instalment such
that sufficient time is available for utilizing the entire amount
within the financial year. This should be evaluated in the context
of existing financial rules and procedures.
WDC– F28
WDC – R22
All states should dedicatedly follow the ridge to valley approach
rather than a village-based development approach. For the
selection of new projects, it is advisable to focus on the
sequential development of micro-watersheds rather than the
complete watershed in one go. A watershed has 4-5 micro
watersheds. There should be a priority among micro watersheds.
Working sequentially through micro watersheds is more feasible
as they are hydrologically linked.
WDC– F30

Page | 836
Sl.no Recommendation Finding
WDC – R23
For post-project maintenance, there should be a fixed amount
from the project itself which will enhance project sustainability.
Moreover, there should be a mechanism to enhance these
resources by CSR funds or involvement of IFIs. An appropriate
amount of money can be left with SLNA as a fixed deposit for
the maintenance of assets which have been created under a
project.
WDC– F33
WDC – R24
There is a need to develop and impart knowledge concerning
cropping system in sync with the natural resources. Therefore,
the capacity building and training modules should incorporate
specific topics on cropping system for overall success and
sustainability of the watershed projects.
WDC– F34
Monitoring and evaluation
WDC – R25
At the National level, there is a need to augment professional
capacity for better and effective monitoring. This should be
ensured through active involvement of National Rainfed Area
Authority, the Indian Council of Agricultural Research, Indian
Institute of Soil and Water Conservation, etc. Further, the central
ministry should also consider engaging professional agencies for
setting up a program monitoring unit.
WDC – F35
WDC – R26
The accuracy of Bhuvan-SRISHTI portal varies by as much as 30
to 40 meters sometimes. Accuracy of the app should be
improved by technical upgradation.
WDC – F36
WDC – R27
All approvals for WDC projects are currently made at the State
level. It is recommended that some of the approving powers
should be delegated to the Nodal Officer at the District level or
to the inter-departmental team/ committee (as recommended
under R11) so that implementation process is expedited.
WDC – F36
WDC – R28
At present, the end line impact evaluations are sanctioned by the
SLNA for the projects undertaken in their respective states. This
leaves the issue of transparency and objectivity in question.
WDC – F37
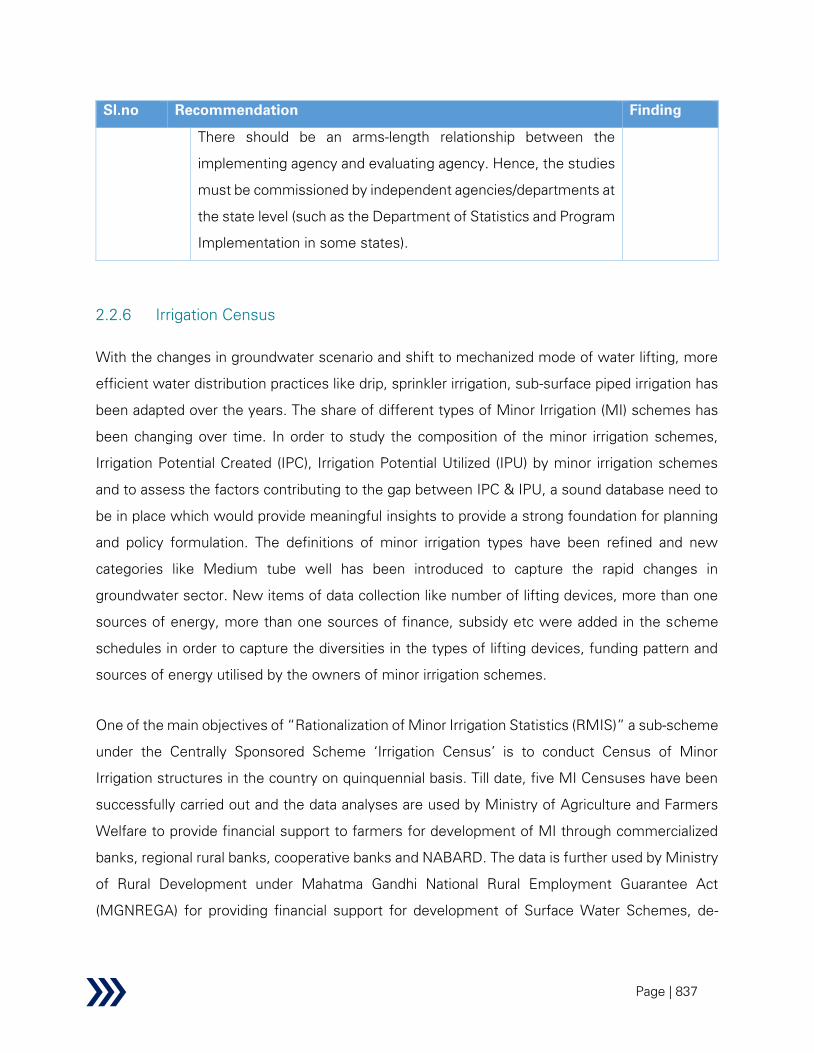
Page | 837
Sl.no Recommendation Finding
There should be an arms-length relationship between the
implementing agency and evaluating agency. Hence, the studies
must be commissioned by independent agencies/departments at
the state level (such as the Department of Statistics and Program
Implementation in some states).
2.2.6 Irrigation Census
With the changes in groundwater scenario and shift to mechanized mode of water lifting, more
efficient water distribution practices like drip, sprinkler irrigation, sub-surface piped irrigation has
been adapted over the years. The share of different types of Minor Irrigation (MI) schemes has
been changing over time. In order to study the composition of the minor irrigation schemes,
Irrigation Potential Created (IPC), Irrigation Potential Utilized (IPU) by minor irrigation schemes
and to assess the factors contributing to the gap between IPC & IPU, a sound database need to
be in place which would provide meaningful insights to provide a strong foundation for planning
and policy formulation. The definitions of minor irrigation types have been refined and new
categories like Medium tube well has been introduced to capture the rapid changes in
groundwater sector. New items of data collection like number of lifting devices, more than one
sources of energy, more than one sources of finance, subsidy etc were added in the scheme
schedules in order to capture the diversities in the types of lifting devices, funding pattern and
sources of energy utilised by the owners of minor irrigation schemes.
One of the main objectives of “Rationalization of Minor Irrigation Statistics (RMIS)” a sub-scheme
under the Centrally Sponsored Scheme ‘Irrigation Census’ is to conduct Census of Minor
Irrigation structures in the country on quinquennial basis. Till date, five MI Censuses have been
successfully carried out and the data analyses are used by Ministry of Agriculture and Farmers
Welfare to provide financial support to farmers for development of MI through commercialized
banks, regional rural banks, cooperative banks and NABARD. The data is further used by Ministry
of Rural Development under Mahatma Gandhi National Rural Employment Guarantee Act
(MGNREGA) for providing financial support for development of Surface Water Schemes, de-

Page | 838
silting of ponds, defunct water bodies to improve storage capacity and creating scope for water
availability for irrigation.
2.2.6.1 Background
Water being a critical input and keeping in view the importance of assured supply of water for
agriculture, the number of major, medium and minor irrigation has increased substantially in India
over the years. On account of introduction of a large number of minor irrigation schemes in
particular, the area under irrigation has also increased significantly.
Minor irrigation schemes are defined as those irrigation schemes or structures, in either
groundwater or surface water category, which have Culturable Command Area (CCA) up to 2000
ha. Owing to low capital investment, short gestation period and widespread coverage, they
deliver irrigation benefits to millions of farmers and account for a major share (> 60 %) of the
total irrigation economy of the country.
The Ministry of Water Resources, River Development and Ganga Rejuvenation (MoWR) conducts
a census of minor irrigation structures to obtain detailed information on their existence,
ownership, working condition, cost of construction, operational expenses and related issues. The
census provides a clear picture of the distribution and utilization of different types of minor
irrigation schemes and is the only available data at the national scale on minor irrigation. So far,
five minor irrigation censuses (MIC) have been completed with reference years 1986-87 (GoI
1993), 1993-94 (GoI 2001), 2000-01 (GoI 2005), 2006-07 (Go 2014) and 2013-14 (GoI 2017).
Objectives of Minor Irrigation Census and Census of Water Bodies
The main objective of the census is to build up a comprehensive and reliable database in Minor
Irrigation (MI) sector for effective planning and policy making. The Census throws light on
important aspects like IPC and IPU through minor irrigation structures (both ground and surface
water), water distribution practices employed by owners of these schemes and also sources
used for energisation of these MI schemes.
The other purpose of MI census is also to study he changes in utilization pattern of these
schemes across time and regions. As of now, the Minor irrigation Census provides a

Page | 839
comprehensive and reliable source of data at the national, regional, state and local scale on minor
irrigation schemes.
Methodology
• The methodology adopted for conducting MI Census involves canvassing paper-based
enumeration schedules for collecting village level and MI scheme-wise data in the rural
areas.
• The village schedules are usually canvassed by Patwaries (field enumerators) through
enquiries with the scheme owners. In case of institutional schemes, the information is
collected through available records.
• Most of the States / UTs conduct field work (canvassing of Village and Scheme level
Schedules) through the Nodal Department and offices of the concerned Department at
District, Block and Village level. Some States entrust the work to private / third party
agencies.
• Steering committees are formed in every State headed by Secretary of the Nodal
Department and members of various departments like Revenue, Irrigation, PRI, State
Planning, NSSO provide technical inputs.
• State Statistical Cell are formed in every State, headed by the Census Commissioner
selected by the States. The State Statistical Cell is responsible for managing the operations
on daily basis pertaining to the Survey. The State Statistical Cell is supported by the MI Stat
Wing of MoWR, RD & GR.
• The enumerators visit the villages and collects information on MI Structures from the
scheme owners. Certain information relating to the scheme is collected by the enumerators
by physical examination of the scheme.
• After filling up the schedules, the enumerators are required to deposit all completed
schedules with the Block development Officer/Officer-in-charge at the block level.
• The overall quality of field work was monitored by Block/District/State level officers, who in
order to ensure the correctness of data conducted frequent site visits of the schemes as per
prescribed norms and checked the entries made by primary enumerators. In addition, Central
team along with the State Statistical Cell officials conducted field visits in the States/UTs
and checked the quality of field work.
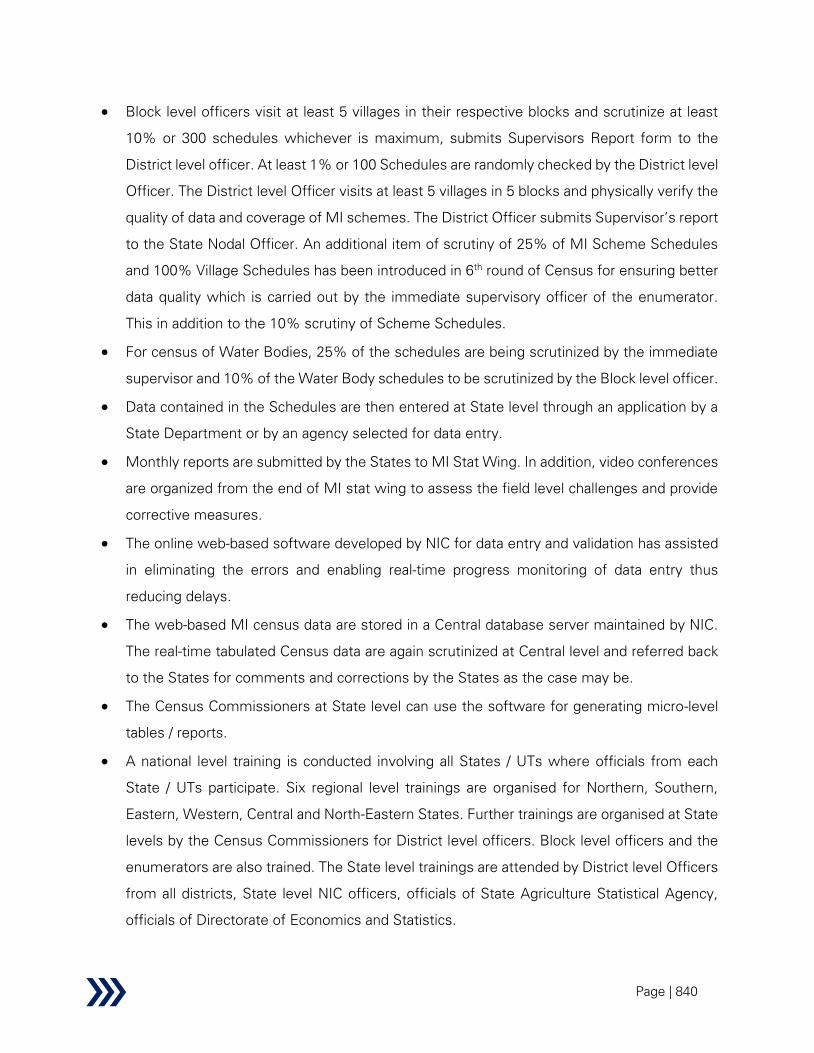
Page | 840
• Block level officers visit at least 5 villages in their respective blocks and scrutinize at least
10% or 300 schedules whichever is maximum, submits Supervisors Report form to the
District level officer. At least 1% or 100 Schedules are randomly checked by the District level
Officer. The District level Officer visits at least 5 villages in 5 blocks and physically verify the
quality of data and coverage of MI schemes. The District Officer submits Supervisor’s report
to the State Nodal Officer. An additional item of scrutiny of 25% of MI Scheme Schedules
and 100% Village Schedules has been introduced in 6th
round of Census for ensuring better
data quality which is carried out by the immediate supervisory officer of the enumerator.
This in addition to the 10% scrutiny of Scheme Schedules.
• For census of Water Bodies, 25% of the schedules are being scrutinized by the immediate
supervisor and 10% of the Water Body schedules to be scrutinized by the Block level officer.
• Data contained in the Schedules are then entered at State level through an application by a
State Department or by an agency selected for data entry.
• Monthly reports are submitted by the States to MI Stat Wing. In addition, video conferences
are organized from the end of MI stat wing to assess the field level challenges and provide
corrective measures.
• The online web-based software developed by NIC for data entry and validation has assisted
in eliminating the errors and enabling real-time progress monitoring of data entry thus
reducing delays.
• The web-based MI census data are stored in a Central database server maintained by NIC.
The real-time tabulated Census data are again scrutinized at Central level and referred back
to the States for comments and corrections by the States as the case may be.
• The Census Commissioners at State level can use the software for generating micro-level
tables / reports.
• A national level training is conducted involving all States / UTs where officials from each
State / UTs participate. Six regional level trainings are organised for Northern, Southern,
Eastern, Western, Central and North-Eastern States. Further trainings are organised at State
levels by the Census Commissioners for District level officers. Block level officers and the
enumerators are also trained. The State level trainings are attended by District level Officers
from all districts, State level NIC officers, officials of State Agriculture Statistical Agency,
officials of Directorate of Economics and Statistics.

Page | 841
Apart from training on concepts, definitions, schedules and instruction manual, field training is
also imparted. The details of the methodology adopted for the census, its procedure, concepts
and definitions etc. are discussed thoroughly and necessary clarifications are also given in such
trainings.
2.2.6.2 Performance
Performance on REESI+E framework
Table 101: IC - performance evaluation using REESIE framework
Parameter Findings from research
Relevance Secondary:
The Centrally Sponsored Plan Scheme “Rationalisation of Minor
Irrigation Statistics (RMIS)” was initiated in 1987 – 88 with 100% Central
assistance to the States / UTs. During XIth
Five Year Plan, RMIS was a
part of Central Sector Scheme “Development of Water Resources
Information System (DWRIS)”. In XIIth
Plan RMIS was taken as a
subcomponent under “Irrigation Census” and currently Minor Irrigation
Census is a standalone component under umbrella scheme “Pradhan
Mantri Krishi Sinchai Yojana”.
The necessity of MI Census is to generate and establish a robust
database and analysis on Minor Irrigation Schemes to formulate policies
on water resources planning.
The gap between IPC and IPU in 5th
MI Census has reduced as compared
to that in 4th
MI census. The IPC-IPU gap in 4th
MI census was 20.5 mha
and that in 5th
MI Census was 18.2 mha. Hence there was reduction of
2.3 mha of IPC-IPU Gap. In such scenario Irrigation Census is relevant in
identifying the IPC-IPU gap and reasons therein and developing policies
to reverse the same.
Identification of all Minor Irrigation sources is undertaken through the
census as all rural and urban water bodies are covered after taking into
account existing data available from Wetland Atlas and other such
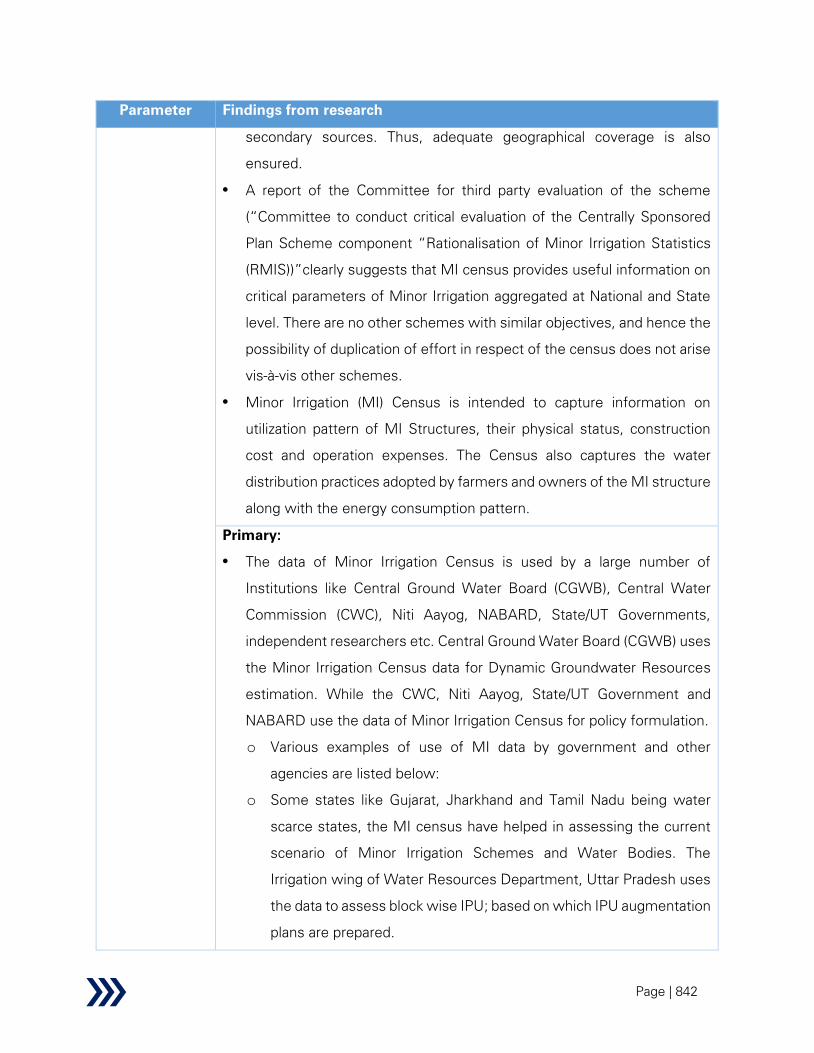
Page | 842
Parameter Findings from research
secondary sources. Thus, adequate geographical coverage is also
ensured.
A report of the Committee for third party evaluation of the scheme
(“Committee to conduct critical evaluation of the Centrally Sponsored
Plan Scheme component “Rationalisation of Minor Irrigation Statistics
(RMIS))”clearly suggests that MI census provides useful information on
critical parameters of Minor Irrigation aggregated at National and State
level. There are no other schemes with similar objectives, and hence the
possibility of duplication of effort in respect of the census does not arise
vis-à-vis other schemes.
Minor Irrigation (MI) Census is intended to capture information on
utilization pattern of MI Structures, their physical status, construction
cost and operation expenses. The Census also captures the water
distribution practices adopted by farmers and owners of the MI structure
along with the energy consumption pattern.
Primary:
The data of Minor Irrigation Census is used by a large number of
Institutions like Central Ground Water Board (CGWB), Central Water
Commission (CWC), Niti Aayog, NABARD, State/UT Governments,
independent researchers etc. Central Ground Water Board (CGWB) uses
the Minor Irrigation Census data for Dynamic Groundwater Resources
estimation. While the CWC, Niti Aayog, State/UT Government and
NABARD use the data of Minor Irrigation Census for policy formulation.
o Various examples of use of MI data by government and other
agencies are listed below:
o Some states like Gujarat, Jharkhand and Tamil Nadu being water
scarce states, the MI census have helped in assessing the current
scenario of Minor Irrigation Schemes and Water Bodies. The
Irrigation wing of Water Resources Department, Uttar Pradesh uses
the data to assess block wise IPU; based on which IPU augmentation
plans are prepared.

Page | 843
Parameter Findings from research
o The Urban Local Bodies use the Water Bodies data to assess the
status of surface water and accordingly plan activities for Urban
water supply. Jharkhand has used the MI census data to identify
illegal encroachments on water bodies and this has helped the
authorities to deal with such cases legally.
o As deliberated by stakeholders from Bihar, Assam and Sikkim, the
MI census process has created demand for new Minor Irrigation
schemes amongst the villagers. The villagers themselves help the
district officials in identifying potential spots for groundwater
sources.
o Gujarat practises Participatory Irrigation Management and hence the
census data and the analyses have helped the Irrigation Department
to plan for water distribution system amongst the farmers using
Minor Irrigation sources. States like Rajasthan use the data to
monitor the status of the deep tubewells. Planning for costing of the
repair of the tubewells is done based on the status of the tubewells.
o “Kaleshwaram Project”, a state sponsored scheme by Govt. of
Telangana is using the MI census data for renovating the MI
Schemes.
o Independent researchers use the data collected through Minor
Irrigation Census for research purposes.
Inference:
Data from the latest minor irrigation census coupled with data collected
through selective sample studies will help to identify the factors
influencing delivery efficiency of minor irrigation systems at the state
level and help estimate the supply of water for minor irrigation.
These reports provide state-wise data not only on IPC and IPU of
groundwater and surface water systems, but also the potential of the
systems that are in use. Analysis of primary data collected alone can help
identify the reasons behind the changes in supply side and demand gaps
and their respective contributions.

Page | 844
Parameter Findings from research
Independent researchers have used the MI census data and provided
important insights in relation to growth of groundwater structures,
energy crisis, regional variations in India’s groundwater economy
amongst several others.
Therefore, the scheme has been rated as ‘satisfactory’ on this
parameter.
Effectiveness Secondary:
The process of MI census has evolved over years. Till date five MI
censuses has been completed and it is observed that each MI census
had unique components included.
o The first census of MI works was conducted with 1986-87 as the
reference year in all states and union territories except Rajasthan
o The second MI census was conducted with 1993-94 as the
reference year, and it provided district-wise and scheme-wise
information for 21 states and four union territories, excluding Gujarat
and Maharashtra, and the union territories of Chandigarh, Daman and
Diu, and Lakshadweep. Additional information on sprinkler & drip
irrigation were collected. Information on use of non-conventional
energy sources was included for the first time and data was
computerized with assistance from NIC for the first time.
o The third MI census was conducted with 2000-01 as the reference
year. It covered 33 states and union territories, excluding Daman and
Diu, and Lakshadweep.
o The fourth MI census covered 33 states and union territories,
excluding Daman and Diu, and Lakshadweep. Information on use of
non-conventional energy sources was included for the first time.
Information on use of non-conventional energy sources was included
for the first time
o In fifth MI census, data entry and validation were done online for the
first time in the portal developed by NIC. Real-time progress
monitoring of data entry and validation was also made available

Page | 845
Parameter Findings from research
through the portal. The fifth MI Census was conducted with
reference year 2013-14 across the country in 33 States/ UTs except
Daman and Diu, Dadra and Nagar Haveli and Lakshadweep.
o First Census of Water Bodies as a part of sixth MI census covering
all Rural and Urban Local Bodies was considered along with census
of sixth MI Census.
It is also seen that with MI census over the years, the coverage has
increased which reflects the effectivity of Irrigation Census
Irrigation Census Total Groundwater
schemes covered
Total Surface water
schemes covered
First (1987) 1,21,97,471 9,17,511
Second (1993-94) 96,51,992 7,71,500
Third (2000-01) 1,85,03,268 12,48,931
Fourth (2006-07) 1,97,57,820 12,48,853
Fifth (2013-14) 2,05,20,305 11,92,249
As Minor Irrigation Census continued over the years from 1986-87, data
tabulation and presentation has improved. The tables contained State-
wise aggregate data viz., number of MI Schemes, IPC, IPU, crop-wise
irrigation, sources of finance for construction of schemes, distribution of
schemes as per social category, type of farmers and many other
parameters.
Also, the MI Census contained State / UT wise detailed tables separately
thus providing an assessment of state specific situation. District level
data is available on the website of the Ministry while details below
district level can be obtained through NIC unit in the Ministry after a
request is made to the Ministry indicating the purpose for which data is
being sought and due approval of the request.
New items of data collection like number of lifting devices, types of
energy sources, financial sources, subsidy etc. were added in the
scheme schedules.

Page | 846
Primary:
o Data validation checks have been inbuilt in the data entry process
through software. For the first time, online web-based software was
developed for computerisation of data of the 5th MI census by the
National Informatics Centre (NIC). This eliminated the need for
separate installation of software in States/UTs, as in previous
Census. The Progress Monitoring tool provides real-time progress
updates during data collection and allows for timely corrective
actions both at the Central as well as State/UT level, thereby
reducing delays and improving data accuracy.
o The data of Minor Irrigation Census is used by a large number of
Institutions like Central Ground Water Board (CGWB), Central Water
Commission (CWC), Niti Aayog, NABARD, State/UT Governments,
Researchers etc.
o CGWB uses the Minor Irrigation Census data for Dynamic
Groundwater Resources estimation. Block wise number of dug well,
shallow tube well and deep tube well have been utilized. Data on
type of lifting device and source of energy are also utilized by CGWB.
o Data on Culturable Command Area (CCA) is utilized for comparison
and rationalization of unit draft in the context of Dynamic GW
Resource estimation.
o CWC, Niti Aayog and State/UT Government use the data of Minor
Irrigation Census for policy formulation.
o Data collected under Minor Irrigation Census especially information
on source of finance, lifting device, source of energy etc are used by
NABARD.
o Independent researchers use the data collected under Minor
Irrigation census to understand how minor irrigation has evolved
over years.
o Irrigation Census data and its analyses are available up to the district
level. In addition, the data upto village level of the censuses
conducted so far are available in the public domain https://data.gov.in/
Page | 847
In addition, the schedules of enquiry, published reports and
guidelines for data collection of the previous censuses are available
at http://micensus.gov.in/ along with a dashboard which facilitates easy
dissemination of 5th
MI census data. The inferences from the data
and its analyses however do not reach the blocks and villages,
particularly in areas with limited or no internet connection. As a
result, the issues and challenges pertaining to groundwater and
surface water minor irrigation structures remain unavailable to the
farming community in such areas.
o Census of Water Bodies is done by using GIS application through
mobiles, which has been included as new module in 6th
Irrigation
Census. Most of the States have conducted the census of water
bodies without much difficulty by virtue of extensive capacity
building and handholding. Significant capacity building measures
have helped the enumerators to capture data and supervisors in
minimizing the errors. All States agreed to the fact that Irrigation
Census helps in identifying villages having scarcity of water
resources. After publishing of the results, such issues are discussed
and the fund availability for augmenting irrigation schemes in such
villages are elaborately discussed by the district authorities. Such
meetings are attended by all departments. Decisions are taken in
such meetings for preparing DPRs specific to those villages.
o At State level, revenue department contributes enormously towards
MI census, providing land use statistics to the Statistical Cells. This
has been acknowledged by all the States. The officials of revenue
department also extend their support towards training of the
enumerators as well as in monitoring of the data collected.
o The Principal Secretary of the nodal department or Chief Engineer is
the Census Commissioner for the State. The responsibility of
implementing the Census in a State lies with the Census
Commissioner. He is assisted by a Statistical Cell headed by a Joint
Page | 848
Director or Assistant Director supported by five other officials in a
large State or two other officials in a small State.
o The nodal department has its structure at the district and below
levels which undertake the Census work under the overall guidance
and supervision of the State Statistical Cell.
o In states like Bihar, community involvement is ensured through
panchayat. The validation of the enumerated data is done by the
Ward members and ensures the completeness and coverage of
Minor Irrigation schemes and Water Bodies. The analyses of the
Irrigation Census data particularly for Ground Water Irrigation are
communicated to the villagers. Issues like depletion of groundwater
level are communicated to concerned villages in form of alerts.
o States like Andhra Pradesh, Telangana and Tamil Nadu have gone
ahead with geo-tagging of all minor irrigation sources. Thus, a
database for minor irrigation is in place, which is being used by
Agriculture departments for planning.
o Although the MI census reports has elaborated on major key
performance indicators like IPC, IPU, gap between IPC & IPU, CCA,
state-wise ground and surface water scheme performances, power
supply and discharge of water, etc. but does not covers socio-
economic parameters like livelihood generated from
operationalisation of minor iriigation, change in income level of
farmers, spending on health, education, etc.

Page | 849
Parameter Findings from research
Inference:
It is understood from the previous Irrigation Census Reports and
deliberations by the National and State Stakeholders that, adequate
analyses are done for minor irrigation viz., IPC, IPU, IPC-IPU gap, CCA,
source of finance for private MI scheme development, utilisation
potential of ground and surface water etc. However, no analyses are
done for socio-economic parameters like cost-benefit analysis of MI
schemes, livelihood change, spending on education and health and
migration.
It is apparent that detailed tabulation of data is done for usage by key
stakeholders in minor irrigation like CGWB, CWC, Water Resources
Department at States, NITI Aayog for policy formulation and preparing
master plans. No evidence for data dissemination or usage at the
grassroot level (viz. block, panchayat and village) was made available
during the KIIs. Varied level of sharing is seen across the states. While
in some states, the findings on groundwater sources are shared and
discussed with the farmers, in other states, the data is used for planning
by the district level officials only.
Extensive application of GIS for census of Water Bodies has been done
in the 6th
MI census which has helped the ULBs and the Zilla Parishads
in identifying these Water Bodies and identifying administrative issues
like encroachments, garbage disposal, etc.
Major issues like scarcity of groundwater have been effectively identified
on account of Minor Irrigation Census. Area specific groundwater level
data has been captured and proposals for augmentation of groundwater
are being prepared by the respective authorities.
Therefore, the scheme has been rated as ‘satisfactory’ on this
parameter.
Efficiency Secondary:
Prior to initiation of Irrigation Census, states need to collect data from
various departments. At times, states faced many challenges in
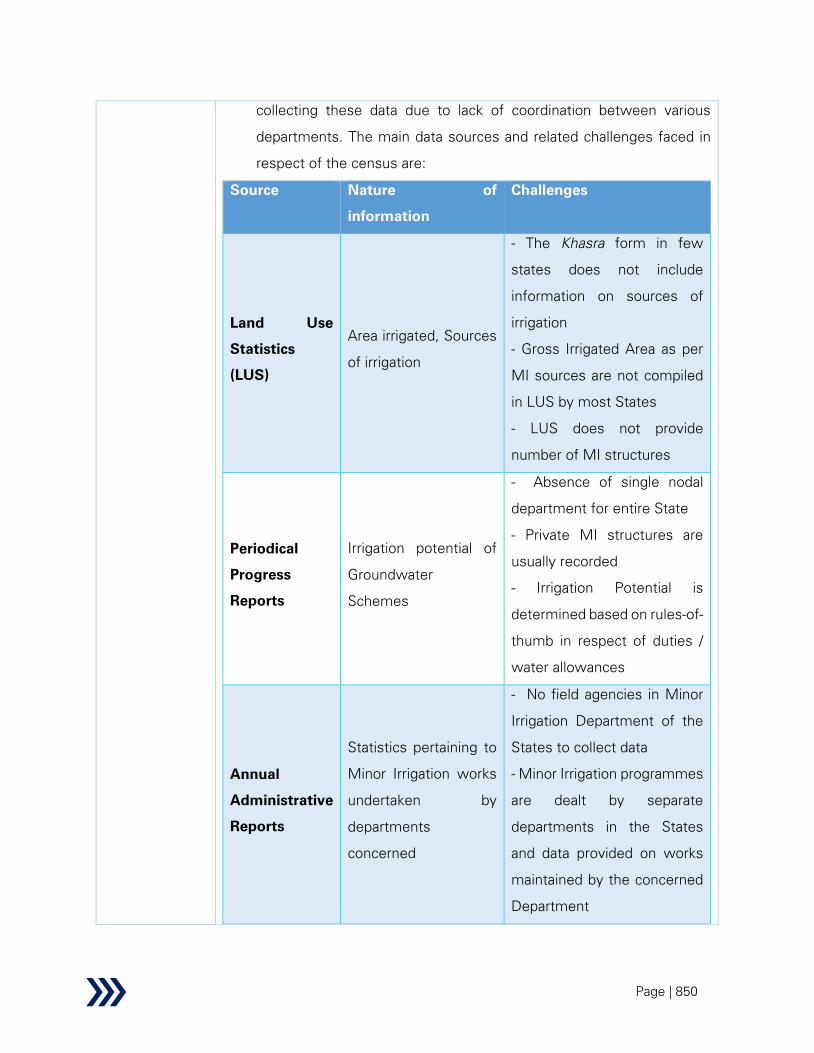
Page | 850
collecting these data due to lack of coordination between various
departments. The main data sources and related challenges faced in
respect of the census are:
Source Nature of
information
Challenges
Land Use
Statistics
(LUS)
Area irrigated, Sources
of irrigation
- The Khasra form in few
states does not include
information on sources of
irrigation
- Gross Irrigated Area as per
MI sources are not compiled
in LUS by most States
- LUS does not provide
number of MI structures
Periodical
Progress
Reports
Irrigation potential of
Groundwater
Schemes
- Absence of single nodal
department for entire State
- Private MI structures are
usually recorded
- Irrigation Potential is
determined based on rules-of-
thumb in respect of duties /
water allowances
Annual
Administrative
Reports
Statistics pertaining to
Minor Irrigation works
undertaken by
departments
concerned
- No field agencies in Minor
Irrigation Department of the
States to collect data
- Minor Irrigation programmes
are dealt by separate
departments in the States
and data provided on works
maintained by the concerned
Department

Page | 851
Parameter Findings from research
Ad-hoc
Reports
These reports are
intended to focus on
socio-economic impact
- Priorities and weightage
given to irrigation data for
minor irrigation statistics
suffer from several
deficiencies
The Patwaris who are primarily responsible for data collection generally
are not able to devote enough time required for collection of LUS data,
leading to inefficiencies in Census process.
Primary:
• Extensive support is provided by Secretary, Department of Water
Resources, RD & GR, Ministry of Jal Shakti with the representatives
from NITI Aayog, Ministry of Agriculture, Ministry of Panchayati Raj,
National Statistics Office, Registrar General Office, Ministry of Rural
Development, Ministry of Housing and Urban Affairs, Central Water
Commission, Central Ground Water Board.
• For the first time, a dedicated online portal for 5th Minor Irrigation
(MI) Census has been developed which facilitated online data entry,
updation, validation and tabulation. Since data can be accessed by
both Central level and State level users in real-time, the bottlenecks
in data entry and validation were removed instantaneously which
resulted in quick processing /verification of data and finalization of
results.
• The tools for data collection and validation have changed from manual
process to digital, resulting in less errors and quicker turnaround and
dissemination of results. However, as per the KII with the State
counterparts (Nodal Officers and Census Commissioners), five out of
six states with whom KIIs were conducted so far, are still continuing
with manual filling up of Village and Scheme Schedules, although
Page | 852
data tabulation and validation is done by all states through software
developed by NIC.
• In addition, a Steering Committee for conduct of 6th
Minor Irrigation
Census and Census of Water Bodies under the Centrally Sponsored
Scheme “Irrigation Census” has been constituted under the
Chairmanship of Secretary, (WR, RD & GR) with Chairman, Central
Water Commission (CWC), Chairman Central Ground Water Board
(CGWB), Director General, National Sample Survey Organization,
Director General, Economic Statistics Division, Ministry of Statistics
and Programme Implementation (MoSPI), Advisor (Water
Resources), NITI Aayog, Joint Secretary (Governance), Ministry of
Panchayati Raj, Joint Secretary (Swatch Bharat Mission), Ministry of
Housing & Urban Affairs, JS & FA, Department of WR, RD & GR,
Additional Registrar General and Deputy Director General (Census),
O/o Registrar General India, Deputy Director General (Agriculture
Census), Ministry of Agriculture , Cooperation and Farmers Welfare,
Joint Secretary (MGNREGA), Department of Rural Development,
Secretary (Revenue), Government of Rajasthan, Member Secretary,
Minor Irrigation and Ground Water Department, Government of Uttar
Pradesh, Special Chief Secretary, Planning Department, Government
of Telangana, Additional Chief Secretary and Financial Commissioner
(Revenue), Government of Haryana, Additional Chief Secretary,
Water Resources Investigation and Development Department,
Government of West Bengal, Secretary, Water Resources and River
Development Department, Government of Sikkim, Commissioner
(SPR), Ministry of Jal Shakti, DDG, National Informatics Centre (NIC)
as Members and Wing in-charge, Minor Irrigation Statistics Wing,
Ministry of Jal Shakti as Member Secretary to guide and advise the
conduct of the Census.
• Each State has identified a nodal department for the implementation
of the Census. Depending on the State, it is either Revenue or

Page | 853
Parameter Findings from research
Agriculture or Minor Irrigation or Directorate of Economics and
Statistics.
• A structured monitoring system is in place thus ensuring timely
submission of data and ensuring desired data quality. All States
follow the workflow as directed by MI Stat Wing. On account of the
monitoring system, 4 Sates have completed the field work and
another 9 States have completed more than 80% of the field work.
These States were on track to complete the field survey at the time
of writing this report but were delayed due to the current pandemic
situation.
• In states of Tamil Nadu, Andhra Pradesh and Telangana the data
collected during MI Census are compared with the MI data available
with departments like Panchayat and Rural Development,
Municipalities, Agricultural Department, Water Resources
Department, etc. The gaps are identified thereof, and corrective
actions are taken by the State Statistical Cell.
• For MI census, Revenue Village is the basic unit, which helps in
assessing the water resources in a village, enabling village specific
proposals and not source specific. This approach helps in identifying
issues on water resources for a geographically defined area. The
authorities are also able to prioritize the area based on the severity of
the problems.
• A case study of Andhra Pradesh is deliberated below which
elaborates on the “paperless” approach adopted by the State thus
replacing the manual canvassing of minor irrigation schedules.
CASE STUDY – ENUMERATION OF MI DATA IN ANDHRA
PRADESH
Andhra Pradesh is one of the few States that have conducted
“Paperless” 6th
Minor Irrigation Census. During the State Level
Coordination Committee (SLCC) meeting prior to execution of 6th
MI census it was decided to conduct the survey through tab/mobile

Page | 854
Parameter Findings from research
app without canvassing the schedules to save time and avoid data
entry errors. Accordingly, customized software was developed in
house. Tab / mobile app was developed with android version for
canvassing all schedules of 6th
Minor Irrigation Census and Census
of Water Bodies. All the 5 schedules (Ground Water, Surface
Water, Census of Water Bodies in Rural and Urban areas and
Village schedule) as designed by GoI were integrated into 3
schedules covering all the information. “Postgre SQL” is used for
storing the captured data through tab/mobile application.
Trainings were conducted to the field and supervisory functionaries
at State, District and Mandal level before commencement of the
census.
Pilot survey was done to test the application covering all the
schedules of groundwater, surface water schemes and water
bodies @ 2 schemes each in all 13 districts both in Rural and Urban
areas. All the table scrutiny checks have been incorporated in the
app as per instructions of GoI. Photographs along with latitudes
and longitudes of water bodies are captured in the Census of
Water Bodies. The app has been developed with provision to
upload the canvassed data automatically in the NIC software
structure in one go through back end bulk data entry.
Exclusive Web portal (http://aproms.ap.gov.in/mic6/dashboard)
was established for day to day monitoring of the fieldwork of 6th
MIC & CWB featuring different MIS Reports viz., (1) Survey
progress (2) Schemes covered and pace (3) Supervision status and
(4) Other reports. WhatsApp group was formed to resolve the field
level issues and to share the clarifications. Senior Officers from
DE&S were allotted districts for monitoring and supervision. Core
Group Team was Constituted with group of officials. The team
visited all districts and explained the process of rectification of

Page | 855
Parameter Findings from research
errors in the portal at mandal level as part of validation of the
enumerated data.
Inference:
From the above facts it is evident that, Minor Irrigation Census is a well-
coordinated event at National level. However, during KIIs, states (Nodal
Officers and Census Commissioners) reported a lack of coordination
with other departments (except for Revenue Department). As per the
secondary sources, challenges are faced by the Nodal department and
the State Statistical Cell in obtaining relevant ground level information
from other State departments.
Except Andhra Pradesh and West Bengal, all States are still continuing
data collection through canvassing of paper-based Village and Scheme
Schedules. This approach is time consuming and even on-spot validation
cannot ensure that data collected are error free.
Online data tabulation and data validation modules developed by NIC has
helped in reducing time-lag and cost of survey. The web-based approach
has also helped the State Statistical Cell in checking data quality and
referring back to the Districts for necessary clarifications with minimum
time lag.
The data is uploaded to a designated website, data tables are easily
accessed by all officials at State, District and Block level.
The Key Informant Interviews (KIIs) with State and district level
stakeholders reveal that contribution of departments like revenue,
panchayat and rural development, agriculture, municipal affairs and
water resources have significantly contributed towards providing base
data and monitoring of the data. In most of the States, these
departments have actively participated in the process and contributed to
the technical aspects of minor irrigation.
Most of the States have ensured full coverage of Minor Irrigation
schemes and water bodies both in rural and urban areas. In some states
Page | 856
Parameter Findings from research
like Uttar Pradesh, Bihar, Karnataka, Jharkhand, the panchayat samitis
also extend their support in ensuring that no sources are left out.
Steering Committee has been formed in every state, which extends
support in resource mobilization for the survey. The Steering Committee
has provided technical support to the State Statistical Cell.
Hand holding measures on data collection and canvassing of schedules
is done through Intensive field visits undertaken by the supervisors.
Need for refresher training for selected enumerators is ascertained and
trainings are conducted based on the observations made during such
visits.
Therefore, the scheme has been rated as ‘satisfactory’ on this
parameter.
Sustainability Secondary:
With the existing institutional and operational framework at National,
State, District, Block and Village level, since 4th
Minor Irrigation Census,
there has been no disruption of MI census.
Minor Irrigation Census being Centrally Sponsored Scheme with 100 per
cent Central Funding and hence the States do not have any financial
burden of executing MI Census activities or part of the activities.
As per the SFC, the report of the Committee, on third party
evaluation(Committee for evaluation of Centrally Sponsored Plan
Scheme component “Rationalisation of Minor Irrigation Statistics
(RMIS)”) has clearly stated that MI Census is the only comprehensive
and reliable data set and provides useful information on regular basis to
National level, State level and District level stakeholders apart from other
institutions, agencies. Strong recommendations have been given for
continuance of the Minor Irrigation Census.
Minor Irrigation Census is the only scheme for collecting and analysing
data on various parameters of Minor Irrigation Schemes and there are no
overlapping schemes or sub schemes having similar objectives.
Primary:
Page | 857
Parameter Findings from research
States have confirmed that there are no financial resource gaps (100%
provided by the Ministry) or manpower resource gaps (provided by State
governments). These two factors have helped in continuing Minor
Irrigation Census since 1986-87.
Strong institutional set up established for Minor Irrigation Census at
National and State level makes the census activity sustainable. The
institutional arrangement established at the State level, over the years,
has ensured data quality, completeness and data validation process.
Though the previous five MI Census have contributed to ensuring data
completeness and correctness but the process has also evolved in terms
of scientific approach towards data collection and validation.
However, the state officials have expressed their dependence on the
central government for continuation of MI census surveys as most of
the states do not have adequate manpower/ resources to identify new
parameters for such surveys, statistical analysis, etc. The states have
expressed their inability to fund the statistical cells to carry out all the
activities required under MI Census.
Inference:
Instituional set up: At Central level, MI Stat wing plans the operations of
the census with technical support rom the NIC. For the implementation
of the scheme, each State/UT has identified a Nodal Department for
compilation of Minor Irrigation Statistics. State Statistical Cells are
generally created within the Nodal Department so identified. These Cells
assist the Head of the Nodal Department or Census Commissioner in
organising, coordinating and supervising the Minor Irrigation Census.
Minor irrigation being extremely critical to agriculture, the changing
nature of minor irrigation needs to be understood and disseminated. The
data is being utilized at both central and state levels. Usefulness of MI
Census is expected to lead to its continued sustenance.
The States have however expressed the fact that, the MI census cannot
be conducted with their own capacities, particularly tabulating, analysing
Page | 858
Parameter Findings from research
the enumerated data and publishing the same in form of a
comprehensive report. Overall guidance from the end of Govt. Of India
with respect to schedule designing, tabulation and analyses is necessary
for continuation. Moreover, the states do not have the financial support
to continue the functioning o State Statistical Cells as they are guided by
MI stat wing, MoWR, RD & GR, Govt. of India. These State Statistical
Cells act as coordinating office between the State and the Centre.
Impact Secondary:
Important insights were developed on account of the data available
through five MI Irrigation Census conducted between 1986 – 87 and
2013 – 14:
o Groundwater schemes continue to dominate MI schemes while the
usage of Surface water schemes have gone down
o Minor Irrigation schemes are planned by Govt. of India and State
Governments based on the findings from MI Census. Schemes for
Surface Minor Irrigation has been developed based on the findings
on Surface water minor irrigation through MI census.
Policy thrust on tube well electrification is to be planned by Govt. of West
Bengal on account of findings on increased usage of electric pumps.
Primary:
As deliberated by the Deputy Director General, MI Stat wing, MoWR,
RD & GR, Govt. of India, a major scheme Atal Bhujal Yojana for
Groundwater is largely based on the 5th
Minor Irrigation Census data.
Also, the data enumerated for surface water schemes, have provided a
significant basis towards framing the scheme Repair, Renovation and
Restoration (RRR) of water bodies.Further, Minor Irrigation census is also
conducted for collection of details of tanks providing irrigation, which is
adequately provided through MI census.
The Fisheries Department of Govt. of Kerala has expressed their keen
interest in MI Census data as the information and analyses of surface
Page | 859
Parameter Findings from research
water irrigation and water bodies will help them in developing measures
pertaining to pisciculture.
Fisheries department, Govt. of West Bengal has also expressed their
interest in using the data on Water Bodies as to be enumerated during
6th
MI census for augmenting measures in pisciculture.
Other uses of MI Census data:
o CGWB uses the MI census data for dynamic groundwater resources
estimation.
o Data on type of lifting device and source of energy is also used by
the CGWB
MI census has provided access to adequate data on MI schemes and
water bodies to the panchayat, district and state authorities on area
specific current status of groundwater and surface water sources. This
has helped in addressing immediate and overall issues.
In some states like Kerala, Tamil Nadu, Bihar and Uttar Pradesh, the
villagers were made aware of the groundwater problems after data
analysis. However, there are no evidences of addressing such issues at
village level, through framing policies and regulations pertaining to usage
of groundwater for specific blocks and districts.
MI census has helped in strengthening intra-departmental coordination
at State and District levels. Evidences of coordination between State
Statistical Cell and Revenue department were narrated by State and
District stakeholders from all States during KIIs. It was mentioned that
support was extended by other departments like panchayat, agriculture
and irrigation for providing baseline data prior to initiation of survey and
also towards monitoring during the survey.
Computerization of Irrigation Census have led to generation of a
comprehensive database and analysis of the Minor Irrigation scheme
performace across the country. Adoption of IT based techniques and
tools for MI Census has led to:

Page | 860
Parameter Findings from research
o Efficient planning and decision making for development of Water
Resources through consistent and consolidated information.
o Empower end users to perform in-depth Analysis.
o Prediction of irrigation potential/utilization and segmentation of
areas through OLAP models.
NABARD has proposed investment of Rs. 2,700 Cr. for surface water
minor irrigation schemes, based on the analysis of MI Census data such
as revenue generated by individual farmers, their savings and their
investments in Minor Irrigation schemes.
Although the analyses of MI Census has been significantly used by
stakeholders at national for new schemes like Atal Bhujal Yojana and
RRR and at State level for schemes like “Kaleshwaram Lift Irrigation
scheme”, but the area specific findings on ground and surface water
are not communicated to the farmers in form of key messages.
Inference:
As per the secondary sources and KIIs with State Stakeholders, it is
evident that the policy makers at National level and State levels use MI
census data for programme formulation, planning of interventions for
agriculture, pisciculture, horticulture etc.
Atal Bhujal Yojana has been designed with the principal objective of
strengthening the institutional framework for participatory groundwater
management and bringing about behavioral changes at the community
level for sustainable groundwater resources management in seven
States, viz. Gujarat, Haryana, Karnataka, Madhya Pradesh, Maharashtra,
Rajasthan and Uttar Pradesh. The data and the analyses of groundwater
scenario which have been derived from the Minor Irrigation Census,
have been significantly used for the scheme.
MI Census data has contributed towards development of new irrigation
schemes and modification of components under existing schemes.
Repair, Renovation and Restoration (RRR) of water bodies was designed
in 2005, based on inputs from MI census data.

Page | 861
Parameter Findings from research
MI Census has resulted in problem identification pertaining to irrigation
water sources. The dissemination of the results has helped the major
stakeholders involved in irrigation to have an understanding of issues in
each area.
MI census have helped in accessibility of loans from institutions like
NABARD for minor irrigation to the scheme owners and farmers.
The census findings are not converted into usable knowledge for the
benefit of the farming community and MI scheme owners to enable
water resources planning, water budgeting, optimal usage of water
resources, recycling of water, etc.
Therefore, the scheme has been rated as ‘average’ on this parameter.
Equity Secondary:
The data tables in the MI Census report indicate that a detailed study
has been made wherein the following aspects have been covered:
o Ownership of MI Sources by type of farmers
o Ownership of MI Sources according to land holding size
o Ownership of MI sources according to caste
No gender specific analyses as well as analyses of socio-economic
factors like livelihood change, migration, increased investment on health
and education, etc. are included within the scope of MI census.
Primary:
As per the responses from stakeholders, inclusion of socio-economic
parameters would make the questionnaire lengthy, and therefore, it will
not be advisable to include the same within the scope of MI census
Most of the state level stakeholders agreed that the issue of gender and
caste / class wise interpretation of data were not considered in any MI
census but suggested that the parameters can be included in the next
census.
Involvement of Patwaris (enumerators) who are the village level revenue
or agriculture field officers for MI census survey, has ensured coverage
of all villages. From KIIs with district authorities of north-eastern states

Page | 862
Parameter Findings from research
like Assam, Manipur, Nagaland and Sikkim, it was understood that even
hard-to-reach villages are adequately covered.
Inference:
The MI Census captures substantial information on ownership of MI
schemes by class of farmers, land holding capacities and caste. Such
data provides a comprehensive picture of ownership of MI schemes as
per social and economic categories.
Owing to the operational and human resource deployment plan, all
villages in all states are covered. Inclusion of left out areas is ensured by
comparing the baseline village list available with other departments in
each state.
Impact of minor irrigation on socio-economic aspects is currently not
included in MI Census. The inclusion of such parameters shall enrich the
overall context of Minor Irrigation and agricultural practices.
Analyses like distribution of MI schemes as per number of MI schemes
managed by WUAs, gram sabhas, local farmers’ association, etc. are not
being done.
Therefore, the scheme has been rated as ‘average’ on this parameter.
A summary analysis and performance of the scheme on the identified themes is presented
below:
Table 102: IC - summary of performance evaluation using REESIE framework
Parameter Performance
Relevance
Effectiveness
Efficiency
Sustainability
Impact
Equity
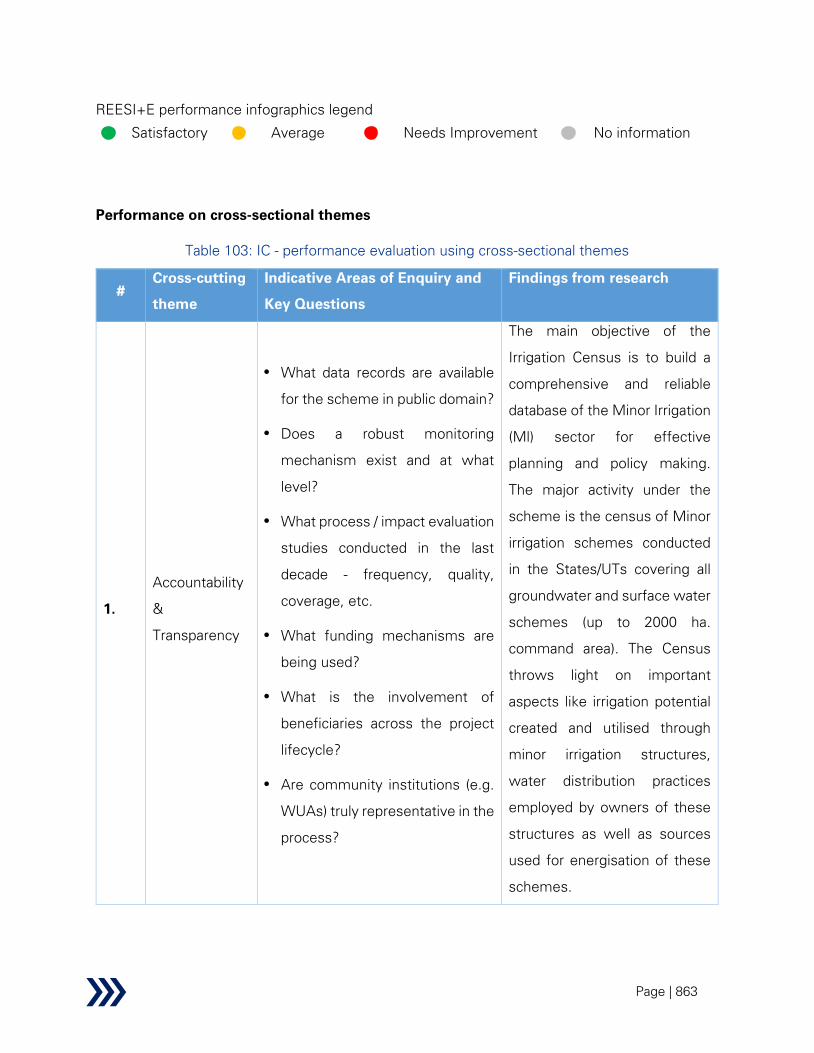
Page | 863
REESI+E performance infographics legend
Satisfactory
Average
Needs Improvement
No information
Performance on cross-sectional themes
Table 103: IC - performance evaluation using cross-sectional themes
#
Cross-cutting
theme
Indicative Areas of Enquiry and
Key Questions
Findings from research
1.
Accountability
&
Transparency
What data records are available
for the scheme in public domain?
Does a robust monitoring
mechanism exist and at what
level?
What process / impact evaluation
studies conducted in the last
decade - frequency, quality,
coverage, etc.
What funding mechanisms are
being used?
What is the involvement of
beneficiaries across the project
lifecycle?
Are community institutions (e.g.
WUAs) truly representative in the
process?
The main objective of the
Irrigation Census is to build a
comprehensive and reliable
database of the Minor Irrigation
(Ml) sector for effective
planning and policy making.
The major activity under the
scheme is the census of Minor
irrigation schemes conducted
in the States/UTs covering all
groundwater and surface water
schemes (up to 2000 ha.
command area). The Census
throws light on important
aspects like irrigation potential
created and utilised through
minor irrigation structures,
water distribution practices
employed by owners of these
structures as well as sources
used for energisation of these
schemes.
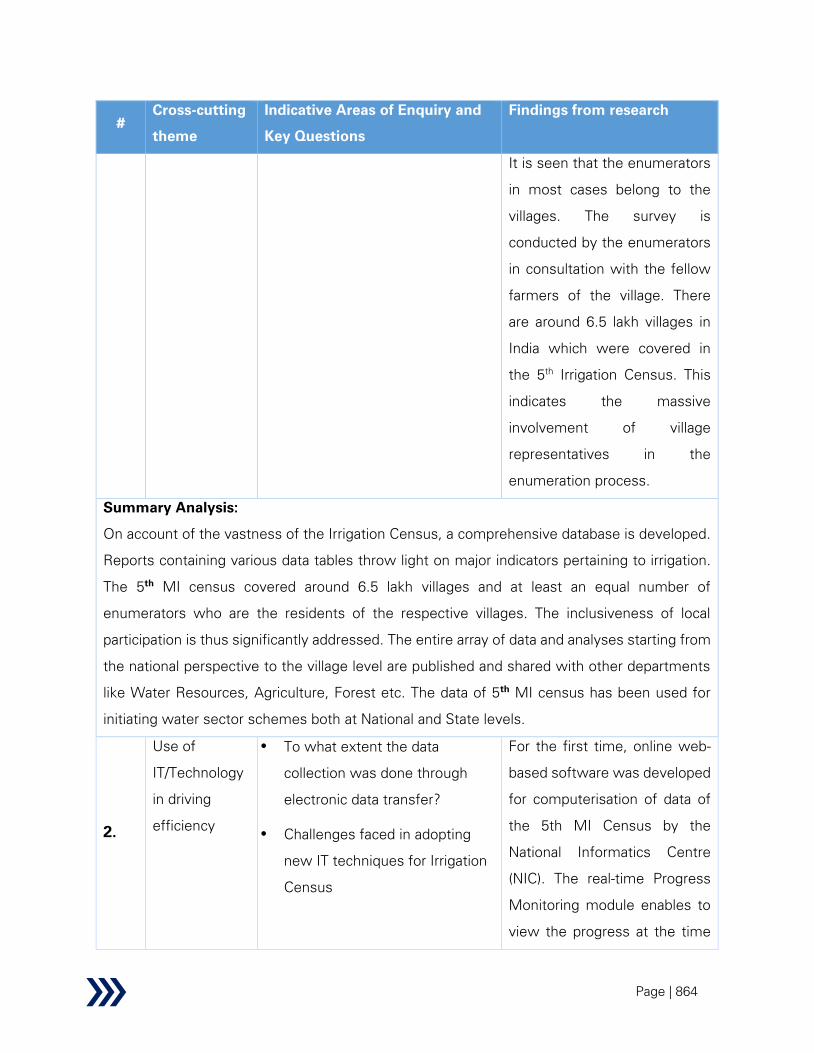
Page | 864
#
Cross-cutting
theme
Indicative Areas of Enquiry and
Key Questions
Findings from research
It is seen that the enumerators
in most cases belong to the
villages. The survey is
conducted by the enumerators
in consultation with the fellow
farmers of the village. There
are around 6.5 lakh villages in
India which were covered in
the 5th
Irrigation Census. This
indicates the massive
involvement of village
representatives in the
enumeration process.
Summary Analysis:
On account of the vastness of the Irrigation Census, a comprehensive database is developed.
Reports containing various data tables throw light on major indicators pertaining to irrigation.
The 5th
MI census covered around 6.5 lakh villages and at least an equal number of
enumerators who are the residents of the respective villages. The inclusiveness of local
participation is thus significantly addressed. The entire array of data and analyses starting from
the national perspective to the village level are published and shared with other departments
like Water Resources, Agriculture, Forest etc. The data of 5th
MI census has been used for
initiating water sector schemes both at National and State levels.
2.
Use of
IT/Technology
in driving
efficiency
To what extent the data
collection was done through
electronic data transfer?
Challenges faced in adopting
new IT techniques for Irrigation
Census
For the first time, online web-
based software was developed
for computerisation of data of
the 5th MI Census by the
National Informatics Centre
(NIC). The real-time Progress
Monitoring module enables to
view the progress at the time

Page | 865
#
Cross-cutting
theme
Indicative Areas of Enquiry and
Key Questions
Findings from research
of data entry and thus help to
take timely corrective action
both at the Central as well as
State/ UT level, thereby
reducing delays. In addition,
the software has different
modules for data entry, data
validation and data update by
States/ UTs apart from
tabulation and other useful
reports.
Integration of GIS with all MI
schemes can be a challenge in
terms of execution of the
modules since significant
capacity building of the
functionaries at all levels
involved in Irrigation Census
will be required. There are also
certain issues pertaining to
data accuracy vis-a-vis location
and mapping of the MI
schemes.
As the MI Census involves
significant data collection and
data mining, hence, there are
instances of application of
Information Technologies at
National and State levels. At
National level, software for

Page | 866
#
Cross-cutting
theme
Indicative Areas of Enquiry and
Key Questions
Findings from research
data tabulation and validation
was introduced in 5th Minor
Irrigation Census. A module
was developed by MI stat
wing, MoWR with support
from NIC and the State
Statistical Cells for all states
were trained.
In addition, states like Andhra
Pradesh and West Bengal has
developed mobile/ tab
applications for data entry,
wherein validation
mechanisms were inbuilt. This
has reduced time lag in data
validation and made the
tabulation process easier.
Summary Analysis:
Use of IT in MI census have evolved over time. From 4th
MI census onwards, inclusion of IT
applications like data entry modules and data validation modules was introduced. Remote
sensing techniques and GIS was used for 5th
MI census for identifying Water Bodies. Some
states like Andhra Pradesh and West Bengal has applied with new IT applications. Similar
initiatives may be rolled out for rest of the States to ensure error free enumeration and faster
analysis.
However, there is a scope to reduce the data checking at field level, thereby introducing
computer based schedules in place of paper schedules.
In addition, options of geo-tagging of all Minor Irrigation schemes may be actively considered
in the forthcoming censuses. This shall ensure further data accuracy for MI schemes viz.,
location of the schemes and exact count.

Page | 867
#
Cross-cutting
theme
Indicative Areas of Enquiry and
Key Questions
Findings from research
3.
Stakeholder
and
Beneficiary
behavioural
change
What percent of total allocation
is directed towards Awareness
generation or sensitization?
What is the utilization rate? and
How much impact has it been
able to generate in terms of
behaviour change?
The scheme guidelines do not
have any provision for
earmarking funds for
awareness generation/
sensitization. The total fund
support goes not only for
survey works but also for
strengthening of State
Statistical Cells.
No state has any mechanism of
disseminating the findings
obtained from the analysis of
Irrigation Census data.
Although every state publishes
state specific tabulation of
data, but such representation is
not shared at the grassroot
level in form of key issues.
The information/ issues
identified through MI Census
may be communicated to the
communities through mediums
like TV, Radio, web-based
advertisements. Apart from the
above, group meetings may be
adopted as an effective means
for disseminating the identified
issues pertaining to Surface
water and groundwater.
Summary Analysis:

Page | 868
#
Cross-cutting
theme
Indicative Areas of Enquiry and
Key Questions
Findings from research
There is no earmarked fund for awareness generation and sensitization. The aspect of
stakeholder and beneficiary behavioural change has remained unaddressed till date. The
mechanisms for dissemination of MI Census results to the grassroot level are not available and
therefore, the findings and insights from the MI Census are not able to reach the intended
beneficiaries.
4.
Development,
dissemination
& adoption of
innovative
practices,
technology &
know-how
What is the impact of innovative
technologies and practices on
scheme and sectoral
outcomes?
So far as data enumeration is
concerned few states like
Andhra Pradesh has shown
adoption of newer techniques
leading to time based
enumeration and ensuring error
free raw data. However, there
is a scope for adoption of new
techniques pertaining to data
anlysis and development of
insights, which as reiterated
earlier can be done by involving
research agencies.
Summary Analysis
Adoption of new techniques in the area of data collection, validation, tabulation, analysis, report
generation and dissemination (as evidenced in Andhra Pradesh and few other states) can also
be replicated by other states and in other major censuses like agricultural census, population
census, SECC, etc. to name a few. On the other hand, the techniques adopted for surveys like
NSSO for survey planning, drawing survey schedules, fileld instructions, validation and
tabulation techniques and release of reports may be referred to in case of MI Census.
5.
Research &
Development
What percentage of total
allocation (Sector as well as
Scheme specific) is directed
Premiere institutes like IWMI-
Tata Water Policy Programme
and IASRI have strongly
recommended assessment of
the Ml Censuses completed so

Page | 869
#
Cross-cutting
theme
Indicative Areas of Enquiry and
Key Questions
Findings from research
towards R&D? How much of
that percent is being utilized?
What is status of availability of
any Institute or centre or
department dedicated for R&D
in the Sector?
far and provided
recommendations to
strengthen the usability of data
for future research, planning
and policy making. Several
researchers suggested
collection of data on additional
parameters like post monsoon
groundwater level in the
villages, energy consumption
data to identify constraints for
low groundwater development
in Eastern and North Eastern
India.
In some states like Bihar and
Uttar Pradesh, IITs have used
the Irrigation Census data.
Summary Analysis:
Premiere institutes like IWMI-Tata Water Policy Programme and IASRI have strongly
recommended assessment of the Ml Censuses completed so far and provided
recommendations to strengthen the usability of data for future research, planning and policy
making. However, not much information is available on the R&D activities that can be
undertaken to improve the MI Census.
6.
Unlocking
Synergies with
other
Government
Program
What activities are undertaken
to ensure convergence at
community level? Are there any
Action Plans prepared at
It has been recommended that
the Agriculture Census may be
dovetailed with Irrigation
Census to have correlated

Page | 870
#
Cross-cutting
theme
Indicative Areas of Enquiry and
Key Questions
Findings from research
State/District/Block level to
ensure the same?
What are the areas for potential
convergence / synergy across
govt. programs?
views on irrigation and
agriculture. Agriculture Census
provides detailed information
on basic characteristics of
operational holdings such as
land-use, cropping pattern,
irrigation status, tenancy and
dispersal of holdings etc. The
information is tabulated by
different economic classes and
social groups and serves as an
input for development
planning, socio-economic
policy formulation and
establishment of national
priorities. The Census also
provides basis for development
of a comprehensive integrated
national system of agricultural
statistics. Agriculture Census
are conducted wherein 20% of
the villages are selected based
on random sampling for timely
reporting system. Based on the
data obtained from 20 percent
of the villages, tables are
generated at the
Taluk/District/State levels after
adopting suitable estimation
procedure. The estimations
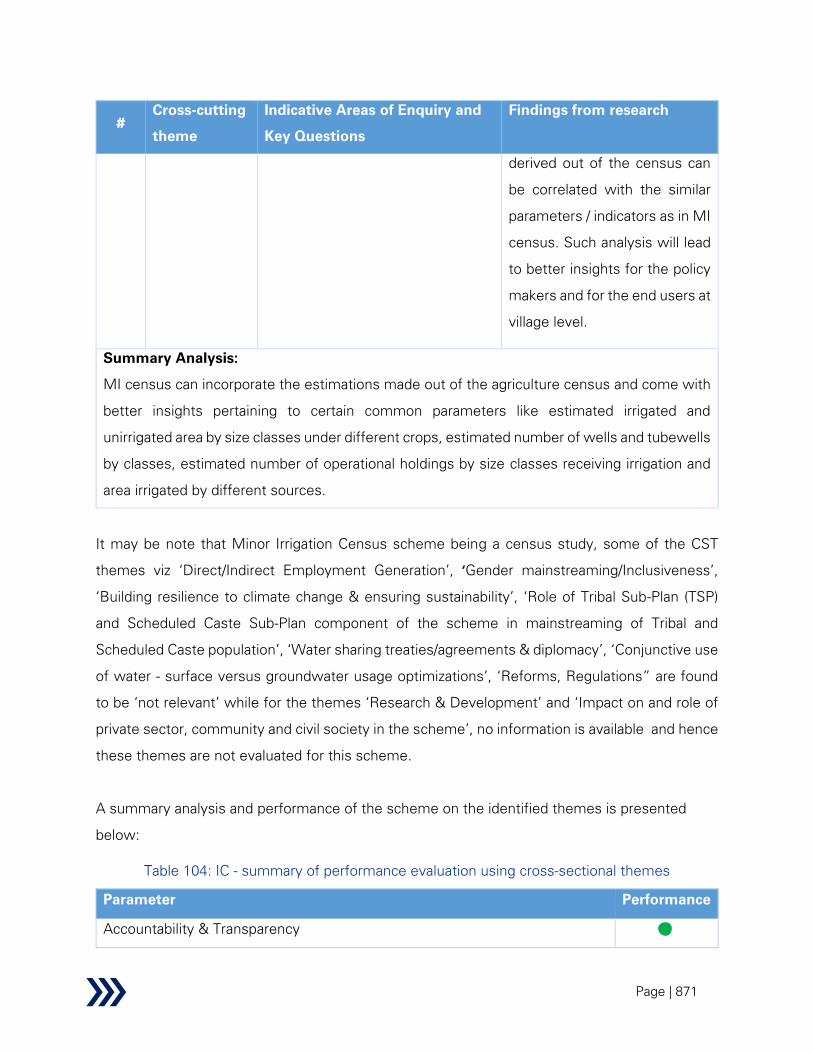
Page | 871
#
Cross-cutting
theme
Indicative Areas of Enquiry and
Key Questions
Findings from research
derived out of the census can
be correlated with the similar
parameters / indicators as in MI
census. Such analysis will lead
to better insights for the policy
makers and for the end users at
village level.
Summary Analysis:
MI census can incorporate the estimations made out of the agriculture census and come with
better insights pertaining to certain common parameters like estimated irrigated and
unirrigated area by size classes under different crops, estimated number of wells and tubewells
by classes, estimated number of operational holdings by size classes receiving irrigation and
area irrigated by different sources.
It may be note that Minor Irrigation Census scheme being a census study, some of the CST
themes viz ‘Direct/Indirect Employment Generation’, ‘Gender mainstreaming/Inclusiveness’,
‘Building resilience to climate change & ensuring sustainability’, ‘Role of Tribal Sub-Plan (TSP)
and Scheduled Caste Sub-Plan component of the scheme in mainstreaming of Tribal and
Scheduled Caste population’, ‘Water sharing treaties/agreements & diplomacy’, ‘Conjunctive use
of water - surface versus groundwater usage optimizations’, ‘Reforms, Regulations” are found
to be ‘not relevant’ while for the themes ‘Research & Development’ and ‘Impact on and role of
private sector, community and civil society in the scheme’, no information is available and hence
these themes are not evaluated for this scheme.
A summary analysis and performance of the scheme on the identified themes is presented
below:
Table 104: IC - summary of performance evaluation using cross-sectional themes
Parameter Performance
Accountability & Transparency

Page | 872
Parameter Performance
Direct/Indirect Employment Generation
Gender mainstreaming/Inclusiveness
Building resilience to climate change (including but not limited to developing
water disaster preparedness) & ensuring sustainability
Role of Tribal Sub-Plan (TSP) and Scheduled Caste Sub-Plan component of
the scheme in mainstreaming of Tribal and Scheduled Caste population
Use of IT/Technology in driving efficiency
Stakeholder and Beneficiary behavioural change
Development, dissemination & adoption
Research & Development
Water sharing treaties/agreements & diplomacy
Conjunctive use of water - surface versus groundwater usage optimizations
Unlocking Synergies with other Government Program
Reforms, Regulations
Impact on and role of private sector, community and civil society in the
scheme
Cross-sectional themes performance infographics legend
High
Medium
Low
Not relevant
No information
2.2.6.3 Issues and challenges
This sub-section describes the scheme issues and challenges and their mapping with the source
of information viz. primary source, secondary source and household survey (if applicable).
Table 105: IC – Issues and challenges
Sl.no Area Issues & Challenges Secondary KII HH
Scheme Design
IC – F1 Data source
• Currently, the main sources of Minor
Irrigation data are Land Use Statistics,
Periodical Progress from State
departments, Annual Administrative

Page | 873
Sl.no Area Issues & Challenges Secondary KII HH
Reports and Ad-hoc reports prepared
by various agencies.
• However, the 5th
Irrigation Census
Report specifies issues pertaining to
collection of above-mentioned reports.
Currently, the census data has use for
a limited set of users.
• There is scope to improve utility of the
survey. The MI census scheme can be
easily extended to address the needs
of a larger set of stakeholders such as
departments like Fisheries, Tribal
Welfare (survey the MI practices
prevalent in tribal areas), etc.
• Key messages on area specific issues
on groundwater and surface water are
not disseminated to the villagers.
Issues like excessive use of
groundwater, depletion of
groundwater table and optimisation in
usage are not discussed with the
farmers.
IC – F2 Methodology
• As reiterated above, on one hand in
some of the States the enumeration is
done through canvassing of paper
schedules and on the other hand there
are few States who have gone
“paperless” in terms of data
collection.
• Enumeration by manually filling up
Village and Scheme schedules leaves
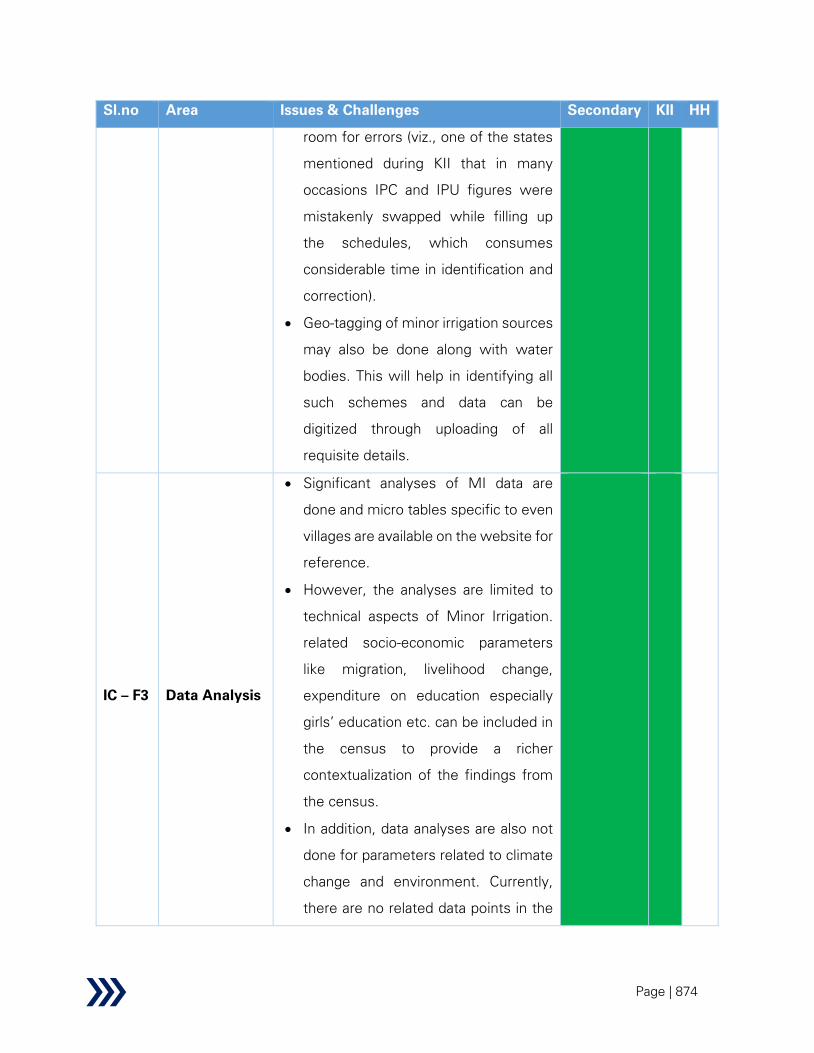
Page | 874
Sl.no Area Issues & Challenges Secondary KII HH
room for errors (viz., one of the states
mentioned during KII that in many
occasions IPC and IPU figures were
mistakenly swapped while filling up
the schedules, which consumes
considerable time in identification and
correction).
• Geo-tagging of minor irrigation sources
may also be done along with water
bodies. This will help in identifying all
such schemes and data can be
digitized through uploading of all
requisite details.
IC – F3 Data Analysis
• Significant analyses of MI data are
done and micro tables specific to even
villages are available on the website for
reference.
• However, the analyses are limited to
technical aspects of Minor Irrigation.
related socio-economic parameters
like migration, livelihood change,
expenditure on education especially
girls’ education etc. can be included in
the census to provide a richer
contextualization of the findings from
the census.
• In addition, data analyses are also not
done for parameters related to climate
change and environment. Currently,
there are no related data points in the

Page | 875
Sl.no Area Issues & Challenges Secondary KII HH
schedules designed for Irrigation
Census.
IC – F4
Scheme
integration
• Although the scope of Agriculture
Census and Minor Irrigation are quite
different in many aspects with each
other but there is some overlap
particularly in respect of irrigation.
• Also, there are no censuses for major
and medium irrigation schemes. A
single database having all details of
Major, Medium and Minor irrigation
schemes needs to be in place to
provide a comprehensive assessment
of the irrigation situation.
IC – F5
Data
management
• There exists a large body of census
data on the basis of the five MI
censuses that have been completed
so far.
• However, restoration of historical data
and ability to access them is a
challenge especially at district level, if
data restoration, segregation and
retrieving policies are not made and
practised at State, District and Block
level.
• Village wise data sharing currently
doesn’t exist. Gram Panchayat wise
handbooks should be made available
which may contain MI scheme wise
details. Individual farmers or MI
scheme owners can thus get access to

Page | 876
Sl.no Area Issues & Challenges Secondary KII HH
requisite data. Such data availability at
grassroot level will help in local level
planning.
IC – F7
Dissemination
of data
The website https://data.gov.in/
provides data and tables from MI
Census. However, considering the
quantum of data available pertaining
to MI census, a more functional
dashboard that allows for preliminary
data analysis (e.g. filtering, sorting,
etc.) is required.
• Given that each MI Census is a time
taking process that spans more than a
year and data from various states
comes in at different points in time,
there exists a significant delay in
making the census data available
publicly.
IC –F8
Participatory
Planning
• Participatory planning process using
techniques like Participatory Rural
Appraisal (PRA) has proved to be a
useful tool for identifying resources at
village level. The scheme currently
does not provide the opportunity for
such exercises at village level for
identifying the type and location of MI
structures.
• Currently, data access at panchayat
samiti and village level doesn’t exist.
Mechanisms for availability of data at
gram panchayat and village level will
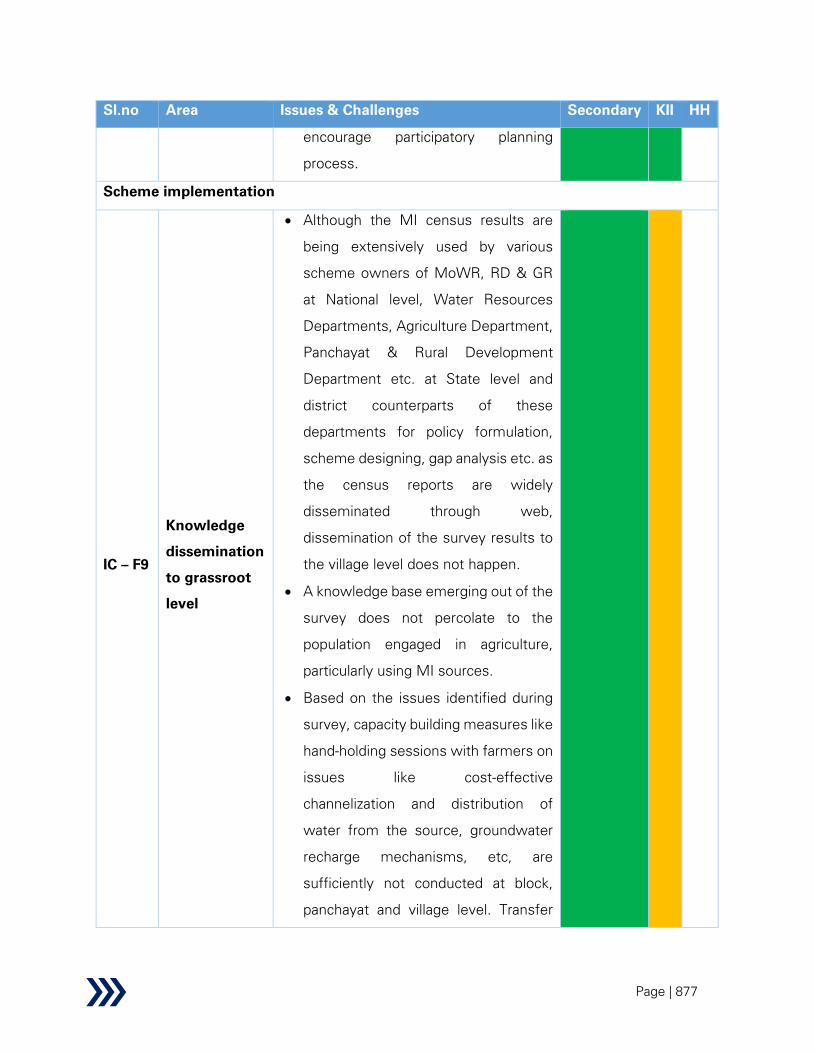
Page | 877
Sl.no Area Issues & Challenges Secondary KII HH
encourage participatory planning
process.
Scheme implementation
IC – F9
Knowledge
dissemination
to grassroot
level
• Although the MI census results are
being extensively used by various
scheme owners of MoWR, RD & GR
at National level, Water Resources
Departments, Agriculture Department,
Panchayat & Rural Development
Department etc. at State level and
district counterparts of these
departments for policy formulation,
scheme designing, gap analysis etc. as
the census reports are widely
disseminated through web,
dissemination of the survey results to
the village level does not happen.
• A knowledge base emerging out of the
survey does not percolate to the
population engaged in agriculture,
particularly using MI sources.
• Based on the issues identified during
survey, capacity building measures like
hand-holding sessions with farmers on
issues like cost-effective
channelization and distribution of
water from the source, groundwater
recharge mechanisms, etc, are
sufficiently not conducted at block,
panchayat and village level. Transfer

Page | 878
Sl.no Area Issues & Challenges Secondary KII HH
and exchange of technology also has
not happened sufficiently.
IC –
F10
Inter-
Departmental
Coordination
• Strong involvement of the Revenue
department in the Irrigation Census
process is evident based on the KIIs
with State level stakeholders;
however, departments like finance,
tribal welfare, forest etc, are not
usually involved.
• As understood from the KIIs at State
level, lack of coordination between key
departments at State level exists.
• The Nodal Officer and Census
Commissioner face difficulties in
obtaining information about MI
structures existing in villages as well
as other details pertaining to MI
schemes like land details, ownership,
source, channel details etc.
IC–
F11
Role /
Responsibility
modification
• The role of State Statistical Cell
remains limited to managing day-to-
day activities like monitoring of data
entry progress, validation, and
operational and logistical issues.
• The role of the State Statistical cell is
not thought beyond the current
scopes. The State Statistical Cell
should perform data analysis for
district, block and village level.
• The enumerators are considered for
data collection only. The enumerators

Page | 879
Sl.no Area Issues & Challenges Secondary KII HH
are not considered for dissemination of
results of the census, given the fact
that they are extensively trained on the
technical aspects of minor irrigation
prior to the census survey.
IC –
F12
Management
of Records
• The village schedules are normally
canvassed by Patwaries through
enquires from village level
workers/gram pradhans and the
information available from revenue or
land records maintained in the office of
Government authorities.
• In case of institutional schemes, the
information is collected through
available records.
• Securing access to such records to the
field enumerators is a challenge and
causes serious delays in data
collection.
• In many states, it is understood that
the land records are not maintained,
and the relevant details cannot be filled
up in the village and scheme schedule.
IC–
F13
Capacity
Building
• Trainings for supervisors and
enumerators are organized and are
imparted on the technical aspects of
Minor Irrigation.
• As the scope of irrigation census does
not include environmental issues, the
enumerators are not trained on basic
aspects like vegetation, rainfall and

Page | 880
Sl.no Area Issues & Challenges Secondary KII HH
temperature and their effect on ground
and surface water availability.
• The trainings primarily focus on the
nuances of filling up the Village and
Scheme Schedules. The trainings lack
on imparting knowledge on soft skills
required during enumeration viz.,
communication skills, time
management, crisis management etc.
Monitoring and evaluation
IC –
F14
Supervision
Mechanisms
• Significant time is spent on monitoring
and supervision of the enumerations at
field level.
• Sample manual checking of filled up
schedules and subsequent submission
of supervisors’ reports at Block and
District level consumes time but
remain prone to errors.
• Some States like Tamil Nadu,
Karnataka, Kerala and Assam do have
mechanism of involving the panchayat
samiti members in identifying
coverage gaps, but other states do not
have similar mechanisms.
IC –
F15
Community
involvement
• Enumerators (Patwaris) collect data on
Minor Irrigation in consultation with
the local people. Usually the
enumerators are the residents of the
locality and hence know the presence
of MI schemes in the area.

Page | 881
Sl.no Area Issues & Challenges Secondary KII HH
• The presence of local person as
enumerators on one hand provides
support in identification of MI sources
but on the other hand leads to casual /
non-systematic approach.
• In such cases, involvement of villagers
become less, and the ownership of
such information also reduces on part
of the villagers and validation of the
information on MI schemes by the
villagers also is not done.
IC –
F16
Inter-
Departmental
Coordination
• Baseline information on land, minor
irrigation source, water bodies are
provided to the State Statistical Cell by
the respective departments of the
states.
• Coordination between various
departments like Water Resources
Department, Agriculture Department
with State Statistical Cell during the
survey does not happen at the desired
level.
• In some states, the technical issues
pertaining to MI schemes viz.,
classification of MI schemes as per
discharge rate, IPU, inclusion of MI
schemes as per its coverage, irrigated
area etc, remains unresolved which
surfaces out during enumeration due
to lack of coordination between the
Departments.
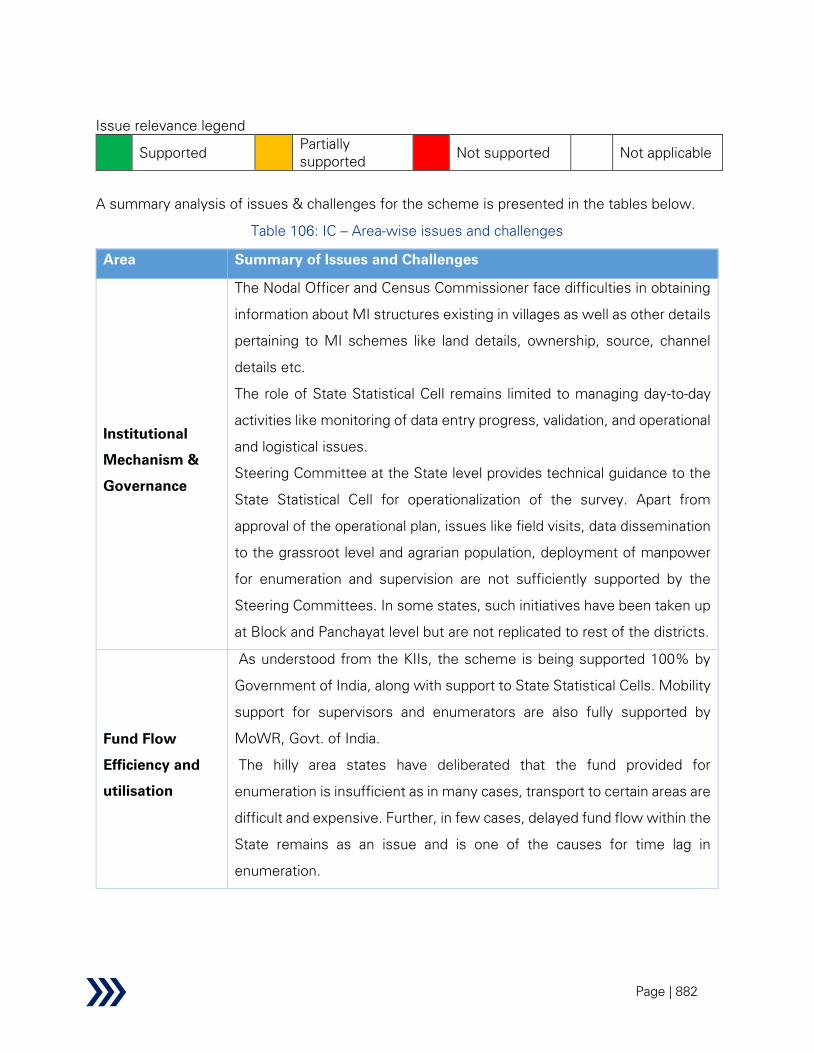
Page | 882
Issue relevance legend
Supported Partially
supported Not supported
Not applicable
A summary analysis of issues & challenges for the scheme is presented in the tables below.
Table 106: IC – Area-wise issues and challenges
Area Summary of Issues and Challenges
Institutional
Mechanism &
Governance
The Nodal Officer and Census Commissioner face difficulties in obtaining
information about MI structures existing in villages as well as other details
pertaining to MI schemes like land details, ownership, source, channel
details etc.
The role of State Statistical Cell remains limited to managing day-to-day
activities like monitoring of data entry progress, validation, and operational
and logistical issues.
Steering Committee at the State level provides technical guidance to the
State Statistical Cell for operationalization of the survey. Apart from
approval of the operational plan, issues like field visits, data dissemination
to the grassroot level and agrarian population, deployment of manpower
for enumeration and supervision are not sufficiently supported by the
Steering Committees. In some states, such initiatives have been taken up
at Block and Panchayat level but are not replicated to rest of the districts.
Fund Flow
Efficiency and
utilisation
As understood from the KIIs, the scheme is being supported 100% by
Government of India, along with support to State Statistical Cells. Mobility
support for supervisors and enumerators are also fully supported by
MoWR, Govt. of India.
The hilly area states have deliberated that the fund provided for
enumeration is insufficient as in many cases, transport to certain areas are
difficult and expensive. Further, in few cases, delayed fund flow within the
State remains as an issue and is one of the causes for time lag in
enumeration.

Page | 883
Area Summary of Issues and Challenges
Unavailability of
resource
persons
The role of the State Statistical cell is not thought beyond the current
scopes. The State Statistical Cell should perform data analysis for district,
block and village level.
Monitoring and
evaluation
The presence of local person as enumerators on one hand provides
support in identification of MI sources but on the other hand leads to
casual / non-systematic approach.
Less involvement of panchayat samiti, Water Users Association, local
CBOs is noted as evident from the KIIs. In some cases it is felt that, lack
of involvement of NGOs and CBOs hampered the process with respect to
time and coverage. The issues generating out of the survey analysis are
also not discussed in a widespread manner.
GIS-based applications are already being used for census of water bodies,
which has immensely helped in correct identification of sources as well as
capturing physical attributes like location, area, etc. On the other hand,
except Andhra Pradesh and West Bengal, none of the states has adopted
web-based application for Census of minor irrigation sources. Software
based monitoring will lead to less error and will save time and generate
more accurate analyses.
Capacity
building
The trainings primarily focus on the nuances of filling up the Village and
Scheme Schedules. The trainings lack on imparting knowledge on soft
skills required during enumeration viz., communication skills, time
management, crisis management etc.
A knowledge base emerging out of the survey does not percolate to the
population engaged in agriculture, particularly using MI sources. Given the
fact that the enumerators have been extensively trained on the technical
aspects of minor irrigation sources, their enhanced capacities are not used
for knowledge transfer to farmers and minor irrigation (MI) scheme
owners, leading to better management of MI schemes.
Operational
efficiency
A single database having all details of Major, Medium and Minor irrigation
schemes needs to be in place to provide a comprehensive assessment of
the irrigation situation.

Page | 884
Area Summary of Issues and Challenges
Unavailability of key records during enumeration. and the relevant details
cannot be collected thus resulting in information gap.
The chain of interventions undertaken in course of Irrigation Census do
not include dissemination of key messages to the farmers on local
issues identified pertaining to ground and surface water. There is a need
for publishing area-specific analysis starting from district till village level
issues.
Table 107: IC - summary of issues and challenges
Parameter Performance
Institutional Mechanism & Governance
Fund Flow Efficiency and utilisation
Unavailability of resource persons
Monitoring and evaluation
Capacity building
Operational efficiency
Performance infographics legend
Satisfactory
Average
Needs Improvement
2.2.6.4 Recommendations and solutions
This sub-section describes the scheme recommendation and solutions from the perspective of
scheme design, scheme implementation and monitoring & evaluation, along with their mapping
with the issues and challenges described in the preceding sub-section.
Table 108: IC – recommendations and solutions
Sl.no Recommendations Finding
Scheme design

Page | 885
Sl.no Recommendations Finding
IC -R1
• The MI census should be designed to include newer parameters
that cover the needs of other departments like Fisheries, Tribal
Welfare, MSME, etc. The data tabulation modules should also
enable other such users to customize fields and view micro-tables
as per their requirement.
IC -F1
IC -R2
• The enumeration process for MI census should be mandatorily
computerized with validation modules integrated with the Village
and Scheme Schedules. This would help enumeration process data
error free and in addition shall save time in validation of numeric
fields. Errors pertaining to other fields such as village name, location
can be avoided entry if geo-tagging is adopted.
• Integration of MI schemes with GIS applications as done for census
of water bodies, will help in correct identification of such sources
and collation of area-wise MI schemes can be automated, thereby
saving time on checking.
IC-F2
IC-R3
Although significant analyses are done on technical parameters of
Minor Irrigation, but analysis of socio-economic parameters likes
migration, livelihood change, cost benefit analysis of the MI
schemes, expenditure on education etc. should be included in the
next Census Report. Such additional reports would help social
scientists, researchers, Welfare departments to design schemes
or include components pertaining to above-mentioned aspects into
the existing schemes.
IC-F3
IC-R4
The scope of Irrigation Census should be expanded to cover Major,
Medium, Minor and especially Micro-irrigation. Such a
comprehensive census of all types of irrigation schemes in India
would provide a better scenario of irrigation status as whole. Data
points like IPC, IPU, CCA, etc. would provide the macro picture. In
such scenario the schedule designing, database and table modules
need to be modified appropriately.
IC-F4

Page | 886
Sl.no Recommendations Finding
IC- R5
A dashboard should be developed to present the census data that
is currently available on the website of MI Stat Wing. The
dashboard should contain real-time progress of enumeration and
supervision process, newer initiatives by the States, infographics
on major indicators and indexes and basic data analyses facility.
IC – F7
IC – R6
Assessment of number of MI schemes by types should be done
before initiation of the survey. The assessment should be done by
the villagers through PRA techniques like resource mapping,
transect walk and should provide a basis for updating of Village and
Block level records available for MI schemes. Alternatively,
independent agencies may be engaged to conduct pre-survey
assessments. Such initiatives can ensure complete coverage of the
schemes.
IC – F8
Scheme implementation
IC – R7
The enumeration process can be mandatorily be done electronically
with help of applications on mobiles and tabs. This will help in
reducing data losses, data capturing errors and reducing time in
transmitting data from village level to subsequent higher levels.
Such practice has already been adopted by states like Andhra
Pradesh (Ref: case study of Andhra Pradesh – Primary findings under
effectiveness of Irrigation Census)
Dissemination of MI census results to block and village level should
be ensured. It is understood that although village level analyses are
made and tables are made available on websites, but dissemination
of findings for major indicators viz., net cropped area for the current
MI census in comparison to net cropped area during previous MI
census to the farming community is important. The dissemination
of the findings may be done through multiple channel (e.g. GP
notice board, mobile phones, public advisory, etc.). Strategy for IEC
on Minor Irrigation should be developed and disseminated to the
IC – F9
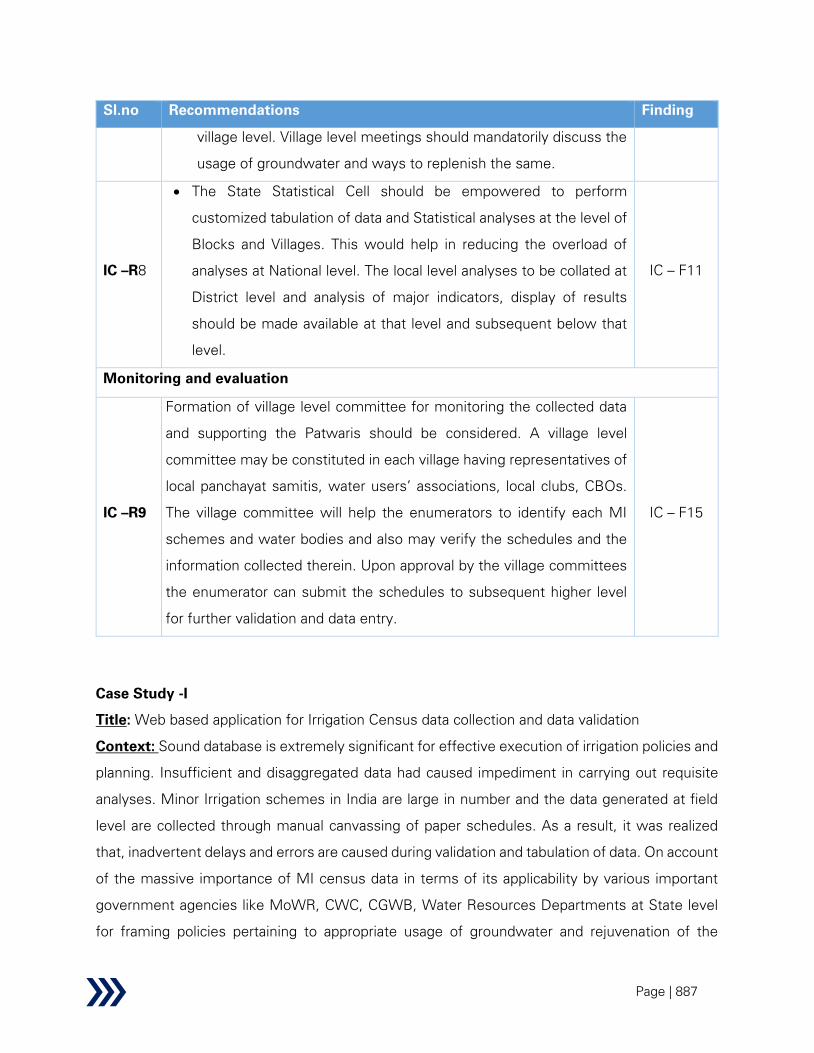
Page | 887
Sl.no Recommendations Finding
village level. Village level meetings should mandatorily discuss the
usage of groundwater and ways to replenish the same.
IC –R8
• The State Statistical Cell should be empowered to perform
customized tabulation of data and Statistical analyses at the level of
Blocks and Villages. This would help in reducing the overload of
analyses at National level. The local level analyses to be collated at
District level and analysis of major indicators, display of results
should be made available at that level and subsequent below that
level.
IC – F11
Monitoring and evaluation
IC –R9
Formation of village level committee for monitoring the collected data
and supporting the Patwaris should be considered. A village level
committee may be constituted in each village having representatives of
local panchayat samitis, water users’ associations, local clubs, CBOs.
The village committee will help the enumerators to identify each MI
schemes and water bodies and also may verify the schedules and the
information collected therein. Upon approval by the village committees
the enumerator can submit the schedules to subsequent higher level
for further validation and data entry.
IC – F15
Case Study -I
Title: Web based application for Irrigation Census data collection and data validation
Context: Sound database is extremely significant for effective execution of irrigation policies and
planning. Insufficient and disaggregated data had caused impediment in carrying out requisite
analyses. Minor Irrigation schemes in India are large in number and the data generated at field
level are collected through manual canvassing of paper schedules. As a result, it was realized
that, inadvertent delays and errors are caused during validation and tabulation of data. On account
of the massive importance of MI census data in terms of its applicability by various important
government agencies like MoWR, CWC, CGWB, Water Resources Departments at State level
for framing policies pertaining to appropriate usage of groundwater and rejuvenation of the
Page | 888
sources, a need for having web-based application for accuracy and quick processing of data was
understood by the MI Stat wing, MoWR. After adopting the system, certain advantages like
elimination of duplicate entries, timeliness, need based generation of tabulated data, archiving of
historical data were realized.
Implementation Details: National Informatics Centre (NIC) was requested to develop a software
meeting the above-mentioned requirements. The work was adequately taken up by all States
and extended to the districts, wherein manpower and/or agencies were appointed for data entry.
In 5th
MI census, a web-based software was created for the first time wherein, three different
schedules for data entry namely, village schedule, groundwater schedule and surface water
schedule were introduced. For 6th
MI census and 1st Census of Water Bodies, five schedules viz.,
village schedule, groundwater schedule, surface water schedule, urban schedule and the water
body schedule, were incorporated for web-based data entry. The reliability of the data was
checked through sample checks by the supervisors. In order to ensure data accuracy, timely
tabulation of data and analysis, the software that was developed had following features:
User friendliness
Data verification ability
Modules for data tabulation
Data dissemination through websites
Inbuilt models for identifying trends like pattern
Decision Support System with Query Module
The overall objective of the project was to gather the correct data and process for different
purposes. The databases collected from all States/UTs have been merged for making a National
level database and several reports have been generated. The application has been divided into
three modules based on their functionality i.e. Data Entry Module, Abstract Creation and Decision
Support System (DSS). The objective of Data Entry Module is to gather the validated
base/enumerated data. Abstract Creation Module will process these data (base/enumerated data)
for generating a database that will be used by Decision Support System. DSS Module will
generate all types of reports, queries and provide useful information.
Impact: Minor Irrigation Schemes are environment friendly and provide gainful employment
opportunities to the rural population, resulting in optimum utilization of resources. This also
contributes to rural economic growth and plays an important role in increasing agricultural
production to meet the needs of the growing population. In the States these schemes are being
Page | 889
implemented by many departments/organizations like Agriculture, Rural Development, Irrigation,
and Social Welfare. At the Central level also, several departments have been implementing
programmes on minor irrigation. The government has been instrumental in providing credit to
farmers for the development of minor irrigation through Commercial Banks, Regional Rural
Banks, Co-operatives and National Bank for Agriculture & Rural Development (NABARD).
The major impacts that has happened due to wide application of the web-based software are:
Efficient planning and decision making for development of Water Resources through
consistent and consolidated information.
Empowerment of end users to perform in-depth analysis
Prediction of irrigation potential utilization and segmentation of areas through Online
Analytical Processing (OLAP) models.
2.2.7 Servicing of Loans from NABARD under PMKSY
The Long Term Irrigation Fund (LTIF) was announced in 2016-17 for financing 99 projects
undertaken under Accelerated Irrigation Benefits Program (AIBP) including Command Area
Development and Water Management (CADWM). Subsequently, funding for other projects such
as the Polavaram project in Andhra Pradesh, North Koel project in Bihar and Jharkhand, Relining
of Sirhind Feeder and Rajasthan Feeder Canal in Punjab and Rajasthan and Shahpur Kandi Dam
was taken up under LTIF.
Under the scheme, National Bank for Agriculture and Rural Development (NABARD) provides
loans towards Central and State shares for AIBP with a tenure of 15 years. The Central Share is
provided to National Water Development Agency (NWDA) whereas the loan towards State Share
is availed by the State Governments.
Loans towards Central share are entirely funded through Extra Budgetary Resources in the form
of Government of India fully serviced bonds. The State shares are funded through borrowings
from the market. The loans are extended to State Governments at 6% per annum and the
difference between the cost of fund for NABARD and 6% is compensated by Government of
India through interest subvention.
Page | 890
The total amount of loan sanctioned until March 2020 was Rs. 81,865 Cr. (53% for central share,
while remaining for state share) while the total disbursement was Rs. 44,719 Cr. (52% for central
share while remaining for stare share). During 2019-20, the GoI allotted Rs. 1,994 Cr. for servicing
of loans from NABARD under PMKSY.
2.2.7.1 Background
The key objective of the AIBP schemes was to provide additional funds in the form of CA to
states implementing Major and Medium Irrigation projects to expedite the completion of the
project works. Since its inception in October 1996, the government has adopted various funding
arrangements for AIBP in the form of Central Loan Assistance and grants. However, a large
number of projects taken up under AIBP have witnessed slow progress or were stalled owing to
financial constraints. Large amount of investments in the projects were lying idle.
In view of this, in 2016-17 the government announced creation of dedicated Long Term Irrigation
Fund (LTIF) in NABARD with an initial corpus of Rs. 20,000 Cr. to bridge the resource gaps in
identified projects under PMKSY-AIBP (including CADWM). To make the loans under LTIF
attractive for states, it was envisaged to extend funds to both Centre and States at 6% (inclusive
of 0.6% margin to NABARD) during the entire borrowing period. Interest on Central share is to
be paid in quarterly instalments over 15 years, whereas the principal amount is to be repaid at
the end of 15 years as a bullet repayment; the interest during moratorium period shall also be
serviced by NWDA.
During 2016-17 and 2017-18, loans were extended to both Centre and State at 6% per annum,
which were funded through resources raised directly by NABARD and Extra Budgetary
Resources (EBRs) serviced by GoI. While from April’18 onwards, loans extended to Centre was
entirely funded through EBRs by GoI through fully serviced bonds while for loans extended to
States, the GoI compensated NABARD the difference between actual cost of mobilizing funds
and the lending cost of 6% per annum through Interest Subvention scheme.
2.2.7.2 Performance
The 99 AIBP projects were initially conceived to be completed by December 2019 at an estimated
balance cost of Rs. 48,546 Cr. (as on March.2016), which was revised to Rs. 73,348 Cr. (as on

Page | 891
March 2016). It may be noted here that the aforementioned cost is exclusive of the cost for
CADWM works of these projects, which was initially estimated to be Rs. 29,049 Cr. (as on March
2016). As on March 2020, for the 99 AIBP projects (along with CADWM projects), loan to the
tune of Rs. 70,943 Cr. (Rs. 32,588 towards Central Share and Rs. 38,355 Cr. towards State Share)
has been sanctioned. Out of which around Rs. 36,335 Cr. (51% of the sanctioned amount) has
been released (Rs. 13,209 towards Central Share and Rs. 23,126 Cr. towards State Share).
State-wise details of loan sanctioned and disbursed under NABARD for PMKSY-AIBP and the
other four projects is stated below.
Table 109: LTIF – loans sanctioned and released till March 2020232
State
Loan Sanctioned (in Rs.Cr.) Loan released as percentage of
sanctioned
Central share State Share Central share State Share
Andhra Pradesh 425 514 22% 95%
Assam 195 0 2% 0%
Bihar 240 0 55% 0%
Chhattisgarh 166 80 34% 0%
Goa 18 0 0% 0%
Gujarat 8159 3611 67% 100%
Jammu &
Kashmir 57 0 59% 0%
Jharkhand 1847 518 41% 100%
Karnataka 1837 0 51% 0%
Kerala 49 0 0% 0%
Madhya Pradesh 3538 2863 21% 35%
Maharashtra 4628 18021 31% 57%
Manipur 310 390 66% 54%
Odisha 1752 5612 70% 48%
Punjab 144 0 36% 0%
Rajasthan 1085 314 36% 74%
Telangana 3479 0 15% 0%
Uttar Pradesh 4662 6431 25% 64%
Sub-Total 32588 38355 41% 60%
Polavaram 8232 0 93% 0%
North Koel
Reservoir 1379 0 48% 0%
232 https://www.nabard.org/content1.aspx?id=655&catid=8&mid=488 (accessed on 11
th July 2020)

Page | 892
Shahpurkandi
Dam 485 0 12% 0%
Relining of
Sirhind Feeder
and Rajasthan
Feeder
826 0 0% 0%
Gross-total 43510 38355 50% 60%
Performance on REESI+E framework
Table 110: LTIF – performance evaluation using REESIE framework
Parameter Findings from research
Relevance
Secondary:
• The scheme’s objectives indirectly aim to address the following
Sustainable Development Goals:
o SDG Goal 2 – hunger
o SDG Goal 6 – clean water and sanitation
o SDG Goal 10 – reduced inequalities
• The scheme aims at faster completion of ongoing MMI projects through
financing of prioritized projects which in turn is expected to address the
below challenges:
o Food security challenges – food grain production in 2016 stood at
255 MMT against estimated requirement of 291 MMT in 2025 and
450 MMT in 2050
o Inaccessibility to assured irrigation: in 2016, Ultimate Irrigation
Potential (UIP) was 140 mha while Irrigation Potential Created
(IPC) is 113 mha233
. The 99 Priority AIBP projects on completion
shall help in creating 76.03 lakh ha of irrigation potential
o Doubling of farmers’ income by 2022 in line with the Central
government target
• Large number of major and medium irrigation projects under AIBP were
stalled due to inadequate provision of funds leading to locking up of
233 Data shared by DoWR,RD&GR

Page | 893
Parameter Findings from research
funds already invested in the stalled projects. Since its inception in 1996-
97, 297 irrigation/multipurpose projects were included under AIBP, out
of which only 143 projects (48%) got completed leading to an irrigation
potential creation of 24.39 lakh ha only under AIBP up to March 2014,
while the overall potential creation through all AIBP schemes up to
March 2014 is 80.6 Lakh Ha. Total CA/ grants to the states for these
projects was Rs. 56,068 Cr.233
up to March 2016.
• In 2016-17, 99 AIBP projects were incorporated under PMKSY to
expedite their completion. The Ultimate Irrigation Potential (UIP) of 99
projects prioritized during 2016-17 is 76 Lakh Ha out of which 41.39 lakh
Ha was created up to March 2016 and target balance potential was 34.63
Lakh Ha. All the projects were expected to be completed by December
2019 (currently extended to March 2023) at an estimated balance cost
of Rs. 48,546 Cr. (as on March 2016) (out of which balance CA
admissible was Rs. 16,818 Cr. while the state share was Rs. 31,728 Cr.).
Rs. 73,348 Cr. is the revised balance cost of these projects (as on March
2016). It may be noted here that the above-mentioned cost is exclusive
of the cost for CADWM works of these projects which was initially
estimated to be Rs. 29,049 Cr. (as on March 2016).
• Thus, the budget requirement of Rs. 73,348 Cr. over 5 years translates
into around Rs. 14,700 Cr. per year which is roughly four times the
expenditure incurred of Rs. 3,650 Cr. per year234
during the last two
decades (1996-2016).
Primary:
Discussions with the key informants like Directors (Monitoring & Appraisal)
CWC regional offices, Chief Engineers, Superintending Engineers and
equivalents from State Government departments provided the following
insights in relation to relevance:
234 https://archive.indiaspend.com
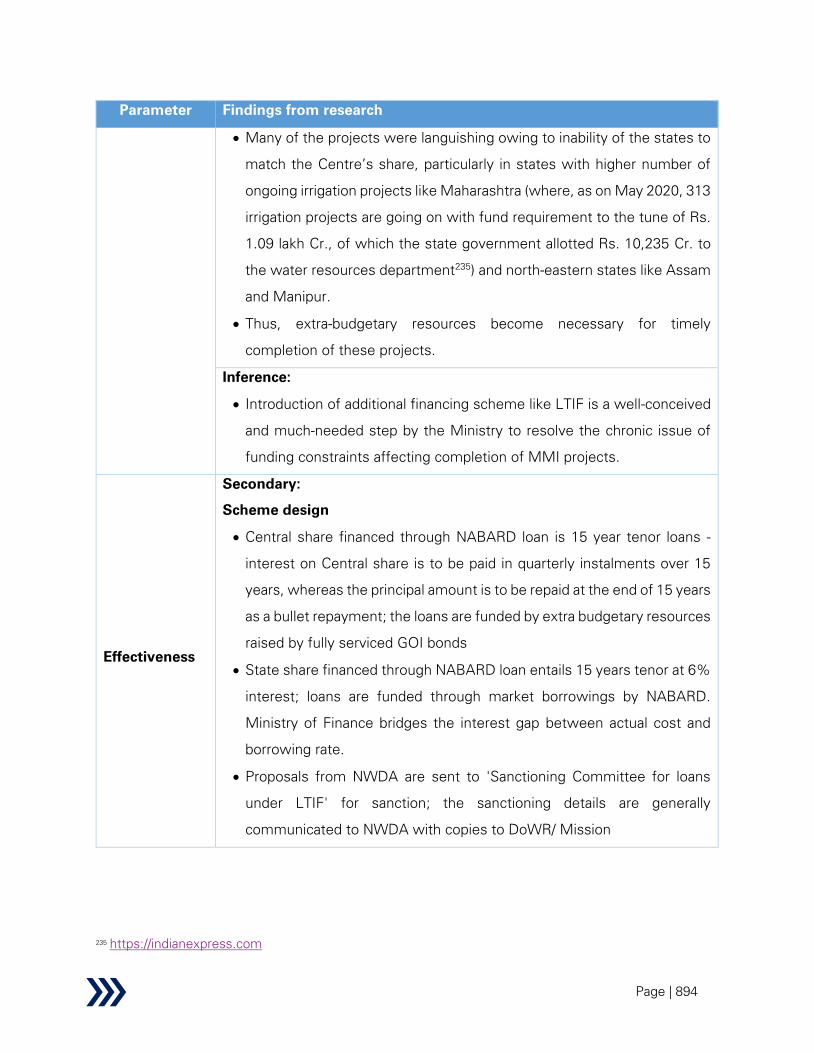
Page | 894
Parameter Findings from research
• Many of the projects were languishing owing to inability of the states to
match the Centre’s share, particularly in states with higher number of
ongoing irrigation projects like Maharashtra (where, as on May 2020, 313
irrigation projects are going on with fund requirement to the tune of Rs.
1.09 lakh Cr., of which the state government allotted Rs. 10,235 Cr. to
the water resources department235
) and north-eastern states like Assam
and Manipur.
• Thus, extra-budgetary resources become necessary for timely
completion of these projects.
Inference:
• Introduction of additional financing scheme like LTIF is a well-conceived
and much-needed step by the Ministry to resolve the chronic issue of
funding constraints affecting completion of MMI projects.
Effectiveness
Secondary:
Scheme design
• Central share financed through NABARD loan is 15 year tenor loans -
interest on Central share is to be paid in quarterly instalments over 15
years, whereas the principal amount is to be repaid at the end of 15 years
as a bullet repayment; the loans are funded by extra budgetary resources
raised by fully serviced GOI bonds
• State share financed through NABARD loan entails 15 years tenor at 6%
interest; loans are funded through market borrowings by NABARD.
Ministry of Finance bridges the interest gap between actual cost and
borrowing rate.
• Proposals from NWDA are sent to 'Sanctioning Committee for loans
under LTIF' for sanction; the sanctioning details are generally
communicated to NWDA with copies to DoWR/ Mission
235 https://indianexpress.com
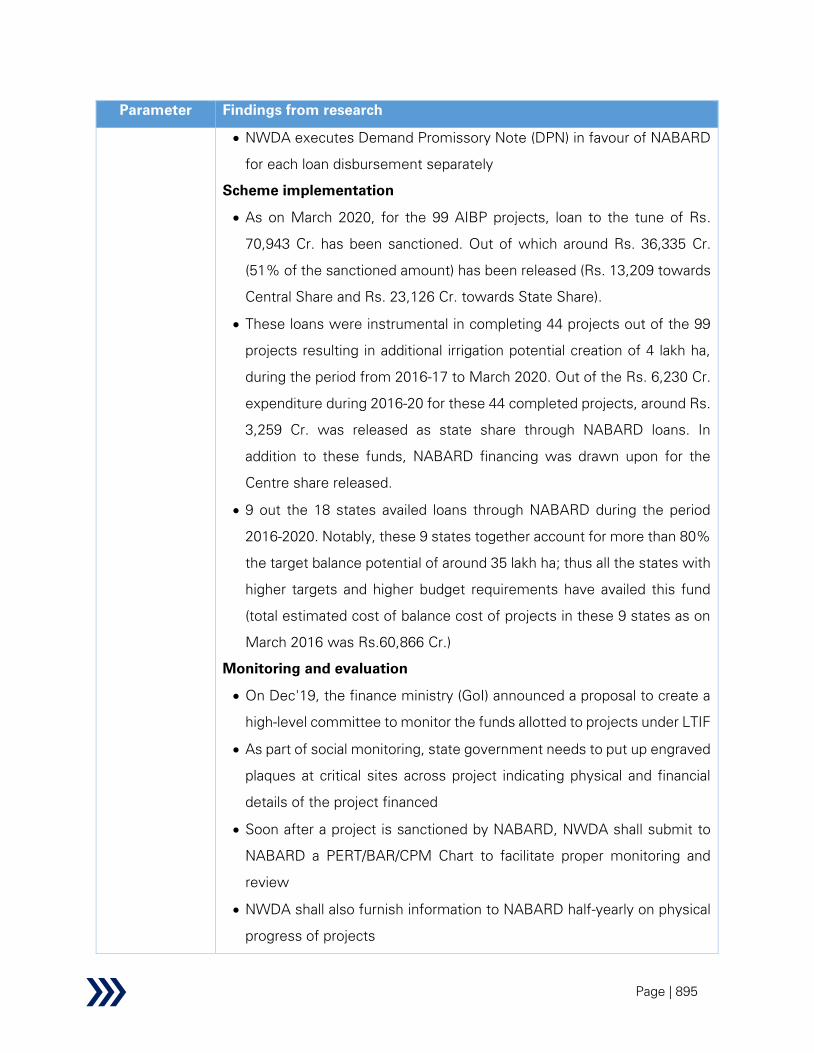
Page | 895
Parameter Findings from research
• NWDA executes Demand Promissory Note (DPN) in favour of NABARD
for each loan disbursement separately
Scheme implementation
• As on March 2020, for the 99 AIBP projects, loan to the tune of Rs.
70,943 Cr. has been sanctioned. Out of which around Rs. 36,335 Cr.
(51% of the sanctioned amount) has been released (Rs. 13,209 towards
Central Share and Rs. 23,126 Cr. towards State Share).
• These loans were instrumental in completing 44 projects out of the 99
projects resulting in additional irrigation potential creation of 4 lakh ha,
during the period from 2016-17 to March 2020. Out of the Rs. 6,230 Cr.
expenditure during 2016-20 for these 44 completed projects, around Rs.
3,259 Cr. was released as state share through NABARD loans. In
addition to these funds, NABARD financing was drawn upon for the
Centre share released.
• 9 out the 18 states availed loans through NABARD during the period
2016-2020. Notably, these 9 states together account for more than 80%
the target balance potential of around 35 lakh ha; thus all the states with
higher targets and higher budget requirements have availed this fund
(total estimated cost of balance cost of projects in these 9 states as on
March 2016 was Rs.60,866 Cr.)
Monitoring and evaluation
• On Dec'19, the finance ministry (GoI) announced a proposal to create a
high-level committee to monitor the funds allotted to projects under LTIF
• As part of social monitoring, state government needs to put up engraved
plaques at critical sites across project indicating physical and financial
details of the project financed
• Soon after a project is sanctioned by NABARD, NWDA shall submit to
NABARD a PERT/BAR/CPM Chart to facilitate proper monitoring and
review
• NWDA shall also furnish information to NABARD half-yearly on physical
progress of projects

Page | 896
Parameter Findings from research
• NABARD has a right to inspect projects on a random basis; in case
NABARD finds non-satisfactory project progress it may stipulate
appropriate conditions in consultation with DoWR
Primary:
Scheme implementation
• Most of the informants across selected states (particularly Andhra
Pradesh, Maharashtra and Manipur) confirmed that loans through
NABARD has been a life-line and has greatly streamlined the fund flow.
This funding mechanism has greatly resolved the issue of states’
inabilities to match central’s releases.
Monitoring and evaluation
• A rigorous monitoring mechanism has been set up through NWDA,
CWC, online MIS portal and third-party monitoring through WAPCOS.
Monitoring mechanisms may be further improved through continuous
monitoring of the expenditure incurred by the states out of the funds
disbursed through NABARD. A real-time view of the fund utilization will
help to ensure better planning and allocation of resources (currently,
Ministry is apprised of the unspent balance lying with the states, only
when the states send proposals for second instalment).
• Most of the informants from states (selected on random basis) like
Andhra Pradesh (Gundlakamma, Musurumulli and Pushkara LIS
projects), Assam (Borolia and Champamati projects), Maharashtra
(Dhom Balkaawadi project) when enquired about social audit replied in
the negative.
Inference:
• The LTIF fund (through NABARD loan) has been instrumental in
expediting many of the projects particularly in states with higher targets
and financial burden (like Maharashtra, north-eastern states, etc.)
• Social monitoring is found to be inadequate in most of the states
(selected on a random basis); though its needs to be further validated at
other states before generalization.
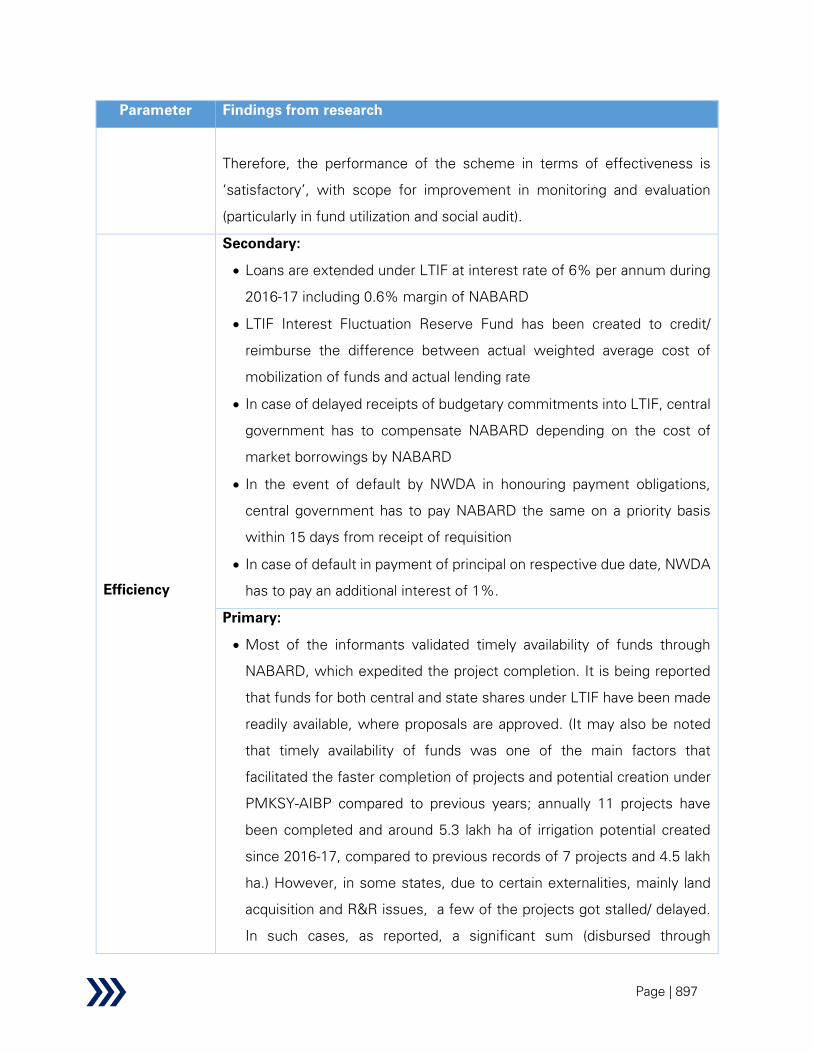
Page | 897
Parameter Findings from research
Therefore, the performance of the scheme in terms of effectiveness is
‘satisfactory’, with scope for improvement in monitoring and evaluation
(particularly in fund utilization and social audit).
Efficiency
Secondary:
• Loans are extended under LTIF at interest rate of 6% per annum during
2016-17 including 0.6% margin of NABARD
• LTIF Interest Fluctuation Reserve Fund has been created to credit/
reimburse the difference between actual weighted average cost of
mobilization of funds and actual lending rate
• In case of delayed receipts of budgetary commitments into LTIF, central
government has to compensate NABARD depending on the cost of
market borrowings by NABARD
• In the event of default by NWDA in honouring payment obligations,
central government has to pay NABARD the same on a priority basis
within 15 days from receipt of requisition
• In case of default in payment of principal on respective due date, NWDA
has to pay an additional interest of 1%.
Primary:
• Most of the informants validated timely availability of funds through
NABARD, which expedited the project completion. It is being reported
that funds for both central and state shares under LTIF have been made
readily available, where proposals are approved. (It may also be noted
that timely availability of funds was one of the main factors that
facilitated the faster completion of projects and potential creation under
PMKSY-AIBP compared to previous years; annually 11 projects have
been completed and around 5.3 lakh ha of irrigation potential created
since 2016-17, compared to previous records of 7 projects and 4.5 lakh
ha.) However, in some states, due to certain externalities, mainly land
acquisition and R&R issues, a few of the projects got stalled/ delayed.
In such cases, as reported, a significant sum (disbursed through
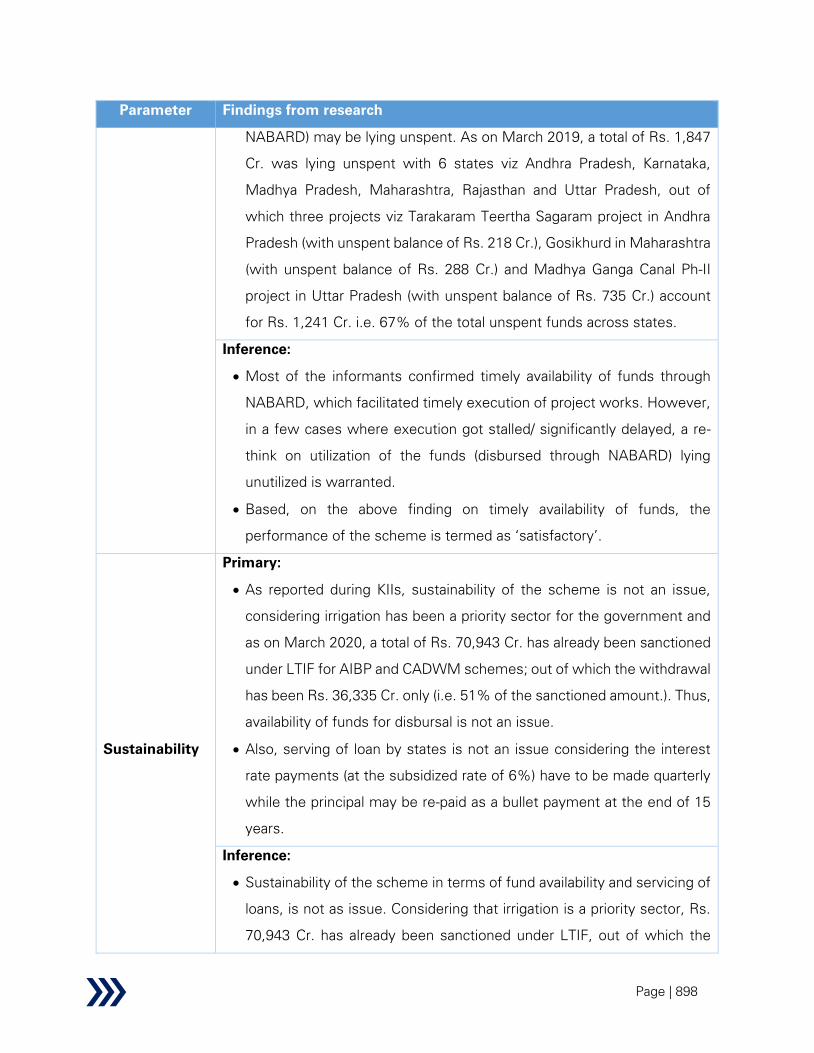
Page | 898
Parameter Findings from research
NABARD) may be lying unspent. As on March 2019, a total of Rs. 1,847
Cr. was lying unspent with 6 states viz Andhra Pradesh, Karnataka,
Madhya Pradesh, Maharashtra, Rajasthan and Uttar Pradesh, out of
which three projects viz Tarakaram Teertha Sagaram project in Andhra
Pradesh (with unspent balance of Rs. 218 Cr.), Gosikhurd in Maharashtra
(with unspent balance of Rs. 288 Cr.) and Madhya Ganga Canal Ph-II
project in Uttar Pradesh (with unspent balance of Rs. 735 Cr.) account
for Rs. 1,241 Cr. i.e. 67% of the total unspent funds across states.
Inference:
• Most of the informants confirmed timely availability of funds through
NABARD, which facilitated timely execution of project works. However,
in a few cases where execution got stalled/ significantly delayed, a re-
think on utilization of the funds (disbursed through NABARD) lying
unutilized is warranted.
• Based, on the above finding on timely availability of funds, the
performance of the scheme is termed as ‘satisfactory’.
Sustainability
Primary:
• As reported during KIIs, sustainability of the scheme is not an issue,
considering irrigation has been a priority sector for the government and
as on March 2020, a total of Rs. 70,943 Cr. has already been sanctioned
under LTIF for AIBP and CADWM schemes; out of which the withdrawal
has been Rs. 36,335 Cr. only (i.e. 51% of the sanctioned amount.). Thus,
availability of funds for disbursal is not an issue.
• Also, serving of loan by states is not an issue considering the interest
rate payments (at the subsidized rate of 6%) have to be made quarterly
while the principal may be re-paid as a bullet payment at the end of 15
years.
Inference:
• Sustainability of the scheme in terms of fund availability and servicing of
loans, is not as issue. Considering that irrigation is a priority sector, Rs.
70,943 Cr. has already been sanctioned under LTIF, out of which the

Page | 899
Parameter Findings from research
withdrawal has been 51% only. Also, loan servicing needs to be done
through quarterly financial payments and principal as bullet payment at
the end of 15 years; the interest rate at 6% is a cheaper option for the
states compared to many other fund sources.
Therefore, the performance of the scheme under sustainability has been
termed as ‘satisfactory’.
Impact
• Since the main objective of the scheme is to expedite the completion of
the PMKSY-AIBP projects, performance of the scheme under ‘impact’
has been rated same as that of AIBP in one of the earlier sections..
Equity
• Since the main objective of the scheme is to expedite the completion of
the PMKSY-AIBP projects, performance of the scheme under ‘equity’
has been rated same as that of AIBP in one of the earlier sections.
Table 111: LTIF – summary of performance evaluation using REESIE framework
Parameter Performance
Relevance
Effectiveness
Efficiency
Sustainability
Impact
Equity
REESI+E performance infographics legend
Satisfactory
Average
Needs Improvement
No information
Performance on cross-sectional themes
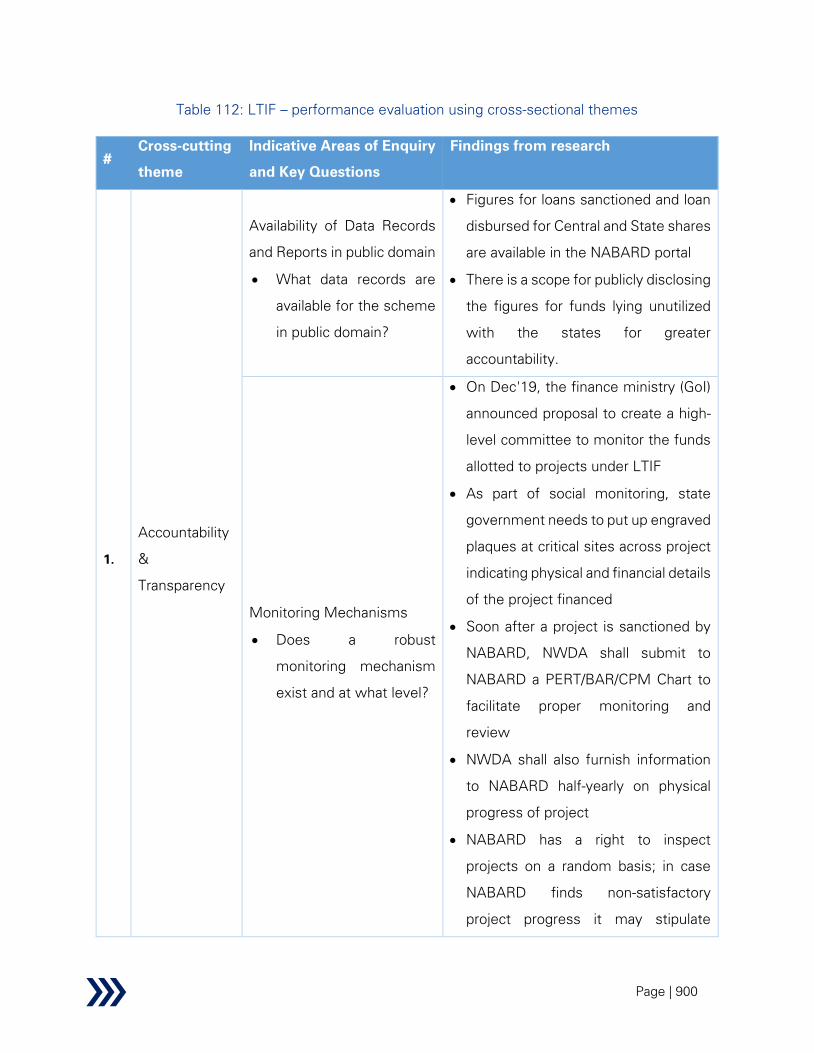
Page | 900
Table 112: LTIF – performance evaluation using cross-sectional themes
#
Cross-cutting
theme
Indicative Areas of Enquiry
and Key Questions
Findings from research
1.
Accountability
&
Transparency
Availability of Data Records
and Reports in public domain
• What data records are
available for the scheme
in public domain?
• Figures for loans sanctioned and loan
disbursed for Central and State shares
are available in the NABARD portal
• There is a scope for publicly disclosing
the figures for funds lying unutilized
with the states for greater
accountability.
Monitoring Mechanisms
• Does a robust
monitoring mechanism
exist and at what level?
• On Dec'19, the finance ministry (GoI)
announced proposal to create a high-
level committee to monitor the funds
allotted to projects under LTIF
• As part of social monitoring, state
government needs to put up engraved
plaques at critical sites across project
indicating physical and financial details
of the project financed
• Soon after a project is sanctioned by
NABARD, NWDA shall submit to
NABARD a PERT/BAR/CPM Chart to
facilitate proper monitoring and
review
• NWDA shall also furnish information
to NABARD half-yearly on physical
progress of project
• NABARD has a right to inspect
projects on a random basis; in case
NABARD finds non-satisfactory
project progress it may stipulate

Page | 901
#
Cross-cutting
theme
Indicative Areas of Enquiry
and Key Questions
Findings from research
appropriate conditions in consultation
with DoWR
Financial Accountability
• What funding
mechanisms are being
used?
• Central share through NABARD loan
comprises 15 years tenor loans -
interest on Central share is to be paid in
quarterly instalments over 15 years,
whereas the principal amount is to be
repaid at the end of 15 years as a bullet
repayment; the loans are funded by
extra budgetary resources raised by
fully serviced GOI bonds
• State share through NABARD loan
entails 15 years tenor at 6% interest;
loans are funded through market
borrowings by NABARD. Ministry of
Finance bridges the interest gap
between actual cost and borrowing
rate.
• LTIF Interest Fluctuation Reserve
Fund has been created to credit/
reimburse the difference between
actual weighted average cost of
mobilization of funds and actual
lending rate
• In case of delayed receipts of
budgetary commitments into LTIF,
central government has to
compensate NABARD depending on
the cost of market borrowings by
NABARD
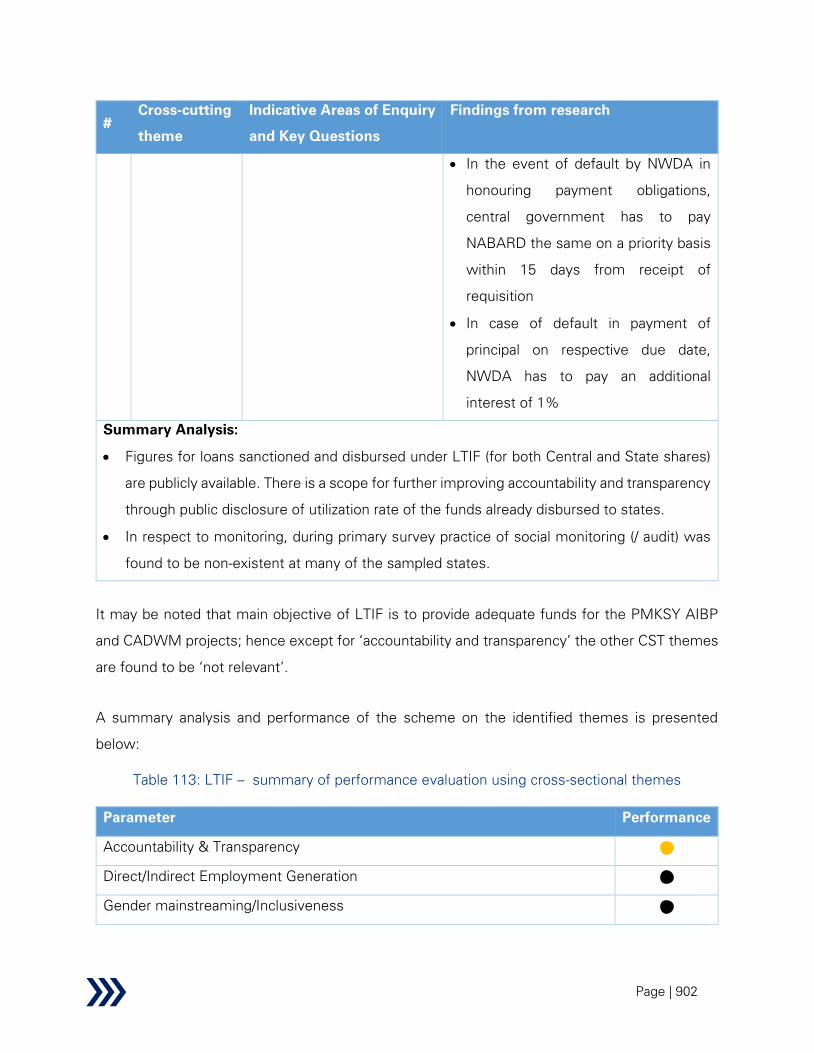
Page | 902
#
Cross-cutting
theme
Indicative Areas of Enquiry
and Key Questions
Findings from research
• In the event of default by NWDA in
honouring payment obligations,
central government has to pay
NABARD the same on a priority basis
within 15 days from receipt of
requisition
• In case of default in payment of
principal on respective due date,
NWDA has to pay an additional
interest of 1%
Summary Analysis:
• Figures for loans sanctioned and disbursed under LTIF (for both Central and State shares)
are publicly available. There is a scope for further improving accountability and transparency
through public disclosure of utilization rate of the funds already disbursed to states.
• In respect to monitoring, during primary survey practice of social monitoring (/ audit) was
found to be non-existent at many of the sampled states.
It may be noted that main objective of LTIF is to provide adequate funds for the PMKSY AIBP
and CADWM projects; hence except for ‘accountability and transparency’ the other CST themes
are found to be ‘not relevant’.
A summary analysis and performance of the scheme on the identified themes is presented
below:
Table 113: LTIF – summary of performance evaluation using cross-sectional themes
Parameter Performance
Accountability & Transparency
Direct/Indirect Employment Generation
Gender mainstreaming/Inclusiveness
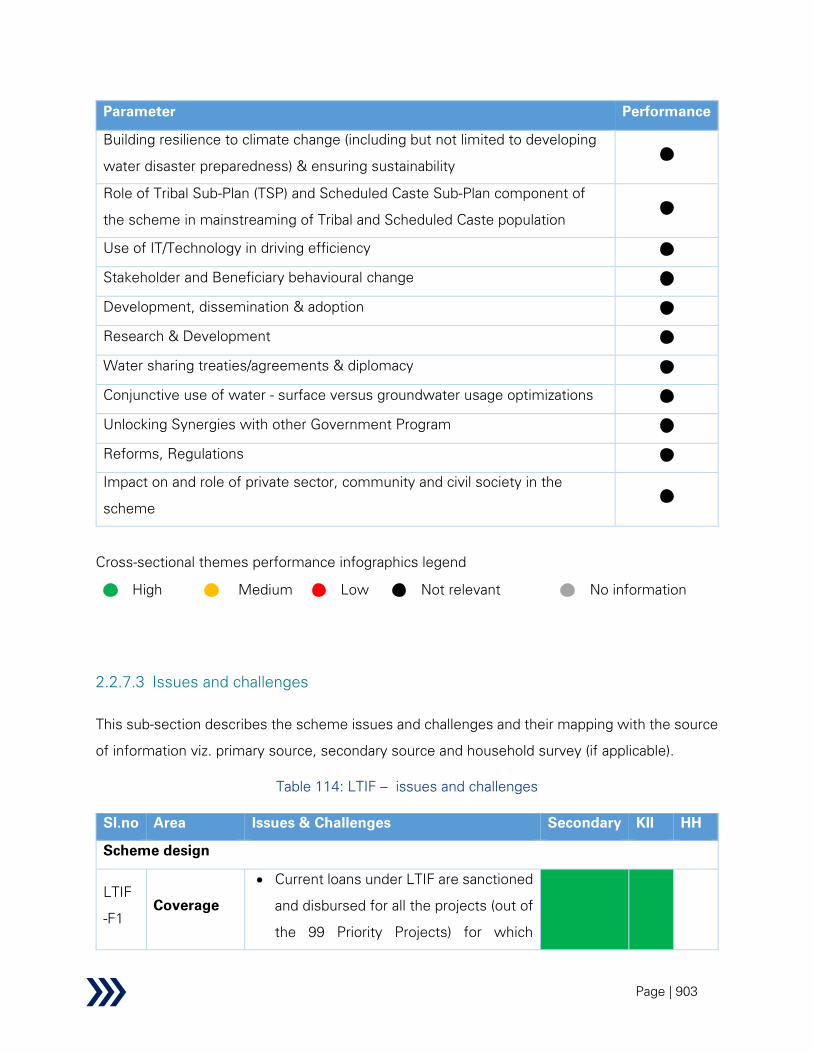
Page | 903
Parameter Performance
Building resilience to climate change (including but not limited to developing
water disaster preparedness) & ensuring sustainability
Role of Tribal Sub-Plan (TSP) and Scheduled Caste Sub-Plan component of
the scheme in mainstreaming of Tribal and Scheduled Caste population
Use of IT/Technology in driving efficiency
Stakeholder and Beneficiary behavioural change
Development, dissemination & adoption
Research & Development
Water sharing treaties/agreements & diplomacy
Conjunctive use of water - surface versus groundwater usage optimizations
Unlocking Synergies with other Government Program
Reforms, Regulations
Impact on and role of private sector, community and civil society in the
scheme
Cross-sectional themes performance infographics legend
High
Medium
Low
Not relevant
No information
2.2.7.3 Issues and challenges
This sub-section describes the scheme issues and challenges and their mapping with the source
of information viz. primary source, secondary source and household survey (if applicable).
Table 114: LTIF – issues and challenges
Sl.no Area Issues & Challenges Secondary KII HH
Scheme design
LTIF
-F1
Coverage
• Current loans under LTIF are sanctioned
and disbursed for all the projects (out of
the 99 Priority Projects) for which
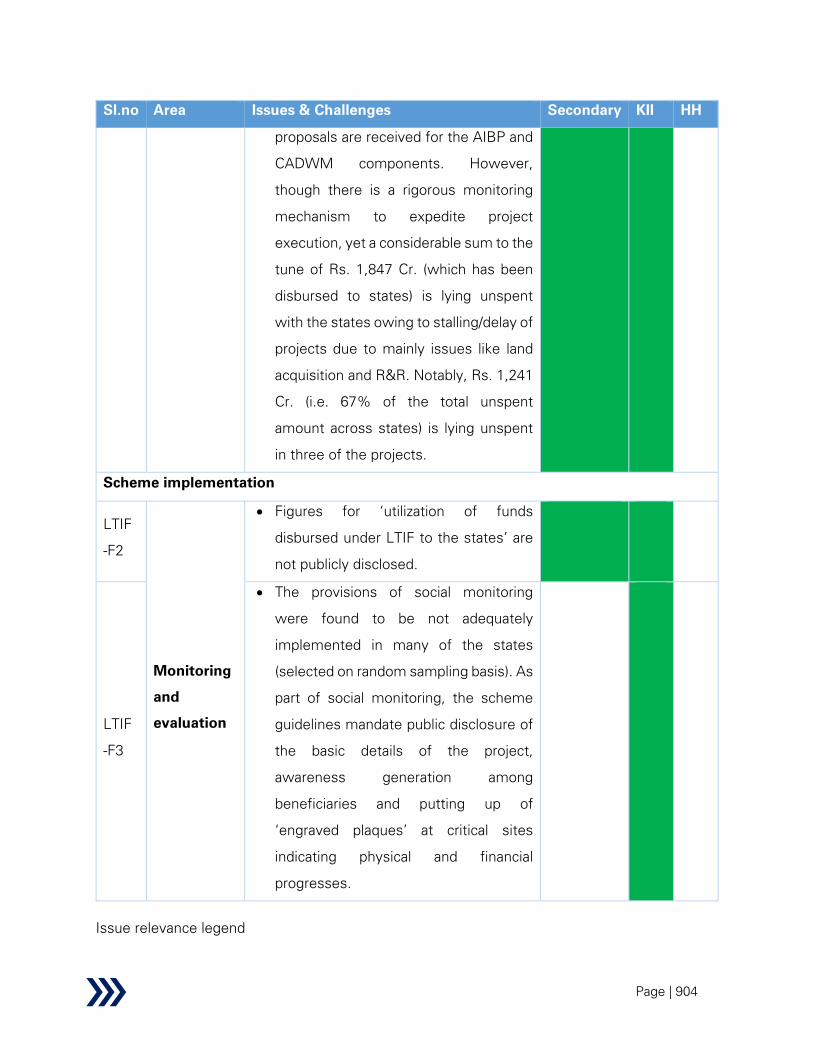
Page | 904
Sl.no Area Issues & Challenges Secondary KII HH
proposals are received for the AIBP and
CADWM components. However,
though there is a rigorous monitoring
mechanism to expedite project
execution, yet a considerable sum to the
tune of Rs. 1,847 Cr. (which has been
disbursed to states) is lying unspent
with the states owing to stalling/delay of
projects due to mainly issues like land
acquisition and R&R. Notably, Rs. 1,241
Cr. (i.e. 67% of the total unspent
amount across states) is lying unspent
in three of the projects.
Scheme implementation
LTIF
-F2
Monitoring
and
evaluation
• Figures for ‘utilization of funds
disbursed under LTIF to the states’ are
not publicly disclosed.
LTIF
-F3
• The provisions of social monitoring
were found to be not adequately
implemented in many of the states
(selected on random sampling basis). As
part of social monitoring, the scheme
guidelines mandate public disclosure of
the basic details of the project,
awareness generation among
beneficiaries and putting up of
‘engraved plaques’ at critical sites
indicating physical and financial
progresses.
Issue relevance legend

Page | 905
Supported
Partially
supported
Not supported
Not applicable
A summary analysis of issues & challenges for the scheme is presented below:
Table 115: LTIF – summary of issues and challenges
Parameter Performance
Institutional Mechanism and governance
Fund flow efficiency and utilization
Monitoring and evaluation
Performance infographics legend
Satisfactory
Average
Needs Improvement
2.2.7.4 Recommendations and solutions
This sub-section describes the scheme recommendation and solutions from the perspective of
scheme design, scheme implementation and monitoring & evaluation, along with their mapping
with the issues and challenges described in the preceding sub-section.
Table 116: LTIF – recommendations and solutions
Sl.no Recommendations Finding
Scheme design
LTIF -R1
Provisions for ensuring optimal utilization of unspent balances
lying in some projects
• Provisions under LTIF can be introduced to optimally utilize the
unspent funds (already disbursed through LTIF) lying idle in
projects stalled/ significantly delayed due to externalities like land
acquisition, R&R and other chronic issues. Some of the suggested
approaches are listed below:
o To reduce the exposure risks to externalities, guidelines
may be developed to disburse the funds to states in
LTIF -F1

Page | 906
Sl.no Recommendations Finding
several tranches (instead of a single lump sum) based
on utilization of previous tranche; however in such
cases adequate provisions need to be built in so as to
streamline the procedure between proposal/
application (by state) and release of funds (from
NABARD) to avoid any inadvertent delays
o In case of funds lying unspent in a particular project for
more than a defined time period, the amount should be
returned to NWDA/ NABARD who may then disburse it
to another PMKSY-AIBP project in that or other states
Monitoring and evaluation
LTIF -R2
Figures for disbursal and utilization of funds under LTIF to states is
proposed to be made available in public domain to bring in more
transparency and accountability; it may be linked to the AIBP MIS
Dashboard
LTIF -F2
LTIF -R3
Include stricter norms for social monitoring
• Stricter norms may be introduced to ensure social monitoring by
linking subsequent disbursals with performance of social
monitoring
LTIF -F3

Page | 907
2.2.8 National River Conservation Plan
Water pollution is one of the biggest issues facing India right now. As may be evident, untreated
sewage is the biggest source osf such form of pollution in India due to rapid urbanization,
industrialization and increase in population. There are other sources of pollution such as runoff
from the agricultural sector as well as unregulated unit that belongs to small scale as well as large
scale industries. The situation is so serious that perhaps there is no waterbody in India that is not
polluted to some extent or the other. In fact, it is said that almost 80% waterbodies in India are
highly polluted. The Comptroller and Audit General (CAG) in India has expressed deep concerns
over the high pollution levels in river water and noted that almost all rivers are fed with huge
waste from industries as well as urban local bodies (Source: The Hindu, 15th Feb 2015).
Rivers may be polluted from both point and non-point sources. Among the total measurable
pollution in the rivers from point sources, 75% can be attributed to municipal sewage generated
from towns situated along riverbanks and remaining 25% from industrial effluents. Major point
sources of pollution include:
• Domestic sewage: In urban areas, about 70-80% of water supplied for domestic purpose
drains out to nearby water bodies through municipality drain or nallah without treatment
which causes pollution.
• Industrial effluents: This is an area of concern for river water and other water bodies due to
the higher concentration of the pollutants and complex profile owing to the presence of
chemical, metals and other toxic materials. Industrial effluent contains heavy metals like
lead, zinc, mercury etc. and harmful bacteria and virus which contaminates the river water.
• Agricultural effluents: The use of various types of fertilizers, pesticides and insecticides in
agriculture causes water pollution and these effluents are directly discharged without
treatment into water bodies causing river water pollution.
Apart from the above-mentioned sources, there are other non-point sources of pollution such as
runoff from solid waste dumps, agricultural run-off, areas used for open defecation, dumping of
un-burnt/ half burnt bodies, animal carcasses, dhobi ghats, cattle wallowing etc.
There are 12 major river basins and 46 medium river basins in India. The Central Pollution Control
Board (CPCB) in association with the State Pollution Control Board (SPCB) monitors the water
Page | 908
quality of rivers, lakes, ponds, tanks and other water bodies across the country through a network
of monitoring stations under the National Water Quality Monitoring Programme. A survey was
carried out by CPCB on the sewage generation of Class I & Class II towns of the country and the
capacity required for treatment of the generated sewage. As per the CPCB report published in
March 2015, it was estimated that around 61,948 million litre per day (MLD) sewage is being
generated from these towns and the treatment capacity available against this was only 23,277
MLD from 816 STPs. The CPCB also has been carrying out studies on the status of pollution of
the rivers and as per the latest study, 351 polluted river stretches have been identified on 275
rivers across the country.
2.2.8.1 Background
The Central Government started the river pollution abatement programme with the launching of
the Ganga Action Plan (GAP) Phase I in the year 1985 as a 100% centrally funded scheme with
the objective to improve the water quality of river Ganga to acceptable standards as set by CPCB.
Under GAP Phase I, pollution abatement works were taken up for 21 Class I towns of Uttar
Pradesh, Bihar & West Bengal. The Phase I was completed on 31st March 2000 at a cost of Rs.
451.70 Cr.
The Ganga Action Plan (Phase II) was launched in 1993 and the scheme was extended to river
Yamuna, Gomti & Damodar, the major tributaries of river Ganga. This action plan covered the
pollution abatement works of 95 towns along the polluted stretches of 4 rivers spread over 7
states with an approved cost of Rs. 1498.96 Cr. on a 50:50 cost sharing basis between Centre &
State Government.
Later, it was felt that the river pollution abatement programme needs to be expanded to the other
major rivers of the country and hence, in 1995 all river conservation works were carried out under
the aegis of the National River Conservation Plan (NRCP) with an approved cost of Rs. 772.08 Cr.
on a 50:50 cost sharing between Centre & State Government. Accordingly, the then Ganga
Project Directorate was converted to National River Conservation Directorate (NRCD) for
servicing the National River Conservation Authority and Steering Committee. Initially the mission
covered 46 towns along the polluted stretches of 18 rivers spread over 10 states. Finally, in
Page | 909
December 1996, GAP Phase II was merged with NRCP and all projects for river cleaning in the
country was brought under one umbrella scheme of NRCP.
From August 2014 onwards, all works related to Ganga and its tributaries was transferred to
Ministry of Water Resources, River Development and Ganga Rejuvenation (MoWR, RD & GR).
The National Mission for Clean Ganga (NMCG) has been formed to act as the implementation
arm of the National Ganga River Basin Authority (NGRBA). Currently NRCP (excluding Ganga &
its tributaries) covers polluted stretches of 34 rivers in 77 towns spread across 16 states. The
NRCD was previously under the Ministry of Environment, Forest and Climate Change
(MoEF&CC) but currently, NRCD has been brought under the aegis of the newly formed Ministry
of Jal Shakti.
Stated Objectives of the Scheme
The objective of NRCP is to reduce the pollution load in rivers by implementing the various
pollution abatement programmes and thereby improving the quality of river water which in turn
helps to improve the biodiversity and ecosystem of the river and the environmental condition of
the town. Various activities have been included under NRCP related to pollution abatement works
such as:
• Interception and diversion work to capture the raw sewage flowing into the rivers through
open drains and diverting them for treatment
• Construction of sewage treatment plants for treatment of diverted sewage
• Construction of low-cost sanitation works to prevent open defecation on riverbanks
• Construction of electric crematoria and improved wood crematoria to conserve the use of
wood and ensure proper cremation of body brought to burning Ghats
• Construction of bathing ghats
• Riverfront development works
• Public awareness and public participation
• Capacity building, training & research in the area of river conservation
Funding Pattern of the Scheme

Page | 910
The National River Conservation Plan (NRCP) scheme was launched in 1995 to reduce the
pollution load on major rivers in India on a cost sharing basis of 50:50 between Centre & State
Government. Since its inception the funding pattern has changed several times.
• In November 1998 the funding pattern was changed to 100% centrally funded
• In 2001, the funding pattern became 70:30 between Central & State Government
• In 2015, the funding pattern changed to 50:50 between Central and State Government and
for North-Eastern states it became 80:20
• Since 2016, the funding pattern for North-Eastern states is 90:10 and for other states it is
60:40
• The funding pattern for the JICA assisted Mula-Mutha Action Plan under Pune Municipal
Corporation is 85:15 between the Central & State Government
According to the NRCP scheme guidelines, funding is provided for construction of STPs and the
O&M for the commissioned STPs is the sole responsibility of the State Government and Project
Implementing Agency (PIA). Therefore, the O&M costs shall be borne by the State Government
and PIAs. In this regard, a tripartite agreement is also signed between State Government, PIA
and NRCD as a condition for sanction of the projects. The local bodies may take loan from any
financial institution such as HUDCO for their share. Any additional expense or cost overrun of the
project due to delay, inflation or any other reasons shall be borne by State Government and PIAs.
List of Projects and Beneficiary States
Currently the NRCP has covered polluted stretches of 34 rivers in 77 towns spread across 16
states in the country at a sanctioned cost of Rs. 5,870.54 Cr. A central share of Rs. 2,452.35 Cr.
was released to the State Governments for implementation of various pollution abatement
works. The state-wise and town wise constructed STP details along with the DPR cost are
presented in the table below.
Table 117: Detailed allocation of Budget State-wise & Project-wise
State Town
Name of
River
Sanctioned
Cost (DPR)
Expenditure
by State
STP
Capacity
Sanctioned
STP
Capacity
Created
(Rs. Lakh) (Rs. Lakh) (MLD) (MLD)
1. Rajamundry 1. Godavari 2,178.60 1,958.84 30.04 30.00

Page | 911
State Town
Name of
River
Sanctioned
Cost (DPR)
Expenditure
by State
STP
Capacity
Sanctioned
STP
Capacity
Created
(Rs. Lakh) (Rs. Lakh) (MLD) (MLD)
1. Andhra
Pradesh Sub Total 2,178.60 1,958.84 30.04 30.00
2. Goa
2. Panaji 2. Mandovi 1,409.52 1,349.93 12.50 12.50
Sub Total 1,409.52 1,349.93 12.50 12.50
3. Gujarat
3. Ahmedabad 3. Sabarmati 54,639.87 28,743.42 442.60 280.00
4. Surat 4. Mindhola 26,213.14 37,188.98 53.00 53.00
4. Surat 19. Tapi 97,125.00
Sub Total 177,978.01 65,932.40 495.60 333.00
4. Jharkhand
5. Ghatshila
5.
Subarnarekha
65.43 23.71 0.00 0.00
6. Jamshedpur 174.52 37.83 0.00 0.00
7. Ranchi 74.21 36.11 0.00 0.00
Sub Total 314.16 97.65 0.00 0.00
5. Jammu &
Kashmir
8. Udhampur 6. Devika & 7.
Tawi 18,674.00 1,300.00 13.06 0.00
Sub Total 18,674.00 1,300.00 13.06 0.00
6. Karnataka
9. Bangalore 8. Pennar 4,627.00 3,593.78 0.00 0.00
10. Bhadravati 9. Bhadra 376.98 413.95 5.83 5.83
11. Davangere 10.
Tungabhadra
466.05 405.34 19.45 19.45
12. Harihara 249.94 216.54 8.84 8.84
13. K.R.Nagar
11. Cauvery
57.80 72.53 1.45 1.45
14. Kollegal 108.65 107.64 3.34 3.34
15. Nanjangud 223.86 114.67 1.47 1.37
16. Shimoga 12. Tunga
Cauvery
370.38 260.30 18.16 0.00
17. Srirangapatna 144.01 173.79 1.36 1.36
Sub Total 6,624.67 5,358.54 59.90 41.64
7. Kerala
18. Pamba 13. Pamba 1,844.98 3,369.00 4.50 4.50
Sub Total 1,844.98 3,369.00 4.50 4.50
8. Madhya
Pradesh
19. Burhanpur 14. Tapti 481.47 387.81 10.00 6.00
20. Chapara
15.
Wainganga 39.85 36.83 1.20 1.20
21. Hoshangabad
16. Narmada
1,299.07 367.34 16.00 0.00
22. Jabalpur 133.85 118.19 0.00 0.00
23. Keolari 15.
Wainganga
36.16 32.59 0.75 0.75
24. Seoni 25.10 24.25 0.00 0.00
Sub Total 2,015.50 967.01 27.95 7.95
25. Karad 17. Krishna 318.72 313.94 28.00 28.00

Page | 912
State Town
Name of
River
Sanctioned
Cost (DPR)
Expenditure
by State
STP
Capacity
Sanctioned
STP
Capacity
Created
(Rs. Lakh) (Rs. Lakh) (MLD) (MLD)
9.
Maharashtra
26. Kolhapur
18.
Panchganga 7,429.00 5,537.42 76.00 78.00
27. Nanded 1. Godavari
1,346.76 1,241.88 26.00 26.00
28. Nashik 6,201.76 6,128.16 100.00 100.00
29. Prakkasha 19. Tapi 244.43 96.11 0.00 0.00
30. Sangli 17. Krishna 2,555.27 3,063.52 27.00 27.00
31.
Trimbakeshwar 1. Godavari 1,164.00 1,152.50 1.00 1.00
32. Pune
20. Mula
Mutha 99,026.00 3,869.00 396.00 0.00
Sub Total 118,285.94 21,402.53 654.00 260.00
10. Nagaland
33. Dimapur
21. Diphu &
Dhansir
8,280.09 3,500.00 25.43 0.00
Sub Total 8,280.09 3,500.00 25.43 0.00
11. Odisha
34. Chandbali 22. Brahamini 34.90 34.90 0.00 0.00
35. Cuttack 23. Mahanadi 804.30 804.30 33.00 33.00
36. Dharamsala 22. Brahamini 19.63 19.63 0.00 0.00
37. Puri Coastal Area 8,044.86 7,945.74 15.00 15.00
38. Talcher 22. Brahamini 370.20 220.76 2.00 2.00
Sub Total 9,273.89 9,025.33 50.00 50.00
12. Punjab
39. Banga 24. Satluj 1,198.35 1,264.09 3.00 3.00
40. Bholath
25. Beas &
Satluj
1,541.78 1,723.33 4.00 4.00
41. Dasuya 899.68 1,155.89 4.00 4.00
42. Hoshiyarpur 9,405.00 8,256.34 30.00 30.00
43. Jalandhar
24. Satluj
26,428.78 26,527.29 185.00 185.00
44. Kapurthala 1,256.26 1,278.75 19.30 25.00
45. Ludhiana 13,351.21 18,445.30 311.00 311.00
46. Moga 25. Beas &
Satluj
5,909.00 5,909.42 27.00 27.00
47. Mukerian 1,467.09 1,513.24 5.00 5.00
48. Nawanshehar
24. Satluj
1,707.22 1,633.42 6.00 6.00
49. Phagwara 4,975.40 4,256.78 36.00 36.00
50. Philaur 1,063.10 901.14 5.60 5.60
51. Sultanpur
Lodhi 240.74 164.49 2.60 2.60
52. Tanda 25. Beas &
Satluj
2,288.62 2,246.80 4.00 4.00
53. Khanauri 26. Ghaggar 1,345.86 946.82 4.00 4.00
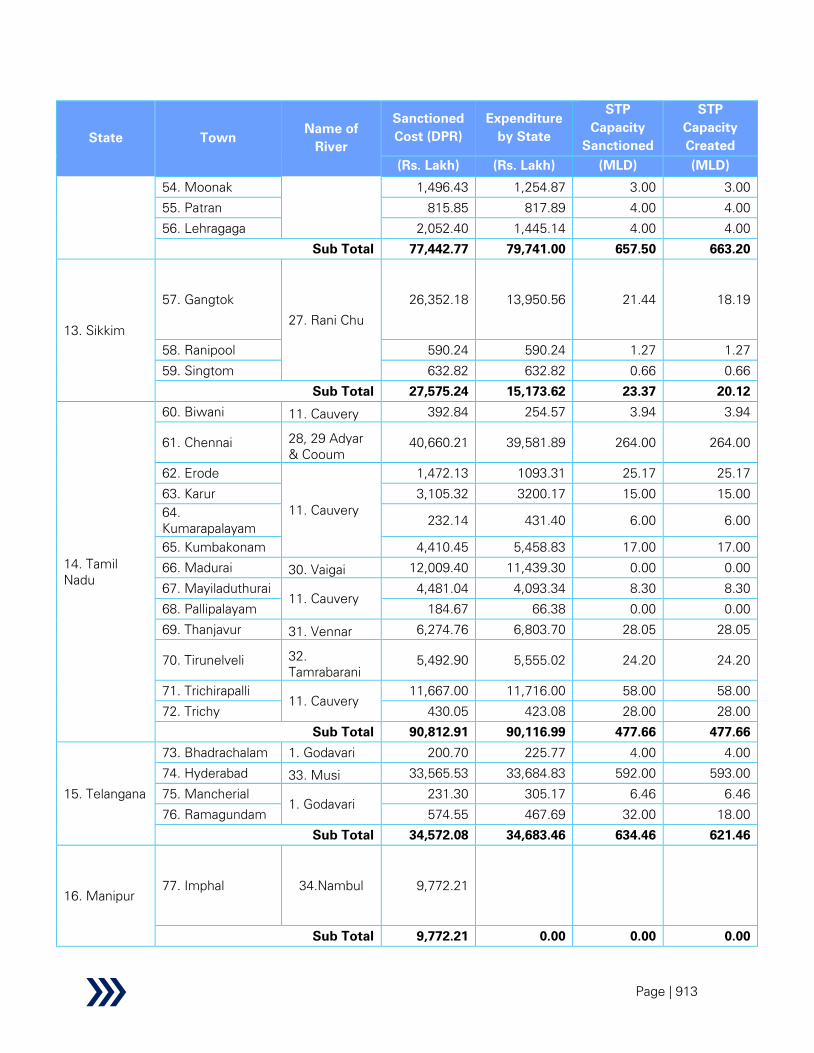
Page | 913
State Town
Name of
River
Sanctioned
Cost (DPR)
Expenditure
by State
STP
Capacity
Sanctioned
STP
Capacity
Created
(Rs. Lakh) (Rs. Lakh) (MLD) (MLD)
54. Moonak 1,496.43 1,254.87 3.00 3.00
55. Patran 815.85 817.89 4.00 4.00
56. Lehragaga 2,052.40 1,445.14 4.00 4.00
Sub Total 77,442.77 79,741.00 657.50 663.20
13. Sikkim
57. Gangtok
27. Rani Chu
26,352.18 13,950.56 21.44 18.19
58. Ranipool 590.24 590.24 1.27 1.27
59. Singtom 632.82 632.82 0.66 0.66
Sub Total 27,575.24 15,173.62 23.37 20.12
14. Tamil
Nadu
60. Biwani 11. Cauvery 392.84 254.57 3.94 3.94
61. Chennai 28, 29 Adyar
& Cooum
40,660.21 39,581.89 264.00 264.00
62. Erode
11. Cauvery
1,472.13 1093.31 25.17 25.17
63. Karur 3,105.32 3200.17 15.00 15.00
64.
Kumarapalayam 232.14 431.40 6.00 6.00
65. Kumbakonam 4,410.45 5,458.83 17.00 17.00
66. Madurai 30. Vaigai 12,009.40 11,439.30 0.00 0.00
67. Mayiladuthurai
11. Cauvery
4,481.04 4,093.34 8.30 8.30
68. Pallipalayam 184.67 66.38 0.00 0.00
69. Thanjavur 31. Vennar 6,274.76 6,803.70 28.05 28.05
70. Tirunelveli 32.
Tamrabarani
5,492.90 5,555.02 24.20 24.20
71. Trichirapalli
11. Cauvery
11,667.00 11,716.00 58.00 58.00
72. Trichy 430.05 423.08 28.00 28.00
Sub Total 90,812.91 90,116.99 477.66 477.66
15. Telangana
73. Bhadrachalam 1. Godavari 200.70 225.77 4.00 4.00
74. Hyderabad 33. Musi 33,565.53 33,684.83 592.00 593.00
75. Mancherial
1. Godavari
231.30 305.17 6.46 6.46
76. Ramagundam 574.55 467.69 32.00 18.00
Sub Total 34,572.08 34,683.46 634.46 621.46
16. Manipur
77. Imphal 34.Nambul 9,772.21
Sub Total 9,772.21 0.00 0.00 0.00
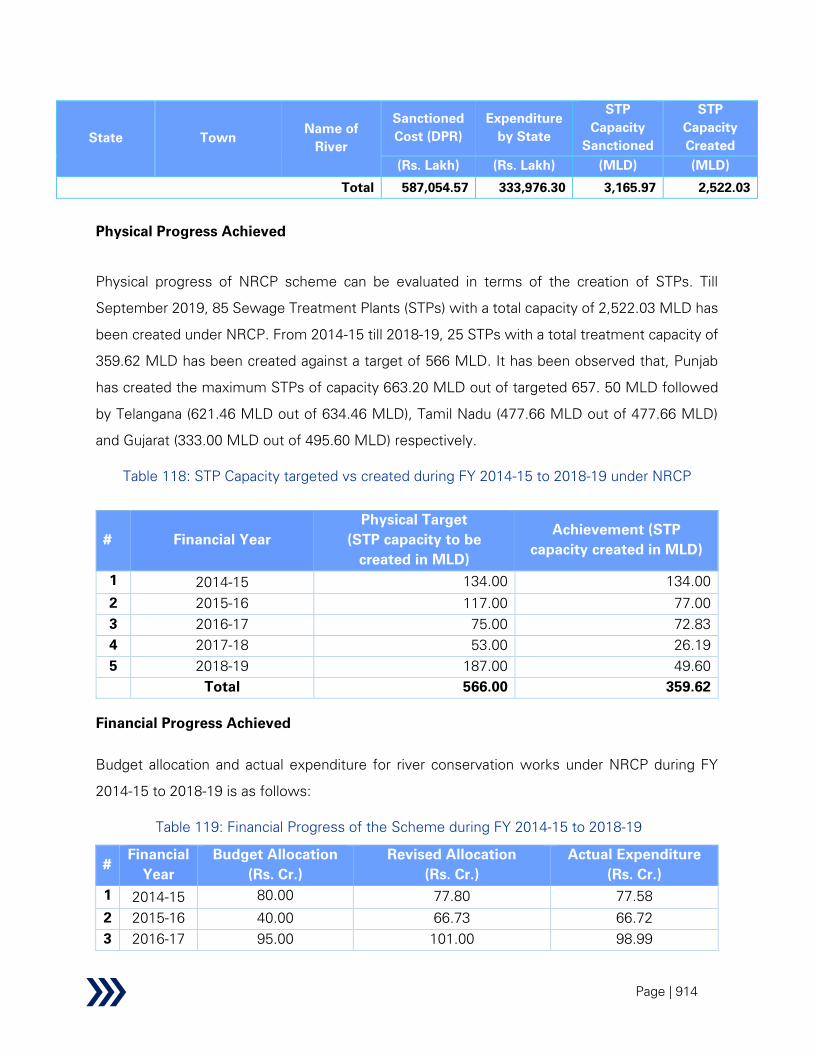
Page | 914
State Town
Name of
River
Sanctioned
Cost (DPR)
Expenditure
by State
STP
Capacity
Sanctioned
STP
Capacity
Created
(Rs. Lakh) (Rs. Lakh) (MLD) (MLD)
Total 587,054.57 333,976.30 3,165.97 2,522.03
Physical Progress Achieved
Physical progress of NRCP scheme can be evaluated in terms of the creation of STPs. Till
September 2019, 85 Sewage Treatment Plants (STPs) with a total capacity of 2,522.03 MLD has
been created under NRCP. From 2014-15 till 2018-19, 25 STPs with a total treatment capacity of
359.62 MLD has been created against a target of 566 MLD. It has been observed that, Punjab
has created the maximum STPs of capacity 663.20 MLD out of targeted 657. 50 MLD followed
by Telangana (621.46 MLD out of 634.46 MLD), Tamil Nadu (477.66 MLD out of 477.66 MLD)
and Gujarat (333.00 MLD out of 495.60 MLD) respectively.
Table 118: STP Capacity targeted vs created during FY 2014-15 to 2018-19 under NRCP
# Financial Year
Physical Target
(STP capacity to be
created in MLD)
Achievement (STP
capacity created in MLD)
1 2014-15 134.00 134.00
2 2015-16 117.00 77.00
3 2016-17 75.00 72.83
4 2017-18 53.00 26.19
5 2018-19 187.00 49.60
Total 566.00 359.62
Financial Progress Achieved
Budget allocation and actual expenditure for river conservation works under NRCP during FY
2014-15 to 2018-19 is as follows:
Table 119: Financial Progress of the Scheme during FY 2014-15 to 2018-19
#
Financial
Year
Budget Allocation
(Rs. Cr.)
Revised Allocation
(Rs. Cr.)
Actual Expenditure
(Rs. Cr.)
1 2014-15 80.00 77.80 77.58
2 2015-16 40.00 66.73 66.72
3 2016-17 95.00 101.00 98.99

Page | 915
#
Financial
Year
Budget Allocation
(Rs. Cr.)
Revised Allocation
(Rs. Cr.)
Actual Expenditure
(Rs. Cr.)
4 2017-18 173.50 173.50 173.34
5 2018-19 173.50 150.50 150.32
6 2019-20 196.00 196.00 75.00 (Sept 2019)
Total 758.00 765.53 641.95
The financial progress of the states has been measured in terms of expenditure by the states
against the sanctioned cost or DPR cost. It has been observed that till September 2019, Tamil
Nadu has utilized its maximum allocation (Rs. 901.17 Cr. out of Rs. 908.13 Cr.) followed by Punjab
(Rs. 797.41 Cr. out of 774.43 Cr.) and Telangana (Rs. 345.72 Cr. out of Rs. 346.83 Cr.)
respectively.
For laying of sewerage network and installation of sewage treatment plants to meet the gap in
sewage treatment capacity of 61,948 MLD (as per Report of CPCB 2015) expenditure of around
Rs. 200,000 – 300,000 Cr. is expected. The budgetary allocation at Centre, State and local body
level for the sewage sector are highly inadequate vis-a-vis the requirement and would need to be
substantially increased if the pollution in the river from untreated sewage generated in towns is
to be controlled.
Project Sanction Mechanism by NRCD
The process of submission of proposals by State Governments for consideration under NRCP
scheme and final approval by NRCD with subsequent release of funds for implementation is
presented in the schematic diagram on the next page

Page | 916
Figure 41: Project Sanction Mechanism by NRCD
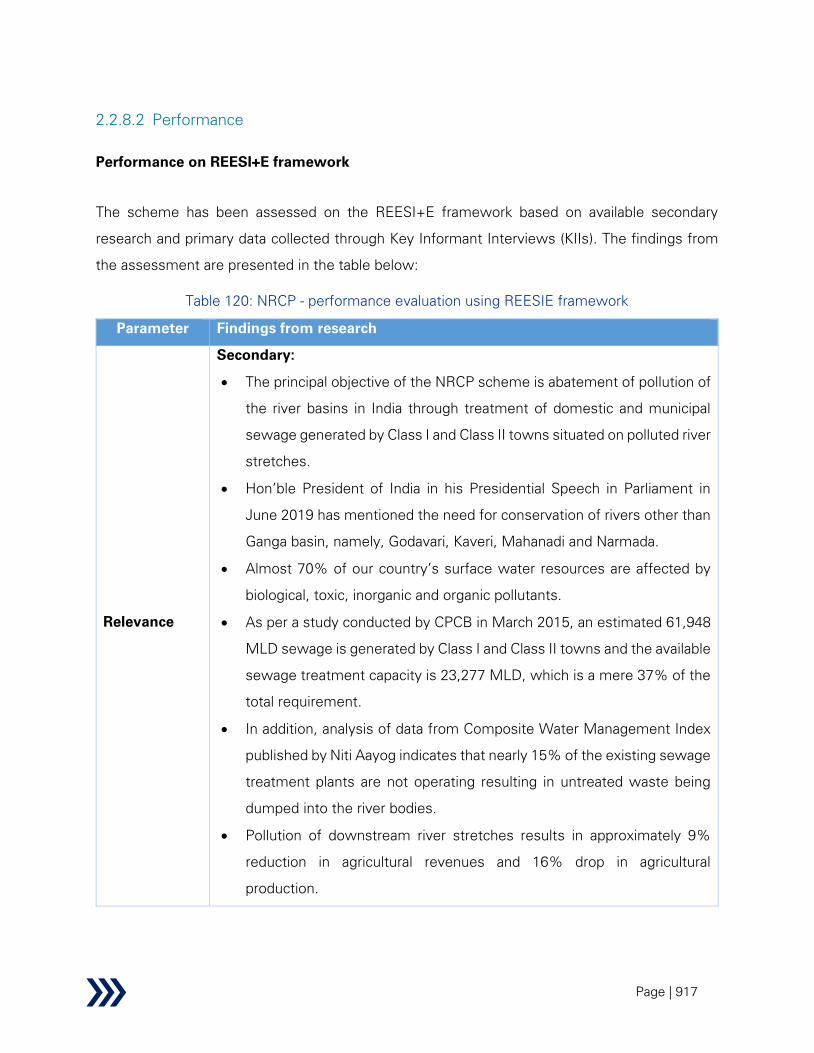
Page | 917
2.2.8.2 Performance
Performance on REESI+E framework
The scheme has been assessed on the REESI+E framework based on available secondary
research and primary data collected through Key Informant Interviews (KIIs). The findings from
the assessment are presented in the table below:
Table 120: NRCP - performance evaluation using REESIE framework
Parameter Findings from research
Relevance
Secondary:
• The principal objective of the NRCP scheme is abatement of pollution of
the river basins in India through treatment of domestic and municipal
sewage generated by Class I and Class II towns situated on polluted river
stretches.
• Hon’ble President of India in his Presidential Speech in Parliament in
June 2019 has mentioned the need for conservation of rivers other than
Ganga basin, namely, Godavari, Kaveri, Mahanadi and Narmada.
• Almost 70% of our country’s surface water resources are affected by
biological, toxic, inorganic and organic pollutants.
• As per a study conducted by CPCB in March 2015, an estimated 61,948
MLD sewage is generated by Class I and Class II towns and the available
sewage treatment capacity is 23,277 MLD, which is a mere 37% of the
total requirement.
• In addition, analysis of data from Composite Water Management Index
published by Niti Aayog indicates that nearly 15% of the existing sewage
treatment plants are not operating resulting in untreated waste being
dumped into the river bodies.
• Pollution of downstream river stretches results in approximately 9%
reduction in agricultural revenues and 16% drop in agricultural
production.
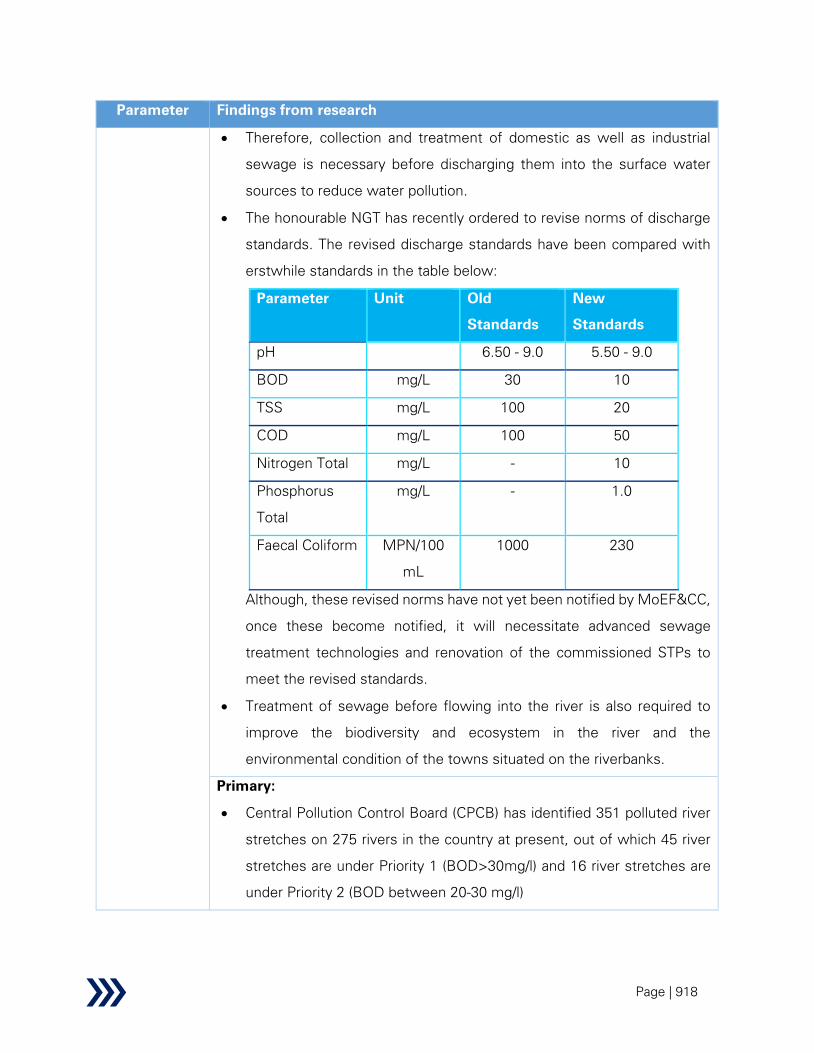
Page | 918
Parameter Findings from research
• Therefore, collection and treatment of domestic as well as industrial
sewage is necessary before discharging them into the surface water
sources to reduce water pollution.
• The honourable NGT has recently ordered to revise norms of discharge
standards. The revised discharge standards have been compared with
erstwhile standards in the table below:
Parameter Unit Old
Standards
New
Standards
pH 6.50 - 9.0 5.50 - 9.0
BOD mg/L 30 10
TSS mg/L 100 20
COD mg/L 100 50
Nitrogen Total mg/L - 10
Phosphorus
Total
mg/L - 1.0
Faecal Coliform MPN/100
mL
1000 230
Although, these revised norms have not yet been notified by MoEF&CC,
once these become notified, it will necessitate advanced sewage
treatment technologies and renovation of the commissioned STPs to
meet the revised standards.
• Treatment of sewage before flowing into the river is also required to
improve the biodiversity and ecosystem in the river and the
environmental condition of the towns situated on the riverbanks.
Primary:
• Central Pollution Control Board (CPCB) has identified 351 polluted river
stretches on 275 rivers in the country at present, out of which 45 river
stretches are under Priority 1 (BOD>30mg/l) and 16 river stretches are
under Priority 2 (BOD between 20-30 mg/l)

Page | 919
Parameter Findings from research
• Discussions held with the National River Conservation Directorate
(NRCD) clearly emphasize the growing awareness about depolluting
river stretches both from environmental, hygienic as well as religious
perspectives. Proposals for rejuvenation of major river basins such as
Namami Kaveri, Mission Clean Krishna and Godavari are being submitted
by states to the centre, particularly after the advent and success of the
National Mission for Clean Ganga (NMCG).
• Discussions with key informants including Punjab Water Supply and
Sewerage Board (PWSSB), Bangalore Water Supply and Sewerage
Board (BWSSB), Water Resources Department of Andhra Pradesh and
Tamil Nadu along with State Pollution Control Boards of Karnataka,
Punjab, Andhra Pradesh and Maharashtra as well as municipal
corporations provided the following insights with respect to relevance of
the scheme.
o Most rivers have major cities situated on their banks such as
Rajamundry and Vijayawada on Rivers Krishna and Godavari,
Ludhiana and Jalandhar on the banks of Rivers Sutlej and Beas,
Trichy and Erode on River Kaveri. Large quantities of municipal and
industrial sewage seep in at specific pockets into the rivers.
o Existing treatment capacities are insufficient to treat the incoming
domestic sewage. Some instances are mentioned below-
▪ Vijayawada Municipality with a population of 20 Lakh has a
treatment capacity of only 30 MLD and a major proportion of
generated municipal sewage goes untreated into the river.
▪ Rajamundry, situated on River Godavari generates 60 MLD
sewage but has a treatment capacity of only 30 MLD.
▪ Maharashtra Pollution Control Board noted that out of 2700 MLD
sewage generated, only 50% is currently being treated.
▪ As mentioned by Jharkhand SPCB during the KII, some industries
have themselves established STPs in the colonies for treatment
of domestic and industrial sewage. But the treatment capacity is

Page | 920
Parameter Findings from research
far less than that required and a lot of untreated sewage flows
into Subarnarekha river. No STP for treatment of domestic
sewage has been set up in Jharkhand.
▪ In Chennai, the current 264 MLD treatment capacity is not
enough and some untreated sewage still flows into the River
Cooum. This is being taken up separately by Chennai River
Restoration Trust (CRRT).
▪ In Surat, some STPs are present under Surat Municipal
Corporation, but in the urban and rural areas beyond the
corporation’s purview, there are no STPs and a significant
quantity of untreated sewage flows into the river Tapi.
▪ It was noted by UEED, J&K that the current treatment capacity
in the state is not enough to treat the sewage generated and
more treatment plants, sewerage networks and sewage
collection infrastructure is needed.
▪ It was noted by Odisha State Pollution Control Board that more
STP creation is required in other cities in the state to be able to
treat the generated municipal sewage.
o There are other sources of pollution of river water such as that noted
by Andhra Pradesh Water Resources Department (APWRD) wherein
silt from the Eastern Ghats accumulates in River Krishna
deteriorating the quality of river water and reducing river capacity.
Inference:
• Lack of sewage treatment infrastructure in the Class I and Class II towns
make NRCP scheme highly significant.
• The scheme will continue to aid in the abatement of pollution level in the
river basins in India, thereby improving the river water quality,
surrounding environmental condition and river ecology.
• There has been a growing need for conservation of major river basins in
the country.
Page | 921
Parameter Findings from research
• Hence, assessment of the findings from secondary and primary research
indicates that the NRCP scheme is highly relevant.
Effectiveness
Secondary:
Physical progress:
• Since the scheme inception, a total of 85 Sewage Treatment Plants in
77 towns over 34 rivers (excluding Ganga & its tributaries) spread across
16 states have been constructed till September 2019 at a total
sanctioned cost of Rs. 5,870.54 Cr.
• As on September 2019, 347 projects have been sanctioned among
which 340 projects have already been completed
• STPs designed for treatment of 3166 MLD domestic sewage have been
sanctioned, out of which only 2522.03 MLD STP capacity has been
created
• This includes one of the biggest STPs in India – a 339 MLD Upflow
Anaerobic Sludge Blanket (UASB) technology based STP on River Musi
in Hyderabad, which is currently being operated by the Hyderabad
Metropolitan Water Supply and Sewerage Board (HMWSSB)
• From FY 2014-15 to 2018-19, 359.62 MLD STP capacity (only 63%) has
been constructed against a target of 566 MLD.
• Along with construction of STPs, works such as interception and
diversion of sewage, laying of sewer lines, rehabilitation of sewer mains,
solid waste management facilities, new pumping station for STPs,
renovation of existing intermediate pumping stations have also been
taken up under NRCP.
• Construction of community based low cost toilets (especially in slum and
fringe areas), bathing ghats, electric crematoria, riverfront development
activities, cleaning and fencing of riverbanks, afforestation have been
undertaken to take care of other factors causing pollution.

Page | 922
Parameter Findings from research
• This has also been corroborated in the impact evaluation studies of
schemes in 10 identified towns in Region 1,2,3 in India submitted to
NRCD in 2014 which indicates -
o Construction of core structures - Interception & Diversion (I&D)
works, STPs were completed.
o Construction of non-core structures such as Community Toilet
Facilities, Electric/ Improved Crematoria, River front development as
well as construction of washer’s platform, afforestation and solid
waste disposal were undertaken under the scheme.
Performance of states:
• Till September 2019, Punjab has created the maximum STPs of capacity
(663.20 MLD out of targeted 657. 50 MLD), followed by Telangana
(621.46 MLD out of 634.46 MLD), Tamil Nadu (477.66 MLD out of
477.66 MLD) and Gujarat (333.00 MLD out of 495.60 MLD) respectively.
• Andhra Pradesh, Goa, Kerala, Odisha, Punjab, Sikkim, Tamil Nadu and
Telangana have performed better than average performing states both
in terms of physical and financial progress.
• Maximum STP capacity yet to be created as against the target is in
Maharashtra (394 MLD) and Madhya Pradesh (20 MLD)
• There has been very little progress in states like Nagaland and Jammu &
Kashmir
• Jharkhand has not shown any progress in creation of STPs. There has
been around Rs. 300 Cr. projects sanctioned and Rs. 100 Cr. has been
spent by State Government, but all works are in pending phase.
Improvement in river water quality:
• Water quality standards from STPs discharging into rivers has improved
and is currently well below the 30 mg/l BOD level.
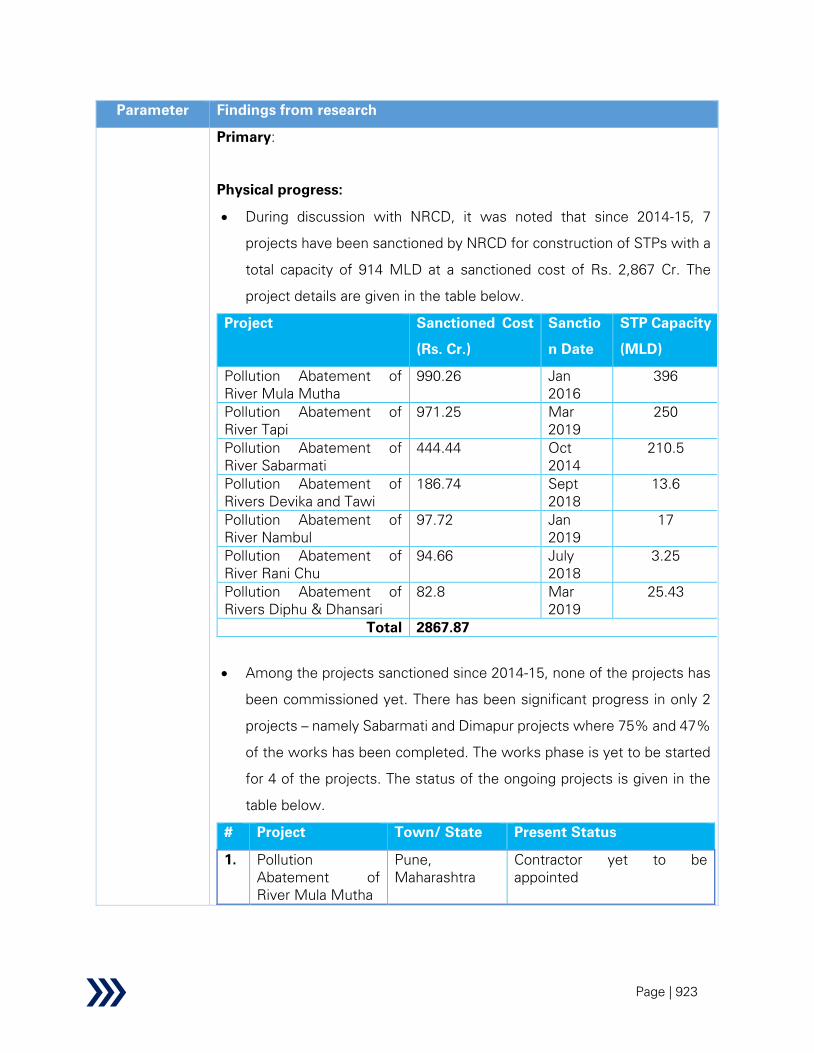
Page | 923
Parameter Findings from research
Primary:
Physical progress:
• During discussion with NRCD, it was noted that since 2014-15, 7
projects have been sanctioned by NRCD for construction of STPs with a
total capacity of 914 MLD at a sanctioned cost of Rs. 2,867 Cr. The
project details are given in the table below.
Project Sanctioned Cost
(Rs. Cr.)
Sanctio
n Date
STP Capacity
(MLD)
Pollution Abatement of
River Mula Mutha
990.26 Jan
2016
396
Pollution Abatement of
River Tapi
971.25 Mar
2019
250
Pollution Abatement of
River Sabarmati
444.44 Oct
2014
210.5
Pollution Abatement of
Rivers Devika and Tawi
186.74 Sept
2018
13.6
Pollution Abatement of
River Nambul
97.72 Jan
2019
17
Pollution Abatement of
River Rani Chu
94.66 July
2018
3.25
Pollution Abatement of
Rivers Diphu & Dhansari
82.8 Mar
2019
25.43
Total 2867.87
• Among the projects sanctioned since 2014-15, none of the projects has
been commissioned yet. There has been significant progress in only 2
projects – namely Sabarmati and Dimapur projects where 75% and 47%
of the works has been completed. The works phase is yet to be started
for 4 of the projects. The status of the ongoing projects is given in the
table below.
# Project Town/ State Present Status
1. Pollution
Abatement of
River Mula Mutha
Pune,
Maharashtra
Contractor yet to be
appointed

Page | 924
Parameter Findings from research
2. Pollution
Abatement of
River Tapi
Surat, Gujarat Tenders awarded for 2 STPs,
work not yet started
3. Pollution
Abatement of
River Sabarmati
Ahmedabad,
Gujarat
Physical Progress 75%
4. Pollution
Abatement of
Rivers Devika and
Tawi
Udhampur,
Jammu &
Kashmir
Physical Progress 10%
5. Pollution
Abatement of
River Nambul
Imphal, Manipur Physical Progress 4%
6. Pollution
Abatement of
River Rani Chu
Gangtok, Sikkim Physical Progress 2.8%
7. Pollution
Abatement of
Rivers Diphu &
Dhansari
Dimapur,
Nagaland
Physical Progress 47.08%
• As noted during secondary research, it was verified during KIIs also, that
civil structures such as bathing ghats, low cost public toilets, sewer lines,
crematoria, pumping stations have been created which are functional
and people are being encouraged to use the facilities.
Improvement in river water quality:
• Discussions with stakeholders highlighted that there has been an
improvement in river water quality in many states such as Andhra
Pradesh, Maharashtra, Punjab, Tamil Nadu, Odisha etc.
o In Punjab, pollutant levels which were 200-300 mg/l BOD prior to
treatment have been reduced to 30 mg/l BOD.
o In Tamil Nadu, 2 polluted river stretches – Tamrabarani and Bhavani
have been proposed to be delisted and River Kaveri has been
proposed to be downgraded in pollution ranking.
o In Chennai, as mentioned by CMWSSB, the commissioned STP
under NRCP scheme has been operational since last 10 years and

Page | 925
Parameter Findings from research
there has been around 30% reduction in pollution level on Rivers
Adyar and Cooum.
o Also, in Maharashtra, previously there were 9 polluted river stretches
of Priority 1 but currently there is only 1 polluted river stretch of
Priority 1.
o In Kolhapur, Maharashtra, 90-95% reduction in pollution level on
River Panchganga has been achieved due to the construction of the
76 MLD STP under NRCP scheme.
o In Odisha, the project interventions have helped develop sewerage
network for the entire town of Puri and helped reduce pollution in the
sea and beaches in Puri. The river water quality of Mahanadi has
improved in the last few years and is meeting extant discharge
norms.
o In Rajamundry in Andhra Pradesh, to a large extent, flow of untreated
sewage into the River Godavari has been checked and quality of river
water has improved
o In Surat in Gujarat, 50 Sewage Pumping Stations and 37 STPs are
being constructed as part of the Tapi River project which is expected
to treat all incoming domestic sewage before being discharged into
the river.
o In Sikkim, as noted during the KII with Sikkim Pollution Control Board,
there has been an improvement in river water quality in the River Rani
Chu.
o Further, in Sikkim, 4 polluted river stretches in Category V had been
identified by CPCB, but current reports indicate significant
improvement in BOD levels and hence Sikkim Pollution Control Board
has proposed CPCB to delist those polluted river stretches.
o In addition, it was noted by PHED Sikkim, that many projects for
construction of STPs, rehabilitation of STPs, laying of sewerage
networks have been taken up under NRCP scheme in and around
Gangtok on different tributaries of River Teesta, most of which have
Page | 926
Parameter Findings from research
been successfully completed. These STPs are all operational and
have helped improve the river water quality significantly.
• In some projects such as the Tapi River Project, treatment of domestic
sewage flowing into small creeks has also been brought under the
purview of NRCP project. Under the Tapi River project, 23 small STPs at
23 locations on small water bodies, creeks are being constructed in rural
areas.
• As part of the NRCP project on River Devika and Tawi in Udhampur,
Jammu & Kashmir, construction of 3 STPs of 13.61 MLD capacity, 128
km sewer lines, 7 pumping stations, 3 solar power plant and 2 hydel
power plants have been taken up which the respondent from Urban
Environmental Engineering Department (UEED), J&K believes will help
in significantly improving the condition in Udhampur town and
surrounding areas of River Devika. As part of the ongoing works, 700
manholes and 690 IC chambers have also been built for collection of
municipal sewage. In addition, works for installation of bio-remediation
plant is also being proposed.
• However, as noted by the informant from Odisha State Pollution Control
Board, some activities such as septage treatment is not being taken up
under the NRCP scheme. Hence, untreated faecal sludge gets
discharged into drains which eventually flows into the rivers.
Operational effectiveness:
• It was noted during the KIIs, that in some cases, the designed capacity
of the treatment plants was much less than the actual sewage generated
and hence a large portion of untreated sewage is being discharged into
the rivers. For instance,
o In Ludhiana in Punjab, the sewage generated is 650 MLD against an
existing treatment capacity of 325 MLD.
o In Trichy in Tamil Nadu, sewage generated in 128 MLD and the
current treatment facilities include only an 88 MLD oxidation pond
and 30 MLD pumping station
Page | 927
Parameter Findings from research
Impeding Factors:
• In areas where large cities and towns are situated on the banks of the
rivers, industrial sewage along with domestic sewage is being dumped
into the river but since only treatment of domestic sewage is taken up,
the industrial sewage from smaller auxiliary plants (which do not have
their own ETPs) are left untreated. This was mentioned during KIIs with
Punjab Water Supply and Sewerage Board (PWSSB) and Chennai
Metropolitan Water Supply and Sewerage Board (CMWSSB).
• Some untreated domestic sewage as well as industrial effluents are
often discharged into nearby lakes, ponds and small water bodies which
flows into the rivers downstream.
• Also, in many areas all the lateral and branch lines and house connections
are not connected to main sewer lines.
• Most rivers in India except the northern rivers have become seasonal
with flows only between June to February and no flow in the rest of the
year to help in dilution of the pollutants. Hence the pollution levels
measured are often higher in the off-season.
• Most rivers in South India frequently experience floods which cause soil
erosion on the riverbanks and negatively impact river conservation.
Monitoring and Evaluation
• Although there is a provision in the scheme guideline for appointment of
3rd
party independent agency for monitoring, most PIAs sample treated
sewage manually twice a month and test it in their internal laboratories.
• Even in projects, where a private party has been appointed for O&M, the
PIA relies on SPCB reports, internal lab testing and no 3rd
party testing
agency is appointed for testing quality of treated sewage before being
discharged into the river.
• Although NRCD has a dedicated MIS for monitoring physical and
financial progress of projects and expenditures, the state level bodies
Page | 928
Parameter Findings from research
and PIAs do not have any dedicated MIS for regular monitoring and
evaluation of the projects.
• In ongoing projects, Online Continuous Monitoring (OCM) is being
implemented. For instance,
o In the Mula Mutha river project, SCADA system is being
implemented for centralized monitoring of functioning of STPs. GIS
mapping of sewerage facilities for better asset management is also
being done.
o In the ongoing Udhampur project on River Devika and Tawi in J&K,
SCADA system is being proposed for online monitoring.
• In some cases where STP has already been commissioned, SCADA and
OCM is being proposed, but has not been implemented yet.
Inference:
• The scheme has been effective in significantly improving the level of
pollution in river water in most of the areas.
• Secondary research and KIIs with national and state level stakeholders
indicate that there has been creation of assets and non-core
infrastructure under the scheme to tackle the issue of rising river
pollution levels.
• Independent monitoring and evaluation are not being done for the
projects regularly through appointment of 3rd
party monitoring agencies
and MIS by PIAs.
• However, there are some challenges due to which the scheme has not
been able to fully achieve reduction in pollution level in the rivers such
as
o Designed capacity of STPs being less than actual sewage generated
Case Study: Odisha State Pollution Control Board regularly does
biomonitoring of rivers. Samples of micro invertebrates are collected and
based on the number of types of samples, a diversity index is calculated.
The higher the index, the more diversity of bio-organisms in the river and
hence it indicates cleaner river water.

Page | 929
Parameter Findings from research
o Mixing of industrial effluents with domestic sewage at certain
pockets
o All house connections not being connected to sewer lines
o Seasonal rivers having very little flow in lean season
• Hence, assessment of the findings from secondary and primary research
indicates that the effectiveness of the NRCP scheme is average.
Efficiency
Secondary:
Financial Progress:
• Between 2014-15 to 2018-19, funds of Rs. 765.53 Cr. was allocated, and
utilization was Rs. 641.95 Cr. which is around 84% of the total
sanctioned funds.
• Till September 2019, sanctioned cost of projects under the NRCP
scheme was Rs. 5,870.54 cr and funds released by NRCD was Rs.
2,510.63 Cr.
• Till September 2019, actual expenditure on NRCP projects has been Rs.
3,339.96 Cr.
• Tamil Nadu has utilized its maximum allocation (Rs. 901.17 Cr. out of Rs.
908.13 Cr.), followed by Punjab (Rs. 797.41 Cr. out of 774.43 Cr.) and
Telangana (Rs. 345.72 Cr. out of Rs. 346.83 Cr.) respectively.
Project Time and Cost Overrun:
• Till September 2019, STPs with capacity of 3,166 MLD has been
sanctioned against which a treatment capacity of only 2,522 MLD has
been created. Remaining capacity is yet to be created on ground.
• Since 2014-15, only 7 projects have been sanctioned by NRCD, none of
which have been completed yet.
• Since transfer of funds to PIAs requires fund release by both central and
State Government, most of the projects were delayed due to delay in
release of matching state share of funds.

Page | 930
Parameter Findings from research
• Recently, the Ministry of Jal Shakti has written to Gujarat Government
noting the inordinate delay in completion of the NRCP projects on River
Sabarmati and River Tapi.
• However, it was mentioned, that projects which had been
commissioned in the early years (before 2009-10) had been completed
on time and there had been no delay in funds transfers. This includes
projects under Rajamundry Municipal Corporation and CMWSSB.
Operational Efficiency:
• Performance Evaluation of STPs under NRCD (Aug 2013) shows that
only 97 STPs out of 153 STPs, constructed under this scheme were
meeting the prevalent NGT standards for discharging of environmental
pollutants into water bodies in terms of BOD & COD levels.
• Although, ongoing projects are implementing latest treatment
technologies, most of the STPs under the scheme which were
commissioned previously have not been upgraded to modern
technologies which sometimes reduces the efficiency of the scheme.
• According to a CPCB report published in March 2015, 10% of STPs in
India were non-operational, i.e. out of 816 STPs in the country, 79 STPs
with a total capacity of 1,237.13 MLD were non-operational.
Inter-departmental Coordination:
• There is good coordination between state level departments and central
ministry.
Primary:
Financial progress:
• Most key informants noted that although there has been delay in receipt
of funds, but there was timely utilization of the funds available.
• However, it was noted by NRCD that, in some cases, there have been
delays in submission of utilization certificates by the PIAs to the centre.
Project time and cost overrun:

Page | 931
Parameter Findings from research
• From FY 2014-15 to 2018-19, 359.62 MLD STP capacity (only 63%) has
been constructed against a target of 566 MLD.
• Among the 2,522 MLD STP capacity created under NRCP schemes,
2,162 MLD STP capacity has been created before 2014-15. Clearly, this
indicates that there has not been much progress and STP capacity
creation during the recent years.
• Some informants noted that impending monsoons sometimes affected
the project implementation timeline leading to project execution being
delayed
• The Mula Mutha River project was sanctioned in January 2016 but is still
in tendering phase for appointment of contractor for constructing the
STPs. The primary reasons for delay in project timelines as noted by
NRCD and Pune Municipal Corporation are: -
o Delay in appointment of consultant for review of works due to O.M.
issued by the DEA
o Issues in land acquisition
o Delay in conducting the study by JICA (funding agency)
o Multi-stage tendering process along with delay in finalization of
tenders by the PIAs
o Currently the process is stalled since the bids received by PMC have
been rejected due to high quotes
• The project proposal for Tapi River in Surat was prepared by Surat
Municipal Corporation during submission to NRCD. However, during
implementation, the work in the rural areas was given to the Gujarat
Water Supply and Sewerage Board (GWSSB). As noted by the informant
from GWSSB, during the KII, the DPR and cost estimates again needed
to be revised by GWSSB before beginning work which caused some
delay in project timelines.
• It was mentioned by UEED, Jammu & Kashmir, (the implementing
agency for the River Devika and Tawi project in Udhampur, Jammu &
Page | 932
Parameter Findings from research
Kashmir), that unavailability of local labourers post revocation of Article
370 in J&K was one major reason for delay of the project works.
Delays in fund transfer
• It has been noted that there have been delays in fund flows primarily
because of the funding pattern. Funds for 60% of the project cost are
first released by the centre to which 40% of funds are added by State
Government which is then transferred to the implementing agencies.
This often causes delays in receipt of funds and hence in payments, due
to state government’s inability to provide matching state share. For
instance,
o In Jharkhand, as noted by Jharkhand State Pollution Control Board,
3 projects with a total cost of Rs. 314 Cr. has been sanctioned but
no fund has been released by the centre, only state funds amounting
to Rs. 97 Cr. has been released. Hence, there has been no progress
o The pollution abatement work for Rivers Diphu and Dhansari in
Nagaland being implemented by PHED Nagaland was initially
sanctioned in August 2005 and central share of funds was released
in Oct 2005. However, the state could not release matching fund
share and the project was stalled for 10 years. Revised DPR was
submitted which was later sanctioned in 2014 and work on the
project has been restarted.
o In addition to the above, the funding pattern of NRCP projects in
Nagaland in 2005 was 70:30 share between centre and state and
hence the sanctioned project on Rivers Diphu and Dhansari follows
this funding pattern. However, currently, the funding pattern for
north-eastern states has become 90:10 between centre and state
and PHED Nagaland has submitted proposal to NRCD for change in
the funding pattern for the remaining works.
o For the pollution abatement works on River Devika and Tawi, central
share of funds was released in Oct 2018 to the state government,
Page | 933
Parameter Findings from research
but the fund was transferred to the PIA with matching state share
only in August 2019, after a year.
o PWSSB particularly noted that arbitration with contractors are
ongoing due to delayed payments on account of delay in fund
release.
o The informant from Surat Municipal Corporation noted that although
central share of funds had been released to the state, it took another
year for them to receive the funds because of state not being able
to provide the matching share of funds. Moreover, it was noted that
the central share of funds (in this case Rs. 13 Cr.) was lying idle with
the state government with no interest being accrued.
Delays due to land acquisition
• Issues and ongoing litigations due to land acquisition in some cases have
led to projects being stalled for 3-4 years resulting in project time and
cost overruns. For instance,
o Pollution abatement works in Sikkim on River Rani Chu is yet to start
due to issues with land acquisition
o Project on River Sabarmati which started in 2014 is also not
expected to be completed by scheduled completion date due to land
acquisition problems. The scheduled completion date was
September 2018 which was later extended to March 2020 and has
again been extended to March 2021.
o The works for the ongoing project in Surat on River Tapi has stopped
due to land acquisition problems. Nearly 70-80% of the land required
for construction of STP has still not been acquired for the project
which was sanctioned in March 2019. Further, in this case, the
project is proposed on Gauchar land and as per the directive of
Supreme Court, alternative land needs to be given before Gauchar
land can be acquired. There is huge technical risk envisaged since
tenders have already been awarded for the project even though the

Page | 934
Parameter Findings from research
land has still not been acquired. The land acquisition is still resting
with the State Government and has not been approved.
o The project on River Mahanadi in Cuttack and in Puri was delayed
due to ongoing litigations relating to land acquisition.
o Similarly, it was noted by the informant from PHED Sikkim that land
acquisition issues caused major delays in project completion
primarily because residents were reluctant to give NOC on their
private land for laying sewerage networks.
o The informant from Kolhapur Municipal Corporation in Maharashtra
noted that land acquisition problems delayed project completion by
2-3 years.
Operational efficiency:
• During KIIs with PIAs where STPs have already been commissioned
before 2014-15, it was noted that the STPs are operating upto 85-90%
capacity. These include 30 MLD STP on River Godavari in Rajamundry in
Andhra Pradesh, 264 MLD STP on River Adyar and Cooum in Chennai in
Tamil Nadu and 76 MLD STP on River Panchganga in Kolhapur in
Maharashtra.
• It was noted by Odisha Water Supply and Sewerage Board (OWSSB)
that the 15 MLD STP constructed in Puri was not operating to full
capacity because maximum 11 MLD sewage can be collected with
existing sewerage networks. Although 750 commercial sewerage
connections have been built, all houses are not connected to a sewerage
network because of old city planning.
• In Sikkim, as mentioned by the informant from PHED Sikkim, the STPs
are operating upto 85% capacity.
• Discussions with PIAs such as Nasik Municipal Corporation and Pune
Municipal Corporation indicate that the STPs are constructed using latest
treatment technologies such as UABS, MBBR, SBR and are efficiently
treating the effluents.

Page | 935
Parameter Findings from research
• Both national and state level key informants noted that although STPs
have been constructed, many treatment plants have become defunct or
are not functioning up to the capacity and level of treatment required.
One reason cited by the informants was that since the STPs were
designed for treatment of domestic sewage, they do not function
properly when industrial effluents mixes with the domestic sewage. For
instance,
o In Ludhiana 1-2 STPs with a treatment capacity of 48 MLD are not
functioning
o In Odisha, the 33 MLD STP built in Cuttack over River Mahanadi is
currently under renovation and is not working which is causing a lot
of untreated waste being discharged into the river. Since, it is under
renovation, it is also not being monitored by Odisha State Pollution
Control Board (OSPCB).
• In addition, few informants such as Punjab Pollution Control Board and
Nasik Municipal Corporation also noted that lack of O&M and lack of
funds for upgradation and retrofitting of the assets has resulted in
reduction of efficiencies of the treatment plants.
Cost Efficiency:
• In some cases, lower cost treatment plants are being set up where lower
quality treated water is being used. For instance,
o Low cost plant for treating water up to 100 mg/l BOD can be used
for irrigation purposes in agriculture.
o Treatment of sewage upto 30 mg/l BOD can only be done for potable
uses
Adequacy of fund:
• Inadequacy of fund has also been noted by NRCD because of which
many projects could not be sanctioned. Since 2014-15, only 7 projects
with a total sanctioned cost of Rs. 2,867 Cr. has been approved whereas
proposals amounting to nearly Rs. 5,400 Cr. was returned by NRCD to
the State Government due to lack of funds.

Page | 936
Parameter Findings from research
• It was noted during the KII with PHED Sikkim that submission of
proposals to NRCD requires lot of effort, expenses for the PIA to prepare
feasibility report, DPR, conduct studies etc. and these are often rejected
by NRCD citing unavailability of funds. This causes a lot of effort, time
and cost to be spent without result.
• Similarly, the informant from Ahmedabad Municipal Corporation noted
that due to lack in clarity on sanction of new projects, there is often a big
gap in execution between subsequent projects. For instance, the first
NRCP project on River Sabarmati was completed in 2004 and the
second, ongoing project was sanctioned and approved in 2014.
• It has been estimated by NRCD that to bridge the present gap in sewage
treatment capacity, funds ranging from Rs. 2,00,000 – Rs. 3,00,000 Cr.
would be required.
• Due to lack of funds, many components of the schemes are being taken
up under convergence with other schemes such as AMRUT or also being
funded by IFIs such as JICA.
• Some associated works with STP construction for the Panchganga River
Project in Kolhapur has been taken up under Maharashtra Suvarna
Jayanti Nagarotthan Abhiyan.
Inter-departmental coordination:
• Coordination between NRCD, State Government and PIAs are
satisfactory.
• In some states such as Gujarat, there is a River Rejuvenation Committee
(RRC) which coordinates all STP/ ETP works on river bodies in the state
and has members from other state departments. However, due to lack
Case Study: The Mula Mutha River Project in Pune being implemented by
the Pune Municipal Corporation has a loan assistance of 19.064 billion Yen
from JICA. The project cost is being shared between Government of India
and Pune Municipal Corporation in the ratio of 85:15.
Page | 937
Parameter Findings from research
of coordination between RRC and other departments such as land,
revenue, finance, the existing issues in implementation of projects (land
acquisition, funding delays) are not resolved in a timely manner.
Inference:
• Most of the STPs commissioned before 2014-15 are functional and
operating upto 85-90% of their treatment capacity.
• Nearly 10-15% of the STPs are defunct due to lack of O&M.
• Delay in fund transfer to the PIAs and issues due to land acquisition have
primarily led to project time and cost overruns.
• STPs constructed after 2014-15 are equipped with latest sewage
treatment technologies, but STPs commissioned previously need
upgradation
• Fund with NRCP is not adequate and proposals by State Governments
are being rejected due to fund constraints.
• Hence, assessment of the findings from secondary and primary research
indicates that the efficiency of the NRCP scheme is average.
Sustainability
Secondary:
Performance of STPs:
• Due to lack in focus towards O&M, post completion of construction of
STP, some STPs created have become idle after initial years of operation.
• Nearly 10-15% of the STPs are defunct or not operating with latest
treatment technologies due to lack of O&M.
Financial Sustainability:
• Impact evaluation studies of schemes in 10 identified towns in Region
1,2,3 in India submitted to NRCD in 2014 indicates
o For O&M of STPs, ULBs were still dependent on state departments
like PHED for technical and financial assistance.
o There is limited revenue generation during O&M phase through
approaches such as reuse of treated wastewater, reuse of treated
sludge etc.
Capacity Building and Public Awareness

Page | 938
Parameter Findings from research
• Some activities such as Shivirs, Padyatras, Shramdans, Exhibitions and
Ghat cleaning have been undertaken to create awareness among the
people residing in town on riverbanks.
• A Communication Advisory Committee has been set up with Ministry
officials to identify communication requirements, identification of target
groups and media communication to generate awareness.
Primary:
Performance of STPs:
• Some PIAs such as Rajamundry Municipal Corporation, CMWSSB, Surat
Municipal Corporation, UEED J&K, OWSSB and Kolhapur Municipal
Corporation noted that a private operator has been appointed for O&M
activities post construction for a period of 5-10 years through a tendering
process. These PIAs are self-sufficient and are capable of funding the
O&M activities through internal finances.
• Some PIAs such as OWSSB, Ahmedabad Municipal Corporation are
operating and maintaining the assets created themselves and it is being
funded by the State Government.
• In some cases, as noted by PWSSB, due to lack of availability of funds,
proper O&M activities such as upgradation and retrofitting of STPs with
newer technologies, repair and maintenance is not being taken up.
Hence structures are becoming defunct or obsolete after a few years of
operation or STPs are not able to operate upto full capacity.
• It was also noted by the informant from Odisha State Pollution Control
Board that, more focus and interventions are needed for efficient O&M
of the commissioned STPs so that they can operate to full capacity and
meet extant discharge norms.
• In addition, CPCB noted during the KII that, the norms and measures of
level of pollutants for meeting quality standards keeps changing and
hence the treatment process and treatment standards of the STPs
needs to be upgraded accordingly. For instance,
Page | 939
Parameter Findings from research
o Standards notified 15 years back when the STP was created has
changed over the years as per directives of NGT and CPCB.
o According to the recent directives published by the National Green
Tribunal (NGT), there is proposed revision of discharge standards. It
is proposed that the treated sewage should have BOD level of 10
mg/L, COD level of 50 mg/l and TSS should be less than 20 mg/l.
Although these have not yet been notified by MoEF&CC but once it
gets notified, it will necessitate upgradation of STPs to comply with
stringent discharge norms.
Financial Sustainability:
• Most informants including the Punjab Pollution Control Board, PIAs such
as Pune Municipal Corporation, Directorate of Environment of Manipur
and Punjab Water Supply and Sewerage Board noted that the current
procurement model and funding pattern under the scheme gives limited
importance to O&M and does not include any O&M costs. The PIAs in
many cases are unable to bear the financial burden of O&M activities.
• It was mentioned during the KIIs that even though large municipal
corporations may be able to financially sustain O&M activities, projects
in smaller towns are unable to do so and need funding support from
centre and state.
• In Sikkim, it was particularly noted that due to the hilly terrain and
unavailability of large pieces of land, small STPs are built which have very
high energy consumption necessitating high O&M costs. Although, a
Case Study: In the ongoing Tapi River Project, a private contractor is being
appointed for construction and 7 years O&M which shall be funded by the
State Government and Panchayat department.
Case Study: For the Panchganga River project in Kolhapur, the Kolhapur
Municipal Corporation has appointed a private contractor for a period of 15
years on DBOT mode. The contractor is made quarterly payments for
O&M activities. There is no fixed construction period. The contractor is
incentivized to complete construction early and start operation so that they
can get paid early.
Page | 940
Parameter Findings from research
minimum user charge is levied for sewerage connection, the entire
O&M cost cannot be loaded onto the residents. Also, in Sikkim revenue
generation through selling of treated wastewater is not an option
because of the high elevation of houses at of 5,500 ft. in Gangtok and
the STP being situated at a lower elevation of 2,000 ft. Hence, funding
support from state and centre is required for effective O&M.
• Proposals for upgradation of STPs to latest treatment standards are
being submitted by the PIAs to NRCD for funding as new projects.
• There is limited focus on revenue generation during O&M phase under
the scheme guidelines through approaches such as reuse of treated
wastewater, reuse of treated sludge etc. Although, most projects
completed before 2014-15, have no such revenue generation
mechanism, there are few cases which deserve mention: -
o In some recent ongoing projects such as the Tapi River project, it is
proposed that treated wastewater will be sold to the industries.
Revenue generation from agriculture department through reuse of
treated wastewater for irrigation purposes is also envisaged.
o Some ULBs are coming up with innovative revenue generation
models to sustain O&M expenditures such as BWSSB which sells
the treated wastewater for use to airports and corporates such as
BHEL, Arvind Mills, for gardening and landscaping, irrigation
purposes in neighbouring Kolar district etc.
o Some PIAs such as Rajamundry Municipal Corporation are currently
using treated wastewater for beautification and gardening in
municipal parks. In recently submitted proposals to NRCD, revenue
generation options have been proposed including selling of treated
wastewater for use in power plants, railways good sheds and bus
stations.
Page | 941
Parameter Findings from research
o During the KII with PHED Nagaland, it was noted that a sewerage
tariff is proposed to be levied for household connections along with
selling of treated sludge as manure, selling of treated wastewater
for irrigation to fund O&M activities.
Capacity Building and Public Awareness
• Some informants noted the that there is no trained manpower for O&M
of the created assets since no trainings or workshops are conducted to
increase awareness about extant discharge norms, latest treatment
technologies, cost efficient treatment etc.
• In line with the above, the Additional Chief Secretary, UEED, J&K and
OWSSB noted that there is lack of expertise in PIAs for undertaking such
projects. The staff does not have the required technical knowhow for
designing and operating the assets created, particularly, in terms of
treatment technology, waste disposal mechanism etc. Long term
workshops and training programs are needed for building technical
expertise of the PIAs.
• It was also noted both by PHED Sikkim and Sikkim Pollution Control
Board that training and capacity building workshops are required so that
the STPs can be properly maintained, retrofitted, upgraded to latest
treatment technologies to operate efficiently and meet extant discharge
standards. For instance, the STPs in Gangtok were commissioned by a
private contractor from Pune, Maharashtra. Hence, whenever there is a
breakdown, local staff is unable to repair it and depend on the contractor
from Pune for repair and maintenance.
• It was mentioned during the KII with Surat Municipal Corporation that
although a budget has been allocated for IEC campaigns to increase
Case Study: OWSSB collects charges for sewerage connections for 8000
connections among which 750 connections are commercial connections.
This revenue source partially funds the O&M.
Case Study: Ahmedabad Municipal Corporation collects sewerage tax

Page | 942
Parameter Findings from research
public awareness about the Tapi River project, such campaigns are yet
to be designed and launched.
• During KIIs, it was also noted that there was lack of community
awareness about the NRCP scheme, projects and objectives and
hence, the community structures created such as bathing ghats
and low-cost public toilets created have not been maintained
properly.
Inference:
• O&M is the sole responsibility of the state government and the PIA.
• Many PIAs have appointed private contractors for O&M and the activities
are being funded by the ULBs themselves.
• Some PIAs noted that they did not have adequate funds to sustain in the
O&M phase and there was limited focus on revenue generating activities
in the post-construction phase.
• In few of the recent ongoing projects, options for revenue generation
through reuse of treated sludge and treated wastewater, levy of
sewerage cess etc. are being explored.
• Lack of skilled manpower and public awareness has also impacted the
upkeep of assets created in the post-construction phase.
Case Study: An organization “Love Tapi, Care Tapi” has been formed
headed by SHGs. The organization comprises technical experts,
doctors, politicians, local people, ULB and is involved in project
activities, creating awareness about the program and taking
suggestions for improving river health. Every year, birthday of River
Tapi is celebrated on 27th
July by the organization.
Case Study: Under the Godavari River project in Rajamundry, 14 low
cost public toilets were constructed under NRCP scheme. These
have been given to Sulabh International for operations and
maintenance and for encouraging public usage.

Page | 943
Parameter Findings from research
• Hence, assessment of the findings from secondary and primary research
indicates that the sustainability aspect of the NRCP scheme is average.
Impact
Secondary:
Improvement in river water quality:
• At present 76 towns have been selected over 34 rivers spread across 16
states to reduce the pollution level of water being discharged into rivers.
• It is difficult to quantify the benefits derived from the NRCP scheme in
physical terms
• Impact evaluation studies of schemes in 10 identified towns in Region
1,2,3 in India submitted to NRCD in 2014 indicates that construction of
I&D works has helped improve the quality of river water, biodiversity and
ecosystem of the river.
Improvement in social condition:
• Construction of public toilets and bathing ghats has given access to the
marginalized section to clean sanitation and bathing facilities.
Primary:
Improvement in river water quality:
• Key regulators such as Maharashtra Pollution Control Board, Punjab
Pollution Control Board and Tamil Nadu Pollution Control Board noted
that ensuring no untreated water flowing into the rivers has helped
improve the quality of the river water. For instance,
o In Punjab, Beas river has been downgraded to Category B
o In Tamil Nadu, 2 polluted river stretches – Tamrabarani and Bhavani
have been proposed to be delisted and River Kaveri has been
proposed to be downgraded in pollution ranking.
o In Chennai, as mentioned by CMWSSB, the commissioned STP
under NRCP scheme has been operational since last 10 years and
there has been around 30% reduction in pollution level on Rivers
Adyar and Cooum.
Page | 944
Parameter Findings from research
o Also, in Maharashtra, previously there were 9 polluted river stretches
of Priority 1 but currently there is only 1 polluted river stretch of
Priority 1.
o In Kolhapur, Maharashtra, 90-95% reduction in pollution level on
River Panchganga has been achieved due to the construction of the
76 MLD STP under NRCP scheme.
o In Odisha, the project interventions have helped develop sewerage
network for the entire town of Puri and helped reduce pollution in the
sea and beaches in Puri. The river water quality of Mahanadi has
improved in the last few years and is meeting extant discharge
norms.
o In Rajamundry in Andhra Pradesh, to a large extent, flow of untreated
sewage into the River Godavari has been checked and quality of river
water has improved
Improvement in environmental condition:
• Discussions with key informants noted that river front development and
afforestation activities has helped improve the environmental condition
along the river.
• Construction of public toilets has minimized open defecation along
riverbanks and related health hazards.
• Policies for wastewater reuse by some state water supply and sewerage
boards such as BWSSB and PWSSB for use by corporates, usage in
garden beautification, irrigation and construction purposes has helped
improve environmental conditions.
• Some water bodies due to improved treatment facilities have also
developed into recreational spots for boating and other activities such as
Jakkur Lake in Karnataka
• As part of the Tapi River project, plantation of 1 lakh trees along with
installation of an imported vermi-compost plant is envisaged which will
hugely benefit the surrounding environmental condition.

Page | 945
Parameter Findings from research
• However, as part of impact analysis under the NRCP scheme, bio-impact
analysis or physico-chemical analysis to gauge the impact on bio-
organisms (flora and fauna) in the river water is not being carried out.
• Only, Odisha State Pollution Control Board regularly does biomonitoring
of rivers. Samples of micro invertebrates are collected and based on the
number of types of samples, a diversity index is calculated. The higher
the index, the more diversity of bio-organisms in the river and hence it
indicates cleaner river water.
• It was also noted by UEED, J&K that the interventions being done on
River Devika and Tawi under the NRCP project will help preserve the
natural beauty of the region and the River Tawi, religiously worshipped
as GuptGanga by the locals.
• OWSSB noted during the KII that the NRCP projects have had a
significant impact on sea beach environmental condition.
Improvement in social condition:
• Improvement in water quality has taken care of issues such as mosquito
breeding
• Incidence of water borne diseases due to inadequate water quality has
been reduced.
• Issues such as waterlogging due to absence of sewer lines to houses
has been mitigated leading to improved quality of lives.
• There has been improvement in social and hygienic conditions of the
slum areas located on the riverbanks.
Case Study: Rajamundry Municipal Corporation has employed a
team of Sanitary Inspectors who monitors activities such as
throwing of garbage, construction debris etc. by riverbank residents
into the rivers.
Case Study: Surat Municipal Corporation has banned religious
activities such as Ganesh Visarjan on River Tapi since 2017 and small
artificial ponds have been built for the immersion activities.
rivers.

Page | 946
Parameter Findings from research
• Some informants also noted that there were issues with overflow of
septic tank in households and flow of faecal sludge into the fields leading
to contamination which have been overcome.
• Bathing ghats allows many residents to take bath and reduce
groundwater usage for bathing purposes.
• Improvement in river water quality has also had a positive impact on
livelihood and local employment generation through -
o pisciculture and fishing activities
o income generation through local employment for O&M of STPs
o components such as river front development also offers tourism
opportunities and support local employment generation
Inference:
• Various reports, KIIs at the state and district level show that the scheme
has led to positive impacts in improving the river water quality in many
polluted rivers stretches.
• Project components such as treatment facilities, riverfront development
and afforestation has helped in marked improvement in the environmental
condition surrounding the river bodies.
• Moreover, opportunities for employment generation through O&M of
STPs, pisciculture, recreation etc. has also helped improve the livelihood
of the project region.
• Hence, assessment of the findings from secondary and primary research
indicates that the impact of the NRCP scheme has been satisfactory.
Equity
Secondary:
• One of the scheme components include construction of low-cost
sanitation structures and bathing ghats especially in the slum and fringe

Page | 947
Parameter Findings from research
areas which can be used by marginalized and weaker sections of the
society.
• The funding pattern under the scheme favours equity. The funding pattern
of North Eastern states including Sikkim is 90:10% and for the remaining
states and UTs, the funding pattern in 60:40.
Primary:
• During the discussion with NRCD, it was noted that there is a separate
budget ~18% of the project costs for undertaking actions targeted for
the SC/ST population
• As part of the projects, some targeted actions to ensure equity in the
project include –
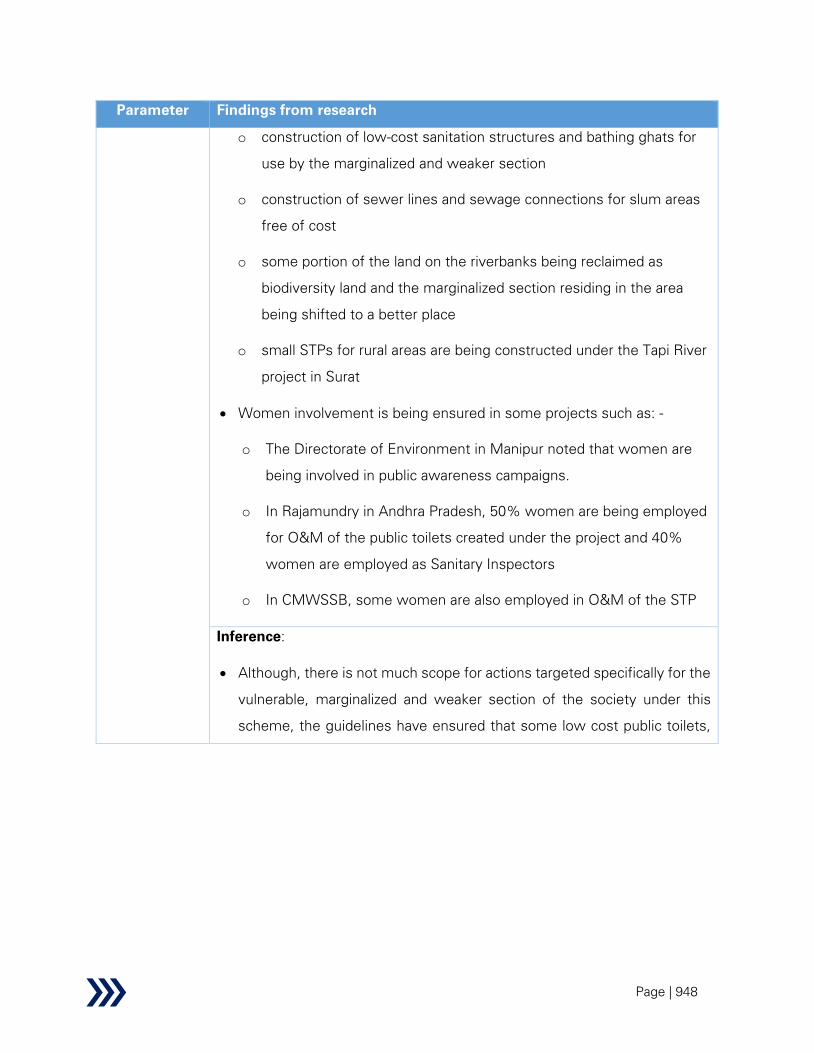
Page | 948
Parameter Findings from research
o construction of low-cost sanitation structures and bathing ghats for
use by the marginalized and weaker section
o construction of sewer lines and sewage connections for slum areas
free of cost
o some portion of the land on the riverbanks being reclaimed as
biodiversity land and the marginalized section residing in the area
being shifted to a better place
o small STPs for rural areas are being constructed under the Tapi River
project in Surat
• Women involvement is being ensured in some projects such as: -
o The Directorate of Environment in Manipur noted that women are
being involved in public awareness campaigns.
o In Rajamundry in Andhra Pradesh, 50% women are being employed
for O&M of the public toilets created under the project and 40%
women are employed as Sanitary Inspectors
o In CMWSSB, some women are also employed in O&M of the STP
Inference:
• Although, there is not much scope for actions targeted specifically for the
vulnerable, marginalized and weaker section of the society under this
scheme, the guidelines have ensured that some low cost public toilets,
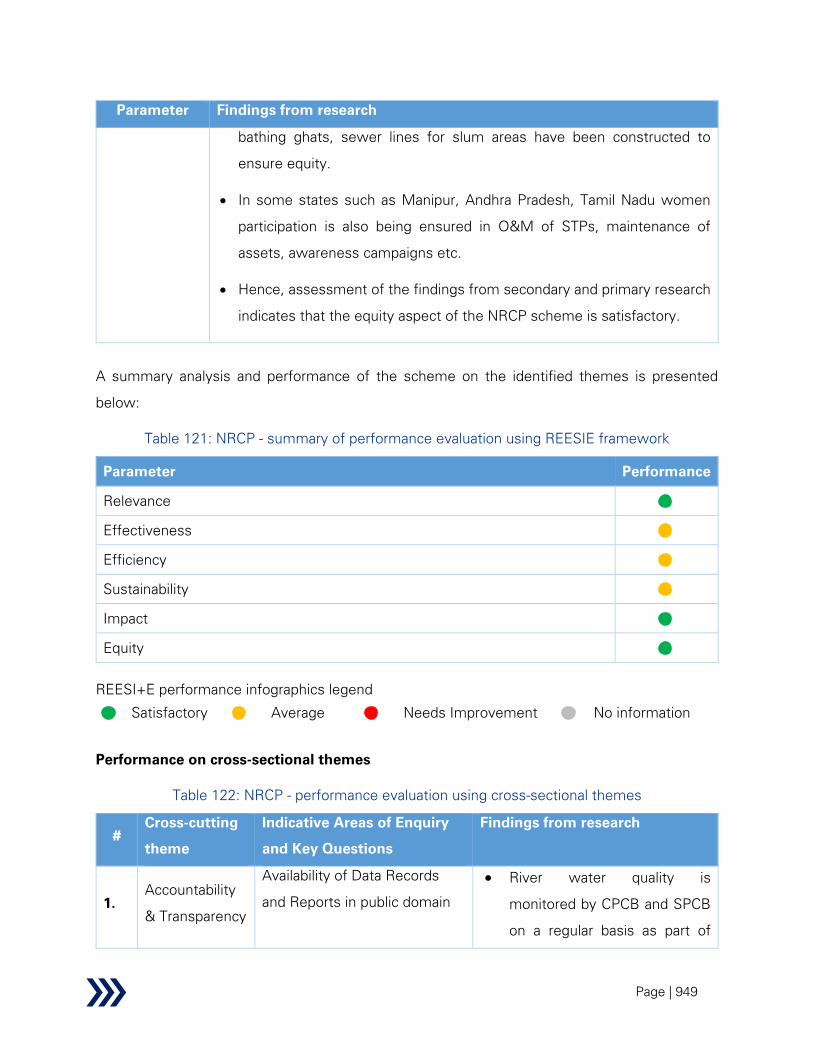
Page | 949
Parameter Findings from research
bathing ghats, sewer lines for slum areas have been constructed to
ensure equity.
• In some states such as Manipur, Andhra Pradesh, Tamil Nadu women
participation is also being ensured in O&M of STPs, maintenance of
assets, awareness campaigns etc.
• Hence, assessment of the findings from secondary and primary research
indicates that the equity aspect of the NRCP scheme is satisfactory.
A summary analysis and performance of the scheme on the identified themes is presented
below:
Table 121: NRCP - summary of performance evaluation using REESIE framework
Parameter Performance
Relevance
Effectiveness
Efficiency
Sustainability
Impact
Equity
REESI+E performance infographics legend
Satisfactory
Average
Needs Improvement
No information
Performance on cross-sectional themes
Table 122: NRCP - performance evaluation using cross-sectional themes
#
Cross-cutting
theme
Indicative Areas of Enquiry
and Key Questions
Findings from research
1.
Accountability
& Transparency
Availability of Data Records
and Reports in public domain
• River water quality is
monitored by CPCB and SPCB
on a regular basis as part of
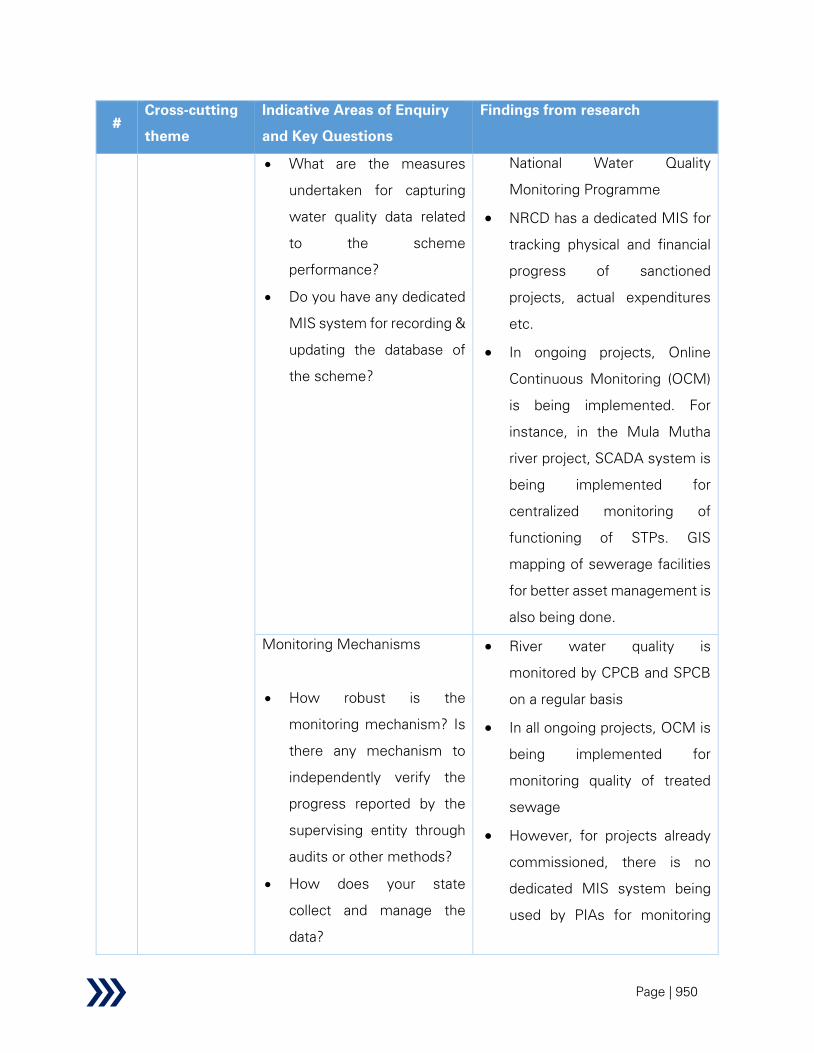
Page | 950
#
Cross-cutting
theme
Indicative Areas of Enquiry
and Key Questions
Findings from research
• What are the measures
undertaken for capturing
water quality data related
to the scheme
performance?
• Do you have any dedicated
MIS system for recording &
updating the database of
the scheme?
National Water Quality
Monitoring Programme
• NRCD has a dedicated MIS for
tracking physical and financial
progress of sanctioned
projects, actual expenditures
etc.
• In ongoing projects, Online
Continuous Monitoring (OCM)
is being implemented. For
instance, in the Mula Mutha
river project, SCADA system is
being implemented for
centralized monitoring of
functioning of STPs. GIS
mapping of sewerage facilities
for better asset management is
also being done.
Monitoring Mechanisms
• How robust is the
monitoring mechanism? Is
there any mechanism to
independently verify the
progress reported by the
supervising entity through
audits or other methods?
• How does your state
collect and manage the
data?
• River water quality is
monitored by CPCB and SPCB
on a regular basis
• In all ongoing projects, OCM is
being implemented for
monitoring quality of treated
sewage
• However, for projects already
commissioned, there is no
dedicated MIS system being
used by PIAs for monitoring
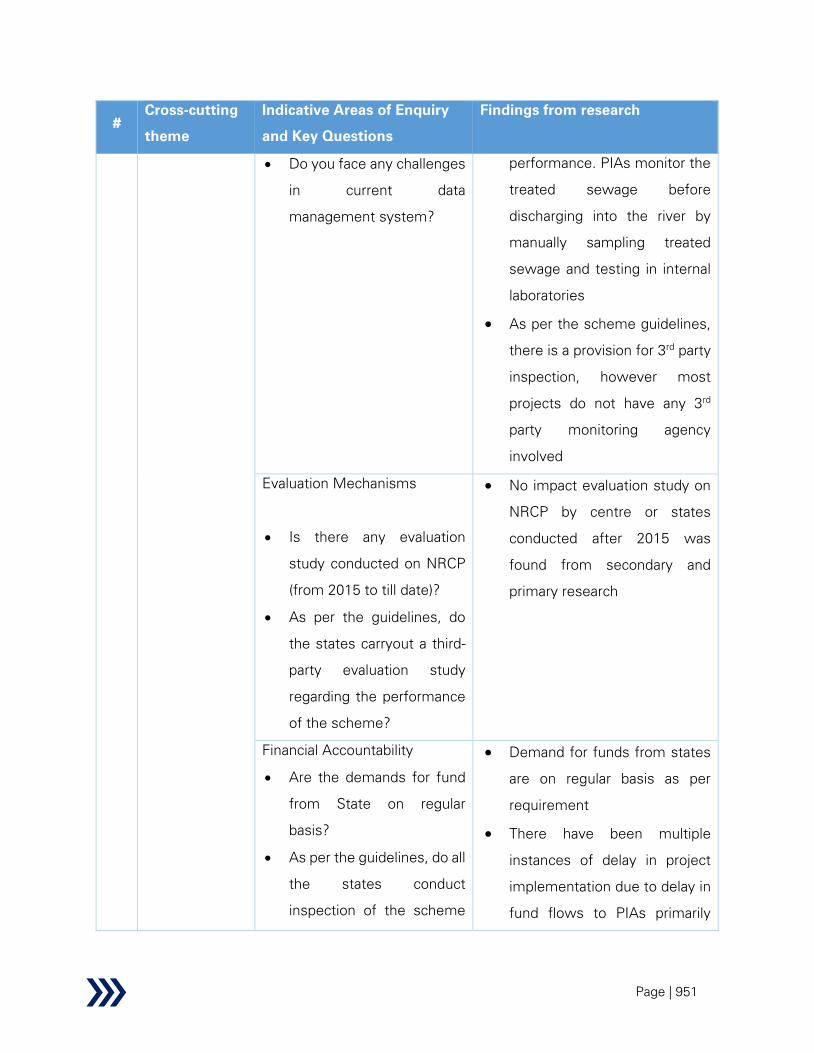
Page | 951
#
Cross-cutting
theme
Indicative Areas of Enquiry
and Key Questions
Findings from research
• Do you face any challenges
in current data
management system?
performance. PIAs monitor the
treated sewage before
discharging into the river by
manually sampling treated
sewage and testing in internal
laboratories
• As per the scheme guidelines,
there is a provision for 3rd
party
inspection, however most
projects do not have any 3rd
party monitoring agency
involved
Evaluation Mechanisms
• Is there any evaluation
study conducted on NRCP
(from 2015 to till date)?
• As per the guidelines, do
the states carryout a third-
party evaluation study
regarding the performance
of the scheme?
• No impact evaluation study on
NRCP by centre or states
conducted after 2015 was
found from secondary and
primary research
Financial Accountability
• Are the demands for fund
from State on regular
basis?
• As per the guidelines, do all
the states conduct
inspection of the scheme
• Demand for funds from states
are on regular basis as per
requirement
• There have been multiple
instances of delay in project
implementation due to delay in
fund flows to PIAs primarily
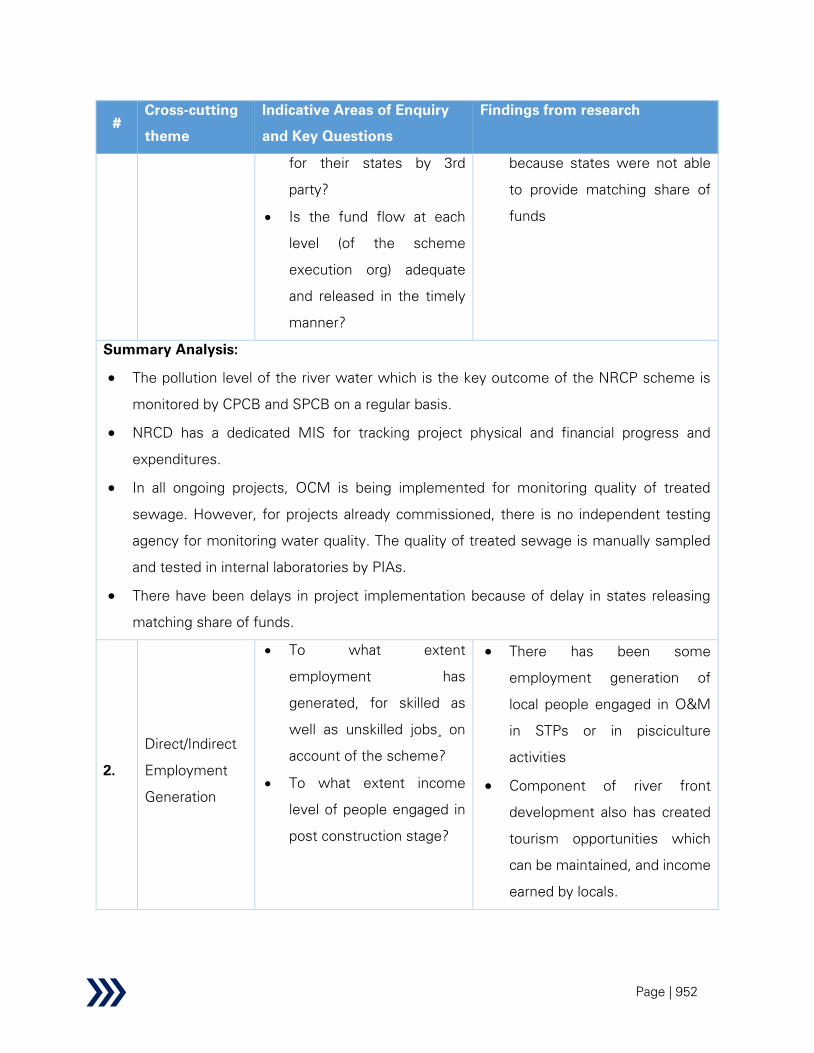
Page | 952
#
Cross-cutting
theme
Indicative Areas of Enquiry
and Key Questions
Findings from research
for their states by 3rd
party?
• Is the fund flow at each
level (of the scheme
execution org) adequate
and released in the timely
manner?
because states were not able
to provide matching share of
funds
Summary Analysis:
• The pollution level of the river water which is the key outcome of the NRCP scheme is
monitored by CPCB and SPCB on a regular basis.
• NRCD has a dedicated MIS for tracking project physical and financial progress and
expenditures.
• In all ongoing projects, OCM is being implemented for monitoring quality of treated
sewage. However, for projects already commissioned, there is no independent testing
agency for monitoring water quality. The quality of treated sewage is manually sampled
and tested in internal laboratories by PIAs.
• There have been delays in project implementation because of delay in states releasing
matching share of funds.
2.
Direct/Indirect
Employment
Generation
• To what extent
employment has
generated, for skilled as
well as unskilled jobs¸ on
account of the scheme?
• To what extent income
level of people engaged in
post construction stage?
• There has been some
employment generation of
local people engaged in O&M
in STPs or in pisciculture
activities
• Component of river front
development also has created
tourism opportunities which
can be maintained, and income
earned by locals.
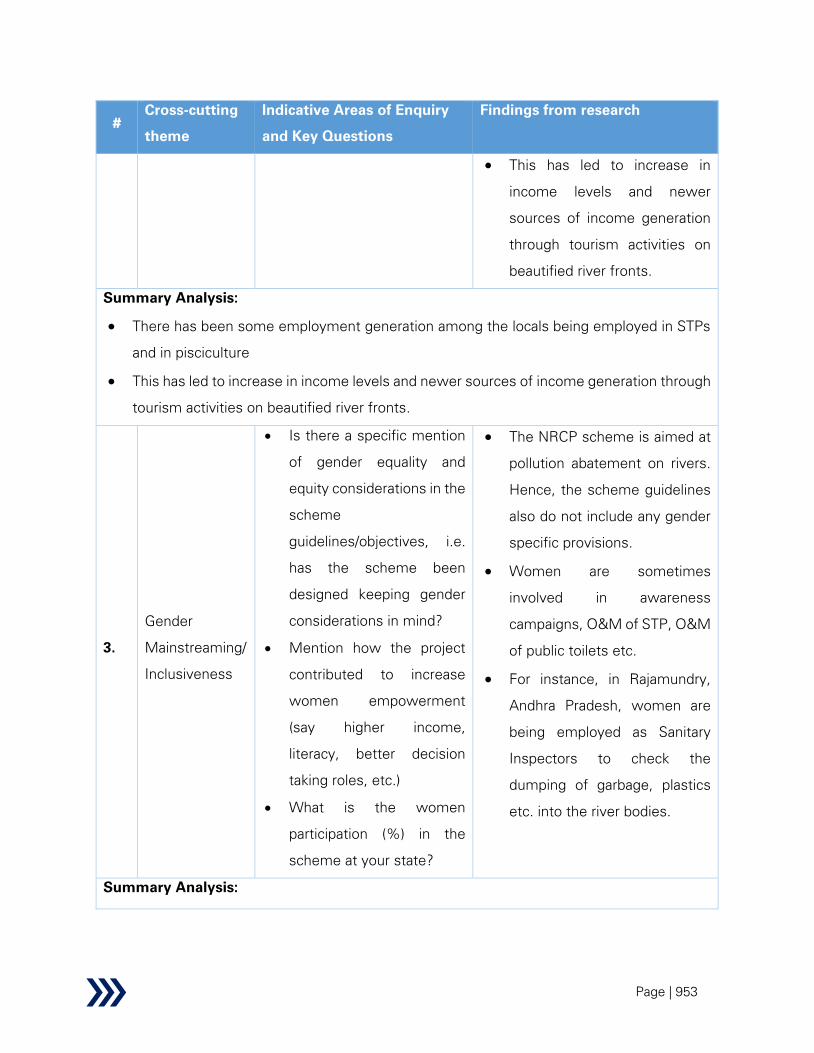
Page | 953
#
Cross-cutting
theme
Indicative Areas of Enquiry
and Key Questions
Findings from research
• This has led to increase in
income levels and newer
sources of income generation
through tourism activities on
beautified river fronts.
Summary Analysis:
• There has been some employment generation among the locals being employed in STPs
and in pisciculture
• This has led to increase in income levels and newer sources of income generation through
tourism activities on beautified river fronts.
3.
Gender
Mainstreaming/
Inclusiveness
• Is there a specific mention
of gender equality and
equity considerations in the
scheme
guidelines/objectives, i.e.
has the scheme been
designed keeping gender
considerations in mind?
• Mention how the project
contributed to increase
women empowerment
(say higher income,
literacy, better decision
taking roles, etc.)
• What is the women
participation (%) in the
scheme at your state?
• The NRCP scheme is aimed at
pollution abatement on rivers.
Hence, the scheme guidelines
also do not include any gender
specific provisions.
• Women are sometimes
involved in awareness
campaigns, O&M of STP, O&M
of public toilets etc.
• For instance, in Rajamundry,
Andhra Pradesh, women are
being employed as Sanitary
Inspectors to check the
dumping of garbage, plastics
etc. into the river bodies.
Summary Analysis:
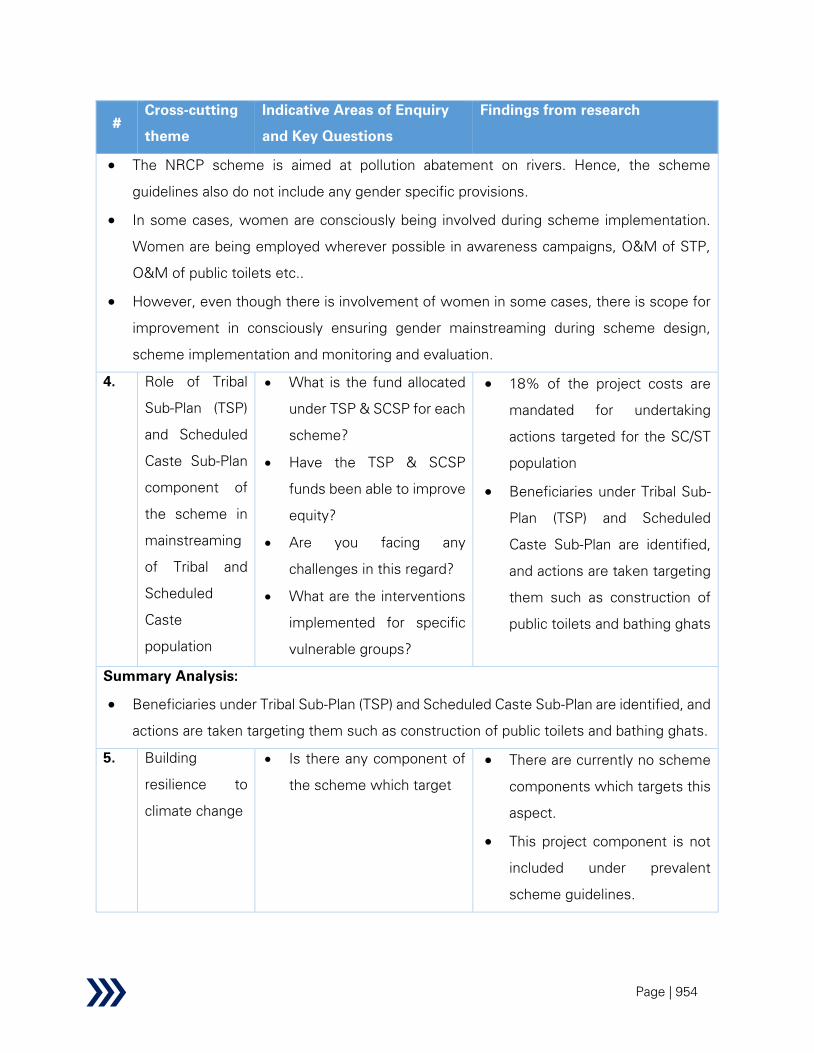
Page | 954
#
Cross-cutting
theme
Indicative Areas of Enquiry
and Key Questions
Findings from research
• The NRCP scheme is aimed at pollution abatement on rivers. Hence, the scheme
guidelines also do not include any gender specific provisions.
• In some cases, women are consciously being involved during scheme implementation.
Women are being employed wherever possible in awareness campaigns, O&M of STP,
O&M of public toilets etc..
• However, even though there is involvement of women in some cases, there is scope for
improvement in consciously ensuring gender mainstreaming during scheme design,
scheme implementation and monitoring and evaluation.
4. Role of Tribal
Sub-Plan (TSP)
and Scheduled
Caste Sub-Plan
component of
the scheme in
mainstreaming
of Tribal and
Scheduled
Caste
population
• What is the fund allocated
under TSP & SCSP for each
scheme?
• Have the TSP & SCSP
funds been able to improve
equity?
• Are you facing any
challenges in this regard?
• What are the interventions
implemented for specific
vulnerable groups?
• 18% of the project costs are
mandated for undertaking
actions targeted for the SC/ST
population
• Beneficiaries under Tribal Sub-
Plan (TSP) and Scheduled
Caste Sub-Plan are identified,
and actions are taken targeting
them such as construction of
public toilets and bathing ghats
Summary Analysis:
• Beneficiaries under Tribal Sub-Plan (TSP) and Scheduled Caste Sub-Plan are identified, and
actions are taken targeting them such as construction of public toilets and bathing ghats.
5. Building
resilience to
climate change
• Is there any component of
the scheme which target
• There are currently no scheme
components which targets this
aspect.
• This project component is not
included under prevalent
scheme guidelines.

Page | 955
#
Cross-cutting
theme
Indicative Areas of Enquiry
and Key Questions
Findings from research
o There is need for inclusion of
measures for holistic river
conservation due to climate
change such as nson-
structural approaches for
protection of river basins
through construction of
alternatives to
embankments for flood
management such as
floodplain zoning, catchment
area treatment and other
Summary Analysis:
• There are currently no scheme components which target this aspect.
6. Use of
IT/Technology
in driving
efficiency
• Is geotagging and use of
geotagged photographs
being done? Mention what
are the benefits accrued
due to geo-tagging and
what are the challenges.
• Which states are leading in
terms of technology use
and which are lagging
behind?
• How is technology being
used for on-ground data
collection?
• Do you envisage any other
advanced technologies for
• NRCD has a dedicated MIS for
tracking physical and financial
progress of sanctioned
projects, actual expenditures
• In ongoing projects, Online
Continuous Monitoring (OCM)
is being implemented. For
instance, in the Mula Mutha
river project, SCADA system is
being implemented for
centralized monitoring of
functioning of STPs. GIS
mapping of sewerage facilities
for better asset management is
also being done.
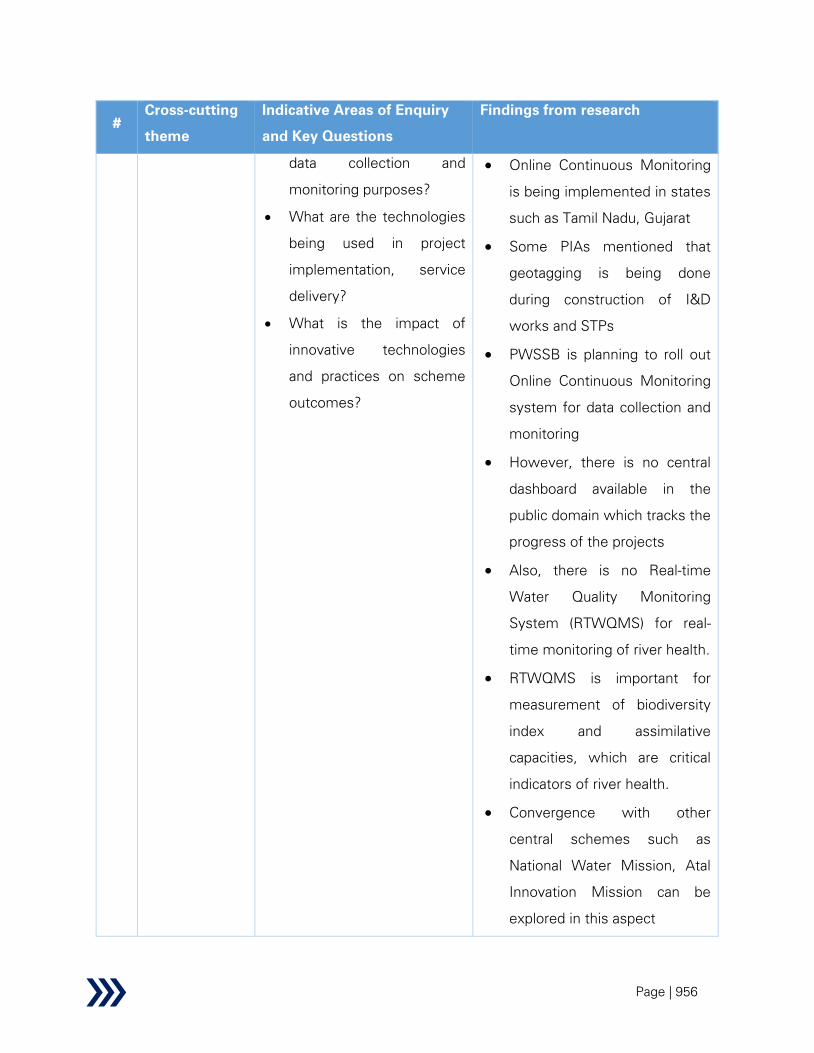
Page | 956
#
Cross-cutting
theme
Indicative Areas of Enquiry
and Key Questions
Findings from research
data collection and
monitoring purposes?
• What are the technologies
being used in project
implementation, service
delivery?
• What is the impact of
innovative technologies
and practices on scheme
outcomes?
• Online Continuous Monitoring
is being implemented in states
such as Tamil Nadu, Gujarat
• Some PIAs mentioned that
geotagging is being done
during construction of I&D
works and STPs
• PWSSB is planning to roll out
Online Continuous Monitoring
system for data collection and
monitoring
• However, there is no central
dashboard available in the
public domain which tracks the
progress of the projects
• Also, there is no Real-time
Water Quality Monitoring
System (RTWQMS) for real-
time monitoring of river health.
• RTWQMS is important for
measurement of biodiversity
index and assimilative
capacities, which are critical
indicators of river health.
• Convergence with other
central schemes such as
National Water Mission, Atal
Innovation Mission can be
explored in this aspect

Page | 957
#
Cross-cutting
theme
Indicative Areas of Enquiry
and Key Questions
Findings from research
Summary Analysis:
• OCM is being used by some states and is currently being implemented in all ongoing
projects
• Some PIAs use geotagging during construction phase but data collection is done manually
by most.
• However, there is no central dashboard available in the public domain which tracks the
progress of the projects.
• Also, there is no Real-time Water Quality Monitoring System (RTWQMS) for real-time
monitoring of river health.
• Convergence with other central schemes such as National Water Mission, Atal Innovation
Mission can be explored in this aspect.
7. Stakeholder
and Beneficiary
behavioural
change
• What percent of total
allocation is directed
towards Awareness
generation or sensitization?
What is the utilization rate?
How much impact has it
been able to generate in
terms of behaviour
change?
• There is a component of
capacity building under the
scheme, which is the
responsibility of the state
government, but awareness
generation activities are not
being undertaken
• Some activities such as
Shivirs, Padyatras,
Shramdans, Exhibitions and
Ghat cleaning have been
undertaken by NRCD to
create awareness among
the people residing in town
on riverbanks.
• A Communication Advisory
Committee has been set up

Page | 958
#
Cross-cutting
theme
Indicative Areas of Enquiry
and Key Questions
Findings from research
with Ministry officials to
identify communication
requirements, identification
of target groups and media
communication to generate
awareness.
Summary Analysis:
• There is a component of capacity building under the scheme, but awareness generation
activities are not being undertaken
8. Development,
dissemination
& adoption
• What percent of total
allocation is directed
towards development,
dissemination and adoption
of innovative practices and
technology? How much of
it is utilized?
• There is no such component
under the scheme
• In ongoing projects, latest
treatment technologies are
being proposed
• For instance, waste
stabilization ponds are being
built as an alternative to STPs in
small towns
Summary Analysis:
• There is no such component under the scheme.
• In ongoing projects, latest treatment technologies are being proposed.
9. Research &
Development
• Is there any percentage of
total allocation is directed
towards R&D in the field of
river conservation?
• There is no such component
under the scheme. Scheme
guidelines does not mention
any R&D efforts or any
earmarked funds for R&D.
• In some cases, NRCD funds
R&D activities on case to case
basis.

Page | 959
#
Cross-cutting
theme
Indicative Areas of Enquiry
and Key Questions
Findings from research
• However, with respect to
NRCP scheme, it is important
to have streamlined research
and development efforts in the
areas of latest technologies for
sewage treatment, options for
usage of treated wastewater,
treated sludge, advanced river-
health monitoring
mechanisms, bio-diversity
mapping, measurement of e-
flow etc.
• Ongoing, continuous tie-ups
with academia (such as IITs),
Industry experts needs to be
taken up for R&D on cost
effective treatment, latest
sewage treatment technology,
innovative methods for bio-
impact analysis - biodiversity
index, assimilative capacities,
options for usage of treated
wastewater, treated sludge,
maintaining min e-flow in rivers
etc.
Summary Analysis:
• There is no such component under the scheme.
• In some cases, NRCD funds R&D activities on case to case basis.
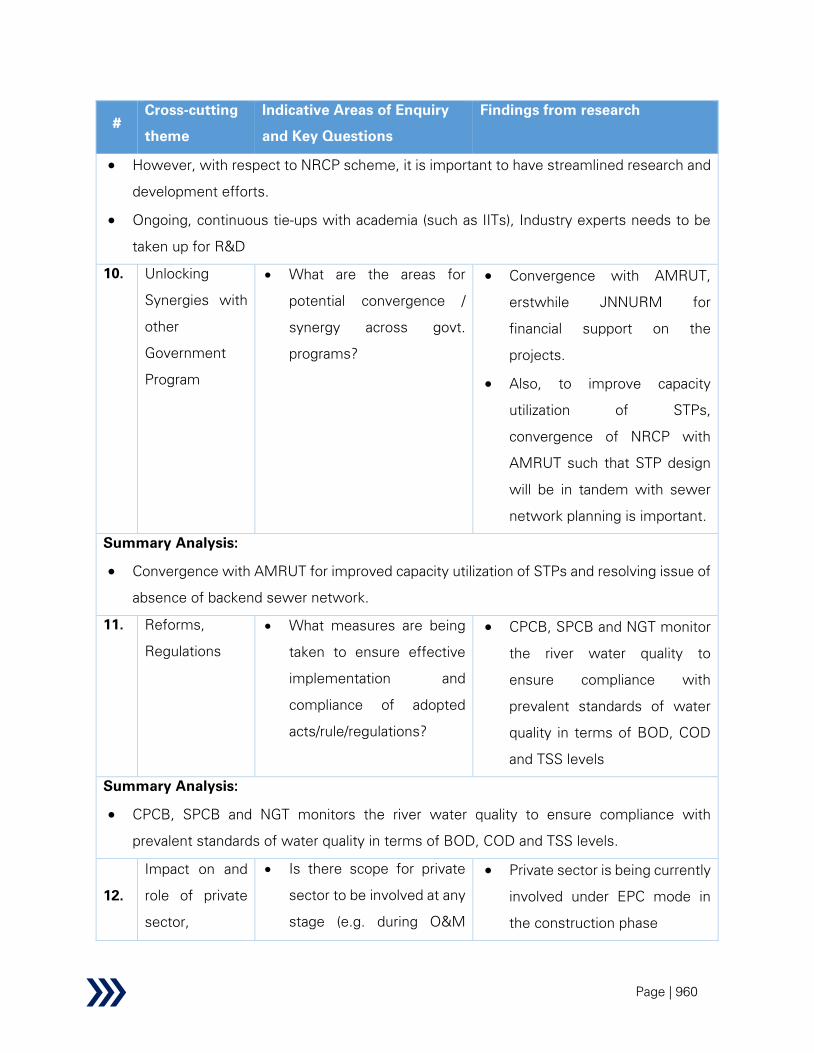
Page | 960
#
Cross-cutting
theme
Indicative Areas of Enquiry
and Key Questions
Findings from research
• However, with respect to NRCP scheme, it is important to have streamlined research and
development efforts.
• Ongoing, continuous tie-ups with academia (such as IITs), Industry experts needs to be
taken up for R&D
10. Unlocking
Synergies with
other
Government
Program
• What are the areas for
potential convergence /
synergy across govt.
programs?
• Convergence with AMRUT,
erstwhile JNNURM for
financial support on the
projects.
• Also, to improve capacity
utilization of STPs,
convergence of NRCP with
AMRUT such that STP design
will be in tandem with sewer
network planning is important.
Summary Analysis:
• Convergence with AMRUT for improved capacity utilization of STPs and resolving issue of
absence of backend sewer network.
11. Reforms,
Regulations
• What measures are being
taken to ensure effective
implementation and
compliance of adopted
acts/rule/regulations?
• CPCB, SPCB and NGT monitor
the river water quality to
ensure compliance with
prevalent standards of water
quality in terms of BOD, COD
and TSS levels
Summary Analysis:
• CPCB, SPCB and NGT monitors the river water quality to ensure compliance with
prevalent standards of water quality in terms of BOD, COD and TSS levels.
12.
Impact on and
role of private
sector,
• Is there scope for private
sector to be involved at any
stage (e.g. during O&M
• Private sector is being currently
involved under EPC mode in
the construction phase

Page | 961
#
Cross-cutting
theme
Indicative Areas of Enquiry
and Key Questions
Findings from research
community and
civil society in
the scheme
phase) with a view to
increase employment
opportunities?
• Is there any private
investment in any states
for this program?
• Is there any PPP model
prevalent in this area?
• Are there any private
sector,
community/collectives/coo
peratives and civil society
involved in any activities
under this Scheme?
• In some of the commissioned
projects, private sector has
been involved for O&M
activities of the STP.
• In some projects such as Mula
Mutha River project, a
consultant has been hired to
monitor and review the project
• No private sector investment in
any state in this program
• No PPP model is prevalent
• No private sector communities
are involved in any activities
Summary Analysis:
• There is a need for private sector to be involved through PPP or HAM and adopt a lifecycle
based participatory procurement model to ensure technical and financial sustainability
during O&M phase.
Apart from the above, other cross-sectional themes such as Water sharing treaties and
Conjuctive Use of Water have not been evaluated from NRCP scheme since these are not
relevant. Accordingly, these have been marked “Not Relevant” in the table below. A summary
analysis and performance of the scheme on the identified themes is presented below:
Table 123: NRCP - summary of performance evaluation using cross-sectional themes
Parameter Performance
Accountability & Transparency
Direct/Indirect Employment Generation
Gender mainstreaming/Inclusiveness
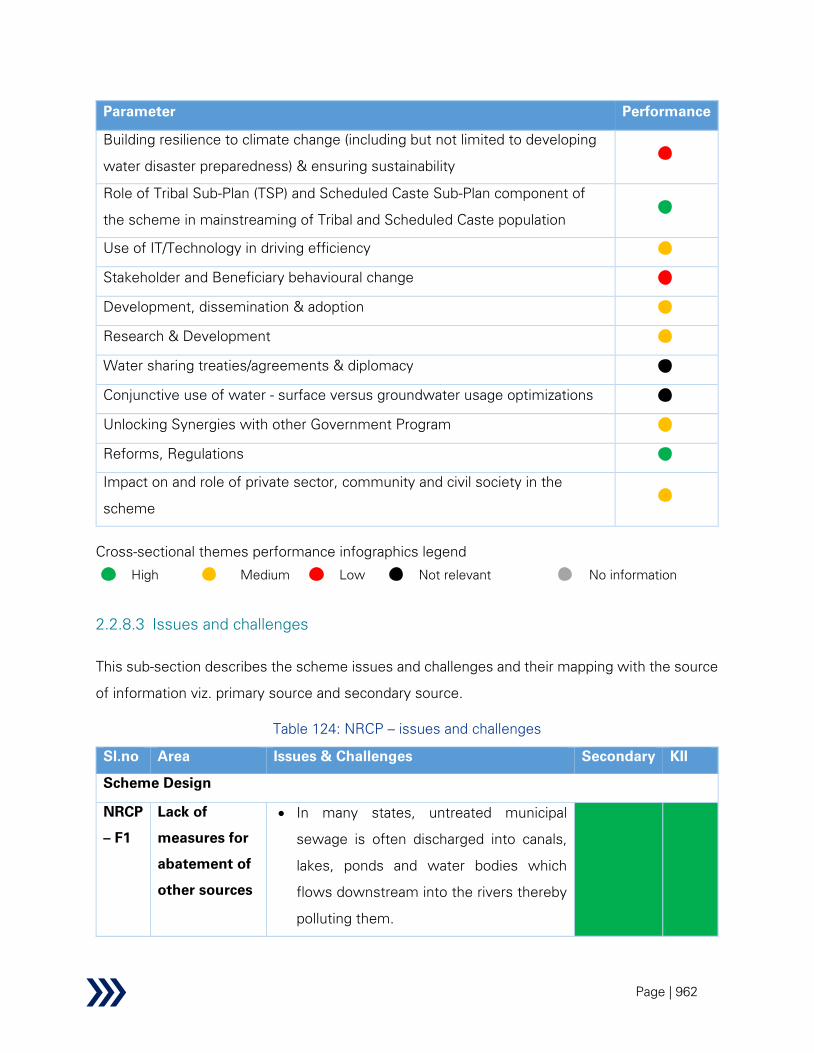
Page | 962
Parameter Performance
Building resilience to climate change (including but not limited to developing
water disaster preparedness) & ensuring sustainability
Role of Tribal Sub-Plan (TSP) and Scheduled Caste Sub-Plan component of
the scheme in mainstreaming of Tribal and Scheduled Caste population
Use of IT/Technology in driving efficiency
Stakeholder and Beneficiary behavioural change
Development, dissemination & adoption
Research & Development
Water sharing treaties/agreements & diplomacy
Conjunctive use of water - surface versus groundwater usage optimizations
Unlocking Synergies with other Government Program
Reforms, Regulations
Impact on and role of private sector, community and civil society in the
scheme
Cross-sectional themes performance infographics legend
High Medium Low Not relevant No information
2.2.8.3 Issues and challenges
This sub-section describes the scheme issues and challenges and their mapping with the source
of information viz. primary source and secondary source.
Table 124: NRCP – issues and challenges
Sl.no Area Issues & Challenges Secondary KII
Scheme Design
NRCP
– F1
Lack of
measures for
abatement of
other sources
• In many states, untreated municipal
sewage is often discharged into canals,
lakes, ponds and water bodies which
flows downstream into the rivers thereby
polluting them.
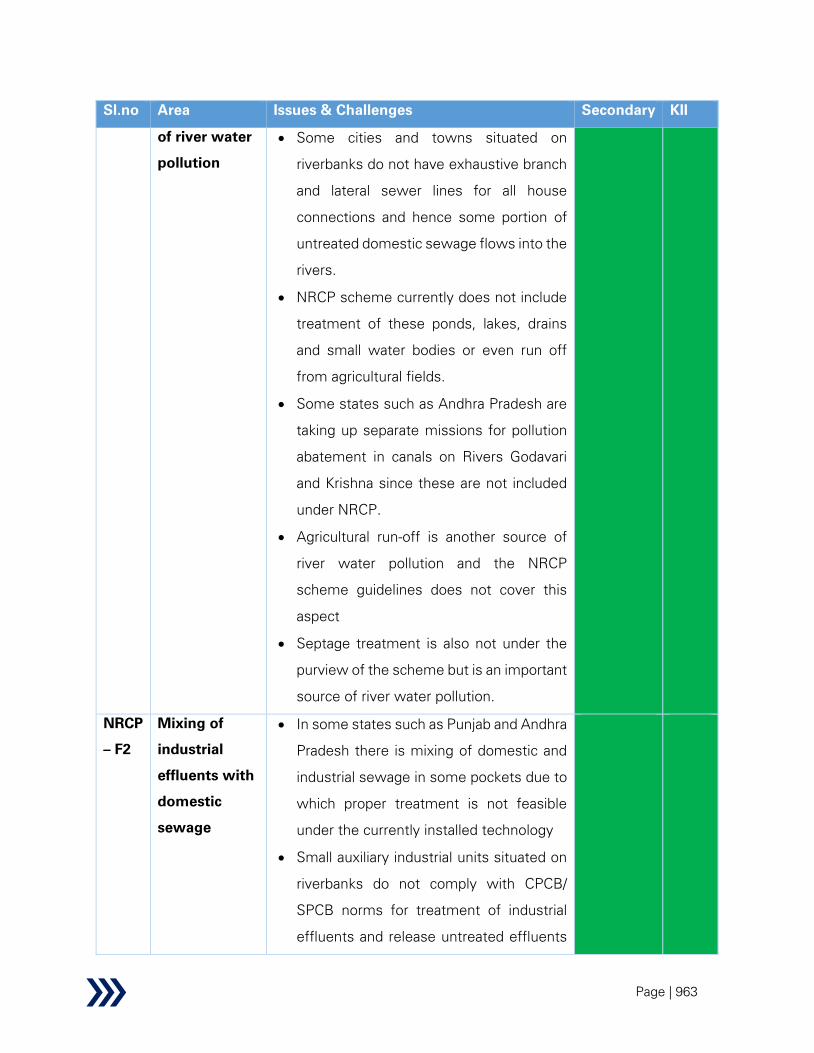
Page | 963
Sl.no Area Issues & Challenges Secondary KII
of river water
pollution
• Some cities and towns situated on
riverbanks do not have exhaustive branch
and lateral sewer lines for all house
connections and hence some portion of
untreated domestic sewage flows into the
rivers.
• NRCP scheme currently does not include
treatment of these ponds, lakes, drains
and small water bodies or even run off
from agricultural fields.
• Some states such as Andhra Pradesh are
taking up separate missions for pollution
abatement in canals on Rivers Godavari
and Krishna since these are not included
under NRCP.
• Agricultural run-off is another source of
river water pollution and the NRCP
scheme guidelines does not cover this
aspect
• Septage treatment is also not under the
purview of the scheme but is an important
source of river water pollution.
NRCP
– F2
Mixing of
industrial
effluents with
domestic
sewage
• In some states such as Punjab and Andhra
Pradesh there is mixing of domestic and
industrial sewage in some pockets due to
which proper treatment is not feasible
under the currently installed technology
• Small auxiliary industrial units situated on
riverbanks do not comply with CPCB/
SPCB norms for treatment of industrial
effluents and release untreated effluents
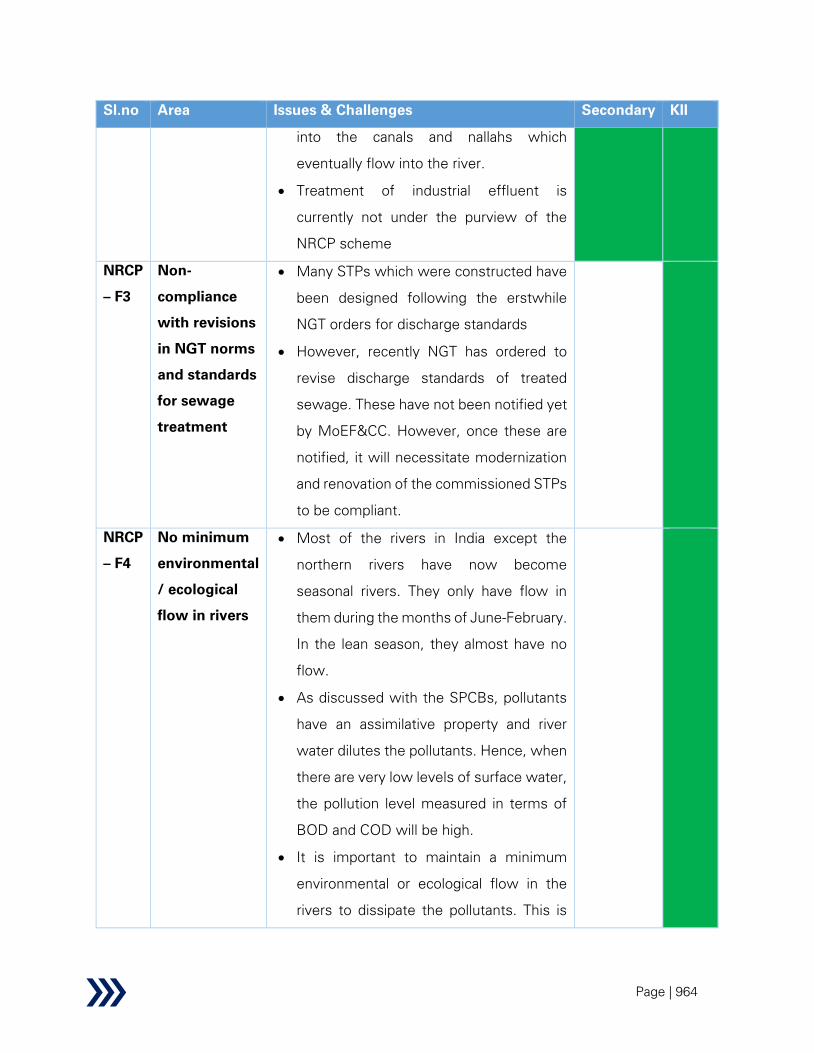
Page | 964
Sl.no Area Issues & Challenges Secondary KII
into the canals and nallahs which
eventually flow into the river.
• Treatment of industrial effluent is
currently not under the purview of the
NRCP scheme
NRCP
– F3
Non-
compliance
with revisions
in NGT norms
and standards
for sewage
treatment
• Many STPs which were constructed have
been designed following the erstwhile
NGT orders for discharge standards
• However, recently NGT has ordered to
revise discharge standards of treated
sewage. These have not been notified yet
by MoEF&CC. However, once these are
notified, it will necessitate modernization
and renovation of the commissioned STPs
to be compliant.
NRCP
– F4
No minimum
environmental
/ ecological
flow in rivers
• Most of the rivers in India except the
northern rivers have now become
seasonal rivers. They only have flow in
them during the months of June-February.
In the lean season, they almost have no
flow.
• As discussed with the SPCBs, pollutants
have an assimilative property and river
water dilutes the pollutants. Hence, when
there are very low levels of surface water,
the pollution level measured in terms of
BOD and COD will be high.
• It is important to maintain a minimum
environmental or ecological flow in the
rivers to dissipate the pollutants. This is
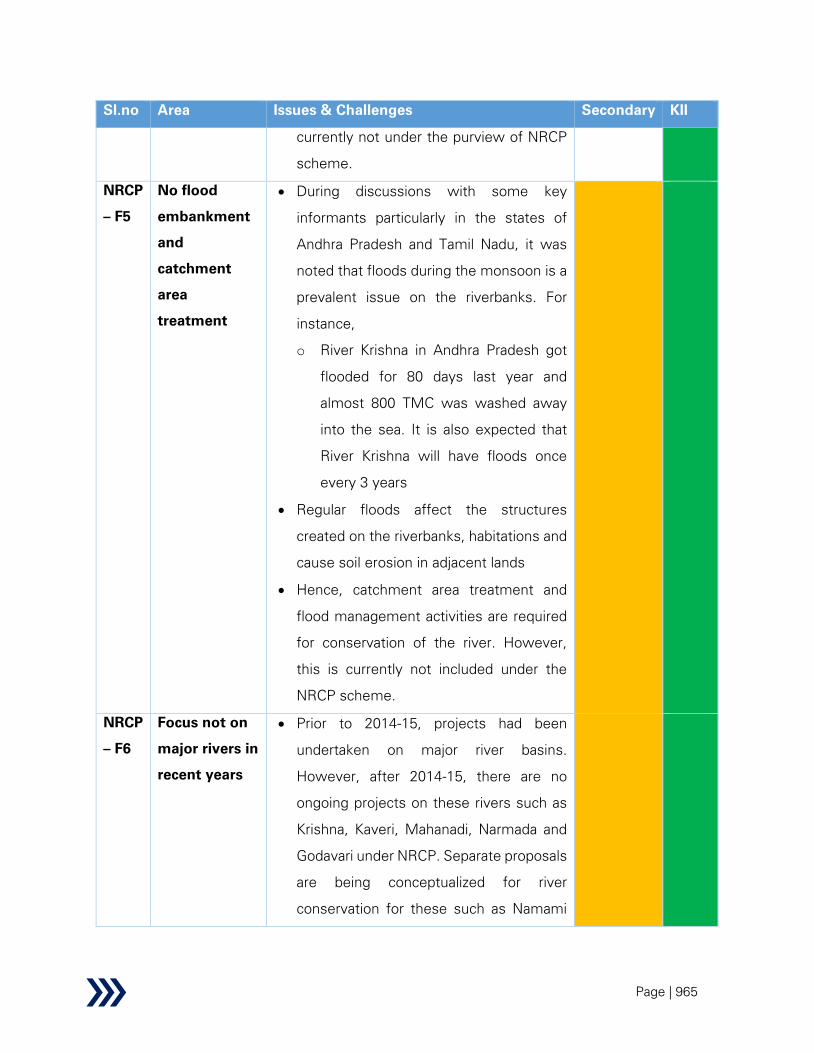
Page | 965
Sl.no Area Issues & Challenges Secondary KII
currently not under the purview of NRCP
scheme.
NRCP
– F5
No flood
embankment
and
catchment
area
treatment
• During discussions with some key
informants particularly in the states of
Andhra Pradesh and Tamil Nadu, it was
noted that floods during the monsoon is a
prevalent issue on the riverbanks. For
instance,
o River Krishna in Andhra Pradesh got
flooded for 80 days last year and
almost 800 TMC was washed away
into the sea. It is also expected that
River Krishna will have floods once
every 3 years
• Regular floods affect the structures
created on the riverbanks, habitations and
cause soil erosion in adjacent lands
• Hence, catchment area treatment and
flood management activities are required
for conservation of the river. However,
this is currently not included under the
NRCP scheme.
NRCP
– F6
Focus not on
major rivers in
recent years
• Prior to 2014-15, projects had been
undertaken on major river basins.
However, after 2014-15, there are no
ongoing projects on these rivers such as
Krishna, Kaveri, Mahanadi, Narmada and
Godavari under NRCP. Separate proposals
are being conceptualized for river
conservation for these such as Namami
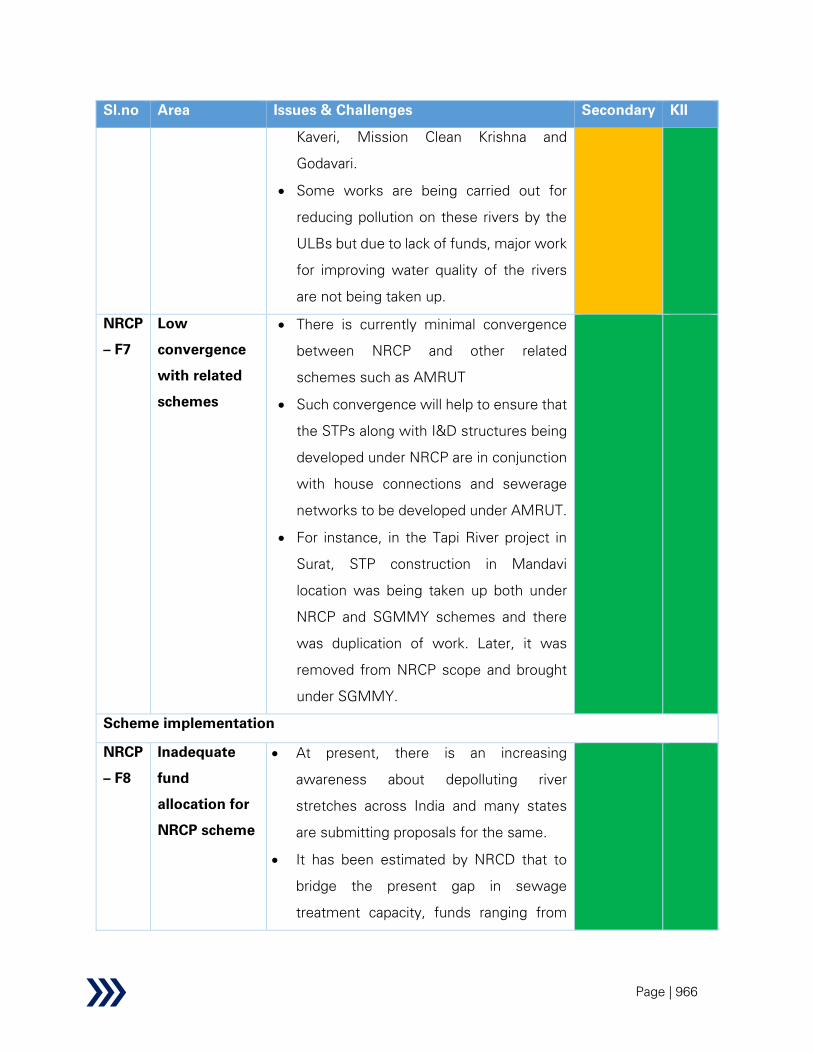
Page | 966
Sl.no Area Issues & Challenges Secondary KII
Kaveri, Mission Clean Krishna and
Godavari.
• Some works are being carried out for
reducing pollution on these rivers by the
ULBs but due to lack of funds, major work
for improving water quality of the rivers
are not being taken up.
NRCP
– F7
Low
convergence
with related
schemes
• There is currently minimal convergence
between NRCP and other related
schemes such as AMRUT
• Such convergence will help to ensure that
the STPs along with I&D structures being
developed under NRCP are in conjunction
with house connections and sewerage
networks to be developed under AMRUT.
• For instance, in the Tapi River project in
Surat, STP construction in Mandavi
location was being taken up both under
NRCP and SGMMY schemes and there
was duplication of work. Later, it was
removed from NRCP scope and brought
under SGMMY.
Scheme implementation
NRCP
– F8
Inadequate
fund
allocation for
NRCP scheme
• At present, there is an increasing
awareness about depolluting river
stretches across India and many states
are submitting proposals for the same.
• It has been estimated by NRCD that to
bridge the present gap in sewage
treatment capacity, funds ranging from

Page | 967
Sl.no Area Issues & Challenges Secondary KII
Rs. 2,00,000 – Rs. 3,00,000 Cr. would be
required.
• Since 2014-15, among the proposals
received by NRCD from the states, only 7
projects at a total sanctioned cost of Rs.
2,867 Cr. has been approved whereas
projects amounting to a total cost of Rs.
5,400 Cr. have been rejected due to
shortage of funds.
• Lack of clarity with the PIAs and ULBs
regarding availability of fund with NRCD,
often results in wastage of effort, time
and money being spent on preparation of
proposals, feasibility reports, DPRs for
new projects by the states, which
eventually cannot be sanctioned due to
unavailability of funds with NRCD.
• There is uncertainty about year wise fund
allocation which makes it difficult to take
up more projects.
NRCP
– F9
Delay in
planning
phase of the
projects
• Since 2014-15, among the 7 projects
sanctioned, none has been commissioned
yet.
• There has been significant progress in
only 2 projects – namely Sabarmati and
Dimapur projects where 75% and nearly
47% of the works has been completed
respectively.
• The works phase is yet to be started for
the remaining
• For instance,
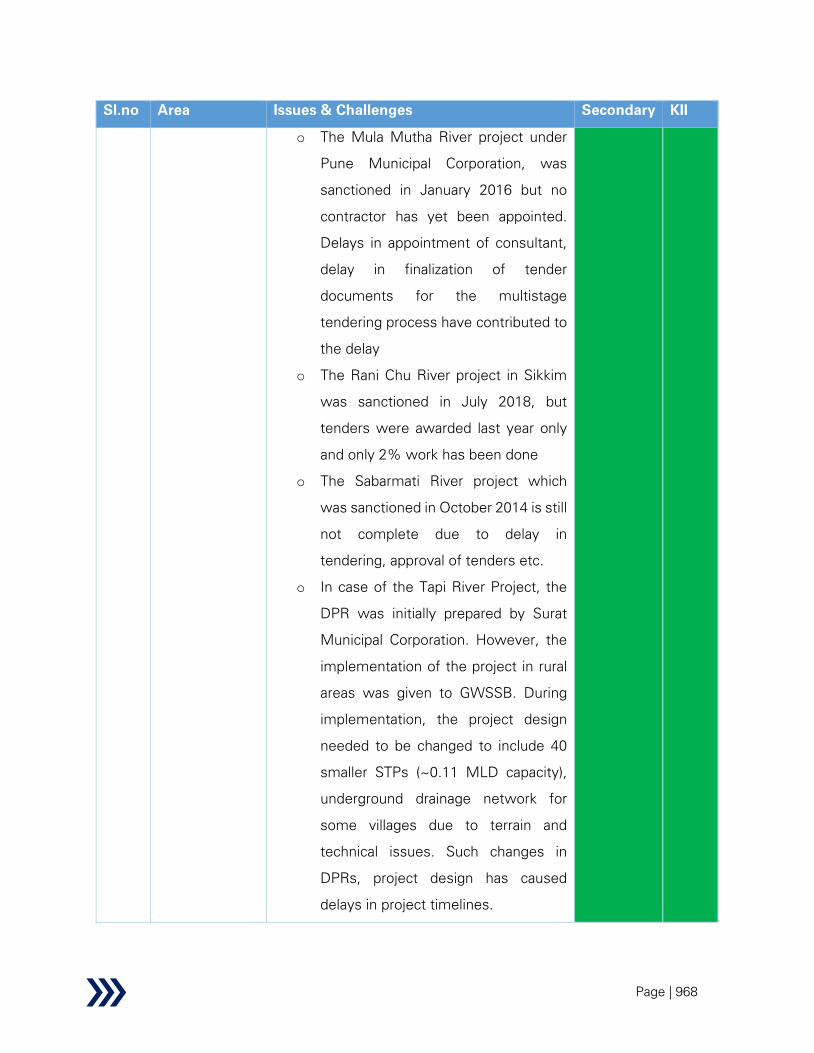
Page | 968
Sl.no Area Issues & Challenges Secondary KII
o The Mula Mutha River project under
Pune Municipal Corporation, was
sanctioned in January 2016 but no
contractor has yet been appointed.
Delays in appointment of consultant,
delay in finalization of tender
documents for the multistage
tendering process have contributed to
the delay
o The Rani Chu River project in Sikkim
was sanctioned in July 2018, but
tenders were awarded last year only
and only 2% work has been done
o The Sabarmati River project which
was sanctioned in October 2014 is still
not complete due to delay in
tendering, approval of tenders etc.
o In case of the Tapi River Project, the
DPR was initially prepared by Surat
Municipal Corporation. However, the
implementation of the project in rural
areas was given to GWSSB. During
implementation, the project design
needed to be changed to include 40
smaller STPs (~0.11 MLD capacity),
underground drainage network for
some villages due to terrain and
technical issues. Such changes in
DPRs, project design has caused
delays in project timelines.

Page | 969
Sl.no Area Issues & Challenges Secondary KII
NRCP
– F10
Issues in land
acquisition
• One of the key issues noted was land
acquisition along the riverbanks for
construction of the treatment plants. For
instance,
o PWSSB noted that litigations due to
land acquisition issues caused project
delays
o The Sabarmati River project which
was sanctioned in October 2014 is still
not complete due to delay in land
acquisition
o Pollution abatement works in Sikkim
on River Rani Chu is yet to start due to
issues with land acquisition
o The works for the ongoing project in
Surat on River Tapi has stopped due to
land acquisition problems.
o The informant from Kolhapur
Municipal Corporation noted that
project completion was delayed by 2-
3 years due to land acquisition issues.
NRCP
– F11
Insufficient
capacity
design of
STPs
• In some instances, the actual discharge is
much more than that envisaged and
hence, the STP is unable to treat the
entire collected sewage and a part of the
sewage flows untreated into the river. For
instance,
o In Punjab the treatment capacity is
only 325 MLD but sewage generated
is 650 MLD

Page | 970
Sl.no Area Issues & Challenges Secondary KII
o In Trichy in Tamil Nadu, sewage
generated in 128 MLD and the current
treatment facilities include only an 88
MLD oxidation pond and 30 MLD
pumping station
• In some instances, the STP cannot be
operated to full capacity due to absence of
sufficient I&D network to tap the entire
sewage generated. Construction of I&D
and sewerage networks which are the
responsibilities of the state government
are often delayed resulting in lack
estimated sewage inflow to the STPs
resulting in lack of capacity utilization. For
instance,
o In Puri, Odisha, 15 MLD STP
constructed is not operating to full
capacity because maximum 11 MLD
sewage can be collected with existing
sewerage networks. Although 750
commercial sewerage connections
have been built, all houses are not
connected to a sewerage network
because of lack of coherency with the
old city planning.
NRCP
– F12
Delay in fund
transfer to
PIAs
• Delay in release of matching state share
against the funds released by the centre
has caused implementation delays in many
projects. For instance,
o The project on Rivers Diphu and
Dhansari in Nagaland being
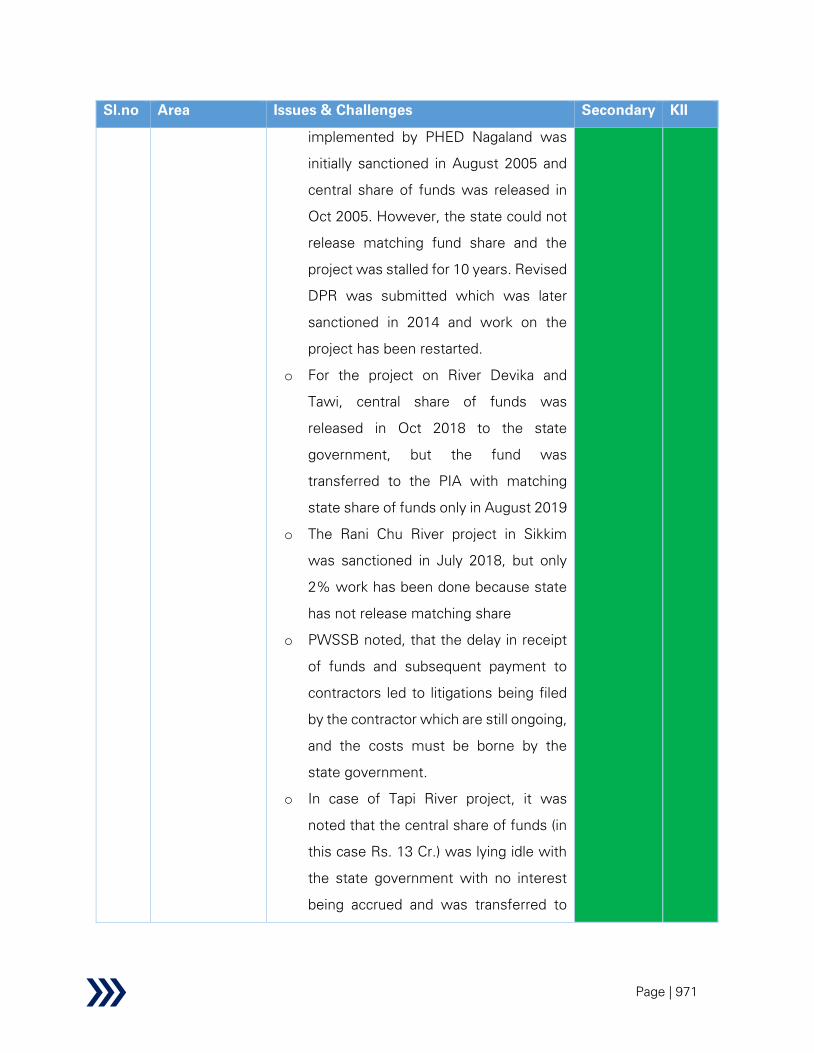
Page | 971
Sl.no Area Issues & Challenges Secondary KII
implemented by PHED Nagaland was
initially sanctioned in August 2005 and
central share of funds was released in
Oct 2005. However, the state could not
release matching fund share and the
project was stalled for 10 years. Revised
DPR was submitted which was later
sanctioned in 2014 and work on the
project has been restarted.
o For the project on River Devika and
Tawi, central share of funds was
released in Oct 2018 to the state
government, but the fund was
transferred to the PIA with matching
state share of funds only in August 2019
o The Rani Chu River project in Sikkim
was sanctioned in July 2018, but only
2% work has been done because state
has not release matching share
o PWSSB noted, that the delay in receipt
of funds and subsequent payment to
contractors led to litigations being filed
by the contractor which are still ongoing,
and the costs must be borne by the
state government.
o In case of Tapi River project, it was
noted that the central share of funds (in
this case Rs. 13 Cr.) was lying idle with
the state government with no interest
being accrued and was transferred to
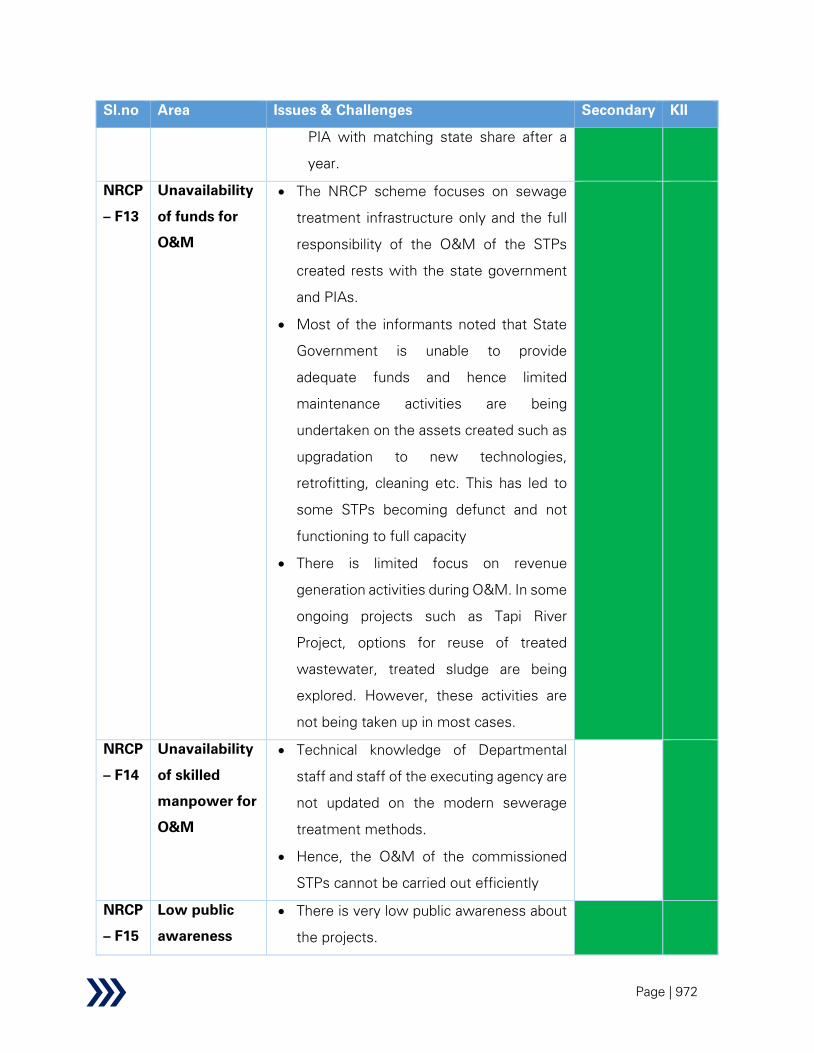
Page | 972
Sl.no Area Issues & Challenges Secondary KII
PIA with matching state share after a
year.
NRCP
– F13
Unavailability
of funds for
O&M
• The NRCP scheme focuses on sewage
treatment infrastructure only and the full
responsibility of the O&M of the STPs
created rests with the state government
and PIAs.
• Most of the informants noted that State
Government is unable to provide
adequate funds and hence limited
maintenance activities are being
undertaken on the assets created such as
upgradation to new technologies,
retrofitting, cleaning etc. This has led to
some STPs becoming defunct and not
functioning to full capacity
• There is limited focus on revenue
generation activities during O&M. In some
ongoing projects such as Tapi River
Project, options for reuse of treated
wastewater, treated sludge are being
explored. However, these activities are
not being taken up in most cases.
NRCP
– F14
Unavailability
of skilled
manpower for
O&M
• Technical knowledge of Departmental
staff and staff of the executing agency are
not updated on the modern sewerage
treatment methods.
• Hence, the O&M of the commissioned
STPs cannot be carried out efficiently
NRCP
– F15
Low public
awareness
• There is very low public awareness about
the projects.

Page | 973
Sl.no Area Issues & Challenges Secondary KII
• During our KIIs, many state water
resources departments and bodies were
not aware of the projects and scheme
objectives
• Because of lack of awareness, private
participation is also low in using and
maintaining the facilities created under
the scheme
Monitoring and evaluation
NRCP
– F16
Non-
involvement
of 3rd
party
monitoring
agency
• As per NRCP guidelines involvement of a
3rd party monitoring agency to evaluate
the treatment efficacy is mandated
• However, most PIAs do not appoint any
external agency for testing and rely on
SPCB monitoring reports.
• The PIAs manually collect samples and
test them in their internal laboratories
once or twice a month.
NRCP
– F17
Absence of
central
dashboard for
real-time
monitoring
• NRCD has a dedicated MIS system for
tracking physical and financial progress of
projects
• Currently, continuous monitoring system
is being implemented in few ongoing
projects and some PIAs use geotagging
during construction of STPs
• However, there is no central dashboard
for tracking progress of projects, sanction
of funds, latest norms and guidelines,
status of projects, etc.
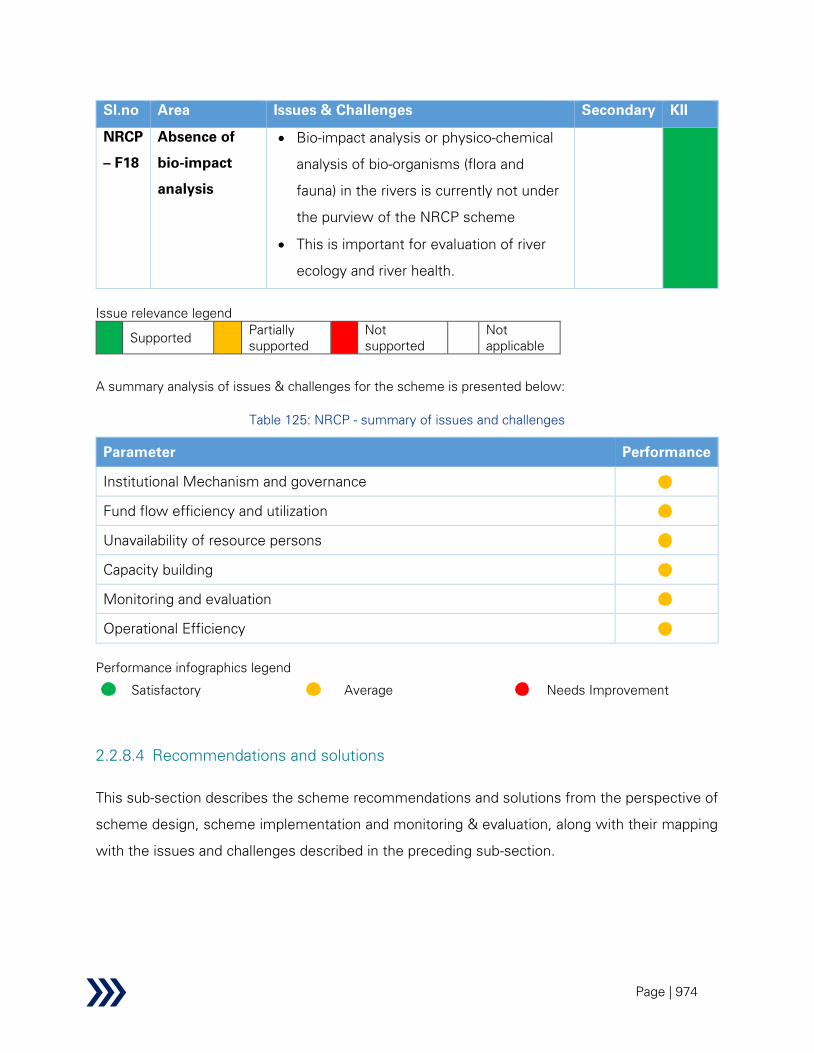
Page | 974
Sl.no Area Issues & Challenges Secondary KII
NRCP
– F18
Absence of
bio-impact
analysis
• Bio-impact analysis or physico-chemical
analysis of bio-organisms (flora and
fauna) in the rivers is currently not under
the purview of the NRCP scheme
• This is important for evaluation of river
ecology and river health.
Issue relevance legend
Supported Partially
supported
Not
supported
Not
applicable
A summary analysis of issues & challenges for the scheme is presented below:
Table 125: NRCP - summary of issues and challenges
Parameter Performance
Institutional Mechanism and governance
Fund flow efficiency and utilization
Unavailability of resource persons
Capacity building
Monitoring and evaluation
Operational Efficiency
Performance infographics legend
Satisfactory Average Needs Improvement
2.2.8.4 Recommendations and solutions
This sub-section describes the scheme recommendations and solutions from the perspective of
scheme design, scheme implementation and monitoring & evaluation, along with their mapping
with the issues and challenges described in the preceding sub-section.

Page | 975
Table 126: NRCP – recommendations and solutions
Sl.no Recommendation Finding
Scheme design
NRCP –
R1
Revision in scheme guidelines and earmarking funds for
inclusion of additional project components to take care of
holistic conservation of rivers
• The following components should also be included under the
purview of NRCP scheme to ensure holistic conservation of the
river.
o Maintaining ecological and environmental flow of rivers
throughout the year through:
o Construction of checked dams and barrages on the
rivers, deconcretisation of riverbeds, to maintain
minimum environmental or ecological flow in the
rivers during the lean season of February to June.
• Examples: NMCG has similar
provisions for Aviral Dhara or
Wholesome River. Environmental
water requirement (EWR) assessment
methods, for ascertaining how much
water should be retained in rivers to
sustain ecological functioning and
desired levels of biodiversity, have
been developed under Aviral Dhara.
Under NMCG, there is special focus on
increasing base flow and aquifer
recharge. Minimum environmental
flows have been notified for different
sections of the Ganga and violation of
the e-flow norms would lead to closure
of respective water-consuming
NRCP-F1
NRCP-F4
NRCP-F5
NRCP-F10

Page | 976
Sl.no Recommendation Finding
projects such as hydroelectric projects
and/ or imposing heavy penalties.
• For non-perennial rivers it is often
difficult to get data on hydrology, and
ecological functioning. However,
many tributaries of Ganga like the
Damodar, Hindon, Kali etc are non-
perennial. Hence the learnings from
“Aviral Dhara” programme remains
applicable.
• For non-perennial rivers a case study
through a method known as “DRIFT-
ARID”236
was adopted in South Africa
which needs to be looked upon in the
case of NRCP as well. This method
explores refining the normal technique
of EWR measurements over a period,
through different types of non-
perennial rivers. Many non-perennial
rivers have enough water even during
the dry season to carry out EWR
measurements to be extrapolated
using the DRIFT model data of
perennial rivers. The fundamental
requirement of such method is
availability of enough data. Hence this
needs to be adopted initially in select
non-perennial rivers with a minimum e-
236 Environmental Water Requirements of Non-Perennial Rivers, Michael C Grenfell
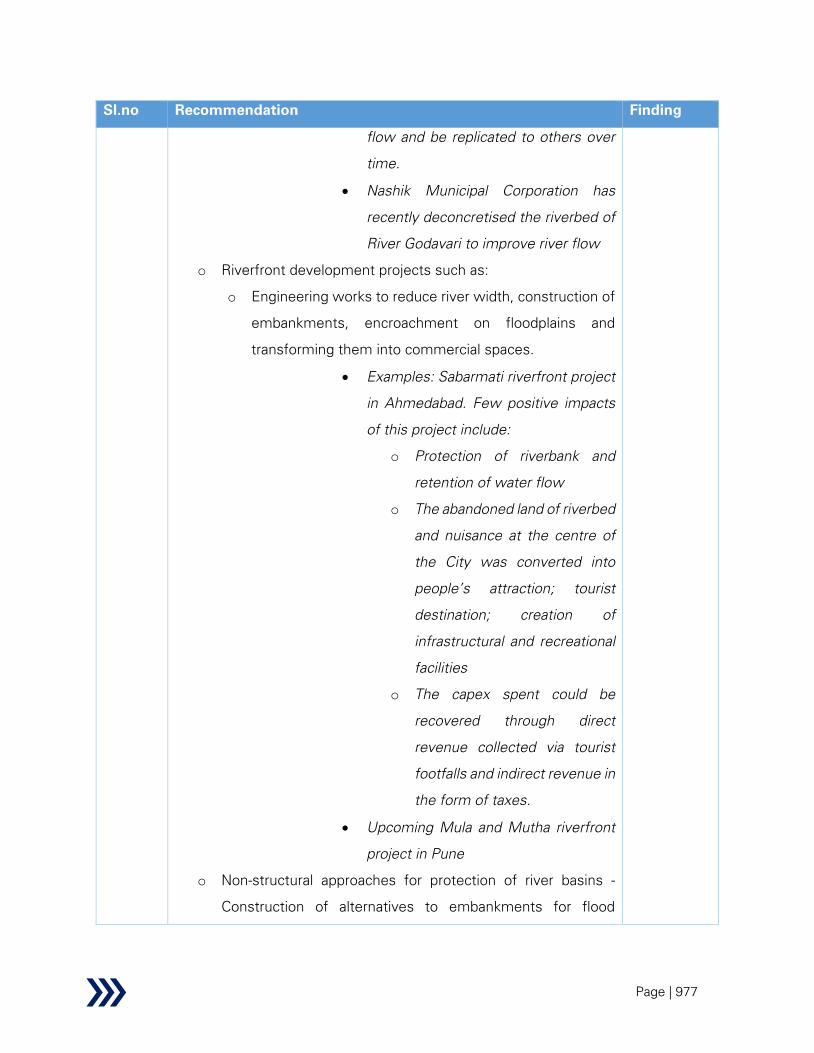
Page | 977
Sl.no Recommendation Finding
flow and be replicated to others over
time.
• Nashik Municipal Corporation has
recently deconcretised the riverbed of
River Godavari to improve river flow
o Riverfront development projects such as:
o Engineering works to reduce river width, construction of
embankments, encroachment on floodplains and
transforming them into commercial spaces.
• Examples: Sabarmati riverfront project
in Ahmedabad. Few positive impacts
of this project include:
o Protection of riverbank and
retention of water flow
o The abandoned land of riverbed
and nuisance at the centre of
the City was converted into
people’s attraction; tourist
destination; creation of
infrastructural and recreational
facilities
o The capex spent could be
recovered through direct
revenue collected via tourist
footfalls and indirect revenue in
the form of taxes.
• Upcoming Mula and Mutha riverfront
project in Pune
o Non-structural approaches for protection of river basins -
Construction of alternatives to embankments for flood
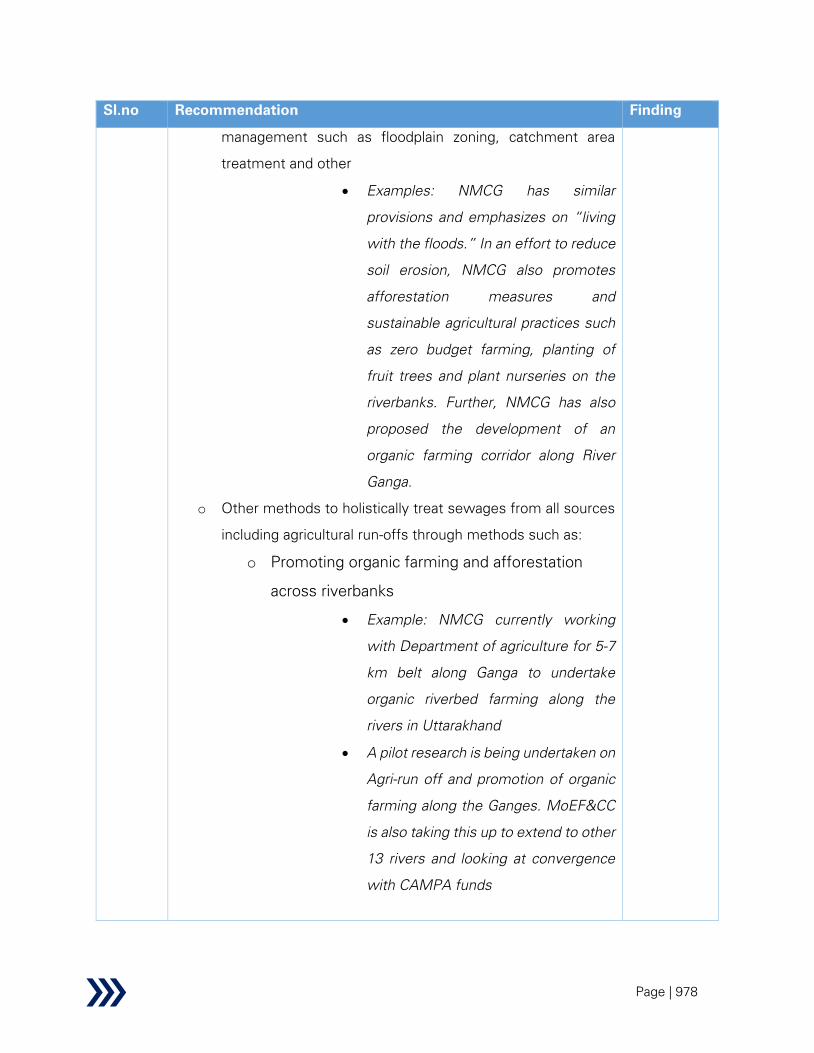
Page | 978
Sl.no Recommendation Finding
management such as floodplain zoning, catchment area
treatment and other
• Examples: NMCG has similar
provisions and emphasizes on “living
with the floods.” In an effort to reduce
soil erosion, NMCG also promotes
afforestation measures and
sustainable agricultural practices such
as zero budget farming, planting of
fruit trees and plant nurseries on the
riverbanks. Further, NMCG has also
proposed the development of an
organic farming corridor along River
Ganga.
o Other methods to holistically treat sewages from all sources
including agricultural run-offs through methods such as:
o Promoting organic farming and afforestation
across riverbanks
• Example: NMCG currently working
with Department of agriculture for 5-7
km belt along Ganga to undertake
organic riverbed farming along the
rivers in Uttarakhand
• A pilot research is being undertaken on
Agri-run off and promotion of organic
farming along the Ganges. MoEF&CC
is also taking this up to extend to other
13 rivers and looking at convergence
with CAMPA funds

Page | 979
Sl.no Recommendation Finding
o In areas of land constraints approvals could be granted by
NRCP for construction of small capacities of phyto-
remediation and bio-remediation plants (~10-20 KLD) or
fabricated STPs (~0.1 MLD) This could also be relevant for
areas where there are many small canals, creeks which are
discharging untreated sewage into the rivers like in
Jharkhand, Gujarat
o construction of septage treatment plants to ensure that
faecal sludge collected from the municipalities will be first
treated in septage treatment plants and only the treated
water will be discharged into the nearby rivers.
NRCP –
R2
Earmarked fund for modernization of commissioned STPs after
the notification of the NGT order by MoEF&CC
• Inventorisation of STPs by state government by river basins
• Identification of STPs commissioned before 2019 which are not
operating to their full capacity and/ or the treated sewage is not
compliant with current NGT norms of water quality and sewage
treatment standards of BOD, COD and TSS levels. The main
reasons and associated solutions for lack of capacity utilization
includes:
o Lack of back-end sewer network. - Can be solved by
constructing suitable I&D network and diverting the
untreated sewage from open drains to the STPs
o Lack of adequate demand – Demand projection is
done keeping a horizon of 30 years. If population
growth does not happen in sync with projection, then
capacity utilization remains low. This can be solved by
developing STPs in a phased manner and avoiding
adding of full capacity at one go.
o Lack of trained manpower – many STPs created
under EPC mode using new technologies remain
NRCP-F3
Page | 980
Sl.no Recommendation Finding
underutilized because of inadequate knowledge
transfer or capacity building to the ULB engineers.
This can be solved through long term O&M (at least
10 years) by the contractor/ concessionaire. Also,
imparting training and capacity building to the ULB
engineers could be a part of the responsibility of the
contractor prior to handover.
o Lack of regular monitoring of capacity utilization: This
can be achieved through performance linked O&M
contracts wherein payments to the contractor/
concessionaire is linked to capacity utilization
parameter as one of the KPI.
• Formation of a commensurate fund earmarked for renovation and
modernization of these identified STPs. Renovation and
modernisation of existing STPs will be cost effective compared
to setting up of new STPs. E.g. Renovating an existing Activated
Sludge Process technology based STP to meet the revised norms
will cost around Rs. 0.75 - 1 Cr./MLD. However, if we set up a
new STP to meet the revised norms it will cost around Rs. 1.75-
2 Cr./MLD. Additionally, the undepreciated cost of the old STP
will be lost as well.
NRCP –
R3
Revision in scheme guidelines – convergence with other
schemes
• Opportunities for convergence with other schemes should be
explored for effective implementation of the scheme
components and holistic conservation of the river basin. This may
include –
o Convergence with AMRUT – to ensure that the STPs and the
I&D structures that are being constructed under NRCP
scheme are in conjunction with future planning of sewerage
NRCP-F1
NRCP-F5
NRCP-F7
NRCP-F11
Page | 981
Sl.no Recommendation Finding
networks and household connections under AMRUT
considering correct population figures
o Convergence with FMBAP – to ensure protection of river
from floods
o Convergence with RRR – to ensure that no untreated
domestic or industrial sewage flows into lakes, ponds or
small adjoining water bodies which flow into the river
downstream
o Convergence with Swachh Bharat Mission – for construction
of bathing ghats and low-cost public toilets
o Convergence with state level schemes/ activities
NRCP –
R4
Close coordination and periodic knowledge sharing with
NMCG
• Since NMCG also functions with the overarching objective of
pollution abatement on River Ganga and its tributaries, close
coordination between the schemes can be looked at. In
particular, periodic review meetings between officials for
knowledge sharing of learnings, best practices, project progress
etc. can prove to be helpful for improving the implementation
efficiency of NRCP scheme.
• In the long term, NMCG can play an advisory role in river
rejuvenation programs undertaken across the country. Also,
involvement of a central authority will raise private investor’s
confidence in NRCP projects.
• Lastly, administrative and functional restructuring of NRCD is
required to expand mandates to include components which will
lead to a more holistic river rejuvenation programme similar to
NMCG.
NRCP-F1
NRCP-F6
NRCP-F8
NRCP-F9
NRCP –
R5
Prioritization of rivers and targeting river basins NRCP-F6

Page | 982
Sl.no Recommendation Finding
• Since the fund available with NRCP is limited, projects for
conservation and sewage treatment along major river basins
should be prioritized to be taken up under the scheme
• For each performance year, there should be targets for pollution
abatement on most polluted river stretches on major river basins
such as Krishna, Godavari, Kaveri, Narmada, Mahanadi etc. and
funds should be allocated for the same
• There are currently proposals being submitted for this under
separate schemes such as Namami Kaveri, Mission Clean
Krishna and Godavari. All these separate schemes should be
brought under the umbrella of NRCP.
• Learnings from international case studies of river basin
conservation needs to be inculcated as well. One noteworthy
being:
o The Rhine river: The river flows across Switzerland,
France, Germany and the Netherlands to reach the
North Sea. During the rapid industrialization of 1800s,
there was rampant river pollution where untreated
chemicals from industries as well as untreated
sewage was thrown into the river much like in India
today. Multiple actions and international cooperation
were targeted through the Rhine Action Programme.
However, results only started being visible in the
1980s. Restoration of river water quality to drinking
standards, ecological rehabilitation, restoring salmon
population were few of the key success indicators.
Currently, Rhine 2020 programme is ongoing to
continuously monitor and maintain the river health
including flood prevention and groundwater
protection. This entire programme wouldn’t have
been successful without intense trans-boundary
Page | 983
Sl.no Recommendation Finding
cooperation between multiple governments and
citizens.
o A key learning from the Rhine Action programme is
that a river basin conservation effort is not a one-time
effort but a continuous process and spans decades
and requires immense collaboration and stakeholder
engagement throughout the process.
• Currently, a cabinet note is being worked upon to have a similar
institutional structure like NMCG and expand/ scale up NRCP
scheme since other iconic rivers of India are also important along
with River Ganga.
NRCP –
R6
Eliminating mixing of domestic and industrial sewage
• Inventorisation of grossly polluting units which are not complying
with CPCB/SPCB/ NGT effluent treatment norms and discharging
untreated effluents into the nallahs/ canals/ water bodies/ rivers
thereby mixing domestic and industrial sewage is required.
• Notifying CBCB/ SPCB and NGT through listing of such non-
compliant industrial units and requesting immediate
interventions. Educational institutions such as IITs/ NITs can be
roped in this similar to the way NMCG has done.
• Similar to NGRBA under CPCB, a cell may be proposed to be set
up under CPCB for more focused monitoring of ETPs.
• Extant norms such as Zero Liquid Discharge Norms for industries
or Ministry of Power guidelines for mandatory reuse of
wastewater within 50 km of a thermal power plant should be
evoked and non-compliant entities should be reported.
• Thermal Power Plants should be encouraged to collaboratively
adopt wastewater treatment technologies and wastewater
reuse.
NRCP-F2
Page | 984
Sl.no Recommendation Finding
• CETPs may be set up for small scale industries or charters should
be developed on how to set up and upgrade ETPs for small
industries such as paper, pulp etc.
o E.g.: NMCG has set up a CETP at Kanpur for the tannery
sector and CETPs are proposed for tanneries at Unnao and
Banther and for textile industries
• Treatment of industrial effluents separately or treatment of
mixed sewage should be taken up
o E.g.: NMCG has set up STPs at Bhagalpur, Farukkabad which
treats mixed sewage (domestic + industrial sewage)
• Treated Wastewater (TWW) Reuse can ensure self-regulation
and control by industries as well as STP operators. Properly
treated effluent / sewage can be reused within industries and/ or
be sold to other users. This can encourage industries/ STP
operators to treat the effluent/ sewage to the acceptable quality
level. An enabling policy to make TWW use across the country is
being developed by Ministry of Jal Shakti. This policy will guide
the states (those which doesn’t have a TWW policy yet) to
prepare state level policies ensuring increase in compliance and
self-regulation by industries and ULBs.
Scheme implementation
NRCP –
R7
Exploring funding options for NRCP
• The funding for NRCP needs to be increased considering the
existing sewage treatment gap and the funds required to bridge
the gap
• NRCD should explore funding options with bilateral/ multilateral
funding agencies such as World Bank, ADB, JICA, USAID, DFID
• Explore PPP procurement models such as Hybrid Annuity
Models will help in bringing private sector funding through capex
sharing with private players. Under such model, government
benefits from staggered and distributed capital payments over a
NRCP-F8
NRCP-F12

Page | 985
Sl.no Recommendation Finding
longer period. This will also enable the authority to have additional
funds for taking up more projects
• Create an enabling structure to get into long term tripartite
agreements which are essential for developing and maintaining
PPP projects (similar to the arrangement in NMCG projects
where NMCG is a party to the PPP contracts with the state
government and concessionaire). This can be enabled through
creating a society or corporation or SPVs backed by Government
of India which can enter long term contract and provide cushion
to the private players investing in the projects.
• Explore funding options from leading NGOs, large philanthropic
organizations such as Bill and Melinda Gates Foundation (BMGF)
need to be explored (similar to Clean Ganga Fund)
• Private players can also be roped in through their CSR funds,
especially in river front development and beautification activities
leveraging the local aesthetic appeal many rivers may be having
to the community.
• Innovative financing instruments such as Municipal Bonds,
Green Bonds and alternate funding options including
microfinance, private finance etc. can be explored.
• Finally, the scheme requires operational and institutional
independence like NMCG and a dedicated year wise funding
allocation such that more projects can be taken up.
•
NRCP –
R8
Additions to the current scheme guidelines for fund release –
Conditions Precedent
• The NRCP scheme should add certain time bound “Conditions
Precedent” which needs to be satisfied prior to approval of
projects and sanction of funds by NRCD. . The Conditions
Precedent should include the following in addition to the
prevalent terms and conditions:
NRCP-F9
NRCP-F10
NRCP-F12

Page | 986
Sl.no Recommendation Finding
o Submission of Certificate of Possession of the land to be
used for construction of STP by the PIA
o Consent of state and Panchayat departments for usage of
the land for construction of STP
o Testing of influent parameters by NABL accredited
laboratory and reporting of industrial contaminants (if any)
o Identification of fund by state govt. for contribution to state
matching share of the project
o Identification of PIAs for implementation of the project along
with approval of project design by the PIA as per DPR. No
further changes in the project design shall be permitted
during implementation phase except written approval from
NRCD.
NRCP –
R9
Adoption of lifecycle-based procurement model
• To tackle the challenge of unavailability of funds and manpower
during O&M phase, a lifecycle-based procurement model with
private sector participation such as Hybrid Annuity Model and/ or
EPC with long term O&M should be explored. Standard bid
documents for these models should be prepared gathering
learnings from NMCG projects.
• Under these models, the contractor is appointed for construction
of the STP and shall also have O&M responsibility for a period
of10-15 year.
• In addition, execution of a performance-based contract
throughout the project lifecycle shall ensure that the
concessionaire is performing well, and discharge parameters
shall always comply with extant norms.
• Further, technology neutral contracts should be explored where
the concessionaire can choose the best suited treatment
technology among centralized STP/ decentralized STP/ FSTP/ co-
NRCP-F8
NRCP-F13
NRCP-F14
NRCP-F15

Page | 987
Sl.no Recommendation Finding
treatment etc. based on STP location, existing conditions and
treatment gap.
• Concepts like one city-one operator model wherein one private
operator will be responsible for development and O&M of all the
sewerage networks and STPs in the city can also be explored
especially in the larger towns.
• The concessionaire shall also have an option to generate revenue
in post-construction phase through innovative ways such as –
o Selling of treated wastewater for use in nearby industries
o Selling of treated wastewater for horticulture, gardening and
beautification, irrigation etc. as per prevalent wastewater
reuse policies
o Selling of treated sludge as manure after stabilization
o Generating power in the plant from biogas produced from
sewage for running mechanical and electrical equipment in
the STP or can also set up solar power plants.
o E.g.: Learning can be derived from the case study of River
Nag and Pili in Nagpur on wastewater treatment and reuse.
▪ In April 2020, pollution abatement works on Rivers Nag
and Pili in Nagpur has been approved at a total cost of
Rs. 2,324 Cr. to be funded by JICA and partially (15%) by
Nagpur Municipal Corporation. The project includes
construction of 2 STPs (48 MLD and 43 MLD
respectively) and laying of 1,362 km of sewage lines for
diversion of sewage from 100 small streams that flow
into River Nag/ Pili downstream.
An arrangement of water swap has been undertaken for
wastewater reuse. Raw water sent in bulk to the
industries under Nagpur Municipal Authority is diverted
to water treatment plants for the city, thus increasing
availability of potable water for Nagpur residents. In turn,
Page | 988
Sl.no Recommendation Finding
recycled water from the city is again being diverted for
industrial use. This water swap arrangement, operational
since 2015, is additionally using municipal treated
wastewater from Nagpur for cooling purposes in the
power plants at Koradi, Khaparkheda and Mauda.
NRCP –
R10
Increasing public awareness about NRCP
• The concessionaire should also take up awareness campaigns for
sensitizing the local populace and encouraging use of the project
structures created. NGOs and voluntary organizations should be
engaged for this purpose.
• More activities such as Shivirs, Padyatras, Shramdans,
Exhibitions and Ghat cleaning should be undertaken by the states
to create awareness among the people residing in towns situated
on riverbanks. The Communication Advisory Committee should
closely coordinate with State Governments to oversee this
• Social media footprint should be enhanced by creating Facebook
page, Instagram profile, Twitter handles to make people more
aware of the projects being undertaken. Related schemes such
as National Mission for Clean Ganga, AMRUT have such social
media presence.
• Rivers have a local appeal and often have religious connects with
the people. This people-river connect needs to be strengthened
by building more organizations in line with “Love Tapi Care Tapi”
group and involving more grass-root level people and SHGs.
• There should be a dedicated component and budget allocation
for IEC campaigns in the NRCP scheme guideline to increase
public awareness about the program.
• Increasing public awareness about NRCP should be monitored
by public perception surveys that can also act as feedback to
implementing agency and be helpful in outcome monitoring.
NRCP-F15

Page | 989
Sl.no Recommendation Finding
NRCP-
R11
Training and Capacity Building Workshops by NRCD
• Ensure engagement of technically accredited bodies to conduct
these periodic trainings and impart knowledge sharing via
industry experts.
• NRCD should conduct training sessions and workshops for the
PIAs to impart knowledge on the following: -
o latest sewage treatment technologies
o latest cost-efficient treatment methods
o revised discharge standards notified by NGT
o River quality monitoring
o TWW recycling
o latest notifications from CPCB and SPCBs
o standard procurement process and model tender document
o exploring revenue generation options from reuse of treated
wastewater and treated sludge
o modalities for public awareness campaigns
• Training sessions can also be conducted by Indian Council of
Agricultural Research (ICAR) on novel models for biological
wastewater treatment. The Indian Agricultural Research Institute
(IARI) is also currently working on developing environmentally
sustainable de-centralized wastewater treatment technologies
with low Capex/ Opex and can impart knowledge to the PIAs.
NRCP-F14
NRCP –
R12
Change in funding and fund transfer mechanism to PIA
• There should be a mechanism of providing in-principle approval
for a project based on pre-feasibility report submitted by the
state/ PIA. A detailed project assessment, DPR can be submitted
post the in-principle approval and before fund sanction. This
would save effort, cost and time of the PIAs submitting detailed
proposals for projects which might get rejected later.
• Alternatively, budget allocation for river basins for a financial year
can be made under NRCP scheme to give more clarity to PIAs.
NRCP-F8
NRCP-F12
Page | 990
Sl.no Recommendation Finding
• It is proposed that central share of funds be released directly to
the PIA in tranches through creation of an SPV. The fund can be
transferred to an escrow account. For instance, a token 25% of
central share of funds can be transferred to the PIA at the start
of the project. Once the PIA submits the Utilization Certificates
and raises request for subsequent funds, NRCD can release the
central share in tranches.
• The state government may release their share in tranches as per
availability and requirement.
Monitoring and evaluation
NRCP –
R13
Revision in scheme guidelines – Guidelines for project
monitoring
• Appointment of a 3rd party independent agency for regular
monitoring and evaluation (who shall conduct monthly
verification of the quality of the treated sewage) should be
completed before release of last tranche of funds.
• Appointment of an Environmental Officer at the SPMU who shall
submit bi-monthly reports on the quality of the treated sewage.
• Coordination with the Central Monitoring Committee set up by
NGT (to enforce national plan to make polluted river stretches
pollution free) and River Rejuvenation Committees in the states
is important to ensure improvement in river water quality.
• A special cell for water quality monitoring of rivers along with
monitoring of sewage and river health should be proposed to be
set up under CPCB (similar to the cell set up for River Ganga)
o Learning can be drawn from NMCG. For example:
Under the NMCG programme, Central Pollution
Control Board (CPCB) is carrying out the water quality
monitoring of River Ganga at 97 locations in five
States viz. Uttarakhand, Uttar Pradesh, Bihar,
Jharkhand and West Bengal in association with State
NRCP-F16
NRCP-F18

Page | 991
Sl.no Recommendation Finding
Pollution Control Boards. The objective of monitoring
is to assess the fitness of water for bathing water
quality criteria. There are 63 water quality parameters
which are currently being monitored comprising -
Field Parameters (9); Bio Monitoring (3); Core
Parameters (7); General Parameters (19); Micro-
pollutants - Heavy Metals (10) and Pesticides (15).
• Inclusion of bio-diversity monitoring of rivers including calculation
of bio-diversity index in the river body, hygienic surveys with
respect to Fecal coliform, Fecal streptococci in bathing waters
should be undertaken.
o Learning can be drawn from NMCG- Biomonitoring of
river Ganga at various locations (Haridwar to Diamond
Harbour in West Bengal) has been carried out to study
the Benthic Macro Invertebrates, which reflects the
biological health of river. It has been observed that
water quality of Ganga supports diversified
community structure and there is an improvement in
biological water quality from moderate to good which
indicates that river environment is having tendency
towards enhancing its ecological health.
• Create provision of water quality monitoring on a real-time basis
through setting up Real-time Water Quality Monitoring Stations
(RTWQMS) on the main stem of the river much like in the River
Ganges.
o E.g.: Twenty Real-time Water Quality Monitoring
Stations (RTWQMS) were installed on main stem of
river Ganga; nine on the tributaries. These real-time
stations measure water quality of river Ganga on 24x
7 basis for 17 parameters through sensors.

Page | 992
Sl.no Recommendation Finding
• River health monitoring should be done based on monitoring
stations placed at different points on the river and not only in
the vicinity of STPs. STPs discharge will anyway be
monitored by flow meters and sensors measuring
parameters like BOD, COD, TDS, TSS, etc.
• The National Green Tribunal, in an order dated 20.09.2018
has ordered the state environmental agencies to tackle the
pollution of identified critically polluted and highly polluted
river stretches in the states. The Action Plan will be directed
to address the monitoring and control of sources of pollution.
Rivers have assimilative capacity to respond to any upset of
equilibrium in water quality or sediment load through self-
adjusting processes of erosion and sedimentation.
“Assimilative capacity is the relationship between water
quality and quantity, land use (not only urban development,
but also activities such as agriculture, aggregate extraction,
and recreational activities), and the ability of a watercourse or
river to resist the effects of these disturbances without the
impairment of water quality below levels set by provincial
standards.”237
A mass balance approach along with empirical relationships
can be used to compute the assimilative capacity. However,
the prerequisite is the availability of sufficient water quality
data. Hence presence of Real-time Water Quality Monitoring
Stations (RTWQMS) becomes critical. The calculation of
assimilative capacity with proper monitoring
instrumentations helps in identifying the pollution hotspots in
237 Lake Simcoe Region Conservation Authority, Assimilative Capacity Study, 2006. Retrieved from
http://www.lsrca.on.ca/watershed-health/reports/assimilative-capacity-study

Page | 993
Sl.no Recommendation Finding
a riverbed and accordingly interventions can be planned to
maintain the assimilative capacity
NRCP –
R14
Development of a central dashboard for Monitoring
• A central dashboard needs to be developed by NRCD which shall
give regular progress updates on the following parameters –
o Planning Phase–
▪ Projects under consideration for sanction
▪ Proposals submitted and their evaluation status
o Works Phase -
▪ Project physical progress - STPs, bathing ghats created
etc.
▪ Project financial progress - sanctioned versus actual
expenditure
▪ STP capacity in MLD – target vs achieved
▪ I&D works in km - target vs achieved
▪ Project progress - status of each project in each state and
activity tracker
▪ Ongoing tenders
o Post-construction phase
▪ Real-time monitoring of STP performance – inlet & outlet
BOD, COD and TSS level
▪ River water quality parameters from the Real-time Water
Quality Monitoring Stations
▪ Monitoring reports submitted by ULBs
• Installation of real-time monitoring instrumentation systems
should be done during the construction of the STPs. The
contractors should be entrusted with the responsibility of
installing the real-time monitoring systems along with the assets
and the related bid documents for hiring contractors should have
the detailed technical specifications of the meters, sensors and
instrumentation systems.
NRCP-F17
Page | 994
2.2.9 Flood Management and Border Area Programmes
The projects for flood management and flood control are formulated and implemented by
respective state governments/Union Territories from their own resources and as per their priority.
Central Government provides financial assistance and technical assistance to states/UTs for
implementing some projects in critical areas. Central Government has been providing financial
assistance through a scheme called Flood Management Programme (FMP) since XI Plan. The
scheme since its inception has undergone several changes as per demands of states/UTs and
also on account of various directions and policies of Govt. of India.
2.2.9.1 Background
During X Plan, following four schemes were sanctioned to provide central assistance to the flood
prone states to take up flood control and river management works in critical areas:
a) Critical Anti-erosion works in Ganga Basin States (a Centrally Sponsored Scheme)
b) Critical Flood Control and Anti Erosion Schemes in Brahmaputra and Barak Valley States (a
State Sector Scheme),
c) Improvement of Drainage in critical areas in the country (a State Sector Scheme) and
d) Critical Anti-erosion Works in Coastal and other than Ganga Basin States (a State Sector
Scheme)
Flood Management Programme:
The Flood Management Programme (FMP) was implemented during XI Plan with an outlay of Rs.
8,000 Cr. after subsuming above four schemes. Under the Programme, central assistance was
provided to State Governments for taking up works related to river management, flood control,
anti-erosion, drainage development, flood proofing, restoration of damaged flood management
works and anti-sea erosion. The pattern of funding was 90 % (Centre):10 % (State) for Special
Category States and 75 % (Centre): 25 % (State) for General/ Non-Special Category States.
During XI Plan, 420 works with a total estimated cost of Rs.7,857.08 Cr. was approved under
FMP. Central assistance to the States/UTs to the tune of Rs. 3566.00 Cr. was released during
this plan period. During XII Plan, the Government of India approved continuation of “Flood
Management Programme” with an outlay of Rs.10,000 Cr. The funding pattern under the

Page | 995
Scheme for the special Category States covering the North Eastern States, Sikkim, Himachal
Pradesh, Jammu & Kashmir and Uttarakhand was 70% (Centre) :30% (State) and General States
– 50% (Centre) : 50% (State). The project eligibility criteria for inclusion under the Scheme in
respect of special Category States was project with estimated cost of Rs. 10 Cr. or above with
Benefit Cost ratio of more than 1.0; and in respect of General States was Rs. 40 Cr. or above
with Benefit Cost ratio of more than 1.0. The inclusion of projects, inter-se priority of the works,
etc. were decided through an Inter-Ministerial Committee headed by Secretary (Water
Resources), Government of India. During XII Plan (up to 31-03-2017), 102 works with a total
estimated cost of Rs.5,381.28 Cr. were approved under FMP. Central assistance to the
States/UTs to the tune of Rs. 1307.07 Cr. was released during this plan period. Thus, total release
during XI & XII Plan under FMP was Rs. 4,873.07 Cr.
River Management Activities and Works Related to Border Areas (RMBA):
During XI Plan, Government of India had approved implementation of the Central Sector Scheme
“River Management Activities and Works related to Border Areas” with a total outlay of Rs. 820
Cr. for taking up non-structural measures such as Hydrological Observation and Flood Forecasting
works on common border rivers, payment to neighbouring countries (China) for supplying HO
data on common rivers, investigation of WR projects in neighbouring countries, activities of GFCC
and Pancheswar Development Authority (PDA) was funded through this scheme. In addition to
above activities, 100% Central Assistance was also provided for taking up structural measures
such as Anti Erosion/Flood Management schemes on rivers on international borders and Union
Territories.
The Scheme was continued during XII Plan, with a total outlay of Rs. 740.0 Cr. to cover the
following continuing and new activities.
i. Hydrological observations and flood forecasting on common border rivers with neighbouring
countries
ii. Investigations & Pre-construction activities for WR projects on common border rivers
iii. Pancheshwar Development Authority (PDA)
iv. Grant in Aid to States/UTs for flood management/anti –sea erosion works
v. Maintenance of flood protection works of Kosi & Gandak projects (in Nepal)

Page | 996
vi. Flood Protection/anti-erosion works in the border areas with Bangladesh and Pakistan by
States and Flood Management/anti-erosion works/anti- sea erosion works in UTs
vii. Activities of Ganga Flood Control Commission (GFCC)
The RMBA being specific to activities in border areas with neighbouring countries viz.
Bangladesh, Nepal, China, Pakistan and Bhutan and for taking up Anti Erosion/Flood Management
schemes on rivers on international borders and Union Territories, the projects/ works are funded
with 100% central assistance. A Grant-in-Aid of Rs. 563.61 Cr. (Rs. 340.41 Cr.-XI Plan & Rs.
223.20 Cr.-XII Plan) were released to various states under this Scheme.
Flood Management and Border Areas Programme (FMBAP)
The Outcome review/Third party evaluation of the two Plan Schemes 'Flood Management
Programme (FMP)' and 'River Management Activities & Works related to Border Areas (RMBA)'
implemented during XII Plan was carried out by a Committee constituted under the chairmanship
of Director, National Institute of Hydrology, Roorkee. The Outcome Review/Third Party Evaluation
Committee recommended that only those schemes which are very critical for long-term
protection against floods, costing above Rs. 40 Cr., may be considered for funding by Union
Government under Flood Management Programme. Other schemes / works may be taken up by
the concerned State Governments through State Plan allocation. Since the FMP and RMBA
schemes have common nature to some extent, the modalities for merging the two schemes in
a hybrid/umbrella scheme may be explored and both the schemes may be merged into a single
scheme.
For the period 2017-18 to 2019-20, a comprehensive scheme titled “Flood Management and
Border Areas Programme (FMBAP)” with an outlay of Rs. 3342.00 Cr. (FMP-Rs. 2642 Cr. &
RMBA-Rs. 700 Cr.) with merged components from the XII Plan Schemes viz. Flood Management
Programme (FMP) and River Management Activities & Works related to Border Areas (RMBA)
schemes was approved by the Union Cabinet.
The funding pattern for works in general category states under FMP component remained as 50
% (Centre): 50 % (State) and for projects of 8 North Eastern States, J&K, Himachal Pradesh and
Uttarakhand, the funding pattern continued to be 70 % (Centre):30 % (State). Whereas, RMBA

Page | 997
component being specific to activities in border areas with neighbouring countries viz.
Bangladesh, Nepal, China, Pakistan and Bhutan the funding pattern continued as 100% central
assistance.
During the period 2017-18 to 2019-20 Rs. 1536.95 Cr. has been released as Grant-in Aid to the
States under FMP component and Rs. 485.33 Cr. has been spent under RMBA component of
FMBAP, thereby making a total of Rs. 2022.28 Cr.
The projects completed so far under the Scheme have provided flood protection to an area of
4.987 mha and benefitted population of 51.97 million. This protected area also includes
restoration of earlier protected area (damaged due to force majeure like conditions) by means of
works like raising & strengthening of embankments etc.
Some of the salient features of FMBAP Scheme as approved by Union Cabinet for the period
2017-18 to 2019-20 are-
i. FMBAP Scheme is for completion of the spill over works in respect of 83 ongoing projects
as well as for the works which are completed and included earlier under FMP during Xl & Xll
Plan. Also, as assessed/required and dropping 16 ongoing projects in which the current work
progress is less than 50 percent.
ii. The Scheme has a provision only for clearing the committed liabilities of ongoing and
completed projects as per extant Xl/ Xll Plan guidelines and that no new project to be included
under FM component of FMBAP Scheme till then.
iii. In this Scheme, Administrative Ministry has been authorized to decide the inter-sub-
component and inter-item redistribution of provisions within the overall cost of the respective
components of FM (Rs. 2642 Cr.) and RMBA (Rs. 700 Cr.) under the Scheme.
iv. The techno-economic Appraisal and Investment Clearance of flood management works under
FMBAP continued to be done as per the procedures laid down by Department of Water
Resources, River Development & Ganga Rejuvenation.
v. The Inter-Ministerial Committee (IMC) headed by Secretary (WR, RD & GR) with members
drawn from Ministry of Finance (Department of Expenditure), Planning Commission (Now
NITI Aayog) and other line Ministries / Departments/Organisations constituted during XII Plan
to be continued under the scheme for FMP component. For the works under RMBA
Page | 998
component, the procedure is proposed to be in accordance with the bilateral mechanism with
neighbouring countries.
vi. For release of Central assistance to State Government for Projects included under FMP,
detailed guidelines of DoWR, RD & GR of October,2013 describing procedures about
submission of documents, budget provisions, Utilisation Certificates, monitoring reports,
Concurrent Report, instalments for release of central share to States, etc is followed.

Page | 999
State / UT Wise Status
Table 127: State-Wise Works Approved, Works Completed and Funds Released under Flood Management Programme ( FMP ) during XI
Plan, XII Plan, 2017-18, 2018-19 & 2019-20
Rs. in Cr.
Sl.
No.
State XI Plan XII Plan Total (XI + XII Plan) Status Under FMP component of
FMBAP
Works Approved Funds
Released
( XI Plan)
Works Approved Funds
Released
( XII
Plan)
Works Approved Number of
Works
Completed
Total
Funds
Released
( XI + XII
Plan)
2017-
18
2018-
19
2019-
20
Total
funds
released Nos. Estimated
Cost
Nos. Estimated
Cost
Nos. Estimated
Cost
1 Arunachal
Pradesh 21 224.69 81.69 0 0.00 87.91 21 224.69 11 169.60 21.18 190.78
2 Assam 100 996.14 748.86 41 1386.97 64.89 141 2383.11 95 813.75 245.49 142.12 85.03 1286.39
3 Bihar 48 1370.42 723.18 4 447.63 184.64 52 1818.05 41 907.82 16.58 924.41
4 Chhattisgarh 3 31.13 15.57 0 0.00 3.75 3 31.13 0 19.32 19.32
5 Goa 2 22.73 9.98 0 0.00 2.00 2 22.73 2 11.98 11.98
6 Gujarat 2 19.79 2.00 0 0.00 0.00 2 19.79 1 2.00 2.00
7 Haryana 1 173.75 46.91 0 0.00 0.00 1 173.75 0 46.91 46.91
8 Himachal
Pradesh 3 225.32 165.98 4 1139.62 221.87 7 1364.94 1 387.85 87.50 162.60 176.41 814.36
9 Jammu &
Kashmir 28 408.22 252.57 15 562.47 169.95 43 970.69 8 422.52 110.40 52.20 92.74 677.85
10 Jharkhand 3 39.30 18.44 0 0.00 4.27 3 39.30 2 22.71 22.71
11 Karnataka 3 59.46 23.80 0 0.00 0.00 3 59.46 0 23.80 23.80
Table 128: State-Wise Grant in Aid Released under RMBA during XII Plan, 2017-18, 2018-19 & 2019-20

Page | 1000
Rs. in lakh
SN State 2012-13 2013-14 2014-15 2015-16 2016-17 Total in
XII Plan 2017-18 2018-19 2019-20 Total releases
1 Assam 0.00 0.00 0.00 0.00 0.00 0.00 0.00
2 Bihar 924.20 0.00 5127.33 4784.24 0.00 10835.77 5257.07 11569.70 6529.00 34191.54
3 UP 0.00 0.00 0.00 2664.09 0.00 2664.09 9043.18 7229.20 18936.47
4 Tripura 0.00 0.00 0.00 1402.45 0.00 1402.45 1402.45
5 West Bengal 0.00 630.91 0.00 2969.09 0.00 3600 6565.54 10165.54
6 J&K 0.00 997.76 0.00 0.00 0.00 997.76 877.50 283.25 431.80 2590.31
7 Punjab 0.00 0.00 0.00 1494.50 0.00 1494.5 747.25 2241.75
8 Puducherry 0.00 0.00 1325.63 0.00 0.00 1325.63 1325.63
9 Lakshadweep 0.00 0.00 0.00 0.00 0.00 0.00 0,00
Total 924.20 1628.67 6452.96 13314.37 0.00 22320.20 15925.00 25647.69 6960.80 70853.69
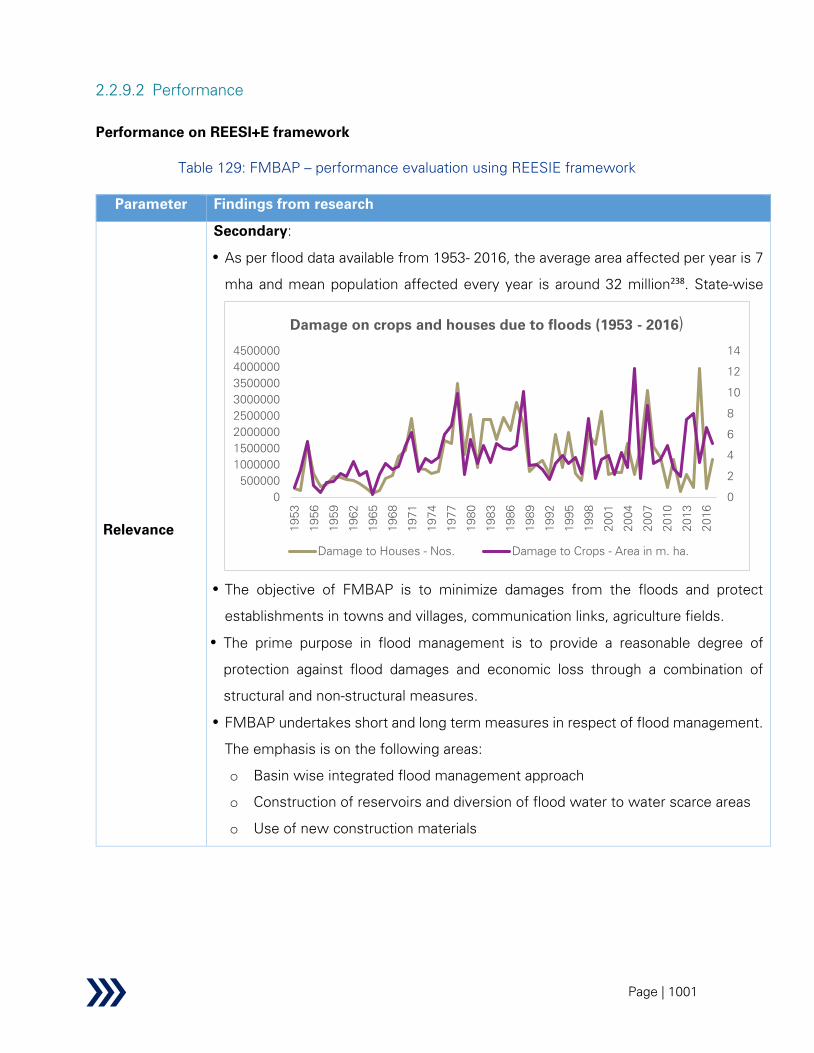
Page | 1001
2.2.9.2 Performance
Performance on REESI+E framework
Table 129: FMBAP – performance evaluation using REESIE framework
Parameter Findings from research
Relevance
Secondary:
As per flood data available from 1953- 2016, the average area affected per year is 7
mha and mean population affected every year is around 32 million238
. State-wise
The objective of FMBAP is to minimize damages from the floods and protect
establishments in towns and villages, communication links, agriculture fields.
The prime purpose in flood management is to provide a reasonable degree of
protection against flood damages and economic loss through a combination of
structural and non-structural measures.
FMBAP undertakes short and long term measures in respect of flood management.
The emphasis is on the following areas:
o Basin wise integrated flood management approach
o Construction of reservoirs and diversion of flood water to water scarce areas
o Use of new construction materials
0
2
4
6
8
10
12
14
0
500000
1000000
1500000
2000000
2500000
3000000
3500000
4000000
4500000
1953
1956
1959
1962
19
65
1968
1971
1974
1977
1980
1983
1986
1989
1992
1995
1998
2001
2004
2007
2010
2013
2016
Damage on crops and houses due to floods (1953 - 2016)
Damage to Houses - Nos. Damage to Crops - Area in m. ha.
Page | 1002
Parameter Findings from research
o Modernisation of flood forecasting network and its extension to other areas and
reservoirs
o Automatic reservoir release information system
The general approach about flood management has been in the form of physical
measure to prevent the flood water from reaching potential damage centres. The
main thrust of the flood protection programme undertaken in India, so far has been
of structural measures like:
o Embankment / Flood Walls
o Dams & Reservoirs
o Natural Detention Basin
o Channel improvement
o Drainage improvement
o Diversion of flood water
In addition to above, non-structural components to mitigate the flood damages are
taken up such as:
o Facilitating timely evacuation of the people and moving their movable
property to safer grounds by having advance warning of incoming flood i.e.
flood forecasting, flood warning in case of threatened inundation
o Discouraging creation of assets/settlement of the people in the areas prone
to frequent flooding i.e. enforcing flood plain zoning regulation
Primary:
Between 1953 and 2016, the average area affected (in mha), population affected,
and value of crops, houses and public utilities damaged by state is provided
below238
.
State Average Area
Affected (in mha)
Average Population
affected (in lakh)
Average value of
damages (in Rs. Cr.)
Assam 0.81 26 123
Bihar 1.30 60 235
238 Flood Forecasting Monitoring Directorate, Central Water Commission, “State wise flood damage statistics”
Page | 1003
Parameter Findings from research
Himachal
Pradesh
0.33 15 349
Uttar
Pradesh
1.70 65 303
There are 20 river basins (12 major and 8 composite) in India, out of which three
major river systems, namely Ganga, Brahmaputra and Indus are shared with
neighbouring countries i.e. Nepal, Bhutan, China, Bangladesh and Pakistan. These
three river systems alone drain a total of 42 % of geographical area in India.
As per stakeholders from GFFC, the Koshi River system has its sources in the
territory of Tibet and flows through an old channel near the border with Nepal and
the Indian city of Bihar. The frequent floods are a constant threat to the livelihoods
of the local population in the northern Indian state of Bihar. Areas like Sharsa in Bihar
and Sunsari in Nepal are generally severly affected. Similarly, areas in North 24
Parganas district of West Bengal bordering Bangladesh are severely affected by
flood from the rivers Teesta, Torsa, Jaldhaka, Raidak I & II. Ferozpur in Punjab is
affected due to water coming from Sutlej River due to heavy flow of water from
Pakistan due opening of headwork gates in Kasur area.
Considering the above facts, hydrological observations and flood forecasting of
border rivers are included as an important scope of FMBAP.
Various Monitoring Agencies (like CWC, GFCC & BB) have been set up to provide
technical support to the States in respect of techno-economic appraisal of Flood
Management schemes, generating flood forecasts, and monitoring and coordinating
flood management schemes across border areas of Nepal, Bhutan, Bangladesh,
China and Pakistan.
The Monitoring Agencies also support the states by providing data modelling and
forecasting through damage statistics by means of 199 Flood Forecasting stations.
The percentage accuracy is around 95%. Currently, there are around 878 Hydro-
meteorological sites covering the 20 River Basins in India239
.
The states coming under Ganga river basin viz., Uttarakhand, Himachal Pradesh,
Haryana, Delhi, Uttar Pradesh, Rajasthan, Madhya Pradesh, Chhattisgarh, Bihar,
239 Data shared by Central Water Commission
Page | 1004
Parameter Findings from research
Jharkhand and West Bengal, are monitored by GFCC. While, the States coming
under Brahmaputra river basin viz., Arunachal Pradesh, Assam, Nagaland,
Meghalaya, Sikkim and West Bengal are monitored and supported by Brahmaputra
Board. The Brahmaputra river drains an area of 5,80, 000 sq. km., which is shared
by six states namely Arunachal Pradesh (41.88%), Assam (36.33%), Nagaland
(5.57%), Meghalaya (6.10%), Sikkim (3.75%) and West Bengal (6.47%)240
.
The rest of the States are monitored and technically supported by CWC. However,
CWC is the only agency monitoring the Flood Forecasting and Hydro-meteorological
stations.
Wireless Communication system installed in almost 550 stations is the backbone of
the communication system required for flood forecasting activities.
States like Bihar, Assam, Himachal Pradesh, Jammu & Kashmir have effectively
implemented structural measures, as a result of which problems like erosion and
inundations have been reduced to a considerable extent.
Structural measures like embankments, porcupines, spurs have proven effective in
flood control. In Himachal Pradesh, around 10,000 hectares of land could be brought
under protection through channelization of Swan river. Additionally, treatment of
catchment area of tributaries falling from Jhalera bridge, as the Swan River flows
from Jhalera Bridge to Sanktogarh Bridge in District Una of Himachal Pradesh and
Bata river channelization works have protected around 107 hectares of land241
.
In Jammu & Kashmir, as erosion due to flash floods and cloud bursts is a major
problem, the emphasis is on erosion control and drainage development. Amongst
water sector schemes, maximum investment is made for flood control schemes
(Rs. 55 Cr. in comparison to major and medium irrigation schemes (Rs. 52 Cr.) and
Minor Irrigation (Rs. 2 Cr.)242
.
Bihar, on the other hand, experiences the problem of inundation due to flood,
resulting insignificant damage to life and property. As on date, a total of around 3,500
km of embankment across 12 river basins have been constructed. Approximately,
240 Data shared by Brahmaputra Board
241 Data shared by Jalshakti Bivag, Himachal Pradesh
242 Data shared by Water Resources and Flood Control department, Jammu & Kashmir

Page | 1005
Parameter Findings from research
294 mha of area is protected243
. Amongst the states under Ganga river basin, Bihar
is implementing the maximum number of projects (29), followed by Uttar Pradesh
(10) and West Bengal (2).
The total length of Brahmaputra river in Assam is 640 km and hence Assam had the
requirement of most structural measures like construction of embankments and
flood walls, river training and bank protection works, anti-erosion and town
protection works, river channelization, drainage improvement/ sluices and raised
platforms. However, no long-term measures have been implemented so far to
mitigate the flood and erosion problems of the state. Till date, only immediate and
short-term measures have been implemented by the state Water Resources
Department.
Inference:
FMBAP is considered relevant as far as flood protection is concerned as it provides
the flexibility of implementing area specific and problem specific structural
measures. The benefits of such measures have increased over the years.
FMBAP undertakes flood protection measures through financial assistance for
construction of structural components. The scheme intends to protect valuable land
and assets such as housing, public infrastructures, livestock, crops from erosion and
flooding. The structural measures are meant to reduce flood flows by artificially
creating reservoir across a river, by diversion of a part of the peak flow to another
river or basin, by constructing a parallel channel bypassing an area, by raising the
effective river bank through embankments and through channel and drainage
improvement works.
The non-structural measures endeavor to mitigate the flood damage by facilitating
timely evacuation of the people and shifting of their movable property to safer
grounds by generating warnings of incoming flood i.e. through flood forecasting,
flood warning in case of threatened inundation and discouraging creation of valuable
assets/ settlement of the people in the areas subject to frequent flooding i.e.
enforcing flood plain zoning regulation.
243 Data shared by GFCC
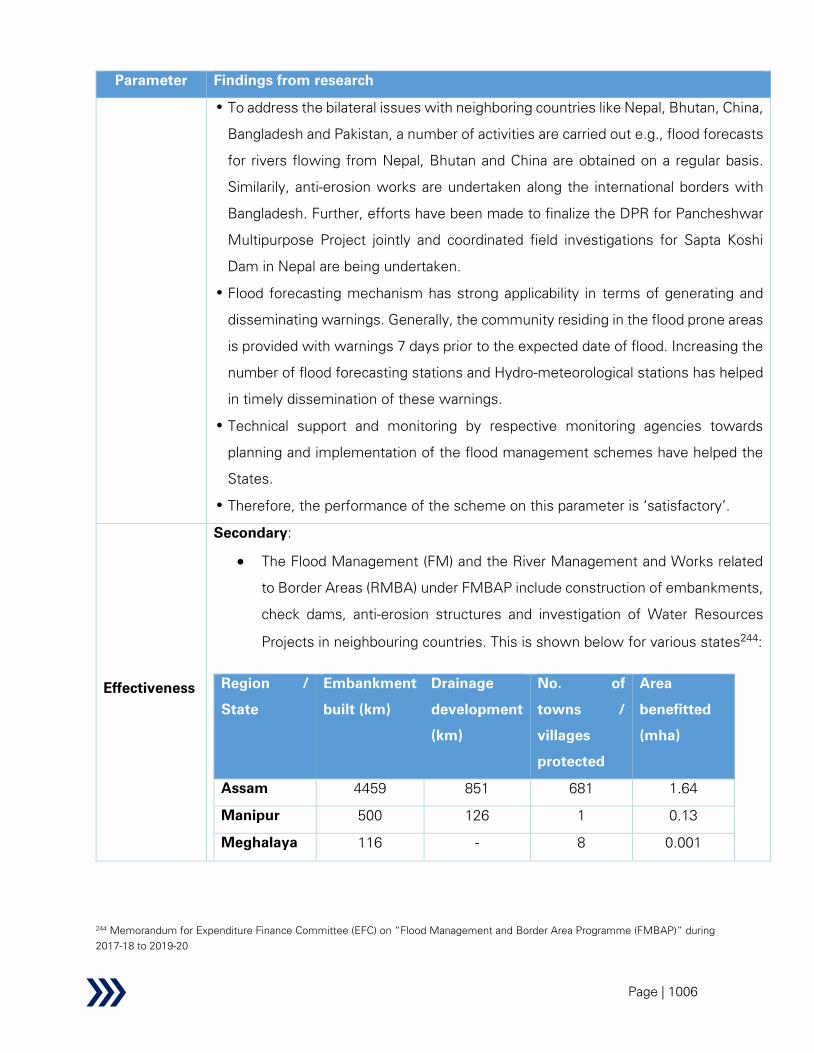
Page | 1006
Parameter Findings from research
To address the bilateral issues with neighboring countries like Nepal, Bhutan, China,
Bangladesh and Pakistan, a number of activities are carried out e.g., flood forecasts
for rivers flowing from Nepal, Bhutan and China are obtained on a regular basis.
Similarily, anti-erosion works are undertaken along the international borders with
Bangladesh. Further, efforts have been made to finalize the DPR for Pancheshwar
Multipurpose Project jointly and coordinated field investigations for Sapta Koshi
Dam in Nepal are being undertaken.
Flood forecasting mechanism has strong applicability in terms of generating and
disseminating warnings. Generally, the community residing in the flood prone areas
is provided with warnings 7 days prior to the expected date of flood. Increasing the
number of flood forecasting stations and Hydro-meteorological stations has helped
in timely dissemination of these warnings.
Technical support and monitoring by respective monitoring agencies towards
planning and implementation of the flood management schemes have helped the
States.
Therefore, the performance of the scheme on this parameter is ‘satisfactory’.
Effectiveness
Secondary:
• The Flood Management (FM) and the River Management and Works related
to Border Areas (RMBA) under FMBAP include construction of embankments,
check dams, anti-erosion structures and investigation of Water Resources
Projects in neighbouring countries. This is shown below for various states244
:
Region /
State
Embankment
built (km)
Drainage
development
(km)
No. of
towns /
villages
protected
Area
benefitted
(mha)
Assam 4459 851 681 1.64
Manipur 500 126 1 0.13
Meghalaya 116 - 8 0.001
244 Memorandum for Expenditure Finance Committee (EFC) on “Flood Management and Border Area Programme (FMBAP)” during
2017-18 to 2019-20
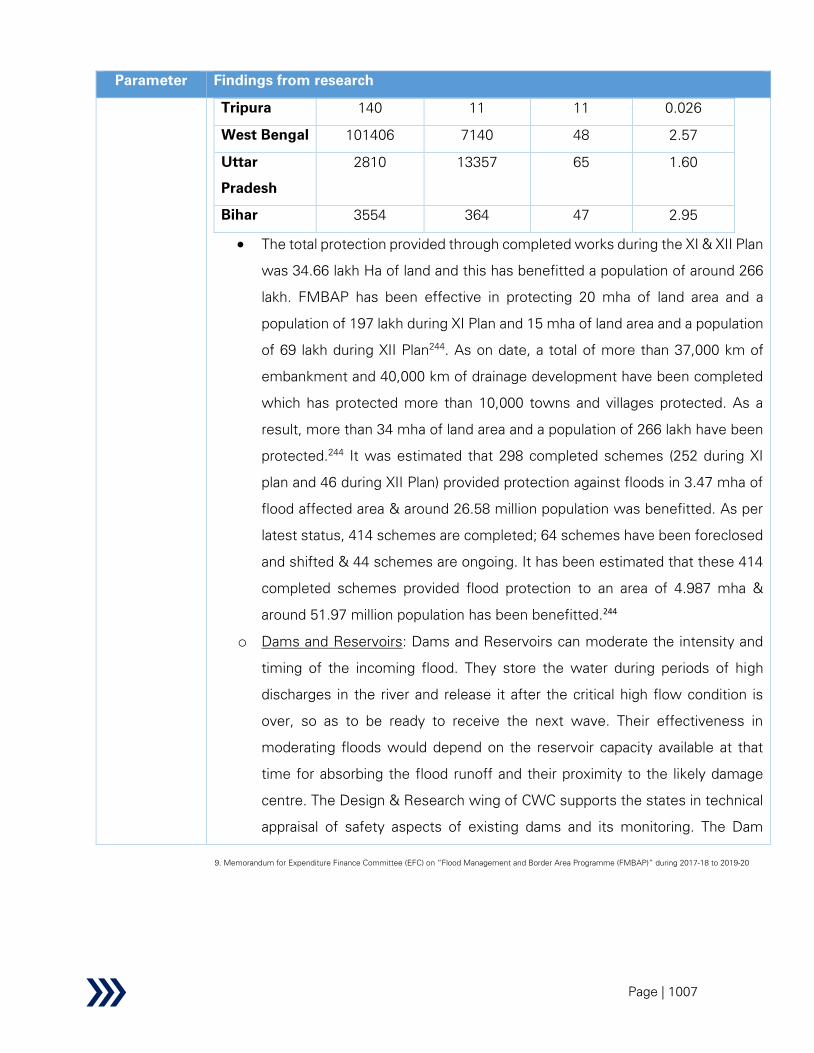
Page | 1007
Parameter Findings from research
Tripura 140 11 11 0.026
West Bengal 101406 7140 48 2.57
Uttar
Pradesh
2810 13357 65 1.60
Bihar 3554 364 47 2.95
• The total protection provided through completed works during the XI & XII Plan
was 34.66 lakh Ha of land and this has benefitted a population of around 266
lakh. FMBAP has been effective in protecting 20 mha of land area and a
population of 197 lakh during XI Plan and 15 mha of land area and a population
of 69 lakh during XII Plan244
. As on date, a total of more than 37,000 km of
embankment and 40,000 km of drainage development have been completed
which has protected more than 10,000 towns and villages protected. As a
result, more than 34 mha of land area and a population of 266 lakh have been
protected.244
It was estimated that 298 completed schemes (252 during XI
plan and 46 during XII Plan) provided protection against floods in 3.47 mha of
flood affected area & around 26.58 million population was benefitted. As per
latest status, 414 schemes are completed; 64 schemes have been foreclosed
and shifted & 44 schemes are ongoing. It has been estimated that these 414
completed schemes provided flood protection to an area of 4.987 mha &
around 51.97 million population has been benefitted.244
o Dams and Reservoirs: Dams and Reservoirs can moderate the intensity and
timing of the incoming flood. They store the water during periods of high
discharges in the river and release it after the critical high flow condition is
over, so as to be ready to receive the next wave. Their effectiveness in
moderating floods would depend on the reservoir capacity available at that
time for absorbing the flood runoff and their proximity to the likely damage
centre. The Design & Research wing of CWC supports the states in technical
appraisal of safety aspects of existing dams and its monitoring. The Dam
9. Memorandum for Expenditure Finance Committee (EFC) on “Flood Management and Border Area Programme (FMBAP)” during 2017-18 to 2019-20

Page | 1008
Safety Organization of CWC looks after issues related to Dam Safety which
can be broadly categorized as under:
o Maintenance of National Register of Large Dams.
o Convening meeting of National Committee on dam safety and National
Committee on Seismic Design Parameters.
o Instrumentation in Dams and Powerhouse Caverns, besides other
hydraulic structures.
o Special Analysis like Dam Break Modelling and foundation problems.
Additionally, the Ministry of Water Resources constituted a Standing
Committee in 1982 to review the existing practices and to evolve unified
procedures of dam safety for all dams in India, under the Chairmanship of
Chairman, Central Water Commission. Subsequently Government of India,
Ministry of Water Resources reconstituted the Standing Committee in 1987
as the National committee on dam Safety to:
o Monitor the follow-up action on the report on Dam safety Procedures
both at the Centre and at the State level,
o Oversee dam safety activities in various states and suggest
improvements/ remedial measures to bring dam safety practices in line
with state-of the art practices consistent with Indian conditions,
o Act as a forum for exchange of views on techniques adopted for
remedial measures to relieve distress in dams.
Dam Rehabilitation & Improvement Project (DRIP):
o Ministry of Water Resources, Government of India is implementing
Dam Rehabilitation and Improvement Project (DRIP) with financial
assistance from the World Bank. DRIP involves rehabilitation of about
225 large dams in seven States i.e. Madhya Pradesh, Orissa, Kerala,
Tamil Nadu Karnataka, Jharkhand (DVC) and Uttarakhand (UJVNL) at an
estimated cost of Rs. 2,100 Cr. In addition, DRIP also involves
institutional strengthening (for dam safety) of all participating States as
well as central level organizations like the Central Water Commission.
The main implementation agencies for DRIP are the owners of dams
viz. the Water Resources Departments and State Electricity Boards in
the participating States.

Page | 1009
o Embankments: Embankments (including ring bunds and town protection
works) confine the flood flows and prevent spilling, thereby reducing the
damage. These are generally cheap, quick and most popular method of flood
protection and have been constructed extensively in the past. These are
reported to have given considerable protection at comparatively lower costs,
particularly in the lower reaches of large rivers. The total length of
embankment constructed so far is around 37073 Kms till 2017.
o Channelization of Rivers: Channelization of rivers, is effective, in the context
of tackling the extensive meandering problems of the rivers, activating
navigational channels and training these rivers into their original courses.
o Channel improvement: The method of improving the channel by improving the
hydraulic conditions of the river channels by desilting, dredging, lining etc., to
enable the river to carry its discharges at lower levels or within its banks has
been often advocated but adopted on a very limited extent because of its high
cost and other problems.
o Drainage improvement: Stress has been laid on improving the existing natural
drainage system in the flood plains so that what should essentially be flooding
of a few days should not get prolonged for months. In this context, the
importance of the system of ‘dhars’ or ‘old channels’, which efficiently served
the function of draining away the spillage and surface flows generated by local
rains, are recognised. Till date, a total of 39727 km of drainage has been built.
As per CWC’s Annual Report (2019-2020), under non-structural measures of
FMBAP, 325 Flood Forecasting stations are installed through which, on an
average 7,000 flood forecasts are issued every year (which have accuracy of
around 98%). The flood forecasts are categorized as “Above Normal”, “Severe
Flood Situation” and “Extreme Flood Sitiation”. During flood season of 2019,
9,754 flood forecasts were issued out of which around 87% of the forecasts were
found within the accuracy limit. During this year, 245 daily bulletins, 768 orange
bulletins for Severe Flood Situations and 113 Red Bulletins for Extereme Flood
were issued. There are around 1,569 Hydrological Observation Stations in
different river basins of the country to collect data on water level, discharge, water
quality and siltation. Also, 75 exclusive meteorological observation stations are
operational.
Page | 1010
Information systems on flood management are maintained by the individual
states whose coverage is currently limited to the number of schemes and the
physical and financial progress data only. Also, MIS is being maintained by the
Flood Management wing, DoWR. However, augmenting the MIS so as to include
key performance indicators (KPIs) may be considered. A detailed Flood
Management Information System (FMIS),as piloted in states of Bihar and Uttar
Pradesh, may be rolled out in more states in a phased manner. The FMIS covers
improved hydrologic observations and telemetry, more reliable and longer term
rainfall forecasts, enhanced flood forecast and inundation prediction with better
models, airborne Synthetic Aperture Radar (ASAR) surveys for real-time
inundation information during floods, close-contour surveys of the flood plain
using LIDAR Technology, mapping floodplain geomorphology including micro-
relief to understand and improve drainage, improved communication links and
information flow, risk and vulnerability analysis, institutional and community
outreach mechanisms and real-time flood data dissemination. The fully upgraded
FMIS would support preparation of master plan for flood control and drainage,
irrigation improvement and overall water sector development in Bihar and Uttar
Pradesh.
Institutional structure: At the national level FMBAP is overseen by Flood
Management Wing of DoWR, RD & GR. The major functions of Flood
Management wing are:
o Examination and implementation of FMBAP
o Monitoring of flood situation in the country
o Support in formation of expert committees / task forces / working groups on
flood management
o All matters relating to India-Bangladesh and India – Nepal water resources
development/ projects on common / border rivers
o Technical matters related to Ganga Flood Control Commission
o At the regional level, there are three monitoring agencies namely Central
Water Commission (CWC), Ganga Flood Control Commission (GFCC) and
Brahmaputra Board (BB). While GFCC monitors the flood management
measures implemented by the States in Ganga River Basin and BB does so in

Page | 1011
Brahmaputra – Barak river basin, CWC monitors the flood management
measures implemented by the states in rest of the country.
Monitoring and Evaluation: Monitoring of the scheme/projects under FMP are
carried out by the Central Water Commission (CWC), Ganga Flood Control
Commission (GFCC) and Brahmaputra Board (BB) in their respective jurisdictions.
For the schemes costing less than Rs. 12.50 Cr., the performance is evaluated
after the schemes are completed. The Performance evaluation of the completed
works are conducted by independent specialized/ professional agencies having
expertise in related fields in consultation with CWC/ GFCC/ BB as the case may
be. Monitoring teams of CWC/GFCC/BB are entrusted with the monitoring of the
physical and financial progress of the schemes. They are to conduct sample
checks on the quality of construction materials and quality of works during their
field visits. The samples taken/ witnessed at site by the teams are tested for
quality checks and results thereof are reflected in the monitoring reports.
Training: Apart from approval of schemes, monitoring and fund management, FM
wing of DoWR, RD & GR and the monitoring agencies impart training on techno-
economic aspects of flood management. In addition, trainings on flood
management measures are imparted by National Water Academy (NWA), Pune.
The trainings mainly cover preparation of DPRs, Master Plans, Flood Warning
System, River Management and Basin Planning, customized state specific
training modules on Dam Break models, record management. During 2019-
20, NWA organized 29 training programmes training programmes on hydrological
aspects in project planning and preparation of DPR, GIS, Design Flood Estimation
and Hydrological Modelling, DRIP implementation, Also, trainings on STAAD Pro
and other design and analysis softwares like FLAC 2D have been imparted.
Flood Plain Zoning: Flood-plain zoning measures aim at demarcating zones or
areas likely to be affected by floods of different magnitudes or frequencies and
specify the types of permissible developments in these zones, so that whenever
floods actually occur, the damage can be minimised, if not avoided. Unfortunately,
while this approach was endorsed in principle by many, yet not adequate scant
attention has been given to it in practice, leading to increased flood damages. The
Central Water Commission (CWC) has been continuously impressing upon the
states the need to take follow-up action to implement the flood plain zoning
Page | 1012
Parameter Findings from research
approach. A model draft bill for flood plain zoning legislation was also circulated
by the union government in 1975 to all the states.
Formation of River Basin Organizations: It has been recognised that
comprehensive management of river basin can be promoted through setting up
of River Basin Organisation (RBO). To enable the development of other rivers in
the country, the River Boards Act was enacted in 1956. The Act spells out the
need to regulate and develop the inter-state rivers and river valleys or any
specified projects, by setting up a River Board under the consent of the respective
state governments. Several River Basin Authorities like Tungabhadra Board,
Bhakra-Beas Management Board, Cauvery River Authority, Narmada Control
Authority has been formed but, these boards do not play any role in implementing
flood management measures. The major functions of these River Basin Boards
are limited to preparation of basin level and regional plans, generation of
hydroelectric power, maintenance of multi-purpose projects and monitoring of
water resources projects.
Although there are technical guidelines for FMP and flood forecasting (prepared
by CWC), no scheme guidelines are available which specify the overview,
objectives, components and fund management for FMBAP. Such guidelines will
help the States in following uniform regulations for implementation of schemes
as well as facilitate proper fund management.
Fund sharing: The fund sharing pattern for structural measures is 50:50 for all
states except states in Hilly Areas like Uttarakhand, J&K and Himachal Pradesh
and 8 North Eastern States. For Hilly Areas, the fund sharing pattern is 70:30 i.e.,
70% of the total project cost is provided as Central Share and the residual 30% is
contributed by the State. No additional cost towards cost escalation for structural
measures are supported by the DoWR, RD & GR. Any such cost escalations have
to be met by the States.
No fund is allocated for operations and maintenance of the completed Flood
Management schemes. Once the scheme is completed, the same becomes the
asset of the State and hence the responsibility of maintaining the structures
becomes State’s responsibility.
Page | 1013
Primary:
FMBAP Scheme encompasses completion of the spill over works of 83 ongoing
projects as well as the works which are completed and included earlier under
FMP during Xl & Xll Plan. As per FMP guidelines of XII plan for release of Central
Assistance, restoration of flood control/ management works damaged due to
force majeure like conditions are only taken up. During the KIIs with regional level
stakeholders it was reported that some projects were dropped due to land
acquisition problems, non-contribution of states’ share and morphological
changes in rivers.
The projects completed so far under the Scheme have provided flood protection
to an area of 4.987 mha and benefitted population of 51.97 million.245
This
protected area also includes restoration of earlier protected area by means of
works like raising and strengthening of embankments etc.
It may be noted that, most of the States adopt specific and short-term structural
measures such as construction of embankments, permeable and impermeable
spurs, revetments, anti-erosion and town protection measures, river
channelization and pro-siltation works, etc. but long-term measures like improving
river connectivity, planned urban development, graded development plan near the
sea are not undertaken. Better effectiveness in terms of flood management can
be achieved through adoption of long-term measures having far-reaching impact.
At State level, FMBAP is managed by state departments – mostly the Water
Resources Department, headed by Chief Engineer with Superintending Engineers
at sub-divisional level and Executive Engineers/Assistant Engineers at district
level. At block level, the scheme is being implemented and monitored by Junior
Engineers. Apart from the above structure, each state has a State Technical
Advisory Committee (STAC) and a State Flood Control Board. The members of
the STAC are engineer representatives of State departments and their prime
responsibility is to examine and approve flood control schemes forwarded by the
State nodal department. DPRs after examination from CWC/GFCC are considered
by Advisory Committee of DoWR, RD&GR for techno-economic approval. The
committee is chaired by Secretary, DOWR and members of the committee are
from CWC, GFCC, State/UT Government representative and other Ministries
representatives. The DPRs prepared by the Water Resources/Irrigation and Flood

Page | 1014
245 Data shared by FM wing, DoWR,RD&GR

Page | 1015
Control department with value between Rs. 12.5 Cr. and Rs. 25 Cr. are approved
by State Technical Advisory Committee and then by Flood Control Board. The
DPRs of value more than Rs. 25 Cr. are approved by the respective monitoring
agencies. All states have monthly and quarterly reporting system in place as per
requirement of the respective monitoring agencies which was confirmed by the
states of Bihar, Uttar Pradesh, West Bengal and Jammu & Kashmir.
In terms of the number of FMP schemes approved as well as completed schemes
so far, the states of Himachal Pradesh, Chhattisgarh, Goa, Odisha, Gujarat,
Jharkhand, Tamil Nadu, Arunachal Pradesh, Manipur, Tripura have performed
well. There are some States like Assam, J&K, Bihar, West Bengal, UP,
Uttarakhand etc where some schemes are still ongoing. Further some States like
Assam, Sikkim foreclosed many schemes due to various issues like litigations,
land acquisition and non-starter projects. A significant number of anti-erosion
works are taken up in Bihar and Uttar Pradesh on account of the flood problems
caused by Kosi and Gandak rivers. In Bihar, around 300 anti-erosion structures
have been completed, which have reduced the damage caused by flood over the
years. States like Bihar have allocations ready for the state’s share, as the problem
of inundation and erosion is quite significant. The States like Bihar, Jammu &
Kashmir, and Uttar Pradesh have several state sponsored flood management
schemes as well.
States like Bihar and Uttar Pradesh are in process of developing a Flood
Management Information System (FMIS). FMIS is in the process of preparing a
database of natural resource profile, hydrological and hydro-meteorological data
for the state of Bihar. The FMIS of Uttar Pradesh on the other hand has
components like Real-time data acquisition system, embankment asset
management system and flood forecasting model.
Trainings are imparted to the states primarily by CWC and by National Water
Academy, Pune. Trainings are given on advanced technologies applicable for
structural measures to the state representatives. Basic trainings on DPR
preparation and preparing mathematical models for feasibility studies of schemes
are also organized for the states by CWC. However, as reported during KIIs with
State level officials, generally no trainings are given to the district and block levels
officials. The State nodal departments also do not have any training plan in place

Page | 1016
Parameter Findings from research
for building the capacity of district officials, block officials, panchayat members
and village level functionaries.
Inference:
It is evident both from the secondary sources and interactions with the
stakeholders that adequate structural measures have been undertaken which has
effectively protected assets like land, crops, infrastructures and most importantly
human lives. Also, follow ups with the river basin authorities of the neighbouring
countries (Nepal, Bangladesh, Bhutan, Pakistan and China) have helped in
addressing the issues like flood forecasting, inflow forecasts in an effective
manner.
Additionally, initiatives like DRIP, have strengthened the institutional set up at
State levels. This has improved the monitoring mechanism of the Dams and has
resulted in regular maintenance. However, DRIP is limited to few states and may
be extended to other States affected by flood.
In addition, Hydrological observations are also carried out under RMBA
component of FMBAP, which involve investigation and pre-construction activities
of Water Resources projects in neighbouring countries. Such measures have
increased the effectiveness of the robust flood forecast mechanisms already
existing, thereby assising in regular dissemination of the flood forecasts and
warnings.
Involvement of departments like PWD, water resources department, etc. for flood
management at State level is evident from both secondary and primary reaearch
findings. With respect to construction of structural measures at the State level,
various departments like Water Resources Department, PWD provide support in
cost estimation, monitoring, etc. Additionally, Department of Space/NRSC is
reported to be associated in monitoring of physical progress of the schemes
through Remote Sensing Techniques. Thus, involvement of various departments
at Central and State level has helped the States in successfully implementing the
flood management measures. The institutional set up at State levels is adequately
supported by the monitoring agencies i.e., CWC, BB and GFCC apart from the FM
wing at central level. The states are provided support with respect to

Page | 1017
implementation of FMBAP projects, monitoring of the mesaures, technical
support and international border area related flood issues. Such support has
increased the effectiveness of FMBAP measures at the State level thereby
identifying immediate issues and the remedial measures. Regular
communications through notifications, issuance of guidelines from the end of FM
wing, DoWR,RD&GR and their updation have helped the States in effectively
planning flood management measures (both structural and non-structural). As for
instance, detailed guidelines on flood forecasting have augmented the flood
forecast system and their dissemination mechanism.
Initiatives like Flood Management Information System (FMIS) have helped in
predicting flood situations and adopting protective measures prior to the floods.
Such activities have increased the effectiveness of the scheme. Such information
dissemination tools are expected to enhance the capacity of the implementing
agencies from disaster response to improved disaster preparedness and to
effectively support flood control and management in the focus area.
The monitoring agencies viz. the CWC, GFCC and BB have been effectively
extending support to the states by providing techno-economic inputs on
preparation of DPRs, assessment of the DPRs, concurrent and end-term
evaluation of the flood management schemes. Involvement of technical institutes
like IITs and NITs also has been made for evaluation of the completed projects.
Such inputs have helped the states in identifying the correct nature of structural
measures as per the area and nature of flooding.
Trainings are mainly imparted to the State Officials on techno-economic aspects
of flood management by National Water Academy (NWA), Pune and Central
Water Commission (CWC). However, trainings on parameters like assessment of
livelihood, migration and disease control may also be included.
Construction of embankments results in increasing the silt charge in the flow due
to prevention of spill of silt laden water. Huge volume of silt, entrapped into the
river water, gets deposited in the riverbed. Consequently, the depth of the
channel is reduced. Therefore, while constructing embankments, factors like river
channel geometry, longitudinal profile, river morphology, etc. should be
considered. River dredging can also be adopted as one of the key activities under
FMBAP.

Page | 1018
Parameter Findings from research
Parameters like area under protection, human lives protected, cattle protected,
protection of public infrastructure and utilities are measured on regular basis but
aspects like incidence of diseases, loss of livelihood, availability of safe drinking
water, sanitation and hygiene may additionally be considered for assessing the
effectiveness of the schemes.
Setting up of River Basin Organization at Central level and at the level of the River
Basins has been long pending. The RBOs will boost the preparation of basin level
flood plans and monitoring of flood management measures.
Long term reform measures like implementation of Flood Plain Zoning Bill will
help Govt. of india and the States in managing the flood situations more
effectively. Issues like encroachments and human activities on flood plains will be
dealt specifically in a way that will reduce incidences of flood.
Therefore, FMBAP has been effective in its execution of structural measures and
rolling out the non-structural measues across the flood affected areas in our
country and performance against this parameter is ‘satisfactory’.
Efficiency
Secondary:
During the XI plan the total central assistance released was Rs. 3,566.00 Cr.
Central Assistance released during XII Plan was Rs. 1,307 Cr. During 2017-18,
2018-19 & 2019-20, the Central Assistances released in FMP component of
FMBAP is Rs. 563 Cr., Rs.428 Cr. and Rs. 546 Cr. respectively.244
In most cases as evident from the CAG reports (like “Report No. of 10 of 2017
(Performance Audit) Flood Control and Flood Forecasting”), the time lag between
DPR submission and fund release is 2 – 5 months on an average. The FMP
guidelines stipulate that the first instalment is to be released immediately on
approval of the scheme by the Empowered Committee. Also, the corresponding
State Shares are to be released to the project authorities within 15 days of receipt
of CA.
As per constitutional provisions,” Flood Management” falls within the purview of
the States. The flood control and management schemes are planned, investigated
and implemented by the State Governments with its own resources as per priority
within the State. The Union Government renders assistance to States which is
Page | 1019
technical, advisory, catalytic and promotional in nature. Therefore, a two-tier
system of flood management exists in India. State Level Mechanism - It includes
the Water Resources Departments, State Technical Advisory Committee and
Flood Control Board. In some States, the Irrigation Department and Public Works
Department look after flood related issues. Central Level Mechanism – The Union
Government has set up following organizations and various expert committees to
enable the State Governments in addressing flood problems in a comprehensive
manner.
o National Disaster Management Authority (NDMA) - For prevention and
mitigation of effects of disasters including floods and for undertaking a
holistic, coordinated and prompt response to any disaster situation, the
Government of India has set up a National Disaster Management
Authority (NDMA) in 2005 under the Chairmanship of Hon’ble Prime
Minister of India.
o Central Water Commission (CWC) – The Government of India has set
up the Central Water Commission in 1945 for achieving the goal of
furthering and promoting measures of flood control andconservation
and utilization of water resources throughout the country. The CWC
plays direct role in real-time collection of flood data, flood forecasting
and dissemination of flood forecasts to the local administration for
planning suitable administrative measures including evacuation of
people from flood affected areas to the safer locations.
o Brahmaputra Board – The Government of India has set up the
Brahmaputra Board under Brahmaputra Board Act, 1980 (46 of 1980)
under the then Ministry of Irrigation (now Ministry of Water Resources)
Its jurisdiction includes all NE States including Sikkim and North
Bengal.
o Ganga Flood Control Commission - The Ganga Flood Control
Commission (GFCC) was set up by Government of India in 1972 for
preparation of comprehensive plan of flood control for Ganga Basin and
to draw out a phased coordinated programme of implementation of

Page | 1020
works and monitoring & appraisal of flood management schemes of
Ganga basin States.
During XI Plan, the approval of the individual schemes was given by an
Empowered Committee headed by the Secretary (Expenditure), Ministry of
Finance, Government of India after taking into consideration the critical and
emergent situation and availability of annual budget/plan outlay and provision of
State share and Central share by the respective State Govts. From XII Plan
onwards, approval for inclusion under FMP is given by Inter-Ministerial
Committee for Flood Management Plan (IMC-FMP) chaired by Secretary DoWR,
RD&GR. Further prior to that, Investment Clearance was accorded by Planning
Commission. Now, the Government has approved the transfer of powers for
according Investment clearance to major, medium irrigation, Extension,
Renovation & Modernisation (ERM) of projects, Flood Control and Multi-purpose
projects from the erstwhile Planning Commission to DoWR, RD & GR.
In order to enable the States to take up major works of urgent nature
expeditiously, it was recommended during the XII Plan that only critical flood
management works with Benefit Cost Ratio of more than 1.0 and costing Rs. 10
Cr. for special category states and Rs. 40 Cr. for general states, may be funded
under Central Sector Scheme FMBAP and flood management /anti sea erosion
works below above criteria may be undertaken by the State Governments through
their State plans244.
The Model Bill for Flood Plain Zoning (MBFPZ) is a key policy document that
reflects Government of India’s position on floodplain zoning and captures the
governance mechanism that it has tried to impress upon on the states. The
MBFPZ is the only policy document that lays down the procedural and operative
aspects of floodplain zoning in India.
o Manipur enacted the floodplain zoning legislation in 1978 and has made
concerted efforts to implement it fully. By 1988, the flood zoning area
had been published. The most recent activity undertaken in this aspect
includes an eviction campaign to free the banks of the Imphal river.
o Uttarakhand has issued two floodplain zoning notifications for two
tehsils of the state — Haridwar and Uttarkashi for zones extending
horizontally by 50 kms and 10 kms, respectively. These contain

Page | 1021
Parameter Findings from research
elaborate information on landholdings that lie within the restricted
zones.
o Tamil Nadu had proposed forming a committee to provide
recommendations on how to enact a floodplain zoning law.
o While Uttar Pradesh has taken measures to regulate the economic and
development activities in the floodplains in the state.
o West Bengal has made some progress by preparing a draft bill on
floodplain zoning.
o Madhya Pradesh has demarcated 36 towns affected by floods and has
carried out the necessary administrative work towards the demarcation
of flood zones.
Primary:
Flood Management projects under FMBAP scheme are planned by State
Governments and appraised by CWC and GFCC. The schemes are accepted by
Advisory Committee of DoWR, RD&GR after appraisal is completed. After that
the project is cleared by Investment Clearance Committee of DoWR, RD&GR and
included in FMBAP by Inter Ministerial Committee subsequently. Inter-Ministerial
Committee (IMC) is the competent authority for approval of FMP projects during
XII Plan and is chaired by Secretary MoWR, RD&GR and includes Member (RM)
CWC, Chairman GFCC, Chairman BB and Advisor, Planning Commission. The
committee was formed during XII Plan. The IMC approves the spill over projects
at various stages of completion. Also, the feasibility with respect to criterion for
critical and long term protection measures of the works proposed to be included
under FMBAP would be taken care of by a Committee to be constituted headed
by Secretary (WR, RD & GR) in line with the Inter Ministerial Committee on Flood
Management Programme (IMC-FMP) of XII Plan. Thus, there exists a mechanism
to efficiently handle approval of the projects for flood management.
Central Assistance proposals along with requisite documents are prepared by the
concerned State Govts as per FMP guidelines. These proposals are submitted to
FM Wing of DoWR, RD&GR though CWC (except Ganga basin states & North
Eastern States), GFCC (Ganga basin States) & Brahmaputra Board (North Eastern
Page | 1022
Parameter Findings from research
States). The monitoring agencies and the States maintain a regular
communication amongst them during preparation, incorporating additional
technical inputs into the DPRs, which are finally reviewed by the monitoring
agencies prior to submission to FM Wing. Also, regular communications between
the monitoring agencies and the States are maintained for performing mid-term
assessments of the ongoing schemes and final evaluation of the completed
projects.
Concurrent Evaluation and Performance Evaluation of the project are third party
evaluation of the project and is done by any reputed government institutes like
IITs, NITs or any State Engineering College. Concurrent Evaluation Study is carried
out to check/ monitor the progress of ongoing project on various construction
parameters. Performance Evaluation of the project is carried out to examine the
performance of a completed and operational project in relation to its desired
benefits/ outcome. Such evaluation mechanisms help in assessment of the
outcomes achieved viz., number of human lives protected, land protecred,
number of houses protected, crops protected, reduction in incidences of health
hazards, etc. These mechanisms also help in deciding the fund allocation for the
ongoing projects, terminating the stagnant projects and fund requirement for new
schemes.
The planning process for a structural measure in States starts from the villages.
In states like Himachal Pradesh, Bihar and Uttar Pradesh, the district officials
interact with the villagers and visit the sites. The plan is shared and discussed
with a group of villagers and suggestions are noted.
At the local level, some convergences with MGNREGA scheme has been
reported. E.g. during the Focus Group Discussions (FGDs) with villagers in Assam,
it was reported that at the local level, repairment works of flood management
structures like check dams, channels and drainage repairment works are
undertaken through the MGNREGA scheme. Also, reclaimation of waterlogged
lands, repair of the sluice gates, culverts etc. are also carried out by the villagers
through MGNREGA.
Inference:

Page | 1023
Parameter Findings from research
As on date, a total of 522 schemes under FMBAP have been sanctioned out
of which 414 Schemes have been completed; 64 schemes have been
foreclosed and balance 44 schemes are onoing. The above facts signify the
efficiency of the institutional structure, funding and operational mechanisms.
An amount of Rs. 2022.22 Cr. has been released to various States/ UTs
towards FMBAP activities, out of which Rs. 615.61 Cr. has been released to
various states in 2019-20. The release of funds is as per Ministry of Finance,
Govt. of India and are adequate and without any time lag, which have ensured
timely implementation of the scheme. With the monitoring agencies providing
support to the States in preparation and validation of DPRs, the time lag
between submission of DPRs and fund release has reduced. In most cases as
evident from the CAG reports, the time lag between DPR submission and fund
release is 2 – 5 months on an average.
In order to efficiently manage floods, which is recurrent in nature, both the
Central and State governments have established institutional structure at their
respective levels. At central level, the Flood Management wing is supported
by CWC, GFCC and Brahmaputra Board. At the State level, the flood
management is looked after by State Technical Advisory Committee,
supported by Water Resources Department and Flood Control Board. Under
FMBAP, guidance is provided regularly to the States by circulation of
guidelines and other communications, thereby, updating the States on the
change in policies. Further, queries raised are regularly responded to. The
monitoring agencies have issued detailed guidelines on DPR preparation,
prepared handbooks on technologies required for structural measures,
prepared handbooks on flood forecasting, etc. In addition to these, site visits
and publication of newsletters are taken up regularly by CWC, BB & GFCC for
the States.
In the Flood Management component, the projects/ works of non-special
category States, within the scope of Flood Management Programme, costing
Rs. 40 Cr. and above and having Benefit Cost Ratio more than 1.0, were
included for funding under Flood Management Programme during 2017-20.
Page | 1024
Parameter Findings from research
However, in case of Special Category States, which consists of North Eastern
States, Sikkim, J&K, Himachal Pradesh and Uttarakhand, all projects/ works
within the scope of Flood Management Programme, costing Rs. 25 Cr. and
above and having Benefit Cost Ratio more than 1.0 were included for funding
during 2017-20. Such criteria ensure efficiency of the scheme in terms of cost
and the components that are planned to provide intended benefits.
It is understood that adoption of Flood Plain Zoning at State level will further
expedite the execution of structural measures as issues like encroachments,
resettlements need to be dealt by the States resulting in delays.
Therefore, on this parameter, the performance of the scheme is ‘satisfactory’.
Sustainability
Secondary:
As per the CAG Report (Report 10 of 2017 on Flood Control and Flood
Forecasting), most of the States do not adopt any integrated approach
(covering entire stretch of river and flood plain zones).
The issues of land encroachment, acquisition of land by the State
Governments and re-settlement of the population are huge impediments to
proper site selection and ensuring correct technical execution, thereby causing
risks to sustainability of the structures.
The current scope of FMBAP does not includes any Central Assistance for
maintenance of existing structural measures. Funds for O&M of existing
structures are solely borne by states, which burden the States with additional
allocation of funds.
The O&M of the flood management structures are lagging to some extent
because of inadequate fund allocation by the States. Also, involving the local
people in maintaining the structures was reported to be lacking. Various
organizations like the World Meteorological Organization and Global Water
Partnership have suggested involvement of the local community in O&M to
instill a sense of ownership among them.
With regard to upkeep and maintenance of the existing FMP projects, the
project authority at State level need to plan for maintenance of works after
their completion for effective utilisation of investment on the project. Most of

Page | 1025
Parameter Findings from research
the States have not planned for upkeep and maintenance of the completed
projects.
The NDMA has been mandated with laying down policies on disaster
management and guidelines which would be followed by different Ministries,
Departments of the Government of India and State Government in taking
measures for disaster risk reduction.
Mainstreaming DRR into the developmental plans is an important mandate of
the Disaster Management Act 2005. Integration of disaster risk reduction
measures into ongoing flagship programmes of Government of India is being
used as an entry point for mainstreaming DRR in development plans.
However, currently the DRRs are not prepated by the states as part of the
overall Master Plans. Few states like Assam and Bihar although have disaster
management plans but are heavily focussed on crisis management rather than
on integrated approach which includes infrastructures, service delivery,
addressing emerging risks and recovery strategy.246
Primary:
Currently, FMBAP scheme guidelines have no provisions for O&M activities.
However, as per FMP guidelines of XII plan, if restoration of flood control/
management works damaged due to force majeure like conditions are taken
up, then Central Assistance is to be released.
Many States do not prepare the Master Plan at State level. The Master Plan
typically involves detailed study of the river basins in a State along with
identification of vulnerable zones and areas susceptible to flood. GFCC has
already issued a guideline for preparation of comprehensive plan for Flood
Management. A Master Plan should include details of topography, soil
conditions, river course, drainage details, rainfall trends, land use pattern,
socio-econ omic pattern, hydrology, river morphology to name a few. Master
plan provides adequate guidance to the States towards framing strategies for
sustenance of structural measures.
246 Strengthening disaster risk management in India: A review of five state disaster management plans - Climate Development Knowledge Network (CDKN), Overseas
Development Institute (ODI), All India Disaster Mitigation Institute (AIDMI), Kul 2016

Page | 1026
Parameter Findings from research
Disaster Risk Reduction (DRR) is a part of sustainable development, and calls
for involvement of society, government, non-governmental organizations and
the professional and private sectors. It therefore requires a people-centred and
multi-sector approach, building resilience to multiple, cascading and
interacting hazards and creating a culture of prevention and resilience.
As indicated in the PDNA – Kerala, National Action Plan for Climate change is
existing and need to be linked with the Master Plans. Also, Govt. of India
alongwith UNDP has prepared and circulated a manual for districts on
mainstreaming Disaster Risk Reduction and Climate Change Adaptations
(CCA) into district plans in 2017 but , no evidences through the Key Informant
Interviews (KII) have been found wherein such plans are prepared at the state
or district level.
Inference:
Although States prepare O&M plan for the completed schemes through State
Share; but they being inadequate in most of the cases, adequate O&M
activities are not carried out, thereby reducing the effectiveness and
sustainability of the structures. Also, current allocation towards O&M of flood
control/ management structures addresses only the immediate issues with
the structures, rather than addressing long-term sustainability of those
structures.
Activities like preparation of Disaster Risk Reduction (DRR) plan, incorporation
of Climate Change Adaptations and preparation of Master Plans by the States
with support from the monitoring agencies are not done. Consequently, the
planning is not integrated and risks the effectiveness and sustainability of the
works.
The Master Plans or the River Basin Plans do not address the risk to the
communities due to floods or identify the root cause for vulnerability in detail.
FMBAP schemes appears to be stand alone in their approach as inter-sectoral
approach leading to sustainability and equity dimensions are not addressed.
Involvement of community in sustaining the structures and reform measures
planned for sustaining the projects need to be considered. Community level
trainings on flood management are also not conducted, which otherwise are

Page | 1027
Parameter Findings from research
expected to instil a sense of ownership and build a technical pool of skilled
workforce for maintenance of the flood management structures. Absence of
trained person at local level make the flood protection structures
unsustainable. Involvement of such persons at panchayat and/ or village level
will help in identifying long-term measures for massive structures like
embankments, porcupines, revetments, etc.
Therefore, on sustainability the performance of the scheme is rated as
“Average”.
Impact
Secondary:
The direct impacts of flood protection measures have been adequately
documented, which shows that substantial quantum of land and number of
houses, human lives are being protected against the damages.
The impact of FMBAP measures is evident from the fact that, population affected,
and damage to crops and houses have reduced considerably over the years. The
quantum of damage to public properties has also reduced significantly, as
illustrated in the two graphs below (data source: CWC’s ‘State-wise flood damage
statistics – regarding’ dated 10th May 2018)
The decadal loss of human lives due to flood has also reduced from 18,670 (2001-
2010) to 11,697 (2010-2017).
0.00
10.00
20.00
30.00
40.00
50.00
60.00
70.00
80.00
1953
1955
1957
1959
1961
1963
1965
1967
1969
1971
1973
1975
1977
1979
1981
1983
19
85
1987
1989
1991
1993
1995
1997
1999
2001
2003
2005
2007
2009
20
11
2013
2015
Damage on land and population (1953 - 2016)
Area affected in m.ha. Population affected in million

Page | 1028
Parameter Findings from research
In addition to the structural flood protection measures, non-structural measures
like flood forecasting and warnings of incoming floods have played a significant
role in reducing the loss of life and movable property apart from alerting authorities
in-charge to take appropriate measures to deal with floods.
Primary:
The short-term measures have successfully contributed to reducing the
damages to houses, agricultural land, public infrastructure.
Active people’s participation is evident as from the case study of Channelization
of Swan River in Una district of Himachal Pradesh. As per the FGDs with the
villagers and KIIs with the officials, it was evident that the local people donated
land and also free labour for the construction of the project. However, such
participation did not happen overnight but through continuous meetings,
interactions have helped in mobilizing the local people. As a result of the project,
the overall economy of the locality, which is primarily based on vegetable
cultivation, got a boost. From the FGDs with the villagers, it is understood that
not only the cultivation but also transportation of the vegetables to the markets
of the neighbouring districts was possible due to following improvement of the
infrastructure, particularly roads.
3,513
9,439
25,595
19,65218,921 18,670
9,682
0
5,000
10,000
15,000
20,000
25,000
30,000
1953-1960 1961-1970 1971-1980 1981-1990 1991-2000 2001-2010 2011-2016
Human lives lost (1953-2016)
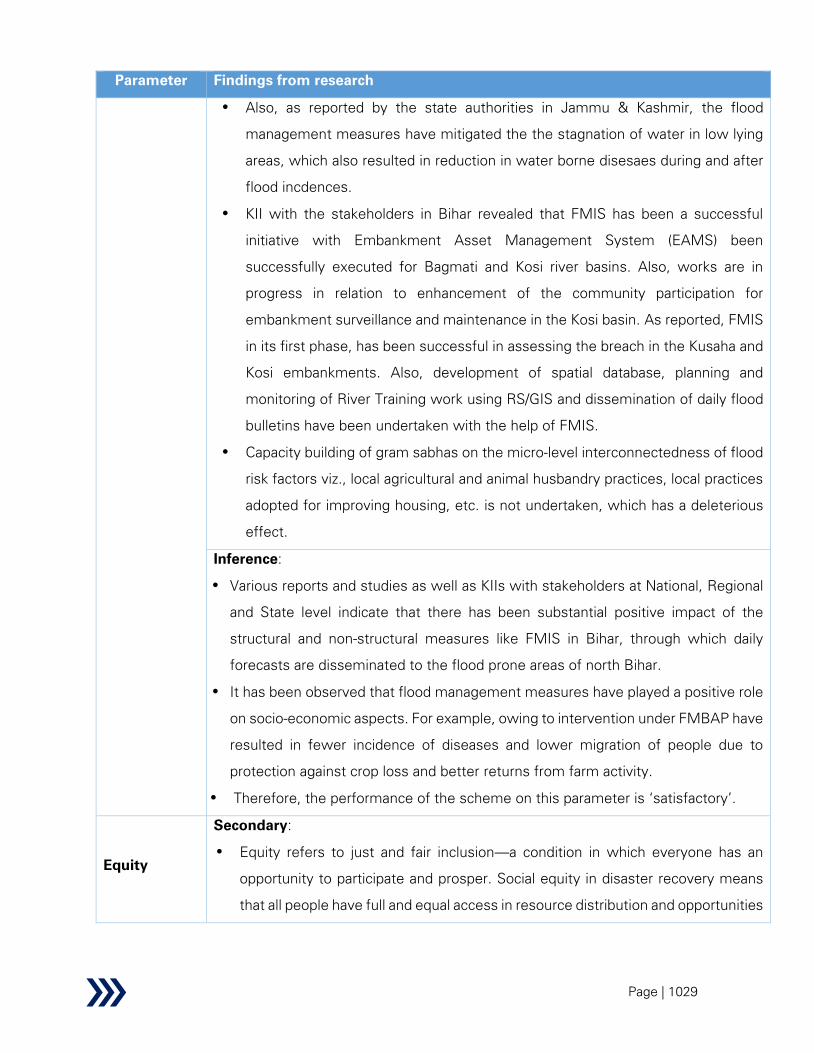
Page | 1029
Parameter Findings from research
Also, as reported by the state authorities in Jammu & Kashmir, the flood
management measures have mitigated the the stagnation of water in low lying
areas, which also resulted in reduction in water borne disesaes during and after
flood incdences.
KII with the stakeholders in Bihar revealed that FMIS has been a successful
initiative with Embankment Asset Management System (EAMS) been
successfully executed for Bagmati and Kosi river basins. Also, works are in
progress in relation to enhancement of the community participation for
embankment surveillance and maintenance in the Kosi basin. As reported, FMIS
in its first phase, has been successful in assessing the breach in the Kusaha and
Kosi embankments. Also, development of spatial database, planning and
monitoring of River Training work using RS/GIS and dissemination of daily flood
bulletins have been undertaken with the help of FMIS.
Capacity building of gram sabhas on the micro-level interconnectedness of flood
risk factors viz., local agricultural and animal husbandry practices, local practices
adopted for improving housing, etc. is not undertaken, which has a deleterious
effect.
Inference:
Various reports and studies as well as KIIs with stakeholders at National, Regional
and State level indicate that there has been substantial positive impact of the
structural and non-structural measures like FMIS in Bihar, through which daily
forecasts are disseminated to the flood prone areas of north Bihar.
It has been observed that flood management measures have played a positive role
on socio-economic aspects. For example, owing to intervention under FMBAP have
resulted in fewer incidence of diseases and lower migration of people due to
protection against crop loss and better returns from farm activity.
Therefore, the performance of the scheme on this parameter is ‘satisfactory’.
Equity
Secondary:
Equity refers to just and fair inclusion—a condition in which everyone has an
opportunity to participate and prosper. Social equity in disaster recovery means
that all people have full and equal access in resource distribution and opportunities
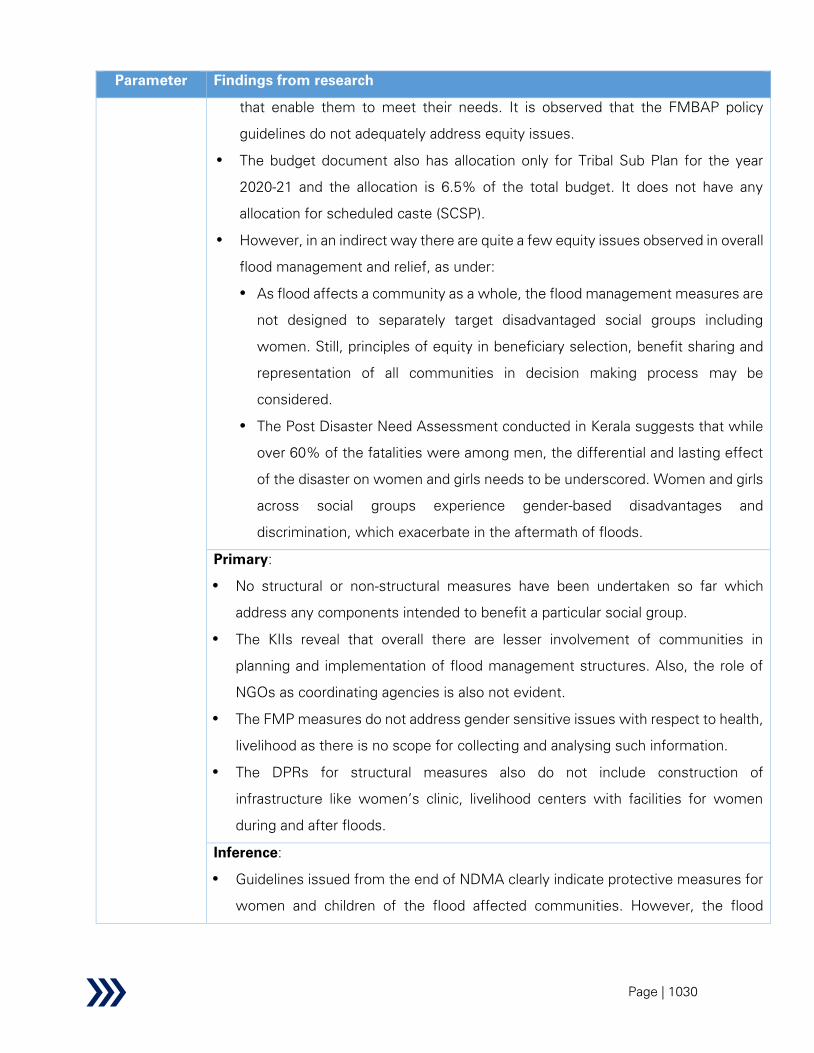
Page | 1030
Parameter Findings from research
that enable them to meet their needs. It is observed that the FMBAP policy
guidelines do not adequately address equity issues.
The budget document also has allocation only for Tribal Sub Plan for the year
2020-21 and the allocation is 6.5% of the total budget. It does not have any
allocation for scheduled caste (SCSP).
However, in an indirect way there are quite a few equity issues observed in overall
flood management and relief, as under:
As flood affects a community as a whole, the flood management measures are
not designed to separately target disadvantaged social groups including
women. Still, principles of equity in beneficiary selection, benefit sharing and
representation of all communities in decision making process may be
considered.
The Post Disaster Need Assessment conducted in Kerala suggests that while
over 60% of the fatalities were among men, the differential and lasting effect
of the disaster on women and girls needs to be underscored. Women and girls
across social groups experience gender-based disadvantages and
discrimination, which exacerbate in the aftermath of floods.
Primary:
No structural or non-structural measures have been undertaken so far which
address any components intended to benefit a particular social group.
The KIIs reveal that overall there are lesser involvement of communities in
planning and implementation of flood management structures. Also, the role of
NGOs as coordinating agencies is also not evident.
The FMP measures do not address gender sensitive issues with respect to health,
livelihood as there is no scope for collecting and analysing such information.
The DPRs for structural measures also do not include construction of
infrastructure like women’s clinic, livelihood centers with facilities for women
during and after floods.
Inference:
Guidelines issued from the end of NDMA clearly indicate protective measures for
women and children of the flood affected communities. However, the flood
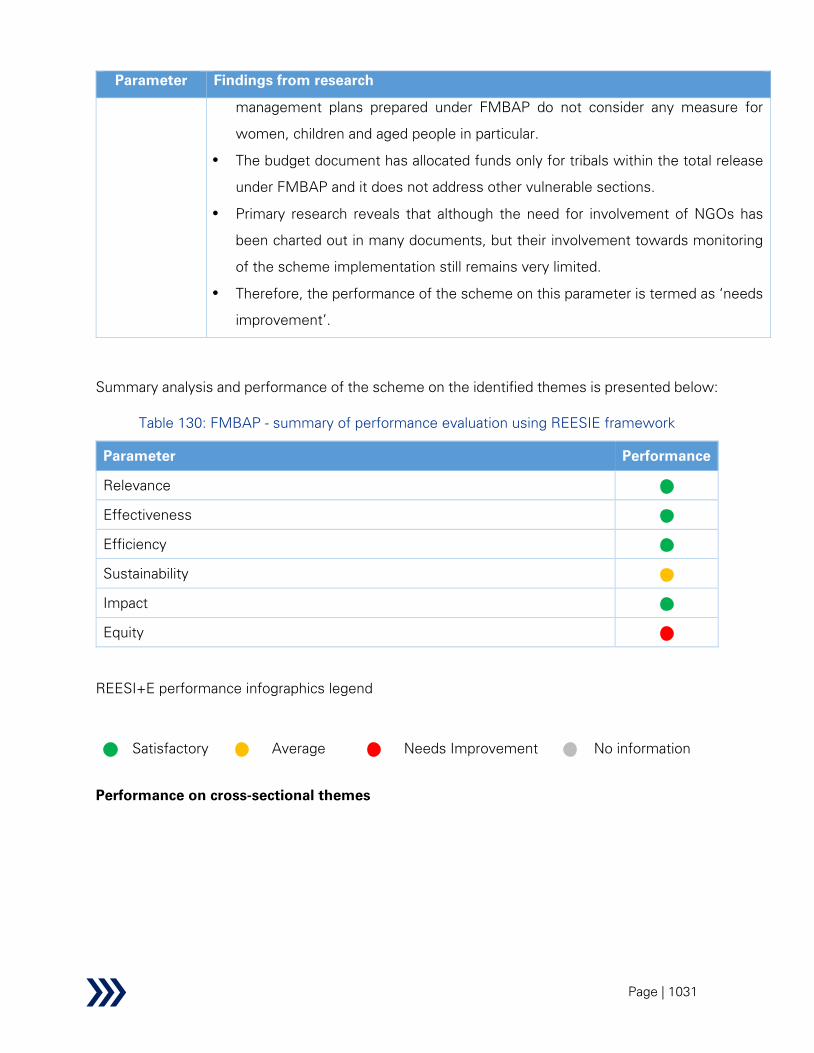
Page | 1031
Parameter Findings from research
management plans prepared under FMBAP do not consider any measure for
women, children and aged people in particular.
The budget document has allocated funds only for tribals within the total release
under FMBAP and it does not address other vulnerable sections.
Primary research reveals that although the need for involvement of NGOs has
been charted out in many documents, but their involvement towards monitoring
of the scheme implementation still remains very limited.
Therefore, the performance of the scheme on this parameter is termed as ‘needs
improvement’.
Summary analysis and performance of the scheme on the identified themes is presented below:
Table 130: FMBAP - summary of performance evaluation using REESIE framework
Parameter Performance
Relevance
Effectiveness
Efficiency
Sustainability
Impact
Equity
REESI+E performance infographics legend
Satisfactory
Average
Needs Improvement
No information
Performance on cross-sectional themes

Page | 1032
Table 131: FMBAP - performance evaluation using cross-sectional themes
# Cross-cutting theme
Indicative Areas of
Enquiry and Key
Questions
Findings from research
1.
Accountability &
Transparency
What data records are
available for the scheme
in public domain?
Does a robust
monitoring mechanism
exist and at what level?
What process / impact
evaluation studies
conducted in the last
decade - frequency,
quality, coverage, etc.
What funding
mechanisms are being
used?
What is the involvement
of beneficiaries across
the project lifecycle?
Are community
instiutions truly
representative in the
process?
• The schemes under Flood
Management Programme is
monitored by the Central
Water Commission (CWC),
Ganga Flood Control
Commission (GFCC) and
Brahmaputra Board (BB) in
their respective jurisdictions.
The Department of Space is
also associated in monitoring
of physical progress of the
works through remote
sensing techniques.
• After the completion of
works, performance
evaluation studies are
conducted by independent
agencies in consultation with
CWC/GFCC/Brahmaputra
Board as the case may be.
• Monitoring of flood
management schemes under
FMBAP is done by various
Regional offices except for
Ganga Basin States (which is
done by GFCC) and North-
Eastern States (which is
done by Brahmaputra Board).

Page | 1033
# Cross-cutting theme
Indicative Areas of
Enquiry and Key
Questions
Findings from research
• Regular submission of
progress reports: Most of
the states do not follow the
system of submitting
monthly reports to the
monitoring agencies and to
Flood Management wing of
DoWR. Also, the mechanism
of regular report submission
from district level to the state
level is not clear. Further, no
mechanism exists for
reporting to the district by the
circle, block or panchayats.
Summary Analysis:
Monitoring is primarily done by the the regional offices viz., CWC, GFCC and Brahnmaputra
Board. However, there are no regular monitoring mechanisms in form of monthly reports
submitted by the States on the physical and financial progress made for structural and non-
structural measures. The monitoring dashboard currently maintained by DoWR, Govt, of India
also does not track the current status of the ongoing and the performance of the completed
project sunder FMBAP. The accountability of local people in planning and monitoring of flood
management measures needs to be considered. Involvement of local community in monitoring
the status of completed projects and the progress of ongoing projects is not in place. Apart
from the monitoring agencies who perform techno-economical appraisal, other departments
at National, State and District level need to be involved for assessing the projects from social
benefit perspective. Dissemination of progress data of projects to local people will also ensure
transparency pertaining to implementation. Presence of designated officials at Panchayat level
for Flood Management Programmes for planning, supervision and monitoring is not evidenced.
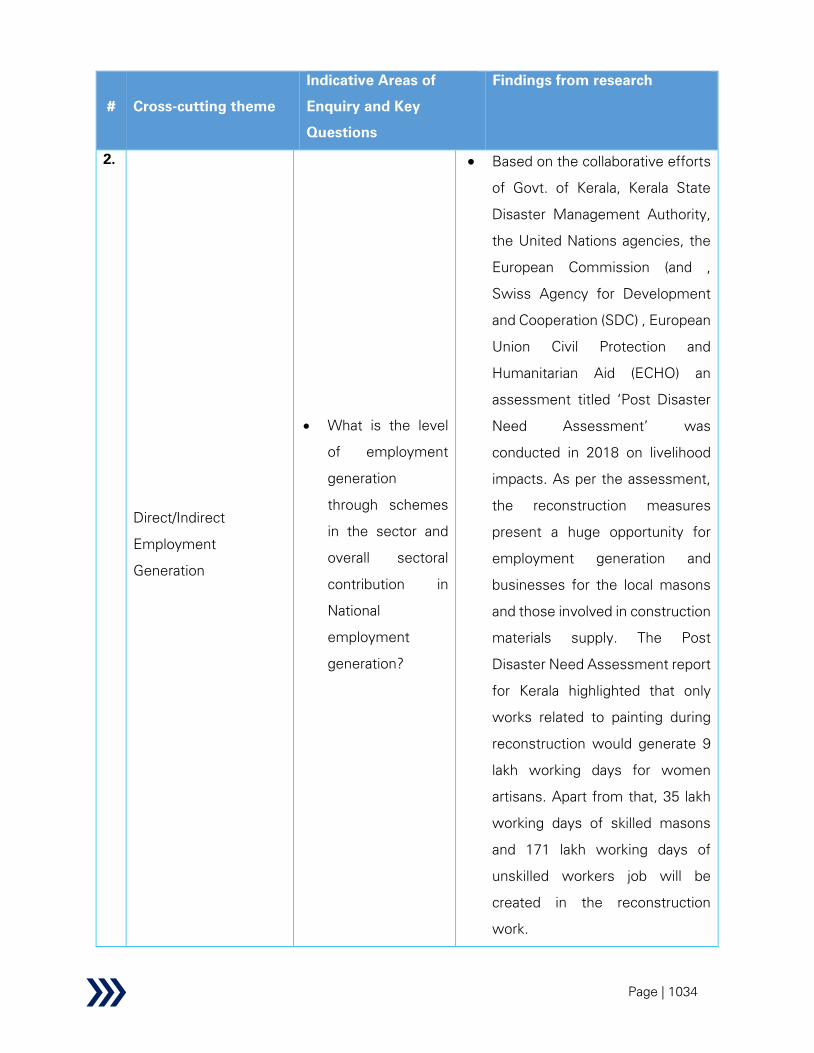
Page | 1034
# Cross-cutting theme
Indicative Areas of
Enquiry and Key
Questions
Findings from research
2.
Direct/Indirect
Employment
Generation
• What is the level
of employment
generation
through schemes
in the sector and
overall sectoral
contribution in
National
employment
generation?
• Based on the collaborative efforts
of Govt. of Kerala, Kerala State
Disaster Management Authority,
the United Nations agencies, the
European Commission (and ,
Swiss Agency for Development
and Cooperation (SDC) , European
Union Civil Protection and
Humanitarian Aid (ECHO) an
assessment titled ‘Post Disaster
Need Assessment’ was
conducted in 2018 on livelihood
impacts. As per the assessment,
the reconstruction measures
present a huge opportunity for
employment generation and
businesses for the local masons
and those involved in construction
materials supply. The Post
Disaster Need Assessment report
for Kerala highlighted that only
works related to painting during
reconstruction would generate 9
lakh working days for women
artisans. Apart from that, 35 lakh
working days of skilled masons
and 171 lakh working days of
unskilled workers job will be
created in the reconstruction
work.
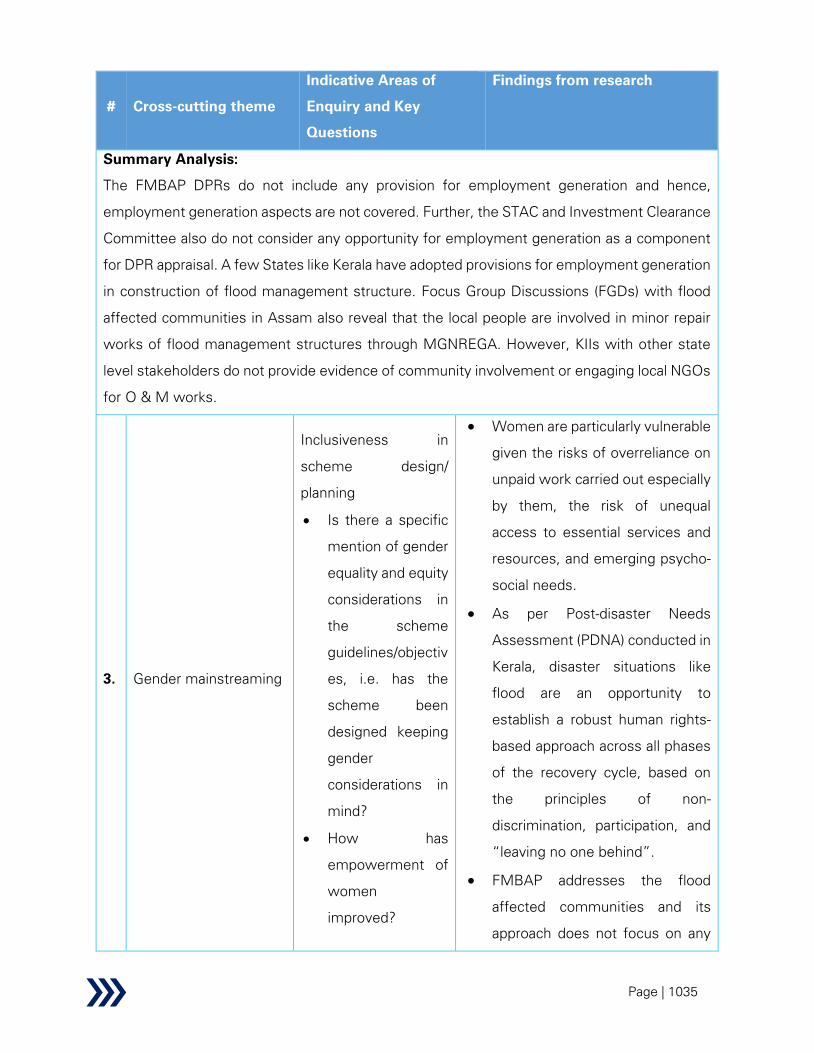
Page | 1035
# Cross-cutting theme
Indicative Areas of
Enquiry and Key
Questions
Findings from research
Summary Analysis:
The FMBAP DPRs do not include any provision for employment generation and hence,
employment generation aspects are not covered. Further, the STAC and Investment Clearance
Committee also do not consider any opportunity for employment generation as a component
for DPR appraisal. A few States like Kerala have adopted provisions for employment generation
in construction of flood management structure. Focus Group Discussions (FGDs) with flood
affected communities in Assam also reveal that the local people are involved in minor repair
works of flood management structures through MGNREGA. However, KIIs with other state
level stakeholders do not provide evidence of community involvement or engaging local NGOs
for O & M works.
3. Gender mainstreaming
Inclusiveness in
scheme design/
planning
• Is there a specific
mention of gender
equality and equity
considerations in
the scheme
guidelines/objectiv
es, i.e. has the
scheme been
designed keeping
gender
considerations in
mind?
• How has
empowerment of
women
improved?
• Women are particularly vulnerable
given the risks of overreliance on
unpaid work carried out especially
by them, the risk of unequal
access to essential services and
resources, and emerging psycho-
social needs.
• As per Post-disaster Needs
Assessment (PDNA) conducted in
Kerala, disaster situations like
flood are an opportunity to
establish a robust human rights-
based approach across all phases
of the recovery cycle, based on
the principles of non-
discrimination, participation, and
“leaving no one behind”.
• FMBAP addresses the flood
affected communities and its
approach does not focus on any
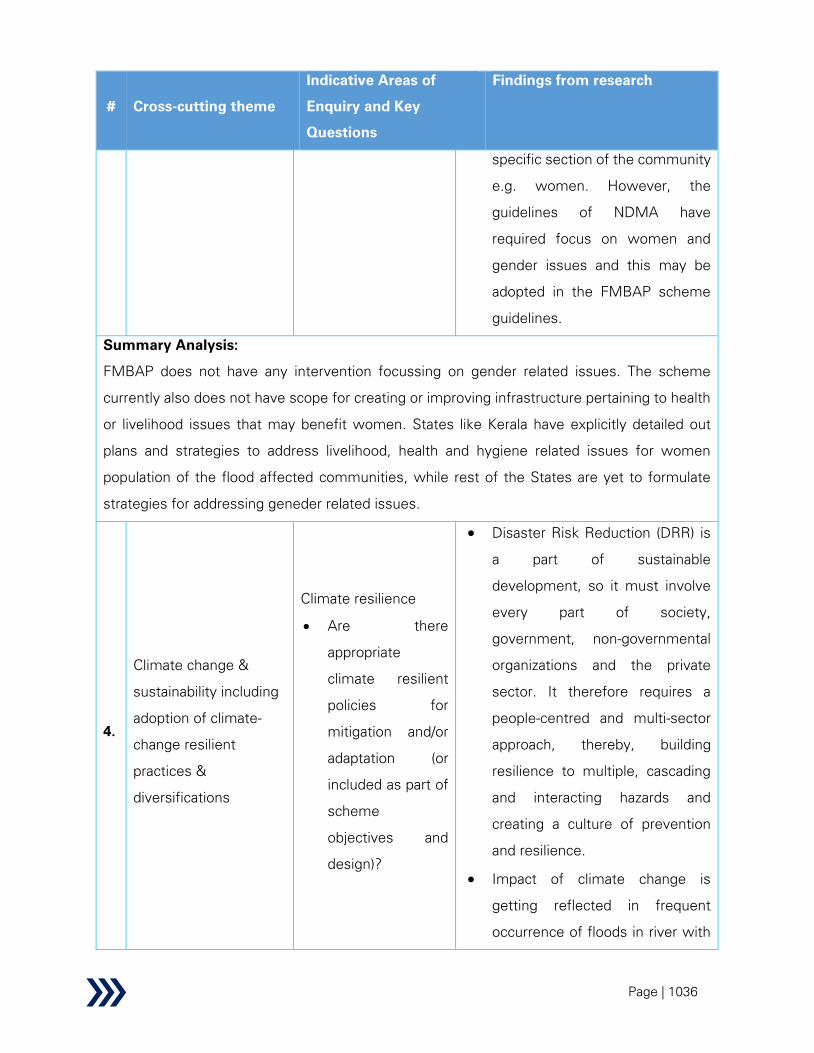
Page | 1036
# Cross-cutting theme
Indicative Areas of
Enquiry and Key
Questions
Findings from research
specific section of the community
e.g. women. However, the
guidelines of NDMA have
required focus on women and
gender issues and this may be
adopted in the FMBAP scheme
guidelines.
Summary Analysis:
FMBAP does not have any intervention focussing on gender related issues. The scheme
currently also does not have scope for creating or improving infrastructure pertaining to health
or livelihood issues that may benefit women. States like Kerala have explicitly detailed out
plans and strategies to address livelihood, health and hygiene related issues for women
population of the flood affected communities, while rest of the States are yet to formulate
strategies for addressing geneder related issues.
4.
Climate change &
sustainability including
adoption of climate-
change resilient
practices &
diversifications
Climate resilience
• Are there
appropriate
climate resilient
policies for
mitigation and/or
adaptation (or
included as part of
scheme
objectives and
design)?
• Disaster Risk Reduction (DRR) is
a part of sustainable
development, so it must involve
every part of society,
government, non-governmental
organizations and the private
sector. It therefore requires a
people-centred and multi-sector
approach, thereby, building
resilience to multiple, cascading
and interacting hazards and
creating a culture of prevention
and resilience.
• Impact of climate change is
getting reflected in frequent
occurrence of floods in river with
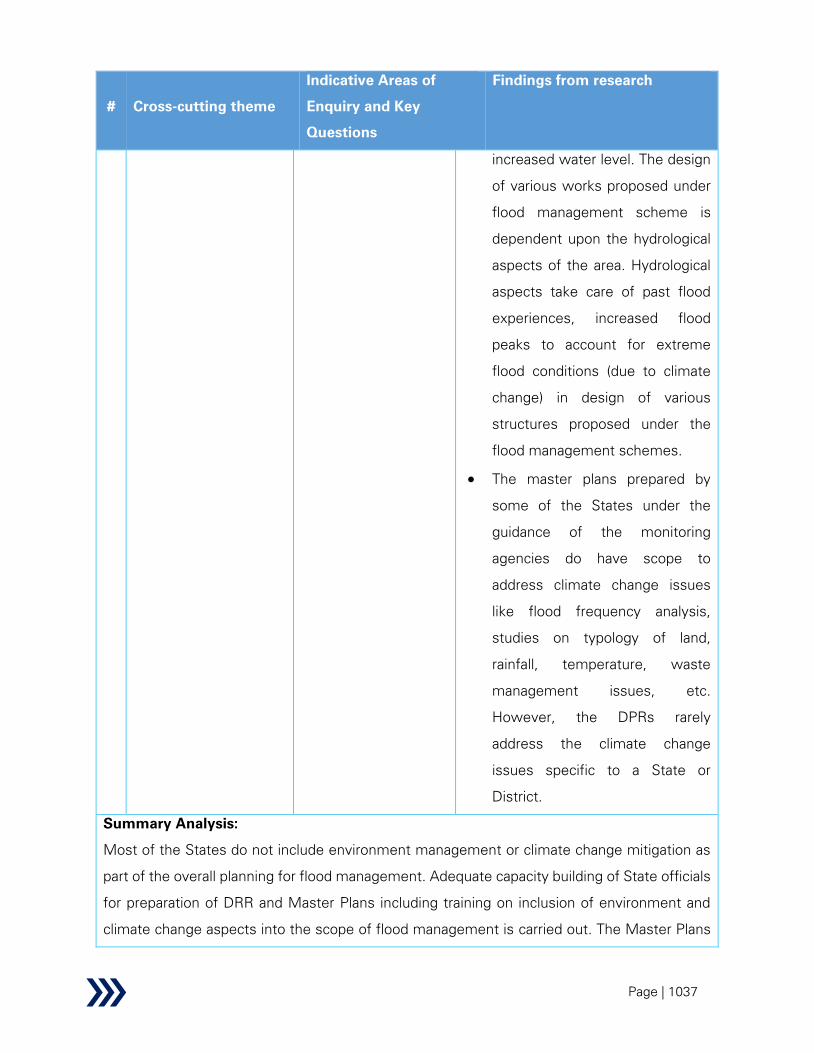
Page | 1037
# Cross-cutting theme
Indicative Areas of
Enquiry and Key
Questions
Findings from research
increased water level. The design
of various works proposed under
flood management scheme is
dependent upon the hydrological
aspects of the area. Hydrological
aspects take care of past flood
experiences, increased flood
peaks to account for extreme
flood conditions (due to climate
change) in design of various
structures proposed under the
flood management schemes.
• The master plans prepared by
some of the States under the
guidance of the monitoring
agencies do have scope to
address climate change issues
like flood frequency analysis,
studies on typology of land,
rainfall, temperature, waste
management issues, etc.
However, the DPRs rarely
address the climate change
issues specific to a State or
District.
Summary Analysis:
Most of the States do not include environment management or climate change mitigation as
part of the overall planning for flood management. Adequate capacity building of State officials
for preparation of DRR and Master Plans including training on inclusion of environment and
climate change aspects into the scope of flood management is carried out. The Master Plans

Page | 1038
# Cross-cutting theme
Indicative Areas of
Enquiry and Key
Questions
Findings from research
also do not include Climate Change Adaptability (CAA) although trainings are imparted to the
state officials by institutes like NWA, Pune and CWC.
5. Role of Tribal Sub-Plan
(TSP) and Scheduled
Caste Sub-Plan
component of the
scheme in
mainstreaming of Tribal
and Scheduled Caste
population
• What is the fund
allocated under
TSP & SCSP for
each scheme?
• What has been
the effect of the
TSP & SCSP
funds on
improving equity?
• What are the
interventions
implemented for
specific
vulnerable
groups?
• %-ge fund
allocation for TSP
& SCSP
• Amt. of fund
allocated for TSP
& SCSP for last 3
years
• The budget documents mention
special allocation for TSP and
allocation to States towards
Scheduled Tribes is done
accordingly. As per the budget of
DoWR for FY 2020-21, Rs. 50 Cr.
has been allocated towards Tribal
Area Sub Plan (TSP). However, no
allocation is made for SCSP.
Summary Analysis:
As per the budget for 2020-21, a total of 5.6% of the total budget is allocated towards TSP.
However, no allocation is made for Schedule caste sub plan (SCSP).
6. Use of IT/Technology in
driving efficiency
• Range of use of
GIS technology
• It may be observed that
advancement in Information
Technology in the form of

Page | 1039
# Cross-cutting theme
Indicative Areas of
Enquiry and Key
Questions
Findings from research
and Satellite data
for flood control
• Technologies that
are used for flood
forecasting and
hydrological
observations
• Extent of
coordination with
expert agencies
in using the
technologies
• Use of
information
collected through
GIS and remote
sensing
Internet, GIS, Remote Sensing,
satellite communication, etc. can
help a great deal in planning and
implementation of hazards
reduction measures. GIS can
improve the quality and power of
analysis of natural hazards
assessments, guide development
activities and assist planners in
the selection of lessening
measures and in the
implementation of emergency
preparedness and response
action. Remote Sensing, on the
other hand, as a tool can very
effectively contribute towards
identification of hazardous areas,
monitor the planet for its changes
on a real-time basis and give early
warning to many impending
disasters.
• Venture with Google: India’s
Central Water Commission
(CWC) has signed a Collaboration
Agreement with Google that will
help crisis management agencies
deal with extreme hydrological
events, such as floods, more
effectively.
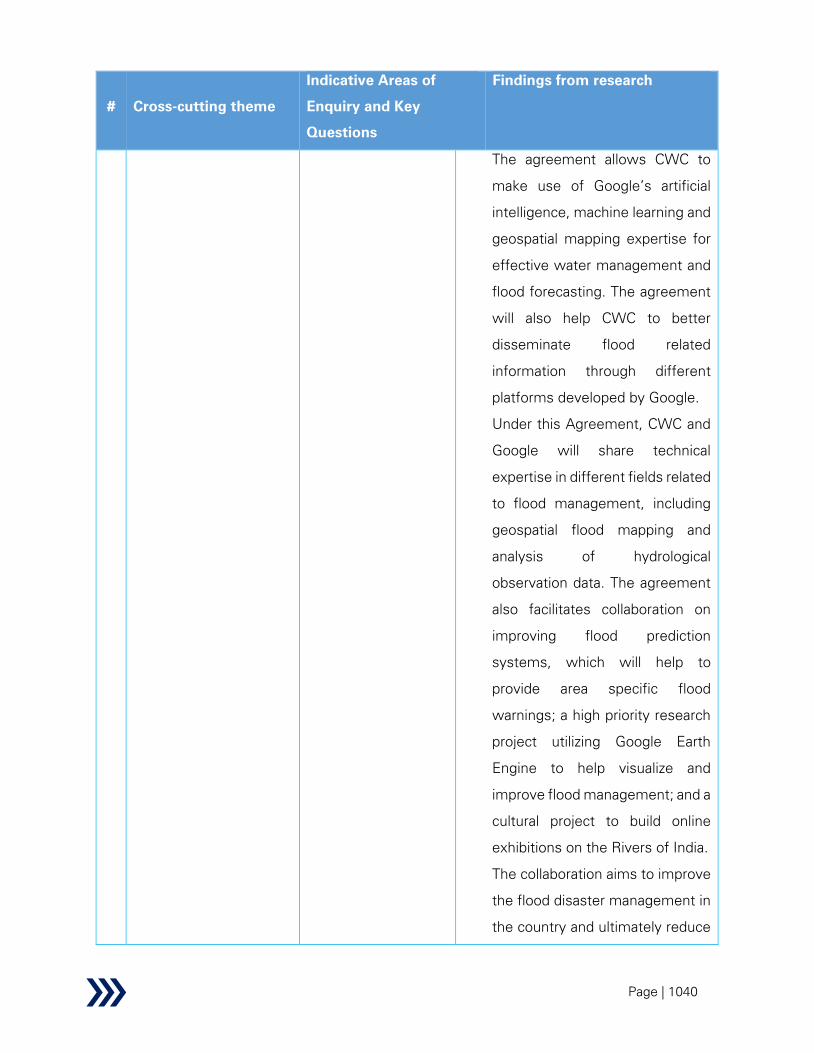
Page | 1040
# Cross-cutting theme
Indicative Areas of
Enquiry and Key
Questions
Findings from research
The agreement allows CWC to
make use of Google’s artificial
intelligence, machine learning and
geospatial mapping expertise for
effective water management and
flood forecasting. The agreement
will also help CWC to better
disseminate flood related
information through different
platforms developed by Google.
Under this Agreement, CWC and
Google will share technical
expertise in different fields related
to flood management, including
geospatial flood mapping and
analysis of hydrological
observation data. The agreement
also facilitates collaboration on
improving flood prediction
systems, which will help to
provide area specific flood
warnings; a high priority research
project utilizing Google Earth
Engine to help visualize and
improve flood management; and a
cultural project to build online
exhibitions on the Rivers of India.
The collaboration aims to improve
the flood disaster management in
the country and ultimately reduce
Page | 1041
# Cross-cutting theme
Indicative Areas of
Enquiry and Key
Questions
Findings from research
the impact of flooding on the
people’s lives and properties. The
initiative on flood forecasting is
likely to help lessen the impact of
floods on communities. The
collaborative agreement commits
Google to use their expertise in
the realm of artificial intelligence
as well as using their high-
resolution Digital Elevation Model
and vast computing resources to
generate flood inundations with
the level forecast input data
provided by CWC. These maps
can be used for disaster risk
management and emergency
response efforts by enabling the
Government and disaster
management organisations to
effectively identify the locations
and population that are at risk
from floods and require warnings
and information. This
collaborative initiative is expected
to be a milestone in flood
management and in mitigating the
flood losses in India.
• Need for strengthening
hydrological pattern, geographical
data, inter-institutional

Page | 1042
# Cross-cutting theme
Indicative Areas of
Enquiry and Key
Questions
Findings from research
convergence: Central Water
Commission (CWC), in
association with India Space
Research Organization (ISRO),
has set up a web enabled Water
Resources Information System in
the Country (India-WRIS). The
India-WRIS is a 'Single Window'
solution for comprehensive,
authoritative and consistent
information and data of India's
water resources along with allied
natural resources in a
standardized national GIS
framework. It has tools to search,
access, visualize, understand and
analyze the data for assessment,
monitoring, planning,
development and Integrated
Water Resources Management
(IWRM).
Following hydrological data
related to surface water are
collected at CWC Hydrological
Observation (HO) sites:
(i) River water level (Gauge, G)
(ii) River discharge (Discharge, D),
(iii) Sediment flow (Silt, S); and
(iv) Water quality (Quality Q)

Page | 1043
# Cross-cutting theme
Indicative Areas of
Enquiry and Key
Questions
Findings from research
• Besides hydrological observation,
CWC also monitors some
selected sites, selected
meteorological parameters such
as rainfall, maximum-minimum
temperature, humidity, pan-
evaporation, solar radiation and
wind velocity on some specific
sites.
• Flood Management Information
System (FMIS): Currently a Web
based FMIS is being adopted by
Flood Management Improvement
Support Centre, Bihar and
Irrigation and Water Resources
Department, Uttar Pradesh. The
FMIS in both the States provides
information on innovative
concepts and technologies to
improve flood management,
develop databases, utilize
analytical tools and information
products, enable effective
dissemination of the information,
thus providing an interface
between flood management
stakeholders.
Summary Analysis:
The FMIS is an important initiative with respect to management of information on floods and
intends to build a common information platform across various stakeholders in the States.
Page | 1044
# Cross-cutting theme
Indicative Areas of
Enquiry and Key
Questions
Findings from research
However, such an initiative is only being executed in the states of Bihar and Uttar Pradesh.
Although the monitoring agencies are providing guidelines on flood management information
system, such initiatives are awaited from other flood affected states.
On the other hand, Information Technology is observed to be more used for non-structural
measures. As a result of which, improvements in frequency and accurateness of flood
forecasts have taken place. Initiatives in this regard such as partnership with Google Analytics
on flood warning system using Artificial Intelligence and accurate predictions of floods has
already been taken. Also, Central Water Commission (CWC) in collaboration with ISRO has
set up web-based Water Resources Information System (WRIS) which will provide regular
updates on river water level, river discharge, sediment flow and water quality. In addition,
hydro-meteorological informations on rainfall, maximum – minimum rainfall, humidity,
evaporation etc. are provided through hydro-meteorological stations.
7. Stakeholder and
Beneficiary behavioural
change
• What percent of
total allocation is
directed towards
Awareness
generation or
sensitization?
What is the
utilization rate?
and How much
impact has it
been able to
generate in terms
of behaviour
change?
• What activities
are undertaken at
District/Block
level to promote
• Review of secondary sources
reveals that, sporadic awareness
generation activities like
publishing reports in public
domain are taken up by CWC for
creating awareness about river
valley projects and environmental
issues in India. States like Jammu
& Kashmir have recently initiated
community awareness towards
measures for minimizing flood
damages. Overall, the
involvement of local community
for flood management at local
level is lacking. The budgetary
allocation for trainings and
awareness generation as in the
budget document for FMBAP is

Page | 1045
# Cross-cutting theme
Indicative Areas of
Enquiry and Key
Questions
Findings from research
adoption of good
practices?
• What are the
major
challenges? Are
there any areas
which needs
more attention in
terms of bringing
behaviour
change?
only Rs. 4.13 Cr., which is very
minimal considering the total
quantum of fund for FMBAP.
Also, such funds are utilized by
CWC and NWA, Pune for
imparting trainings on flood
managememnt to State and
District officials. However, no
evidences on fund utilization vis-à-
vis the nature of trainings
conducted is evident from any
reports.
Summary Analysis:
Under institutional reform measures taken up within the ambit of FMBAP, only Rs. 4.13 Cr.
has been allotted for Capacity Building and Awareness Generation. However, details of such
activities are not available and it is understood that initiatives like community awareness for
responsible human activities to minimize flood events, capacity building of the community
towards O&M of structural measures have not been taken up adequately.
8. Research &
Development
• Nature of support
sought from the
institutes towards
flood risk reduction
• Types of research
done on various
aspects of flood
management
• Financial support
towards R&D for
last three years
• In order to deal with the specific
hydrological problems of different
regions of the country, a number
of training, research and
development institutes are in
place:

Page | 1046
1. Centre of Flood Management
Studies, National Institute of
Hydrology, Roorkee
2. All India Disaster Mitigation
Institute, Ahmedabad
3. National Institute of Disaster
Management
4. Indian Institute of Remote
Sensing
• A research and design wing of
CWC is in place which is
responsible for providing
guidance and support in planning,
feasibility studies, standardization
and designs of river valley
projects in the country, safety
aspects of major and medium
dams, hydrological studies for the
projects, coordination of research
activities, etc.
• Research by IITs: Under Rebuild
Kerala Initiative, the Irrigation
Department has entrusted the
Indian Institute of Technology,
Madras, (IIT-Madras), with the
task of conducting
hydrodynamics studies for
implementing the ‘Room for the
River’ concept in the flood-prone
Kuttanad region. The study will
look at multiple components that
are integral to reducing flooding in
low-lying Kuttanad. It will include
Page | 1047
# Cross-cutting theme
Indicative Areas of
Enquiry and Key
Questions
Findings from research
methods to improve the
efficiency of the Thottapally
spillway system, the feasibility of
further extending the Alappuzha-
Changanassery Canal (AC Canal)
and possible solutions to the
formation of sandbars at the
estuary mouth beyond the
spillway. As the name suggests,
the concept hinges on managing
flooding by giving rivers more
‘room’ to flow. In December
2019, the State government had
given administrative sanction for
preparing the detailed project
report at a cost of Rs. 4.5 Cr. The
money for carrying out
hydrodynamics studies will be
sourced from this amount.
In a recent study, researchers
from the Indian Institute of
Technology Bombay (IIT Bombay)
and the Indian Institute of
Technology Kharagpur (IIT
Kharagpur) have used a
combination of global climate
models along with local rainfall
and river flow models to
determine the odds of flood
inundation of individual villages.
Page | 1048
# Cross-cutting theme
Indicative Areas of
Enquiry and Key
Questions
Findings from research
They demonstrated their
approach by predicting the flood
risks for villages in Jagatsinghpur
district of Odisha. The study,
funded by the ISRO-IITB Space
Technology Cell, and the
Department of Science &
Technology, Government of India
(SPLICE-Climate Change
Programme), was published in the
journal Science of the Total
Environment. The study
highlights that climate change will
only worsen the situation over
time. State authorities are already
taking long-term disaster planning
measures, such as regulating the
flood water using the Hirakud
Dam on the Mahanadi,
constructing embankments along
the rivers, planting mangroves
along the Bay of Bengal coastline,
and resettlement of residents in
the flood-prone areas to elevated
areas. While such activities are
indispensable, the study shows
that they are not enough to
mitigate potential damages to life
and property.
Summary Analysis:

Page | 1049
# Cross-cutting theme
Indicative Areas of
Enquiry and Key
Questions
Findings from research
Flood is a wide subject involving technology, environment, social development, international
cooperation and many other such areas. Adequate funding for Research and development is
required, so that a knowledge hub can be created and the results can be shared with various
stakeholders at different levels leading to improvement in flood management plans. A few
research activities pertaining to flood management have been taken up by the research wing
of CWC; however, the detailed reports are not available in the public domains for the greater
benefit of the stakeholders, reaserchers, academicians at large.
9.
Water Sharing
Diplomacy
• What are the
range of issues
covered in the
water sharing
agreements with
neighbouring
countries? How
well are such
agreements
enforced?
• Under River Management
Activities & Works related to
Border Areas (RMBA) component
of FMBAP, some initiatives been
actively taken up and are
monitored on regular basis; some
of which are listed below:
- Flood forecasting on rivers
common to India and Nepal
- Hydrological observations
on rivers originating in
Bhutan
- Joint observations on rivers
common to Bangladesh
and neighbouring countries
- Update of DPR for
Pancheshwar Multipurpose
Project
- Surveys & investigation of
Kosi High Dam located in
Nepal

Page | 1050
# Cross-cutting theme
Indicative Areas of
Enquiry and Key
Questions
Findings from research
• A total of Rs.1,795.70 Cr. has
been allotted for the aforesaid
components under RMBA during
the period 2017-2020.
• Following activities have been
taken up pertaining to
international matters:
1. India-Bangladesh
Cooperation: Government of
India is providing necessary
flood data of Ganga-
Brahmaputra-Meghna basin at
free of cost to Bangladesh
during for flood forecasting,
which has enabled Bangladesh
to save property and lives of
people.
2. India-Bhutan Cooperation: A
scheme titled “Comprehensive
Scheme for Establishment of
Hydro- meteorological and
Flood Forecasting Network on
rivers common to India and
Bhutan” is in operation. The
network consists of 35 hydro-
meteorological/ meteorological
stations located in Bhutan and
being maintained by the Royal
Government of Bhutan with
funding from India. The data
Page | 1051
# Cross-cutting theme
Indicative Areas of
Enquiry and Key
Questions
Findings from research
received from these stations
are utilized in India by Central
Water Commission for
formulating flood forecasts. A
Joint Expert Team (JET)
consisting of officials from the
Government of India and Royal
Government of Bhutan
continuously review the
progress and other
requirements of the scheme.
3. India-China Cooperation:
The Government of India has
signed MOUs with China for
sharing of hydrological
information of Chinese
Stations on rivers Yaluzangbu/
Brahmaputra and
Langquenzangbu/Sutlej during
monsoon season. Both the
countries have also set up an
Expert Level Mechanism for
addressing the issues
pertaining to trans-boundary
rivers.
4. India-Nepal Cooperation: To
discuss various issues related
to water resources between
India and Nepal, a three-tier
mechanism comprising:

Page | 1052
# Cross-cutting theme
Indicative Areas of
Enquiry and Key
Questions
Findings from research
- Joint Ministerial Level
Commission on Water
Resources (JMCWR) headed
by Ministers of Water
Resources of India and Nepal,
- Joint Committee on Water
Resources (JCWR) headed by
Secretaries of Water
Resources and
- Joint Standing Technical
Committee (JSTC) headed by
the Chairman, Ganga Flood
Control Commission, Patna
from Indian side, exists.
- A Treaty on Integrated
Development of Mahakali
(Sharda in India) river including
Sharda Barrage, Tanakpur
Barrage and Pancheshwar
Multipurpose Project was
signed between the
Government of India and the
Government of Nepal in
February 1996. Treaty is valid
for a period of 75 years.
5. India-Pakistan Co-
operation: India and Pakistan
signed Indus Waters Treaty in
1960, and two permanent
posts of Commissioners

Page | 1053
# Cross-cutting theme
Indicative Areas of
Enquiry and Key
Questions
Findings from research
were created, one each in
India and Pakistan. The two
Commissioners together
form the Permanent Indus
Commission. In fulfilment of
the requirements of Indus
Water Treaty, the daily data
of 280 hydrological sites in six
basins namely Indus, Jhelum,
Chenab, Ravi, Beas and Sutlej
is regularly sent to Pakistan
every month. Besides, Flood
warnings are transmitted by
India to Pakistan through
Telegrams, Telephones and
Radio Broadcasts during
every monsoon for Indus
River system.
Summary Analysis:
Around 25% of the total outlay for FMBAP (2017-20) has been allocated for Water Sharing
Diplomacy component, from which it may be inferred that significant focus is being given on
the international waterfront to fulfil the objective of FMBAP. The border states like Bihar have
been benefitted through such measures. However, initiatives like expediting steps for
construction of large storage dams in Nepal viz. Pancheshwar Multi-purpose Project and Sapta
Kosi High Dam should be taken up and emphasis may be given on flood control measures
apart from irrigation and hydropower generation. Also, the outstanding bilateral issues
regarding mutual acceptance on the DPR of Pancheswar Multi-Purpose Project may be
resolved with Nepal at the earliest.

Page | 1054
# Cross-cutting theme
Indicative Areas of
Enquiry and Key
Questions
Findings from research
10.
Unlocking Synergies
with other government
programmes
• What activities
are undertaken to
ensure
convergence at
community level?
• Are there any
Action Plans
prepared at
State/District/Blo
ck level to ensure
the same?
• The aim of FMBAP is to assist the
State Governments to provide
reasonable degree of protection
against floods in critical areas by
adopting optimum combination of
structural and non-structural
measures and enhancing
capabilities of State/ Central
Government officials in related
fields. Although the Flood
Management wing of DoWR,
Govt. of India has implemented
substantial number of structural
and non-structural measures, the
linkage with other social aspects
like livelihood generation, disease
control, etc. is not evident.
FMBAP is focussed towards flood
management as a whole only and
do not address long term
measures such as afforestation in
a significant way.
• Ministry of Water Resources,
River Development & Ganga
Rejuvenation through Central
Water Commission with an
objective to improve safety and
operational performance of
selected dams, along with
institutional strengthening with

Page | 1055
# Cross-cutting theme
Indicative Areas of
Enquiry and Key
Questions
Findings from research
system wide management
approach, embarked upon the
Dam Rehabilitation and
Improvement Project (DRIP) with
World Bank assistance at a cost of
Rs. 2,100 Cr. DRIP has been
successful in rehabilitation of
dams, other important activities
likle Design Flood Review,
publication of important
guidelines as well as manuals
dealing with Dam Safety
Management, preparation of
O&M Manuals, Emergency
Action Plans, development of
web based asset management
tool i.e. Dam Health And
Rehabilitation Monitoring
Application (DHARMA), Seismic
Hazard Mapping along with
development of Seismic Hazard
Assessment Information System
(SHAISYS).
Summary Analysis:
• FMBAP has been restricted to structural and non-structural measures at large and
significant focus is made on the short-term measures than on the long-term measures like
flood plain zoning, basin level planning, inter-linking of river basins, community awareness
and capacity building. In order to implement such long-term measures coordination with
land departments, river conservation schemes, urban development department etc. is
required. Moreover, FMBAP does not have any provision for linkages with other schemes

Page | 1056
# Cross-cutting theme
Indicative Areas of
Enquiry and Key
Questions
Findings from research
like livelihood mission, health programme, which otherwise could have activities within its
scope addressed towards generation of livelihood and reducing incidences of diseases
and health hazards in post flood situtaions. Also, coordination with financial institutions,
funding agencies like World Bank, ADB etc for effective addressing of O&M of flood
management structures like embankments has been taken up. However, not much
progress is observed in this aspect.
11. Reforms Regulations
• What measures
are being taken to
ensure effective
implementation
and compliance
of adopted
acts/rule/regulati
ons? (like in areas
of safety,
accountability,
transparency
etc.)
• As reiterated in previous portions
of the report, long term measures
like country wide implementation
of flood plain zoning as suggested
in Flood Plain Zoning Draft Bill
(1975) has been implemented
only in a few states. Formation of
river basin organizations and
community level involvement
although been suggested for
active consideration, yet no such
measures have been taken up.
Adopting such long-term reform
measures will effectively reduce
the flood incidences as well as
damages caused by flood.
• The Standing Committee on
Water Resources (2016-17) has
noted that the Ministry needs to
coordinate with the State
Governments to ensure that
pending enactment of legislation
in this regard should be taken up
to prevent further encroachment
Page | 1057
# Cross-cutting theme
Indicative Areas of
Enquiry and Key
Questions
Findings from research
of areas located in the flood plain
zone.
• In addition, River Basin
Organizations at National and river
basin levels may be formed as
apart of the reform activitiy. This
would enable preparing basin
level planning integrated into the
state specific master plans.
Summary Analysis:
• Flood Plain Zoning Draft Bill (1975) has still not been enacted in most of the flood prone
states. This measure is critical in ensuring reduction in encroachments and human
activities in the flood plains thereby reducing flood inciences and random meandering of
rivers.
• Formation of River Basin Organizations at National and Basin level needs to be integrated
into the state specific master plans so as to have basin level plans.
12.
Impact on and role of
private sector,
community
• What is the
percentage of
private
investment in the
clusters/program
s run by the
government?
• How well have
PPP functions in
the Sector? What
are the
challenges
faced?
• As suggested in various
secondary sources like the report
‘Public-private partnerships in
emergency and disaster
management: examples from the
Quensland floods 2010-11’ by
Peter Hastings, et al. (2015),
public private partnerships in flood
management may be explored by
the governments for maintaining
critical infrastructure like power,
logistical support like distribution
mechanisms for consumable
Page | 1058
# Cross-cutting theme
Indicative Areas of
Enquiry and Key
Questions
Findings from research
• How many
private sector,
community/collec
tives/cooperative
s and civil society
have availed the
benefits under
any Scheme?
goods, insurance at lower costs,
etc.
• Numerous international studies
have corroborated the value of
public–private sector partnerships
in reducing vulnerability and
building resilience to
emergencies and disasters. An
initiative in Australia towards
Public-Private Partnerships in
emergency and disaster
management proposes a simple
conceptual framework for public-
private partnerships in emergency
and disaster management that
could be applied to research and
policy analysis. The framework
proposes three dimensions:
sector types (public, business and
community), partnership
arrangements (legislated and
formal to informal agreements),
and partnership roles (strategic
and resilience-building and
response and recovery). Public–
private partnerships during and
after the Queensland floods of
2010–11 were used to illustrate
the relationships presented in the
framework and to give a snapshot
Page | 1059
# Cross-cutting theme
Indicative Areas of
Enquiry and Key
Questions
Findings from research
of these partnerships in
Queensland.
• Community involvement in
planning and monitoring of
FMBAP measures are lacking and
may need considerations. The
flood affected communities may
be involved in identification of
problem areas, site selection,
resource mobilization and regular
monitoring of the progress of the
ongoing projects and
performance of the completed
ones.
Summary Analysis:
A number of studies have suggested the government to explore various PPP models in relation
to flood management; but the adoption of same in India is limited. In relation to FMBAP, it is
observed that community involvement in overall planning and monitoring of measures is
limited.
The CST theme ‘Conjunctive use of water - surface versus groundwater usage optimizations’
was found to be ‘not relevant’ for this scheme and hence it has not been evaluated. While, in
absence of adequate information, the ‘Development, dissemination & adoption’ theme has been
marked as ‘no information’.
A summary analysis and performance of the scheme on the identified themes is presented
below:

Page | 1060
Table 132: FMBAP - summary of performance evaluation using cross-sectional themes
Parameter Performance
Accountability & Transparency
Direct/Indirect Employment Generation
Gender mainstreaming/Inclusiveness
Building resilience to climate change (including but not limited to developing
water disaster preparedness) & ensuring sustainability
Role of Tribal Sub-Plan (TSP) and Scheduled Caste Sub-Plan component of
the scheme in mainstreaming of Tribal and Scheduled Caste population
Use of IT/Technology in driving efficiency
Stakeholder and Beneficiary behavioural change
Development, dissemination & adoption
Research & Development
Water sharing treaties/agreements & diplomacy
Conjunctive use of water - surface versus groundwater usage optimizations
Unlocking Synergies with other Government Program
Reforms, Regulations
Impact on and role of private sector, community and civil society in the
scheme
Cross-sectional themes performance infographics legend
High
Medium
Low
Not relevant
No information
2.2.9.3 Issues and challenges
This sub-section describes the scheme issues and challenges and their mapping with the source
of information viz. primary source, secondary source and household survey (if applicable).
Table 133: FMBAP – issues and challenges
Sl.no Area Issues & Challenges Secondary KII
HH
/
FGD
Scheme Design
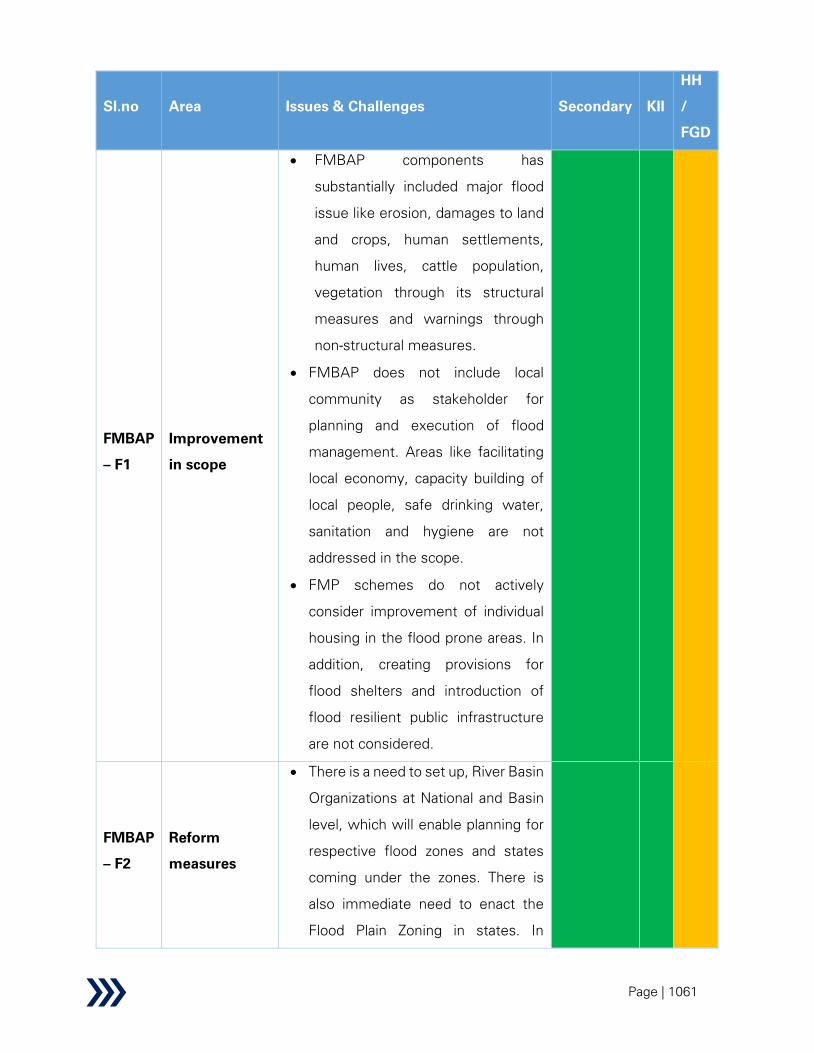
Page | 1061
Sl.no Area Issues & Challenges Secondary KII
HH
/
FGD
FMBAP
– F1
Improvement
in scope
• FMBAP components has
substantially included major flood
issue like erosion, damages to land
and crops, human settlements,
human lives, cattle population,
vegetation through its structural
measures and warnings through
non-structural measures.
• FMBAP does not include local
community as stakeholder for
planning and execution of flood
management. Areas like facilitating
local economy, capacity building of
local people, safe drinking water,
sanitation and hygiene are not
addressed in the scope.
• FMP schemes do not actively
consider improvement of individual
housing in the flood prone areas. In
addition, creating provisions for
flood shelters and introduction of
flood resilient public infrastructure
are not considered.
FMBAP
– F2
Reform
measures
• There is a need to set up, River Basin
Organizations at National and Basin
level, which will enable planning for
respective flood zones and states
coming under the zones. There is
also immediate need to enact the
Flood Plain Zoning in states. In
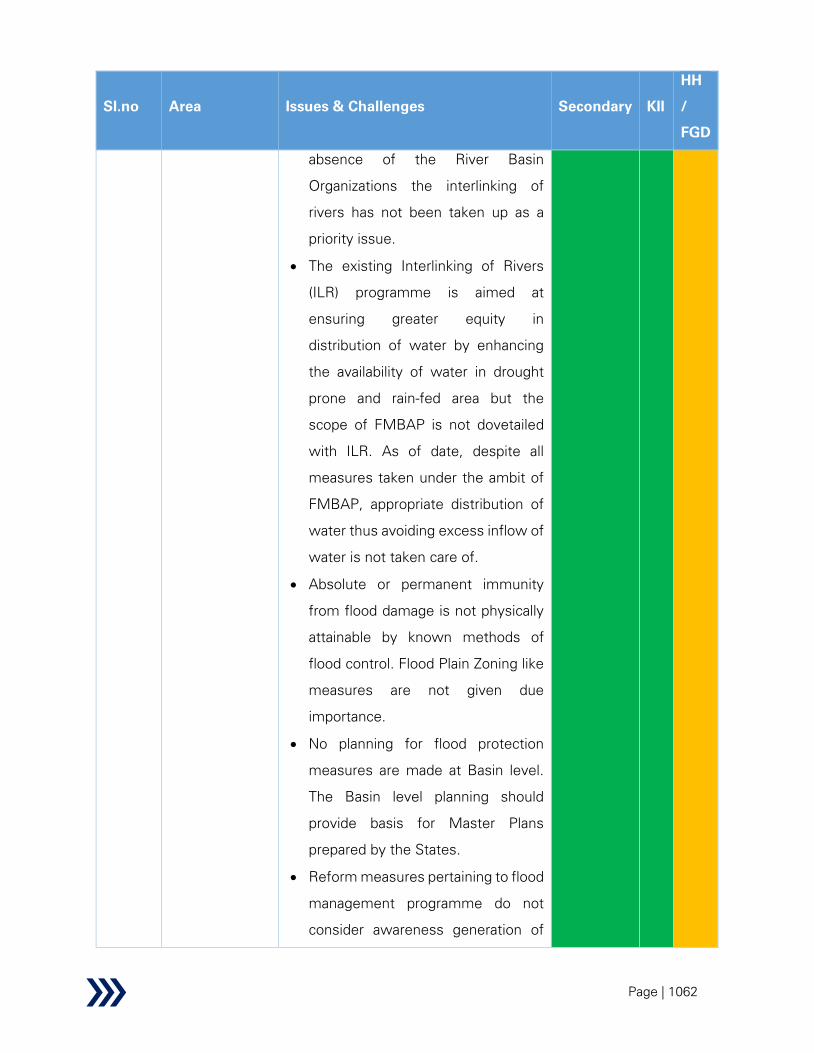
Page | 1062
Sl.no Area Issues & Challenges Secondary KII
HH
/
FGD
absence of the River Basin
Organizations the interlinking of
rivers has not been taken up as a
priority issue.
• The existing Interlinking of Rivers
(ILR) programme is aimed at
ensuring greater equity in
distribution of water by enhancing
the availability of water in drought
prone and rain-fed area but the
scope of FMBAP is not dovetailed
with ILR. As of date, despite all
measures taken under the ambit of
FMBAP, appropriate distribution of
water thus avoiding excess inflow of
water is not taken care of.
• Absolute or permanent immunity
from flood damage is not physically
attainable by known methods of
flood control. Flood Plain Zoning like
measures are not given due
importance.
• No planning for flood protection
measures are made at Basin level.
The Basin level planning should
provide basis for Master Plans
prepared by the States.
• Reform measures pertaining to flood
management programme do not
consider awareness generation of

Page | 1063
Sl.no Area Issues & Challenges Secondary KII
HH
/
FGD
the community on practices that
lead to reduction in incidences of
flood like extraction of soil, sand
from river beds and near river banks,
removal of forest cover, drainage
cleaning, etc.
FMBAP
– F3
Addressing
social issues
• No activities have been planned to
address social issues such as:
o health and nutrition related
issues of the population
o drinking water, sanitation and
hygiene
o employment and livelihoods
o community mobilization
The DPRs for structural measures in
no way address improvement of
health, drinking water and sanitation
related infrastructures.
FMBAP
– F4
Capacity
Building
• -Trainings are mainly given to the
State Officials on techno-economic
aspect of flood management.
Trainings on managing parameters
like livelihood, migration, disease
control are not included in the
existing training modules
• Important issues like climate change
are also not adequately addressed
through trainings by institutions like
National Water Academy, Pune.

Page | 1064
Sl.no Area Issues & Challenges Secondary KII
HH
/
FGD
• Apart from trainings, no evidences
of exposure visits and on-site
trainings have been found.
FMBAP
– F5
Inclusiveness
of all schemes
FMBAP includes projects approved
only by Empowered Committee (XI
Plan) or Inter-Ministerial Committee.
In such a scenario, a holistic picture
of flood management measures and
their benefits remains unknown.
Scheme implementation
FMBAP
– F6
Protectiveness
by the scheme
• Sound technical support is provided
to states by the monitoring agencies
towards execution of structural
measures.
• Although there are adequate
number of schemes, but some are
still ongoing thus minimizing the
protection against envisaged results.
• The FMP schemes are limited to
protection of habitations, agricultural
fields in majority of cases. The
schemes do not cover other vital
infrastructure like hospitals,
educational institutions, public
offices and infrastructure related to
power.
• Although construction of
embankments are taken up in a large
scale as protection measures
against floods, however, on account
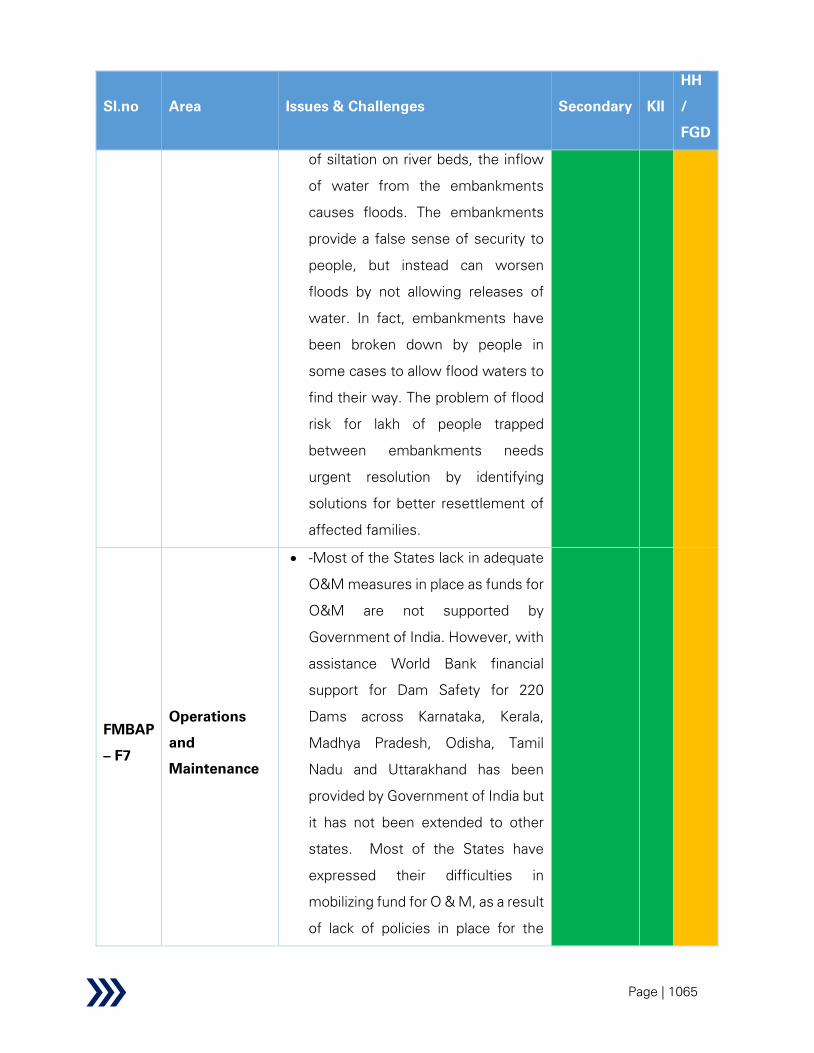
Page | 1065
Sl.no Area Issues & Challenges Secondary KII
HH
/
FGD
of siltation on river beds, the inflow
of water from the embankments
causes floods. The embankments
provide a false sense of security to
people, but instead can worsen
floods by not allowing releases of
water. In fact, embankments have
been broken down by people in
some cases to allow flood waters to
find their way. The problem of flood
risk for lakh of people trapped
between embankments needs
urgent resolution by identifying
solutions for better resettlement of
affected families.
FMBAP
– F7
Operations
and
Maintenance
• -Most of the States lack in adequate
O&M measures in place as funds for
O&M are not supported by
Government of India. However, with
assistance World Bank financial
support for Dam Safety for 220
Dams across Karnataka, Kerala,
Madhya Pradesh, Odisha, Tamil
Nadu and Uttarakhand has been
provided by Government of India but
it has not been extended to other
states. Most of the States have
expressed their difficulties in
mobilizing fund for O & M, as a result
of lack of policies in place for the

Page | 1066
Sl.no Area Issues & Challenges Secondary KII
HH
/
FGD
same. The role of State Technical
Advisory Committee also does not
focus about providing guidance to
the state nodal department for
mobilizing such funds.
FMBAP
– F8
Need for a
Database
• No Database exists for assessing
the physical and financial progress
and regular scheme and State-wise
report of physical and financial
progress. Monthly and quarterly
reports are also not regularly
submitted which can adequately
feed in regular progress related
information into the Database.
FMBAP
– F9
Community
involvement
• No evidences of involvement of
NGOs / CBOs / Local clubs / Mahila
Mandals in monitoring of structural
measures or disseminating flood
forecasts to the villages was found
during the KIIs undertaken so far.
• Formal Block/Panchayat level
planning mechanisms do not exist
for any states. No evidences were
found where local planning was
carried out through discussions or
meetings. Involvement of specific
groups like women was also not
found.
FMBAP
– F10
Integrating
environment
• -Activities like preparation of
Disaster Risk Reduction (DRR) and

Page | 1067
Sl.no Area Issues & Challenges Secondary KII
HH
/
FGD
with flood
management
Master Plans by the States with
support from the monitoring
agencies are not done.
Consequently, the planning is not
integrated and risks the
effectiveness and sustainability of
the works
Monitoring and evaluation
FMBAP
– F11
Inclusiveness
of social
development
indicators
• Parameters like area under
protection, human lives protected,
cattle protected, protection of public
infrastructures and utilities are
measured on regular basis but
aspects like incidences of diseases,
loss of livelihood, availability of safe
drinking water, sanitation and
hygiene are not considered for
assessing the effectiveness of the
schemes.
• Some studies have been made on
socio-economic feasibility of flood
management schemes but they do
not adequately emphasize on the
need to address issues like health,
livelihood, gender safety, hygiene,
etc. while developing master plans
and DPRs.
• Impact evaluation studies also
remain limited to techno-economic
aspects only.
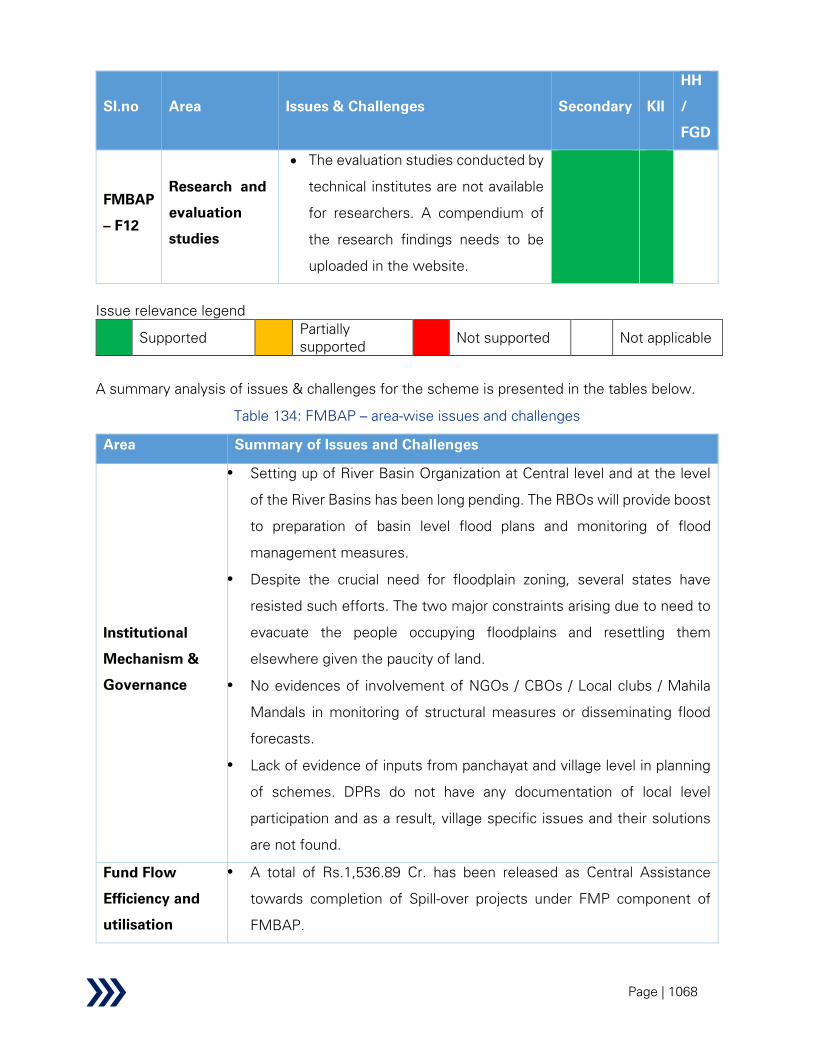
Page | 1068
Sl.no Area Issues & Challenges Secondary KII
HH
/
FGD
FMBAP
– F12
Research and
evaluation
studies
• The evaluation studies conducted by
technical institutes are not available
for researchers. A compendium of
the research findings needs to be
uploaded in the website.
Issue relevance legend
Supported Partially
supported Not supported
Not applicable
A summary analysis of issues & challenges for the scheme is presented in the tables below.
Table 134: FMBAP – area-wise issues and challenges
Area Summary of Issues and Challenges
Institutional
Mechanism &
Governance
Setting up of River Basin Organization at Central level and at the level
of the River Basins has been long pending. The RBOs will provide boost
to preparation of basin level flood plans and monitoring of flood
management measures.
Despite the crucial need for floodplain zoning, several states have
resisted such efforts. The two major constraints arising due to need to
evacuate the people occupying floodplains and resettling them
elsewhere given the paucity of land.
No evidences of involvement of NGOs / CBOs / Local clubs / Mahila
Mandals in monitoring of structural measures or disseminating flood
forecasts.
Lack of evidence of inputs from panchayat and village level in planning
of schemes. DPRs do not have any documentation of local level
participation and as a result, village specific issues and their solutions
are not found.
Fund Flow
Efficiency and
utilisation
A total of Rs.1,536.89 Cr. has been released as Central Assistance
towards completion of Spill-over projects under FMP component of
FMBAP.

Page | 1069
Area Summary of Issues and Challenges
Since FMBAP does not have the scope of supporting Operations and
Maintenance of Flood Management structures, hence some states face
difficulty in maintaining the structures due to paucity of funds
Monitoring and
evaluation
Although a sound monitoring system exists for assessing the
progress of structural measures and the efficacy of non-structural
measures, through officials at National. Regional, State & District.
However, grass root level monitoring through beneficiaries / WUAs /
Panchayat Samitis etc. does not exist.
Monitoring and supervision of structural measures are done by the
district level officials. There are no village level or panchayat level
committees involved in monitoring of the completed as well as
ongoing schemes on a regular basis.
Few evaluation studies have been conducted to assess the efficiency
of the scheme, but with the changing scenario like increased
investments, Impact study of social and environmental impact on the
flood affected population is of extreme necessity.
Capacity
building
Regular trainings are imparted to the State officials but primarily on
Techno -economic aspect. The trainings are imparted by the
monitoring agencies, i.e. CWC, GFCC & BB. Apart from these
organizations, training on flood management is also imparted by
National Water Academy, Pune.
No trainings on participatory planning and monitoring have been
done so far.
Operational
efficiency
Although web-based Flood Management Information System (FMIS)
exists in Uttar Pradesh and Bihar, requisite flood related data pertaining
to structural measures, status of completed and ongoing schemes,
monthly progress, etc. are not being uploaded in the corresponding
state websites.
No Database exists for assessing the physical and financial progress
and regular scheme and State-wise report of physical and financial
progress.
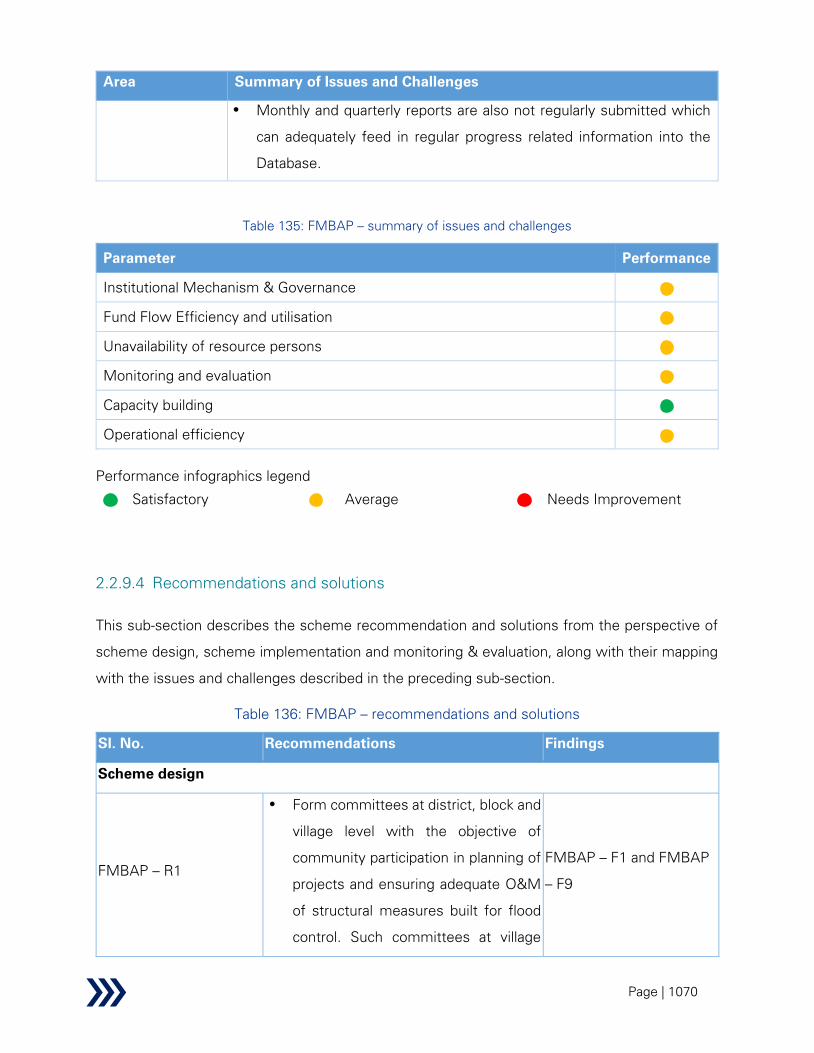
Page | 1070
Area Summary of Issues and Challenges
Monthly and quarterly reports are also not regularly submitted which
can adequately feed in regular progress related information into the
Database.
Table 135: FMBAP – summary of issues and challenges
Parameter Performance
Institutional Mechanism & Governance
Fund Flow Efficiency and utilisation
Unavailability of resource persons
Monitoring and evaluation
Capacity building
Operational efficiency
Performance infographics legend
Satisfactory
Average
Needs Improvement
2.2.9.4 Recommendations and solutions
This sub-section describes the scheme recommendation and solutions from the perspective of
scheme design, scheme implementation and monitoring & evaluation, along with their mapping
with the issues and challenges described in the preceding sub-section.
Table 136: FMBAP – recommendations and solutions
Sl. No. Recommendations Findings
Scheme design
FMBAP – R1
Form committees at district, block and
village level with the objective of
community participation in planning of
projects and ensuring adequate O&M
of structural measures built for flood
control. Such committees at village
FMBAP – F1 and FMBAP
– F9
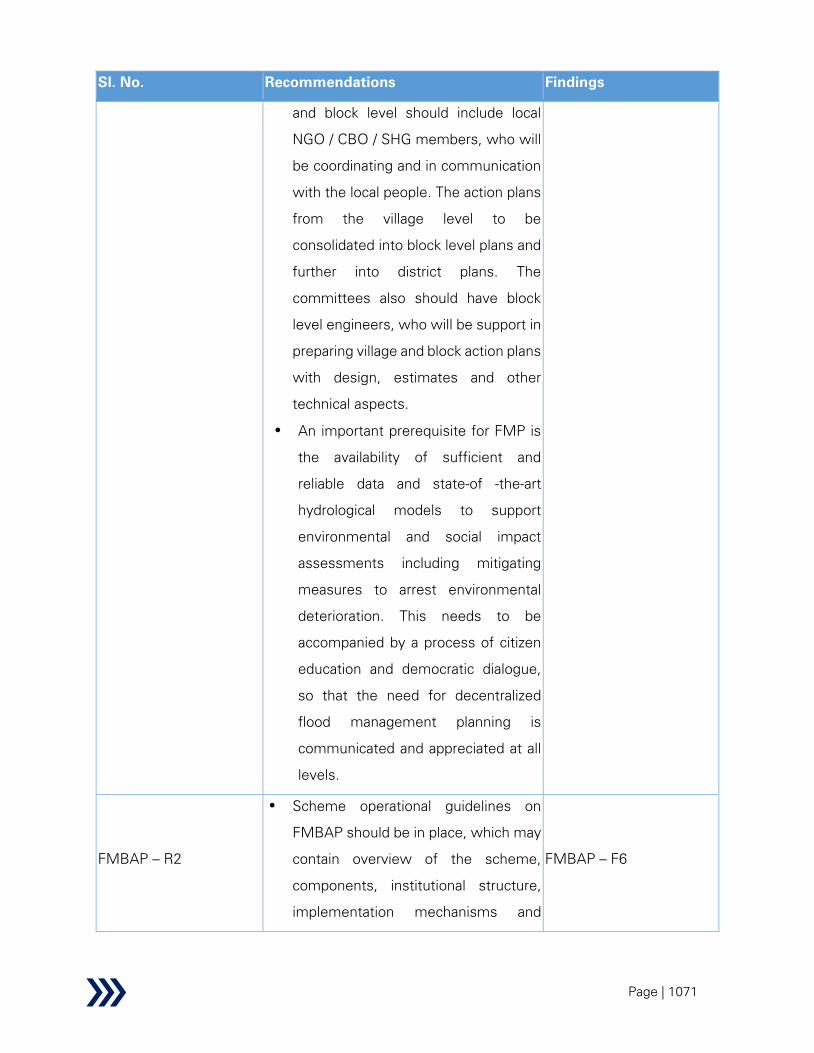
Page | 1071
Sl. No. Recommendations Findings
and block level should include local
NGO / CBO / SHG members, who will
be coordinating and in communication
with the local people. The action plans
from the village level to be
consolidated into block level plans and
further into district plans. The
committees also should have block
level engineers, who will be support in
preparing village and block action plans
with design, estimates and other
technical aspects.
An important prerequisite for FMP is
the availability of sufficient and
reliable data and state-of -the-art
hydrological models to support
environmental and social impact
assessments including mitigating
measures to arrest environmental
deterioration. This needs to be
accompanied by a process of citizen
education and democratic dialogue,
so that the need for decentralized
flood management planning is
communicated and appreciated at all
levels.
FMBAP – R2
Scheme operational guidelines on
FMBAP should be in place, which may
contain overview of the scheme,
components, institutional structure,
implementation mechanisms and
FMBAP – F6

Page | 1072
Sl. No. Recommendations Findings
financial managements norms. Such
guidelines shall help all states in
following a uniform set of norms and
also shall help the Department of
Flood Management. DoWR in
effective monitoring.
FMBAP – R3
Preparation of Master Plan at state
level should be made mandatory and
should be a prerequisite for granting
approval of any new project
proposed. Preparation of basin-wide
master plans linking upstream, and
downstream zones should be
prioritised. The state specific master
plans should contain demographic,
morphological, environmental and
social information so that it becomes
a perspective plan and provides a
basis for scheme wise DPR
preparation.
FMBAP – F10
Scheme implementation
FMBAP – R4
Flood Plain Zoning: Flood Plain
Zoning Act should be enacted
immediately and necessary actions in
keeping with the provisions of the Act
should be implemented by the states.
Flood-plain zoning demarcates zones
or areas likely to be affected by floods
of different magnitudes or
frequencies and probability levels,
and specify the types of permissible
FMBAP – F2
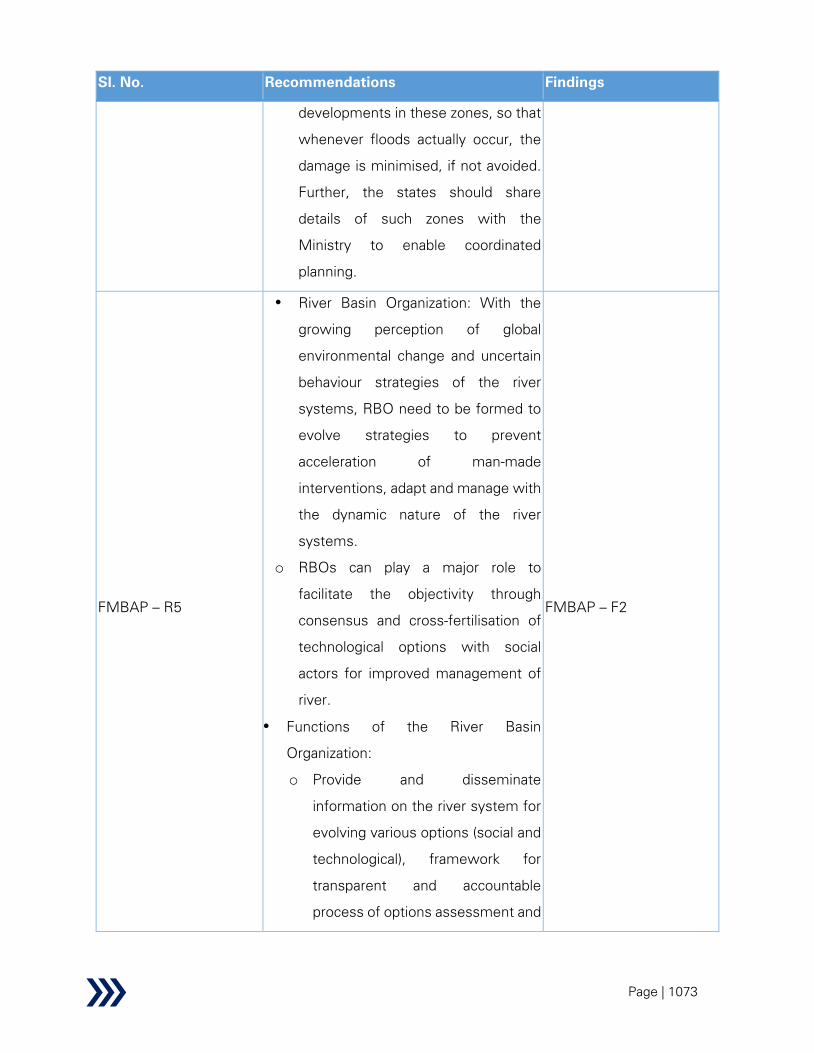
Page | 1073
Sl. No. Recommendations Findings
developments in these zones, so that
whenever floods actually occur, the
damage is minimised, if not avoided.
Further, the states should share
details of such zones with the
Ministry to enable coordinated
planning.
FMBAP – R5
River Basin Organization: With the
growing perception of global
environmental change and uncertain
behaviour strategies of the river
systems, RBO need to be formed to
evolve strategies to prevent
acceleration of man-made
interventions, adapt and manage with
the dynamic nature of the river
systems.
o RBOs can play a major role to
facilitate the objectivity through
consensus and cross-fertilisation of
technological options with social
actors for improved management of
river.
Functions of the River Basin
Organization:
o Provide and disseminate
information on the river system for
evolving various options (social and
technological), framework for
transparent and accountable
process of options assessment and
FMBAP – F2

Page | 1074
Sl. No. Recommendations Findings
management interventions
pertaining to flood control
o The RBO can then prioritise the
complementary management
intervention for implementation in a
phased manner. This will enable
the RBO to equip itself with various
interest groups with a new kind of.
professionalism for community
participation and spreading river
basin management particularly
focussing on flood management.
FMBAP – R6
River dredging: Dredging of the river
would dig out sediments from the
riverbed and will increase the water
retention capacity of the river.
Consequently, the pressure on the
banks would be reduced minimizing
the chances of flood and erosion. An
initiative taken by the Govt. of Assam
as a solution to the mayhem of flood
and erosion that has gobbled up huge
mass of land on both bank of the
mighty river Brahmaputra is the
dredging of the river. This initiative
will allow more water to stay in the
river and reduce flooding. Selective
desilting/dredging at
outfalls/confluences or local reaches
can, also can be adopted as a
measure to tackle the problem locally.
FMBAP – F6

Page | 1075
Sl. No. Recommendations Findings
Monitoring and Evaluation
FMBAP – R7
An online database and monitoring
tool containing data pertaining to
structural measures undertaken
under FMBAP as well as real-time
flood forecasting information should
be created. This comprehensive
database will be useful for integrated
planning by states, monitoring of
works by agencies such as CWC /
GFCC & BB, states and districts, and
for disaster response agencies in
accessing timely information on
floods.
The online database should be
supported with a dashboard.
Although a dashboard (http://pmksy-
mowrnic.in/fmbap/) exists, but it
primarily contains graphical
representations of state-wise and
year wise release of Central Shares
for Flood Management Programmes
(FMP) and River Management
Activities and Works Related to
Border Areas (RMBA). State-wise
physical progress of ongoing FMBAP
and State sponsored schemes need
to be represented in the dashboard.
State specific FMIS as in case of Bihar
and Uttar Pradesh need to be re-
designed in a way so that it contains
FMBAP – F8
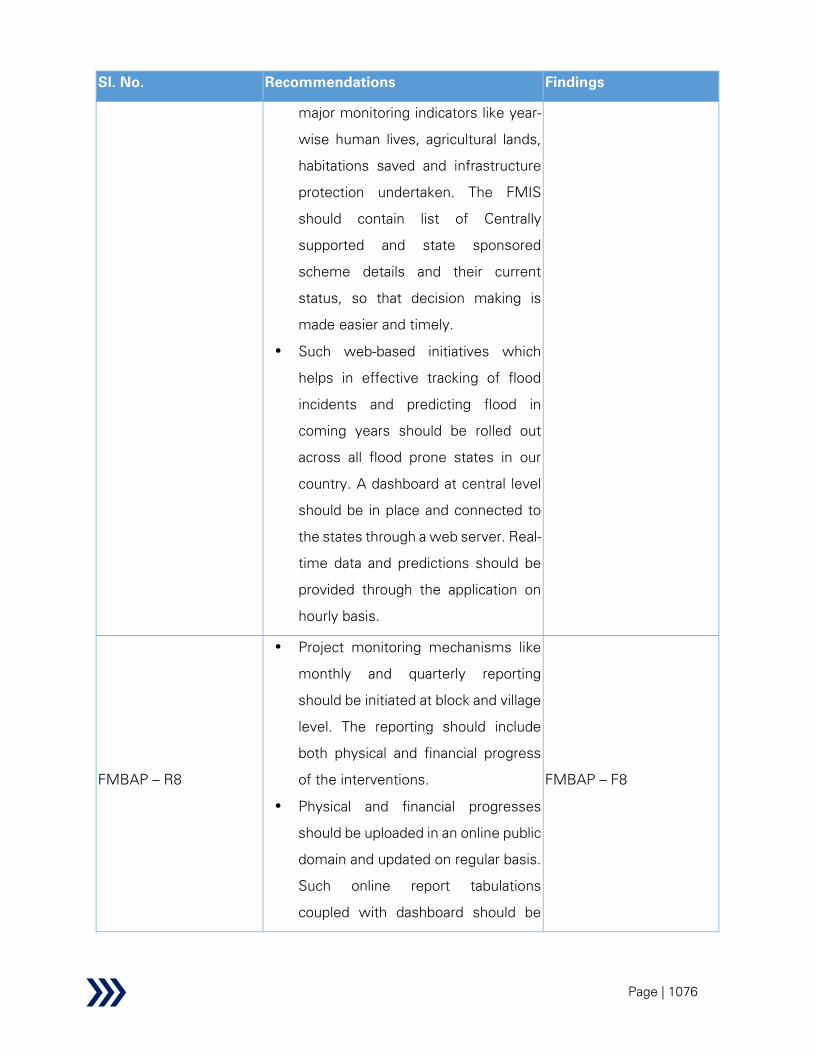
Page | 1076
Sl. No. Recommendations Findings
major monitoring indicators like year-
wise human lives, agricultural lands,
habitations saved and infrastructure
protection undertaken. The FMIS
should contain list of Centrally
supported and state sponsored
scheme details and their current
status, so that decision making is
made easier and timely.
Such web-based initiatives which
helps in effective tracking of flood
incidents and predicting flood in
coming years should be rolled out
across all flood prone states in our
country. A dashboard at central level
should be in place and connected to
the states through a web server. Real-
time data and predictions should be
provided through the application on
hourly basis.
FMBAP – R8
Project monitoring mechanisms like
monthly and quarterly reporting
should be initiated at block and village
level. The reporting should include
both physical and financial progress
of the interventions.
Physical and financial progresses
should be uploaded in an online public
domain and updated on regular basis.
Such online report tabulations
coupled with dashboard should be
FMBAP – F8

Page | 1077
Sl. No. Recommendations Findings
based on the monthly / quarterly
reports obtained from the States.
FMBAP – R9
The concurrent evaluation of the
schemes should include scope of
evaluating not only the techno-
economic aspects of a flood control
scheme but also the socio-economic
aspects viz., livelihood status before
and after completion of the structural
measure. Additionally, it should also
include environmental factors like salt
intrusion of water, loss of vegetation,
etc. A central database containing all
concurrent evaluations should be in
place for use by researches and policy
makers.
Regular third-party evaluation should
be mandatorily done by the States,
wherein a holistic assessment of
benefits is made at regular interval of
time. Project-wise interim evaluation
reports by third parties may be a pre-
condition to fund release for
subsequent instalments.
FMBAP – F8
Case Study I
1. Scheme details:
a. Scheme Name: Channelization of Swan River
b. Target Area: Swan River watershed, Una district, Himachal Pradesh
c. Total Project Cost: Rs. 945.49 Cr.
d. Scheme Outline:
Page | 1078
i. Afforestation
ii. Civil works for soil and river management (check dams and embankments,
etc.)
iii. Soil protection and land reclamation (terracing and soil addition, etc.)
iv. Livelihood improvement activities (agricultural development, small-scale
infrastructure installation, income generating activities, etc.)
v. Institutional building (purchase of equipment, training, hiring of facilitators,
etc.)
e. Implementing Agency: Forest Department and Irrigation and Flood Control
Department, Government of Himachal Pradesh
f. Area covered: 95 Gram Panchayats of Una District, within which 61, 900 Ha of
land were treated to protect the lands from soil erosion and floods, regenerate the
forest cover and enhance agricultural productivity.
2. Background: District Una is situated on the bank of Swan River, which flows from North
to West direction. This river during monsoon period creates devastating floods in District
Una. Due to continuous silting, the bed of Swan River had risen constantly due to which
meandering action took place. The width of the river had increased, and fertile land
situated on both banks was turning barren due to silt deposits. Besides, some of the
fertile land situated near the banks had been lost during the floods.
Approximately, 10,000 Ha. of agriculture land was affected by floods and annually 2,000
Ha. of fertile land were not being cultivated due to fear of floods. During the past 10-12
years extensive damage to civil structures, properties, human life and livestock had
happened. The estimated loss to crops and property was to the extent of Rs. 15 Cr. per
annum.
3. Project implementation: The forest department was the nodal department for the
project. The participating line departments were agriculture, horticulture and animal
husbandry. The overall administration, planning and implementation of the project was
with the Project Management Unit (PMU). The Chief Project Director was the overall in
charge of the Project and responsible for all administration and financial matters and
maintaining liaison with the government. He was assisted by a team of Additional
Director, Joint Director (administration), Deputy Project Directors Agriculture,
Horticulture, Animal Husbandry, Social Development Expert, Environment Education
Expert and Training Expert. Three Project Implementation Units were established at Una,

Page | 1079
Amb, and Gagret headed by the Deputy Directors. At Panchayat level Panchayat
Development Committees (PDCs) were established in all the 96 Gram Panchayats of the
Project area.
The Detailed Project Report for providing embankments on both banks of Swan River for
a length of 16.67 km. from Jhalera bridge to Santokhgarh bridge in Phase-1 was prepared
based on mathematical modelling studies carried out by Central Water Power Research
Station (CWPRS), Pune. This project amounting to Rs. 102.71 Cr. was accepted by the
Technical Advisory Committee of Ministry of Water Resources, Govt. of India. For
integrated approach to the project it was proposed to treat entire catchment instead of
just the sanctioned portion of 16.67 km. In all 42 most vulnerable points requiring
emergent flood control works were identified and of these 40 have since been completed
at a cost of Rs. 9.28 Cr. An additional amount of Rs. 24.57 Cr. has been approved under
NABARD for phase-I.
Also, a provision has been made of Rs. 106.83 Cr. for treatment of catchment area of
tributaries falling from Jhalera bridge to Santokhgarh bridge. The Forest Department has
planted around 60,000 trees of different varieties, in 50 ha.,. In addition to this, check
dams in the tributaries and planting of grass and bushes for bank protection have also
been done.
4. Community involvement: People's participation was key to the success of this project
and community participation was seen as an important aspect. No fund had to be
allocated for land acquisition as the villagers had come forward and donated their land for
the project. This saved around Rs. 500 Cr. The people donated their land with the
expectation that the agriculture in the remaining portion of land after construction of the
project would give them better returns. The report by JICA says that “The project will be
implemented on national forests and on private land chosen through community
participation. The project will not involve any land acquisition or involuntary resettlement.”
5. Impact: The Swan River Project has benefitted the villages situated by the side of the
river from the massive erosion and siltation caused by the flash floods. The villagers of
Una, Amb and Gagret villages had contributed their land for construction of the
embankment. The Focus Group Discussion with villagers of Una captured ”Since the
Channelization of Swan River has been implemented by the Government, it changed our
destiny for better as today, we are earning a reasonable money by producing seasonal
Page | 1080
vegetables and cash crops on the reclaimed land and have shifted back to our traditional
vocation of farming”.
a. The analysis of cropping pattern revealed that the total area under cereals
decreased from 69% to 54%; however, with the increase in the irrigation facilities
by the project interventions, the area under vegetable crops increased from 31%
to 46 % of total cropped area. The cropping intensity increased from 193% to
199% after the project implementation.
b. During the project implementation period, the average size of livestock unit
increased from 1.62 to 2.71. The share of milk to the total income from livestock
was found to be highest among different livestock products.
c. As a result of proportionate increase in the income from agricultural crops, fruit
crops and livestock by about 43%, 35%, and 55%, respectively, the overall farm
income has increased by 50 per cent during the project implementation period.
d. The employment generation in field crops has increased with the implementation
of the project. The annual per farm labour employment in horticulture and
livestock, showed an increase of 213% and 65%, respectively on overall farms
situation.
e. Commodity-based groups formed under the project were found to be facilitators
for other members in arranging critical inputs. They were doing pioneering
services with respect to production and marketing of produce.
Case Study II
1. Project details:
a. Scheme Name: Flood Management Information System (FMIS)
b. Target Area: Bihar
c. Total Project Cost: Bihar – Rs. 10.86 Cr. funded by World Bank
d. Scheme Outline:
i. Development of technical and institutional capacity of the State for flood
management
ii. Improved flood forecasting in terms of lead time and accuracy
iii. Prediction of expected inundation
iv. Development of updated flood control manuals
v. Upgrading hydrologic measurements

Page | 1081
vi. Use of Online Analytical Processing (OLAP) and data mining tools for
planning of schemes using forecasted data
vii. Preparation of a comprehensive Embankment Asset Management
System: Embankment Asset Management System (EAMS) for Bagmati-
Adhwara basin up to Dumri bridge intends to support flood management
functions including maintenance and strengthening of existing
embankment, anti-erosion works and flood-fighting measures etc. It would
also assist in developing further flood management measures which may
include planning of additional new flood control structures. The
development of community participation for embankment surveillance and
to update embankment safety information in the EAMS will be piloted.
e. Implementing Agency: Flood Management Information System Cell (FMISC),
Government of Bihar
f. Area covered: Phase – I : Flood prone area in North Bihar, from Burhi Gandak river
in the west to Kosi river in the east, including the districts of East Champaran,
Muzaffarpur, Begusarai, Samastipur, Dharbanga, Sitamarhi, Sheohar, Madhubani,
Supaul, Saharsa, and Khagaria covering about 26,000 sq. km. in area.
Phase – II: Entire North Bihar together with Patna, Bhagalpur and Munger district
have been targeted to be developed.
2. Background: Flood Management Information System, Bihar finds its genesis in the
brainstorming meeting on Jan 18, 2006 in which the Government of Bihar (GoB) and the
World Bank agreed on a water sector partnership matrix and action plan in three-time
horizons. In the short term, it was proposed to improve the technical and institutional
capacity of the State of Bihar for flood management, introduce the extensive use of
modern information technologies and develop and implement a comprehensive Flood
Management Information System (FMIS) in priority areas. Flood Management Information
System Cell (FMISC) was created under the overall supervision of Chief Engineer (CE),
Monitoring and Planning, in Water Resources Department (WRD), GoB, and under
Superintending Engineer (SE), Flood Monitoring Circle, to develop and operate the Flood
Management Information System (FMIS) with technical assistance from the World Bank.
Currently, one Executive Engineer as In-Charge, and six Assistant Engineers (and one
peon) have been deputed to FMISC.
Major functions of FMISC are:

Page | 1082
To ensure operational readiness of FMIS prior to each flood season.
To operate and disseminate information products as per plan and schedule.
To respond to emergency data requirements through the use of FMIS.
To follow-up on dissemination to enable effective utilization.
To analyze feedback and experience of every flood season for improving FMIS.
3. Scheme implementation: The FMIS in the first stage covered the focus area from Burhi
Gandak River in the west to Kosi River in the east in North Bihar that is most flood prone
area in the State. This included 11 districts i.e. East Champaran, Sheohar, Sitamarhi,
Muzaffarpur, Madhubani, Dharbanga, Samastipur, Supaul, Saharsa, Khagaria, and
Begusarai covering 26,000 sq. km.
The FMIS Phase I was initiated in August 2006 and was scheduled to be completed by
31.10.07. The extension to the project till 30.06.08 was granted by the World Bank and
the project was completed and closed on this date. The project components included
development of FMIS, improved flood forecasting, Bihar Flood Information Website,
updated flood control manual, training and upgrading hydrologic measurements and
telemetry.
FMIS Phase-II started on 31-05-2010. In the meantime, the FMIS sustained itself on the
internal resources of the Water Resources Department from 01-07-2008 to30-05-2010.
The FMIS Phase II was scheduled to be completed by 31 December 2012, which was
extended till 30 Nov. 2014.
4. Impact: As a result of FMIS in Bihar, following achievements have been realized:
a. Flood modelling: Real-time Flood Forecasts are made using statistical and
deterministic model.
b. FMISC is coming out with monthly E-Bulletin since May-2007. This is an in-house
production and gives a brief account of activities in FMISC.
c. Flood Management Information System Cell, Bihar, Patna issues Daily Flood
Information Bulletin during monsoon season generally from 15th June to 15th
October. The bulletin carries information on observed rainfall in Nepal, Bihar and
three days maximum rainfall forecast from IMD and river water level for all six sub-
basins/rivers of North Bihar viz Gandak, Burhi Gandak, Bagmati (including Adhwara
group of rivers), Kamala, Kosi and Mahananda.

Page | 1083
d. Inundation Maps: These maps show a real extent of flood water spread. The
inundation extent is derived from RADARSAT Layers/Imagery provided by NRSC
in processed 1bit image format.
e. FMISC also supplements with regular embankment news, detailing the status of
embankments in Bihar. Embankment Assets Management System for Bagmati
and Kosi is currently functional and is providing up to date information on
Embankment conditions by collecting information from department officials and
select community members through field data collection application and SMS.
f. Following information products are regularly uploaded in the website for public
viewing:
i. Inundation map
ii. Flood intensity map
iii. Village level inundation map
iv. River status map during flood
v. Post flood River Status Map
Page | 1084
2.2.10 Impact Assessment Studies
Impact Assessment Studies (IAS), a centrally sponsored scheme, aims to conduct monitoring
and evaluation activities for AIBP projects under PMKSY.
The objectives of the scheme as available in the Monthly Newsletter of CWC (May 2019) are
stated below:
• Project analysis: Reviewing the performance of the project vis-à-vis envisaged targets and
evaluating the impact and outcomes of AIBP on irrigation projects.
• Implementation and O&M: It mainly involves the assessment of (i) extent of utilization of
irrigation potential created; (ii) strength and weakness of projects; (iii) nature & effectiveness
of procedures/modalities being used for equitable and effective distribution of water; and (iv)
the nature & extent of activities taken up for promoting participation of grass root level
stakeholder/local community in planning, implementation and maintenance of assets created
under the project.
• Impact evaluation: It mainly involves evaluation of the nature & effectiveness of On-Farm
Development (OFD) works; nature & extent of socio-economic development; changes in
environment/ecology; extent of acceptability of project; purpose for which the acquired land
is used; seek the perception, views and opinions of projects beneficiaries; and assess the
nature & extent of rehabilitation of displaced families.
2.2.10.1 Background
The guidelines for PMSKY stipulate that Government of India may retain 1.5% of PMKSY
provision for information, education and communication (IEC) activities and another 1.5% for
administrative, monitoring, evaluation and any contingencies that may arise during the
implementation of the scheme by each participating department. The IAS scheme was
introduced in view of the substantial expenditure by the government towards creation of irrigation
potential and the lack of assessment studies of the sub-components of PMKSY. Such analysis
would also lead to identification of gaps and aid in overall streamlining of the PMKSY scheme.
Since its inception, the IAS scheme has successfully conducted impact assessment for 10
completed AIBP projects.
Page | 1085
The scope of issues to be covered under the impact assessment studies (conducted for 10
completed AIBP projects247
), can be divided under the broad heads as follows:
• Procedural parameters:
- Status of project at the time of inclusion under AIBP
- Status of efforts made for equitable distribution of water, people’s participation at
different stages of the project
- Number of projects out of total irrigation projects in the state have been included under
AIBP
- Status of funds received other than AIBP for completion
• Planning and execution:
- Quality of construction of various components of the project
- Review whether the work has been carried out following the original approved DPR or
has been revised for completion
- Status of people’s participation in completion of the project
- Status of monitoring mechanism available for resolving inter-departmental and inter-
ministerial issues
- Status of Command Area Development programme
• Financial aspects:
- Status of the cost of the project whether completed as per the original estimation or
revised in due course of time and effect of revision on cost escalation
- Review whether the Ministry has released central assistance as per MoU on time
- Review whether the states have released their share and central assistance to the
implementing agencies on time
- Status of financial management in project implementation
- Cost benefit ratio
- Reasons for cost escalation/ revision, time taken in releasing an adequacy of funds for
physical works schedule
• Hydrological parameters:
- Status of IPC and IPU before and after inclusion under AIBP
247 MoWR, RD & GR (2016), RFP for Appointment of Consultant for Impact Assessment of AIBP on 10 Completed
Projects Selected from Five Regions

Page | 1086
- Status and efficacy of On-farm Development (OFD) works
- Increase in groundwater table in the project area before and after the project
- Status of drainage system in the area with and without the project
- Extent of water-logged area before and after the project
• Impact assessment parameters:
- Coverage in terms of whether the scheme has reached the un-served areas, different
classes of users and tail end users have been benefitted
- Impact on agricultural yield and productivity in the project area as a result of
implementation of the project
- Whether sustainable practices, such as water-use efficiency, water footprint, conjunctive
use of water etc, are followed
- Extent to which cost recovery through user charges has been achieved from different
classes of users
- Use and promotion of innovation and technology in planning and implementation of
scheme and managing operations
• Outcome of project:
- Estimate social-cost benefit of implementation of the scheme and comparison of the
projected vs actual benefits
- Change in cropping pattern and crop rotation
- Increase in irrigation intensity
- Increase in groundwater
- Change in economic status of the people residing in the area
- Status of rehabilitated families in the project area
- Overall impact of the project in the area
2.2.10.2 Performance
An impact assessment study of 10 completed AIBP projects was conducted by Academy of
Management Studies (AMS), Lucknow at a cost of Rs.60 lakh.

Page | 1087
Table 137: IAS – List of completed projects248
# Project Name Beneficiary state
1 Shahnehar Project Himanchal Pradesh
2 Providing Kharif Channel in Hindon
Krishni Doab (HK Doab) Project Uttar Pradesh
3 Hawaipur Lift Irrigation Scheme Assam
4 Upper Kolab Irrigation Project Odisha
5 Jhuj Irrigation Project Gujrat
6 Mahi Bajaj Sagar Project Rajasthan
7 Priyadarshini Jurala Project Telangana
8 Maskinala Medium Irrigation Project Karnataka
9 Purna Medium irrigation Maharashtra
10 Sindh Phase I Project Madhya Pradesh
Table 138: IAS: Financial Progress249
(Rs. Cr.)
Scheme 2015-16 2016-17 2017-18 2018-19 2019-20
Budget
est.
Actual
exp.
Budget
est.
Actual
exp.
Budget
est.
Actual
exp.
Budget
est.
Actual
exp.
Budget
est.
Exp
up to
Sep
2019
Impact
Assessment
Studies
5.00 0.04 1.00 0.07 1.00 0.14 1.00 0.28 1.00 0.25
Performance on REESI+E framework
Table 139: IAS – Performance evaluation based on REESIE framework
Parameter Findings from research
Relevance
Secondary:
• Considering that large volume of capital was invested in the AIBP
projects, a need was felt to assess the impact created by AIBP projects
248 Impact Assessment of Accelerated Irrigation Benefits Programme on 10 completed projects selected from five
regions by AMS
249 Data shared by Mo WR, RD & GR on 1 Nov 2019
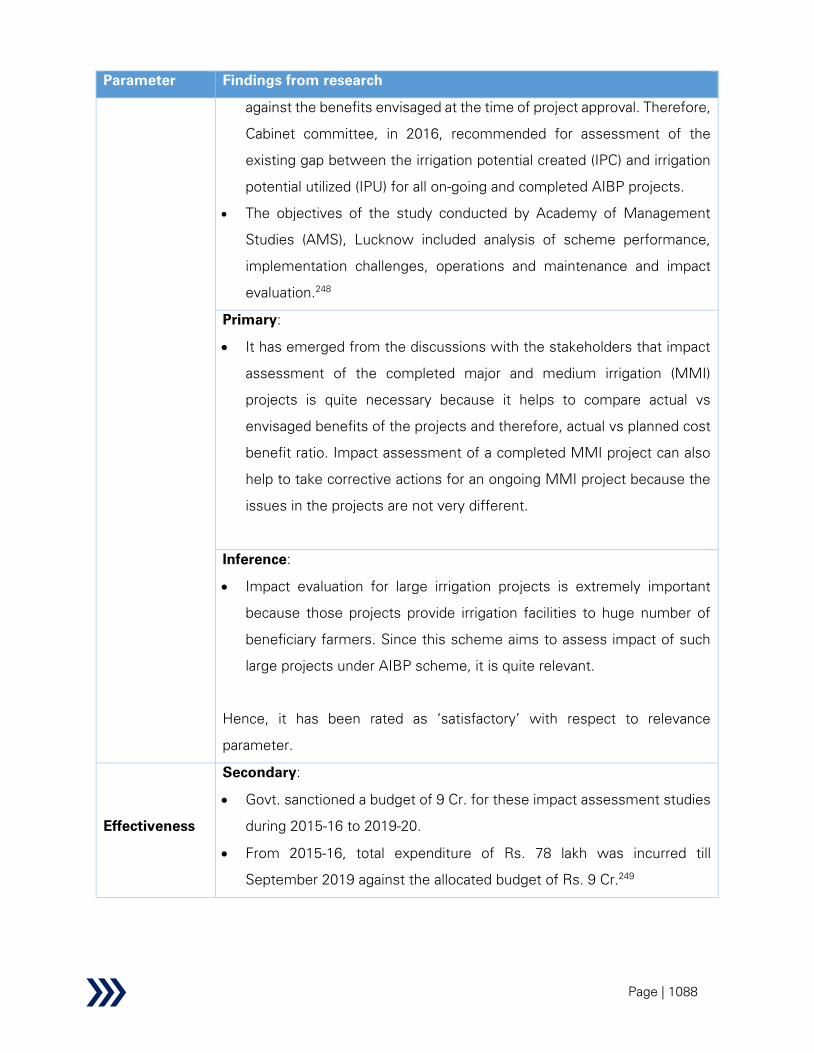
Page | 1088
Parameter Findings from research
against the benefits envisaged at the time of project approval. Therefore,
Cabinet committee, in 2016, recommended for assessment of the
existing gap between the irrigation potential created (IPC) and irrigation
potential utilized (IPU) for all on-going and completed AIBP projects.
• The objectives of the study conducted by Academy of Management
Studies (AMS), Lucknow included analysis of scheme performance,
implementation challenges, operations and maintenance and impact
evaluation.248
Primary:
• It has emerged from the discussions with the stakeholders that impact
assessment of the completed major and medium irrigation (MMI)
projects is quite necessary because it helps to compare actual vs
envisaged benefits of the projects and therefore, actual vs planned cost
benefit ratio. Impact assessment of a completed MMI project can also
help to take corrective actions for an ongoing MMI project because the
issues in the projects are not very different.
Inference:
• Impact evaluation for large irrigation projects is extremely important
because those projects provide irrigation facilities to huge number of
beneficiary farmers. Since this scheme aims to assess impact of such
large projects under AIBP scheme, it is quite relevant.
Hence, it has been rated as ‘satisfactory’ with respect to relevance
parameter.
Effectiveness
Secondary:
• Govt. sanctioned a budget of 9 Cr. for these impact assessment studies
during 2015-16 to 2019-20.
• From 2015-16, total expenditure of Rs. 78 lakh was incurred till
September 2019 against the allocated budget of Rs. 9 Cr.249

Page | 1089
Parameter Findings from research
• Under the scheme, an impact assessment study of 10 completed AIBP
projects by was completed by Academy of Management Studies (AMS),
Lucknow at a cost of Rs. 60 lakh.249
Primary:
• Only a miniscule amount has been incurred so far on these studies vis-
à-vis the allocated budget.
• It has emerged from the discussions with the stakeholders that impact
assessment of any MMI project is suitable only after 4-5 years post
completion of that project because it takes around 4-5 years for the
project to mature and start producing benefits, which were envisaged
during project inception. The 99 projects under PMKSY-AIBP will be
assessed after few years when these projects will reach their maturity
stage and can be considered for impact assessment.
Inference:
• 143 AIBP projects were completed by March 2014. However, impact
evaluation has been performed only for 10 projects during 2015-16 to
2019-20. It takes around 4-5 years for any MMI project to reap its
benefits. Still, impact assessment of any other project has not been
initiated despite substantial budget allocation for that. Hence, it can be
concluded that the scheme has not been effectively implemented so far.
Hence, the scheme has been rated as ‘needs improvement’ with respect to
effectiveness parameter.
Efficiency Data not available
Sustainability Data not available
Impact Data not available
Equity Data not available
A summary analysis and performance of the scheme on the identified themes is presented below:

Page | 1090
Table 140: IAS: Summary of performance evaluation based on REESIE
Parameter Performance
Relevance
Effectiveness
Efficiency
Sustainability
Impact
Equity
REESI+E performance infographics legend
High
Medium
Low
Not relevant
No information
2.2.10.3 Issues and challenges
This sub-section describes the scheme issues and challenges.
Table 141: IAS – Issues and challenges
Sl.no Issues & Challenges
IAS - F1
The scheme objectives are stated in the Monthly Newsletter of CWC (May
2019). However, no scheme related documents are available. Implementation
guidelines, institutional arrangements etc. are not specified anywhere.
IAS – F2
The progress of this scheme, impact assessment study reports, etc. are not
available in public domain.
2.2.10.4 Recommendations and solutions
This sub-section describes the scheme recommendations and solutions along with their mapping
with the issues and challenges described in the preceding sub-section.
Table 142: IAS – Recommendations and solutions
Sl.no Recommendation Finding
IAS - R1
Operational Guidelines should be published for this scheme. That
will help in understanding the implementation mechanism,
IAS-F1

Page | 1091
Sl.no Recommendation Finding
institutional arrangements, eligibility criteria, scope of assessment
etc.
IAS – R2
MIS of PMSKY-AIBP can be leveraged for tracking progress
(physical as well as financial) of this scheme. Also, impact
assessment study reports should be made available in PMKSY-AIBP
portal.
IAS-F2
Page | 1092
2.2.11 Other Schemes
In addition to the analysis of schemes presented above, two other schemes: viz. i) Atal Bhujal
Yojana and ii) Assistance for Sutlej Yamuna Link Project were originally proposed to be included
for analysis as per the terms of reference of this study. However, due to non-availability of
scheme related documents for the above two schemes at the time of writing this report, these
two schemes have not been taken up for further analysis. Brief summaries on these two
schemes are provided below.
2.2.11.1 Atal Bhujal Yojana
Government of India has announced the Atal Bhujal Yojana, a Central Sector Scheme, with the
aim to improve the situation of groundwater resources in India. The Union Cabinet gave approval
on 24 December 2019 for implementation of this scheme to be implemented over a period of
five years from 2020-21 to 2024-25 at a cost of Rs. 6,000 Cr. with assistance from World Bank.
This scheme has two major components:
Institutional Strengthening and Capacity Building: This component will work towards
strengthening institutional arrangements for sustainable groundwater management in the
selected states and improving monitoring networks, capacity building, strengthening of Water
User Associations etc.
Incentive Component: This component will work towards incentivising the beneficiary states for
achievements in improved groundwater management practices, such as data dissemination,
preparation of water security plans, implementation of management interventions through
convergence of ongoing schemes, adopting demand side management practices etc.
Background
Groundwater has significant contribution to irrigation (around 65% of total irrigated area) as well
as rural drinking water supply (around 85%) in India. However, the groundwater resources are
depleting due to the increasing demands of growing population, urbanization and industrialization.
In addition to that, unregulated groundwater extraction in many areas has caused rapid and
widespread decline in groundwater levels as well as hampered the sustainability of groundwater
abstraction structures. The deteriorating groundwater quality in some parts of the country has

Page | 1093
exacerbated the issues of low groundwater storage. Therefore, it is utmost necessary to take
preventive / remedial measures; otherwise, the increasing stress on groundwater due to over-
exploitation, contamination and associated environmental impacts will endanger the food security
of the nation.
In this context, the Mo WR, RD and GR has undertaken an initiative for ensuring long term
sustainability of groundwater resources through the Atal Bhujal Yojana (ATAL JAL) in identified
groundwater stressed blocks in seven states, representing a range of geomorphic, climatic and
hydrogeologic and cultural settings. The Central Groundwater Authority (CGWA) will be
responsible for regulating groundwater development under this scheme.
Objective
The objective of this scheme is sustainable management of groundwater resources across
priority areas in the country through strengthening the institutional framework for participatory
groundwater management and bringing about behavioural changes at the community level. The
identified over-exploited and water-stressed areas for the scheme fall across Gujarat, Haryana,
Karnataka, Madhya Pradesh, Maharashtra, Rajasthan and Uttar Pradesh.
The scheme aims to provide benefits to nearly 8,350 Gram Panchayats in 78 districts in the
beneficiary states.
Funding
The funding for the scheme shall be shared equally (i.e. 50:50) between the Government of India
and the World Bank. The funds will be made available to the participating states as grants.
Primary Activities
• Institutional strengthening for improving groundwater monitoring networks and capacity
building of stakeholders at different levels which will enhance groundwater data storage,
exchange, analysis and dissemination
• Improved and realistic water budgeting based on an improved database and preparation of
community-led Water Security Plans at Panchayat level
• Implementation of Water Security Plans through convergence of various ongoing/new
schemes of the Government of India and State Governments to facilitate judicious and
effective utilization of funds for sustainable groundwater management

Page | 1094
• Efficient use of available groundwater resources with emphasis on demand side measures
such as micro-irrigation, crop diversification, electricity feeder separation, etc.
Benefit
• This scheme will help in achieving source sustainability for Jal Jeevan Mission in the project
area with active participation of local communities
• This scheme will contribute towards the goal of doubling the farmers’ income
• This scheme will promote participatory groundwater management
• This scheme will help in improving water use efficiency on a mass scale and cropping pattern
• This scheme will help in promoting efficient and equitable use of groundwater resources
and behavioural change at the community level
Evaluation
Since the scheme was approved very recently in December 2019 and scheme guidelines are not
available, evaluation of this scheme has not been taken up. However, considering the current
context as outlined in the above, this scheme is quite relevant, and it is expected to play an
important role in groundwater resource management.
2.2.11.2 Assistance for Sutlej Yamuna Link Project
Sutlej Yamuna Link (SYL) project is a proposed canal of more than 200 km with about 121 km in
Punjab and 90 km in Haryana and is designed to convey 3.45 million acre feet (MAF) out of 3.5
MAF of Haryana’s average annual share of surplus Ravi-Beas waters as per a 1981 agreement
between the Governments Punjab, Haryana and Rajasthan. Once complete, the project will
irrigate 4.46 lakh ha. in Haryana and 1.28 lakh ha. in Punjab and generate 50 MW of power.
Construction of Haryana’s portion of the canal is complete. Punjab’s portion of the canal has not
been completed and project is stalled due to differences between the Governments of Punjab
and Haryana for the past several decades.
Since no information about this scheme was available, this scheme has not been evaluated.

Page | 1095
2.3 Scheme Level Summary
2.3.1 Performance Summary on REESI+E Framework
Summary analysis of the performance of all the schemes based on the REESI+E framework is
presented below:
Table 143: Performance Summary on REESI+E Framework
Scheme
Name Relevance Effectiveness Efficiency Sustainability Impact Equity
AIBP
CADWM
RRR
SMI
GWI
SPFM
PDMC
WDC
IC
LTIF
NRCP
FMBAP
IAS
REESI+E performance infographics legend
Satisfactory
Average
Needs
Improvement
Not
applicable
No
information
2.3.2 Performance Summary on Cross-sectional themes
Summary analysis of the performance of all the schemes based on the identified cross-sectional
themes is presented below:
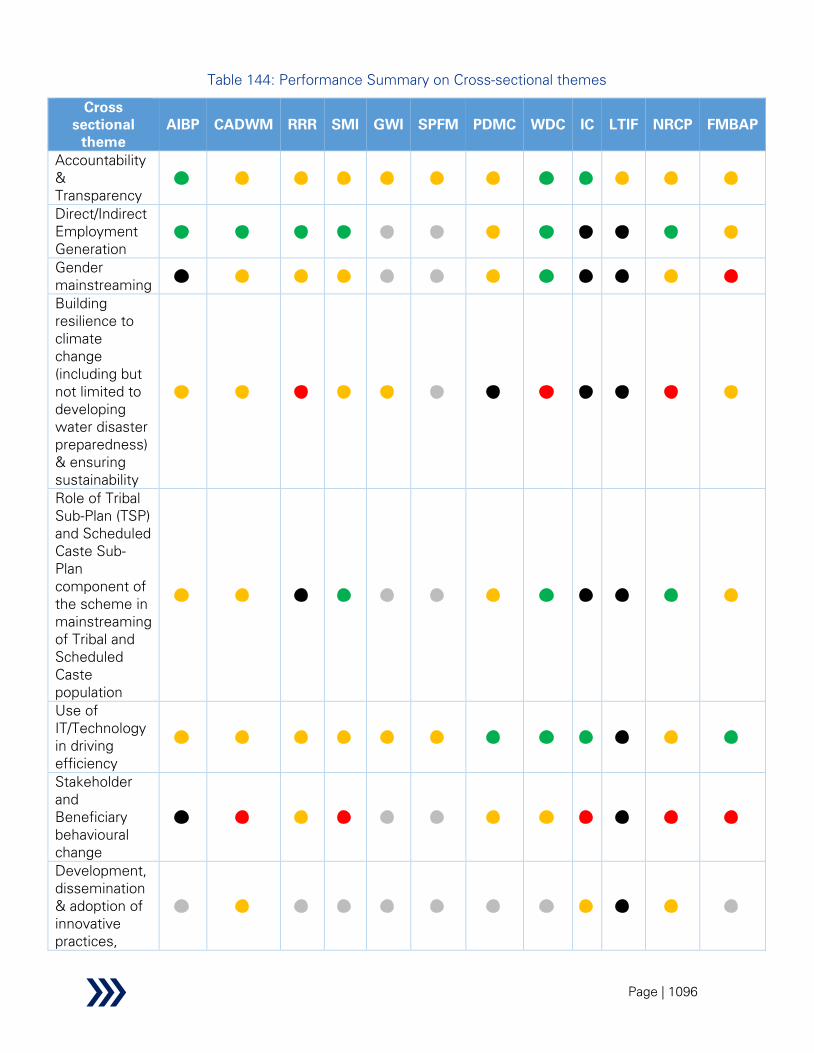
Page | 1096
Table 144: Performance Summary on Cross-sectional themes
Cross
sectional
theme
AIBP CADWM RRR SMI GWI SPFM PDMC WDC IC LTIF NRCP FMBAP
Accountability
&
Transparency
Direct/Indirect
Employment
Generation
Gender
mainstreaming
Building
resilience to
climate
change
(including but
not limited to
developing
water disaster
preparedness)
& ensuring
sustainability
Role of Tribal
Sub-Plan (TSP)
and Scheduled
Caste Sub-
Plan
component of
the scheme in
mainstreaming
of Tribal and
Scheduled
Caste
population
Use of
IT/Technology
in driving
efficiency
Stakeholder
and
Beneficiary
behavioural
change
Development,
dissemination
& adoption of
innovative
practices,
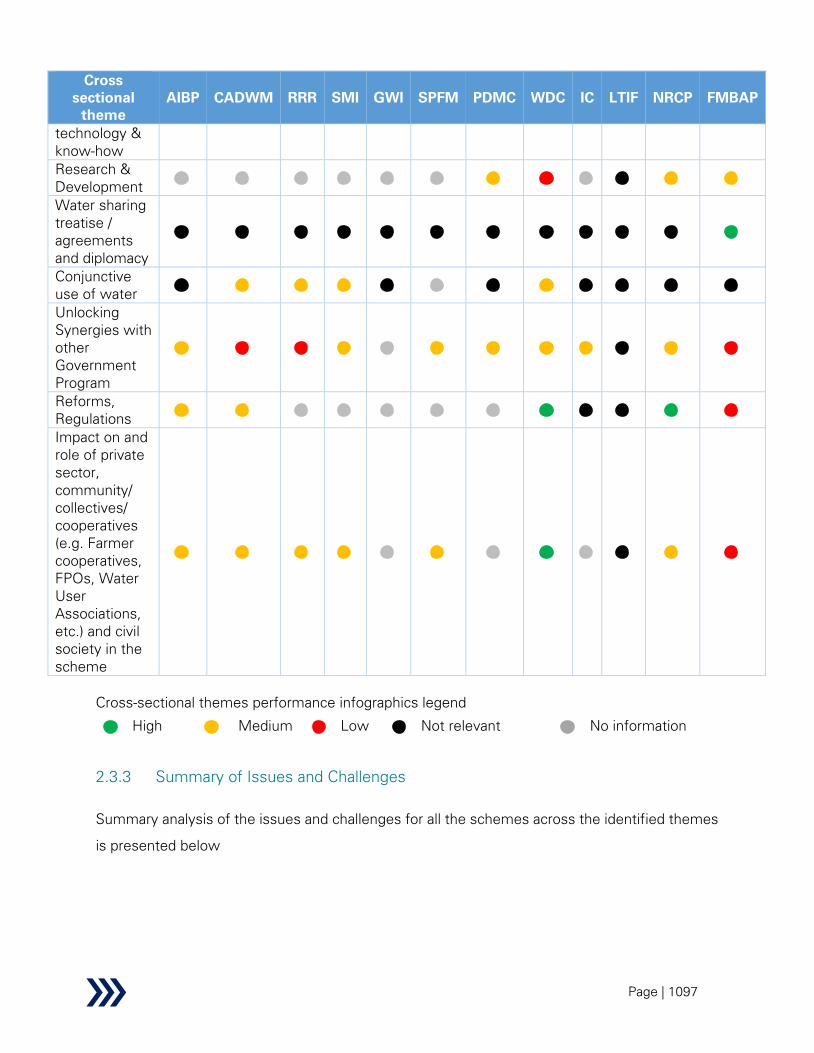
Page | 1097
Cross
sectional
theme
AIBP CADWM RRR SMI GWI SPFM PDMC WDC IC LTIF NRCP FMBAP
technology &
know-how
Research &
Development
Water sharing
treatise /
agreements
and diplomacy
Conjunctive
use of water
Unlocking
Synergies with
other
Government
Program
Reforms,
Regulations
Impact on and
role of private
sector,
community/
collectives/
cooperatives
(e.g. Farmer
cooperatives,
FPOs, Water
User
Associations,
etc.) and civil
society in the
scheme
Cross-sectional themes performance infographics legend
High
Medium
Low
Not relevant
No information
2.3.3 Summary of Issues and Challenges
Summary analysis of the issues and challenges for all the schemes across the identified themes
is presented below

Page | 1098
Table 145: Summary of Issues and Challenges
Scheme
Name
Institutional
Mechanism
&
Governance
Fund
Flow
Efficiency
and
utilisation
Unavailability
of resource
persons
Capacity
Building
Monitoring
and
Evaluation
Other
issues*
AIBP
CADWM
RRR
SMI
SPFM
PDMC
WDC
IC
LTIF
NRCP
FMBAP
* The ‘other issue’ observed for each scheme is as follows:
- for AIBP,CADWM, IC, NRCP, FMBAP: operational efficiencies
- SMI: non-usage of surface water schemes
- RRR: encroachment of surface water bodies
Performance infographics legend
Satisfactory Average Needs Improvement

Page | 1099
3 Conclusions and recommendations:
Water resources
3.1 Gap Analysis of Sectoral Issues
3.1.1 Interventions Gaps at Sector Level
As mentioned in the sector performance section, water resources are a vast sector comprising
several important sub-sectors. Some of the key sub-sectors include groundwater, surface water,
reservoirs and large irrigation projects, micro-irrigation, water consumption and demand
management and wastewater. In addition to the Ministry of Jal Shakti (GoI), various other central
government ministries as well as state line departments and MFIs have undertaken multiple
interventions to address the varied issues facing the water resources sector. A brief overview of
major central sector schemes (CS), centrally sponsored schemes (CSS), state schemes as well
as IFI sponsored key initiatives currently active in the water resources sector is summarised in
the table below. Only schemes having direct impact on the sector have been considered. The
table below also indicates the gap map, i.e. the specific issues which are currently not being
addressed by any major scheme or intervention. The list is indicative in nature and not exhaustive.
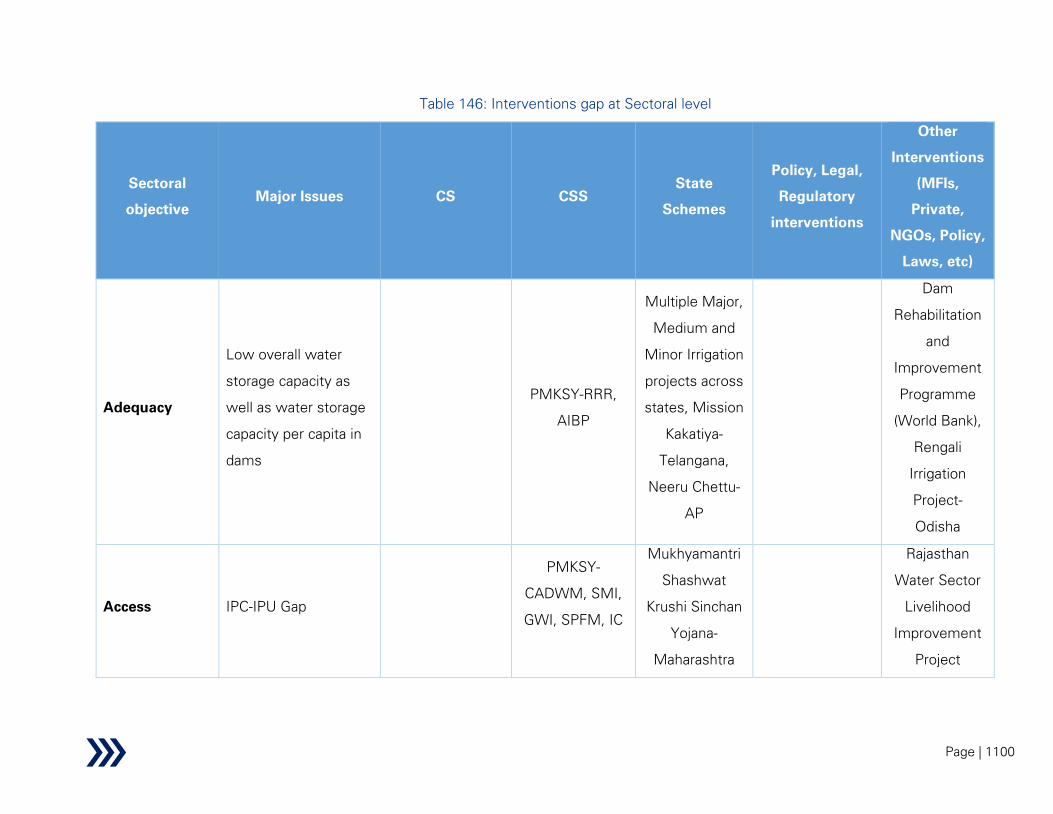
Page | 1100
Table 146: Interventions gap at Sectoral level
Sectoral
objective
Major Issues CS CSS
State
Schemes
Policy, Legal,
Regulatory
interventions
Other
Interventions
(MFIs,
Private,
NGOs, Policy,
Laws, etc)
Adequacy
Low overall water
storage capacity as
well as water storage
capacity per capita in
dams
PMKSY-RRR,
AIBP
Multiple Major,
Medium and
Minor Irrigation
projects across
states, Mission
Kakatiya-
Telangana,
Neeru Chettu-
AP
Dam
Rehabilitation
and
Improvement
Programme
(World Bank),
Rengali
Irrigation
Project-
Odisha
Access IPC-IPU Gap
PMKSY-
CADWM, SMI,
GWI, SPFM, IC
Mukhyamantri
Shashwat
Krushi Sinchan
Yojana-
Maharashtra
Rajasthan
Water Sector
Livelihood
Improvement
Project
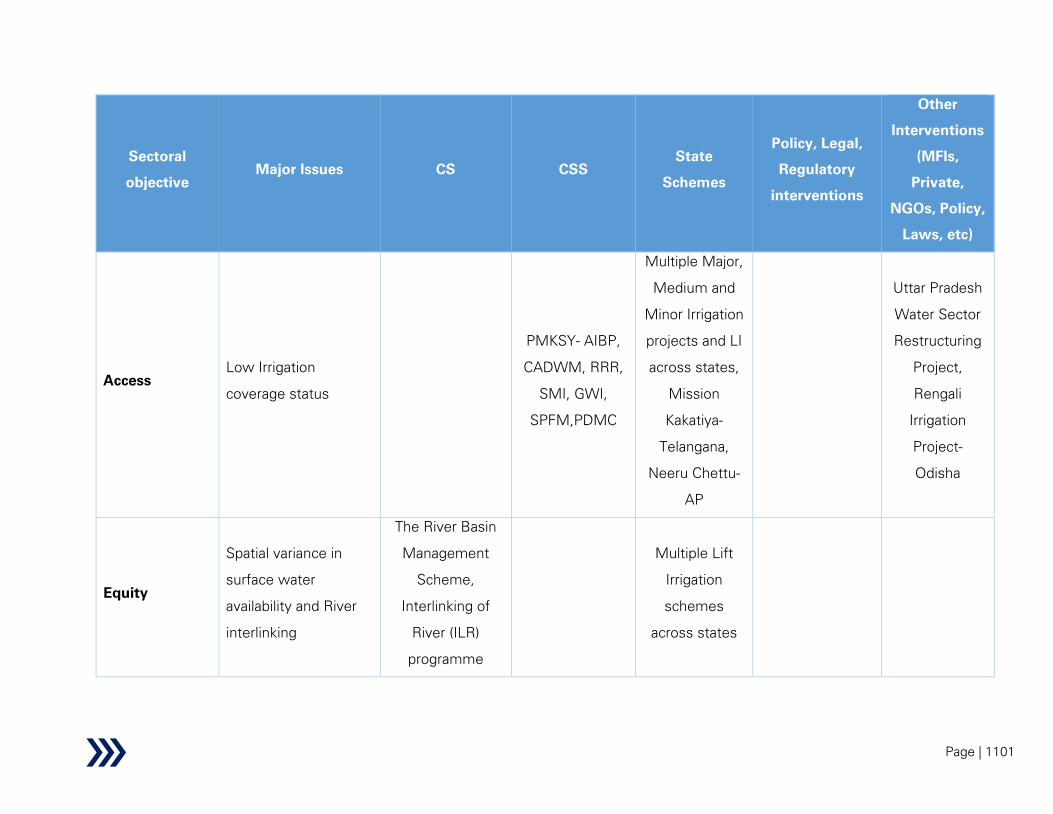
Page | 1101
Sectoral
objective
Major Issues CS CSS
State
Schemes
Policy, Legal,
Regulatory
interventions
Other
Interventions
(MFIs,
Private,
NGOs, Policy,
Laws, etc)
Access
Low Irrigation
coverage status
PMKSY- AIBP,
CADWM, RRR,
SMI, GWI,
SPFM,PDMC
Multiple Major,
Medium and
Minor Irrigation
projects and LI
across states,
Mission
Kakatiya-
Telangana,
Neeru Chettu-
AP
Uttar Pradesh
Water Sector
Restructuring
Project,
Rengali
Irrigation
Project-
Odisha
Equity
Spatial variance in
surface water
availability and River
interlinking
The River Basin
Management
Scheme,
Interlinking of
River (ILR)
programme
Multiple Lift
Irrigation
schemes
across states

Page | 1102
Sectoral
objective
Major Issues CS CSS
State
Schemes
Policy, Legal,
Regulatory
interventions
Other
Interventions
(MFIs,
Private,
NGOs, Policy,
Laws, etc)
Equity
Low efficiency of
canal network
PMKSY- AIBP,
CADWM, SPFM
Sustainability
High extraction of
groundwater and its
regulation
Participatory
Groundwater
Management,
Atal Bhujal Yojana
PMKSY- WDC,
Jal Shakti
Abhiyan
State GW Rules
Sustainability
High Dependency on
groundwater for
irrigation
PMKSY- AIBP,
SMI, WDC
Multiple Major ,
Medium and
Minor Irrigation
projects and LI
across states,
Mission
Kakatiya-
Telangana,
Neeru Chettu-
AP
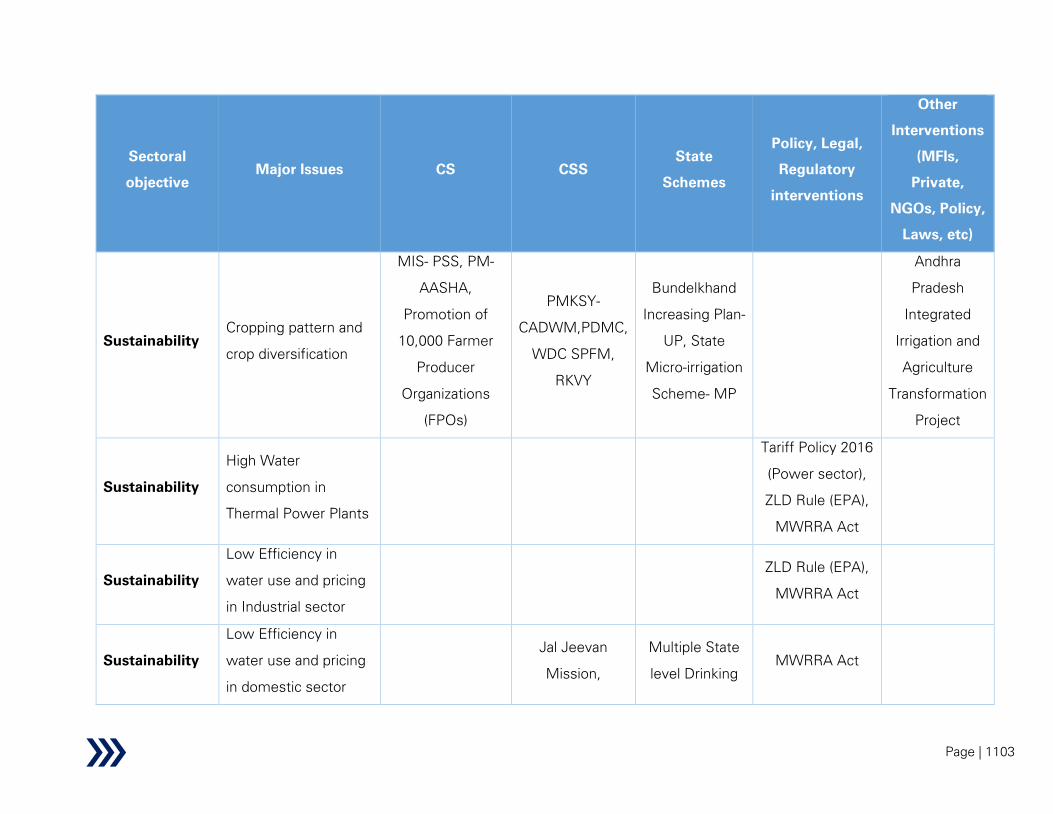
Page | 1103
Sectoral
objective
Major Issues CS CSS
State
Schemes
Policy, Legal,
Regulatory
interventions
Other
Interventions
(MFIs,
Private,
NGOs, Policy,
Laws, etc)
Sustainability
Cropping pattern and
crop diversification
MIS- PSS, PM-
AASHA,
Promotion of
10,000 Farmer
Producer
Organizations
(FPOs)
PMKSY-
CADWM,PDMC,
WDC SPFM,
RKVY
Bundelkhand
Increasing Plan-
UP, State
Micro-irrigation
Scheme- MP
Andhra
Pradesh
Integrated
Irrigation and
Agriculture
Transformation
Project
Sustainability
High Water
consumption in
Thermal Power Plants
Tariff Policy 2016
(Power sector),
ZLD Rule (EPA),
MWRRA Act
Sustainability
Low Efficiency in
water use and pricing
in Industrial sector
ZLD Rule (EPA),
MWRRA Act
Sustainability
Low Efficiency in
water use and pricing
in domestic sector
Jal Jeevan
Mission,
Multiple State
level Drinking
MWRRA Act

Page | 1104
Sectoral
objective
Major Issues CS CSS
State
Schemes
Policy, Legal,
Regulatory
interventions
Other
Interventions
(MFIs,
Private,
NGOs, Policy,
Laws, etc)
AMRUT, Smart
Cities
Water
schemes
Sustainability
O&M and financing
deficiencies
LTIF, PMKSY-
WDC, NRCP
Sustainability Climate Change
Climate Change
Action Plan
PMKSY- WDC,
Jal Shakti
Abhiyan
Maharashtra
Project on
Climate
Resilient
Agriculture
Sustainability
Lack of Micro level
information on all
depleted aquifers
NAQUIM
Sustainability
Gap between demand
and supply of water
Multiple
Schemes
Multiple
Schemes
Multiple
Schemes
Uttarakhand
Decentralized
Watershed
Development
II Project
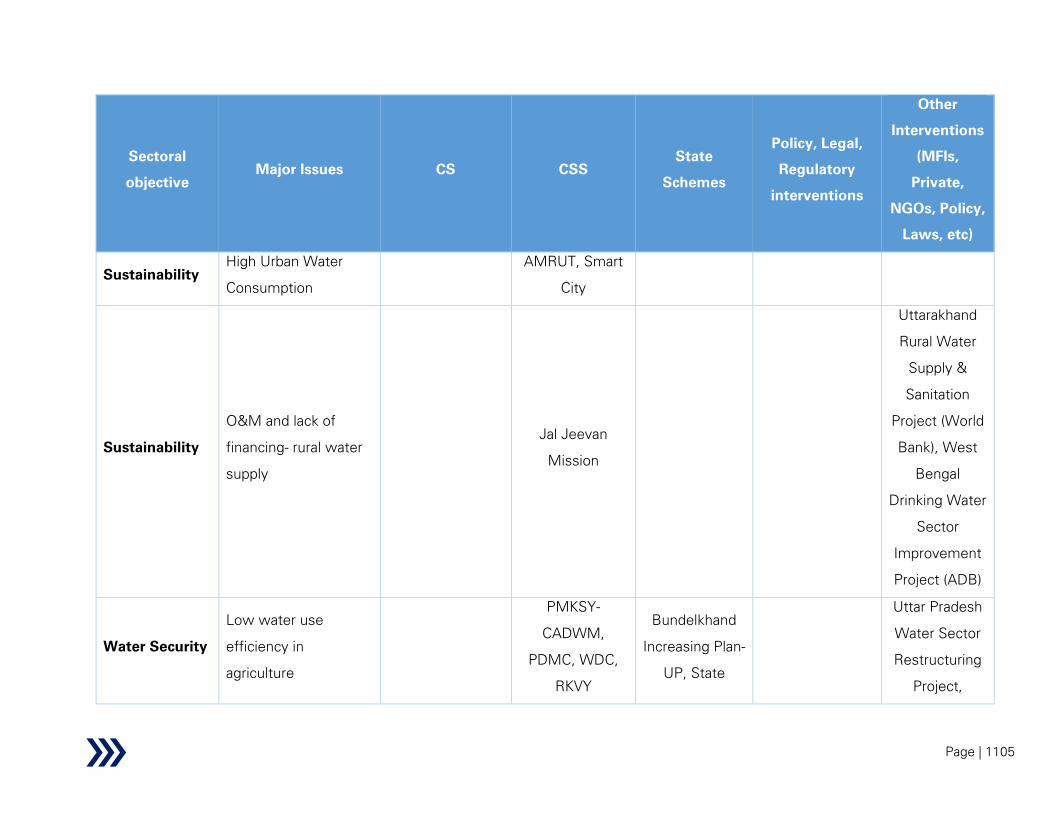
Page | 1105
Sectoral
objective
Major Issues CS CSS
State
Schemes
Policy, Legal,
Regulatory
interventions
Other
Interventions
(MFIs,
Private,
NGOs, Policy,
Laws, etc)
Sustainability
High Urban Water
Consumption
AMRUT, Smart
City
Sustainability
O&M and lack of
financing- rural water
supply
Jal Jeevan
Mission
Uttarakhand
Rural Water
Supply &
Sanitation
Project (World
Bank), West
Bengal
Drinking Water
Sector
Improvement
Project (ADB)
Water Security
Low water use
efficiency in
agriculture
PMKSY-
CADWM,
PDMC, WDC,
RKVY
Bundelkhand
Increasing Plan-
UP, State
Uttar Pradesh
Water Sector
Restructuring
Project,

Page | 1106
Sectoral
objective
Major Issues CS CSS
State
Schemes
Policy, Legal,
Regulatory
interventions
Other
Interventions
(MFIs,
Private,
NGOs, Policy,
Laws, etc)
Micro-irrigation
Scheme- MP
Andhra
Pradesh
Integrated
Irrigation and
Agriculture
Transformation
Project, Tamil
Nadu Irrigated
Agriculture
Modernization
Project
Water Security
Low Agriculture
Sector Contribution to
GDP
PM- KISAN, PM-
AASHA,
Promotion of
10,000 Farmer
Producer
Organizations
Uttar Pradesh
Water Sector
Restructuring
Project

Page | 1107
Sectoral
objective
Major Issues CS CSS
State
Schemes
Policy, Legal,
Regulatory
interventions
Other
Interventions
(MFIs,
Private,
NGOs, Policy,
Laws, etc)
(FPOs), Nutrient
Based Subsidy,
Transport and
Marketing
Assistance (TMA)
Scheme for
specified
agriculture
products,
Pradhan Mantri
Kisan Sampada
Yojana
Water Security
Using recycled water
for agriculture
PMKSY- PDMC,
Smart City,
AMRUT, SBM

Page | 1108
Sectoral
objective
Major Issues CS CSS
State
Schemes
Policy, Legal,
Regulatory
interventions
Other
Interventions
(MFIs,
Private,
NGOs, Policy,
Laws, etc)
Water Security
Effect of water stress
on households- Socio
Economic Impact
Jal Jeevan
Mission
State level
Drinking Water
programs
Uttarakhand
Rural Water
Supply &
Sanitation
Project (World
Bank), West
Bengal
Drinking Water
Sector
Improvement
Project (ADB)
Water Security
Effect of water stress
on households- Health
Impact
Jal Jeevan
Mission
State level
Drinking Water
programs
Uttarakhand
Rural Water
Supply &
Sanitation
Project (World
Bank), West

Page | 1109
Sectoral
objective
Major Issues CS CSS
State
Schemes
Policy, Legal,
Regulatory
interventions
Other
Interventions
(MFIs,
Private,
NGOs, Policy,
Laws, etc)
Bengal
Drinking Water
Sector
Improvement
Project (ADB)
Water Security
Water sharing treaties
/ agreements and
diplomacy
The River Basin
Management
Scheme,
Interlinking of
River (ILR)
programme
FMBAP
MWRRA Act,
Indus Water
Treaty, India-
Bangladesh
Treaty, Water
Disputes
Tribunal-
Godavari,
Krishna,
Narmada, Ravi,
Cauvery

Page | 1110
Sectoral
objective
Major Issues CS CSS
State
Schemes
Policy, Legal,
Regulatory
interventions
Other
Interventions
(MFIs,
Private,
NGOs, Policy,
Laws, etc)
Overall nature
and
responsiveness
of Water sector
planning
Need for better
Planning and data
management in the
sector
Water Resources
Information
System (WRIS),
National
Hydrology Project
(NHP),
National Water
Mission
Irrigation
Census, FMBAP
Reservoirs
Water Level
Monitoring
System-
Jharkhand, AP
WRIMS
North East
Water
Resources
Information
Base
Overall nature
and
responsiveness
of Water sector
planning
Requirement for
increase in
coordination between
the various central
government level
organisations and the
state government
departments
Multiple task
forces

Page | 1111
Sectoral
objective
Major Issues CS CSS
State
Schemes
Policy, Legal,
Regulatory
interventions
Other
Interventions
(MFIs,
Private,
NGOs, Policy,
Laws, etc)
Overall nature
and
responsiveness
of Water sector
planning
Groundwater Level
Monitoring
NHP APWRIMS
Overall nature
and
responsiveness
of Water sector
planning
Conjunctive use of
surface and
groundwater
NHP
Overall nature
and
responsiveness
of Water sector
planning
Water for
environmental needs
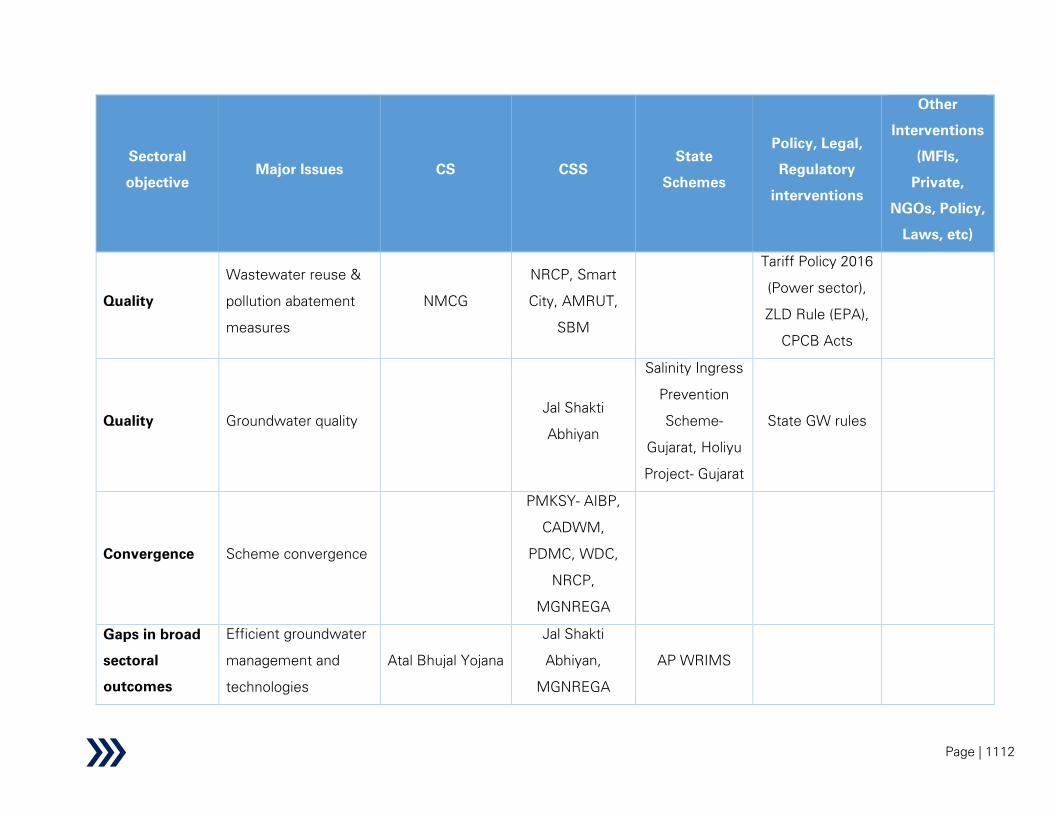
Page | 1112
Sectoral
objective
Major Issues CS CSS
State
Schemes
Policy, Legal,
Regulatory
interventions
Other
Interventions
(MFIs,
Private,
NGOs, Policy,
Laws, etc)
Quality
Wastewater reuse &
pollution abatement
measures
NMCG
NRCP, Smart
City, AMRUT,
SBM
Tariff Policy 2016
(Power sector),
ZLD Rule (EPA),
CPCB Acts
Quality Groundwater quality
Jal Shakti
Abhiyan
Salinity Ingress
Prevention
Scheme-
Gujarat, Holiyu
Project- Gujarat
State GW rules
Convergence Scheme convergence
PMKSY- AIBP,
CADWM,
PDMC, WDC,
NRCP,
MGNREGA
Gaps in broad
sectoral
outcomes
Efficient groundwater
management and
technologies
Atal Bhujal Yojana
Jal Shakti
Abhiyan,
MGNREGA
AP WRIMS

Page | 1113
Sectoral
objective
Major Issues CS CSS
State
Schemes
Policy, Legal,
Regulatory
interventions
Other
Interventions
(MFIs,
Private,
NGOs, Policy,
Laws, etc)
Gaps in broad
sectoral
outcomes
Wastewater reuse
policy
WW Reuse
policy- Gujarat,
Karnataka,
Punjab,
Rajasthan, etc.
Gaps in broad
sectoral
outcomes
Need for water
regulator for all states
and /or central
MWRRA Act,
Punjab Water
Resources
Ordinance- 2019,
UP Water
Management &
Regulatory
Commission Act-
2008, Jharkhand
WRRA- 2014,
J&K Water
Resources
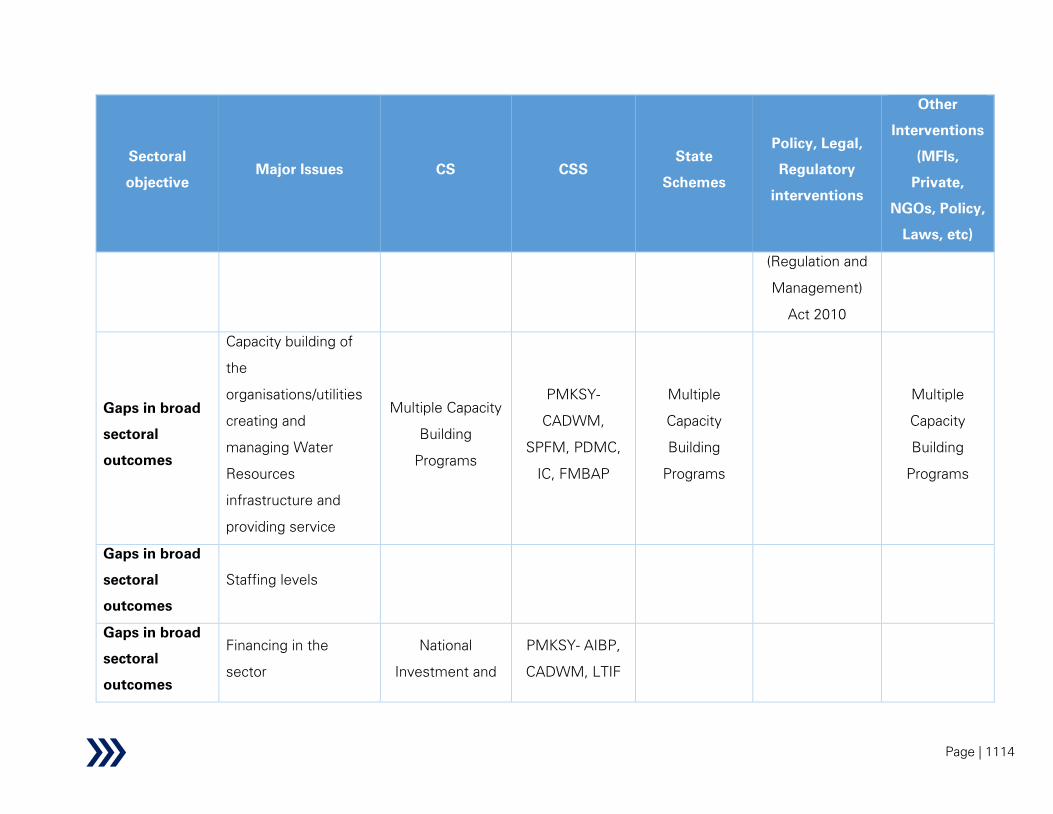
Page | 1114
Sectoral
objective
Major Issues CS CSS
State
Schemes
Policy, Legal,
Regulatory
interventions
Other
Interventions
(MFIs,
Private,
NGOs, Policy,
Laws, etc)
(Regulation and
Management)
Act 2010
Gaps in broad
sectoral
outcomes
Capacity building of
the
organisations/utilities
creating and
managing Water
Resources
infrastructure and
providing service
Multiple Capacity
Building
Programs
PMKSY-
CADWM,
SPFM, PDMC,
IC, FMBAP
Multiple
Capacity
Building
Programs
Multiple
Capacity
Building
Programs
Gaps in broad
sectoral
outcomes
Staffing levels
Gaps in broad
sectoral
outcomes
Financing in the
sector
National
Investment and
PMKSY- AIBP,
CADWM, LTIF

Page | 1115
Sectoral
objective
Major Issues CS CSS
State
Schemes
Policy, Legal,
Regulatory
interventions
Other
Interventions
(MFIs,
Private,
NGOs, Policy,
Laws, etc)
Infrastructure
Fund
Gaps in broad
sectoral
outcomes
Project Management
issues and Slow
project execution
PMKSY- AIBP,
SPFM, WDC
Gaps in broad
sectoral
outcomes
Enforceable water
entitlements
Gaps in broad
sectoral
outcomes
R&D in the sector CS under ICAR
PMKSY- PDMC,
WDC
3.1.2 Gap Map Synthesis of Sector and CSS Schemes
An analysis of nine CSS being evaluated as part of this study and their mapping with the key sector issues have been undertaken in the
table below.
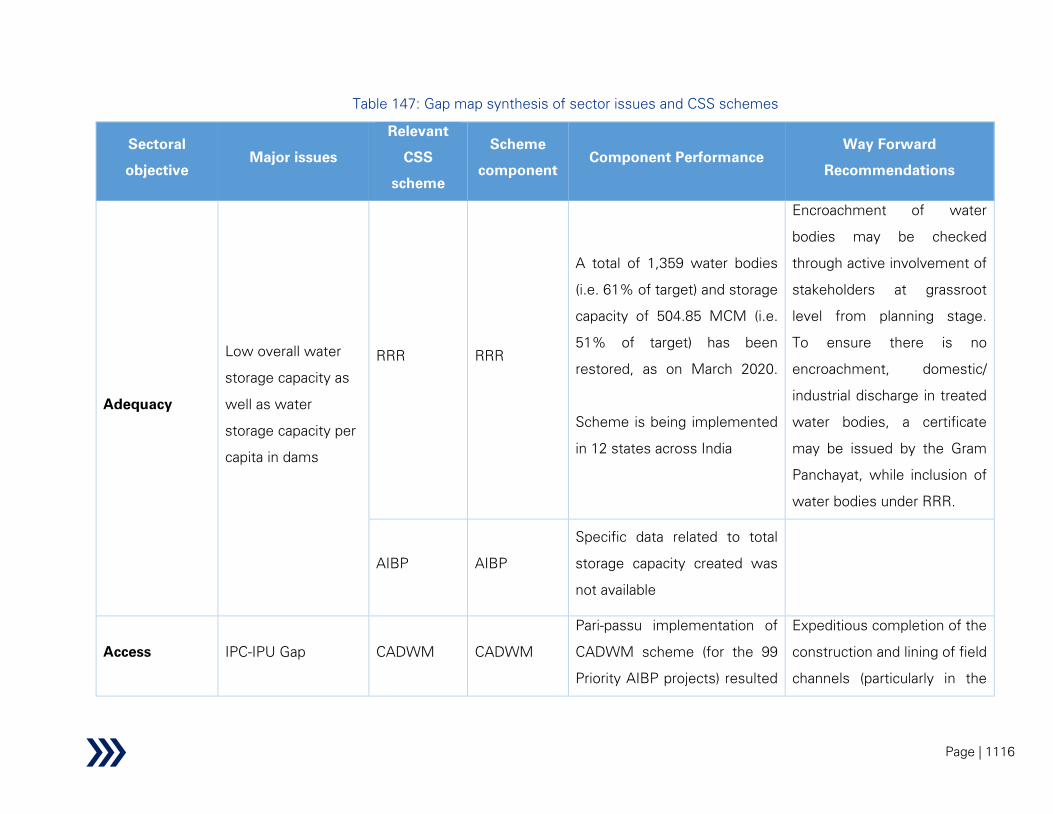
Page | 1116
Table 147: Gap map synthesis of sector issues and CSS schemes
Sectoral
objective
Major issues
Relevant
CSS
scheme
Scheme
component
Component Performance
Way Forward
Recommendations
Adequacy
Low overall water
storage capacity as
well as water
storage capacity per
capita in dams
RRR RRR
A total of 1,359 water bodies
(i.e. 61% of target) and storage
capacity of 504.85 MCM (i.e.
51% of target) has been
restored, as on March 2020.
Scheme is being implemented
in 12 states across India
Encroachment of water
bodies may be checked
through active involvement of
stakeholders at grassroot
level from planning stage.
To ensure there is no
encroachment, domestic/
industrial discharge in treated
water bodies, a certificate
may be issued by the Gram
Panchayat, while inclusion of
water bodies under RRR.
AIBP AIBP
Specific data related to total
storage capacity created was
not available
Access IPC-IPU Gap CADWM CADWM
Pari-passu implementation of
CADWM scheme (for the 99
Priority AIBP projects) resulted
Expeditious completion of the
construction and lining of field
channels (particularly in the

Page | 1117
Sectoral
objective
Major issues
Relevant
CSS
scheme
Scheme
component
Component Performance
Way Forward
Recommendations
in 14.18 lakh ha utilization of
irrigation potential in an
additional CCA (against the
targeted figure of 45.08 ha).
This is complimented by non-
structural interventions through
creation of 6,981 WUAs (51%
of targeted 13,734).
tail reaches). Ensure effective
functioning of the registered
WUAs through proper
capacity building and
devolution of authority
GWI GWI
This scheme aims to increase
irrigation potential creation
(IPC) through groundwater for
small and marginal farmers
across the safe groundwater
areas (i.e. areas other than
over-exploited, critical or semi-
critical areas). Ground Water
irrigation (65-70%) is more
efficient than surface water
irrigation (30-65%) due to low
conveyance loss and proximity
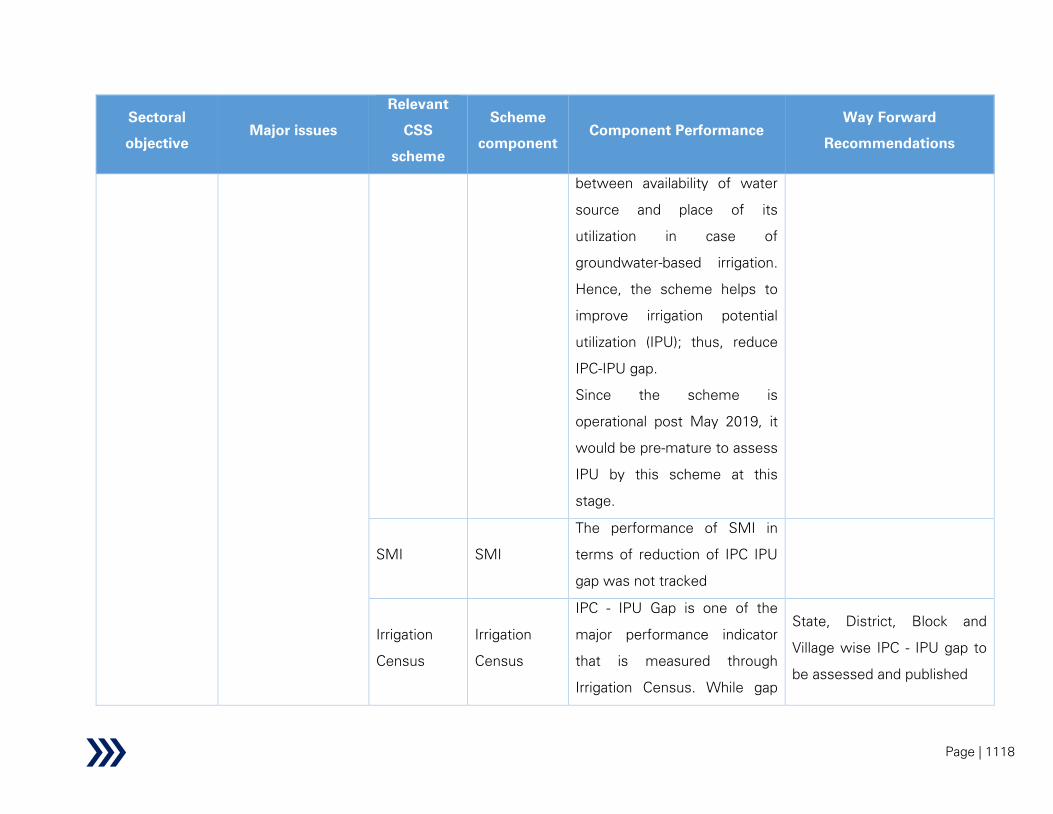
Page | 1118
Sectoral
objective
Major issues
Relevant
CSS
scheme
Scheme
component
Component Performance
Way Forward
Recommendations
between availability of water
source and place of its
utilization in case of
groundwater-based irrigation.
Hence, the scheme helps to
improve irrigation potential
utilization (IPU); thus, reduce
IPC-IPU gap.
Since the scheme is
operational post May 2019, it
would be pre-mature to assess
IPU by this scheme at this
stage.
SMI SMI
The performance of SMI in
terms of reduction of IPC IPU
gap was not tracked
Irrigation
Census
Irrigation
Census
IPC - IPU Gap is one of the
major performance indicator
that is measured through
Irrigation Census. While gap
State, District, Block and
Village wise IPC - IPU gap to
be assessed and published

Page | 1119
Sectoral
objective
Major issues
Relevant
CSS
scheme
Scheme
component
Component Performance
Way Forward
Recommendations
between IPC and IPU was
almost double in 3rd Census
(22Mha) as compared to 2nd
Census, the gap was 20 mha in
4th. The gap was found to be
further reduced in 5th Census
(18Mha)
Sustainability
High extraction of
groundwater and its
regulation
GWI GWI
Unregulated extraction of
groundwater is a major
challenge in current water
stressed situation in the
country. As per the scheme
guidelines, the criteria for an
area to be eligible for this
scheme:
- The area should not be
classified as over-
exploited, critical or
semi-critical in respect of
groundwater resources
Convergence with other
schemes, such as PMKSY-
Watershed Component,
MGNREGA, PMKSY-Per Drop
More Crop etc., for supporting
water harvesting and
groundwater recharge
interventions/ demand side
interventions can be explored
to achieve long-term
sustainability of groundwater
resources.
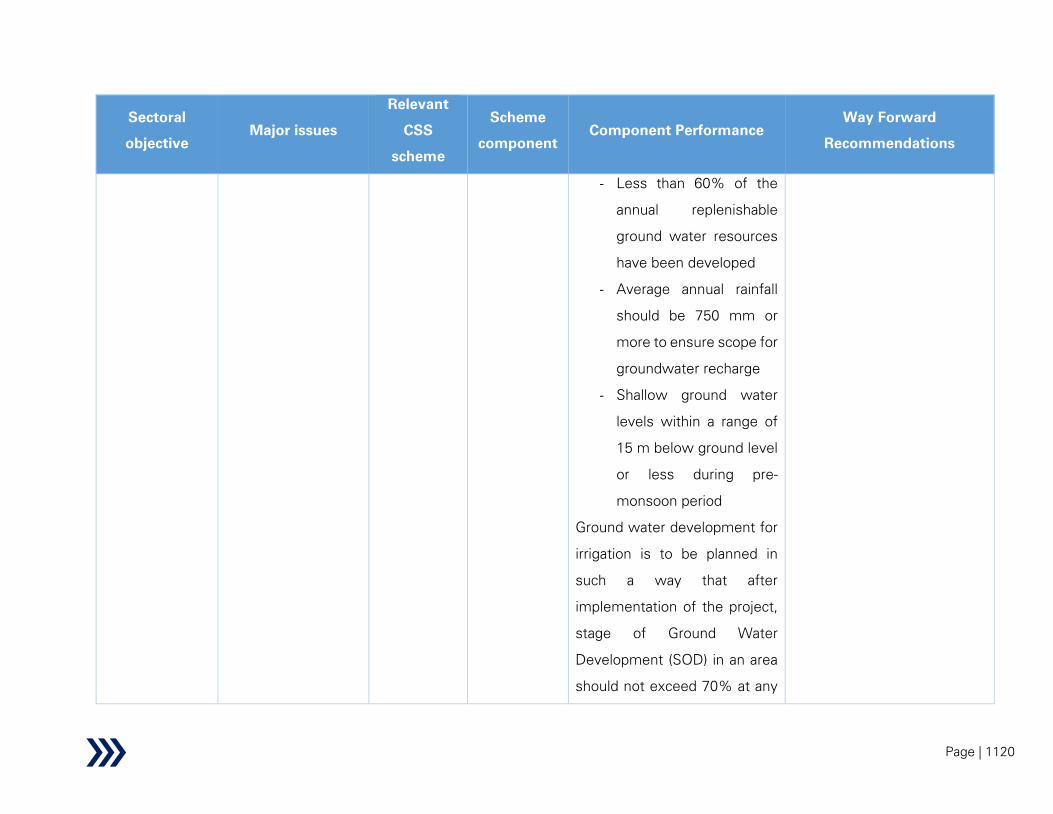
Page | 1120
Sectoral
objective
Major issues
Relevant
CSS
scheme
Scheme
component
Component Performance
Way Forward
Recommendations
- Less than 60% of the
annual replenishable
ground water resources
have been developed
- Average annual rainfall
should be 750 mm or
more to ensure scope for
groundwater recharge
- Shallow ground water
levels within a range of
15 m below ground level
or less during pre-
monsoon period
Ground water development for
irrigation is to be planned in
such a way that after
implementation of the project,
stage of Ground Water
Development (SOD) in an area
should not exceed 70% at any

Page | 1121
Sectoral
objective
Major issues
Relevant
CSS
scheme
Scheme
component
Component Performance
Way Forward
Recommendations
time. Below steps are taken for
achieving this:
- In a potential
assessment unit, the
maximum probable
wells, that can be drilled
which can lead SOD
beyond 70%, are
identified.
- The limit of admissible
number of wells in each
assessment unit has
been kept 20% less than
the wells required to lead
SOD to 70%.
- Further, number of wells
proposed in State
Government proposals
are kept significantly less
than the admissible
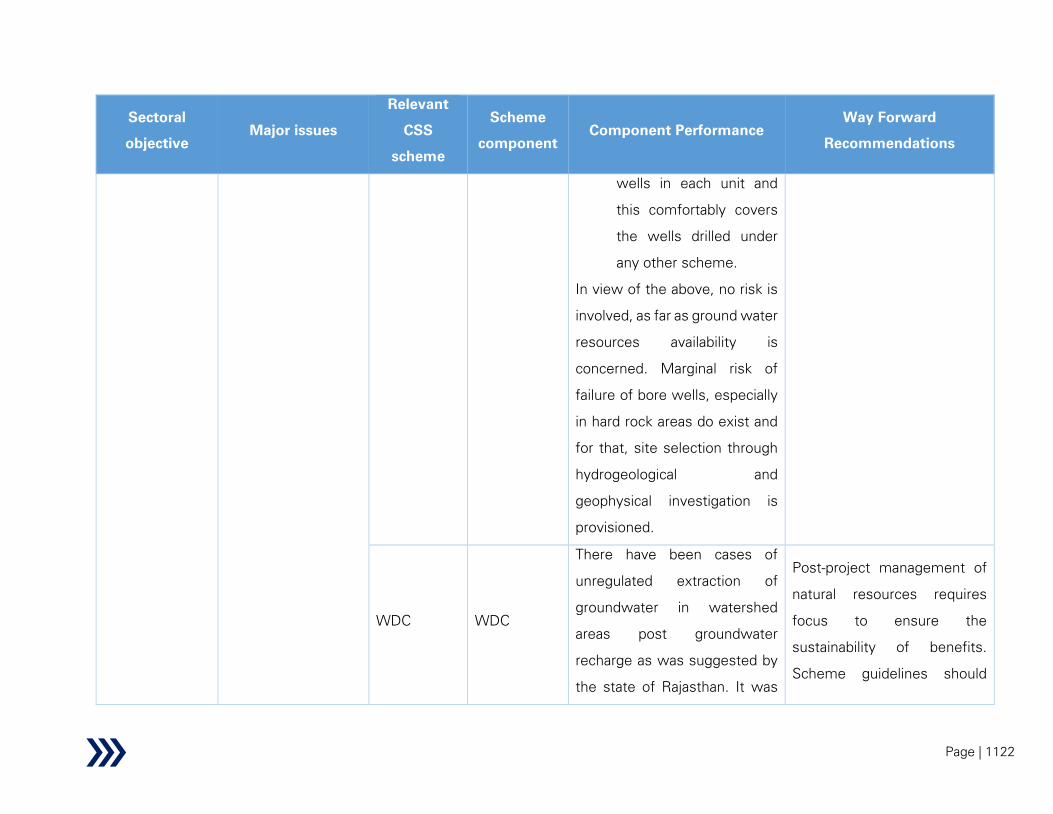
Page | 1122
Sectoral
objective
Major issues
Relevant
CSS
scheme
Scheme
component
Component Performance
Way Forward
Recommendations
wells in each unit and
this comfortably covers
the wells drilled under
any other scheme.
In view of the above, no risk is
involved, as far as ground water
resources availability is
concerned. Marginal risk of
failure of bore wells, especially
in hard rock areas do exist and
for that, site selection through
hydrogeological and
geophysical investigation is
provisioned.
WDC WDC
There have been cases of
unregulated extraction of
groundwater in watershed
areas post groundwater
recharge as was suggested by
the state of Rajasthan. It was
Post-project management of
natural resources requires
focus to ensure the
sustainability of benefits.
Scheme guidelines should
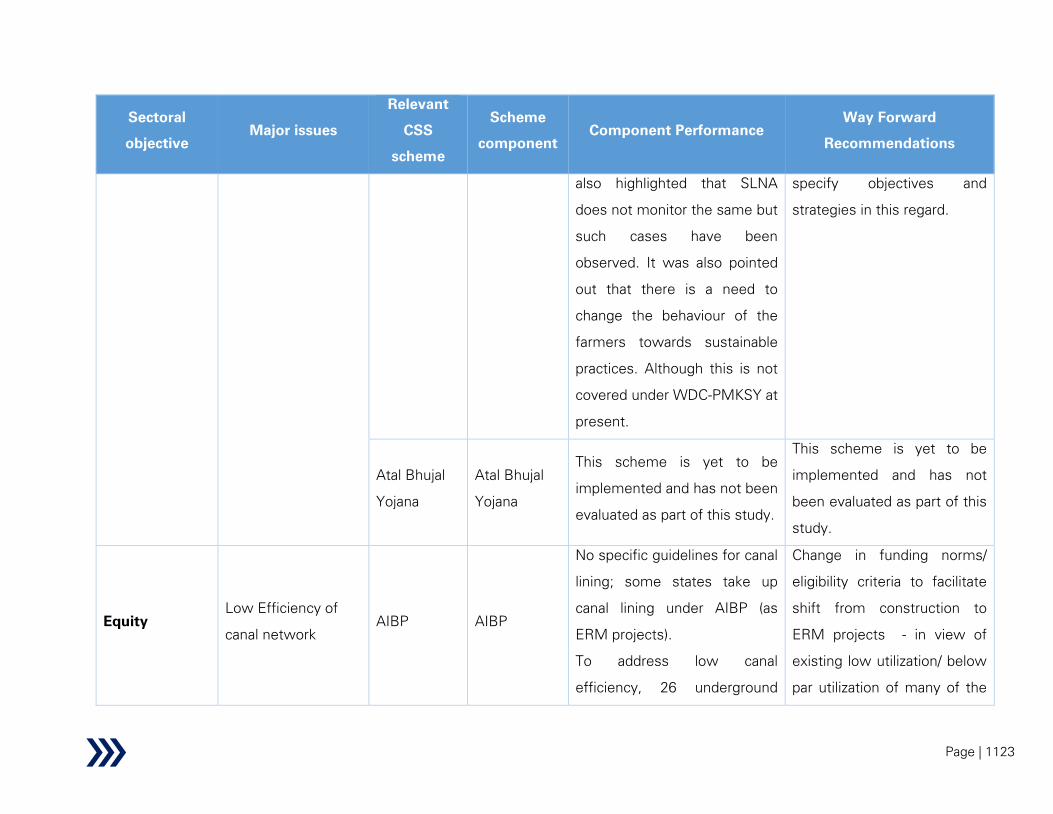
Page | 1123
Sectoral
objective
Major issues
Relevant
CSS
scheme
Scheme
component
Component Performance
Way Forward
Recommendations
also highlighted that SLNA
does not monitor the same but
such cases have been
observed. It was also pointed
out that there is a need to
change the behaviour of the
farmers towards sustainable
practices. Although this is not
covered under WDC-PMKSY at
present.
specify objectives and
strategies in this regard.
Atal Bhujal
Yojana
Atal Bhujal
Yojana
This scheme is yet to be
implemented and has not been
evaluated as part of this study.
This scheme is yet to be
implemented and has not
been evaluated as part of this
study.
Equity
Low Efficiency of
canal network
AIBP AIBP
No specific guidelines for canal
lining; some states take up
canal lining under AIBP (as
ERM projects).
To address low canal
efficiency, 26 underground
Change in funding norms/
eligibility criteria to facilitate
shift from construction to
ERM projects - in view of
existing low utilization/ below
par utilization of many of the

Page | 1124
Sectoral
objective
Major issues
Relevant
CSS
scheme
Scheme
component
Component Performance
Way Forward
Recommendations
piped distribution networks
have been initiated among the
99 PMKSY-AIBP projects
MMI projects (widening IPC-
IPU gap), it is proposed that
government needs to bring in
a paradigm shift in its priority
selection; a shift towards
ERM (encapsulating canal
lining and canal automation
projects) and maintenance of
existing projects is desirable.
Also, whereby possible,
feasibility of construction of
UGPL instead of conventional
canals for branch and minors
should be explored
CADWM CADWM
One of the objectives of
CADWM is to ensure equitable
water distribution among
cultivators in head and tail
reaches
Lining and maintenance of
field water courses along with
correction of system
deficiencies; effective
implementation of PIM to

Page | 1125
Sectoral
objective
Major issues
Relevant
CSS
scheme
Scheme
component
Component Performance
Way Forward
Recommendations
ensure equitable water
distribution
SPFM SPFM
The major and medium
irrigation (MMI) projects under
this scheme involve
construction of conventional
open channels which are prone
to huge seepage and
evaporation losses, resulting
into overall low conveyance
efficiency.
The use of underground
pipelines (UGPL) in the projects
wherever feasible, has been
promoted by the GoI to
improve water conveyance
efficiency. Detailed guidelines
on design and use of UGPL
were issued by MoWR, RD &
The use of underground
pipelines (UGPL) needs to be
enhanced across more
projects wherever feasible.
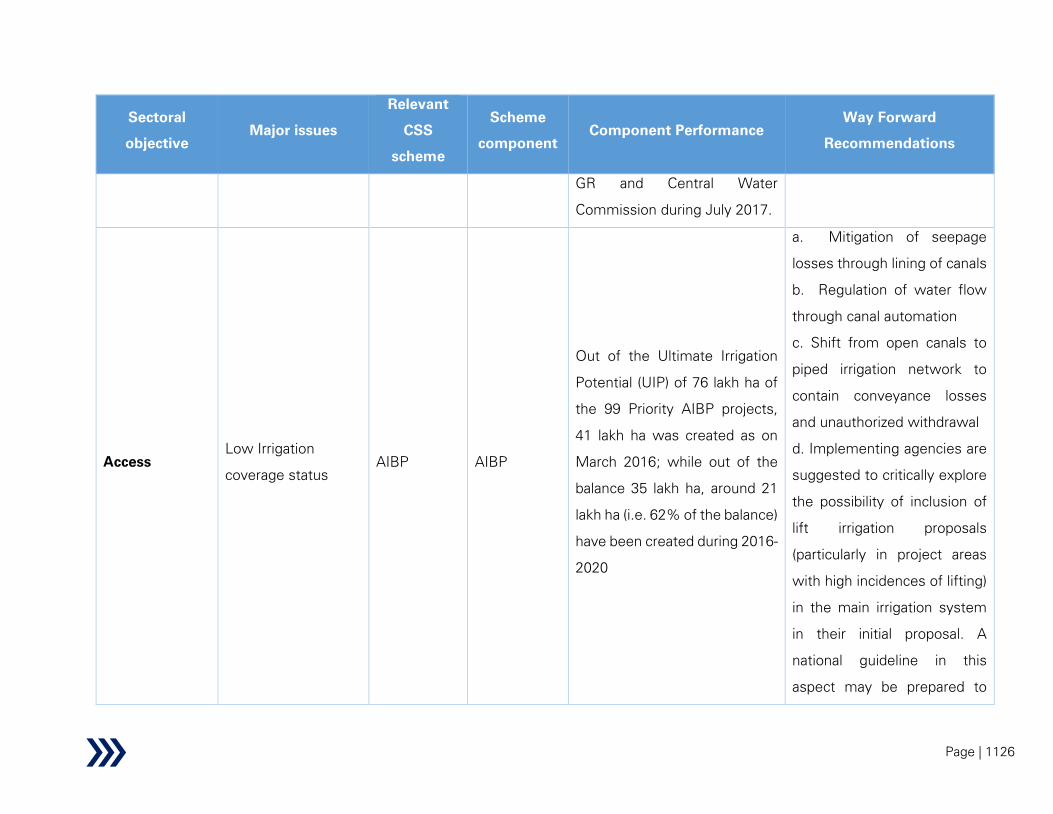
Page | 1126
Sectoral
objective
Major issues
Relevant
CSS
scheme
Scheme
component
Component Performance
Way Forward
Recommendations
GR and Central Water
Commission during July 2017.
Access
Low Irrigation
coverage status
AIBP AIBP
Out of the Ultimate Irrigation
Potential (UIP) of 76 lakh ha of
the 99 Priority AIBP projects,
41 lakh ha was created as on
March 2016; while out of the
balance 35 lakh ha, around 21
lakh ha (i.e. 62% of the balance)
have been created during 2016-
2020
a. Mitigation of seepage
losses through lining of canals
b. Regulation of water flow
through canal automation
c. Shift from open canals to
piped irrigation network to
contain conveyance losses
and unauthorized withdrawal
d. Implementing agencies are
suggested to critically explore
the possibility of inclusion of
lift irrigation proposals
(particularly in project areas
with high incidences of lifting)
in the main irrigation system
in their initial proposal. A
national guideline in this
aspect may be prepared to
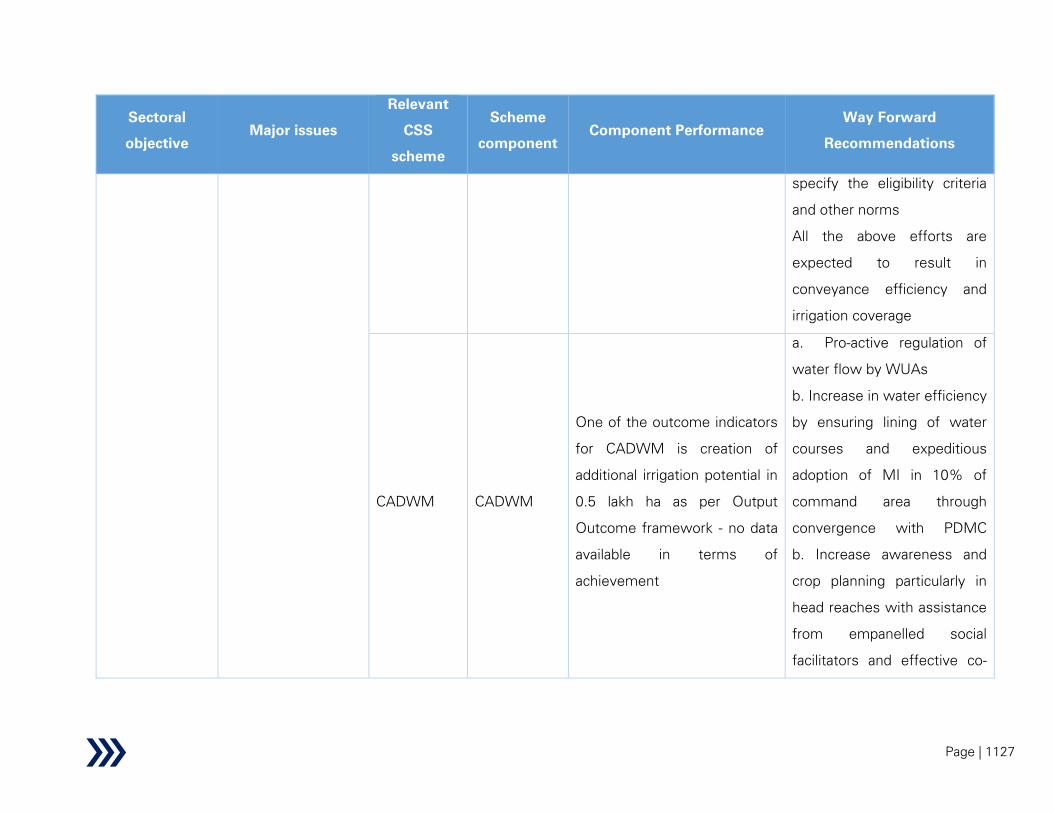
Page | 1127
Sectoral
objective
Major issues
Relevant
CSS
scheme
Scheme
component
Component Performance
Way Forward
Recommendations
specify the eligibility criteria
and other norms
All the above efforts are
expected to result in
conveyance efficiency and
irrigation coverage
CADWM CADWM
One of the outcome indicators
for CADWM is creation of
additional irrigation potential in
0.5 lakh ha as per Output
Outcome framework - no data
available in terms of
achievement
a. Pro-active regulation of
water flow by WUAs
b. Increase in water efficiency
by ensuring lining of water
courses and expeditious
adoption of MI in 10% of
command area through
convergence with PDMC
b. Increase awareness and
crop planning particularly in
head reaches with assistance
from empanelled social
facilitators and effective co-
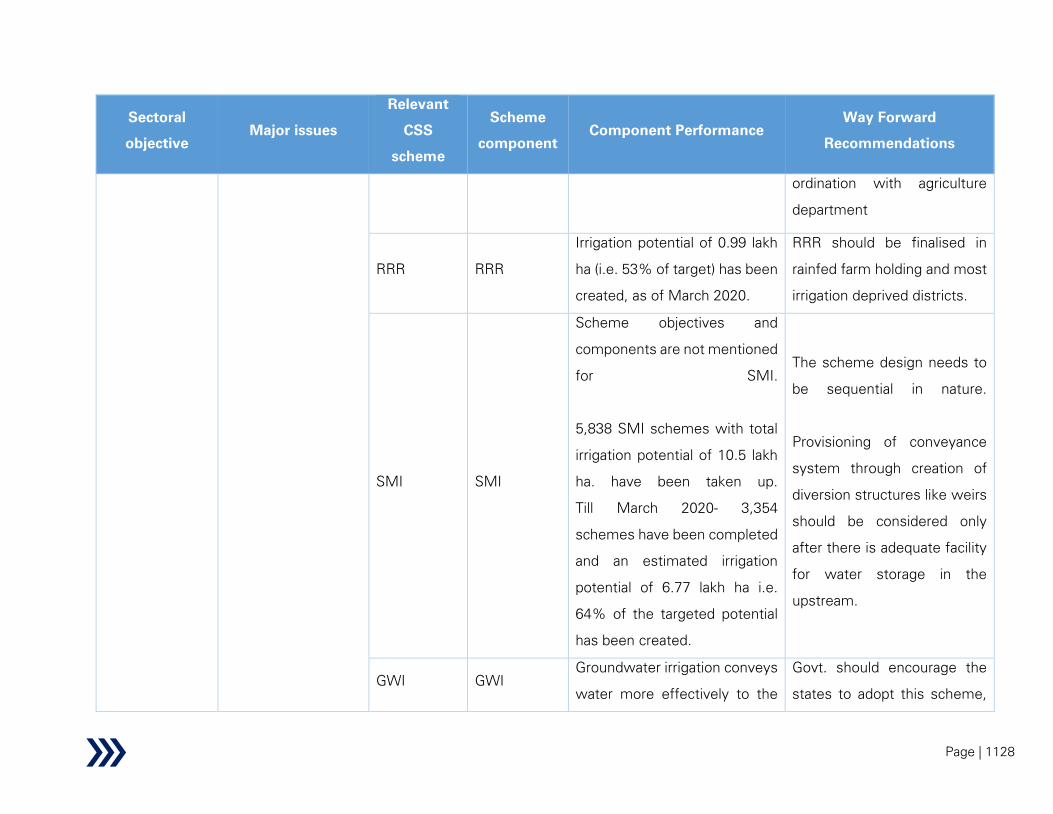
Page | 1128
Sectoral
objective
Major issues
Relevant
CSS
scheme
Scheme
component
Component Performance
Way Forward
Recommendations
ordination with agriculture
department
RRR RRR
Irrigation potential of 0.99 lakh
ha (i.e. 53% of target) has been
created, as of March 2020.
RRR should be finalised in
rainfed farm holding and most
irrigation deprived districts.
SMI SMI
Scheme objectives and
components are not mentioned
for SMI.
5,838 SMI schemes with total
irrigation potential of 10.5 lakh
ha. have been taken up.
Till March 2020- 3,354
schemes have been completed
and an estimated irrigation
potential of 6.77 lakh ha i.e.
64% of the targeted potential
has been created.
The scheme design needs to
be sequential in nature.
Provisioning of conveyance
system through creation of
diversion structures like weirs
should be considered only
after there is adequate facility
for water storage in the
upstream.
GWI GWI
Groundwater irrigation conveys
water more effectively to the
Govt. should encourage the
states to adopt this scheme,

Page | 1129
Sectoral
objective
Major issues
Relevant
CSS
scheme
Scheme
component
Component Performance
Way Forward
Recommendations
farms as it targets smaller area
as compared to the major or
medium irrigation schemes.
So, the scheme is supposed to
enhance irrigation productivity,
thus reducing gap in irrigation
coverage.
Scheme is operational in
Assam and Arunachal Pradesh
since May 2019. Irrigation
potential creation has been
14,216 ha (74% of target) and
1,072 ha (60% of target)
respectively in Assam and
Arunachal Pradesh.
wherever the project area
qualifies the eligibility criteria
as mandated in the scheme
guidelines, for utilizing the
available groundwater
resources in sustainable way.
SPFM SPFM
Irrigation potential creation
from 2018-19 to 2019-20 is
around 90,410 ha (24% of
target) under this scheme.
Recommendation will be like
that of AIBP and SMI scheme
since this scheme involves 83
SMI and 8 MMI projects

Page | 1130
Sectoral
objective
Major issues
Relevant
CSS
scheme
Scheme
component
Component Performance
Way Forward
Recommendations
PDMC PDMC
This micro-irrigation scheme
has enhanced irrigation
productivity by 30% to 70%.
Thus, the scheme has reduced
gap in irrigation coverage
In 2004, the Task Force on
Micro-irrigation (MI) had
estimated a potential of 69
mha for micro-irrigation. Out
of this, only 12.6 mha was
covered till March 2020. Since
MI is highly capable of
increasing irrigation
productivity, adoption of MI
system should be encouraged
Sustainability
High Dependency
on groundwater for
irrigation
AIBP AIBP
Objective of scheme is to
expedite completion of
selected AIBP projects - access
to assured irrigation (however
owing to shift towards high
water intensive crops and
increase in groundwater level
owing to canal water, farmers
are resorting to groundwater in
a. Expedite completion of
branch canals to ensure
reliability of water supply at
outlets
b. Ensure conjunctive use of
surface and groundwater
through construction of tanks/
decentralized storages at chak
levels to act as buffer during
dry and / rabi season(s). As

Page | 1131
Sectoral
objective
Major issues
Relevant
CSS
scheme
Scheme
component
Component Performance
Way Forward
Recommendations
command area to supplement
the canal water)
suggested in PIRC meetings,
the MI funds under CADWM
scheme may be utilized to
facilitate conjunctive use of
groundwater in places with
‘safe’ groundwater level
RRR RRR
Though objectives of RRR
include groundwater recharge
and conjunctive use of surface
and groundwater; continued
dependence on individual
beneficiary-oriented
groundwater-based structure
has been observed in parts of
Bihar, Telangana, Madhya
Pradesh and Rajasthan due to
quick creation, easy access to
electricity and year-round
assured water supply.
Conjunctive use of surface
and groundwater resources
may be ensured through
participatory planning by the
WUAs and Gram Panchayats.
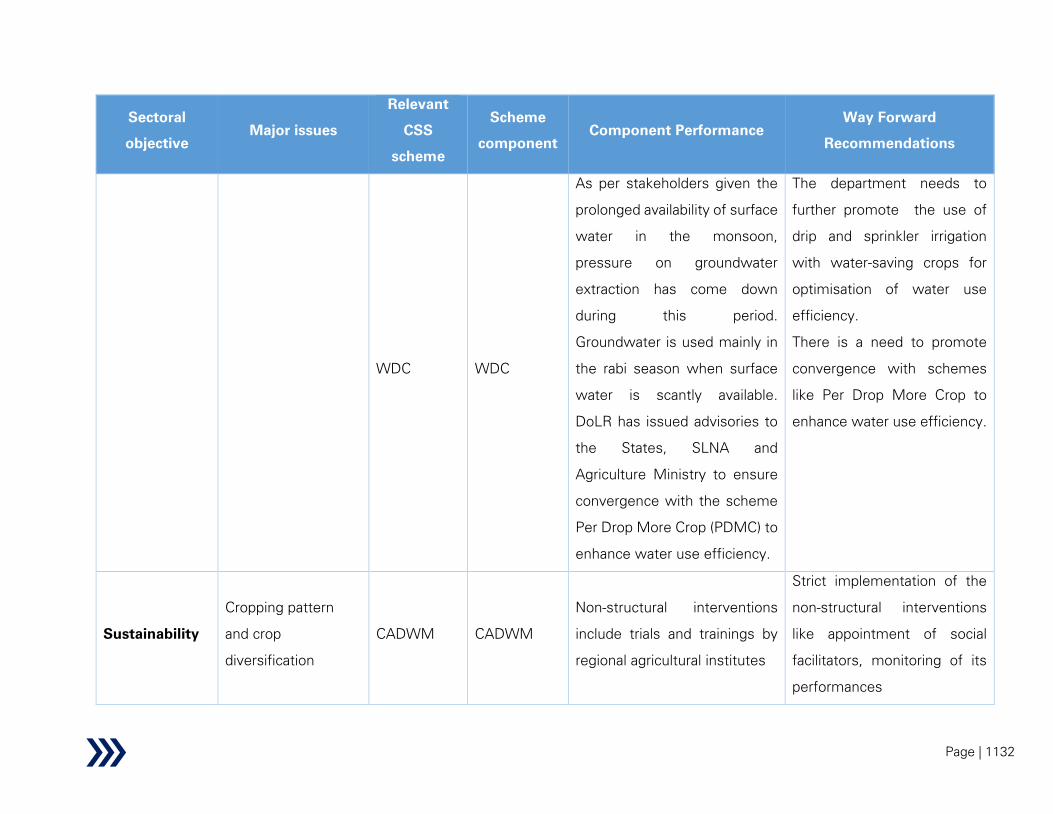
Page | 1132
Sectoral
objective
Major issues
Relevant
CSS
scheme
Scheme
component
Component Performance
Way Forward
Recommendations
WDC WDC
As per stakeholders given the
prolonged availability of surface
water in the monsoon,
pressure on groundwater
extraction has come down
during this period.
Groundwater is used mainly in
the rabi season when surface
water is scantly available.
DoLR has issued advisories to
the States, SLNA and
Agriculture Ministry to ensure
convergence with the scheme
Per Drop More Crop (PDMC) to
enhance water use efficiency.
The department needs to
further promote the use of
drip and sprinkler irrigation
with water-saving crops for
optimisation of water use
efficiency.
There is a need to promote
convergence with schemes
like Per Drop More Crop to
enhance water use efficiency.
Sustainability
Cropping pattern
and crop
diversification
CADWM CADWM
Non-structural interventions
include trials and trainings by
regional agricultural institutes
Strict implementation of the
non-structural interventions
like appointment of social
facilitators, monitoring of its
performances

Page | 1133
Sectoral
objective
Major issues
Relevant
CSS
scheme
Scheme
component
Component Performance
Way Forward
Recommendations
SPFM SPFM
Maharashtra has adopted an
approach called 'Volumetric
Supply of Water' to manage
sustainable water sources
without curbing farmers'
freedom of crop selection. In
this approach, farmers are
informed the amount of water
they will receive in a period so
that they can plan cropping
pattern based on availability of
water. Also, they are educated
to save water during rabi
season in order to compensate
the water requirement of hot
season
Participatory Irrigation
Management (PIM) should be
strengthened so that water
use by farmers can be
effectively monitored by the
WUAs
PDMC PDMC
MI is used for water intensive
crops, such as sugarcane,
cotton, banana etc. across
many states
MI system has very high-
water use efficiency (80-
90%). Hence, using MI for
water intensive crops can

Page | 1134
Sectoral
objective
Major issues
Relevant
CSS
scheme
Scheme
component
Component Performance
Way Forward
Recommendations
reduce risks of water scarcity
and become a sustainable
solution for these crops.
Therefore, extensive
awareness should be created
among farmers regarding
benefits of MI adoption for
water intensive crops
WDC WDC
Impact evaluation studies
show that :
Cropping intensity has gone up
in intervention watershed over
pre-project level.
The area under horticulture
crops have also gone up.
Crop production has risen.
There is need to promote
climate resilient cropping
patterns.
It is also required to avoid
water intensive cropping
pattern in these areas.
Water Security
Low Agriculture
water use efficiency
CADWM CADWM
Mandatory coverage of 10%
CCA with micro-irrigation
structures - only 3.1% of target
has been achieved
a. Merging with ‘Other
Interventions’ component
under PDMC scheme to
streamline the government

Page | 1135
Sectoral
objective
Major issues
Relevant
CSS
scheme
Scheme
component
Component Performance
Way Forward
Recommendations
subsidy flow for MI
equipment and increased
awareness generation by
horticulture departments
b. To ensure sustainability of
the MI infrastructure during
dry/ Rabi seasons, conjunctive
use of groundwater through
bore wells/ tube wells may be
facilitated utilizing the funds
earmarked for MI
PDMC PDMC
Micro-irrigation system has
increased water use efficiency
in the range of 30% to 100%
across various states
There is an untapped potential
of around 56.4 mha for MI in
India. Hence, Govt. should
enhance focus on MI through
several measures including
IEC activities, institutional
strengthening etc.
WDC WDC
DoLR has issued advisories to
the States, SLNA and
The department needs to
further promote the use of
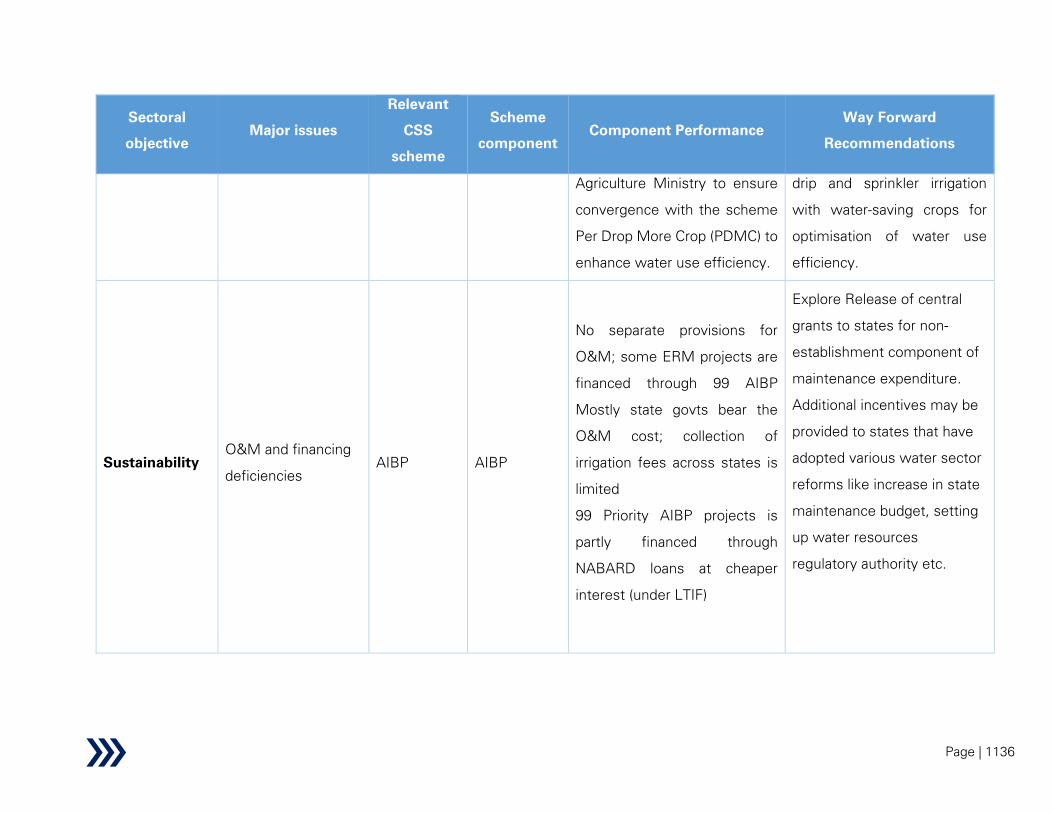
Page | 1136
Sectoral
objective
Major issues
Relevant
CSS
scheme
Scheme
component
Component Performance
Way Forward
Recommendations
Agriculture Ministry to ensure
convergence with the scheme
Per Drop More Crop (PDMC) to
enhance water use efficiency.
drip and sprinkler irrigation
with water-saving crops for
optimisation of water use
efficiency.
Sustainability
O&M and financing
deficiencies
AIBP AIBP
No separate provisions for
O&M; some ERM projects are
financed through 99 AIBP
Mostly state govts bear the
O&M cost; collection of
irrigation fees across states is
limited
99 Priority AIBP projects is
partly financed through
NABARD loans at cheaper
interest (under LTIF)
Explore Release of central
grants to states for non-
establishment component of
maintenance expenditure.
Additional incentives may be
provided to states that have
adopted various water sector
reforms like increase in state
maintenance budget, setting
up water resources
regulatory authority etc.

Page | 1137
Sectoral
objective
Major issues
Relevant
CSS
scheme
Scheme
component
Component Performance
Way Forward
Recommendations
CADWM CADWM
O&M of assets below outlets is
the sole responsibility of the
WUAs
a. Ensure effective
functioning of the WUAs
through proper hand-
holding and delegation of
authority like fees
collection
b. States may be
incentivized to share a
substantial portion (say
>50%) of the irrigation
fees collected with the
WUAs by enacting
amendment in their
respective PIM acts
WDC WDC
There is need for sensitization
of the local community with
proper handholding for
appropriate maintenance of
assets during the O&M phase.
There is a need for appropriate
guidelines to ensure the
utilization of Watershed
Development Fund (WDF) for
maintenance of assets during

Page | 1138
Sectoral
objective
Major issues
Relevant
CSS
scheme
Scheme
component
Component Performance
Way Forward
Recommendations
Watershed Development Fund
that is being generated through
the Watershed Programs is on
occasions not sufficiently
utilised to manage, repair and
maintain assets being created
under the project.
the O&M period.
Guidelines issued by
Karnataka can be treated as
model guidelines and can be
modified by states as per their
requirement. This is essential
for the sustainability of
watershed projects.
There is a need for raising
awareness of the local
community with proper
handholding for proper
maintenance of assets during
the O&M phase.

Page | 1139
Sectoral
objective
Major issues
Relevant
CSS
scheme
Scheme
component
Component Performance
Way Forward
Recommendations
RRR RRR
The scheme guidelines
mention WUAs to charge for its
services and build up corpus for
maintenance and management
of water bodies. However,
there are no details on its
implementation structure and
unavailability of funds for O&M
has been cited as a major threat
to scheme sustainability across
Andhra Pradesh, Manipur,
Meghalaya, Rajasthan and
Telangana.
Revenue generation
mechanism for WUA needs to
be defined.
Use of water bodies for
economic benefits through
activities like fisheries may be
encouraged to inculcate
feeling of ownership within
the community.
SMI SMI
Though the guidelines mention
O&M to be done by WUAs,
states face challenges in this
regard. Irrigation department
has to intervene in states like
Bihar, Meghalaya and
Roles and responsibilities of
WUA, along with mechanism
for revenue generation needs
to be defined.
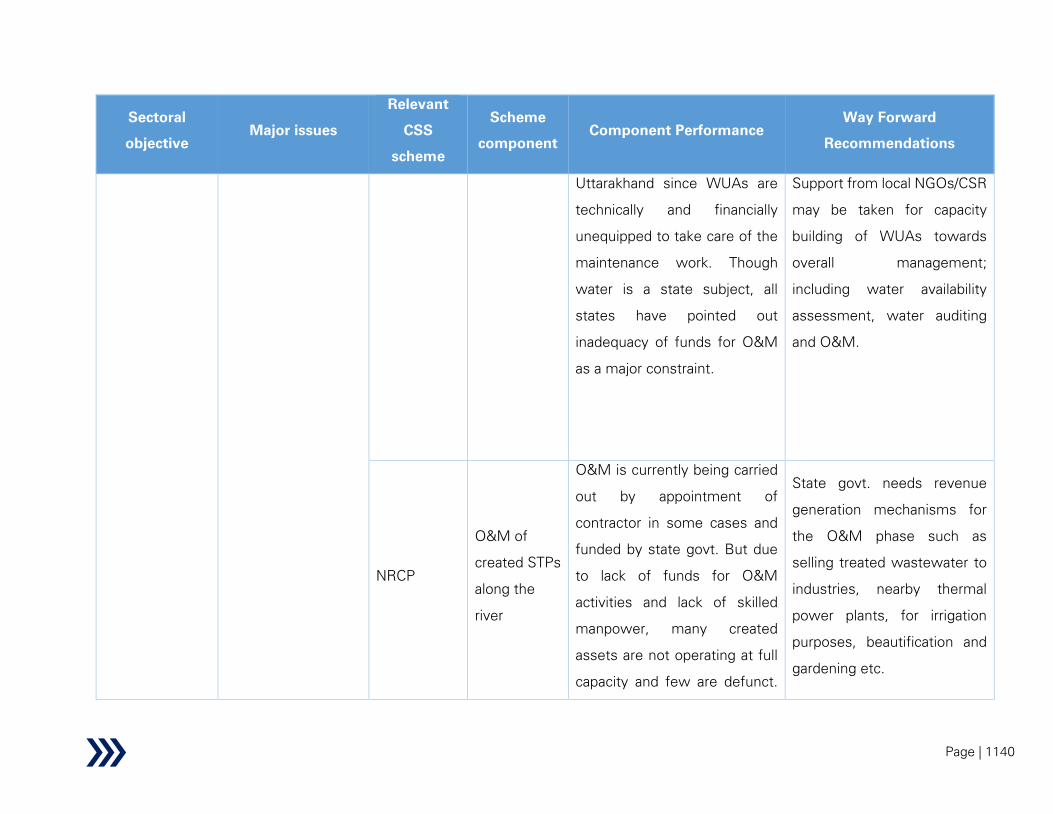
Page | 1140
Sectoral
objective
Major issues
Relevant
CSS
scheme
Scheme
component
Component Performance
Way Forward
Recommendations
Uttarakhand since WUAs are
technically and financially
unequipped to take care of the
maintenance work. Though
water is a state subject, all
states have pointed out
inadequacy of funds for O&M
as a major constraint.
Support from local NGOs/CSR
may be taken for capacity
building of WUAs towards
overall management;
including water availability
assessment, water auditing
and O&M.
NRCP
O&M of
created STPs
along the
river
O&M is currently being carried
out by appointment of
contractor in some cases and
funded by state govt. But due
to lack of funds for O&M
activities and lack of skilled
manpower, many created
assets are not operating at full
capacity and few are defunct.
State govt. needs revenue
generation mechanisms for
the O&M phase such as
selling treated wastewater to
industries, nearby thermal
power plants, for irrigation
purposes, beautification and
gardening etc.

Page | 1141
Sectoral
objective
Major issues
Relevant
CSS
scheme
Scheme
component
Component Performance
Way Forward
Recommendations
This often causes some
untreated sewage to flow into
the river bodies thus polluting
the river water.
PPP model (HAM) as used in
NMCG may be explored,
where the concessionaire will
be responsible both for
construction and O&M for at
least 5-10 year period.
Overall nature
and
responsiveness
of Water sector
planning
Need for better
Planning and data
management in the
sector
Irrigation
Census
Irrigation
Census
Irrigation Census is conducted
quinquennially which collects
enormous quantum of data on
Minor Irrigation Schemes and
their performances. Based on
MI Census data, Atal Bhujal
Yojana was framed. At State
and District level, new
proposals for Minor Irrigation
schemes are prepared based
on MI census data and its
analyses
Despite the fact that State
level planning is done based
on MI census data but the
village level wise data should
be used for participatory
planning of Minor Irrigation
involving the farmers and MI
scheme owners.
FMBAP FMBAP
Although substantial measures
has been undertaken in
Need to have performance
database at State and Scheme

Page | 1142
Sectoral
objective
Major issues
Relevant
CSS
scheme
Scheme
component
Component Performance
Way Forward
Recommendations
FMBAP both for Structural and
non-Structural measures, but,
physical and financial progress
data are not obtained from the
States on regular basis. As a
result of which database on
performance of the measures
is lacking.
Apart from Bihar and Uttar
Pradesh, no comprehensive
MIS is seen in any state which
provides information on the
nature and historical data of
damages, status of structural
measures (both completed and
ongoing), hydrological and
flood forecasting information.
level at least at Regional level
i.e., at the level of CWC,
GFCC & Brahmaputra Board.
A dashboard containing the
above-mentioned data need
to be in place.
Online database and
dashboards depicting the
details of the flood affected
areas and the community
residing therein,
environmental status, details
of the FMBAP as well as state
sponsored schemes, their
status, best practices, etc.
may be considered, which will
help in addressing cross
sectional issues with respect
to socio-economic and

Page | 1143
Sectoral
objective
Major issues
Relevant
CSS
scheme
Scheme
component
Component Performance
Way Forward
Recommendations
environmental features of
flood affected areas.
Quality
Wastewater reuse &
pollution abatement
measures
NRCP
Creation of
STPs along
banks of
polluted river
stretches
There has definitely been
improvement in the river water
quality in the polluted river
stretches due to the
interventions under the NRCP
schemed
Efficient design of STPs for
treatment of both domestic
and industrial sewage and
adoption of latest
technologies can lead to more
efficient pollution abatement
in the rivers. Additionally, one
can explore performance-
based contract where
discharge parameters are
clearly specified as per extant
norms and private partner has
to comply to such norms
during entire lifecycle of the
project.
Sustainability Climate Change WDC WDC
In present times many extreme
climatic events because of
climate change are being
The design principles of
watershed projects, especially
production system, needs to

Page | 1144
Sectoral
objective
Major issues
Relevant
CSS
scheme
Scheme
component
Component Performance
Way Forward
Recommendations
observed, climate change
resilience has not been brought
into the watershed scheme
design.
be modified to embed
resilience to risks posed by
climate change. Necessary
training to develop awareness
and capacity in this regard
should be planned.
FMBAP FMBAP
Improving climate literacy and
promoting decentralised action
for adaptation and mitigation
are critical for building climate
change resilience. While the
floods cannot be exclusively
attributed to climate change
impact, climate change
predictions do indeed forecast
increases in rainfall intensity in
the years to come.
Furthermore, coastal areas are
prone to waterlogging and
flooding due to increased water
Requisite IEC and capacity
building measures need to be
planned within the ambit of
FMBAP, wherein the
community and population at
large need to be educated on
environmental protection
measures and the impact of
environmental degradation on
flood. Also post disaster
environmental assessment
should be made part of the
impact and concurrent
evaluations currently
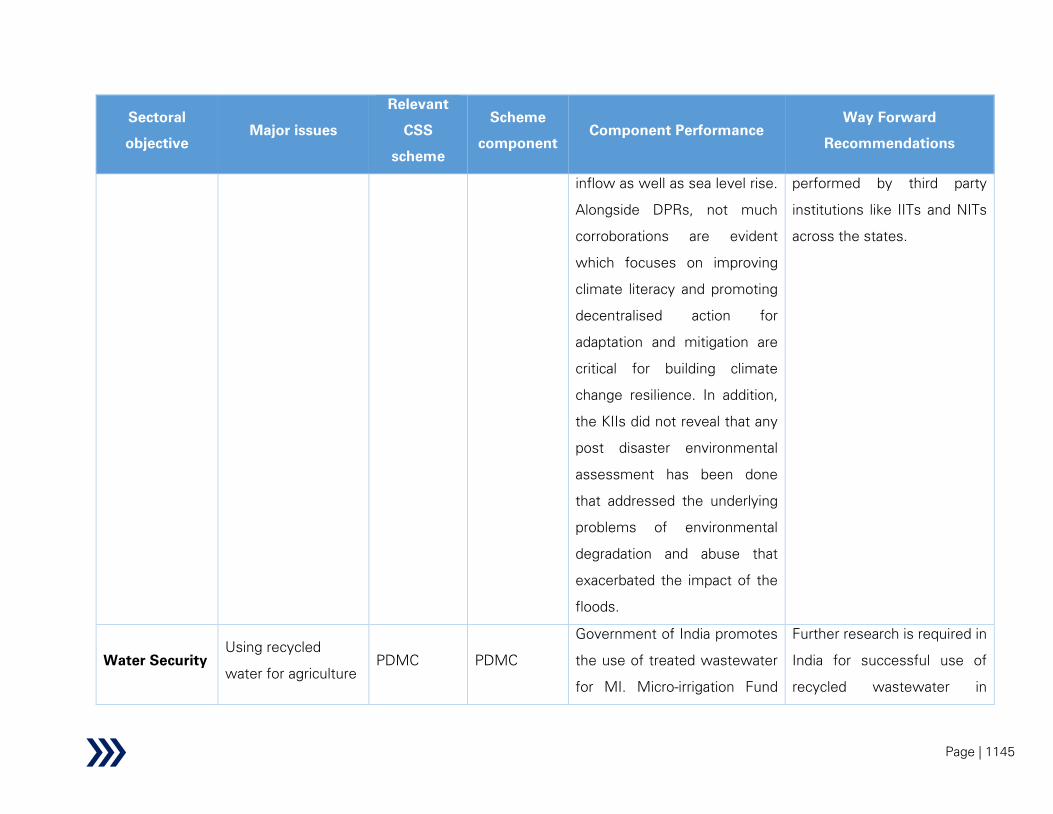
Page | 1145
Sectoral
objective
Major issues
Relevant
CSS
scheme
Scheme
component
Component Performance
Way Forward
Recommendations
inflow as well as sea level rise.
Alongside DPRs, not much
corroborations are evident
which focuses on improving
climate literacy and promoting
decentralised action for
adaptation and mitigation are
critical for building climate
change resilience. In addition,
the KIIs did not reveal that any
post disaster environmental
assessment has been done
that addressed the underlying
problems of environmental
degradation and abuse that
exacerbated the impact of the
floods.
performed by third party
institutions like IITs and NITs
across the states.
Water Security
Using recycled
water for agriculture
PDMC PDMC
Government of India promotes
the use of treated wastewater
for MI. Micro-irrigation Fund
Further research is required in
India for successful use of
recycled wastewater in
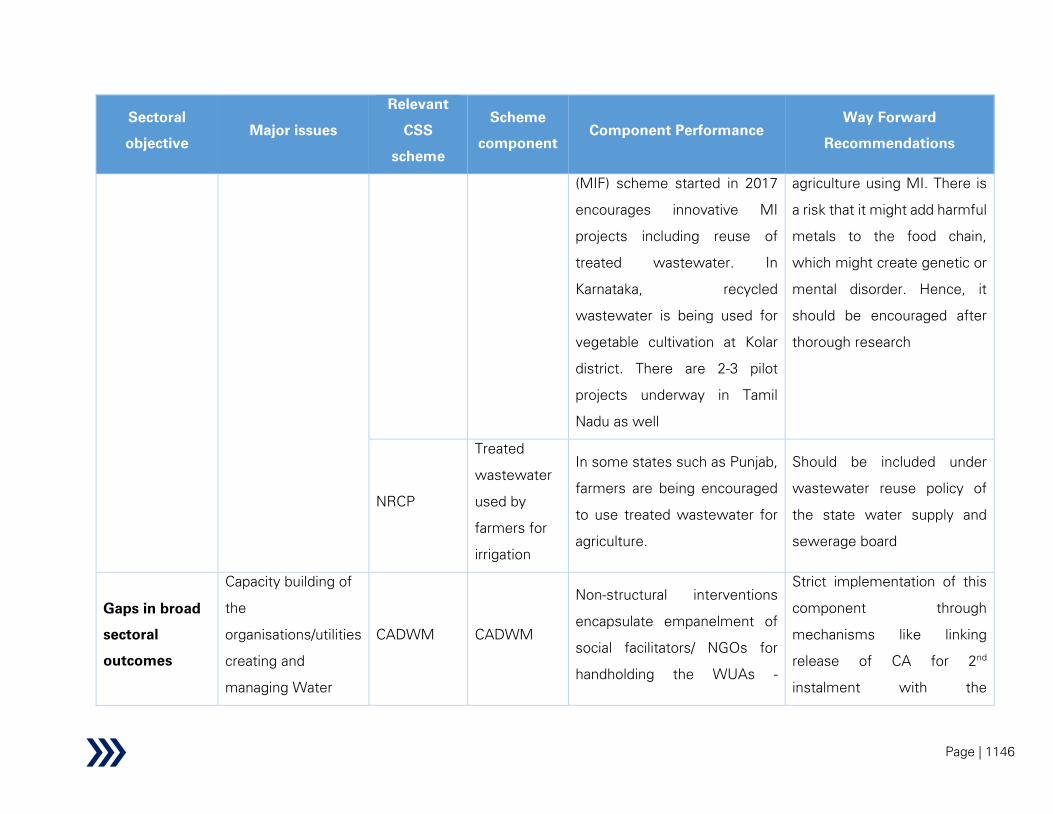
Page | 1146
Sectoral
objective
Major issues
Relevant
CSS
scheme
Scheme
component
Component Performance
Way Forward
Recommendations
(MIF) scheme started in 2017
encourages innovative MI
projects including reuse of
treated wastewater. In
Karnataka, recycled
wastewater is being used for
vegetable cultivation at Kolar
district. There are 2-3 pilot
projects underway in Tamil
Nadu as well
agriculture using MI. There is
a risk that it might add harmful
metals to the food chain,
which might create genetic or
mental disorder. Hence, it
should be encouraged after
thorough research
NRCP
Treated
wastewater
used by
farmers for
irrigation
In some states such as Punjab,
farmers are being encouraged
to use treated wastewater for
agriculture.
Should be included under
wastewater reuse policy of
the state water supply and
sewerage board
Gaps in broad
sectoral
outcomes
Capacity building of
the
organisations/utilities
creating and
managing Water
CADWM CADWM
Non-structural interventions
encapsulate empanelment of
social facilitators/ NGOs for
handholding the WUAs -
Strict implementation of this
component through
mechanisms like linking
release of CA for 2nd
instalment with the

Page | 1147
Sectoral
objective
Major issues
Relevant
CSS
scheme
Scheme
component
Component Performance
Way Forward
Recommendations
Resources
infrastructure and
providing service
performance quite poor in
these components
empanelment of social
facilitators and their
performance
SPFM SPFM
It is difficult for the govt. to
manage the irrigation assets
over entire lifetime. WUAs
should be accountable for that.
However, WUAs are currently
not able to manage the assets
effectively due to lack of
knowledge. Therefore, training
and capacity building activities
should be enhanced.
Local NGOs or private
organizations can be involved
for training and capacity
building activities
PDMC PDMC
Most of the states are running
awareness creation and
capacity building activities to
demonstrate the benefits of
MI, educate the farmers about
how to use MI, perform
maintenance activity etc.
• Govt. may mandate to
enhance involvement of MI
companies, educational
institutes, KVKs for
increasing scale of
awareness campaign &
capacity building activities.

Page | 1148
Sectoral
objective
Major issues
Relevant
CSS
scheme
Scheme
component
Component Performance
Way Forward
Recommendations
through various mediums such
as radio broadcasting
(Akashvani), TV advertising
(Doordarshan), wall painting,
leaflet distribution, exposure
visits, demo of best practices
over workshops, user manual
of MI system etc. along with
the empanelled MI companies,
educational institutes and
Krishi Vigyan Kendra (KVK).
However, the need to rapidly
scale up such activities with a
view to improve adoption rates
has widely been acknowledged
among stakeholders.
• Digital media platform (e.g.
YouTube, Facebook) can be
explored. This can increase
the reach while reducing
cost of the activities. e.g.
Andhra Pradesh has started
such activities through
displaying small videos,
audio-visual sessions (e.g.
installation, maintenance,
benefit of MI etc.) at village
level kiosks of Rythu
Bharosa Kendra (RBK).
• Govt. may consider
separate allocation for such
activities which are
currently expended from
5% fund allocated for admin
expenses.
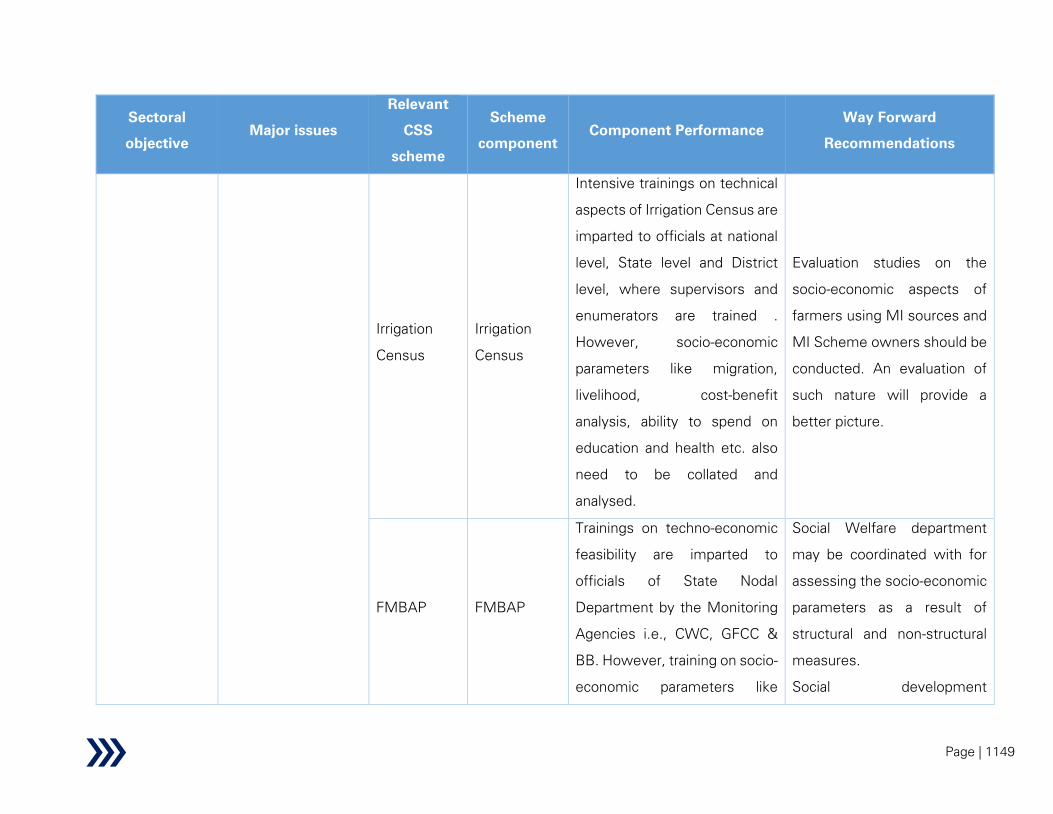
Page | 1149
Sectoral
objective
Major issues
Relevant
CSS
scheme
Scheme
component
Component Performance
Way Forward
Recommendations
Irrigation
Census
Irrigation
Census
Intensive trainings on technical
aspects of Irrigation Census are
imparted to officials at national
level, State level and District
level, where supervisors and
enumerators are trained .
However, socio-economic
parameters like migration,
livelihood, cost-benefit
analysis, ability to spend on
education and health etc. also
need to be collated and
analysed.
Evaluation studies on the
socio-economic aspects of
farmers using MI sources and
MI Scheme owners should be
conducted. An evaluation of
such nature will provide a
better picture.
FMBAP FMBAP
Trainings on techno-economic
feasibility are imparted to
officials of State Nodal
Department by the Monitoring
Agencies i.e., CWC, GFCC &
BB. However, training on socio-
economic parameters like
Social Welfare department
may be coordinated with for
assessing the socio-economic
parameters as a result of
structural and non-structural
measures.
Social development

Page | 1150
Sectoral
objective
Major issues
Relevant
CSS
scheme
Scheme
component
Component Performance
Way Forward
Recommendations
community organization,
gender involvement, migration,
livelihood development etc. is
lacking. Thus, all DPRs / Flood
Management Proposals solely
focus on techno-economic
aspects of structural measures
organizations / NGOs may
also be invited on regular
basis to assess environmental
issues and their bearing on
flood, mitigating social issues
like migration, livelihood ,
health etc.
Convergence
Scheme
convergence
CADWM
MI
component
CADWM guidelines mandate
adoption of MI structures in
10% of the command area.
However, as on date only 3%
of the total target under MI has
been met
To increase awareness
among cultivators and ensure
faster access to subsidy for
drips and sprinklers under
PDMC scheme, transfer of MI
component to ‘Other
Interventions’ component
under PDMC scheme, which
has similar provisions, is
suggested
CADWM
Structural
interventions
–
Convergence with MGNREGA
for construction of water
courses was found to be
Detailing out the CADWM
components which can be
carried out while satisfying
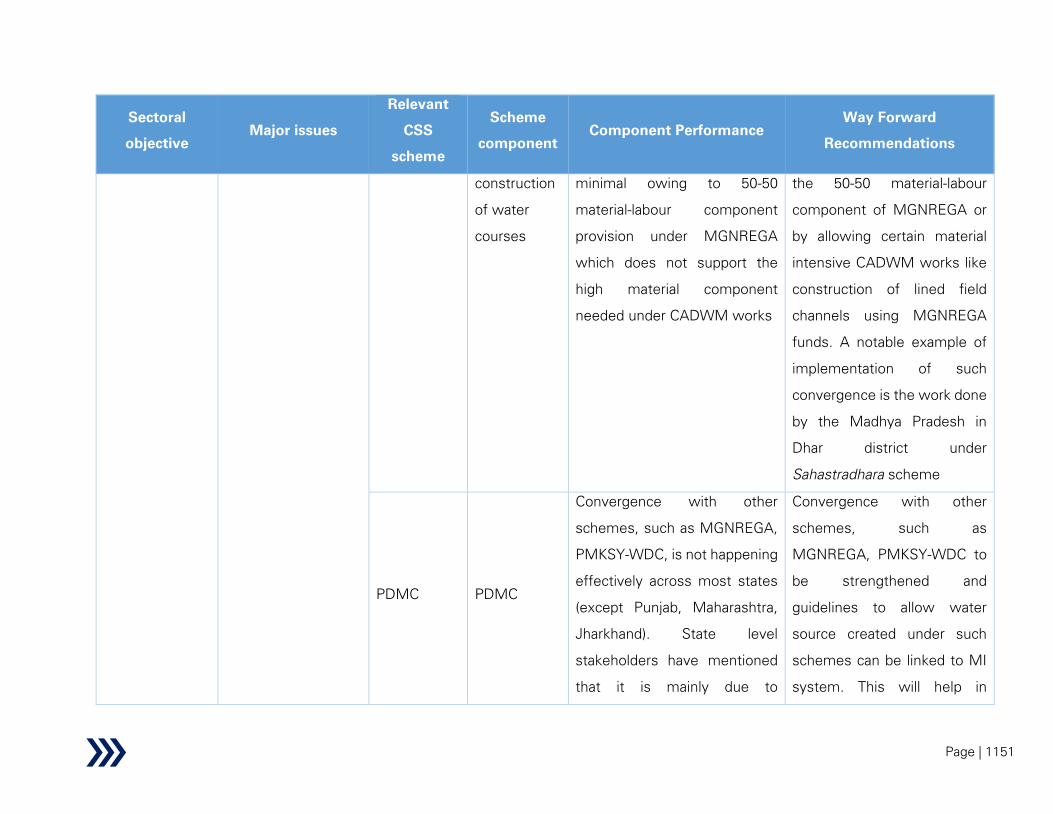
Page | 1151
Sectoral
objective
Major issues
Relevant
CSS
scheme
Scheme
component
Component Performance
Way Forward
Recommendations
construction
of water
courses
minimal owing to 50-50
material-labour component
provision under MGNREGA
which does not support the
high material component
needed under CADWM works
the 50-50 material-labour
component of MGNREGA or
by allowing certain material
intensive CADWM works like
construction of lined field
channels using MGNREGA
funds. A notable example of
implementation of such
convergence is the work done
by the Madhya Pradesh in
Dhar district under
Sahastradhara scheme
PDMC PDMC
Convergence with other
schemes, such as MGNREGA,
PMKSY-WDC, is not happening
effectively across most states
(except Punjab, Maharashtra,
Jharkhand). State level
stakeholders have mentioned
that it is mainly due to
Convergence with other
schemes, such as
MGNREGA, PMKSY-WDC to
be strengthened and
guidelines to allow water
source created under such
schemes can be linked to MI
system. This will help in

Page | 1152
Sectoral
objective
Major issues
Relevant
CSS
scheme
Scheme
component
Component Performance
Way Forward
Recommendations
coordination issues between
departments responsible for
implementing various schemes
saving funds spent on OI
component
WDC WDC
It is pertinent to mention here
that, as per the available
information with DoLR, about
19% of the expenditure in the
watershed project areas has
been mobilized through
convergence with the other
relevant schemes.
DoLR has been taking
measured to guide states to
effective convergence
however states have been
found wanting in this respect.
Some states have not yet
created an institutional
As per DoLR, the States
should expedite the
implementation and
completion of projects on
priority by optimal utilization of
available funds and mobilizing
funds through convergence
with schemes of similar
nature like MGNREGA etc.
There is also a need to ensure
convergence with MGNREGA
for the maintenance of the
built structures.
DoLR has been taking
measured to guide states to
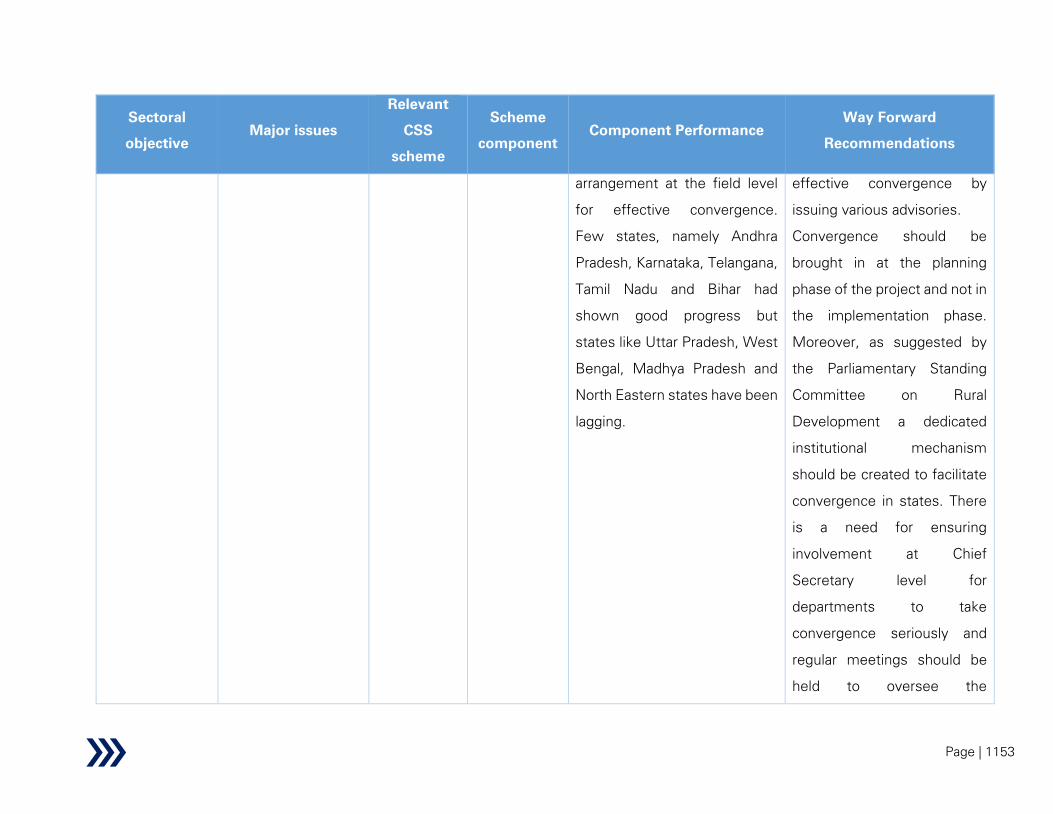
Page | 1153
Sectoral
objective
Major issues
Relevant
CSS
scheme
Scheme
component
Component Performance
Way Forward
Recommendations
arrangement at the field level
for effective convergence.
Few states, namely Andhra
Pradesh, Karnataka, Telangana,
Tamil Nadu and Bihar had
shown good progress but
states like Uttar Pradesh, West
Bengal, Madhya Pradesh and
North Eastern states have been
lagging.
effective convergence by
issuing various advisories.
Convergence should be
brought in at the planning
phase of the project and not in
the implementation phase.
Moreover, as suggested by
the Parliamentary Standing
Committee on Rural
Development a dedicated
institutional mechanism
should be created to facilitate
convergence in states. There
is a need for ensuring
involvement at Chief
Secretary level for
departments to take
convergence seriously and
regular meetings should be
held to oversee the

Page | 1154
Sectoral
objective
Major issues
Relevant
CSS
scheme
Scheme
component
Component Performance
Way Forward
Recommendations
convergence work on a rolling
basis.
NRCP
Convergence
with AMRUT
and funding
from IFIs
Due to lack of funds, in some
projects, the projects are being
implemented along with
AMRUT and also funded by IFIs
such as JICA
Proper convergence
mechanism is required to be
able to identify convergence
opportunities
Gaps in broad
sectoral
outcomes
Financing in the
sector
AIBP and
CADWM
LTIF (loan
servicing
through
NABARD)
Initial fund shortage by states
addressed now with loans at
subsidized rates from NABARD
(under LTIF scheme).
However, funds disbursed to
the tune of Rs. 1,847 Cr. is
reported to be lying unutilized
in 6 states; with 3 projects
contributing to around 67% of
the unutilized funds
i. Guidelines may be
developed to disburse the
funds to states in several
tranches (instead of a
single lump sum) based on
utilization of previous
tranche; however in such
cases adequate provisions
need to be built in so as to
streamline the procedure
between proposal/
application (by state) and

Page | 1155
Sectoral
objective
Major issues
Relevant
CSS
scheme
Scheme
component
Component Performance
Way Forward
Recommendations
release of funds (from
NABARD) to avoid any
inadvertent delays
ii. In case of funds lying
unspent in a particular
project for more than a
defined time period, the
amount should be returned
to NWDA/ NABARD who
may then disburse it to
another PMKSY-AIBP
project in that or other
states
Gaps in broad
sectoral
outcomes
Project Management
issues and Slow
project execution
AIBP AIBP
a. Delay due to land acquisition
and R&R issues
b. Inability of states to match
state budget
c. Delay in transfer of funds
from states to implementing
a. R&R - creation of separate
R&R wing under water
resources department to
expedite resolving R&R
issues
b. Land acquisition- task force

Page | 1156
Sectoral
objective
Major issues
Relevant
CSS
scheme
Scheme
component
Component Performance
Way Forward
Recommendations
agencies
affected contractor
mobilization
d. Inability of contractors to
simultaneously mobilize
resources across different
projects (particularly to address
the critical paths)
involving different
departments to be created
who should meet monthly to
resolve inter-departmental
clearance issues
c. Direct transfer of fund in
case of states prone to delay
in transfer of funds to
implementing agencies
d. Development of a
contractor management tool
at national level for earlier
detection of bottlenecks and
critical paths
SPFM SPFM
As per cabinet note, 69 SMI
and 2 MMI projects should
have been completed by June
2020. However, only 18 SMI
projects have been completed
so far. Many projects are
• Periodic review meeting
among high level officials
(e.g. secretary)
• Central level monitoring to
expedite clearances

Page | 1157
Sectoral
objective
Major issues
Relevant
CSS
scheme
Scheme
component
Component Performance
Way Forward
Recommendations
delayed because of issues
related to land acquisition,
R&R, etc.
• Separate agency for
managing rehabilitation and
resettlement related
activities
• Local NGOs to be involved
to educate PAPs about
project benefits
WDC WDC
The key reasons for delay in
project execution is delay in
release of funds. The key
factors for which this delay is
caused is as follows:
• States often delay in the
release of their matching share
making it very difficult to
complete the projects on time.
• Delayed, staggered and
inadequate release of funds by
GOI has resulted in stretching
the project beyond the
• States should take
necessary measures to
release their contribution to
watershed projects on time to
ensure speedy completion of
projects. Further, timely
release of funds from the
Centre is important in this
regard. In case of absence of
proper documentation or
deficiencies in the proposals,
such delays are caused.
Therefore, proper capacity
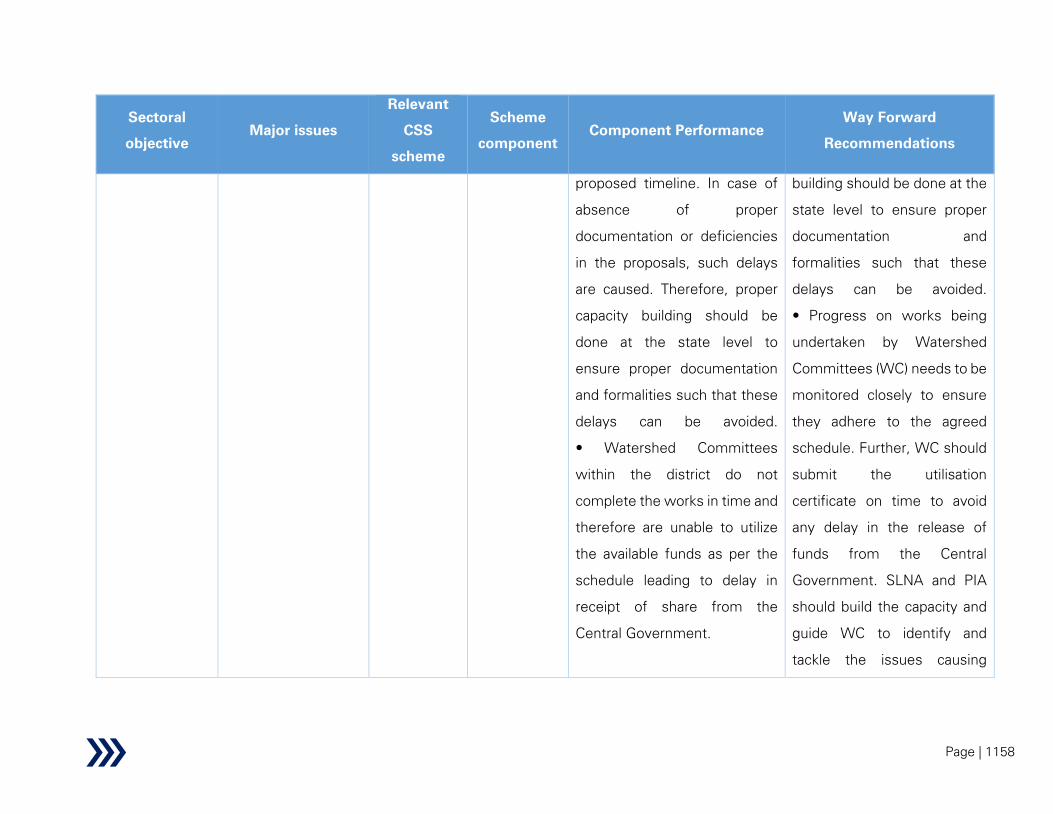
Page | 1158
Sectoral
objective
Major issues
Relevant
CSS
scheme
Scheme
component
Component Performance
Way Forward
Recommendations
proposed timeline. In case of
absence of proper
documentation or deficiencies
in the proposals, such delays
are caused. Therefore, proper
capacity building should be
done at the state level to
ensure proper documentation
and formalities such that these
delays can be avoided.
• Watershed Committees
within the district do not
complete the works in time and
therefore are unable to utilize
the available funds as per the
schedule leading to delay in
receipt of share from the
Central Government.
building should be done at the
state level to ensure proper
documentation and
formalities such that these
delays can be avoided.
• Progress on works being
undertaken by Watershed
Committees (WC) needs to be
monitored closely to ensure
they adhere to the agreed
schedule. Further, WC should
submit the utilisation
certificate on time to avoid
any delay in the release of
funds from the Central
Government. SLNA and PIA
should build the capacity and
guide WC to identify and
tackle the issues causing
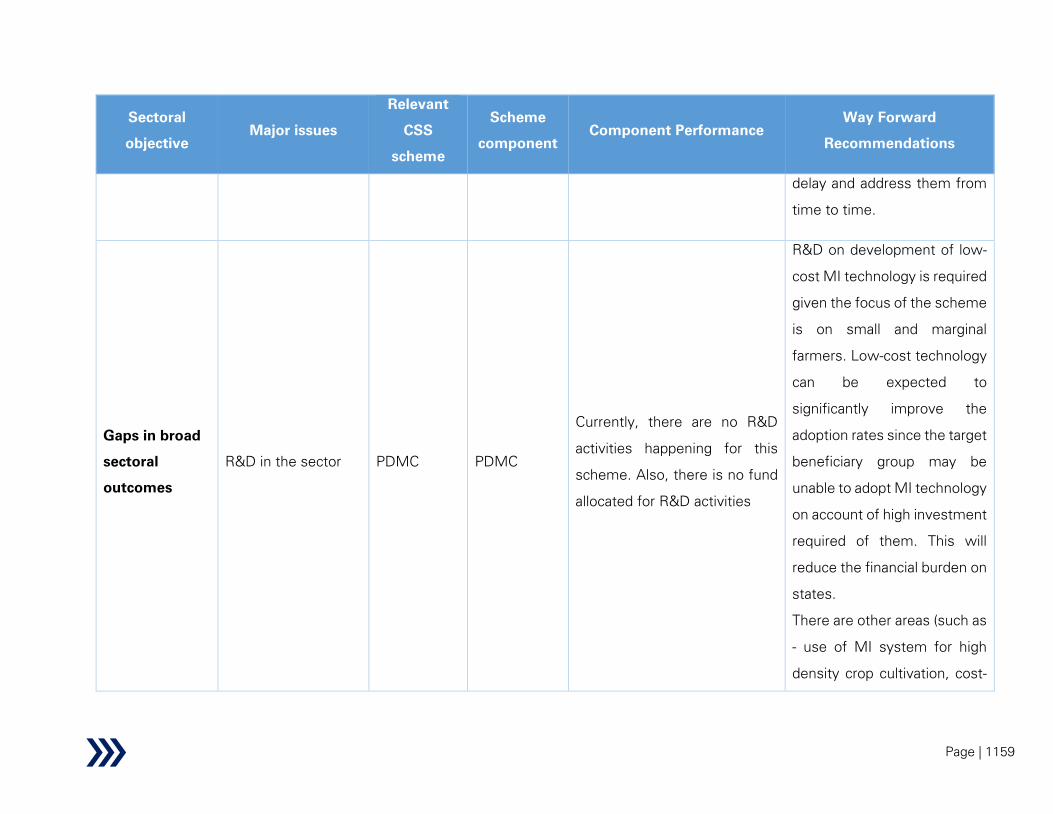
Page | 1159
Sectoral
objective
Major issues
Relevant
CSS
scheme
Scheme
component
Component Performance
Way Forward
Recommendations
delay and address them from
time to time.
Gaps in broad
sectoral
outcomes
R&D in the sector PDMC PDMC
Currently, there are no R&D
activities happening for this
scheme. Also, there is no fund
allocated for R&D activities
R&D on development of low-
cost MI technology is required
given the focus of the scheme
is on small and marginal
farmers. Low-cost technology
can be expected to
significantly improve the
adoption rates since the target
beneficiary group may be
unable to adopt MI technology
on account of high investment
required of them. This will
reduce the financial burden on
states.
There are other areas (such as
- use of MI system for high
density crop cultivation, cost-
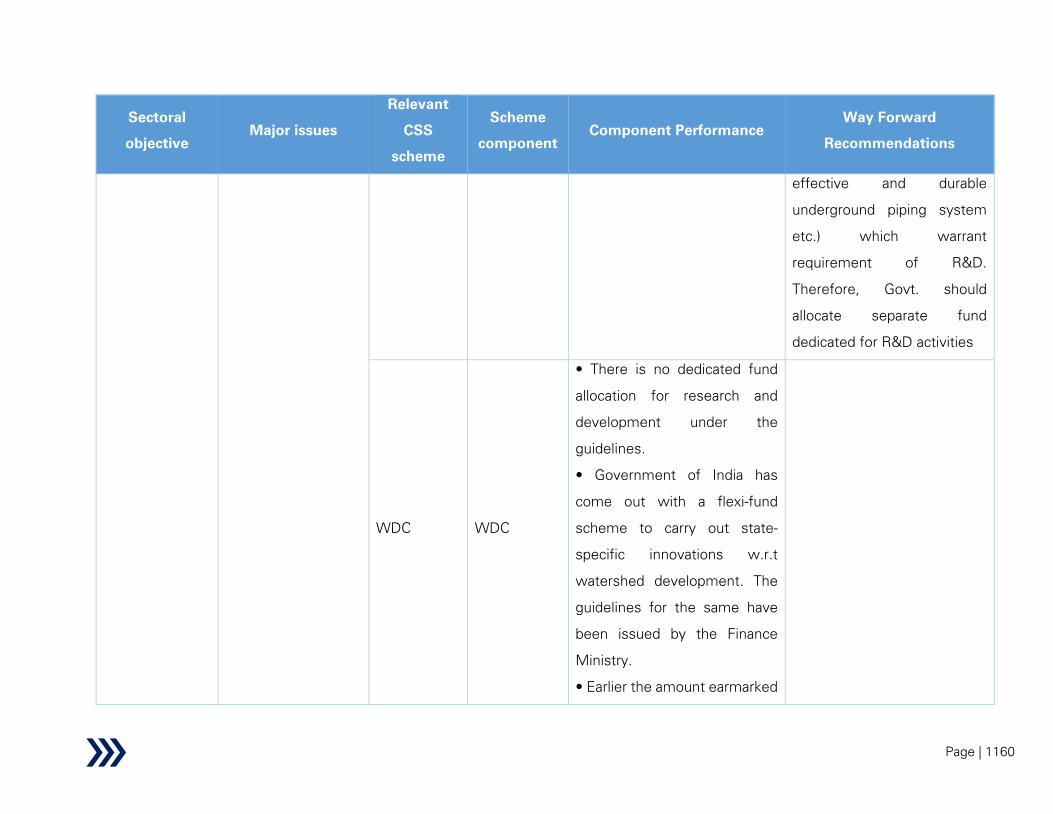
Page | 1160
Sectoral
objective
Major issues
Relevant
CSS
scheme
Scheme
component
Component Performance
Way Forward
Recommendations
effective and durable
underground piping system
etc.) which warrant
requirement of R&D.
Therefore, Govt. should
allocate separate fund
dedicated for R&D activities
WDC WDC
• There is no dedicated fund
allocation for research and
development under the
guidelines.
• Government of India has
come out with a flexi-fund
scheme to carry out state-
specific innovations w.r.t
watershed development. The
guidelines for the same have
been issued by the Finance
Ministry.
• Earlier the amount earmarked
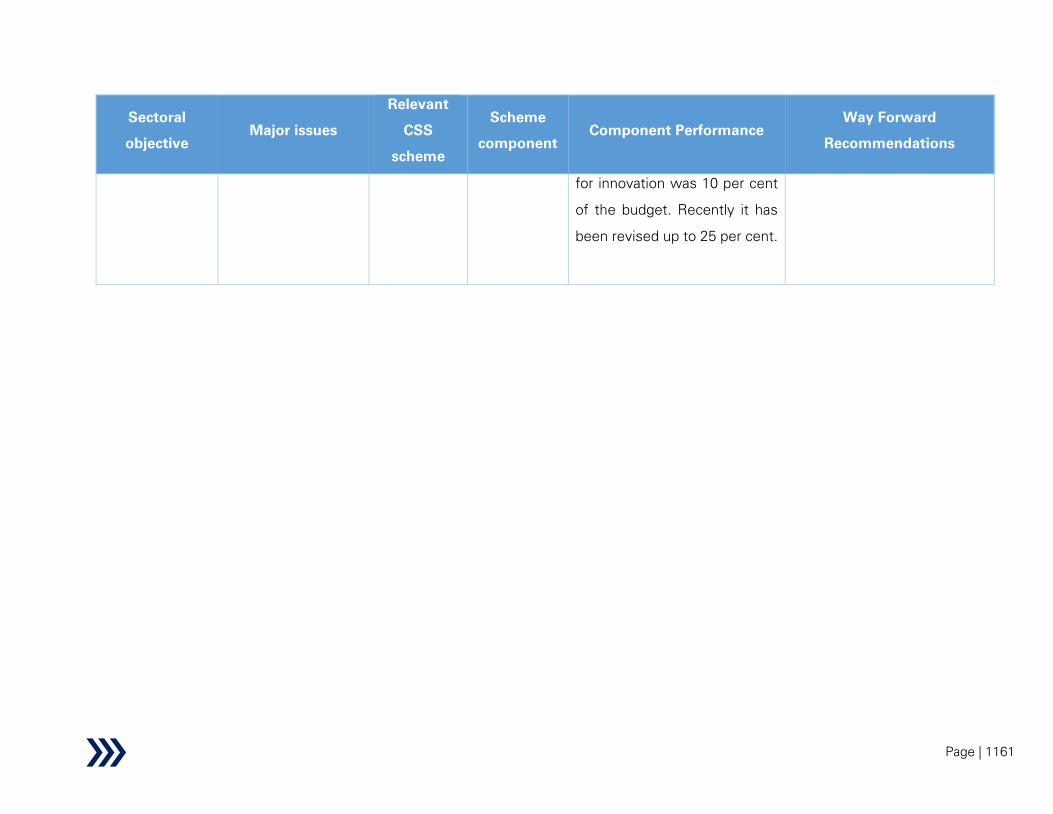
Page | 1161
Sectoral
objective
Major issues
Relevant
CSS
scheme
Scheme
component
Component Performance
Way Forward
Recommendations
for innovation was 10 per cent
of the budget. Recently it has
been revised up to 25 per cent.

Page | 1162
3.2 Recommendations at Sectoral Level
The detailed recommendations for the water resources sector is provided earlier. The table below
summarises the key issues and corresponding recommendations at sectoral level.
Table 148: Recommendations – Sectoral level
Sl.no Recommendations
Supply Side
1.
Issue: Low total water storage capacity leads to inadequate buffer stock during periods
of droughts, summer months as well as high run-off of surface water into sea
Solution:
• Focus on creating additional decentralised storage structures across the country
on large scale at village levels. Existing village ponds to be rejuvenated, desilted
and/or expanded.
• A large-scale initiative on de-siltation of all existing major and medium irrigation
reservoirs may be initiated. Further the silt recovered may be provided to
farmers/WUAs for improving fertility of their agricultural fields and the sand can be
used for construction works. Alternatively, dredging of accumulated silt may also
be attempted for very large dams. Extensive catchment area treatment should also
be undertaken for all reservoirs to avoid silt deposition.
• A feasibility study to increase the existing height of the reservoirs may be taken up
in a systematic manner. If feasible the height of the reservoirs may be increased
• Going forward, since the focus should remain on small decentralised storage
structures, a robust census of Minor Irrigation and other such small storage
structures created is of utmost importance
• State WRDs must have dedicated budget (including pre-planned O&M schedule)
for operations and maintenance of the dams to address the existing O&M issues
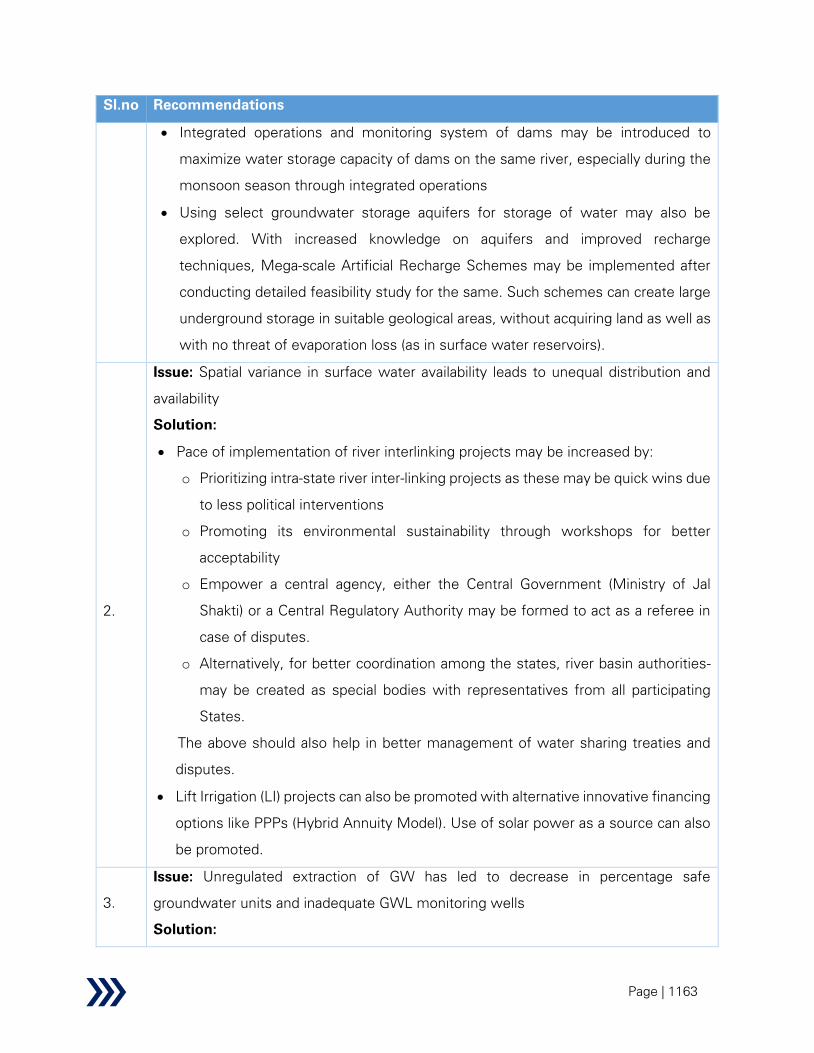
Page | 1163
Sl.no Recommendations
• Integrated operations and monitoring system of dams may be introduced to
maximize water storage capacity of dams on the same river, especially during the
monsoon season through integrated operations
• Using select groundwater storage aquifers for storage of water may also be
explored. With increased knowledge on aquifers and improved recharge
techniques, Mega-scale Artificial Recharge Schemes may be implemented after
conducting detailed feasibility study for the same. Such schemes can create large
underground storage in suitable geological areas, without acquiring land as well as
with no threat of evaporation loss (as in surface water reservoirs).
2.
Issue: Spatial variance in surface water availability leads to unequal distribution and
availability
Solution:
• Pace of implementation of river interlinking projects may be increased by:
o Prioritizing intra-state river inter-linking projects as these may be quick wins due
to less political interventions
o Promoting its environmental sustainability through workshops for better
acceptability
o Empower a central agency, either the Central Government (Ministry of Jal
Shakti) or a Central Regulatory Authority may be formed to act as a referee in
case of disputes.
o Alternatively, for better coordination among the states, river basin authorities-
may be created as special bodies with representatives from all participating
States.
The above should also help in better management of water sharing treaties and
disputes.
• Lift Irrigation (LI) projects can also be promoted with alternative innovative financing
options like PPPs (Hybrid Annuity Model). Use of solar power as a source can also
be promoted.
3.
Issue: Unregulated extraction of GW has led to decrease in percentage safe
groundwater units and inadequate GWL monitoring wells
Solution:

Page | 1164
Sl.no Recommendations
• States should be encouraged to adopt the Groundwater (Sustainable Management)
Bill, 2017, after suitable customizations. Focus on decentralised and participatory
enforcement of GW related regulations through WUAs and similar grassroot level
organisations.
• Remote and real-time telemetry-based water sensors may be installed across
states for accurate and updated GWL data. Rain gauges may also be installed for
accurate data on rainfall. Modelling and analysis of real-time GWL and rainfall data
to track extraction of GW.
• Participatory GWL Monitoring may also be undertaken by involving SHGs, WUAs
or volunteers who may be trained to monitor GWL at GP level. The same may be
shared with the State level GW authorities by phone or through an application on
a regular basis.
• Implement real-time telemetry-based meters for GWL measurement to monitor
GW extraction through bore wells
• Additional analysis using satellite data (such as NASA's Gravity Recovery and
Climate Experiment) of groundwater level changes may also be undertaken at
regular intervals to measure seasonal changes in groundwater levels
4.
Issue: Inadequate micro level information of depleted aquifers
Solution:
• Water budgeting at GP level may be carried out by using micro level (at least GP)
information. Such water budgeting document can be used to prepare a GP-wise
water security plan
• GP level rainwater and GWL recording can be used to understand the extent of
natural recharge of the aquifer and therefore plan for artificial GW recharge
initiatives
• Attempts may be made to digitize GWL data and integration of data from all GWL
recorders (under the NHP or NWIC) and use advanced mathematical techniques
like artificial algorithms to check the quality of the data sets. Thereafter, the existing
data may be used for analysis and planning of GW recharge initiatives. CGWB may
collaborate with IITs and NITs to undertake research on the GWL data collected.
Demand Side- Irrigation

Page | 1165
Sl.no Recommendations
5.
Issue: There is a large gap between IPC and IPU
Solution:
• Standard guidelines and methodology should be developed for assessing the IPC
and IPU
• For monitoring IPU effectively, remote sensing may be used for real-time data on
cropping.
• Completion of distributary networks, field channels, lining of canals and adequate
O&M of the existing canals need to be undertaken. The MoJS may plan for
incentivising the states in the form of additional subsidy/central funds, based on
reduction of IPC-IPU gap.
6.
Issue: Low irrigation coverage and low agricultural productivity
Solution:
• The existing Irrigation Census may be further strengthened by introducing
community participation and support from WUAs initiatives and technology to
collect this data.
• Creation of additional small and decentralised storage structures under
PMKSY/MGNREGA
• Rainwater harvesting at village level may be further encouraged for increasing the
coverage of irrigation in convergence with the recently launched Jal Shakti Abhiyan
(JSA)
• Artificial GW recharge initiatives in select water scarce zones
• River Interlinking projects and Lift Irrigation projects will also increase irrigation
coverage.
7.
Issue: High dependency on groundwater for irrigation
Solution:
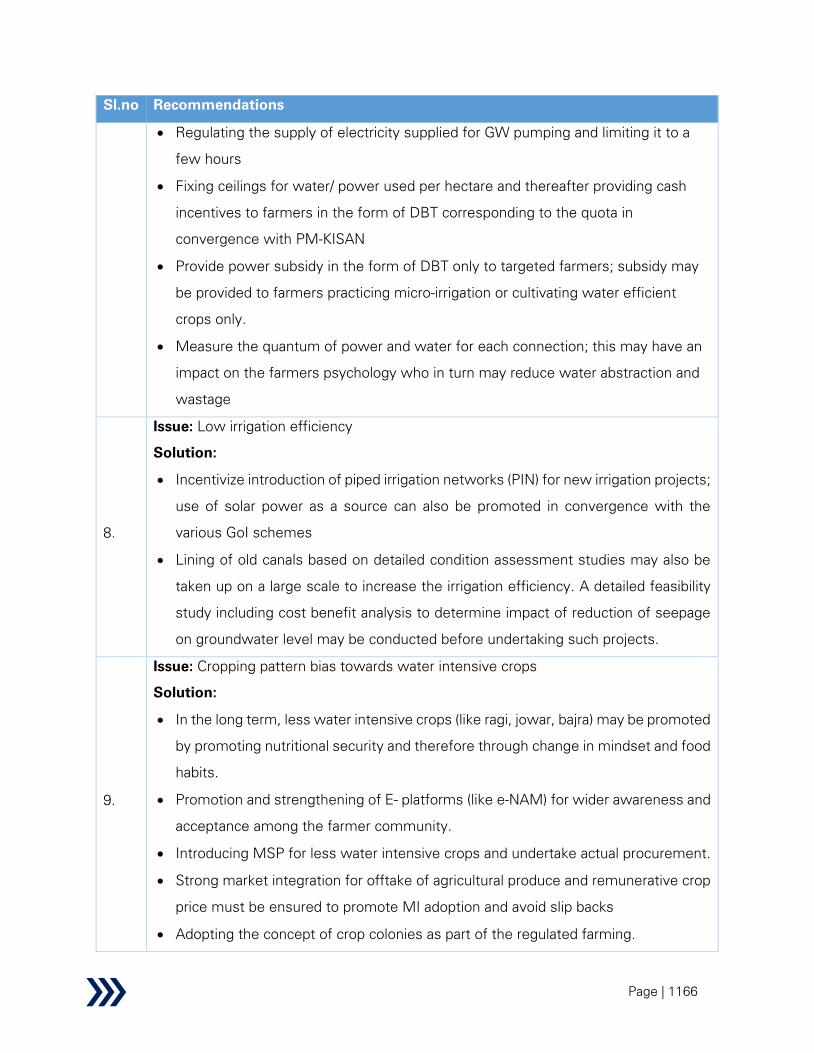
Page | 1166
Sl.no Recommendations
• Regulating the supply of electricity supplied for GW pumping and limiting it to a
few hours
• Fixing ceilings for water/ power used per hectare and thereafter providing cash
incentives to farmers in the form of DBT corresponding to the quota in
convergence with PM-KISAN
• Provide power subsidy in the form of DBT only to targeted farmers; subsidy may
be provided to farmers practicing micro-irrigation or cultivating water efficient
crops only.
• Measure the quantum of power and water for each connection; this may have an
impact on the farmers psychology who in turn may reduce water abstraction and
wastage
8.
Issue: Low irrigation efficiency
Solution:
• Incentivize introduction of piped irrigation networks (PIN) for new irrigation projects;
use of solar power as a source can also be promoted in convergence with the
various GoI schemes
• Lining of old canals based on detailed condition assessment studies may also be
taken up on a large scale to increase the irrigation efficiency. A detailed feasibility
study including cost benefit analysis to determine impact of reduction of seepage
on groundwater level may be conducted before undertaking such projects.
9.
Issue: Cropping pattern bias towards water intensive crops
Solution:
• In the long term, less water intensive crops (like ragi, jowar, bajra) may be promoted
by promoting nutritional security and therefore through change in mindset and food
habits.
• Promotion and strengthening of E- platforms (like e-NAM) for wider awareness and
acceptance among the farmer community.
• Introducing MSP for less water intensive crops and undertake actual procurement.
• Strong market integration for offtake of agricultural produce and remunerative crop
price must be ensured to promote MI adoption and avoid slip backs
• Adopting the concept of crop colonies as part of the regulated farming.
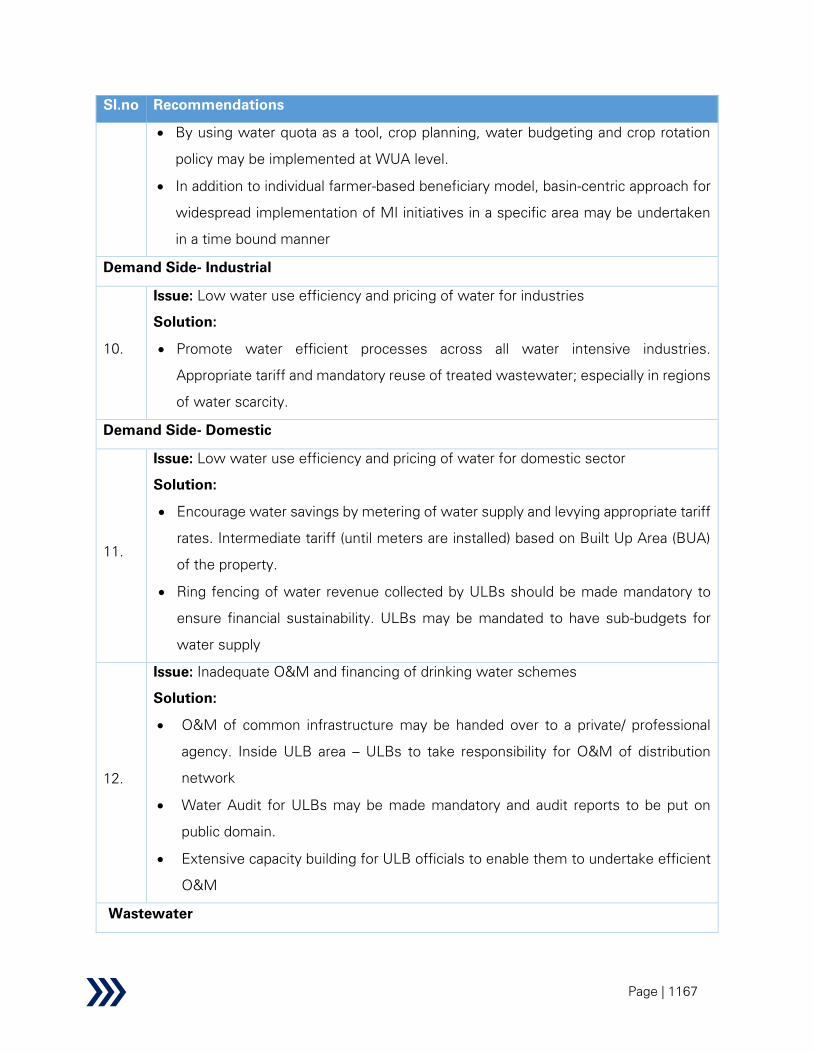
Page | 1167
Sl.no Recommendations
• By using water quota as a tool, crop planning, water budgeting and crop rotation
policy may be implemented at WUA level.
• In addition to individual farmer-based beneficiary model, basin-centric approach for
widespread implementation of MI initiatives in a specific area may be undertaken
in a time bound manner
Demand Side- Industrial
10.
Issue: Low water use efficiency and pricing of water for industries
Solution:
• Promote water efficient processes across all water intensive industries.
Appropriate tariff and mandatory reuse of treated wastewater; especially in regions
of water scarcity.
Demand Side- Domestic
11.
Issue: Low water use efficiency and pricing of water for domestic sector
Solution:
• Encourage water savings by metering of water supply and levying appropriate tariff
rates. Intermediate tariff (until meters are installed) based on Built Up Area (BUA)
of the property.
• Ring fencing of water revenue collected by ULBs should be made mandatory to
ensure financial sustainability. ULBs may be mandated to have sub-budgets for
water supply
12.
Issue: Inadequate O&M and financing of drinking water schemes
Solution:
• O&M of common infrastructure may be handed over to a private/ professional
agency. Inside ULB area – ULBs to take responsibility for O&M of distribution
network
• Water Audit for ULBs may be made mandatory and audit reports to be put on
public domain.
• Extensive capacity building for ULB officials to enable them to undertake efficient
O&M
Wastewater
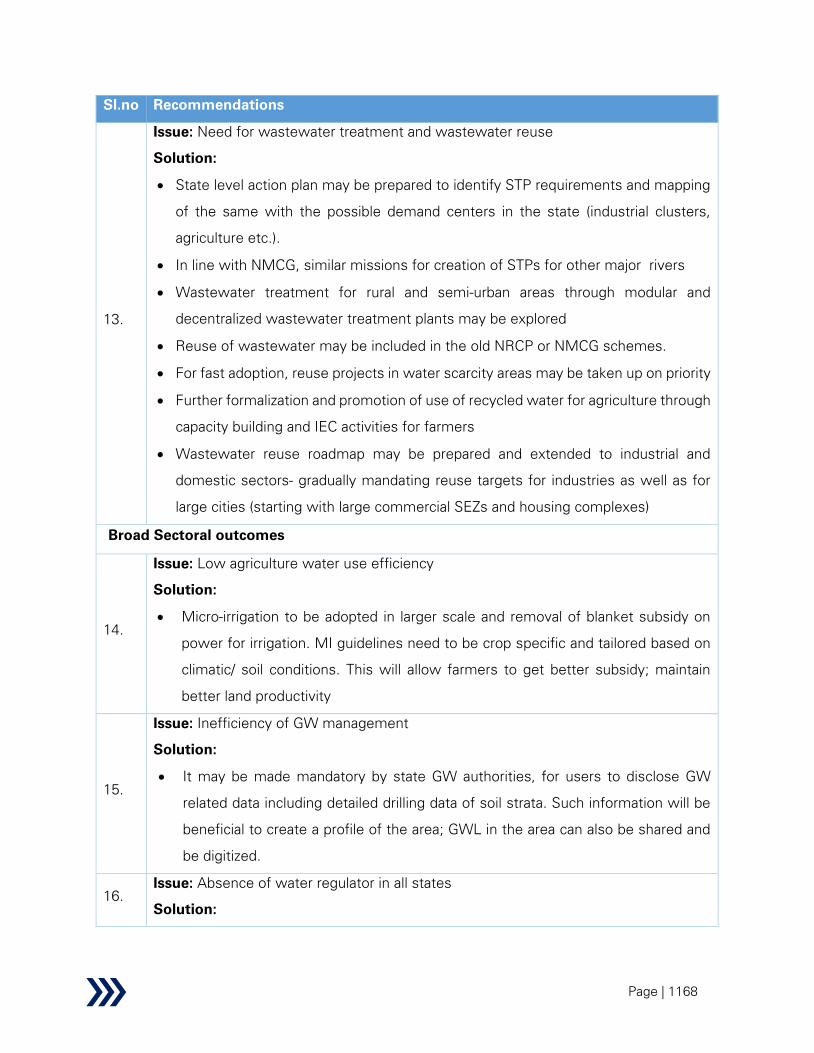
Page | 1168
Sl.no Recommendations
13.
Issue: Need for wastewater treatment and wastewater reuse
Solution:
• State level action plan may be prepared to identify STP requirements and mapping
of the same with the possible demand centers in the state (industrial clusters,
agriculture etc.).
• In line with NMCG, similar missions for creation of STPs for other major rivers
• Wastewater treatment for rural and semi-urban areas through modular and
decentralized wastewater treatment plants may be explored
• Reuse of wastewater may be included in the old NRCP or NMCG schemes.
• For fast adoption, reuse projects in water scarcity areas may be taken up on priority
• Further formalization and promotion of use of recycled water for agriculture through
capacity building and IEC activities for farmers
• Wastewater reuse roadmap may be prepared and extended to industrial and
domestic sectors- gradually mandating reuse targets for industries as well as for
large cities (starting with large commercial SEZs and housing complexes)
Broad Sectoral outcomes
14.
Issue: Low agriculture water use efficiency
Solution:
• Micro-irrigation to be adopted in larger scale and removal of blanket subsidy on
power for irrigation. MI guidelines need to be crop specific and tailored based on
climatic/ soil conditions. This will allow farmers to get better subsidy; maintain
better land productivity
15.
Issue: Inefficiency of GW management
Solution:
• It may be made mandatory by state GW authorities, for users to disclose GW
related data including detailed drilling data of soil strata. Such information will be
beneficial to create a profile of the area; GWL in the area can also be shared and
be digitized.
16.
Issue: Absence of water regulator in all states
Solution:
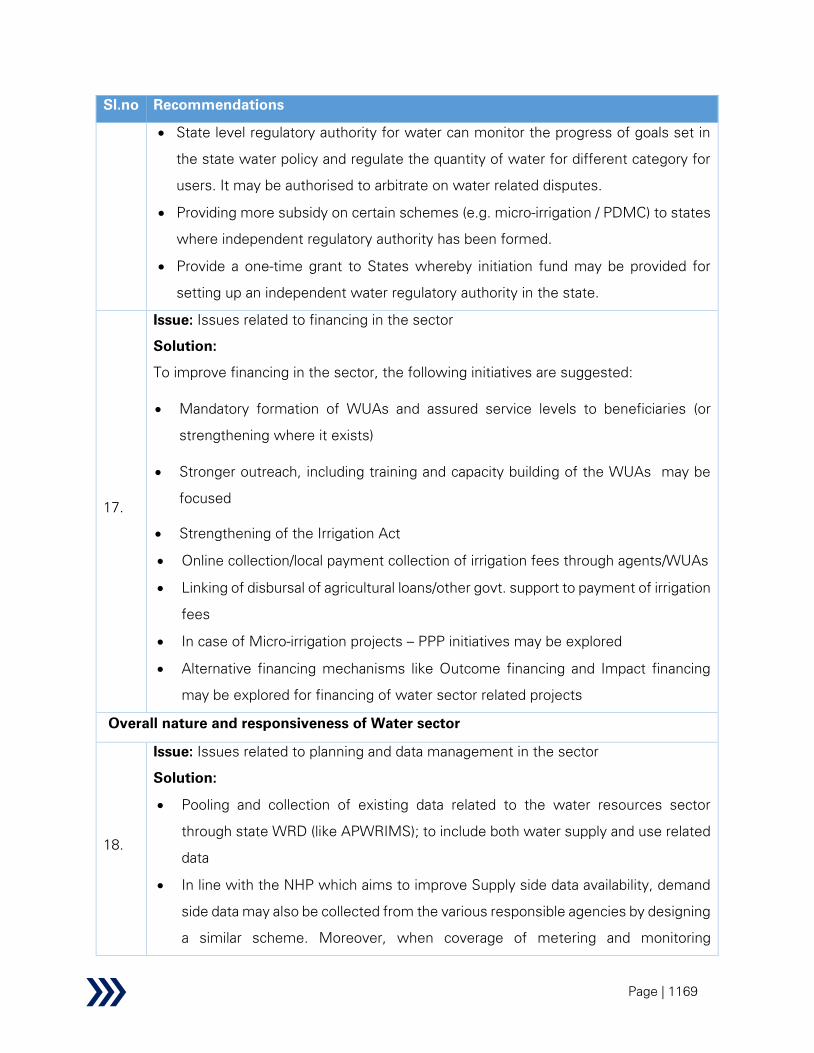
Page | 1169
Sl.no Recommendations
• State level regulatory authority for water can monitor the progress of goals set in
the state water policy and regulate the quantity of water for different category for
users. It may be authorised to arbitrate on water related disputes.
• Providing more subsidy on certain schemes (e.g. micro-irrigation / PDMC) to states
where independent regulatory authority has been formed.
• Provide a one-time grant to States whereby initiation fund may be provided for
setting up an independent water regulatory authority in the state.
17.
Issue: Issues related to financing in the sector
Solution:
To improve financing in the sector, the following initiatives are suggested:
• Mandatory formation of WUAs and assured service levels to beneficiaries (or
strengthening where it exists)
• Stronger outreach, including training and capacity building of the WUAs may be
focused
• Strengthening of the Irrigation Act
• Online collection/local payment collection of irrigation fees through agents/WUAs
• Linking of disbursal of agricultural loans/other govt. support to payment of irrigation
fees
• In case of Micro-irrigation projects – PPP initiatives may be explored
• Alternative financing mechanisms like Outcome financing and Impact financing
may be explored for financing of water sector related projects
Overall nature and responsiveness of Water sector
18.
Issue: Issues related to planning and data management in the sector
Solution:
• Pooling and collection of existing data related to the water resources sector
through state WRD (like APWRIMS); to include both water supply and use related
data
• In line with the NHP which aims to improve Supply side data availability, demand
side data may also be collected from the various responsible agencies by designing
a similar scheme. Moreover, when coverage of metering and monitoring

Page | 1170
Sl.no Recommendations
infrastructure becomes more widespread, decentralized data collection from all
demand centers (irrigation, domestic and industrial) may be attempted.
Involvement and support from various associations like WUAs, civil societies,
industry associations, etc. may be sought for this.
• A separate scheme may be undertaken dedicated to water resources planning at
state level. A comprehensive sector plan covering - water supply and demand for
irrigation, industrial and domestic sector, water use efficiency etc. is required to
be undertaken.
• In Irrigation department at state level, three wings. (1) Construction and Design
Wing- Focus on technical designs, asset creation and (2) Operations wing- Focus
on O&M of existing assets, and other softer aspects like Community mobilization,
and (3) Commercial Wing - focusing on commercial aspects like service fee
collection, etc. A fixed percentage of the capital expenses budget for the
department should be allocated for O&M.
• Water entitlement for all category of users- domestic (bulk), industrial and irrigation
may be implemented to promote water use efficiency.
• In drinking water supply - bulk water production and transmission may be
undertaken by a single entity (preferably Water Supply Authorities in case of Urban
and ZPs in case of rural), whereas drinking water distribution related activities are
conducted by a separate entity (preferably ULBs in case of Urban and GPs via
VWSCs in case of rural).

Page | 1171
3.3 Synthesis of Scheme/ Umbrella Level Recommendations
The summary recommendations for major issues identified at scheme level for the PMKSY, IC,
NRCP and FMBAP schemes are listed in this section.
Table 149: AIBP– Recommendations
Sl.no Recommendation
1.
Issue: Progress in almost all the ongoing MMI projects is marred by delays owing to
land acquisition and R&R issues.
Recommendation: Creation of an inter-departmental task force in every state (with
on-going projects) who should meet on a month basis to fast-track clearances and
creation of a separate R&R wing under each state water resources department to
expedite resolutions of R&R issue specific to the projects
2.
Issue: The economic utility of the capital intensive MMI projects has been called to
question many a times because of their unreliability in delivering the envisaged benefits
to the end beneficiaries. One of the main causes is negligible maintenance of the
assets over the period which stems from lack of accountability of the scheme-owners
to the beneficiaries.
Recommendation: Adopt a progressive shift from construction based to service-
based approach. This may be attempted by adopting the following approaches:
• Change in funding approach: The eligibility criteria for selection of MMI projects
receiving central grants could be made more favourable for ERM of old projects.
Measures like canal automation (as part of ERM projects) is expected to deliver twin
benefits of higher state regulation of water resources and better service delivery to
the end beneficiaries.
• Improvement in maintenances: The central government may explore introducing a
new scheme through which central grants may be released to states for (non-
establishment component of) maintenance expenditure for the maintenance of
selected MMI projects. Additional incentives may be provided to states that have
adopted various water sector reforms like increase in state budget allocation for
maintenances, setting up water resources regulatory authority, etc.

Page | 1172
Sl.no Recommendation
• Change in organizational structure: The shift towards better service delivery and
operation plan needs to be backed by change in current resource profile of the
irrigation departments; resources from other disciplines like agro-economists,
anthropologists/sociologists could be deployed along with those from engineering
disciplines. Also, in view of the huge spread of irrigation projects, outsourcing of
non-core works (like maintenance, revenue assessment and fees collection) to
private agencies may be explored (as already being initiated by some states like
Andhra Pradesh).
3.
Issue: Current distribution loss in irrigation systems in India (40% to 50%) is quite high
compared to other countries like Philippines, Malaysia, Colombia, Egypt and others.
Recommendation: Develop guidelines mandating state to explore feasibility of piped
distribution networks in all branch and distributary networks for all new/ ongoing
projects.
4.
Issue: Unabated water withdrawal particularly by cultivators at higher elevation or rim
of the storage reservoirs
Recommendation: The Ministry should explore options for introducing provisions for
expanding command area by legalizing the lift irrigation schemes – a national guideline
in this aspect may be prepared to specify the eligibility criteria and other norms. The
implementing agencies should be encouraged to critically explore the possibility of
inclusion of lift irrigation proposals (particularly in project areas with high incidences of
lifting) in the main irrigation system in their initial proposal.
5.
Issue: Some of the outcome parameters as defined in the Ministry of Finance’s ‘Output
Outcome Framework’ are not tracked. Also, conduct of impact assessment studies
was observed to be limited.
Recommendation: Ensure transparency by conducting regular third party impact
studies (under the Impact Assessment Studies scheme) along with holistic tracking of
indicators (both output and outcome indicators) in MIS dashboard
Standard guidelines may be developed for assessment of the parameters like IPC-IPU
over the years, which should be followed by adequate dissemination of those
guidelines to the relevant stakeholders and accordingly trainings of state personnel
may be conducted to avoid disparities in methods of calculation across states. Creation

Page | 1173
Sl.no Recommendation
of statistical cells at both central and state levels for reconciliation of project level data
and use of remote sensing technologies (along the lines of Ministry’s recent initiatives
of remote crop assessment) may be explored to ensure timely update of IPC-IPU
figures.
Also, as short-term measures, linking the existing MIS dashboard with the CADWM
MIS dashboard for IPU data and reconciliation of groundwater related data with state
dashboards like APWRIMS/ monthly or quarterly reports by State Ground Water Boards
are suggested.
Table 150: CADWM – Recommendations
Sl.no Recommendation
1.
Issue: Limited involvement of WUAs at the time of project inception/ planning stage
and also in stages thereafter, which is further complicated by laxity in implementation
of non-structural components like appointment of social facilitators
Recommendation: Prioritize implementation of non-structural components over
structural ones. To ensure acceptability of the scheme among the cultivators and
sustenance of the WUAs and scheme, the release of 2nd CA instalment (or some
portion thereof) for structural interventions may be made subject to the completion of
the following: registration of the WUAs, appointment of social facilitator for the project,
conduct of specified trainings by social facilitators and release of the one-time
infrastructural component (in those areas already catered by the 1st instalment). A
national pool of social facilitators may be created by integrating similar agencies
working across related sectors like watershed development, rural drinking water (under
Jal Jeevan Mission), etc.
2.
Issue: Non-revision of cost-norms under structural interventions
Recommendation: Revision of cost norms based on market prices and state’s
schedule of rates is suggested; formula for revising the base price of different cost
components based on inflation indices should be developed
3.
Issue: Progress under micro-irrigation component has been minimal; major issues
being lack of awareness, cultivator’s unwillingness and unreliable water availability

Page | 1174
Sl.no Recommendation
Recommendation: Explore scheme rationalization by transferring the micro-irrigation
component to the Other Interventions component under the extant Per Drop More
Crop Scheme (of MoA&FW) and ensure assured water supply round the year through
adoption of conjunctive use of groundwater measures. Construction of tubewells/ bore
wells under the MI component may be explored to ensure water availability in off
seasons (say summer or Rabi season) in areas with adequate groundwater level.
4.
Issue: Deficiencies in MIS dashboard have been noted for some of the non-structural
interventions.
Recommendation: The ministry should ensure regular and proper update of MIS
database. Linking of subsequent CA instalment releases with physical and financial
progresses reflected in MIS may be explored. This should be supported by adequate
hand-holding of state agencies through trainings by NIC and continuous monitoring and
support by regional CWC offices
5.
Issue: Limited convergence with other government schemes
Recommendation: Ministry should identify type of works under CADWM that may be
covered in line with the 50:50 material – labour component mandated under
MGNREGA
Also, adequate consultations with MoA&FW are suggested to identify the extant
agricultural subsidy schemes where WUAs could be registered as beneficiaries.
Table 151: RRR– Recommendations
Sl.no Recommendation
1.
Issue: The current checklist for B-C ratio, takes only irrigation potential into account;
despite the scheme having multiple other objectives like groundwater recharge and
provisioning of drinking water.
Recommendation: The checklist for calculation needs to be revised to include other
factors like provisioning of drinking water, groundwater recharge, livelihood generation
activities like pisciculture and other direct-indirect benefits of the scheme, including
socio economic benefits.

Page | 1175
Sl.no Recommendation
2.
Issue: Output-outcome framework does not mention separate outcome for each
scheme objective.
Recommendation: There is a need to evolve format and procedures to carry out post
project evaluation. The output- outcome framework and objective based outcomes
should be tracked at RRR scheme. Additional indicators (mainly outcome based)
corresponding to scheme objectives like groundwater recharge, agricultural
productivity, improvement of catchment area of tank commands, capacity building,
revenue generation from fisheries, tourism, domestic and industrial water supply may
be tracked to understand holistic benefits accruing from the scheme.
3.
Issue: Erratic rainfall pattern poses a major risk to scheme sustainability, which is
unaddressed under current scheme guidelines.
Recommendation: To ensure sustainable irrigation management, power subsidies
that favour indiscriminate abstraction of water resources should be reduced/removed
and replaced by direct benefit transfer, as initiated by Telangana and Odisha. Scope of
work under RRR may be enhanced to include percolation tanks. Additionally,
waterbodies may be connected to adjacent canal system so that excess flood waters
may be stored in these canals when water demand for irrigation is comparatively less.
This would reduce the incidences of flooding while additional water stored may be
gainfully utilized for irrigation and other allied purpose during dry season.
4.
Issue: Encroachment of water body limits scheme implementation and further
contributes to adverse impacts like flash floods.
Recommendation: Challenges like encroachments can be addressed through active
involvement of WUAs since project inception. Encouraging the use of water body by
the villagers for economic benefits like assured income generation activities may
motivate villagers to protect them. A proportion of revenue generated through
activities like fisheries, drinking water provision, agriculture undertaken in restored
water bodies may be utilised by WUAs to generate funds for O&M.Additionally, a
certificate may be issued by the Gram Panchayat before inclusion of water bodies
under RRR instead of waiting till the release of second instalment.
Table 152: SMI– Recommendations

Page | 1176
Sl.no Recommendation
1.
Issue: High seepage and transmission losses in unlined canals constructed under SMI
in few states. Such canals are more prone to siltation, waterlogging and damages.
Recommendation: Replacing earthen canals with lined canals/ provisioning of pipe
distribution network may be considered to improve water use efficiency. Canal lining
may lead to increase in velocity and rugosity coefficient. Hence, the discharge carrying
capacity of canal would increase, while seepage losses, water logging and
maintenance cost would reduce. However, water losses from unlined canals and
infiltration surplus of applied water has also been found to increase aquifer recharge.
While canal lining augments the potential for groundwater development in some
geographies; it contributes to issues like waterlogging and soil salinity in others.
Hence, decision of canal lining and selection of lining material may be based on local
aquifer characteristics likes soil permeability, watershed physiograpy and underlying
climatic pattern.
2.
Issue: Temporary and permanent non-usage of the surface water schemes due to low
discharge and drying up of water bodies.
Recommendation: To ensure utility of SMI, the scheme design needs to be sequential
in nature. Provisioning of conveyance system through creation of diversion structures
like weirs should be considered only after there is adequate facility for water storage
in the upstream. In this regard, the scheme could be operated in close coordination
and convergence with RRR/other centrally/ state sponsored which includes component
of creation/ restoration of surface water structures.
3.
Issue: Despite the vast amount of untreated wastewater generated by the country,
which is expected to grow further, there are no provisions for wastewater reuse in SMI
guidelines.
Recommendation: Inclusion of wastewater resuse as a part of scheme guidelines
would aid in creation of nutrient rich and reliable water supply for irrigation. Necessary
studies in this regard may be undertaken to develop safety norms for use of treated
wastewater in agriculture and from the perspective of public health.
4.
Issue: Envisaged aim/ output/ outcome/ impact are not mentioned in HKKP -SMI
scheme guidelines.

Page | 1177
Sl.no Recommendation
Recommendation: Other challenges like unclear scheme guidelines; increasing
pressure on groundwater resources and lack of O&M provisioning may be addressed
by making the scheme guidelines more comprehensive with well-defined output,
outcome and impact indicators; provisioning of IEC-BCC activities to create awareness
and financial strengthening of WUAs.
Table 153: PDMC – Recommendations
Sl.no Recommendation
1.
Issue: In some states, separate departments are responsible for MI and OI
components (e.g. Agriculture/ Horticulture department is responsible for MI and
Watershed department is responsible for OI component). Hence, there is either less
focus on water storage structure creation under OI component or such structures
under OI are not effectively linked to MI systems and it hampers the progress of MI
cultivation.
Recommendation: A single department should be accountable for implementing the
entire PDMC scheme (both MI as well as OI components) at state level. This will help
to integrate the water sources created under OI components with MI systems
effectively, which is currently not happening in effective way across many states due
to presence of two different departments for managing these two components. This
arrangement would help to achieve better progress of MI.
Similar arrangement is observed in some states (e.g. Maharashtra, Tamil Nadu); where
single department (i.e. Horticulture department) manages both the components and
there is no such challenge in linking water sources under OI with MI systems.
2.
Issue: There is huge variance between market prices and cost norms per guidelines
for the MI and OI components.
Recommendation: Unit cost norms for material cost of MI system (such as drip,
sprinkler etc.) and material and installation cost of OI components (construction of tube
well/ bore well, water lifting devices, construction of community tanks/ farm ponds
etc.) specified in the scheme guidelines should be revised so that base prices for all
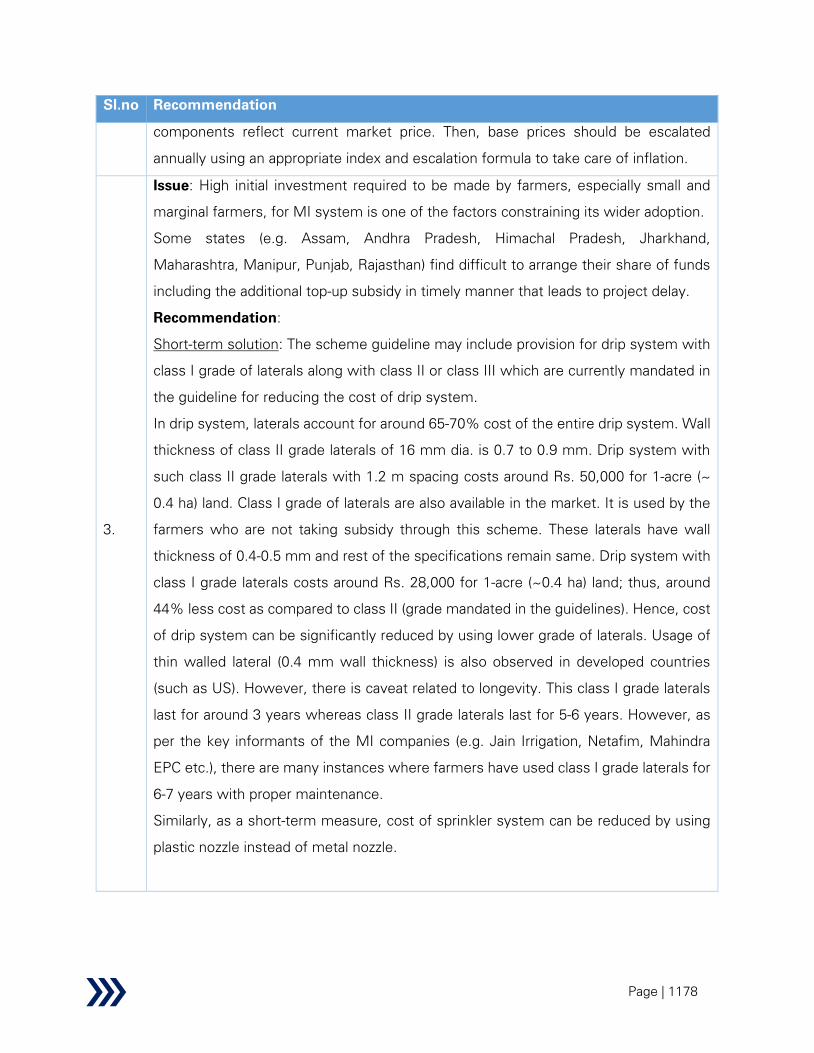
Page | 1178
Sl.no Recommendation
components reflect current market price. Then, base prices should be escalated
annually using an appropriate index and escalation formula to take care of inflation.
3.
Issue: High initial investment required to be made by farmers, especially small and
marginal farmers, for MI system is one of the factors constraining its wider adoption.
Some states (e.g. Assam, Andhra Pradesh, Himachal Pradesh, Jharkhand,
Maharashtra, Manipur, Punjab, Rajasthan) find difficult to arrange their share of funds
including the additional top-up subsidy in timely manner that leads to project delay.
Recommendation:
Short-term solution: The scheme guideline may include provision for drip system with
class I grade of laterals along with class II or class III which are currently mandated in
the guideline for reducing the cost of drip system.
In drip system, laterals account for around 65-70% cost of the entire drip system. Wall
thickness of class II grade laterals of 16 mm dia. is 0.7 to 0.9 mm. Drip system with
such class II grade laterals with 1.2 m spacing costs around Rs. 50,000 for 1-acre (~
0.4 ha) land. Class I grade of laterals are also available in the market. It is used by the
farmers who are not taking subsidy through this scheme. These laterals have wall
thickness of 0.4-0.5 mm and rest of the specifications remain same. Drip system with
class I grade laterals costs around Rs. 28,000 for 1-acre (~0.4 ha) land; thus, around
44% less cost as compared to class II (grade mandated in the guidelines). Hence, cost
of drip system can be significantly reduced by using lower grade of laterals. Usage of
thin walled lateral (0.4 mm wall thickness) is also observed in developed countries
(such as US). However, there is caveat related to longevity. This class I grade laterals
last for around 3 years whereas class II grade laterals last for 5-6 years. However, as
per the key informants of the MI companies (e.g. Jain Irrigation, Netafim, Mahindra
EPC etc.), there are many instances where farmers have used class I grade laterals for
6-7 years with proper maintenance.
Similarly, as a short-term measure, cost of sprinkler system can be reduced by using
plastic nozzle instead of metal nozzle.

Page | 1179
Sl.no Recommendation
Long-term solution: R&D on development of low-cost MI technology may be explored
given the focus of the scheme is on small and marginal farmers. Also, a separate
allocation may be considered for such R&D activities.
Govt. can collaborate with MI companies and the research institutes to find out other
ways to reduce the cost of MI systems.
Low-cost technology can be expected to significantly improve the adoption rates since
the target beneficiary group may be unable to adopt MI technology on account of high
investment required of them.
If cost of MI system can be reduced, this will also reduce the subsidy requirement and
thus, the financial burden on states.
4.
Issue: Many states (such as Bihar, Assam, Manipur etc.) have indicated fragmented
landholding as an issue because more than 80-90% farmers are small and marginal in
these states. The farm holding is as low as 0.1 acre. Since minimum area mentioned
in the MI guideline is 0.4 ha (around 0.99 acre) and subsidy for farm size smaller than
that is calculated on pro-rata basis, it leads to comparatively higher costs for MI
systems in case of such smaller farms. For example, let’s consider two farms - 0.4 acre
and 0.2 acre. If all other factors remain same, the subsidy calculated for 0.2 acre will
be half of that for 0.4 acre. However, the actual cost of MI implementation for 0.2 acre
will not be half of that for 0.4 acre, instead it may be more than that because there are
few fixed components (e.g. filter, venturi fertilizer injector assembly etc.) and costs of
those components do not vary with the farm size (in case of such smaller farms).
Recommendation: Farm holding of less than 0.4 ha and appropriate cost norms for
such farms to be provided in the guidelines. This will help to increase MI adoption rate
among the farmers having fragmented landholdings.
5.
Issue: Subsidy allocation is currently made based on SC/ST population in a state. Some
states are unable to utilize the entire funding allocated for SC/ST farmers since their
landholding is significantly lower compared to their population.
Recommendation: SC/ST fund allocation should be determined based on their
landholding instead of their concentration in the overall population in the state. This will
reduce instances of unutilized funds allocated for SC/ST farmers.

Page | 1180
Sl.no Recommendation
6.
Issue: There is lack of awareness campaign, training sessions, capacity building
programs, which are essential to improve MI adoption rates, across many states (e.g.
Assam, Manipur, Bihar, Jharkhand, Punjab etc.). Additionally, some states (e.g.
Maharashtra, Rajasthan, Tamil Nadu, Andhra Pradesh etc.) have reported that absence
of dedicated allocation for these activities could be possible reason for inadequate
training and capacity building across some states.
Recommendation: A separate allocation of fund for IEC and capacity building may be
made considering their importance in improving awareness and adoption of MI
technology. This fund may be carved out of the 5% funding currently provided for
administrative expenses. The guideline should lay down the specific objectives of IEC
and capacity building, activities to be undertaken, how the outputs and outcomes of
such activities will be tracked.
Digital media should be adopted for awareness campaign, training program and
capacity building activities. One innovative model could be awareness creation through
social media platforms, such as Facebook, YouTube etc. Short 5-minute video (e.g.
video for MI installation, system maintenance, Do’s and Don’ts, crop wise cultivation
using MI etc.) can be uploaded over such digital platforms. It will increase reach while
reducing cost of awareness program and capacity building activities. For example,
Andhra Pradesh has started such activities through displaying small videos, audio-visual
sessions (e.g. installation, maintenance, benefit of MI etc.) at village level kiosks of
Rythu Bharosa Kendra (RBK).
Key Performance Indicators (KPI) for the services being offered by the MI companies
can be defined and the MI companies can be incentivized/disincentivized based on KPI
ratings. This may help to improve monitoring of the work undertaken by the MI
companies.
7
Issue: Most states provide top-up subsidy over and above the stipulated limit (i.e. 55%
for small and marginal farmers and 45% for others). However, some states (e.g.
Assam, Andhra Pradesh, Himachal Pradesh, Jharkhand, Maharashtra, Manipur, Punjab,
Rajasthan) find it difficult to arrange their share of funds including the additional subsidy
in timely manner that leads to delay.
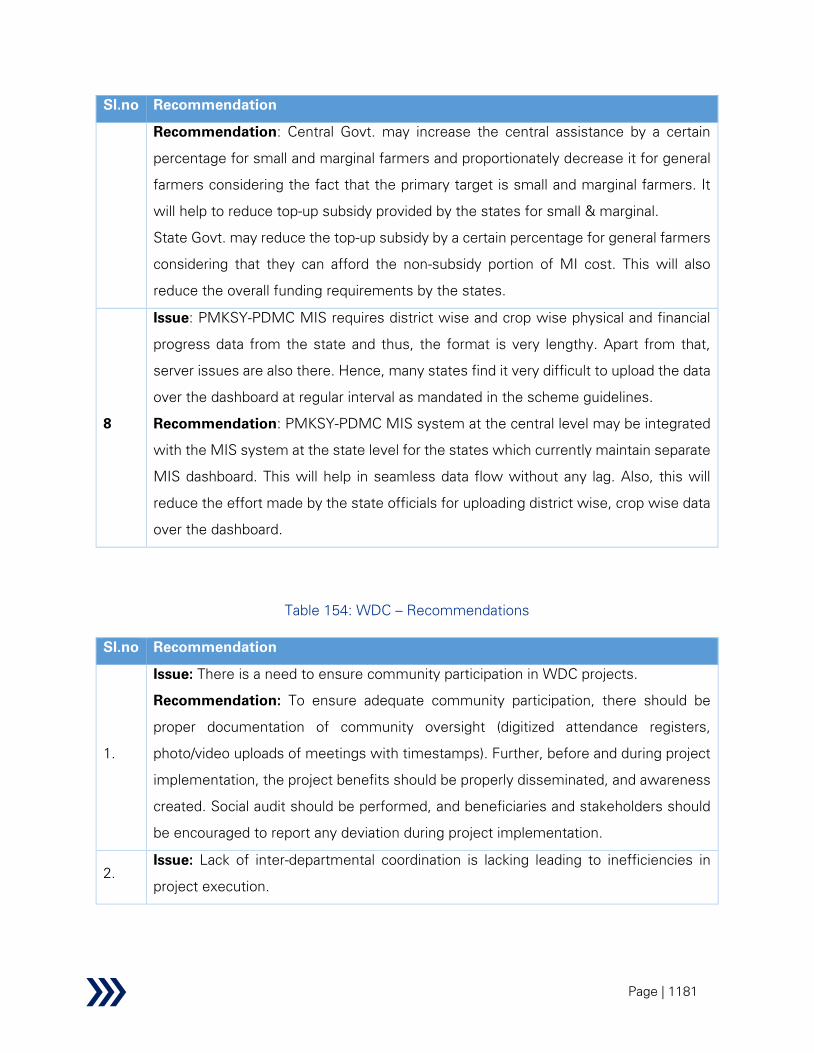
Page | 1181
Sl.no Recommendation
Recommendation: Central Govt. may increase the central assistance by a certain
percentage for small and marginal farmers and proportionately decrease it for general
farmers considering the fact that the primary target is small and marginal farmers. It
will help to reduce top-up subsidy provided by the states for small & marginal.
State Govt. may reduce the top-up subsidy by a certain percentage for general farmers
considering that they can afford the non-subsidy portion of MI cost. This will also
reduce the overall funding requirements by the states.
8
Issue: PMKSY-PDMC MIS requires district wise and crop wise physical and financial
progress data from the state and thus, the format is very lengthy. Apart from that,
server issues are also there. Hence, many states find it very difficult to upload the data
over the dashboard at regular interval as mandated in the scheme guidelines.
Recommendation: PMKSY-PDMC MIS system at the central level may be integrated
with the MIS system at the state level for the states which currently maintain separate
MIS dashboard. This will help in seamless data flow without any lag. Also, this will
reduce the effort made by the state officials for uploading district wise, crop wise data
over the dashboard.
Table 154: WDC – Recommendations
Sl.no Recommendation
1.
Issue: There is a need to ensure community participation in WDC projects.
Recommendation: To ensure adequate community participation, there should be
proper documentation of community oversight (digitized attendance registers,
photo/video uploads of meetings with timestamps). Further, before and during project
implementation, the project benefits should be properly disseminated, and awareness
created. Social audit should be performed, and beneficiaries and stakeholders should
be encouraged to report any deviation during project implementation.
2.
Issue: Lack of inter-departmental coordination is lacking leading to inefficiencies in
project execution.
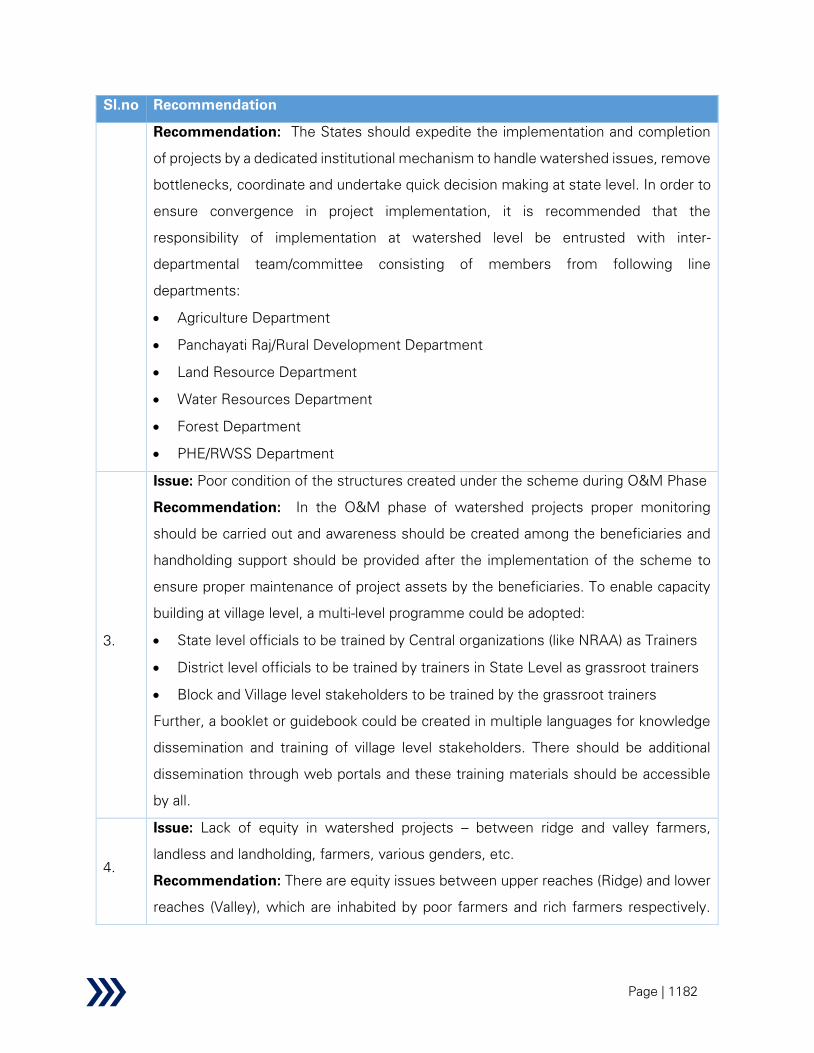
Page | 1182
Sl.no Recommendation
Recommendation: The States should expedite the implementation and completion
of projects by a dedicated institutional mechanism to handle watershed issues, remove
bottlenecks, coordinate and undertake quick decision making at state level. In order to
ensure convergence in project implementation, it is recommended that the
responsibility of implementation at watershed level be entrusted with inter-
departmental team/committee consisting of members from following line
departments:
• Agriculture Department
• Panchayati Raj/Rural Development Department
• Land Resource Department
• Water Resources Department
• Forest Department
• PHE/RWSS Department
3.
Issue: Poor condition of the structures created under the scheme during O&M Phase
Recommendation: In the O&M phase of watershed projects proper monitoring
should be carried out and awareness should be created among the beneficiaries and
handholding support should be provided after the implementation of the scheme to
ensure proper maintenance of project assets by the beneficiaries. To enable capacity
building at village level, a multi-level programme could be adopted:
• State level officials to be trained by Central organizations (like NRAA) as Trainers
• District level officials to be trained by trainers in State Level as grassroot trainers
• Block and Village level stakeholders to be trained by the grassroot trainers
Further, a booklet or guidebook could be created in multiple languages for knowledge
dissemination and training of village level stakeholders. There should be additional
dissemination through web portals and these training materials should be accessible
by all.
4.
Issue: Lack of equity in watershed projects – between ridge and valley farmers,
landless and landholding, farmers, various genders, etc.
Recommendation: There are equity issues between upper reaches (Ridge) and lower
reaches (Valley), which are inhabited by poor farmers and rich farmers respectively.

Page | 1183
Sl.no Recommendation
Most of the harvesting structures are constructed in the valley. This can be mitigated
to an extent by involvement of multiple departments as recommended.
In addition to this, the scheme planning, and design should also ensure social equity –
by ensuring involvement of and benefits to weaker sections including SC/ST, women,
landless farmers, etc. This may be ensured by putting weightage on social equity at
the time of selection of SHGs as well as selection and prioritization of projects. Further,
there should be an added emphasis on livelihood component, which supports the
poorer farmers/stakeholders in a watershed.
5.
Issue: Poor quality DPR leading to implementation challenges in watershed projects
Recommendation: To improve the quality of DPRs and the overall scheme, the
following could be adopted:
• Each state creates a list of empanelled reputable consultants/agencies to prepare
DPR. This could be based on some minimum technical and financial parameters
set by the Centre for such consultants/agencies
• Centre could publish guidelines for DPR preparation, which among other things
emphasizes on extensive local consultations and a bottom-up approach
• Centre could prepare a model DPR document, which could be used by states or
agencies appointed by them in preparing DPRs
• An automated IT based system for preparing DPRs could be created, which
generates a DPR on input of technical information.
• A national level PMU is formed for vetting and approving all DPRs for the scheme.
Table 155: Irrigation Census- Recommendations
Sl.no Recommendations
1.
Issue: Manual enumeration of Village and Scheme level schedules, leading to errors
and increase of time-lag.
Recommendation: The enumeration process may be made “paperless” i.e., the
schedules should be entered on a tab or similar equipment where all the fields will be
entered electronically as practised in States like Andhra Pradesh. The data collection
module should have in-built validation mechanism. This will help in reducing the time
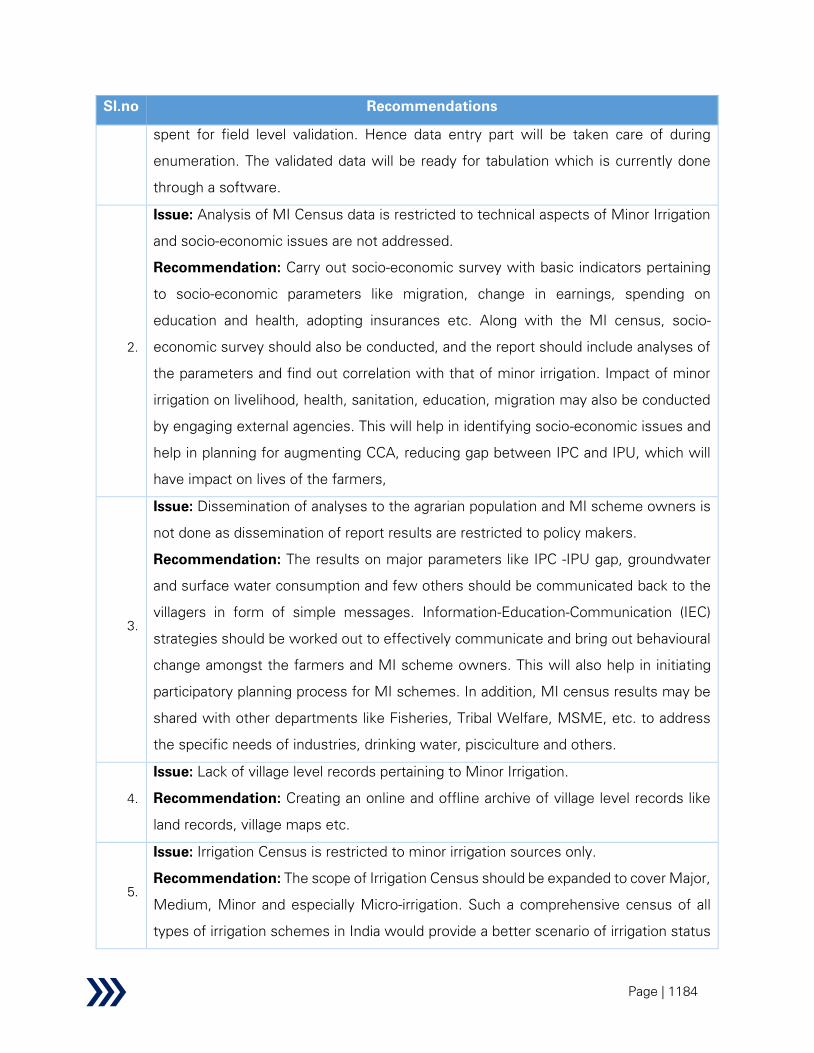
Page | 1184
Sl.no Recommendations
spent for field level validation. Hence data entry part will be taken care of during
enumeration. The validated data will be ready for tabulation which is currently done
through a software.
2.
Issue: Analysis of MI Census data is restricted to technical aspects of Minor Irrigation
and socio-economic issues are not addressed.
Recommendation: Carry out socio-economic survey with basic indicators pertaining
to socio-economic parameters like migration, change in earnings, spending on
education and health, adopting insurances etc. Along with the MI census, socio-
economic survey should also be conducted, and the report should include analyses of
the parameters and find out correlation with that of minor irrigation. Impact of minor
irrigation on livelihood, health, sanitation, education, migration may also be conducted
by engaging external agencies. This will help in identifying socio-economic issues and
help in planning for augmenting CCA, reducing gap between IPC and IPU, which will
have impact on lives of the farmers,
3.
Issue: Dissemination of analyses to the agrarian population and MI scheme owners is
not done as dissemination of report results are restricted to policy makers.
Recommendation: The results on major parameters like IPC -IPU gap, groundwater
and surface water consumption and few others should be communicated back to the
villagers in form of simple messages. Information-Education-Communication (IEC)
strategies should be worked out to effectively communicate and bring out behavioural
change amongst the farmers and MI scheme owners. This will also help in initiating
participatory planning process for MI schemes. In addition, MI census results may be
shared with other departments like Fisheries, Tribal Welfare, MSME, etc. to address
the specific needs of industries, drinking water, pisciculture and others.
4.
Issue: Lack of village level records pertaining to Minor Irrigation.
Recommendation: Creating an online and offline archive of village level records like
land records, village maps etc.
5.
Issue: Irrigation Census is restricted to minor irrigation sources only.
Recommendation: The scope of Irrigation Census should be expanded to cover Major,
Medium, Minor and especially Micro-irrigation. Such a comprehensive census of all
types of irrigation schemes in India would provide a better scenario of irrigation status

Page | 1185
Sl.no Recommendations
as whole. Data points like IPC, IPU, CCA, etc. would provide the macro picture. In such
scenario the schedule designing, database and table modules need to be modified
appropriately.
6.
Issue: Comprehensive dashboards depicting the existing scenario of each State,
District, Block and Village is lacking.
Recommendation: A dashboard should be developed to present the census data that
is currently available on the website of MI Stat Wing. The dashboard should contain
real-time progress of enumeration and supervision process, newer initiatives by the
States, infographics on major indicators and indexes and basic data analyses facility.
Table 156: NRCP – Recommendations
Sl.no Recommendations
1.
Issue: Inadequate capacity of sewage treatment infrastructure due to lack of ULB
capacity and unavailability of financial resources with the states
Recommendation: NRCP guidelines should include the following components: -
• Creating city level sewerage master plan with population projection
• Developing phase wise plan for creation of sewer networks, STPs, integrating
existing septage systems
• Exploring alternate funding options for rapid capacity addition – PPP HAM, IFI
funding, philanthropic organizations, CSR funds of private players
• Exploring innovative models such as - One City One Operator
• Creating enabling structure for long term tripartite agreements for PPP
2.
Issue: Lack of measures for holistic river conservation and abatement of other sources
of pollution
Recommendation:
• Maintaining min e-flow in rivers throughout the year
• Non-structural approaches for protecting river basins during floods – floodplain
zoning, catchment area treatment
• Treatment of sewage from all sources – septage treatment plants, organic farming,
afforestation

Page | 1186
Sl.no Recommendations
• Knowledge sharing of best practices available with NMCG
3.
Issue: Lack of capacity utilization of STPs due to lack of backend sewer network
Recommendation:
• Increase in capacity utilization of STPs through construction of I&D network
• Convergence with AMRUT to ensure STPs and I&D structures are created in
conjunction with future planning of sewer networks, household connections
4.
Issue: Lack of O&M in constructed assets due to unavailability of fund and manpower
causing STPs to become defunct
Recommendation:
• Exploring private sector participation – HAM or EPC with long term O&M
• Execution of performance-based contracts or technology neutral contracts to
ensure operational efficiency of STP
• Including revenue generation options for contractor – selling of treated wastewater,
treated sludge, agreements with thermal power plants
5.
Issue: Non-compliance with recent revisions in NGT norms and discharge standards of
sewage treatment
Recommendation:
• Inventorisation of STPs by treatment technology, output parameters & compliance
• Earmarking of funds for modernization of STPs for compliance with revised NGT
norms post notification of NGT order by MoEF&CC
6.
Issue: Mixing of industrial effluents with domestic sewage
Recommendation:
• Inventorisation of non-compliant industrial units, notification to CPCB/ SPCB
• Mandatory policies to ensure self-regulation & control by industries
7.
Issue: Lack of holistic river basin pollution monitoring infrastructure
Recommendation:
• Setting up of Real-time Water Quality Monitoring Stations (RTWQMS)
• Monitoring of river health through biodiversity index, assimilative capacities
• Development of a central dashboard with indicators from RTWQMS and tracking
parameters in planning, works and post–construction phases

Page | 1187
Sl.no Recommendations
8.
Issue: Even for the sanctioned projects, completion schedules are often stretched due
to delay in receipt of funds primarily due to states not being able to provide matching
share of funds. It is proposed that changes in the fund sanction and fund transfer
mechanism to the PIA be explored.
Recommendation:
• There should be a mechanism of providing in-principle approval for a project based
on pre-feasibility report submitted by the state/ PIA. A detailed project assessment,
DPR can be submitted post the in-principle approval and before fund sanction. This
would save effort, cost and time of the PIAs submitting detailed proposals for
projects which might get rejected later.
• The central share of funds may be released directly to the PIA in tranches through
creation of an SPV. The fund can be transferred to an escrow account basis
utilization.
• The state government may release their share in tranches as per availability and
requirement.
9.
Issue: There has been delay in implementation of projects due to issues such as delay
in planning, land acquisition litigations and delay in release of matching state share
against funds from centre.
Recommendation: It is proposed that NRCP scheme should add certain time bound
“Conditions Precedent” which needs to be satisfied prior to approval of projects and
sanction of funds by NRCD. including. -
• Submission of Certificate of Possession of the land to be used for construction of
STP by the PIA
• Consent of state and Panchayat departments for usage of the land for construction
of STP
• Testing of influent parameters by NABL accredited laboratory and reporting of
industrial contaminants (if any)
• Identification of fund by state government for contribution to state matching share
of the project
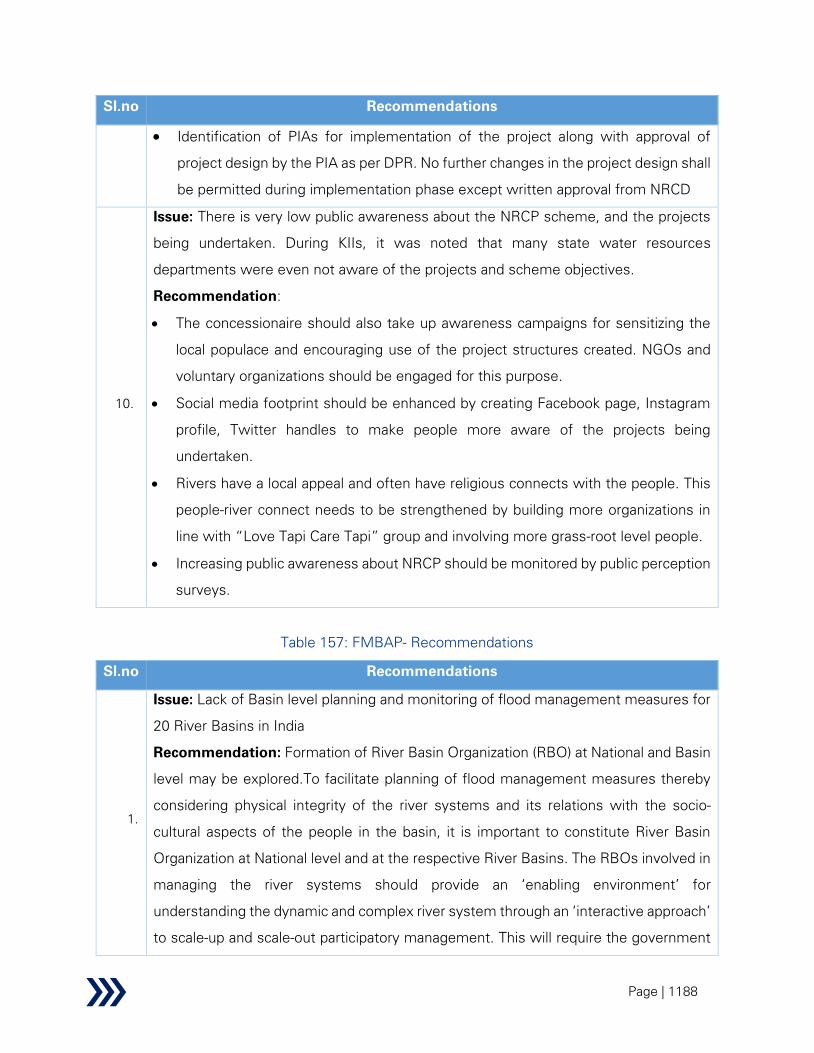
Page | 1188
Sl.no Recommendations
• Identification of PIAs for implementation of the project along with approval of
project design by the PIA as per DPR. No further changes in the project design shall
be permitted during implementation phase except written approval from NRCD
10.
Issue: There is very low public awareness about the NRCP scheme, and the projects
being undertaken. During KIIs, it was noted that many state water resources
departments were even not aware of the projects and scheme objectives.
Recommendation:
• The concessionaire should also take up awareness campaigns for sensitizing the
local populace and encouraging use of the project structures created. NGOs and
voluntary organizations should be engaged for this purpose.
• Social media footprint should be enhanced by creating Facebook page, Instagram
profile, Twitter handles to make people more aware of the projects being
undertaken.
• Rivers have a local appeal and often have religious connects with the people. This
people-river connect needs to be strengthened by building more organizations in
line with “Love Tapi Care Tapi” group and involving more grass-root level people.
• Increasing public awareness about NRCP should be monitored by public perception
surveys.
Table 157: FMBAP- Recommendations
Sl.no Recommendations
1.
Issue: Lack of Basin level planning and monitoring of flood management measures for
20 River Basins in India
Recommendation: Formation of River Basin Organization (RBO) at National and Basin
level may be explored.To facilitate planning of flood management measures thereby
considering physical integrity of the river systems and its relations with the socio-
cultural aspects of the people in the basin, it is important to constitute River Basin
Organization at National level and at the respective River Basins. The RBOs involved in
managing the river systems should provide an ‘enabling environment’ for
understanding the dynamic and complex river system through an ‘interactive approach’
to scale-up and scale-out participatory management. This will require the government

Page | 1189
Sl.no Recommendations
institutions to restructure with a view to devolve powers to community institutions for
evolving rational options for river basin development in light of flood management.
Such institutions that are community-based should be ‘learning organisations’, that will
emerge gradually through debates and networking with different actors by devolving
responsibilities to the local institutions, promote realistic options for basin development
and provides a flexible framework for managing the complex and dynamic river basin
system.
2.
Issue: Scientific assessment of flood prone areas due absence of State specific Master
Plans
Recommendation: Mandate preparation of State specific Master Plans. Necessary
support for preparation of Master Plans need to be given by the Monitoring Agencies.
The Master Plans will help in demarcating various flood zones digitally through imagery
process. The Master Plans will also include interlinking of rivers which would help in
beneficially diverting the flood waters.
3.
Issue: Enactment of Flood Plain Zoning Bill 1975 across all States,
Recommendation: Flood-plain zoning measures aim at demarcating zones or areas
likely to be affected by floods of different magnitudes or frequencies and probability
levels, and specify the types of permissible developments in these zones, so that
whenever floods actually occur, the damage can be minimised, if not avoided.
4.
Issue: Lack of planning at grassroot level for structural measures
Recommendation: Formation of village level committees or involvement of existing
committees like WUAs. Substantial planning for flood management structures and non-
structural measures is done at the State level with technical support from CWC, GFCC
and BB. However, community involvement in planning of Structural measures and
monitoring the progress of the structures will help in increasing the ownership towards
flood management as a whole. The issues of operations and maintenance can also be
effectively looked after by the community-based organizations so formed or existing
CBOs.
5.
Issue: Flood Management Plans do not consider the socio-economic factors like
reducing migration, sustaining livelihood, health and sanitation issues/

Page | 1190
Sl.no Recommendations
Recommendation: Inclusion of the socio-economic parameters into the Flood
Management Plans may be explored. Such measures will help in planning and ascertain
fund allocation towards activities for livelihood generation, reducing incidences of
diseases.
6.
Issue: The FMP component is confined to structural measures like construction of
embankments, check dams spurs, revetments, porcupines etc. Anti-siltation activities
are nor taken up in a significant manner.
Recommendation: Apart from the structural measures undertaken so far within the
scope of FMBAP, additional activities / interventions like River Dredging and Catchment
Area Treatment should be actively considered.
River Dredging: Silting at places where the rivers emerge from the hills into the plains,
at convex bends and near their outfall into another river or lake or sea, is a natural
phenomenon. Accordingly, rivers exhibit a tendency to braid/meander/form deltas.
Dredging of the river would dig out sediments from the river-bed and will increase the
water retention capacity of the river. Consequently, the pressure on the banks would
be reduced minimizing the chances of flood and erosion. Selective desilting/dredging
at outfalls/confluences or local reaches can, however, can be adopted as a measure to
tackle the problem locally.
Catchment Area Treatment: The rivers bring heavy sediment load from the
catchments. These coupled with inadequate carrying capacity of the rivers are
responsible for causing floods, drainage congestion and erosion of riverbanks.
Inadequate capacity of the rivers to contain within their banks the high flows brought
down from the upper catchment areas following heavy rainfall, leads to flooding.
The state governments/SDMAs should, therefore, take up appropriate watershed
management measures including afforestation, check dams, detention basins etc. in
the catchment of rivers to prevent soil erosion, enhance water conservation and
minimize water and sediment runoff.

Page | 1191
3.4 Summary for Rationalization of Scheme
Some potential opportunities for scheme rationalization have been identified based on the study
so far as listed below. However, these need to be studied and analysed in more depth to develop
any specific recommendations in this regard.
Table 158: Summary for Rationalization of Scheme
Scheme
Name
Scheme
Performance250
Relevance
of the
scheme
Rationalisation
Recommendation
Discussion or Way Forward
CADWM
Transferring and merging the
micro-irrigation component
under CADWM with the OI
component under PDMC
scheme may be considered to
streamline subsidy flow for
drips and sprinklers and
generate more acceptability
among the cultivators through
the awareness generation
campaigns undertaken by
horticulture department under
PDMC.
Surface
Minor
Irrigation
(SMI)
Bringing HKKP-SMI under
HKKP-RRR may be considered
since objective of RRR viz;
improvement and
enhancement of storage
capacity of water bodies is a
necessary condition to ensure
Repair,
Renovation
and
Restoration
250 Based on weighted analysis of EESI+E
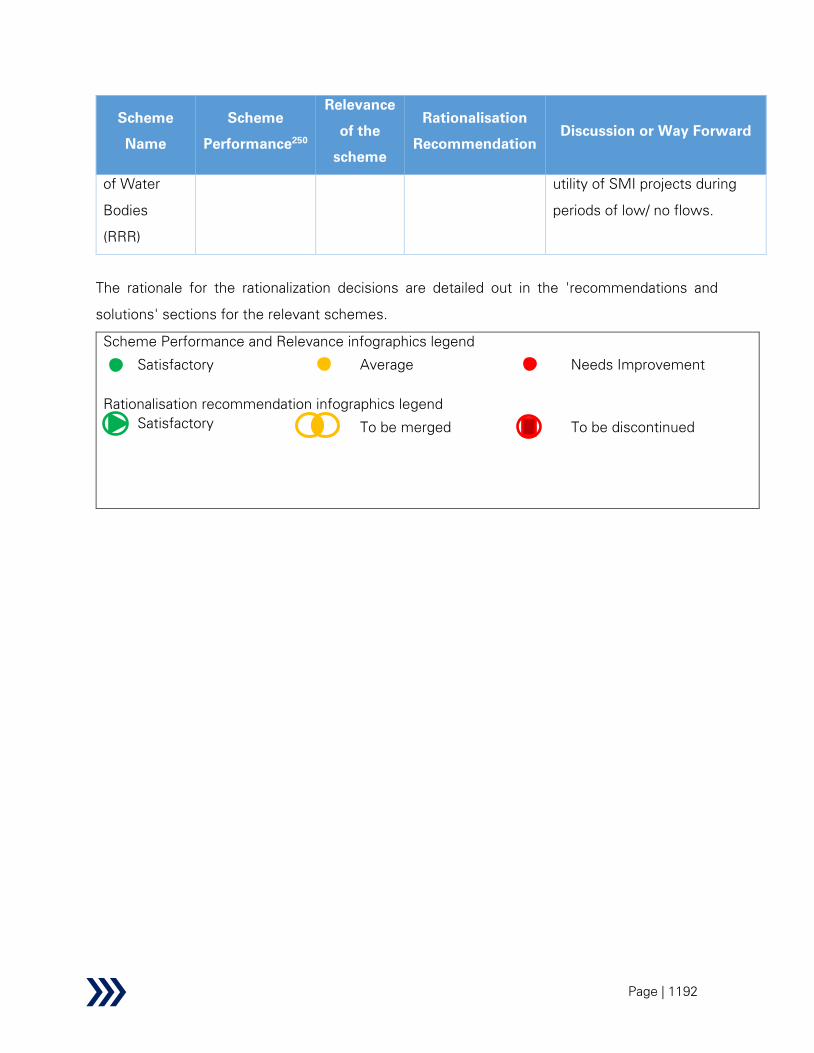
Page | 1192
Scheme
Name
Scheme
Performance250
Relevance
of the
scheme
Rationalisation
Recommendation
Discussion or Way Forward
of Water
Bodies
(RRR)
utility of SMI projects during
periods of low/ no flows.
The rationale for the rationalization decisions are detailed out in the 'recommendations and
solutions' sections for the relevant schemes.
Scheme Performance and Relevance infographics legend
Satisfactory
Average
Needs Improvement
Rationalisation recommendation infographics legend
Satisfactory
To be merged
To be discontinued

Page | 1193
Appendix
Appendix 1: Case Studies
1. Enhancing existing resource utilization through effective irrigation system
management by WRD department, Madhya Pradesh
Problem statement: During 2009-2011, area under the WRD department in Madhya Pradesh
witnessed a sharp decline in irrigation system utilization (i.e. % of irrigation potential utilized
against the irrigation potential created) – 32% and 34% utilization were recorded in 2009-10 and
2010-11 respectively. During 2010-11, out of the 2.79 mha area under WRD management in Rabi
season, only 0.94 mha (35%) has been utilized.
Solution offered: In 2011-12,the WRD department set a target to arrest the gap between IPC
and IPU and increase the irrigation potential utilized to 1.6 mha in rabi season, which is almost a
70% increase over the preceding years. To bridge the gap between IPC and IPU, emphasis on
pre-irrigation maintenance, rehabilitation of old irrigation projects and improved management
using target setting and monitoring through conventional and web-based tools were adopted.
Some of the key initiatives adopted by the department are summarized below:
• Real-time measurement and monitoring of the available water resources
o Web-based monitoring of smaller reservoirs and tanks were established, thus
eliminating the need of paper-based reporting
o To avoid internet connectivity constraints, a SMS based module for major
reservoirs water readings was developed which was integrated into the WRD
Enterprise Information Management System (EMIS)
o Web-based monitoring system facilitated in disclosure of real-time data for target
and actual irrigated area and thus helped in ensuring accountability and
transparency; the public information was also triangulated through ground truthing
by tail reach farmers, members of WUAs, etc.

Page | 1194
o Regular monitoring by higher management using ICT and video-conferences were
set up; water access at tail-end villages was fixed as one of the key performance
metrics
• Timely pre-emptive maintenance was given utmost priority to improve system
performance
o Pre-Rabi inspections were made mandatory for WRD staff to ensure FSL at main
canal. This was complimented by delegation of additional authority to divisional
offices to conduct small maintenance work during the month-long maintenance
timeframe between mid-September to mid-October
o Last-mile connectivity were ensured through rehabilitation of 4,000 minor
irrigation schemes, lining of old earthen canals which led to a jump in area served
from 0.37 mha to 0.76 mha in just 2 years
o The above initiatives were supported by adequate and timely budget support from
the state government; annual expenditure per unit area increased from Rs. 112/
ha in 2009-10 to Rs. 820/ ha in 2015-16
o Also, participation of WUAs was ensured through delegation of civil works of less
than Rs. 50 lakh each to 50 WUAs under Madhya Pradesh Water Sector
Restructuring Project
Impact: During 2009-10 to 2015-16, the state succeeded in creating 2.06 mha of which around
64% was achieved through improved management of existing schemes and the remaining
through construction of new schemes. The average utilization efficiency increased from 32% in
2009-10 to 85% in 2015-16. All these concerted efforts also resulted in increase in irrigated area
from 2.53 mha in 2013-14 to 2.69 mha in 2014-15 and 2.81 mha in 2015-16 and increase in food
grain production from 30.07 MT in 2013-14 to 34.09 MT in 2014-15 and 37 MT (expected) in
2015-16.
Sustainability: The sustainability of the irrigation management measures undertaken is
bolstered to some extent by the adoption of the following practices: real-time public disclosure
of system outputs (like irrigated area) and constant feedback from tail reach farmers ensuring

Page | 1195
proper accountability and performance of the irrigation staff, commitment of additional regular
funds for maintenance by state government through shift in approach from build-neglect-
rehabilitate model to one of sustainable irrigation development and management and
empowerment of the WUAs.
(Reference: RS Julaniya et al., A Management Approach to Increase Irrigated Area and Production
in Madhya Pradesh, India; Dr Tushar Shah (2016) “Har Khet ko Pani?: Madhya Pradesh’s irrigation
reform as a model”)

Page | 1196
2. Improvement in water use efficiency through canal automation under PMKSY-
AIBP ERM project at Narayanpur Left Bank Canal, Karnataka
Problem statement: The Narayanpur Left Bank Canal system in Karnataka was suffering from
various system deficiencies – it was operating at 31.75% WUE (water use efficiency) against the
designed efficiency of 51%; water shortages were being recorded in 1,05,632 Ha of tail end
villages and 37,000 ha area reported water logging and salinity issues. Some of the key
contributing factors were high seepages in unlined portions of canals, pooling owing to excessive
siltation, canal breeches and damages in sluices and gates leading to water-logging incidences,
unauthorized water withdrawal and violation of rotational/ warabandi schedule affecting water
supply at tail ends, absence of any water regulatory system and rampant violation of the cropping
pattern and over-irrigation leading to salinity and absence of adequate operators for canal
maintenance and operation.
Solution offered: The Krishna Bhagya Jala Nigam Limited (KBJNL) initiated remodelling and
automation of the NLBC system along with SCADA implementation and GIS based Irrigation
Management Information system (INMIS) to improve the water efficiency. Phase I of the system
was launched in 2014 and it was later incorporated under PMKSY – AIBP ERM projects in 2016.
As on date, Phase I of SCADA automation and GIS system has been completed while Phase II is
in progress. Some of the key projects features are summarized below:
• Implementation of SCADA system: SCADA system software was implemented for
monitoring and operation of the automated gates and integration of the system
information with the wider information system network.
• Automation of the existing gates: All existing radial gates at CR and HR locations were
retrofitted with SCADA based electrical and mechanical fitments comprising water level
sensors, remote gate control panels, adequate wireless data communication networks
etc. for ensuring automatic flow discharges and metering applications. The automated
gates are powered by solar powered system.
• Setting up a hybrid wireless data communication network: Considering huge span of the
canal network, a main SCADA centre, data concentrator station and slave stations were
set up to ensure hybrid wireless data communication network.

Page | 1197
• Establishment of an Irrigation Network Management System (INMIS): An INMIS was set
up and integrated with existing systems of KBJNL to ensure seamless data flow between
the irrigation management staff and end users. This system controls all information
related to water demand and usage and is integrated with the SCADA software for canal
water regulation and revenue bill generation.
• Setting up information kiosks for farmers: 210 information kiosks were set up for
dissemination of information to farmers in relation to irrigation schedule, weather
forecasts, state wide commodity prices, access to other important government links. It
also stores details of the farmers along with canal jurisdiction offices, cropping pattern
adopted and water demands.
A graphical representation of the modus operandi of the entire system is illustrated below:
Outcome:. Automated gate control reduced water losses endemic in manual operations
and systematic water allocation and distribution resulted in overall improvement in
system efficiency. Water was delivered to the tail end reaches for the first time. Online
water demand raising and automatic bill generation facilitated increase in operational
efficiency. Improved system responsiveness and dissemination of information improved
user experiences. The completion of works is expected to result in improvement in total
water use efficiency to the tune of 21.69% - while conveyance efficiency is expected to
increase from 60% to 75%, on farm field application efficiency from 53% to 71% and
drainage efficiency from 71% to 80%.
Farmers/
WUCs
raise water
demand
based on
weather
updates
Command
area water
demand
report
generated
through
INMIS
Irrigation
schdule
published
in
dashboard
and fed to
canal
controls &
SCADA
Necessary
software
triggers
fed to
gates and
feedback
given to
SCADA
and INMIS
Water bills
generated
through
INMIS

Page | 1198
Sustainability: To ensure sustainability of the scheme benefits, active involvement of
the water users has been initiated through establishment of Facilitation Centres for
farmers at Narayanpur and regular conduct of IEC activities in the command area by the
irrigation officials. Interactive information exchange, assurance of demand based supply
and performance based disbursements to WUCs are facilitating in generating more
interest among the water users.
(Reference: Sidharth Charkha et al (2019)., “Narayanpur Left Bank Canal Automation Project”;
documents shared by project authorities during KPMG primary survey; Krishna Bhagya Jala
Nigam Limited “Presentation on Improvement in Water Use Efficiency”)
Page | 1199
3. Facilitating canal restoration and effective WUA operation through community
mobilization by specialized agency at Satak Tank project in Khargone district,
Madhya Pradesh
Problem statement: The Satak tank minor irrigation scheme at Khargone in Madhya Pradesh
was facing deterioration in irrigation system structures with decline in water availability at tail
reaches. This was further exacerbated by the lack of any legal provision for enabling the WUAs
to impose any collection levy on the water users to conduct regular maintenances.
Solution offered: Action for Social Advancement (ASA), an NGO, was appointed to facilitate
capacity building of the WUAs for the Satak minor irrigation scheme in Khargone district. The key
objective was to ensure effective functioning of the Satak WUAs and generate adequate funds
for the canal restoration process through community collection drive. Some of the steps taken
by ASA to ensure the same are summarized below:
a. Community mobilization through awareness campaigns:
• ASA held series of awareness campaigns using village wise quiz competitions,
local folk media (Kalki-turra) and wall paintings. 36 community volunteers were
trained as Jal Praharis, who also helped later in the water distribution process.
Baseline surveys were conducted to understand the needs of the farmers and also
agriculture support services were provided.
b. Capacity building initiatives:
• A training module was prepared by ASA – in the 1st phase emphasis was put on
communicating the rights, role and responsibilities of the WUA and its members
while in the 2nd
phase, attention was focussed on developing the institutional
capacity of both the WUA and WRD through training programmes on water
distribution management, gender sensitization and dispute resolution. Training
were conducted on social audit.
• Exposure visits were conducted to neighbouring states
c. Community contribution collection drive:
• To ensure a transparent collection process, a formalized instrument of agreement
‘anshdaan anuband’ was introduced between the WUA and the users.

Page | 1200
Contribution receipts were given to the payees and collected fund was deposited
in the common bank account
• To encourage more collection, letters of appreciation were issued to the payees
and printed posters were pasted at the gram choupal
d. Gender mainstreaming
• WUA voting rights were extended to spouses of the existing WUA members
through necessary amendment in the PIM act.
• Extensive awareness campaigns were conducted to sensitize the villages about
women participation and franchise rights
• Self-help groups were set up to ensure women empowerment
Impact:
• Community contribution by farmers touched 20% of the cost of physical works which
exceed the 10% target set by the authority (ICEF). Such contributions for canal restoration
also helped to create a sense of ownership among farmers.
• Increase in irrigation rotation frequencies resulted in 20-30% improvement in wheat
production (in Balkhar village), increase in jobs for agricultural laborers with greater
adoption of labour intensive commercial crops like cotton and chilli which greatly helped
the landless labourers
• Around 73% of spouses of landowners casted vote in the last reported WUA elections
• Social audits were conducted in every 6 months
Sustainability: Hand-holding activities and capacity building programmes organized by ASA
improved the technical competency of the WUAs. Also the half-yearly social audits and the
transparent mechanisms set up for fees payment and undertaking of physical works helped to
instil of sense of trust among the WUA members. However, in terms of sustainability the
following concerns were reported:
• Scope for further hand-holding of sub-committee member and women participants were
reported for ensuring sustenance of their operation
• Continuation of equitable water distribution particularly to tail end farmers is dependent
on the physical condition of the canal structures to operate at full discharge capacity

Page | 1201
• Financial sustainability of the WUAs need to be ensured by retaining their ability to levy
and collect taxes and through establishment of backward and forward market linkages to
agricultural activities.
(Reference: Action for Social Advancement, “ICEF-M.P. WRD Project on Participatory
Restoration and Management of Irrigation Systems by Water Users Associations in M.P.”)

Page | 1202
4. Ensuring effective convergence with other government programmes like
MNREGS at Dhar district, Madhya Pradesh
Problem statement: The CAD guidelines have proposed executing works in convergence with
existing watershed programmes and MGNREGA schemes; however the extent of actual
convergence achieved was reported to be quite low due to absence of any detailed enabling
policy guidelines and tardy implementation of the same by the implementing authorities.
Solution offered: In 2008, the MP Panchayat and Rural Development department formulated
two schemes for facilitating development and management of irrigation infrastructure using
MNREGS funds. Some of the key features of the implementation strategy is highlighted below:
• Enabling policies: MNREGS funds used for canal rehabilitation and construction of field
channels under Sahastradhara scheme.
• Joint planning: Joint walk-throughs conducted with farmers by NVDA to prepare detailed
estimates of minor canal repairs followed by submission of technical sanction plan by
Executive Engineer to the Panchayat.
• Faster fund disbursal: Funds were directly transferred to the WUA’s account by the Jilla
Panchayat (thus bypassing the Gram Panchayat)
• Hand-holding by specialized agencies: NVDA together with the appointed NGO
Development Support Centre (DSC) provided technical support to the WUAs in relation
to technical planning and estimation, MNREGS labour orientation, training of supervisors
(/ mate), preparation of job cards, bookkeeping and accounting. Exposure visits for WUA
members were arranged by DCS to successful projects in Madhya Pradesh, Gujarat and
Maharashtra. 20 local youths were trained as Kolaba Sahayaks/ mate of MNREGS works.
IEC and awareness campaigns involving graphic and visual shows were arranged to
sensitize the villagers.
• Implementation by WUAs: The WUAs got the opportunity to carry out the R&M under
the MNREGS assisted canal repairing works themselves, thus obviating the need for
appointment of departmental/ private contractors.
Impact:

Page | 1203
• 147 km of canal network was repaired and 93 km of earther field channels were created
in Maan and Jobat projects. New field channels facilitated water access to tail end users
in Kukshi block.
• Direct transfer of MNREGS funds to WUAs instilled a sense of ownership and
accountability among the members.
• 6,500 ha of additional area was brought under irrigation. Irrigated area in Maan and Jobat
projects increased from 7000 ha and 5000 ha in 2007-08 to 11,400 ha and 7,700 ha in
2009-10 respectively.
• The farmers reported increase in net income by Rs. 10,000/ ha. Majority of the farmers
were able to irrigate more than 50% of their land and sow two crops in a season by
adoption of new crops like wheat, cotton, chilly, pulses, etc.
• Substantial increase in groundwater was reported in areas where field channels have
been constructed.
(Reference: Tapan Patel et. al. (2010), “Best Practices on MNREGS Assisted Canal Rehabilitation
under Participatory Irrigation Management in Dhar, Madhya Pradesh).

Page | 1204
5. Ensuring proper maintenance of field water courses through innovative
community contribution facilitated by Khairani WUA at Baksa, Assam
Context: The Khairani WUA was set up by a group of volunteers in Assam to restore flood
mitigation structures. It was formally registered in 1990s mainly with an intention to streamline
the receipt of government subsidies and technical assistance of the irrigation officials. As on date,
the WUA is functioning effectively with 14 Central Level Committees (CLCs) and has adopted
certain set of uniform working rules and compliance methods. Considering the economic position
of the WUA members where a large chunk of the members hail from scheduled tribes and
backward classes with agriculture as the primary source of income and thus the economic, an
innovative contribution system has been developed.
Solution: The WUA’s working rules have no provision for monetary collection of water taxes. All
the taxes are collected in the form of labour and activities undertaken by WUA. Participation and
contribution of labour for WUA’s activities are mandatory for each member, failing which stiff
monetary penalty of Rs. 150/ day is imposed. Absence in more than 3 consecutive days attracts
an additional penalty of Rs. 125/ day. Additional penalties are further applied in case of absence
in more than 50% working days. In case of non-payment of penalties, strict actions like seizing
of properties worth the penalty fees are applied. Also, fines are imposed in case of withdrawal
more water compared to the allotted one. The penalty fees form an important source for
conducting repair and maintenance organization.
(Reference: Vasant P. Gandhi et al., November 2019, Institutional Structure, Participation, and
Devolution in Water Institutions of Eastern India)

Page | 1205
6. Enhancing water storage capacity through community-based tank desiltation
works: Mission Kakatiya, Telangana
Problem statement: While agriculture in Telangana has traditionally been dependent on tanks;
most of these ran dry by 2014 owing to continued negligence and reducing tank storage capacity.
Hence, dependency on groundwater increased and water table in the vicinity depleted.
Solution offered: “Mission Kakatiya” was launched by the Government of Telangana in 2014 to
prioritise restoration of 46, 531 minor irrigation tanks to their original capacity towards effective
utilisation of water allocated for minor irrigation sector (255 TMC).
The strategy adopted is as follows:
• Identification and prioritisation of tanks:
o Reconciliation survey was conducted to ascertain number of different types of
minor irrigation sources viz. percolation tanks, private kuntas and small tanks for
restoration.
o The tanks for which repair works had already been undertaken under programs
like RRR/ state plan were identified.
o The tanks with greater ayacut and those which had not been covered under any
other program were given priority. The order of prioritisation was decided in
consultation with district minister/ local MLA/ public representatives.
• Civil works:
o Tanks were desilted, dilapidated sluices/ weirs were repaired and bunds were
strengthened.
o Irrigation channels were re-sectioned to ensure smooth distribution of water to
fields.
• The importance of the program was publicised and end-users were motivated to
participate.
• Interdepartmental coordination was ensured by constitution of District Level
Implementation, Monitoring and Evaluation Committee; which constituted members
from irrigation and CAD, agriculture, fishery, rural development, forest, fishery, revenue,
groundwater and public relation department.

Page | 1206
Impact: By March 2018, the program was successful in restoration of 22,500 tanks, leading to
outcomes like increased water storage capacity and enhanced on-farm moisture retention. It
resulted in reduction of gap ayacut by 63%, agricultural diversification, reduced use of chemical
fertilisers, enhanced on-farm water retention, improved soil nutritive value and water accessibility
to small and medium farmers. Additionally, it also led to development of fisheries and livestock,
increase in groundwater levels and income augmentation of farmers.
(References: Composite Water Management Index by NITI Aayog, August 2019. Selected best
practices in Water Management, prepared by NITI Aayog with the support of Teri University,
August 2017. Mission Kakatiya, Irrigation and CAD Department, Government of Telangana)

Page | 1207
7. Ensuring water security through community-based tank desiltation: Gaalmukt
Dharan Gaalyukt Shivar Yojana
Problem statement: Out of 580,000 tanks of various sizes spread across India, Maharashtra has
the highest i.e. 42% of irrigation tanks. Since these come under the purview of state government;
various line departments are involved in management while community involvement is limited.
As a result of siltation, compounded by lack of regular maintenance; the storage capacity of these
traditional structures diminished, leading to cascading effect on environmental and socio-
economic condition of the state.
Solution offered: Gaalmukt Dharan Gaalyukt Shivar Yojana’ (silt free water reservoirs and silt
applied farms), launched in 2017, is an initiative by Maharashtra Government towards ensuring
water security through activities like community-based tank desiltation under RRR and WDC,
along with awareness generation for efficient water utilisation.
• A Desilting Policy Committee was established by the state, which recommended
desiltation of 31,459 small dams and water tanks in the state.
• Considering its potential in improving drought resilience, the program was included as
part of revised state water policy in 2019.
• Active involvement of CSRs/NGOs was promoted: While the state government provided
fuel subsidy; machine rent cost was contributed by community/ pooled through CSR/
NGO funds.
Impact: Impact evaluation study by The Nature Conservancy and Watershed Organisation Trust
indicates:
• Increase in water holding capacity and improved organic carbon in the soil after silt
application. However, the effect was found to vary depending on soil characteristics:
texture, bulk density and water holding capacity.
• The total area under cultivation increased during both Rabi and Kharif season while
proportion of rainfed and wasteland areas reduced. Additionally, area under water saving
technology increased by more than 2 times.
• A reduction in per acre cost of fertilisers was observed for major crops.
Page | 1208
• The average annual income was found to increase from Rs. 37, 489 to Rs. 92, 855. This
further led to enhancement in socio-economic status of farmers:
• With benefit-cost ratio of 1.31 (for three tanks), desiltation was found as economically
viable activity, even when only enhancement in soil fertility was considered. Other direct-
indirect benefits of desiltation like increased water storage capacity and improved soil
texture were not accounted for in calculations.
• Other impacts: reduction in migration, increase in biomass leading to more fodder for
livestock and groundwater recharge.
(References: Zade et al, 2020. ‘Gaalmukt Dharan, Gaalyukt Shivar (Tank Desiltation) Scheme in
Maharashtra, India: Policy Concerns and the Way Forward’, 16/0 Law, Environment and
Development Journal. Sood et al., 2018. ‘An Impact Evaluation Study and Proposed Guidelines
for Water Tank Desiltation in Maharashtra’ by The Nature Conservancy, India and Watershed
Organisation Trust.)
Page | 1209
8. Technical strategies to operate minor and medium irrigation schemes towards
improving groundwater systems: Vavuniya, Sri Lanka
Problem statement: With increase in abstraction of groundwater resources due to rise in
population, the pressure on groundwater resources is increasing. This has led to issues like
declining water table and waterlogging.
Solution offered: A regional aquifer simulation model was developed for a restricted catchment:
185.23 km2 in Vavuniya district, Sri Lanka. This was used to find out operational policy favouring
groundwater conservation. It found:
• Case 1: Foregoing cultivation by 25-35% for two consecutive seasons reduced water
table loss by 45-65% in 80% of the catchment area.
• Case 2: Peripheral boundary treatment to reduce permeability by 35-45% lead to rise in
water table by 0.457-0.838 m in areas closer to treated boundary during recharging
season.
• Case 3: Combining 1&2 i.e. peripheral reduction in permeability by 35-45% and foregoing
cultivation by 45-55% lead to increase in water table by 1.067 - 1.448 m during discharge
season. Similar trend was observed during recharge season but to lesser extent. Overall,
60-70% of loss in water table was reduced between two seasons in 95% of the
catchment area.
Envisaged impact: The gain in water table would reduce the cost of energy (fuel/ electricity).
This shall increase the degree of economic cultivation per unit irrigation water, thereby increasing
economic crop yield. It would also indirectly contribute to GDP and GNP.
(Reference: Sivakumar, 2013; Conjunctive Use of Surface and Groundwater to Improve Food
Productivity in Vavuniya District in the Dry Zone Area)

Page | 1210
9. Comparative Benefit-Cost analysis to evaluate most appropriate material for
canal lining: Case Study of Neera Devdhar Canal
Problem statement: Water flowing in canals is prone to seepage and evaporation losses.
Seepage losses are dependent on channel geometry while evaporation losses are proportional
to area of free surface. Increased seepage losses in unlined canals may lead to rise in water table,
resulting in waterlogging and soil salinity. This would reduce cultivable area and may further need
installation of costly drainage systems.
Solution offered: The benefits of canal lining and corresponding B-C ratio were evaluated in
Neera Devdhar canal. The results obtained upon lining are as follows:
HDPE +
Concrete
HDPE +
Shotcrete
IITD +
Concrete
IITD +
Shotcrete
B/C ratio 10.43 7.33 9.59 6.88
• Seepage losses were found to reduce by 70% upon lining with concrete while they
reduced by 90% when lined with shotcrete. However, these materials would also require
continuous maintenance due to expansion and contraction of cracks.
• The study concluded HDPE sheets as best option for lining to aid in reducing seepage
losses from lining cracks. Subsidies are also provided by the government to use these
sheets for lining.
• Concrete and shotcrete may be used as covering, towards protecting HDPE from
damages.
• Further, sensor system (Radar/ bubbler) may be used to evaluate discharge at different
sections of canal. This could aid in locating section-wise seepage losses.
Impact: With the help of HDPE sheets and sensor system, seepage losses in canal may reduce
up to 100%. This would lead to increase in command area, reduce requirement for maintenance
and increase channel capacity.

Page | 1211
(Reference: Kadu, Rajmane and Hailkar (2017), ‘Case Study of Neeru Devdhar canal seepage
losses and canal lining0, International Journal for research in applied science and engineering
technology.)

Page | 1212
10. Solar Powered Community Lift-Micro-irrigation Project in Talwara and Hazipur
Blocks of District, Hoshiarpur
Problem statement: The Kandi belt comprising 10% of the total area of Punjab is mostly rainfed.
The area suffers from severe shortage of drinking water and poor socio-economic conditions of
the farmers. Hoshiarpur district falls in this Kandi belt. Soil erosion is another major concern in
this area as during monsoon period most of fertile soil gets eroded, resulting in unavailability of
assured irrigation source coupled with soil degradation. Being sub-mountainous and remote area,
the electricity supply is highly unreliable. The productivity is also very less as the farmers are only
able to do mono-cropping and that too depends on rainfall only. The Govt of Punjab, taking stock
of this situation, constructed Kandi canal which became lifeline of Kandi area. However, there
was another problem in that area. The right canal bank being at lower elevation is possible to be
irrigated through gravitational flow whereas the left canal bank being at higher elevation could be
irrigated utilizing lift irrigation only.
Solution offered: The Govt of Punjab approved a Solar Powered Lift-Micro-irrigation project with
total cost of Rs. 42.10 Cr. with funding from under RKVY and NABARD. The project was started
in January 2015 and commissioned on 7th
August 2017. The project is operated and maintained
by hand holding local community and Water User Associations (WUA's) for initial 7 years thus
providing gestation period for farmers to develop their fiscal and technical capacity. The project
was designed as integrated solar powered, fully computerized and automated micro-irrigation
project. The solar energy gives leverage over grid-based systems. The micro-irrigation and
automation (SCADA, Remote Terminal Units, Hydraulic Valves, Level Transmitters, Pressure
Transmitters etc.) help in water conservation and equitable distribution of scarce resource
respectively. The project consists of 3 main lift points from Kandi canal and booster stations
(sump wells) are also provided at various points to enable water to reach at higher elevations. A
total of 1,200 households and 8,500 beneficiaries have been benefitted by this project. The
project beneficiaries include 3,730 women and 2,450 SC people.
Impact:
• Increase in income has been observed in the range of around 85% to 229% (Maize: 85%,
Wheat: 127%, Mustard: 125%, Sesamum: 229% etc.)
Page | 1213
• The project has given employment opportunity to local youth, who are working in the
project as helper, guard etc.
• People who earlier migrated for work have started cultivating their own lands. Linkages
established with local processing units are also helping these farmers getting instant cash
return
• The farmers are getting demo of best practices, knowledge about latest agricultural
practices, water conversation technologies etc. through the established training centres
and experts from prestigious institutions. These training centres are also providing
livelihood-based training sessions to landless and women community
• Due to proximity of urban areas, allied activities such as dairy farming is also growing
Replicability: Water scarcity issue is also prevalent in many other states (e.g. Haryana, Rajasthan
etc.) in India. In those states, many areas suffer from unreliable electricity supply. Hence, similar
model can be adopted across those areas to leverage benefits of micro-irrigation and improve
socio-economic condition of farmers.
Sustainability: Being solar energy based, the project has ensured sustainable resource use in
terms of energy. The project has focused on sustainable water resources management through
efficient water use by micro-irrigation systems. Training centres are educating the beneficiary
farmers and WUAs for effective O&M of irrigation assets, sustainable use of water etc., helping
in proper utilization and maintenance of irrigation assets.
(Reference: https://dswcpunjab.gov.in/contents/success-stories/Solar-Powered-Community-Lift-
Micro-Irrigation-Project.html)

Page | 1214
11. Ramthal Drip Irrigation Project, Ramthal, Karnataka
Problem statement: Around 60% water was being lost due to conveyance, evaporation,
percolation and seepage in traditional methods of canal network and flow irrigation. Being a
drought-ridden state, it was difficult for Karnataka to afford such huge water loss. There were
other problems in the canal command areas including inequitable distribution of water, salinity
problem due to excess irrigation, gap in design and actual area and flow, poor drainage, less
water at the tail end of canals, no measuring device or control structures, uneven crop growth
and yield, soil deterioration at canal head ends due to water logging and poor drainage etc.
Solution offered: The Govt. of Karnataka launched Asia’s largest drip irrigation programme under
Stage II of Ramthal Lift Irrigation Project in 2017. This project is an example of Integrated Micro-
irrigation. In this project, canal water is delivered directly using HDPE/PVC piping network to
irrigate around 24,000 ha area. Salient features of this project:
• Mega community drip irrigation project
• Total beneficiary: More than 15,000 farmers
• Infrastructure cost borne by the Govt.
• System operation through wireless automation
• O&M of system for first 5 years by Krishna Bhagya Jala Nigam Limited (KBJNL)
• Formation of WUA and marketing linkages
Impact:
• 90% additional area coverage using same quantity of water (i.e. 12,571 ha area covered
in stage I by flood irrigation through canals vs 24,000 ha area covered in stage II by
integrated drip irrigation. In both stages, water requirement remains same i.e. 2.77 TMC)
• Doubled the no. of beneficiaries with same resources
• Equitable distribution of water irrespective of topography and distance of farm from the
water source
• Improved standard of living of project beneficiaries
• Improved crop quality and produce
Page | 1215
Replicability: Similar integrated micro-irrigation project can be adopted in other states where
canal or other assured irrigation source is available. Govt. of Haryana is also planning for similar
project powered by solar energy.
Sustainability: O&M by 3rd
party, participatory irrigation management by WUAs and marketing
linkages will be helpful for maintaining sustainability of this project.
(Reference: http://pmksy-mowr.nic.in/aibp-
mis/Manual/Ramthal%20Micro%20Irrigation,%20karnataka.pdf;
http://www.kbjnl.karnataka.gov.in/kbjnlenglish/content/ramthal-marol-lift-irrigation-scheme )

Page | 1216
12. Upliftment of SC farmers to mitigate migration: A case study of Jangalahalli
village of Kapalamadagu GP in Kolar (Karnataka)
Problem statement: Under Batch-4 PMKSY-WDC programme implemented in Mulbagal taluk,
Schedule Caste (SC) farmers having aggregate landholdings of up to 10 hectares in Jangalahalli
village of Kapalamadagu GP were migrating to towns in search of jobs. Their lands were
unproductive and were left barren/fallow.
Solution offered: After project intervention due to land treatment from upper reach to lower
reach and via various watershed activities such as bunding, construction of Nalabund and check
dams, agroforestry, dry land horticulture, boulder checks and diversion channels have converted
uncultivable land into productive cultivable lands. Water stored in the water harvesting structure
has helped the farmers to undertake intensive cultivation of commercial crops.
Impact: In Jangalahalli village, watershed development programme has not only raised the
income level of SC farmers but also facilitated them to sustainably settle down in their farm,
thereby reducing migration and poverty.
Sustainability: By overall upliftment of farmers’ economic condition along with sustainable
management and conservation of soil and water the watershed project in Jangalahalli village has
contributed substantially towards the sectoral challenge, national priority and Sustainable
Development Goals (SDG). The intervention has helped the farmers to sustainably settle on their
land with adequate sources of livelihood.
(References: As reported by WCDC of Kolar in the written response to the questionnaire)

Page | 1217
13. Construction of Recharge Shafts to improve groundwater table; a Case study
of Tamil Nadu
Problem statement: Recharge of groundwater sources in a cost-effective manner
Solution offered: SLNA of Tamil Nadu reported that they have adopted the construction of
Recharge Shafts to improve the groundwater table as a cost-effective and innovative
intervention. It was reported by the SLNA that Recharge Shafts are the most efficient and cost-
effective structure to recharge the shallow aquifers. Recharge Shafts of 0.5 to 1 metre diameter
and 10 to 15 metres deep were constructed across the state watersheds.
Impact: The impact reported was the rise in groundwater level from 0.33 meter to 3.28 meter in
the intervention watershed areas of Tamil Nadu.
Sustainability: Given the success and cost-effectiveness, so far 17,879 Recharge Shafts have
been created with an expenditure of Rs. 68.10 Cr. These structures are sustainable and are
effective for long duration leading to sustainable recharging of groundwater sources.
(Reference: Based on written response against questionnaire submitted by the SLNA of Tamil
Nadu)
Page | 1218
14. Environment Sustainability: A Case study of Salulamang village in Mokokchung
district of Nagaland
Problem statement: Salulamang is one of the few villages in Mokokchung district where public
transportation is not available. The main occupation of the villagers was Jhum cultivation and
Jhum cultivation was practised extensively before the intervention of PMKSY-WDC. Around 60
households were engaged in Jhum cultivation over a total area of around 90 Hectares in 2012.
Solution offered: In the initial 2-3 years, mixed cropping was done in the rubber plantation area.
About 27 units of piggery have been initiated under livelihood activities, rubber plantation has
been encouraged on a large scale and setting up of micro-enterprise unit has provided a source
of income for the villagers. Technical inputs on land use and construction of engineering
structures, viz. water harvesting structures and gully plugs have made water available for use in
fields and other plantation areas. The technical assistance provided through the programme for
management of orange plantation has been beneficial to the farmers and contributed to the
success of the activity, eventually increasing production and generating more income for the
farmers.
Impact: However, after the intervention of WDC, Jhum cultivation has gradually decreased and
the villagers have taken up rubber plantation. During the study and monitoring visits by the
evaluating agency, it was noted by the agency that the Land Resources Department has been
performing commendably in reaching out to villages through PMKSY-WDC. The average land
under Jhum per household has exhibited a decreasing trend, i.e. 1.5 Hectare per household in
2012 to 0.75 Hectare per household in 2016, resulting in a reduction of the total area under Jhum
to 22.5 Hectares (2016) from 90 Hectares (2012).
Sustainability: Green coverage created by plantation crops over abandoned Jhum land provides
safe shelter for wildlife, birds, insects and microbes. Thereby, through watershed intervention
and promotion of economic activities in the villages under PMKSY-WDC, there has been a
significant reduction in Jhum practice in the state which has a favourable impact on the
environment.
(Reference: Various social impacts of PMKSY-WC with special focus on reduction of Jhum
cultivation, 2016, MELD in Nagaland-NABARD Consultancy Services Pvt. Ltd.)
Page | 1219
15. Recharge of groundwater sources; Case Study of Gokak Taluk of Belagavi
district
Problem statement: The latest Assessment of Dynamic Groundwater Resources of the State
2017 is made jointly by the Central Ground Water Board and the State Ground Water Department.
As per the last report, Gokak taluk was categorised as "Semi Critical" based on the stage of
groundwater development ('Semi Critical' is where Groundwater extraction is between 70 to
90%).
Solution offered: Karnataka Watershed Development Department is implementing PMKSY-
WDC (formerly IWMP) in a phased manner all over the State. As per the department, the
watershed development activities have helped in water conservation, groundwater recharge,
reduction in soil erosion, increased productivity etc. The project (IWMP-20/11-12) was sanctioned
in the year 2011-12 to treat an area of 2080 hectare in Gokak Taluk of Belagavi district at an
estimated cost of Rs. 312 lakh under Batch-Ill. In an area of about 548 hectares bunding was
done and 127 Water Harvesting Structures (WHS) was constructed by spending Rs. 265.77 lakh.
Impact: The interventions made through watershed development activities in the form of
rainwater harvesting structures have led to a spurt in recharge of the aquifers in the area. Thus
cumulatively 20,310 cubic metres of rainwater is made available for recharge to groundwater
body in the area annually. However, the watershed development activities have helped in
augmenting the water resources in the taluk and has restored the taluk to "Safe" category. The
farmers were favourably impacted as their wells were getting groundwater inflows as before.
The effect of watershed activities observed in the rejuvenation of defunct wells is demonstrated
as the irrigated area increased from 0 to 37 acres in Kharif and 0 to 25 acres in Rabi.
Sustainability: The permeable topsoil and weathered and fractured rocks underneath are the
factors that lead to good recharge. Such recharge has rejuvenated the defunct wells, can sustain
additional wells in the area, and also can sustain the water yield from wells over an extended
period.
(Reference: Rejuvenation of defunct Dug wells due to watershed development activities', 2020,
Watershed Development Department, Government of Karnataka.)
Page | 1220
16. Sustainable livelihood opportunities for women; Case Study of Yeiikha and
Yow Miijaiim Self-Help Groups (SHGs) in Phek district of Nagaland
Problem statement: Providing sustainable livelihood opportunities to landless and women
Solution offered: Land Resource Department of Phek District facilitated the formation of two
SHGs, namely; Yeiikha SHG & Yow Miijaiim SHG in the year 2017 with ten women members in
each group. The primary purpose of collectivizing and forming the groups was to improve the
socio-economic status of poor rural women, especially to enhance their income. Seed money
amounting to Rs. 10,000 each was given to both the groups. Tree beans (Parkia), a very important
multipurpose tree species, having many utilities such as rich nutritional value as it is abundant in
minerals and vitamins, medicinal value, use as insecticides and pesticides, enriching the soil by
fixing atmospheric nitrogen, etc. Besides, tree bean (Parkia) the SHG members are also engaged
in weaving and kitchen gardening.
Impact: Each SHG has been earning Rs. 40,000-50,000 annually from the sale of Parkia. The Self-
Help groups collect the entire produce of their village and transport it to the nearest market which
is 114 km away from their village and sells it.
Sustainability: The group maintains cash book, savings book, meeting minutes register and all
other relevant registers thereby facilitating their financial independence in the long run. The
livelihood component of the programme has helped the women in the SHGs to earn a sustainable
livelihood thereby contributing to equity.
(Reference: Success stories: Bringing visible changes in the economy of the rural community,
Booklet provided by SLNA of Nagaland)

Page | 1221
17. From source of sorrow to place of prosperity, Swan River in Himachal Pradesh
Scheme details:
• Scheme Name: Channelization of Swan River
• Target Area: Swan River watershed, Una district, Himachal Pradesh
• Total Project Cost: Rs. 945.49 Cr.
• Broad Scope:
▪ Afforestation
▪ Civil works for soil and river management (check dams and embankments, etc.)
▪ Soil protection and land reclamation (terracing and soil addition, etc.)
▪ Livelihood improvement activities (agricultural development, small-scale infrastructure
installation, income generating activities, etc.)
▪ Institutional building (purchase of equipment, training, hiring of facilitators, etc.)
• Implementing Agency: Forest Department and Irrigation and Flood Control Department,
Government of Himachal Pradesh
• Area covered: 95 Gram Panchayats of Una District, within which 61, 900 Ha of land were
treated to protect the land from soil erosion and floods, regenerate the forest cover and
enhance agricultural productivity.
The Problem: District Una is situated on the bank of Swan River, which flows from North to
West direction. This river during monsoon period creates devastating floods in District Una. Due
to continuous silting, the bed of Swan River had risen constantly due to which meandering action
took place. The width of the river had increased, and fertile land situated on both banks was
turning barren due to silt deposits. Besides, some of the fertile land situated near the banks had
been lost during the floods.
Approximately, 10,000 ha. of agriculture land was affected by floods and annually 2,000 ha. of
fertile land were not being cultivated owing to fear of floods. During the past 10-12 years
extensive damage to civil structures, properties, human life and livestock had been reported. The
estimated loss to crops and property was to the extent of Rs. 15 Cr. per annum.

Page | 1222
Solution offered: The forest department was the nodal department for the project. The
participating line departments were agriculture, horticulture and animal husbandry. The overall
administration, planning and implementation of the project was with the Project Management
Unit (PMU). The Chief Project Director was the overall in charge of the project and responsible
for all administration and financial matters and maintaining liaison with the government. He was
assisted by a team of Additional Director, Joint Director (administration), Deputy Project Directors
Agriculture, Horticulture, Animal Husbandry, Social Development Expert, Environment Education
Expert and Training Expert. Three Project Implementation Units were established at Una, Amb,
and Gagret headed by the Deputy Directors. At Panchayat level Panchayat Development
Committees (PDCs) were established in all the 96 Gram Panchayats of the Project area.
The Detailed Project Report for providing embankments on both banks of Swan River for a length
of 16.67 km. from Jhalera bridge to Santokhgarh bridge in Phase-1 was prepared based on
mathematical modelling studies carried out by Central Water Power Research Station (CWPRS),
Page | 1223
Pune. This project amounting to Rs. 102.71 Cr. was accepted by the Technical Advisory
Committee of Ministry of Water Resources, Govt. of India. To adopt an integrated approach, it
was proposed to treat the entire catchment instead of just the sanctioned portion of 16.67 km.
In all 42 most vulnerable points requiring emergent flood control works were identified. Out of
these, 40 have since been completed at a cost of Rs. 9.28 Cr. An additional amount of Rs. 24.57
Cr. has been approved under NABARD for phase-I.
Also, a provision of Rs. 106.83 Cr. has been made for treatment of catchment area of tributaries
falling from Jhalera bridge to Santokhgarh bridge. The Forest Department has planted around
60,000 trees of different varieties in 50 ha. In addition to this, check dams in the tributaries and
planting of grass and bushes for bank protection have also been done.
Community involvement: People's participation was key to the success of this project and
community participation was seen as an important aspect. No fund needed to be allocated for
land acquisition as the villagers had come forward and donated their land for the project. This led
to savings to the tune of Rs. 500 Cr. The people donated their land with the expectation that the
agriculture in the remaining portion of land after construction of the project would give them
better returns. The report by JICA says that “The project will be implemented on national forests
and on private land chosen through community participation. The project will not involve any land
acquisition or involuntary resettlement.”
Impact: The Swan River Project has benefitted the villages situated by the side of the river from
the massive erosion and siltation caused by the flash floods. During the Focus Group Discussion
with villagers of Una, the villagers reported ”Since the Channelization of Swan River has been
implemented by the Government, it changed our destiny for better as today, we are earning a
reasonable money by producing seasonal vegetables and cash crops on the reclaimed land and
have shifted back to our traditional vocation of farming”. Some of the benefits are summarized
below:
• The analysis of cropping pattern revealed that the total area under cereals decreased from
69% to 54%; however, with the increase in the irrigation facilities by the project
interventions, the area under vegetable crops increased from 31% to 46 % of total
cropped area. The cropping intensity increased from 193% to 199% after the project
implementation.
Page | 1224
• During the project implementation period, the average size of livestock unit increased
from 1.62 to 2.71. The share of milk to the total income from livestock was found to be
highest among different livestock products.
• As a result of increases in the income from agricultural crops, fruit crops and livestock by
about 43%, 35%, and 55%, respectively, the overall farm income has increased by 50%
during the project implementation period.
• The employment generation in agriculture has increased with the implementation of the
project. The annual per farm labour employment in horticulture and livestock, showed an
increase of 213% and 65% respectively.
• Community-based groups formed under the project are involved in marketing of produce.
Sustainability: In order to ensure the proper utilization of created facilities over time, there is a
need for adopting certain measures at local level - local asset management committees may be
formed under the guidance of the block and district authorities.
(References: FGD & KII as part of primary survey; Research Report No. 70: Impact analysis of
integrated watershed project in Swan catchment, Una district, Himachal Pradesh, Department of
Agricultural Economics, Extension Education and Rural Sociology, CSK HPKV, March 2014)

Page | 1225
18. Combating flood with information driven actions, Bihar
Project details:
• Scheme Name: Flood Management Information System (FMIS)
• Target Area: Bihar
• Total Project Cost: Bihar – Rs. 10.86 Cr. funded by World Bank
• Scheme Scope:
▪ Development of technical and institutional capacity of the State for flood
management
▪ Improved flood forecasting in terms of lead time and accuracy
▪ Prediction of expected inundation
▪ Development of updated flood control manuals
▪ Upgrading hydrologic measurements
▪ Use of Online Analytical Processing (OLAP) and data mining tools for planning of
schemes using forecasted data
• Implementing Agency: Flood Management Information System Cell (FMISC), Government
of Bihar
• Area covered: Phase – I : Flood prone area in North Bihar, from Burhi Gandak river in the
west to Kosi river in the east, including the districts of East Champaran, Muzaffarpur,
Begusarai, Samastipur, Dharbanga, Sitamarhi, Sheohar, Madhubani, Supaul, Saharsa, and
Khagaria covering about 26,000 sq. km. in area; Phase – II: Entire North Bihar together with
Patna, Bhagalpur and Munger district have been targeted to be developed.
Solution offered: Flood Management Information System, Bihar finds its genesis in the
brainstorming meeting on Jan 18, 2006 in which the Government of Bihar (GoB) and the World
Bank agreed on a water sector partnership matrix and action plan in three time horizons. In the
short term, it was proposed to improve the technical and institutional capacity of the State of
Bihar for flood management, introduce extensive use of modern information technologies, and
develop and implement a comprehensive Flood Management Information System (FMIS) in
priority areas. Flood Management Information System Cell (FMISC) was created under the overall
supervision of Chief Engineer (CE), Monitoring and Planning, in Water Resources Department
(WRD), GoB, and under Superintending Engineer (SE), Flood Monitoring Circle, to develop and
operate the Flood Management Information System (FMIS) with technical assistance from the

Page | 1226
World Bank. Currently, one Executive Engineer as In-Charge, and six Assistant Engineers (and
one peon) have been deputed to FMISC.
Major functions of FMISC are:
To ensure operational readiness of FMIS prior to each flood season.
To operate and disseminate information products as per plan and schedule.
To respond to emergency data requirements through the use of FMIS.
To follow-up on dissemination to enable effective utilization.
To analyze feedback and experience of every flood season for improving FMIS.
The FMIS in the first stage covered the focus area from Burhi Gandak River in the west to Kosi
River in the east in North Bihar which is the most flood prone area in the State. This included 11
FMIS Development
Framework
FMIS1
Flood hazard
characterization &
emergency Response
FMIS 2
Improved flood
forecasting and early
spatial warning
FMIS 3
Flood hazard
mitigation
FMIS4
Flood management
planning
Key Performance Outcomes
•Strengthening Flood
Knowledge Base and
Analysis •Dissemination and
Outreach (information
products, website,
institutional mechanisms,
public news media, cell
phone, etc)
•Improvement of short-term
flood preparedness (updated
flood manual, community
participation) •Planning
improved observation
network and telemtry
•Improved flood forecasts
and inundation modeling with
better models and improved
rainfall forecasts
•Improved flood forecasts
and inundation modeling with
improved hydrologic
database, better models and
improved rainfall forecast
•Early warning with
improved topographic
database (close contour
survey of flood plain, and
micro relief), models for over
bank flow and embankment
breach, multimodal
communication links
•Airborne SAR surveys for
real-time data collection and
integration •Improved
information systems
•Risk and vulnerability
assessment
•Improved flood
management, by expanded
geographical coverage,
scope, detail, and real-time
data collection and
dissemination
•Improved preparedness,
with very large scale
databases, and targeted
communication
•Support to improved
drainage & flood
management planning, and
improved irrigation
management

Page | 1227
districts i.e. East Champaran, Sheohar, Sitamarhi, Muzaffarpur, Madhubani, Dharbanga,
Samastipur, Supaul, Saharsa, Khagaria, and Begusarai covering 26,000 sq. km.
The FMIS Phase I was initiated in August 2006 and was scheduled to be completed by October
2007. Further extension to the project till June 2008 was granted by the World Bank and the
project was eventually completed on this date. The project components included development
of FMIS, improvement of flood forecasting, update of Bihar Flood Information Website,
preparation of updated flood control manual, conducting training and upgradation of hydrologic
measurements and telemetry.
FMIS Phase-II started on May 2010. In the meantime, the FMIS sustained itself on the internal
resources of the Water Resources Department during 2008 to 2010. The FMIS Phase II was
scheduled to be completed by 31 December 2012 , which was extended till 30 November 2014.
Impact: As a result of FMIS in Bihar, following achievements have been realized:
• Flood modelling: Real-time Flood Forecasts are made using statistical and deterministic
model.
• FMISC is releasing monthly E-Bulletin since May-2007. This is an in-house production and
gives a brief account of activities in FMISC.
• Flood Management Information System Cell, Bihar, Patna issues Daily Flood Information
Bulletin during monsoon season generally from 15th June to 15th October. The bulletin
carries information on observed rainfall in Nepal, Bihar and three days maximum rainfall
forecast from IMD and river water level for all six sub-basins/rivers of North Bihar viz
Gandak, Burhi Gandak, Bagmati (including Adhwara group of rivers), Kamala, Kosi and
Mahananda.
• Inundation Maps: These maps indicate the extent of flood water spread. The inundation
extent is derived from RADARSAT Layers/ Imagery provided by NRSC in processed 1bit
image format.
• FMISC also provides regular embankment news, detailing the status of embankments in
Bihar. Embankment Assets Management System for Bagmati and Kosi is currently
functional and is providing up to date information on embankment conditions by collecting
information from department officials and select community members through field data
collection application and SMS.
• Following information products are regularly uploaded in the website for public viewing:

Page | 1228
o Inundation map
o Flood intensity map
o Village level inundation map
o River status map during flood
o Post flood River Status Map
Replicability: In order to address the flood situations in the flood prone states in India, the FMIS
need to be rolled out across all states. Further the FMIS should contain modules for addressing
land planning, zoning of flood plains, silt management besides integrating with flood forecasting
and hydro-meteorological observations. The water flow data can also be used for irrigation in arid
and semi-arid regions.
Sustainability: Sustainability analysis mechanisms, including ‘Dynamic Sustainability’ concepts,
may be adopted in the flood management planning process. To ensure sustenance of benefits
realized through FMIS, it is imperative to upgrade the application models in the FMIS and also
ensure seamless integration with new applications.
(References: http://www.fmis.bih.nic.in; KII as part of primary survey)
Page | 1229
19. IT based enumeration of Irrigation Census in Andhra Pradesh
Problem Statement: Irrigation Census involves enumeration of data for all groundwater and
surface water minor irrigation sources across all villages in India. The 6th
Irrigation census also
involved canvassing of data for water bodies in villages and urban local bodies. The enumeration
process is done by canvassing five schedules to cover all aspects of minor irrigation. Huge data
collection leading to issues like manual errors, missing data, operational issues are frequently
experienced leading to increased time and resource lag, needless to say of issues like
coordination, data tabulation and data validation techniques.
Solution offered: Andhra Pradesh is one of the few States that have conducted “Paperless” 6th
Minor Irrigation Census. During the State Level Coordination Committee (SLCC) meeting prior to
execution of 6th
MI census, it was decided to conduct the survey through tab/ mobile app without
canvassing the schedules to save time and avoid data entry errors. Accordingly, customized
software was developed in-house. Tab / mobile app was developed with android version for
canvassing all schedules of 6th
Minor Irrigation Census and Census of Water Bodies. All the 5
schedules (Ground Water, Surface Water, Census of Water Bodies in Rural and Urban areas and
Village schedule) as designed by GoI were integrated into the 3 schedules covering all the
information. “Postgre SQL” is used for storing the captured data through tab/ mobile application.
Trainings were conducted for the field and supervisory functionaries at State, District and Mandal
level before commencement of the census.
Pilot survey was done to test the application covering all the schedules of groundwater, surface
water schemes and water bodies @ 2 schemes each in all 13 districts both in Rural and Urban
areas. ‘All the table’ scrutiny checks were incorporated in the app as per instructions of GoI.
Photographs along with latitudes and longitudes of water bodies are captured in the Census of
Water Bodies. The app has been developed with provision to upload the canvassed data
automatically in the NIC software structure in one go through back end bulk data entry.
Exclusive Web portal (http://aproms.ap.gov.in/mic6/dashboard) was established for day to day
monitoring of the fieldwork of 6th
MIC & CWB featuring different MIS Reports viz., (1) Survey
progress (2) Schemes covered and pace (3) Supervision status and (4) Other reports.

Page | 1230
WhatsApp group was formed to resolve the field level issues and to share the clarifications.
Senior Officers from DE&S were allotted districts for monitoring and supervision. Core Group
Team was constituted with group of officials. The team visited all districts and explained the
process of rectification of errors in the portal at Mandal level as part of validation of the
enumerated data.
Impact: The application has immensely benefitted the enumerators in terms of data collection
and primary data validations, thus saving time and resource. The data consolidation was done in
much lesser time. The progress of data collection was effectively monitored by the supervisors
using the desktop application. The gaps or delays were monitored, and corrective actions were
taken immediately.
Replicability: The applications that were used for Irrigation Census in Andhra Pradesh are very
common and widely used in various IT applications across all sectors of business and social
sectors. The modules can thus be replicated in other states and UTs. Furthermore, MI Stat wing,
can further improve the application and incorporate provisions for online transmission of data to
the server for data tabulation. Inbuilt data validation modules may be made a part of the overall
application to complete correctness of data prior to tabulation.
Page | 1231
Such an approach may be adopted for survey of medium and micro-irrigation schemes as well.
A consolidated IT based application operatable with mobile / tab containing multiple schedules
with inbuilt validation modules for all irrigation schemes can be thought of. The application may
also use Machine Learning / AI techniques for analysis and predictions pertaining to water
availability and demand. Such prognosis will immensely help the irrigation sector as a whole in
identifying area specific issues and devise plans accordingly.
(Reference: KII with Nodal Officer, Andhra Pradesh as part of primary survey)

Page | 1232
20. Automating the Irrigation Census – ensuring data reliability
Problem Statement: Minor Irrigation schemes in India are large in number and the data
generated at field level are collected through manual canvassing of paper schedules. As a result,
inadvertent delays and errors are experienced during validation and tabulation of data. On account
of the massive importance of MI census data in terms of its applicability by various important
government agencies like MoWR, CWC, CGWB, Water Resources Departments at State level
for framing policies pertaining to appropriate usage of groundwater and rejuvenation of the
sources, a need for having web-based application for accuracy and quick processing of data was
felt by the MI Stat wing, MoWR. It was understood that adoption of the system may led to certain
advantages like elimination of duplicate entries, timeliness, need based generation of tabulated
data and archiving of historical data.
Solution offered: National Informatics Centre (NIC) was requested to develop a software,
meeting the above-mentioned requirements. The work was adequately taken up by all States
and extended to the districts, wherein adequate manpower was appointed for data entry. In the
5th
MI census, a web-based software was created for the first time wherein, three different
schedules for data entry namely, village schedule, ground water schedule and surface water
schedule were introduced. For the 6th
MI census and 1st Census of Water Bodies, five schedules
viz., village schedule, ground water schedule, surface water schedule, urban schedule and the
water body schedule, were incorporated for web-based data entry. The reliability of the data was
checked through sample checks by the supervisors. In order to ensure data accuracy, timely
tabulation of data and analysis, a software was developed with the following features:
User friendliness
Data verification ability
Modules for data tabulation
Data dissemination through websites
Inbuilt models for identifying trends like pattern
Decision Support System with Query Module
The overall objective of the project was to gather correct data. The databases collected from all
States/ UTs have been merged for making a National level database and several reports have
Page | 1233
been generated. The application has been divided into three modules based on their functionality
i.e. Data Entry Module, Abstract Creation and Decision Support System (DSS). The objective of
Data Entry Module is to gather the validated base/enumerated data. Abstract Creation Module
will process these data (base/enumerated data) for generating a database that will be used by
Decision Support System. DSS Module will generate all types of reports, queries and provide
useful information.
Impact: Some of the major impacts noticed due to wide application of the web-based software
are as follows:
Efficient planning and decision making for development of Water Resources through
consistent and consolidated information.
Empowerment of end users to perform in-depth analysis
Prediction of irrigation potential utilization and segmentation of areas through Online
Analytical Processing (OLAP) models.
Replicability: The application documentation can be shared with other sectoral departments.
Currently the scope of Irrigation Census is limited to Minor Irrigation only. The modules can be
made applicable for medium and micro-irrigation schemes as well. Such an approach will bring
majority of the irrigation schemes and their data under single accessibility. This will facilitate
coverage of broader issues pertaining to irrigation and will help the policy makers in framing better
schemes or revising components of the existing schemes as well.
Sustainability: Such a system can definitely be sustained by enabling strong data archives and
archives of the analyses. Introduction of newer modules, software and update of the application
on regular basis will ensure easier use of the application. Better analysis through application of
Machine Learning techniques will also help the researchers towards analysis of village specific
irrigation issues in a detailed manner.
(Reference: KII with DDG, MI Stat wing, DoWR, Govt. of India)

Page | 1234
21. Balanced and sustainable development of river ecosystem through bio-
monitoring efforts
Problem statement: The presence and growth of flora and fauna in rivers to a large extent
depends on the quality of river water. Hence, it is important to monitor the presence of bio-
organisms in the river to assess river health.
Solution offered: Odisha State Pollution Control Board (OSPCB) regularly undertakes
biomonitoring of rivers. The mechanism involves sampling flora and fauna such as micro
invertebrates and calculation of a bio-diversity index based on the population of different types of
samples. The higher the bio-diversity index, the more diversity of micro-organisms in the river
water, which indicates cleaner river water.
Impact: Regular bio-monitoring mechanism has helped OSPCB in assessing the river health and
taking appropriate measures in notifying the concerned department about actions.
Replicability: Such bio-monitoring mechanisms can be adopted by other State Pollution Control
Boards to assess the health of the river ecosystem and presence of flora and fauna in the rivers.
(Reference: KII with Odisha State Pollution Control Board)

Page | 1235
22. Financial support for projects through assistance from multilateral funding
agencies
Problem statement: It was noted that the funds available with NRCD is inadequate to bridge
the existing sewage treatment gap in the country. In addition, multiple proposals submitted for
central funding under NRCP scheme have been rejected in recent years due to shortage of funds.
Hence, external funding options such as multilateral funding agencies needs to be explored.
Solution offered: The Mula Mutha River Project in Pune is being implemented by the Pune
Municipal Corporation under NRCP scheme with a loan assistance from JICA. The loan amount
is 19.064 billion Yen. The remaining project cost is being shared between Government of India
and Pune Municipal Corporation in the ratio of 85:15. Although, the funding pattern for states
(other than north-eastern states) is 60:40, here since a significant portion of the project cost is
being funded by JICA, central funding for the remaining cost is higher than in other cases.
Impact: Financial support has helped the Pune Municipal Corporation to take up such a large
project (396 MLD STP) on River Mula Mutha.
Replicability: Since 2014-15, proposals amounting to Rs. 5,400 Cr. have been rejected by NRCD
citing shortage of funds. Considering the shortage of funds with NRCD, such innovative funding
mechanisms such as loan assistance from MFIs will enable large projects to be undertaken under
NRCP scheme.
(Reference: KII with National River Conservation Directorate and Pune Municipal Corporation)
Page | 1236
23. Improving sustainability of assets created under NRCP through appointment of
private contractors for long terms
Problem statement: In many cases, the operational efficiency of the STPs created under NRCP
is low and some STPs have become defunct due to lack of operations and maintenance (O&M)
primarily owing to lack of funds and technical expertise. Hence, there is a need to involve private
contractors for long term O&M to improve sustainability of the assets being created.
Solution offered: The Kolhapur Municipal Corporation has appointed a private contractor for a
period of 15 years on Design, Build, Operate and Transfer (DBOT) mode. The contractor is
responsible both for construction and O&M post construction. The contractor is made quarterly
payments only during the O&M period. There is no fixed construction period. The contractor is
incentivized to complete construction early and start operation so that they can get paid early.
Impact: The involvement of the private contractor has ensured smooth running of the 76 MLD
STP in Kolhapur on River Panchganga. The STP is currently operating at 95% capacity. This has
also ensured regular upgradation, retrofitting and modernization of sewage treatment technology
to meet extant NGT discharge standards.
Sustainability: The involvement of private contractors has helped improved sustainability of the
assets created under NRCP scheme and incentives such as renewal of contract based on
contractor performance can also ensure that desired performance levels are achieved.
(Reference: KII with Kolhapur Municipal Corporation)
Page | 1237
24. Holistic river conservation through maintaining of minimum environmental/
ecological flow in rivers
Problem statement: Most rivers in India except the Himalayan rivers have become seasonal
with no flow in them during the lean season. They only have flow in them during the months of
June-February. In the lean season, they almost have no flow. pollutants have an assimilative
property and river water dilutes the pollutants. Hence, when there are very low levels of surface
water, the pollution level measured in terms of BOD and COD will be high. It is important to
maintain a minimum environmental or ecological flow in the rivers to dissipate the pollutants.
This is currently not under the purview of NRCP scheme.
Solution offered: NMCG has provisions for Aviral Dhara or Wholesome River. Environmental
water requirement (EWR) assessment methods, for ascertaining how much water should be
retained in rivers to sustain ecological functioning and desired levels of biodiversity, have been
developed under Aviral Dhara. Under NMCG, there is special focus on increasing base flow and
aquifer recharge. Minimum environmental flows have been notified for different sections of the
Ganga and violation of the e-flow norms would lead to closure of respective water-consuming
projects such as hydroelectric projects and/ or imposing heavy penalties.
For non-perennial rivers it is often difficult to get data on hydrology, and ecological functioning.
However, many tributaries of Ganga like the Damodar, Hindon, Kali etc are non-perennial. Hence
the learnings from “Aviral Dhara” programme remains applicable.
For non-perennial rivers a case study through a method known as “DRIFT-ARID”251
was adopted
in South Africa which needs to be looked upon in the case of NRCP as well. This method explores
refining the normal technique of EWR measurements over a period, through different types of
non-perennial rivers. Many non-perennial rivers have enough water even during the dry season
to carry out EWR measurements to be extrapolated using the DRIFT model data of perennial
rivers. The fundamental requirement of such method is availability of enough data. Hence this
needs to be adopted initially in select non-perennial rivers with a minimum e-flow and be
replicated to others over time.
251 Environmental Water Requirements of Non-Perennial Rivers, Michael C Grenfell

Page | 1238
Impact: Adoption of such measures will ensure a minimum ecological flow in the rivers
throughout the year and help reduce pollution in river water.
Sustainability: Additional project components for inclusion of the measures discussed above is
needed for the NRCP scheme. This will help improve efficacy of the scheme and enhance
sustainability.
(Reference: KII with National Mission for Clean Ganga and Environmental Water Requirements
of Non-Perennial Rivers, Michael C Grenfell)

Page | 1239
25. Holistic river conservation through river front development measures
Problem statement: Protection of riverbanks is an integral part of river conservation. In
particular, during monsoon, regular floods affect the structures created on the riverbanks,
habitations and cause soil erosion in adjacent lands. Hence, riverbank protection is needed for
holistic river conservation.
Solution offered: Sabarmati riverfront project in Ahmedabad under which the Sabarmati
riverfront has been beautified and developed as a tourist attraction.
Impact:
• Protection of riverbank and retention of water flow
• The abandoned land of riverbed and nuisance at the centre of the City was converted into
people’s attraction; tourist destination; creation of infrastructural and recreational facilities
• The capex spent could be recovered through direct revenue collected via tourist footfalls
and indirect revenue in the form of taxes.
Replicability: The model is replicable for any river front and can be adopted as a measure to
protect the riverbanks especially during floods.
(Reference: KII with Ahmedabad Municipal Corporation)
Page | 1240
26. Holistic river conservation through afforestation measures
Problem statement: Protection of riverbanks is an integral part of river conservation. In
particular, during monsoon, regular floods affect the structures created on the riverbanks,
habitations and cause soil erosion in adjacent lands. Hence, riverbank protection is needed for
holistic river conservation.
Solution offered: NMCG currently working with Department of agriculture for 5-7 km belt along
Ganga to undertake organic riverbed farming along the rivers in Uttarakhand. A pilot research is
being undertaken on Agri-run off and promotion of organic farming along the Ganges. MoEF&CC
is also taking this up to extend to other 13 rivers and looking at convergence with CAMPA funds.
Impact: Such afforestation measures not only protects riverbanks but also is a source of revenue
generation through organic farming.
Replicability: The model is replicable for any river front and can be adopted as a measure to
protect the riverbanks.
(Reference: KII with National Mission for Clean Ganga)
Page | 1241
27. Holistic river conservation through adoption of river basin conservation
approach
Problem statement: Since the fund available with NRCP is limited, projects for conservation and
sewage treatment along major river basins should be prioritized to be taken up under the scheme.
Hence, there is a need to take an approach towards river basin conservation of major rivers.
Solution offered: The Rhine river flows across Switzerland, France, Germany and the
Netherlands to reach the North Sea. During the rapid industrialization of 1800s, there was
rampant river pollution where untreated chemicals from industries as well as untreated sewage
was thrown into the river much like in India today. Multiple actions and international cooperation
were targeted through the Rhine Action Programme. However, results only started being visible
in the 1980s. Restoration of river water quality to drinking standards, ecological rehabilitation,
restoring salmon population were few of the key success indicators. Currently, Rhine 2020
programme is ongoing to continuously monitor and maintain the river health including flood
prevention and groundwater protection. This entire programme wouldn’t have been successful
without intense trans-boundary cooperation between multiple governments and citizens.
Impact: The Rhine 2020 program has been immensely successful in improving the quality of
water of River Rhine.
Sustainability: A key learning from the Rhine Action programme is that a river basin conservation
effort is not a one-time effort but a continuous process and spans decades and requires immense
collaboration and stakeholder engagement throughout the process.
(Reference: Rhine 2020 Action Program)

Page | 1242
28. Exploring revenue generation options during O&M through wastewater reuse
Problem statement: The NRCP scheme focuses on sewage treatment infrastructure only and
the full responsibility of the O&M of the STPs created rests with the state government and PIAs.
In some cases, it was noted that Project Implementing Agencies (PIAs) are unable to provide
adequate funds and hence limited maintenance activities are being undertaken on the assets
created such as upgradation to new technologies, retrofitting, cleaning etc. This has led to some
STPs becoming defunct and not functioning to full capacity. There is also limited focus on revenue
generating activities during O&M.
Solution offered: Learnings can be derived from the case study of River Nag and Pili in Nagpur
on wastewater treatment and reuse. In April 2020, pollution abatement works on Rivers Nag and
Pili in Nagpur has been approved at a total cost of Rs. 2,324 Cr. to be funded by JICA and partially
(15%) by Nagpur Municipal Corporation. The project includes construction of 2 STPs (48 MLD
and 43 MLD respectively) and laying of 1,362 km of sewage lines for diversion of sewage from
100 small streams that flow into River Nag/ Pili downstream. An arrangement of water swap has
been undertaken for wastewater reuse. Raw water sent in bulk to the industries under Nagpur
Municipal Authority is diverted to water treatment plants for the city, thus increasing availability
of potable water for Nagpur residents. In turn, recycled water from the city is again being diverted
for industrial use. This water swap arrangement, operational since 2015, is additionally using
municipal treated wastewater from Nagpur for cooling purposes in the power plants at Koradi,
Khaparkheda and Mauda.
Impact: The above water swap arrangement has helped Nagpur Municipal Corporation take up
wastewater reuse in a unique way and ensuring long term sustainability of the project.
Sustainability: The above model is sustainable in the long term since there will always be a
demand for water from the industries and there will always be wastewater generated from the
city. This model can be adopted where there are major towns and cities situated on riverbanks.
(Reference: Nagpur Pili river water swap arrangement published in news articles)

Page | 1243
29. Water resources management balancing economic principles, ecological
sustainability and political contexts, Murray-Darling River Basin in Australia
Problem statement: The Murray-Darling River Basin in Australia, which accounts for almost one-
seventh of the total land mass of Australia, witnesses extreme spatial and temporal variation of
rainfall. The rainfall, within the Basin, varies from 1,400 mm/ year in the highlands to 300 mm/
year in the northwest. The basin also witnesses large variation in seasonal rainfall year to year –
annual variation to the extremes of 10,000:1 has been reported in the Darling river. Notably, the
basin also has relatively low annual discharge compared to other river systems in the world.
Solution offered: Water shortages together with environmental concerns and degrading water
quality (as indicated by declining biodiversity, increase in algal bloom and water salinity), led to
the adoption and evolution of various frameworks and legislations in the Basin related water
allocation, inter-region water trading, water quality trading and water delivery and pricing, as
discussed below.
• Cap on surface water diversion, along with periodic monitoring and audits, to contain the
declining river health
o Various caps on water diversion are set for the states
o Periodic audits of compliance to the Cap on water diversions are enabled by the
Murray-Darling Basin Agreement and agreements by the Council of Australian
Governments (COAG). The Murray-Darling Basin Authority (MDBA) has developed
Sustainable Diversion Limit Reporting and Compliance Framework to manage
water use exceeding limits in dry and wet years. Compliance to these agreements
are further incentivized through tranche payments to the states based on the
status of the reforms undertaken.
o Water allocation plans, as prepared at the local level, are given the status of
statutory documents and thus states are accountable to implement them.
o These Cap measures are further facilitated by introduction of inter-region water
trading.
• Introduction of inter-region water trading
Page | 1244
o Different instruments of water trading have been introduced like high security
licences where agreed volume of water is provided except in drought condition
and low/ general security licences with varying water volume from year to year
based on availability.
o Introduction of legislations by some states (like South Australia and New South
Wales) allowing separation of land and water titles and practice of both permanent
and temporary (say lease of water for a particular period) trades allows even
persons with no land to posses water licence as an investment. Also, water title
holders may sell surplus water without selling the land.
o To account for transmission gains and losses in the system, various exchange
rates have been introduced; e.g. transfers upstream are assigned exchange rate
of 0.9 (10 ML in South Australia = 9 ML in New South Wales which is upstream).
• Development of a system for dealing with salinity issues
o Introduction of salinity interception schemes with various restrictions on states;
e.g. states like Victoria and New South Wales are not allowed to approve any
proposals, that may increase salinity by 0.1 EC in the Murray river, unless they
have any access to salinity credits.
o A Salinity Audit was undertaken to develop a new salinity strategy and strengthen
the existing salinity interception schemes.
• Development of frameworks and legislations in relation to water pricing and delivery
o Various economic considerations in relation to water pricing and fees collection
were codified by the COAG in its water pricing policy.
o Various states have established adequate institutional mechanisms to facilitate the
cost recovery measures.
▪ States like New South Wales have set up an Independent Pricing and
Regulatory Tribunal (IPART) which is responsible for determining the cost
structure for bulk water pricing.

Page | 1245
▪ In South Australia, a catchment water board is responsible for levying
water charges based on future infrastructure and water requirements.
Different pricing slabs are introduced for industrial and domestic users
while irrigators with only valid licenses are allowed to draw water. All new
infrastructure/ projects are approved based on full cost recovery principle.
• Involvement of various stakeholders and separation of the role of planning and regulation
from operation
o Skill based local boards, set up in various jurisdictions, are responsible for
determination of water allocation.
o Day to day operations and water delivery are entrusted to the corporations, who
have no direct role in policy development. Many of the states have undertaken
‘corporatization’ of the operations of water delivery through involvement of private
parties, e.g. the Murray Irrigation Limited, a private entity, holds around 75% of
New South Wales general water security entitlements.
Impact: During the initial year, New South Wales recorded sales amounting to more than 10%
of total entitlements while a two year pilot project in the Malle region of South Australia, Victoria
and New South Wales saw trade volumes to the tune of 9.8 GL. Water trading facilitated the
adoption of water efficient practices and gradual shift from lower to higher value agricultural
products like viticulture and horticulture crops. Under the salinity interception schemes, states
like Victoria and New South Wales have earned salinity credits of 15 EC. The salinity interception
schemes led to reduced salinity in South Australia and more awareness and adoption of cost
effective measures to protect irrigated lands from land degradation. ‘Corporatization’ of the water
delivery mechanisms including the involvement of consortiums of private irrigators ensured buy-
in from the water users in both the planning and delivery processes including cost recovery.
As on July 2020, 13 water resource plans are in place and over 2,100 GL of water is managed by
the Basin’s environmental water holders. The 2020 Basin Plan Evaluation report highlighted
achievement of various positive ecological responses including delivery of adequate water to
Coorong, Lower Lakes and Murray Mouth during the drought season. The report also noted how
ongoing reforms in water trading markets (surface water), particularly in the well-established
Page | 1246
southern Basin market, have led to improvement in drought resilience and transition towards
high value water usages.
Sustainability: In order to ensure the sustenance of the water management practices introduced
earlier, it is imperative to update the provisions based on the recent developments. For example,
the initially exempted institutes like Australian Commonwealth Territory and Queensland need to
adopt the water Cap measures to avoid any potential conflict with other water users who are
currently under the ambit of the Cap measures. Various contentious issues like introduction of
Cap on groundwater and farm diversions need to be reconsidered. To further facilitate the water
trading mechanisms, there is a need to reduce the transaction costs (like the brokerage fees,
time cost and approval costs). Also, provisions like strengthening the long-term commitments
need to be introduced to account for the ecological impacts of the trade.
The Interim Report (August 2019) of the Australian Competition and Consumer Commission
(ACCC) has highlighted various deficiencies in relation to settings and governance of water
trading mechanisms, that are understood to undermine the efficiency of the trading mechanisms.
The 2020 Basin Plan Evaluation report identified six priority areas for the future ranging from full
implementation of Basin plan to adoption of various climate resilience and integrated water
management practices to achieve social, economic and environmental outcomes.
(Reference: Darla Hatton Mac Donal and Mike Young, International Water Management Institute
” A Case Study of the Murray-Darling Basin”; Murray-Darling Basin Authority “The 2020 Basin
Plan Evaluation” https://www.mdba.gov.au/sites/default/files/pubs/bp-eval-2020-overview.pdf,
Murray-Darling Basin Authority website https://www.mdba.gov.au)

Page | 1247
30. Addressing water shortages through quota control and economic incentives,
Shiyang River Basin in China
Problem statement: During the early 2000s, the Shiyang River Basin, an inland river basin in
Northwest China, was witnessing significant decline in both surface water and groundwater
levels owing to increase water demand, resulting in severe water conflict among the water users
in the different reaches. From 1950 to 2003, irrigated area in this region increased by 30% while
water use increased by 75%.The increasing water demand led to a decrease in surface water
flow from 500 million m3 in 1950s to 98 million m
3 in 2003 while the number of tubewells in the
Minqin County alone peaked to 14,000.
Solution offered: To mitigate the water shortages and the ecological crisis, a River Basin
Management Bureau was set up and a comprehensive water management plan (CWMP) was
approved by the Ministry in 2006 outlining the following targets – increase in surface water
availability in downstream Minqin area from 98 million m3 in 2003 to 290 million m
3 by 2020,
decrease in groundwater extraction from 517 million m3 in 2003 to 86 million m
3 by 2020 in the
Minqin area and from 747 million m3 to 418 million m
3 in the whole basin during this period. A
number of institutional mechanisms and economic measures have been initiated to meet the
targets, the most notable being introduction of water consumption permits, as discussed in detail
below:
• Water consumption permits have been granted to the individual households, which were
determined based on the number of household members and type of crops cultivated.
For example in the Minqin County, the permit allows water consumption for developing
2.5 mu of irrigated area per capita while household with more than 2.5 mu irrigated area
per capita could obtain additional water through plantation of horticulture crops and
transforming land to greenhouses.
• An Integrated Circuit Card (IC card) technology was introduced to monitor water
consumption permit. The electronic systems were installed in the tubewell and the
respective WUAs were allotted the IC card. Each farmer was entitled to purchase
maximum water permits of 415 m3 per mu. The WUAs coordinated the consumption
patterns of the members to ensure equitable distribution.
Page | 1248
• In irrigated areas dependent solely on groundwater or a mixture of both surface water
and groundwater, a two-part (basic + volumetric) has been introduced. Also, different
tariff levels were set for various cropping patterns – water for greenhouse and drip
irrigation were exempted from the basic water fee and also eligible for availing 20% and
50% discounts in surface water and groundwater fees respectively while tariff for water
intensive crops attracts a premium of 50% for groundwater and 30% for surface water
respectively.
• Steep premiums, to the tune of 150% to 300%, were imposed on fees charged, in case
of consumption exceeding the permissible limits.
Impact: Water cost recovery in the area has significantly improved over time, with surface water
fee per m3 in the middle reaches increasing from 0.08 yuan to 0.2 yuan during 2007 to 2017,
while that in the lower reaches recording increase from 0.1 yuan to 0.24 yuan. Water
consumption permits facilitated adoption of water efficient practices with the economic output
per m3 of water increasing from 1.3 yuan in 2009 to 9.33 yuan in 2015. These measures facilitated
the shift from traditional grain crops to cash crops in the SRB province with farmer’s income
registering a two-fold increase. As reported, implementation of various provisions of the CWMP
led to a jump in average agricultural water-use coefficient from 0.53 to 0.58 and reduction in
water use per irrigated land from 626 m3 to 430 m
3 during 2007 to 2015.
Sustainability: As per the evaluation reports released by the Gansu government, significant
improvement in water usages during 2007 to 2015 have been reported owing to these measures.
To ensure sustenance of these benefits, measures like water consumption benefits were
supplemented by adequate changes in institutional and funding mechanisms like development
of WUAs and special fund/ subsidy allocations.
However, it may be noted that the water permit trading has been limited to only between the
WUAs within the same ID. Also, a decline in trade volume was recorded between 2015 and 2016.
At the local level, the trade was limited due to heterogeneity issues, while at the national and
state levels, it was impaired by lack of necessary regulatory framework and legislation.
(Reference: Liuyang Yao et al., MDPI, “China’s Water-saving Irrigation Management System:
Policy, Implementation and Challenge”, December 2017)

Page | 1249
31. Improvement in water fees collection through canal contracting in Jinghuiqu
Irrigation District in China
Background: In the late 1900s, the Jinghuiqu irrigation bureau initiated a number of institutional
reforms including reforms of lateral canal management – lateral canals were contracted to private
parties (individual or consortium). As on 2000, 428 of the 538 lateral canals were contracted.
Some of the key features of the contracting mechanism are highlighted below:
• The using rights of the lateral canals were auctioned with minimum bid price of 2,000
yuan per km
• The terms of validity ranged from 10-15 years for irrigation staff to 15-20 years for other
contractors
• Each contractor was entitled to minimum water diversions based on the past five years
data with an annual increase of 3% in future
• Development of right of land along the lateral canals was entrusted to the contractor
• A performance linked salary mechanism was introduced for the administrative staff in
each irrigation bureau
Impact: In general, as noted in the article ‘Irrigation reform in Asia: A review of 108 cases of
irrigation management transfer’ by Aditi Mukherjee et al. (2010), the model of lateral canal
contracting to private contractors yielded ‘better results’ compared to Participatory Irrigation
Management PIM in China. In the Jinghuiqu irrigation district, the contracting reforms facilitated
a substantial reduction in number of staff in the irrigation stations which led to savings to the
tune of 1.4 million yuan for the irrigation bureau.
Sustainability: To sustain the irrigation facility management and avoid potential issues in relation
to water allocation, water volume metering and fee collection, the irrigation bureau released
standardized rules for invoicing, metering, construction cost for lateral canal improvement
projects and water fee for the reformed canals. To ensure transparency, the methods of water
charging and amount charged need to be publicly disclosed.
(Reference: Yongsomg Liao et al., International Water Management Institute, ”China’s Water
Pricing Reforms for Irrigation: Effectiveness and Impact”, 2008)
Page | 1250
Appendix 2: Bibliography
Sector Analysis
• Composite Water Management Index, 2019
• Water and Related Statistics, CWC, 2015
• EnviStats India 2020 - Supplement on Environmental Accounts, Ministry of Statistics and
Programme Implementation, 2020
• Water For The Future - Challenges For India & Its Industries, Frost & Sullivan, 2012
• Overview of Groundwater in India, PRS Legislative Research, 2016
• Sectoral Paper on Water Resources, NABARD, 2018
• Water in India: Situation and Prospects, UNICEF, FAO, 2013
• Aligning India’s Water Resource Policies with the SDGs, The Energy and Resources
Institute, 2018
• Annual Policy Review (FY18-19), PRS Legislative Research, 2019
• Perspectives on a Water Resource Policy for India, The Energy and Resources Institute,
2014
• Three Year Action Agenda - 2017-18 to 2019-20, NITI Aayog, 2017
• Water Security and the Sustainable Development Goals, UNESCO, i-WSSM, 2019
• Socio Economic Impact of Commercial Exploitation of Water by Industries (2017-18),
MoWR, 2018
• Report of the Committee on Doubling Farmers' Income - Comprehensive Policy
Recommendations (Vol 14), Committee on Doubling Farmers’ Income, M o A&FW, 2018
• A 21st Century Institutional Architecture for India’s Water Reforms, Mihir Shah Committee,
2016
• Water Resources Issues and Management in India, Journal of Scientific and Engineering
Research, 2018
Accelerated Irrigation Benefits Program
• NITI Aayog (2017), Roadmap of Pradhan Mantri Krishi Sinchayee Yojana
• Ministry of WR, RD & GR (2017), Operational Guidelines of PMKSY
• NITI Aayog (2019), Composite Water Management Index
• AIBP-PMKSY website (http://pmksy-mowr.nic.in/aibp-mis/)
Page | 1251
• Ministry of Water Resources, Press Information Bureau (26 July 2018), Details of Irrigation
Projects under AIBP
• Status of the Projects/Schemes of the SPR Wing (shared by the Ministry)
• National Water Development Agency website (http://nwda.gov.in/content/innerpage/pmksy-
aibp.php)
• Deepak Kumar, Director, CWC, Presentation on AIBP
• MoWR, RD & GR (July 2016), Note for the Cabinet – PMKSY – Establishment of Mission for
completion of prioritized irrigation projects and funding arrangements
• Ministry of Finance, Output Outcome Framework 2019-20 (Major Central Sector & Centrally
Sponsored Schemes)
• MoWR, RD & GR (2019), Impact Assessment of Accelerated Benefits Programme on 10
Completed Projects Selected from 5 Regions
• MoWR, RD & GR (2018), Report of the CAG of India on Accelerated Benefits Programme
(Performance Audit)
• MoWR, RD & GR (2013), Modified Guideline for Accelerated Benefits Programme effective
from October 2013
• Programme Evaluation Organization, Planning Commission (2010), Evaluation Study on
Accelerated Benefits Programme (AIBP)
• IIM Ahmedabad (2008), Studying Gap between Irrigation Potential Created and Utilized in
India
• MoWR (2011), Report of the Working Group on Major & Medium Irrigation and Command
Area Development for the XII Five Year Plan
• Standing Committee on Water Resources, MoWR, RD & GR (2017), Review of Accelerated
Benefits Programme
Har Khet ko Pani
Command Area Development & Water Management
• NITI Aayog (August 2019), Composite Water Management Index
• NITI Aayog (December 2015), Evaluation Study on Command Area Development & Water
Management Programme
• D/o Water Resources, RD & GR, M/o Jal Shakti (2019), CADWM-MIS Dashboard

Page | 1252
• MoWR (January 2017), Guidelines for Central Assistance for Command Area Development
Works in Prioritized AIBP Funded Irrigation Projects
• MoWR (November 2011), Report of the Working Group on Major & Medium Irrigation and
Command Area Development for the XII Five Year Plan (2012-2017)
• MoWR Note for the Cabinet (July 2016), PMKSY – Establishment of mission for completion
of prioritized irrigation projects and funding arrangements
• MoWR (Report no, 22 of 2018), Report of the Comptroller and Auditor General of India on
AIBP
• Standing Committee on Water Resources (2016-17), Review of Accelerated Irrigation
Benefits Programme (AIBP)
• Programme Evaluation Organization, Planning Commission (November 2010), Evaluation
Study on Accelerated Irrigation Benefits Programme (AIBP)
• Dr. Mihir Shah, Water: Towards a Paradigm Shift in the Twelfth Plan
Repair, Renovation and Restoration of Water Bodies
• NITI Aayog (January 2017), Roadmap of Pradhan Mantri Krishi Sinchayee Yojana
• NITI Aayog (August 2017), Selected Best Practices in Water Management
• NITI Aayog (August 2019), Composite Water Management Index
• D/o Water Resources, RD & GR, M/o Jal Shakti (2019), Repair, Renovation and Restoration
(RRR) Dashboard
• Standing Committee on Water Resources (2012-13), Repair, Renovation and Restoration of
Water Bodies, Sixteenth Report
• Standing Committee on Water Resources (2015-16), RRR of water bodies – encroachment
on water bodies and steps required to remove the encroachment and restore the water
bodies
• Standing Committee on Water Resources (2017-18), Demand for Grants (2018-19) -
Twentieth Report
• Cabinet Note on Economic Affairs (September 2013), Approval for continuation of Repair,
Renovation and Restoration (RRR) of Water Bodies in Xll Plan
• M/o Water Resources, River Development and Ganga Rejuvenation (June 2017), Guidelines
for the scheme of Repair, Renovation and Restoration (RRR) of water bodies under PMKSY
(HKKP)
Page | 1253
• M/o Water Resources, River Development and Ganga Rejuvenation (November 2017),
Report of 5th Census of Minor Irrigation Schemes
• Tushar Saha and others (June 2016), Rethinking Pradhan Mantri Krishi Sinchayee Yojana
(PMKSY), IWMI-Tata Policy Paper
• India Water Portal (2019), Background Note on Repair, Renovation and Restoration (RRR) of
Water Bodies
Surface Minor Irrigation
• NITI Aayog (January 2017), Roadmap of Pradhan Mantri Krishi Sinchayee Yojana
• NITI Aayog (August 2019), Composite Water Management Index
• D/o Water Resources, RD & GR, M/o Jal Shakti (2019), Surface Minor Irrigation (SMI)
Dashboard
• Standing Committee on Water Resources (2017-18), Demand for Grants (2018-19) -
Twentieth Report
• M/o Water Resources, River Development and Ganga Rejuvenation (November 2017),
Report of 5th Census of Minor Irrigation Schemes
• Tushar Saha and others (June 2016), Rethinking Pradhan Mantri Krishi Sinchayee Yojana
(PMKSY), IWMI-Tata Policy Paper
• Data Shared by D/o Water Resources, RD & GR, M/o Jal Shakti, MI Division
Ground Water Irrigation
• MoWR, RD & GR (May 2019), Operational Guidelines – PMKSY-HKKP-Groundwater
Irrigation
Special Package for Irrigation Projects in agrarian districts of Maharashtra
• MoWR, RD & GR (June 2018), Cabinet Note – Special Package for Maharashtra
• MoWR, RD & GR, MIS Dashboards - Special Package for Maharashtra
• Data shared by SPR wing under MoWR, RD & GR
Per Drop More Crop
• NITI Aayog (2017), Roadmap of Pradhan Mantri Krishi Sinchayee Yojana
• Ministry of Agriculture & Farmers Welfare (2017), Operational Guidelines of Per Drop More
Crop (Micro-irrigation) component of PMKSY

Page | 1254
• NITI Aayog (2019), Composite Water Management Index
• Ministry of Agriculture (2014), National Mission on Micro-irrigation (NMMI) – Impact
Evaluation Study
• Planning Commission, GoI (2014), Evaluation Study on Integrated Scheme of Micro-irrigation
• Ministry of Agriculture & Farmer’s Welfare website (MIS Dashboard and Reports)
• Qazi Syed (2019), Critical Policy Interventions to Fast Forward Micro-irrigation in India, The
Energy & Resources Institute (TERI)
• IAI, FICCI, Grant Thornton (2016), Accelerating growth of Indian agriculture: Micro-irrigation
an efficient solution
• Department of Agriculture Cooperation & Farmers Welfare (2017), Presentation on Pradhan
Mantri Krishi Sinchayee Yojana (PMKSY)- “Per Drop More Crop”-Micro-irrigation, 2017
• Department of Agriculture Cooperation & Farmers Welfare (2017), Presentation on Pradhan
Mantri Krishi Sinchayee Yojana (PMKSY)- “Per Drop More Crop”-Micro-irrigation, 2017
• Ministry of Agriculture & Farmer’s Welfare (2018), Agricultural Statistics at a Glance
• Global Water Forum (2017), Micro-irrigation in India: An assessment of bottlenecks and
realities
• ICRIER (2018) Towards sustainable, productive, and profitable agriculture: Case of Rice and
Sugarcane
• Economic Affairs (2018), Social Costs and Benefits Analysis of Drip Irrigation System in
Northern Maharashtra
• Kurukshetra (2019), Micro-irrigation for Agricultural Growth
• Output Outcome Framework 2019-20 (Major Central Sector & Centrally Sponsored
Schemes), Ministry of Finance
• Ministry of Agriculture & Farmers Welfare (2017), Operational Guidelines of Per Drop More
Crop (Micro-irrigation) component of PMKSY
• Vaibhav Bhamoriya et al (2014), An Analysis of Resource Conservation Technology: A Case
of Micro-Irrigation System (Drip Irrigation), IIM Ahmedabad
• IWMI (2017), Beyond ‘More Drop Per Crop: Evolving Thinking on Agricultural Water
Productivity
• Ministry of Water Resources (2006), Report of Swaminathan Committee on More Crop and
Income per Drop of Water
Page | 1255
• Ministry of Agriculture & Farmers Welfare (2017), Operational Guidelines of Micro-irrigation
Fund, PMKSY
• Report of the Committee on Doubling Farmer’s Income (2018), Ministry of Agriculture &
Farmers Welfare
Watershed Development Component
• Presentation of Ministry of Rural Development- Department of Land Resources on
01.08.2019 at The Energy and Resources Institute. Accessed from TERI website on
29.10.2019
• The World Bank, 02-Dec-2018, Project Appraisal Document, Neeranchal National Watershed
Project
• Report of the Committee on Doubling Farmers’ Income, Volume VI, November 2017,
Ministry of Agriculture & Farmers’ Welfare.
• WDC-PMKSY Booklet provided by DoLR
• Standing Committee on Rural Development (2016-2017), July 2017, 'Watershed
Development Component of Pradhan Mantri Krishi Sinchayee Yojana (WDC-PMKSY)
erstwhile IWMP
• Government of India, 2011, Common guidelines for Watershed development projects-2008,
Revised Edition – 2011
• Centre for Water Resources Development and Management, 2019, Endline evaluation of
PMKSY-WDC watershed projects
• WAPCOS, 2019, Impact Assessment of IWMP Projects In Assam, Published by NITI Aayog,
Government of India
• WAPCOS, 2019, Impact Assessment of IWMP Projects In Meghalaya, Published by NITI
Aayog, Government of India
• WAPCOS, 2019, Impact Assessment of IWMP Projects In Rajasthan, Published by NITI
Aayog, Government of India
Irrigation Census
• Presentation on "Fifth Minor Irrigation Census" by MI (Stat) Wing, DoWR, RD & GR
• Overview of Groundwater in India by Roopal Suhag, Feb 2016
• SFC Memorandum for continuation of Centrally Sponsored Schemes "Irrigation Census"

Page | 1256
• Irrigation Census in India by FAO
• Presentation on "Brief Description of the RMIS Scheme" by Minor Irrigation (Stat.) Wing
• Report of 5th Census of Minor Irrigation Schemes
• Evaluation of Rationalization of RMIS by IASRI
Servicing of Loans from NABARD under PMKSY
• D/o Water Resources, RD & GR, Operational Guidelines for Loan from NABARD to NWDA
for Central Share from Long Term Irrigation Fund (LTIF) under PMKSY
• NABARD website (https://www.nabard.org/content1.aspx?id=655&catid=8&mid=488)
• NABARD, Annual Report 2018-19
National River Conservation Plan
• Website of National River Conservation Directorate, Ministry of Water Resources, River
Development & Ganga Rejuvenation, GoI
• Guidelines for preparation of Project Report under NRCP & NGRBA, MoEF & NRCD - Dec
2010
• Report No 21 of 2011-12 of CAG Performance Audit on Water Pollution
• Performance Evaluation of STP under NRCD by CPCB (Aug 2013)
• A brief note on National River Conservation Plan (NRCP) by Department of Water Resources,
River Development & Ganga Rejuvenation
• Impact evaluation studies of schemes in 10 identified towns in Region 2 of India, under
National River/ Lake Conservation Plan by SMEC submitted to NRCD 2014
• Water Pollution in India, Ministry of Environment & Forest, Public Accounts Committee,
2014-15
Flood Management and Border Area Programmes (FMBAP)
• Memorandum for Expenditure Finance Committee (EFC) on “Flood Management and Border
Area Programme (FMBAP) during 2017-20 to 2019 – 20
• Task Force Report for Flood Management / Erosion Control December 2014
• Guideline on Flood Management by National Disaster Management Authority-Jan 2008
• Report of Working Group on Flood Management and Region-Specific Issues for XII Plan –
Oct 2011
Page | 1257
• Annual Report by MoWR, RD & GR 2017 – 18
• Annual Report by MoWR, RD & GR 2018 – 19
• Report of the Comptroller and Auditor General of India on Schemes for Flood Control & Flood
Forecasting – Report No. 10 of 2017
• Output Outcome Framework 2019 -20; Pg. 161
• State-wise flood Damage Statistics May 2018
• Standard Operating Procedure for Flood Forecasting April 2017 by MoWR, RD & GR
• Office Memorandums dt. March 27, 2019 & May 17, 2019 on Flood Management and Border
Area Programme (FMBAP) for Flood Management Works in the entire country and River
Management Activities and Works related Border Area during 2017 – 18 to 2019 – 20
• Financial Aspects of Flood Control, Anti-sea Erosion and Drainage Projects by Central Water
Commission April 2013
• Operational Research to support Mainstreaming of Integrated Flood Management under
Climate Change
• Flood Forecasting and Warning Network Performance Appraisal 2008 by Central Water
Commission
• Handbook for Flood Protection, Anti-Erosion & River Training Works by Flood Management
Organization, June 2012
Impact Assessment Studies
• Information provided by Department of Water Resources on November 01, 2019 by email
• Impact assessment of Accelerated Irrigation Benefits Program (AIBP) on 10 completed
projects selected from five regions: Report by AMS
Atal Bhujal Yojana
• Ministry of Water Resources, Press Information Bureau (Dec 2019), Atal Bhujal Yojana
(https://pib.gov.in/newsite/PrintRelease.aspx?relid=196080)
• Ministry of Water Resources, Press Information Bureau (Feb 2019), Atal Bhujal Yojana
(https://pib.gov.in/newsite/PrintRelease.aspx?relid=188193)
• Ministry of Water Resources, Press Information Bureau (June 2018), Atal Bhujal Yojana
(https://pib.gov.in/newsite/PrintRelease.aspx?relid=188193)
Page | 1258
• Ministry of Water Resources, RD & GR (http://jalshakti-
dowr.gov.in/sites/default/files/ABHY.pdf)
Assistance for Sutlej Yamuna Link Project
• Information available on by Department of Water Resources website accessed on
November 01, 2019 (http://mowr.gov.in/sutlej-yamuna-link-canal)

Eva
luat
ion
of
Cen
tral
ly S
po
nso
red
Sch
emes
in W
ater
Res
ou
rces
, Env
iro
nm
ent
and
Fo
rest
Sec
tor
Volu
me
2: W
ater
Res
ou
rces
Report 2020/UCSS09/2
Development Monitoring and Evaluation Office
NITI Bhawan, Sansad Marg, New Delhi-110001
[email protected] | https://dmeo.gov.in/
Commentary,Narration and Analysis Survey Partner
Volume 2: Water Resources
December 2020
Evaluation of Centrally Sponsored Schemes inWater Resources, Environment and Forest Sector