Road Pricing to Decongest Mumbai - Shakti Sustainable ...
113
Road Pricing to Decongest Mumbai
-
Upload
khangminh22 -
Category
Documents
-
view
3 -
download
0
Transcript of Road Pricing to Decongest Mumbai - Shakti Sustainable ...
Road Pricingto Decongest
Mumbai
The work is licensed under a Creative Commons Atrribution BY 4.0 License. Feel free to copy, distribute and transmit, as long as you attribute the work.
Disclaimer: The views/analysis expressed in this report/document do not necessarily reflect the views of Shakti Sustainable Energy Foundation. The Foundation also does not guarantee the accuracy of any data included in this publication nor does it accept any responsibility for the consequences of its use.
Vaishali Singh | Anuj Dhole | Shreya Gadepalli | Parin Visariya | Archna Menon | Sivasubramaniam Jayaraman
Study team:
May 2020
W: india.itdp.org E: [email protected]
W: shaktifoundation.in
For private circulation only
An initiative supported by:
Prepared by:
Table of Contents
Acknowledgment 8
1 Introduction 9
1.1 Objective of this study 9
1.2 What is congestion pricing 9
1.3 Structure of the report 9
2 Measures to Reduce Traffic Congestion 11
2.1 Introduction to the chapter 11
2.2 The need to reimagine transport 11
2.3 More road space does not solve traffic congestion 11
2.4 Travel demand management measures 13
2.4.1 Parking management 13
2.4.2 Licence plate number restrictions 14
2.4.3 Vehicle quota systems 15
2.4.4 Congestion pricing 15
2.5 Comparison of Congestion Pricing with other TDM measures 16
2.5.1 Parking Management vs. Congestion Pricing 16
2.5.2 Licence plate number restriction vs. Congestion Pricing 17
2.5.3 Vehicle quota system vs. Congestion Pricing 17
2.6 Providing sustainable alternatives 17
2.6.1 Improve public transport 17
2.6.2 Improve walking and cycling transport facilities 18
2.6.3 Strengthen last mile connectivity with micro-mobility 19
2.6.4 Create inclusive compact cities 19
2.7 Is congestion pricing equitable? 19
3 Congestion Pricing Around the World 20
3.1 Types of congestion pricing 20
3.1.1 Area-based congestion pricing 20
3.1.2 Corridor-based congestion pricing 21
3.1.3 Network-based congestion pricing 21
3.2 Case studies of congestion pricing in cities worldwide 22
3.2.1 Singapore 22
3.2.2 London 24
3.2.3 Stockholm and Gothenburg 26
| 2
3.2.4 High Occupancy Toll Lanes (HOT lanes) in USA 28
4 The Context of Greater Mumbai 30
4.1 Introduction to the chapter 30
4.2 Mumbai Metropolitan Region and Greater Mumbai 30
4.3 Traffic congestion in Mumbai 31
4.4 Travel modes and their contribution to traffic congestion in Mumbai 35
4.5 Current and proposed public transport network in Greater Mumbai 37
4.5.1 Mumbai suburban rail network 37
4.5.2 Fleet and ridership of BEST buses 37
4.5.3 Mumbai Metro and Monorail 38
4.5.4 Ridership of public transportation modes 39
5 Planning for Congestion Pricing in Mumbai 40
5.1 Introduction to the chapter 40
5.2 Preparing a congestion pricing plan for Greater Mumbai 40
5.3 Step to take prior to considering congestion pricing 42
5.4 Analysis for congestion pricing: Island city of Mumbai 42
5.4.1 Area definition & traffic patterns: Island city of Mumbai 42
5.4.2 Implementation plan for Island city of Mumbai 44
5.5 Analysis for congestion pricing: The western suburb 46
5.5.1 Area definition & traffic patterns in the western suburb 46
5.5.2 Congestion pricing implementation plan for Western Express Highway 48
5.6 Network-based congestion pricing in Greater Mumbai 51
5.7 Conclusion 51
6 Pricing Structure for Congestion Charging in Mumbai 52
6.1 Introduction to the chapter 52
6.2 Determining which modes to charge and which ones to exempt 52
6.3 User surveys 53
6.4 Data analysis 55
6.4.1 Willingness-to-pay 55
6.4.2 Relationship between congestion charge and traffic reduction 56
6.4.3 Mechanism for user fee adjustment in the future 58
6.4.4 Willingness to shift to alternatives 59
6.5 Congestion pricing user fee in Mumbai 61
6.5.1 Area-based congestion pricing in Island city of Mumbai 61
6.5.2 Corridor-based congestion pricing along WEH 63
6.5.3 Network pricing in Mumbai 67
| 3
6.6 Informing users about applicable congestion charges 67
6.6.1 Online portal 67
6.6.2 On-street signages 67
6.6.3 App-based information and payment system 68
7 Technology for Congestion Pricing in Mumbai 69
7.1 Introduction to the chapter 69
7.2 Roundtable discussion with technology experts 69
7.2.1 Network-pricing with GNSS technology 70
7.2.2 Gantry-based pricing using RFID and ANPR technology 71
7.3 Conclusion 72
8 Socio-Economic Cost-Benefit Analysis 74
8.1 Introduction to the chapter 74
8.2 Financial feasibility of congestion pricing in Mumbai 74
8.3 Indirect economic cost of congestion and benefits of congestion pricing 76
8.4 Impact of congestion on environment and health 77
8.5 Total cost-benefit analysis of congestion pricing 79
8.6 Recommendations for revenue utilization 80
9 Implementing Congestion Pricing in Mumbai 84
9.1 Introduction to the chapter 84
9.2 Garnering public support for the system 85
9.2.1 Create political capital for congestion pricing 85
9.2.2 Bring aboard key influencers 85
9.2.3 Spread the word widely 86
9.3 Establishing a strong legislative and institutional framework 87
9.3.1 Legislative framework 87
9.3.2 Key public stakeholders 88
9.3.3 Ensuring Institutional coordination 89
9.3.4 Private-sector stakeholders 90
9.4 Financing and operation of system 90
9.5 Assessing the impacts of congestion pricing 92
9.6 Implementation challenges 92
9.6.1 Coordination between 92
9.6.2 Capturing vehicles with wrong vehicle tag 92
9.6.3 Low uptake of RFID tags 92
9.6.4 Capturing out-of-city vehicles 93
9.6.5 Identifying violations 93
| 4
9.6.6 Poor reliability due to adverse weather conditions 94
9.7 Implementation timeline 94
Annexure 96
1. Methods of toll collection and technology choices available 96
1.1. Toll gates 96
1.2. Non-stop Toll Collection by non-electronic systems 96
1.3. Non-stop toll collection by electronic systems 97
2. Prerequisites for selection of technology for congestion pricing 100
3. Capacity evaluation of different technologies 102
4. Emission factor for vehicles 105
5. Health cost of congestion 106
6. Survey questionnaire 107
| 5
List of Figures
Figure 1 Paid parking is in force in most areas of Amsterdam where the costs vary by zones. The parking charges are higher in the city centre with higher demand than in the outer neighbourhoods ................................................................................................... 14
Figure 2 The charges for obtaining Certificate of Entitlement (COE) in Singapore that gives the right to register, own and use a vehicle for a period of 10 years................. 15
Figure 3 Potential benefits of congestion pricing for Mumbai ............................................................... 22
Figure 4 Mumbai Metropolitan Region ................................................................................................................31
Figure 5 Three zones of Greater Mumbai and Traffic speeds across these zones during Evening Peak Period ................................................................................................................................ 33
Figure 6 Traffic Speeds in Island City .................................................................................................................. 33
Figure 7 Traffic Speeds in Western Suburb ..................................................................................................... 34
Figure 8 Traffic Speeds in Eastern Suburb ....................................................................................................... 34
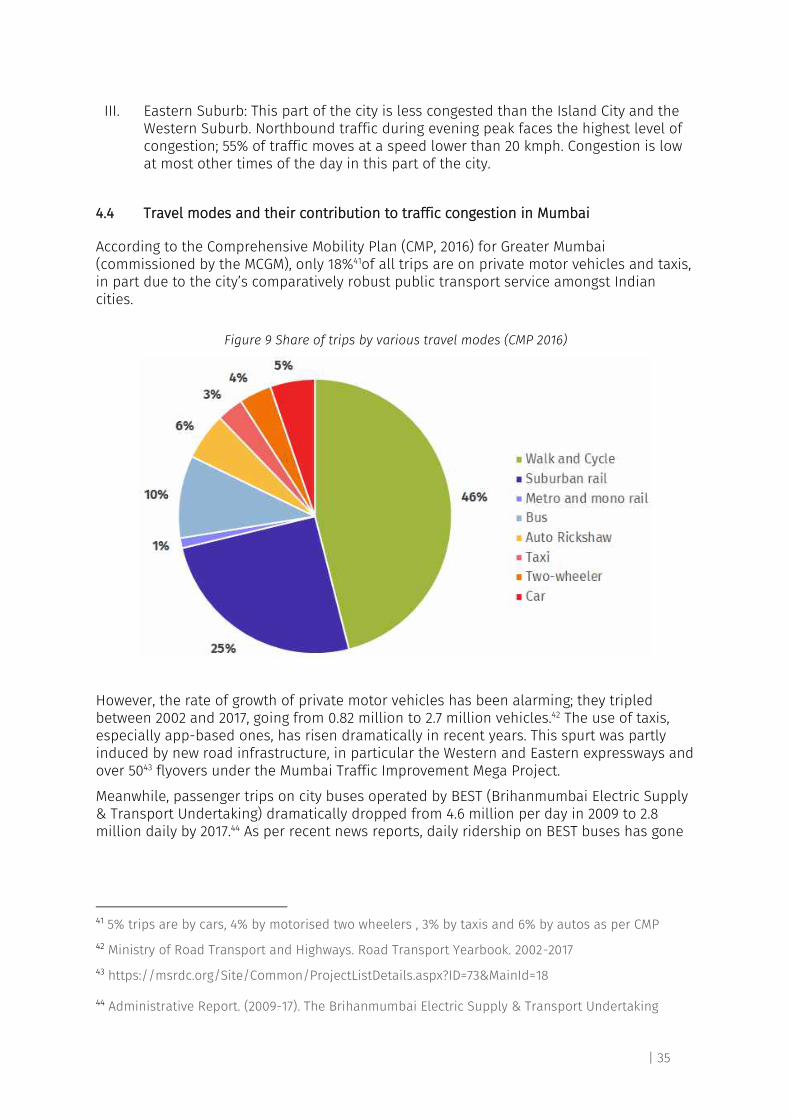
Figure 9 Share of trips by various travel modes (CMP 2016) ................................................................... 35
Figure 10 Comparison of people transported vs road space occupied by various road-based motorised modes in Mumbai in the evening peak hour ........................................ 36
Figure 11 Existing and proposed metro network ........................................................................................... 38
Figure 12 Ridership of Public Transportation Modes, 2018 ...................................................................... 39
Figure 13 Level of Service at as per traffic volume on different types of roads (Indo-HCM) .. 41
Figure 14 Level of Service at as per traffic speed on different types of roads (Indo-HCM) ..... 41
Figure 15 Traffic volumes crossing the three cordons in Island City .................................................. 43
Figure 16 Traffic Speeds in the Island City of Greater Mumbai and potential congestion pricing cordons........................................................................................................................................... 44
Figure 17 Traffic Volumes Before and After Congestion Charging to maintain LOS C ................ 45
Figure 18 Traffic Speeds on a network of roads in Greater Mumbai at 6 pm ................................. 46
Figure 19 Traffic Volume Counts near Andheri on Western Express Highway, SV Road and New Link Road in Western Suburb ................................................................................................... 47
Figure 20 Traffic Volume and speeds on Western Express Highway in the morning (10 to 11 am- Southbound) and evening peak hours (6 to 7 pm- Northbound ....................... 48
Figure 21 Traffic Volume on WEH (near Andheri) before and after congestion charging to maintain LOS C ........................................................................................................................................... 49
Figure 22 Location of congestion pricing gantries on WEH ...................................................................... 50
Figure 23 Charged and exempted vehicles under congestion pricing ............................................... 53
Figure 24 Photos from focus group discussion in Mumbai ...................................................................... 54
Figure 25 Relationship between traffic reduction and the amount of congestion charge ...... 57
Figure 26 Willingness to shift to alternatives: Car, taxi/auto-rickshaw and two-wheeler users ................................................................................................................................................................ 59
Figure 27 Traffic Speeds in the Island City of Greater Mumbai and potential congestion pricing cordons........................................................................................................................................... 61
| 6
Figure 28 Traffic volume reduction and deterrent charges required for northbound traffic in Island City .................................................................................................................................. 62
Figure 29 Traffic volume reduction and deterrent charges required for southbound traffic in Island City .................................................................................................................................. 63
Figure 30 Location of congestion pricing gantries on WEH ..................................................................... 64
Figure 31 Traffic volume reduction and deterrent charges required for northbound traffic on Western Express Highway (WEH) near Andheri ..................................................... 65
Figure 32 Traffic volume reduction and deterrent charges required for southbound traffic on Western Express Highway (WEH) near Andheri ..................................................... 66
Figure 33 Roundtable meeting conducted by ITDP ...................................................................................... 69
Figure 34 Environmental impact of congestion pricing in Mumbai in 2019 ..................................... 78
Figure 35 Investment required for Sustainable Transport Projects .................................................... 81
Figure 36 Comparison of Sustainable Transport Infrastructure Costs and Congestion Pricing Revenue .......................................................................................................................................... 82
Figure 37 RFID FASTag being used at National Highways in India ........................................................ 91
Figure 38 Gantries equipped with both DSRC and ANPR cameras in Singapore to charge vehicles and detect violations respectively ................................................................................. 94
Figure 39 Congestion Pricing Project Implementation Timeline ........................................................... 95
Figure 40 Vehicle queuing assessment for area-based congestion pricing ................................. 104
Figure 41 Vehicle queuing assessment for corridor-based congestion pricing .......................... 104
| 7
List of Tables
Table 1 Congestion charge required to reduce the traffic volume to achieve LOS C ................. 57
Table 2 List of participants in the technology roundtable meeting .................................................... 70
Table 3 Comparison of Toll Collection Mechanisms in different cities/regions ............................ 71
Table 4 Comments given by technology experts during the roundtable .......................................... 72
Table 5 Cost of Implementing different Congestion Pricing Schemes in Mumbai ....................... 75
Table 6 Value of productivity and fuel loss saved with congestion pricing in a year ................. 77
Table 7 Cost of congestion and benefit of congestion pricing on health in a year ..................... 79
Table 8 Total costs-benefits of congestion pricing...................................................................................... 80
Table 9 Assumptions taken for cost estimation ............................................................................................ 81
Table 10 Acceptance for congestion pricing scheme in case study cities ........................................ 86
Table 11 Measures required for Congestion Pricing Implementation ................................................ 95
Table 12 Supporting Infrastructure Requirement for Toll Collection Technologies ..................100
Table 13 Supporting Infrastructure Requirement and system abilities of Toll Collection Technologies .............................................................................................................................................. 101
Table 14 Assessment of the tolling infrastructure capacity................................................................... 102
Table 15 Assumptions for the assessment of tolling technology ....................................................... 103
Table 16 Emission Factor for Vehicles as given by ARAI .......................................................................... 105
Table 17 Health Cost of Congestion for Mumbai, 2001 by Sengupta and Mandal ....................... 106
Table 18 GDP Inflation adjusted Health Cost of Congestion for Mumbai, 2019 ........................... 106
| 8
Acknowledgment
A very special thanks to Shakti Sustainable Energy Foundation without whose support this study on congestion pricing in Mumbai would not have been possible.
We wish to convey our deepest appreciation to Mumbai Metropolitan Region Development Authority (MMRDA) for initiating a conversation about congestion pricing in Mumbai and supporting us in hosting two roundtable meetings with multiple stakeholders and experts at its office.
We would also like to thank our knowledge partner Symbiosis School of Economics for their valuable inputs at various stages of the study, as well as TomTom, a leading global location technology specialist, for providing the key data required for assessing traffic congestion in Mumbai.
The congestion pricing report would not have been possible without the insights offered by LNITS, VTRAC, IBI Group, C-Dac,CSTEP, IIT-B, Technocrats, PWC, SOJITZ during the roundtable meeting for discussing congestion pricing technologies. A special thank you to ITS experts Mr. Manohar Meena and Mr. Varun Agarwal for sharing their insights in the technology sector and providing data on performance of tolling infrastructure in India.
We would also like to express our gratitude to Ms. Pranjali Deshpande and Mr. Harshad Abhyankar, former staff of the ITDP India Programme, for their support. Additionally, we wish to thank the entire team at the Institute for Transportation and Development Policy for their support.
Supported by Shakti Sustainable Energy Foundation
| 9
1 Introduction
1.1 Objective of this study
This study aims to assess the need and effectiveness of congestion pricing in Greater Mumbai as a Travel Demand Management (TDM) measure alongside other TDM measures and provides a roadmap for its implementation.
As a compendium to this study, the team has also prepared a simple and accessible toolkit: The Congestion Pricing Basics. Other Indian cities interested in congestion pricing can use this study and the toolkit as guidance to develop their plans.
1.2 What is congestion pricing
Since road space is limited, unabated travel demand inevitably results in traffic congestion. Congestion pricing is a tool to mitigate traffic congestion by charging motor vehicles a fee for road use. When the fee is sufficiently high, it deters the desired percentage of vehicles from using congestion-prone roads. This decongests the road(s) and improves the level of service for those willing to pay and remain on the road.
The purpose is not to recover the cost of creating new road infrastructure as is the case typically with tolled roads; the goal is to optimize the use of existing road infrastructure. Congestion pricing encourages vehicle users to switch to more efficient and environment- friendly modes such as public transport, or change their route or time of travel, or avoid the trip altogether.
Singapore first put this in practice starting in the 1970s. Since then, multiple cities across the world have implemented congestion pricing alongside other complementary measures to reduce travel demand by private motor vehicles but improve mobility and access to opportunities for all. People have saved time and money; they have also benefited from cleaner air and a better quality of life.
1.3 Structure of the report
This report provides a step-by-step process to plan and implement congestion pricing and, in doing so, presents a plan for congestion pricing in Mumbai. Below is a brief description of each chapter, framed as a set of questions that the chapter attempts to answer.
Chapter 2: Measures to reduce traffic congestion
● What are the various measures to reduce the use of private motor vehicles? ● What is the role of congestion pricing? How does it complement the other
measures? What shortcoming of the other measures does it address? ● What other complementary measures are required for the success of congestion
pricing?
Chapter 3: Congestion pricing basics
● What are the different types of congestion pricing? ● Which cities globally have implemented congestion pricing? How did they
implement and what benefits did they derive from congestion pricing?
Chapter 4: The context of Greater Mumbai
| 10
● Which parts of the city are severely congested? ● Which travel modes cause congestion? ● What is the status of public transport in Mumbai?
Chapter 5: Planning for congestion pricing in Mumbai
● What are the steps to prepare a congestion pricing plan? ● Where in Mumbai can congestion pricing be implemented and which type of
congestion pricing is suitable at each of these locations? ● By how much must traffic be reduced at different times of a day at each location to
decongest the roads?
Chapter 6: Pricing structure for congestion charging in Mumbai
● How will people respond to congestion pricing? ● What is the relationship between user fee and traffic reduction? ● What should be the fee structure in Mumbai? When and how should the fee be
revised?
Chapter 7: Technology for congestion pricing in Mumbai
● What technology options exist for charging vehicle use and detecting violations? ● Which of these options are most appropriate in the Indian context for easy
implementation and seamless operation?
Chapter 8: Socio-economic cost-benefit analysis
● How much does it cost to implement congestion pricing? Is it financially viable? ● What are the other indirect costs and benefits? ● How does Mumbai stand to benefit from congestion pricing?
Chapter 9: Implementing congestion pricing in Mumbai
● Whose support is required to implement congestion pricing? ● What are the means to garner support? ● How can legal hurdles be overcome? ● Who should implement congestion pricing and how? ● Which public institutions must be engaged? ● What is the role of the private sector? ● Which indicators should be measured to assess system impact?
| 11
2 Measures to Reduce Traffic Congestion
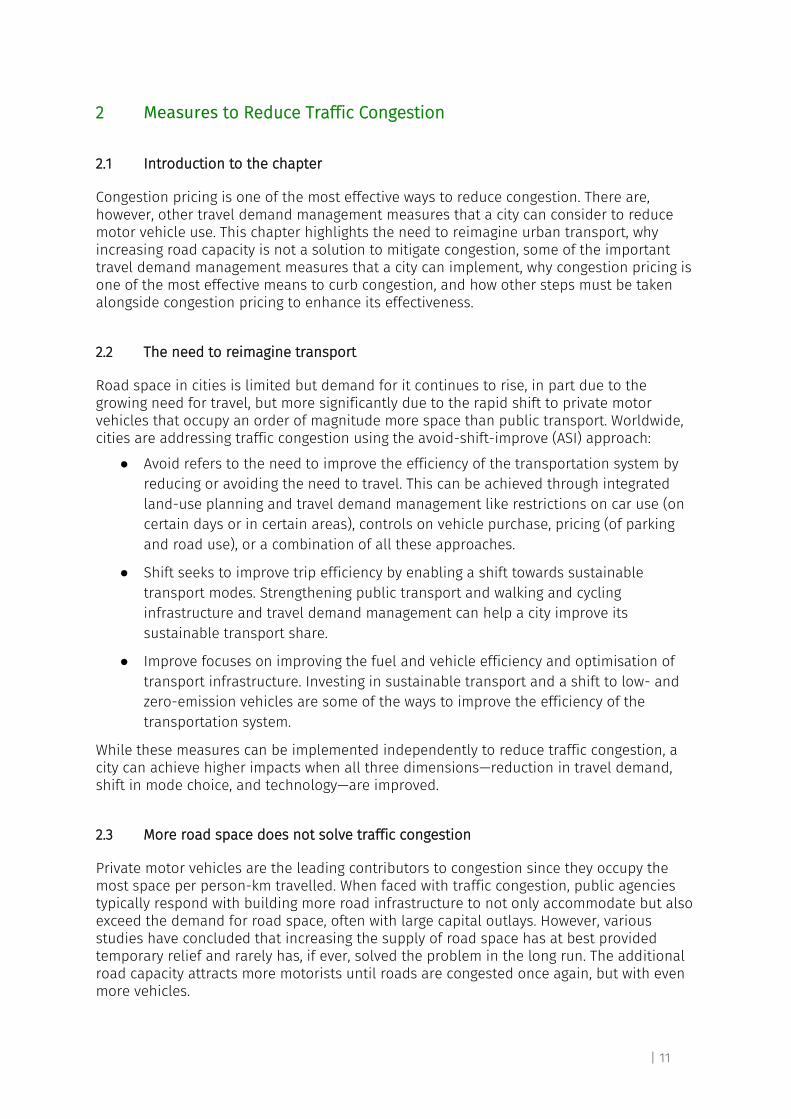
2.1 Introduction to the chapter
Congestion pricing is one of the most effective ways to reduce congestion. There are, however, other travel demand management measures that a city can consider to reduce motor vehicle use. This chapter highlights the need to reimagine urban transport, why increasing road capacity is not a solution to mitigate congestion, some of the important travel demand management measures that a city can implement, why congestion pricing is one of the most effective means to curb congestion, and how other steps must be taken alongside congestion pricing to enhance its effectiveness.
2.2 The need to reimagine transport
Road space in cities is limited but demand for it continues to rise, in part due to the growing need for travel, but more significantly due to the rapid shift to private motor vehicles that occupy an order of magnitude more space than public transport. Worldwide, cities are addressing traffic congestion using the avoid-shift-improve (ASI) approach:
● Avoid refers to the need to improve the efficiency of the transportation system by reducing or avoiding the need to travel. This can be achieved through integrated land-use planning and travel demand management like restrictions on car use (on certain days or in certain areas), controls on vehicle purchase, pricing (of parking and road use), or a combination of all these approaches.
● Shift seeks to improve trip efficiency by enabling a shift towards sustainable transport modes. Strengthening public transport and walking and cycling infrastructure and travel demand management can help a city improve its sustainable transport share.
● Improve focuses on improving the fuel and vehicle efficiency and optimisation of transport infrastructure. Investing in sustainable transport and a shift to low- and zero-emission vehicles are some of the ways to improve the efficiency of the transportation system.
While these measures can be implemented independently to reduce traffic congestion, a city can achieve higher impacts when all three dimensions—reduction in travel demand, shift in mode choice, and technology—are improved.
2.3 More road space does not solve traffic congestion
Private motor vehicles are the leading contributors to congestion since they occupy the most space per person-km travelled. When faced with traffic congestion, public agencies typically respond with building more road infrastructure to not only accommodate but also exceed the demand for road space, often with large capital outlays. However, various studies have concluded that increasing the supply of road space has at best provided temporary relief and rarely has, if ever, solved the problem in the long run. The additional road capacity attracts more motorists until roads are congested once again, but with even more vehicles.
| 12
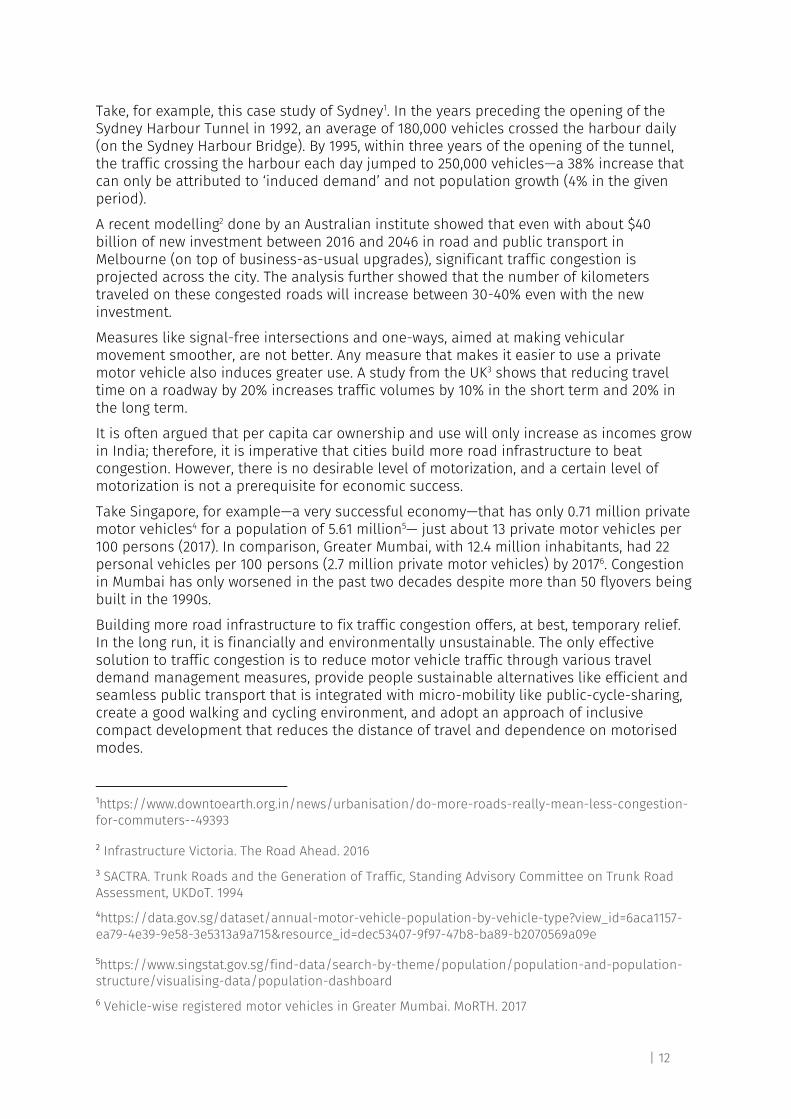
Take, for example, this case study of Sydney1. In the years preceding the opening of the Sydney Harbour Tunnel in 1992, an average of 180,000 vehicles crossed the harbour daily (on the Sydney Harbour Bridge). By 1995, within three years of the opening of the tunnel, the traffic crossing the harbour each day jumped to 250,000 vehicles—a 38% increase that can only be attributed to ‘induced demand’ and not population growth (4% in the given period).
A recent modelling2 done by an Australian institute showed that even with about $40 billion of new investment between 2016 and 2046 in road and public transport in Melbourne (on top of business-as-usual upgrades), significant traffic congestion is projected across the city. The analysis further showed that the number of kilometers traveled on these congested roads will increase between 30-40% even with the new investment.
Measures like signal-free intersections and one-ways, aimed at making vehicular movement smoother, are not better. Any measure that makes it easier to use a private motor vehicle also induces greater use. A study from the UK3 shows that reducing travel time on a roadway by 20% increases traffic volumes by 10% in the short term and 20% in the long term.
It is often argued that per capita car ownership and use will only increase as incomes grow in India; therefore, it is imperative that cities build more road infrastructure to beat congestion. However, there is no desirable level of motorization, and a certain level of motorization is not a prerequisite for economic success.
Take Singapore, for example—a very successful economy—that has only 0.71 million private motor vehicles4 for a population of 5.61 million5— just about 13 private motor vehicles per 100 persons (2017). In comparison, Greater Mumbai, with 12.4 million inhabitants, had 22 personal vehicles per 100 persons (2.7 million private motor vehicles) by 20176. Congestion in Mumbai has only worsened in the past two decades despite more than 50 flyovers being built in the 1990s.
Building more road infrastructure to fix traffic congestion offers, at best, temporary relief. In the long run, it is financially and environmentally unsustainable. The only effective solution to traffic congestion is to reduce motor vehicle traffic through various travel demand management measures, provide people sustainable alternatives like efficient and seamless public transport that is integrated with micro-mobility like public-cycle-sharing, create a good walking and cycling environment, and adopt an approach of inclusive compact development that reduces the distance of travel and dependence on motorised modes.
1https://www.downtoearth.org.in/news/urbanisation/do-more-roads-really-mean-less-congestion-for-commuters--49393
2 Infrastructure Victoria. The Road Ahead. 2016
3 SACTRA. Trunk Roads and the Generation of Traffic, Standing Advisory Committee on Trunk Road Assessment, UKDoT. 1994
4https://data.gov.sg/dataset/annual-motor-vehicle-population-by-vehicle-type?view_id=6aca1157-ea79-4e39-9e58-3e5313a9a715&resource_id=dec53407-9f97-47b8-ba89-b2070569a09e
5https://www.singstat.gov.sg/find-data/search-by-theme/population/population-and-population-structure/visualising-data/population-dashboard
6 Vehicle-wise registered motor vehicles in Greater Mumbai. MoRTH. 2017
| 13
2.4 Travel demand management measures
2.4.1 Parking management
The availability of convenient and free (or cheap) parking is a major factor in people choosing to drive. Ample parking—especially when it is free—invites more private motor vehicle ownership and usage. The result: traffic jams, toxic air, and miserable urban life. When priced right, parking management can not only lead to a reduction in personal motor vehicle use but also provide cities with substantial revenue to invest in sustainable transport initiatives.
Off-street parking requirements in buildings adds a substantial cost to property owners and employers—in its construction and for its maintenance. These costs are often hidden or dramatically subsidized, but are still paid by everyone—in higher rents for all residents, whether or not they own a vehicle, or passed on to all customers, regardless of their mode of travel. Unbundling parking space from the sale of property, and charging for it based on demand ensures a more efficient supply and utilisation of parking.
Cities should take two key steps to reform parking:
I. Charge the right price for on-street parking at high-demand locations to reduce its demand, and nudge vehicles to park in nearby but lower-demand parking locations. Eventually, push almost all parking into off-street market-priced private parking facilities.
II. Remove minimum off-street parking requirements. Instead, control the supply of off-street parking through building- and area-level caps to reduce the ownership and use of motor vehicles.
The European Parking U-Turn7—a 2011 publication by ITDP—has case studies of parking practices from 10 European cities that highlight that the introduction of parking fees—along with parking maximums, i.e., limitation of the total amount of parking available in a building and/or zone—managed to counter decades of car-centric policies, resulting in a reduction of traffic and improvement of quality of life for all.
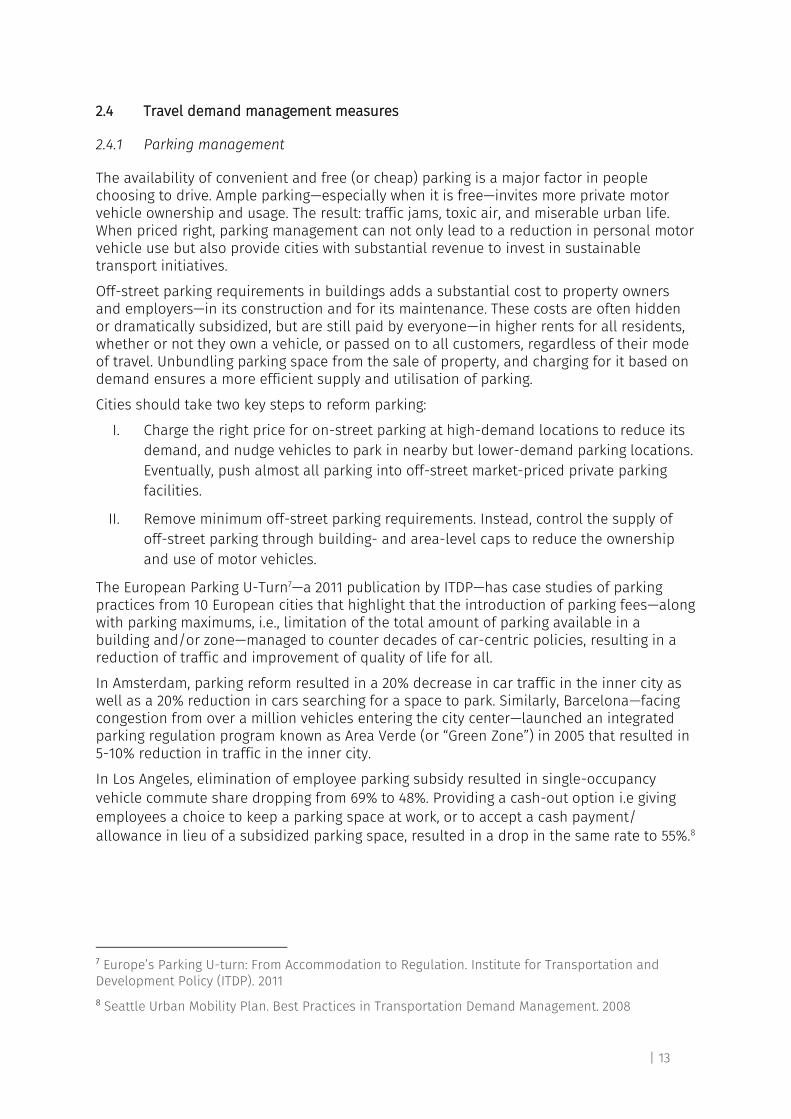
In Amsterdam, parking reform resulted in a 20% decrease in car traffic in the inner city as well as a 20% reduction in cars searching for a space to park. Similarly, Barcelona—facing congestion from over a million vehicles entering the city center—launched an integrated parking regulation program known as Area Verde (or “Green Zone”) in 2005 that resulted in 5-10% reduction in traffic in the inner city.
In Los Angeles, elimination of employee parking subsidy resulted in single-occupancy vehicle commute share dropping from 69% to 48%. Providing a cash-out option i.e giving employees a choice to keep a parking space at work, or to accept a cash payment/ allowance in lieu of a subsidized parking space, resulted in a drop in the same rate to 55%.8
7 Europe’s Parking U-turn: From Accommodation to Regulation. Institute for Transportation and Development Policy (ITDP). 2011
8 Seattle Urban Mobility Plan. Best Practices in Transportation Demand Management. 2008
| 14
Figure 1 Paid parking is in force in most areas of Amsterdam where the costs vary by zones. The parking charges are higher in the city centre with higher demand than in the outer neighbourhoods
To deal with the parking problem, Mexico City adopted a progressive parking management policy in 2017 converting minimum parking requirements to maximum allowed parking depending on the land use of the construction. This put Mexico City—the largest city in North America—far ahead of American cities in this commitment of prioritizing people over cars.9 Similar to Mexico City, Rio de Janeiro in 2018 approved new building codes to restrict off-street parking and promote non-motorized transport by removing parking minimums, making Rio the first Brazilian city to pass parking legislation.10
While parking management is one of the most commonly deployed means of travel demand management in cities across the world, it is not without shortcomings. These are highlighted later in this chapter.
2.4.2 Licence plate number restrictions
After parking management, this is the second most commonly deployed means of travel demand management. The number of vehicles that can be brought on the road on any given day of the week are restricted based on their licence plate number. Called the odd-even scheme in common parlance, the restriction could apply to 20% to 50% of the cars in the city depending upon how it is structured. Such restrictions may apply either the whole day or only during peak hours, across the whole city or only in designated areas.
9 How Mexico City Became A Leader in Parking Reform. ITDP. 26th July 2017. https://www.itdp.org/2017/07/26/mexico-city-became-leader-parking-reform/
10 Rio de Janeiro Joins Other Latin American City Leaders in Parking Reform. ITDP. 31 Jan, 2019.
https://www.itdp.org/2019/01/31/rio-joins-parking-reform-leaders/
| 15
The allure of this measure is its simplicity but it is not without shortcomings. It can be a useful short-term measure but loses its efficacy in the long term.
2.4.3 Vehicle quota systems
Some cities, most prominently Singapore, have tried to limit the number of motor vehicles that can be registered in the city by charging a steep price—often through a process of auction—to allow a person or business to purchase a motor vehicle.
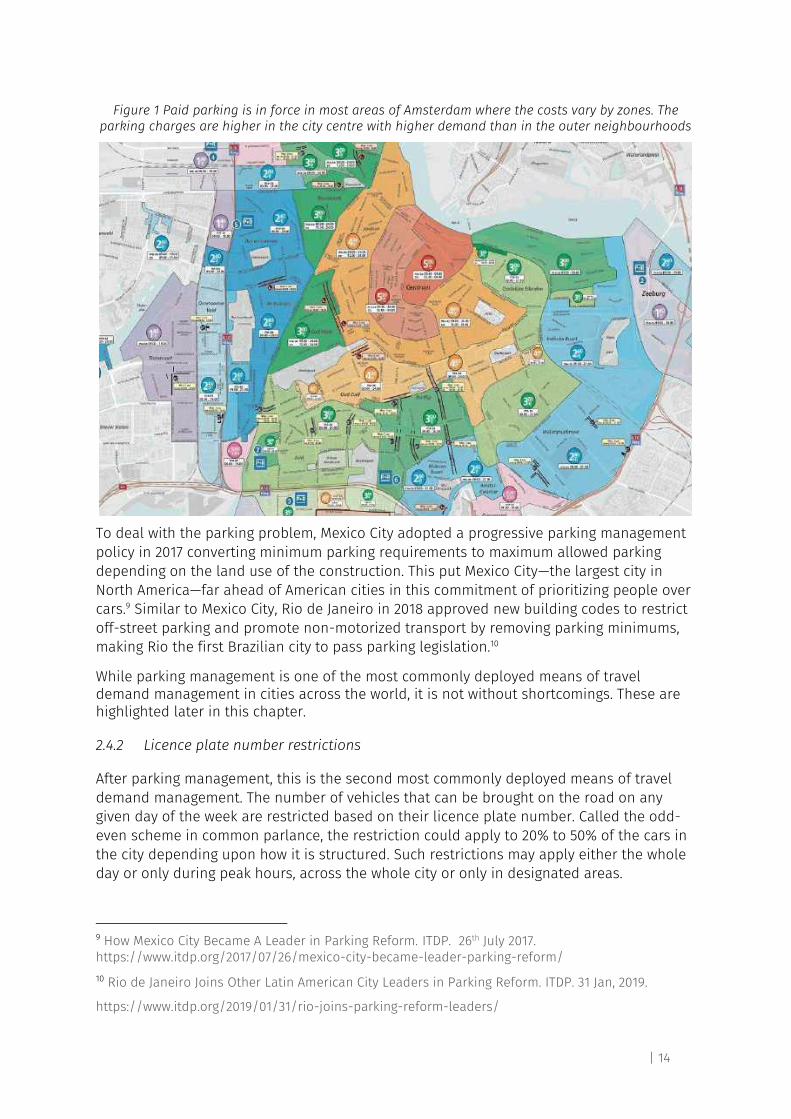
Singapore’s “Vehicle Quota System” limits the number of new vehicles that can be registered each month. Its “Weekend/Off-peak Car Scheme” allows cars to be registered for use only on weekends, public holidays and off-peak hours during weekdays. The cost of obtaining a Certificate of Entitlement (COE) is so high that Singapore has one of the lowest rates of car ownership in the world..
Figure 2 The charges for obtaining Certificate of Entitlement (COE) in Singapore that gives the right to register, own and use a vehicle for a period of 10 years
Source: https://www.motorist.sg/coe-result/2020-02-19
2.4.4 Congestion pricing
As mentioned in the previous chapter, congestion pricing is a tool to mitigate traffic congestion by charging motor vehicles a fee for road use. When roads are priced, ie, vehicle users have to pay each time they wish to access roads or entire areas that are prone to traffic congestion, and the price is sufficiently high, some of them consider other options. Road use comes down, and thereby, traffic congestion.
Creating better alternatives such as public transport—complemented with streets that prioritise walking and cycling—is an important and welcome step. However, these do not address the issue of congestion. More buses do not mitigate traffic congestion. Instead, passengers on those buses are stuck in congestion that others cause. Priority lanes for
| 16
buses release them from congestion but mixed traffic lanes remain congested. To mitigate congestion, proactive measures are required to deter the use of private motor vehicles, taxis, and freight vehicles. Congestion pricing is the solution many cities have chosen.
Singapore first put this in practice starting in the 1970s. Since then, multiple cities across the world have implemented congestion pricing—alongside other complementary measures—to reduce travel demand by private motor vehicles but improve mobility and access to opportunities for all. People have saved time and money; they have also benefited from cleaner air and a better quality of life.
2.5 Comparison of Congestion Pricing with other TDM measures
Congestion pricing is one of the most direct means of curbing congestion. This section presents a comparison of various TDM measures with congestion pricing and how the latter is more effective at mitigating congestion. However, some of these other measures, especially parking, can complement congestion pricing where it falls short.
2.5.1 Parking Management vs. Congestion Pricing
Parking management is one of the most commonly deployed TDM measures in cities around the world. However, it falls short as an effective TDM measure in some respects, especially in the Indian context:
● Parking reform primarily affects private motor vehicles. Taxis, auto-rickshaws, as well as new age shared-mobility modes continue to add to traffic since they, unlike private motor vehicles, aren’t parked most of the time.
● Parking doesn’t affect chauffeur-driven cars. People get dropped at their destination and their drivers take their car to another location, even back home, to park. The net impact is even more vehicle kilometres travelled (VKT).
● Unless parking management is done city-wide, higher parking charges in certain areas may prompt offices and businesses to shift to areas farther out where ample and free (or cheap) parking is available, prompting people to travel longer.
In all these cases, the VKT—along with its allied ills of GHG, air pollution, and road crashes—may continue to increase. Congestion pricing, which targets VKT directly, should be implemented to reduce vehicle traffic and congestion. However, congestion pricing is not a replacement for effective parking management.
Parked vehicles occupy a third or more of the road space in many cities—an extremely poor use of limited road space in any city. Parking is also a localised problem. Even though parking supply in an area might be sufficient to meet the demand, some streets are overwhelmed by intense and haphazard parking while other streets in the vicinity have ample parking space.
Congestion pricing doesn’t impact this gross misuse of precious road space or the imbalance of parking activity within a locality. Only effective parking pricing, along with strict enforcement, can solve this problem and also push parking into private off-street market-priced facilities. This distributes on-street parking more evenly and clears up street space for better uses like walking and cycling infrastructure that is often missing in Indian cities.
Congestion pricing also doesn’t address the issue of wasteful parking supply in buildings due to minimum parking requirements mandated by building regulations in many cities.
| 17
This forces owners to mandatorily buy parking space along with residential or commercial property they purchase. They pass this cost onto tenants whether or not the latter need vehicle parking. Because of the bundling of parking with property, most off-street parking supply is either unused or only partially used for a limited duration in a day. It is a wasted resource—a burden on the economy. Only off-street parking reform can address this.
2.5.2 Licence plate number restriction vs. Congestion Pricing
Licence plate restrictions are useful mainly as a short term measure to dramatically reduce vehicle use when pollution goes sky high. It tends to lose its effect with time. For example, in the case of Mexico City, number plate restriction was successful initially. But as time passed, more than one-fifth of the households purchased additional cars (usually cheaper, older, and more polluting ones) with alternate plates to circumvent the restriction. In Santiago and Bogotá, the car ban schedule is changed every few months to overcome this issue.11
In addition, licence plate restrictions typically do not apply on taxis—an important contributor to congestion in cities worldwide, including India. A congestion pricing system can be applied on taxis with relative ease. It can discourage the use of taxis, where they cause congestion, when they cause congestion.
Finally, licence plate restrictions cost money for enforcement; they do not generate any revenue. While the reason for implementing congestion pricing or parking pricing is not revenue generation—they are meant to be travel demand management measures first and foremost—they often result in substantial funds for cities to invest in sustainable transport.
2.5.3 Vehicle quota system vs. Congestion Pricing
A vehicle quota system primarily limits vehicle ownership. Once users acquire a vehicle, they are free to use their vehicle as much as they wish unless measures like congestion pricing are in place to control their usage. People can register their vehicles outside the city that has a quota system. The only way to control the use of such vehicles within the city is to control their access to the city at all points of entry. This is somewhat similar to congestion pricing.
As evident, congestion pricing has an apparent advantage over other travel demand management measures with the ability to reduce traffic congestion significantly. However, like Singapore, a city should implement multiple measures simultaneously to effectively manage travel demand. They must also provide sustainable alternatives.
2.6 Providing sustainable alternatives
2.6.1 Improve public transport
Investment in high-quality public transport is an important step for the successful implementation of congestion pricing. While traveling in off-peak hours or choosing alternate routes can be options for some, availability of good public transport is essential
11 Vehicle Restrictions in Four Latin American Cities: Is Congestion Pricing Possible?.A Mahendra. 2006.
| 18
for many who may not have the flexibility to change trip time, origin, and/or destination. For public transport to be a viable alternative, it must:
● Be easily accessible ● Serve the routes that people need ● Be of a quality that people are willing to shift to ● Have enough capacity to absorb the additional demand ● Are frequent to minimize travel time
Access to any form of transit within a comfortable walking distance is essential. Cities can use effective proxy indicators like People near Transit (PNT) to measure how accessible their transit services are to its citizens. For example, ITDP’s PNT analysis in Pune showed that only 66% people had access to high-frequency bus services (headway less than 5 minutes) in 201912. The analysis exposed the accessibility gaps in the existing systems and identified areas in need of frequent transit services. Indian cities must aim to provide at least 600 buses per million residents13 with at least 80% of the population having easy walking access to frequent transit.
To provide more comfortable travel experience and encourage people to shift to public transport, Transport for London (TfL) introduced 300 new buses on the day congestion charge was introduced. In Singapore, bus service to the congestion zone was improved significantly, while in the case of Stockholm, the introduction of 197 new buses and 16 new bus routes preceded the congestion pricing trial.14
People’s perceptions and expectations from the public transport system—in terms of comfort, access, and quality—should be assessed through public surveys and focused group discussions. Addressing people’s concerns will improve the reliability of public transit and increase its ridership.
2.6.2 Improve walking and cycling transport facilities
In most Indian cities, a third to half of all trips happen on foot or a bicycle. Most public transport trips also start and end with a walking trip. Walking and cycling provide basic affordable mobility and access to public transport. They also improve health and wellbeing. Improving conditions for walking and cycling reduces the demand for travel by private vehicles and the associated costs of traffic congestion. Walking and cycling also significantly improve the economic performance of cities. Well-designed streets help give a fillip to local businesses as well as lower household transport costs.
To nudge people towards sustainable transport modes, London added significant bicycle infrastructure and improved walking facilities before and during congestion pricing implementation. Similarly, Stockholm also improved the walking infrastructure and expanded its bicycle network.
Some Indian cities have started improving their walking and cycling infrastructure after realizing its importance. Pune and Chennai are at the top of the list. They have adopted a
12 People near Transit, Transit near People. ITDP. 2019
13 Service Level Benchmarks for Urban Transport. MoUD. 2013
14 Congestion Pricing in London, Stockholm and Singapore: A Way Forward for New York. Tri-state Transportation Campaign. 2017
| 19
non-motorized transport policy15 and, with technical assistance from the ITDP India Programme, have developed customised street design guidelines that prioritise walking and cycling.16 These cities are now implementing ambitious citywide walking and cycling improvement plans.
2.6.3 Strengthen last mile connectivity with micro-mobility
Public cycle sharing and other micro-mobility modes are good alternatives to private motor vehicles for local trips. Even cities that have good public transport cannot provide door-to-door accessibility to everyone. Micro-mobility should be integrated with public transport to provide seamless connectivity to all parts of the city. They are a much better alternative to the somewhat misguided idea of park-n-ride.
2.6.4 Create inclusive compact cities
A fine grid of people-friendly streets, vibrant public spaces, and inclusive mixed-use development that strikes the right balance between density and liveability are the means to create cities less dependent on personal automobility. In the long-run, inclusive compact cities reduce the number of trips and vehicle kilometers travelled—lowering emissions and congestion. Shorter trips also reduce the burden on public transport (as the same number of trips can be made with fewer buses).
2.7 Is congestion pricing equitable?
Congestion pricing should not become an unfair burden on low-income families. In Mumbai, the share of trips on private motor vehicles and taxis was less than 20% in 2016. This indicates that the majority—especially low income residents of the city—will be unaffected by congestion pricing. On the other hand, they stand to benefit. City bus service, on which many of them depend as their primary or secondary mode of transport, can improve greatly because of congestion pricing:
● Freed from congestion, buses will run faster. The time people save can go into productive uses. Various studies have shown that even marginal increase in household income of low income families can go a long way to improve their nutrition, health, access to education, and the quality of life.
● City buses, now freed from congestion, can ply for more kilometres each day. With better asset utilisation, cost of operations comes down. This can result in lower fares, or better service quality, or both. Bus frequency can improve even without the addition of buses; commuters have to wait less and get to travel in greater comfort.
● Revenue from congestion pricing can (and should) be used to improve walking, cycling and public transport infrastructure. Bus service improves; bus fares come down. It is a win-win for bus commuters.
Even those previously using private motor vehicles or taxis can save money by travelling on the improved public transport. Lastly, those who wish to pay and stay in their private motor vehicles (or taxis) benefit from time saved. All of these point to one thing: congestion pricing is an equitable solution that benefits everyone, especially low income people.
15 https://www.itdp.in/wp-content/uploads/2014/10/NMT-Policy.pdf
16 https://www.itdp.in/wp-content/uploads/2016/07/Urban-street-design-guidelines.pdf
| 20
3 Congestion Pricing Around the World
3.1 Types of congestion pricing
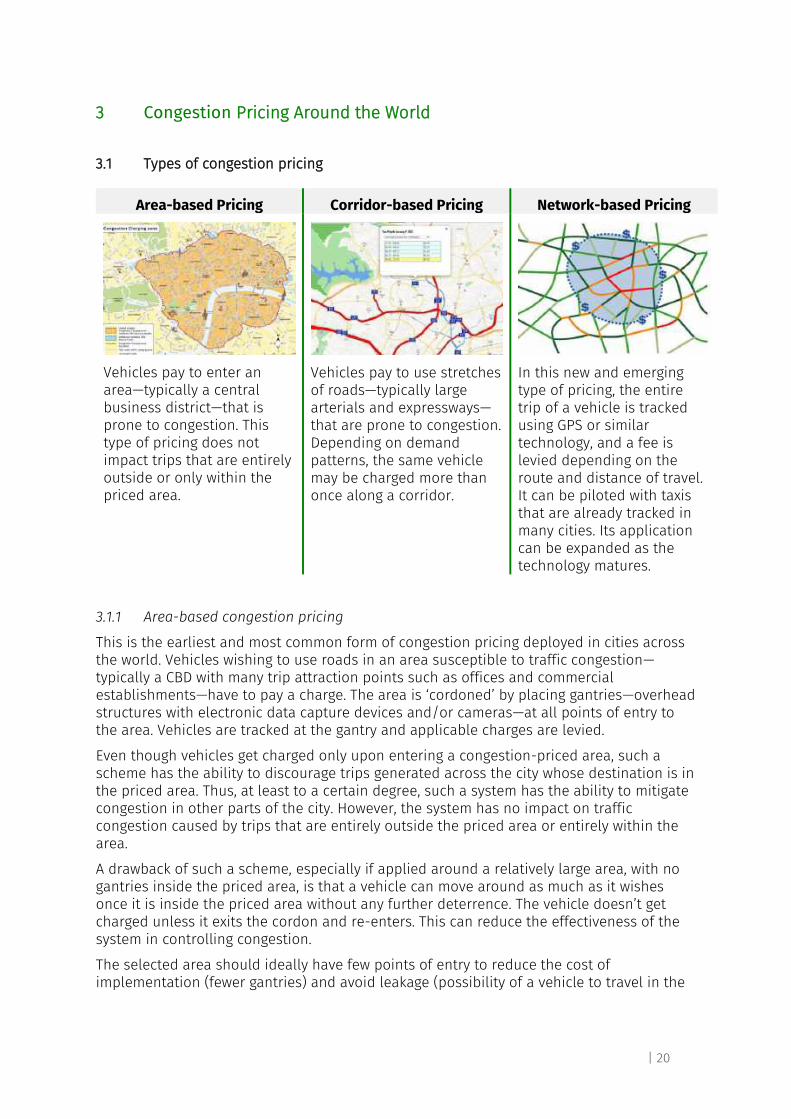
Area-based Pricing Corridor-based Pricing Network-based Pricing
Vehicles pay to enter an area—typically a central business district—that is prone to congestion. This type of pricing does not impact trips that are entirely outside or only within the priced area.
Vehicles pay to use stretches of roads—typically large arterials and expressways—that are prone to congestion. Depending on demand patterns, the same vehicle may be charged more than once along a corridor.
In this new and emerging type of pricing, the entire trip of a vehicle is tracked using GPS or similar technology, and a fee is levied depending on the route and distance of travel. It can be piloted with taxis that are already tracked in many cities. Its application can be expanded as the technology matures.
3.1.1 Area-based congestion pricing
This is the earliest and most common form of congestion pricing deployed in cities across the world. Vehicles wishing to use roads in an area susceptible to traffic congestion—typically a CBD with many trip attraction points such as offices and commercial establishments—have to pay a charge. The area is ‘cordoned’ by placing gantries—overhead structures with electronic data capture devices and/or cameras—at all points of entry to the area. Vehicles are tracked at the gantry and applicable charges are levied.
Even though vehicles get charged only upon entering a congestion-priced area, such a scheme has the ability to discourage trips generated across the city whose destination is in the priced area. Thus, at least to a certain degree, such a system has the ability to mitigate congestion in other parts of the city. However, the system has no impact on traffic congestion caused by trips that are entirely outside the priced area or entirely within the area.
A drawback of such a scheme, especially if applied around a relatively large area, with no gantries inside the priced area, is that a vehicle can move around as much as it wishes once it is inside the priced area without any further deterrence. The vehicle doesn’t get charged unless it exits the cordon and re-enters. This can reduce the effectiveness of the system in controlling congestion.
The selected area should ideally have few points of entry to reduce the cost of implementation (fewer gantries) and avoid leakage (possibility of a vehicle to travel in the
| 21
priced area without paying). Further, parking management in the immediate periphery outside the priced area is essential.
Case Study
London introduced a congestion charge in 2003 in the 20.7 sq km area of Central London with an aim to reduce traffic congestion, thereby improving speeds. Similar area-based charging has also been implemented by Stockholm over the 35 sq. km area in Central Stockholm to reduce congestion, reduce emissions and generate revenue.
3.1.2 Corridor-based congestion pricing
When traffic congestion is widespread in a city and charging for entry into an area doesn’t suffice, a corridor-based approach comes to the rescue. Vehicles are charged for passing through different road stretches that are susceptible to traffic congestion in the absence of road pricing. Typically, such road stretches, called corridors, act as a conduit for large volumes of traffic whose destination may not be on the corridor itself.
The fee vehicles have to pay can vary from location to location, depending on the extent of demand to use that road stretch at any given time of the day. This form of pricing is more nuanced compared to an area-based approach and more effective at mitigating congestion.
These stretches, however, must have limited points of entry to reduce the cost of implementation and avoid leakages.
Case Study
Singapore started with an Area Licensing Scheme in 1975 to manage the number of cars on roads and improve travel time. However, 1998 onwards, the scheme was converted into a corridor-based pricing with the help of Electronic Road Pricing (ERP).
3.1.3 Network-based congestion pricing
This is an even more refined version of corridor-based pricing. A vehicle is charged not by being captured at a series of gantries but through a global positioning system (GPS) or similar technology that tracks its route in real-time. The congestion charge is applied for each road segment of the route, depending on the level of congestion on that segment.
This evolving approach can be piloted with taxis. They happen to be a fraction in number compared to private motor vehicles in most cities but contribute significantly to traffic since they are on the road most of the day. Further, taxis are already tracked in many cities (for online metering as well as to manage passenger safety concerns). Therefore, implementation can be relatively easy and inexpensive.
Bringing all vehicles under the ambit of such a system may be complicated. Privacy concerns as well as untested compliance systems can become stumbling blocks. In a few years, technology may evolve to the point that this approach can become a default in cities worldwide.
| 22
Case Study
São Paulo since 2016 has been levying a network-based charge (mileage fee) on e-hail cabs. The registered cab aggregators bid at the auction for credits that permit them to drive a certain number of miles over two months. Cars that exceed their allotment have to pay a surcharge. Singapore is also moving towards the implementation of network-based pricing on roads and doing away with the current gantry-based pricing system in the next 2-3 years.
3.2 Case studies of congestion pricing in cities worldwide
This section presents case studies of various cities worldwide that have implemented congestion pricing. It explores what motivated them to implement congestion pricing and the benefits these cities have derived.
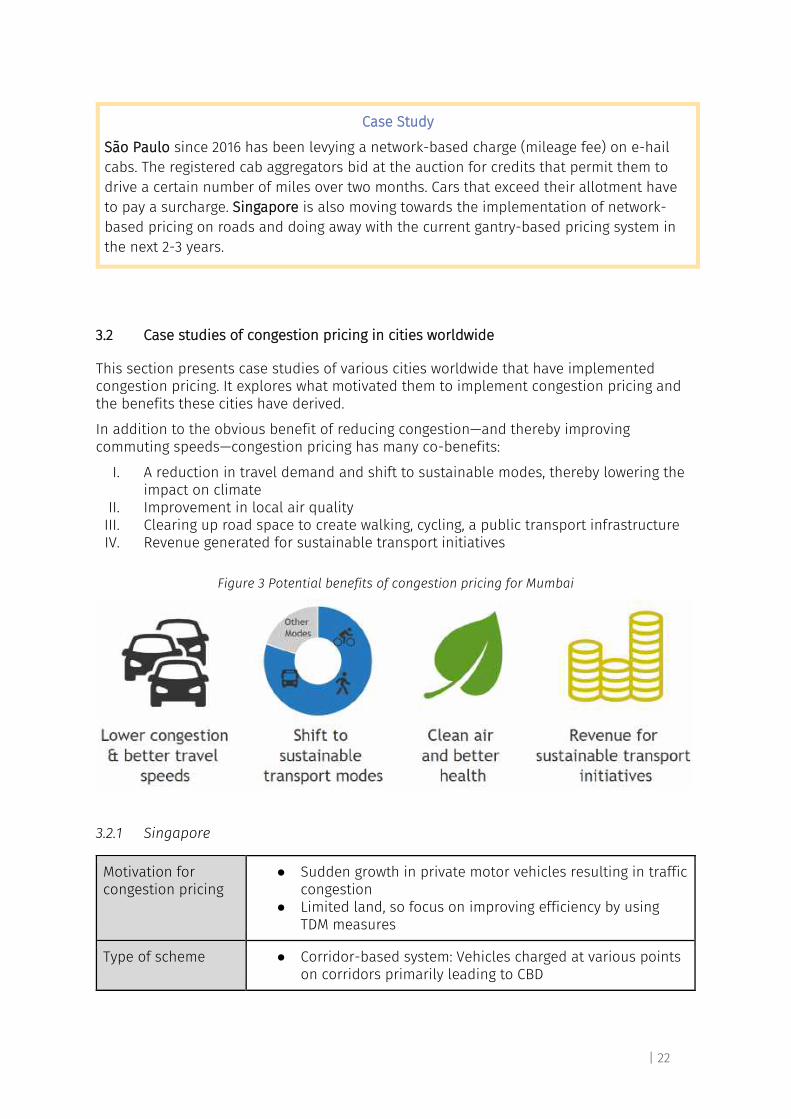
In addition to the obvious benefit of reducing congestion—and thereby improving commuting speeds—congestion pricing has many co-benefits:
I. A reduction in travel demand and shift to sustainable modes, thereby lowering the impact on climate
II. Improvement in local air quality III. Clearing up road space to create walking, cycling, a public transport infrastructure IV. Revenue generated for sustainable transport initiatives
Figure 3 Potential benefits of congestion pricing for Mumbai
3.2.1 Singapore
Motivation for congestion pricing
● Sudden growth in private motor vehicles resulting in traffic congestion
● Limited land, so focus on improving efficiency by using TDM measures
Type of scheme ● Corridor-based system: Vehicles charged at various points on corridors primarily leading to CBD
| 23
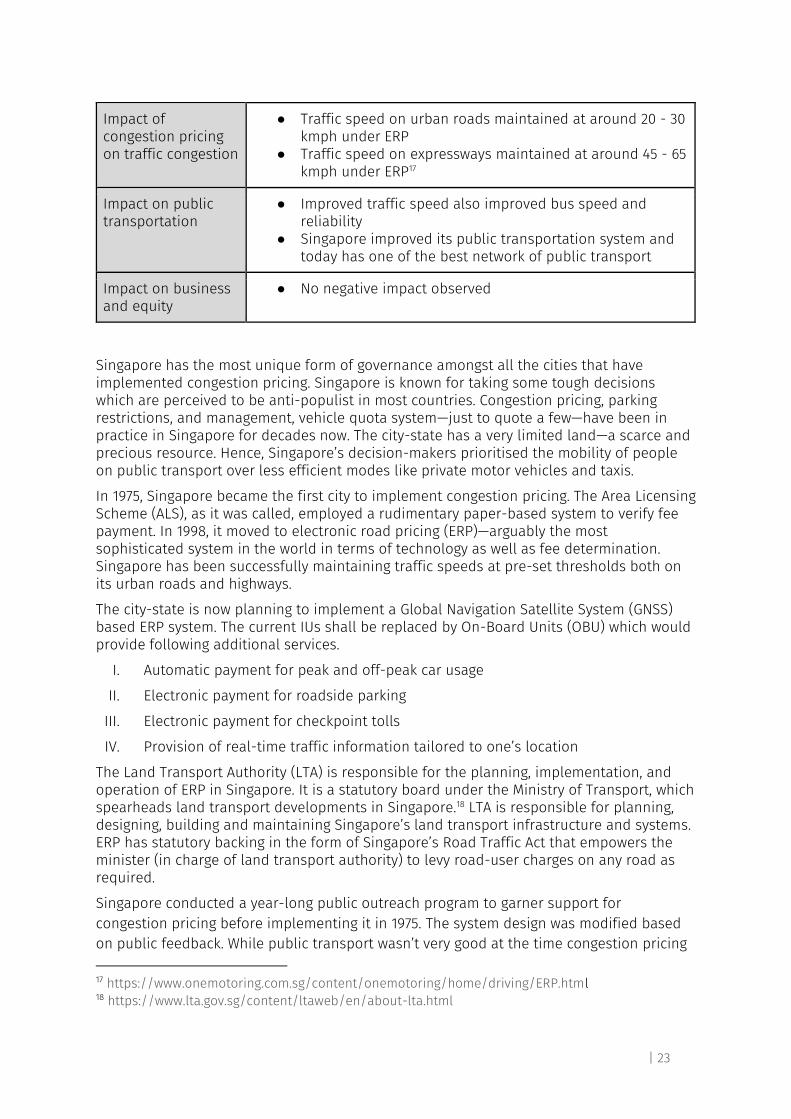
Impact of congestion pricing on traffic congestion
● Traffic speed on urban roads maintained at around 20 - 30 kmph under ERP
● Traffic speed on expressways maintained at around 45 - 65 kmph under ERP17
Impact on public transportation
● Improved traffic speed also improved bus speed and reliability
● Singapore improved its public transportation system and today has one of the best network of public transport
Impact on business and equity
● No negative impact observed
Singapore has the most unique form of governance amongst all the cities that have implemented congestion pricing. Singapore is known for taking some tough decisions which are perceived to be anti-populist in most countries. Congestion pricing, parking restrictions, and management, vehicle quota system—just to quote a few—have been in practice in Singapore for decades now. The city-state has a very limited land—a scarce and precious resource. Hence, Singapore’s decision-makers prioritised the mobility of people on public transport over less efficient modes like private motor vehicles and taxis.
In 1975, Singapore became the first city to implement congestion pricing. The Area Licensing Scheme (ALS), as it was called, employed a rudimentary paper-based system to verify fee payment. In 1998, it moved to electronic road pricing (ERP)—arguably the most sophisticated system in the world in terms of technology as well as fee determination. Singapore has been successfully maintaining traffic speeds at pre-set thresholds both on its urban roads and highways.
The city-state is now planning to implement a Global Navigation Satellite System (GNSS) based ERP system. The current IUs shall be replaced by On-Board Units (OBU) which would provide following additional services.
I. Automatic payment for peak and off-peak car usage
II. Electronic payment for roadside parking
III. Electronic payment for checkpoint tolls
IV. Provision of real-time traffic information tailored to one’s location
The Land Transport Authority (LTA) is responsible for the planning, implementation, and operation of ERP in Singapore. It is a statutory board under the Ministry of Transport, which spearheads land transport developments in Singapore.18 LTA is responsible for planning, designing, building and maintaining Singapore’s land transport infrastructure and systems. ERP has statutory backing in the form of Singapore’s Road Traffic Act that empowers the minister (in charge of land transport authority) to levy road-user charges on any road as required.
Singapore conducted a year-long public outreach program to garner support for congestion pricing before implementing it in 1975. The system design was modified based on public feedback. While public transport wasn’t very good at the time congestion pricing 17 https://www.onemotoring.com.sg/content/onemotoring/home/driving/ERP.html 18 https://www.lta.gov.sg/content/ltaweb/en/about-lta.html
| 24
was introduced, since then, the Government of Singapore has significantly improved rail as well as bus services. In recent years, Singapore has been making significant investments to improve walking and cycling infrastructure and encourage these non-motorised modes.
3.2.2 London
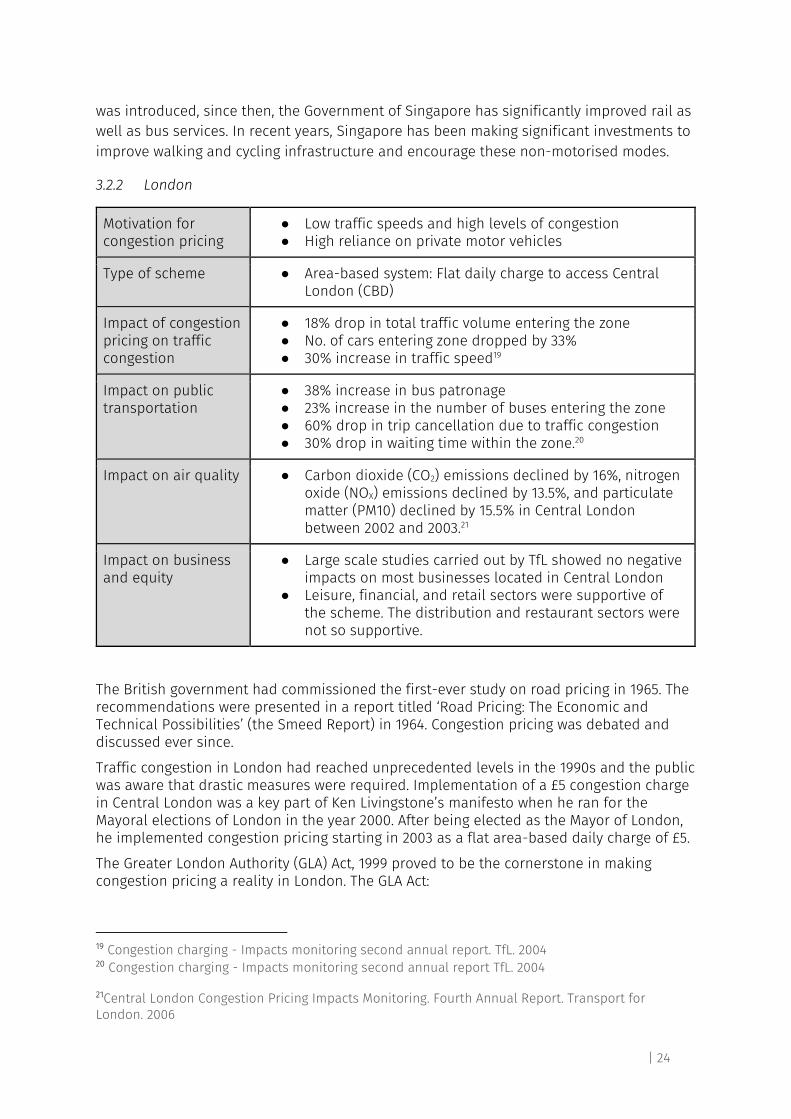
Motivation for congestion pricing
● Low traffic speeds and high levels of congestion ● High reliance on private motor vehicles
Type of scheme ● Area-based system: Flat daily charge to access Central London (CBD)
Impact of congestion pricing on traffic congestion
● 18% drop in total traffic volume entering the zone ● No. of cars entering zone dropped by 33% ● 30% increase in traffic speed19
Impact on public transportation
● 38% increase in bus patronage ● 23% increase in the number of buses entering the zone ● 60% drop in trip cancellation due to traffic congestion ● 30% drop in waiting time within the zone.20
Impact on air quality ● Carbon dioxide (CO2) emissions declined by 16%, nitrogen oxide (NOX) emissions declined by 13.5%, and particulate matter (PM10) declined by 15.5% in Central London between 2002 and 2003.21
Impact on business and equity
● Large scale studies carried out by TfL showed no negative impacts on most businesses located in Central London
● Leisure, financial, and retail sectors were supportive of the scheme. The distribution and restaurant sectors were not so supportive.
The British government had commissioned the first-ever study on road pricing in 1965. The recommendations were presented in a report titled ‘Road Pricing: The Economic and Technical Possibilities’ (the Smeed Report) in 1964. Congestion pricing was debated and discussed ever since.
Traffic congestion in London had reached unprecedented levels in the 1990s and the public was aware that drastic measures were required. Implementation of a £5 congestion charge in Central London was a key part of Ken Livingstone’s manifesto when he ran for the Mayoral elections of London in the year 2000. After being elected as the Mayor of London, he implemented congestion pricing starting in 2003 as a flat area-based daily charge of £5.
The Greater London Authority (GLA) Act, 1999 proved to be the cornerstone in making congestion pricing a reality in London. The GLA Act:
19 Congestion charging - Impacts monitoring second annual report. TfL. 2004 20 Congestion charging - Impacts monitoring second annual report TfL. 2004
21Central London Congestion Pricing Impacts Monitoring. Fourth Annual Report. Transport for London. 2006
| 25
● Empowered the Mayor of London to use congestion pricing as an instrument to curb traffic congestion
● Set up Transport for London (TfL) as a statutory body as an umbrella organisation to oversee London’s land transport.
A single organisation administering all the prominent aspects of road transport guarantees efficient coordination and effective action. TfL’s responsibilities include:
● Provide and manage public passenger transport systems to from and within Greater London.
● As a highway and traffic authority, to regulate how the public uses highways and other responsibilities - traffic signs, traffic control systems, road safety and traffic reduction
● Taxi and private hire licensing
The use of congestion pricing was legalised in the entire England and Wales by the Transport Act, 2000.
The congestion charge in London was revised thrice after it was initially set at £5 in 2003. In 2005, it was ramped up to £8; in 2011, to £10; and to £11.5 in 2014. But a report published in 2017 titled ‘London Stalling’ stated that traffic speeds were dropping despite a decrease in the use of private cars since 2004. Private hire vehicles, a.k.a the minicabs, were the problem. These vehicles were exempt from congestion charge and their numbers grew 70% in a mere 3.5 years starting in 2014. To address this, London removed the exemption in 2019.
Currently the Cleaner Vehicle Discount (CVD) is only given to Battery Electric Vehicles (BEV) and hybrid vehicles conforming to Euro VI standards, emit no more than 75g/km of CO2, and have a minimum 20 mile zero emission capable range. Starting in 2021, CVD will only be applicable for BEVs and by 2025, CVD will be removed for all vehicles22.
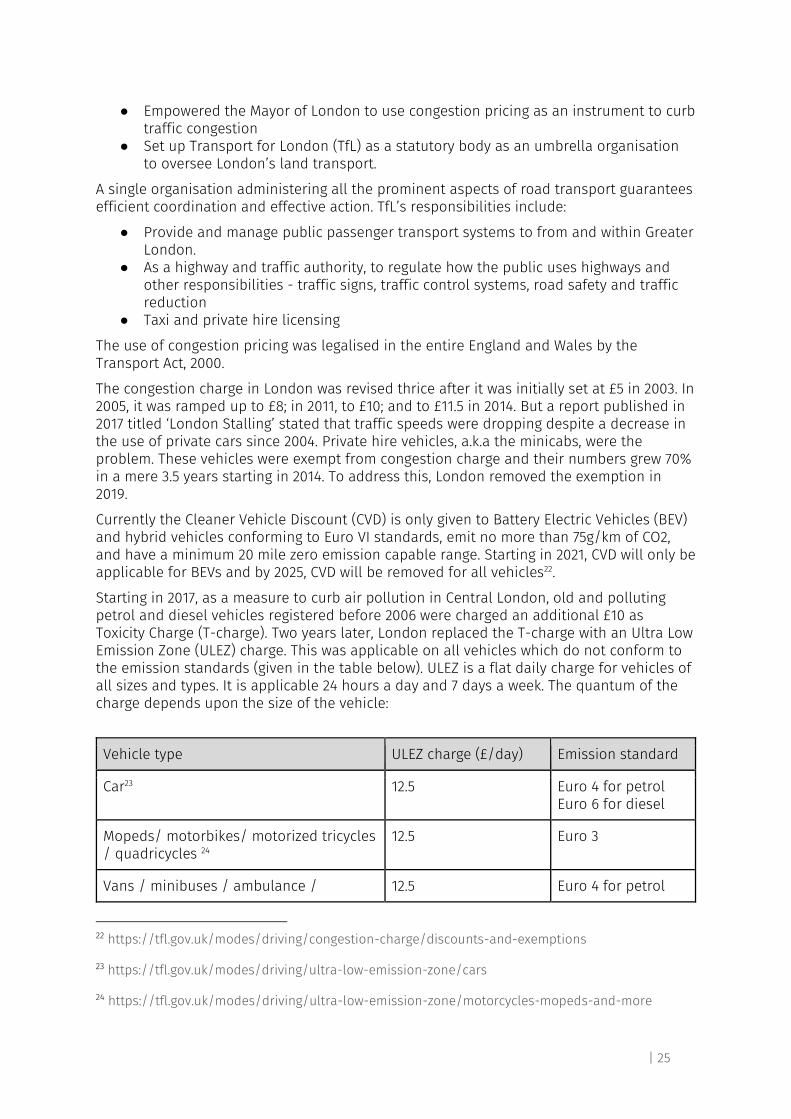
Starting in 2017, as a measure to curb air pollution in Central London, old and polluting petrol and diesel vehicles registered before 2006 were charged an additional £10 as Toxicity Charge (T-charge). Two years later, London replaced the T-charge with an Ultra Low Emission Zone (ULEZ) charge. This was applicable on all vehicles which do not conform to the emission standards (given in the table below). ULEZ is a flat daily charge for vehicles of all sizes and types. It is applicable 24 hours a day and 7 days a week. The quantum of the charge depends upon the size of the vehicle:
Vehicle type ULEZ charge (£/day) Emission standard
Car23 12.5 Euro 4 for petrol Euro 6 for diesel
Mopeds/ motorbikes/ motorized tricycles / quadricycles 24
12.5 Euro 3
Vans / minibuses / ambulance / 12.5 Euro 4 for petrol
22 https://tfl.gov.uk/modes/driving/congestion-charge/discounts-and-exemptions
23 https://tfl.gov.uk/modes/driving/ultra-low-emission-zone/cars
24 https://tfl.gov.uk/modes/driving/ultra-low-emission-zone/motorcycles-mopeds-and-more
| 26
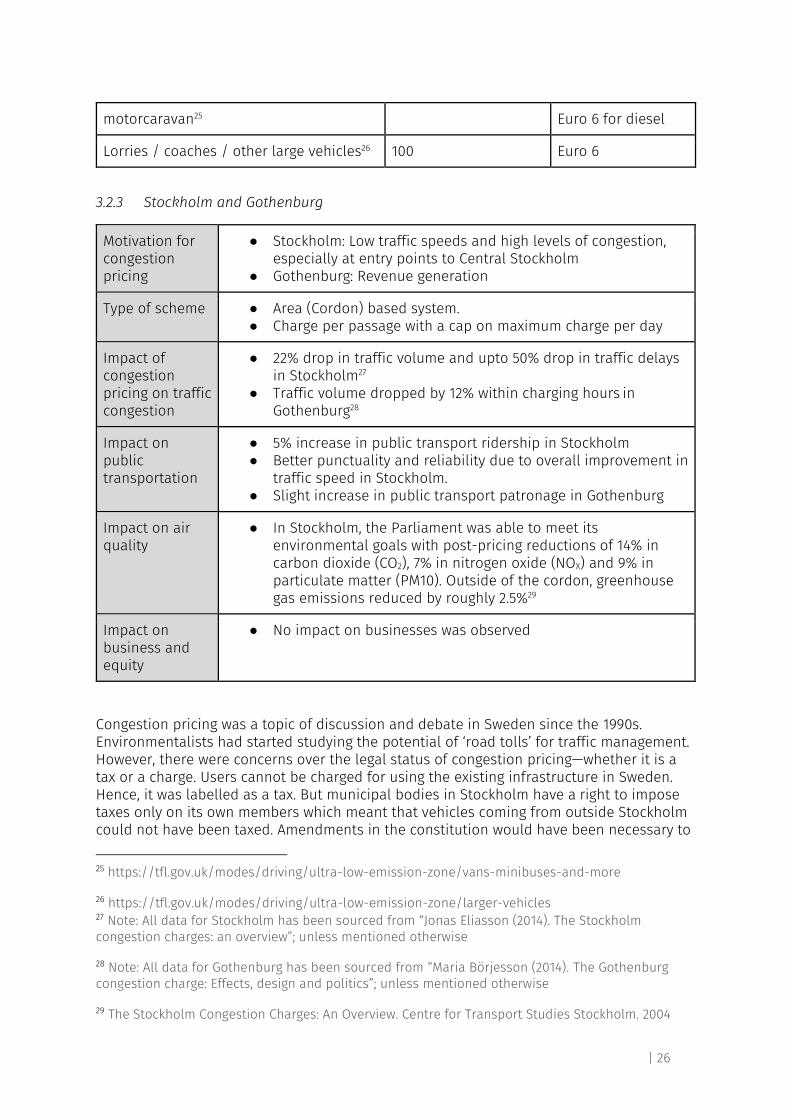
motorcaravan25 Euro 6 for diesel
Lorries / coaches / other large vehicles26 100 Euro 6
3.2.3 Stockholm and Gothenburg
Motivation for congestion pricing
● Stockholm: Low traffic speeds and high levels of congestion, especially at entry points to Central Stockholm
● Gothenburg: Revenue generation
Type of scheme ● Area (Cordon) based system. ● Charge per passage with a cap on maximum charge per day
Impact of congestion pricing on traffic congestion
● 22% drop in traffic volume and upto 50% drop in traffic delays in Stockholm27
● Traffic volume dropped by 12% within charging hours in Gothenburg28
Impact on public transportation
● 5% increase in public transport ridership in Stockholm ● Better punctuality and reliability due to overall improvement in
traffic speed in Stockholm. ● Slight increase in public transport patronage in Gothenburg
Impact on air quality
● In Stockholm, the Parliament was able to meet its environmental goals with post-pricing reductions of 14% in carbon dioxide (CO2), 7% in nitrogen oxide (NOX) and 9% in particulate matter (PM10). Outside of the cordon, greenhouse gas emissions reduced by roughly 2.5%29
Impact on business and equity
● No impact on businesses was observed
Congestion pricing was a topic of discussion and debate in Sweden since the 1990s. Environmentalists had started studying the potential of ‘road tolls’ for traffic management. However, there were concerns over the legal status of congestion pricing—whether it is a tax or a charge. Users cannot be charged for using the existing infrastructure in Sweden. Hence, it was labelled as a tax. But municipal bodies in Stockholm have a right to impose taxes only on its own members which meant that vehicles coming from outside Stockholm could not have been taxed. Amendments in the constitution would have been necessary to
25 https://tfl.gov.uk/modes/driving/ultra-low-emission-zone/vans-minibuses-and-more
26 https://tfl.gov.uk/modes/driving/ultra-low-emission-zone/larger-vehicles 27 Note: All data for Stockholm has been sourced from “Jonas Eliasson (2014). The Stockholm congestion charges: an overview”; unless mentioned otherwise
28 Note: All data for Gothenburg has been sourced from “Maria Börjesson (2014). The Gothenburg congestion charge: Effects, design and politics”; unless mentioned otherwise
29 The Stockholm Congestion Charges: An Overview. Centre for Transport Studies Stockholm. 2004
| 27
grant such powers to the municipal bodies. Hence, congestion tax in Stockholm was permanently imposed as a national-level tax in 2007 after a six month-long trial. The charges were set at SEK 10, 15 and 20 for different time periods during the day.
The revenue however was transferred to the city and the national government decided to allocate an additional grant to the congestion tax collected from the city in the form of a ‘transportation package’. This played a pivotal role in encouraging political will in both Stockholm and Gothenburg.
The Swedish Transport Agency (STA) is responsible for imposition and collection of congestion tax from all the cities of Sweden. The Swedish Transport Agency is responsible for most regulation and supervision in the transport sector. Its activities encompass all modes of transport, i.e. roads, railways, aviation and shipping. In addition, it administers motor vehicle tax, congestion charges and the super green car rebate.30 The Swedish Law on congestion tax (2004: 629) empowered the Swedish Transport Agency to collect congestion taxes.31
Alternative fuel vehicles were given exemption initially to boost their sales. The share of alternative-fuel vehicles in overall annual car sales in Sweden increased from 3% in 2006 to 15% in 2009. Thus, the exemption for alternative-fuel vehicles was removed in 2009. Exemptions for all vehicles, including BEVs and HEVs were removed in 2012.
In Stockholm, public opinion surveys showed that support was just 34% just before trials began in 2005. However, once the trials started and effects were visible, support grew to 53%. The media image also changed from intensely critical to mostly positive during the trials. After the end of the trial period, the referendum resulted in 65% voting for keeping the charge. During this period the national government changed, but decided to follow the outcome of the referendum even though they initially opposed the idea of congestion pricing. In 2013, congestion pricing saw growing support; 72% citizens voted for it.
In Gothenburg, a public referendum similar to Stockholm was conducted in 2014 just before the implementation. 57% of the respondents opposed the idea of congestion taxes. The results were however ignored and congestion tax was imposed—primarily for revenue generation—despite public opposition.
In 2016, important changes were made in Stockholm:
● Congestion taxes were revised to SEK 11, 15, 25 and 35 for various time slots during the day.
● Exemption for vehicles using Essingeleden motorway was removed. Charges of SEK 11, 15, 22 and 30 were imposed for various time slots during the day.
● Exemption for foreign vehicles was removed
In January 2020, major changes were made again.32 The system starts at 6 am, half an hour earlier than before. Further, congestion taxes now vary by season. The peak season is between 1 March and the day before Midsummer Eve (typically between June 20 and June 25), and between 15 August and 30 November. The rest of the year is off-peak season. The amounts have been revised to:
30 https://www.government.se/government-agencies/swedish-transport-agency/
31https://www.riksdagen.se/sv/dokument-lagar/dokument/svensk-forfattningssamling/lag-2004629-om-trangselskatt_sfs-2004-629
32https://www.transportstyrelsen.se/en/road/Congestion-taxes-in-Stockholm-and-Goteborg/congestion-tax-in-stockholm/stockholm-congestion-taxes-modified-on-1-january-2020/
| 28
● Central Stockholm: SEK 11, 15, 20, 30, 45 for peak season and SEK 11, 15, 25 and 35 for off-peak season
● Essingeleden motorway: SEK 11, 15, 20, 27, 40 for peak season and SEK 11, 15, 22, 30 off-peak season
● Congestion taxes extended to the first five weekdays of July: Earlier, congestion taxes were suspended in the entire month of July.
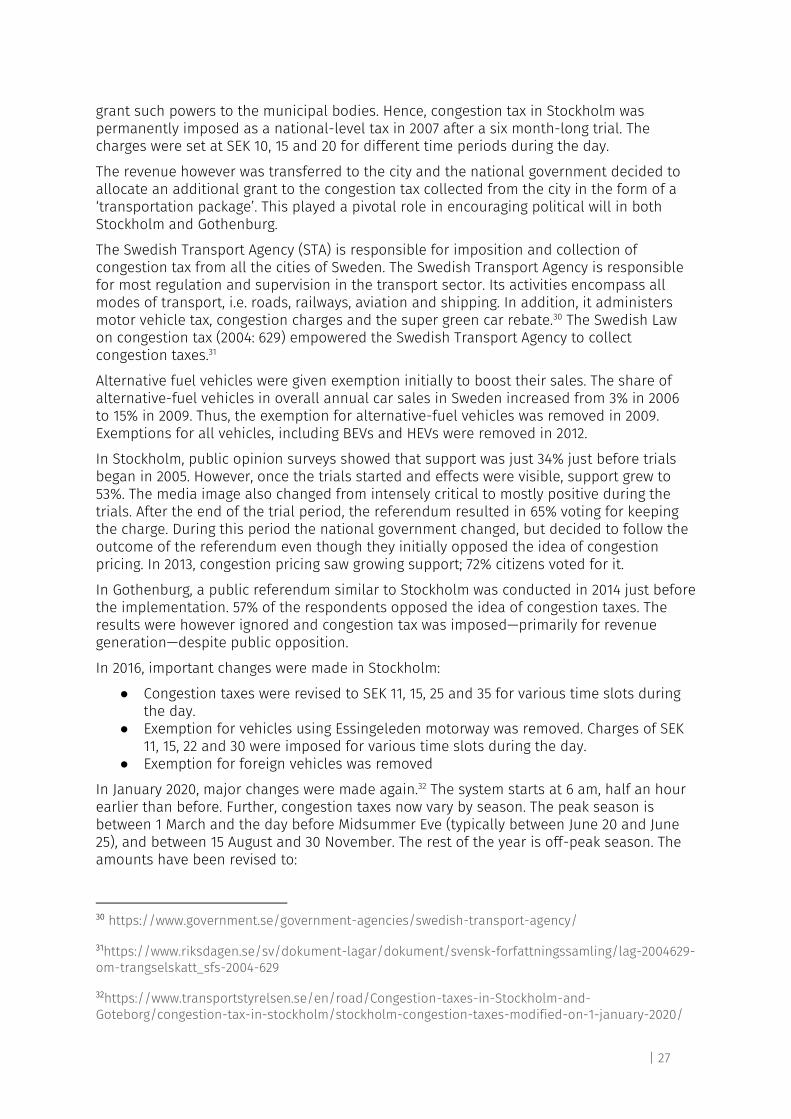
3.2.4 High Occupancy Toll Lanes (HOT lanes) in USA
Motivation for congestion pricing
● HOV lane infrastructure not being used to full potential ● High level of congestion ● Low traffic speeds on freeways
Type of scheme ● Corridor based system: Vehicles charged at various points on various corridors
● Dynamic charges based on real time congestion levels
Impact of congestion pricing on traffic congestion
● Traffic within HOT lanes maintained at free flow speed, hence does not dilute the purpose of HOV lanes
● The system provides an alternative to motorists who do not meet the HOV criteria, but are ready to pay for a faster commute.
Impact on public transportation
● HOT lanes have not been very instrumental in encouraging a mode-shift from private motor vehicles to public transport.
The United States of America (USA) already had High Occupancy Vehicle (HOV) lanes on its freeways. HOV lanes were dedicated lanes for vehicles fulfilling high occupancy criteria (2+ or 3+ passengers). The facility was to encourage carpooling and the use of public transport by giving them preference priority, especially during peak hours. The HOV lanes were however not being used to their full potential. Hence, existing HOV infrastructure was converted to High Occupancy Toll lanes. Vehicles that do not fulfill the occupancy criteria can access HOV lanes by paying a fee. The fee is demand-responsive. Price is adjusted to ensure that the traffic is always in free flow.
The operators for HOT lanes vary from transit agencies, state department of transportation to tolling agencies. The 23 U.S.Code 166(b)(4) empowers the public authorities to allow vehicles not meeting the HOV requirements to use the facility in exchange for a fee. The laws pertaining to HOT lanes differ from state to state.
There are more than 10 HOT lane facilities currently operating in more than eight states of the USA which add up to over 100 miles (161 km) .
Similarities between various HOT lane facilities in USA:
● Physical separation of HOT lanes from other general purpose lanes
● All employ electronic toll collection using transponder based short range radio communication technology
● Provision of information system using variable message signs to provide information about access, occupancy requirements, hours, prices and enforcement.
Differences between various HOT lane facilities in USA:
● Number of lanes range from one to four, with or without reversibility.
| 29
● In San Diego all HOV vehicles ride free. In Orange County (California), HOVs pay reduced tolls. In Houston HOV3 (vehicles with at least 3 passengers) vehicles have free access while HOV2 vehicles have to pay a toll.
● Pricing policies include fixed differences by vehicle type and variations by time of day or level of demand.
● Ownership and operating structures may vary widely from private sector developers to local planning organizations, transit agencies and state departments of transportation (DOTs)
| 30
4 The Context of Greater Mumbai
4.1 Introduction to the chapter
The first step is to identify locations where congestion pricing may be warranted. To find this, a city should:
● Map traffic speeds on the entire primary road network of the city at all hours of a day in a typical week of the year to identify congested locations. Areas with speeds of less than 20 kmph on arterial roads and 40 kmph on expressways may be considered congested.
● At each of the congested locations, count and analyse traffic volumes and occupancy (disaggregated by mode), at each hour of the day to determine the extent by which traffic must be reduced at different hours in a day to achieve the desired speed.
This chapter starts with the geographic context of Mumbai followed by data analysis to identify locations of severe congestion in Mumbai. This chapter also contains a brief assessment of existing and proposed public transport infrastructure in Mumbai as a viable alternative to private vehicle use.
The second step mentioned above, i.e., a detailed assessment of traffic volumes and desired traffic reduction, is addressed in Chapter 5.
4.2 Mumbai Metropolitan Region and Greater Mumbai
The Mumbai Metropolitan Region (MMR) is spread over an area of 4,254 sq. km. and has a population of 22.8 million people. The region includes eight Municipal Corporations and nine Municipal councils. Greater Mumbai—a peninsula jutting out from the mainland that is principally managed by the Municipal Corporation of Greater Mumbai (MCGM)—occupies merely 11% of the metropolitan region but is home to 55% of the region’s population.33
Within MMR, there are several Special Planning Authorities (SPA) which cover the areas outside the limits of Greater Mumbai and other municipal corporations, with most of them currently under the Mumbai Metropolitan Region Development Authority (MMRDA). The broad responsibilities of the Mumbai Metropolitan Region Development Authority includes34
● Preparation of Regional Development Plans ● Formulate policies and programs ● Providing financial assistance for significant regional projects ● Providing help to local authorities and their infrastructure projects ● Coordinating execution of projects and/or schemes in MMR ● Restricting any activity that could adversely affect appropriate development of MMR,
etc.
In particular, it conceives, promotes and monitors the key projects for developing new growth centres and brings about improvement in sectors like transport, housing, water supply and environment in the region.
33 Draft Mumbai Metropolitan Regional Plan 2016-2036
34 https://mmrda.maharashtra.gov.in/who-we-are
| 31
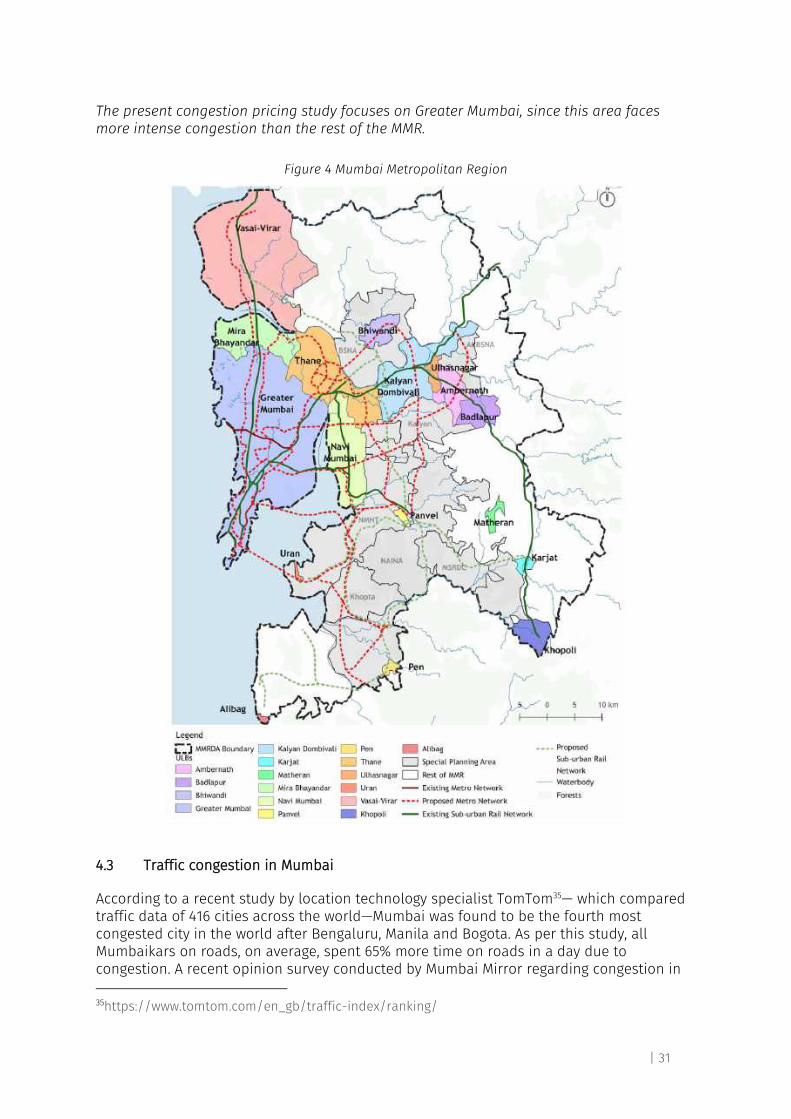
The present congestion pricing study focuses on Greater Mumbai, since this area faces more intense congestion than the rest of the MMR.
Figure 4 Mumbai Metropolitan Region
4.3 Traffic congestion in Mumbai
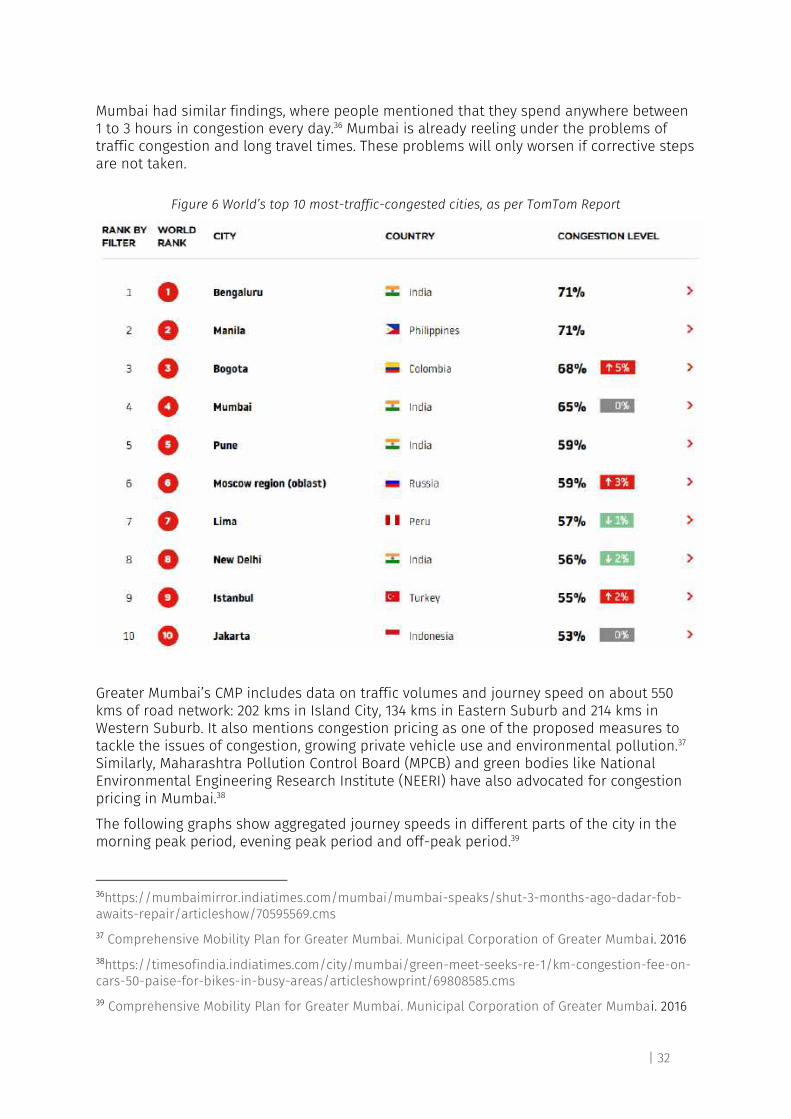
According to a recent study by location technology specialist TomTom35— which compared traffic data of 416 cities across the world—Mumbai was found to be the fourth most congested city in the world after Bengaluru, Manila and Bogota. As per this study, all Mumbaikars on roads, on average, spent 65% more time on roads in a day due to congestion. A recent opinion survey conducted by Mumbai Mirror regarding congestion in 35https://www.tomtom.com/en_gb/traffic-index/ranking/
| 32
Mumbai had similar findings, where people mentioned that they spend anywhere between 1 to 3 hours in congestion every day.36 Mumbai is already reeling under the problems of traffic congestion and long travel times. These problems will only worsen if corrective steps are not taken.
Figure 6 World’s top 10 most-traffic-congested cities, as per TomTom Report
Greater Mumbai’s CMP includes data on traffic volumes and journey speed on about 550 kms of road network: 202 kms in Island City, 134 kms in Eastern Suburb and 214 kms in Western Suburb. It also mentions congestion pricing as one of the proposed measures to tackle the issues of congestion, growing private vehicle use and environmental pollution.37 Similarly, Maharashtra Pollution Control Board (MPCB) and green bodies like National Environmental Engineering Research Institute (NEERI) have also advocated for congestion pricing in Mumbai.38
The following graphs show aggregated journey speeds in different parts of the city in the morning peak period, evening peak period and off-peak period.39
36https://mumbaimirror.indiatimes.com/mumbai/mumbai-speaks/shut-3-months-ago-dadar-fob-awaits-repair/articleshow/70595569.cms
37 Comprehensive Mobility Plan for Greater Mumbai. Municipal Corporation of Greater Mumbai. 2016
38https://timesofindia.indiatimes.com/city/mumbai/green-meet-seeks-re-1/km-congestion-fee-on-cars-50-paise-for-bikes-in-busy-areas/articleshowprint/69808585.cms
39 Comprehensive Mobility Plan for Greater Mumbai. Municipal Corporation of Greater Mumbai. 2016
| 33
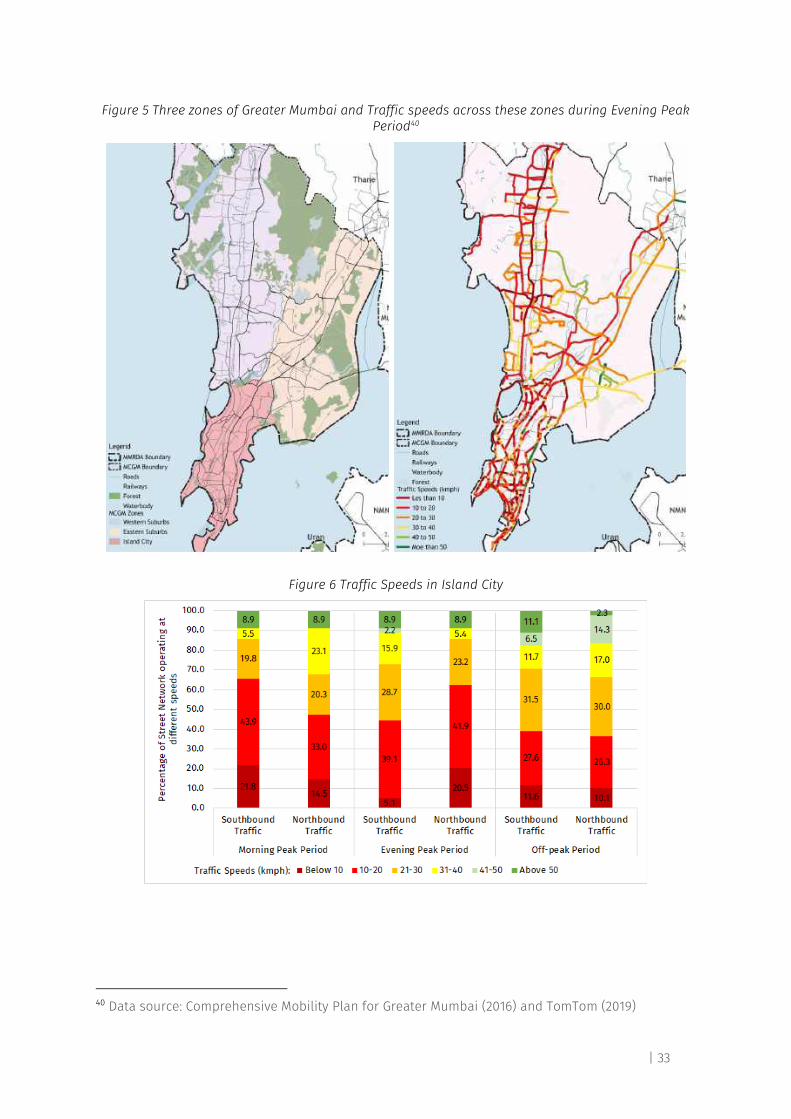
Figure 5 Three zones of Greater Mumbai and Traffic speeds across these zones during Evening Peak Period40
Figure 6 Traffic Speeds in Island City
40 Data source: Comprehensive Mobility Plan for Greater Mumbai (2016) and TomTom (2019)
| 34
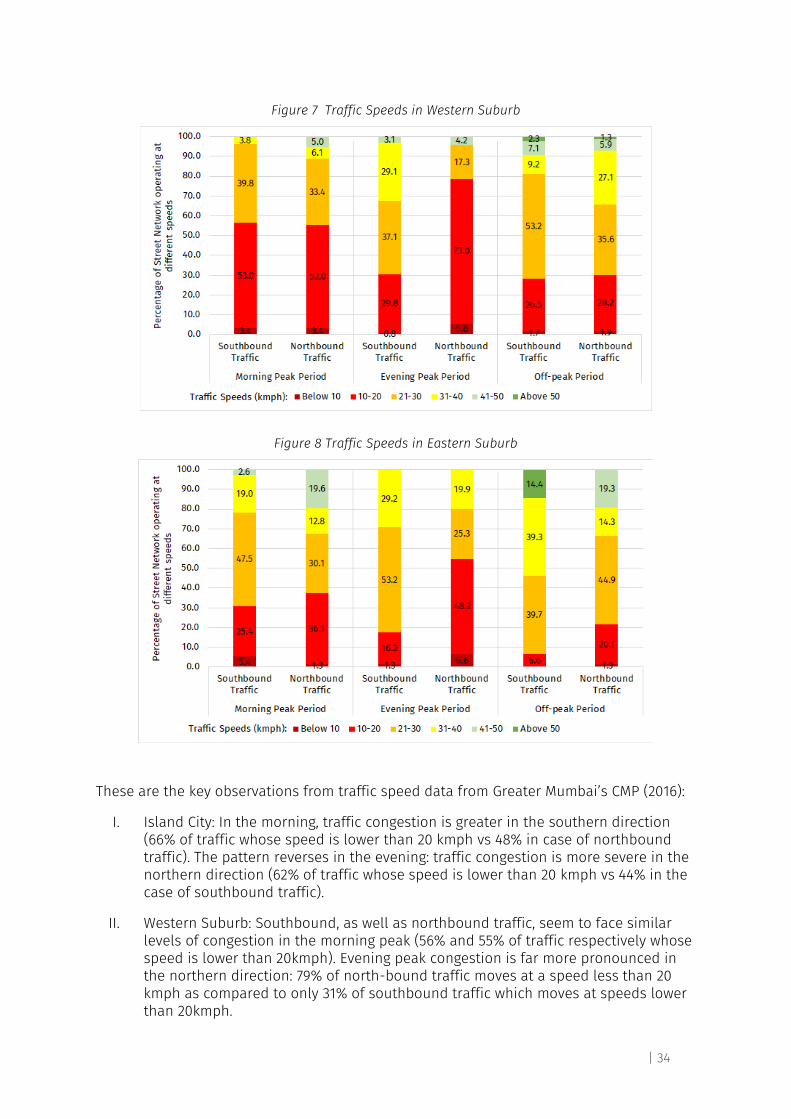
Figure 7 Traffic Speeds in Western Suburb
Figure 8 Traffic Speeds in Eastern Suburb
These are the key observations from traffic speed data from Greater Mumbai’s CMP (2016):
I. Island City: In the morning, traffic congestion is greater in the southern direction (66% of traffic whose speed is lower than 20 kmph vs 48% in case of northbound traffic). The pattern reverses in the evening: traffic congestion is more severe in the northern direction (62% of traffic whose speed is lower than 20 kmph vs 44% in the case of southbound traffic).
II. Western Suburb: Southbound, as well as northbound traffic, seem to face similar levels of congestion in the morning peak (56% and 55% of traffic respectively whose speed is lower than 20kmph). Evening peak congestion is far more pronounced in the northern direction: 79% of north-bound traffic moves at a speed less than 20 kmph as compared to only 31% of southbound traffic which moves at speeds lower than 20kmph.
| 35
III. Eastern Suburb: This part of the city is less congested than the Island City and the Western Suburb. Northbound traffic during evening peak faces the highest level of congestion; 55% of traffic moves at a speed lower than 20 kmph. Congestion is low at most other times of the day in this part of the city.
4.4 Travel modes and their contribution to traffic congestion in Mumbai
According to the Comprehensive Mobility Plan (CMP, 2016) for Greater Mumbai (commissioned by the MCGM), only 18%41of all trips are on private motor vehicles and taxis, in part due to the city’s comparatively robust public transport service amongst Indian cities.
Figure 9 Share of trips by various travel modes (CMP 2016)
However, the rate of growth of private motor vehicles has been alarming; they tripled between 2002 and 2017, going from 0.82 million to 2.7 million vehicles.42 The use of taxis, especially app-based ones, has risen dramatically in recent years. This spurt was partly induced by new road infrastructure, in particular the Western and Eastern expressways and over 5043 flyovers under the Mumbai Traffic Improvement Mega Project.
Meanwhile, passenger trips on city buses operated by BEST (Brihanmumbai Electric Supply & Transport Undertaking) dramatically dropped from 4.6 million per day in 2009 to 2.8 million daily by 2017.44 As per recent news reports, daily ridership on BEST buses has gone
41 5% trips are by cars, 4% by motorised two wheelers , 3% by taxis and 6% by autos as per CMP
42 Ministry of Road Transport and Highways. Road Transport Yearbook. 2002-2017
43 https://msrdc.org/Site/Common/ProjectListDetails.aspx?ID=73&MainId=18
44 Administrative Report. (2009-17). The Brihanmumbai Electric Supply & Transport Undertaking
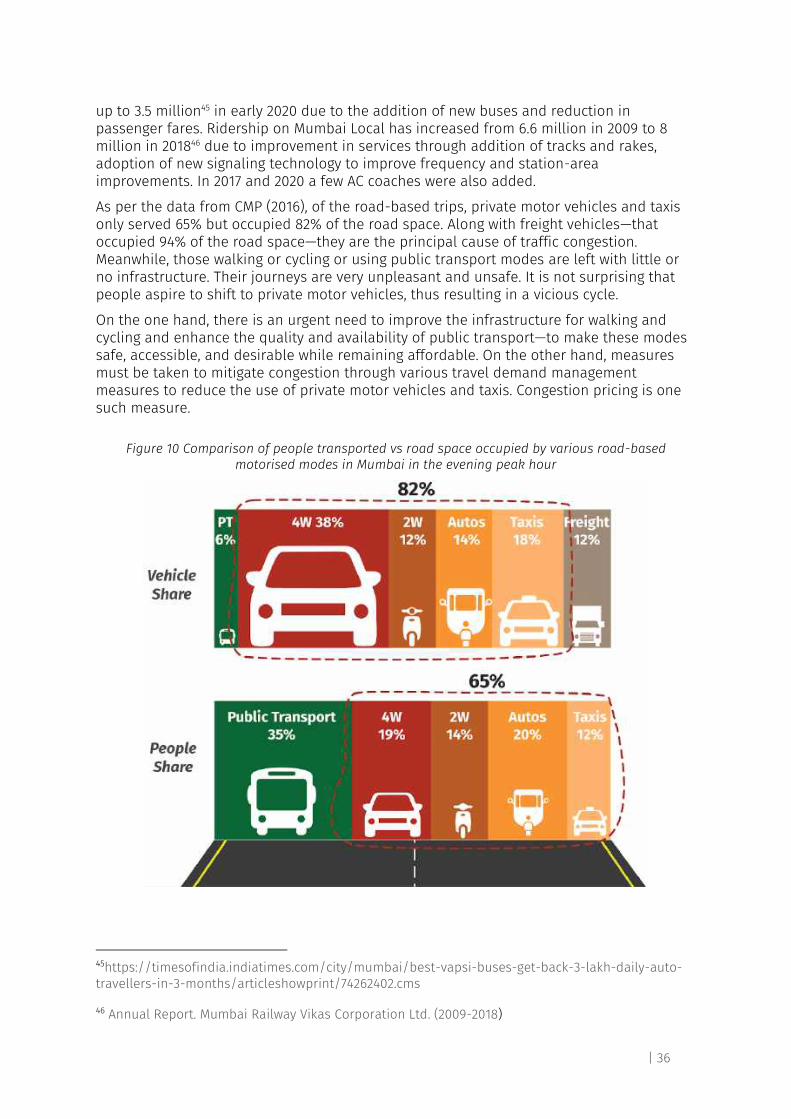
| 36
up to 3.5 million45 in early 2020 due to the addition of new buses and reduction in passenger fares. Ridership on Mumbai Local has increased from 6.6 million in 2009 to 8 million in 201846 due to improvement in services through addition of tracks and rakes, adoption of new signaling technology to improve frequency and station-area improvements. In 2017 and 2020 a few AC coaches were also added.
As per the data from CMP (2016), of the road-based trips, private motor vehicles and taxis only served 65% but occupied 82% of the road space. Along with freight vehicles—that occupied 94% of the road space—they are the principal cause of traffic congestion. Meanwhile, those walking or cycling or using public transport modes are left with little or no infrastructure. Their journeys are very unpleasant and unsafe. It is not surprising that people aspire to shift to private motor vehicles, thus resulting in a vicious cycle.
On the one hand, there is an urgent need to improve the infrastructure for walking and cycling and enhance the quality and availability of public transport—to make these modes safe, accessible, and desirable while remaining affordable. On the other hand, measures must be taken to mitigate congestion through various travel demand management measures to reduce the use of private motor vehicles and taxis. Congestion pricing is one such measure.
Figure 10 Comparison of people transported vs road space occupied by various road-based motorised modes in Mumbai in the evening peak hour
45https://timesofindia.indiatimes.com/city/mumbai/best-vapsi-buses-get-back-3-lakh-daily-auto-travellers-in-3-months/articleshowprint/74262402.cms
46 Annual Report. Mumbai Railway Vikas Corporation Ltd. (2009-2018)
| 37
4.5 Current and proposed public transport network in Greater Mumbai
People in the region heavily depend on public transport, primarily the suburban rail and public city bus service. With rapid urbanization of the region and influx of population every year, the pressure on public transportation has increased enormously. Considering the rising demand for mobility and the strained condition of existing public transport systems, MMRDA is developing an extensive network of metro rail. A line each of metro rail and monorail are operational. MMRDA has also proposed the expansion of suburban rail network.
4.5.1 Mumbai suburban rail network
Mumbai Suburban Rail, called the Local in common parlance, is the lifeline of the region. The 433 km network47 carries 8 million passengers every day48 which is 68% of all public transport trips and 47% of all motorized trips49.
MMRDA has also proposed a new suburban rail network of 248 km in the Mumbai Metropolitan Regional Plan 2036. There are existing rail lines in MMR that are currently not part of the suburban network. MMRDA has proposed that all existing railway networks in MMR will be suburbanized on priority, in view of the current spatial trends and to boost development in the peripheries of MMR with a view towards a more balanced regional development.50
4.5.2 Fleet and ridership of BEST buses
In Greater Mumbai, Brihanmumbai Electric Supply and Transport Undertaking (BEST) is the principal public bus transport service provider with a fleet strength of 3392 buses51, carrying around 3.5 million passengers every day. According to 2014 data, total bus trips account for 18% of total trips (excluding walking and cycling trips) in Greater Mumbai52. However, the number of buses on the road and the daily ridership of BEST has been dropping over the last few years.
Greater Mumbai does not have a BRT system. The buses share the carriageway with other vehicles, and hence their operating speed is adversely affected by traffic congestion. Therefore, it may be useful to explore the possibility of implementing congestion pricing along corridors with a high frequency of BEST buses. Congestion pricing may also allow the simultaneous creation of a BRT system.
47 cr.indianrailways.gov.in/cris/view_section.jsp?lang=0&id=0,6,287,391,561,1025 https://wr.indianrailways.gov.in/view_section.jsp?lang=0&id=0,6,629
48 2017-18 Annual Report. Mumbai Railway Vikas Corporation Ltd.
49 Comprehensive Mobility Plan for Greater Mumbai. MCGM. 2016
50 Mumbai Metropolitan Regional Plan 2016-2036
51 Administrative Report. BEST Undertaking. 2015-16
52 Comprehensive Mobility Plan for Greater Mumbai. MCGM. 2016
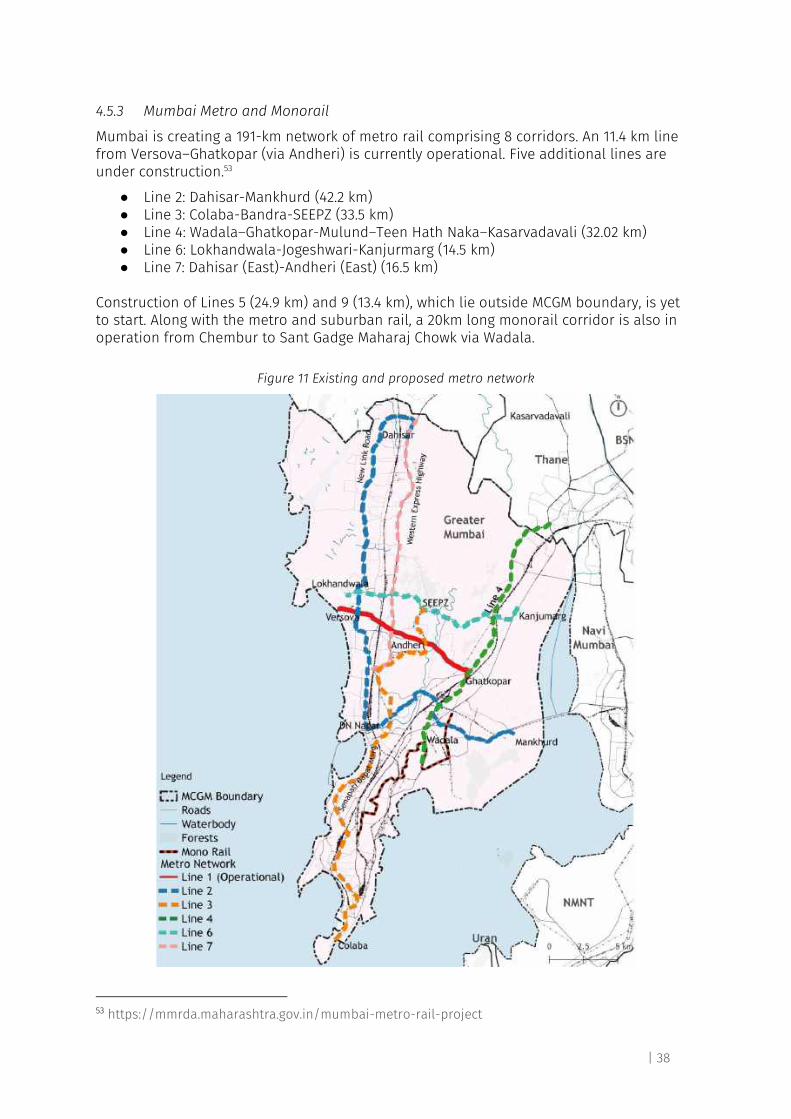
| 38
4.5.3 Mumbai Metro and Monorail
Mumbai is creating a 191-km network of metro rail comprising 8 corridors. An 11.4 km line from Versova–Ghatkopar (via Andheri) is currently operational. Five additional lines are under construction.53
● Line 2: Dahisar-Mankhurd (42.2 km) ● Line 3: Colaba-Bandra-SEEPZ (33.5 km) ● Line 4: Wadala–Ghatkopar-Mulund–Teen Hath Naka–Kasarvadavali (32.02 km) ● Line 6: Lokhandwala-Jogeshwari-Kanjurmarg (14.5 km) ● Line 7: Dahisar (East)-Andheri (East) (16.5 km)
Construction of Lines 5 (24.9 km) and 9 (13.4 km), which lie outside MCGM boundary, is yet to start. Along with the metro and suburban rail, a 20km long monorail corridor is also in operation from Chembur to Sant Gadge Maharaj Chowk via Wadala.
Figure 11 Existing and proposed metro network
53 https://mmrda.maharashtra.gov.in/mumbai-metro-rail-project
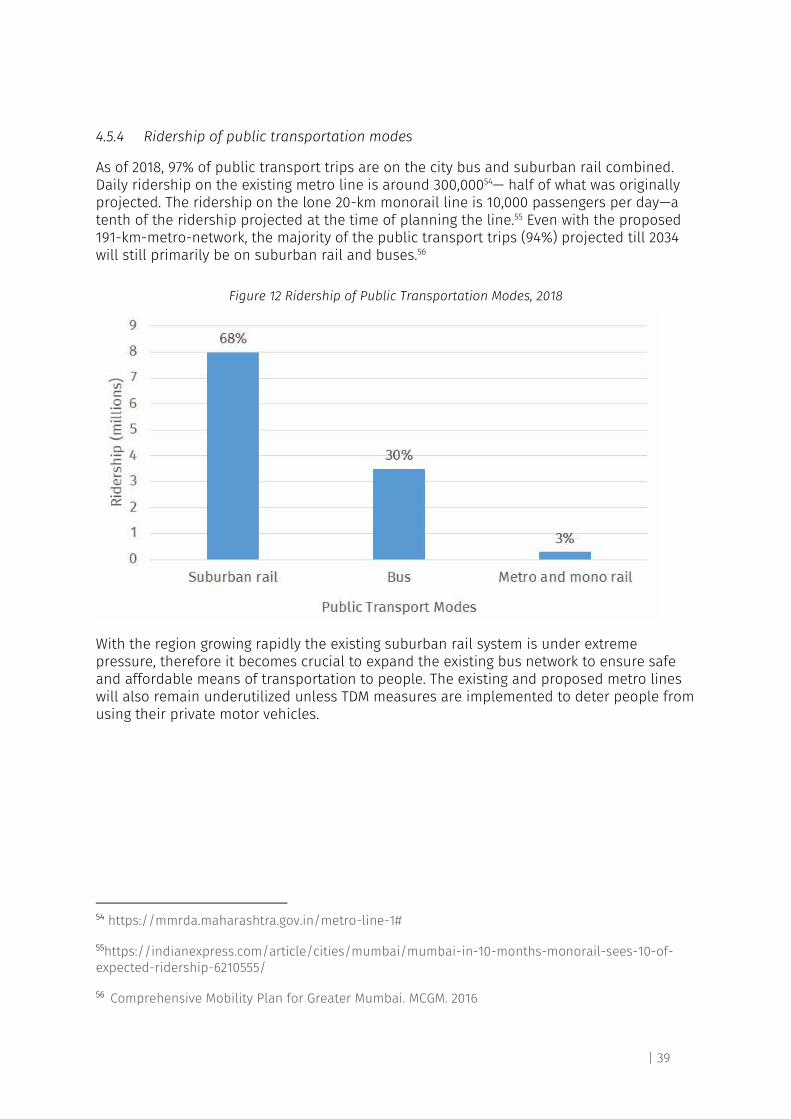
| 39
4.5.4 Ridership of public transportation modes
As of 2018, 97% of public transport trips are on the city bus and suburban rail combined. Daily ridership on the existing metro line is around 300,00054— half of what was originally projected. The ridership on the lone 20-km monorail line is 10,000 passengers per day—a tenth of the ridership projected at the time of planning the line.55 Even with the proposed 191-km-metro-network, the majority of the public transport trips (94%) projected till 2034 will still primarily be on suburban rail and buses.56
Figure 12 Ridership of Public Transportation Modes, 2018
With the region growing rapidly the existing suburban rail system is under extreme pressure, therefore it becomes crucial to expand the existing bus network to ensure safe and affordable means of transportation to people. The existing and proposed metro lines will also remain underutilized unless TDM measures are implemented to deter people from using their private motor vehicles.
54 https://mmrda.maharashtra.gov.in/metro-line-1#
55https://indianexpress.com/article/cities/mumbai/mumbai-in-10-months-monorail-sees-10-of-expected-ridership-6210555/
56 Comprehensive Mobility Plan for Greater Mumbai. MCGM. 2016
| 40
5 Planning for Congestion Pricing in Mumbai
5.1 Introduction to the chapter
The previous chapter identified key congested locations in Mumbai. This chapter presents a detailed assessment of traffic volumes at these locations and the extent of traffic reduction needed at different hours of the day at these locations to achieve the desired speeds.
The key steps of this process are as follows:
● Count traffic volumes and occupancy, disaggregated by vehicle type, on the congested stretches (identified in the previous chapter).
● Compare traffic volume at each hour of the day on these stretches with the capacity of the road. Identify the hours when traffic volume exceeds the limit where the level of service (LOS) drops from C to D. Derive the percentage reduction in traffic required to bring traffic flow to LOS C.
● Based on the congestion pattern in the city, deploy one or more of the three congestion pricing measures i.e area pricing, corridor pricing, and network pricing.
This chapter also highlights the need for well-designed streets and their management, the absence of which can also be an important reason for traffic congestion. These must be resolved prior to implementing a measure like congestion pricing.
5.2 Preparing a congestion pricing plan for Greater Mumbai
The first step of preparing a congestion pricing plan is to map traffic speeds at all hours of a day on the entire primary road network of the city, for a typical week. This mapping helps identify congested areas and corridors and the peak hours of congestion at these locations. The next step is to count traffic volumes and occupancy for each vehicle type at these critically congested locations.
Traffic flow is categorized from Level of Service A (condition of free flow) to Level of Service F (very slow traffic when there are stop-go conditions). The traffic moves smoothly till LOS C. LOS D onwards, the vehicular movement is affected and level of comfort and convenience becomes poor. Thus, area(s) and/or corridor(s) which are operating at a level of service worse than ‘C’ can be considered for implementing congestion pricing. Further analysis should be done of such areas/corridors.
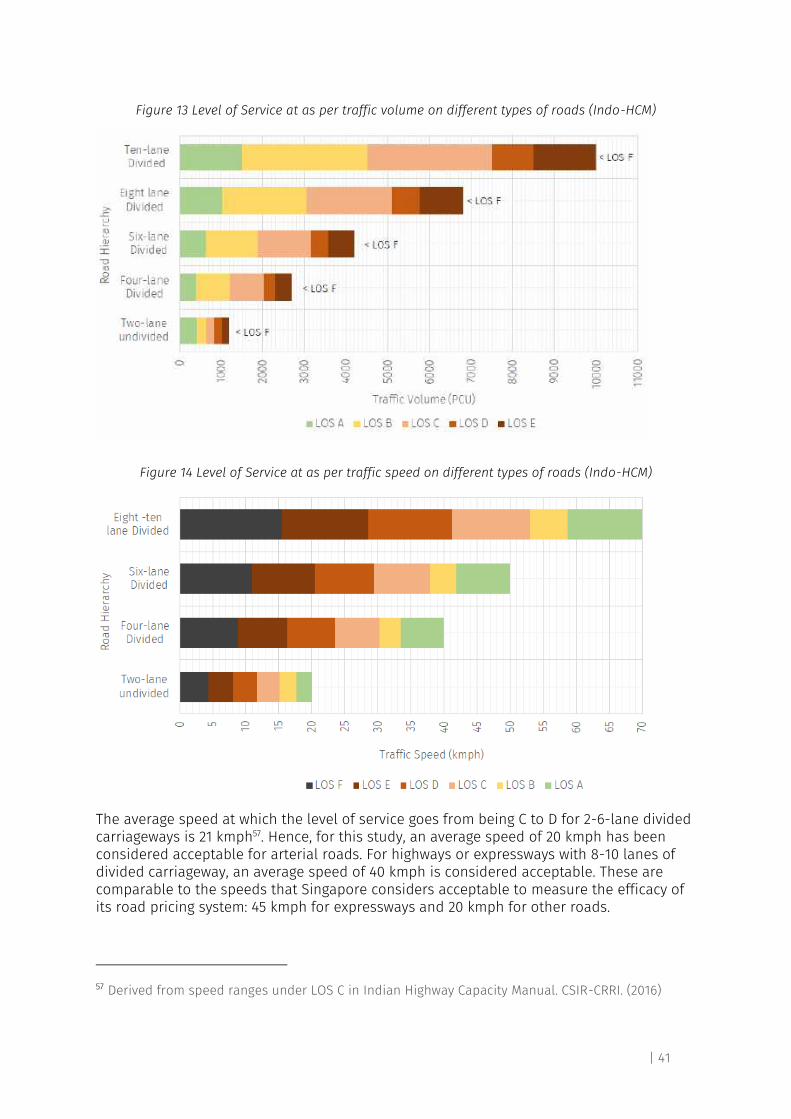
| 41
Figure 13 Level of Service at as per traffic volume on different types of roads (Indo-HCM)
Figure 14 Level of Service at as per traffic speed on different types of roads (Indo-HCM)
The average speed at which the level of service goes from being C to D for 2-6-lane divided carriageways is 21 kmph57. Hence, for this study, an average speed of 20 kmph has been considered acceptable for arterial roads. For highways or expressways with 8-10 lanes of divided carriageway, an average speed of 40 kmph is considered acceptable. These are comparable to the speeds that Singapore considers acceptable to measure the efficacy of its road pricing system: 45 kmph for expressways and 20 kmph for other roads.
57 Derived from speed ranges under LOS C in Indian Highway Capacity Manual. CSIR-CRRI. (2016)
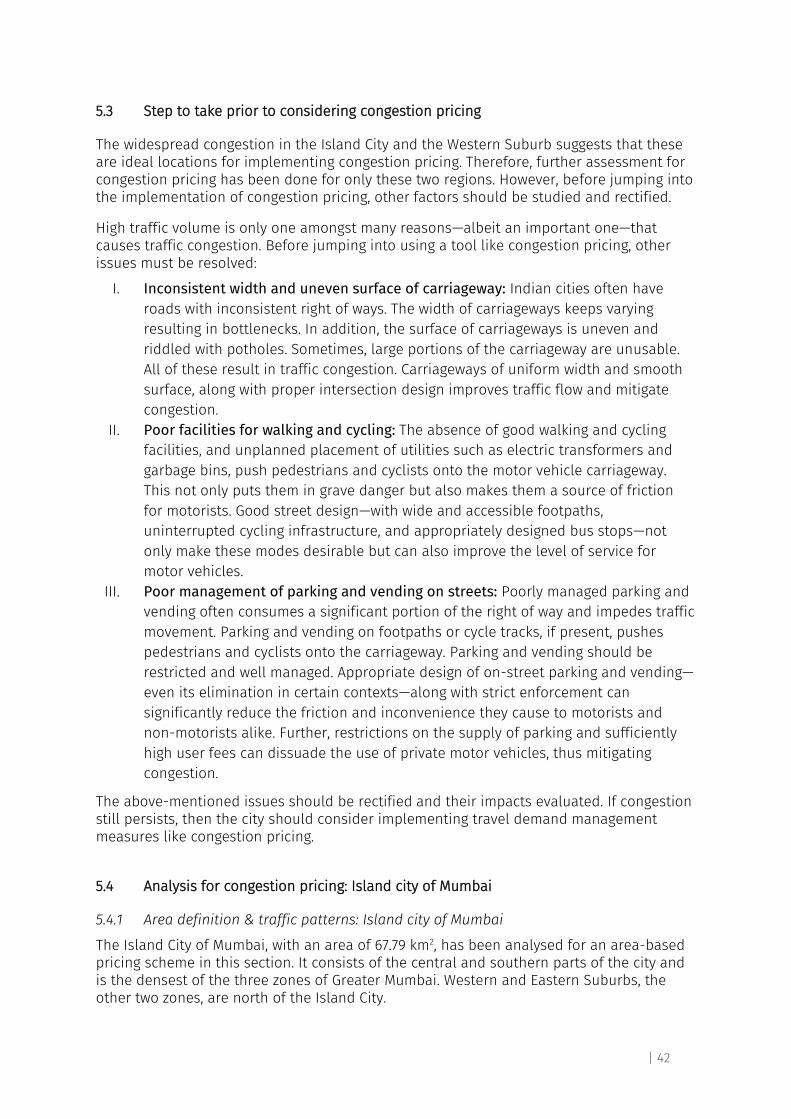
| 42
5.3 Step to take prior to considering congestion pricing
The widespread congestion in the Island City and the Western Suburb suggests that these are ideal locations for implementing congestion pricing. Therefore, further assessment for congestion pricing has been done for only these two regions. However, before jumping into the implementation of congestion pricing, other factors should be studied and rectified.
High traffic volume is only one amongst many reasons—albeit an important one—that causes traffic congestion. Before jumping into using a tool like congestion pricing, other issues must be resolved:
I. Inconsistent width and uneven surface of carriageway: Indian cities often have roads with inconsistent right of ways. The width of carriageways keeps varying resulting in bottlenecks. In addition, the surface of carriageways is uneven and riddled with potholes. Sometimes, large portions of the carriageway are unusable. All of these result in traffic congestion. Carriageways of uniform width and smooth surface, along with proper intersection design improves traffic flow and mitigate congestion.
II. Poor facilities for walking and cycling: The absence of good walking and cycling facilities, and unplanned placement of utilities such as electric transformers and garbage bins, push pedestrians and cyclists onto the motor vehicle carriageway. This not only puts them in grave danger but also makes them a source of friction for motorists. Good street design—with wide and accessible footpaths, uninterrupted cycling infrastructure, and appropriately designed bus stops—not only make these modes desirable but can also improve the level of service for motor vehicles.
III. Poor management of parking and vending on streets: Poorly managed parking and vending often consumes a significant portion of the right of way and impedes traffic movement. Parking and vending on footpaths or cycle tracks, if present, pushes pedestrians and cyclists onto the carriageway. Parking and vending should be restricted and well managed. Appropriate design of on-street parking and vending—even its elimination in certain contexts—along with strict enforcement can significantly reduce the friction and inconvenience they cause to motorists and non-motorists alike. Further, restrictions on the supply of parking and sufficiently high user fees can dissuade the use of private motor vehicles, thus mitigating congestion.
The above-mentioned issues should be rectified and their impacts evaluated. If congestion still persists, then the city should consider implementing travel demand management measures like congestion pricing.
5.4 Analysis for congestion pricing: Island city of Mumbai
5.4.1 Area definition & traffic patterns: Island city of Mumbai
The Island City of Mumbai, with an area of 67.79 km2, has been analysed for an area-based pricing scheme in this section. It consists of the central and southern parts of the city and is the densest of the three zones of Greater Mumbai. Western and Eastern Suburbs, the other two zones, are north of the Island City.
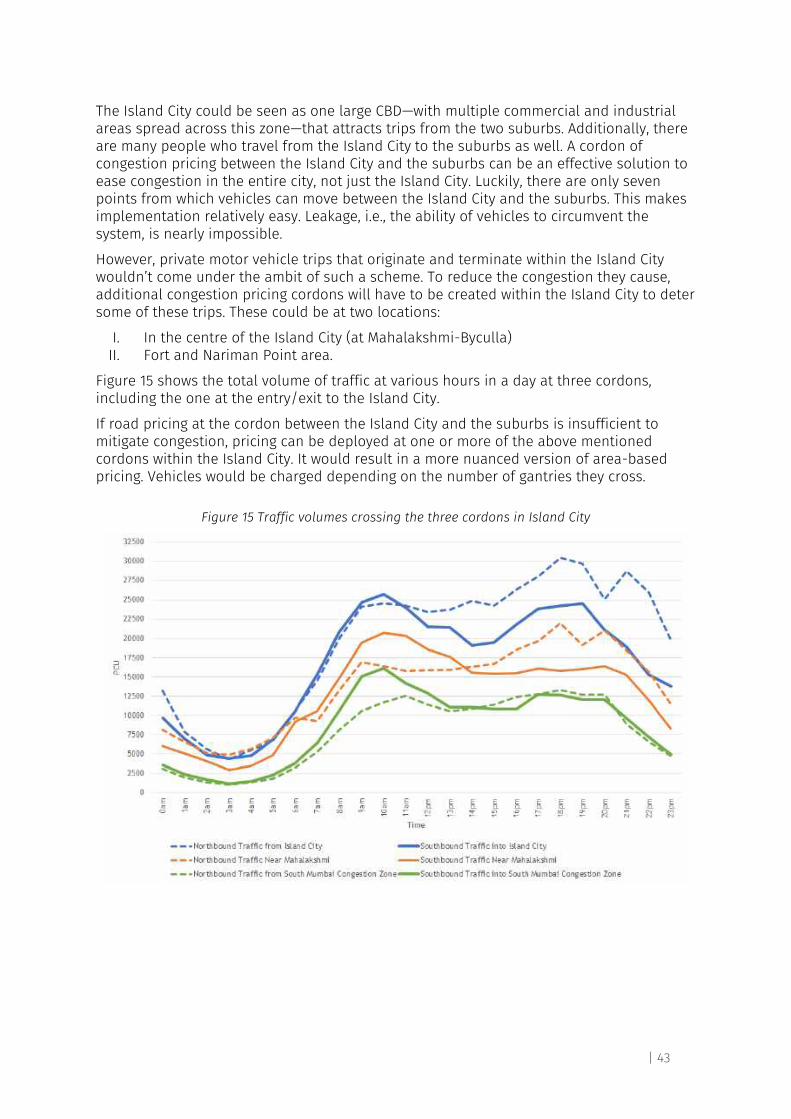
| 43
The Island City could be seen as one large CBD—with multiple commercial and industrial areas spread across this zone—that attracts trips from the two suburbs. Additionally, there are many people who travel from the Island City to the suburbs as well. A cordon of congestion pricing between the Island City and the suburbs can be an effective solution to ease congestion in the entire city, not just the Island City. Luckily, there are only seven points from which vehicles can move between the Island City and the suburbs. This makes implementation relatively easy. Leakage, i.e., the ability of vehicles to circumvent the system, is nearly impossible.
However, private motor vehicle trips that originate and terminate within the Island City wouldn’t come under the ambit of such a scheme. To reduce the congestion they cause, additional congestion pricing cordons will have to be created within the Island City to deter some of these trips. These could be at two locations:
I. In the centre of the Island City (at Mahalakshmi-Byculla) II. Fort and Nariman Point area.
Figure 15 shows the total volume of traffic at various hours in a day at three cordons, including the one at the entry/exit to the Island City.
If road pricing at the cordon between the Island City and the suburbs is insufficient to mitigate congestion, pricing can be deployed at one or more of the above mentioned cordons within the Island City. It would result in a more nuanced version of area-based pricing. Vehicles would be charged depending on the number of gantries they cross.
Figure 15 Traffic volumes crossing the three cordons in Island City
| 44
Figure 16 Traffic Speeds in the Island City of Greater Mumbai and potential congestion pricing cordons
5.4.2 Implementation plan for Island city of Mumbai
The seven roads that provide entry into the Island City are as follows:
● Bandra-Worli Sea Link (8-lanes) ● SV Road (4 lanes) ● Sion-Bandra Link Road (6-lanes) ● LBS Road (4-lanes)
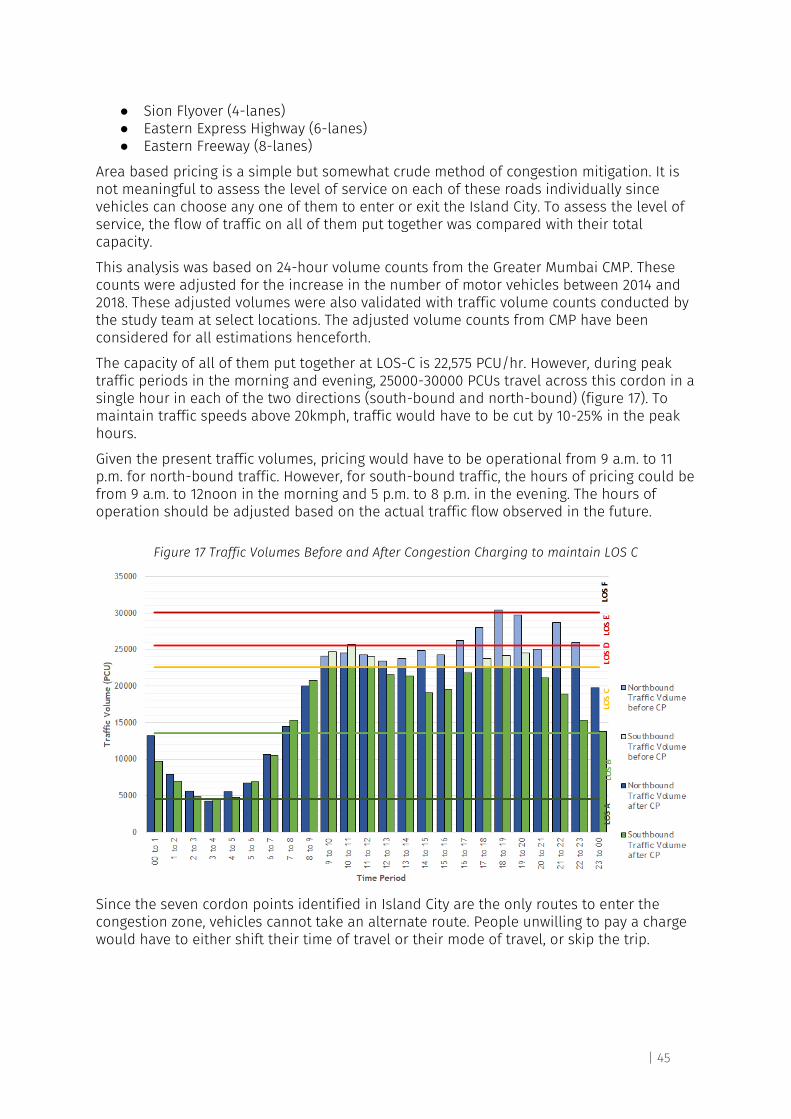
| 45
● Sion Flyover (4-lanes) ● Eastern Express Highway (6-lanes) ● Eastern Freeway (8-lanes)
Area based pricing is a simple but somewhat crude method of congestion mitigation. It is not meaningful to assess the level of service on each of these roads individually since vehicles can choose any one of them to enter or exit the Island City. To assess the level of service, the flow of traffic on all of them put together was compared with their total capacity.
This analysis was based on 24-hour volume counts from the Greater Mumbai CMP. These counts were adjusted for the increase in the number of motor vehicles between 2014 and 2018. These adjusted volumes were also validated with traffic volume counts conducted by the study team at select locations. The adjusted volume counts from CMP have been considered for all estimations henceforth.
The capacity of all of them put together at LOS-C is 22,575 PCU/hr. However, during peak traffic periods in the morning and evening, 25000-30000 PCUs travel across this cordon in a single hour in each of the two directions (south-bound and north-bound) (figure 17). To maintain traffic speeds above 20kmph, traffic would have to be cut by 10-25% in the peak hours.
Given the present traffic volumes, pricing would have to be operational from 9 a.m. to 11 p.m. for north-bound traffic. However, for south-bound traffic, the hours of pricing could be from 9 a.m. to 12noon in the morning and 5 p.m. to 8 p.m. in the evening. The hours of operation should be adjusted based on the actual traffic flow observed in the future.
Figure 17 Traffic Volumes Before and After Congestion Charging to maintain LOS C
Since the seven cordon points identified in Island City are the only routes to enter the congestion zone, vehicles cannot take an alternate route. People unwilling to pay a charge would have to either shift their time of travel or their mode of travel, or skip the trip.
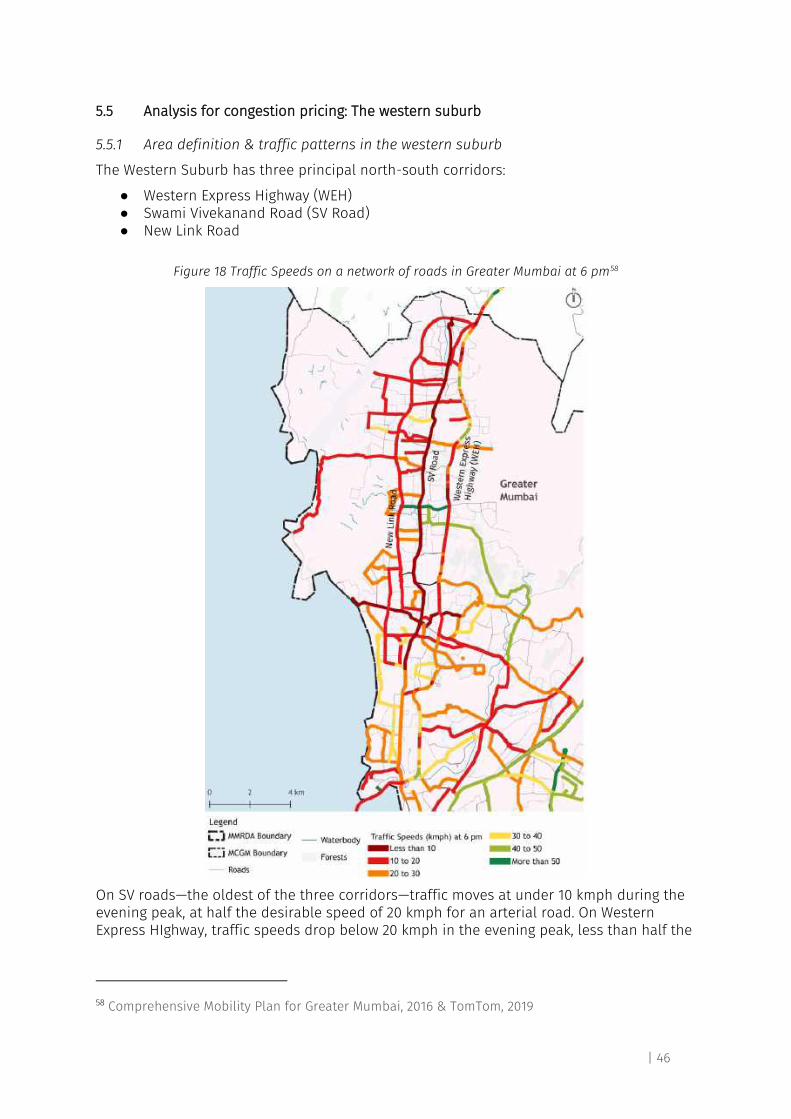
| 46
5.5 Analysis for congestion pricing: The western suburb
5.5.1 Area definition & traffic patterns in the western suburb
The Western Suburb has three principal north-south corridors:
● Western Express Highway (WEH) ● Swami Vivekanand Road (SV Road) ● New Link Road
Figure 18 Traffic Speeds on a network of roads in Greater Mumbai at 6 pm58
On SV roads—the oldest of the three corridors—traffic moves at under 10 kmph during the evening peak, at half the desirable speed of 20 kmph for an arterial road. On Western Express HIghway, traffic speeds drop below 20 kmph in the evening peak, less than half the
58 Comprehensive Mobility Plan for Greater Mumbai, 2016 & TomTom, 2019
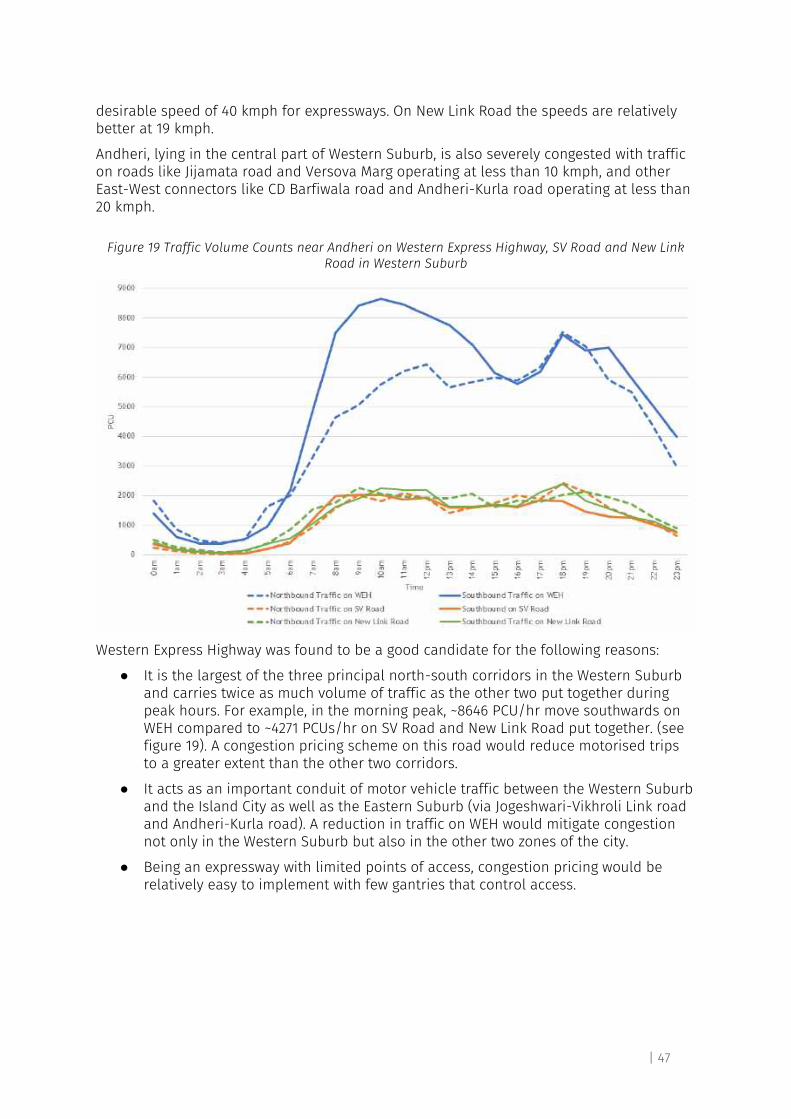
| 47
desirable speed of 40 kmph for expressways. On New Link Road the speeds are relatively better at 19 kmph.
Andheri, lying in the central part of Western Suburb, is also severely congested with traffic on roads like Jijamata road and Versova Marg operating at less than 10 kmph, and other East-West connectors like CD Barfiwala road and Andheri-Kurla road operating at less than 20 kmph.
Figure 19 Traffic Volume Counts near Andheri on Western Express Highway, SV Road and New Link Road in Western Suburb
Western Express Highway was found to be a good candidate for the following reasons:
● It is the largest of the three principal north-south corridors in the Western Suburb and carries twice as much volume of traffic as the other two put together during peak hours. For example, in the morning peak, ~8646 PCU/hr move southwards on WEH compared to ~4271 PCUs/hr on SV Road and New Link Road put together. (see figure 19). A congestion pricing scheme on this road would reduce motorised trips to a greater extent than the other two corridors.
● It acts as an important conduit of motor vehicle traffic between the Western Suburb and the Island City as well as the Eastern Suburb (via Jogeshwari-Vikhroli Link road and Andheri-Kurla road). A reduction in traffic on WEH would mitigate congestion not only in the Western Suburb but also in the other two zones of the city.
● Being an expressway with limited points of access, congestion pricing would be relatively easy to implement with few gantries that control access.
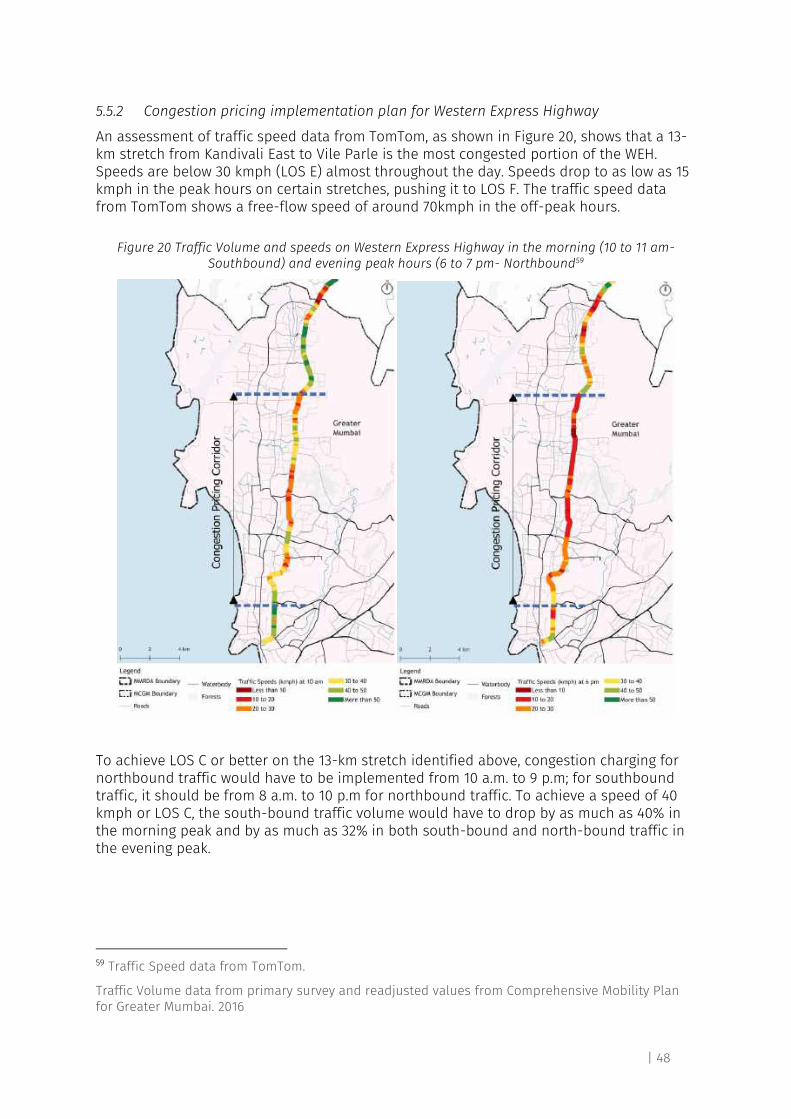
| 48
5.5.2 Congestion pricing implementation plan for Western Express Highway
An assessment of traffic speed data from TomTom, as shown in Figure 20, shows that a 13-km stretch from Kandivali East to Vile Parle is the most congested portion of the WEH. Speeds are below 30 kmph (LOS E) almost throughout the day. Speeds drop to as low as 15 kmph in the peak hours on certain stretches, pushing it to LOS F. The traffic speed data from TomTom shows a free-flow speed of around 70kmph in the off-peak hours.
Figure 20 Traffic Volume and speeds on Western Express Highway in the morning (10 to 11 am- Southbound) and evening peak hours (6 to 7 pm- Northbound59
To achieve LOS C or better on the 13-km stretch identified above, congestion charging for northbound traffic would have to be implemented from 10 a.m. to 9 p.m; for southbound traffic, it should be from 8 a.m. to 10 p.m for northbound traffic. To achieve a speed of 40 kmph or LOS C, the south-bound traffic volume would have to drop by as much as 40% in the morning peak and by as much as 32% in both south-bound and north-bound traffic in the evening peak.
59 Traffic Speed data from TomTom.
Traffic Volume data from primary survey and readjusted values from Comprehensive Mobility Plan for Greater Mumbai. 2016
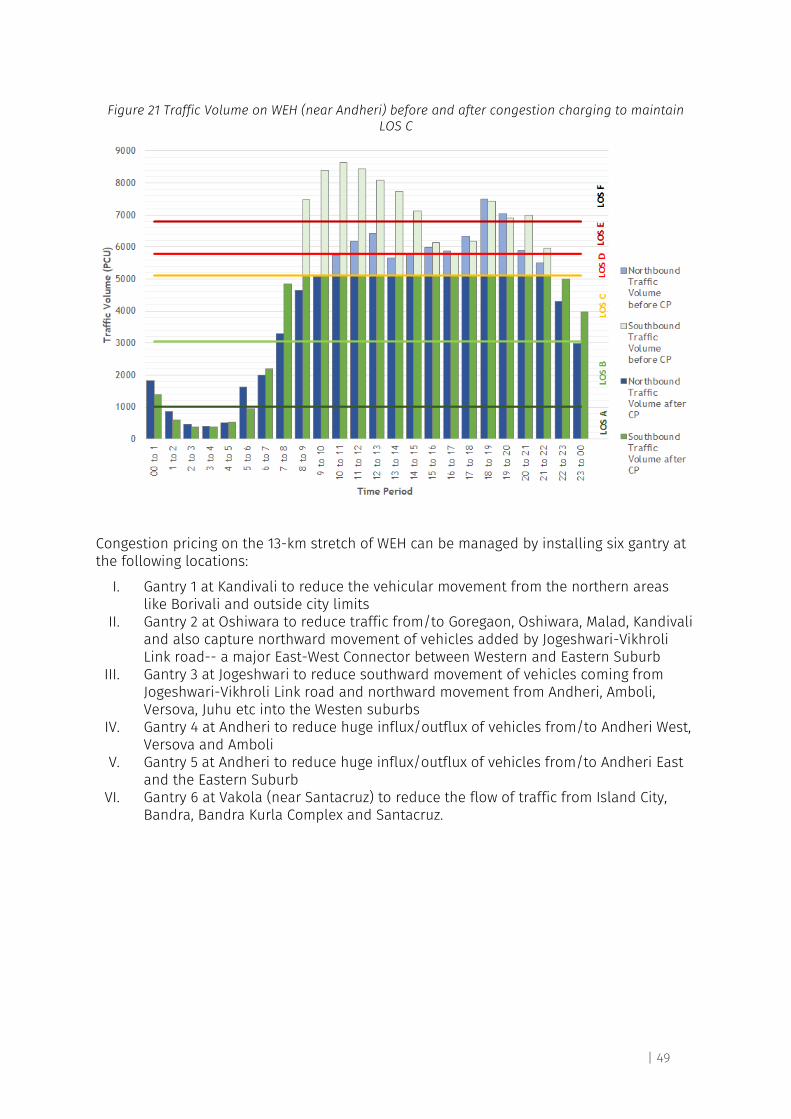
| 49
Figure 21 Traffic Volume on WEH (near Andheri) before and after congestion charging to maintain LOS C
Congestion pricing on the 13-km stretch of WEH can be managed by installing six gantry at the following locations:
I. Gantry 1 at Kandivali to reduce the vehicular movement from the northern areas like Borivali and outside city limits
II. Gantry 2 at Oshiwara to reduce traffic from/to Goregaon, Oshiwara, Malad, Kandivali and also capture northward movement of vehicles added by Jogeshwari-Vikhroli Link road-- a major East-West Connector between Western and Eastern Suburb
III. Gantry 3 at Jogeshwari to reduce southward movement of vehicles coming from Jogeshwari-Vikhroli Link road and northward movement from Andheri, Amboli, Versova, Juhu etc into the Westen suburbs
IV. Gantry 4 at Andheri to reduce huge influx/outflux of vehicles from/to Andheri West, Versova and Amboli
V. Gantry 5 at Andheri to reduce huge influx/outflux of vehicles from/to Andheri East and the Eastern Suburb
VI. Gantry 6 at Vakola (near Santacruz) to reduce the flow of traffic from Island City, Bandra, Bandra Kurla Complex and Santacruz.
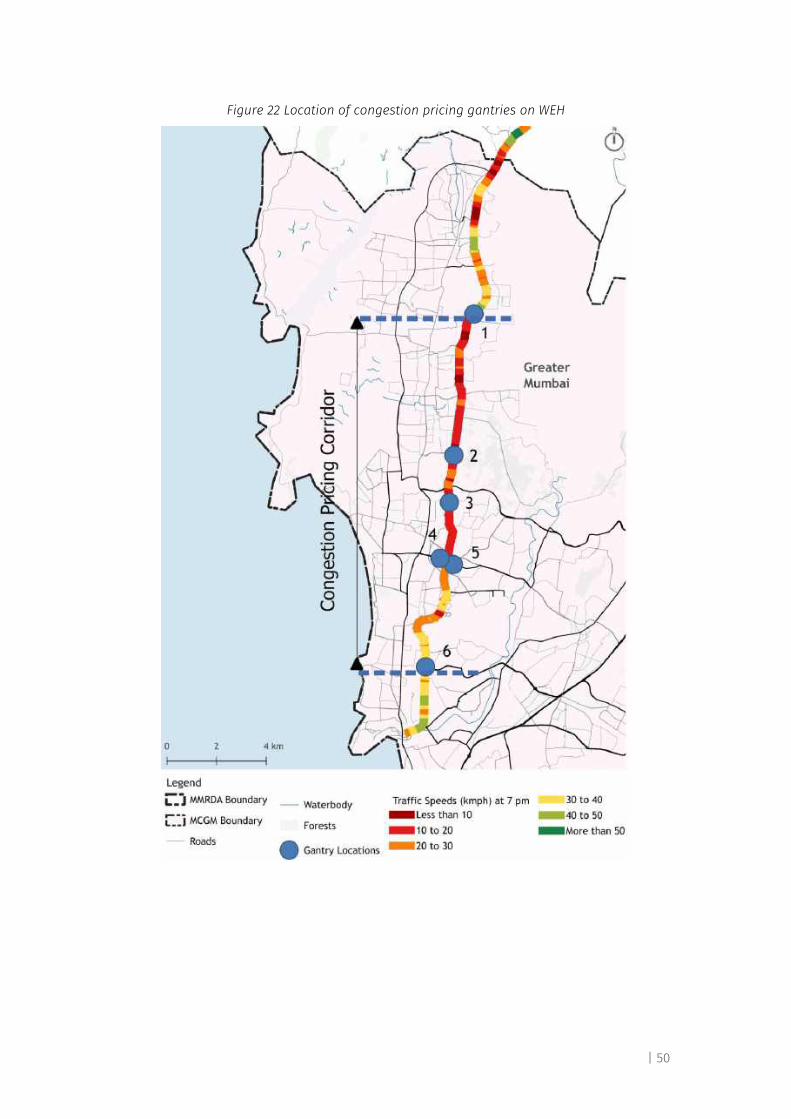
| 50
Figure 22 Location of congestion pricing gantries on WEH
| 51
5.6 Network-based congestion pricing in Greater Mumbai
In Greater Mumbai, traffic congestion is widespread. Though congestion in the Eastern Suburb is marginally lower than the other two zones of the city, it is only a matter of time before it gets worse there too unless TDM measures are implemented.
With such levels of congestion, Greater Mumbai can also consider implementing a pan-city network-based congestion pricing scheme as described in section 3.1.3. However, the technology required for network-based pricing has not matured as of yet, and implementing it across all modes throughout the city may be difficult. As cities like Singapore pilot it and improve the technology, this model of congestion pricing could become the norm in the future.
Presently, Mumbai can consider implementing a network-based congestion charge on taxis and auto-rickshaws like São Paulo has. One of the prerequisites for such a system is real-time vehicle tracking. As per the Indian Motor Vehicles (Vehicle Location and Tracking Device and Emergency Button) Order (2018), all public transport vehicles that come under the rules will have to be fitted with a vehicle location tracker.
Currently, the number of taxis and autos in the city is about a third of private cars. However, taxis and autos contribute to 70% more vehicular trips as compared to cars. Thus, bringing them under the ambit of congestion pricing can dramatically reduce the Vehicle Kilometres Travelled (VKT) and, therefore, the congestion in the city. In the coming years, as the technology matures, other modes can also be charged through such a system.
5.7 Conclusion
This chapter assessed the level of congestion in the Island City of Mumbai and Western Suburb and proposed appropriate congestion pricing schemes for these two zones. Further, it recommended a pan-city network-based pricing scheme for taxis and auto-rickshaws. The next chapter will address the pricing structure for these different schemes.
| 52
6 Pricing Structure for Congestion Charging in Mumbai
6.1 Introduction to the chapter
This chapter addressed the question of setting user fees that will deter neither too many nor too few from using the congestion-prone areas or corridors. The following steps will help the city in deriving the right price:
● Conduct focus group discussions with a cross-section of citizens to understand people’s perspectives.
● Follow-up on the focus group discussions with a willingness-to-pay survey of a large sample of respondents.
● Use the findings from the survey to deduce the relationship between user fees and traffic reduction for each mode of travel.
● Set the user fee for each vehicle type for each hour of the day at each one of the locations based on the ‘user fee - traffic volume’ relationship.
● Revise the congestion charge at each location, for each hour of the day, for different vehicle types at regular intervals (typically once every three months) based on observed traffic volumes using a predefined formula.
6.2 Determining which modes to charge and which ones to exempt
Private cars, taxis, and auto-rickshaws together constitute 82% of the volume of Mumbai's traffic. These modes are least efficient in terms of per capita road space consumption as well. For these reasons, imposing congestion charges on these modes becomes inevitable.
Two-wheelers constitute 12% of the traffic volume, comparatively lower than cars, taxis, and auto-rickshaws put together. Two-wheelers are cheaper than using cars and taxis and are more convenient than using public transport, especially for short to medium distance trips. Exempting two-wheelers could make their use even more attractive, thereby defeating the purpose of congestion pricing. Hence, two-wheelers can also be proportionately charged.
The number of goods vehicles might be small compared to motorised two-wheelers but their contribution to traffic is the same at 12%. Mumbai has taken some steps to restrict the entry of heavy goods vehicles in the peak hours. Light good vehicles may be allowed to operate at all hours but charged as per the road space they consume where congestion pricing is in force. Like other vehicles, light goods vehicles that do not wish to pay a congestion fee can operate during off-peak hours when congestion pricing isn’t in force, or chose an alternate route.
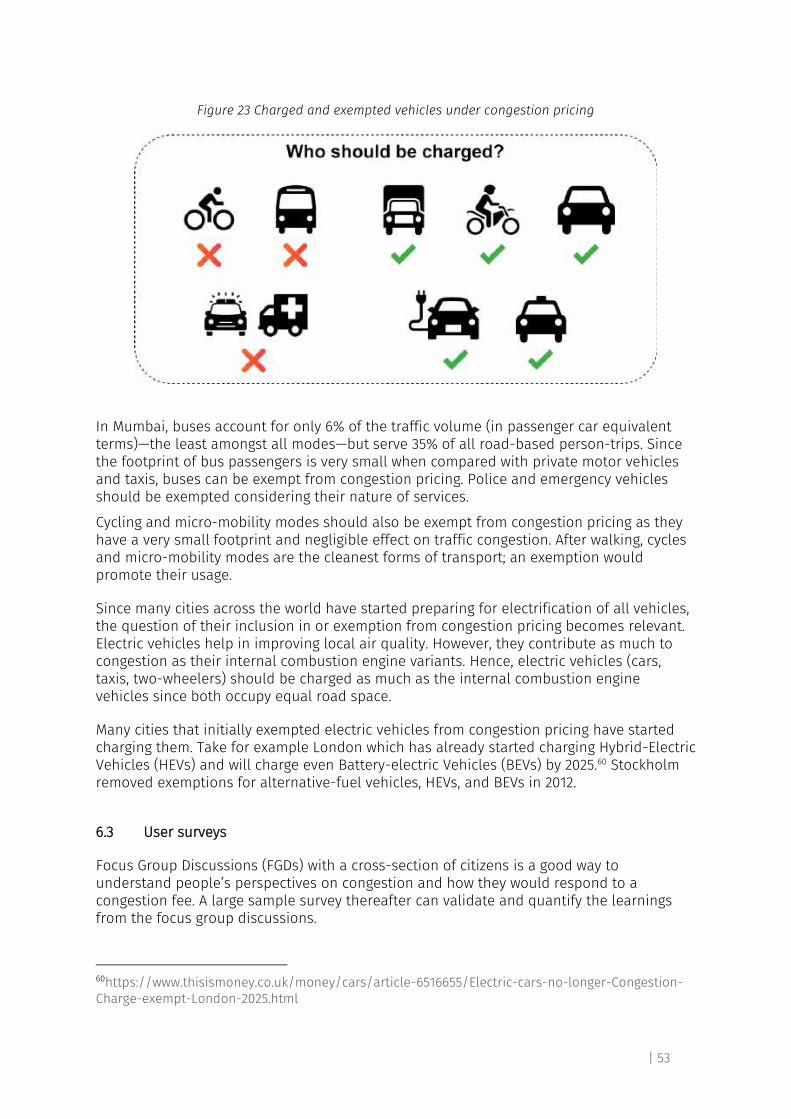
| 53
Figure 23 Charged and exempted vehicles under congestion pricing
In Mumbai, buses account for only 6% of the traffic volume (in passenger car equivalent terms)—the least amongst all modes—but serve 35% of all road-based person-trips. Since the footprint of bus passengers is very small when compared with private motor vehicles and taxis, buses can be exempt from congestion pricing. Police and emergency vehicles should be exempted considering their nature of services.
Cycling and micro-mobility modes should also be exempt from congestion pricing as they have a very small footprint and negligible effect on traffic congestion. After walking, cycles and micro-mobility modes are the cleanest forms of transport; an exemption would promote their usage.
Since many cities across the world have started preparing for electrification of all vehicles, the question of their inclusion in or exemption from congestion pricing becomes relevant. Electric vehicles help in improving local air quality. However, they contribute as much to congestion as their internal combustion engine variants. Hence, electric vehicles (cars, taxis, two-wheelers) should be charged as much as the internal combustion engine vehicles since both occupy equal road space.
Many cities that initially exempted electric vehicles from congestion pricing have started charging them. Take for example London which has already started charging Hybrid-Electric Vehicles (HEVs) and will charge even Battery-electric Vehicles (BEVs) by 2025.60 Stockholm removed exemptions for alternative-fuel vehicles, HEVs, and BEVs in 2012.
6.3 User surveys
Focus Group Discussions (FGDs) with a cross-section of citizens is a good way to understand people’s perspectives on congestion and how they would respond to a congestion fee. A large sample survey thereafter can validate and quantify the learnings from the focus group discussions.
60https://www.thisismoney.co.uk/money/cars/article-6516655/Electric-cars-no-longer-Congestion-Charge-exempt-London-2025.html
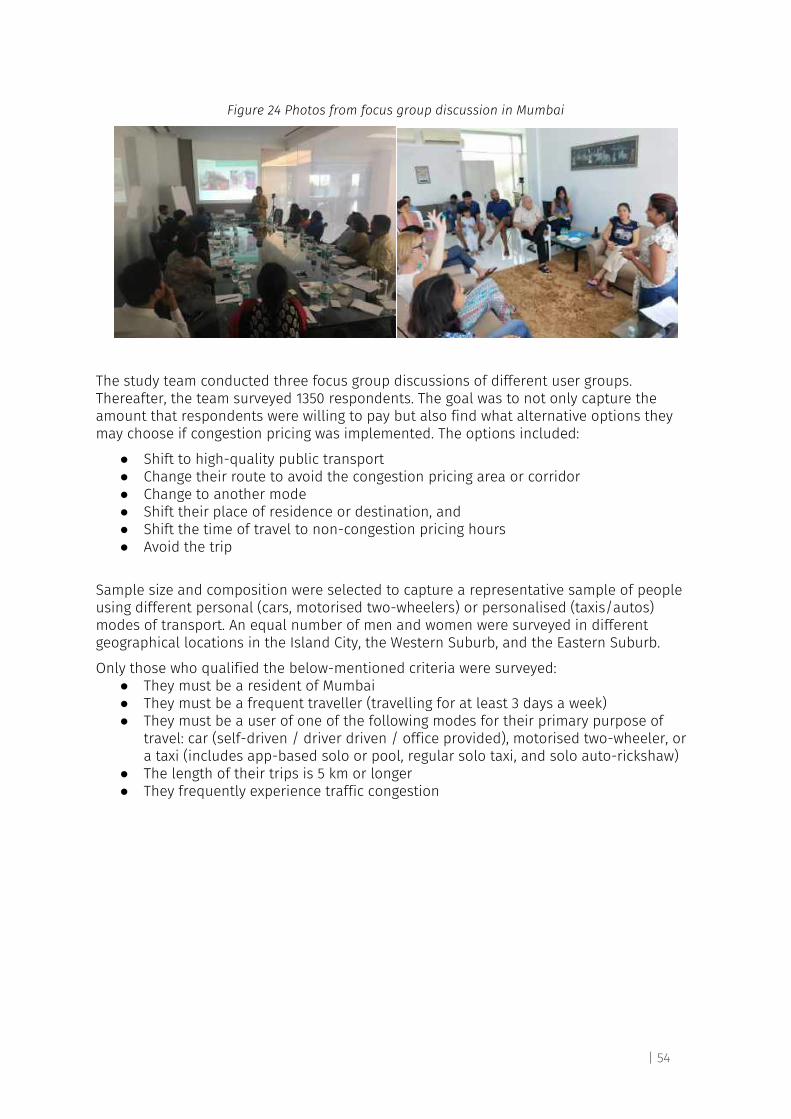
| 54
Figure 24 Photos from focus group discussion in Mumbai
The study team conducted three focus group discussions of different user groups. Thereafter, the team surveyed 1350 respondents. The goal was to not only capture the amount that respondents were willing to pay but also find what alternative options they may choose if congestion pricing was implemented. The options included:
● Shift to high-quality public transport ● Change their route to avoid the congestion pricing area or corridor ● Change to another mode ● Shift their place of residence or destination, and ● Shift the time of travel to non-congestion pricing hours ● Avoid the trip
Sample size and composition were selected to capture a representative sample of people using different personal (cars, motorised two-wheelers) or personalised (taxis/autos) modes of transport. An equal number of men and women were surveyed in different geographical locations in the Island City, the Western Suburb, and the Eastern Suburb.
Only those who qualified the below-mentioned criteria were surveyed: ● They must be a resident of Mumbai ● They must be a frequent traveller (travelling for at least 3 days a week) ● They must be a user of one of the following modes for their primary purpose of
travel: car (self-driven / driver driven / office provided), motorised two-wheeler, or a taxi (includes app-based solo or pool, regular solo taxi, and solo auto-rickshaw)
● The length of their trips is 5 km or longer ● They frequently experience traffic congestion
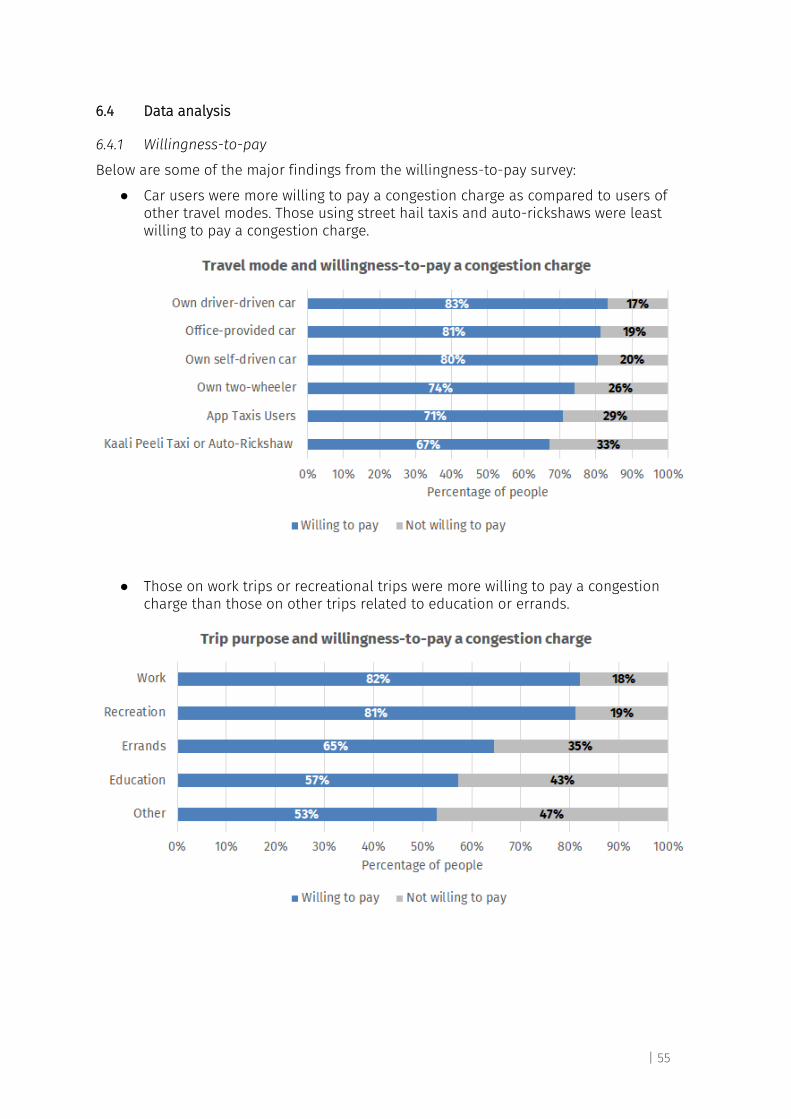
| 55
6.4 Data analysis
6.4.1 Willingness-to-pay
Below are some of the major findings from the willingness-to-pay survey:
● Car users were more willing to pay a congestion charge as compared to users of other travel modes. Those using street hail taxis and auto-rickshaws were least willing to pay a congestion charge.
● Those on work trips or recreational trips were more willing to pay a congestion charge than those on other trips related to education or errands.
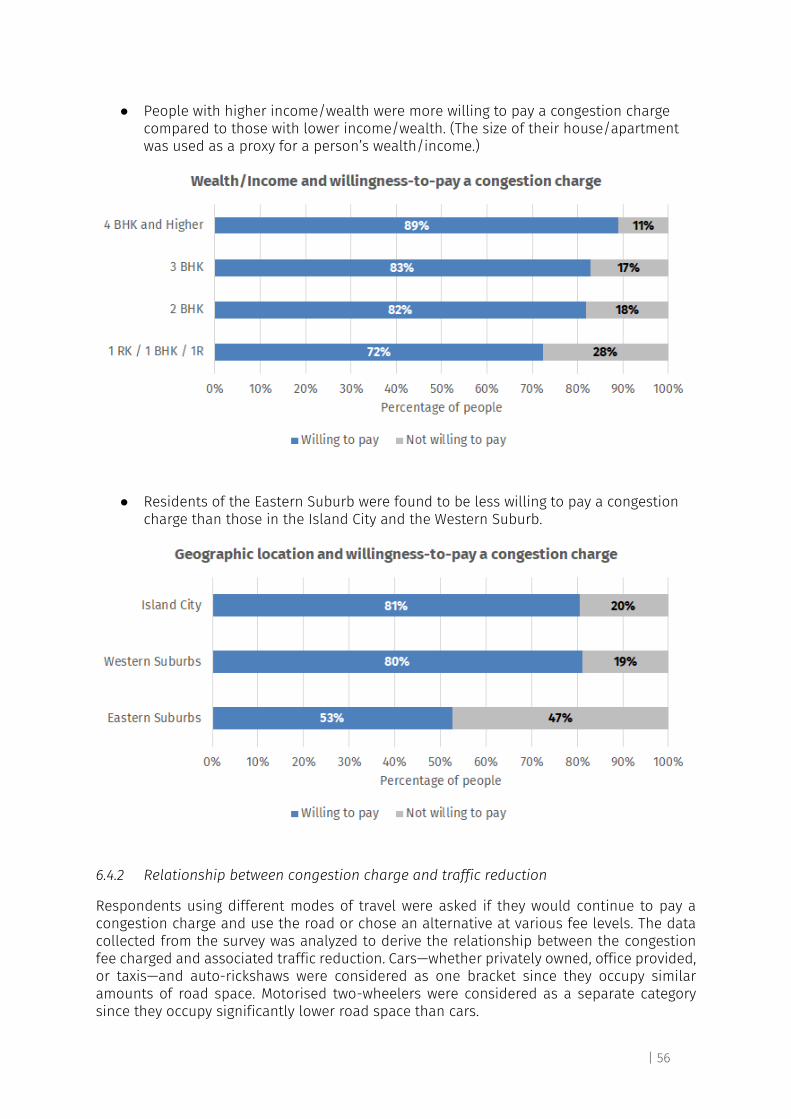
| 56
● People with higher income/wealth were more willing to pay a congestion charge compared to those with lower income/wealth. (The size of their house/apartment was used as a proxy for a person’s wealth/income.)
● Residents of the Eastern Suburb were found to be less willing to pay a congestion charge than those in the Island City and the Western Suburb.
6.4.2 Relationship between congestion charge and traffic reduction
Respondents using different modes of travel were asked if they would continue to pay a congestion charge and use the road or chose an alternative at various fee levels. The data collected from the survey was analyzed to derive the relationship between the congestion fee charged and associated traffic reduction. Cars—whether privately owned, office provided, or taxis—and auto-rickshaws were considered as one bracket since they occupy similar amounts of road space. Motorised two-wheelers were considered as a separate category since they occupy significantly lower road space than cars.
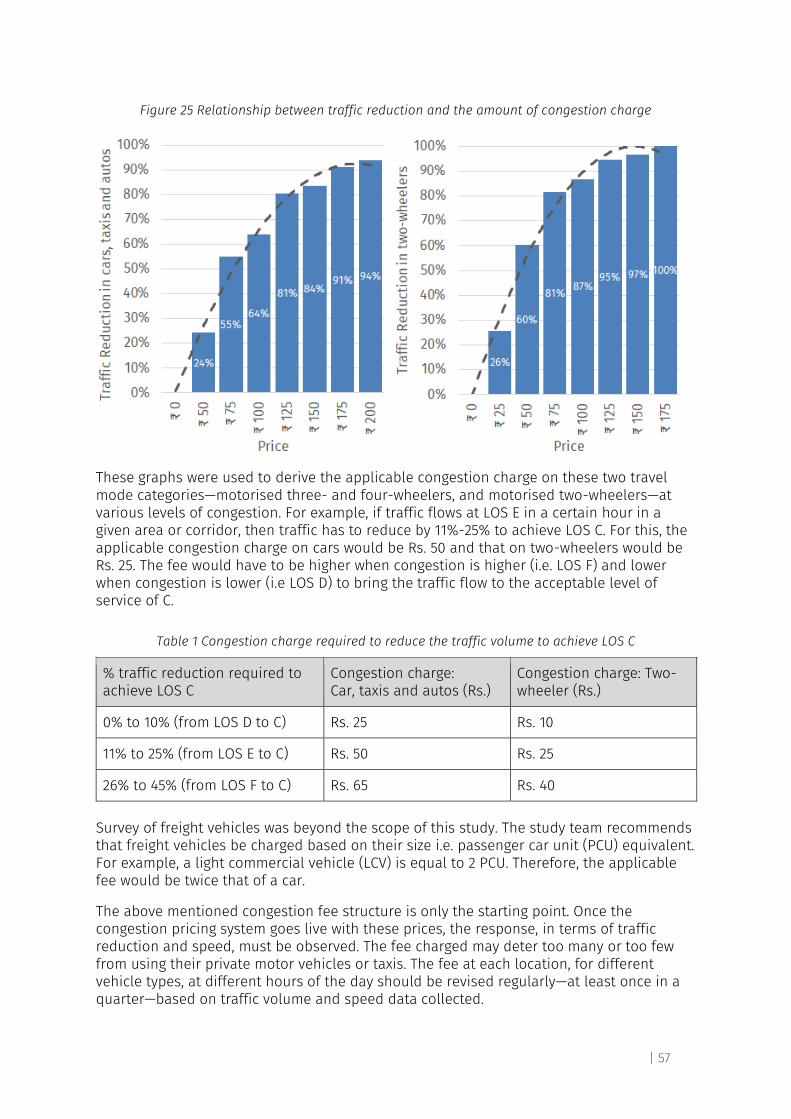
| 57
Figure 25 Relationship between traffic reduction and the amount of congestion charge
These graphs were used to derive the applicable congestion charge on these two travel mode categories—motorised three- and four-wheelers, and motorised two-wheelers—at various levels of congestion. For example, if traffic flows at LOS E in a certain hour in a given area or corridor, then traffic has to reduce by 11%-25% to achieve LOS C. For this, the applicable congestion charge on cars would be Rs. 50 and that on two-wheelers would be Rs. 25. The fee would have to be higher when congestion is higher (i.e. LOS F) and lower when congestion is lower (i.e LOS D) to bring the traffic flow to the acceptable level of service of C.
Table 1 Congestion charge required to reduce the traffic volume to achieve LOS C
% traffic reduction required to achieve LOS C
Congestion charge: Car, taxis and autos (Rs.)
Congestion charge: Two-wheeler (Rs.)
0% to 10% (from LOS D to C) Rs. 25 Rs. 10
11% to 25% (from LOS E to C) Rs. 50 Rs. 25
26% to 45% (from LOS F to C) Rs. 65 Rs. 40
Survey of freight vehicles was beyond the scope of this study. The study team recommends that freight vehicles be charged based on their size i.e. passenger car unit (PCU) equivalent. For example, a light commercial vehicle (LCV) is equal to 2 PCU. Therefore, the applicable fee would be twice that of a car.
The above mentioned congestion fee structure is only the starting point. Once the congestion pricing system goes live with these prices, the response, in terms of traffic reduction and speed, must be observed. The fee charged may deter too many or too few from using their private motor vehicles or taxis. The fee at each location, for different vehicle types, at different hours of the day should be revised regularly—at least once in a quarter—based on traffic volume and speed data collected.
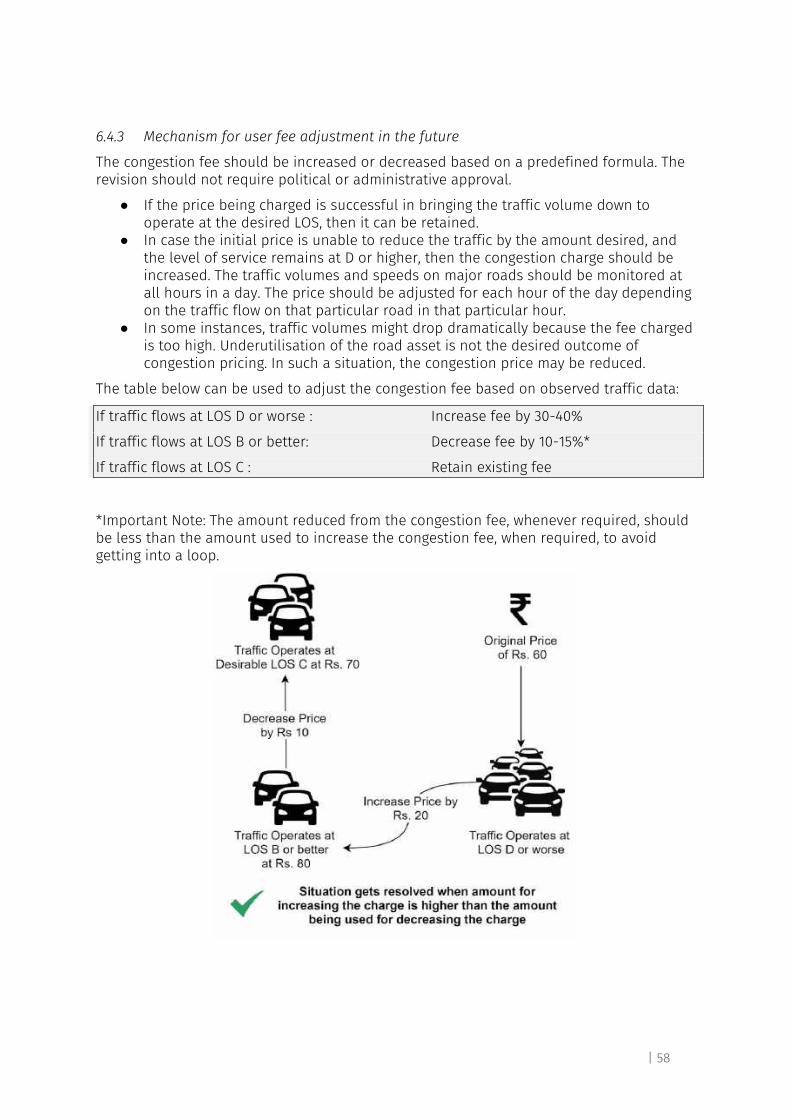
| 58
6.4.3 Mechanism for user fee adjustment in the future
The congestion fee should be increased or decreased based on a predefined formula. The revision should not require political or administrative approval.
● If the price being charged is successful in bringing the traffic volume down to operate at the desired LOS, then it can be retained.
● In case the initial price is unable to reduce the traffic by the amount desired, and the level of service remains at D or higher, then the congestion charge should be increased. The traffic volumes and speeds on major roads should be monitored at all hours in a day. The price should be adjusted for each hour of the day depending on the traffic flow on that particular road in that particular hour.
● In some instances, traffic volumes might drop dramatically because the fee charged is too high. Underutilisation of the road asset is not the desired outcome of congestion pricing. In such a situation, the congestion price may be reduced.
The table below can be used to adjust the congestion fee based on observed traffic data:
If traffic flows at LOS D or worse : Increase fee by 30-40%
If traffic flows at LOS B or better: Decrease fee by 10-15%*
If traffic flows at LOS C : Retain existing fee
*Important Note: The amount reduced from the congestion fee, whenever required, should be less than the amount used to increase the congestion fee, when required, to avoid getting into a loop.
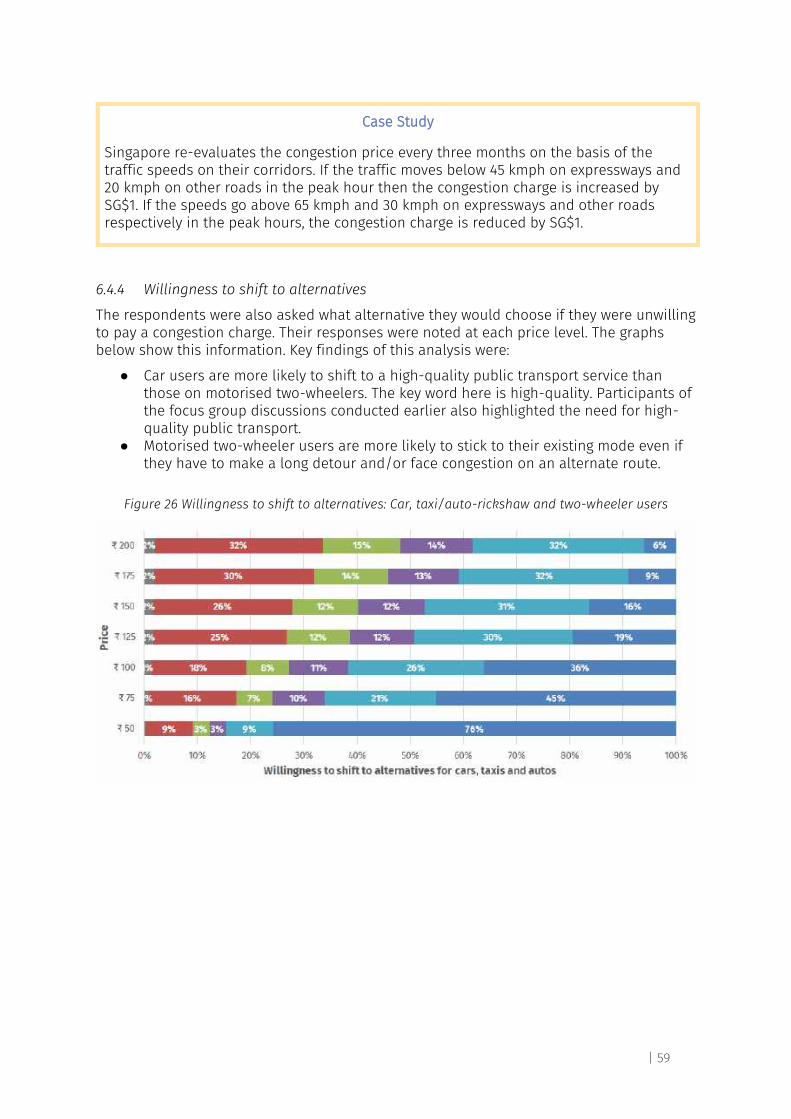
| 59
Case Study
Singapore re-evaluates the congestion price every three months on the basis of the traffic speeds on their corridors. If the traffic moves below 45 kmph on expressways and 20 kmph on other roads in the peak hour then the congestion charge is increased by SG$1. If the speeds go above 65 kmph and 30 kmph on expressways and other roads respectively in the peak hours, the congestion charge is reduced by SG$1.
6.4.4 Willingness to shift to alternatives
The respondents were also asked what alternative they would choose if they were unwilling to pay a congestion charge. Their responses were noted at each price level. The graphs below show this information. Key findings of this analysis were:
● Car users are more likely to shift to a high-quality public transport service than those on motorised two-wheelers. The key word here is high-quality. Participants of the focus group discussions conducted earlier also highlighted the need for high-quality public transport.
● Motorised two-wheeler users are more likely to stick to their existing mode even if they have to make a long detour and/or face congestion on an alternate route.
Figure 26 Willingness to shift to alternatives: Car, taxi/auto-rickshaw and two-wheeler users
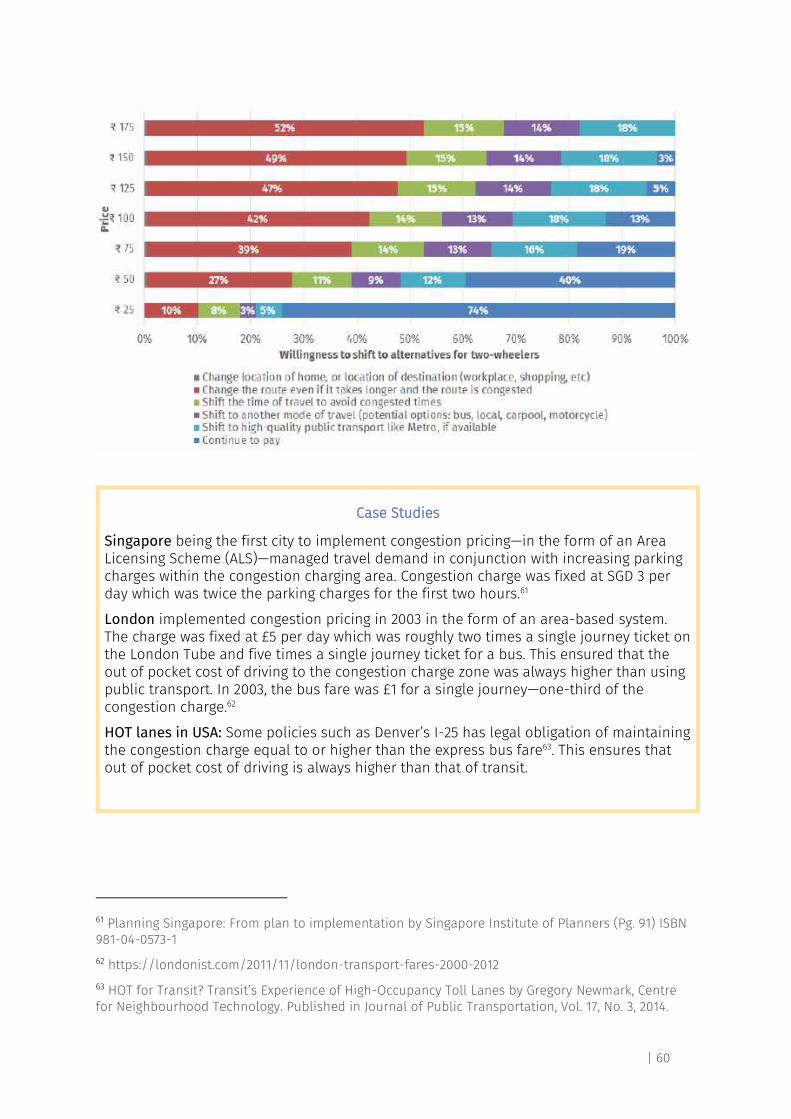
| 60
Case Studies
Singapore being the first city to implement congestion pricing—in the form of an Area Licensing Scheme (ALS)—managed travel demand in conjunction with increasing parking charges within the congestion charging area. Congestion charge was fixed at SGD 3 per day which was twice the parking charges for the first two hours.61
London implemented congestion pricing in 2003 in the form of an area-based system. The charge was fixed at £5 per day which was roughly two times a single journey ticket on the London Tube and five times a single journey ticket for a bus. This ensured that the out of pocket cost of driving to the congestion charge zone was always higher than using public transport. In 2003, the bus fare was £1 for a single journey—one-third of the congestion charge.62
HOT lanes in USA: Some policies such as Denver’s I-25 has legal obligation of maintaining the congestion charge equal to or higher than the express bus fare63. This ensures that out of pocket cost of driving is always higher than that of transit.
61 Planning Singapore: From plan to implementation by Singapore Institute of Planners (Pg. 91) ISBN 981-04-0573-1
62 https://londonist.com/2011/11/london-transport-fares-2000-2012
63 HOT for Transit? Transit’s Experience of High-Occupancy Toll Lanes by Gregory Newmark, Centre for Neighbourhood Technology. Published in Journal of Public Transportation, Vol. 17, No. 3, 2014.
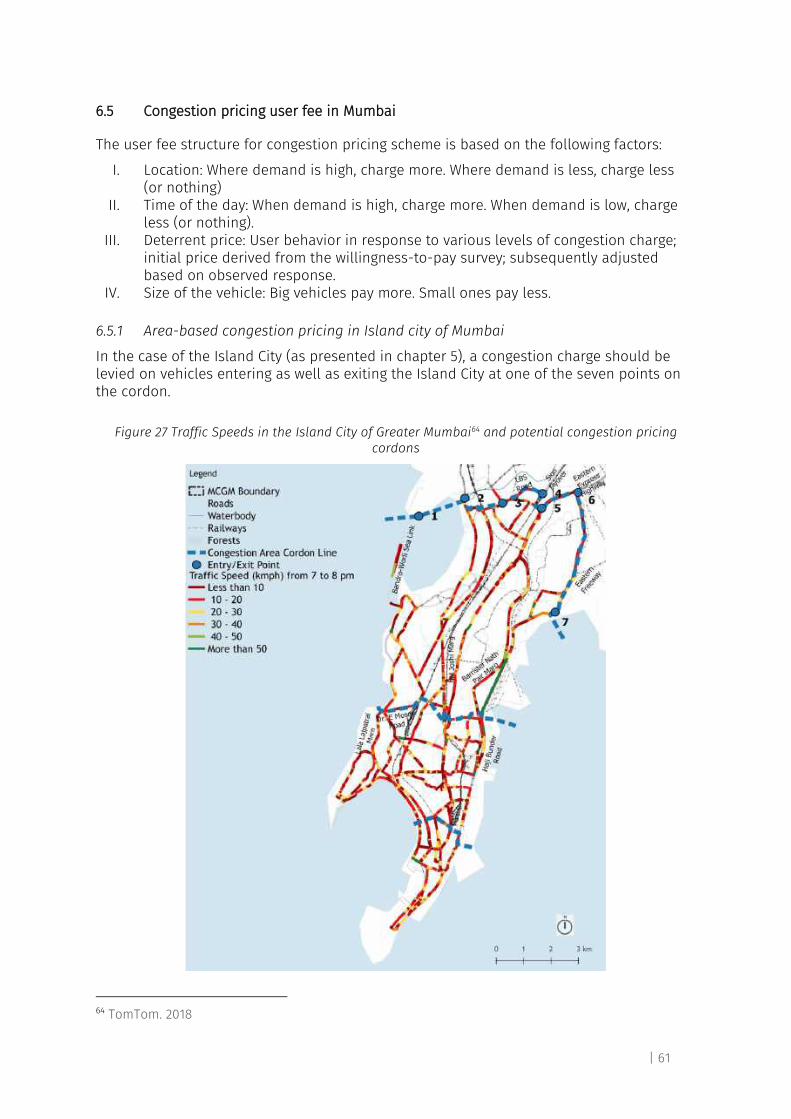
| 61
6.5 Congestion pricing user fee in Mumbai
The user fee structure for congestion pricing scheme is based on the following factors:
I. Location: Where demand is high, charge more. Where demand is less, charge less (or nothing)
II. Time of the day: When demand is high, charge more. When demand is low, charge less (or nothing).
III. Deterrent price: User behavior in response to various levels of congestion charge; initial price derived from the willingness-to-pay survey; subsequently adjusted based on observed response.
IV. Size of the vehicle: Big vehicles pay more. Small ones pay less. 6.5.1 Area-based congestion pricing in Island city of Mumbai
In the case of the Island City (as presented in chapter 5), a congestion charge should be levied on vehicles entering as well as exiting the Island City at one of the seven points on the cordon.
Figure 27 Traffic Speeds in the Island City of Greater Mumbai64 and potential congestion pricing cordons
64 TomTom. 2018
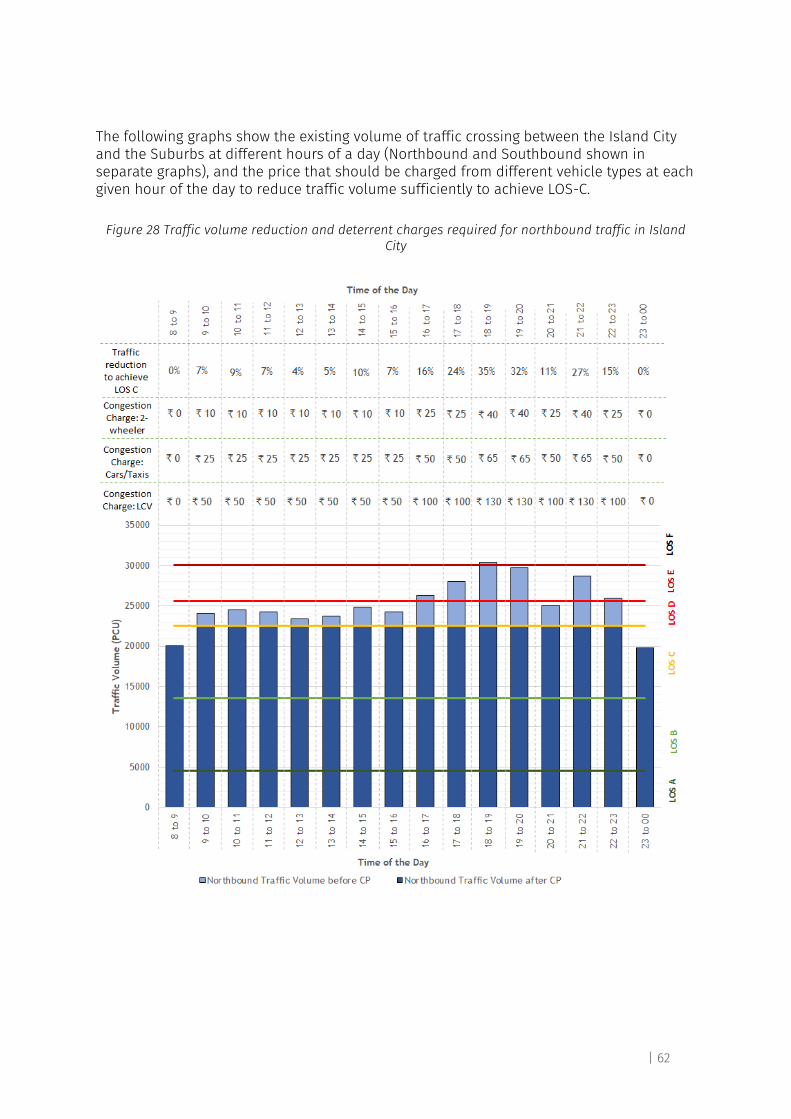
| 62
The following graphs show the existing volume of traffic crossing between the Island City and the Suburbs at different hours of a day (Northbound and Southbound shown in separate graphs), and the price that should be charged from different vehicle types at each given hour of the day to reduce traffic volume sufficiently to achieve LOS-C.
Figure 28 Traffic volume reduction and deterrent charges required for northbound traffic in Island City
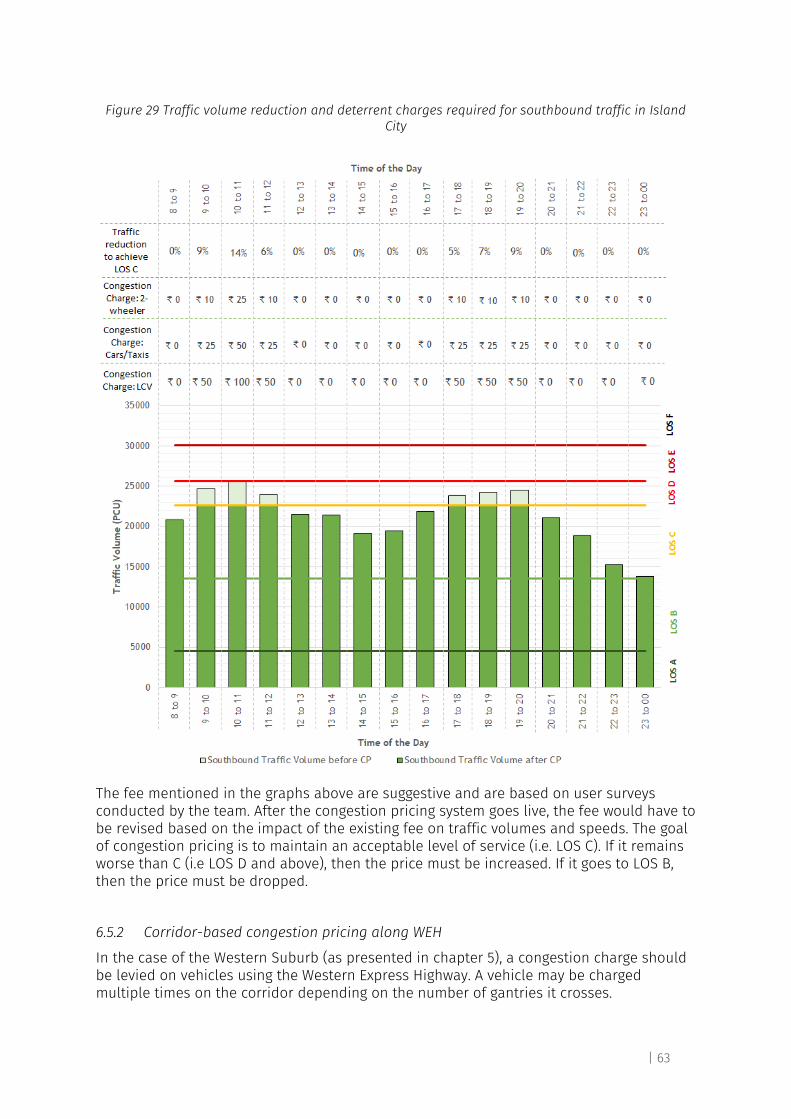
| 63
Figure 29 Traffic volume reduction and deterrent charges required for southbound traffic in Island City
The fee mentioned in the graphs above are suggestive and are based on user surveys conducted by the team. After the congestion pricing system goes live, the fee would have to be revised based on the impact of the existing fee on traffic volumes and speeds. The goal of congestion pricing is to maintain an acceptable level of service (i.e. LOS C). If it remains worse than C (i.e LOS D and above), then the price must be increased. If it goes to LOS B, then the price must be dropped.
6.5.2 Corridor-based congestion pricing along WEH
In the case of the Western Suburb (as presented in chapter 5), a congestion charge should be levied on vehicles using the Western Express Highway. A vehicle may be charged multiple times on the corridor depending on the number of gantries it crosses.
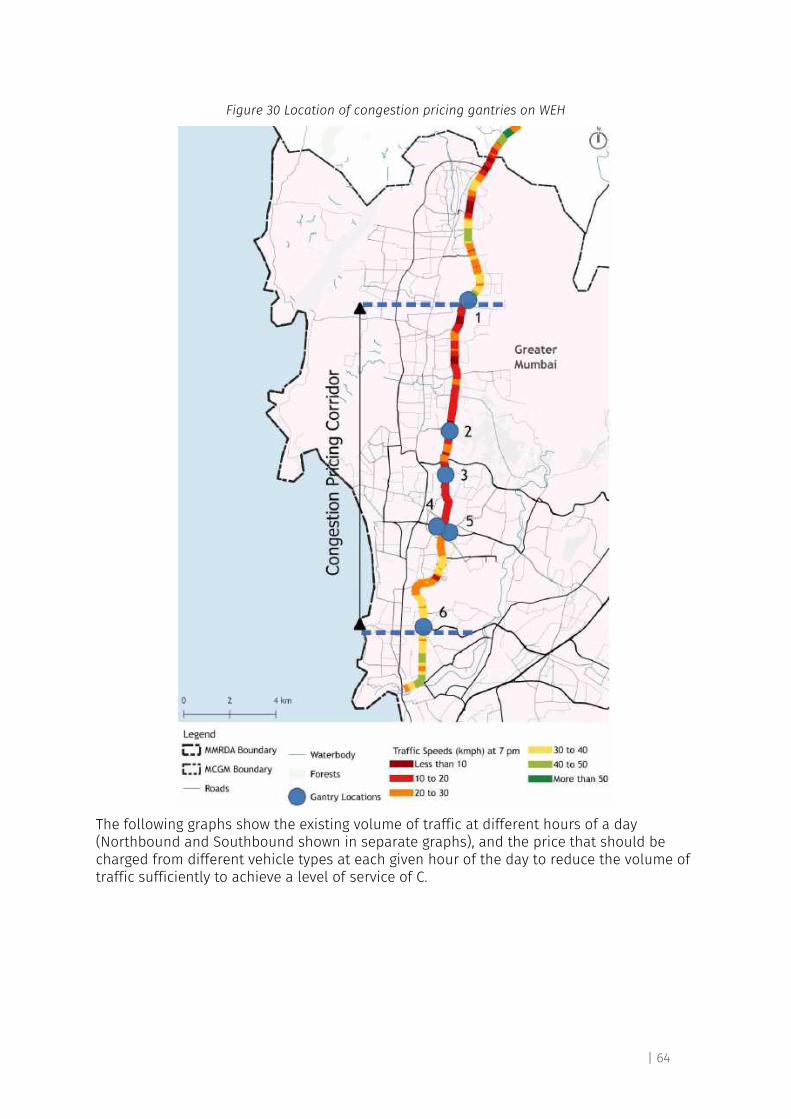
| 64
Figure 30 Location of congestion pricing gantries on WEH
The following graphs show the existing volume of traffic at different hours of a day (Northbound and Southbound shown in separate graphs), and the price that should be charged from different vehicle types at each given hour of the day to reduce the volume of traffic sufficiently to achieve a level of service of C.
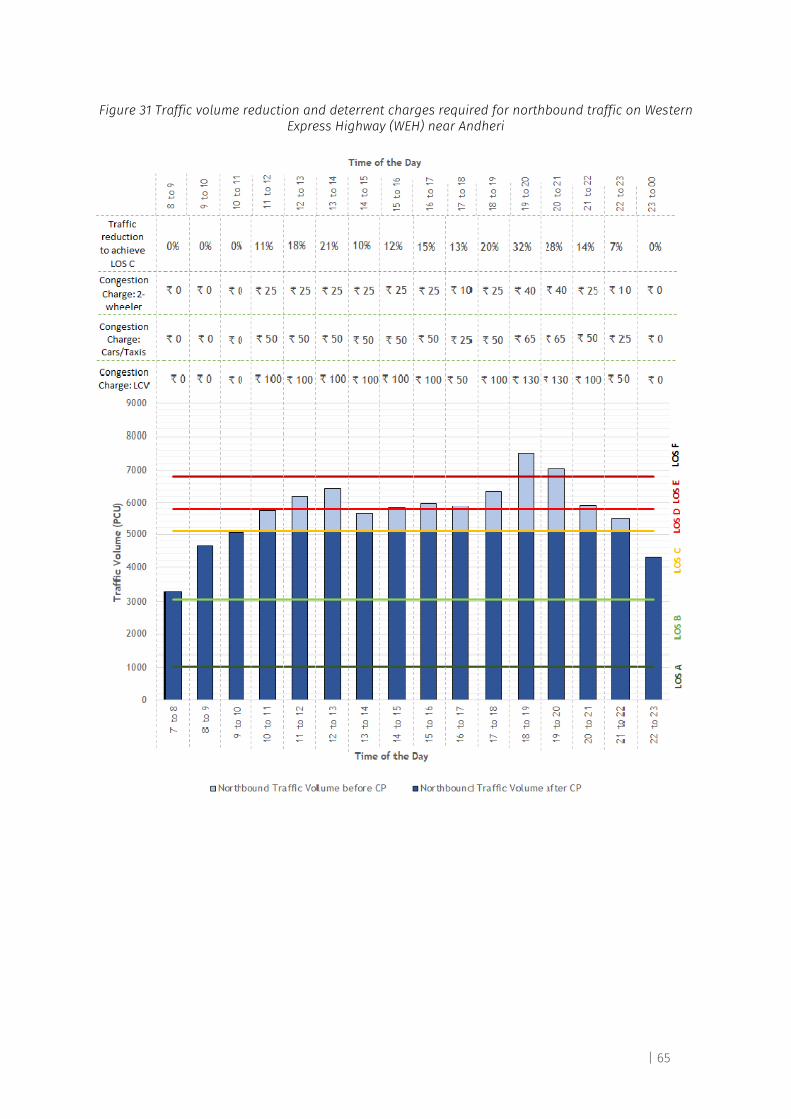
| 65
Figure 31 Traffic volume reduction and deterrent charges required for northbound traffic on Western Express Highway (WEH) near Andheri
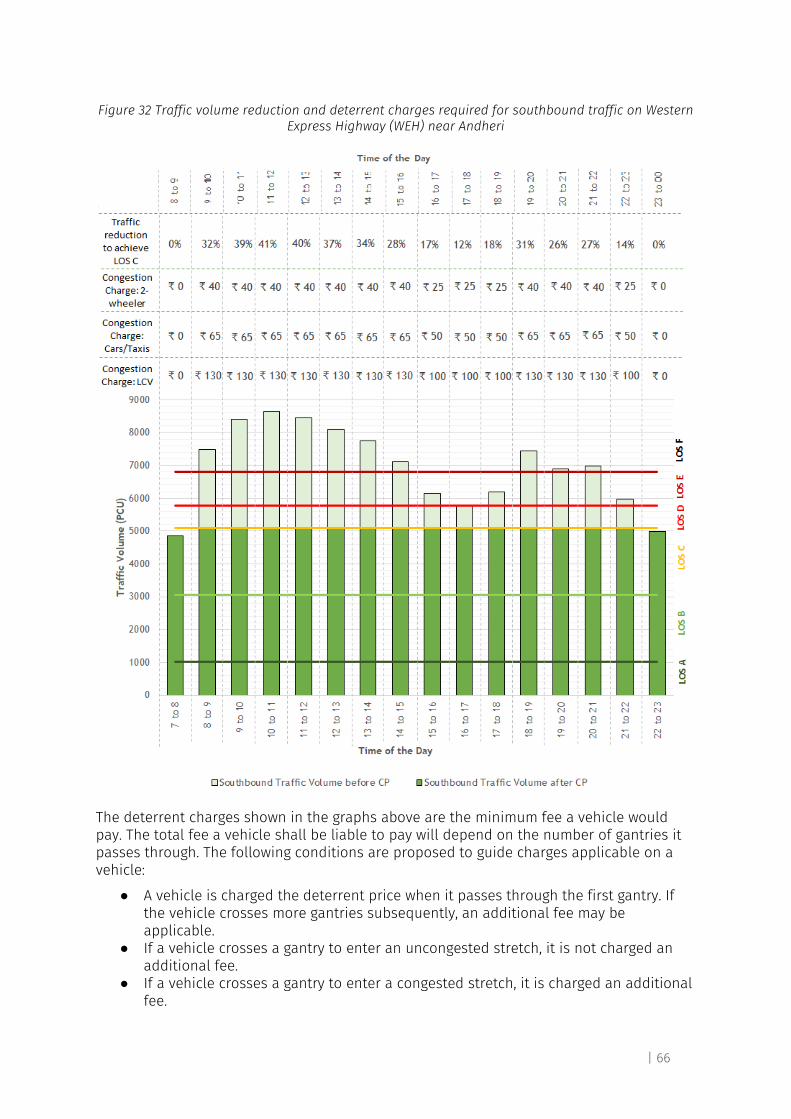
| 66
Figure 32 Traffic volume reduction and deterrent charges required for southbound traffic on Western Express Highway (WEH) near Andheri
The deterrent charges shown in the graphs above are the minimum fee a vehicle would pay. The total fee a vehicle shall be liable to pay will depend on the number of gantries it passes through. The following conditions are proposed to guide charges applicable on a vehicle:
● A vehicle is charged the deterrent price when it passes through the first gantry. If the vehicle crosses more gantries subsequently, an additional fee may be applicable.
● If a vehicle crosses a gantry to enter an uncongested stretch, it is not charged an additional fee.
● If a vehicle crosses a gantry to enter a congested stretch, it is charged an additional fee.
| 67
6.5.3 Network pricing in Mumbai
Determining the congestion charge for a network-based system would require speed and traffic volume trends from all over the city. Such extensive data was not collected for this study and should be treated as a limitation. However, the mechanism to arrive at an initial price is presented here.
The goal can be to maintain traffic flow at LOS C on the entire road network and the price mechanism presented for corridor based pricing can be used to set an initial price. The price can vary based on the PCU factors of the vehicles.
Network-based pricing requires each trip to be tracked for calculating an accurate charge. Singapore is planning to provide real-time route recommendations for commuters as a service through the onboard units (OBUs) which are expected to replace the current in-vehicle units (IUs). Such recommendations can help commuters to choose a route based on their preferences such as cheapest route, fastest route, etc.
Some navigation tools (Waze, Google maps, etc.) already provide options to commuters to choose their route based on distance, speed, tolls, etc. These navigational platforms are also capable of informing commuters about toll booths, speed traps, real-time incidents, etc. Such platforms can be leveraged to provide real-time congestion charge alerts to commuters. Such features would keep the congestion pricing system transparent, provide easy access to information, provide choices to commuters and distribute traffic on less congested routes in real-time.
6.6 Informing users about applicable congestion charges
Vehicle users should be pre-informed about the price they would be charged before they enter the congestion zone to enable them to make a well-informed decision: to pay the congestion charge or choose an alternative. A city can inform the commuters about congestion pricing through the following ways:
6.6.1 Online portal
The easiest way the authorities can disseminate information about congestion pricing is by providing adequate information about the area/corridors being charged, the placement of gantries, the time of operations, the congestion charge, the vehicles being exempted, how to obtain an RFID tag and penalties on a dedicated online portal which anyone can use online. The authorities can also integrate the payment information system with a user ID on the portal so that a user can monitor their daily expenses and dues.
6.6.2 On-street signages
On-street signages are important to give information to the users while they are on a trip. A large number of people might not use online portals to get information. Therefore, all users should be informed about the congestion zone/corridor through on-street signage before the entry point. An electronic display at the entry point should inform users about the congestion charge for that particular location at that specific hour for different vehicle types.
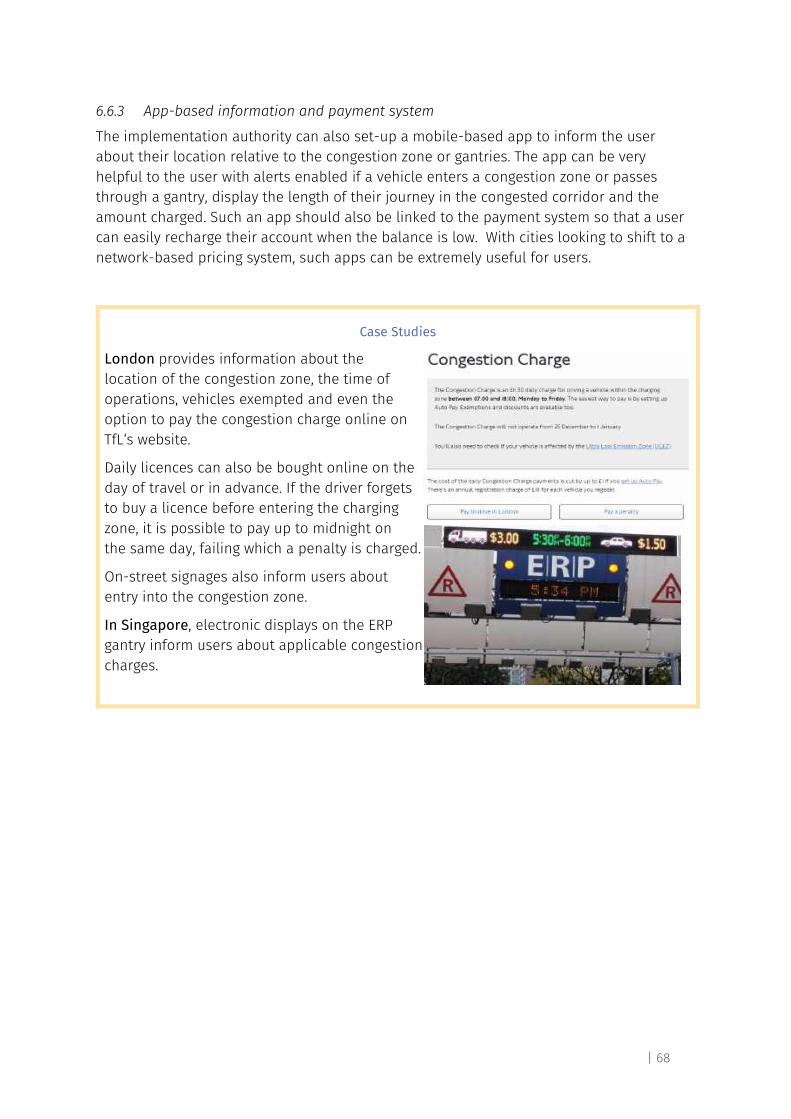
| 68
6.6.3 App-based information and payment system
The implementation authority can also set-up a mobile-based app to inform the user about their location relative to the congestion zone or gantries. The app can be very helpful to the user with alerts enabled if a vehicle enters a congestion zone or passes through a gantry, display the length of their journey in the congested corridor and the amount charged. Such an app should also be linked to the payment system so that a user can easily recharge their account when the balance is low. With cities looking to shift to a network-based pricing system, such apps can be extremely useful for users.
Case Studies
London provides information about the location of the congestion zone, the time of operations, vehicles exempted and even the option to pay the congestion charge online on TfL‘s website.
Daily licences can also be bought online on the day of travel or in advance. If the driver forgets to buy a licence before entering the charging zone, it is possible to pay up to midnight on the same day, failing which a penalty is charged.
On-street signages also inform users about entry into the congestion zone.
In Singapore, electronic displays on the ERP gantry inform users about applicable congestion charges.
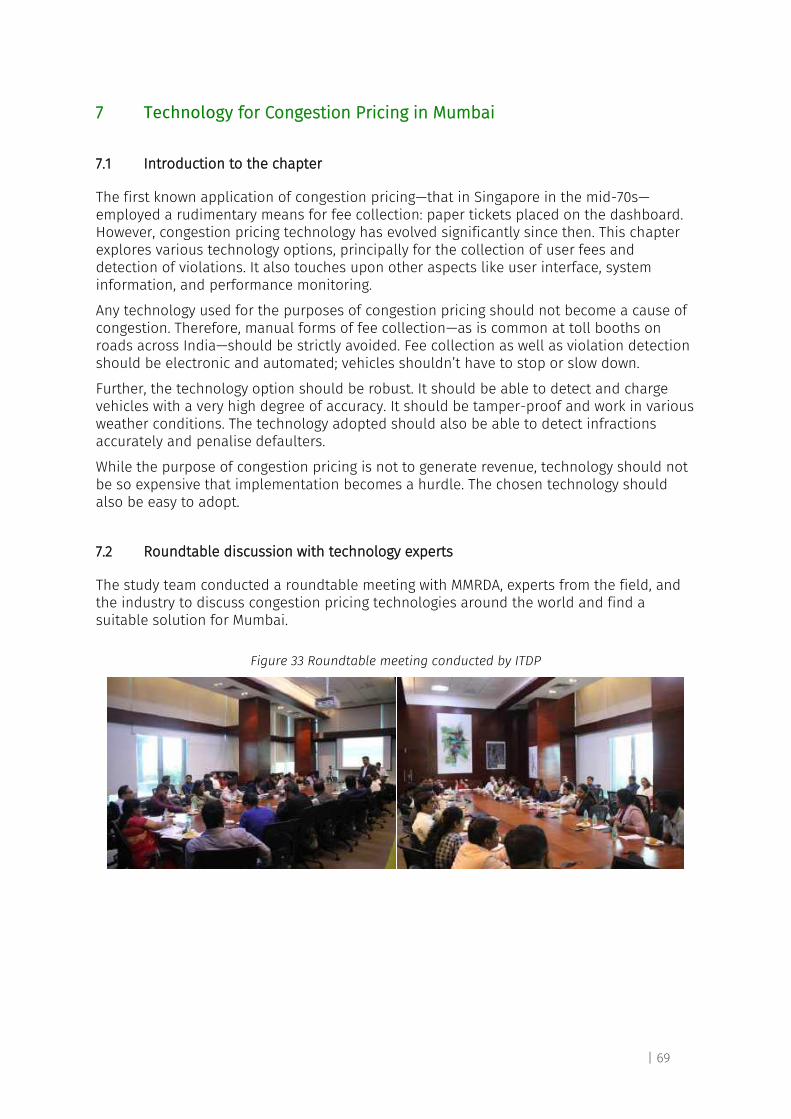
| 69
7 Technology for Congestion Pricing in Mumbai
7.1 Introduction to the chapter
The first known application of congestion pricing—that in Singapore in the mid-70s— employed a rudimentary means for fee collection: paper tickets placed on the dashboard. However, congestion pricing technology has evolved significantly since then. This chapter explores various technology options, principally for the collection of user fees and detection of violations. It also touches upon other aspects like user interface, system information, and performance monitoring.
Any technology used for the purposes of congestion pricing should not become a cause of congestion. Therefore, manual forms of fee collection—as is common at toll booths on roads across India—should be strictly avoided. Fee collection as well as violation detection should be electronic and automated; vehicles shouldn’t have to stop or slow down.
Further, the technology option should be robust. It should be able to detect and charge vehicles with a very high degree of accuracy. It should be tamper-proof and work in various weather conditions. The technology adopted should also be able to detect infractions accurately and penalise defaulters.
While the purpose of congestion pricing is not to generate revenue, technology should not be so expensive that implementation becomes a hurdle. The chosen technology should also be easy to adopt.
7.2 Roundtable discussion with technology experts
The study team conducted a roundtable meeting with MMRDA, experts from the field, and the industry to discuss congestion pricing technologies around the world and find a suitable solution for Mumbai.
Figure 33 Roundtable meeting conducted by ITDP
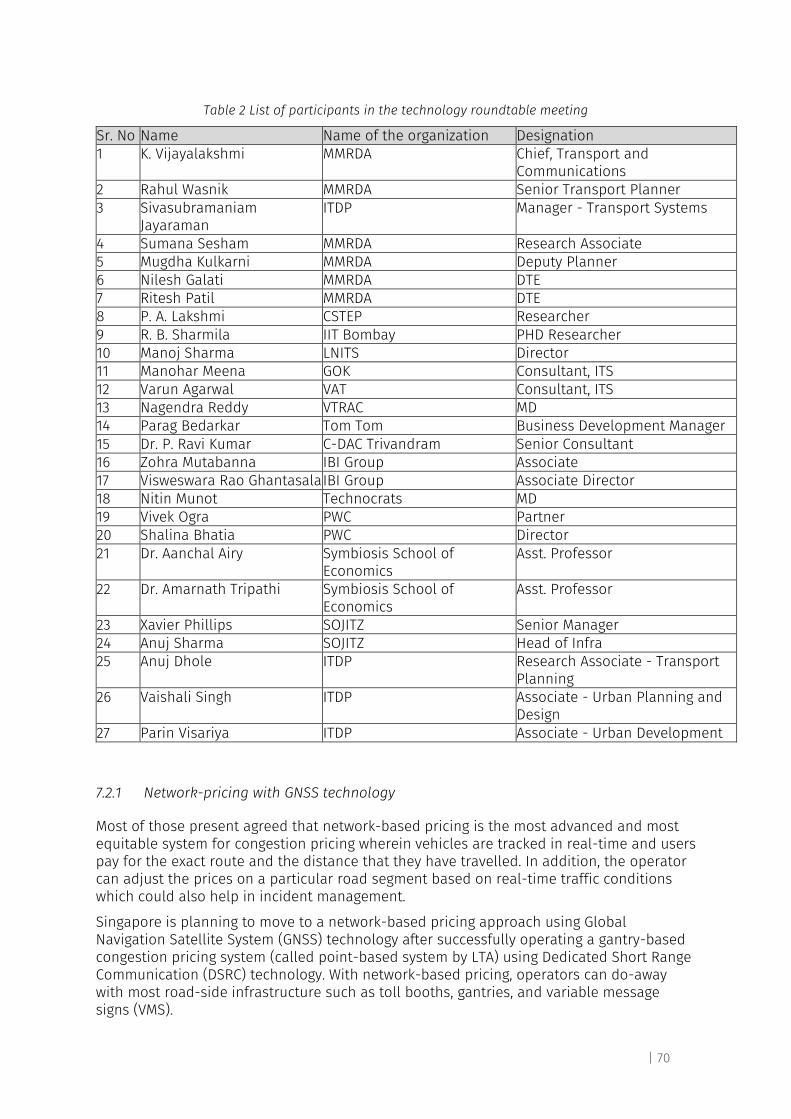
| 70
Table 2 List of participants in the technology roundtable meeting
Sr. No Name Name of the organization Designation 1 K. Vijayalakshmi MMRDA Chief, Transport and
Communications 2 Rahul Wasnik MMRDA Senior Transport Planner 3 Sivasubramaniam
Jayaraman ITDP Manager - Transport Systems
4 Sumana Sesham MMRDA Research Associate 5 Mugdha Kulkarni MMRDA Deputy Planner 6 Nilesh Galati MMRDA DTE 7 Ritesh Patil MMRDA DTE 8 P. A. Lakshmi CSTEP Researcher 9 R. B. Sharmila IIT Bombay PHD Researcher 10 Manoj Sharma LNITS Director 11 Manohar Meena GOK Consultant, ITS 12 Varun Agarwal VAT Consultant, ITS 13 Nagendra Reddy VTRAC MD 14 Parag Bedarkar Tom Tom Business Development Manager 15 Dr. P. Ravi Kumar C-DAC Trivandram Senior Consultant 16 Zohra Mutabanna IBI Group Associate 17 Visweswara Rao Ghantasala IBI Group Associate Director 18 Nitin Munot Technocrats MD 19 Vivek Ogra PWC Partner 20 Shalina Bhatia PWC Director 21 Dr. Aanchal Airy Symbiosis School of
Economics Asst. Professor
22 Dr. Amarnath Tripathi Symbiosis School of Economics
Asst. Professor
23 Xavier Phillips SOJITZ Senior Manager 24 Anuj Sharma SOJITZ Head of Infra 25 Anuj Dhole ITDP Research Associate - Transport
Planning 26 Vaishali Singh ITDP Associate - Urban Planning and
Design 27 Parin Visariya ITDP Associate - Urban Development
7.2.1 Network-pricing with GNSS technology
Most of those present agreed that network-based pricing is the most advanced and most equitable system for congestion pricing wherein vehicles are tracked in real-time and users pay for the exact route and the distance that they have travelled. In addition, the operator can adjust the prices on a particular road segment based on real-time traffic conditions which could also help in incident management.
Singapore is planning to move to a network-based pricing approach using Global Navigation Satellite System (GNSS) technology after successfully operating a gantry-based congestion pricing system (called point-based system by LTA) using Dedicated Short Range Communication (DSRC) technology. With network-based pricing, operators can do-away with most road-side infrastructure such as toll booths, gantries, and variable message signs (VMS).
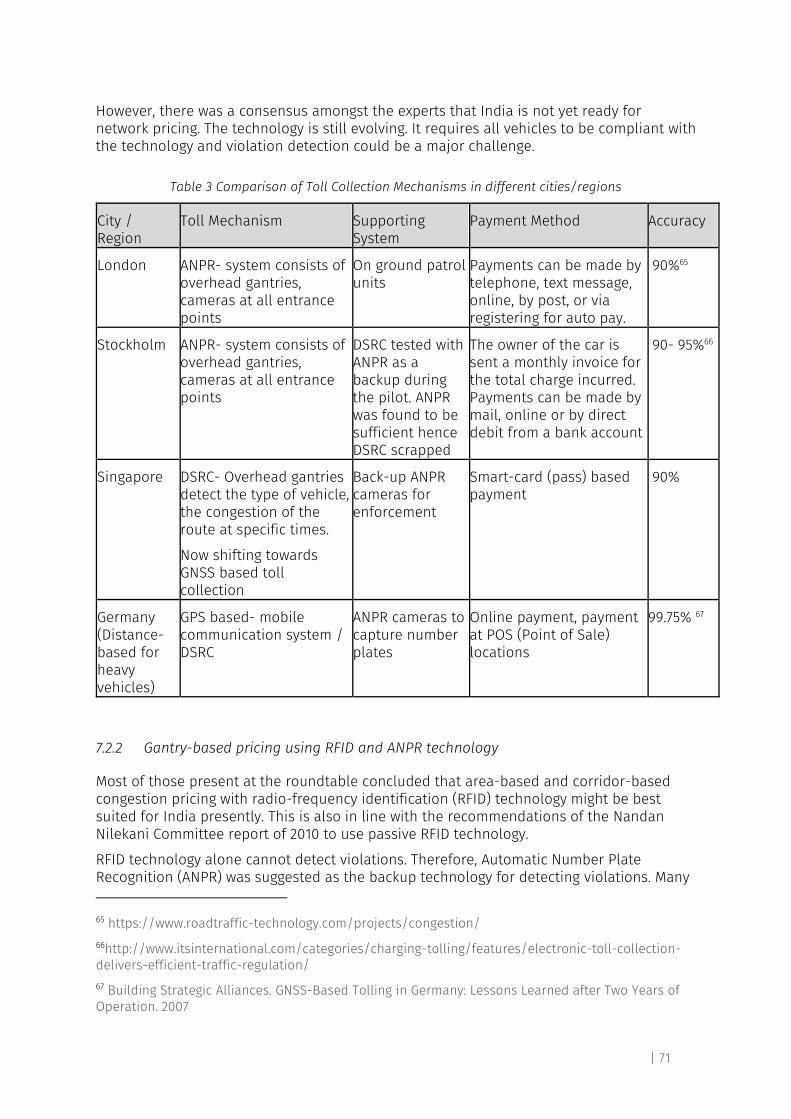
| 71
However, there was a consensus amongst the experts that India is not yet ready for network pricing. The technology is still evolving. It requires all vehicles to be compliant with the technology and violation detection could be a major challenge.
Table 3 Comparison of Toll Collection Mechanisms in different cities/regions
City / Region
Toll Mechanism Supporting System
Payment Method Accuracy
London ANPR- system consists of overhead gantries, cameras at all entrance points
On ground patrol units
Payments can be made by telephone, text message, online, by post, or via registering for auto pay.
90%65
Stockholm ANPR- system consists of overhead gantries, cameras at all entrance points
DSRC tested with ANPR as a backup during the pilot. ANPR was found to be sufficient hence DSRC scrapped
The owner of the car is sent a monthly invoice for the total charge incurred. Payments can be made by mail, online or by direct debit from a bank account
90- 95%66
Singapore DSRC- Overhead gantries detect the type of vehicle, the congestion of the route at specific times.
Now shifting towards GNSS based toll collection
Back-up ANPR cameras for enforcement
Smart-card (pass) based payment
90%
Germany (Distance-based for heavy vehicles)
GPS based- mobile communication system / DSRC
ANPR cameras to capture number plates
Online payment, payment at POS (Point of Sale) locations
99.75% 67
7.2.2 Gantry-based pricing using RFID and ANPR technology
Most of those present at the roundtable concluded that area-based and corridor-based congestion pricing with radio-frequency identification (RFID) technology might be best suited for India presently. This is also in line with the recommendations of the Nandan Nilekani Committee report of 2010 to use passive RFID technology.
RFID technology alone cannot detect violations. Therefore, Automatic Number Plate Recognition (ANPR) was suggested as the backup technology for detecting violations. Many 65 https://www.roadtraffic-technology.com/projects/congestion/
66http://www.itsinternational.com/categories/charging-tolling/features/electronic-toll-collection-delivers-efficient-traffic-regulation/
67 Building Strategic Alliances. GNSS-Based Tolling in Germany: Lessons Learned after Two Years of Operation. 2007
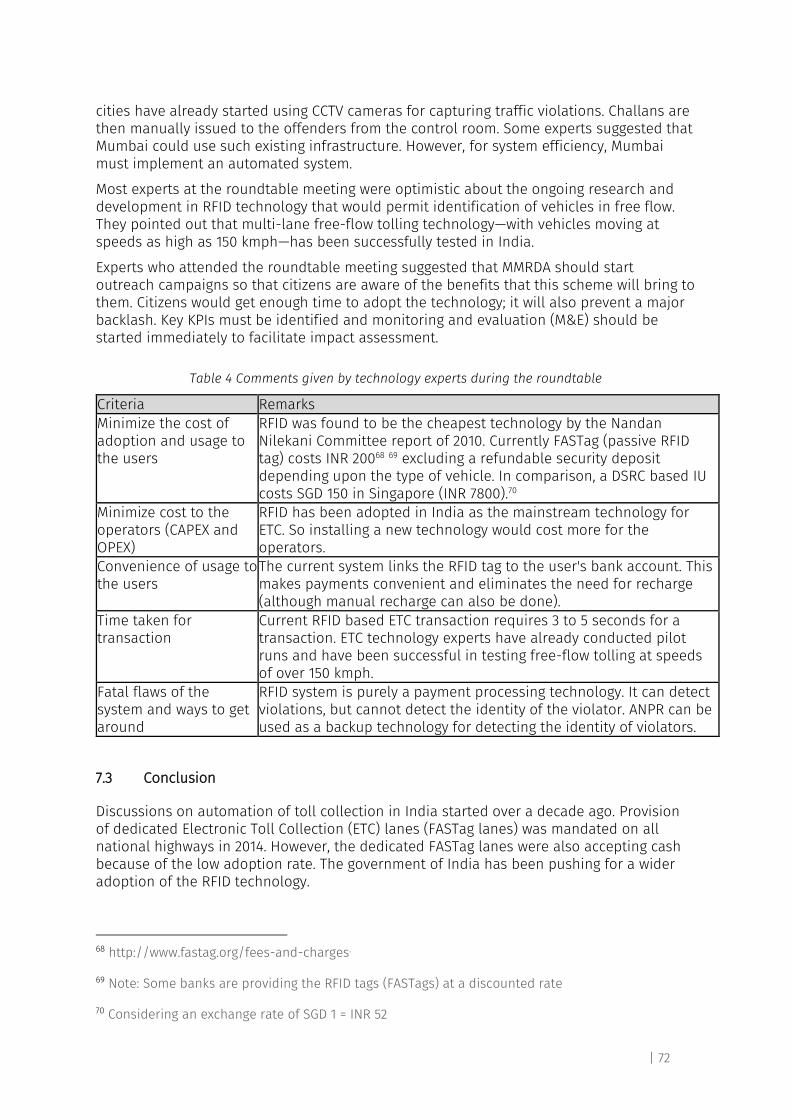
| 72
cities have already started using CCTV cameras for capturing traffic violations. Challans are then manually issued to the offenders from the control room. Some experts suggested that Mumbai could use such existing infrastructure. However, for system efficiency, Mumbai must implement an automated system.
Most experts at the roundtable meeting were optimistic about the ongoing research and development in RFID technology that would permit identification of vehicles in free flow. They pointed out that multi-lane free-flow tolling technology—with vehicles moving at speeds as high as 150 kmph—has been successfully tested in India.
Experts who attended the roundtable meeting suggested that MMRDA should start outreach campaigns so that citizens are aware of the benefits that this scheme will bring to them. Citizens would get enough time to adopt the technology; it will also prevent a major backlash. Key KPIs must be identified and monitoring and evaluation (M&E) should be started immediately to facilitate impact assessment.
Table 4 Comments given by technology experts during the roundtable
Criteria Remarks Minimize the cost of adoption and usage to the users
RFID was found to be the cheapest technology by the Nandan Nilekani Committee report of 2010. Currently FASTag (passive RFID tag) costs INR 20068 69 excluding a refundable security deposit depending upon the type of vehicle. In comparison, a DSRC based IU costs SGD 150 in Singapore (INR 7800).70
Minimize cost to the operators (CAPEX and OPEX)
RFID has been adopted in India as the mainstream technology for ETC. So installing a new technology would cost more for the operators.
Convenience of usage to the users
The current system links the RFID tag to the user's bank account. This makes payments convenient and eliminates the need for recharge (although manual recharge can also be done).
Time taken for transaction
Current RFID based ETC transaction requires 3 to 5 seconds for a transaction. ETC technology experts have already conducted pilot runs and have been successful in testing free-flow tolling at speeds of over 150 kmph.
Fatal flaws of the system and ways to get around
RFID system is purely a payment processing technology. It can detect violations, but cannot detect the identity of the violator. ANPR can be used as a backup technology for detecting the identity of violators.
7.3 Conclusion
Discussions on automation of toll collection in India started over a decade ago. Provision of dedicated Electronic Toll Collection (ETC) lanes (FASTag lanes) was mandated on all national highways in 2014. However, the dedicated FASTag lanes were also accepting cash because of the low adoption rate. The government of India has been pushing for a wider adoption of the RFID technology.
68 http://www.fastag.org/fees-and-charges.
69 Note: Some banks are providing the RFID tags (FASTags) at a discounted rate
70 Considering an exchange rate of SGD 1 = INR 52
| 73
Even after a decade-long effort, National Payments Corporation of India (NPCI) has reported that toll collection by electronic means stands at only 25% of the total toll collection as of 2019.71 However, the recent decision by the Ministry of Road Transport and Highways—that mandates that ETC-only lanes be the norm rather than the exception at all toll plazas on national highways (only one lane is allowed for cash payment) from December 201972—could boost the adoption of RFID technology.
Various technology options were assessed (see annexure). They point to the fact that congestion pricing can become a bottleneck if cash payment is accepted at one or more lanes. System should also not employ the current RFID reader technology deployed by NHAI which requires vehicles to stop momentarily.
A hassle-free interface can help users understand the system quickly, thereby increasing the acceptability of the system. The interface should also be equipped to capture violations.
● Building on the FASTag backbone, the system can employ RFID for fee collection. However, the latest generation RFID readers are essential to detect vehicles in free flow.
● ANPR cameras can be deployed as a backup technology to capture vehicle number-plates to identify violations.
● People should be informed about the congestion zone and applicable fee through electronic signage displays before they enter the priced zone.
● A control center should be established to manage user accounts, provide customer support, and monitor system performance. A mobile app and a web portal are required for user signup, system information, and complaint resolution.
71 Times of India https://timesofindia.indiatimes.com/business/india-business/e-payments-account-for-25-of-toll-collection-in-india-npci/articleshow/68696840.cms
72http://www.newindianexpress.com/nation/2019/aug/20/automatic-toll-payment-fastags-mandatory-from-december-centre-2021532.html
| 74
8 Socio-Economic Cost-Benefit Analysis
8.1 Introduction to the chapter
A cost-benefit analysis can help the city in making the decision to implement congestion pricing. A city should consider the following parameters:
● Financial feasibility of the system through an assessment of capital cost, operating expenditure, and user fee revenue
● An environmental and health cost-benefit analysis through estimation of emissions before and after the scheme
● Productivity improvement from time savings
These aspects have been assessed in this chapter.
Revenue is not the main reason why a city should implement congestion pricing. However, revenue surplus, if any should be utilised to improve sustainable mobility. This chapter also touches upon this important aspect in Mumbai’s context.
8.2 Financial feasibility of congestion pricing in Mumbai
Cost-benefit analysis is a simple methodology for weighing decisions on the basis of total benefits, total costs, and net benefit/cost. For the congestion pricing project, the financial costs and benefits have been assessed by taking implementation costs and revenues as the basic parameters as these are the upfront costs and benefits that the government will get from the project.
Congestion pricing, like any other project, has two cost components: capital expenditure and operating expenditure. Capital expenditure includes the cost of gantries, signages, IT infrastructure, control room, and vehicle tags. Operating expenditure includes manpower, electricity, maintenance, and other recurring expenditure.
Key points considered for cost estimation:
● The roadside infrastructure cost estimations were done per carriageway lane. The off-road infrastructure costs were calculated for the entire system.
● The cost per lane for roadside infrastructure of various technology options were obtained from technology providers who participated in the Technology Roundtable. These include IBI Group, ARS T & TT, Videonetics, Technocrat, TomTom, and Sojitz Corporation.
● The cost for RFID tags was considered to be the same as existing FASTags. ● In the case of Stockholm the annual operating cost is 5% of the initial investment,
while in Singapore annual operating cost is 18% of the initial investment.73 For Mumbai, operations and maintenance cost was estimated to be 15% of the capital cost.
● It was also discussed during the roundtable meeting that 25% of all vehicles in Mumbai already have an RFID tag. Therefore, only the remaining 75% of vehicle population was considered when estimating the RFID cost.
73 Road Pricing in London, Stockholm and Singapore: A way forward for New York City. Tri-state Transportation Campaign. 2017
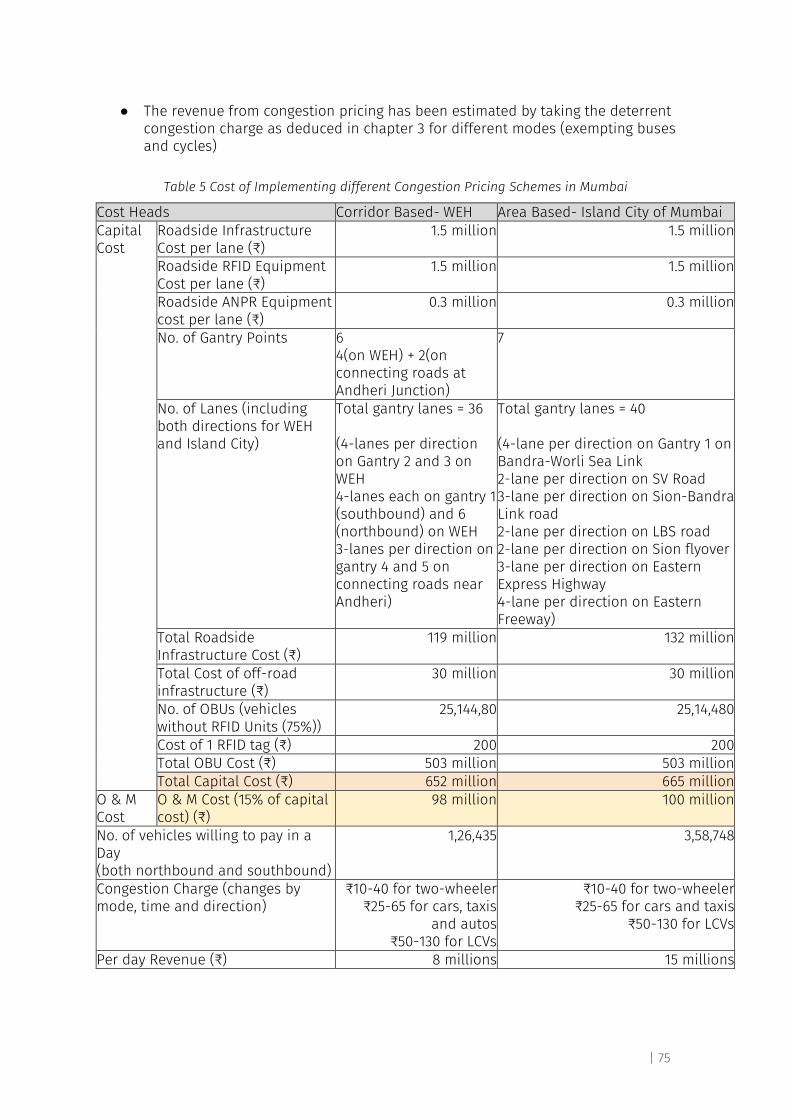
| 75
● The revenue from congestion pricing has been estimated by taking the deterrent congestion charge as deduced in chapter 3 for different modes (exempting buses and cycles)
Table 5 Cost of Implementing different Congestion Pricing Schemes in Mumbai
Cost Heads Corridor Based- WEH Area Based- Island City of Mumbai Capital Cost
Roadside Infrastructure Cost per lane (₹)
1.5 million 1.5 million
Roadside RFID Equipment Cost per lane (₹)
1.5 million 1.5 million
Roadside ANPR Equipment cost per lane (₹)
0.3 million 0.3 million
No. of Gantry Points 6 4(on WEH) + 2(on connecting roads at Andheri Junction)
7
No. of Lanes (including both directions for WEH and Island City)
Total gantry lanes = 36 (4-lanes per direction on Gantry 2 and 3 on WEH 4-lanes each on gantry 1 (southbound) and 6 (northbound) on WEH 3-lanes per direction on gantry 4 and 5 on connecting roads near Andheri)
Total gantry lanes = 40 (4-lane per direction on Gantry 1 on Bandra-Worli Sea Link 2-lane per direction on SV Road 3-lane per direction on Sion-Bandra Link road 2-lane per direction on LBS road 2-lane per direction on Sion flyover 3-lane per direction on Eastern Express Highway 4-lane per direction on Eastern Freeway)
Total Roadside Infrastructure Cost (₹)
119 million 132 million
Total Cost of off-road infrastructure (₹)
30 million 30 million
No. of OBUs (vehicles without RFID Units (75%))
25,144,80 25,14,480
Cost of 1 RFID tag (₹) 200 200 Total OBU Cost (₹) 503 million 503 million Total Capital Cost (₹) 652 million 665 million
O & M Cost
O & M Cost (15% of capital cost) (₹)
98 million 100 million
No. of vehicles willing to pay in a Day (both northbound and southbound)
1,26,435
3,58,748
Congestion Charge (changes by mode, time and direction)
₹10-40 for two-wheeler ₹25-65 for cars, taxis
and autos ₹50-130 for LCVs
₹10-40 for two-wheeler ₹25-65 for cars and taxis
₹50-130 for LCVs
Per day Revenue (₹) 8 millions 15 millions
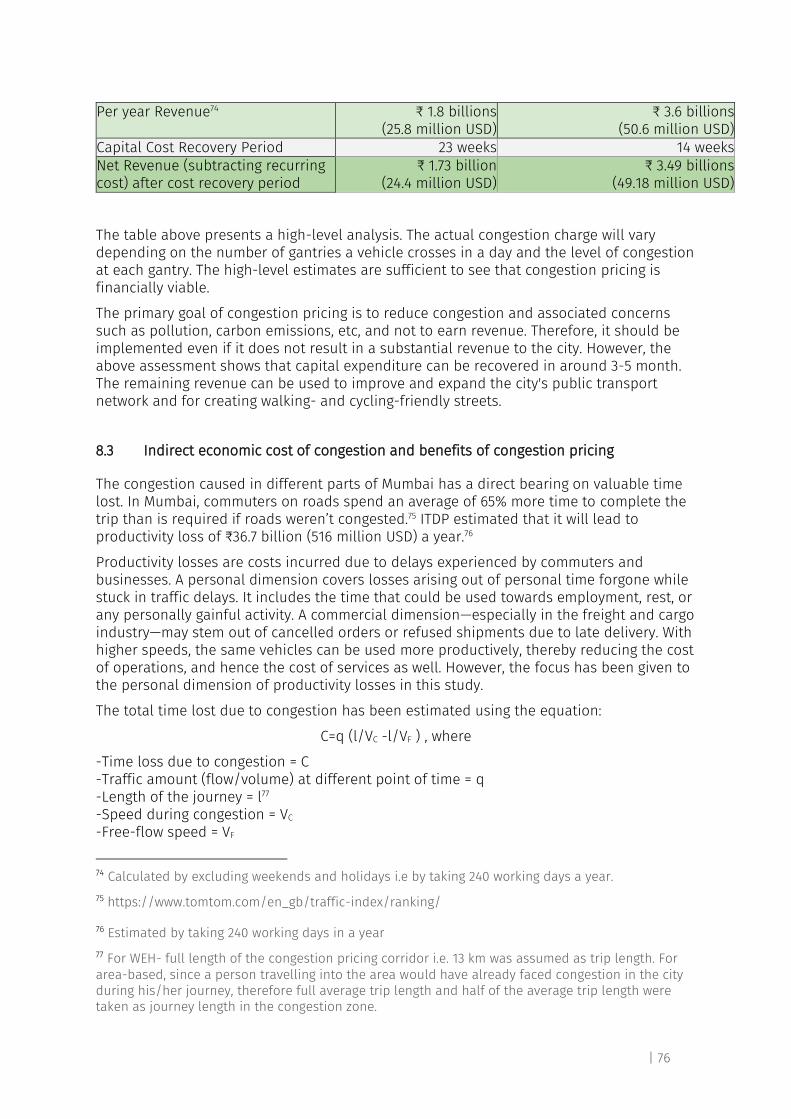
| 76
Per year Revenue74 ₹ 1.8 billions (25.8 million USD)
₹ 3.6 billions (50.6 million USD)
Capital Cost Recovery Period 23 weeks 14 weeks Net Revenue (subtracting recurring cost) after cost recovery period
₹ 1.73 billion (24.4 million USD)
₹ 3.49 billions (49.18 million USD)
The table above presents a high-level analysis. The actual congestion charge will vary depending on the number of gantries a vehicle crosses in a day and the level of congestion at each gantry. The high-level estimates are sufficient to see that congestion pricing is financially viable.
The primary goal of congestion pricing is to reduce congestion and associated concerns such as pollution, carbon emissions, etc, and not to earn revenue. Therefore, it should be implemented even if it does not result in a substantial revenue to the city. However, the above assessment shows that capital expenditure can be recovered in around 3-5 month. The remaining revenue can be used to improve and expand the city's public transport network and for creating walking- and cycling-friendly streets.
8.3 Indirect economic cost of congestion and benefits of congestion pricing
The congestion caused in different parts of Mumbai has a direct bearing on valuable time lost. In Mumbai, commuters on roads spend an average of 65% more time to complete the trip than is required if roads weren’t congested.75 ITDP estimated that it will lead to productivity loss of ₹36.7 billion (516 million USD) a year.76
Productivity losses are costs incurred due to delays experienced by commuters and businesses. A personal dimension covers losses arising out of personal time forgone while stuck in traffic delays. It includes the time that could be used towards employment, rest, or any personally gainful activity. A commercial dimension—especially in the freight and cargo industry—may stem out of cancelled orders or refused shipments due to late delivery. With higher speeds, the same vehicles can be used more productively, thereby reducing the cost of operations, and hence the cost of services as well. However, the focus has been given to the personal dimension of productivity losses in this study.
The total time lost due to congestion has been estimated using the equation:
C=q (l/VC -l/VF ) , where
-Time loss due to congestion = C -Traffic amount (flow/volume) at different point of time = q -Length of the journey = l77 -Speed during congestion = VC -Free-flow speed = VF
74 Calculated by excluding weekends and holidays i.e by taking 240 working days a year.
75 https://www.tomtom.com/en_gb/traffic-index/ranking/
76 Estimated by taking 240 working days in a year
77 For WEH- full length of the congestion pricing corridor i.e. 13 km was assumed as trip length. For area-based, since a person travelling into the area would have already faced congestion in the city during his/her journey, therefore full average trip length and half of the average trip length were taken as journey length in the congestion zone.
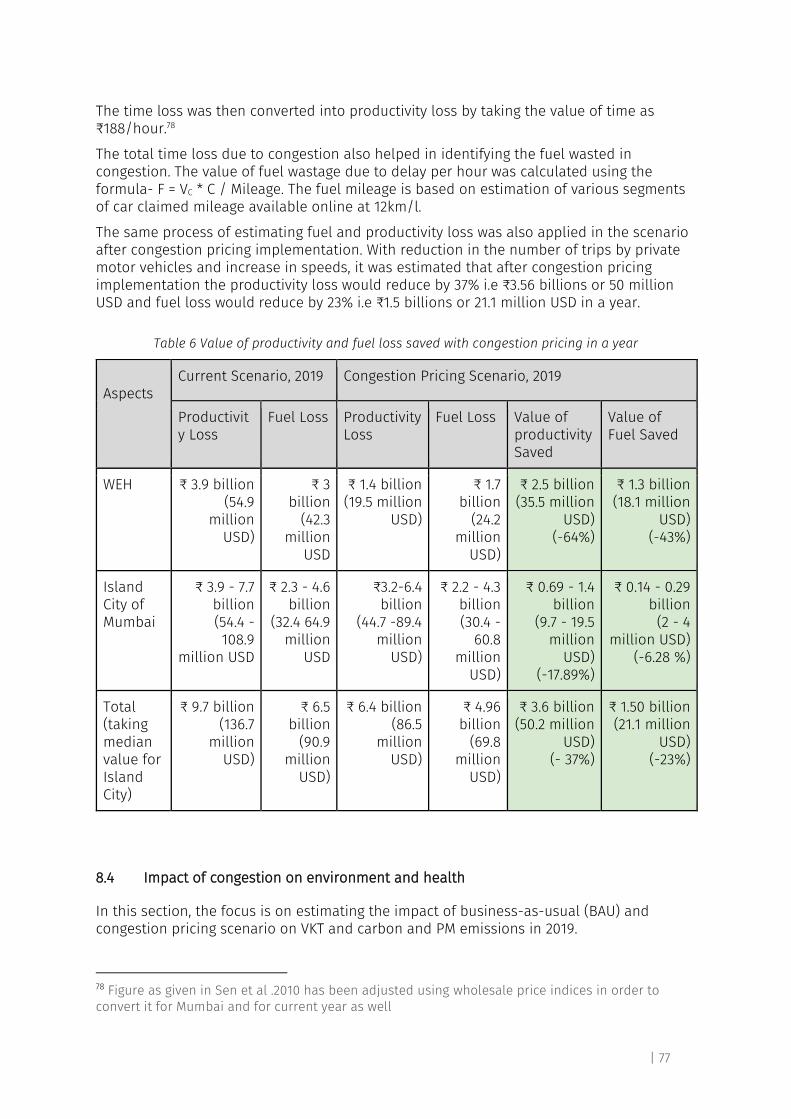
| 77
The time loss was then converted into productivity loss by taking the value of time as ₹188/hour.78
The total time loss due to congestion also helped in identifying the fuel wasted in congestion. The value of fuel wastage due to delay per hour was calculated using the formula- F = VC * C / Mileage. The fuel mileage is based on estimation of various segments of car claimed mileage available online at 12km/l.
The same process of estimating fuel and productivity loss was also applied in the scenario after congestion pricing implementation. With reduction in the number of trips by private motor vehicles and increase in speeds, it was estimated that after congestion pricing implementation the productivity loss would reduce by 37% i.e ₹3.56 billions or 50 million USD and fuel loss would reduce by 23% i.e ₹1.5 billions or 21.1 million USD in a year.
Table 6 Value of productivity and fuel loss saved with congestion pricing in a year
Aspects
Current Scenario, 2019 Congestion Pricing Scenario, 2019
Productivity Loss
Fuel Loss Productivity Loss
Fuel Loss Value of productivity Saved
Value of Fuel Saved
WEH ₹ 3.9 billion (54.9
million USD)
₹ 3 billion
(42.3 million
USD
₹ 1.4 billion (19.5 million
USD)
₹ 1.7 billion
(24.2 million
USD)
₹ 2.5 billion (35.5 million
USD) (-64%)
₹ 1.3 billion (18.1 million
USD) (-43%)
Island City of Mumbai
₹ 3.9 - 7.7 billion (54.4 - 108.9
million USD
₹ 2.3 - 4.6 billion
(32.4 64.9 million
USD
₹3.2-6.4 billion
(44.7 -89.4 million
USD)
₹ 2.2 - 4.3 billion (30.4 -
60.8 million
USD)
₹ 0.69 - 1.4 billion
(9.7 - 19.5 million
USD) (-17.89%)
₹ 0.14 - 0.29 billion (2 - 4
million USD) (-6.28 %)
Total (taking median value for Island City)
₹ 9.7 billion (136.7
million USD)
₹ 6.5 billion
(90.9 million
USD)
₹ 6.4 billion (86.5
million USD)
₹ 4.96 billion
(69.8 million
USD)
₹ 3.6 billion (50.2 million
USD) (- 37%)
₹ 1.50 billion (21.1 million
USD) (-23%)
8.4 Impact of congestion on environment and health
In this section, the focus is on estimating the impact of business-as-usual (BAU) and congestion pricing scenario on VKT and carbon and PM emissions in 2019.
78 Figure as given in Sen et al .2010 has been adjusted using wholesale price indices in order to convert it for Mumbai and for current year as well
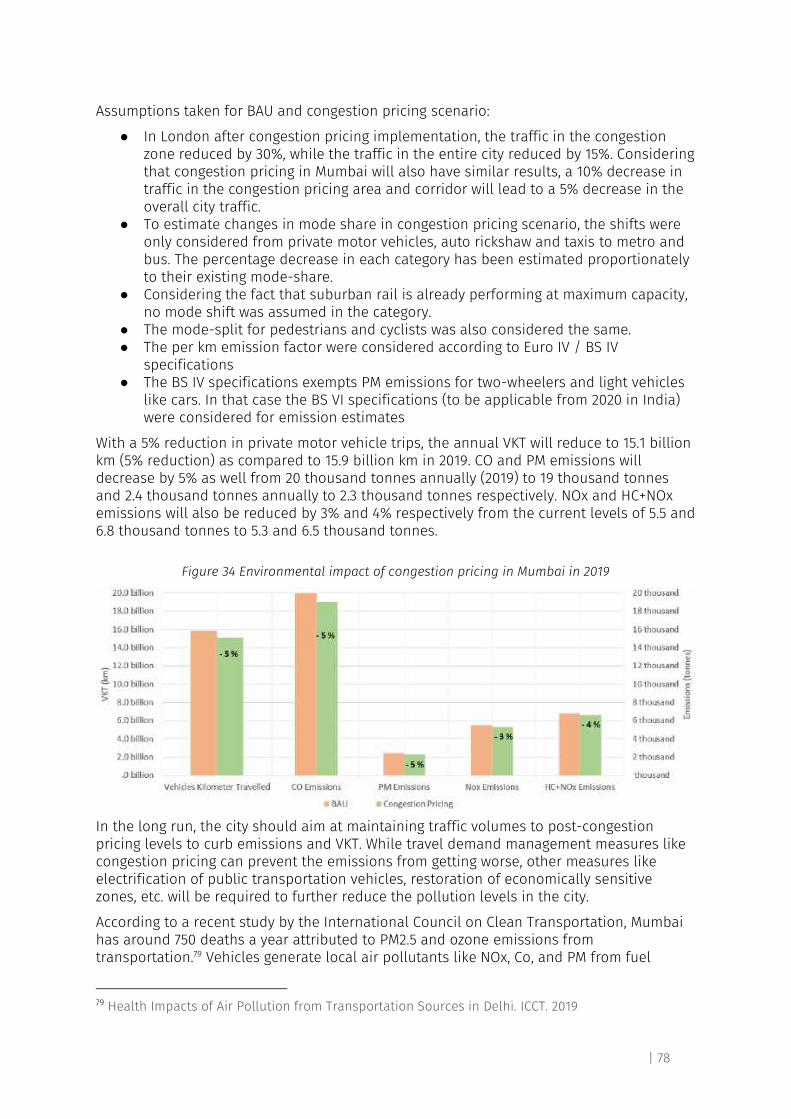
| 78
Assumptions taken for BAU and congestion pricing scenario:
● In London after congestion pricing implementation, the traffic in the congestion zone reduced by 30%, while the traffic in the entire city reduced by 15%. Considering that congestion pricing in Mumbai will also have similar results, a 10% decrease in traffic in the congestion pricing area and corridor will lead to a 5% decrease in the overall city traffic.
● To estimate changes in mode share in congestion pricing scenario, the shifts were only considered from private motor vehicles, auto rickshaw and taxis to metro and bus. The percentage decrease in each category has been estimated proportionately to their existing mode-share.
● Considering the fact that suburban rail is already performing at maximum capacity, no mode shift was assumed in the category.
● The mode-split for pedestrians and cyclists was also considered the same. ● The per km emission factor were considered according to Euro IV / BS IV
specifications ● The BS IV specifications exempts PM emissions for two-wheelers and light vehicles
like cars. In that case the BS VI specifications (to be applicable from 2020 in India) were considered for emission estimates
With a 5% reduction in private motor vehicle trips, the annual VKT will reduce to 15.1 billion km (5% reduction) as compared to 15.9 billion km in 2019. CO and PM emissions will decrease by 5% as well from 20 thousand tonnes annually (2019) to 19 thousand tonnes and 2.4 thousand tonnes annually to 2.3 thousand tonnes respectively. NOx and HC+NOx emissions will also be reduced by 3% and 4% respectively from the current levels of 5.5 and 6.8 thousand tonnes to 5.3 and 6.5 thousand tonnes.
Figure 34 Environmental impact of congestion pricing in Mumbai in 2019
In the long run, the city should aim at maintaining traffic volumes to post-congestion pricing levels to curb emissions and VKT. While travel demand management measures like congestion pricing can prevent the emissions from getting worse, other measures like electrification of public transportation vehicles, restoration of economically sensitive zones, etc. will be required to further reduce the pollution levels in the city.
According to a recent study by the International Council on Clean Transportation, Mumbai has around 750 deaths a year attributed to PM2.5 and ozone emissions from transportation.79 Vehicles generate local air pollutants like NOx, Co, and PM from fuel
79 Health Impacts of Air Pollution from Transportation Sources in Delhi. ICCT. 2019
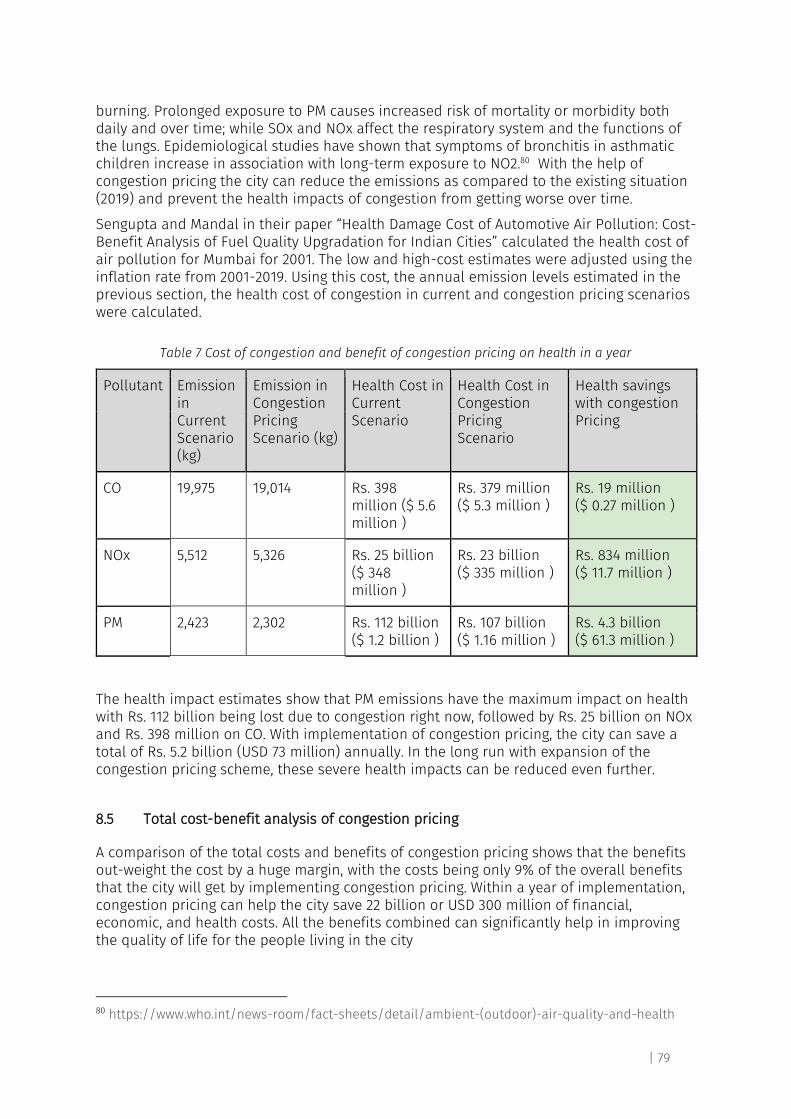
| 79
burning. Prolonged exposure to PM causes increased risk of mortality or morbidity both daily and over time; while SOx and NOx affect the respiratory system and the functions of the lungs. Epidemiological studies have shown that symptoms of bronchitis in asthmatic children increase in association with long-term exposure to NO2.80 With the help of congestion pricing the city can reduce the emissions as compared to the existing situation (2019) and prevent the health impacts of congestion from getting worse over time.
Sengupta and Mandal in their paper “Health Damage Cost of Automotive Air Pollution: Cost-Benefit Analysis of Fuel Quality Upgradation for Indian Cities” calculated the health cost of air pollution for Mumbai for 2001. The low and high-cost estimates were adjusted using the inflation rate from 2001-2019. Using this cost, the annual emission levels estimated in the previous section, the health cost of congestion in current and congestion pricing scenarios were calculated.
Table 7 Cost of congestion and benefit of congestion pricing on health in a year
Pollutant Emission in Current Scenario (kg)
Emission in Congestion Pricing Scenario (kg)
Health Cost in Current Scenario
Health Cost in Congestion Pricing Scenario
Health savings with congestion Pricing
CO 19,975 19,014 Rs. 398 million ($ 5.6 million )
Rs. 379 million ($ 5.3 million )
Rs. 19 million ($ 0.27 million )
NOx 5,512 5,326 Rs. 25 billion ($ 348 million )
Rs. 23 billion ($ 335 million )
Rs. 834 million ($ 11.7 million )
PM 2,423 2,302 Rs. 112 billion ($ 1.2 billion )
Rs. 107 billion ($ 1.16 million )
Rs. 4.3 billion ($ 61.3 million )
The health impact estimates show that PM emissions have the maximum impact on health with Rs. 112 billion being lost due to congestion right now, followed by Rs. 25 billion on NOx and Rs. 398 million on CO. With implementation of congestion pricing, the city can save a total of Rs. 5.2 billion (USD 73 million) annually. In the long run with expansion of the congestion pricing scheme, these severe health impacts can be reduced even further.
8.5 Total cost-benefit analysis of congestion pricing
A comparison of the total costs and benefits of congestion pricing shows that the benefits out-weight the cost by a huge margin, with the costs being only 9% of the overall benefits that the city will get by implementing congestion pricing. Within a year of implementation, congestion pricing can help the city save 22 billion or USD 300 million of financial, economic, and health costs. All the benefits combined can significantly help in improving the quality of life for the people living in the city
80 https://www.who.int/news-room/fact-sheets/detail/ambient-(outdoor)-air-quality-and-health
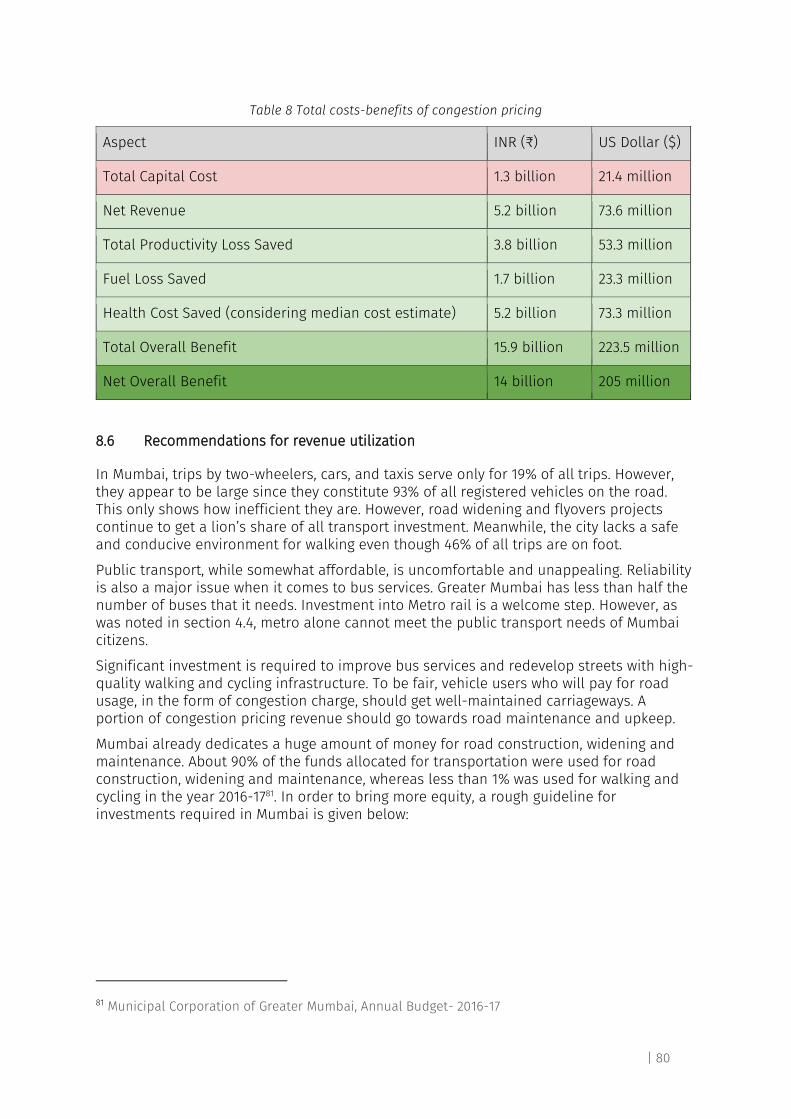
| 80
Table 8 Total costs-benefits of congestion pricing
Aspect INR (₹) US Dollar ($)
Total Capital Cost 1.3 billion 21.4 million
Net Revenue 5.2 billion 73.6 million
Total Productivity Loss Saved 3.8 billion 53.3 million
Fuel Loss Saved 1.7 billion 23.3 million
Health Cost Saved (considering median cost estimate) 5.2 billion 73.3 million
Total Overall Benefit 15.9 billion 223.5 million
Net Overall Benefit 14 billion 205 million
8.6 Recommendations for revenue utilization
In Mumbai, trips by two-wheelers, cars, and taxis serve only for 19% of all trips. However, they appear to be large since they constitute 93% of all registered vehicles on the road. This only shows how inefficient they are. However, road widening and flyovers projects continue to get a lion’s share of all transport investment. Meanwhile, the city lacks a safe and conducive environment for walking even though 46% of all trips are on foot.
Public transport, while somewhat affordable, is uncomfortable and unappealing. Reliability is also a major issue when it comes to bus services. Greater Mumbai has less than half the number of buses that it needs. Investment into Metro rail is a welcome step. However, as was noted in section 4.4, metro alone cannot meet the public transport needs of Mumbai citizens.
Significant investment is required to improve bus services and redevelop streets with high-quality walking and cycling infrastructure. To be fair, vehicle users who will pay for road usage, in the form of congestion charge, should get well-maintained carriageways. A portion of congestion pricing revenue should go towards road maintenance and upkeep.
Mumbai already dedicates a huge amount of money for road construction, widening and maintenance. About 90% of the funds allocated for transportation were used for road construction, widening and maintenance, whereas less than 1% was used for walking and cycling in the year 2016-1781. In order to bring more equity, a rough guideline for investments required in Mumbai is given below:
81 Municipal Corporation of Greater Mumbai, Annual Budget- 2016-17
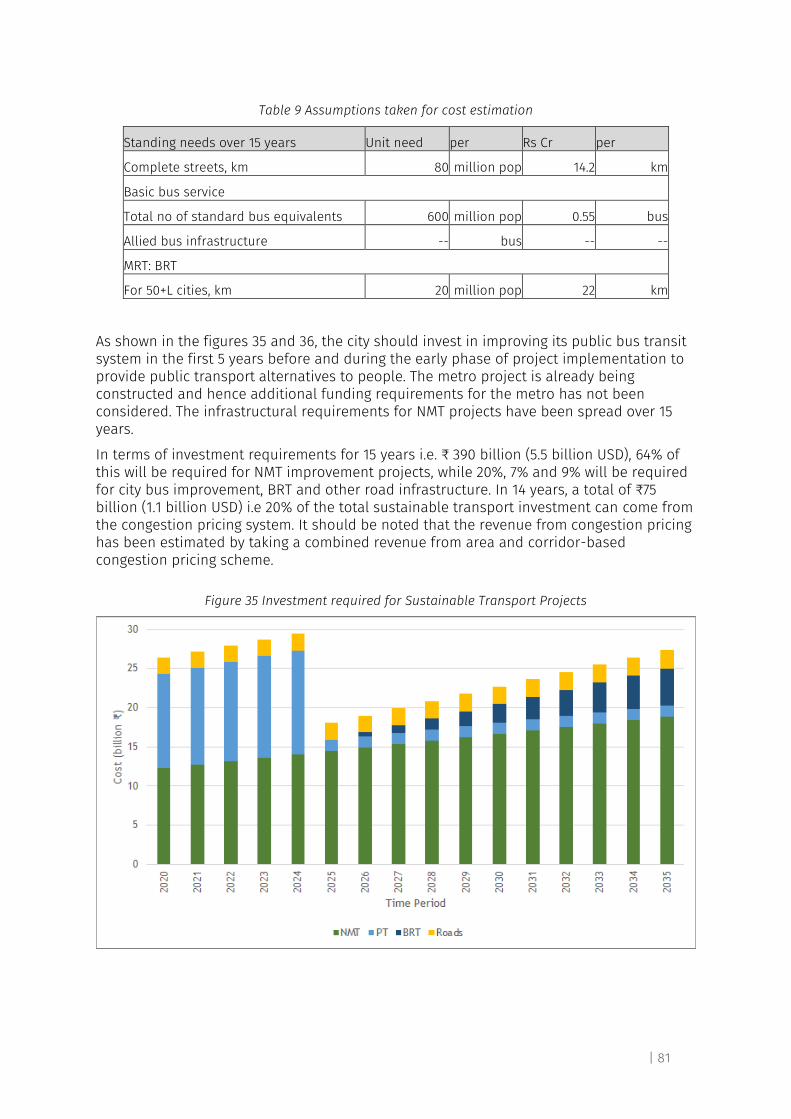
| 81
Table 9 Assumptions taken for cost estimation
Standing needs over 15 years Unit need per Rs Cr per
Complete streets, km 80 million pop 14.2 km
Basic bus service
Total no of standard bus equivalents 600 million pop 0.55 bus
Allied bus infrastructure -- bus -- --
MRT: BRT
For 50+L cities, km 20 million pop 22 km
As shown in the figures 35 and 36, the city should invest in improving its public bus transit system in the first 5 years before and during the early phase of project implementation to provide public transport alternatives to people. The metro project is already being constructed and hence additional funding requirements for the metro has not been considered. The infrastructural requirements for NMT projects have been spread over 15 years.
In terms of investment requirements for 15 years i.e. ₹ 390 billion (5.5 billion USD), 64% of this will be required for NMT improvement projects, while 20%, 7% and 9% will be required for city bus improvement, BRT and other road infrastructure. In 14 years, a total of ₹75 billion (1.1 billion USD) i.e 20% of the total sustainable transport investment can come from the congestion pricing system. It should be noted that the revenue from congestion pricing has been estimated by taking a combined revenue from area and corridor-based congestion pricing scheme.
Figure 35 Investment required for Sustainable Transport Projects
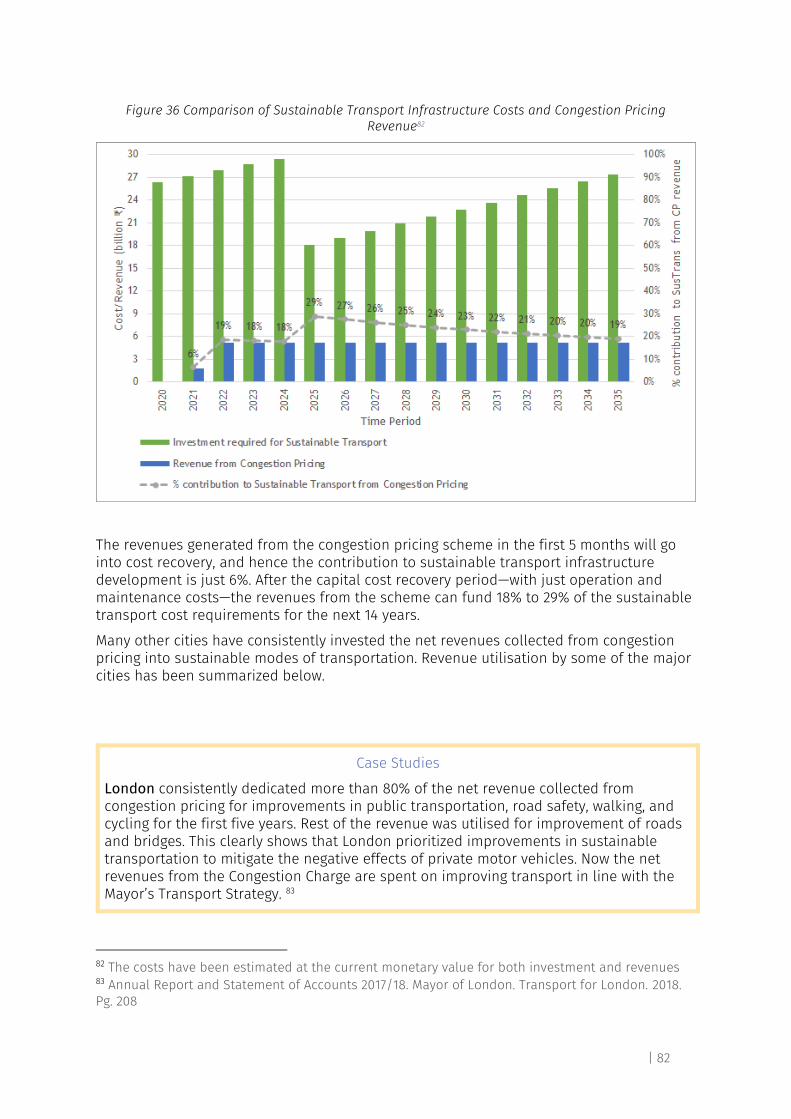
| 82
Figure 36 Comparison of Sustainable Transport Infrastructure Costs and Congestion Pricing Revenue82
The revenues generated from the congestion pricing scheme in the first 5 months will go into cost recovery, and hence the contribution to sustainable transport infrastructure development is just 6%. After the capital cost recovery period—with just operation and maintenance costs—the revenues from the scheme can fund 18% to 29% of the sustainable transport cost requirements for the next 14 years.
Many other cities have consistently invested the net revenues collected from congestion pricing into sustainable modes of transportation. Revenue utilisation by some of the major cities has been summarized below.
Case Studies
London consistently dedicated more than 80% of the net revenue collected from congestion pricing for improvements in public transportation, road safety, walking, and cycling for the first five years. Rest of the revenue was utilised for improvement of roads and bridges. This clearly shows that London prioritized improvements in sustainable transportation to mitigate the negative effects of private motor vehicles. Now the net revenues from the Congestion Charge are spent on improving transport in line with the Mayor’s Transport Strategy. 83
82 The costs have been estimated at the current monetary value for both investment and revenues 83 Annual Report and Statement of Accounts 2017/18. Mayor of London. Transport for London. 2018. Pg. 208
| 83
In Singapore the revenue generated from congestion pricing is pooled in with other sources of revenue of the public exchequer for allocation in the annual budgets. However, Singapore has consistently invested in high quality public transport and has paid special attention to improvements for walking and cycling facilities in recent years.
Stockholm: The revenue from congestion taxes collected in Sweden are invested in road-related works, public transport and housing. Agreements are forged out periodically between municipalities, state government and politicians outlining major items for investment of revenue from congestion taxes84.
Agreement of 2007: SEK 27.2 billion were invested in metros and roads in and around Stockholm out of which over 80% came from congestion taxes. A by-pass road for Stockholm was the most expensive investment amongst all projects.
Agreement of 2013: SEK 25.7 billion were invested in expansion of metro and construction of 78,000 houses out of which 35% came from congestion taxes. A major share came from government and municipal grants.
Agreement of 2017: SEK 30.2 billion were invested in expansion of the metro, 30 bicycle tracks and 100,370 housing units. About 25% of the investment funds came from congestion taxes. USA
All states and cities in the USA have statutory obligation to devote the first portion of the gross revenue to operation and maintenance activity of the facilities. The remaining portion is exclusively used for improvements in transit and carpool facilities.
Minnesota state law section 160.93 , subdivision 2 mandates use of net revenues as follows: 50% for capital improvement within the corridor (HOT lane) 50% for expansion and improvement of bus transit service beyond the level of service provided on the date of implementation of congestion charge on the corridor. California state law also mandates use of net revenues for improvements in transit and carpool facilities. States in the USA are focusing on horizontal equity by heavily investing in public transportation. As congestion pricing schemes in the USA are imposed on a fixed number of lanes on specific corridors, vertical inequity is compensated as a free alternate route is available
84https://www.trafikverket.se/resa-och-trafik/vag/Trangselskatt--infrastrukturavgifter/trangselskatt-i-stockholm/
| 84
9 Implementing Congestion Pricing in Mumbai
9.1 Introduction to the chapter
This chapter touches upon four key aspects of implementation:
I. Garnering public support for the system
II. Establishing a strong institutional and legislative framework
III. Financing system implementation
IV. Measuring the right set of indicators to assess system performance
Without proactive and effective communication at all stages—from inception to implementation, and well into operations—the initiative can fail. It is essential to garner the support of all key stakeholders—political, media, businesses, and motor vehicle users—for the success of this initiative:
● Find political champions. Congestion pricing is not easy to implement without strong political support backing the idea.
● Bring aboard key influencers by holding consultations with important stakeholders who can influence public opinion. Understand their perspectives to finesse the message.
● Inform people about how congestion pricing will work and how they will benefit. Spread the right message through the media.
Congestion pricing requires the support of multiple stakeholders for planning, execution, and monitoring. Engage with the right set of stakeholders to establish a strong institutional and legislative framework:
● Identify key public agencies that have a role to play in implementing congestion pricing. These range from road-owning and city planning agencies, to those that manage vehicle licencing and traffic management.
● Obtain legislative backing to ensure the legality of congestion pricing. Amend or create acts and policies to enable the implementation of congestion pricing.
● Ensure inter-agency coordination. This might take the shape of a high-level working group with clear roles and responsibilities assigned to each agency.
● Establish a dedicated Congestion Pricing Unit with necessary statutory authority and a team of competent professionals to implement congestion pricing and subsequently oversee its day-to-day operation.
● Hire a competent operator to install infrastructure and manage day-to-day operations and system monitoring.
● Share revenues with the stakeholders as defined by the inter-agency agreement and service contracts through an escrow account.
Financing and implementation of the system is best done by a competent private sector agency selected through competitive bidding.
Assess the impact of congestion pricing to take corrective steps as traffic and travel dynamics change in the city. Results should be shared with all public agencies and used to take corrective measures. The data is also useful to communicate results to various stakeholders to retain their support.
This chapter highlights key implementation challenges that a city should be aware of and how it can overcome them. It ends with a proposed timeline of implementing congestion pricing in Mumbai.
| 85
9.2 Garnering public support for the system
9.2.1 Create political capital for congestion pricing
Congestion pricing is not easy to implement without a strong political champion backing the idea. Here are a few recommendations to garner strong support for the scheme:
● Enough time must be invested in finding a political champion in the city and make them understand the benefits of such a project. In the Indian context, it is essential that both the elected and administrative wings offer their full support. For example, Ken Livingstone, elected as the Mayor of London in 2000, included congestion charge as an important part of his manifesto and had plans for the implementation of the scheme, which indicated the political commitment at the city level.
● The implementation planning of the project should start at the beginning of the political cycle and implementation should be done by mid-cycle so that there is sufficient time for things to settle down before the next election. No politician would like to implement a tough measure like congestion pricing towards the end of their term, just before new elections.
9.2.2 Bring aboard key influencers
The political decision-making process is often driven by the public debate around the topic, rather than the technical transportation-related arguments. Therefore, it becomes crucial to inform people about how congestion pricing will work and how they will benefit from it.
Case Studies
The Minnesota Metropolitan Council organized extensive consensus-building and stakeholder activities throughout the consideration of the pricing project. An important feature of consensus-building was to reach out to the elected official and community leader first- who can then communicate with their constituents to get the support of the public.
The Singaporean government has taken a long-term approach to public outreach and education. The Land Transport Authority (LTA) Transportation Gallery for example teaches the students about the need for good transportation planning and how ERP is an effective demand management tool.
Both London and Stockholm invested years in public debate before going ahead with congestion pricing implementation. The public concerns were addressed throughout the planning process.
Dutch Ministry of Transport has also invested heavily in public outreach and education. The government developed very clear key messages like “drive less, pay less” and delivered the purpose and benefits of pricing in a timely manner.
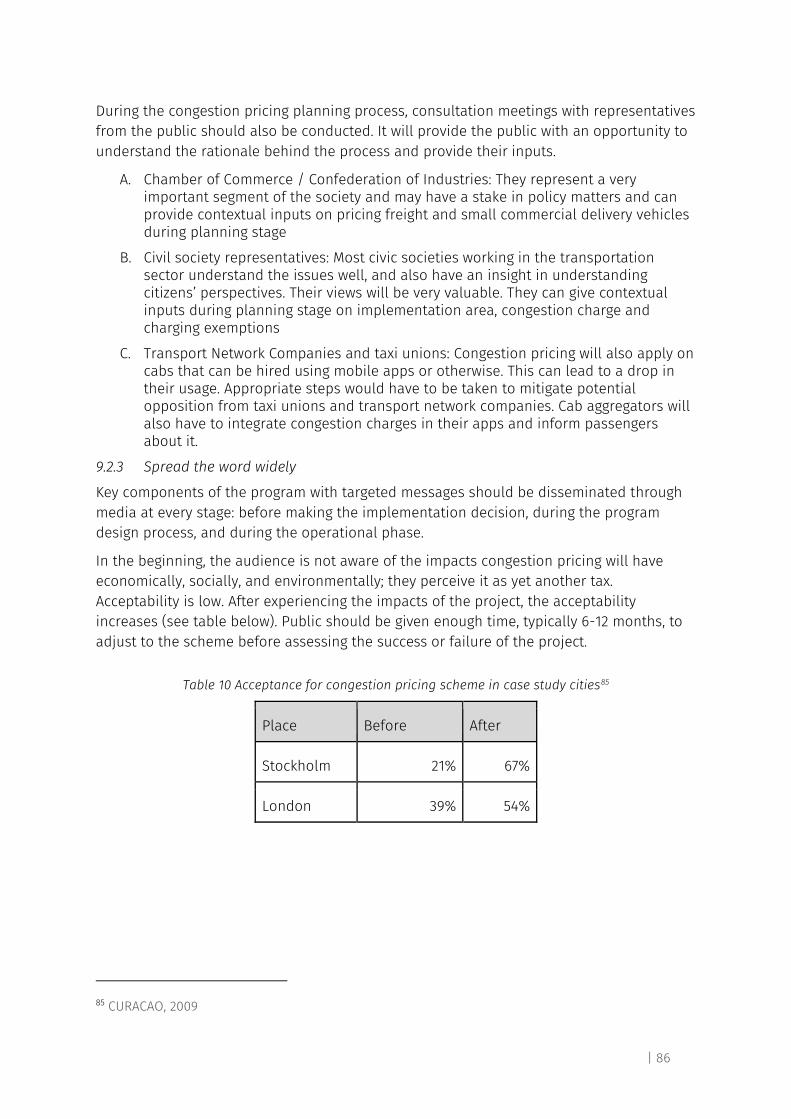
| 86
During the congestion pricing planning process, consultation meetings with representatives from the public should also be conducted. It will provide the public with an opportunity to understand the rationale behind the process and provide their inputs.
A. Chamber of Commerce / Confederation of Industries: They represent a very important segment of the society and may have a stake in policy matters and can provide contextual inputs on pricing freight and small commercial delivery vehicles during planning stage
B. Civil society representatives: Most civic societies working in the transportation sector understand the issues well, and also have an insight in understanding citizens’ perspectives. Their views will be very valuable. They can give contextual inputs during planning stage on implementation area, congestion charge and charging exemptions
C. Transport Network Companies and taxi unions: Congestion pricing will also apply on cabs that can be hired using mobile apps or otherwise. This can lead to a drop in their usage. Appropriate steps would have to be taken to mitigate potential opposition from taxi unions and transport network companies. Cab aggregators will also have to integrate congestion charges in their apps and inform passengers about it.
9.2.3 Spread the word widely
Key components of the program with targeted messages should be disseminated through media at every stage: before making the implementation decision, during the program design process, and during the operational phase.
In the beginning, the audience is not aware of the impacts congestion pricing will have economically, socially, and environmentally; they perceive it as yet another tax. Acceptability is low. After experiencing the impacts of the project, the acceptability increases (see table below). Public should be given enough time, typically 6-12 months, to adjust to the scheme before assessing the success or failure of the project.
Table 10 Acceptance for congestion pricing scheme in case study cities85
Place Before After
Stockholm 21% 67%
London 39% 54%
85 CURACAO, 2009
| 87
9.3 Establishing a strong legislative and institutional framework
9.3.1 Legislative framework
Statutory backing ensures the legality of congestion pricing. It's important to amend or create acts and policies to enable the implementation of congestion pricing.
Case Studies
In Sweden, for example, congestion charges are legally formulated as a national tax, and thus requires the involvement of a national tax agency. In practice, the Swedish Transport Administration takes care of the necessary roadside equipment, the Swedish Transport Agency runs the back office and charges and invoices vehicle owners and the tax agency is only involved in collecting the revenues from the Swedish Transport Agency.86
The Greater London Authority (GLA) Act, 1999 empowered the Mayor of London to use congestion pricing to curb traffic congestion. The use of congestion pricing was extended to entire England through the Transport Act, 2000.
In Greater Mumbai, MCGM is the primary owner of roads in Mumbai, but some roads like the Western Express Highway, Eastern Express Highway, Eastern Freeway fall under the purview of MMRDA. Hence, they have legal jurisdiction over the right-of-way.
And assessment of the ‘Mumbai Metropolitan Region Development Authority Act, 1974’ (as modified up to the 18th July 2011) and the ‘Bombay Motor Vehicle tax Act, 1958’, suggests that the current legislative and institutional framework is sufficient to give a legal backing to MMRDA to collect congestion charges in the form of a toll with the permission of the state government.87 MMRDA also has full control over the revenue generated through the process and can utilize it for any development process defined under the acts.
According to the Bombay Act No. III of 1888-- the Mumbai Municipal Corporation Act (As modified up to the 18th January 2016), MCGM has the authority to collect congestion charge or implement any other travel demand management process, in consultation with the Commissioner of Police. The revenues generated will go to the municipal fund and can be utilized for any development process carried out by the authority.88
Since Brihanmumbai Electricity Supply and Transport (BEST), the agency that operates city bus services, is an undertaking of the municipal corporation under the Act, MCGM can invest the revenues generated from congestion pricing to improve BEST services and even explore the possibility of creating dedicated lanes to improve existing operations and provide good and affordable alternative to people who wish to change their mode of transport if a congestion charge is applicable.
86 Introduction to Congestion Charging. GIZ China. 2015
87 Refer to The Mumbai Metropolitan Region Development Authority Act, 1974’ (as modified up to the 18th July 2011), Chapter IV, Section 17, Sub-section (1); Sub-section (4); Chapter V, Section 18, Sub-section (1g) and Bombay Motor Vehicle tax Act, 1958, Section 20, Sub-section (1A) (a)
88 Refer to Bombay Act No. III of 1888- The Mumbai Municipal Corporation Act (As modified up to the 18th January 2016), Chapter XI, Section 326(B) and Chapter VII, Section 111
| 88
The State Transport Department is responsible for policy and legislation. If required, it may have to provide additional legal backing for the implementation of the system, including passing new policies or amending existing acts. Maharashtra’s draft Sustainable Urban Transport Policy emphasizes discouraging use of private motor vehicles, while encouraging sustainable transportation modes. If congestion pricing is successful in Mumbai, the Transport Department may want to consider implementing it in other cities in the state.
9.3.2 Key public stakeholders
The implementation of congestion pricing projects requires different organizations and stakeholders to work together. Defining clear agency responsibilities is essential to ensure that different agencies can work together as a team. In Mumbai, the following organizations have been identified as the stakeholders of this study on congestion pricing:
Primary Implementing Agency: the agency responsible for planning, executing, and monitoring the project. Its remit includes preparing a detailed project report, conducting public and political outreach for the project, coordinating with different agencies to ensure implementation, procuring the services of a private-sector system operator, and conducting monitoring and evaluation of the project.
In cities like London and Singapore, the unified metropolitan transport authorities have been responsible for implementing congestion pricing. However, Mumbai UMTA is not operational yet. In Mumbai’s case, MMRDA and MCGM are the two principal stakeholders of this initiative. Either of them could be the lead implementing agency but a deep engagement of the other is essential.
Traffic management agency: that ensures enforcement and management of traffic on ground. Imposing and collecting fines, managing congestion outside the congestion pricing zone and enforcing parking rules inside and outside the congestion pricing zone are its responsibilities too. The traffic management agency may also be co-opted as a co-implementer as they are responsible for the on-ground enforcement of the project.
In Mumbai’s case, the Traffic Police is the principal traffic management agency. It is responsible for the management of traffic and enforcement of traffic rules, including imposing and collecting fines for traffic infractions. Congestion pricing may lead to various consequences (such as congestion outside the system cordon/network, illegal parking, etc) which will have to be managed by the police. Therefore, it is important that the traffic police is fully aligned with any proposed congestion pricing scheme, and is willing to provide any necessary support in traffic management and enforcement.
Vehicle licensing agency: It is essential to have the backing of the vehicle registration agency for identification of vehicles which is a prime requirement for congestion pricing implementation. The agency should create and maintain an up-to-date digital vehicle registry and allow electronic integration of the vehicle database with the congestion pricing system
In Mumbai’s case, the Regional Transport Office and the Transport Commissioner’s office, which oversees the Road Transport Office, are responsible for managing the registration of all vehicles. All TDM measures are closely related to managing and controlling the number of vehicles in a city.
Public transport agencies: Public transport agencies provide transit services in the city. Their responsibility will be to provide good quality, safe and reliable public transport services to people to enable a shift from private vehicle use
| 89
Most of the metro rail network and the sole monorail line in Mumbai are under the purview of MMRDA. Mumbai metro line-3 implementation is under MMRCL, a joint venture of the Govt. of India (GOI) and the Government of Maharashtra (GOM). Congestion pricing may induce demand for Metro. Hence, Metro planning should take this into account.
Congestion pricing may result in an increased demand for BEST bus services. In that case, BEST might have to take any steps necessary to support the additional demand by increasing the number of buses, with higher frequencies to serve the needs of the existing as well as new users. It may have to create differentiated services to meet the needs of more demanding users who expect higher quality than what BEST buses presently provide.
It seems unlikely that congestion pricing will induce a modal shift from personal vehicles, especially cars, to the suburban rail. Yet, the suburban rail is an extremely important part of Greater Mumbai’s transportation fabric, and any study on congestion pricing should consider this mode. Indian railways can support congestion pricing implementation by improving the station area to make the experience of existing users more comfortable.
Electronic payment and settlement agency: that enables electronic payment to charge vehicles is essential for implementation of congestion pricing. The payment agency should provide a safe and common channel to enable seamless charging of vehicles and settlement in case of conflicting charges.
National Payments Corporation of India (NPCI) is an umbrella organization for all retail payments in India. The existing RFID toll payment system uses this channel. The same would also be required to enable congestion charging in Mumbai.
9.3.3 Ensuring Institutional coordination
Multi-agency working group of all relevant public agencies should be formed with clearly identified roles and responsibilities for each agency. A dedicated ‘Congestion Pricing Unit’ with necessary statutory authority and a team of competent professionals should be created to implement congestion pricing and subsequently oversee its day-to-day operation.
The system revenue generated should be deposited in an escrow account and distributed amongst the agencies as defined by inter-agency agreements and service contracts.
Case Study
To resolve coordination issues, Los Angeles Metro, for example, held weekly staff meetings and included an agenda item at every other meeting to discuss how the senior staff were coordinating on the project. However to achieve this, a cooperative agreement defining roles and responsibilities between LA metro and Caltrans was developed.89
In Miami, there was no formal agreement but staff were given specific authority during project planning, construction, and operation. It involved six authorities working together well without official agreements.90
89 Congestion Pricing A Primer on Institutional Issues. US Department of Transportation. Federal Highway Administration
90 Congestion Pricing A Primer on Institutional Issues. US Department of Transportation. Federal Highway Administration
| 90
New York had a much greater institutional complexity which made it complicated to gain public and political support. While the city led a strong multi-agency working group including city, State, and transit agencies, the Metropolitan Transportation Authority (MTA) would have spent the money. Despite several provisions in the proposed authorizing legislation, many questioned whether the revenues would be spent as intended, undercutting support for the plan. The scheme, however, is ready for implementation after almost 10 years of deliberations and efforts
9.3.4 Private-sector stakeholders
Private-sector stakeholders are required for day-to-day operation of the congestion pricing infrastructure and provide innovation in charging technologies. Robust and innovative charging technologies are essential to provide seamless charging experience to users and also reduce bugs in the system.
Competent private-sector operator to handle day-to-day operations: Installing infrastructure and managing day-today operation is best done by a competent private sector agency hired through a competitive bid under a Build-Operate-Transfer model. Its remit includes:
● Installing hardware: gantries, RFID readers, cameras, signages, etc ● Developing software for system operations and reporting ● Operating a control centre to monitor the system in real-time ● Developing and managing web and mobile apps for system information, user
accounts, and payment ● Maintaining the system
Data and mobile app companies: Mobility management apps like TomTom, Google Maps, Chalo, Mobond, and Ridl could provide options to take alternative routes that may be priced differently under a congestion pricing regime. They may also be able to provide data on traffic speeds, delays, and incident reports. Such data can be useful at the planning as well as monitoring and evaluation stage for the implementation authority.
IT companies: Congestion pricing may generate “big data”. This data can be analyzed to fine-tune the congestion pricing schemes to make them more effective. They can help the implementation authority develop models to analyse the data collected for monitoring and evaluation
9.4 Financing and operation of system
The primary goal of congestion pricing schemes is to curb traffic and stimulate mode shift to more efficient and sustainable modes of transportation. Congestion pricing is a technology-intensive initiative that requires personnel with expertise in the field of ETC. Considering these factors, congestion pricing is best implemented by a private sector agency under public supervision.
Installing infrastructure and managing day-today operation is best done by a competent private sector agency hired through a competitive bid under a Build-Operate-Transfer mode. The cost of infrastructure should be borne by the private sector operator. Its remit should include:
● Installing hardware, gantries, RFID readers, cameras, signages etc ● Developing software for system operations and reporting
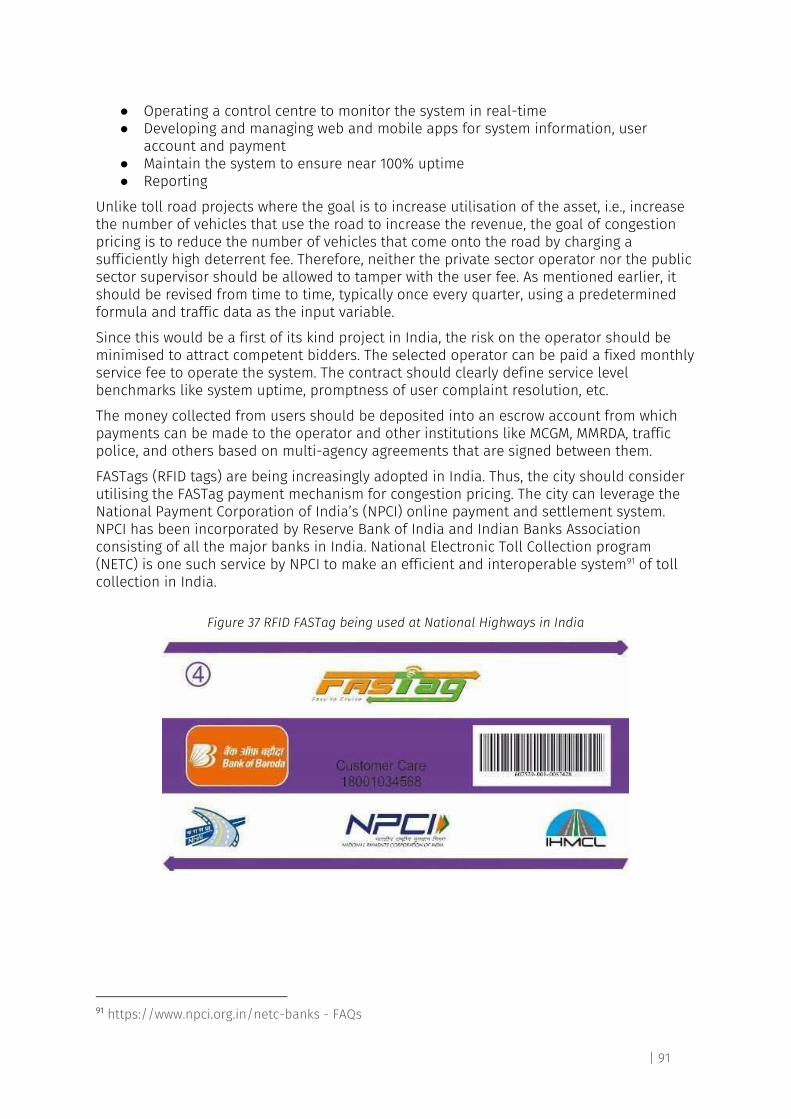
| 91
● Operating a control centre to monitor the system in real-time ● Developing and managing web and mobile apps for system information, user
account and payment ● Maintain the system to ensure near 100% uptime ● Reporting
Unlike toll road projects where the goal is to increase utilisation of the asset, i.e., increase the number of vehicles that use the road to increase the revenue, the goal of congestion pricing is to reduce the number of vehicles that come onto the road by charging a sufficiently high deterrent fee. Therefore, neither the private sector operator nor the public sector supervisor should be allowed to tamper with the user fee. As mentioned earlier, it should be revised from time to time, typically once every quarter, using a predetermined formula and traffic data as the input variable.
Since this would be a first of its kind project in India, the risk on the operator should be minimised to attract competent bidders. The selected operator can be paid a fixed monthly service fee to operate the system. The contract should clearly define service level benchmarks like system uptime, promptness of user complaint resolution, etc.
The money collected from users should be deposited into an escrow account from which payments can be made to the operator and other institutions like MCGM, MMRDA, traffic police, and others based on multi-agency agreements that are signed between them.
FASTags (RFID tags) are being increasingly adopted in India. Thus, the city should consider utilising the FASTag payment mechanism for congestion pricing. The city can leverage the National Payment Corporation of India’s (NPCI) online payment and settlement system. NPCI has been incorporated by Reserve Bank of India and Indian Banks Association consisting of all the major banks in India. National Electronic Toll Collection program (NETC) is one such service by NPCI to make an efficient and interoperable system91 of toll collection in India.
Figure 37 RFID FASTag being used at National Highways in India
91 https://www.npci.org.in/netc-banks - FAQs
| 92
9.5 Assessing the impacts of congestion pricing
A key step is to assess the impact of congestion pricing and take corrective steps as traffic and travel dynamics change in the city. The data also comes in handy to communicate results to various stakeholders to retain their support.
The city must evaluate the impact of congestion pricing by collecting the data for the following indicators before and after the implementation of the scheme:
● Total traffic volume count (to measure reduction levels) ● Average speeds on major corridor(s) (to measure improvement in speeds) ● Traffic conditions on alternate routes (to assess shift in travel routes) ● Ridership of different public transport services (to evaluate percentage shift to
public transport) ● Air pollution at street level ● User perception ● Net revenue generated
9.6 Implementation challenges
9.6.1 Coordination between
Implementation of congestion pricing requires strong coordination between the RTO and National Payments Corporation of India (NPCI) to enable sharing of vehicle databases and connect it with the RFID payment mechanism. Coordination with RTO can be assured through signing of multi-agency agreements, while the terms of settlements can be clarified with NCPI to enable charging through the existing mechanism.
As per a press release note by NPCI in April 2019, the organization is already working on an attractive State/City/SPV onboarding policy, whereby they would provide financial assistance to the State/City/SPV authority for implementation of NETC (National Electronic Toll Collection) program.92
9.6.2 Capturing vehicles with wrong vehicle tag
Since congestion fee is based on the size and type of vehicle, some vehicles may misuse tags meant for categories whose fee is lower. The design of RFID tags—which tear if an attempt is made to remove them—can mitigate this concern. The agency that issues RFID tags should inspect the vehicle prior to affixing the tag on the vehicle to avoid misuse and ensure compliance.
9.6.3 Low uptake of RFID tags
From 2017, all new vehicles in India come with an RFID tag. Starting in 2020, vehicles without a FASTag have to pay twice the amount of toll to pass through toll plazas of the National Highway Authority of India. This step has already accelerated widespread
92https://www.npci.org.in/sites/default/files/Press%20release-%20Extending%20FASTag%20program%20across%20State%20and%20City%20toll%20plaza....pdf
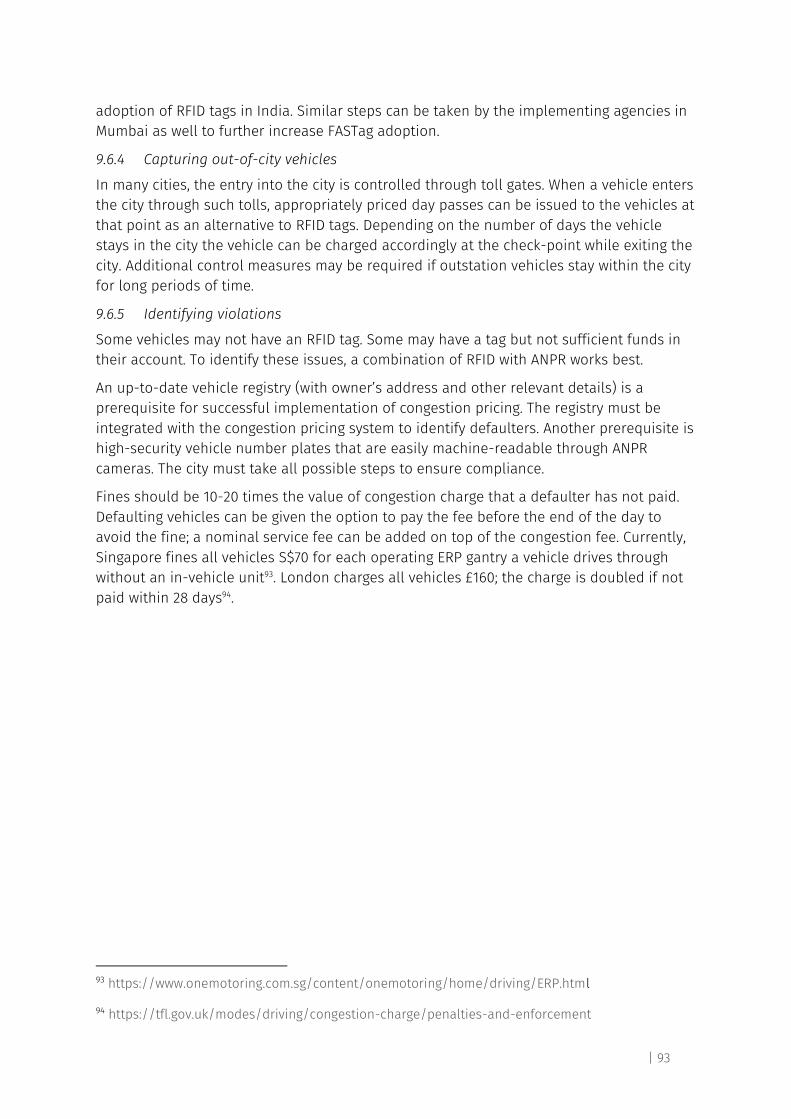
| 93
adoption of RFID tags in India. Similar steps can be taken by the implementing agencies in Mumbai as well to further increase FASTag adoption.
9.6.4 Capturing out-of-city vehicles
In many cities, the entry into the city is controlled through toll gates. When a vehicle enters the city through such tolls, appropriately priced day passes can be issued to the vehicles at that point as an alternative to RFID tags. Depending on the number of days the vehicle stays in the city the vehicle can be charged accordingly at the check-point while exiting the city. Additional control measures may be required if outstation vehicles stay within the city for long periods of time.
9.6.5 Identifying violations
Some vehicles may not have an RFID tag. Some may have a tag but not sufficient funds in their account. To identify these issues, a combination of RFID with ANPR works best.
An up-to-date vehicle registry (with owner’s address and other relevant details) is a prerequisite for successful implementation of congestion pricing. The registry must be integrated with the congestion pricing system to identify defaulters. Another prerequisite is high-security vehicle number plates that are easily machine-readable through ANPR cameras. The city must take all possible steps to ensure compliance.
Fines should be 10-20 times the value of congestion charge that a defaulter has not paid. Defaulting vehicles can be given the option to pay the fee before the end of the day to avoid the fine; a nominal service fee can be added on top of the congestion fee. Currently, Singapore fines all vehicles S$70 for each operating ERP gantry a vehicle drives through without an in-vehicle unit93. London charges all vehicles £160; the charge is doubled if not paid within 28 days94.
93 https://www.onemotoring.com.sg/content/onemotoring/home/driving/ERP.html
94 https://tfl.gov.uk/modes/driving/congestion-charge/penalties-and-enforcement
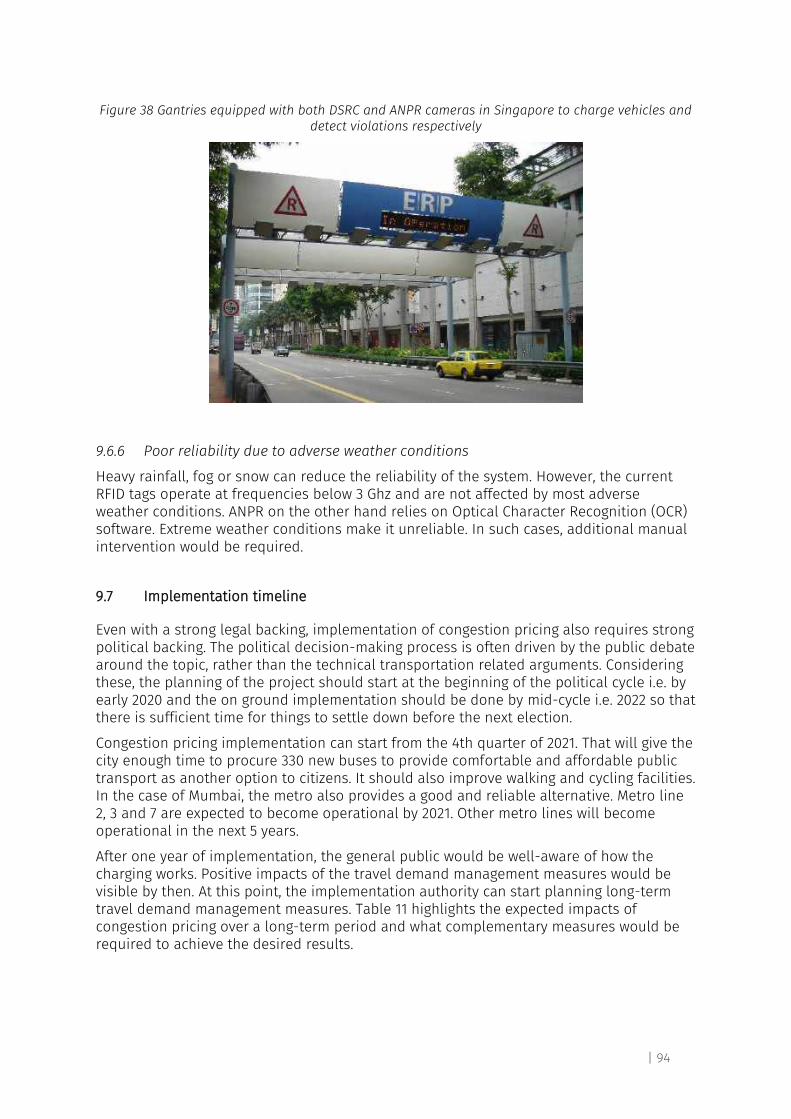
| 94
Figure 38 Gantries equipped with both DSRC and ANPR cameras in Singapore to charge vehicles and detect violations respectively
9.6.6 Poor reliability due to adverse weather conditions
Heavy rainfall, fog or snow can reduce the reliability of the system. However, the current RFID tags operate at frequencies below 3 Ghz and are not affected by most adverse weather conditions. ANPR on the other hand relies on Optical Character Recognition (OCR) software. Extreme weather conditions make it unreliable. In such cases, additional manual intervention would be required.
9.7 Implementation timeline
Even with a strong legal backing, implementation of congestion pricing also requires strong political backing. The political decision-making process is often driven by the public debate around the topic, rather than the technical transportation related arguments. Considering these, the planning of the project should start at the beginning of the political cycle i.e. by early 2020 and the on ground implementation should be done by mid-cycle i.e. 2022 so that there is sufficient time for things to settle down before the next election.
Congestion pricing implementation can start from the 4th quarter of 2021. That will give the city enough time to procure 330 new buses to provide comfortable and affordable public transport as another option to citizens. It should also improve walking and cycling facilities. In the case of Mumbai, the metro also provides a good and reliable alternative. Metro line 2, 3 and 7 are expected to become operational by 2021. Other metro lines will become operational in the next 5 years.
After one year of implementation, the general public would be well-aware of how the charging works. Positive impacts of the travel demand management measures would be visible by then. At this point, the implementation authority can start planning long-term travel demand management measures. Table 11 highlights the expected impacts of congestion pricing over a long-term period and what complementary measures would be required to achieve the desired results.
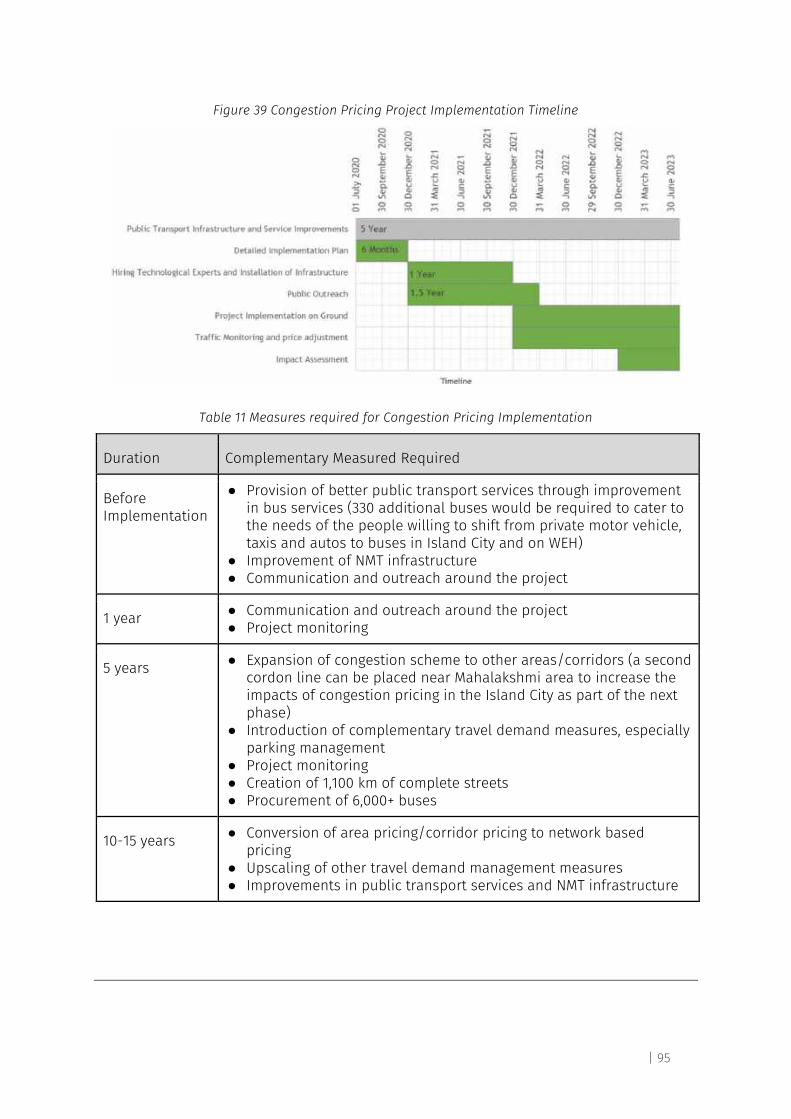
| 95
Figure 39 Congestion Pricing Project Implementation Timeline
Table 11 Measures required for Congestion Pricing Implementation
Duration Complementary Measured Required
Before Implementation
● Provision of better public transport services through improvement in bus services (330 additional buses would be required to cater to the needs of the people willing to shift from private motor vehicle, taxis and autos to buses in Island City and on WEH)
● Improvement of NMT infrastructure ● Communication and outreach around the project
1 year ● Communication and outreach around the project ● Project monitoring
5 years ● Expansion of congestion scheme to other areas/corridors (a second cordon line can be placed near Mahalakshmi area to increase the impacts of congestion pricing in the Island City as part of the next phase)
● Introduction of complementary travel demand measures, especially parking management
● Project monitoring ● Creation of 1,100 km of complete streets ● Procurement of 6,000+ buses
10-15 years ● Conversion of area pricing/corridor pricing to network based pricing
● Upscaling of other travel demand management measures ● Improvements in public transport services and NMT infrastructure
| 96
Annexure
1. Methods of toll collection and technology choices available
1.1. Toll gates
Such a system requires vehicles to stop at the toll gate. Toll gates are usually equipped with automatic boom barriers (manually operated barriers is a rudimentary form of automatic barriers).
I. Manual collection:
Manual collection is the most widely used method for collecting tolls in India. It requires a toll collector or attendant who collects the cash toll based on the vehicle category. The collector dispenses the change and marks the vehicle entry in the system and issues a receipt to the patron. Due to manual intervention, the processing time is very high.
II. Automated Coin Machine (ACM) based collection:
Operating agencies issue tokens which the commuter has to purchase at the designated center. The vehicle has to stop at the toll booth and insert a coin into the machine. Depending on the toll rate, the use of automated coin or token collection instead of manual collection reduces transaction and processing time as well as the operating cost.
III. Automated card operation:
In such a system, certain tolling booths designated slots accept credit/debit cards. A ticket is issued at the first tolling booth which the user has to insert in the last booth. A bill is generated and the user can pay using his debit/credit card.
Advantages of toll gates:
● Minimum capital expenditure ● No technology/hardware component, so the system cannot fail ● All vehicles are automatically compliant as no vehicle modifications are required ● Generates jobs
Disadvantages of toll gates: ● Loss of time and fuel in queuing at the toll gates ● Increase in emissions due to idling of vehicles in queues
1.2. Non-stop Toll Collection by non-electronic systems
Such a system allows toll payment without the need for the vehicle to stop. Though some rudimentary systems have been used in the past, automation of toll collection is a major objective of this system which has been achieved, thanks to the advancements in technology.
Paper based system:
In such a method, toll operators issue passes/labels which are stuck at a designated location on the vehicle (such as windshield, window panes, etc.). Such passes are made available at various convenience stores, fuel stations, etc. Singapore started collecting congestion charges with such a system. Different types of passes were designed in different shapes, colours, etc. Designs were revised periodically to avoid evasion. Some countries have used bar-codes to make each pass unique. Difficulty in accurate placement of barcodes and scanners are the reasons for low popularity of barcodes.
Advantages of paper-based system:
| 97
● Rudimentary method which is simple to understand ● No modifications/additions to vehicles are necessary ● Low capital cost if passes are monitored manually by appointed personnel
Disadvantages of paper-based system:
● High operating cost for manual monitoring. ● A visit to the designated center is a must for renewal
1.3. Non-stop toll collection by electronic systems
Electronic Toll Collection (ETC) is a system that automatically identifies a vehicle equipped with a valid encoded data tag or transponder as it moves through a toll lane or checkpoint. The ETC system then posts a debit or charge to a patron's account, without the patron having to stop to pay the toll. ETC increases the lane throughput because vehicles don’t have to stop to pay the toll. ETC systems incorporate four major components, namely Automated Vehicle Identification, Automated Vehicle Classification (AVC), Customer Service, and Violation Enforcement.95 The various toll collection technologies under electronic toll collection have been discussed in brief below
I. Dedicated short-range communications (DSRC) technology:
It uses microwaves or Infrared technology to transmit data over short distances between motorway systems and on-board units (OBU)/ mobile units that are installed in a vehicle which usually works in 5.8 GHz communication range. The sensors on the roadside infrastructure identify the road user when the OBU comes in proximity in order to initiate the payment. Depending on the complexity of the technical implementation, the on-board unit can be represented by a simple identification tag or storing more information supporting the vehicle classification and the identification of the travelled path. The DSRC technology is used either in a single lane environment (as in the case of the systems operated in Italy, France and Spain, among others) or in a free-flow environment (as for the cases of Austria, Czech Republic and Poland).96
II. Radio Frequency Identification (RFID) technology:
It uses radio waves to automatically identify on-board devices, very much like for the DSRC technology. But operating on a different frequency bandwidth (in the range of 915 MHz) RFID-based tolling systems still make use of a “tag” installed in the vehicle, which is detected and identified by means of a reader antenna installed within a toll plaza or over the carriageways. More recent RFID technology achieves similar performance levels to DSRC, although the lower frequency and the limitations on the emitted power imply a certain reduction of service level, especially in a free-flow multilane environment.13
III. Calm active infrared is a relatively new technology:
It is similar to the RFID system; the only difference is that it has an active infrared unit installed on vehicles which contains all the information. In comparison to RFID, it has a faster data reading rate, reliability, accuracy, efficiency and it works well in all environment
95 Washington State Comprehensive Tolling Study Final Report – Volume 2. 2006
96 State of the Art of Electronic Road Tolling. MOVE/D3/2014-259. European Commission Directorate-General for Mobility and Transport Study. 2015
| 98
conditions. It also comes over the problem of interference. Lack of interoperability, vendor support and high cost are the roadblocks in usage of this technology.97
IV. Automated Number Plate Recognition (ANPR):
It utilizes a stationary camera to record and identify the number plate of vehicles passing through the toll plaza. The identified licence numbers are matched in the database (connected with the transport office) and toll is deducted. If the recorded number is not read properly or not found in the records, it issues an enforcement violation alarm to alert the authorities. In this way, it simultaneously solves two objectives; identification of vehicles for deduction of toll tax and issuing/recording violation enforcement alert. The technology however has constraints of high cost and reduced accuracy under bad weather conditions.14
V. Tachograph based tolling:
It is based on the registration of the mileage driven by the vehicle within a toll domain by means of an OBU connected electronically to the vehicle's odometer. Mileage data is copied to a special chip card, provided by the tolling authorities and integrated within the OBU. At the end of each month, the information recorded within the chip card are transferred to the operator for billing purposes. The tolling system is complemented with roadside equipment (RSE) at border control stations, which activate and deactivate the OBU when crossing the border so as to charge only for mileage driven within the country.98
VI. The e-Vignette:
It is based on the electronic storage of rights of use. This authorization to use the roads is acquired via the Internet, mobile via smartphone, at a point-of-sale, e.g. petrol station or other sales partner. All purchasing options are also available to foreign road users, so that the system is non-discriminatory. Several payment means are accepted to procure the e-Vignette, such as cash, debit, credit and fuel cards. Alongside the registration number, only the data relevant to the toll charge is registered during the booking process. After purchase of the electronic vignette, all the necessary data, such as the relevant validity and vehicle data, is stored and encoded centrally by the toll system operator and is immediately available for control purposes. The controls to enforce compliance of the e-Vignette are similar to other compliance measures utilising fixed or mobile number plate recognition means, as well as manual controls. This kind of scheme is already used in Hungary (for the e-Vignette for the light vehicles) and is planned to be introduced in Germany (again for the e-Vignette for the light vehicles).
Advantages of electronic systems:
● Low operational cost due to automation ● Electronic wallets make recharges/renewal convenient ● Most systems may not require vehicles to slow down near the roadside equipment ● Such systems allow operators to charge commuters based on their usage which
makes it more equitable ● In-vehicle units can be used to make payments for other services such as parking
Disadvantages of electronic systems:
● High cost for roadside infrastructure 97 Electronic toll collection technologies: A state of art review. International Journal of Advanced Research in Computer Science and Software Engineering..2014.
98 New ways of financing transport infrastructure projects in Europe. STOA - Science and Technology Options Assessment. 2018.
| 99
● Regular maintenance of the roadside infrastructure ● Commuters may have to bear the cost of in-vehicle units ● Use of electronic wallets may be a challenge for users in developing countries ● Such systems require an exhaustive database of all vehicles which is a challenge in
developing countries ● Some systems cannot identify violators on their own. ANPR has to be used in the
background for this purpose ● There are chances of failure in case of active in-vehicle units that require an
external power supply. VII. Satellite-based systems
Global Navigation Satellite Systems (GNSS) allow us to determine the vehicle ́s position on the base of the signals received from a network of orbiting satellites. In this case the onboard unit (OBU) is more complex, since it needs to identify its location and to collect and process the necessary information to measure the road usage, without the aid of roadside units. This is the technology that has been selected for the national tolling systems for heavy vehicles in Germany, Hungary, and Slovak republic system. This will also be used in Belgium as part of the Viapass system.
Advantages of GNSS:
● No roadside infrastructure required ● Most equitable system as commuters can be charged precisely based on their
usage ● The OBUs can be used for providing other services such as navigation
Disadvantages of GNSS:
● All vehicles are automatically tracked which could cause privacy issues ● As there is no roadside infrastructure, vehicle compliance with the technology must
be 100%.
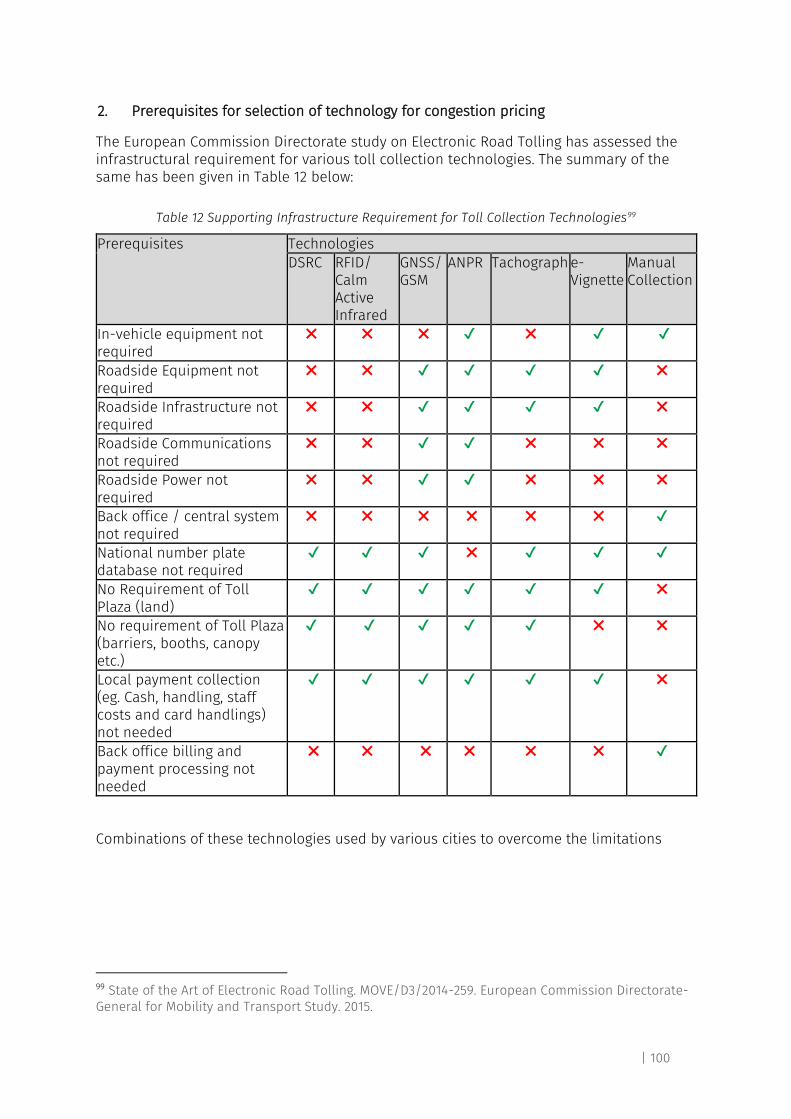
| 100
2. Prerequisites for selection of technology for congestion pricing
The European Commission Directorate study on Electronic Road Tolling has assessed the infrastructural requirement for various toll collection technologies. The summary of the same has been given in Table 12 below:
Table 12 Supporting Infrastructure Requirement for Toll Collection Technologies99
Prerequisites Technologies DSRC RFID/
Calm Active Infrared
GNSS/ GSM
ANPR Tachograph e- Vignette
Manual Collection
In-vehicle equipment not required
✖ ✖ ✖ ✔ ✖ ✔ ✔
Roadside Equipment not required
✖ ✖ ✔ ✔ ✔ ✔ ✖
Roadside Infrastructure not required
✖ ✖ ✔ ✔ ✔ ✔ ✖
Roadside Communications not required
✖ ✖ ✔ ✔ ✖ ✖ ✖
Roadside Power not required
✖ ✖ ✔ ✔ ✖ ✖ ✖
Back office / central system not required
✖ ✖ ✖ ✖ ✖ ✖ ✔
National number plate database not required
✔ ✔ ✔ ✖ ✔ ✔ ✔
No Requirement of Toll Plaza (land)
✔ ✔ ✔ ✔ ✔ ✔ ✖
No requirement of Toll Plaza (barriers, booths, canopy etc.)
✔ ✔ ✔ ✔ ✔ ✖ ✖
Local payment collection (eg. Cash, handling, staff costs and card handlings) not needed
✔ ✔ ✔ ✔ ✔ ✔ ✖
Back office billing and payment processing not needed
✖ ✖ ✖ ✖ ✖ ✖ ✔
Combinations of these technologies used by various cities to overcome the limitations
99 State of the Art of Electronic Road Tolling. MOVE/D3/2014-259. European Commission Directorate-General for Mobility and Transport Study. 2015.
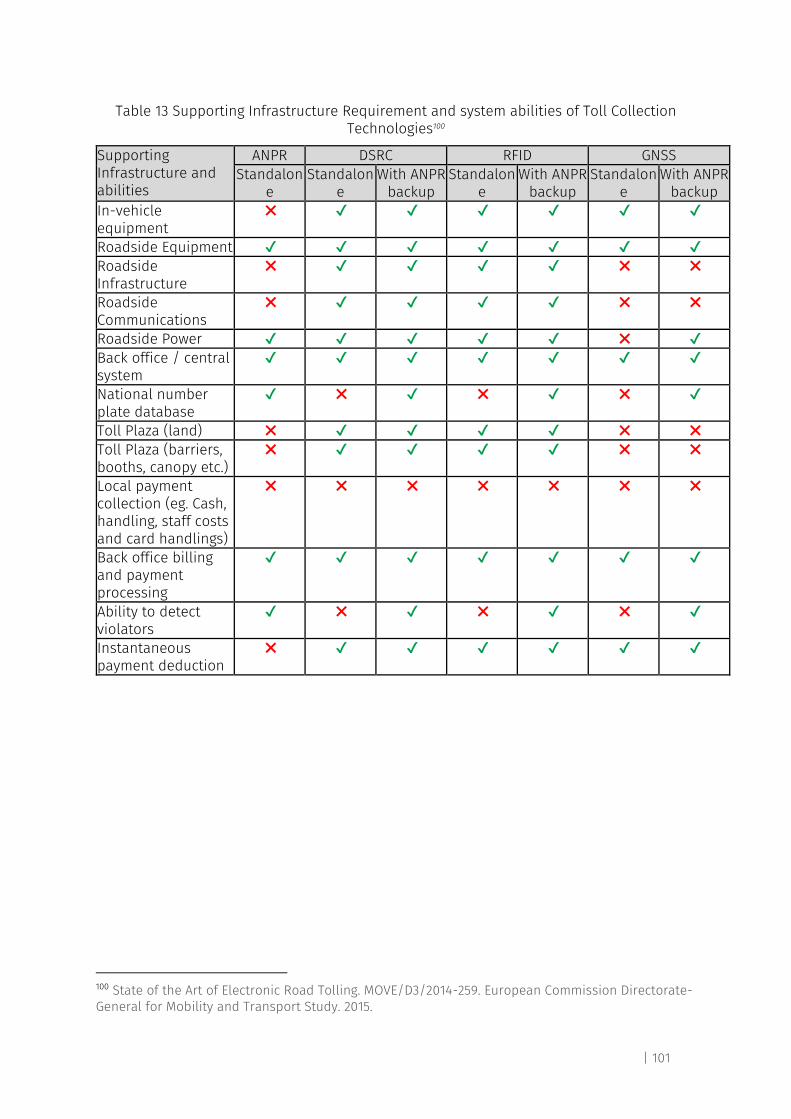
| 101
Table 13 Supporting Infrastructure Requirement and system abilities of Toll Collection Technologies100
Supporting Infrastructure and abilities
ANPR DSRC RFID GNSS Standalon
e Standalon
e With ANPR
backup Standalon
e With ANPR
backup Standalon
e With ANPR
backup In-vehicle equipment
✖ ✔ ✔ ✔ ✔ ✔ ✔
Roadside Equipment ✔ ✔ ✔ ✔ ✔ ✔ ✔ Roadside Infrastructure
✖ ✔ ✔ ✔ ✔ ✖ ✖
Roadside Communications
✖ ✔ ✔ ✔ ✔ ✖ ✖
Roadside Power ✔ ✔ ✔ ✔ ✔ ✖ ✔ Back office / central system
✔ ✔ ✔ ✔ ✔ ✔ ✔
National number plate database
✔ ✖ ✔ ✖ ✔ ✖ ✔
Toll Plaza (land) ✖ ✔ ✔ ✔ ✔ ✖ ✖ Toll Plaza (barriers, booths, canopy etc.)
✖ ✔ ✔ ✔ ✔ ✖ ✖
Local payment collection (eg. Cash, handling, staff costs and card handlings)
✖ ✖ ✖ ✖ ✖ ✖ ✖
Back office billing and payment processing
✔ ✔ ✔ ✔ ✔ ✔ ✔
Ability to detect violators
✔ ✖ ✔ ✖ ✔ ✖ ✔
Instantaneous payment deduction
✖ ✔ ✔ ✔ ✔ ✔ ✔
100 State of the Art of Electronic Road Tolling. MOVE/D3/2014-259. European Commission Directorate-General for Mobility and Transport Study. 2015.
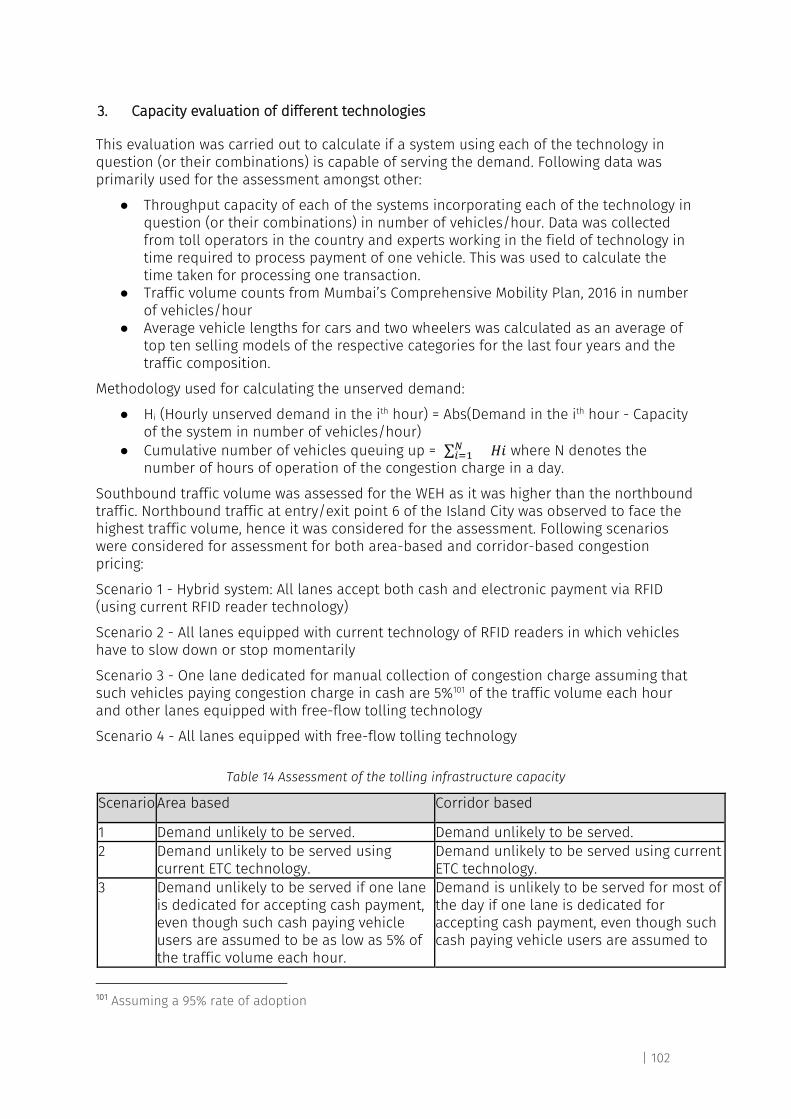
| 102
3. Capacity evaluation of different technologies
This evaluation was carried out to calculate if a system using each of the technology in question (or their combinations) is capable of serving the demand. Following data was primarily used for the assessment amongst other:
● Throughput capacity of each of the systems incorporating each of the technology in question (or their combinations) in number of vehicles/hour. Data was collected from toll operators in the country and experts working in the field of technology in time required to process payment of one vehicle. This was used to calculate the time taken for processing one transaction.
● Traffic volume counts from Mumbai’s Comprehensive Mobility Plan, 2016 in number of vehicles/hour
● Average vehicle lengths for cars and two wheelers was calculated as an average of top ten selling models of the respective categories for the last four years and the traffic composition.
Methodology used for calculating the unserved demand:
● Hi (Hourly unserved demand in the ith hour) = Abs(Demand in the ith hour - Capacity of the system in number of vehicles/hour)
● Cumulative number of vehicles queuing up = ∑𝑁𝑖=1 𝐻𝑖 where N denotes the
number of hours of operation of the congestion charge in a day.
Southbound traffic volume was assessed for the WEH as it was higher than the northbound traffic. Northbound traffic at entry/exit point 6 of the Island City was observed to face the highest traffic volume, hence it was considered for the assessment. Following scenarios were considered for assessment for both area-based and corridor-based congestion pricing:
Scenario 1 - Hybrid system: All lanes accept both cash and electronic payment via RFID (using current RFID reader technology)
Scenario 2 - All lanes equipped with current technology of RFID readers in which vehicles have to slow down or stop momentarily
Scenario 3 - One lane dedicated for manual collection of congestion charge assuming that such vehicles paying congestion charge in cash are 5%101 of the traffic volume each hour and other lanes equipped with free-flow tolling technology
Scenario 4 - All lanes equipped with free-flow tolling technology
Table 14 Assessment of the tolling infrastructure capacity
Scenario Area based Corridor based
1 Demand unlikely to be served. Demand unlikely to be served. 2 Demand unlikely to be served using
current ETC technology. Demand unlikely to be served using current ETC technology.
3 Demand unlikely to be served if one lane is dedicated for accepting cash payment, even though such cash paying vehicle users are assumed to be as low as 5% of the traffic volume each hour.
Demand is unlikely to be served for most of the day if one lane is dedicated for accepting cash payment, even though such cash paying vehicle users are assumed to
101 Assuming a 95% rate of adoption
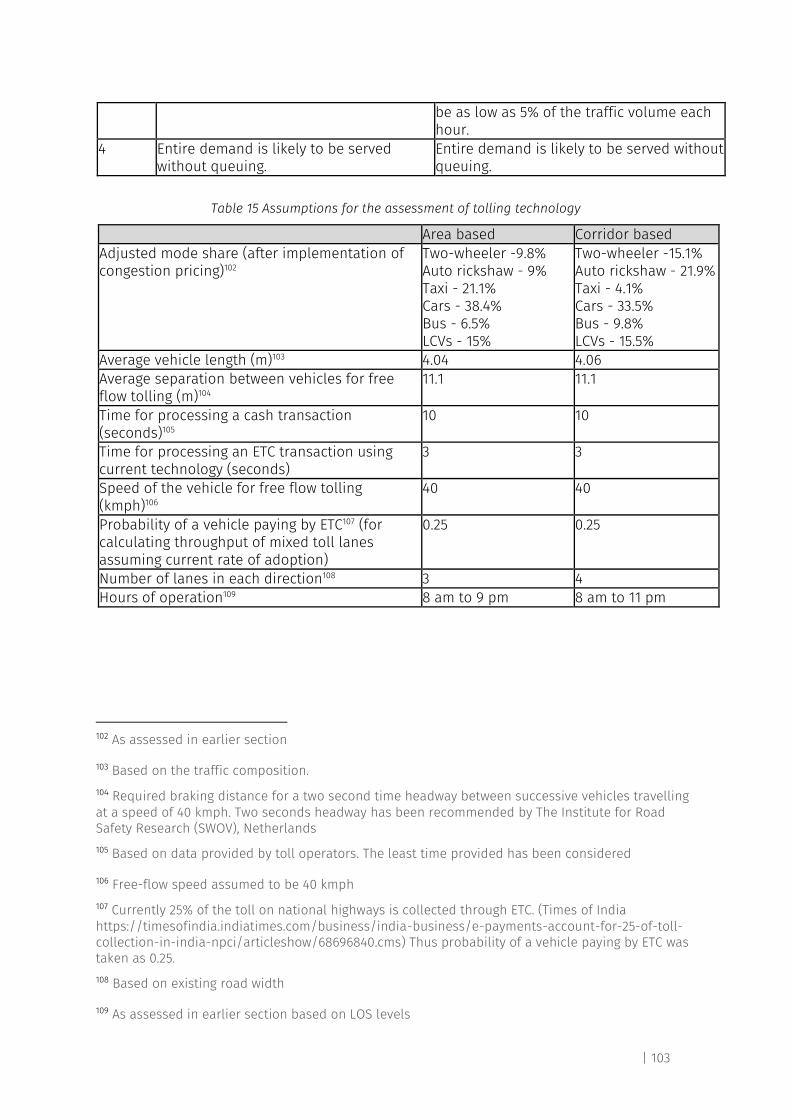
| 103
be as low as 5% of the traffic volume each hour.
4 Entire demand is likely to be served without queuing.
Entire demand is likely to be served without queuing.
Table 15 Assumptions for the assessment of tolling technology
Area based Corridor based Adjusted mode share (after implementation of congestion pricing)102
Two-wheeler -9.8% Auto rickshaw - 9% Taxi - 21.1% Cars - 38.4% Bus - 6.5% LCVs - 15%
Two-wheeler -15.1% Auto rickshaw - 21.9% Taxi - 4.1% Cars - 33.5% Bus - 9.8% LCVs - 15.5%
Average vehicle length (m)103 4.04 4.06 Average separation between vehicles for free flow tolling (m)104
11.1 11.1
Time for processing a cash transaction (seconds)105
10 10
Time for processing an ETC transaction using current technology (seconds)
3 3
Speed of the vehicle for free flow tolling (kmph)106
40 40
Probability of a vehicle paying by ETC107 (for calculating throughput of mixed toll lanes assuming current rate of adoption)
0.25 0.25
Number of lanes in each direction108 3 4 Hours of operation109 8 am to 9 pm 8 am to 11 pm
102 As assessed in earlier section
103 Based on the traffic composition.
104 Required braking distance for a two second time headway between successive vehicles travelling at a speed of 40 kmph. Two seconds headway has been recommended by The Institute for Road Safety Research (SWOV), Netherlands
105 Based on data provided by toll operators. The least time provided has been considered
106 Free-flow speed assumed to be 40 kmph
107 Currently 25% of the toll on national highways is collected through ETC. (Times of India https://timesofindia.indiatimes.com/business/india-business/e-payments-account-for-25-of-toll-collection-in-india-npci/articleshow/68696840.cms) Thus probability of a vehicle paying by ETC was taken as 0.25.
108 Based on existing road width
109 As assessed in earlier section based on LOS levels
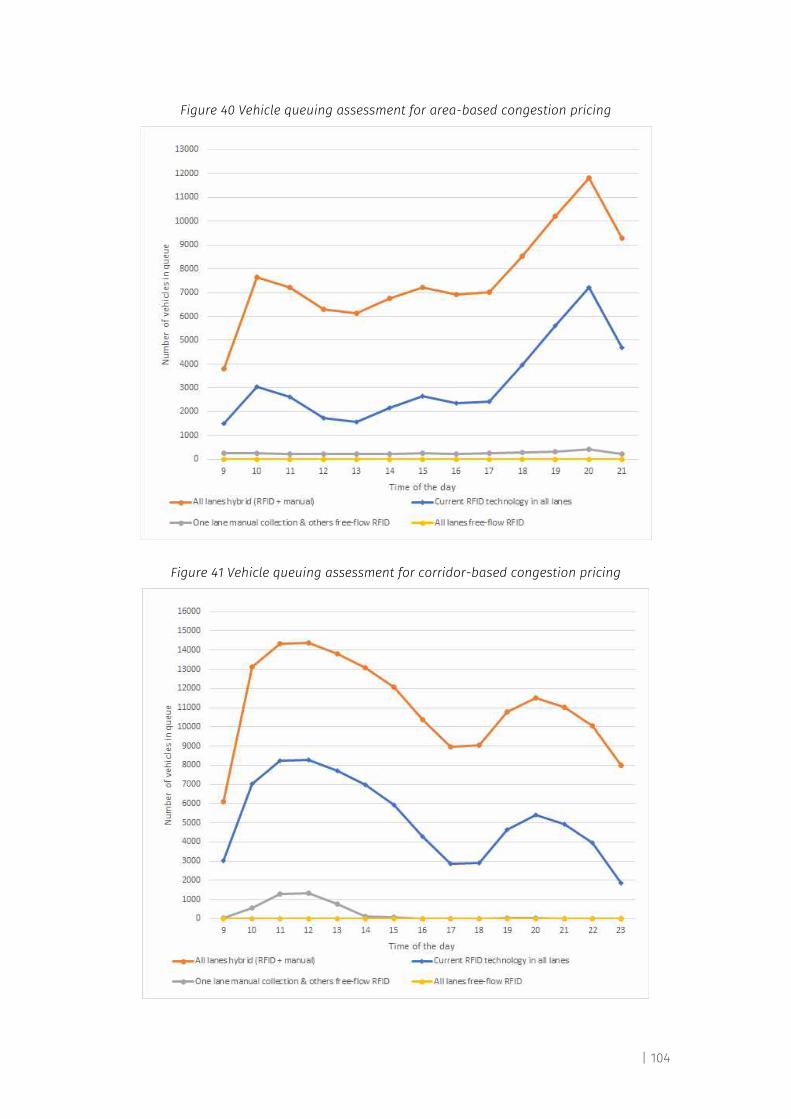
| 104
Figure 40 Vehicle queuing assessment for area-based congestion pricing
Figure 41 Vehicle queuing assessment for corridor-based congestion pricing
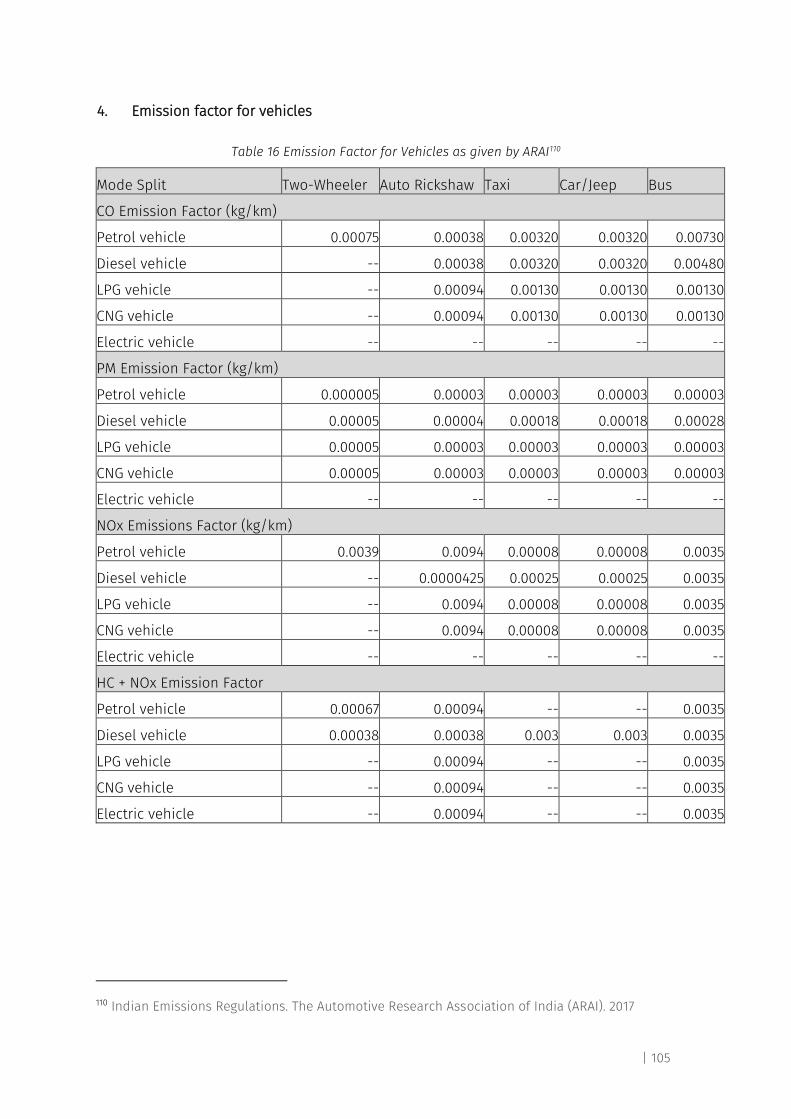
| 105
4. Emission factor for vehicles
Table 16 Emission Factor for Vehicles as given by ARAI110
Mode Split Two-Wheeler Auto Rickshaw Taxi Car/Jeep Bus
CO Emission Factor (kg/km)
Petrol vehicle 0.00075 0.00038 0.00320 0.00320 0.00730
Diesel vehicle -- 0.00038 0.00320 0.00320 0.00480
LPG vehicle -- 0.00094 0.00130 0.00130 0.00130
CNG vehicle -- 0.00094 0.00130 0.00130 0.00130
Electric vehicle -- -- -- -- --
PM Emission Factor (kg/km)
Petrol vehicle 0.000005 0.00003 0.00003 0.00003 0.00003
Diesel vehicle 0.00005 0.00004 0.00018 0.00018 0.00028
LPG vehicle 0.00005 0.00003 0.00003 0.00003 0.00003
CNG vehicle 0.00005 0.00003 0.00003 0.00003 0.00003
Electric vehicle -- -- -- -- --
NOx Emissions Factor (kg/km)
Petrol vehicle 0.0039 0.0094 0.00008 0.00008 0.0035
Diesel vehicle -- 0.0000425 0.00025 0.00025 0.0035
LPG vehicle -- 0.0094 0.00008 0.00008 0.0035
CNG vehicle -- 0.0094 0.00008 0.00008 0.0035
Electric vehicle -- -- -- -- --
HC + NOx Emission Factor
Petrol vehicle 0.00067 0.00094 -- -- 0.0035
Diesel vehicle 0.00038 0.00038 0.003 0.003 0.0035
LPG vehicle -- 0.00094 -- -- 0.0035
CNG vehicle -- 0.00094 -- -- 0.0035
Electric vehicle -- 0.00094 -- -- 0.0035
110 Indian Emissions Regulations. The Automotive Research Association of India (ARAI). 2017
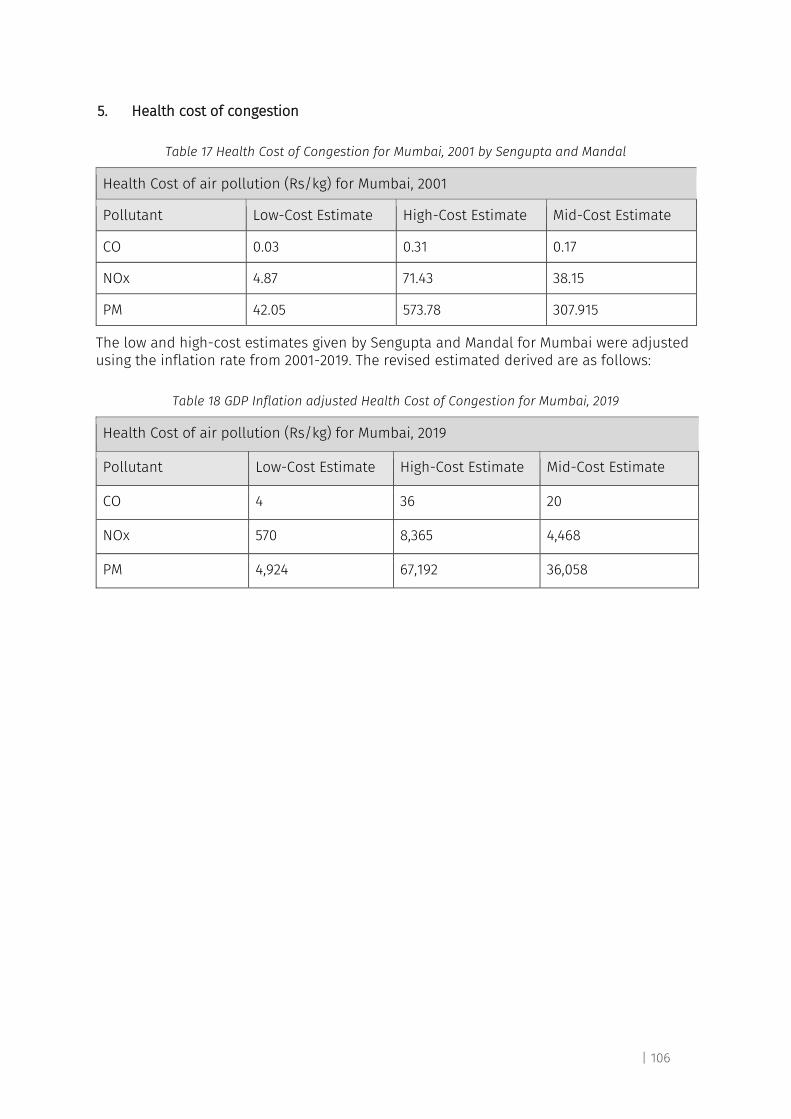
| 106
5. Health cost of congestion
Table 17 Health Cost of Congestion for Mumbai, 2001 by Sengupta and Mandal
Health Cost of air pollution (Rs/kg) for Mumbai, 2001
Pollutant Low-Cost Estimate High-Cost Estimate Mid-Cost Estimate
CO 0.03 0.31 0.17
NOx 4.87 71.43 38.15
PM 42.05 573.78 307.915
The low and high-cost estimates given by Sengupta and Mandal for Mumbai were adjusted using the inflation rate from 2001-2019. The revised estimated derived are as follows:
Table 18 GDP Inflation adjusted Health Cost of Congestion for Mumbai, 2019
Health Cost of air pollution (Rs/kg) for Mumbai, 2019
Pollutant Low-Cost Estimate High-Cost Estimate Mid-Cost Estimate
CO 4 36 20
NOx 570 8,365 4,468
PM 4,924 67,192 36,058
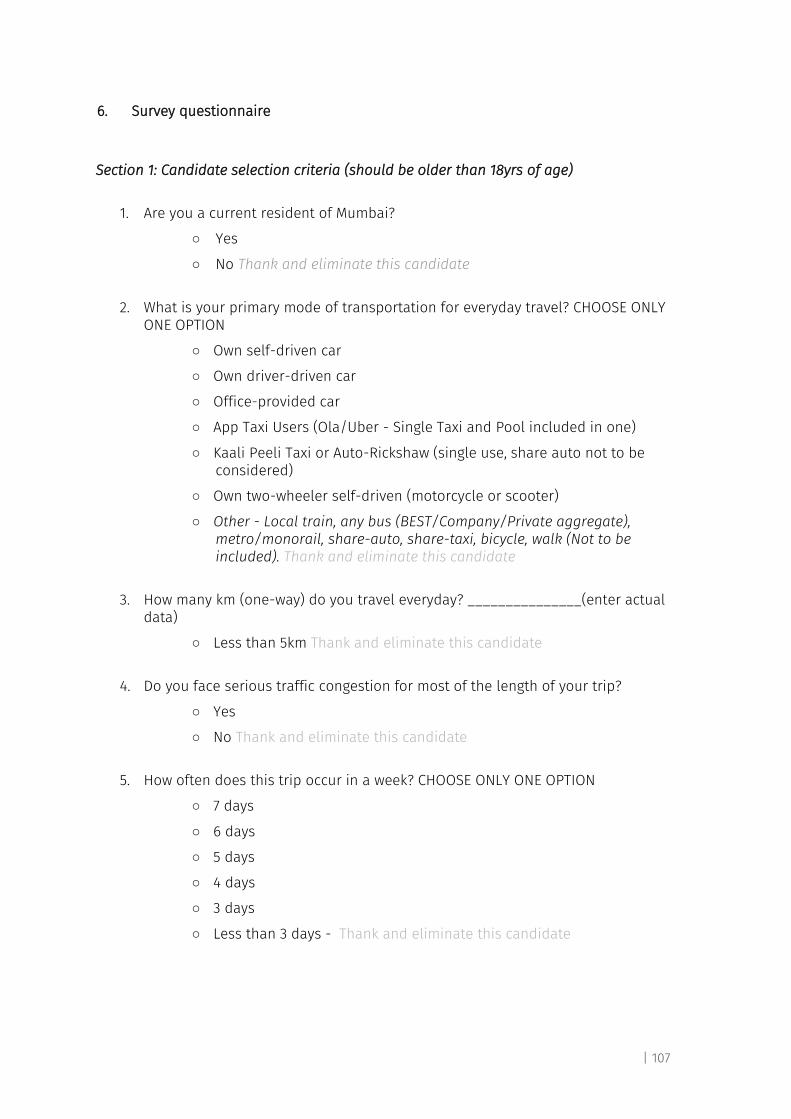
| 107
6. Survey questionnaire
Section 1: Candidate selection criteria (should be older than 18yrs of age)
1. Are you a current resident of Mumbai?
○ Yes
○ No Thank and eliminate this candidate
2. What is your primary mode of transportation for everyday travel? CHOOSE ONLY
ONE OPTION
○ Own self-driven car
○ Own driver-driven car
○ Office-provided car
○ App Taxi Users (Ola/Uber - Single Taxi and Pool included in one)
○ Kaali Peeli Taxi or Auto-Rickshaw (single use, share auto not to be considered)
○ Own two-wheeler self-driven (motorcycle or scooter)
○ Other - Local train, any bus (BEST/Company/Private aggregate), metro/monorail, share-auto, share-taxi, bicycle, walk (Not to be included). Thank and eliminate this candidate
3. How many km (one-way) do you travel everyday? _______________(enter actual
data)
○ Less than 5km Thank and eliminate this candidate
4. Do you face serious traffic congestion for most of the length of your trip?
○ Yes
○ No Thank and eliminate this candidate
5. How often does this trip occur in a week? CHOOSE ONLY ONE OPTION
○ 7 days
○ 6 days
○ 5 days
○ 4 days
○ 3 days
○ Less than 3 days - Thank and eliminate this candidate
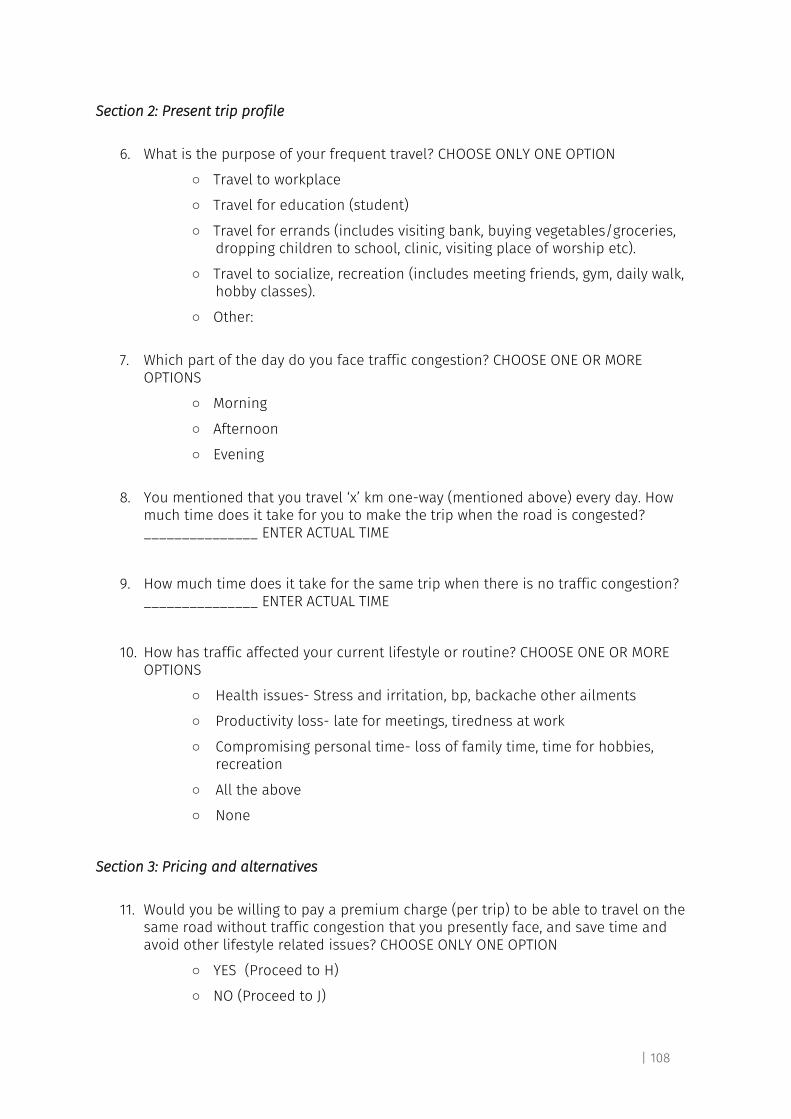
| 108
Section 2: Present trip profile
6. What is the purpose of your frequent travel? CHOOSE ONLY ONE OPTION
○ Travel to workplace
○ Travel for education (student)
○ Travel for errands (includes visiting bank, buying vegetables/groceries, dropping children to school, clinic, visiting place of worship etc).
○ Travel to socialize, recreation (includes meeting friends, gym, daily walk, hobby classes).
○ Other:
7. Which part of the day do you face traffic congestion? CHOOSE ONE OR MORE
OPTIONS
○ Morning
○ Afternoon
○ Evening
8. You mentioned that you travel ‘x’ km one-way (mentioned above) every day. How
much time does it take for you to make the trip when the road is congested? _______________ ENTER ACTUAL TIME
9. How much time does it take for the same trip when there is no traffic congestion?
_______________ ENTER ACTUAL TIME
10. How has traffic affected your current lifestyle or routine? CHOOSE ONE OR MORE
OPTIONS
○ Health issues- Stress and irritation, bp, backache other ailments
○ Productivity loss- late for meetings, tiredness at work
○ Compromising personal time- loss of family time, time for hobbies, recreation
○ All the above
○ None
Section 3: Pricing and alternatives
11. Would you be willing to pay a premium charge (per trip) to be able to travel on the
same road without traffic congestion that you presently face, and save time and avoid other lifestyle related issues? CHOOSE ONLY ONE OPTION
○ YES (Proceed to H)
○ NO (Proceed to J)
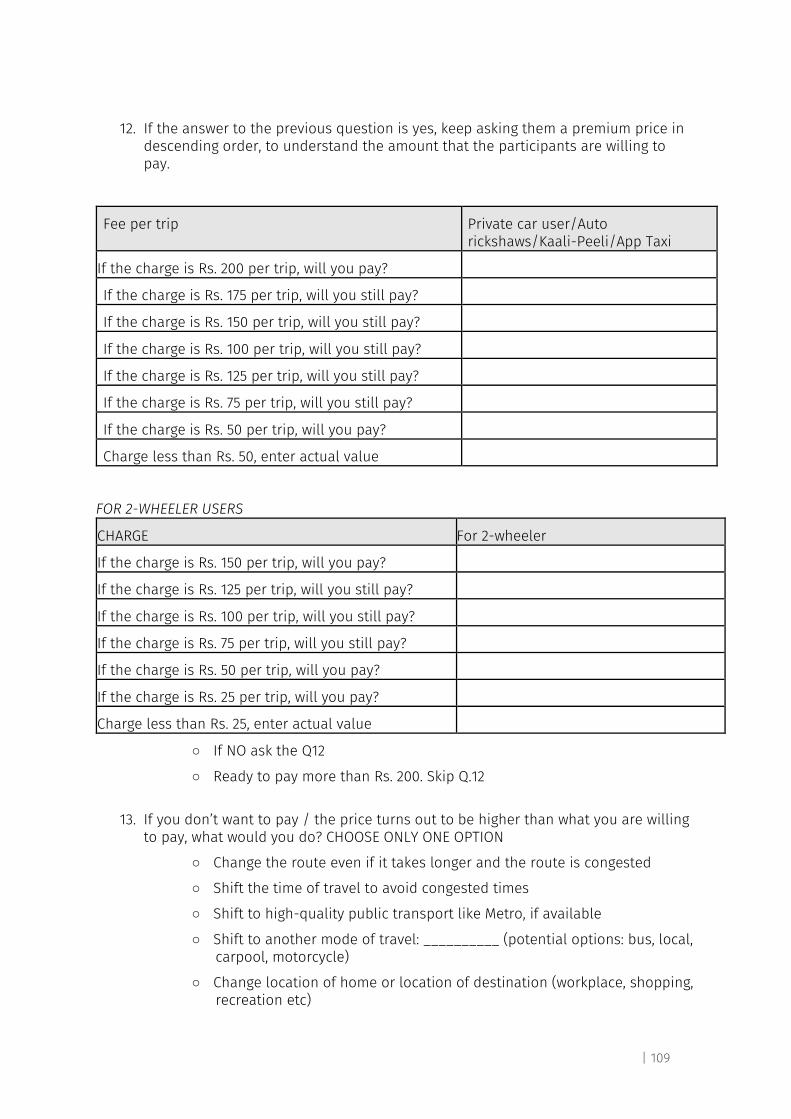
| 109
12. If the answer to the previous question is yes, keep asking them a premium price in
descending order, to understand the amount that the participants are willing to pay.
Fee per trip Private car user/Auto rickshaws/Kaali-Peeli/App Taxi
If the charge is Rs. 200 per trip, will you pay?
If the charge is Rs. 175 per trip, will you still pay?
If the charge is Rs. 150 per trip, will you still pay?
If the charge is Rs. 100 per trip, will you still pay?
If the charge is Rs. 125 per trip, will you still pay?
If the charge is Rs. 75 per trip, will you still pay?
If the charge is Rs. 50 per trip, will you pay?
Charge less than Rs. 50, enter actual value
FOR 2-WHEELER USERS
CHARGE For 2-wheeler
If the charge is Rs. 150 per trip, will you pay?
If the charge is Rs. 125 per trip, will you still pay?
If the charge is Rs. 100 per trip, will you still pay?
If the charge is Rs. 75 per trip, will you still pay?
If the charge is Rs. 50 per trip, will you pay?
If the charge is Rs. 25 per trip, will you pay?
Charge less than Rs. 25, enter actual value
○ If NO ask the Q12
○ Ready to pay more than Rs. 200. Skip Q.12
13. If you don’t want to pay / the price turns out to be higher than what you are willing
to pay, what would you do? CHOOSE ONLY ONE OPTION
○ Change the route even if it takes longer and the route is congested
○ Shift the time of travel to avoid congested times
○ Shift to high-quality public transport like Metro, if available
○ Shift to another mode of travel: __________ (potential options: bus, local, carpool, motorcycle)
○ Change location of home or location of destination (workplace, shopping, recreation etc)

| 110
Section 4: To estimate their household income profile
14. Where do you live in Mumbai?
○ Location name __________________________
15. Size of apartment
o 1R
o 1 RK
o 1bhk
o 2bhk,
o 3 bhk
o 4 bhk and higher
o ______________ (Write house square feet if mentioned) ○ Number of people in the house-hold _____________
16. Is the apartment rented or self-owned?
○ Rented ○ Self-owned
17. If you own/use a vehicle or have an office car, can you please share the model of
your car(s) or two-wheeler(s): (Eg. Hyundai Santro)
○ Model: _________________
○ Model: _________________
○ Model: _________________
Section 5: Surveyor fills himself/herself 18. Age
○ Under 30 yrs
○ 30-45yrs
○ 45-65yrs
○ Over 65yrs
19. Gender: (observe and tick)
○ Male
○ Female
○ Other ________________