A Cost-Benefit Analysis of Resettlement Policy: A Case Study of Ob Luang National Park, Northern
64
i Economy and Environment Program for Southeast Asia Tanglin PO Box 101 Singapore 912404 Phone: (65) 6831-6854 Fax: (65) 6235-1849 E-mail: [email protected] Web site: www.eepsea.org R E S E A R C H R E P O R T NO. 2003-RR10 A Cost-Benefit Analysis of Resettlement Policy: A Case Study of Ob Luang National Park, Northern Thailand Orapan Nabangchang, Sukhothai Thammatirat Open University, Tambon Bang Pud, Amphoe Pakkret, Nonthaburi, Thailand, 66-2-9654737-8 ([email protected] [email protected]) This report investigates whether farmers living in a village within the boundaries of one of Thailand‟s most important national parks should continue to live there or be resettled. It analyzes the costs and benefits of several scenarios for the future of the villagers. These include resettlement, “business-as-usual” and a compromise in which the villagers are involved in helping conserve the park. It finds that resettlement is not only unnecessary, but would actually cost more - environmentally and socially - than letting the farmers stay and help manage the park. In light of this, the report describes how the compromise scenario might be made to work and recommends that this approach be considered in other conflict resolution situations in Thailand.
-
Upload
independent -
Category
Documents
-
view
1 -
download
0
Transcript of A Cost-Benefit Analysis of Resettlement Policy: A Case Study of Ob Luang National Park, Northern

i
Economy and Environment Program for Southeast Asia Tanglin PO Box 101 Singapore 912404 Phone: (65) 6831-6854 Fax: (65) 6235-1849 E-mail: [email protected] Web site: www.eepsea.org
R E S E A R C H R E P O R T
NO. 2003-RR10
A Cost-Benefit Analysis of
Resettlement Policy: A
Case Study of Ob Luang
National Park, Northern
Thailand
Orapan Nabangchang,
Sukhothai Thammatirat Open
University, Tambon Bang Pud,
Amphoe Pakkret, Nonthaburi,
Thailand, 66-2-9654737-8
___________________________________
This report investigates whether farmers living in a village within the boundaries of one of Thailand‟s most important national parks should continue to live there or be resettled. It analyzes the costs and benefits of several scenarios for the future of the villagers. These include resettlement, “business-as-usual” and a compromise in which the villagers are involved in helping conserve the park. It finds that resettlement is not only unnecessary, but would actually cost more - environmentally and socially - than letting the farmers stay and help manage the park. In light of this, the report describes how the compromise scenario might be made to work and recommends that this approach be considered in other conflict resolution situations in Thailand.
ii
A Cost-Benefit Analysis of Resettlement Policy: A Case
Study of Ob Luang National Park, Northern Thailand
Orapan Nabangchang
September, 2003

iii
Comments should be sent to: Orapan Nabangchang, Sukhothai Thammatirat Open University, Tambon Bang Pud, Amphoe Pakkret, Nonthaburi, Thailand, 66-2-9654737-8
Tel Nos. : 9654747/8
Email: [email protected]; [email protected]
EEPSEA was established in May 1993 to support research and training in environmental and resource economics. Its objective is to enhance local capacity to undertake the economic analysis of environmental problems and policies. It uses a networking approach, involving courses, meetings, technical support, access to literature and opportunities for comparative research. Member countries are Thailand, Malaysia, Indonesia, the Philippines, Vietnam, Cambodia, Lao PDR, China, Papua New Guinea and Sri Lanka.
EEPSEA is supported by the International Development Research Centre (IDRC); the Swedish International Development Cooperation Agency (Sida); and the Canadian International Development Agency (CIDA).
EEPSEA publications are produced by Corpcom Services Sdn. Bhd. in association with the Montfort Boys Town, Malaysia. This program provides vocational training to boys from low-income families and home-based work to mothers. EEPSEA publications are also available online at http://www.eepsea.org.

iv
ACKNOWLEDGEMENTS
I would like to thank the following persons for their assistance and support without whom it would not have been possible to complete this study. Mr. Boonchana Klankamsorn, the Regional Forestry Officer of the Royal Forestry Department (RFD) for introducing me to the site which was ultimately selected as the study area; Mrs. Charasri and Mr. Sanya Sripraditr of the Regional Forestry Office; Mr. Manoch Wongsureerat of the National Parks Division; Dr. Warin Wonghanchao, Eathipol Srisawaluck and Ms. Chaluay Bunmark of the Land Institute Foundation.
My appreciation for the schoolteachers of Ban Pa Kluay without whose support it would not have been possible to enter the study site. My gratitude is also extended to the villagers of the target villages who have endured long hours of interviews and provided the data and information for the analysis.
I would like to thank Dr. Glover for the opportunity to attend EEPSEA‟s 4th Regional Training Course in Environmental and Resource Economics, April 3rd -May 1st, 2000 in Los Banos, the Philippines. The one-month training has been a very valuable experience that has had much positive impact in my academic career in the field of natural resource economics. The technical and financial assistance for undertaking this research has made the experience of Los Banos more valuable by allowing me to consolidate the theory with the practical details of research in this field.
My gratitude to Dr. Nancy Oleweiler for her comments and suggestions from the conceptualization of this study back in 2000 during the Los Banos training. Dr. Oleweiler‟s energy and enthusiasm for this branch of economics has given me much confidence to undertake this study. Her comments during the Biannual Workshops have also helped me become more focussed.
My sincerest gratitude to Dr. Herminia Francisco who spent long hours reading and who has given me the technical advice, mental as well as moral support throughout the research period. Her attention to details has been the inspiration for the work prepared and has been guidelines for adjustments of approaches to ensure conceptual consistency and validity of the arguments. From Dr. Francisco, I have learnt much both on the tools as well as on the research method, which has made this 18-months period highly valuable.

v
TABLE OF CONTENTS
Executive Summary 1
1.0 Introduction 2
1.1 Research Problem 2
1.2 Conceptual Framework 4 1.2.1 The Economic Services of Forestry Resources and
Sustainability Issues 4 1.3 Research Objectives 6
1.4 Hypothesis and Research Questions to be Answered. 7
1.5 Methodology 7 1.5.1 The Tools of Analysis 7 1.5.2 Data Collection 11
2.0 Review of Related Literature 13
2.1 Water Buffering Functions 13
2.2 Soil Erosion Mitigation 14
2.3 Regulation of Streamflow 15 2.4 Carbon Storage. 16
3.0 Description of the Study Area 16
3.1 Forestry Situation in Chiang Mai 16
3.2 Profile of the Study Site 17 3.2.1 On-site Location: Ban Pa Kluay 17 3.2.2 Profile of the Off- site (Downstream) Communities 18
3.3 Review of the History and the Setting of Conflicts 19
3.4 Description of Alternative Scenarios. 22 3.4.1 The Status Quo Scenario 22 3.4.2 The Compromise Scenario. 23 3.4.3 The Resettlement Scenario. 24
4.0 Findings from Field Survey and Baseline Data for CBA 25
4.1 Socio-economic Characteristics 25
4.2 Estimation of Forest Economic Values 35
4.3 Perceptions over Non-use Values of Forestry Resources among Downstream Villages 38
5.0 Costs and Benefits of the Three Options for Resolving Upland-
Lowland Conflicts 38
5.1 Basic Assumptions in the Calculations of Costs and Benefits 38

vi
5.1.1 Policy Option 1: Status Quo 38 5.1.2 Compromise option 41 5.1.3 Scenario 3: Resettlement Option 42
5.2 Sensitivity Tests. 46
6.0 Analysis of Distribution of Costs and Benefits of the Three Options 46
7.0 Conclusion and Policy Implications 50
References 53

vii
LIST OF TABLES
Table 1 Secondary Data Sources and Key Informants for In-depth Interviews 13
Table 2 Changes in Size of Population, 1975-2002 18
Table 3 Chronology of Events of Conflict 20
Table 4 Age Structure of Respondents in Upstream and Downstream Community, 2001 26
Table 5 Distribution of Ban Pa Kluay Residents by Period of Settlement, 2001. 27
Table 6 Perceptions of Changes in Soil Fertility among the Upstream Respondents 28
Table 7 Distribution of Respondents by Size of Land Holdings 28 Table 8 Distribution of Respondents by Number of Parcels 29
Table 9 Distance between Production Parcel and Settlement 30
Table 10 Land Tenure Status of Downstream Respondents 31
Table 11 Land Use Profile 32
Table 12 Annual Land Rent in Ban Pa Kluay 33
Table 13 Average Off-farm and Non-farm Income of Upstream Community 33
Table 14 The Volumes of TFPs and NTFPs Collected by Ban Pa Kluay Residents in the Year 2000 36
Table 15 Annual Use Values of Other NTFPs by Upstream Inhabitants 1/ 37
Table 16 Costs and Benefits of the Various Options (Net Present Values at 6% Discount Rate) Unit: million Baht 40
Table 17 Distribution of Benefits and Costs to Upstream and Downstream Communities, All Options 48


1
A Cost-Benefit Analysis of Resettlement Policy: A Case
Study of Ob Luang National Park, Northern Thailand
Orapan Nabangchang
EXECUTIVE SUMMARY
In Thailand, a number of enclave settlements are located in ecologically fragile areas such as watersheds, national forestry reserves, national parks and wild life sanctuaries. As such, threats to forest destruction come from within and from gradual encroachment from the outer boundaries of the forest areas. Past policies have always concentrated on institutional and legal measures. If environmental issues have been considered at all, they are primarily focussed on technical and scientific aspects and do not adequately address the economic aspects.
To demonstrate that resettlement of communities is not just an administrative task, this study uses Cost-Benefit Analysis (CBA) to quantify the costs and gains to society under three policy options. The first is the Status Quo, which is to make no additional investments beyond what is currently provided. In the second option, i.e., the Compromise option, additional investments would be allocated to protect and conserve the forest, and a number of restrictions on land and forest use would be imposed on the upstream community in return for recognizing its rights to remain and use forest areas already converted to agriculture. Under the Resettlement option, the upstream community would be resettled outside of the protected area, with additional investments to provide adequate social and economic livelihood for the incumbents.
Our results show that the Net Present Values (NPVs) for the Status Quo scenario are negative for all variations of this scenario, except where the current rate of deforestation can be controlled. The NPVs of the Compromise option are the highest of all the options and scenarios. The findings show that settlements in enclaves cannot live inside protected areas without incurring a net loss to society. On the other hand, if the upstream community is allowed to remain in the forest under tighter conditions, further losses could be minimized, if not stopped altogether.
The results also show that speed has a crucial effect on the feasibility of the Resettlement options. In all but one scenario, the NPVs of Resettlement were found to be negative. Only if Resettlement can be launched by the 6th year would it be feasible to consider it at all. Nonetheless, since Resettlement has been debated in Thailand for more than two decades with no resolution, speeding up the negotiation process is unlikely, confirming the preferability of the Compromise option with respect to distribution of costs and benefits among the direct users of resources and the general public as well as the social implications of resource allocation. The feasibility of the Compromise scenario is subject to the parties concerned accepting conditions and the altered costs and benefits.
To implement these recommendations, several complementary institutional and legal measures are needed with respect to boundaries, rights and responsibilities of the upstream and downstream communities. Likewise, the agencies concerned will need to provide technical support and services to ensure the sustainable use of natural resources.

2
1.0 INTRODUCTION
1.1 Research Problem
Throughout the 1970s, parallel to the decline in forest coverage, agricultural land expanded. Between 1984 and 1993, the increase in agricultural acreage and the reduction of forest coverage has been alarming. To a certain extent, deforestation was also influenced by public investment programmes to expand road networks particularly in the North and Northeastern Region. It was also related to market opportunities for cash crops, especially upland crops cultivation, combined with a lack of a unified and comprehensive land policy and an apparent laisser faire (I can do what I want) attitude towards land clearance and occupation which resulted in a vast clearance of forest cover to bring land under cultivation. The perceived abundance of land has influenced an extensive rather than an intensive cropping pattern; a situation in which increased output can be achieved through bringing more land for cultivation, thus postponing the necessity of rationalizing land use to ensure greater land productivity.
By the middle of 1980s, associations was gradually made between the increasing rate of depletion and environmental consequences manifested in terms of higher frequency of flash flooding, long periods of droughts, dried up streams and disappearing forest products that once constituted a significant source of non-marketable food supplies. The trade-offs between continued expansion of extensive cultivation and environmental loss was becoming more apparent which expedited policy responses and launching of measures to protect the forest resources and at the same time compromise the needs of marginal farmers for land. Between 1993 and 1995, approximately 1.2 million rai1 of forest area was converted to agricultural land. This highlights the ineffectiveness of control mechanism and of the urgency to find workable means for control and monitoring of resources. 2
Towards the end of the 1990s, not only was there concern over less than satisfactory measures to protect the remaining 25% of the total area of Thailand which still remains under forest coverage, but there was also concern over the unsuitable agricultural practices which underlie the problem of land degradation. Particularly with the diminishing supply of land suitable for crop production, marginal farmers including small and landless farmers are pushing into frontier land, clearing more forests which are not only unsuitable for crop production but also constitute the root cause for soil erosion. Soil erosion from mis-utilization of land resources which is a widespread problem in Thailand now expands over an area of 21.4 million ha.3 Apart from posing serious environmental threats, agricultural production on marginal lands can also prove to be cost ineffective. Producers become increasingly reliant on chemical fertilizers and pesticides. While factor costs followed a steady rising trend, the primary agricultural commodity prices did not. In many incidences, limited knowledge of appropriate application techniques for these inputs has created environmental externalities such as soil contamination and seepage of chemicals into water bodies and underground water tables. Chemical residues in fruits and vegetable products also constitute an emerging area of concern. The sustained output from the agricultural sector and Thailand‟s ability
1 Rai is a local unit of area measurement where 1 hectare is equal to 6.25 rai. 2 Agricultural Statistics of Thailand, Crop Year 1996/97, Office of Agricultural Economics, Ministry of Agriculture and Cooperatives 3 The Land Department Development of the Ministry of Agriculture and Cooperatives
3
to maintain her status as one of the world‟s major food exporter is generally subsidized by under-valued resource rent, both in terms of labour and environmental-natural resources.
A larger segment of the small-scale farmers are now occupying ecologically fragile areas such as watershed areas, slope areas, enclaves in areas declared as national forestry reserves, national parks and wildlife sanctuaries. In the absence of clear physical boundaries of the „Protected Areas‟ (PAs), i.e., the National Forest Reserves, National Parks, Wildlife Sanctuaries combined with the limitations of public resources to patrol the areas to prevent intruders, the entry to the PAs were more or less open access.
Complications arise where social economic circumstances of the polluters prevent the State from being able to address the situation by placing equity and political considerations prior to environmental and economic considerations. As such, policies and measures to address issues relating to forest encroachment and settlements in so-called public areas have been predominantly institutional and legal while economic arguments are generally downplayed. Even arguments highlighting environmental concerns have been primarily focused on technical issues strictly pure-science based and seldom backed up by economic reasoning.
Past measures have been compromising by nature, such as land reform measures and various models of land allocation and resettlement schemes. In numerous cases, the legality of claims are questionable. Therefore, a series of complicated cross-examinations of land rights was held in an attempt to scientifically prove the period of settlements by using maps and aerial photographs. This was done to prove or counter prove claims, whatever the case may be. Such efforts have incurred large sums of public spending but have not had the desired impact of effectively distributing land or contributing to the increase in real income of the beneficiaries (Nabangchang 1992). More importantly, they were not effective in controlling further encroachment of forest resources as evidenced by the continued decline in forest up to the present state by an approximate rate of 2.5 million rai per year.4 Forests are classified into three major categories. Zone C refers to PAs where no form of utilization is permitted. In Zone A and E forests, some limited activities may be allowed so long as the manner of utilization conforms to pre-set conditions. Aerial photographs of forest areas, particularly in the Northern Region of Thailand show enclave settlements inside Protected Areas Zone C. A number of settlements are inhabited by hill tribe groups. Given the close association of these inhabitants to the opium production and drug trafficking, authorities have tried to employ the „carrot‟ rather than the „stick‟ policy, which means allowing them to stay in return for an agreement to switch to other crops. The selective treatment provides roots for dissatisfaction which is intensified by the recently much publicized issue of the externalities in the downstream areas as a result of agricultural production practices of the communities inhabiting the upstream areas.
The threat to forest destruction is both from within the enclaves and from the gradual encroachment of the forest from the outer boundaries of the forest areas. The „buffer zones‟ refer to the strip of land about 3-5 km in width, which border the PAs formerly under forest coverage and have been cleared for crop production and establishment of rural settlements. The concept of the „buffer zones‟ emerged as a potential means to
4 Based on statistics of the Royal Forestry Department (RFD)

4
build alliances with the people living in those areas so that they will act as the „buffer‟ against newcomers into those areas.5 The return for their cooperation would be a tacit acceptance of the State for their continued settlement and rights to utilize land for cultivation. In this respect, it is the expectation that tenurial security granted may induce changes in perceptions over resource values. Moreover, in view of the limitations of manpower and financial resources referred to earlier, there are perceivable advantages for the public agencies to develop partnerships with the communities in the buffer zone areas to establish community fences denying open access to external intruders, or monitor use profiles within permitted limits.
Resettlement of communities in buffer zones is not just an administrative task of moving people out of enclaves and placing them in buffer zones and using the communities as social-cum-physical barrier to enter the PAs, thereby eliminating situation of open access. Decision-making must be based on more solid arguments that go beyond straightforward accounting costs, which appear to be the main points of reference in all discussions over these issues. The shortcomings of legal and institutional means are apparent given the steady reduction in the area under forest coverage. Moreover, it is unrealistic to expect environmental improvement to be adequately financed by the public resources and to anticipate active involvement in the protection and management of land resources from the stakeholders in the absence of appropriate economic incentives.
It is the intention of this proposed research to put forward an argument that winners and losers to resettlement policies extend far beyond the physical boundaries of the PAs and its buffer zones. If allowances are made for settlements to be located within enclaves, or if public resources are used to finance resettlements, more satisfactory explanations are required on the costs and gains to society from these options. It is also aimed at quantifying and bringing forward the economic arguments as to what resettlement policies might mean to sustainability of natural resources utilization.
With costs and benefits verified, solid arguments can therefore be put forward on who are the „winners‟ and „losers‟ of resettlement of communities in enclaves in the buffer zone areas. It will also generate information to determine the fees and taxation for the exploitation of land resources as well as user charges that more accurately reflect the resource-scarcity rent value.
1.2 Conceptual Framework
1.2.1 The Economic Services of Forestry Resources and Sustainability
Issues
The natural resources perform two fundamental functions to the economy. The first is through the supply of natural resources for direct consumption and as inputs for production and processing activities. The second function is to reabsorb part of the waste streams, which cannot be technically disposed off from production, processing, distribution and consumption activities back into the eco-system.
5 Distinctions should be made here between the term 'buffer' used by the RFD referring to the strip of standing trees, which principally function as fences to the forest.

5
The forest is a major provider. Land and soil resources are among the key inputs that the natural resource and environmental system supplies the production and consumption cycles of the economic system. In principle, supply of land is subject to four conditional factors, namely physical, technical, economic and institutional (Barlowe 1986). As noted in the opening paragraph, expansion of agricultural acreage has been at the expense of continued decline in forest coverage. The underlying reasons have been the physical abundance of land combined with the technical and economic feasibility (driven by market demands for output) of bringing land under production. Here is a clear demonstration of the manner in which physical characteristics of the natural resource base can influence the behaviour of economic agents. The perceived abundance of land has influenced an extensive rather than an intensive cropping pattern; a situation in which increases in output can be achieved through utilizing more land for cultivation, thus postponing the necessity of rationalizing land use to ensure greater land productivity.
Conversion of forestland to generate supplies of agricultural land can be said to have been induced by institutional factors, which are themselves dynamic and responsive to market signals of opportunities and threats. Conversion of forest areas was, for example, to a large extent influenced by public investment programs to expand road networks particularly in the North and Northeastern Regions. The results have been mutually enforcing since improved infrastructures not only increased accessibility to the yet unexploited natural resource base, but also increased marketability, prices and additional demand for land. Market signals for cash crops, supported by a combination of subsidized credit and input schemes also provided the economic incentives for conversion of vast tracts of forestland for upland crop cultivation. The resulting laisser faire attitude towards land clearance and occupation, unfortunately in the absence of a unified and comprehensive land policy, has often been referred to as the fundamental cause for conflicting claims and the existence of false signals for land acquisition and utilization that remains unsolved until today.
With the physical supply of land diminishing, the balance between physical, economic, technical and institutional determinants of land supply was altered. Towards the end of the 1990s, the physical supply of land has been more or less exhausted which means that there are no more forests to convert and whatever forestry resources left are not suitable for agricultural production. The changes in the land supply situation conditioned adjustments in institutional framework, which no longer supported further conversion of forest areas for alternative land use.
The supply of ‘physical space’ for agricultural production in Thailand can be classified into two distinct areas. The first refers to approximately 25% of the total area of Thailand still under natural forests, protected areas such as watersheds, national parks, and wildlife sanctuaries. From the economic perspective, the eco-systems in these protected areas have ‘use’ and ‘non-use’ values. From environmental perspectives, they perform ecological functions. And although we may not easily perceive the value of such functions while the ecosystem remain intact, when there is imbalance, we eventually encounter them as costs to mitigate the problems. The critical issue over this land typology is that the demand for land expansion to accommodate agricultural production and other alternative uses impose increasing pressure for further conversion.
The second spatial typology is the land already converted to agricultural production which can be divided into two additional sub-categories, namely land under commercial

6
agricultural production and land in the fringe areas referring to areas which, in the past two to three decades, have been converted from natural forests for alternative uses. Generally, these are lands brought under production by marginal farmers including small and landless farmers. The major characteristics of the areas classified under the second sub-category are (i) usually marginal land found in many open-access situation, (ii) property rights of people in these areas are ill-defined which underlies the root of conflicts between the public sector and marginal farmers who claim de facto occupancy rights over the land by virtue of having utilized their labour to clear and convert forests for productive uses, (iii) the economic hardships of the majority of these occupiers generally prevent decision-makers from putting equity concerns before straightforward economic reasoning.
The environmental concerns over this type of land is that not only are these terrain unsuitable for crop production but land use in these areas are understood to be the root cause for soil erosion since most of these are located in highland areas of more than 35% slope.6 Given the ecological fragility of many of these areas, it is precisely in these locations where poor agricultural practices can create a range of negative externalities. It can be said that optimal level of use of resources, the ability to use these resources to generate adequate level of revenue will reduce the pressure on the more ecologically sensitive areas. The main issue becomes how agricultural production in marginal areas can fulfil its primary functions without the need to compromise environmental concerns. The complications are, however, that while technical means for sustainable resource use could be developed to put marginal land into production but the higher costs involved, particularly if these were to be entirely private costs, would not meet economic feasibility criteria from perspective of the resource users. The fact that resource users continue to put land under production is mainly because that part of the costs of non-sustainable use of land resources is transferred to society as social costs.
1.3 Research Objectives
In the context described in the preceding section, the objective of this study is to conduct a CBA of investment of the State to resettle communities inhabiting within Protected Area Zone C by selecting Ban Pa Kluay village, an enclave settlement in the Ob Luang National Park and Doi Inthanon National Park in Chiang Mai Province as the case study area. The situation in Ban Pa Kluay represents many other cases of enclave settlements in PA and it is the expectation that findings from this study would contribute to filling knowledge gaps thereby supporting policy formulation and decision-making.
The specific objectives of this study are as follows:
1. To study the user profile of Ban Pa Kluay Village.
2. To identify and monetize the externalities of forest resource utilization and inappropriate land use practices.
3. To estimate the costs and benefits of resettlement of communities in PAs and derive the net social welfare gains from resettlement policy.
6Highland areas as defined by the Department of Land Development of the Ministry of Agriculture and Cooperatives.

7
4. To compare the differences in costs and benefits to society if communities in enclaves are resettled and if they are permitted to remain.
5. To discuss the differential impacts to the downstream and upstream communities of the various management options.
1.4 Hypothesis and Research Questions to be Answered.
The hypothesis of this study is that while there may be private gains for the settlements in the protected areas in the short and the immediate time frame, the losses of ecological functions as well as both on-site and off-site externalities in the long run will outweigh the combined gains of all the individuals of the enclave settlement.
Against this line of argument, the major research questions are:
What are the private gains and gains to society if communities are permitted to remain in enclaves in PAs, and what are the costs to society to allow settlements in PAs?
What are the costs and benefits to society if settlements are allowed to remain in the enclave but subject to their agreement to abide by a number of rules to help protect forest resources and ensure sustainable utilization?
What are the costs and benefits to society from resettlement in buffer zones?
What are the distribution of costs and benefits to the immediate stakeholders and society at large of the different management options?
Are settlements in enclaves utilizing forest resources in a sustainable manner? If the answer is positive, what are the factors that can offset the equilibrium resulting in non-sustainability of resource use?
1.5 Methodology
1.5.1 The Tools of Analysis
Cost-Benefit Analysis is a tool to help decision-making by the public sector about allocation of resources. CBA has been conducted to evaluate and compare three scenarios of dealing with communities in a critical upland area. These scenarios are discussed in detail later.
The conduct of this study follows the 9 step procedures:
Step 1: Defining the referent groups.
The referent group refers to the group(s) of individuals whose welfare will be accounted for when assessing the costs and benefits of the project. Within this study, the two main referent groups are (1) the upstream community referring to the Ban Pa Kluay inhabitants and (2) the downstream community referring to thirteen downstream villages in the same Tambon (sub-district) as Ban Pa Kluay, three of which, selected on the basis of shared resources, are covered by the survey.

8
Step 2: Selecting the portfolio of the project.
The portfolio of the project consists of three scenarios:
Scenario 1: Status Quo scenario in which no interference from the public sector will be introduced other than those that are being implemented under normal conditions.
Scenario 2: Compromise scenario in which extra conditions will be imposed on the upstream community in return for allowance to remain inside PAs. Extra provisions will be made available to tighten measures for protection and conservation of forestry resources.
Scenario 3: Resettlement scenario in which the entire 86 households of the upstream community will be resettled in locations outside the PA.
Step 3: Listing of outputs and impacts and potential impacts.
The costs and benefits to the upstream and downstream communities within the three scenarios described above will vary. The itemization of the outputs, impacts and potential impacts are partly derived from findings of the field survey and consultation of research documents of the RFD and the Land Development Department (LDD). Information was also obtained from reviews of documents, literature and articles. Meetings were held with village headmen of the upstream and downstream communities as well as villagers who are members of the forest fire protection volunteer groups, and local NGOs. Some of the criteria for determining the costs and benefits of each scenario are also based on information from interviews with officials in Chom Thong District Offices, RFD Central and Regional Offices. Assumption is made over the timing of the costs (investments) and benefits (impacts). Under the Compromise scenario, it is assumed that given the required preparatory measures the earliest benefits that can be realized are from year 4 onwards. Under the Resettlement scenario, given the sensitivity of the issue, negotiations may take a considerable period to reach, and the earliest the benefits can be realized is from year 11 onwards.
Step 4: Quantifying the outputs and impacts.
Basic assumptions for quantifying the outputs and impacts are based on field survey findings discussed in Section 4 of the report. Some of the scientific parameters were drawn from researches conducted by RFD and the LDD. Some parameters used were also drawn from literature and previous researches conducted such as a recent paper on the Value of Forest Ecosystems by D. Pearce and C. Pearce, “The Economic Value of Biodiversity” (Pearce and Pearce 2001). As generally observed, the calculations in this stage will be performed with varying levels of uncertainty (Hanley 2000). The predictions of the changes follow the logical line of reasoning. Under the Status Quo scenario, there is a high probability that further conversion of forest areas will continue. Under the Compromised scenario and Resettlement scenario, with additional measures introduced to protect and conserve forest resource, plus extra investments in supporting development activities, the expected outcome will be to reduce pressure for further conversion of forest land, thereby avoiding the loss of services provided by the forest ecosystem.

9
Step 5: Monetization of the outputs and impacts
The monetization of outputs and impacts does not imply that money is all that matters, but merely a convenient way of translating the physical measures of the impact comparable in common units (Hanley 2000). Given that many of the environmental goods and services are not traded in the market, there are no prices to use as reference. In this study, a number of indirect methods have been adopted in order to derive the monetary values used in the calculation. These are:
Defensive or preventive expenditures method. This method assumes the sum that people spend to prevent losses and the consequences of losses of ecological services can be used to reflect how much they value those services (Perrings et al. 1995). This concept is applied to the present study wherein the downstream communities (victims) perceive the benefits of the watersheds in regulating and assuring the supply of surface water from the Mae Soi river and have taken steps to protect the watershed through organization of forest fire prevention volunteer group, through reforestation efforts and investment of labor inputs in putting up fences around the watershed areas to prevent encroachment and disturbances.
The Shadow Project Method. Under this method, the proxy for environmental services is valued by the costing of shadow projects that would provide for substitute environmental services that in principle, can compensate for the potential loss (Perrings et al. 1995). In this study, the cost to conserve the topsoil by planting vetiver is used as a substitute value for the cost (benefit) of forest cover in preventing loss of topsoil. This is done with full recognition of the weakness of the assumption that such a soil conservation method can effectively prevent loss of topsoil.
Benefits Transfer. Under the Benefits Transfer, the values estimated from previous studies in the „study sites‟ are applied in the current „policy site‟. The validity of the transfer depends on the similarities of characteristics between the „study site‟ and the „policy site‟. The credibility of the transfer also relies on sufficient similarity between demand and supply functions of the two sites. Thus while Benefits Transfer can be a quick and inexpensive method, the values adopted will contain the biases and the limitations of the valuation tools adopted in the study site.
Two values have been transferred namely carbon storage value and the existence value of biodiversity.
1. Carbon storage value.
Using USD 10 per tC (tonne of carbon) as a conservative estimate for the value of carbon-trading prices, Pearce& Pearce (2001) converted the storage value loss as closed primary forests are converted to shifting agriculture and permanent agriculture at USD 2,040/ha and USD 2,220/ha respectively. The values adopted for this study is the estimated value of carbon-storage loss of closed secondary forests to permanent agriculture of USD 1,520/ha converted to Baht per rai value. This is because the forests in the study area have already been disturbed to a great extent and there are some secondary growths. Moreover, the Mongs are no longer practising shifting cultivation but have changed to permanent agriculture.

10
2. The existence value of biodiversity
The existence and option value of biodiversity was estimated at USD 220/ha (Panayotou and Parasuk 1990; Thongpan and Panayotou 1990).
3. The value of soil and water conservation.
The value of soil and water conservation was estimated at USD 367/ha.7
Step 6: Calculation of NPV
The values of the costs and benefits during the 20 years of the project period are discounted to get the „present values‟ by using 6%, 8%, 10% and 12% discount rates, each rate indicating differences in time preferences for consumption now as opposed to the choice of delaying consumption to future periods. The sum of discounted benefits and costs of the different projects are then compared. In principle, all projects with NPVs > 0 are considered to have passed the NPV test since it is deemed as an improvement in the social welfare. Comparison of the values of NPVs constitutes the main criteria to choose among projects. A number of other criterion such as the B/C ratio and the Internal Rate of Return (IRR) while useful as supporting information, are not the decisive factor to determine whether or not projects should be adopted. The B/C ratio indicates the cost effectiveness of investment while the IRR can support decision-making by comparing returns of one project against another relative to the opportunity cost of funds. 8
The NPV of a project is equivalent to the present value of the total cost minus the total benefits. With the project time frame of this study being 20 years, the NPV is calculated from the following:
20
NPV = Bt - Ct
t =0 (1+ I)t
Step 7: Describe distribution of costs and benefits
Under this Status Quo scenario, only the Mongs would, in the short run, be the „winner‟ while the „losers‟ would consist of the communities in the downstream settlements who would directly absorb the externalities from the mis-utilization of forest resources and the resultant imbalance of the forest eco-system. Under this scenario, the general public who are also public resource owners would also be the loser for the resources lost and for all the costs incurred to address the externalities generated.
The adoption of the Compromise scenario number two would tend to suggest a win-win situation. The gain of the inhabitants of Ban Pa Kluay would be endorsement of the right to stay. Moreover, if the continuation of the conditional right is subject to measurable performance that enclave settlements are utilizing sustainable production
7 Values are from the same study cited above. 8 Hanley, op. cit. p. 115

11
practices, the downstream communities and the general public need not also be the „loser‟ to this policy option.
At the onset, winners and losers of the Resettlement scenario would be the reverse of the Status quo scenario. If inhabitants of Ban Pa Kluay can be resettled in the buffer zone, the downstream communities and the general public will become the winner. In the short run, the Mongs will be the losers of this policy option. If, however, the resettled community can generate a living out of the land allocated and ends up in no worse condition than they were before but with the benefit of greater land tenure security, there may not be any losers to this policy option at all.
Step 8: Performing sensitivity analysis
The purpose for conducting the sensitivity analysis stems from the uncertainty over various assumptions that relate to the predictions of the parameters and their future relative values (Folmer and Gabel 1998). Sensitivity analyses are therefore an essential stage of CBA to determine the sensitivity of the NPV given changes in key parameters. The changes assumed in this study are with respect to the different rates of deforestation and the assumed delay period in which carbon storage value would become tradable in the world market. Details are described in Section 5 of this report.
Step 9: Making recommendations
After having gone through the successive steps described above, the interpretation of the results of the CBA must be made with recognition of the principle of what the tool offers as well as the limitations in application. The limitations can arise from the fact that a number of parameters may be unpredictable while others maybe unknown in the present times, ecosystems can be complex and changes in physical impact can be uncertain as can responses and adaptation of social and economic agents (Hanley 2000).
1.5.2 Data Collection
Primary Data Collection
For primary data collection, three groups of samples were interviewed. The first two groups were chosen to represent the target groups for the quantitative analysis of the study.9 In-depth interviews were conducted for the third group which comprises of the key informants. Details of each group are as follows:
9 In the original proposal submitted to EEPSEA, a third group of target respondents were mentioned, namely, the Karen community whose settlements have been found, elsewhere in Chiang Mai, to be located in the middle level elevation area. The inclusion of this third group was for two purposes. Firstly, the views of the Karens can be used to balance the extreme views of the upstream and the downstream communities that are shaped by interests and motivations of whether settlements should be located within or outside the enclaves. Secondly, if the settlements of the Karen communities are located within the same ecosystem and they also utilize the same resources, then it is possible that they may have contributed to the observed externality. If so, it is necessary to deduct the adverse impacts that could have been caused by the Karens to derive at the net impact that could have been caused by the upstream communities. In the case of Ban Pa Kluay and with respect to the users of water supply from Mae Soi tributary, only Ban Pa Kluay and the two downstream villages share the use of this water source. The third group of respondents is therefore no longer applicable to the situation.

12
Group 1: Refers to villagers in Ban Pa Kluay village located in the Ob Luang National Park and Doi Inthanon National Park which officially represent the Forest Zone C (Conservation Area). This group represents the upstream community who are heavily dependent on forest resources for their livelihood. All 86 households currently living in this village were interviewed. Given the open conflict between Ban Pa Kluay and the downstream communities as elaborated in the section on the history of conflict, there is a high level of mistrust of outsiders. Interviews were therefore administered by the school teachers of Ban Pa Kluay who were considered as part of the community and therefore enjoyed a degree of trust among its inhabitants. To ensure that the purpose of the research is strictly for academic purpose which would focus only on aspects of agriculture and land use and that the researcher was not in any respect acting in the interest of any groups of stakeholders, permission of the village headman was requested for the interviews to be conducted. The survey of the upstream community was completed on April 15, 2002.
Group 2: The samples under this group were farmers who live in the downstream areas. The settlement of Ban Pa Kluay and the land used for cultivation are located in four headwaters of the Ping River, namely Mae Piah, Mae Pok, Mae Tim and Mae Soi. After having consulted the District Officer, the District Forestry Officer and Kamnan10, two of the 13 downstream villages in this Tambon, who have been very active in pressuring for resettlement, were chosen for the study. These are the two villages which utilize water from Mae Soi, namely Wang Nam Yad and Huey Ha. One other downstream village, namely Ban Sob Soi was selected as the control group for the downstream community since the residents are not active members of the downstream pressure group to resettle Ban Pa Kluay inhabitants, although they live in the same Tambon and rely on the Mae Ping as the main surface water supply. The views of the residents of this village should therefore be more balanced and objective on the subject-matter.
Group 3: This group included the key informants whose working mandates involve management and administrative matters with the upstream and downstream communities. Among the people who provided information for the analysis of this study through in-depth interviews were local community members who have been involved in forest fire protection activities, village headmen of the 13 downstream communities, members of the Tambon Administration Organization and government officials. NGOs active at the local level who represent the two extreme views over man-in the forest issues were also interviewed. Man-in the forest issues refer to two different ideologies whereby one extreme believes that man can live in the forest without upsetting the natural ecosystem while another extreme believes that the only way to save the forest is to take the people out.
Secondary Data Collection
Details of secondary data compiled and sources of information from in-depth interviews used to support the analysis of this study are shown in Table 1.
10 Tambon is a level within the structure of local administration of Thailand, running from the Province, the District, the Tambon (or the Sub-District level) and the village. The head of the Tambon is called Kamnan.

13
Table 1 Secondary Data Sources and Key Informants for In-depth Interviews Local Information Resources Purpose of Interview and Information Obtained
District Officer also Head of Working Group for resettlement of Ban Pa Kluay Community
Courtesy call to request permission to conduct the survey in Chom Thong District and to pose questions on background of conflict and perception on likelihood of three options proposed in the study
Chiang Mai Regional Forestry Office
District Forestry Official
Information on the state of the forests Perception of problems of deforestation Satellite imagery of Mae Soi watershed
and Ob Luang National Park Aeriel photographs of settlement and
production area Land use of Ban Pa Kluay residents by
parcel Cost for implementing Royal initiated
project, "The Little House in the Forest" Chom Thong District Health Office Results of monitoring blood samples to detect
evidences of contamination from chemicals from agricultural production
Chom Thong Local Administration Office
Population statistics
Chom Thong Public Welfare Department Office
PWD activities to support hill-tribe communities in highland areas
Kamnan of Tambon Mae Soi Consultation over selection of downstream villages which are in conflict with Ban Pa Kluay
Thammanart Foundation Local NGO that have been main activists in protecting the waterhead of Mae Soi river
Headmaster of Ban Pa Kluay Village School
Overview of the social and economic situation of the people in Ban Pa Kluay and consultation about organization of the survey.
Hod District Water Supply Authority Results from monitoring of water quality from the Mae Soi tributary for use as crude water for production of water supply for Chom Thong.
Chom Thong Community Development Department
Baseline socio-economic data of Ban Pa Kluay and the selected downstream villages.
2.0 REVIEW OF RELATED LITERATURE
Forestry resources and watersheds serve a number of ecological functions. This section discusses the findings of earlier studies on the parameters of changes in the ecological functions as forest resources are converted to alternative uses.
2.1 Water Buffering Functions
Studies have been undertaken to measure the differences in the water buffering function from different types of land use in the Basin area of the Tone River, which is Japan‟s largest river. Retention water depth of paddy fields, due to the construction of the levees and dykes, averaged higher at 208.26 mm compared to water retention depth of forest areas of 175 mm. However, the total retention capacity in the same table is higher for the forests given the higher area coverage. Retention water capacity of orchards was

14
estimated to be around half of that of paddy‟s at 106 mm and around two thirds of the water retention capacity of forest areas (Ohnishi and Nakanishi 2001).
2.2 Soil Erosion Mitigation
Most social scientists believe that the forest can prevent soil erosion. The canopy of trees reduces the speed and the strength of the impact before the raindrop reaches the ground. In dense forests, the ground is covered with leaves (forest litter), which makes it even less probable for direct contact with the soil. Root systems also transmit water down to the topsoil where organic matter and microorganisms perform sponge-like functions in absorbing the water. Deeper roots also transport water to the lower level soils. The deeper the soil depth is, the greater is its water buffering capacity.
With forests cleared, raindrops directly contact the topsoil, hence there is higher risk of soil loss as the topsoil becomes more exposed. With less forest cover, studies have shown that the rate of decomposition of forest litter becomes faster and the topsoil becomes more compact.
With the compaction of the topsoil, infiltration of the water to the lower level soils is slowed down. Rainfall will directly hit the topsoil, causing sheet and gully type of erosion. Organic matter and microorganisms in the topsoil will then be washed away. Thus, in addition to the loss of the topsoil, erosion also washes away important nutrients needed for plant growth. It is said that some soil nutrients may still remain within the first 2-3 years, after which rapid decline in soil fertility will be unavoidable.
Studies done by the Department of Land Development on land degradation focused particularly on problems of soil erosion. For hilly areas and those with slopes of greater than 35% (representing around 26% of the total area of the country), 15.7% of the land have 'moderate' erosion while 2.3% have 'very severe' degree of soil erosion. Combining both categories will give a total land area with severe degree of soil erosion of 12.94 million rai.11
If watershed forests are in their fertile and undisturbed condition, even with heavy rainfall, no more than 0.16 tonnes/rai of topsoil will be washed away (TFSMP 1993; Ruangpanit 1971; Lal 1983).12 Forest fires, which destroy the tree and vegetation coverage, can increase topsoil erosion by as much as ten times. Empirical experiments found topsoil loss from conversion of forest to plant maize to be 13-16 tonnes/rai.13 Conversion of forests in watershed Class 1A can increase the topsoil loss by 4 times, i.e., from 6 tonnes/rai/year under natural forests to 24 tonnes/rai/year.14 With conversion of forest land to monocropping, for example, canopy level would reduce from 3-5 levels to only 1. If land is converted for monocropping agriculture, diversity of species would decline from 150 species to only 2-3 species and biomass would reduce from 350-500 tonnes/ha to 1.6 tonnes/ha. Foresters estimate that 25% of biomass loss will recover within a period of 20 years with accelerated rate of recovery from the 21st year onwards
11 Department of Land Development, Soil Erosion in Thailand, 2000. Moderate level of erosion is defined as an average loss between 5-15 tonnes/rai/year and 15-20 tonnes/rai/year and over 20 rai/year for 'severe' and 'very severe' rates of erosion. 12 Tangtham also confirmed that topsoil loss in pristine watershed forests to be much less than 1 tonne/rai/year (Tangtham 1991). 13 Takahashi et al. (1983). 14 Kraipanond et al. based on field study in Nan Province.

15
with expected full recovery within a period of 50 years. It was also estimated that around 75% of organic matter could be revived within 20 years, with full recovery expected in a period of 50 years. The cost of topsoil loss is estimated from the cost of transporting the equivalent amount of soil to replace what‟s lost. The 1,800 Baht (USD 42)/13 tonnes of soil is derived from a rate of soil loss of 0.14 tonnes/rai/year. The volume of 1 tonne of soil equals 1 m3 and a ten-wheel truck can load 13 tonnes of soil for a charge of 1,800 Baht (USD 42)/trip.
With the forest to cover the topsoil gone, there will also be smaller volumes of sediments which are washed away into the streams, canals, rivers and other types of surface water sources. Rocks and stones that are washed down generally deposit at the foothills, where as sand and soil particles tend to wash down into streams and rivers. Accumulation of sediment deposits reduces their capacity to absorb streamflow, hence increasing the likelihood of overflow of streams and riverbanks.
With accumulation of soil nutrients in the sediments, the balance of organic matter in the river ecosystem is altered. The increase in the volume of phosphorous and nitrogen generally accelerates plant growth reducing the amount of oxygen for fishes, etc. The situation is aggravated by the use of chemicals in agricultural production, which leaves chemical residues in the water.
2.3 Regulation of Streamflow
Records show that the volume of rainfall in highland areas covered by forests is 10% higher than the same type of terrain without forest cover during the rainy season and 100% higher during the dry season (Bruijnzeel 1990). Studies have shown that deforestation resulted in increase in the volume and the rate of streamflow (Hamilton & Pearce 1986; Bruijnzeel 1990). Peak flow increases 3 to 4 times higher than before the forest was cleared. (Naparaxawong and Savadiluk 1983).
Water buffering function of tropical forests is also known to be higher partly because of sponge-like quality as well as deeper topsoil, which can be as deep as 10 m in some areas. The deep topsoil functions like a reservoir storing water, most of which is sub-surface flow with very little overland flow. Streamflow from watersheds in the Northern Region of Thailand is from 8 to 70% depending on the amount of rainfall and the topographical feature (Tangtham 1998).
There are studies which concluded that loss of forest coverage results in increased streamflow and accelerating peak flow (Hamilton and Pearce 1986; Bruijnzeel and Proctor 1995). This is confirmed by empirical studies done in River Ping, Wang, Yom and Nan which found that annual peak flow is around one month earlier than in the preceding decade (Chankaew and Mokarapirom 1979). Studies conducted in the Northern Region of Thailand concluded that the canopy of trees in montane forest can absorb 9% of the rainfall whereas evergreen forest and teak, natural teak forests and dipterocarp forest can absorb 40%, 63% and 61% of rainfall, respectively. Comparative studies show that tropical forest has a higher rainfall absorptive capacity than temperate forest. Unfortunately, evergreen forest and teak are the types of forests, which are subject to high risks for conversion to alternative land use (Tangtham 2000). Conversion of montane forest to plant upland rice, maize or other types of annual field crops can increase streamflow by 5 times.

16
2.4 Carbon Storage.
Given that carbon stored in the standing forests is close to the „carbon balance‟,
conversion of forests to alternative land uses will also result in the loss of carbon storage value of the forest. Brown and Pearce (1994) estimated that closed primary and secondary forests in tropical countries have original value of carbon stored of 283 tC/ha and 194 tC/ha, respectively. Conversion of closed primary forest will result in shifting agriculture and a loss of 204 tC/ha. If converted to permanent agriculture, the loss would be higher at 220 tC/ha. If closed secondary forests were converted to shifting and permanent agriculture, carbon storage losses have been estimated at –106 tC/ha and -152 tC/ha, respectively (Brown and Pearce 1994).
3.0 DESCRIPTION OF THE STUDY AREA
3.1 Forestry Situation in Chiang Mai
The study area is located in the Northern Region, which still has 106 million rai under forest coverage or equivalent to 43% of the total remaining forests of the country. Watershed Classes 1 and 2 expand over 66,000 km2, accounting for 47.7% of the total area of the Northern Region. It is classified as being sub-tropical climate with average rainfall of 2,000 mm/year. At least three types of forests can be found namely montane, evergreen and cloud forests. Soils are generally acidic with low nutrient content. Nearly 70% of Chiang Mai is still under forest coverage, some of which are still primarily fertile forests and watershed areas.15 Chiang Mai has 12 National Parks and three Wild Life Sanctuaries. Some of these have been declared as PAs16. The forests of Chiang Mai are among the last remaining areas still rich in biodiversity resources. In the Doi Inthanon National Park, 161 families of vegetation, 158 genus and 127 species have been documented. Altogether 37 species are those that were first found in Doi Inthanon and 31 species can only be found in Doi Inthanon. There are 23 groups of plants, which are of economic value, and 8 species, which are becoming extinct both in Thailand and elsewhere in the world (Tangtham 2000).
Chiang Mai however, is no exception to the trend in deforestation facing continued pressures for conversion of forestland, not, all of which are from agriculture. Details in Table 3 show a steady decline in forest area in Chiang Mai Province. Interestingly, up until the early 1990s, the decline in forest areas was paralleled by the increase in agricultural acreage as well as steady increase in unclassified areas. From 1992/93 onwards, agricultural land appeared to have contracted with acreage reducing by around 17% from the previous year. In contrast, „unclassified‟ areas have continued to increase. Area unclassified at the end of the 1990s increased to 2.3 million rai from 1.43 million rai at the beginning of the decade, an increase of over 60%. Much of the increase could be a combination of areas converted from forest to agriculture as well as agricultural land converted to non-agricultural uses. A more detailed survey to verify the conditions of change could provide some useful answers on the dynamics of land use change during the past decade.
15 1998 RFD data. 16 Cabinet Decision, March 17, 1992.

17
3.2 Profile of the Study Site
3.2.1 On-site Location: Ban Pa Kluay
Ban Pa Kluay is one of the villages in Tambon Maesoi, Chom Thong District of Chiang Mai Province located approximately 1,400 m above sea level in the basin area formed by Mae Piah, Mae Pok, Mae Pim and Mae Soi rivers, which joins to form the Ping River. It is one of the 10 villages located inside the Ob Luang National Park which expands over an area of 55,330 ha, located in watershed Class 2 and Class 1A. Altogether 354 households are living inside the PAs, making a total population of 2,289 people occupying an area of 5,525 rai.
Based on the RFD survey during the end of 1998, the settlement covers an area of 122 rai or 19.52 ha. 17 Although the settlement is located inside the Ob Luang National Park, the production area of 137.28 ha comprises three separate parcels located in Doi Inthanon National Park. The first patch of land, Doi-Mahin-Luang, expands over an area of 92.96 ha18 that lies northwest of the village. This land parcel is located between 1,300 and 1,600 m above sea level (m.a.s.l) with a slope between 16 and 35%. The area where this parcel is located is the watershed area of Mae Tia river. The second land parcel, Doi-Liem is the watershed area of Mae Pae river. This land parcel is actually located in an administrative boundary of a different Tambon called Doi-Kaew. The approximate area of the third parcel, Khun-Pae-Li which is the watershed of the Mae Soi river is 32 ha. The RFD has identified three sites, which have been brought under cultivation along three other waterheads, namely Huey Praya Norn, Huey Ob and Doi Liem with a combined area of 67.2 ha of productive land.
Tambon Mae Soi has altogether 14 villages, 3,006 households and a population of 8,279 persons.19. Ban Pa Kluay is the only upstream community. All the residents are Mong ethnic group. In 1975, the Military Mobile Unit moved 4 Mong households from Chiang Rai to resettle here. Around 25 years later, according to the population registration records of the Department of Local Administration, Ban Pa Kluay now consists of 94 households and a population of 795.
The big jump between 1975 and 1985 reflect the large number of in-migration of relatives from Chiang Rai and Nan (Northern Region) and Phetchabun (Northeastern Region). The reduction in 1993 was because some households were moved to a rehabilitation centre for drug addicts in Saraburi (Table 2).
17 RFD, Map L 7017 4754IV, scale 1: 50,000 location 455078 E 2028283 N 18 According to the cadastral survey conducted in 1993 by the staff of the Chom Thong's Land Department. 19 Chom Thong District Office, 2000.

18
Table 2 Changes in Size of Population, 1975-2002
Year No. of households Population 1975 4 67 1985 104 473 1993 88 654 1995 135 767 1997 No data 713 2000 76 827
2002 1/ 86 704 Source: Chom Thong District Office
1/ 2002 figures are from field survey conducted under this study
In terms of social infrastructure, apart from the village school established in 1982, other public offices located in the area include a Hill Tribe Development and Assistance Unit and Ob Luang National Park Protection Unit with six resident staff.
3.2.2 Profile of the Off- site (Downstream) Communities
Ban Huey Ha and Wang Nam Yad are two of the 13 downstream villages in Tambon Mae Soi, that utilize water from the Mae Soi river. Water from the Mae Soi is apparently a major source of water supply for domestic use as well as for production of longans, which is the main source of income. Between 1983 and 1986, with the common practice of construction of weirs to divert water from the stream to the fields in the upstream areas, the water from the Mae Soi had stopped flowing altogether. Although foresters and scientists still debate over the relationship between the densities of forest coverage and incidences of rainfall, the downstream communities tend to equate the reduction of surface water flow with the deteriorated condition of the watersheds. Since no action was taken to respond to the protests against the alleged destructive practices of the upstream communities, with the help of a local monk and a financial benefactor who believed in the importance of watersheds, the downstream communities have mobilized efforts in putting up physical barriers, in replanting and in making forest fire protection lines to protect the Mae Soi waterheads. The move taken by the downstream community prompted the National Security Council to call for a meeting. Although the downstream communities were told that they were not justified in putting up the fence, nothing has been done either to take the fence down, or to resettle the upstream communities. The fence is still there now and it appeared to have worked in at least getting the upstream and downstream communities to acknowledge where the boundary is.
Ban Sob Soi is one of the 13 downstream villages selected as a control group. Unlike Ban Huey Ha and Wang Nam Yad, villagers from this community were not actively involved in the movement to relocate Ban Pa Kluay. The major crops in this village are paddy and longans and the main water source is the Ping river.
Ban Huey Ha has altogether 118 households while Wang Nam Yad has 220 households.20 Ban Sob Soi has 125 households. Altogether 20% of the total number of
20 Information obtained from the national rural development surveys conducted by the Community Development Department of the Ministry of Interior.

19
households in each village population sample was interviewed, using a simple random sampling approach.
3.3 Review of the History and the Setting of Conflicts
Ministerial Order no. 212 in 1967 declared Chom Thong forest as a National Forest Reserve. 21 The original settlers, as mentioned earlier were relocated from their original settlement in Chiang Rai by the Mobile Military Unit in 1982, nine years after which Tambon Mae Soi which covers both the settlement and the cultivated land was declared as part of the Ob Luang National Park in 1991.
The root of conflicts lies in the accusation of the downstream communities that the hill tribe ethnic groups are responsible for large-scale deforestation. Downstream communities believe that the Mongs of Ban Pa Kluay still practice swidden agriculture, rotating production among many parcels. With no measures used to conserve the topsoil as the land becomes unproductive, it is eventually abandoned and more forestland is cleared for cultivation. Apart from field rice grown mainly for household consumption, poppy had been the major source of income among the various hill tribe groups. Poppy can only be grown in steep highland areas. The crop is usually planted amidst weeds and other natural vegetation. Large-scale conversion of land use from poppy to commercial upland crops tends to leave large areas of topsoil exposed. This creates high risks of flash flooding which leaves deposits of sediments that makes the supply of water unsuitable for human consumption. The discontent of the downstream communities, however, has more to do with diversion of surface water of Ban Pa Kluay to plant field crops by building weirs and PVC pipes than with the soil erosion problem. Apart from the belief that this is the main cause of the reduced volume of surface flow, the intensive use of chemicals and the practice of cleaning up of chemical mixing containers in the stream were also believed to cause water contamination.22
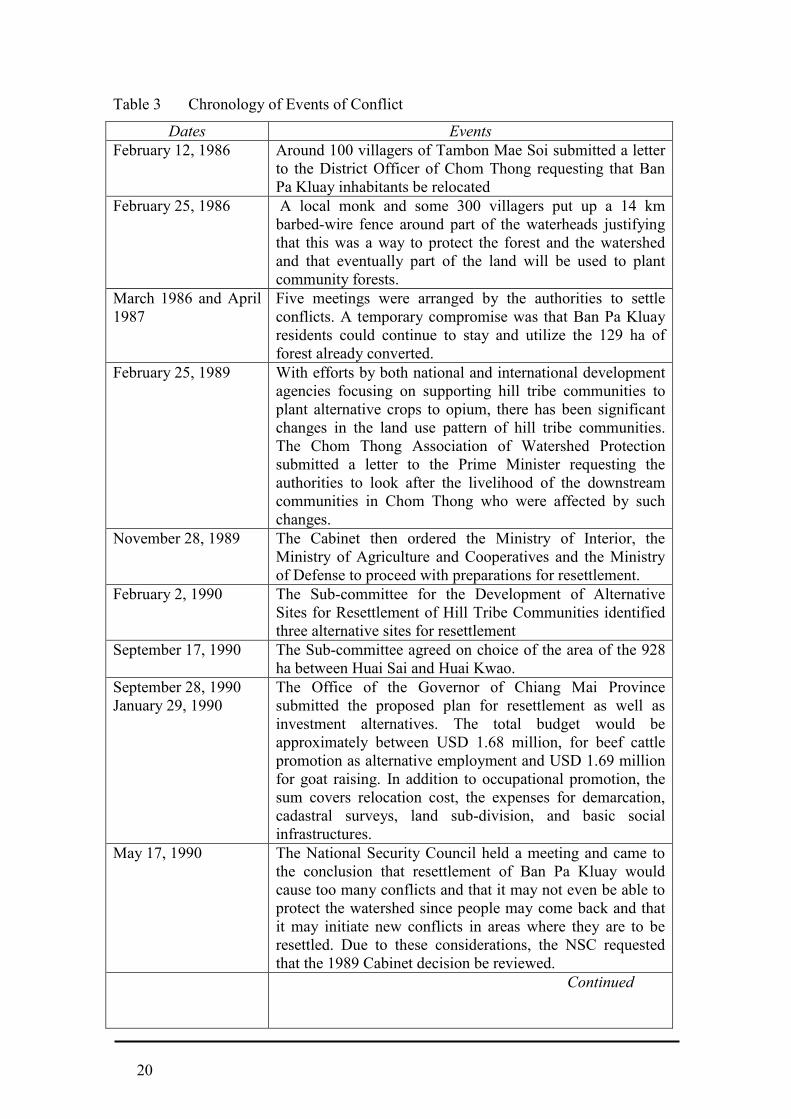
The history of open conflict dates back some 14 years with brief chronicle of events presented in Table 3.
21 But was not publicly announced in the Royal Gazette. 22 Erosion as well as demand for water could be reduced with the observed changes in land use from field crops to tree crops in some of the land parcels. Counterviews are however, that change towards tree crops do not reflect willingness to convert to practices that are environmentally less destructive but an action of putting up physical claims to the land parcels.
20
Table 3 Chronology of Events of Conflict
Dates Events February 12, 1986 Around 100 villagers of Tambon Mae Soi submitted a letter
to the District Officer of Chom Thong requesting that Ban Pa Kluay inhabitants be relocated
February 25, 1986 A local monk and some 300 villagers put up a 14 km barbed-wire fence around part of the waterheads justifying that this was a way to protect the forest and the watershed and that eventually part of the land will be used to plant community forests.
March 1986 and April 1987
Five meetings were arranged by the authorities to settle conflicts. A temporary compromise was that Ban Pa Kluay residents could continue to stay and utilize the 129 ha of forest already converted.
February 25, 1989
With efforts by both national and international development agencies focusing on supporting hill tribe communities to plant alternative crops to opium, there has been significant changes in the land use pattern of hill tribe communities. The Chom Thong Association of Watershed Protection submitted a letter to the Prime Minister requesting the authorities to look after the livelihood of the downstream communities in Chom Thong who were affected by such changes.
November 28, 1989 The Cabinet then ordered the Ministry of Interior, the Ministry of Agriculture and Cooperatives and the Ministry of Defense to proceed with preparations for resettlement.
February 2, 1990 The Sub-committee for the Development of Alternative Sites for Resettlement of Hill Tribe Communities identified three alternative sites for resettlement
September 17, 1990 The Sub-committee agreed on choice of the area of the 928 ha between Huai Sai and Huai Kwao.
September 28, 1990 January 29, 1990
The Office of the Governor of Chiang Mai Province submitted the proposed plan for resettlement as well as investment alternatives. The total budget would be approximately between USD 1.68 million, for beef cattle promotion as alternative employment and USD 1.69 million for goat raising. In addition to occupational promotion, the sum covers relocation cost, the expenses for demarcation, cadastral surveys, land sub-division, and basic social infrastructures.
May 17, 1990 The National Security Council held a meeting and came to the conclusion that resettlement of Ban Pa Kluay would cause too many conflicts and that it may not even be able to protect the watershed since people may come back and that it may initiate new conflicts in areas where they are to be resettled. Due to these considerations, the NSC requested that the 1989 Cabinet decision be reviewed.
Continued

21
Table 3 continued January 1991 The villagers of Ban Pa Kluay submitted a Decree to His
Majesty the King expressing that they do not desire to be resettled with the Karens.
April 7, 1998 The Chairman of the Society of Watersheds in Chom Thong requested that the case for resettlement of the inhabitants of Ban Pa Kluay be revived in a meeting chaired by the Minister of Agriculture and Cooperatives.
May 26, 1998 Two Working Groups were appointed to look into the possibility for resettlement. One to study the socio-economic situation of the Mongs as well as identify any areas where the community might cause environmental impact for downstream communities. The other WG was to survey the existing land use, identify possible resettlement sites and the expected costs.
June 1998 As an immediate response to protests of the downstream communities, a Cabinet Resolution was passed that in the event where communities are found to be located in Zone C and there is a need to resettle, the Royal Forestry Department (RFD) should assess the possibility for resettlement. In 1999, the RFD was given an order to move the Mongs out within 24 hours.
November 28, 1999 Cabinet Decision was reached that Ban Pa Kluay inhabitants be moved down from the watershed 1A area.
No actions were carried out in response to this decision however, which had been partly due to the warning of the National Security Council (NSC) that resettlement was not an appropriate option given that - from the military perspective - there was no suitable alternative sites and that resettlement would be a costly endeavour. The NSC requested that resettlement should be delayed and that in the interim, the option is to control land use until some permanent solutions can be carried out. The NSC had cited the resettlement failure experience in Kamphaeng Phet wherein the return to the old settlements was not prevented. The NSC also argues that within a period of 10 years between 1987 and 1998, the production area has only increased by 6.4 ha implying that control measures to prevent further encroachment of forest resources have been quite effective. While it is true that there has been very limited expansion of production land in the vicinity area of the existing parcels, new patches of forest are being cleared at further distances by Ban Pa Kluay residents. Control of further expansion may therefore not have been as effective as the NSC would claim.23 Resettlement is therefore still an option, among other things, because there are stakeholders who are still to this day, pressing for it. On suitable alternative sites, apart from sites which have been identified by the RFD but were rejected on the basis of technical complications, political reasons (because these are ethnic minorities), and security reasons (because of the allegation of involvement with drug trafficking), there are also public lands including the military and degazetted forest land which can be considered. What is needed are clear indications of costs and benefits of the different alternatives.
23 RFD survey of land use

22
A number of interesting aspects can be drawn from the above chronology. First, it highlights the inconsistency of policies described in the earlier section. In this case, while the upstream community is illegal from the point of view of the Forestry Law, other Departments such as the Department of Local Administration, the Department of Health, the Public Welfare Department and the Department of Education treat this particular hill tribe groups just as any other Thai citizen. The Cabinet on the other hand, acts on pressure by reviving the possibility of resettlement each time there are protests by downstream communities. The National Security Council have their own motives related to security issues and drug trafficking; in some instances using the hill tribe communities as informers on cross-border movements of people as well as of drugs. The elaborate plans to develop mountain areas generally prioritize activities meeting security objectives and these have tended to overrule environmental considerations. These reasons combined go a long way in explaining the privileges which tend to accrue to the occupants of the highlands in ways that few poverty stricken ethnic Thais in other rural areas have received. There are some very high profile projects, for example, which directly address livelihood issues of the ethnic hill tribe groups. Not only are hill tribe settlements located in the highlands which are by legal definition, protected areas, but they receive full scale assistance in terms of social welfare, occupational promotion, and others to the extent that people downstream are beginning to jokingly claim that one has to pretend to be an ethnic hill tribe to deserve some attention from public authorities. One most recent project of this type has resettled around 20 families from different hill tribe groups in the same location to test whether (a) they can live together and (b) whether they can help protect the forest. Again, it is not the type of project that can be repeated elsewhere because without that push from the very top of the pyramid of the Thai society, less than half the financial and technical resources can be expected.
3.4 Description of Alternative Scenarios.
3.4.1 The Status Quo Scenario
The Status Quo scenario assumes that nothing will be done in addition to the efforts already invested. The inhabitants of Ban Pa Kluay in the upstream community will continue to utilize the land for cultivation, collect TFPs and NTFPs and expand the area utilized through continued conversion of the remaining forests in the PAs. Social opinions will remain divided between groups who believe that man can live inside PAs without necessarily disturbing the balance of the ecosystem and the others who are convinced that the best way to protect the forest will be to move human settlements out. Although both sides consist of academics and NGOs, the latter group consists of the villages in the downstream areas and a particular local NGO which has provided volunteered inputs for forest fire protection and replanting of parts of the degraded watersheds.
Under this Status Quo scenario, the public agencies will continue to perform their normal mandates as in the past. They will respond to the situations or problems as they arise on an ad hoc basis, be they incidences of forest fires, the occasional arrests for poaching and cutting trees, or dealing with protests for and against resettlement. Relationship between the upstream and downstream communities will be at best limited to formal interaction between village headmen in the monthly scheduled meeting at the District Office. General feeling will remain strained by the downstream communities‟ perceptions that the causes of irregularity or sometimes shortage of water supply is due

23
to the manner in which the upstream community utilizes forestry and water resources. Downstream community will continue to bear grudges against the lack of contribution by the upstream community to forest fire prevention efforts. They may continue to harbour suspicion that incidences of forest fire in the area are man-made and may even become more involved with the on-going debate over whether or not to allow for community forests inside PAs.
Psychologically, the upstream community will not be able to entirely dismiss the idea that the policy to resettle will not be revived if there are political pressures. In a seemingly difficult position is the Ban Pa Kluay village headman, who has to reflect the opinions of the outside world to members of his community and communicate the necessity of understanding the resource supply constraints and alleged impact from its use. Gathering from the communication with the Ban Pa Kluay village headman, he appears to be fully aware of the need to control further expansion and the need to prove sustainable utilization of land use in the area. Surprisingly, the village headman appeared to be indifferent to the movement of NGOs and academics in support of the idea that settlements of hill-tribe communities be allowed to remain inside PAs as reflected by the remark that he felt the community was being used and that “we think that these people don’t have any work to do”.24
3.4.2 The Compromise Scenario.
Under this scenario, Ban Pa Kluay inhabitants will be granted a conditional right to stay and become partners with the RFD to patrol and protect the forest. This would entail however, a range of supporting institutional and legal adjustments as well as financial provisions to cover administrative and operating expenses for the monitoring and protection of forestry resources.
Firstly, the conditional rights granted under policy scenario allows only the existing number of people to remain in the PA and these must be registered and closely monitored. The community will not be allowed to expand the area already brought under cultivation. Communities will enter into agreement with the RFD acknowledging ceilings on size of population and land restriction imposed. This entails an agreement that communities will make their own decision as to who will remain and who will stay when population exceeds the maximum number allowed given that the excess number will not be granted the same entitlement to remain in the PAs.
Secondly, the area utilized by the enclave community will have to be verified and used as a benchmark for monitoring further encroachment of forest areas. Collection of TFPs and NTFPs will no longer be permitted. An area will be set aside however, for use as community forest. The total area to be provided would be 114 rai. This will be divided into 3 parcels of approximately 38 rai where fast growing trees can be grown to supply firewood for domestic use. Given the limitation in the natural resources, it is not possible for the upstream villagers to be self-sufficient with respect to the supply of TFPs. As such, the only alternative is to encourage them to use alternative non-wood based construction materials.
24 Italic scripts are literal translations from the discussion with the village headman of Ban Pa Kluay on June 10, 2002

24
Thirdly, each household will have to enter an agreement with the RFD to patrol and protect assigned coverage of forest areas and accept that conditional rights of that particular household will be terminated should any damage occur in the assigned area.
Fourthly, legal adjustments will have to be made to support this change and specify the conditionalities, entitlement and responsibilities of the contractual parties, namely the enclave communities and the RFD.
The likelihood of upstream community accepting these conditions is not entirely unrealistic. A certain degree of conformity can be observed. Each month, the village headman attends meeting with other village headmen of the same District.25 Even if such meetings are under formal settings, they have helped minimize the isolation of the upstream community and made it possible to interact and resolve issues of misunderstanding. Moreover, the status of Ban Pa Kluay as a village in Tambon Mae Soi is more recognized with the appointment of the village headman 6 years ago after which time, there has been inflow of assistance from a number of line agencies. Currently, a number of conditions are already imposed on the upstream community, although they may not be as strictly defined as proposed under the compromise scenario of this study. There are currently policy directives to effect the containment of area already utilized and enforce against further encroachment into the forest. On area expansion for example, the village headman said that the villagers know that if they cut down trees and convert more forestland, the foresters will arrest them. Any attempts to violate these conditions will be at their own risks. The people of Ban Pa Kluay tolerate even the barbed wire fence around the waterhead put up by the downstream community.
3.4.3 The Resettlement Scenario.
Under this scenario, the Ban Pa Kluay would be resettled outside the PA. Based on discussion with the headmen of the 13 downstream villages of Tambon Mae Soi, the desire for resettlement is still very strong. Although it is generally admitted that dialogues are possible at the leadership level, there remains doubts whether the Ban Pa Kluay village headman can obtain compliance from his villagers. Downstream villagers feel that demand for resources will increase with the increasing population. There is also resentment over the observed wealth “they came with nothing, now they have pick-up trucks…” 26 and the free access to resources..“.. just think.. when we want land, we have to work for it. They just go out and clear the forest and get the land for free…". and resentment for outsiders who support the idea of communities in the forest…” some people raise the issue of human rights… what about our rights? Who do we claim our rights from?” And on the entitlement to some form of compensation should Ban Pa Kluay residents agree to resettle elsewhere, there is a clear non-acceptance of the legitimacy of claims as expressed by the statement “..compensation? …they should repay the mother land, not ask for compensation!” These are strong statements, from the perspective of the downstream respondents, well justified particularly when they have mobilized cooperation among downstream villagers for forest conservation and protection activities. Apart from the drastic measure of putting up the barbed-wire fence described earlier, villagers have organized a team of 230 volunteers from 4 villages in
25 This monthly meeting is a routine practice where at the beginning of each month, the district officer holds a meeting of Kamnans and village headmen to inform them of all official announcements, etc. 26 Italic scripts are literal translations from the meeting held with the village headmen from the 13 downstream villages on June 10, 2002

25
regular forest fire protection; 200 of these volunteers are from the three downstream villages covered by the survey of this study. The main motivation is the belief that effective forest fire prevention is the only way to protect the watersheds, which supplied water for longans and thus is of crucial importance particularly during the dry season. With the inputs of the volunteers to clear up the 52 km of forest fire line, was part of the assurance for the continued flow of the Mae Soi throughout the year.
The feeling of animosity between the upstream and downstream communities are further reinforced by the observation of the forest fire volunteers. They find that not only the upstream villagers do not help to put out the forest fires, they also tend to group around and jeer as the volunteers worked. The other cause for discontent is the suspicion that some incidences of forest fire were purposely started. One incident of a very large forest fire on April 16 just before the survey of this study, the fire started in three places in slope area which was difficult for the volunteers to access. The volunteer fire fighters claimed that forest fire started by natural causes would take only 2 hours to put out. This particular incident took 2 days, even with input from RFD forest fire unit from Chiang Mai.27
Much more effort would be involved in the implementation of this scenario. In addition to the expenses for resettlement, sufficient inputs would be needed to ensure that once relocated in the destination settlement, the upstream community would be able to earn an income comparable to the level in their previous settlement. Parallel measures would be needed to rehabilitate the degraded forests and to prevent both the returns of Ban Pa Kluay residents as well as encroachment of new comers. Previous discussions as described in the earlier part of this section has sought to identify resettlement sites within other parts of the forest that are at lower elevations and are considered to be of lower ecological importance. Presently, all the alternative sites mentioned have been occupied by lowlanders. As such, the possibility of resettlement within forest areas is low. This leaves only the option of resettlement outside of the forests, a solution which directs attention to another agency, namely the Agricultural Land Reform Office (ALRO), a public agency whose mandate is to redistribute and reallocate land to the small and landless farmers. Under the arrangements between the ALRO and the RFD, the latter will degazette degraded forest areas and transfer the authority over the management of such land to ALRO. Under normal circumstances, the forest land degazetted and the land allocated and granted occupancy rights are the same and most of ALRO‟s work is to cross-examine the history of land occupation to ensure that land is allocated to those who have cleared and brought the land under cultivation. It is not uncommon, however, for ALRO to allocate land to beneficiaries in new locations. With the stock of land that consists of those that remain allocated and those that remain to be degazetted, ALRO‟s involvement in the resettlement appears to be the most logical and probable solution.
4.0 FINDINGS FROM FIELD SURVEY AND BASELINE DATA FOR CBA
4.1 Socio-economic Characteristics
Details in this section were based on field survey data of 86 households in the upstream community and 140 households in the three downstream villages.
27 Interview with Mintr Kantajai, head of Forest Fire Volunteer Group of Mae Soi and Assistant Village Headman of Wang Nam Yad Village

26
a. Demographic Structure
The population structure of upstream and downstream communities shows a slightly higher proportion of dependent population (those aged 10 or less and over 60) in the former. There is a distinct difference, however, in that the population of the upstream is by comparison a much younger population, i.e., with slightly over 30% who are under 10 years old. Taking this into account together with another 40% of the population between the age of 15-40 years, the increase in the size of the population due to natural growth rate alone is likely to be much higher in the upstream community. Thus increasing demand for natural resources to feed the increasing population will be a significant issue even without the high probability of population size increase due to migratory factors (Table 7).
Table 4 Age Structure of Respondents in Upstream and Downstream Community, 2001
Age Upstream Downstream 0-10 222
(31.5) 80
(13.9) 10-15 105
(14.5) 30
(5.2) 15-40 283
(40.2) 198
(34.3) 40-60 81
(11.5) 178
(30.8) Over 60 13
(1.8) 91
(15.8) Source: Field Survey 2001
Note: Figures in parenthesis are percentages
b. Settlement Period, Expansion of Settlement and Cultivated Areas
The information from the field survey generally contradicts the historical account that in 1975, the military had resettled four households in Ban Pa Kluay since over 60% of the respondents claimed to have settled for over 20 years (Table 8). One viable explanation could be that many households in Ban Pa Kluay had indeed been living in the proximity areas of Ban Pa Kluay and had moved into the settlement permanently following the formal resettlement of the four households, which, in many respects, can be interpreted as formal recognition of the settlement. Interestingly, the account of why they have settled in Ban Pa Kluay also indicates that more than half of the population of Ban Pa Kluay is in-migrants (another factor which adds to the pressure on natural resources).

27
Table 5 Distribution of Ban Pa Kluay Residents by Period of Settlement, 2001.
Unit: % of sample No. of years of residence in Ban
Pa Kluay Upstream Downstream
N = 140 1-5 0
(0.0) 1
(0.7) 5-10 1
(1.2) 8
(5.8) 10-20 30
(34.9) 15
(10.8) 20-40 46
(53.5) 58
(41.7) Over 40 years 9
(10.5) 57
(41) Total 86
(100.00) 140
(100.00) Source: Field survey 2001
Note: Figures in parenthesis are percentages
The registration survey and corresponding information on the size of landholding collected in 1998 was used to compare with the 2002 survey data. The data highlighted two interesting issues. Firstly, the 86 households are essentially members of one of the 8 families of this community. This is consistent with statements that a larger segment of the population is in-migrants who have moved to this settlement to join members of kins or clans already settled there. Sociologically, one could only expect that such a community would be highly homogenous, tightly knitted by kinship, hence difficulty for integration with the downstream or lowland Thais. The second interesting factor is that landholding has increased by 370 rai, an increase of nearly 65% between 1998 and 2002. This evidence strongly contradicts the statement of the National Security Council that there has been negligible increase in the land either for expansion of settlement or for production purposes.28 Data from the field survey indicate that nearly all the parcels have been cleared post of 1975. Altogether 14 parcels were said to have been brought under cultivation for more than 30 years which could be land cleared by Mongs who had been living in the area prior to the formal establishment of the community. Some of the expansion could have been due to the recent establishment of new households as offsprings get married. Data reveal that there are 18 cases with no records of land occupation in 1998. In terms of area coverage, these 18 cases accounted for an increase of 179 rai of land or nearly 50% of the net increase in the aggregate size of land holding during the interval of 4 years. Interestingly, only 16 households experienced marginal reduction in the size of holdings. In contrast, the size of holdings of 15 other households almost doubled within a space of 5 years. The remaining households interviewed included those whose holdings either increased slightly or remained constant in size. This indicates that land conversion is still very much an on-going process and not entirely under control as one would have liked to believe.
c. Perceptions over Changes in Soil Fertility
Indications of soil fertility decline appear to be quite apparent among the Ban Pa Kluay inhabitants with nearly 80% of respondents noting that yields have declined despite increase in level of input application. Just under 6% of the remaining respondents in this 28 See section 3.3

28
group noted changes in fertility but feel that yields can be maintained with more inputs used. Around 15% are respondents who have experienced no signs of change. Though respondents among this group do not associate yield changes to declining soil fertility, they have taken into account the need to apply either more fertilizer, pesticides or weedicides inputs to maintain the level of output. This is an indication that sustaining land productivity will require increasing inputs use (Table 9). Table 6 Perceptions of Changes in Soil Fertility among the Upstream Respondents
Upstream No change 4
(4.7) No change but have to increase amount of fertilizer
4 (4.7)
No change but have to increase amount of pesticides
2 (2.3)
No change but have to increase amount of weedicides
3 (3.5)
Yield increase but have to increase inputs
5 (5.8)
Yields decline despite increase in inputs
68 (79.1)
Source: Field Survey 2001
Note: Figures in parenthesis are percentages
d. Distribution of Size of Holdings and Parcels
Notably, the average size of holding is larger for upstream community at 10.28 rai/hh than downstream communities with an average holding size of 6.25 rai/hh. Over 50% of the households in the downstream villages own less than 5 rai. Most of the holdings in the upstream area are between 5-10 rai and 10-20 rai, relatively large holdings compared to the downstream communities and taking into consideration that these are holdings within the protected forest boundaries (Table 10). Table 7 Distribution of Respondents by Size of Land Holdings
Size (rai/hh) Upstream Downstream 1-5 16
(18.6) 75
(55.1) 5-10 40
(46.5) 41
(30.1) 10-20 29
(33.7) 17
(12.5) 20-40 1
(1.2) 3
(2.2) More than 40 0
(0)
Total sample 86 (100.00)
140 (100.00)
Source: Field Survey 2001
Note: Figures in parenthesis are percentages
Hh - household

29
One other characteristic of land tenure is land fragmentation. The 86 households interviewed were utilizing altogether 255 parcels of land. As shown in Table 10, around 76% of the upstream village utilize about 2 to 4 parcels. Only 8 respondents (9%) occupy and utilize 1 parcel. There are those who occupy 5 to 6 parcels. The exceptional cases are the two respondents, one stating that he occupies 7 parcels and the other 10 parcels. The parcel sizes are small with nearly 50% being parcels between 1 to 3 rai and 15% being less than 1 rai. Parcel sizes between 3-4 rai, 4-5 rai and 5-10 rai which represent over 30% of the total number of parcels may be considered small by downstream standard but can be considered as quite large considering the location of those parcels within protected areas (Table 11).
Table 8 Distribution of Respondents by Number of Parcels
Number of parcels Upstream Downstream 0-1 39
(15.3) 106
(31.6) 1-2 73
(28.6) 83
(24.8) 2-3 51
(20.0) 71
(21.2) 3-4 30
(11.8) 24
(7.2) 4-5 30
(11.8) 23
(6.9) 5-10 30
(11.8) 28
(8.4) 10-20 2
(0.8) 0
(0.0) Total 255 335
Source: Field survey 2001
Note: Figures in parenthesis are percentages
As discussed in the previous section, the production parcels are located a distance away from the settlement. In terms of walking period between settlement and cultivation parcels, about half of the parcels are within 1 hour walking distance. Around 33% of the parcels are between 1-2 hour walking distance. The rest are parcels that are further than 10 km, indicate occupation of land outside the boundary of the village itself (Table 12).
Despite the larger average size of holdings and significant increase in land occupied and utilized, around 80% of the Ban Pa Kluay respondents said that the land owned is still insufficient and that an average of 8 rai more would be needed.29 Around 19% of the Ban Pa Kluay respondents referred to a total of 31 parcels with an approximate area of 83 rai that are no longer utilized. For 8 of the respondents (out of 16 respondents who had land they no longer use), the reason was because the land had been confiscated by RFD. For 4 respondents (out of 16 respondents who had land they no longer use), it was because the soil fertility had declined.
29 The 69 respondents who mentioned the need for additional land, the range is from 2 to 20 households. Based on mean value of 8, this translates into 560 rai of extra land.

30
Table 9 Distance between Production Parcel and Settlement
Distance from settlement Number of parcels Less than 1 km 149
(57.53) 1-2 101
(39.00) 2-3 5
(1.93) 3-4 1
(0.39) 4-5 3
(1.16) Total 259
(100.00) Source: Field survey 2001
Note: Figures in parenthesis are percentages
e. Security of Tenure
Different types of land document in principle indicate the varying degrees of security of tenure. The most desirable document is the title deed since it signifies full legal rights over a parcel of land and all the entitlements of private property. Before the landowner can be issued title deeds, they are first issued N.S.3 and N.S.3 k, which can be interpreted as stages of advance of the holder towards receiving the title deed. Financial institutions accept both documents as collateral. The ALRO 4-01 are documents issued by the Agricultural Land Reform Office. Beneficiaries of land reform in the Thai context are predominantly those who have occupied degraded forest areas and have brought the land under cultivation - a de facto claim and occupancy rights to the land under the Agricultural Land Reform Law. The occupancy rights are, nonetheless subject to period of occupation in conjunction with declaration of various categories of protected forest areas. With restrictions on transfers of occupancy rights and use as collateral for loans from financial institutions, ALRO 4-01 are by comparison to the title deed, less desirable. Other types of documents listed indicate insecurity of tenure status of the holder with nearly 58% of the parcels utilized by the downstream community belonging to this category. As many parcels have been occupied and utilized for a considerably long period of time, such right is no longer challenged (Table 13).
The tenurial security that comes with de facto claim from the long period of utilization cannot be applied to Ban Pa Kluay. Firstly, both settlement and production parcels are located inside the National Park. Secondly, legitimacy is questionable given the nature of land acquisition through conversion of forest areas for alternative uses.

31
Table 10 Land Tenure Status of Downstream Respondents Type of land document Downstream
(n = 334 parcels) Title deed 1 77
(23.05) N.S.3.K 1/ 48
(14.37) N.S.3 1/ 16
(4.79) ALRO 4-01 2/ 2
(0.60) Occupancy rights 3/ 75
(22.45) No document 90
(26.95) Reserve documents 4/ 25
(7.49) Sor Khor 1 5/ 1
(0.30%) Total number of parcels 334
Source: Field Survey 2001
Note: 1 = title deed; 2 = Land document issued by the Agricultural Land Reform Office; 3 = Land tenure document issued by the RFD. 28 parcels in this category are located in Rainfed Project under the Patronage of His Majesty the King; 4 = Issued by Department of Lands as at the initial stage of land occupation, which should, after a period of time be transformed into higher forms of document; and 5 = Issued by the Department of Lands a preliminary form of rights which can be re-issued as N.S.3, N.S.3 K and eventually as title deed subject to a certain specified period of use.
f. Land Use Profile
Altogether 52% of the parcels were used to cultivate cabbages. The next most important cash crop is potatoes, which accounted for around 16% of the parcels. Fruit tree crops are also becoming an important source of income (16%), most commonly planted are Chinese persimmons and apricots. Only 17 parcels (out of 247 parcels or 7%) are used to cultivate rice. Expected higher income as well as soil erosion prevention purposes have been given by Ban Pa Kluay residents for planting Chinese apricot within rice fields. The downstream community sees this step as a way for upstream community to lay claim to the land.
Land use pattern in downstream areas is mostly dominated by longans with 71% of the parcels cultivating this cash crop. Rice parcels on the other hand occupy around 19% of the land. (Table 14)
Costs and revenues from production of cabbages are based on data from 115 plots of cabbages. The combined area of these parcels amount to 396.5 rai. Average yield was 1,883 kg/rai. The average price was 1.44 Baht (USD 0.033)/kg. The aggregate output from the 115 parcels was 664,275 kg, which generated a gross revenue of 956,556 Baht (USD 22,245). Chemical fertilizer is extensively used (92%) though the amount used is low at 676 Baht (USD 16)/rai. Around 75% also used organic fertilizer in addition to the chemical fertilizer. A very low percentage of 6.5% of the total number of parcels also used hormones to accelerate plant growth. The total production cost of the 115 parcels (396.5 rai) amounted to 129,667 Baht (USD 3,016) (excluding the value of family labour), which averaged 327 Baht (USD 8) per rai.

32
Table 11 Land Use Profile
Upstream
Downstream
Number of parcels N = 247 n = 325 Mean size of land holdings 10.28 6.25 Rice 17 63 Cabbages 115 0 Potatoes 52 0 Maize 12 0 Fruit tree crops 1/ Plum Persimmons Oranges Mangoes
28 7 3 2 3
0
Longans 0 230 Fallow (not utilized) 6 17 Others (e.g., flowers, homestead, shops)
2 15
Source: Field survey 2001
Note: Figures in parenthesis are percentages
1/ some of these are only recently planted and do not as yet generate any income
One other important cash crop is potatoes. There are altogether 52 parcels of potatoes with a combined area of 157.5 rai. Average yield is 1,686 kg/rai and average price of 14.06 Baht (USD 0.33) /kg. Based on reported price received and output per parcel, the gross revenue from potatoes can be estimated at 3,547,429 Baht (USD 82,498) per year. Chemical fertilizer is used for 65% of the parcels while organic fertilizer is applied in just over half of the parcels. Average cost per rai for chemical fertilizer has been estimated at 175 Baht (USD 4) while the cost of organic fertilizer was 121 Baht (USD 3)/rai. The use of hormones is less common and applied to only four out of the 52 parcels (8%) used for potato crop. The total cost of factor inputs for the 52 parcels was 128,595 Baht (USD 2,290), net revenue.
Only 12 parcels are currently used to cultivate maize with a combined area of 24.25 rai. Average yields were only 288 kg/rai. The average price obtained was 5.58 Baht (USD 0.13)/kg. The total revenue has been calculated from yield per parcel and prices obtained for each producer which amounted to 38,225 Baht (USD 889). With maize not being a major cash crop, use of inputs are very limited to use of chemical fertilizer, which averaged at 243 Baht (USD 6)/rai. There is one case where the farmer applied chemical pesticides and is therefore not representative of the general practice.
Rice acreage covers a total of 43.5 rai. The total output is 17.09 tonnes. Rice is mainly produced for household consumption. The equivalent market value has been derived by using the farmgate price of 4,621 Baht (USD 107)/tonnes for a total revenue of 62,615 Baht (USD 1,456). The level of input use is low averaging only at 444 Baht (USD 10)/rai. Input costs such as chemical fertilizer and weedicides amounted to 10,688 Baht (USD 249) for the total land area.

33
Another source of income is fruit trees and tree crops. Altogether 16 parcels (out of 247 parcels or 6%) were found planted with fruit trees and flower crops occupying a total area of 44.5 rai. In 15 other plots (out of 247 parcels or 6%) fruit trees and flower crops are intercropped either with potatoes or cabbages. Table 13 shows the details of cost and revenue from production of the various cash crops.
The net revenue per rai for each crop shown below are derived from the total revenue minus the labour cost per rai for each crop and minus the expected return to capital which is here assumed to be 15% of the combined input and labour costs. Based on this procedure, the net income per rai was estimated to be 4,430 Baht (USD 103) or a total net revenue of 2,951,488 Baht (USD 68,639) for the entire 666.25 rai brought under cultivation by the upstream community (Table 15).
Table 12 Annual Land Rent in Ban Pa Kluay Cabbages Potatoes Maize Rice Chinese
persimmons Area (rai) 396.5 157.5 24.25 43.5 44.5 Total Output (kg)
664,275 257,595 6,525 13,200
Price (Baht/kg)
1.44 14.06 5.58 4.62
Total revenue 1,000,975 3,547,429 38,225 62,615 133,805
Average revenue/rai
2,412 22,523 1,576 1,436 3, 006
Average revenue/rai
5,651
Factor input costs (Baht/rai)
327 816 444 82 969
Note: 1 USD = 43 Baht
Only 15 people out of 86 (17%) in Ban Pa Kluay said they earn income from sources other than crops. Weighted income from non-farm activity is 1,132 Baht (USD 26.3)/hh. Just under 40% of the downstream respondents earn income from non-crop and non-farm activities such as handicraft-making and small-scale trading. Weighted income is 5,283 Baht (USD 123)/hh (Table 16).
Table 13 Average Off-farm and Non-farm Income of Upstream Community
Income source Baht/hh/year Off-farm 3,168 Non-farm 1,132
Total 4,300 Source: Field survey 2001
Note: Figures in parenthesis are percentages
1 USD = 43 Baht

34
h. Source of Water for Domestic Consumption
Water supply for domestic consumption in Ban Pa Kluay is entirely from natural resources (hills water supply system). Supply is not available all year round and the months of shortage is usually between March and May. Water supply for agricultural production is from a number of surface water sources, namely Huey Manao (32.1%), Huey Mae Soi (26.2%) and Huey Khanun (20.2%). Other surface water supply includes Huey Mae Tiah (6%), Khun Pae Li (4.8%) and three or more smaller streams.
The distance from water source to settlement ranges from half a kilometer to 13 km. The mean distance is 5.24 km. Water is diverted from these water sources to the fields by using pipes (97%). Water supply shortage is between March and May during which time no crop production is possible. Seventy-one percent of the respondents said that they do not do any farming. Water supply shortage is commonly recognized as a problem in crop production. Around 15% noted that the problem could be due to the drying up of the watershed. Only 10 of the 86 respondents noted that conservation measures such as planting trees and other measures to protect the watersheds are solutions to the water supply problem.
One of the major allegations is over high intensity of chemical use in sloping areas which causes water pollution in downstream communities. While there may be grounds for such a concern, empirical studies on the use of pesticides in watershed areas found the concentration of residues to be within acceptable WHO standards (Somyos et al.1992). In Kraipanond et al. (1995), water samples were tested from over 16% of watershed 1A areas. It was found that both the concentration of bacteria and chemical residues are well within the acceptable limits. It was noted that water quality had deteriorated in midstream areas where there are outlets of community wastewater. In Chom Thong itself, back in 1989, downstream residents have filed a complaint to the District Authority against the use of chemicals in crop production. The results of evaluation of water samples in the downstream areas collected and analyzed in 1989 by the Chom Thong District Health Office concluded that the concentration of chemical residues were not sufficient to pose any threat to the health of the humans and animals 30. These tests indicate that there is no certainty that water contamination is a cost created by upstream inhabitant. More recent data obtained from the District Water Supply Authority (2001) and the District Health Office (1997) confirmed the 1989 conclusion, which suggests that health impact is a non-issue.
One of the allegations of land use in the slope areas is the forgone function of regulation of streamflow. Verbal accounts of incidences of floods are, however, too isolated to relate to the land use practices upstream. Four out of 140 respondents for example, recalled crop losses due to floods but the incidences were in different years. A more common problem encountered is drought. About 34% of respondents in the downstream villages have experienced crop losses during the drought period of 1996. Similar dry period was noted in the year 2001. Estimated value of crop losses for about 50% of those affected was under 20,000 Baht (USD 465). For the remaining, the value of loss ranged from 30,000 Baht (USD 698) to 100,000 Baht (USD 2,326). The highest loss record incurred was 200,000 Baht (USD 4,651).
30 Letter issued by the Chiang Mai Provincial Office ref. 0015.2/1490 dated April 23, 1992.

35
4.2 Estimation of Forest Economic Values
One main use of the forest is supply of timber for household construction. The respondents were asked the amount of timber collected in the previous years. Most households collect about 3 to 6 m3 for purpose of repairing their houses.31 Total wood supply collected amounted to 385 m3 can be translated into the equivalent market value of 4,212,900 Baht (USD 97,974). The net value after deducting labour cost, transportation and marketing can be estimated at 4,170,645 Baht (USD 96,992). This is equivalent to 48,496 Baht (USD 1,128)/hh per year.
Timber is also collected for making agricultural appliances such as handles of ploughs, and others. When and how much is collected is subject to the need that arises. At the time of the survey, 13 of the 86 households said they had collected some timber for this purpose. But the amount collected in total is small and involves only a total of 14 man-days.
For the downstream community, the standing forest is no longer the major source of supply of wood and timber product. From the survey however, some 5% of the sampled population did actually collect timber for purpose of household construction and repair. The total amount collected was 65 m3 or the equivalent of 0.76 m3/per household per year. The collection costs in terms of man-days, based on the account of the respondents was 82 man-days. If translated into monetary values using the local wage rate of 120 Baht (USD 2.8)/day, collection costs would amount to 9,840 Baht (USD 229) or approximately 150 Baht (USD 3.5)/m3.
Non-Timber Forest Products (NTFPs)
One of the main use values for the forest for almost all the members of the upstream community is firewood, which is used mainly for cooking. Not much effort is used for collection; the supplies are collected when needed involving the efforts of one or two persons at a time. Nearly all the Ban Pa Kluay residents collect firewood for domestic use. Estimated total volume collected is 154 m3 using some 147 man-days. Current consumption of firewood, based on per capita consumption rate of 1.34 m3 per person per year is 943 m3. Based on the market price of 200 Baht (USD 4.7)/m3, 32 the market value of the supply collected can be estimated at around 188,600 Baht (USD 4,386)/year. Deducting the gross revenue with collection and marketing costs, the net return for TFPs becomes 59,320 Baht (USD 1,379).
Translated into the number of trees using the conversion rate of 0.125 m3, the amount of firewood collected would be equivalent to 7,547 trees. If the average density of 200 trees per rai is adopted, 33 the area of forests that have to be cleared to generate this amount of firewood can be estimated at 38 rai (7,547/200 trees). (Table 17)
31 The figures are what respondents said they collected in the previous year. Though not all the timber collected would be used up, it is stored for use when needed. 32 Based on market price of 200 Baht/m3 for eucalyptus wood that is used as firewood. 33 The density of 200 trees/rai is the standard density that the RFD uses for calculation of the saplings for reforestation.

36
Table 14 The Volumes of TFPs and NTFPs Collected by Ban Pa Kluay Residents in the Year 2000
Volume collected 1/
m3/year Number of respondents
collecting timber for building houses
Number of respondents collecting timber for
firewood 2 2
(2.4) 23
(27.7) 3 16
(19.3) 52
(62.7) 4 24
(28.9) 6
(7.2) 5 24
(28.9) 1
(1.2) 6 11
(13.3) 1
(1.2) 7 2
(2.4) -
9 3 (3.6)
-
10 1 (1.2)
-
Total 83 (100)
83 (100)
Source: Field survey 2001
Note: 1/ Volume collected refers to the volume collected by the respondent in the previous year.
Figures in parenthesis are percentages
One area of conflict is access to and the use of NTFPs. NTFPs provide substantial food supplies for the upstream community. Bamboo shoots are collected by 63% of this group. The combined volume collected in the previous year has been around 1,074 kgs. The supplies are primarily for household consumption though, the equivalent market value is 10,740 Baht (USD 250) averaging at around 88 Baht (USD 2) to each of the collectors.
Around 21% of the upstream village collect wild mushrooms for household consumption. The amount collected ranges from 2 kg per trip up to 15 kg per household. The combined volume collected is 139 kg which may bring an equivalent market value of 4,170 Baht (USD 97) from an equivalent input of approximately 26 man-days (Table 18).

37
Table 15 Annual Use Values of Other NTFPs by Upstream Inhabitants 1/
NTFPs % of household
Volume (kg/yr)
Collection Cost/yr
Value (Baht/yr)
Bamboo shoots 63 1074 5,016 2/ 10,740 (10)
Mushrooms 21 139 1,848 4,170 (30)
Total income 6,864 14,910 Income per household
79.8 173.4
Source: Field survey 2001
Note: figures in parentheses are unit price of the product in terms of Baht/kg.
1/ Volume collected are based on responses on the amount collected in the previous year which is used to represent the annual volume collected by the Ban Pa Kluay residents
2/ Derived from 57 man-days input times the value of opportunity cost of time assumed to be equivalent to 88 Baht/day
1 USD = 43 Baht
The total weight of the bamboos and mushrooms which would occupy around 60% of truck load capacity is 1,213 kg. The transportation and handling cost would come up to 190 Baht (USD 4.42). The opportunity cost of the 97 man-days would be 8,536 Baht (USD 199). Deducting both collection and transportation cost from the gross revenue would give a net revenue of 6,184 Baht (USD 144) [or the equivalent of 72 Baht (USD 1.7)/hh)] .
The downstream communities also have some use values of the forest - in terms of NTFPs. Over the years, however, the use of NTFPs has evidently declined. The three common types of NTFPs that are still collected and consumed by a few downstream respondents are wild mushrooms, green sweet lettuce, and bamboo shoots. About 12% of the sampled downstream households collect green sweet lettuce. Like all NTFPs, almost all households spend one or two days going out alone or in pairs to collect these greens for consumption. In the previous year, a total of 22 man-days for the entire Ban Pa Kluay have been used which brought in 25 kg with the total equivalent market value of 1,000 Baht (USD 23).
Around 10% of the downstream respondents collect wild mushrooms for household consumption. At the local market price of 30 Baht (USD 0.7)/kg, the combined value collected is 975 Baht (USD 23) or approximately 100 Baht (USD 2.3)/person, which is more or less comparable to the local daily wage rate. Another NTFP, which is no longer collected by most of the downstream respondents, are bamboo shoots. Only 5% of the sampled households collect this product, a combined volume of 42.5 kg, which is sold at local market price of 10 Baht (USD 0.25)/kg. Considering that 13 man-days in total are involved, the equivalent market value of 425 Baht (USD 10) would not make collection of bamboo shoots a worthwhile allocation of time, which is why it is only collected by few and only for household consumption.
Bamboos are used as poles to support the branches of longan trees. These would be collected when needed and at the time of the survey, two of the sampled households collected 130 bamboo sticks, which if sold would fetch 11 Baht (USD 0.26)/stick. The total market value from 17 man-days work would be 1,430 Baht (USD 33).

38
4.3 Perceptions over Non-use Values of Forestry Resources among Downstream
Villages
There is no consensus of opinion on the risks of further forest encroachment. There is a consensus, however, on the threat of further loss of forest cover from forest encroachment and destructive practices. There are a few, nonetheless, who think positively on account of increased efforts vested in monitoring and conservation in addition to more activities to replant trees, demarcate forest boundaries and help prevent forest fires.
5.0 COSTS AND BENEFITS OF THE THREE OPTIONS FOR RESOLVING
UPLAND-LOWLAND CONFLICTS
5.1 Basic Assumptions in the Calculations of Costs and Benefits
5.1.1 Policy Option 1: Status Quo
Costs Upstream.
Under the Status Quo option, the Ban Pa Kluay residents are assumed to face rising costs of production as the quality of the resource base declines in the absence of conservation measures or methods of sustainable extraction. Differential rates of increase in production cost are assumed during the 20-year project period from 10% during year 1 to 5 up to 30% increase in cost per rai beyond the 5th year. Likewise, collection costs of TFPs and NTFPs are assumed to increase 10% each year due to rising wage rate as well as increasing scarcity of timber.
Costs Downstream.
The downstream communities and the general public absorb costs in terms of monetized value of environmental damages in terms of loss of existence value of forest resources and loss of ecological functions. Benefits in terms of damages avoided were imputed based on the costs of the measures that would be required to address the negative impacts. Negative impacts were valued using preventive cost estimates. For instance, soil loss impact is monetized by how much investment would be required to prevent soil loss. The lowest cost technology of planting vetiver strips is used in the calculation. Unit cost per rai is multiplied by the forest area that would be converted. The same expenses would be incurred each year after adjusting for conversion of forest area to alternative uses each year, plus a 10% increase in the cost of maintaining vetiver grass each year. Carbon storage value was included as foregone benefit, using benefit transfers figure. While the actuality of the carbon storage value being tradable is still uncertain, several assumptions were made to reflect the time frame when carbon storage value will likely become tradable. The value is based on the estimate of changes in carbon with the conversion of closed secondary forest to permanent agriculture. This value is multiplied by the accumulative loss of forest cover in each year.
Non-uses value of biodiversity resources was also adopted to represent what would be lost if forestland of high ecological importance (as is the case for watershed class 1A) would be converted to alternative uses. Based on field survey, the increase in area occupied by the Ban Pa Kluay residents is 370 rai within a period of 4 years or an

39
average forest loss of 93 rai/year. The existence value is transferred from Thongpan and Panayotou‟s study (1990) and Panayotou and Parasuk (1990) and converted to 2002 prices.
Benefits Upstream
The economic rent of land is indicated in terms of net revenue generated from one rai of land (gross revenue minus cost) multiplied by the total cultivated area where in each year, cultivated land will increase by the equivalent area that forest areas reduce, i.e. at 2.5% p.a. The net revenue from TFPs and NTFPs is based on the equivalent market value of the types of TFPs collected per household less the collection and marketing costs. Both values are assumed to increase by 2.5% p.a. due to the increase in the number of households in Ban Pa Kluay during the 20-year period.
The Results
The NPVs for the Status Quo option are negative for all cases with the exception of the case where the current rate of deforestation can be controlled to only a net loss of forest coverage of 10 rai per year. The inclusion of environmental services of the forest in terms of carbon storage values will alter the NPV. That is, the later the inclusion of carbon storage value, the higher the NPV. As shown in Table 19, if carbon storage value is excluded altogether, the NPV of the Status Quo option is -30.46 million Baht (USD -0.7 million). With greater effectiveness of the measures to slow down the rate of deforestation, positive NPV (at discount rate of 6%) of 2.47 million Baht (USD 0.06 million) may be realizable. To do 'nothing' as would be the case under the Status Quo option would benefit the upstream community solely. In this case, the downstream communities and the general public absorb the larger share of the present value of cost of 91.52 million Baht (USD 2 million).

40
Table 16 Costs and Benefits of the Various Options (Net Present Values at 6% Discount Rate) Unit: million Baht
Policy Options Benefit Cost NPV
Base Case
Base case: Status Quo 102 234.21 -132.21
Base case: Compromise 294.82 83.41 211.42
Base case: Resettlement 229.54 162.92 -42.03
Excluding carbon value
Status Quo: Excluding carbon value 102 132.45 -30.46
Compromise: : Excluding carbon value 198.48 78.00 120.47
Resettlement: : Excluding carbon value 81.40 125.00 -43.60
Deforestation controlled
Status Quo: Deforestation controlled 93.99 91.52 2.47
Compromise: Deforestation controlled 78.92 72.73 6.20
Resettlement: Deforestation controlled 82.26 107.32 -26.09
Excluding carbon storage value year 1 to year 5
Status Quo: Excluding carbon storage value year 1 to year 5
102 221.68 -119.69
Compromise: Excluding carbon storage value year 1 to year 5
287.71 78.00 209.70
Resettlement: Excluding carbon storage value year 1 to year 5
112.77 150.58 -37.82
Excluding carbon storage value year 1 to year 10
Status Quo: Excluding carbon storage value year 1 to year 10
102 196.1 -94.11
Compromise: Excluding carbon storage value year 1 to year 10
262.12 78.00 184.12
Resettlement: Excluding carbon storage value year 1 to year 10
118.90 125.00 -6.10
Excluding carbon storage value year 1 to year 15
Status Quo: Excluding carbon storage value year 1 to year 15
102 164.86 -62.86
Compromise: Excluding carbon storage value year 1 to year 15
230.88 78.00 152.88
Resettlement: Excluding carbon storage value year 1 to year 15
102.92 125.00 -22.07
Resettlement delay 5 years 223.02 142.70 80.31
Resettlement delay 15 years 97.66 97.85 -194.23
Note: 1/ Benefit from Compromise scenario will not be realized until year 4.
2/ Benefit from Resettlement option will not be realized until year 11.
1 USD = 43 Baht

41
5.1.2 Compromise Option
In this policy option, all expected benefits will commence from year 4 onwards under the assumption that reaching agreements and all preparatory measures would take at least 3 years. Each year that the benefits are delayed means that the expected benefits from value of ecological functions will become opportunities forgone and will therefore be represented as costs.
Costs to Upstream Community
The costs to the upstream community under the Compromise option are in terms of forgone revenue from TFPs and NTFPs. The upstream community will not encounter the cost of complying with the conditions of the Compromise option until the 4th year of the project. The revenues forgone in the successive years of the project period are assumed to increase by 2.5% p.a. corresponding to the annual loss rate of forest coverage.
Costs to Downstream Communities
While the upstream community confronts losses of private revenue, the downstream communities have to incur the costs of implementing the various components of this option. Demarcating the watershed and the production areas for example would involve building a buffer forest around the headwaters as well as the settlement and production areas to envelop the settlement and function as the physical boundary and buffer of the area. Demarcation would also involve recurrent costs for fence maintenance, forest fire patrols, investment in forest fire protection and maintenance of forest fire line. Budgets would need to be earmarked for procuring a full package of forest fire equipment and accessories as well as the operating costs for forest fire patrol and fire extinguisher. While no additional investment would be required for building reservoirs, distribution canals and ponds to supply water for extinguishing the fire, annual operating and maintenance costs equivalent to 5% of the investment would have to be allocated.
No expenses would be required to replant the watersheds since a local NGO, the Thammanart Foundation, has already invested in replanting a total area of 500 rai. It is therefore assumed that only supplementary planting would be required which is considered as recurrent costs throughout the project period. One other recurrent cost item is to cover for the monthly stakeholders meetings, which would contribute to establishing a common understanding between resource users. Both upstream and downstream communities are expected to share responsibilities in forest protection and conservation. This calls for investments in training to provide basic knowledge and create practical skills for the tasks. Again, a budget will need to be earmarked for this purpose to cover the training expenses as well as per diem for the attending participants.
In addition to the training expenses, in view of the area restrictions imposed on the upstream community, it is proposed that supporting measures be provided to ensure that the upstream communities can increase the productivity of the land as well as to encourage the switch to alternative occupations which are less land-based and less forest-based. Moreover, with the area restriction, access to the nearby forests will also be prohibited. By way of compensation, an area will be allocated for the establishment of a community village woodlot to supply the firewood for domestic uses. The Ban Pa Kluay residents will no longer benefit from the TFPs since the land requirement would be considerably much higher if sufficient volume of timber is to be grown to meet the

42
needs of the existing inhabitants, given the longer rotation period. In this option, only land for planting fast growing trees for fuelwood will be provided. The establishment of a village woodlot would include the expenses for the saplings, the planting, the maintenance as well as the opportunity cost of the land.
The monetary loss of the value of ecological functions is included for a period of three years to reflect the start up period of the Compromise option. The same items covered are the existence value of forest area that would have been converted to alternative use, the imputed cost of soil erosion and the loss of carbon storage value. The same approach for calculation is adopted as in the Status Quo option.
Benefits Upstream
Under the Compromise option, the benefits to the Ban Pa Kluay residents will be in terms of the Economic Rent of Land that would be limited to only the area already brought under cultivation. In addition, during the three years start-up phase, Ban Pa Kluay residents will continue to derive net benefits from TFPs and NTFPs.
Benefits Downstream
The benefits of the downstream community are measured in terms of existence value of biodiversity resources in areas that would have been cleared. The inclusion of investment in forest protection and conservation measures would reduce, if not eliminate, the pressure on biodiversity resources of the forest. With the conditional stay option, it is assumed that continued deforestation will stop. The benefits are calculated from the value per unit area multiplied by the forest areas that would have been converted. Benefits have therefore been quantified in terms of damage avoidance of cost of soil erosion. The same principle is followed to get the imputed value for arresting climate change. The same approach for calculation is adopted as in the Status Quo option, but the values obtained represent benefits.
The Results
The NPVs of the Compromise option are highest amongst all the options. In the base case where the value of environmental services are included from year 1, NPV for this option is highest among the options at 211.42 million Baht (USD 4.9 million). Even if the carbon storage value is excluded altogether, the NPV of the Compromise option is high at 120.47 million Baht (USD 2.8 million), the only option with a positive NPV. The assumption that deforestation can be effectively controlled to a marginal increase of 10 rai per year on the other hand narrows the gap between NPVs from the Compromise and the Status Quo options. Nonetheless, at 6% discount rate, the NPV of this option is only 6.20 million Baht (USD 0.14 million), which is still higher than the Status Quo‟s NPV of 2.47 million Baht (USD 0.06 million). Moreover, there is also a major difference in that there is more equitably shared costs and benefits between the upstream and the downstream communities in this option.
5.1.3 Scenario 3: Resettlement Option
All expected benefits of this scenario are shown to commence from year 11 onwards under the assumption that reaching agreements and all preparatory measures would take at least 10 years. Each year that the benefits are delayed means that the expected

43
benefits from value of ecological functions will become opportunities forgone and have therefore been represented as costs.
Costs Upstream
During the period when negotiations for resettlement is taking place which is expected to take about 10 years, the upstream communities will still continue to reap benefits from land resources. The same assumptions over changes in production cost during this period are assumed as in the case of the Status Quo option. The same assumptions as in the case of the Status Quo option over changes in collection costs of TFPs and NTFPs also apply here.
Once resettled, the Ban Pa Kluay residents will no longer be able to utilize the land, the forgone revenue equivalent to the economic rent of the land is therefore considered as a cost. Since it is assumed that actual resettlement will not take place until year 11, the upstream community will not encounter this cost until year 11. Moreover, since compensation payment will be provided during the first two years of resettlement, the cost in year 11 and 12 will be the difference in the value of compensation and what they would have earned, had they been allowed to remain in the protected area. From year 13 onwards, the cost to the upstream community will be the difference in net revenue of what upstream residents would have earned in the protected area and in the destination area.
The Ban Pa Kluay residents will continue to benefit from the revenue of TFPs and NTFPs for the full 10 years of the project. Unlike the land economic rent, no compensation will be granted for this forgone revenue. The value that could have been collected had they been allowed to stay is therefore considered a cost item to the upstream community. The value used is what they would have earned from year 11 onwards.
Costs Downstream
To implement the Resettlement option, a range of costs will be required. The first among these is compensation cost for the loss of revenue during the relocation period. With the actual relocation not taking place until year 11, no compensation for forgone revenue either for economic rent of land or for the equivalent values of TFPs and NTFPs are due until year 11. During the first two years of resettlement, when Ban Pa Kluay inhabitants settle into the new area, they will not be able to generate income from the land. Based on this assumption, it is therefore assumed that livelihood provisions should be considered as a cost to the society. The amount of compensation is based on economic rent of land only (assuming that other types of income can be derived from the alternative location of settlement) which is equivalent to what Ban Pa Kluay would have earned in that year times the 86 households who would be entitled for this compensation.
A number of provisions will also need to be put in place to prevent the possibility of Ban Pa Kluay residents returning to their former settlements as well as to stop any other parties from entering the area once vacated. For example, though the Ban Pa Kluay residents are resettled elsewhere, it is still necessary to clearly demarcate the headwaters by planting strips of buffers to fence off the headwaters. Once planted, the trees in the „buffer‟ have to be looked after to ensure a higher survival rate. In the calculation, annual sums are therefore earmarked for maintenance of all areas that have been

44
replanted to cover for additional replanting to aid the natural regeneration process of the watersheds. Once the Ban Pa Kluay residents are resettled, it will also be possible to re-afforest the area that was formerly used for the settlement as well as agricultural production. The replanting and maintenance costs have therefore been included.
Even with Ban Pa Kluay inhabitants resettled elsewhere, both the natural regeneration of the forest and success ratio of re-afforestation depend on the effective prevention of forest fires. The same level of investment as in the Compromise option is therefore considered to be essential for the investment in the forest fire equipment packages, the maintenance of forest fire line and the forest fire operating expenses and the same approach for cost calculation have therefore been adopted. Similar to the above argument with respect to investment in making forest fire lines, even if the Ban Pa Kluay residents are resettled, the natural regeneration of plant growth and survival ratio of the saplings plants depends on assurance against any disturbance and further encroachment. Forest patrol expenses are therefore considered a substantial investment and have been included as a recurrent cost for each year.
With delays in negotiation process before implementation of resettlement policy, continued losses of forest area and consequent loss in existence value of the forest will occur. Similarly, the expected benefits are in terms of avoided loss of ecological functions, namely costs of soil erosion and loss of carbon storage value.
Apart from the budget for provisions to protect the area vacated, there are the cost of resettlement itself, management and administration costs which cover activities such as validation of land rights, conduct of cadastral surveys, documentation, and others. The Resettlement option also includes the value of the land itself where community will be relocated.
Public hearings to create a common understanding among the stakeholders are of critical importance in the Resettlement option. Expected expenses are given as a lump sum but could actually be used to cover a series of meetings during the first year of the resettlement.
Benefits Upstream
On the benefit side, it was assumed that during the 10-year lag before resettlement can take place, Ban Pa Kluay inhabitants would continue to generate benefits from land resources in the „protected area‟. Though revenue will be stopped when resettlement actually takes place, resettled households will be granted compensation equivalent to the economic rent of the revenue they would be earning in the destination area. Subsequently, their revenue is assumed to be equivalent to the net farm income for the average farm household in the Northern Region of Thailand during the 1999/2000-crop year.34
As for benefits from the Resettlement option to the downstream communities and the general public, with people being relocated elsewhere and with additional investment in the replanting, it is assumed that resource stock will recover and with it the value of TFPs which had formerly been harvested. For this calculation, it is assumed that 10% of the original TFPs value harvested can be recovered from the 11th year onwards, thereby increasing each year from the preceding year by 10%. In the case of the regeneration of 34 Office of Agricultural Economics, Ministry of Agriculture and Cooperatives.

45
NTFPs, it is assumed that 30% of the original value of the NTFPs can be recovered from the beginning of the 11th year increasing by another 30% in year 12. The original market value of the NTFPs is expected to be fully recovered at the end of year 13.
Benefits Upstream
Among the expected environmental benefits of the Resettlement option is that the threat to biodiversity resources would diminish. As such, society will benefit in terms of the existence value as well as the value of ecological functions of watersheds in areas that would otherwise have been subject to deforestation.
The Results
Resettlement involves higher expenditures than the Compromise option. This is because under Resettlement, in addition to the required expenses for protection and conservation of forestry resources, there are also expenses for the land acquisition in the destination areas as well as the management costs for land allocation for each household currently living in Ban Pa Kluay. The assumed delay of 10 years for negotiation means that during this period, the values of the ecological services would be considered as costs to the downstream communities. This is partially neutralized by the benefits of the upstream community from their being able to continue to benefit from land use, TFPs and NTFPs values. After resettlement however, the loss will be incurred by the upstream, mainly through loss of revenue from TFPs and NTFPs which they had benefited from whilst living in protected area.
One condition, which has a direct influence on the NPV, is the period of inclusion of the carbon storage value. One other built-in condition is the 10-year allowance for negotiations before any action can take place with respect to actual resettlement. As with the conditions over the timing of the inclusion of environmental services, the purpose is to better reflect the real situation. The delay in actions for resettlement for example, is based on the „on‟ and „off‟ situation in the discussions over resettlement over the past 20 years or so. In effect, the delay in launching resettlement reflect the forgone value of the environmental services that can otherwise be captured. On the other hand, the opportunity cost of delay would be lower if there are no tradable markets for environmental services. If for instance, no markets for carbon trade can be negotiated up to year 10, there would be no cost or benefit from the carbon storage value. Until the 10th year, the upstream community will have benefited from the use value of land and the equivalent market values of TFPs and NTFPs whereas from year 11 onwards, the downstream community will benefit from the damage avoidance cost of the ecological functions of the forest that would have been lost if deforestation continues.
The results show that the NPVs for the Resettlement option is negative in all scenarios. The only case where the NPV can be positive is where negotiations for resettlement can be concluded within 5 years and actual resettlement can take place from the beginning of year 6. In this case, the NPV would be 80.31 million Baht (USD 1.9 million) (at 6% discount rate). What the results also indicate is that it would be more worthwhile for policy-makers to step up efforts in reducing the rate of deforestation, than to attempt to push for resettlement. This is based on the NPVs for the Status Quo and the Resettlement under this scenario of 2.47 million Baht (USD 0.06 million) and -26.09 million Baht (USD –0.6 million), respectively.

46
5.2 Sensitivity Tests.
In addition to the three main options, namely Status Quo, Compromise and Resettlement, several variations have been made to illustrate sensitivity of the NPVs to several parameters. For each sub-scenario, four discount rates are used in the calculation of NPV, namely 6%, 8%, 10% and 12%. The parameters for conducting sensitivity analysis for this study will include:
1) Two different rates of deforestation, i.e., one which assumes that the rate will be the same as the average loss per year at 93 rai. The other assumes that deforestation has been more or less contained and that forest conversion will be quite marginal to a net reduction of forest of 10 rai per year.
The change in the effectiveness in controlling deforestation is a major factor determining the outcome of each policy option and scenario. Assuming that deforestation can be slowed down, the NPV of the Status Quo would become positive [2.47 million Baht (USD 0.06 million)]. Moreover, there would not be much difference between the NPVs of the Status Quo and the Compromise options. Policy implication wise therefore, it would be worthwhile also to look into modalities of how the present measures to control deforestation can be made more effective. The main difference now will center on distribution of gains and losses, which will still differ across options, as shown in the next section.
2) Changes in the inclusion of carbon storage value. The market for carbon trade emissions is very much in the premature stage and it may take a number of years before the „tradable value‟ of carbon storage can be fully realized. Several sub-scenarios have therefore been assumed with variation of the number of years before the market for carbon trade can become functional, from 5 years, 10 years, 15 years to a scenario where the value of carbon storage is excluded altogether.
3) The timing of resettlement also has a significant impact on the NPVs. As shown in Table 18, the only scenario that can render the Resettlement option feasible would be if negotiations can be concluded for resettlement within 5 years. On the other hand, given that resettlement has been an 'on' and 'off' option for more than 2 decades, it would appear most unlikely that the agreement for resettlement can be concluded within the next 5 years or so.
6.0 ANALYSIS OF DISTRIBUTION OF COSTS AND BENEFITS OF THE
THREE OPTIONS
The efficiency of the Compromise option was seen in the comparisons of the NPVs of the various policy options. It is also worth looking at the distribution of costs and benefits to upland and downstream communities of the various options, as this may have a bearing on the choice of the option in the final analysis.
Under the Status Quo option, the costs can be divided into private (cost to upstream community) and external costs (cost to downstream communities). The first refers to the private cost of the Ban Pa Kluay residents in terms of rising input costs associated with deforestation. The second category refers to external costs borne by the downstream communities - mostly in terms of the imputed value of negative impacts of deforestation. In terms of benefits, only the upstream members can earn benefit from

47
this option in the form of land rent and revenue from TFPs and NTFPs. The present value of net benefit at 6% discount rate is approximately 27.66 million Baht (USD 0.64 million) under the Status Quo option.
As anticipated, the downstream communities face net losses from the Status Quo option regardless of the assumptions over reduced rate of deforestation or inclusion of environmental services of the forests in the calculation. In particular, the net cost to downstream communities of the Status Quo option is some 159.87 million Baht (USD 3.7 million). Note that the downstream communities are the major losers under the Status Quo option.
Under the Compromise option, the upstream community will continue to reap benefits from the land. They would also continue to benefit from NTFPs in terms of supply of firewood. However, given that the source of NTFPs will be from the community forestry, the supply sustainability would depend on efforts allocated to protect as well as maintain the resources. In addition to the community forestry, the Ban Pa Kluay residents would also be able to obtain use value from the buffer forests that are planted around the watersheds, the settlement and the production parcels. Much depends on how the community members themselves reach an agreement over the rules and the manner in which they will be able to benefit from the resources. Despite restrictions on further expansion of land use, the compensation to the Ban Pa Kluay residents are provided in several aspects. Among these are security of tenure and extension services for occupational promotion, which would, among other things, enhance ability to maximize returns from land and possibly open up channels for alternative off-farm and non-land based employment opportunities. In return, beyond agreeing to the area expansion restriction, the upstream community will have to agree to share a number of cost items which have been formerly borne by the downstream communities. Among these are the costs of forest fire protection, forest patrol, replanting and maintenance of watersheds. The social implication of the cost sharing and mutual benefits of this option would be the integration of members of the upstream community into the Thai society. Naturally, how far this social integration can be made more than a 'symbolic' change will depend on the sincerity of each stakeholder in abiding by the commitments entailed in this option. Because of these restrictions, the NPV to the upstream community, though still positive, is lower at 3.90 million Baht (USD 0.9 million).
For the downstream communities, the highest NPV is realizable under the Compromise option at 207.50 million Baht (USD 4.8 million), using a 6% discount rate. If the carbon storage value is excluded altogether, this option would be the only one where the downstream communities earn a net gain of 116 million Baht (USD 2.7 million). Under assumed control over deforestation, the downstream communities would face net losses but as expected, the net loss under the Compromise option would be lower with an imputed loss of 2.3 million Baht (USD 0.05 million).

48
Table 17 Distribution of Benefits and Costs to Upstream and Downstream Communities, All Options
Upstream (Baht)
Downstream (Baht)
Benefit Cost NET Benefit Cost NET
Base case
Base case: Status Quo
101,994,673 74,331,901 27,662,772 0 159,872,784 -159,872,784
Base case: Compromise
47,719,869 43,812,296 3,907,573 247,103,174 39,595,684 207,507,490
Base case: Resettlement
67,226,391 50,893,481 16,332,910 53,667,376 111,028,928 -57,361,552
Excluding carbon value
Status Quo: Excluding carbon value
101,994,673 74,331,901 27,662,772 0 58,121,568 -58,121,568
Compromise: Excluding carbon value
47,719,869 43,812,296 3,907,573 150,756,246 34,191,397 116,564,849
Resettlement: Excluding carbon value
67,226,046 50,893,481 16,332,565 14,172,511 74,107,877 -59,935,366
Deforestation controlled
Status Quo: Deforestation controlled
93,992,870 74,331,901 19,660,969 0 17,190,623 -17,190,623
Compromise: Deforestation controlled
52,354,641 43,812,296 8,542,345 26,570,236 28,912,592 -2,342,355
Resettlement: Deforestation controlled
63,390,787 50,893,481 12,497,306 17,867,793 54,081,395 -36,213,602
Excluding carbon storage value year 1 to year 5
Status Quo: Excluding carbon storage value year 1 to year 5
101,994,673 74,331,901 27,662,772 0 147,350,407 -147,350,407
Compromise: Excluding carbon storage value year 1 to year 5
47,719,869 43,812,296 3,907,573 239,985,084 34,191,397 205,793,687
Resettlement: Excluding carbon storage value year 1 to year 5
67,226,046 50,893,481 16,332,565 45,541,712 99,690,425 -54,148,713
Continued

49
Table 17 continued
Excluding carbon storage value year 1 to year 10
Status Quo: Excluding carbon storage value year 1 to year 10
101,994,673 74,331,901 27,662,772 0 121,767,859 -121,767,859
Compromise: Excluding carbon storage value year 1 to year 10
47,719,869 43,812,296 3,907,573 241,402,537 34,191,397 207,211,140
Resettlement: Excluding carbon storage value year 1 to year 10
67,226,046 50,893,481 16,332,565 51674024 74107877 -22,433,853
Excluding carbon storage value year 1 to year 15
Status Quo: Excluding carbon storage value year 1 to year 15
101,994,673 74,331,901 27,662,772 0 90,526,752 -90,526,752
Compromise: Excluding carbon storage value year 1 to year 15
47,719,869 43,812,296 3,907,573 183,161,430 34,191,397 148,970,033
Resettlement: Excluding carbon storage value year 1 to year 15
67,226,046 50,893,481 16,332,565 35,702,018 74,107,877 -38,405,859
Resettlement delayed for 5 years
47,796,409 68,430,942 20,634,533 175,220,041 74,273,632 100,946,409
Resettlement delayed 15 years
84,816,302 26,098,122 58,718,181 12,841,816 73,508,817 -60,666,778
Note: 1 USD = 43 Baht
Under the Resettlement option, the interests of the upstream and downstream tend to diverge. Work delayed is in the interest of the upstream community since they will continue to benefit from the use value of the land and forestry resources. The longer the delay in resettlement, the higher is the costs to the downstream communities. Furthermore, apart from the higher costs and administrative inputs, there are elements of uncertainty of the suitability of the new location and the ability to generate income from the land in the destination area. All these factors may neutralize any benefits in terms of security of tenure that those being relocated might or might not feel and may work against the objective of enhancing social integration of ethnic hill tribes. For the upstream community, the net benefit is shown to be higher for the Resettlement [16 million Baht (USD 0.37 million)] than the Compromise option [3.9 million Baht (USD 0.9 million)]. This result is based on the assumed 10-years delay in the implementation of resettlement. During those years, the upstream community is allowed to continue to access and utilize forest resources.

50
In all the scenarios, the downstream communities also confront net losses for the Resettlement options. Again, there is only one exception and that is where execution of resettlement can be speeded up. If this was the case, the net gain to the downstream community would be 101 million Baht (USD 2.35 million), most of which is the value of damage cost avoidance and the existence value of the forestry resources.
While the net gains to the upstream community under Resettlement may be contrary to expectations, this was due to the ability of the upstream people to utilize resources while negotiations take place. In addition, there is compensation for livelihood loss and the revenue they would earn in destination settlement. The results thus show that the longer the delay, the higher the net gain to the upstream community. If, however, resettlement could be speeded up, i.e., if negotiations only take 5 years, the upstream would face a net loss of approximately 21 milllion Baht (USD 0.5 million) because of the loss of revenue from TFPs and NTFPs as well as comparatively lower income from land as opposed to increasing revenue from continuation of expansion of production acreage. In fact, to speed up implementation of resettlement would be the only case where the upstream community would face a net loss and the only scenario where the downstream communities would reap net gains from resettlement.
7.0 CONCLUSION AND POLICY IMPLICATIONS
To return to the major research question of this study - whether settlements in enclaves are utilizing resources in a sustainable manner - the answer appears to be negative. This is suggested by evidence of continued conversion of forest areas on the one hand and the increase in the population size due to natural increases and in-migration. Moreover, although the off-site externalities from agricultural production cannot be directly linked to practices of the upstream inhabitants, community members themselves report declining output in spite of increased inputs; these are indications of the negative on-site impact of current agricultural practices.
The results of our CBA showing higher NPVs under the Compromise option should in no way be interpreted to mean that „man‟ can live in the forest without upsetting the balance of the ecosystem. Costs have already been incurred in terms of continued loss of forest coverage and associated losses of ecological functions. Given the past pattern of resources utilization, more losses are inevitable if nothing is done, as illustrated by the negative NPVs of all Status Quo options in which the rate of conversion of forest areas is assumed to continue at the current pace.
Our finding that the Compromise option is the most viable one suggests that „man‟ cannot live in the forest without incurring a net loss to society - but that the upstream community could be allowed to remain in the forest if tighter conditions are enforced to minimize further losses. These conditions involve a range of investments to protect and conserve the forest as well as a number of limits on the upstream community‟s
activities. These costs would be spread fairly evenly over the twenty years of the project period, each year not exceeding 10 million Baht (USD 0.23 million). This by itself is an advantage of the Compromise option, given the greater likelihood of resource mobilization than under the Resettlement option. The latter involves high upfront payments in Year 1 of the project. In addition, with less uprooting and fewer drastic changes, the Compromise option should be more acceptable to the upstream community. The Compromise option would also be more politically desirable for those

51
who champion the arguments of the rights of ethnic minorities as well as those who dispute the allegation that ethnic groups utilize resources in ways that create negative externalities and social costs.
Under Resettlement, in addition to the cost of land acquisition and administrative expenses for reallocation, provision must be made to ensure against the return of old settlers and the entry of newcomers. Reaching a consensus over resettlement is difficult given that opinions in society have become highly polarized. The results of the CBA also suggest that speed is crucial to the viability of the Resettlement option. Apart from the increasing difficulty of executing resettlement as time passes, delays also neutralize the benefits that make this option feasible at all. One of the complications that would arise will be in terms of land supply. That is, with the pressure for land, particularly among the landless and the near-landless lowland Thais, any news of resettlement and information about the possible relocation sites will result in the targeted land being occupied and claimed, as ocurred at the potential relocation site in this study. Thus, the longer the delay in launching the resettlement process, the greater the net loss to society.
There are several on-going measures to develop the highland areas. Most of these introduce sustainable land use practices in conjunction with the delivery of social services and basic infrastructure, the goal being the social integration of ethnic minorities for security purposes. Many of these measures tend to treat conflicts of interest between the upland and lowland communities as „external‟ to the analysis. When participatory processes have been built into these activities, they have been oriented more towards social and political issues than the value of losses and gains to the parties concerned. In a seminar to present the findings of this study, agencies such as the Office of Environmental Policy and Planning, the RFD and the Office of the Prime Minister had recommended that the findings be translated into Thai and used as a model for conflict negotiation that incorporates economic analysis. This would add another dimension for negotiation by spelling out the losses and gains to the negotiating parties in comprehensible terms.
While the results of the Compromise option suggest a win-win situation, the option is only feasible if the parties concerned accept the conditions and the altered costs and benefits. One channel where the findings of this study could be translated into action is the Tambon Administration Organization (TAO). The 1997 Constitution authorizes the TAO to look after natural resources. Being the most grassroots local organization, the TAO can provide a forum where the conditions imposed on the upstream community can be discussed in conjunction with the recognition of those terms and the commitments of the downstream community. Representatives of the concerned agencies, such as Department of Local Administration, the Community Development Department and the RFD, should also be present, primarily to provide information about the technicalities of implementation and about the technical and financial resources available.
The TAO might also share the costs of implementation, since the sums required are quite affordable. Moreover, such a contribution would also enhance the TAO‟s ability to negotiate for contributions of cash or kind from their constituents to look after the forests.
Once a general agreement on the basic conditions has been reached, the details of the Compromise option need to be discussed. Most important are the boundaries of the

52
settlement, the three production parcels, the watersheds and protected areas that need to be fenced off. It should be an accepted principle that the Ban Pa Kluay residents be entitled to utilize the resources within the area defined by the above boundaries.
Community rights should be granted, as opposed to individual rights. Under the umbrella of community rights, the individual rights of those who are presently utilizing the land would be recognized. The joint rights of the community and the boundaries agreed upon should be written as a Tripartite Agreement between three parties - the upstream and downstream villages and the RFD (the latter acting on behalf of the general public). Where violation of the boundary occurs, the community should undertake measures to penalize the violators, this being a precondition for the continued recognition of the upstream community‟s occupation rights .
Among the factors needed to uphold the restrictions on agricultural expansion would be measures to increase productivity. Although the field survey results show that the Ban Pa Kluay residents can earn a satisfactory level of income, the use of slope areas to plant annual crops such as potatoes and cabbages, the use of chemicals, and the growing demand for water suggest that such land use practices may generate unwarranted private and external costs. Moreover, if left to market mechanisms, farmers may switch to fruit tree crops, which require greater use of chemicals and water, a change that may intensify conflicts that have been accumulating over the years. This is already occurring in nearby districts of Chiang Mai. Some interventions to encourage Ban Pa Kluay residents to alter land use patterns that are equally rewarding but less environmentally threatening may be necessary. Increasing the capacity of the upstream community to use resources sustainably is very much in the interest of the downstream communities and the general public.

53
REFERENCES
Barlowe, R. 1986. Land resource economics: The economics of real estate, 4th Edition, Prentice Hall.
Brown J. and D.W. Pearce, 1994. The economic value of carbon storage in tropical forests, J. Weiss (ed), In The economics of project appraisal and the environmental, Cheltenham: Edward Elgar, 102-23.
Bruijnzeel I.A. 1990. Hydrology of Most Tropical Forests and Effects of Conversion: A State of Knowledge Review. Free University. Amsterdam.
Bruijnzeel I.A. and J. Proctor. 1995. Hydrology and Biochemistry of Tropical Montane and Cloud Forest: What Do We Really Know? pp. 37-78 In L. Hamilton , J.O. Juvik and F.N. Scatena eds. Tropical Montane Cloud Forests. Springer Verlag, New York.
Chankaew K. and P. Mokarapirom. 1979. The Impact of Deforestation on Streamflow of the Main Rivers of the Northern Region of Thailand. Paper presented at the annual conference on Forests and Environment organized by the Royal Forestry Department, 20-28 November 1979.
Community Development Department, Ministry of Interior, 2001. National Rural Development Survey.
Department of Land Development, 2000. Soil erosion in Thailand.
Folmer H. and H.L. Gabel. 1998. Principles of Environmental Resources Economics, Edward Elgar, p.117
Hamilton L.S. and A.J. Pearce, 1986. Biophysical Aspect in Watershed Management, pp. 35-52 In Easter et al. (eds), Watershed Resources Management - An Integrated Framework with Studies from Asia and the Pacific Studies in Water Policy and Management No. 10, Westview Press, Boulder and London.
Hanley N. 2000. Cost-Benefit Analysis, in H. Folmer and H. Landis Gabel, Principles of Environmental and Resources Economics, Edward Elgar. pp. 104-129.
Kraipanond N., N. Chumyen, S. Tasingha, S. Thanawibunsetr, O. Chantrapol, P. Borisut and P. Yaemchoo. 1995. The Study of the Environmental Quality in the Basin Area in the Highlands of Tak Province In Soil and Water Conservation Journal, Year 15 Vol. 2, pp. 27-39 (in Thai).
Nabangchang O. 1992. The socio-economic impact of land reform in Thailand: The case study of the involvement of the Agricultural Land Reform Office, 1975-1989, Doctoral Thesis, University of Cambridge, United Kingdom.
Naparaxawong and Savadiluk. 1983. Change of inflow hydrograph after dam construction. Seminar proceeding in Seasonal Streamflow Forecasting Vientiane.
OAE (Office of Agricultural Economics) 1982. Ministry of Agriculture and Cooperatives. Agricultural Statistics of Thailand, Crop Year 1981/82.

54
______________________________________ 1983. Ministry of Agriculture and Cooperatives. Agricultural Statistics of Thailand, Crop Year 1982/83.
______________________________________ 1984. Ministry of Agriculture and Cooperatives. Agricultural Statistics of Thailand, Crop Year 1983/84.
_______________________________________ 1985. Ministry of Agriculture and Cooperatives. Agricultural Statistics of Thailand, Crop Year 1984/85.
_______________________________________ 1986. Ministry of Agriculture and Cooperatives. Agricultural Statistics of Thailand, Crop Year 1985/86.
_______________________________________ 1987. Ministry of Agriculture and Cooperatives. Agricultural Statistics of Thailand, Crop Year 1986/87.
_______________________________________ 1988. Ministry of Agriculture and Cooperatives. Agricultural Statistics of Thailand, Crop Year 1987/88.
_______________________________________ 1989. Ministry of Agriculture and Cooperatives. Agricultural Statistics of Thailand, Crop Year 1988/89.
_______________________________________ 1990. Ministry of Agriculture and Cooperatives. Agricultural Statistics of Thailand, Crop Year 1989/90.
_______________________________________ 1991. Ministry of Agriculture and Cooperatives. 1997. Agricultural Statistics of Thailand, Crop Year 1990/91.
_______________________________________ 1992. Ministry of Agriculture and Cooperatives. 1997. Agricultural Statistics of Thailand, Crop Year 1991/92.
_______________________________________ 1993. Ministry of Agriculture and Cooperatives. 1997. Agricultural Statistics of Thailand, Crop Year 1992/93.
_______________________________________ 1994. Ministry of Agriculture and Cooperatives. 1997. Agricultural Statistics of Thailand, Crop Year 1993/94.
_______________________________________ 1995. Ministry of Agriculture and Cooperatives. 1997. Agricultural Statistics of Thailand, Crop Year 1994/95.
_______________________________________ 1996. Ministry of Agriculture and Cooperatives. 1997. Agricultural Statistics of Thailand, Crop Year 1996/97.
_______________________________________ 1997. Ministry of Agriculture and Cooperatives. 1997. Agricultural Statistics of Thailand, Crop Year 1997/98.
_______________________________________ 1998. Ministry of Agriculture and Cooperatives. 1997. Agricultural Statistics of Thailand, Crop Year 1998/99.
_______________________________________ 1999. Agricultural Statistics of Thailand, Crop Year 1998/99.
Ohnishi R. and N. Nakanishi. 2001. The water conservation function and appropriate management of agricultural land. Paper presented at the International Seminar

55
on Multi-Functionality of Agriculture, October 17-19 2001 at JIRCAS, Tsukuba, Ibaraki, Japan Organized by the FFTC in Cooperation with Japan International Research Centre for Agricultural Sciences (JIRCAS), Policy Research Institute, Ministry of Agriculture, Forestry and Fisheries (PRIMAFF), National Institute for Agro-Environmental Sciences, (NIAES) and National Institute for Rural Engineering (NIRE).
Lal R. 1983, Soil Erosion in the Humid Tropics with Particular Reference to Agricultural Land Development and Soil Management. IASH Publications.
Panayotou T. and V. Parasuk. 1990. Land and Forest: Protecting Demand and Managing Encroachment Encroachment. Thailand Development Research Institute, Bangkok.
Pearce D.W. and C. Pearce, 2001. The Value of Forest Ecosystems, A Report to the Secretariat of the Convention of Biodiversity.
Perrings C. (eds) Authors E.B. Barbier, S.Dalmazzone, C. Folke, M. Gadgil, N. Hanley, C.S. Holling, W.H. Lesser, K.G. Maler, P, Mason, T. Panayotou, C. Perring, R.K. Turner, M. Wells, The Economic Value of Biodiversity in Global Biodiversity Assessment, United Nations Environment Programme, Cambridge University Press, 1995.
Royal Forestry Department (RFD), Ministry of Agriculture and Cooperatives. 1993. Thai Forestry Sector Master Plan.
Ruangpanit N. 1971. Effect of Crown Cover on Surface Runoff and Soil Erosion in Hill Evergreen Forest. Ms. Thesis , Kasetsart University, Thailand.
Somyos R., P. Saengborisut and B. Disaeng. 1992. The Study of Types and Quantity of Heavy Metal Content in and Toxic Residuals for Agriculture in the Water and Sediments in the Northern Region of Thailand (in Thai).
Takahashi T., K. Nagahori, C. Mongkolsawat and M. Losirikul, 1983. Runoff and Soil Loss In K. Kyuma and C. Pairintra (eds), Shifting Cultivation - An Experiment at Nam Phrom, Northeast Thailand and Its Implication for Upland Farming in the Monsoon Tropics, Kyoto University.
Tangtham, N. 1991. Erosion Study and Control in Thailand. pp. 126-142. Proceeding of the RTPESA 5 Workshop on Soil Erosion and Debris Flow Control, Yogyakarta, Indonesia 5-8 November, 1991. Regional Training Programme on Erosion and Sedimentation for Asia. Indonesia Institute of Science Incorporation with the Ministry of Public Works and Ministry of Forestry of Indonesia.
________________1998. Hydrological Roles of the Highland Watersheds in Thailand in B. Thaiusa, C. Traymor and S. Thammincha, (ed.), In Highland ecosystem management. Proceedings of the International Symposium on Highland Ecosystem Management, Angkhang Project Foundation, Chiang Mai, Thailand, 26-31 May 1998.

56
___________ 2000. The causes of natural disasters. Paper delivered in seminar on The crisis of the watersheds of the Northern Region of Thailand: Are there peaceful solutions: The case of Chom Thong river basins, Chiang Mai Province. April 26-28, 2000, Amity Green Hills, Chiang Mai.
____________ 2000. Forest ecosystem and impact. Paper delivered in seminar on The crisis of the watersheds of the Northern Region of Thailand: Are there peaceful solutions: The case of Chom Thong river basins, Chiang Mai Province. April 26-28, 2000, Amity Green Hills, Chiang Mai.
Thongpan S. and T. Panayotou. 1990. Natural Resources for a Sustainable Future: Spreading the benefits, deforestation and Poverty; Can Commercial and Social Forestry Break the Vicious Circle? Research Report no. 2. TDRI Year End Conference, 8-9 December, 1990, Ambassador City Jomtien, Chonburi, Thailand.