Rossi, M., Vrontis, D. and Thrassou A (2011), “Financing Innovation: Venture Capital Investments...
23
Int. J. Technology Marketing, Vol. 6, No. 4, 2011 355 Copyright © 2011 Inderscience Enterprises Ltd. Financing innovation: venture capital investments in biotechnology firms Matteo Rossi University of Sannio, Via delle Puglie, 82 Benevento, Italy Fax: 00390824305777 E-mail: [email protected] Alkis Thrassou and Demetris Vrontis* School of Business, University of Nicosia, 46 Makedonitissas Ave., P.O. Box 24005, 1700 Nicosia, Cyprus Fax: 00357-22-353-722 E-mail: [email protected] E-mail: [email protected] *Corresponding author Abstract: This secondary data-based research defines and describes the role of venture capital (VC) in the financing of the innovation system of the biotech industry; with a special focus on Italy. The research further analyses the international and Italian biotech industry and verifies the correlation between VC and value creation for biotech firms. Its value stems from the fact that it defines and helps in the comprehension of the link between the biotech industry and particular risk capital investors (VCs); while providing a context of prescriptive actions and processes and a valuable theoretical basis for empirical development and practical application. The findings show that Italian biotech companies have become an established industrial reality, capable of maximising investments in terms of value creation, portraying internationally competitive scientific excellence, with valuable links to academia, and innovative in spirit. For biotech companies, especially Italian ones, VC appears to be a factor of growth and success, with all evidence indicating that the amalgam of VC and biotech companies sums up to more than its constituent parts. It is also presumed that it is the very differences in their organisational competencies and drivers that lead to success. Keywords: venture capital; VC; financing innovation; Italy; technology; value creation; capitalisation; strategic marketing; innovative product developments; investment; biotech firms. Reference to this paper should be made as follows: Rossi, M., Thrassou, A. and Vrontis, D. (2011) ‘Financing innovation: venture capital investments in biotechnology firms’, Int. J. Technology Marketing, Vol. 6, No. 4, pp.355–377.
Transcript of Rossi, M., Vrontis, D. and Thrassou A (2011), “Financing Innovation: Venture Capital Investments...
Int. J. Technology Marketing, Vol. 6, No. 4, 2011 355
Copyright © 2011 Inderscience Enterprises Ltd.
Financing innovation: venture capital investments in biotechnology firms
Matteo Rossi University of Sannio, Via delle Puglie, 82 Benevento, Italy Fax: 00390824305777 E-mail: [email protected]
Alkis Thrassou and Demetris Vrontis* School of Business, University of Nicosia, 46 Makedonitissas Ave., P.O. Box 24005, 1700 Nicosia, Cyprus Fax: 00357-22-353-722 E-mail: [email protected] E-mail: [email protected] *Corresponding author
Abstract: This secondary data-based research defines and describes the role of venture capital (VC) in the financing of the innovation system of the biotech industry; with a special focus on Italy. The research further analyses the international and Italian biotech industry and verifies the correlation between VC and value creation for biotech firms. Its value stems from the fact that it defines and helps in the comprehension of the link between the biotech industry and particular risk capital investors (VCs); while providing a context of prescriptive actions and processes and a valuable theoretical basis for empirical development and practical application. The findings show that Italian biotech companies have become an established industrial reality, capable of maximising investments in terms of value creation, portraying internationally competitive scientific excellence, with valuable links to academia, and innovative in spirit. For biotech companies, especially Italian ones, VC appears to be a factor of growth and success, with all evidence indicating that the amalgam of VC and biotech companies sums up to more than its constituent parts. It is also presumed that it is the very differences in their organisational competencies and drivers that lead to success.
Keywords: venture capital; VC; financing innovation; Italy; technology; value creation; capitalisation; strategic marketing; innovative product developments; investment; biotech firms.
Reference to this paper should be made as follows: Rossi, M., Thrassou, A. and Vrontis, D. (2011) ‘Financing innovation: venture capital investments in biotechnology firms’, Int. J. Technology Marketing, Vol. 6, No. 4, pp.355–377.
356 M. Rossi et al.
Biographical notes: Matteo Rossi is an Assistant Professor of Corporate Finance at the University of Sannio, Italy. His prime research interests are on corporate finance, wine marketing, local development, innovation systems and business strategies; areas in which he has published book chapters, scientific papers, and national and international conference proceedings. He is also a member of the EuroMed Research Business Institute (EMRBI) and the Athens Institute for Education and Research (ATINER) and he is a member of the editorial board of Euromed Journal of Business and International Journal of Organizational Analysis.
Alkis Thrassou is an Associate Professor of Marketing at the University of Nicosia, Cyprus. He obtained his BEng (Hons) and PhD, both from the University of Leeds (UK). He is additionally, a Chartered Marketer (CIM, UK); a Chartered Builder (CIOB, UK), an Associate Research Fellow of the EuroMed Research Business Institute, and a member of other academic and professional organisations. Following seven years as a manager at a construction consulting firm in Cyprus, he joined academia in 2002. Since then he has been extensively involved in scholarly activities, including lecturing and supervising students at all levels, organising and chairing scientific conferences, heading the marketing department and various university committees, participating in scientific journal editorial boards, reviewing papers and more. He has undertaken significant research in the fields of strategic marketing, services and consumer behaviour; and his work has been published in many highly esteemed scientific journals. He retains his strong ties with the industry, acting also as a consultant.
Demetris Vrontis is Professor of Marketing and Dean of the School of Business, at the University of Nicosia in Cyprus (EU). He is the Editor-in-Chief of the EuroMed Journal of Business (EMJB) and the President of the EuroMed Research Business Institute (EMRBI). His prime research interests are in strategic marketing planning, branding and marketing communications; areas in which he has widely published in over 70 refereed journals and 16 books and gave numerous presentations in conferences around the globe. He is a Fellow Member and certified Chartered Marketer of the Chartered Institute of Marketing and a Chartered Business and Chartered Marketing Consultant certified by the Chartered Association of Business Administrators. He also serves as a Consultant and member of board of directors to a number of international companies.
This paper is a revised and expanded version of a paper entitled ‘Financing innovation in biotechnology firms’ presented at the 4th Annual Conference of the EuroMed Academy of Business, Crete, 2011.
1 Introduction
The sources of finance for innovative enterprises include a multiplicity of equity provision, as well as a wide spectrum of public and private investors. In recent years the lion’s share of studies and policy reports on the supply of risk capital has focused on venture capital (VC). This has broadly been portrayed as an increasingly necessary, although not sufficient, condition for the formation of new business especially in high tech sectors [Mina, (2009), p.3].
Financing innovation 357
VC can be defined as “independent, professionally managed, dedicated pools of capital that focus on equity or equity-linked investments in privately held, high growth companies” [Lerner, (2009) p.146].1 Furthermore “VC is a type of private equity finance involving investments in unquoted companies with growth potential. It is generally medium to long term in nature made in exchange for a stake in a company” [Dagogo and Ollor, (2009), p.41]. In short, it is essentially “a professionally managed pool of equity capital” (Hisrich and Peters, 1998). VC plays a role in translating research and development (R&D) activities into commercial outcomes and is therefore credited with a catalytic role in innovation (Christofidis and Debande, 2001). In other words, venture capitalists invest in technologies firms where growth and returns are expected to be significantly higher than other industries.
The analysis of VC in the literature proceeds in two directions [Sharpe et al., (2009), p.4]:
1 VC as a financial asset class
2 VC as a means of supporting new technology-based firms.
In this paper the second direction is analysed, studying the VC role in the innovation financing process. The analysis focuses on small and new firms that are recognised as important drivers of innovation (Acs and Audretsch, 1990). Hellmann and Puri (2000) underline that VC financing particularly regards small, young and innovative firms.
VCs have two different functions:
1 to bring new capitals
2 to realise an operative and strategic support to financed firms.
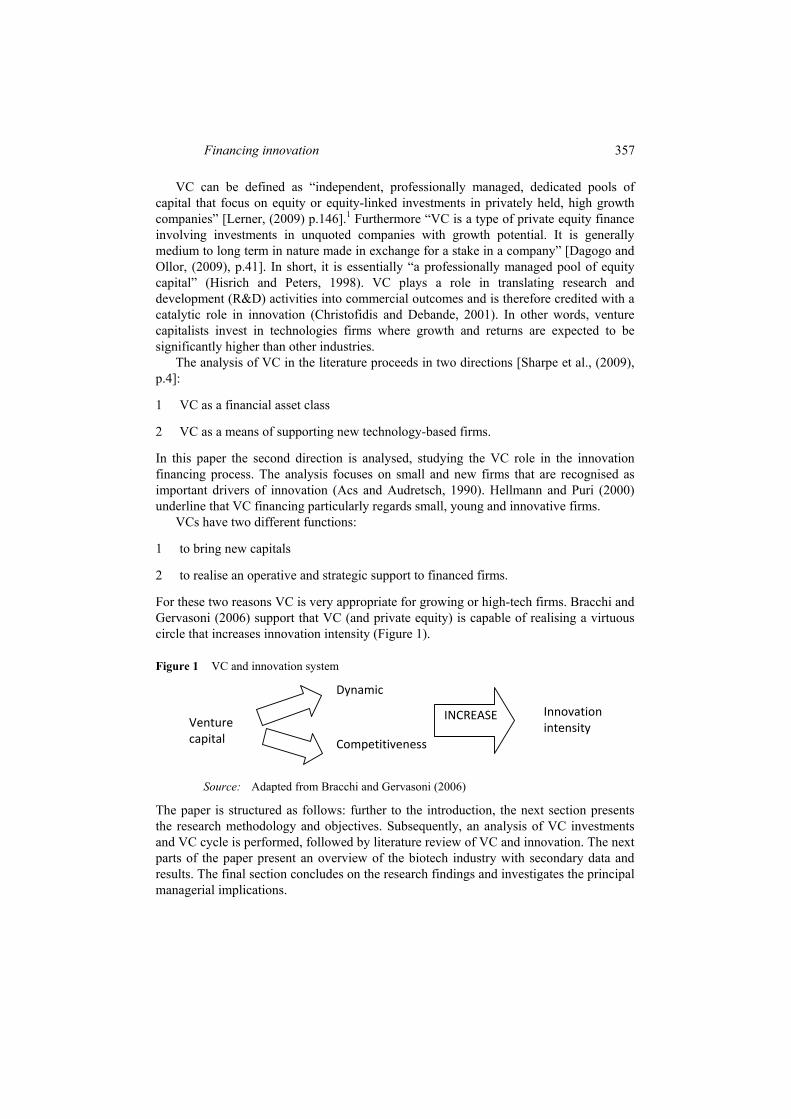
For these two reasons VC is very appropriate for growing or high-tech firms. Bracchi and Gervasoni (2006) support that VC (and private equity) is capable of realising a virtuous circle that increases innovation intensity (Figure 1).
Figure 1 VC and innovation system
Venture capital
Dynamic
Competitiveness
INCREASE Innovation intensity
Source: Adapted from Bracchi and Gervasoni (2006)
The paper is structured as follows: further to the introduction, the next section presents the research methodology and objectives. Subsequently, an analysis of VC investments and VC cycle is performed, followed by literature review of VC and innovation. The next parts of the paper present an overview of the biotech industry with secondary data and results. The final section concludes on the research findings and investigates the principal managerial implications.
358 M. Rossi et al.
2 Research methodology
2.1 Aims and objectives
This research is based on secondary data (EUROPE INNOVA, 2007; AIFI, 2011; Blossom & Company, 2011; Ernst & Young, 2011a, 2011b) and aims to describe the role of VC in financing the Innovation system; and specifically the biotech industry.
With different scholars (Gorman and Sahlman, 1989; Hellman and Puri, 2000; Lerner, 1995) supporting that VC backed firms grow faster than their industry counterparts, this paper represents an overview of the state of the art biotech industry in Italy, with a specific focus on the relationship between venture capitalists and biotech companies. The research’s objectives are:
1 to identify and define the role of VC in financing innovation
2 to describe, analyse and understand the international and Italian biotech industry
3 to verify the correlation between VC and value creation for biotech firms.
2.2 Research value
The value of the paper stems from the fact that it defines and helps in the comprehension of the link between the biotech industry and particular risk capital investors (VCs). The research provides a context of prescriptive actions and processes, while offering also a valuable theoretical basis for empirical development and practical application.
2.3 Research limitations and further research
The limitations of the paper are a consequence of its very nature, i.e., the fact that it is a secondary data-based research and a largely conceptual one. Consequently, further research should firstly empirically test this research’s findings. It is also recommended that intra-industry comparative research takes place within the biotech industry; as the strategic behaviour of firms within the same industry, especially in Italy, may differ depending on their typology, e.g., family versus non-family firms (see also Bresciani et al., 2011). Correspondingly, it is recommended that inter-industry comparative research takes place between the biotech industry and other industries of similar typology (innovative, high-tech etc.). Such research may identify similarities that will, by transference, offer much value in innovation-related processes, such as the exploration activity (see also Chebbi et al, 2011), the wider strategic marketing of innovative product developments (see Thrassou et al., 2011) and others; especially for the newer and under-researched Italian biotech industry.
3 Overview of VC investments
VC investments in new ventures can be classified according to the different stages of funding (Ruhnka and Young, 1987). These stages determine the financing lifecycle of the venture and may have different shareholders (Figure 2).

Financing innovation 359
Figure 2 New venture financing lifecycle (see online version for colours)
Source: Yepez (2004)
From the early stage to IPO and M&A stage, VC plays an important role in financing new technology-based start-ups. Gompers and Lerner (1999) explain the VC cycle that involves investors, VC funds and new technology-based firms (Figure 3).
Figure 3 The VC cycle (see online version for colours)
Source: EVCA (2009)
360 M. Rossi et al.
It is possible to identify three different stages in this cycle:
1 VC firms get their funding from limited partnership with private and institutional investors for medium-long period (10 years), after which they have to be renewed or returned to investors.
2 After the first step, VC becomes ready to invest in high growth companies; generally venture capitalists prefer a diversified investment portfolio of companies over which they have constant control and monitoring.
3 VCs have very high expectations on the return of their investment. The most expected measure of success is liquidity, even where the portfolio company exists by means of going public or by being acquired by another company.
4 VC and innovation: a literature review
The recent rise of VC markets, has been accompanied by renewed concerns regarding their effects. These concerns emphasise the need to evaluate the impact of these transactions on firm performance by examining the effects on short-run stock prices, long-run stock prices, returns to investors, or their impact on innovation process.2
Gorman and Sahlman (1989), Hellman and Puri (2000) and Lerner (1995) have studied what VC firms do and theorise how they add value. Hellmann and Puri (2000) and Engel (2002) find that VC backed firms grow faster than their industry counterparts. Rapid growth also characterises venture-backed firms in Japan (Suzuki, 1996).
Regarding innovation, Kortum and Lerner (2001) find that patents granted to VC backed companies are cited more often than other patents, suggesting that VC backed companies are engaged in important innovative activities. At industry level, Kortum and Lerner (2001) find that in the US VC investments account for patent count disproportionately relative to R&D expenditures.
Using German data, Tykvova (2000) also finds the positive relation between VC investment and patent application. A common interpretation of the results found in the literature cited above is that VC spurs growth and innovation of new firms. Hirukawa and Ueda (2011) confirm a positive correlation between VC and innovation, but they develop two hypothesis: the first one is that VC investments stimulate innovation (VC-first hypothesis), the second one is that innovations induce VC investments (innovation-first hypothesis).3
Another branch of research has used evidence from surveys of VC investment partnerships to describe the characteristics of these investments (MacMillan et al., 1985, 1987; Fried and Hisrich, 1994).
Faced with valuation uncertainty, Sahlman (1990) describes and analyses the structure of venture-capital organisations, focusing on the relationship between investors and venture capitalists and between venture-capital firms and the ventures in which they invest. He suggests that the coping mechanism is to either design investment contracts, which materially skew the distribution of the payoffs from the project to the VC investors or involve the active participation of the VC investor to assure that the project has the professional managerial expertise to succeed.
Financing innovation 361
Kaplan and Strömberg (2005) compare the characteristics of real world financial contracts to their counterparts in financial contracting theory. “We do so by conducting a detailed study of actual contracts between venture capitalists (VCs) and entrepreneurs. We consider VCs to be the real world entities who most closely approximate the investors of theory” [Kaplan and Strömberg, (2005), p2177]. The authors show that almost all VC investors receive convertible preferred stock in the firm when they pay in the funds. Optional redemption and put provisions are commonly used to strengthen the liquidation rights of the VC’s investments. Regarding the expected profit from VC investment, it is found that the median IPO stock price is 3.0 times greater than the cash infusion (the estimated value of the company) in the initial financing round (payment of the installment options). Over a four-year horizon, this works out to a return of 31% per year [Kaplan and Strömberg, (2005), p.2198].
Hellman and Puri (2000) focus their attention on VC operations and the nature of the firm, stating in fact that “VC projects also vary in terms of the nature of the proposed firm” [Davis et al., (2002), p.7]. For Hellman and Puri (2000), these firms can be split into innovator or imitator firms. The difference is that “innovators are those firms that are the first to introduce new products or services for which no close substitute is yet offered in the market. Imitators are also engaged in relatively new products and technologies, but they are not the first movers in their markets, and therefore tend to compete on aspects other than innovation” [Hellman and Puri, (2000), p.962]. Another important difference is that innovator firms have targets set by internal performance (e.g., development of patents, successful completion of research projects), while imitator firms have targets set by external performance (e.g., sales targets, cash flows or attainment of predetermined market share levels).
On these statements Hellman and Puri (2000) develop their study to find that “firms pursuing an innovator rather than an imitator strategy are more likely to obtain venture capital financing. We also find that obtaining venture capital is associated with faster time to market, especially for innovators” (p.986). They further uncover implications both for firms and VCs: “From a finance perspective, our results suggest that the appropriateness of choosing an involved investor depends on the strategic objectives of the company. From an industrial organization perspective, our results suggest that a firm’s choice of financing seems to affect its ability to secure first-mover advantages”. In summary, Hellman and Puri (2000) underline the significant role of VC for innovative companies and their “results refute the sometimes voiced criticisms that venture capital does not support the most innovative start-ups, or that venture capitalists invest in innovative companies only when they are already older and less risky” (p.964).
5 Biotech industry analysis
5.1 Overview
The new competitive dynamics and the recognised importance of knowledge are drivers of economic development and focus attention on highly innovative-cognitive industries. Between these sectors, the biotechnology (biotech) industry plays an important role. Over the last few years, biotechnology has had a good growth potential and affects the supply of many other, desirable public and private goods and services.
362 M. Rossi et al.
Biotech is “the application of science and technology to living organism, as well as parts, products and model thereof, to alter living or non-living materials for the production of knowledge, goods and services” [OECD, (2006) p.7]. This definition suggests that biotechnology encompasses a wide range of technologies and numerous completely different applications and products. In fact and in many ways, biotech has been defined like a platform not a sector (Chiesa, 2003; Powell and Brantley, 1992; Pyka and Saviotti, 2001; Malerba and Orsenigo, 2002): biotech is a cross-sectional technology. Onetti and Zuchella (2008) use the expression ‘meta-sector’ (p.51) to underline both the specific nature (like platform) and capabilities to create new business, new sectors and to modify the rules of existing sectors. “Biotechnology does not constitute an industry in the traditional sense of the term, but rather a ‘technological platform’ applied in a variety of sectors” [Blossom & Company, (2009) p.34].
Biotech companies are “companies that use modern biological techniques to develop products or services for human and animal health, agricultural productivity, food processing, renewable resources, industrial manufacturing or environmental management” [Ernst & Young, (2011a), p.86]. Differently put, a biotechnology firm can be defined as a firm that is engaged in biotechnology by using at least one biotechnology technique to produce goods or services and/or to perform biotechnology R&D. Some of these firms may be large, with only a small share of total economic activity attributable to biotechnology [OECD, (2009), p.10].
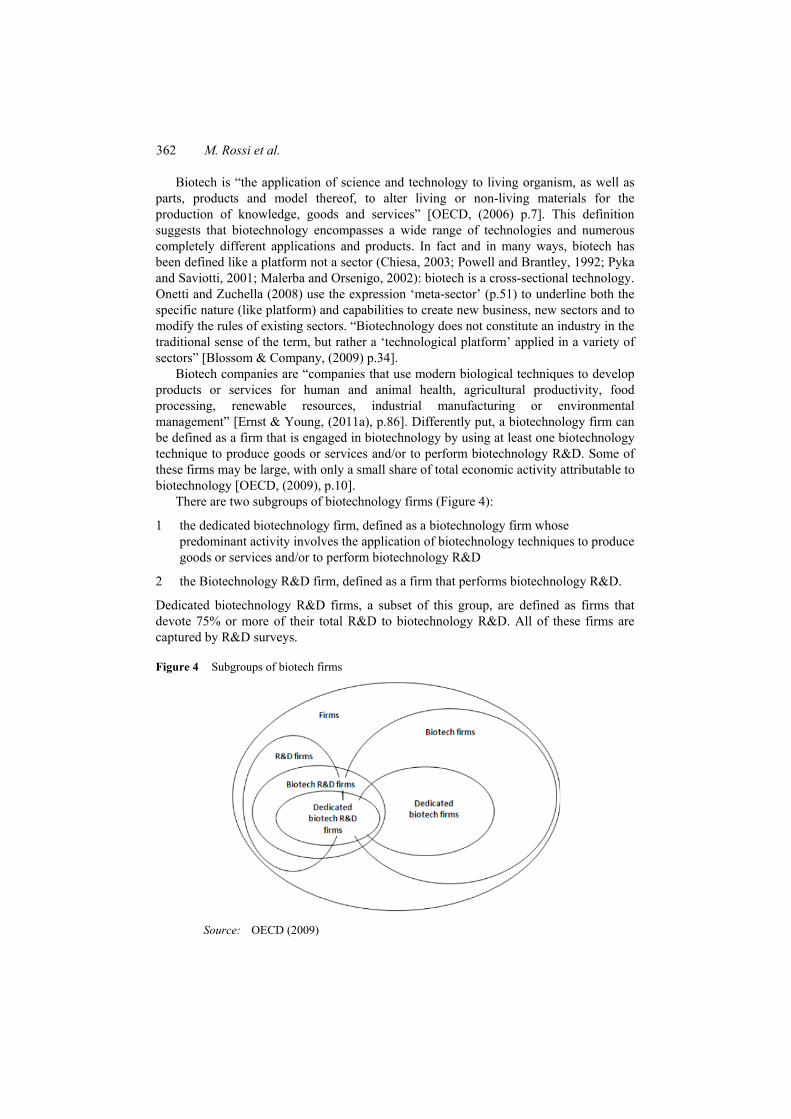
There are two subgroups of biotechnology firms (Figure 4):
1 the dedicated biotechnology firm, defined as a biotechnology firm whose predominant activity involves the application of biotechnology techniques to produce goods or services and/or to perform biotechnology R&D
2 the Biotechnology R&D firm, defined as a firm that performs biotechnology R&D.
Dedicated biotechnology R&D firms, a subset of this group, are defined as firms that devote 75% or more of their total R&D to biotechnology R&D. All of these firms are captured by R&D surveys.
Figure 4 Subgroups of biotech firms
Source: OECD (2009)
Financing innovation 363
To distinguish between the different application areas, a colour code has emerged. Thereby, a distinction is made between red, green, white biotechnology [EUROPE INNOVA, (2007), p.30]:
• red biotechnology (pharmaceutical biotechnology), development and production of (bio)pharmaceuticals, vaccines and diagnostics
• green biotechnology (agricultural biotechnology), transgenic plants for nutrition and as renewable raw materials for sustainable chemistry
• white biotechnology (industrial biotechnology), fermentation and biotransformation of chemicals and natural products and raw materials.
The global biotech industry was capable to deliver a strong financial performance in 2009, with the world’s established biotech centres realising profitability for the first time in their history. However, the gap between the ‘haves’ and ‘have nots’ in the industry continued to widen in 2009, posing new challenges for emerging firms in accessing the capital needed for R&D: “Biotech companies have long confounded predictions on their ability to survive difficult economic conditions and 2009 was no different. Companies will continue to face a challenging funding environment for the foreseeable future. The firms best poised for success are those that can seize the opportunities latent in the near-universal need for increased efficiency – from capital efficiency to new approaches to R&D and creative models for funding and partnering” [Ernst & Young, (2010), p.1].
5.2 Principal data of biotech firms
Despite the global recession from 2008, the biotech’s revenue growth in 2009 held up well. This result isn’t explicative of real biotech world. It was not surprising, since the sector’s revenues come from a relatively small group of companies that were largely unscathed by the downturn, but to understand the real impact of the crisis, it was necessary to look lower down on the income statement – to R&D expense and net income – where the travails of smaller companies had a palpable impact on the industry’s performance. Ernst & Young (2011b) identifies four established biotechnology centres: the USA, Europe, Canada and Australia. In each of these centres “large numbers of firms undertook drastic cost-cutting measures to survive” (p.37). In fact while the focus on operating efficiency has its benefits, it has come at a high cost. In an industry where R&D costs represent the biggest outflows, it was expected that deep spending cuts would lead companies to slash R&D expenditures (–21% in 2009).
“In 2010 the picture has improved considerably. The industry appears to have turned the corner, though it has not returned to pre-crisis levels of normalcy. Across the established biotech centres, revenues grew by 8% […] R&D expenditures, which had plummeted by 21% in 2009, grew by a modest 2% in 2010 – a positive development, but far below the investments that biotech companies have historically made in innovation. In 2009, 64% of US companies and 55% of European companies decreased their R&D spend; in 2010, those numbers fell to 49% and 45%, respectively. In another sign of stabilization, the number of public companies, which fell by 11% in 2009 amid a widespread culling of struggling firms, stayed flat in 2010 […]. Net income grew by 30%, from US$3.6 billion in 2009 to US$4.7 billion in 2010, an all-time record survive.” [Ernst & Young, (2011b), p.38].
364 M. Rossi et al.
5.3 The four established biotechnology centres – US biotechnology
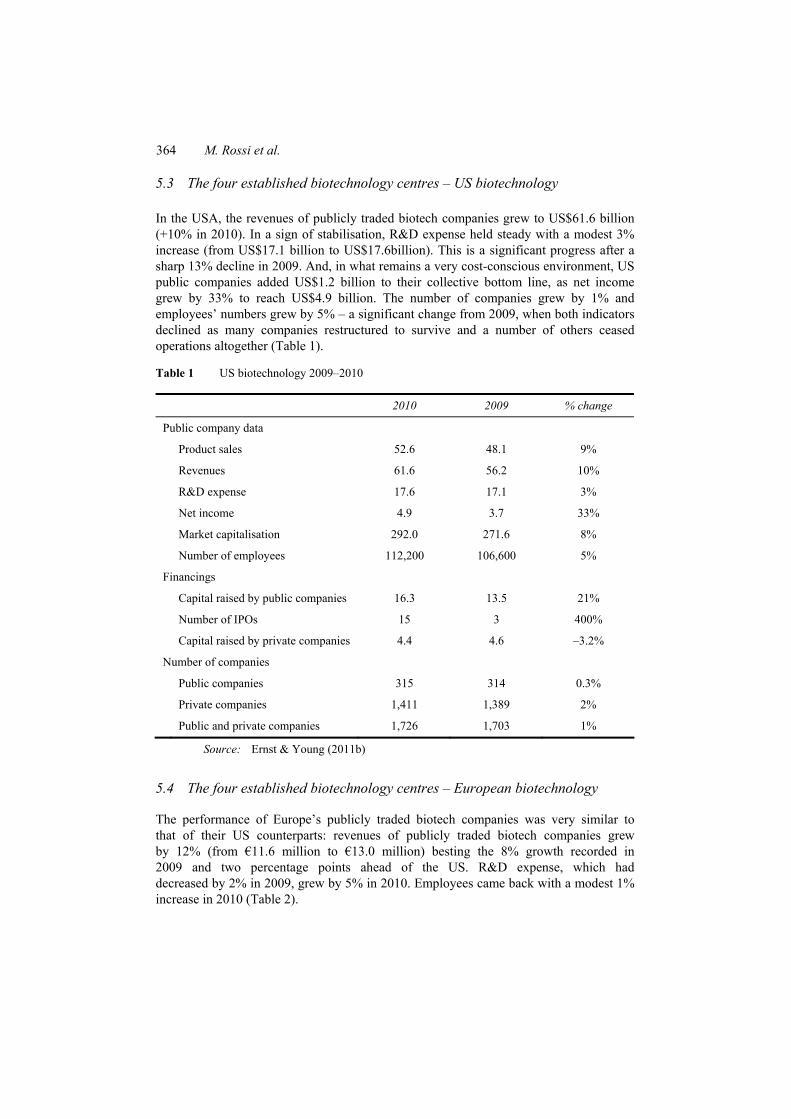
In the USA, the revenues of publicly traded biotech companies grew to US$61.6 billion (+10% in 2010). In a sign of stabilisation, R&D expense held steady with a modest 3% increase (from US$17.1 billion to US$17.6billion). This is a significant progress after a sharp 13% decline in 2009. And, in what remains a very cost-conscious environment, US public companies added US$1.2 billion to their collective bottom line, as net income grew by 33% to reach US$4.9 billion. The number of companies grew by 1% and employees’ numbers grew by 5% – a significant change from 2009, when both indicators declined as many companies restructured to survive and a number of others ceased operations altogether (Table 1).
Table 1 US biotechnology 2009–2010
2010 2009 % change
Public company data
Product sales 52.6 48.1 9%
Revenues 61.6 56.2 10%
R&D expense 17.6 17.1 3%
Net income 4.9 3.7 33%
Market capitalisation 292.0 271.6 8%
Number of employees 112,200 106,600 5%
Financings
Capital raised by public companies 16.3 13.5 21%
Number of IPOs 15 3 400%
Capital raised by private companies 4.4 4.6 –3.2%
Number of companies
Public companies 315 314 0.3%
Private companies 1,411 1,389 2%
Public and private companies 1,726 1,703 1%
Source: Ernst & Young (2011b)
5.4 The four established biotechnology centres – European biotechnology
The performance of Europe’s publicly traded biotech companies was very similar to that of their US counterparts: revenues of publicly traded biotech companies grew by 12% (from €11.6 million to €13.0 million) besting the 8% growth recorded in 2009 and two percentage points ahead of the US. R&D expense, which had decreased by 2% in 2009, grew by 5% in 2010. Employees came back with a modest 1% increase in 2010 (Table 2).

Financing innovation 365
Table 2 European biotechnology 2009–2010
2010 2009 % change
Public company data Revenues 13,004 11,606 12% R&D expense 3,400 3,229 5% Net income (loss) (459) (467) –2% Market capitalisation 59,433 47,420 25% Number of employees 49,060 48,660 1% Financings Capital raised by public companies 1,862 2,091 –11% Number of IPOs 10 3 233% Capital raised by private companies 1,021 792 29% Number of companies Public companies 172 167 2% Private companies 1,662 1,675 –1% Public and private companies 1,834 1,842 –0.5%
Source: Ernst & Young (2011b)
Table 3 Canadian biotechnology 2009–2010
2010 2009 % change
Public company data Revenues 1,308 2,110 –38% R&D expense 222 287 –23% Net income (loss) (336) (11) 3,209% Market capitalisation 5,176 6,782 –24% Number of employees 4,870 6,370 –24% Financings Capital raised by public companies 396 633 –38% Number of IPOs 0 0 0% Capital raised by private companies 87 100 –13% Number of companies Public companies 63 67 –6% Private companies 230 260 –12% Public and private companies 293 327 –10%
Source: Ernst & Young (2011b)
5.5 The four established biotechnology centres – Canadian biotechnology
The financial performance of the Canadian biotech industry was overshadowed by the Valeant/Biovail merger, which removed the largest biotechnology Canadian firm. In 2009, Biovail had accounted for almost 40% of the Canadian industry’s revenues.
366 M. Rossi et al.
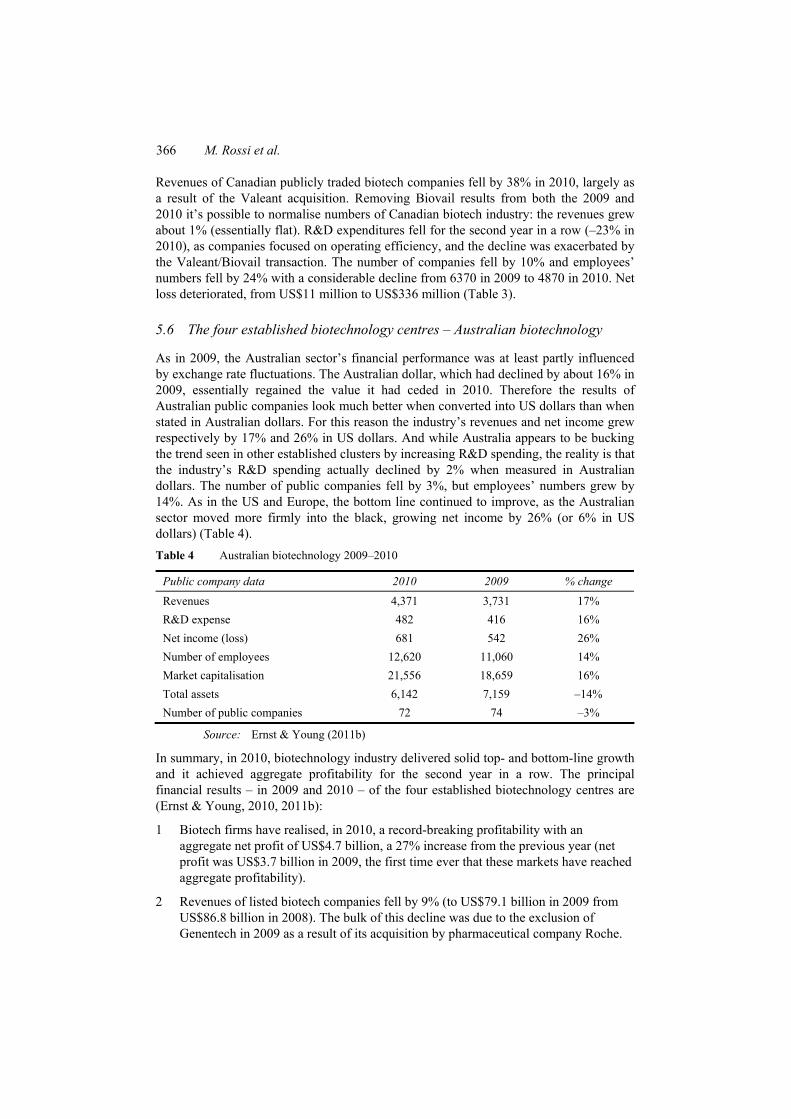
Revenues of Canadian publicly traded biotech companies fell by 38% in 2010, largely as a result of the Valeant acquisition. Removing Biovail results from both the 2009 and 2010 it’s possible to normalise numbers of Canadian biotech industry: the revenues grew about 1% (essentially flat). R&D expenditures fell for the second year in a row (–23% in 2010), as companies focused on operating efficiency, and the decline was exacerbated by the Valeant/Biovail transaction. The number of companies fell by 10% and employees’ numbers fell by 24% with a considerable decline from 6370 in 2009 to 4870 in 2010. Net loss deteriorated, from US$11 million to US$336 million (Table 3).
5.6 The four established biotechnology centres – Australian biotechnology
As in 2009, the Australian sector’s financial performance was at least partly influenced by exchange rate fluctuations. The Australian dollar, which had declined by about 16% in 2009, essentially regained the value it had ceded in 2010. Therefore the results of Australian public companies look much better when converted into US dollars than when stated in Australian dollars. For this reason the industry’s revenues and net income grew respectively by 17% and 26% in US dollars. And while Australia appears to be bucking the trend seen in other established clusters by increasing R&D spending, the reality is that the industry’s R&D spending actually declined by 2% when measured in Australian dollars. The number of public companies fell by 3%, but employees’ numbers grew by 14%. As in the US and Europe, the bottom line continued to improve, as the Australian sector moved more firmly into the black, growing net income by 26% (or 6% in US dollars) (Table 4). Table 4 Australian biotechnology 2009–2010
Public company data 2010 2009 % change
Revenues 4,371 3,731 17% R&D expense 482 416 16% Net income (loss) 681 542 26% Number of employees 12,620 11,060 14% Market capitalisation 21,556 18,659 16% Total assets 6,142 7,159 –14% Number of public companies 72 74 –3%
Source: Ernst & Young (2011b)
In summary, in 2010, biotechnology industry delivered solid top- and bottom-line growth and it achieved aggregate profitability for the second year in a row. The principal financial results – in 2009 and 2010 – of the four established biotechnology centres are (Ernst & Young, 2010, 2011b):
1 Biotech firms have realised, in 2010, a record-breaking profitability with an aggregate net profit of US$4.7 billion, a 27% increase from the previous year (net profit was US$3.7 billion in 2009, the first time ever that these markets have reached aggregate profitability).
2 Revenues of listed biotech companies fell by 9% (to US$79.1 billion in 2009 from US$86.8 billion in 2008). The bulk of this decline was due to the exclusion of Genentech in 2009 as a result of its acquisition by pharmaceutical company Roche.

Financing innovation 367
If Genentech is excluded from both years, industry revenues would have grown by 8%. This result was confirmed in 2010, in fact revenues grew by 8% well below the 12% seen in 2008 or the high double-digit growth rates the industry was able to deliver in many prior years.
3 Capital raised increased sharply in 2009 with firms in the USA, Europe and Canada raising US$23.2 billion in 2009 (+42%). A significant portion of this capital was raised by a handful of established public companies in follow-on offerings, as access to capital for many companies remained scarce. In 2010 companies in Canada, Europe and the US raised US$25 billion (+7.8%), equalling the average for the four years before the global financial crisis.
4 Funding for innovation declines, in the US, large debt financings by mature, profitable companies grew by 150% over 2009. Conversely, there was a 20% decline in the amount of ‘innovation capital’ for the sector, defined as total funding minus large debt financings.
5 More skewed funding. 82.6% of funding went to just 20% of US companies, up from 78.5% in 2009. The bottom 20% of companies raised 0.4% of funds, down from 0.6% in 2009.
6 Strategic alliance activity remained robust, but not up-fronts, the total potential value of strategic alliances remained strong, totalling more than US$40 billion. However, up-front payments from partners to biotech companies dropped 37% to US$3.1 billion. On the M&A side deal-making slows, in fact Merger and Acquisitions involving European or US biotech firms dropped sharply from 58 deals in 2009 to 45 deals in 2010, while the aggregate value of these transactions remained relatively flat (after normalising the 2009 numbers to exclude the mega-acquisition of Genentech).
It is thus possible to conclude that in 2010 the biotech industry appears to have turned the corner of economic crisis of 2008–2009. Particularly in this period “the European biotech community showed great fortitude in meeting the challenges of the economic downturn” [Ernst & Young, (2010), p.2]. After a flat of R&D funding in 2009 (realised with a cost cutting), European biotechs and their counterparts globally have increased R&D expenses and together reaching profitability for two consecutive years with an aggregate net profit of US$3.7 billion in 2009 and US$4.7 billion in 2010.
6 Secondary data research results - the Italian biotechnology industry
Despite the fact that the Italian biotech industry is young, it is one of the fastest growing biotech industries in Europe. The science base is unusual, nurtured by a large pharmaceutical industry, a well-educated workforce and an amicable cooperation between university, industry and government. Several initiatives are in progress in Italy to support the growth of biotech industry, starting from a solid academic and research background.
The importance of the Italian biotech industry is highlighted by the following data, that also confirm the high degree of innovation of the biotech system.
368 M. Rossi et al.
• 86% of the projects are in the discovery phase and almost 80% in the preclinical phase, thus fuelling innovation by pharmaceutical companies, which play a crucial role in the clinical development of drugs
• pharmaceutical firms support almost 70% of the R&D investments in biotechnology for human health
• over 75% of the products and projects developed in Italy are classified as “first class” and more than 80% have been granted at least one patent.
“Over the last few years, biotechnology in Italy has become an established industrial reality in all fields of application, including human health, agro-food, and industry. The path has been difficult, but even so the biotech sector has progressed enormously, resulting in well-earned respect on an international level.” [Ernst & Young, (2011), p.3].
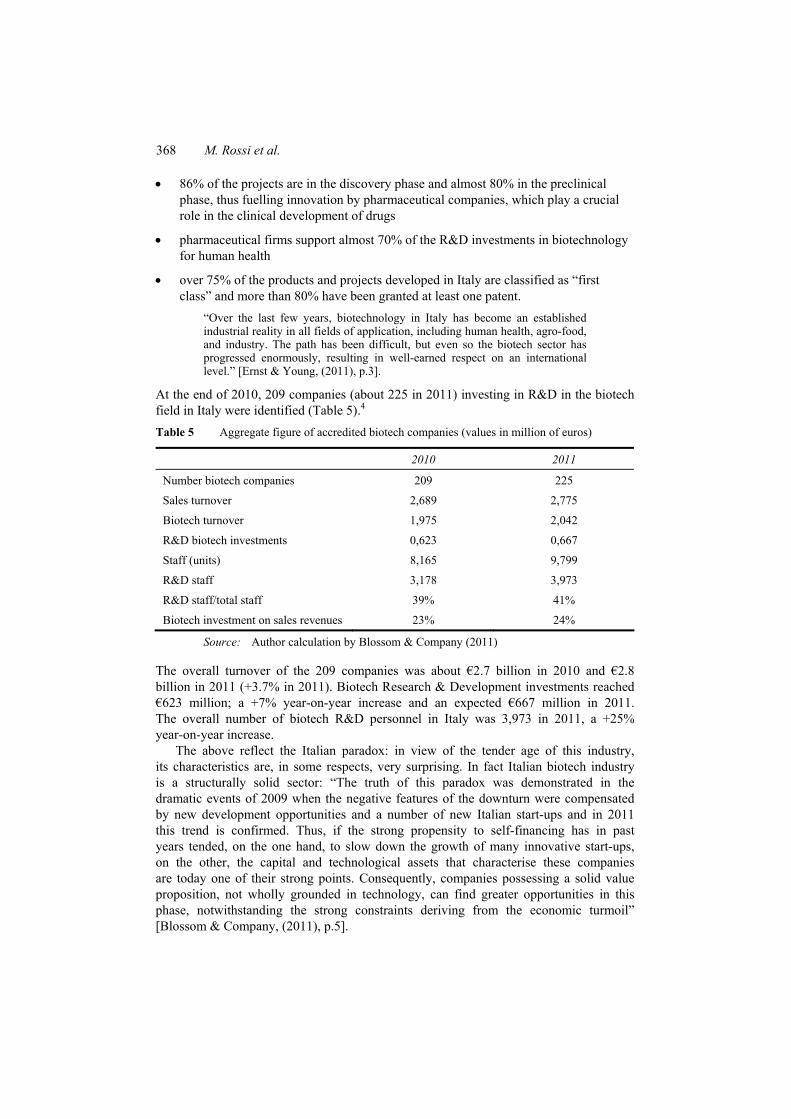
At the end of 2010, 209 companies (about 225 in 2011) investing in R&D in the biotech field in Italy were identified (Table 5).4 Table 5 Aggregate figure of accredited biotech companies (values in million of euros)
2010 2011
Number biotech companies 209 225
Sales turnover 2,689 2,775
Biotech turnover 1,975 2,042
R&D biotech investments 0,623 0,667
Staff (units) 8,165 9,799
R&D staff 3,178 3,973
R&D staff/total staff 39% 41%
Biotech investment on sales revenues 23% 24%
Source: Author calculation by Blossom & Company (2011)
The overall turnover of the 209 companies was about €2.7 billion in 2010 and €2.8 billion in 2011 (+3.7% in 2011). Biotech Research & Development investments reached €623 million; a +7% year-on-year increase and an expected €667 million in 2011. The overall number of biotech R&D personnel in Italy was 3,973 in 2011, a +25% year-on-year increase.
The above reflect the Italian paradox: in view of the tender age of this industry, its characteristics are, in some respects, very surprising. In fact Italian biotech industry is a structurally solid sector: “The truth of this paradox was demonstrated in the dramatic events of 2009 when the negative features of the downturn were compensated by new development opportunities and a number of new Italian start-ups and in 2011 this trend is confirmed. Thus, if the strong propensity to self-financing has in past years tended, on the one hand, to slow down the growth of many innovative start-ups, on the other, the capital and technological assets that characterise these companies are today one of their strong points. Consequently, companies possessing a solid value proposition, not wholly grounded in technology, can find greater opportunities in this phase, notwithstanding the strong constraints deriving from the economic turmoil” [Blossom & Company, (2011), p.5].
Financing innovation 369
The most important segment of the biotech field is that related to human health (red biotech); both in terms of number of companies and employees, as well as volume of R&D investments and turnover. Red biotech accounts for about 96% of the overall biotech turnover in Italy. In terms of type of company, most of the sample (57%) is made up of companies falling under the pure biotech category. The remaining 43% is mainly made of multinational subsidiaries in Italy (19%) and other Italian biotech companies (14%). The segmentation of companies by number of employees shows that a large majority (71%) have less than 50 employees. Therefore, they are classified as micro or small companies. The analysis of financing sources shows that today companies usually resort to public contributions on a regional, government, European or even international level, as well as to VC/PE and debt. It should be specified that this feature is closely linked to the pure biotech segment, as pharmaceutical companies most commonly rely on self-financing.
Green biotech refers to the use of modern biotech methods in the production of plants and vegetable cultures with applications in the food, chemical and material sector; molecular pharming (production of drugs using plants); and testing to reveal the presence of ingredients and contaminants in food. Numerically, the green biotech group ranks second after the red biotech cluster, and includes dedicated green biotech companies plus multi-core companies also operating in other biotech application fields. The number of multi-core companies is rapidly increasing, accounting for 45% of total green companies.
In terms of size, the green segment is characterised by the predominance of micro and small companies, which account for almost 80% of the sample. However, in the case of green biotech there is a marked difference in the average number of employees of dedicated companies: the other biotech companies employ on average 120 people, while pure biotech companies have about 23 employees.
Industrial biotechnology (white biotech) refers to the use of modern biotech methods for the manufacturing and production of chemicals, materials and fuels, including bioremediation technologies applied to the environment. 50% of the 41 companies are dedicated white biotech companies and 20 are multi-core biotech companies, with activities also in other biotech application fields. Pure biotech companies account for almost all the turnover of white biotech companies: the companies not dedicated to biotech develop their activities within the white biotech field more as a support to their core business, rather than an additional source of turnover.
With regard to size, the white biotech scenario is much segmented: as much as 61% of the companies employ less than 10 people, and only 9% of them employ more than 50 people. In Italy there are no large white biotech companies (with more than 250 employees): although they deal with products and technology for industrial use, the big companies of the biotech field prefer to gather the required expertise through outsourcing. It is estimated that the companies operating in the white biotech field employ overall 873 people, of whom 290 are dedicated to R&D activities. When focusing on dedicated white biotech companies (both pure and non-pure), we see that other biotech companies employ on average a higher number of people even if the number of R&D employees is proportionally much lower.
The innovative biotech sector in Italy is largely composed of small start-ups5 that represent 89% (+10% year-on-year increase) of the certified companies. Medium-size companies account for about 6% (–7% year-on-year decrease) of the sample. At 10, the number of large-sized companies6 represent 5% of accredited companies (Figure 5).

370 M. Rossi et al.
Figure 5 Companies-size distribution (see online version for colours)
186
13 10
SmallMedium-sizedLarge-sized
Source: Author calculation by Blossom & Company (2011)
Almost 78% of the overall biotech sales of 2010 was accomplished by the ten large companies, 14% of the biotech turnover was generated by the 13 medium-sized companies, while small companies accounted for 8% of the biotech turnover (Table 6).
Table 6 Turnover and R&D investment companies-size distribution
Turnover R&D investment
Small 222.984.824 8% 174.339.462 28%
Medium 369.744.895 14% 173.084.131 28%
Large 2.097.038.615 78% 275.734.965 44%
Source: Author calculation by Blossom & Company (2011)
7 Secondary data research results – capital structure and fund raising of Italian biotechnology firms
The Italian biotech industry has an overall capitalisation of €0.97 billion. EBIT analysis reveals an overall figure of €93 million (Figure 6), which breaks down as follows [Blossom & Company, (2011), p.7]:
1 the small-sized companies against overall investments for €174 million posted an overall negative EBIT of €45 million
2 the medium-sized companies against €173 million in overall investments posted an EBIT slightly in excess of €5 million
3 large-size companies against overall investments of over €275 million posted an EBIT of over €133 million.

Financing innovation 371
Figure 6 EBIT companies-size distribution (see online version for colours)
-44.947.252
5.832.112
132.888.789
-60.000.000-40.000.000-20.000.000
020.000.00040.000.00060.000.00080.000.000
100.000.000120.000.000140.000.000
Small Medium-sized Large-sized
Source: Author calculation by Blossom & Company (2011)
A solid corporate capitalisation (32%) characterises the sector (+2% in 2010). Aggregate indebtedness is fully sustainable given that net gearing returns value is 0.7. There was an increment of fixed assets with a reduction of equity/fixed asset ratio: from 0.80 (2009) to 0.80 (2010).
As concerns the large companies in 2010 their capitalisation profile is broadly in line with 2009. The most significant data show an increase of fixed assets (from 44% to 45%) and a value of debt/equity ratio of 0.7. Medium-sized companies exhibit an increase in fixed assets. Non-current assets fell 1 percentage points, with a net preference for working capital (76%). In terms of net equity, the medium-sized companies exhibit a capitalisation of 28%, with a debt/equity ratio of 0.8. Small companies have a clear preference for medium to long-term liabilities with respect to the short-term. The fixed assets are 40% in 2010 and the equity/fixed asset ratio has remained unchanged at 0.9 (Table 7). Table 6 Fixed assets and debt/equity ratio companies-size distribution
Fixed assets Debt/equity ratio
Small 40% 0.9 Medium 29% 0.8 Large 45% 0.7
Source: Author calculation by Blossom & Company (2011)
Access to financial support is a priority issue for most of the Italian biotech firms, especially those in the initial phase of development. On an international level, the difficult economic situation, which began in 2008, has resulted in a huge decline in the funds available for the whole sector even if, over the last two years, the financing trend has been constantly growing, suggesting a rapid return to the pre-crisis situation.
372 M. Rossi et al.
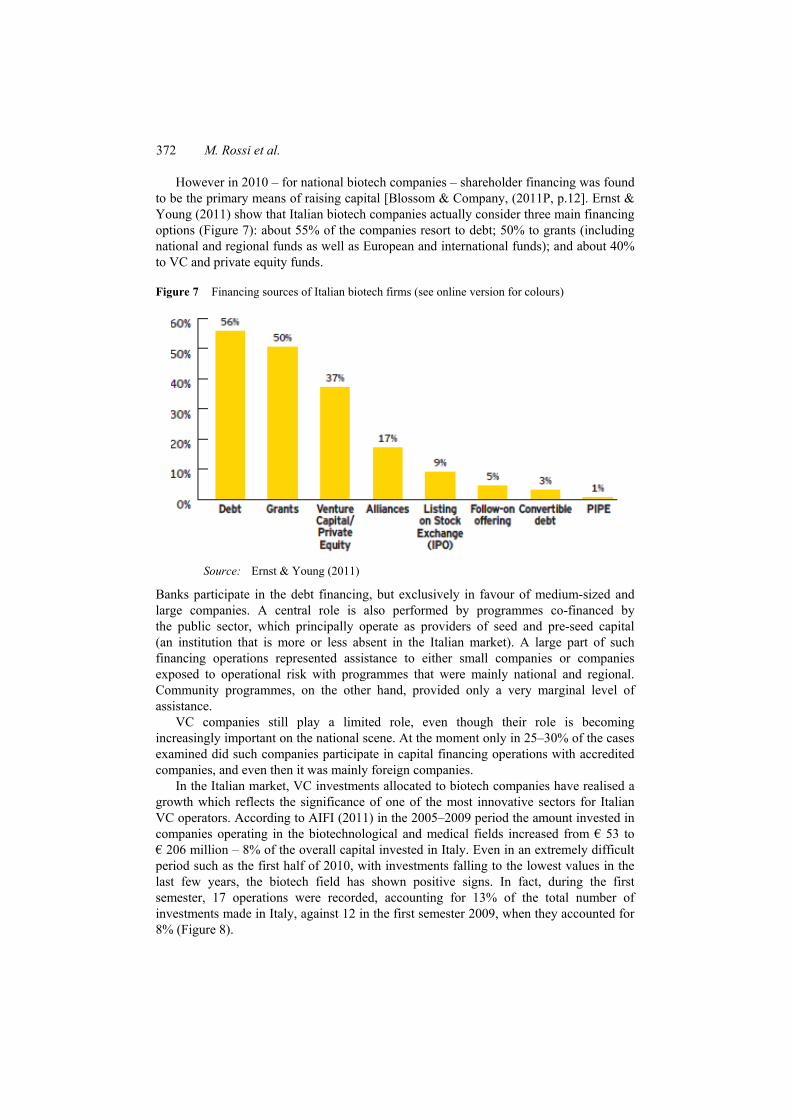
However in 2010 – for national biotech companies – shareholder financing was found to be the primary means of raising capital [Blossom & Company, (2011P, p.12]. Ernst & Young (2011) show that Italian biotech companies actually consider three main financing options (Figure 7): about 55% of the companies resort to debt; 50% to grants (including national and regional funds as well as European and international funds); and about 40% to VC and private equity funds.
Figure 7 Financing sources of Italian biotech firms (see online version for colours)
Source: Ernst & Young (2011)
Banks participate in the debt financing, but exclusively in favour of medium-sized and large companies. A central role is also performed by programmes co-financed by the public sector, which principally operate as providers of seed and pre-seed capital (an institution that is more or less absent in the Italian market). A large part of such financing operations represented assistance to either small companies or companies exposed to operational risk with programmes that were mainly national and regional. Community programmes, on the other hand, provided only a very marginal level of assistance.
VC companies still play a limited role, even though their role is becoming increasingly important on the national scene. At the moment only in 25–30% of the cases examined did such companies participate in capital financing operations with accredited companies, and even then it was mainly foreign companies.
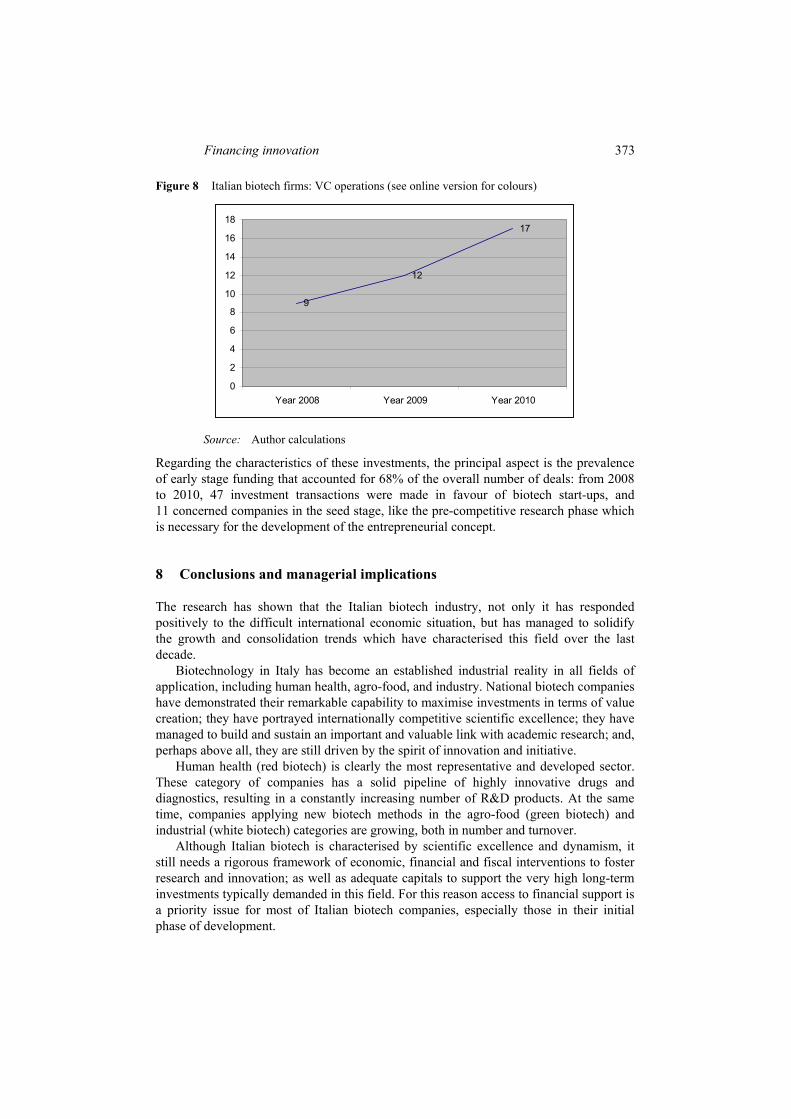
In the Italian market, VC investments allocated to biotech companies have realised a growth which reflects the significance of one of the most innovative sectors for Italian VC operators. According to AIFI (2011) in the 2005–2009 period the amount invested in companies operating in the biotechnological and medical fields increased from € 53 to € 206 million – 8% of the overall capital invested in Italy. Even in an extremely difficult period such as the first half of 2010, with investments falling to the lowest values in the last few years, the biotech field has shown positive signs. In fact, during the first semester, 17 operations were recorded, accounting for 13% of the total number of investments made in Italy, against 12 in the first semester 2009, when they accounted for 8% (Figure 8).
Financing innovation 373
Figure 8 Italian biotech firms: VC operations (see online version for colours)
9
12
17
0
2
4
6
8
10
12
14
16
18
Year 2008 Year 2009 Year 2010
Source: Author calculations
Regarding the characteristics of these investments, the principal aspect is the prevalence of early stage funding that accounted for 68% of the overall number of deals: from 2008 to 2010, 47 investment transactions were made in favour of biotech start-ups, and 11 concerned companies in the seed stage, like the pre-competitive research phase which is necessary for the development of the entrepreneurial concept.
8 Conclusions and managerial implications
The research has shown that the Italian biotech industry, not only it has responded positively to the difficult international economic situation, but has managed to solidify the growth and consolidation trends which have characterised this field over the last decade.
Biotechnology in Italy has become an established industrial reality in all fields of application, including human health, agro-food, and industry. National biotech companies have demonstrated their remarkable capability to maximise investments in terms of value creation; they have portrayed internationally competitive scientific excellence; they have managed to build and sustain an important and valuable link with academic research; and, perhaps above all, they are still driven by the spirit of innovation and initiative.
Human health (red biotech) is clearly the most representative and developed sector. These category of companies has a solid pipeline of highly innovative drugs and diagnostics, resulting in a constantly increasing number of R&D products. At the same time, companies applying new biotech methods in the agro-food (green biotech) and industrial (white biotech) categories are growing, both in number and turnover.
Although Italian biotech is characterised by scientific excellence and dynamism, it still needs a rigorous framework of economic, financial and fiscal interventions to foster research and innovation; as well as adequate capitals to support the very high long-term investments typically demanded in this field. For this reason access to financial support is a priority issue for most of Italian biotech companies, especially those in their initial phase of development.
374 M. Rossi et al.
VCs have a particularly important role to perform in the growth of biotech firms in their infancy. Their role though, transcends the strict financial contribution to touch upon other aspects of strategic management towards growth. Specifically, VCs contribute significantly also through:
1 management assistance to the portfolio company, analogous to that provided by a management consulting firm
2 intensive monitoring performance, reflecting the incentives to monitoring arising from equity ownership
3 the power to act using the venture capitalist’s ability to give the portfolio company credibility with third parties, similar to the role played by other reputational intermediaries such as investment bankers.
Data on national biotech firms in fact, confirm that VC backed firms grow faster than their industry counterparts. Though it is a logical assumption that VCs invest in the most promising companies to begin with, the hypothesis does not appear to alone explain the phenomenon. A possible explanation, further and in conjunction to the above-stated contributions, is that VCs have strong incentives to monitor entrepreneurs’ performance, deriving from equity ownership. They also receive strong control levers, often disproportionate to the size of their equity investment: “the initial investment is typically insufficient to allow the portfolio company to carry out its business plan. The venture capital will decide later whether to provide the additional funding that the portfolio company needs. The company’s need for additional funds gives its management a performance incentive in the form of a hard constraint, analogous to the use of debt in leveraged buyouts” [Blossom & Company, (2011), p.32].
The Italian experience shows that in most cases the investments have the objective of supporting the early stage of a company development, or even of turning a concept or a project which is deemed very innovative into an entrepreneurial activity. The interest of VCs to invest in the Italian biotech firms may be explained by the high potential of innovative firms in combination with their managerial and financial incapabilities. Therefore, the best situation for innovative Italian companies with an excellent technology “would be to find a specialized venture capital network, a specialized advisor and specialized investors that believe in and can assist the development of the project by providing the skills, networking and capital flows necessary for accelerating pipeline and technology development” [Blossom & Company, (2011), p.12].
On a catalectic note, for biotech companies, especially Italian ones, VC appears to be a factor of growth and success. Though cause and effect has no clear boundary in this relationship, all evidence indicates that the amalgam of VC and biotech companies sums up to more than its constituent parts. It is presumably the very differences in their nature that leads to success: on the one hand the biotech companies with scientific competences and innovation drive, and on the other VCs, with financial and managerial proficiencies and business drive. In essence, the one compliments and enhances the other; for the good of the individual investments, the individual companies, and collectively, the industry as a whole.
Financing innovation 375
References Acs, A. and Audretsch, B (Eds.) (1990) The Economics of Small Firms: A European Challenge,
Kluwer, Netherlands. AIFI (2011) Yearbook 2011, Bancaria Editrice, Roma. Blossom & Company (2011) ‘Biotechnology in Italy 2009’, The Financial Perspective, Milan. Bracchi, G. and Gervasoni, A. (2006) ‘L’importanza del capitale di rischio per lo sviluppo del
sistema economico’, in Bracchi, G. and Gervasoni, A. (a cura di): Venti Anni di Private Equità, EGEA, Milano.
Bresciani, S., Thrassou, A. and Vrontis, D. (2011) ‘The link between family business and innovation: evidence from an Italian sample’ in 4th EuroMed Conference, Business Research Challenges in a Turbulent Era, pp.290–307.
Chebbi, H., Yahiaoui, D., Thrassou, A. and Vrontis, D. (2011), “The Exploration Activity’s Added Value into the Innovation Process” in 4th EuroMed Conference, Business Research Challenges in a Turbulent Era, pp. 328–342.
Chiesa, V. (2003) ‘La bioindustria. Strategie competitive e organizzazione industriale nel settore delle biotecnologie farmaceutiche’, Etas, Milano.
Christofidis, C. and Debande, O. (2001) ‘Financing innovative firms through venture capital’, EIB Sector Papers, European Investment Bank, available at http://www.eib.org/attachments/pj/ vencap.pdf (accessed on 14 October 2011)
Cumming, D., Siegel, D.S. and Wright, M. (2007) ‘Private equity, leveraged buyouts and governance’, Journal of Banking and Finance, Vol. 13, No. 4, pp.441–456.
Dagogo, D.W. and Ollor, W.G. (2009) ‘The effect of venture capital financing on the economic value added profile of Nigerian SMEs’, African Journal of Accounting, Economics, Finance and Banking Research, Vol. 5, No. 5, pp.37–51.
Davis, M., Schachermayer, W. and Tompkins, R. (2002) The Evaluation of Venture Capital as an Instalment Option: Valuing Real Options Using Real Options, available at http://www2.imperial.ac.uk/~mdavis/docs/Venture1.pdf (accessed on 01 October 2011).
Engel D. (2002) ‘The impact of venture capital on firm growth: an empirical investigation’, ZEW Discussion Paper, No. 02-02, available at http://econstor.eu/bitstream/10419/24804/1/ dp0202.pdf (accessed on 06 October 2011)
Ernst & Young (2010) Biotech Industry Showing Resilience Despite Changelling Conditions, Singapore.
Ernst & Young (2011a) BioInItaly. Report 2011, Milan. Ernst & Young (2011b) Beyond Borders. Global Biotechnology Report 2011, London. Europe Innova (2007) Access to Finance in The Biotechnology Sector, Brussels, available at
http://ec.europa.eu/enterprise/sectors/biotechnology/files/docs/financing_biopharma_product_dev_en.pdf (accessed on 10 October 2011)
European Private Equity & Venture Capital Association (EVCA) (2009) EVCA Governing Principles, Brussels, available at http://www.evca.eu/uploadedFiles/Home/Toolbox/Industry_ Standards/evca_governing_principles_2009.pdf (accessed on 08 October 2011)
Fried, V. and Hisrich, R. (1994) ‘Towards a model of venture capital investment decision making’, Financial Management, Vol. 23, No. 3, pp.28–37.
Gompers, P. and Lerner, J. (1999) The Venture Capital Cycle, The MIT Press, Cambridge. Gorman, M.S. and Sahlman, W.A. (1989) ‘What do venture capitalists do?’, Journal of Business
Venturing, Vol. 4, No. 4, pp.231–248. Hellmann, T. and Puri, M. (2000), ‘The interaction between product market and financing strategy:
the role of venture capital’, The Review of Financial Studies, Vol. 13, No. 4, pp.959–984.

376 M. Rossi et al.
Hirukawa, M. and Ueda, M. (2011) ‘Venture capital and innovation: which is first?’, Pacific Economic Review, Vol. 16, No. 4, pp.421–465.
Hisrich, R.D. and Peters, M.P. (1998) Entrepreneurship, McGraw-Hill, Boston. Kaplan, S.N. and Strömberg, P. (2005) ‘Characteristics, contracts and actions: evidence from
venture capitalist analyses’, The Journal of Finance, Vol. 59, No. 5, pp.2177–2210. Kortum, S. Lerner, J. (2001) ‘Does venture capital spur innovation?’, in Libecap G. (Ed.):
Entrepreneurial Inputs and Outcomes, Vol. 13, Elsevier, Amsterdam. Lerner J. (2000), ‘Money chasing deals? The impact of fund inflows on private equity valuations’,
Journal of Financial Economics, Vol. 55, No. 2, pp.281–325. Lerner, J. (1995) ‘Venture capitalists and the oversight of private firms’, Journal of Finance,
Vol. 50, No. 1, pp.301–318. MacMillan, I. Zemann, L. Subbanarasimha, P.N. (1987) ‘Criteria distinguishing successful from
unsuccessful ventures in the venture screening process’, Journal of Business Venturing, Vol. 2, No. 2, pp.123–137.
MacMillan, I.C., Siegel, R. and Subbanarashima, P.N. (1985) ‘Criteria used by venture capitalists to evaluate new venture proposals’, Journal of Business Venturing, Vol. 1, No. 1, pp.119–128.
Malerba, F. Orsenigo, L. (2002) ‘Innovation and market structure in the dynamics of the pharmaceutical industry and biotechnology: towards a history-friendly model’, Industrial and Corporate Change, Vol. 11, No. 4, pp.667–703.
Mina, A. (2009) ‘Risk capital and innovation: literature review – Part B’, Finance, Innovation & Growth (FINNOV), available at: http://www.finnov-fp7.eu/sites/default/files/FINNOV_ DP3.1B_0.pdf (accessed on 04 October 2011).
National Venture Capita Association (1998) NVCA Year Book, NVCA. OECD (2006) Biotechnology Statistics 2006, OECD, Paris. OECD (2008) Biotechnology Statistics, OECD, Paris OECD (2009) Biotechnology Statistics, OECD, Paris, available at http://www.oecd.org/
dataoecd/4/23/42833898.pdf (accessed on 09 October 2011) Onetti, A. and Zucchella, A. (2008) ‘Imprenditorialità, internazionalizzazione e innovazione. I
business model delle imprese biotech’, Carocci Editore, Roma. Powell, R.J. and Young, J. (1987) ‘A venture capital model of the development process for new
ventures’, Journal of Business Venturing, Vol. 2, pp.167–184. Powell, W.W. and Brantley, P. (1992) ‘Competitive cooperation in biotechnology: learning through
networks?’, in Eccles R. (Ed.): Networks and Organizations: Structure, Form and Action, Harvard Business School Press, Boston (MA).
Pyka, A. and Saviotti. P. (2001), ‘Networking in biotechnology industries: from translator to explorers’, SEIN – Project Working Paper.
Ruhnka, J.C. and Young, J.E. (1987) ‘A venture capital model of the development process for new ventures’, Journal of Business Venturing, Vol. 2, No. 2, pp.167–184.
Sahlman, W. (1990) ‘The structure and governance of venture capital organisations’, Journal of Financial Economics, 27, pp.473–524
Sharpe, S., Cosh, A., Connell, D. and Parnell, H (2009) The Role of Micro Funds in the Financing of New Technology Firms, National Endowment for Science, Technology and Arts, London.
Suzuki, K. (1996) ‘Nihon ni okeru venture management no jittai (Facts on venture managements in Japan)’, in Yanagi K. and Yamamoto T. (Eds.): Venture Management no Henkaku, Nihon Keizai Shimbumsha, Tokyo.
Thrassou, A., Vrontis, D., Chebbi, H. and Yahiaoui, D. (2011) ‘A preliminary strategic marketing framework for new product development’, in 4th EuroMed Conference, Business Research Challenges in a Turbulent Era, pp.1771–1792,
Tykvova, T. (2000) ‘Venture capital in Germany and its impact on innovation’, available at http://papers.ssrn.con/paper.taf?abstract_id=235512 (accessed on 2 October 2011).

Financing innovation 377
Yepez, C. (2004) ‘Venture capital investment dynamics: modeling the Ottawa boom-and-bust’, Thesis for the degree of Master of Engineering in Telecommunications Technology Management – Faculty of Graduate Studies and Research, Carleton University, Ottawa, Canada, available at http://http-server.carleton.ca/~callahan/yepez2004.pdf (accessed on 1 October 2011).
Notes 1 “Venture capital is a type of private equity finance involving investments in unquoted
companies with growth potential. It is generally medium to long term in nature made in exchange for a stake in a company” [Dagogo and Ollor, (2009), p.41].
2 In fact a lot of studies focus their attention on VCs and their effects on innovation: according to National Venture Capital Association (1998) 80% of venture capital investment is towards high-tech industries such as computers, communications, medical and health, and biotechnology.
3 VC spurs growth and innovation of new firms but “there may be an opposite causality; when there arise abundant opportunities for new firms to innovate and/or to grow fast, these firms demand venture capital investments and as a consequence venture capital markets grow because venture capitalists are complementary assets for such firms” [Hirukawa and Ueda, (2011), p.422].
4 This data has reported from Biotechnology in Italy 2011. The financial perspective realised from BLOSSOM ASSOCIATI S.R.L. “The Report has recorded numerous start-ups but at the same time it also encountered a significant downsizing among important multinationals, in the form of restructuring processes aimed at shrinking or relocating R&D centres. Consequently, as some important multinationals have been excluded from survey” [Blossom& Company, (2011), p.5].
5 Small firms employing fewer than 50 workers and have maximum one million euros in revenue.
6 Large-sized companies are defined by generating an annual turnover of over E 50 million and employing more than 250 employees.