WATER RESOURCES VULNERABILITY AND ADAPTATION TO CLIMATE CHANGE IN YEMEN REPUBLIC: SURDUD DRAINAGE...
21
FACULTY OF SCIENCE BULLETIN مجلة كليةعلوم الSana’a University Publications ISSN : 1684-100X BULLETIN Sana’a University Volume 26 Oct. 2014 1-79 © 2014 Sana’a University. All rights reserved Reprint
-
Upload
independent -
Category
Documents
-
view
4 -
download
0
Transcript of WATER RESOURCES VULNERABILITY AND ADAPTATION TO CLIMATE CHANGE IN YEMEN REPUBLIC: SURDUD DRAINAGE...
FACULTY OF SCIENCE
BULLETIN
العلوم كلية مجلة
Sana’a University Publications
ISSN : 1684-100X
BULLETIN
Sana’a University
Volume
26
Oct. 2014 1-79
© 2014 Sana’a University.
All rights reserved
Reprint
Faculty of Science Bulletin, 26 (2014) 01-19 © 2014 Sana’a University ISSN 1684-100X
1
WATER RESOURCES VULNERABILITY AND
ADAPTATION TO CLIMATE CHANGE IN YEMEN
REPUBLIC: SURDUD DRAINAGE BASIN
Saif Alhakimi1*, Bassim Al-khirbash
1 and
Abdulla Noaman2
1 Department of Earth & Environmental Sciences, Faculty of Science, Sana'a
University, Sana'a, Yemen Republic 2 Faculty of Engineering, Sana’a University, Sana’a, Yemen Republic *Corresponding author: Email: [email protected]
(Received: 19 July 2013)
ABSTRACT
The purpose of this study is to assess climate change impacts on water resources and water
management in Wadi Surdud drainage basin area, under certain climate change scenarios, and to
identify the required and adequate measures and adaptation strategies that can be applied in such
area. Wadi Surdud drainage basin constitutes one part of the western drainage basins area of
Yemen. It occupies a surface area of nearly 4050 km2, and is featured by an arid/semi-arid climate. The average rainfall in the drainage basin is reported to be between 200 mm and 400
mm, for the upper and middle catchment areas, respectively, but is significantly less in the
Tihama part (around 100 mm). Presently, Water resources in the area suffer from an escalating pressure, due to the high consumption of water by agriculture activities, to cope with the
increasing demand by population in cities. Therefore, a reduction in rainfall, as a result of
climate change, will make the situation even worst. In this study, a Water Evaluation and Planning software (WEAP) was used to evaluate water demands, supplies and scarcity, among
all water users under a range of potential climate change scenarios and adaptation strategies.
The simulation period in this study was twenty five years (2008-2033) and the adapted strategies and measures were the Rehabilitation of traditional irrigation channels, Conveying
irrigation water through closed conduits, the use of drip irrigation method, and changing crop
patterns. The simulation results, showed an improvement in irrigation efficiency through the use of drip irrigation technique, proving to be the best strategy that can be adapted by farmers,
followed by the use of closed conduits for conveying irrigation water to farms, and then the least
preferred strategy, called the rehabilitation of traditional irrigation channels. The strategy, changing crop pattern, was found to have little impact on water savings. The amount of water
saved for the preferred adapted strategies, the use of drip irrigation and use of closed conduits,
are 157.3 MCM/y and 91 MCM/y, respectively.
Keywords: Surdud, water resources, climate change, adaptation, WEAP.
INTRODUCTION
Yemen, which is currently a home to 23 million people, has limited resources, notably,
scarce water, shortage of arable land and declining oil reserves. Its population is young,
predominantly rural (73 percent) and rapidly growing (World Bank (WB), 2009). The long
WATER RESOURCES VULNERABILITY AND ADAPTATION….. S. AL-HAKIMI, et al.
2
term average amount of water available is less than 200 m3 per capita per year (Van der
Gun, 2009), and is predicted to decline to below 150 m3 per capita per year, by the year
2013 (EPA, 2009). The National Water Resources Authority (NWRA) indicated that the
country sustainable use of water per year is 2,100 to 2,500 Mm3 and that the current use is
about 3,400 Mm3; thus, the country suffers from an acute water shortage. Although
agriculture contributes small amount to the Gross Domestic Product (GDP), it surely
provides employment and family income for more than half the country’s labor force.
However, agriculture is found to consume about 95 percent of the available water
resources.
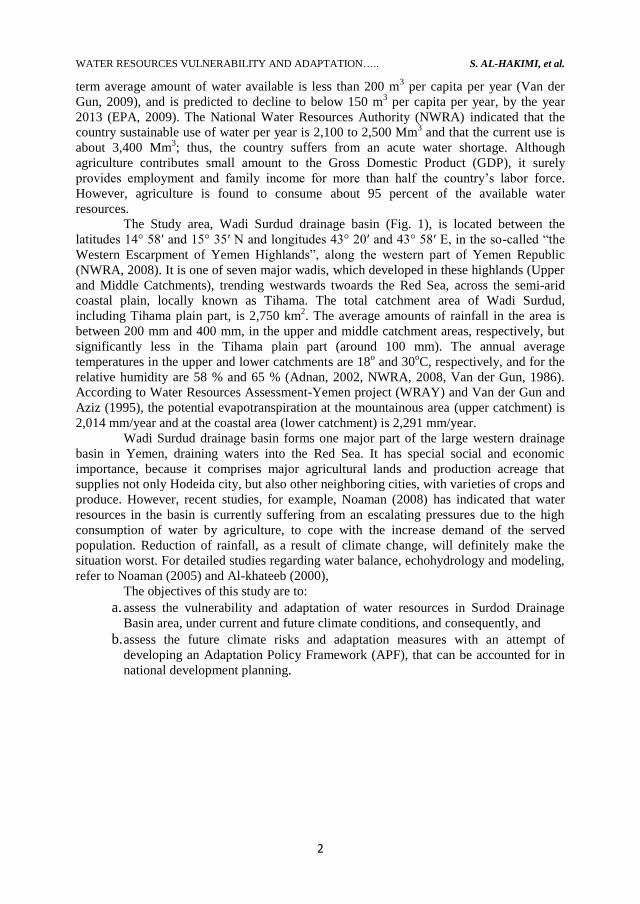
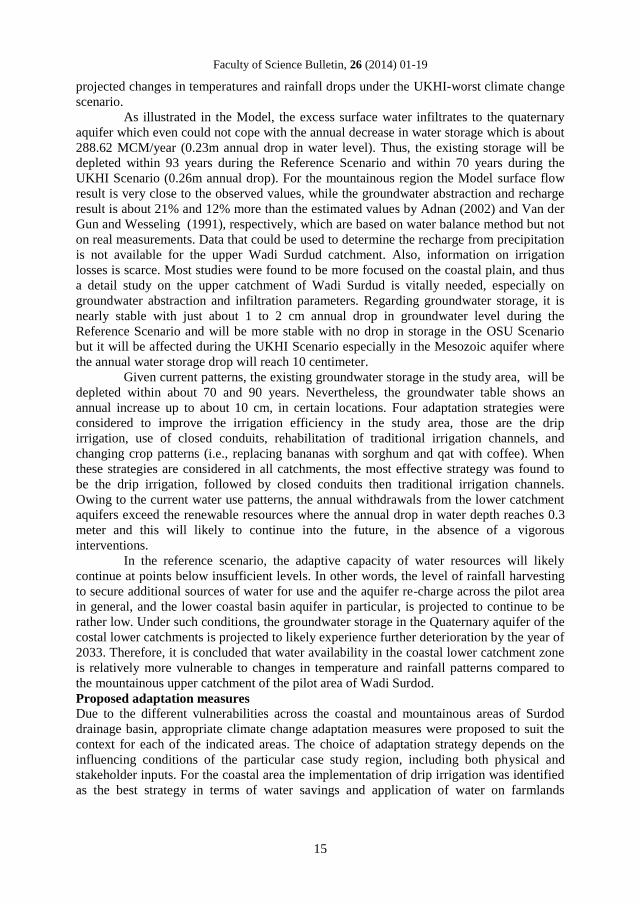
The Study area, Wadi Surdud drainage basin (Fig. 1), is located between the
latitudes 14° 58′ and 15° 35′ N and longitudes 43° 20′ and 43° 58′ E, in the so-called “the
Western Escarpment of Yemen Highlands”, along the western part of Yemen Republic
(NWRA, 2008). It is one of seven major wadis, which developed in these highlands (Upper
and Middle Catchments), trending westwards twoards the Red Sea, across the semi-arid
coastal plain, locally known as Tihama. The total catchment area of Wadi Surdud,
including Tihama plain part, is 2,750 km2. The average amounts of rainfall in the area is
between 200 mm and 400 mm, in the upper and middle catchment areas, respectively, but
significantly less in the Tihama plain part (around 100 mm). The annual average
temperatures in the upper and lower catchments are 18o and 30
oC, respectively, and for the
relative humidity are 58 % and 65 % (Adnan, 2002, NWRA, 2008, Van der Gun, 1986).
According to Water Resources Assessment-Yemen project (WRAY) and Van der Gun and
Aziz (1995), the potential evapotranspiration at the mountainous area (upper catchment) is
2,014 mm/year and at the coastal area (lower catchment) is 2,291 mm/year.
Wadi Surdud drainage basin forms one major part of the large western drainage
basin in Yemen, draining waters into the Red Sea. It has special social and economic
importance, because it comprises major agricultural lands and production acreage that
supplies not only Hodeida city, but also other neighboring cities, with varieties of crops and
produce. However, recent studies, for example, Noaman (2008) has indicated that water
resources in the basin is currently suffering from an escalating pressures due to the high
consumption of water by agriculture, to cope with the increase demand of the served
population. Reduction of rainfall, as a result of climate change, will definitely make the
situation worst. For detailed studies regarding water balance, echohydrology and modeling,
refer to Noaman (2005) and Al-khateeb (2000),
The objectives of this study are to:
a. assess the vulnerability and adaptation of water resources in Surdod Drainage
Basin area, under current and future climate conditions, and consequently, and
b. assess the future climate risks and adaptation measures with an attempt of
developing an Adaptation Policy Framework (APF), that can be accounted for in
national development planning.
Faculty of Science Bulletin, 26 (2014) 01-19
3
Figure 1: Location of Wadi Surdud Drainage Basin.
GENERAL APPROACH AND METHODOLOGY
The assessments of water resources, under current and future climate conditions,
were made through the following:
Collection of all available and relevant data on water resources, land use and
demand, water use sectors and demand, meteorological data and socio-economic
aspects, from reports, maps and other sources.
Rapid rural appraisal method through the use of questionnaire, was used for
participatory assessments, among stakeholders and decision makers, to discuss
their concerns regarding issues of water scarcity and possible adaptation measures.
The use of WEAP and MCA-WEAP modeling software and tools, developed by
Stockholm Environment Institute (SEI), in USA, for determining water balance
conditions and evaluating water needs and scarcity among all water users and
sectors, under two potential climate change scenarios (dry and wet conditions),
and various adaptation measures.
Identification of key policy issues, to assist in scoping the scale of risks associated
with projected climate change, and to aid in the identification of priorities for
adaptation and support, in the development of a national adaptation strategy.
Identification of the expected outputs of the study and linking them to the national
development planning priorities.
Geologic Setting
The geologic setting of Wadi Surdud drainage basin is largely controlled by the Red Sea
Graben formation, especially the present Tihama Plain part, which was formed during the
Tertiary period, and initiated by fracturing, step faulting and rifting, along the mega-
anticlinal structure of the African-Arabian shield. The Red Sea rift valley is an elongate
NNW-SSE basin, between the African Continent and the Arabian Peninsula, separated on
both sides from the prominent escarpments of the uplifted margins of the Precambrian
Shields, by parallel and stepped faults. The main stratigraphic units that are present in the

WATER RESOURCES VULNERABILITY AND ADAPTATION….. S. AL-HAKIMI, et al.
4
study area are Precambrian Basement, Paleozoic and Mesozoic sedimentary rocks,
Cenozoic Tertiary Volcanic and plutonic rocks, and Quaternary Sediments (SAWAS,
1996).
Aquifers, Hydro-meteorology and WEAP
There are three aquifers in the study area, the Mesozoic aquifer, in the mountainous area,
the Shallow aquifer along Wadi Surdud reaches and the Quaternary aquifer in the coastal
area. The shallow aquifer is recharged by valley bed infiltration from wadi flood and base
flow as interflow from Mesozoic aquifer. In the mountainous area there are six sub-
catchments, draining down into six tributaries, which constitute the whole Wadi Surdud
head flow, and all are reflected in the WEAP Model used for this study. In the coastal area
there are thirteen sub-catchments or agriculture lands. Based on Van der Gun and
Wesseling (1991) and field investigation data on the area, all data for the sub-catchments
were accounted for in the WEAP model, including land use, crop patterns, crop coefficient
values, the kc’s (FAO, 1989) and crop production costs. It was generally assumed that there
is 1.5 % annual increase in the agriculture land area. In the WEAP model, for municipal
waters, it is represented by two demand nodes, one for the mountainous region and the
other for the coastal region.
Two rainy seasons are common in the study area, one in spring and the other in
summer, with 45% of rainfall occurring during July and August. The number of rainy days
(>10 mm) is around 17, which is typical of the desert climate. The rainy events are
characterized by a rapid onset and high intensity short duration. Rainfall in the
mountainous and steep Upper Wadi Surdud catchment is quickly followed by runoff peaks
in the wadis, like elsewhere in Yemen. Technical Dutch Assistance (TDA) considered
hydrological monitoring as the most essential input to a better hydrological assessment of
Wadi Surdud. Consequently, a hydrological network was designed, installed and operated.
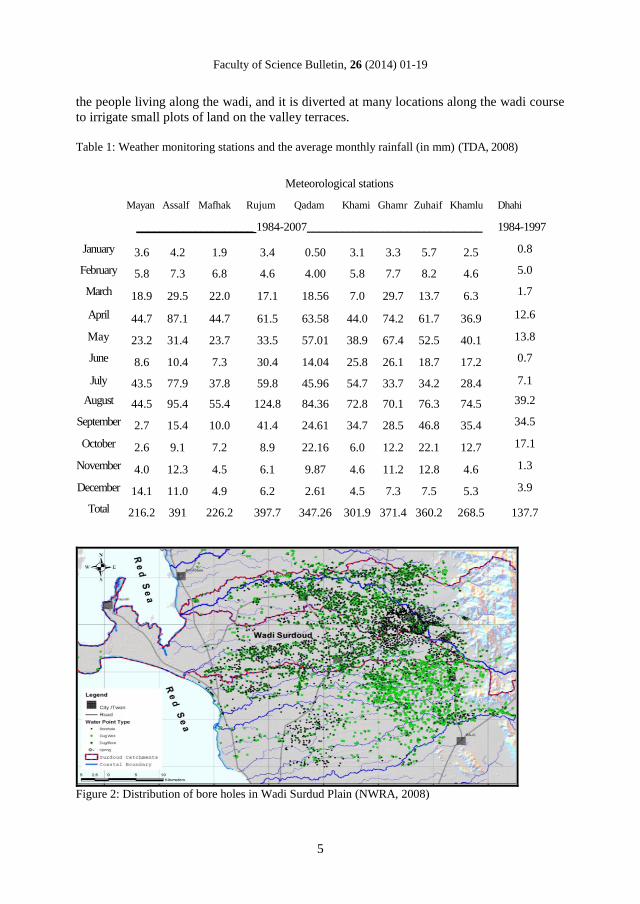
Weather monitoring stations and the average monthly rainfall are shown in Table 1.
Based on the available data, Wadi Surdud has a volume annual runoff between 50
and 100 Mm3, gauged, and the calculated average for the periods 1965-1969 and 1984-
1989 is 69.3 Mm3. It has a permanent base-flow of 0.5-1.0 m
3/s, as observed for the last
few years, of which 90 % of it yields in Khamis Bani Sa'ad branch. The base flow
contributes around 40 % of the annual flow volumes (Jac van der Gun and Wesseling,
1991). A double peaked floods event is common, the observed maximum flood peak (600
m3/s) was recorded in May 1984 (Jac van der Gun, 1986) and there was no record after
1991.
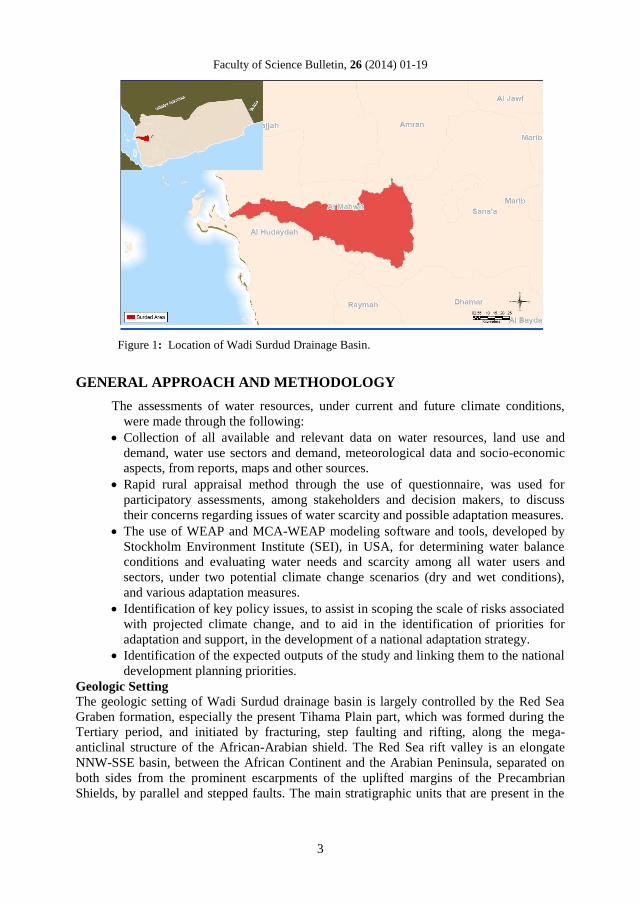
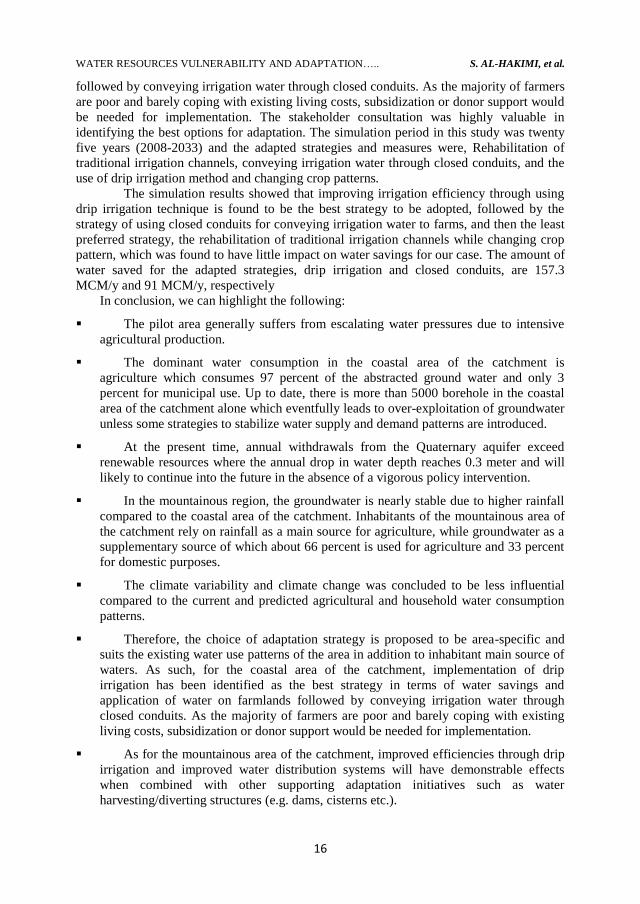
Groundwater
While groundwater availability in the Surdud Basin is currently plentiful, groundwater
overexploitation varies widely from one zone to another as evidenced by the distribution of
groundwater boreholes (Fig. 2). The total groundwater storage for all aquifers is estimated
to be around 3,700 million cubic meters (Adnan, 2002; Van der Gun, and Aziz, 1995). The
flow in Wadi Surdod is divided into two parts: direct flow and base flow. Direct flow is
associated with the channel precipitation, overland flow and interflow. The base flow is a
regional aquifer system of Mesozoic sediments, drained by the so-called Ayoun Surdud
("Surdud springs"). The base flow rates of Wadi Surdud immediately downstream of the
confluence with Wadi Dayan are typically in the range of 18.92- 31.54 MCM/year, not
counting possible underflow through the wadi bed. Only some 10% of this base flow is
contributed by Wadi Dayan (SAWAS, 1996). This base flow is a vital source of water for
Faculty of Science Bulletin, 26 (2014) 01-19
5
the people living along the wadi, and it is diverted at many locations along the wadi course
to irrigate small plots of land on the valley terraces.
Table 1: Weather monitoring stations and the average monthly rainfall (in mm) (TDA, 2008)
Figure 2: Distribution of bore holes in Wadi Surdud Plain (NWRA, 2008)
Meteorological stations
Mayan
Assalf Mafhak
Rujum
Qadam
Khami
s
Ghamr
Zuhaif
Khamlu
Dhahi
Range
______
Month
____________________ 1984-2007______________________________ 1984-1997
_____ January
3.6 4.2 1.9 3.4 0.50 3.1 3.3 5.7 2.5 0.8
February
5.8 7.3 6.8 4.6 4.00 5.8 7.7 8.2 4.6 5.0
March
18.9 29.5 22.0 17.1 18.56 7.0 29.7 13.7 6.3 1.7
April
44.7 87.1 44.7 61.5 63.58 44.0 74.2 61.7 36.9 12.6
May
23.2 31.4 23.7 33.5 57.01 38.9 67.4 52.5 40.1 13.8
June
8.6 10.4 7.3 30.4 14.04 25.8 26.1 18.7 17.2 0.7
July
43.5 77.9 37.8 59.8 45.96 54.7 33.7 34.2 28.4 7.1
August
44.5 95.4 55.4 124.8 84.36 72.8 70.1 76.3 74.5 39.2
September
2.7 15.4 10.0 41.4 24.61 34.7 28.5 46.8 35.4 34.5
October
2.6 9.1 7.2 8.9 22.16 6.0 12.2 22.1 12.7 17.1
November
4.0 12.3 4.5 6.1 9.87 4.6 11.2 12.8 4.6 1.3
December
14.1 11.0 4.9 6.2 2.61 4.5 7.3 7.5 5.3 3.9
Total
216.2 391 226.2 397.7 347.26 301.9 371.4 360.2 268.5 137.7
WATER RESOURCES VULNERABILITY AND ADAPTATION….. S. AL-HAKIMI, et al.
6
DETAILED METHODOLOGY
Current water demand and supply data, and the estimated future trends in water use which
are obtained from a number of Yemeni and international data sources, were incorporated
into a scenario-driven water balance modelling platform, known as Water Evaluation and
Planning software (WEAP). In this case study, WEAP was used to analyze water
availability for a number of climate change scenarios, including a reference scenario
(herein referred to as ‘Reference’). The reference scianrio projected existing trends in water
supply and demand into the future (2,033), in the absence of adaptation measures.
In the Reference scenario , the climate sequence for future years was developed by
repeating the sequence of available historical data and assuming a similar periodicity into
the future period (2008-2033). In other words, the reference scienario is based on
projecting of seasonable and periodical historic climate events into the future. This scenario
has assumed that such seasonable and periodical historic climate events will deveope
similar trends in the future. The average change in precipitation/temperature predicted by
regional downscaling of global climate models was applied. The Water Year Method, as
applied by WEAP, allows the use of historical data in a simplified form and easily explores
the effects of future changes in hydrological patterns. It describe very wet relative to
normal, very dry relative to normal, etc, then defines a sequence of climate years (i.e, four
years of dry conditions, followed by a normal year, then another dry year, etc) using the
historical average precipitation and temperature as well as ratios for modification. In the
reference scenario, a number of key assumptions such as demographic and economic
growth parameters were projected. For instance, urban population is assumed to continue
growing at an expected rate of 3.5% annually, whereas rural population growth are
expected to decline due to migration to major cities. Agricultural production is expected to
grow proportionally with expected population growth rates.
On the other hand, three climate change scenarios which incorporats changes in
precipitation and temperature through 2033 were used. These are, firstly, the the Oregon
State University model (OSU Core) and secondly, the U.K Meteorological Office High
Resolution General Circulation model (UKHI), and the MAX Plan Institute model
(ECHAM3TR). Such scenarioes have been previously used in Yemen during an earlier
project known as Netherlands Climate Change Studies Assistance Program (NCCSAP :
1996-2000) to support climate change impact assessment in some pilot areas in the country.
The OSU Core model represents an ‘expected’ climate trajectory. However, to reflect the
range of local rainfall over Yemen, which may occur, other GCM scienarioes, were
therefore selected. The UKHI model representes a ‘worst case’, drier trajectory, wherease,
the ECHAM3TR represents the wet scenario. Notably, the two alternative GCMs were not
selected because they were performed using necessarily the ‘best’ models, but because they
respectively show greater wetting and drying characteristcs than the ‘core’ which is
relatively more typical to the local climate conditions over Yemen. The indicated climate
change scenarios, the UKHI dry, ECHAM3TR wet, and OSU Core were downscaled to
local conditions in the study area either the mountainous or the coastal region.
Also, extensive stakeholder consultations were conducted to characterize current
water availability, future water resource vulnerability, and possible adaptation strategies to
mitigate water scarcity. Stakeholder consultations were undertaken using rapid rural
appraisal techniques and focused on local perceptions of water scarcity, climatic change
factors, and development challenges; overall strategy preferences of various interest groups
Faculty of Science Bulletin, 26 (2014) 01-19
7
(e.g., farmers, policy makers, water utilities officials) were collected based on perceived
feasibility, cost, and value in terms of water savings. These structured stakeholder
discussions were then synthesized into a set of inputs for water resource modelling and
prioritizing adaptation initiatives using MCA-WEAP, an Excell based tool, summarizing
responses of structured questions, that are based on the used informal and rapid appraisal
questionnaire (not included).
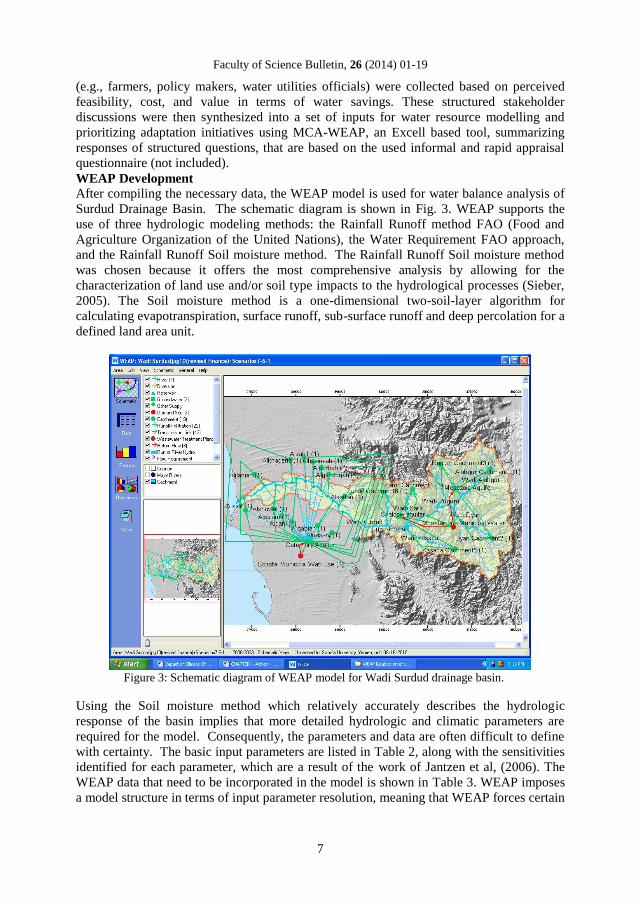
WEAP Development
After compiling the necessary data, the WEAP model is used for water balance analysis of
Surdud Drainage Basin. The schematic diagram is shown in Fig. 3. WEAP supports the
use of three hydrologic modeling methods: the Rainfall Runoff method FAO (Food and
Agriculture Organization of the United Nations), the Water Requirement FAO approach,
and the Rainfall Runoff Soil moisture method. The Rainfall Runoff Soil moisture method
was chosen because it offers the most comprehensive analysis by allowing for the
characterization of land use and/or soil type impacts to the hydrological processes (Sieber,
2005). The Soil moisture method is a one-dimensional two-soil-layer algorithm for
calculating evapotranspiration, surface runoff, sub-surface runoff and deep percolation for a
defined land area unit.
Figure 3: Schematic diagram of WEAP model for Wadi Surdud drainage basin.
Using the Soil moisture method which relatively accurately describes the hydrologic
response of the basin implies that more detailed hydrologic and climatic parameters are
required for the model. Consequently, the parameters and data are often difficult to define
with certainty. The basic input parameters are listed in Table 2, along with the sensitivities
identified for each parameter, which are a result of the work of Jantzen et al, (2006). The
WEAP data that need to be incorporated in the model is shown in Table 3. WEAP imposes
a model structure in terms of input parameter resolution, meaning that WEAP forces certain
WATER RESOURCES VULNERABILITY AND ADAPTATION….. S. AL-HAKIMI, et al.
8
parameters to describe the entire catchment and others to describe smaller land unit areas
such as the soil classification or land use category.
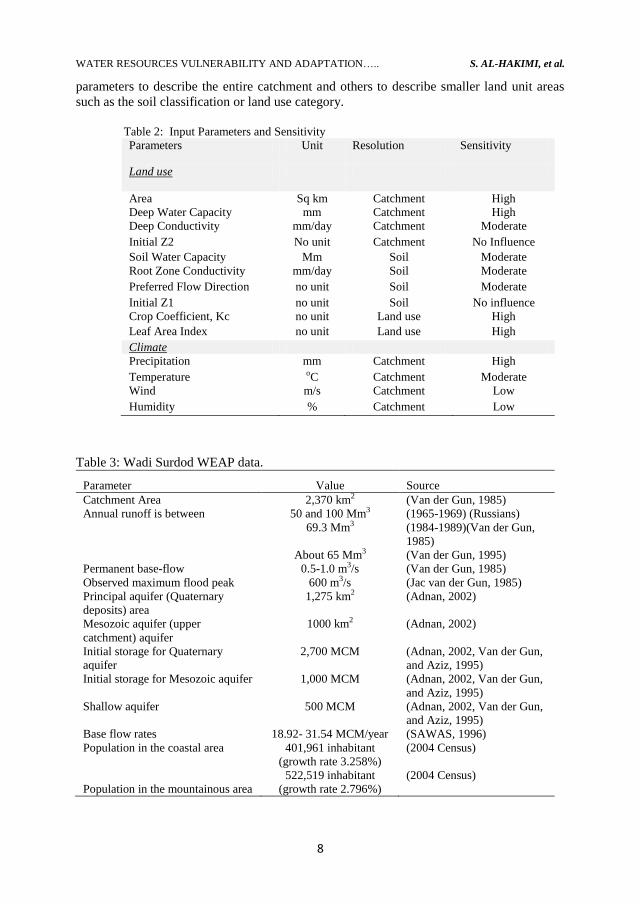
Table 2: Input Parameters and Sensitivity
Parameters Unit Resolution Sensitivity
Land use
Area Sq km Catchment High
Deep Water Capacity mm Catchment High
Deep Conductivity mm/day Catchment Moderate
Initial Z2 No unit Catchment No Influence
Soil Water Capacity Mm Soil Moderate
Root Zone Conductivity mm/day Soil Moderate
Preferred Flow Direction no unit Soil Moderate
Initial Z1 no unit Soil No influence
Crop Coefficient, Kc no unit Land use High
Leaf Area Index no unit Land use High
Climate
Precipitation mm Catchment High
Temperature oC Catchment Moderate
Wind m/s Catchment Low
Humidity % Catchment Low
Table 3: Wadi Surdod WEAP data.
Parameter Value Source
Catchment Area 2,370 km2 (Van der Gun, 1985)
Annual runoff is between 50 and 100 Mm3 (1965-1969) (Russians)
69.3 Mm3 (1984-1989)(Van der Gun,
1985)
About 65 Mm3 (Van der Gun, 1995)
Permanent base-flow 0.5-1.0 m3/s (Van der Gun, 1985)
Observed maximum flood peak 600 m3/s (Jac van der Gun, 1985)
Principal aquifer (Quaternary
deposits) area
1,275 km2 (Adnan, 2002)
Mesozoic aquifer (upper
catchment) aquifer
1000 km2 (Adnan, 2002)
Initial storage for Quaternary
aquifer
2,700 MCM (Adnan, 2002, Van der Gun,
and Aziz, 1995)
Initial storage for Mesozoic aquifer 1,000 MCM (Adnan, 2002, Van der Gun,
and Aziz, 1995)
Shallow aquifer 500 MCM (Adnan, 2002, Van der Gun,
and Aziz, 1995)
Base flow rates 18.92- 31.54 MCM/year (SAWAS, 1996)
Population in the coastal area 401,961 inhabitant
(growth rate 3.258%)
(2004 Census)
Population in the mountainous area
522,519 inhabitant
(growth rate 2.796%)
(2004 Census)
Faculty of Science Bulletin, 26 (2014) 01-19
9
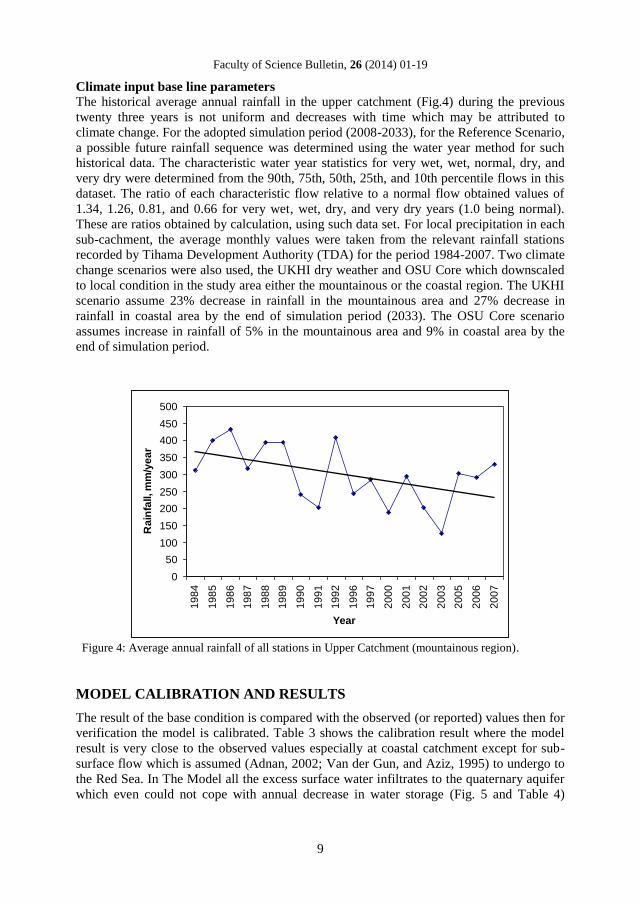
Climate input base line parameters
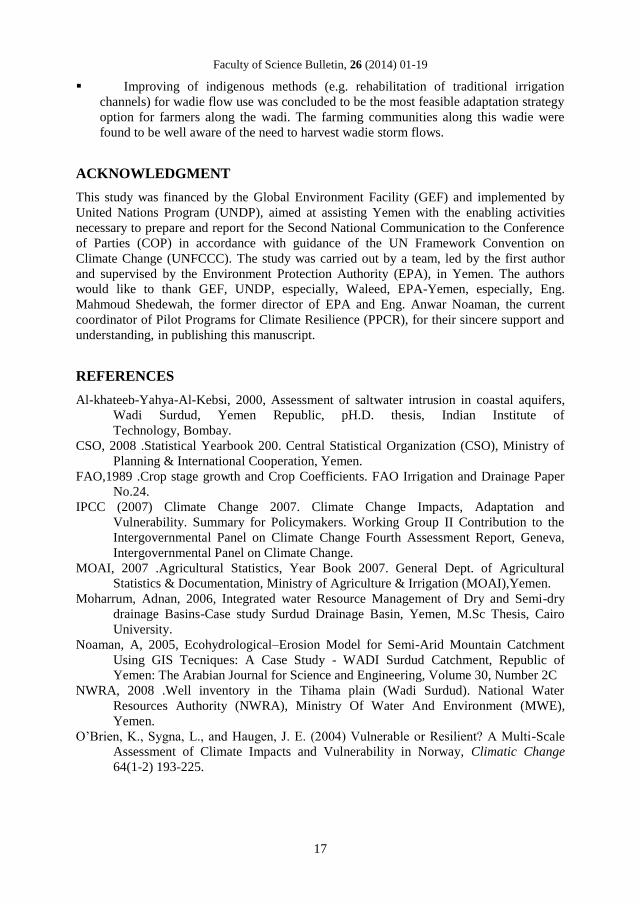
The historical average annual rainfall in the upper catchment (Fig.4) during the previous
twenty three years is not uniform and decreases with time which may be attributed to
climate change. For the adopted simulation period (2008-2033), for the Reference Scenario,
a possible future rainfall sequence was determined using the water year method for such
historical data. The characteristic water year statistics for very wet, wet, normal, dry, and
very dry were determined from the 90th, 75th, 50th, 25th, and 10th percentile flows in this
dataset. The ratio of each characteristic flow relative to a normal flow obtained values of
1.34, 1.26, 0.81, and 0.66 for very wet, wet, dry, and very dry years (1.0 being normal).
These are ratios obtained by calculation, using such data set. For local precipitation in each
sub-cachment, the average monthly values were taken from the relevant rainfall stations
recorded by Tihama Development Authority (TDA) for the period 1984-2007. Two climate
change scenarios were also used, the UKHI dry weather and OSU Core which downscaled
to local condition in the study area either the mountainous or the coastal region. The UKHI
scenario assume 23% decrease in rainfall in the mountainous area and 27% decrease in
rainfall in coastal area by the end of simulation period (2033). The OSU Core scenario
assumes increase in rainfall of 5% in the mountainous area and 9% in coastal area by the
end of simulation period.
0
50
100
150
200
250
300
350
400
450
500
19
84
19
85
19
86
19
87
19
88
19
89
19
90
19
91
19
92
19
96
19
97
20
00
20
01
20
02
20
03
20
05
20
06
20
07
Year
Ra
infa
ll, m
m/y
ea
r
Figure 4: Average annual rainfall of all stations in Upper Catchment (mountainous region).
MODEL CALIBRATION AND RESULTS
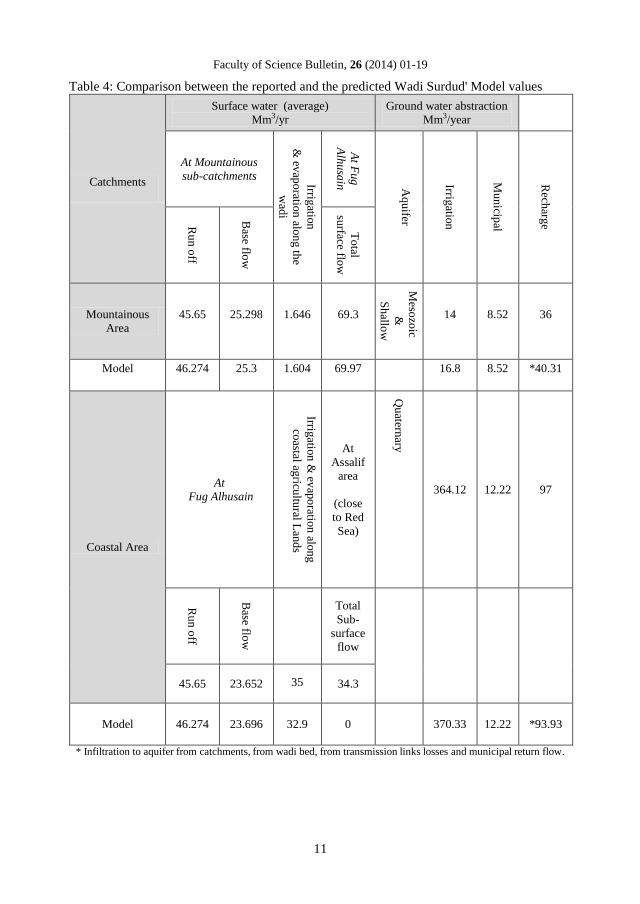
The result of the base condition is compared with the observed (or reported) values then for
verification the model is calibrated. Table 3 shows the calibration result where the model
result is very close to the observed values especially at coastal catchment except for sub-
surface flow which is assumed (Adnan, 2002; Van der Gun, and Aziz, 1995) to undergo to
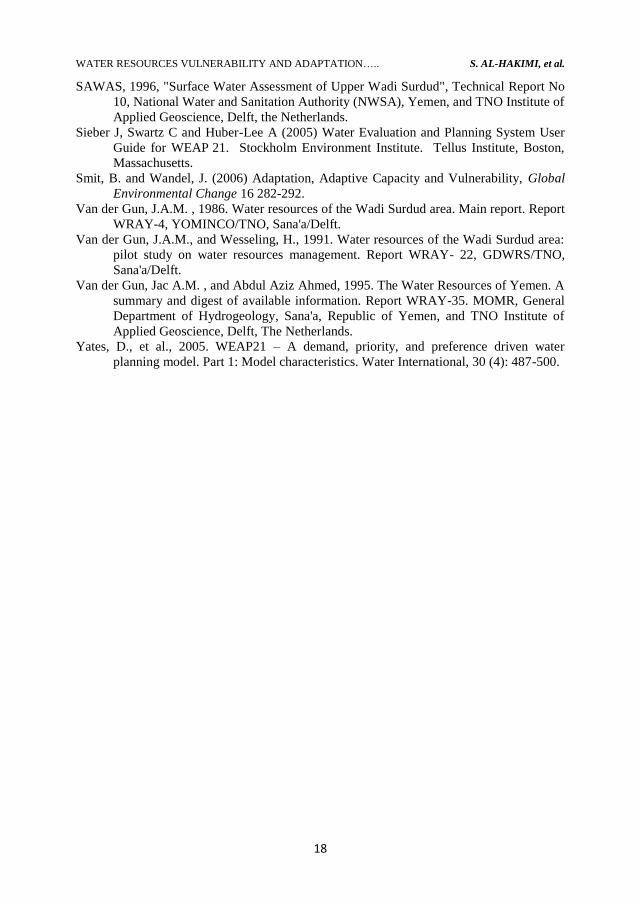
the Red Sea. In The Model all the excess surface water infiltrates to the quaternary aquifer
which even could not cope with annual decrease in water storage (Fig. 5 and Table 4)
WATER RESOURCES VULNERABILITY AND ADAPTATION….. S. AL-HAKIMI, et al.
10
which is about 288.62 MCM/year (0.23m annual drop) and thus the existing storage will be
depleted within 93 years during the Reference Scenario and within 70 years during the
UKHI Scenario (0.26m annual drop). In recent time due to overexploitation from some
places of western area like Al Urg, Al Jarb and Al Turbah areas, the groundwater flow
direction in these areas changed from all directions to the center of cone of depletion and
seawater intrusion hazard became more serious, where about 5000 borehole are in the
coastal area (NWRA, 2008). The conclusion is that groundwater flow pattern evidently
related with the aquifer deposits types and with the total abstraction from the aquifer
(NWRA, 2008). For the mountainous region the Model surface flow result is very close to
the observed values while the groundwater abstraction and recharge result is respectively
about 21 and 12% more than the estimated values by Adnan (2002) and Van der Gun and
Wesseling (1991) which are based on water balance method but not on real measurements.
Data that could be used to determine the recharge from precipitation is not available for the
upper Wadi Surdud catchment. Also, information on irrigation losses is scarce. Most of the
studies are concentrated on coastal plain and thus a detail study on upper catchment of
Wadi Surdud is vitally needed especially on groundwater abstraction and infiltration.
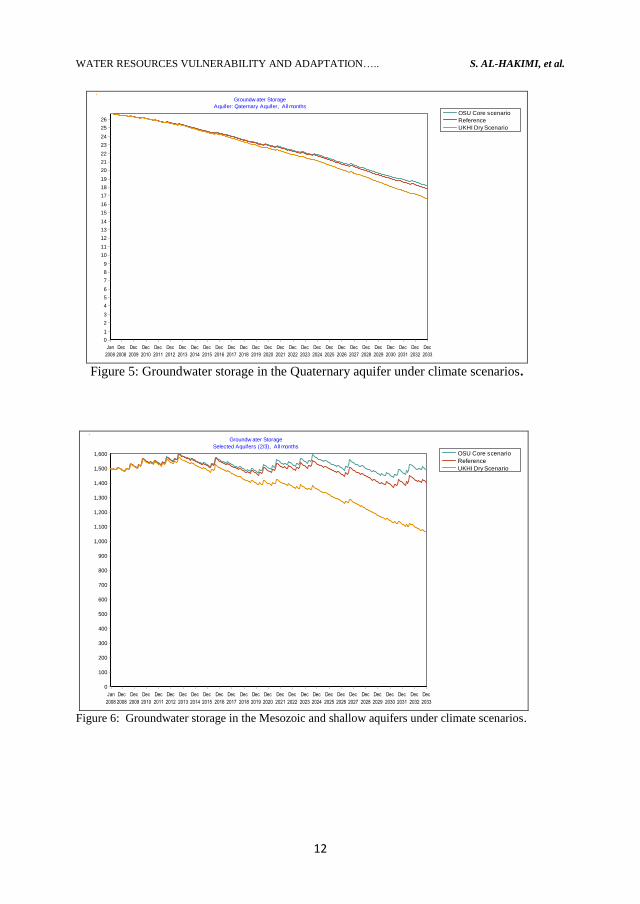
Regarding groundwater storage it is nearly stable with just with about 1 to 2 cm annual
drop (Fig. 5) during the Reference Scenario and will be more stable with no drop in storage
in the OSU Scenario but it will be affected during the UKHI Scenario especially in the
Mesozoic aquifer (Fig. 6) where the annual water storage drop will reach 10 cm.
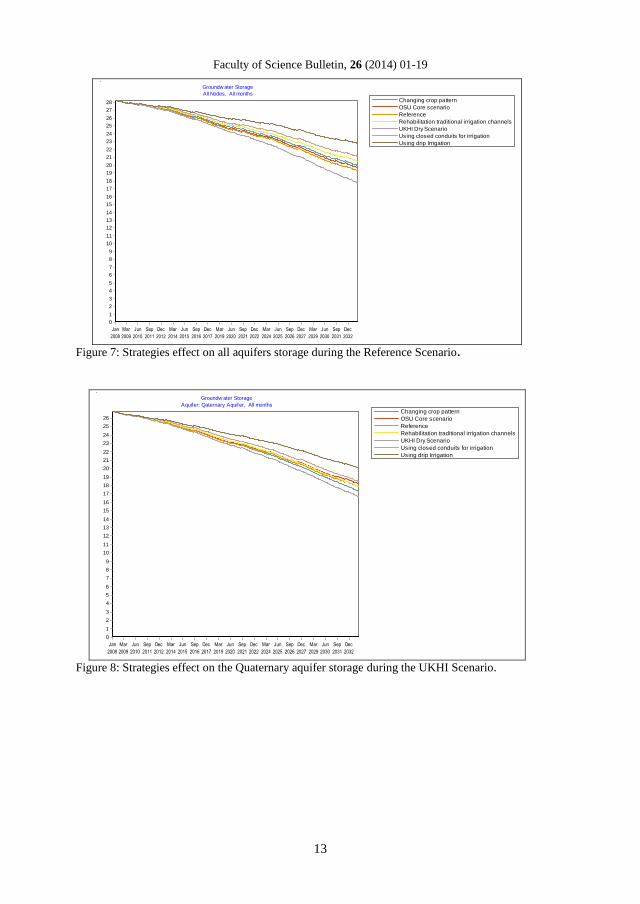
When considering irrigation efficiency (Fig.7), three strategies were introduced,
during the Reference and UKHI dry weather scenarios. The three strategies are, the use of
drip irrigation (assuming 30% gain of water), the use of closed conduits (15% gain of
water) and the rehabilitation of traditional irrigation channels (10% gain of water). In
addition, a fourth strategy was introduced, simply changing crop pattern, by replacing
Banana with Sorghum and Qat with Coffee. Generally, it can be seen that when these
strategies are applied to all catchments during the Reference Scenario, the most effective
strategy is drip irrigation followed by closed conduits, then traditional irrigation channels.
In terms of storage improvement percentages, for drip irrigation, it is about 6.3% for the
coastal aquifer and 4.4% for the mountainous aquifers, followed by closed conduits with
nearly half of those values, then rehabilitation of irrigation channels, amounting to one
third of those values. Changing crop pattern has very limited effect in terms of storage
improvement percentage, it is only 1.4% for the Quaternary aquifer and 0.1% for the
Mesozoic and Shallow aquifers. This sequence of strategies is also evident in figures 8 and
9, when such strategies are applied under the UKHI dry weather scenario, but with less
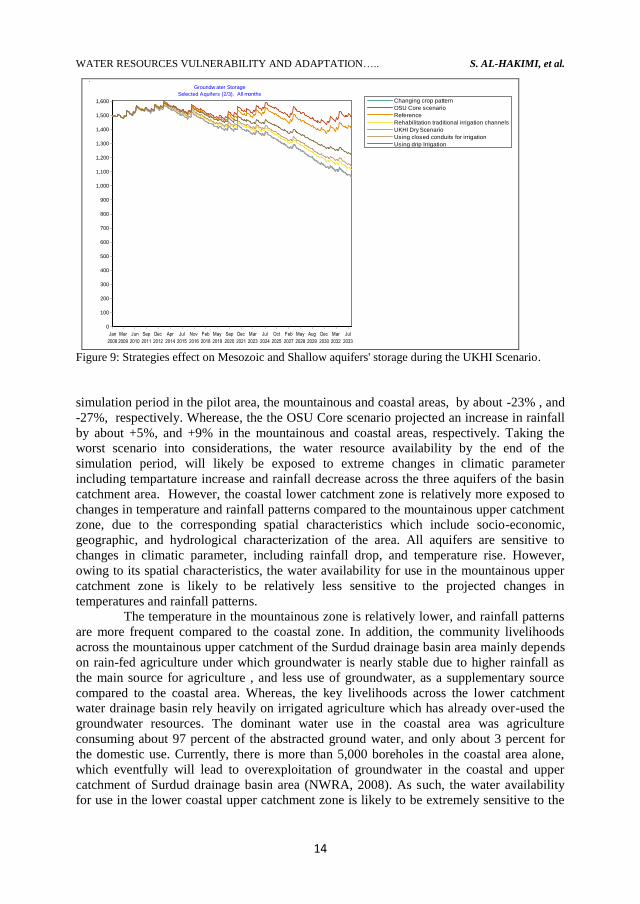
effect. Based on the forgoing explanation, the drip irrigation technique proved to be very
effective in improving the storage capacity of the Quaternary aquifer in the coastal area
(Fig. 9), but less effective for the Mesozoic and Shallow aquifers in the mountainous area.
KEY FINDINGS AND CONCLUSIONS
The three scienarioes used in this study, projected an increase in temprature but differing
projections of rainfall. They have been illusterated by the three modeling results at the end
of the simulaion period. The UKHI scenario projected a decrease in rainfall by end of
Faculty of Science Bulletin, 26 (2014) 01-19
11
Table 4: Comparison between the reported and the predicted Wadi Surdud' Model values
Catchments
Surface water (average)
Mm3/yr
Ground water abstraction
Mm3/year
At Mountainous
sub-catchments Irrigatio
n
& ev
apo
ration
alon
g th
e
wad
i
At F
ug
Alh
usa
in A
qu
ifer
Irrigatio
n
Mu
nicip
al
Rech
arge
Ru
n o
ff
Base flo
w
To
tal
surface flo
w
Mountainous
Area
45.65 25.298 1.646 69.3
Meso
zoic
&
Sh
allow
14 8.52 36
Model 46.274 25.3 1.604 69.97
16.8 8.52 *40.31
Coastal Area
At
Fug Alhusain
Irrigatio
n &
evap
oratio
n alo
ng
coastal ag
ricultu
ral Lan
ds
At
Assalif
area
(close
to Red
Sea)
Qu
aternary
364.12 12.22 97
Ru
n o
ff
Base flo
w
Total
Sub-
surface
flow
45.65 23.652 35 34.3
Model 46.274 23.696 32.9 0
370.33 12.22 *93.93
* Infiltration to aquifer from catchments, from wadi bed, from transmission links losses and municipal return flow.
WATER RESOURCES VULNERABILITY AND ADAPTATION….. S. AL-HAKIMI, et al.
12
OSU Core scenario
Reference
UKHI Dry Scenario
Groundw ater Storage
Aquifer: Qaternary Aquifer, All months
Jan
2008
Dec
2008
Dec
2009
Dec
2010
Dec
2011
Dec
2012
Dec
2013
Dec
2014
Dec
2015
Dec
2016
Dec
2017
Dec
2018
Dec
2019
Dec
2020
Dec
2021
Dec
2022
Dec
2023
Dec
2024
Dec
2025
Dec
2026
Dec
2027
Dec
2028
Dec
2029
Dec
2030
Dec
2031
Dec
2032
Dec
2033
Billio
n C
ubic
Mete
r
26
25
24
23
22
21
20
19
18
17
16
15
14
13
12
11
10
9
8
7
6
5
4
3
2
1
0
Figure 5: Groundwater storage in the Quaternary aquifer under climate scenarios.
OSU Core scenario
Reference
UKHI Dry Scenario
Groundw ater Storage
Selected Aquifers (2/3), All months
Jan
2008
Dec
2008
Dec
2009
Dec
2010
Dec
2011
Dec
2012
Dec
2013
Dec
2014
Dec
2015
Dec
2016
Dec
2017
Dec
2018
Dec
2019
Dec
2020
Dec
2021
Dec
2022
Dec
2023
Dec
2024
Dec
2025
Dec
2026
Dec
2027
Dec
2028
Dec
2029
Dec
2030
Dec
2031
Dec
2032
Dec
2033
Millio
n C
ubic
Mete
r
1,600
1,500
1,400
1,300
1,200
1,100
1,000
900
800
700
600
500
400
300
200
100
0
Figure 6: Groundwater storage in the Mesozoic and shallow aquifers under climate scenarios.
Faculty of Science Bulletin, 26 (2014) 01-19
13
Changing crop pattern
OSU Core scenario
Reference
Rehabilitation traditional irrigation channels
UKHI Dry Scenario
Using closed conduits for irrigation
Using drip Irrigation
Groundw ater Storage
All Nodes, All months
Jan
2008
Mar
2009
Jun
2010
Sep
2011
Dec
2012
Mar
2014
Jun
2015
Sep
2016
Dec
2017
Mar
2019
Jun
2020
Sep
2021
Dec
2022
Mar
2024
Jun
2025
Sep
2026
Dec
2027
Mar
2029
Jun
2030
Sep
2031
Dec
2032
Billio
n C
ubic
Mete
r
28
27
26
25
24
23
22
21
20
19
18
17
16
15
14
13
12
11
10
9
8
7
6
5
4
3
2
1
0
Figure 7: Strategies effect on all aquifers storage during the Reference Scenario.
Changing crop pattern
OSU Core scenario
Reference
Rehabilitation traditional irrigation channels
UKHI Dry Scenario
Using closed conduits for irrigation
Using drip Irrigation
Groundw ater Storage
Aquifer: Qaternary Aquifer, All months
Jan
2008
Mar
2009
Jun
2010
Sep
2011
Dec
2012
Mar
2014
Jun
2015
Sep
2016
Dec
2017
Mar
2019
Jun
2020
Sep
2021
Dec
2022
Mar
2024
Jun
2025
Sep
2026
Dec
2027
Mar
2029
Jun
2030
Sep
2031
Dec
2032
Billio
n C
ubic
Mete
r
26
25
24
23
22
21
20
19
18
17
16
15
14
13
12
11
10
9
8
7
6
5
4
3
2
1
0
Figure 8: Strategies effect on the Quaternary aquifer storage during the UKHI Scenario.
WATER RESOURCES VULNERABILITY AND ADAPTATION….. S. AL-HAKIMI, et al.
14
Changing crop pattern
OSU Core scenario
Reference
Rehabilitation traditional irrigation channels
UKHI Dry Scenario
Using closed conduits for irrigation
Using drip Irrigation
Groundw ater Storage
Selected Aquifers (2/3), All months
Jan
2008
Mar
2009
Jun
2010
Sep
2011
Dec
2012
Apr
2014
Jul
2015
Nov
2016
Feb
2018
May
2019
Sep
2020
Dec
2021
Mar
2023
Jul
2024
Oct
2025
Feb
2027
May
2028
Aug
2029
Dec
2030
Mar
2032
Jul
2033
Millio
n C
ubic
Mete
r
1,600
1,500
1,400
1,300
1,200
1,100
1,000
900
800
700
600
500
400
300
200
100
0
Figure 9: Strategies effect on Mesozoic and Shallow aquifers' storage during the UKHI Scenario.
simulation period in the pilot area, the mountainous and coastal areas, by about -23% , and
-27%, respectively. Wherease, the the OSU Core scenario projected an increase in rainfall
by about +5%, and +9% in the mountainous and coastal areas, respectively. Taking the
worst scenario into considerations, the water resource availability by the end of the
simulation period, will likely be exposed to extreme changes in climatic parameter
including tempartature increase and rainfall decrease across the three aquifers of the basin
catchment area. However, the coastal lower catchment zone is relatively more exposed to
changes in temperature and rainfall patterns compared to the mountainous upper catchment
zone, due to the corresponding spatial characteristics which include socio-economic,
geographic, and hydrological characterization of the area. All aquifers are sensitive to
changes in climatic parameter, including rainfall drop, and temperature rise. However,
owing to its spatial characteristics, the water availability for use in the mountainous upper
catchment zone is likely to be relatively less sensitive to the projected changes in
temperatures and rainfall patterns.
The temperature in the mountainous zone is relatively lower, and rainfall patterns
are more frequent compared to the coastal zone. In addition, the community livelihoods
across the mountainous upper catchment of the Surdud drainage basin area mainly depends
on rain-fed agriculture under which groundwater is nearly stable due to higher rainfall as
the main source for agriculture , and less use of groundwater, as a supplementary source
compared to the coastal area. Whereas, the key livelihoods across the lower catchment
water drainage basin rely heavily on irrigated agriculture which has already over-used the
groundwater resources. The dominant water use in the coastal area was agriculture
consuming about 97 percent of the abstracted ground water, and only about 3 percent for
the domestic use. Currently, there is more than 5,000 boreholes in the coastal area alone,
which eventfully will lead to overexploitation of groundwater in the coastal and upper
catchment of Surdud drainage basin area (NWRA, 2008). As such, the water availability
for use in the lower coastal upper catchment zone is likely to be extremely sensitive to the
Faculty of Science Bulletin, 26 (2014) 01-19
15
projected changes in temperatures and rainfall drops under the UKHI-worst climate change
scenario.
As illustrated in the Model, the excess surface water infiltrates to the quaternary
aquifer which even could not cope with the annual decrease in water storage which is about
288.62 MCM/year (0.23m annual drop in water level). Thus, the existing storage will be
depleted within 93 years during the Reference Scenario and within 70 years during the
UKHI Scenario (0.26m annual drop). For the mountainous region the Model surface flow
result is very close to the observed values, while the groundwater abstraction and recharge
result is about 21% and 12% more than the estimated values by Adnan (2002) and Van der
Gun and Wesseling (1991), respectively, which are based on water balance method but not
on real measurements. Data that could be used to determine the recharge from precipitation
is not available for the upper Wadi Surdud catchment. Also, information on irrigation
losses is scarce. Most studies were found to be more focused on the coastal plain, and thus
a detail study on the upper catchment of Wadi Surdud is vitally needed, especially on
groundwater abstraction and infiltration parameters. Regarding groundwater storage, it is
nearly stable with just about 1 to 2 cm annual drop in groundwater level during the
Reference Scenario and will be more stable with no drop in storage in the OSU Scenario
but it will be affected during the UKHI Scenario especially in the Mesozoic aquifer where
the annual water storage drop will reach 10 centimeter.
Given current patterns, the existing groundwater storage in the study area, will be
depleted within about 70 and 90 years. Nevertheless, the groundwater table shows an
annual increase up to about 10 cm, in certain locations. Four adaptation strategies were
considered to improve the irrigation efficiency in the study area, those are the drip
irrigation, use of closed conduits, rehabilitation of traditional irrigation channels, and
changing crop patterns (i.e., replacing bananas with sorghum and qat with coffee). When
these strategies are considered in all catchments, the most effective strategy was found to
be the drip irrigation, followed by closed conduits then traditional irrigation channels.
Owing to the current water use patterns, the annual withdrawals from the lower catchment
aquifers exceed the renewable resources where the annual drop in water depth reaches 0.3
meter and this will likely to continue into the future, in the absence of a vigorous
interventions.
In the reference scenario, the adaptive capacity of water resources will likely
continue at points below insufficient levels. In other words, the level of rainfall harvesting
to secure additional sources of water for use and the aquifer re-charge across the pilot area
in general, and the lower coastal basin aquifer in particular, is projected to continue to be
rather low. Under such conditions, the groundwater storage in the Quaternary aquifer of the
costal lower catchments is projected to likely experience further deterioration by the year of
2033. Therefore, it is concluded that water availability in the coastal lower catchment zone
is relatively more vulnerable to changes in temperature and rainfall patterns compared to
the mountainous upper catchment of the pilot area of Wadi Surdod.
Proposed adaptation measures
Due to the different vulnerabilities across the coastal and mountainous areas of Surdod
drainage basin, appropriate climate change adaptation measures were proposed to suit the
context for each of the indicated areas. The choice of adaptation strategy depends on the
influencing conditions of the particular case study region, including both physical and
stakeholder inputs. For the coastal area the implementation of drip irrigation was identified
as the best strategy in terms of water savings and application of water on farmlands
WATER RESOURCES VULNERABILITY AND ADAPTATION….. S. AL-HAKIMI, et al.
16
followed by conveying irrigation water through closed conduits. As the majority of farmers
are poor and barely coping with existing living costs, subsidization or donor support would
be needed for implementation. The stakeholder consultation was highly valuable in
identifying the best options for adaptation. The simulation period in this study was twenty
five years (2008-2033) and the adapted strategies and measures were, Rehabilitation of
traditional irrigation channels, conveying irrigation water through closed conduits, and the
use of drip irrigation method and changing crop patterns.
The simulation results showed that improving irrigation efficiency through using
drip irrigation technique is found to be the best strategy to be adopted, followed by the
strategy of using closed conduits for conveying irrigation water to farms, and then the least
preferred strategy, the rehabilitation of traditional irrigation channels while changing crop
pattern, which was found to have little impact on water savings for our case. The amount of
water saved for the adapted strategies, drip irrigation and closed conduits, are 157.3
MCM/y and 91 MCM/y, respectively
In conclusion, we can highlight the following:
The pilot area generally suffers from escalating water pressures due to intensive
agricultural production.
The dominant water consumption in the coastal area of the catchment is
agriculture which consumes 97 percent of the abstracted ground water and only 3
percent for municipal use. Up to date, there is more than 5000 borehole in the coastal
area of the catchment alone which eventfully leads to over-exploitation of groundwater
unless some strategies to stabilize water supply and demand patterns are introduced.
At the present time, annual withdrawals from the Quaternary aquifer exceed
renewable resources where the annual drop in water depth reaches 0.3 meter and will
likely to continue into the future in the absence of a vigorous policy intervention.
In the mountainous region, the groundwater is nearly stable due to higher rainfall
compared to the coastal area of the catchment. Inhabitants of the mountainous area of
the catchment rely on rainfall as a main source for agriculture, while groundwater as a
supplementary source of which about 66 percent is used for agriculture and 33 percent
for domestic purposes.
The climate variability and climate change was concluded to be less influential
compared to the current and predicted agricultural and household water consumption
patterns.
Therefore, the choice of adaptation strategy is proposed to be area-specific and
suits the existing water use patterns of the area in addition to inhabitant main source of
waters. As such, for the coastal area of the catchment, implementation of drip
irrigation has been identified as the best strategy in terms of water savings and
application of water on farmlands followed by conveying irrigation water through
closed conduits. As the majority of farmers are poor and barely coping with existing
living costs, subsidization or donor support would be needed for implementation.
As for the mountainous area of the catchment, improved efficiencies through drip
irrigation and improved water distribution systems will have demonstrable effects
when combined with other supporting adaptation initiatives such as water
harvesting/diverting structures (e.g. dams, cisterns etc.).
Faculty of Science Bulletin, 26 (2014) 01-19
17
Improving of indigenous methods (e.g. rehabilitation of traditional irrigation
channels) for wadie flow use was concluded to be the most feasible adaptation strategy
option for farmers along the wadi. The farming communities along this wadie were
found to be well aware of the need to harvest wadie storm flows.
ACKNOWLEDGMENT
This study was financed by the Global Environment Facility (GEF) and implemented by
United Nations Program (UNDP), aimed at assisting Yemen with the enabling activities
necessary to prepare and report for the Second National Communication to the Conference
of Parties (COP) in accordance with guidance of the UN Framework Convention on
Climate Change (UNFCCC). The study was carried out by a team, led by the first author
and supervised by the Environment Protection Authority (EPA), in Yemen. The authors
would like to thank GEF, UNDP, especially, Waleed, EPA-Yemen, especially, Eng.
Mahmoud Shedewah, the former director of EPA and Eng. Anwar Noaman, the current
coordinator of Pilot Programs for Climate Resilience (PPCR), for their sincere support and
understanding, in publishing this manuscript.
REFERENCES
Al-khateeb-Yahya-Al-Kebsi, 2000, Assessment of saltwater intrusion in coastal aquifers,
Wadi Surdud, Yemen Republic, pH.D. thesis, Indian Institute of
Technology, Bombay.
CSO, 2008 .Statistical Yearbook 200. Central Statistical Organization (CSO), Ministry of
Planning & International Cooperation, Yemen.
FAO,1989 .Crop stage growth and Crop Coefficients. FAO Irrigation and Drainage Paper
No.24.
IPCC (2007) Climate Change 2007. Climate Change Impacts, Adaptation and
Vulnerability. Summary for Policymakers. Working Group II Contribution to the
Intergovernmental Panel on Climate Change Fourth Assessment Report, Geneva,
Intergovernmental Panel on Climate Change.
MOAI, 2007 .Agricultural Statistics, Year Book 2007. General Dept. of Agricultural
Statistics & Documentation, Ministry of Agriculture & Irrigation (MOAI),Yemen.
Moharrum, Adnan, 2006, Integrated water Resource Management of Dry and Semi-dry
drainage Basins-Case study Surdud Drainage Basin, Yemen, M.Sc Thesis, Cairo
University.
Noaman, A, 2005, Ecohydrological–Erosion Model for Semi-Arid Mountain Catchment
Using GIS Tecniques: A Case Study - WADI Surdud Catchment, Republic of
Yemen: The Arabian Journal for Science and Engineering, Volume 30, Number 2C
NWRA, 2008 .Well inventory in the Tihama plain (Wadi Surdud). National Water
Resources Authority (NWRA), Ministry Of Water And Environment (MWE),
Yemen.
O’Brien, K., Sygna, L., and Haugen, J. E. (2004) Vulnerable or Resilient? A Multi-Scale
Assessment of Climate Impacts and Vulnerability in Norway, Climatic Change
64(1-2) 193-225.
WATER RESOURCES VULNERABILITY AND ADAPTATION….. S. AL-HAKIMI, et al.
18
SAWAS, 1996, "Surface Water Assessment of Upper Wadi Surdud", Technical Report No
10, National Water and Sanitation Authority (NWSA), Yemen, and TNO Institute of
Applied Geoscience, Delft, the Netherlands.
Sieber J, Swartz C and Huber-Lee A (2005) Water Evaluation and Planning System User
Guide for WEAP 21. Stockholm Environment Institute. Tellus Institute, Boston,
Massachusetts.
Smit, B. and Wandel, J. (2006) Adaptation, Adaptive Capacity and Vulnerability, Global
Environmental Change 16 282-292.
Van der Gun, J.A.M. , 1986. Water resources of the Wadi Surdud area. Main report. Report
WRAY-4, YOMINCO/TNO, Sana'a/Delft.
Van der Gun, J.A.M., and Wesseling, H., 1991. Water resources of the Wadi Surdud area:
pilot study on water resources management. Report WRAY- 22, GDWRS/TNO,
Sana'a/Delft.
Van der Gun, Jac A.M. , and Abdul Aziz Ahmed, 1995. The Water Resources of Yemen. A
summary and digest of available information. Report WRAY-35. MOMR, General
Department of Hydrogeology, Sana'a, Republic of Yemen, and TNO Institute of
Applied Geoscience, Delft, The Netherlands.
Yates, D., et al., 2005. WEAP21 – A demand, priority, and preference driven water
planning model. Part 1: Model characteristics. Water International, 30 (4): 487-500.
Faculty of Science Bulletin, 26 (2014) 01-19
19
قابلية وتكيف مصادر المياه للتغيرات المناخية في الجمهورية اليمنية:
مستجمع وادي سردد التصريفي –ة دراسة حال
سيف الحكيمي
1بسيم الخرباش، و*
1نعمان هللا عبدو ،
2
، كلية العلوم، جامعة صنعاء، صنعاء، الجمهورية اليمنية قسم علوم األرض والبيئة 1
2 هندسة، جامعة صنعاء، صنعاء، الجمهورية اليمنيةالكلية
[email protected] :البريد اإللكتروني *
ملخصالمناخ على مصادر المياه وادارتها في مستجمع حوض وادي سردد رتهدف هذه الدراسة الى تقييم تأثير تغي
التصريفي وذلك باستخدام سيناريوهات تغيرات مناخية محددة للتعرف على االجراءات المطلوبة والمناسبة واختيار
يشكل حوض وادي سردد احد ى األحواض التصريفية المنطقة. تكيف مالئمة من الممكن تطبيقها على تاستراتيجيا
الرئيسية الواقعة في الجزء الغربي من البالد والتي تصب كل أوديتها في البحر األحمر. تبلغ مساحة هذا الحوض
كم 0404التصريفي حوالي 2
مم 244حيث يتميز بمناخ جاف أو شبه جاف ويتراوح معدل األمطار السنوية فيه من
مم( في الجزء 144مم للجزء العلوي والمتوسط من المستجمع ، على التوالي ، ولكنه أقل بكثير )حوالي 044 الى
الساحلي الواقع ضمن سهل تهامة. في الوقت الحالي، يعاني هذا الحوض من ضغوط متزايدة بسبب االستهالك الجائر
ة في المدن المجاورة. ولذلك، فان أي تناقص في معدل للمياه في الزراعة والتزايد في الطلب على المنتجات الزراعي
سيكون من شأنه أن يجعل الوضع اكثر سوء. في هذه الدراسة ، تم يهطول األمطار في الحوض بسب التغير المناخ
وهو أحد البرامج التي تعتمد على المحاكاة والتي تساعد على (WEAP)استخدام برنامج تقييم وتخطيط مصادر المياه
تقييم التزويد بالمياه والطلب على المياه ، وندرتها ، بين كل الفئات ذات المصلحة والمستخدمة للمياه ، وتحت
ي هذه الدراسة المحاكاة فسيناريوهات تغيرات مناخية محددة واتباع استراتيجيات تكيف مناخية معلومة ، وقد كانت فترة
إعادة تأهيل قنوات المتبعة للتكيف للمناخ هيواإلجراءات ، واالستراتيجيات( م2422-2442خمس وعشرون سنة )
وقد ل متغيرة. يصاأنماط محبالتقطير واتباع ري الإستعمال طريقة و قنوات مغلقة عبرري ال مياه ونقل الري التقليدية
استراتيجية تكيف يمكن أفضل بالتقطير وثبت انها ري التقنية استعمال عندتحسينا في كفاءة الري محاكاة نتائج البينت
وهي تأهيل قنوات الري التقليدية ثمالقنوات المغلقة، ويليها استراتيجية نقل مياه الري عبرمن قبل المزارعين، اتباعها
ادخار كميات المياه بسيطا في تأثير لها أن المحصول فقد تبين بنمط تغيير اتيجية التي تتضمنأما االسترتفضيال، األقل
ات المياه المدخرة عند اتباع استراتيجيات التكيف الري بالتقطير ونقل مياه الري عبر إن كميكمياة المياه ، حيث تبين
.، على التواليمليون متر مكعب في السنة 91 و مليون متر مكعب في السنة 10752 قنوات مغلقة هي
WEAP، التكيف، التغير المناخي، مصادر المياه، يةاليمنالجمهورية وادي سردد، :المفتاحيةالكلمات
Sana’a University
FACULTY OF SCIENCE BULLETIN Vol. 26 Oct. (2014) 1-79
CONTENTS
WATER RESOURCES VULNERABILITY AND ADAPTATION TO CLIMATE CHANGE IN YEMEN REPUBLIC: SURDUD DRAINAGE BASIN. Saif Alhakimi, Bassim Al-khirbash, and Abdulla Noaman (Geology)
1
USING REMOTE SENSING AND GIS TECHNIQUES FOR DETECTING LAND COVER CHANGES
OF MANGROVE HABITATS IN GOA, INDIA. Hisham. M. Nagi, Rouchelle S. Rodrigues, Mani Murali R., and Tanaji G. Jagtap (Marine Science)
21
DETECTION OF VIBRIOES IN THE AQUATIC ENVIRONMENT AND THE SEWAGE SYSTEM BY
CULTURE METHOD IN SELECTED AREAS IN YEMEN. Mohammed F. Al-Helali, Nisreen Yahya Al-Kahtani, and Hassan A. Al-Shamahy (Microbiology)
35
THE EFFECT OF HONEY ON METHICILLIN RESISTANT STAPHYLOCOCCUS AUREUS
ISOLATED FROM ANTERIOR NARES AND WOUNDS IN TAIZ CITY, YEMEN. A. M. Al-kolaibe and M. O. Abdel Monem (Microbiology)
45
BACTERIAL PROFILE AND ANTIMICROBIAL SUSCEPTIBILITY PATTERN AMONG
FOOD POISONING PATIENTS IN DHAMAR CITY, YEMEN. Najla M. Baghza (Microbiology)
55
GEOHISTORY ANALYSIS OF THE CRETACEOUS SEDIMENTS OF THE BLOCK 7 (BARQA
AREA), SABATAYN BASIN, YEMEN. Adel M. Al-Matary and Hisham Sufian (Geology)
63
ISSN : 1684-100X
Sana’a University Publications © 2014 Sana’a University.
All rights reserved