CLIMATE CHANGE VULNERABILITY ASSESSMENT AND ADAPTATION OPTIONS: A CASE STUDY OF KARTIKSWAMI VDC,...
71
1 SchEMS School of Environmental Science and Management Pokhara University Master Thesis No: CLIMATE CHANGE VULNERABILITY ASSESSMENT AND ADAPTATION OPTIONS: A CASE STUDY OF KARTIKSWAMI VDC, JUMLA DISTRICT NEPAL Karmath Subedi 2012
-
Upload
independent -
Category
Documents
-
view
2 -
download
0
Transcript of CLIMATE CHANGE VULNERABILITY ASSESSMENT AND ADAPTATION OPTIONS: A CASE STUDY OF KARTIKSWAMI VDC,...

1
SchEMS
School of Environmental Science and Management
Pokhara University
Master Thesis No:
CLIMATE CHANGE VULNERABILITY ASSESSMENT AND
ADAPTATION OPTIONS: A CASE STUDY OF KARTIKSWAMI VDC,
JUMLA DISTRICT NEPAL
Karmath Subedi
2012

2
Climate Change Vulnerability Assessment and Adaptation Options: A Case Study Of
Kartikswami VDC, Jumla District Nepal
By
Karmath Subedi
A thesis report submitted in partial fulfillment of the requirements for Degree of Master of
Science in Environmental Management
Examination Committee: Mr. Madhukar Upadhya (Advisor)
Mr. Ngabindra Dahal (External Examiner)
Prof. Dr.Ananda Raj Joshi (Director, Academic Department)
Sunita Khatiwoda
Previous Degree: Bachelor Degree in Environmental Science
Amrit Science College
Thamel, Kathmandu
School of Environmental Science and Management (SchEMS)
New Baneshwor
Kathmandu

3
Certification
This is to certify that the thesis entitled “CLIMATE CHANGE VULNERABILITY
ASSESSMENT AND ADAPTATION OPTIONS: A CASE STUDY OF KARTIKSWAMI VDC,
JUMLA DISTRICT NEPAL” submitted by Mr. Karmath Subedi towards partial fulfillment of
Degree of Master of Science in Environmental Management is based on her original research and
study under the guidance of Mr. Madhukar Upadhya. The thesis in part or full is the property of
School of Environmental Science and Management (SchEMS) and thereof should not be used
for the purpose of awarding any academic degree in any other institution.
Mr. Madhukar Upadhya Date:
Faculty member, SchEMS
(Advisor)
Mr. Ngabindra Dahal Date:
(External Examiner)
Prof.Dr.Ananda Raj Joshi Date:
Director, Academic Department,
SchEMS

4
Abstract
Reducing the impacts of climate change and variability is not as significant for the countries like
Nepal, which is unfortunately one of the most vulnerable countries in the world to the climate
change. The very sensitive mountain environment and the alpine ecosystem with less elasticity
towards the changing environment, complex geo-physical structure and poor socio-economic
status had made the people residing at higher altitude more vulnerable with less adaptive
capacity. The purpose of the study was to investigate the degree of vulnerability of the higher
altitude residents and find out the prevailing adaptation practices. Another important aim of the
study was to correlate the rice productivity with the changing climatic parameters i.e.
temperature and precipitation. Further this research also intends to assess the patterns and
trends of climate change and the socio-economic status of the community. The questionnaire
survey, key informant interview, focus group discussion were the major methods applied in the
field while the secondary hydro-meteorological data and the rice productivity data were analyzed
and interpreted. Upon the analysis of the primary and secondary data this study disclosed that
the people residing in the study area are moderately vulnerable to climate change and the socio
economic status are far below in compare to the other parts of the country. Further the
productivity of the rice plant has the positive impact with the change in temperature whereas it
responds inversely to the change in precipitation. From the study it can be concluded that there is
changing climate in the area and has a notable impact on people's daily life. In the village
adaptive capacity is low due to economic status and inequitable access to the resources. The
results also showed that the high variation in climatic pattern have significant impact on
livelihoods of people. The results are highly supported by hydro-meteorological data which
showed change in the weather condition of the study area. Moreover, rice cultivation in Jumla
was found to be associated with socio-cultural as well as special agronomic practices.

5
Acknowledgement
I would never have been able to finish my dissertation without the guidance of my seniors, help
from friends, and support from my family.
I would like to express my deepest gratitude to my advisor, Mr.Madhukar Upadhya, for his
excellent guidance, caring, patience, and providing me with an excellent atmosphere for doing
research.
I would like to thank Nawraj Sapkota, who as a good friend was always willing to help and give
his best suggestions. Many thanks to Bikalpa Adhikari, Dibas Babu Panta and Nabin Bhattarai
for helping me to perform questionnaire survey and other data collection at the field. My
research would not have been possible without their helps.
Similarly, I am indebted to Prof. Dr. Ananda Raj Joshi (Academic Director, SchEMS), Prof. Dr.
Kunjani Joshi (Pokhara University) and Mr. Ajay Mathema (SchEMS) for their constructive
feedbacks and guidance during several stages of the research.
I would also like to thank my parents,Mr. Jeevan Prasad Subedi and Mrs Sumitra Subedi,
younger brother Mr. Nirbheek Kamal Subedi and elder sister Ms. Bandana Subedi. They were
always supporting me and encouraging me with their best wishes.
I am grateful to my good wishers Sanam Akchhya Raj, Ganesh Karki, Shanta Pandit, Som Nath
Bhattarai, Tahir Mohammad Miya, Nawaraj Neupane, Poojan Bhandari and all other friends
whose continuous concerns in my study and inspirational support always motivated me to
complete my research successfully.
Finally, I would like to thank my friend, Sunita Khatiwoda. She was always there cheering me up
and help me with every small and big problems I encounter with during my research.

6
Contents Introduction ...................................................................................................................................... 9
1.1 Background ............................................................................................................................. 9
1.2 Statement of the Problem ..................................................................................................... 11
Literature Review ........................................................................................................................... 12
2.1 Global Context ...................................................................................................................... 12
2.2 United Nation's Framework Convention on Climate Change .............................................. 13
2.4 Nepal and Climate Change ................................................................................................... 13
2.4.1 Nepal in the UNFCCC ................................................................................................... 14
2.5 Climate Variability and Change ........................................................................................... 14
2.6 Impacts of Climate Change in Nepal .................................................................................... 16
2.6.1 Impacts on Water Resources ......................................................................................... 16
2.6.2 Impacts on Agriculture Sector ....................................................................................... 16
2.6.3 Impact of Climate Change on Natural Forest, Bio-diversity and Wildlife .................... 16
2.7 Vulnerability and Adaptation ............................................................................................... 16
2.8 Climate Change and other climatic study of Jumla .............................................................. 20
Rational of the study ....................................................................................................................... 22
Objectives, Scope and Limitation ................................................................................................... 23
4.1 General Objectives: .............................................................................................................. 23
4.2 Specific Objectives: .............................................................................................................. 23
4.3 Scope and Limitation ............................................................................................................ 23
Materials and Methods ................................................................................................................... 24
5.1 Study Area ............................................................................................................................ 24
5.1.1 Kartikswami VDC ............................................................................................................. 26
5.2 Research Design ................................................................................................................... 28
5.3 Sample Size and Sampling Technique ................................................................................. 28
5.4 Data Collection ..................................................................................................................... 29
5.4.1 Primary Data Collection ................................................................................................ 29
5.4.2 Secondary Data .............................................................................................................. 29
5.5 Data Analysis ........................................................................................................................ 29
Result and Discussion ..................................................................................................................... 31
6.1 Social and Economic Status ................................................................................................. 31

7
6.2 Hydro-Meteorological Data Analysis: .................................................................................. 32
6.2.1 Temperature Analysis .................................................................................................... 32
6.2.2 Precipitation Analysis .................................................................................................... 37
6.3 Correlation between Rice Productivity and Temperature and Precipitation ........................ 42
6.3.1 Precipitation and Rainfall .............................................................................................. 43
6.3.2 Temperature and sunshine ............................................................................................. 43
6.4 Public Perception on Climate Change .................................................................................. 43
6.5 Climate Change Impacts and Adaptation practices .............................................................. 44
6.5.1 Agriculture ..................................................................................................................... 44
6.5.2 Water Resources ............................................................................................................ 44
6.5.3 Forest and Biodiversity .................................................................................................. 45
6.5.4 Human and Livestock Health ........................................................................................ 45
6.6 Vulnerability and Climate Change ....................................................................................... 45
Conclusions and Recommendation ................................................................................................ 47
7.1 Conclusion ............................................................................................................................ 47
7.2 Recommendation .................................................................................................................. 48
References: ..................................................................................................................................... 49
Appendix I: Questionnaire for Household Survey ......................................................................... 54
Appendix II: Checklist for focal group discussion ........................................................................ 59
Appendix III: Checklist for key informant interview ................................................................... 60
Appendix IV: Mean Maximum Temperature Data of Jumla ......................................................... 61
Appendix V: Mean Minimum Temperature of Jumla .................................................................... 62
Appendix VI: Precipitation Data of Jumla ..................................................................................... 63
Appendix VII: Vulnerability Analysis form ................................................................................... 64

8
Table of Figure:
Figure 1 Map of Nepal.................................................................................................................... 25
Figure 2 : Annual mean temperature (1981 – 2010) ...................................................................... 32
Figure 3: Annual mean temperature with trend .............................................................................. 33
Figure 4: Seasonal mean temperature with trend ........................................................................... 33
Figure 5: Annual mean maximum temperature with trend ............................................................. 34
Figure 6: Seasonal mean maximum temperature with trend .......................................................... 35
Figure 7: Annual mean minimum temperature with trend ............................................................. 36
Figure 8: Seasonal mean minimum temperature with trend ........................................................... 36
Figure 9: Seasonal rainfall distribution (%) ................................................................................... 37
Figure 10: Mean monthly rainfall (1980 -2010) ............................................................................. 38
Figure 11: Annual mean rainfall with trend ................................................................................... 38
Figure 12: Mean monthly rainfall of wettest months with trend .................................................... 39
Figure 13: Mean monthly rainfall of driest months with trend ...................................................... 39
Figure 14: Total rainfall in winter season ....................................................................................... 40
Figure 15: Total rainfall in Pre monsoon season ............................................................................ 40
Figure 16: Total rainfall in monsoon season .................................................................................. 41
Figure 17: Total rainfall in post monsoon season ........................................................................... 41
List of Tables
Table 1: Demographic Distribution of Jumla District .................................................................... 26
Table 2: Demography of Kartikswami VDC .................................................................................. 27
Table 3: Ward wise Population Distribution of Kartikswami VDC ............................................... 27
Table 4: Average land holding size of households ......................................................................... 31
Table 5: Summary table on statistical analysis of annual and seasonal mean temperature ............ 34
Table 6: Summary table on statistical analysis of Maximum temperature ..................................... 35
Table 7: Summary table on statistical analysis of annual and seasonal mean temperature ............ 37
Table 8: Summary table on statistical analysis of Rainfall ............................................................ 41
Table 9: Annual temperature, precipitation and rice yield of Jumla from 1995 to 2008 ............... 42
Table 10 Vulnerability Calculation ................................................................................................ 45

9
Introduction
1.1 Background
Reducing the impacts of climate change and the variability is very critical for the countries like
Nepal, which is unfortunately one of the most vulnerable countries in the world to the impacts of
climate change. Various factors including the topography, economy, social structure,
infrastructure for development make the communities vulnerable across the country but it is more
so in the high altitude areas where access to services, information, technology etc are lacking in
comparison to the other parts of the country. The complex geo-physical structures makes it poorly
accessible with the many part of the country, while makes people deprived of the taste of
development. Furthermore, the very sensitive mountain environment and the alpine ecosystem
with less flexibility towards the climatic variations make it one of the most vulnerable places
throughout the globe.
In general, there is lack of appropriate technologies to cope with those impacts all over the
country. In fact, the available technologies are also not adequate and are not sufficient to uplift
the living standard of the vulnerable to climate change communities. For Nepal, to minimize the
possible impacts of climate change, adaptation is the only option left. Smith and Wandela, 2006
state that Nepal has to focus more on adaptation approach rather than controlling emission,
because it contributes minimal to GHGs emission.
Widespread implications of climate change indicate that climate change is a complex and cross-
cutting issue as we are globally interconnected. Along with the mitigation approach to climate
change and associated risk, mainly for the developing countries, it is the coping mechanism
developed within the community that counts for risk reduction due to climate change.
The options and opportunities to adapt range from technological options, behavioral changes at
the individual level to other strategies including early warning systems for extreme events, better
water management, improved risk management, property and life insurance, bio-diversity
conservation, change in living style etc. The proper implementation of adaptation strategy at
community level is the best approach to reduce the impacts of climate change and climate
variability. (Agarawal, 2008)
Climate change is an issue of concern for Nepal as over two million Nepalese people depend
upon climate sensitive sectors like agriculture and forestry for their livelihood (Garg, Sukla and
Kapse, 2007). Least developing countries like Nepal are most susceptible to climate change and
its impacts due to their limited capacity to cope with hazards associated with the changes in
climate (Kates, 2000). Even a slight change on Nepal‟s climate may have a greater impact over
both the natural and human systems of Nepal. The share of Nepal in total emission is not so high
as compared to other developed countries. However, Nepal is likely to be affected highly which
means most of the communities of Nepal are vulnerable to climate change and its impacts.
Vulnerability is a subjective concept that includes three dimensions: exposure, sensitivity and
adaptive capacity of the affected system. IPCC, 2007 defines vulnerability of a system as “a
function of the character, magnitude and the rate of climate variation to which a system is
exposed.” In disaster planning, vulnerability is the social, economic and environmental exposure
and sensitivity.

10
As already stated above, even though the share of Nepal in GHG emission is very less compared
to other developed nations, it is likely to be affected more from the climate induced disaster. The
complex topography and fragile economic status guide toward higher vulnerability. The country
can do very less towards decreasing the emissions due to its negligible contribution towards
climate change. Hence, it has to focus in adaptation.
Adaptation is all processes through which communities make themselves better able to cope with
an uncertain future climatic disaster. Adapting to climate change entails, making the right
measures to reduce the negative effects of climate change (also exploiting the positive ones) by
making the appropriate adjustment in natural and human systems to a new or changing
environment (Dow and Downing, 2006). Adaptive capacity is the ability to understand climate
change and hazards, to evaluate their consequences for vulnerable peoples, place and economies
and to moderate potential damages to take advantage of opportunities or to cope with the
consequences (Dow and Downing, 2006).
Rural livelihood is at risk as many natural systems are being affected by regional climate and
elevating temperature (IPCC, 2007). Predictions on climate change indicates that climate change
has its widespread implications on agriculture, water resources, fisheries, forestry, human health,
ecosystem as well as social, economic and political systems making climate much complex
global issue of social , economic and political dimension (Reilly,2001).
In order to assess the vulnerability to climate change it is necessary to strengthen the adaptive
capacity of the community to address these changes. Adaptation can be spontaneous or planned,
and can be carried out in response to or in anticipation of changes in climatic conditions (UKCIP,
2004). It is the property of a system to adjust its characteristics or behavior, in order to expand its
coping range under existing climate variability, or future climate conditions. The adaptive
capacity in actions lead to adaptations which enhance a system‟s coping capacity increasing its
coping range and reducing its vulnerability to climate hazards. The adaptive capacity inherent in a
system represents the set of resources available for adaptation, as well as the ability or capacity of
that system to use these resources effectively in the pursuit of adaptation. (UNDP, 2005).
To access the vulnerability to climate change the first step is to identify the vulnerable
community based on the topography, socio-economic scenario and the availability of the
resources. Keeping mind in all these factors Jumla district's Kartikswami VDC is chosen as the
study area of the study. Jumla district falls under Himalayan Region of Nepal with a variation of
altitude from 915m to 4679 m from the sea level. It is a unique place in Nepal where rice is
cultivated in the highest altitude in the world and the specific place Chhumchour (3000 m) has
got the privileged of rice cultivation in the highest altitude in the world (Paudel & Thakur, 2009).
The Himalayan region is more vulnerable to climate change and is warming 0.040C per year,
higher than any other region of Nepal (ICIMOD 2010). The Kartikswami VDC is situated in the
bank of Tila River. All the nine wards of the VDC have human settlement with almost all the
communities residing in the bank of Tila River.This study has focused on the effects of climate
change in the livelihood of the people of Kartikswami VDC of Jumla District. The vulnerability
due to climate change was calculated based on the sensitivity, exposure and adaptability of these
people towards these changes. Moreover, this study has co-related the impacts of the climate
change in the productivity of the traditional rice plant of the Jumla district.
The questionnaire survey, key informant interview, FGD and the secondary data analysis were
used to conduct this study. The one month stay in a field was a unique experience which helped

11
to witness the complex socio-economic scenario of the remote part of the country. Out of the
total 434 households the 50 household questionnaire survey was conducted. The literacy rate was
good enough given all of its complex constraints. The people are helpful and curious about the
research and offer every possible help.
The study revealed that the people of this particular VDC are moderately vulnerable to climate
change which is mainly due to the increase in the access towards technology and development
because of the vibes of development in nearby district headquarter. The people are slowly
acquiring the knowledge about the climate change and its impacts along with the coping
mechanism. The hydro-meteorological data analysis showed that the both temperature and
precipitation pattern are changing in comparison to the past. Hence, the urgent need of the
availability of the adaptation measures to cope with these changes to minimize its probable future
impacts was clearly perceptible after this study.
1.2 Statement of the Problem
Climate change is the well accepted fact with the presence of the various evidences round the
globe. Its impacts are clearly visible in the vegetation, hydrology, productivity and availability of
an entire ecosystem. The unpredictable weather with the untimely and high intensity rainfall,
consequence with the flash floods and other severe impacts are more frequent these days.
Moreover, the drought in the Himalayan regions with the less snowfall and rising temperature
with the short and sudden high intensity rainfall have seriously affected the livelihood of the
people residing in these areas. Although, they have been adapting these erratic changes with their
own knowledge and skills, the current changes in the climate and its impacts will be clearly
irresistible to deal with.
The socio-economic scenario of the Karnali region is very woeful. The life of its resident have
already started being affected by the impacts of the climate change which is likely to go from bad
to worse in the near future if not addressed timely. For this, a scientific study of the vulnerability
to climate change of the residents of these areas along with the impact of climate change is very
vital. The impact of the changing climatic parameters in the productivity of the traditional rice
plants is very crucial to gauge the climate change effects as a whole.

12
Chapter II
Literature Review
Climate includes the long-term averages of temperature, precipitation, atmospheric circulation
and atmospheric chemistry of a region as measured over a period of several seasons to decades.
Man and his environment are in crucial state of destruction and degradation. Men who are in
return hampering themselves directly or indirectly have degraded environment. Changes in the
Earth's climate are forced by a number of factors. The movement of the Earth's crust influences
climate over periods of millions of years through changes in the geographic arrangement of
oceans and continents. Climate change brings major new challenges to the environment. Any
systematic change in the long-term statistics of climate elements (such as temperature, pressure,
or winds) sustained over several decades or longer. Climate change may be due to natural
external forcing, such as changes in solar emission or slow changes in the earth's orbital elements,
natural internal processes of the climate system: or anthropogenic forcing.
Climate change is a phenomenon due to emissions of greenhouse gases from fuel combustion,
deforestation, urbanization and industrialization (Upreti, 1999) resulting variations in temperature
and precipitation. It is a real threat to the lives in the world that largely affects water resources,
agriculture, coastal regions, freshwater habitats, vegetation and forests, snow cover and melting
and geological processes such as landslide, desertification and floods, and has long-term effects
on food security as well as in human health.
Changes in the atmospheric concentrations of GHGs and aerosols, land cover alter the energy
balance of the climate system and are drivers of climate change. They affect the absorption,
scattering and emission of radiation within the atmosphere and at the Earth‟s surface. The
resulting positive or negative changes in energy balance due to these factors are expressed as
radioactive forcing, which is used to compare warming or cooling influences on global climate
(IPCC, 2007).
2.1 Global Context
The almost static environment throughout the earth only few century back was exploited
dramatically after the successful industrial revolution. The exponential growth in the population
and the successful scientific era lead to the intensive exploitation of the nature to full fill the
demand of growing population. In order to live a life with ease, the productions of luxurious
commodities accelerate demanding more use of natural resources as a raw material as well as
fuel. This eventually led to the emission of harmful gases and polluting the pristine environment.
The world didn't need long to witness the impact of these unwise exploitation of the nature. Soon,
some of the environment scientist started visualizing the future as a dead end if this abolish of the
nature is not stooped immediately. With this consensus the first historical conference on Human
Environment (Stockholm, 1972) was held which for the first time made people think about the
environmental issues. It was in this conference that the relationship between economic
development and environmental degradation was first place on international agenda. It paved the
way in succeeding years to integrate environmental concerns into national economic planning and
decision making (Hoksins, 2002)
The Brundtland Commission in 1983, put forwarded the concept of sustainable development as
an alternative approach based on economic growth and defined it as "the development which

13
meets the need of the present without compromising the ability of future generations to meet their
needs." The commission published the report in 1987 which was primarily focused on securing
the global equity, redistributing resource towards poorer nations whilst encouraging their
economic growth. The report highlighted three fundamental components to sustainable
development: environmental protection, economic growth and social equity.
In 1992, the UN organized "The Earth Summit" in Rio de Generio of Brazil. The primary goal of
the summit was to come an understanding of "development" that will support the socio-economic
development as well as prevent the deterioration of the environment. The Rio conference
produced two international agreements, two statement of principles and a major action of agenda
on worldwide sustainable development (UNFCCC,1992).
2.2 United Nation's Framework Convention on Climate Change
The Convention on Climate Change sets an overall framework for intergovernmental efforts to
tackle the challenge posed by climate change. It recognizes that the climate system is a shared
resource whose stability can be affected by industrial and other emissions of carbon dioxide and
other greenhouse gases. The Convention enjoys near universal membership, with 192 countries
having ratified.
Under the Convention, governments should:
gather and share information on greenhouse gas emissions, national policies and best
practices;
launch national strategies for addressing greenhouse gas emissions and adapting to
expected impacts, including the provision of financial and technological support to
developing countries; and
cooperate in preparing for adaptation to the impacts of climate change
The Convention entered into force on 21 March 1994 at the global level. The ultimate objective
of this Convention and any related legal instruments that the Conference of Parties may adopt is
to achieve, in accordance with the relevant provisions of the Convention, stabilization of
greenhouse gas concentrations in the atmosphere at a level that would prevent dangerous
anthropogenic interference with the climate system. Such a level should be achieved within a
time-frame sufficient to allow ecosystems to adapt naturally to climate change, to ensure that
food production is not threatened and to enable economic development to proceed in a
sustainable development
2.4 Nepal and Climate Change
Nepal joined the climate change movement through submitting the Initial National
Communication (INC) document as a party of United Nations Framework Convention on Climate
Change (UNFCCC) in July 2004. Ratified Kyoto Protocol in 2005 and designated Ministry of
Environment as Designated Authority for Clean Development Mechanism (CDM). There is a
Climate Change Network representing government, NGOs, academicians, and donor agencies
working. National Climate Change Policy 2009 has been formulated by the government and other
climate change policies are either formulated or underway. A high level Climate Change Council
under the chairmanship of Prime Minister has been formulated. A National Committee for the
preparation COP 15/CMP 5 has been set up and ready to function. Nepal organized South Asian
Regional Conference on Climate Change „Kathmandu to Copenhagen‟ which came up with

14
common stance among the countries of the region. It also formulated a consortium of the donor
countries for climate change. A regional conference of youth was also organized. National
Adaptation Program of Action (NAPA) is under preparation.
2.4.1 Nepal in the UNFCCC
The diverse topography and regional differences put Nepal under the special category as specified
in UNFCCC Principle 4.8 while considering both the adverse impacts of climate change and the
impact of implementation of response measures by the Parties. Principle 4.8 of the UNFCCC
states that:
In the implementation of the commitments (under Article 4.0), the Parties shall give full
consideration to what actions are necessary under the Convention, including actions
related to funding, insurance and the transfer of technology, to meet the specific needs and
concerns of developing country Parties arising from the adverse effects of climate change
and/or the impact of the implementation of response measures, especially on countries
with areas i) prone to natural disasters; ii) fragile ecosystems, including mountainous
ecosystems; and iii) land-locked countries.
Nepal thus realizing the special place and role to play among the global community in addressing
the global climate change issues ratified the UNFCCC in May 1994 as 70th country to ratify the
Convention and since then actively taking part in all the Conference of Parties (COP) meetings.
In September 2005, Nepal has accessed to the Kyoto Protocol and it has entered into force since
December 2005. The possibility of extending co-operation under both the UNFCCC and Kyoto
Protocol, thus have to do with the national capacity building, technology transfer and additional
new investments that Nepal can receive as specified under the Principle 4.8 and the Clean
Development Mechanism (CDM) in order to promote the adaptation and mitigation measures and
in the meantime achieving and sustaining high economic growth for fulfilling the basic needs of
the people.
2.5 Climate Variability and Change
Rapid changes in the altitude and aspect along the latitudes have made strong gradient in the
spatial as well as temporal patterns of climatic conditions in Nepal (Chalise, 1994). Therefore,
within a span of less than 200 km Nepal captures almost all types of climates, subtropical to
alpine/arctic. Physically, this is more apparent that the country has been home of diverse habitats,
vegetation and fauna. However, such climatic gradient along east-west direction is mainly due to
the seasonal atmospheric characteristics that determine climatic variations.
A number of studies related to the climate of Nepal have been carried out over the last four
decades (Chalise, 1994; Kripalani et al., 1996; Shrestha et al., 1999, 2000; Shrestha, 2000).
According to most of these studies, Summer Monsoon brings more than 80 percent of the annual
rainfall in Nepal during the rainy months, June through September. The remaining amount of
precipitation is predominantly released by the western disturbances, which influences rest of the
months (October through May). Spatial distribution of surface air temperature in Nepal nearly
follows the geographical configuration of the country. Chalise (1994) emphasized the role of
Himalayan regions as a climate barrier between the lower and mid-latitudes in the global
atmospheric circulation systems and therefore, the Himalayan regions are responsible for the
moist summers and mild winter in South Asia.

15
Moreover, it was found that temperature is increasing at a higher rate in upland than in lowland
Nepal, and that erratic rainfall is characteristic of both regions. Chaulagain (2006) also found
temperature change to be more pronounced at higher altitudes than at lower altitudes. However,
the analysis of the stability of mean monthly rainfall, and monthly maximum and minimum
temperatures employing t-test does not show any significant trend. Ichiyanagi et al. (2007) found,
too, that winter rainfall over western Nepal has increased. The graph of total rainfall shows a
small increase in the last 30 years. Dey and Kumar (1983) found an inverse relationship (negative
correlation) between Indian Summer Monsoon (ISM) rainfall and the extent of snow cover in the
Himalayas, which suggests that there might be a link between increasing rainfall and decreasing
snowfall in the Mustang region. Arnell (1999) explained that a rise in temperature can lead to a
general reduction in the proportion of precipitation falling as snow, and a consequent reduction in
many areas in the duration of snow cover. Average annual maximum temperature data over a 30-
year period have revealed a significant rise in temperature in Marpha, which supports both
Arnell‟s statement concerning a link between rising temperatures and decreasing snowfall, and
farmers‟ perception of increasing temperatures in Mustang. Shrestha et al. (1999) stated that the
analysis of maximum temperatures from 1971 to 1994 showed an increasing trend after 1977,
ranging from 0.06 to 0.12 0C year in the Middle Mountain and Himalayan regions, while the
Siwalik (hills bordering the Gangetic plain with little potential for agricultural production) and
Terai regions show a comparatively lower increase in temperature. The chi-square test showed a
significant match between actual changes in temperature and farmers‟ perception of temperature
changes; the test for changes in rainfall, however, is not significant. Similarly, the t-test showed
an insignificant result for change in mean monthly maximum and minimum temperatures as well
as mean monthly rainfall. The comparison of farmers‟ perceptions and the climatic records has
revealed a close match between both, and provided evidence for the ability of farmers to
accurately observe and recall climatic events. This proves that farmers in both study areas are
aware of climate change. This ability combined with farming experience provides the basis for
their various endeavors to adapt their land use to the increasing impacts of climate change.
The impact of climate change on the Himalayan cryosphere is not understood sufficiently to be
able to estimate the full scale of the downstream impact of reduced snow and ice coverage.
Baseline studies are lacking for most areas and the varied Himalayan topography and climatic
variability mean that extrapolations from studies carried out elsewhere do not give an accurate
picture. In mountain areas the extreme topography causes temperature and precipitation to vary
over very short distances, which makes projections difficult. Equally, poor accessibility, low
population and poor infrastructure, means that little direct „data is collected‟. Three levels of
impact of climate change can be identified: i) local effects; ii) downstream effects; and iii) global
feedback effects. The development of adaptive strategies can be approached from the perspective
of each of these three different levels. All three levels are interlinked and interrelated – and also
full of uncertainty. Given the current state of knowledge about climate change, determining the
diversity of impacts is a challenge for researchers, and risk assessment is needed to guide future
action. The lack of data related to climate and water in the region hinders a comprehensive
assessment of changes in extreme climatic events. (ICIMOD, 2009)

16
2.6 Impacts of Climate Change in Nepal
The ongoing climatic changes and changes those are projected to occur in the future are likely to
have impacts on different sectors of Nepal. Impacts on some sectors are likely to be more severe.
Following sections provides accounts of some observed impacts and impacts that are likely to
occur in the future in different sectors.
2.6.1 Impacts on Water Resources
Nepalese river basins are spread over such a diverse and extreme geographical and climatic
condition that the potential benefits of water are accompanied by risks. Though the available
surface water of Nepal (202 km3) could fulfill the demand of the country up to the end of 21st
century, the availability of only 26 km3 water in dry season shows that water scarcity is eminent
in Nepal unless water resources are properly managed. Besides, rising temperatures have caused
glaciers to melt and retreat faster. Receding glaciers mean an increased risk of the sudden
flooding following glacial lake outbursts.
2.6.2 Impacts on Agriculture Sector
NARC carried out impacts of climate change study on some of the cereal crops of Nepal.
Vulnerability assessment of Rice yield showed that at 4o C rise in temperature and 20 % increase
in precipitation could result in marginal increase yield from 0.09 to 7.5 % and beyond that the
yield would continue to decline. In case of wheat the actual yield of wheat showed increased
output in western region of Nepal with the rise of temperature but decline in other regions.
Similarly, temperature rise showed a decrease in maize yield with increase in temperature.
Though temperature rise had more negative effects on maize yield, the trend was almost similar
to wheat. However, rice, wheat and maize responded positively under double CO2. Wheat
potential went as high as 60 %, rice yield 21 % and maize yield 12 % under double CO2
condition.
2.6.3 Impact of Climate Change on Natural Forest, Bio-diversity and Wildlife
Rising temperatures, glacial retreat and changes in water availability will also lead to changes in
natural biodiversity. Nepal supports a disproportionately high number of globally important wild
animal and plant species and contributes to majority of people's livelihood. Global warming may
cause forest damage through migration of forests towards the polar region, change in their
composition, and extinction of species. Tropical wet forest and warm temperate rain forest would
disappear, and cool temperate vegetation would turn to warm temperate vegetation. Vegetation
pattern would be different under the incremental scenario (at 20C rise of temperature and 20%
rise of rainfall) than the existing types. Climate change will also have direct impact on wildlife.
Furthermore, migration of vegetation and decline in bio-diversity will have further adverse
impact on wildlife. (Initial National Communications, Nepal, 2004).
2.7 Vulnerability and Adaptation
Vulnerability is a term that describes the susceptibility of a group to the impact of hazards. It is
the degree to which a system is likely to experiences harm due to its exposure to hazard. It is
determined by the capacity of a system to anticipate, cope with, resist and recover from the
impact of hazard. Exposure to natural hazard of the community is increasing day by day, making
it more vulnerable with increasing global change and frequent extreme event (Tunner II, 2003).

17
Vulnerability is deeply rooted within the framework of societies, since it is determined by social
systems and power at a local, national and international level, not by the natural environment.
Brook (2003) classifies vulnerability as bio-physical vulnerability and social vulnerability.
Biophysical vulnerability is defined in terms of hazard and related to outcome of occurrence of
hazard or damage incurred by the system due to action of hazard upon the system. While social
vulnerability is defined independent of hazard and it is the inherent current state of the system or
communities. It may also be defined as one of the determinant of bio-physical vulnerability.
In context of climate change, O‟Brian et al. (2004) classifies vulnerability as „end-point‟ and
„starting point‟ interpretation of vulnerability. The „end point‟ interpretation mainly focuses on
climate change mitigation and compensation policy and technical adaptation. While, „starting
point‟ interpretation focuses on vulnerability of society to climatic hazards, adaptation policy and
sustainable development of societies.
Vulnerability is the degree to which a system is susceptible to, and unable to cope with, adverse
effects of climate change, including climate variability and extremes. Vulnerability is a function
of the character, magnitude, and rate of climate change and variation to which a system is
exposed, its sensitivity, and its adaptive capacity (IPCC, 2007a).
Vulnerability of a system refers to its physical, social, and economic aspects. According to IPCC,
vulnerability is a function of the character, magnitude and rate of climate variation to which a
system is exposed; its sensitivity; and adaptive capacity (IPCC, 2001).
From the above definition, we can note that IPCC uses three terms to define vulnerability
exposure, sensitivity, and adaptive capacity. Hence, vulnerability is a function of all the three
terms.
Mathematically, this can be denoted as
Vulnerability = (Exposure*Sensitivity/ Adaptive Capacity)
In other words, the greater the exposure or sensitivity, the greater is the vulnerability. However,
adaptive capacity is inversely related to vulnerability. So, the greater the adaptive capacity, the
lesser is the vulnerability.
Therefore, reducing vulnerability would involve reducing exposure through specific measures
like building a dyke in case of sea level rise, or increasing adaptive capacity through activities
that are closely aligned with development priorities. The terms exposure, sensitivity and adaptive
capacity is very crucial to determine the degree of vulnerability.
Exposure is defined as, "degree of climate stress upon a particular unit analysis; it may be
represented as either long-term changes in climate conditions, or by changes in climate
variability, including the magnitude and frequency of extreme events" (IPCC, 2001).
There are two main elements to consider in exposure.
Things that can be affected by climate change (populations, resources, property, and so on)
The change in climate itself (sea level rise, precipitation and temperature changes, and so on)

18
Sensitivity is the degree to which a system will be affected by, or responsive to climate stimuli
(Smith et al., 2001).
Sensitivity is basically the biophysical effect of climate change; but sensitivity can be altered by
socio-economic changes. For example, new crop varieties could be either more or less sensitive
to climate change.
Adaptive capacity refers to the potential or capability of a system to adjust to climate change,
including climate variability and extremes, so as to moderate potential damages, to take
advantage of opportunities, or to cope with consequences (Smit and Pilifosova, 2001). As the
name suggests, adaptive capacity is the capability of a system to adapt to impacts of climate
change.
Smit et al., 2001, have identified the following seven factors that determine adaptive capacity.
Wealth
Technology
Education
Institutions
Information
Infrastructure
Social capital
Nepal demonstrates diverse geo-physical and climatic conditions within relatively small areas
resulting vast biological diversity, therefore, it is an ideal place to study climate change impacts
on natural and socioeconomic spheres. In context of Nepal, a few studies have been carried out
on a vulnerability and risk assessment of natural hazards and most of them are based on the
available information of the past without or in only some extent to climate change and potential
future risk of climate change related disaster. Some of them are (Dhital, Khanal, & Thapa, 1993),
(Mool, Bajarachyra & Joshi 2001),(Khanal 2005), (ICIMOD 2007). Although Nepal is
responsible for only about 0.025%of total annual greenhouse gas emission of the world (Karkai,
2007), it is experiencing the increasing trends and the associated effects of global warming.
The response for country like Nepal to these consequences is adapting to these changes. The
capacity to adapt to climate hazards and stresses depends on country's wealth, resource and
governance (Kates, 2000).The climate change risk can be traced by studying the rate of
snowmelt, landslides, flooding and changing of vegetation. For vulnerable assessment, the place
based (micro scale) study is more relevant than the larger area if we give due consideration to
spatial variation of natural hazard and vulnerability (Tunner II, 2003 as cited in Sharma, 2009).
The degree of vulnerability for the livelihood will depend on availability and accessibility of
factors such as arable-land and water resources, farming technology and inputs, crop varieties,
knowledge, infrastructure, agricultural extension services, marketing and storage systems, rural
financial markets and wealth etc (Smit and Pilifosova, 2001). Regmi et al. (2008) state that the
poor and marginalized people are more vulnerable to impact of climate change as they are heavily
depended upon natural resources, lack access to technology, information and infrastructure.
Mirza (2003) studied vulnerability of communities to floods in Bangladesh and concluded that
vulnerability to extreme climatic hazards increases due to unemployment, high population

19
density, illiteracy, widespread poverty, enormous pressure upon rural land and economy
dominated by agriculture.
The vulnerability of rural communities can be reduced through effective governance over natural
resources (Cleaver and Schreiber, 1994), increasing access to market and enhancing human
capital (Paavola, 2008). Adaptation strategy can be of various types viz. shifting natural resources
management practices and agricultural practices, building institutions and strengthening
communities, raising awareness about climate change and possible ways to adapt, development of
new technology and better infrastructure etc. (Hedger et al., 2008). Depending upon degree of
severity of climate change on different sectors, different measures have to be considered. Despite
of availability of wide range of adaptation strategies, there are numerous barriers such as
technological, financial, behavioral, cognitive, social and cultural (IPCC, 2007a). The
international communities have important role to play for building adaptive capacity of least
developed countries. The costs required for adopting different adaptation measures ranges from
US$10-40 billion to US$ 86 billion. This amount equals to 0.2% GDP of developed country or
one tenth equivalent to their current military expenditure (UNDP, 2008). The economic affluence,
social capital, local and international networks, cultural and traditional values, perception and
recognition of risk are also important to improve adaptive capacity (IPCC, 2007a).
The adaptation measures complementary to development are desirable (Ribot et al., 1996). The
adaptation measures are aimed at reducing vulnerability of people to climate change and
necessary care should be taken that these measures do not have detrimental effect upon the
vulnerability (Hedger et al., 2008). However, some adaptation measures aggravate existing
vulnerabilities (Westerhoff and Smit, 2009). For example: the shrimp farming though has
economic and livelihood benefits against climate change but worsens vulnerability to sea-level
rise (Agrawala et al., 2005).
Adaptation refers to outcome of series of actions undertaken at different spatial scales to cope or
adjust in given new environment created due to stress or hazards or opportunity (Smit and
Wandel, 2006). Adaptation practices varies depending upon spatial and temporal scale, nature of
sector, actors involved, actions, climatic zone, socio-economic base or combination of these
factors and others (Yohe and Tol, 2002). The adaptation programs and policies should be
designed as such that they will address cross sectoral issues of poverty alleviation, bio-diversity
and ecosystem services conservation, reduction of land degradation and soil erosion and increase
food security enabling achievement of sustainable development at various scales (FAO, 2008).
Policies and plans like National Adaptation Plans of Action are regarded as anticipatory
adaptation measures (Bohle, 2001; Burton et al., 2003). Earlier, the adaptation studies were
scenario-driven based on Global Climate Models, also known as top-down approach. These
studies were limited to modeling the impact of temperature, rain and sea-level rise (Alast et al.,
2008); but did not take into account the adaptive capacity of the societies and individuals. The
bottom-up adaptation assessment approach involves local stakeholders in examining current
vulnerability to climatic variability and extremes and current adaptation measures and policies
(Alast et al., 2008).

20
2.8 Climate Change and other climatic study of Jumla
The poor people are more vulnerable to climatic extremes as well as gradual changes in climate
than the rich because they have less protection, less reserves, fewer alternatives and lower
adaptive capacity and because they are reliant more on primary production which affect their
health and livelihoods and undermines growth opportunities crucial for poverty reduction (IPCC,
2008).
Developing countries like Nepal are more susceptible to the climate change and its impacts due to
their limited capacity to cope with hazards associated with changes in climate. The impacts of
climate change are associated with water and food shortages, coastal inundation, distribution of
vector borne diseases such as malaria and dengue fever, and the rate of extinction of many
species (IPCC, 2001a).
Sapkota et.al, 2010: Jumla is the unique place where rice is cultivated in the highest altitude
(3000 m) in the world. To find out changes in rice production due to climatic effect, six VDCs of
Jumla were chosen for the study. Despite the replacement of local varieties by improved ones the
production trend seems to be stagnant. One of the factors on stagnant of rice production in Jumla
is due to the lack of desirable variety with genetic traits of early maturity, less nutrient
requirement compared to Jumli Marshi to cope up with the climate congruently supporting to
cultural practices regarding the unique rice production systems of Jumla.
Gentle et.al. 2012: the study based on the remote mountainous Jumla District of Nepal to explore
how climate change is affecting the livelihood of local communities and how different wellbeing
groups are differentially impacted. Effects of climate change tend to be more severe where people
rely on weather dependent rain-fed agriculture for their livelihoods. In rural mountain
communities with limited livelihood options, adaptive capacity is low due to limited information,
poor access to services, and inequitable access to productive assets. Looking from a wellbeing
lens, adaptation practices by households as well as local support mechanisms were explored to
predict the severity of effects now and into the future.
Action works Nepal in October 2010 conducted a detail study on the impact of climate change in
the livelihood of the people of Jumla district. The study revealed many evidences of climate
change and its impact on the life and livelihoods of people of Jumla district. The erratic and low
rain/snowfall, prolonged dry winters has already impacted on the production of crops and food
security. As the crop production, especially the cultivation of high altitude paddy, is a very
complex and weather based phenomenon, it has seriously affected due to delay and erratic
rainfall. Similarly, the winter crops like wheat, barley, millet and potato are also seriously
affected by low and erratic snowfall.
The secondary source of income as well as the means of transportation is based on livestock. The
livestock rearing has also affected by limited and less productive grazing lands due to low
moisture content and over exploitation of the resources.
Recently, the district has a road access to the district headquarters and it has made easy in the
transportation of food and other essential commodities. However with the road access, the
unplanned urbanization has been increased in and around the district headquarters and road sides.
It has already resulted in deforestation and extraction of stones and soil from the community and
government managed forests. Similarly, the community has reported the low availability of non-

21
timber forest products, which is another source of income. The community in Lamra VDC
reported the reduced availability of drinking and irrigation water sources.
The increased vulnerability and reduced livelihood options has also increased the off season
migration to India, which has increased the risks of indebtedness of the poor families and
additional burden to women, children and elder population to cope with extreme vulnerabilities.
The impacts of climate change are not evenly distributed between different communities. Poor
and marginalized communities, who often live in vulnerable areas with limited information,
limited livelihoods options and low adaptive capacity, are obviously most vulnerable to climate
change. Similarly, women are on the frontline of climate change due to their multiple burdens to
manage their livelihoods. The predicted impacts of climate change will heighten existing
vulnerabilities, inequalities and exposure to hazards.
The social and financial safety nets are not in an easy access to poor community. The institutions
like micro-finance groups, community forestry user groups although have a potential role in
providing social, environmental and financial safety nets, most of the groups are captured by
local elites.
It has been observed that the adaptation needs of marginalized community is far more than the
powerful groups so there is a strong rationale for pro-poor investments and international
cooperation for strengthening social protection safety nets for poor and marginalized community.
There is a need to mainstream climate change adaptation in the national development plans as
well as national and local level adaptation plan of action.

22
Chapter III
Rational of the study
Global climate change is burning issues in the world and it has been found that the rate of
warming is higher than average global warming rate in Hindu Kush Himalayas (Eastern
Himalayan Region). Nepal‟s greenhouse gas contribution to the atmosphere is not significant in
global terms but the impacts of climate change in the country‟s economy and local livelihoods are
significant. Based on available data it is found that the annual warming in annual temperature
between 1977 and 2000 was 0.060C/yr. (Shrestha et al., 1999). In such Scenario the high altitude
people will face problem in their lives and daily activities.
The sensitive sectors are agriculture, forestry, water and energy, health, urban and infrastructure,
tourism industry and overall livelihoods and economy. The analysis shows that Nepal is highly
vulnerable to climate change. The analysis also suggests that more than 1.9 million people are
highly vulnerable and 10 million are increasingly at risk, with climate change likely to increase
this number significantly in future. Jumla district is a highly vulnerable zone for Drought. The
overall climate change trend of the district is also very high. The agricultural sector is one of the
major sectors likely to have the impacts of climate change particularly the change in temperature
and precipitation. Jumla district is the high altitude district where precipitation is very less and
has moderate temperature. Most of the places is snow covered trough out the winter and have
very low temperature during this time. It is necessary to co-relate the impacts of these climatic
variables with the production of the major crop especially in the higher altitude district as Jumla.
Moreover, the economic condition of the district is very poor with the maximum population
living below the poverty line. In such circumstances, it is essential to study the socio-economic
condition, change in the climatic patterns and the vulnerability to climate change of the district
like Jumla. Hence, this study intends to access the vulnerability of the local people of Himalayan
region and co-relate the change in temperature and precipitation with the production of the major
crop i.e. rice.

23
Chapter IV
Objectives, Scope and Limitation
4.1 General Objectives:
The general objective of this study is to assess the vulnerability due to climate change and outline
the adaptive capacity of the people living in Himalayan region of Jumla district.
4.2 Specific Objectives:
To assess the pattern and trends of climate change based on secondary hydro-meteorological data
To co-relate the impact of climate change with the production of rice
To assess the socio-economic status, vulnerability and adaptation of a community
4.3 Scope and Limitation
This study was carried out in the month of the May 2012. It mostly focus on the livelihood of the
people of Kartikswami VDC which is nearer to the district headquarter in comparison to other
remote VDC of the district. This study can't figure up the vulnerability of the people living far
from headquarter of the district where in comparison has more facilities than the other places.
The secondary data are taken from the VDC office on the basis of the household survey in 2009,
any changes in the socio-economic factors beyond the date is not addressed by this study. The
hydro-meteorological data are taken from the district headquarter and the rice production data till
2008 were only used. The household survey was done using simple random sampling and the
socially active and older inhabitants were chosen as the key informant for the study purpose.
Hence, this study is limited to the perception of these people and may not address the voice of all
the population. The vulnerability calculations were done using the ranking which were ranked
according to the field area's socio-economical and geological background. The statistical
calculations were done using MS-Excel software. Moreover, this research has focused on the
impacts on the major agricultural product i.e. rice plant. The result of the impacts of climatic
factors on the productivity of rice is limited within the temperature and precipitation; however
other factors may be present which affects the productivity.

24
Chapter V
Materials and Methods
5.1 Study Area
The study area of this research is Kartikswami VDC which lies in the Jumla District of Karnali
zone in Mid-Western Development region. Jumla District is the zonal headquarter of Karnali
zone and has the altitude variation from 915m to 4679m above sea level. It is extended from
18005'08" to 29
016'31" N to 81
005'10"E to 82
011'00" E in the Himalayan Region of Nepal. It is
the gateway of Rara Trek (Rara National Park). Dolpa (in the east), Jajarkot (south), Kalikot
(west) and Mugu (north) are neighboring districts of Jumla.
It takes about two days bus to reach there from Surkhet, the nearest city. The air service is also
available but is not reliable because of unpredictable weather of the region.
It is a unique place in Nepal where rice is cultivated in the highest altitude in the world and the
specific place Chhumchour (3000 m) has got the privileged of rice cultivation in the highest
altitude in the world (Paudel & Thakur, 2009). The Tila valley as well as the Sinja Valley is
covered with paddy fields growing the „Kala Marci‟ rice variety, unique red rice that is sought
after for its special taste. The origin of Nepali language is Sinja of Jumla. Therefore, the Nepali
dialect "Khas Bhasa" is still spoken among the people in this region.
This region has a diverse climate due to the altitude variation and geographical structure. The
district constitutes higher mountains to lower river basin. The higher mountains have very low
temperature throughout the year while the mid hills have moderate climate with warm summer
and cold winter. The low river basins are hot in summer with the maximum temperature up to
32C while cool in winter. The average annual maximum temperature of the district is30C and
average annual minimum temperature is 12C. This district receives 800mm of mean annual
rainfall. In the winter season most of the parts of the district receives snow and the temperature
falls up to -14C. The maximum snowfall was recorded as 46.6 cm in 2054/55 B.S while the
minimum snowfall of 2.7 cm was recorded in 2055/56 B.S. (www.ddcjumla.gov.np )
Agriculture and animal husbandry is the main occupation nevertheless many youths come down
to Terai region (Nepalgunj) or even India for the part time job. The HDI is only 0.165 and is
ranked 70 which is very low with comparison to the number 1 ranked Kathmandu among the 75
districts of Nepal. (Asia-Pacific Population Journal) Vol. 10, No. 2 (1995), pp. 3-14)

25
Figure 1 Map of Nepal

26
Table 1: Demographic Distribution of Jumla District
Details Numbers
a. Total Population
b. Population Growth Rate
c. Female
d. Male
89426
1.63
45848
43579
Number of Household 15850
Average Family size 5.64
Population Density 35
Average Literacy Rate (Percentage)
a. Male
b. Female
32.5%
47%
16.8%
Ethnic Group (Percent)
a. Chhetri
b. Brahmin
c. Damai/Kami/Sarki
d. Rai/Limbu/Gurung/Tamang/Magar
e. Newar
f. Muslim
g. Thakuri
h. Others Dalit
i. Others
63.12%
9.54%
13.73%
1.07%
0.33%
0.04%
5.67%
2.25%
4.25%
Total 100%
Source: District Profile, Jumla
5.1.1 Kartikswami VDC
Kartikswami VDC was selected as the study area to study the adaptability, sensitivity and
exposure towards the climate change induced disaster in order to calculate the vulnerability of
this region due to climate change. The geographical location of the VDC is 29009' N to 29
016'N
latitude and 82008'E to 82
014'E longitude. This VDC is adjoined to neighboring VDC Depalgaun
VDC in east, Hanku VDC in west, Jajorkot District in south and Tila River in north. The total
population of the VDC is 2554. The table below shows the demographic composition of the
VDC.

27
Table 2: Demography of Kartikswami VDC
Details Numbers
Total Population
Female
Male
2554
1256
1298
Number of Household 437
Average Family size 5.8
Average Literacy Rate (Percentage)
Male
Female
79.7
84.62
74.71
Ethnic Group (Percent)Brahmin/Chhetri
Dalit
80.10
19.90
Total 100
Source: VDC Profile, 2066
Table 3: Ward wise Population Distribution of Kartikswami VDC
Ward No. Household Male Female Total Population
1 64 214 174 388
2 51 132 141 273
3 61 179 172 351
4 69 161 188 349
5 40 134 136 270
6 51 176 139 315
7 56 181 184 365
8 25 76 76 152
9 29 45 46 91
Total 437 1298 1256 2554
Source: VDC Profile, 2066

28
5.2 Research Design
Diagram shows the overall view of the study process in the form of step-wise box web.
.
5.3 Sample Size and Sampling Technique
The sampling technique used in this research was purposive random sampling in which
households were randomly selected. The total number of household in the Kartikswami VDC is
437 of which around 10% households were chosen randomly for the survey. For the key
informant interview the local residents for more than twenty years were chosen.
Super
vis
or
consu
ltat
ion
Vulnerability
Lit
erat
ure
Rev
iew
Secondary
Data Collection
Socioeconomic
Final Thesis
Thesis Preparation
Data Tabulation
And Analysis
Primary Data Collection
Field Visit and
Sampling Size Design
Site Selection
Methodology development
Research Proposal
Super
vis
or
consu
ltat
ion
Vulnerability
Lit
erat
ure
Rev
iew
Secondary
Data Collection
Socioeconomic
Final Thesis
Thesis Preparation
Data Tabulation
And Analysis
Primary Data Collection
Field Visit and
Sampling Size Design
Site Selection
Methodology development
Research Proposal

29
5.4 Data Collection
5.4.1 Primary Data Collection
For the collection of the primary data both closed and open ended questions were used to collect
information.
a) Household Survey: A representative sampling of 50 households on random basis was
surveyed in Kartikswami VDC to get the required data. For household survey random
sampling of household was done and the set of questionnaire was prepared. While
choosing the respondents, focuses was given for elder people.
b) Key Informant Interview (KII): To document the changes and adaptive practices, Key
informant survey was conducted by taking the key persons who have got knowledge of
the community, its changing situation and indicator of community exposure to climate
change and disasters. Local elder people and key person of village were taken as key
informant.
c) Focus Group Discussion: Discussion was conducted with local stakeholders to get
information about the past and present condition of climate, changes in the agriculture
product and pattern, their economic shifting, availability of water resources, condition of
forest and biodiversity, sources of energy etc. People who have been residing in the
community for at least twenty years were selected for this purpose and discussion was
carried on the basis of checklist prepared in order to extract required information.
5.4.2 Secondary Data
a) Hydro-meteorological data: The hydro-meteorological data (Temperature and
Precipitation) were collected from the department of hydrology and meteorology,
Kathmandu for the year 1987 to 2008 A.D for Jumla district.
b) Agricultural Productivity data: The agricultural productivity data from Ministry of
Agriculture and Co-operatives were used to correlate the rice productivity with change
in the climate i.e. change in temperature and precipitation
c) Desk Review: Various literature and dissertation regarding vulnerability due to
climate change and adaptation and socio-economic data were collected and reviewed
from internet, various NGOs, books, journals, newspaper etc. for study.
5.5 Data Analysis
Data obtained through different sources were proceed, analyzed and interpreted. All the data
were analyzed using Microsoft Excel Software. To determine the climatic trend, the time series
regression and correlation analysis of the hydro-meteorological data were done. Similarly, to
correlate the impact of the climatic parameters (Temperature and Precipitation) on the production
of rice crop, correlation between the temperature and productivity of rice and precipitation and
productivity of rice were calculated based on the Hydro-meteorological and crop productivity
data. Further, to calculate the vulnerability, the adaptability, exposure and sensitivity of the local
people were ranked with the suitable scale. The relation between adaptability, exposure and
sensitivity gives the vulnerability of the local people due to climate change. The relation is given
by,
Vulnerability = Exposure X Sensitivity/ Adaptability

30
To calculate Exposure, temperature trend analysis, precipitation analysis, physical change,
change in activities regarding livelihood and change in the hazard event were calculated giving
the suitable rankings. (Appendix-VII).
Similarly, for sensitivity, Impact of hazards in human and ecological parameters were ranked and
calculated using the appropriate scale. (Appendix-VII)
The adaptability was calculated using gateway system analysis. The primary, secondary and
tertiary indicators were ranked 1 to 4 based upon the access of the people towards those
indicators. The ranking were used to calculate the adaptability. (Appendix-VII)
The vulnerability thus calculated was thus ranked 1-4 with the criteria as below:
V1 = < 1.75
V2= 1.76 – 2.50
V3= 2.51 – 3.25
V4= 3.26 – 4

31
Chapter VI
Result and Discussion
6.1 Social and Economic Status
The socioeconomic conditions of Kartikswami VDC were reveled by Households survey. The
total number of 50 households was taken in this survey. Majority of the respondents are male and
most of them had formal education. Out of 50 respondents, 82.4 % were male whereas female
respondents accounted as 17.6%. Peoples from Brahmin and Chettri were the dominant group in
the community followed by Dalit. Out of the total population, Brahmin/Chettri constitute 75.6 %
whereas Dalit was found to be 24.2 %.
Most of the people live in single family. The average size of the family was found to be 7.57 per
households. The education level of the VDC was found to be good rather than other VDCs of
Jumla district. About 73.2% of the total respondents were literate; among them 57.1 % of male
and 42.9% of female were literate. The study reveled that 26.8% were illiterate. The illiteracy rate
was high among Dalit i.e. 92.5% where as 7.5% of Brahmin/Chettri were found to be illiterate.
Most of the respondents were engaged on agriculture for their subsistence livelihood. Agriculture
is also a major livelihood source of income for country i.e. more than 80% of the population is
involved in agriculture, which is the second largest contributor (33%) to GDP (ADB, 2009).
Agriculture (55.1%) and Government service (24.6 %) was the major source of income of the
respondents. Very few respondents were involved in business (3.7 %) and other activities (2.1%).
Rests of the peoples are used to go to India for Job. Most of the households have food sufficiency
for 7 month on average per year. Many people especially from Dalit community were used to go
India for Job (labor). Daily wage labor is used every year to meet the food deficit. Educated
people joint the civil service and rich people were migrated towards major city of the western
Terai.
Landholding of the respondents was categorized into four groups as almost landless (<1 ropani),
small (1-5 ropani), medium (5-10 ropani) and Large (>10 ropani). From the analysis it was found
that most of the respondents were medium landowners i.e. (1-5 ropani). The average landholding
size was 3.75 ropani per household. A total of 55% respondents have their cropland for cereals
production. Dalit people have very few agritural lands (<1 ropani) than other people on the
community. All the Khet lands were at the side of the Tila River.
Table 4: Average land holding size of households
S.N Land holding (in Ropani) % Of households
1 Almost landless (<1) 8
2 Small (1-5) 60
3 Medium (5-10) 16
4 Large (>10) 16
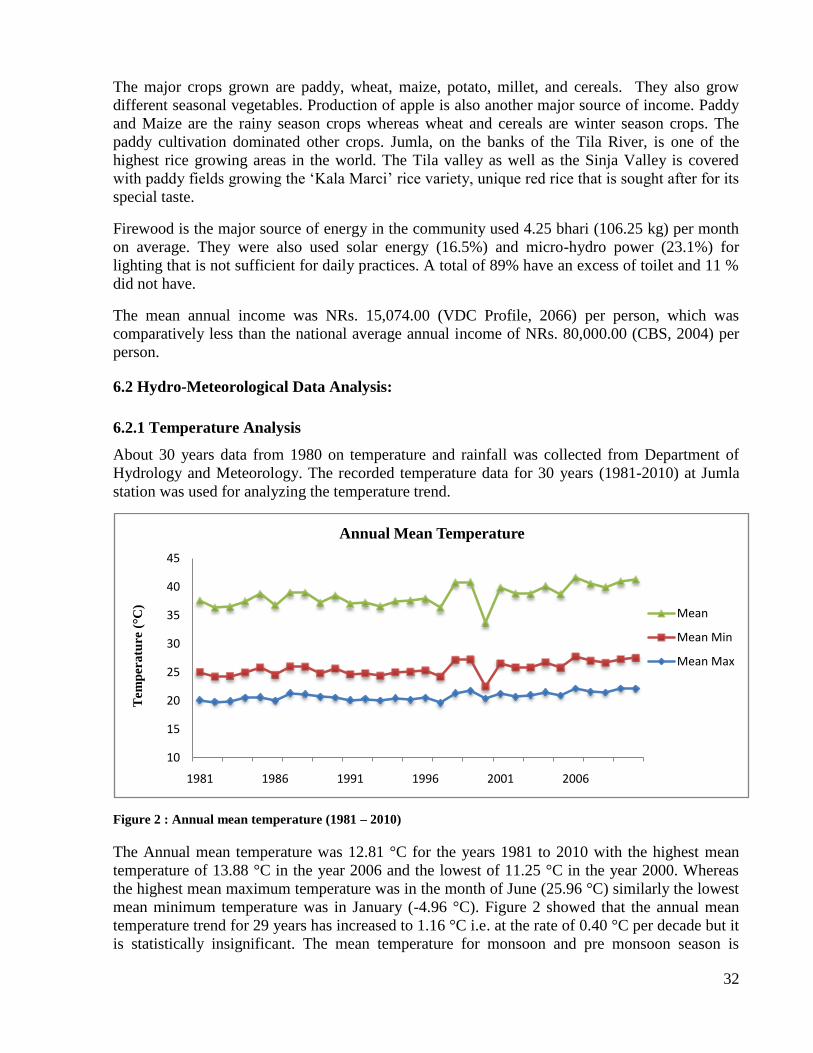
32
The major crops grown are paddy, wheat, maize, potato, millet, and cereals. They also grow
different seasonal vegetables. Production of apple is also another major source of income. Paddy
and Maize are the rainy season crops whereas wheat and cereals are winter season crops. The
paddy cultivation dominated other crops. Jumla, on the banks of the Tila River, is one of the
highest rice growing areas in the world. The Tila valley as well as the Sinja Valley is covered
with paddy fields growing the „Kala Marci‟ rice variety, unique red rice that is sought after for its
special taste.
Firewood is the major source of energy in the community used 4.25 bhari (106.25 kg) per month
on average. They were also used solar energy (16.5%) and micro-hydro power (23.1%) for
lighting that is not sufficient for daily practices. A total of 89% have an excess of toilet and 11 %
did not have.
The mean annual income was NRs. 15,074.00 (VDC Profile, 2066) per person, which was
comparatively less than the national average annual income of NRs. 80,000.00 (CBS, 2004) per
person.
6.2 Hydro-Meteorological Data Analysis:
6.2.1 Temperature Analysis
About 30 years data from 1980 on temperature and rainfall was collected from Department of
Hydrology and Meteorology. The recorded temperature data for 30 years (1981-2010) at Jumla
station was used for analyzing the temperature trend.
Figure 2 : Annual mean temperature (1981 – 2010)
The Annual mean temperature was 12.81 °C for the years 1981 to 2010 with the highest mean
temperature of 13.88 °C in the year 2006 and the lowest of 11.25 °C in the year 2000. Whereas
the highest mean maximum temperature was in the month of June (25.96 °C) similarly the lowest
mean minimum temperature was in January (-4.96 °C). Figure 2 showed that the annual mean
temperature trend for 29 years has increased to 1.16 °C i.e. at the rate of 0.40 °C per decade but it
is statistically insignificant. The mean temperature for monsoon and pre monsoon season is
10
15
20
25
30
35
40
45
1981 1986 1991 1996 2001 2006
Tem
per
atu
re (°C
)
Annual Mean Temperature
Mean
Mean Min
Mean Max

33
increasing at the rate of 1.23 °C and 0.96 °C per decade respectively whereas 0.45 °C and 1.7 °C
per decade for winter and post monsoon respectively. The annual mean temperature has positive
correlation with year i.e. 0.59. Similarly, pre monsoon, monsoon, post monsoon and winter
season also has positive correlation with year i.e. 0.57, 0.56, 0.30 and 0.42 respectively.
Figure 3: Annual mean temperature with trend
Figure 4: Seasonal mean temperature with trend
y = 0.0408x + 12.181
10
11
12
13
14
15
1981 1986 1991 1996 2001 2006
Tem
per
atu
re (°C
)
Annual Mean Temperature with Trend
y = 0.045x + 4.702
y = 0.095x + 16.57
y = 0.123x + 35.64
y = 0.169x + 45.72
0
10
20
30
40
50
60
1981 1986 1991 1996 2001 2006
Tem
per
atu
re(°
C)
Seasonal Mean Temperature with Trend
Post Monsoon
Monsoon
Pre Monsoon
Winter

34
Table 5: Summary table on statistical analysis of annual and seasonal mean temperature
Annual Winter Pre Monsoon Monsoon Post Monsoon
Mean (°C) 12.81 5.41 12.65 19.49 10.81
Standard deviation 0.61 0.96 0.95 0.53 0.72
Maximum (°C) 13.88 7.83 14.53 20.21 12.43
Minimum (°C) 11.25 3.53 10.37 17.69 9.58
Trend (°C/decade) 0.40 0.45 0.96 1.23 1.7
Correlation (r) 0.59 0.42 0.57 0.56 0.30
Figure 5: Annual mean maximum temperature with trend
y = 0.0569x + 19.919
18
19
20
21
22
23
1981 1986 1991 1996 2001 2006
Tem
per
ature
(°C
)
Annual Mean Maximum Temperature with Trend

35
Figure 6: Seasonal mean maximum temperature with trend
The mean maximum temperature was found to be 20.80 °C for the years 1981 to 2010 with the
highest mean maximum temperature 22.13 °C in the year 2006 and 2009 and the lowest of 19.60
°C in the year 1997. Figure 5 showed that the mean maximum temperature trend has increased to
1.65 °C between 1981 and 2010 i.e. at the rate of 0.57 °C per decade which is statistically
insignificant. Figure 4 showed that maximum temperature is in increasing trend. The post
monsoon season showed the greatest rate (2.4°C/decade) of change while the winter season
showed the lowest rate (0.72°C/decade) of change. Similarly, the rate of maximum temperature
change per decade on Pre monsoon and monsoon season is 1.42°C and 1.73°C respectively. The
annual mean maximum temperature showed highest positive correlation with the year i.e. 0.69.
Similarly, winter, pre monsoon, monsoon and post monsoon also showed positive correlation
with the year i.e. 0.47, 0.45, 0.23 and 0.26 respectively
Table 6: Summary table on statistical analysis of Maximum temperature
Annual Winter Pre Monsoon Monsoon Post Monsoon
Mean (°C) 20.80 14.99 21.43 24.95 20.28
Standard deviation 0.72 1.34 1.20 0.52 1.02
Maximum (°C) 22.13 18.33 24.20 25.90 22.10
Minimum (°C) 19.60 12.63 19.57 23.90 22.10
Trend (°C/decade) 0.57 0.72 1.42 1.73 2.4
Correlation (r) 0.69 0.47 0.45 0.23 0.26
y = 0.071x + 13.87
y = 0.142x + 34.21
y = 0.172x + 58.69
y = 0.24x + 77.92
0
10
20
30
40
50
60
70
80
90
100
1981 1986 1991 1996 2001 2006
Tem
per
ature
(°C
)
Seasonal Mean Maximum Temperature with Trend
Post Monson
Monsoon
Pre Monsoon
Winter

36
Figure 7: Annual mean minimum temperature with trend
Figure 8: Seasonal mean minimum temperature with trend
The mean minimum temperature was found to be 4.83°C for the year 1981 to 2010 with the
highest mean minimum temperature of 5.84°C in the year 1998 and the lowest of 2.13°C in the
year 2000. Figure 7 showed that the annual mean minimum temperature has increased to 0.71°C
between 1981 and 2010 i.e. at the rate of 0.25°C per decade which is also statistically not
significant. The minimum temperature is increasing for winter, pre monsoon, monsoon and post
monsoon i.e. at the rate of 0.19°C/decade, 0.75°C/decade, 0.99°C/decade and 0.45°C/decade
respectively. The rate of increase is more pronounced in monsoon season. The annual mean
minimum temperature showed positive correlation with the year i.e. 0.33. Similarly, winter, pre
monsoon, monsoon and monsoon season also showed positive correlation with year i.e. 0.20,
0.001, 0.28, 0.73 respectively.
y = 0.0246x + 4.4434
1
2
3
4
5
6
7
1981 1984 1987 1990 1993 1996 1999 2002 2005 2008
Tem
per
ature
(°C
)Annual Mean Minimum Temperature with Trend
y = 0.019x - 4.470
y = 0.044x - 3.539
y = 0.075x - 0.135
y = 0.099x + 13.53
-10
-5
0
5
10
15
20
25
1981 1983 1985 1987 1989 1991 1993 1995 1997 1999 2001 2003 2005 2007 2009
Tem
per
ature
(°C
)
Seasonal Mean Minimum Temperature with Trend
Monsoon
Pre MonsoonPost MonsoonWinter

37
Table 7: Summary table on statistical analysis of annual and seasonal mean temperature
6.2.2 Precipitation Analysis
About 30 (1980 – 2010) years rainfall data of Jumla station were used for analyzing the rainfall
pattern of Jumla. The rainfall contribution of monsoon season is highest among other season
accounting for about 58% of total rainfall whereas pre monsoon and winter season account 22%
and 11% respectively. The post monsoon rain is least accounting for about 9% of total rainfall. In
Nepal as a whole, monsoon season received about 79.6% of total annual precipitation whereas
pre monsoon, post monsoon and winter received only 12.7%, 4.2% and 3.5% respectively
(Marahatta et al., 2009)
Figure 9: Seasonal rainfall distribution (%)
Figure 10 showed that the mean rainfall was highest during the month of July followed by August
with the average rainfall of 183.3 mm and 177.73 mm respectively where as lowest in the month
11%
22%
58%
9%
Seasonal Rainfall Distribution (%)
Winter Pre Monsoon Monsoon Post Monsoon
Annual Winter Pre Monsoon Monsoon Post Monsoon
Mean (°C) 4.83 -4.18 1.33 3.87 14.04
Standard deviation 0.66 0.84 0.92 1.08 0.66
Maximum (°C) 5.84 -2.67 3.95 5.07 14.95
Minimum (°C) 2.13 -7.33 -0.95 -0.53 11.48
Trend (°C/decade) 0.71 0.19 0.75 0.99 0.45
Correlation (r) 0.33 0.20 0.01 0.28 0.73

38
of December with the average rainfall of 9.86 mm. The average annual rainfall of the station was
about 68.28 mm for the years 1980 to 2010 with the highest annual rainfall of 87.59 mm in the
year 1982 and the lowest of 52.35 in the year 1984. Figure 11 showed that the annual
precipitation trend has decreased to -11.79 mm i.e. at the rate of -0.39 mm per year for 30 years.
The annual rainfall data showed that there was more fluctuation showing erratic in yearly rainfall.
Figure 10: Mean monthly rainfall (1980 -2010)
Figure 11: Annual mean rainfall with trend
Jan Feb Mar Apr May Jun Jul Aug Sep Oct Nov Dec
Rainfall (mm) 27.8 39.2 55.8 41.6 57.0 76.4 183. 177. 102. 34.3 9.86 13.6
0
50
100
150
200
Rain
fall
(m
m)
Mean Monthly Rainfall
y = -0.3932x + 74.571
40
50
60
70
80
90
1980 1985 1990 1995 2000 2005 2010
Rai
nfa
ll (
mm
)
Annual Mean Rainfall with Trend

39
Figure 12: Mean monthly rainfall of wettest months with trend
Figure 13: Mean monthly rainfall of driest months with trend
July and August are the two wettest months for Jumla. Figure 12 showed that the rainfall trend
for July has decreased to -25.2 mm between 1980 and 2010 i.e. the rate of -0.84 mm per year.
Similarly, the rainfall trend for august has decreased to -23.7 mm between 1980 and 2010 i.e. at
the rate of -0.79 mm per year. November and December are the two driest months for Jumla. The
rainfall trend between 1980 and 2010 has decreased for November to -23.1 mm i.e. at the rate of -
0.77 mm per year while increased for December to 0.27 mm i.e. at the rate of 0.009mm per year.
y = -0.8402x + 196.74
y = -0.794x + 373.73
0
100
200
300
400
500
600
1980 1985 1990 1995 2000 2005 2010
Rai
nfa
ll (
mm
)
Mean Monthly Rainfall of Wettest Months with Trend
August
July
y = 0.0094x + 9.7077
y = -0.7714x + 35.806
0
20
40
60
80
100
120
140
1980 1985 1990 1995 2000 2005 2010
Rai
nfa
ll (
mm
)
Mean Monthly Rainfall of Driest Months with Trend
Dec
Nov

40
Figure 14: Total rainfall in winter season
Figure 15: Total rainfall in Pre monsoon season
y = -1.2058x + 99.957
0
50
100
150
200
250
1980 1985 1990 1995 2000 2005 2010
Rai
nfa
ll (
mm
)
Total Rainfall in Winter Season
y = -2.0054x + 186.58
0
50
100
150
200
250
300
350
400
1980 1985 1990 1995 2000 2005 2010
Rai
nfa
ll (
mm
)
Total Rainfall in Pre Monsoon Season

41
Figure 16: Total rainfall in monsoon season
Figure 17: Total rainfall in post monsoon season
The rainfall trend in pre monsoon season has most declined to -60.27 mm in between 1980 and
2010 i.e. at the rate of -2.009 mm per year. Similarly, monsoon season has decreased to -27.00
mm in between 1980 and 2010 i.e. at the rate of -0.900 mm per year while at winter rainfall has
decreased to -36.15 mm in between 1980 and 2010 i.e. at the rate of -1.205 mm per year. The
annual rainfall has negatively correlated with year i.e. -0.4. Similarly, monsoon and post
monsoon rainfall has also negative correlation with year i.e. -0.07 and -0.45 respectively while
winter, pre monsoon and monsoon has weak positive correlation with year i.e. 0.33 and 0.21
respectively.
Table 8: Summary table on statistical analysis of Rainfall
y = -0.9004x + 551.65
100
300
500
700
900
1980 1985 1990 1995 2000 2005 2010
Rai
nfa
ll (
mm
)
Total rainfall in Monsoon Season
y = -0.1327x + 46.352
0
20
40
60
80
100
120
140
160
180
200
1980 1985 1990 1995 2000 2005 2010
Rai
nfa
ll (
mm
)
Total Rainfall in Post Monsoon Season

42
Annual Winter Pre Monsoon Monsoon Post Monsoon
Mean (°C) 68.35 80.75 154.6 536.46 45.45
Standard deviation 9.00 46.61 71.39 94.64 45.36
Maximum (°C) 87.59 211.5 362.00 792.5 177.5
Minimum (°C) 52.35 14.00 38.00 359.70 ---
Trend (mm/year) -0.39 -1.20 -2.00 -0.90 -0.13
Correlation (r) -0.4 0.33 0.21 -0.07 -0.45
6.3 Correlation between Rice Productivity and Temperature and Precipitation
Table 9: Annual temperature, precipitation and rice yield of Jumla from 1995 to 2008
Source: #Department of Hydrology and Meteorology, Nepal 2008/009 ## MoAc, Nepal
2008/009
The above table shows the annual rainfall, annual temperature and annual production of the rice
in kilogram per hector from the year 1995 to 2008.
Year # T max
(°C)
# T min
(°C)
#Annual
Temp
(°C)
# Annual
rainfall
(mm)
## Rice
area (ha)
## Rice
yield (kg/ha)
1995 20.18 4.89 12.53 829.0 1371 1985
1996 20.52 4.78 12.65 832.8 1350 2000
1997 19.60 4.60 12.10 773.6 1400 1707
1998 21.33 5.84 13.59 833.7 1450 1761
1999 21.78 5.45 13.61 675.7 1500 1000
2000 20.36 2.13 11.25 886.6 1835 1460
2001 21.21 5.35 13.28 728.1 2800 1000
2002 20.68 5.18 12.93 842.2 2775 1457
2003 21.00 4.83 12.91 842.9 2800 1457
2004 21.48 5.27 13.38 685.4 2800 1579
2005 20.93 4.88 12.90 669.5 2850 1173
2006 22.13 5.63 13.88 747.7 2850 1700
2007 21.57 5.45 13.51 831.8 2850 1700
2008 21.43 5.21 13.32 966.7 2850 1700

43
6.3.1 Precipitation and Rainfall
It has been found that rainfall pattern of Jumla (1995 to 2008) has almost a smooth pattern that
coincide with the yield of rice however, after 1997 with the fluctuating rainfall the status of rice
yield is also following the rainfall trend as well.
There has been experience of inconsistent rainfall pattern with higher intensities of rain and less
number of rainy days in Jumla. This could be the effect of climate change. Such fluctuations in
rainfall pattern are responsible for excessive dryness during drought and damage to the rice field
during heavy down pours. These consequences have ultimately led to the problem of leaching and
damage to rice field at the river side field. On the other hand, decrease in soil moisture in the
sloppy area has less capacity to retain water. Basnet (2009) reported that to produce 1 kg rice
tentatively 3,000 liter of water is required whereas to grow rice in one hectare of land it needs
800,000 liter water. In Jumla, due to erratic rainfall there is uncertainty of irrigation facility to
rice cultivation. Such vagaries of rainfall and shortage of irrigation to rice are responsible for
environment degradation. Raut (2010) reported that emission of methane from rice field supplied
with 50% nitrogen fertilizer was 49kg/ha which is quite high in rain fed irrigation.
6.3.2 Temperature and sunshine
Rice plant is very much susceptible to temperature and it thrives fairly with temperature ranging
from 20° C to 40°C.The optimum temperature of 30°C during day time and 20°C during night
time seems to be more favorable for its development and growth. Rice yield has been fluctuating
along with the fluctuation of temperature. The yield of rice is influenced by the solar radiation
particularly during the last 35 to 45 days of its ripening period (www.Wikipedia, 2010). The
effect of solar radiation is more profound where water, temperature and nitrogenous nutrients are
not limiting. But in the case of Jumla nitrogen is a limiting factor for all crops and rice is no
exception because Jumla has been declared organic district in 2009 by the DDC, Jumla.
Therefore, after declaration of Jumla as organic district, there is no question of applying any
chemical fertilizers for the farming and rice could not be an exception until the declaration
prevails. In hills because of clouds during reproductive phase of rice, for example, rice varieties
Chandanath-1 and Chandannath-3 in Jumla face less sunshine duration during the grain filling
period resulting to low assimilation. However, as the crop advances there is bright sunshine
during ripening period of the crop that hastens development of carbohydrates in the grains despite
low temperature in high altitudes.
The correlation between the annual average temperature and the productivity of the rice is found
to be -0.13632 whereas the correlation between the annual precipitation and the productivity of
rice is found to be 0.535504. This implies that the increase in annual average temperature has
negative impact in the productivity of rice whereas the increase in the precipitation has positive
impact in the productivity of rice.
6.4 Public Perception on Climate Change
Focus group discussion, Key informants (socially active persons) and households' survey were
taken to collect the information about past evidence of climate and its impacts. Local adaptation
measures were also observed. Respondents showed their experience over past climatic events,
however 75 % of respondents were unclear about climate change and 95% people were well
satisfied with the present weather and climatic condition.

44
Very less respondents were well aware about climate change, its possible impacts and needs of
adaptation. But they have had experienced increase in temperature, erratic rainfall pattern, flash
flood and drought. Before 3 years ago they have the problem of drought at the community but in
the recent years they have sufficient rainfall at a time. A number of indicator have been used by
respondents to justify the rise in temperature like as diseases in rice plant (99%), elongated
growing periods (78.9%), early snow melt (66%), introduction of mosquito (98%), decreases
amount of water resources (78.6%), drought. In these years they were facing untimed rainfall and
big hailstorm.
Extreme rainfall and hailstorm occurs on post monsoon season. Regarding the perception on
changes in temperature, 95% showed in these years weather condition is much good than
previous years. They were agreed about the month of coldness and snow fall time has been
changed in the recent years. The most significant evidence of climate change is associated with
agriculture diseases.
6.5 Climate Change Impacts and Adaptation practices
6.5.1 Agriculture
Agricultural land at the bank of the Tila River is one of the highest productive lands for Jumla.
Most of the residents of the Kartikswami VDC have their agricultural land at the side of Tila
River. Rice, wheat, barley, potato, maize etc. are the major production. They have the traditional
and local practices of farming. According to respondents and key informants due to erratic
rainfall, hailstorm and increased temperature quickly affects the production of agriculture.
Especially production of local Rice (Orizya sativa) has been decreased by 50%.
Introduction of new diseases (blast) on rice were the major problem (Rice blast is caused by the
Ascomycota fungus). However, respondents said that they were using new varieties of rice seed
(Chandanath 1 & 3) have been good in recent years. In the recent days very few peoples have
grown high altitude local rice (Marci rice) because of their wellbeing only, said one of the
respondents. There were also reported that the production of barley, corn and potato had also
decreased due to early snowmelt, hailstorm and erratic rainfall. According to respondents the
quality of apple is also slightly decreasing in the recent years it is due to the less snowfall on
winter. Respondents also reported that there has been changing in cropping time by two weeks in
the recent years.
Due to the less production and crop failure in the community especially in Dalit community
seasonal migration to India and selling labor in local market and community is used as common
adaptation measures. According to the participants of focus group discussion in the village they
are taking loan for food security every year.
6.5.2 Water Resources
The area is not vulnerable to water scarcity and water related hazard. But according to
respondents the source of water in springs, ponds/wells are decreasing. They were also reported
that in the recent years the quantity of water in the river has been decreasing. In all focus group
discussion and key informant interview respondents reported, early snow melts, very less
snowfall at the mountains and low and erratic rainfall would be the causes of less water at the
river in dry season. The sources of drinking water near village were drying up and they have to go
far for drinking water in near future.

45
6.5.3 Forest and Biodiversity
Deforestation is the major problems of the district, human impact on forest had found very high.
Many wild species and medicinal plant were found at the jungle before 10 years but in the recent
years no wild species can be seen at the nearby jungle. Collection of NTFPs was the major source
of income for poor houses in the area has been decreasing every year. Out of total respondents
85% reported that there was the shifting of flowering time by one month of many plant species.
6.5.4 Human and Livestock Health
The village is not induced by climate related health hazard yet. In the focus group discussion, key
informant interview and households survey they were not reported any new diseases on human
and livestock health. There were the facilities of health post. But medicine and capable human
resources at the health post was the problem.
6.6 Vulnerability and Climate Change
Table 10 Vulnerability Calculation
See Appendix-VII
The Kartikswami VDC is found to be medium vulnerable to climate change and its induced
disaster with the 2.16 vulnerability ranking based on the adaptive capacity, exposure and
sensitivity towards climate change.
The adaptation capacity was medium with the ranking 2.58 as it has the modest access to the
primary, secondary and tertiary indicators of the adaptive capacity. With more than 85%
households having access to the drinking water facility, less than 10km distance for the access to
the district headquarter and with impressive literacy rate, sanitation rate and access to technical
Exposure (E)* Sensitivity (S)* Adaptability (A)* Vulnerability= E*S/A
2.5 2.23 2.58 2.16
Box 1.
Mr. Dal Bahadur Kami said,
"Due to the less production of crops, there was the pressure to harvest timber and non-
timber forest products whereas due to the less moisture, the rangelands have been less
productive in the recent years. Less snowfall and erratic rainfall have affected on
rangelands, grazing of livestock and collection of Non-Timber Forest Products."

46
services the VDC is moderately capable to adapt against any climate induced disaster in near
future.
The exposure towards the climate change and its induced disaster is also moderate with the
exposure ranking of 2.5 out of 4 in average. As there is no any significant change in the average
temperature and precipitation the exposure is quite normal. The flowering time of some species
and the harvest of some crops have changed with average 15 days, which can be the alarming for
future exposure.
Similarly, the sensitivity towards the climate change is also moderate with the value of just 2.23.
The increase in some diseases like asthma, dysentery etc in Humans and the introduction of
disease like blast in the rice is the area of concern. Since, all the cultivable land of this VDC are
situated in the bank of Tila River the VDC is likely to affected by the water induced hazard like
flooding, erosion etc in near future.
Although, the overall effect of the climate induced hazard on the Kartikswami VDC is moderate
still the exposure and sensitivity can accelerate in any time in future. Similarly, the adaptive
capacity also needs to be increased significantly to address the climate induced hazard in the
coming future.

47
Chapter VII
Conclusions and Recommendation
7.1 Conclusion
From the study it can be concluded that the climate of the area is changing and has a impact on
people's daily life. In the village adaptive capacity is low due to economic status and inequitable
access to the resources. The results showed that the high variation in climatic pattern have
significant impact on livelihoods of villagers. The results also supported by hydro-
meteorological data showed changing in weather condition of the study area. Moreover, rice
cultivation in Jumla was found to be associated with socio-cultural as well as special agronomic
practices. The rice yield kg/He was decreasing tremendously in the past few years which is
somewhat increasing in the present days. The traditional Marshi rice is being replaced with the
newer variety like Chandanath 1 and Chandanath 2. The temperature change has negative co-
relation with the productivity whereas the change in precipitation has positive co-relation with
the productivity.
The Kartikswami VDC is found to be medium vulnerable to climate change and its induced
disaster with the 2.16 vulnerability ranking based on the adaptive capacity, exposure and
sensitivity towards climate change. The adaptive capacity is not adequate and is unlikely to
support the climate induced disaster in the future. However, due to the availability of some of the
development infrastructure recently and based on the changing socio-economic scenario of the
district the condition is likely to improve in the near future.
After the study of the impact of climate change in the Kartikswami VDC it is found that due to
the less production and crop failure in the community especially in Dalit community seasonal
migration to India and selling labor in local market have risen up in recent days. According to the
participants of focus group discussion in the village they are taking loan for food security every
year. This represents the tragic situation of the Karnali as a whole. The responsible stake holders
need to come up with the detail planning and programs as soon as possible to stop the flowing of
people as a labor in India.
The study of the people's perception about climate change is very interesting and thinkable.
About 95% of the respondents believe that the temperature is rising in these days and they are
enjoying this risen temperature in compare to the past crispy and cold days. But, the extreme
rainfall and hailstorm occurrence on post monsoon season have been real problem and is proved
to be very damaging. The rainfall duration has decreased than past but the intensity has
increased.

48
7.2 Recommendation
The climatic impact on the livelihood of people at higher altitudes needs a multi dimensional
approach to tackle the issue. On the basis of the findings and observations of this study, the
following recommendations are made:-
1. There is a lack of sufficient study on the impacts of climate change in the higher altitude.
Hence, more study and research is recommended to know the consequences of these
changes in the livelihood of the people.
2. The research study focusing on the reasons behind the change in the climatic factors in
the higher Himalayas should be done elaborately.
3. The livelihood strategies need to be diversified to include other income sources besides
farming. This may include skill enhancement on adding values to the agriculture produce
such as fruits and vegetables for export by processing them.
4. Introducing drought resistant varieties of crops can help reduce loss of production due to
drought.
5. Micro finance schemes such as micro-credit, micro insurance etc with provisions for
providing loan with low rate of interest to the households suffering from losses due to
climatic condition is essential. Crop and livestock insurance scheme, agricultural subsidy
program should be launched by the government to the vulnerable communities.
6. Any new project that is implemented should include climate adaptation elements to
increase their resiliency.
7. The promotion of other crops like Marshi, Chino, Uwa, Barley, Millet etc. which have
higher calorie value than the rice plant is highly recommended to tackle with the existing
food security problem of the Karnali zone.
8. The access to the basic health facilities, education, transportation, communication etc.
needs to be increased which helps to upgrade the standard of living of the local people
making them more capable to face the climate induced disaster.
9. Karnali zone is very beautiful and appealing, having a huge potential of tourism in future.
The responsible stakeholders should promote the eco-tourism which will definitely help
the locals to enhance the resistivity against the climate change.

49
References:
Aalst, M.K.V., Cannon, T. and Burton, I. (2008). Community level adaptation to climate change:
The potential role of participatory community risk assessment. Global Environmental Change
18(1), 165-179.
Adaptation Assessment. Version 2. Prepared by T.R. Carter on behalf of the Intergovernmental
Panel on Climate Change, Task Group on Data and Scenario Support for Impact and Climate
Assessment, 66 pp.
Agrawala, S., Gigli, S., Raksakulthai, V., Hemp, A., Moehner, A., Conway, D., El Raey, M.,
Amhed, A.U., Risbey, J., Baethgen, W. and Martino, D. (2005). Climate change and natural
resource management: key themes from case studies. Bridge Over Troubled Waters – Linking
Climate Change and Development, S. Agrawala, Ed., OECD, Paris, 85-146.
Agrawala, S., Raksakulthai, V., van Alast, M., Larsen, P., Smith, J. and Reynolds, J. (2003).
Development and climate change in Nepal: Focus on water resources and hydropower.
Organization for Economic Co-operation and Development,
COM/ENV/EPOC/DCD/DAC(2003)1/FINAL.
Agrawala, S., V. Raksakulthai, M.van Aalast, P. Larsen, J. Smith and J. Reynolds, 2003:
Development and climate change in Nepal: Focus on water resources and hydropower.
Organization for Economic Co-operation and Development, Paris, 64 pp.
Arnell NW (1999) Climate change and global water resources. Global Environ Change 9:S31–49
Arun Bhakta Shrestha. (2009). The changing Himalayas. ICIMOD
Baidya, S.K ., Shrestha, M. L. and Sheikh, M. M. (2008). Trends in daily climatic extremes of
temperature and precipitation in Nepal. Journal of Hydrology and Meteorology, 5 (1), 38-51.
Bajracharya, S.R., Mool, P.K., and Shrestha, B.R. (2007). Impact of climate change on
Himalayan glaciers and glacial lakes: Case studies on GLOF and associated hazards in Nepal
and Bhutan. International Center for Integrated Mountain Development (ICIMOD), Nepal.
Bohle, H. (2001). Vulnerability and criticality: perspectives from social geography. IHDP
Update, 2.
Brooks, N. (2003). Vulnerability, risk and adaptation: A conceptual framework. Tyndall Centre
for Climate Change Research and Centre for Social and Economic Research on the Global
Environment (CSERGE), School of Environmental Sciences University of East Anglia. Tyndall
Center Working paper 38.
Chalise, S. (1994). Mountain Environment and Climate Change in the Hindu-Kush Himalays. In:
Mountain Environment in Changing Climates [(Benisten M. (ed.)],London, pp. 382-404

50
Chaulagain, NP (2006) Impacts of climate change on water resources of Nepal, the physical and
socioeconomic dimensions. Unpublished master‟s thesis, University of Flensburg, Germany
Cleaver, K.M. and Schreiber, G.A. (1994). The population, agriculture and environment nexus in
Sub-Saharan Afric. The World Bank, Washington, DC.
Dey B, Kumar O (1983) Himalayan winter snow cover area and summer monsoon rainfall over
India. J Geophys Res 88(C9):5471–5474
Dhital, M., Khanal, N., & Thapa, T. (1993). The Role of Extreme Weather Events, Mass
Movements and Land-use Changes in increasing Natural Hazards. Kathmandu: ICIMOD.
Dow, K., & T. E. Downing (2006). The Atlas of Cliamte Change: Mapping the world's greatest
challange. London, UK: Earth Scan.
Eakin, H. and Bojorquez-Tapia, L.A. (2008). Insights into the composition of household
vulnerability from multi-criteria decision analysis. Global Environmental Change 18(1) 112-127.
FAO (2008). Climate change and adaptation and mitigation. The Food and Agriculture Sector.
Technical background document from expert consultation held on 5-7 March 2008
Grieser J. (2007) Investigation of Climate-Change Impact on Agriculture:Application of FAO
Strategy to Cereals in Morocco pp. 3,29. Institut National de la Recherche Agronomique (INRA,
Morocco),Istituto di Biometeorologia di Concilio delle Riceche Nationale (IBIMET of CRN,
Italia) and FAO of the UN.
Hedger, M.M., Mitchell, T., Leavy, J., Greeley, M. and Downie, A. (2008). Desk Review:
Evaluation of adaptation to climate change from a development perspective. Institute of
Development Studies. Global Environment facility.
Huq S., Rahman A., Konate M., Sokona Y. & Reid H. (2003) Mainstreaming Adaptation to
Climate Change in Least Developed Countries (LDCs) pp. 8-11. United Nation, UK.
Ichiyanagi K, Yamanaka MD, Muraji Y, Vaidya BK (2007) Precipitation in Nepal between 1987
and 1996. Int J Climatol 27(13):1753–1762
Intergovernmental Panel on Climate Change. (2001a) Climate Change 2001: The Scientific
Basis. Intergovernmental Panel on Climate Change.
Intergovernmental Panel on Climate Change. (2007a) Working Group I: The Physical Basis of
Climate Change. Accessed on 8 May 2007 from http://ipccwg1. ucar.edu/wg1/wg1-report.html.
IPCC Technical Summary, 2001. Climate Change 2001: The Scientific Basis. Technical
Summary of the Working Group I Report [Houghton, J.T., Y. Ding, D.J. Griggs, M. Noguer, P.J.
van der Linden, X. Dai, K. Maskell, and C.A. Johnson (eds.)]. Cambridge University Press,
Cambridge, United Kingdom and New York, NY, USA, 94pp.

51
IPCC-TGICA, 2007: General Guidelines on the Use of Scenario Data for Climate Impact and
Karki, M. B. (2007). Nepal's Experience in Climate Change Issues. 14th
Asia Pacific Seminar on
Climate Change. Sydney, Australia: 14th
Asia Pacific Seminar on Climate Change.
Kates, R.W. (2000). Cautionary Tales: Adaptation and the Global Poor. Climate Change, 45 (1),
5-17.
Kelkar U., Narula K. K., Sharma V. & Chanda U. (2008) Vulnerability and Adaptation to
Climate Variablility and Water Stress in Uttarakhand State, India. Global Environmental Change
18.
Kelly, P.M. and Adger, W.N. (2000). Theory and practice in assessing vulnerability to climate
change and facilitating adaptation. Climatic Change, 47 (4), 325–352.
Khanal, N.R.(2005). Water Induced Disasters: Case Studies from the Nepal Himalayas. (A.
Hermann, Ed.) pp. 179-188.
Kurukulasuriya P. & Rosenthal S. (2003) Climate Change and Agriculture:A Review of Impacts
and Adaptations pp. 3-4. The World Bank Environment Department, Washington, D.C. ,U.S.A.
Lim, B and E. Spanger-Siegfried (eds), I.Burton, E. Malone, S. Huq, 2005: Adaptation Policy
Frameworks for Climate Change. Developing Strategies, Policies and Measures, UNDP.
Manandhar, S. (2009). Perception of and adaptation to climate change by farmers in different
ecological zones of the western development region of Nepal. (Master‟s thesis, Asian Institute of
Technology, 2009). Bangkok: Asian Institute of Technology.
Marahatta, S., Dongol, B.S., Gurung, G.B., 2009. Temporal and spatial variability of climate
change over Nepal (1976 – 2005). Practical Action Nepal Office, 2009.
Marrakesh from 29 Octuber to 10 November 2001. United Nations Framework Convention on
Climate Change .
Mirza, M. M. Q. (2003). Climate change and extreme weather events: can developing countries
adapt? Climate Policy 3 (3), 233–248.
O‟Brien, K., Leichenko, R., Kelkar, U., Venema, H., Aandahl, G., Tompkins, H., Javed, A.,
Bhadwal, S., Barg, S., Nygaard, L., and West, J. (2004). Mapping vulnerability to multiple
stressors: climate change and globalization in India. Global Environment Change, 14 (4), 303-
313.
Paavola, J. (2008). Livelihoods, vulnerability and adaptation to climate change in Morogoro,
Tanzania. Environmental Science and Policy, 11 (7), 642-654.

52
Regmi, B.R., Thapa, L., Sharma, G.B. and Koirala, S. (2008). Climate change risk, vulnerability
and adaptation strategies at community level. Local Initiatives for Biodiversity, Research and
Development (LI-BIRD). Kathmandu, Nepal.
Reilly, J. (2001). Agriculture: The potential Consequence of Climate Variability and Change for
the United States. NewYork, NY: US National Assessment of the Potential Consequences of
Climate Variability and Change, US Global reseach Program,London, Cambridge University
Press.
Ribot, J.C., Magalhães, A.R. and Panagides, S.S. Eds. (1996). Climate Variability, Climate
Change and Social Vulnerability in the Semi-Arid Tropics. Cambridge University Press,
Cambridge, pp. 189.
Sharma, A.R. (2009). Community Vulnerabilities to Climate Change and Local Coping
Mechanisms in Khudi Watershed. Thesis submitted for the partial fulfillment of the award of
MSC in Environmental Science to Centre Department of Environmental Science, Tribhuvan
University, Kirtipur, Kathmandu, Nepal.
Smit, B. and Pilifosova, O. (2001). Adaptation to Climate Change in the Context of Sustainable
Development and Equity. Contribution of the Working Group to the Third Assessment Report of
the Intergovernmental Panel on Climate Change. Cambridge University Press, Cambridge, UK,
pp. 879–912
Smit, B. and Wandel J. (2006). Adaptation, adaptive capacity and vulnerability. Global
Environmental Change, 16 (3), 282-292.
Smith, J.B. (1997). Setting priorities for adapting to climate change. Global Environmental
Change, 7(3), 251-264.
Sujata Manandhar • Dietrich Schmidt Vogt Sylvain R. Perret • Futaba Kazama. (2010). Adapting
cropping systems to climate change in Nepal:a cross-regional study of farmers’ perception and
practices Springer-Verlag 2010
Tunner II, B.L. (2003). Science and Technology for Sustainable Development Special Feature: A
framework for vulnerability analysis in sustainability science. Proceeding of the national
Academy of Sciences of the United State of America (PNAS), 100, 8059-8061.
UKCIP , 2004: Costing the impacts of climate change in the UK, Oxford UK
UNFCCC. (1992). United Nations Framework on Convention on Climate Change. United
Nations.
UNFCCC. (2001). United Nations Framework Convention on Cliamte Change. Retrieved July
29, 2010, from http://unfccc.int/resource/docs/cop7/13a02.pdf
UNFCCC. (2002). Report of the Conference of the parties on its seventh session held at

53
UNFCCC. (2006). Climate Change:Impacts, Vulnerabilities and Adaptation in Developing
Countries. United Nations Framework Convention on Climate Change.
UNFCCC. (2007). UNFCCC Retrieved September 13, 2007, from United Nations Framework
Convention on Climate Change: http://unfccc.int
UNISDR. (2005). International Strategy for Disaster Reduction. Retrieved January 10,2010,
from http://www.unisdr.org/eng/public_aware/world_camp/2005/2005- iddr.htm
Westerhoff, L. and Smit, B. (2009). The rains are disappointing us: dynamic vulnerability and
adaptation to multiple stressors in the Afram Plains, Ghana. Mitigation and Adaptation
Strategies for Global Change, 14 (4), 317-337.
WMO. (2004). Weather, Climate and Water in the Information Age. World Meteorological
Organization.
Yohe, G. and Tol, R., (2002). Indicators for social and economic coping capacity moving toward
a working definition of adaptive capacity. Global Environmental Change, 12 (1), 25-40.

54
Appendix I: Questionnaire for Household Survey
Interviewee: Sex: M/F Age:
Village:
Location:
Households Information:
1. Are you permanent resident of this locality?
Yes-1 No-2
If No:
From where you are migrated to this place?
Same locality-1 Same District-2
Same nation-3 Out of Nepal-4
If local migration (from same locality):
What is the cause of migration?
………………………………………………………………………………………………………
………………………………………………………………………………………………………
………………………………………………………………………………
How much time you have spent here?
Less than 10 years More than 10 years
2. How many members in your household are economically active?

55
3. What is your yearly income and expenditure (recent years)?
S.N Income
Expenditure
Sources Member involved Amount Sources Amount
1 Agriculture Food
2 Business Cloths
3 Gov service Education
4 Private service Health
5 Job abroad Occasion/Festival
6 Daily wages Agriculture
7 Others Other
Total Total
4. Do your family income generation activities changes these days?
Yes-1 No-2
If Yes:
What are your family income generation activities in past?
………………………………………………………………………………………………………
Agriculture:
1. Land Holding
Irrigated land Rainfed land Others
Khet
Bari
Pakha
2. How many seasons you conduct agricultural activities?
3. What are the major types of crops you cultivate?
4. What are the common Fertilizer uses?
5. What are the common pesticide/ chemical uses?

56
6. Are you facing any problem due to agro-chemicals in farm?
7. Do you know about organic farming?
8. Can you give the statistic of animal in this this area?
Buffalo ______________ Cows_________________ Goat_______________
Pig ____________________ Chicken_________________ Other_______________
Climate change Information:
1. Have you noticed any changes in your environment (weather, climate, temp, wind etc) over
the past 10-20 years?
Yes No Not Sure
If yes, can you tell me what changes you have noticed?
………………………………………………………………………………………………………
………………………………………………………………………………………………………
2. Before this interview, had you heard about climate change?
Yes No Don‟t Know
3. What is your source of hearing about?
a) Radio b) Newspaper
c) Television d) NGO/GO bodies
e) Others, specify plz
4. Which components of environment are affected?
a) Water Resources b) Agriculture
c) Environment and Sanitation d) Human settlement and Infrastructures
e) Others, Please specify,

57
5. Have you recently experienced any extreme/unusual weather events for example, extreme
flood, landslide, GLOF and Drought etc?
Yes No Don‟t Know
If “yes”, please describe the most recent significant event:
When did it happen?......................................
What happened?............................................................
6. Have you recently attended a consultation, workshop or school lessons on Climate Change?
Yes No Don‟t Know
If yes, who arrange the event?...................................................
7. What are your thoughts about the following statements about CC?
Agree Disagree Unsure
a) Climate Change is happening?
b) CC is affecting the people of this community already?
c) Every individual can do something to ADAPT to climate change?
d) Living for today is more important than worrying about the effects of Climate
Change.
e) CC will reduce the quality of life of your children & grandchildren in the future?
Adaptation:
Read out:
“Adaptation means doing something NEW or DIFFERENT to what you or your community did
in the past in order to adapt to climate change”
1. What have you done ALREADY to adapt to climate change?
2. Have you already planned to do any things in the FUTURE to adapt to climate change?

58
3. If necessary, in the long term, would you be prepared to move with your family to?
4. The central/local government is doing things to help you to ADAPT to CC locally?
Yes No
If “yes” please give the examples:
CAUSES OF CLIMATE CHANGE
1. What do you think what are the main cause of climate change?
a) Deforestation
b) Burning fossils fuels
c) Don‟t know
d) Others (please specify)
2. Do you have anything you would like to add about any climate change issues?
______________________________________________________________________________
______________________________________________________________________________
______________________________________________________________________________
______________________________________________________________________________

59
Appendix II: Checklist for focal group discussion
1. Have this community experienced any changes in temperature within last 30 years?
2. State what type of changes?
3. What do you think about the impacts of these changes in agriculture, water resources, and
diseases spreading?
4. What are the measures adopted to cope with these temperature changes?
5. Have this community experienced any changes in rainfall pattern within last 30 years?
6. State what type of changes?(increase/ decrease)
7. Do you fell the following?
a) Unusual rainfall
b) Heavy rainfall at once
c) Long rainy seasons
d) Delay in monsoon starting time (on set of monsoon)
e) Longer drought
f) Winter rainfall (increase/decrease)
g) Increase in hail storm
h) Wind storm
8. What do you think are the consequences of changed rainfall pattern in?
a) Agriculture (increase/decrease in agriculture yield)
b) Water resources (increase/decrease in water availability, flood frequency, drought)
9. What are you doing to cope with these rainfall changes? (Delay cropping, new variety of
plantation etc.)
10. Have you noticed any changes in wind pattern in this area?
11. Is there any long drought in this area in past years? How long was it? What are the impacts
and how you mitigate?
12. Enlisting new emerging problems relating to climate (agriculture, change in forest
characteristics, flowering and fruiting seasons, changes in water resources, health problem,
pest and diseases)
13. Measures adopted to cope with these problems (change in consumption pattern, use of
fertilizer and manure, migration)
14. Most significance disaster in this community? Its main cause?
15. What are the losses due to disaster within last 10 years? Any persons migrate from this area
due to disasters?

60
Appendix III: Checklist for key informant interview
1. Information on observed trend in rainfall, temperature and natural disasters.
2. Information on sources and use of water resources, extent of dependency and use of forest
and wetland resources, forest area of research area)
3. Recently observed change in forest, water and wetland resources.
4. Characteristics of agricultural crops (irrigation, temperature, fertilizer use)
5. Enlisting new emerging problems relating to climate (agriculture, change in forest
characteristics, flowering and fruiting seasons, changes in water resources, health problem,
pest and diseases)
6. Enlisting infrastructure in the area.
7. Any capacity development training especially for new agriculture practices, income
generation activities.
8. Profile on local government, NGO, INGO, Government office, other external organization.

61
Appendix IV: Mean Maximum Temperature Data of Jumla
Year Jan Feb Mar Apr May Jun Jul Aug Sep Oct Nov Dec
1981 12.50 15.30 16.10 21.30 24.00 26.70 23.70 23.70 23.40 22.10 17.20 15.30
1982 14.1 13.6 16.6 20.6 21.8 23.4 25 24.2 23.3 20.5 17.9 16.3
1983 13.9 13 17.9 19.8 22.4 25.3 25.1 25.2 24 20.6 17.3 14.4
1984 11.7 14.2 21.1 20.9 26.2 25.4 23.8 25 22.9 22.4 16.7 16.2
1985 10.8 17.5 21.5 22.2 24.1 25.8 23.5 24.8 23.4 20.1 17.8 16.4
1986 13.9 15.3 17.7 20.9 21.8 25.9 24.2 24.4 23.6 20.7 18.8 12.9
1987 14.9 15.9 18.8 20.7 22.1 27 24.8 25.2 25.4 21.9 20.8 18.6
1988 16.1 15.5 17 22.7 25.3 26.3 24.8 23.9 25.1 22.8 18.3 15.6
1989 12 14.2 18.8 22.1 24.7 26.1 26 24.5 24.3 22.3 17.3 16.1
1990 18.2 12.4 15.4 20.6 23.8 27.1 23.5 24.4 25.3 21.6 19.3 15.1
1991 12.2 14.3 16.5 19.9 24.7 24.9 25.9 24.5 24.6 22.7 17.2 13.9
1992 13.3 13.6 18.3 22.6 22.8 26 25.1 23.8 23.6 20.8 17.9 15.9
1993 12 15.9 14.4 20.4 23.9 24.4 25 24.8 22.3 22.1 18.7 16.5
1994 13.5 12.7 20.3 19.6 23.8 26.8 25.9 23.7 24.8 22.2 17.1 14.9
1995 10.5 12.8 17.1 20.9 25.5 26.3 24.9 24.1 24.3 23 18.1 14.6
1996 12.7 13.6 18.8 21.2 24.8 25.5 25.3 23.9 24.2 19.9 18.9 17.4
1997 12.4 13.7 18 19.3 22.9 25.7 26.7 24.5 24.5 19 16.7 11.8
1998 15 15.2 16.2 21.9 26 27.4 25.1 24.6 24.8 22.5 19.3 18
1999 14.4 17.7 21.4 25.3 25.9 25 25.1 24.4 24.5 21.5 19.4 16.7
2000 13.9 11.9 16.8 22.6 24.4 23.9 24.2 24.4 23.1 23.1 18.6 17.4
2001 14.8 16.5 17.7 20.8 23.8 24.3 25.4 25.3 25.7 23.5 19.8 16.9
2002 12.6 14.8 18.7 21.4 23.9 26.5 26.4 24.4 22.3 22 19 16.2
2003 15.7 14.6 18 22.1 24 26.1 24.6 24.9 23.9 23.3 19.5 15.3
2004 13.3 17.9 22.7 22.4 24.4 26.2 25.6 25 24.8 20.5 17.7 17.3
2005 11.8 12.9 19.1 21.7 24.3 28.1 24.5 25.4 24.5 22.8 19.9 16.2
2006 17.1 20.4 18.7 21.4 25.1 26.3 25.7 25.4 26 22.8 19.1 17.5
2007 16.6 14.2 18 23.9 24.5 26.7 24.8 24.9 25.2 23.3 19.5 17.2
2008 12.3 16.4 20.2 22.6 23.6 24.9 24.8 24.8 24.7 22.5 21.5 18.9
2009 18 18.2 20.3 24.2 24.2 27.9 26.4 25.7 23.6 21.8 18.9 16.3
2010
16.6 15.6 22.5 24.9 24.6 26.8 24.7 24.7 24.1 23.4 20.8 16.6

62
Appendix V: Mean Minimum Temperature of Jumla
Year Jan Feb Mar Apr May Jun Jul Aug Sep Oct Nov Dec
1981 -4.9 -2.7 1 5 8.3 9.2 15.9 15.5 11.7 4.7 -1 -3.3
1982 -3.7 -2.1 0.5 3.3 5.7 12.6 14.8 15.1 10.7 2.6 -0.5 -5.6
1983 -4.9 -4.3 -0.3 2.8 7.6 10.5 15.3 15.7 13.3 5.6 -2.3 -5.8
1984 -7.2 -4.5 0.5 4 9.2 15.1 15.3 14.7 10.2 3.7 -3 -4.8
1985 -4.2 -4 0.7 3.8 8 13.3 15.5 15.9 12.9 5.7 -1.6 -3.9
1986 -5.2 -3.5 0.1 3.4 6.1 12.9 15.4 14.8 12 4.2 -1.7 -4
1987 -4.6 -2.4 0.6 3.8 5.7 12.2 15.6 15.4 12.4 3.7 -2.5 -4.1
1988 -4.4 -2.7 0.6 3.7 7.7 12.7 16 15.3 11.9 3.1 -1.8 -3.8
1989 -5.8 -4.9 -1.7 1.7 7.2 12.7 15.3 14.7 13.1 3.6 -2.1 -4.4
1990 -5.1 -1.4 -0.1 2.9 9.2 14 15.4 14.9 13.3 3.8 -1.6 -4.4
1991 -6.2 -1.8 0.7 2.9 6.9 13.4 15.7 15.4 12 2.2 -2.1 -4.4
1992 -3.7 -4.3 0.3 2.8 6.6 11.7 14.5 15.1 12 5 -0.6 -5.1
1993 -4.4 -1.3 -1.1 3.7 8.3 13 15.7 15.5 10.5 0.8 -2.7 -5.8
1994 -4.3 -3.9 0.1 2.4 7.5 13.9 16.3 15.6 12.9 1.5 -1.9 -5.4
1995 -7 -3 0.7 2.7 8.1 15 15.7 15.3 12.9 4.4 -1.5 -4.6
1996 -4.8 -3 1.3 3.2 6.8 13.4 15.7 15.2 11.8 5.7 -2 -5.9
1997 -5.9 -3.6 0.6 4.1 5.4 11.9 16.5 14.8 12.6 3 -0.4 -3.8
1998 -5.1 -2.9 0.7 4.7 9.2 13.8 16.5 16 13.5 7.9 0 -4.2
1999 -4.8 -1.4 0 4.3 10.2 13.3 16 15.2 13.2 5.4 -1.9 -4.1
2000 -8.1 -9.1 -5.9 -0.5 4.8 9.2 11 14.4 11.3 3.6 -0.3 -4.8
2001 -5 -3.4 0.1 4.4 9.9 14.4 16.1 15.4 12.3 6.1 -1.3 -4.8
2002 -4.9 -2.6 1 4.4 9.3 13.3 16.1 15.4 11.6 4.6 -1.4 -4.6
2003 -5.4 -2.5 0.5 4.4 6.1 13.1 15.8 15.6 13.8 3.2 -2.1 -4.6
2004 -4.2 -3.5 0.8 5.5 8.3 13 15.3 15.1 13.4 4.7 -1.5 -3.7
2005 -3.9 -1.7 1.7 2.9 6.6 12.2 16.1 15.3 13.3 4.8 -3.3 -5.5
2006 -4.2 -0.6 0.8 3.8 10 12.8 16.6 15 12.8 4.2 -0.5 -3.2
2007 -5.8 -1.4 0.6 4.9 8.8 14 15.9 15.7 13.2 4.9 -1.3 -4.1
2008 -3.5 -3.6 0.8 4.1 8.1 14.9 16 15.4 10.4 4.4 -1.6 -2.9
2009 -3.3 -2.8 0.4 4.2 8.3 12.2 16.1 15.8 12.3 4 -1.4 -3.7
2010
-4.3 -2.7 1.8 5.3 8.1 12.6 16.1 16.1 13.4 4.7 0 -6.1

63
Appendix VI: Precipitation Data of Jumla
Year Jan Feb Mar Apr May Jun Jul Aug Sep Oct Nov Dec
1981 9.5 33.4 132 14.2 45.4 147 277.2 280.9 87.4 5.1 0 13.8
1982 27.8 26.2 73.5 27.4 50.8 DNA 268.9 192.2 201.8 0.3 45.4 10.6
1983 46.4 133.1 168 49.1 144.9 63.6 82.4 200.4 118.7 3 9.5 32
1984 34.9 14.2 16.8 89.5 86.4 73.3 104.4 191.3 160.9 112.3 0 11.3
1985 22.3 37.6 25.6 29 16.1 117.2 136 104 118.7 16.2 0 5.5
1986 42.4 2.1 27.5 55.1 45.1 47.8 170.1 128.8 143.1 147 0 67.6
1987 2.8 20.3 51.9 70.3 71.3 33.1 327.5 126.1 47.3 58.2 1.1 46.3
1988 10.6 26.7 19.5 76.3 109 57.6 166.8 89.9 45.4 78.8 0 16
1989 9.1 85.3 117.6 26.4 45.4 83.4 274.9 164.5 39.6 0.6 1 37.2
1990 9.1 8.8 34.4 8.6 31.5 51.5 249.7 190.4 81.5 26.8 8.6 2.9
1991 0 76.1 96 30.9 28.9 98.8 183.5 196.3 89.1 17.7 1 11
1992 54.1 0 146.8 88.1 88.4 73.4 155.8 224.2 31.1 0 9.8 21.2
1993 58.1 13.5 28.1 14.3 42.3 44.5 153.6 233.7 138.5 31 0 0
1994 40.2 41.3 136.8 27.5 63.3 116.7 107.1 133.6 154.8 0 0 0
1995 40.8 54.1 7.8 46.5 55.2 31.1 318.7 207 51.6 0 0.8 0
1996 79.5 44.4 45.1 18.3 6.8 100.6 199.4 159.1 98.6 0.6 73.8 2.8
1997 46.9 109.9 31.2 29.2 20.1 47 105 251.8 89.3 102.4 0 0
1998 57.1 20.9 18.1 40.5 36.1 40.1 173.8 146.4 66.7 42.9 35.8 95.2
1999 2 41.6 91.1 47 47.7 58.6 106.1 171 171.7 51.3 45.6 0
2000 15.9 17.6 4.1 6.5 27.4 113.1 194.9 97.2 131.8 65.7 0 1.5
2001 9.5 41 42.4 55.8 74.2 159.7 197 143.4 145.8 3.8 9.8 4.2
2002 28.7 45.4 50.7 40.2 84.7 181.9 108.9 130.5 44.3 11.6 1.2 0
2003 74.7 55.2 62 114.9 45.6 29.3 44.3 290.9 89.8 12.2 23.3 0
2004 44.4 65.1 43.2 48.1 31.3 63.6 171.2 236.3 121.4 10.3 0 8
2005 22.6 0.7 0 59.3 79.1 64.9 123.7 215.7 71.8 46.4 1.2 0
2006 37.9 51.5 33.9 17.4 26.9 12.7 302.4 85.9 80 8.5 0 12.4
2007 0 0.5 46.2 45.1 59.5 36.6 236.8 218.4 57.9 10 23.2 13.5
2008 1.4 44.7 119.6 23.4 48 83.1 206.3 144.8 136.6 19.5 0.4 4
2009 24.7 2.2 32.1 36.7 82 201.8 178.2 250.8 141.4 15.1 0 1.7
2010
1.3 34.6 15.9 20.7 70.3 12.1 168.2 82 112.7 163.4 14.1 1

64
Appendix VII: Vulnerability Analysis form
1. Gateway System Analysis (Adaptive Capacity)
A. Primary System (Core System)
VDC Energy Water Land Food
Sufficiency
* (%
households
Total
Cooking
(%
relying on
traditional
sources)
Lighting
(% with
access
to solar
and
electricity)
Access to
Drinking
Water
(no.
households
)
Irrigation
(Ha.
arable
land
irrigated)
Average
landholding
size (ha)
Disaster
-affected
land
(%)
86 (1) 80.1(3) 99 (4) 32.1 (1) 0.141 (1) 42(3) 13.5(1) (14)
* Food sufficient households indicates the households with enough food provision for 12 months
B. Secondary System
V.D.C Transportation Communication Livelihood Shelter Total
Average
distance
to
highway
(km)
Road density
(distance/area)
Households per
mobile
(no.)
Population
engaged in
agriculture
(%)
Households
affected by
climate hazards
(%)
Households
living in
cement
houses
(%)
<10 (4) <5(1) 100(3) 92.7(1) 30(3) <5(1) (13)
C. Tertiary System
V.D.C Literacy
(%)
Sanitation
Coverage*
(%)
Cooperatives
(no.)
Nearest
markets
(Km)
Local
organizations
(no.)
Distance to
nearest
government
office (km)
Access to
technical
service at
district(%)**
Total
79.7 (4) 53.1 (4) 2 (1) <10 (4) >7 (4) <5 (4) 100 (4) (25)
* Sanitation Coverage= no. of households with toilets
** Technical Service Provider= Agriculture, Forest, Health, Animals etc.

65
D. Criteria and Indicators for Adaptation Capacity Assessment
Adaptation
Capacity
Indicators Criteria: Rank (1-4)
Cooking % relying on traditional sources <50:4; 50-70:3;70-90:2;>90:1
%access to solar and electricity <20:1; 20-50:2;50-85:3;>85:4
Number of households with drinking water tube well <20:1; 20-50:2;50-85:3;>85:4
Irrigated land (Ha) <50:1; 50-150:2;150-250:3;>250:4
Land holding size (Ha) <0.5:1; 0.5-1.5:2;1.5-3:3;>3:4
Disaster affected land <30:4; 30-60:3;60-75:2;>75:1
Food sufficient households <15:1; 15-30:2;30-50:3;>50:4
Distance to Highway <10:4; 10-25:3;25-50:2;>50:1
Road Density <5:1; 5-15:2;15-50:3;>50:4
Household per mobile <50:1; 50-200:2;200-700:3;>700:4
Population engaged in agriculture % <50:4; 50-70:3;70-85:2;>85:1
Household affected by climate hazard <10:4; 10-30:3;30-60:2;>60:1
Households living in cemented house <5:1; 5-10:2;10-20:3;>20:4
Literacy % <30:1;30-50:2;50-70:3;>70:4
Sanitation % <10:1; 10-30:2;30-50:3;>50:4
Cooperatives <3:1; 3-5:2;5-9:3;>9:4
Distance to the nearest market <10:4; 10-30:3;30-50:2;>50:1
Number of local organizations <3:1; 3-5:2;5-7:3;>7:4
Distance to nearest government office <5:4; 5-10:3;10-30:2;>30:1
Access to technical services <10:1; 10-30:2;30-65:3;>65:4

66
2. Analysis of Climate Change Exposure
A. Temperature Trend Analysis
V.D.C Temperature Indicators and Scoring of Temperature Change Trend
Less
exposure
(1)
Moderate
Exposure
(2)
High
Exposure
(3)
Very High
Exposure
(4)
Remarks
Hot
temperature
or days
Very less
or no
change at
all
Normal
Change
(Hot days
rise by less
than 1
month)
Moderate
Change
(Hot days
rise by 1-2
months)
Remarkable
Change
(Hot days
rise by
more than 2
months)
2
Cold
temperature
or Days
Very less
or no
change at
all
Normal
Change
(Hot days
rise by less
than 1
month)
Moderate
Change
(Hot days
rise by 1-2
months)
Remarkable
Change
(Hot days
rise by
more than 2
months)
2
B. Precipitation Change Analysis
V.D.C Precipitation Indicators and Scoring of Temperature Change Trend
Less
exposure
(1)
Moderate
Exposure
(2)
High
Exposure
(3)
Very High
Exposure
(4)
Remarks
Monsoon
Rainfall
Very less
or no
change at
all
Normal
Change
(Rainfall
days rise
by less
than 1
month)
Moderate
Change
(Rainfall
days rise
by 1-2
months)
Remarkable
Change
(Rainfall
days rise by
more than 2
months)
2
Winter
Rainfall
Very less
or no
change at
all
Normal
Change
(Rainfall
days rise
by less
than 1
month)
Moderate
Change
(Rainfall
days rise
by 1-2
months)
Remarkable
Change
(Rainfall
days rise by
more than 2
months)
3

67
C. Changes in the behavior of Plants
V.D.C Plant's
behavior
Indicators and Scoring of Plant behavior Change Trend
Less
exposure
(1)
Moderate
Exposure
(2)
High
Exposure
(3)
Very High
Exposure
(4)
Remarks
Change in
the plant's
flowering
and fruiting
time
Very less
or no
change at
all (less
than 7
days)
Normal
Change (8
to 15 days)
Moderate
Change
(16 to 21
days)
Remarkable
Change
(more than
21 days)
3
Absence of
local
species/
Presence of
new species/
Presence of
new disease
of insects
Very less
or no
change at
all
Normal
Change (1
new
species)
Moderate
Change (2
new
species)
Remarkable
Change (3
or more
species)
3
D. Change in availability of Water Resource (Physical Change)
V.D.C Availability
of Water
resource
Less
exposure
(1)
Moderate
Exposure
(2)
High
Exposure
(3)
Very High
Exposure
(4)
Remarks
Decrease in
Water
Resource
Very less
or no
change at
all
Normal
Change
(Water
availability
decrease
by less
than 1
month)
Moderate
Change
(Water
availability
decrease
by 1-2
month)
Remarkable
Change
(Water
availability
decrease by
more than 2
months)
3

68
E. Change in the activities regarding livelihood
V.D.C Activities
regarding
Livelihood
Less
exposure
(1)
Moderate
Exposure
(2)
High
Exposure
(3)
Very High
Exposure
(4)
Remarks
Change in
the sowing
and
harvesting
of
agricultural
crops
Very less
or no
change at
all (less
than a
week)
Normal
Change (1-
2 weeks)
Moderate
Change (2-
3 weeks)
Remarkable
Change
(more than
3 weeks)
2
New disease
in Human
No new
disease
reported
1 new
disease
reported
2 new
disease
reported
More than
2 new
disease
reported
2
F. Change in the Hazard Events
V.D.C Rate of
Hazard
Less
exposure
(1)
Moderate
Exposure
(2)
High
Exposure
(3)
Very High
Exposure
(4)
Remarks
Increase in
the event,
number and
order of
Hazard
Very less
or no
change at
all (Once
in a 10
years)
Normal
Change (2-
3 in a 10
years)
Moderate
Change (4-
6 in a 10
years)
Remarkable
Change
(More than
10 in a 10
years)
3

69
3. Climate Change Impact's Order (Sensitivity)
A. Impact of Hazard (Humans)
V.D.C Human Loss
(Less-1
Very high-
4)
Loss in a
human
settlements and
physical infra
structure (Less-
1 Very high -4)
Loss in a
land
(Less-1
Very
high -4)
Impact on
Human
Health
(Less-1
Very high -
4)
Impact on
Refugee or
Migration
(Less-1
Very high -
4)
Total
Impact
(Less-1
Very high -
4)
1 2 2 2 2 9
B. Impact of Hazard (Ecological)
V.D.C Change in
Agricultural
Products, Bio-
diversity
(Less-1 Very
high-4)
Change in
Forest area,
Wildlife (Less-1
Very high -4)
Change in the
Water
resource and
Energy (Less-
1 Very high -
4)
Other Areas
(Graze land,
Aesthetic) (Less-
1 Very high -4)
Total
Impact
(Less-1
Very high -
4)
2 3 3 3 11

70

71