ZIMBABWE Vulnerability Assessment Committee - Famine ...
215
SIRDC ZIMBABWE Vulnerability Assessment Committee VAC
-
Upload
khangminh22 -
Category
Documents
-
view
1 -
download
0
Transcript of ZIMBABWE Vulnerability Assessment Committee - Famine ...

SIRDCZIMBABWE
VulnerabilityAssessment Committee
VAC


Zimbabwe Rural Livelihood Baseline Profiles 2011
Page | 1
Zimbabwe Vulnerability Assessment Committee August 2011
Financed by:
The Zimbabwe Rural Livelihood Baselines was made possible by contributions from the following ZimVAC members who supported the process in data collection, analysis and report writing:
Office of the President and Cabinet
Food and Nutrition Council
Ministry of Local Government, Rural and Urban Development
Ministry of Agriculture, Mechanisation and Irrigation Development
Ministry of Labour and Social Services
Zimbabwe National Statistics Agency
Ministry of Health and Child Welfare
Ministry of Education, Sports, Arts and Culture
Save the Children
Concern Worldwide
Oxfam
Action Contre la Faim
Food and Agriculture Organisation
World Food Programme
United States Agency for International Development
FEWS NET
The Baseline work was coordinated by the Food and Nutrition Council (FNC) with Save the Children providing technical leadership on behalf of ZimVAC.
The ZimVAC acknowledges the personnel, time and material contributions of all implementing partners that made this work possible
Implementation partners:
For enquiries, please contact the ZimVAC Chair: Food and Nutrition Council SIRDC Complex 1574 Alpes Road, Hatcliffe, Harare, Zimbabwe Tel: +263 (0)4 883405, +263 (0)4 860320-9, Email: [email protected] Web: www.fnc.org.zw

Zimbabwe Rural Livelihood Baseline Profiles 2011
Page | 1
Acknowledgements
The Zimbabwe Vulnerability Assessment Committee (ZimVAC) would like to extend its gratitude to the UK Department for International Development (UKaid) and the European Commission (EC) who provided funding for implementation of the Rural Livelihood Baseline Project through Save the Children.
The ZimVAC also extends its appreciation to all government Ministries and organisations who dedicated their staff to this project; Ministry of Agriculture, Mechanisation and Irrigation development; Ministry of Health and Child Welfare; Ministry of Local Government, Rural and Urban Development; Ministry of Labour and Social Services; Zimbabwe National Statistics Agency (ZIMSTAT); Food and Nutrition Council; Save the Children; Concern Worldwide; Action Contre La Faim and Oxfam GB.
The ZimVAC acknowledges the leadership of the SADC RVAA PMU and FEG Consulting who provided training and technical backstopping to the field teams.
Gratitude is extended to Daison Ngirazi and Jerome Bernard from Save the Children who provided management and technical leadership. Technical support and report writing for the project was provided by Waddington Chinogwenya of FEG Consulting.
Gratitude is extended to the ZimVAC chair Mr. George Kembo for the professional guidance and strategic leadership.

Zimbabwe Rural Livelihood Baseline Profiles 2011
2 | P a g e
Table of Contents
Acknowledgements .................................................................................................................................... 1
List of Figures and Tables ............................................................................................................................ 3
Glossary of Terms and Acronyms ............................................................................................................... 9
Livelihood Zones Acronyms ...................................................................................................................... 10
INTRODUCTION ..................................................................................................................................................... 11
THE NATIONAL LIVELIHOOD ZONE MAP .................................................................................................................... 21
INDIVIDUAL RURAL LIVELIHOOD BASELINE PROFILES ................................................................................................... 27
Kariba Valley Kariangwe Jambezi Communal ............................................................................................... 28
Livestock and Cereal Farming in Forests Communal .................................................................................... 35
Agro-Fisheries Livelihood Zone ..................................................................................................................... 43
Northern Zambezi Valley Communal ............................................................................................................ 50
Cereal and High Cotton Producing Communal ............................................................................................. 56
Cereal and Low Cotton Producing Communal .............................................................................................. 63
Lusulu Lupane South Gokwe Mixed Agriculture ........................................................................................... 70
Mutorashanga Informal Mining .................................................................................................................... 76
Western Kalahari Sandveld Communal ........................................................................................................ 82
Eastern Kalahari Sandveld Communal .......................................................................................................... 90
Matabeleland Middle- Highveld Communal ................................................................................................. 98
Southern Cattle and Cereal Farming ........................................................................................................... 106
Northern Cattle and Cereal Farming ........................................................................................................... 113
Eastern Highlands Prime Communal........................................................................................................... 120
Eastern Highlands Commercial Farming ..................................................................................................... 128
Irrigated Commercial Sugar and Fruit Farming ........................................................................................... 133
Highland Prime Cereal and Cash Crop Resettlement Farming ................................................................... 138
Highveld Prime Communal ......................................................................................................................... 145
Masvingo Manicaland Middleveld Smallholder Communal ....................................................................... 153
Mwenezi Chivi and South Midlands Communal ......................................................................................... 160
Bikita Zaka Highland Communal ................................................................................................................. 166
Save River Valley and Ndowoyo Communal ............................................................................................... 173
Beitbridge South Western Lowveld Communal .......................................................................................... 180
Central and Northern Semi-Intensive Farming ........................................................................................... 187
Greater Mudzi Communal Livelihood Zone ................................................................................................ 195
APPENDICES .................................................................................................................................................... 203
Appendix I: Population by District and Livelihood zone ......................................................................... 203
Appendix II: List of Wards visited during the assessment ...................................................................... 209

Zimbabwe Rural Livelihood Baseline Profiles 2011
3 | P a g e
List of Figures
Figure 1: HEA Conceptual Framework ................................................................................................. 14
Figure 2: Outcome Analysis illustration ............................................................................................... 17
Figure 3: Livelihood zones Visited and Sampled sites ......................................................................... 18
Figure 4: Zimbabwe Livelihood Zone Map ........................................................................................... 21
Figure 5: KVKJ Livelihood zone Map .................................................................................................... 29
Figure 6: KVKJ Seasonal Calendar ........................................................................................................ 30
Figure 7: KVKJ Wealth group characteristics ....................................................................................... 31
Figure 8: KVKJ HH sizes ........................................................................................................................ 31
Figure 9: KVKJ Food sources ................................................................................................................ 31
Figure 10: KVKJ Food groups ................................................................................................................ 32
Figure 11: KVKJ Cash Income sources .................................................................................................. 32
Figure 12: KVKJ Expenditure patterns ................................................................................................. 33
Figure 13: LCFF Livelihood zone map ................................................................................................... 36
Figure 15: LCFF HH sizes ....................................................................................................................... 38
Figure 14: LCFF Seasonal Calendar ...................................................................................................... 38
Figure 16: LCFF Wealth group characteristics ..................................................................................... 39
Figure 17: LCFF Food sources ............................................................................................................... 39
Figure 18: LCFF Food groups ................................................................................................................ 40
Figure 19: LCFF Cash Income Sources .................................................................................................. 41
Figure 20: LCFF Expenditure patterns .................................................................................................. 41
Figure 21: AGFC Livelihood zone map ................................................................................................. 44
Figure 22: AGFC Seasonal Calendar ..................................................................................................... 45
Figure 23: AGFC Wealth group characteristics .................................................................................... 46
Figure 24: AGFC HH sizes ..................................................................................................................... 46
Figure 25: AGFC Food sources ............................................................................................................. 47
Figure 26: AGFC Food groups............................................................................................................... 47
Figure 27: AGFC Cash Income sources ................................................................................................. 48
Figure 28: AGFC Expenditure patterns ................................................................................................ 48
Figure 29: NZVC Livelihood Zone Map ................................................................................................. 50
Figure 30: NZVC Seasonal Calendar ..................................................................................................... 51
Figure 31: NZVC Wealth group characteristics .................................................................................... 52
Figure 32: NZVC HH sizes ..................................................................................................................... 52
Figure 33: NZVC Food sources ............................................................................................................. 53
Figure 34: NZVC Food groups .............................................................................................................. 53
Figure 35: NZVC Cash Income sources ................................................................................................. 54
Figure 36: NZVC Expenditure patterns ................................................................................................ 54
Figure 37: CHCC Livelihood zone map ................................................................................................. 56
Figure 38: CHCC Seasonal Calendar ..................................................................................................... 57
Figure 39: CHCC Wealth group characteristics .................................................................................... 58
Figure 40: CHCC HH sizes ..................................................................................................................... 58
Figure 41: CHCC Food sources ............................................................................................................. 59
Figure 42: CHCC Food groups .............................................................................................................. 60
Figure 43: CHCC Cash Income sources ................................................................................................. 60
Figure 44: CHCC Expenditure patterns ................................................................................................ 61
Figure 45: CLCC Livelihood zone map .................................................................................................. 64

Zimbabwe Rural Livelihood Baseline Profiles 2011
4 | P a g e
Figure 46: CLCC Seasonal calendar ...................................................................................................... 65
Figure 47: CLCC Wealth group characteristics ..................................................................................... 65
Figure 48: CLCC HH sizes ...................................................................................................................... 66
Figure 49: CLCC Food sources .............................................................................................................. 66
Figure 50: CLCC Food Groups ............................................................................................................... 67
Figure 51: CLCC Cash Income sources ................................................................................................. 67
Figure 52: CLCC Expenditure patterns ................................................................................................. 68
Figure 53: LLSG Livelihood zone map .................................................................................................. 70
Figure 54: LLSG Seasonal Calendar ...................................................................................................... 71
Figure 55: LLSG Wealth group characteristics ..................................................................................... 72
Figure 56: LLSG HH sizes ...................................................................................................................... 72
Figure 57: LLSG Food sources .............................................................................................................. 73
Figure 58: LLSG Food groups ................................................................................................................ 73
Figure 59: LLSG Cash Income sources .................................................................................................. 73
Figure 60: LLSG Expenditure patterns ................................................................................................. 74
Figure 61: MTIM Livelihood zone map ................................................................................................ 76
Figure 62: MTIM Seasonal Calendar .................................................................................................... 77
Figure 63: MTIM Wealth group characteristics ................................................................................... 78
Figure 64: MTIM HH sizes .................................................................................................................... 78
Figure 65: MTIM Food sources ............................................................................................................ 79
Figure 66: MTIM Food groups.............................................................................................................. 79
Figure 67: MTIM Cash income sources ................................................................................................ 80
Figure 68: MTIM Expenditure patterns ............................................................................................... 80
Figure 69: WKSC Livelihood zone map................................................................................................. 83
Figure 71: WKSC Wealth group characteristics ................................................................................... 84
Figure 70: WKSC Seasonal Calendar .................................................................................................... 84
Figure 72: WKSC HH sizes .................................................................................................................... 85
Figure 73: WKSC Food sources ............................................................................................................ 85
Figure 74: WKSC Food groups .............................................................................................................. 86
Figure 75: WKSC Cash income sources ................................................................................................ 87
Figure 76: WKSC Expenditure patterns ................................................................................................ 88
Figure 77: EKSC Livelihood zone map .................................................................................................. 91
Figure 78: EKSC Seasonal calendar ...................................................................................................... 92
Figure 79: EKSC Wealth group characteristics ..................................................................................... 93
Figure 80: EKSC HH sizes ...................................................................................................................... 94
Figure 81: EKSC Food sources .............................................................................................................. 94
Figure 82: EKSC Food groups ............................................................................................................... 95
Figure 83: EKSC Cash income sources .................................................................................................. 95
Figure 84: EKSC Expenditure patterns ................................................................................................. 96
Figure 85: MMHC Livelihood Zone map .............................................................................................. 99
Figure 86: MMHC Seasonal Calendar ................................................................................................ 100
Figure 87: MMHC Wealth group characteristics ............................................................................... 101
Figure 88: MMHC HH sizes ................................................................................................................. 101
Figure 89: MMHC Food sources ......................................................................................................... 102
Figure 90: MMHC Food groups .......................................................................................................... 102
Figure 91: MMHC Cash income sources ............................................................................................ 103
Figure 92: MMHC Expenditure patterns ............................................................................................ 104

Zimbabwe Rural Livelihood Baseline Profiles 2011
5 | P a g e
Figure 93: SCCF Livelihood zone map ................................................................................................ 107
Figure 94: SCCF Seasonal Calendar .................................................................................................... 108
Figure 95: SCCF Wealth group characteristics ................................................................................... 109
Figure 96: SCCF HH sizes .................................................................................................................... 109
Figure 97: SCCF Food sources ............................................................................................................ 110
Figure 98: SCCF Food groups ............................................................................................................. 110
Figure 100: SCCF Expenditure patterns ............................................................................................. 111
Figure 99: SCCF Cash income sources ................................................................................................ 111
Figure 101: NCCF Livelihood zone map ............................................................................................. 114
Figure 103: NCCF Wealth groups characteristics ............................................................................... 115
Figure 102: NCCF Seasonal Calendar ................................................................................................. 115
Figure 104: NCCF HH sizes ................................................................................................................. 116
Figure 105: NCCF Food sources ......................................................................................................... 117
Figure 106: NCCF Food Groups .......................................................................................................... 117
Figure 107: NCCF Food sources ......................................................................................................... 118
Figure 108: NCCF Expenditure patterns ............................................................................................ 118
Figure 109: EHPC livelihood zone map .............................................................................................. 121
Figure 110: EHPC Seasonal Calendar ................................................................................................. 122
Figure 111: EHPC Wealth group characteristics ................................................................................ 123
Figure 112: EHPC HH sizes ................................................................................................................. 123
Figure 113: EHPC Food sources ......................................................................................................... 124
Figure 114: EHPC Food groups ........................................................................................................... 124
Figure 115: EHPC Cash income sources ............................................................................................. 125
Figure 116: EHPC Expenditure patterns............................................................................................. 126
Figure 117: EHCF Livelihood zone map .............................................................................................. 128
Figure 118: EHCF Seasonal Calendar ................................................................................................. 129
Figure 119: EHCF Wealth group Characteristics ................................................................................ 130
Figure 120: EHCF HH sizes .................................................................................................................. 130
Figure 121: EHCF Food sources .......................................................................................................... 130
Figure 122: EHCF Food groups ........................................................................................................... 131
Figure 123: EHCF Cash income sources ............................................................................................. 131
Figure 124: EHCF Expenditure patterns ............................................................................................. 131
Figure 125: ICSF Livelihood zone map ............................................................................................... 133
Figure 126: ICSF Seasonal Calendar ................................................................................................... 134
Figure 127: ICSF Wealth group characteristics .................................................................................. 135
Figure 128: ICSF HH Sizes ................................................................................................................... 135
Figure 129: ICSF Food sources ........................................................................................................... 135
Figure 130: ICSF Food groups ............................................................................................................ 136
Figure 131: ICSF Cash income sources ............................................................................................... 136
Figure 132: ICSF Expenditure patterns .............................................................................................. 137
Figure 133: HPCR Livelihood zone map ............................................................................................. 139
Figure 134: HPCR Seasonal Calendar ................................................................................................. 139
Figure 135: HPCR Wealth group characteristics ................................................................................ 140
Figure 136: HPCR HH sizes ................................................................................................................. 140
Figure 137: HPCR Food sources ......................................................................................................... 141
Figure 138: HPCR Food groups .......................................................................................................... 142
Figure 139: HPCR Cash income sources ............................................................................................. 142

Zimbabwe Rural Livelihood Baseline Profiles 2011
6 | P a g e
Figure 140: HPCR Expenditure patterns ............................................................................................ 143
Figure 141: HVPC Livelihood zone map ............................................................................................. 145
Figure 143: HVPC Wealth group characteristics ................................................................................ 147
Figure 142: HVPC Seasonal Calendar ................................................................................................. 147
Figure 144:HVPC HH sizes .................................................................................................................. 148
Figure 145: HVPC Food sources ......................................................................................................... 149
Figure 146: HVPC Food Groups .......................................................................................................... 149
Figure 147: HVPC Cash income sources ............................................................................................. 150
Figure 148: HVPC Expenditure patterns ............................................................................................ 151
Figure 149: MMMC Livelihood zone map .......................................................................................... 153
Figure 150: MMMC Seasonal Calendar ............................................................................................. 154
Figure 151: MMMC Wealth group characteristics ............................................................................ 155
Figure 152: MMMC HH sizes .............................................................................................................. 155
Figure 153: MMMC Food sources ...................................................................................................... 156
Figure 154: MMMC Food groups ....................................................................................................... 156
Figure 155: MMMC Cash income Sources ......................................................................................... 157
Figure 156: MMMC Expenditure patterns ......................................................................................... 157
Figure 157: MCSM Livelihood zone map ........................................................................................... 160
Figure 158: MCSM Seasonal Calendar ............................................................................................... 161
Figure 159: MCSM Wealth group characteristics .............................................................................. 162
Figure 160: MCSM HH sizes ............................................................................................................... 162
Figure 161: MCSM Food sources ....................................................................................................... 163
Figure 162: MCSM Food groups ........................................................................................................ 163
Figure 163: MCSM Cash income sources ........................................................................................... 164
Figure 164: MCSM Expenditure patterns .......................................................................................... 164
Figure 165: BZHC Livelihood zone map ............................................................................................. 166
Figure 166: BZHC Seasonal Calendar ................................................................................................. 167
Figure 167: BZHC Wealth group characteristics ................................................................................ 168
Figure 168: BZHC HH sizes ................................................................................................................. 168
Figure 169: BZHC Food sources ......................................................................................................... 169
Figure 170: BZHC Food groups ........................................................................................................... 169
Figure 171: BZHC Cash income sources ............................................................................................. 170
Figure 172: BZHC Expenditure patterns ............................................................................................ 171
Figure 173: SRVN Livelihood zone map ............................................................................................. 173
Figure 174: SRVN Seasonal Calendar ................................................................................................. 174
Figure 175: SRVN Wealth group characteristics ................................................................................ 175
Figure 176: SRVN HH sizes ................................................................................................................. 175
Figure 177: SRVN Food sources ......................................................................................................... 176
Figure 178: SRVN Food groups .......................................................................................................... 177
Figure 179: SRVN Cash income sources ............................................................................................. 177
Figure 180: SRVN Expenditure patterns ............................................................................................ 178
Figure 181: BSWL Livelihood zone map ............................................................................................. 180
Figure 182: BSWL Seasonal Calendar ................................................................................................. 182
Figure 183: BSWL Wealth group characteristics ................................................................................ 182
Figure 184: BSWL HH sizes ................................................................................................................. 183
Figure 185: BSWL Food sources ......................................................................................................... 183
Figure 187: BSWL Cash income sources ............................................................................................ 184

Zimbabwe Rural Livelihood Baseline Profiles 2011
7 | P a g e
Figure 186: BSWL Food groups .......................................................................................................... 184
Figure 188: BSWL Expenditure patterns ............................................................................................ 185
Figure 189: CNSI Livelihood zone map............................................................................................... 187
Figure 191: CNSI Wealth group characteristics ................................................................................. 189
Figure 190: CNSI Seasonal Calendar .................................................................................................. 189
Figure 192: CNSI HH sizes .................................................................................................................. 190
Figure 193: CNSI Food sources .......................................................................................................... 190
Figure 194: CNSI Food groups ............................................................................................................ 191
Figure 195: CNSI Cash income sources .............................................................................................. 192
Figure 196: CNSI Expenditure patterns .............................................................................................. 193
Figure 197: GMUC Livelihood zone map ........................................................................................... 196
Figure 198: GMUC Seasonal Calendar ............................................................................................... 197
Figure 199: GMUC Wealth group characteristics .............................................................................. 198
Figure 200: GMUC HH sizes ............................................................................................................... 199
Figure 201: GMUC Food sources ....................................................................................................... 199
Figure 202: GMUC Food groups ......................................................................................................... 200
Figure 203: GMUC Cash income sources ........................................................................................... 200
Figure 204: GMUC Expenditure patterns........................................................................................... 201

Zimbabwe Rural Livelihood Baseline Profiles 2011
8 | P a g e
List of Tables
Table 1: Baseline data collection sources ............................................................................................ 17
Table 2: Interview levels ...................................................................................................................... 18
Table 3: Number of Interviews Completed ......................................................................................... 19
Table 4: Participating ZIMVAC members ............................................................................................. 20
Table 5: Rural Livelihood Zones Summaries ........................................................................................ 22
Table 6: KVKJ Monitoring Indicators .................................................................................................... 34
Table 7: LCFF Monitoring indicators .................................................................................................... 42
Table 8: AGFC Monitoring Indicators ................................................................................................... 49
Table 9: NZVC Monitoring Indicators ................................................................................................... 55
Table 10: CHCC Monitoring indicators ................................................................................................. 62
Table 11: CLCC Monitoring indicators ................................................................................................. 69
Table 12: LLSG Monitoring indicators .................................................................................................. 75
Table 13: MTIM Monitoring indicators ................................................................................................ 81
Table 14: WKSC Monitoring indicators ................................................................................................ 89
Table 15: EKSC Monitoring indicators.................................................................................................. 97
Table 16: MMHC Monitoring indicators ............................................................................................ 105
Table 17: SCCF Monitoring indicators ................................................................................................ 112
Table 18: NCCF Monitoring indicators ............................................................................................... 119
Table 19: EHPC Monitoring indicators ............................................................................................... 127
Table 20: EHCF Monitoring indicators ............................................................................................... 132
Table 21: ICSF Monitoring indicators ................................................................................................. 137
Table 22: HPCR Monitoring indicators ............................................................................................... 144
Table 23: HVPC Monitoring indicators ............................................................................................... 152
Table 24: MMMC Monitoring indicators ........................................................................................... 159
Table 25: MCSM Monitoring indicators ............................................................................................. 165
Table 26: BZHC Monitoring indicators ............................................................................................... 172
Table 27: SRVN Monitoring indicators ............................................................................................... 179
Table 28: BSWL Monitoring indicators .............................................................................................. 186
Table 29: CNSI Monitoring indicators ................................................................................................ 194
Table 30: GMUC Monitoring indicators ............................................................................................. 202

Zimbabwe Rural Livelihood Baseline Profiles 2011
9 | P a g e
Glossary of Terms and Acronyms
AIDS Acquired Immune Deficiency Syndrome
AGRITEX Agricultural Technical and Extension Service
BEAM Basic Education Assistance Module
BO Better-off wealth group
CAMPFIRE Community Areas Management Programme for Indigenous Resources
CSC Cold Storage Commission
COTTCO Cotton Company of Zimbabwe
DFID Department for International Development
EC European Commission
FEG Food Economy Group
FEWSNET Famine Early Warning Systems Network
GMB Grain Marketing Board
Ha Hectare
HEA Household Economy Approach
HIV Human Immunodeficiency Virus
HH Household
Kcal Kilo calories
LBVA Livelihoods Based Vulnerability Analysis
LPD Livestock Production Department
LSC Large-Scale Commercial Farms
M Middle wealth group
MOA Ministry of Agriculture, Mechanisation and Irrigation Development
NGO Non Governmental Organisation
P Poor wealth group
PRA Participatory Rural Appraisal
RDC Rural District Council
RRA Rapid Rural Appraisal
SHOAT Sheep and goats
VP Very Poor wealth group
UNICEF United Nations Children’s Fund
USD United States Dollar
ZAR South African Rand
ZIMASCO Zimbabwe Mining and Smelting Company
ZimVAC Zimbabwe Vulnerability Assessment Committee

Zimbabwe Rural Livelihood Baseline Profiles 2011
10 | P a g e
Livelihood Zones Acronyms
1 Agro-fisheries AGFC
2 Beitbridge South Western Lowveld Communal BSWL
3 Bikita Zaka Highlands Communal BZHC
4 Central Northern Semi Intensive Farming CNSI
5 Cereal and High Cotton Communal CHCC
6 Cereal and Low Cotton Communal CLCC
7 Eastern Highlands Commercial Farming EHCF
8 Eastern Highlands Prime Communal EHPC
9 Eastern Kalahari Sandveld Communal EKSC
10 Greater Mudzi Communal GMUC
11 Highveld Prime Cereal and Cash Crop Resettlement HPCR
12 Highveld Prime Communal HVPC
13 Irrigated Commercial Sugar and Fruit Farming ICSF
14 Kariba Valley and Kariangwe-Jambezi Communal KVKJ
15 Livestock and Cereal Farming Communal In Forests LCFF
16 Lusulu Lupane and Southern Gokwe Mixed Agriculture LLSG
17 Mwenezi Chivi and South Midland Communal MCSM
18 Matabeleland Middleveld Communal MMHC
19 Masvingo Manicaland Middleveld Smallholder MMMC
20 Mutorashanga Informal Mining MTIM
21 Northern Cattle and Cereal Farming NCCF
22 Northern Zambezi Valley Communal NZVC
23 Southern Cattle and Cereal Farming SCCF
24 Save River Valley and Ndowoyo Communal SRVN
25 Western Kalahari Sandveld Communal WKSC

Zimbabwe Rural Livelihood Baseline Profiles 2011
11 | P a g e
INTRODUCTION
The emergence of livelihood analysis as a major theme in development has begun to address knowledge gaps in the economic lives and livelihoods of poor populations. The Zimbabwe Vulnerability Assessment Committee (ZimVAC) has adopted the application of livelihoods analysis as an approach to strengthen its analysis of household vulnerability. The ZimVAC’s purpose is to undertake assessments and analysis with the objective of improving the understanding of vulnerability, as well as informing programming and policy to reduce vulnerability. The ZimVAC has adopted a Livelihoods-Based Vulnerability Approach (LBVA) known as the Household Economy Approach (HEA) to achieve its purpose. This livelihoods-based vulnerability approach generates information and analysis that provides a foundation for better understanding of the dynamics of change and vulnerability within households.
In November 2009, the ZimVAC conducted a livelihood rezoning exercise, which was followed by the HEA
baseline assessments in all the 251 livelihood zones in Zimbabwe which are discussed in this report. These
activities form the first stage in the establishment of a livelihood information and monitoring system within the ZimVAC that is designed to generate a deeper understanding of rural livelihoods, food access issues and the ability of households from different wealth groups to cope with shocks and vulnerability. This report summarizes the key descriptive information captured in the ZimVAC HEA livelihood baseline studies for each livelihood zone and wealth group. It provides a basic understanding of rural livelihood patterns in Zimbabwe. This baseline information is employed as an analytical modelling tool by the ZimVAC for monitoring household food and livelihood security; it will also be used to generate analysis for understanding the impact of different programming and policy on vulnerability and food and livelihood security. The LBVA approach adopted by the ZimVAC is aimed at providing relevant information and analysis on food access and livelihoods to different Government Ministries, as well as international organizations and civil society to inform early warning, rural development strategies, poverty reduction, safety nets programming, monitoring and evaluation of food security and livelihoods programmes and food security policy formulation.
This report is organized into three main sections: a brief discussion of key concepts and methodology, a section on the field data collection and analysis, followed by a series of baseline profiles for each of the 25 livelihood zones. Each of the livelihood baseline profiles is divided up into a number of sections:
Main Conclusions and Implications summarises the main findings from the zone. This section also provides insights that will inform the planning of various types of interventions, including emergency response, disaster mitigation and development programming.
Zone description offers a general description of local livelihood patterns (crop production, livestock rearing, off-farm income generation etc).
Markets section contains basic information on the marketing of local production and on any importation of staple food into the zone.
Seasonal Calendar sets out the timing of key activities during the year. This is useful in a variety of ways, e.g. to judge the likely impact of a hazard according to its timing during the year, or to assess whether a particular activity is being undertaken at the normal time in the current year.
This is followed by three sections that provide the core information on the ‘food economy’ of the zone.
1 The rezoning exercise came up with 24 livelihood zones, however after the baseline work boundaries were further refined and one of the biggest
zones was further divided into two zones as there were some distinct features in some livelihood strategies.
Zimbabwe Rural Livelihood Baseline Profiles 2011
12 | P a g e
The Wealth Breakdown section describes four main wealth groups (‘Very poor’, ‘poor’, ‘middle’ and ‘better-off’), explaining the differences between these groups and how this affects potential access to food and cash
income2.
The Sources of Food and Sources of Cash sections examine patterns of food and income access at each level of wealth, relating these to the characteristics of each group.
The sections on Hazards provide information on the different types of hazards that affect the zone, differentiated by wealth group where this is appropriate.
Response Strategies describe the various strategies available to different types of households in the zone,
together with a judgement of the likely effectiveness of the strategies3.
Early warning involves identifying and interpreting key events that indicate that a severe food shortage or famine may be developing. The final section, Indicators of Imminent Crisis, draws upon the classification of
early warning indicators proposed by Fred Cuny4. This section provides information on the key indicators
and their likely timing by zone, based upon an understanding of local livelihoods and local patterns of coping
with income shortage5.
This report is not a vulnerability assessment and nor is it a comparative analysis across zones; rather, it provides a general description of the baseline livelihood information that the ZimVAC has collected.
In coming years it is envisaged that the ZimVAC and any other interested institutions will use the baseline information to assess changes in livelihood access but more specifically the baselines will be useful on three levels, as follows:
1. An Introductory Guide to Food Security in the Country
The baseline profiles pack considerable information and analysis into a few pages of presentation. They should therefore form a useful briefing for a newcomer who needs to get a quick grasp of food security conditions around the country. The geographical divisions are relatively small-as far as this is consistent with ground realities-so that the reader can take in the general pattern and the basic differences between areas and populations.
Development planners can also benefit from using the livelihood profiles. One objective of development is to reduce people’s vulnerability to hazards and to increase their capacity to cope. An important first step is to understand who is vulnerable, to which hazards, and why. Likewise, efforts to reduce poverty require an understanding of how the poorest households survive in different areas of the country and the reasons for their poverty.
2. Early Warning and Food Security Monitoring
Most early warning and food security monitoring systems draw heavily from two information sources: (i) crop and/or livestock production data; and (ii) market price information. Given the predominance of production data, local food security is often equated with production outcomes. Hence, a chronic or temporary production deficit against local food requirements is immediately translated into chronic or temporary food insecurity.
2 It is important to bear in mind for this analysis that we are thinking of wealth in relative (and local) terms. In a livelihoods analysis we are interested in understanding some of the differences between different groups within the community and the reasons for these – in which case it is not particularly useful to use absolute scales as in statistical national scales that may lump 80% or 90% of the population together into one group. 3 The term response strategy is preferred to coping strategy for two reasons. Firstly, the term coping strategy is often used to refer to regular components of everyday livelihood (e.g. firewood sale), which strictly speaking are only coping strategies when intensified in response to a hazard. Secondly, ‘coping’ can be taken to imply that the strategy in question is cost-free, which is not always the case. 4 ‘Famine, Conflict and Response: A Basic Guide’, Cuny F. C. and Hill R. B. Kumarian Press, 1999, pp 33-42. 5 Fred Cuny identified two types of early warning indicators, those that provide advance warning of a famine (indicators of imminent crisis) and those that confirm the existence of famine (indicators of famine). The latter group includes indicators such as distress sales of productive assets (e.g. plough oxen), consumption of seeds, increased malnutrition and increased mortality. Indicators of famine are not generally context specific (i.e. a single list could be prepared that would apply to all livelihood zones). They are also of little use in predicting or preventing severe food shortage or famine. For these reasons they have not been included in the livelihood profiles.
Zimbabwe Rural Livelihood Baseline Profiles 2011
13 | P a g e
This is almost never the whole story. A full account of the food economy addresses; food supply—that is, what food people produce—and food demand—what food people buy, and how they earn cash to buy it. Thus, data on casual employment or wild foods, or charity from relatives or the sale of handicrafts is equally important to the livelihood story as data on crop and livestock production.
Using a baseline livelihood profile, we can then inquire into household capacity to adapt to economic stress, especially failed crop or livestock production; and we can appreciate household activities at different periods in the yearly cycle. All of which feeds directly into our analysis of need, helping to answer key questions such as; which areas and what types of households are likely to cope should a hazard strike and which will need assistance? What types of intervention will be most appropriate, and when and for how long should they be implemented?
Thus, for instance, one could point to the position of poor households in a given geographical area who are highly dependent on urban employment. If urban employment declines, their labour will be less in demand: can they find alternative income elsewhere – and will they be competing with people from other zones in these activities?
National officers working within their national early warning systems have an immense knowledge of their countries. The livelihoods approach helps to provide a framework for the full use of that knowledge, as well as adding a new level of information to it.
3. Policy Development
Disaster management has been the main impetus to the spread of early warning systems. The rationale in early warning is to improve the efficiency in the scale and timing of emergency food aid. However, increasingly planners are looking at alternatives to food aid in early emergency intervention—and this often requires changes in policy and practice. A case in point is the stabilization of market prices for basic foods. Livelihoods analysis can expose the likely effects of such interventions on different households’ capacities to survive a crisis. The analysis can also recommend the optimum timing for an intervention.
Livelihood analysis can also be applied to other policy changes. For example, if government taxes on kerosene were reduced, or charges made for government veterinary drugs, what would be the impact on households? More generally, the household viewpoint offers a more secure footing for looking at the increasingly voluminous discussion of poverty alleviation. It allows one to look at the story which lies behind national statistics.
Key Concepts and Methodology
This section explains a number of key concepts and methods, which are essential for understanding how data has been gathered, analysed, organized and presented in this report.
The Household Economy Approach (HEA) is based on Amartya Sen’s theory of exchange entitlements and
economic theories of risk6. The HEA has been used as one of the approaches to assess food and non-food
needs once a hazard has actually struck. The approach was developed by Save the Children UK in the 1990s7.
The HEA first describes and quantifies household economy or the way in which typical households, with defined wealth characteristics, survive in normal times. This understanding and quantification is then combined with monitoring data within an analytical framework to assess the current situation with respect to food and livelihood security and to predict the effects of changes in the external environment.
6 See Sen, A. Poverty and Famines: An essay in entitlement and deprivation. Claredon Press, (1981) 7 See ‘The Household Economy Approach’, Seaman J., Clarke P., Boudreau T., Holt J., Save the Children UK 2000.
The Household Economy Approach

Zimbabwe Rural Livelihood Baseline Profiles 2011
14 | P a g e
Since this report presents only HEA baseline information, not analysis or predictions, a full explanation of the analytical methodology is not presented here, a short overview of the main elements of the basic analytical framework is presented in Appendix I.
Steps in HEA and Key Concepts
Figure 1: HEA Conceptual Framework
BASELINE + HAZARD + COPING = OUTCOME
The HEA process consists of 6 steps in compiling a household economy analysis. The first 2 are concerned with dividing the population into groups of households that share similar characteristics in terms of their access to food and cash income. The assumption underlying these 2 steps is that access to food and income is determined by 2 main factors: geography and economic status (that is, relative wealth). While geography (where a household lives) determines the options for obtaining food and income, wealth generally determines a household’s ability to exploit those options. The third step involves developing a baseline picture of food access, income and expenditure for each wealth group. The fourth, fifth and final steps involve combining information on baseline access with that on hazard and coping in order to generate current and projections of future food and income access. The following is a brief description of steps of the HEA process applicable to this report.
Step 1: Livelihood Zoning. The first step in a food economy analysis is to prepare a livelihood zone map. This involves deciding on the main geographical units with similar patterns of livelihood. It involves mapping out areas where households share similar options for obtaining food and income. The approach is to identify local factors (such as climate, soil, proximity to rivers, access to markets etc.) which determine the basic food and income options (the crops that will grow, the livestock that can be raised, the wild plants that can be collected, the fish that can be caught, and so on) and then to group similar areas together. In the case of Zimbabwe, the exercise has defined 25 rural livelihood zones in work done by ZimVAC in 2009. This was done through a review of available secondary source material, a workshop at national level involving all ZimVAC members and a series of key informant interviews at district level with relevant technical personnel.
Step 2: Wealth Breakdown. Defining the different wealth groups in each zone is the second step in a food economy analysis, the output from which is a wealth breakdown, that is, to break down the population within a particular Livelihood Zone into groups of households according to their ability to exploit the local food and income options of the zone. Wealth is a major factor determining the ability of a household to exploit the available options within a given zone. It is obvious, for example, that better-off households owning larger farms will in general produce more crops and be more food secure than their poorer neighbours. In any community, even one where everybody may be considered poor in absolute terms (i.e. compared to other better-off parts of the country or compared to those living in other countries); there will be differences between households. The different types of households live in different ways and are able to respond to external shocks (e.g. crop failures, price increase, loss of labour markets, etc) in different ways (with differing levels of success).
Zimbabwe Rural Livelihood Baseline Profiles 2011
15 | P a g e
The major factor that differentiates one ‘type’ of household from another is ‘wealth’. In HEA, ‘wealth groups’ or socio-economic groups within a Livelihood Zone are sets of households which have similar levels of assets, and employ similar strategies to gain access to food and cash income. In HEA, wealth is always in relative (and local) terms not in absolute terms. Statistical data may indicate that 80% or even 90% of the rural population in the district lives below the national poverty line, but this is a measure of poverty on a national, absolute scale. In a livelihoods analysis, we are interested in understanding some of the differences in livelihood patterns between different groups of households within the community – in which case it is not particularly useful to lump 80% or 90% of the population together in one group. In an analysis of relative wealth, the ‘middle’ is in the majority. ‘Poor’ means poorer than most households, while ‘better-off’ means better-off than most households; in this case wealth is considered in relative terms – simply who is better than the other within a defined area.
Community-based key informants derive the wealth groups, with guidance from the HEA practitioner using different rapid rural appraisal techniques (proportional piling, etc). A wealth breakdown has 2 elements: (1) a division of the population (that is, an estimate of the percentage of the population falling into each group) and (2) a description of the key defining resources and characteristics of the wealth group. In each Livelihood Zone, the different wealth groups are identified and described and it is these groups that form the basis for the focus group interviews from which baseline access information is obtained. The population can be divided into three, four, five or even more wealth groups, depending on how the community view their society as well as the purpose and level of analysis required in the HEA. The most frequently used number of wealth groups, and which the ZimVAC chose for the current baseline, is three: the ‘very poor’, the ‘poor’, the ‘middle’ and the ‘better-off’. The extreme ends of the wealth spectrum: the very poorest (destitute) households that are largely dependent on charity, or the richest households (the ‘richest of the rich’), are normally not of interest in HEA analysis. These 2 groups tend to constitute only a small minority of households and in the case of the former are often not economically active.
The criteria used to divide households into wealth groups depends on the defining characteristics for the options of accessing food and income. Relative wealth is determined by a number of factors including landholding, cultivation size, capital, education, skills and/or household labour, and livestock holdings. In the case of Zimbabwe, the rural economy is predominately subsistence agricultural with production of food and cash crops and livestock with a few areas depending on employment. Wealth groups were therefore largely determined by the size of land cultivation and production levels of the household, ownership of livestock, ownership of productive assets, as well as access to social capital.
Wealth groups are different from a vulnerable group. It is important to highlight that in HEA, defining ‘wealth’ is not defining ‘vulnerability’. It is not possible to talk about ‘vulnerable’ groups without giving a context (i.e. cattle disease, drought, closure of markets), as different households are vulnerable to different things. A better-off household that does not purchase staple food, is not very vulnerable to increases in staple food prices, but is vulnerable to crop failure through drought, whilst a poor household, which purchases all its food and buys this food through the sale of goats, is vulnerable to fluctuations in goat prices and food price increases. Poverty and richness are relatively constant states -a household is poor all the time- but vulnerability depends on the context. The same household is vulnerable to food failure in some circumstances, but not in others. This is a critical distinction in understanding what is meant by the term “vulnerability”.
Step 3: Analysis of Baseline Access. Having grouped households according to where they live and their wealth, the next step is to generate livelihood baseline information for typical households in each group for a defined reference or baseline year. Livelihood access is determined by investigating the sum of ways through which households obtain food — what food they grow, gather or receive as gifts, how much food they buy, how much cash income is earned in a year and what other essential needs must be met with the income earned. The analysis of baseline access involves the quantification of sources of food, income and expenditure in a reference year for typical households within each wealth group. The reference year is generally defined as a ‘typical’ or ‘normal’ year. The process is one of:
Zimbabwe Rural Livelihood Baseline Profiles 2011
16 | P a g e
Identifying sources of food and income and their relative importance to the household’s total food
and income access.
Quantifying access to food and income and expenditure over a 12-month baseline period.
Sources of food are foods the household consumes and includes food gained through own crop and livestock production, food exchanged with labour or other commodities, food purchased, food collected (e.g. wild foods, hunting, fishing, etc.), or food received from gifts and relief. The importance of differentiating between methods by which food is obtained is that the way a household gets food defines its vulnerability; for example, a household is vulnerable to crop failure if the household grows crops. The analysis provides an understanding of the how and how much food and income are obtained from different sources within a reference year and provides the starting point for analysing the impact of a hazard.
Due to the problems of ‘adding up’ different foods, HEA focuses on adequacy of household access to food energy, measured in kilocalories (kcal). All ‘food’ consumed by a household is first converted into kilocalorie equivalents of energy using food composition tables and then each total kcal for the different sources of food is expressed as a percentage of total kilocalories of food consumed. To assess whether a household has adequate access to food, total energy value is compared against a minimum calorie requirement8 for the household based upon household size.
Sources of income in HEA are sources of cash income derived from the sale of goods or services, including crop sales, paid employment (salaried and casual labour), remittances, livestock and livestock product sales, natural resource exploitation (for example, gold panning, firewood, wild fruits, honey, grass, etc), self-employment (for example, petty trade, brick moulding, small business, beer brewing, handicraft sales, etc.), and land or asset rental. Cash income is net income rather than gross income, meaning that production costs are deducted from the gross value.
Step 4, 5 and 6: Outcome Analysis. Outcome analysis refers to the effects of a hazard such as price increases or crop failure (or a combination of both) on future access to food and income, so that decisions can be made about the most appropriate types of interventions to implement. The rationale behind this approach is that a good understanding of how people have survived in the past provides a sound basis for projecting into the future. Three types of information are combined; (i) information on baseline access, (ii) information on hazards (i.e. factors affecting access to food/income, such as crop production or market prices) and (iii) information on response strategies (i.e. the sources of food and income that people turn to when exposed to a hazard).
The idea is that once the baselines have been compiled they can be used repeatedly over a number of years until significant changes in the underlying economy render them invalid. A good livelihood baseline will generally be valid for between 5 and 10 years. What varies is the prevailing level of food security, but this is a function of variations in hazard, not variations in the baseline. Put another way, the level of maize production may vary from year to year (hazard), but the underlying pattern of agricultural production does not (the baseline).
The food economy analytical framework described here sets out the types of information and analysis that are required to understand the impact of a hazard on food security and local livelihoods. As much of this information as possible has been included in the current profiles. However, this report presents baseline, hazard and some household response strategies as a background description of the different livelihood zones in Zimbabwe and does not present any outcome analysis. This approach can be summarised in the figure overleaf:
8 A standard minimum energy requirement for a population with a developing country demographic profile is estimated at 2,070 kcal
per person per day see WFP/UNHCR, Guidelines for Estimating food and nutritional needs in emergencies, 1997. ZimVAC uses an
estimate of 2100 kcal/person/day in calculating minimum energy requirements.

Zimbabwe Rural Livelihood Baseline Profiles 2011
17 | P a g e
Zimbabwe Rural Livelihood Baseline Assessment
The livelihood baselines were compiled using data collected at several different levels, as shown in Table 1. This report contains a description of the first four categories of information that the ZimVAC collected during the May 2010 –February 2011 Assessment (livelihood zone description, wealth breakdowns, baseline access, hazard information and household coping/response strategies).
Table 1: Baseline data collection sources
Baseline Data source Wealth Breakdown
Baseline Access
Hazard Coping/Response
Secondary Data X X
District Key Informants X
Market visit or Trader interview X
Community key informants X X X
Wealth group focus group X X X
The second step is to consider the response strategies that can be pursued by households exposed to a hazard and the amount of food and/or income that can be generated from these.
In the example, the ‘poor’ keep from 3-5 goats, and in a crisis can exchange 2 of these for 1-2 sacks of grain – enough to cover roughly 10% of annual food needs. This has the effect of reducing the deficit from 25% to roughly 15%.
The first step is to superimpose the hazard on the baseline to assess its effects on food access at household level.
This requires that the hazard be expressed in quantitative terms, e.g. a 50% reduction in crop production, a 20% reduction in milk output, etc.
In the example below, a 50% reduction in crop production results in a 25% deficit in food access for the ‘poor’, since crops provide half of baseline food needs for this group.
The baseline picture provides a starting point or context for understanding the likely impact of a shock or hazard on food access at household level.
If, for example, ‘poor’ households are heavily dependent upon crop production, then they may be vulnerable to hazards affecting crops, such as drought or pest attack. Households that rely upon other sources of food and income are, on the other hand, less vulnerable to these hazards.
= Outcome
Outcome Analysis: Baseline + Hazard + Coping = Outcome
crops
milk/meat
labour
gifts
crops milk/meat
deficit
labour
gifts
crops milk/meat
l/stock sale
deficit
labour
gifts
Baseline Hazard e.g. 50% crop
failure
Coping e.g. sale of 2
goats
+
+
The outcome represents the final result, expressed in terms of the food intake deficit likely to result from a particular hazard, once household-level responses have been taken into account.
In the example, the conclusion is that a 50% crop failure is likely to result in a food intake deficit of 15% for ‘poor’ households. Similar analyses undertaken for other types of household (e.g. the ‘middle’ and the ‘better-off’) will indicate their vulnerability to this particular hazard.
Figure 2: Outcome Analysis illustration

Zimbabwe Rural Livelihood Baseline Profiles 2011
18 | P a g e
The basic methods for data collection made use of were the rapid rural appraisal (RRA) and participatory rural appraisal (PRA) tools and interview techniques. 2 features of this approach are that the field enquiry is semi-structured and it allows preliminary analysis on the spot to strengthen data quality. This means that it is sufficiently flexible to allow the enquiry to take an unexpected direction, should this be necessary, and it allows information to be cross-checked or important leads to be followed up before the team leaves the field. In the field, information is gathered primarily through key informant and focus group interviews undertaken at various levels. The process is summarised in Table 2, below.
Table 2: Interview levels
Level interview undertaken
Participants in the interview
Outputs
National
District Technical staff from local government (e.g. MoA), NGOs and other relevant organisations.
- Verification of Livelihood Zones within the district - Information on recent hazards affecting food security (including recent crop production data)
Community/Village Community key informants - Seasonal Calendar of crop production and other food and income acquisition strategies - Wealth Breakdown - Information on recent hazards and responses to these
Market /trader Traders in selected markets
-Understanding of market functionality and prices in baseline -Information on trade routes of commodities
Individual wealth group
Focus groups consisting of members of a specific wealth group
- Quantified data on food and income access for a 12-month baseline period. - Information on current hazard and response
Figure 3: Livelihood zones Visited and Sampled sites

Zimbabwe Rural Livelihood Baseline Profiles 2011
19 | P a g e
Table 3: Number of Interviews Completed
Livelihood Zone District Number of Community interviews
Number of Focus group interviews
Agro-fisheries Binga; Hwange; Kariba 10 40
Beitbridge South Western Lowveld Communal
Beitbridge; Gwanda; Mangwe; Matobo
12 48
Bikita Zaka Highlands Communal Bikita; Zaka 8 32
Central and Northern Semi-intensive Farming
Buhera; Chikomba; Chirumhanzu; Gutu; Hurungwe; Kariba; Mutoko; UMP
12 48
Cereal and High Cotton Communal Gokwe North; Gokwe South 10 40
Cereal and Low Cotton Communal Binga; Gokwe North; Hurungwe; Kariba
11 44
Eastern Highlands Commercial Farming Chimanimani; Chipinge; Mutare; Mutasa; Nyanga
12 48
Eastern Highlands Prime Communal Chimanimani; Chipinge; Mutasa; Nyanga
12 48
Eastern Kalahari Sandveld Communal Bubi; Gweru; Kwekwe; Lupane; Nkayi 12 48
Greater Mudzi Communal Mudzi; Nyanga; Rushinga; UMP 12 48
Highveld Prime Cereal and Cash Crop Resettlement
Bindura; Chegutu; Goromonzi; Hurungwe; Makonde; Marondera; Mazowe; Seke; Zvimba
13 52
Highveld Prime Communal Guruve; Makoni; Mt Darwin; Murehwa
12 48
Irrigated Commercial Sugar and Fruit Farming
Chiredzi 8 32
Kariba Valley and Kariangwe Jambezi Communal
Binga; Hwange; Kariba 12 48
Livestock and Cereal Farming Communal in Forests
Bubi; Lupane; Nkayi 8 32
Lusulu Lupane Southern Gokwe Mixed Agriculture
Binga; Gokwe South; Kwekwe; Lupane; Sanyati
12 48
Masvingo Manicaland Middleveld Smallholder
Buhera; Chirumhanzu; Gutu; Masvingo; Mutare; Zvishavane
13 52
Matabeleland Middleveld Communal Gwanda; Insiza; Mberengwa; Umzingwane; Umguza
12 48
Mutorashanga Informal Mining Zvimba 8 24
Mwenezi Chivi and South Midland Chivi; Mberengwa; Mwenezi 12 48
Northern Cattle and Cereal Farming Chikomba; Chiredzi; Chirumhanzu; Kwekwe ; Mhondoro-Ngezi; Zvishavane
12 48
Northern Zambezi Valley Mbire; Mt Darwin; Muzarabani 13 52
Save River Valley and Ndowoyo Communal
Bikita; Chipinge; Chiredzi 10 40
Southern Cattle and Cereal Farming Gwanda; Gweru; Beitbridge; Bubi; Insiza; Matobo; Umguza
13 52
Western Kalahari Sandveld Bulilima; Tsholotsho 10 40
TOTAL = 279 1096
Figure 3 and Table 4 show the sampled sites and number of interviews conducted for the livelihood baseline assessment.

Zimbabwe Rural Livelihood Baseline Profiles 2011
20 | P a g e
Defining the Baseline Year
In HEA assessment, it is considered desirable to develop an analysis for a ‘normal’ year, i.e. one that could be considered reasonably typical of conditions prevailing in Zimbabwe in most years. It was not easy to select a specific recent year that met this criterion, since the economic challenges experienced since 2000 to 2008. For this reason, the year 2009 to 2010 was the only year available for assessment for with the introduction of the multiple currency system, the macro economy stabilised and hence the year is good as a reference point and was agreed as the reference year for the baseline data. Twenty five zones were included in the livelihoods baseline assessment survey and the reference year is April 2009 to March 2010.
Implementation of the Baseline Survey
The assessment was done over a continuous period of 10 months from March 2010. The assessment team consisted of ZimVAC members drawn from both government ministries and non-governmental organisations. The work built-on the revision and updating of livelihood zones completed in November 2009. The initial phase of the assessment focused on the training of 7 HEA team leaders and 48 practitioners with the former responsible for providing technical leadership and supervision on data collected by the latter. 4 ZimVAC field teams composed of 12 people undertook the baseline fieldwork from March 2010 to December 2010. Approximately 2 weeks was spent on data collection and one week on analysis in each of the zones covered.
Table 4: Participating ZIMVAC members
Ministry of Health and Child Welfare
Ministry of Agriculture, Mechanisation and Irrigation Development
Ministry of Local Government
Ministry of Labour and Social Welfare
Food and Nutrition Council
Zimbabwe National Statistics Agency
Save the Children
FEWS NET
OXFAM GB
Action Contre la Faim
Concern Worldwide
World Food Programme
Food and Agriculture Organisation

Zimbabwe Rural Livelihood Baseline Profiles 2011
21 | P a g e
THE NATIONAL LIVELIHOOD ZONE MAP
Figure 4: Zimbabwe Livelihood Zone9 Map
Zimbabwe has 25 rural Livelihood zones, which have been mapped using ward boundaries as the lowest administrative unit; it is important to note that while the livelihood boundaries cut across district and provincial administrative boundaries it still retains capacity for decisions to be made at district and provincial level as the boundaries follow ward administrative boundaries. In this way, one district and provincial administrative area may contain different livelihood zones. Conversely, one livelihood zone may cover several administrative zones.
The Rural Livelihood Zones
The National Livelihood Zone Map of Zimbabwe has 25 livelihood zones. This level of disaggregation provides useful details for planners working at regional and district level. More broadly, the livelihood zones fall into 8 main types. (i) The Eastern Highveld Re-settled Zone: Export crops such as sugar cane, tea and coffee are grown together with a diversity of grains, root crops, vegetables and fruit. The lumber industry is an important commercial activity in the region providing local employment opportunities. (ii) Mid/Highveld Communal Zones: Densely populated and intensively farmed, maize is popular but is one crop of many in a region that is well-suited to a range of food and cash crops. A second season of winter wheat provides an additional harvest during the year. (iii) Mid/Highveld Re-settled Zones: Maize, winter wheat and vegetables are grown for food and cash on re-settled former large-scale commercial farms. Those LSC farms still in operation remain with a core commercial farm worker population.
9 A livelihood zone is an area within which people share broadly the same patterns of access to food (i.e. they grow the same crops,
keep the same types of livestock, etc). They also share broadly the same access to markets.

Zimbabwe Rural Livelihood Baseline Profiles 2011
22 | P a g e
(iv) Middleveld Communal Zones: Middleveld agriculture is dominated by maize and millet (the food crops), and groundnuts, sorghum and some cotton or paprika (the cash crops). Better-off farmers earn cash mainly from crop and livestock sales. The poor make ends meet by combining mixed agriculture with daily wage work and gold panning. (v) Mid/Lowveld Cotton Zones: Agriculture is a riskier proposition in the drier lowlands. Maize is the chief food crop and cotton the chief cash crop. The proportional importance of maize or cotton varies within the mid/lowveld “cotton” zones. Livestock sales, gold panning and daily wage work provide essential income for food purchases. (vi) Lowveld Re-settled Zones: Former large-scale game and beef ranches were transformed into mixed agriculture and mixed herds as new A2 commercial and A1 farmers resettled land in south-central Zimbabwe. (vii) Lowveld Agro-Pastoral Communal Zones: Only one zone in the south (Beitbridge lowveld) is most accurately described as agro-pastoral. The other lowveld economies (such as in the Kariba Valley) have a crop-livestock economic base that is increasingly propped up by remittances, local wage work and gold panning. (viii) Re-settled Ex-Commercial Irrigated Zones: Relatively small, these pockets of re-settled (formerly) irrigated commercial fruit and sugar cane estates are found principally in southern Zimbabwe.
Table 5: Rural Livelihood Zones Summaries
Livelihood Zone Name
Zone Description Population 2012 est.
Middleveld Livelihood Zones
Central and Northern Semi-
intensive Farming
This zone is spread across the central Middleveld, and extends to the north eastern and north western lowlands. Maize and small grains are the dominant crops in this agricultural zone, providing both food and cash income. Better-off households are self-sufficient in cereals, and also cultivate groundnuts for cash income. Poor households depend equally on own crop production, construction wages, gold panning and craft sales.
641,640
Bikita-Zaka Highlands Communal
This zone covers communal lands in the north-east of Masvingo, Zaka north and Bikita west districts. Semi-Intensive farming of maize and groundnuts provides better-off farmers with a stable source of food and cash income. The poor combine maize cultivation and agriculture labour opportunities with (limited) gold panning and local employment (such as in the Bikita mines). Fertile soils increase the potential for improved crop production. High population density and small farm sizes are the biggest constraints to increased crop production.
91,808
Highveld Prime Cereal and Cash
Crop Resettlement
This is a large zone found in various districts across all the Mashonaland Provinces. Prime land and large resettled farms provide surplus production of maize and pulses, and significant cash income from cotton and tobacco production. Better-off households also own sizeable cattle and goat herds. There are several distinct population groups in the zone. Whereas the A1 farmers and commercial farm owners are typically food secure, the (ex-commercial) farm workers are highly mobile and often at risk of food insecurity.
1,133,556
Masvingo, Manicaland Middleveld Smallholder
Livelihoods in this zone are characterised by cereal agriculture supplemented by cash cropping (groundnuts, round nuts and cotton), animal husbandry and remittances from migratory labour. A number of other income sources help the poor make ends meet including: sales of wild fruits and vegetables, gold panning, legal gold and diamond mining, sales of beer and handicrafts and casual labour. Fishing is also opportunistically practised in the rivers and streams, as is some cross-border trade.
1,094,365
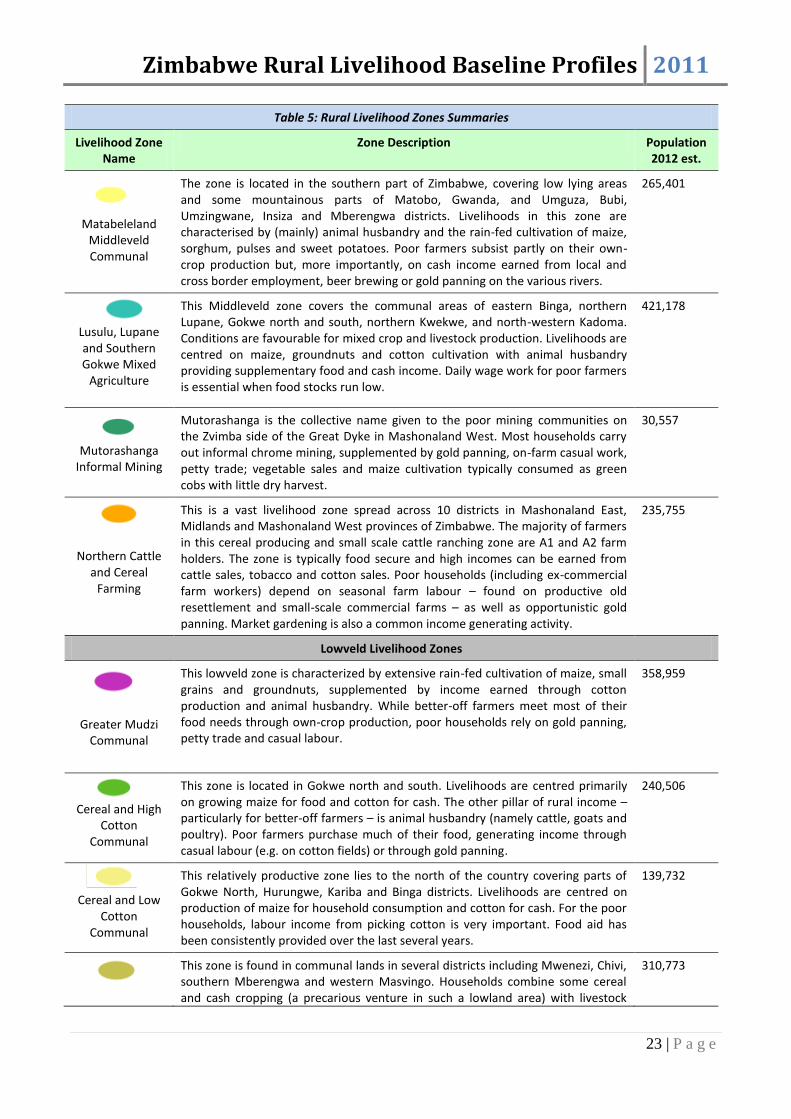
Zimbabwe Rural Livelihood Baseline Profiles 2011
23 | P a g e
Table 5: Rural Livelihood Zones Summaries
Livelihood Zone Name
Zone Description Population 2012 est.
Matabeleland Middleveld Communal
The zone is located in the southern part of Zimbabwe, covering low lying areas and some mountainous parts of Matobo, Gwanda, and Umguza, Bubi, Umzingwane, Insiza and Mberengwa districts. Livelihoods in this zone are characterised by (mainly) animal husbandry and the rain-fed cultivation of maize, sorghum, pulses and sweet potatoes. Poor farmers subsist partly on their own-crop production but, more importantly, on cash income earned from local and cross border employment, beer brewing or gold panning on the various rivers.
265,401
Lusulu, Lupane and Southern Gokwe Mixed
Agriculture
This Middleveld zone covers the communal areas of eastern Binga, northern Lupane, Gokwe north and south, northern Kwekwe, and north-western Kadoma. Conditions are favourable for mixed crop and livestock production. Livelihoods are centred on maize, groundnuts and cotton cultivation with animal husbandry providing supplementary food and cash income. Daily wage work for poor farmers is essential when food stocks run low.
421,178
Mutorashanga Informal Mining
Mutorashanga is the collective name given to the poor mining communities on the Zvimba side of the Great Dyke in Mashonaland West. Most households carry out informal chrome mining, supplemented by gold panning, on-farm casual work, petty trade; vegetable sales and maize cultivation typically consumed as green cobs with little dry harvest.
30,557
Northern Cattle and Cereal
Farming
This is a vast livelihood zone spread across 10 districts in Mashonaland East, Midlands and Mashonaland West provinces of Zimbabwe. The majority of farmers in this cereal producing and small scale cattle ranching zone are A1 and A2 farm holders. The zone is typically food secure and high incomes can be earned from cattle sales, tobacco and cotton sales. Poor households (including ex-commercial farm workers) depend on seasonal farm labour – found on productive old resettlement and small-scale commercial farms – as well as opportunistic gold panning. Market gardening is also a common income generating activity.
235,755
Lowveld Livelihood Zones
Greater Mudzi Communal
This lowveld zone is characterized by extensive rain-fed cultivation of maize, small grains and groundnuts, supplemented by income earned through cotton production and animal husbandry. While better-off farmers meet most of their food needs through own-crop production, poor households rely on gold panning, petty trade and casual labour.
358,959
Cereal and High Cotton
Communal
This zone is located in Gokwe north and south. Livelihoods are centred primarily on growing maize for food and cotton for cash. The other pillar of rural income – particularly for better-off farmers – is animal husbandry (namely cattle, goats and poultry). Poor farmers purchase much of their food, generating income through casual labour (e.g. on cotton fields) or through gold panning.
240,506
Cereal and Low Cotton
Communal
This relatively productive zone lies to the north of the country covering parts of Gokwe North, Hurungwe, Kariba and Binga districts. Livelihoods are centred on production of maize for household consumption and cotton for cash. For the poor households, labour income from picking cotton is very important. Food aid has been consistently provided over the last several years.
139,732
This zone is found in communal lands in several districts including Mwenezi, Chivi, southern Mberengwa and western Masvingo. Households combine some cereal and cash cropping (a precarious venture in such a lowland area) with livestock
310,773

Zimbabwe Rural Livelihood Baseline Profiles 2011
24 | P a g e
Table 5: Rural Livelihood Zones Summaries
Livelihood Zone Name
Zone Description Population 2012 est.
Mwenezi, Chivi and south Midland
Communal
production and market purchases. Casual work opportunities are found on plantations, estates and mines within the zone as well as further afield. A number of rivers provide gold panning and some fishing opportunities. Nonetheless, this is an area of chronic poverty and food insecurity.
Southern Cattle and Cereal
Farming
This livelihood zone covers a vast area across southern and central Zimbabwe spread across 15 districts. This is a predominantly mixed farming area with cereal cropping and cattle ranching. The majority of farmers are A1 and A2 farm beneficiaries. Production of maize, sorghum, and groundnuts, round nuts, cowpeas and sweet potatoes is moderate. Other economic activities include gold panning, grass sales, casual labour and brick moulding. This is a food secure zone.
403, 956
Northern Zambezi Valley
Communal
The zone is located on the border with Mozambique in the Zambezi Valley. Extensive small grain, groundnut and cotton production together with animal husbandry provide food and cash income. Maize, sorghum and pearl millet yields are typically poor. Local seasonal employment on better-off farmers’ cotton fields helps generate needed income for the poor.
201,309
Save River Valley and Ndowoyo
Communal
The zone is located in south-eastern Zimbabwe, covering parts of Chipinge, Chiredzi and Bikita districts. This dry, lowland area is primarily agricultural. Households grow mainly small grains (sorghum and millet) as well as maize and groundnuts. The zone boasts of good soils but cropping is limited by erratic rainfall. Consequently, cash income earned through seasonal casual work, petty trading and the sale of handicrafts, goats and some cotton is fundamental to the food economy. Remittances are also increasingly important.
279,711
Eastern Kalahari Sandveld
Communal
The zone covers the communal lands of Lupane, Nkayi, western Zhombe, Silobela and Inkosikazi. Livelihoods are built around three main activities: agriculture, animal husbandry and labour (local and migratory). Sorghum and maize farming is widespread but production is unreliable as the zone is semi-arid. Livestock and remittances are a key safety net for the better-off. For the poor, income earned from local work, forest products and/or gold panning (in Kwekwe and Gweru) is their mainstay.
302,186
Western Kalahari Sandveld
Communal
This zone is spread across Tsholotsho, Bulilima and Hwange districts in the Matabeleland provinces. Livelihoods are based on the rain-fed cultivation of sorghum and millet mixed with animal husbandry, and supported by cross-border labour migration. This low-lying, dry land zone has the advantage of proximity to labour markets in South Africa and Botswana. Thus an important aspect of the household economy is having someone working elsewhere and who remits money. Other important livelihood activities include craft making, grass cutting and firewood sales.
203,029
Agro-fisheries
This is a livelihood zone interspersed across Binga, Hwange, and Kariba rural districts. Livelihoods are characterised by fishing and related activities, supplemented by rain fed agriculture and animal husbandry. Production of maize, millet and sorghum is low to moderate in most years. There is a distinct gender division of labour whereby men spend most of the year in fishing camps along the lakes (Lake Kariba and Lake Chivero) while the women and children live further inland where they practice limited agriculture and animal husbandry. Crafts trade is the only other economic activity. Income earning opportunities are limited in the zone.
54,862

Zimbabwe Rural Livelihood Baseline Profiles 2011
25 | P a g e
Table 5: Rural Livelihood Zones Summaries
Livelihood Zone Name
Zone Description Population 2012 est.
Livestock and Cereal Farming Communal in
Forests
Livelihoods in this forested western zone are built around three main activities: livestock (mainly cattle), cereal cropping, and the exploitation of forest resources. It lies in Matabeleland North province in western Zimbabwe. It covers the forest areas of Ngamo, Gwaai, Bembesi and Gwampa in Lupane, Nkayi and Bubi Districts. Maize, sorghum, millet and pulse yields are reasonable in most years; Livestock sales are a key safety net; and the poor find casual work either on farms, constructing houses, as well as selling some honey. Poor availability of inputs, poor market access, lack of sufficient draught power and limited water supplies are the main constraints to food security.
25,833
Kariba Valley and Kariangwe
Jambezi Communal
This zone lies in north western Zimbabwe and includes parts of Kariba, Binga and Hwange districts. It is a dry, remote and resource-poor area that suffers from chronic food insecurity. Cultivation of maize, sorghum, millet and pulses is unreliable and wild foods are consumed during the lean season. Goat sales are the most common source of cash income but fishing, local wage work, craft and beer sales must also be pursued. Close proximity to Hwange provides some work opportunities on commercial farms for the poor, as well as access to the tourist craft market near Hwange, Kariba and Victoria Falls. Infertile soils, adverse weather conditions, foraging wild animals and poor input and output market access are the biggest constraints to crop production.
135,083
Irrigated Commercial
Sugar and Fruit Farming
Livelihoods in this arid zone found in south-eastern Zimbabwe are based on livestock and cereal production. Cereal production is primarily small grains, and legumes such as groundnuts, round nuts, and cowpeas. Maize is also widely grown, despite the harsh climatic conditions. Cotton is the main cash crop, which is supplemented by income from animal husbandry. Residents of this zone also include households who live and work permanently on the irrigated commercial sugar and fruit estates in Triangle and Hippo Valley, as well as some small-holder (A1) resettled farmers. The commercial farm workers depend on wage earnings and petty trade income to secure their food needs.
86,783
Beitbridge South-Western Lowveld
Communal
This is a semi-arid zone heavily dependent on livestock production. Harsh climatic conditions restrict crop production activities. It is located along the border with South Africa and Botswana in the southern parts of Beitbridge, Gwanda, Matobo, Mangwe, and Chiredzi districts. Employment is also a key source of food and cash income. Proximity to A2 farms and southern commercial estates and job markets around the border with South Africa and Botswana opens up significant employment opportunities. Sorghum cropping, mopane worm sales and gold panning supplement wage earnings of the poor.
285,562
Highveld Livelihood Zones
Eastern Highlands
Commercial Farming
The zone covers parts of Nyanga, Chimanimani, Chipinge and Mutasa districts of Manicaland Province. This high potential zone produces fruit, vegetables, flowers, tea, coffee and sugar cane for export. Timber is an important industry in this rugged, forested Highveld zone. Both the commercial farms and the saw mills offer labour opportunities to poor farmers as well as to farm-workers (who often need to pick up additional work to supplement on-farm income).
196,404

Zimbabwe Rural Livelihood Baseline Profiles 2011
26 | P a g e
Table 5: Rural Livelihood Zones Summaries
Livelihood Zone Name
Zone Description Population 2012 est.
Eastern Highlands Prime
Communal
This livelihood zone is in Manicaland province and covers Nyanga, Mutasa, Chimanimani, and Chipinge districts. This is a high potential zone where the greater part of available land is classified as some of the most productive communal land. It is characterized by intensively farmed small plots of mixed food and cash crops. Maize is primary but crop diversity is a key feature here (cereals, root crops, fruits, tea/coffee, tobacco). Poor farmers find wage work locally in the commercial agriculture sector.
213,286
Highveld Prime Communal
Livelihoods in this prime agricultural zone centre on rain-fed production of cash and food crops. Maize is the predominant food crop but cultivation is diversified and includes groundnuts, paprika, millet, sorghum, round nuts, cow peas, sweet potatoes, soya beans, tobacco and cotton. The zone has relatively high production potential although production is limited due to dense population. Poor road network limits trade.
1,363,480

Zimbabwe Rural Livelihood Baseline Profiles 2011
27 | P a g e
INDIVIDUAL RURAL LIVELIHOOD BASELINE PROFILES
The forthcoming section presents the rural livelihood information contained within the ZIMVAC livelihood baselines that were collected between May 2010 and July 2012. Information presented is detailed by livelihood zone for each of the 25 livelihood zones assessed. The ZIMVAC baseline information will be used by the ZimVAC to monitor household food security and to forecast vulnerability, as well as serving as a basis for further analysis designed to inform programming and policy on issues related to poverty alleviation and improved livelihood and food security. The information covers: livelihood zone descriptions, seasonal calendars, wealth groups, household’s sources of food and income by wealth group, information on the hazards to food and livelihood security that households are likely to face, household coping and response strategies, monitoring indicators for wealth groups and zones and some recommendations on implications for programming derived from these profiles. The ZIMVAC has set up relational databases that store this baseline data as well as generate livelihood outcomes for future livelihood outcome analysis.
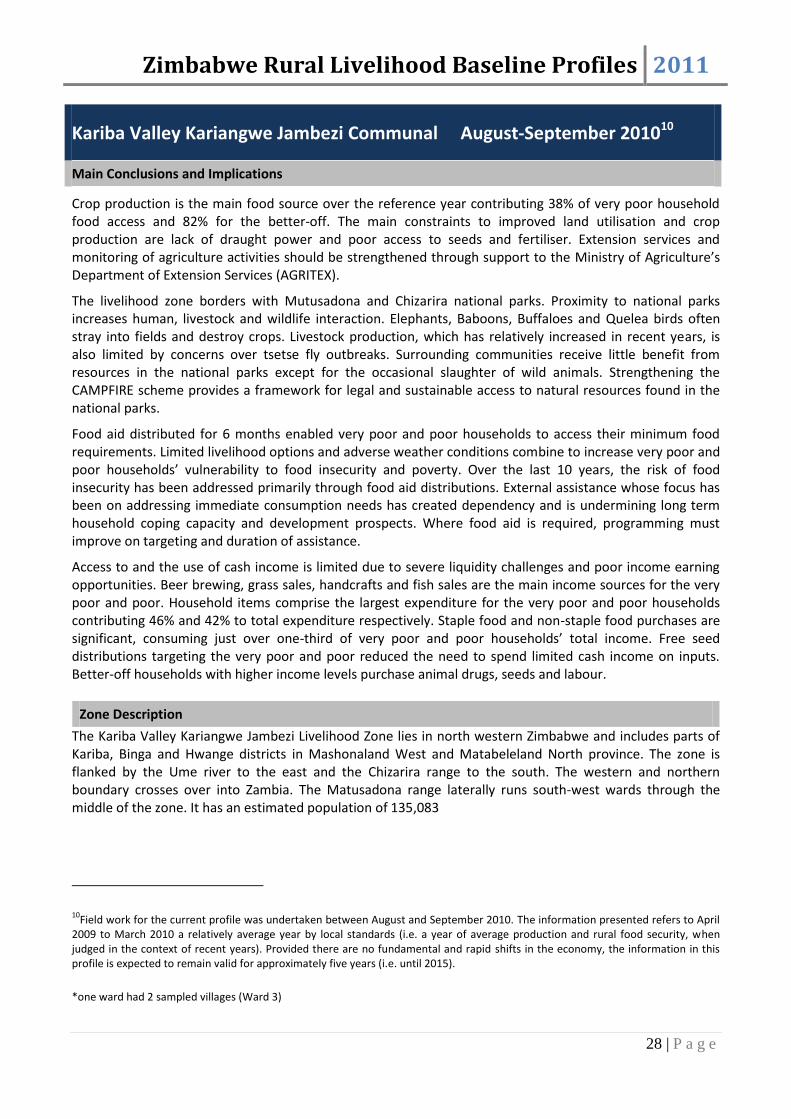
Zimbabwe Rural Livelihood Baseline Profiles 2011
28 | P a g e
Kariba Valley Kariangwe Jambezi Communal August-September 201010
Main Conclusions and Implications
Crop production is the main food source over the reference year contributing 38% of very poor household food access and 82% for the better-off. The main constraints to improved land utilisation and crop production are lack of draught power and poor access to seeds and fertiliser. Extension services and monitoring of agriculture activities should be strengthened through support to the Ministry of Agriculture’s Department of Extension Services (AGRITEX).
The livelihood zone borders with Mutusadona and Chizarira national parks. Proximity to national parks increases human, livestock and wildlife interaction. Elephants, Baboons, Buffaloes and Quelea birds often stray into fields and destroy crops. Livestock production, which has relatively increased in recent years, is also limited by concerns over tsetse fly outbreaks. Surrounding communities receive little benefit from resources in the national parks except for the occasional slaughter of wild animals. Strengthening the CAMPFIRE scheme provides a framework for legal and sustainable access to natural resources found in the national parks.
Food aid distributed for 6 months enabled very poor and poor households to access their minimum food requirements. Limited livelihood options and adverse weather conditions combine to increase very poor and poor households’ vulnerability to food insecurity and poverty. Over the last 10 years, the risk of food insecurity has been addressed primarily through food aid distributions. External assistance whose focus has been on addressing immediate consumption needs has created dependency and is undermining long term household coping capacity and development prospects. Where food aid is required, programming must improve on targeting and duration of assistance.
Access to and the use of cash income is limited due to severe liquidity challenges and poor income earning opportunities. Beer brewing, grass sales, handcrafts and fish sales are the main income sources for the very poor and poor. Household items comprise the largest expenditure for the very poor and poor households contributing 46% and 42% to total expenditure respectively. Staple food and non-staple food purchases are significant, consuming just over one-third of very poor and poor households’ total income. Free seed distributions targeting the very poor and poor reduced the need to spend limited cash income on inputs. Better-off households with higher income levels purchase animal drugs, seeds and labour.
Zone Description
The Kariba Valley Kariangwe Jambezi Livelihood Zone lies in north western Zimbabwe and includes parts of Kariba, Binga and Hwange districts in Mashonaland West and Matabeleland North province. The zone is flanked by the Ume river to the east and the Chizarira range to the south. The western and northern boundary crosses over into Zambia. The Matusadona range laterally runs south-west wards through the middle of the zone. It has an estimated population of 135,083
10Field work for the current profile was undertaken between August and September 2010. The information presented refers to April
2009 to March 2010 a relatively average year by local standards (i.e. a year of average production and rural food security, when judged in the context of recent years). Provided there are no fundamental and rapid shifts in the economy, the information in this profile is expected to remain valid for approximately five years (i.e. until 2015).
*one ward had 2 sampled villages (Ward 3)
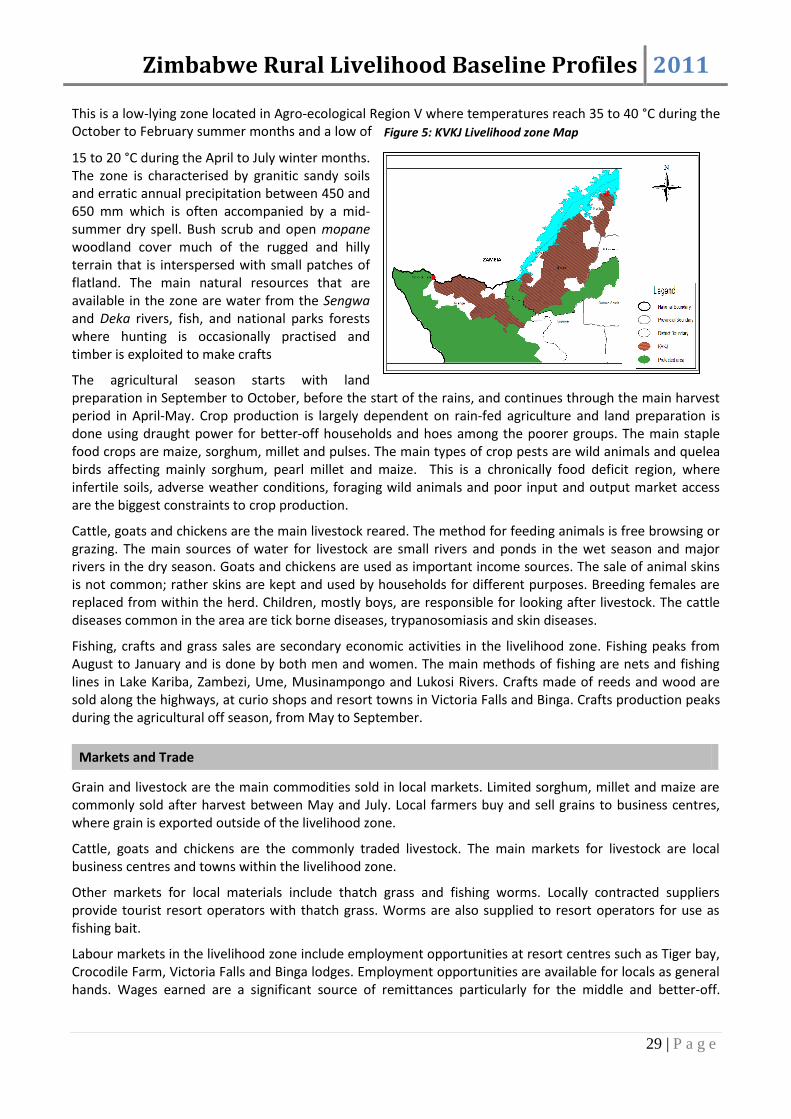
Zimbabwe Rural Livelihood Baseline Profiles 2011
29 | P a g e
This is a low-lying zone located in Agro-ecological Region V where temperatures reach 35 to 40 °C during the October to February summer months and a low of
15 to 20 °C during the April to July winter months. The zone is characterised by granitic sandy soils and erratic annual precipitation between 450 and 650 mm which is often accompanied by a mid-summer dry spell. Bush scrub and open mopane woodland cover much of the rugged and hilly terrain that is interspersed with small patches of flatland. The main natural resources that are available in the zone are water from the Sengwa and Deka rivers, fish, and national parks forests where hunting is occasionally practised and timber is exploited to make crafts
The agricultural season starts with land preparation in September to October, before the start of the rains, and continues through the main harvest period in April-May. Crop production is largely dependent on rain-fed agriculture and land preparation is done using draught power for better-off households and hoes among the poorer groups. The main staple food crops are maize, sorghum, millet and pulses. The main types of crop pests are wild animals and quelea birds affecting mainly sorghum, pearl millet and maize. This is a chronically food deficit region, where infertile soils, adverse weather conditions, foraging wild animals and poor input and output market access are the biggest constraints to crop production.
Cattle, goats and chickens are the main livestock reared. The method for feeding animals is free browsing or grazing. The main sources of water for livestock are small rivers and ponds in the wet season and major rivers in the dry season. Goats and chickens are used as important income sources. The sale of animal skins is not common; rather skins are kept and used by households for different purposes. Breeding females are replaced from within the herd. Children, mostly boys, are responsible for looking after livestock. The cattle diseases common in the area are tick borne diseases, trypanosomiasis and skin diseases.
Fishing, crafts and grass sales are secondary economic activities in the livelihood zone. Fishing peaks from August to January and is done by both men and women. The main methods of fishing are nets and fishing lines in Lake Kariba, Zambezi, Ume, Musinampongo and Lukosi Rivers. Crafts made of reeds and wood are sold along the highways, at curio shops and resort towns in Victoria Falls and Binga. Crafts production peaks during the agricultural off season, from May to September.
Markets and Trade
Grain and livestock are the main commodities sold in local markets. Limited sorghum, millet and maize are commonly sold after harvest between May and July. Local farmers buy and sell grains to business centres, where grain is exported outside of the livelihood zone.
Cattle, goats and chickens are the commonly traded livestock. The main markets for livestock are local business centres and towns within the livelihood zone.
Other markets for local materials include thatch grass and fishing worms. Locally contracted suppliers provide tourist resort operators with thatch grass. Worms are also supplied to resort operators for use as fishing bait.
Labour markets in the livelihood zone include employment opportunities at resort centres such as Tiger bay, Crocodile Farm, Victoria Falls and Binga lodges. Employment opportunities are available for locals as general hands. Wages earned are a significant source of remittances particularly for the middle and better-off.
Figure 5: KVKJ Livelihood zone Map
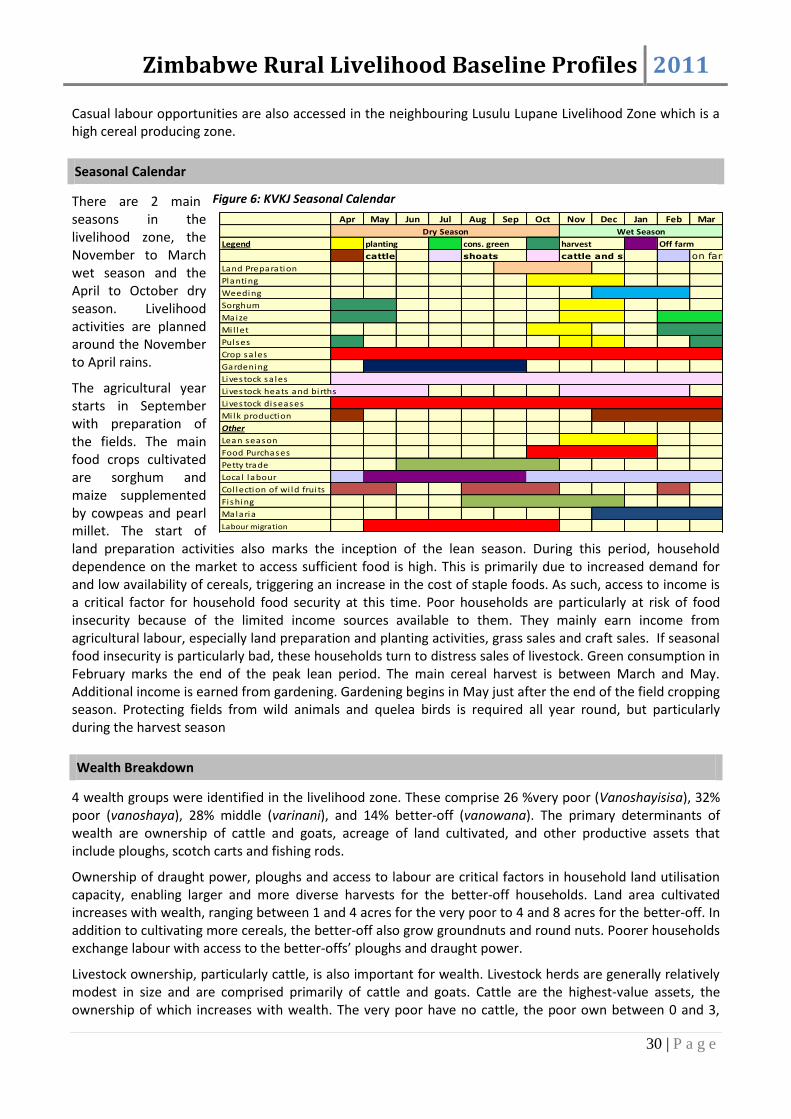
Zimbabwe Rural Livelihood Baseline Profiles 2011
30 | P a g e
Casual labour opportunities are also accessed in the neighbouring Lusulu Lupane Livelihood Zone which is a high cereal producing zone.
Seasonal Calendar
There are 2 main seasons in the livelihood zone, the November to March wet season and the April to October dry season. Livelihood activities are planned around the November to April rains.
The agricultural year starts in September with preparation of the fields. The main food crops cultivated are sorghum and maize supplemented by cowpeas and pearl millet. The start of land preparation activities also marks the inception of the lean season. During this period, household dependence on the market to access sufficient food is high. This is primarily due to increased demand for and low availability of cereals, triggering an increase in the cost of staple foods. As such, access to income is a critical factor for household food security at this time. Poor households are particularly at risk of food insecurity because of the limited income sources available to them. They mainly earn income from agricultural labour, especially land preparation and planting activities, grass sales and craft sales. If seasonal food insecurity is particularly bad, these households turn to distress sales of livestock. Green consumption in February marks the end of the peak lean period. The main cereal harvest is between March and May. Additional income is earned from gardening. Gardening begins in May just after the end of the field cropping season. Protecting fields from wild animals and quelea birds is required all year round, but particularly during the harvest season
Wealth Breakdown
4 wealth groups were identified in the livelihood zone. These comprise 26 %very poor (Vanoshayisisa), 32% poor (vanoshaya), 28% middle (varinani), and 14% better-off (vanowana). The primary determinants of wealth are ownership of cattle and goats, acreage of land cultivated, and other productive assets that include ploughs, scotch carts and fishing rods.
Ownership of draught power, ploughs and access to labour are critical factors in household land utilisation capacity, enabling larger and more diverse harvests for the better-off households. Land area cultivated increases with wealth, ranging between 1 and 4 acres for the very poor to 4 and 8 acres for the better-off. In addition to cultivating more cereals, the better-off also grow groundnuts and round nuts. Poorer households exchange labour with access to the better-offs’ ploughs and draught power.
Livestock ownership, particularly cattle, is also important for wealth. Livestock herds are generally relatively modest in size and are comprised primarily of cattle and goats. Cattle are the highest-value assets, the ownership of which increases with wealth. The very poor have no cattle, the poor own between 0 and 3,
Figure 6: KVKJ Seasonal Calendar
Apr May Jun Jul Aug Sep Oct Nov Dec Jan Feb Mar
Legend
cattle on farm
Land Preparation
Planting
Weeding
Sorghum
Maize
Mi l let
Pulses
Crop sa les
Gardening
Livestock sa les
Livestock heats and births
Livestock diseases
Mi lk production
Other
Lean season
Food Purchases
Petty trade
Local labour
Col lection of wi ld frui ts
Fishing
Malaria
Labour migration
Off farm
shoats cattle and shoats
Wet Season
planting cons. green harvest
Dry Season

Zimbabwe Rural Livelihood Baseline Profiles 2011
31 | P a g e
middle households own between 2 and 5, and the better-off have up to 10. Goats are also important and provide more regular but relatively lower levels of income when sold.
Figure 7: KVKJ Wealth group characteristics
Cattle Goats Chickens
Very Poor 5 - 6 1 - 4
Maize, Sorghum, Cow
peas, Millet, G/nuts,
R/nuts,
0 0-2 2-50-1 Fishing
rods
Poor 5 - 6 2 - 4
Maize, Sorghum, Cow
peas, Millet, G/nuts,
R/nuts,
0 -3 2-4 4-8
0-2 Fishing
rods
0-1 Plough
Middle 5 - 6 4 - 6
Maize, Sorghum, Cow
peas, Millet, G/nuts,
R/nuts,
2 - 5 4-8 6-13
0-2 Fishing
rods
0-1 Plough
0-1 scotch carts
Better Off 5 - 6 4 - 8
Maize, Sorghum, Cow
peas, Millet, G/nuts,
R/nuts,
6 - 10 7-11 10-18
0-2 Fishing
rods
0-1 Plough
0-1 scotch carts
Wealth Groups Characteristics
Livestock Holding
HH size
Land area
cultivated
(acres)
Crops cultivated Other Assets
15%
27%
32%
26%
% of population
Sources of Food (Reference Period 2009/10)
Own crop production is the main source of food for all wealth groups. The main food crops cultivated are sorghum, maize, millet, round nuts and limited quantities of cow peas. Own crop production contributes 82% for the better-off, 74% for the middle, 43% for the poor and 38% very poor’s consumption requirements. Better-off households have improved production through the use of ammonium nitrate fertiliser and cattle manure. The poor received inputs as part of the input support programme. Food purchases are the second most important food source supplementing crop production. The main food purchased by the poorer wealth groups are staple cereals
In the graph, food access is expressed as a percentage of minimum food requirements, taken as an average food energy intake of 2100 kcals per person per day
Staple maize cereal purchases peak during the lean October to January period when cereal stocks have been depleted. Better-off households who have higher production purchase less staples and more non staple sugar and oil. Food purchases contribute 13% to the very poor and poor household’s consumption, 21% to the middle’s households and 19% for the better-off.
Household composition is an important determinant of wealth. Very Poor households have a household size of 5, the smallest compared to 6 for the poor, middle and better-off. All wealth groups have between 2 and 3 adults in the household. Very poor, middle and better-off households each have on average 2 children in school, while the poor have between 1 and 2. Children under 6 years of age are between 1 and 2 for the poor, middle and better-off, and on average 1 for the very poor.
0
1
2
3
4
5
6
7
Very Poor Poor Middle Better off
HH Size
# Adults
Under 6 Yrs
6-18 Yr Olds
# in School
Figure 9: KVKJ Food sources
Figure 8: KVKJ HH sizes
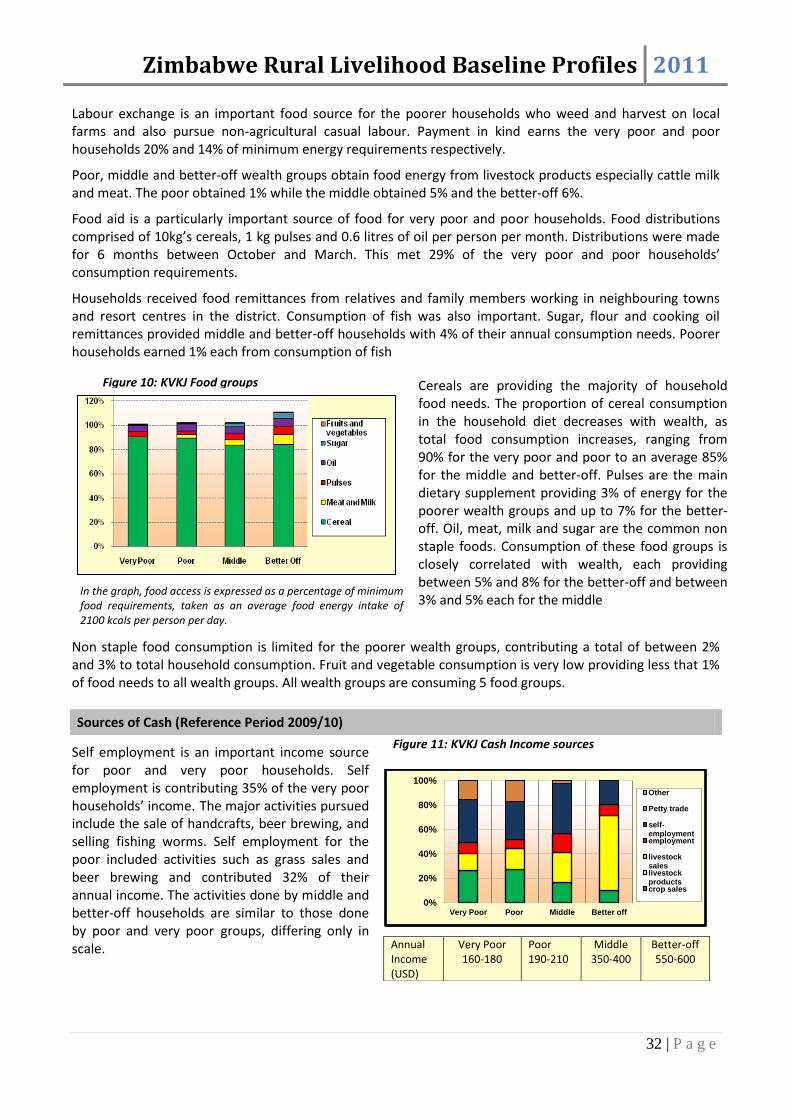
Zimbabwe Rural Livelihood Baseline Profiles 2011
32 | P a g e
Labour exchange is an important food source for the poorer households who weed and harvest on local farms and also pursue non-agricultural casual labour. Payment in kind earns the very poor and poor households 20% and 14% of minimum energy requirements respectively.
Poor, middle and better-off wealth groups obtain food energy from livestock products especially cattle milk and meat. The poor obtained 1% while the middle obtained 5% and the better-off 6%.
Food aid is a particularly important source of food for very poor and poor households. Food distributions comprised of 10kg’s cereals, 1 kg pulses and 0.6 litres of oil per person per month. Distributions were made for 6 months between October and March. This met 29% of the very poor and poor households’ consumption requirements.
Households received food remittances from relatives and family members working in neighbouring towns and resort centres in the district. Consumption of fish was also important. Sugar, flour and cooking oil remittances provided middle and better-off households with 4% of their annual consumption needs. Poorer households earned 1% each from consumption of fish
In the graph, food access is expressed as a percentage of minimum food requirements, taken as an average food energy intake of 2100 kcals per person per day.
Cereals are providing the majority of household food needs. The proportion of cereal consumption in the household diet decreases with wealth, as total food consumption increases, ranging from 90% for the very poor and poor to an average 85% for the middle and better-off. Pulses are the main dietary supplement providing 3% of energy for the poorer wealth groups and up to 7% for the better-off. Oil, meat, milk and sugar are the common non staple foods. Consumption of these food groups is closely correlated with wealth, each providing between 5% and 8% for the better-off and between 3% and 5% each for the middle
Non staple food consumption is limited for the poorer wealth groups, contributing a total of between 2% and 3% to total household consumption. Fruit and vegetable consumption is very low providing less that 1% of food needs to all wealth groups. All wealth groups are consuming 5 food groups.
Sources of Cash (Reference Period 2009/10)
Self employment is an important income source for poor and very poor households. Self employment is contributing 35% of the very poor households’ income. The major activities pursued include the sale of handcrafts, beer brewing, and selling fishing worms. Self employment for the poor included activities such as grass sales and beer brewing and contributed 32% of their annual income. The activities done by middle and better-off households are similar to those done by poor and very poor groups, differing only in scale.
Annual Income (USD)
Very Poor 160-180
Poor 190-210
Middle 350-400
Better-off 550-600
0%
20%
40%
60%
80%
100%
Very Poor Poor Middle Better off
Other
Petty trade
self-employment employment
livestock sales livestock products crop sales
Figure 10: KVKJ Food groups
Figure 11: KVKJ Cash Income sources

Zimbabwe Rural Livelihood Baseline Profiles 2011
33 | P a g e
The middle households received 41% of their annual income from self employment activities while the better-off received 20%. Employment is an important income source for all the wealth groups in this zone
The poor and very poor households are employed locally by wealthier households performing on-farm activities. These activities include land clearing, weeding and harvesting. Employment contributed 9% of total cash income to the very poor households, 7% to the poor, 15% to the middle and 9% to the better-off. Casual labour opportunities that include weeding are also done outside the zone in Lusulu and Lupane. This livelihood zone is a net exporter of labour.
Livestock sales are an important indicator of wealth, contributing 14%, 18%, 25% and 61% of total annual cash income to very poor, poor, middle and better-off households respectively. Poorer households sold at least 1 goat, the middle 3 goats and the better-off 3 goats and at least 1 cow. These significant incomes from livestock sales require support from programmes providing dipping chemicals and vaccinations to protect livestock from diseases.
Crops are commonly bartered to meet grinding costs. Sale of crops contributes 26%, 27%, 16% and 10% for the very poor, poor, middle and better-off households respectively. All groups sold vegetable produce as part of their crop sales.
Expenditure Patterns (Reference Period 2009/10)
Expenditure patterns vary across wealth groups. Staple food expenditure decreases with wealth contributing 25% and 23% of very poor and poor expenditure, and 18% and 12% for the middle and better-off households respectively. Poor crop production is the main reason for increased staple food expenditure. The combined expenditure on staple food and non staple food is 32% for the very poor, 34% for the poor and better-off, and 38% for the middle households. This makes food the biggest expenditure line in the household budget.
Annual Expenditure (USD)
Very Poor 160-180
Poor 190-210
Middle 350-410
Better-off 550-400
As such, an increase in food prices and poor cereal availability in the market pose a serious risk to household food security.
Amounts spent on household items that include grinding costs, salt, utensils, tea and kerosene/candles increases with wealth; however its proportional importance to total household expenditure decreases with wealth. Very poor households spend USD 74 (46%), poor USD 78 (41%), middle USD 92 (25%) and better-off USD 113 (20 %).
Very poor and poor households’ expenditure on social services is low, comprising 12% of total expenditure for both wealth groups. Most of the expenditure on social services is on education costs which include stationery, uniform and teacher incentives. Expenditure on social services increases with wealth from USD 20 (12%) for the very poor, USD 22 for the poor USD 22 (12%), USD 70 for the middle (19%) and USD 92 (16%) for the better-off households. Government subsidies on primary education and health assist households in the zone to access these services at a limited cost.
Better-off households are spending 7% of their income on seeds, labour and animal drugs and it is equivalent to USD 46. Poorer households did not purchase any seeds because they received seed distributions and also routinely used retained seed.
Figure 12: KVKJ Expenditure patterns

Zimbabwe Rural Livelihood Baseline Profiles 2011
34 | P a g e
Expenditure on clothes, both purchased and received as remittances from relatives, ranged from 5% for the poorer wealth groups to 9% for the better-off. Most of the clothing purchased was for children.
Discretionary expenditure on transport, beer, airtime and cigarettes increases with wealth from 7% for the very poor, 8% for the poor and middle and 14% for the better-off.
Hazards
Chronic hazards: Erratic rainfall is a chronic hazard to crop production. Crop production is also affected by crickets and quelea birds. HIV and AIDS is also a major problem throughout this zone. This zone is also prone to veld fires which destroy grazing land.
Intermittent hazards: Roughly every 3 to 5 years within a decade, rainfall is below average for the zone.
Coping Strategies
Increased sale of livestock: This is a coping strategy mainly employed by the middle and better-off households who own big herd sizes for cattle and goats. The poor groups increase sale of goats and chicken.
Increased consumption of wild foods: Collection of wild foods happens every year but in bad years the poorer groups increase the collection of wild foods such as Mutiri and Tamarind.
Labour Migration: The richer households tend to migrate in search of labour to local towns and bigger towns whilst in some instances they migrate to neighbouring countries.
Increased fish poaching: The poorer groups often poach fish in dams and rivers in the zone. The fishing is usually illegal and the fish is sold for cash or bartered for grain
Key Parameters for Monitoring
Table 6: KVKJ Monitoring Indicators
Item Key Parameter - Quantity Key Parameter – Price Crops Maize
Sorghum
Millet
Vegetables
Vegetables
Livestock production Cattle
Goats
Chicken
Cattle
Goats
Chicken
Other food and cash income Weeding
Remittances
Self employment
Barter income
Weeding
Remittances
Self employment
Barter income

Zimbabwe Rural Livelihood Baseline Profiles 2011
35 | P a g e
Livestock and Cereal Farming in Forests Communal September 201011
Main Conclusions and Implications
Livelihoods in this zone are based on livestock (mainly cattle), rain fed cereal cropping and exploitation of forest resources (grass). Maize, sorghum and millet are the commonly cultivated crops providing modest yields in most years. Maize is the staple cereal in the zone used to meet consumption needs and also exchanged for other food and household items. Crop production is the main source of food providing over half of the very poor households’ minimum consumption needs and upwards of 90% of the better-offs. Significant potential to increase crop production and improve food security in the livelihood zone lies in addressing poor availability of inputs, lack of sufficient draught power and limited water supplies. Agricultural extension services through governmental or non-governmental organisations to improve cropping practices are also important.
Livestock primarily serve as the traditional store of wealth providing access to significant income both in normal years and in the face of adverse events. Poorer households that do not own livestock depend on household labour to earn most of their income by pursuing casual labour, gold panning and grass sales opportunities. Intensifying the search for on-farm and off-farm labour opportunities is the primary coping strategy for poorer households. Heavy reliance on agriculture makes both poor and better-off households’ food security particularly vulnerable to the occurrence of drought. Remittances from South Africa and Botswana are important during normal times and more so during drought periods given their relative insulation from its effects.
Food Aid has been distributed to very poor and poor households annually since 2007, providing one quarter of their food needs during the baseline year. During these emergency years, food aid was an effective mechanism for addressing short term food deficits. A prominent side effect however of the predictable food distributions is that communities now plan for the food aid as part of their annual food entitlement. This has eroded local mechanisms for dealing with adversity or taking advantage of existing opportunities to improve their livelihoods. This development implores humanitarian agencies and development partners to refine food aid programming and where appropriate provide interventions that address the underlying causes of food insecurity. Livelihood strengthening and diversification interventions are critically important.
Food markets play an important role in providing access to sufficient food in the livelihood zone. Staple food, mainly maize, expenditure is relatively low in the baseline year comprising between 3% and 5% of household expenditure across all wealth groups. Non staple sugar, oil and small quantities of meat are the main foods purchased taking up between 20% and 25% of household income. Total expenditure on both staple and non staple food provides access to an average 10% of annual food needs in the livelihood zone.
Social services expenditure is among the main expenditure categories for all households. Education comprises on average 80% of total social service expenditure. There are however significant disparities in education spending among the wealth groups. With between 2 and 3 children in school, middle and better-off households are spending 3 to 4 times more on education compared to the very poor households, and double what the poor are spending. Higher levels of investment in education significantly improve long term development prospects of the middle and better-off. Lower spending on education by the poor potentially perpetuates inter- generational poverty among the poorer wealth groups.
11
Field work for the current profile was undertaken between September and October 2010. The information presented refers to April 2009 to March 2010 a relatively average year by local standards (i.e. a year of average production and rural food security, when judged in the context of recent years). Provided there are no fundamental and rapid shifts in the economy, the information in this profile is expected to remain valid for approximately five years (i.e. until 2015).

Zimbabwe Rural Livelihood Baseline Profiles 2011
36 | P a g e
Expenditure on inputs is relatively low in the livelihood zone. Input supply interventions take much of the credit for the relatively low expenditure on seeds and fertiliser in the livelihood zone. Poorer households have been receiving free seed distributions and have not incurred any agriculture inputs expenditure. Middle and better-off households have been receiving subsidised inputs and have spent less in the baseline year as they ordinarily would have had to.
Proximity of the livelihood zone to the forest areas of Ngamo, Gwaai, Bembesi and Gwampa potentially offers opportunities for the harvesting of natural products and wildlife. Government interest in protecting the natural environment and concerns over the unsustainable harvest of forest products have resulted in regulation that limits the surrounding communities to grass cutting in the forests.
Poor road and transport infrastructure limit the role of markets in addressing food and livelihood insecurity in the livelihood zone.
Zone Description
The Livestock and Cereal Farming in Forests livelihood zone lies in Matabeleland North province in western Zimbabwe. It covers the forest areas of Ngamo, Gwaai, Bembesi and Gwampa. The estimated population of 25,833 reside in Lupane, Nkayi and Bubi Districts in Agro-ecological Region IV. Annual rainfall is between 420 mm and 620 mm providing precipitation for the abundant Zambezi teak, False Mopane and Mukwa trees that grow in sandy soils with low water holding capacity that seep most the rainfall into the Mbembesi, Bubi, Gwaai and Lupane rivers
Figure 13: LCFF Livelihood zone map
This is a mixed farming livelihood system based on livestock, rain fed cereal cropping and exploitation of forest resources. The main livestock owned are cattle, goats and chicken. Livestock primarily serve as the traditional store of wealth providing access to significant income both in normal years and in the face of adverse events. Cattle are esteemed livestock owned mainly by middle and better-off households. They are rarely slaughtered and are sparingly sold. Household herd management practices prioritise herd growth during normal years to build up buffer stocks that provide a safety net during hardship. The sale of 1 cow each, in response to a significant cash need such as education, is the single largest source of cash income for the middle and better-off households in the baseline year. Goat herds are smaller compared to cattle herds and are both slaughtered and sold by the poor, middle and better-off households. Chickens are the commonly sold livestock providing small but regular cash inflows for all wealth groups enabling them to meet their day to day expenditure needs. During the wet season, livestock access water from major rivers passing through the zone and drink from boreholes and wells during the dry season. Anthrax and tick borne diseases, mainly heart water and red water are the common cattle diseases. Black leg, foot and mouth and Pulp Kidney are also encountered. Chickens are commonly affected by Coccidiosis and New Castle.
Cereals and pulses are the commonly cultivated crops that provide modest yields in most years. The main cereals are maize, sorghum and millet cultivated during the summer months of November and April. The main pulses are groundnuts, round nuts and cowpeas. Conventional ox drawn ploughs are used for draught power. Crop production is the main source of food providing over half of the very poor household’s minimum consumption needs and upwards of 90% of the better-off. Maize is the main cop produced in the livelihood zone providing half of the middle and better-off households’ consumption needs, and a third and a quarter of the poor and very poor’s consumption needs respectively. Sorghum and millet are often

Zimbabwe Rural Livelihood Baseline Profiles 2011
37 | P a g e
cultivated to supplement maize yields. These small grains are less preferred but better suited to the often erratic and poorly distributed rainfall that commonly retards maize yields. Significant potential to increase crop production and improve food security in the livelihood zone lies in addressing poor availability of inputs, lack of sufficient draught power and limited water supplies. The main pests affecting crop production are quelea birds, the maize stalk borer and also wild animals particularly elephants.
Poorer households that do not own livestock depend on household labour to earn most of their income. The common labour-based income sources are casual labour and grass sales. Agriculture labour is the main employment type providing both food and cash income peaking during weeding, harvesting and land preparation. Intensifying the search for on-farm and off-farm labour opportunities is the primary coping strategy for poorer households. Heavy reliance on agriculture makes both poor and better-off households’ food and livelihood security particularly vulnerable to drought. Remittances from South Africa and Botswana are important during normal times and are a relatively reliable safety net during drought periods.
Proximity to forested areas of Ngamo, Gwaai, Bembesi and Gwampa potentially provides opportunities for the harvest of natural products such as grass, timber, firewood and game. Construction work thatching and fencing housing structures provides the most labour based cash income. Further exploitation of the surrounding natural forests is regulated by conservation policies concerned about depletion of natural forests and environmental degradation. When communities harvest grass, half of the grass is used for household purposes and the other half is paid to the Forestry Commission.
Markets and Trade
The main labour markets are local, including seasonal daily labour in the fields of better-off households and temporary migration to the nearby urban centres such as Bulawayo, Lupane, Hwange and Victoria Falls. Botswana and South Africa provide a key opportunity for employment for both food and cash. Proportions of labour markets indicate that 73% of households get employed outside the zone and 27% find work in the zone and local towns.
Maize and Sorghum are the commonly sold commodities mainly exchanged on a local basis. The peak cereal trade is from May to December. The majority of farmers purchase maize and sorghum for household consumption between December and March.
Livestock are generally sold farmer to farmer, to local butcheries or to private traders. The buyers export the animals to abattoirs and the Cold Storage Commission in Bulawayo. Livestock are traded throughout the year and peaking during the festive season between December and January.
Market access in the zone is poor because most settlements are far from urban centres, have poor roads and are affected by poor availability of transport. The Bulawayo to Zambia highway via Victoria Falls provides modest cross border commodity and labour trade for villages close to Botswana and Zambia.
Seasonal calendar
There are 2 main seasons in the livelihood zone, summer (Ihlobo) from November to April and winter (ubusika) from May to October. Livelihood activities are planned according to the November to March rainy season. Land preparation activities begin in late August in anticipation of the onset of the rains. The main crops cultivated are maize, sorghum, millet, groundnuts, round nuts and cowpeas, which are planted in early November. Cereals are intercropped with legumes.

Zimbabwe Rural Livelihood Baseline Profiles 2011
38 | P a g e
Land preparation activities and the rains occur as the lean season approaches. The lean season begins in November and peaks in December, beginning to subside in January. During this period, dependence on food purchases increases to make up for the diminished contribution of own crop production to household consumption requirements. Shortfalls in cereal availability in the market lead to a spike in staple food prices. As such, access to income is critical for household food security. For the poorer households, much of their income is earned from local labour opportunities, primarily performing agriculture activities. Replenished water sources and regenerated pastures in December mark the start of the livestock production season
Livestock births between December and February provide milk to enrich the diets of livestock holding households, who are typically the better-off. Livestock holding households typically avoid depleting herds through unsustainable sales. Growing herds provide the opportunity to earn much needed income from livestock sales which tentatively start in September in the run up to the lean season and peak in December and January.
The start of the consumption year and the much anticipated break to the lean season begins in February. Households start with the consumption of green maize. The main harvest of maize and sorghum takes place in April and May. From the harvest onwards, household dependence on food purchases declines significantly and food prices drop. Local harvesting labour opportunities are available during this time.
As the harvest draws to a close, poorer households begin to search for off farm casual labour opportunities in construction, thatching and fencing houses. The main human disease is malaria, associated with the onset and offset of rains.
Wealth Breakdown
There are 4 wealth groups in the livelihood zone, namely the very poor (21%), poor (30%), middle (28%) and better-off (21%). The main determinants of wealth in the zone are livestock holdings and the amount of land cultivated. Households in this zone have similar demographic profiles. All wealth groups have on average 6 household members. Of these 6, 2 are adults capable of working, 2 are children under the age of 6 years old and an additional 2 are children between the ages of 6 to 18 years
Figure 15: LCFF HH sizes
0
1
2
3
4
5
6
7
Very Poor Poor Middle Better off
HH Size
# Adults
Under 6 Yrs
6-18 Yr Olds
# in School
Livestock provide access to cash and food for the household. Ownership of livestock is the preferred means of storing wealth in the livelihood zone. Household herd management practices prioritise cattle herd growth during normal years to build up stocks that build resilience into household livelihoods. Cattle are the prized
Figure 14: LCFF Seasonal Calendar
Apr May Jun Jul Aug Sep Oct Nov Dec Jan Feb Mar
Legend planting cons. green harvest
cattle shoats cattle and shoats
Land Preparation
Planting
Weeding
Harvesting
Guarding Fields
Geen Consumption
Livestock sales
Livestock heat and births
Milk production
Other
Crafts trade
Lean season
Food Purchases
Off farm labour
On farm labourMalaria
Dry Season Wet Season

Zimbabwe Rural Livelihood Baseline Profiles 2011
39 | P a g e
livestock assets owned primarily by middle and better-off households. They are rarely slaughtered or sold. Mature female cows are highly valued for breeding. The sale of a single cow is the largest source of income for the middle and better-off households. Goat herds are smaller compared to cattle herds and are occasionally slaughtered and sold by the poor, middle and better-off households. Poorer households typically own poultry which are often sold for regular access to income. Problems of livestock production include poor water availability and a high prevalence of diseases, particularly anthrax; tick borne diseases, black leg, foot and mouth and pulp kidney
The amount of land cultivated is a characteristic of wealth. Land is the primary production asset, providing access to food and income. Land is equally allocated by local authorities across the zone population. The capacity to utilise the available land is determined by wealth. Chief among these factors is ownership of draught power and a plough. The main constraints to higher land utilisation and more crop production among the poor are the lack of draught power and lack of income to purchase seeds and fertilisers. To overcome these constraints the poor exchange labour for draught power with the better-off and also use retained seed
Sources of Food (Reference Year 2009/10)
Own crop production is the main source of food for all wealth groups increasing from 55% for the very poor, 61% for the poor, 80% for the middle and 91% for the better-off. Maize is the main cereal produced and provides close to 50% of consumption for all the wealth groups. Minor cereals produced are sorghum and millet. Cowpeas, round nuts and groundnuts are the pulses cultivated. Wealthier households cultivate bigger pieces of land, use cattle manure and fertilisers to improve productivity and also hire labour at critical cropping periods contributing to their significantly higher production
In the graph, food access is expressed as a percentage of minimum food requirements, taken as an average food energy intake of 2100 kcals per person per day.
Cattle Goats Chickens
Very Poor 5 - 7 2 - 5
Maize, Sorghum, Cow
peas, Millet, G/nuts,
R/nuts,
0 0-2 6-12 2-4 Hoes
Poor 5 - 7 3 - 7
Maize, Sorghum, Cow
peas, Millet, G/nuts,
R/nuts,
2 -4 3-5 7-152-4 Hoes
0-1 Plough
Middle 5 - 7 5 - 12
Maize, Sorghum, Cow
peas, Millet, G/nuts,
R/nuts,
5 - 10 4-9 8-15
4-6 Hoes
0-2 Plough
0-1 scotch
carts
Better Off 5- 7 8 - 12
Maize, Sorghum, Cow
peas, Millet, G/nuts,
R/nuts,
11 - 19 6-11 12-20
4-6 Hoes
1-2 Ploughs
1-2 scotch
carts
Figure 2.4 Wealth Groups Characteristics
Livestock Holding
HH size
Land area
cultivated
(acres)
Crops cultivated Other Assets
22%
28%
30%
20%
% of population
0%
20%
40%
60%
80%
100%
120%
140%
V.Poor Poor Middle Better-off
Figure 2.5 Food Sources
Other
food aid
purchase
payment in kind
livestock prod.
crops
Figure 16: LCFF Wealth group characteristics
Figure 17: LCFF Food sources

Zimbabwe Rural Livelihood Baseline Profiles 2011
40 | P a g e
Food aid is the second most important food source providing 23% of very poor and poor water availability s’ consumption and 10% of the middle households. Food aid was provided by non-governmental organisations for 5 months. The monthly food aid basket per person comprised of 10 kg cereals, 1kg pulses, and 0.6 litres oil.
During the cropping season, poorer households find work in the fields of the better-off and get paid in cereal. Payment in kind earns the very poor and poor 17% and 11% of their annual consumption respectively.
Food purchases are not significant in the livelihood zone. Staple food purchases are very low largely due to high production among the better-off and food aid for the poorer groups. Staple food purchases are on average 2% across the wealth groups. The main foods purchased are non staple sugar and oil. Food purchases provide 15% consumption to the better-off, 12% to the middle, 6% to the poor and very poor.
The poor, middle and the better-off groups obtain 3, 6 and 12% of their annual energy needs respectively from the consumption of cow milk
Figure 18: LCFF Food groups Cereals are contributing the vast majority of households’ food energy needs, on average 80% across the wealth groups. Maize is the main cereal supplemented by millet and sorghum. The contribution of staple cereal to household consumption decreases across wealth groups from 70% to the very poor and 50% to the better-off.
Pulses are the main dietary supplement. Consumption of cowpeas, round nuts and groundnuts increases with wealth providing between 10% and 15% across the wealth groups. Livestock products, namely meat and milk, are consumed by the middle and better-off. Cow milk consumption earns the better-off 11% of consumption, 5% for the middle and 3% for the poor.
In the graph, food access is expressed as a percentage of minimum food requirements, taken as an average food energy intake of 2100 kcals per person per day.
Oil and sugar are the main non staple foods. Oil contributes on average 5% for the poorer wealth groups and 8% for the middle and better-off. Vegetable and fruit consumption is low. The very poor are consuming 5 food groups, the poor are consuming 6, and the middle and better-off are consuming 7 food groups
0%
20%
40%
60%
80%
100%
120%
140%
Very Poor Poor Middle Better Off
Figure 2.6 Food Groups Consumed
Fruits and vegetables
Sugar
Oil
Milk
Meat
Cereal

Zimbabwe Rural Livelihood Baseline Profiles 2011
41 | P a g e
Sources of Cash (Reference Period 2009/10)
Figure 19: LCFF Cash Income Sources Poorer households are earning most of their income from employment activities. These include agriculture labour, construction work and some remittances. Employment earns the very poor and poor half of their total cash income. The middle and better-off are earning 17% and 24% from remittances respectively.
The middle and better-off are earning most of their income from livestock sales. The sale of a single cow earns the middle and better-off 52% and 44% of their total income respectively. There are some goat sales but these make a small contribution to income.
Annual Income in USD
Very Poor 170-190
Poor 250-300
Middle 475-530
Better-off 580-620
Crop sales are relatively important for all wealth groups. Income from crop sales is earned from the sale of maize. Crop sales are earning on average 20% of total income for all the wealth groups
Expenditure Patterns (Reference Period 2009/10)
The expenditure patterns of the wealth groups in this livelihood zone vary across the groups. The very poor and poor households spend 3% and 5% of their total income on staple food purchase as compared to 6% and 5% for the middle and better–off households, respectively. Non staple oil and sugar are the most expensive food items. Non staple food comprises of 17% of the very poor households’ expenditure, 19% of the poor’s, and 24% of the middle and better-offs’ The combined expenditure on staple and non staple food makes food the most expensive item on the household expenditure for all wealth groups.
Household items, which include basic survival items such as grinding, soap, tea, utensils, and kerosene, are the single largest expenditure line for all households. This expenditure increases with wealth ranging from USD 70 for the very poor to USD 114 for the better-off. However, its proportional importance to total expenditure decreases with wealth from 19% for the middle and better-off, 30% for the middle and 38% for the very poor.
The proportion of total expenditure spent on education and health averages 18% for all wealth groups. The main social service paid for is education.
Annual Expenditure in USD
Very Poor 170-190
Poor 250-300
Middle 475-530
Better-off 580-620
The better-off are spending three and half and two and a half times more money on education compared to the very poor wealth group. The main education items purchased are stationery, books and uniforms. The difference in expenditure on education points to the wide disparity in the quality of education accessed by the better-off as compared to the poorer wealth groups. The government also subsidises access to health services and also school fees for rural areas.
0%
20%
40%
60%
80%
100%
V.Poor Poor Middle Better-off
Figure 2.7 Income Sources
self-employment
employment
livestock sales
crop sales
0%
20%
40%
60%
80%
100%
V.Poor Poor Middle Better-off
Figure 2.8 Expenditure Patternother
clothes
social serv.
inputs
tax
HH items
non-staple foodstaple food
Figure 20: LCFF Expenditure patterns
Zimbabwe Rural Livelihood Baseline Profiles 2011
42 | P a g e
Expenditure on inputs, primarily seed and some fertiliser purchased on the local market and GMB comprises 8% and 12% of total expenditure for the middle and better-off respectively. Seed distributions have reduced the pressure on poorer wealth groups to purchase inputs.
‘Other’ expenditure includes transport, beer, gifts, festivals and community obligations and all wealth groups have a proportion of their total expenditure going to other items
Hazards
Chronic hazards: Erratic rainfall, input shortages and wild animals are regular hazards which limit crop production. Human diseases, particularly HIV and AIDS and malaria are also a major problem throughout this zone. This zone is furthermore prone to stock theft
Periodic hazards: Roughly every 3 to 5 years within a decade, rainfall is below average for the zone.
Coping Strategies
Increased sale of livestock: The better-off and middle groups engage in the sale of livestock such as cattle and goats whilst the poorer groups sell livestock such as chickens and goats.
Premature harvesting of crops: All wealth groups prematurely harvest crops during food stress periods.
Reduction in the number of meals and quantity of food consumed per day: The poor groups reduce the number of meals they consume in a day to try and manage during food crisis periods.
Key Parameters for Monitoring
Table 7: LCFF Monitoring indicators
Item Key Parameter - Quantity Key Parameter – Price
Crops Millet; Maize; Sorghum Vegetables; Maize
Livestock production Cattle; Goats Cattle; Goats
Other food and cash income Labour Labour

Zimbabwe Rural Livelihood Baseline Profiles 2011
43 | P a g e
Agro-Fisheries Livelihood Zone August-September 201012
Main Conclusions and Implications
This is a fishing-based livelihood system complemented by limited crop and livestock production. Households in this zone are settled along the shores of Lake Kariba and Chivero, and in the valleys of the Zambezi and Hunyani rivers, from where they pursue fishing. Fishing earns very poor households 36% of their total income, and 90% for the better-off. The potential for increased fish production can be improved through the acquisition of fishing licences and improved fishing equipment.
Crop production of millet, sorghum and maize is moderate in most years for Hwange and Binga and marginal in Kariba where farmers contend with a hot and dry climate and small landholdings. Crop production meets just less than half of annual consumption requirements for the better-off households and close to one-third for the poorer households. Strengthening of agriculture extension services provided by the Ministry of Agriculture department for extension services can improve farmer practises and production.
Livestock production of cattle, goats and chickens provide both food and cash income. Livestock holdings are important for household capacity to cope with shocks and the generally low numbers among poorer households exposes them to the risk of extreme poverty.
Very poor and poor households received food aid during the reference year for 35% and 15% of their minimum consumption requirements respectively. The high dependency on food aid in the zone is indicative of limited options to earn food and cash income.
Sustainable use of natural resources found in surrounding national parks offers opportunities for improved livelihood options for the local community. The CAMPFIRE scheme offers a framework for communities to legally benefit from existing natural resources.
There is poor road access in the zone with most roads and bridges in disrepair. Poor transport network reduces access to markets particularly for highly perishable fish. Fish are often dried before transportation to the market and fetch a lower price.
Low crop production means households have to spend more money on food purchases. Expenditure on staple and non staple food accounts for 38% and 31% of very poor and poor household expenditure respectively. Increases in food prices pose a significant threat to household food security in the livelihood zone.
The disproportionately high expenditure on food and limited access to cash leave households with less to spend on essential items and services. Expenditure on social services, inputs and household items is generally low for all households. Low expenditure on education and health is partly attributed to subsidies in school and medical fees provided by both government and non-governmental organisations. However, the quality of the services remains low due to difficulties attracting and retaining staff in this remote zone with poor infrastructure. Interventions to distribute maize seed and cotton inputs have been effective in addressing market access and income constraints faced by households in this livelihood zone.
12Field work for the current profile was undertaken between September and October 2010. The information presented refers to April
2009 to March 2010 a relatively average year by local standards (i.e. a year of average production and rural food security, when judged in the context of recent years). Provided there are no fundamental and rapid shifts in the economy, the information in this profile is expected to remain valid for approximately five years (i.e. until 2015).

Zimbabwe Rural Livelihood Baseline Profiles 2011
44 | P a g e
Zone Description
This is a livelihood zone interspersed across Binga, Hwange, and Kariba rural districts in Matabeleland North and Mashonaland West provinces to the north of Zimbabwe. It lies in Agro-ecological Region V and is dominated by bush scrub, baobab and mopane trees.
Its 54,862 inhabitants live along the shores of Lake Kariba and Chivero, and in the valleys of the Zambezi and Hunyani rivers. Fishing, complemented by crop and livestock production, is the predominant livelihood system.
Figure 21: AGFC Livelihood zone map
Agriculture activities in infertile sandy soils are rain fed by annual precipitation between 450 mm and 650 mm. In most years, moderate rainfall enables the cultivation of different crops the most important of which are millet, sorghum and maize most of which is consumed and sometimes bartered for grinding. Production is low to moderate in most years and the zone faces a food deficit once every 3 years. Ox-ploughs are used to prepare the land by the better-off, whilst weeding and harvesting are the most labour intensive crop production activities, for which on limited occasions the middle and better-off groups pay labour in grain or fish. The main pests are aphids which commonly affect millet.
The main types of livestock are cattle, goats and chickens which free graze and also feed on crop residues. In both the wet and dry seasons, water is obtained from Lake Kariba and Chivero, and from the Zambezi and Hunyani rivers. Livestock are a traditional store of wealth and provide access to significant income when sold. Cattle are prized and rarely sold. Goats and chickens however, are sold more often and provide regular income. Humans bath and wash their clothes in the same water sources where animals drink from. The main livestock disease is the liver fluke which mostly affects goats.
Other economic activities in the zone include making and selling crafts. Women dominate this activity and trade baskets and ropes for fish. Less commonly pursued activities include gold panning, petty trade and casual labour opportunities
Markets and Trade
Fish is the main commodity sold. Fish is sold to private buyers who come from Harare, Kariba, Chinhoyi and Karoi. Fish sales contribute significantly to the income of the middle and better-off households. Poor road networks and limited transportation force fishermen to resort to selling less preferred and lower earning dried fish.
Goats and chicken are the commonly sold livestock. Cattle holdings are small and are rarely sold. Livestock trade takes place all year round on the local market and peaks between July and January. The main employment opportunities are local in the fields of the middle and better-off and on fishing ventures. Maize, millet and sorghum are supplied into the local community from Hurungwe and Lusulu. Demand for cereals peaks between August and January. Cash is limited in the zone. Labour and grain transactions are often exchanged with fish.
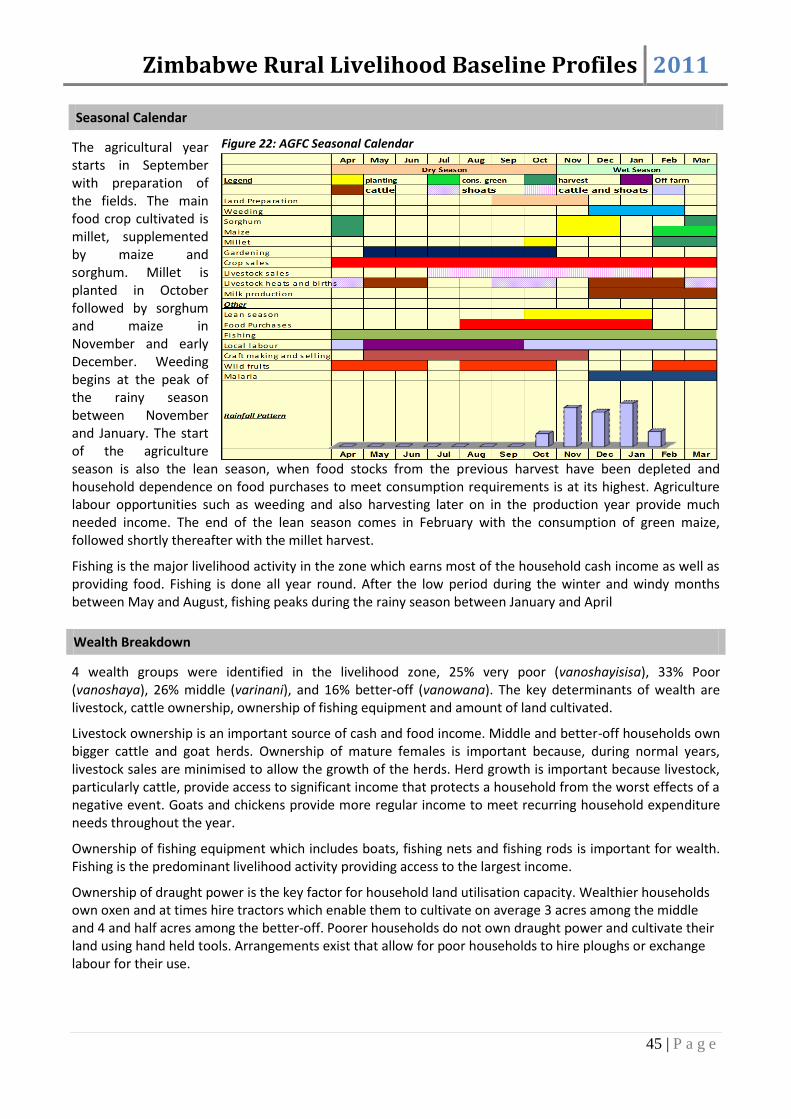
Zimbabwe Rural Livelihood Baseline Profiles 2011
45 | P a g e
Seasonal Calendar
The agricultural year starts in September with preparation of the fields. The main food crop cultivated is millet, supplemented by maize and sorghum. Millet is planted in October followed by sorghum and maize in November and early December. Weeding begins at the peak of the rainy season between November and January. The start of the agriculture season is also the lean season, when food stocks from the previous harvest have been depleted and household dependence on food purchases to meet consumption requirements is at its highest. Agriculture labour opportunities such as weeding and also harvesting later on in the production year provide much needed income. The end of the lean season comes in February with the consumption of green maize, followed shortly thereafter with the millet harvest.
Fishing is the major livelihood activity in the zone which earns most of the household cash income as well as providing food. Fishing is done all year round. After the low period during the winter and windy months between May and August, fishing peaks during the rainy season between January and April
Wealth Breakdown
4 wealth groups were identified in the livelihood zone, 25% very poor (vanoshayisisa), 33% Poor (vanoshaya), 26% middle (varinani), and 16% better-off (vanowana). The key determinants of wealth are livestock, cattle ownership, ownership of fishing equipment and amount of land cultivated.
Livestock ownership is an important source of cash and food income. Middle and better-off households own bigger cattle and goat herds. Ownership of mature females is important because, during normal years, livestock sales are minimised to allow the growth of the herds. Herd growth is important because livestock, particularly cattle, provide access to significant income that protects a household from the worst effects of a negative event. Goats and chickens provide more regular income to meet recurring household expenditure needs throughout the year.
Ownership of fishing equipment which includes boats, fishing nets and fishing rods is important for wealth. Fishing is the predominant livelihood activity providing access to the largest income.
Ownership of draught power is the key factor for household land utilisation capacity. Wealthier households own oxen and at times hire tractors which enable them to cultivate on average 3 acres among the middle and 4 and half acres among the better-off. Poorer households do not own draught power and cultivate their land using hand held tools. Arrangements exist that allow for poor households to hire ploughs or exchange labour for their use.
Figure 22: AGFC Seasonal Calendar
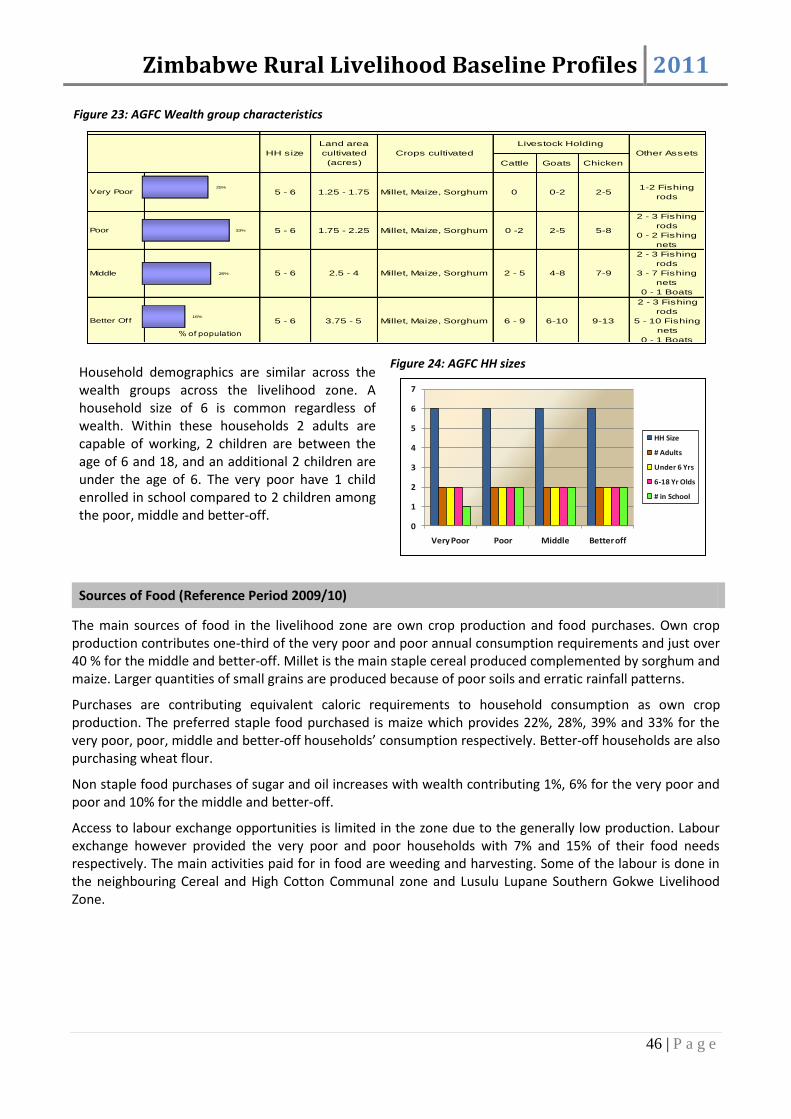
Zimbabwe Rural Livelihood Baseline Profiles 2011
46 | P a g e
Figure 23: AGFC Wealth group characteristics
Household demographics are similar across the wealth groups across the livelihood zone. A household size of 6 is common regardless of wealth. Within these households 2 adults are capable of working, 2 children are between the age of 6 and 18, and an additional 2 children are under the age of 6. The very poor have 1 child enrolled in school compared to 2 children among the poor, middle and better-off.
Figure 24: AGFC HH sizes
Sources of Food (Reference Period 2009/10)
The main sources of food in the livelihood zone are own crop production and food purchases. Own crop production contributes one-third of the very poor and poor annual consumption requirements and just over 40 % for the middle and better-off. Millet is the main staple cereal produced complemented by sorghum and maize. Larger quantities of small grains are produced because of poor soils and erratic rainfall patterns.
Purchases are contributing equivalent caloric requirements to household consumption as own crop production. The preferred staple food purchased is maize which provides 22%, 28%, 39% and 33% for the very poor, poor, middle and better-off households’ consumption respectively. Better-off households are also purchasing wheat flour.
Non staple food purchases of sugar and oil increases with wealth contributing 1%, 6% for the very poor and poor and 10% for the middle and better-off.
Access to labour exchange opportunities is limited in the zone due to the generally low production. Labour exchange however provided the very poor and poor households with 7% and 15% of their food needs respectively. The main activities paid for in food are weeding and harvesting. Some of the labour is done in the neighbouring Cereal and High Cotton Communal zone and Lusulu Lupane Southern Gokwe Livelihood Zone.
Cattle Goats Chicken
Very Poor 5 - 6 1.25 - 1.75 Millet, Maize, Sorghum 0 0-2 2-51-2 Fishing
rods
Poor 5 - 6 1.75 - 2.25 Millet, Maize, Sorghum 0 -2 2-5 5-8
2 - 3 Fishing
rods
0 - 2 Fishing
nets
Middle 5 - 6 2.5 - 4 Millet, Maize, Sorghum 2 - 5 4-8 7-9
2 - 3 Fishing
rods
3 - 7 Fishing
nets
0 - 1 Boats
0 - 1 Plough
Better Off 5 - 6 3.75 - 5 Millet, Maize, Sorghum 6 - 9 6-10 9-13
2 - 3 Fishing
rods
5 - 10 Fishing
nets
0 - 1 Boats
Figure 3.3 Wealth Groups Characteristics
Livestock Holding
HH size
Land area
cultivated
(acres)
Crops cultivated Other Assets
16%
26%
33%
25%
% of population
0
1
2
3
4
5
6
7
Very Poor Poor Middle Better off
HH Size
# Adults
Under 6 Yrs
6-18 Yr Olds
# in School
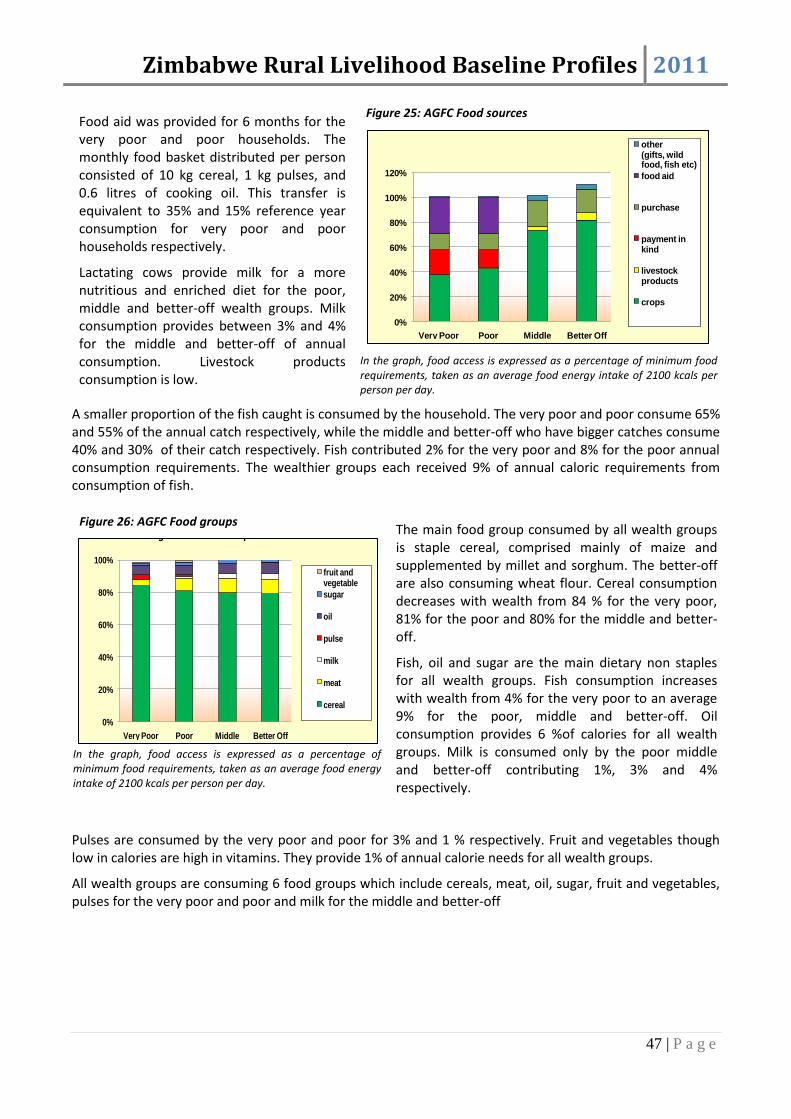
Zimbabwe Rural Livelihood Baseline Profiles 2011
47 | P a g e
Food aid was provided for 6 months for the very poor and poor households. The monthly food basket distributed per person consisted of 10 kg cereal, 1 kg pulses, and 0.6 litres of cooking oil. This transfer is equivalent to 35% and 15% reference year consumption for very poor and poor households respectively.
Lactating cows provide milk for a more nutritious and enriched diet for the poor, middle and better-off wealth groups. Milk consumption provides between 3% and 4% for the middle and better-off of annual consumption. Livestock products consumption is low.
In the graph, food access is expressed as a percentage of minimum food requirements, taken as an average food energy intake of 2100 kcals per person per day.
A smaller proportion of the fish caught is consumed by the household. The very poor and poor consume 65% and 55% of the annual catch respectively, while the middle and better-off who have bigger catches consume 40% and 30% of their catch respectively. Fish contributed 2% for the very poor and 8% for the poor annual consumption requirements. The wealthier groups each received 9% of annual caloric requirements from consumption of fish.
In the graph, food access is expressed as a percentage of minimum food requirements, taken as an average food energy intake of 2100 kcals per person per day.
The main food group consumed by all wealth groups is staple cereal, comprised mainly of maize and supplemented by millet and sorghum. The better-off are also consuming wheat flour. Cereal consumption decreases with wealth from 84 % for the very poor, 81% for the poor and 80% for the middle and better-off.
Fish, oil and sugar are the main dietary non staples for all wealth groups. Fish consumption increases with wealth from 4% for the very poor to an average 9% for the poor, middle and better-off. Oil consumption provides 6 %of calories for all wealth groups. Milk is consumed only by the poor middle and better-off contributing 1%, 3% and 4% respectively.
Pulses are consumed by the very poor and poor for 3% and 1 % respectively. Fruit and vegetables though low in calories are high in vitamins. They provide 1% of annual calorie needs for all wealth groups.
All wealth groups are consuming 6 food groups which include cereals, meat, oil, sugar, fruit and vegetables, pulses for the very poor and poor and milk for the middle and better-off
0%
20%
40%
60%
80%
100%
120%
Very Poor Poor Middle Better Off
Figure 3.5 Sources of Food other (gifts, wild food, fish etc)
food aid
purchase
payment in kind
livestock products
crops
0%
20%
40%
60%
80%
100%
Very Poor Poor Middle Better Off
Figure 3.5 Food Groups Consumed
fruit and vegetable
sugar
oil
pulse
milk
meat
cereal
Figure 25: AGFC Food sources
Figure 26: AGFC Food groups

Zimbabwe Rural Livelihood Baseline Profiles 2011
48 | P a g e
Sources of Cash (reference Period 2009/10)
The fish trade is by far the most lucrative economic activity in the zone for all wealth groups. Better-off and middle households who own nets, boats and have licences for fishing earns USD 918 and USD 612 from fish. The very poor and poor earn USD 82 and USD 269 respectively. Wealthier groups operate on a more commercial basis than do the poorer groups. They sell a bigger proportion of their annual catch. The very poor and poor sell 35% and 45% of the annual catch respectively, while the middle and better-off who have bigger catches sell 60% and 75% of their catch respectively.
Annual Income in USD
Very Poor 200-230
Poor 350-400
Middle 675-725
Better-off 1000-1100
The importance of fish trade to household income increases with wealth from 37% for the very poor, 73% for the poor, 86% for the middle and 88% for the better-off. In the absence of cash, fish are the preferred currency in barter transactions. Fish is bartered in exchange with all food and non food items. In the reference year, 1 kg of fish was bartered for 2 kg of maize meal or 1 kg of salt, 3 kg of fish was bartered with 2 kg of sugar or 1 bar of soap and 4 kg of fish was also bartered with 1 kg of oil.
Livestock sales are typical for all wealth groups with the poorer groups typically selling chickens and wealthier groups selling goats and chickens. This is an important source of income for the very poor, poor, middle and better-off households with a contribution of 5%, 15%, 8% and 7% respectively, of total annual incomes. The trade in locally produced cereals is very limited. Crop sales income is earned primarily from garden vegetable sales. Very small quantities of maize and millet are also sold. The limited vegetable income is mostly pursued by poorer households earning the very poor 12% of their income, the poor 8%, 6 % of the middle’s and 4% of the better-off’s. Cereals are also often used as payment for grinding.
Self employment activities were mostly done by the very poor and poor households and included handcrafts. Contribution from handicrafts sale accounts for 38% and 4% of annual income for the very poor and poor groups.
Expenditure Patterns (Reference Period 2009/10)
Annual Expenditure in USD
Very Poor 160-180
Poor 190-210
Middle 350-410
Better-off 550-400
The very poor, poor, middle and better-off households spend 39%, 29%, 21% and 16% on staple food. The main staple food purchased is maize meal, purchased mostly between August and February during the lean season. Non staple sugar and oil is lower than staple food expenditure. Total food expenditure increases with wealth, but its proportional importance decreases with wealth, decreasing from 53% among the very poor, 48% among the poor, 39% for the middle and 29% for the better-off. Food expenditure has the highest expenditure for all wealth groups.
0%
20%
40%
60%
80%
100%
Very Poor Poor Middle Better off
Figure 3.7 Income SourcesFish sales
self-employment
livestock sales
crop sales
0%
20%
40%
60%
80%
100%
Very Poor Poor Middle Better off
Figure 3.8 Expenditure Patternother
gifts
tax
clothes
social serv.
inputs
water
HH items
non-staple food
staple food
Figure 27: AGFC Cash Income sources
Figure 28: AGFC Expenditure patterns

Zimbabwe Rural Livelihood Baseline Profiles 2011
49 | P a g e
Expenditure on social services is low due to government subsidises for health and education services. Expenditure on social services as a percentage of total household expenditure is almost similar across wealth groups; very poor: 7%, poor: 7%, middle: 10% and better-off: 7%.
Expenditure on household items that include grinding costs, salt, utensils tea and kerosene/candles is typical for all wealth groups. This basket of basic commodities costs the very poor USD 65 annually, USD 87 for the poor and USD 94 for the middle and USD 126 for the better-off.
Expenditure on inputs is significantly higher for the middle and better-off. Fishing nets and other equipment and agriculture labour are their biggest productive expenditure. Very poor and poor households spend 2 % and 3 % of better-off households’ productive expenditure respectively, explaining the wide disparity in income and long term growth prospects. The middle and better-off are spending USD 84 and USD 264 on fish nets and labour, equivalent of 12% and 25% of the total income respectively.
Hazards
Chronic hazards: Wild animals such as elephants, Hippo and Quelea birds destroy crops on an annual basis while hippos and crocodiles attack fishermen and livestock. The area also receives erratic rainfall which affects annual production potential. Theft of livestock and fishing equipment occurs particularly in areas on the shores of Kariba by Zambian counterparts
Intermittent hazards: Fish trade restrictions resulting from disease outbreaks
Coping strategies
Bartering fish for staple: Fish is usually sold for cash however during difficult periods fish is bartered for staple. All wealth groups adopt this as a coping strategy and they barter with external traders who usually take advantage of their distressing situation.
Increased consumption of wild foods: Collection of wild foods happens every year but in bad years the poorer groups increase the collection of wild foods such as Mutiri and Tamarind.
Increased labour migration: During bad years the poor have household members migrating outside the zone (Hwange, Victoria Falls, Gokwe, Hurungwe, Kariba and outside the country Zambia) for employment
Key Parameters for Monitoring
Table 8: AGFC Monitoring Indicators
Item Key Parameter – Quantity Key Parameter – Price
Crops Millet
Maize
Sorghum
Vegetables
Maize
Millet
Livestock production Cattle
Goats
Chickens
Milk
Cattle
Goat
Milk
Other food and cash income Fish
Agriculture labour
Fish
Labour rates (land preparation, weeding, harvesting)

Zimbabwe Rural Livelihood Baseline Profiles 2011
50 | P a g e
Northern Zambezi Valley Communal October- November 201013
Main Conclusions and Implications
This zone is characterized by erratic rains and very high temperatures. Maize, sorghum and pearl millet are the main staple food crops grown although yields are very poor. Farmers are dependent on cotton as a cash crop. However, prices for cotton have been consistently low. Household income fluctuates according to prices on the international cotton market as well as according to harvest outcome. In this zone, most households cannot cover their annual food needs from own-crop production alone, hence, for much of the year poorer households’ purchase their food from the market. There is potential for increased production for both consumption and selling if communities adopt increased cultivation of suitable crop type and varieties e.g. small grains and short season varieties. Timely access to such agricultural inputs i.e. seed and fertilisers will also support increased crop production. There is high potential for increased cotton production if issues to do with cotton pricing are resolved. Road maintenance will help promote production and marketing of agricultural commodities as well as aiding travelling for people in this zone. This is especially crucial in the agricultural season where the greater part of the zone is mostly inaccessible due to bad roads in wet weather.
Livestock restocking programmes especially for the poor wealth groups will help provide draught power, which is currently limiting land size cultivated. This will also improve herd sizes and can act as a good income source in bad years. Communication technology needs to be improved in the areas found within the zone. This is because currently the greater part of the zone is not serviced by cellular networks whilst the ordinary landline communication systems are dysfunctional. Improved communication will also improve market systems as currently private traders take advantage of information gaps thereby offering unfavourable trading terms.
A lot needs to be done to enhance access to social services in the form of health and education. Low expenditure on these can be attributed to unavailability of adequate secondary schools and clinics in the zone. The lack of schools has in most instances resulted in drop-outs as pupils shun travelling long distances to neighbouring institutions.
Zone Description
The zone is located in the Zambezi Valley covering communal lands in Mbire district, northern parts of Centenary and Mt Darwin districts and is inhabited by 201,309 people. The zone is categorised in agro ecological region IV, which is characterised by low annual rainfall and very high temperatures. Soils are clay loams, which are fertile for agricultural production. Minimum temperatures in the zone range between 15-25oC during winter in June to July (chando) and the maximum ranges between 35oC-40oC during summer in September and October (chirimo).
Figure 29: NZVC Livelihood Zone Map
13
Field work for the current profile was undertaken in October 2010. The information presented refers to April 2009 to March 2010 a
relatively average year by local standards (i.e. a year of average production and rural food security, when judged in the context of recent years). Provided there are no fundamental and rapid shifts in the economy, the information in this profile is expected to remain valid for approximately five years (i.e. until 2015).

Zimbabwe Rural Livelihood Baseline Profiles 2011
51 | P a g e
Most parts are generally flat sloping towards the Zambezi River in the north on the border with Mozambique, bordering with Matusadona range to the south. The dominant vegetation is Mopani, Muuyu, and Musau Trees and acacia species. The major rivers; Angwa, Msengezi, Hunyani, Mukumbura and Hoya run through the zone.
The dominant livelihood activity is rain-fed food and cash crop production supplemented by livestock production. The zone is known for low crop production potential due to the low and erratic rains. The main cropping season is the rain-fed which starts in November and ends in March. Main crops grown for consumption include sorghum, maize and groundnuts with cotton as the cash crop. Livestock mainly cattle and goats are found in relatively small numbers with cattle providing draught power for agricultural production as well as cash income. Goats and chickens are basically for consumption and also sold for cash income. Cows are the only livestock that are milked during the wet season. Main livestock diseases are tick borne diseases (red water, heart water), black leg and Newcastle in poultry. Tsetse fly in part of the zone has decreased although it still affects livestock production.
Other important livelihood activities include sale of wild fruits from the abundant Musau trees as well as labour migration to highland areas as well as Mozambique in bad years. Fishing is mostly done by communities near the Zambezi river and the major rivers running through the zone.
Markets and Trade
Market access is generally bad in the zone due to bad roads especially during the rainy season and unprofitable producer prices for cotton and livestock as buyers determine pricing. Cotton, which is the main cash crop, is sold at local buying points for cotton companies with ginneries in Mbire, Muzarabani and Mt Darwin. Surplus sorghum and maize are sold locally mostly between farmers. Maize is usually purchased outside the zone in neighbouring uplands where it is mainly bartered with cattle usually at unfavourable exchange terms.
Cattle and goats are sold to or exchanged with private buyers mainly from Harare and private companies like Montana Meats who have located cattle buying points within the zone.
The main labour markets are outside the zone with people working in highland areas of Guruve, Centenary and Mt Darwin. In bad years people migrate to Mozambique for casual labour mostly in fishing camps. Local casual labour is in the form of agriculture work particularly for cotton production. Vegetable sales are done locally.
Seasonal Calendar
The seasons are split into 2 distinct
periods. These are zhizha/rainy season November - March and the dry season with 2 period’s chando/winter (April-July) and chirimo/spring (August-October). Agriculture activities start with land preparation in August-October ahead of the rainy season. Harvest of food crops is mainly done in April and cotton harvest is done from May to June. Livestock sales are mainly done between July and January. The opportunity to do local agricultural labour coincides with land preparation, weeding and harvesting time. In bad years, there is a
Figure 30: NZVC Seasonal Calendar

Zimbabwe Rural Livelihood Baseline Profiles 2011
52 | P a g e
reduced market for casual labour and households have to travel long distances in search of opportunities
Wealth Breakdown
Livestock ownership, mainly cattle and goats, acreage of land area cultivated and ownership of productive assets are the main determinants of wealth in the zone. 4 wealth groups were identified namely the very poor (vanoshayisisa), the poor (vanoshaya), the middle (varipakati) and the better-off (varinani). The wealthier households own more cattle compared with the poor households who typically own very small numbers of livestock mostly goats and chickens. The wealthier (better-off and middle) households are able to cultivate larger acreages using their own draught power. The poor wealth groups combine their cattle to enable tillage of more land whilst the very poor mostly use hand cultivation or hire draught power in exchange of casual labour with the better-off. Figure 31: NZVC Wealth group characteristics
Lack of productive assets like ploughs and scotch carts also differentiates the four wealth groups as the better-off own ox-drawn implements whilst the very poor own hand tools. The better-off have more access to cotton inputs i.e. seed and fertilizers owing to their recognisable asset base which acts as a collateral for these loans. This enables them to cultivate larger pieces of land with cash crops.
In terms of the proportion of total households in the different wealth groups, the very poor and poor make over half of the population both constituting about 63% of the household population in the zone. The middle and better-off households are about 23% and 14% of the total households in the zone respectively
The very poor wealth group has small household sizes 4-6 compared with the other wealth groups ranging from 5-6 people. The very poor wealth group consists of young parents and elderly households. The number of adults able to work is the same across wealth groups. All children of school going age are in school even for the very poor who benefit from various educational support mechanisms.
Figure 32: NZVC HH sizes
Cattle Goats Poultry
Very Poor 4-6 2-4
Sorghum; Maize; Cow
Peas; Ground Nuts;
Cotton
0 0-2 2-7 Hand hoes
Poor 5-6 3-6
Sorghum; Maize; Cow
Peas; Ground Nuts;
Cotton
1-2 2-3 4-10Hand hoes;
Plough
Middle 5-6 4-8
Sorghum; Maize; Cow
Peas; Ground Nuts;
Cotton
3-6 4-7 6-13
Hand hoes;
2 Ploughs;
Scotch cart
Better Off 5-6 8-12
Sorghum; Maize; Cow
Peas; Ground Nuts;
Cotton
5-9 4-7 10-15
Hand hoes;
2 Ploughs;
Cultivator;
Scotch cart
Wealth Groups Characteristics
Livestock Holding
HH size
Land area
cultivated
(acres)
Crops cultivatedOther
Assets
13%
23%
31%
33%
% of population
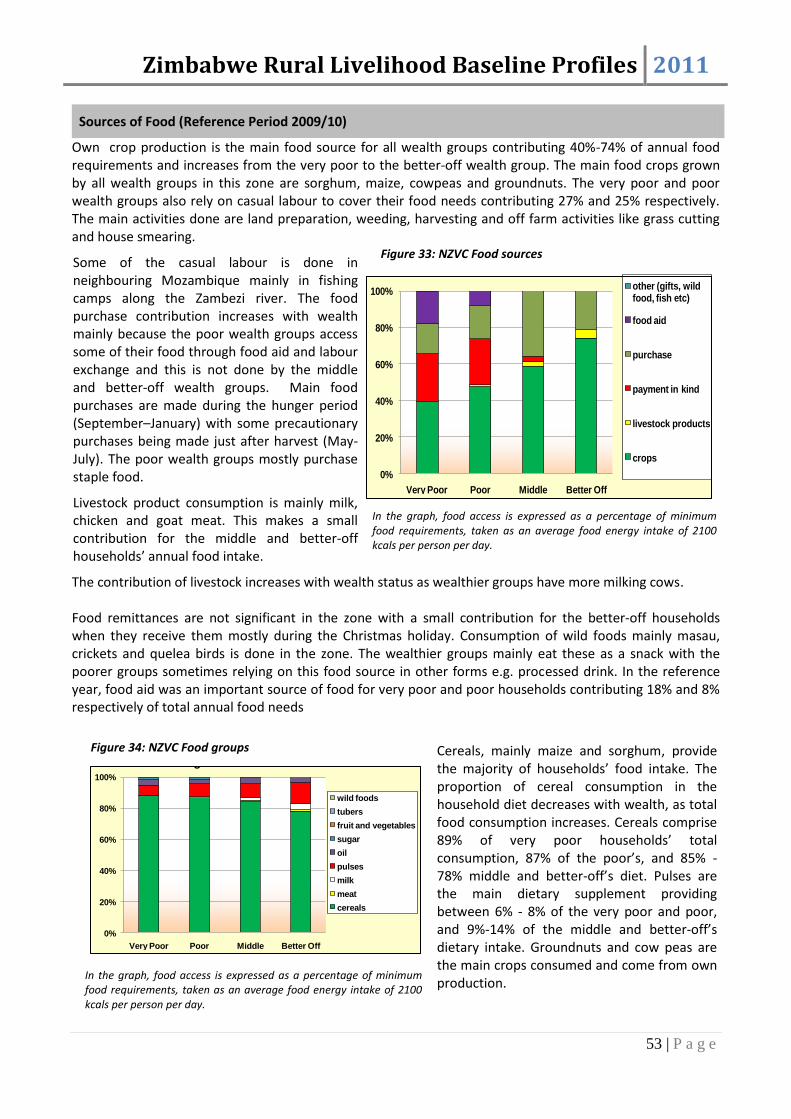
Zimbabwe Rural Livelihood Baseline Profiles 2011
53 | P a g e
Sources of Food (Reference Period 2009/10)
Own crop production is the main food source for all wealth groups contributing 40%-74% of annual food requirements and increases from the very poor to the better-off wealth group. The main food crops grown by all wealth groups in this zone are sorghum, maize, cowpeas and groundnuts. The very poor and poor wealth groups also rely on casual labour to cover their food needs contributing 27% and 25% respectively. The main activities done are land preparation, weeding, harvesting and off farm activities like grass cutting and house smearing.
Some of the casual labour is done in neighbouring Mozambique mainly in fishing camps along the Zambezi river. The food purchase contribution increases with wealth mainly because the poor wealth groups access some of their food through food aid and labour exchange and this is not done by the middle and better-off wealth groups. Main food purchases are made during the hunger period (September–January) with some precautionary purchases being made just after harvest (May-July). The poor wealth groups mostly purchase staple food.
Livestock product consumption is mainly milk, chicken and goat meat. This makes a small contribution for the middle and better-off households’ annual food intake.
In the graph, food access is expressed as a percentage of minimum food requirements, taken as an average food energy intake of 2100 kcals per person per day.
The contribution of livestock increases with wealth status as wealthier groups have more milking cows. Food remittances are not significant in the zone with a small contribution for the better-off households when they receive them mostly during the Christmas holiday. Consumption of wild foods mainly masau, crickets and quelea birds is done in the zone. The wealthier groups mainly eat these as a snack with the poorer groups sometimes relying on this food source in other forms e.g. processed drink. In the reference year, food aid was an important source of food for very poor and poor households contributing 18% and 8% respectively of total annual food needs
In the graph, food access is expressed as a percentage of minimum food requirements, taken as an average food energy intake of 2100 kcals per person per day.
Cereals, mainly maize and sorghum, provide the majority of households’ food intake. The proportion of cereal consumption in the household diet decreases with wealth, as total food consumption increases. Cereals comprise 89% of very poor households’ total consumption, 87% of the poor’s, and 85% - 78% middle and better-off’s diet. Pulses are the main dietary supplement providing between 6% - 8% of the very poor and poor, and 9%-14% of the middle and better-off’s dietary intake. Groundnuts and cow peas are the main crops consumed and come from own production.
0%
20%
40%
60%
80%
100%
Very Poor Poor Middle Better Off
Figure 4.5 Food Sourcesother (gifts, wild food, fish etc)
food aid
purchase
payment in kind
livestock products
crops
0%
20%
40%
60%
80%
100%
Very Poor Poor Middle Better Off
Figure 4.5 Food Sources
wild foods
tubers
fruit and vegetables
sugar
oil
pulses
milk
meat
cereals
Figure 33: NZVC Food sources
Figure 34: NZVC Food groups

Zimbabwe Rural Livelihood Baseline Profiles 2011
54 | P a g e
Fruit and vegetables contribute 1% of all wealth groups’ food intake. Cow’s milk is consumed by the poor to the better-off households and increases with wealth from 1%-4%. Pulses, sugar and oil are the commonly purchased and consumed non staple foods. Sugar comprises 1%-2% of the household diet for all wealth groups and oil contributes 3%-5% of the household diet for all wealth groups. The better-off receive a more nutritious diet compared to the poor primarily from the consumption of meat which provides 1% of the annual household diet
Sources of Cash (Reference Period 2009/10)
Crop sale is the major income source of cash income for all wealth groups. The importance of crop sales increases from the lower to the higher wealth groups. The income from this source accounts for 39%-53% for the middle and better-off and 30%-35% of total income for very poor and poor households respectively. The poor groups mainly sell food crops and vegetables whilst the better-off sell cotton. The main livestock sold are goats and cattle with chickens for the poor groups. The contribution of this income source increases with wealth. Livestock sales contribute 16%-36% for the very poor and poor group and 25%-39% for the better-off and middle group total annual income.
Annual Income in USD
Very Poor 190-200
Poor 280-320
Middle 425-450
Better-off 630-680
Employment is an important income source for the poor and very poor households who are employed locally by wealthier households and in neighbouring zones. Activities that are done are weeding and cotton picking which contribute income that covers 25% and 11% of total income for the very poor and poor households respectively. Self employment is mainly characterised by fish trading, beer brewing, crafts and grass and firewood sales. Other income is mainly realised through sale of the wild masau fruit by the poor groups and cotton loans for the better-off wealth groups
Expenditure Patterns (Reference Period 2009/10)
Annual Expenditure in USD
Very Poor 180-200
Poor 280-300
Middle 400-450
Better-off 600-670
Expenditure on essential household items such as salt, grinding, soap, tea and paraffin accounts for most of the very poor and poor wealth group annual expenditure constituting 38% and 30% respectively. Actual expenditure on household items increases with wealth where-as proportions on total expenditure generally decrease with wealth; very poor USD72 (38%), poor USD88 (30%), middle USD95 (22%) and better-off USD121 (19%).
Expenditure on food for the poor groups is lower than on household items due to the provision of food aid and labour exchange.
0%
20%
40%
60%
80%
100%
Very Poor
Poor Middle Better off
Figure 4.7 Sources of IncomeOther (Barter, Loans, Wild food Sales)
Petty trade
self-employment
employment and remittances
livestock sales
crop sales
0%
20%
40%
60%
80%
100%
Very Poor Poor Middle Better off
Figure 4.8 Expenditure Patterns other
gifts
tax
social serv.
inputs
water
HH items
non-staple food
staple food
Figure 35: NZVC Cash Income sources
Figure 36: NZVC Expenditure patterns

Zimbabwe Rural Livelihood Baseline Profiles 2011
55 | P a g e
Across wealth groups, the highest expenditure was on staples with the exception of the better-off wealth group. All the 4 wealth groups incurred some expenditure on inputs and these increased from the very poor to the better-off wealth group. These are expenses incurred purchasing seed, fertilisers and livestock drugs. The considerable expenditure by the middle and better-off groups is mainly the cotton loan repayments. Expenditure on social services ranges between 10-14% of total expenditure for the 4 wealth groups. The highest expenditure is on education costs especially school fees and stationery. Expenditure on medication is low because of government subsidises. All wealth groups pay household and livestock taxes as well as give out gifts for funeral assistance/chema and thanks giving/zvipo in church.
Other expenditure is on beer and transport. In a year, all households spend some money to buy clothes particularly after they sell their cotton and towards Christmas for children
Hazards
Chronic hazards: The following hazards limit crop production yearly; erratic rainfall, crop pest especially crickets and quelea birds, input shortages and lack of draught power for the poor groups
Periodic hazards: The following hazards also impact production in some but not all years; drought which occurs once in every 2 years as well as low cotton prices that have been prevailing since the 2008/9 agricultural season.
Coping Strategies
Increased casual labour: This is a coping strategy mainly used by the poor households. The households extend the number of times they do local casual labour or stay longer periods in neighbouring districts and in Mozambique. Households may also increase the number of members involved in casual labour.
Increased sale of livestock: This coping strategy is mostly used by better-off households who sell more cattle and goats. Poor households are only able to sell mostly chickens and goats.
Increased collection of wild foods: The poor increase collection of masau to sell and other wild foods for consumption.
Increased panning of minerals: Gold panning occurs in normal years but in bad years households extend the period they do this activity
Key Parameters for Monitoring
Table 9: NZVC Monitoring Indicators
Item Key Parameter - Quantity Key Parameter – Price
Crops Maize
Sorghum
Groundnuts
Vegetables
Cotton
Sorghum
Cotton
Livestock production Cattle
Goats
Cattle
Goats
Other food and cash income Wild Foods
Land Preparation
Weeding
Harvesting
Remittances
Cotton Loans
Barter trade
Self employment (Grass sales, Gold panning)
Wild Foods
Land Preparation
Weeding
Harvesting
Remittances
Cotton Loans
Barter Terms of trade
Self employment (Grass sales, Gold panning)

Zimbabwe Rural Livelihood Baseline Profiles 2011
56 | P a g e
Cereal and High Cotton Producing Communal May-June 201014
Main Conclusions and Implications
Crop production is the main source of income and food source across wealth groups in this livelihood zone. There is potential for increased production for poorer households if challenges with draught power, low cultivated acreage and access to appropriate seed and fertilisers are improved. Extension services and monitoring of agriculture activities could be strengthened through support by the MOA’s Department of Extension Services (AGRITEX).
Cotton production is directly affected by producer prices with farmers contemplating reducing cotton acreage due to poor prices. There is a need for transparency in the price structures offered by cotton buyers, as well as a review of the terms for contract farming to ensure viability of this cash crop. The reliance on cotton for income places the population in this zone at a greater risk to price fluctuations.
The very poor and poor households have significant income from on-farm and off–farm activities and in years of drought, on–farm activities are severely affected resulting in a reduction or complete loss of income. Labour payment terms must be monitored closely as these have a direct impact on income for poorer households.
Expenditure on social services is low for all wealth groups and this is partly due to interventions in the health and education sectors. Though the education system is subsidized, there are still relatively high expenditures related to higher levels of educational attainment, presenting obstacles for poorer households. Additionally there is a general lack of facilities, highly qualified teachers, classrooms and school supplies.
Food aid is distributed in this zone to poor and very poor households, resulting in difficulties for understanding if and how these households source their food requirements in years of normal and poor production.
Zone Description
This zone has an estimated population of 240,506 people and lies in the north of the country covering parts of Gokwe North and South Districts in Midlands province.
It is known for being one of the most productive areas in Zimbabwe and is classified as Agro-ecological Region IV; average annual rainfall is around 450-650mm. The area consists of semi-arid lowlands, covered predominantly by mopane and acacia trees.
There are 4 major rivers; the Sengwa in the southwest, the Sasame and Ume rivers cutting through the middle and the Sanyati river along the northern border of the zone.
Figure 37: CHCC Livelihood zone map
14
Field work for the current profile was undertaken in May-June 2010. The information presented refers to April 2009 to March 2010 a relatively average year by local standards (i.e. a year of average production and rural food security, when judged in the context of recent years). Provided there are no fundamental and rapid shifts in the economy, the information in this profile is expected to remain valid for approximately five years (i.e. until 2015).

Zimbabwe Rural Livelihood Baseline Profiles 2011
57 | P a g e
The Gokwe South - Binga road runs from the south to the north-west of the zone. Aside from agriculture, there is commercial coal mining, commercial gold mining, and game parks on the northern and western edges of the zone
The zone is low lying and is found between the Mapfungautsi plateau and the Zambezi Valley, with dry, deep and sandy soils that have generally low fertility. However, the production potential is high for cotton and low for cereals. Livelihoods are primarily agricultural, centred on growing maize for food and cotton for cash.
Cash crop sales provide a key income source for the majority of households and recent years have seen an increase in the area of cotton grown at the expense of staple food crops. The climatic conditions - low rainfall and high temperatures - are ideally suited to growing cotton. Income from cotton is obviously affected by fluctuations in the price of cotton, reducing its stability as an income source. Cotton is also affected by pests, specifically red bull worm and red spider mite, the sprays of which are available for purchase or on credit from cotton companies.
Most households keep livestock, with cattle, goats and poultry being the common types. Goats and cattle are both milked and replacement generally comes from within the herd. Within the zone, there is also a dairy project with milk being produced and sold to local markets as well as Gokwe town.
Other income generating activities include local employment, casual labour and gold panning.
Markets and Trade
The main commodities are exchanged through government parastatals; Cotton is sold to cotton companies, such as Cottco, Cargill, Grafax and FSI Agricom companies. The cotton ginneries at Nembudziya and Gokwe town also purchase cotton from the farmers. Cotton arrives at these depots via a network of cotton collection points which exist at most business centres throughout the zone.
Cattle are marketed to private buyers, local beef committees and local butcheries and through agents on behalf of abattoirs. The following are sold on the local market; surplus garden vegetables, salted and boiled groundnuts, peanut butter, thatch grass and local beer.
The main employment opportunities are local although some households have a family member working in major urban centres (mainly Harare as well as Gokwe, Gweru, Bulawayo, or Kwekwe) or in the mines. For poor households, there are casual labour opportunities on local cotton fields, as well as gold panning in Munyati, Sanyati, and Kakwira rivers.
Seasonal Calendar
The seasonal calendar
shows the timing of crop, livestock and income activities. Cotton related activities occur almost throughout the entire year, while the majority of other crops are planted in November-December and harvested in April - May, making these months peak labour
Figure 38: CHCC Seasonal Calendar
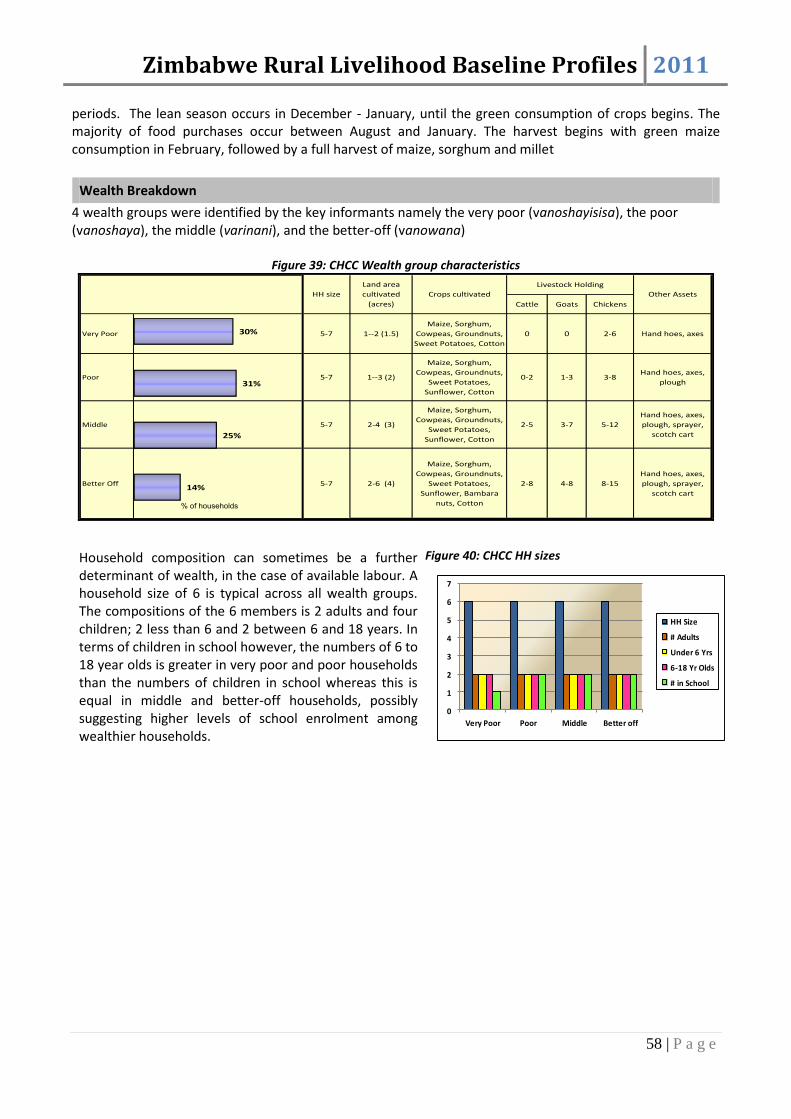
Zimbabwe Rural Livelihood Baseline Profiles 2011
58 | P a g e
periods. The lean season occurs in December - January, until the green consumption of crops begins. The majority of food purchases occur between August and January. The harvest begins with green maize consumption in February, followed by a full harvest of maize, sorghum and millet
Wealth Breakdown
4 wealth groups were identified by the key informants namely the very poor (vanoshayisisa), the poor (vanoshaya), the middle (varinani), and the better-off (vanowana)
Figure 39: CHCC Wealth group characteristics
Cattle Goats Chickens
Very Poor 5-7 1--2 (1.5)
Maize, Sorghum,
Cowpeas, Groundnuts,
Sweet Potatoes, Cotton
0 0 2-6 Hand hoes, axes
Poor 5-7 1--3 (2)
Maize, Sorghum,
Cowpeas, Groundnuts,
Sweet Potatoes,
Sunflower, Cotton
0-2 1-3 3-8Hand hoes, axes,
plough
Middle 5-7 2-4 (3)
Maize, Sorghum,
Cowpeas, Groundnuts,
Sweet Potatoes,
Sunflower, Cotton
2-5 3-7 5-12
Hand hoes, axes,
plough, sprayer,
scotch cart
Better Off 5-7 2-6 (4)
Maize, Sorghum,
Cowpeas, Groundnuts,
Sweet Potatoes,
Sunflower, Bambara
nuts, Cotton
2-8 4-8 8-15
Hand hoes, axes,
plough, sprayer,
scotch cart
HH size
Land area
cultivated
(acres)
Crops cultivated
Livestock Holding
Other Assets
14%
25%
31%
30%
% of households
Household composition can sometimes be a further determinant of wealth, in the case of available labour. A household size of 6 is typical across all wealth groups. The compositions of the 6 members is 2 adults and four children; 2 less than 6 and 2 between 6 and 18 years. In terms of children in school however, the numbers of 6 to 18 year olds is greater in very poor and poor households than the numbers of children in school whereas this is equal in middle and better-off households, possibly suggesting higher levels of school enrolment among wealthier households.
0
1
2
3
4
5
6
7
Very Poor Poor Middle Better off
HH Size
# Adults
Under 6 Yrs
6-18 Yr Olds
# in School
Figure 40: CHCC HH sizes
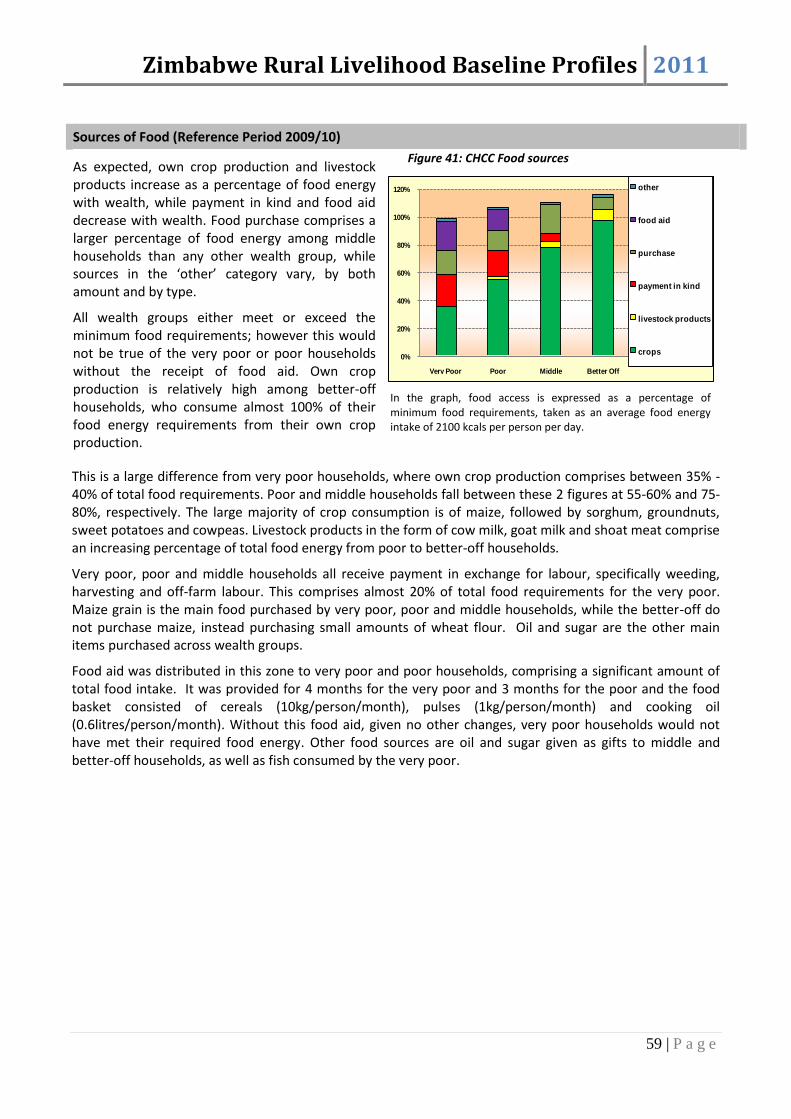
Zimbabwe Rural Livelihood Baseline Profiles 2011
59 | P a g e
Sources of Food (Reference Period 2009/10)
As expected, own crop production and livestock products increase as a percentage of food energy with wealth, while payment in kind and food aid decrease with wealth. Food purchase comprises a larger percentage of food energy among middle households than any other wealth group, while sources in the ‘other’ category vary, by both amount and by type.
All wealth groups either meet or exceed the minimum food requirements; however this would not be true of the very poor or poor households without the receipt of food aid. Own crop production is relatively high among better-off households, who consume almost 100% of their food energy requirements from their own crop production.
In the graph, food access is expressed as a percentage of minimum food requirements, taken as an average food energy intake of 2100 kcals per person per day.
This is a large difference from very poor households, where own crop production comprises between 35% - 40% of total food requirements. Poor and middle households fall between these 2 figures at 55-60% and 75-80%, respectively. The large majority of crop consumption is of maize, followed by sorghum, groundnuts, sweet potatoes and cowpeas. Livestock products in the form of cow milk, goat milk and shoat meat comprise an increasing percentage of total food energy from poor to better-off households.
Very poor, poor and middle households all receive payment in exchange for labour, specifically weeding, harvesting and off-farm labour. This comprises almost 20% of total food requirements for the very poor. Maize grain is the main food purchased by very poor, poor and middle households, while the better-off do not purchase maize, instead purchasing small amounts of wheat flour. Oil and sugar are the other main items purchased across wealth groups.
Food aid was distributed in this zone to very poor and poor households, comprising a significant amount of total food intake. It was provided for 4 months for the very poor and 3 months for the poor and the food basket consisted of cereals (10kg/person/month), pulses (1kg/person/month) and cooking oil (0.6litres/person/month). Without this food aid, given no other changes, very poor households would not have met their required food energy. Other food sources are oil and sugar given as gifts to middle and better-off households, as well as fish consumed by the very poor.
0%
20%
40%
60%
80%
100%
120%
Very Poor Poor Middle Better Off
Figure 5.5 Food Sources
other
food aid
purchase
payment in kind
livestock products
crops
Figure 41: CHCC Food sources
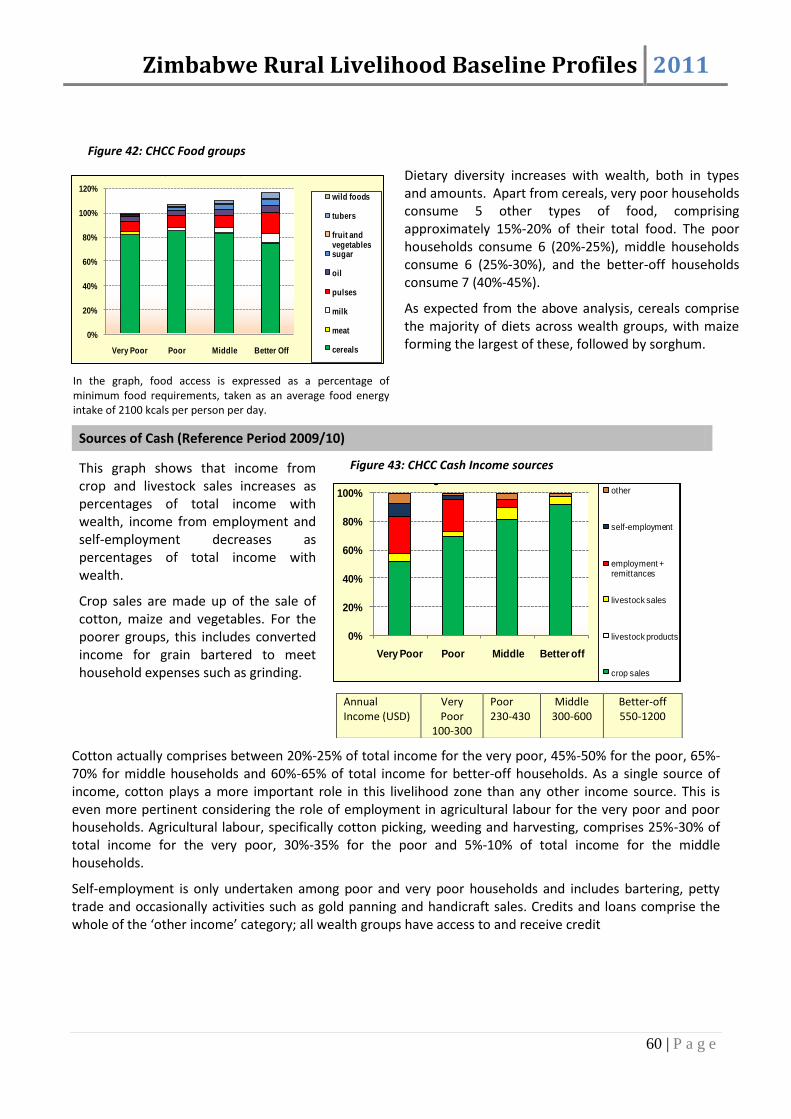
Zimbabwe Rural Livelihood Baseline Profiles 2011
60 | P a g e
In the graph, food access is expressed as a percentage of minimum food requirements, taken as an average food energy intake of 2100 kcals per person per day.
Dietary diversity increases with wealth, both in types and amounts. Apart from cereals, very poor households consume 5 other types of food, comprising approximately 15%-20% of their total food. The poor households consume 6 (20%-25%), middle households consume 6 (25%-30%), and the better-off households consume 7 (40%-45%).
As expected from the above analysis, cereals comprise the majority of diets across wealth groups, with maize forming the largest of these, followed by sorghum.
Sources of Cash (Reference Period 2009/10)
This graph shows that income from crop and livestock sales increases as percentages of total income with wealth, income from employment and self-employment decreases as percentages of total income with wealth.
Crop sales are made up of the sale of cotton, maize and vegetables. For the poorer groups, this includes converted income for grain bartered to meet household expenses such as grinding.
Annual Income (USD)
Very Poor
100-300
Poor 230-430
Middle 300-600
Better-off 550-1200
Cotton actually comprises between 20%-25% of total income for the very poor, 45%-50% for the poor, 65%-70% for middle households and 60%-65% of total income for better-off households. As a single source of income, cotton plays a more important role in this livelihood zone than any other income source. This is even more pertinent considering the role of employment in agricultural labour for the very poor and poor households. Agricultural labour, specifically cotton picking, weeding and harvesting, comprises 25%-30% of total income for the very poor, 30%-35% for the poor and 5%-10% of total income for the middle households.
Self-employment is only undertaken among poor and very poor households and includes bartering, petty trade and occasionally activities such as gold panning and handicraft sales. Credits and loans comprise the whole of the ‘other income’ category; all wealth groups have access to and receive credit
0%
20%
40%
60%
80%
100%
120%
Very Poor Poor Middle Better Off
Figure 5.6 Food Groups Consumed
wild foods
tubers
fruit and vegetablessugar
oil
pulses
milk
meat
cereals
0%
20%
40%
60%
80%
100%
Very Poor Poor Middle Better off
Figure 5.7 Income Sourcesother
self-employment
employment + remittances
livestock sales
livestock products
crop sales
Figure 42: CHCC Food groups
Figure 43: CHCC Cash Income sources

Zimbabwe Rural Livelihood Baseline Profiles 2011
61 | P a g e
Expenditure Patterns (Reference Period 2009/10)
Annual Income (USD)
Very Poor 100-300
Poor 230-430
Middle 300-600
Better-off 550-1200
While staple food purchases decrease as percentages with wealth, non-staple food purchases appear to be smallest as percentages of total expenditure among the very poor and better-off households, and larger among poor and middle households. Staple and non-staple food purchases are detailed in the analysis on food sources.
Household items as percentages of expenditure decrease with wealth, of which grinding costs form the largest percentage, followed by soap, salt, tea and kerosene. Inputs increase with wealth as percentages and actual amounts, the largest being seeds, followed by fertilizers and pesticides. The better-off households also have expenditure on labour in a similar amount to seeds. Very poor households only purchase pesticides; they have no expenditure on fertilizers or seeds as a result of input distribution by NGOs.
The majority of social services expenditure is on educational costs, with only relatively small amounts being spent on health care, due to subsidies. High expenditures on education by the better-off households demonstrate that despite government subsidies on education, barriers remain for attaining higher levels of education among poorer households. Other items include transport, mobile phone airtime, alcohol and tobacco and these all decrease slightly with wealth.
Hazards
Chronic hazards: Crop pests, wild animals and livestock diseases are regular problems that households in this zone have to contend with. Water logging in the heavy black soils is a further problem as is gullying in some parts of the zone. A major concern however is the marketing of their produce. Cotton prices are dictated by the international market and farmers have to speculate on whether or not they will be able to cover their production costs. Malaria is an annual threat to human health, which is most prevalent between April and July and can have a severe impact on people’s ability to work. HIV and AIDS is a chronic problem than affects many households in this zone and which limits productivity and increases household expenditure on health care. Another health hazard is the chemicals used in cotton production which are hazardous. As very often farmers do not wear protective clothing, they run the risk of diseases associated with the sprays. A few households live near Chirisa Game Reserve and every year their crops are at risk of damage by wild animals, especially elephants between December and May.
Periodic hazards: Roughly every 3 in 10 years the zone is affected by drought. Foot and mouth disease and anthrax are also 2 diseases that affect livestock periodically in this zone.
Coping Strategies
Reduced purchase of non essentials: The poor households reduce expenditure on goods deemed to be non essential. In very difficult years, the consumption of such non essentials can go down to zero. The goods considered to be non essentials include sugar, cooking oil and flour.
0%
20%
40%
60%
80%
100%
Very Poor Poor Middle Better off
Figure 5.8 Expenditure Patterns other
tax
clothes
social services
inputs
hh items
non-staple food
staple
Figure 44: CHCC Expenditure patterns

Zimbabwe Rural Livelihood Baseline Profiles 2011
62 | P a g e
Increased consumption of wild foods: Collection of wild foods happens every year but in bad years all households increase collection of wild foods for sale and consumption.
Reduction in the number of meals and quantity of food consumed per day: The poor households reduce the number of meals they consume in a day to try and manage during food crisis periods. In addition to the reduction of the number of meals, the pot size is also reduced.
Gold panning: The poor households engage in gold panning. The gold is bartered for cereal or sold for cash which is in turn used to purchase cereal.
Key Parameters for Monitoring
Table 10: CHCC Monitoring indicators
Item Key Parameter – Quantity Key Parameter – Price
Crops Maize, sorghum and groundnuts Maize grain, sorghum
Livestock production Cattle and Goat Cattle and Goat
Other food and cash income Cotton Labour rates (land preparation, weeding, harvesting)
Cotton

Zimbabwe Rural Livelihood Baseline Profiles 2011
63 | P a g e
Cereal and Low Cotton Producing Communal July-August 201015
Main Conclusions and Implications
Crop production is the main source of income and food in this zone and there is potential for increased production for poorer households if challenges of draught power and low acreage are improved along with access to appropriate seed and fertilisers. Extension services and monitoring of agriculture activities could be strengthened through support by the MOA’s Department of Extension Services (AGRITEX). In areas where irrigation is feasible, it would assist local farmers during the mid-season dry spell.
Cotton production is directly affected by producer prices with farmers contemplating reducing cotton acreage due to poor prices. Current pricing does not always offer viable returns to farmers. There is a need for transparency in the pricing structures offered by cotton buyers, as well as a review of the terms for contract farming to ensure viability of this cash crop. The reliance on cotton for income places the population in this zone at risk of unstable incomes resulting from fluctuations in cotton prices.
Livestock production is low in the zone and this reduces the coping capacity of households in bad years. Restocking programmes could support the stability of livelihoods from year to year as well as increasing crop cultivation.
Exploitation of natural resources needs to be strengthened to allow sustainable access to wildlife resources for the local community. The strengthening of the CAMPFIRE scheme will provide a framework for communities to legally benefit from existing natural resources.
There is poor road access in the zone with most roads and bridges requiring repair to improve access in the zone. The poor accessibility has implications for market access and competitive pricing on purchases and sales.
Food Aid in this zone has been present for the past 10 years with very poor and poor households becoming dependent on assistance. This has resulted in a decline in coping mechanisms and with no incentives for the expansion of existing livelihood strategies. This has critical implications on livelihood security for these households in the long-term. Any emergency food aid must be strictly targeted and the handout approach reviewed.
Very poor and poor households earn significant income from on-farm and off–farm activities and in times of drought, on-farm activities are severely affected resulting in reduction or loss of income. Labour payment terms should be monitored closely.
Expenditure on social services is low for all wealth groups and this is partly due to interventions in the social, health and education sectors. Despite subsidies, education is not truly accessible for all and future interventions should increasingly target poorer households in order to increase their enrolment levels. Other challenges include lack of facilities, highly qualified teachers, electricity and school supplies.
Zone Description
This zone has an estimated population of 139,732 people and lies in the north of the country covering parts of Gokwe North, Hurungwe, Kariba and Binga Districts in Midlands, Mashonaland West and Matabeleland North Province
15
Field work for the current profile was undertaken in July-August 2010. The information presented refers to April 2009 to March 2010 a relatively average year by local standards (i.e. a year of average production and rural food security, when judged in the context of recent years). Provided there are no fundamental and rapid shifts in the economy, the information in this profile is expected to remain valid for approximately five years (i.e. until 2015).

Zimbabwe Rural Livelihood Baseline Profiles 2011
64 | P a g e
It is known for being one of the most productive areas in Zimbabwe and is classified as Agro-ecological Region IV and V. It falls within a low-lying area, the majority of vegetation is forest and bush and average annual rainfall is approximately 450-650mm falling mostly between November and March.
In general the soils are fertile with sandy patches, mainly in Gokwe North District. Overall production potential is low in Nyaminyami and Binga Districts and moderate in Gokwe North and Hurungwe Districts. The zone is traditionally a food deficit area.
Figure 45: CLCC Livelihood zone map
The Sanyati river stretches through Gokwe North and Hurungwe Districts and the Ume river passes through Gokwe North and Nyaminyami Districts with the Matusadona game park and Tashinga safari camp also located in the zone.
Livelihoods are primarily agricultural, centred on growing maize for food and cotton for cash. Cash crop sales provide a key income source for the majority of households and recent years have seen an increase in the area of cotton grown at the expense of staple food crops. The climatic conditions - low rainfall and high temperatures - are ideally suited to growing cotton. However, cotton production in the short run is affected by price fluctuations. Maize, sorghum, groundnuts and cowpeas are the traditional food crops grown, with ox ploughs and hand hoes as the main methods of production. Fertilizers (Compound L, D and AN) pesticides and seed are used as inputs for production and are provided on credit from cotton companies.
Most households keep livestock, with cattle, goats and poultry being the common types. Other income generating activities include local employment, casual labour and gold panning. The Sanyati and Angwa rivers provide sites for gold panning for the Hurungwe and Gokwe North communities. External traders from urban centres buy the precious stones from the illegal miners. Fishing using mosquito nets and poaching (all illegal) take place in parks and rivers within the zone by the Binga and Nyaminyami communities. The products are sold to the formally employed people and trusted visitors.
Markets and Trade
The main commodities are exchanged through private buyers and companies. Cotton is sold to cotton companies, such as Cottco, Cargill, and Grafax which buy through a network of cotton collection points which exist at most business centres throughout the zone. Cattle are marketed to private buyers, local beef committees and local butcheries. The following are sold on the local market; surplus garden vegetables, groundnuts, peanut butter, thatch grass and local beer. Market access is generally good for cotton but poor for other agriculture and livestock products.
The main employment opportunities are local although some households go to neighbouring livelihood zones (Cereal and High Cotton Communal in particular) in search of casual employment opportunities. Other employment opportunities for villages close to Matusadona exist in the form of wage employment in safari areas as well as Gokwe (Copper Queen) and Hurungwe (Magunje and Tengwe) resettlement areas, Kariba and Chalala.

Zimbabwe Rural Livelihood Baseline Profiles 2011
65 | P a g e
Seasonal Calendar
Although agricultural labour is needed throughout the growing season, it peaks around December and January for weeding and from April to June for the harvest. Cotton provides a source of labour for much of the year, as its season requires more labour time than any other crop.
The agricultural year starts in October with preparation of the fields. The main food crop grown is maize, supplemented by groundnuts, millet (pearl and finger), sorghum and some round nuts. Groundnuts need to be sown on sandy soil, therefore, only the northern part of this zone is suitable for groundnut production. Maize is the first crop to be ready, as it can be eaten green before the main harvest. Green maize makes a valuable contribution to people’s diet as it provides a source of food at a time when household stocks are low. Wild foods (e.g. baobab and masau) are also consumed but have low food energy value.
Wealth Breakdown
4 wealth groups were identified by the key informants namely the very poor (vanoshayisisa), the poor (vanoshaya), the middle ( varinani), and the better-off (vanowana).
In terms of the proportion of the total households in the different wealth groups, the very poor and poor comprise approximately half of the households while middle and better-off households comprise approximately 25%-35% %and 10%-20% respectively, of total households in the zone.
Cattle Goats Chickens
Very Poor 4 - 6 1 - 2
Maize, Sorghum,
Cowpeas, Sweet
potatoes, G/nuts
0 0 - 3 3 - 7 Hand tools
Poor 5 - 7 2 - 4
Maize, Sorghum,
Cowpeas, Sweet
potatoes, G/nuts,
Cotton
0 - 2 3 - 5 6 - 100 - 1 Ploughs
Handtools
Middle 5 - 7 4 - 6
Maize, Sorghum,
Sunflower,
Cowpeas, Sweet
potatoes, G/nuts,
Cotton
3 - 5 5 - 7 10 - 12
1 plough
0 - 1 cart
Hand tools
Better Off 5 - 7 5 - 10
Maize, Sorghum,
Sunflower,
Cowpeas, Sweet
potatoes, G/nuts,
Cotton
6 - 10 8 - 12 10 -18
1 - 2 Ploughs
1 cart
0 - 1 cultivator
0 - 1 Ox Harrow
Hand tools
Figure 6.3 Wealth Groups Characteristics
HH size
Land area
cultivated
(acres)
Crops cultivated
Livestock Holding
Other Assets
16%
29%
31%
24%
% of households
Figure 47: CLCC Wealth group characteristics
Figure 46: CLCC Seasonal calendar

Zimbabwe Rural Livelihood Baseline Profiles 2011
66 | P a g e
The main determinants of wealth in the zone are livestock holdings, ownership of productive assets and amount of land cultivated. Livestock holdings are generally low due to lack of pastures; however wealthier households relatively own more cattle and goats while poorer households typically own very small numbers of livestock – usually goats and chickens.
Land ownership is open and allocated equally regardless of wealth status. The amount of land cultivated, however, varies significantly by wealth status. Wealthier households cultivate larger areas and use draught power with some households hiring tractors. Poorer households cultivate small pieces of land mainly as they lack draught power or resources to hire it.
In terms of ownership of productive assets, the very poor and poor typically own hand hoes and axes. The wealthier households own ox ploughs, scotch carts, and chemical sprayers.
Household size is slightly smaller among very poor households, as is the number of children enrolled in school. Poor and better-off households have the smallest number of adults capable of work, and children between 6 and 18 years old are generally the same across wealth groups. There does not appear to be a clear trend of household composition and wealth in this zone, at least not from the interview results.
0
1
2
3
4
5
6
7
Very Poor Poor Middle Better off
HH Size
# Adults
Under 6 Yrs
6-18 Yr Olds
# in School
Sources of Food (Reference Period 2009/10)
Total food energy consumed increases with wealth, as does food energy from own crop production and livestock products. Payment in kind decreases as a percent of total food with wealth, as does food aid. Food purchases do not have an obvious pattern across wealth groups.
Own crop production increases significantly with wealth, from less than 40% among very poor households to 85%-95% among better-off households. Not being able to rely on one’s own production for food translates to a dependency on outside sources for food, and food as a larger expenditure.
In the graph, food access is expressed as a percentage of minimum food requirements, taken as an average food energy intake of 2100 kcals per person per day.
Consumption of own crop production is mostly maize, comprising 15%-20%, 25%-30%, 35%-40% and 60%-65% of total food energy requirements for the very poor, poor, middle and better-off households, respectively. Other crops consumed are sorghum, cowpeas, sweet potatoes, groundnuts and vegetables across all wealth groups, with middle and better-off households also consuming sunflower seeds. Livestock products consumed among the poor, middle and better-off households consist mainly of cow’s milk. Goats milk and shoat meat is consumed by all 4 wealth groups, but in such small quantities that it is insignificant with respect to total food energy.
Payment of food in exchange for labour occurs only in very poor and poor households, where it is a key source of food. Payment in food was earned through weeding, cutting cotton stalks and some various forms
-10%
10%
30%
50%
70%
90%
110%
Very Poor Poor Middle Better Off
Figure 6.5 Food Sources
other
food aid
purchase
payment in kind
livestock products
crops
Figure 48: CLCC HH sizes
Figure 49: CLCC Food sources

Zimbabwe Rural Livelihood Baseline Profiles 2011
67 | P a g e
of off-farm labour including thatching, cutting poles and fencing. Payment was generally in the form of maize grain, but sometimes included sugar.
Food is purchased by all wealth groups; the main item purchased among very poor, poor and middle households was maize grain, while the better-off did not purchase maize. Wheat flour was purchased in small quantities by middle and better-off households, while all 4 wealth groups purchased oil and sugar.
In addition to a reliance on labour exchange for food, very poor and poor households also depended on food aid to meet their minimum food energy requirements in this zone. Given this food aid distribution, a clear picture is not available as to how very poor and poor households source their food without outside interventions, as they would be required to make up for 25%-35% of total food energy.
In the graph, food access is expressed as a percentage of minimum food requirements, taken as an average food energy intake of 2100 kcals per person per day.
While all wealth groups met their minimum required food energy, dietary diversity, both in type and amount increases with wealth. Beyond cereals (discussed in the above section), very poor households consume 5 other types of food, comprising approximately 15% of total food energy requirements. Across the rest of the wealth groups it is as follows; poor households consume 5 types (15%-20%), middle households consume 6 types (25%-30%), and better-off households consume seven types (30%-35%).
Sources of Cash (Reference Period 2009/10)
Income amounts increase with wealth, so do the activities and patterns of sources. Income from crop sales and livestock sales increases in both actual amounts and as percentages of total wealth. Income from employment, self-employment and petty trade or barter income all decrease as percentages of total income with wealth. Crop sales vary across wealth groups, both in types of crops sold and income received.
Annual Income (USD)
Very Poor 100-200
Poor 200-330
Middle 300-500
Better-off 500-1000
Very poor households do not commonly grow and sell cotton, instead earning income through maize, vegetable and tomato sales. As wealth increases, edible crop sales become less important and cotton becomes more important for income. Income from cotton sales as a percentage of crop sales was approximately 65%-70% for poor households, 75%-80% of crop sales for middle households and 85%-90% for better-off households.
0%
20%
40%
60%
80%
100%
Very Poor Poor Middle Better Off
Figure 6.6 Food Groups Consumed
wild foods
tubers
fruit and vegetables
sugar
oil
pulses
milk
meat
cereals
0%
20%
40%
60%
80%
100%
Very Poor Poor Middle Better off
Figure 6.7 Income Sources other
self-employment
employment +
remittances
livestock sales
livestock product
sales
crop sales
Figure 50: CLCC Food Groups
Figure 51: CLCC Cash Income sources
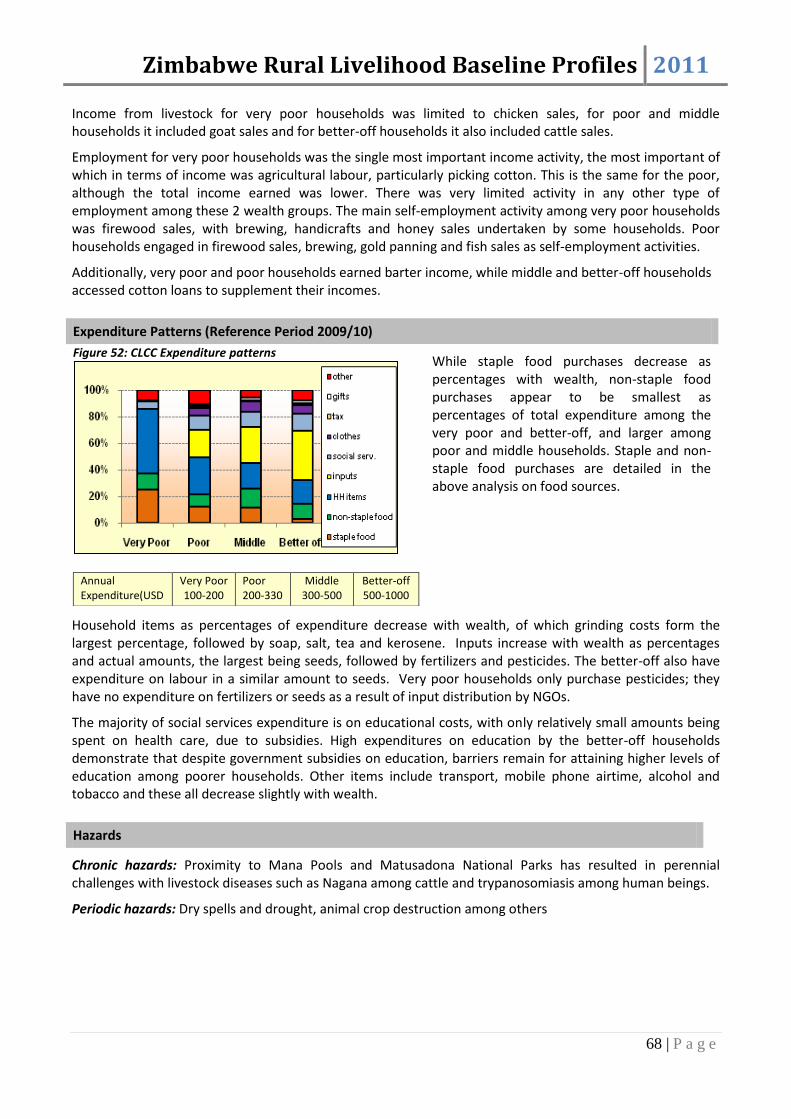
Zimbabwe Rural Livelihood Baseline Profiles 2011
68 | P a g e
Income from livestock for very poor households was limited to chicken sales, for poor and middle households it included goat sales and for better-off households it also included cattle sales.
Employment for very poor households was the single most important income activity, the most important of which in terms of income was agricultural labour, particularly picking cotton. This is the same for the poor, although the total income earned was lower. There was very limited activity in any other type of employment among these 2 wealth groups. The main self-employment activity among very poor households was firewood sales, with brewing, handicrafts and honey sales undertaken by some households. Poor households engaged in firewood sales, brewing, gold panning and fish sales as self-employment activities.
Additionally, very poor and poor households earned barter income, while middle and better-off households accessed cotton loans to supplement their incomes.
Expenditure Patterns (Reference Period 2009/10)
Figure 52: CLCC Expenditure patterns
Annual Expenditure(USD
Very Poor 100-200
Poor 200-330
Middle 300-500
Better-off 500-1000
While staple food purchases decrease as percentages with wealth, non-staple food purchases appear to be smallest as percentages of total expenditure among the very poor and better-off, and larger among poor and middle households. Staple and non-staple food purchases are detailed in the above analysis on food sources.
Household items as percentages of expenditure decrease with wealth, of which grinding costs form the largest percentage, followed by soap, salt, tea and kerosene. Inputs increase with wealth as percentages and actual amounts, the largest being seeds, followed by fertilizers and pesticides. The better-off also have expenditure on labour in a similar amount to seeds. Very poor households only purchase pesticides; they have no expenditure on fertilizers or seeds as a result of input distribution by NGOs.
The majority of social services expenditure is on educational costs, with only relatively small amounts being spent on health care, due to subsidies. High expenditures on education by the better-off households demonstrate that despite government subsidies on education, barriers remain for attaining higher levels of education among poorer households. Other items include transport, mobile phone airtime, alcohol and tobacco and these all decrease slightly with wealth.
Hazards
Chronic hazards: Proximity to Mana Pools and Matusadona National Parks has resulted in perennial challenges with livestock diseases such as Nagana among cattle and trypanosomiasis among human beings.
Periodic hazards: Dry spells and drought, animal crop destruction among others

Zimbabwe Rural Livelihood Baseline Profiles 2011
69 | P a g e
Coping Strategies
Reduced purchase of household goods and food: The households reduce expenditure on household items and food in bad years.
Increased sale of livestock: All wealth groups engage in the sale of livestock such as cattle, goats and chickens. The livestock is usually sold to buyers who come from outside the zone.
Reduction in the number of meals and quantity of food consumed per day: The poor groups reduce the number of meals they consume in a day to try and manage during food crisis periods. In addition to the reduction of the number meals, the pot size is also reduced.
Increased labour migration: During the bad years there is increased labour migration to the neighbouring zones. The labourers are employed in the tourism sector and the fishing industry.
Increased poaching: The poorer groups often poach wildlife in the surrounding game reserves in bad years. The meat is either sold or bartered for cereal
Key Parameters for Monitoring
Table 11: CLCC Monitoring indicators
Item Key Parameter - Quantity Key Parameter – Price
Crops Maize
Sorghum
Vegetables
Groundnuts
Cotton
Maize grain
Vegetables
Cotton
Livestock production Cattle
Chickens
Goats
Cattle
Chickens
Goats
Other food and cash income Gifts-cereal
Barter income
Labour off farm
Cotton loans
Labour rates (land preparation, weeding, harvesting)
Gifts-cereal,
Barter income
Labour off farm
Cotton loans
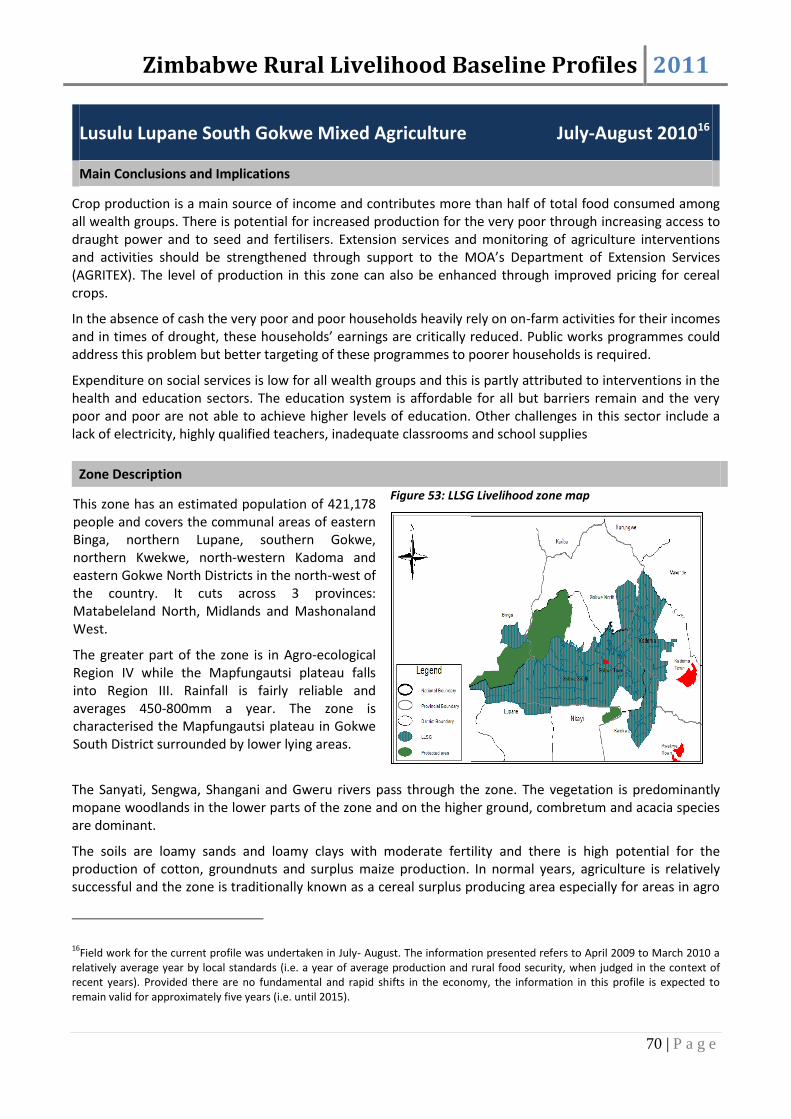
Zimbabwe Rural Livelihood Baseline Profiles 2011
70 | P a g e
Lusulu Lupane South Gokwe Mixed Agriculture July-August 201016
Main Conclusions and Implications
Crop production is a main source of income and contributes more than half of total food consumed among all wealth groups. There is potential for increased production for the very poor through increasing access to draught power and to seed and fertilisers. Extension services and monitoring of agriculture interventions and activities should be strengthened through support to the MOA’s Department of Extension Services (AGRITEX). The level of production in this zone can also be enhanced through improved pricing for cereal crops.
In the absence of cash the very poor and poor households heavily rely on on-farm activities for their incomes and in times of drought, these households’ earnings are critically reduced. Public works programmes could address this problem but better targeting of these programmes to poorer households is required.
Expenditure on social services is low for all wealth groups and this is partly attributed to interventions in the health and education sectors. The education system is affordable for all but barriers remain and the very poor and poor are not able to achieve higher levels of education. Other challenges in this sector include a lack of electricity, highly qualified teachers, inadequate classrooms and school supplies
Zone Description
This zone has an estimated population of 421,178 people and covers the communal areas of eastern Binga, northern Lupane, southern Gokwe, northern Kwekwe, north-western Kadoma and eastern Gokwe North Districts in the north-west of the country. It cuts across 3 provinces: Matabeleland North, Midlands and Mashonaland West.
The greater part of the zone is in Agro-ecological Region IV while the Mapfungautsi plateau falls into Region III. Rainfall is fairly reliable and averages 450-800mm a year. The zone is characterised the Mapfungautsi plateau in Gokwe South District surrounded by lower lying areas.
Figure 53: LLSG Livelihood zone map
The Sanyati, Sengwa, Shangani and Gweru rivers pass through the zone. The vegetation is predominantly mopane woodlands in the lower parts of the zone and on the higher ground, combretum and acacia species are dominant.
The soils are loamy sands and loamy clays with moderate fertility and there is high potential for the production of cotton, groundnuts and surplus maize production. In normal years, agriculture is relatively successful and the zone is traditionally known as a cereal surplus producing area especially for areas in agro
16Field work for the current profile was undertaken in July- August. The information presented refers to April 2009 to March 2010 a
relatively average year by local standards (i.e. a year of average production and rural food security, when judged in the context of recent years). Provided there are no fundamental and rapid shifts in the economy, the information in this profile is expected to remain valid for approximately five years (i.e. until 2015).
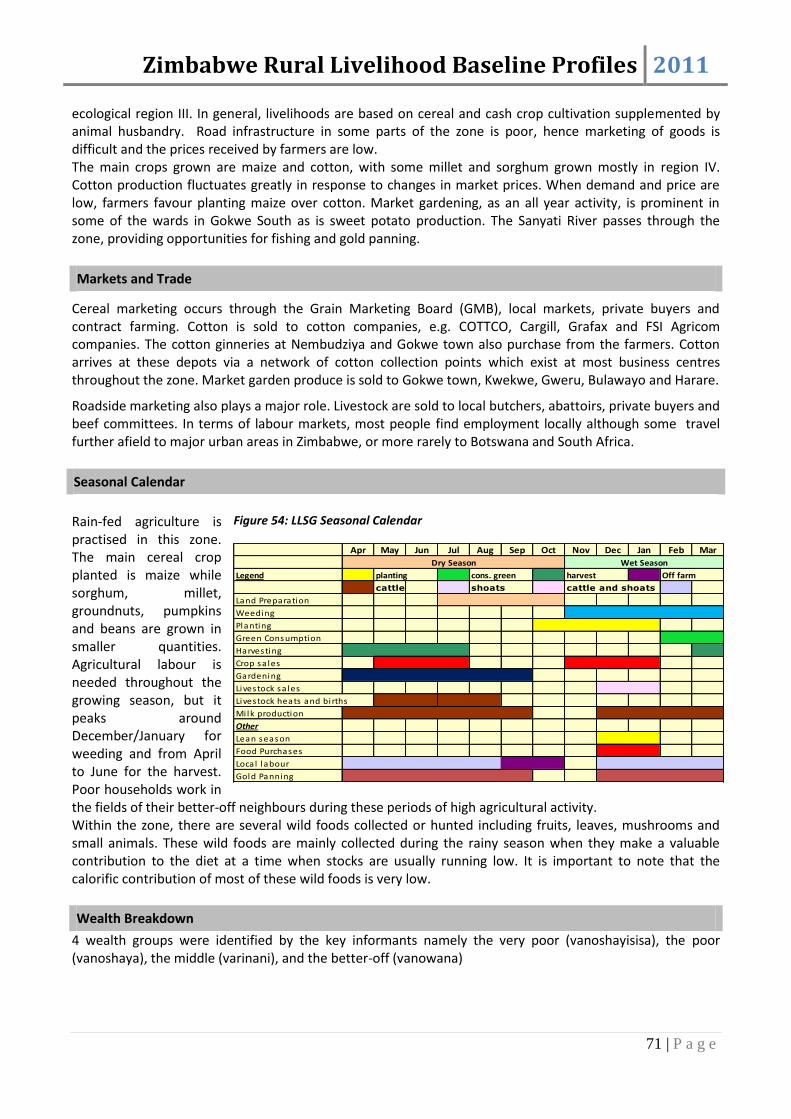
Zimbabwe Rural Livelihood Baseline Profiles 2011
71 | P a g e
ecological region III. In general, livelihoods are based on cereal and cash crop cultivation supplemented by animal husbandry. Road infrastructure in some parts of the zone is poor, hence marketing of goods is difficult and the prices received by farmers are low. The main crops grown are maize and cotton, with some millet and sorghum grown mostly in region IV. Cotton production fluctuates greatly in response to changes in market prices. When demand and price are low, farmers favour planting maize over cotton. Market gardening, as an all year activity, is prominent in some of the wards in Gokwe South as is sweet potato production. The Sanyati River passes through the zone, providing opportunities for fishing and gold panning.
Markets and Trade
Cereal marketing occurs through the Grain Marketing Board (GMB), local markets, private buyers and contract farming. Cotton is sold to cotton companies, e.g. COTTCO, Cargill, Grafax and FSI Agricom companies. The cotton ginneries at Nembudziya and Gokwe town also purchase from the farmers. Cotton arrives at these depots via a network of cotton collection points which exist at most business centres throughout the zone. Market garden produce is sold to Gokwe town, Kwekwe, Gweru, Bulawayo and Harare.
Roadside marketing also plays a major role. Livestock are sold to local butchers, abattoirs, private buyers and beef committees. In terms of labour markets, most people find employment locally although some travel further afield to major urban areas in Zimbabwe, or more rarely to Botswana and South Africa.
Seasonal Calendar
Rain-fed agriculture is practised in this zone. The main cereal crop planted is maize while sorghum, millet, groundnuts, pumpkins and beans are grown in smaller quantities. Agricultural labour is needed throughout the growing season, but it peaks around December/January for weeding and from April to June for the harvest. Poor households work in the fields of their better-off neighbours during these periods of high agricultural activity. Within the zone, there are several wild foods collected or hunted including fruits, leaves, mushrooms and small animals. These wild foods are mainly collected during the rainy season when they make a valuable contribution to the diet at a time when stocks are usually running low. It is important to note that the calorific contribution of most of these wild foods is very low.
Wealth Breakdown
4 wealth groups were identified by the key informants namely the very poor (vanoshayisisa), the poor (vanoshaya), the middle (varinani), and the better-off (vanowana)
Figure 54: LLSG Seasonal Calendar
Apr May Jun Jul Aug Sep Oct Nov Dec Jan Feb Mar
Legend
cattle
Land Preparation
Weeding
Planting
Green Consumption
Harvesting
Crop sa les
Gardening
Livestock sa les
Livestock heats and births
Mi lk production
Other
Lean season
Food Purchases
Local labour
Gold Panning
Off farm
shoats
Wet Season
planting cons. green harvest
Dry Season
cattle and shoats

Zimbabwe Rural Livelihood Baseline Profiles 2011
72 | P a g e
Figure 55: LLSG Wealth group characteristics
The main determinants of wealth in the zone are livestock holdings, ownership of productive assets and amount of land cultivated. Livestock holdings are generally low due to lack of pastures, wealthier households own larger amounts and types of livestock, while poorer households own less and smaller livestock.
Land is allocated equally regardless of wealth status; however utilisation of owned land varies significantly by wealth status. The wealthier households are able to cultivate larger areas of land and use draught power. The poorer households cultivate small pieces of land mainly because they lack draught power and the resources to hire it.
In terms of ownership of productive assets, the very poor and poor typically own hand hoes and axes. The wealthier households own ox ploughs, scotch carts, cultivators, planters and chemical sprayers (for those that grow cotton).
In this livelihood zone, household composition is generally similar across wealth groups, with no clear relationship between available labour and wealth.
There appears to be higher levels of school enrolment among households in the zone.
Figure 56: LLSG HH sizes
0
1
2
3
4
5
6
7
Very Poor Poor Middle Better off
HH Size
# Adults
Under 6 Yrs
6-18 Yr Olds
# in School
Sources of Food (Reference Period 2009/10)
It is important to understand the patterns of food sources across wealth groups and the total access for each wealth group. Crop production as a food source increases with wealth, as do food purchases and livestock products, while payment in kind as a percentage of total food decreases with wealth. Own crop production as a food source is very high in this livelihood zone, particularly among the poor, middle and better-off households.
Cattle Goats Chickens Donkey
Very Poor 5-7 2--4 0 0--2 6--10 0 2 Fruit tree 4 hoes
Poor 5-7 4--5 1--3 1--3 6--10 0-21 plough 5 hoes 2
fruit trees
Middle 5-7 5--8 4--8 3--6 5--15 0--4
5 hoes 1 plough 1
scotchcart 1
cultivator 3 fruit
trees
Better Off 5-7 8--15 8--15 4--8 10--15 0--4
2 ploughs 6 hoes 1
scotchcart 1
cultivator 4 fruit
trees
HH size
Land area
cultivated
(acres)
Livestock Holding
Other Assets
Figure 7.3 Wealth Groups Characteristics
15%
26%
33%
26%
% of households
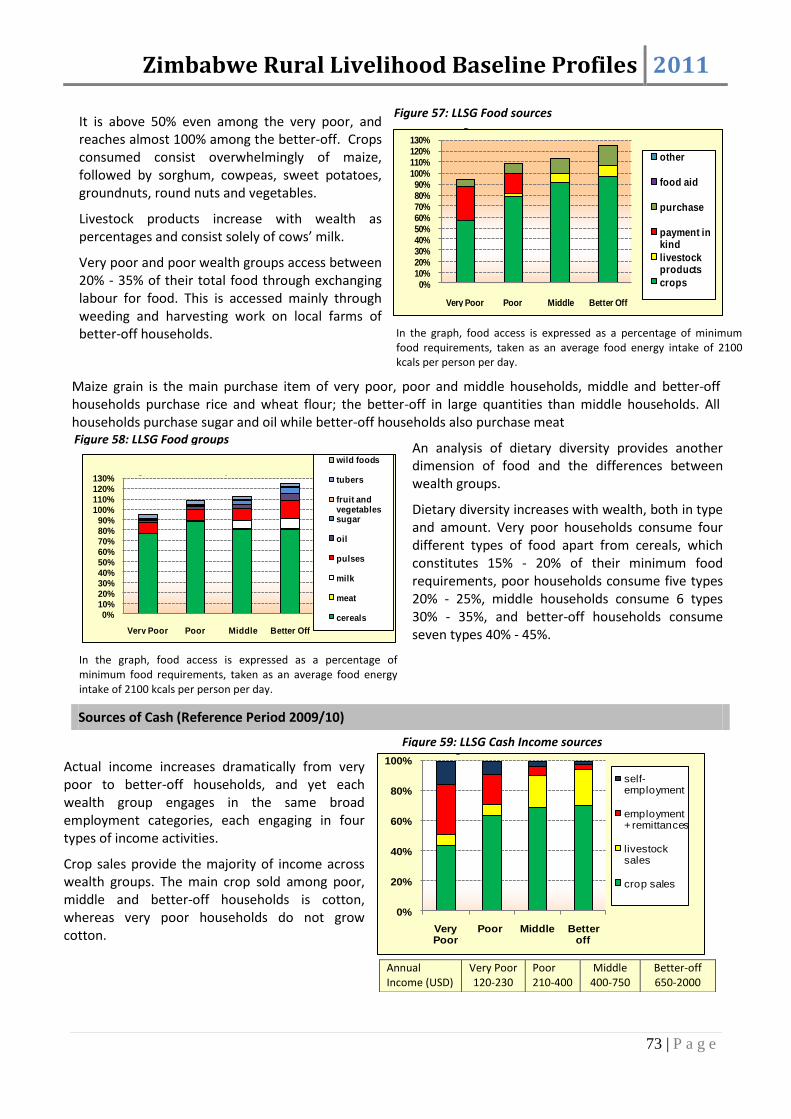
Zimbabwe Rural Livelihood Baseline Profiles 2011
73 | P a g e
It is above 50% even among the very poor, and reaches almost 100% among the better-off. Crops consumed consist overwhelmingly of maize, followed by sorghum, cowpeas, sweet potatoes, groundnuts, round nuts and vegetables.
Livestock products increase with wealth as percentages and consist solely of cows’ milk.
Very poor and poor wealth groups access between 20% - 35% of their total food through exchanging labour for food. This is accessed mainly through weeding and harvesting work on local farms of better-off households. In the graph, food access is expressed as a percentage of minimum
food requirements, taken as an average food energy intake of 2100 kcals per person per day.
Maize grain is the main purchase item of very poor, poor and middle households, middle and better-off households purchase rice and wheat flour; the better-off in large quantities than middle households. All households purchase sugar and oil while better-off households also purchase meat
In the graph, food access is expressed as a percentage of minimum food requirements, taken as an average food energy intake of 2100 kcals per person per day.
An analysis of dietary diversity provides another dimension of food and the differences between wealth groups.
Dietary diversity increases with wealth, both in type and amount. Very poor households consume four different types of food apart from cereals, which constitutes 15% - 20% of their minimum food requirements, poor households consume five types 20% - 25%, middle households consume 6 types 30% - 35%, and better-off households consume seven types 40% - 45%.
Sources of Cash (Reference Period 2009/10)
Actual income increases dramatically from very poor to better-off households, and yet each wealth group engages in the same broad employment categories, each engaging in four types of income activities.
Crop sales provide the majority of income across wealth groups. The main crop sold among poor, middle and better-off households is cotton, whereas very poor households do not grow cotton.
Annual Income (USD)
Very Poor 120-230
Poor 210-400
Middle 400-750
Better-off 650-2000
0%10%20%30%40%50%60%70%80%90%
100%110%120%130%
Very Poor Poor Middle Better Off
Figure 7.5 Food Sources
other
food aid
purchase
payment in kind
livestock products
crops
0%10%20%30%40%50%60%70%80%90%
100%110%120%130%
Very Poor Poor Middle Better Off
Figure 7.6 Food Groups Consumedwild foods
tubers
fruit and vegetablessugar
oil
pulses
milk
meat
cereals
0%
20%
40%
60%
80%
100%
Very Poor
Poor Middle Better off
Figure 7.7 Income Sources
self-employment
employment + remittances
livestock sales
crop sales
Figure 57: LLSG Food sources
Figure 58: LLSG Food groups
Figure 59: LLSG Cash Income sources

Zimbabwe Rural Livelihood Baseline Profiles 2011
74 | P a g e
Cotton sales comprise approximately 50%-60% of income from crop sales for poor, middle and better-off households. Maize is the next largest (and largest among very poor households), followed by vegetables, groundnuts and cowpeas. Maize is sold at USD 0.22/kg and between 25% and 50% of total household maize production is sold. Chickens were sold by all wealth groups whilst goats and cattle were mostly sold by better-off and middle groups. Very poor and poor households engage in various types of agricultural labour, comprising the majority of employment income, as well as house smearing and brick production. Middle and better-off households receive (relatively) small amounts of remittances, comprising the whole of income earned in this category.
All wealth groups engage in some form of self-employment for relatively small percentages of their total income. Middle and better-off households earn income from brewing drinks and petty trade, while very poor and poor households earn income panning for gold.
Expenditure Patterns (Reference Period 2009/10)
Annual Expenditure (USD)
Very Poor 120-230
Poor 210-400
Middle 400-750
Better-off 650-2000
Expenditure patterns tend to vary across wealth groups, as is the case with this livelihood zone. Expenditure on staple food is very low across all wealth groups, ranging between 5 and 10 %. Expenditure on non-staple foods is higher, but generally similar across wealth groups with slightly higher percentages among very poor and better-off households. Details of these expenditures were highlighted in the above food sources section.
Household items comprise a large percentage of expenditure among very poor households and then sharply decrease to the poor and other wealth groups. Actual expenditure on these items increases with wealth, however obviously not to the same degree as income increases. Grain grinding costs comprises a large amount of this expenditure and are roughly the same across wealth groups. Soap is the next highest expenditure, followed by salt, kerosene and tea. Poor, middle and better-off households also purchase utensils.
Expenditure on inputs increases substantially by means of wealth; very poor households only purchase a small amount of seeds. Poor households additionally purchase fertilizer while middle and better-off households also purchase pesticides and hire agricultural labour.
While social services are almost the same across wealth groups, actual expenditure on education increases by a factor of 6 between very poor and better-off households. Other expenditure includes items such as transport, mobile phone airtime, tobacco and alcohol.
Hazards
Chronic hazards: Poor infrastructure means that marketing of produce is difficult and producers often do not earn favourable prices. Purchased goods are usually relatively expensive for the same reason. HIV and AIDS is a persistent problem that affects household labour capacity and can lead to increased expenditure on health care. Cholera is also a seasonal health hazard. Crop pests and livestock diseases such as anthrax and foot and mouth, affect farmers in this zone. Gullies are also problematic in the Gokwe areas of this zone. Problem animals are a constant hazard near wildlife areas.
0%
20%
40%
60%
80%
100%
Very Poor Poor Middle Better off
other
gifts
tax
clothes
social serv.
inputs
water
HH items
non-staple food
staple food
Figure 60: LLSG Expenditure patterns

Zimbabwe Rural Livelihood Baseline Profiles 2011
75 | P a g e
Periodic hazards: Roughly 3 in every 5 years will be drought years.
Coping Strategies
Reduced purchase of non essentials: The poor households reduce expenditure on goods deemed to be non essential. The goods considered to be non essentials include sugar, cooking oil and flour.
Increased consumption of wild foods: Collection of wild foods happens every year but in bad years all households increase collection of wild foods for sale and consumption.
Increased gold panning: The poor households engage in gold panning. The gold is bartered for cereal or sold for cash which in turn is used to purchase cereal.
Increased sale of livestock: The better-off and middle groups engage in the sale of livestock such as cattle and goats whilst the poorer groups sell livestock such as chickens and goats. Increased poaching: The poorer groups often poach wildlife in the surrounding game reserves in bad years. The meat is either sold or bartered for cereal
Key Parameters for Monitoring
Table 12: LLSG Monitoring indicators
Item Key Parameter - Quantity Key Parameter – Price
Crops Maize Sorghum Groundnuts
Maize Sorghum
Livestock production Cattle Goats
Cattle
Goats
Other food and cash income Cotton Labour rates (land preparation, weeding, harvesting)
Cotton

Zimbabwe Rural Livelihood Baseline Profiles 2011
76 | P a g e
Mutorashanga Informal Mining September-October 201017
Main Conclusions and Implications
Labour exchange is the main source of food for the poor and middle households in the zone while purchases are the only source of food for the better-off households in the zone. Crop production is minimal due to unavailability of land to the residents of these mining compounds and poor and middle households have limited access to land. Production is by use of hand tools. The better-off do not produce any crops because they are formally employed and do not have any plots. Another factor contributing to low levels of crop production is the soil type. The soils are rich in minerals hence poor for crop production.
Human capital is essential as it affects households’ ability to earn food and income. The poor and middle households heavily rely on on-farm casual work for their incomes while the better-off depend on formal employment for their income and purchases for their food.
Food purchases are important for all the wealth groups with the poor and middle supplementing with crop production on small plots in their compounds. There is need to closely monitor changes in prices of food.
The poor and middle wealth groups depend on income from casual labour and self-employment. These sources are dependent on the availability of work on the farms and in the mines. Monitoring the performance of the agricultural season on the surrounding farms as well as the prices of chrome will be useful in tracking changes in access to cash among these wealth groups.
Zone Description
This zone has an estimated population of 30,557 and is located in the northern part of Zvimba District along the Great Dyke. Mutorashanga is the collective name given to the mining communities on the Zvimba side of the Great Dyke. It falls under Agro-ecological Region III. Average rainfall in the zone is 600 mm to 750 mm per annum.
The major natural resource in the zone is chrome ore although there are some gold deposits on the outskirts of the zone.
Vegetation is greatly affected by the presence of serpentine in the soil which inhibits growth of most plant species along the great dyke.
Figure 61: MTIM Livelihood zone map
As a result the zone is characterised by stunted trees and poor grass stands that are suitable for grazing and thatching.
Large mountains lie along the Great Dyke which stretches from the north to the south of the zone. Along the western side of the Great Dyke runs a railway line and a tarmac road used to carry chrome ore from the
17
Field work for the current profile was undertaken between September and October 2010. The information presented refers to April 2009 to March 2010 a relatively average year by local standards (i.e. a year of average production and rural food security, when judged in the context of recent years). Provided there are no fundamental and rapid shifts in the economy, the information in this profile is expected to remain valid for approximately five years (i.e. until 2015).
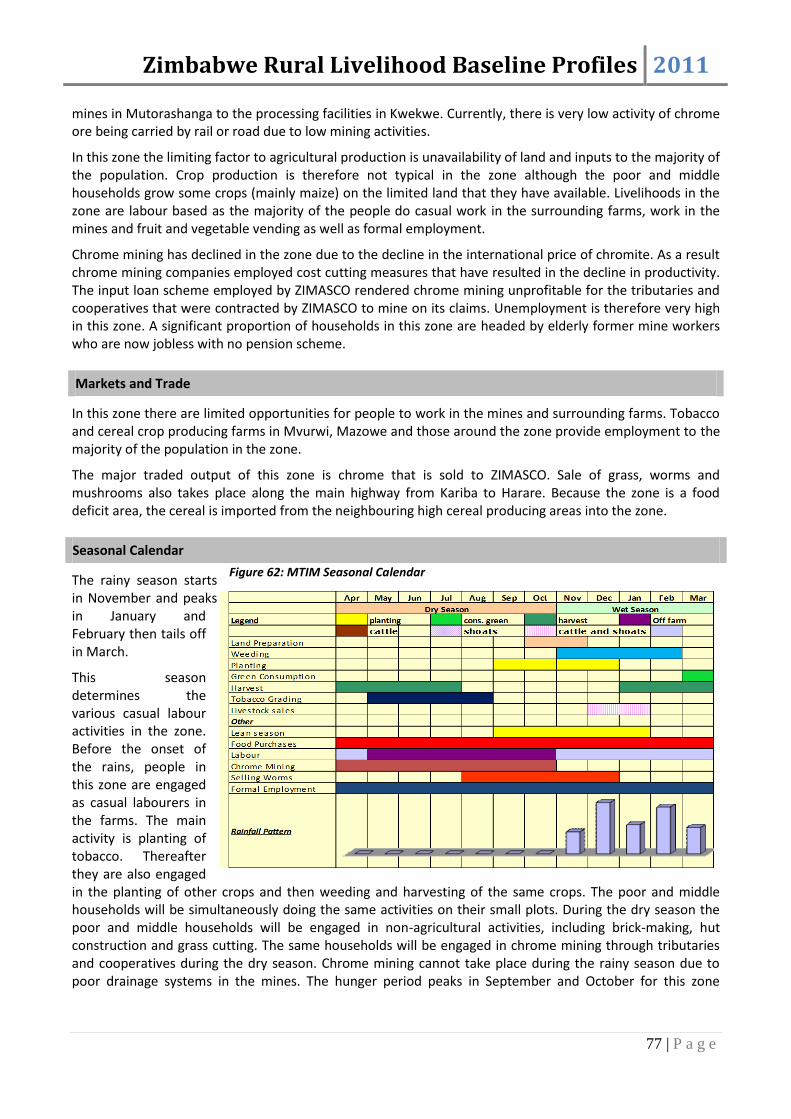
Zimbabwe Rural Livelihood Baseline Profiles 2011
77 | P a g e
mines in Mutorashanga to the processing facilities in Kwekwe. Currently, there is very low activity of chrome ore being carried by rail or road due to low mining activities.
In this zone the limiting factor to agricultural production is unavailability of land and inputs to the majority of the population. Crop production is therefore not typical in the zone although the poor and middle households grow some crops (mainly maize) on the limited land that they have available. Livelihoods in the zone are labour based as the majority of the people do casual work in the surrounding farms, work in the mines and fruit and vegetable vending as well as formal employment.
Chrome mining has declined in the zone due to the decline in the international price of chromite. As a result chrome mining companies employed cost cutting measures that have resulted in the decline in productivity. The input loan scheme employed by ZIMASCO rendered chrome mining unprofitable for the tributaries and cooperatives that were contracted by ZIMASCO to mine on its claims. Unemployment is therefore very high in this zone. A significant proportion of households in this zone are headed by elderly former mine workers who are now jobless with no pension scheme.
Markets and Trade
In this zone there are limited opportunities for people to work in the mines and surrounding farms. Tobacco and cereal crop producing farms in Mvurwi, Mazowe and those around the zone provide employment to the majority of the population in the zone.
The major traded output of this zone is chrome that is sold to ZIMASCO. Sale of grass, worms and mushrooms also takes place along the main highway from Kariba to Harare. Because the zone is a food deficit area, the cereal is imported from the neighbouring high cereal producing areas into the zone.
Seasonal Calendar
The rainy season starts in November and peaks in January and February then tails off in March.
This season determines the various casual labour activities in the zone. Before the onset of the rains, people in this zone are engaged as casual labourers in the farms. The main activity is planting of tobacco. Thereafter they are also engaged in the planting of other crops and then weeding and harvesting of the same crops. The poor and middle households will be simultaneously doing the same activities on their small plots. During the dry season the poor and middle households will be engaged in non-agricultural activities, including brick-making, hut construction and grass cutting. The same households will be engaged in chrome mining through tributaries and cooperatives during the dry season. Chrome mining cannot take place during the rainy season due to poor drainage systems in the mines. The hunger period peaks in September and October for this zone
Figure 62: MTIM Seasonal Calendar

Zimbabwe Rural Livelihood Baseline Profiles 2011
78 | P a g e
because there will be less demand for casual labour. After October, commercial farmers begin to pay for weeding with grain; hence availability of food is improved in the zone.
Wealth Breakdown
3 wealth groups were identified by the key informants namely the poor (vanoshaya), the middle (varinani), and the better-off (vanowana).
Figure 63: MTIM Wealth group characteristics
In terms of the proportion of total households in the different wealth groups, the poor comprise of 44% of the population. The middle and better-off households constitute approximately 39% and 17% respectively, of the total households in the zone.
The main determinant of wealth in the zone is the level of income that the households can access, which is dependent on the amount of labour in the households. Better-off households in this zone have at least 1 household member who is skilled or semi- skilled and formally employed in the public service or in the mining companies in the zone like ZIMASCO. Their annual income is therefore above USD 600.00. The middle households are usually male headed with 2 adults capable of working. However they are often unskilled or semiskilled. Their income ranges between USD 300 and USD 600. The poor households on the other hand are female or elderly headed (mainly) with few economically active members that provide fewer labour hours. They depend on casual labour for income. Their income is usually below USD 300.00
The poor and middle households have some land for crop cultivation but land cultivated is not a major wealth determinant.
The household size for the poor and better-off households was 5 whilst the middle households had 6 members. The poor and the better-off had 1 under 6 child while the middle had 2 under 6 members. All children of school going age were attending school.
Figure 64: MTIM HH sizes
0
1
2
3
4
5
6
7
Poor Middle Better off
HH Size
# Adults
Under 6 Yrs
6-18 Yr Olds
# in School
Poor 5 - 6 0.25 - 1Casual labour; Petty
trade;
Female/Elderly
headed; 1-2
members providing
less labour hours
<USD 300
Middle 5 - 6 0.25 - 1Casual labour; Petty
trade; Mining
Male headed; Has
able bodied adults;
Unskilled/semi
skilled
USD 301
to USD
600
Better Off 5 - 6 0 Formal employment
Male headed; Has
able bodied adults;
Skilled/semi skilled
>USD 600
Figure 8.3 Wealth Groups Characteristics
HH size
Land area
cultivated
(acres)
Income Sources HH DescriptionIncome
level
17%
39%
44%
% of households

Zimbabwe Rural Livelihood Baseline Profiles 2011
79 | P a g e
Sources of Food (Reference Period 2009/10)
The graph (figure 66) provides a breakdown of different food sources, as percentages of minimum required food energy. Aside from the natural increase in total food intake with wealth, the patterns of food sources
within and across wealth groups are particularly important for understanding livelihoods.
Food sources in this livelihood zone are particularly unique, given the low levels of crop production and high levels of employment.
Crop production provides minimal food in this zone; it contributes less than 25% of annual food requirements for the poor and middle group. This consumption is mostly maize and green consumption of maize. Land for crop production is either unsuitable or unavailable to the majority of households.
Payment in grain in exchange for labour is the most important food source for poor and middle households and is approximately equally divided between weeding and harvesting. Workers are hired to weed and harvest tobacco and maize fields in the surrounding large-scale farms.
In the graph, food access is expressed as a percentage of minimum food requirements, taken as an average food energy intake of 2100 kcals per person per day.
The purchase of food is the sole food source for better-off households and contributes to approximately 15%-30% of total food among poor and middle households. Better-off households purchase between 75% and 85% of their total food in the form of maize grain, with poor and middle households also purchasing maize to supplement their diet. Rice, soya chunks, meat and rice are also purchased by better-off households, while middle households purchase small quantities of wheat flour as well. All wealth groups purchase sugar, oil and vegetables
In the graph, food access is expressed as a percentage of minimum food requirements, taken as an average food energy intake of 2100 kcals per person per day.
While dietary diversity increases with wealth in both type and amount, the diversity of food is very low across all wealth groups. Poor households only consume 2 types of food apart from cereals, comprising less than 5% of total required food. Middle households also consume only 2 other types of food, with only a slightly larger percentage of total food. Better-off households consume 4other types of food, comprising between 20% and 25% of total food. This is better than the other 2 wealth groups, but remains low overall.
0%
20%
40%
60%
80%
100%
120%
Poor Middle Better Off
purchase
payment in kind
livestock products
crops
0%
20%
40%
60%
80%
100%
120%
Poor Middle Better Off
wild foods
tubers
sugar
oil
pulses
Figure 65: MTIM Food sources
Figure 66: MTIM Food groups
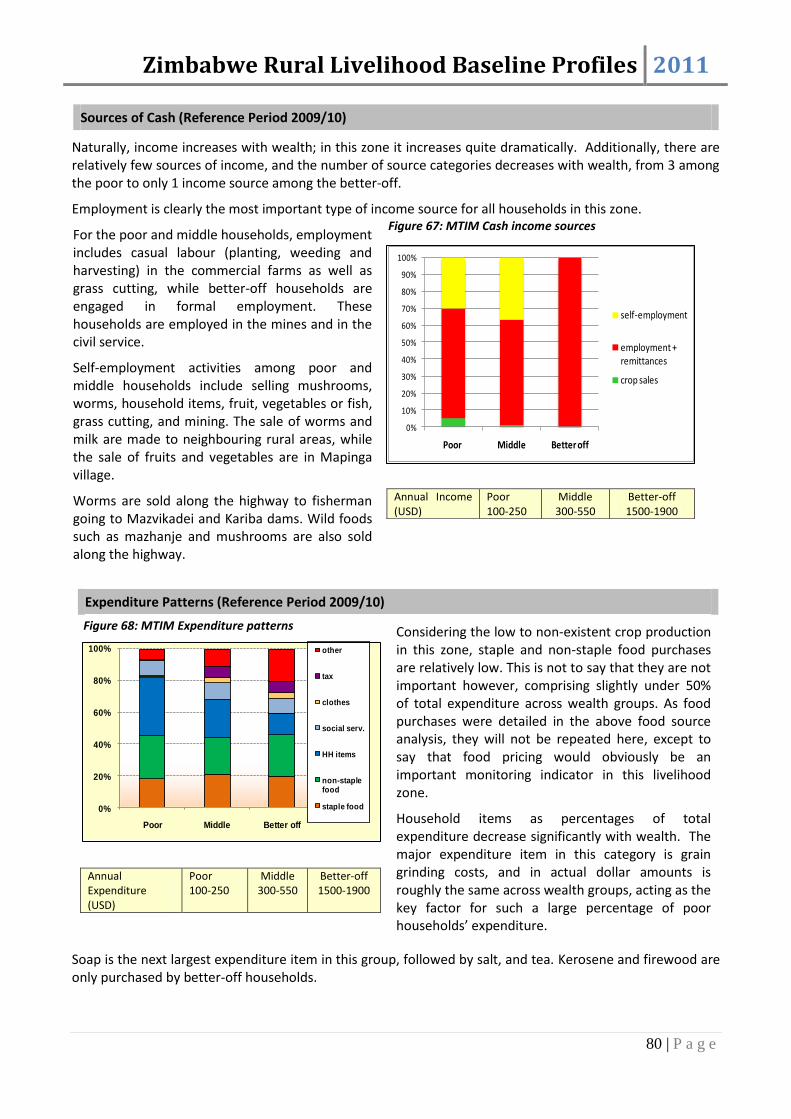
Zimbabwe Rural Livelihood Baseline Profiles 2011
80 | P a g e
Sources of Cash (Reference Period 2009/10)
Naturally, income increases with wealth; in this zone it increases quite dramatically. Additionally, there are relatively few sources of income, and the number of source categories decreases with wealth, from 3 among the poor to only 1 income source among the better-off.
Employment is clearly the most important type of income source for all households in this zone.
For the poor and middle households, employment includes casual labour (planting, weeding and harvesting) in the commercial farms as well as grass cutting, while better-off households are engaged in formal employment. These households are employed in the mines and in the civil service.
Self-employment activities among poor and middle households include selling mushrooms, worms, household items, fruit, vegetables or fish, grass cutting, and mining. The sale of worms and milk are made to neighbouring rural areas, while the sale of fruits and vegetables are in Mapinga village.
Worms are sold along the highway to fisherman going to Mazvikadei and Kariba dams. Wild foods such as mazhanje and mushrooms are also sold along the highway.
Annual Income (USD)
Poor 100-250
Middle 300-550
Better-off 1500-1900
Expenditure Patterns (Reference Period 2009/10)
Annual Expenditure (USD)
Poor 100-250
Middle 300-550
Better-off 1500-1900
Considering the low to non-existent crop production in this zone, staple and non-staple food purchases are relatively low. This is not to say that they are not important however, comprising slightly under 50% of total expenditure across wealth groups. As food purchases were detailed in the above food source analysis, they will not be repeated here, except to say that food pricing would obviously be an important monitoring indicator in this livelihood zone.
Household items as percentages of total expenditure decrease significantly with wealth. The major expenditure item in this category is grain grinding costs, and in actual dollar amounts is roughly the same across wealth groups, acting as the key factor for such a large percentage of poor households’ expenditure.
Soap is the next largest expenditure item in this group, followed by salt, and tea. Kerosene and firewood are only purchased by better-off households.
0%
10%
20%
30%
40%
50%
60%
70%
80%
90%
100%
Poor Middle Better off
self-employment
employment + remittances
crop sales
0%
20%
40%
60%
80%
100%
Poor Middle Better off
other
tax
clothes
social serv.
HH items
non-staple food
staple food
Figure 67: MTIM Cash income sources
Figure 68: MTIM Expenditure patterns

Zimbabwe Rural Livelihood Baseline Profiles 2011
81 | P a g e
Expenditure on social services is low across all wealth groups mainly due to government subsidy on services such as health and education. Education costs comprise the largest expenditure item in this category, and increase with wealth in actual amounts, demonstrating that barriers exist for higher educational attainment among poorer households, despite subsidies.
‘Other’ expenditure includes transport, beer and airtime and all wealth groups have a proportion of their total expenditure allocated for these items.
Hazards
Chronic hazards: Chrome prices are unstable and unfavourable to the mining community. This has led to the closure of mines including tributaries and cooperatives resulting in high levels of unemployment in the zone. Unavailability of land for crop production is also a major chronic hazard affecting the poor and middle households in the zone.
Periodic hazards: Unreliable rainfall is the major periodic hazard in this zone that will in turn affect the availability of casual work on the surrounding commercial farms. Human diseases such as cholera also occasionally affect households. Inflation and unavailability of food on the market are other hazards that have affected the area lately.
Coping Strategies
Reduced purchase of household goods and food: The households reduce expenditure on household items and food in bad years.
Increase in collection and sale of wild fruits: During the bad years there is increased collection and sale of wild fruits such as mazhanje. The fruits are sold along main highways in the zone. Additionally the households cope by selling thatch grass and fishing worms along the main highways in the zone.
Increased casual labour: Households often seek employment in the surrounding farms on a casual basis. Casual labour is often employed in the preparation of tobacco fields, planting and management of the tobacco crop.
Key Parameters for Monitoring
Table 13: MTIM Monitoring indicators
Item Key Parameter - Quantity Key Parameter – Price
Crops Maize Maize
Oil Sugar
Other food and cash income Mining employment Labour rates Chrome
Zimbabwe Rural Livelihood Baseline Profiles 2011
82 | P a g e
Western Kalahari Sandveld Communal August-September 201018
Main Conclusions and Implications
Livelihoods in this zone are based on rain-fed grain cultivation mixed with animal husbandry and supported by labour migration into neighbouring South Africa and Botswana. Crop production in the Western Kalahari Sandveld livelihood zone is low mainly due to the unfertile Kalahari sands and poor rainfall distribution. However crops remain an important source of food in the zone contributing between 30% - 40% of very poor households’ annual food access and close to three quarters of the better-off. There is potential for increased crop production for both consumption and sale, provided challenges with access to inputs and improved water availability are addressed. External assistance in the agriculture sector must prioritise the provision of extension services to improve cropping practices.
Livestock sales income is important for all wealth groups. Interventions to support livestock markets have significant potential to improve producer prices as well as organising livestock markets. The main constraints to livestock production are poor access to veterinary services and poor herd management practices. Cattle are the preferred livestock for both ownership and trade, earning the middle and better-off households their largest income. Small livestock production and marketing is moderate in the zone.
Expenditure on both staple and non staple food is the largest expenditure item for all wealth groups. It accounts for close to half of very poor and poor households’ expenditure. Well functioning and efficient food markets are critically important for household food security. Food aid has been important for very poor and poor household access to food and the relationship between food aid and food markets must be critically considered before food aid provision. Interventions that improve household purchasing power and access to income are viable alternatives to ensuring the poor have access to their minimum energy requirements.
Interventions to promote access to education and health have improved access for all households to these services in the zone. Poor employment opportunities have reduced the incentive for continued education and have resulted in significant cross-border migration to South Africa and Botswana. Affordable and accessible education does not have the same appeal to the local community as is migration to neighbouring countries. South Africa and Botswana provide a market for labour for most family members from this zone. Migratory labour and remittances earned a significant portion of very poor and poor households’ annual household income, between 45% and 55%.
Zone Description
The Western Kalahari Sandveld Communal livelihood zone is spread across Tsholotsho, Bulilima and Hwange districts in the Matabeleland provinces. It borders Hwange National Park to the North and Botswana to the West. 203,029 sparsely settled residents subsist in this low lying dry land in Agro-ecological Region IV. Annual rainfall is erratic and averages between 450 mm to 650 mm between the months of November and March. During this period, temperatures reach a maximum of 40 oC. Temperatures drop to 20 to 25oC during the June to July winter months. Livelihoods in this zone are primarily based on rain-fed grain cultivation mixed with animal husbandry.
18
Field work for the current profile was undertaken between July and August 2010. The information presented refers to April 2009 to March 2010 a relatively average year by local standards (i.e. a year of average production and rural food security, when judged in the context of recent years). Provided there are no fundamental and rapid shifts in the economy, the information in this profile is expected to remain valid for approximately five years (i.e. until 2015).

Zimbabwe Rural Livelihood Baseline Profiles 2011
83 | P a g e
Labour migration to neighbouring South Africa and Botswana and remittances are an important part of the rural economy. The main crops cultivated are drought tolerant small grains that include millet and sorghum. Maize, groundnuts, cowpeas and water melons are cultivated for household consumption. Seasonal droughts, severe dry spells and poor soil fertility limit crop production. The main pests affecting crop production are quelea birds that affect millet and sorghum, wild animals, maize stalk borer and Smut. The commonly owned livestock are cattle, goats, donkeys and chickens. Free grazing on communally held spaces is the common source of pasture and browse.
Figure 69: WKSC Livelihood zone map
Livestock drink from local dams, minor rivers and seasonal pools during the wet season and from boreholes in the dry season. Livestock sales are the largest source of income. Cattle are prized for milk production that is consumed and sold for cash income. Ownership of oxen within the herd is important for draught power. Donkeys also provide draught power and are an important source of labour for the households. Goats are also sold and provide milk for household consumption. Chickens are slaughtered and sold regularly. Livestock holdings are relatively higher than further north in Zimbabwe and if challenges with access to water for livestock are improved, the zone has the potential of increasing its herd size. The main livestock diseases are foot and mouth disease, parasites, lumpy skin, pulp kidney and black leg. Foot and mouth is the most common affecting primarily affecting all cloven hoofed animals. The zone has moderate to high potential for livestock production.
Other important livelihood activities include craft making, grass cutting and firewood sales. A small population trades in dry marula nuts. Both men and women seek seasonal agricultural and casual labour opportunities. Cross border migration and remittances are a significant source of cash income.
Markets and Trade
The main labour markets are local, including seasonal daily labour in the fields of better-off households and temporary migration to the nearby urban centres such as Bulawayo. South Africa provides a key opportunity for employment for men, as does – though to a lesser extent- Botswana. Peak migration period is between June and September during the off agriculture season. Inflows of remittances increase between December and February during the festive season. On average, two-thirds of the labour opportunities are available outside the zone.
Commodities are mainly exchanged on a local basis. Livestock are generally sold to local butcheries or to private traders who come to the auctions organised by Rural District Councils. Livestock buyers export the animals to Bulawayo where they are sold to abattoirs and the Cold Storage Commission. The peak cattle trading period is in January, May and September.
Millet is commonly traded both to earn some income and purchased for household consumption. Maize is purchased between August and February coming in from Plumtree via Tsholotsho. Bad roads and long distances between markets are the main constraints to trade activity. Low cattle producer prices limit livestock trade.
Seasonal calendar
There are 2 main seasons in the zone, the dry season between March and October and the wet season from November to February. Agricultural and non-agricultural livelihood activities are planned according to the

Zimbabwe Rural Livelihood Baseline Profiles 2011
84 | P a g e
rainy season. The agriculture production season begins in October with land preparation activities. Men using hand held and ox drawn ploughs normally perform these activities.
Planting commences with the rains in November and is done by both men and women. The onset of the rains rejuvenates pasture and replenishes water sources allowing for livestock production. Livestock births and milk production take place at this time. The agriculture production season is also the lean season, when food stocks from the previous production year are depleted. During this time agriculture labour, both locally and in neighbouring districts provides much needed income to poorer households for food purchases. Livestock sales earn the better-off households most of their income for food purchases. The inflow of remittances also increases during this time.
The break to the lean season comes in February with the consumption of green maize and water melons. The main harvest of millet, maize, sorghum and pulses happens between April and May. Harvesting also provides labour for poorer households. After the main harvest, households resume vegetable gardening activities. Non-agricultural casual labour opportunities also increase at this time in construction and crafts trade. Labour migration to more distant labour markets in Botswana and South Africa also increases. The common human disease is malaria which is associated with the offset of rain in February and March.
Wealth Breakdown
There are 4 wealth groups in the zone, namely 30%-40% of the very poor (abaswelisisayo), 25% -35% the poor (abaswelayo), 15% to 25% of the Middle (abaphakhati) and 10% to 20% considered to be better-off (abatholayo). The primary determinants of wealth in the zone are livestock holdings, oxen, plough and scotch cart ownership as key factors in the amount of land cultivated.
Figure 71: WKSC Wealth group characteristics
Cattle Goats Chicken
Very Poor 5 - 7 1 - 4Millet, Maize, Sorghum,
Pulses0 2-4 5-7 2-4 Hoes
Poor 5 - 7 2- 5Millet, Maize, Sorghum,
Pulses, Water melons2 -3 3-5 5-7
2-4 Hoes
1 plough
Middle 5 - 7 4 - 8Millet, Maize, Sorghum,
Pulses, Water melons5 - 8 6-8 8-12
1-3 donkeys
3-5 Hoes
1 Plough
1 scotch cart
Better Off 5 - 7 6 - 10Millet, Maize, Sorghum,
Pulses, Water melons8 - 15 8-12 10-20
2-4 donakeys
3-5 Hoes
1 Plough
1 scotch cart
Figure 9.3 Wealth Groups Characteristics
Livestock Holding
HH size
Land area
cultivated
(acres)
Crops cultivated Other Assets
14%
20%
31%
35%
% of population
Figure 70: WKSC Seasonal Calendar
Apr May Jun Jul Aug Sep Oct Nov Dec Jan Feb Mar
Legend
cattle
Land Preparation
Planting
Weeding
Maize Green consumption
Harvesting
Guarding fields
Gardening
Livestock sa les
Livestock births
Mi lk production
Other
Lean season
Food Purchases
Agriculture labour
Casual labour
Labour migration
Craft sa les
Remittances
Wild food
Malaria
Dry Season Wet Season
planting cons. green harvest
cattle and shoats
Off farm
shoats

Zimbabwe Rural Livelihood Baseline Profiles 2011
85 | P a g e
Ownership of land is not a determinant of wealth as land was allocated without regard for wealth. The key factor is the capacity to cultivate available land as determined by ownership of oxen and sometimes donkeys, for draught power and a plough.
The middle and better-off own draught power and ploughs cultivate between 4 to 8 acres and 6 to 10 acres respectively. Poorer households who cultivate using hand held tools or sometimes exchange labour for draught power cultivate between 1 quarter and half of the land cultivated by the wealthier groups. The main crops cultivated by all wealth groups are millet, maize, sorghum, cowpeas, groundnuts and water melons.
Livestock holdings are an important productive asset providing both food and income. In a zone where crop production is generally low, livestock, particularly cattle are the traditional store of wealth providing income and more importantly providing an esteemed form of insurance against the worst effects of a negative event. The wealthier households own significantly high numbers of cattle and goats while the poorer households typically own very small numbers of livestock – usually goats and chickens.
The main constraints for the poor in building more wealth is the lack of draught power and lack of inputs. Local arrangements for the poor to exchange labour for draught power means they commit valuable production time in the fields of the better-off than working in their own fields. Limited water and pasture and the destruction of crops by wild animals affects all wealth groups.
The average household size across the wealth groups is 6. The households have 2 adults, 2 under 6 and 2 children aged 6 to 18 across all wealth groups.
The number of children in school is 2 across the wealth groups, though an important distinction is the level of education enrolled. Children from poorer households end school in primary and some in secondary, while children from better-off households are able to attend tertiary education.
Figure 72: WKSC HH sizes
0
1
2
3
4
5
6
7
Very Poor Poor Middle Better off
HH Size
# Adults
Under 6 Yrs
6-18 Yr Olds
# in School
Sources of Food (Reference Period 2009/10)
The main food crops cultivated by all wealth groups are millet, maize, sorghum, ground nuts, round nuts and cow peas. Millet and maize are the staple cereals. Crop production in the zone is limited by poor rainfall and poor soils, and contributes between 30% and 40% of very poor and poor household annual consumption and on average three quarters of the better-offs. Maize provides the bulk of the food, consumed both green to break the lean season and also dry at harvest time. Food purchases increase during the lean season to supplement both staple consumption and also provide for access to non staple dietary supplements.
In the graph, food access is expressed as a percentage of minimum food requirements, taken as an average food energy intake of 2100 kcals per person per day.
0%
20%
40%
60%
80%
100%
120%
Very Poor Poor Middle Better Off
Figure 9.5 Sources of Food
other (gifts, wild food, fish etc)
food aid
purchase
payment in kind
livestock products
crops
Figure 73: WKSC Food sources
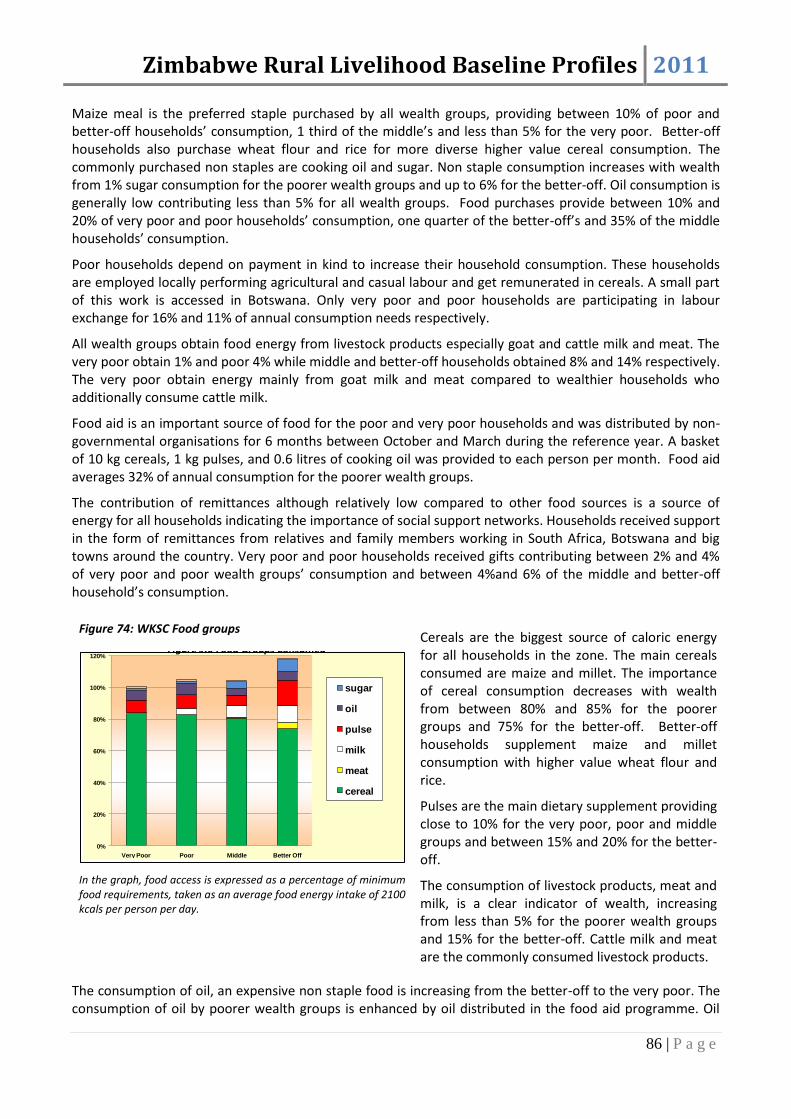
Zimbabwe Rural Livelihood Baseline Profiles 2011
86 | P a g e
Maize meal is the preferred staple purchased by all wealth groups, providing between 10% of poor and better-off households’ consumption, 1 third of the middle’s and less than 5% for the very poor. Better-off households also purchase wheat flour and rice for more diverse higher value cereal consumption. The commonly purchased non staples are cooking oil and sugar. Non staple consumption increases with wealth from 1% sugar consumption for the poorer wealth groups and up to 6% for the better-off. Oil consumption is generally low contributing less than 5% for all wealth groups. Food purchases provide between 10% and 20% of very poor and poor households’ consumption, one quarter of the better-off’s and 35% of the middle households’ consumption.
Poor households depend on payment in kind to increase their household consumption. These households are employed locally performing agricultural and casual labour and get remunerated in cereals. A small part of this work is accessed in Botswana. Only very poor and poor households are participating in labour exchange for 16% and 11% of annual consumption needs respectively.
All wealth groups obtain food energy from livestock products especially goat and cattle milk and meat. The very poor obtain 1% and poor 4% while middle and better-off households obtained 8% and 14% respectively. The very poor obtain energy mainly from goat milk and meat compared to wealthier households who additionally consume cattle milk.
Food aid is an important source of food for the poor and very poor households and was distributed by non-governmental organisations for 6 months between October and March during the reference year. A basket of 10 kg cereals, 1 kg pulses, and 0.6 litres of cooking oil was provided to each person per month. Food aid averages 32% of annual consumption for the poorer wealth groups.
The contribution of remittances although relatively low compared to other food sources is a source of energy for all households indicating the importance of social support networks. Households received support in the form of remittances from relatives and family members working in South Africa, Botswana and big towns around the country. Very poor and poor households received gifts contributing between 2% and 4% of very poor and poor wealth groups’ consumption and between 4%and 6% of the middle and better-off household’s consumption.
In the graph, food access is expressed as a percentage of minimum food requirements, taken as an average food energy intake of 2100 kcals per person per day.
Cereals are the biggest source of caloric energy for all households in the zone. The main cereals consumed are maize and millet. The importance of cereal consumption decreases with wealth from between 80% and 85% for the poorer groups and 75% for the better-off. Better-off households supplement maize and millet consumption with higher value wheat flour and rice.
Pulses are the main dietary supplement providing close to 10% for the very poor, poor and middle groups and between 15% and 20% for the better-off.
The consumption of livestock products, meat and milk, is a clear indicator of wealth, increasing from less than 5% for the poorer wealth groups and 15% for the better-off. Cattle milk and meat are the commonly consumed livestock products.
The consumption of oil, an expensive non staple food is increasing from the better-off to the very poor. The consumption of oil by poorer wealth groups is enhanced by oil distributed in the food aid programme. Oil
0%
20%
40%
60%
80%
100%
120%
Very Poor Poor Middle Better Off
Figure 9.6 Food Groups Consumed
sugar
oil
pulse
milk
meat
cereal
Figure 74: WKSC Food groups

Zimbabwe Rural Livelihood Baseline Profiles 2011
87 | P a g e
consumption comprises between 4% and 5% for the middle and better-off, and between 6% and 7% for the middle and better-off. Sugar is the next important non staple food providing on average 1% for the very poor and poor and between 4% and 7% for the middle and better-off.
All households are consuming vegetables. However, their significance to total food energy consumed is low because of the low caloric value of vegetables.
Very poor and poor households are consuming 6 food groups while the middle and better-off households consume 7.
Sources of Cash (reference Period 2009/10)
Income sources are limited in the livelihood zone. Poorer wealth groups earn less income from a wider range of income sources. Labour activities earn the poor households most of their income. The single largest source of income for the very poor and poor households is self-employment. The common activity is selling poles, yokes and other natural products harvested from the surrounding environment. These activities earn them 1 quarter of their total annual income. Livestock sales are just as important to the very poor and poor earning them an additional 25% and 18% of their income.
Commonly sold livestock by the poorer wealth groups are goats and chickens. Livestock sales are the most important source of income for the middle and better-off households. Cattle sales earn them most of their cash. Combined with the sale of goats and chickens, the middle and better-off households earn on average ZAR 3000 and ZAR 4500 respectively over the year. Agricultural labour and construction work smearing and thatching houses earn the very poor and poor households between 30% and 40% of their annual income. Most of this work is done on the farms of the better-off both in the local community and in neighbouring farming areas.
Annual Income in ZAR
Very Poor 1300-1700
Poor 1800-2200
Middle 4800-5300
Better-off 6500-7500
Remittances from South Africa and Botswana are highest for the middle and better-off households, providing them on average ZAR 1300 and ZAR 2160 respectively over the year.
Millet and vegetables are the commonly sold crops. The very poor and poor only sell vegetables for 4% of their income. The middle households sell both vegetables and millet and earn on average ZAR 190 annually, equivalent to 4% of their income. The better-off consume all their vegetable produce and sell only millet for an average 3% of their annual income.
0%
10%
20%
30%
40%
50%
60%
70%
80%
90%
100%
Very Poor Poor Middle Better off
Figure 9.7 Income Sources
self-employment
employment
livestock sales
crop sales
Figure 75: WKSC Cash income sources
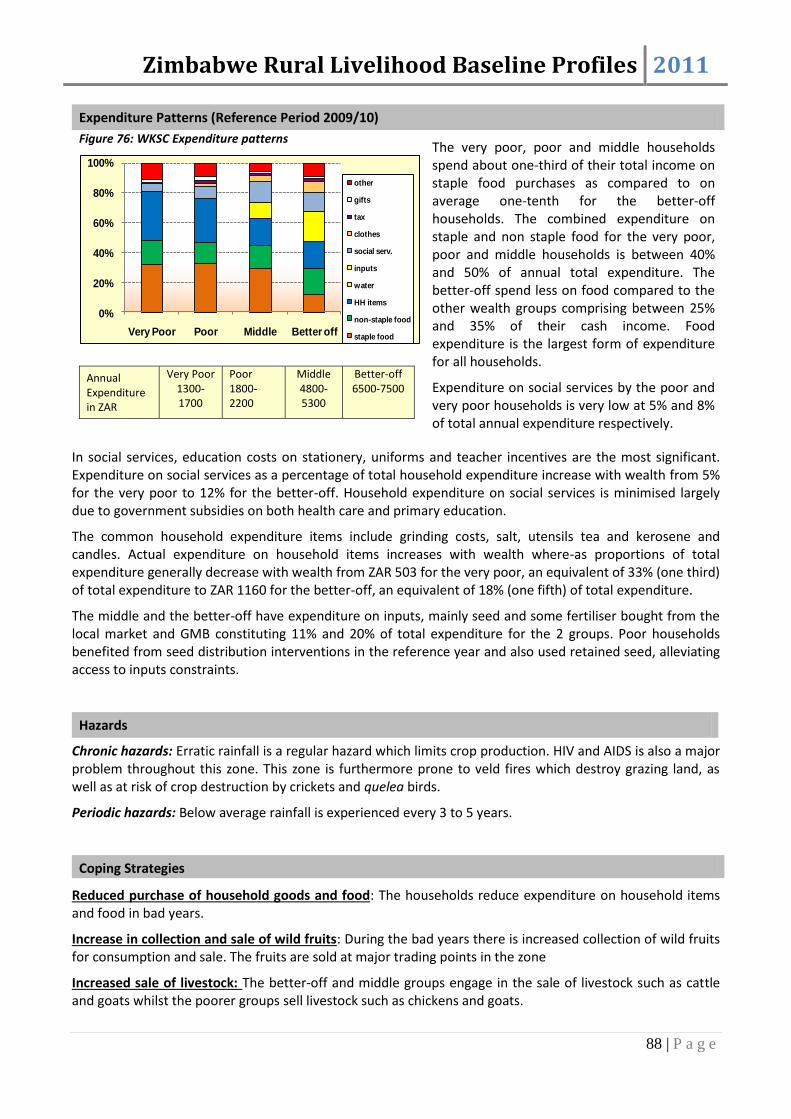
Zimbabwe Rural Livelihood Baseline Profiles 2011
88 | P a g e
Expenditure Patterns (Reference Period 2009/10)
Figure 76: WKSC Expenditure patterns
Annual Expenditure in ZAR
Very Poor 1300-1700
Poor 1800-2200
Middle 4800-5300
Better-off 6500-7500
The very poor, poor and middle households spend about one-third of their total income on staple food purchases as compared to on average one-tenth for the better-off households. The combined expenditure on staple and non staple food for the very poor, poor and middle households is between 40% and 50% of annual total expenditure. The better-off spend less on food compared to the other wealth groups comprising between 25% and 35% of their cash income. Food expenditure is the largest form of expenditure for all households.
Expenditure on social services by the poor and very poor households is very low at 5% and 8% of total annual expenditure respectively.
In social services, education costs on stationery, uniforms and teacher incentives are the most significant. Expenditure on social services as a percentage of total household expenditure increase with wealth from 5% for the very poor to 12% for the better-off. Household expenditure on social services is minimised largely due to government subsidies on both health care and primary education.
The common household expenditure items include grinding costs, salt, utensils tea and kerosene and candles. Actual expenditure on household items increases with wealth where-as proportions of total expenditure generally decrease with wealth from ZAR 503 for the very poor, an equivalent of 33% (one third) of total expenditure to ZAR 1160 for the better-off, an equivalent of 18% (one fifth) of total expenditure.
The middle and the better-off have expenditure on inputs, mainly seed and some fertiliser bought from the local market and GMB constituting 11% and 20% of total expenditure for the 2 groups. Poor households benefited from seed distribution interventions in the reference year and also used retained seed, alleviating access to inputs constraints.
Hazards
Chronic hazards: Erratic rainfall is a regular hazard which limits crop production. HIV and AIDS is also a major problem throughout this zone. This zone is furthermore prone to veld fires which destroy grazing land, as well as at risk of crop destruction by crickets and quelea birds.
Periodic hazards: Below average rainfall is experienced every 3 to 5 years.
Coping Strategies
Reduced purchase of household goods and food: The households reduce expenditure on household items and food in bad years.
Increase in collection and sale of wild fruits: During the bad years there is increased collection of wild fruits for consumption and sale. The fruits are sold at major trading points in the zone
Increased sale of livestock: The better-off and middle groups engage in the sale of livestock such as cattle and goats whilst the poorer groups sell livestock such as chickens and goats.
0%
20%
40%
60%
80%
100%
Very Poor Poor Middle Better off
other
gifts
tax
clothes
social serv.
inputs
water
HH items
non-staple food
staple food

Zimbabwe Rural Livelihood Baseline Profiles 2011
89 | P a g e
Reduction in the number of meals and quantity of food consumed per day: The poor groups reduce the number of meals they consume in a day to try and manage during food crisis periods. In addition to the reduction of the number of meals, the pot size is also reduced.
Key Parameters for Monitoring
Table 14: WKSC Monitoring indicators
Item Key Parameter - Quantity Key Parameter – Price
Crops Millet
Maize
Sorghum
Groundnuts
Millet
Maize
Livestock production Cattle herds
Goat herds
Poultry
Livestock deaths
Cattle prices
Goat prices
Poultry prices
Other food and cash income Maize meal
Grass
Handicrafts
Maize meal prices
Construction daily labour rate
Handicrafts prices
Grass prices

Zimbabwe Rural Livelihood Baseline Profiles 2011
90 | P a g e
Crop production is the main source of food in the zone and there is potential for increased production for both consumption and sales if problems related to rainfall shortages, particularly the chronic dry spell in January, as well as timely access to appropriate short season varieties are improved. Any support by government and non-governmental organisations (NGOs) in the agricultural sector (provision of seed, fertilizer and ploughing costs) should be coupled with an adequate extension on timing for planting as well as the provision of irrigation facilities in areas where feasible. Income from livestock sales is an important cash source for all wealth groups, however prevailing prices in the baseline were low due to reduced bargaining power for sellers. This vital income source could be maintained if access to animal drugs is increased and training in herd management and sustainability is provided. Marketing of cattle is supported by Rural District Councils in some areas, organizing market days which are helpful for increasing market access in these areas. Adoption of this practice across the zone could be of great benefit to the community. Smaller livestock, such as goats, have limited demand although their production is relatively moderate. Expenditure on social services is low for all wealth groups and this is partly attributed to interventions in the health and education sectors, but also due to a high drop-out rate of children in primary and secondary school as they emigrate to seek employment in neighbouring South Africa and Botswana. The primary education system is subsidized and therefore theoretically affordable across wealth groups. However, uniform and supplies costs, coupled with the fact that the very poor and poor tend to require labour and income, act as barriers for attaining higher levels of education. In this zone, it is crucial that the benefits of higher education be disseminated throughout communities while at the same time informing on benefits, costs and realities of emigration for employment The very poor and poor wealth groups met their food energy requirements in the reference year and their expenditure more or less equals to total income, mainly due to the presence of food aid that was provided for the poor and very poor households. Food aid has been distributed in this zone for some time now, potentially undermining household coping strategies by sustainably using assets. The impacts of free food with regards to this, particularly regarding livestock use, need to be considered. South Africa and Botswana provide a market for labour for most family members from this zone. This requires close tracking of migration patterns in this zone as shifts in labour markets in these neighbouring countries have a serious bearing on household incomes. Migratory labour and remittances income earned in the reference year indicate a significant portion of very poor and poor households.
This zone has an estimated population of 302,186 and is located in the Midlands and Matabeleland North districts of western Zimbabwe. The zone falls into the districts of Kwekwe, Gweru, Nkayi, Lupane and Bubi. The zone covers the mainly communal lands of Lupane, Nkayi, western Zhombe, Silobela and Inkosikazi. The zone borders Livestock, Cereal farming in Forests in the south and Lusulu Lupane Southern Gokwe Mixed Agriculture in the north. The zone also borders Cereal and Cattle Farming zones on the eastern side. It is categorised as Agro-ecological Region IV and has relatively poor soils, which are dry, sandy and loamy throughout the zone with marginal productive potential for agriculture. Annual rainfall ranges between 450-650mm.
19
Field work for the current profile was undertaken in October-November 2010. The information presented refers to April 2009 to March 2010 a relatively average year by local standards (i.e. a year of average production and rural food security, when judged in the context of recent years). Provided there are no fundamental and rapid shifts in the economy, the information in this profile is expected to remain valid for approximately five years (i.e. until 2015).
Eastern Kalahari Sandveld Communal October-November 201019
Main Conclusions and Implications
Zone Description

Zimbabwe Rural Livelihood Baseline Profiles 2011
91 | P a g e
Generally, the zone is located in the gazetted forest areas of Ngamo, Gwaai, Bembesi, Lake Alice and Gwampa which are dominated by Zambezi Teak, False Mopane and Mukwa. This location provides opportunities for exploitation of forest resources such as grass, timber, firewood, wild fruits and game. Major rivers in the zone are Gwaai, Lupane, Bubi, Shangani and Mbembesi.
Livelihoods in this zone are based on rain-fed grain cultivation mixed with animal husbandry and supported by labour migration into Bulawayo, South Africa and Botswana, as well as the exploitation of grassland resources (grass). An important aspect of the household economy is having someone working elsewhere who remits money to the family remaining in the rural areas.
Crops grown for consumption include maize, millet, sorghum, groundnuts, bambara nuts and cowpeas. Maize, millet and sorghum are the main crops which are sold. Crops are cultivated using ox drawn plough or hand-hoe digging and land preparation provides the majority of agricultural labour. Maize is afflicted by 2 different pests, maize stalk borer and armyworm, which are treated by carbaryl and malathion respectively. Sorghum is affected by shoot fly, which is counteracted by timely planting, a higher rate of seed use or thionexcarbary. Inputs for crop production are fertiliser (Compound D and AN). All inputs are available on the market for purchase or sometimes provided for free by the MOA or NGOs.
The main types of livestock are cattle, donkeys, goats, and chicken which are reared in the free communal grazing areas or designated cattle posts. Cattle, goats and chickens are sold for cash income, while goats are the main animals slaughtered during the festive seasons, funerals, and ceremonial gatherings such as umbuyiso.
The source of water for livestock in the wet season is major rivers, seasonal pools and shallow wells. Cattle are the only animals that are milked in the zone. Main livestock diseases are Foot and mouth disease, Parasites, Lumpy skin, pulp kidney and Black leg. The main disease is foot and mouth which affects all the cloven hoofed animals mainly cattle. These are treated through dipping or vaccination, all available either through animal levies through the MOA’s Department of Veterinary Services, NGOs, or on the market.
Other important livelihood activities include crafts, construction activities, sale of grass and firewood and brewing. Casual labour is done mainly within the zone by the poor and very poor households and is a critical food source in the zone for these households. Main activities are weeding, harvesting, land preparation and off-farm employment which include fencing, hut construction related activities (smearing and thatching). Grass sales are mainly undertaken in Bubi, Lupane and Nkayi from June to August and are done locally. This activity is mainly undertaken by women. Handicrafts are carried out in particular areas of the zone depending on the availability of resources. The main ethnic groups are Ndebele and Shona in Lower Gweru area.
These listed factors limit agricultural potential. Minimum temperatures in the zone range between 15oC - 25oC during winter, from June to July (umqando) and the maximum ranges between 35oC -40oC during summer, from September and October (isilimo).
Overall, the zone can be described as having low potential for crop agriculture and moderate-high potential for livestock production. There exists only one growing season for crops extending from November to April and this zone is generally known as a food deficit zone with an average rain fed production of maize.
Figure 77: EKSC Livelihood zone map
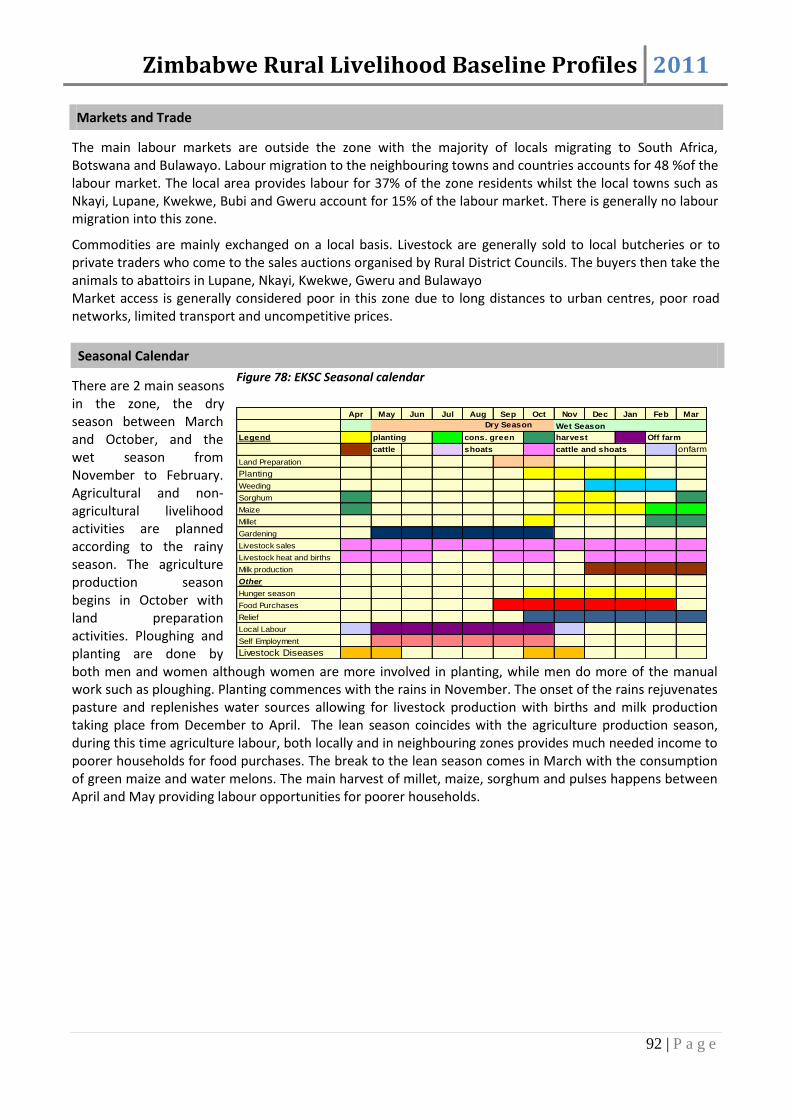
Zimbabwe Rural Livelihood Baseline Profiles 2011
92 | P a g e
The main labour markets are outside the zone with the majority of locals migrating to South Africa, Botswana and Bulawayo. Labour migration to the neighbouring towns and countries accounts for 48 %of the labour market. The local area provides labour for 37% of the zone residents whilst the local towns such as Nkayi, Lupane, Kwekwe, Bubi and Gweru account for 15% of the labour market. There is generally no labour migration into this zone.
Commodities are mainly exchanged on a local basis. Livestock are generally sold to local butcheries or to private traders who come to the sales auctions organised by Rural District Councils. The buyers then take the animals to abattoirs in Lupane, Nkayi, Kwekwe, Gweru and Bulawayo Market access is generally considered poor in this zone due to long distances to urban centres, poor road networks, limited transport and uncompetitive prices.
There are 2 main seasons in the zone, the dry season between March and October, and the wet season from November to February. Agricultural and non-agricultural livelihood activities are planned according to the rainy season. The agriculture production season begins in October with land preparation activities. Ploughing and planting are done by both men and women although women are more involved in planting, while men do more of the manual work such as ploughing. Planting commences with the rains in November. The onset of the rains rejuvenates pasture and replenishes water sources allowing for livestock production with births and milk production taking place from December to April. The lean season coincides with the agriculture production season, during this time agriculture labour, both locally and in neighbouring zones provides much needed income to poorer households for food purchases. The break to the lean season comes in March with the consumption of green maize and water melons. The main harvest of millet, maize, sorghum and pulses happens between April and May providing labour opportunities for poorer households.
Markets and Trade
Seasonal Calendar
Figure 78: EKSC Seasonal calendar
Apr May Jun Jul Aug Sep Oct Nov Dec Jan Feb Mar
Wet Season
Legend planting cons. green harvest Off farm
cattle shoats cattle and shoats onfarm
Land Preparation
Planting
Weeding
Sorghum
Maize
Millet
Gardening
Livestock sales
Livestock heat and births
Milk production
Other
Hunger season
Food Purchases
Relief
Local Labour
Self Employment
Livestock Diseases
Dry Season

Zimbabwe Rural Livelihood Baseline Profiles 2011
93 | P a g e
Figure 79: EKSC Wealth group characteristics
Cattle Goats Chickens
Very Poor 5 - 7 1.5 - 2.5
Maize; Sorghum; Cow
peas; Millet; Sweet
potatoes; Groundnuts;
Round nuts;
Vegetables; Tomatoes
0-1 0-2 0 Handtools
Poor 5 - 7 2.5 - 4
Maize; Sorghum; Cow
peas; Millet; Sweet
potatoes; Groundnuts;
Round nuts;
Vegetables; Tomatoes
1-3 2-4 0-2Handtools;
Ploughs 0 -1
Middle 5 - 7 4-7
Maize; Sorghum; Cow
peas; Millet; Sweet
potatoes; Groundnuts;
Round nuts;
Vegetables; Tomatoes
4-7 4-6 0-4Handtools;
Ploughs 1
Better Off 5 - 7 4-8
Maize; Sorghum; Cow
peas; Millet; Sweet
potatoes; Groundnuts;
Round nuts;
Vegetables; Tomatoes
8-12 4-10 0-4
Handtools;
Ploughs 1 - 3;
Wheelbarrows
0 - 1
Livestock HoldingHH size
Land area
cultivated
(acres)
Crops cultivated Other Assets
15%
27%
32%
26%
% of households
4 wealth groups were identified by the key informants, namely the very poor (abaswelisisayo), the poor (abaswelayo), the middle (abaphakhati) and the better-off (abatholayo).
In terms of the proportion of total households in the different wealth groups, the very poor and poor make just over half of the population both constituting approximately 55%-65% of household population in the zone. The middle and better-off households comprise approximately 25%-30% and 10%-20% of total households in the zone, respectively. The main determinants of wealth in the zone are livestock holdings, acreage of land cultivated, ownership of productive assets and education levels. The wealthier households own significantly high numbers of cattle and goats while the poorer households typically own very small numbers of livestock – usually goats and chickens. Ownership of land is not a determinant of wealth as land allocation is done equally regardless of wealth status. The amount of land available for cultivation in the zone is generally limited; however it varies by wealth status. The wealthier households are able to cultivate larger areas as they use draught power. The poorer households, on the other hand can only cultivate small pieces of land as they use basic tools like hand hoes.
The main constraints to crop production among poorer households is lack of draught animals, lack of inputs and needing to divide their available household labour between their own fields and casual labour for cash income. The main constraints to crop production for better-off households are a lack of available and accessible seed and fertilizer as well as a lack of accessible markets for crop sales. Additionally, there is a lack of irrigation equipment and inputs for vegetable production among the poorer households.
Having a member of the family working and remitting income is a key determinant of wealth in this zone.
Income activities for the poorer households mainly include casual labour (mainly weeding); sale of grass, construction work, sale of crafts, and beer brewing. Whereas income activities mainly done by the wealthier households include sale of livestock, sale of crops, remittances and formal employment.
In terms of ownership of productive assets, the very poor and poor households typically own hand hoes, axes and the middle and better-off households in addition own scotch carts and mould-board ploughs. In terms of livestock, poorer households are not able to keep even moderate numbers of livestock due to lack of cash income, the need to sell livestock when faced with food insecurity and lack of cash income to purchase animal drugs.
Wealth Breakdown

Zimbabwe Rural Livelihood Baseline Profiles 2011
94 | P a g e
The chart (figure 82) provides the details of how each wealth group sourced their total food intake in the reference year. Crop production increases as a food source with wealth, as do livestock products, as expected. Also as expected, payment in kind and food aid decrease as a proportion of total food with wealth. Additionally, food purchases increase with wealth. This chart demonstrates how reliant the poor and very poor households are on food aid and labour exchange in order to meet their basic food requirements. Food aid comprises 25%-30% of calories for the very poor households and 10%-20% for poor households causing some concern on the sustainability of this food source. The main food crops grown by all wealth groups in this zone are maize, sorghum, millet, sweet potatoes, round nuts and to a lesser extent ground nuts and cow peas. Own crop production contributes approximately 85-95 % of total food requirements for better-off households, 80%-90% for the middle, 60%-65% for the poor and 45%-55% for the very poor. Wealthier households cultivate larger pieces of land and this contributes to higher production and reliance on own crops compared to the poorer households.
The main labour exchange activities for this source of food are weeding, harvesting, land clearing, fencing, thatching and hut smearing and the payments were generally made in maize or sorghum per unit of work finished.
Poor, middle and better-off households obtained small amounts of food energy from cattle milk and goat meat, which increased with wealth ranging from 3% to 10%.
Food aid was distributed to poor and very poor households by NGOs for 6 months from October to March in the reference year. The food provided consisted of cereals -10kg/person/month, pulses- 1kg/person/month
The household size is similar, 6, across wealth groups, the very poor and poor households tend to
have fewer children in school than those households in the middle and better-off wealth groups. Additionally, the very poor have fewer children less than 6 years of age. The number of adults capable of work is 2across wealth groups, as is the number of 6-18 year olds, with the exception of households in the poor wealth group who have slightly less.
0
1
2
3
4
5
6
7
Very Poor Poor Middle Better off
HH Size
# Adults
Under 6 Yrs
6-18 Yr Olds
# in School
Sources of Food (Reference Period 2009/10)
Poorer households however benefited from agricultural input support from NGOs and the GoZ resulting in more productive land per unit area than better-off households.
The main food purchased is maize grain and other food purchased by all wealth groups includes cooking oil and sugar, while the middle and better-off households also purchased wheat flour. Food purchase contribution comprises increasing proportion of total food requirements from approximately 5% -15% across wealth groups.
The very poor and poor households exchanged labour for food and sourced approximately 15%-20% of their total food requirements from labour exchange.
In the graph, food access is expressed as a percentage of minimum food requirements, taken as an average food energy intake of 2100 kcals per person per day.
0%
20%
40%
60%
80%
100%
Very Poor Poor Middle Better Off
other (gifts, wild food, fish etc)
food aid
purchase
payment in kind
livestock products
crops
Figure 80: EKSC HH sizes
Figure 81: EKSC Food sources
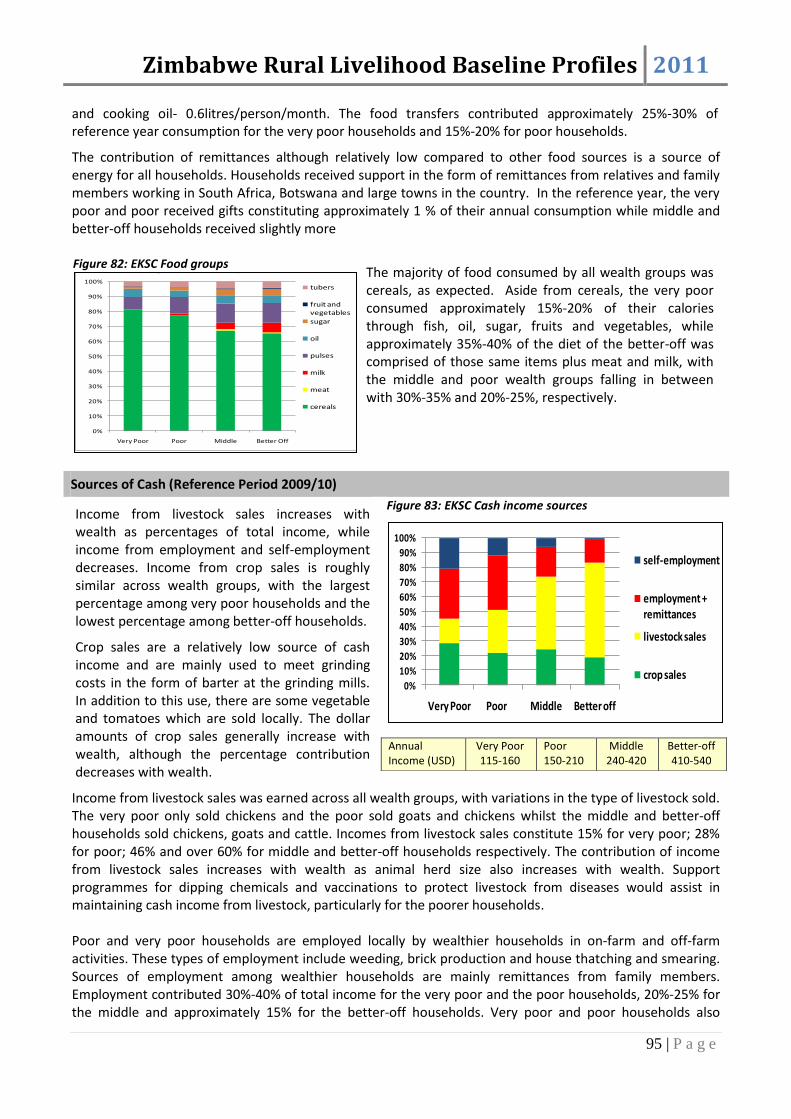
Zimbabwe Rural Livelihood Baseline Profiles 2011
95 | P a g e
and cooking oil- 0.6litres/person/month. The food transfers contributed approximately 25%-30% of reference year consumption for the very poor households and 15%-20% for poor households.
The contribution of remittances although relatively low compared to other food sources is a source of energy for all households. Households received support in the form of remittances from relatives and family members working in South Africa, Botswana and large towns in the country. In the reference year, the very poor and poor received gifts constituting approximately 1 % of their annual consumption while middle and better-off households received slightly more
Income from livestock sales was earned across all wealth groups, with variations in the type of livestock sold. The very poor only sold chickens and the poor sold goats and chickens whilst the middle and better-off households sold chickens, goats and cattle. Incomes from livestock sales constitute 15% for very poor; 28% for poor; 46% and over 60% for middle and better-off households respectively. The contribution of income from livestock sales increases with wealth as animal herd size also increases with wealth. Support programmes for dipping chemicals and vaccinations to protect livestock from diseases would assist in maintaining cash income from livestock, particularly for the poorer households. Poor and very poor households are employed locally by wealthier households in on-farm and off-farm activities. These types of employment include weeding, brick production and house thatching and smearing. Sources of employment among wealthier households are mainly remittances from family members. Employment contributed 30%-40% of total income for the very poor and the poor households, 20%-25% for the middle and approximately 15% for the better-off households. Very poor and poor households also
Figure 82: EKSC Food groups
The majority of food consumed by all wealth groups was cereals, as expected. Aside from cereals, the very poor consumed approximately 15%-20% of their calories through fish, oil, sugar, fruits and vegetables, while approximately 35%-40% of the diet of the better-off was comprised of those same items plus meat and milk, with the middle and poor wealth groups falling in between with 30%-35% and 20%-25%, respectively.
Sources of Cash (Reference Period 2009/10)
Income from livestock sales increases with wealth as percentages of total income, while income from employment and self-employment decreases. Income from crop sales is roughly similar across wealth groups, with the largest percentage among very poor households and the lowest percentage among better-off households.
Crop sales are a relatively low source of cash income and are mainly used to meet grinding costs in the form of barter at the grinding mills. In addition to this use, there are some vegetable and tomatoes which are sold locally. The dollar amounts of crop sales generally increase with wealth, although the percentage contribution decreases with wealth.
Figure 83: EKSC Cash income sources
Annual Income (USD)
Very Poor 115-160
Poor 150-210
Middle 240-420
Better-off 410-540
0%
10%
20%
30%
40%
50%
60%
70%
80%
90%
100%
Very Poor Poor Middle Better Off
Figure 10.6 Food Groups Consumed
tubers
fruit and vegetables
sugar
oil
pulses
milk
meat
cereals
0%
10%
20%
30%
40%
50%
60%
70%
80%
90%
100%
Very Poor Poor Middle Better off
Figure 10.7 Income Sources
self-employment
employment + remittances
livestock sales
crop sales

Zimbabwe Rural Livelihood Baseline Profiles 2011
96 | P a g e
earned income from handicraft sales, grass sales and beer brewing, with self-employment comprising a larger percentage of incomes of the very poor than the poor.
Actual expenditure on household items increases with wealth where-as proportions of total expenditure generally decrease with wealth; very poor households spend USD 66 (47%), poor households spend USD 76 (43%), middle households spend USD 90 (29%) and better-off households spend USD 111 (21%). This includes items such as grinding costs, salt, utensils, tea and kerosene/candles.
Expenditure on social services by the poor and very poor households is very low at 10% of total annual expenditure for both groups. The largest expenditure area in the social services group is education, particularly on stationery, uniform and teacher incentives. Expenditure on social services as a percentage of total household expenditure increases with wealth status; very poor and poor households spend approximately 10% of their total expenditure on social services; middle and better-off households spend approximately 15%. Overall there is low expenditure on social services due to government subsidises on services such as health and primary education.
The middle and the better-off households spend income on inputs, mainly seed and some fertiliser bought from the local market and GMB, constituting between 10% - 15% of total expenditure for the 2 groups. Poorer households do not purchase seed as a result of the seed distribution interventions in the reference year and use of retained seed for those who failed to access free seed.
‘Other’ expenditure includes transport, beer, cigarettes and mobile phone airtime and is roughly similar across wealth groups as percentages of total expenditure at approximately 10 %.
Payment of taxes included payments for households and livestock and increases slightly with wealth and herd sizes.
Chronic hazards: Erratic rainfall is a regular hazard which limits crop production. HIV and AIDS is also a major problem throughout this zone. This zone is furthermore prone to veld fires, which destroy grazing land, as well as at risk of crop destruction by crickets and quelea birds.
Periodic hazards: Roughly every 3 to 5 years within a decade, rainfall is below average for the zone.
Expenditure Patterns (Reference Period 2009/10)
Annual Expenditure (USD)
Very Poor 115-160
Poor 150-210
Middle 240-420
Better-off 410-540
The expenditure patterns of the wealth groups in this livelihood zone vary across the groups. Very poor and poor households spend approximately 10 %of their total income on staple food purchases whilst middle and better-off households spend between 5% - 10%. These percentages are very low, particularly among the very poor and poor households where it can be upwards of 50% in other areas. Considering that food aid comprises such a large proportion of calories consumed, constituting 25%-30% and approximately 15% for very poor and poor households’ annual food needs respectively this is not as surprising.
Hazards
0%
20%
40%
60%
80%
100%
Very Poor Poor Middle Better off
Figure 10.8 Expenditure Patternsother
gifts
tax
clothes
social serv.
inputs
HH items
non-staple food
staple food
Figure 84: EKSC Expenditure patterns

Zimbabwe Rural Livelihood Baseline Profiles 2011
97 | P a g e
Bartering/Sale of livestock for staple: The poor households’ barter livestock such as chickens and goats for cereal whilst the better-off increase the livestock sales particularly goats, chickens and cattle Increased consumption of wild foods: The poor households collect wild foods for consumption during bad years. The foods collected include tamarind. Livestock drugs: The poorer households use natural herbs to treat livestock whilst the richer households pool their resources to buy livestock drugs.
Table 15: EKSC Monitoring indicators
Item Key Parameter - Quantity Key Parameter – Price
Crops • Maize; Sorghum • Millet; Groundnuts, • Round nuts; Vegetables • Cotton
• Maize • Vegetables • Cotton
Livestock production • Cattle • Goats • Chickens
• Cattle • Goats • Chickens
Other food and cash income • Agricultural and off-farm labour • Self-Employment
• Labour rates • Remittances • Self-Employment
Coping Strategies
Key Parameters for Monitoring

Zimbabwe Rural Livelihood Baseline Profiles 2011
98 | P a g e
Matabeleland Middle- Highveld Communal
August-September 201020 Main Conclusions and Implications
Crop and livestock production are the main sources of food and cash income in the livelihood zone. Crop production contributes two-thirds of very poor households’ food access and between 80% and 90% for the better-off. Livestock production contributes two thirds to the better-off households’ cash income and one-tenth of the very poor’s. Food purchases and labour exchange are important for the poorer groups as they try to supplement crop production. There is potential for increased crop production by the poorer households if challenges with draught power, and timely access to affordable seed and fertilisers are addressed. To enhance production, agriculture monitoring and extension services should be strengthened by resourcing and further training of staff in the MOA’s department of extension services (AGRITEX). Irrigation is an appropriate development plan given the poor rainfall regime in the zone.
Availability of household labour is a key factor for households to earn income. The very poor and poor households, who have about 2 adults capable of working, rely on on-farm casual work for a significant portion of their food and cash incomes. During drought years, income from weeding and harvesting are severely affected resulting in reduced access to income. All wealth groups receive cash and food remittances from relatives in domestic urban centres or in South Africa.
The very poor and poor wealth groups managed to meet 94% - 101% of their minimum food energy requirements respectively in the reference year. These groups are living on the edge and a natural or market related shock can push them deeper into poverty. Increased cash income would improve the well being of these 2 groups.
Expenditure on staple and non staple food by the very poor and poor households accounts for between 30% - 40% of total expenditure. Increases in food prices pose a serious threat to these households’ food security. There is need to closely monitor changes in food prices especially maize grain as well as the exchange rate of the SA Rand to the US Dollar.
Expenditure on social services is low for the poor and this is partly attributed to interventions in the social services sector such as health and education. In the education sector, BEAM is paying school fees for children from poor and very poor households while UNICEF is providing stationery. The better-off households spend more on school uniforms and some send their children to boarding schools.
The poor and very poor households are not spending money on inputs. They use retained seed and get free field and garden crops inputs. However, the better-off households spend money on seed, fertilizer and animal drugs.
Zone Description
This zone has an estimated population of 265,401 people and is located in the southern part of Zimbabwe, covering low lying areas and some mountainous parts of Matobo, Gwanda, and Umguza, Bubi, Umzingwane, Insiza and Mberengwa districts. The zone lies in Agro-ecological Region IV where annual rainfall averages 650 mm. Bush scrub, grassland, acacia and mopane trees grow in the infertile loam sands.
20Field work for the current profile was undertaken between September and October 2010. The information presented refers to April
2009 to March 2010 a relatively average year by local standards (i.e. a year of average production and rural food security, when judged in the context of recent years). Provided there are no fundamental and rapid shifts in the economy, the information in this profile is expected to remain valid for approximately five years (i.e. until 2015).
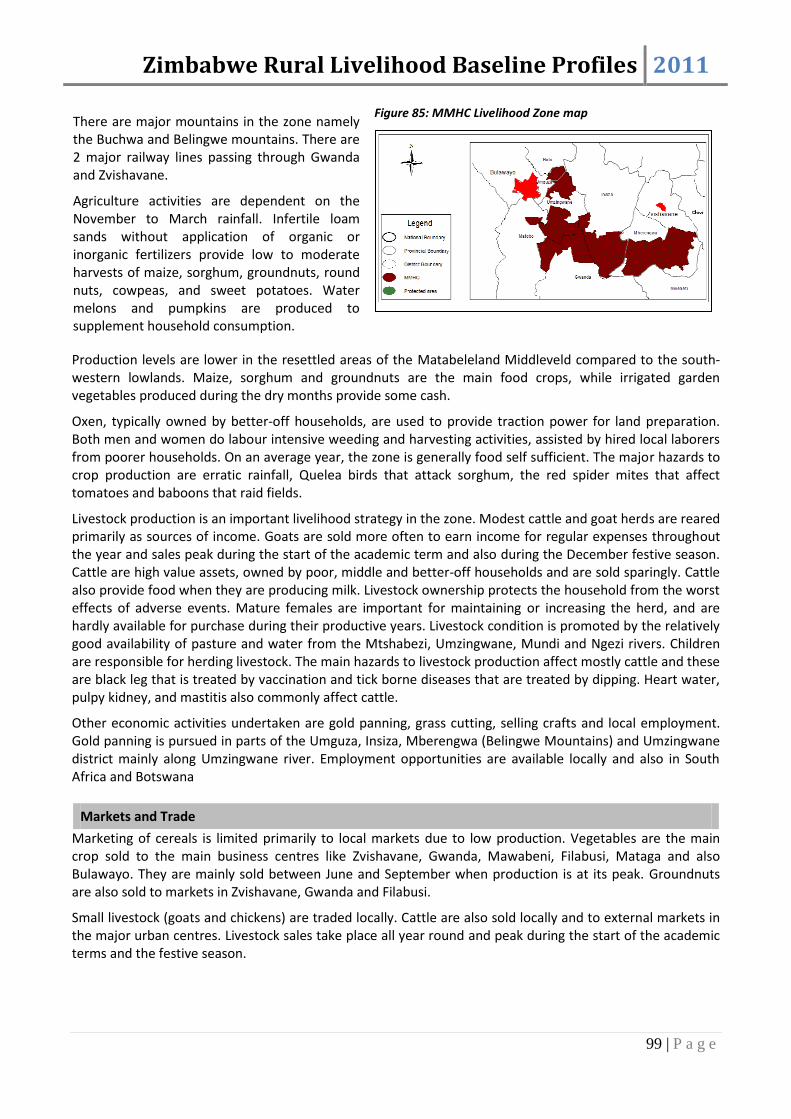
Zimbabwe Rural Livelihood Baseline Profiles 2011
99 | P a g e
There are major mountains in the zone namely the Buchwa and Belingwe mountains. There are 2 major railway lines passing through Gwanda and Zvishavane.
Agriculture activities are dependent on the November to March rainfall. Infertile loam sands without application of organic or inorganic fertilizers provide low to moderate harvests of maize, sorghum, groundnuts, round nuts, cowpeas, and sweet potatoes. Water melons and pumpkins are produced to supplement household consumption.
Figure 85: MMHC Livelihood Zone map
Production levels are lower in the resettled areas of the Matabeleland Middleveld compared to the south-western lowlands. Maize, sorghum and groundnuts are the main food crops, while irrigated garden vegetables produced during the dry months provide some cash.
Oxen, typically owned by better-off households, are used to provide traction power for land preparation. Both men and women do labour intensive weeding and harvesting activities, assisted by hired local laborers from poorer households. On an average year, the zone is generally food self sufficient. The major hazards to crop production are erratic rainfall, Quelea birds that attack sorghum, the red spider mites that affect tomatoes and baboons that raid fields.
Livestock production is an important livelihood strategy in the zone. Modest cattle and goat herds are reared primarily as sources of income. Goats are sold more often to earn income for regular expenses throughout the year and sales peak during the start of the academic term and also during the December festive season. Cattle are high value assets, owned by poor, middle and better-off households and are sold sparingly. Cattle also provide food when they are producing milk. Livestock ownership protects the household from the worst effects of adverse events. Mature females are important for maintaining or increasing the herd, and are hardly available for purchase during their productive years. Livestock condition is promoted by the relatively good availability of pasture and water from the Mtshabezi, Umzingwane, Mundi and Ngezi rivers. Children are responsible for herding livestock. The main hazards to livestock production affect mostly cattle and these are black leg that is treated by vaccination and tick borne diseases that are treated by dipping. Heart water, pulpy kidney, and mastitis also commonly affect cattle.
Other economic activities undertaken are gold panning, grass cutting, selling crafts and local employment. Gold panning is pursued in parts of the Umguza, Insiza, Mberengwa (Belingwe Mountains) and Umzingwane district mainly along Umzingwane river. Employment opportunities are available locally and also in South Africa and Botswana
Markets and Trade
Marketing of cereals is limited primarily to local markets due to low production. Vegetables are the main crop sold to the main business centres like Zvishavane, Gwanda, Mawabeni, Filabusi, Mataga and also Bulawayo. They are mainly sold between June and September when production is at its peak. Groundnuts are also sold to markets in Zvishavane, Gwanda and Filabusi.
Small livestock (goats and chickens) are traded locally. Cattle are also sold locally and to external markets in the major urban centres. Livestock sales take place all year round and peak during the start of the academic terms and the festive season.

Zimbabwe Rural Livelihood Baseline Profiles 2011
100 | P a g e
Local agriculture opportunities are available in the fields of the better-off households. Additional labour opportunities are found in the major urban centres of Bulawayo, Gwanda and Zvishavane and surrounding commercial farms.
The main constraints to marketing activities are poor roads and limited transport services.
Seasonal Calendar
There are 2 main seasons in the livelihood zone, namely the summer wet months (Ihlobo) between October and April, and the winter dry months (Ubusika) between May and September.
Livelihood activities are planned around the wet season starting with production of maize, sorghum, millet, groundnuts, round nuts, cowpeas, sweet potatoes and watermelons. The consumption year begins in February with the consumption of green maize and water melons. The main harvest of cereal crops and pulses begins in March and peaks in April and May.
The livestock production season begins with both cattle and goat births in October and November, as the rains rejuvenate pasture and replenish the main water bodies. The main lactation period lasts for 4 months, from November to February. Goats also give birth in January and between June and July. Livestock sales, particularly for goats occur throughout the year, though peak trading season is during the start of the academic terms and the Christmas season.
Food purchases along with food prices steadily increase from September onwards, reaching a peak during the lean season from October to January. Poorer households with smaller harvests intensify the search for cash income during this period, providing agriculture labour both locally and in surrounding commercial farms and get paid in grain. Off farm work, that includes gold panning and construction, is sought during the dry season.
Wealth Breakdown
4 wealth groups were identified by the key informants namely the 26% very poor (abaswelisisayo), the 34% poor (abaswelayo), 25% middle (abanconywana), and 15% better-off (abancono). The main determinants of wealth in the zone are livestock holdings, amount of land cultivated and ownership of draught power (ploughs, hoes, and scotch carts) which determine the method of land cultivation used.
Figure 86: MMHC Seasonal Calendar
Apr May Jun Jul Aug Sep Oct Nov Dec Jan Feb Mar
Legend
cattle onfarm
Land Preparation
Planting
Weeding
Cereals
Pulses
Crop sa les
Gardening
Livestock sa les
Livestock heats and births
Mi lk production
Other
Lean season
Food Purchases
Fishing
Local labour
Craft making and sel l ing
Wild frui ts
Malaria
Wet Season
planting cons. green harvest
Dry Season
cattle and shoats
Off farm
shoats
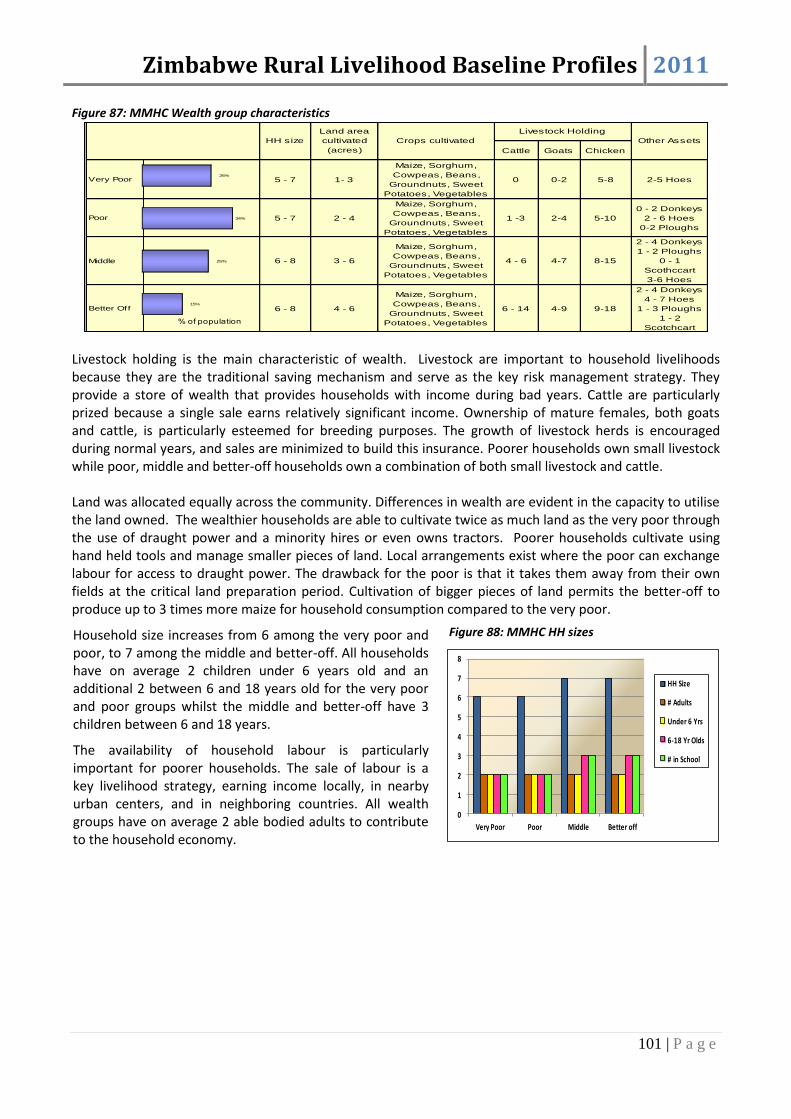
Zimbabwe Rural Livelihood Baseline Profiles 2011
101 | P a g e
Figure 87: MMHC Wealth group characteristics
Livestock holding is the main characteristic of wealth. Livestock are important to household livelihoods because they are the traditional saving mechanism and serve as the key risk management strategy. They provide a store of wealth that provides households with income during bad years. Cattle are particularly prized because a single sale earns relatively significant income. Ownership of mature females, both goats and cattle, is particularly esteemed for breeding purposes. The growth of livestock herds is encouraged during normal years, and sales are minimized to build this insurance. Poorer households own small livestock while poor, middle and better-off households own a combination of both small livestock and cattle. Land was allocated equally across the community. Differences in wealth are evident in the capacity to utilise the land owned. The wealthier households are able to cultivate twice as much land as the very poor through the use of draught power and a minority hires or even owns tractors. Poorer households cultivate using hand held tools and manage smaller pieces of land. Local arrangements exist where the poor can exchange labour for access to draught power. The drawback for the poor is that it takes them away from their own fields at the critical land preparation period. Cultivation of bigger pieces of land permits the better-off to produce up to 3 times more maize for household consumption compared to the very poor.
Household size increases from 6 among the very poor and poor, to 7 among the middle and better-off. All households have on average 2 children under 6 years old and an additional 2 between 6 and 18 years old for the very poor and poor groups whilst the middle and better-off have 3 children between 6 and 18 years.
The availability of household labour is particularly important for poorer households. The sale of labour is a key livelihood strategy, earning income locally, in nearby urban centers, and in neighboring countries. All wealth groups have on average 2 able bodied adults to contribute to the household economy.
0
1
2
3
4
5
6
7
8
Very Poor Poor Middle Better off
HH Size
# Adults
Under 6 Yrs
6-18 Yr Olds
# in School
Cattle Goats Chicken
Very Poor 5 - 7 1- 3
Maize, Sorghum,
Cowpeas, Beans,
Groundnuts, Sweet
Potatoes, Vegetables
0 0-2 5-8 2-5 Hoes
Poor 5 - 7 2 - 4
Maize, Sorghum,
Cowpeas, Beans,
Groundnuts, Sweet
Potatoes, Vegetables
1 -3 2-4 5-10
0 - 2 Donkeys
2 - 6 Hoes
0-2 Ploughs
Middle 6 - 8 3 - 6
Maize, Sorghum,
Cowpeas, Beans,
Groundnuts, Sweet
Potatoes, Vegetables
4 - 6 4-7 8-15
2 - 4 Donkeys
1 - 2 Ploughs
0 - 1
Scothccart
3-6 Hoes
Better Off 6 - 8 4 - 6
Maize, Sorghum,
Cowpeas, Beans,
Groundnuts, Sweet
Potatoes, Vegetables
6 - 14 4-9 9-18
2 - 4 Donkeys
4 - 7 Hoes
1 - 3 Ploughs
1 - 2
Scotchcart
Figure 11.3 Wealth Groups Characteristics
Livestock Holding
HH size
Land area
cultivated
(acres)
Crops cultivated Other Assets
15%
25%
34%
26%
% of population
Figure 88: MMHC HH sizes
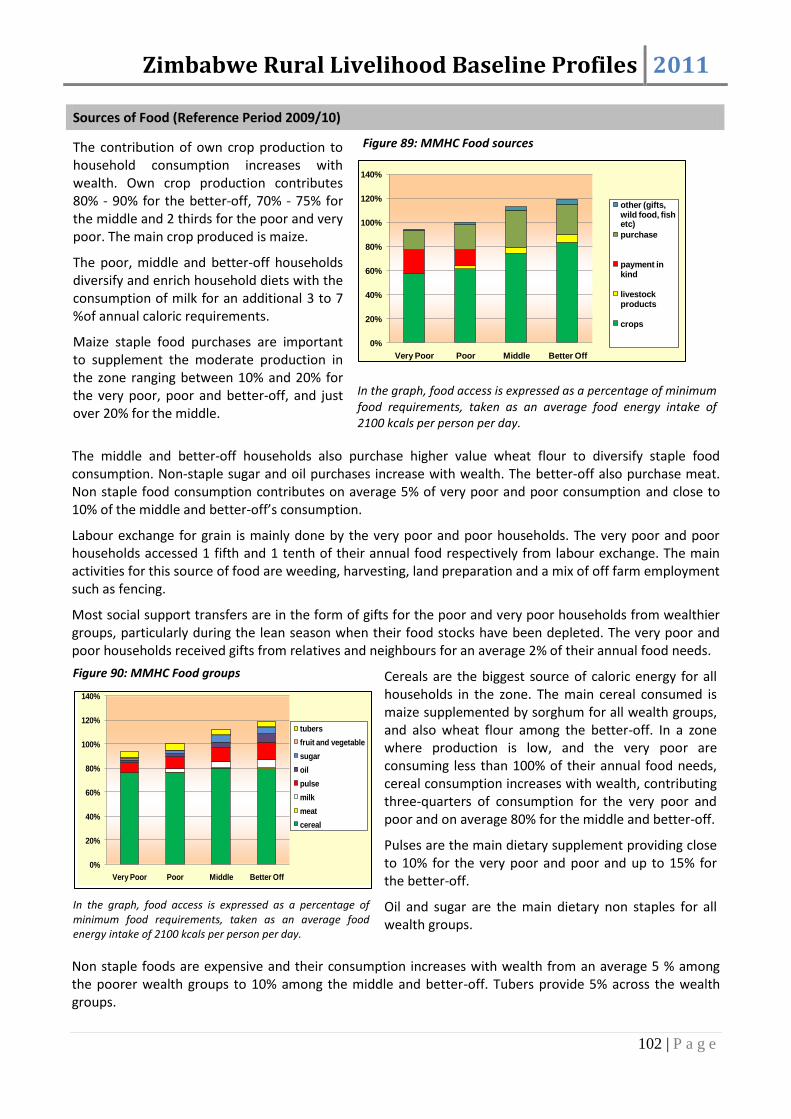
Zimbabwe Rural Livelihood Baseline Profiles 2011
102 | P a g e
Sources of Food (Reference Period 2009/10)
The contribution of own crop production to household consumption increases with wealth. Own crop production contributes 80% - 90% for the better-off, 70% - 75% for the middle and 2 thirds for the poor and very poor. The main crop produced is maize.
The poor, middle and better-off households diversify and enrich household diets with the consumption of milk for an additional 3 to 7 %of annual caloric requirements.
Maize staple food purchases are important to supplement the moderate production in the zone ranging between 10% and 20% for the very poor, poor and better-off, and just over 20% for the middle.
In the graph, food access is expressed as a percentage of minimum food requirements, taken as an average food energy intake of 2100 kcals per person per day.
The middle and better-off households also purchase higher value wheat flour to diversify staple food consumption. Non-staple sugar and oil purchases increase with wealth. The better-off also purchase meat. Non staple food consumption contributes on average 5% of very poor and poor consumption and close to 10% of the middle and better-off’s consumption.
Labour exchange for grain is mainly done by the very poor and poor households. The very poor and poor households accessed 1 fifth and 1 tenth of their annual food respectively from labour exchange. The main activities for this source of food are weeding, harvesting, land preparation and a mix of off farm employment such as fencing.
Most social support transfers are in the form of gifts for the poor and very poor households from wealthier groups, particularly during the lean season when their food stocks have been depleted. The very poor and poor households received gifts from relatives and neighbours for an average 2% of their annual food needs.
In the graph, food access is expressed as a percentage of minimum food requirements, taken as an average food energy intake of 2100 kcals per person per day.
Cereals are the biggest source of caloric energy for all households in the zone. The main cereal consumed is maize supplemented by sorghum for all wealth groups, and also wheat flour among the better-off. In a zone where production is low, and the very poor are consuming less than 100% of their annual food needs, cereal consumption increases with wealth, contributing three-quarters of consumption for the very poor and poor and on average 80% for the middle and better-off.
Pulses are the main dietary supplement providing close to 10% for the very poor and poor and up to 15% for the better-off.
Oil and sugar are the main dietary non staples for all wealth groups.
Non staple foods are expensive and their consumption increases with wealth from an average 5 % among the poorer wealth groups to 10% among the middle and better-off. Tubers provide 5% across the wealth groups.
0%
20%
40%
60%
80%
100%
120%
140%
Very Poor Poor Middle Better Off
tubers
fruit and vegetable
sugar
oil
pulse
milk
meat
cereal
0%
20%
40%
60%
80%
100%
120%
140%
Very Poor Poor Middle Better Off
other (gifts, wild food, fish etc)
purchase
payment in kind
livestock products
crops
Figure 89: MMHC Food sources
Figure 90: MMHC Food groups
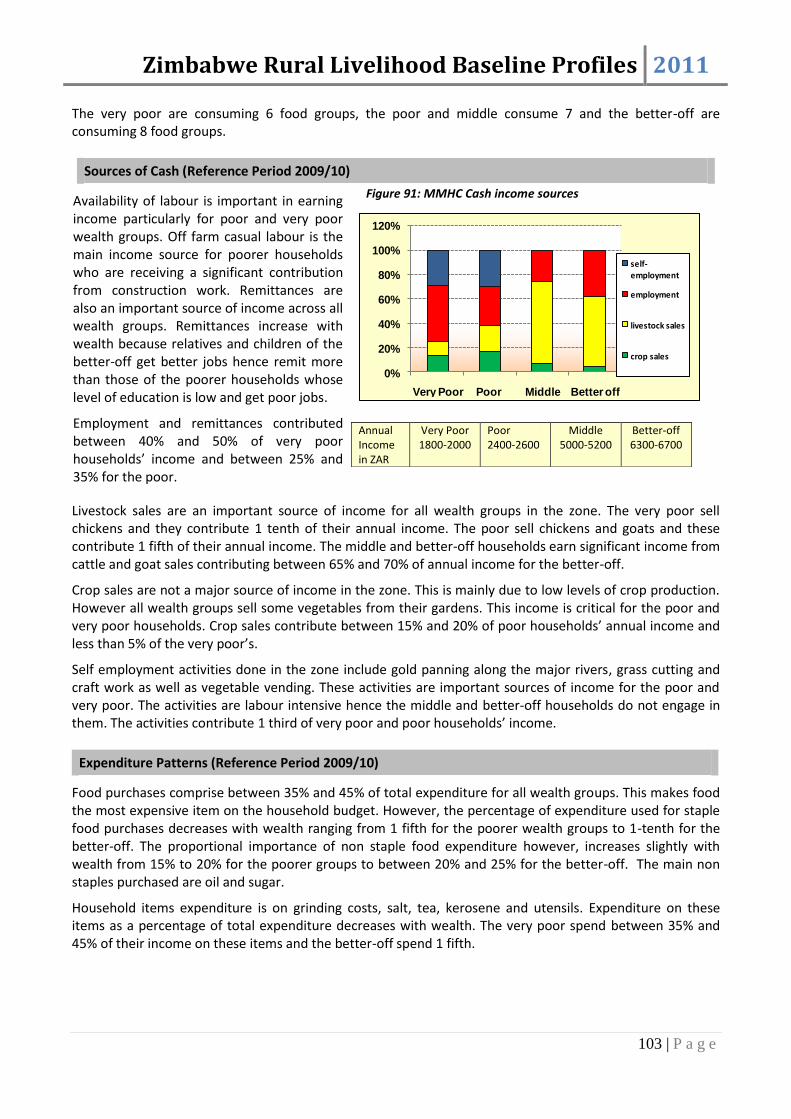
Zimbabwe Rural Livelihood Baseline Profiles 2011
103 | P a g e
The very poor are consuming 6 food groups, the poor and middle consume 7 and the better-off are consuming 8 food groups.
Sources of Cash (Reference Period 2009/10)
Availability of labour is important in earning income particularly for poor and very poor wealth groups. Off farm casual labour is the main income source for poorer households who are receiving a significant contribution from construction work. Remittances are also an important source of income across all wealth groups. Remittances increase with wealth because relatives and children of the better-off get better jobs hence remit more than those of the poorer households whose level of education is low and get poor jobs.
Employment and remittances contributed between 40% and 50% of very poor households’ income and between 25% and 35% for the poor.
Annual Income in ZAR
Very Poor 1800-2000
Poor 2400-2600
Middle 5000-5200
Better-off 6300-6700
Livestock sales are an important source of income for all wealth groups in the zone. The very poor sell chickens and they contribute 1 tenth of their annual income. The poor sell chickens and goats and these contribute 1 fifth of their annual income. The middle and better-off households earn significant income from cattle and goat sales contributing between 65% and 70% of annual income for the better-off.
Crop sales are not a major source of income in the zone. This is mainly due to low levels of crop production. However all wealth groups sell some vegetables from their gardens. This income is critical for the poor and very poor households. Crop sales contribute between 15% and 20% of poor households’ annual income and less than 5% of the very poor’s.
Self employment activities done in the zone include gold panning along the major rivers, grass cutting and craft work as well as vegetable vending. These activities are important sources of income for the poor and very poor. The activities are labour intensive hence the middle and better-off households do not engage in them. The activities contribute 1 third of very poor and poor households’ income.
Expenditure Patterns (Reference Period 2009/10)
Food purchases comprise between 35% and 45% of total expenditure for all wealth groups. This makes food the most expensive item on the household budget. However, the percentage of expenditure used for staple food purchases decreases with wealth ranging from 1 fifth for the poorer wealth groups to 1-tenth for the better-off. The proportional importance of non staple food expenditure however, increases slightly with wealth from 15% to 20% for the poorer groups to between 20% and 25% for the better-off. The main non staples purchased are oil and sugar.
Household items expenditure is on grinding costs, salt, tea, kerosene and utensils. Expenditure on these items as a percentage of total expenditure decreases with wealth. The very poor spend between 35% and 45% of their income on these items and the better-off spend 1 fifth.
0%
20%
40%
60%
80%
100%
120%
Very Poor Poor Middle Better off
self-employment
employment
livestock sales
crop sales
Figure 91: MMHC Cash income sources

Zimbabwe Rural Livelihood Baseline Profiles 2011
104 | P a g e
Annual Expenditure (ZAR)
Very Poor 1800-2000
Poor 2400-2600
Middle 5000-5200
Better-off 6300-6700
Expenditure on Social Services (Education and Health) is very low for the very poor households. These households have fallen behind on paying school fees. Expenditure on Education is increasing with wealth meaning the better-off households are investing more in their children’s education and health compared to the poorer households. While the BEAM programme is assisting the poorer households, its coverage is not adequate and it needs strengthening to ensure it meets its objectives. Health services are for free for all wealth groups at local council clinics.
‘Other’ expenditure includes transport, beer, gifts, festivals and community obligations and all wealth groups have a proportion of their total expenditure going to other items.
Hazards
Chronic hazards: The main chronic hazard affecting the zone is erratic rainfall. Poor infrastructure is also a problem affecting livelihoods. HIV and AIDS infection is a serious problem in this zone.
Intermittent hazards: Input unavailability and livestock diseases such as Heart-water and blackleg have continuously affected livestock production. Livestock theft is a regular hazard.
Coping Strategies
Increase in remittances: Remittances play a significant role in the zone in the bad years. Almost all wealth groups have relatives/family members working in South Africa owing to the zone’s proximity to South Africa. These family members play a significant role in the bad years by increasing the remittances they send back home.
Increased local casual labour: In the bad years there are increased local casual labourers. The labour activities often include irregular menial jobs in the mining sector.
Gold panning: The poor households engage in gold panning. The gold is bartered for cereal or sold for cash which in turn is used to purchase cereal.
Increased sale of livestock: The better-off and middle groups engage in the sale of livestock such as cattle and goats whilst the poorer groups sell livestock such as chickens and goats.
0%
20%
40%
60%
80%
100%
Very Poor Poor Middle Better off
other
gifts
tax
clothes
social serv.
inputs
water
HH items
non-staple food
staple food
Figure 92: MMHC Expenditure patterns

Zimbabwe Rural Livelihood Baseline Profiles 2011
105 | P a g e
Key Parameters for Monitoring
Table 16: MMHC Monitoring indicators
Item Key Parameter - Quantity Key Parameter – Price
Crops Maize
Sorghum
Ground nuts
High prices from May
Livestock production Cattle sales
Goat sales
Chicken sales
Herd sizes
Cattle prices/ barter for cereal
Goat prices/ barter for cereal
Barter for cereal
Other food and cash income Vegetable production
Casual labour
Grass
Vegetable prices
Labour exchange rate
Grass bundle prices

Zimbabwe Rural Livelihood Baseline Profiles 2011
106 | P a g e
Southern Cattle and Cereal Farming August-September 201021
Main Conclusions and Implications
Crop production is a key livelihood strategy in the livelihood zone. Own crop production of maize, sorghum, pulses and sweet potatoes contributed three quarters of the very poor households’ food consumption in the reference year. There is potential for improved production for the very poor through providing support with draught power, access to seed and fertilisers and provision of irrigation facilities since the zone generally receives low rainfall. The level of crop production in this zone can also be enhanced through strengthening grain markets. Extension services and monitoring of agriculture interventions and activities should be strengthened through support to the MOA’s department of extension services (AGRITEX). Very poor and poor households also depend on on-farm activities for both food and cash income. During drought years, the loss of agricultural income can be compensated for through well targeted public works programmes.
Expenditure on staple and non staple food by the very poor and poor households accounts for between 35% - 40% of very poor expenditure and 5% - 33% of the poor’s total household expenditure. Heavy reliance on food purchases exposes these households to food price fluctuations. The zone is also characterized by some significant sale of livestock particularly cattle for the middle and the better-off.
The very poor and poor wealth groups managed to meet their food energy requirements without food aid in the reference year. These groups require livelihood protection and promotion of interventions to build productive asset ownership and reduce poverty.
Expenditure on social services is low for the very poor and poor wealth groups and this is partly attributed to interventions in the social services sector such as health and education. A key constraint to delivery of quality educational and health services is poor infrastructure in the zone and the resulting failure to attract technical staff.
This zone has some wealth groups investing in inputs particularly the middle and the better-off regardless of the presence of seed distribution interventions, a clear indication that packages provided were in most cases not adequate for the land area cultivated and also some seed types were not provided so some households had to purchase.
Zone Description
This large livelihood zone covers a vast area across southern and central Zimbabwe. It is spread across 15 districts, namely Bulilima, Mangwe, Umguza, Matobo, Lupane, Bubi, Umzingwane, Insiza, Gwanda, Mberengwa, Mwenezi, Beitbridge, Tsholotsho, Chiredzi, and Gweru districts. It has an estimated population of 403,956. The zone is mainly in Agro-ecological Regions III and IV, and the southern part in Beitbridge falls into Agro-ecological Region V. Average annual rainfall varies across the zone. In the northeast, annual rainfall averages a relatively high 650 to 800mm. The south and central areas are drier receiving an average of 450mm annually. Temperatures in the zone range between 15 to 20 oC in winter and 30 to 35oC in summer.
21
Field work for the current profile was undertaken in January 2011. The information presented refers to April 2009 to March 2010 a relatively average year by local standards (i.e. a year of average production and rural food security, when judged in the context of recent years). Provided there are no fundamental and rapid shifts in the economy, the information in this profile is expected to remain valid for approximately five years (i.e. until 2015).

Zimbabwe Rural Livelihood Baseline Profiles 2011
107 | P a g e
The zone is characterised by isolated hills and relatively flat land. The vegetation comprises of Mopane and Miombo woodlands with limited teak forests in Umguza and Bubi district. The major rivers found in this area include Bubi, Umguza, Mbembesi, Mtshabezi and Shangani rivers which provide water for both animal and human use. During the dry season water is available from boreholes and deep wells. Gold and chrome deposits are also found in the area. Mopane worms are found in the zone though they are gradually declining in the southern part of the zone.
Figure 93: SCCF Livelihood zone map
This is a predominantly mixed farming area with cereal cropping and cattle ranching. The majority of farmers are A1 and A2 farm beneficiaries of the Fast Track Land Reform Programme of 2000. In the southern part of the zone, crop production is practised in sandy loam soils that are less productive compared to the clay loam soils found in the north. Rain fed production of maize, ground nuts, round nuts, cowpeas, sweet potatoes and sorghum is practised for consumption. A small portion of the maize and groundnut produce is sold to earn the households cash. Production levels are moderate in the south and higher high in the north. The zone is generally food sufficient except for Bubi and Matobo districts. Ox drawn ploughing and hand digging are the common crop production methods. Some better-off households also hire tractors. Agriculture activities are shared between men and women. Women mainly perform the weeding and harvesting and men perform the laborious land preparation tasks. Stalk borer and weevils are the main pests affecting cereal crop production.
The main livestock types are cattle, goats and poultry. Livestock feed is available on communally owned free grazing land supplemented by crop residue. Cattle are reared both for milk and meat. Livestock are esteemed for both productive and social reasons. Cattle provide much needed insurance and options for access to income in the event of adverse events. The main diseases affecting cattle are black leg, red water, lumpy skin and foot and mouth. Goats are mostly affected by pulp kidney. Newcastle is the common poultry disease. Treatment for all diseases is found on the market. There is a high potential for livestock production supported by good pasture and water availability.
Other economic activities pursued in the zone include gold panning, mostly practised in Bubi and Gwanda, and also grass sales, casual labour and brick moulding. Agriculture and casual labour opportunities are available locally and engaged in commonly by men. The livelihood zone is well serviced by a number of major road networks that include the Bulawayo to Harare highway, Harare to Masvingo and the Bulawayo to Beitbridge highway. The Bulawayo to Beitbridge railway line also cuts across the zone. Residents have access to major urban centres that include Bulawayo, Gwanda, Beitbridge and Gweru.
Markets and Trade
Maize is marketed through the Grain Marketing Board (GMB), local markets and private buyers from May to December. Private buyers export the maize to Bulawayo, Gwanda, Beitbridge and Gweru. Roadside marketing also plays a major role. Livestock are sold to local butchers, abattoirs, private buyers and beef committees. Cattle sales peak in January, May and September for export to Bulawayo, Gwanda, Beitbridge and Gweru. Goats are sold locally all year round to meet major expenses such as education costs. In terms of labour markets, most people find employment locally although some travel to major urban areas in Zimbabwe and neighbouring South Africa and Botswana. The zone provides herding opportunities for migrants from Binga, Nkayi, Lupane and Masvingo throughout the year. Despite a good road network connecting the zone to major urban centres, local communities and marketing activities are affected by poor road networks, uncompetitive prices and very limited transport services.

Zimbabwe Rural Livelihood Baseline Profiles 2011
108 | P a g e
Seasonal calendar
This livelihood zone has 2 seasons, the summer season from November to April, and the dry season from May to October. The rains typically begin in November and stretch till April. Land preparation activities are done over 2 periods, the winter ploughing phase between May and July, and the main land preparation period which starts in September in anticipation of the rains and ends in November.
Cultivation of maize and sorghum begins in December and harvesting is done in June and July. Groundnuts, round nuts and sweet potatoes are planted at the same time as cereals but are harvested a month earlier in May. Vegetable production begins after the crop production season from May to October. Areas with irrigation facilities cultivate vegetables all year round.
Livestock sales and milk production take place throughout the year.
Owing to good production, the lean season is relatively shorter lasting from December to February. During this period food purchases increase along with food prices. To meet this and other income needs in the year, households engage in agriculture labour in the fields of the better-off and surrounding farms.
Within the zone, there are several wild foods collected or hunted including fruits, leaves, mushrooms, mopane worms and small animals. These wild foods are mainly collected during the rainy season when they make a valuable contribution to the diet at a time when stocks are usually running low.
Wealth Breakdown
4 wealth groups were identified in the livelihood zone. These are the very poor (abaswelisisayo), the poor (abaswelayo), the middle (abaphakhati), the better-off (abancono). The very poor and poor wealth groups together make up two thirds of the population while the middle and better-off comprise 20% - 25% and 10% 15% of the population respectively.
The chief determinants of wealth are the amount of land cultivated and livestock owned. The amount of land cultivated increases with wealth primarily depending on ownership of draught power and ploughs. Draught power is typically provided by oxen. Better-off households own oxen and ploughs and cultivate 7 to 12 acres, compared to the very poor who rarely own oxen or a plough and cultivate 3 to 7 acres of land. Poorer households often engage in agriculture and casual labour for the better-off households in exchange for draught power. Better-off households also purchase seeds and fertiliser which further enhances their capacity to cultivate more land compared to the poor who receive inputs distributions late into the production season. The use of retained seed enables timely cultivation by the poor though production levels are low. Poor households cite lack of ploughs, oxen and money for agricultural inputs as their biggest barriers to productivity.
Figure 94: SCCF Seasonal Calendar
Apr May Jun Jul Aug Sep Oct Nov Dec Jan Feb Mar
Legend
cattle onfarm
Land Preparation
Cereal planting
Weeding
Maize
Sorghum
Gardening
Crop sa les
Pulses
Livestock sa les
Livestock heats and births
Mi lk production
Other
Lean season
Food Purchases
Fishing
Local labour
Wild food
Off farm
shoats
Wet Season
planting cons. green harvest
Dry Season
cattle and shoats

Zimbabwe Rural Livelihood Baseline Profiles 2011
109 | P a g e
Figure 95: SCCF Wealth group characteristics
Livestock herds provide access to a large source of income. Goats make up the largest herds and are sold more often providing regular income for the household through the year. Cattle herds are still big and the middle and better-off households own larger herds. Cattle are highly valued assets that present the potential for relatively significant earnings from a single sale. Equally important, livestock are the main risk management strategy, providing security from the worst effects of a bad year. Mature females are important in this respect, growing the herd in normal years. The main constraint to livestock production among the poor is shortage of money to purchase livestock. The main factors limiting increased livestock holdings among the better-off are llimited water sources for animals, limited veterinary services and dip tanks and unfavourable cattle price
Household demographics are similar across the wealth groups across the livelihood zone. A household size of 6 is common regardless of wealth. Within the very poor, poor and middle households 2 adults are capable of working, and 3 among the better-off. 2 children are under the age of 6, among the very poor, poor and middle, and 1 within the better-off. An additional 2 children are between 6 and 18. All wealth groups have 2 children in school.
Figure 96: SCCF HH sizes
Sources of Food (Reference Period 2009/10)
Crop production is the main source of food in the zone. High crop production enables production of maize both for food and cash. Other crops cultivated for food are ground nuts, round nuts, cow peas and sweet potatoes. The contributions of crop production with respect to wealth group are between 75% and 80% for the very poor and poor and close to 90% for the better-off. Food purchase is another important source of food in the zone. The main food items bought are sugar, cooking oil, flour and rice, all high value staple and non staple food items. As such, food purchases increase with wealth from between 10% and 15% for the very poor to almost 20% for the better-off.
Cattle Goats Chicken
Very Poor 5 - 7 3 - 7
maize, sorghum,
cowpeas, groundnuts,
roundnuts, sweet
potatoes, vegetables
1-2 3-5 7-15
0-1 ploughs
2-4 fruit trees
0-1 beehives
0-1 donkeys
Poor 5 - 7 4 - 7.5
maize, sorghum,
cowpeas, groundnuts,
roundnuts, sweet
potatoes, vegetables
4-6 4-6 8-15
0-1 ploughs
3-4 fruit trees
0-1 beehives
0-2 donkeys
Middle 5 - 7 7- 12
maize, sorghum,
cowpeas, groundnuts,
roundnuts, sweet
potatoes, vegetables
8 - 12 5-10 10-17
1-2 ploughs
4-5 fruit trees
1-2 beehives
1-4 donkeys
Better Off 5 - 7 7- 12
maize, sorghum,
cowpeas, groundnuts,
roundnuts, sweet
potatoes, vegetables
13 - 19 7-15 10-17
1-3 ploughs
4-7 fruit trees
1-3 beehives
3-6 donkeys
Figure 12.3 Wealth Groups Characteristics
Livestock Holding
HH size
Land area
cultivated
(acres)
Crops cultivated Other Assets
13%
22%
33%
32%
% of population
0
1
2
3
4
5
6
7
Very Poor Poor Middle Better off
HH Size
# Adults
Under 6 Yrs
6-18 Yr Olds
# in School
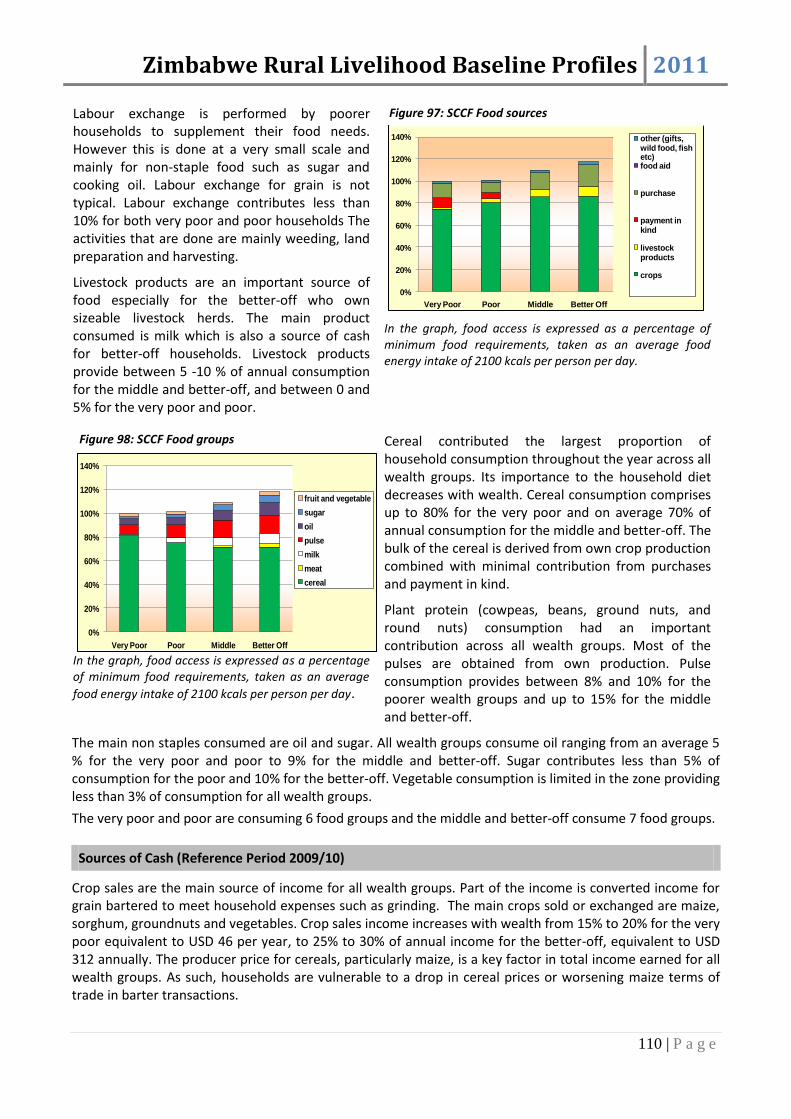
Zimbabwe Rural Livelihood Baseline Profiles 2011
110 | P a g e
Labour exchange is performed by poorer households to supplement their food needs. However this is done at a very small scale and mainly for non-staple food such as sugar and cooking oil. Labour exchange for grain is not typical. Labour exchange contributes less than 10% for both very poor and poor households The activities that are done are mainly weeding, land preparation and harvesting.
Livestock products are an important source of food especially for the better-off who own sizeable livestock herds. The main product consumed is milk which is also a source of cash for better-off households. Livestock products provide between 5 -10 % of annual consumption for the middle and better-off, and between 0 and 5% for the very poor and poor.
In the graph, food access is expressed as a percentage of minimum food requirements, taken as an average food energy intake of 2100 kcals per person per day.
In the graph, food access is expressed as a percentage of minimum food requirements, taken as an average
food energy intake of 2100 kcals per person per day.
Cereal contributed the largest proportion of household consumption throughout the year across all wealth groups. Its importance to the household diet decreases with wealth. Cereal consumption comprises up to 80% for the very poor and on average 70% of annual consumption for the middle and better-off. The bulk of the cereal is derived from own crop production combined with minimal contribution from purchases and payment in kind.
Plant protein (cowpeas, beans, ground nuts, and round nuts) consumption had an important contribution across all wealth groups. Most of the pulses are obtained from own production. Pulse consumption provides between 8% and 10% for the poorer wealth groups and up to 15% for the middle and better-off.
The main non staples consumed are oil and sugar. All wealth groups consume oil ranging from an average 5 % for the very poor and poor to 9% for the middle and better-off. Sugar contributes less than 5% of consumption for the poor and 10% for the better-off. Vegetable consumption is limited in the zone providing less than 3% of consumption for all wealth groups.
The very poor and poor are consuming 6 food groups and the middle and better-off consume 7 food groups.
Sources of Cash (Reference Period 2009/10)
Crop sales are the main source of income for all wealth groups. Part of the income is converted income for grain bartered to meet household expenses such as grinding. The main crops sold or exchanged are maize, sorghum, groundnuts and vegetables. Crop sales income increases with wealth from 15% to 20% for the very poor equivalent to USD 46 per year, to 25% to 30% of annual income for the better-off, equivalent to USD 312 annually. The producer price for cereals, particularly maize, is a key factor in total income earned for all wealth groups. As such, households are vulnerable to a drop in cereal prices or worsening maize terms of trade in barter transactions.
0%
20%
40%
60%
80%
100%
120%
140%
Very Poor Poor Middle Better Off
other (gifts, wild food, fish etc)food aid
purchase
payment in kind
livestock products
crops
0%
20%
40%
60%
80%
100%
120%
140%
Very Poor Poor Middle Better Off
fruit and vegetable
sugar
oil
pulse
milk
meat
cereal
Figure 97: SCCF Food sources
Figure 98: SCCF Food groups

Zimbabwe Rural Livelihood Baseline Profiles 2011
111 | P a g e
The importance of livestock sales to household income increases with wealth. Better-off and middle households who have larger livestock herds sell a combination of cattle and goats and earn on average USD 637 annually, equivalent to 55% of their income, and USD 366 equivalent to 45% of income respectively.
Ownership of cattle, while serving as an important coping strategy, earns the better-off and middle households significant income. Poorer households sell goats and chickens for 10% of their annual income. Larger cattle herds also earn the better-off just below 5 % of annual income from milk provided by lactating mature females.
Poorer households depend on labour for a significant portion of their income. Self employment activities such as brick moulding, firewood sales and grass sales are important sources of income for these households. These activities earn both very poor and poor households between 10% and 15% of annual income. Self employment opportunities are mostly available during the winter months during the off farming season.
Annual Income in USD
Very Poor 225-275
Poor 320-360
Middle 775-825
Better-off 1000-1300
Household labour also provides agricultural and casual labour opportunities for the poor during the farming season from activities that include land preparation, weeding, harvesting and threshing for the better-off. Very poor households earn close to half of their income from agriculture and labour equivalent to USD 120 annually. The wealthier households receive remittances from social networks employed in urban centres in neighbouring Botswana and South Africa for an average 10% of their annual income.
Expenditure Patterns (Reference Period 2009/10)
Figure 100: SCCF Expenditure patterns
Annual Expenditure (USD)
Very Poor 225-275
Poor 320-360
Middle 775-825
Better-off 1000-1300
Expenditure on staple food increases with wealth with the very poor and poor spending between USD 20 and USD 30, and the middle and better-off spending between USD 55 and USD 65 annually. Primarily because of good production, only very poor households are purchasing maize staple. For the other wealth groups, expenditure on staple food is on higher value items such as rice and flour.
Non staple food provides access to more diversified and nutritious diets for households. Expenditure on and consumption of non staple sugar and oil is related to wealth ranging from USD 85 for the very poor to almost double that amount for the better-off who are spending on average USD 160 annually.
The proportional importance of expenditure on non staple food however decreases with wealth, from between 6% and 7% for the poor, middle to between 10% and 15% for the very poor households.
Owning more productive assets for higher land utilisation, the better-off households have the highest expenditure on seeds and fertiliser. They spend on average USD 270 purchasing improved seed varieties and
0%
20%
40%
60%
80%
100%
120%
Very Poor Poor Middle Better off
self-employment
employment
livestock sales
livestock products
crop sales
Figure 99: SCCF Cash income sources

Zimbabwe Rural Livelihood Baseline Profiles 2011
112 | P a g e
artificial fertilisers for better yields. Very poor households are not spending money on seeds or fertiliser but use seed received from government distributions, retained seed and organic manure instead.
The most significant expenditure item on social services is education. Most poor households can only afford to take their children as far as primary level while children from better-off households attain secondary level education. The proportional importance of social services expenditure was between 10% and 11% for all wealth groups.
Expenditure on clothes also increases with wealth with the very poor spending USD10, poor USD16, middle USD40 and better-off USD60. Very poor households do not have much income to spend on clothes. Discretionary expenditure on transport, communication, beer and cigarettes also increases with wealth.
Hazards
Chronic hazards: Poor access to seeds, fertilizer and veterinary drugs and wild animals that frequently destroy crops are the chronic hazards in the livelihood zone.
Periodic hazards: Erratic rainfall once every 2 or 3 years is a hazard to crop and livestock production.
Coping Strategies
Increased sale of livestock: This is a coping strategy mainly employed by the middle and better-off households who own big herd sizes for cattle and goats.
Increased consumption of wild foods: Collection of wild foods happens all years but in bad years the poorer and better-off households increase the collection of wild foods such as Mutiri and Tamarind.
Labour Migration: The richer households tend to migrate in search of labour to local towns and bigger towns whilst in some instances they migrate to neighbouring countries.
Use of retained seed: All wealth groups make use of retained seed for planting. The seed which is retained in bad years is mostly maize as ground nuts seed is retained in both good and bad years.
Increased gold panning: The poor households engage in gold panning. The gold is bartered or sold for cash which in turn is used to purchase various household needs.
Key Parameters for Monitoring
Table 17: SCCF Monitoring indicators
Item Key Parameter - Quantity Key Parameter – Price
Crops Maize, sugar beans, groundnuts, Maize, sugar beans, groundnuts
Livestock production Cattle, Goats, Chickens
Cow milk
Cattle and Goat price
Cow milk
Other food and cash income Labour rates (land preparation, weeding, harvesting)

Zimbabwe Rural Livelihood Baseline Profiles 2011
113 | P a g e
Northern Cattle and Cereal Farming January 201122
Main Conclusions and Implications
The livelihood zone is predominantly agro-based with high cereal production and limited cattle ranching. This zone is populated primarily by A1 beneficiary farmers of the Land Reform Programme of 2000. Crop production is the main source of food and cash income, providing between 80% and 90% of annual food consumption for all households. Food self sufficiency can be attained by the majority of farmers if support with traction power and access to seed and fertiliser is provided. Strengthening of extension services provided by the MOA’s Department of Extension Services (AGRITEX) is also important to improve both cereal marketing and cropping practices. Providing labour for crop production earns the poor households significant income. Public works programmes targeted at poor households to improve community infrastructure are an appropriate intervention to support household cash incomes.
The very poor and poor wealth groups managed to meet their food energy requirements without food aid in the reference year. Own crop production is complemented by non staple sugar and oil, and small quantities of wheat flour and rice purchases. Expenditure on staple and non staple food by the very poor and poor households accounts for 1 third of their household budget. Staple cereal purchases are relatively low and the bulk of this expenditure is on non staple sugar and oil.
Most of the income is earned by middle and better-off households from the sale of surplus cereal production and livestock sales. Given the high crop production and access to income that enables purchase of remaining food needs, this zone is well suited for livelihood protection and promotion interventions to build resilience and productivity.
Expenditure on social services is low for all wealth groups and this is partly attributed to interventions in the social services sector such as health and education. The education system is relatively affordable permitting access for all wealth groups. The education and health sectors however are affected by poor infrastructure and challenges in attracting qualified personnel into the zone.
Middle and better-off households purchase significant quantities of seeds and fertiliser to supplement packages provided through government distributions.
Zone Description
This is a vast livelihood zone spread across 11 districts in Mashonaland East, Midlands and Mashonaland West provinces of Zimbabwe. The 235,755 residents are located in Gokwe South, Kwekwe, Gweru, Shurugwi, Zvishavane, Gutu, Hwedza, Mhondoro-Ngezi, Chirumanzu, Chikomba and Seke districts. It is classified as Agro-ecological Region III and IV. Variable annual rainfall ranges from 650 mm and 800 mm providing precipitation for the mopane trees and short grasses found on the isolated hills and relatively flat topography. Temperatures in the zone range between 15 to 20 oC during the May to August winter months and 30 oC to 35oC over the September to March summer months.
The major roads which are found in the zone include Harare to Masvingo, Masvingo to Bulawayo and Harare to Bulawayo highways. Residents procure services from Gweru, Kwekwe, Kadoma, Zvishavane and Chivhu.
22
Field work for the current profile was undertaken in January 2011. The information presented refers to April 2009 to March 2010 a relatively average year by local standards (i.e. a year of average production and rural food security, when judged in the context of recent years). Provided there are no fundamental and rapid shifts in the economy, the information in this profile is expected to remain valid for approximately five years (i.e. until 2015).

Zimbabwe Rural Livelihood Baseline Profiles 2011
114 | P a g e
The main economic activities in the zone are cereal production and small scale cattle ranching. Small scale tobacco and cotton production is practised in Chikomba and Zvishavane respectively.
Agriculture activities are dependent on the November to March rains with most agricultural activity taking place in old and new resettled areas. As such, the majority of farmers are A1 and A2 farm holders. A few large scale commercial farms are also found in the area.
Water for human and animal consumption is found in the Runde, Sebakwe and Munyati rivers, and also from minor perennial rivers.
Figure 101: NCCF Livelihood zone map
Sandy loam and red clay loam soils present the potential for good harvests from the production of maize, sweet potatoes, soya beans, ground nuts and round nuts particularly in Zvishavane and Mhondoro. Maize, ground nuts and round nuts are the main food crops, while surplus maize and groundnuts are the main cash crops in addition to vegetables. Oxen are used to provide traction power for land preparation. Both men and women do labour intensive weeding and harvesting activities, assisted by hired local laborers. Good soils complemented by good rainfalls contribute to make this zone food sufficient. Crop production activities in the zone provide labour opportunities for migrant workers from surrounding communal areas. There are no major hazards to crop production.
Livestock holdings are low in the livelihood zone. Cattle, goats and chickens are the most reared livestock. Cattle and goats free graze on crop residue and/or grass whilst chickens feed on grain. Livestock are an important source of income. Most income from livestock is obtained from the sale of cattle. Goats are sold just as often as cattle but are more readily slaughtered. The ownership of livestock is an integral part of households’ strategy for coping with shocks to livelihoods. A growing herd provides an asset base that will support the household to withstand the impact of a shock on regular food and income sources. Productive animals are replaced from within the herd. The main hazards to livestock production are tick borne diseases that affect cattle. Vaccination and treatment are available from the market.
Other economic activities include small scale mining and market gardening. Small gold and chrome mines are found mainly in Mhondoro Ngezi, Chirumanzu and Zvishavane. Basic hand tools are used by both men and women miners throughout the year. Market gardening is done in the dry season.
Markets and Trade
Cereal marketing occurs through the Grain Marketing Board (GMB), local markets, and private buyers between April and November. Roadside marketing also plays a major role for the local community. Peak cereal purchases by the local community are made between December and February.
Livestock are sold to local butchers, abattoirs, private buyers and beef committees. Cattle are sold all year round peaking from October to January.
Local farms provide most of the labour opportunities for the community. Migrant workers flow into the region during the agricultural season.

Zimbabwe Rural Livelihood Baseline Profiles 2011
115 | P a g e
Seasonal Calendar
There are 2 main seasons in the zone, namely, (zhizha) from September to April, and (chirimo) from May to August the dry months from April to September. Agriculture activities are dependent on the rainy season from November to March. Land preparation for all crops begins in May with winter ploughing and
intensifies as the planting period approaches November to January. Maize is planted in November and both pulses and sweet potatoes are planted in December. The consumption year begins in March and ends in February. The main harvest is from April to July. Livestock births start during the rainy season in November when pasture and water has been replenished. The peak crop sales period follows immediately after harvest from July to September and continues for the rest of the year.
During the peak food purchase season from December to February, the middle and better-off households earn income from crop sales. Poor households rely on availability of labour to get income for food purchases. Agriculture labour opportunities are available for most of the year but peak availability is between December and January for planting and from April to June for harvesting. Mining activities also provide income in May and September when agriculture activities have slowed down.
There are several wild foods collected or hunted including fruits, leaves, mushrooms and small animals. These wild foods are mainly collected during the rainy season when they make a valuable contribution to the household diet.
Wealth Breakdown
4 wealth groups were identified in the livelihood zone, and these include the very poor (vanoshayisisa), the poor (vanoshaya), the middle (varipakati nepakati), and the better-off (vanowana). The very poor and poor comprise close to two thirds of the population in the livelihood zone
Figure 103: NCCF Wealth groups characteristics
Cattle Goats Chicken
Very Poor 5 - 7 4 - 8 Millet, Maize, Sorghum 0 3-5 10-204-6 Hoes
0-1 Ploughs
Poor 5 - 7 6 - 10 Millet, Maize, Sorghum 2 -3 3-5 10-20
0-1 Ploughs
0-1 Cultivators
0-1 Scothcart
Middle 5 - 7 7.5 - 15 Millet, Maize, Sorghum 4 - 8 3-5 10-20
0-1 Donkeys
1-2 Ploughs
0-1 Cultivators
0-1 Scotchcart
Better Off 5 - 7 7.5 - 15 Millet, Maize, Sorghum 9 - 13 4-6 10-20
0-1 Ploughs
1-3 Ploughs
0-1 Cultivators
0-1 Scotchcart
Figure13.3 Wealth Groups Characteristics
Livestock Holding
HH size
Land area
cultivated
(acres)
Crops cultivated Other Assets
12%
20%
31%
37%
% of population
Figure 102: NCCF Seasonal Calendar
Apr May Jun Jul Aug Sep Oct Nov Dec Jan Feb Mar
Legend
cattle onfarm
Land Preparation
Planting
Weeding
Maize
Pulses
Gardening
Crop sa les
Livestock births
Livestock sa les
Mi lk production
Other
Lean season
Food Purchases
Off farm labour
On farm labour
Mining
Wild foods
Wet Season
planting cons. green harvest
Dry Season
cattle and shoats
Off farm
shoats
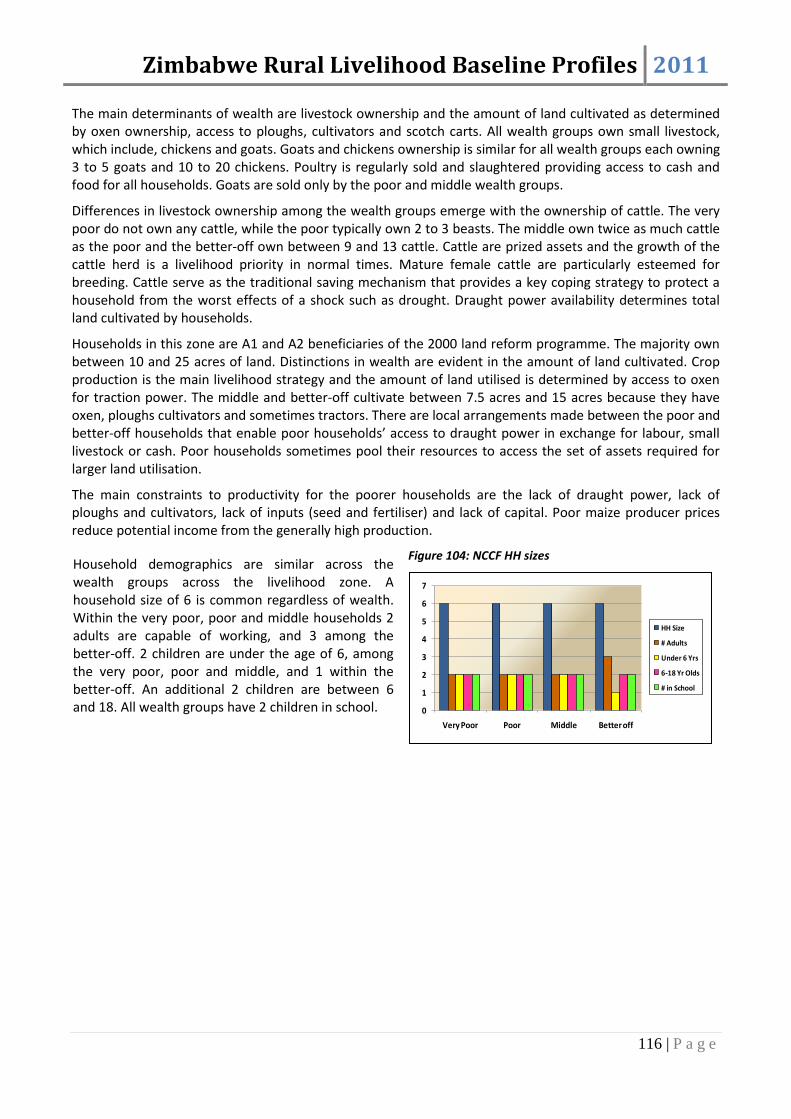
Zimbabwe Rural Livelihood Baseline Profiles 2011
116 | P a g e
The main determinants of wealth are livestock ownership and the amount of land cultivated as determined by oxen ownership, access to ploughs, cultivators and scotch carts. All wealth groups own small livestock, which include, chickens and goats. Goats and chickens ownership is similar for all wealth groups each owning 3 to 5 goats and 10 to 20 chickens. Poultry is regularly sold and slaughtered providing access to cash and food for all households. Goats are sold only by the poor and middle wealth groups.
Differences in livestock ownership among the wealth groups emerge with the ownership of cattle. The very poor do not own any cattle, while the poor typically own 2 to 3 beasts. The middle own twice as much cattle as the poor and the better-off own between 9 and 13 cattle. Cattle are prized assets and the growth of the cattle herd is a livelihood priority in normal times. Mature female cattle are particularly esteemed for breeding. Cattle serve as the traditional saving mechanism that provides a key coping strategy to protect a household from the worst effects of a shock such as drought. Draught power availability determines total land cultivated by households.
Households in this zone are A1 and A2 beneficiaries of the 2000 land reform programme. The majority own between 10 and 25 acres of land. Distinctions in wealth are evident in the amount of land cultivated. Crop production is the main livelihood strategy and the amount of land utilised is determined by access to oxen for traction power. The middle and better-off cultivate between 7.5 acres and 15 acres because they have oxen, ploughs cultivators and sometimes tractors. There are local arrangements made between the poor and better-off households that enable poor households’ access to draught power in exchange for labour, small livestock or cash. Poor households sometimes pool their resources to access the set of assets required for larger land utilisation.
The main constraints to productivity for the poorer households are the lack of draught power, lack of ploughs and cultivators, lack of inputs (seed and fertiliser) and lack of capital. Poor maize producer prices reduce potential income from the generally high production.
Household demographics are similar across the wealth groups across the livelihood zone. A household size of 6 is common regardless of wealth. Within the very poor, poor and middle households 2 adults are capable of working, and 3 among the better-off. 2 children are under the age of 6, among the very poor, poor and middle, and 1 within the better-off. An additional 2 children are between 6 and 18. All wealth groups have 2 children in school.
Figure 104: NCCF HH sizes
0
1
2
3
4
5
6
7
Very Poor Poor Middle Better off
HH Size
# Adults
Under 6 Yrs
6-18 Yr Olds
# in School

Zimbabwe Rural Livelihood Baseline Profiles 2011
117 | P a g e
Sources of Food (Reference Period 2009/10)
In the graph, food access is expressed as a percentage of minimum food requirements, taken as an average food energy intake of 2100 kcals per person per day.
This is a zone with high crop production levels that enable maize cultivated to provide significant food and cash income. Other crops grown for food are ground nuts, round nuts, cowpeas and sweet potatoes. All wealth groups have access to between 80% and 90% of their annual consumption requirements from own crop production. Households in this zone are food self sufficient from own crop production.
Food purchases are an important source of food, particularly for dietary diversity. Staple food purchase in the zone is only for high value cereals such as rice and wheat flour. No households purchase maize staple. Food purchases increase with wealth because the main foods purchased are non staple sugar and cooking oil. The middle and better-off households also purchase small amounts of meat and kapenta. Non staple food is purchased throughout the year.
Labour exchange in the zone is done by poor households to supplement their food needs. However this is done at a very small scale and mainly for non-staple foods such as sugar and cooking oil. Labour exchange for grain is not typical in the zone because of the good harvests that are obtained by most households. The activities that are done include land preparation, weeding, and harvesting on the lands of the better-off.
Livestock products are consumed by the better-off for a more nutritious diet. The main products being consumed are milk and meat. The very poor households only consume chickens which do not give them much caloric energy.
In the graph, food access is expressed as a percentage of minimum food requirements, taken as an average food energy intake of 2100 kcals per person per day.
Cereal consumption constitutes the bulk of the diet. Maize is the main cereal consumed. Better-off households also consume rice and wheat flour. Cereal consumption increases with wealth because the better-off are consuming well above their minimum annual consumption needs.
The next important component of the diet is pulse consumption which provides on average 12% of food for all wealth groups. Sugar consumption is common across all wealth groups, ironically decreasing with wealth because the poorer wealth groups receive payment for labour in sugar. Oil also contributes between 5%- 10% of consumption for all wealth groups. Tubers and vegetables are part of the household diet for all groups for an additional 5% of food needs annually.
Very poor households consume 6 food groups, 7 among the poor and 8 among the middle and better-off
0%
20%
40%
60%
80%
100%
120%
140%
Very Poor Poor Middle Better Off
tubers
fruit and vegetablessugar
oil
pulses
milk
meat
cereals
0%
20%
40%
60%
80%
100%
120%
140%
Very Poor Poor Middle Better Off
other (gifts, wild food, fish etc)food aid
purchase
payment in kind
livestock products
crops
Figure 105: NCCF Food sources
Figure 106: NCCF Food Groups
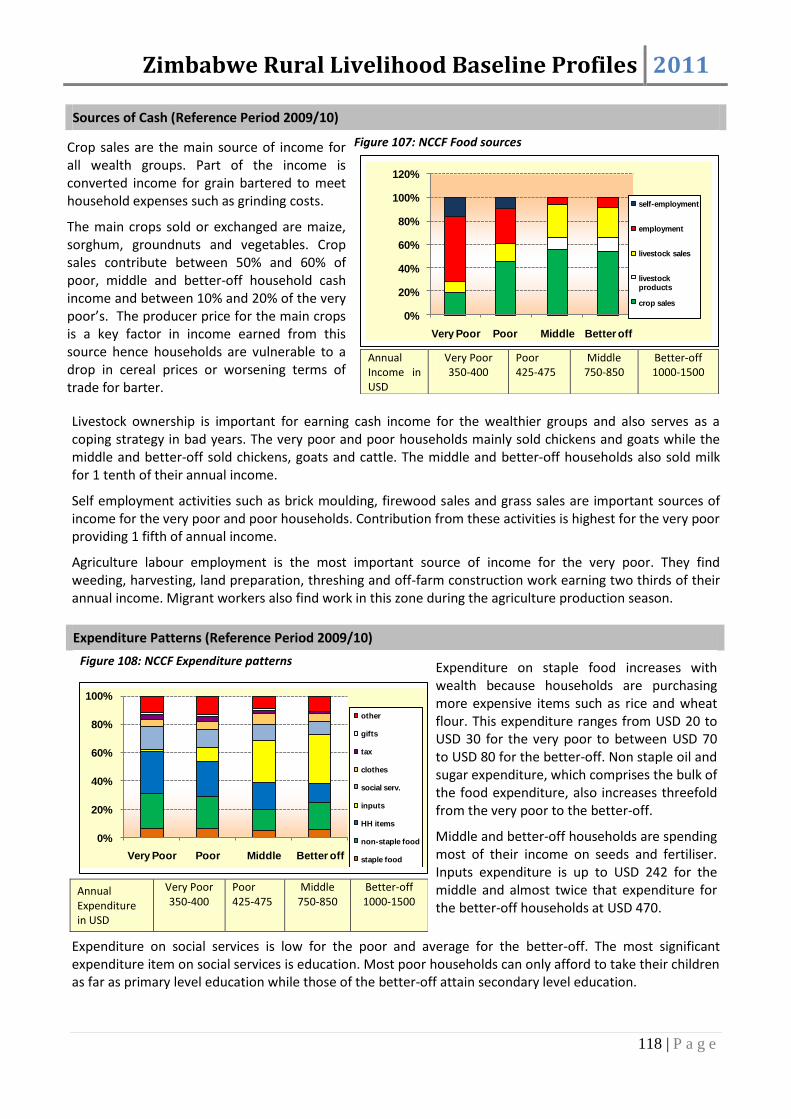
Zimbabwe Rural Livelihood Baseline Profiles 2011
118 | P a g e
Sources of Cash (Reference Period 2009/10)
Crop sales are the main source of income for all wealth groups. Part of the income is converted income for grain bartered to meet household expenses such as grinding costs.
The main crops sold or exchanged are maize, sorghum, groundnuts and vegetables. Crop sales contribute between 50% and 60% of poor, middle and better-off household cash income and between 10% and 20% of the very poor’s. The producer price for the main crops is a key factor in income earned from this source hence households are vulnerable to a drop in cereal prices or worsening terms of trade for barter.
Annual Income in USD
Very Poor 350-400
Poor 425-475
Middle 750-850
Better-off 1000-1500
Livestock ownership is important for earning cash income for the wealthier groups and also serves as a coping strategy in bad years. The very poor and poor households mainly sold chickens and goats while the middle and better-off sold chickens, goats and cattle. The middle and better-off households also sold milk for 1 tenth of their annual income.
Self employment activities such as brick moulding, firewood sales and grass sales are important sources of income for the very poor and poor households. Contribution from these activities is highest for the very poor providing 1 fifth of annual income.
Agriculture labour employment is the most important source of income for the very poor. They find weeding, harvesting, land preparation, threshing and off-farm construction work earning two thirds of their annual income. Migrant workers also find work in this zone during the agriculture production season.
Expenditure Patterns (Reference Period 2009/10)
Annual Expenditure in USD
Very Poor 350-400
Poor 425-475
Middle 750-850
Better-off 1000-1500
Expenditure on staple food increases with wealth because households are purchasing more expensive items such as rice and wheat flour. This expenditure ranges from USD 20 to USD 30 for the very poor to between USD 70 to USD 80 for the better-off. Non staple oil and sugar expenditure, which comprises the bulk of the food expenditure, also increases threefold from the very poor to the better-off.
Middle and better-off households are spending most of their income on seeds and fertiliser. Inputs expenditure is up to USD 242 for the middle and almost twice that expenditure for the better-off households at USD 470.
Expenditure on social services is low for the poor and average for the better-off. The most significant expenditure item on social services is education. Most poor households can only afford to take their children as far as primary level education while those of the better-off attain secondary level education.
0%
20%
40%
60%
80%
100%
120%
Very Poor Poor Middle Better off
self-employment
employment
livestock sales
livestock products
crop sales
0%
20%
40%
60%
80%
100%
Very Poor Poor Middle Better off
other
gifts
tax
clothes
social serv.
inputs
HH items
non-staple food
staple food
Figure 108: NCCF Expenditure patterns
Figure 107: NCCF Food sources
Zimbabwe Rural Livelihood Baseline Profiles 2011
119 | P a g e
Hazards
Chronic hazards: Proximity to Mana Pools and Matusadona National Parks has resulted in livestock diseases such as Nagana among cattle and trypanosomiasis among the human population. Periodic hazards: Dry spells and drought and animal crop destruction.
Coping Strategies
Increased sale of livestock: This is a coping strategy mainly employed by the middle and better-off households who own big herd sizes for cattle and goats.
Increased consumption of wild foods: Collection of wild foods happens in all years but in bad years the poorer and better-off households increase the collection of wild foods such as Mutiri and Tamarind.
Labour Migration: The richer households tend to migrate in search of labour to local towns and bigger towns whilst in some instances they migrate to neighbouring countries.
Use of retained seed: All wealth groups make use of retained seed for planting. The seed which is retained in bad years is mostly maize as ground nuts seed is retained in both good and bad years.
Increased gold panning: The poor households engage in gold panning. The gold is bartered or sold for cash which in turn is used to purchase various household needs.
Key Parameters for Monitoring
Table 18: NCCF Monitoring indicators
Item Key Parameter - Quantity Key Parameter – Price
Crops Maize; Sugar beans; Groundnuts
Vegetables
Maize; Sugar beans; Groundnuts
Vegetables
Livestock production Cattle; Goats; Chickens
Cow milk
Cattle; Goat price;
Cow milk
Other food and cash income Casual labour availability Labour rates (land preparation, weeding, harvesting)

Zimbabwe Rural Livelihood Baseline Profiles 2011
120 | P a g e
Eastern Highlands Prime Communal
May 201023 Main Conclusions and Implications
Crop production is the main source of income in the zone contributing 1 quarter of very poor household food access in the reference year and over two thirds for the better- off. There is potential for increased production for both consumption and trade if constraints regarding timely access to appropriate seed and fertilisers are addressed. Access to productive land is also a constraint to crop production. Ongoing support with inputs from government and non-governmental organisations must be complemented by strengthening of the MOA’s department of Extension Services (AGRITEX).
Income levels are low in the livelihood zone. Limited crop sales, banana sales, agricultural and casual labour opportunities are the main income sources for all wealth groups. Marketing opportunities are restricted by poor road conditions and market infrastructure, affecting the prices of potentially income earning commodities. Improving road conditions through public works programmes will improve access to markets.
Expenditure on staple and non staple food by the very poor and poor households accounts for on average 50% and between 30% and 40% of total household expenditure. Food purchases are the largest expenditure in the household budget. Food prices, particularly staple maize meal, require close monitoring.
Expenditure on social services is low for all wealth groups and this is partly attributed to interventions in the social services sector such as health and education. The education system is affordable for all but due to some differences in the wealth status of households, the very poor and poor are not able to progress with their education. The other challenge is lack of facilities such as electricity, highly qualified teachers, and inadequate classrooms.
The very poor and poor wealth groups managed to meet their food energy requirements in the reference year with significant amounts of food aid. Food aid provided by Plan International, Africare and ACF across the districts in the zone provided between 30% and 40% of annual consumption for these households. High dependence on food aid is indicative of extreme vulnerability and lack of productive opportunities in the livelihood zone
Zone Description
This livelihood zone is in Manicaland province and covers Nyanga, Mutasa, Chimanimani, and Chipinge districts to the east of Zimbabwe. The zone is found along the Inyangani mountain range. It has an estimated population of 213,286 settled in scattered communal lands near the border with Mozambique.
Typical of this highland topography, it has mild to high temperatures ranging between a minimum of 5 to 10 °C between June and July and a maximum of 25-30 °C in October. The area received high annual rainfall between 750 and 1400 mm between mid October and March. Several rivers that include Gairezi in the north, Mutarazi and Pungwe in the centre, along with numerous streams that flow through the zone. Water for human and animal consumption is collected from these water sources.
23
Field work for the current profile was undertaken in May 2010. The information presented refers to April 2009 to March 2010 a relatively average year by local standards (i.e. a year of average production and rural food security, when judged in the context of recent years). Provided there are no fundamental and rapid shifts in the economy, the information in this profile is expected to remain valid for approximately five years (i.e. until 2015).
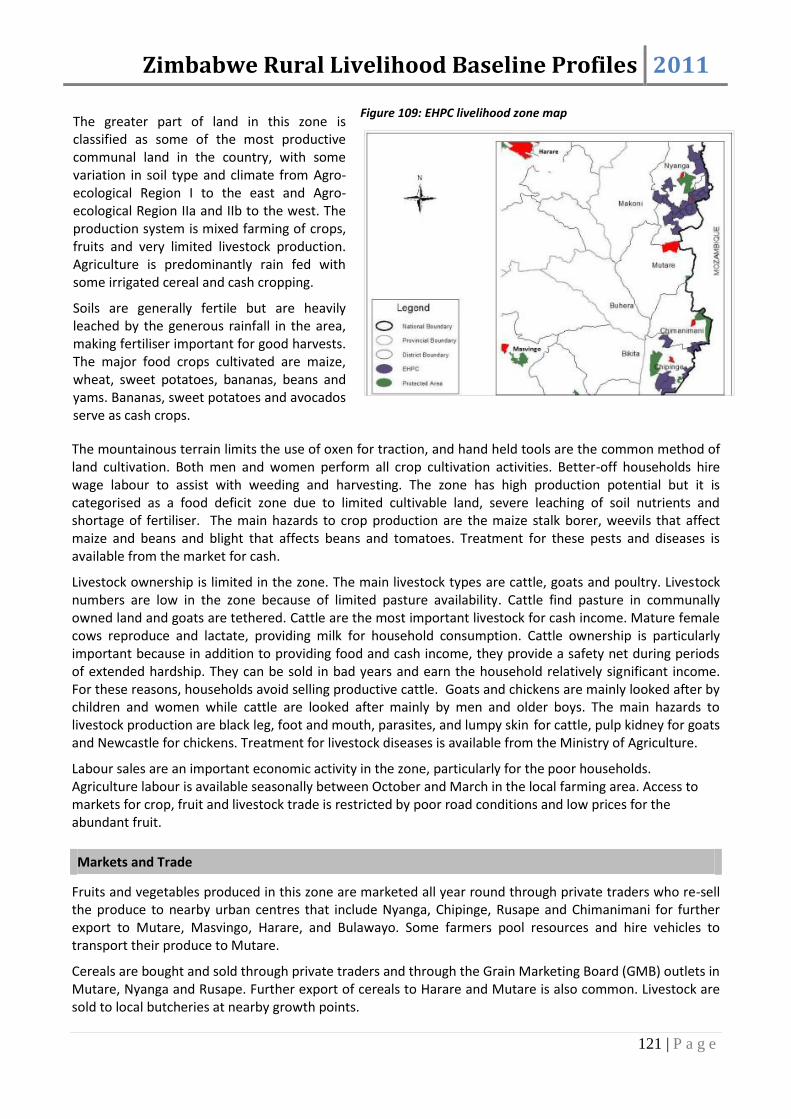
Zimbabwe Rural Livelihood Baseline Profiles 2011
121 | P a g e
The greater part of land in this zone is classified as some of the most productive communal land in the country, with some variation in soil type and climate from Agro-ecological Region I to the east and Agro-ecological Region IIa and IIb to the west. The production system is mixed farming of crops, fruits and very limited livestock production. Agriculture is predominantly rain fed with some irrigated cereal and cash cropping.
Soils are generally fertile but are heavily leached by the generous rainfall in the area, making fertiliser important for good harvests. The major food crops cultivated are maize, wheat, sweet potatoes, bananas, beans and yams. Bananas, sweet potatoes and avocados serve as cash crops.
Figure 109: EHPC livelihood zone map
The mountainous terrain limits the use of oxen for traction, and hand held tools are the common method of land cultivation. Both men and women perform all crop cultivation activities. Better-off households hire wage labour to assist with weeding and harvesting. The zone has high production potential but it is categorised as a food deficit zone due to limited cultivable land, severe leaching of soil nutrients and shortage of fertiliser. The main hazards to crop production are the maize stalk borer, weevils that affect maize and beans and blight that affects beans and tomatoes. Treatment for these pests and diseases is available from the market for cash.
Livestock ownership is limited in the zone. The main livestock types are cattle, goats and poultry. Livestock numbers are low in the zone because of limited pasture availability. Cattle find pasture in communally owned land and goats are tethered. Cattle are the most important livestock for cash income. Mature female cows reproduce and lactate, providing milk for household consumption. Cattle ownership is particularly important because in addition to providing food and cash income, they provide a safety net during periods of extended hardship. They can be sold in bad years and earn the household relatively significant income. For these reasons, households avoid selling productive cattle. Goats and chickens are mainly looked after by children and women while cattle are looked after mainly by men and older boys. The main hazards to livestock production are black leg, foot and mouth, parasites, and lumpy skin for cattle, pulp kidney for goats and Newcastle for chickens. Treatment for livestock diseases is available from the Ministry of Agriculture.
Labour sales are an important economic activity in the zone, particularly for the poor households. Agriculture labour is available seasonally between October and March in the local farming area. Access to markets for crop, fruit and livestock trade is restricted by poor road conditions and low prices for the abundant fruit.
Markets and Trade
Fruits and vegetables produced in this zone are marketed all year round through private traders who re-sell the produce to nearby urban centres that include Nyanga, Chipinge, Rusape and Chimanimani for further export to Mutare, Masvingo, Harare, and Bulawayo. Some farmers pool resources and hire vehicles to transport their produce to Mutare.
Cereals are bought and sold through private traders and through the Grain Marketing Board (GMB) outlets in Mutare, Nyanga and Rusape. Further export of cereals to Harare and Mutare is also common. Livestock are sold to local butcheries at nearby growth points.

Zimbabwe Rural Livelihood Baseline Profiles 2011
122 | P a g e
Proximity to Mozambique provides for lively cross border trade in sugar and fruit from Zimbabwe and rice and clothing from Mozambique. The local community also finds labour and employment opportunities from commercial fruit farms, commercial sawmills, large local farms and within the local community.
Marketing activities are affected by a poor road network and limited transport services which create an environment where middlemen and private buyers can offer low prices for local produce.
Seasonal Calendar
There are 2 seasons in the zone, namely the dry season from April to October, and the wet season from November to March. Land preparation activities are planned around the rainy season. Land preparation activities start in August and end in October. All crops, which include Maize, other cereals, potatoes, pulses and sweet potatoes, are planted in November. A variety of fruits are cultivated including bananas, avocadoes, peaches, oranges, pineapples, mangoes and guavas.
Consumption from own crops starts in February and March with the consumption of green maize. The main harvest starts in April and lasts until June. Soon after harvest, a second crop of sweet potatoes is planted and is ready for harvest in November and December as the cropping seasons starts again. Although activities such as ploughing and planting are done by both men and women, women are more involved in planting, while men do more of the land preparation. During the agricultural year, labour opportunities in land preparation, planting, weeding and harvest are available.
The meagre livestock production season begins with the onset of rains. Livestock births and milk production commences in late December lasting until February. Livestock sales, though very limited are ongoing through the year as large expenses for education, and health demand increased income for the household.
Food purchases start from September and intensify towards November up till February when food stocks have been depleted. The second potato crop harvested at the start of the production year is important for easing the severity of food shortages during the lean season.
Figure 110: EHPC Seasonal Calendar
Apr May Jun Jul Aug Sep Oct Nov Dec Jan Feb Mar
Legend
cattle onfarm
Land Preparation
Planting
Weeding
Maize
Sweet Potato
Beans
Bananas
Livestock sa les
Livestock heats and births
Mi lk production
Other
Lean season
Food Purchases
Local labour
Off farm
shoats
Wet Season
planting cons. green harvest
Dry Season
cattle and shoats

Zimbabwe Rural Livelihood Baseline Profiles 2011
123 | P a g e
Wealth Breakdown
Figure 111: EHPC Wealth group characteristics
There are 4 wealth groups in the livelihood zone, namely the very poor (vanoshayisisa), the poor (vanoshaya), the middle (varinani) and the better-off (vanowana). Very poor and poor households comprise between 20% and 30%, and 35% to 45% respectively. The middle are between 20% and 30% while the better-off comprise 10% of households.
The main determinants of wealth are livestock holdings and the amount of land cultivated. Wealthier households own large numbers of cattle and goats while the poorer households typically own very small numbers of livestock – usually goats and chickens. Livestock ownership is a source of both food and cash income. Cattle sold by only the better-off households provide the largest income from livestock. Ownership of cattle, more importantly, is a form of insurance providing security from the worst effects of a bad year.
Ownership of land is not a determinant of wealth as land allocation is done equally regardless of wealth status. The amount of land for cultivation in the zone is generally limited. The wealthier households cultivate 2 to 3 times more land compared to the very poor because of oxen ownership. Use of draught power is limited because of the terrain, but it still makes a difference to household land utilisation. Additionally, middle and better-off households hire labourers to assist with crop cultivation. Poorer households use hand held tools for cultivation and spend time during critical farming periods working in the fields of the better-off.
Household size increases with wealth from 5 among the very poor households to 7 among the better-off. Very poor and better-off households each have 1 child under 6 years old compared to the poor and middle who have 2 children under 6 years old. The better-off have the highest number of adults capable of working, and also children between 6 and 18 years old. This provides them with more household labour compared to the other wealth groups.
Figure 112: EHPC HH sizes
Sources of Food (Reference Period 2009/10)
The main food crops grown by all wealth groups in this zone are maize, yams, bananas and sweet potatoes. Maize is the main staple and most land is allocated to its production. Production per unit area cultivated increases with wealth groups due to use of improved seed and fertilisers by the better-off households. Own
Cattle Goats Chicken
Very Poor 5 - 7 0.5 - 1.5
Maize, Sweet
Potato,Yams,
Vegetables, Fruits
0 2-4 5-7
Poor 5 - 7 0.5 - 1.5
Maize, Sweet
Potato,Yams,
Vegetables, Fruits
0 2-4 5-7
Middle 5 - 7 1- 3
Maize, Beans, Wheat,
Sweet Potato,Yams,
Groundnuts,
Vegetables, Fruits
0- 3 3-7 8-15 0-1 Ploughs
Better Off 6 - 8 1 - 5
Maize, Beans, Wheat,
Sweet Potato,Yams,
Groundnuts,
Vegetables, Fruits
4- 8 3-7 10-20 0-1 Ploughs
Figure 14.3 Wealth Groups Characteristics
Livestock Holding
HH size
Land area
cultivated
(acres)
Crops cultivated Other Assets
11%
36%
28%
25%
% of population
0
1
2
3
4
5
6
7
8
Very Poor Poor Middle Better off
HH Size
# Adults
Under 6 Yrs
6-18 Yr Olds
# in School

Zimbabwe Rural Livelihood Baseline Profiles 2011
124 | P a g e
crop production provides for three quarters of better-off annual food consumption, two thirds of the middle’s and just less than 1 third of the poor and very poor’s.
Food purchases are an important source of food for all wealth groups increasing with wealth. Most of the food is purchased during the October to February lean period. Staple food purchases decrease with wealth from between 10% and 15% for the very poor and poor to half that amount for the better-off. However, better-off households purchase more non staple sugar and oil through the year.
Labour exchange is an important food source for the poorer households. Poorer households are employed locally and a smaller proportion migrates to Mozambique for agriculture labour opportunities. Middle households also receive food income from agriculture labour in Mozambique. Very poor and poor households received one fifth of their food from labour exchange.
In the graph, food access is expressed as a percentage of minimum food requirements, taken as an average food energy intake of 2100 kcals per person per day.
Social support networks are strong in the zone and as such, the poorer households receive gifts from the wealthier households especially after the main harvest. In the reference year, middle and better-off households received remittances typically 1 to 2 times over the year for just less than 5 %of their annual consumption. Most of the food provided as remittances was sugar and cooking oil. Food aid distributed by non-governmental organisations for 6 months between October and March earned the very poor and poor beneficiary households between 30% and 40% of the consumption needs. The food aid basket/ person/ month was comprised of 10kg cereal and 0.6 litres of cooking oil.
In the graph, food access is expressed as a percentage of minimum food requirements, taken as an average food energy intake of 2100 kcals per person per day.
Cereals are providing the majority of household food needs. The proportion of cereal consumption in the household diet decreases with wealth as total food consumption increases, ranging from 75% for the very poor and poor to an average 65% for the better-off.
Pulses cooked in oil are the main dietary supplement providing on average 3% of energy needs for all wealth groups. Oil and sugar are the common non staple foods. Consumption of these food groups is correlated with wealth, each providing between 5% and 1% respectively for the poorer wealth groups, and up to 7 %each for the better-off.
0%
20%
40%
60%
80%
100%
120%
140%
Very Poor Poor Middle Better Off
other (gifts, wild food, fish etc)food aid
purchase
payment in kind
livestock products
0%
20%
40%
60%
80%
100%
120%
140%
Very Poor Poor Middle Better Off
tubers
fruit and vegetablessugar
oil
pulses
milk
meat
cereals
Figure 113: EHPC Food sources
Figure 114: EHPC Food groups

Zimbabwe Rural Livelihood Baseline Profiles 2011
125 | P a g e
Fruit and vegetable consumption is relatively high in the zone averaging 5% for the poor and up to 10% for the better-off. Very poor and poor wealth groups consume 6 food groups, the middle consume 7 and the better-off 8 food groups.
Sources of Cash (Reference Period 2009/10)
Employment and casual labour are a significant source of income for all households. The poor and very poor households are employed by wealthier households during the agriculture season and earn between 40% and 45% of their annual income respectively.
The better-off also earn income from agriculture activities when they are hired to plough the land of households without traction power.
Remittances from relatives and friends employed in nearby urban areas, on commercial farms or in neighbouring Mozambique are the main forms of employment income for the better-off, earning these households one third of their annual income.
Annual Income in USD
Very Poor 130-160
Poor 175-225
Middle 400-460
Better-off 900-1000
Sale of fruit crops is another important source of income for all wealth groups, with the poorer households getting a significant proportion mainly from the sale of bananas and vegetables. The middle and better-off households in addition to fruit sales also trade cereals. Fruit and crop sales contribute between 25% and 30% of total income for both very poor and better-off households.
Self-employment activities such as crafts, sale of construction materials and firewood, gold panning and beer brewing are important sources of income especially for the very poor and poor households, providing between 15% and 20% of their income.
All the wealth groups trade livestock. The better-off mostly trade cattle and goats for 1 fifth of their income. Poor and middle wealth groups earn most of their income from goat and poultry sales. The very poor sell poultry for an average 5 % of annual income.
0%
20%
40%
60%
80%
100%
120%
Very Poor Poor Middle Better off
self-employment
employment
livestock sales
crop sales
Figure 115: EHPC Cash income sources

Zimbabwe Rural Livelihood Baseline Profiles 2011
126 | P a g e
Expenditure Patterns (Reference Period 2009/10)
Figure 116: EHPC Expenditure patterns
Annual Expenditure in USD
Very Poor
130-160
Poor 175-225
Middle 400-460
Better-off 900-1000
Staple food expenditure decreases with wealth from between 25% and 35% of very poor total expenditure and just less than 10% for the better-off. The main staple purchased is maize. The better-off purchase small amounts of rice and wheat flour to supplement their staple consumption.
Non staple food expenditure on oil and sugar increases with wealth. For the very poor, poor and middle households, income spent on non staple food is less than staple food expenditure. However, for the better-off households, non staple food expenditure is almost double that of staple foods. Combined expenditure on staple and non staple food comprises 50% of very poor households’ total expenditure and 25% of the better-off’s.
Expenditure on household items as a percentage of total expenditure decreases with wealth, though in absolute amounts this expenditure increases with wealth. The main household expenditure items are grinding costs, salt, utensils, tea and kerosene/candles. These items cost the very poor between USD 66 and USD 75, equivalent to half of their total expenditure and USD 135 for the better-off, equivalent to an average 15% of total expenditure.
Expenditure on social services by the poor and very poor households is very low at less than 5 %of very poor total expenditure and almost 20% of the poor’s. Education costs that include teacher incentives, stationery and uniforms comprise the largest form of social service costs. Better-off households spend between USD 180 and USD 200 on social services, almost 30 times more compared to the very poor.
The middle and the better-off households have expenditure on inputs, mainly seed and some fertiliser bought from the local market and GMB. Poorer households do not spend money on inputs. Seed and fertiliser distributions enabled the very poor to enhance production without any expenditure on inputs. The better-off spent up to USD 130 on inputs over the reference year.
‘Other’ expenditure includes transport, beer, gifts, festivals and community obligations. Only middle and better-off households are spending on discretionary items.
Hazards
Chronic hazards: Fluctuation of cereal, banana and vegetable prices are a chronic hazard. HIV and AIDS and malaria are chronic health problems affecting productivity each year in the zone. Siltation of water sources for irrigation is another chronic problem limiting crop output.
Periodic hazards: Over a decade, roughly 1 to 3 years during the 10 year period will be affected by extreme climate conditions affecting harvests. Hazards include frost, insufficient rain, or cyclones as well as landslides. Tick borne diseases and internal parasites affect livestock. Another hazard is forest fires (and deforestation) which can lead to reduced water flow in important perennial rivers
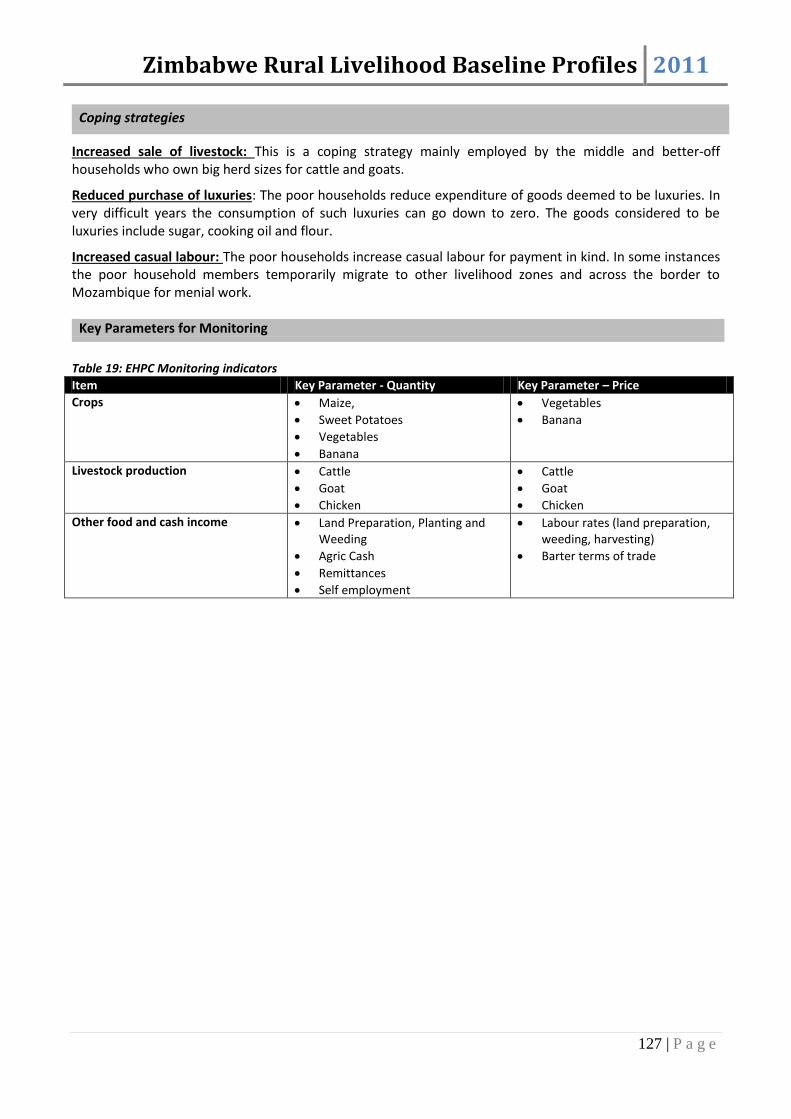
Zimbabwe Rural Livelihood Baseline Profiles 2011
127 | P a g e
Coping strategies
Increased sale of livestock: This is a coping strategy mainly employed by the middle and better-off households who own big herd sizes for cattle and goats.
Reduced purchase of luxuries: The poor households reduce expenditure of goods deemed to be luxuries. In very difficult years the consumption of such luxuries can go down to zero. The goods considered to be luxuries include sugar, cooking oil and flour.
Increased casual labour: The poor households increase casual labour for payment in kind. In some instances the poor household members temporarily migrate to other livelihood zones and across the border to Mozambique for menial work.
Key Parameters for Monitoring
Table 19: EHPC Monitoring indicators
Item Key Parameter - Quantity Key Parameter – Price
Crops Maize,
Sweet Potatoes
Vegetables
Banana
Vegetables
Banana
Livestock production Cattle
Goat
Chicken
Cattle
Goat
Chicken
Other food and cash income Land Preparation, Planting and Weeding
Agric Cash
Remittances
Self employment
Labour rates (land preparation, weeding, harvesting)
Barter terms of trade
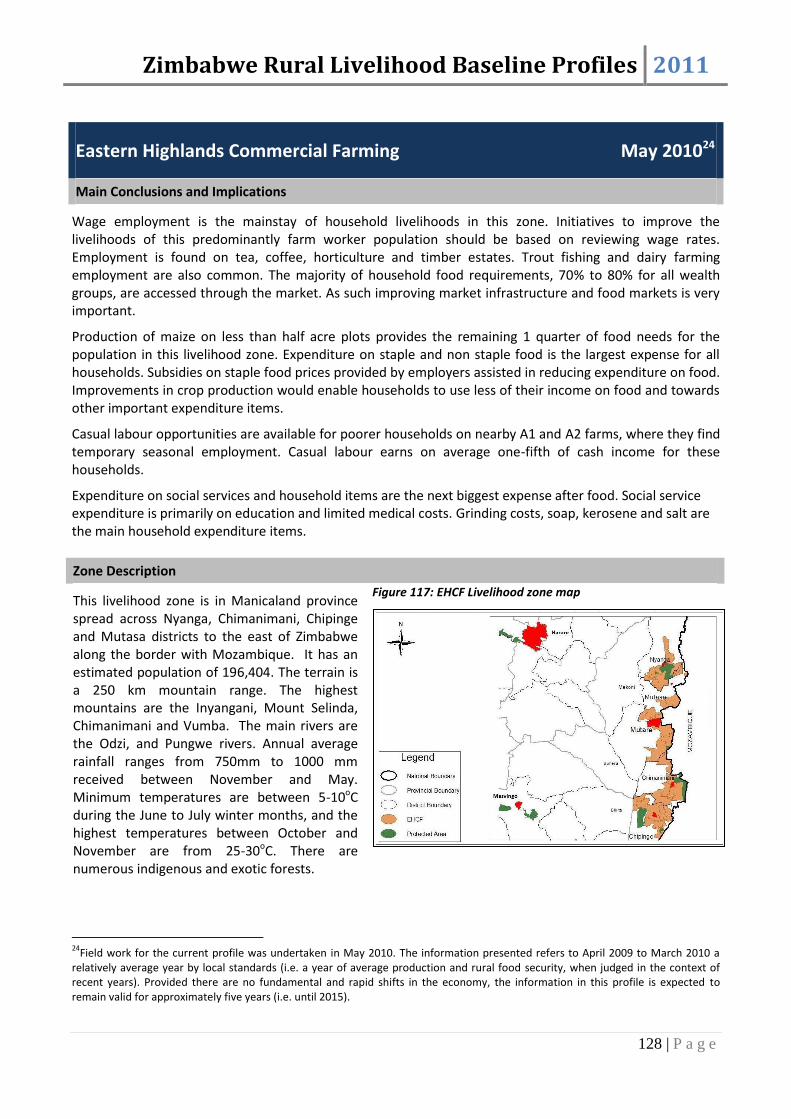
Zimbabwe Rural Livelihood Baseline Profiles 2011
128 | P a g e
Eastern Highlands Commercial Farming May 201024
Main Conclusions and Implications
Wage employment is the mainstay of household livelihoods in this zone. Initiatives to improve the livelihoods of this predominantly farm worker population should be based on reviewing wage rates. Employment is found on tea, coffee, horticulture and timber estates. Trout fishing and dairy farming employment are also common. The majority of household food requirements, 70% to 80% for all wealth groups, are accessed through the market. As such improving market infrastructure and food markets is very important.
Production of maize on less than half acre plots provides the remaining 1 quarter of food needs for the population in this livelihood zone. Expenditure on staple and non staple food is the largest expense for all households. Subsidies on staple food prices provided by employers assisted in reducing expenditure on food. Improvements in crop production would enable households to use less of their income on food and towards other important expenditure items.
Casual labour opportunities are available for poorer households on nearby A1 and A2 farms, where they find temporary seasonal employment. Casual labour earns on average one-fifth of cash income for these households.
Expenditure on social services and household items are the next biggest expense after food. Social service expenditure is primarily on education and limited medical costs. Grinding costs, soap, kerosene and salt are the main household expenditure items.
Zone Description
This livelihood zone is in Manicaland province spread across Nyanga, Chimanimani, Chipinge and Mutasa districts to the east of Zimbabwe along the border with Mozambique. It has an estimated population of 196,404. The terrain is a 250 km mountain range. The highest mountains are the Inyangani, Mount Selinda, Chimanimani and Vumba. The main rivers are the Odzi, and Pungwe rivers. Annual average rainfall ranges from 750mm to 1000 mm received between November and May. Minimum temperatures are between 5-10oC during the June to July winter months, and the highest temperatures between October and November are from 25-30oC. There are numerous indigenous and exotic forests.
Figure 117: EHCF Livelihood zone map
24
Field work for the current profile was undertaken in May 2010. The information presented refers to April 2009 to March 2010 a relatively average year by local standards (i.e. a year of average production and rural food security, when judged in the context of recent years). Provided there are no fundamental and rapid shifts in the economy, the information in this profile is expected to remain valid for approximately five years (i.e. until 2015).

Zimbabwe Rural Livelihood Baseline Profiles 2011
129 | P a g e
The agro-ecological region is a combination of Agro-ecological Region I, IIa and IIb. There are a variety of commercial farming estates that include tea and coffee production and processing in Mutare and Chipinge, timber production in the forests of Nyanga and Chimanimani, horticulture production of flowers and vegetables, fruit growing, as well as fish farming and dairy production. Most of the products cultivated in the zone are for international markets in Europe, Malaysia and South Africa.
Fertile soils provide for good maize, yam and sweet potato yields produced for consumption. Crop production is limited by poor access to land. Most households cultivate just less than half an acre. Hand held tools are used for cultivation. Chickens are the main type of livestock owned. Other economic activities are
casual labour opportunities performing weeding, pruning, and thinning on estates and plantations.
Markets and Trade
Staple maize purchases from nearby farms are the main local marketing activity in the zone. Maize is purchased all year round. Labour markets are all local on the commercial farms. Local marketing activities are constrained by bad roads
Seasonal Calendar
The main livelihood activity in the livelihood zone is employment on timber producing forests, tea and coffee plantations and fruit plantations. Employment is all year round on the plantations.
Own crop production activities begin with planting of Irish potatoes in October, followed by maize and sweet potatoes in November and December. Beans are planted late in the rainy season in January and February. Various agriculture-related casual labour opportunities are available between December and July when commercial agriculture production are at their peak. Purchases of food are done throughout the year with a marginal decline during own crop harvest between April and July.
Wealth Breakdown
3 wealth groups were identified namely 63% poor (vanoshaya), 25% middle (varinani) and 12% better-off (vanowana). The main determinant of wealth is skill level, position within the commercial estates and the commensurate wages.
Apr May Jun Jul Aug Sep Oct Nov Dec Jan Feb Mar
Dry Season
Legend
weeding
Land Preparation
Transplanting
Nursery
Weeding
Fireguards
Harvesting
Weeding
Pruning
Ferti l i sation
Spraying
Picking
Process ing
Nursery
Transplanting
Pruning
Stone Harvest Pomes Harvest
Nursery
Transplanting
Fertilisation
Weeding
Harvesting
Maize
Irish Potatoes
Sweet Potatoes
Beans
Weeding
Harvesting
Employment
Casual labour
Food Purchases
TEA and COFFEE
Stone and Pome
Bananas
FRUITS
Own Crop Production
Wet Season
Off farm planting cons. green harvest
FORESTS
Figure 118: EHCF Seasonal Calendar

Zimbabwe Rural Livelihood Baseline Profiles 2011
130 | P a g e
Poor households earn on average USD 55 per month, the middle earn between USD 65 and USD 75 monthly and the better-off earn on average between USD 80 and USD 100 monthly.
Land is not owned in the zone. Employers provide each household on average 0.4 acres to farm workers for the duration of their employment. There is no livestock ownership.
Figure 119: EHCF Wealth group Characteristics
Figure 120: EHCF HH sizes
Household demographics are the same across the wealth groups. Household size is between 5 and 7 across the different wealth groups.
The number of adults capable of working average 2 across all households. Households in this zone have one child under 6 years old, 2 between 6 and 18 years old and 2 children in school.
Sources of Food (Reference Period 2009/10)
The main source of food for all wealth groups are food purchases. Food purchases contribute between 70% and 80% of annual consumption for the poor and middle households and between 75% and 85% for the better-off. Maize staple is the main food purchase providing up to two-thirds of annual consumption. Wheat flour and rice complement maize staple purchases. Non staple kapenta, sugar and oil are the main dietary supplements purchased.
Own crop production of maize, Irish potatoes, sweet potatoes, beans and yams provide one fifth of annual energy requirements for all households. Payment in kind is a food source for the poor and middle wealth groups providing between 10% and 15% of poor household consumption and less than 5% of the middle’s.
In the graph, food access is expressed as a percentage of minimum food requirements, taken as an average food energy intake of 2100 kcals per person per day.
0
1
2
3
4
5
6
Poor Middle Better off
HH Size
# Adults
Under 6 Yrs
6-18 Yr Olds
# in School
0%
20%
40%
60%
80%
100%
120%
140%
Very Poor Poor Middle Better Off
other (gifts, wild food, fish etc)food aid
purchase
payment in kind
livestock products
Figure 121: EHCF Food sources

Zimbabwe Rural Livelihood Baseline Profiles 2011
131 | P a g e
Cereals are the main food consumed comprising between 80% and 90% of household consumption. Oil and sugar are the main dietary supplements. Oil provides between 5% and 10% of consumption for the poor and middle and between 8% and 15% for the better-off.
Fruits, vegetables, meat and tubers provide on average 2 % of consumption for all wealth groups. All wealth groups consume 6 food groups.
Sources of Cash (Reference Period 2009/10)
Employment on the commercial estates is the only source of income for all wealth groups. Employment opportunities are primarily full time, though the poor seek seasonal employment opportunities.
Annual Income in USD
Poor 650-700
Middle 800-850
Better-off 1000-1200
Expenditure Patterns (Reference Period 2009/10)
Annual Expenditure (USD)
Poor 650-700
Middle 800-850
Better-off 1000-1200
The combined expenditure on staple food and non staple food for all wealth groups comprises between 40% and 50% of total expenditure for all wealth groups.
Household expenditure items that include grinding costs, soap, kerosene and salt comprise 20% of poor household expenditure and between 10% and 20% for the middle and better-off.
Social service expenditure mainly on education costs is significant in the household budget. Social service expenditure increases with wealth from between USD 50 and USD 60 among the poor, to just more than double that among the better-off.
Discretionary expenditure is significant across the wealth groups. Discretionary expenditure includes transport, beer, gifts, airtime and cigarettes. Transport is the largest of the discretionary expenditure because the population in this zone commutes regularly to Nyanga and Mutare to access services.
0%
20%
40%
60%
80%
100%
120%
140%
Very Poor Poor Middle Better Off
tubers
fruit and vegetablessugar
oil
pulses
milk
meat
cereals
0%
20%
40%
60%
80%
100%
120%
Poor Middle Better off
employment
0%
20%
40%
60%
80%
100%
Poor Middle Better off
other
gifts
tax
social serv.
inputs
water
HH items
non-staple foodstaple food
Figure 122: EHCF Food groups
Figure 123: EHCF Cash income sources
Figure 124: EHCF Expenditure patterns
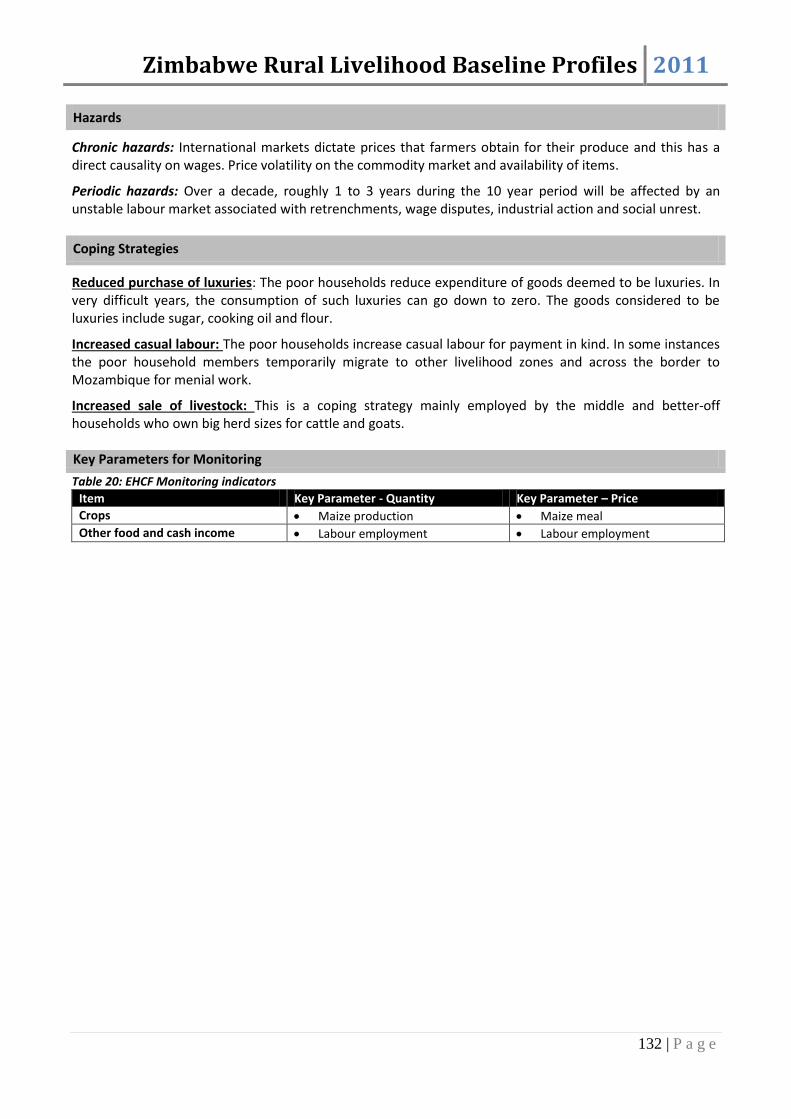
Zimbabwe Rural Livelihood Baseline Profiles 2011
132 | P a g e
Hazards
Chronic hazards: International markets dictate prices that farmers obtain for their produce and this has a direct causality on wages. Price volatility on the commodity market and availability of items.
Periodic hazards: Over a decade, roughly 1 to 3 years during the 10 year period will be affected by an unstable labour market associated with retrenchments, wage disputes, industrial action and social unrest.
Coping Strategies
Reduced purchase of luxuries: The poor households reduce expenditure of goods deemed to be luxuries. In very difficult years, the consumption of such luxuries can go down to zero. The goods considered to be luxuries include sugar, cooking oil and flour.
Increased casual labour: The poor households increase casual labour for payment in kind. In some instances the poor household members temporarily migrate to other livelihood zones and across the border to Mozambique for menial work.
Increased sale of livestock: This is a coping strategy mainly employed by the middle and better-off households who own big herd sizes for cattle and goats. Key Parameters for Monitoring
Table 20: EHCF Monitoring indicators
Item Key Parameter - Quantity Key Parameter – Price
Crops Maize production Maize meal
Other food and cash income Labour employment Labour employment

Zimbabwe Rural Livelihood Baseline Profiles 2011
133 | P a g e
Irrigated Commercial Sugar and Fruit Farming January 201125
Main Conclusions and Implications
Wage employment is the main source of household livelihoods in this zone. Livelihoods revolve around sugar production in the zone and employment is found on resettled and traditional sugar estates which include A1 and A2 farmers and the traditional sugar production estates which include Tongaat Hullets. Annual food requirements for all wealth groups are attained through markets as the population does not have access to land for own crop production. As such, improving market infrastructure and food markets is very important. To improve the livelihoods of this predominantly farm worker population, efforts should be made on reviewing wage rates for the small-scale resettled farmers and estate employees.
Workers are employed as seasonal or permanent staff. Seasonal staff is called upon during the peak demand periods for cane cutting and planting activities whilst the permanent employees are mostly employed at the mill which runs for 11 months of the year.
Basic infrastructure in the zone includes schools, clinics, irrigation systems, housing, water and sanitation facilities which are offered by the employers. Estate worker’s access piped and treated water whilst A1 and A2 employees access untreated water from irrigation canals. The source of water for drinking and domestic use is the same in both the wet and dry seasons. Generally there is no livestock in the zone mostly because people are employed and have small plots in which only vegetable production can be done hence limited contribution of own crop production.
The main food source in the zone is purchases which are done on a monthly basis from market places in and around Chiredzi town. Access to markets where the general population accesses food continues to be important. There is need to ensure that the market chain to the zone is not affected as this could trigger price changes in grain which is accessed at the market. The market system should thus be as open as possible to avoid any bottlenecks as these could affect access to food in the zone.
Expenditure on social services is low for the very poor, poor and middle wealth groups whilst it is high for the better- off groups. Education had the highest expenditure under social services which shows the importance and value education is getting.
Zone Description
This zone lies in the south eastern lowveld of Zimbabwe, covering part of Chiredzi District, with an estimated population of 86,783. The zone is an arid region categorised as Agro-ecological Region V and is dominated by mopane trees and short grasses locally known as mbavani grass.
Acacia species and bush shrubs are also found in the zone. The soils are loamy sands and sandy loams which are reddish brown in colour and are generally fertile with moderate production potential for cotton and small grains.
Figure 125: ICSF Livelihood zone map
25
Field work for the current profile was undertaken in January 2011. The information presented refers to April 2011 to March 2012 a relatively average year by local standards (i.e. a year of average production and rural food security, when judged in the context of recent years). Provided there are no fundamental and rapid shifts in the economy, the information in this profile is expected to remain valid for approximately five years (i.e. until 2017).

Zimbabwe Rural Livelihood Baseline Profiles 2011
134 | P a g e
Rainfall averages 450-650 mm per annum in the summer, from November to March. Mean annual temperature ranges from 17-23oCelsius, with average summer temperatures ranging from 32-40oCelsius.
The Chiredzi river is the main river which passes through the zone, providing water for irrigation in the estates. Chiredzi is the main market for all the basic commodities and there is a major tarmac road which stretches from Ngundu to Mutare. The zone includes Hippo Valley and Triangle Sugar Estates which provide some employment opportunities for households in the zone.
Livelihoods in the zone are based on wage employment at the estates. There are 4 wealth groups in the zone which covers both resettled farmers and traditional estates. Sugarcane production relies heavily on irrigation as the zone experiences rainfall of about 350 to 450mm. Water is moved from rivers such as Chiredzi river through canals to facilitate flood irrigation
Markets and Trade
This livelihood zone is characterised by a relatively good road network however some areas are far from Chiredzi town. The good road network allows easy access to the Chiredzi market where grain is traded. Grain is imported into the zone from locations as far as Gokwe, Chipinge and Banket. Grain imports are done all year round in the zone.
The labour market is supplied from within the zone and from areas such as Chipinge, Zaka, Chibi and Mwenezi. Labourers migrate from the mentioned areas and reside in the zone during the peak agriculture demand periods. The main employment activities include weeding and harvesting of cane.
Seasonal Calendar
Sugar cane production is
dependent on irrigation and as can be seen, irrigation is done all year round. General labourers are employed on a seasonal basis and the activities they conduct include planting, weeding, cutting and trashing of cane. The mill runs for 11 months of the year and closes in February for service and repairs. During that period there are no cane cutting and trashing activities. The seasonal workers are laid off during this period. Households engage in off agriculture season activities which include mat making. The mats are made from reeds and sold outside the zone. The self-employment activities are conducted between March and November.
Wealth Breakdown
4 wealth groups 26were identified namely very poor (vanoshayisisa) 13%, poor (vanoshaya) – 42%, middle (varinani) – 23% and the better-off (vanowana) – 13%. The main determinant of wealth is skill level, position
26 Four wealth groups were identified by the key informants for the both estate and resettled farmers namely the very poor
(vanoshaisisa), the poor (Vanoshaya), the middle (varinani) and the better-off (Vanowana). Upon comparison of the wealth groups across the zone it was noted that the poor for the estates matched the middle for the A1 and A2 farmers and likewise the middle for the estate workers matched the better-off for the resettled farmers.
Figure 126: ICSF Seasonal Calendar

Zimbabwe Rural Livelihood Baseline Profiles 2011
135 | P a g e
within the commercial estates and the commensurate wages. Very poor households earn on average USD 90, the poor between USD 130 and 165 per month, the middle earn between USD 170 and USD 290 monthly and the better-off earn on average between USD 1000 and USD 1500 monthly.
Figure 127: ICSF Wealth group characteristics
The very poor have a household size of 4 members which are 2 adults, 1 child under 6 and 1 child between 6 and 18 years. The poor, middle and better-off have households each have 6 members which are have similar breakdown of 2 adults, 2 under 6 and 2 to 6 to 18 children.
All children of school going age were attending school. The very poor had one child of school going age whilst the other groups had 2 children of school going age.
Figure 128: ICSF HH Sizes
0
1
2
3
4
5
6
7
Very Poor Poor Middle Better off
HH Size
# Adults
Under 6 Yrs
6-18 Yr Olds
# in School
Sources of Food (Reference Period 2009/10)
The food source in this wage dependent zone is mostly purchases. The food purchased however differed by wealth group. The very poor and poor groups spent 37% and 38% of their income on staple purchases whilst the middle and better-off spent 26% and 7% respectively on staple. The staple purchased was mostly maize, maize meal, flour and rice. The richer groups purchased beans and milk which were not purchased by the poor groups. All wealth groups received sugar gifts from their employers as reward for their work. The sugar was received as gifts not as wage payment by workers at the estates; this was however not received by resettled farmers’ employees.
Figure 129: ICSF Food sources
In the graph, food access is expressed as a percentage of minimum food requirements, taken as an average food energy intake of 2100 kcals per person per day.
HH size
Income
gradesIncome Grades
Annual
income
Very Poor 3-4 70 - 110 Grade A for A2 farmers 1116
Poor 5-6 130 - 165Grade A1-A3 estates
and Grade B for A2 1912
Middle 5-6 170 - 290
Grade B1-B3 for
Estates and Grade C
for A2 farmers
2921
Better Off 5-6 1000 - 1500Grade C1 – C5 for
Estates 15875
Wealth Groups Characteristics
20%
25%
42%
13%
% of population
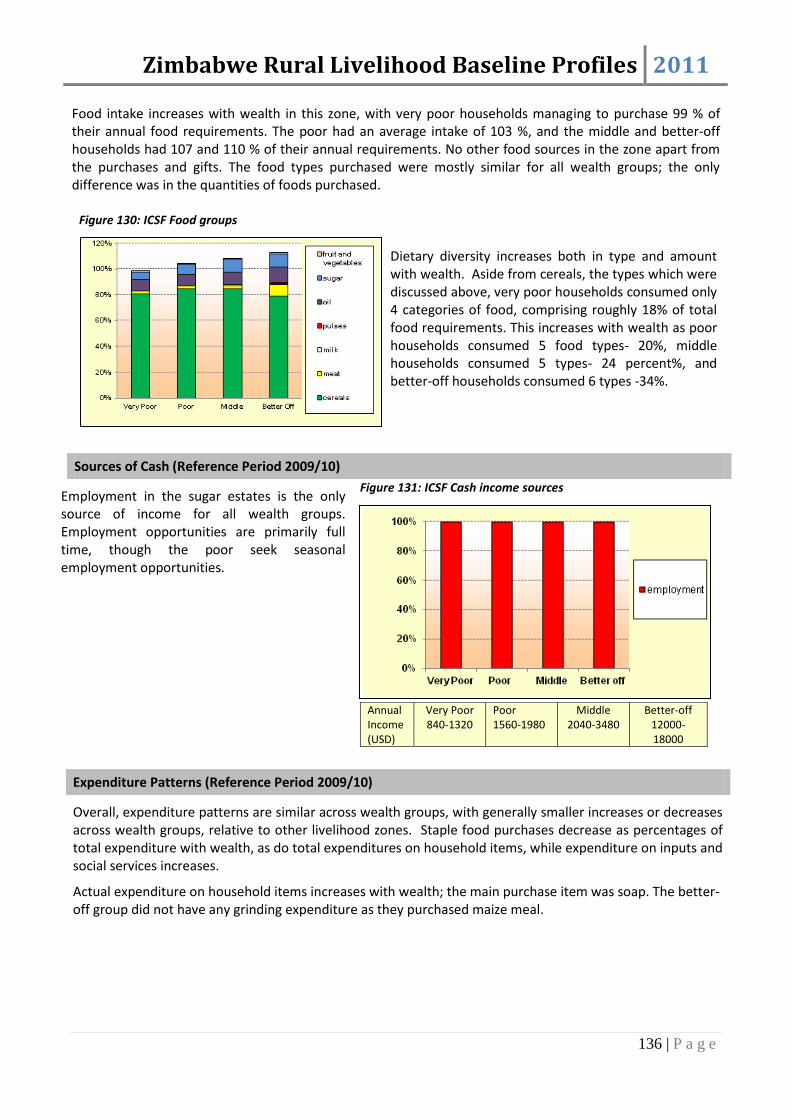
Zimbabwe Rural Livelihood Baseline Profiles 2011
136 | P a g e
Food intake increases with wealth in this zone, with very poor households managing to purchase 99 % of their annual food requirements. The poor had an average intake of 103 %, and the middle and better-off households had 107 and 110 % of their annual requirements. No other food sources in the zone apart from the purchases and gifts. The food types purchased were mostly similar for all wealth groups; the only difference was in the quantities of foods purchased.
Figure 130: ICSF Food groups
Dietary diversity increases both in type and amount with wealth. Aside from cereals, the types which were discussed above, very poor households consumed only 4 categories of food, comprising roughly 18% of total food requirements. This increases with wealth as poor households consumed 5 food types- 20%, middle households consumed 5 types- 24 percent%, and better-off households consumed 6 types -34%.
Sources of Cash (Reference Period 2009/10)
Employment in the sugar estates is the only source of income for all wealth groups. Employment opportunities are primarily full time, though the poor seek seasonal employment opportunities.
Figure 131: ICSF Cash income sources
Annual Income (USD)
Very Poor 840-1320
Poor 1560-1980
Middle 2040-3480
Better-off 12000-18000
Expenditure Patterns (Reference Period 2009/10)
Overall, expenditure patterns are similar across wealth groups, with generally smaller increases or decreases across wealth groups, relative to other livelihood zones. Staple food purchases decrease as percentages of total expenditure with wealth, as do total expenditures on household items, while expenditure on inputs and social services increases.
Actual expenditure on household items increases with wealth; the main purchase item was soap. The better-off group did not have any grinding expenditure as they purchased maize meal.

Zimbabwe Rural Livelihood Baseline Profiles 2011
137 | P a g e
Figure 132: ICSF Expenditure patterns
Annual Expenditure (USD)
Very Poor 840-1320
Poor 1560-1980
Middle 2040-3480
Better-off 12000-18000
The cost of paraffin for lighting energy was generally similar across all wealth groups.
The poor, middle and better-off had some amount going to tax which the very poor did not have. For the better-off, taxes consumed 29% of their annual income. Pesticides were the only inputs purchased by the very poor, while the poor and middle each had 6 and 9 % of their income going towards taxes.
Expenditure on education was the main expenditure item in the social services category. Expenditure on items such as transport, tobacco, alcohol and mobile phone airtime also increased by wealth group.
Hazards
Chronic hazards: Droughts are the main hazard which affects sugar cane production. The droughts indirectly affect water levels in the reservoirs such as Mutirikwi Dam, Lake Kyle, Bangala and Siye Dams which supply water for irrigation. The lowering of water levels in these reservoirs poses threats to the livelihoods of people in the zone particularly the seasonal staff.
Periodic hazards: Market destabilisation occurs when droughts are experienced and grain is in short supply. This tends to negatively influence cereal prices, therefore affecting purchases of grain which is the main source of food.
Coping Strategies
Reduced remittances: The zone depends on employment and is a net remitter outside the zone. All wealth groups often reduce remittances to their rural homes
Reduced purchase of luxuries: The poor households reduce expenditure of goods deemed to be luxuries. In very difficult years, the consumption of such luxuries can go down to zero. The goods considered to be luxuries include sugar, cooking oil and flour Key Parameters for Monitoring
Table 21: ICSF Monitoring indicators
Item Key Parameter - Quantity Key Parameter – Price
Other food and cash income Labour employment Labour employment

Zimbabwe Rural Livelihood Baseline Profiles 2011
138 | P a g e
Highland Prime Cereal and Cash Crop Resettlement Farming October 201027
Main Conclusions and Implications
Crop production is a main source of income and a key to livelihood success in the zone. Own crop production contributed 62% of the very poor households’ food access in the reference year and 96% for the better-off. There is great potential for increased production for all wealth groups through providing support with draught power and access to seed and fertilisers. Extension services and monitoring of agriculture interventions and activities should be strengthened through support to the MOA’s Department of Extension Services (AGRITEX). The level of production in this zone can also be enhanced through improved pricing for the cereal crops and cotton.
In the absence of cash, the very poor and poor households heavily rely on on-farm activities for their incomes and in times of drought, activities like weeding are severely affected resulting in loss of income. During these bad years, public works programmes would address this problem but they need to be better targeted to ensure that the poorest households get the most employment opportunities.
Expenditure on staple and non staple food by the very poor and poor households accounts for 19% and 13% of the total household expenditure respectively. It is worth noting that such households will be seriously impacted by increases in the prices of food and therefore there is need to closely monitor changes in food prices especially maize grain.
The very poor and poor wealth groups managed to meet their food energy requirements without food aid in the reference year and their expenditure more or less equals to total income. These groups require livelihood protection and promotion interventions so as to improve on their asset wealth and reduce predisposal to deeper vulnerability and poverty.
Expenditure on social services is low for all wealth groups and this is partly attributed to interventions in the social services sector such as health and education. The education system is affordable for all but due to some differences in the wealth status of households, the very poor and poor are not able to progress with their education. The other challenge is lack of facilities such as proper infrastructure, qualified teachers as well as stationery.
This zone has all wealth groups investing in inputs regardless of the presence of seed distribution interventions by the government, a clear indication that packages provided were in most cases not adequate for the land area cultivated and also some seed types were not provided so households had to purchase.
Zone Description
This large livelihood zone has an estimated population of 1,133,556 and is found in all the Mashonaland provinces. It covers 18 districts that include Bindura, Chegutu, Mazowe, Guruve, Hurungwe, Hwedza, Makoni, Mhondoro-Ngezi, Mount Darwin, Muzarabani, Murewa, Zvimba, Marondera, Mutare, Shamva, Makonde, Seke and Goromonzi.
27Field work for the current profile was undertaken in May 2010. The information presented refers to April 2009 to March 2010 a
relatively average year by local standards (i.e. a year of average production and rural food security, when judged in the context of recent years). Provided there are no fundamental and rapid shifts in the economy, the information in this profile is expected to remain valid for approximately five years (i.e. until 2015).
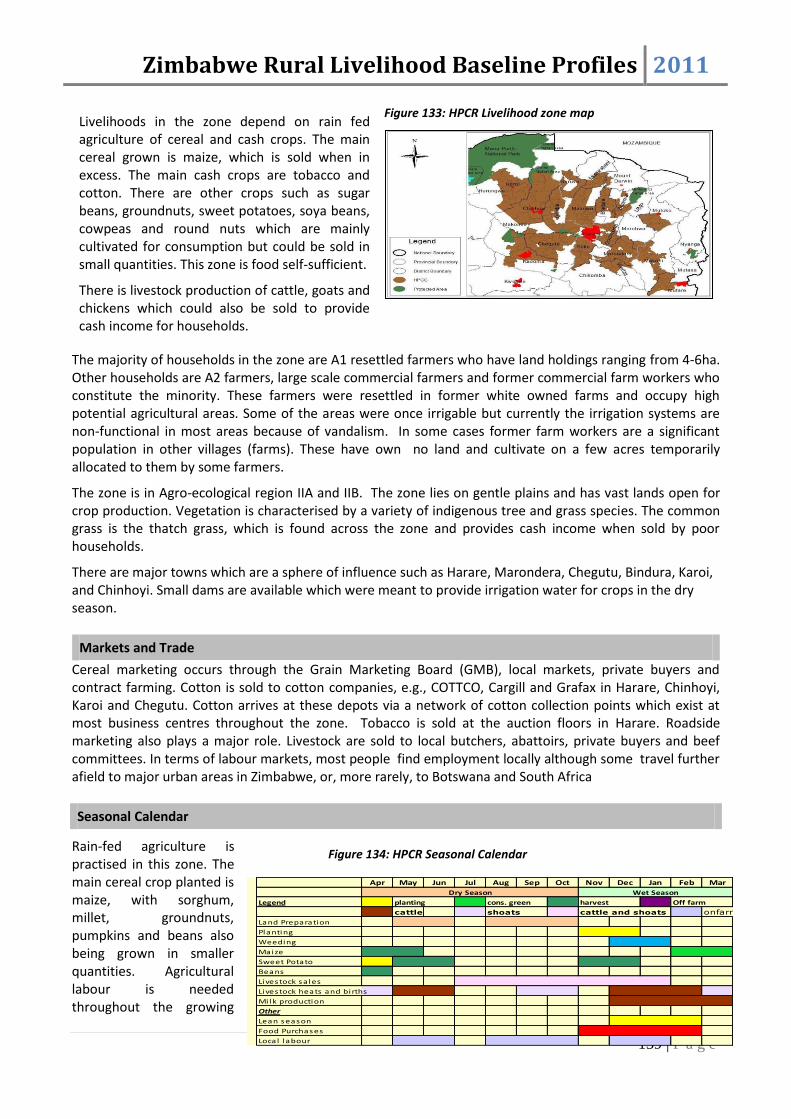
Zimbabwe Rural Livelihood Baseline Profiles 2011
139 | P a g e
Livelihoods in the zone depend on rain fed agriculture of cereal and cash crops. The main cereal grown is maize, which is sold when in excess. The main cash crops are tobacco and cotton. There are other crops such as sugar beans, groundnuts, sweet potatoes, soya beans, cowpeas and round nuts which are mainly cultivated for consumption but could be sold in small quantities. This zone is food self-sufficient.
There is livestock production of cattle, goats and chickens which could also be sold to provide cash income for households.
Figure 133: HPCR Livelihood zone map
The majority of households in the zone are A1 resettled farmers who have land holdings ranging from 4-6ha. Other households are A2 farmers, large scale commercial farmers and former commercial farm workers who constitute the minority. These farmers were resettled in former white owned farms and occupy high potential agricultural areas. Some of the areas were once irrigable but currently the irrigation systems are non-functional in most areas because of vandalism. In some cases former farm workers are a significant population in other villages (farms). These have own no land and cultivate on a few acres temporarily allocated to them by some farmers.
The zone is in Agro-ecological region IIA and IIB. The zone lies on gentle plains and has vast lands open for crop production. Vegetation is characterised by a variety of indigenous tree and grass species. The common grass is the thatch grass, which is found across the zone and provides cash income when sold by poor households.
There are major towns which are a sphere of influence such as Harare, Marondera, Chegutu, Bindura, Karoi, and Chinhoyi. Small dams are available which were meant to provide irrigation water for crops in the dry season.
Markets and Trade
Cereal marketing occurs through the Grain Marketing Board (GMB), local markets, private buyers and contract farming. Cotton is sold to cotton companies, e.g., COTTCO, Cargill and Grafax in Harare, Chinhoyi, Karoi and Chegutu. Cotton arrives at these depots via a network of cotton collection points which exist at most business centres throughout the zone. Tobacco is sold at the auction floors in Harare. Roadside marketing also plays a major role. Livestock are sold to local butchers, abattoirs, private buyers and beef committees. In terms of labour markets, most people find employment locally although some travel further afield to major urban areas in Zimbabwe, or, more rarely, to Botswana and South Africa
Seasonal Calendar
Rain-fed agriculture is practised in this zone. The main cereal crop planted is maize, with sorghum, millet, groundnuts, pumpkins and beans also being grown in smaller quantities. Agricultural labour is needed throughout the growing
Figure 134: HPCR Seasonal Calendar
Apr May Jun Jul Aug Sep Oct Nov Dec Jan Feb Mar
Legend
cattle onfarm
Land Preparation
Planting
Weeding
Maize
Sweet Potato
Beans
Livestock sa les
Livestock heats and births
Mi lk production
Other
Lean season
Food Purchases
Local labour
Off farm
shoats
Wet Season
planting cons. green harvest
Dry Season
cattle and shoats
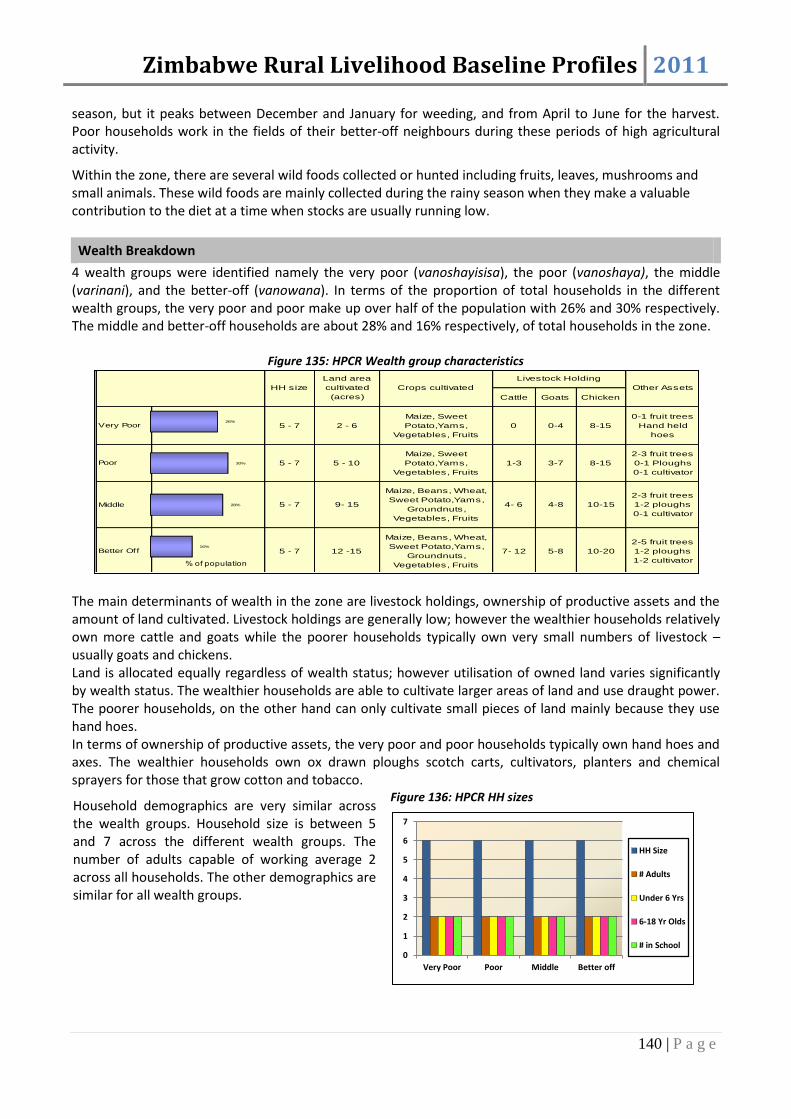
Zimbabwe Rural Livelihood Baseline Profiles 2011
140 | P a g e
season, but it peaks between December and January for weeding, and from April to June for the harvest. Poor households work in the fields of their better-off neighbours during these periods of high agricultural activity.
Within the zone, there are several wild foods collected or hunted including fruits, leaves, mushrooms and small animals. These wild foods are mainly collected during the rainy season when they make a valuable contribution to the diet at a time when stocks are usually running low.
Wealth Breakdown
4 wealth groups were identified namely the very poor (vanoshayisisa), the poor (vanoshaya), the middle (varinani), and the better-off (vanowana). In terms of the proportion of total households in the different wealth groups, the very poor and poor make up over half of the population with 26% and 30% respectively. The middle and better-off households are about 28% and 16% respectively, of total households in the zone.
Figure 135: HPCR Wealth group characteristics
The main determinants of wealth in the zone are livestock holdings, ownership of productive assets and the amount of land cultivated. Livestock holdings are generally low; however the wealthier households relatively own more cattle and goats while the poorer households typically own very small numbers of livestock – usually goats and chickens. Land is allocated equally regardless of wealth status; however utilisation of owned land varies significantly by wealth status. The wealthier households are able to cultivate larger areas of land and use draught power. The poorer households, on the other hand can only cultivate small pieces of land mainly because they use hand hoes. In terms of ownership of productive assets, the very poor and poor households typically own hand hoes and axes. The wealthier households own ox drawn ploughs scotch carts, cultivators, planters and chemical sprayers for those that grow cotton and tobacco.
Household demographics are very similar across the wealth groups. Household size is between 5 and 7 across the different wealth groups. The number of adults capable of working average 2 across all households. The other demographics are similar for all wealth groups.
Figure 136: HPCR HH sizes
Cattle Goats Chicken
Very Poor 5 - 7 2 - 6
Maize, Sweet
Potato,Yams,
Vegetables, Fruits
0 0-4 8-15
0-1 fruit trees
Hand held
hoes
Poor 5 - 7 5 - 10
Maize, Sweet
Potato,Yams,
Vegetables, Fruits
1-3 3-7 8-15
2-3 fruit trees
0-1 Ploughs
0-1 cultivator
Middle 5 - 7 9- 15
Maize, Beans, Wheat,
Sweet Potato,Yams,
Groundnuts,
Vegetables, Fruits
4- 6 4-8 10-15
2-3 fruit trees
1-2 ploughs
0-1 cultivator
Better Off 5 - 7 12 -15
Maize, Beans, Wheat,
Sweet Potato,Yams,
Groundnuts,
Vegetables, Fruits
7- 12 5-8 10-20
2-5 fruit trees
1-2 ploughs
1-2 cultivator
Figure 17.3 Wealth Groups Characteristics
Livestock Holding
HH size
Land area
cultivated
(acres)
Crops cultivated Other Assets
16%
28%
30%
26%
% of population
0
1
2
3
4
5
6
7
Very Poor Poor Middle Better off
HH Size
# Adults
Under 6 Yrs
6-18 Yr Olds
# in School

Zimbabwe Rural Livelihood Baseline Profiles 2011
141 | P a g e
Sources of Food (Reference Period 2009/10)
The main sources of food across all wealth groups in this livelihood zone include own crop production, purchase, labour exchange and livestock products. Own crop production and purchase have a significant contribution of about 62% - 96% and 14% - 20% respectively across all wealth groups. Labour exchange contributes about 20% of annual consumption for the very poor and 9% for the poor households. Livestock products including milk and meat provide 2% – 9% of annual consumption for the middle and better-off households. Below is a detailed description of how each food source contributes to the household annual food income for each wealth group.
The main food crops grown by all wealth groups in this zone are maize, sorghum groundnuts, bambara nuts, sweet potatoes, cowpeas and vegetables. Maize is the main staple. Own crop production contributes between 90% and 100% of middle and better-off households’ consumption, 75% for the poor and 60% of very poor households’ food needs. Production increases with wealth and this is simply because wealthier households cultivate bigger pieces of land, use hired labour from poorer households and also use fertilisers and or manure to enrich soils. These factors are important in improving production for any wealth group in particular poorer groups that cultivate less land.
In the graph, food access is expressed as a percentage of minimum food requirements, taken as an average food energy intake of 2100 kcals per person per day.
Labour exchange is an important source of food in the zone for poor and very poor households. The very poor and poor households accessed 20% and between 5% and 10% respectively from labour exchange. The main activities are weeding and harvesting. This huge contribution makes these households vulnerable to fluctuations in payment rates particularly in drought years when supply of work will drop. The availability of these on-farm activities depends on the performance of the season and in bad years this food income source significantly reduces. Food purchase is a source of food for all the wealth groups in this zone. Main food purchases are made during the hunger period (October – January), although during other months of the year, households still purchase food particularly non staple to supplement own production. The main food purchased is maize grain and other foods purchased by all wealth groups included cooking oil, sugar. The middle and better-off households obtain food energy from livestock products especially milk. The poor obtained less than 5% of annual consumption from livestock products and the middle and better-off consumed between 5% and 10% of their annual consumption from milk.
0%
20%
40%
60%
80%
100%
120%
140%
Very Poor Poor Middle Better Off
purchase
payment in kind
livestock products
crops
Figure 137: HPCR Food sources
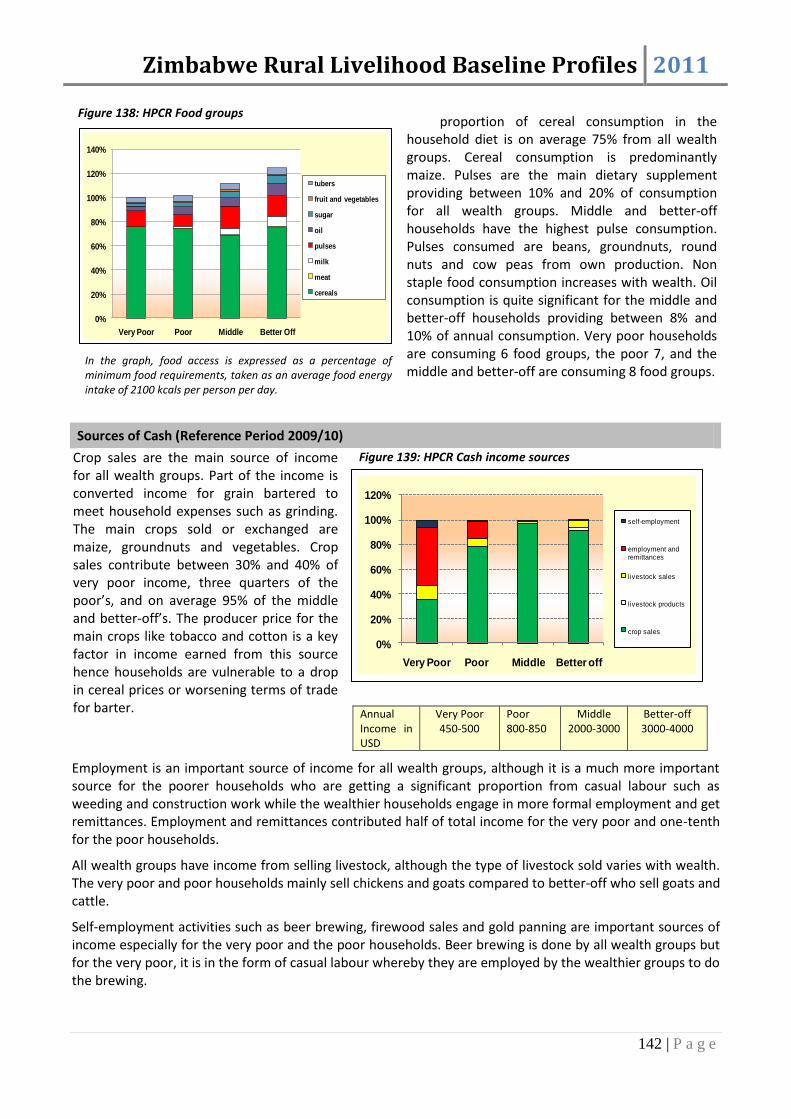
Zimbabwe Rural Livelihood Baseline Profiles 2011
142 | P a g e
In the graph, food access is expressed as a percentage of minimum food requirements, taken as an average food energy intake of 2100 kcals per person per day.
The proportion of cereal consumption in the household diet is on average 75% from all wealth groups. Cereal consumption is predominantly maize. Pulses are the main dietary supplement providing between 10% and 20% of consumption for all wealth groups. Middle and better-off households have the highest pulse consumption. Pulses consumed are beans, groundnuts, round nuts and cow peas from own production. Non staple food consumption increases with wealth. Oil consumption is quite significant for the middle and better-off households providing between 8% and 10% of annual consumption. Very poor households are consuming 6 food groups, the poor 7, and the middle and better-off are consuming 8 food groups.
Sources of Cash (Reference Period 2009/10)
Crop sales are the main source of income for all wealth groups. Part of the income is converted income for grain bartered to meet household expenses such as grinding. The main crops sold or exchanged are maize, groundnuts and vegetables. Crop sales contribute between 30% and 40% of very poor income, three quarters of the poor’s, and on average 95% of the middle and better-off’s. The producer price for the main crops like tobacco and cotton is a key factor in income earned from this source hence households are vulnerable to a drop in cereal prices or worsening terms of trade for barter.
Annual Income in USD
Very Poor 450-500
Poor 800-850
Middle 2000-3000
Better-off 3000-4000
Employment is an important source of income for all wealth groups, although it is a much more important source for the poorer households who are getting a significant proportion from casual labour such as weeding and construction work while the wealthier households engage in more formal employment and get remittances. Employment and remittances contributed half of total income for the very poor and one-tenth for the poor households.
All wealth groups have income from selling livestock, although the type of livestock sold varies with wealth. The very poor and poor households mainly sell chickens and goats compared to better-off who sell goats and cattle.
Self-employment activities such as beer brewing, firewood sales and gold panning are important sources of income especially for the very poor and the poor households. Beer brewing is done by all wealth groups but for the very poor, it is in the form of casual labour whereby they are employed by the wealthier groups to do the brewing.
0%
20%
40%
60%
80%
100%
120%
140%
Very Poor Poor Middle Better Off
tubers
fruit and vegetables
sugar
oil
pulses
milk
meat
cereals
0%
20%
40%
60%
80%
100%
120%
Very Poor Poor Middle Better off
self-employment
employment and remittances
livestock sales
livestock products
crop sales
Figure 138: HPCR Food groups
Figure 139: HPCR Cash income sources

Zimbabwe Rural Livelihood Baseline Profiles 2011
143 | P a g e
Expenditure Patterns (Reference Period 2009/10)
Annual Expenditure in USD
Very Poor 450-500
Poor 800-850
Middle 2000-3000
Better-off 3000-4000
Actual expenditure on grinding costs, salt, utensils tea and kerosene/candles increases with wealth, although its proportion to total expenditure decreases with wealth. Very poor households spend on average USD 109 on household items, while the better-off spend USD 224 annually. Expenditure on household items is highest for the very poor and poor wealth groups.
Expenditure on food is almost similar across wealth groups with all the groups spending more on non staple than staple foods. Combined expenditure on staple and non staple foods as a proportion of total annual household expenditure is between 15% and 20% for the very poor and poor and between 5% and 10% for the middle and better-off.
Purchasing inputs is essential for all wealth groups, regardless of ongoing seed distribution interventions. Inputs expenditure is the largest form of expenditure for the poor, middle and better-off, comprising between 35% and 45% of total expenditure for the poor, 50% to 60% for the middle, and two thirds of total household expenditure for the better-off.
Expenditure on social services is low across all wealth groups mainly because government subsidises services like health and education. The most significant area in social services is education costs especially uniform. Expenditure on social services as a percentage of total household expenditure decreases with wealth from an average 13% of total expenditure for the very poor to 5% for the better-off.
‘Other’ expenditure includes transport, beer, gifts, festivals and community obligations and all wealth groups have a proportion of their total expenditure going to other items.
Hazards
Chronic hazards: Lack of capital to finance agriculture production and unfavourable markets for agricultural produce particularly cotton. Periodic hazards: Erratic rainfall and drought conditions once every 3 years.
Coping Strategies
Reduced purchase of non essentials: The poor households reduce expenditure of goods deemed to be non essential. In very difficult years the consumption of such non-essentials can go down to zero. The goods considered to be non essentials include sugar, cooking oil and flour.
Increased reliance on employment: All wealth groups in the zone tend to rely more on employment during the difficult years.
0%
20%
40%
60%
80%
100%
Very Poor Poor Middle Better off
other
gifts
tax
social serv.
inputs
HH items
non-staple food
staple food
Figure 140: HPCR Expenditure patterns
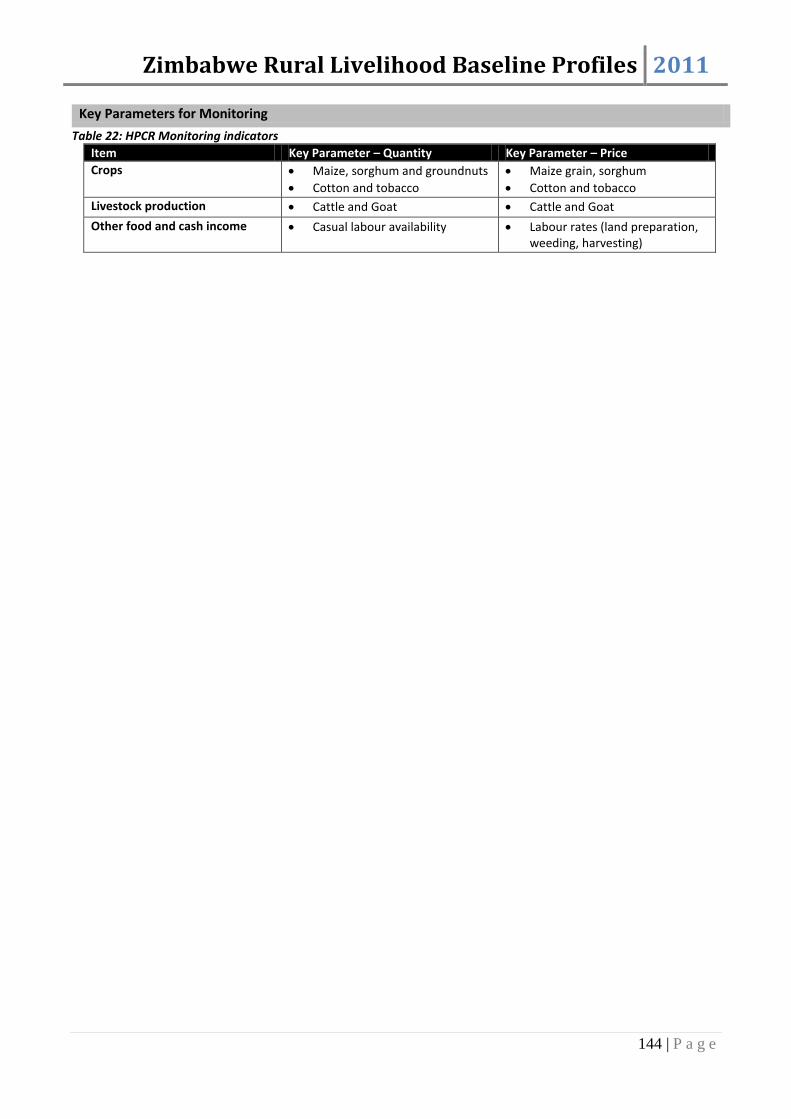
Zimbabwe Rural Livelihood Baseline Profiles 2011
144 | P a g e
Key Parameters for Monitoring
Table 22: HPCR Monitoring indicators
Item Key Parameter – Quantity Key Parameter – Price
Crops Maize, sorghum and groundnuts
Cotton and tobacco
Maize grain, sorghum
Cotton and tobacco
Livestock production Cattle and Goat Cattle and Goat
Other food and cash income Casual labour availability Labour rates (land preparation, weeding, harvesting)
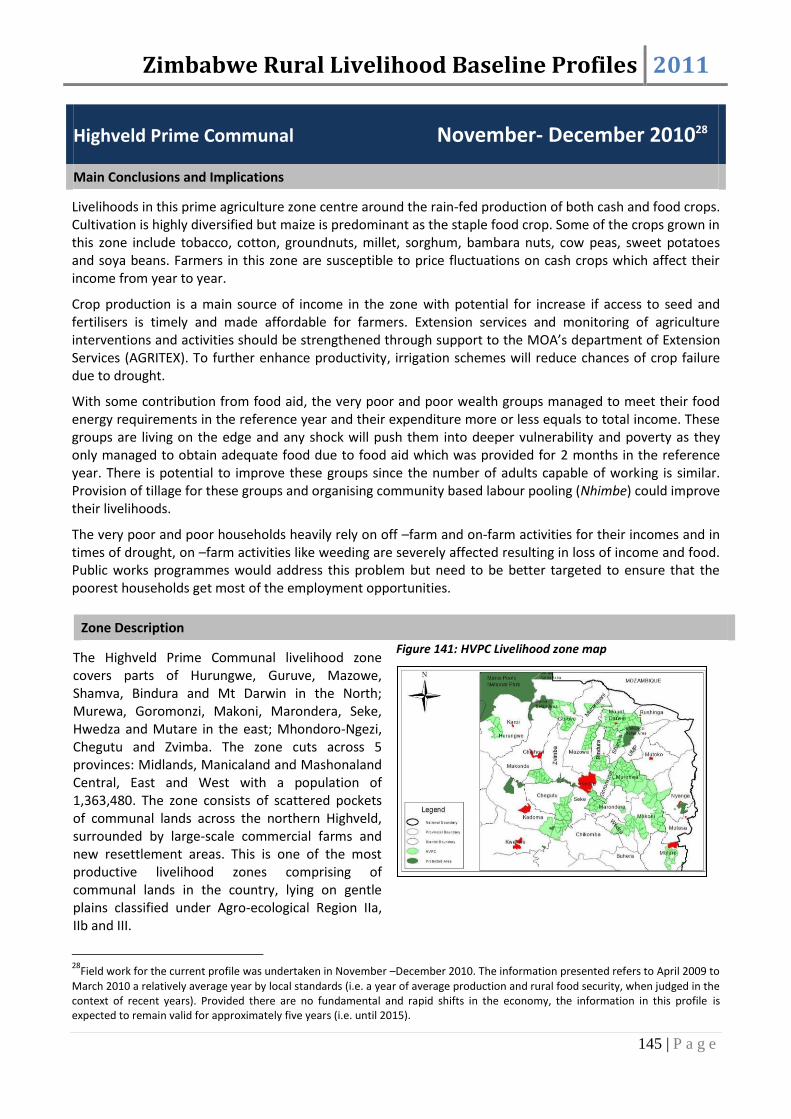
Zimbabwe Rural Livelihood Baseline Profiles 2011
145 | P a g e
Highveld Prime Communal November- December 201028
Main Conclusions and Implications
Livelihoods in this prime agriculture zone centre around the rain-fed production of both cash and food crops. Cultivation is highly diversified but maize is predominant as the staple food crop. Some of the crops grown in this zone include tobacco, cotton, groundnuts, millet, sorghum, bambara nuts, cow peas, sweet potatoes and soya beans. Farmers in this zone are susceptible to price fluctuations on cash crops which affect their income from year to year.
Crop production is a main source of income in the zone with potential for increase if access to seed and fertilisers is timely and made affordable for farmers. Extension services and monitoring of agriculture interventions and activities should be strengthened through support to the MOA’s department of Extension Services (AGRITEX). To further enhance productivity, irrigation schemes will reduce chances of crop failure due to drought.
With some contribution from food aid, the very poor and poor wealth groups managed to meet their food energy requirements in the reference year and their expenditure more or less equals to total income. These groups are living on the edge and any shock will push them into deeper vulnerability and poverty as they only managed to obtain adequate food due to food aid which was provided for 2 months in the reference year. There is potential to improve these groups since the number of adults capable of working is similar. Provision of tillage for these groups and organising community based labour pooling (Nhimbe) could improve their livelihoods.
The very poor and poor households heavily rely on off –farm and on-farm activities for their incomes and in times of drought, on –farm activities like weeding are severely affected resulting in loss of income and food. Public works programmes would address this problem but need to be better targeted to ensure that the poorest households get most of the employment opportunities.
Zone Description
The Highveld Prime Communal livelihood zone covers parts of Hurungwe, Guruve, Mazowe, Shamva, Bindura and Mt Darwin in the North; Murewa, Goromonzi, Makoni, Marondera, Seke, Hwedza and Mutare in the east; Mhondoro-Ngezi, Chegutu and Zvimba. The zone cuts across 5 provinces: Midlands, Manicaland and Mashonaland Central, East and West with a population of 1,363,480. The zone consists of scattered pockets of communal lands across the northern Highveld, surrounded by large-scale commercial farms and new resettlement areas. This is one of the most productive livelihood zones comprising of communal lands in the country, lying on gentle plains classified under Agro-ecological Region IIa, IIb and III.
Figure 141: HVPC Livelihood zone map
28
Field work for the current profile was undertaken in November –December 2010. The information presented refers to April 2009 to
March 2010 a relatively average year by local standards (i.e. a year of average production and rural food security, when judged in the context of recent years). Provided there are no fundamental and rapid shifts in the economy, the information in this profile is expected to remain valid for approximately five years (i.e. until 2015).

Zimbabwe Rural Livelihood Baseline Profiles 2011
146 | P a g e
The soils are sandy loamy and require fertiliser for crop production. The vegetation in the zone consists of bushes and some grassland with some parts suffering deforestation. Rainfall is relatively high averaging between 650 and 1,000mm per year, rather than soil conditions (which are poor to fair). Minimum temperatures in the zone range between 15oC to 20oC during winter (muchando) and the maximum ranges between 30oC and 35oC during summer (chirimo).
The main livelihood is based on rain-fed cultivation of food and cash crops supplemented by livestock production, formal and casual employment. Main casual labour activities include weeding for cash and food, land clearing and tobacco grading. Agriculture depends on rainfall which falls in November to March. The zone has a relatively high production potential although production is limited due to the dense population.
The high population limits cultivation and grazing land consequently households can only be productive to a certain level. Cattle and goats are the main livestock kept in the zone although the herd sizes are small. Chickens and goats are the main livestock slaughtered usually during festive holidays for consumption. Overall, the zone is a relatively wealthy zone, even the poorest households own small livestock. Cropping is carried out on small fields (due to high population density) and cultivation is done by hand (for the poor) or animal traction (the better-off). The main crops sold for income are maize, cotton, groundnuts, soya beans and tobacco. The inadequacy of public transport and the poor road network limits the marketing of produce.
Markets and Trade
This zone produces more grain than is needed for subsistence. Excess grain is sold directly to Grain Marketing Board outlets and through private traders. The main market for selling horticulture produce such as mangoes, tomatoes and rape is in nearby Harare at the Mbare market although the fruit and vegetables are also sold in urban centres throughout the zone. Cash crops such as tobacco and cotton are sold to contractors. Livestock are sold to private buyers and local butcheries. The Livestock Production Department (LPD) also organises market days throughout the zone. A number of major roads pass through or near the zone, providing an opportunity to sell thatch, wild foods, fruits, handicrafts and vegetables to passing travellers.
The main labour market is local through either casual work in the mines or in the fields of richer households and outside the zone for permanent employment on commercial farms in the surrounding Highveld Prime Cereal and Cash Crop Resettlement Zone. Households from all wealth groups - but particularly from the better-off group- have a family member working in major towns, including Harare, Bindura, Mutare, Chinhoyi, Karoi, Chegutu, Kadoma and Gweru.
Seasonal calendar
There are 2 main seasons: chirimo/ zhizha rainy season (November-April) and the dry season split into chando/winter (May-July) and spring (August-October). The consumption year starts with the main dry harvest in April which the people depend on for their food and cash income.
Land preparation is done in 2 forms with initial ploughing soon after harvest in May-July known as kuhwinda/winter ploughing
and the preparation for planting mainly done in October. Planting starts in November with the fall of effective rains extending to December.

Zimbabwe Rural Livelihood Baseline Profiles 2011
147 | P a g e
In most cases cattle births occur
between November and January and those of goats in October- November and April-May. Milking of cows is mainly done for five months during the rainy season- December-April. Sale of goats and cattle is done throughout the year but peaks in September as households raise income to buy inputs as well as in January during the peak hunger period and to raise school fees for children.
Although agricultural labour is needed throughout the growing season, it peaks around December-January for weeding and from April-June for harvesting. In bad years when the local labour market is limited, households move to neighbouring A2 resettlement areas and commercial farms to look for work mainly in January-April. Food purchases particularly staple start in September and continue until the end of the hungry season, February. Crop sales occur soon after harvest in May-October; cash crops are mainly sold in April-June with vegetables and excess food crops being sold up to October. Wild fruits, mushrooms and edible insects including caterpillars, mice and flying ants are available in this zone in December-April.
Wealth Breakdown
The main determinants of wealth in the zone are livestock holdings mainly cattle and goats and the acreage of land cultivated. These increase with wealth from the very poor to the better-off wealth group. Livestock holdings are generally low due to lack of pastures; however the wealthier households relatively own more cattle and goats while the poorer households typically own very small numbers of livestock – usually goats and chickens. 4 wealth groups were identified by the key informants namely the very poor (vanoshayisisa), the poor (vanoshaya), the middle (varinani), and the better-off (vanowana). Figure 143: HVPC Wealth group characteristics
Figure 142: HVPC Seasonal Calendar
Cattle Goats Chickens
Very Poor 5 - 7 1 - 2
Maize; Cow Peas;
Ground Nuts;
Sunflower, Bambara
Nuts, Beans
0 0 - 1 2-60 - 1 Gold panning
equipment
Poor 5 - 7 1 - 3
Maize; Cow Peas;
Ground Nuts;
Sunflower, Bambara
Nuts, Beans
0-2 1-2 3-7
0 - 1 Gold panning
equipment
0 - 1 ploughs
Middle 5 - 7 2 - 3
Maize; Cow Peas;
Ground Nuts;
Sunflower, Bambara
Nuts, Beans, Tobacco,
Cotton
2-4 2-4 4-8
0 - 1 Gold panning
equipment
0 - 1 ploughs
0 - 1 Scotch carts
Better Off 5 - 7 2 - 4
Maize; Cow Peas;
Ground Nuts;
Sunflower, Bambara
Nuts, Beans, Tobacco,
Cotton
4-6 3-6 6-100 - 1 ploughs
0 - 1 Scotch carts
Livestock Holding
HH size
Land area
cultivated
(acres)
Crops cultivated Other Assets
15%
24%
28%
33%
% of population

Zimbabwe Rural Livelihood Baseline Profiles 2011
148 | P a g e
Land ownership is open and allocated equally regardless of wealth status. The amount of land cultivated, however, varies significantly by wealth status. The wealthier households are able to cultivate larger areas using animal draught power. The very poor households who do not own cattle and have limited means to hire draught power use hand hoes and hence cultivate small pieces of land. All wealth groups cultivate the same types of crops with the exception of cash crops; tobacco and cotton that are cultivated by the middle and better-off households. The local economic arrangements are mainly through poorer households providing labour mainly in exchange for money or food and in some instance to get draught power from better-off households. Shortage of veterinary services and lack of money prevent the poor from keeping cattle and more goats while grazing land is the main limiting factor for livestock production.
Ownership of productive assets for mineral panning and agriculture production places a limit to poorer households as they rely on asking the better-off households for tools such as ox ploughs hence delaying their planting time.
The presence of a family member working in town and who is in a position to remit income is also a key determinant of wealth for households. Households with such members usually afford to educate their family members up to secondary and tertiary level. The importance of high levels of education is noticed in the proportion of income the wealthier households get from formal employment and the likely guarantees from their educated children. For the poorer households, the opposite is true in that the restriction to primary school education limits their long term capacity to obtain better paying jobs.
The very poor and poor wealth groups make up over half of the population with 33% and 28% respectively. The middle and better-off households are about 24% and 15% of total households in the zone respectively.
Household sizes are similar across the 4 wealth groups ranging between 5-7 people. The number of adults capable of working on average is 2 people; the difference for wealth groups is in the form of work being done by adult members where the very poor and poor households rely on casual employment compared with middle and better-off households who may have 1 member permanently employed in neighbouring towns. The better-off households have fewer children under the age of 6 and more children in school. The education subsidy and policies by government enables children from all wealth groups to attend primary education.
Figure 144:HVPC HH sizes
Sources of Food (Reference Period 2009/10)
The graph below reveals that all wealth groups cover their annual food requirements. The contribution of own harvest is significant for all wealth groups and demonstrates the importance of crop production to food security, even contributing 40-49% of the very poor and poor annual food. Contribution of own harvest increases from very poor to the better-off households. The main food crops grown by all wealth groups in this zone are maize, groundnuts, sweet potatoes, sunflower, bambara nuts, cowpeas, beans and vegetables. Maize is the main staple hence all households strive to maximise production.
0
1
2
3
4
5
6
7
Very Poor Poor Middle Better off
HH Size
# Adults
Under 6 Yrs
6-18 Yr Olds
# in School

Zimbabwe Rural Livelihood Baseline Profiles 2011
149 | P a g e
The second most important source for all wealth groups is food purchase and exchange. Main staple food purchases are done during the hunger period (October– January) although in the year, households still purchase non-staple food to supplement what they get from own production. The very poor and poor wealth groups mainly purchase staple foods while the middle and better-off households buy expensive staples such as rice, wheat flour and non staples (sugar and cooking oil). Labour exchange is mainly done by very poor and poor households as providing labour during weeding and harvesting times and get food in exchange. Labour exchange is significant for these 2 groups contributing 31% and 24% respectively, this huge contribution makes these households vulnerable to fluctuation in labour supply and payment rates in bad years. Foods from purchase and exchange systems decrease from the very poor to the better-off wealth group.
In the graph, food access is expressed as a percentage of minimum food requirements, taken as an average food energy intake of 2100 kcals per person per day.
Livestock products (whole milk and meat) make a small contribution to household food intake generally increasing with wealth. The middle and better-off households obtain more food from animal products as they milk more animals and slaughter goats compared with poorer households who rely on chicken meat. Most social support transfers are in the form of remittances for the middle and better-off households from relatives and children working in towns. The very poor and poor wealth groups received food aid which was provided for 6 months.
In the graph, food access is expressed as a percentage of minimum food requirements, taken as an average food energy intake of 2100 kcals per person per day.
Cereals are providing the majority of household annual food intake. The proportion of cereal consumption in the household diet decreases with wealth, as total food consumption increases. Cereals comprise 81% and 79% of very poor and poor total consumption and 72%-73% of the middle and better-off’s diet. Decrease in cereal consumption, particularly maize, the cheapest staple calories, is correlated with increase in household food consumption. Maize comprises the vast majority of caloric energy accessed by all households. However, the middle and better-off households are supplementing maize consumption with more expensive cereals such as rice and wheat flour.
Pulses are the main dietary supplement providing between 8% and 10% for the very poor and poor households and 15%-16% of the middle and better-off’s food intake. Pulse consumption increases with wealth and this is related to production.
Sugar and oil are the commonly purchased and consumed non-staple foods. Oil consumption is similar across wealth groups ranging between 5%-6% of household diet. For the very poor and poor households, part of the oil is relief whilst for the better-off wealth groups it is exclusively purchases. Sugar dietary contribution increases from very poor to better-off households averaging 1%-4% for all wealth groups. Tubers, mostly sweet potatoes, contribute to household diet; 3% for poor groups and 5% for wealthier
0%
20%
40%
60%
80%
100%
120%
140%
Very Poor Poor Middle Better Off
other (gifts, wild food, fish etc)
food aid
purchase
payment in kind
livestock products
crops
0%
20%
40%
60%
80%
100%
120%
140%
Very Poor Poor Middle Better Off
wild foods
tubers
fruit and vegetables
sugar
oil
pulses
milk
meat
cereals
Figure 145: HVPC Food sources
Figure 146: HVPC Food Groups

Zimbabwe Rural Livelihood Baseline Profiles 2011
150 | P a g e
groups. The better-off receive a more nutritious diet compared to the poor primarily from the consumption of milk which provides up to 3% of the annual household diet. Vegetables provide very low energy intake.
Sources of Cash (Reference Period 2009/10)
Absolute income in the zone ranges from USD100 to USD700. Crop sales are an important source for all households particularly for middle and better-off households. The contribution increases with wealth constituting 19-22% and 47-76% of the poor and better-off wealth group respectively. The crops sales were done in cash and through barter exchange due to lack of cash flow in the zone. The poorer wealth groups mainly sold and exchanged food crops and vegetables with the wealthier groups selling cotton and tobacco in addition to food crops. Livestock sales, mainly of chicken and goats, are also important to all wealth groups. Cattle sales are low in the zone due to the small herd sizes and selling off is indicative of a crisis need such as health costs.
Employment is an important source of income for all wealth groups, the poorer households rely on casual labour such as weeding, tobacco grading, cotton stalk clearing. Brick production and construction work while the wealthier households engage in more formal employment and get remittances. This is an important source for poor wealth groups contributing 33% and 32% respectively as well as the middle households gaining 23% of their income from employment and remittances.
Annual Income in USD
Very Poor 160-170
Poor 200-250
Middle 360-400
Better-off 500-700
Self employment activities such as firewood sales, grass sales, petty trade, and gold panning are important sources of income especially for the very poor and poor groups contributing 38% and 32% respectively. Contributions of this source decline with wealth up to the middle wealth group as better-off households do not engage in these activities. The middle and better-off wealth groups have access to cotton loans which they get from cotton buying companies in the form of cotton seed, fertilisers and chemicals.
0%
20%
40%
60%
80%
100%
120%
Very Poor
Poor Middle Better off
Other (cotton loan)
Petty trade
self-employment
employment and remittances
livestock sales
crop sales
Figure 147: HVPC Cash income sources
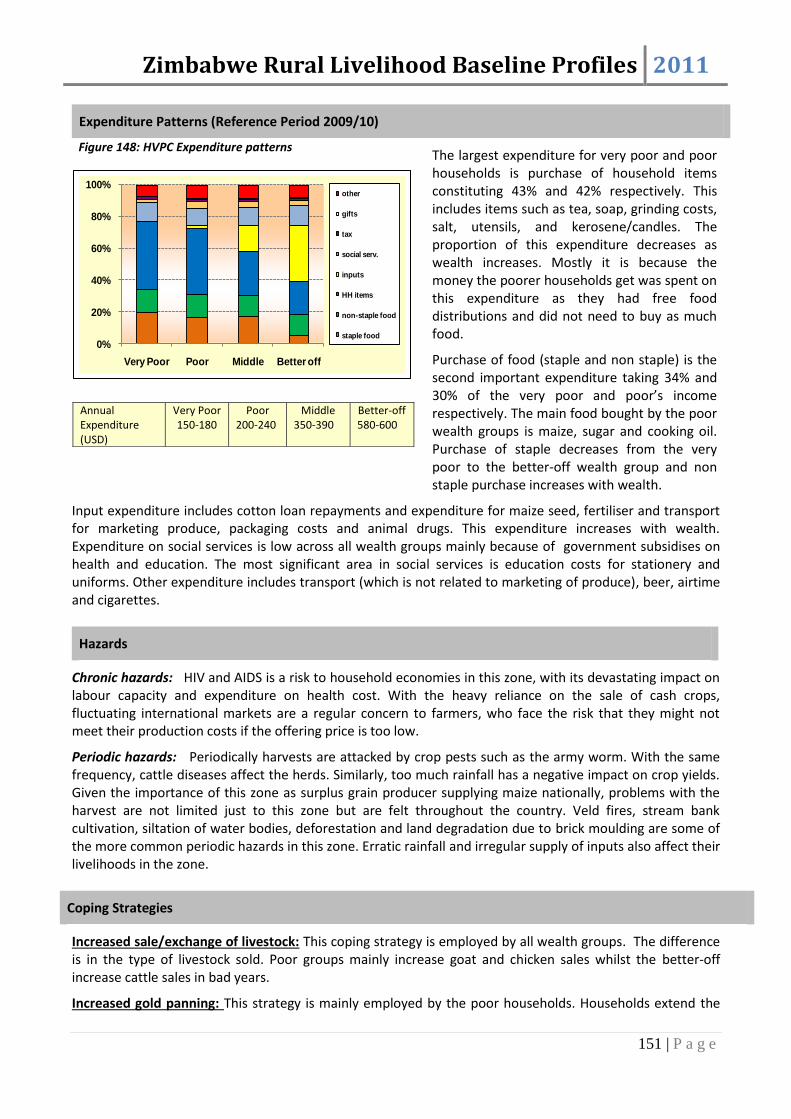
Zimbabwe Rural Livelihood Baseline Profiles 2011
151 | P a g e
Expenditure Patterns (Reference Period 2009/10)
Annual Expenditure (USD)
Very Poor 150-180
Poor 200-240
Middle 350-390
Better-off 580-600
The largest expenditure for very poor and poor households is purchase of household items constituting 43% and 42% respectively. This includes items such as tea, soap, grinding costs, salt, utensils, and kerosene/candles. The proportion of this expenditure decreases as wealth increases. Mostly it is because the money the poorer households get was spent on this expenditure as they had free food distributions and did not need to buy as much food.
Purchase of food (staple and non staple) is the second important expenditure taking 34% and 30% of the very poor and poor’s income respectively. The main food bought by the poor wealth groups is maize, sugar and cooking oil. Purchase of staple decreases from the very poor to the better-off wealth group and non staple purchase increases with wealth.
Input expenditure includes cotton loan repayments and expenditure for maize seed, fertiliser and transport for marketing produce, packaging costs and animal drugs. This expenditure increases with wealth. Expenditure on social services is low across all wealth groups mainly because of government subsidises on health and education. The most significant area in social services is education costs for stationery and uniforms. Other expenditure includes transport (which is not related to marketing of produce), beer, airtime and cigarettes.
Hazards
Chronic hazards: HIV and AIDS is a risk to household economies in this zone, with its devastating impact on labour capacity and expenditure on health cost. With the heavy reliance on the sale of cash crops, fluctuating international markets are a regular concern to farmers, who face the risk that they might not meet their production costs if the offering price is too low.
Periodic hazards: Periodically harvests are attacked by crop pests such as the army worm. With the same frequency, cattle diseases affect the herds. Similarly, too much rainfall has a negative impact on crop yields. Given the importance of this zone as surplus grain producer supplying maize nationally, problems with the harvest are not limited just to this zone but are felt throughout the country. Veld fires, stream bank cultivation, siltation of water bodies, deforestation and land degradation due to brick moulding are some of the more common periodic hazards in this zone. Erratic rainfall and irregular supply of inputs also affect their livelihoods in the zone.
Coping Strategies
Increased sale/exchange of livestock: This coping strategy is employed by all wealth groups. The difference is in the type of livestock sold. Poor groups mainly increase goat and chicken sales whilst the better-off increase cattle sales in bad years.
Increased gold panning: This strategy is mainly employed by the poor households. Households extend the
0%
20%
40%
60%
80%
100%
Very Poor Poor Middle Better off
other
gifts
tax
social serv.
inputs
HH items
non-staple food
staple food
Figure 148: HVPC Expenditure patterns
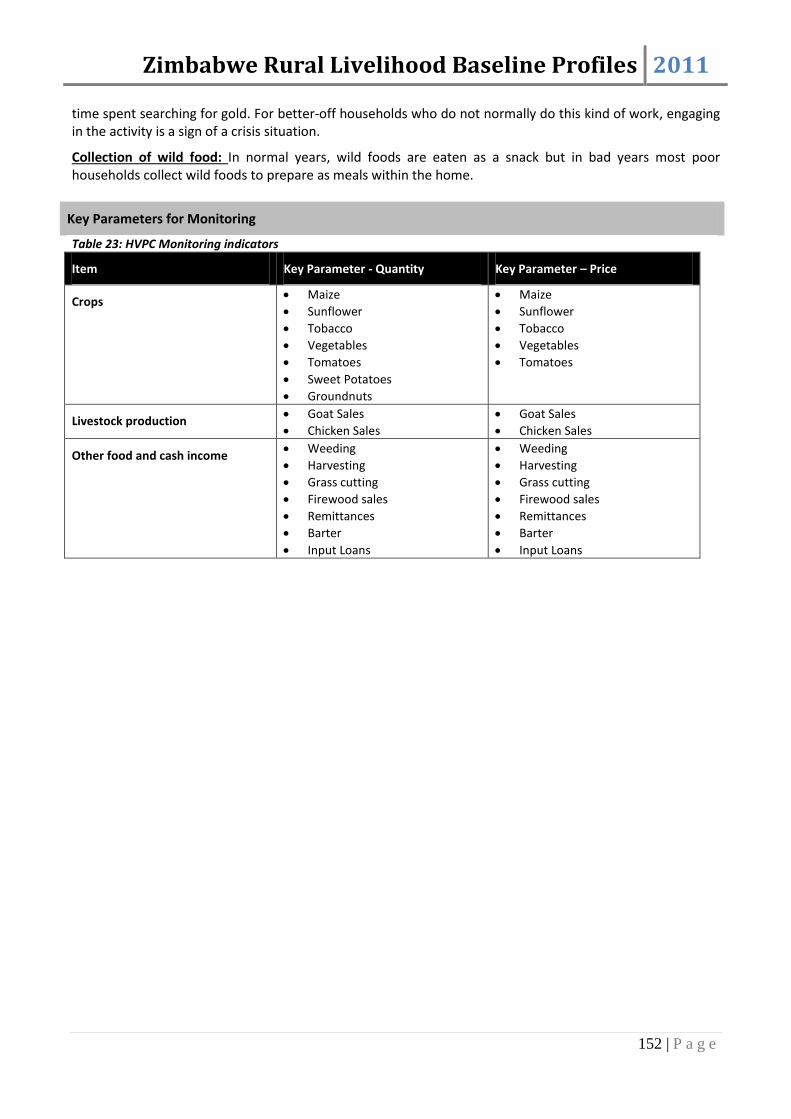
Zimbabwe Rural Livelihood Baseline Profiles 2011
152 | P a g e
time spent searching for gold. For better-off households who do not normally do this kind of work, engaging in the activity is a sign of a crisis situation.
Collection of wild food: In normal years, wild foods are eaten as a snack but in bad years most poor households collect wild foods to prepare as meals within the home.
Key Parameters for Monitoring
Table 23: HVPC Monitoring indicators
Item Key Parameter - Quantity Key Parameter – Price
Crops Maize
Sunflower
Tobacco
Vegetables
Tomatoes
Sweet Potatoes
Groundnuts
Maize
Sunflower
Tobacco
Vegetables
Tomatoes
Livestock production Goat Sales
Chicken Sales
Goat Sales
Chicken Sales
Other food and cash income Weeding
Harvesting
Grass cutting
Firewood sales
Remittances
Barter
Input Loans
Weeding
Harvesting
Grass cutting
Firewood sales
Remittances
Barter
Input Loans

Zimbabwe Rural Livelihood Baseline Profiles 2011
153 | P a g e
Masvingo Manicaland Middleveld Smallholder Communal September-October 201029
Main Conclusions and Implications
Livelihoods in this zone are primarily agricultural, but crop production is low due to unpredictable rainfall distribution and high temperatures despite the relatively fertile clay loamy soils. There is potential for increased production for both consumption and sale if communities adopt increased cultivation of suitable crop types and varieties e.g. small grains and short season varieties. Timely access to such agricultural inputs i.e. seed and fertilisers will also support increased crop production. Dam construction, rehabilitation and irrigation development will go a long way in reducing food crop deficits always caused by erratic rainfall usually received in the zone.
Sale of livestock e.g. goats and cattle offers opportunities for high income earnings in this livelihood zone. Holding sizes are relatively small due to poor grazing and depletion in the previous year characterised by hyperinflation. Restocking especially of cattle and goats will help increase herd size and capacitate the poor groups with draught power, which has been a hindrance to crop production.
Expenditure on social services is low for the poor wealth groups and this is partly attributed to interventions in the social services sector such as health and education, but also due to drop-outs of children in primary and secondary school. Actual expenditure on education for the better-off households is relatively high, as these are not usually targeted by education assistance programmes. Increased education assistance for the poor wealth groups is advocated to avoid dropouts of children from poor households.
Zone Description
This Middleveld zone cuts across communal areas in the districts of Chivi, Masvingo, Zaka, Bikita and Gutu in Masvingo province; Buhera, Mutare and Chimanimani in Manicaland province and Zvishavane, Shurugwi and Chirumanzu districts of Midlands Province with a population of 1,094,365.
Most of the zone is categorised in agro ecological region IV and V with a few areas in Region III. Annual rainfall is very low averaging between 450-600mm. Soils are relatively fertile clay loams and sandy soils. Minimum temperatures in the zone range between 15-20oC during winter In June to July (chando) and the maximum ranges between 35oC -40oC during summer in September and October (chirimo).
Figure 149: MMMC Livelihood zone map
The zone has a number of major rivers and a number of seasonal small rivers; Save, Runde, Odzi, Devure and Tokwe pass through the zone and drain towards the Limpopo river. These provide limited opportunities for fishing and gold panning. The small rivers also provide greater opportunities for irrigation schemes.
29
Field work for the current profile was undertaken in September- October 2010. The information presented refers to April 2009 to
March 2010 a relatively average year by local standards (i.e. a year of average production and rural food security, when judged in the context of recent years). Provided there are no fundamental and rapid shifts in the economy, the information in this profile is expected to remain valid for approximately five years (i.e. until 2015).
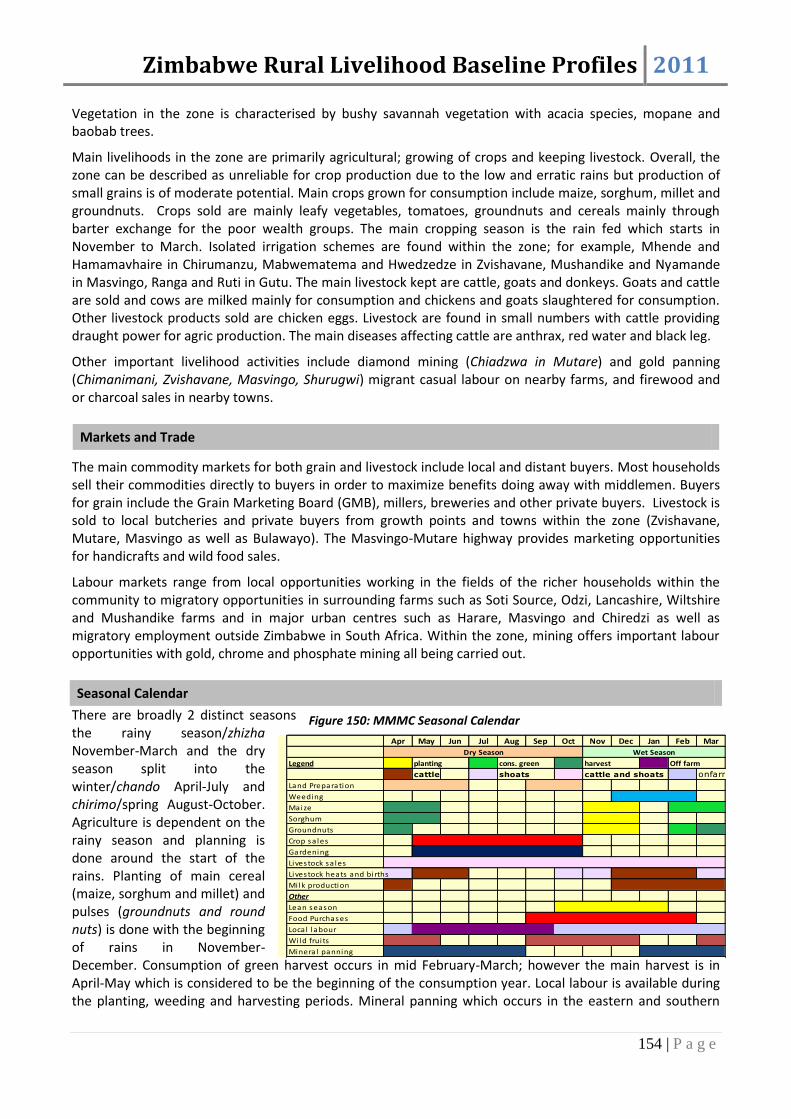
Zimbabwe Rural Livelihood Baseline Profiles 2011
154 | P a g e
Vegetation in the zone is characterised by bushy savannah vegetation with acacia species, mopane and baobab trees.
Main livelihoods in the zone are primarily agricultural; growing of crops and keeping livestock. Overall, the zone can be described as unreliable for crop production due to the low and erratic rains but production of small grains is of moderate potential. Main crops grown for consumption include maize, sorghum, millet and groundnuts. Crops sold are mainly leafy vegetables, tomatoes, groundnuts and cereals mainly through barter exchange for the poor wealth groups. The main cropping season is the rain fed which starts in November to March. Isolated irrigation schemes are found within the zone; for example, Mhende and Hamamavhaire in Chirumanzu, Mabwematema and Hwedzedze in Zvishavane, Mushandike and Nyamande in Masvingo, Ranga and Ruti in Gutu. The main livestock kept are cattle, goats and donkeys. Goats and cattle are sold and cows are milked mainly for consumption and chickens and goats slaughtered for consumption. Other livestock products sold are chicken eggs. Livestock are found in small numbers with cattle providing draught power for agric production. The main diseases affecting cattle are anthrax, red water and black leg.
Other important livelihood activities include diamond mining (Chiadzwa in Mutare) and gold panning (Chimanimani, Zvishavane, Masvingo, Shurugwi) migrant casual labour on nearby farms, and firewood and or charcoal sales in nearby towns.
Markets and Trade
The main commodity markets for both grain and livestock include local and distant buyers. Most households sell their commodities directly to buyers in order to maximize benefits doing away with middlemen. Buyers for grain include the Grain Marketing Board (GMB), millers, breweries and other private buyers. Livestock is sold to local butcheries and private buyers from growth points and towns within the zone (Zvishavane, Mutare, Masvingo as well as Bulawayo). The Masvingo-Mutare highway provides marketing opportunities for handicrafts and wild food sales.
Labour markets range from local opportunities working in the fields of the richer households within the community to migratory opportunities in surrounding farms such as Soti Source, Odzi, Lancashire, Wiltshire and Mushandike farms and in major urban centres such as Harare, Masvingo and Chiredzi as well as migratory employment outside Zimbabwe in South Africa. Within the zone, mining offers important labour opportunities with gold, chrome and phosphate mining all being carried out.
Seasonal Calendar
There are broadly 2 distinct seasons the rainy season/zhizha November-March and the dry season split into the winter/chando April-July and chirimo/spring August-October. Agriculture is dependent on the rainy season and planning is done around the start of the rains. Planting of main cereal (maize, sorghum and millet) and pulses (groundnuts and round nuts) is done with the beginning of rains in November-December. Consumption of green harvest occurs in mid February-March; however the main harvest is in April-May which is considered to be the beginning of the consumption year. Local labour is available during the planting, weeding and harvesting periods. Mineral panning which occurs in the eastern and southern
Figure 150: MMMC Seasonal Calendar
Apr May Jun Jul Aug Sep Oct Nov Dec Jan Feb Mar
Legend
cattle onfarm
Land Preparation
Weeding
Maize
Sorghum
Groundnuts
Crop sa les
Gardening
Livestock sa les
Livestock heats and births
Mi lk production
Other
Lean season
Food Purchases
Local labour
Wild frui ts
Minera l panning
Off farm
shoats
Wet Season
planting cons. green harvest
Dry Season
cattle and shoats

Zimbabwe Rural Livelihood Baseline Profiles 2011
155 | P a g e
parts of the zone occurs during the rainy season but peaks soon after the rains as water in rivers will not be too full and agriculture activities will be low.
Wealth Breakdown
The main determinants of wealth in the zone are livestock holdings, acreage of land cultivated and ownership of productive assets in particular ploughs for cultivation. The wealthier households own more cattle and goats compared with the poor households who typically own very small numbers of livestock mostly goats and chickens. 4 wealth groups were identified in the zone; the very poor (vanoshayisisa), the Poor (vanoshaya), the Middle (varipakati) and the Better-off (varinani). Figure 151: MMMC Wealth group characteristics The wealthier households are able to cultivate larger areas using their own draught power and have better access to fertilisers, organic manure and hybrid seeds making their land more productive. The poorer households, on the other hand, can only cultivate small pieces of land owing to lack of draught power as well as lack of inputs. There is no difference in crops grown by all the wealth groups. Ownership of productive assets increases with wealth with the middle and better-off wealth groups owning ploughs and ox carts in addition to hand tools owned by the poor groups. A local arrangement in the zone is when the poor groups provide labour in exchange for ploughing services
Household size in the zone is 6 members across all wealth groups. The very poor wealth group has fewer children less than 6 years, mostly these are elderly households and those newly married. The number of children in school is less than those of school going age in this group mostly due to dropouts in secondary school. Although the number of adults is the same across wealth groups, the type of work done is different as the poor groups rely on casual work compared to semi-skilled work done by the middle and better-off wealth groups.
Figure 152: MMMC HH sizes
Sources of Food (reference Period 2009/10)
The main source of food across all wealth groups in this livelihood zone is own crop production. The contribution of own harvest increases from the very poor to the better-off wealth group ranging from 38%
0
1
2
3
4
5
6
7
Very Poor Poor Middle Better off
HH Size
# Adults
Under 6 Yrs
6-18 Yr Olds
# in School
Cattle Goats Poultry
Very Poor 5-6 1-3
Millet; Finger Millet;
Sorghum; Maize; Cow
Peas; Ground Nuts;
Roundnuts; Sweet
Potatoes
0 0-3 2-6 Hand hoes
Poor 5-6 2-4
Millet; Finger Millet;
Sorghum; Maize; Cow
Peas; Ground Nuts;
Roundnuts; Sweet
1-3 2-4 4-8 Hand hoes
Middle 5-6 2-6
Millet; Finger Millet;
Sorghum; Maize; Cow
Peas; Ground Nuts;
Roundnuts; Sweet
Potatoes
2-4 2-5 5-13Hand hoes;
Plough
Better Off 5-6 4-6
Millet; Finger Millet;
Sorghum; Maize; Cow
Peas; Ground Nuts;
Roundnuts; Sweet
Potatoes
4-7 4-6 6-15
Hand hoes;
Plough;
Scotch cart
Livestock Holding
HH size
Land area
cultivated
(acres)
Crops cultivatedOther
Assets
13%
20%
34%
33%
% of population
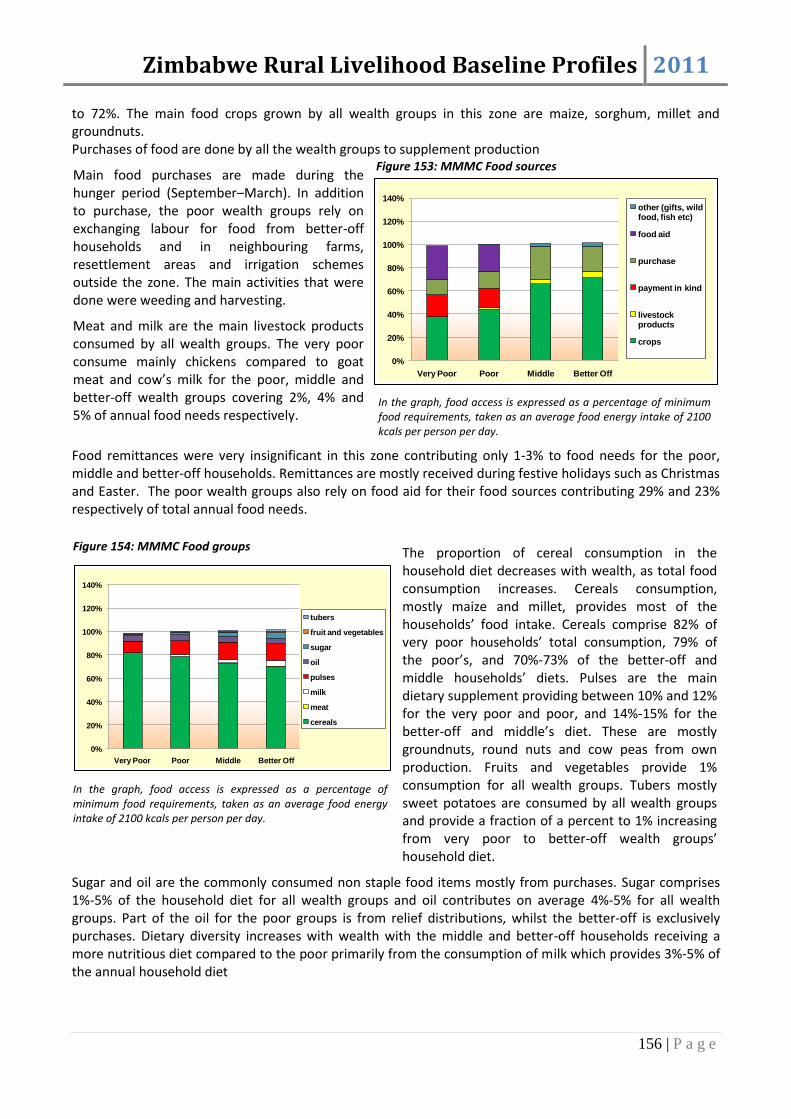
Zimbabwe Rural Livelihood Baseline Profiles 2011
156 | P a g e
to 72%. The main food crops grown by all wealth groups in this zone are maize, sorghum, millet and groundnuts. Purchases of food are done by all the wealth groups to supplement production
Main food purchases are made during the hunger period (September–March). In addition to purchase, the poor wealth groups rely on exchanging labour for food from better-off households and in neighbouring farms, resettlement areas and irrigation schemes outside the zone. The main activities that were done were weeding and harvesting.
Meat and milk are the main livestock products consumed by all wealth groups. The very poor consume mainly chickens compared to goat meat and cow’s milk for the poor, middle and better-off wealth groups covering 2%, 4% and 5% of annual food needs respectively.
In the graph, food access is expressed as a percentage of minimum food requirements, taken as an average food energy intake of 2100 kcals per person per day.
Food remittances were very insignificant in this zone contributing only 1-3% to food needs for the poor, middle and better-off households. Remittances are mostly received during festive holidays such as Christmas and Easter. The poor wealth groups also rely on food aid for their food sources contributing 29% and 23% respectively of total annual food needs.
In the graph, food access is expressed as a percentage of minimum food requirements, taken as an average food energy intake of 2100 kcals per person per day.
The proportion of cereal consumption in the household diet decreases with wealth, as total food consumption increases. Cereals consumption, mostly maize and millet, provides most of the households’ food intake. Cereals comprise 82% of very poor households’ total consumption, 79% of the poor’s, and 70%-73% of the better-off and middle households’ diets. Pulses are the main dietary supplement providing between 10% and 12% for the very poor and poor, and 14%-15% for the better-off and middle’s diet. These are mostly groundnuts, round nuts and cow peas from own production. Fruits and vegetables provide 1% consumption for all wealth groups. Tubers mostly sweet potatoes are consumed by all wealth groups and provide a fraction of a percent to 1% increasing from very poor to better-off wealth groups’ household diet.
Sugar and oil are the commonly consumed non staple food items mostly from purchases. Sugar comprises 1%-5% of the household diet for all wealth groups and oil contributes on average 4%-5% for all wealth groups. Part of the oil for the poor groups is from relief distributions, whilst the better-off is exclusively purchases. Dietary diversity increases with wealth with the middle and better-off households receiving a more nutritious diet compared to the poor primarily from the consumption of milk which provides 3%-5% of the annual household diet
0%
20%
40%
60%
80%
100%
120%
140%
Very Poor Poor Middle Better Off
other (gifts, wild food, fish etc)
food aid
purchase
payment in kind
livestock products
crops
0%
20%
40%
60%
80%
100%
120%
140%
Very Poor Poor Middle Better Off
tubers
fruit and vegetables
sugar
oil
pulses
milk
meat
cereals
Figure 153: MMMC Food sources
Figure 154: MMMC Food groups

Zimbabwe Rural Livelihood Baseline Profiles 2011
157 | P a g e
Sources of Cash (Reference Period 2009/10)
The overall cash income generated by different households has a positive correlation with wealth status and assets owned by each wealth group. Employment is an important income source for all the wealth groups in this zone.
This is a main income source for the poor and very poor households who are employed locally by wealthier households, whereas the better-off households hire out agricultural equipment such as ploughs and scotch carts. Remittances are important income sources for the wealthier households. The contributions of these sources proportionally decrease with wealth. Income from livestock sales increase with wealth. All the wealth groups sell poultry and goats with the middle and better-off selling cattle as well. Considerable incomes are earned by the middle and better-off wealth groups accounting for 51% and 72% of total annual income respectively making them more vulnerable to shocks that affect livestock.
Annual Expenditure in USD
Very Poor 180-200
Poor 200-260
Middle 350-400
Better-off 400-460
All wealth groups earn incomes from sale of mainly leafy vegetables, tomatoes and groundnuts. Self-employment activities such as firewood sales, beer brewing and mining activities are important sources of income across the 4 wealth groups. The very poor and poor get 16% and 29% of annual income respectively.
Expenditure Patterns (Reference Period 2009/10)
Annual Expenditure in USD
Very Poor 180-200
Poor 200-260
Middle 350-400
Better-off 400-460
The expenditure patterns of the wealth groups in this livelihood zone vary across the groups. Household items purchases constitute the greater proportion of the very poor and poor expenditure, and this declines with wealth although in absolute terms the middle and better-off households spend more money (USD103-USD108) than the poor and very poor (USD78-86). This includes items such as grinding costs, salt, utensils tea and kerosene/candles. Purchase of household items is second priority after food and this trend is mainly because the poor groups received food aid and hence income was allocated to the second most important expenditure item leading to a decreased expenditure on food.
Food purchases are another important expenditure for all wealth groups with differences in the allocation of expenditure between staple and non staple purchase. Most expenditure of the poor is mainly on staples. Expenditure on food takes 32%-33% for very poor and poor and 39%-34% for middle and better-off total annual expenditure respectively. In absolute terms, expenditure on non staple food is low on the very poor
0%
20%
40%
60%
80%
100%
120%
Very Poor Poor Middle Better off
self-employment
employment
livestock sales
crop sales
0%
20%
40%
60%
80%
100%
Very Poor Poor Middle Better off
other
gifts
tax
social serv.
inputs
HH items
non-staple food
staple food
Figure 155: MMMC Cash income Sources
Figure 156: MMMC Expenditure patterns

Zimbabwe Rural Livelihood Baseline Profiles 2011
158 | P a g e
and poor wealth about USD21-USD34 but rises steeply to USD63-USD74 for the middle and better-off wealth groups.
Expenditure on social services ranges between 12%-17% of total expenditure for the 4 wealth groups mainly payments for education and health costs. Actual expenditure is low for the poor wealth groups as they benefit from education assistance programmes from government and non-governmental organisations. Overall there is very low expenditure on medication because government subsidises health services in communal areas.
Expenditure on inputs is incurred by all wealth groups except the very poor and increases from the poor to the better-off wealth group. The very poor use donated inputs as well as retained seed from other sources such as grain from food aid whilst the other groups purchase varying amounts to complement donated seed.
All the 4 groups have small amounts spent on clothes and taxes with proportions of 1%-3% of total annual expenditure. ‘Other’ expenditure items include transport, beer, and communication expenses. All wealth groups spend on these items on different scales, with the actual expenditure increasing with wealth.
Hazards
Chronic hazards: Erratic rainfall is a regular hazard, which limits crop production. Inputs shortage has been a phenomenon for the past agricultural seasons impeding negatively on production. Lack of draught power for the poor groups has been a yearly drawback on production for these groups.
Periodic hazards: Drought is a periodic hazard, which affects agriculture production in this zone. Crop pests and livestock diseases also periodically affect production nearly 1 in every 5 years.
Coping Strategies
Increased sale of labour: The very poor and poor households in bad years increase the number of times they do casual work locally and also migrate to neighbouring zones and farms seeking labour opportunities.
Increased remittances: The middle and better-off households mostly rely on increased remittances from family members in bad years, whilst the poor rely on local gifts from better-off households.
Increased sale of crafts: In bad years households increase marketing of crafts along main highways running through the zone and travel to neighbouring towns to increase their chances of getting crafts bought.
Increased sale of livestock: This strategy is mostly used by the better-off households who have bigger herd sizes who sell goats and cattle. The poor households increase the sale or exchange of chickens in bad years.
Collection of wild foods: This is a strategy mainly employed by the very poor and poor households. This also includes collecting of less preferred wild foods such as chakata/hacha.

Zimbabwe Rural Livelihood Baseline Profiles 2011
159 | P a g e
Key Parameters for Monitoring
Table 24: MMMC Monitoring indicators
Item Key Parameter - Quantity Key Parameter – Price
Crops Maize
Sorghum
Groundnuts
Vegetables
Vegetables
Livestock production Cattle
Goats
Chicken
Cattle
Goats
Chicken
Other food and cash income Weeding
Harvesting
Construction (Thatching, Brick moulding)
Remittances
Self employment (Brewing, Grass sales, Firewood sales, Panning)
Weeding
Construction (Thatching, Brick moulding)
Remittances
Self employment (Brewing, Grass sales, Firewood sales, Panning)
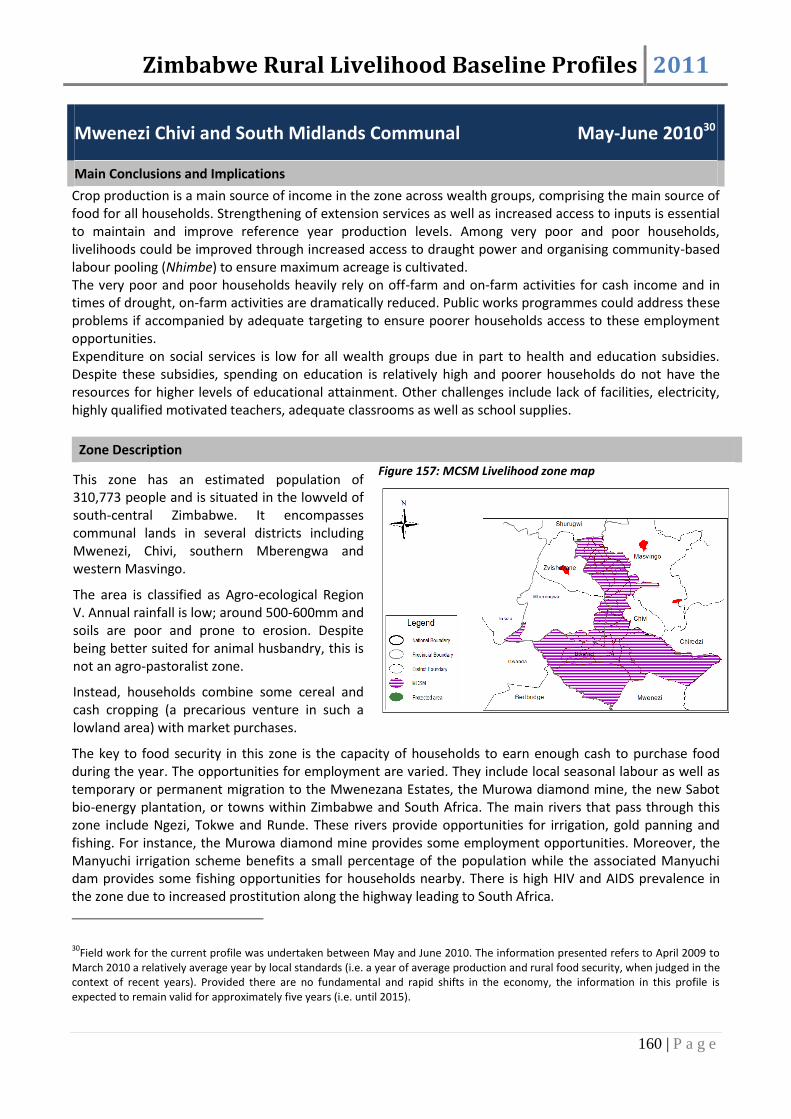
Zimbabwe Rural Livelihood Baseline Profiles 2011
160 | P a g e
Mwenezi Chivi and South Midlands Communal May-June 201030
Main Conclusions and Implications
Crop production is a main source of income in the zone across wealth groups, comprising the main source of food for all households. Strengthening of extension services as well as increased access to inputs is essential to maintain and improve reference year production levels. Among very poor and poor households, livelihoods could be improved through increased access to draught power and organising community-based labour pooling (Nhimbe) to ensure maximum acreage is cultivated. The very poor and poor households heavily rely on off-farm and on-farm activities for cash income and in times of drought, on-farm activities are dramatically reduced. Public works programmes could address these problems if accompanied by adequate targeting to ensure poorer households access to these employment opportunities. Expenditure on social services is low for all wealth groups due in part to health and education subsidies. Despite these subsidies, spending on education is relatively high and poorer households do not have the resources for higher levels of educational attainment. Other challenges include lack of facilities, electricity, highly qualified motivated teachers, adequate classrooms as well as school supplies.
Zone Description
This zone has an estimated population of 310,773 people and is situated in the lowveld of south-central Zimbabwe. It encompasses communal lands in several districts including Mwenezi, Chivi, southern Mberengwa and western Masvingo.
The area is classified as Agro-ecological Region V. Annual rainfall is low; around 500-600mm and soils are poor and prone to erosion. Despite being better suited for animal husbandry, this is not an agro-pastoralist zone.
Instead, households combine some cereal and cash cropping (a precarious venture in such a lowland area) with market purchases.
Figure 157: MCSM Livelihood zone map
The key to food security in this zone is the capacity of households to earn enough cash to purchase food during the year. The opportunities for employment are varied. They include local seasonal labour as well as temporary or permanent migration to the Mwenezana Estates, the Murowa diamond mine, the new Sabot bio-energy plantation, or towns within Zimbabwe and South Africa. The main rivers that pass through this zone include Ngezi, Tokwe and Runde. These rivers provide opportunities for irrigation, gold panning and fishing. For instance, the Murowa diamond mine provides some employment opportunities. Moreover, the Manyuchi irrigation scheme benefits a small percentage of the population while the associated Manyuchi dam provides some fishing opportunities for households nearby. There is high HIV and AIDS prevalence in the zone due to increased prostitution along the highway leading to South Africa.
30Field work for the current profile was undertaken between May and June 2010. The information presented refers to April 2009 to
March 2010 a relatively average year by local standards (i.e. a year of average production and rural food security, when judged in the context of recent years). Provided there are no fundamental and rapid shifts in the economy, the information in this profile is expected to remain valid for approximately five years (i.e. until 2015).

Zimbabwe Rural Livelihood Baseline Profiles 2011
161 | P a g e
Markets and Trade
Cereals are traded through private buyers (breweries and millers for instance) as well as the Grain Marketing Board (GMB). Established cotton buyers (COTTCO, Cargill, Olam, Teraffin and Comtex) have their depots in Triangle, Ngundu, Chivi Growth Point and Chiredzi. The roads linking these depots to the communal areas are generally poor. Groundnuts and round nuts are exported to South Africa. Prices of cereals are generally at their lowest between March and August, linked to the increased availability of food at harvest time. Animals are usually sold to private buyers and local butcheries both with established and mobile selling points. Handicrafts are usually sold along the highway.
Opportunities for labour include local casual work, seasonal farm work for local better-off households, farm work on plantations and estates in Chiredzi and Mwenezi and casual or permanent jobs in the asbestos mines in Zvishavane or in South Africa. New activities at Nuanetsi (Sabot) Ranch – namely large-scale crocodile farming and bio-energy production have been providing casual work and will likely create more labour opportunities for the local population as production peaks in the farm. Casual labourers have already been employed to clear the land. The Murowa diamond mine and Sabi gold mine also employ people in the zone.
Seasonal Calendar
The rainfall season begins in November and lasts until March. The main crops cultivated are millet, sorghum and maize, round nuts, groundnuts and cowpeas. Maize production is generally low and is harvested around March. The hunger period lasts from September to March. Prices of maize and other cereals are highest between September and February; as this is when household food stocks are generally low. Cotton is the main cash crop grown in the zone. The main cultivation period for cotton is between November and June. Mopane worms are harvested in December and March. The availability of various other wild foods and insects is seasonal; notably they are consumed by all households across the wealth groups. Gardening activities occur between March and September.
Wealth Breakdown
The wealth breakdown exercise was determined by the descriptions that the community key informants made of the typical characteristics that differentiated each wealth group. 4 wealth groups were identified by the key informants namely the very poor (vanoshayisisa), the poor (vanoshaya), the middle (varinani), and the better-off (vanowana).
Figure 20.2 Seasonal Calendar
Apr May Jun Jul Aug Sep Oct Nov Dec Jan Feb Mar
Legend
cattle
Land Preparation
Mil let
Maize
Sorghum
Gold Panning
Wet Season
planting cons. green harvest
Dry Season
cattle and shoats
Off farm
shoats
Apr May Jun Jul Aug Sep Oct Nov Dec Jan Feb Mar
Legend
cattle
Land Preparation
Mil let
Maize
Sorghum
Gold Panning
Wet Season
planting cons. green harvest
Dry Season
cattle and shoats
Off farm
shoats
Figure 158: MCSM Seasonal Calendar
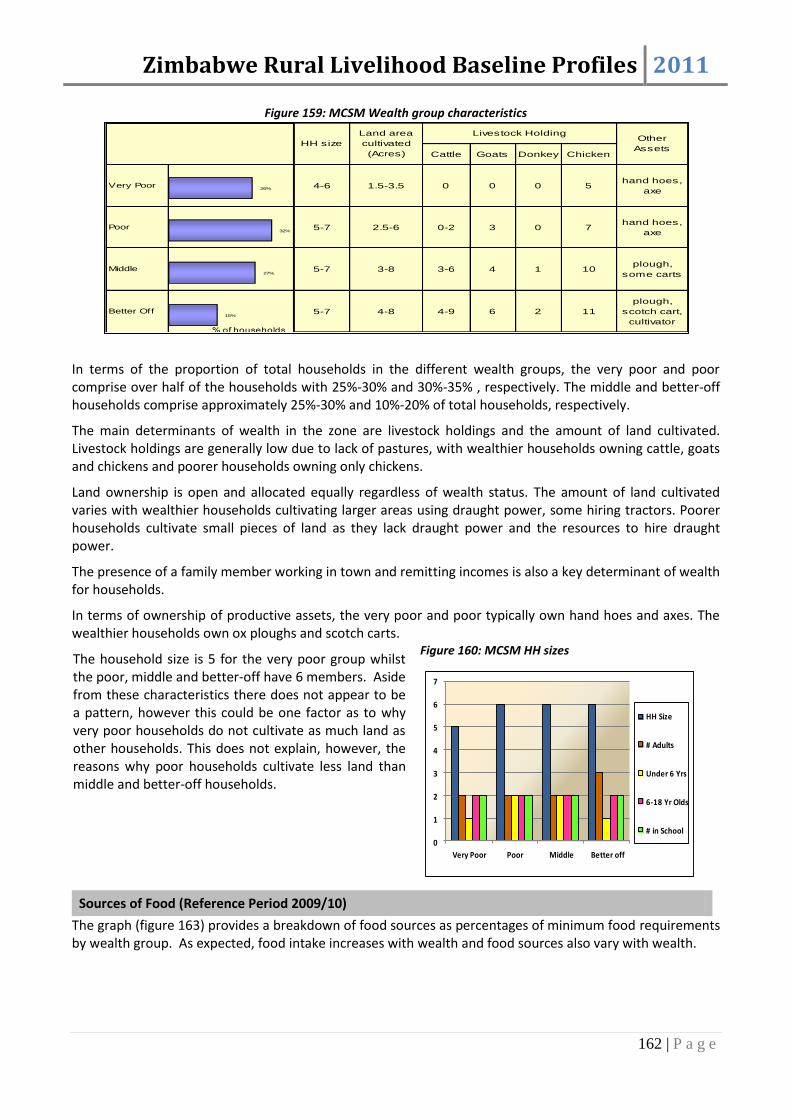
Zimbabwe Rural Livelihood Baseline Profiles 2011
162 | P a g e
Figure 159: MCSM Wealth group characteristics
In terms of the proportion of total households in the different wealth groups, the very poor and poor comprise over half of the households with 25%-30% and 30%-35% , respectively. The middle and better-off households comprise approximately 25%-30% and 10%-20% of total households, respectively.
The main determinants of wealth in the zone are livestock holdings and the amount of land cultivated. Livestock holdings are generally low due to lack of pastures, with wealthier households owning cattle, goats and chickens and poorer households owning only chickens.
Land ownership is open and allocated equally regardless of wealth status. The amount of land cultivated varies with wealthier households cultivating larger areas using draught power, some hiring tractors. Poorer households cultivate small pieces of land as they lack draught power and the resources to hire draught power.
The presence of a family member working in town and remitting incomes is also a key determinant of wealth for households.
In terms of ownership of productive assets, the very poor and poor typically own hand hoes and axes. The wealthier households own ox ploughs and scotch carts.
The household size is 5 for the very poor group whilst the poor, middle and better-off have 6 members. Aside from these characteristics there does not appear to be a pattern, however this could be one factor as to why very poor households do not cultivate as much land as other households. This does not explain, however, the reasons why poor households cultivate less land than middle and better-off households.
Figure 160: MCSM HH sizes
0
1
2
3
4
5
6
7
Very Poor Poor Middle Better off
HH Size
# Adults
Under 6 Yrs
6-18 Yr Olds
# in School
Sources of Food (Reference Period 2009/10)
The graph (figure 163) provides a breakdown of food sources as percentages of minimum food requirements by wealth group. As expected, food intake increases with wealth and food sources also vary with wealth.
Cattle Goats Donkey Chicken
Very Poor 4-6 1.5-3.5 0 0 0 5hand hoes,
axe
Poor 5-7 2.5-6 0-2 3 0 7hand hoes,
axe
Middle 5-7 3-8 3-6 4 1 10plough,
some carts
Better Off 5-7 4-8 4-9 6 2 11
plough,
scotch cart,
cultivator
HH size
Land area
cultivated
(Acres)
Livestock HoldingOther
Assets
Wealth Groups Characteristics
15%
27%
32%
26%
% of households
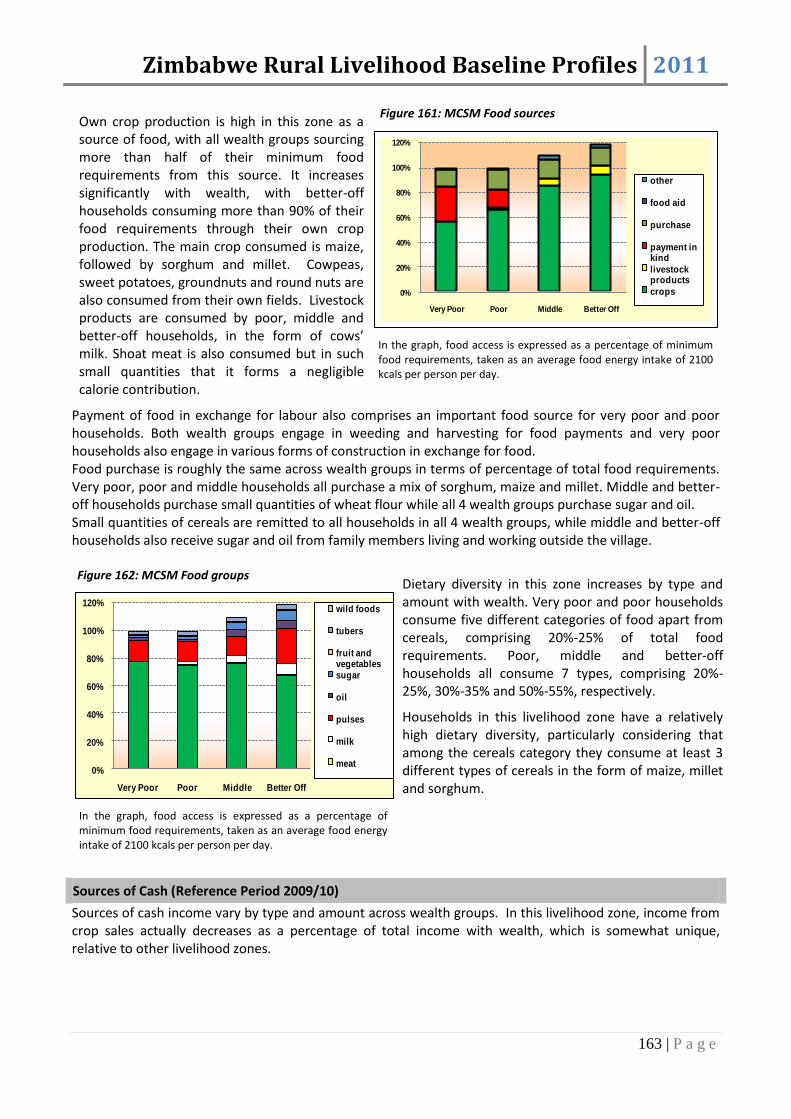
Zimbabwe Rural Livelihood Baseline Profiles 2011
163 | P a g e
Own crop production is high in this zone as a source of food, with all wealth groups sourcing more than half of their minimum food requirements from this source. It increases significantly with wealth, with better-off households consuming more than 90% of their food requirements through their own crop production. The main crop consumed is maize, followed by sorghum and millet. Cowpeas, sweet potatoes, groundnuts and round nuts are also consumed from their own fields. Livestock products are consumed by poor, middle and better-off households, in the form of cows’ milk. Shoat meat is also consumed but in such small quantities that it forms a negligible calorie contribution.
In the graph, food access is expressed as a percentage of minimum food requirements, taken as an average food energy intake of 2100 kcals per person per day.
Payment of food in exchange for labour also comprises an important food source for very poor and poor households. Both wealth groups engage in weeding and harvesting for food payments and very poor households also engage in various forms of construction in exchange for food. Food purchase is roughly the same across wealth groups in terms of percentage of total food requirements. Very poor, poor and middle households all purchase a mix of sorghum, maize and millet. Middle and better-off households purchase small quantities of wheat flour while all 4 wealth groups purchase sugar and oil. Small quantities of cereals are remitted to all households in all 4 wealth groups, while middle and better-off households also receive sugar and oil from family members living and working outside the village.
In the graph, food access is expressed as a percentage of minimum food requirements, taken as an average food energy intake of 2100 kcals per person per day.
Dietary diversity in this zone increases by type and amount with wealth. Very poor and poor households consume five different categories of food apart from cereals, comprising 20%-25% of total food requirements. Poor, middle and better-off households all consume 7 types, comprising 20%-25%, 30%-35% and 50%-55%, respectively.
Households in this livelihood zone have a relatively high dietary diversity, particularly considering that among the cereals category they consume at least 3 different types of cereals in the form of maize, millet and sorghum.
Sources of Cash (Reference Period 2009/10)
Sources of cash income vary by type and amount across wealth groups. In this livelihood zone, income from crop sales actually decreases as a percentage of total income with wealth, which is somewhat unique, relative to other livelihood zones.
0%
20%
40%
60%
80%
100%
120%
Very Poor Poor Middle Better Off
other
food aid
purchase
payment in kind
livestock products
crops
0%
20%
40%
60%
80%
100%
120%
Very Poor Poor Middle Better Off
wild foods
tubers
fruit and vegetablessugar
oil
pulses
milk
meat
Figure 161: MCSM Food sources
Figure 162: MCSM Food groups

Zimbabwe Rural Livelihood Baseline Profiles 2011
164 | P a g e
Income from livestock sales increase with wealth, which is expected given the different livestock types kept by each wealth group detailed above in the wealth breakdown.
Vegetables and groundnuts are the main crops sold across all 4 wealth groups, while middle and better-off households also sell maize grain. Actual income from crop sales increases with wealth, but as a percentage of total income it decreases. Livestock sales are obviously limited to chickens among very poor households, chickens and goats among poor households and chickens, goats and cattle among middle and better-off households.
Annual Income (USD)
Very Poor 100-200
Poor 150-260
Middle 300-700
Better-off 700-1100
All 4 wealth groups receive cash income in the form of remittances, although middle and better-off households receive much larger amounts than poor and very poor households. Poor and very-poor households also engage in agricultural labour for cash income, as well as various forms of self-employment including gold panning, beer brewing and handicrafts.
Expenditure Patterns (Reference Period 2009/10)
Annual Expenditure (USD)
Very Poor 100-200
Poor 150-260
Middle 300-700
Better-off 700-1100
In this livelihood zone, expenditure amounts and types vary across wealth groups. Staple food purchases decrease with wealth, while non-staple food is roughly similar across wealth groups, slightly higher among poor and middle households. The details of these food purchases were discussed above in the food sources section and will not be repeated here.
Household expenditure items are comprised mainly of grain grinding costs, the actual expenditure of which is roughly the same across wealth groups and explains the decrease as a percentage between poor and middle households.
Soap, salt, tea and kerosene comprise the rest of this expenditure and are purchased by all wealth groups. Salt, like grinding costs, is similar in actual expenditure amounts across wealth groups.
The only inputs purchased are animal drugs by middle and better-off households and seeds by better-off households. There is a seed distribution scheme in this zone in addition to the general provision of subsidised inputs across types and wealth groups.
Social services, mainly education comprise a large percentage of total expenditure, particularly given that education is partially subsidized by the government. Actual expenditure on education increases fairly dramatically with wealth, demonstrating why it is difficult for poorer households to achieve higher levels of educational attainment.
0%
20%
40%
60%
80%
100%
Very Poor Poor Middle Better off
other
gifts
tax
clothes
social serv.
inputs
water
HH items
non-staple food
staple food
Figure 163: MCSM Cash income sources
Figure 164: MCSM Expenditure patterns

Zimbabwe Rural Livelihood Baseline Profiles 2011
165 | P a g e
Other expenditures include transport, tobacco, alcohol and community obligations, and these comprise a portion of expenditure across all wealth groups.
Hazards
Chronic hazards: HIV and AIDS affects the household economy through lowered production and higher expenses. Crops in the zone are also prone to attacks by quelea birds at the ripening stage. Gold panning activities have created gullies and increased the risk of soil erosion and landslides. Furthermore, mining activities are associated with lung infections from the dust. Livestock diseases such as Foot and Mouth Disease and anthrax are endemic in this zone. Cutting down of trees especially in A1 areas is causing serious deforestation.
Periodic hazards: Rainfall is below average roughly every 4 years. Flooding along the rivers is another hazard and at such times people and livestock have been known to drown. Cholera occasionally affects people in this zone due to poor water and sanitation. Veld fire burning during the dry season are very common.
Coping Strategies
Increase in remittances: Remittances play a significant role in the zone in the bad years. Almost all wealth groups have relatives/family members working in South Africa owing to the zone’s proximity to South Africa. These family members play a significant role in the bad years by increasing the remittances they send back home.
Increased labour migration: In the bad years there is increased migration to main towns such as Masvingo. The labourers usually migrate for long periods of time.
Reduction in the number of meals and quantity of food consumed per day: The poor groups reduce the number of meals they consume in a day to try and manage during food crisis periods. In addition to the reduction of the number meals consumed, the pot size is also reduced.
Key Parameters for Monitoring
Table 25: MCSM Monitoring indicators
Item Key Parameter - Quantity Key Parameter – Price
Crops Maize
Sorghum
Groundnuts
Maize grain
Sorghum
Livestock production Cattle
Goats
Cattle
Goats
Other food and cash income Casual Labour
Cotton production
Labour rates (land preparation, weeding, harvesting)
Cotton
Zimbabwe Rural Livelihood Baseline Profiles 2011
166 | P a g e
Bikita Zaka Highland Communal November-December 201031
Main Conclusions and Implications
Crop production is the main source of food and cash income in this zone and there is potential for an improvement in crop production if access to seed and fertilisers is timely and made affordable for farmers. Extension services and the monitoring of agriculture activities should be strengthened through support by the MOA’s Department of Extension Services (AGRITEX). Livestock re-stocking programmes targeting poorer households would provide these households with draught power, removing a key limitation on the size of land cultivated. Damming of perennial streams and subsequent irrigation development will also help alleviate over-reliance on rain-fed agriculture, increasing food security.
Poorer households rely on on-farm and off-farm casual work for both cash and food income. In times of drought, on–farm employment is reduced and results in a reduction or complete loss of income. This considerable reliance on household labour is substantially affected by fluctuations in payment rates and the availability of work. Schemes such as public works are appropriate for and would address food and cash access challenges; however there is a need for better targeting to ensure the poorest households receive more employment opportunities.
Additionally, monitoring the terms of trade of grain payments for labour is critical in this zone as any decline will have a serious impact on poorer households. These issues are particularly critical considering the poorer wealth groups slightly failed to meet their food energy requirements in the reference year, meaning these groups are particularly vulnerable to increased poverty.
High expenditure on food (both staple and non-staple) means that increases in the food prices, particularly maize grain, should be monitored.
Low expenditure on social services for all wealth groups is a result of subsidies in the health and education sectors. The education system is subsidized; however educational attainment levels remain low among poor and very poor households. Increased targeting of poor and very poor households with regards to educational programmes beyond subsidizing school fees could increase school attendance levels among these households.
Zone Description
This zone has an estimated population of 91,808 and covers communal lands in the north-east of Masvingo, the northern part of Zaka and the western part of Bikita Districts of Masvingo Province. The zone consists of communal lands across the northern Highveld, surrounded by formerly large-scale commercial farms and is generally a food sufficient area.
The zone falls under Agro-ecological Region III with relatively fertile red soils and rainfall averages around 600mm-800mm per year
Figure 165: BZHC Livelihood zone map
31
Field work for the current profile was undertaken in November and December 2010. The information presented refers to April 2009 to March 2010, a relatively average year by local standards (i.e. a year of average production and rural food security, when judged in the context of recent years). Provided there are no fundamental and rapid shifts in the economy, the information in this profile is expected to remain valid for approximately five years (i.e. until 2015).

Zimbabwe Rural Livelihood Baseline Profiles 2011
167 | P a g e
Minimum temperatures in the zone range between 30 oC- 35 oC during winter (muchando) and the maximum range between 15oC- 25 oC during summer (chirimo). Rain-fed agriculture dominates the rural economy. Maize and groundnuts are the primary crops, supplemented by finger millet, round nuts sweet potatoes and vegetables. One of the main limitations to crop production is land access. The area is densely populated and therefore farmers’ fields are correspondingly small. Crop cultivation is supplemented by various other income generating activities including local employment, beer brewing and animal husbandry.
Livestock production is limited by the lack of grazing areas due to the dense population; this has affected herd sizes which have decreased in recent years.
Markets and Trade
Cereal, in particular maize, is marketed locally between farmers. Sweet potatoes and wild fruits (guavas and mazhanje) are sold on major highways passing through the zone.
Livestock are sold on a small scale to local butcheries and private buyers. Overall trends show a decline in livestock sales.
Labour markets in the zone are mostly in the form of casual employment but a significant number of households seek labour opportunities outside the zone in nearby farms, such as Mutendi, Gava and Munagarwa.
Seasonal Calendar
Agricultural labour takes place throughout the growing season, peaking around December and January for weeding and from April to May for the harvest period. The rainy season begins in November and tails off in March.
The main cereal grown in this zone is rain-fed maize and other food crops include cowpeas, groundnuts, round nuts and sweet potatoes. As demonstrated in the above seasonal calendar, the main planting season is from November to January, with the main harvest season occurring from February to May. The lean season lasts from October to January when earlier harvests will be finished and household food stocks are low. The lean season finishes with the beginning of the harvest in February. This lean season begins earlier and therefore lasts longer for poorer households. Milk production and consumption for those who keep cattle lasts from November to April.
Wealth Breakdown
The wealth breakdown exercise was determined by the descriptions that the community key informants made of the typical characteristics that differentiated each wealth group. 4 wealth groups were identified by the key informants namely the very poor (vanoshayisisa), the poor (vanoshaya), the middle (varinani), and the better-off (vanowana).
Figure 166: BZHC Seasonal Calendar
Apr May Jun Jul Aug Sep Oct Nov Dec Jan Feb Mar
Legend
cattle onfarm
Land Preparation
Weeding
Planting
Green Consumption
Harvesting
Gardening
Livestock sa les
Livestock heats and births
Mi lk production
Other
Lean season
Local labour
Wild frui ts
Off farm
shoats
Rainy Season
planting cons. green harvest
Dry Season
cattle and shoats

Zimbabwe Rural Livelihood Baseline Profiles 2011
168 | P a g e
Figure 167: BZHC Wealth group characteristics
Cattle Goats Poultry
Very Poor 5-7 1-2
Finger millet; maize;
cowpeas; groundnuts;
roundnuts; sweet
potatoes
0 0 2-8
Poor 5-7 1.5-2.5
Finger millet; maize;
cowpeas; groundnuts;
roundnuts; sweet
potatoes
0-2 2-4 3-8
Middle 5-7 2.5-4.5
Finger millet; maize;
cowpeas; groundnuts;
roundnuts; sweet
potatoes
3-4 3-5 5-12 Wheelbarrow
Better Off 5-7 2.5-5
Finger millet; maize;
cowpeas; groundnuts;
roundnuts; sweet
potatoes
5-8 4-8 7-15
Wheel barrow,
Cultivator,Scotc
h cart
Land area
cultivatedCrops cultivated
Livestock Holding
Other AssetsHH size
13%
23%
33%
31%
% of households
In terms of proportion of total households, the majority of households in this zone are either very poor or poor, together comprising approximately 60%-65% of households. The middle and better-off households are approximately 20%-25% and 10%-15%, respectively. Household size is generally consistent across wealth groups, with a range of 5 to 7 household members.
The main determinants of wealth in the zone are livestock holdings and the acreage of land cultivated. Additionally, the majority of middle and better-off households have a family member who works outside the zone and remits cash income and food back to the household. This is further detailed below in the income sources section. While this wealth determinant is not immediately visible from the above table, it is an important division between the poorer and the middle and better-off households. The types of crops cultivated remain the same across wealth groups.
Livestock holdings are generally low due to lack of pastures; the average amount of cattle among the better-off households is approximately 5 to 8, while goats range between approximately 4 and 8 heads. Very poor households generally keep only chickens and poor households keep goats and chickens, with a few keeping small numbers of cattle as well.
Land ownership is low across all wealth groups and allocations are equal regardless of wealth status. The amount of land cultivated varies by the means accessible to the households. Wealthier households are able to cultivate larger areas through the use of draught power and some hired labour. Poorer households cultivate small pieces of land as they lack draught power and other inputs, cultivating using hand hoes.
Productive asset ownership increases with wealth. The very poor and poor typically own hand tools such as hand hoes and axes. The wealthier households own ox drawn implements such as the ploughs, scotch carts, and wheelbarrows.
The household is 5 for the very poor whilst it is 6 for the poor, middle and better-off. The better-off have 3 adults whilst the other groups have 2 adults, this makes the better-off have more labour to support agricultural activities than the other groups. All children of school age were going to school in the zone.
Figure 168: BZHC HH sizes
0
1
2
3
4
5
6
7
Very Poor Poor Middle Better off
HH Size
# Adults
Under 6 Yrs
6-18 Yr Olds
# in School

Zimbabwe Rural Livelihood Baseline Profiles 2011
169 | P a g e
Sources of Food (Reference Period 2009/10)
The main sources of food across all wealth groups in this livelihood zone include own crop production, purchase, labour exchange, livestock products, and gifts/remittances. The graph (figure 171) shows the breakdown of food source by wealth group.
As is expected, the diversity of food sources and amounts of food intake increase with wealth. Very poor and poor households rely on food purchase and labour exchange almost as much as on their own crop production, while own crop production comprises between 75% and 90% of total food requirements among middle and better-off households.
The main food crops grown by all wealth groups in this zone are maize, finger millet, round nuts, groundnuts, cowpeas and sweet potatoes; the majority being maize with own maize production comprising approximately three-quarters of own crop consumption, across wealth groups.
In the graph, food access is expressed as a percentage of minimum food requirements, taken as an average food energy intake of 2100 kcals per person per day.
Livestock products, mainly cattle milk and shoat meat, comprise a small food source for those who keep this type of livestock. As a percentage of total food energy, livestock products increase slightly with wealth from zero to approximately 3% to 5%. Maize grain is the largest food item purchased by both actual cost and caloric contribution among the very poor, poor and middle households. Better-off households did not purchase any maize and, together with middle households, purchased small amounts of rice and wheat flour. Sugar and oil comprise the remaining food purchases and increase with wealth from approximately 2 to 5 % of total food energy among the very poor to 8 to 10 % among the better-off. Labour exchange is a key source of food in the zone for poorer wealth groups. The main activities undertaken in exchange for food are threshing, planting and weeding. Additionally, labour migration comprised a small amount of food energy through labour exchange among some of the very poor households. Payment in kind for all types of work comprised approximately 30% and 25% of food energy for very poor and poor households, respectively. Middle and better-off households received a small amount of food (approximately 2 %for each wealth group) as remittances from a family member living and working outside of the zone or country.
In the graph, food access is expressed as a percentage of minimum food requirements, taken as an average food energy intake of 2100 kcals per person per day.
The diversity of consumed food increases with wealth, by both type and amount. Apart from cereal consumption, nearly all food types increase with wealth as percentage of total food energy. The diet of very poor households consists of 5 non-cereal foods, comprising approximately 15% of total food energy; the diet of better-off households consists of 7 non-cereal foods comprising approximately 30% of total food energy. Poor and middle households consume 6 non-cereals comprising approximately 15%-20% and 25%-30% of total food energy, respectively. This is in addition to the fact that middle and better-off households also have more diversity within their cereal consumption, as noted above.
0%
20%
40%
60%
80%
100%
120%
Very Poor Poor Middle Better Off
other
purchase
payment in kind
livestock products
crops
0%
20%
40%
60%
80%
100%
Very Poor Poor Middle Better Off
wild foods
tubers
fruit and vegetablessugar
oil
pulses
milk
meat
cereals
Figure 169: BZHC Food sources
Figure 170: BZHC Food groups

Zimbabwe Rural Livelihood Baseline Profiles 2011
170 | P a g e
Sources of Cash (Reference Period 2009/10)
The sources of cash for wealth groups vary in both total amounts and type of activity across wealth groups. The graph shows a breakdown of the type of income activity as a percentage of total income, while the table below it shows the actual range of income for each wealth group.
The number of income activities decreases with wealth, with very poor households engaging in up to 6 different income categories in order to earn between USD 100 and 190, while the better-off engage in on average 4 income categories to earn between USD 400 and 1000. In addition, as detailed below, poorer households may engage in multiple types of employment and self-employment for income.
Annual Income (USD)
Very Poor 100-190
Poor 160-250
Middle 230-400
Better-off 400-1000
All wealth groups earn cash income from selling their crops; however the types and amounts of crops sold vary. All wealth groups sell maize, vegetables and tomatoes, while the poor, middle and better-off sell sweet potatoes and the better-off also sell finger millet. The highest valued crops sold were vegetables and tomatoes (USD 0.50/kg each), finger millet (USD 0.30/kg) and sweet potatoes (USD 0.28/kg). Maize was sold for USD 0.22/kg, but was mainly exchanged for grinding services. Additionally, bananas and avocados are sold mainly by the very poor and poor households. While as a percentage, crop sales decrease with wealth, as actual amounts they increase by large amounts. Regarding livestock sales, all wealth groups sell chickens, poor, middle and better-off households sell goats and only better-off households sell cattle. The price of 1 chicken in this zone in the reference year was approximately USD 4, the price of 1 goat was approximately USD 30 and the price of 1 cow was approximately USD 300.
The very poor engage in thatching and brick production as main sources of income, with agricultural labour and herding also a source of cash income for some households. Firewood collection is the main source of self-employment among the very poor, with a few households engaging in brewing or grass collecting as an alternative. Additionally, ‘relief sales’ comprise a portion of self-employment and income under the “other” category is the income earned from wild food sales. Among poor households, the employment activities are the same as very poor households with the exception that a few households receive small amounts of remittances. Brewing and petty-trade are the main self-employment activities of the poor households, with little to no engagement in firewood sales. The majority of employment income among middle and better-off households is in the form of remittances, with middle households also engaging in some construction activities. Self-employment income among middle and better-off households is earned mainly from brewing.
As a whole, the main income activities that separate the middle and better-off from the poor and very poor are the income these households receive from remittances, as well as the income earned from livestock sales in the case of the better-off households. Crop sales increase with wealth, but not to the same degree as these other 2 income sources.
0%
20%
40%
60%
80%
100%
Very Poor Poor Middle Better off
other
self-employment
employment + remittances
livestock sales
crop sales
Figure 171: BZHC Cash income sources

Zimbabwe Rural Livelihood Baseline Profiles 2011
171 | P a g e
Expenditure Patterns (Reference Period 2009/10)
Annual Expenditure (USD)
Very Poor 100-190
Poor 160-250
Middle 230-400
Better-off 400-1000
The graph (figure 174) provides a breakdown of annual expenditure as a percentage by wealth group, while the table below provides the actual range of household annual expenditure for each wealth group. This graph shows that expenditure on basic items such as food and household items decreases with wealth, while more ‘luxury’ items such as inputs, social services, clothes, transport and mobile phone airtime increase with wealth. As expected, given the above breakdown of crop production as a food source, staple food purchases decrease significantly from very poor households (25%-30%) to better-off households (5%-10%). Types of staple and non-staple food purchases are detailed above in the food source section.
Household items increase in actual amounts with wealth, but decrease as a percentage of expenditure. The largest household item across wealth groups is grain grinding costs, followed by soap, salt, kerosene and then tea, although very poor households did not purchase kerosene. Expenditure on inputs was only typical for the middle and better-off households as the poorer households had access to inputs distributed by development agencies in the reference year.
Expenditure on social services is comprised of education and healthcare costs, with education costs comprising the majority of this expenditure across wealth groups. While health and education are subsidized by the government, poor, middle and better-off households were paying approximately USD 25, USD 50 and USD 90 per year respectively, on items such as uniforms and school supplies, demonstrating that barriers remain in blocking access to education for poorer households.
All households managed to pay household tax in the reference year with wealthier groups paying additional tax for livestock. Other items increasing with wealth include items such as transport, mobile phone air time, beer and tobacco.
Hazards
Chronic hazards: Erratic rainfall patterns have been the major problem limiting crop production in this zone in the recent years. This has been worsened by an inadequate and late supply of inputs by government and other development agencies. Access to markets also remains a challenge especially for wards lying deep in the zone away from major highways cutting across the zone. This limits the community’s potential to acquire more income from sale of such items as garden produce as well as wild fruits which are in abundance in the zone.
Periodic hazards: Drought hits this zone roughly every 4 years. Livestock diseases such as foot and mouth, anthrax or Newcastle disease for chickens affect this zone periodically.
Coping Strategies
Increased sale of livestock: This is a coping strategy mainly employed by the middle and better-off households who own big herd sizes for cattle and goats.
0%
20%
40%
60%
80%
100%
Very Poor Poor Middle Better off
other
gifts
tax
clothes
social serv.
inputs
HH items
non-staple foodstaple food
Figure 172: BZHC Expenditure patterns

Zimbabwe Rural Livelihood Baseline Profiles 2011
172 | P a g e
Increased consumption of wild foods: Collection of wild foods happens every year but in bad years all households increase collection of wild foods for sale and consumption.
Increased labour migration: Traditionally the zone experiences migration to neighbouring countries but in a bad year, household members mostly men migrate for longer periods only sending remittances.
Reduction in the number of meals and quantity of food consumed per day: The poor groups reduce the number of meals they consume in a day to try and manage during food crisis periods. In addition to the reduction of the number meals consumed, the pot size is also reduced.
Key Parameters for Monitoring
Table 26: BZHC Monitoring indicators
Item Key Parameter - Quantity Key Parameter – Price
Crops Maize
Finger Millet
Round nuts
Vegetables
Sweet Potatoes
Livestock production Goats
Chickens
Cattle
Goats
Chickens
Cattle
Other food and cash income Casual labour Casual labour rates
Mazhanje

Zimbabwe Rural Livelihood Baseline Profiles 2011
173 | P a g e
Save River Valley and Ndowoyo Communal July- August 201032
Main Conclusions and Implications
Livelihood success in this zone depends on the outcome of communal agricultural production, animal husbandry, petty trading and remittances as well as casual employment. Despite good soils, cereal and cash cropping are limited by erratic rainfall. Most of the households own some animals, which provide an essential safety net as they can be sold for cash to buy food when needed.
There is potential for increased production of the poorer groups if challenges with draught power, timely access to affordable seed and fertilisers are addressed. To enhance production agriculture monitoring and extension services should be strengthened by resourcing and further training staff in the MOA’s department of Extension Services (AGRITEX). Irrigation is an appropriate development plan in this rainfall poor zone.
Human capital is essential for households to earn income. The very poor and poor households heavily rely on on-farm casual work for their incomes and in times of drought, activities like weeding are severely affected resulting in reduced or loss of income. In such bad years public works programmes would address this problem, although there is need to ensure that the poorest households get most of the employment opportunities.
Food purchases are important for the poorer groups as they try to supplement production. There is need to closely monitor changes in price of food especially maize grain.
Zone Description
The zone is located in south-eastern Zimbabwe, covering parts of Chipinge, Chiredzi and Bikita districts in Manicaland and Masvingo provinces with a population of 279,711.
The zone lies in flat Lowveld areas with some areas lying in the Save river valley and stretches to the hilly traces in Bikita. It is categorised as Agro-ecological Region IV and V characterised by low erratic rainfall. Soils are relatively rich riverine and black vertisol with some parts having red clay soils that are prone to erosion. The limiting factor to agriculture is not soils but rainfall. Throughout the zone, average rainfall is only 450-600mm per year.
Figure 173: SRVN Livelihood zone map
The major rivers; Save, Runde and Mwenezi run through the zone. The zone is bordered by wildlife conservancies to the north and Gonarezhou national park in the south and borders with Mozambique to the east.
Notwithstanding low and erratic rainfall, the zone is dependent on crop production and livestock production to sustain local livelihoods. Households mainly grow small grain cereals (sorghum, finger millet and pearl millet) as well as maize and groundnuts.
32
Field work for the current profile was undertaken in July-August 2010. The information presented refers to April 2009 to March
2010 a relatively average year by local standards (i.e. a year of average production and rural food security, when judged in the context of recent years). Provided there are no fundamental and rapid shifts in the economy, the information in this profile is expected to remain valid for approximately five years (i.e. until 2015).
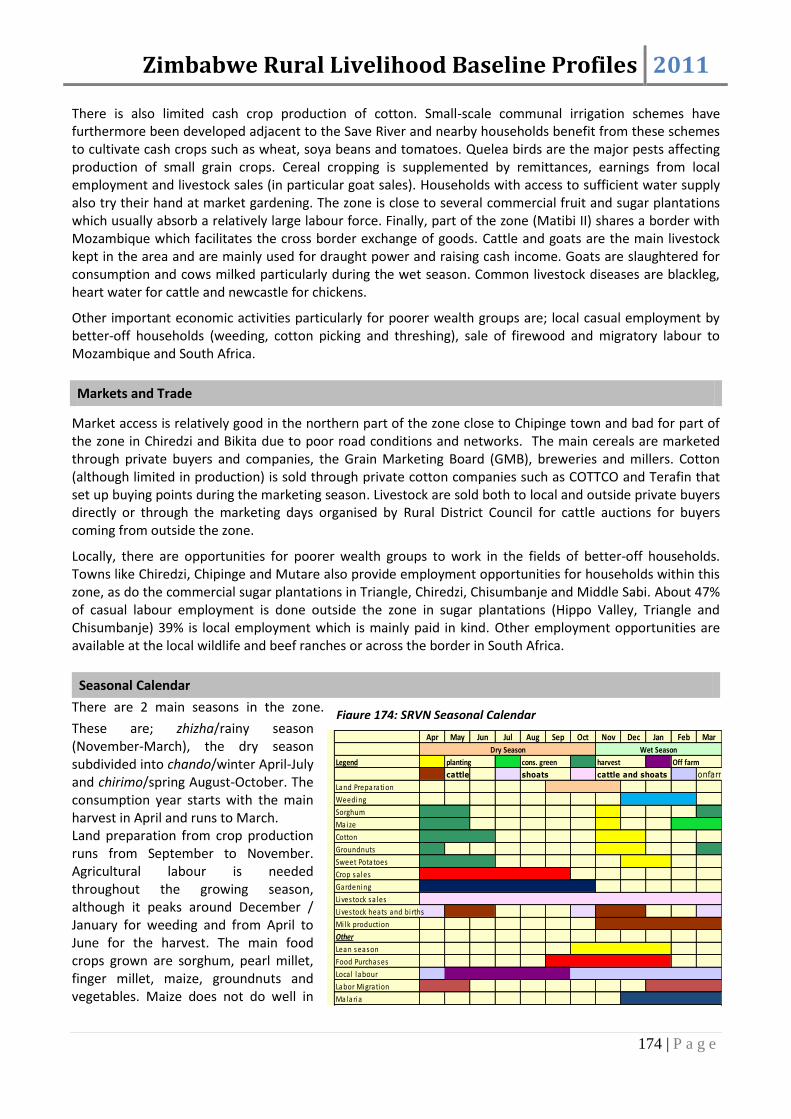
Zimbabwe Rural Livelihood Baseline Profiles 2011
174 | P a g e
There is also limited cash crop production of cotton. Small-scale communal irrigation schemes have furthermore been developed adjacent to the Save River and nearby households benefit from these schemes to cultivate cash crops such as wheat, soya beans and tomatoes. Quelea birds are the major pests affecting production of small grain crops. Cereal cropping is supplemented by remittances, earnings from local employment and livestock sales (in particular goat sales). Households with access to sufficient water supply also try their hand at market gardening. The zone is close to several commercial fruit and sugar plantations which usually absorb a relatively large labour force. Finally, part of the zone (Matibi II) shares a border with Mozambique which facilitates the cross border exchange of goods. Cattle and goats are the main livestock kept in the area and are mainly used for draught power and raising cash income. Goats are slaughtered for consumption and cows milked particularly during the wet season. Common livestock diseases are blackleg, heart water for cattle and newcastle for chickens.
Other important economic activities particularly for poorer wealth groups are; local casual employment by better-off households (weeding, cotton picking and threshing), sale of firewood and migratory labour to Mozambique and South Africa.
Markets and Trade
Market access is relatively good in the northern part of the zone close to Chipinge town and bad for part of the zone in Chiredzi and Bikita due to poor road conditions and networks. The main cereals are marketed through private buyers and companies, the Grain Marketing Board (GMB), breweries and millers. Cotton (although limited in production) is sold through private cotton companies such as COTTCO and Terafin that set up buying points during the marketing season. Livestock are sold both to local and outside private buyers directly or through the marketing days organised by Rural District Council for cattle auctions for buyers coming from outside the zone.
Locally, there are opportunities for poorer wealth groups to work in the fields of better-off households. Towns like Chiredzi, Chipinge and Mutare also provide employment opportunities for households within this zone, as do the commercial sugar plantations in Triangle, Chiredzi, Chisumbanje and Middle Sabi. About 47% of casual labour employment is done outside the zone in sugar plantations (Hippo Valley, Triangle and Chisumbanje) 39% is local employment which is mainly paid in kind. Other employment opportunities are available at the local wildlife and beef ranches or across the border in South Africa.
Seasonal Calendar
There are 2 main seasons in the zone.
These are; zhizha/rainy season (November-March), the dry season subdivided into chando/winter April-July and chirimo/spring August-October. The consumption year starts with the main harvest in April and runs to March. Land preparation from crop production runs from September to November. Agricultural labour is needed throughout the growing season, although it peaks around December / January for weeding and from April to June for the harvest. The main food crops grown are sorghum, pearl millet, finger millet, maize, groundnuts and vegetables. Maize does not do well in
Figure 174: SRVN Seasonal Calendar
Apr May Jun Jul Aug Sep Oct Nov Dec Jan Feb Mar
Legend
cattle onfarm
Land Preparation
Weeding
Sorghum
Maize
Cotton
Groundnuts
Sweet Potatoes
Crop sa les
Gardening
Livestock sa les
Livestock heats and births
Mi lk production
Other
Lean season
Food Purchases
Local labour
Labor Migration
Malaria
Wet Season
planting cons. green harvest
Dry Season
cattle and shoats
Off farm
shoats
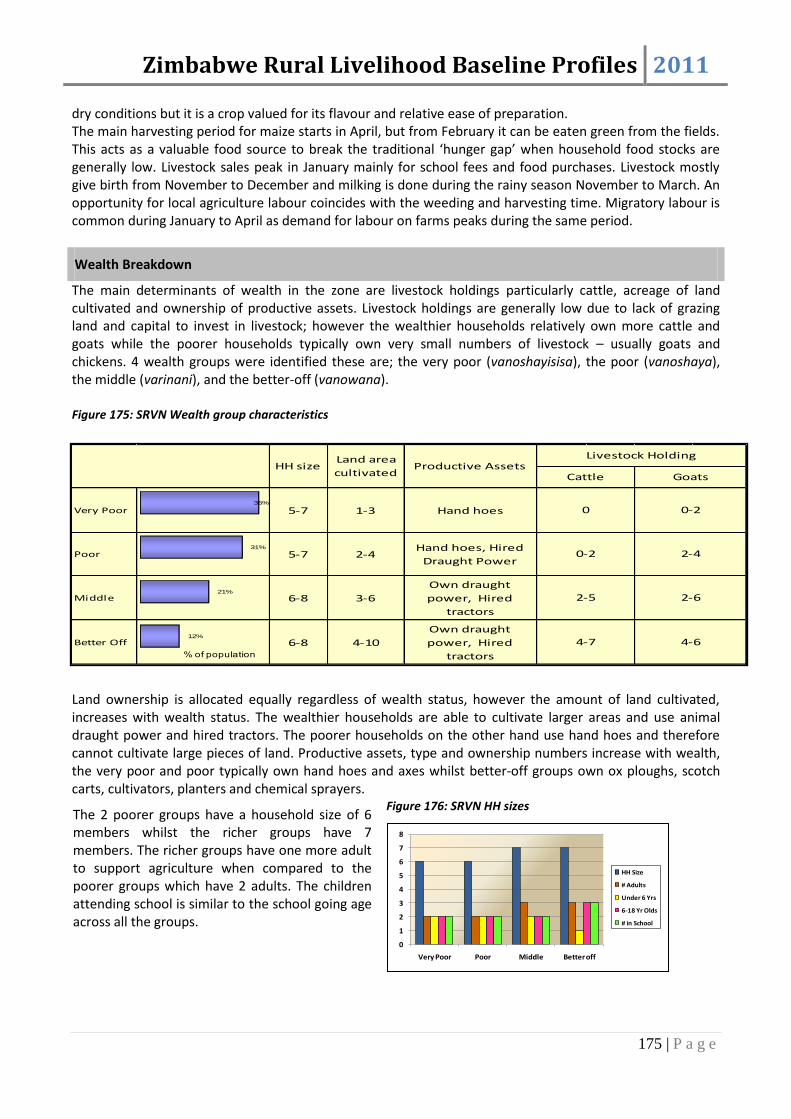
Zimbabwe Rural Livelihood Baseline Profiles 2011
175 | P a g e
dry conditions but it is a crop valued for its flavour and relative ease of preparation. The main harvesting period for maize starts in April, but from February it can be eaten green from the fields. This acts as a valuable food source to break the traditional ‘hunger gap’ when household food stocks are generally low. Livestock sales peak in January mainly for school fees and food purchases. Livestock mostly give birth from November to December and milking is done during the rainy season November to March. An opportunity for local agriculture labour coincides with the weeding and harvesting time. Migratory labour is common during January to April as demand for labour on farms peaks during the same period.
Wealth Breakdown
The main determinants of wealth in the zone are livestock holdings particularly cattle, acreage of land cultivated and ownership of productive assets. Livestock holdings are generally low due to lack of grazing land and capital to invest in livestock; however the wealthier households relatively own more cattle and goats while the poorer households typically own very small numbers of livestock – usually goats and chickens. 4 wealth groups were identified these are; the very poor (vanoshayisisa), the poor (vanoshaya), the middle (varinani), and the better-off (vanowana). Figure 175: SRVN Wealth group characteristics Land ownership is allocated equally regardless of wealth status, however the amount of land cultivated, increases with wealth status. The wealthier households are able to cultivate larger areas and use animal draught power and hired tractors. The poorer households on the other hand use hand hoes and therefore cannot cultivate large pieces of land. Productive assets, type and ownership numbers increase with wealth, the very poor and poor typically own hand hoes and axes whilst better-off groups own ox ploughs, scotch carts, cultivators, planters and chemical sprayers.
The 2 poorer groups have a household size of 6 members whilst the richer groups have 7 members. The richer groups have one more adult to support agriculture when compared to the poorer groups which have 2 adults. The children attending school is similar to the school going age across all the groups.
Figure 176: SRVN HH sizes
0
1
2
3
4
5
6
7
8
Very Poor Poor Middle Better off
HH Size
# Adults
Under 6 Yrs
6-18 Yr Olds
# in School
Very Poor 5-7 1-3 Hand hoes
Poor 5-7 2-4Hand hoes, Hired
Draught Power
Middle 6-8 3-6
Own draught
power, Hired
tractors
Better Off 6-8 4-10
Own draught
power, Hired
tractors
Livestock HoldingHH size
Land area
cultivatedProductive Assets
GoatsCattle
0 0-2
0-2 2-4
2-6
4-6
2-5
4-712%
21%
31%
36%
% of population
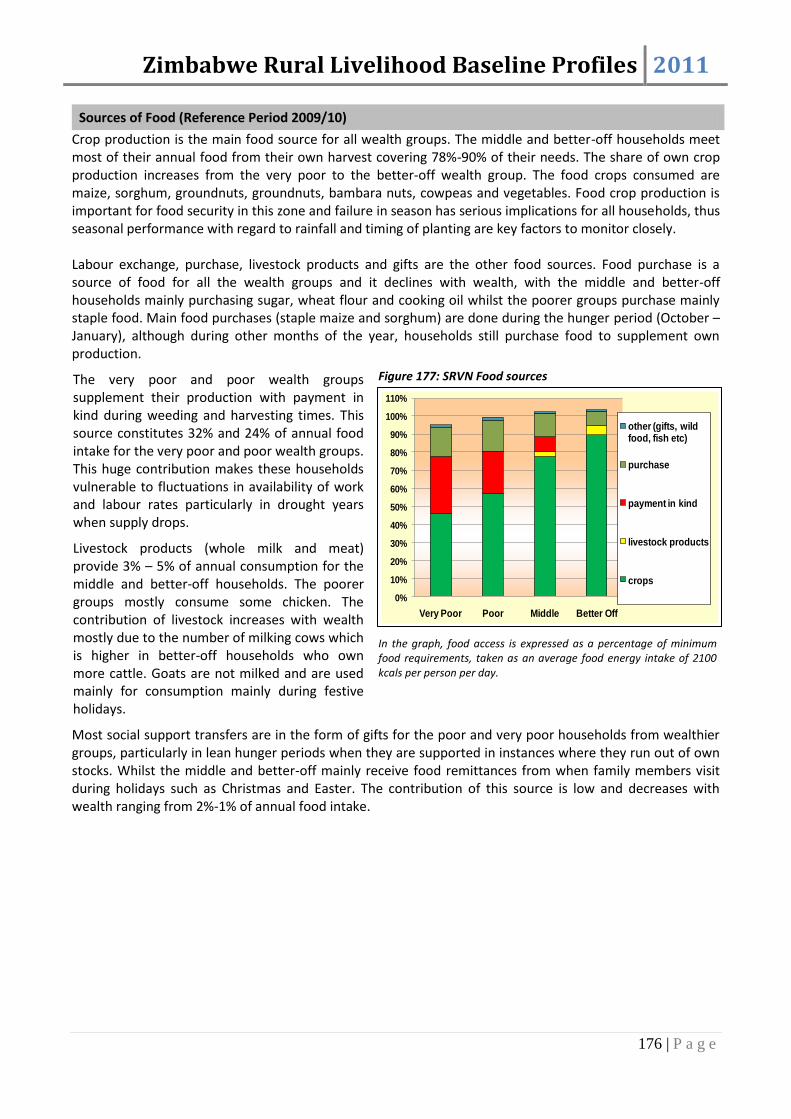
Zimbabwe Rural Livelihood Baseline Profiles 2011
176 | P a g e
Sources of Food (Reference Period 2009/10)
Crop production is the main food source for all wealth groups. The middle and better-off households meet most of their annual food from their own harvest covering 78%-90% of their needs. The share of own crop production increases from the very poor to the better-off wealth group. The food crops consumed are maize, sorghum, groundnuts, groundnuts, bambara nuts, cowpeas and vegetables. Food crop production is important for food security in this zone and failure in season has serious implications for all households, thus seasonal performance with regard to rainfall and timing of planting are key factors to monitor closely. Labour exchange, purchase, livestock products and gifts are the other food sources. Food purchase is a source of food for all the wealth groups and it declines with wealth, with the middle and better-off households mainly purchasing sugar, wheat flour and cooking oil whilst the poorer groups purchase mainly staple food. Main food purchases (staple maize and sorghum) are done during the hunger period (October – January), although during other months of the year, households still purchase food to supplement own production.
The very poor and poor wealth groups supplement their production with payment in kind during weeding and harvesting times. This source constitutes 32% and 24% of annual food intake for the very poor and poor wealth groups. This huge contribution makes these households vulnerable to fluctuations in availability of work and labour rates particularly in drought years when supply drops.
Livestock products (whole milk and meat) provide 3% – 5% of annual consumption for the middle and better-off households. The poorer groups mostly consume some chicken. The contribution of livestock increases with wealth mostly due to the number of milking cows which is higher in better-off households who own more cattle. Goats are not milked and are used mainly for consumption mainly during festive holidays.
In the graph, food access is expressed as a percentage of minimum food requirements, taken as an average food energy intake of 2100 kcals per person per day.
Most social support transfers are in the form of gifts for the poor and very poor households from wealthier groups, particularly in lean hunger periods when they are supported in instances where they run out of own stocks. Whilst the middle and better-off mainly receive food remittances from when family members visit during holidays such as Christmas and Easter. The contribution of this source is low and decreases with wealth ranging from 2%-1% of annual food intake.
0%
10%
20%
30%
40%
50%
60%
70%
80%
90%
100%
110%
Very Poor Poor Middle Better Off
other (gifts, wild food, fish etc)
purchase
payment in kind
livestock products
crops
Figure 177: SRVN Food sources
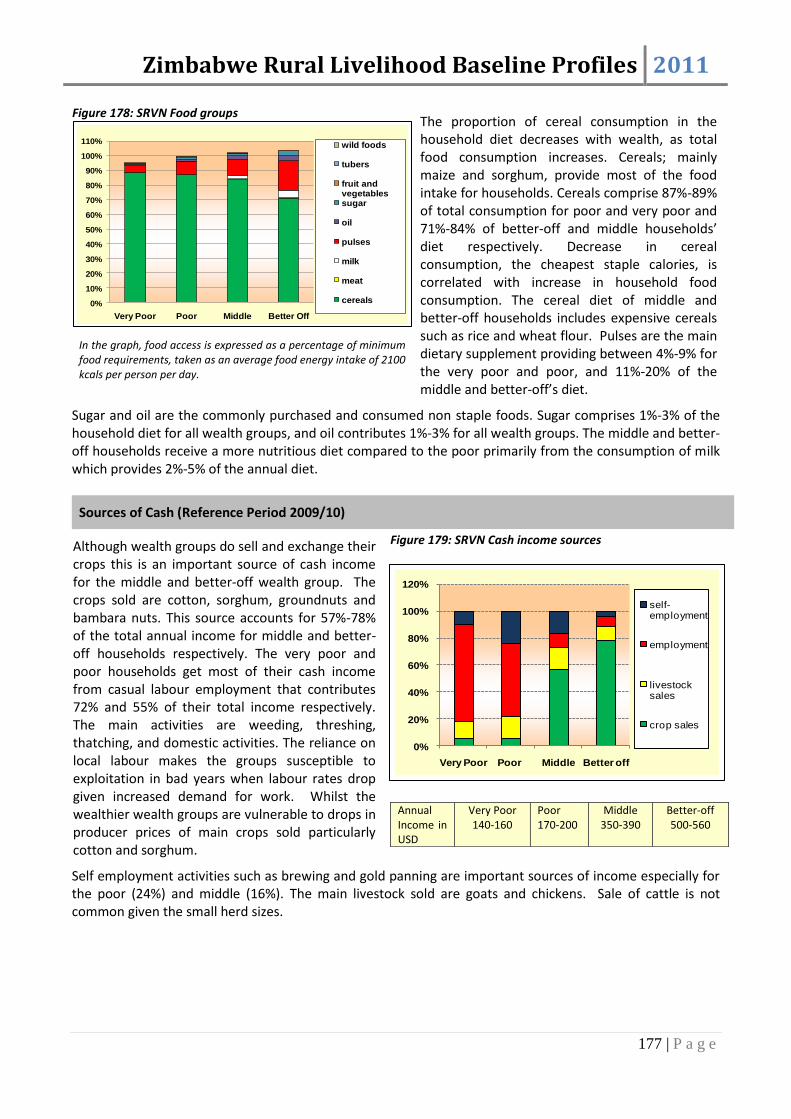
Zimbabwe Rural Livelihood Baseline Profiles 2011
177 | P a g e
In the graph, food access is expressed as a percentage of minimum food requirements, taken as an average food energy intake of 2100 kcals per person per day.
The proportion of cereal consumption in the household diet decreases with wealth, as total food consumption increases. Cereals; mainly maize and sorghum, provide most of the food intake for households. Cereals comprise 87%-89% of total consumption for poor and very poor and 71%-84% of better-off and middle households’ diet respectively. Decrease in cereal consumption, the cheapest staple calories, is correlated with increase in household food consumption. The cereal diet of middle and better-off households includes expensive cereals such as rice and wheat flour. Pulses are the main dietary supplement providing between 4%-9% for the very poor and poor, and 11%-20% of the middle and better-off’s diet.
Sugar and oil are the commonly purchased and consumed non staple foods. Sugar comprises 1%-3% of the household diet for all wealth groups, and oil contributes 1%-3% for all wealth groups. The middle and better-off households receive a more nutritious diet compared to the poor primarily from the consumption of milk which provides 2%-5% of the annual diet.
Sources of Cash (Reference Period 2009/10)
Although wealth groups do sell and exchange their crops this is an important source of cash income for the middle and better-off wealth group. The crops sold are cotton, sorghum, groundnuts and bambara nuts. This source accounts for 57%-78% of the total annual income for middle and better-off households respectively. The very poor and poor households get most of their cash income from casual labour employment that contributes 72% and 55% of their total income respectively. The main activities are weeding, threshing, thatching, and domestic activities. The reliance on local labour makes the groups susceptible to exploitation in bad years when labour rates drop given increased demand for work. Whilst the wealthier wealth groups are vulnerable to drops in producer prices of main crops sold particularly cotton and sorghum.
Annual Income in USD
Very Poor 140-160
Poor 170-200
Middle 350-390
Better-off 500-560
Self employment activities such as brewing and gold panning are important sources of income especially for the poor (24%) and middle (16%). The main livestock sold are goats and chickens. Sale of cattle is not common given the small herd sizes.
0%
10%
20%
30%
40%
50%
60%
70%
80%
90%
100%
110%
Very Poor Poor Middle Better Off
wild foods
tubers
fruit and vegetablessugar
oil
pulses
milk
meat
cereals
0%
20%
40%
60%
80%
100%
120%
Very Poor Poor Middle Better off
self-employment
employment
livestock sales
crop sales
Figure 178: SRVN Food groups
Figure 179: SRVN Cash income sources

Zimbabwe Rural Livelihood Baseline Profiles 2011
178 | P a g e
Expenditure Patterns (Reference Period 2009/10)
Annual Expenditure in USD
Very Poor 140-160
Poor 170-190
Middle 340-360
Better-off 490-530
The expenditure on staple food, mainly maize grain decreases with wealth whilst expenditure on non food items decreases with wealth. The poorer groups have 19%-23% of their expenditure on staple food. Combined with non staple food, expenditure constitutes 34%-35% more than a third of annual expenses for the poor groups. It is worth noting that such households will be seriously impacted by increases in the prices of food. Expenditure on household items decreases with wealth although in actual fact, it increases with wealth; very poor USD60 (40%), poor USD73 (40%), middle USD108 (31%) and better-off USD116 (23%). Only the middle and better-off incur costs on inputs mainly in the form of cotton loan repayments and maize seed purchase. The poorer groups use mostly retained seed for small grains.
The government subsidies on health and various interventions in education contribute to the low expenditure on social services. Expenditure on social services as a percentage of total household expenditure increases with wealth status; Very Poor: 13%, Poor: 14%, Middle: 20% and Better-off: 22%. Expenditure on clothes is generally made by the middle and better-off households; however it is low with most households purchasing basic clothing for children.
Household and cattle tax was an expenditure incurred in the reference year with poorer household paying household tax whilst better-off households paid for livestock. ‘Other’ expenditure includes transport, beer, gifts, festivals and community obligations.
Hazards
Chronic hazards: Rainfall is unreliable in this zone and the farming period regularly is disrupted when the rain stops mid-season. HIV and AIDS infection is a serious problem in this zone. Prostitution is becoming rampant. Crop pests such as the quelea birds attack cereals (in particular millet, sorghum as well as wheat grown on the irrigation scheme) at harvest time. Livestock theft is a regular hazard in this zone where stolen cattle are driven into Mozambique making their recovery impossible
Periodic hazards: Crop pests, veld fires, drought and floods are problems that occur on an occasional basis in this zone. Human diseases such as cholera also occasionally affect households. Livestock diseases, such as Newcastle disease affecting chickens and heart-water for cattle, are a periodic – but increasingly common – problem in the zone.
Coping Strategies
Increased labour sales: The very poor and poor households usually extend the period they stay for labour migration and the number of people involved in labour.
Increased livestock sales: This coping strategy is mostly applied by the middle and better-off households mostly for increasing goats and cattle. Whilst the poor sell chickens in bad years
0%
20%
40%
60%
80%
100%
Very Poor Poor Middle Better off
other
gifts
tax
social serv.
inputs
HH items
staple food
Figure 180: SRVN Expenditure patterns

Zimbabwe Rural Livelihood Baseline Profiles 2011
179 | P a g e
Increased collection of wild foods: This is commonly applied by the poor households.
Reduced expenditure on non-essential household items: The better-off cut expenditure on non staples to buy staples in bad years.
Key Parameters for Monitoring
Table 27: SRVN Monitoring indicators
Item Key Parameter - Quantity Key Parameter – Price
Crops Maize
Sorghum
Cotton
Vegetables
Round nuts
Maize
Sorghum
Cotton
Vegetables
Livestock production Cattle
Goats
Chicken
Cattle
Goats
Chicken
Other food and cash income Weeding
Harvesting
Construction (brick moulding &thatching)
Remittances
Self Employment (Firewood sales, Brewing and fruit sales)
Weeding
Construction (brick moulding &thatching)
Remittances
Self Employment (Firewood sales, Brewing and fruit sales)

Zimbabwe Rural Livelihood Baseline Profiles 2011
180 | P a g e
Beitbridge South Western Lowveld Communal May-June 201033
Main Conclusions and Implications
This is an agro-pastoral zone although employment is also a key source of food and cash income. The majority of households own some animals and these are a key safety net; livestock can be sold to buy staple cereals if the need arises. Many rural households also have relatives who work in town and who remit money to their village. Proximity to southern commercial estates and job markets around the border with South Africa and Botswana opens up significant employment opportunities.
Crop production in this zone is low due to the poor soils and low and poorly distributed rainfall. However crops remain an important source of income in the zone. There is potential for increased production for both consumption and sale if problems to do with poor rainfall particularly the chronic dry spell in January as well as timely access to appropriate short season varieties are addressed. Any support by government and non-governmental organisations in the agricultural sector (provision of seed, fertilizer and ploughing costs) should be coupled with extensive extension on timing for planting as well as provision of irrigation facilities in areas where feasible.
Income from livestock sales is an important source for all wealth groups; however prevailing low prices are due to reduced bargaining by sellers. This critical income source can be maintained if access to animal drugs is enhanced and training in management of quality herds. Marketing of cattle is very good with the support of Rural District Councils in organising market days across the zone, however smaller livestock like goats have limited demand although their production is high.
Expenditure on social services is low for all wealth groups and this is partly attributed to interventions in the social services sector such as health and education, but also due to high drop out of children in primary and secondary school as they go to seek jobs in neighbouring South Africa and Botswana. The education system is affordable for all but due to some differences in the wealth status of households, the very poor and poor are not able to progress with their education. In this zone it is crucial that the value for better education be instilled in the community at the same time demystifying the Diaspora phenomenon.
Zone Description
This lowveld zone is a long strip of communal lands along the south western part of the country on the border with South Africa and Botswana covering the southern parts of Beitbridge, Gwanda, Matobo, Mangwe, and Chiredzi districts in Matabeleland South and Masvingo province respectively with a population of 285,562 people.
It is predominantly located in Agro-ecological Region V characterised by very low annual rainfall averaging less than 475mm. Minimum temperatures in the zone range from 20 oC -25oC during winter/umqando in June to July and the maximum ranges between 35oC -40oC during summer/isilimo in September to October. Mopani trees and thorn bushes are the major
Figure 181: BSWL Livelihood zone map
33
Field work for the current profile was undertaken in May-June 2010. The information presented refers to April 2009 to March 2010
a relatively average year by local standards (i.e. a year of average production and rural food security, when judged in the context of recent years). Provided there are no fundamental and rapid shifts in the economy, the information in this profile is expected to remain valid for approximately five years (i.e. until 2015).

Zimbabwe Rural Livelihood Baseline Profiles 2011
181 | P a g e
vegetation in the zone.
Important rivers pass through this zone, in particular the Limpopo, Tuli, Umzingwane and Shashi. Livelihoods are characterised as primarily agro-pastoral. Small grains are mainly grown as well as cotton in some parts of the zone, particularly in Chiredzi District, due to the drier weather pattern. Weeding and harvesting are the agricultural activities requiring most household labour. Food and cash income from livestock is supplemented by income from seasonal work on the nearby A2 and large-scale commercial farms or by migratory work in South Africa and Botswana. Animal holdings are generally larger in this zone compared with other parts of the country, especially around Beitbridge, as land there is more suited for grazing. Arable land for crop cultivation is generally small. 2 major highways run through the zone; Bulawayo-Beitbridge and Masvingo-Beitbridge, providing a market opportunity for fresh green crops and crafts as these roads are mostly used by visitors into Zimbabwe from South Africa.
Overall, the zone can be described as having low potential for cereal food crops and moderate-high potential for livestock production. The main cropping season is the rain fed which starts in November to March. Crops grown for consumption include millet, sorghum, maize, cowpeas, water melons and groundnuts. The main livestock kept are cattle, donkeys, goats, and chicken which are reared in the free communal grazing areas or designated cattle posts. The sources of water for livestock in the wet season are major rivers, seasonal pools and shallow wells. Cattle and goats are sold for cash and also provide milk for consumption. Chickens and goats are slaughtered for meat. Donkeys are mostly used for transportation and draught power. Main livestock diseases are foot and mouth disease, parasites, lumpy skin, black leg and pulp kidney.
Other cash income activities include seasonal and migratory employment for households as well as remittances by family members mainly in South Africa. Remittances require careful consideration as fluctuations in the job market in South Africa has implications for household food and cash income in the zone.
Markets and Trade
A good road network facilitates trade within the livelihood zone and between the zone and external markets. Furthermore most rural markets are very close to urban markets; Beitbridge, Gwanda, Plumtree, Bulawayo and other rural service centres within the zone. Cattle are mainly sold to local traders who come to the villages and purchase animals for re-sale to butcheries or abattoirs in town. Own farm produce such as melons and sweet cane are sold to travellers along the Masvingo-Beitbridge and Bulawayo-Beitbridge highways or in urban centres within the zone. Cereals are sold to private buyers. There is relatively lively cross border activity as households and traders travel to neighbouring countries to obtain goods and seek employment opportunities.
Local jobs can be found in the form of agricultural labour for better-off farmers especially herding cattle, or casual work on A2 and large scale commercial farms neighbouring the zone. More lucrative job opportunities are found across the border in South Africa or Botswana as well as in major urban centres within Zimbabwe. Such work opportunities are exploited by all wealth groups however the level of qualification is a key factor in determining the type of jobs obtained as the members from poor and very poor households are usually employed in farms and other low paying jobs whereas those from wealthier households with better education tend to get the more lucrative jobs.
Seasonal Calendar
The seasons are divided into 2 which are the rainy season (November-April) and dry season subdivided into the umqando/winter May-July and isilimo/spring (August-October). Livestock heat is mainly in winter for cattle and births occur in November to February and most milking starts in December and runs up to May.

Zimbabwe Rural Livelihood Baseline Profiles 2011
182 | P a g e
Goats have 2 periods where births mostly occur i.e. October-November and March-April. Although livestock sales may occur all year round most sales are done after harvest in June to January. Sales are mostly done through the cattle markets organised by rural district councils. Purchasing of food is done throughout the year but most notably coincides with the hunger season. Given the small farm sizes, food crops usually only cover around half of the annual food needs, so households have to rely on market purchases for the remaining months. The main crops grown are millet, sorghum, water melons, cowpeas and groundnuts. Migratory labour opportunities are available in December to February mainly for weeding in farms.
Wealth Breakdown
Wealth is determined by ownership of livestock, amount of land cultivated and presence of a family member remitting. On the basis of this criteria, 4 wealth groups very poor/Abaswelisisayo), poor/abaswelayo, middle/abaphakhati and better-off/abatholayo were identified. The wealthier households own significantly high numbers of cattle and goats while the poorer households typically own very small numbers of livestock.
Figure 183: BSWL Wealth group characteristics
Ownership of land is not a determinant of wealth as land allocation is done equally regardless of wealth status, however the acreage of land cultivated is given its impact on total production. Wealthier households are able to cultivate relatively bigger areas and use draught power. Whilst poorer households, can only cultivate small pieces of land using hand hoes or exchange labour for ploughing service by wealthier households. The presence of a family member working in towns or in South Africa is also a determinant of wealth as reflected by the contribution of the kinship safety net to household income. Most households in the zone have a family member in either South Africa or Botswana but the level of remittance increases with wealth. This is mainly a factor of level of education attained: the wealthier households’ members are better educated and get formal better paying employment, whilst most of members from poorer households have low educational qualifications which limit their capacity to obtain better paying jobs.
Figure 182: BSWL Seasonal Calendar
Apr May Jun Jul Aug Sep Oct Nov Dec Jan Feb Mar
Legend
cattle onfarm
Land Preparation
Weeding
Sorghum
Maize
Mi l let
Groundnuts
Gardening
Crop sa les
Livestock sa les
Livestock heats and births
Mi lk production
Other
Lean season
Food Purchases
Local labour
Labor Migration
Livestock Diseases
Malaria
Wet Season
planting cons. green harvest
cattle and shoats
Dry Season
Off farm
shoats
Cattle Goats Donkeys Chicken
Very Poor 6-8 1-3
Mi l let; Sorghum;
Maize; Cow Peas ;
Ground Nuts
0 3-7 0-2 4-10Hand hoes ,
axes
Poor 6-8 2-3
Mi l let; Sorghum;
Maize; Cow Peas ;
Ground Nuts
1-5 4-10 2-4 6-12
Hand hoes ,
axes , ox
plough,
donkey cart
Middle 6-8 4-6
Mi l let; Sorghum;
Maize; Cow Peas ;
Ground Nuts
6-12 10-15 3-6 10-15
Hand hoes ,
axes , ox
plough,
donkey cart
Better Off 5-7 4-8
Mi l let; Sorghum;
Maize; Cow Peas ;
Ground Nuts
15-25 15-25 6-8 15-25
Hand hoes ,
axes , ox
plough,
donkey cart
Livestock Holding
HH s ize
Land area
cultivated
(acres)
Crops cultivated Other Assets
12%
20%
37%
31%
% of population
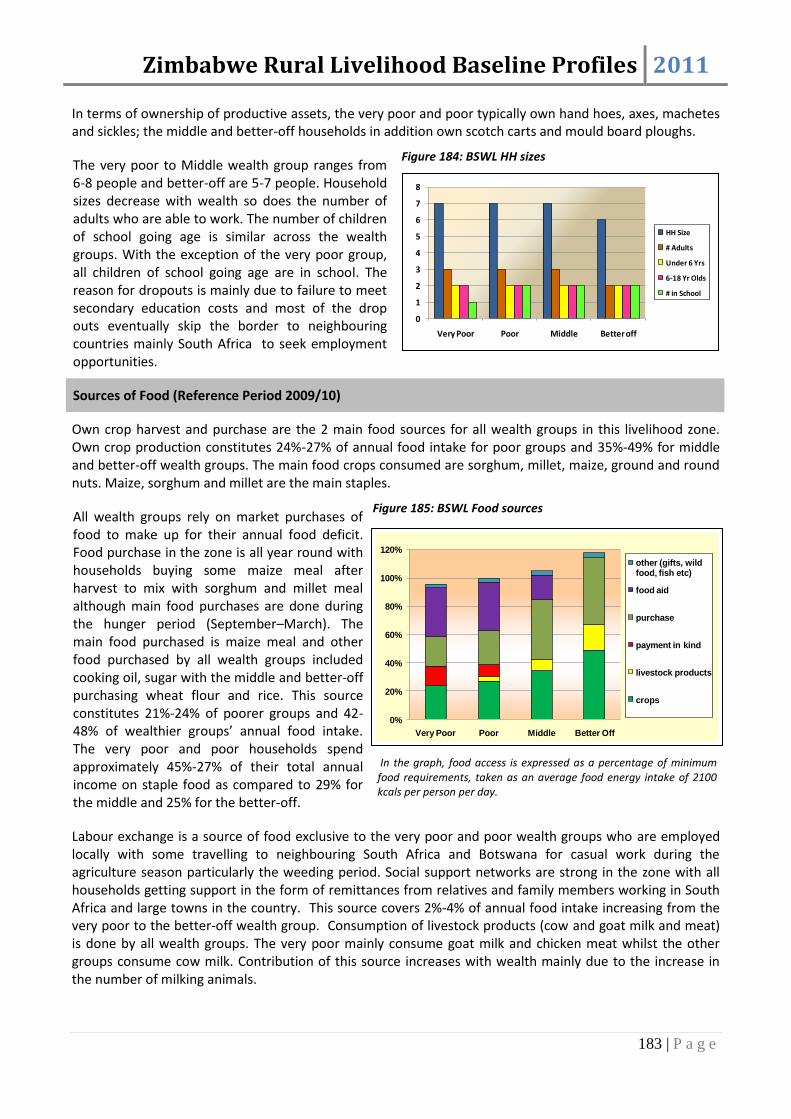
Zimbabwe Rural Livelihood Baseline Profiles 2011
183 | P a g e
In terms of ownership of productive assets, the very poor and poor typically own hand hoes, axes, machetes and sickles; the middle and better-off households in addition own scotch carts and mould board ploughs.
The very poor to Middle wealth group ranges from 6-8 people and better-off are 5-7 people. Household sizes decrease with wealth so does the number of adults who are able to work. The number of children of school going age is similar across the wealth groups. With the exception of the very poor group, all children of school going age are in school. The reason for dropouts is mainly due to failure to meet secondary education costs and most of the drop outs eventually skip the border to neighbouring countries mainly South Africa to seek employment opportunities.
Figure 184: BSWL HH sizes
Sources of Food (Reference Period 2009/10)
Own crop harvest and purchase are the 2 main food sources for all wealth groups in this livelihood zone. Own crop production constitutes 24%-27% of annual food intake for poor groups and 35%-49% for middle and better-off wealth groups. The main food crops consumed are sorghum, millet, maize, ground and round nuts. Maize, sorghum and millet are the main staples.
All wealth groups rely on market purchases of food to make up for their annual food deficit. Food purchase in the zone is all year round with households buying some maize meal after harvest to mix with sorghum and millet meal although main food purchases are done during the hunger period (September–March). The main food purchased is maize meal and other food purchased by all wealth groups included cooking oil, sugar with the middle and better-off purchasing wheat flour and rice. This source constitutes 21%-24% of poorer groups and 42-48% of wealthier groups’ annual food intake. The very poor and poor households spend approximately 45%-27% of their total annual income on staple food as compared to 29% for the middle and 25% for the better-off.
In the graph, food access is expressed as a percentage of minimum food requirements, taken as an average food energy intake of 2100 kcals per person per day.
Labour exchange is a source of food exclusive to the very poor and poor wealth groups who are employed locally with some travelling to neighbouring South Africa and Botswana for casual work during the agriculture season particularly the weeding period. Social support networks are strong in the zone with all households getting support in the form of remittances from relatives and family members working in South Africa and large towns in the country. This source covers 2%-4% of annual food intake increasing from the very poor to the better-off wealth group. Consumption of livestock products (cow and goat milk and meat) is done by all wealth groups. The very poor mainly consume goat milk and chicken meat whilst the other groups consume cow milk. Contribution of this source increases with wealth mainly due to the increase in the number of milking animals.
0
1
2
3
4
5
6
7
8
Very Poor Poor Middle Better off
HH Size
# Adults
Under 6 Yrs
6-18 Yr Olds
# in School
0%
20%
40%
60%
80%
100%
120%
Very Poor Poor Middle Better Off
other (gifts, wild food, fish etc)
food aid
purchase
payment in kind
livestock products
crops
Figure 185: BSWL Food sources

Zimbabwe Rural Livelihood Baseline Profiles 2011
184 | P a g e
In the reference year food aid was provided for very poor to middle households for 6 months and 3 months respectively. This source constituted 34% for very poor and poor wealth group food needs respectively.
In the graph, food access is expressed as a percentage of minimum food requirements, taken as an average food energy intake of 2100 kcals per person per day.
Cereals provide most of the household’s food energy intake. The proportion of cereal consumption in the household diet decreases with wealth, as total food consumption increases. Cereals comprise 80% of very poor total consumption, 78% of the poor’s, and 75% and 74% of the middle and better-off’s diet. The main staple is the purchased maize meal and maize, sorghum and millet from production. The middle and better-off households also consume more expensive cereals such as rice and wheat flour. Pulses are the main dietary supplement providing 7% for the very poor and poor, and 8%-12% the middle and better-off’s diet. Contribution of pulses increases with wealth. Sugar and oil are the commonly purchased non staple foods, their contribution to household diet increases with wealth.
Sugar comprises 2%-6% of the household diet for all wealth groups, and oil contributes 5%-8% for all wealth groups. Oil for the poor groups consists of relief and a few remittances whilst the better-off is mainly remittances and purchases. The middle and better-off households have a more nutritious diet compared to the poor primarily from the consumption of meat and milk which provides 8-18% of the annual households’ diet respectively. Vegetables provide 1%-2% of consumption for all wealth groups. Wild foods are most consumed by the poor and very poor and provide 1% of the annual food intake.
Sources of Cash (Reference Period 2009/10)
All wealth groups earn income through livestock sales. It is the main income source for poor, middle and better-off households constituting 55%-86% of their total annual income. The contribution of this income source increases with wealth. Cattle and goats are the main livestock sold. The very poor instead depend on labour sales for much of their income constituting 64% of total income. The poorer groups are employed locally by wealthier households for construction related work like brick moulding and field fencing. The wealthier households engage in more formal employment and get remittances from family members.
Figure 187: BSWL Cash income sources
Annual Income in ZAR
Very Poor 2500-2785
Poor 4300-4600
Middle 6900-7100
Better-off 8000-8500
Self employment activities such as crafts, sale of construction materials, and firewood sales are income sources specifically for the very poor and poor. Sale of food crops is another source of income for all wealth groups, and it decreases with wealth. Most of this income is food crops exchanged for grinding costs,
0%
20%
40%
60%
80%
100%
Very Poor Poor Middle Better off
self-employment
employment +remittances
livestock sales
crop sales
0%
20%
40%
60%
80%
100%
120%
Very Poor Poor Middle Better Off
wild foods
tubers
fruit and vegetables
sugar
oil
pulses
milk
meat
cereals
Figure 186: BSWL Food groups

Zimbabwe Rural Livelihood Baseline Profiles 2011
185 | P a g e
vegetables and water melon sales. This source contributes 11%-15% for the poor and very poor wealth group’s annual income.
Expenditure Patterns (Reference Period 2009/10)
Annual Expenditure in ZAR
Very Poor 2500-2710
Poor 4250-4550
Middle 6750-7050
Better-off 7900-8100
For the poorer groups, 27%-46% of the expenditure goes to staple food purchase; mainly maize meal. The proportion of this expenditure decreases with wealth although the middle and better-off households also spend more on non-staple food. Overall, expenditure on food constitutes much of the expenditure for all wealth groups constituting 37%-51% of total expenditure. This makes food the most expensive item on the household expenditure list making households more vulnerable to increases in the price of food as well as non availability of commodities on the market.
The expenditure on household items is of similar proportion from 16%-19% for all wealth groups although actual expenditure increases with wealth. This includes items such as grinding costs, salt, utensils, tea and kerosene/candles.
Social services expenditure increases with wealth status from 7%-12% except for the poor. Overall there is low expenditure on social services mainly because government subsidises services like health and education. Expenses on inputs are only incurred by the middle and the better-off households; mainly maize seed and some fertiliser bought from the local market and Grain Marketing Board. The poorer households mostly benefited from seed distributions and use retained seed.
‘Other’ expenditure includes transport, beer and festivals. All households spend on these items on different scales, the actual expenditure on other increases with wealth representing a proportion of 14%, 20%, 15% and 13% of annual expenditure for the very poor, poor, middle and better-off households.
Other expenditures include clothes, gifts and taxes for livestock and household tax.
Hazards
Chronic hazards: Low and erratic rainfall regularly reduces crop production as well as the availability of grazing for cattle. Furthermore, quelea birds often destroy crops. Finally, cross-border migratory labour opportunities have led to a relatively high incidence of HIV and AIDS in the zone which also affects production.
Periodic hazards: Livestock diseases are problems that occur every 4 to 7 years out of 10. Periodic floods also occur as the zone is low lying.
Coping Strategies
Increased sale of livestock: This is a coping strategy mainly employed by the middle and better-off households who own big herd sizes for cattle and goats. The poor groups increase sale of goats and chickens.
Increased consumption of wild foods: Collection of wild foods happens every year but in bad years all
0%
20%
40%
60%
80%
100%
Very Poor Poor Middle Better off
other
gifts
tax
clothes
social serv.
inputs
HH items
non-staple food
Figure 188: BSWL Expenditure patterns

Zimbabwe Rural Livelihood Baseline Profiles 2011
186 | P a g e
households increase collection of wild foods for sale and consumption. Mostly Mopani worms and mushrooms are collected and sold on the road sides.
Increased labour migration: Traditionally the zone experiences migration to neighbouring countries but in bad years, household members mostly men migrate for longer periods and stay in South Africa only sending remittances.
Key Parameters for Monitoring
Table 28: BSWL Monitoring indicators
Item Key Parameter - Quantity Key Parameter – Price
Crops Green Consumption
Sorghum
Millet
Vegetables
Vegetables
Livestock production Cow’s Milk
Cattle
Goats
Cattle
Goats
Other food and cash income Weeding
Construction (Fencing, Brick moulding, hut building)
Remittances
Construction (Fencing, Brick moulding, hut building)
Remittances

Zimbabwe Rural Livelihood Baseline Profiles 2011
187 | P a g e
Central and Northern Semi-Intensive Farming July-August 201034
Main Conclusions and Implications
Crop production in this zone is average due to the low fertile, sandy, loamy soils, as well as unpredictable rainfall distribution. However, crops remain an important source of income in the zone contributing between 40% – 52% of total calories consumed across the 4 wealth groups in the reference year. There is potential for increased production for both consumption and sales if problems to do with poor rainfall, particularly the chronic dry spell in January, as well as timely access to agricultural inputs, i.e. seed and fertilisers, are addressed. Any support by government and non-governmental organisations in the agricultural sector (provision of seed, and fertilizer and ploughing costs) should be coupled with adequate extension on timing for planting as well as the provision of irrigation facilities in areas feasible.
Income from livestock sales was relatively low in the zone as livestock sales were generally limited to small livestock (poultry and goats) by all the wealth groups. Sale of cattle was not typical even among better-off households owing to small herd sizes. Interventions designed to restock cattle could be vital in providing draught power for increased cultivation as well as providing an income source for food purchase during poor years of crop production.
Expenditure on social services is low for poorer households, which can partly be attributed to interventions and subsidies in the health and education sectors, but is also a result of children in these households leaving school after or during primary education. Actual expenditure on education by better-off households is relatively high, as these are not usually targeted by education assistance programmes. Increased education assistance for poorer wealth groups is advocated to increase higher education attainment levels among children from these households.
Zone Description
This zone is located in the mainly communal lands of; Gweru, Shurugwi, Chirumanzu Districts of Midlands; Nyanga, Mutasa, Buhera Districts of Manicaland Province; Mutoko and UMP in Mashonaland East; Mt Darwin in Mashonaland Central and Kariba, Hurungwe and Makonde in Mashonaland West with a population of 641,640 people. Major rivers such as the Nyadire, Shashe, Save and Nyazvidzi all pass through this livelihood zone.
This zone is categorised as falling into agro ecological regions III and IV, with annual rainfall averaging between 650mm-800mm. Soils are relatively infertile as it is largely sandy loams, requiring fertilizers for agricultural production.
Figure 189: CNSI Livelihood zone map
These factors limit agricultural potential. Minimum temperatures in the zone range between 15 oC -20oC during winter, in June to July (chando) and the maximum ranges between 35oC -40oC during summer, in September and October (chirimo). Overall, the zone can be described as moderately productive for both
34
Field work for the current profile was undertaken in July-August 2010. The information presented refers to April 2009 to March 2010, a relatively average year by local standards (i.e. a year of average production and rural food security, when judged in the context of recent years). Provided there are no fundamental and rapid shifts in the economy, the information in this profile is expected to remain valid for approximately five years (i.e. until 2015).

Zimbabwe Rural Livelihood Baseline Profiles 2011
188 | P a g e
crop and livestock production. Vegetation is characterised by bush savannah vegetation, particularly the mupfuti, and acacia species with some isolated short grasses. Grazing in the zone deteriorates in the dry season, providing limited grazing for animals. Northern areas within the zone have granite mined mountains and also gentle plains. Generally the central parts of the zone have gentle plains, vleis and flat land.
The main cropping season is the rainy season, which lasts from November to March with some irrigated winter gardening across the zone and scattered vlei cropping of wheat in some areas. Crops grown for consumption include maize, groundnuts, millet, sorghum, cowpeas and roundnuts.
Crops grown are mainly cereals, which include maize, sorghum and millet. Groundnuts are also grown, which provide cash income when sold. Horticultural production of tomatoes, butternuts, cucumbers, onions and leaf vegetables are predominant in the northern parts of the zone, providing cash income for the households. Field crops are grown in the wet season and are mainly rain fed, with garden vegetable production occurring in the dry season. Wild fruits found and consumed in the zone include mazhanje, chakata, hute and masau.
The most important crops grown for consumption include maize, groundnuts and sorghum, while the most important crops grown for sale include fruits and leafy vegetables, groundnuts and maize. While there are no major recurring pests or diseases affecting crops, there were isolated reports of quelea birds in sorghum, aphids and lady birds in cowpeas and red spider mites in tomatoes. Inputs used include fertilizer (Compound D and Top Dressing, either Ammonium Nitrate or UREA), seed for maize and tomatoes, and animal manure. Fertilizers and seed are either purchased on the market or subsidized or provided for free from NGOs, while animal manure is produced and used on the same farm.
Livestock kept include mainly cattle and goats and are found in small numbers throughout the zone. Cattle provide draught power for agricultural production, as well as milk for consumption. Oxen and milking cows are generally replaced from within the herd. Goats and chickens are kept mainly for consumption but are also sold for cash income. The sources of water for livestock are major rivers, seasonal pools and shallow wells in the wet season and boreholes in the dry season. Cows are the only livestock that are milked. The main livestock diseases are tick borne diseases (red water, heart water) and blackleg, which affect cattle in some parts of the zone. There were also incidences of Newcastle disease and fowl pox in poultry in some parts of the zone. Dips for treating tick borne diseases and vaccines for Newcastle disease were provided free from the Ministry of Agriculture, while vaccines for blackleg disease were purchased on the market.
Other important livelihood activities include crafts, grass sales and construction-related activities such as thatching and brick moulding, which provide some income in the livelihood zone. These activities are seasonal (mainly June-October), provide a small amount of income and are undertaken in isolation in particular areas of the zone. Markets and Trade
The main labour markets are local, where the poor wealth groups work for the better-off in exchange for commodities as well as cash income. A significant proportion of casual labour is done outside the zone, with people working on surrounding farms (e.g. in Gutu, Chivhu, Mutoko) and on other farms bordering the zone.
Crops and livestock are sold locally within the zone. However some horticultural produce of vegetables and other fruits are sold in urban centres (e.g. Harare, Chivhu and Mutoko). The cost of transport to markets varies throughout the zone and in some areas can be quite high. In areas such as Chikomba, the distance to the market is quite long.
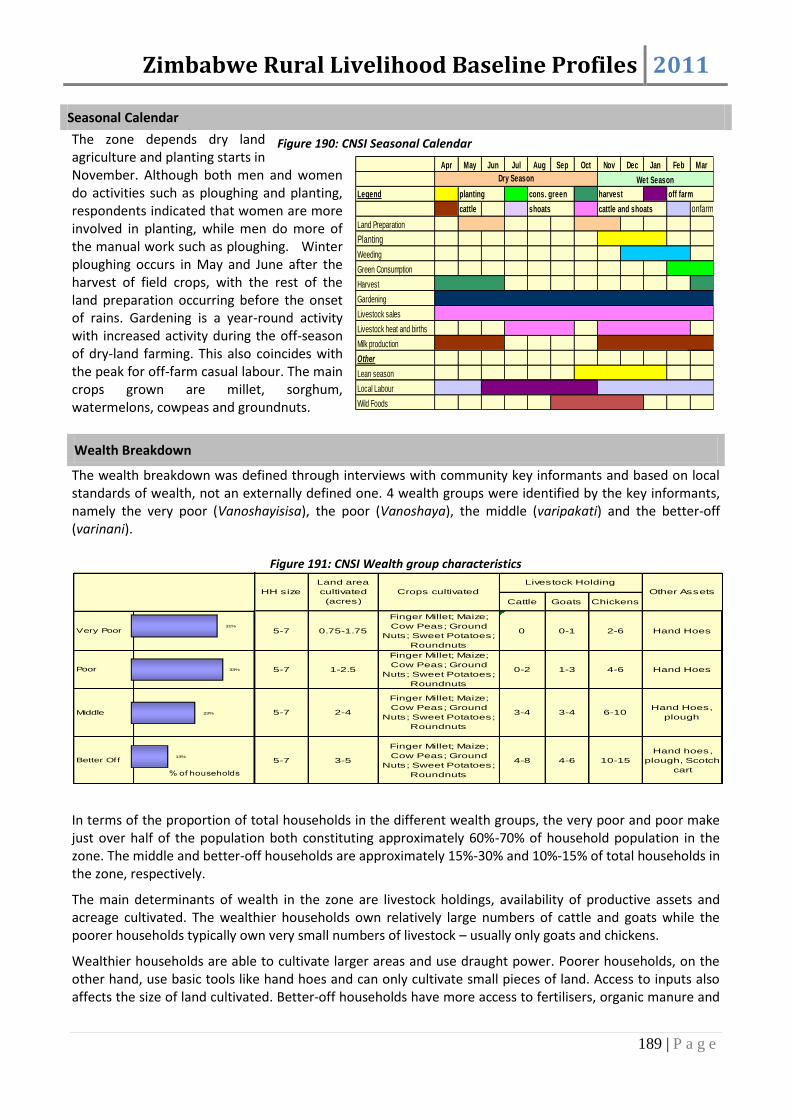
Zimbabwe Rural Livelihood Baseline Profiles 2011
189 | P a g e
Seasonal Calendar
The zone depends dry land agriculture and planting starts in November. Although both men and women do activities such as ploughing and planting, respondents indicated that women are more involved in planting, while men do more of the manual work such as ploughing. Winter ploughing occurs in May and June after the harvest of field crops, with the rest of the land preparation occurring before the onset of rains. Gardening is a year-round activity with increased activity during the off-season of dry-land farming. This also coincides with the peak for off-farm casual labour. The main crops grown are millet, sorghum, watermelons, cowpeas and groundnuts.
Wealth Breakdown
The wealth breakdown was defined through interviews with community key informants and based on local standards of wealth, not an externally defined one. 4 wealth groups were identified by the key informants, namely the very poor (Vanoshayisisa), the poor (Vanoshaya), the middle (varipakati) and the better-off (varinani).
Figure 191: CNSI Wealth group characteristics
In terms of the proportion of total households in the different wealth groups, the very poor and poor make just over half of the population both constituting approximately 60%-70% of household population in the zone. The middle and better-off households are approximately 15%-30% and 10%-15% of total households in the zone, respectively.
The main determinants of wealth in the zone are livestock holdings, availability of productive assets and acreage cultivated. The wealthier households own relatively large numbers of cattle and goats while the poorer households typically own very small numbers of livestock – usually only goats and chickens.
Wealthier households are able to cultivate larger areas and use draught power. Poorer households, on the other hand, use basic tools like hand hoes and can only cultivate small pieces of land. Access to inputs also affects the size of land cultivated. Better-off households have more access to fertilisers, organic manure and
Cattle Goats Chickens
Very Poor 5-7 0.75-1.75
Finger Millet; Maize;
Cow Peas; Ground
Nuts; Sweet Potatoes;
Roundnuts
0 0-1 2-6 Hand Hoes
Poor 5-7 1-2.5
Finger Millet; Maize;
Cow Peas; Ground
Nuts; Sweet Potatoes;
Roundnuts
0-2 1-3 4-6 Hand Hoes
Middle 5-7 2-4
Finger Millet; Maize;
Cow Peas; Ground
Nuts; Sweet Potatoes;
Roundnuts
3-4 3-4 6-10Hand Hoes,
plough
Better Off 5-7 3-5
Finger Millet; Maize;
Cow Peas; Ground
Nuts; Sweet Potatoes;
Roundnuts
4-8 4-6 10-15
Hand hoes,
plough, Scotch
cart
Figure 24.3 Wealth Groups Characteristics
Livestock Holding
HH size
Land area
cultivated
(acres)
Crops cultivated Other Assets
13%
23%
33%
31%
% of households
Figure 190: CNSI Seasonal Calendar
Apr May Jun Jul Aug Sep Oct Nov Dec Jan Feb Mar
Legend planting cons. green harvest off farm
cattle shoats cattle and shoats onfarm
Land Preparation
Planting
Weeding
Green Consumption
Harvest
Gardening
Livestock sales
Livestock heat and births
Milk production
Other
Lean season
Local Labour
Wild Foods
Dry Season Wet Season
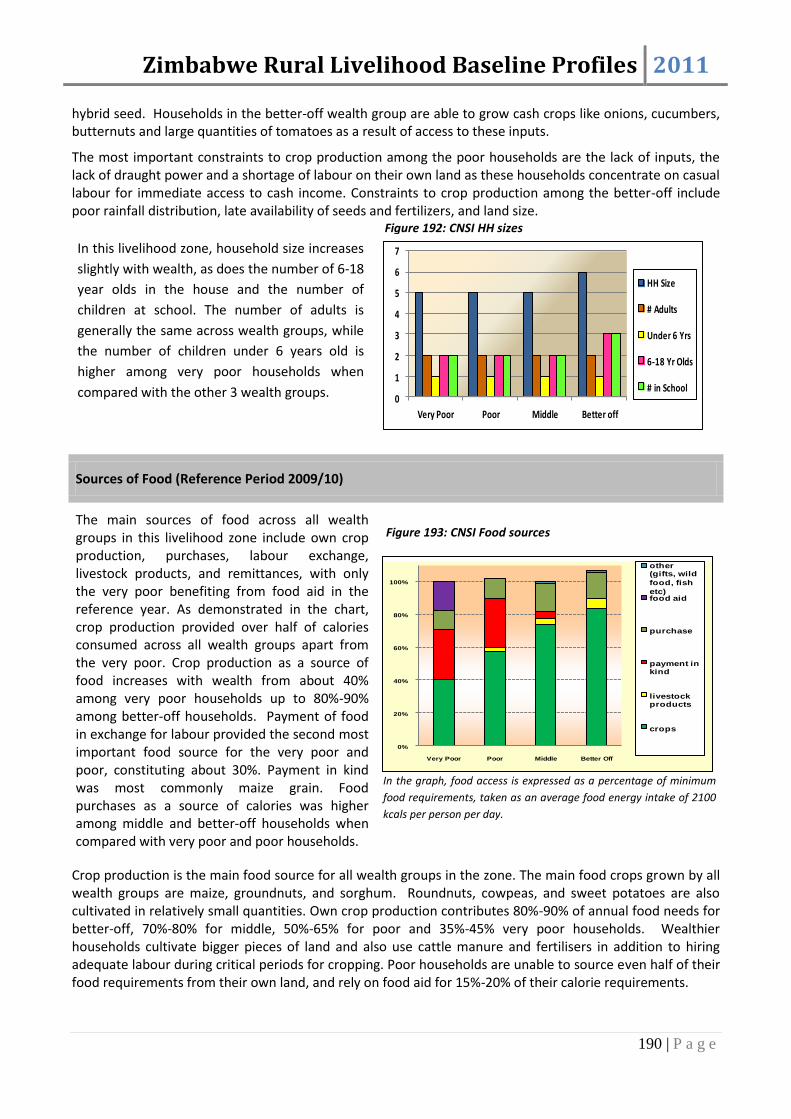
Zimbabwe Rural Livelihood Baseline Profiles 2011
190 | P a g e
hybrid seed. Households in the better-off wealth group are able to grow cash crops like onions, cucumbers, butternuts and large quantities of tomatoes as a result of access to these inputs.
The most important constraints to crop production among the poor households are the lack of inputs, the lack of draught power and a shortage of labour on their own land as these households concentrate on casual labour for immediate access to cash income. Constraints to crop production among the better-off include poor rainfall distribution, late availability of seeds and fertilizers, and land size.
In this livelihood zone, household size increases
slightly with wealth, as does the number of 6-18
year olds in the house and the number of
children at school. The number of adults is
generally the same across wealth groups, while
the number of children under 6 years old is
higher among very poor households when
compared with the other 3 wealth groups. 0
1
2
3
4
5
6
7
Very Poor Poor Middle Better off
HH Size
# Adults
Under 6 Yrs
6-18 Yr Olds
# in School
Sources of Food (Reference Period 2009/10)
The main sources of food across all wealth groups in this livelihood zone include own crop production, purchases, labour exchange, livestock products, and remittances, with only the very poor benefiting from food aid in the reference year. As demonstrated in the chart, crop production provided over half of calories consumed across all wealth groups apart from the very poor. Crop production as a source of food increases with wealth from about 40% among very poor households up to 80%-90% among better-off households. Payment of food in exchange for labour provided the second most important food source for the very poor and poor, constituting about 30%. Payment in kind was most commonly maize grain. Food purchases as a source of calories was higher among middle and better-off households when compared with very poor and poor households.
In the graph, food access is expressed as a percentage of minimum
food requirements, taken as an average food energy intake of 2100
kcals per person per day.
Crop production is the main food source for all wealth groups in the zone. The main food crops grown by all wealth groups are maize, groundnuts, and sorghum. Roundnuts, cowpeas, and sweet potatoes are also cultivated in relatively small quantities. Own crop production contributes 80%-90% of annual food needs for better-off, 70%-80% for middle, 50%-65% for poor and 35%-45% very poor households. Wealthier households cultivate bigger pieces of land and also use cattle manure and fertilisers in addition to hiring adequate labour during critical periods for cropping. Poor households are unable to source even half of their food requirements from their own land, and rely on food aid for 15%-20% of their calorie requirements.
0%
20%
40%
60%
80%
100%
Very Poor Poor Middle Better Off
other (gifts, wild
food, fish
etc)food aid
purchase
payment in kind
livestock products
crops
Figure 192: CNSI HH sizes
Figure 193: CNSI Food sources

Zimbabwe Rural Livelihood Baseline Profiles 2011
191 | P a g e
Labour exchange (working directly in exchange for food) is an important food source for the poorer households. They are employed mostly outside the zone in neighbouring farms, while a few households work locally within the zone. Very poor and poor households accessed about 30% of their annual food needs from labour exchange. The main types of work done in exchange for food were mostly weeding and harvesting, with some households also digging manure and planting for the better-off households. In years of poor rain, or consecutive years of poor rain, this food source is likely to be critically reduced if wealthier farms decrease the amount of labour they hire.
Households from all wealth groups purchased mainly cereals to supplement other food sources. The peak months for purchasing food are during the hunger period (October – January). Other foods purchased by all wealth groups included cooking oil and sugar, while the better-off additionally purchased wheat flour. Food purchase contribution to annual consumption was 10%-15% for the very poor and poor, 15%-20% for the middle and 10%-20% for the better-off.
Meat and milk from own livestock were consumed by the poor, middle and better-off wealth groups, comprising less than 10% of their total calories required.
In the reference year, food aid was an important source of food for very poor households contributing 15-20 % of total annual food needs. This was supplied by NGOs for 3 months from January to March. Food distributed included cereals (10kg/person/month), pulses (1kg/person/month) and cooking oil (0.6litres/person/month). The presence of food aid in the reference year makes it difficult to know if and how very poor households would meet their food requirements if this food source were not present. Food remittances (included in ‘other’) were very insignificant in this zone, contributing only 1 % to food needs of middle and better-off households. Remittances were mostly received once during the festive season and consisted of non staple foods.
In the graph, food access is expressed as a percentage of minimum
food requirements, taken as an average food energy intake of 2100
kcals per person per day.
Cereals constituted between 70% and 85% of the
food consumed by all wealth groups, followed by
pulses for the very poor, and oil for the poor,
middle and better-off. Milk and meat comprised
an increasing percentage of calorie intakes with
wealth, as did fruits and vegetables. Fish
comprised a small amount of energy consumed
by all wealth groups. There is increasing dietary
diversity, both in types and amounts, as wealth
increases.
0%
20%
40%
60%
80%
100%
Very Poor Poor Middle Better Off
wild foods
tubers
fruit and vegetablessugar
oil
pulses
milk
meat
cereals
Figure 194: CNSI Food groups

Zimbabwe Rural Livelihood Baseline Profiles 2011
192 | P a g e
Sources of Cash (Reference Period 2009/10)
The graph provides a breakdown of income sources as percentages of total income by wealth group. Actual income ranges for each wealth group are provided in the table below.
All wealth groups engage in the same 4 broad income groups, with slightly varying patterns, but no significant increases or decreases across wealth groups exist except maybe in the case of self-employment which decreases as a percent of total income with wealth.
Crop sales contribute the most income across all wealth groups. Crops sold are mainly vegetables and tomatoes and these are mostly sold in nearby towns (e.g. Chivhu, Mutoko and Harare).
Annual Income (USD)
Very Poor 55-210
Poor 100-250
Middle 215-500
Better-off 350-650
Better-off households are engaged in sale of other food crops and this is attributed to high food crop production Crops sold by the better-off include cereals (maize, millet or sorghum) and groundnuts. Crop sales contributed 35-55 % of total annual income across the wealth groups.
Very poor and poor households are employed locally by wealthier households as well as on neighbouring farms during the agricultural season and in construction related work in the off-season. Better-off households hire out agricultural equipment e.g. ploughs and scotch carts to supplement their cash income. Remittances are an important income source for the wealthier wealth groups i.e. middle and better-off households. Employment and remittances contributed 25%-40% of total income for the very poor, 15%-30% for the poor, 20%-30% for the middle and 25%-35% for the better-off. Handicraft sales, sale of construction materials, and firewood and grass sales are important sources of income for very poor and poor households, contributing approximately 10%-25% of annual income.
All wealth groups sell livestock, with variations in the type of livestock sold. The very poor mainly sell chickens, while poor, middle and better-off households sell goats as well as chickens in varying quantities.
Livestock sales contribute 5%-10%, 15%-25%, 10%-25% and 15%-25% of total annual incomes for very poor, poor, middle and better-off households, respectively. No cattle sales were reported in this zone owing to a low herd count for all the wealth groups.
Expenditure Patterns (Reference Period 2009/10)
Expenditure patterns vary across wealth groups. Very poor households spend 15%-25% of their total income on staple food purchase as compared to approximately 5%-15% for households from the other wealth groups. The combined expenditure on staple food and non staple food for the very poor 30%-40% of total annual expenditure compared with 25%-35% for the other wealth groups. Expenditure on staple foods by very poor households would likely increase by a significant amount without the distribution of food aid. The annual cost of 100% of the daily required kilocalories is approximately USD 280 across all wealth groups.
Actual expenditure on household items increases with wealth, whereas proportions of total expenditure on these items generally decrease with wealth. Household items include grinding costs, salt, utensils, tea, kerosene and candles.
Expenditure on social services (education and health) by very poor households is low at less than 10% of total annual expenditure. This expenditure almost doubles in all of the other wealth groups
0%
20%
40%
60%
80%
100%
Very Poor Poor Middle Better off
self-employment
employment + remittanceslivestock sales
crop sales
Figure 195: CNSI Cash income sources

Zimbabwe Rural Livelihood Baseline Profiles 2011
193 | P a g e
Annual Expenditure (USD)
Very Poor 55-210
Poor 100-250
Middle 215-500
Better-off 350-650
The largest expenditure area in social services is education, and this includes stationery, uniform and school fees. Overall expenditure on social services is low, generally as a result of government subsidises in the health and primary education sectors.
The middle and the better-off wealth groups also spend income on inputs, mainly seed and some fertiliser bought from the local market and GMB, constituting 5-10 %and 15-25 %of total expenditure for the 2 groups.
This expenditure does not appear for poorer households due to seed distribution interventions in the reference year and the use of retained seed for those who failed to access free seed. The middle and better-off wealth groups also spent an extremely small amount of money on clothes.
Other’ expenditure includes transport, beer and cigarettes and communication expenses and households in all wealth groups spent up to 10% of their income on these items in the reference year. Tax was a very minor expenditure item across all wealth groups in the reference year.
Hazards
Chronic hazards: Erratic rainfall is a regular hazard which limits crop production. Crop pests such as quelea birds and aphids affect small grains production and horticultural production respectively. Livestock diseases such as blackleg and red water for cattle and fowl pox for poultry also affect households herd sizes.
Periodic hazards: Roughly every 3 to 5 years within a decade, rainfall is below average for the zone.
Coping Strategies
Reduced purchase of household goods and food: The households reduce expenditure on household items and food in bad years.
Increased sale of livestock: All wealth groups engage in the sale of livestock such as cattle, goats and chickens. The livestock is usually sold to buyers who come from outside the zone. Reduction in number of meals & quantity of food consumed per day: The poor groups reduce the number of meals they consume in a day to try and manage during food crisis periods. In addition to the reduction of the number of meals consumed, the pot size is also reduced.
Increased labour migration: During the bad years the zone is a net exporter of labour to other zones. The labourers are employed in major towns in and around the zone and send remittances back home.
0%
20%
40%
60%
80%
100%
Very Poor Poor Middle Better off
other
gifts
tax
clothes
social serv.
inputs
HH items
non-staple food
staple food
Figure 196: CNSI Expenditure patterns

Zimbabwe Rural Livelihood Baseline Profiles 2011
194 | P a g e
Key Parameters for Monitoring
Table 29: CNSI Monitoring indicators
Item Key Parameter - Quantity Key Parameter – Price
Crops Maize
Sorghum
Millet
Vegetables
Vegetables
Livestock production Cattle
Goats
Chicken
Cattle
Goats
Chicken
Other food and cash income Weeding
Remittances
Self employment
Barter income
Weeding
Remittances
Self employment
Barter income

Zimbabwe Rural Livelihood Baseline Profiles 2011
195 | P a g e
Greater Mudzi Communal Livelihood Zone August-September 201035
Main Conclusions and Implications
Crop production in this zone is generally low due to unavailability of inputs, lack of sufficient draught power and poorly distributed rainfall. However crops remain an important source of income in the zone contributing 35%-45% of very poor households’ caloric requirements in the reference year and 80%-90% for the better-off households. There is potential for increased production for both consumption and sale if problems with regards to timely provision of inputs, small land cultivation and livestock restocking are given particular attention. Any support by government and non-governmental organisations in the agricultural sector (provision of seed, fertilizer and ploughing facilities) should be coupled with an adequate extension on timing for planting as well as the provision of irrigation facilities in feasible areas. There is poor road access in the zone with most roads and bridges requiring repair to improve access in the zone. This results in poor market access in the zone and uncompetitive prices.
Food aid in this zone has been present for a couple of years and it has now become an annual entitlement for very poor and poor households. This has resulted in high dependency on relief for these groups as they plan for it as an annual food source rather than exploring alternatives for improving their own livelihood sustainability. The impact of this reliance is the decline in coping ability and expansion of existing livelihood strategies; this has serious long term implications on livelihood security for people receiving food aid in this zone. Any emergency food aid must be strictly targeted and the handout approach reviewed. Benefiting households must also be supported to also improve on their productivity. Current livelihoods interventions must target production drivers beyond access to inputs.
The very poor and poor households have significant income from on-farm and off–farm activities outside the zone such that in times of drought, on–farm activities like weeding and harvesting are severely affected resulting in reduction or loss of income. Labour payment terms must be monitored closely as these have a direct impact on income for poorer households.
Expenditure on staple and non staple food by the very poor, poor and middle households accounts for 35%, 40% and 42% respectively, of total household expenditure. It is worth noting that such households will be seriously impacted by increases in the price of food and therefore there is need to closely monitor changes in prices of food, particularly maize grain.
Very poor households are typically not spending on inputs due to current interventions in free seed distributions. In addition, support in the agricultural sector in the form of provision of subsidised inputs has resulted in middle and better-off households having to spend less on these essential items and reference year expenditure is mainly for cotton inputs. Expenditure on social services is low for all wealth groups and this is partly attributed to interventions in the social services sector such as health and education, but also due to high drop out of children in primary and secondary due to accumulating debts. The education system is affordable for all however as a result of other demands, children from very poor and poor households are not attaining higher levels of education.
35Field work for the current profile was undertaken between August and September 2010. The information presented refers to April
2009 to March 2010 a relatively average year by local standards (i.e. a year of average production and rural food security, when judged in the context of recent years). Provided there are no fundamental and rapid shifts in the economy, the information in this profile is expected to remain valid for approximately five years (i.e. until 2015).

Zimbabwe Rural Livelihood Baseline Profiles 2011
196 | P a g e
Zone Description
This zone has an estimated population of 358,959 people and is situated in the North Eastern corner of Zimbabwe on the border with Mozambique. It includes the communal lands of Mudzi (Chikwizo, Mkota, and Ngarwe), North East Mutoko, Nyanga North, parts of Makoni, UMP (Maramba and Pfungwe area) and Rushinga Districts. The zone is classified as lowland in the Agro-ecological Region IV. The annual rainfall for the zone ranges from 450mm to 650mm. The summer season ranges from November to March with a typical mid season dry spell in January. Temperatures are relatively warm in winter and very high in the summer season ranging from 20 oC to 35 oC.
Figure 197: GMUC Livelihood zone map
The soils are predominantly granite sands which are relatively infertile. The zone is marginal for agricultural production due to adverse climatic conditions (erratic rainfall, high temperatures) and low soil fertility. It is a lowland zone transacted by a major tarmac road connecting Mozambique and Zimbabwe through the Nyamapanda border post. The Mudzi, Rwenya, Nyamombe, Mazowe, Nyadire, Nyagadzi, and Nyamutsanzara rivers also pass through the zone providing opportunities for gold panning and fishing.
Generally the vegetation is dominated by slow growing trees species such as thorn trees with some Acacia trees, Baobab and Masawu trees scattered across the zone. In the zone there is Makaha/Benson mine, and LaFarge Circle Cement plant which provide potential employment opportunities. Gold and wild foods such as Manyanya, Mauyu and Masawu provide potential sources of livelihoods in the zone.
The lowveld zone is characterised by extensive rain fed crop production specifically food crops which includes small grains (sorghum and millet), maize, groundnuts, sunflower and cotton production on a small scale as a cash crop for better-off households. Groundnuts are typically grown for consumption, however surpluses are sold to supplement cash income, particularly as cotton production has been declining due to lower prices. Previous research show that the zone used to produce to a level of food self sufficiency, however in the reference year it was a food deficit zone due to poor distribution of rain, unavailability of inputs and lack of draught power leading to food aid being typical for most poor households in the zone. Quelea birds are the most common pest and affect sorghum and millet, while red spider mites and bollworms affect cotton. Fertilizers (AN and animal manure), cotton seed and maize seed are the most common inputs used and are available on the market, from the GMB or NGOs. Cotton companies offer hybrid cotton seed on credit.
Households also keep livestock such as cattle, goats and poultry with small livestock dominating across all wealth groups. Small scale livestock keeping (0-6 cattle) and small livestock such as goats and poultry are common for most households in the zone. Livestock are reared in the free communal grazing areas. The source of water for livestock in the wet season is major rivers, seasonal pools and shallow wells. Cattle are the only livestock that are milked, and both oxen and milking cows are generally replaced from within the herd although cattle purchases occur following a good farming season. Cattle, goats and poultry are all sold, and only goats and poultry are generally slaughtered, during festive seasons and ceremonial gatherings. Anthrax, Red and Heart water as well as Black Leg all affect cattle in this zone, while pulpy kidney affects goats. The Ministry of Agriculture’s Department of Veterinary Services provides vaccinations and sporadic dipping either for free or through animal levies.

Zimbabwe Rural Livelihood Baseline Profiles 2011
197 | P a g e
Gold panning, petty trading and casual labour outside the zone supplements income and food sources for most poor households in the zone. Casual labour is predominantly done outside the zone. Households in the Maramba-Pfungwe area go to Uzumba, Shamva and Mutoko. Those in Rushinga go to Chesa Farms in Mt Darwin whilst those in Mudzi and Nyanga mostly go to Mozambique. Types of labour undertaken include land preparation, weeding, harvesting, garden fencing and cotton picking. Labour demand is high during weeding followed by harvesting then land preparation and planting. Both men and women are involved in these activities. In the reference year, some households were actually going to neighbouring Mozambique to do casual labour for both food and cash.
Gold Panning is done by riverine extraction and pit extraction. Riverine is mostly done in wards nearer to Mazowe river in UMP, Mudzi and Rushinga Districts and Rwenya (Nyangombe) river in Nyanga. Pit extraction is done by collection of ore from pits. The ore is ground into powder extracting the gold. Riverine gold is extracted using centrifuge extracting pans. All labour is undertaken by both men and women, and casual labour is undertaken all year round, while gold panning takes place from July until October.
Markets and Trade
The main labour markets are local, including seasonal daily labour in the fields of better-off households and temporary migration to the nearby urban centres such as Nyanga, Mutare and Harare. Mozambique provides a key opportunity for employment for both food and cash. Proportions of labour markets indicate that 60%-70% of households are employed outside the zone and 30%-40% find work within the zone and local towns.
Commodities are mainly exchanged on a local basis. Livestock are generally sold farmer to farmer, to local butcheries or to private traders. The buyers then take the animals to abattoirs or to the Cold Storage Commission in Mutare or Harare. There is a relatively lively cross border activity for villages that are close to Mozambique as households and traders travel to obtain goods and seek employment opportunities. Most of the work is casual and domestic employment with a household member migrating for short periods. Market access is generally considered poor throughout the zone, as most villages are far from urban centres, there are poor road networks, and sellers receive uncompetitive prices.
Seasonal calendar
Land preparation starts generally in September whilst planting starts in November in the zone. The crops include cotton, groundnuts and cereals. Given the low productivity of the land, food crops usually only cover around half of the annual food needs, so households have to rely on market purchase for the remaining months. The main crops grown are maize, millet, sorghum, sunflower, cowpeas
Figure 198: GMUC Seasonal Calendar
Apr May Jun Jul Aug Sep Oct Nov Dec Jan Feb Mar
Legend
cattle onfarm
Land Preparation
Planting
Weeding
Cereal
Non cereal
Cotton
Gardening
Livestock sa les
Livestock heats and births
Mi lk production
Other
Lean season
Food Purchases
Petty trade
Local labour
Gold panning
Malaria
Off farm
shoata cattle and shoats
Wet Season
planting cons. green harvest
Dry Season

Zimbabwe Rural Livelihood Baseline Profiles 2011
198 | P a g e
and groundnuts. Cereals are usually intercropped with smaller crops such as cowpeas and sunflower.
Wealth Breakdown
The wealth breakdown exercise was determined by the descriptions that the community key informants made of the typical characteristics that differentiated each wealth group. 4 wealth groups were identified by the key informants namely the very poor (vanoshayisisa), the poor (vanoshaya), the middle (varipakati) and the better-off (vanowana).
Figure 199: GMUC Wealth group characteristics
In terms of proportion of total households in the different wealth groups, the very poor and poor make just over half of the population both constituting approximately 60%-70% of household population in the zone. The middle and better-off households are about 20%-25% and 10%-15% respectively, of total households in the zone.
The main determinants of wealth in the zone are livestock holdings, amount of land cultivated, land preparation methods, ownership of productive assets and education levels. Wealthier households own significantly high numbers of cattle and goats while the poorer households typically own very small numbers of livestock – usually goats and chickens. Better-off households are generally the only wealth group that grow cotton.
Ownership of land is not a determinant of wealth as land allocation is allocated equally regardless of wealth status. The amount of land for cultivation in the zone is generally limited because of the terrain; however it varies by wealth status. The wealthier households are able to cultivate larger areas and use draught power. The poorer households cultivate small pieces of land using hand hoes. They also must divide their labour between their own fields and casual labour in order to supplement their food sources and purchase other items.
Better-off households are constrained in expanding their own crop production by the unavailability of seed and fertilizer in local shops, far distances to markets and uncompetitive prices to sell surplus crops, and poor road networks to gain access to markets.
Additionally, the poor face constraints in keeping livestock in that they lack income to purchase livestock, it is difficult to build or even maintain herd size as they are required to sell the livestock they have when faced with food insecurity, and they lack income to purchase animal drugs and vaccines to maintain herd size. Better-off households are generally constrained in livestock keeping by limited grazing land, lack of suitable pastures for animal husbandry and unsuitable terrain and weather for livestock.
Income activities mainly done by the poorer households include casual labour (mainly weeding and harvesting) the bulk of them outside the zone and in neighbouring Mozambique and gold panning along the
Cattle Goats Chickens
Very Poor 5 - 6 1-3 acres
Maize, Sorghum,
millet, sunflower,
cotton, groundnuts,
cowpeas
0 0-1 3-7 Hand tools
Poor 5 - 61.5-3.5
acres
Maize, Sorghum,
millet, sunflower,
cotton, groundnuts,
cowpeas
0-2 2-4 4-10 Hand tools
Middle 5 - 6 3-5 acres
Maize, Sorghum,
millet, sunflower,
cotton, groundnuts,
cowpeas
2-4 4-5 6-15Pairing with
neighbours
Better Off 5 - 6 3-6 acres
Maize, Sorghum,
millet, sunflower,
cotton, groundnuts,
cowpeas
4-8 5-10 8-15
Hand tools,
Own draught
power
Figure 25.3 Wealth Groups Characteristics
Livestock Holding
HH size
Land area
cultivated
(acres)
Crops cultivated Other Assets
13%
23%
33%
31%
% of households

Zimbabwe Rural Livelihood Baseline Profiles 2011
199 | P a g e
major rivers which pass through the zone whereas wealthier households include sale of livestock, sale of crops and remittances.
In terms of ownership of productive assets, the very poor and poor typically own hand hoes, axes and the middle and better-off households in addition own ploughs and scotch carts.
While household size remains the same across wealth groups, the very poor and poor households tend to have fewer children at school than those households in the middle and better-off wealth groups. The number of adults capable of work is the same across wealth groups, as is the number of 6-18 year olds.
Figure 200: GMUC HH sizes
0
1
2
3
4
5
6
7
Very Poor Poor Middle Better off
HH Size
# Adults
Under 6 Yrs
6-18 Yr Olds
# in School
Sources of Food (reference Period 2009/10)
Crop production increases with wealth, as do food purchases, which is to be expected. Livestock products such as milk and meat comprise a portion of food intake for middle and better-off households, while payment in kind for labour comprise a percent of food energy intake for the very poor and poor households.
Additionally, very poor and poor households appear to be relying on food aid as the second largest food source, only 10 % less than crop production among the very poor.
This causes difficulty in understanding how and if very poor and poor households cope without this food aid, particularly considering that this was considered a normal year for production.
The main food crops grown by all wealth groups in this zone are small grains (sorghum and millet) maize, ground nuts, cow peas, sunflower and sweet potatoes. Own crop production contributes 80%-85% of food energy requirements for better-off households, 70%-75% for middle households, 45%-50% for poor households and 35%-45% for very poor households. Wealthier households cultivate larger pieces of land and also use cattle manure and fertilisers in addition to hiring adequate labour during critical periods for cropping.
In the graph, food access is expressed as a percentage of minimum food requirements, taken as an average food energy intake of 2100 kcals per person per day.
Purchase of staple foods, plus cooking oil and sugar, is common across all the wealth groups. The main food purchased is maize grain and other food purchased by all wealth groups included cooking oil, and sugar with the middle and better-off purchasing wheat flour. Food purchases increase with wealth as a percentage of food energy requirements and are as follows: 10%-15% for the very poor, 15%-20% for the poor, and 20%-25% for the middle and better-off households. The very poor and poor spend approximately 20%-25% of their total annual income on staple food as compared to 25%-30% for the middle and 10%-20% for the better-off.
0%
20%
40%
60%
80%
100%
120%
Very Poor Poor Middle Better Off
food aid
purchase
payment in kind
livestock products
crops
Figure 201: GMUC Food sources
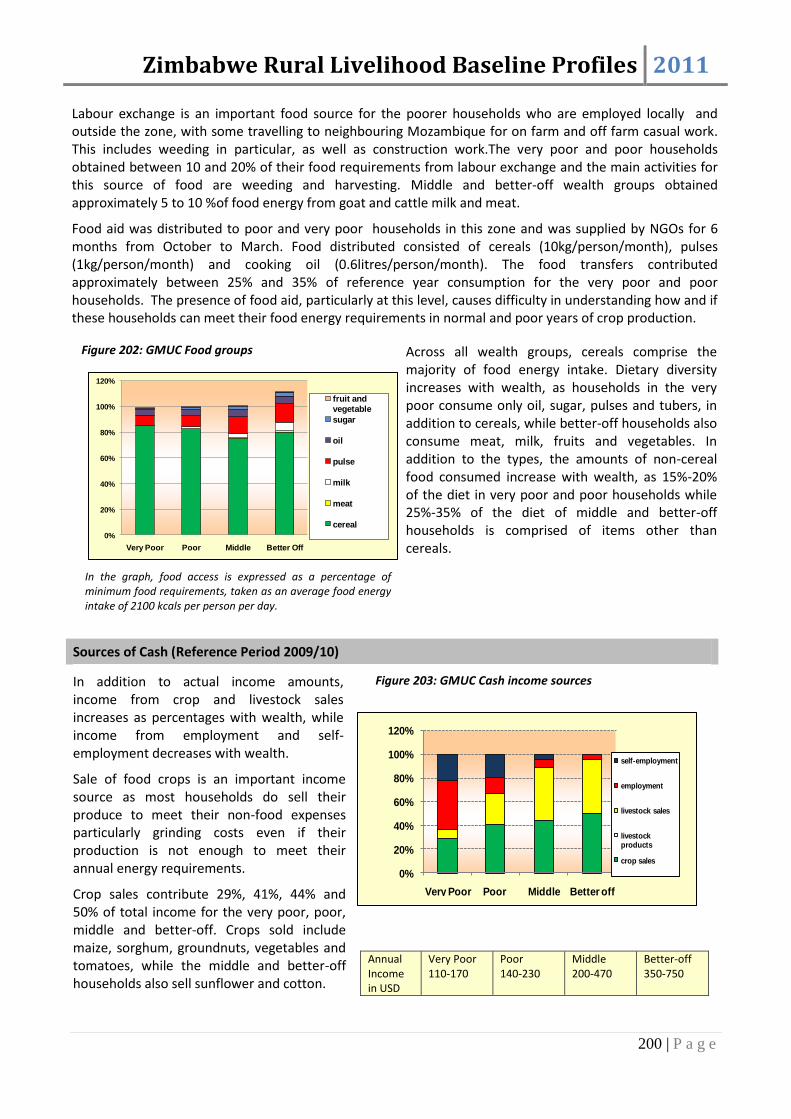
Zimbabwe Rural Livelihood Baseline Profiles 2011
200 | P a g e
Labour exchange is an important food source for the poorer households who are employed locally and outside the zone, with some travelling to neighbouring Mozambique for on farm and off farm casual work. This includes weeding in particular, as well as construction work.The very poor and poor households obtained between 10 and 20% of their food requirements from labour exchange and the main activities for this source of food are weeding and harvesting. Middle and better-off wealth groups obtained approximately 5 to 10 %of food energy from goat and cattle milk and meat.
Food aid was distributed to poor and very poor households in this zone and was supplied by NGOs for 6 months from October to March. Food distributed consisted of cereals (10kg/person/month), pulses (1kg/person/month) and cooking oil (0.6litres/person/month). The food transfers contributed approximately between 25% and 35% of reference year consumption for the very poor and poor households. The presence of food aid, particularly at this level, causes difficulty in understanding how and if these households can meet their food energy requirements in normal and poor years of crop production.
In the graph, food access is expressed as a percentage of minimum food requirements, taken as an average food energy intake of 2100 kcals per person per day.
Across all wealth groups, cereals comprise the majority of food energy intake. Dietary diversity increases with wealth, as households in the very poor consume only oil, sugar, pulses and tubers, in addition to cereals, while better-off households also consume meat, milk, fruits and vegetables. In addition to the types, the amounts of non-cereal food consumed increase with wealth, as 15%-20% of the diet in very poor and poor households while 25%-35% of the diet of middle and better-off households is comprised of items other than cereals.
Sources of Cash (Reference Period 2009/10)
In addition to actual income amounts, income from crop and livestock sales increases as percentages with wealth, while income from employment and self-employment decreases with wealth.
Sale of food crops is an important income source as most households do sell their produce to meet their non-food expenses particularly grinding costs even if their production is not enough to meet their annual energy requirements.
Crop sales contribute 29%, 41%, 44% and 50% of total income for the very poor, poor, middle and better-off. Crops sold include maize, sorghum, groundnuts, vegetables and tomatoes, while the middle and better-off households also sell sunflower and cotton.
Annual Income in USD
Very Poor 110-170
Poor 140-230
Middle 200-470
Better-off 350-750
0%
20%
40%
60%
80%
100%
120%
Very Poor Poor Middle Better Off
fruit and
vegetable
sugar
oil
pulse
milk
meat
cereal
0%
20%
40%
60%
80%
100%
120%
Very Poor Poor Middle Better off
self-employment
employment
livestock sales
livestock products
crop sales
Figure 202: GMUC Food groups
Figure 203: GMUC Cash income sources

Zimbabwe Rural Livelihood Baseline Profiles 2011
201 | P a g e
All wealth groups sell livestock with variations in the type of livestock sold. The very poor and poor mainly sell chickens and goats with middle and better-off households mainly selling goats and cattle. The contribution of income from livestock sales increases with wealth as does animal type and herd size.
The types of labour undertaken include land preparation, weeding, harvesting, construction and cotton picking. Employment contributed 40%-45% of total income for the very poor and 10%-20% for the poor. Income for middle and better-off households in this category are in the form of remittances. Self employment activities particularly gold panning, sale of construction materials and grass sales are important sources of income especially for the very poor, the poor and the middle contributing 20%-25%, 15%-20% and approximately 5 % of annual income respectively.
Expenditure Patterns (Reference Period 2009/10)
Annual Expenditure in USD
Very Poor 110-170
Poor 140-230
Middle 200-470
Better-off 350-750
The expenditure patterns of the wealth groups in this livelihood zone vary across the groups. The combined expenditure on staple food and non-staple food for the very poor and poor households is 35%-45%, with the middle and the better-off spending 45%-55% and 25%-30% of total annual household expenditure respectively. Considering the large amount of food aid distributed to households among very poor and poor households, these items would likely increase significantly if that aid was not present.
As would be expected, actual expenditure on household items increases with wealth, however, as proportions of total expenditure they decrease with wealth. This includes items such as grinding costs, salt, utensils tea and kerosene/candles.
Expenditure on social services by the poor and very poor households is very low at less than 10 % of total annual expenditure. The most significant area in social services is education costs. Despite subsidies, there remain associated costs which act as barriers against higher enrolment of poorer households.
Middle and better-off households spend income on inputs, mainly seed and some fertiliser, purchased from the local market and GMB and constituting 10%-15% and 15%-25% of total expenditure for the 2 groups.
These items purchased by poorer households as a result of seed distribution interventions in the reference year and the use of retained seed for those who failed to access free seed.
‘Other’ expenditure includes transport, beer, gifts, festivals and community obligations and all wealth groups have a proportion of their total expenditure going to other items. Expenditure on these items decrease slightly as proportions with wealth. All households with the exception of the very poor purchased clothes particularly basic clothing for children. Payment of household and livestock tax was typical in the reference year.
0%
20%
40%
60%
80%
100%
Very Poor Poor Middle Better off
other
gifts
tax
social serv.
inputs
HH items
staple food
Figure 204: GMUC Expenditure patterns

Zimbabwe Rural Livelihood Baseline Profiles 2011
202 | P a g e
Hazards
Chronic hazards: Erratic rainfall is a regular hazard which limits crop production. Human diseases are also a major problem throughout this zone. This zone is furthermore prone to stock theft as well as at risk of crop destruction by crickets and quelea birds.
Intermittent hazards: Roughly every 3 to 5 years within a decade, rainfall is below average for the zone.
Coping Strategies
Increased casual labour: The poor households increase casual labour for payment in kind. In some instances the poor household members temporarily migrate to other livelihood zones and across the border to Mozambique for casual work.
Increased gold panning: The poor households increase in gold panning along the Mazowe and Nyangombe rivers. The gold is sold for cash or bartered for commodities.
Use of retained seed: All wealth groups make use of retained seed for planting; however when households cannot access certified maize seed they use retained seed which has a low yield. The better-off additionally use animal manure as an alternative for inorganic fertilisers during difficult years.
Increased sale of livestock: The poorer households sell livestock –mainly goats and chickens whilst the richer groups sell –mainly goats and cattle to informal traders.
Key Parameters for Monitoring
Table 30: GMUC Monitoring indicators
Item Key Parameter – Quantity Key Parameter – Price
Crops Maize
Sorghum
Cotton
Groundnuts
Maize grain
Sorghum
Cotton
Livestock production Cattle and Goats Cattle and Goats
Other food and cash income Casual Labour Labour rates (land preparation, weeding, harvesting)
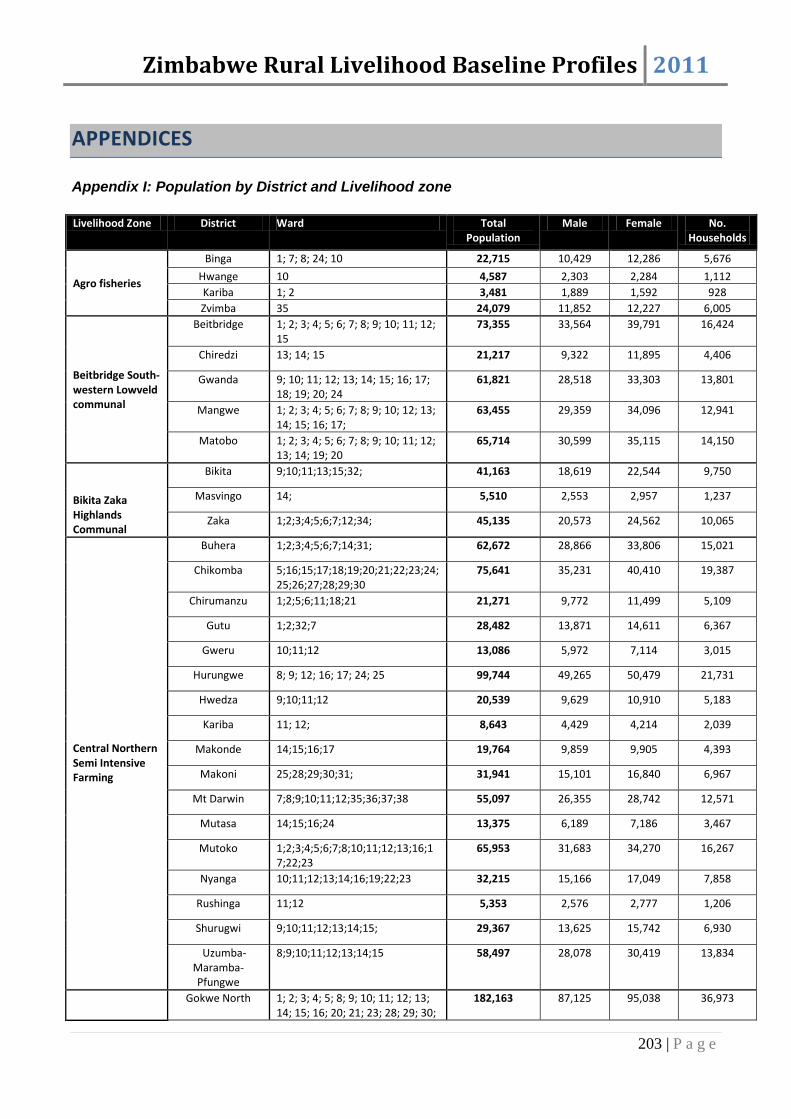
Zimbabwe Rural Livelihood Baseline Profiles 2011
203 | P a g e
APPENDICES
Appendix I: Population by District and Livelihood zone
Livelihood Zone District Ward Total
Population Male Female No.
Households
Agro fisheries
Binga 1; 7; 8; 24; 10 22,715 10,429 12,286 5,676
Hwange 10 4,587 2,303 2,284 1,112
Kariba 1; 2 3,481 1,889 1,592 928
Zvimba 35 24,079 11,852 12,227 6,005
Beitbridge South-western Lowveld communal
Beitbridge 1; 2; 3; 4; 5; 6; 7; 8; 9; 10; 11; 12; 15
73,355 33,564 39,791 16,424
Chiredzi 13; 14; 15 21,217 9,322 11,895 4,406
Gwanda 9; 10; 11; 12; 13; 14; 15; 16; 17; 18; 19; 20; 24
61,821 28,518 33,303 13,801
Mangwe 1; 2; 3; 4; 5; 6; 7; 8; 9; 10; 12; 13; 14; 15; 16; 17;
63,455 29,359 34,096 12,941
Matobo 1; 2; 3; 4; 5; 6; 7; 8; 9; 10; 11; 12; 13; 14; 19; 20
65,714 30,599 35,115 14,150
Bikita Zaka Highlands Communal
Bikita 9;10;11;13;15;32; 41,163 18,619 22,544 9,750
Masvingo 14; 5,510 2,553 2,957 1,237
Zaka 1;2;3;4;5;6;7;12;34; 45,135 20,573 24,562 10,065
Central Northern Semi Intensive Farming
Buhera 1;2;3;4;5;6;7;14;31; 62,672 28,866 33,806 15,021
Chikomba 5;16;15;17;18;19;20;21;22;23;24;25;26;27;28;29;30
75,641 35,231 40,410 19,387
Chirumanzu 1;2;5;6;11;18;21 21,271 9,772 11,499 5,109
Gutu 1;2;32;7 28,482 13,871 14,611 6,367
Gweru 10;11;12 13,086 5,972 7,114 3,015
Hurungwe 8; 9; 12; 16; 17; 24; 25 99,744 49,265 50,479 21,731
Hwedza 9;10;11;12 20,539 9,629 10,910 5,183
Kariba 11; 12; 8,643 4,429 4,214 2,039
Makonde 14;15;16;17 19,764 9,859 9,905 4,393
Makoni 25;28;29;30;31; 31,941 15,101 16,840 6,967
Mt Darwin 7;8;9;10;11;12;35;36;37;38 55,097 26,355 28,742 12,571
Mutasa 14;15;16;24 13,375 6,189 7,186 3,467
Mutoko 1;2;3;4;5;6;7;8;10;11;12;13;16;17;22;23
65,953 31,683 34,270 16,267
Nyanga 10;11;12;13;14;16;19;22;23 32,215 15,166 17,049 7,858
Rushinga 11;12 5,353 2,576 2,777 1,206
Shurugwi 9;10;11;12;13;14;15; 29,367 13,625 15,742 6,930
Uzumba-Maramba-Pfungwe
8;9;10;11;12;13;14;15 58,497 28,078 30,419 13,834
Gokwe North 1; 2; 3; 4; 5; 8; 9; 10; 11; 12; 13; 14; 15; 16; 20; 21; 23; 28; 29; 30;
182,163 87,125 95,038 36,973
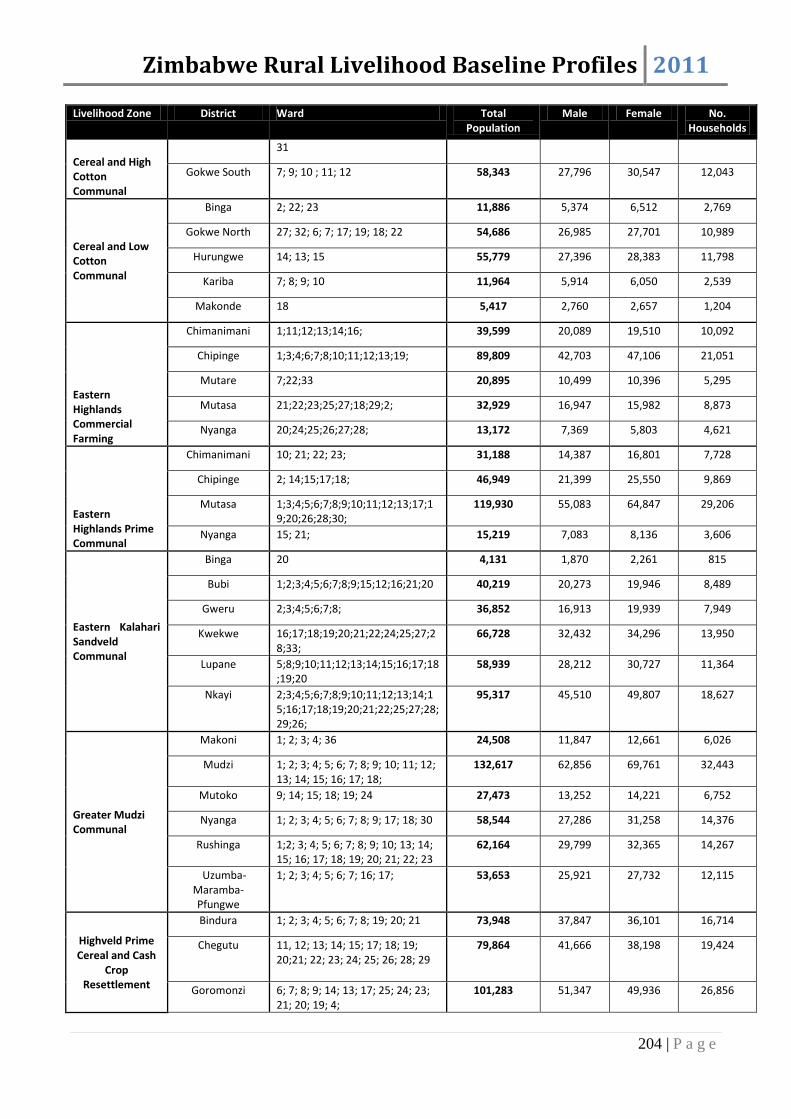
Zimbabwe Rural Livelihood Baseline Profiles 2011
204 | P a g e
Livelihood Zone District Ward Total Population
Male Female No. Households
Cereal and High Cotton Communal
31
Gokwe South 7; 9; 10 ; 11; 12 58,343 27,796 30,547 12,043
Cereal and Low Cotton Communal
Binga 2; 22; 23 11,886 5,374 6,512 2,769
Gokwe North 27; 32; 6; 7; 17; 19; 18; 22 54,686 26,985 27,701 10,989
Hurungwe 14; 13; 15 55,779 27,396 28,383 11,798
Kariba 7; 8; 9; 10 11,964 5,914 6,050 2,539
Makonde 18 5,417 2,760 2,657 1,204
Eastern Highlands Commercial Farming
Chimanimani 1;11;12;13;14;16; 39,599 20,089 19,510 10,092
Chipinge 1;3;4;6;7;8;10;11;12;13;19; 89,809 42,703 47,106 21,051
Mutare 7;22;33 20,895 10,499 10,396 5,295
Mutasa 21;22;23;25;27;18;29;2; 32,929 16,947 15,982 8,873
Nyanga 20;24;25;26;27;28; 13,172 7,369 5,803 4,621
Eastern Highlands Prime Communal
Chimanimani 10; 21; 22; 23; 31,188 14,387 16,801 7,728
Chipinge 2; 14;15;17;18; 46,949 21,399 25,550 9,869
Mutasa 1;3;4;5;6;7;8;9;10;11;12;13;17;19;20;26;28;30;
119,930 55,083 64,847 29,206
Nyanga 15; 21; 15,219 7,083 8,136 3,606
Eastern Kalahari Sandveld Communal
Binga 20 4,131 1,870 2,261 815
Bubi 1;2;3;4;5;6;7;8;9;15;12;16;21;20 40,219 20,273 19,946 8,489
Gweru 2;3;4;5;6;7;8; 36,852 16,913 19,939 7,949
Kwekwe 16;17;18;19;20;21;22;24;25;27;28;33;
66,728 32,432 34,296 13,950
Lupane 5;8;9;10;11;12;13;14;15;16;17;18;19;20
58,939 28,212 30,727 11,364
Nkayi 2;3;4;5;6;7;8;9;10;11;12;13;14;15;16;17;18;19;20;21;22;25;27;28;29;26;
95,317 45,510 49,807 18,627
Greater Mudzi Communal
Makoni 1; 2; 3; 4; 36 24,508 11,847 12,661 6,026
Mudzi 1; 2; 3; 4; 5; 6; 7; 8; 9; 10; 11; 12; 13; 14; 15; 16; 17; 18;
132,617 62,856 69,761 32,443
Mutoko 9; 14; 15; 18; 19; 24 27,473 13,252 14,221 6,752
Nyanga 1; 2; 3; 4; 5; 6; 7; 8; 9; 17; 18; 30 58,544 27,286 31,258 14,376
Rushinga 1;2; 3; 4; 5; 6; 7; 8; 9; 10; 13; 14; 15; 16; 17; 18; 19; 20; 21; 22; 23
62,164 29,799 32,365 14,267
Uzumba-Maramba-Pfungwe
1; 2; 3; 4; 5; 6; 7; 16; 17; 53,653 25,921 27,732 12,115
Highveld Prime Cereal and Cash
Crop Resettlement
Bindura 1; 2; 3; 4; 5; 6; 7; 8; 19; 20; 21 73,948 37,847 36,101 16,714
Chegutu
11, 12; 13; 14; 15; 17; 18; 19; 20;21; 22; 23; 24; 25; 26; 28; 29
79,864 41,666 38,198 19,424
Goromonzi 6; 7; 8; 9; 14; 13; 17; 25; 24; 23; 21; 20; 19; 4;
101,283 51,347 49,936 26,856

Zimbabwe Rural Livelihood Baseline Profiles 2011
205 | P a g e
Livelihood Zone District Ward Total Population
Male Female No. Households
Guruve 1;2; 3; 13; 14; 15; 17; 21 35,351 18,331 17,020 7,605
Hurungwe 1; 2; 3; 4; 5; 6; 18; 19; 20; 21; 22 116,092 59,384 56,708 24,341
Hwedza 1; 2; 3; 4 19,051 10,029 9,022 4,521
Makonde 1; 2; 3; 4; 5; 6; 8; 9; 10; 11; 12; 13; 19
16,634 8,500 8,134 3,544
Makoni 6; 11; 17; 34; 37; 38; 33; 49,126 25,509 23,617 11,937
Marondera 1; 2; 3; 4; 5;6; 7; 8; 9; 21;22; 23 66,007 34,323 31,684 17,086
Mazowe 6; 14; 16; 18; 19; 20; 21;22; 23; 24; 25;26; 27; 29; 30; 31; 32; 34; 35
136,437 68,543 67,894 40,487
Mhondoro-Ngezi 10; 14; 15; 16 26,296 13,646 12,650 5,540
Mt Darwin 19; 8,946 4,583 4,363 1,929
Murewa 23; 29 15,292 7,576 7,716 3,770
Mutare 1; 2; 3; 31; 34 48,586 24,798 23,788 10,459
Mutoko 21; 25; 26;27; 28; 29 39,852 19,838 20,014 8,860
Muzarabani 11; 12; 13; 14; 21; 25; 28; 6 37,400 19,021 18,379 8,494
Sanyati 1; 2; 3; 7 47,817 25,093 22,724 10,873
Seke 9;10;11;12;13; 14; 15; 16; 17; 19; 20; 21
44,495 23,076 21,419 11,326
Shamva 14; 15; 17; 19; 18; 29; 28;21; 20 43,585 22,645 20,940 9,799
Zvimba 13; 14; 17; 18; 19; 21; 30; 31; 33;34; 27; 26; 25; 24
127,494 65,219 62,275 29,840
Highveld Prime Communal
Bindura 10; 9; 11; 12; 13; 14; 15; 16; 17; 18;
50,212 24,065 26,147 11,855
Chegutu 1; 2; 3; 4; 5; 6; 7; 8; 9; 10; 27 69,161 33,267 35,894 16,951
Goromonzi 1; 2; 3; 4; 5; 10; 11; 12; 15; 16; 18;
122,596 59,026 63,570 29,392
Guruve 4; 5; 6; 7; 8; 9; 10; 11; 12; 16; 17; 18; 19; 20; 22; 23; 24
88,116 41,973 46,143 20,348
Hurungwe 10; 11; 23; 26; 39,569 19,340 20,229 8,829
Hwedza 5; 6; 7; 8; 15 26,614 12,655 13,959 6,580
Makonde 1; 2; 3; 4; 5; 6; 8; 9; 10; 11; 12 104,055 52,714 51,341 22,345
Makoni 5; 7; 8; 9; 10; 12; 13; 14; 15; 16; 18; 19; 20; 21; 22; 23; 24; 26; 27; 35; 39;
166,308 80,454 85,854 38,584
Marondera 10; 11; 12; 13; 14; 15; 16; 17; 18; 19; 20
50,420 24,233 26,187 12,719
Mazowe 1;2; 3; 4; 5; 6; 7; 8; 9; 10; 11; 12; 13
79,352 37,398 41,954 18,760
Mhondoro-Ngezi 1; 2; 3; 4; 5; 6; 7; 8; 9; 11 53,261 27,035 26,226 12,864
Mt Darwin
13; 14; 15; 17; 18; 20; 21; 23; 22; 24; 25; 27; 28; 29; 30; 39; 40
87,717 43,060 44,657 18,492
Murewa 1; 2; 3; 4; 5; 6; 7; 8; 9; 10; 11; 12; 13; 14; 15; 16; 17; 18; 19; 20; 21;
179,793 85,791 94,002 42,909
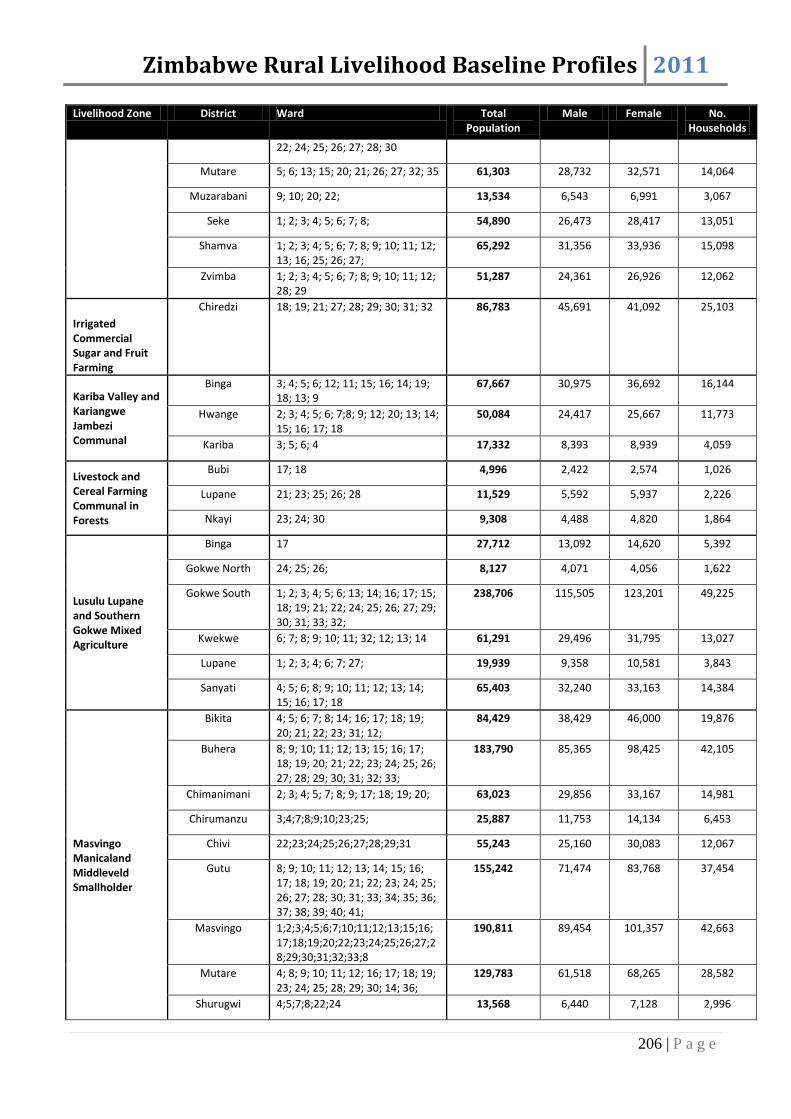
Zimbabwe Rural Livelihood Baseline Profiles 2011
206 | P a g e
Livelihood Zone District Ward Total Population
Male Female No. Households
22; 24; 25; 26; 27; 28; 30
Mutare 5; 6; 13; 15; 20; 21; 26; 27; 32; 35 61,303 28,732 32,571 14,064
Muzarabani 9; 10; 20; 22; 13,534 6,543 6,991 3,067
Seke 1; 2; 3; 4; 5; 6; 7; 8; 54,890 26,473 28,417 13,051
Shamva 1; 2; 3; 4; 5; 6; 7; 8; 9; 10; 11; 12; 13; 16; 25; 26; 27;
65,292 31,356 33,936 15,098
Zvimba 1; 2; 3; 4; 5; 6; 7; 8; 9; 10; 11; 12; 28; 29
51,287 24,361 26,926 12,062
Irrigated Commercial Sugar and Fruit Farming
Chiredzi 18; 19; 21; 27; 28; 29; 30; 31; 32 86,783 45,691 41,092 25,103
Kariba Valley and Kariangwe Jambezi Communal
Binga 3; 4; 5; 6; 12; 11; 15; 16; 14; 19; 18; 13; 9
67,667 30,975 36,692 16,144
Hwange 2; 3; 4; 5; 6; 7;8; 9; 12; 20; 13; 14; 15; 16; 17; 18
50,084 24,417 25,667 11,773
Kariba 3; 5; 6; 4 17,332 8,393 8,939 4,059
Livestock and Cereal Farming Communal in Forests
Bubi 17; 18 4,996 2,422 2,574 1,026
Lupane 21; 23; 25; 26; 28 11,529 5,592 5,937 2,226
Nkayi 23; 24; 30 9,308 4,488 4,820 1,864
Lusulu Lupane and Southern Gokwe Mixed Agriculture
Binga 17 27,712 13,092 14,620 5,392
Gokwe North 24; 25; 26; 8,127 4,071 4,056 1,622
Gokwe South 1; 2; 3; 4; 5; 6; 13; 14; 16; 17; 15; 18; 19; 21; 22; 24; 25; 26; 27; 29; 30; 31; 33; 32;
238,706 115,505 123,201 49,225
Kwekwe 6; 7; 8; 9; 10; 11; 32; 12; 13; 14 61,291 29,496 31,795 13,027
Lupane 1; 2; 3; 4; 6; 7; 27; 19,939 9,358 10,581 3,843
Sanyati 4; 5; 6; 8; 9; 10; 11; 12; 13; 14; 15; 16; 17; 18
65,403 32,240 33,163 14,384
Masvingo Manicaland Middleveld Smallholder
Bikita 4; 5; 6; 7; 8; 14; 16; 17; 18; 19; 20; 21; 22; 23; 31; 12;
84,429 38,429 46,000 19,876
Buhera 8; 9; 10; 11; 12; 13; 15; 16; 17; 18; 19; 20; 21; 22; 23; 24; 25; 26; 27; 28; 29; 30; 31; 32; 33;
183,790 85,365 98,425 42,105
Chimanimani 2; 3; 4; 5; 7; 8; 9; 17; 18; 19; 20; 63,023 29,856 33,167 14,981
Chirumanzu 3;4;7;8;9;10;23;25; 25,887 11,753 14,134 6,453
Chivi 22;23;24;25;26;27;28;29;31 55,243 25,160 30,083 12,067
Gutu 8; 9; 10; 11; 12; 13; 14; 15; 16; 17; 18; 19; 20; 21; 22; 23; 24; 25; 26; 27; 28; 30; 31; 33; 34; 35; 36; 37; 38; 39; 40; 41;
155,242 71,474 83,768 37,454
Masvingo 1;2;3;4;5;6;7;10;11;12;13;15;16;17;18;19;20;22;23;24;25;26;27;28;29;30;31;32;33;8
190,811 89,454 101,357 42,663
Mutare 4; 8; 9; 10; 11; 12; 16; 17; 18; 19; 23; 24; 25; 28; 29; 30; 14; 36;
129,783 61,518 68,265 28,582
Shurugwi 4;5;7;8;22;24 13,568 6,440 7,128 2,996

Zimbabwe Rural Livelihood Baseline Profiles 2011
207 | P a g e
Livelihood Zone District Ward Total Population
Male Female No. Households
Zaka 8;9;10;11;13;14;15;16;17;18;19;20;21;22;23;25;26;27;28;29;30;31;32;33;24;
135,971 61,407 74,564 30,185
Zvishavane 2;3;4;6;7;8;9;10;11;12;13;15;16;17;18;
56,618 26,643 29,975 12,176
Matabeleland Middleveld Communal
Gwanda 1;2;3;4;5;6;7;8; 32,384 15,453 16,931 7,015
Insiza 1;2;4;5;6;3;7;8;9;11;12;16 44,948 21,607 23,341 9,283
Matobo 15 5,089 2,494 2,595 1,082
Mberengwa 3;4;6;7;8;9;10;11;12;13;14;15;16;187;18;19;23;26;28;29;30;31;33;34;37;
123,490 56,785 66,705 25,922
Umzingwane 1;2;3;4;5;6;7;8;9;10;11;12;13;19 45,707 22,147 23,560 9,960
Umguza 3;4;5;6; 13,783 6,774 7,009 2,820
Mutorashanga Informal Mining
Zvimba 20; 32; 15 30,557 15,372 15,185 7,376
Mwenezi Chivi and South Midland Communal
Chivi 1; 2; 3; 4; 5; 6; 7; 8; 9; 10; 11; 12; 13; 14; 15; 16; 17; 18; 19; 20; 21; 30; 32;
111,034 50,742 60,292 24,315
Masvingo 9; 21 10,260 4,913 5,347 2,051
Mberengwa 5; 20; 21; 22; 24; 25; 32; 32,427 14,542 17,885 6,679
Mwenezi 1; 2; 3; 4; 5; 6; 7; 8; 9; 10; 11; 12; 13; 14; 15; 16; 17
157,052 72,287 84,765 31,910
Northern Cattle and Cereal Farming
Chikomba 1;2;3;4;7;8;10;13;14; 45,521 22,769 22,752 11,268
Chirumanzu 16;17;22;12;19;20;15; 33,929 16,886 17,043 8,174
Gokwe South 28 10,201 4,978 5,223 1,956
Gutu 3;4;5;6;29; 19,809 9,331 10,478 4,423
Hwedza 13;14 4,269 2,126 2,143 989
Kwekwe 1;2;3;4;5;15;23;26;30;31; 47,816 25,350 22,466 11,130
Mhondoro-Ngezi 12;13; 24,504 13,535 10,969 5,226
Seke 18 1,752 890 862 409
Shurugwi 1,2,3;6;16;17;18;19;20;21;23 34,525 17,728 16,797 7,208
Zvishavane 5; 14; 19 13,429 7,118 6,311 2,924
Northern Zambezi Valley Communal
Mbire 1; 2; 3; 4; 5; 6; 7; 8; 9; 10; 11; 12; 13; 14; 15; 16
81,908 40,434 41,474 18,130
Mt Darwin 1; 2; 3; 4; 5; 6; 31; 32; 33; 34 52,342 25,274 27,068 12,609
Muzarabani 1; 2; 3; 4; 5; 6; 7; 8; 17; 18; 19; 23; 24; 27;
67,059 33,215 33,844 14,703
Save River Valley and Ndowoyo Communal
Bikita 1;2;3;24;25;26;28;29; 35,761 16,414 19,347 7,972
Chipinge 5;16;20;21;22;23;24;25;26;27;28;29;30
164,034 75,100 88,934 35,483
Chiredzi
1;2;3;4;5;6;7;8;9;10;11;12;22;25; 79,916 35,806 44,110 16,629

Zimbabwe Rural Livelihood Baseline Profiles 2011
208 | P a g e
Livelihood Zone District Ward Total Population
Male Female No. Households
Southern Cattle and Cereal Farming
Beitbridge 13; 14; 6,980 3,952 3,028 2,172
Bubi 11; 13; 14; 10; 22; 23 16,973 9,203 7,770 4,592
Bulilima 15; 16; 17; 18; 19 11,005 5,460 5,545 2,268
Chiredzi 16; 17; 20; 23; 24; 26 88,926 42,566 46,360 18,727
Gwanda 23; 22; 21 22,152 12,553 9,599 5,957
Gweru 1;13;14;15;16;17;18;19;30; 43,190 22,724 20,466 9,792
Insiza 13; 14; 15; 17; 18; 19; 20; 21; 22; 23; 10
54,845 27,574 27,271 12,118
Lupane 24 1,283 620 663 270
Mangwe 11 3,550 2,119 1,431 865
Matobo 22; 21; 23; 18; 17; 16; 24; 25 23,188 11,925 11,263 5,517
Mberengwa 1; 2; 35; 36 30,247 15,758 14,489 6,251
Mwenezi 15 9,211 4,518 4,693 2,057
Tsholotsho 20; 1,868 969 899 417
Umguza 1; 2; 7; 8; 9; 10; 11; 12; 13; 14; 15; 16; 17; 18; 19
73,735 39,175 34,560 16,675
Umzingwane 14; 15; 16; 17; 20 16,803 8,649 8,154 4,490
Western Kalahari Sandveld Communal
Bulilima 1; 2; 3; 4; 5; 6; 7; 8; 9; 10; 11; 12; 13; 14; 20; 21; 22;
79,752 36,453 43,299 17,493
Hwange 1; 4,076 2,157 1,919 960
Lupane 22 7,174 3,451 3,723 1,457
Tsholotsho 1; 2; 3; 4; 5; 6; 7; 8; 9; 10; 11; 12; 13; 14; 15; 16; 17; 18; 19; 21; 22;
112,027 51,660 60,367 23,734
Grant Total 8,715,714 4,204,572 4,511,142 1,987,728

Zimbabwe Rural Livelihood Baseline Profiles 2011
209 | P a g e
Appendix II: List of Wards visited during the assessment
Livelihood Zone District Selected wards
Agro fisheries
Binga 1; 8; 10 (6 villages)
Hwange 10 (2 villages)
Kariba 2 (2 villages)
Beitbridge South-western Lowveld communal
Beitbridge 1;5;10
Gwanda 11; 17; 24;
Mangwe 3; 7; 10;
Matobo 7; 10; 20;
Bikita Zaka Highlands Communal
Bikita 15; 10; 11
Zaka 1; 3; 5; 7; 12
Northern Cattle and Cereal Farming
Chikomba 1;4;14
Chiredzi 32; 29; 27
Chirumanzu 22;12
Kwekwe 1;4
Mhondoro Ngezi 13
Zvishavane 14
Southern Cattle and Cereal Farming
Gwanda 21;22
Gweru 1;19
Beitbridge 13;14
Bubi 11
Insiza 14; 21
Matobo 17;25
Umuguza 14; 7
Central and Northern Semi-intensive Farming
Buhera 5; 9
Chikomba 18; 28
Chirumanzu 1
Gutu 1
Hurungwe 17; 9
Kariba 12
Mutoko 6; 16
UMP 10;
Cereal and High Cotton Communal Gokwe North 1; 28; 8; 35; 15; 21; 11;
Gokwe South 9; 7; 11
Cereal and Low Cotton Communal
Binga 2 (2 villages)
Gokwe North 6; 17; 22; 32
Hurungwe 13 (2 villages)
Kariba 7*; 10 (3 villages)
Eastern Highlands Commercial Farming
Chimanimani 16; 11; 12
Chipinge 4; 7; 13
Mutare 7
Mutasa 23; 27
Nyanga 25 (2 villages); 27
Eastern Highlands Prime Communal
Chimanimani 21; 23;
Chipinge 9; 18
Mutasa 1; 5; 8; 11; 20; 13
Nyanga 21 (2 villages)
Eastern Kalahari Sandveld Communal
Bubi 21; 3
Gweru 3
Kwekwe 17; 25; 33
Lupane 8; 16
Nkayi 7; 14; 17; 19
Greater Mudzi Communal Mudzi 15; 8; 5; 17;

Zimbabwe Rural Livelihood Baseline Profiles 2011
210 | P a g e
Livelihood Zone District Selected wards
Nyanga 17;6;2
Rushinga 15; 5; 21
UMP 2; 16;
Highveld Prime Cereal and Cash Crop Resettlement
Bindura 5
Chegutu 22; 29
Goromonzi 20
Hurungwe 1; 20
Makonde 11; 19
Marondera 6
Mazowe 30;
Seke 9
Zvimba 30; 19;
Highveld Prime Communal
Guruve 7; 18; 20;
Makoni 8; 22;
Mt Darwin 18; 23; 28;
Murewa 2; 11; 17;22;
Irrigated Commercial Sugar and Fruit Farming Chiredzi 21; 19; 31; 28;18 (8 villages)
Kariba Valley and Kariangwe Jambezi Communal
Binga 3; 6; 14; 13; 15
Hwange 5; 8; 12; 14
Kariba 3*;6 (3 villages)
Livestock and Cereal Farming Communal in Forests
Bubi 17 (2 villages)
Lupane 21 (2 villages); 26 (2 villages)
Nkayi 23 (2 villages)
Lusulu Lupane Southern Gokwe Mixed Agriculture
Binga 17;
Gokwe South 14; 13; 4; 2
Kwekwe 8; 11
Lupane 27; 7
Sanyati 14; 4; 12;
Masvingo Manicaland Middleveld Communal
Buhera 27; 17;
Chirumanzu 3
Gutu 22; 36; 12
Masvingo 6; 17; 28
Mutare 16; 29
Zvishavane 4; 7
Matabeleland Middleveld Communal
Gwanda 4; 6
Insiza 5; 1
Mberengwa 7; 16; 31; 11
Umzingwane 10; 8; 13
Umguza 3
Mutorashanga Informal Mining Zvimba 15; 32; 20 (8 villages)
Mwenezi Chivi and South Midland
Chivi 19; 15; 12, 13; 6;1
Mberengwa 22; 5
Mwenezi 4; 8; 13; 10
Northern Zambezi Valley
Mbire 2; 12; 15; 13; 4
Mt Darwin 1; 34; 2
Muzarabani 6; 3; 2; 4; 18
Save River Valley and Ndowoyo Communal
Bikita 25; 3
Chipinge 21; 5; 24; 28
Chiredzi 1;9; 3; 12
Western Kalahari Sandveld Bulilima 9; 22; 14; 1; 5;
Tsholotsho 1; 5; 8; 14; 17

Zimbabwe Rural Livelihood Baseline Profiles 2011
211 | P a g e
Appendix III: Assessment team members
Name Organisation Position
1. Alexandra King FEG Consultant (Lead Trainer of trainers)
2. Evance Chapasuka SADC RVAA PMU Regional Livelihood Expert (Co-Lead Trainer of trainers)
3. Daison Ngirazi Save the Children HEA Project Manager (Lead Trainer)
4. George Chimuseu SADC HEA Expert (Training Team Leader)
5. Masozi Kachale SADC HEA Expert (Training Team Leader)
6. Sebastian Gavhera Concern Worldwide HEA Team Leader (Trainer) 7. Alfornce Chiputsa Action Contre La Faim HEA Team Leader (Trainer) 8. Anesto Mundeiri Ministry of Agriculture, Mechanisation and
Irrigation Development Chief Trainer (Trainer)
9. Timothy Mudakureva Ministry of Labour and Social Services Senior Research Economist (Trainer)
10. Rabson Shirichena OXFAM GB HEA Team Leader (Trainer) 11. Amos Chinyama Save the Children HEA Team Leader (Trainer) 12. Elizabeth Chigwidi Save the Children M&E Coordinator (Trainer) 13. Charlene P Ambali Action Contre La Faim M&E Officer 14. Dennis Zimunya Action Contre La Faim M&E Officer 15. Keitometsi Abu-Basutu Action Contre La Faim M&E Officer 16. Claudio Mhlanga Concern Worldwide Field Officer 17. Joel Chinamasa Concern Worldwide Field Officer 18. Samson R Munemo Concern Worldwide Food Security Officer 19. Shupikayi Zimuto Concern Worldwide Project Coordinator 20. Yvonne Mavhunga Food and Nutrition Council HEA Officer 21. Catherine Nhamo Food and Nutrition Council HEA Officer 22. Nhlanhla Dube Ministry of Agriculture, Mechanisation and
Irrigation Development Agribusiness Specialist
23. Robson Chihumba Ministry of Agriculture, Mechanisation and Irrigation Development
Agronomist
24. Ancetta Moyo Ministry of Agriculture, Mechanisation and Irrigation Development
Extension Officer
25. Caristo Masiwa Ministry of Agriculture, Mechanisation and Irrigation Development
Extension Officer
26. Sangweni Fortune Ministry of Agriculture, Mechanisation and Irrigation Development
Provincial Agronomist
27. Chibi Ellen Ministry of Agriculture, Mechanisation and Irrigation Development
Training Specialist
28. Tasiana Nyadzayo Ministry of Health and Child Welfare Nutrition Surveillance Manager 29. Bokani S Ncube Ministry of Health and Child Welfare Nutritionist 30. Chipangura Tawanda Ministry of Health and Child Welfare Nutritionist 31. Eddington Mututuvari Ministry of Health and Child Welfare Nutritionist 32. Lee Farayi Moto Ministry of Health and Child Welfare Nutritionist 33. Matimbira Isheunesu Ministry of Health and Child Welfare Nutritionist 34. Meggie Gabida Ministry of Health and Child Welfare Nutritionist

Zimbabwe Rural Livelihood Baseline Profiles 2011
212 | P a g e
Name Organisation Position
35. Msauki Annie C Ministry of Health and Child Welfare Nutritionist 36. Mthulisi Dube Ministry of Health and Child Welfare Nutritionist 37. Mufaro Chiriga Ministry of Health and Child Welfare Nutritionist 38. Musa Mahefu Ministry of Health and Child Welfare Nutritionist 39. Placedes Chinamasa Ministry of Health and Child Welfare Nutritionist 40. Ruth Machaka Ministry of Health and Child Welfare Nutritionist 41. Simbarashe Chingoma Ministry of Health and Child Welfare Nutritionist 42. Gumbo Nkosilathi Ministry of Labour and Social Services Assistant Social welfare Officer 43. Size Munkuli Ministry of Labour and Social Services Assistant Social Welfare Officer 44. Diana Mafoti Ministry of Labour and Social Services Senior Policy Analyst 45. Bhebhe Sithandazile Ministry of Labour and Social Services Social welfare Officer 46. Johanes Tivenge Ministry of Labour and Social Services Social welfare officer 47. Trevor Sithole Ministry of Labour and Social Services Social Welfare Officer 48. Lydia Muyambo Oxfam GB HEA Officer 49. Shumirai Jakaza Oxfam GB HEA Officer 50. Destelia Ngwenya Oxfam GB M&E Officer 51. Masocha Mackenzie Oxfam GB Project Officer 52. Peter Dube Oxfam GB Project Officer 53. Terrence Mlauzi Save the Children CMAM Officer 54. Sizwile Nyamande Save the Children Livelihoods Officer 55. Brian Svesve Save the Children M&E Officer 56. Tatenda Chipindura Save the Children M&E Officer 57. Chachu Tadicha Save the Children- Kenya Emergency Response Person 58. Clever Chingwara ZIMSTAT Chief Statistician 59. Arnold Damba ZIMSTAT Statistician