ndlovu g.pdf - University of Zimbabwe Institutional Repository
Upload
khangminh22Category
view
3download
0
AN EVALUATION OF BRAND EQUITY IN THE ZIMBABWEAN SEE D
INDUSTRY: A CASE STUDY OF AGRISEEDS (PVT) LTD (2009 -2012)
DEAN MUUNGANI
(R0019274)
A DISSERTATION SUBMITTED IN PARTIAL FULFILLMENT OF THE
REQUIREMENTS FOR THE MASTERS IN BUSINESS ADMINISTRA TION
DEGREE
GRADUATE SCHOOL OF MANAGEMENT,
UNIVERSITY OF ZIMBABWE
SUPERVISOR:DR D MARAVANYIKA
July 2012

ii
DECLARATION
I, …………………………………………….,do hereby declare that this
dissertation is a result of my own investigation and research, except to the
extent indicated in the Acknowledgements, References and comments
included in the body of the report, and that it has not been submitted in part or
in full for any other degree to any other university.
……………………………… ………………………
Student Signature Date
………………………………… …………………………..
Supervisor Signature Date

iii
ACKNOWLEDGEMENTS
Special thanks goes to my supervisor, Dr D.Maravanyika who through his
patience, guidance,support and encouragement, not only motivated me but
inspired me to enrich andcomplete this arduous study timeously.
I would also like to take this opportunity to extend my sincerest gratitude
andappreciation to all those busy individuals who sacrificed some of their
precioustime in order to allow me to interview them and for the great insights
they sharedwith me.
I also wish to extendmy sincere gratitude to my employer, Agriseeds (Pvt)
Ltd.and colleagues for providing me the opportunity and support to do my
MBA studies, including allowing me to do this study.
My gratitude also extends to the Graduate School of Management (GSM) for
affording me an opportunity to undertake MBA studies and the profound
knowledge I have gained over the past two and half years.
Words cannot express enough my appreciation to my family, in particular my
lovely wife,Tariro, my special daughter, Atipa (Angie) and son, Tadana, who
were very supportive throughout this journey.Lastly this journey would not
have been the same without the support andencouragement from my friends
and fellow MBA students. Above all, I glorify the Almighty God for the
strength, courage, wisdom and inspiration throughout the period of my
studies.

iv
ABSTRACT
Brand equity has received tremendous attention from both academics and
practitioners owing to the several advantages it brings to firms. Brand equity
provides an opportunity for successful extensions, resilience against
competitors, and creation of barriers to entry and ultimately can be used to
sustain competitive advantage. There are several ways to build brand equity
and these include advertising, enhancing product portfolio, public relations,
warranties, slogans, jingles. Despite Agriseeds adopting some of these
strategies to build brand equity like rebranding in 2009, its market share did
not improve instead it dropped significantly the same year. The main objective
of the study was to assess the level of Agriseeds brand equity and check
whether it explains the lack of growth experienced by the business.
A qualitative approach was adopted for the study as it gave the researcher an
in-depth understanding of the Agriseeds brand equity. A total of eighteen
buyers were interviewed using semi-structured interviews. The research found
that customers were not aware of Agriseeds products but instead were aware
of Seed Co, Pioneer and Pannar. The study also found that although
customers continue to order seed from Agriseeds, they were not necessarily
loyal to Agriseeds. The study also found that customers associated Agriseeds
with inferior products and weak marketing activities. The study found that
Agriseeds brand equity is very low and this could be the explanation for the
poor growth in sales and revenue experienced by the business. The study
recommended that Agriseeds revisits its product awareness strategy, pricing
policy, deal with customer complaints effectively and treat its customers as
special and valued customers in order to benefit from strong brand equity.

v
TABLE OF CONTENTS DECLARATION ............................................................................................... ii
ACKNOWLEDGEMENTS ............................................................................... iii
ABSTRACT ..................................................................................................... iv
LIST OF TABLES .......................................................................................... viii
LIST OF FIGURES ......................................................................................... ix
CHAPTER 1 .................................................................................................... 1
1.0 INTRODUCTION ....................................................................................... 1
1.1.1 Industry Analysis .............................................................................. 2
1.1.2 Background to the Case Study Organisation: Agriseeds (Pvt) Ltd ... 3
1.2 PROBLEM STATEMENT ....................................................................... 5
1.3 JUSTIFICATION ..................................................................................... 6
1.4 OBJECTIVES ......................................................................................... 7
1.5 RESEARCH QUESTIONS ..................................................................... 7
1.6 RESEARCH PROPOSITION .................................................................. 8
1.7 ASSUMPTIONS ..................................................................................... 8
1.8 LIMITATION OF THE STUDY ................................................................ 8
1.9 STRUCTURE OF THE RESEARCH ...................................................... 8
CHAPTER 2 .................................................................................................. 10
2.0 LITERATURE REVIEW ............................. .............................................. 10
2.1 INTRODUCTION .................................................................................. 10
2.2 OVERVIEW OF BRANDING ................................................................ 10
2.2.1 What is a brand? ............................................................................ 11
2.2.2 The role of brands .......................................................................... 11
2.3 BRAND EQUITY .................................................................................. 12
2.3.1 What is brand equity? .................................................................... 12
2.3.2 Motivations for studying brand equity ............................................ 14
2.4 BRAND EQUITY PERSPECTIVES ...................................................... 15
2.4.1 Firm-based brand equity (FBBE) ................................................... 15
2.4.2 Customer-based brand equity (CBBE)........................................... 16
2.4.3 Combined perspective ................................................................... 17
2.5 BRAND EQUITY CONSTRUCTS ......................................................... 17
2.5.1 Brand awareness ........................................................................... 19
2.5.2 Brand loyalty .................................................................................. 20

vi
2.5.3 Perceived quality ........................................................................... 22
2.5.4 Brand image .................................................................................. 24
2.5.5 Brand associations ........................................................................ 24
2.5.6 Proprietary brand assets ................................................................ 26
2.6 BRAND EQUITY MEASUREMENT ...................................................... 26
2.6.1 Direct approach ............................................................................. 27
Other direct approaches ......................................................................... 29
2.6.2 Indirect approach ........................................................................... 30
2.7 BUILDING BRAND EQUITY ................................................................. 32
2.8 CONCEPTUAL FRAMEWORK ............................................................ 33
2.9 CHAPTER SUMMARY ......................................................................... 34
CHAPTER 3 .................................................................................................. 36
3.0 RESEARCH METHODOLOGY .......................... ..................................... 36
3.1 INTRODUCTION .................................................................................. 36
3.1 RESEARCH DESIGN ........................................................................... 36
3.2 RESEARCH PHILOSOPHY ................................................................. 37
3.2.1 Quantitative (positivist) approach ................................................... 37
3.2.2 Qualitative (phenomenological) approach...................................... 37
3.2.3 The suitable approach ................................................................... 38
3.3 RESEARCH STRATEGY ..................................................................... 38
3.4 CASE STUDY STRATEGY .................................................................. 39
3.5 DATA COLLECTION ............................................................................ 40
3.5.1 Population ...................................................................................... 40
3.5.2 Sampling procedures ..................................................................... 40
3.6 DATA SOURCES ................................................................................. 41
3.6.1 Observation ................................................................................... 42
3.6.2 Questionnaire ................................................................................ 42
3.6.3 Interviews ....................................................................................... 42
3.9 DATA ANALYSIS ................................................................................. 43
CHAPTER 4 .................................................................................................. 44
4.0 RESULTS AND DISCUSSION ........................ ........................................ 44
4.1 INTRODUCTION .................................................................................. 44
4.2 INTERVIEWS ....................................................................................... 45
4.2.1 Section A: Demographic information ............................................. 45
4.2.2 Section B: Brand awareness .......................................................... 46
vii
4.2.3 Section C: Brand loyalty ................................................................. 48
4.2.4 Section D: Perceived quality .......................................................... 51
4.2.5 Section E: Brand associations ....................................................... 59
4.2.6 Section F: Brand equity.................................................................. 61
4.3 SUMMARY OF FINDINGS ................................................................... 62
4.3.1 Brand awareness ........................................................................... 62
4.3.2 Brand loyalty .................................................................................. 64
4.3.3 Perceived quality ........................................................................... 66
4.3.4 Brand associations ........................................................................ 67
4.6 CONCLUSIONS ................................................................................... 68
CHAPTER 5 .................................................................................................. 69
5.0 CONCLUSION & RECOMMENDATIONS .................. ............................. 69
5.1 INTRODUCTION .................................................................................. 69
5.2 CONCLUSIONS ................................................................................... 69
5.2.1 Brand awareness ........................................................................... 69
5.2.2 Brand loyalty .................................................................................. 69
5.2.3 Perceived quality ........................................................................... 69
5.2.4 Brand associations ........................................................................ 70
5.2.5 Test of the Research proposition ................................................... 70
5.3 RECOMMENDATIONS ........................................................................ 70
5.3.1 Brand awareness ........................................................................... 70
5.3.2 Brand loyalty .................................................................................. 71
5.3.3 Perceived quality ........................................................................... 71
5.3.3 Brand associations ........................................................................ 72
5.4 STUDY LIMITATIONS AND AREAS FOR FURTHER RESEARCH ..... 72
REFERENCES .............................................................................................. 73
APPENDIX 1 INTERVIEW GUIDE FOR RESPONDENTS ............................ 81
viii
LIST OF TABLES
Table 1.1 Changes to the Agriseeds logo and name ....................................... 5
Table 2.1 Brand equity definitions .................................................................. 13
Table 2.2 Consumer based brand equity constructs ...................................... 18
Table 3.1: List of respondents ........................................................................ 40
Table 4.2: Demographic information of the respondents ............................... 45
Table 4.3 Level of brand and product awareness .......................................... 46
Table 4.4 Seed companies customers ordered from previously .................... 48
Table 4.5 Seed companies customers would want to continue/discontinue .. 48
Table 4.6 Level of customer satisfaction with seed companies ..................... 49
Table 4.7 Reasons for satisfaction ................................................................. 49
Table 4.8 Level of seed company dissatisfaction among customers ............. 50
Table 4.9 The leading brand .......................................................................... 51
Table 4.10 The most innovative seed company ............................................. 52
Table 4.11 General perceived quality ............................................................ 53
Table 4.12 Brand value .................................................................................. 54
Table 4.13 Perception on seed cost ............................................................... 55
Table 4.14 Role of seed packaging in seed marketing and sales .................. 56
Table 4.15 Seed companies with the best and worst packaging ................... 57
Table 4.16 In-store displays and friendliness of the marketing team ............. 58
Table 4.17 Brand uniqueness (differentiation) ............................................... 59
Table 4.18 Organizational associations ......................................................... 60
Table 4.19 Overall brand equity ..................................................................... 61
Table 4.20 Overall brand equity ..................................................................... 62
ix
LIST OFFIGURES
Figure 1.1 Commercial seed sales in 2011 ...................................................... 3
Figure 1.2 Agriseeds seed production and sales trends (2006 – 2012) ........... 4
Figure 2.1 Brand equity measurement methodologies. .................................. 27
Figure 2.2 Conceptual framework .................................................................. 33
x
LIST OF ACRONYMS &ABBREVIATIONS
AWCG Agricultural Coordination Working Group
CBBE Consumer Based Brand Equity
FBBE Financial Based Brand Equity
OPV Open Pollinated Variety
1
CHAPTER 1
1.0 INTRODUCTION
1.1 BACKGROUND TO THE STUDY
Brand equity has received tremendous attention from researchers in the past
decade or so due to the several advantages it brings to a firm. As a measure of
marketing performance, it provides a richer understanding of marketing
performance, reconciling short- and long-term performance (Ambler,
2003).Tangible (financial) measures, such as sales and profit, which have
been traditionally used, only provide partial indicators of marketing
performance due to their historical orientation and typically short-term horizon
(Mizik and Jacobson, 2008).
Brand equity has gained popularity due to its strategic role and importance in
creating sustainable competitive advantage (Atliganet al, 2005, p. 237).
Positive brand equity leads to greater revenue, lower costs, and higher profits
and has direct implications for the firm’s ability to command higher prices and
the success of brand extensions and licensing opportunities (Keller, 2003).
Brand equity also creates barriers to competitive entry and allows for resilience
against competitors’ promotional pressures, (Farquhar, as cited in Fayrene and
Lee, 2011). High brand equity is associated with greater customer loyalty,
better customer response to communications, and more cooperation from
trade and other intermediaries (Gill and Dawra, 2010, p. 189). High brand
equity also leads to higher consumer preferences and purchase intentions, as
well as higher stock returns (Fayrene and Lee, 2011, p 34). Successful brand
building could strengthen a producer’s competitive position to withstand the
increasing power of retailers (Park and Srinivasan, as cited in Pappu et al,
2005, p. 143).
Due to its importance in today’s marketplace, brand equity has attracted
adherence from both academics and practitioners. Several studies have been
done in an attempt to understand this concept and use it for creating
sustainable competitive advantage.
in the US and the developed world with limited work in
general and Zimbabwe in particular. In addition very few studies were also
done in the seed industry. It is against this background that, this study hopes to
contribute to this important concept with specific reference to the Zimbabwean
seed industry.
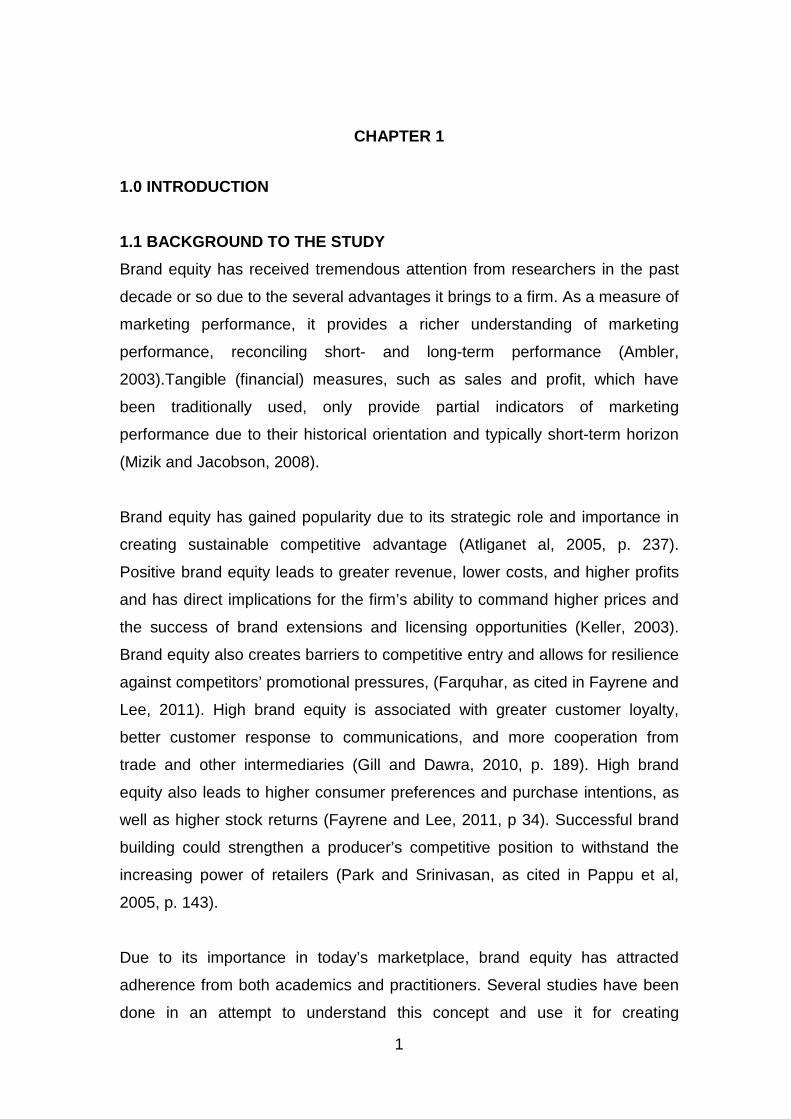
1.1.1Industry Analysis
The maize seed industry is one of the most important
agricultural sector of Zimbabwe
Seed Co, Pioneer, Pannar, Agriseeds, Progene Seeds,
Seeds, Pristine, National Tested Seeds
Seed Co, which started operations i
marketer of seed in Zimbabwe taking a 44
sales market (Figure 1)
largest player started operations in Zimbabwe in 1992.Pannar
based seed company has also gone
the other seed companies are indigenous seed companies
Zimbabwe.
Pioneer10,80031%
Pannar5,20015%
Agriseeds2,800
8%
2
sustainable competitive advantage. However, most of these studies
the US and the developed world with limited work in the developing
general and Zimbabwe in particular. In addition very few studies were also
ne in the seed industry. It is against this background that, this study hopes to
contribute to this important concept with specific reference to the Zimbabwean
1.1.1Industry Analysis
seed industry is one of the most important sub-
of Zimbabwe. It consists of nine seed companies namely,
Pioneer, Pannar, Agriseeds, Progene Seeds, Prime Seeds, ARDA
National Tested Seeds and Agpy Seeds.
Seed Co, which started operations in 1940, is the leading producer and
of seed in Zimbabwe taking a 44% share of the 2011 commercial
(Figure 1). Pioneer, a global seed company and
started operations in Zimbabwe in 1992.Pannar, a South African
based seed company has also gone international. Agriseeds and the rest of
other seed companies are indigenous seed companies
Seed Co15,50044%
Pioneer10,80031%
Agriseeds2,800
NTS2500%
ARDA 3001%
Progene2501%
However, most of these studies have been
the developing world in
general and Zimbabwe in particular. In addition very few studies were also
ne in the seed industry. It is against this background that, this study hopes to
contribute to this important concept with specific reference to the Zimbabwean
-sectors in the
seed companies namely,
Prime Seeds, ARDA
is the leading producer and
% share of the 2011 commercial
and the second
, a South African
international. Agriseeds and the rest of
other seed companies are indigenous seed companies based in
Seed Co15,50044%

3
Figure 1.1 Commercial seed sales in 2011
Prior to dollarization seed was mainly sold through government and NGO
tenders due to reduced seed output during the period 2000 – 2009. Structural
changes in the agricultural sector (fast track land reform program in 2000-
2004 which ushered in more smallholder farmers who generally operate under
resource-constrained conditions), successive droughts, and an inimical
macroeconomicenvironment (inflationary pressure 2004 -2008) were some of
the causes of the reduced seed output. Given the importance of the sector to
the national economy, government and NGOs intervened by buying the limited
seed that was available and distributing directly to farmers leading to the
collapse of the normal seeddelivery channel.
The advent of the multi-currency regime (dollarization) saw a huge
improvement in seed output, which has led to the withdrawal of the
government and NGOs in seed distribution and the revival oftraditional seed
marketing channels. The market requires between 35,000 – 40,000 metric
tonnes of seed annually but has over 84,000 metric tonnes (AWCG, 2011).
This implies that there is serious competition on the market and therefore seed
companies have to adopt strategies to survive and grow in this market, which
is characterized by flattening or slow growth. As a result, building brand equity
has become increasingly important for seed companies in order to maintain or
improve their economic performance.
1.1.2 Background to the Case Study Organisation: Ag riseeds (Pvt) Ltd
Agriseeds (Pvt) Ltd was established in 1988, focusing mainly on exporting oil
seeds (sunflower), legumes (field bean and cowpea) and small grain seed
crops (sorghum, millet). It then diversified into maize seed production in 2006,
following the banning of seed exports. Currently, it now deals with production
and marketing of maize, sorghum, millet, field bean and cowpea seed for local
consumption.
Prior to 2009 all the maize seed that was produced by Agriseedswas bought by
both the government and NGOs for onward distribution to farmers. Given the
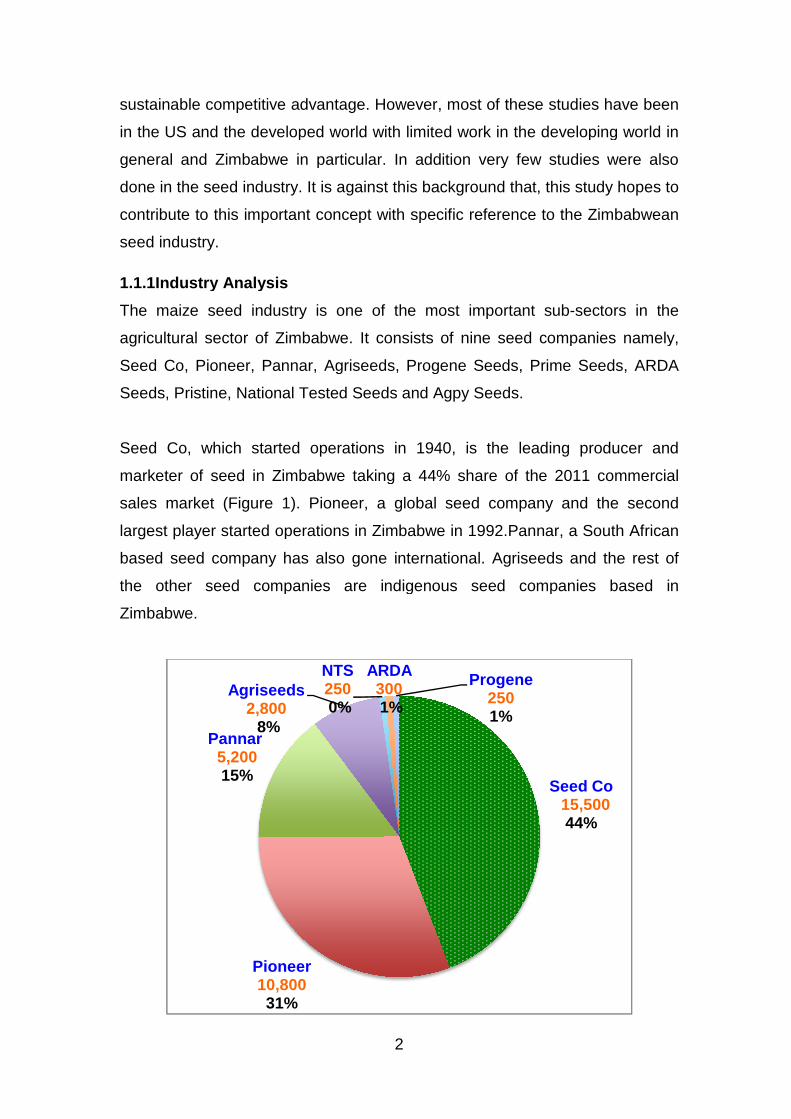
performance of the industry, Agriseeds adopted an ambitious plan of doubling
its production from about 4,000 metric tonnes to about 8,400 metric
tonnes(Figure 1.2). This
Figure 1.2 Agriseeds seed produc
their production which led to the availability of more than double the annual
seed requirements of the country. In order to compete in this highly competitive
market Agriseeds adopted
a. exclusive distributorship with Wiruma (Pvt) Ltd. However, this has since
been reversed following the acquisition of Wiruma by Castrol Zimbabwe
in February 2012
implying stiffer competition for Agriseeds
b. merchandising and ambassadorial activities in retail outlets
c. participation in agricultural shows, Agritex field days and dry shows
d. conducting road shows to promote awareness of the brand and
products
e. distribution of flyers and brochures at field days,
f. selling both hybrids and open pollinated varieties (OPVs). Hybrids
yield OPVs by 30% under high potential environments and 18% under
low potential environments (Pixley and Banziger, 2001)
OPVs are cheaper to produce
0
1000
2000
3000
4000
5000
6000
7000
8000
9000
10000
2006
4
performance of the industry, Agriseeds adopted an ambitious plan of doubling
from about 4,000 metric tonnes to about 8,400 metric
This is the same year other seed companies also doubled
Agriseeds seed produc tion and sales trends (2006
their production which led to the availability of more than double the annual
seed requirements of the country. In order to compete in this highly competitive
Agriseeds adopted severalgeneralbrand building strategies
exclusive distributorship with Wiruma (Pvt) Ltd. However, this has since
been reversed following the acquisition of Wiruma by Castrol Zimbabwe
in February 2012. Wiruma has now opened up to Pioneer and Pannar
competition for Agriseeds,
merchandising and ambassadorial activities in retail outlets
participation in agricultural shows, Agritex field days and dry shows
road shows to promote awareness of the brand and
distribution of flyers and brochures at field days, and shows
elling both hybrids and open pollinated varieties (OPVs). Hybrids
OPVs by 30% under high potential environments and 18% under
low potential environments (Pixley and Banziger, 2001)
OPVs are cheaper to produce (they do not require detasselling when
2007 2008 2009 2010 2011
Production
Sales
performance of the industry, Agriseeds adopted an ambitious plan of doubling
from about 4,000 metric tonnes to about 8,400 metric
is the same year other seed companies also doubled
tion and sales trends (2006 – 2012)
their production which led to the availability of more than double the annual
seed requirements of the country. In order to compete in this highly competitive
gies:
exclusive distributorship with Wiruma (Pvt) Ltd. However, this has since
been reversed following the acquisition of Wiruma by Castrol Zimbabwe
Wiruma has now opened up to Pioneer and Pannar
merchandising and ambassadorial activities in retail outlets,
participation in agricultural shows, Agritex field days and dry shows,
road shows to promote awareness of the brand and
and shows,
elling both hybrids and open pollinated varieties (OPVs). Hybrids out
OPVs by 30% under high potential environments and 18% under
low potential environments (Pixley and Banziger, 2001). However,
quire detasselling when
Production
Sales
producing seed hence the low cost of seed
is, if farmers fail to buy seed, they
from what they harvest
g. charging prices that are on
lower than major players Seed Co, Pioneer, Pannar
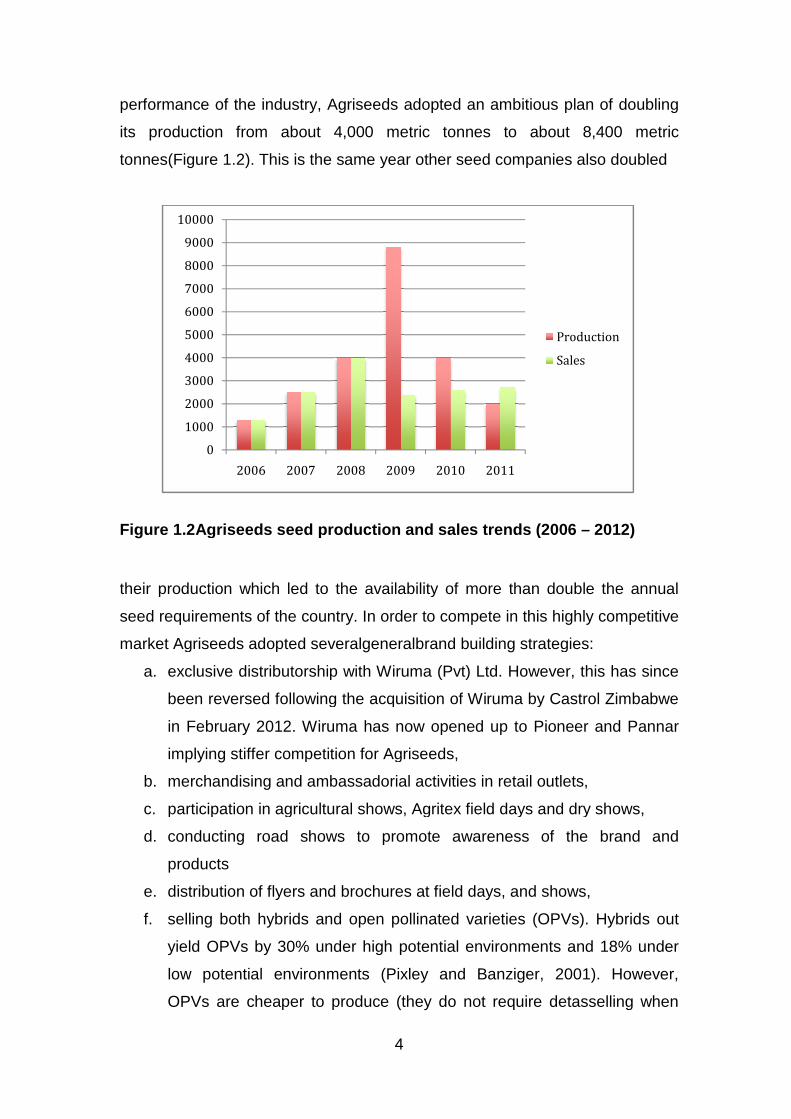
In addition to these general brand building
marketing budget from about 27% to 40
Agricultural Seeds & Services (Pvt) Ltd to Agriseeds
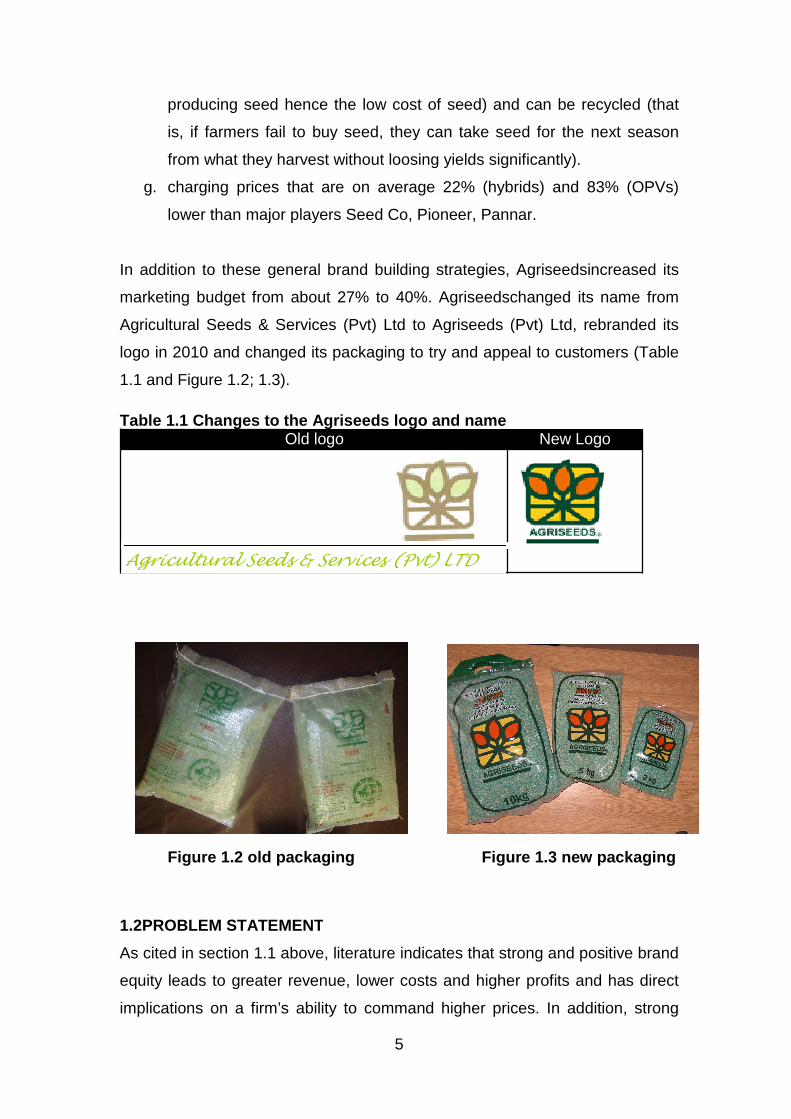
logo in 2010 and changed its packaging to try an
1.1 and Figure 1.2; 1.3).
Table 1.1 Changes to the Agriseeds logo and nameOld logo
Agricultural Seeds
Figure 1.2 old packaging
1.2PROBLEM STATEMENT
As cited in section 1.1 above,
equity leads to greater revenue, lower costs and higher profits and has direct
implications on a firm’s ability
5
hence the low cost of seed) and can be recycled
fail to buy seed, they can take seed for the next season
from what they harvest without loosing yields significantly).
charging prices that are on average 22% (hybrids) and 83% (OPVs)
lower than major players Seed Co, Pioneer, Pannar.
In addition to these general brand building strategies, Agriseeds
marketing budget from about 27% to 40%. Agriseedschanged its name from
Seeds & Services (Pvt) Ltd to Agriseeds (Pvt) Ltd
and changed its packaging to try and appeal to customers
.
Table 1.1 Changes to the Agriseeds logo and name Old logo New Logo
eeds & Services (Pvt) LTD
1.2 old packaging Figure 1.3 new packaging
PROBLEM STATEMENT
As cited in section 1.1 above, literature indicates that strong and positive
greater revenue, lower costs and higher profits and has direct
implications on a firm’s ability to command higher prices. In addition, strong
and can be recycled (that
take seed for the next season
without loosing yields significantly).
average 22% (hybrids) and 83% (OPVs)
, Agriseedsincreased its
changed its name from
(Pvt) Ltd, rebranded its
d appeal to customers (Table
New Logo
new packaging
strong and positive brand
greater revenue, lower costs and higher profits and has direct
In addition, strong

6
brand equity also creates barriers to entry, leads to higher consumer
preferences and greater customer loyalty.
The background to Agriseeds, shows that Agriseedsadopted various marketing
strategies to improve its performancegiven the intensity of the competition on
the Zimbabwean seed market. However, contrary to literature, Agriseeds does
not seem to be enjoying the brand building initiatives it has embarked on. In
fact, the growth is very insignificant, if any.
Consequently, this might result in Agriseedsbeing pushed out of business by
its competitors. Therefore there is need to assess what level of brand equity
Agriseeds commands, so as to correct any brand equity deficiencies if there
are any. There is need to ask such questions as, what is the level of
awareness of the Agriseeds brand, which customers are loyal to Agriseeds,
what is the perceived quality of Agriseedsamong customers, what is the
Agriseeds brand associated with in front of customers. The research problem
is to evaluate the level of Agriseeds brand equity and assess how it can benefit
from a strong brand equity.
1.3JUSTIFICATION
Brand equity has become an increasingly important topic in recent years. This
is mainly because positive brand equity establishes all sorts of benefits to a
firm (customer loyalty, higher margins, brand extension opportunities, more
powerful communication opportunities). However, despite the interest in brand
equity, there is very little consensus on its meaning, content and measurement.
Several studies have been done to try and conceptualize, measure and
manage this concept. However, most of these studies were mainly done in the
US and a few developed countries. Very few, studies if any have been
conducted in Zimbabwe. In addition these studies were done on groceries,
clothing, footwear, and very few if any were done in a seed industry.It is
therefore envisaged that this study will contribute to the existing body of
knowledge on brand equity especially in seed industry contexts. The study
attempts to empirically expand existing knowledge on consumer based brand
equity by applying dimensions available in literature.

7
This study endeavors to evaluate the level of Agriseeds brand equity on the
market. It is envisaged that this study will at least benefit marketing and brand
mangers who seem to be battling to justify marketing expenditure in these
tough economic times. It will allow them to use brand equity to drive growth
and create shareholder value. If marketing managers start focusing on
strategies that will not only drive short term sales but strengthen brand equity
whilst creating shareholder value, the brand building initiatives will become part
of business strategy to drive business growth. It is also envisaged that this
study will help marketing managers especially in a seed industry to focus on
brand investments that will drive business profitability.
Considering the unique nature of the seed industry, it is inappropriate to assert
that a generic consumer based brand equity model can provide a reliable and
valid measuring mechanism. Thus the development of industry specific models
becomes a necessary step forward. Several studies have been done to try and
develop industry specific models. It is therefore envisaged that this study will
contribute to the development of consumer based brand equity model that is
applicable to a seed industry.
1.4OBJECTIVES
The main aim of the study is to assess the level of Agriseeds’ brand equity.
The study specifically aims:
• To assess the level of Agriseeds brand awareness among its
customers.
• To assess the level of Agriseeds brand loyalty among customers.
• To assess the level of perceived quality of Agriseeds brands among its
customers.
• To assess the level of Agriseeds brand associations among customers.
1.5RESEARCH QUESTIONS
• WhichAgriseeds customers are aware of the products the company
sells?
• Which group of customers is loyal to Agriseeds and its products?

8
• What is the perceived quality of Agriseeds products amongst its
customers?
• What is the image of Agriseeds in the face of its customers?
• What is the Agriseeds brand associated with?
1.6RESEARCH PROPOSITION
• The performance of Agriseeds (Pvt) Ltd. is largely influenced by the
level of brand equity it commands in the market.
1.7ASSUMPTIONS
• It is an assumption that decisions made by buyers from the different
customers represent the interests of their respective companies and
those of their customers (farmers).
• It is also an assumption that Agriseeds executives do not review the
performance of the main marketing asset and how it has changed but
tend to focus more on financial metrics.
• Although marketing is seen as an important function to drive business
objectives, Agriseeds does not use its brands effectively as important
drivers of future business growth.
1.8 LIMITATION OF THE STUDY
• The sample will be purposively (judgmental) generated and therefore
the results can not be statistically inferred to the general population.
• The sample was drawn in Harare only. Although most head offices are
located in Harare, the sample excludes unique cases typical of other
areas outside Harare.
• Agriseeds (Pvt) Ltd is not listed therefore annual report information
cannot be made public.
• The last limitation concerns the context of the study (Zimbabwe) which
put constraints on the generalisability of the results to other companies
and other national contexts.
1.9 STRUCTURE OF THE RESEARCH
Chapter 1.0

9
This chapter covers the introduction of the research. It gives the background
of the study, the problem statement and the background of the organization
being used as the case study. The objectives and justifications of the research
are also indicated in this chapter.
Chapter 2.0
This chapter focuses on the literature review. It outlines some of the work that
has been carried out by other researchers and the theory on the subject
matter.
Chapter 3.0
The methodology that will be used in carrying out the research is outlined in
this chapter. This chapter outlines the analytical framework of the research
design chosen, the justification for a single case study approach, the
preparation for data collection, the main sources of data, and the data
collection process and data analysis.
Chapter 4.0
The chapter looks at data analysis and discusses the findings. This chapter will
apply the theoretical framework from Chapter 2 to the case study, and will see
how the selected theory can explain the results obtained from the case study.
Within this chapter, the posed research questions in chapter 1 will be
answered. The findings from the case study are discussed in this chapter as
well.
Chapter 5.0
This chapter will conclude the report by looking at the theory, its application
and recommendations.

10
CHAPTER 2
2.0 LITERATURE REVIEW
2.1 INTRODUCTION
Reviewing knowledge accumulated about a question or topic is an essential
step in the research process. The assumption is that knowledge accumulates
and people learn and build from what others have done. Literature review is a
means to an end and not an end in itself, because the purpose of literature
review is not to determine the answers about what is known on a topic, but
rather to develop sharper and more insightful questions about the topic (Yin,
2003, p. 9). The purpose of this literature review is to demonstrate familiarity
with the brand equity body of knowledge and establish credibility, show the
path of prior brand equity research and how this study is linked to it, integrate
and summarize what is known in brand equity, and learn from others and
stimulate new ideas (Neuman, 2006, p. 111).
This chapter critically reviews literature pertaining to brand equity
conceptualization and measurement. The literature review initiallygives an
overview of branding and the role of brands both to consumers and the firm. It
then defines brand equity before looking at brand equity perspectives, brand
equity constructs and finally brand equity measurement.The chapter discusses
in detail, brand awareness, brand loyalty, perceived quality, brand image,
brand associations and proprietary brand assets. Finally this review gives a
brief discussion of brand building before giving the conceptual framework for
the study.
2.2OVERVIEW OF BRANDING
Branding is endowing products and services with the power of a brand.
Branding has evolved over time and has now become a common term used in
marketing. It is essentially about building a conceptual identity that will reflect a
11
key message with the objective of developing a name that is strategically
sound and makes sense to the company and target audiences over time.
2.2.1 What is a brand?
A brand is a name, term, sign, symbol, design or a combination of them, or any
other feature, intended to identify the goods or services of one seller or group
of sellers and to differentiate them from those of competitors(Kotler, 1991, p.
442; Wood, 2000, p. 664).Keller (1993) called these individual brand
components brand identities and their totality the brand. A brand is not just a
product but rather the sum total of everything a company does, the good, the
bad and even the off strategy, that creates a large context or an identity in the
consumer’s mind (Bedbury, 2000). According to de Chernatonyet al, (2004) it
is a cluster of functional and emotional values which are unique and can
provide customers with favorable experience.
A brand is a trademark that communicates a promise, which is a set of
symbolic and functional attributes that the market place associates with the
brand(Phillips, 1998). Symbolic attributes are those that fulfill internally
generated needs for self-enhancement, role position, group membership or
ego identification (Park et al., 1986) whereas functional brand attributes solve
an externally generated consumption related problem.
A successful brand is valuable, since it can enable marketers to gain
competitive advantage by facilitating potential brand extensions, developing
resilience against competitors’ promotional pressures, and creating entry
barriers to competitors (Kim et al, 2003; Rangaswamy et al, 1993).In order to
be successful, images and symbols must relate to and indeed exploit the
needs, values and lifestyles of consumers in such a way that the meanings
involved give added values, and differentiate the brand from other brands
(Broadbent and Cooper, 1987).
2.2.2 The role of brands
The primary function of a brand is to provide convenience and clarity in
decision making by providing a guarantee of performance and communicating
a set of expectations thereby offering certainty and facilitating the buying
12
process (Kotler and Keller, 2006, p. 275). On the emotional side, the function
of a brand is to evoke a set of associations and furthermore symbolize the
consumer’s persona through brand imagery. A brand is an important tool in
marketing as it is used as a cue by customers to infer product
quality.According to Kolter and Keller (2006) brands assist both customers and
firms.
For customers brands:
a. identify the source of a product or service which allows customers to
assign responsibility to a particular manufacturer, distributor or service
provider,
b. brands simplify consumer decision making and reduce risk. Customers
learn about brands from past experiences and therefore identify which
brands satisfy their needs and which ones do not.
For firms brands:
a. simplify product handling or tracing,
b. help organize inventory and accounting records,
c. offer legal protection. The brand name can be protected through
registered trademarks, manufacturing processes and products from
research can be protected through patents, packaging can be protected
through copyrights and designs. Thus through these intellectual property
rights a firm can safely benefit from the brand and reap benefits of a
valuable asset,
d. can signal a certain level of quality which can result in satisfied
customers choosing the brand again (loyalty). Loyalty can translate into
willingness to pay a higher price (price premium).
2.3BRAND EQUITY
2.3.1 What is brand equity?
The content and meaning of brand equity have been debated in different ways
for different purposes (Atligan et al, 2005, p. 238). Reviewing extant literature
on brand equity shows that there is a plethora of brand equity definitions (Table
2.1).

13
Table 2.1 Brand equity definitions
Study Definition
Leuthesser, (as
cited in Fayrene and
Lee, 2011, p. 34)
The set of associations and behaviors on the part of the
brand's consumers, channel members, and parent
corporation that permits the brand to earn greater volume or
greater margins than it would without the brand name and
that gives the brand a strong, sustainable and differentiated
advantage over competitors.
Aaker (as cited in
Fayrene and Lee,
2011, p. 34)
The value consumers associate with a brand, as reflected in
the dimensions of brand awareness, brand associations,
perceived quality, brand loyalty and other proprietary brand
assets.
Park and
Srinivasan, 1994;
(Yoo, Donthu, and
Lee, 2000)
Brand equity is the incremental utility gained by a product or
service by virtue of its brand name. Brands high in equity
such as Microsoft, Wal-Mart, Lexus, and Citibank have been
known to command high degrees of recognition and resulting
success.
Yoo and Donthu
(2001, p. 1)
Consumers’ different response between a focal brand and an
unbranded product when both have the same level of
marketing stimuli and product attributes.
Pride and Ferrell
(2003, p 299)
The marketing and financial value associated with a brand’s
strength in the market, including actual proprietary brand
assets, brand name awareness, brand loyalty, perceived
brand quality, and brand associations.
Srinivasan et al,
2005
The incremental contribution ($) per year obtained by the
brand in comparison to the underlying product (or service)
with no brand building efforts.
Christodoulides and
de Chernatony
(2010, p. 48)
Brand equity is a set of perceptions, attitudes, knowledge,
and behaviours on the part of consumers that result in
increased utility and allows a brand to earn a greater volume
14
or greater margins than it could without the brand name.
Source: The authors
Clearly, over the years the concept of brand equity has proliferated into
different meanings, with accountants defining it differently from marketers
(Wood, 2000, p. 662). A closer look at the definitions shows that early research
centered on financial terms while extant literature is increasingly defining brand
equity in customer-based contexts (Fayrene and Lee, 2011, p. 34).
Although there is no universally accepted definition of brand equity, one
important consensus among the definitions is that brand equity is defined as
the marketing effects that accrue to a product with its brand name compared to
those that would accrue if the same product did not have the brand name
(Ailiwadi et al, 2003, p. 1). The specific effects can either be consumer level
constructs such as attitudes, awareness, image and knowledge, or firm level
outcomes such as price, share price, market share revenue, and cashflow.
Brand equity is an important concept in brand management for both theoretical
and practical reasons. From a theoretical perspective, it is relevant to
understand what key elements make up brand equity (Punj andHillyer, 2004).
From a practical perspective, it is important to figure out how brand equity can
be reinforced in order to enhance the overall brand experience.
Brand equity can be built through marketing communications, borrowed
through brand extensions or bought through licensing or purchase of brand
names (Kotler and Keller, 2006). Basically, brand equity stems from the greater
confidence that consumers place in a brand than they do in its competitors.
This confidence translates into consumers’ loyalty and their willingness to pay
a premium price for the brand.
2.3.2 Motivations for studying brand equity
According to Keller (1993, p.1) there are mainly two motivations for studying
brand equity and these are:
15
a. financially based: brand equity is studied to estimate the value of a
brand more precisely for accounting purposes (asset valuation, for the
balance sheet) or for merger, acquisition, or divestiture purposes,
b. strategy-based: to improve marketing productivity. Given higher costs,
greater competition and flattening demand in many markets, firms seek
to increase the efficiency of their marketing expenses.
2.4BRAND EQUITY PERSPECTIVES
Although there has been no consensus on the definition and measurement of
brand equity, past research has broadly divided brand equity into financial and
customer-based brand equity (Ahmad and Butt, 2012, p. 2). The first
perspective generallyreferred to as firm-based brand equity (FBBE) stresses
the value of a brand to the firm (Simon and Sullivan, 1993; Farquhar et al.
1991). The second perspective generally referred to as consumer-based brand
equity (CBBE) defines brand equity as the value of a brand to the consumer
(Kamakura and Russell, 1993; Keller, 1993; Yoo andDonthu 2001; Vazquez et
al. 2002; de Chernatony et al. 2004; Pappu et al. 2005, p. 144; Christodoulides
et al. 2006). Kim et al (2003) adds a third perspective, the combined
perspective, which incorporates both the CBBE and FBBE (Dyson et al., 1996;
Motameni andSharhrokhi, 1998).Although the two perspectives might seem
different, theyare linked because firm-level outcomes (incremental volume,
revenue, price commanded, cash flow, and profit) are the aggregated
consequence of consumer-level effects (positive image, attitude, knowledge,
and loyalty) (Ailiwadi et al, 2003, p. 1).
2.4.1 Firm-based brand equity (FBBE)
The financial perspective discusses the financial value brand equity creates to
the business (Christodoulides and de Chernatony, 2010, p. 46). It views brand
equity as the financial asset value created by brands (Bailey and Ball, 2006),
which may be manifested as ‘the additional cashflow created by a brand’ (Biel,
1992). In other words, it views brand equity in terms of discounted incremental
future cash flows that result from a branded product in comparison to cash
flows that would occur if the same product did not have the brand name. FBBE
looks at the incremental cash flows which accrue to branded products over
unbranded products. Financial brand equity refers mostly to the value of a
16
brand for accounting purposes (Keller, 1993).
Researchers have developed and effectively tested accounting methods for
appraisal of the asset value of a brand name (Simon and Sullivan, 1993). The
brand equity’s value is extracted from the value of the firm’s assets. The
methodology separates the value of the firm’s securities into tangible and
intangible assets, and then carves brand equity out from the intangible assets
(Kim et al, 2003, p. 338). However, the financial value of brand equity is only
the outcome of consumer response to a brand name (Christodoulides and de
Chernatony, 2010, p. 46).Therefore the FBBE method measures the outcome
of customer-based brand equity.
2.4.2 Customer-based brand equity (CBBE)
Consumer-based brand equity (CBBE) views brand equity in the context of
marketing decision-making, which is concerned with how product or service
brands are perceived by customers (Kim et al, 2003, p. 336). CBBE is based
on the premise that the power of the brand lies in what customers have learnt,
felt, seen and heard about the brand as a result of their experiences over time
(Keller, 1993). In other words, the power of a brand lies in the minds of existing
or potential customers and what they have experienced directly or indirectly
about the brand (Kotler and Keller, 2006, p. 276). CBBE is considered the
driving force of increased market share and profitability of the brand,
(Christodoulides and de Chernatony, 2010, p. 44).
Within the literature, operationalization of CBBE usually falls into two groups:
consumer perception (brand awareness, brand associations, perceived quality)
and consumer behavior (brand loyalty, willingness to pay a high price) (Kim et
al, 2003, p. 336). Aaker’s (1991) key sources of brand equity incorporate both
perceptual and behavioral dimensions in the definition whereas Lassar et al
(1995) strictly distinguish the perceptual dimension from the behavioral
dimension so that behavior is a consequence of brand equity rather than brand
equity itself.
The conceptualizations of CBBE have mainly been derived from cognitive
17
psychology and information economics, with the dominant stream being
grounded on cognitive psychology focusing on memory structure
(Christodoulides and de Chernatony, 2010, p. 44).
Researchers such as Farquhar, (1989) have argued in favour of a consumer-
based measurement of brand equity (Pappu et al, 2005, p. 144). There is value
to the investor, the manufacturer and the retailer only if there is value for the
consumer (Cobb- Walgren et al., as cited in Pappu et al, 2005, p. 144). It is
from this background that this study will adopt the CBBE approach.
2.4.3 Combined perspective
The combined perspective incorporates both CBBE and FBBE to make up for
the insufficiencies that may arise when only one of the two perspectives is
emphasized (Kim et al, 2003, p. 338). There are mainly two studies to the best
of the researcher’s knowledge that have combined the two perspectives,
Dyson et al, (1996) and Montameni and Shahrokhi (1998). Dyson et al, (1996)
described a survey research system designed to place a financially related
value on the consumer-based equity of brand images and associations.
Montameni and Shahrokhi (1998) proposed global brand equity valuations,
which combine brand equity from the marketing perspective and brand equity
from the financial perspective.
2.5BRAND EQUITY CONSTRUCTS
Understanding, building and measuring brand equity are the most critical
aspectsof a brand management process. Brand building initiatives will only
yield positive results if sources of brand equity are identified and measured
correctly as wrongful inclusion/ exclusion would only jeopardize the whole
process (Ahmad and Butt, 2011, p. 9). It is therefore paramount to identify
sources of brand equity before initiating any brand building exercise.
Extant research is replete with various ways of conceptualizing and measuring
thismulti-dimensional construct. Two frameworks that encompass the facets
espoused in most CBBE conceptualizations are those of Aaker (1996) and
Keller (1993). Aaker (1996, p. 15) views brand equity as a set of assets (or
liabilities) linked to a brand’s name and symbol that adds to (or subtracts from)

18
the value provided by a product or service to a firm and/or to that firm’s
customers. Keller (1993, p. 2) views CBBE as the differential effect of brand
knowledge on consumer response to the marketing of the brand. Table 2.2
shows some of the sources of brand equity as suggested by various
researchers.
Table 2.2Consumer based brand equity constructs
Study Dimensions of CBBE
Aaker (1991, 1996) Brand awareness
Brand associations
Perceived quality
Brand loyalty
Blackston (1992) Brand relationship (trust, customer satisfaction with
the brand
Keller (1993) Brand knowledge (brand awareness and brand
associations)
Sharp (1995) Company/brand awareness
Brand image
Relationships with customers/existing customer
franchise
Berry (2000) Brand awareness
Brand meaning
Burmann et al (2009) Brand benefit clarity
Perceived brand quality
Brand benefit uniqueness
Brand sympathy
Brand trust
Source:Christodoulides and de Chernatony (2010, p.48)
Considering the various suggestions presented in the literature, it is concluded
that brand awareness, perceived quality, brand associations, and brand loyalty
are the most cited and researched in literature (Aaker, 1996; Yoo et al., 2000).
This study will therefore use these constructs in trying to answer the research
questions.
19
2.5.1 Brand awareness
Brand awareness refers to the ability of a consumer to recognize or recall a
brand in its product category (Keller, 2003, p.76; Pappu et al, 2005, p. 145).
Brand awareness creates value for a firm and its customers by developing
positive attitudes and reasons to buy that brand (Aaker, 1991). The focus of a
marketer in creating awareness should be to draw favourable purchase
intentions (Ahmad and Butt, 2012, p. 10).
Brand awareness is related to the strength of a brand’s presence in
consumers’ minds and is measured through brand recognition and recall under
different conditions (Keller, 1993; Aaker, 1996). Brand awareness links the
brand name, logo, symbol to certain associations in memory (Keller, 1993).
Consumers feel more comfortable in purchasing products from brands they
already know. Consumers are not willing to buy an unknown brand. Therefore
brands for which customers have a strong recall or top of the mind awareness
possess a competitive superiority over unknown brands as consumers tend to
purchase brands they are familiar and confident with.
Brand awareness becomes the core asset as it is the basis on which loyalty,
associations and perceived quality are grounded. A well-known brand has a
good opportunity, as and when a consumer decides to make purchasing
decisions of the same product category. Given the limited time consumers
have in making buying decisions, well-known brands always have an edge
over unknown brands in the market. Potential consumers also usually deal with
brands that they might have heard of.
Three classical measures of brand awareness exist and these include aided
awareness, spontaneous awareness and top of the mind awareness. Top of
the mind awareness represents the first brand that comes to the mind of a
potential buyer when need arises, among many alternatives that can meet the
same need. For example, if a consumer thinks of buying toothpaste, if Colgate,
is the first brand that comes to their minds, then Colgate has a high top of the
mind awareness among consumers.

20
2.5.2 Brand loyalty
Aaker (as cited in Fayrene and Lee, 2011, p. 39) defines brand loyalty as the
attachment that a consumer has to a brand. According toYoo and Donthu
(2001, p.3) brand loyalty is the tendency to be loyal to a focal brand, which is
demonstrated by the intention to buy the brand as a primary choice. Oliver’s
(1999, p. 34) defines brand loyalty as a deeply held commitment to re-buy or
re-patronize a preferred product/ service consistently in the future, thereby
causing repetitive same-brand or same brand-set purchasing, despite
situational influences and marketing efforts having the potential to cause
switching behavior. Thus brand loyalty adds to the value of the brand by
ensuring habitual and repeated purchases over along period of time (Ahmad
and Butt, 2012, p. 10).
Yoo and Donthu (2001) and Oliver’s (1999) definitions emphasize both
behavioral and attitudinal (cognitive loyalty) perspectives. Behavioral loyalty
refers to the behavior of consumers in the marketplace as indicated by the
number of repeated purchases or commitment to rebuy the brand as a primary
choice (Ahmad and Butt, 2012, p. 10; Gill and Dawra, 2010, p. 192; Fayrene
and Lee, 2011, p. 39). On the hand attitudinal (cognitive) loyalty means the
attitude, beliefs and intentions of the customer towards the brand (Ahmad and
Butt, 2012, p. 10; Fayrene and Lee, 2011, p. 39). In other words, cognitive
loyalty refers to a situation where a brand comes up first in a consumer’s mind,
when the need to make a purchase decision arises (Fayrene and Lee, 2011, p.
39). For example, when a consumer intents to buy pizza, if Pizza Inn comes up
in their mind as soon as that need arises, then that customer has cognitive
loyalty to Pizza Inn. A brand should become a consumer’s first choice
(cognitive loyalty) and therefore be purchased repeatedly (behavioral loyalty).
Brand loyalty is linked to price premiums, the amount a customer is willing to
pay for the brand in comparison to another brand offering similar benefits
(Aaker, 1996). For example, if a customer is willing to pay 10% more for
Nugget shoe polish than for Kiwi, then it implies that they are loyal to Nugget.

21
Brand loyalty is considered a core dimension of brand equity, as it is key for
building entry barriers, forming a price premium and avoiding deleterious price
competition, and gaining strategic advantages in response to the actions of
competitors (Aaker, 1996).Brand loyalty is the pillar on which the idea of brand
equity stands because it is impossible to build and sustain long term consumer
based brand equity without investing in loyal customers (Ahmad and Butt,
2012, p. 10). Brand loyalty leads to greater and continual sales since it’s the
same brand being purchased repeatedly irrespective of situational constraints
(Chaudhuri, 1995, p. 28).
According to the “double jeopardy” theory advanced by Chaudhuri (1995),
small market share brands are at a disadvantage relative to large market share
brands in two ways. Firstly, small market share brands have few buyers and
secondly they are purchased less frequently by these buyers while large
market share brands have more buyersand are purchased more by the same
buyers. The principal reason is that there is greater awareness and distribution
support for higher market share brands. For example, a high market share
brand may be the only available brand in certain stores, and thus distribution
patterns may favour habitual buying of high market share brands. In other
words, higher market share brands may demonstrate greater levels of repeat
purchasing behavior among their buyers. Attitudinally as well, some people like
popular (high market share brands) products more than less popular ones
(Chaudhuri, 1995, p. 27).
According to Aaker (1996) brand loyalty can be measured through price
premium and customer satisfaction. Price premium is the amount customers
are willing to pay for the brand in comparison with another brand (or set of
brands) offering the same benefits. When measuring price premium, it is useful
to segment the market by loyalty (brand buyers, switchers, and non customers)
because aggregating over loyalty groups can provide a less sensitive
measurement (Aaker, 1996, p. 106). Price premium is defined with respect to a
competitor or a set of competitors who must be clearly specified. Alternatively,
price premium can be measured through conjoint analysis or trade-off analysis.
22
Customer satisfaction is a measure that can be applied to existing customers
who at least have used the product or service within a defined period of time
(Aaker 1996, p. 108). Satisfaction is defined as the summary psychological
state resulting when the emotion surrounding disconfirmed expectations is
coupled with prior feelings about the consumer experience (Oliver 1999, p.
28).Satisfaction has been conceptualized differently in marketing literature.
Some researchers have argued that satisfaction is a transaction-specific
measure, others view it as an overall evaluation based on the total purchase
consumption and experience (Pappu and Quester, 2006, p. 5). Generally,
satisfaction has been conceptualized as whether a product or service meets
the customer needs and expectations. In a seed retail industry, context,
satisfaction can be defined by the sales volumes achieved, level of support
offered by the seed company and ability of the seed to meet the expectations
and needs of farmers.
2.5.3Perceived quality
Perceived quality refers to the consumer’s judgment about a product’s overall
excellence or superiority (Yoo and Donthu, 2001, p. 3). It is related to a
consumer’s opinion on the extent to which a particular product will be able to
meet his expectations (Gill and Dawra, 2010, p. 193). There is always
uncertainty in the minds of the customers with regards product quality due to
information asymmetry between buyers and sellers (Kirmani and Rao, 2000).
Buyers will make inference based on information provided by sellers. Therefore
brand name, product design, packaging, advertisements and other brand
identities are the types of information that communicate unobservable quality
(Gill and Dawra, 2010, p. 194).
Perceived quality differs from objective quality in that, objective quality refers to
the technical, measurable and verifiable nature of products/ services,
processes and quality controls (Fayrene and Lee, 2011, p. 38). However,
objective quality does not necessarily contribute to brand equity since it is
impossible for consumers to make complete and correct judgments of objective
quality (Fayrene and Lee, 2011, p. 38). Hence perceived quality is used to
23
judge the overall quality of a product or service. Consumers tend to use quality
attributes to infer quality of an unfamiliar product.
Perceived quality gives value and reason to buy the brand, allows
differentiation, and provides a strong base for extension (Ahmad and Butt,
2012, p. 11). Perceived quality has been shown to be associated with price
premiums, price elasticities, brand usage and remarkably stock return (Aaker,
1996, p.109).
Perceived quality can be subdivided into intrinsic and extrinsic attributes.
Intrinsic attributes relate to the physical aspects of a product (such ascolour,
flavour, form and appearance) while extrinsic attributes relate to the non-
physical aspects of a product (such as brand name, stamp of quality, price,
store, packaging and product information (Fayrene and Lee, 2011, p. 38).
Consumers generally use price as an important extrinsic cue and indicator of
product quality or benefits (Yoo et al, 2000, p. 198). In other words, customers
infer quality from price, that is, they compare the price of the current product to
the price of either another product or a price in memory(Hilgenkamp and
Shanteau, 2010, p. 563). If the current price is higher than the comparison
price, then the current product is perceived as higher quality. A product that is
least expensive is looked at as having lower quality than a product of a higher
price.Price is therefore positively related to perceived quality. A low-priced
product gives customers transaction utility (paying less than the consumer’s
internal reference price) whereas a high priced product gives high quality
image or acquisition utility, leading to reduced consumer risk (Yoo et al, 2000,
p. 199).
It is also important to note that brand-loyal customers are willing to pay the full
price for their favourite brand because they are less price sensitive than non-
brand loyal customers, implying that changing that price level does not affect
brand loyalty (Yoo et al, 2000, p. 199).

24
Perceived quality measurement involves competitor reference. For example,
respondents can be asked which vehicle brand has high quality, average
quality, or inferior quality when they compare Ford, Nissan and Toyota.
However, the interpretation of perceived quality reported among loyal
customer, switchers and loyal customers to another brand will usually be
different (Aaker, 1996, p.109).
2.5.4Brand image
Brand image is composed of consumers’ perceptions about a brand as
reflected by a set of meaningful associations in their memories (Aaker, 1991;
Keller, 1993), and thus can be appropriately represented by brand
associations. It comprises the attributes and benefits associated with a brand
that make the brand distinctive, thereby distinguishing the firm’s offer from
competition (Webster and Keller, 2004).
2.5.5Brand associations
Brand associations help consumers in arranging and retrieving brand related
information for facilitating purchase decisions (Ahmad and Butt, 2012, p. 10).
Brand associations consist of all brand-related thoughts, feelings, perceptions,
images experiences, beliefs, attitudes and is anything linked in memory to a
brand (Fayrene and Lee, 2011, p. 34). Keller (1993) depicts attitudes as the
most abstract and highest level of brand association.
Brand associations are consumer memory structures linked with a brand and
considered an important antecedent for a consumer’s purchasing behavior
(Ahmad and Butt, 2012, p. 10). According to the associative network model,
human memory consists of associative networks believed to consist of several
nodes (Pappu and Quester, 2006, p. 6). For example, if Econet is a node then
attributes such as “widest voice and data coverage” and “good customer care”
could be the other important nodes linked to the Econet node. These attributes,
‘widest voice and data coverage” and “good customer care” serve as
associations to the telecommunications service provider, Econet.
This notion of cognitive psychology is popular in marketing, because
consumers associate product categories with brands, countries or even

25
retailers. For example, generally in Zimbabwe products that come from China
are associated with poor quality, and are commonly refered to as “zhingzhong”.
Topics, Greatermans and Meikles stores are generally associated with good
quality clothing, kitchenware and other cosmetics in Zimbabwe.
Consumers’ memory based associations have both direction and strength with
some researchers arguing that brand-product category associations are bi-
directional (Pappu and Quester, 2006, p. 6). For example, whenthe product
category “cinemas” is mentioned, the brand name “Rainbow” is mentioned and
whenever the brand name “Rainbow” is mentioned consumers recall the
product category “cinemas”. Furthermore, activating one node in memoryleads
to the activation of other linked nodes. For example when a customer thinks of
TN Holdings, other liked nodes such as “convenience stores” and a “variety of
products” might be activated in the mind of the customer. The possibility of
retrieval/ activation of the related node depends on the strength of association
between the nodes (Keller, 1993). The strength of the association between the
two nodes depends on the number of times the two nodes have been
associated with each other in the past (Pappu and Quester, 2006, p. 6). Atilgan
et al(2005, p. 241) categorized brand associations into - product associations,
and organizational associations.
Product associations
Product associations can be subdivided into functional attribute associations
and non-functional associations. Functional attributes are the tangible features
of a product while the non-functional attributes include symbolic attributes
(intangible features that meet customer’s needs for social approval, personal
expression or self-esteem) (Fayrene and Lee, 2011, p. 36). When customers
are evaluating a brand they link the performance of the functional attributes to
the brand, that is, if a brand does not perform the functions for which it is
designed, it will have a low level of brand equity (Fayrene and Lee, 2011, p.
36). With regards symbolic attributes (intangible features) customers link social
image, perceived value, trustworthiness, differentiation and country of origin to
a brand.
26
There are four factors that combine in the mind of the consumer to determine
the perceived value of the brand: brand awareness, the level of perceived
quality compared to competitors, the level of confidence, of significance, of
empathy, of liking and the richness and attractiveness of the images conjured
up by the brand (Kapferer, 1997).
Organizational associations
Organizational associations are those associations related to the company’s
expertise in producing and delivering its outputs and corporate social
responsibility associations (Fayrene and Lee, 2011, p. 36). According to Aaker
(1996, p. 113) the organizational association perspective considers the
organization as the people, values and programs that lie behind the brand.
2.5.6 Proprietary brand assets
This focuses on assets like trademarks and channel relationships. The most
valuable proprietary assets for a company are in the form of trademarks, that
are legally bound and cannot be easily copied. A trademark is the brand’s
identity consisting of three components namely the name, logo and slogan. A
logo is a graphic design that a firm uses, with or without its name to identify
itself or its products (Henderson and Cote, 1998). Logos help to reduce search
costs for consumers by providing them with the sense of reassurance about
the quality of the product (Kohil and Suri, 2002).
Although in his original work Aaker (1991, 1996) proposed other proprietary
brand assets as the fifth dimension of CBBE, this dimension is normally
omitted because it falls outside the consumer perceptional domain (Buil et al,
2008, p. 385).
2.6BRAND EQUITY MEASUREMENT
Although Aaker (1991) and Keller (1993) conceptualized customer-based
brand equity, they never operationalized a scale for its measurement,
spawning a number of methodologies to quantify it (Christoduolides and de
Chernatorny, 2010). Some researchers (Park and Srinivasan, 1994;
Leuthesser et al, 1995) employed complex statistical procedures, which have
proved difficult to comprehend and use among practicing marketers. Empirical
27
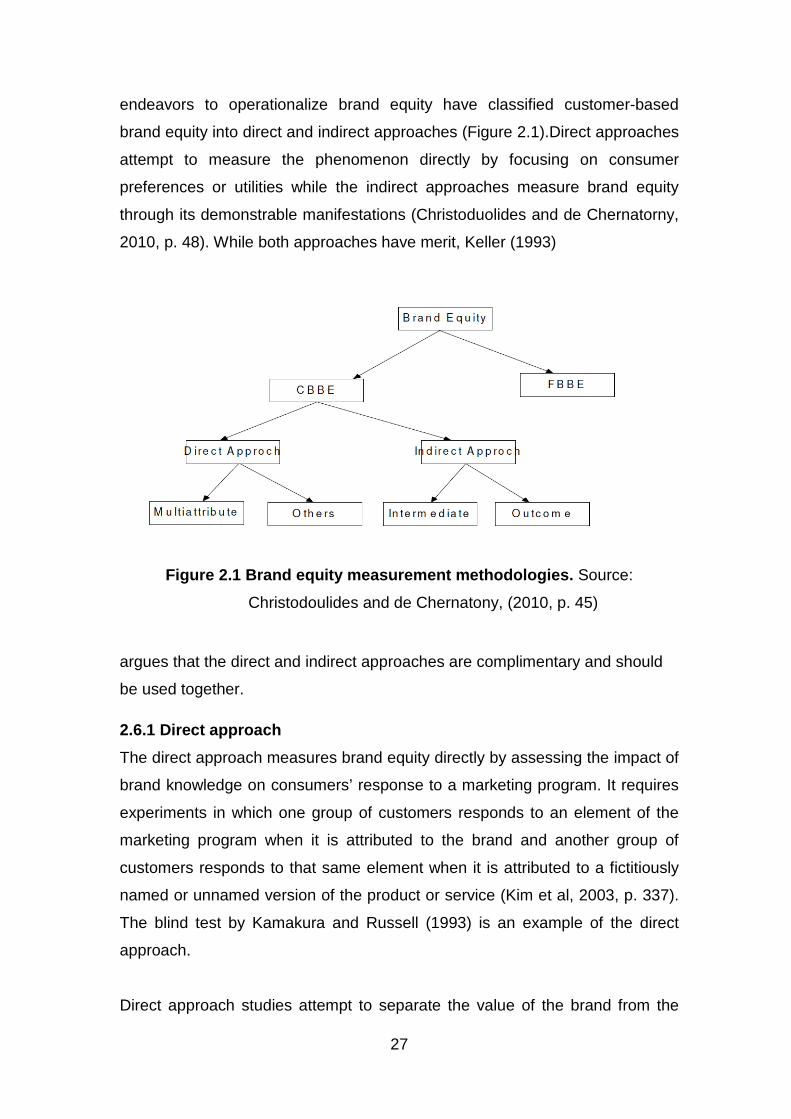
endeavors to operationalize brand equity have classified customer-based
brand equity into direct and indirect approaches (Figure 2.1).Direct approaches
attempt to measure the phenomenon directly by focusing on consumer
preferences or utilities while the indirect approaches measure brand equity
through its demonstrable manifestations (Christoduolides and de Chernatorny,
2010, p. 48). While both approaches have merit, Keller (1993)
Figure 2.1 Brand equity measurement methodologies. Source:
Christodoulides and de Chernatony, (2010, p. 45)
argues that the direct and indirect approaches are complimentary and should
be used together.
2.6.1 Direct approach
The direct approach measures brand equity directly by assessing the impact of
brand knowledge on consumers’ response to a marketing program. It requires
experiments in which one group of customers responds to an element of the
marketing program when it is attributed to the brand and another group of
customers responds to that same element when it is attributed to a fictitiously
named or unnamed version of the product or service (Kim et al, 2003, p. 337).
The blind test by Kamakura and Russell (1993) is an example of the direct
approach.
Direct approach studies attempt to separate the value of the brand from the

28
value of the product (e.g by using the multi-attribute model), although this has
proved to be conceptually and methodologically problematic as brands
supervene on products (Christoduolides and de Chernatorny, 2010, p. 50).
As the indirect measure is unable to capture the strength and favorability of
associations, direct measures are employed.
Multi-attribute approaches
Srinivasan (as cited in Christodoulides and de Chernatony, 2010, p. 51)
measures brand equity by comparing observed preferences based on actual
choice with consumer preferences derived from a multi-attribute conjoint
analysis. The difference between the overall preference and the preference
estimated by the multi-attribute model is subsequently quantified by means of a
monetary scale (dollar-metric scale). Similar to other attempts that attempt to
measure brand equity directly, this approach does not shed light on the
sources of brand value (Christodoulides and de Chernatony, 2010, p. 51).
Park and Srinivasan (1994) divided brand equity into two components: an
attribute-based component (based on consumers’ evaluations of the physical
characteristics) and a non-attribute-based component (based on symbolic
associations attached to the brand). They defined, brand equity as the sum
ofthe attribute-based component and the non-attribute-based component. The
attribute-based component being the difference between subjectively
measured attribute preference and objectively measured attribute preference,
and the non-attribute-based component the difference between the preference
of an individual towards a brand and his subjective attribute-based
preference.Objective preferences can be obtained by laboratory tests, blind
tests or surveys with experts (Christodoulides and de Chernatony, 2010, p.
51). Although this method provides insights into the perceptual distortions
caused by a specific product attribute, this method does not break down the
non-attribute based component of brand equity (Christodoulides and de
Chernatony, 2010, p. 51). The other challenge is that acquiring an objective
attribute rating from experts is not only tedious butthe objective attribute ratings
provided by the experts are not really objective, as they may be influenced by
29
their own biases (Gill and Dawra, 2010, p. 191).
Other direct approaches
Without significantly deviating from the underlying logic in multi-attribute
models, Leuthesser et al, (1995), developed a method that assumes that
personal evaluation of a given brand on a number of attributes is biased. This
bias is caused by the fact that consumers are exposed to brands they know.
Unlike previous studies, which focus on preference, Kamakura and Russell
(1993) proposed a method to measure brand value using the actual purchase
behavior of consumers by means of a segmentwiselogit model. Using scanner
panel data to capture actual purchase behavior (under regular market
conditions under which brands are purchased), they measured brand equity as
the ‘implied utility or value assigned to a brand by consumers’ (Kamakura and
Russel, 1993, p.10). The brand value was thought of as the value attached by
the consumers to the brand ‘after removing the effects of short-term advertising
and price promotions’. The authors came up with a proxy of brand value which
consist of two components, namely brand intangible value and brand tangible
value. Brand tangible value was considered as a function of physical attributes,
and the value not arising from physical attributes was termed brand intangible
value. Brand intangible value consisted of the value derived by the consumer
from brand name associations and perceptual distortions. Although the method
offersadvantages of reflecting actual purchase behavior it is only confined to
contexts where scanner data is available.Therefore this method cannot be
used in countries where the presence of organized retail is meager. Similar to
Srinivasan (1979), this method does not allow evaluating consumer-based
brand equity at the individual consumer level. The other challenge of this
method is that a particular brand could have been purchased as a competing
brand was not available or a particular brand was purchased from a retail outlet
with a limited range, as it did not stock the brand of choice.
Building on the information economics paradigm, Swait et al, (as cited in
Christodoulides and de Chernatony, 2010, p. 53) adopted an approach, which
uses the entire utility value attached to a brand rather than isolating specific
parameters thereof. The authors proposed a new measure ‘Equalisation Price’
30
which encompasses the monetary expression of the utility a consumer
attributes to a bundle consisting of a brand name, product attributes and price
(Christodoulides and de Chernatony, 2010, p. 53). This instrument allows the
identification of sources of brand associations and determines important
weights in the function of consumer utility (Christodoulides and de Chernatony,
2010, p. 53).
Shankar et al, (2008) developed a model that combines financial and
consumer survey data. Although this method has an advantage in that it allows
estimation of brand equity in multi-category brands it makes comparisons with
rival brands difficult due to competitor financial measures unavailability at the
brand level (Christodoulides and de Chernatony, 2010, p. 54).
2.6.2 Indirect approach
Compared to direct approaches, indirect approaches adopt a more holistic
view of the brand and seek to measure brand equity either through its manifest
dimensions or through an outcome variable such as a price premium
(Christodoulides and de Chernatony, 2010, p. 54). Indirect approaches require
measuring brand awareness and the characteristics and relationships among
brand associations (Kim et al, 2003, p. 337). Indirect approaches can be
divided into intermediate and outcome.
Intermediate approaches
Understanding the complexity of direct approaches to brand equity
measurement, Lassar et al (1995) paved the way for a simple paper-and-pencil
instrument that enables managers to easily monitor their brand equity through
its constituent dimensions. The authors suggested five CBBE dimensions,
namely performance, value, social image, trustworthiness and commitment.
Despite its merits, the scale focuses solely on associations and excludes
significant behavioral components of brand equity (such as behavioral loyalty)
(Christodoulides and de Chernatony, 2010, p. 55).
Vazquez et al, (2002, p. 28) defined brand equity as the overall utility that the
consumer associates to the use and consumption of the brand, including
31
associations expressing both functional and symbolic utilities. This definition
highlights ex-post (utilites obtained by consumers following a brand’s
purchase) as opposed to ex-ante (utilities obtained prior to purchase), the latter
being the focus of investigation under the information economics paradigm
(Christodoulides and de Chernatony, 2010, p. 55). Their scale offers several
advantages over preceding methods of brand equity measurement. Unlike
previous methods, which involve complex statistical modeling, the method is
relatively easy, the scale sheds light on the sources of brand equity and it
allows measurement at the individual level. However, the scale was calibrated
solely in the context of athletic shoes and therefore requires adaptation to other
contexts. In addition, Kocak et al (2007) conclude that it may also require
adaptation in different cultural context albeit being used in the same athletic
industry.
Yoo and Donthu (2001) sought to develop an individual-level measure of
CBBE, that is reliable, valid, parsimonious and draws on the theoretical
dimensions put forward by Aaker (1996) and Keller (1993)(Christodoulides and
de Chernatony, 2010, p. 56). Among the indirect approaches to CBBE
measurement, this scale has the most strengths and fewer weaknesses
(Christodoulides and de Chernatony, 2010, p. 56). The scale is culturally valid,
it is applicable to various product categories without requiring further
adjustments as in the case of Vazquez et al, (2002). The instrument is
parsimonious and easy to administer, making it simple for brand managers to
regularly assess the equity of their brands, measurement is made at individual
level(Christodoulides and de Chernatony, 2010, p. 56). However, brand
awareness and brand associations, two theoretically distinct underlying
constructs of brand equity collapsed into one dimension. Although the two are
clearly correlated (Aaker, 1996; Keller, 1993), the two dimensions are not
synonymous since one can be aware of a brand without having a strong set of
associations linked in memory(Christodoulides and de Chernatony, 2010, p.
57). According to Aaker’s (1991) conceptualization, brand awareness must
precede brand associations.
Outcome approaches
32
Price premium is an outcome variable that can be used to indirectly measure
CBBE. This method calculates the additional income or profit that is generated
as a result of the differential selling price between a branded product and a
generic (non-branded) product (Barwiseas cited in Christodoulides and de
Chernatony, 2010, p. 56). Revenue premium is another outcome
variableproposed by Ailiwadi et al (2003). Although this method is relatively
easy and relies on actual data (not subjective judgments) it does not provide
insights into sources of brand equity (Christodoulides and de Cherntony, 2010,
p. 58).
2.7 BUILDING BRAND EQUITY
Brand equity can be created, maintained and expanded by strengthening the
dimensions of brand equity (Yoo et al, 2000, p. 196). There are several
antecedents of brand equity, for example any marketing activity can potentially
affect brand equity, since it represents the effect of accumulated marketing
investments into the brand. Brand equity should therefore be managed over
time by maintaining the brand consistency, protecting sources of brand equity,
making appropriate decisions between fortifying and leveraging the brand, and
fine-tuning the supporting marketing program (Yoo et al, 2000, p. 197).
For branding strategies to be successful and brand value to be created,
consumers must be convinced that there are meaningful differences among
brands in the product or service category (Kotler and Keller, 2006, p. 276).
Customers must not think that all brands in the same product or service
category are the same.
Simon and Sullivan (1993) have listed advertising expenditures, sales force
and marketing research expenditures, age of the brand, advertising share,
order of entry, and product portfolio as sources of brand equity. Other
marketing activities that can be listed as sources of brand equity include, the
use of public relations, warranties, slogans or jingles, symbols and packages,
company image, country of origin, promotional events and brand-naming
strategies (Yoo et al, 2000, p. 197).
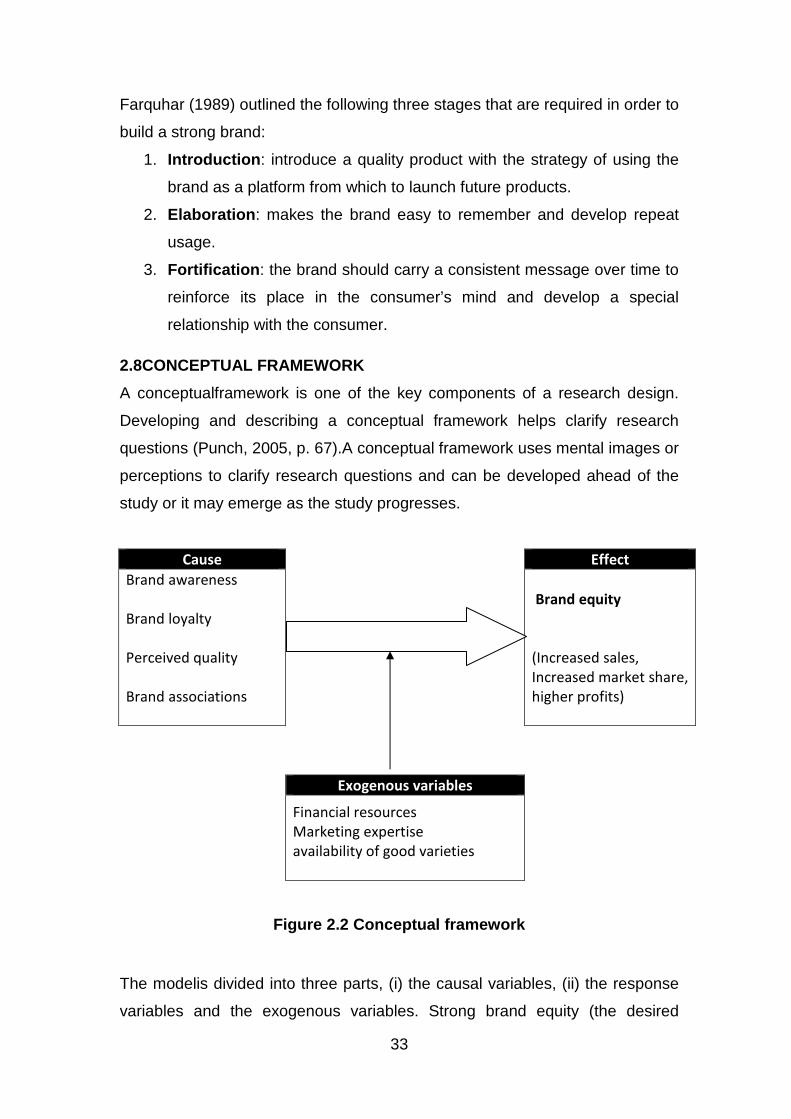
33
Farquhar (1989) outlined the following three stages that are required in order to
build a strong brand:
1. Introduction : introduce a quality product with the strategy of using the
brand as a platform from which to launch future products.
2. Elaboration : makes the brand easy to remember and develop repeat
usage.
3. Fortification : the brand should carry a consistent message over time to
reinforce its place in the consumer’s mind and develop a special
relationship with the consumer.
2.8CONCEPTUAL FRAMEWORK
A conceptualframework is one of the key components of a research design.
Developing and describing a conceptual framework helps clarify research
questions (Punch, 2005, p. 67).A conceptual framework uses mental images or
perceptions to clarify research questions and can be developed ahead of the
study or it may emerge as the study progresses.
Cause Effect
Brand awareness
Brand loyalty
Perceived quality
Brand associations
Brand equity
(Increased sales,
Increased market share,
higher profits)
Exogenous variables
Financial resources
Marketing expertise
availability of good varieties
Figure 2.2 Conceptual framework
The modelis divided into three parts, (i) the causal variables, (ii) the response
variables and the exogenous variables. Strong brand equity (the desired

34
marketing consequence) is dependent on high brand awareness, positive
brand associations, high perceived quality and high brand loyalty. However,
there are variables that affect the achievement of the desired marketing state
(strong brand equity) and these include, resources available to launch a strong
marketing campaign, expertise within the organization, the availability of good
varieties.
2.9CHAPTER SUMMARY
From the above analysis, it can be noted that brands are very important for
organisations. Brands are beneficial to both firms and customers. They provide
convenience and clarity in decision making and provide a guarantee of
performance. Brands can be used by firms to create and sustain competitive
advantage as they cannot be easily imitated by competitors.
From the review, it can also be noted that brand equity has received
tremendous attention from both academics and practitioners owing to the
several benefits it provides to firms. Positive brand equity gives greater
customer loyalty, higher margins, brand extension opportunities and higher
stock returns.
The literature review has also shown that, despite this considerable interest
among researchers and practitioners, there is no agreement regarding what
brand equity is and more importantly how it is measured. Generally
researchers have defined and conceptualized it differently, although the
definitions can be classified into two categories, a financial perspective and a
customer perspective. The financial perspective discusses the financial value
brand equity brings to the business. On the other hand, the customer
perspective looks at the value consumers associate with a brand. It looks at
the perceptions, attitudes, knowledge and behavior on the part of consumers
that result in increased utility. Some authors combined the two perspectives to
make up for deficiencies that may arise when only one perspective is
emphasized. This study is based on the customer perspective because of the
benefits it brings to a firm.

35
From the review it can be noted that understanding, building and measuring
brand equity are the most critical aspects of brand equity. Several studies have
been done in an attempt to conceptualize, measure and manage brand equity.
Two frameworks that encompass facets espoused in most CBBE
conceptualizations are those of Aaker (1996) and Keller (1993). Considering
various suggestions as presented in literature, brand awareness, perceived
quality, brand associations, and brand loyalty are the most common brand
equity constructs. This study adopted these brand equity constructs to answer
the research questions.
The review has also shown that, although, Aaker (1996) and Keller (1993)
conceptualized CBBE, they did not operationalize a scale of measurement and
leading to a number of methodologies being developed. CBBE measurement
can be classified into two approaches of measurement, direct and indirect.
Direct approaches attempt to measure the phenomenon directly by focusing on
consumer preferences or utilities while the indirect approaches measure brand
equity through its demonstrable manifestations. Although several studies have
been done to come up with measurement scales, most of these studies have
largely been done in the US and other developed countries with very few if
any, in Zimbabwe. In addition the studies largely focused on health care,
clothing, television sets, insurance, cars, food and electronics with very few if
any focusing on a seed industry. Several studies have been done to try and
replicate scales in different countries and cultures and have been seen to be
failing when replicated in other cultures and countries. This study therefore
attempts to apply some of these scales in a seed industry context.
Brand equity can be created, maintained and expanded by strengthening the
dimensions or constructs of brand equity. Advertising expenditures, sales force
and marketing research expenditures, age of the brand, advertising share,
order of entry, product portfolio, slogans, jingles, symbols and packaging, and
promotional events can be sources of brand equity. There are three stages that
are required to build brand equity and these are, introduction, elaboration and
fortification.
36
To be to clarify the research questions, a conceptual framework was
developed. The framework has three parts, (i) the causal variables, (ii) the
response variable and (iii) the exogenous variables. Strong brand equity
(dependent variable) is dependent on brand awareness, positive brand
associations, high perceived quality and high brand loyalty. However, these
variables are dependent on other factors such as the availability of financial
resources.
CHAPTER 3
3.0 RESEARCH METHODOLOGY
3.1 INTRODUCTION
This chapter discusses the research design, philosophy and strategy applied in
this study. With regards, the research design, the researcherinitially discusses
in detail the case study research strategy, looking at its applicability, prejudices
and finally why it was chosen for this study. The researcher thendiscusses
sampling techniques, population, data collection and data analysis.
3.1RESEARCH DESIGN
A research design is the logical sequence that connects the empirical data to a
study’s initial research questions and ultimately to its conclusions (Yin, 2003. p.
20). In general it involves all issues involved in planning and executing a
research project, that is, from identifying the problem through to reporting and
publishing the results (Punch, 2005, p. 66). Specifically research design looks
at how a researcher should guard against and tries to rule out, alternative
interpretations of results.
Research design includes four main ideas: (a) strategy, (b) conceptual
framework (c), who or what will be studied, and (d) tools and procedures for
collecting and analyzing the data (Punch, 2005 p. 66). The research strategy
for this study is given in detail in section 3.4. The conceptual framework for this
study is given in section 2.8. The other elements of the research design for this

37
study are given in sections 3.4 to 3.9.
3.2RESEARCH PHILOSOPHY
Research involves the use of theory, which can either be made explicit in the
design of the research or the presentation of findings or conclusions (Saunders
et al, 1997, p. 70).There are three distinct approaches to research:
quantitative, qualitative and what is variously called multi-method, multi-
strategy, mixed methods, or mixed methodology (Bryman, 2006, p. 97).
3.2.1 Quantitative (positivist) approach
Quantitative research is based on positivist theory and is a systematic,
objective investigation of phenomena and their relationships(Leedy and
Ormrod, 2005). Quantitative research, whichis normally characterized by
quantification and mathematical model development involves hypothesis
deduction, operationalizing the hypothesis, testing the operational hypothesis,
examining the specific outcome of the enquiry, modifying theory in line with
findings and verifying the revised theory by repeating the procedure (Saunders
et al, 1997, p. 71).
3.2.2 Qualitative (phenomenological) approach
Qualitative approach is an unstructured research methodology that is carried
out using a small number of carefully selected individuals to produce non-
quantifiable insights into behaviour, motivations and attitudes(Wilson, 2006). It
is based on interpretive theory and involves an in-depth understanding within a
context and is characterized by rich, complete and detailed descriptions.
Qualitative methods are more flexible compared to quantitative methods
because they allow more spontaneity and adaptation of the interaction
between the researcher and the respondent (Mark et al,2005). Qualitative
methods use open-ended interviews to explore opinions, behaviours and
attitudes of individuals or groups of individuals (White, 2000). The data
collected using such methods is usually in the form of descriptions. The
advantage of this approach is that it provides a deeper understanding of social
phenomena than would be obtained from purely quantitative data (Silverman,
2000).

38
3.2.3 The suitable approach
Usually, the research problem defines how the research will be conducted and
the researcher selects the research approach based on the purpose of the
research(Leedy and Ormrod, 2005). If the purpose is to explain, predict,
confirm, validate or test a theory, then quantitative method is selected.
However if the purpose of the research is to describe, explain, explore,
interpret or build a theory then qualitative research method is recommended. In
addition qualitative methods allow flexibility in that they allow the researcher to
probe the respondents by further asking “how” and “why” questions (Mark et al,
2005).
This study attempts to explain why, after adopting various brand building
initiatives, Agriseeds is failing to benefit from such efforts. In other words, the
study is looking for the presumed link between brand equity constructs and
performance of Agriseeds. Qualitative research will give the researcher an in-
depth understanding Agriseeds brand equity deficienciesthrough probing
respondents on issues that require explanation.
3.3 RESEARCH STRATEGY
A research strategy is the reasoning, or the set of ideas by which the study
intends to proceed in order to answer its research questions (Punch, 2005, p.
66).There are several strategies that can be used in conducting research and
these include, case studies, experiments, history, surveys and the analysis of
archival information. The choice of the research strategy will depend on (a) the
research question, (b), the control the researcher has over actual behavioral
events and (c) the degree of focus on contemporary as opposed to historical
phenomena (Yin, 2003, p. 5).
An experiment is a classical form of research which owes much to the naturals
sciences, although it features strongly in social science research, particularly
psychology (Saunders et al, 1997, p. 75). A survey is a research method where
information is typically gathered using a well defined and standardized data
collection procedure, by asking a subset of people questions on a specific topic
and generalizing the results to a larger population (Groves et al, 2004). A case
39
study involves the development of detailed, intensive knowledge about a single
case or a small number of related cases (Saunders et al, 1997, p. 76).
Contrary to most researchers’ beliefs, case studies are not only confined to
exploratory studies, but rather they can be used in explanatory and descriptive
studies (Yin, 2003, p. 3). This study will involve the use of a case study
because the researcher specifically wants to assess the level ofAgriseeds
brand equity.
3.4 CASE STUDY STRATEGY
Case studies answer “how” and “why” questions about a contemporary set of
events, over which the investigator has little or no control(Yin, 2003). The focus
of this study was to answer “why” questions about brand equity at Agriseeds.
According to Yin (2003, p. 6) “how” and “why” questions are more explanatory
and likely lead to the use of case studies, histories and experiments as the
preferred research strategies. He further indicated that histories are more
applicable when dealing with the “dead” past, that is when there are no
relevant persons to report, even retrospectively. On the other hand case
studies deal with contemporary events, but when the relevant behaviors cannot
be manipulated. Yin (2003) emphasizes that a case study is an empirical
inquiry that investigates a contemporary phenomenon within its real-life
context, especially when the boundaries between phenomenon and context
are not clearly evident. Although experiments can be used in contemporary
studies, they are done when an investigator can manipulate behavior directly,
precisely and systematically. For example, exposing a certain group of
customers to a certain marketing program or activity then comparing their
behavior with an unexposed group.
The case study research strategy enabled the researcher to obtain an in-depth
knowledge (Silverman, 2000) on the level of Agriseeds brand equity. The
researcher also selected the case study strategy because of the limited time to
carry out the research and accessibility to research information (Anderson,
1993).

40
3.5DATA COLLECTION
3.5.1 Population
A population is a set of units (usually people, objects, transactions, or events)
that one is interested in studying (Salant and Dillman, 1994). In this study,
population referred to all customer (retailers, hardwares) that were selling
Agriseeds products in the previous four to five years. The sample used in this
study constituted buyers from the large hardware and farm supply outlets such
as Farm and City, N. Richards, smaller hardwares, mostly individually owned,
large retail outlets such as Oks, TMs and Spars and small retail outlets, which
are mostly owned by individuals. A total of 18 buyers from the different retail
categories were interviewed face to face (Table 3.1). The sample selected
ensured that varied views were captured amongst the different profiles of
customers.
Table 3.1: List of respondents
Respondent Total interviewed
Major Hardwares (Farm & City, N. Richards) 4
Smaller Hardwares (Individually owned) 5
Major Retail Outlets (Oks, TMs, Spars) 4
Smaller Retail Outlets (Individually owned) 5
3.5.2 Sampling procedures
To be able to answer research questions data needs to be collected. When
data is collected and analyzed from every possible case or group member it is
called a census. However due to limitations of time, labour, or access, it may
be impossible to collect data from each possible case or group member
leading to sampling. There are two types of sampling techniques, (a)
probability or random sampling and (b) non-probability or non-random
sampling (Saunders et al, 1997, p. 126). Probability sampling involves
choosing a sample in such a manner that the chance or probability of each

41
case being selected is known and is usually equal for all cases. For non-
probability sampling the probability of each case being selected from the total
population is unknown. Although generalizations can be made about a
population for both techniques, it is not possible to make statistical inferences
about a population when non-probability sampling has been used. It is for this
reason that non-probability sampling is often used in case studies. This study
is going to use non-probability sampling.
There are a range of non-probability sampling techniques and these include,
quota sampling, purposive, snowball, self-selection and convenience sampling.
Quota sampling is a type of stratified sampling technique in which selection of
cases within strata is entirely non-random (Saunders et al, 1997, p. 142).
Snowball sampling is used when it is difficult to identify members of a
population, for example, individuals working but claiming unemployment
benefits (Saunders et al, 1997, p. 147). Self-selection sampling occurs when a
case, usually an individual, is allowed to identify their desire to participate in
research, through publicizing in the media or asking them to participate
(Saunders et al, 1997, p. 147). Convenience sampling involves selecting those
cases that are easiest to obtain for a sample. Purposive or judgmental
sampling involves the use of judgment by the researcher in the selection of
cases which will best enable one to answer research questions and meet
objectives (Saunders et al, 1997, p. 145). It is often used when one is working
with very small samples, such as in the case of case studies and when one
wishes to select cases that are particularly informative. This study employed
the purposive sampling technique as it seeks to focus on key issues that
buyers for retails outlets focus on.
3.6DATA SOURCES
There are two types of data sources that can be used to answer research
questions primary and secondary data. Primary data is data which is gathered
directly from the elements of the population while secondary data is data
thathad already been collected for some other purpose (Salant and Dillman,
1994). Secondary data may either be raw data or published summaries (or
complied data) (Saunders et al, 1997, p. 159). This study used both primary
42
and secondary data though the emphasis was mainly on primary data. Primary
data was collected through interviews and the secondary data was obtained
from annual reports.There are various instruments or methods that can be
used to collect primary data and these includeobservations, questionnaires and
interviews.
3.6.1 Observation
An observation is a purposeful, systematic way of watching and listening to an
interaction or phenomenon as it takes place (Kumar, 1996, p. 105). It can
either be participant or non-participant. Participant is where the researcher
attempts to participate fully in the lives and activities of subjects and thus
becomes a member of their group, organization or community (Saunders et al,
1997, p. 187). On the other hand non-participative, the researcher does not get
involved in the activities of the group but remains a passive observer.
3.6.2 Questionnaire
A questionnaire is a data collection technique where each person is asked to
respond to the same set of questions in a pre-determined order. A
questionnaire offers advantages in that it is versatile, quick and cost-effective
and can cover a wider geographic area (Boyd et al., 2004). A questionnaire is
more appropriate when the study involves issues respondents may feel
reluctant to discuss with the researcher (Kumar, 1996, p. 111). However, it has
disadvantages which include, limited application (applicable to a population
that can read and write), low response rate, self-selecting bias (not all
questionnaires are filled by the desired respondents), lack of opportunity to
clarify issues, no room for spontaneous responses, and responses may be
influenced by responses to other questions (Kumar, 1996, p. 114).
3.6.3 Interviews
An interview is a person-to-person interaction between two or more individuals
with a specific purpose in mind (Kumar, 1996, p. 109). Interviews can be
structured or unstructured depending on the degree of flexibility. Structured
interviews use questionnaires based on a predetermined and standardized
order or identical set of questions asked in the same order as specified in the
interview schedule (Saunders et al, 1997, p. 211). An interview schedule is a

43
written list of questions, open or close-ended, prepared for use by an
interviewer, in a person-to-person interaction (which may be face-to-face, by
telephone or other electronic media) (Kumar, 1996, p. 109). An unstructured
interview, also known as an in-depth interview, involves the use of an interview
guide, a framework within which to conduct the interview, by the researcher.
Using this structure the interviewer formulates questions spontaneously during
an interview. An interview is more appropriate if the study population is
illiterate, very young or very old. However, interviews are time-consuming and
expensive, the quality of the data depends on the quality of the interaction and
may vary when many interviewers are used, and there might be interviewer-
interviewee bias (Kumar, 1996, p. 115).
Although the study involved sensitive issues that respondents could have felt
reluctant to discuss with the researcher, interviewswere used as the research
instrument, due to the weakness associated with questionnaires as cited
above.
The interview scheduleconsisted both open and close-ended
questionsalthough the bulk were open-ended. In an open-ended question the
possible answers are not given while in a close-ended question the possible
answers are set out in the questionnaire or schedule and the respondent or the
investigator ticks that best describes the respondent’s answer (Kumar, 1996, p.
116). Open-ended questions provide in-depth information if used by an
experienced interviewer and allows respondents to express themselves freely,
though it might lead to interviewer-interviewee bias. The interview schedule
consisted of sections covering demographic characteristics, brand awareness,
brand loyalty, perceived quality,brand associations, and overall brand equity.
3.9DATA ANALYSIS
There is no standard format in data analysis in qualitative research (Neuman,
2006). However, data analysis can be approached from two perspectives, a
deductive approach or an inductive approach (Saunders et al, 1997, p. 348).
The deductive approach is used when one seeks to use existing theory to
shape the approach which will be adopted to the qualitative research process

44
and to aspects of data analysis. On the other hand, the inductive approach is
used when one seeks to build up theory which is relatively grounded in a
number of relevant cases. This study adopted the deductive approach where it
seeks to advance brand equity theory to answer research questions. According
to Yin (1994) when one uses existing theory they should use theoretical
propositions to devise a framework to help organize and direct data analysis.
This study used a study proposition to devise a conceptual framework that was
used to direct data analysis.
The data obtained from the research was therefore analysed through the use
of data displays. Data analysis entails deciding what and which meanings can
be attributed to the words and what are the implications to that effect and how
does it relate to the topic under investigation (Miles and Hurberman, 1994).
The data was analysed by going through all the questions and establishing
common themes, patterns and relationships (Miles and Huberman, 1994). All
the information gathered was analysed against theory cited in the literature
review and the appropriate inferences were made.
CHAPTER 4
4.0 RESULTS AND DISCUSSION
4.1 INTRODUCTION
This chapter presents the research findings from the analyses of in-depth
interviews through the use of content analytic tables. This chapter reveals the
demographic profile of the respondents and provides aggregate information
about responses. The aggregate information was presented in tables which
were explained followed by a discussion of the implications and the link to
literature.
The main objective of the study as highlighted in the introduction of this report
was to assess the level of Agriseeds brand equity on the Zimbabwean maize
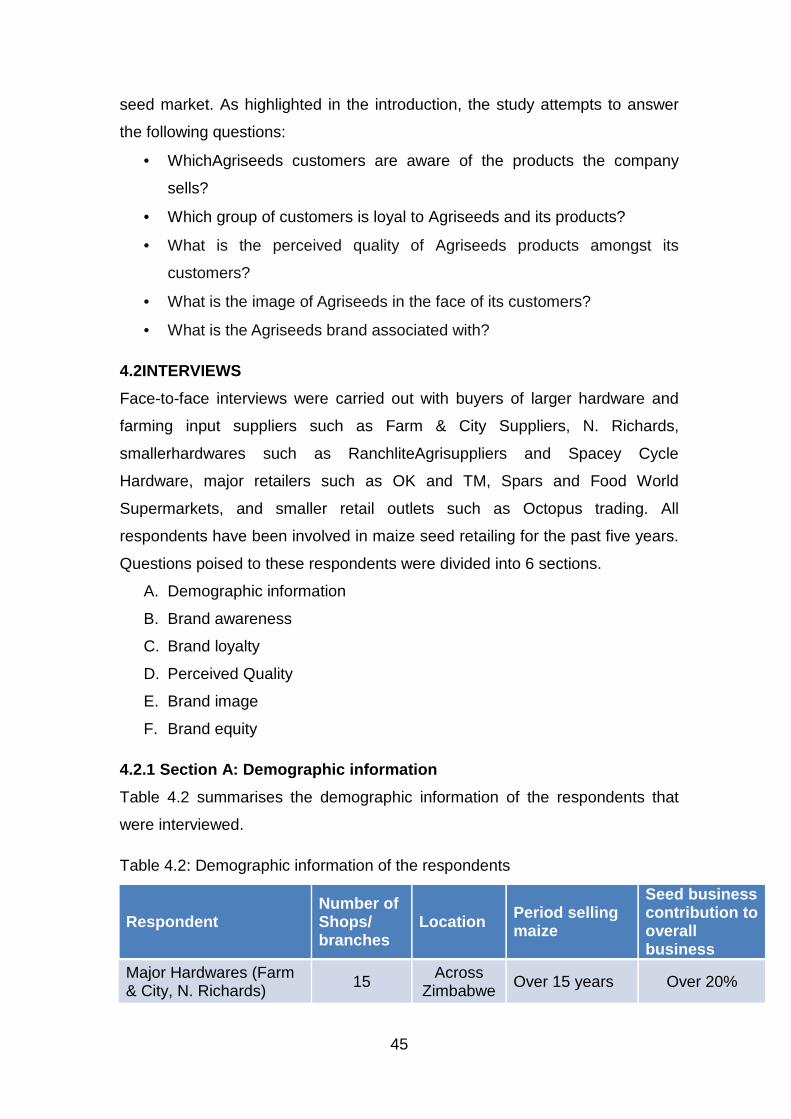
45
seed market. As highlighted in the introduction, the study attempts to answer
the following questions:
• WhichAgriseeds customers are aware of the products the company
sells?
• Which group of customers is loyal to Agriseeds and its products?
• What is the perceived quality of Agriseeds products amongst its
customers?
• What is the image of Agriseeds in the face of its customers?
• What is the Agriseeds brand associated with?
4.2INTERVIEWS
Face-to-face interviews were carried out with buyers of larger hardware and
farming input suppliers such as Farm & City Suppliers, N. Richards,
smallerhardwares such as RanchliteAgrisuppliers and Spacey Cycle
Hardware, major retailers such as OK and TM, Spars and Food World
Supermarkets, and smaller retail outlets such as Octopus trading. All
respondents have been involved in maize seed retailing for the past five years.
Questions poised to these respondents were divided into 6 sections.
A. Demographic information
B. Brand awareness
C. Brand loyalty
D. Perceived Quality
E. Brand image
F. Brand equity
4.2.1 Section A: Demographic information
Table 4.2 summarises the demographic information of the respondents that
were interviewed.
Table 4.2: Demographic information of the respondents
Respondent Number of Shops/ branches
Location Period selling maize
Seed business contribution to overall business
Major Hardwares (Farm & City, N. Richards)
15 Across Zimbabwe
Over 15 years Over 20%

46
Smaller Hardwares (mostly individually owned)
2 Harare 5 – 10years Over 20%
Major Retail Outlets (Oks, TMs, Spars)
40 Across Zimbabwe
10 -15 years 5-10%
Smaller Retail Outlets (mostly individually owned)
1 Harare 5- 10 years 10-20%
Table 4.2 gives a summary of the demographic information for the respondents
used in this study. The figures given are an average per each category. All the
respondents were drawn from an Agriseeds customer list that is kept with the
Marketing Department. The respondents have all been involved in maize seed
sales for at least five years. This implies that the respondents were both
experienced and had a strong understanding of the operations of the seed
industry during the period covered by the case study (2009 – 2012). The
diversity of their operations which encompass major and smaller hardwares,
major and smaller retail outlets, enabled the researcher to obtain rich
information from the perspectives of businesses with very different
backgrounds, vision and operations. The major outlets, both retail and
hardwares are owned by groups of shareholders and have different visions,
mission statements from smaller outlets, which in most cases are individually
owned.
4.2.2 Section B: Brand awareness
Table 4.3 Level of brand and product awareness Respondent Question Response
Large Hardwares (Farm & City, N.
Richards)
Which seed companies are you aware of?
Seed Co, Pioneer, Pannar, Agriseeds, Progene, ARDA, Agpy
Which companies come first before ordering seed?
Seed Co
Which varieties are you aware of?
SC501, SC513, SC506, SC403, Pan 6777, Pan695, PHB3043, PHB30G97, PHB30G19, tsoko, mbizi, nzou
Smaller hardwares (mostly Individually
owned)
Which seed companies are you aware of?
Seed Co, Pioneer, Pannar, Agriseeds, Progene, ARDA
Which companies come first before ordering seed?
Seed Co ,
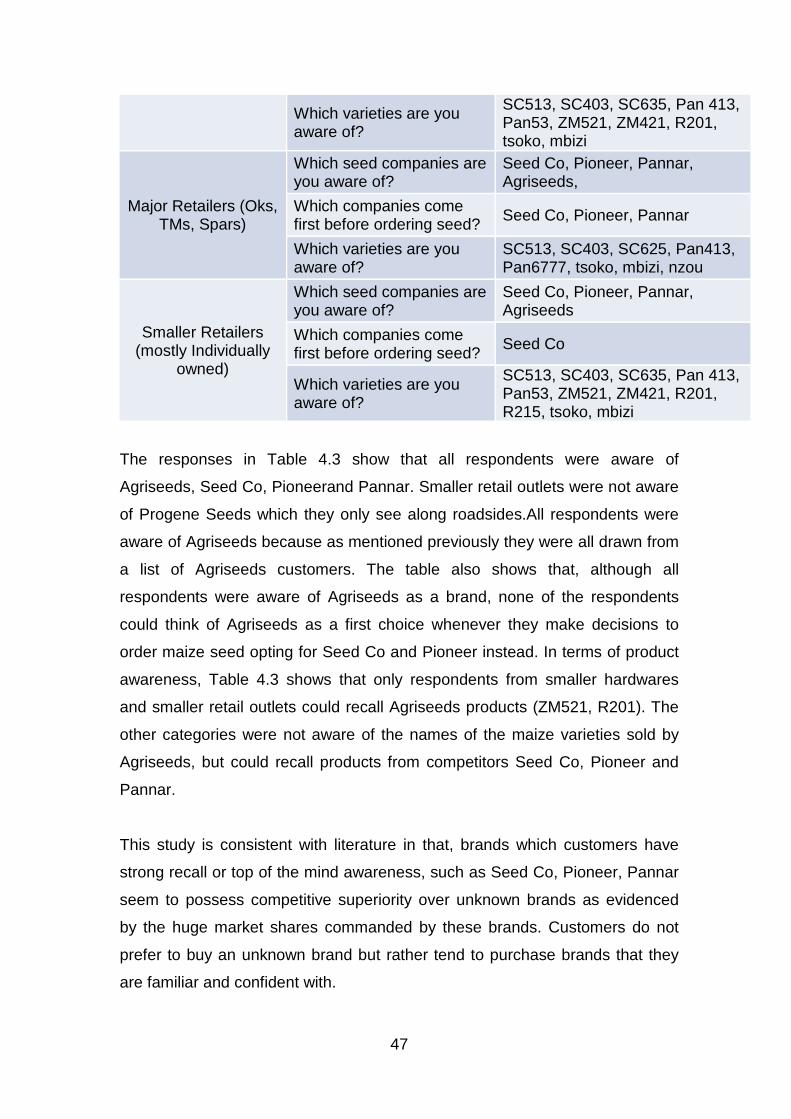
47
Which varieties are you aware of?
SC513, SC403, SC635, Pan 413, Pan53, ZM521, ZM421, R201, tsoko, mbizi
Major Retailers (Oks, TMs, Spars)
Which seed companies are you aware of?
Seed Co, Pioneer, Pannar, Agriseeds,
Which companies come first before ordering seed? Seed Co, Pioneer, Pannar
Which varieties are you aware of?
SC513, SC403, SC625, Pan413, Pan6777, tsoko, mbizi, nzou
Smaller Retailers (mostly Individually
owned)
Which seed companies are you aware of?
Seed Co, Pioneer, Pannar, Agriseeds
Which companies come first before ordering seed?
Seed Co
Which varieties are you aware of?
SC513, SC403, SC635, Pan 413, Pan53, ZM521, ZM421, R201, R215, tsoko, mbizi
The responses in Table 4.3 show that all respondents were aware of
Agriseeds, Seed Co, Pioneerand Pannar. Smaller retail outlets were not aware
of Progene Seeds which they only see along roadsides.All respondents were
aware of Agriseeds because as mentioned previously they were all drawn from
a list of Agriseeds customers. The table also shows that, although all
respondents were aware of Agriseeds as a brand, none of the respondents
could think of Agriseeds as a first choice whenever they make decisions to
order maize seed opting for Seed Co and Pioneer instead. In terms of product
awareness, Table 4.3 shows that only respondents from smaller hardwares
and smaller retail outlets could recall Agriseeds products (ZM521, R201). The
other categories were not aware of the names of the maize varieties sold by
Agriseeds, but could recall products from competitors Seed Co, Pioneer and
Pannar.
This study is consistent with literature in that, brands which customers have
strong recall or top of the mind awareness, such as Seed Co, Pioneer, Pannar
seem to possess competitive superiority over unknown brands as evidenced
by the huge market shares commanded by these brands. Customers do not
prefer to buy an unknown brand but rather tend to purchase brands that they
are familiar and confident with.
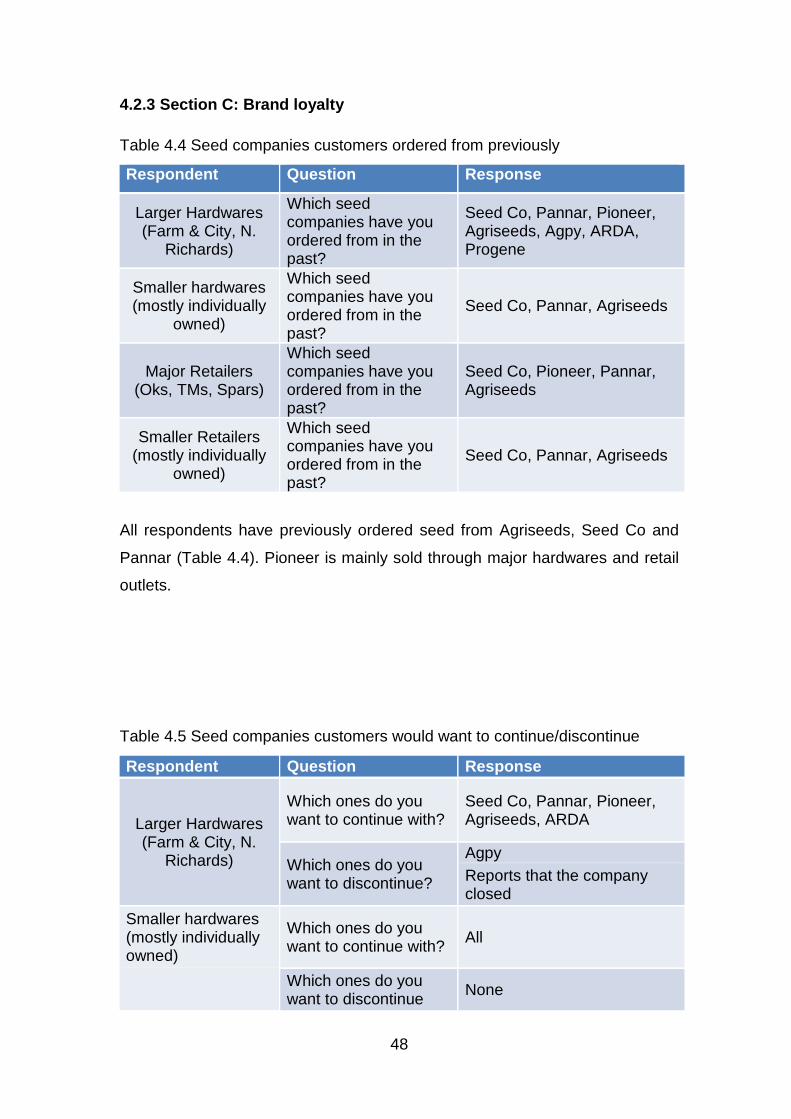
48
4.2.3 Section C: Brand loyalty
Table 4.4 Seed companies customers ordered from previously
Respondent Question Response
Larger Hardwares (Farm & City, N.
Richards)
Which seed companies have you ordered from in the past?
Seed Co, Pannar, Pioneer, Agriseeds, Agpy, ARDA, Progene
Smaller hardwares (mostly individually
owned)
Which seed companies have you ordered from in the past?
Seed Co, Pannar, Agriseeds
Major Retailers (Oks, TMs, Spars)
Which seed companies have you ordered from in the past?
Seed Co, Pioneer, Pannar, Agriseeds
Smaller Retailers (mostly individually
owned)
Which seed companies have you ordered from in the past?
Seed Co, Pannar, Agriseeds
All respondents have previously ordered seed from Agriseeds, Seed Co and
Pannar (Table 4.4). Pioneer is mainly sold through major hardwares and retail
outlets.
Table 4.5 Seed companies customers would want to continue/discontinue
Respondent Question Response
Larger Hardwares (Farm & City, N.
Richards)
Which ones do you want to continue with?
Seed Co, Pannar, Pioneer, Agriseeds, ARDA
Which ones do you want to discontinue?
Agpy Reports that the company closed
Smaller hardwares (mostly individually owned)
Which ones do you want to continue with? All
Which ones do you want to discontinue
None
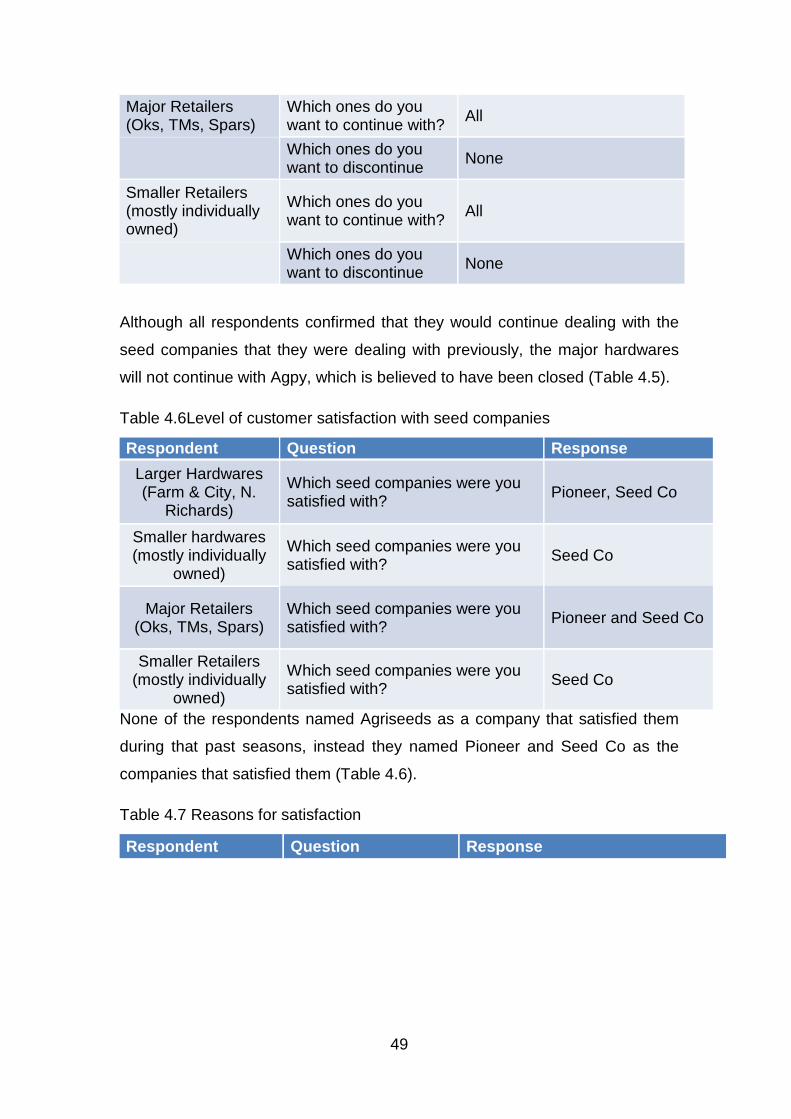
49
Major Retailers (Oks, TMs, Spars)
Which ones do you want to continue with? All
Which ones do you want to discontinue
None
Smaller Retailers (mostly individually owned)
Which ones do you want to continue with? All
Which ones do you want to discontinue None
Although all respondents confirmed that they would continue dealing with the
seed companies that they were dealing with previously, the major hardwares
will not continue with Agpy, which is believed to have been closed (Table 4.5).
Table 4.6Level of customer satisfaction with seed companies
Respondent Question Response
Larger Hardwares (Farm & City, N.
Richards)
Which seed companies were you satisfied with? Pioneer, Seed Co
Smaller hardwares (mostly individually
owned)
Which seed companies were you satisfied with? Seed Co
Major Retailers (Oks, TMs, Spars)
Which seed companies were you satisfied with?
Pioneer and Seed Co
Smaller Retailers (mostly individually
owned)
Which seed companies were you satisfied with? Seed Co
None of the respondents named Agriseeds as a company that satisfied them
during that past seasons, instead they named Pioneer and Seed Co as the
companies that satisfied them (Table 4.6).
Table 4.7 Reasons for satisfaction
Respondent Question Response
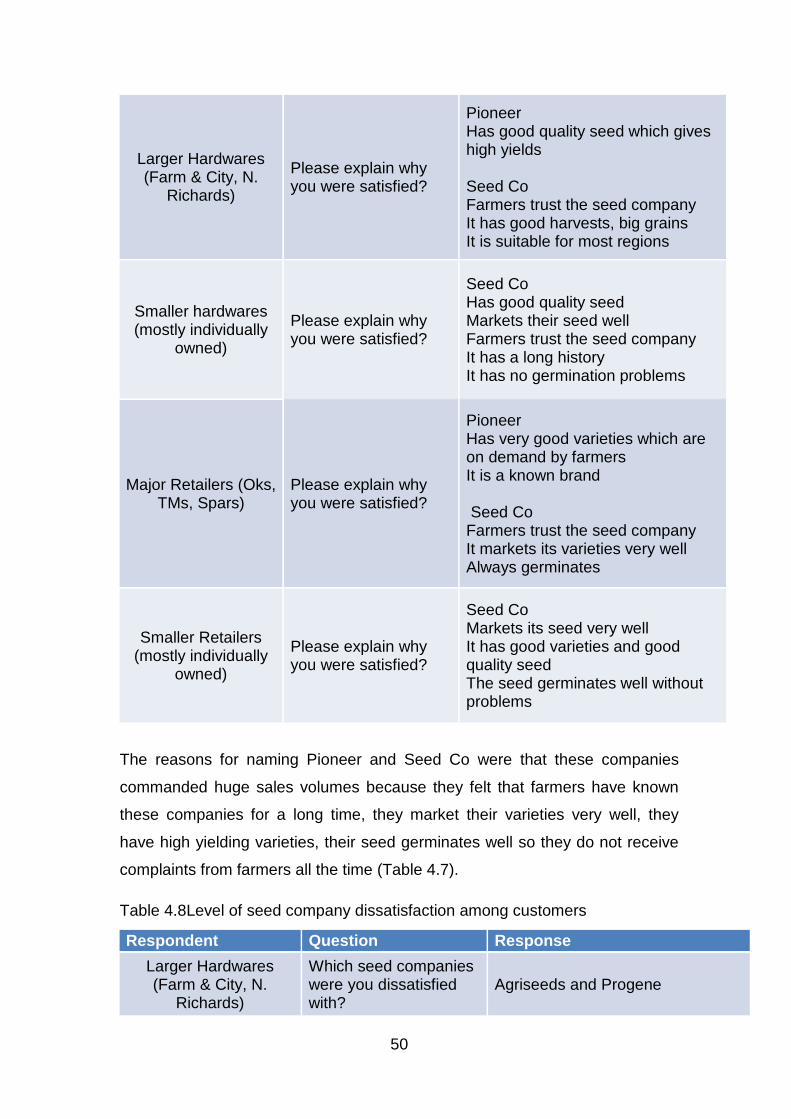
50
Larger Hardwares (Farm & City, N.
Richards)
Please explain why you were satisfied?
Pioneer Has good quality seed which gives high yields Seed Co Farmers trust the seed company It has good harvests, big grains It is suitable for most regions
Smaller hardwares (mostly individually
owned)
Please explain why you were satisfied?
Seed Co Has good quality seed Markets their seed well Farmers trust the seed company It has a long history It has no germination problems
Major Retailers (Oks, TMs, Spars)
Please explain why you were satisfied?
Pioneer Has very good varieties which are on demand by farmers It is a known brand Seed Co Farmers trust the seed company It markets its varieties very well Always germinates
Smaller Retailers (mostly individually
owned)
Please explain why you were satisfied?
Seed Co Markets its seed very well It has good varieties and good quality seed The seed germinates well without problems
The reasons for naming Pioneer and Seed Co were that these companies
commanded huge sales volumes because they felt that farmers have known
these companies for a long time, they market their varieties very well, they
have high yielding varieties, their seed germinates well so they do not receive
complaints from farmers all the time (Table 4.7).
Table 4.8Level of seed company dissatisfaction among customers
Respondent Question Response
Larger Hardwares (Farm & City, N.
Richards)
Which seed companies were you dissatisfied with?
Agriseeds and Progene

51
Please explain why you were dissatisfied?
Their seed is not marketed well and never invite retailers for their field days They sell OPVs which are not liked by farmers
Smaller hardwares (mostly individually
owned)
Which seed companies were you dissatisfied with?
Agriseeds
Please explain why you were dissatisfied?
The marketing is very weak
Major Retailers (Oks, TMs, Spars)
Which seed companies were you dissatisfied with?
Agriseeds, Pannar
Please explain why you were dissatisfied?
Agriseeds Poor marketing activities The seed produces very small cobs Pannar Only two varieties known by farmers Pan 413 and Pan53 Pan413 is easily weeviled Lack of product information
Smaller retailers (mostly individually
owned)
Which seed companies were you dissatisfied with?
Agriseeds
Please explain why you were dissatisfied?
The marketing is very weak They good for horticultural crops not maize seed
All respondents were not pleased with the way Agriseeds markets its products
(Table 4.8). The customers felt that Agriseeds sells varieties that are low
yielding and that produce very small cobs with very small kernels.
4.2.4 Section D: Perceived quality
Table 4.9The leading brand
Respondent Question Response
Larger Hardwares (Farm & City, N.
Richards)
Which seed company do you think is the leading brand?
Seed Co, Pioneer
Please explain why you think its leading?
Seed Co The first company to produce seed in Zimbabwe and has been there
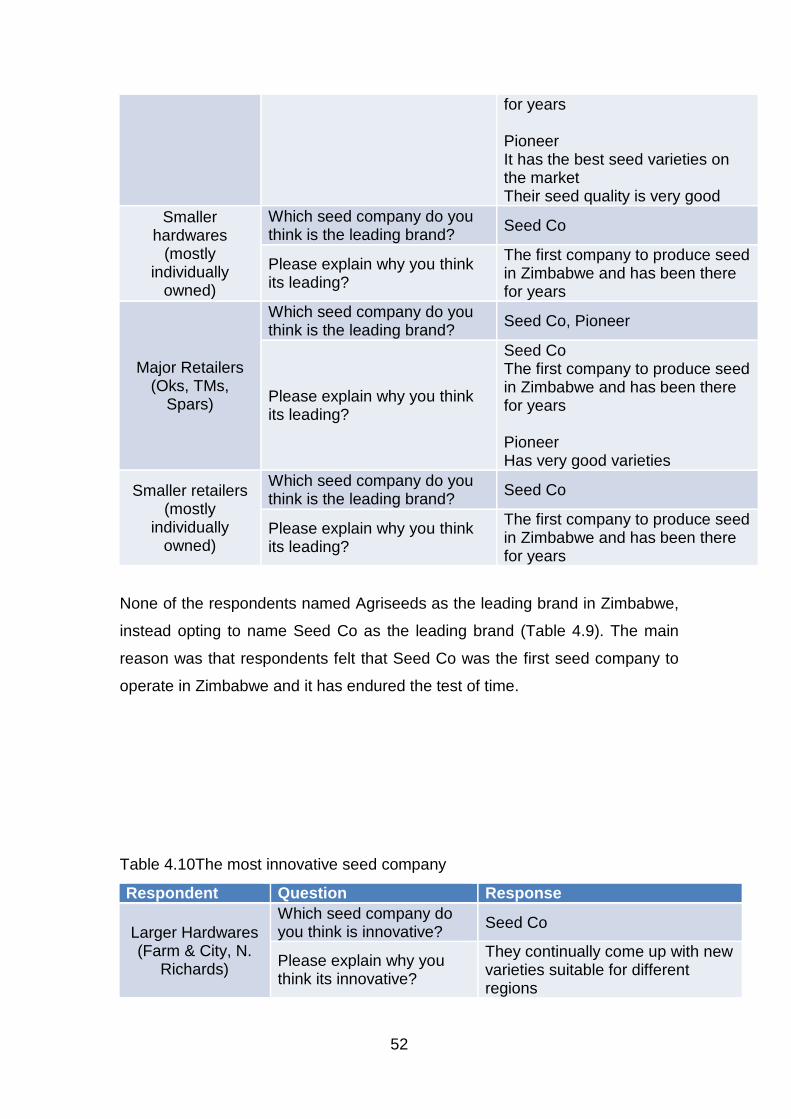
52
for years Pioneer It has the best seed varieties on the market Their seed quality is very good
Smaller hardwares
(mostly individually
owned)
Which seed company do you think is the leading brand?
Seed Co
Please explain why you think its leading?
The first company to produce seed in Zimbabwe and has been there for years
Major Retailers (Oks, TMs,
Spars)
Which seed company do you think is the leading brand?
Seed Co, Pioneer
Please explain why you think its leading?
Seed Co The first company to produce seed in Zimbabwe and has been there for years Pioneer Has very good varieties
Smaller retailers (mostly
individually owned)
Which seed company do you think is the leading brand? Seed Co
Please explain why you think its leading?
The first company to produce seed in Zimbabwe and has been there for years
None of the respondents named Agriseeds as the leading brand in Zimbabwe,
instead opting to name Seed Co as the leading brand (Table 4.9). The main
reason was that respondents felt that Seed Co was the first seed company to
operate in Zimbabwe and it has endured the test of time.
Table 4.10The most innovative seed company
Respondent Question Response
Larger Hardwares (Farm & City, N.
Richards)
Which seed company do you think is innovative?
Seed Co
Please explain why you think its innovative?
They continually come up with new varieties suitable for different regions

53
They lead in marketing strategies
Smaller hardwares (mostly individually
owned)
Which seed company do you think is innovative?
Seed Co
Please explain why you think itsinnovative?
They continually come up with new varieties suitable for different regions They lead in marketing strategies
Major Retailers (Oks, TMs, Spars)
Which seed company do you think is innovative? Seed Co
Please explain why you think its innovative?
They continually come up with new varieties suitable for different regions They lead in marketing strategies
Smaller Retailers (mostly individually
owned)
Which seed company do you think is innovative?
Seed Co
Please explain why you think its innovative?
They continually come up with new varieties suitable for different regions They lead in marketing strategies
The responses in Table 4.10, show that none of the respondents named
Agriseeds as an innovative seed company, but instead named Seed Co. The
main reason for naming Seed Co was that it continuously develops new
varieties that are adapted to different farming environments. The respondents
also felt that Seed Co generally has innovative marketing strategies that assist
in the marketing of their varieties.
Table 4.11 General perceived quality
Respondent Question Response
Larger Hardwares (Farm & City, N. Richards)
Which seed companies do you think has the best varieties? Seed Co, Pioneer
Which companies have the worst varieties?
Agriseeds, Progene, ARDA
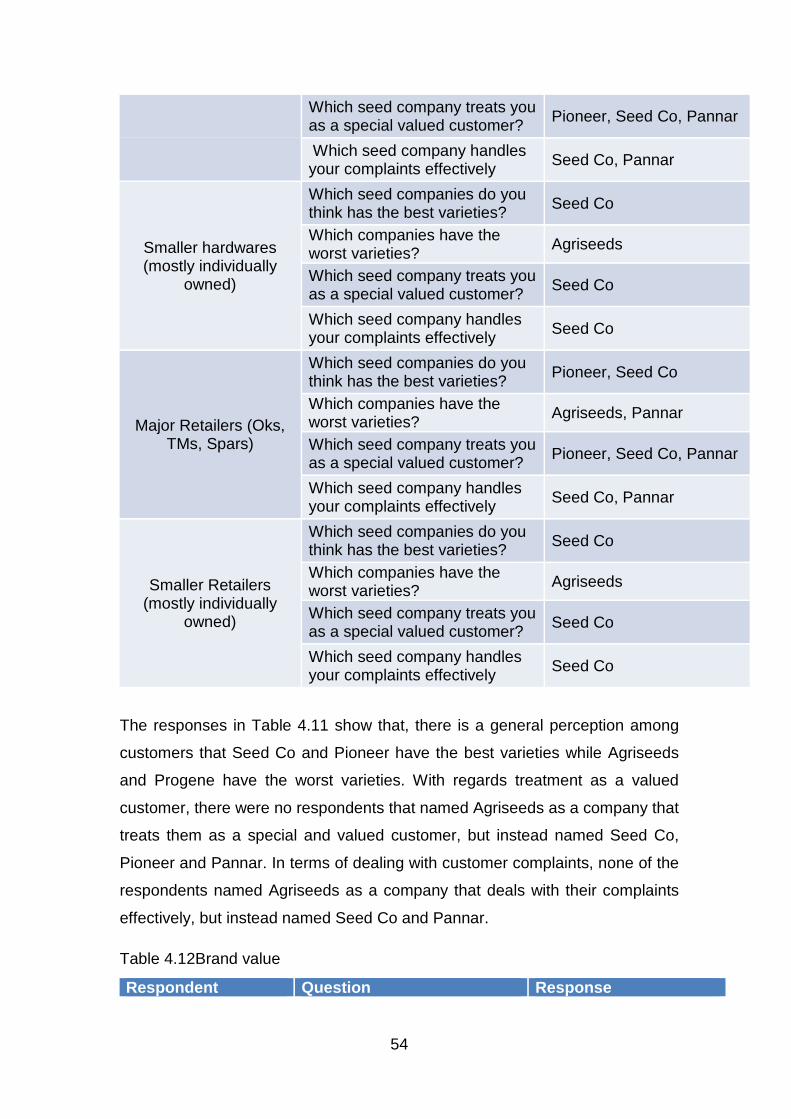
54
Which seed company treats you as a special valued customer? Pioneer, Seed Co, Pannar
Which seed company handles your complaints effectively Seed Co, Pannar
Smaller hardwares (mostly individually
owned)
Which seed companies do you think has the best varieties? Seed Co
Which companies have the worst varieties?
Agriseeds
Which seed company treats you as a special valued customer? Seed Co
Which seed company handles your complaints effectively Seed Co
Major Retailers (Oks, TMs, Spars)
Which seed companies do you think has the best varieties? Pioneer, Seed Co
Which companies have the worst varieties?
Agriseeds, Pannar
Which seed company treats you as a special valued customer? Pioneer, Seed Co, Pannar
Which seed company handles your complaints effectively Seed Co, Pannar
Smaller Retailers (mostly individually
owned)
Which seed companies do you think has the best varieties? Seed Co
Which companies have the worst varieties?
Agriseeds
Which seed company treats you as a special valued customer? Seed Co
Which seed company handles your complaints effectively Seed Co
The responses in Table 4.11 show that, there is a general perception among
customers that Seed Co and Pioneer have the best varieties while Agriseeds
and Progene have the worst varieties. With regards treatment as a valued
customer, there were no respondents that named Agriseeds as a company that
treats them as a special and valued customer, but instead named Seed Co,
Pioneer and Pannar. In terms of dealing with customer complaints, none of the
respondents named Agriseeds as a company that deals with their complaints
effectively, but instead named Seed Co and Pannar.
Table 4.12Brand value
Respondent Question Response

55
Larger Hardwares (Farm & City, N. Richards)
Which seed has the most expensive seed?
Pioneer
Do you think the seed provides value for money Yes
Please explain?
When you grow the varieties they give high yields if all the procedures are followed
Smaller hardwares (mostly individually
owned)
Which seed has the most expensive seed? Seed Co
Do you think the seed provides value for money Yes
Please explain?
Farmers believe that Seed Co varieties yield well and they germinate well
Major Retailers (Oks, TMs, Spars)
Which seed has the most expensive seed? Pioneer
Do you think the seed provides value for money Yes
Please explain? When you grow the varieties they give high yields
Smaller Retailers (mostly individually
owned)
Which seed has the most expensive seed?
Seed Co
Do you think the seed provides value for money Yes
Please explain? Farmers say that they get good yields with Seed Co varieties
Table 4.12 shows that, none of the respondents named Agriseeds as a
supplier of the most expensive seed on the market, but instead naming
Pioneer and Seed Co. However, all respondents felt that although Pioneer and
Seed Co have the most expensive seed on the market, the seed provides
value for money as it gives high yields, the seed of high quality and farmers
prefer their varieties.
Table 4.13 Perception on seed cost
Respondent Question Response

56
Larger Hardwares (Farm & City, N. Richards)
Which seed company has the least expensive seed? Agriseeds, Progene, ARDA
Smaller hardwares (mostly individually owned)
Which seed company has the least expensive seed?
Agriseeds
Major Retailers (Oks, TMs, Spars)
Which seed company has the least expensive seed? Agriseeds
Smaller retailers (mostly individually owned)
Which seed company has the least expensive seed?
Agriseeds
The responses in Table 4.13 show that all respondents named Agriseeds as
the supplier of the least expensive seed on the market. This is true mainly
because Agriseeds prices its products at on average 22% (hybrids) lower than
its major competitors, Seed Co, Pannar, Pioneer. Agriseeds also sells OPVs,
which are priced at 83% lower than the cost of hybrid seeds, the only varieties
sold by its major competitors, Seed Co, Pioneer and Pannar.
Table 4.14 Role of seed packaging in seed marketing and sales Respondent Question Response
Larger Hardwares (Farm & City, N. Richards)
Do you think packaging plays an important role in seed marketing?
Yes It appeals to customers It communicates very important information
Smaller hardwares (mostly individually
owned)
Do you think packaging plays an important role in seed marketing?
Yes It appeals to customers Makes seed handling easy
Major Retailers (Oks, TMs, Spars)
Do you think packaging plays an important role in seed marketing?
Yes It appeals to customers Communicates information
Smaller Retailers (mostly individually
owned)
Do you think packaging plays an important role in seed marketing?
Yes Good for handling seed
Table 4.14 shows that, all respondents felt that seed packaging has a role to
play in the marketing of seed in Zimbabwe. The main reason being that it can
be used to appeal to customers and that it communicates very important
information to customers and that it allows easy seed handling. All respondents
named Agriseeds as the company with the best packaging. The main reason
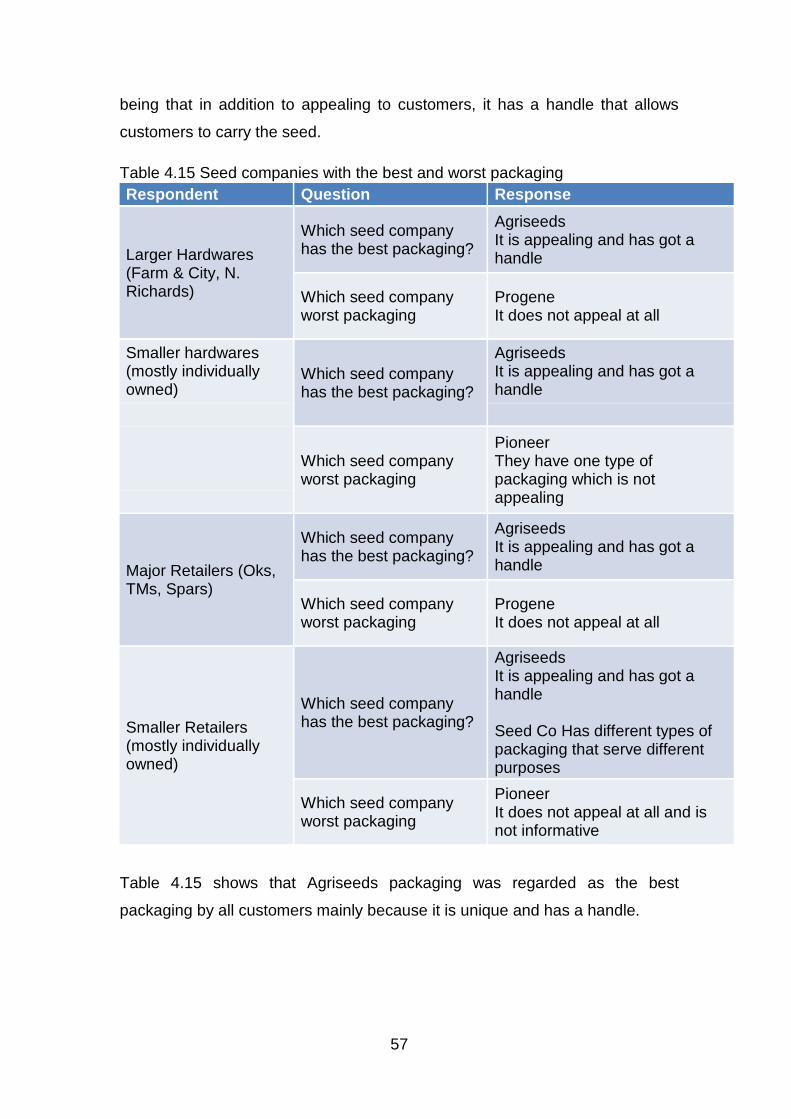
57
being that in addition to appealing to customers, it has a handle that allows
customers to carry the seed.
Table 4.15 Seed companies with the best and worst packaging Respondent Question Response
Larger Hardwares (Farm & City, N. Richards)
Which seed company has the best packaging?
Agriseeds It is appealing and has got a handle
Which seed company worst packaging
Progene It does not appeal at all
Smaller hardwares (mostly individually owned)
Which seed company has the best packaging?
Agriseeds It is appealing and has got a handle
Which seed company worst packaging
Pioneer They have one type of packaging which is not appealing
Major Retailers (Oks, TMs, Spars)
Which seed company has the best packaging?
Agriseeds It is appealing and has got a handle
Which seed company worst packaging
Progene It does not appeal at all
Smaller Retailers (mostly individually owned)
Which seed company has the best packaging?
Agriseeds It is appealing and has got a handle Seed Co Has different types of packaging that serve different purposes
Which seed company worst packaging
Pioneer It does not appeal at all and is not informative
Table 4.15 shows that Agriseeds packaging was regarded as the best
packaging by all customers mainly because it is unique and has a handle.
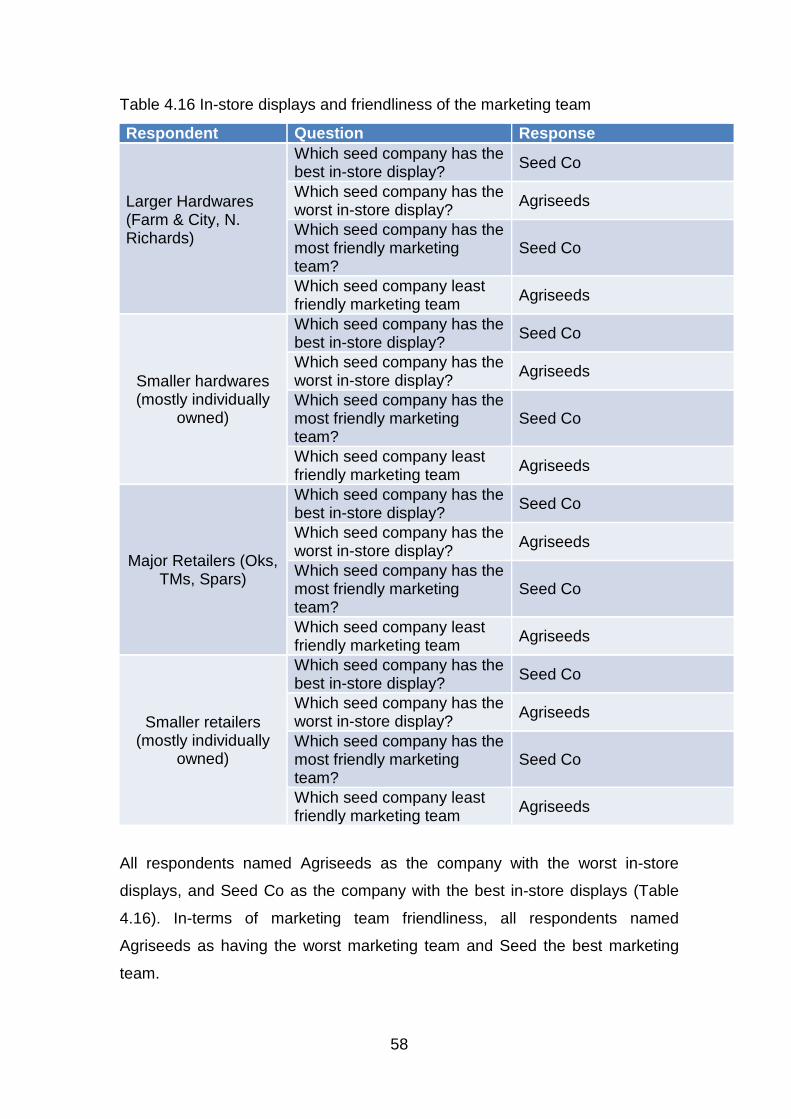
58
Table 4.16 In-store displays and friendliness of the marketing team
Respondent Question Response
Larger Hardwares (Farm & City, N. Richards)
Which seed company has the best in-store display? Seed Co
Which seed company has the worst in-store display?
Agriseeds
Which seed company has the most friendly marketing team?
Seed Co
Which seed company least friendly marketing team Agriseeds
Smaller hardwares (mostly individually
owned)
Which seed company has the best in-store display?
Seed Co
Which seed company has the worst in-store display?
Agriseeds
Which seed company has the most friendly marketing team?
Seed Co
Which seed company least friendly marketing team Agriseeds
Major Retailers (Oks, TMs, Spars)
Which seed company has the best in-store display?
Seed Co
Which seed company has the worst in-store display? Agriseeds
Which seed company has the most friendly marketing team?
Seed Co
Which seed company least friendly marketing team
Agriseeds
Smaller retailers (mostly individually
owned)
Which seed company has the best in-store display? Seed Co
Which seed company has the worst in-store display? Agriseeds
Which seed company has the most friendly marketing team?
Seed Co
Which seed company least friendly marketing team
Agriseeds
All respondents named Agriseeds as the company with the worst in-store
displays, and Seed Co as the company with the best in-store displays (Table
4.16). In-terms of marketing team friendliness, all respondents named
Agriseeds as having the worst marketing team and Seed the best marketing
team.
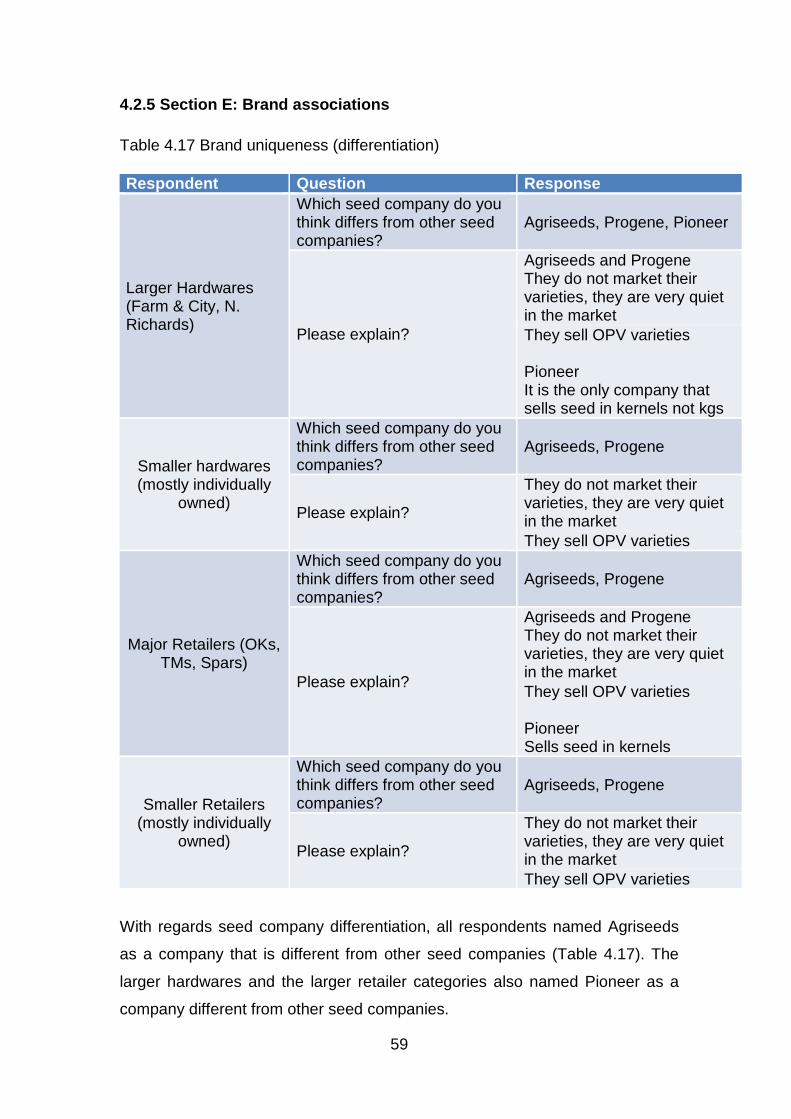
59
4.2.5 Section E: Brand associations
Table 4.17 Brand uniqueness (differentiation)
Respondent Question Response
Larger Hardwares (Farm & City, N. Richards)
Which seed company do you think differs from other seed companies?
Agriseeds, Progene, Pioneer
Please explain?
Agriseeds and Progene They do not market their varieties, they are very quiet in the market They sell OPV varieties Pioneer It is the only company that sells seed in kernels not kgs
Smaller hardwares (mostly individually
owned)
Which seed company do you think differs from other seed companies?
Agriseeds, Progene
Please explain?
They do not market their varieties, they are very quiet in the market They sell OPV varieties
Major Retailers (OKs, TMs, Spars)
Which seed company do you think differs from other seed companies?
Agriseeds, Progene
Please explain?
Agriseeds and Progene They do not market their varieties, they are very quiet in the market They sell OPV varieties Pioneer Sells seed in kernels
Smaller Retailers (mostly individually
owned)
Which seed company do you think differs from other seed companies?
Agriseeds, Progene
Please explain?
They do not market their varieties, they are very quiet in the market They sell OPV varieties
With regards seed company differentiation, all respondents named Agriseeds
as a company that is different from other seed companies (Table 4.17). The
larger hardwares and the larger retailer categories also named Pioneer as a
company different from other seed companies.
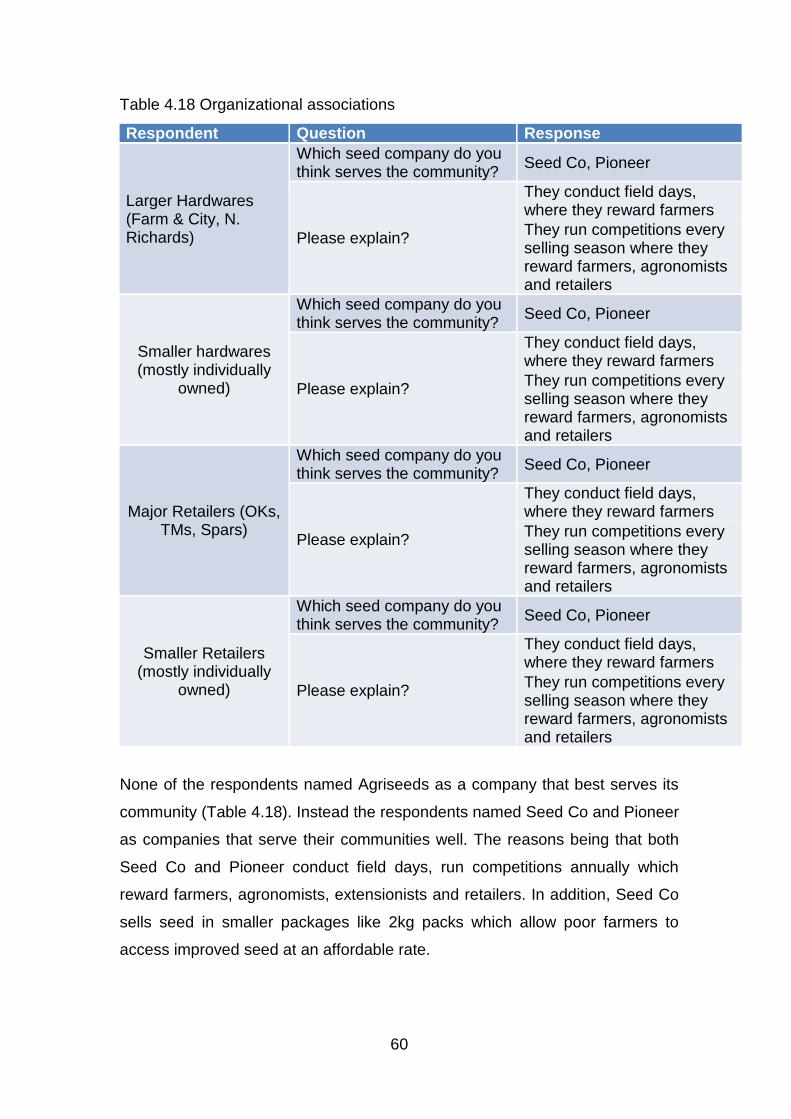
60
Table 4.18 Organizational associations
Respondent Question Response
Larger Hardwares (Farm & City, N. Richards)
Which seed company do you think serves the community? Seed Co, Pioneer
Please explain?
They conduct field days, where they reward farmers They run competitions every selling season where they reward farmers, agronomists and retailers
Smaller hardwares (mostly individually
owned)
Which seed company do you think serves the community? Seed Co, Pioneer
Please explain?
They conduct field days, where they reward farmers They run competitions every selling season where they reward farmers, agronomists and retailers
Major Retailers (OKs, TMs, Spars)
Which seed company do you think serves the community? Seed Co, Pioneer
Please explain?
They conduct field days, where they reward farmers They run competitions every selling season where they reward farmers, agronomists and retailers
Smaller Retailers (mostly individually
owned)
Which seed company do you think serves the community? Seed Co, Pioneer
Please explain?
They conduct field days, where they reward farmers They run competitions every selling season where they reward farmers, agronomists and retailers
None of the respondents named Agriseeds as a company that best serves its
community (Table 4.18). Instead the respondents named Seed Co and Pioneer
as companies that serve their communities well. The reasons being that both
Seed Co and Pioneer conduct field days, run competitions annually which
reward farmers, agronomists, extensionists and retailers. In addition, Seed Co
sells seed in smaller packages like 2kg packs which allow poor farmers to
access improved seed at an affordable rate.

61
4.2.6 Section F: Brand equity
Table 4.19 Overall brand equity
Respondent Question Response
Larger Hardwares (Farm & City, N. Richards)
If all seed companies were offering the same mark-up (5 or 10%, which seed company would you choose?
Pioneer
Please explain? It has high yielding varieties
Smaller hardwares (mostly individually
owned)
If all seed companies were offering the same mark-up (5 or 10%, which seed company would you choose?
Pioneer
Please explain? It has high yielding varieties
Major Retailers (OKs, TMs, Spars)
If all seed companies were offering the same mark-up (5 or 10%, which seed company would you choose?
Pioneer
Please explain? It has high yielding varieties
Smaller Retailers (mostly individually
owned)
If all seed companies were offering the same mark-up (5 or 10%, which seed company would you choose?
Pioneer
Please explain? It has high yielding varieties
The larger hardware category is willing to pay more to acquire Pioneer seeds
than any other company products (Table 4.19). It shows that there is a 5-10%
premium that Pioneer seeds can get due to the perception that it has high
yielding and good quality seeds compared to other seed companies.
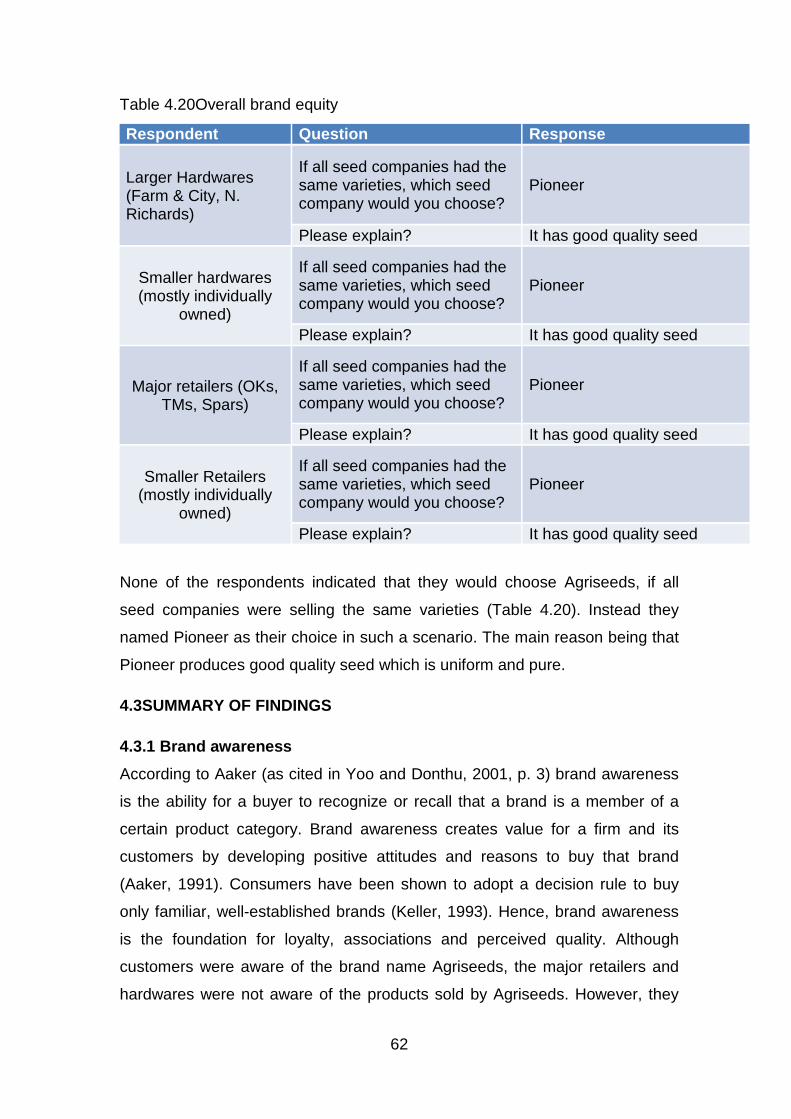
62
Table 4.20Overall brand equity
Respondent Question Response
Larger Hardwares (Farm & City, N. Richards)
If all seed companies had the same varieties, which seed company would you choose?
Pioneer
Please explain? It has good quality seed
Smaller hardwares (mostly individually
owned)
If all seed companies had the same varieties, which seed company would you choose?
Pioneer
Please explain? It has good quality seed
Major retailers (OKs, TMs, Spars)
If all seed companies had the same varieties, which seed company would you choose?
Pioneer
Please explain? It has good quality seed
Smaller Retailers (mostly individually
owned)
If all seed companies had the same varieties, which seed company would you choose?
Pioneer
Please explain? It has good quality seed
None of the respondents indicated that they would choose Agriseeds, if all
seed companies were selling the same varieties (Table 4.20). Instead they
named Pioneer as their choice in such a scenario. The main reason being that
Pioneer produces good quality seed which is uniform and pure.
4.3SUMMARY OF FINDINGS
4.3.1 Brand awareness
According to Aaker (as cited in Yoo and Donthu, 2001, p. 3) brand awareness
is the ability for a buyer to recognize or recall that a brand is a member of a
certain product category. Brand awareness creates value for a firm and its
customers by developing positive attitudes and reasons to buy that brand
(Aaker, 1991). Consumers have been shown to adopt a decision rule to buy
only familiar, well-established brands (Keller, 1993). Hence, brand awareness
is the foundation for loyalty, associations and perceived quality. Although
customers were aware of the brand name Agriseeds, the major retailers and
hardwares were not aware of the products sold by Agriseeds. However, they

63
could recall products from Agriseeds competitors such as Seed Co,
Pioneer,Pannar. The customers that recalled Agriseeds products recalled only
R201, ZM521 and OPVs as varieties sold by Agriseeds. This shows that
customers are not aware of new varieties registered by Agriseedssuch ZAP51,
ZAP61 and AGS41 that are as high yielding as products from the major
competitors, Seed Co and Pioneer (ART Farm, 2012).
Kotler and Keller (2006, p. 278) found that it is possible to “overspend” on
brand building if money is not spent wisely as in the case of beverage
companies such as Michelob, Miller and Lite. Their sales declined in the 1990s
despite sizeable marketing support because of poorly targeted and delivered
marketing campaigns. Despite increasing the marketing budget from 27% to
about 35%, having ambassadors and merchandisers in shops, changing
packing to appeal customers cannot recall Agriseeds product names. Through
a well executed “Got Milk” campaign, California Milk Processor Board
managed to increase milk consumption despite being outspent by beverage
brands such as Coca-Cola, Pepsi and Budweiser (Kotler and Keller, 2006, p.
278). It is therefore not the quantity of investment in brand building that is a
critical factor but rather the quality. The objective of increasing awareness is
therefore to generate brand recall and recognition attitudes that generate
favourable intentions.
Customers that could not recall the names of Seed Co varieties, they recalled
“tsoko” “mbizi”, “nzou” which are Seed Co brand names for their maize
products. Given the fact that there are lot of varietal names on the market,
Seed Co adopted an “animal concept” to name its varieties according to
maturity. This was done to simplify decision making at the time of purchase
and allow farmers to recall products that they had experienced previously or
what their colleagues had experienced previously. According to Keller (1993, p.
3) brand awareness relates to the likelihood that a brand name will come to
mind and the ease with which it does so. He also defined brand recognition as
consumers ability to confirm prior exposure to the brand when given the brand
as a cue. Given the fact that there are more than eighty-five registered
varieties in Zimbabwe and farmers have to choose varieties and decisions are

64
made in-store at times, such innovation assist farmers select their favourite
varieties.
According to Hilgenkamp and Shanteau (2010), knowledge of a brand name
helps to increase perceptions of quality as long as it is a brand with a higher
brand value. This implies that knowledge of the brand alone does not imply
high brand equity, but it should be associated with higher brand value for it to
generate favourable purchase intentions. According to Pappu and Quester
(2006), customers highly satisfied with a firm, may recall the name of the brand
readily, compared to customers who are less satisfied. However, they further
pointed that customers who are strongly dissatisfied may in fact exhibit higher
brand awareness quite possibly because of the dissatisfaction. At some point
Pannar became popular for selling varieties that are easily weeviled.This
implies that farmers that were dissatisfied with varieties from this company
exhibited high brand awareness.
This study also found that Seed Co and Pioneer are top of the mind brands for
customers implying that at any given opportunity customers feel more
comfortable in ordering from these seed companies. These findings confirm
the relative market shares found in the Zimbabwean seed industry as depicted
in Figure 1 above.
4.3.2 Brand loyalty
Brand loyalty looks at what makes customers consistently purchase one brand
over another. Aaker (1991) defined brand loyalty as a situation which reflects
how likely a customer would switch to another brand, especially when that
brand has made a change either in price or other product features. For
example, if a seed company develops a variety which is better than what the
customer is currently growing, what is the likelihood that the customer would
switch.Aaker (1996) proposed that brand loyalty can be measured through
price premium and satisfaction. Price premium is the amount a customer is
willing to pay for the brand in comparison with another brand offering similar
benefits (Fayrene and Lee, 2011, p. 39). Satisfaction was best defined by
Oliver (1999, p. 28) as the summary psychological state resulting when the

65
emotion surrounding disconfirmed expectation is coupled with prior feelings
about the consumer experience.
The results showed that, if all seed companies had the same variety, or were
selling at the same price, none of the customer groups named Agriseeds as
their choice. However, some customers indicated that they would choose
Pioneer because it produces good quality seed (uniform and less chaff).
Others indicated that they would choose Seed Co because it has a long history
and they trust the company. This shows that customers are more loyal to
Pioneer and Seed Co and are therefore willing to pay a premium to acquire
seed from these seed companies.
The results showed that customers were satisfied with seed companies that
had high sales volumes. They attributed this to good marketing teams, trust of
the companies by farmers, good seed germination (no complaints from
farmers). Customer satisfaction is an antecedent of brand loyalty because if
customers are not satisfied with a brand, they will not be loyal to the brand but
search for another brand (Kim et al, 2003, p. 339). Customer satisfaction is
known to lead to customer retention, and is believed to influence consumer
purchase intentions, repeat purchase behavior and willingness to pay a higher
price (Pappu and Quester, 2006, p. 5).Thus creating customer satisfaction
improves a firm’s economic performance.
Although all respondents indicated that they would want to continue ordering
seed from Agriseeds, it does not necessarily imply that they are loyal to
Agriseeds. This implies that in the event that another seed company comes on
board, or Agriseeds increases its price, customers might easily switch to the
new customer or other customers. However, customers are more loyal to
Pioneer and Seed Co, implying that they will be willing to pay a premium to
secure seed from these seed companies.
However, one needs to be careful in concluding that customers are loyal to
Seed Co and Pioneer, due to the “double jeopardy” theory. According to
Chaudhuri (1995), small market share brands are at a disadvantage relative to
66
large market share brands in two ways. This is because small market share
brands have fewer buyers and are purchased less frequently by these buyers
while large market share brands have more buyers and are purchased more
frequently by the same buyers. Higher market share brands tend to have
greater awareness and distribution support and therefore tend to demonstrate
greater levels of repeat purchasing behavior among their buyers. Attitudinally
as well, some people like popular (high market share brands) products more
than less popular ones (Chaudhuri, 1995, p. 27). Since, Seed Co and Pioneer
command higher markets shares (Figure 1.) than other seed companies they
might tend to be behaviorally or attitudinally advantaged over their competitors.
4.3.3 Perceived quality
According to Aaker (1996) perceived quality is one of the key dimensions of
brand equity because it has been shown to be associated with price premiums,
price elasticities, brand usage, and remarkably stock return. Perceived quality
can be divided into two factors, intrinsic attributes and extrinsic attributes
(Fayrene and Lee, 2011, p. 38). Intrinsic attributes look at the physical aspects
of a product (grain colour, grain yield, disease resistance and maturity) while
extrinsic attributes relate to the product but not the physical part (brand name,
price, and packaging).
The results showed that customers felt that Pioneer and Seed Co have high
yielding varieties, that are resistant to diseases, while Agriseeds and Pannar
have low yielding varieties, that produce small cobs, and are easily weeviled.
The results further showed that Pioneer has the most expensive seed and is
associated with high quality attributes while Agriseeds has the least expensive
seed but it is associated with low quality attributes. These results show that
customers in a seed industry generally assume that price and quality are highly
correlated and that as the price of a product increases, its quality increases
commensurately. According to Hilgenkamp and Shanteau, (2010, p. 563),
customers infer quality from price, that is, they compare the price of the current
product to the price of either another product or a price in memory. If the
current price is higher than the comparison price, then the current product is
perceived as higher quality. A product that is least expensive is looked at as
67
having lower quality than a product of a higher price.This implies that pricing
strategies have a bearing on the overall brand equity of a seed company.
To counter the lack of sensitivity that might come with perceived quality as a
measure of brand equity, Aaker (1996, p. 110) introduced a brand leadership
(or popularity) measure. Leadership captures the dynamic nature of markets.
The results showed that there were no customers that named Agriseeds as
either a leading or most innovative company in Zimbabwe. Instead customers
named Seed Coas the leading and most innovative brand in Zimbabwean. This
is because it was the first company to sell seed and has been there for many
years. This shows that Seed Co has a resource that cannot be imitated by
competitors, “path dependency”. There are resources that firms can have
because of what happened along the path of their development.Seed Co was
established by farmers in Zimbabwe and had long term partnerships with the
government. Neither, Agriseeds, Pioneer, Pannar nor any other seed company
can buy or create this resource easily or quickly even with expensive marketing
programs.Seed Co was also named the most innovative because of the new
varieties and innovative marketing strategies that it continuously brings on to
the market.
4.3.4Brand associations
Brand associations are consumer memory structures linked with a brand and
considered an important antecedent for a consumer’s purchasing behavior
(Ahmad and Butt, 2012, p. 10). According to the associative network model,
human memory consists of associative networks believed to consist of several
nodes (Pappu and Quester, 2006, p. 6). The results show that Seed Co and
Pioneer are nodes that are associated in the minds of customers with nodes
such as good seed quality, good varieties that yield very well, good marketing
campaigns and serving communities. In contrast, Agriseeds and Pannar are
associated with poor marketing, limited product information, poor varieties. In
order to win the minds of customers, seed companies need to generate
positive associations with their brands.
68
Uniqueness is defined as the degree to which customers feel the brand is
different from competing brands (Netemeyer et al, 2004, p. 211). If the brand is
not perceived to be unique from competitors, it will have a difficult time in
supporting a premium price relative to other brands. Agriseeds and
Progenewere named as companies which differ from other companies
because they sell both hybrids and OPVs while their major competitors Seed
Co, Pioneer and Pannar sell hybrids only. On the other hand, Pioneer was also
considered to be different from other seed companies because it sells seed in
kernels and not in kilograms as other seed companies. This is a key
differentiator for large scale farmers because they can calculate their seed
requirements based on the actual number of kernels. Since the size of kernels
differs some kilograms may have fewer or more kernels than others which may
complicate planting by commercial farmers. However, uniqueness can also
result in a company being associated with certain characteristics. Agriseeds
was named as unique brand because it sells OPVs, which are perceived by
customers to be of poor quality.
The results further show that Seed Co is associated with serving the
community well because it sells seed in small packs such as 2kg. This shows
that customers are not aware that Agriseeds also introduced small pack sizes
in 2010.
4.6 CONCLUSIONS
The chapter was mainly concerned with reporting and discussing research
findings, looking at their implications and link to literature.Thefindings above
show that customers are not aware of Agriseeds products, and if they recall
they only recall inferior products. However, the same customers are aware of
products from Agriseeds competitors. The findings also show that customers
who could not recall Seed Co varieties recalled the Seed Co brand names
“tsoko”, ”mbizi” and “nzou”. The findings also show that customers were
satisfied and were more loyal to Pioneer and Seed and thus were wiling to pay
more for these brands. The findings further show that customers were not
satisfied with Agriseeds, Progene and Pannar because of their poor marketing
activities, and poor varieties which produce small cobs and are easily weeviled.
69
CHAPTER 5
5.0 CONCLUSION& RECOMMENDATIONS
5.1 INTRODUCTION
In this chapter the researcher makes inferences and conclusions of the
research using the information obtained from the findings as discussed in the
previous chapter. Recommendations and areas of further study will also be
given in this chapter.
5.2 CONCLUSIONS
5.2.1 Brand awareness
The first objective of the study was to assess the level of Agriseeds brand
awareness amongst its customers. The first major finding from this study was
that although customers were aware of the Agriseeds brand, they could not
recall the names of varieties sold by Agriseeds. The other finding is that
customers that could not recall Seed Co varieties by name, could recall brand
names such as “tsoko”, “mbizi” and “nzou”. This shows that the animal concept
has allowed customers to recall and recognize Seed Co products.
5.2.2 Brand loyalty
The second objective of this study was to assess the level of Agriseeds brand
loyalty among customers. Another significant finding from this study was that
although customers were willing to continue ordering seed from Agriseeds,
they were not necessarily loyal to Agriseeds. They were in fact loyal to Pioneer
and Seed Co.
5.2.3Perceived quality
The third objective of the study was to assess the level of perceived quality of
Agriseeds brands among customers. The finding from this study is that the
Agriseeds brand has very low perceived quality. It has the least expensive
seed but has the worst varieties. Brands with high perceived quality were Seed
Co and Pioneer.
70
The study also found that customers infer product quality from the price. They
believe that price is positively correlated with quality, that is, as price of a
product increases its quality increases commensurately.
The study also found that customers generally felt Agriseeds does not have
any attributes that characterize a leading and innovative brand. Customers felt
that Seed Co and Pioneer were the leading and innovative brands
5.2.4 Brand associations
Generally customers associate Agriseeds with poor quality products and poor
marketing activities. Whenever they hear of Agriseeds they have these
negative associations with Agriseeds. However, the same customers associate
Seed Co, and Pioneer with good seed varieties, good marketing strategies and
good seed quality. This could explain some of the reasons why Agriseeds
products are not sold enough as the company could expect.
5.2.5 Test of the Research proposition
The research proposition is restated as follows:
The performance of Agriseeds is largely influenced by the level of brand equity
it commands on the market.
To a large extent the study confirms that the lack of growth in sales and
revenue is largely due to low levels of brand equity Agriseeds commands on
the market.
5.3 RECOMMENDATIONS
5.3.1 Brand awareness
Agriseeds needs to design their marketing strategy in a manner that gets the
brand into the prospect’s awareness set, which is finally transferred to the
choice set.The seed company must also learn which other brands remain in
the consumer choice set, so that it knows its competition and can plan its
appealsstragegy.
71
Agriseeds needs to revisit its product awareness strategy to improve its
performance. Agriseeds needs to invite its customers (retailers) to its field days
so that they are aware of varieties being sold by Agriseeds. Agriseeds also
needs to identify a branding concept similar to Seed Co’s “animal concept”
which will simplify decision making at the time of purchase. This is mainly
crucial when the customer’s best variety is not available or the customer has
forgotten the variety name that they want.
5.3.2 Brand loyalty
Given the importance of customer satisfaction in generating brand loyalty
which in turn creates opportunities for price premiums, it is important for
Agriseeds marketing managers to develop an understanding of the outcomes
of customer satisfaction. Some of the reasons for dissatisfaction amongst key
Agriseeds customers were that they were not invited to field days conducted by
Agriseeds. It is therefore important for Agriseeds to invite such key customers
so that they generate positive associations with the company.
There is also need to reassess the level of brand loyalty of Seed Co and
Pioneer brands as this might be affected by the “double jeopardy theory”.
5.3.3 Perceived quality
Given that customers in the Zimbabwean seed industry use price to infer
quality, Agriseeds management should adopt pricing policies that do not hurt
but instead build brand equity. Although there might be a need to balance
between several strategies, like use of penetration pricing to lure customers, it
might have a negative effect on the perception of customers and their overall
purchasing behavior.
Most customers did not name Agriseeds as a company that treats them as a
valued and special customer or deals with their customer complaints
effectively. It is therefore important for Agriseeds marketing team to identify
issues that will make customers feel that they are special and valued.
Addressing these issues will generate positive brand associations with the
Agriseeds brand. Agriseeds should also be at the forefront of dealing with
customer complaints effectively. These issues should be dealt with in such a

72
manner that when the node Agriseeds is activated in consumers memory,
positive association nodes are also reactivated.
5.3.3 Brand associations
Agriseeds has to come up with marketing strategies that generate positive
associations in the minds of customers if it is to improve performance.
5.4 STUDY LIMITATIONS AND AREAS FOR FURTHER RESEARC H
The research was based on a single case study which only focused on
Agriseeds customers. The results may be inconclusive since more solid
inferences can be made by looking at a broad spectrum of retailers and
hardwares involved in the retail of maize seed.
This study was conducted only in Harare despite the fact that seed is sold
across the country. Although most head offices are located in Harare, there are
some unique characteristics that can come from customers outside Harare
where most of the seed is grown.
This study did not look at the antecedents of brand equity such as marketing
mix elements, price, distribution, product on brand equity. This field has very
limited literature especially in the seed industry. Further research is therefore
required to look at the impact of marketing mix elements such as price,
distribution intensity, promotion, store on brand equity in a seed industry.
73
REFERENCES
Aaker, D. A., & Jacobson, R. (1994). Study shows brand building pay-offs for
stockholders. Advertising Age, 65(30): 18 – 33
Aaker, D. A. (1991). Managing brand equity. The Free Press, New York
Aaker, D. A. (1996). Measuring brand equity across products and markets.
Carlifornia Management Review, 38(3) 102 – 120
Ahmad, S., & Butt, M. (2006). Can after sales generate brand equity. Marketing
Intelligence and Planning 30(3), 1 – 33
Ailiwadi, K. L., Lehmann, D. R., &Neslin, S. A. (2003). Revenue premium as an
outcome measure of brand equity. Journal of Marketing, 67(4), 1-17
Ambler, T. (2003). Marketing and the bottom line: Creating the measures of
success. London Financial Times, Prentice Hall
Atilgan, E., Aksoy, S., &Akinci, S. (2005). Determinants of the brand equity. A
verification approach in the beverage industry in Turkey.Marketing Intelligence
and Planning, 23(3), 237 – 248
AWCG. (2011). Agriculture Coordination Working Group Journal, September
2011, Number 64
http://www.fao.org/fileadmin/templates/tc/tce/pdf/Zimb_Journal_Sep_2011.pdf
Bailey, R., & Ball, S. A. (2006). An exploration of the meanings of hotel brand
equity. The Service Industries Journal 26(1), 15 – 38
Barwise, P., Higson, C., Likierman, A., & Marsh, P. (1989). Accounting for
Brands. London Business School. London
Bedbury, S (2000). The Lawlor Review. Winter.66-67
74
Biel, A. L. (1992). How brand image drives brand equity. Journal of Advertising
Research, 9(1), 1 – 15
Broadbent, K., & Cooper, P. (1987). Research is Good for You. Marketing
Intelligence & Planning, 5(1): 3-9.
Bryman, A. (2006). Intergrating quantitative and qualitative research: how it is
done. Quantitaive Research, 6(1), 97-113
Buil, I. de Chernatony, L., & Martinez, E., (2008). A cross-national validation of
the consumer-based brand equity scale. Journal of Product and Brand
Management, 17(6), 384 - 392.
Chaudhuri, A. (1995). Brand equity or double jeopardy. Journal of Product and
Brand Management, 4(1), 26-32
Christodoulides, G., & de Chernatony, L. (2010). Customer-based brand equity
conceptualisation and measurement. A literature review. International Journal
of Marketing Research, 52(1), 43-66
Christodoulides, G., de Chernatony, L., Furrer, O., Shiu, E., &Abimbola, T.
(2006). Conceptualising and measuring the equity of online brands. Journal of
Marketing Management 7(8), 799 – 825
Cobb-Walgren, C. J., Ruble, C. A., &Donthu, N. (1995). Brand equity, brand
preference and purchase intent. Journal of Advertising, 24(3), 25-40
deChernatony, L. Harris, F., &Christodoulides, G. (2004). Developing a brand
performance measure of financial services brands. The Service Industries
Journal 24(2), 15 – 33
Dyson, P. Farr, A. & Hollis, N. S. (1996). Understanding, measuring, and using
brand equity. Journal of Advertising Research, 36(6), 9-21
75
Farquhar, P. H. (1989). Managing brand equity. Marketing Research, 1, 24-33
Fayrene, C., & Lee, G. C. (2011). Customer-based brand equity: A literature
review. Journal of Arts Science and Commerce, 2(1), 33-42
Gill, M, S., &Dawra, J. (2010). Evaluating Aaker's sources of brand equity and
the mediating role of brand image. Journal of Targetting, Measurement, and
Analysis of Marketing, 18(3), 189-198
Groves, R. M., Fowler, F. J., Couper, M. P., Lepowski, & Singer, E. (2004).
Survey Methodology. John Wiley & Sons. New Jersey
Henderson, P. W., & Cote, J. A. (1998). Guidelines for selecting or modifying
logos. Journal of Marketing, 62(1), 1 – 15
Herrmann, A. Huber, F., Shao, A. T., &Bao, Y. (2007). Building brand equity
via product quality. Total Quality Management, 18(5), 531 – 544
Hilgenkamp, H. &Shanteau, J. (2010). Functional measurement analysis of
brand equity. Does brand name affect perceptions of quality.Psicologica, 31(1),
561 – 575
Kamakura, W. A & Russell, G. J. (1993). Measuring brand value with scanner
data. International Journal of Research in Marketing, 10(1), 9 – 22
Kapferer, J. N. (1997). Strategic brand management.: Creating and sustaining
brand equity long term. Kpgan Page. 2nd Ed. London.
Keller, K. L. (1993). Conceptualising, measuring and managing customer-
based brand equity. Journal of Marketing, 57(1), 1-22
Kim, H., Kim, W. G., &An J. A. (2003). The effect of consumer-based brand
equity on firms' financial performance. Journal of Consumer Marketing, 20(4),
335 - 351
76
Kirmani, A., & Rao, A. R. (2000). No pain, no gain: A critical review of the
literature on signaling unobervable product quality. Journal of Marketing, 64(2),
66-79
Kocak, A., Abimbola, T., &Ozer, A. (2007). Consumer brand equity in a cross-
cultural replication: an evaluation of a scale. Journal of Marketing
Management, 23(1/2), 157-173
Kohil, C., &Suri, R. (2002). Creating effective logos. Insights from theory and
practice. Business Horizons, 45(3), 1 – 15
Kotler, P. H. (1991). Marketing management: Analysis, planning, and control.
(8thed.). Englewood Cliffs, NJ: Prentice-Hall, Inc.
Kotler, P., & Keller, K. L. (2006). Marketing management. Twelfth Edition.
Prentice Hall. New Jersey
Kumar, R. (1996). Research methodology. A step by step for beginners.
Longman. Australia
Lassar, W., Mittal, B. & Sharma, A. (1995). Measuring customer-based brand
equity. Journal of Consumer Marketing, 12(4), 4-11
Leedy, D.L. and Ormrod, J.E. 2005. Practical Research: Planning and Design,
New Jersey: Pearson Education Ltd.
Leuthesser, L., Kohli, C. S., &Harich, K. R. (1995). Brand equity: the halo effect
measure. European Journal of Marketing, 29(4), 57 – 66
Leuthesser, L. (1988). Defining, measuring and managing brand equity. A
conference summary. Marketing Science institute. Cambridge

77
Mark. N, Woodsong. C, Macqueen, K.M, Guest, G, &Namey, E, (2005).
Qualitative Research Methods: A collector’s field guide,Family Health
International
Mizik, N., & Jacobson, R. (2008). The financial value impact of perceptual
brand attributes. Journal of Marketing Research, 45(1), 15-32
Miles, M.D and Huberman, A.M. (1994), Qualitative Data Analysis: An
Expanded Sourcebook. Second Edition. Sage Publications, London.
Motameni, R &Shahrokhi, M. (1998). Brand equity valuation: a global
perspective. Journal of Product and Brand Management, 7(4), 275 – 290
Netemeyer, R. G., Krishnan, B., Pullig, C., Wang, G., Yagci, M., Dean, D.,
Ricks, J., & Wirth, F. (2004). Developing and validating measures of facets of
consumer-based brand equity. Journal of Business Research, 57(1/2), 209 –
224
Neuman, W.L., (2006).Social Research Methods, Qualitative and Quantitative
Approaches. Sixth Edition. Pearson International. Boston
O'Malley, D. (1991). Brand means business. Accountancy, 107(1), 107 – 108
Oliver, R. L. (1999). Whence consumer loyalty. Journal of Marketing,
63(Special issue), 33 – 44
Pappu, R., Quester, P. G., & Cooksey, R. W. (2005). Consumer-based brand
equity: improving the measurement- empirical evidence. Journal of Product
and Brand Management, 14(3), 143 – 154
Pappu, R.,& Quester, P. (2006). Does customer satisfaction lead to improved
brand equity? An empirical examination of two categories of retail brands.
Journal of Product and Brand Management, 15(1), 4 – 14
78
Park, C., & Srinivasan, V. (1994). A survey-based method for measuring and
understanding brand equity and its extendability. Journal of Marketing
Research, 31(1), 271-288
Park, C., Whan, B. J.J., and Deborah J. MacInnis. (1986). Strategic Brand
Concept Image Management. Journal of Marketing, 50(6), 1 – 35.
Phillips, P. (1998). Buying a Brand: What You Can’t See Can Hurt You. Design
Management Journal ,43 – 46.
Pixley, K &Banziger, M, 2001. Open pollinated maize varieties: A backward
step or a valuable option for farmers? Proceedings of the Seventh Eastern and
Southern Africa Regional Maize Conference, 11–15 February, Nairobi.
www.cimmyt.org/english/docs/proceedings /africa/pdf/7_Pixley.pdf. Accessed
10 July 2012
Pride, W. M., & Ferrell, O. C. (2003). Marketing. Concepts and strategies.
Houghton Mifflin Company. Boston
Punch, K. F. (2005). Introduction to social research: Quantitative and
qualitative approaches. Sage Publications. London
Punj, G. N., &Hillyer, C. L. (2004). A cognitive model of consumer based brand
equity for frequently purchased products. Conceptual framework and empirical
results. Journal of Consumer Psychology, 14(1/2), 124 – 131
Rangaswamy, A., Burke, R. R., &Oliva, T. A. (1993). Brand equity and the
extendability of brand names. International Journal of Research in Marketing,
10(1), 61-75
Saunders, D., Lewis, P. &Thornhill, A. (1997). Research methods for business
students. Pitman Publishing. London
79
Salant, P and D.A Dillman (1994)How to Conduct Your Own Survey. John
Willy & Sons Inc
Shankar, V., Azar, P., & Fuller, M. (2008). BRAN*EQT: a multicategory brand
equity model and its application at Allstate. Marketing Science, 27(4), 567-584
Silverman, D., (2000).Doing qualitative research. A practical handbook. Sage
Publications, London.
Simon, C. J., & Sullivan, M. W. (1993). The measurement and determinants of
brand equity: a financial approach. Marketing Science, 12(1), 28-52
Srinivasan, V., Park, C. S., & Chang, D. R. (2005). An approach to the
measurement, analysis, and prediction of brand equity and its sources.
Management Science, 51(9), 1433-1448
Srinivasan, V. (1979). Network models for estimating brand-specific effects in
multi-attribute marketing models. Management Science, 25(1), 11-21
Swait, J., Ederm, T., Louviere, J. &Dubelaar, C. (1993). The equalisation price:
a measure of consumer percieved brand equity. International Journal of
Research in Marketing, 10(1), 23 – 45
Vazquez, R., Rio, A. B., & Iglesias, V. (2002). Consumer-based brand equity:
Development and validation of a measurement instrument. Journal of
Marketing Management, 18(1/2), 27-48
Webster, F. E. Jnr and Keller, K. L (2004). A roadmap for branding in industrial
markets. Brand Management, 11(5), 388 – 402
White. B, (2000). Dissertation Skills for Business and Management Students,
Continuum

80
Wilson. A, (2006), Marketing Research: An integrated Approach, 2nd Edition,
Prentice Hall.
Wood, L. (2000). Brands and brand equity: definition and management.
Management Decision, 38(9), 662-669
Yin, R. K. (1994). Case study research. Design and methods. Second Edition.
Thousand Oaks. Carlifonia
Yin, R. K. (2003). Case study research. Design and methods. Third Edition.
Applied Social Research Methods Series 5. Sage Publications. Carlifornia
Yoo, B., &Donthu, N. (2001) Developing and validating a multi-dimensional
consumer-based brand equity scale. Journal of Business Research, 52, 1-14
Yoo, B., Donthu, N. & Lee, S. (2000). An examination of selected marketing
mix elements of brand equity. Journal of the Academy of Marketing Science,
28, 195-211
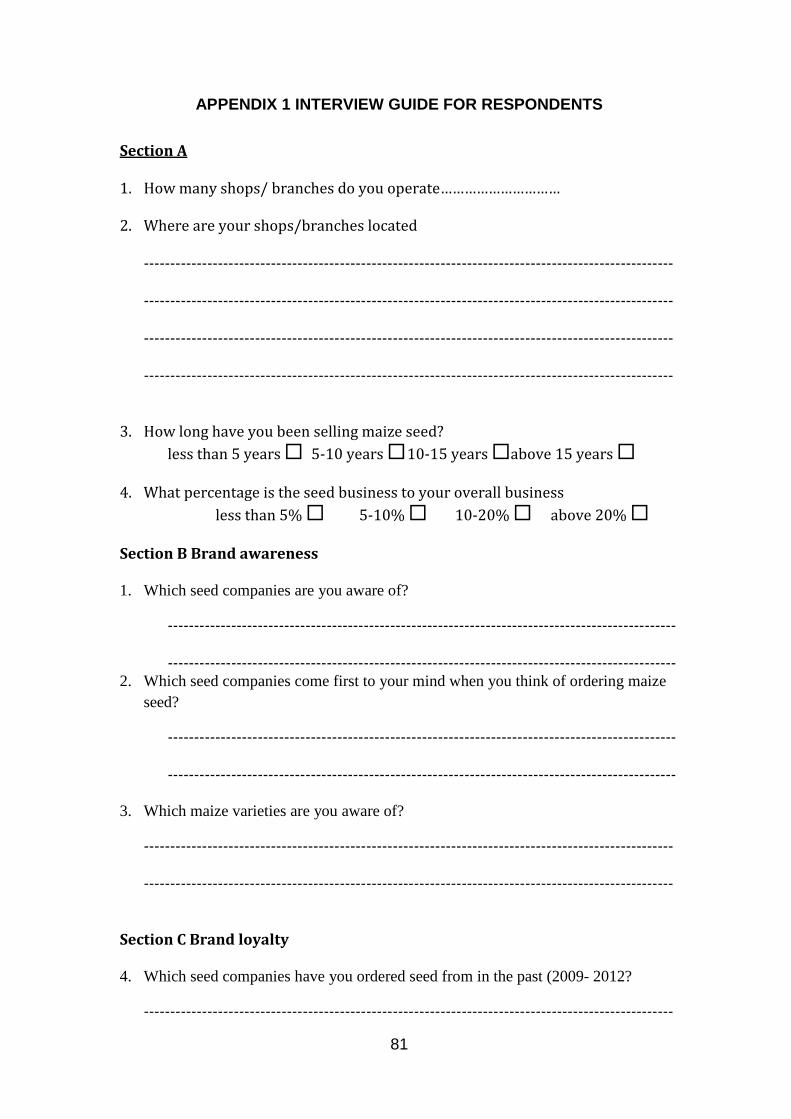
81
APPENDIX 1 INTERVIEW GUIDE FOR RESPONDENTS
Section A
1. How many shops/ branches do you operate…………………………
2. Where are your shops/branches located
----------------------------------------------------------------------------------------------------
----------------------------------------------------------------------------------------------------
----------------------------------------------------------------------------------------------------
----------------------------------------------------------------------------------------------------
3. How long have you been selling maize seed?
less than 5 years � 5-10 years � 10-15 years �above 15 years �
4. What percentage is the seed business to your overall business
less than 5% � 5-10% � 10-20% � above 20% �
Section B Brand awareness
1. Which seed companies are you aware of?
------------------------------------------------------------------------------------------------
------------------------------------------------------------------------------------------------ 2. Which seed companies come first to your mind when you think of ordering maize
seed?
------------------------------------------------------------------------------------------------
------------------------------------------------------------------------------------------------ 3. Which maize varieties are you aware of?
----------------------------------------------------------------------------------------------------
----------------------------------------------------------------------------------------------------
Section C Brand loyalty
4. Which seed companies have you ordered seed from in the past (2009- 2012?
----------------------------------------------------------------------------------------------------

82
----------------------------------------------------------------------------------------------------
5. Of the seed companies you have ordered from, which seed companies would you
continue ordering seed from?
----------------------------------------------------------------------------------------------------
6. Of the seed companies you have ordered from, which seed companies would you discontinue ordering seed from?
----------------------------------------------------------------------------------------------------
7. Please explain, why you would discontinue ordering seed from this/these seed companies?
----------------------------------------------------------------------------------------------------
----------------------------------------------------------------------------------------------------
----------------------------------------------------------------------------------------------------
----------------------------------------------------------------------------------------------------
8. Which seed companies were you satisfied with?
----------------------------------------------------------------------------------------------------
----------------------------------------------------------------------------------------------------
9. Please explain, why you were satisfied?
----------------------------------------------------------------------------------------------------
----------------------------------------------------------------------------------------------------
----------------------------------------------------------------------------------------------------
----------------------------------------------------------------------------------------------------
----------------------------------------------------------------------------------------------------
10. Which seed companies were you dissatisfied with?
----------------------------------------------------------------------------------------------------
----------------------------------------------------------------------------------------------------
11. Please explain, why you were dissatisfied?

83
----------------------------------------------------------------------------------------------------
----------------------------------------------------------------------------------------------------
----------------------------------------------------------------------------------------------------
----------------------------------------------------------------------------------------------------
----------------------------------------------------------------------------------------------------
12. In your opinion, which seed company do you think is the leading brand?
----------------------------------------------------------------------------------------------------
13. Please explain, why you think its leading?
----------------------------------------------------------------------------------------------------
----------------------------------------------------------------------------------------------------
----------------------------------------------------------------------------------------------------
14. In your opinion, which seed company do you think is innovative?
----------------------------------------------------------------------------------------------------
15. Please explain, why you think its innovative?
----------------------------------------------------------------------------------------------------
----------------------------------------------------------------------------------------------------
----------------------------------------------------------------------------------------------------
Section D Perceived Quality
16. Which seed company do you think has the best maize varieties?
----------------------------------------------------------------------------------------------------
17. Which seed company do you think has the worst maize varieties?
----------------------------------------------------------------------------------------------------
18. Which seed company (or companies) treats you as a special valued customer?
----------------------------------------------------------------------------------------------------
19. Which seed company (or companies) handles your complaints effectively?

84
---------------------------------------------------------------------------------------------------- Section E Brand Associations
20. Which seed company has the most expensive seed?
----------------------------------------------------------------------------------------------------
21. Do you think the seed provides value for money? yes � no �
please explain ----------------------------------------------------------------------------------------------------
----------------------------------------------------------------------------------------------------
----------------------------------------------------------------------------------------------------
22. Which seed company has the least expensive seed?
----------------------------------------------------------------------------------------------------
23. Do you think packaging plays an important role in seed marketing? yes � no
�
please explain ----------------------------------------------------------------------------------------------------
----------------------------------------------------------------------------------------------------
----------------------------------------------------------------------------------------------------
24. Which seed company has the best packaging?
----------------------------------------------------------------------------------------------------
25. Which seed company has the worst packaging?
----------------------------------------------------------------------------------------------------
26. Which seed company had the best in-store display?
----------------------------------------------------------------------------------------------------
27. Which seed company had the worst in-store display?
----------------------------------------------------------------------------------------------------
28. Which seed company has the most friendly marketing team?
----------------------------------------------------------------------------------------------------
85
29. Which seed company has the least friendly marketing team?
----------------------------------------------------------------------------------------------------
Section F Brand equity
30. If all seed companies were offering a 5% mark-up on their seed which seed
company would you choose, and why?
----------------------------------------------------------------------------------------------------
----------------------------------------------------------------------------------------------------
----------------------------------------------------------------------------------------------------
31. If all seed companies had the same varieties, which seed company would you choose, and why?
----------------------------------------------------------------------------------------------------
----------------------------------------------------------------------------------------------------
----------------------------------------------------------------------------------------------------
32. Which seed company do you think differs from other seed companies?
---------------------------------------------------------------------------------------------------- please explain ----------------------------------------------------------------------------------------------------
----------------------------------------------------------------------------------------------------
---------------------------------------------------------------------------------------------------- 33. Which seed company (or companies) do you think serves the community?
----------------------------------------------------------------------------------------------------
please explain ----------------------------------------------------------------------------------------------------
----------------------------------------------------------------------------------------------------
-----------------------------------------------------------------------------------------------------
Copyright © 2022 FDOKUMEN