Zimbabwe An Industrial Sector Memorandum
189
Report No. 6349-ZIM Zimbabwe An Industrial Sector Memorandum May 22, 1987 Industrial Development andFinance Division Eastern and Southern Africa Region FOR OFFICIAL USEONLY Document of theWorldBank This document has arestricted distribution andmay be used by recipients onlyin theperformance of theirofficial duties. Its contents may not otherwise bedisclosed without World Bank authorization. Public Disclosure Authorized Public Disclosure Authorized Public Disclosure Authorized Public Disclosure Authorized Public Disclosure Authorized Public Disclosure Authorized Public Disclosure Authorized Public Disclosure Authorized
-
Upload
khangminh22 -
Category
Documents
-
view
0 -
download
0
Transcript of Zimbabwe An Industrial Sector Memorandum

Report No. 6349-ZIM
ZimbabweAn Industrial Sector MemorandumMay 22, 1987
Industrial Development and Finance DivisionEastern and Southern Africa Region
FOR OFFICIAL USE ONLY
Document of the World Bank
This document has a restricted distribution and may be used by recipientsonly in the performance of their official duties. Its contents may not otherwisebe disclosed without World Bank authorization.
Pub
lic D
iscl
osur
e A
utho
rized
Pub
lic D
iscl
osur
e A
utho
rized
Pub
lic D
iscl
osur
e A
utho
rized
Pub
lic D
iscl
osur
e A
utho
rized
Pub
lic D
iscl
osur
e A
utho
rized
Pub
lic D
iscl
osur
e A
utho
rized
Pub
lic D
iscl
osur
e A
utho
rized
Pub
lic D
iscl
osur
e A
utho
rized

CtRR!NCY aQUIVA- lS
Currency Unit
Zimbabwean Dollar (Z$)
Exchange Rates
Calendar 1985 February 1987
US$ 1.00 Z$ 1.61 US$1.00 = Z$1.63Z$1.00 US$ 0.62 Z$1.00 - LTS$0.61
Fiscal Year
July 1 to June 30
GLOSSARY OF ABBREVIATIONS
AFC - Agricultural Finance CorporationAIPC - Agricultural Inputs Priority CommitteeAMA - Agricultural Marketing AuthorityCZI - Confederation of Zimbabwean IndustryELCC - External Loans Coordinating CommitteeFIC - Foreign Investment CommitteeIDC - Industrial Development CorporationIPC - Investment Projects CommitteeMIT - Ministry of Industry and TechnologyNCD - Negotiable Certificate of DepositOPIC - Overseas Private Investment CorporationRBZ - Reserve Bank of ZimbabweSABLE - Sable Chemicals Industries, Ltd.UDI - Unilateral Declaration of IndependenceZDB - Zimbabwe Development BankZFC - Zimbabwe Fertilizer Co., Ltd.ZIMPHOS- Zimbabwe Phosphate Industries, Ltd.ZISCO - Zimbabwe Iron and Steel Co.

- 1- BFOR OMCIAL USE ONLY
AN INDUSTRIAL SECTOR M1(ORANDUN
TABL! OF CONTENTS
Page No
PART 1: MXCUTIVE SUHARY x - xxiv
INTEODUCTION .......... , 1
PART 2: MAIN RKPORT
I1. HISTORICAL BACKGROUND ........................ ***** , 3
The Initial Push: World War II ........................... 3The Federation of Rhodesia and Nyasaland, 1953-1963.."460.... 4Unilateral Declaration of Independence, 1965-808.............. 5Economic Policies and Performance during Sanctions............ 6
Policies ... ......... 6Performance .... , *..*.*.. .****.*** ** ***.**............... 8
Sources of Manufacturing Growth............................... 12Independence to the Present .................................. . . 13
II. PRESENT STRUCTURE OF THE MANUYFACTURING SECTOR ................ , 17
Size of Manufacturing Sector. .. .. . . , ...................... . .. 17Structure of Production by Subeector.......................... 17Financial Characteristics....... ........................... , 19Ownership and Geographical Location.......................... 21Manufacturing Employment ................................. , 21Import Dependence 25Manufactured Exotr.. 26Structure and Age of Capital Stock ......... 28Investment Lvl .......,,,, ,,,30
This report is based on the findings of an industrial sectormission that visited Zimbabwe during October-November, 1985. Mission memberswere: Messrs. Pedro Belli (economist, mission chief); Luciano Borin (chemicalengineer); Carl Dahlman (industrial economist); Reginald Grills (consultant,textile engineer); William Haraf (consultant, financial economist); WilliamHarvey (consultant, steel engineer). Messrs. Edward Mangan, (steel engineer),William Steel (industrial economist), and R. Venkateswaran, (financial analyst),contributed to the drafting of the report. Mr. Howard Pack (consultant,industrial economist) contributed to the analysis of the textile subsector.Ms. Hilda Luz Scioville typed the report.
This document has a restricted distribution and may be used by recipients only in the performanceof their official duties. Its contents may not otherwise be disclosed without World Bank authorization.

- iii -
Page No.
Choice of Technology. .. . . .. ... ..............e.. .. ......... . . ........ * 34
III. POLICy mNVIRO1fMNT ......................... 36
Introduction . ....... .......... . 36Foreign Exchange Allocation System............................. 36Exchange Rate Level and Exchange Rate Management .............. 37Investment Controls . ....... * * * * * * * * * ** S ........ 39Price Controls................... .......... ....... 41Trade Rele...............................44
Customs Duties .o..oo.....oo......o.........o........eo............. 44Export Incentives ................................. 44Financial Policy and its Impact on Industry................... 45Labor Las...............................47Effects of Control Systems on Industrial Incentives and
Performancee o*oooooooosooo*........ S,oo* 52Implicit Taxes and Subsidies............................... 52Transport Costs and Anti-Export Bias....................... 55
Uneven Sectoral Protectiono....... ... . . .o... .. o... .. o........... 57
IV* ZYMC"1ENCY ..o................................ o....soseesoooososo 60
Capital Output Ratios o......o....oo......o.....o..oo..o.........o... 60Protection and Domestic Resource Cost......................... 63Technical Efficiency in the Textile Subsector ................. 66
Economic Efficiency in the Textile Subsector............... 68Efficiency in Steel and Fertilizer Manufacturing.............. 69Problems with the Present System.............................. 70
V. FEODMMFNDATIONS 73
Alternative Policy Modifications 76A Second Best Alternative.6.6.5.5.. .o. .. .. 6 *e. .*... 81
PART 3: SUBSECTORAL STUDIES 83
VIe TEXTILES ......... ,84
Introductioloooosooooeosoosooeaoo neso 84Markets ~~~~~~~~~~~~~84

- iv -
Page No.
Garment Exports ........................ 85Machinery & Equ npment,. . , 85
Age of Machinery.......... *...... .... ***.es.*.. ,,,... . .e 85Conditions of Machinery.os e.g........,.,..,,,.*...,*.,...., 86
Quality of Management. .......................... 86Efficiency..,,,....................... ,..,,,..,,,...........,, ,. 87
Machine Efficienciese s.., e..s...... ........... g ,O, . ,. 87Labor Productvity ... . . . . g. .......... ,. g 88
Energy Utlization, .. ................ e,, 89Domestic Resource Cost ......... eg , , 90Relative Total Factor Productivity......................... 90
Constraints ......... , ,., ,., , 94
VII. FERTILIZERS .. ................ *5g. ,, ,,.,, .g.. 96
Introduction........................,,,, ,,,, ,,...... 96M a r k e ts.... egg e geeegge *5 eggs g 5 ee egggg.gge.e ..... s ggeeec e 96
5 ,.,,,,,,,,.... 555g55e5e *598
Sable Chemicals Industries, Ltd. (SABLE)....,,,,,,,,,......... 98Zimbabwe Phosphate Industries, Ltd. (ZIMPHOS) ..........gee.e. 99ZFC and Windmill .....Managementdmll. .. *5ee ............ .......... gg ee ge e. s s 100Economic Efficiency 101Constraints ...... gge...se...... esesee. 555C. 1 0 1eeggO
Pyrites. c.ge .5 .e..... sSce .g.g.. e.g e,.. .101Pricing Structure ..... ., . ... e ...... e , 102
CIII. STonL (ZIS.O) ............................................... 104
Historical Background. . e .e to. e .s e . ee e .. e. le 104General Description. . .... ... ..... .. ...... ,, ,., .104Markets. ................. e,,, C. ,,,,,,, geg.ggg ,gg 5e5e55g 105
Efficiency ...... . .e5e,, ,, ... eg.ee g *..ee.g*ae c ee.a.. 110
Technical Efficiency. gg.geggeg.e.. go gee. . e. .e. s ,ee 110Economic Efficiency ....... .. ....... 112
Constraints.. .. ssge..eg eeee*e.g...e.g ,,,.,, . 5e. .5 ,.,e 115
Alternative Possibilities for ZISC0 .. 115
STATISTICAL APPENDIX .. ,.g ..... g.. 118-164

- v -
LIST OF T3ZT TABLES
Page No.
CHAPTR 1:
I.1 Selected Economic Indicators, 1939-1953................. 3I.2 Common External Tariff of the Federation of Rhodesia
and Nyasaland .......... .,, 41.3 Selected Economic Indicators, 1954-1965................. 5I.4 Inflation and Interest Rates, 1966-1979................. 7I.5 Effects of Sanctions on Exports......................... 9I.6 Expenditure on GDP, 1973-1975, Selected Years........... 10I.7 Sources of Industrial Growth, 1965-79................... 12I.8 Subsectoral Structure of Production,
1967, 1975, 1979, 1982 .................................. 13I.9 Growth Rates of the Main Productive Sectors and Demand
Components, 1980-84.................................. 141.10 Sources of Industrial Growth, 1979-82................... 151.11 Real Growth Rates of Exports, 1980-84, Percentages...... 16
CHAPTER II:
II.1 Selected Economic Indicators, 1970-84................... 17II.2 Distribution of Manufacturing Units, Output, Exports,
Employees, and Capital Stock......................... 18II.3 Structural Characteristics of Manufacturing Subsectors.. 19II.4 Main Financial Indicators of the Public Traded Companies
1 9 8 0 -84 ~~~~~~~~~~~~20II.5 Sources and Uses of Funds of Fifty-Two Publicly Traded
Companies, 1980-1985... . . . .. . . . ............. . . ....... 20II.6 Percent Distribution of Employment by Sectors........... 22II.7 Skill and Racial Distribution of Manufacturing
Employment Compared with Total Employment inNon-Educational Establishments 1981..81.............. 23
II.8 Nationality of Professional Skilled and Semi-SkilledEmployed: Manufacturing and Total Employed inNon-Educational Establishments 1981.................. 24
II.9 Balance of Trade of the Manufacturing Sector, 1982...... 25II.10 Shares of Total Exports ....... . . . . . .. . . . .......... . . . . . . 26II.11 Export Growth Rates at Constant 1980 US Dollars ......... 27II.12 Distribution of Capital Stock According to Sector and
Type of Investments, 12.2 28I1.13 Unit Cost Comparison Between Open-End and Ring
Spinning under Alternative Wage Rate Assumptions..... 35II.14 Unit Cost Comparisons between Three-Loom Technologies
under Alternative Wage Rate Assumptions..............e 35

- vi -
Page No.
CHAPTU III:
III.1 Exchange Rate Premium, 1980-83 ......................... 39III.2 Concentration of Manufacturing Firms, Employment, and
Output, 1 982 .......... . 40III.3 Domestic Prices of Steel and Fertilizer Products
Relative to Production and Opportunity Costs, 1985.. 43III.4 Real Effective Rate for Industrial Exporters..... so... 45III 5 Real Deposit and Lending Ratesa...o.....t es..........o 48III.6 Evolution of Minimum Wages, 1980-85.................... 50III.7 Indices of Average Real Earnings, 1970-84.............. 51III.8 Minimum Wage Compared to Other Developing Countries.... 52III.9 Prices in Harare Relative to Prices in Washington, D.C.
Metropolitan Area... 53III.10 Share of Value Added Produced at Various Prices
Relative to International Prices....... 54III.11 Selected Domestic Prices Compared to Export Prices..*.. 56II.12 Distribution of Value Added in Manufacturing According
to Effective Rates of Protection Received........... 58
CHAPTER IV:
IV. 1 Manufacturing Sector: Capital and Labor Inputs perUnit of Net Outu. u t putooooooo000000 62
IV.2 Distribution of Value Added According to DomesticResource Cost Incurred. . . . . . . .. .. .. ... 64
IV.3 Estimates of Overall Spinning and Weaving Efficiencies. 66IV.4 Labor Productivity in the Textile Sector Relative to
Productivity in Various Countries ...... 69IV.5 Average Sector-Wide Unit Labor and Equipment Require-
ments and Total Factor Productivity Relative toBest srac tion for 70
IV.6 Domestic Resource Cost Calculations for SteelManufacturing........... , 71
IV.7 Domestic Resource Cost Calculations for FertilizerMauactrngoo fa ctu ring6o6*040*,,**o 72
CHAPTER V:
V.1 5-Year Plan Targets Compared to Past Achievements inManufacturing .......... ! ! ......... oooosso 73

- vil -
Page No.
CHAPTER VI:
VI.1 FOB Value of Clothing Exports.......................... 85VI.2 Estimated Cost of Renovating Capital Equipment in
Textile Subsector......... *****. ....... * * *... , 86VI.3 Estimates of Overall Spinning and Weaving Efficiencies. 88VI.4 Labor Productivity in the Textile Sector Relative to
Productivity in Various Countries...ntrles.......... 89VI.5 Domestic Resource Cost in Textile Manufacturinguring... 90
VI.6 Unit Labor and Equipment Requirements and RelativeTotal Factor Produictivity... ..... s... ecee....... 9y
VI.7 Average Sector-Wide Unit Labor and EquipmentRequirements and Total Factor Productivity Relativeto Best Practice in Selected Countries ............. 92
VI.8 Hours Worked per Year in Textile Subsector ............ 94
CHAPTR VII:
VII.1 Growth Rates of Fertilizer Consumption, 1970-1985,Selected Yeas. 98
VII.2 SABLE - Historical Production...e..................... 99VII.3 ZIMPHOS Historical Productione........................, 99VII.4 Comparison between Domestic and World Prices of
Fertilizers.......... 100VII.5 Indicators of Economic Efficiency in the Fertilizer
Subsector. .... *......... geecee. , . ... *e*. ..... 101
CHAPTER VIII:
VIII.1 Key Financial and Economic Indicators of ZISCO,1980-1984 ..................... 105
VIII.2 Sales of ZISSCO.. 106VIII.3 Export Prcs 107VIII.4 Nominal Protection for Steel Products, 1984 8 4.......... 108VIII.5 Domestic List and Net Export Rebate Priceslc........es. 109VIII.6 Comparison of Domestic List Prices with Estimate
Production Costs... ecee..... * *. 110VIII.7 Key Efficiency Indicators in Steel Mill s 110VIII.8 Operating Costs at ZISCO Compared with those in Brazil. 112VIII.9 Estimated Domestic Resource Costs for ZISCOSo.e.C.OeeCO 114

- viii -
STNOPSIS
Zimbabwe gained political independence in 1980, fifteen yearsafter the previous regime unilaterally declared independence from GreatBritain. During these fifteen years, known as UDI, the country had toadjust its economy to economic sanctions levied against it by most UnitedNations member countries. The authorities, faced with a drasticallyreduced world market as a result of sanctions, geared the economy tooperate with a reduced external sector, both in terms of imports andexports. In the process, they imposed a superstructure of economiccontrols that affected virtually every facet of economic life andespecially the allocation of foreign exchange, and investment and pricingdecisions. Some of the most important adjustments took place within theindustrial sector. Suddenly isolated from outside competition, it turned toimport substitution as a way of life.
When economic sanctions were lifted with formal Independence fromthe United Kingdom, the new Government faced a new set of circumstances anda new challenge, the challenge of re-integrating Zimbabwe to the worldeconomy. Six years after Independence, however, the inherited policyenvironment is still substantially unchanged from UDI days. This reportattempts to answer three main questions: (i) to what extent is theindustrial sector equipped to respond to the country's export needs; (ii)to what extent is the policy environment adequate to stimulate growth anddiversification of manufacturing production; and (Mi) are any policychanges required to take advantage of the new opportunities.

- ix -
PART 0143: EXCUTIVE SUMMARY

x -
AN INDUTRIAL SCTO)R N0ORMIDWEnurv SU -IZDCUTIVI 8SINAR
Introduction
i. The Government of Zimbabwe's First Five Year National DevelopmentPlan for 1986-1990 singles out the manufacturing sector as the "key forchanging the structure of the Zimbabwean economy and for achieving rapidgrowth ... and development." Among other things, manufacturing output, ex-ports, and employment are targeted to expand at 6.5X, 8.2% and 2% per year,respectively. During 1980-84, growth of manufacturing value added was athird of the Plan's target; growth of exports was less than one-tenth, andgrowth of employment just over one-half. These targets, then, constitute amajor challenge for the sector. The analysis of this report indicates thatthe achievement of these targets would require significant policy changes.
ii. The current state of the sector needs to be assessed in a contextinherited from the previous regime. In response to the Unilateral Declara-tion of Independence (UDI) in 1965, the bulk of the country's tradingpartners, with the major exception of South Africa, applied sanctions that,despite significant evasions, had a major impact on the availability offoreign exchange. In response to sanctions, the previous Governmentimposed a wide-ranging system of economic controls on a relatively market-oriented and open economy--exports and imports were on the order of 35% ofGDP in 1965--with the aim of keeping the economy going despite the restric-tions on external trade. The core of the system was the comprehensiverationing of foreign exchange, supported by investment regulation and pricecontrols.
iii. Although sanctions disappeared with Independence in 1980, thesystem of economic controls designed during UDI remains substantiallyunchanged. One of the main purposes of this report is to assess whetherthis system of incentives is still adequate for dealing with Zimbabwe'schanged circumstances. The report describes the historical evolution andpresent structure of the industrial sector, examines the effects of currentpolicies on its performance and structure, and assesses the case for policychanges to support future industrial growth. This summary presents a con-densed account of the conclusions, starting with an overview of the policyframework.
iv. The report draws on two previous studies prepared for the Minis-try of Industry and Technology--a 1985 report by UNIDO and a 1983 report byDr. D. Jansen. However, much of the analysis is new, and the conclusionsare based both on general analysis of the sector and the results of analy-sis of three subsectors--iron and steel, textiles and fertilizers.

- xi -
The Policy Framework
Foreign Exchange Allocation
v. The foreign exchange allocation system is the core of the currentpolicy environment and has a pervasive influence on the whole structure ofprices and pattern of activity in the economy. In its present form, theforeign exchange rationing exercise begins with a six-month projection ofthe balance of payments within a four-year horizon. Given expected inflowsof foreign exchange, the Government deducts legally committed uses (e.g.,external debt service, profit remittances) and sets aside enough to main-tain international reserves at an adequate level. It then allocatesforeign exchange to priority uses (e.g., imports of fuel, medicines,tires). The remainder is allocated to industry, agriculture, mining andcommerce on the base of the assessed need, using historical shares as astarting point for the firm-by-firm allocation, but modified for newentrants and for changes in the needs of existing firms.
Exchange Rate Management
vi. The Zimbabwean dollar is not pegged against any currency. Com-pared to a basket of currencies of its main trading partners, however, theZimbabwean dollar has depreciated by about 26% in real terms sitce 1965--the year immediately prior to the introduction of foreign exchange ration-ing. The bulk of this long-term movement occurred during the UDI period,when the real depreciation was largely a consequence of a relatively lowdomestic inflation rate. In the first two years after independe-Ace theexchange rate appreciated by about 20% in real terms. The authoritiesdevalued by 20% in December 1982, and have subsequently maintained aflexible exchange rate policy involving frequent small movements against abasket of currencies of Zimbabwe's principal trading partners. The effectof this has been a steady real depreciation and the real effective exchangerate is now below its 1980 level. Despite this real depreciation, there isstill excess demand for foreign exchange for both current and capitalaccount transactions at the current exchange rate, and foreign exchangerationing is essential to the maintenance of external balance.
Investment Control
vii. All new investments or expansions involving the use of foreignexchange, either for purchases of capital equipment or current inputs, haveto be submitted for approval to the Investments Projects Committee (IPC).In practice, the main criteria for approval are that ex ante the projectnot be a net user of foreign exchange during any twelve-month period of itsexpected life and that it does not compete with local production unless it

- xii -
also produces for export. Comprehensive financial or economic analysis isnot undertaken. The assessment of foreign exchange use also takes accountof any use of foreign funds. Projects requiring more than the equivalentof Z$2.5 million (US$1.6 million) in foreign loans need additional approvalfrom the External Loans Coordinating Committee. In addition, projects withmore than 15% foreign ownership must obtain the approval of the ForeignInvestment Committee. These criteria, however, have recently been relaxedfor emerging entrepreneurs.
Price Controls
viii. Price controls apply to all goods except export goods, goods soldby public auction, second hand goods (other than used automobiles), foodand drink sold for consumption on the premises (except beer), eggs in theshell, fresh flowers, fresh vegetables, and fresh fruits. There are threetypes of price controls: specific price controls that set the actual price(e.g., on bread, maize, milk, vegetable oils), controls over the pricingformula for the particular good (e.g., on motor vehicle parts, agriculturalimplements, chemicals, fertilizers), and controls over the mark-up at thewholesale and retail level (mostly applied to consumer goods).
Overview of the Policy Framework
ix. Much of thie report is concerned with assessing how the above setof policies has influenced the pattern of development of the manufacturingsector. However, it is worth stressing at the outset that the policyframework has a pervasive influence on the overall pattern of economicactivity in Zimbabwe. A principal characteristic of the core policies---!hecombination of administered foreign exchange with excess demand for foreignexchange at the current exchange rate--is that it confers a high degree ofprotection on activities oriented toward the domestic market, from bothimports and, in many cases, from potential domestic firms. It also allowsa highly variable degree of protection for individual activities toevolve. This especially favors domestically oriented manufacturing activi-ties and non-traded activities (largely in the service sectors). It isrelatively disadvantageous to the agriculture and mining sectors. It isbeyond the scope of this report to analyze these intersectoral isues, buttlis provides an important context for the assessment of the relationshipbetween the policy framework and the performance of the manufacturing sec-tor.
x. After providing an outline of the general characteristics of themanufacturing sector, the report assesses the three key areas in which theabove policies have an impact on its past and potential future performance:the impact of protection on growth and efficiency; the impact of the policyframework on export performance; and the issue of investment.
General Characteristics of the Industrial Sector
xi. At present, Zimbabwe's industrial sector stands out in the Sub-Saharan African context in a number of respects. First, it is unusuallywell developed. Manufacturing contributes about one-quarter to GDP

- xiii -
(roughly three times as much as the average for developing Africancountries). It is the second most important source of employment--afteragriculture--and accounts for about 17% of total export revenues. Manufac-turing production is also highly diversified, with production of virtuallyall consumer products, a wide range of intermediate products (includingiron and steel) and a small, but significant, range of capital goods.
xii. Second, manufacturing firms are generally in good financialhealth. Most firms have very low levels of debt, with average leverageratios of 0.73 and long-term leverage ratios of only 0.17. These finan-cially sound firms are conservatively managed, using mostly their ownresources to finance capital expansion. An analysis of the sources anduses of funds in 1980-85 shows that internally generated funds providednearly three quarters of new resources, with increases in long-term debtadding a modest one-tenth. One-half of these new resources were used toacquire fixed assets.
xiii. Third, there is an unusually high share of private and foreignownership for Sub-Saharan Africa. Private and unincorporated enterprisesaccount for about 86% of recorded manufacturing output, with parastatals infoodstuffs and textiles accounting for about 10% and public firms under theIndustrial Development Corporation for about 4%. Estimates of the extentof foreign ownership vary widely. The Confederation of Zimbabwean Industryestimates foreign ownership somewhere in between 30% and 60%, whereas otherstudies put it at between 25% and 50%. The substantial participation offoreign firms provides easy access to technology and marketing informa-tion. On the other hand, to the extent that foreign firms may be tied tomultinational concerns, they may hinder exports in response to global cor-porate strategies if these exports compete with subsidiaries in other coun-tries. Reduction of foreign control has been a policy objective sinceIndependence.
xiv. Fourth, industrial activity is highly concentrated both in termsof products and location. In 1982, of 6,000 identifiable products one-halfwere being manufactured under monopoly conditions (one firm) and four-fifths under oligopoly conditions (at most three firms) and production wasconcentrated around the main urban centers. In terms of spatial concentra-tion, Harare, the country's largest city, accounts for about one-half ofmanufacturing output and employment. Bulawayo, the second largest city,accounts for about one-quarter of manufacturing output and employment. TheKwekwe-Redcliff industrial complex contributes 7% to manufacturing outputand about 5% to overall manufacturing employment. Together, these threecenters contribute 82% of total manufacturing output and account for 79% ofmanufacturing employment.

- xiv -
xv. Fifth, the range and diversity of production of the manufacturingsector has made it less dependent on imports than the manufacturing sectorsof many other countries at similar stages of development. About a quarterof the value of gross manufacturing output represents input purchases fromother manufacturing industries and there are also substantial linkages withagriculture, mining, and construction. These linkages enable Zimbabwe'smanufacturing sector to use relatively less foreign exchange per unit ofoutput and to come very close to being self-sustaining in terms of foreignexchange. In 1982 only about one-quarter of the inputs into manufacturingwere imported (compared to 73% in Ghana, for example). Preliminary esti-mates for 1984 indicate that industrial exports were equivalent to about85% of the sector's imported current inputs. This proportion comparesfavorably with other countries such as Tanzania (20% in 1985), Ethiopia(22% in 1981), and Ecuador (43% in 1980). This characteristic means thatan export drive would soon have a positive impact on the balance of trade.
Protection, Growth and Economic Efficiency
xvi. Protection has played a large role in the evolution of thisdiversified, financially sound and highly concentrated industrial sector.Much of the sector was formed prior to UDI, and, especially after World WarII, it emerged as the industrial center for Central Africa. In the 1950s,this was facilitated by the formation of the Federation of Rhodesia andNyasaland that provided protection through tariffs for the manufacturingsector. With UDI, manufacturing firms lost the bulk of the establishedCentral African export market. At the same time the new set of policiesprovided firms with a major increase in protection. Through the foreignexchange allocation system, imports that competed with domestic productionwere effectively barred (including imports from South Africa, according tothe information available to the mission).
xvii. Despite a significant fall in exports, the manufacturing sectorthrived in the new conditions during the first seven years of sanctions.Sanctions made international trade difficult, but with the help of theremoval of external competition from the domestic market and initially lowcapacity utilization--a product of high investment during the Federation--Zimbabwean entrepreneurs were able to respond quickly to the changed domes-tic cor*itons In fact, by satisfying a growing domestic demand and subs-tituting imports, manufacturing output grew at 8% per year between 1966 and1974. From 1975 to 1980, manufacturing output declined at a rate of 2% peryear as the liberation war intensified and macroeconomic conditions wor-sened. Nevertheless, the initial growth spurt was so strong that by 1980industrial output was double that of 1966. The source of this growth wasmainly domestic demand expansion and some import substitution, with exportexpansion playing a negligible role.
xviii. Industrialization behind some form of protective barrier is acommon phenomenon in developing countries. Zimbabwe's case is unusual inthat the high levels of protection conferred by the foreign exchange

- xv -
allocation system were imposed on a sector that was already fairly well-developed, as roughly one-half of Zimbabwe's manufacturing capacity wasalready in place at the time of sanctions.
xix. This unusual evolution is important to assessing the consequencesof the system. High protective barriers in countries with relatively smalleconomies usually give rise to inefficient industrial structures becausethe small domestic market does not permit taking advantage of economies ofscale. In Zimbabwe, many industrial f'.rms remained relatively efficient byinternational standards. Previous studies have shown that as much as one-half of the industrial value added is being produced under efficient condi-tions (DRCs below one) and that only about 12X can be labelled as beingproduced under very inefficient conditions (DRCs above 2). This type ofstudy has to be treated with caution, owing to data problems, but both spotchecks of these findings and alternative assessments of efficiency thatwere undertaken in connection with this report, also showed that averagelevels of industrial efficiency are relatively high for a highly protectedsector.
xx. Overall measures of industrial efficiency, however, hide markeddisparities in efficiency, both between subsectors and between firms inindividual subsectors, that are reflected in a high dispersion in indica-tors of efficiency found in these previous studies. The system of incen-tives permitted the establishment and survival of inefficient firmsalongside efficient ones. Thus, dispersed through every subsector, thereare now firms as efficient as any in developed countries, as well as veryinefficient ones. The limited degree of domestic competition together withthe high degree of protection, prevented the winnowing out of poor perfor-mers, leading to inefficient resource allocation, and as a consequence,lower output and employment.
xxi. Thus, although the system of controls served Zimbabwe better thanmany developing countries, it took a toll. The first underlying problem isthat the protection conferred by the foreign exchange allocation system,complemented by price controls, allowed relative prices to evolve in a man-ner that was severely out of line with respect to international prices(some as much as five times above, others as much as one-half below), andsome sectors (e.g., domestic appliances) grew despite high-cost and ineffi-cient production.
xxii. These price distortions are in effect implicit taxes and subsi-dies that often unintendedly conflict with Government objectives. Forexample, in 1984 the agricultural sector implicitly transferred about US$17million to the fertilizer companies via higher domestic fertilizer prices.Similarly, domestic consumers of ZISCO's steel products received about US$5million in subsidies. Relative price distortions stimulate investment inactivities that may be financially attractive, but not appropriate from

- xvi -
economic and social viewpoints, while discouraging investment in activitiesthat may have high rates of economic return. One major consequence of thisimpact on relative prices is the pervasive anti-export bias--discussed inthe next section.
xxiii. The second problem is the highly conservative bias of the sys-tem. The protection from external and domestic competition with largelycost-based price controls effectively preserves the profits of existingfirms and exacerbates the anti-export bias. It has also allowed the rela-tive neglect of marketing, through severing entrepreneurs from day-to-daymarketing struggles. This conservative bias is particularly important, if,as will be argued below, a dynamic process involving shifts in the struc-ture of production and markets will be necessary for sustained growth inthe future.
xxiv. A third problem concerns capital accumulation. By ignoring costsand benefits stemming from the use of domestic resources and placing a highpremium on benefits denominated in foreign exchange, the investment approv-al system inhibited investment, erected formidable barriers to entry, andcontributed to the high degree of concentration in the sector.
xxv. Finally, by administratively adjusting imports co the foreign ex-change available, the system deprived the authorities of the most visiblesigns of disequilibria in the external accounts, namely changes in thestock of international reserves and movements in the nominal exchangerate. Also, by allowing Zimbabwe to operate with an exchange rate higherthan would have prevailed without rationing, the system created a "foreignexchange shortage."
Exports and the Incentive System
xxvi. Manufactured exports today are a quarter lower in real terms thanin 1965 and the share of manufacturing output that is now exported hasfallen from about 20% at the time of UDI, to less than half that propor-tion. In view of the key role of manufactured exports to the provision offoreign exchange for future growth, as clearly described in the Plan, thisis a central concern.
xxvii. An analysis of the sources of growth during UDI shows that aboutthree-quarters of the growth that took place in the industrial sector wasto satisfy the expansion of domestic demand, while about one-quarter was tosubstitute imports. Manufactured exports declined in volume terms and, asa consequence, export expansion played a negligible role in the growth ofmost subsectors, except for ferro-alloys and iron products where exportsaccounted for 35% of its growth. The imposition of sanctions explains someof the poor performance, especially in the initial years of UDI, but isonly part of the explanation. Indeed, in contrast to the highly protected

- xvii -
manufacturing sector, both the mining and agricultural sectors enjoyedrelatively high rates of export growth, at least until the liberation warintensified.
xxviii, With the advent of Independence, the export market became againreadily accessible, yet the pattern of growth for the period 1979-82 wasremarkably similar to that of UDI. Domestic demand expansion accounted for80% or more of the growth for all sectors but one and import substitutionaccounted for most of the remainder of growth in this period. Manufacturedexports have also experienced substantial fluctuations from year to yearsince Independence. After an initial surge of 14% in volume terms in 1980,exports of manufactures declined by 16% in 1981 and 22% in 1982, and thengrew by 11% in 1983 and 26% in 1984. The 1983 growth was entirely due toiron and steel, but in 1984 it was highly diversified: iron and steelcontracted, while exports from the remainder of the sector grew by anestimated 69%. In 1985 preliminary figures suggest that any real growthwas due to iron and steel again.
xxix. A principal conclusion of this report is that both the very weaklong-term export performance and the fluctuations since Independence arelargely a consequence of the incentives system that places manufacturingexports at a severe relative disadvantage compared with production for thedomestic market. There are other factors as well, of course. Zimbabwe'slandlocked position also leads to relatively high costs of trading comparedwith some countries. This was exacerbated by the loss of the CentralAfrican market in 1965, and has probably worsened again with thedifficulties over transit via the Mozambican port of Beira in the past fewyears. However, high transport costs do not explain the long-term declinein exports or the recent fluctuations.
xxx. The incentives system leads to a severe anti-export bias 4r thewhole economy, but especially the manufacturing sector, in three ways.First, the protection conferred by the foreign exchange allocation systemleads to major price differentials between domestic and export sales--themission found differenc-es of between 18% and 90%. This makes exports farless attractive than domestic sales. For example, export sales brought 34%less revenue than domestic sales for textile firms. As noted above, themanufacturing sector is The primary beneficiary of this protection; equallyimportant, the degree of protection and consequently the degree of anti-export bias is highly variable across manufacturing activities. Second,the lack of domestic competition makes domestic sales an easier and a morereliable activity compared with exports. Third, to the extent that the ex-ckange rate is overvalued i.e., above an appropriate level for medium-termgrowth, this reduces the profitability of exporting.
xxxi. The role of the anti-export bias in the inherited incentive sys-tem explains the initially weak export performance after Independence. In1980-81, the combination of a profitable and expanding domestic market andan appreciating real exchange rate provided a poor environment for exports.

- xviii -
This was exacerbated in 1982 by the effects of cutbacks in foreign exchangeallocations on the sector; a natural response to tighter rationing offoreign exchange was to have a sharper reduction in less profitable ex-ports. However, this was subsequently compensated by three policy changes:the devaluation of the Zimbabwean Dollar in December 1982 and subsequentflexible exchange rate management; the introduction of an export incentivesystem from 1982 that, in addition to an existing duty drawback system,raised the effective incentive for exporting; and the extension of an ex-port revolving fund, in 1983, to provide automatic allocation of foreignexchange for inputs for manufactured exports. These measures significantlyreduced the average degree of anti-export bias in 1983-84, especially inthe context of the depressed domestic market, and explain the sharp growthin exports (other than iron and steel) in 1984.
xxxii. The policy changes introduced since Independence are important,but they provide only a shaky basis for sustained export growth. First,the short-run success was in part due to the weak state of the domesticmarket. There is evidence that some firms were exporting at little or noprofit--as long as export prices covered variable costs this made financialsense (labor costs are part of fixed costs in the short run owing to thestrong labor security legislation). Growth in domestic demand (as occurredin 1985) would lead to reduced export sales. Second, the changes failed totackle the problem of the highly variable degree of protection andconsequently the high variability in anti-export bias for the domesticmarket. Although the average level of anti-export bias was reduced, itsvariability was not.
xxxiii. Labor Costs. Relatively high labor costs in terms of foreigncurrency also militate against exports. The current minimum wage, conver-ted at the present exchange rate, is four times higher than in Sudan andZaire, one and one-half times higher than in Brazil, and about the same asin Mexico. The average pay in the manufacturing sector is about as high asin Chile and higher than in Korea, countries with almost three timesZimbabwe 's per capita GDP. High labor costs contribute to making exportsuncompetitive in world markets. Of course, labor costs relative to othercountries would be brought down with an appropriate exchange rate. Indeed,the minimum wage has declined in US dollar terms some 18% as a result of adepreciation of the Zimbabwe dollar vis-a-vis the US dollar. Exchange ratemovements that exceed domestic inflation would further improve competitive-ness.
Capacity Utilization and Investment Levels
xxxiv. The existing capital stock in the manufacturing sector has twostriking characteristics: it is highly utilized and it is old. Zimbabwe'smanufacturing sector is working at about 80% of capacity. There are, ofcourse, significant variations--many firms are working around the clock all

- xix -
year long while others are at much lower levels of capacity utilization.Yet the average degree of utilization is high, especially by African stand-ards. This is a reflection of the fact that Zimbabwe's foreign exchangeshortage, and the overall degree of disequilibrium, is much less severethan in other Sub-Saharan African countries, where cepacity utilization isoften a fraction of installed capacity. For firms working at high levelsof capacity utilization, more abundant foreign exchange could improve theirefficiency of resource use--by, for example, allowing textile firms tosubstitute imported man-made fibers for domestic cotton, or vice-versa,depending on relative prices--but it would not increase their output subs-tantially.
xxxv. Foreign exchange shortage has, however, been an acute problem forinvestment and renovation of capital stock. Investment levels in manufac-turing peaked in 1974-75, and have been low in recent years--60% lower thanin 1972 and 40% lower than in 1980-81 when the Government increased foreignexchange allocation for investment. Mission estimates indicate thatinvestment levels in 1974-82 were not adequate to cover estimated deprecia-tion of equipment, suggesting either that the capital stock actually con-tracted, or that the sector was working with equipment that had outlivedits economic usefulness. Subsectoral data support the latter hypothesis.Of the three sectors studied, the textile subsector was the one with thehighest investment rate since Independence. Neither steel nor fertilizerhad undertaken major investments since the mid-1970s. Yet even in the tex-tile sector spinning equipment is, on average, 20 years old, while loomsare about 16 years old. In the fertilizer subsector the main facilitiesdate back to 1972, with some dating back to 1979. In the steel subsector,one blast furnace was built in 1961, the other in 1975, along with oxygenconvertors and continuous castirg mills. Equipment in other sectors issimilarly old. In the paper subsector, the newest machine in a sample ofrespondent firms dates back to 1952, with some dating back to 1926, and insoaps and detergents to 1978 (the newest) and to 1959 (the oldest). Onlyin the paper suh6ector had this equipment undergone modernization. Giventhat the sector is working close to full capacity, any prolonged exportdrive would soon fizzle out unless sustained with new investment.
xxxvi. Entrepreneurs cite several reasons for the low investment levels,some of them political in nature, some economic. Among the economicreasons, the shortage of foreign exchange is the most frequent one--foreignexchange rationing at the prevailing exchange rate has clearly heldinvestment below levels desired by manufacturing firms. Virtually allinvestment projects require imported capital goods or imported currentinputs and hence must be approved by Government. According to UNIDO, in1984 for every project approved, four were rejected largely, although notexclusively, because of foreign exchange shortage. Low profits and ensuingpessimistic expectation also partially account for low investment levels upto 1984. For the 52 publicly traded companies, pre-tax profits fell from

- xx -
16% of sales in 1980 to 6% in 1984 and returns on equity fell from 16% in1980 to 7% in 1984 before partially recovering in 1985. The uncertainpolitical situation in the region is also cited as cause for concern.
xxxvii. In addition to the effect of foreign exchange rationing oninvestment levels, it also affects investment choices. As noted above, ofthe three subsectors studied only textiles has undertaken major investmentssince Independence and the investment that has taken place has been remark-ably labor-saving. For example, almost all of Zimbabwe's recently instal-led capacity in spinning and weaving is of the most modern variety; itgenerates considerable less employment per dollar of investment than con-ventional machinery and the unit cost of output is higher, bringing noapparent economic benefit to the firm. Yet a bias toward a capital-intensive investment choice would be expected within the current incentivessystem. If an allocation can be obtained, then the foreign exchange forcapital goods imports is cheap relative to domestic prices; uncertaintyover future allocation provides an added incentive to invest in the mostmodern equipment; the domestic cost of investment finance is low; and thelabor security legislation provides an incentive to minimize employmentlevels.
xxxviii. Low investment levels are a serious barrier to growth becausecapacity utilization is already high and a good proportion of Zimbabwe'scapital stock is old and needs to be renovated. Whatever medium-termgrowth the sector can attain must be accompanied with capacity expansionand renovation of capital stock.
Policy Recommendations
xxxix. Attaining the industrial growth and employment goals of the FirstFive Year National Development Plan will require significant changes in theindustrial sector. The past pattern of growth cannot be repeated becausethe manufacturing sector will have to play a different macroeconomic role,if overall growth of GDP is to be sustained. In particular the resource-based sectors (and especially mining) cannot be expected to provide a sur-plus of foreign resources to finance the continued expansion of manufactur-ing as in the past, both due to terms of trade losses for primary commodi-ties and to constraints on the rate of volume growth in these sectors.This implies that increased efficiency in the use of both domestic andforeign resources, with an improvement in the net foreign exchange positionof the sector, will be essential for future industrial growth, just as theexpansion of manufactured exports will be crucial to aggregate growth inthe economy. This is likely to require changes in the structure of outputtoward greater specialization in efficient activities than now exists inZimbabwe.
xl. lnvestment will be the key vehicle in effecting this change.Zimbabwe's aged and heavily utilized capital stock severely limits growththrough more intensive utilization of installed capacity. Unlike many

- xxi -
other countries in Sub-Saharan Africa, where dramatic production gains arepossible through a reallocation of current resources, Zimbabwe must achievethese gains mainly through increased capacity. For this changes to occur,it will be necessary to tackle the problems with existing policies outlinedabove. Changes in incentives that indirectly encourage appropriate newinvestment are of particular importance in Zimbabwe since the industrialsector is primarily in private sector hands. However, it should be stress-ed that it is of equal importance that any further public investment inmanufacturing be guided by appropriate incentives.
xli. The Government has a wide range of policy alternatives. However,the analysis of this report indicates the goal of sustained growth ofindustrial output, employment and exports can be most effectively realizedby the formulation of a consistent package of policy changes that wouldhave as its core the combination of further exchange rate movement andreform of the foreign exchange allocation system, complemented by changesin investment regulation and price controls and a supportive macroeconomicframework. This report assesses the key areas of policy action, but doesnot go into the phasing of possible policy changes. However, because ofthe key role of investment and the fact that investment decisions are bynature long-term and require a gestation period, it is important to provideclear and coherent signals on the future incentive environment to convincethe private sector of the direction and permanence of any changes.
xlii. Further movement of the exchange rate (in real terms) would helpattenuate the anti-export bias by raising the profitability of exports bothin absolute terms and relative to domestic sales. It would raise domesticprices of imports and lower labor costs relative to other countries,improving Zimbabwe's competitive position in world markets and protectingdomestic industry from outside competition. In addition to its impact onthe manufacturing sector it would also lead to shifts in overall relativeprices in the economy that would encourage resource movements into the pro-ductive sectors in general, and exporting activities in particular. Over aperiod of time exchange rate movement would increase foreign exchangeavailability through increased export earnings and relax one of the mostserious constraints on growth.
xliii. Liberalization of the foreign exchange allocation system willbe critical to the provision of incentives for resources to move intoappropriate activities. As discussed above, quantitative rationing offoreign exchange has led both to a pattern of relative prices that do notreflect the structure of economic costs for Zimbabwe and is strongly biasedtoward maintenance of the status quo through protection of existing activi-ties. The reduction in the high degreee of firm-specific protection is animportant step in the overall package of measures recommended here. Thiswould require a significant trade liberalization. However, the report isnot advocating the full removal of protection, but rather the substitution

- xxii -
of tariffs for the existing variable quota system. The benefits from ashift from a quota to tariff-based system of protection are well-documentedfrom international experience. Zimbabwe's current tariff schedule, thoughnot ideal, has a relatively moderate spread in rates of protection by thestandards of developing countries and provides a reasonable initial frame-work.
xliv. Reform of the foreign exchange allocation system will change thepattern of incentives for investment in the economy. It will have to becomplemented by measures that allow factors to move into relatively profit-able activities if the benefits are to be realized. This will necessitatedomestic deregulation, especially of investment. In particular, it will beimportant to ensure that firms have the resources (including of foreignexchange) to invest as required to meet foreign competition. However, itis important that any reform of investment regulation take place in thecontext of a concurrent or planned program of trade liberalization, other-wise there would be incentives for resources to flow into highly protectedactivities at a high cost to the economy.
xlv. The price control system would also be effected by reform of theforeign exchange allocation system. Since the bulk of controls are largelyceilings that relate to production costs, they would gradually be renderedunnecessary by the introduction of competing imports. Competition wouldeffectively take over the role of price controls in limiting monopoly pro-fits. Where specific prices of industrial products are set, decontrolwould be necessary to support trade liberalization.
i.lvi. The broad changes in the incentive system would provide a muchmore favorable environment for export growth. However, there would remaina strong case for the maintenance and improvement of specific export-prom-o,ing measures, to encourage short-run export growth, especially if thebroader chaages are implemented over a period of time. The main existing.teasures--the duty drawback, the export incentive and the export revolvingfur.d (ERF)--provide an adequate starting point. It would be advisable,however, to phase out the export incentive if it carries the risk ofcountervailing duties, or other retaliation, when injury is caused totrading partners. In addition, both the duty drawback and ERF could beimproved to ensure adequate and quick access to new and indirectexporters. In the future there may also be a need to improve theavailability of credit to aew exporters. Finally direct trade promotionactivities to improve information on exporting at home and abroad plays auseful complementary role.
xlvii. Reform of the incentives system would have to be supported bymacroeconomic measures to ensure that the process is not jeopardized byshort-run external imbalance, and to allow for growth in aggregate

- xxiii -
investment. This will require appropriate exchange rate and demandmanagement policy. Appropriate exchange rate movements could be effectedby the continuation of a flexible administered rate. However, carefulmonitoring of the external accounts would be necessary to ensure that thepace of exchange rate adjustment is consistent with the degree of importliberalization being introduced. As an alternative, the Government couldconsider adopting a market-determined exchange rate through the removal ofrationing of foreign exchange for current (though probably not capital)transactions, either via a floating rate or a foreign exchange auction.
xlviii. Other complementary measures are needed to encourage a higherrate of capital accumulation and a more efficient allocation of capitalresources. Significant progress in reducing the public sector deficit isanother important element of the strategy. This would encourage financialsavings for private capital accumulation and allow the RBZ more freedom tofocus on stabilizing the growth of money and credit at non-inflationarylevels. Failure to reduce the deficit would put much greater pressure onthe exchange rate in maintaining external balance during trade liberaliza-tion. The manner in which the deficit reduction is achieved, however, iscrucial. Preferably, it should be done through expenditure reduction, butnot through increased taxes, as there is evidence that high marginal taxrates are already distorting savings and investment decisions. A strategyof deficit reduction through increased taxes on capital or income mightexacerbate rather than alleviate the capital accumulation problem.
xlix. Liberalization attempts in other countries have shown that tradeliberalization without appropriate exchange rate and macroeconomicmanagement is not sustainable. Zimbabwe's own experience in the immediatepost-Indiependence period illustrates the risks of liberalizing imports withan inconsistent exchange rate and macroeconomic framework. The increasedallocations of foreign exchange in the expectation of higher externalassistance and exports in 1980-82, in the? context of both an overvaluedexchange rate and expansionary domestic demand led to quick depletion ofinternational reserves and to an eventual reduction of foreign exchangeallocations.
1. Zimbabwe is in a better position than many other African nationsto undertake a liberalization program. Industrial firms are in soundfinancial condition and the bulk of the sector already has the capabilityto compete with imports. The existing tariff schedule, together withtransport costs, would be sufficient to provide most existing firms with anadequate umbrella of protection and permit them to compete, withinZimbabwe, on an equal (or better) footing with foreign-based firms. This

- xxiv -
is not to deny that a liberalization program, coupled with exchange rateadjustment, would have a substantial impact on the profitability of manyfirms. Some export-oriented, relatively efficient enterprises, such asZISCO--now operating at a loss--would experience a major improvement infinancial performance. Others, now financially sound, but economicallyinefficient, would be negatively affected. The latter firms would have toincrease the efficiency of their operations or else be forced out of themarket. But the evidence on the sector assessed in this report suggeststhe amount of disruption in inefficient firms would be relatively small.In addition to providing the basis for sustained growth over the mediumterm, this implies that the short-run impact of the proposed policy changeson industrial output and employment would also be beneficial.

-1--
INTIOOUCION
Mining and agriculture dominated Zimbabwe's economy before WorldWar II. Mining employed about 93,000 workers in 1938 and the country'seconomic performance was closely tied to world prices for gold, asbestos,and chrome ore, the country's principal mineral exports. In contrast, themanufacturing sector employed about 18,000 workers and accounted for aboutone-tenth of exports and Net Domestic Output. At the time of IndependenceIn 1980, manufacturing accounted for about 16% of expcrts and a quarter ofGDP--more than mining and agriculture combined--employed about 150,000people and produced a wide range of consumer goods. Outside of theRepublic of South Africa, Zimbabwe's manufacturing sector was larger andmore diversified than that of any other Sub-Saharan African country.
The growth of the industrial sector in the intervening years wasnothing short of remarkable, all the more so because it took place inexceptional circumstances, circumstances that have now disappeared. Yet,the economic policies adopted to meet the challenge of these exceptionalcircumstances are still in place. The Zimbabwean authorities are examiningappropriate ways of using these policies or modifying them to takeadvantage of Zimbabwe's new circumstances, especially the ability to useworld markets to Zimbabwe's advantage. This report aims at helping theauthorities in these deliberations.
The report is the IBRD's first attempt to understand the pastperformance and assess the growth prospects of Zimbabwe's industrialsector. As such, it aims at gathering the main conclusions of previousstudies and providing a stepping stone for future studies. After a briefhistorical introduction, the report provides a description of the structureof Zimbabwe's industrial sector, then analyses the adequacy of the policyenvironment to today's circumstances, and finally looks at the effects ofthese policies on the performance and structure of three subsectors. Thereport also includes an analysis of the financial sector and its relationto industrial growth.

- 2 -
PART 0: MAIN ll!ORT

3
The Initial Push: World War II.
1.01 Three events were of signal importance in the growth of themanufacturing sector: the breakout of World War II, the creation of theFederation of Rhodesia and Nyasaland in 1953, and the Unilateral Declara-tion of Independence (UDI) in 1965. The outbreak of World War II interrup-ted Zimbabwe's (then known as Southern Rhodesia) normal trade routes andrendered certain imported item either unavailable or very costly, provid-ing temporary protection to Southern Rhodesia's economy. The war alsobrought British armed forces training camps to Southern Rhodesia in 1940,increasing the European population by about 202 and stimulating demand forconstruction and other services. With the end of the war, SouthernRhodesia's temporary umbrella of protection disappeared but the interna-tional economic boom that followed the war stimulated the demand for itsexports, and to some extent compensated for the disappearance of theprotective shield. Between 1939 and 1953 gross manufacturing output roseat an annual rate of nearly 122 per year. At the end of the period, theratio of net manufacturing output relative to Net Domestic Product haddoubled, from less than one-tenth to about one fifth, and the share ofmanufacturing exports relative to total exports had mre than tripled, fromabout one-tenth to about one-third, as Table I.1 shows. 2/
Table I.1: ZIMBABWE - SELECTED ECONOMIC INDICATORS,1939 - 1953
AnnualItem 1939 1953 Growth Rates
Net Domestic Productat 1939 Prices (1939-100) 100 251 6.82
Gross Manufacturing OutputVolume Index (1939-100) 100 470 11.7%
Net Manufacturing Outputas % of NDP 8.5% 19.4Z n.ae a/
Share of Manufacturesin Total Exports 8.9% 31.0% 23.1%
a/ Not applicable.Source: Doris Jansen, Zimbabwe: Government Policy and the
Manufacturing Sector, mimeo, 1983.
1/ Most of the first chapter's historical material is taken from DorisJansen, Zimbabwe: Government Policy and the Manufacturing Sector,mimeo, 1983.
2/ Shares relative to NDP available for earlier years are not comparableto shares relative to GDP (available for later years), but both givean idea of changes through time. See, Jansen, ibid. p.18.

-4-
The Federation of Rhodesia and Nyasaland, 1953-1963.
1.02 The formation of the Federation of Rhodesia and Nyasaland inSeptember 1953, which resulted in the elimination of all trade restrictionsand tariffs between the three colonies that comprised it, provided an en-larged protected domestic market and further stimulated the growth ofSouthern Rhodesia's industrial sector. By the end of 1956, the countriesthat are now known as Zimbabwe, Zambia, and Malawi, had adopted a commonexternal tariff with moderate duty rates (Table I.2) and formed a truecommon market. The Federation provided Southern Rhodesia with the oppor-tunity to displace the Republic of South Africa as Zambia's and Malawi'smain supplier of industrial goods. Whereas prior to 1953 both the Republicof South Africa and Southern Rhodesia had been able to export duty-free toNorthern Rhodesia and Nyasaland, now only Southern Rhodesia could do so.Behind a uniform tariff wall, Southern Rhodesian goods became more attrac-tive to Northern Rhodesia and Nyasaland buyers relative to South Africangoods.
Table I.2: ZIMBABWE - COMMON EXTERNAL TARIFF OF THEFEDERATION OF RHODESIA AND NYASALAND
Rates on Revenue ProtectedSchedule Trading Partners inputs items items
D UK, Colonies,S. Africa, be-fore 1960 0% 5%-1O% 1O%-20%
C Other Common-wealth, S. Africaafter 1960 0% O%-20% 1O%-20%
B Most FavoredNations 5% 20%-25% 20%-35%
A All Others 10% up to 40% 20%-35%
Source: Jansen, op. cit., p. 23.
1.03 For Southern Rhodesia, the creation of the Federation doubled itsdomestic market. Although the country accounted for only about a third ofthe Federation's population, its GDP was equal to that of the two othercountries combined. More importantly, Southern Rhodesia's manufacturingsector produced nearly four-fifths of the Federal total, placing it in anenviable position to become the Federation's main industrial center.Southern Rhodesian manufacturers, anticipating a growing demand, investedabout one-third of their output in 1956-60 and moved the sector into aposition of excess capacity by the late 1950s.

-5-
Table I.3: ZIMBABWE - SELECTED ECONOMIC INDICATORS1954-1965
1954 1957 1960 1963 1965
Manufacturing Gross Outputas X of GDP 14.6 15.0 16.0 17.2 18.8
Investment as x of GDP 27.8 33.9 23.9 14.7 13.2
Investment in Manufacturingas % of GDP 3.1 5.0 4.1 2.8 2.0
Investment in Manufacturingas X of Manuf. Gross Output 21.1 33.2 25.7 16.2 10.4
Source: Jansen, op. cit., Vol II, p. 27, mission estimates.
1.04 Economic activity during the first six years of Federal life wasbrisk. Between 1954 and 1960, the Federation's GDP grew at an annual rateof about 6%, while Southern Rhodesia's grew at about 7.2%. The manufac-turing sector, taking advantage of its enviable position, grew at about 11%per year.3/ During the period, manufacture's share of GDP rose from 15%to 16%, as Table I.3 shows.
1.05 By the end of the Federation in 1963, Southern Rhodesia's economyhad become an extremely open one, with imports and exports being equivalentto about one-third and one-half of GDP, respectively. The manufacturingsector, in particular, was exporting nearly two-fifths of its production(equivalent to about one-third of all exports).4/
Unilateral Declaration of Independence, 1965-1980.
1.06 On November 11, 1965 the Smith Government unilaterally declaredRhodesia independent of the United Kingdom. In retaliation, Britain (i)excluded Rhodesia from the sterling area and froze all Rhodesian assets;(ii) prohibited all capital transactions between the United Kingdom andRhodesia; (iii) placed an embargo on all trade with Rhodesia (except goodsconsidered necessary for "humanitarian" purposes); and (iv) terminated allofficial aid.
3/ Jansen, op. cit., p. 26.
4/ IBRD, "Zimbabwe: Country Economic Memorandum, Performance, Policiesand Prospects", Report No. 5458-ZIM, Table 3.08, p.107.

- 6 -
1.07 A majority of United Nations members joined Britain in thesesanctions. Participating countries accounted for about two-thirds ofRhodesia's foreign trade and included Zambia, at the time Rhodesia's bestcustomer. There were, however, some notable exceptions: The Republic ofSouth Africa, Portugal (that then included Rhodesia's neighbor,Mozambique), Malawi, and Switzerland.
1.08 Rhodesia was not totally cut off from world trade, but the sanc-tions took their toll. In the first year of sanctions the volume of bothimports and exports declined by 36x; it was not until 1973 that real ex-ports regained their 1965 level. Moreover, Rhodesia had to import at apremium and sell at a discount. The countries willing to trade with theoutcast were willing to do so only at a price: between 1965 and 1966,Rhodesia's terms of trade fell by 18%.5/
Economic Policies and Performance during Sanctions
Policies
1.09 Information concerning both economic performance and policiesduring UDI is extremely scarce. The sparse information available conveysthe impression of a tightly run economy with stable prices, high savingsand investment rates, positive real interest rates, and a slowly deprecia-ting currency in real terms. There was also a great deal of Governmentintervention, with close cooperation from the private sector. Sanctionsforced the Smith Government to take several economic measures that stillexert profound influence on Zimbabwe's economic life. To deal with theforeign exchange shortfall, the Smith Government introduced a system ofimport quotas and administrative allocation of foreign exchange thatremains in place to this day. In particular, the Government began toallocate foreign exchange to each firm on the basis of what it estimatedwould be the total foreign exchange available to the country. Based onthis global estimate and on each firm's imports during the base year(1965), the Ministry of Trade and Commerce then allocated foreign exchangeto each coomercial and industrial importer. Manufacturing firms (indeedall importers) could then purchase foreign inputs either by receiving anallocation, or by obtaining the inputs from an importer who had received anallocation.
1.10 This measure by itself provided manufacturing with a comfortableumbrella of protection, as imports that competed with domestic productionwere effectively barred. Eventually, the Government went even further andplaced controls on investment in order to prevent the duplication offacilities and ensure that whatever new projects were undertaken wouldeither be fully funded from external sources, or would not place a drain on
5/ Jansen, op. cit., p. 36.

-7-
Central Bank international reserves. Thus, only projects that either (i)did not use foreign exchange, or (ii) substituted for importe (or generatedexports) were approved by Government. Projects which required importedcapital equipment but whose final output was solely for the domestic marketwould ordinarily be turned down. The foreign exchange allocation systemcoupled with the investment control system protected Rhodesian firms fromboth outside and domestic competition.
1.11 Although the documentation concerning the exact nature of theeconomic policies pursued is not available, economic indicators show thatduring the first seven years of UDI prices were L'ore stable in Rhodesiathan in the industrialized countries, and that domestic interest rates,adjusted for exchange rates variations, were higher than in the industrial-ized countries (Table 1.4). Real yields on Government bonds, for example,were higher in Rhodesia during this period than real yields on 3-yearTreasury bills in the United States. Although the capital account wastightly controlled and interest rate arbitrage would not have beenpossible, during the first half of UDI there was no economic incentive toplace money outside Rhodesia. This may account for the high degree of fi-nancial deepening present at the time of Independence.
Table I.4: ZIMBABWE - INFLATION AND INTEREST RATES, 1966-1979(Percentages)
Item 1966-73 1974-79
Annualized Inflation Rate 2.0 10.0International Inflation Rate a/ 5.6 10.7Rhodesia Government Bond Yield 6.4 6.5Domestic Real Interest Rate 4.3 -3.2Z$ Equivalent of Eurodollar Rate b/ 5.7 11.8
a/ Annual increase in Manufacturing Unit Value Index.
b/ Eurodollar rate adjusted for exchange rate movements. Yield shows whatRhodesian investors would have received in Z$.
1.12 Internal price stability helped Rhodesia improve its competitive-ness vis-a-vis the outside world: in 1964-73, the real exchange rate de-preciated about 9Z with respect to a basket of currencies of what were tobecome its main trading partners in 1982, improving Rhodesia's competitiveposition (Figure No. I.1). This real depreciation was solely due to thelower Rhodesian inflation rate as the nominal cross rates were virtuallyunciianged during the period.

-8-
Figure I.1
Zimbabwe: Real Exchange Rate, 1965-73(194100)
98 T -7 >---------- -- t
97 -4 -+''-
3 ---- --- 1
" ~~~~~~~~, .. __----- ---,,,1
I~ ~ ~~ ~~ ~ ~~ ~ ~~~~~~~~~~~~~~~~~~~~~~~~~~ i I
par tnr in 1982=
, II \ I
190 1966 1967 1968 1909 1970 1971 1972 1973
Based on a basket of currencies of Zimbabwe's main tradingpartners in 1982.
Performance
1.13 Economic performance during UDI falls into three distinct pe-riods. During the first year, economic activity faltered as the economyreeled under sanctions. The next seven years were characterized by a sus-tained recovery during which Rhodesia attained the fastest growth rates inany seven year period in ita history, doubling its industrial output (asmeasured by value added) and essentially constructing the productive capac-ity now in place. The last five years of UDI witnessed a deterioration inexternal conditions and in economic policies-the latter brought aboutmainly by excessively slow response to the change in external circum-stances. Manufacturing production contracted from 1974 to 1979 and onlyexceeded its 1974 output level after Independence.
1.14 Exports declined by about one-fifth during the first five yearsof sanctions. Manufactures and agriculture took the brunt of the impact,as metals and minerals actually increased 7% per annum during this period,

- 9 -
(Table I.5). Sanctions not only disrupted trade in manufactured goods, butthey also forced a change in the sector's export orientation. From 1953 to1965 the share of exports with' respect to total manufacturing output hadrisen from 16% to 21% and the share of manufactured exports in total ex-ports had gone up from 19% to 25%.6/ With sanctions, Zambia, a majorindustrial-goods client, reduced its imports from Rhodesia by one-third inthe first year of sanctions. With trade restricted to South Africa,Switzerland, Portugal (including Mozambique), and Malawi, industrialexports fell in absolute terms almost 25% (in current prices) in 1966.
Table I.5: ZIMBABWE - EFFECTS OF SANCTIONS ON EXPORTS
Annualized Exports i.n 1970Growth Rates as % of Exports in 1965
Item 1965-1970
Agriculture -0.9 95Metals/Minerals 7.0 140Manufactures -9.2 62
TOTAL EXPORTS -3.9 82
Source: Central Statistical Office, Statement of External Trade,various issues; mission estimates.
1.15 Initially, the fall in export earnings and the adverse change inthe terms of trade hampered economic performance and GDP declined 4.6% in1966. But the economy rebounded in 1967 and for the next seven years realannual GDP growth averaged 8.9% and never fell below 4%.7/ Althoughforeign savings virtually vanished, national savings more than made up forthe shortfall, increasing from 7.5% of GDP in 1965 to 19.4% in 1970 and to24.2% in 1975. Practically all of the additional savings came out ofprivate consumption, which fell from 78.1% of GDP in 1965 to 66.9% in 1970and to 60.7% in 1975, while Government consumption's share of GDP remainedstable (Table 1.6). The investment rate also rose from 15.5% of GDP in1965 to 20.6% in 1970 an6 29.1% in 1975. This high investment ratepartially explains GDP's fast growth rate during the first seven years ofsanctions. The manufacturing sector, executing a program of importsubstitution behind a protective barrier that it had never enjoyed eitherduring World War II or the Federal period, grew at an annual rate of nearly8%. The impact of the sudden contraction of the external market was more
6/ This definition of "industrial exports" does not coincide with thedefinition used later in this report and hence shares are notcomparable to present day shares.
7/ Jansen, op. cit., p. 40.

- 10 -
than offset by the expansion of the domestic market stemming from thestrict rationing of imports. Manufacturing industries were able to main-tain a high rate of growth by switching from export to domestic sales. Theneed to supply nearly all of domestic demand also stimulated innovation anddiversification of manufacturing production.
Table I.6: ZIMBABWE - EXPENDITURE ON GDP, 1963-1975, SELECTED YEARS(Percentages)
Statistical Discrepancy 1963 1965 1970 1975
Gross Domestic Product 100.0 100.0 100.0 100.0
Resource Gap -2.6 4.7 -0.8 2.6Imports (G+NFS) -35.4 -37.1 -29.2 -32.2Exports (G+NFS) 38.0 32.4 30.0 29.6Statistical Discrepancy -5.4 -12.1 -0.7 -1.4
Total Expenditures 92.0 104.7 99.2 102.6
Consumption 78.9 89.2 78.6 73.5Gove.rnment 12.8 11.1 11.7 12.8Private 66.1 78.1 66.9 60.7
Investment 13.1 15.5 20.6 29.1Fixed 13.9 13.3 16.2 23.4Change in Stocks -0.8 2.1 4.4 5.7
Domestic Savings 15.7 10.8 21.4 26.5Net Factor Income -4.5 -3.3 -1.9 -2.3Current Transfers 0.0 0.0 0.0 0.0National Savings 11.2 7.5 19.4 24.2
Financing for Investment 13.1 15.5 20.6 29.1National Savings 11.2 7.5 19.4 24.2Foreign Savings 2.0 8.0 1.1 4.9
Source: IMF, 1984 IFS Yearbook, p. 680; mission estimates.
1.16 The world recession of 1974-75, the rise in oil prices of theearly 1970s, and the intensification of the War of Liberation in Rhodesiabrought the boom to an end. In 1974 the terms of trade deteriorated by 4%and they continued to deteriorate in each of the next five years, givingRhodesia a cumulative adverse shift of 36% during 1974-79. Manufacturingoutput declined 6% in 1976 as a result of the need to reduce foreign ex-change allocations to manufacturing in order to meet higher energy importsin 1975. Construction fell in 1976 as many private sector projects were

- 11 -
Figure I.2
Zimbabwe: Real Exchange Rate, 1973-79
91 00 ~ ~ ~ ~ ~ ~ 110
89
8 --- --------
t-- -.. __ ---- t -r1---*4\---.' ---- -. ~82 t t Figure-1-
cancelled. The- dontr con-tine in 197 and 198 Weak demnd coule
so -t- - ------
wit acut-e shorage of esetia imore ra maeil nd ciey
77 -, __ -
1973 1074 1975 MO7 1977 1978 1979
See note to Figure I.1
cancelled. The downturn continued in 1977 and 1978. Weak demand, coupledwith acute shortages of essential imported raw materials and machinery,owing to reduced foreign exchange allocations, caused manufacturing outputto decline 13.6% between 1975 and 1978. The share of fixed investment inGDP fell from 23% in 1975 to 15% in 1979; investment in manufacturing,relative to manufacturing output, fell from 26% to 8%. As a result of allof these factors, manufacturing value added in 1975-1980 grew at an anemic1.9% per year; manufacturing employment grew only 0.4%, as discussed inChapter II.
1.17 Real interest rates turned negative, as inflation increased dur-ing this period to (10% per year) while nominal interest rates remainedstable. To be sure, Rhodesia was not alone--real interest rates were alsonegative in the United States. But, unlike the first half of UDI, interestrate arbitrage became economically attractive, as Eurodollar yields (denom-inated in Z$) surpassed yields on Rhodesia Government bonds. The differ-ence in yields stemmed not from difference in interest rates, but from thenominal depreciation of the Zimbabwe dollar with respect to the US dollar.The Smith Government continued with stable domestic interest rates whiledepreciating the currency, allowing inconsistencies to creep into itsmacroeconomic policies. Thus, while interest rate policies stimulated

- 12 -
capital flight, the real exchange rate continued to depreciate. Towardsthe end of UDI, the Zimbabwean dollar was about 20% lower in real termsthan in 1964 (Figure I.2).
Sources of Manufacturing Sector Growth 1965-1979
1.18 Given the effect of sanctions on manufactured exports and theeffect of the foreign exchange allocation system on the supply of importedmanufactures, domestic demand provided the main growth impetus to the manu-facturing sector during UDI. Import substitution played a secondary butimportant role, and export expansion played a negligible role. Indeed insome cases there was export contraction, as Table I.7 shows.
Table No. I.7: ZIMBABWFE - SOURCES OF INDUSTRIAL GROWTH, 1965-79(Percentages)
Export Import DemandSubsectors Expansion Substitution Expansion
Beer Wine & Spirits -2.8 1.2 101.6Fertilizers -1.5 23.4 78.1Rubber Products 1.2 19.6 79.2Plastic Products 0.0 51.4 48.6Ferro Alloys & Iron Products 35.9 14.3 49.8Textiles 4.7 26.8 68.5Clothing & Footwear 7.3 8.0 84.7Paper, Printing & Publishing -1.4 19.6 81.8Non-metal Min. Products -0.5 3.6 96.9Wood & Furniture 4.4 14.9 80.8
Source: Central Statistical Office, Statement of External Trade andQuarterly Digest of Statistics, various issues; mission estimates.
1.19 The effect of sanctions on the structure of the manufacturingsector was surprisingly small. UDI stimulated increasing variety of pro-duction within the major subsectors, but relatively little shift in theirshares of total production, as shown in Table I.8. It is important to notethat the manufacturing sector was not born under sanctions, and that, bythe mid-1960s, there already was significant production of intermediate andcapital goods as well as of consumer goods. The doubling of manufacturingproduction that took place between 1965 and 1974 came on top of an alreadydeveloped sector. This means that the expansion that took place under UDIwas superimposed on an export-oriented--probably efficient--sector that hadbeen born under a moderate umbrella of protection. The origins of theZimbabwean industrial sector, then differ from those of many less-developedcountries where industrial sectors were born as a result of protection.

- 13 -
Table 1.8: ZIMBABWE - SUBSECTORAL STRUCTURE OF PRODUCTION,1967, 1975, 1979, 1982
(Percentage of total gross output)
Subsectors 1967 1975 1979 1982
Foodstuffs 24.6 19.7 23.5 25.0Drinks & tobacco 9.4 7.0 7.5 7.4Textiles & ginning 9.2 10.4 11.2 9.4Clothing & footwear 8.5 6.8 6.1 6.7Wood & furniture 3.7 2.8 3.1 3.2Paper, printing, etc. 5.8 5.7 4.7 5.2Chemicals, petroleum 13.3 14.0 13.3 14.8Non-metallic mineral
products 3.1 3.7 2.6 3.0Metals & products 14.5 22.1 21.5 18.1Electrical machinery 4.1 3.0 2.7 3.0Transport equipment 2.8 3.9 2.7 3.1Other 1.0 1.0 1.2 1.2
Total manufacturing 100.0 100.0 100.0 100.0
Volume of Production(1964-100) n.a 201.9 192.2
Note: Totals may not add up due to rounding.
Source: IBRD, Zimbabwe: Country Economic Memorandum, op. cit., Table8. 37,(current prices)
Independence to the Present
1.20 The first two years of Independence brought unprecedented ratescf economic growth to Zimbabwe. GDP, which in 1979 was 12% below the 1974level, grew 16% in 1980 and in 1981, recouping all that had been lostbetween 1975 and 1979 and adding some 17% to boot. This boom was the re-sult of several factors. First, in 1980 the terms of trade turned 24% inZimbabwe's favor, for a windfall gain equivalent to about 6% of GDP.Second, aggregate demand rose as investment soared and consumption expandedrapidly. At the same time, the Government relaxed the foreign exchangeconstraint on capital and intermediate goods imports, allowing the manufac-turing and services sectors (including construction) to meet the increaseddemand and grow about 15% (Table 1.9). In 1981 good weather, coupled withhigher prices for agricultural goods produced bumper crops and the terms oftrade improved again, this time by some 11%. Investment continued to soarand consumption to grow fast. All this bonanza was accompanied by stillhigher allocations of foreign exchange, which went from Z$530 million in1979 to Z$868 million in 1981 (or US$780 and US$1260, respectively). Themanufacturing sector expanded nearly 10%. Imports rose but without acorresponding increase in exports, leading to a deficit in the current

- 14 -
account of the balance of payments equivalent to about 12X of GDP in 1981.Inflation, fueled by high Central Government deficits (on the order of 10%of GDP), rose to 132 in 1981, contributing to a 10% real appreciation ofthe Zimbabwe dollar. The manufacturing sector, then, was confronted duringthe first two years after Independence with fast-growing domestic demandand with a slowly eroding competitive position vis-a-vis the outside world--a fatal combination for exports that resulted in an actual decline ofmanufactured exports of 29% in the two years.
Table 1.9: ZIMBABWE - GROWTH RATES OF THE MAIN PRODUCTIVE SECTORSAND DEMAND COMPONENTS, 1980-84
(Percentages)
Item 1980 1981 1982 1983 1984
Agriculture & Forestry 3.2 8.3 1.2 -6.4 12.8Mining & Quarrying -2.4 -4.9 4.8 -0.4 4.2Manufacturing 15.1 9.9 -0.5 -2.9 -4.8Other Sectors 14.7 18.8 -0.7 -3.3 0.3
Consumption 15.1 12.0 3.1 8.0 n.a.Investment 45.7 75.0 17.6 -43.1 n.a.of which: Fixed Capital Formation (19.2) (36.9) (7.9) (-16.8) n.a.GDP at Constant Market Prices 15.6 15.7 -0.6 1.7 0.6
Memorandum Items:Terms of Trade Index (1980-100) 100.n 111.2 108.3 104.2 106.1Gross Domestic Income Growth Rate 22.4 18.3 -1.3 1.0 0.8
Source: Central Statistical Office, Quarterly Digest of Statistics,March 1985; mission estimates.
1.21 In 1982 the terms of the trade turned against Zimbabwe (some 3%)and export earnings, measured in US dollars, declined some 5%. The bal-ance of payments current account deficit was again equivalent to 15% ofGDP, and the Central Government deficit was nearly one-tenth of GDP. Itbecame evident that a stabilization program was necessary. Domestic demandwas curbed through tax increases, cuts in Government expenditure, tightcontrol over domestic credit, and a general wage freeze. The demandcontraction was keenly felt as manufacturing fell 0.5% and GDP 0.6%. Inaddition, Zimbabwe suffered from one of the worst droughts on record andagricultural value added fell by 6% in 1983.
1.22 From 1979 to 1982, domestic demand continued to be the mainsource of growth for manufacturing (Table I.10). Following the suspensionof sanctions, manufacturing became, surprisingly, even more inward-looking. The iron end metal products subsector, for example, for which ex-

- 15 -
ports had been an important source of growth during UDI, cut down its ex-ports; other subsectors showed remarkably little change, almost as if sanc-tions had been still in effect.
Table 1.10: ZIMBABWE - SOURCES OF INDUSTKLiAL GROWTH, 1979-82
Export Import DemandSubsectors Expansion Substitution Expansion
Beer, Wine & Spirits 0.0 1.4 98.6Fertilizers -0.1 2.9 97.2Rubber Products 0.0 17.3 82.7Plastic Products 0.0 31.4 68.6Ferro Alloys & Iron Products 0.1 0.6 99.2Pulp & Paper -1.6 13.6 88.0Textiles -4.5 7.4 97.1Clothing & Footwear -4.8 -5.6 110.3Paper, Printing & Publishing 0.5 -3.0 102.4Non-metal, Min. Prod. 3.7 11.6 84.7Wood & Furniture 6.2 2.4 91.5
Sources: Central Statistical Office, Statement of External rrade andQuarterly Digest of Statistics, various issues; missionestimates.
1.23 In retrospect, this growth pattern is understandable. Zimbabwe'smanufacturing sector had been wor Lng close to full capacity at least sinceIndependence and, as will be discussed in Chapter III, prices for domesticsales are much higher than for exports. The real appreciation of theZimbabwe dollar during the first two years after Independence made exportsless profitable; the severe cuts in foreign exchange allocations restrictedaccess to inputs. Faced with growing domestic demand, higher profits inthe domestic market than in exports, a virtual monopoly in the domesticmarket, near full capacity utilization (estimated at about 80% by bothUNIDO and D. Jansen), and a more binding foreign exchange constraint,Zimbabwean manufacturers turned to the domestic market rather than to ahighly competitive, riskier, and less profitable export market.
1.24 After the crunch of 1982, the authorities began to adopt expendi-ture-switching along with expenditure-reducing measures. First, they de-valued the Zimbabwean dollar 20% in December 1982 and followed with otherdevaluations that together brought the real value of the dollar down some11% in real terms in 1983. Second, they extended export credit terms forindustrial products from three to six months. Finally, they established anexport revolving fund for imports of raw materials and other inputs used inthe production of exports, effectively removing the foreign exchange cons-traint in export activities in the manufacturing sector. To reduce the de-ficit in the current account of the balance of payments, the authoritiesreduced foreign exchange allocations even further to US$680 million (equi-valent to a 30% decline in real terms). Ms a result, although manufactur-ing output declined about 2.5% in 1983, anufactured exports increasedalmost 11% and an astounding 26% in 1984, as Table I.11 shows.

- 16 -
Table I.11: ZIMBABWE: REAL GROWTH RATES OF EXPORTS, 1980-84(Percentages)
1984Item 1980 1981 1982 1983 (preliminary)
Exports of Goods -3.3 -4.8 14.1 -4.4 6.1
Manufactured Exports 14.2 -16.0 -22.0 10.9 25.8of which: .ron & Steel (15.3) (-39.2) (-1.2) (27.4) (-23.6)
: Otiier Manu. (13.4) (2.4) (-31.8) (0.3) (68.9)
Source: Central Statistical Office, Statement of External Trade, variousissues; mission estimates.
1.25 Several conclusions may be drawn from the post-Independenceexperience. First, it is evident that sanctions were not a bindingconstraint on manufactured exports. The latter rose some 14% in real termsin the first year after sanctions were lifted, but fell some 16% thefollowing year and some 22% the year after. Some of the fall may be attri-buted to a decline in steel exports owing to technical problems at ZISCO,but in 1982 the decline stemmed from cuts in foreign exchange allocationsthat resulted in shortages of imported inputs. The shortage of foreignexchange, then, was more binding than sanctions. When in 1983 the foreignexchange constraint was removed from export activities, exports boomed.Second, depressed domestic demand favored exports. As will be discussed inChapter III, domestic prices are substantially higher than export prices sothat if exports entail diverting production from the domestic market,exporting has a high opportunity cost for the firm. But with domesticdemand depressed, manufacturers were able to shift production away from thedomestic market towards exports with ease and little, if any, opportunitycost. If domestic demand were to pick up, exports would probably fallagain. Third, installed capacity could soon become a constraint onexports. In 1981 capacity utilization was at an all-time high, with aboutone-quarter of subsectors working at over 90% capacity and about one-halfworking at over 80%. Again, were domestic demand to pick up, installedcapacity would soon become a constraint. To sustain an export drive over aperiod of more than a couple of years, additional capacity would beneeded. To make exports more attractive, their price, relative to domesticprices, nmst increase; in fact, the absolute as well as relative price ofexports (in Zimbabwe dollars) must increase. Fiiially, management in theindustrial sector responds quickly to incentives, as attested by theirreaction to the establishment of the export revolving fund. With properincentives, it would probably establish manufacturing among the leadingexporting sectors once again. The next three chapters will explore thesethemes in more detail.

- 17 -
II. PRESENT STRUCTUREOF THE NAWACTURING SEC CR
Size of Manufacturing Sector1/
2.01 The relative importance of Zimbabwe's manufacturing sector standsout in the African context. Manufacturing contributes about a quarter ofvalue added to GDP (roughly three times the average for developing Afri-ca), it is the third most important source of employment in the economy,and accounts for about 17% of total export revenues. These features, toge-ther with its diversity and potential role in exports, give it a major roleto play in Zimbabwe's on-going economic recovery and future development.Table II.1 gives some selected economic indicators of manufacturing's im-portance and past performance.
Table II.1: ZIMBABWE - SELECTED ECONOMIC INDICATORS, 1970-84
1984 1985Indicator 1970 1975 1980 estimate
Manufacturing GDP(millions 1980 Z$) 513 729 802 811 847
Share in total GDP (%) 21.0 23.5 24.9 22.8 22.9
Employment (thousand) 115 156 159 167 169
Wage share of value added 53 54 55 63a/ n.a.(percentage)
Average annual growthrates (x): 1970-75 1975-80 1980-85
Manufacturing GDP 7.3 1.9 1.1
Employment 6.3 0.4 1.2a/ 1982 figure.
Source: IBRD, Zimbabwe: Country Economic Memorandum, op. cit., Tables1.02, 2.02, and Republic of Zimbabwe, First Five Year Nationalevelopment Plan, 1986-1990, April 1986, mimeo, Vol. 1, pp. 13 and19; mission estimates.
Structure of Production by Subsector
2.02 At present, three subsectors--foodstuffs, chemicals, and metalproducts--account for over half of the sector's total value of production.Metal products, in particular, dominates in terms of number of firms, netoutput, employment, exports, and capital stock, as shown in Table II.2.
1/ The discussion refers to recorded manufacturing enterprises, whichexcludes a substantial number of artisanal, informal and home manufac-turing activities

- 18 -
Table II.2: ZIMBABWE - DISTRIBUTION OF MANUFACTURING UNITS,OUTPUT, EXPORTS, EMPLOYEES, AND CAPITAL STOCK
(Percentage)
No. of Net CapitalSubsectors units output Exports Employees stock
Foodstuffs 11.1 15.9 7.4 14.9 15.3Drinks & tobacco 3.9 10.9 0.9 7.5 9.1Textiles & ginning 4.9 8.6 20.9 11.8 9.7Clothing & footwear 10.9 8.9 3.9 12.4 3.2Wood & furnicure 7.2 3.9 3.3 7.3 2.2Paper, printing, etc. 8.4 6.7 0.9 5.4 5.0Chemicals, petroleum 9.2 12.7 5.4 7.3 13.5Non-meta'llic mineralproducts 4.3 4.5 0.6 4.4 6.5
Metals & products 29.9 23.3 53.1 24.0 32.4Transport equipment 3.4 2.9 1.3 3.0 2.3Other 6.9 1.5 2.4 1.9 0.8
Total manufacturing 100.0 100.0 100.0 100.0 100.0
Source: IBRD, Zimbabwe: Country Economic Memorandum, op. cit., Tables,1.02, 2.02.
2.03 Foodstuffs is the second most important subsector in every cate-gory but exports. After these two subsectors, the ranking varies greatlyaccording to the category. For example, textiles and ginning are secondmost important in terms of exports, but sixth in terms of net output andfourth in terms of capital stock (Table 1I.2). The important point, how-ever, is that Zimbabwe's industry is noteworthy in terms of range and di-versity. Even by the mid-1960s, there was significant production of inter-mediate and capital goods as well as consumer goods, and no major subsectorwas negligible in terms of output. UDI stimulated increasing variety ofproduction within these major subsectors, though relatively little shift intheir shares of total production, as discussed in paragraph 1.20.
2.04 Table II.4 presents some indicators of capital intensity andproductivity at the subsector level. The chemicals subsector has the high-est capital per worker, which is translated into the highest labor produc-tivity (both gross and net of purchases). Beverages and tobacco, likewise,have relatively high capital per worker and high productivity. The non-metallic mineral products and the metals and metal products subsectors, onthe other hand, are relatively capital-intensive, but they have average orbelow-average productivity per worker and the lowest output/capitalratios. This indicates some problems in translating capital expendituresinto higher efficiency and productivity.

- 19 -
Table Il.3: ZIMBABWE - STRUCTURAL CHARACTERISTICS OF MANUFACTURINGSUBSECTORS(Thousand Z$)
Gross Output Capital Net Output Net Outputper per per per as x of as % of
Subsectors Unit Worker worker worker Gross CapitalOutput
Foodstuffs 5186 29.9 21.7 7.5 25 35Drinke & tobacco 4336 17.4 25.8 10.3 59 40Textiles & ginning 4514 14.5 17.5 5.2 36 30Clothing & footwear 1427 9.7 5.5 5.1 53 93Wood & furniture 959 7.3 6.5 3.8 52 59Paper, printing, etc. 1434 17.3 20.0 8.9 52 44Chemicals, petroleum 3137 30.5 39.2 12.3 40 31Non-metallic mineralproducts 1627 12.1 31.1 7.3 60 23
Metals & products 1567 15.1 28.9 6.9 46 24Transport equipment 2040 17.9 16.4 7.0 39 42Other 396 10.9 9.0 5.5 51 61
Total manufacturing 2235 17.3 21.3 7.1 41 33
Source: UNIDO, Study of the Manufacturing Sector in Zimbabwe, 1985.Tables 2.6 and 2.7.
Financial Characteristics
2.05 The strength of the balance sheet is another outstanding charac-teristic of Zimbabwe's manufacturing firms. Zimbabwe has a stock exchangepresently listing fifty-two companies, accounting for about one-half ofsales in the manufacturing sector in 1981. The mission analyzed the per-formance and financial characteristics of these 52 companies on the basisof their published balance sheets and income statements. These firmsshowed unusually strong balance sheets, with average leverage of only 0.73for the six year period 1980-1985. Most of the debt was short-term, as in-dicated by the low long-term leverage ratio of 0.17 and a current ratio2/of 1.4:1. These ratios suggest that manufacturing firms in Zimbabwe drawlightly upon financial institutions and work mostly with their own resour-ces. The surprisingly high current ratio indicates that most of their debtis short-term, with only about one-quarter of their total liabilities beinglong-term. The indebtedness of these firms rose slight.iy in 1982-84, withthe slowdown of economic activity, (leverage ratio rose to about 0.76), butdeclined again in 1985 to 0.68 with improvement in economic conditions.Table II.4)
2/ current ratio - current assets/current liabilities.

- 20 -
Table II.4: ZIMBABWE - MAIN FINANCIAL INDICATORS OF THE PUBLICLY TRADEDCOMPANIES, 1980-1984 a/
1980 1981 1982 1983 1984 1985
Pre-tax Profit as% of Sales 16.0 13.8 8.4 6.0 6.0 7.5
After-tax Profitas Z of Sales 11.1 10.1 5.2 3.8 3.7 5.4
Return on Equity 16.0 15.5 8.8 6.5 6.7 10.3Return on Total Assets 9.5 9.0 4.9 3.7 3.8 6.1Effective Tax Rates 30.8 27.4 38.2 37.4 38.8 27.8Pay-out Ratios 50.9 42.7 56.8 54.6 47.8 37.9
Leverage 0.69 0.71 0.78 0.76 0.76 0.68Long-Term Leverage 0.17 0.19 0.25 0.28 0.29 0.20
a/ Based on number of respondent firms which varies from year to year.For most years, 52 publicly trade firms were included in the sample;for 1985 the sample was somewhat smaller.
Source: Statistical Appendix Table 6; mission estimates.
2.06 An analysis of the sources and uses of funds conveys the impres-sion of aptly and conservatively managed firms, with internally generatedfunds (profits and depreciation) providing nearly three quarters of newresources in 1980-85, and acquisition of fixed assets absorbing one-half ofthese new resources. An interesting point is that dividends and taxes werealmost exactly matched (18X each), indicating that the fisc and theshareholders claimed an equal share of the funds generated during thisperiod.
Table II.5: ZIMBABWE - SOURCES AND USES OF FUNDS OF FIFTY-TWOPUBLICLY TRADED COMPANIES, 1980-1985
(Percentages)
Sources:
Profits 56.2Depreciation/Non-cash Items 19.9Net Increase in Long-Term Debt 10.7Increase in Share Capital 7.5Other Sources 5.7
Uses:
Net Acquisition of Fixed Assets 49.0Dividends 18.0Taxes 18.5Other Uses 14.5
Sources: Statistical Appendix Table 6, mission estimates.

- 21 -
Ownership and Geographical Location
2.07 Ownership. Private and unincorporated enterprises account for 86%of recorded manufacturing turnover, with parastatals in foodstuffs andtextiles accounting for 10% and public firms under the IndustrialDevelopment Corporation for 4% (mainly in metals).3/ The predominance ofprivate ownership is a positive feature of Zimbabwe's manufacturing sectorin terms of ability to respond to competitive pressures and incentives.
2.08 Estimates of the extent of foreign ownership in the manufacturingsector vary widely according to the definition of foreign ownership usedand according to the different extrapolations from sample surveys to thesector as a whole. Legally, any firm with more than 15% equity in foreignhands is foreign-owned. This definition may give rise to the widely heldbelief that about 80. of the industrial firms are foreign owned. The Con-federation of Zimbabwean Industry (CZI), estimates foreign ownership atsomewhere in between 30% and 60%. Both UNIDO and Doris Jansen estimate itat between 25% and 50%.
2.09 Reduction or foreign control has been a policy objective sinceIndependence. The substantial participation of foreign firms in Zimbabwe'smanufacturing sector, however, could be viewed as giving it access to thetechnology and marketing information needed to develop exports and moreefficient domestic production. Both objectives can be pursued by retainingsome foreign participation, but reduc.ng it to minority control.
2.10 Location. In Zimbabwe, as in many countries, industrial activityis highly concentrated. Harare (including Chitungwiza), with only 11% ofthe country's population, accounts for 50% of manufacturing output andabout 46% of manufacturing employment. Bulawayo, the second largest citywith 5% of the total population, accounts for 23% of manufacturing outputand 28% of manufacturing employment, and the Kwe Kwe-Redcliff industrialcomplex (ZISCO's site) contributes 7% to manufacturing output and 5% tooverall manufacturing employment. Together these three centers contribute82% of total manufacturing output and account for 79% of manufacturing em-ployment. In the five-year period 1977-1982 there has been a slight in-crease in industrial concentration in these three areas, although with afall in the Kwe Kwe-Redcliff share. Statistical Appendix Table 4 providesthe details on industrial concentration and recent trends.
Manufacturing Employment
2.11 The manufacturing sector, the third most important employer afterservices and agriculture, employs the highest proportion of skilled workersand professionals and has contributed one-third of net employment creationin recent years (Tables II.6 and II.7). This impressive performance took
3/ UNIDO, Study, op. cit., Table 2.11, p. 45.

- 22 -
place mainly between 1965 and 1975, when manufacturing employment nearlydoubled. From 1975 to 1984, manufacturing employment grew, but at snail'space--0.4% per year. To be sure, even this sluggish rate of growth outdidthat of the economy as a whole, for employment declined during these years,despite a modest upturn in 1980-84. This is particularly worrisome in viewof the estimated 80,000 who leave school every year in search of a job.There is no doubt that the drought of 1981-84 was an important cause in thefall of employment--agricultural employment accounts for the total decline-- but even in the hey days of employment creation, no more than 30,000 jobswere created annually. This is well below the 80,000 annual schoolleavers.
Table II.6 - ZI1M4MA: PERCr DISTXBUIICN OF EwD'1 BY SCIEtWS(Percentage)
Contribution tonet increase in
epalcyment1965 1970 1975 1980 1984* 1984-85
Agriculture, Forestry & Fishing 39.5 34.9 34.6 32.4 25.7 -10.5Mining and Qarying 6.3 6.7 6.0 6.6 5.3 2.8Maifacturing 10.7 13.4 14.9 15.8 16.1 30.0Electricity and Water 0.7 0.7 0.7 0.7 0.7 0.6Costruction 3.6 5.0 5.8 4.2 4.5 6.9Public AdMmnistratimn 4.0 4.6 4.7 7.0 8.5 20.4E&cation 3.9 3.6 3.4 4.1 8.2 19.3Other Services 31.2 31.2 30.1 29.2 30.9 30.2Total (Thcusands) 747.5 853.3 1,050.2 1,009.9 1,034.0 286.5
* Based on June 1984 data.
Source: Central Statistical Office, Quarterly Digt of Statistics, March 1985, Table 6.1,p. 6; ,idssion estimates.
2.12 Compared to total employment in non-educational establishments,manufacturing has a relatively larger percentage of skilled and semiskilledworkers, the vast majority of which are African (see Table II.7).According to the National Manpower Survey carried out in 1981 nearly halfof employment in the manufacturing sector is semi-skilled, skilled orprofessional.

- 23 -
Table II.7: ZMAIE - SKLL AND RIaL D1S9BII= CNF MEACU3RDG EM Ir U]MaWREDWilH MUTAL ElNWDUIr DN Nti4U1ATIQIAL NMLNSiWiNNS 1981
(-)
Siam of MamufacturingTotal in Nar-ekaetional In Total Nbneducationl
EatablWhu.nts a/ Establtshtents
A. Profeuiaml Sdllad,Seml-d.4Ued 43.3 37.0 24.9
of wtkddh
African 78.3 74.7 26.1Euvpean 18.9 22.2 21.3Asian/Cblored 2.8 3.1 22.0
1. rofeuuicnal 3.6 4.6 16.9of whidh:
African Z3.9 39.0 10.3Europen 71.6 56.7 21.3Asian/Colored 4.5 4.2 18.0
2. Skilled 13.4 10.9 26.4of wich:
African 67.7 61.1 29.2Europan 27.9 34.6 21.3Asian/Colored 4.4 4.3 27.3
3. SemL4ciIled 26.4 21.6 26.1
African 90.5 89.0 26.5Europenm 7.0 8.6 21.2Asian/Colored 1.7 2.3 18.7
B. Urndlled b/ 56.7 63.0 19.2
UTAL 21.3 100.0 21.3
8/ The total for all psam repwted (includig persw reported in edzcatiaual estab1istuents)wa 862,014. Teir ddU category bredcwduen 8 foliaes: 66,826 profeminal, 105,745skllled, 176,001 senak-iUlled and 513,442 wrmkilled
b/ Racial breaikA&n for unjiJLled mm nDt available.
Source: Mlnistry of Marwer Plwming and Dewekponnt. Natiomal MsnQcwer &irvey 1981, pp. 167, 174and 307.

- 24 -
2.13 In the category professionals, manufacturing is more dependent onforeigners than the rest of the economy. More than 70% of the profes-sionals in the manufacturing sector are Europeans, a higher proportion thanin non-ec. sational establishments as a whole (56.7%). In addition, thepercentage of non-Zimbabwean citizens among professionals in manufacturing(30.2X) is significantly higher than in non-manufacturing employment as awhole (21.9%), as Table II.8 shows. The dependence on foreigners has madethe manufacturing sector more vulnerable to the large emigration flows thathave taken place in Zimbabwe in the past 10 years.
Table II.8: 7JMBAE - NATI(AITY (F PROgFESSICNL 3LLD AND 94-SCaILI EMPOUED:M&UFACJRNG AND TUMAL EMWYED IN NON-EWJCNAT L ESEULISHiS 1981
(Percentages)
Share of MmnufacturingTotal in Non-educational in Total Non-educatiowal
Manufacturing Establishments a/ Establishments
Professianal 8.4 12.4 16.9of which:
Zimhabhan 63.6 72.1 14.9alai 6.2 6.0 17.5NkrnZimbab,*en 30.2 21.9 23.3
*killed 31.0 29.3 26.4of which:
Zimbahoi_.n 80.9 81.2 26.3European 3.3 3.0 29.3Asian/Colored 15.8 15.5 26.3
Semi-Skilled 60.6 58.3 25.9of wtiich:
Zimbah4ean 88.3 88.4 25.9Dual 0.5 0.8 14.2Non-Zimbabwean 11.2 10.8 26.9
Total Professional 24.9 100.0 24.9
Ziubabwean 83.9 84.3 24.8Dulal 1.8 2.1 21.6Non-Zimbabwean 14.2 13.6 26.0
a/ Total professional, skilled and semi-skilled was 298,391 of which 24.9%, or 74,373, were inumifacturing.
Source: Ministry of Manpeier Planning and Development, National Manpower Survey 1981, pp. 179, 186.

- 25 -
Import Dependence
2.14 Use of domestic rather than imported inputs is an important fea-ture of the manufacturing sector. In 1982, only 25% of inputs into manu-facturing were imported (Table II.9), compared to 73% in Ghana, whose (pre-viously) well-developed industrial sector also has experienced a sustainedperiod of import scarcity.4/ Only the chemicals and the transport equip-ment subsectors imported over half of their inputs.
Table II.9: ZIMBABWE - BALANCE OF TRADE OF THE MANUFACTURING SECTOR, 1982(Million Z$)
Exported ImportedGross Value Imported Trade Share Share of
Subsectors Output Added Inputs Exports Balance of Output Inputs
Foodstuffs 788 198 14 20 6 2.6% 2.4%Drinks & Tobacco 229 136 22 2 -20 1.1% 24.0%Textiles & Ginnlnga/ 302 107 45 58 13 19.1% 23.0%Clothing & Footwear 211 111 39 11 -28 5.1% 39.0%Wood & Furniture 94 49 6 9 3 9.6% 14.0%Paper, Printing, & Publi. 163 84 19 2 -17 1.5% 24.0%Chemicals & Petroleum 395 159 123 15 -108 3.8% 52.0%Non-metallic Mineral
Products 94 57 6 2 -4 1.8% 16.0%Metals & Products 639 291 143 147 5 23.0% 41.0%Transport Equipment 94 36 34 4 -31 3.7% 60.0%Other 37 19 5 7 2 17.6% 25.3%
Total Manufacturing 3,048 1,249 456 277 -179 9.1% 25.3%
Memrandum Items:Textiles Excluding
Cotton Ginning 251 n.a n.a. 6 n.a. 2.4% n.a.
Totals ExcludingCotton Ginning 2,997 n.a n.a. 225 n.a. 7.5% n.a.
a/ Includes ginned cotton.
Source: UNIDO, Study of the Mainufacturing Sector in Zimbabwe, nimeo, Sept. 1985; missionestimates.
4/ IBRD, Ghana: Industrial Policy, Performance and Recovery, 1985,Report No. 5716-GH, Annex table 24.

- 26 -
2.15 As might be expected from the discussion in Chapter I, substan-tial inter-industry linkages within manufacturing also exist. About aquarter of the value of gross manufacturing output represents input pur-chases from other manufacturing industries, and a breakdown of these flowsinto 33 industries reveals that input-output linkages occur in about three-quarters of all the possible cases. The metals and metal products subsec-tor is an especially important input into all other subsectors, providing31% of total intersectoral inputs. Manufamttrin4 (as both a purchaser anda supplier) also has substantial linkages wiLh agriculture, mining, andconstruction.
2.16 These linkages enable Zimbabwe's manufacturing sector to use lessforeign exchange per unit of output than manufacturing sectors in othercountries, but they do not make the sector totally independent of importsbecause the possibilities for substitution of one input for another arefew. For example, in the textile sector, imported inputs consist of man-made fibers, chemicals, and dyestuffs. Cotton can be used instead of man-made fibers, but there are no domestic substitutes for chemicals and dye-stuffs. In the fertilizer sector, imported ammonia accounts for aboutone-third of total ammonia input (the balance is produced locally). Ammo-nia is essential for the production of amonium nitrate and has no localsubstitute. Furthermore, the sector still relies on imported capitalequipment. A medium-term program to raise exports, then, would probablyincrease the sector's import requirements both for inputs and to expand andreplace capital equipment.
Manufactured Exports
2.17 Manufactured exports (SITC 5-9 minus 68 and ferro-alloys) accoun-ted for about 17% of total exports in 1984, as Table II.10 shows. Althoughiron and steel account for about one-quarter of total manufacturedproducts, the range is wide and exports account for about one-tenth oftotal sales for the sector as a whole.
Table II.10: ZIMBABWE - SHARES OF TOTAL EXPORTS(At current prices)
1965 1970 1975 1979 1980 1984
Agriculture 41.2 34.3 44.9 37.2 32.8 41.1Metals/minerals 19.8 37.6 30.2 30.2 31.5 26.0Manufactures 25.3 21.6 16.9 19.2 18.3 16.8Iron and Steel (2.9) (4.8) (2.5) (8.7) (8.4) (3.9)Other Manufactures (22.4) (16.8) (14.4) (10.5) (9.9) (12.9)
Other Exports 13.7 6.5 8.0 13.4 17.4 16.1Gold (4.2) (4.2) (6.3) (9.3) (12.7) (11.1)Migrant's effects - - - (3.6) (4.1) (3.5)Re-exports 9.5 2.3 1.7 0.5 0.7 (1.5)
TOTAL 100.0 100.0 100.0 100.0 100.0 100.0minm X -mm ===Wm ==o" D mum==
Source: Central Statistical Office, Statement of External Trade, variousissues; mission estimates.

- 27 -
2.18 In 1965, non-metal manufacturing contributed 221 of exportrevenues. Sanctions, and the incentive system, however, had a strongnegative effect on manufactured exports which declined 3.5% per annumin real terms over 1965-79 (Table 11.11). Given the strong positiveperformance of manufacturing output during most of this period, thedecline in exports can be attributed largely to the increase in domesticabsorption, as discussed in Chapter I.
Table I1.11: ZIMBABWE - EXPORT GROWTH RATES AT CONSTANT 1980 US DOLLARS19W5-84
ActualSector 1965-79 1980-84
Agriculture 1.5 9.2Metals/minerals 4.9 -4.6Manufactures -3.5 0.6Gold 4.0Total a,' -04 3.o
a/ Includes migrants' effects and re-exports.
Source: Central Statistical Office, Statement of External Trade;mission estimates.
2.19 The share of manufacturing output that is exported has fallenfrom about 20% at the time of UDI, to less than half that proportion now.The decline in export share was particularly sharp over 1978-82. Although1982 was an exceptionally bad year and manufactured exports have revivedsince, there is cause for concern about the ability of Zimbabwe's manufac-turing sector to recapture export markets as its production recovers.Manufactured exports today are a quarter lower in real terms than in 1965.It is not, however, a question of simply re-entering old markets. Condi-tions have changed considerably, both in international competition in theseproducts and in neighboring markets. To penetrate today's markets,Zimbabwe needs adequate policy environment, capital stock, and produc-tivity.
2.20 Owing to Zimbabwe's relatively small dependence on imported in-puts, the balance of trade for the manufacturing sector is more favorablethan for many countries at similar stages of development. As Table I1.10shows, in 1982-a very bad year for manufactured exports-the sector's ex-ports covered about 60% of the sector's recurrent input requirements. Thisestimate is on the high side because, in Table II.10, exports of manufac-tured goods include ginned cotton. Excluding ginned cotton from exportsand assuming that inputs would have remained at the same level, the sectorwould have covered about 50% of its import requirements. Industrialexports were 51% higher in 1984 than in 1982, but industrial production

- 28 -
declined. This means that use of recurrent inptuts for the sector also dec-lined and that the sector balance of trade improved considerably. In fact,the mission estimates that in 1984 industrial exports may have been equiva-lent to about 85% of the sector's imported inputs-a very high and unusualproportion for a country at Zimbabwe's stage of development. The propor-tion, for example, was 22% for Ethiopia in 1981; 20% for Tanzania in 1985,and 43% for Ectuador in 1980.
Structure and Age of Capital Stock
2.21 Three subsectors--metals and metal products, foodstuffs, andchemicals and petrochemical products--account for 61% of the total capitalstock. Roughly one third of the total capital stock is land and buildings,and two thirds is plant, equipment and vehicles. The capital-labor ratiofor the sector as a whole is about Z$21 thousand (US$13,000) per employee.The most capital intensive subsector per unit of labor is chemical and pe-troleum products (Z$39,000), followed by non-metallic minerals (Z$31,000),metals and metal products (Z$28,000), and drink and tobacco (Z$29,000).The most capital intensive per unit of value added, however, is non-metal-lic minerals, followed by metals and metal products, textiles, and chemi-cals, all of which are above the national average of 3.01 (see TableII.12).
Table II.12: ZIMBABWE - DISTRIBUTION OF CAPITAL STOCK ACCORDING 10 SCIURAND TYPE OF INVESTMENTS, 1982
CapitalStock in
Land & Plant & Subsector Capital-Buildings Equipment Vehicles Total (Million Output
Percentages 1982 Z$) Ratios
Foodstuffs 6.7 6.7 1.8 15.3 573 2.89Drinks & Tobacco 3.6 4.4 1.1 9.1 341 2.50
Textiles 2.8 6.6 0.2 9.7 363 3.38Clothing & Footwear 1.1 1.8 0.3 3.2 120 1.08Wood & Furniture 0.6 1.1 0.4 2.2 84 1.70Paper, Print. & Publish. 1.3 3.4 0.4 5.0 189 2.25Chemical & Pet. Prod. 3.6 9.0 1.0 13.1 507 3.19Non-metal Mineral Prod. 2.2 3.7 0.6 6.5 243 4.28Metals & Metal Prod. 7.8 23.1 1.6 32.4 1219 4.19Transport Equipment 1.1 1.0 0.2 2.3 86 2.36Other 0.2 0.5 0.1 0.8 31 1.63
TOTAL 31.1 61.3 7.7 100.0 3756 3.01
Source: Statistical Appendix Table 8; mission estimates.

- 29 -
Ligure II. 1
Zimbabwe: Age Distribution of Spinners
30P1 5
/, r, .1 / /
Fi ure 11I_
Zimbabwe-, Age D)istributioi-i of Looms
70 - { ''A; ,v
; 70- u',, ','',/ '.- A
'S 1 K ' ;,' " .......'
50 -5 00707008
I 40o
Pro-51 60 65 70 75 S0 65
Tear of Design

- 30 -
2.22 The most complete data concerning ti.e age of the capital stockcomes from the textile subsector. In this sub'e tor, the vast majority ofthe equipment was in place in 1975 and is at 1 t ten years old. Nine-tenths of the weaving equipment dates back to 1975 and about one-quarter isof 1965 vintage or older, as Figure 11.1 shows. More investment has takenplace in spinning equipment recently so that there are more new machines inplace. Nevertheless, nearly 70X of the spinning equipment is of 1975 vint-age or older.
2.23 In the fertilizer subsector, the main facilities consist of anammonium nitrate plant, a nitric acid plant, two sulfuric acid plants, andone phosphoric acid plant. The ammonium nitrate and nitric acid plantswere commissioned in 1979; the rest date to 1972. In the steel subsector,there are two blast furnaces now in operation, one built in 1961 and theother in 1975. The oxygen convertors and the continuous casting mills werealso built in 1975. The other main facilities--the bar mill and the rodsmill--are of 1975 vintage or older. In the paper subsector, the newest ma-chine in the sample of respondent firms dates back to 1952, with some dat-ing back to 1926, with modernizations having been undertaken in the1980's. In the soap and detergents subsectors machines dated to 1978 (new-est) and to 1959 (oldest).
2.24 Other evidence also points in the same direction. A surveyconducted by the Confederation of Zimbabwean Industry (CZI) indicatedthat the main reasons for wanting to replace capital were:
1. Capital worn out 61.5%2. Shortage of spare parts 18.2%3. Too costly to operate 11.4%4. Productivity too low to
maintain competitiveness 7.1%5. Other reasons 2.2%
Investment Levels
2.25 Investment levels peaked around 1974-75. With the intensifica-tion of the War of Liberation and the decline of economic activity duringthe mid-1970s (see Chapter I), investment in manufacturing declined preci-pitously in 1976 and continued to decline until after Independence in 1980(see Figure 11.3). In fact, total investment in manufacturing in the years1976-79 was about equal to the investment undertaken in 1975. The lowgross investment levels of recent years mean that the sector is workingwith equipment that is past its useful economic life. In the absence ofnet investment and time series figures on the capital stock, the missionestimated the capital stock from 1970 to 1982 based on gross investmentfigures and the UNIDO estimate of capital stock in place in 1982. Economiclife was assumed to be 40 years for buildings, 15 years for plant andequipment, and 5 years for vehicles. The resulting estimates weresubtracted from gross investment figures and the capital stock adjustedaccordingly. The results imply that the capital stock in plant andequipment was higher in 1976 than in 1982, about the same in

- 31 -
vehicles, although lower In land and buildings. It is unlikely that thecapital was depleted; the most likely hypothesis is that investment in1975-82 added to existing equipment and that the manufacturing sector keptold machines working. Given the rationing of foreign exchange and the hightransaction costs implicit In its procurement, keeping old equipmentworking probably makes financial sense for the firms, even if maintenancecosts are high. The mission's findings at the subsectoral level indicatethat firms added new machinery, but did not discard old equipment. Thethree subsectors studied in detail have Invested little since 1975. Allthree subsectors are working with rather old equipment and only thetextiles subsector had added modern equipment since 1975.
2.26 Investment increased again after Independence in 1980 and 1981,but fell during the following three years. Compared to the 1975 peak,average annual investment in 1980-83 was down by about one-half. Althoughinvestment data for 1984 and 1985 was not available at the time that themission was in the field, business surveys and other data indicate that in-vestment continued low in 1984, but began to recover in 1985. The BusinessOpinion Survey of the Business School of the University of Zimbabwe showsthat the number of firms with investment plans in December 1984 was lowerthan in 1981 and that the volume of investment planned in December 1984 andJune 1985 for the following six months was only one-fifth of that plannedin mid-1981. Foreign exchange allocations approved by the IPC for new in-vestment projects fell from Z$26 million in 1983 to Z$14 million in 1984,but recovered to an estimated Z$16 million in 1985. Finally, net fixed as-set acquisitions of the 52 publicly traded companies was only 10% of netfixed assets in 1984, compared to 15% in the preceeding four years.
2.27 There is general agreement that the main reason for the low in-vestment levels is the rationing of foreign exchange. Virtually allinvestment projects require imported capital goods and, therefore, IPCapproval. In 1984, for example, the foreign exchange component of indus-trial projects submitted to IPC was some 70% of the total project value.According to UNIDO, for every project approved, four were rejected. Thehigh rejection rate was attributed largely, although not exclusively, toforeign exchange shortage.
2.28 Low profits and the ensuing pessimistic expectations also par-tially account for the investment decline. For the 52 publicly traded com-panies, for example, pre-tax profits as a percentage of sales fell from 16%in 1980 to 8.4% in 1982 and to 6% in 1984. Return on equity also fell,from 16% in 1980 to 6.7% in 1984, while return on total assets dropped,from 1.8% in 1980 to 0.2% in 1984. Despite these negative trends, cashflow remained healthy; firms had cash surpluses in four out of the fiveyears and high dividend-payout ratios equivalent to about 45% to 55% of netprofits. Of the total investment that took place, 58% was financed withinternal cash generation, 27% with long-term debt, and 15% with new sharecapital. Considering that these firms were almost free of debt and thatcomercial banks were liquid, higher investment levels could easily andprudently have been financed with debt. Lack of investible funds, there-fore, was probably not a constraint.

- 32 -
ZIMBABWE: Capital Stock Estimates,1370-U
1 .1 - N
I-I~~~~~~~~~~~~~~~~~~~~~~~~~~~~~~~~~~~~~~~~~~~~~~~~~~~~~~~~~~~~~~~~~~~~~~~~~~~~~~~~~~~~~~~~~~~~~~~~~~~~~~~~~~~~~~~~~~~~~~~~~~~~~~
0 - ? N 1 i |~~~~~~~~- 1
0.7-4
0.2 - ir p ! v ,tir r<
x hAf ASaX Vl> hq
0.1
1@N 13 71 1¶72 1375 1374 1371 1976 1377 1376 1379 1360 19U1 1962 136
Erz illn= Ez ihn Vohkb
ZIMBABWE: Gross Fixed CcPitalFormaflon In Manufaturing. 1 70-83
3 60 -~ , - - - -,. ,.,......,*.
340-
320 --
300--
260 -
240-
* 220-
c 200,A
160~*
140 -1
120-
100-
00 -
704- 11 1 1 1362 131970 1971 1972 1973 1974 1975 1976 1977 1979 1979 1I@0 1981 1982 19 U

- 33 -
2.29 The business climate, however, was bearish from 1981 to the mid-dle of 1984. Thus, in April of 1981, 38% of the firms expected business toimprove and 37% to remain stable. By December of 1981, only 15% expectedan improvement; a year later, only 8%. At the time that the mission was inthe field, firms were becoming more bullish, yet the external environment,particularly the situation in the Republic of South Africa, was st'll acause for concern. As one senior Zimbabwean executive put it: "Son, youare sitting in the middle of Africa. The countries around you are fallingapart. Eighty percent of your production has to go through South Africa.Why would you invest in Zimbabwe?"
2.30 Government policies wera also cause for concern. UNIDO cites Go-vernment's failure to enunciate a detailed industrial strategy, especiallyuncertainty about the future pattern of State involvement in the sector andabout taxation levels, profit repatriations, and definitions of what willconstitute foreign/local enterprises. For foreign investors, UNIDO citestwo additional reasons: the country's negative image in the outside busi-ness community, and the absence of an agreement with the United StatesOverseas Private Investment Corporation (OPIC).
2.31 The mission's findings at the subsectoral level show a combina-tion of these factors, each working to hold investment down in each subsec-tor. In the fertilizer subsector for example--considered of strategic im-portance by the Government--investment has been held back by low profitrates. In one company, shareholders are allowed a 22.5% pre-tax return onthe issued share capital. This translated into an after-tax return of 7.3%on shareholders' equity in 1984 and 7.5% in 1983; yields on Post OfficeBank savings accounts were 8.5%-10% during the same period. The share-holders of this company certainly had no incentive to invest, as intereston Post Office Savings Bank accounts are tax-free. Another fertilizercomp' ky is allowed a 17.5% return on fixed and working capital, which inthese two years translated into an after-tax return on shareholders equityof about 15%--a more adequate return in view of the alternative yields inthe country. Of course, neither of these yields would be attractive for aforeign company because the devaluation of the Zimbabwe dollar would havebrought them down to nil or even less than zero when denominated in USdollars. Both of these companies had dividend pay-out ratios of nearly100%. In ZISCO, lack of investible funds and lack of decision about Itsexpansion plans have held investment down. On the other hand, shortage offoreign exchange was the principal cause cited by managers in the textilesubsector as the main constraint to their investment plans.
2.32 The economic situation has improved since mid-1984 and with itthe business climate. Thus, in June 1985, 64% of the firms in the Univer-sity of Zimbabwe's Business Survey were bullish and 23% expected nochange. By December 1985 only 42% expected improvements, but the number offirms that expected either no change or an improvement was still 87%. Tothe extent that business climate has been a constraint on investment, themore optimistic outlook augurs well for the future.

- 34 -
Choice of Technology
2.33 Of the three subsectore studied in more detail by the mission,only the textile subsector has undertaken substantial investments since In-dependence. The equipment purchased in this subsector in recent years hasbeen remarkably modern and labor-saving.
2.34 The relevant technologies that can be employed in spinning andweaving can be represented in a continuum of choice between conventionaland very modern equipment 5/ in the following schematic outline:
Conventional Spinning Very Modern
I~~~~~~~~~~~~~~ .. I 1. Ring spinning 2. Ring spinning 3. Open-end
with automated spinningmaterial movements
Conventional Weaving Very Modern
l I lI.Automatic looms 2.Automatic looms 3.Automatic looms 4.Automatic loomswith mechanical with uniform with airiet with gripperweft insertion attachments weft insertion weft insertion
2.35 Almost all of Zimbabwe's recently installed capacity in spinningand weaving falls into category 3 (i.e., very modern). Such moderm equip-ment generates considerably less employment per dollar than does conven-tional machinery. Indeed, much of this equipment has not been widely adop-ted until recently in developed country textile mills despite their muchhigher wage rates (Statistical Appendix Table 35).
2.36 Cost calculations indicate that less modern, more labor intensivetechnologies would be less expensive per unit of output than the technologyactually chosen, suggesting entrepreneurial mistakes in the choice of tech-nology. Given the high degree of sophistication and efficiency demonstrat-ed otherwise, an entrepreneurial mistake would seem unlikely. Other expla-nations could include clever purchases of second-hand equipment, laborlaws, or foreign exchange shortage.
5/ Still a third category, preconventional technology is available fromsome countries such as South Korea. This additional dimension ofchoice is not considered here as it does not appear to be economicallyrelevant at current Zimbabwean wage levels.

- 35 -
Table II.13: ZIMBABWE - UNIT COST COMPARISON BETWEEN OPEN-END AND RINGSPINNING UNDER ALTERNATIVE WAGE RATE ASSUMPTIONSa/
Unit CostsWage Rate: Ring Spinning Open-end
Full Market Price 100 105One-half Market Price 100 106
a/ To emphasize relative cost, unit cost is set at 100 for ringSpinning In each case. Interest rate was assumed at 15% in bothcases.
Source: Direct firm information; mission estitates.
2.37 The cost dlfferences shown in Tables 11.13 and II.14 may not havematerialized in Zimbabwe as firum report having purchased much of thisequipment second hand. Clever purchases of used equipment may well haveresulted in sufficiently low acquisition costs which alter the resultsshown in these tables. It is also clear that given existing labor legisla-tion, particularly the difficulty involved in laying off workers, thatfirm may be willing to pay a short-term cost premium even with new equip-ment in order to achieve greater cost flexibility in the long run. One un-intended result of such labor legislation is the encouragement of equipmentpurchases that reduce total employment opportunities in the textile sector.
Table II.14: ZIMBABWE - UNIT COST COMPARISONS BETWEEN THREE LOOMTECHNOLOGIES UNDER ALTERNATIVE WAGE RATE
ASSUMPTIONSa/
Unit CostWage Rate: Conventional AirJet S
Full Market Price 100 110 246One-half Market price 100 121 294
a/ Transformation cost in weaving, excluding cost of yarn.
Source: Direct firm information; mission estimates.
2.38 Another factor militating in the same direction is recurrent for-eign exchange shortages. Given the perception that firum in other coun-tries will adopt newer technologies over time, Zimbabwean firms may ration-ally try to protect themselves by buying the most modern equipment wheneverthey can obtain the foreign exchange. The short-term excess in averagecosts of production may be viewed as a premium against longer term loss ofcompetitiveness, should unavailability of foreign exchange preclude the up-grading of equipment.

- 36 -
III. POLICY EVIROhOUNT
Introduction
3.01 Zimbabwe's industrial policy environment dates back to UDI andconsists principally of three basic instruments: the foreign exchangeallocation system and its attendant exchange rate management system, theprice control system, and the investment control system. Taxation andlabor laws also affect industrial structure and growth, but to a lesserextent than the three control systems. This policy environment aroselargely to cope with the reduction in foreign trade due to sanctions, butit had important, if unintended side effects. First, it afforded indus-trial firms an unusual degree of protection. Second, it engendered incen-tives to direct resources to particular sectors in the economy and toparticular subsectors within industry. Third, it accentuated the naturalexport disadvantage inherent in Zimbabwe's landlocked position by makingdomestic sales far more profitable and safer than exports (i.e., it intro-duced an anti-export bias). Finally, by isolating Zimbabwean managers fromoutside competition, the environment also fostered a managerial orientationtowards production rather than marketing, and by erecting formidablebarriers to entry, it tended to protect established firms against domesticcompetition to the detriment of all newcomers, but especially of emergingbusinessmen. Although both external and domestic conditions have changedsignificantly since Independence, the policy environment remains virtuallyintact. The critical question to be examined in this Chapter is the extentto which the system of direct controls and implicit industrial protectionremains appropriate to foster growth in Zimbabwe's changed circumstances.
Foreign Exchange Allocation
3.02 The three main control systems-foreign exchange allocation, in-vestment, and prices were instituted anticipating a reduction of foreignexchange earnings and difficult access to imported goods as a result ofsanctions. To reduce the demand for foreign exchange, the Smith Governmentclamped down on imports and relegated the exchange rate as an adjustmentmechanism to a secondary role. Equilibrium in the external accounts wasattained through rationing and discretional foreign exchange allocationsrather than exchange rate adjustments. This system has undergone somemodifications since Independence, but it survives largely intact from UDIdays. In its present form the rationing exercise begins with a six-monthprojection of the balance of payments within a four-year horizon. Givenexpected inflows of foreign exchange, the Government deducts legally com-mitted uses (e.g., external debt service, profit remittances, etc.) andsets aside enough to keep international reserves at an adequate interna-tional reserve position. It then allocates foreign exchange to priorityuses (e.g., imports of fuel, medicines, tires). The remainder is allocatedto industry and commerce using historical shares as a basis for the firm byfirm allocation. These shares are modified for new entrants and changes inthe needs of existing firms.

- 37 -
3.03 Through the foreign exchange allocation system the Governmentcontrols the use of foreign exchange almost completely, and it also heavilyinfluences investment, interest rates, and prices. Although after twentyyears of experience the bureaucratic machine functions smoothly and theprivate sector has learned to adjust to the system's idiosyncracies, thediscretional allocation of foreign exchange has major shortcomings that nodegree of administrative efficiency and entrepreneurial adaptability canovercome. These shortcomings have to do with resource allocations with in-centives to use resources efficiently, and with depressing effects on eco-nomic growth. The system of foreign exchange rationing allows the main-tenance of an exchange rate at which there is excess demand for foreignexchange, without causing overt balance of payments problems, as externalaccounts are brought into balance through a forced reduction of imports andnot through adjustments in the exchange rate or the level of internationalreserves. This means that two of the most visible signs of disequilibriumin the external accounts are not available to the Zimbabwean authorities.
3.04 The foreign exchange allocation system acts as a variable quotasystem (i.e., the amounts of goods imported into the country are determinedby quotas assigned by the Government). The amount of the quota is decidedtwice a year according to projected foreign exchange availabilities and Go-vernment priorities. As all quota systems, it protects existing firms frominternational competitive pressures. In Zimbabwe this protection is vir-tually absolute. First, importation of goods that would compete with do-mestic production is not permitted, allowing industrial firms to operatewithin the domestic market without external competitive pressures. Second,foreign exchange is denied to entrepreneurs w'shing to start new firms thatwould produce goods already in domestic production, protecting establishedfirms from domestic competition as well. This is one of the reasons whythere is such a high degree of industrial concentration in the Zimbabweanindustrial sector, as discussed in paragraph 3.11. The foreign exchangeallocation system has other shortcomings, but they are so intimately rela-ted to the investment and price control systems that the discussion ofthese weaknesses is better done for the three systems as a whole.
Exchange Rate Level and Exchange Rate Management
3.05 Exchange rate management in Zimbabwe has been among the best inSub-Saharan Africa. The authorities have not pegged the exchange rate toany particular currency, but administer a flexible exchange rate policywith frequent adjustments in the exchange rate. As a result, vis-a-vis abasket of currencies of Zimbabwe's main trading partners, the exchange ratehas depreciated some 26% in real terms since 1965--the last year withrelatively free trade in which the external accounts could be characterizedas having been in equilibrium. Despite this relatively good management ofthe exchange rate, however, the authorities exert virtually completecontrol over the allocation of foreign exchange and there are strongindications suggesting that there is excess demand for foreign exchange andthat discretionary allocation is necessary both to limit the overall demandof foreign exchange as well as to direct its use to priority activities.

- 38 -
3.06 There are several manifestations of excess demand. First, an-nual request for foreign exchange allocations received by the authoritiesexceed by a wide margin the overall supply of foreign exchange. Second, inthose years when there was an attempt to liberalize allocations, the supplywas more than exhausted and international reserves declined. Thus, totalallocations increased from Z$530 million in 1979 (US$360 million) to Z$746million (US$479 million) in 1980 and to Z$868 million (US$597 million) in1981. The entire allocations were exhausted. Imports of goods (at currentprices) rose parl passu with foreign exchange allocations-by 52% in 1980and by 26% in 1981. Net forelgn assets fell, from Z$261 million at end-1980 to Z$54 million at end-1981. The current account deficit of the bal-ance of payments was equivalent to about 11.52 of GDP in 1981. In 1982allocations had to be cut to Z$717 million (US$543 million) and evenfurther in 1983 and 1984. This required belt tightening that broughtimports (current prices) down by about one-quarter in 1983 and a further 6%in 1984 (from about 24% of GDP in 1982 to 18% in 1984). In short, importshave been as high as allowed by the foreign exchange constraint, and higherthan exports, suggesting that there is excess demand. Finally, interviewswith the managers of industrial firms pointed to "foreign exchangeshortage" as the main constraint to the expansion of output and investment.
3.07 It is extremely difficult to assess how much excess demand thereis because one of the principal shortcomings of the present system is thefact that the more telling signs of disequilibria are not available. Forthis reason, it is also difficult to estimate the level of the exchangerate that would bring the external accounts into equilibrium. A usefulsource of comparison in other countries-the black or parallel marketrate--is not readily visible in Zimbabwe. There is no officially sanction-ed parallel market and no readily apparent organized black market. Never-theless there have been attempts to measure the divergence between the of-ficial exchange rate and the rate in the probably thin black market. A1982 study estimated that the black market rate for import licenses wastwice the official rate. The same study reported that the price of Kruger-rands--a close substitute for a convertible currency-commanded a price 2.8times higher than the world market price at the official exchange rate in1982. Another publication, the World Currency Yearbook, estimates that theblack market rate for unlicensed transfers abroad was as high as 128% andas low as 30% above the official rate in the period 1980-83 (see TableIII.1). Casual conversations with businessmen indicated a 100% premium forthe black market rate. Since the black market rate inevitably reflects notonly scarcity premia, but also risk and demand for capital outflows, theovervaluation of the currency for current account transactions is likely tobe less than 100%. Nevertheless, on the basis of the real changes in termsof trade and historically low volume growth in exports a significantdepreciation of the real exchange rate--of at least 20%-- would probably benecessary for the achievement of long-run equilibrium on the currentaccount with the prevailing tariff schedule, assuming the Governmaent issuccessful in maintaining positive net inflows on the capital account overthe next decade.

- 39 -
Table III.1: ZIMBABWE - EXCHANGE RATE PREMIUM, 1980-83
1980 1981 1982 1983
Official Rate (US$/Z$) 1.57 1.39 1.09 0.95Black Market Rate (US$/Z$) 0.94 0.84 0.80 0.42Black Market Rate Premium (x) 67.80 65.40 30.40 128.70
Source: World Currency Yearbook. 23rd Edition, p. 851; mission estimates.
3.08 These rates, are of course, merely indicative. The exchange ratethat would be consistent with external equilibrium could be ascertained bycontinued administered adjustments, or by the removal of foreign exchangerationing for current transactions and adoption of a market-determinedrate. The important points, however, are that there is overvaluation ofthe exchange rate for current transactions and that the degree of over-valuation is not severe by Sub-Saharan African standards. As a consequenceof the overvaluatinx, importers do not pay the full cost to society for thegoods that they import and exporters receive a smaller amount for theirexports. The Government, standing in the middle and discretionally alloca-ting the scarce foreign exchange, effectively taxes exporters and subsi-dizes importers. Foreign firms also, in effect, receive subsidies whenthey remit profits, as they purchase foreign exchange for this purpose atthe official exchange rate.
Investment Controls
3.09 In a further effort to save foreign exchange by avoiding the du-plication of facilities, the Smith Government also instituted strict con-trols over investments. As in the case of the foreign exchange allocationsystem, the institutions conceived under UDI survive substantially un-changed. At present, all new investments or expansions involving foreignexchange have to be submitted for approval to the Investment Projects Com-mittee (IPC), a committee chaired by the Ministry of Industry and Technol-ogy (MIT). Projects requiring more than the equivalent of Z$2.5 million(US$1.6 million) in foreign loans require additional approval from the Ex-ternal Loans Coordinating Committee (ELCC). Projects with more than 15%foreign ownership require additional approval by the Foreign InvestmentCommittee (FIC). Investments requiring no foreign exchange for eithercapital equipment or recurrent inputs need not be submitted for approval.
3.10 The IPC does not conduct a thorough financial or economicanalysis of projects. Since its inception, its main preoccupation has beenwith the effects of new projects on the country's balance of payments.Thus, to receive IPC approval a project should: (i) replace essentialimports and/or produce exports; (ii) recoup the initial foreign exchangeoutlay within twelve months and continue saving foreign exchange throughoutits life; (iii) not produce goods already in local production, unless it

- 40 -
also produces for the export market; (iv) sell at competitive prices andsatisfactory quality; (v) show firm export orders, preferably on acontinuing basis. Although these criteria appear unduly stringent, theyare not strictly enforced. In practice, the first two criteria are themost important. IPC approval is granted to any project that, ex ante, isnot a net user of foreign exchange in any twelve-month period during itsprojected life and that does not compete with local production unless italso produces for export.!/ Historically, other criteria have weighedvery little. Since Independence, the Government has stated that IPCcriteria would be modified to favor local investors and emergingentrepreneurs, but at the time of the writing of this report, the newcriteria had not yet been made public. IPC, however, has allowed emergingentrepreneurs to establish, on an exceptional basis, new firms that did notsatisfy the first two criteria.
3.11 The criteria that the project be a net non-user of foreignexchange to receive approval has impeded the establishment of firms that atleast ex ante are set up to exploit domestic markets exclusively withouteither increasing exports or substituting imports. Zimbabwe's industrialinvestment projects have been sifted according to these criteria during thepast 20 years and, as a result, there is now a high degree of industrialconcentration. Half of the over 6,000 identifiable products produced inZimbabwe are manufactured under monopoly conditions and an additional 30%under oligopoly conditions (three firms or fewer).2 / Over half ofproduction and employment is in the 11% of firms with more than 500 workers(Table II1.2). Established firms, then, not only enjoy protection fromoutside competition, but also from actual and potential domesticcompetitors.
Table III.2: ZIMBABWE - CONCENTRATION OF MANUFACTURING FIRMS,EMPLOYMENT AND OUTPUT, 1982
Size of Firm According to Number of Employees
less than 50 51-100 101-500 501-750 750 or more Total
No. of units (%) 52.3 15.3 21.4 3.2 7.8 1,344Employment (%) 7.8 7.9 31.4 9.5 43.4 176,223Output (%) 8.0 8.0 31.0 12.0 41.0 100.0
Source: UNIDO, Study of the Manufacturing Sector in Zimbabwe, 1985,Table 2.3.
1/ External financing is considered an inflow. Projects with externalfinancing, therefore, are not considered net users of foreign exchangeduring the construction period.
2/ UNIDO, Study., 2p. cit., p. 29.

- 41 -
3.12 The investment control system has also contributed to low invest-ment levels. At the beginning of UDI the investment control system wasprobably not binding because opportunities for substituting imports wereample; investment in manufacturing during 1970-74 grew at 23.6% per year.Investment began to decline in 1975 and, despite a modest recovery in 1979-81, it is still lower than during the mid-1970s. As discussed in ChapterII, the downturn in economic activity after 1974 and the intensification ofthe War of Liberation affected investment negatively. But in recent yearsthe investment control system has also kept investment down, owing largelyto the rationing of foreign exchange by the IPC, as noted in paragraph2.27.
3.13 In retrospect, this high rejection rate is not surprising. Themain selection criteria, that the project not be a net user of foreign ex-change, is equivalent to weighting foreign exchange with an extremely highshadow price--a shadow price that is practically infinite-or completelyignoring net benefits derived from the use of domestic resources. This isa very difficult hurdle to overcome. This can be seen in the followingillustration. Take a project whose benefits overweigh its costs. Let theforeign exchange benefits and costs be denoted by B* and C*, respectively,and domestic currency benefits and costs by B and C. Since the project'sbenefits outweigh its costs,
(B*+B) - (C*+C)> 0
We can regroup benefits and costs as follows:
(B*-C*) + (B-C) > 0
According to IPC criteria if the project is a net user of foreign exchange(i.e., if (B*-C*) ( 0) then permission is denied. This means that nomatter how large the net domestic currency benefits may be (i.e., no matterhow large (B-C) may be), as long as (B*-C*) - 0, the project is notapproved. This is ,equivalent to ignoring the quantity (B-C) or giving(B*-C*) an extremely high weight.
Price Controls
3.14 The price control system attempts to reduce the cost of basicfoodstuffs and the scarcity rents that could arise from the foreign ex-change allocation and the high degree of concentration spawned by the in-vestment control system. In trying to solve these problems, price controlscreate other problems. First, price controls are not equally effective forall types of goods. Second, because price controls are largely enforced ona cost-plus basis, they allowed the evolution of a domestic price structuresubstantially divergent from that prevailing internationally. Finally, inspite of the price controls, the overall policy environment, includingrationing of foreign exchange and investment controls, allows most domestic

- 42 -
prices to become noticeably higher than export prices making the domesticmarket far more lucrative than exports. In combination with themonopolistic structure of the sector and the overvaluation of the ex-change rate, price and investment controls together render the domesticmarket not only far more lucrative, but much less risky. The safer andmore lucrative domestic market results In a strong anti-export bias.
3.15 Price controls are enforced in at least five different ways, ac-cording to the type of good. In some cases, the Government, sets the priceof the good, in some others, the authorities, approve a pricing formula, inyet others, the authorities approve mark-ups over cost. The most stricttype of price control requires prior ministerial and Cabinet approval andcovers a handful of basic consumer goods (bread, milk, sugar, beef, maize-meal, vegetable oils and fats, Kapenta fish), three key intermediate inputs(chemical fertilizers, cement, and petroleum fuels), and motor vehicles(passenger cars, motorcycles, and light commercial vehicles). For a secondtype of good there is also strict control over the actual price of thegood, but only ministerial approval is required for price changes. Thesegoods include agricultural seeds, newspapers, batteries, tires, pork andpoultry products, paper and paper packing material, plastic packing bags,and glass and metal containers. A third category covers those goods forwhich the importer's or local producer's pricing formula must be approvedby the Ministry of Trade and Commerce (MTC). These goods include motorvehicle parts; agricultural tractors, implements, equipment, and chemicals;lubricating oils; jute grain bags; explosives and accessories; educationaland technical books; typewriters; cash registers; calculators; duplicatingand copying machines, and drugs. Other essential and popular consumergoods are subject to maximum mark-ups at the wholesale and retail level,ranging from 10% to 30% and from 10% to 50%, respectively. The fifth andfinal category covers all other goods for which the mark-up is limited tothe mark-up that existed in December 1981. Goods for which there are noprice controls include export goods, goods sold at public auctions, second-hand goods (except motor cars), food and drink sold for consumption on thepremises (except beer), eggs in the shell, and fresh flowers, vegetables,and fruit.
3.16 There is little doibt that both by design and implementation pri-ce controls are not equally e'fective for all types of products. Retaildealers are required to disrlay all prices clearly and there is a specialinspectorate section in the "fTC to monitor prices. However, at the timethat the mission was in the fi'ld, there were only 69 inspectors for theentire country. The mission was able to determine that for commodity-likeproducts (e.g., steel products, cement, fertilizers) enforcement is effec-tive and price ceilings are binding. For other products (e.g., textiles,small appliances), enforcement is loose because firms differentiate theirproducts to escape price controls, even if they only succeed temporarily.Moreover, the base used to calculate the profit margin is a a vague con-cept. As one manager put it: "my margin is 20%." When asked 20% of what,he answered: "20% of everything that I can put in." For products that aremanufactured in batch processes or that are essentially unique (e.g., capi-tal goods manufactured to specifications), enforcement is non-existent. Fi-nally, entrepreneurs always find ways of legally escaping price controls.

- 43 -
For example businessmen have established superfluous distribution layers inorder to boost the price between factory and final consumer. At each stepalong the way the legal margin was charged, but the sum total resulted Ingrossly inflated overall margins. Anether example involved avoidance ofprice controls on automobiles assembled in Zimbabwe; dealers stopped sell-ing them, but began offering long-term leases instead. Although some ofthese loopholes have already been plugged, experience in Zimbabwe and othercountries suggests that there is a never ending race between the authori-ties plugging loopholes and the public discovering new ones. The end re-sult is unequal treatment for different subsectors and higher profits foractivities that more successfully escape controls. This treatment createsincentives for expansion of the activities that are more successful in es-caping controls.
3.17 The mechanisms for setting prices are not consistent and oftenobey historical rather than economic reasons. For example, the price ofammonium nitrate is set so as to guarantee the manufacturer a pre-tax re-turn of 22.5Z per annum on the issued share capital. The price of phos-phate fertilizers, on the other hand, is set so as to guarantee the manu-facturer a 17.5% return per annum on fixed and working capital. Prices forcompound fertilizers are set according to cost-plus formulae not directlyrelated to profit rates. The disparate treatment arises from agreements-some of them dating back to UDI, entered into between the various firms andthe Government. Pricing of steel products, on the other hand, is unrelatedto either costs of production or to opportunity costs. As Table III.3shows, the price of only one of ZISCO's main products covers productioncosts.
Table III.3: ZIMBABWE - DOMESTIC PRICES OF STEEL AND FERTILIZER PRODUCTSRELATIVE TO PRODUCTION AND OPPORTUNITY COSTS, 1985
Domestic Price as Z of:Production Cost Opportunity Cost
Blooms & Billets 128.9 105.5Medium Mill Sections 99.0 84.2Light Mill Sections 82.8 88.7Bar/Rod Sections 97.0 88.9Ammonium Nitrate 113.4 a/ 106.0Triple Superphosphate
From Pyrites 129.3 120.1From Imported Sulphur 'Q0.4 120.1
Compound Fertilizers n.a 144.1
a/ Cost excludes depreciation.

- 44 -
The Trade Regime
Customs Duties
3.18 Customs duties have not played an important role in the develop-ient of the Zimbabwean industrial sector. Protection has been accomplished
ainly through the foreign exchange allocation and investment control sys-t,"ms rather than through customs duties, as is the case in many developingcountries. C.ustoms duties, since the time of the Federation of Rhodesiaand Nyasaland, have been moderate and have served mainly as a source offiscal revenues. Rates are mostly ad valorem and applied to the CIF valueaccording to the following schedule:
Most raw materials: Free to 5%Most others: 25-30%Petrol: 40%Luxuries: 35%Motor cars: Maximum of 50%
In addition, there is an import surtax of 20% levied on the FOB value ofall imports except petrol, medical, surgical, and other goods limited byinternational treaty. Government imports and capital goods for statutorybodies are also exempt. Industrial firms can obtain a rebate of duties butnot of the surtax and also enjoy the benefits of an export drawback schemefor both customs duties and surtax levied on imported current inputs forexport production. In the 1981-84 period, customs duties as percent ofimports of goods increased every year, ranging from 9.5% in 1981 to 24.6%in 1984. According to the Jansen report, in 1981 industrial domesticprices were, on average, only 9% above border prices, with only a minorityof firms charging prices 30% or more above the comparable internationalprice. This finding suggests that the price system has been successful inkeeping firms from reaping monopoly rents. It also suggests that the vastmajority of Zimbabwean firms would be able to compete in the domesticmarket with imports under the present import duty schedule.
Export Incentives
3.19 In addition to the import duty drawback, export incentives in-clude an outright 9% export subsidy applicable to all manufactured goods.In theory, the import duty drawback places the manufacturer in a positionequivalent to that that would have prevailed if there had been no importduty. In practice, there is a difference if there is a lag between thetime that the manufacturer pays the import duty and the time that he re-ceives the rebate, for he incurs a cost equivalent to the interest foregoneon the amounts involved. Similarly, if there are delays in receiving theexport subsidy, these delays decrease its value. In Zimbabwe, manufac-turers claim that the delay is about six months, which would reduce thevalue of the subsidy by some 7%, to about 8.4%.
3.20 Exports subsidies increase the value of exports by the amount ofthe subsidy and in that respect increase the effective exchange rate re-ceived by exporters. The mission calculated that the effective exchange

- 45 -
received by exporters of manufacturers in Zimbabwe from 1980 through 1985increased by 1602 in the period, as shown in Table III.4.
3.21 The effective exchange rate, however, is only part of the pic-ture. Although in nominal terms an exporter may be receiving more Zimbab-wean dollars in 1985 than in 1980, the prices of inputs and labor may haveincreased since, lowering the purchasing power of every Zimbabwean dollarreceived. The consumer price index provides imperfect, but useful measureof such cost increases. The effective exchange rate, adjusted for infla-tion provides an idea of the purchasing power of each dollar of exportsover time. In Zimbatwe, the devaluation of the currency has been more pro-nounced than price increases, leading to a 30% improvement in the exchangerate recelved by exporters of manufactures In 1980-85, as Table III.6shows. This explains in part the recovery of manufactured exports in1983-84.
Table III.4: ZIMBABVE - REAL EFFECTIVE RATE FOR INDUSTRIAL EXPORTERS
1980 1981 1982 1983 1984 1985
Nominal Rate (Z$/US$) 0.643 0.689 0.757 1.011 1.244 1.612Export Subsidy (Z$) 0.022 0.000 0.031 0.067 0.097 0.126a/Effective Rate (Z$/US$) 0.665 0.689 0.788 1.078 1.341 1.738Consumer Price Index(1980 - 100) 1.000 1.131 1.252 1.541 1.852 2.006
Real Rate (Z$/US$) 0.665 0.609 0.629 0.699 0.724 0.866Real Rate Index(1980 * 100) 100.0 91.7 94.7 105.2 109.0 130.3
a/ Assumes same percentage as in 1984.
Financial Policy and its Impact on Industry
3.22 Financial policy can have an important influence on the perfor-mance of the manufacturing sector through its impact on interest rates andcredit allocation. In the past, access to credit for working capital orfixed investment has not been perceived as a constraint on the sector.There is no intervention in the allocation of credit to the private sectorand short-run monetary management by the Reserve Bank has maintained stablenominal interest rates. Nevertheless, there are areas of concern for thefuture both in the area of the workings of the financial sector in themacroeconomy and in the mlcroeconomic allocation of credit.
3.23 The core of the macroeconomic concern is that the credit require-ments of manufacturing could be crowded out by public sector borrowing.Both the Central Government budget and the Agricultural Marketing Authorityhave been major users of domestic financial resources--the budget primarilyfrom the institutional investors and the post office, the AMA mainly from

- 46 -
the commercial banks. Crowding out via the financial system has notoccurred to any significant extent in the past. The maintenance of lowinterest rates is evidence of this given the lack of credit rationing.Indeed, as Table 1II,5 shows, real deposit rates (nominal rates deflated bythe consumer price index) have been negative in real terms sinceIndependence, and most lending rates only became positive in 1983 or 1984.However, the primary reason for the coexistence of a large public sectorborrowing requirement and the absence of crowding out in this period is theforeign exchange allocation system. Access to foreign exchange for workingand fixed capital has been the predominant constraint on the activities offirms, and the demand for credit has been correspondingly depressed. Theshare of private credit in GDP fell from 18% in 1983/84 to 15% in1985/86--the manufacturing sector forms only one component of total privateborrowing, but it has generally followed this overall trend. If productiveinvestment is to rise, and this will be essential to future growth, thenthe demand for credit by the manufacturing sector would also recover. Areduction in the public sector borrowing requirement would then benecessary to avoid crowding out either by credit rationing or significantincrease in interest rates for the private sector.
3.24 The second area of concern is the conservative bias of thefinancial institutions in their lending policies. Almost all privatesector lending by private financial institutions in Zimbabwe goes towell-established firms. Lending decisions are generally made on the basisof prior earnings, credit history and the strength of their balance sheetas a measure of credit worthiness. Banks, in particular, lend on a termbasis for general expansion or against equipment purchases only tolong-standing clients. Private financial institutions undertake verylittle project-oriented financing. None of them appear to use rate ofreturn calculations in assessing lending opportunities. Severalindividuals in the private financial sector acknowledged that competitivepressures to seek out new lending opportunities were not sufficientlypresent. One argued that financial market expertise was limited, and thatthe existing club-like arrangement among financial institutions provides noincentive for firms to be aggressive lenders to new businesses. Theselending policies and procedures tend to work against emergent businesseswho have no connections with the financial community and offer littlecollateral.
3.25 Commercial Banks provide demand and term deposit accounts to bothindividual and corporate customers. The bulk of commercial bank lending isshort term, primarily for working capital and agricultural finance. Mostof these loans are lines of credit (overdrafts), usually secured bv realproperty or commercial assets. In some instances, medium-term (three toseven year) lending can be arranged, but this type of credit is generallyprovided by merchant bank or finance company subsidiaries. The services ofthe four merchant banks, technically known as accepting houses, are gearedclosely to corporate needs and large account holders--financing of foreigntrade through acceptance credits, processing commercial letters of creditand foreign bills of exchange, short and medium-term financing, bridgefinancing, and foreign exchange transactions and dealings. Together with

- 47 -
the commercial banks, merchant banks are the country's only authorizedprivate foreign currency brokers. Merchant banks also engage in theflotation of public companies and are authorized to underwrite new issues,manage portfolios, raise development capital, and arrange financing fortakeovers and mergers.
3.26 Insurance companies and pension plans are essentially long-terminvestors. Sixty percent of insurance and pension plan assets must be, atpresent, Intvested in Central Government and parastatal securities. Apartfrom statutory investments in public sector securities, their portfoliosconsist of property, equity, corporate debentures, and some directindustrial term loans. There are also several Government-sponsored andjointly owned public/private institutions designed to channel officialand/or private sector capital to specific economic activities, and a marketfor securities with 52 publicly traded companies listed as of 1985.
3.27 Banks and insurance companies are prohibited from borrowing andlending outside their traditional areas without prior approval from therelevant Registrar. In addition, private non-financial firms are notallowed to issue bonds to the public and must borrow from financialinstitutions. The segmentation of the market by type of institution hasfacilitated cooperative market sharing agreements. A merchant banker said,"We have a semi-gentleman's agreement with the commercial bankers. Wedon't undercut their overdraft rates, and they don't come into the banker'sacceptance market."
Labor Laws
3.28 Minimum wages in manufacturing were set at a sectoral level be-fore Independence* Owing to the heterogeneity of labor, this led to con-siderable variation in the agreed monthly minima; in 1980 the range wentfrom Z$35 (private security) to Z$99.88 (Dunlop factory), with an averageof Z$58.56. In July 1980, three months after Independence, the Governmentintroduced a uniform wage covering all manufacturing industries, followedby a new minimum wage on January 1981 and again on January 1982. In addi-tion, in 1982 the Government also passed legislation controlling wage in-creases for different earning levels, the percentage increases ranging from23.5% for employees with annual incomes of up to Z$1,200 to only 1% forthose with incomes up to Z$20,000. As discussed in Chapter II, the Govern-ment adopted austere economic policies in 1982; the package included a gen-eral wage freeze. Minimum wages remained frozen until new levels were es-tablished in July 1985. As a result, real minimum wages in manufacturingwere virtually unchanged five years after Independence, as Table III.5shows. Average real earnings in manufacturing followed a similar pattern:they increased by about 20% in 1980-82, fell in 1983-84 and ended 1984 be-low the 1980 level (see Table III.5). This post-Independence record issimilar to that of the five years preceding Independence when real averageannual earnings declined from the 1975 peak by about 5% in the followingfive years. The growth pattern of real wages has followed more closely theups and downs of economic activity than the dictums of legislative decrees.

- 48 -
T1We ml.5 MW E - IML ANI )MI G R4D( Qzstp, ove the % )
198) 1981 19S 1983 19W# 1985 (3)MN M KIX X KIN MX KIN MX M IX MIN MX
.~~~~~~~~~~~ IDepmdt (1) -5.65 -4.97 -9.95 -0.09 -&58 -2.88 -6.38 -. 45 -3.75 -0.42 -4.16 -2.38IA (4) -1.53 -4.53 -6.20 -1.40 -457 -4.57 -2.95 -2.95 a47 005 005
Lepout (1) -5.42 -4-74 A686 -0.31 --&29 -3.09 --&99 -1.02 -4642 -0.861 --4 16 -3.14tedig (5) -2.90 -2.68 -7.64 -2.27 -6.60 -5.84 -4.97 -4.54 -2.19 -1.53 -2.25 -2.16
FR#M HIDepo,it (2) -4.74 -3.59 -9.03 -4.77 -8.58 -7.84 -7.03 -6.27 -3.08 -2.97 -3.49 -0.39lierdig (6) 0.76 7.67 -3.36 7.33 -0.35 3.87 3.06 6.50 6.70 9.36 6.25 89)
K~ FM SOV]N B&AI Depoit (2) -4.28 -4.28 -8.81 -5.32 -&37 -8.37 1 -6.81 -6.81 -3.53 -2.19 -2.61 -2.61
BLIuMC SX'flFDEpadlt (2) -4.05 -4.05 -8.60 -4.23 -7.32 -7.32 -5.74 -5.74 -2.42 -2.42 -2.83 -2.83Mottp Advl l
Reidetial -1.30 -1.3D -5.98 -1,18 -4.36 -4.35 -2.73 -2.73 0.69 0.69 0.27 0.27Ccmnrcal -0.61 -0.61 -5.32 0.13 -3.51 -3.09 J -1.88 -1.88 1.58 1.58 1.16 1.16
(1) 3 mxth -te(2) 12 mxth ra(3) ¶ixdi Jum, 1985(4) Moixnm OC dt Row2(5) Minmum Rate an Amea±gem Okedts(6) Hire Rzrde Rate
So : Pezve Badk of ZIntM, Qlaterly E ;caic ar Satstical PeAe, missin etlnut.

- 49 -
Figure III.1
MANUFACtJRING AVERAGE EARNINGS PER MON1HAS A RJNCIION OF GNP PER CAPIrA
South Afriea
Zimbabwe (1982) C/ile
_ ~~~~Ziabbw*b (1983)/
:: Ch^ac " Dominican RepublicCosta lies
N F~n aC i5 K IenT "
m31zlsvi #India
01 al T_
o 200 4.00 600 eoo 1000 12oo 1O 1600 1800 2000 22001983 PER CAPlr GNP (1980 US$)
3.30 The minimum wage in 1985/86 was equivalent to about US$90 amonth, four times higher than that of Sudan and Zaire, one and one-halftimes that of Brazil, and about the same as Mexico, as Table III.8 shows.It is way out of line for a country of Zimbabwe's per capita income. Aver-age earnings are also out of line. In 1982, they were about the same asChile and higher than Korea, countries with almost three times Zimbabwe'sper capita GNP, but significantly below average earnings in South Africa,the principal competitor in the regional market. The devaluation of theZimbabwean dollar at the end of 1982 and the gradual subsequent deprecia-tion brought labor costs closer to those of other developing countries,although they are still significantly higher than what is typical for acountry of its per capita income (see Figure III.3, Table III.8, and Stat-istical Appendix Table 34). While labor costs are just one of the compo-nents of total costs, the relatively high average earnings in manufacturing

- 50 -
puts Zimbabwe at a relative disadvantage in competition with exports fromother developing countries, adding to the country's already difficultposition owing to high transport costs. High labor costs, of course, arethe other side of the coin of an overvalued exchange rate. Depreciation ofthe currency in real. terms would reduce labor costs relative to othercountries and strengthen Zimbabwe's competitive position.
Table III.6: ZIMBABWE - EVOLUTION OF MINIMUM WAGES, 1980-85(Z$ per month)
1.7.80a/ 1.1.81b/ 1.1.82c/ 9.1.83d/ 7.1.84d/ 7.1.85e/
DomesticEmployees 30 30 50 55 60 77
AgriculturalEmployees 30 30 50 55 60 75
Mining 43 58 105 110 115 144Agro-ind. f/ 70 85 105 110 115 144Manufacturing
and Other 70 85 105 115 125 144CPI (1980-100) g/ 100 112 123 164 179 200*Real Manufac-turing wages(in 1980 prices) 70.0 76.2 85.6 70.0 69.9 71.9
* - Estimate.a/ Established by Statutory Instrument 367 of 1980 and Statutory
Instrument 441A of 1980.b/ Established by Statutory Instrument 925B of 1981.c/ Established by Statutory Instrument 455A of 1983.d/ Inferred from "National Wage Policy Determination" paper, 1985.e/ Established by Statutory Instrument 186 of 1985.f/ Until 1985 this only applied to skilled employees in sawmilling and
sugar processing. In 1985, it was expanded to "an undertaking engagedexclusively or primarily in the processing of timber or an agriculturalproduct including fruit, meat, sugar, tea, coffee, and other foodcrops, cash crops or livestock products."CPI is average for year for 1980, 1981 and 1982, actual one forrespective month for years thereafter.
3.31 In December 1981 the Government introduced legislation attemptingto prevent employers from dismissing or laying-off "any employee... withoutthe prior written approval of the Minister." This act places a particularlyheavy burden on firms during recessions, as it did in 1982-84. Firmsreported that it took from six months to two years to obtain the requiredapproval.

- 51 -
Table III.7: ZIMBABWE - INDICES OF AVERAGE REAL EARNINGS,1970-84 (1970-100)
Index of Index of Index ofAverage Average Real Average Real Index ofReal Annual Annual Earn- Annual Earnings Manufac-Earnings in ings in in all sectors turingManufacturingb/ all Sectors but Agriculture Employment
1970 100.0 100.0 100.0 100.01971 101.9 101.6 104.5 106.01972 108.9 103.5 108,0 113.01973 112.2 107.2 111.4 121.51974 116.6 111.6 115.2 131.91975 120.4 116.4 119.2 136.01976 119.2 117.2 119.7 133.91977 118.4 117.4 119.6 126.51978 118.3 117.3 119.9 121.41979 115.1 116.3 117.7 126.21980 129.8 134.8 134.8 139.01981 141.9 147.6 137.5 151.01982 148.4 161.1 146.6 157.41983 136.8 144.0 129.5 151.21984 a/ 119.5 123.7 111.7 145.2
a/ Based on June data.b/ Deflating Average nominal earning by low income price index based on
1980.Source: Central Statistical Office, Quarterly Digest of Statistics, March
1985.
3.32 Minimum wage and "no firing" legislation are a two-edged sword.On the one hand they protect the employee's income and job security, but onthe other hand, they also reduce firm's flexibility and probably have a ne-gative medium-term impact on employment. Firms reported that as economicactivity recovered, they hired labor on short-term contracts rather than asregular full-time employees to avoid the 'no-firing" restriction. To theextent possible, they prefer to use overtime rather than employment. Thelaw did not prevent firing; it merely made it difficult, as attested by theemployment data from 30 of the 52 publicly traded companies. These datashow that for the five years 1980-84, employment peaked in 1982 but was down112 by 1984, Aggregate data for the manufacturing sector show similartrends (Table III.7). Finally, to the extent that restrictions make labormore of a fixed factor of production, the law will create a bias in favor ofmore capital-intensive technology. This undoubtedly contributed to thechoice of the highly labor-saving technology bought by the textile sector inthe post-Independence years, as discussed in Chapter II.

- 52 -
Table I1I.8: ZIMBABWE - MINIMUM WAGE COMPARED TO OTHER DEVELOPINGCOUNTRIES
Absolute Relativelevel to Zimbabwe
(US$ per month) (%)
Brazil 58 64.4Ethiopia 24 26.7Korea none -O-Lesotho 62 68.9Malawi 15 16.7Mexico 105 116.7Sudan 24 26.7Tanzania 46 51.1Zaire 24 26.7Zimbabwe 90 100.0
Source: Various IBRD reports; mission estimates.
Effects of Control Systesis on Industrial Incentives and Performance
3.33 The combination of foreign exchange allocation, price controls,and investment controls has produced better results in Zimbabwe than in manyother countries. To the extent that the results of the Jansen study stillhold, the domestic level of industrial ex factory prices differs onlymoderately from the one that would prevail under conditions of free trade.Nevertheless, the similarities in the overall level of prices hidesubstantial disparities in relative prices. Moreover, Zimbabwe's incentivesystem has a serious anti-export bias, favors industry at the cost of othersectors, and exacerbates barriers to entry for the emerging businessman.
Implicit Taxes and Subsidies
3.34 Price controls and foreign exchange rationing entail implicitsubsidies and taxes that sometimes conflict with efficiency and Governmentobjectives. The difference between the price of competing imports and thatof domestic goods may be interpreted as an implicit tax (if domestic pricesare higher) or as an implicit subsidy (if domestic prices are lower). Forexample, ZISCO's consumers are paying prices that are lower than the priceof equivalent imported goods (i.e., less than the opportunity cost). Con-trolling inflation is the ostensible reason for holding down the price ofZISCO's products in the domestic market. Yet, in part because of low pri-ces, ZISCO requires a fiscal subsidy that contributes to the large publicsector deficit and to inflationary pressures. Had ZISCO charged the oppor-tunity cost for all of its products in 1985, it would have reduced itslosses by some US$6 million (or by about 16%), Because the fisc subsidizesZISCO's losses, these US$6 million eventually become a transfer from thetaxpayers to ZISCO's consumers and to exporting middlemen. The latter

- 53 -
receive part of the subsidy because ZISCO sells to them at a price lowerthan what ZISCO gets when it exports directly. In the fertilizer sector thesituation is exactly the opposite: the pricing system is implicitly taxingfarmers to the tune of about US$17 million per year.3/ Yet, farming ingeneral, but communal farming in particular, is a hih Government priority.Part of this tax pays for inefficiencies in production, part representseconomic rents. Neither the subsidy to ZISCO's consumers, nor the tax onagriculture can be justified on either efficiency or equity grounds. Byshielding domestic producers from foreign competition, the foreign exchangerationing system allows domestic prices to be set as high as price controlspermit and creates incentives for directing resources to those activitieswhere prices are higher and diminishes incentives for those activities whereprices are lower. For example, the two firms that produce straightfertilizers ascribed their lack of investment in recent years to the lowrates of return produced by the price control system.
3.35 The mission also compared food and consumer durable prices in Ha-rare with prices in the Washington, D. C. metropolitan area as of November-December 1985. This comparison shows that food prices are, on average,about 45% lower in Harare than in Washington, D. C. Appliances, on theother hand, are about 2.5 times more expensive in Harare--some are as muchas six times (see Statistical Appendix Table 7). Other consumer goods areabout equal in price and agricultural implements are lower in Harare, asshown in Table III.9. A simple average of these prices would show thatprices in Harare are about 20% higher than in Washington--a not too signifi-cant difference. However, the simple average would not reflect differencesin the general price level.
Table III.9: ZIMBABWE - PRICES IN HARARE RELATIVE TO PRICES INWASHINGTON, D.C. METROPOLITAN AREA
Coefficient ofAverage Difference Variation
Food -45.0% O.ffManufactured Goods:
Appliances 150.8% 1.20Other Consumer Goods - 1.9% -44.90Agricultural Implements -41.8% 0.30
Source: Statistical Appendix Table 7; mission estimates.
3/ This subsidy is equal to the difference between the price of imports(net of import duties) and the price of domestic products multiplied bythe volume.

- 54 -
3.36 The Jansen report also indicates that there are substantial varia-tions between domestic and international prices, but that the average levelin 1981 was only 9% higher (roughly equivalent to the average duty rate)than comparable international prices, suggesting that the main distortioneffect of the price control system on ex-factory industrial prices has beenon relative prices and not on the general level. According to the Jansenreport, 36% of industrial value added was being produced at prices that wereat or below international levels; 38% at prices that were between 10% and20% above international levels, and 26% at prices 20% or more above interna-tional levels (see Table I11.11). Unlike mission findings, however, theJansen report did not indicate wide differences between domestic andinternational prices in any sector. Its findings show that some firm'soutput prices were at most 17% below international price or at most 44%above. Because the Jansen report shows only aggregate subsectoral data, theprice variances are likely to be smaller than for individual prices.Mission data was based on individual products and models; the variance,therefore, was likely to be higher. Neither the Jansen report nor themission made allowances for quality differences. Scarcity is anotherimportant point not reflected by the data. In many cases goods were inshort supply and waits as long as six months were common. Light bulbs,stoves, and some agricultural implements, for example, were unavailable atthe time that the mission was in the field. Finally, it must be emphasizedthat the difference between domestic and international prices is likely tofluctuate considerably from year to year, as domestic price revisions arebased on costs of individual firms and not on international pricefluctuations.
Table III.10: ZIMBABWE - SHARE OF VALUE ADDED PRODUCED AT VARIOUS PRICESRELATIVE TO INTERNATIONAL PRICES
(Percentages)
CumulativeShare Share
Value added share produced at orbelow international prices 36 36
Value added share produced at pricesbetween 0 and 10% above internationalprices 6 42
Value added share produced at pricesbetween 10% and 20% aboveinternational prices 32 74
Value added share produced at prices20% to 30% above international prices 14 88
Value added share produced at prices30% or more above international prices 12 100
Source: Statistical Appendix Table 8; mission estimates.

- 55 -
Transport Costs and Anti-Export Bias
3.37 Zimbabwe's transportation costs are unusually high owing to itslandlocked position. This situation makes exports less profitable than thedomestic market and creates a natural export disadvantage that increasesexponentially with transportation costs. In recent years, access to Mozam-bique's Beira worridor has been unreliable and Zimbabwean manufacturershave had to resort to the Republic of South Africa's trade routes, furtherincreasing transportation costs. These costs alone provide both a protec-tive barrier and an export obstacle. Under free-trade conditions, trans-port costs of 5% would raise domestic prices 10 above export prices;transport costs of 15X would raise them by 35.3%; and transport costs of20% by 50%. For ZISC0, transport costs raise prices by a miniaum of 18%(medium mill products) and a maximum of 27% (bloom and billets). Evenunder free trade conditions, ZISCO could make anywhere from 452 to 692 morein the domestic market than in exports. For low-bulk, high-value products,of course, transportation costs make a much smaller difference.
3.38 In addition to the bias against trade due to transport costs, theincentive system introduces a strong anti-export bias into the structure ofincentives in the economy. The complete protection of domestic producersfrom foreign competition, supported by cost-based price controls, allowsdomestic prices to be higher than import-equivalent prices and even higherthan export prices (Table III.11). In addition, the overvaluation of theexchange rate makes exports absolutely less profitable. Finally, owing toprice and investment controls, and the power of domestic firms, there islikely to be much less intense competition from other domestic producersthan there would be in export markets, and little fear of new competition.The incentive system has particularly perverse effects on domestic relativeprices, because they allow higher-cost activities to charge prices evenmore out of line with external prices than low-cost efficient activities.The corollary of a highly variable degree of protection is a highly vari-able degree of anti-export bias. Under these circumstances, the behaviorof industrial exports in the three years following independence is veryunderstandable. Faced with a growing domestic market that: (i) is capableof maintaining the sector working at near full capacity; (ii) is substan-tially more profitable than the export market; and (iii) is virtually freeof competitive pressures, entrepreneurs naturally turned away from ex-ports. It was not until the domestic market began to crumble in 1982 thatexport sales became attractive and exports expanded. At the same time, theGovernment devalued the Zimbabwean dollar, introduced a special exportsubsidy and later lifted the foreign exchange constraint on exports withthe establishment of the export revolving fund. These two decisions madeexports more profitable and, by reducing transactions costs in the procure-ment of foreign exchange, cheaper to produce. As a result, exports boomedin 1983-84. Nevertheless, the recent export bonanza may be said to be abonanza by default. There is a very high risk that exports may fall againas the domestic market recovers. To ensure that an export drive is sus-tained for longer periods, more comprehensive measures to reduce the extentof the anti-export bias introduced by the incentive system would benecessary.

- 56 -
Table III.11: ZIMBABWE - SELECTED DOMESTIC PRICES COMPARED TOEXPORT PRICES
RatioDomestic Export (Dom./Exp.)
Steel Products: (Z$/ton)Billets 290 211 137.4Medium Mill Sections 418 342 122.2Light Mill Sections 400 298 134.2Bar/Rod Sections 398 294 135.4
Textiles:Grey Cloth (Z$/m, Firm A) 1.83 1.47 124.5Grey Cloth (Z$/m, Firm B) 2.25 1.38 163.0Dyed Piece Goods (Z$/m) 2.15 1.83 117.5Printed Sheeting (Z$/m ) 1.57 0.83 189.2Terry Fabrics (Z$/unit) 1.56 1.15 135.7
Source: Direct firm information; mission estimates.
3.39 The highly concentrated structure of the sector, together withsanctions, has also bred a managerial class with a strong orientation to-wards production and efficiency, but practically no orientation towards mar-keting. This is a common phenomenon in countries with a small internal mar-ket shielded from outside competition and a natural result of operating in anon-competitive and highly protected seller's market. The importance of de-veloping a marketing orientation when attempting to penetrate export marketscannot be overemphasized. As stated by D. Morawetz in his study on Colom-bian clothing exports:
"Being able to supply goods at a competitive price is a necessarycondition for successful garment exporting--but it is by no meanssufficient. The potential exporter must also be able, at aminimum, to locate a potential buyer, to produce a garment ofacceptable quality, and to guarantee delivery time."4/
4/ See D. Morawetz, Why the Emperor's New Clothes are not Made inColombia, Oxford University Press for the World Bank, 1981,

- 57 -
The same necessary conditions apply to practically any exporting activity.Zimbabwean manufacturers have had little pressures to satisfy any of theseconditions in the domestic market. Prices have been set by a combination ofGovernment decree and market forces, the domestic market has always pro-vided a potential buyer, competitive pressares to produce high quality goodshave been mild, and timely delivery has not been a requirement becausemanufacturers have operated in a seller's market since the time of UDI. Tocompete successfully in the world market, Zimbabwean manufacturers mustfirst cut their teeth in the domestic market, as the more visible exportingcountries have done. This would require increasing domestic competition,which in turn would require relaxing the tight controls over investment andimports.
Uneven Sectoral Protection
3.40 Nominal and effective protection are measures that help assess theeffects of policies on the incentives structure and perforrmance of indus-try. The nominal protection coefficient (NPC) is the ratio of the domesticprice of goods to the equivalent international price (net of import du-ties). An NPC below one implies that, at a given exchange rate, the domes-tic price of the good is lower than the price of a similar imported good af-ter transportation costs are taken into account. If a firm with an NPC be-low one is making profits, its cost structure is such that even withoutimport duties it could compete with imports and still be profitable.Nominal protection could be low either becau'se tariffs are low, or becausethere is intensive domestic competition. Given the virtual absence ofdomestic competition and the ban on competing imports that the foreignexchange allocation system entails, in Zimbabwe, low nominal protectionimplies that the price control system is successftul in keeping prices down.
3.41 The effective protection coefficient (EPC) is the ratio of valueadded generated by a firm (or subsector) at domestic prices compared to va-lue added at international prices. An EPC greater than one implies that thefirm's value added is higher than could be obtained if its outputs and in-puts were valued at international prices. In such a case, either profits,or wages, or taxes are higher by virtue of the protective system. Thismeans that the firm is either perceiving high rents, or incurring highcosts.
3.42 Based on the Jansen study-which covered 122 firms in 33 subsec-tors, accounting for 62% of value added--the amount of nominal protectionafforded to Zimbabwe's industrial sector in 1981 was quite low: an overall9% above equivalent free-trade prices. Only three out of the 33 subsectors(paper, heavy metal equipment, and household electrical equipment) reportedaverage ex factory prices more than 30% above the border price. Because thepotential scarcity rents available to producers of goods prohibited fromimports were certainly much higher than this, price controls must have beenreasonably effective in preventing firms from capturing these rents. Thenominal protection coefficients below one for beer and several foodprocessing industries implies that these firms actually received less thanthe world price for their output and that they could receive adequateprofits even under conditions of free trade. However, NPC

- s8 -
and EPC calculations are extremely sensitive to CIF pricee and hence shouldbe used with a good deal of care. Unfortunately, the CIF prices used in theJansen study are not available. These conclusions, then, assume that theCIF prices used are rougly correct.
3,43 The Jansen study estimated the average EPC for Zimbabwe's manu-facturing sector to be 1.33 in 1981 (i.e., 332 above value added at worldprices). This rate could be considered moderate, relative to other Africancountries and to the scarcity rents potentially available. The variation ineffective protection, however, is considerably greater than for nominalprotection, with two of the 33 subsectore below the lowest nominal coeffi-cient of 0.83 and 18 above 1.33-including four subsectore (steel, paper,textiles other than CMB, and household electrical equipment) for whichdomestic value added is more than double what they would be at free tradeprices.
3.44 Variations in effective rates of protection are more pronouncedthan for nominal protection and range from a negative 17% (slaughtering andmeat processing) to 177% (household electrical equipment). The dispersionof the distribution for all subsectors masks some important differences bet-ween groups. Effective protection is relatively low in food, beverages andtobacco subsectors, whereas it is quite high in wood and paper industriesand in chemical and metal subsectors. Were it not for the investment con-trol system, this pattern would tend both to induce resources to flow fromthe former into the latter, and to permit greater inefficiencies in the let-ter.
Table III,12: ZIMBABWE - DISTRIBUTION OF VALUE ADDED IN MANUFACTURINGACCORDING TO EFFECTIVE RATES OF PROTECTION RECEIVED
Value CumulativeEffective Rates of Added Value AddedProtection (2) (2)
Negative 17 170 - 10% 10 2710% - 20Z 16 2320% - 30% 10 5330% - 50% 14 67Above 50% 33 100
Source: Appendix Table 8; mission estimates.
3.45 Under conditions of uneven protection such as in Zimbabwe, positi-ve effective protection to one sector usually entails lower (maybe negative)effective protection to another sector. Only a system of uniform tariffscoupled with international competition can achieve equal protection for allsectors. In Zimbabwe some sector (probably agriculture) is laboring under

- 59 -
lower protection, indeed maybe even negative protection. An sasessoent ofeffective protection afforded the agriculture and services sectors wasoutside the scope of this report. But the comparison of consumer prices inHarare with prices prevalent in the Washington, D.C. metropolitan area showsthat, almost uniformly, food prices are substantially lower in Zimbabwe,whereas industrial goods prices are higher. To the extent that this limitedsample reflects a widely prevalent situation, the Zimbabwean farmer is beingimplicitly taxed to finance the Zimbabwean manufacturer or middleman.

- 60 -
Iv. IFICIENCY
4.01 As in Zimbabwe, manufacturing developed in the more industrial-ized countries under some form of protection. Protection encourages growthby providing the extra time and resources needed to go through the processof learning and instituting the most efficient techniques, management andorganization for both the industry's and the country's particular circum-stances. But it also discourages efficiency by providing a shield fromcompetition and protecting profits even when costs are not carefully con-trolled. Protection inevitably involves some combination of costs andrents, the former stemming from inefficient or high-cost use of resources,the latter from the induced scarcity of the protected goods. If protectionis uneven across different industries and sectors, it can also induce re-sources to move into the protected, but less productive activities.
4.02 The costs of protection can be attenuated if coupled with compet-itive pressures. These pressures can come from actual or potential compe-tition from domestic firms, or from imports that keep prices down. Costscan also be reduced through the administration of resource allocation andpricing in such a way as to encourage cost reduction. In Zimbabwe, compet-itive pressures played a negligible role, but the price and investment con-trol systems were attempts to attenuate monopoly rents and prevent re-sources from moving into the more protected and profitable sectors. Thesecontrols have "hung together" and, imposed, as they were, on a fairly de-veloped and lightly protected industrial sector, they did not give rise towidespread gross industrial inefficiency, as in many other developing coun-tries.
4.03 The average degree of efficiency found in the Zimbabwean manufac-turing sector is relatively high, despite the limited degree of competitionand the cushion provided by the price control system. However, the averagemeasure hides substantial disparities in efficiency among firms. The mainissue that emerges in this respect is that the incentives systems, whilenot fostering overall inefficiency, allowed efficient and inefficient firmsto survive. The effects of the incentives on intersectoral allocation ofresources is not an issue that has been addressed in this report. However,there is a presumption that the incentives system has favored industryrelative to agriculture, mining and services.
Capital Output Ratios
4.04 The mission used several measures of efficiency. The first oneis a rough estimation of capital-output and labor-output ratios for themajor subsectors. While this measure does not tell much about absoluteefficiency, it sheds light on relative efficiency among subsectors. Anefficient subsector, compared to an inefficient one, would use fewer inputs

- 61 -
Figure IV.1
Z AEABE: CAP ITAL AND LAB0R NPT PER UNIT OF NET OUTPLTMANLFACTLRNG SECTaRSN 18
K:
,4Non-Ketallic Mineral Productsr: Metals and Motel Products
Textiles (inc. ginning)
- r Chmicals andPetroleum Products DAverage
C Foodstuf f _
Drinks and.Tobaccop Transport
Paper "Equipment iD Printing &
Publishing Wood andFurniture S
Other Manufacturing8 Products
_ Clothing and _V Footwear
o_ § ~ ~ ~ ~ I I I I I
u.75 1.00 1.25 1.50 1.75 2.00 .. 2.5C 2.75
LABOR PER UNrT OF NET OLfl PU

- 62 -
to produce the same output. A graph showing the different capital- andlabor-output ratio. for the different subsectors would indicate whichsectors are relatively more efficient. Oving to different productionprocesses, one sector my use more labor to produce one unit of output thananother sector. If at the same time it also uses less capital, thennothing can be said about efficiency of the two sectors without additionalinformation about relative prices because additional labor costs may bemore than made up in lower capital costs. Thus, it is impossible to tellwhether the chemicals and petroleum subsector--which is capitalintensive--is more or less efficient than drinks and tobacco--which is morelabor but less capital intensive. However, if one sector uses more laborand more capital to produce one unit of output than another sector, then itTs-less efficient. This is the case with non-metallic mineral products,for example, which is more capital and labor intensive than all the sectorsthat lie below it and to its left (chemical and petroleum products, forexample). While absolute efficiency depends on the relative prices oflabor and capital, it is clear that the subsectors that use more of bothinputs are less efficient. These subsectors appear closer to the origin inFigure IV.1. By this criterion it appears that non-metallic mineralproducts, metal and metal products, and textiles (including ginning), areclearly less efficient in using capital and labor to generate valueadded.l/
Table IV.1: ZIMBABWE - MANUFACTURING SECTOR: CAPITAL AND LABOR INPUTSPER UNIT OF NET OUTPUT 1982a/
Capital Input Labor Input perper Unit of Unit ofNet Output Net Output
Foodstuffs 2.89 1.33Drink and Tobacco 2.50 0.97Textiles (including ginning) 3.38 1.94Clothing and Footwear 1.08 1.97Wood and Furniture 1.70 2.63Paper Printing & Publishing 2.25 1.12Chemical and Petroleum Products 3.19 0.81Non-metallic Mineral Products 4.28 1.38Metals and Metal Products 4.19 1.45Transport Equipment 2.36 1.44Other Manufacturing Products 1.63 1.81Average for all Manufacturing 3.0 1.41
a/ All values are denominated in Zimbabwean dollars.
Source: Statistical Appendix Table 9; mission estimates.
1/ This is not, however, a true measure of technical efficiency becausethe structure of protection and price controls affects the rentsobtained by different subsectors and therefore the ratios. Thus, evenif two sectors had the same real technical efficiency, that which hasthe highest rents would appear to be more efficient.

- 63 -
Protection and Domestic Resource Cost
4.05 The effective protection coefflcient (EPC) Is the ratio of valuedadded generated by a firm (or subsector) at domestic prices compared tovalue added generated at internatlonal prices. An effective protectioncoefficient greater than one implies that the firm's value added is higherthan could be obtained if its output and Inputs were valued at interna-tional prices. In such a case, either profits, or wages, or taxes, arehigher by virtue of the protective system. This means that either the firmis perceiving high rents, or Incurring high costs.
4.06 The domestic resource cost coefficient (DRC), closely related toeffective protection, measures the ratio of domestic resources used perunit of foreign exchange savings. By this measure, a firm that uses US$2worth of domestic resources to generate US$1 of foreign exchange savingshas a DRC of 2 and is not an economically efficient proposition.
4.07 According to the Jansen study, effective protection is relativelylow in food, beverages and tobacco subsectors, whereas it is quite high inwood and paper industries and in chemical and metal subsectors. Were itnot for the investment control system, this pattern would tend both toinduce resources to flow from the former into the latter, and to permitgreater inefficiencies in the latter.
4.08 Variations in EPCs for five broad manufacturing groups are shownin Figure IV.2. The solid bars show the percentage distribution of averageEPCs for the subsectors within each group across four ranges: low (EPC be-low 1.0, i.e., negative effective protection); marginal (EPC 1.0-1.25, withprotection compensating for one estimate of the degree of exchange rateovervaluation); high (EPC 1.25-1.50); and very high (over 1.50). The dis-persion of the distribution for all subsectors masks some important differ-ences between groups. The relationship between the pattern of protectionand efficiency is illustrated in Figure IV.3. The shaded bars show thedistribution of domestic resource coefficients. Differences between groupsin the distribution of DRCs reflect differences in the distribution ofEPCs. DRCs tend to be relatively low in food, beverage and tobacco subsec-tors, and quite high in wood and paper industries. Chemicals and non-metallic mineral products, however, tend to be much more efficient by theDRC criterion than would be anticipated on the basis of the pattern ofprotection. Nevertheless, the correlation between DRCs and EPCs is 76%,strongly suggesting that the more efficient firms are those being the leastprotected.
4.09 Although the Jansen study does not conclude that Zimbabwe's ex-change rate was clearly overvalued in 1981, It does estimate that the aver-age DRC wouid be only 1.02 on the hypothesis that it was 25% overvalued.This implies that the system of controls in place during UDI was on the

- 64 -
whole successful in maintaining the overall competitiveness ofmanufacturing production and in preventing firms from increasing costs orprofits to capture the potentially very high protective rents.2/
Table IV.2: ZIMBABWE - DISTRIBUTION OF VALUE ADDED ACCORDING TODOMESTIC RESOURCE OOST INCURRED
Value CumulativeDomestic Resource Added Value Added
Cost (X) (%)
Below 1.00 39 391.00 - 1.10 15 541.10 - 1.20 10 641.20 - 1.30 4 681.30 - 1.40 18 86Above 1.40 14 100
Source: Statistical Appendix Table 8; mission estimates.
4.10 These ranges understate the variation that would be found if thesample had been larger or if DRCs had been calculated for products ratherthan firms, but they are illustrative. Of the 24 subsectors for which thefirm-level range is available, 11 had estimates ranging from low to high orvery high-i.e., both inefficient and efficient firms coexisting in thesame subsector (though not necessarily producing the same product). Thiswas the case whether the subsector average was low or high. Further-more, only two of these 24 subsectors (beer, wine and spirits, and fertili-zers and insecticides) were entirely in the "low" range, and only two couldbe considered unambiguously inefficient (steel and non-ferrous metals, andheavy metal equipment). This means both that a substantial number of lessefficient firms have been able to survive under the prevailing system, andthat these less efficient firms cannot be readily or exclusively associatedwith particular subsectors.
2/ Inter-country comparisons are difficult because of varying degrees ofexchange rate overvaluation (not taken into account in the estimatesdiscussed here), different methodologies and sampling, and differencesin economic conditions at the time estimates were made. Nonetheless,the average of 1.27 for Zimbabwe compares favorably with estimates of1.95 for Ghana and 1.4-3.0 for non-food product groups in Zambia, andis similar to the average of 1.34 found for Ivory Coast, a relativelyopen economy. (Sources: Ghana - S.R. Pearson, G.C. Nelson, and J.D.Stryker, "Incentives and Comparative Advantage in Ghanaian Industryand Agriculture," World Bank Study, 1976; Zambia - World Bank,"Zambia: Industrial Policy and Performance," Report No. 4436-ZA,1984; Ivory Coast - D. Stryker, G. Pursell and T. Monson, "Incentivesand Resource Costs in the Ivory Coast," World Bank study, 1975.)

Figure IV. 3: DISTRIBUTION OF DRCs BY INDUSTRY GROUP
(Percentage of observations in group)
lChewlcOl- s lBDn-_tellles 1 litels | ~~~~All Sect-r
t~~~~~~~~~~~~~~ '
O l. O 2 s IS S >> O 1.00) 1.25 I.SO >> O 1.00 1.25 l.SO 0
jChel.~s. EB.6-- t.tl.k1 PP.* Alld 4.P.
O 1.00 1.25 1.EO > O .W 1.25 1.50 >> O 0 .00 1.2S l.SO
O - 1.00 Low 1.25 - 1.50 High
1.00 - 1.25 Marginal > 1.50 Very high

- 66 -
4.11 It is unusual to find such high degree of efficiency in a countrythat, like Zimbabwe, has been substantially isolated from outside competi-tion on for such a long time and that has labored under such severe importrestriction. The mission undertook some spot checks recalculating DRCs intwo subsectors (fertilizers and steel) and using other measures of effi-ciency in the textile subsector. The mission results show that, if any-thing, the Jansen study underestimated the degree of efficiency because itdid not use shadow prices. But they also reinforce the wide variations inefficiency that the controls system has spawned. In the case of steel(ZISCO), mission results show that this firm, classified as inefficient inthe Jansen study, is efficient if its inputs and outputs are valued ateconomic (or shadow) prices. In the case of textiles subsector, missionfindings show that some firms are as efficient as any in developed coun-tries and that others are very inefficient, even by developing countrystandards.
Technical Efficiency in the Textile Subsector
4.12 Technical efficiency in textile manufacturing can be measuredaccording to two main criteria, machine efficiencies and labor producti-vity. Machine efficiency is defined as the number of hours that a machineactually worked relative to the number of hours that a machine was avail-able for work. Labor productivity is defined as the total number oflabor-hours per unit of output. The mission visited seven firms producingabout 80% of the total value added in the subsector. Four firms providedsufficient data for a complete analysis.
4.13 In spinning operations, machine efficiency is very close to Euro-pean standards, but in weaving it is generally below. In both cases thereare wide variations between firms. With the counts of yarn in productionand the quality of cotton used, ring spinning machine efficiencies would beexpected at about 90%. The average of the four firms was about 90%, withtwo below 90% and one substantially above. Machine efficiencies in weav-ing, on the other hand, are low for the types of fabrics in production andfor the low numbers of looms per weaver, as Table IV.3 shows.
Table No. IV.3: ZIMBABWE - ESTIMATES OF OVERALL SPINNING AND WEAVINGEFFICIENCIESa/
Spinning WeavingRing Rotor Looms
2 _Firm A 85 - 60Firm B 94 - 82Firm C 88 95 73Firm D 90 95 77
a/ Machine efficiency is defined as the ratio of hours worked to hoursavailable for work.
Source: Direct firm information; mission estimate.

FiRure lV.4: RANGE OF DRCS BY SUBSECTOR
MARG-
VERY LOWI LOW IINAL hiia I VERY HIGH0.4 05 Oh 0J 0.8 091.0 L25 L5 2.0 3.0 4.0 5.0 6.0
FOOD, Beer,vine,spirits
BEVERAGES Meet products
AND Bakery productsTOBACCO
Misic. food productsLSugar, confectionery
Grain milling, feeds
Dairy products
Tobacco products
Soft dr nks
TEXTILES Footwear
AND | Knitwear
APPAREL Textiles & ginning MI ...........I...-L Ai i - l.
Clothing 1I
WOOD, FurnitureFURNITURE Sawmilling t I I K
Printing, stationeryPPaper products
CHEIMCALS Glass products : | I I .A_
AND |Soaps, detergents
mu- rFertillzer, insecticides METALIC Plastics
MINERAL MiPRODUCTS Potr
Cement, bricksPlaints, etc.Ij--IL.'-APharmaceuticals[Rubber products
Agricultural implementsI
Industrial Elec. Equip.
METALS Light metal products
Transport Equip.Heavy metal equip. i | -
Household elect. equip.; |
|Steel,non-ferrous metals_ -Lrs \ \ \ \q Range of lowest to highest DRC in subsector. u Average (weighted) subsectoral DRC.

- 68 -
4.14 Labor productivity is also very variable between firms. One firmattained labor productivity in spinning higher than that of the UnitedKingdom (third in the sample of countries), whereas another firm was at thebottom of the list and slightly lower than Turkey (see Table IV.4). Inweaving, the variance in labor productivity was also high, with one firmbeing third in the sample and another firm next to last. These findingsillustrate the shortcomings of the policy environment: the umbrella ofprotection is so broad that all firms survive, be it that they areefficient or inefficient. If the more inefficient ones are making profits,the more efficient ones are enjoying high rents.
Economic Efficiency in the Textile Subsector
4.15 Machine and labor productivities are not measures of economicefficiency because they do not take into account relative factor prices.These two factors of production must be combined in appropriate proportionsin order to compensate for differences in factor costs. To this end, themission used another measure of efficiency--relative total factor producti-vity-in order to assess whether the particular combination of capital andlabor used by textile manufacturers was appropriate for Zimbabwe's coststructure. This approach essentially compared individual factor producti-vity in Zimbabwe with factor productivities in "best practice" plants indeveloped countries and then used a production function to weight the indi-vidual factor productivities. The overall result was then compared to"best practice" for a total relative factor productivity measure. A rela-tive total factor productivity (RTFP) of 1.0 implies .hat Zimbabwe is asefficient as "best practice" plants; whereas an RTFP of 0.50 implies thatZimbabwe is only half as efficient. If the weighted average cost of thefactors relative to their cost in the "best practice" plant is only 25%,for example, then Zimbabwe can produce at a lower cost than the beatpractice plants, despite its lower efficiency.
4.16 The results show that Zimbabwe's RTFP is 79% in ring spinning,77% in open-end spinning and 72% in weaving. This is roughly the same per-formance achieved in Morocco, which has had a long industrial history intextiles; it is superior to that realized in countries such as Kenya andthe Philippines, although inferior to those in Europe and the UnitedStates. It is important to note that Zimbabwe's lower productivity relat-ive to "best practice" stems from lower labor productivity, capital produc-tivity being as almost as high as in "best practice" plants. A lower capi-tal-labor ratio and hence lower output per worker is to be expected, givenlower labor costs in Zimbabwe relative to Europe and the United States.Table IV.5 shows the different input requirements relative to "bestpractice". For example in spinning, Zimbabwe's textile subsector requires1.88 units of labor per unit of output compared to 1.00 unit of laborrequired in "best practice." In weaving, it requires 2.6 units of labor,but exactly the same units of capital as "best practice." Again, the widevariations in productivity are noteworthy. As discussed in Chapter III,given relative factor prices, these differences in productivity mean thatfor Zimbabwe, textile exports are a possibility, but not a strong one.With a lower exchange rate they would be quite competitive.

- 69 -
Table IV.4: - ZIMBABWE LABOR PRODUCTIVITY IN THE TEXTILE SECTORRELATIVE TO PRODUCTIVITY IN VARIOUS COUNTRIES a/
(Percentages)
Ring Spinning S/
USA 100.0 100.0German Federal Rep. 79.4 60.0Zimbabwe B 62.7 29.1United Kingdom 42.5 33.3Zimbabwe C 40.0 4.6Kenya B 35.4 16.7Turkey 33.7 18.8Zimbabwe A 30.7 15.2Kenya A 17.9 7.5Zimbabwe D n.a 14.7
a/ Four sets of values are quoted fox Zimbabwe and two for Kenya.The values for Zimbabwe are for different mills. The valuefor Kenya A is for a typical mill; the value for Kenya B is for abrand new mill with modem ring spinning and preparatory equip-ment, and modern shuttle weaving.
b/ The figures quoted for ring spinning refer to ring spinning only.Rotor spinning and that part of the preparatory processes thatmight be attributed to rotor spinning have been removed from thecalculation. Activity on combing was also removed to bring allmills on to a common basis for ring span carded yarn with countadjustment to a nominal 30's tex.
Efficiency in Steel and Fertilizer Manufacturing
4.17 The mission calculated DRCs in the steel and fertilizer sectorsusing the following set of accounting ratios:
Foreign exchange: 1.40Skilled labor: 1.80Unskilled lab3r: 0.42Electricity: 0.79Coal: 0.46
4.18 In the steel sector, the results show that ZISCO's operation hasa DRC of 0.42 for domestic sales, 0.76 for exports, and 0.58 for overallaverage, indicating that steel making is an economically justifiableoperation. These results are much better than the ones obtained in theJansen study. There are several reasons for the improvement. Since theJansen study was published, the exchange rate has been devalued. Theexchange rate in 1981 was Z$C.72 per US$, while the one used for the

- 70 -
current calculation was Z$1.60 per US$. This difference in exchange rateswould bring the DRC down by about one-half, from 4.4 as calculated in theJansen study, to about 2. Second, the adjustments to costs steuming fromthe use of shadow prices favor ZISCO in several ways: (i) by lowering thecost of labor; (II) by lowering the cost of coal; and (iii) by raising thevalue of ZISCO's product on account of the exchange rate adjustment. Theseadjustments bring the DRC down to 0.58. The difference between these andearlier results, then, comes from methodological procedures rather thangains in efficiency in ZISCO's operations.
Table IV.5: ZIMBABWE - AVERAGE SECTOR-WIDE UNIT LABOR AND EQUIPMENTREQUIREMENTS AND TOTAL FACTOR PRODUCTIVITY
RELATIVE TO BEST PRACTICE
SELECTED COUNTRIESZimbabwe Kenya Philippines Morocco
Spinning
Labor 1.88 3.57 2.05 1.88Equipment 1.03 1.07 1.29 1.00Total factorproductivity .79 .69 .73 .78
Weaving
Labor 2.60 4.62 4.23 1.94Equipment 1.00 1.05 1.39 1.16Total factorproductivity .72 .68 .55 .73
Source: Direct firm information; mission estimates.
4.19 In the fertilizer sector, the DRCs vary considerably from firm tofirm. The lowest DRC recorded was 0.28,, while the highest was 0.91. Asales-weighted average DRC would show a DRC of 0.62, suggesting that thissector Is also efficient, but once more pointing out that there are widevariations between firms, regardless of the sector.
Problems with the Present System
4.20 Although data are lacking on the size of scarcity rents thatresulted from import scarcities under UDI, it is clear that opportunitiesfor windfall gains were considerable. In such a situation, controls typi-cally either break down, or, if they are effective, discourage continuedproduction in controlled activities and encourage shifting into less con-trolled or illegal activities. Nevertheless, manufacturing production

- 71 -
flourished, at least during the first half of UDI, apparently without theseverely distorting impact on efficiency that is found in many othercountries with high protective systems. What accounts for the relativesuccess with which controls apparently were operated under UDI? Why didthis system produce a relatively efficient manufacturing sector?
Table IV.6: ZIMBABWE - DOMESTIC RESOURCE COST CALCULATIONSFOR STEEL MANUFACTURING
D R C ProtectionExport Domestic Nominal EffectiveSales Sales Overall % %
Jansen Study n.a. n.a. 4.4 20.0 87.0
Mission Estimates
Blooms & Billets 0.71 0.32 0.59 4.4 5.3Medium Sections 0.72 0.35 0.39 -15.7 -29.8Light Sections 2.64 0.54 0.55 -11.3 -26.1Bar/Rods 1.07 0.53 0.75 -11.1 -23.1
Average 0.76 0.42 0.58 -7.6 -16.6
Source: Direct ZISCO information; mission estimates.
4.21 Import allocation and pricing decisions for -.anufacturers werebased largely on firms' imports and profit rates prior to the imposition ofsanctions, limiting the extent to which firms could capture windfall gainsdue to the scarcity of competing imports. The monitoring of prices andcosts during UDI appears to have been reasonably successful in maintainingthe degree of efficiency that had made Zimbabwe's industry competitive onexport markets and the remarkable price stability may have helped keep re-quests for price revisions down to a minimum. With the data available itis not possible to say whether monetary and fiscal policies kept inflation-ary prestlares down, or whether inflation rates merely reflect the effect ofprice controls. The acceleration of inflation in the second half of UDIand after Independence suggest that monetary and fiscal policies during thefi.st half of UDI were at least partially responsible for the low inflationrates. Another important factor, mentioned in Chapter I, is the fact thatZimbabwe's manufacturing sector was not born during UDI. In fact, aboutone-half of today's productive capacity was already built by 1965. Thisproductive capacity was put in place by the private sector under conditionsof relatively free trade and hence could be presumed to be competitiveworld-wide. The investment that took place during UDI built upon thisbase. Time limitations prevented the mission from evaluating whether thefirms established during UDI were more or less efficient than those thatcame before, but future research might try to answer this question.

- 72 -
Table IV,7: ZIMBABWE - DOMESTIC RESOURCE COST CALCULATIONS FORFERTILIZER MANUFACTURING
ProJectionDRC Nominal Effective
Firm A 0,72 24.8 141.6Firm B 0.91 28.3 142,9Firm C 0.28 6.3 10.0
Source: Direct information from firms; mission estimates.
4.22 In sum, the implicit protection afforded to Zimbabwe's industrialsector by the foreign exchange allocation system and investment controlsystems has not distorted the sector to the same extent as in other coun-tries. Nevertheless, the system has entailed some costs. Both inefficientand efficient firms coexist peacefully in the same subsectors, have accessto precious foreign exchange and only mild incentives to improve (they havethe carrot of profits but the stick of bankruptcy stems only from the re-duction of markets, not from competitive pressures). The high degree ofefficiency coupled with the generally moderate differences between domesticand international prices imply that opening the economy to outside competi-tion would not be highly disruptive to the sector during the t-ansitionperiod. In fact, even with the present import duty rates, the firms thatmight be squeezed produce only about 11X of value added. But the combina-tion of relatively high efficiency and high capacity utilization also meansthat the gains from reallocation of current resources would be minor. Togrow, Zimbabwean industry needs to modernize and expand its capital stock,i.e., invest. Because private ownership prevails, investment will comeabout only in response to perceived business opportunities in what is now agenerally unfavorable environment owing to the political uncertainties ofSouthern Africa. The business environment, then, must be favorable enoughto counterbalance this situation.

- 72 -
Table IV,7: ZIMBABWE - DOMESTIC RESOURCE COST CALCULATIONS FORFERTILIZER MANUFACTURING
ProjectionDRC Nominal Effective
Firm A 0.72 24.8 141.6Firm B 0.91 28.3 142.9Firm C 0.28 6.3 10.0
Source: Direct information from firms; mission estimates.
4.22 In sum, the implicit protection afforded to Zimbabwe's industrialsector by the foreign exchange allocation system and investment controlsystems has not distorted the sector to the same extent as in other coun-tries. Nevertheless, the system has entailed some costs. Both inefficientand efficient firms coexist peacefully in the same subsectors, have accessto precious foreign exchange and only mild incentives to improve (they havethe carrot of profits but the stick of bankruptcy stems only from the re-duction of markets, not from competitive pressures). The high degree ofefficiency coupled with the generally moderate differences between domesticand international prices imply that opening the economy to outside competi-tion would not be highly disruptive to the sector during the t-ansitionperiod. In fact, even with the present import duty rates, the firms thatmight be squeezed produce only about 11X of value added. But the combina-tion of relatively high efficiency and high capacity utilization also meansthat the gains from reallocation of current resources would be minor. Togrow, Zimbabwean industry needs to modernize and expand its capital stock,i.e., invest. Because private ownership prevails, investment will comeabout only in response to perceived business opportunities in what is now agenerally unfavorable environment owing to the political uncertainties ofSouthern Africa. The business environment, then, must be favorable enoughto counterbalance this situation.

- 73 -
V. UtOOHNNDATIONS
5.01 The Government of Zimbabwe's First Five Year National DevelopmentPlan 1986-1990 published in April 1986, singles out the manufacturingsector as the "key for changing the structure of the Zimbabwean economy andfor achieving rapid growth and...developmtent." Among other things, manu-facturing is expected to employ 31,000 new workers, invest Z$1.4 billion(of which Z$1 billion would be private investment) and expand its exportsat an annual rate of 8.2% during the Plan period. Compared to past achie-vements, these are very ambitious targets. The growth rate of manufacturedexports is particularly ambitious: the plan projects a ten-fold increasein the growth rate of exports over the growth rate achieved in 1980-84 (seeTable V.1). Of the total increase in merchandise exports projected for thePlan period, manufactured exports are expected to account for 36.5%.
Table V.1: ZIMBABWE - 5-YEAR PLAN TARGETS COMPARED TO PAST ACHIEVEMENTSIN MANUFACTURING
Actual Plan19P80-1984 1986-90 Plan/Actual
Growth RatesValue Added a/ 1.8 6.5 3.6Exports 0.9 8.2 9.5Employment 1.2 2.0 1.7
Volumes (Million 1980 Z$)Investment 656 659 1.0
a/ Based on 1980-83 data.
Source: First Five Year Development Plan; mission estimates.
5.02 Previous Bank analysis has also made the manufacturing sector thecenterpiece of Zimbabwe's economic development. The 1985 Country EconomicMemorandum (Report No. 5458-ZIM) concluded that foreign exchange would beZimbabwe's main constraint to growth and that increasing manufactured ex-ports was the country's most promising avenue to ease this constraint. TheBank's projections showed that a modest rate of economic growth of 4.2% peryear in 1986-90 would be possible if exports increased at about 4.9% peryear. This would lead to a 7% improvement in per capita income in 1990compared to 1980. A 1.5% per year export growth rate, on the other hand,would lead to only 3.0% per year GDP growth. In the latter case, ten yearsafter Independence, Zimbabwe's per capita income would be at exactly thesame level as in 1980.

- 73 -
V. 3EODHBNDATIONS
5.01 The Government of Zimbabwe's First Five Year National DevelopmentPlan 1986-1990 published in April 1986, singles out the manufacturingsector as the "key for changing the structure of the Zimbabwean economy andfor achieving rapid growth and...development." Among other things, manu-facturing is expected to employ 31,000 new workers, invest ZS1.4 billion(of which Z$1 billion would be private investment) and expand its exportsat an annual rate of 8.2X during the Plan period. Compared to past achie-vements, these are very ambitious targets. The growth rate of manufacturedexports is particularly ambitious: the plan projects a ten-fold increasein the growth rate of exports over the growth rate achieved in 1980-84 (seeTable V.1). Of the total increase in merchandise exports projected for thePlan period, manufactured exports are expected to account for 36.5%.
Table V.1: ZIMBABWE - 5-YEAR PLAN TARGETS COMPARED TO PAST ACHIEVEMENTSIN MANUFACTURING
Actual Plan1980-1984 1986-90 Plan/Actual
Growth RatesValue Added a/ 1.8 6.5 3.6Exports 0.9 8.2 9.5Employment 1.2 2.0 1.7
Volumes (Million 1980 Z$)Investment 656 659 1.0
a/ Based on 1980-83 data.
Source: First Five Year Development Plan; mission estimates.
5.02 Previous Bank analysis has also made the manufacturing sector thecenterpiece of Zimbabwe's economic development. The 1985 Country EconomicMemorandum (Report No. 5458-ZIM) concluded that foreign exchange would beZimbabwe's main constraint to growth and that increasing manufactured ex-ports was the country's most promising avenue to ease this constraint. TheBank's projections showed that a modest rate of economic growth of 4.2% peryear in 1986-90 would be possible if exports increased at about 4.9% peryear. This would lead to a 7% improvement in per capita income in 1990compared to 1980. A 1.5% per year export growth rate, on the other hand,would lead to only 3.0% per year GDP growth. In the latter case, ten yearsafter Independence, Zimbabwe's per capita income would be at exactly thesame level as in 1980.

- 74 -
5.03 It has been one of the themes of this report that Zimbabwe'smanufacturing sector has the huan resources required to achieve thesetargets. However, they will not be achieved with the present environment.In particular, major policy changes are required to bring the growth rateof manufactured exports from 0.91 per year to 8.21 per year. Within manu-factured exports, iron and steel account for about one-quarter of all ex-ports. ZISCO is not presently in a position to expand exports noticeably,as discussed in Chapter VIII. Other mnufactures, then, must grow at about11% per annum if the target is to be achieved. This would require triplingthe growth rate attained by these exports during the past five years. Sucha turnaround will not happen overnight under present conditions. First,the profitability of exporting needs to improve. Profits in the domesticmarket are much higher than in the export market; manufacturers do not havethe incentives required to expand exports at 11X per annum. Second, thecapital stock is old and is already being utilized at close to full capa-city: the private sector needs an environment that will stimulate invest-ment.
5.04 The discussion of the two preceding chapters indicates that Zim-babwe's manufacturing sector has not suffered to the same extent as othercountries the usual ills associated with industrial development achievedthrough import substitution behind high protective barriers. Some 45% ofthte sector's value added is produced at domestic resource cost at or below1.0 and another 211 is produced at domestic resource cost between 1.0 and1.2. Despite the strict controls on investment and domestic competition,the price control system has succeeded in preventing widespread monopolyrents from accruing to manufacturing firms and becoming an industry-wideproblem. Also, the price control system has succeeded in keeping thegeneral price level down. Finally, at least during the first seven yearsof UDI, the sector's growth rate was high. It could be argued that thestagnation and decline experienced during the second half of UDI could beattributed to political factors and not necessarily to the incentives sys-tem. Why change now?
5.05 There are several reasons why the present system needs to bechanged. The case for reform of the existing incentive system flows fromthe assessment of its limitations, as reported in previous chapters. Thecombination of virtually complete protection from foreign competition anddomestic controls leads to a system that protects high and low-costexisting activities alike. Future growth will depend on higher levels ofinvestment that will allow the evolution of a more consistently efficient,and technologically dynamic sector. This is likely to involve an increasein specialization at the firm and subsector level. The limitationsinherent in the existing incentive system place a severe brake oninvestment and growth and tends to support the continued expansion ofhigh-cost activities that use both domestic and foreign resourcesinefficiently.
5.06 Reform of the environment for the industrial sector appears ur-gent in the mid-1980s owing to the changed macroeconomic conditions (com-pared with the 1960s or early 1970s when the sector was rapidly expanding.)Owing to terms of trade losses and lower potential volume growth for

- 74 -
5.03 It has been one of the themes of this report that Zimbabwe lamanufacturing sector has the human resources required to achieve thesetargets. However, they will not be achieved with the present environment.In particular, major policy changes are required to bring the growth rateof manufactured exports from 0.92 per year to 8.21 per year. Within manu-factured exports, iron and steel account for about one-quarter of all ex-ports. ZISCO is not presently in a position to expand exports noticeably,as discussed in Chapter VIII. Other manufactures, then, munt grow at about11% per annum if the target is to be achieved. This would require triplingthe growth rate attained by these exports during the past five years. Sucha turnaround will not happen overnight under present conditions. First,the profitability of exporting needs to improve. Profits in the domesticmarket are much higher than in the export market; manufacturers do not havethe incentives required to expand exports at 11% per annum. Second, thecapital stock is old and is already being utilized at close to full capa-city: the private sector needs an environment that will stimulate invest-ment.
5.04 The discussion of the two preceding chapters indicates that Zim-babwe's manufacturing sector has not suffered to the same extent as othercountries the usual ills associated with industrial development achievedthrough import substitution behind high protective barriers. Some 45% ofthe sector's value added is produced at domestic resource cost at or below1.0 and another 21% is produced at domestic resource cost between 1.0 and1.2. Despite the strict controls on investment and domestic competition,the price control system has succeeded in preventing widespread monopolyrents from accruing to manufacturing firms and becoming an industry-wideproblem. Also, the price control system has succeeded in keeping thegeneral price level down. Finally, at least during the first seven yearsof UDI, the sector's growth rate was high. It could be argued that thestagnation and decline experienced during the second half of UDI could beattributed to political factors and not necessarily to the incentives sys-tem. Why change now?
5.05 There are several reasons why the present system needs to bechanged. The case for reform of the existing incentive system flows fromthe assessment of its limitations, as reported in previous chapters. Thecombination of virtually complete protection from foreign competition anddomestic controls leads to a system that protects high and low-costexisting activities alike. Future growth will depend on higher levels ofinvestment that will allow the evolution of a more consistently efficient,and technologically dynamic sector. This is likely to involve an increasein specialization at the firm and subsector level. The limitationsinherent in the existing incentive system place a severe brake oninvestment and growth and tends to support the continued expansion ofhigh-cost activities that use both domestic and foreign resourcesinefficiently.
5.06 Reform of the environment for the industrial sector appears ur-gent in the mid-1980s owing to the changed macroeconomic conditions (com-pared with the 1960s or early 1970s when the sector was rapidly expanding.)Owing to terms of trade losses and lower potential volume growth for

- 75 -
primary commodities, combined with higher service outflows than in thepast, the rest of the economy cannot be expected to provide a continuedforeign exchange surplus to finance the further expansion of the industrialsector along its historical path. Moreover, the cost of further increasesin the sector's reliance on the domestic market is likely to rise sinceeasy" import substitution options have been effectively exploited in the
past. This implies that growth in manufactured exports will play a crucialrole both as a source of growth of the industrial sector itself and tosupport the exparnsion of the whole economy. Both the Government's and theBank's analysis agree in that Zimbabwe's future growth will hinge on thecountry's ability to export. Foreign exchange is the most seriousmacroeconomic constraint to growth. Given the country's indebtedness, itwould not be prudent to overcome the constraint solely with additionalexternal borrowing. This leaves aid, foreign investment, and exports asthe main future sources of foreign exchange. Of these, exports is the onlyone likely to provide the volume of foreign exchange necespary to feedZimbabwe's growth needs. The present system of incentives, however, is notgeared to stimulate industrial exports.
5.07 Indeed, as discussed in Chapter III, one of the consequences ofthe current incentive system is a pervasive, if highly variable, biasagainst exports. In 1963 Zimbabwe's exports amounted to about US$350million--equivalent to about US$1.2 billion at 1980 prices. Twenty-oneyears la-er, in 1984, exports were lower--about US$1.1 billion at 1980prices. Industrial exports, in particular, have declined from about US$330million (1980 prices) in 1966 to US$240 million (1980 prices) in 1984,while mining and agricultural exports rose despite sanctions. Thisdisparate behavior suggests that the policy environment affectedperformance as much as sanctions, if not more. By comparison with acountry whose incentive system has been geared towards exports, in 1962Korea's exports were one-seventh of Zimbabwe's, by 1968 they were twice ashigh, by 1970 they were three times as high, and by 1981 they were morethan 20 times higher.
5.08 During UDI, growth of the industrial sector was based on expan-sion of domestic demand and import substitution. Despite the lifting ofsanctions after Independence, growth continued to stem from the same twosources, as discussed in Chapter I. Export expansion, if anything, becamea less significant source of growth. The main reason for this performancelies in the strong anti-export bias inherent in the present system.Zimbabwe's landlocked position increases its transportation costs. ForZimbabwean exporters to be on an equal footing with exporters elsewhere,the incentives system must overcome their natural disadvantage. Far fromdoing this, the present system makes exports, net of transport costs, lessattractive than domestic sales. Not only are domestic prices higher thanexport prices, but domestic sales--unencumbered with competitive pres-sures--are far safer. Under these conditions, it would be surprising tofind that manufacturers prefer the riskier and less profitable export mar-ket to the safer and more lucrative domestic market.
5.09 The quickness with which capacity could become a bottleneck isillustrated by a simple arithmetic exercise. Using the UNIDO estimate ofcurrent capacity utilization (70%), and the share of exports in total

- 75 -
primary commodities, combined with higher service outflows than in thepast, the rest of the economy cannot be expected to provide a continuedforeign exchange surplus to finance the further expansion of the industrialsector along its historical path. Moreover, the cost of further increasesin the sector's reliance on the domestic market is likely to rise since"easy" import substitution options have been effectively exploited in thepast. This implies that growth in manufactured exports will play a crucialrole both as a source of growth of the industrial sector itself and tosupport the expansion of the whole economy. Both the Government's and theBank's analysis agree in that Zimbabwe's future growth will hinge on thecountry's ability to export. Foreign exchange is the most seriousmacroeconomic constraint to growth. Given the country's indebtedness, itwould not be prudent to overcome the constraint solely with additionalexternal borrowing. This leaves aid, foreign investment, and exports asthe main future sources of foreign exchange. Of these, exports is the onlyone likely to provide the volume of foreign exchange necespary to feedZimbabwe's growth needs. The present system of incentives, however, is notgeared to stimulate industrial exports.
5.07 Indeed, as discussed in Chapter III, one of the consequences ofthe current incentive system is a pervasive, if highly variable, biasagainst exports. In 1963 Zimbabwe's exports amounted to about US$350million--equivalent to about US$1.2 billion at 1980 prices. Twenty-oneyears laer, in 1984, exports were lower--about US$1.1 billion at 1980prices. Industrial exports, in particular, have declined from about US$330million (1980 prices) in 1966 to US$240 million (1980 prices) in 1984,while mining and agricultural exports rose despite sanctions. Thisdisparate behavior suggests that the policy environment affectedperformance as much as sanctions, if not more. By comparison with acountry whose incentive system has been geared towards exports, in 1962Korea's exports were one-seventh of Zimbabwe's, by 1968 they were twice ashigh, by 1970 they were three times as high, and by 1981 they were morethan 20 times higher.
5.08 During UDI, growth of the industrial sector was based on expan-sion of domestic demand and import substitution. Despite the lifting ofsanctions after Independence, growth continued to stem from the same twosources, as discussed in Chapter I. Export expansion, if anything, becamea less significant source of growth. The main reason for this performancelies in the strong anti-export bias inherent in the present system.Zimbabwe's landlocked position increases its transportation costs. ForZimbabwean exporters to be on an equal footing with exporters elsewhere,the incentives system must overcome their natural disadvantage. Far fromdoing this, the present system makes exports, net of transport costs, lessattractive than domestic sales. Not only are domestic prices higher thanexport prices, but domestic sales--unencumbered with competitive pres-sures--are far safer. Under these conditions, it would be surprising tofind that manufacturers prefer the riskier and less profitable export mar-ket to the safer and more lucrative domestic market.
5.09 The quickness with which capacity could become a bottleneck isillustrated by a simple arithmetic exercise. Using the UNIDO estimate ofcurrent capacity utilization (70%), and the share of exports in total

- 76 -
production, we have that about 63% of capacity is being used for domesticproduction and about 7% for exports. The Five Year Plan is aiming at 6.5%annual rate of growth of the industrial sector and, as stated before, an8.2% rate of growth of industrial exports. These rates of growth implythat in five years capacity utilization would have to increase by about 38%to 95%. Of course, the actual degree of slack capacity is much lowerbecause not all subsectors have the same export capability and some of themajor exporting sectors (e.g., steel and textiles) are already working ator near full capacity.
5.10 To prevent capital equipment from becoming a binding constraint,levels of investment higher than achieved in recent years will be neces-sary. As rioted in Chapter II, low investment levels have been associatedwith both economic and non-economic reasons. Shortage of foreign exchangeand low profit rates are the two economic reasons most frequently cited byfirms for holding investment back. The political situation in the Republicof South Africa and a perceived lack of clarity in Government economicpolicies are the two most frequently cited non-economic reasons. Althoughmaking more foreign exchange available and increasing profit rates may notbe a sufficient condition to raise investment levels, they are clearlynecessary. Also, both would go a long way towards dispelling doubts aboutthe Government 's economic policies.
Alternative Policy Modifications
5.11 The present policy environment served Zimbabwe reasonably well inthe past and, while the country has not fully exploited its growthpotential, it is not facing imminent disaster either. With the presentpolicy environment the post-Independence GDP and industrial sector growthrates could be maintained, but the ambitious targets set in the Five-YearPlan are not likely to be achieved.
5.12 The Plan's goals rest on a significant export expansion tocomplement the traditional sources of growth. While in the opinion of themission these goals are attainable, as long as policies designed to reducethe anti-export bias are not put into effect, the export expansion islikely to play a negligible role, despite the good performance of 1983 and1984. A more plausible scenario is for industrial exports to continuegrowing while domestic demand remains depressed, and to stagnate--indeed,even fall--when domestic demand picks up again and the opportunity cost ofexporting becomes too high. This see-saw pattern is likely to continueindefinitely and, on average, industrial production is likely to grow onlyabout 1% per year, as it has in the past five years.
5.13 With production expanding at snail's pace, investment is alsolikely to continue depressed and to barely cover depreciation, keeping thecapital stock constant, as has happened since 1974. Moreover, non-economicreasons are keeping investment down, and are likely to continue dampeningentrepreneurial enthusiasm in Southern Africa for some time to come. Thus,only the prospect of excellent business opportunities could counterbalancethem. Finally, without major policy changes, installed capacity--already

- 76 -
production, we have that about 63% of capacity is being used for domesticproduction and about 7% for exports. The Five Year Plan is aiming at 6.5%annual rate of growth of the industrial sector and, as stated before, an8.2% rate of growth of industrial exports. These rates of growth implythat in five years capacity utilization would have to increase by about 38%to 95%. Of course, the actual degree of slack capacity is much lowerbecause not all subsectors have the same export capability and some of themajor exporting sectors (e.g., steel and textiles) are already working ator near full capacity.
5.10 To prevent capital equipment from becoming a binding constraint,levels of investment higher than achieved in recent years will be neces-sary. As rioted in Chapter II, low investment levels have been associatedwith both economic and non-economic reasons. Shortage of foreign exchangeand low profit rates are the two economic reasons most frequently cited byfirms for holding investment back. The political situation in the Republicof South Africa and a perceived lack of clarity in Government economicpolicies are the two most frequently cited non-economic reasons. Althoughmaking more foreign exchange available and increasing profit rates may notbe a sufficient condition to raise investment levels, they are clearlynecessary. Also, both would go a long way towards dispelling doubts aboutthe Government's economic policies.
Alternative Policy Modifications
5.11 The present policy environment served Zimbabwe reasonably well inthe past and, while the country has not fully exploited its growthpotential, it is not facing imminent disaster either. With the presentpolicy environment the post-Independence GDP and industrial sector growthrates could be maintained, but the ambitious targets set in the Five-YearPlan are not likely to be achieved.
5.12 The Plan's goals rest on a significant export expansion tocomplement the traditional sources of growth. While in the opinion of themission these goals are attainable, as long as policies designed to reducethe anti-export bias are not put into effect, the export expansion islikely to play a negligible role, despite the good performance of 1983 and1984. A more plausible scenario is for industrial exports to continuegrowing while domestic demand remains depressed, and to stagnate--indeed,even fall--when domestic demand picks up again and the opportunity cost ofexporting becomes too high. This see-saw pattern is likely to continueindefinitely and, on average, industrial production is likely to grow onlyabout 1% per year, as it has in the past five years.
5.13 With production expanding at snail's pace, investment is alsolikely to continue depressed and to barely cover depreciation, keeping thecapital stock constant, as has happened since 1974. Moreover, non-economicreasons are keeping investment down, and are likely to continue dampeningentrepreneurial enthusiasm in Southern Africa for some time to come. Thus,only the prospect of excellent business opportunities could counterbalancethem. Finally, without major policy changes, installed capacity--already

- 77 -
highly utilized--could eventually become a binding constraint on exportsand production. In short, without modifying present policies, the growthpattern of recent years is likely to continue.
5.14 The analysis of this report indicates that raising the growthrate will require a package of measures that reduces the biases in theexisting system and provides the environment for appropriate newinvestment. An important objective of the policy recommendations of thisreport is to diminish the anti-export bias by increasing the profitabilityof exports atnd reducing protection to the domestic market in order to makeexport expansion a significant source of growth in the future. Anotherimportant objective is to increase the efficiency of resource use anddirect investment to activities where Zimbabwe has a comparativeadvantage. Attaining these objectives requires first, changes in relativeincentives to increase the absolute and relative profitability ofactivities that use resources efficiently, most notably for export, secondthe introduction of a greater degree of competition from both imports andother domestic firms in order to encourage cost control, stimulateinnovation and develop marketing skills, and third, the development of anenvironment that facilitates the movement of factors of production intoexpanding activities. The following paragraphs outline the principal areasof policy reform that are recommended, but it does not go into the questionof the phasing or timeframe for policy implementation.
5.15 Modification of the exchange rate will be a crucial component ofan overall package of policy adjustment. It would simultaneously address anumber of problems. First, a morrf competitive exchange rate would increasethe price of exports, both in absolute terms and relative to domestic pri-ces, tackling one of the main causes s the anti-export bias. Second, bystimulating exports and discouraging imports, it would reduce excess demandfor foreign exchange and thereby provide the environment for reform of theforeign exchange allocation system.
5.16 An adjustment of the exchange rate without trade liberalizationwould only do part of the job. Trade liberalization does not mean puttingZimbabwe on to a free-trade basis, but the removal (if over a period oftime) of the quotas implicit in the foreign exchange allocation system andthe exposure of domestic production to foreign competition with a moderatelevel of tariffs. The current tariff schedule, if not ideal, is alreadyquite moderate by international standards. This liberalization will beessential to effect the changes in relative prices that will be necessaryto support the expansion of the sector on more efficient and specializedlines. Attenuation of the anti-export bias also requires opening thedomestic market to international competition to expose the industrialsector to the exigencies of the market place, preferably at first within afamiliar environment so that managers hone their marketing skills in themarket where they have a competitive edge. Although the first objectivecould theoretically be accomplished by modifying the price control systemso that relative domestic prices are set according to relativeinternational prices, the second objective can only be accomplished by

- 77 -
highly utilized--could eventually become a binding constraint on exportsand production. In short, without modifying present policies, the growthpattern of recent years is likely to continue.
5.14 The analysis of this report indicates that raising the growthrate will require a package of measures that reduces the biases in theexisting system and provides the environment for appropriate newinvestment. An important objective of the policy recommendations of thisreport is to diminish the anti-export bias by increasing the profitabilityof exports antd reducing protection to the domestic market in order to makeexport expansion a significant source of growth in the future. Anotherimportant objective is to increase the efficiency of resource use anddirect investment to activities where Zimbabwe has a comparativeadvantage. Attaining these objectives requires first, changes in relativeincentives to increase the absolute and relative profitability ofactivities that use resources efficiently, most notably for export, secondthe introduction of a greater degree of competition from both imports andother domestic firms in order to encourage cost control, stimulateinnovation and develop marketing skills, and third, the development of anenvironment that facilitates the movement of factors of production intoexpanding activities. The following paragraphs outline the principal areasof policy reform that are recommended, but it does not go into the questionof the phasing or timeframe for policy implementation.
5.15 Modification of the exchange rate will be a crucial component ofan overall package of policy adjustment. It would simultaneously address anumber of problems. First, a more competitive exchange rate would increasethe price of exports, both in absolu!e terms and relative to domestic pri-ces, tackling one of the main causes -s the anti-export bias. Second, bystimulating exports and discouraging imports, it would reduce excess demandfor foreign exchange and thereby provide the environment for reform of theforeign exchange allocation system.
5.16 An adjustment of the exchange rate without trade liberalizationwould only do part of the job. Trade liberalization does not mean puttingZimbabwe on to a free-trade basis, but the removal (if over a period oftime) of the quotas implicit in the foreign exchange allocation system andthe exposure of domestic production to foreign competition with a moderatelevel of tariffs. The current tariff schedule, if not ideal, is alreadyquite moderate by international standards. This liberalization will beessential to effect the changes in relative prices that will be necessaryto support the expansion of the sector on more efficient and specializedlines. Attenuation of the anti-export bias also requires opening thedomestic market to international competition to expose the industrialsector to the exigencies of the market place, preferably at first within afamiliar environment so that managers hone their marketing skills in themarket where they have a competitive edge. Although the first objectivecould theoretically be accomplished by modifying the price control systemso that relative domestic prices are set according to relativeinternational prices, the second objective can only be accomplished by

- 78 -
opening the country to international trade. Import deregulation would notonly exert pressure on domestic prices through competition, but would alsoexpose the sector to the technology and products that are necessary tofoster growth.
5.17 There is a close complementarity between trade liberalization,exchange rate adjustment and macroeconomic management. In particular,deregulation attempts in other countries have shown that an appropriateexchange rate policy that maintains a manageable position in the currentaccount is a necessary condition for success. Studies carried out in Ar-gentina, Brazil, Chile, Indonesia, Korea, Pakistan, Peru, the Philippines,Portugal and Spain concluded that the balance of payments position is thecrucial factor on which the sustainability of a deregulation program de-pends. Balance of payments deficits and the loss of foreign reserves oftenlead to interrupted trade liberalization. Zimbabwe's own experience in theimmediate post-Independence period illustrates the risks of liberalizingimports with an inconsistent exchange rate and macroeconomic framework.The increased allocations of foreign exchange in the expectation of higherexternal assistance and exports in 1980-82, in the context of both anovervalued exchange rate and expansionary domestic demand, led to a quickdepletion of international reserves and to an eventual reduction in foreignexchange allocations.
5.18 It is essential that any liberalization of imports be accompaniedby the simultaneous (or prior) movement of the exchange rate to the extentnecessary to maintain external balance. Careful monitoring of the externalaccounts would be necessary to ensure that the managed exchange ratemovements are consistent with the degree of deregulation being introduced.There are other alternative foreign exchange rate management schemes thatthe authorities may wish to consider. For example, they could adopt amarket-determined exchange rate, either via a float, or one of the manyvariants of foreign exchange auctions introduced in other developingcountries. In any case, controls on the capital account may still benecessary.
5.19 With competing imports increasingly keeping a lid on domesticprices, the price control system would lose its usefulness as a way ofcontrolling monopoly rents and its continuation would only be justified onequity grounds (e.g., to redistribute income to particular groups in thesociety). The perils, however, would remain the same now inherent in thesystem: implicit subsidies and taxes that far from accomplishing theGovernment's goals, actually conflict with them e.g., by reducing output ofbasic necessities with controlled prices. After the country becomes opento outside competition, it would be preferable, both on equity andefficiency grounds to abolish price controls for industrial goodsaltogether.
5.20 The fourth element in the proposed policy approach would be thederegulation of investment controls. Such deregulation is needed tostimulate investment and prevent an aging capital stock from stifling afledgling export drive. This step should follow, or be adopted simulta-neously with, import and price control deregulation. Otherwise, currentprice distortions would give the wrong signals and investment would bechannelled to activities where Zimbabwe does not have a comparativeadvantage.

- 85 -
6.06 Since Independence, Zimbabwean textile manufacturers have beenattempting to penetrate European markets, but only with limited success.Long lead times required by the textile mills have made it impossible topenetrate those market segments where fashion changes rapidly (printedsheets, for example).
Garment Exports
6.07 The Republic of South Africa has also been a major export marketfor Zimbabwe's garment industry, typically taking over 90% of the clothingexports. In 1982 there was a drastic reduction in the value of exportsalmost entirely due to the collapse of the Republic of South Africa market,as shown in Table VI.1. The export decline continued into 1983, with aconsiderable improvement coming in 1984. No details are available forcountry of destination after 1982. While the Republic of South Africaprobably remains the largest single importer of Zimbabwe garments, thetrade with Europe and the United States is growing as the garment producersdevelop those markets as alternatives to the Republic of South Africa.
Table VI.1: - ZIMBABWE FOB VALUE OF CLOIHING EXPORTS(Z$ million)
1979 1980 1981 1982 1983 1984
Republic of South Africa 9.95 11.38 11.32 4.46 n.a. n.a.
Other 1.67 0.82 1.00 2.56 n.a. n.a.
Total 11.62 12.20 12.32 6.96 4.70 10.88
Source: Goverrnment of Zimbabwe, Central Statistical Office.
Machinery & Equipment
Age of Machinery
6.08 Spinning equipment is, on average, about 20 years old whileweaving equipment is about 16 years old. Substantial quantities of ringframes, cards, and five opening lines were manufactured prior to 1951. Inweaving only a number of pirn winders date back that far, but significantnumbers of looms go back to the 1950s. Mill management have plans forrenewal of old equipment, and claim that the shortage of foreign exchangeprevents what would be a major re-equipment phase throughout the textileindustry. To provide a rough idea of the cost of renovating the equipment,the taission estimated what it would cost to renew and renovate the capitalstock, assuming (i) that all equipment predating 1961 is replaced and (ii)that equipment manufactured from and including 1961 and 1970 is renovated

- 86 -
at a cost amounting to 33% of their replacement cost. Such an undertakingwould cost about US$32 million, as shown in Table VI.2. This would be anupper limit, as the equipment is in fairly good condition.
Table VI.2: ZIMBABWE - ESTIMATED COST OF RENOVATING CAPITALEQUIPMENT IN TEXTILE SUBSECTOR
(Million US$)
Renewal Renovation Total
Spinning 18.6 3.1 21.7
Weaving 9.1 1.0 10.1
Total 27.7 4.1 31.8
Conditions of Machinery
6.09 The condition of the machinery is generally good for its agedespite difficulties in obtaining imported spare parts owing to foreignexchange shortages. Some spares are manufactured locally and work reason-ably well.
6.10 In some developing countries automatic pirn ch.ange mechanisms onlooms have been dismantled, owing to lack of spare parts and maintenanceexpertise, thus converting the loom from automatic to a non-automatic. Nosuch situations were found in the Zimbabwe textile industry where allmechanical and electrical functions were fully operational on the machi-nery. Some cannibalization had taken place in older machines to obtainspare parts for machines still in production, but not on any wide scale.Down-time for mechanical repairs and maintenance was greater than might beexpected due to the growing shortage of skilled maintenance workers,mechanics and electricians.
Quality of Management
6.11 Chief executives and senior managers in the textile subsector areof high quality and long experience. This is perhaps the subsector's majorasset. Evidence of managerial competence can be found in the widespreaduse of management control systems, in production planning, maintenance,quality control, low breakage rates, and the ratio of actual to potentialspeed of ring spindles. Zimbabwe is extremely fortunate in this respectbecause a strong and qualified management '8 a rare commodity in countriesat similar stages of development. For many countries at Zimbabwe's stageof development, to attain the same quality of management would be extremelycostly and time consumtng.

- 86 -
at a cost amounting to 33% of their replacement cost. Such an undertakingwould cost about US$32 million, as shown in Table VI.2. This would be anupper limit, as the equipment is in fairly good condition.
Table VI.2: ZIMBABWE - ESTIMATED COST OF RENOVATING CAPITALEQUIPMENT IN TEXTILE SUBSECTOR
(Million US$)
Renewal Renovation Total
Spinning 18.6 3.1 21.7
Weaving 9.1 1.0 10.1
Total 27.7 4.1 31.8
Conditions of Machinery
6.09 The condition of the machinery is generally good for its agedespite difficulties in obtaining imported spare parts owing to foreignexchange shortages. Some spares are manufactured locally and work reason-ably well.
6.10 In some developing countries automatic pirn change mechanisms onlooms have been dismantled, owing to lack of spare parts and maintenanceexpertise, thus converting the loom from automatic to a non-automatic. Nosuch situations were found in the Zimbabwe textile industry where allmechanical and electrical functions were fully operational on the machi-nery. Some cannibalization had taken place in older machines to obtainspare parts for machines still in production, but not on any wide scale.Down-time for mechanical repairs and maintenance was greater than might beexpected due to the growing shortage of skilled maintenance workers,mechanics and electricians.
Quality of Management
6.11 Chief executives and senior managers in the textile subsector areof high quality and long experience. This is perhaps the subsector's majorasset. Evidence of managerial competence can be found in the widespreadu3e of management control systems, in production planning, maintenance,quality control, low breakage rates, and the ratio of actual to potentialspeed of ring spindles. Zimbabwe is extremely fortunate in this respectbecause a strong and qualified management 'l a rare commodity in countriesat similar stages of development. For many countries at Zimbabwe's stageof development, to attain the same quality of management would be extremelycostly and time consuming.

- 87 -
6.12 Most firms employ standard European and American managementinformation and control systems, but perhaps owing to the country's iso-lation from the world economy during UDI, management is more concerned withproduction and internal efficiency than with marketing. This orientationmust change if firms are to compete successfully outside Zimbabwe. Manage-ment is aware of this challenge and at the time of the mission's visit theidentification and development of new markets occupied considerable manage-ment time. Unfortunately, valuable management time is also spent in thepursuit of activities that In other countries-countries that are nowZimbabwe's competitors in the world market-are routine and not worthy ofmanagement's attention, such as the pursuit of foreign exchange forimported inputs. Of the four firms that provided full information, all butone use production planning, production control, inventory control systems,budgetary control, cost control, standard costing systems, wage incentivesand work study routines.
6.13 At the lower levels of management, e.g. section supervisors andskilled foremen, however, there was a shortage of individuals with thedesired degree of experience. The increase in textile demand of the lasttwo years has brought this problem to the fore, particularly where millshave moved from three to four 42-hour shift operation.
Efficiency
6.14 Nowhere is the quality of management more evident than in theefficiency attained by Zimbabwe's textile subsector. The mission usedr;everal measures of efficiency and all showed the same results: withproper exchange policies, the textile subsector would be able to competesuccessfully in world markets. This is not to say that the mills are asefficient as in Europe, East Asia, or the United States, but that they areefficient enough to produce at lower cost with an appropriate exchangerate if they have access to inputs at international prices.
6.15 The first measure of efficiency was a comparison of machine andlabor and energy efficiencies with those attained in other countries. Thesecond measure consisted of domestic resource cost, and the final measuretook into account relative total factor productivity.
Machine Efficiencies
6.16 The most important determinants of machine efficiency, defined asthe number of hours that a machine actually worked relative to the numberof hours it was available for work, are: (i) the nature and quality of thematerial passing through the machine; (ii) the age and condition of themachine; (iii) the skill and attention of the machine attendant; (iv) thestandard of maintenance provided; and (v) the complexity of the productmix. In Zimbabwe man-made fibers are imported and the nature and qualityof cotton is up to international standards. In fact, Zimbabwean cotton isof such high quality that it commands premium in world markets. The stan-dards of maintenance are also high. But the machines are too old and theproduct mix is too diverse to achieve best practice efficiency.

- 87 -
6.12 Most firms employ standard European and American managementinformation and control systems, but perhaps owing to the country's iso-lation from the world economy during UDI, management is more concerned withproduction and internal efficiency than with marketing. This orientationmust change if firms are to compete successfully outside Zimbabwe. Manage-ment is aware of this challenge and at the time of the mission's visit theidentification and development of new markets occupied considerable manage-ment time. Unfortunately, valuable management time is also spent in thepursuit of activities that in other countries-countries that are nowZimbabwe's competitors in the world market-are routine and not worthy ofmanagement's attention, such as the pursuit of foreign exchange forimported inputs. Of the four firms that provided full information, all butone use production planning, production control, inventory control systems,budgetary control, cost control, standard costing systems, wage incentivesand work study routines.
6.13 At the lower levels of management, e.g. section supervisors andskilled foremen, however, there was a shortage of individuals with thedesired degree of experience. The increase in textile demand of the lasttwo years has brought this problem to the fore, particularly where millshave moved from three to four 42-hour shift operation.
Efficiency
6.14 Nowhere is the quality of management more evident than in theefficiency attained by Zimbabwe's textile subsector. The mission usedseveral measures of efficiency and all showed the same results: withproper exchange policies, the textile subsector would be able to competesuccessfully in world markets. This is not to say that the mills are asefficient as in Europe, East Asia, or the United States, but that they areefficient enough to produce at lower cost with an appropriate exchangerate if they have access two inputs at international prices.
6.15 The first measure of efficiency was a comparison of machine andlabor and energy efficiencies with those attained in other countries. Thesecond measure consisted of domestic resource cost, and the final measuretook into account relative total factor productivity.
Machine Efficiencies
6.16 The most important determinants of machine efficiency, defined asthe number of hours that a machine actually worked relative to the numberof hours it was available for work, are: (i) the nature and quality of thematerial passing through the machine; (ii) the age and condition of themachine; (iii) the skill and attention of the machine attendant; (iv) thestandard of maintenance provided; and (v) the complexity of the productmix. In Zimbabwe man-made fibers are imported and the nature and qualityof cotton is up to international standards. In fact, Zimbabwean cotton isof such high quality that it commands premium in world markets. The stan-dards of maintenance are also high. But the machines are too old and theproduct mix is too diverse to achieve best practice efficiency.

- 88 -
Table No. VI.3 : ZIMBABWE - ESTIMATES OF OVERALL SPINNING AND WEAVINGEFFICIENCIESa/
Spinning WeavingRing Rotor Looms
Firm A 85 - 60
Firm B 94 - 82
Firm C 88 95 73
Firm D 90 95 77
a/ Machine efficiency is defined as the ratio of hours worked tohours available for work.
6.17 With the counts of yarn in production and the quality of cottonused, ring spinning efficiencies are expected at the 90% minimum level.Although the average of the four firms is at about 90%, two of the compa-nies fell below while one was significantly above, at 94%. This is anotherillustration of efficient firms coexisting along with inefficient ones.Weaving efficiencies on the other hand are low for the types of fabrics inproduction and for the low numbers of looms per weaver. The various fac-tors that affect spinning efficiency also affect weaving, but the age ofmachinery is paramount--the negative correlation between age of machineryand loom efficiency is about 90%.
Labor Productivity
6.18 As might be expected from prevailing labor laws, almost all, millsare overmanned when judged against European standards (some mills operatewith twice as many people as used in Europe) and output-labor ratios areabout one-half of European standards. Labor laws contribute to delayingacquisition of newer, more efficient machines because labor saving techno-logy is of little use if surplus labor cannot be laid off. Of course,given the differences in relative factor prices, more labor-intensiveproduction vis-a-vis European production is to be expected. Low producti-vity, however, also stems from inadequate traiiiing and supervision.
6.19 Estimates of spinning and weaving labor productivity are givenbelow. In ring spinning, labor productivity in Zimbabwe differed widelyamong firms, the highest being higher than average labor productivity inthe United Kingdom and the lowest being slightly lower than Turkey's. Inweaving, the story was about the same, except that one firm had extremelylow productivity owing to serious overmanning (see Table VI.4).

- 88 -
Table No. VI.3 : ZIMBABWE - ESTIMATES OF OVERALL SPINNING AND WEAVINGEFFICIENCIESa/
Spinning WeavingRing Rotor Looms
Firm A 85 - 60
Firm B 94 - 82
Firm C 88 95 73
Firm D 90 95 77
a/ Machine efficiency is defined as the ratio of hours worked tohours available for work.
6.17 With the counts of yarn in production and the quality of cottonused, ring spinning efficiencies are expected at the 90% minimum level.Although the average of the four firms is at about 90%, two of the compa-nies fell below while one was significantly above, at 94%. This is anotherillustration of efficient firms coexisting along with inefficient ones.Weaving efficiencies on the other hand are low for the types of fabrics inproduction and for the low numbers of looms per weaver. The various fac-tors that affect spinning efficiency also affect weaving, but the age ofmachinery is paramount--the negative correlation between age of machineryand loom efficiency is about 90%.
Labor Productivity
6.18 As might be expected from prevailing labor laws, almost all millsare overmanned when judged against European standards (some mills operatewith twice as many people as used in Europe) and output-labor ratios areabout one-half of European standards. Labor laws contribute to delayingacquisition of newer, more efficient machines because labor saving techno-logy is of little use if surplus labor cannot be laid off. Of course,given the differences in relative factor prices, more labor-intensiveproduction vis-a-vis European production is to be expected. Low producti-vity, however, also stems from inadequate training and supervision.
6.19 Estimates of spinning and weaving labor productivity are givenbelow. In ring spinning, labor productivity in Zimbabwe differed widelyamong firms, the highest being higher than average labor productivity inthe United Kingdom and the lowest being slightly lower than Turkey's. Inweaving, the story was about the same, except that one firm had extremelylow productivity owing to serious overmanning (see Table VI.4).

-89 -
Table VI.4: - ZIMBABWE LABOR PRODUCTIVITY IN THE TEXTILE SECTORRELATIVE TO PRODUCTIVITY IN VARIOUS COUNTRIES a/
(Percentages)
Ring Spinnng Weaving%
USA 100.0 100.0German Federal Rep. 79.4 60.0Zimbabwe B 62.7 29.1United Kingdom 42.5 33.3Zimbabwe C 40.0 4.6Kenya B 35.4 16.7Turkey 33.7 18.8Zimbabwe A 30.7 15.2Kenya A 17.9 7.5Zimbabwe D n.a 14.7
a/ Four sets of values are quoted for Zimbabwe and two for Kenya.The values for Zimbabwe are for different mills. The valuefor Kenya A is for a typical mill; the value for Kenya B is for abrand new mill with modem ring spinning and preparatory equip-ment, and modern shuttle weaving.
b/ The figures quoted for ring spinning refer to ring spinning only.Rotor spinning and that part of the preparatory processess thatmight be attributed to rotor spinning have been removed from thecalculation. Activity on combing was also removed to bring allmills on to a common basis for ring spun carded yarn with countadjustment to a nominal 30's tex.
Energy Utilization
6.20 The two major areas of energy consumption in the textile industryare the electric motors for driving machines, and heat for heating processwater and fabric drying. In spinning and weaving most of the energy usedis electrical motive power for the machinery. Heat is used in the sizingprocess in weaving but this forms a small proportion of the total energyused in weaving.
6.21 In order to assess the relative efficiency of the Zimbabwe tex-tile industry as an energy user, the actual energy consumption was comparedwith energy consumption in the UK for the same product mix. From energyaudits conducted in 180 British textile plants, both the range and the meanenergy consumption per ton of production is known for the Britishindustry. These means were applied to the Zimbabwe production figures.Total estimates of consumption were:
Zimbabwe actual: 1,929.9 terajoulesEstimated on UK means: 2,052.1 terajoules

-89 -
Table VI.4: - ZIMBABWE LABOR PRODUCTIVITY IN THE TEXTILE SECTORRELATIVE TO PRODUCTIVITY IN VARIOUS COUNTRIES a/
(Percentages)
Ring SpInning b/ Weaving
USA 100.0 100.0German Federal Rep. 79.4 60.0Zimbabwe B 62.7 29.1United Kingdom 42.5 33.3Zimbabwe C 40.0 4.6Kenya B 35.4 16.7Turkey 33.7 18.8Zimbabwe A 30.7 15.2Kenya A 17.9 7.5Zimbabwe D n.a 14.7
a/ Four sets of values are quoted for Zimbabwe cAnd two for Kenya.The values for Zimbabwe are for different mills. The valuefor Kenya A is for a typical mill; the value for Kenya B is for abrand new mill with modern ring spinning and preparatory equip-ment, and modern shuttle weaving.
b/ The figures quoted for ring spinning refer to ring spinning only.Rotor spinning and that part of the preparatory processess thatmight be attributed to rotor spinning have been removed from thecalculation. Activity on combing was also removed to bring allmills on to a common basis for ring spun carded yarn with countadjustment to a nominal 30's tex.
Energy Utilization
6.20 The two major areas of energy consumption in the textile industryare the electric motors for driving machines, and heat for heating processwater and fabric drying. In spinning and weaving most of the energy usedis electrical motive power for the machinery. Heat is used in the sizingprocess in weaving but this forms a small proportion of the total energyused in weaving.
6.21 In order to assess the relative efficiency of the Zimbabwe tex-tile industry as an energy user, the actual energy consumption was comparedwith energy consumption in the UK for the same product mix. From energyaudits conducted in 180 British textile plants, both the range and the meanenergy consumption per ton of production is known for the Britishindustry. These means were applied to the Zimbabwe production figures.Total estimates of consumption were:
Zimbabwe actual: 1,929.9 terajoulesEstimated on UK means: 2,052.1 terajoules

- 90 -
Zimbabwe's actual consumption is thus 94% of the estimate based on thefigures for the UK industry. However, no account has been taken of dif-ferences in product specification, i.e., yarn count, cloth weight, etc.Yarn counts and cloth weights tend to be respectively coarser and heavierin Zimbabwe, requiring lower process energy per ton than finer counts andlighter fabrics. After allowing for these differences, the subsector'senergy efficiency would still be reasonable.
Domestic Resource Cost
6.22 The second measure of productivity is based on domestic resourcecost calculations. The Jansen study 3/ showed that the textile subsector(including cotton ginning) had a DRC of 1.28. Spot checks by the missionshowed that the DRC for a sample of one firm was on the order of 1.14.These calculations-shown in Table VI.5 are in line with the previousconclusion that the textile industry is fairly efficient.
Table VI.5: ZIMBABWE - DOMESTIC RESOURCE COST IN TEXTILE MANUFACTURING
ProtectionDRC Nominal Effective
(.X) (X)
Firm A a/ 1.14 60.5 168.5
Firm A b/ 0.89 45.9 107.4
a/ DRC, nominal protection, and effective protection calculated on basisof export sales. Nominal and effective protection, therefore, arebiased upwards.
b/ Assumes that transport costs would add 10% to price of improved goods.
Relative Total Factor Productivity
6.23 Machine productivities and labor productivities are only partialways of looking at the question of competitiveness. Capital and labor mustbe combined in appropriate proportions and used efficiently if a firm, sec-tor, or country is to compete in the world market, i.e., total factor pro-ductivity must be high enough to compensate for differences in factorcosts. In order to obtain an idea of Zimbabwe's ability to compete inworld markets the mission also used a comprehensive measure based on totalfactor productivity. The conclusion of this approach was consistent withthe conclusions derived from the other two measures of productivity:
3/ Doris Jansen, Op. Cit.

- 90 -
Zimbabwe's actual consumption is thus 94% of the estimate based on thefigures for the UK industry. However, no account has been taken of dif-ferences in product specification, i.e., yarn count, cloth weight, etc.Yarn counts and cloth weights tend to be respectively coarser and heavierin Zimbabwe, requiring lower process energy per ton chan finer counts andlighter fabrics. After allowing for these differences, the subsector'senergy efficiency would still be reasonable.
Domestic Resource Cost
6.22 The second measure of productivity is based on domestic resourcecost calculations. The Jansen study 3/ showed that the textile subsector(including cotton ginning) had a DRC of 1.28. Spot checks by the missionshowed that the DRC for a sample of one firm was on the order of 1.14.These calculations-shown in Table VI.5 are in line with the previousconclusion that the textile industry is fairly efficient.
Table VI.5: ZIMBABWE - DOMESTIC RESOURCE COST IN TEXTILE MANUFACTURING
ProtectionDRC Nominal Effective
g%) (X)
Firm A a/ 1.14 60.5 168.5
Firm A b/ 0.89 45.9 107.4
a! DRC, nominal protection, and effective protection calculated on basisof export sales. Nominal and effective protection, therefore, arebiased upwards.
b/ Assumes that transport costs would add 10% to price of improved goods.
Relative Total Factor Productivity
6.23 Machine productivities and labor productivities are only partialways of looking at the question of competitiveness. Capital and labor mustbe combined in appropriate proportions and used efficiently if a firm, sec-tor, or country is to compete in the world market, i.e., total factor pro-ductivity must be high enough to compensate for differences in factorcosts. In order to obtain an idea of Zimbabwe's ability to compete inworld markets the mission also used a comprehensive measure based on totalfactor productivity. The conclusion of this approach was consistent withthe conclusions derived from the other two measures of productivity:
3/ Doris Jansen, Op. Cit.

- 96 -
VII. FETILIZERS
Introduction
7.01 The fertilizer industry in Zimbabwe dates back to 1924 when asmall single superphosphate plant was started in the outskirts of Harare.Some expansion took place immediately after World War II with the estab-lishment of a 1.000 tons per year bulk-blending plant, but the major expan-sion took place in the late 19609 and early 1970s with the establishment ofan ammonia plant based on a sophisticated electrolysis process, and asecond compound fertilizer plant. At present there are four fertilizerplants--all privately owned--producing some 210 thousand tons per year ofammonium nitrate and some 40 thousand tons per year of P20 / in equiva-lent phosphate fertilizers. Two upstream plants--SABLE and ZIMPHOS--manufacture ammonium nitrate and phosphate fertilizers, respectively,mainly from domestic raw materials. These two plants sell their entireproduction to two downstream plants, ZFC and Windmill, that manufacture abroad range of NPK granular compounds. Fertilizers are marketed exclu-sively by ZFC and Windmill (Figure VII.1 shows the present structure of theindustry). Although the subsector is of no importance in terms of exports,and, with only 2,400 employees, of minor importance in terms of employment,the Government considers it of strategic importance for the development ofthe agricultural sector. Because there is an active world trade infertilizers the key issue regarding the subsector is the efficiency withwhich it substitutes potential imports.
Markets
7.02 Virtually all of the fertilizer production is sold in the domes-tic market. Multinutrient fertilizers are marketed in the form of NPK com-pounds with formulations tailored for specific crops. At present, atotal of iD NPK compounds are produced, as shown in Statistical AppendixTable 26. All compounds have a sulphur content ranging from 3% to 10%because of the widespread sulphur deficiency of Zimbabwean soils. Straightfertilizers are supplied mainly in the form of locally produced ammoniumnitrate (AN) and urea--the latter imported in recent years in significantquantities to fill the nitrogen gap left by domestic production.
7.03 Overall fertilizer consumption grew at about 4% per year in thepast decade, peaking at 506,000 tons in crop year 1981/82 (Table VII.1).Fluctuations in demand have been mainly the result of droughts, but changesin Government policies (e.g., elimination of fertilizer subsidies) havealso had a bearing. Since Independence, moreover, there has been a rela-tively higher growth in the demand for fertilizers stemming from the commu-nal farmer. In 1976/77 crop year, 93.5% of the total fertilizer consump-tion in the country was in the commercial farming sector. Sales in thecommunal farming sector were about 20,000 tons. By 1980/81 consumption bycommunal farmers had jumped to 90,000 tons. For crop year 1985/86 consump-tion in the communal sector is forecast at about 120,000 tons, or one-quarter of total fertilizer consumption.
1/ The phosphorous nutrient content of phosphate fertilizers is expressedas phosphorous pentoxide (P205).

- 97 -
Fig VII.1I
ZIB3 - S1WI. OF E rniL SYSTM
DSm | E. E. POWE
LI4UID AL0A AN
I ~P.
JaiIr 1986
SAM_I_ S=
I~ ~ ~ ~ ~ ~ ~~N CDSSP
I~~~~~~z sPtSPUWA~~~~~~R(
Indtiustry DepatmnJawry 1986

- 92 -
Table VI.7: ZIMBABWE - AVERAGE SECTOR-WIDE UNIT LABOR AND EQUIPMENTREQUIREMENTS AND TOTAL FACTOR PRODUCTIVITY
RELATIVE TO BEST PRACTICE IN SELECTEDCOUNTRIES
Zimbabwe Kenya Philippines Morocco
Spinning
Labor 1.88 3.57 2.05 1.88Equipment 1.03 1.07 1.29 1.00Total factorproductivity .79 .69 .73 .78
Weaving
Labor 2.60 4.62 4.23 1.94Equipment 1.00 1.05 1.39 1.16Total factorproductivity .72 .68 .55 .73
6.25 In weaving, the maximum achievable RTFP given the large range ofproducts woven, is about 85%. Hence, either managerial deficiencies or lowtask level productivity among production workers reduce productivity byanother 10 to 12 percentage points. Given that managerial competence isquite high, as demonstrated by attention to production planning, mainte-nance, low breakage rates, and the ratio of actual to potential speed ofring spindles, it is reasonable to infer that much of the shortfall frombest practice productivity reflects low labor productivity, including theimpact of a reported shortage of skilled operatives.
6.26 More than half the deviation of productivity in weaving from bestpractice reflects the diversity of product mix in weaving sheds. Mostmills report that despite the relatively large number of products, fouraccount for 90% or more of their sales. Given the size of the domesticmarket, 'At is unlikely that greater specialization can be achieved withoutsignificantly greater exports. In view of the high transportation costsand their effect on the price of imports, the existing product diversity isprobably close to the social optimum.
6.27 Low task level productivity partly reflects inadequate training.In the four largest mills, there are only four full-time and two part-timeinstructors. The surprisingly high level of task productivity probablyreflects higher earlier levels of training. Although geographic dispersionof the firms militates against centralized training facilities, eitherresidents or expatriates on medium-term contracts could conduct in-housetraining. With probably minor increases in training expenses, firms couldachieve lower unit labor costs.

- 99 -
Table VII.2 - ZIMBABWE: SABLE - HISTORICAL PRODUCTION(Tons)
1981 1982 1983 1984 1985*
Ammonia Produced 72,000 74,000 72,000 70,000 n.a.Ammonia Imported 31,274 39,696 25,687 24,800 n.a.Ammonium Nitrate a/ 225,000 243,000 198,000 206,000 206,000
a/ Includes about 15,000 tpy for explosive grade ammonium nitrate.* Estimate.
Zimbabwe Phosphate Industries Ltd. (ZIMPHOS)
7.06 ZIMPHOS' present fertilizer facilities comprise: (i) one 50,000tpy pyrite-based sulfuric acid plant; (ii) one 75,000 tpy sulphur-basedsulfuric acid plant; (iii) one 21,000 tpy P2O5 phosphoric acid plant; (iv)one single superphosphate/triple superphosphate (SSP/TSP) plant to produceup to 360,000 tpy of SSP and 70,000 tpy ot TSP with a maximum combined
output of 75,000 tpy in the form of P205.
7.07 Approximately 90% of the sulfuric acid produced is used for SSPand phosphoric acid manufacture; the balance is used mainly for productionof monocalcium phosphate (2,500 tpy), aluminium sulphate (4,000 tpy), andoleum (2,400 tpy). In addition, about 6,000 tpy of sulfuric acid are soldfor industrial uses.2/ Of the total sulphuric acid production, about 60%is based on imported sulphur and the rest on local pyrite. Achievable P205production is currently limited to about 45,000 tpy. Historical productionlevels appear in Table VII.3.
Table No. VII.3: ZIMBABWE - ZIMPHOS HISTORICAL PRODUCTION(Tons)
1982 1983 1984 1985*
Sulfuric Acid 46,975 48,214 45,889 37,144(pyrite burning)Sulfuric Acid 60,352 64,379 61,542 40,499(sulphur burning)Phosphoric Acid 10,084 15,078 16,080 8,823Single Superphosphate 162,166 156,927 120,243 104,114Triple Superphosphate 17,065 35,158 39,437 23,114Mono-calcium Phosphate 7,392 4,481 2,552 1,160Total P205 Production 40,810 46,500 40,730 29,950
* Period January-September 1985.
Source: ZIMPHOS, direct information.
2/ ZIMPHOS also manufactures a broad variety of industrial products, suchas sodium silicate solution (for adhesives and flocculants), dilutedammonia solution, gold extraction agents, insecticides, etc.

- 100 -
ZFC and Windmill
7.08 The two d)wnstream companies, ZFC and Windmill, produce compoundfertilizers and started production in 1947, with a small bulk-blendingplant. Production of granular fertilizers atarted in 1960 with a 200,000tpy plant of NPK corpounds. Capacity was doubled in 1971 with the instal-lation of another plant whose actual capacity now amounts to 210,000 tpy ofNPK compounds. Since then, production capacity has not expanded, but bulk-storage facilities have been recently installed. Total installed capacitystill exceeds demand by about 30%. Although old, these plants can meetdemand up to 410,000 tpy, a level that is not expected to be reached withinthe next 15 years.
Management
7.09 Management in all four companies is up to average European stand-ards and the technological complexities of the production processes havenot created any particular difficulties. Good management practices areevident in plant maintenance. SABLE'a nitric acid and ammonium nitrateplants, for example, are old, but their productive capacity is still closeto their design capacity owing to good maintenance practices. At ZIMPHOS,the plants are still capable of producing at a 75% of design capacity,despite their age. The granulation units at ZFC and Windmill are still ingood condition--good enough to secture poduction of NPK compounds for thenext 15 to 20 years.
7.10 Domestic fertilizer prices vary considerably from internationalprices. While the price of ammonium nitrate--a main ingredient in all com-pound fertilizers is only slightly above international prices, triplesuperphosphate (TSP) ts 20,17 above and single superphosphate (SSP) is 4.4%below. All of these are ex-factory prices effective for the downstreamfirms. Compound fertilizera, on the other hand, are on average 44.1% abovecomparable international prices. Because ammonium nitrate, TSP, and SSPare main ingredients in the manufacture of compound fertilizers, the levelof both nominal and effective protection varies widely between straight andcompound fertilizers, as show' in Table VII.4.
Table VII.4: ZIMBABWE - CUiliARISON BETWEEN DOMESTIC AND WORLD PRICESOF FRTILIZERS
Landed Cost Nominal Protection(as % of domestic price)
Ammonium Nitrate 94.1% 6.3%Single Super Phosphate 104.3% - 4.4%Triple Super Phosphate 83.3% 20.1%Compound Fertilizers 69.4% 44.1%
Source: Statistical Appendix Table 30; direct information from fertilizerplants; mission estimates.

- 101 -
Economic Efficiency
7.11 Despite the effective protection levels granted to some fertili-zer firms, efficiency--as measured by domestic resource costs-is high.Three of the four firms provided eufficient information to calculate DRCs.The results show that all three firms have DRCs below one. One firm, inparticular, has a DRC of 0.23. These results axe in line with the esti-mates of the Jansen study. As in the case of ZISCO, the calculations weredone at shadow prices. Shadow pricing, as opposed to market pricing,accounts for the lower DRCs obtained when compared to the Jansen study.
Table No. VII.5: ZIMBABWE - INDICATORS OF ECONOMIC EFRICIENCY IN THEFERTILIZER SUBSECTOR
Nominal EffectiveProtection Protection
Source DRC (%) (%)
Jansen Study 0.83 - 1.0 17.0
Mission a/Plant A 0.72 24.8 141.6Plant B 0.91 28.3 142.9Plant C 0.28 6.3 10.0
a/ DRC calculated using shadow prices. The Jansen study usedmarket prices.
Constraints
7.12 Zimbabwe's fertilizer firms can meet most of the country'spresent fertilizer needs, but a substantial gap could develop if demandgrows even modestly, as SABLE and ZIMPHOS are already working at full capa-city. Particularly worrisome is the low investment levels in the fourfirms. Not one reported investments with a view to expanding capacity.All four reported capital expenditures for maintenance and upkeep ofpresent capacity. The alleged reasons for these low investment levels arethe low returns implicit in the present pricing structure. In the mediumterm, the depletion of sulfur sources might also be a constraint.
Pyrites
7.13 The only known source of sulfur in the country is the Iron Dukepyrite mine. Current level of production is 72,000 tpy of pyrites with 35%sulphur content. At present production levels, pyrites reserves are esti-mated to last for about 20 years. Any expansion of production would bringthe technical life of the mine below acceptable levels. Although theremight be additional reserves in the proximity of the existing mine,

- 102 -
only an extensive exploration program would confirm their existence. Totalproduction cost (excluding depreciation) of TSP from local pyrites is Z$320per ton, compared to a landed cost of imported TSP of Z$360 per ton. Pro-duction costs would increase to Z$412 per ton if based on imported sul-phur. The availability of pyrites is a major, although not pressing,issue. Phosphate rock reserves are plentiful and will not be a constraintat current and foreseeable consumption levels.
Pricing Structure
7.14 Prices are set according to several formulae. Some are cost-plus, others are based on rates of return to a specified asset. At SABLEprices are set so as to provide shareholders with a fixed pre-tax return on
the issued share capital of the company of 22.5% per annum, equivalent to aprofit before taxes of Z$1.3 million per year. These arrangements arisefrom a 1976 agreement between SABLE and the previous Government. ZIMPHOSis allowed a 17.5% return on fixed and working capital employed. ZFC andWindmill are allowed a mark-up on the production costs of compounds of Z$27per ton, equivalent to an after tax return on fixed assets of 6%. Forsales of products for straight application the two companies are allowed afixed mark-up which currently amounts to Z$22 per ton for ammonium sul-phate, sodium chloride, and potassium sulfate; Z$18 per ton for urea andZ$13 per ton for ammonium nitrate. In addition, a 4.5% sales allowances isadded.
7.15 The current pricing structure allows producers to cover allcosts, but it entails a tax on agriculture, discussed in Chapter III andhas two additional negative effects. First, it does not provide incentivesfor expansion and second, it does not stimulate producers to reduce costs.The two upstream firms generate a fixed return on the nominal value of theequity shares, but not enough to finance major investments. In fact, bothcompanies reported no new investments in the past four years.
Conclusions
7.16 In conclusion, fertilizer production in Zimbabwe is an economi-cally efficient activity. Ammonium nitrate is produced from electricity
and phosphate fertilizers from locally available pyrites and phosphatesources. The four firms involved in the manufacture of fertilizers satisfyabout three quarters of domestic demand, a proportion that is likely todecline in the future because of serious constraints to expansion ofsupply.
7.17 There are both economic and physical constraints to expansion.The former arise from price controls, the latter from diminishing resourcesof non-renewable raw materials. Price controla are set so as to provideshareholders with fixed returns on equity--returns that are not high enoughto stimulate investment. As a result, there was virtually no net invest-ment in the subsector in 1981-1985. Yet investments are needed to expandproduction of ammonium nitrate and phosphate-based fertilizers. Physicalconstraints to production result from depletion of known pyrites sources.At current levels of production known pyrites reserves would last

- 103 -
about 20 years. At levels of production required to meet projected demand,known resources would last only 8-10 years. An active exploration programis required to establish the probable and proven levels of reserves and onthat basis formulate plans to meet future demand.
7.18 Even if the policy recommendations outlined in Chapter III arenot followed, it would be advisable to revise price-setting mechanisms soas to bring relative domestic prices closer to international prices. Forexample, the Government could opt for establishing domestic prices atinternational levels plus a fixed percentage margin. This would avoidrelative price distortions and yet provide a margin of protection.

- 104 -
VIII. STEIL (ZISOD)
Historical Background
8.01 Steel production in Zimbabwe dates back to 1938 when a group ofbusinessmen established a small company in Bulawayo using a small electricarc furnace to melt scrap. The steel produced was used primarily in afoundry for castings. The balance was rolled into light sections in asmall mill. In 1942 the Government formed the Rhodesian Iron and SteelCommission (RISCO), a statutory body which took over the Bulawayo works andadjacent limestone deposits. In 1946 work started on a small integratedsteel plant with an 8-foot diameter blast furnace and a 25 ton open-hearthfurnace and small rod mills. The first iron was produced in 1948. In1954-55 the plant was extended with the addition of a 9-foot diameter blastfurnace. RISCO steel took over the company on January 1, 1957 and immedia-tely began a large expansion program. A third blast furnace, the smallerone of the two now operating, was commissioned in 1961. The fourth, andlargest, was commissioned in 1975 as part of a large expansion plan thatincluded the installation of modern basic oxygen convertors for steelmakingas well as the introduction of continuous casting. The liquid steelmakingcapacity of the plant, one million tons a year, makes it the largest steelplant in Black Africa.
General Description
8.02 At Independence, RISCO became the Zimbabwe Iron and Steel Company(ZISCO). Although ZISCO has some private shareholders, it is almost 100%state-owned. The installed capacity of the plant is one million tons ofliquid steel per year, with a saleable steel output of semi-finished andfinished products of approximately 800,000 tons. It has about 5,500 em-ployees; it is the largest foreign exchange earner in the manufacturingsector and the largest single recipient of Government subsidy-a subsidythat in 1984 was equivalent to almost 2% of GDP. In recent years, ZISCO'sexports have declined in relative and absolute terms and its dependence onthe fisc has increased alarmingly, as shown in Table VIII.1. There areclear indications that the plant is currently overmanned and that its effi-ciency could be increased considerably with better training and manage-ment. Economic analyses, nevertheless, indicate that the plant is moreeconomically viable than suggested by its financial situation.

- 105 -
Table No. VIII.1: ZIMBABWE - KEY FINANCIAL AND ECONOMIC INDICATORSOF ZISCO, 1980-1984
1980 1982 1984
Exports as % of Total Exports 7.8 4.3 3.4Subsidy as % of Public SectorDeficit 1.7 1.7 13.3Subsidy as % of ZISCO's Sales 4.7 13.2 93.2
Source: IMF, Zimbabwe -- Recent Economic Developments, mimeo, August 1985,pp. 20, 67,73.
8.03 ZISCO's basic raw materials, iron ore, limestone, and coal, areall available domestically. These materials are processed through conven-tional coke ovens, blast furnaces, and basic oxygen furnaces to produce li-quid steel. Liquid steel is processed into ingots and rolled into blooms,and billets on the continuous billet mill. Semi-finished billets arefurther processed and prepared for shipment or are sent on to the finishingmills for further processing. The finishing mills consist of the mediumand light section mills and the bar/rod mill, the most modern facility inthe rolling mill complex. The section-mills produce a variety of smallstructural sections including angles, flats, channels, I-beams, rounds,rails, plowshares, grader blades, and fencing. The bar/rod mill produces avariety of round and square coils and bars. Other major installationscomprise a sintering plant to produce blast furnace charge materials, alime burning plant consisting of two identical kilns, and a foundry whichproduces iron and steel castings for internal plant use. It is estimatedthat in 1985 the plant operated at approximately 70% of its capacity.Plant capacity constraints were reported to have been caused by lingeringtechnical problems after a major reline of the larger blast furnace in1984.
Markets
8.04 ZISCO supplies approximately 50% of all the steel consumed in thecountry. The balance is imported in the form of large, heavy sections orflat products which the ZISCO mills cannot produce. ZISCO's home marketaccounts for a relatively small percentage of its total sales, rather unus-ual for an integrated steel producer. As Table VIII.2 shows, domesticsales have accounted for slightly less than 30% of total shipments duringthe past five years. Of the 30% sold domestically, a good proportion--15%in 1985--is also exported by middlemen aid other intermediaries. Wheneverdomestic sales result in exports, ZISCO gives a rebate to the exporter (seeparagraph 8.06).

- 106 -
Table VIII.2: ZIMBABWE - SALES OF ZISCO(Thousand Tons)
1981 1982 1983 1984a/ 1985b/
Local Sales of ZISCOProducts
Semi-finished 65.6 47.0 44.1 54.0 59.3Medium Sections 49.4 28.3 16.6 17.3 31.9Light Sections 33.2 33.4 21.8 25.9 36.1Bars & Rods 36.2 25.7 29.5 36.0 37.7Subtotal 184.4 i34.4 TT2T. 13. 163.0Subtotal (Million Z$) n.a. n.a. 33.2 39.4 58.2
Direct Export Sales ofZISCO Products
Semi-finished 224.5 293.2 295.2 241.2 296.7Medium Sections 5.7 11.8 16.3 19.7 7.4Light Sections 1.1 .5 7.8 4.3 .8Bars & Rods 87.4 67.2 64.0 52.9 51.2Subtotal 318.7 372.6 33.3 318.1 356.1Subtotal (Million Z$) n.a. n.a. 66.5 66.0 105.0
Total Sales 503.1 507.0 495.3 451.3 519.1
Sales (Million Z$) n.a. n.a. 99.7 105.4 163.2
a/ Reduced production due to blast furnace reline.b/ Total production constrained due to continuing blast furnace problems.
Source: ZISCO, direct information.
b.05 With domestic demand at approximately 160,000 product-tons, thereis a balance of 640,000 tons available for export. Current exports are re-sulting in net losses to ZISCO due to depressed world prices and hightransportation costs--the latter being as much as 271 of the FOB price (seeTable VIII.3)--because ZISCO must ship through South African ports and thento world markets. Exporting through Mozambican ports is now a risky pro-pt.aition owing to security considerations. If conditions in that countryinprove, ZISCO's transport costs would decline.

- 107 -
Table No. VIII.3: ZIMBABWE - EXPORT PRICES(US$/Ton)
FOB(S. African Transport Net Exporta/
Item Ports) Cost Price
Billets and Blooms 180 48 132Medium Mill Sections 262 48 214Light Mill Sections 234 48 186bar/Rod Sections 232 48 184
8.06 Zimbabwe's landlocked position, while a clear disadvantage forexports, provides natural protection to the industrial sector in generaland to ZISCO in particular. ZISCO's pricing structure is such that in factit charges less than the cost of equivalent imports (i.e., ZISCO receivednegative nominal protection) in 3 out of 4 of its main products. This pri-cing structure means that part of the subsidy that ZISCO receives from thestate is being passed on to the consumer via low product prices. The mis-sion estimates that in 1985, the implicit subsidy passed on to the consumerwas on the order of US$2.8 million. This is without taking into accountthe rebate given to re-exporters. That rebate (which is between 26% and40% of the domestic list price) lowers the net price received on a domesticsale to a level below the net revenue ZISCO would get from exporting theproduct (see Table VIII.5). ZISCO, in effect, over-rebates domestic salesthat are re-exported. Based on 1985 data the over-rebate was in the orderof US$600,000.1/ IThe total implicit subsidy, including the export rebateswas in the order of US$5.7 million.2 /
1/ The calculation is made by multiplying the difference between thedomestic list price after rebates and the net export price by the tonsof domestic sales that receive the export rebate. In the absence of adetailed breakdown of the re-exports by type of steel, it has beenassumed that the 15% figure for re-exports of domestic sales appliesproportionally to all product groups.
2/ This is the sum of the implicit subsidy on sales to the local marketof US$2.8 million, plus ai: estimated US$2.9 million rebate on the 15%of local sales that are re-exported. The latter figure was calculatedby multiplying the difference between the domestic list price afterrebates and the equivalent landed price by the tons re-exported.

- 108 -
Table No. VIII.4: ZIMBABWE - NOMINAL PROTECTION FOR STEEL PRODUCTS, 1984(US$ per ton)
NominalFOB Pricea/ Transport Landed Domestic ProtectionC/(S.A. Port) Cost Price Priceb/ (X)
Blooms 175 48 223 238 6.7Billets 180 48 228 238 4.4Medium Mill 262 48 310 261 -15.7Light Mill 234 48 282 250 -11.3Rod Mill 252 48 280 249 -11.1
a/ These FOB prices are equal to or slightly below the Rotterdam spotprices for the products. They are taken as indicative of the opportu-nity cost of steel imports from South Africa, which would be the mostlikely supplier. If they were actually to come from Rotterdam, an ad-ditional US$20 to US$25 per ton would have to be added to cover over-seab shipping and insurance. In that case all four of the firm's pro-duct would be receiving negative nominal protection.
b/ These base prices have been in effect since February 1985. The pricesactually realized by the company on domestic sales for 1985 are lower(especially for blooms and billets) due to a lag in the February pricestruzture taking effect, sales of billets at discounted prices toLancashire steel (a Government owned re-rolling operation), and therebates given on domestic sales that are re-exported.
cf (Domestic price minus equivalent landed price) divided by equivalentlanded price.
Source: ZISCO, direct information, mission estimates.

- 109 -
Table No. VIII.5: ZIMBABWE - DOMESTIC LIST AND NET EXPORT REBATE PRICES(US$ per ton)
Dcoestic ListPrice After
EVxrt Rebate as Domestic List Exprt RebatesDomestic List % of Donsetic Price After as % of Net
Price List Price Export Rebates Eqxwrt Price
Billets aid Blooms 238 52 114 86
Medium Mill Sectimns 261 37 164 76
Light Mill Sectiis 250 26 184 98
Bar/Rod Sections 249 4 150 81
8.07 The disparity in the nominal rates of protection among ZISCO'sproduct is indicative of another problem with its price structure. Whilethe difference in production costs between the least and most expensiveproduct is more than US$117, that between the highest and the lowest listprice is only US$23. Furthermore, at the current list prices, only bloomsand billets are sold for more than what they cost to produce; the threeother products are all sold at a loss, ranging from 1% of their productioncost for medium sections, to 17% for light sections. This distortion hasprobably resulted from the price control system since steel prices aresubject to absolute price controls.
8.08 Growth in Zimbabwe's GNP and population during the next ten yearswill increase domestic steel demand, but even at an annual growth rate of5%, the domestic requirement for ZISCO products in 1995 would be approxi-mately only 270,000 tons/year, still leaving a large quantity for export.The Preferred Trading Area (PTA), a group of eastern and southern Africacountries that have entered into trade agreement promoting inter-regionaltrade, is the most logical export market for ZISCO products, owing to thegeographical and political links with Zimbabwe. However, in part due totheir depressed economies, shipments to these countries presently amount toonly 5% of total exports. ZISCO, then, must be efficient enough to competeworldwide if it is to export with net economic benefit to Zimbabwe.

- 110 -
Table VIII.6: ZIMBABWE - COMPARISON OF DOMESTIC LIST PRICES WITHESTIMATE PRODUCTION COSTS
Domestic List Production Domestic List PricesMedium Sections Prices Costsa/ Over Product Costs
Blooms & Billets 238 184 1.29
Medium Sections 261 265 .98
Light Sections 250 302 .83
Bar/Rods 249 257 .97
a/ Mission estimates.
Efficiency
Technical Efficiency
8.09 Labor productivity and coke rate are two key indicators of tech-nical efficiency in steel production. The former is usually measured ineither shipped tons per employee, or labor costs per shipped ton. The lat-ter is the ratio of the tons of coke required to manufacture a ton ofiron. On both counts, as Table VIII.7 shows, ZISCO fares relatively wellcompared to Latin America but not well at all compared to the most effi-cient producers in the world, namely Japan and Korea.
Table No. VIII.7: ZIMBABWE - KEY EFFICIENCY INDICATORS IN STEEL MILLS
AnnualShipments Labor Costs Wage Bill Coke Rate Gross
per Per Shipped Ton Per Employee (Kgs/Ton YieldCountry Employee US$ USS of Iron) x
Korea 584 15.0 8,910 480 89.1
Japan 368 57.8 21,270 480 94.7
United States 145 186.8 27,076 500 78.4
Latin Americaa/ 74 72.1 5,335 550 78.1
ZiSCO 88 77.1 6,785 775 72.2
a/ Firms in Argentina, Brazil and Mexico.
Source: For countries other than Zimbabwe, Peter F. Mareus and Karlis M. Kirsis,World Steel Dynamics, March 1986; various IBRD reports; ZISCO, directinformation; mission estimates.

- ill -
8.10 Although, it may seem irrelevant to compare ZISCO to the mostefficient steel producers, the hard and inevitable fact is that ZISCO iscompeting and will continue to compete with these countries in worldmarkets. This means that it must bring its technical efficiency closer totheir standards if it is to compete with them on a more equal footing.
8.11 In any case, the comparisons readily suggest areas for possibleimprovements. Coke rates, for example, are the highest in the sample--61%higher than in Korea and Japan, and 41% higher than in Latin America. Highcoke rates suggest low skills levels. Indeed, supervisory skills andtechnical expertise among the supervisory force at ZISCO are in rathershort supply. Europeans and Zimbabweans of European origin who have hadplant experience, are becoming a smaller percentage of the supervisoryforce. Well-educated Africans are assuming management positions, but un-fortunately they have less experience in steel operations.
8.12 Labor productivity is another area where ZISCO compares unfavora-bly, even more unfavorably than in coke rate. Although ZISCO's labor pro-ductivity is higher than that of the Latin American countries it is only15% as high as in Korea, and 24% as high as in Japan. ZISCO's average wagebill per employee is higher than Latin America's. This is a surprisingfinding especially because the "Latin America" category consists of threeof the most developed Latin American countries, Mexico, Brazil and Argenti-na. These three countries have higher per capita income than Zimbabwe, yetthe average salary paid to employees in steel mills is 12% lower thanZISCO's. As a result, although ZISCO's labor force has a higher producti-vity than these three countries, its labor costs per ton are 7% higher.The comparison with Korea is even more astounding. Korea's average remune-ration per worker is 31% higher than ZISCO's, yet its labor force has aproductivity which is nearly 7 times higher. As a result, ZISCO's laborcosts per shipped ton are 5 times higher (see Table VIII.7).
8.13 ZISCO's higher labor costs are partially the result of overman-ning. With the emigration of highly skilled personnel after Independence,ZISCO's management decided to double-man some positions in order to trainits unskilled personnel along side experienced expatriates. To this ex-tent, technical assistance and time may help reduce ZISCO's costs in thefuture. But high labor costs are also an industry-wide phenomenon, as dis-cussed in Chapter II.
8.14 ZISCO can ill afford to labor under any type of disadvantage,whether it stems from an overvalued exchange rate or technical inefficiencyspecific to the plant. Despite ZISCO's ready access to cheap raw mate-rials, its transport costs are a serious disadvantage. Table VIII.8 compa-res operating costs at ZISCO with those of liquid steel and ingot castslabs in Brazil. Although some liberty was taken in this comparison becau-se the Brazilian plant produces slabs instead of billets, the comparisonstill illustrates the disadvantage that ZISCO must overcome. The rail and

- 112 -
port charges of approximately US$48/ton added to ZISCO's cost compare withan estimated charge of less than US$8/ton for Brazil. This US$40/tondifferential must be absorbed by ZISCO in order for it to compete. It doesnot seem likely that efforts to reduce costs through modernization or othermeans can overcome this differential on semi-finished products.
Table No. VIII.8: ZIMBABWE - OPERATING COSTS AT ZISCO COMPAREDWITH THOSE IN BRAZIL
(US$ per ton)
ZISCO BRAZIL
Liquid Steel 94 97Ingots 103 107Semifinished Product 139 149
Economic Efficiency
8.15 If high transport costs make export sales particularly costly, bythe same token they provide ZISCO with a natural umbrella of protection.Coupled with domestically available cheap raw materials, these two factorssuggest that ZISCO should be an economically justifiable operation as faras domestic sales are concerned, although noc readily competitive in worldmarkets.
8.16 The Jansen study3/ suggested that ZISCO was not an efficientoperation, with a DRC of 474. The Jansen study, however, did not indicatewhether there was any variance among products, whether all of ZISCO'sproduct lines were all equally unattractive, or whether domestic sales wereeconomically justified. To answer these questions, the mission undertook adetailed examination of ZISCO's economic efficiency on the basis of 1985data. A summary of the results (see Table VIII.9 and Statistical AppendixTables 41-45), show more detailed breakdowns of the DRC calculations,including DRC for each of the four products for domestic and export sales,as well as additional sensitivity calculations, including no shadow pricingfor energy inputs.
8.17 To make a rough comparison with the Jansen calculation, a basecase with no shadow pricing for inputs except the removal of taxes and du-ties was made (Case A in Table VIII.9). The DRC for domestic sales was .85but the DRC for export sales was 3.17 largely because of high transportcosts. The reason why the DRC calculated by thc mission is considerablybetter than that obtained in the Jansen study is probably the significantdevaluation that has taken place in the interim, rather than any real im-provement in the efficiency of the plant. The exchange rate in 1981 usedin the Jansen study was Z$0.72 per US$, while the one used for the currentcalculation was Z$1.60 per US$.
3/ Jansen, Zimbabwe. M. cit.

- 113 -
8.18 Once adjustments are made for shadow wage rates and for shadowenergy prices (Case C), the very low DRCs on domestic sales more than com-pensate the DRC on export sales which is still over one. The weighted av-erage for the plant is then slightly below one, implying that the plant ma-kes economic sense to operate. The main reasons why ZISCO makes economicsense, even though it has to export 70% of its output at a tremendoustransport cost disadvantage, is that all of its raw materials areessentially non-tradeables and are produced very cheaply locally.4/
8.19 Because ZISCO uses virtually no imported inputs except equipmentspares, its DRCs improve further if shadow pricing is extended to reflectforeign exchange premia. With a foreign exchange premia of 20% (Case D),the weighted DRC for the plant falls to .67 and export sales are economi-cally viable, with a DRC of .94. With a foreign exchange premia of 40%(Case E) the weighted DRC falls to .58 and even export sales make clear ec-onomic sense.
8.20 Both the technical and economic efficiency of ZISCO could be im-proved considerably. A detailed report outlining some of the action thatZISCO can take has been prepared for delivery to the authorities by theBank mission.5/ As an illustration of the impact that one of these impro-vements could make for the DRC calculations, the last three cases in TableVIII.9 show the DRCs that would be achieved if ZISCO were able to sell itsproducts at the FOB list prices rather than at discounts because of qualityproblems as it currently does. Such quality improvement could be achievedas part of a technical assistance project costing only US$4 million, whichwould also reduce costs and improve operating efficiency.6/
4/ The two main raw materials, iron and coal are non-tradeable because ofthe prohibitively high costs of transporting such high bulk of valueminerals to the ports. In the economic analysis, iron ore was pricedat its financial cost in the absence of any better data on theeconomic cost of producing it, while electricity and coal were pricedat their long run marginal cost of production from prices obtainedfrom the Bank's Energy Department based on an extensive energy pricingstudy done by Coopers and Lybrand for Zimbabwe.
5/ See World Bank, "Assessment Report: Zimbabwe--Zimbabwe Iron and SteelCompany", July 1986.
6/ For more details on this technical assistance program and the more indepth assessment of ZISCO please refer to the report already citedabove.

- 114 -
Table VIII.9: ZIMBABWE - ESTIMATED DOMESTIC RESOURCE COSTS FOR ZISCO
Av. for For Domestic ForCase Plant Sales Exports
A. Base Case: no adjustment except 1.55 .85 3.17removal of taxes
B. Case A: adjusted for shadow 1.19 .65 2.43wage rate
C. Case B: adjusted for shadow .96 .58 1.59energy prices
D. Case C: adjusted for 20% shadow .67 .46 .94Exchange Premium
E. Case C: adjusted for 40% shadow .58 .42 .76Exchange Premium
F. Case C: adjusted for Impact of .81 .53 1.21Technical Assistance
G. Case D: adjusted for Impact of .58 .42 .78Technical Assistance
H. Case E: adjusted for Impact of .51 .39 .65Technical Assistance
The general formula used for the DRC calculations was wl + rk where 1 and kwete labor and capital inputs per ton of steel; w and r were price of laborand capital; and VA was value added at international prices per ton ofsteel.
CASE A: w and 1 used were financial prices actually paid by the firm; VAfor exports was based on actual FOB prices received by ZISCO at S.A. portsminus the US$48 transport cost of getting the steel there, minus the costof raw materials and services; VA for domestic sales was based on actualFOB prices received by ZISCO at S.A. ports plus the US$48 transport chargeminus the cost of raw materials and services note that this means that theequivalent landed price used for imports has been adjusted to reflect thesame quality discounts ZISCO is forced to give on exports).CASE B: same as Case A except that a shadow labor adjustment factor of .30was used for unskilled labor, 1.0 for skilled labor.CASE C: same as Case B except that shadow prices of .45 and .26 were usedfor coal and electricity inputs respectively.CASE D: same as Case C except that a foreign exchange premium of 20% wasassumed. This was also assumed to include the following increases in othershadow price adjustment factors: unskilled labor to .36; skilled labor to1.1; coal to .48; and electricity to .27.CASE E: same as Case D except that a foreign exchange premium of 40% wasassumed. This was also assumed to include the following increases in othershadow price adjustment factors: unskilled labor to .42; skilled labor to1.2; coal to .50; and electricity to .28.CASE F: same as Case C except that list FOB prices rather than actual FOBprices were used in the calculations, sn the assumption that these could bereached after a US$4 million technIcal assistance project. The differencebetween the actual FOB prices and the list FOB prices reflects discountsZISCO has to give because of the poorer quality of some of its shipment.CASE G: same adjustment as in F but to Case D.CASE H: same adjustment as in F but to Case E.

- 115 -
Constraints
8.21 Investments necessary to maintain efficient operations are notbeing made. Consequently, the plant is running down and, if the process isallowed to continue, ZISCO would require even greater subsidies in the fu-ture. In addition, it is alleged that the plant's current high quality oresupply will run out in eight to ten years and that alternative local oresupplies cannot be used without installing a new sinter plant. There isthus the possibility that the plant will be forced to stop unless the newsinter plant is installed. At least two foreign consultant studies havebeen done on a proposed rennovation of the plant. One prepared by Voest-Alpine in 1983 recommended a rennovation program with an estimated capitalcost of Z$185 million (US$116 million) for four major components, includ-ing a new sinter plant. That rennovation program was reviewed by BritishSteel Consultants in December 1984. Their final report, issued in March1985, essentially agreed with the basic strategy outlined by Voest-Alpine,although it took issue with some of the specific project components andsuggested modifications. Based on these studies, ZISCO, in turn, has puttogether its own rehabilitation proposal which includes some additionalcomponents. The estimated capital cost of that proposal is Z$312 million(US$195 million), 71% of which are expected to be foreign exchange.Neither alternative contemplates increasing capacity.
8.22 These are very large investments and it is not clear that evenafter they are made ZISCO will be able to operate profitably or that theymake economic sense because the studies recommending these investments didnot include financial projections for the plant as a whole or economic eva-luations of the investments. Before undertaking these investments, itwould be advisable to conduct a market study and investigate alternatives,including scaling down the plant to operate primarily for the domestic mar-ket with the small blast furnace. A comprehensive market study is neededas a first step in developing an action plan leading to ZISCO's long-termviability. Such a study should address both the domestic market for allsteel products and the niches, in the export markets, that ZISCO could oc-cupy effectively. A financial study of alternatives is also essential toprovide a clear picture of the financial burden that the State will have tocarry if ZISCO is to continue operating and, especially, to select the lessonerous choice. Scaling down the plant, for example, would have the advan-tage of extending the life of the high quality ore deposits and avoidingthe need to install the expensive new sinter plant. On the other hand, theDRC calculations suggest that it makes sense for the plant to continue toexport: a reduction in the size of the plant may increase unit costs somuch as to make more attractive the alternative of continuing at the pres-ent scale but restructuring the firm to increase its overall efficiency.An adequate examination of these difficult trade-offs will require furtheranalytical work with a considerable technical input.
Alternative Possibilities for ZISCO
8.23 There are several alternatives available to the company, each ofwhich will require further analysis of tne company as well as the invest-ment required and the returns.

- 116 -
(a) Continue operations as they exist with continuing effort toreduce production costs. This alternative has the implica-tion of shutting the plant down completely when the presentiron ore mines are depleted.
(b) Scale production down to a level closer to national needswith exports reduced substantially. Scaling down may reducefinancial losses but would also substantially reduce the in-flow of foreign currency. This alternative would involveoperating only one of two blast furnaces at 40-60% of presentcapacity but would extend the life of existing reserves.This alternative would have to be coupled with technical as-sistance to help lower production costs.
(c) Undertake the modernization plan recommended by Voest-Alpineas modified by British Steel and ZISCO. This alternative re-quires an investment of Z$312 million. The study, althoughtechnically complete, is overambitious and the financial im-plications hinge on future world markets and prices. Furtheranalysis should be done on the market-worthiness of thestudy's assumption, based on (a) the market study, (b) up-to-date selling prices, and (c) the financial impact of loan re-payment on the company. An economic evaluation of this al-ternative should also be undertaken.
8.24 In conclusion, as an import substituting activity, ZISCO is anefficient operation even at market prices. Export sales are a financialdrain on the company, but bring a net economic benefit to the country. Thefirm has both managerial and technical deficiencies that, if addressed,could improve both financial health and economic benefits. In particular,there is overmanning and poor quality contiol and top management is justbeginning to acquire familiarity with steel making. The plant is increas-ing losses partly because of its pricing structure. At present, it ischarging too little in the domestic market for some of its products andover-rebating on some of its export products. There is no economic ration-ale for this pricing structure, especially considering that the fisc mustsubsidize ZISCO's operations in order for the firm to subsidize consumersand exporting middlemen.
8.25 The availability of ore is a medium-term problem that must betackled immediately. Ore may run out in 8 to 10 years unl^ss a sinterplant is put into operation soon. ZISCO could also benefit from a moderni-zation of its present facilities, but an economic and financial analysis ofa modernization plan has to be predicated on a marketing study that shouldbe undertaken as a first step.
8.26 It would be advisable to undertake these reforms even in theabsence of the more ambitious steps outlined in Chapter V. The latterreforms, however, would be of considerable benefit to ZISCO. A morecompetitive exchange rate would make its exports substantially moreprofitable thereby improving its financial performance and reducing its

- 117 -
reliance on the fisc. Import liberalization together with price controlliberalization would also help ZISCO, although it would be under pressureto improve its quantity. Finally, ZISCO's future investments would lookmore financially attractive, as a result of increased profitability.

- 118 -
STATISTICAL APPENDIX

TA I
ZlUU - S1UWCM (F S 1WACM, UJL BY MMClIR 1967 ad 1970-82(Z7$ Itlin)
1967 1970 1971 1972 1973 1974 1975 1976 1977 1978 1979 I960 1981 1982Fodtffs (iwutl
stodcfeed) 99.5 138.0 153.6 174.6 214.1 231.9 260.0 295.8 327.4 351.3 415.7 505.3 614.7 809.2Drik and Tdbux 37.9 49.3 55.3 63.6 69.7 80.3 92.1 103.1 104.6 121.2 132.5 160.8 195.5 20.5leutlle (1nchwtlrg
GImd1Z) 37.0 57.4 71.6 88.0 103.0 138.9 136.6 151.2 1156.5 165.8 197.8 254.2 313.8 3D4.5Clodhtig & FoPr 3$.31/ 46.2 53.4 60.6 69.7 84.1 89.0 85.2 79.9 80.0 10W.2 143.3 23.4 215.3Wood & P brnitur 15.0 22.3 25.3 28.2 32.2 38.6 36.3 37.4 33.6 37.2 55.0 82.2 109.6 102.4Paper, PrintIrg &PdIi.dilxg 23.4 -%.1 37.7 43.1 51.5 65.5 74.9 65.5 65.9 71.9 84.0 114.3 148.5 169.7Chmdal & PerolProduts 53.8 82.9 98.9 113.2 120.6 166.0 184.1 170.5 192.0 205.7 235.7 335.3 439.4 477.5lorTChoc MinralP nduca 12.6 24.0 28.3 33.9 39.2 45.1 48.4 45.1 41.5 38.3 46.6 62.0 88.0 95.9etals & ea1 Prodcs 58.4 113.5 140.0 157.3 188.2 249.3 291.7 290.6 267.0 295.7 3E0.1 491.3 574.3 9B5.2Tranlpwt FAdtt 11.4 2D.5 28.1 33.5 29.8 44.0 51.9 45.1 46.7 42.8 47.9 5E.2 79.2 99.7Electrlal taddier 16.5 7D.8 22.8 24.2 28.8 41.1 39.0 35.7 39.6 40.0 47.2 63.9 82.5 96.8
Other tfg. (kms 4.1 6.7 7.8 9.3 10.9 13.7 13.7 13.8 14.8 17.1 21.6 30.5 41.6 38.4
All Mrifacbwig (kup 403.2 615.7 722.7 829.5 957.6 1,198.5 1,317.7 1,339.0 1,369.5 1,470.1 1,771.3 2,301.3 2,A0.5 3,235.3
a/ ids figure 1 fo*bnr.'5xmw: (ktral StMals d OffT , Sqtnw 1985.

- 120 -
Table 2
ZMA - DMinc Ot 'Mo 07 0X M W Cfl3DC 0 =CM
~w u~ O"ca Mm- )htaa Odw O OthFodsdf Wft UalwM:t x "IRWO WA PbwLUJ and Tuat Ec
w til 'a w totE g 1|t 9|g 1J; Pm9mw Pto&xtw Itmductm
593 . 65.2 6. 6.
F 116a 2 W9 Ila t~~~~~~~~~~. Y:3 71.4 1101fl 11 IJ 5.6
U6 37 35 tl9.U t32j I. 9, 20 .65J§, 1°4 6
1975 U zoJ 67.4 61.1 n 6 1 5.4 6S4. 91.5 123A 3.06 115.3 67.1 91.6
11 21 01.5 10735 16 1.3 19 94 l0.412.079 9.1 1M5 109 713 . 1(15' 94.8 1 .6
1932 Jmay ~~~112.5 72.3 63. W 64A6 ":73 *1"IA4 4
bbuwy 12311 70.2 135.9 us7 917 P13 in*' 136.7 67.2116.1 9.7 13D.9 119.0 9:1 ilA 113.7 105 100.6
1i3.1 82.7 13D.0 IQ..1 90. 10S.4 113.1 109.7 17.7 1502.9 U.1 111.1130.3 77.1 1.29.5 135. 97 11. 2.
ij1~~~~~ 123.6 93.3 127.1 12.1 89.3 115.1 126. 112.6 99.3 3D1.8 65.6 113.2ffli ioD lbu 1 :7 2.4 ~ 19.1 126. 113.2 964 173i 62.0 1107.1
= W 1101 I 5 19 2 .7 118.0 .8 121.1 IM~~~90. 19. 937 11
1927 1015 119.7 11.7 77.4 119.9 123.0 116.0 97.2 198.4 61.2 113.4129.4 119.7 111.6 137A. 92.8 119.9 122.4 114.1 10.2 3 D1.6 1 117.61t26.1 113. 79.6 101U3 NJ 96.6 93.4 B3D I7 1 9 12 .0 47.1 96.6
19U3 .mfhy 125 2.4 63.3 61.0 (AA6 102.4 10318 97. 87.6 143.9 39.4 94.3131 91.1 952 119. 90. 109.4 12210 100.3 14000 164. 64. 1.6
I~~~di ~~13D.6 71.7 110.9 11.2 913 13. 121 103 940 1.6 77 1(5
123.4 86.6 123.6 126.6 92.3 1(5.9 116.7 1(3.9 91.2 153.7 69.2 1(8.9~~~~~~~~~~~~~~~~~~~~~~25. 1823 15. 16.7 10.9 91. 7 0.
125.7 78.5 l04.5 115. 63. 109.3 130.7 107.6 92.1 13.6 72.9 1(.0137.2 61.5 107.5 1(3.4 61.1 103.3 13.6 99. 94.6 139.0 72.4 103.7
1im.9 98.1 113.1 1(8.2 79.2 101.7 1.33.6 109.6 112.0 146.3 76.6 111.3idy i34 93g114 41 8.6 133 1. 115.0 99.1 143.3 676 1(3.1
Sqi~~~~~ 125. ~ 97. 1(3.4 111.3 77.2 10.1 123 111.3 go. 1.2 7.1 10B.L
120.7 94.7 113.0 113.9 8. 1. 117.4 128.3 114.4 92.0 146.0 901 107.4124.3 10.N1J 2. 1 104.4 123.4 115.6 92.7 141.1 103.7 9.012D.4 93.2 110.6 1(.6 7.7 90.8 1(5.1 66.6 63.1 106 9.
1966.4 r 117.1 39.0 S6. 44.2 67.0 82.3 75.3 77.5 70.6 09.2 32.7 73.2JMMY ~124.7 63. 99.3 9~S 64 101.3 113.6 90J 1.6 1.53.2 34.7 96.3111r~~ 153.3 61.3 116.1 9. uA 10D.1 19 .8 9. 192.3 115.2 3.S 104.2
1:30.1 61.6 129.7 91.1 73.9 98.4 104.1 92.7 97.9 190.2 35.0 103.3114.8 120 .2 104 77.2 94.7 112.5 93.4 a8.3 114.4 43.0q 97 .3117.8 .3 109.2 100.5 74.9 85.4 116.3 102.9 88.1 117.5 447 97 .6
lily ~~~~11418 91.83 114.7 104.7 81.9 104.1 123.4 91.2 87. la6.3 46.7 10D.64asa 119.1 91 135.5 114. 91.1 IL?. 11. i9 979o2. 46.9 103.3
= W ~~111.2 1(3.6 147. 1163 63.0 1.5 116.3 110 82.3 103.0 91 1MA.
109.2 113.6 13. 5 117.4 95.0 107.0 125.3 112.9 92.3 126.3 (AA L01.5N-mai 119.5 126.3 17918 '25.5 102.4 115.6 127.9 121.3 92.9 113.7 621 116.3
~~ 1963 ~~~~127.4 89.4 103.6 10.4 821 107. 1.22.7 107.1 931 149.6 75.0 101.31984 1201 86.0 12.5 10.6 82.3 1L02 114.3 100.3 69.3 120.6 323 101.

- 121 -
bbl 3ZCw. - .IO A0 Nu aC1J1Ew ?NUFNRDC INLSS
(2$ lilUm)
_M. oitpAt TctOW Pdu ad rl in Stoks Not Outpt
Sol kLa Iudirg salm
F.rlnd C t ftoim Not ltlWu PAthdW t: Friie nt ttduudm ft Ft _m m f Pdtma fo b-S.al fo b-SaJa m the Pdam m eh n_ta
1964 36S.5 33t.1 231.3 201.9 137.2 129.2
19$5 34 370.7 251A 221.2 151.6 146.51986 34.3 351.6 739 14.7 144.5 136.91967 '03.3 372A 245.9 222.4 15.4 130.319 MA6.3 414.6 270.3 215.3 175.9 169.3191i9 523.4 40.1 318.3 208 25.1 197.3
1970 615A6 375.7 367.5 33.9 24o.1 239.71971 722.7 008.4 429.1 38L6 293.6 80r.8
1972 69.5 708.9 496.3 449.9 333.2 319.01973 967.7 90D.2 56.0- 59.7 3S7.6 370.51974 1.19166 1,121.0 721.6 660.3 476.9 460.7
1975 1,318.S 1,234.4 70.3 727.5 53D.5 506.91976 1,350.8 1,269.5 S.5 750.9 5U2.2 518.51977 1,369A 1,30.4 836.2 774.6 533.4 515.81978 1,470.0 1,359.5 867.9 80.1 602.2 564.41979 1,771.3 1,6A2A 1,046.7 976.3 721.6 704.3
1980 2,301.3 2,180.9 1,39.J 1,20.3 951.4 923.71981 2,190.5 2,721.5 169.1 1,5S7.8 1,1ff.5 .,163.7
abl 4
ZrnM - MN WIIT CF T tMIW=MG IIIIS K AMA(Zs ElAal)
Qs Qbtf1.d* mumc 3AI7OW K las ad ?I* Aft qp Kadve Odr Ares !Tbtai
1964 186.4 1IX.1 17.3 16.2 18.8 3.9 8.7 17.1 368.5
1965 D19.7 103.3 30.7 18.4 18.9 3.9 10.7 18.8 403,419f6 195.5 102.7 17.5 18.5 15.6 5.5 9.5 19.5 384.31967 202.6 110.2 14.3 19.2 19.7 5.5 10.9 70.9 403.3196S 221.1 122.5 15.6 21.1 18.4 6.5 11.2 29.8 446.31969 260.2 134.0 21.0 2.5 27.4 7.4 15.1 34.0 523.4
1970 1)6.0 156.0 21.3 30.6 39.6 8.2 17.0 34.8 6U.61971 359.0 179.8 26.5 32.6 47.7 9.2 Z4.2 43.6 722.71972 406.5 206.7 32.9 36.2 56.1 10.3 28.6 52.2 829.51973 400.2 235.2 36.9 41.0 65.5 14.0 39.7 67.3 967.71974 578.5 3DI.1 39.6 61.0 84.4 11.8 40.4 81.7 1,198.6
1975 633.0 311.2 46.2 67.5 116.5 13.2 37.3 93.8 1,318.81976 637.4 297.J 43.9 70.6 t22.7 17.0 43.3 117.9 1,350.81977 655.2 299.2 43.5 60.4 129.2 18.4 45.8 177.8 1,369.51978 702.1 329.3 43.4 63.8 154.2 15.5 39.5 122.3 1,470.01979 83D.6 3I6.5 S6.0 96.4 179.7 19.4 44.9 145.5 1,771.3
190 1,1.22.5 3M.5 77.0 117.6 22.3 20.0 56.8 177.6 2,301.319U 1,439.2 679.7 96.6 136.9 2Z3.2 22.3 62.1 2a.5 2,90.5
* V fTh j= to te flinoiay n A ¶w f lad tfx 1979 1s io dstadlimtmfr4i 7 uWi bsio 3Dhd JA=, 1979 7d 9th Jum, 1980.

- 122 -
TAble 5: Zim :s 1oufubW krta, 1966, 1975-6- 1Oilm z)
ltm 1966 1975 1976 1977 1978 1979 1960 1961 192 1 1964
Vttle &-set 902 1,14 1,672 1,955 1,533 1,776 1,867 2,992 3,136 2,200 3,639So 267 x1 666 54 55 424 1, 3,118 3,441 3,002 6,228Cnio C1 173 252 168 11 199 422 600 632 664 68 484otw 4,426 2,902 2,947 2,09 2,06 2,661 3,997 4,955 4,935 5,663 13,601Utotal 5,766 4,559 5,653 4,295 4,623 5,43 7,747 11,697 12,196 11,553 23,952N=Afaw= by )hArUIa
Umtbe mi tbm pie 72 113 330 446 60 1,376 1,856 1,780 1,391 271 479Tys A tube 945 1,113 201 375 678 1,05 750 1,161 1,371 1,762 2,54Pqr etc 2,711 2,599 997 941 1,2 1,423 1,39 1,120 2,063 4,606 8,148Yam O1 1,60 2,855 3,099 3,010 5,06 5,620 3,948 2,616 2,839 14,218F*rice 1,197 1,S4 3,000 2,860 4,806 4,139 4,862 2,612 1,563 5,255 8,613COWL 315 812 616 651 892 1,05 1,906 1,S29 1,717 4,436 7,581Ot. 7,204 6,691 6,448 5,799 5,509 7,641 9,860 11,166 9,597 17,241 36,699
ACCal 13,330 14,767 14,247 14,173 16,934 21,7M7 26,268 23,518 20,386 36,410 78,286Iz atl PtoductPi&lIon 3,159 1,940 3,538 0 0 547 3,725 816 432 22 36LtU & billet 1,399 8,0S2 11,193 19,777 22,767 25,968 34,224 24,185 28,228 40.666 31,027I= & itel 1,333 3,410 5,862 8,726 16,178 31,931 33,014 17,637 12,969 16,443 18,313ALiwy Coat. interiuls 80 514 249 90 172 316 643 203 1,217 273 477otht- 959 7,996 15,m 4,690 1,778 1,307 1,761 1,966 1,650 5,547 17,461
Ot*r 5,651 7,232 6,543 8,0C0 8,638 9,953 14,147 16,497 10,917 10,291 12,832Utotal 12,581 29,134 42,608 41,303 49,533 70,022 87,511 61,324 55,413 73,242 80,146
'_himzy, m9o?t & therNle1ect. mchiny 2,348 5,893 5,252 5,032 5,401 4,301 6,967 7,238 6,214 4,965 8,369lIul. el4. cble & vir6 2,474 145 138 541 1,916 1,591 2,350 1,666 95 708 1,54Radios, T.Vc 6 pau 3,975 6,145 4,039 2,264 3,129 4,854 4,341 3,462 1,940 2,IX 2,562PAil. VehiclS & SPi. 359 1,221 1,526 2,803 1,839 1,797 1,146 5,293 1,185 1,161 1,443ott. 3,940 2,256 2,032 1,240 1,744 756 416 1,585 2,322 2,940 8,438
S9)total 13,096 15,660 12,987 11,880 14,059 13,299 15,220 19,244 12,656 11,910 22,396Misc. Jwjf. & Camdities1xnitg & Fiztwe 1,307 4,433 4,158 2,626 2,492 3,303 4,744 5,273 3,590 3,531 4,835Suits, jackits, tc rna 1,812 4,716 4,967 3,279 3,441 3,246 3,372 2,766 1,415 967 3,138Drees, blowe, skirts 1,227 3,367 3,906 2,896 3,446 4,007 3,755 4,222 2,762 1,978 4,784Otts clothig 3,831 5,695 6,130 5,377 4,991 4,429 5,185 5,320 2,778 1,760 3,691*ootwe 3,195 5,144 5,734 3,906 4,145 4,594 5,066 6,074 3,819 4,171 5,890Tral god 402 324 446 556 710 826 1,226 1,120 1,229 2,039 3,374Otber 2,752 3,0% 2,892 3,220 4,105 5,802 5,715 6,248 5,081 8,871 11,899btoata 14,526 26.735 A,233 21,860 23,330 26,207 29,083 31,023 20,674 23,317 37,611
Aufactuw izcl. im 6 steel 59,301 90,855 103,728 93,501 106,479 136,796 165,832 146,806 121,329 156,432 242,391Mtfctum mcl. irc6 & steel 52,371 68,953 67,663 60,218 67,584 76,729 92,465 101,979 76,833 93,481 175,077rroa ad steel 6,930 21,902 36,065 33,283 40,895 60,069 73,367 44,827 44,496 62,951 67,314
Sarce: COmtral Scactitical Office, Sttmint of Ektemal Trade, varias isas

- 123 -
Table 5A - Zimbebm-41snufavturad xports, 1966, 1975-84OIillwi 198D0 $)
1966 1975 1976 1977 1978 1979 1980 19U1 1982 1983 1984
(lkal:Ibttle mtrmt 4,235 3,196 4,740 4,433 2,495 2,775 2,917 2,817 2,247 1,131 1,565kwq. 69 217 1,188 33 122 609 2,005 5,113 3,755 4,762 7,642Cr* ClyeTine 926 523 459 467 495 842 938 1,196 1,110 824 2920tk 20,779 8,107 7,462 4,751 5,181 4,613 6,245 7,145 6,552 5,810 11,570
Juttot-l 26,009 12,043 13,849 9,684 8,283 8,839 12,105 16,272 13,665 12,528 21,0701daswm by Ibtwial
Imtber In tb piece 338 316 329 1,016 548 1,455 2,900 3,790 1,949 282 108Tyres & tubs 2,761 3,104 445 727 1,521 2,133 1,172 2,245 2,331 2,103 2,279pow etc 12,728 7,261 2,524 2,134 2,674 4,802 2,178 1,198 2,806 6,637 12,006sarni 4,160 4,484 7,229 7,027 5,421 9,053 8,781 5,719 4,186 2,852 19,851
Fabrics 5,620 5,123 7,596 6,485 0 7,108 7,597 4,070 2,045 7,081 13,448Clmwt 1,479 2,268 1,560 1,476 1,730 1,976 2,978 2,213 2,336 4,606 7,811Other 33,822 18,692 16,327 13,150 10,210 12,321 15,438 16,105 12,742 17,689 31,219
&bhtota 60,907 41,248 36,010 32,015 22,104 38,848 41,044 35,340 28,396 41,250 86,722Iron & steel
Pig Iron 31,491 6,944 13,091 0 0 1,226 5,82D 1,646 BOB 23 40Tgotes & billets 50,579 25,727 42,004 70,531 56,786 41,635 53,475 36,373 44,196 50,100 32,226Irom & steel berm etc 3,511 11,824 23,099 33,371 56,075 53,841 51,584 28,283 20,732 31,389 18,519Railw y Cost. materials 107 1,866 710 418 565 608 1,005 507 942 522 1,396Other 4,502 22,338 38,545 10,635 3,248 2,108 2,752 2,864 2,191 5,691 14,854Subeotal . 90,191 68,699 117,439 114,955 116,675 99,418 114,636 69,674 68,868 87,726 67,085
Otber Metal & )htal Produrts 26,531 20,203 16,567 18,186 15,780 16,049 22,105 23,790 14,495 10,559 10,916M-hinry, tromport & other
Nt I telt. mchinmy 11,023 16,463 13,296 11,410 9,867 6,935 10,886 10,438 8,251 5,094 7,119Insul. elec. cableluire 11,615 405 349 1,227 3,555 2,565 3,672 2,402 1,321 726 1,347Padios, T.V.s & pert. 18,662 17,167 10,227 5,134 5,716 7,827 6,783 4,"2 2,576 2,192 2,179Rail.Vehicles & equip. 1,685 3,411 3,864 6,356 3,360 2,898 1,791 7,633 1,573 1,191 1,228Other 18,498 6,302 5,145 2,812 3,186 1,219 650 2,286 3,083 3,016 7,178
Subtotal 61,484 43,748 32,883 26,939 25,683 21,444 23,781 27,751 16,804 12,220 19,052Miscellaneos mofacturesFumniture & Fixtures 6,136 12,384 10,528 5,955 4,552 5,326 7,413 7,604 4,767 3,623 4,113Suits,jackets,tnou ers 8,507 13,175 12,577 7,435 6,286 5,234 5,269 3,989 1,879 992 2,669Dresses,blouses,skirts 5,761 9,406 9,890 6,567 6,295 6,461 5,867 6,088 3,667 2,029 4,070Other clothiag 17,986 15,910 15,521 12,193 9,118 7,142 8,102 7,672 3,688 1,806 3,140Footwre 15,000 14,370 14,519 8,857 7,572 7,408 7,947 8,759 5,071 4,279 5,011Traw. goods 1,887 905 1,129 1,261 1,297 1,332 1,916 1,615 1,632 2,092 2,870Other 12,920 8,537 7,323 7,302 7,499 9,356 8,930 9,010 6,746 9,102 10,122iutota1 68,197 74,687 71,487 49,569 42,620 42,258 45,442 44,737 27,450 23,923 31,99S
Total su£factures 333,318 260,629 288,235 251,348 231,145 226,857 259,113 217,564 169,678 188,205 236,790Mioufactures ecl. iron & steel 243,127 191,930 170,796 136,393 114,470 127,439 144,477 147,890 100,810 100,480 169,755Index of Total Minufactures 100.0 78.2 86.5 75.4 69.3 68.1 77.7 65.3 50.9 56.5 71.0Tndm of Mnwuf. encl. Iron 6 Ste 100.0 78.9 70.2 56.1 47.1 52.4 59.4 60.8 41.5 41.3 69.8
Source: Ceatral Statistical Office, Statemnt of Etterual Trade, varicus issues; missiam estiamtes

- 124 -
Table 6mu .mm
wIakl.o st I N S "- 35 _a _S
Fdd usG 1 , 1, 1111 1,18 11, 1,13 I ,O 1,3 11,195 0&"Otiidiitlim AN111 ^W OnM WTO IK 4111,11
UR we lok K M U67lown ^^^n ",0bmi. am ,10? 1, 1, 111 11,4 1,6 ,44 U,.,111 S t,"
%vat W IrM 3, l 1^21,1 1113 1 121 33 1,1414,1 @9,44,11volt W,l9 N W4, 0 3,46 S,3A 2
l9*dwt 619,12 1 1 4131,41119 4,10431 O,3,4 1914
lid IlilIltO. volt , ,u l 81,9 87,39 Noll"fr it t 13,91 8496 04,15 115,11 3111 15.11
194 grill 149,99 1,3 1917 7,18 9,3 93,
31 h owvlicdo o Faillts ,09 330 4,1 ,2 1793 ,
_ullt 1*,93 11,219 149,11 114,711 UI,U *,ufwuiadhoAsi cad lOw 3.497 5.8343 6,1V7 3103 09,31 42,4jv
flat ast &mm 11,014 0,3 3,61 ?,4 .0s6 40Iw .. Is ion two. 6 3,17111 12,41W 91,9 00,114 01,4194 4,01
liwrees e catal 41117 1i.2 1,170 35,411111 1,474 . 1*AV Mt 9176 11,411 I 3, 10 13,33 Ii,11 22,3
tuft 1U 214,37 343,317 339,3111 ,11 1194731 3,297 50164
P.*li mu a*lt80 101,1 17,3s 872,219n 159,11 142,431 72j0bstle IN JOIN ta Mt 3,69 1,32,1 17,440 3,973 29,119 48,3
hitt 70,116 3,i,0 ",m 3,32 1,0 532Tactils 4,9 51,17I ,019 42,604 0,974 319P1
ItAf 11,219 U.132 27,210 23,931 9,62 1,291
1310 21 32,m 141,942 l,lp Mm 210,11 197,6
at tenol. billtI 41,61 1,365 IS,A 11,136) 29,913 9,977
' 1.iut 0H,t , 91,3 12,01 ",7,1 17,5Total _ iu e 0n U) 03 7nD 7U 3 pi 409
bli t1ilt.lnt 48 III,.14 094 1is? 31 24 275 34
hFillt attr 1m/le.8 kel 9.401 9.2 C.M 31.711 3.711 0.831fetal att tnIbt wth 15.99 15.45 111.1,2 0.5 1 0.0 1 20.11
CwrUIt oot,PCwvrrt LU9itiUn 1.45 8. 1.37 I.0 1.44 1.3Imm t tuawrfli.l suto 0.15 1.90 0.90 O.97 1.42 1.13
0r,, pnfitoikel leas 20.0n 13.1 0.301 *.9 0.042 7.5Priat ofter IN/_ea)l tI-nr 81.1n 89.61 5.801 3.021 3.191 5.431
IceIis mier ia 1.10 09.19 00.88 9.09 14.419 10.31l bvid li,l4 r.t71 3.31 14.41 84.911 13.721 19.321
livieod pat patio , o."4 42.80N 3.0U2 14.51 47. 1111 37.911b magt vai n pr " i 08 1.24 21.21 8 0.126 08.39 01.41 08.92
IM tiu as * o Irn Proeflit 3X.1Z1 V.431 3.241 37.411 3.7 27.15Slt mkes trto it. I 137M.2 123.6l11 113.451 112.202 19.251
Oilt Fied satsAiSt bi.t I U."1 19.11 5.971 19.531 3.011 58.1.
I n laatvlsl
tI .. --let. Lls./q,itl 0.9 9.78 0.1 .70. 0. 0.05Lag" Two LO,r.-tt. Ostliltt 0.17 0.19 0.25 0.20 4.29 0.20
I/ l be Alloys, I90: a9 tuati, dataa grawibI therfoire teail wr nm_r to If fare.0ft4r tea profits c.twrf en tbr telred r na OSctili dfOrs profits loe tlatih, thereof i rom,eq offer taxproflts by 2,049 t_miM.
2n nill. Aloys. 89H I 2: I iOMa 074 we nuOthm t. i. ar rtb,Cttiley far 'O *'II 41e*ntI.i8 a 1&04 tIIlate] nets td tiltl li,ilitie, * gt wtet c0f tlst"t,
3/ Profits to Ic state t ad $eMCIeee ,ttwabt oe snt tce,,ittetis 191 44674 tIe di ff o0a*gs}) lmg 8933 808,90) dafferese bu cewcen#mes data is, lialf Ofo iac a, 88 Clit) toa 193.
4/ 1..tiga .isea. I tateoeet pi swff/p"n *tetfmot re Net cm,lsteeta, 1980130 tIn ned diftfrfc* *E 9I" 10535' 4l,U rae e 6keteWEeunen data is 1cI010 bfr rt0aIr ii 1912 ad Olsle is 1"3.
SI 10 totls e re daeptlvelv ml) bS " a sIpI ", t eue, of fifes oldof r*ert 19ta t1r t9t 9w.

- 125 -
Table 7
lisbabwt - hDmstic Prices Relative to International Prices................ ................. ..... . ........ .... ............. ............................. ...
Unit Price
It" Units Zimbawe United States Relative Price................................. .............................................................. ,Pargarine Kg 1.13 1.72 -34.02Elio Dozen 0.9 1.09 -18.12hite Flour Kg 0.65 0.44 42.11Ihite Sugar Kg 0.31 1.05 -70.1?Salt Kg 0.25 0.49 -48.41Nilk Kg 0.33 0.53 -37.6?T-bmne Steak Kg 2.43 11.42 -78.71Bround weat Kg 2.21 5.24 -57.91Porterhouse Steak Kg 2.21 9.13 -75.81Rump Steak Kg 3.06 5.70 -46.2lRoast Rib Kg 1.81 6.15 -70.61Whole Chickten Kg. 1.71 2.04 -15.9XToothpaste (Colgate, fai.) One 1.14 1.96 -38.52One-foot candles One 0.09 0.99 -90.41B-size battery One 0.58 0.37 56.1IToilet Paper 1000 sheet roll One 0.63 0.55 14.71Soap One 1.44 1.46 -0.9?Detergent One 1.85 1.07 71.8912.5 cu.ft. refrigerator One 939.53 467.99 100.897.5 cu.ft. freezer One 729.44 374.39 94.6?6 cu.ft. Refrigerator One 593.91 343.19 73.1ZOne door 12.5 cu.ft Refrig. One 666.90 467.99 42.5S4-plate stove with oven One 735.83 311.99 135.922-plate electric stove One 299.15 41.59 616.913-plite stove with oven One 709.00 324.47 119.5?700 h Iron One 29.04 29.11 -0.2XToaster One 29.56 10.39 174.9?Junior bed with bedsprings One 162.19 187.18 -13.3?27' Hen's bicycle One 141.92 155.99 -9.0Z27' lomen's bicycle One 144.01 155.99 -7.7?3'x26xSOe mesh 200 sq ft 9.16 14.59 -37.2XHand Shovel IO x6 One 7.72 10.39 -25.7XHand axe 3xf6 One 4.29 9.88 -56.5?Hand hoe One 2.95 6.03 -51.1?Cenent One 5.66 15.99 -64.6?Pitch fork One 15.90 21.83 -27.6?Shovel (2-mos. wait) One 9.51 16.63 -42.89Pick One 4.41 9.32 -47.0XChild's tricycle One 33.39 31.19 7.1?
Source: Direct information gathered by sission from visits to shops in Harare.

_ 126 -
Table 6
z2 Lam - DOICATOM 0f lCrIaI NQ AM CIWC't IN S NAwACUIMN SIECT1R
CepacAty 0.atpjt/ Avg.VA Utilisatiao F1o,ee lIp
re NmC IPC DlC () (2$ 000) (2$)
1. Pooetuffs 21 0.96 0.66 0.68 a8 86 24711. Slsit, Procei of Plus -T 7.93 0.73 0.79 i2. Oral, Aahm1 Fede 6 0.96 1.02 1.03 100 313. I3 Y uProductl I 1.00 1.04 0.70 61 204. Deity fto*t8 3 1.00 1.04 1.11 92 175. hagar Ref., C4=fGctLOWry 2 0.83 0.44 0.83 a6 266. Othr Food uroats 2 0.95 0.83 0.74 100 44
tI. Tombomm ad 10 1.00 1.04 0. 79 20 34951. NW, mma sUt- = I! 2. Soft ODei I 1.11 1.48 1.32 75 133. Tobo PtoActa 3 1.09 1.19 1.13 76 A.
III. h4tl o lalcdi>tto mm"_1j .18 1.74 1.23 $I 23 2074
(ioclhdiq W)aj 9 1.17 1.79 1.30 62 281s. Cottem 0imai. Taile
(xcludiq c)!/ 4 1.39 2.54 1.72 79 182. kitted rodecte 2 1.24 1.50 1.20 76 11
tV. soi t 1.19 2. 1.05 66 12 19541. QLOedrg '- -M -70 E 2. hootmr 5 1.14 1.21 0.92 87 13
V. lieodl hsrnizt e 3 1.21 1.38 1.33 65 51. 5_11tN WOO Prds -T 1.3 M. 7T -2. Nimiture 1 1.23 1.45 1.32 69 a
VI. Do. prnttt 1_t hX M 3 1.32 1.90 1.87 87 20 4391
1. Pow roducts -7 1. 3 2.4 -m -92. Priotig & Stotloeary 2 1.30 1.52 1.36 79 17
VU'. Q_tcal Prouts 20 1.08 1.29 0.94 a8 38 41951. Portili±er, lct. y 5W T7 0.99 08 2. Soo", Dot., TollAt Pr". 5 1.05 1.10 0.81 100 503. Fthemcaticals 1 1.13 1.36 1.19 93 424. Pointt. tzvh. Qticals 2 1.24 1.57 1.17 75 245. bbber Producta 2 1.23 1.56 1.21 70 356. Plstic Products 2 1.25 1.54 0.95 78 21
VIII. Niftf-11c tlSrolfroducte 5 1.12 1.25 0.96 85 12 2196
1. -T M. 11 1.07 - _
2. Cle 4 GlueC Prodcts I 1.nI 1.20 0.68 94 173. Ceme& rticks 3 1.15 1.29 1.08 84 13
I lMetal & Petal Products 1.28 1.78 2.36 77 23
IA. Steel & tx-Prro(includti ZI50M) 9 1.18 2.03 3.62 86 30
15. Steel & Navo errm(ecludi ZISX) 4 1.15 2.23 2.69 90 53
2. PSsy PeAl 94uqptP : 2 1.33 1.71 1.41 68 133. Uiht Metal ProductO 4 1.17 1-35 1.12 65 164. Agric. Igl1mgU 1 1.16 1.22 0.91 78 145. I uOlid EliC. !quap. I 1.44 2.77 2.29 48 106. Indut. &lC. I14 2 1.18 1.38 1.09 87 26
L TEO bp= 1 1-23 1.49 1.27 70 14 2924
TOia nfecturiq 100 1.09 1.33 1.27 83 21
! Cottoe P4e* tiq loa
Mte, The off c4acy indicators used in ti stUdy include I teaisa proattm Cneffciaot(ISC), effective PToteCtIbO Oeffici.t (DC), MA dOetc reseec Oete mefficiott(OC). NDC Sm t railo o th eift's tevel- to Privet. (_keit) prima to Its revwin sot1 (border) Prim. -- ia ttF atio of vsle added in prtvate pria1 to valueadded in soial priss. P iy, vDI.c r prwfted by a ratio of doestid factor cats1r socl Priem to V" aie in socl Priem.VA MMI - V" ae In s411 pricm for the PrOuP divided by rl edded La oea-1pri. fo, total mafectudit.

T 1* 9
ZDAUE - APr. MME ESrnMM K NSE 9IFC1UR1Q C IN 1982 AT 1962 P
by 9iinntc±o
LmxI& Z Of Plant& %of Z Of btml Z of I"& N2mnt &aflMr" Total * Equp. Total Vddcles Total Cvital Stodk total B1i4p. Equip. Vddcl
&ubsecter (1) (2) (3) (4) (5) (6) (7) (8) (9) (10) (11)
Foodstuffs 254,026 21.8 251,785 10.9 67,33D 23.3 573,141 15.2 44.3 43.9 11.8
Dikxk and Tdccz 136,893 11.7 163,558 7.1 40,753 14.1 3u1,2D 9.1 40.1 47.9 11.9
1MMiJ1 (mIn. glzxixg) 106,483 9.1 247,462 10.8 8,962 3. 362,907 9.7 29.3 68.2 2.5
CLothizg & Foobinr 41,158 3.5 68,753 3.0 9,967 3.4 119,878 3.2 34.3 57.4 8.3
WVM & Fumiturue 24,913 2.1 43,026 1.9 15,6WD 5.4 83,599 2.2 29.8 51.5 18.7
paw.: Printfrg & PRtlishIx 47,514 4.1 127,884 5.5 13,937 4.8 10,335 5.0 25.1 67.5 7.4
(2oical & Petrolm Prodctxs 133,560 11.k 337,085 14.6 36,781 12.7 207,446 13.5 26.3 66.4 7.3
N&m taflic Mkreral PnxhLict 81,066 7.0 138,347 6.0 23,743 8.2 243,176 6.5 33.3 56.9 9.8
Meta3z aid Metal Produacts 292,787 25.1 866,150 37.6 59,936 20.7 1,218,873 32.4 24.0 71.1 4.9
Ttisprct Eqtiipint 40,767 3.5 36,792 1.6 8,475 2.9 86,034 2.3 47.4 42.8 9.5
OtherI M fa±cured Pro&Lx±B 7,27 0.6 2),111 0.9 3,428 1.2 30,762 0.9 23.5 65.4 11.1
ium I ~~~~~166,43) 100.0 2,300,953 100.) 288,972 100.0 3,756,355 100.0 31.0 61.3 7.7
bcurc~e: UNr1".)0, 1exat Tab-le.(anwr- of Pri:ducUma 19W283, Ipble 7, (wmai of Patimi977/78, Tale 7, Ome of P &duciwm M92, 1U1 8., Deflato for amhymr 1962-1962 provided by the C-SD: separate defl*ato, for land & &lifld2H Plant & Equigmin w'4 pzovided f or1969-1982, C-P defi~Atc lmbd for each year.

Table 10ZIMBABWE - BASIC DATA ON MAWNFACTURING SECTOR BY SUBSECTCR FOR 1982
(value figures in thousands of Z$)
Capital Employment Gross Output Net Output KEStock (K) (E) (G) (NQ) RN
Subsector 1 2 3 4 5 6
Foodstuffs 573,141 26,334 788,273 198,320 21,746 2.89
Drirk and Tobacco 341,204 13,206 229,831 136,367 25,837 2.50
Textiles (inel. ginning) 362,907 20,787 302,415 107,31 17,458 3.38
Clothing & Footwear 119,878 21,879 211,259 111,256 5,479 1.08
Wood & Furniture 83,599 12,914 93,964 49,098 6,474 i.70
Paper, Printing and Publishing 189,335 9,445 163,489 84,131 22,420 2.25 1
Chemical & Petroleum Products 507,446 12,945 395,246 159,131 39,200 3.19 co
Non-metallic Mineral Products 243,176 7,818 94,361 56,749 31,105 4.28
Metals and Metal Products 1,218,873 42,237 639,137 290,963 28,191 4.19
Transport Equipment 86,034 5,245 93,836 36,486 16,403 2.36
Other Manufactured Products 30,762 3,411 37,195 18,880 9,018 1.63
TOTAL 3,756,300 176,223 3,049,006 1,248,692 21,316 3.01
Source: Various tables in UNIDO Report.

- 129 -
Table 11
ZIMBABWE - ESTIMATE OF INVESTMENT AND FOREIGN EXCHANGEREQUIREMENTS IN THE MANUFACTURING SECTOR 1983-1985 a/
(Million 1982 Z$)
Total1983 1984 1985 1983-85
GROSS FIXED CAPITAL FORMATION
Land and Building 20.5 23.6 17.3 61.4
Plant, Machinery & Equipment 135.4 249.4 309.3 694.1
Vehicles & Associated Implements 29.3 29.9 26.6 85.8
Office Furniture & Equipment 6.8 8.8 5.8 21.4
TOTAL GFCF 192.0 311.7 359.0 862.7
% Replacement 59X 37% 24% 37%7 New Capital 41% 63% 76% 63%
FOREIGN EXCHANGE REQUIREMENTS
Plant, Machinery & Equipment 92 170 210 472
Vehicles & Associated Implements 20 20 18 58
Office Furniture & Equipment 3 4 3 10
TOTAL FOREIGN EXCHANGE 115 194 231 540
As X of Total GFCF 60% 62% 64% 63%
a/ Sectoral Estimates obtained by enlarging results of sample survey tosector on the assumption that investment requirements of sector were inproportion to sample's share of total manufacturing turnover. Samplefirms accounted for 50% of total manufacturing turnover.
Source: R.C. Ridell and D. Nsiyaladzu. "Investment in the ManufacturingSector: Proiections to 1985 and Foreign Exchange Requirements:Results of a CZI Survey and Initial Comments" Confederation ofZimbabwean Industries: Harare, August 1983 mimeo.

Table 12
ZIMBABWE - SUBSECTORAL SURVEY ESTIMATES OF GROSS FIXED CAPITAL FORMATION FOR THEMANUFACTURING SECTOR 1983 - 1985
(Millinl 1982 Z$)
Replace-ment New Gross
Subsector Capital % Capital % Total Z
Foodstuffs 86.2 15.8 61.5 19.6 148.1 17.2
Drink and Tobacco 18.7 3.4 35.3 11.2 54.0 6.3
Textiles and Ginning 7.7 1.4 13.0 4.1 20.7 2.4
Clothing & Footwear 3.5 0.6 5.7 1.8 9.2 1.0
Wood & Furniture 4.0 0.7 23.9 7.6 27.9 3.2
Paper, Printing and Publishing 36.8 6.8 33.1 10.5 69.9 8.1
Chemical & Petroleum Products 42.3 7.7 61.6 19.5 103.9 12.0
Ncxtl-tallic Mineral Products 19.1 3.5 22.7 7.2 41.8 4.9
Metals and Metal Products 316.9 58.2 54.2 17.2 371.1 43.1
Transport Equiplnt 9.4 1.7 4.0 1.3 13.4 1.6
Other Manufactured Products 0.2 - 0.4 0.1 0.6 0.1
TOTAL 544.8 315.8 860.6
Source: Confederation of Zimbabwean Industry Survey, 1983

Thble 13ZI1MSgd - ESTIMArES OF ANNUAL CAPITAL 1EPLACIEfEN lEQUI fl'ES IN MANIJFACnIRIN
SECTOR BASED ON 1982 CAPITAL STOCK(Z$ million)
Estimated Total Require-Land and Plant & Equipment *ents with Plant & Equt.Buildings Vehicles 3% 5% Replaoemmut Rates at
Subsector (1) (2) (3) (4) 3Z 5Z
Foodstuffs 3.8 5.3 7.6 12.6 16.9 21.7
Drink and Thbacco 2.1 2.9 4.9 8.2 9.9 13.2
Textiles and Ginning 1.6 0.6 7.4 12.4 9.6 14.6
Clothing & Footwear 0.6 0.6 2.1 3.4 3.3 4.6
Wood & Furniture 0.4 1.3 1.3 2.2 3.0 3.9
Paper, Printing and Publishirg 0.7 1.0 3.8 6.4 5.5 8.1
Chemical & Petroleum Products 2.0 2.7 10.1 16.9 14.8 21.6
Non-wtallic Mieral Products 1.2 1.7 4.1 6.9 7.0 9.8
Metals and MPtal Products 4.4 5.0 26.0 43.3 35.4 52.7
Transport Equipment 0.6 0.6 1.1 1.8 2.3 3.0
Other Manufactured Products 0.1 0.2 0.6 1.0 0.9 1.3
TOTAL 17.5 21.9 69.0 115.1 108.4 154.5
1. Assuming a depreciation rate of 1.5%2. Using capital stock values for previous twelve years and a 10 year straight line depreciation rate.3. Assuming a depreciation rate of 3.0%.4. Assuming a depreciation rate of 5.0%.
Source: UNIDO REPORT. Table 12.4, p. 315.

Table 14
ZIMBABWE - COMPARISON OF ACTUAL MANUFACTURING INVES1WTM VERSUS 1982 CZI SAMPLEINIS AND UNIDO ErSTIMAES
(all figures in millions of Z$)
UNIDO Report EstimatesEstimate of Annual New Invest-
Actual Net Investment Requirement Replacement Requirements ment Requirement to SustainInvestment * According to 1982 CZI Estimate Based on 1982 3% and 5% Annual Output Inr-
Sample Survey Capital Stock creases to 19953Z 5%
(1) (2) (3) (4)
1981 231.7 Replacement New Total
1982 168.5 - - 178.6
1983 131.5 112.2 78.7 190.9 108-154 70 173.3
1984 n.a. 115.7 194.3 310.0 w
1985 n.a. 88.1 271.1 359.2
1. From census of production adjusted to constant 1982 Z$ in UNIDO Report.
2. From R.C. Riddel and D.F. Nsiyaludzu "Investment in the Marnfacturing Sector: Projections to 1985 andForeign Exchange Requirements," CZI: Harare, August 1983 mimeo.
3. Table 5.
4. Based on 1984 production levels, 3% and 5% growth targets, sectoral capital stocks from Table 1, averagecapital output ratios for each sector over 1973-1982, and adjusting for previous record levels. FromUNIDO Report, Table 12.6, p. 319.
* Net lnvestment is "total expenditure during the year less trade-in values, proceeds of sales and recoveriesfrom insurance clai m.

7Mbe 15
ZMAB - iiinM OF ii MMINDIR S M w PRLVAn MUD H C INuW=G
Ithlncpxpramed 2 of Private X of QGbermmt z of diaItl 1 X of local X cf lbtalSOCtOr enterprlw total coatppdae aUal lue tt DC ow trc led tota wafaturlg taa aidwrmts total tunw er
obdItuJff 4.6 1 457.0 74 - - 153.7 25 - - 615.3
Ddrkt & hetC 1.6 1 154.8 92 - - 12.4 7 168.8
It11e (lri. gmIxbgE 0.2 - 217.9 62 - - 130.5 38 - - 348.6
Clnotig mod u obw m 2.2 1 192.6 98 1.8 1 - - - - 196.6
Wxd aid Rwrdnre 1.9 1 108.6 99 - - - - - 110.5
Pqwr, PrintUg, ad Pb1iddg 1.1 1 151.3 97 2.6 2 - - - - 155.0
c md Patrolu FWdxts 11.4 3 366.7 97 - - - - - - 378.1
Mm rical ICLirml Pwdwt 0.3 1 87.8 99 - - - - 88.1
Mas 1m a1 MelPnta 4.7 1 516.6 82 l1I.1 17 - - - - 629.1
t lnqortBsll t 1.3 1 120.7 97 1.5 2 - - - - 92.9
Other NPuzfad PDuLts 0.6 1 40.4 99 - - - - - 41.
Total 29.9 1 2,383.8 84.5 114.0 4 294.2 10 12.4 0.5 2,824.3
Read on iqmdilshId inforlit frvLm CRD, UNIDD quetirde rmlts ant kvtrial Oielropt Oxpimi of b*im Itd., Amul Pept and Aclxutsfor the yer ed 3Ddt Jbe 1984.
_ahdklda Nie:
Tbe bgdc data, IE1nc1xtg tqCt timwver f w are for 1981. H* bwer the dlstribtutlm of Unwertam bm v4deen to the (3Eeriip patern pe1ta1rdvg in1985. 1u2xamr under the Dlium h g -Oent.mi bOmerr om and MD0controlled- 1niche the foIof g: ZI90, 1maidre Suei, DelJmm, WLulownae,F. lawla aA Owiit 1K pdqtiig and Staticlmy. 1Hmr, it dos mt I-lalm ral Film i1-ties gad 1Ptliml Fmdtuze .ruhtrIas for idcd 1961tuzer figar mm na wt lible.
Smwroe: Um1An lSpwbMe 2.11, p. 45.

Tabie 16
ZIMBA5 - FD1EIcWDCWSrIC OINRSP PATM O FE HMIMFACIURlIIR SCIRUNIDO AND JMN DAE. CAPA
1i11 Su4y Reslts know aShdwy esltForeign ooMltld EZ tlOedgrI3
Subsectr (!rship dwe total tumaver CMershp du8 total tumover
Foodbtuffs 39.4 65.6 8 70
Drik &Tbbacm 60.9 23.6 61 67
TPxt1ilm (inc1. gimldg) 24.4 47.0 30 70
Clot1lzg and Footwr 17.3 16.1 62 44
Iood ard F,rnriture 37.0 22.4 85 46
Paper, Prfntxrg, and Nbliddig 61.3 68.1 49 61
Chedcal and Pebro1au Products 62.7 70.1 74 77
Non-Metallic Mineral Products 54.1 72.2 65 77
Metals and Neta Prodxicts 52.2 54.8 53 63
Tranwpowt EFulpmnt 47.8 96.6 84 45
other wnifactuzed Products 74.3 75.6 n.a. 0
Total 48.1 56.6 50 65
Source: UNDMO, Study of the Mr i -a±rIxg Sector in Zitubae, 1985, Tale 2.13, p. 49.

_ 135 -
Table 17
ZIMBABWE - NET CAPITAL INVESTMENT IN THE MANUFACTURINGSECTOR 1970-1983
Total NetInvestment Volume Index
(in thousand of Index of ofdollars in constant, Investment Production
1982 prices) (1983-100) 1983-100
1970 129,465 98 631971 154,549 117 691972 171,022 130 771973 285,709 217 831974 308,084 234 891975 340,469 259 861976 190,042 144 811977 122,452 93 771978 85,465 65 751979 72,870 55 821980 170,217 129 1061981 231,665 176 1031982 168,517 128 1031983 131,589 100 1001984
Averages
1980-83 175,497 133 1031976-79 117,707 89 991972-75 276,321 210 84
Source: UNIDO Report Table 12.2 p. 308.

- 136 -
Table 18
ZIMBABWE - INVESTMENT PLANS FOR NEXT SIX MONTHS BY FIRMSSURVEYED: CURRENT AND CONSTANT ZIMBABWE DOLLARS
IN MILLIONS
Number X with Current Constant 1980of Investment Zimbabwe Zimbabwe
Survey Date Respondents Plans Dollars Dollars
April 1981 94. 74.5 97 90
December 1981 96 57.3 53 47
June 1982 111 39.6 33 27
December 1982 112 40.2 n.a. na.
June 1983 104 41.3 37 26
December 1983 106 33.0 21 14
June 1984 105 35.2 36 22
December 1984 n.a. 31.8 30 17
June 1985 105 36.2 34 17
Source: University of Zimbabwe Business Opinion Survey, various issues.

- 137 -
Table 19
ZIMBABWE - IMMIGRATION AND EMIGRATION THROUGH OFFICIALPORTS 1970-1985
Year Immigration a/ Emigration b/ Net Immigration c/
1970 12,345 5,238 7,1071971 14,881 4,713 10,1681972 14,085 4,562 9,5231973 9,511 6,846 2,6651974 9,764 7,982 1,7821975 12,552 9,242 3,3101976 7,941 13,013 -5,0721977 5,914 14,556 -8,6421978 4,650 16,467 -11,8171979 3,647 12,951 -9,3041980 6,407 17,240 -10,8331981 7,794 20,534 -12,7401982 7,715 17,942 -10,2271983 6,944 19,067 -12,1231984 5,567 16,979 -11,4121985 (Jan-July) 3,392 4,846 -1,454
January 448 1,098 -650February 521 700 -179March 575 728 -153April 381 730 -349May 528 640 -112June 448 628 -180July 491 322 169
a/ This is known to be an incomplete record of all migration because(a) it omits cross border movements other than through official ports,(b) some residents who declare they are leaving for less than 12 months(and are therefore not counted as emigrants) stay away permanently orfor more than a year.
b/ Records of African emigration through official ports only startedApril, 1978.
c/ Records of African immigration through official ports only startedJanuary, 1980.
Source: 1970-1984 from Central Statistical Office, Quarterly Digest ofStatistics, March 1985.1985 from Central Statistical Office, Monthly Migration andTourist Statistics, July 1985, p. 3.

Table 20
ZIIS&M - UNIVIRSIITY OF ZD IA' S ESINESS OPINI(3 SXDF: 19811985
Dec. 85 June 85 Dec. 84 June 84 Dec. 83 Jut. 83 Dec. 82 Jum 82 Dec. 81 4mdl 81
Total mber of suryn emt 150 n.a 150 152 147 172 165 184 230Nuber of RDeponAent 105 n.a 105 106 104 112 111 96 94S Participation 70.0 70.0 69.8 70.7 65.1 60.0 49.2 40.91. GUtAL SUSUESS SnIUATIW Ar you
uore or left optimistlc about your firmprospects den you a 6 inthe qo?
More OptImidtlc 63.8 40.9 16.2 9.4 7.7 4.5 8.1 14.6 3S.3No Differemce 22.9 37.3 36.2 28.3 26.9 17.9 23.4 28.1 37.2Less Optistic 13.3 21.8 47.6 62.3 64.4 76.8 67.6 57.3 23.4No respoqe 0 0 0 0 1.0 0.8 0.9 0 9 1.1
2. PRDUCTIN/SAIESDo you expect proaduction salesturnover in the It six mthe to:
Rise more than 2CR 7.6 4.5 '.0 3.8 1.9 0.8 3.6 6.3 18.1Rise 101 to 20Z 27.6 13.6 11.4 4.7 7.7 6.3 9.0 16.7 24.5Rise 52 to 1Ct 34.3 25.5 2D.0 17.0 7.7 6.3 11.7 18.8 33.0Rein the s 22.9 30.9 32.4 22.6 23.1 19.6 32.4 26.0 15.1Fall less than 1CS 2.9 11.8 14.3 18.9 29.6 2.1 18.9 14.6 3.2Fall wre than 101 4.7 12.7 19.0 31.1 27.9 42.9 24.4 16.7 2.1No comnt 0 0.9 1.9 1.9 1.9 - - 0.9 1.0
3. STOCKS1a) Will rw _terials d ompoents stocks over
the I six mosthe:
Increae 22.9 20.0 14.3 16.1 6.7 8.0 8.1 12.5 21.3lmn the em 34.2 35.5 38.0 30.2 31.7 17.0 3D.6 31.3 30.9Decrease 41.0 40.9 45.7 50.9 60.6 71.4 59.5 54.2 44.7No iwver 1.9 0.9 1.9 1.9 1.0 3.6 1.8 2.0 3.1(b) Will stocks of finished goods over the tet
six nmtbe:
Increse 11.4 10.9 14.3 18.9 19.2 14.2 13.5 15.8 16.0Ren the se 51.4 48.2 45.7 34.0 27.9 30.4 40.5 40.9 50.0Decrease 30.5 36.4 35.2 39.6 42.3 37.5 36.9 41.0 26.6No anser 6.7 4.5 4.8 7.5 10.6 17.8 9.1 2.3 7.4

Tbe 21
UMSIVM OrF ZIUA5' US JSS OFININ SJWE: 1981-1985
Dec. 85 Jute 85 Dec. 84 Junm 84 Dec. 83 Jun 83 Dec. 82 Juma 82 Dec. 81 pril 81
4. CAPAITM(a) rI ar firm mctir:
Abwo taret capacity 11.4 7.3 1.9 3.8 3.8 2.7 9.0 10.6 19.2At pl_d output levels 32.4 27.3 17.1 17.9 17.3 23.2 27.0 46.3 52.1Wow tarset cqclty 54.3 64.5 80.0 75.3 73.1 71.4 59.5 41.1 23.4
No - 1.9 0.9 1.3 3.0 5.8 2.7 4.5 2.0 5.3
(b) In the p_t ds a tthi b_ there bee:
An inrem in capalty 25.7 27.3 13.3 17.0 15.4 14.3 11.7 40.9 n.eNo duin 55.2 51.8 59.0 55.6 53.8 51.8 47.8 36.6 n.Scaacity deres 12.4 17.3 23.8 23.8 25.0 25.0 31.5 16.1 n.MD an_mr 6.7 3.6 3.9 5.6 5.8 8.9 9.0 6.4 n.-
%0
5. COSTS
Do ya expect costs over tbe next s*x mtlh to:(a) I materlals M cammt costs
Iae more than 2(K 9.4 8.2 6.7 13.2 10.6 7.1 10.8 14.7 18.1ise 103 to 2(3 61.0 57.3 61.0 62.3 58.7 61.6 62.2 65.3 61.7
Rls Iao then 10( 24.8 25.5 26.7 17.0 19.2 21.4 17.1 15.8 14.91IAD the m 2.9 4.5 5.6 3.8 3.8 7.1 4.5 4.2 4.3No a r 1.9 4.5 0 3.7 7.7 2.8 5.4 0 0
(b) Wige CDsts
Rise nore than 2(3 1.9 2.7 1.0 0.9 1.9 7.1 6.3 34.0 2D.3RIe 10( to 2(K 60.9 38.2 38.1 49.1 51.0 67.0 35.1 54.3 57.5Rie las then 103 3D.5 35.5 40.0 31.1 29.8 18.8 15.3 8.5 16.0Reiln the e 4.8 18.1 19.0 13.2 13.5 3.6 36.0 3.2 6.3No nmr 1.9 5.4 1.9 5.7 3.8 2.8 7.3 0 0
(c) Japort Costs
Rse ore than 20Z 11.4 16.4 17.1 15.1 22.1 14.3 9.0 16.7 14.9Rse 10 to 20K 54.3 46.4 47.6 54.7 39.4 43.8 50.5 57.1 43.6Ris lse than 1(3 25.7 23.6 23.7 16.0 22.1 25.0 2D.7 19.0 21.3_sin the 1.9 5.5 5.7 3.8 5.8 5.4 6.3 3.6 0
Decreae 0 0.9 1.0 1.9 1.0 4.4 0 0 0No amer 6.7 7.3 2.9 8.5 9.6 7.1 11.7 0 2D.2

Tole 22
ZOUAME - UNIVK9ITY OF ZDUMAB'S UJSIDiS OPINIE smnnc: 1961-1985
Dec. 85 June 85 DeC. 84 June 84 Dec. 83 AJn 83 Dec. 82 June 82 Dec. 81 April 81
(d) Unit Cb te
Increase Ims than 52 12.4 11.8 9.5 8.5 6.7 7.1 9.0 4.4 8.5
Rise 5X to 101 48.6 41.5 46.7 34.9 34.6 3D.4 35.1 36.3 36.2
Rise 101 to 152 27.6 26.4 28.6 36.8 33.7 39.3 30.6 35.2 34.0
Else mone than 15X 10.5 15.5 11.4 14.2 16.3 18.8 15.3 23.1 13.8
3mmin the * 0 2.7 1.0 1.9 1.9 0.8 5.4 1.0 3.2
NO Fuu"^Ar 0.9 1.8 2.8 3.7 6.8 3.6 4.6 0 0 a
6. PIRO MANGI0S Do you expect profit auagizn overtihe mxt six umtim to:
Increase 34.3 21.8 13.3 8.5 7.7 3.6 3.6 2.0 9.6
Vi"na the am 40.0 30.0 27.6 22.6 2D.2 19.6 22.5 37.5 59.5
Dereaae 23.8 47.3 56.2 67.9 69.2 72.3 72.1 56.3 30.9
No aommer 1.9 0.9 2.9 1.0 2.9 4.5 1.8 4.2 0
7. 1A0 !JUUMM!MS Do you expect yetw labor forceover the neaft *li artio to: g
Increase 13.3 7.3 6.7 5.7 3.8 3.6 3.6 18.8 33.0
tAnnin the am 74.3 72.7 56.2 64.2 61.5 56.9 73.0 62.5 63.9
Dmcreaae 12.4 17.3 34.3 28.3 31.7 35.7 22.5 17.7 2.1
No answer 0 2.7 2.8 1.8 2.9 1.8 0.9 1.0 1.0
8. SKI1S Is productim beig ilhibited by a *bortageof lled permml?
Serlously 9.5 7.3 12.4 11.3 14.4 19.6 28.8 26.0 31.9
Slightly 44.8 41.8 46.7 45.3 47.1 49.1 49.5 41.7 52.1
not at a11 44.8 49.1 39.0 37.7 3D.8 27.7 17.2 22.9 13.8
No aer 0.9 1.8 1.9 5.7 7.7 3.6 4.5 9.4 2.2
9. INESIT(a) ibuld it im practicable to imereae
prodiction without extra inveatrntin buildirg, pliot, and equient?Yes 64.8 71.8 77.1 71.7 64.4 55.4 45.1 33.3 48.9
Nb 28.6 20.9 19.0 21.7 26.9 36.6 45.9 59.4 48.9
NO a*r 6.6 7.3 3.9 6.6 8.7 8.0 9.0 7.3 2.2
(b) Do you have plam to invest incapital, buIlld etc., over the
t six mthm?Yes 36.2 31.8 35.2 33.0 41.3 4D.2 39.6 57.3 74.5
No - 61.0 58.2 61.0 59.4 47.1 52.7 52.3 34.4 22.3
No a 2.8 10.0 3.8 7.6 11.6 7.1 8.1 8.3 3.2

M1e 23
UNIVIRSITY OF Z 'IAME'S WSINESS OPION SJRW: 1981-1985
Dec. 85 June 85 Dec. 84 June 84 Dec. 83 Jui 83 Dec. 82 June 82 Dec. 81 April 81
10. OR0 BOCS(a) Did yur delivery periods for orders
receive ower the past six sDnthl?Iagthen 32.4 25.5 12.4 11.3 15.4 21.4 24.3 38.9 47.9
imi unchanged 45.7 43.6 45.7 46.2 38.5 34.8 34.2 38.9 40.4
Shorten 14.3 22.7 32.4 32.1 35.6 37.5 33.3 16.8 3.2
No anwer 7.6 8.2 0.5 10.4 10.5 6.3 8.2 5.4 8.5
(b) Is your order be-* today, comared withsix mthw ago?HIgher 42.9 30.0 8.6 17.9 12.5 11.6 17.1 27.1 53.2
About the 37.1 36.4 43.8 25.5 26.0 36.6 31.5 40.6 36.2
LAuer 9.5 27.3 41.9 50.0 53.8 43.8 42.3 24.0 2.1
No anrer 10.5 6.4 5.7 6.6 7.7 8.0 9.1 8.3 8.5
I1. EXPOTS(a) 0ver the past ix wDotha exports have:
Increased 28.6 39.1 28.6 34.0 24.0 10.7 9.9 11.6 22.3
mined the ae 31.4 20.9 28.6 17.9 27.0 19.6 25.2 29.5 33.0
FalIe 15.2 13.6 13.3 13.2 17.3 32.1 27.9 23.2 22.3
No anwwer 24.8 26.3 29.5 34.9 31.7 37.6 37.0 35.7 22.4
(b) Over the next saix oths do you expectexports to:Increase 31.4 24.5 34.3 27.4 27.9 23.2 15.3 12.9 29.8
BP-in the sae 37.1 38.2 33.3 28.2 29.8 2D.5 30.6 25.8 30.9
Fall 10.5 11.8 5.7 10.4 13.5 18.8 21.6 26.9 19.2
No an_wer 21.0 25.5 26.7 34.0 28.8 37.5 32.5 34.4 20.1
12. FA70BS AYFWECt PEDJXTION ADVERSELY(a) What factors are currently attracting
production adversely?Domtic dmand 35 60 77 78 67 52 46 43 61
Import quotas 63 57 52 64 66 72 62 38 67
Ro mterials 49 44 39 40 49 41 48 19 53
Export defm- 12 18 21 20 31 30 23 12 29
orkimg capital 8 13 16 11 12 7 10 8 2
Skilled factory staff 18 IS 19 24 29 33 41 46 52
Fmeative staff 6 0 5 6 7 9 12 4 3Plant capacity 7 7 1 5 10 11 17 42 31
Industrlal disputes am 1e I 2 I 7 5 1 13
Mmual labor no 5 10 4 9 19 17 5
Source: University of Zibabwe: Department of buiness Studies Dusinems opinion 9urver, Nbe. 1-9.

- 142 -
Table 24
ZIMBABWE -RATIO OF ?2 T GDP IN SLZCC DEVELOPING COUNRIE1979 - 1984
Average1979 1980 1981 1982 1983 1984 1979-1984
Algeria 62.0 57.4 56,.9 66.1 71.6 n.a. 62.8Argentina 30.5 29.3 32.0 30.9 31.3 n.a. 30.8Brazil 14.5 11.2 11.2 10.4 10.4 11.6 11.6Chile 19.0 21.5 24.4 31.7 26.4 n.a. 24.6Colombia 18.6 20.3 21.9 21.0 21.7 22.0 20.9Ecuador 22.3 22.6 21.7 22.5 21.2 21.6 22.0Egypt n.a. 67.0 78.2 87.7 88.6 94.0 83.1Ghana 21.1 19.4 15.7 17.3 11.4 n.a. 17.0India 40.6 39.6 40.4 42.7 41.7 n.a. 41.0Indonesia 16.5 17.8 18.8 20.5 20.1 22.4 19.4Ivory Coast 29.1 26.0 27.6 26.6 27.7 n.a. 27.4Jamaica 33.3 36.0 41.7 47j.5 51.1 44.8 42.4Kenya 35.2 30.6 30,2 31.6 28.9 29.5 31.0Korea 31.6 33.1 33,.5 37.6 38.5 36.8 35.2Malawi 20.4 20.4 23.0 23.4 21.3 22.4 21.8Malaysia 48.2 55.9 57.7 61.5 60.6 59.9 58.8Mexico 31.0 30.3 33.0 35.2 31.5 30.6 31.9Mbrocco 43.6 42.7 45.5 39.7 44.3 n.a. 43.2Nigeria 24.7 30.6 32.4 33.8 40.7 43.8 34.3Pakistan 42.6 41.0 38.3 41.0 43.7 40.0 41.1Peru 22.0 25.2 25.0 25.0 28.0 n.a. 25.0Philippines 20.9 20.9 21.5 23.1 24.9 20.0 21.9Portugal 91.3 91.5 94.7 92.5 86.6 n.a. 91.3Senegal 27.7 28.3 32.4 31.1 27.9 n.a. 29.5Sri Lanka 31.6 32.0 30.0 32.3 31.8 29.4 31.2Tanzania 37.9 40.6 40.7 40.9 n.a. n.a. 40.0Thailand 37.0 36.8 37.2 42.9 48.4 54.8 42.9Tunisia 41.5 41.2 42.6 44.2 44.8 44.3 43.1Turkey 24.8 20.9 26.6 29.9 28.8 n.a. 26.2Uruguay 35.7 38.6 43.5 73,.4 47.0 n.a. 47.6Venezuela 36.2 34.9 36.2 39.8 49.1 47.5 40.6Yugoslavia 76.8 79.3 73.4 73.5 73.2 n.a. 75.2Zaire 18.4 19.5 21.2 27.0 25.9 19.3 21.9Zambia 31.3 29.6 28.1 36.4 34.8 36.0 32.7
Average 1979-1984 33.1 35.0 36.4 39.4 38.9 36.5 38.3
Source: International Monetarv Fund, "IFS Data Tape," mission estimates.

- 143 -
Table 25
ZIMBABWE - FERTILIZER SALES BY PRODUCT(tonnes)
Year (1/3-28/2) 1980/81 1981/82 1982/83 1983/84 1984/85
PRODUCT
A 4,655 5,211 3,899 3,170 3,003B 4,142 3,858 3,593 5,267 4,035C 18,066 25,070 26,529 36,729 28,558V 8,769 8,595 7,936 8,088 6,430D 85,559 109,425 100,082 102,835 95,049J 6,395 5,731 5,068 7,535 5,593L 39,731 28,421 28,081 38,209 33,898; 17,831 31,789 28,540 20,792 16,305P 31,835 10,972 7,334 3,718 5,363s 25,000 22,876 14,916 18,003 11,076T 1,174 800 1,676 4,138 1,628X 6,865 4,378 3,227 1,931 2,405Z 20,542 23,467 16,992 15,810 13,646
Subtotal 270,564 280,593 247,900 266,225 226,989
AS 229 432 306 371 315AN 129,044 119,667 168,476 145,415 147,951Sod. N. 1,031 1,279 1,052 1,489 1,642Urea 43,408 78,588 22,690 22,850 7,118SSP 20,395 13,517 10,313 12,594 7,404D Super 5,999 5,995 5,852 6,191 5,532KCl 5,228 5,463 5,858 6,746 4,460K2SO4 514 482 526 720 918
.m.m .. m.m. _ . *--mi m......
TOTAL 476,412 506,016 462,973 462,601 402,329

- 144 -
Table 26
A. 6, .
Citric MLaoSoluble Man1e Nutrient
d trae Phow=bate Ptotah S1lulur r mtmt Uc
0.1X tobaccoA 2 17 15 10.OS boron
(sul)
3 4 17 15 9.0S 0.12 tobacco(sul) boron
C 6 17 15 7.51 0.11 tobacco(11 sul, 4 chlor) 6.51 boron
D 8 14 7 ±ts /gSevral(chlor) 6.51 -
J 15 5 2D 3.41 0.12 fruit troes(chlor) borom
L 5 18 10 8.01 0.252 cotton(Chlor) boron
N 10 10 10 6.52 _ aise/gpraral(odor)
p 10 18 0 6.52 - sunlowers
3 7 21 7 9.01 0.041 idsse/geraral(zul) boron
*T 25 5 5 5.02 t"(sul)
Y 4 17 LS 8.0S 0.1S tobacco(11 sul, 4 chlor) borom
X 20 10 5 3.01 -(chlor) gardening
Z a 14 7 6.5S 0.81 fhise/gorral(chlor) zinc
* IMfzactuted only against firt order.Sul - azuifactured with potaaius *ulphate.Oaor. u m_uDacturd with potassium chloride.
5- -N1Xl
U ccin Nitrate 34,5NUm 46>Sodlin Nitrut 161N
Dcble 94usrPh0*at (CniIW) 372 P205 (Citric Sol) 52 9AuIphr MRn.
Stiula 9RerIOVur1ae (Poder) 18.52 P0 5(Citric SDl) L SUIhUr Mtn.
Pot±miu Chaorie (Mijra of Pota h) 6C0 K2 0
PFoCsim &j4Aute (Suphate of Potsh) 501 K20 16% SuIphur Mln.
Calkium Su1phsce (CGn) 17.5%S

- 145 -
Table 27
ZIMBABWE - FERTILIZER APPLICATION RATESLARGE-SCALE COMMERCIAL SECTOR
Crop Basic Dressing Top DressingKg Compounds/ha (Nitrogen as AN kg/ha)
Tobacco - Virginia 700 75- Burley 800 300
Maize (incl. seed) 360 380Cotton 325 150Sorghum 125 75Groundnuts 300 -
Wheat 650 450Barley 700 200Edible Beans 200 -Soyabeans 250 -Sunflowers 300 100Potatoes 1.800 150Coffee 1,100 300Fruit 400 150Sugar Cane 300 475Tea 600 220Vegetables 1,200 1,000
Source: Agricultural Inputs Priority Committee.

- 146 -
Table 28
ZIMBABWE - RELATIVE FERTILIZER CONSUMPTIONOF THE PRINCIPAL CROPS
X
Maize 61Winter Cereals 8Tobacco 8Cotton 6Coffee and Tea 4Sugarcane 4Potatoes and Vegetables 3Soyabeans 2Others 4
i00
Source: Fertilizer Trade Forecast Government Subcommission.

Table 29z- - s am
(tin)
197(171 197M/n I97/73 1971974 M9775 M976 n777 1978 197W/79 197W 196W8I 11/82 1SM3 118184 11884
Noise 117,198 143,270 147,776 1526 13,043 12,A1 144,702 15,108 1M, 12817 233,758 23UM 2),1 23 8,833 183331bcro 52,900 52,M3 54.68 57,996 65.68 52,93 52,218 51,67B 56,748 56,711 35,632 42,731 41,957 53,4 42,2Tam - 872 1,709 1,58 1,037 1,197 811 1,444 2,663 2,366 1,174 8W 1,676 4,13 1,63
Thtal COmpund 170,098 196,150 114,173 211,950 24,525B 182,373 197,772 210,230 216,968 21,34 270,514 2D,593 217,673 266,225 22b,93
Fa Sxab 9ulpb te .9 432 3Db 371 315Jo ELz MU-rte 119,864 157,769 151,672 147,501 166,035 121,88 136,715 135,9(2 13AS32 133,187 139,04 119,667 18,476 145,415 147,951Ubk 43,N X66 ,8 22,680 22,60 7,118Sbdi Mtrnn"L 2,461 2rMD 1,901 3,433 2,1(3 1,2I3 852 I'm I,V 1,3W 1,3 I'M j02 1,4 IJ642S1zv1 2 13,707 15,611 15,44 14,85 19,394 15,07 14,291 13,694 17,706 20,36 2D,395 13,517 10,313 12,59 7,40MDM1" &W 4,R 5,f95 4,496 7,121 6.396 6,370 9,331 5,36 5,m 5,13 5.,9 5.995 5,352 6,191 5,532~hn Fd 719 765 576 1,144 1,5 692 559 g9 865 663 514 42 5Z6 720 918m adlru 2,911 3,5D 3.11D 4,17 5,m 5,541 6,30 3,562 4.177 4,S5 5,2S 5,463 5,8S 6,74 4,460 -maree 92 125 144 74 49 17 20 9 19 - -DolSem 252 193 72 - - - - _
9Sole 314,304 382,770 381,593 390,63 445,42 336,961 365,9Z 3D,2M8 31,963 377,172 476,412 301,016 462,973 42,601 82,329
Note: PRo 197C171 tD 1979/80 *str it ndt!qpn fertiltaw *walom, we e *m1 amiu ndtrte epzdvalt *d m 1clbde ll Ltd uash of mos aid a mdfi

Table 30
ZIMBABWE - O(XP3ARISON BETWEEN LOCALLY PRODUCKD FERTILIZEROUTPUTS AND IMPORTED K&TERIALS
Landed Cost of Urea Landed Coat of ANSelllg Price Production Coat Economic Fnnancial f/ Economdc Financial r/(ZS/ton N) (Z$7ton N) (Z$/ton N) (Z$/ton N) (Zt$/ton N) (Z$/ton N)
SABLE
AinoniumNitrate 933 8/ 823 b/ 707 c/ 807 878 d/ 998
Z310S(Z$/too P2 05 ) (Z$/ton P2 0 5 ) Landed Cost of TSP
Economic Flnancial(Z$/ton P2 05 ) (Z$/ton P2 0 5 )
TSP e/ From Pyrites 940 727 b/ 4,TSP e/ From Sulfur _ 936 1!/ 783 890 OD
a/ Selling prlce to Windmill and ZFC, ex factory producerb/ Exclude depreciation.c/ Based on assumed USS120/ton FOB urea bagged.d/ Based on assumed US$106/ton FOR AN bagged.e/ ZIMPHOS TSP is at 44Z P2 0 5 . Imported TSP Is at 462 P2 0 5 .fi Includes 201 surtax on CIF African port value of imported materials.

Table 31
ZINDA - I3E LK3 PU CM(Zl/tam w-NRavte)
W 7OUE NIIIUVSS 1971172 1972173 1973/14 1974/75 1975/76 1976/77 1977/78 1976/79 1979/60 910/81 191182 1982/83 19"3/64 19a4/35 1965/86
A 61.00 61.00 61.0D 73.40 100.20 110.80 114.60 123.20 146.00 175.00 201.60 230.60 230.60 327.80 443.20* 64.20 64.20 64.20 77.20 107.00 117.20 122.40 131.60 155.00 165.80 211.40 241.20 241.20 364.00 465.00C 56.80 S6.80 56.60 64.40 94.00 105.00 126.40 136.00 3S5.60 190.40 214.40 Z..i.e0 243.40 347.60 467.80V 62.60 62.60 62.60 75.40 103.40 113.40 118.60 127.60 149.60 179.60 204.60 233.00 233.00 331.00 445.0D ss.40 5S.40 55.40 66.60 91.40 "9.40 106.00 114.20 128.20 IS4.00 166.00 10 .40 189.40 265.20 355.60J - - - - 112.00 107.60 111.00 119.60 131.80 159.60 195.60 211.20 211.20 29.60 410.60L 57.00 57.00 57.00 46.40 94.40 102.20 92.20 96.80 112.20 135.00 18B.00 214.20 214.20 304.60 404.00N 56.40 56.40 56.40 66.60 ".20 95.20 99.00 10.40 117.80 141.20 166.20 184.60 184.60 256.60 350.60p 56.60 56.60 56.60 66.60 9.60 9.6O 110.O0 119.00 130.40 IS4.00 178.60 204.80 206.60 290.40 384.60s 55.80 55.O0 55.60 67.20 88.60 100.40 106.60 114.60 130.00 154.00 160.00 206.60 206.60 337.60 448.00T - - - - - - - - - 212.40 232.20 232.20 336.00 60.40x 63.80 63.80 63.60 75.60 114.20 119.60 130.40 140.60 153.40 160.00 201.00 223.00 223.00 322.20 434.40Z 61.00 61.00 61.00 76.60 109.20 116.40 123.00 126.60 140.20 165.40 181.60 203.00 203.00 230.60 371.20WITRWOGN PEEHLIZZSU:
A_o1ul Nitrate (prilled) 63.20 63.20 63.20 74.20 127.40 116.40 129.40 138.90 141.60 164.20 137.20 206.60 206.60 306.40 *06.00Urea - - - - - - - - - - 249.60 27S.60 275.60 405.60 541.40 'Sodlum Nltrate (cz7tal) 77.80 64.20 84.20 96.00 156.20 153.00 170.20 163.40 214.00 220.00 2S7.60 302.20 302.20 S16.60 609.80 0
P90SA flEtTLIU.1:
Slrgie Superpboepbate (pder) 32.20 32.20 32.20 37.60 43.80 57.40 63.00 67.60 76.20 90.40 117.00 143.60 143.60 196.40 256.00Double Superphepbste (granalar) 70.20 70.20 70.20 31.20 92.80 117.60 138.00 149.60 173.00 Z04.40 230.40 267.40 267.40 376.00 479.60
POTASH FBEIILIZE6S:
murlate of ?otaeh 58.20 58.20 58.20 71.40 118.40 "9.20 89.80 91.60 121.60 155.20 183.00 193.60 L93.80 252.20 351.80Sulphat- of Poteash 70.60 10.60 70.60 85.60 143.40 130.60 119.60 125.40 366.20 201.60 238.60 267.40 267.40 373.80 536.40
0T1ER PODUMcS:
cype _ - 15.40 37.60 21.60 23.40 25.20 26.20 29.00 34.20 33.00 44.20 44.20 52.40 55.40
note: A11 fortilisera ae *old la 50 kg beg (witb the _ptlo. at compund a).

Table 32
ZIMAIWE - FKRT[ILIZY DEUMAD FORECASTS
1984/85 1989/90 1"4/95Product ---- ' 000 tons- Product -' 000 tom.- Product --- '000 toes-----
A. COIPOUNDS Compositlon (tons) N P2 05 K20 (tons) N P2 05 120 (tons) N P2 05 120N P205 K20
Compound A 2 17 15 3.003 0.06 0.51 0.45B 4 17 15 4,035 0.16 0.68 0.60C 6 17 15 28,558 1.71 4.85 4.28V 4 17 15 6,430 0.26 1.09 0.96
Total Tobacco Mixes 42,026 2.19 7.13 6.2, 45,000 2.19 7.13 6.29 45.000 2.19 7.13 6.29
D 8 14 7 95,049 7.60 13.30 6.65J 15 5 20 5,593 0.84 0.28 1.12L 5 18 10 33,898 1.70 6.10 3.39K 10 10 10 16,305 1.63 1.63 1.63P 10 18 0 5,363 0.53 0.96 -S 7 21 7 11,076 0.77 2.32 0.77T 25 5 5 1,628 0.41 0.08 0.08x 4 17 15 2.405 0.09 0.40 0.36Z 8 14 7 13.646 1.09 1.91 0.95
Total Maize and Other Mixes a/ 184.963 14.66 26.98 14.95 247,489 19.62 36.10 20.00 300,936 23.77 43.87 24.07 o
Total Coepound- 226,989 16.85 34.11 21.24 292,480 21.81 43.23 26.29 345.936 25.96 51.00 30.60
B. STRAIGHT FERTILIZERS
Amnius Sulphate 21 0 0 315 0.07 - - 315 0.07 - - 315 0.07 - -Amonium Nitrate 34 5 0 147,951 51.00 - - 184,346 63.60 - - 224,164 77.33 -Sodium Nitrate 16 0 0 1,642 0.26 - - 1,642 0.26 - 1642 0.26 -Urea 46 0 0 7,118 3.27 - - 8,000 3.68 - - 9,000 4.14 -SSP 0.19.0 7,404 - 1.40 - 9,000 - 1.71 - 10,000 - 1.90 -D Super 0.38.0 5,532 - 2.10 - 7,000 - 2.66 - 7,600 - 2.85 -KC1 0.0.60 4,460 - - 2.67 5,000 - - 3.00 5.500 - - 3.30K2504 0.0.50 918 - - 0.46 1,000 - - 0.50 1.200 - - 0.60
Total Straight 175,340 54.60 3.50 3. 3 216,303 67.61 4.37 3.50 259,421 S1.80 4.75 3.90
Total 402,329 71.45 37.61 24.37 508,783 89.42 47.60 29.79 605,357 107.76 55.75 34.28
Dsand/Supply (1.45) 7.39 n.a. (19.42) (2.60) n.a. (37.76) (10.75) n.e.in nutrient term
a/ Include mixes for the (T compound) cotton (L compound) sunflover (P compound) and fruit trees (J compound), oalch carrently total 252 ofMaize mdxes.
bI Local supply availability is estimated at 70,000 tpy N (as aonium nitrate fertilizer grade from SAWLE) and 45,OOOtpy P2 05 (as SSP/TSPfrom ZINPE)S).

-151 -
Table 33
cuimoo lsi (.ip Per 66wCuteof "u14 LSIof e CEtg jita aING
heat', WxICpt. is to6 31 191 19Th 19" 1916q 9111 1919 33163 3W 3963 IIII
III 97.66 ta.i.p 3.1. U.11 39.61 43.3 47.4 11. Wif 66.A ",LeCuAIM 6.643 6.12 6,313 6.96291 6.1131 0.6149 6.1121 9.16631 1.M6 3.37I9 1.41aon6 (jul.. 44.4118 44.9136 MPH91 47,9566 91.7610 62.3103 74. 745 71."I2 44.9174 9.1666 6.6916391166 71.1433 61.716 63.0116 41.3184 16.1371 7.61 74.7445 d6. 797 6.296 6.166 ,61
taaaua 246 1961.51 (vti.p 643.4 1434. 633.6 4119. 675.0 764,6 all.Laci./336 7,331 7.367 6.117 8.26 7.7:I 8.237 16:97 8.26 C.2M 11.141 MM2954 (ai v. 64.7131 81,31444 71.7326 C2.32 973'259 92.976 6344. 386 S.""6 f.446 4.166 6.16"39W11 of 343,7946 327,613 332.4432 332.9276 336.1325 345.53113 4 4364.365 4.466 6.1666 M.w4 06.64
tads, 764 233.96 fIus,4e M6. 9 2W.: 427.3 472.3 5W..6 132. 523,? 611.3MOM13S$ 4.362 6.376 6.946 6.729 6,343 6.116 7,66 6,639 9.43 36.649 3.654 (qesW. 32.2439 13,7437 47.6674 54.6413 63.7332 63.01116 67.7477 79,26 4.0114 6.166 I.,1614316614 331.494 47.916 be,1632 73.4366 7.1.3 71.1311 67.1477 64.3I62II 6116111 6.662 6.16
1146 3i6 2156.43 (t3q,el 1133.4 132.4 223, 38.1 31.7 .
W&,N3l* .4 6.669 CIIII96 6,119 6.116% 4.3616 6.3616 63416 4.3636 6.33 .61166 jul. 6 382.111644 * 4, 7 101. 94.2611140 263.66261 M =.32 I 6 I 6
3916654 6.16 317,6733 17.311612 2631.9616 3126.43211 346.1116 6.1w1 6.61 4,161 6.w6 6L166
lowy. 34 6.2 uelep 7MA, 0. 1111 14. 91.3 3627.7 3684.7 I 15223 131939 3545,7 3673.6LU,3Io 7.t34 7.341 6.367 .2771 7,72 7,1471 7.426 9.64 MM92 13.312 4.VP (Siiv. 363.93661 333.346 345.&5= 13.196 3II.9667 345.334 JAM6.77143.63 343.6237 321.71162 6.16396654 376,4314 71.2634 312.P96 366.3936 63167.113 364.1336 366.712 132.3434 124.04 366.1643 6.016
lagi, 39 ~~~~~~~~~~~479,74 (.i.p 66.4 96. 34340 371,4 311. . 36.6 541Lwa13.3 3.354 3.53 I.1166 3136 3.21 3.26 3.25 1.1331 I.6M 6.669 6.454 (julY. 33.246 ISM29 371.66 367,332 196.3 P 4 224,31 6 63911540 231.266 .211.239 621.365 22.135 IPA71= 6.1666 214.3466 6.164 $.461 $10.466 6.6611
hOd.. 716 632.016 lEmal" M9. 132.6 332.1 434.6 366.6 376,1 26.6 266.6 396.6 337.1 334.75411101ac6 13.6 3.766 I.51 3.16 1.4711 3.473 3.39 3,462 3.321 6.9911 6.11111du4(4., 369.626 226 233.6671 773.6762 36.16 239.92117 126.15 .37.2 396.3 13.94M1 216.62643966166N 342.4156 334166 34.6310 314,M4 2M. 659 295,63411 336156 343.953 3R4211 276.2374 239.3573
Ceets hue 3826 6413.6 lvulap 644.4 3324.6 3243.4 3446,6 3643.6 3167.6 213.4 22426 4411.4 6637.6LMa3/U3 7.959 6.1 IV1179 M." 656 .1 6.516 6174 21.70 37,436 43.166 44.1015414.v. 336.§P§16963 333.9121M 1316.6431363 161.7263123 393.135261 22I.A649 266.793463 126.266 336.911231016 1361,3.62641 I3966VW 3911,7633 246,166 236165341 2291.2192 242.66461 249.92163 246.193 336.223 363.137 333.3463 6.OW6
lusetta 6ebolac 331 1333.37 (usia,, 15,2 324.25 316.2 332.93 134.71 31.41 316.73LU&A31 3.46 3.6 .6 .41113.166 1. 166I. 3.00 3.M6 I.446 3.16 3.6666s Sq.,v. 15.7 326.25 314.211 332.93 345.71 316.4 316.73 4 6 I 396 54 342646 364.1333 31.72134 366.&m: 364.47 366.2637 336.7316 4.146 4.41666 6.41666 O.""6
mile IM7 3546.7 [Weis"i . 4761.6 71363.6 341666 3472764 Jam32 33132,6tualAw siltu~ . 365 37M4 19.M6 39.69 v.969 76.642 91.6311
54(4,t . II-1111 31.6 9966534.716473 79.21476 12371.6624 322.17266 49 162.21111163 6
39W54 4.6164 6.64l6 6.666 4.11 396694 236.4*43 219211 342.6429 21.6379 132.7924 6.16646
ropla 2~~7941 366.31 (ale,, 1#739.4 3116.9 336111.4 69366.0 171967.6 339133.4 344684, 376116.0 MIRA7. ra"Luah/WI #44.41 464.016 464.54 164,666 414.166 54.1 607.414 663416 03,4 7 71.6l16MA 611.3166650 (wi.. K4AM7M13 '9.293363 316,76295213 34.4966 9.9667 246.1921936 241. q2967 216.69651 2977.461116 292.3134971 I396 M4 121.93 2,4294 154.3'41 394.3764 24!.5260 269.296 24i.443 2314.1233 2.16.93 243.795V.1O
1411cs rq~23c 36217 vi.p 21614.4 3432.6 3124.7 4'12.4 7716.64 961,14 '4977. 42611, 3471.8 26121164.6Laial'66 12.504 123.516 3.1436 22.371 22.767 22.69 22.9 2113 a455 3. 62 I2649 ld7.n1A4 (qas,. 224.1 21.96 M3.621216129704Mum1 M3.418663 396.OM9419 6712716:29 9.6243932 331.6PIM19 22.12135746 6Io* V" M11.373 4361692 3661.2642 64M.432 47.42 440.3162 471,7796 313.3416 26.2665 364.694 S.01611
Iaea. 342 361 te,soi 346494.4 3613729.6 J6IM3.6 76614.6 33457.6 721r1,9 244513.9 2591.6 769563.4 739366.6I*aI'154 297. W 294.796 M961 268.536 236.44 2391.341 226,746 MM6O4 749.94611 2.11.13 27,6is, (991.. Sol.fii&5'@ 533I6436326 616,9148177647,6536 63,496 393.3634 361.6h71 77.69143 61.731.12M, 175.13,3751163Ji6at 91 So"s 144.8369 O-69374 3633.643'1 9.34 33'9.14M61 37.47 34671 2.63717,0 SO 210 973.9162 Cow
£ IEvlea ~~~~ ~~2496 "95.3 (u.s.,. 173 31.0 266.6 237.6 26.6 333.6 119.4 '13.0 S49.6 639.6
66 ("IV.. 71,~ 99 76i.631 3,9 77n.55 321.4 w7,74 47.45 5341.39 167195 154539"396616 444 6354 492.7162 342.016 11.3362 O34,9217 413.5353 473.43a 469.11132 432.4314 466n.311 64

- 152 -
Table 34
ZIMBABWE - HOURLY COMPENSATION & GNP PER CAPITA IN SELECTED COUNTRIES(1983)
Hourly Compensation GNP per CapitaCountry Value (1983) Rank Value (1983) Rank
Switzerland 10.47 4 16,290 1United States 12,04 1 14,110 2Norway 10.48 3 14,020 3Sweden 8.89 9 12,470 4Canada 10.92 2 12,310 5Denmark 8.72 10 11,570 6Australia 9.19 8 11,490 7Germany 10.33 5 11,430 8Finland 7.40 13 10,740 9France 7.92 11 10,500 10Japan 6.13 16 10,120 11Netherlands 9.62 6 9,890 12Austria 6.92 14 9,250 13United Kingdom 6.26 15 9,200 14Belgium 9.34 7 9,150 15New Zealand 5.17 18 7,730 16Singapore 2.19 22 6,620 17Italy 7.73 12 6,400 18Hong Kong 1.52 25 6,000 19Israel 4.88 19 5,370 20Ireland 5.60 17 5,000 21Spain 4.64 20 4,780 22Greece 3.66 21 3,920 23Mexico 1.42 27 2,240 24Portugal 1.61 24 2,230 25Korea 1.30 28 2,010 26Brazil 1.46 26 1,880 27Zimbabwe 1.76 23 740 28Sri Lanka 0.25 29 330 29
Regression Results:
Hourly Comp.- .30937 + .000741245 * GNP per capita(.5571) (.000062)
R2- .8408
Kendall's Rank Correlation:
Kendall's Tau: 0.9532Chi Squared: 53.3793
Significant at 99.5%
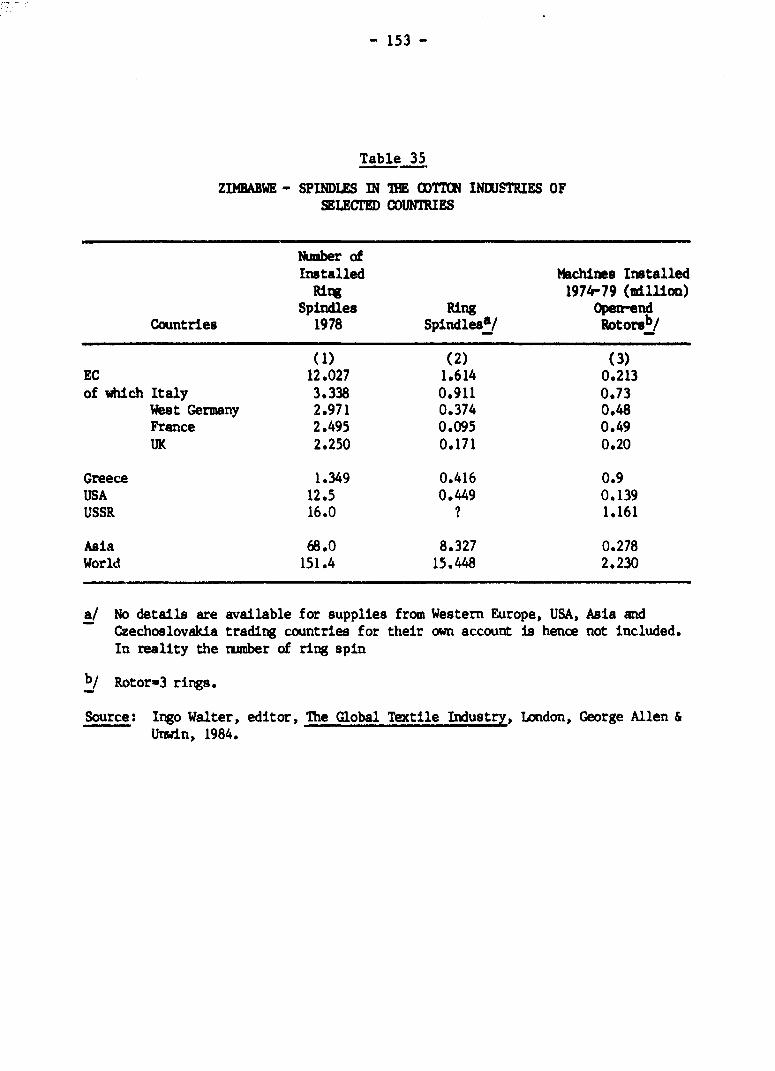
- 153 -
Table 35
ZIMBABWE - SPIMDLES IN TE ODTTON INDUSTRIES OFSELECTED COUNtIXES
Number ofInstalled Machines InstalledRing 1974r79 (million)
Spindles Ring Open-endCountries 1978 Spindlesa/ Rotorsb
(1) (2) (3)EC 12.027 1.614 0.213of which Italy 3.338 0.911 0.73
West Germany 2.971 0.374 0.48France 2.495 0.095 0.49UK 2.250 0.171 0.20
Greece 1.349 0.416 0.9USA 12.5 0.449 0.139USSR 16.0 ? 1.161
Asia 68.0 8.327 0.278World 151.4 15.448 2.230
a/ No details are available for supplies from Western Europe, USA, Asia andCzechoslovakia trading countries for their own account is hence not included.In reality the rumber of ring spin
b/ Rotor-3 rings.
Source: Ingo Walter, editor, The Global Textile Industry, London, George Allen &Unwin, 1984.

- 154 -
Table 36
ZIMBABWE - LOOMS IN THE OOTTON INDUSTRIES OFSELECTED COUNTRIES
Shuttle Looms installedloom 1974-791978 Shuttle Shuttleless
Country '000 '000 '000
(1) (2) (3)
EC 156.7 13.0 32.2of which Belgium 15.9 0.5 1.6
France 36.5 2.2 6.1West Germany 36.1 3.3 6.8Italy 42.7 3.9 12.3UK 20.6 2.5 3.8
USSR8/ 270
USA 246 9.4 21.7China 290Japan 180 28.0 8.6World 2,000
a/ Only the number of advanced technology machines supplied by WesternEurope or Czechoslovakia to Comecon is known (open-end spinning;looms/shuttleless weaving loom).
Source: Ingo Walter, editor, The Global Textile Industry, London, GeorgeAllen & Urwin, 1984.

Table 37ZiNE - AMNL M OF ME Z1SA5 1rnE uUiS
STIt Vol. 1978 1981 1982 1983 1984Niuder Prodk,ct TLype UWdt volum Valu Volt Valu Vobiz Value Vol_ Vae Value
65129 ridttng Yanm ig 10,590 51 9,659 74 5465161 MMC Pyan yartm Ig 42 852,000 1,075 812,000 923 77,172 265 665192/5 10(1 Gotton Yarn ud Threa kg 532,000 825 191,726 373 34,877 88 100,071 257 55865185 tirais Flaent Yn kg 1,941 62S,845 1,741 3,2B065196/7 Yarns of Staple Fibre 148,466 501 10,3156521V/4 IO(1Ottxn Bleadied/UThld.d 2 0 0 73 14,200 18 496 2 5M8,7 962 1,25665233 1(XX (bttat DysI 3) 24 5,497 55 12,337 13 213,645 442 4,25865212 10(1 Got(tn Printed 2 158 151 58,114 102 26,909 48 977,122 1,879 2,45765261 Cia/Thrpaxlin 1 349 574 212,276 555 21,491 121 67,888 216 1,34765399 9yntItic Fire Piece td j 0 ^2 1,163 2,122 739 1,435 766,260 1,556 3S8 u65633 Blar*ets t 81 50 143 9 28 11,904 62 71 165593 bwels ad Naidio t 139 541 225 1,141 85 400 15D 659 2,49765695 Sheets 103m2 2,972 1,345 2,991 2,335 2,3B6 1,853 4,685,617 3,941 5,88265699 Other Hme Llren ig 112 368 5 21 3D5 97084249/79 Claottdirg Knitted no 4,543,000 3,298 2,322,744 2,745 1,32Z,672 1,363 976,647 1,070 1,90865781 Carpetirg kg 63 63,C46 3$1 12,355 65 41,458 3)1 16465614 BW anI Sada n 173,502 52 147,574 69 38,981 43 686556X Rope, 6die lg 744,000 193 93D,OOD 237 80,000 170 62,801 169 190
lrAL 9,492 11,333 6,673 14,269 35,579
Sawce: 1978-1983 - StateItB af ELernal Trade, C9D.
1984-

- 156 -
Table 38
ZIMBABWE - MAJOR TRXTILE D(PORTS
1984/1983Abbreviated Description 1981 1982 1983 1984 Percentage
FIBM (266)
Filament for Marufactureof Fibres (23) - - 123 13 (10)
Viscose Rayon Staple (91) 638 483 50 111 (220)
Acetate Rayon Staple (92) 213 402 7 - -
Polamide (93) - - 165 39 (23)
Acrylic (94) 700 875 649 1,459 (224)
Polythene (95) - - 957 2,241 (234)
Polyester (96) 1,274 2,283 1,313 829 (63)
Artifical/synthetic Nes (99) 2,188 1,070 47 - -
TOTAL 5,016 5,133 3,311 4,692 (142)
YAMS (651)
Knitting (29) 166 79 166 15 (9)
Yarns and Threads of 2 or MoreMbnofil (84/5) 10,412 6,373 7,736 8,764 (113)
Cotton Thread/Yarn (92/6) 3,190 1,231 651 347 (53)
Jute Yarn (91) 33 7 45 104 (231)
Yarns/Threads-Staple Fibres (97) 2,337 1,462 - - -
Yars/Threads Nes (99) 171 337 20 23 (115)
IOTAL 16,276 9,489 8,618 9,253 (104)
Source: CATMA.

- 157 -
Table 39
ZIMBABWE - MAJOR TEXTILE IMPORTS
Annual Totals ($'000)
1984/1983Abbreviated Description 1981 1982 1983 1984 Percentage
0OTTON FABRICS (652)
100% Cotton Bleachedor not (11-13) 2,809 1,372 195 1,100 (564)
100% Cotton Corduron (22) 251 240 204 111 (50)
Other Corduroy (24) 295 297 165 101 (50)
100% Cotton Dyed (31-33) 2,231 524 98 264 (269)
100% Cotton Printed (41/2) 2,323 1,144 1,467 10,726 (732)
100% Cotton of ColouredYarns (51/2) 792 481 - 2 -
Canvas, over 340 g (75) 568 39 11 123 (1,118)
TOTAL 9,269 4,098 2,140 12,427 (580)
NISCELLANKOUS FABRICS (653)
Hessian (42) 1,244 644 419 973 (232)
Rayon, Dyed/Printed (62/3)More 1,569 1,141 - - -
Rayon of Colored Yarn (82) 295 298 22 - -
Other Piece Goods (70) - Knitted (22,127 (22,378 12,070 9,435 (78)Synthetic fibre (99) - Woven ( ( 12,434 11,297 (91)
TOTAL 25,216 24,461 24,949 22,335 (90)
Source: CATMA.
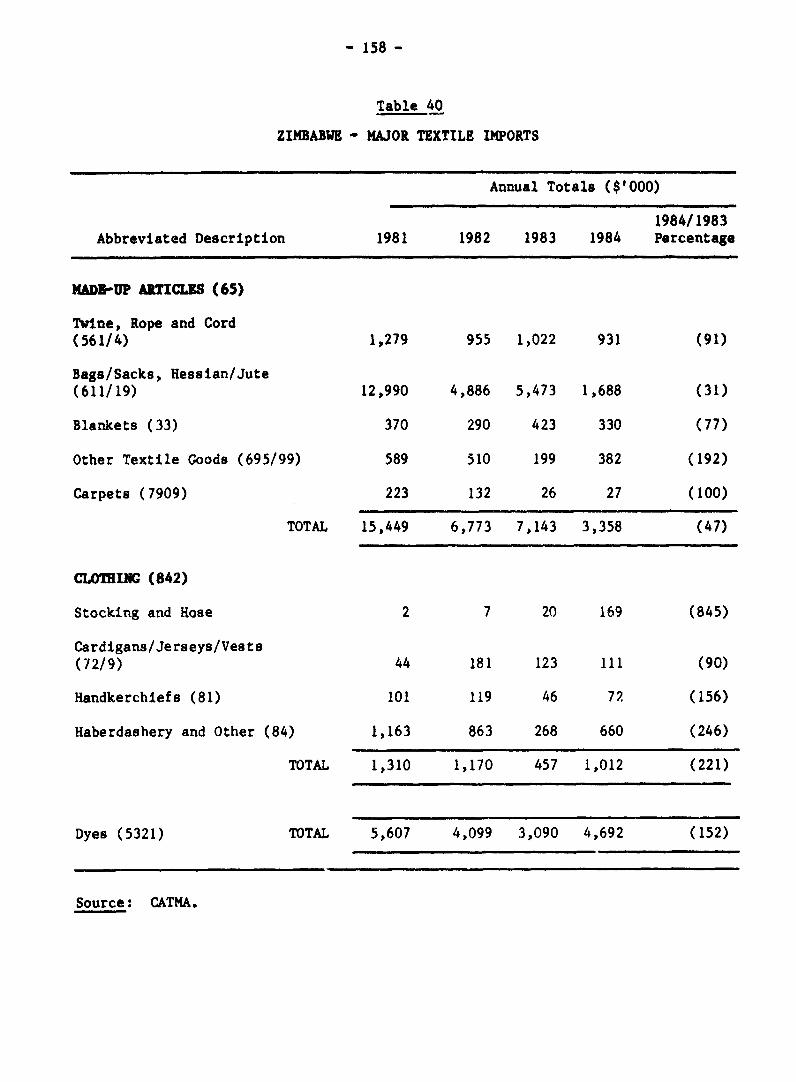
- 158 -
Table 40
ZIMBABWE - MAJOR TEXTILE IMPORTS
Annual Totals ($'000)
1984/1983Abbreviated Description 1981 1982 1983 1984 Percentage
NADI-UP ARTICLIS (65)
Twine, Rope and Cord(561/4) 1,279 955 1,022 931 (91)
Bags/Sacks, Hessian/Jute(611/19) 12,990 4,886 5,473 1,688 (31)
Blankets (33) 370 290 423 330 (77)
Other Textile Goods (695/99) 589 510 199 382 (192)
Carpets (7909) 223 132 26 27 (100)
TOTAL 15,449 6,773 7,143 3,358 (47)
CLOTHING (842)
Stocking and Hose 2 7 20 169 (845)
Cardigans/Jerseys/Vests(72/9) 44 181 123 111 (90)
Handkerchiefs (81) 101 119 46 72 (156)
Haberdashery and Other (84) 1,163 863 268 660 (246)
TOTAL 1,310 1,170 457 1,012 (221)
Dyes (5321) TOTAL 5,607 4,099 3,090 4,692 (152)
Source: CATMA.

- 159 -
Table 41
ZI1'AWE- MAJOR TEXTILE IMPORTS
Annual Totals ($'000)
1984/1983Abbreviated Description 1981 1982 1983 1984 Percentage
IMPORTS FROM BOTSWANA
Yarns and Threads of 2 ormore Monofil (651850) Nil Nil 1,510 1,841 (122)
Fabrics of Synthetic Fibresand piece goods not cotton
rayon - knitted) ^ - 10,794 8,098 (75)) 7!,475 12,538 - - -
- woven ) - - 5,122 2,155 (42)
Printer 100% Cotton Fabric(65242) - - 740 10,739 (1,451)
Carpets and Other Textile 295 119 - 52 -
Stockings and Vests, etc. 12 168 127 277 (218)
Handkerchiefs and Haberdashery 61 304 218 666 (305)
TOTAL 7,843 13,129 18,511 23,828 (129)
Source: CATMA.

- 160 -
Table 42
I SEtTlF 1011IILLCJS 10If l ll E61 13 i LMI
NC CO.UlEAIS -------uiusto re sm U miEOSestic iles
wor I CapiWtal g fro rir Step 6.413 IO.3 133.63 103.A0 WISLus: Ajudvsbt fur S _a huge g te 15.45 25.1 32.12 23.11 22.1
lusted Lar I Capital mp t0.9 11..61 IO.S 79.n 7S.47
RE hetic Sema 0.4 0.51 1.17 1.91 3.SExport Salen
Labr I Capital CIiv from Prior Step 15.12 110.30 133.63 103.0 71.72Lss: Ijustimt for Shmd Ui m ate 15.11 25.69 32.12 23.11 16.62
f lusted Labor I Capital C p 19.5 14.11 101.1 79.Sl n 5.10
PUt Export Sales 2.18 I.S 0.00 4.69 2.43Total Sales
bor I Capital Dwgp from Prior Step 65.34 110.30 133.63 103.40 10.12Lesn: Adjuwtsat for Sgo bge lVte 15.22 25.69 32.12 23.11 11.62
Adusted Lalr I Capitl Clwig. S0.11 14.11 101.51 79.19 61.S0
o,et Ttl sales 1.37 0.59 0.89 1.70 1.18

- 161 -
Table 43- urS
tunsis 99 alP Kwz"t~~~~~~~~~~LI U61n LINt UIULf
main ri No runm mIm EC1 A "MM)IIbetl; its
blw Aw fru Prig Slap 115.74 1.11.6 11?.67 67.9 116.%jsot LaW htaia Casi 11.21 19.24 3.59 1.0o 16.12
Ialpertg tsrsal tws 6.0 6. IA 1.1 L6laul IOWA"t I" .1 16 1.7 670las Pd (6.S12 (6.5) (6.9) (.7) (.73LU rlrtelit Chwpso bSles (2.61) (2.61) (2.61) (2.61) (2.11)Wuls Iwm 6.6 6.10 I.E 6.06 L.0
Adjustew hWi AdIU 115. U I6.22 I 11.06 112.11Lar I Cltal Chrp fro Prir Step SO. 6I.11. 1S1.111 9.." 75.NLtu: Ajuwtt Lar Cuts 9.19 1129 15.12 13.93 ILlU
Cit awc. l.SO 6.12 o.n .U0 .73Add hei: Ierst Shb ihp ate 3.31 S.51 N.1 5.62 1.93
Adjusted Lker I Coital Opr. 14.10 74.10 1.43 70.20 15.18
C 6m'tic Selles 0.3 I.41 .1.s5 6.17 6.10Exet hits
blut Add fro Prier Step 22.92 5.02 (1I.07) 17.07 22.ldjustwnt Laul lhterAal cuts 1.20 11.2i 20.61 19.06 IIS.
lapertedIbterial cets 0.tO 0.00 6.60 0.00 6.10lJterul Iral rt l.41 0.61 6.17 1.74 6.13anes hid (0.SZ) (0.56) (1.91) (M.71) (1.16)Low rrto1dt pges on Sles 2.61 2.01 2.01 2.01 2.11Sells blue 0.60 6.60 6.00 0.00 0.60
_ . , ..... .... ...... ._....... _....
Adjusted blue Addd 40.09 76.25 I.55 38.15 40,49Laber I apital COrp fro Prier Step 49.15 61.61 101.51 71." S5.10Lns: justat Laer Cats 9.03 15.25 19.12 13.93 9.19
CaitAl hcrc 0.159 0.62 0.61 0.68 6. SSAdd bak: Inr1m sdW OW ble 3.25 1.51 6A. 1.0? 3.56
Adjusted Ler I Caital Owrpe 13.18 71.60 66.43 70.20 li.22
NC Export Saln 1.09 0.17 13.51 1.61 1.19low Salts
blwe Aded from Prier Step 36.50 144.36 111.28 17.03 S2.60AdjuiWt Local Ibteril Casts 15.21 19.24 20.61 19.06 16.5?
,rtdlIbterial Casts 0.00 1.00 1.00 0.60 0.00lIterul rawprt 6.4 1.6 4 0.167 6.7 1.51oes Paod (0.2) (IN) (6.9) (0.71) (0.11)LKal rrehttCharges in 5lts 1.31 (1.25) (1.92) 0.31 1.75Sales Wlue L.0 1.00 1.0 L.N 6.60
Adjusttd ble dd 3.6U 162.33 132.7 66.41 65.26Lk I taital Clnrp frrm Prior Step S0.11 I1. 111.51 1.9 11.10Lns: Adjuvsnt Labr tCts 1.06 IS.2 19.12 13.93 11.01
Coital urge 0.19 0.6?12 6.14 1. 0.51A d lck: lacrm Shdw 1gap 3.26 5.11 1.6A 1.0 3."
Adjusted Laer I il Catre 43.13 71.60 06.43 70.20 13.60
Nl lft 61 es 6.13 1.4 1.167 1.16 0.71

- 162 -
Table 44~~~ irnsa mi flI 1111 109
RS Ku uo OK 0 LOt xtlul (__ ~~~~~~~~~~~~~.... . .... ~.... _.
Wm1Fe m nS IS WE (M Il PUl)
i d frWm Prkm St 15.74 165.11 7.M 17.79 116.5U4jtm t Lauc AiWtea CahIL R." J2L% . 21.2 3.
LW rbd ter el Cuts 1** g** LO g* L Nletresi I" i 15 1.4 I 1.26 IL.lh ed (L.O) 41.47) .62) (1.26) (1.25)
ul erolot tbrn a Sale (110 L1 (3 U.) (3.0 (3.1)Sln 161 L.11 1.U LN1 1.11 1.11
inted i. Used 129.3 194.52 14.97 117.5 13.62Lar I Cpia Chvp fro Priv Stop S. 0411 111.51 79." 7S.47Ie: 1i4t Laer Cuts I71 26.U 32.77 213. 23.46
Cteitl r Ch.r L .11 1.M I 1.51 1.25Ms hi: lwe db w e lVte .2? 15.2 19.7 14.n 1 13.79
... . __...... ...... ....... ....... *
isted Lbs a citul tbr 41.63 72.40 A.57 66.4 .56
C iotleic hlss 1.34 03?7 .so 0.59 S .is
bil oidd fro Pior Step 22.92 5.U2 (16.17) 17.07 .661djustneet Les btsriel Costs 26.56 32.n 3S.4 32.n2 27.13
Ieperted lhteril Costs I.10 1.10 1.0 1.00 I.1I!term Ir ert L.13 1.4 1.9 1.26 3.3Tos Pid (.19) (1.47) (1.62) (1.21) (.6)LaUe fri ht Chlap Shl" 3.1" 3.41 3.1 3.41 3.NWales hi. 1.K 0.3 I. .0. OM
Adjusted bew 5d . 52.5 i 91.V 22.70 53.21 53.22U_w I C1 pita w C rom tr P Step t9S 1N.61 101.51 79.99 55.10Ls: djusbtt Uil Cuts IS." 26.22 32.77 23.N 16.9
coital ChWg 0.13 1.41 1.44 1.51 0.9As c: lar Sdoe m p bte 91.11 IS.2 11.27 14.0M4 1.17
Adu ited tmbw I Coital Drp 42.73 72.40 u1.57 61.64 47.17
KC Exprt Sales 1.12 1.79 3.11 1.9 0.0low Selah
blw IW from Prar Step 36.O 141.36 114.21 47.03 S2.00Adut,t LOcW ltrieal Csts 26.07 32. 35.46 32.72 21.10
Lwrtd terlul Cuts 1.U I.K L.O 0.0 .0NIltrel Trepert 113 1.44 1.49 1.26 1.00Tam Pad (1.09) (1.47) (1.62) (1.21) (1.05)Lua TruiOt 0mw., en Selts 2.32 (2.15) (3.29) 0.52 1.21Sels1d La L O1 1.1 0 a.W 0. 1 .0
Aited bl kw 64.03 175.16 14.33 5.26 01.62liar I Ceital Char fro Prr Stop S1.11 04.1 11.S 999 61.50Lns: Jutebt Latr Csts 1S.53 26.22 32.77 23.1 19.0
Capitel 0 . L4 1.41 1.4 1.51 1.Ms cit: lucruse .d. lhp lete 9.13 15.42 19.27 1M. 11.M7
Idjtud Lar a C4tal 0 . LU 724L l.57 6U.64 52.64
dt letw hi L.66 1.11 L1. 1 1.5 1.64

- 163 -
Table 45
ShLIfS Vim tiJBl VilACS LIt
NI51C0 IS W~J P11CE I amIClEY (Otil to tA UIIiIINI)stalt hiss (torrent (shog hi)e
Valde ded fro Prim Sttp 16.7 1 NS.A 117.17 7.7 116.1sAid Sck: jitml Casl Price 111 10.to 11.11 9.95 1.52
her rin 2.11 3. 4.77 6.67 4.03a.. __. _.. * -.--
Adjstid blw Ad 111.07 76.66 I3i.16 163.11 129.5S
OK hwstic hIss (Cvrrent E xaN lte) 6.46 3L47 1.77 0.7 o.SSestic hScn (it 0 ("ke btf ePrwiuu)
bl dd from Prior Sttp 119. .22 I35.U ( 104.06 132.13Add ack: Adjuastnt Coal Frie 7.13 9.1S 1.10 9.05 6.65
Pahr Price 2.41 3.21 .35 5.1I 3.67
Adjusted alu Addd 110.26 j9S 111.13 111h. 144.15
NCt Omstic sales (20? Exchane late Premium) 0.34 1.30 0.51 0.59 0.46bnestic Shles (It 401 Exchan bte Premium)
Vivlue Wd from Prior Step 1 31 12 9 .52 1".97 117.06 143.62Add lack: Adjustent Coal Price S-17 16 6.12 6.78 6.19
PoIer Price 2.41 3.1 1.23 5.03 3.5?
Adjusted Value Added I1.61 2M1.5? 160.03 121.17 153.60
RC h0estic Soles (101 Exchnge bte Premium) 0.32 0.35 I.S4 6.53 0.42Export Stles (Current Excange lte)
Value Added from Prior Step 22.s2 SS.t2 -16.0? 17.07 22.46Add lack: AdjustWent Coal Priee 1.76 10.16 10.01 9.X5 1.98
Power Price 2.68 3.0 4.77 5.67 3.13
Adjusted alut Added 34.3 6.68 1.29 32.69 31.1'
IC Export hles (Current Echange bte) 1.45 1.23 .IM 2.45 1.S9Eport hSles (20M Exchange late Prsqi-)
aluet Added from Prir Step I.i 76.25 6.55 31.15 10.49Add lae: Adjustnent toal Price 7.9 1.15 9.10 9.05 1.16
Par Price 2.44 3.21 4.35 5.16 2.65
Adjusted Value Addt 50.51 11.1 20K. 52.36 S1.50
PC Export Sales (201 Exchang lbt Premuiu) 1.06 6.U3 4.42 1.34 0D."Export Shts (10 Exchge bte Prauiw)
Value Added Irom Pnor Step Y2.3I 91.41 2.JC 53.1 Q3.U2A Back: ldjustnent CaH Price 51.7 6. 6.6 . 6 .41
Pwr Pricte 1.15 2.45 3.25 3.L 2.74
Adjusted Valve Added 6e.17 131.72 32.71 3.IS 62.5
tC Ewport Sales (402 Exchange lte Pruiw") 3.71 6. un .M I.6r I.76

- 164 -
TABLE 46
'U'S
11f5IEI U 0 1111 I it 00.tfuILLEs 3101W LJI iff Um PISIIR CU.CLRf II (._. .. ..fetal Sul" (Cwnrt E an e bRte)
hlie ed fro Prier Step 36.50 119.36 11I.21 97.13 52.01 Sack: Adustmnt tol Price 1.7S 11.06 10.01 1.95 1.1s
Pokw Price 2.66 3.60 9.77 5.6? 3.t1...... ...... ........ ...... ............ ...
Adusted hele Added V7.99 151.02 129.06 6U.6S 6t.56
Ot fetal Siles (Cwrent Excange Rte) I.Os 0.5S 0. 7 1.26 0.95fetal Seln (20? Exng late Prgsu1)ilue Added trom Prior Step 53.03 162.33 132.97 66,t1 69.21Add lcKi: AdjgstAent Coa PriCe 7.95 9.15 9.10 1.05 1.31
Putr Prict 2.f5 3.28 1.3S S.16 3.11..._... ........... ...... ........ ..~
AdJustwd hble Added U.U 174.75 1t6.t2 10.63 10.70
MRC 1etal Sles (20S Echange Rte Prfnizw) 0.69 0.12 0.60 0.67 0.67rti Sales (90 Echge ate Preqiaw)thlu Added freo Prier Step 69.63 175.16 1t6.33 80.26 81.62Add lKi: Adjut,,ent Coal PriCe 5.3 6.96 6.92 6.78 6.t9
Psier Price 1.14 3.05 9.21 9.35 3.00_... .... ........ .. . _.... ...... ... .. .
Adjusted Ualue Added 72.6t 1S.07 IS7.36 91.40 91.11
Oft fatal Salel (901 Exchnop ate l re,ztw) 0.59 0.39 0.SS 0.75 O.S6