Zimbabwe Population, Health and Nutrition Sector Review
133
ReportNo. 4214-ZIM Zimbabwe Population, Health and Nutrition Sector Review (In Two Volumes) Volume 11: (Annexes) June17, 1983 Population,Health and Nutrition Department FOR OFFICIAL USE ONLY U Document of the World Bank This document has a restricted distribution and may be used by reopients only in the performance of their official duties. Its contents may not otherwise be disclosedwithout World Bankauthorization Public Disclosure Authorized Public Disclosure Authorized Public Disclosure Authorized Public Disclosure Authorized
-
Upload
khangminh22 -
Category
Documents
-
view
1 -
download
0
Transcript of Zimbabwe Population, Health and Nutrition Sector Review

Report No. 4214-ZIM
ZimbabwePopulation, Health and Nutrition Sector Review(In Two Volumes) Volume 11: (Annexes)
June 17, 1983
Population, Health and Nutrition Department
FOR OFFICIAL USE ONLY
U
Document of the World Bank
This document has a restricted distribution and may be used by reopientsonly in the performance of their official duties. Its contents may not otherwisebe disclosed without World Bank authorization
Pub
lic D
iscl
osur
e A
utho
rized
Pub
lic D
iscl
osur
e A
utho
rized
Pub
lic D
iscl
osur
e A
utho
rized
Pub
lic D
iscl
osur
e A
utho
rized


FOR OFICIAL USE ONLY
TABLE OF CONTENTS(Volume II)
MAIN TEXT (See Volume I)
Pan
ANNEXES:
1. Note on the Demography of the African Populationof Zimbabwe 1
2. Proposed Child Spacing Project Description 183. Mortality and Morbidity Data 204. Comparison of Existing and Proposed Health Service Models 255. Organizational Structure of Health Services 266. Health Facilities Utilization and Geographical Distribution 297. Proposed Changes in the Malaria, Schistosomiasis and
Immunization Programs 338. Health Manpower Data 359. Training of Health Personnel; Basic Programs 3810. Organizational Structure of the Unified National Health
Information System 4411. Sources of Finance for Health Expenditures 4512. Inpatient Costs and Subsidies 5613. Composition of MOH Budget 5714. Health Development Plans, Cost Implications and Affordability 5815. Nutrition 68
This document has a restricted distribution and may be used by recipients only in the performance oftheir official duties. Its contents may not otherwise be disclosed without World Bank authorization.


ANNEX 1Page 1 of 17
Annex 1: NOTE ON THE DEMOGRAPHY OF THEAFRICAN POPULATION OF ZIMBABWE
Summary
1. Data from the 1969 census of Zimbabwe for the African population,previously analysed by early indirect techniques now gone out of use, werere-analysed by modern methods. Mortality in childhood in the late 1960'swas found to be very low by African standards (though a close match toneighbouring Botswana) with infant mortality in the neighbourhood of 100,and 12-13 percent of children dying between birth and their fifthbirthday. The implied expectation of life at birth ranges from 53-58,depending on the model life table chosen. The total fertility rate isestimated from reported fertility data to have been at least 8. The femalestable age distribution corresponding to these levels of fertility andmortality fits the reported female age distribution of 1969 extraordinarilywell, providing powerful support for the estimates given above. The rateof natural increase for the African population of Zimbabwe may have beennear 4 percent in the late 1960s. The 1962-1969 intercensal rate of growth(4.2 percent for the African population and just under 4 percent for thetotal population) is in accord with these estimates; however the 1969-82intercensal growth rate (2.94 percent for the total population) is not.Possible explanations include overcounting in 1969, undercounting in 1982,emigration (of both Africans and non-Africans) between 1969 and 1982, andmisreporting of fertility and mortality in 1969. No resolution of theproblem can be achieved until the full results of the 1982 census becomeavailable.
Sources
2. There exists as yet only one reliable source of demographic datafor the African population of Zimbabwe; namely, the census of 1969. Thiscollected information on exact age for each individual, and data on thenumber of children ever born, still living, and already dead, as well as onthe date of the last live birth, from each woman aged 15 years or over.Such a set of data allow estimation of fertility and child mortality,though regrettably no information was collected on adult mortality.
3. Two national demographic sample surveys had previously beenconducted, in 1948 and 1953-55. They gathered much potentially valuabledata on births and deaths during the past year, and on number of childrenever born, still alive, and already dead. Unfortunately age was classifiedonly in very broad categories, basically over and under puberty. Withoutprecise age data none of the modern methods of analysis can be properlyapplied, and it is impossible to evaluate the recorded crude birth anddeath rates for the past year. These surveys, therefore, can be of littleuse.
4. The results of the 1969 census are thus exceedingly important.Unfortunately, however, they were not fully analysed at the time. In thelate 1940's and early 1950's C.A.L. Myburgh (for many years a prominentstatistician with the Rhodesian government) had developed empirically basedequations for estimating total fertility and expectation of life at birth

ANNEX 1Page 2 of 17
from the kind of limited information available from the 1948 and 1953-55surveys.l/ These were pioneering efforts, but have now been entirelysuperseded by the body of analytical techniques built up during the 1960'sand 1970's, largely by W. Brass and A.J. Coale, which are based on preciseage data and make much fuller use of all the information available. Thesenewer methods, though then already in common use, were not employed in theanalysis of the 1969 census (except for some consideration of the agestructure by reference to stable models) and the published estimates of thetotal fertility rate and expectation of life at birth (7.5 and 50respectively, yielding a crude birth rate of 52, a crude death rate of 16and a rate of natural increase of 3.6 percent) were almost entirely derivedfrom Myburgh's equations.
5. In these circumstances, a re-analysis of the 1969 data wasindicated, and a standard analysis was accordingly performed.
Mortality
6. The data on children ever born and children surviving by age ofmother were analysed by the well-known Brass child survival technique(Trussell version).2 / Table 1.1 gives the reported proportions ofchildren dead by age of women, and the resulting estimates of theproportion of children who die between birth and a given age (qx); alsopresented are the corresponding levels in the North, South and West3 /families of the Coale-Demeny model life-table system.4 / These model lifetables encapsulate all reliable life tables from the nineteenth centuryup to the 1960's, and hence all accurately recorded human mortalityexperience; therefore the degree of internal consistency within therecorded data with respect to the models provides some test of the overallreasonableness of the data.
1/ Published in C.A.L. Myburgh: 'Estimating the Fertility and Mortality ofAfrican Populations from the total number of children ever born and thenumber of those still living': Population Studies, Vol. X No. 2, Nov.,1956.
2I By this method, the proportions of dead for women aged 15-19, 20-24,25-29, 30-34, 35-39, 40-44, and 45-49 are equated to the life-tablefunctions ql,q2,q3,q5,q10,ql5,q2o, or the probability of surviving frombirth to exact age 1,2,3,5,10,15,20, after adjustment to allow for theage pattern of fertility; the earlier childbearing begins, the olderthe children to women of a given age will be. The exact procedure usedfor adjustment varies according to the version of the technique beingemployed. For further details see 'A Manual of Indirect EstimationTechniques': Hill, Zlotnik and Trussell: UN, 1983 (forthcoming).
3/ East (which shows extremely heavy infant mortality and light childmortality) is omitted because it is very rarely used (never in Bankprojections) and is highly unlikely to be appropriate for Africa.
4/ For each family, (which has a distinctive age pattern of mortality),life table are ranked by female expectation of life at birth from levelI to level 24 with 2.5 years between each level. Level 1 is a femalee° of 20 years, level 24 a female e° of 77.5 years. The male e° islower than the female at each level, typically by about 3 to 4 years.

ANNEX 1Page 3 of 17
Tabe 1. 1: ICFa CF (lRI MO BY AGE CF W, MI'L DZW W'1rBIRTH AM A GIV3 AZ, AM C1E-MM E(UIVA1 a LIFE TAM IEVELS
Proportimn DylxgPropor- Betwom Birth & Age X Ca1e-[e2n Equwlent tate of
Age of tios of (qi) Mtdel LIfe Table level RefereimWomen C1ilren Age X CD NIDrth CD Soth CD Wst Nbrth Soah %wt of qic
15-19 .106 1 .111 .10B .114 13.3 16.2 14.1 196820-24 .125 2 .124 .129 .130 14.5 16.7 14.8 196725-29 .141 3 .133 .142 .140 14.9 16.7 14.8 196530-34 .159 5 .155 .161 .159 14.8 16.2 14.4 19235-39 .178 10 .185 .184 .181 14.6 15.6 14.1 196040-44 .199 15 .204 .202 .200 14.4 15.1 13.8 195745-49 .218 20 .219 .218 .217 14.4 14.9 13.8 1954
It is clear that the results are highly consistent, suggesting thatreporting of child survival was reasonably reliable. There are indicationsof some decline in childhood mortality over the past 15 years (the lowerthe Coale-Demeny level the higher the mortality), although the size of thedecline varies according to the model pattern. It should be rememberedthat the older women probably underreport the proportion of dead childrenmore than do younger women, so that any reported decline can be considereda minimum estimate of the actual fall in mortality.
7. We may take the average of the levels for age groups 20-24 and25-29 as a fair estimate of the level of childhood mortality over the 4 1/2years before the census, i.e. the period 1964-69.5/ For any model pattern,the percentage of children dying before they reach the age of 5 is between15 and 16 percent. The percentage dying before the age of 2 is 12-13percent. Infant mortality varies considerably more according to the exactmodel chosen, but would lie between 95-105 (North - 96, South - 103, West -
105).
8. These estimates of mortality in childhood can be consideredfairly firm. There are no data, however, on mortality in adulthood, andhence this and the overall level of mortality must be inferred frommodels. The selection of model is of some importance, since the balancebetween child and adult mortality varies substantially. Given very muchthe same overall level of childhood mortality, the North model yields anexpectation of life at birth for the period 1964-1969 of 52.5, the Southmodel 57.5, and the West model 52.9, a range therefore of 52 to 58.
5/ The estimate from the 15-19 age group is usually discarded, as it isconsiderably less robust than the others. It is highly sensitive tothe exact shape of fertility pattern used to convert reportedproportions, dead to equivalent qxs, and is also affected by therelatively high infant mortality of teenage mothers.

ANNEX 1Page 4 of 17
9. On a priori grounds, either North or South would seem the mostsuitable for an African population. North is distinguished by relativelylow infant mortality, high child (1-4 years) mortality, high adolescentmortality, and low old age mortality; it is very commonly used for Africanpopulations, (including in our Bank projections) as well as for otherdeveloping cuntries in the tropics. South is distinguished by high infantand child mortality, low adolescent and adult mortality, and high old agemortality: it is commonly used for the population of the Middle East, NorthAfrica and Latin America (including in our Bank projections) as well aselsewhere in the developing world. It seems likely that the estimate fromNorth may be rather too low, since in many Eastern African populations forwhich adult mortality data exist, the level of mortality in adulthoodappears to be relatively low compared to the childhood level.6/ Data fromthe 1971 census in neighbouring Botswana, for example, which did collectadult data, yielded an IMR of 97 and qs of 15.3 percent, coupled with an e°of 55.5; the age pattern of mortality was thus midway between North andSouth.
10. Naturally there can be no guarantee that either South or North,or indeed any available model, accurately reflects the age pattern ofmortality in Zimbabwe. There is no substitute for actual data. It isprobably safe to say however, that the expectation of life at birth inZimbabwe in the late 1960's was over 50, perhaps over 55. Infant mortalitywas in the neighbourhood of 100, and 15 or 16 percent of the children borndid not live to see their fifth birthday. These levels of mortality arevery low by contemporary African, even Eastern African, standards. It isencouraging to note, however, that contemporary child mortality levels inBotswana were apparently so similar.
Fertility
11. The reported fertility data, namely age-specific fertility ratesfor the 12 months before the census, and the mean number of live births perwoman (parity) are shown below in Table 1.2 and in Figure 1.
Table 1.2: AGE-SPECIFIC FERTILITY RATESAND MEAN PARITY, 1969
Age Group of Reported ASFR Reported MeanWomen Parity
15-19 .076 .2520-24 .270 1.5225-29 .302 3.0930-34 .262 4.4835-39 .219 5.5040-44 .147 6.0945-49 .074 6.35
Total Fertility Rate 6.745
6/ See J.G. C. Blacker: "The Estimation of Adult Mortality in AFric fromData on orphanhood": Population Studies 31:1, March 1, 1977.

ANNEX 1Page 5 of 17
12. Clearly fertility, as reported in both ways, is very high;clearly also, the two sources are not quite consistent. The usualinterpretation of the pattern seen in Figure 1 is that current fertilityhas been underreported at all ages (because of misperception of the timeinterval involved, or simple omission of births), while life time fertilityhas been increasingly underreported at older ages because of increasingmemory lapses, problems with large numbers, or greater numbers of deceasedchildren that the respondent may be reluctant to mention. A precisemeasure of the discrepancy between the two fertility curves can be obtainedwith the well-known Brass P/F ratio techniques, by shifting the cumulatedcurrent fertility measures (F) to ages that match reported parity (P)7/(with the aid of some kind of model fertility schedule) and obtaining theP/F ratio for each age group.8/The results are as follows:
Table 1.3: PARITY TO FERTILITYRATIOS, 1669
Age Group of Women P/F Ratio
1. 15-19 1.592. 20-24 1.313. 25-29 1.164. 30-34 1.115. 35-39 1.066. 40-44 1.017. 45-49 .95
13. Underreporting of current fertility is clearly evident here.Brass has suggested that if the series of P/F ratios is reasonablyconsistent and plausible, then the ratio for one or more of the younger aregroups (normally P2/F2 or P3/F3, or the average of P2/F2 and P3/F3 or ofP2/F2, P3/F3 and P4/F4) can be used as a correction factor for the reportedASFRs. The reasoning is that the degree of underreporting should not vary
7/ Cumulated age specific fertility rates refer to the end-point of each5-year age-group, whereas mean parities refer to the mid-point. Hence,for example, cumulated ASFRs for the age groups 15-19 and 20-24 referto exact age 25, while the mean number of children ever born to womenaged 20-24 refers to exact age 22.5 years.
8/ For further details see "A Manual of Indirect Techniques forDemographic Estimation': Hill, Zlotnik and Trussell: UN, 1983(forthcoming).

-6- ANNEX 1
Page 6 of 17
by age ( so that the age pattern of the reported ASFRs is usable); whileyoung women are likely to report their parity fairly accurately, since theevents concerned are few and recent and the level of female education islikely to be higher in recent years than further in the past.
14. This procedure is doubtful in the case of Zimbabwe. As iscommonly found with Eastern African data, the P/F ratios are not consistentand the range of possible correction factors is hence very wide. Impliedtotal fertility rates would vary from 7.9 to 8.9. Moreover, thepercentages of women giving no fertility information were not negligible;the application of the standard El-Badry technique for estimating whatproportion of these women were actually childless, and what proportion truenot-stateds (two categories apt to be confused by interviewers) gave a veryfirm estimate of 6.2 percent true not-stateds in each age group..9/ Thesewomen had been previously included in the fertility calculations (which isequivalent to assuming they were all childless); their exclusion from thedenominator raises the levels of both reported current fertility (to a TFRof 7.2) and reported parity (to a high of 6.8 in the 45-49 age group);hence, although the P/F ratios themselves are not affected, the correctedrates would rise even higher to a range of 8.4 - 9.4. Such very highlevels, though not unprecedented in some population groups (such as theLake provinces of Kenya and the southwestern districts of Uganda) must beconsidered with caution.
15. The weight of the evidence from fertility data, however, seems topoint to a total fertility rate of at least around 8. This can be checkedby analysis of the age distribution. The male age structure shows somesign of disturbance by past migration; the overall sex ratio of thepopulation is 101, with sex ratios above 100 in every age group except 0-5and 15-29, and the proportion under 15 is (untypically) lower for malesthan for females. We therefore examine only the female age distribution,which may be fairly confidently assumed to be approximately stable (i.e. noappreciable migration, constant fertility and at most only a gradualdecline in mortality) and hence both unchanging and determined solely bythe given mortality and fertility rates in force. We compare the stablefemale age distribution resulting from a gross reproduction rate of 4(i.e. a total fertility rate of 8.1 or 8.2) and the rough level of
9/ By this method, age-specific proportions of women reported as childlessare plotted against age-specific proportions of women with not-statedfertility. If a reasonable relationship appears, it is concluded thatincterviewers have linear entered some childless women as not-stated. Aline is then fitted to the plotted data points from which the timeproportions childless and not-stated can be obtained. For furtherdetails see 'A Manual on Indirect Techniques for Demographic Estimates':Hill, Zlotnik and Trussell, UN, 1983 (forthcoming).

-7-
ANNEX 1Page 7 of 17
mortality indicated by child survival data, (i.e. a South model level of 17or a North model level of 14) with the reported female age distribution ofZimbabwe in 1969.10/
16. The results are shown in Table 1.4 and Figures 2 and 3.
Table 1.4: COMPARISON OF REPORTED FEMALE AGE DISTRIBUTION ACCORDING TO THE1969 CENSUS WITH STABLE FEMALE AGE DISTRIBUTION IMPLIED BY A GROSS
REPRODUCTION RATE OF FOUR
Reported Female Coale-DemenyAge Cumulated Age Distribution Stable Population: GRR = 4.0to Age (Percent) North Level 14 South Level 17
5 21.2 21.4 21.310 38.0 37.9 37.915 51.1 51.1 51.120 60.9 61.8 61.825 69.1 70.4 70.330 77.0 77.2 77.235 82.4 82.7 82.640 87.7 87.1 87.045 91.0 90.5 90.350 94.2 93.2 93.055 96.3 95.3 95.160 97.8 96.9 96.865 98.3 98.1 98.070 99.1 99.0 98.975 99.4 99.5 99.575+ 100.0 100.0 100.0
10/ This age distribution is a corrected version of that given in the 1969census report. Age was tabulated not as number of years lived but asdate of birth, and the authors of the report took those born in 1969,1968, 1967, 1966 and 1965 as equivalent to those aged less than 5years. However, the census was held in April, 1969, so that only athird of the true numbers aged less than one year were included. As arough adjustment for this, all those born in 1964 were also counted asunder 5 years here, those born during the previous 5 years as aged 5-9,and during the 5 years before that are aged 10-14. Earlier groupingswere not altered; it is highly probable that in most cases of adults(if not also children) enumerators estimated age in years (by eye, byhistorical calendar, etc.) and then subtracted from 1969 to get date ofbirths, a procedure which would not be affected significantly by thedating of the census. This adjustment produces a somewhat younger agedistribution than that given in the census report: however impliedfertility with the report's distribution is still very high, as can beseen from the estimated TFR of 7.5 derived partly from that agedistribution.

ANNEX 1Page 8 of 17
17. The fit in both cases (particularly at the younger ages) isastonishingly good, given the likely errors in age determination. There canbe little doubt that an estimate of around 8 is appropriate for the totalfertility rate of the late 1960's of the African population of Zimbabwe.The general level of mortality shown by child survival data also seems tobe acceptable.
18. It is of some interest to consider the vital rates of thematching stable population. These should approximate well the vital ratesof the African female population at least, though the male and consequentlytotal population rates will be somewhat disturbed by distortions in themale age structures caused by migration.
19. The stable female birth rate lies between 53 and 54, depending onthe exact model chosen (among North, levels 14 and 15; South, levels 16 and17). The stable female death rate varies from 11 to 14, according to modellevel. The rate of natural increase consequently falls between 3.9 and4.2. Normally one would expect the male population to show a very similarrate of natural increase (though as the product of somewhat higher birthand death rates) and hence the female rate of natural increase wouldprovide a good approximation to the natural increase of the totalpopulation. However, the male population of Zimbabwe appears to haveexperienced some net immigration, visible as a male surplus overall and atolder adult age groups. This would act to reduce the crude birth rate ofthe total population, and probably to increase the crude death rate. Hencethe rate of natural increase for the African population of Zimbabwe in thelate 1960's may have been slightly lower than the range of 3.9 - 4.2percent given above. Precise determination would require choice of a lifetable and age specific fertility schedule and some smoothing of the agedistribution. It is probably safe, however, to put the African rate ofnatural increase for that period as not far below 4 percent.
20. The rate of natural increase for the total population wouldundoubtedly be somewhat below this level, since non-African naturalincrease will have been lower; if it were one or two percent, the nationalrate would be a point or two lower--say 3.8 or 3.9 percent.
21. These new estimates for the late 1960's differ slightly fromthose arrived at in the 1969 census report. Fertility is higher (a TFR ofabout 8 versus 7.5), mortality lower (eO of 53-58 versus 50), and hencenatural increase higher (about 4 percent versus 3.6 percent, for theAfrican population). However, both agree in showing fertility levels thatare among the highest n the world, mortality levels that are low by Africanstandards of the period, and natural increase also among the highest in theworld.
22. How do these estimates of fertility, mortality and naturalincrease fit in with recorded population growth? Table 1.5 below showsintercensal/intersurvey population growth rates from 1901 to 1982.

--ANNEX 1Page 9 of 17
Tab1e 1.5: INERCNSINR SURVEY ERJIXD 1/
Average 1901Aimal Cim/Growth Tax - 1948 1948- 1954 1954 1961/62 1961/62-1969 1969- 1982Rate(%) RegLster Survey Survey Survey Survey "us Census Ceuis Cenus CeUsm
AfricanPop. 2.8 4.0 5.9 4.2
TotalPOP. - - - 3.98 2.94
1/ 7fe 1901-1948 period is taken as 47 years: 1948 - 1953/55 as 6 yeF: 1953/55-1962 as7.6 years: 1961/62-1969 as 7.5 anld 7 years: 1969-1982 as 13.3 years.
23. The 1901-48 growth rate need not be taken too seriously but doesindicate very high growth. So does the 1954-1961/62 rate, although nodoubt heavily biased upwards by the greater coverage of a census than asurvey grant. The 1948-1954 and 1961/62-69 rates, both between comparabletypes of data collection, fit in well with the natural increase estimatesgiven above, allowing for some net immigration and improvement incompleteness of enumeration over time. The 1969-82 growth rate, however,is quite inconsistent and requires explanation.ll/
24. There are several possible causes which could contribute to thisinconsistency. It is known that the non-African population left in largenumbers during the 1970's, although this could account for only a smallpart of the discrepancy. Possibly also some of the foreign Africanimmigrants may have left. Although all the Zimbabwean refugees are thoughtto have returned by the time of the 1982 census , it is still possible thatsome remained abroad. The 1982 census was held at rather short notice on avery tight schedule, and it is possible that the level of undercount washigher than that of 1969; returning exiles and refugees might have beenparticularly likely to be overlooked, and many parts of Zimbabwe must stillhave been in confusion and disorganization from the war and theresettlement of returnees. Alternatively, the 1969 census could have beenan overcount, for unknown reasons (though this seems very improbable) orthe mortality fertility and age data may have been consistently misleadingbecause of misreporting of age, births and deaths. Another possibility isthat natural increase actually fell during the 1970s because of either/orreduced fertility (from war disruption or just conceivably the spread of
11/ Note that the historical series of growth rates published in the WorldBank's annual World Development Indicators reflect this discontinuity inrecorded growth since it is based largely on the recorded intercensalgrowth, following the usual UN system.

-10- ANNEX 1
Page 10 of 17
birth control) or increased mortality (from the direct and indirect effectsof the war).
25. It seems a priori most likely, since all the data prior to the1982 census are in broad agreement on very high growth and naturalincrease, since the liberation war, being short and sharp, probably hadonly a limited effect on fertility and mortality, and since the 1982 censuswas held hurriedly and in less than ideal conditions, that undercounting in1982 is the main cause of these inconsistencies. However no finalconclusions can be reached until the full results of the 1982 census,including mortality, fertility and migration data, have been released andanalysed.

-11-ANNEX 1
FIGURE 1 Page 11 of 17
ZIMBABWE 1969 CENSUS DATAREPORTED FERTILITY DATA
Reported Mean Parity 1969Cumulated Reported A4*--Specific Fertility RatesLive 1968-1969
BirthsPerWomen
7.0
6.0
0 /
5.0 25
A5o ~ ~ ~ ~ ~ ~ ~~g Gru of Woe
~~~/
' //~~
4,.0 //
* /y/~~~
15 00 /S3 S4 55
Ag/ru o oe


-13-FIGURE 2 ANNEX 1
Page 12 of 17ZIMBABWE 1969 CENSUS DATA FEMALESCOMPARED WITH COALE-DEMENY STABLE
Cumulated POPULATION SOUTH MODEL, LEVEL 17Percent of Model Age DistributionTotal
- Reported Age DistributionPopulation
100
90
80
70
60
50
40
30
20
10
0
0 5 10 15 20 25 30 35 40 45 50 55 60 65 70 75 +75Age Group of Females

-14-FIGURE 3 ANNEX 1
Page 14 of 17
ZIMBABWE 1969 CENSUS DATA FEMALESCOMPARED WITH COALE-DEMENY STABLEPOPULATION NORTH MODEL, LEVEL 14
Cumulated Model Age DistributionPercent of - Reported Age DistributionTotalPopulation
100
90
80
70
60
50
40
30
20
10
0
0 5 le 15 20 25 30 35 40 45 50 55 60 65 70 75 +75

-15- ANNEX 1Page 15 of 17
Table 1.7: POPLU[C( (F ZIMAE BY LN CTRSIP,RA(C AND E:STY: 1969 a(t
te Population` TotalArea (km 2) -A rican-- -Nm-African- -Total- Demrit
Category N iers % Nunmers Z Numbers % Numbers
EuropeanAral/ 181,900 47 1,758,830 36 248,907 99 2,007,740 39 U
AfricaArea1 / 181,900 47 3,082,950 64 3,050 1 3,086,000 61 17
Areal/ 26,780 7 2,340 - 199 - 2,540 - 0.1
Total2! 390,580 100 4,846,930 100 252,414 100 5,099,344 100 13
- = less than e perent.Figures my not add exactly to totals, due to roundirg.
Souce: Central Statistical Office: 1969 Popiuation Censts (Interim Report)Volume II; nve African Population: Salishgry, RhDdesia, 1971
I/ Te European area inclue s tie categories Geeral land, Specially Designated Land, Forest Land andParks and Wild Life Land. Tle latter twv, hidch have denities of 3 ard below 1 respectively, mabeup 14 percent of tie total European Area. Ihe African area Includes Camnal lard (er-Tribal TrustlId), African Purchase land, Specally Designated land, Forest land and Parks, ard Wild life lard:the latter tO, agin vwth simlar lw dernities, make up 2% of the total African Area. The NationalArea is also described as Ihreserved lad.
2/ Totals include 3,070 railway travellers (2,810 Africars, 239 Europeare, 5 Asiar and 14 Coloured) wkoare not included in any Ilad category. Figues do not ncessarily add to totals, becase the Africmfigure have been rounded.

-16- ANNEX 1
Page 16 of f7
Table 1.8: IER EA DISIRIBU1ION CF lE AFRICAN KIVE-BCRNpopULAT= CF ZIBA3 BY IAN2aE AMD PR)VDUI OF BIRH: 1969 CENS
Nlebele anil/ Slva 2/ Other Idiius 3/ NDn-Tndigencs4/ TotalProvinoe of Birth Allied LInuaes languags Lanlaws Langaaes
Manicalaid 1 94 3 2 100Masonaland NDrth 83 4 12 100MaSlDflaJAnlS(xlth 1 90 2 8 100d tabelelaid North 68 12 14 5 100Matabelelani South 65 18 15 1 100Midlands 16 79 2 2 100Victorla 7 92 - - 100
Total Born in Zibabe(Percent) 17 74 4 4 100(Number) 740,080 3,329,050 194,550 185,850 4,477,470
- = less than 1 person
Soures: 1969 Poplation Ceosus (Interim Report) Vol. II: The AfricanPopulation; Central Statistical Office, Salisbiry, Rhxdesia, 1971
1/ Includes Ngni, 1ebele and Shagana.
2/ Tj.udes Shona, Kalanga, Kararga, Korekore, Mayika, Ndau, Zezuru and other Shona. 2bte that 41prcnr-t of those born in Manicalwd Province reported Manyika as their La.guaga.
3/ Includes Sena-Ch d, Sotho-Tswna, Tonnga-fr, Tonga, %rda and other lrIdin wsaguages.
4/ ludes Benba, lozi, Ngid, Nyanja, Senga, hsa, Yao and other N-Irnlgous laguages.
5/ Total includes 27,940 "Not stateds"; percentages wiUl not necessarily sun to 100 for this reasonand because of rouding.

-17- ANNEX 1Page 17 of 17
Table 1.9: AFRICAN POPULATION OF ZIMBABWE BY COUNTRY OF BIRTH:1969 CENSUS
Country of Males Females Total Males Females Total SexBirth (Numbers) (Percent) Ratio
Zimbabwe 2,187,440 2,296,650 4,484,090 89.6 95.4 92.5 95Malawi 123,310 40,130 163,440 5.1 1.7 3.4 307Mozambique 77,440 31,670 109,110 3.2 1.3 2.2 245Zambia 29,700 14,810 44,510 1.2 .6 .9 201Other 8,710 12,070 20,780 .4 .5 .4 72Not Stated 13,580 11,420 25,000 .6 .5 .5 119Total 2,440,180 2,406,750 4,846,930 100.0 100.0 100.0 101
Figures may not add exactly to totals, due to rounding
Source: 1969 Population Census (Interim Report): Vol. II: The African Population:Central Statistical Office, Salisbury, Rhodesia, 1971.

-18-
ANNEX 2Page 1 of 2
Annex 2: ZIMBABWE PROPOSED USAID-ASSISTED CHILD-SPACINGPROJECT 1982-86
The project would consist of the following components:
(a) An increase in the cadre of CSFA's fieldeducators/distributors from 308 presently to 668 by FY85/86,and a corresponding increase of their supervisors (groupleaders) from 34 to 70. In addition, the CSFA will train upto 216 field educators/distributors from other organizations(e.g., the Community Development and Women's AffairsMinistry, the MOH, etc.). The mobility of the field staffwill be assured through the provision of bicycles andmotorcycles;
(b) An expansion of the staff of the CSFA's Youth AdvisoryService from three persons at present to 33 persons byFY84/85. This will permit the CSFA to provide populationeducation and elementary child-spacing information to 650schools and to an estimated 100,000 students and teachersannually by FY85/86, up from about 200 schools and 33,000youth presently. A number of similar courses on family lifeeducation will be offered to other interested groups, suchas Church organizations. The CSFA will also launch a newprogram for individual child spacing counselling of youth,starting in the two main cities of Harare and Bulawayo;
(c) The addition of two physicians and four nurses to theclinical services staff at the CSFA's main clinic (theSpilhaus Clinic in Harare), to strengthen contraceptivereferral services, surgical sterilization capability, andinfertility services;
(d) The recruitment and training of 60 Medical Assistants toprovide child spacing counselling and services, includingIUD insertion, at 60 MOH rural health facilities;
(e) The strengthening of the natural child spacing methodselement of the CSFA program through expansion of thecurricula used in the child spacing training of fieldeducators/distributors and their supervisors, medicalassistants, and nursing personnel, and through theproduction of appropriate printed materials;
(f) The development of an information, education andcommunications (IEC) program at the CSFA through theestablishment of an IEC department with a full-time IECspecialist and support staff, the development of IECmaterials, and the provision of equipment for their use inthe field. The IEC program is expected to reach one millionfamilies over the project period;

-19-
ANNEX 2Page 2 of 2
(g) The establishment of a Research and Evaluation Department atCSFA;
(h) The strengthening of CSFA's training program through theprovision of technical assistance to improve teachingmethods and through the development of training materials;and
(i) The strengthening of CSFA's management capability atheadquarters level through increasing management staff, theprovision of technical assistance in financial management,the establishment of a computer-assisted managementinformation system, and the feedback of research andevaluation results into the management process.

-20- ANNEX 3Page 1 of 5
Annex 3: MORTALITY AND MORBIDITY DATA
Table 3.1: ZIMBABWE--MORTALITY BY AGE AND CAUSE,CITY OF HARARE, 1979
Age African Non-African
Under OnePrematurity 228 10Intrapartum asphyxia 56 2Congenital anomalies 55 3Pneumonia 125 5Tetanus 26 0Neonatorum - -Gastroenteritis 70 0Other 84 9
Total Under One 646 29
One to FiveCongenital anomalies 20 1Pneumonia 50 1Gastroenteritis 89Malnutrition 76Measles 70Misadventure 14Other 40 1
Total One to Five 359 3
Fifteen to Twenty-fourRoad Accidents 25 9Assault/Homicide 26 0Rheumatic Heart Disease 17 0Complications of Pregnancy 17 0Renal Failure 13 0Misadventure 11 3Other 84 9
Total Fifteen to Twenty-four 193 21
Twenty-five to Fourty-fourSuicide 20 12Road accident 53 11Homicide 42 2Misadventure 31 2Hypertension 39 3Cancer 55 8Complications of Pregnancy 34 0Other 140 12
Total Twenty-five to Fourty-four 414 50

-21-- ANNEX 3Page 2 of 5
Age African Non-AfricanFourty-five to Sixty-fourC.A.D. 7 71Cancer 115 98Hypertension 50 10Other Cardiovascular 94 21Respiratory illness 31 17Alcohol 50 15Pulmonary TB 13Castroentritis 9Other 21
Total Fourty-five to Sixty-five 390 232
Sixty-five and AboveC.A.D. 1 115Hypertension 27 105Lung cancer 6 25Other cancer 42 80Accident/suicide 10 24Other 145 156
Total Sixty-five and Above 231 505
Source: Annual Report of the Medical Officer of Health,City of Harare, 1979

Table 3.2: EPIDEMICJIGICAL PATEN BY TYTE (F FAIMSAND FRE YJENC CF OM(E
Mbarch 1982
---- 2Mashona - -Victoria--
Age and Sex Cm_ercial African OLned Co_mmnal comual
Under 5 years% of Total 52 34 51 57
% femle 50 60 51 32
Rank Order of OccurraeAll lIE/Cough (Malaria, Scabies URTI/Cough Diarrhea/Dysntery
Diarrhea/Dysentery ( Diarrhea/Dysentery Diarrhea/Dysentery Malaria, Scabies
Boys URtE/Cough Malaria URII/Cough Diarrhea/DysenteryDiarrhea/Dysentery Scabies Diarrhea./ysentery Cmnjunctivitis/Scabies
Girls URl/cugh Diarrhea/bysentery Diarrhea/Dysentery Malaria, pRieiDra
Diarrhea/Dysentery Scabies URII/Cough Diarrhea/Dysentery
e 5 and overZ of Total 48 66 49 43
% female 60 48 54 63
Rank Order of CocurrenceAn Injury Malaria Malaria Malaria
Backachel/ (Vaginal Discharge Headache Venereal Disease(Conjunctivitis
Men Injury Malaria Headache Venereal DiseaseBwacachel/ Venereal Disease Malaria Malaria
Wcmen Abdoninal Pain Mlaria Abdominal Pain Malaria( Backachel/ Vaginal Discharge (Malaria Pelvic Infection m
(Injury (Pelvic Infection i
0
URI = Upper Respiratory Tract Infection F
1/ The tenm 'hackache" sometimes appears in clinical records as an euphemism for venereal disease.
Source: Health Facility Survey, World Bank Health Sector Mission, 1982

ANNEX 3Page 4 of 5
Table 3.3: LEADING DISEASES TREATEDAT HARARE CENTRAL HOSPITAL: 1981
Disease/Injury Number of Cases % of Total
Infective & Parasitic Disease 3,993 10.4Diarrhea 1,360Malaria 623TB 437Measles 137Dysentery 100
Neoplasms 2,239 5.8Malignant 1,569Benign 670
Endocrine, Nutritional & Metabolic 1,732 4.5A. Malnutrition 935
--Kwashiorkor (358)--Nutritional marasmus (313)--Marasmus Kashiorkor (112)--Malnutrition NOS (152)
B. Diabetes mellitus 294C. Dehydration 168
Disease of Blood 621 1.6Anaemia, unspecified 278
Mental Disorder 1,502 3.9Schizophrenia 617
Nervous System & Sense Organs 2,229 5.8Cataracts 536Meningitis 323
Circulatory System 1,943 5.0Congestive Cardiac Failure 445Hypertension 369
Respiratory System 3,300 8.6Bronchopneumonia 1,149Other pneumonia 514URTI 217
Digestive System 1,690 4.4Cirrhosis of Liver 93
Genitourinary System 2,856 7.4Pelvic Inflammatory Disease 779

-24- ANNEX 3Page 5 of 5
Disease/Injury Number of Cases % of Total
Complications of Pregnancy, Child- 3,634 9.4birth & PalaperiumSpontaneous Abortion w/oComplications 2,086
Other Abortions 340Puerperal Sepsis 243
Skin & Subcutaneous Tissue 581 1.5Cellulitis 350
Musculoskeletal 834 2.2Osteomyelitis 329
Congenital Anomalies 626 1.6Unspecified anomalies of heart 51Club foot 50Spina Bifida 37
Conditions of Perinatal Pd. 333 0.9Neonatal tetanus 128
Ill Defined Conditions 1.181 3.1Convulsions 178Pyrexia of unknown origin 132Abdominal pain 131Failure to thrive 107
Injury & Poisoning 5,112 13.3Fractures 1,772Injury & Wounds 1,614Concussions/Traumas 506Adverse Drug Reactions 418Burns 407
Supplementary Factors InfluencingHealth 248 0.6Suicides 40Maternal deaths 36Procedure not carried out 49Supervision of normal pregn. 31Lodger 25
Supplementary Expernal Causeof Injury 3,764 9.8RR Train & Motor Vehicle acc. 806Unarmed fight or brawl 517Other assault 333Accidental poisoning 191
Total 38,418 100.0%
Source: Harare Central Hospital Medical Records, 1982

-25-
hrex 4: A CCWAISN tF ESTMG AND PLANED REITH ANNEX 4Dmy slE IN Z A (M M 9Bm )
-FItiD4Systes---lmd~iwry Syse-
Level Facility.sad Service No. Staff lael Faility and Services NO. Staff
Nbtiol ontra HOSpLtal-oodera loptal 4 Doctors, Mib, Nati.l N)tical Referral 4 Doctors,services ~MS; asn ater cain r 4 -sti am, me,
wort staff ceiral hieptals other
staff
Prtiaca Garal WmpitstaIsdern thspital 11 Doctor, Sis, Proinia Pro iil 11 Doctors,service but s BiAli servi e my As, aKI other HoepLtal-adatiz s5l, Was,not be avilable suort staff geral hspitals aml other
sufWortstaff
District District Hospitals-iepital services 29 Vais but District District 55 3 Doctors,bit -ray I diad 3oAtic filities inils HspLtal-hisptal 21 SMR, 50my not be awilable, oaer cf beds Doctors, 9Ns, services, 140 bes, MIs, sKvar frc. 40 to 160 HAs KI ctber disA tin sd otber
pport staff X-ray filiti supportizstaff
Rural Arm a. 1rl Hospitala-outpatiet and 56 MAs wK pvral Ward Rural Health sbott 2 Nas, atbeld inpstient services but mi dctor help Leve1 / or Cmire-aipt entt 76(0/ let cDistrict about serices, withieel b. local MihDrity about MAs, er 10,00D obsrvation bes, 2 mternity
clinics - auptiest services, other 414 varyig fraon 1 PoPAt- mteruity bs, axl traini,1srvices wry bur my ide to 3 am of ion full oaze cf ME HA, sK 1oberntim bods, maternity beds, them with serces imlHiD4 murse aidei.dxation, dcild spain services _ternity dild spqcig, phsanteaztal are d ddild elfu training, sivirmztalclini numm-aids, snitatimi asd
gerira biep health edtutio
c. Lasimon Hospital aid Clinics-vary about varying fromgreatly fros cinic type servce to 88 clinic levelDistrict Hospital level services staffig to
District_tal I1stdfiq
A 4op Vl-pert tim tai 1 MUof tarar offering 800050 to eivirOKCl20O 1/ sanitati, healthfutiles education, awatiw
sevices for mna,Ilits, referralfor other diseases,and rerral forddld opecing
Urim 1u5cipol cinics-aitstint 42 Urban lmicipal 42Arie serTvices, aternity sKd observtion Areas clinics-existirs
bed, imzztin, child spacing uicijal clinicservices, aneotal a are e+ d1Avelfre clinics
/ Pattern cf srvic delivery for arcialfam are h not yet bom defined.
2/ Tle larr -fssion hq Ltas wil be upgradedto dstrict lnpitals, ile tle mlaer
siim faclities will fumetic a REs.A similAr tformtion.is plamel fornra hospitals.

0 II
U,
'-4 I:1 S iifi
- - -l
N
w iiii I
U �1
0N
N ' IN U,
NU, I!0
-' Km'IU, .u,�
I jI&

-27- ANNEX 5
Page 2 of 3
A%\
LA~~~~~~~~~~i
EII 'U\\\ 4
g ~ ~~ .
lt 1i

-28- ANNEX 5Page 3 of 3
Table 5.3: DIAGRAMATIC REPRESENTATION OF THE PROPOSED HEALTHSERVICES ORGANIZATIONAL STRUCTURE AT THE VARIOUS
LEVELS OF SOCIO-POLITICAL ORGANIZATION
LEVEL OF EXECUTIVE SOCIO-POLITICALCARE BODY ORGANIZATION
|Ministry of k- Other l
/t Health Ministries
National Referral) Centers
TERTIARY )LEVEL )
3 Provincial Health Provincial Health Provincial.Services Authority Committee Authority
SECONDARY District Health District Health LEVEL Services Authority Committee uncil
Health Centers Health Center I- r Committee|3 ~~~~~~~~~CommitteeI
PRIMARY )LEVEL )
)X ) Village Health Workers and
the Village Community
Source: MOH Document

Annex 6: HEALTH FACILITIES UlTLIZATION AND GEOGRAPHICAL DISTRIBUTION
Table 6.1: BED OCCUPANCY RATES PoR HO6YITA1S, 1979
--General Beds - ma ternity Beds Total Bed--Adais- Bed- Occup- Admis- Bed- Occup- Admis- Bed- ocup-sions days a:y sions days aey aione days iey
Institution No. Beds 1,000 1,000 rate Z Beds 1,000 1,000 rate Z Beds 1,000 1,000 rate Z
Central Ho4pitals 4 2,574 85.7 796.7 84 458 37.6 146.6 87 3,032 123.3 943.3 85General Hospitals n 1,758 63.5 562.7 87 146 10.5 51.0 95 1,904 74.0 613.7 88District Hospitals 29 2,094 68.7 663.8 86 300 17.7 99.7 91 2,394 86.4 763.5 87Special Hospitals
(TB) 2 - - - - - - - - 300 1.4 112.0 102Special Hospitals
(Psychia. Serv.) 4 _ _ _ _ _ _ _ _ 1,320 6.6 442.5 91Missions 59 2,396 52.2 563.6 64 547 11.7 73.7 37 2,943 63.9 637.3 59Industry andMines Hospitals 29 - - - - - - - - 1,417 46.3 - 79
Rural Hospitals 56 1,757 47.6 353.0 55 263 11.7 67.1 69 2,020 59.3 420.1 57
Total 193 10,579 317.7 2,939.8 76 1,714 89.2 438.1 70 15,330 461.2 3,932.4 78
1/ Number of beds in table 6.3 differ from those in this table because the WHOreported inventory of facilities used In preparing table 6.3 may not be accurate.As missions are reopening their facilities, estimates of number of beds in missionfacilities may also not be accurate.
Source: Secretary of Health Report 1979Ma! Approved List of Institutions 1981WHO Country Profile 1980
0

ANNEX 6-30- Page 2 of 4
Table 6.2: NUB3 CF HEALTH UNITS BY TYPE CF KM hAL 19AS 19
Populatim No. of Persons per Area perArea sq. ba. in Population Deity Health Halth Unit Health Unit
Type of Area thmmands in thmuaids Perscs/sq.- Units in thouaads in sq .la
cfn LartManicalad 14.9 623.8 41.8 108 5.8 138.1NshxiBalad 42.4 1,153.3 27.2 151 7.6 280.7Matabeleland 55.7 811.1 14.6 91 8.9 611.6Midlad 26.5 741.0 27.9 107 6.9 247.9Victoria 23.1 872.8 37.8 54 16.2 428.0
Total Ccmu.zal Lend 162.6 4,2D2.0 25.8 511 8.2 318.2
Caearal Farm land 166.0 1,500.0 9.0 76 19.7 2,185.5
Total Rural 328.6 5,702.0 17.4 587 9.7 559.8
Source: A Spatial Planmirg Systan for Zimabwe - IUDP/UWHS, ZIM/80/008ME list of Health Fscilities by Central Statistical OfficePowlati estimtes as of December 31, 1979

ANNEX 6-31- Page 3 of 4
Table 6.3:: N?UIER (F EDS BY PKDVE AND TYPE CF DlT=IUlCN, 1980
- - - - - - - - - - - Provie-- - - - - - - - - - Prcent fType of Insttution Manicalar 1 Mashonaland Matabelelarl Midland Victoria Total total beis
ME FaciltiesCentral Hospital 0 1,792 1,106 0 0 2,898 15.9Genral Hospital 350 791 0 318 323 1,782 9.8Maternity Hospital 17 34 0 44 29 124 0.7District Hospital 336 747 773 396 142 2,394 13.2Rural Hospital 223 631 431 331 475 2,091 11.5Special TB Hospital 0 180 120 0 0 300 1.7Special Psychiatric
Services 0 90 898 0 332 1,320 7.3
Total LHE Facilities 926 4,265 3,328 1,089 1,301 10,909 60.1
Other FacilitiesMission General Beds 1,030 1,337 977 857 1,014 5,215 28.7Mission TB Beds 120 180 0 340 0 640 3.5Irdx try and Mines 0 436 320 342 305 1,403 7.7
Total Other Facilities 1,150 1,953 1,297 1,539 1,319 7,258 39.9
TEAuL 2,076 6,218 4,625 2,628 2,620 18,167 100.0
Population (1,000's) 1,110 2,780 1,400 1,040 1,030 7,360
Person per Bed 535 447 303 396 393 405
Note: The beds In local coancil clinics, tbon and rural council clinics,and nuircipal clinics are not included.
Source: HEI docu.ments

-32- AiNNEX 6Page 4 of 4
Table 6.4: NUMMR CF HEALIH INSTITUTICNS BY PROVINKEAND TYPE (F IunTrTU NI, 1980
- - - - - - -- - Province- - - - - - - -Type of Institution Mashonaland Manicaland MidlaInd Victoria Matabeleland Total
Lccal Ccnmunal Clinics 106 73 76 26 57 3381/Tomn and Rural CouncilClinics (includingmobile) 44 6 11 4 11 762/
Rural Hospitals 17 9 9 9 12 56District Hospitals 10 3 5 1 10 29Mission Facilities 18 23 17 18 12 883/
Total Rural 195 114 118 58 102 587
Rural Population inthousands 2,010 1,046 876 1,005 994 5,931
Persons per Health Unitin Rural Areas 10,30B 9,180 7,420 17,327 975 10,103
Mmnicipal Clinics 20 3 8 2' 9 42Gensral Hospitals 4 2 3 2 0 11Cntral Hospitals 2 0 0 0 2 4Industry and Mines 14 1 5 6 4 30
Total for the Country 235 120 134 68 117 644
Total Population inthousands 2,780 1,110 1,040 1,030 1,400 7,360
Area kn2 in thousands 112 35 56 56 131 391Population DensityPersons/km2 24.8 31.7 18.6 15.1 10.7 18.8
Average Number ofPersons per Health Unit 11,800 9,250 7,760 15,147 11,965 11,428
Average Area in sq. kmper Health Unit 476 291 418 824 1,120 607
1/ Some new facilities may have been added since 1981.
2/ Rural Council Clinics include about 26 mobile and about50 static clinies.
3/ Additional mission facilities may have Opened since 1981.
Source: MM3 Approved List of Facilities, Central Statistical OfficeMonthly Digest of Statistics, February 1982.

ANNEX 7Page I of 2
Annex 7: PROPOSED CHANGES IN THE MALARIA, SCHISTOSOMIASIS,AND EXPANDED IMMUNIZATION PROGRAMS
MALARIA:
Changes in the malaria eradication program are plannedl/. Theseinclude:
a. Countrywide insecticide spraying campaign in all endemicareas. Currently the Blair Research Laboratory organizes anddirects all the national anti-malarial spraying campaigns inall provinces. It is the intention of the MOH to decentralizethe organization and implementation of the anti malarialspraying effort, in such a way that each province,andultimately each district, will be in charge of its antimalarial spraying campaign. This will ensure better populationcoverage, and greatly facilitate the monitoring of the antimalarial program, which will be done at comaunity level,rather than at central level as it is done now. To this end,the MOH intends to train health personnel in the methodologiesand techniques of anti malarial spraying which will providethem with skills to direct and carry out sucessfully sprayingcampaigns in their respective provinces and districts.
b. Mass Chemotherapy. Where and when outbreak of malaria occur,spraying and mass chemotherapy will be used to control thedisease. In areas of seasonal epidemics, it may be possibleusing chemoprophylaxis and spraying to reduce the parasitereservoir, and therefore control the disease. The possibilityof utilizing these two methods in conjunction to control thedisease is being reviewed in more detail.
c. Environmental Methods. All water and irrigation projects areto be amnitored very closely to ensure that they do not becomemalaria hazards. Larvicides will be promoted in urban areasas the most economic form of malaria control Drainage of allmarshes near dwelling places as well as clearing ofvegetation, where this is seen to be promoting thetransmission of malaria, will be instituted very rigidlythrough local authorities. In addition, the health educationdepartment will spend a great deal of time in the teaching ofprevention of malaria as this disease is one of the majorpublic health problems.
SCHISTOSOMIASIS
Four methods will be used singly or in combination to controlthis disease. The combination of methods used will depend on diseaseepidemiology in the area and resources available.
a. Chemotherapy. In areas of high intense transmission and highegg excretion rates, this will be the method of choice, as itwill cure many diseased patients and therefore reduce
1/ From MOH documents provided to the mission.

-34-ANNEX 7Page 2 of 2
morbidity and mortality. However, used in isolation it doesnot assure early control of the disease.
b. Mollusciciding. Where large water bodies are grossly infected(for example, dams on farms) mollusciciding will be used toreduce the snail host parasite reservoir. Used inconjunction with mass chemotherapy, control ofSchistosomiasis in the short term in selected areas will begreatly facilitated.
c. Environmental Methods. Environmental methods, such asclearing of marshy vegetation, which creates an environmentwhere snails cannot survive, hold one of the greatest hopesfor snail control in rural areas, especially if accompaniedby sound health education. Education on environmentalmethods to destroy snails will be greatly emphasized inefforts to control Schistosomiasis.
d. Provision of Safe Water Supplies. In providing enough safewater, the need for the person at risk to get in contact withcontaminated water is obviated. The government hopes toprovide safe water for all by the year 1990. This method ofSchistosomiasis control has the added advantage that ifinstituted, it also has an impact in reducing many otherwater related diseases, for example, diarrhoeas, trachoma,etc.
ZIMBABWE EXPANDED PROGRAM OF IMMUNIZATION
Recognizing the problems of immunization coverage in the past theMinistry of Health plans to carry out a survey of those children immunizedin order to get some information on immunization levels in target groups.The results of this survey are not available yet. Following the survey theZimbabwe Expanded Program of Immunization will be implemented. Targets forimmunization coverage are as follows.2 /
1982 45% of target group1983 55% of target group1984 65% of target group1985 75% of target group1986 80% of target group1987 85% of target group1988 90% of target group1989 95% of target group1990 100% of target group
The strategy is to emphasize the fixed facility approach.Immunizations will be offered at fixed facilities with or without outreachcapability by developing the cold chain and training staff to doimmunizations. Mobile services will be phased out except to remote areas.The program will be expanded as cold chain equipment are put into place andthe staff trained.
2/ Target group = children under five, pregnant women and nursingwomen.

-35- ANNEX 8
Page 1 of 3
Anex 8: HEALTH MANX =
Table 8.1: HEALIE PERSCNL RlISTERED WIM IEMEDICAL CLUCIL CF ZIMB13E
(1965-81)
1965 1970 1975 1976 1977 1978 1979 1980 1981
Medical Practioners 861 833 890 919 855 885 1,016 1,189 1,283Dental Surgeons 124 126 144 152 135 131 143 166 178Pharmacetical aCeists 329 310 299 304 271 304 332 364 373Opticians 42 35 32 31 33 27 32 36 37Dispensing Opticians - 15 25 26 26 25 27 31 36Clinical Psydhologists - 2 24 26 21 20 22 32 38Physiotherapists 41 46 110 115 117 124 144 160 175Speec Therapists - - 3 7 7 7 8 9 9Radiographers 6 4 109 124 136 154 184 217 239Occupational Therapists - 2 12 13 12 12 15 19 20Prosthetists and Orthotists - 2 7 6 7 8 7 9 10Medical lab. Technologists 29 48 118 124 96 121 143 163 177Health Inspectors 95 77 85 80 84 77 93 97 101Meat and Other Food Inspectors 90 1 1 1 1 - - - -1&at Inspectors - 3 28 26 34 23 29 42 45Dental Technicians - 15 38 37 37 28 29 31 33Dental Hygienists - 1 10 11 12 7 29 13 14Electroence phalagraphicTechnicianB - - 2 5 7 6 9 10 10
State Registered Nurses 3,208 3,742 4,688 4,761 4,818 4,882 4,642 4,895 5,220State Registered Midwives 1,295 1,552 1,869 2,083 2,155 2,321 2,150 2,468 2,638Maternity Nurses - 158 172 128 173 175 142 141 142Madical Assistants 229 1,153 2,401 2,581 2,781 3,294 2,555 3,593 4,239African Orderlies whohave not been transferredto the Medical AssistantsRegister 1,063 771 321 328 318 307 267 NA NA
Health Assistants 57 195 334 358 387 402 358 400 417African Hygiem demmw-
strators uht have not beentransferred to theHealth Assistants Register 162 108 54 52 50 50 31 Nk NA
Nursing Assistants - 163 789 810 736 746 662 NA NAMaternity Assistants - 209 1,762 1,943 2,035 2,166 1,935 Nk NA
Source: Secretary for Health Amnml Reports 1965-79.Medical Comcil of Zinbabwe for 1980 anrl 1981.

-36- ANNEX 8
Page 2 of 3
Table 8.2: DISTRIBUTION OF KEY CATEGORIES OF STAFFBY TYPE OF INSTITUTION
Type of Institution Doctors SRN MA HA
Central and GeneralHospitals 292 1,575 923 0
District Hospitals 16 ) 348Rural Hospitals 0 ) 210 233Clinics 0 ) 296Provincial Offices 12 ) - 269Municipal Clinics 14 148 4721/ 74Mission Hospitals 40 85 281 NA2/Industry and Mines 27 72 NA2/ NA2 /
Total 401 2,090 2,553 343
Private or notaccounted for 882 3,130 1,686 74
Total Registered 1,283 5,220 4,239 417
1/ 1979 data.
2/ Not available but may not be large.
Source: A variety of sources--MOH officials, Health Secrtary'sReport of 1979, WHO Health Profile 1980, and MissionData--have been used to compile this table. The data is,therefore, not accurate but may suffice for discussion ofdistribution of manpower.

-37- ANN 8Page 3 of 3
Table 8.3: AUrdIRIZED MCH ESTABLISHIENT
Pharmacists,Radiographers Adminis-
and Other Nursirg trative &Doctors Technicians SRN MA HA Aids Trainees General Total
ML Head Officel/ 569Central Hospitals 294 211 1,414 536 0 417 813 2,748 6,433Genral Hospitals 43 34 359 499 0 21 0 757 1,713District Hospitals 24 12 63 433 0 5 0 455 992Rural Hospitals 0 0 0 287 0 0 0 180 467Special Hospitals 8 3 177 81 0 63 0 414 746PMUH Ofices 18 53 87 22 313 4 0 274 771Laboratories 2/ 12 150 3 1 0 0 0 252 418Leave Relief 86 5 64 38 28 0 0 181 402Additional Posts
for Medics 857 857Miscellaneous 2 7 5 14
Total 487 468 2,167 2,761 341 510 813 5,266 13,382
1/ The head office staff are not specified in terms of different categories.
2/ Irwludes Blair Research Laboratory.
Source: MMH Establishment Information

-38-ANNEX 9Page 1 of 6
Annex 9: TRAINING OF HEALTH PERSONNEL
1. The establishment for training of health care personnelconsists of the following: School of Medicine and Pharmacy at theUniversity of Zimbabwe, two centers for training of radiographers,four centers for SRNs, two centers for training of midwives, abouteight mission and two government centers for training of MAs, about 7mission and 1 government center for training of maternity assistants,a center for training of HAs, and a center in each district to trainVHWs. The specialist training in physiotherapy, occupational therapyand dentistry is not available within the country. The followingshows the role of various categories of personnel and the annualintake for training:
No. ofTraining Annual
Category Role Institutions Intake
Doctor Serve in central, general and 1 80district hospitals, privatepractice
Pharmacists Pharmacist services at hospitals, 1 20and private sector
Radiographers Serve in hospitals, and private 2 25sector
SRN Nursing services at central, 4 300general and district hospitals,other hospitals, and private sector
Specialized Specialized nursing services at several smallNursing hospitals
MA Serve as paramedicals in hospitals, 10 110provide curative services in clinicsand rural hospitals
Maternity Maternity services in addition 8 90Assistant to serving as MA
HA Serve in PMOH offices, mainly for 1 25the provision of preventive services
2. The Faculty of Medicine, University of Zimbabwe, has beengranting its own medical degrees since 1977. Earlier, since 1968, theMedical School operated under the sponsorship of BirminghamUniversity. The entry is after requisite grades in the "A" levelexamination. The course is of five years duration, two pre-clinicalyears and three clinical years. It is followed by a year ofinternship. The academic standards are high and the degree is alsorecognized by the Medical Council of South Africa and of the UnitedKingdom. The number of doctors estimated to graduate are 48, 57 and

ANNEX 9Page 2 of 6
60 in 1982, 1983 and 1984 respectively. In 1981, the intake wasincreased and about 80 doctors are likely to graduate each year from1985 onwards. There are no postgraduate examinations; only someclinical training is carried out in Zimbabwe so that the students mayappear in examinations overseas.
3. In 1981, there were about 100 established posts forprofessors and lecturers at the Medical School, of which about 37 werevacant. The faculty strength may have to be increased to cater toincreased intake.
4. The training of doctors has been largely oriented towardsclinical practice and most of the graduates in the past have eithertaken up private practice or worked in large urban hospitals.Recently some have questioned the suitability of the curriculum tomeet the needs of the revised orientation of the health system. Aconsultant provided by WHO has reviewed the curriculum and trainingprogram for physicians. A better understanding of the socio-economiccontext of illness and health care needs of rural areas, and exposureto practice in rural areas by visits and placements, may be necessaryfor a reorientation of the graduates. But the 'what' and 'how' ofsuch changes are still being discussed.
5. About 20 pharmacists are trained each year by the School ofPharmacy at the University of Zimbabwe in a 2-year course. But manyof the graduates are absorbed by private industry. Two polytechnicsalso produce a small number of pharmaceutical technical assistantsthrough a 2-year part-time course. There is a shortage of personnelin pharmaceutical services of MOH and the government would need tosponsor more candidates to these courses than in the past. Twocentral hospitals train about 25 radiographers each year in a 3-yearcourse after 'A' level of training. But it is difficult to recruiteven such small numbers for this course and most candidates whograduate take up jobs in other fields. In view of about 35 vacancies,the service conditions for this category of staff need to bereviewed. There are no training facilities for physiotherapists anddentistry in the country and the Ministry of Education needs to makescholarships available for study abroad in these areas.
6. On an average about 280 SRNs are estimated to graduate eachyear with a diploma in general nursing from the schools at fourcentral hospitals. The entry level requirement is five "O" level ofeducation. The training of three-year duration is based on a blocksystem which alternates between blocks of about 4 weeks of trainingand about 28 weeks of fieldwork. The standard of nursing education ishigh and the qualifying examination is arranged by the MedicalCouncil. The education is oriented towards work in hospitals. In thePHC system, they will also be engaged in preventive work. Severalpossible changes in the training are being discussed to orient SRNs torural areas. One idea is to have a course of State CertificatedNurses, After entry at the same level as that of SRNs and two yearsof nursing training, these students would be expected to work in ruralclinics for a period of about two years. After this serviceexperience in rural areas, they could continue for SRN training which

-40-
ANNEX 9
Page 3 of 6
might take about 18 months. The overall duration of the course would,therefore, increase to five and a half years from three years and itis not clear how many students would opt for such a program.
7. After the diploma in nursing, various other specializedcourses of nursing including midwifery, community health, psychiatricnursing and nursing administration are available. Two centers incentral hospitals offer one year midwifery training for SRNs with oneyear experience after graduation. A total of about 120 studentsgraduate each year. Table 9.1 below shows the courses andinstitutions for various nursing specialties. The number of studentsin each course other than midwifery is small, ranging from 3 to 13.
Table 9.1: SPECIALTIES IN NURSING
Course Duration School No. of Students
Midwifery 1 yr. Two Central Hospitals 90-120
Diploma in Nursing Univ. of ZimbabweEducation 2 yrs. and Mins. of Health 6-12
Diploma in Community 1 yr. Ministry of Health 13-18Health Nursing Harare
Diploma in Nursing 1 yr. Ministry of Health, 7-10Administration Harare
Advanced Clinical 2 yrs. Mpilo Central 6-10Nurses Diploma Hospital
Diploma in 18 mos. Ingutsheni Hospital 11-18Psychiatric Nursing
Intensive Care 1 yr. Parirenyatwa 5 5-6Diploma Harare Central 0
Mpilo 0
Anesthetic Nurse 1 yr. Harare CentralDiploma Mpilo
Operating Theatre 1 yr. Parirenyatwa 5 5-6Diploma Harare 0
Mpilo 0
Diploma in 1 yr. Univ. of Zimbabwe 3-10Health Education and Mins. of Health
Psychiatric 1 yr. Ingutsheni Hospital 6-15Certificate-MedicalAssistants

ANNEX 9Page 4 of 6
8. The MA was first trained as an auxiliary to SRNs but is nowmore widely used. They have been trained by missions since 1950s withgovernment grants. Several of the 15 missions offering this trainingwere closed during the war, but about 8 are reported to have startedagain and others are likely to start soon. Two government schools, atMarandellas and Que Que, also provide this training. The three-yearcourse consists of 246 hours of lectures which include human biology,hygiene, practice of nursing, general principles of medical andsurgical conditions, community health and preventive medicine, familyplanning and laboratory work. About 72 weeks are spent on practicalwork including surgical, medical and pediatric nursing, operatingtheatre and casualty. About 110 MAs graduate each year.
9. MAs, most of them women, serve at all levels of health careinstitutions but are mainly in charge of rural hospitals and clinics.Therefore, they are among the major categories of service providers inrural areas. The training capacity for MAs needs to be sharplyincreased. MAs will continue to be in charge of RHCs in the new PHCmodel and therefore, will need to receive additional training inmanagement of comprehensive services of health centers.
10. Maternity Assistants are medical assistants who havereceived an additional year of training in midwifery. About sevenmission schools and one government school train about 90 maternityassistants a year. In the PHC system the RHCs will be staffed by twoMAs, at least one of whom would also be a maternity assistant.
11. In the past, HAs were posted only at PMOH offices and,therefore, only one school, at Domboshawa, trains about 25 HAs eachyear. This school has 4 tutors and 8 health training officers. Theentry level requirement is the "O" level certificate (see Table 9.2below) and the three-year curriculum includes public health andpreventive medicine, health education and administration, and buildingand sanitation. In the PHC system, one HA will be posted at each RHC,and will be in charge of preventive work in the surrounding ruralarea, and of supervising VHWs in the area. A large increase intraining capacity of HAs will be required to staff RHCs, andmodifications will be required in the curriculum so that they are ableto perform their new role.

Table 9.2: STRUCTURE OF TRAINING FOR MAIN CATEGORIES OFHEALTH MANPOWER
"O" LEVEL "A" LEVELCERTIFICATE CERTIFICATE
PRIMARY SECONDARY
E7j-FJ14jfl-$j 11 {12 J Doctors
Pharmacist
- C - SRN MidwiferyCertificate
SpecializedNursing-
.-HAs Certificate
-C ---MedicalAssistants
Mate nityAssistants

-43-
ANNEX 9Page 6 of 6
12. Some consideration is being given to reducing the durationof training for MAs and HAs from three years to two years. Althoughthe need for increased manpower in the short-term can be partially metby this measure, it is not likely to alleviate the problemsignificantly. The curriculae should be redesigned in view of theirnew roles rather than based on considerations of short-term needs.For a long time in the future, they will be the key personnelproviding health services in rural areas and, once posted in thefield, it will become difficult to upgrade their skills.
13. Prior to 1979, the VHWs were trained for 6 months inhospitals under the overall coordination of PMOH offices. In all,about 190 VHWs were trained. These VHWs performed largely curativework in protected villages during the war. In the PHC system, the VHWwill work part-time and will be the most peripheral worker. He/Shewill be a part of the community and will offer services ofenvi-ronmental sanitation and health education, curative services forminor ailments, and referral of patients for more serious diseases andchild spacing. The VHW is also expected to keep simple records ofbirths and deaths and of causes of communal increases in morbidity andmortality. The VHWs are selected by district councils, using theirown criteria. But all candidates are expected to have basic literacyskills to be able to perform the deisgnated tasks.
14. The VHWs are now trained in each district by a team of oneMA and one HA at the clinic or rural hospital in the area. Theduration of training is 12 weeks; about 8 weeks are spent at thetraining center and the remaining 4 weeks of supervised field workcomplete the training. The curriculum for VHWs includes hygiene,illnesses and diseases due to unclean surroundings, care of thenew-born and infant, common illnesses of the childhood, referral forchild spacing, first-aid procedures, common adult illnesses and adescription of the PHC system. At a time about 6 to 10 VHWs aretrained and a very modest residential accommodation is provided forthe t-rainees at the designated training place in the district. Thefirst batch of about 300 VHWs was trained by December 1981 and hasbeen working since then. Three batches consisting of a total of 900VHWs are expected to be trained each year.
15. The MOH carried out an evaluation of the first batch of VHWsin February 1982 by interviewing 66 VHWs and 121 community members.The only problems in training cited by VHWs were lack of properaccommodation, stationery, and cooking facilities. Most of the VHWsfelt that their training environment was similar to the environment inwhich they work. Health education was considered a strong part of thetraining by 65 percent; water and sanitation, child care andnutrition, and diagnosis and treatment were each considered strong byabout 25 percent, and leadership was considered strong by 14 percentof the respondents. A small number of respondents indicated that thedeficits in the course were in the areas of midwifery and diagnosisand treatment. Thus the evaluation indicates that, by and large,training may have achieved its purpose. Although continuing trainingto maintain the skill level of VHWs is envisaged by the government,specific plans for such training have not been developed.

-44- ANNEX 10Annex 10: UNiFIED NATIONAL HEALTH INORMATIoN SYSTE(
INFORMATTON FLO' MID TERACTION SCHD(
MINSTCRmENTR) ERMNENT f+_ 4TtONALLNTERMNI3TEIALt secRETARr | Y COMMirTEE FOR HEALIH sTAmsTICS
DEPDMIOLO o|CENTRAL HEALT4 it MINISTRY OF HOME AFFAIRSHEIA THSTATISTICS L SNOMIST REGISTRAR GE4ERAL
D* OEATms_ _ BJRTHS AND DEATHS
OTHER I MEDRECOFf a MED. RECORDDEPARTMENTS w rrsTS OF UNIV. TRAJNNC3
I ANI CENTRAL 'UNIT
/ I/ kPTALS
MINISTRY OF ECONOMICIPLANNING AND DEVELOPMENT
- - - } - --~~~~~czrrp-AL smnsTics FFIC./ . / I I ~~~~~compurER U NIT
PROVINCIANL UICIAL E .Of FICER P__ _C. AL
"3 ~ ~ PROVNC GXNIALA*4I HEALI OTHER HOSPTA I.
Wl1 I~STAT(ICS AN fW(MTERNITESTIOFF5IC I STAnincs
OTHER MINISTT,IESL_PICULTURz,MINES, DEFENSE)
AND OTHER INSTITUTIONS______________T_LEVEL(PRISo0NS)
DISTRICT MEDICAL|
L - - - i DISTRICT HEAlTH DISTRICT GENERAL"srATwsTics OFFICE' AND OHERf- HOSPITALS
RECOW.DS AND 5TA;r11 CS
R E (DATACCd4LCflON) VI-{WI
f LLOCAL AUTHORITIES,jjQE5S OTHER HOSPITALS - C4-GOVERNM ENTAL(MISSIQNS,MININC, INDUSTRIALET)
VHW =VIULAGE HEALTH WORKEIR
4 - DI?RECMON OF Th4 INFOWMATION FLOW UPROVSIONALJSource: Jaravaza V.S., et al, "Unified National Health information System"
The Central African Journal of Medicine, pp 28, Vol 28 No. 2Feb. 1982.

-45-
ANNEX 11Page 1 of 11
Annex 11: SOURCES OF FINANCE FOR HEALTH EXPENDITURES
1. This annex contains a detailed explanation of the proceduresand assumptions used in the process of derivation of the figures inTable 6 in the main text. All figures refer to FY80/81.
Operating and Maintenance Expenditures
2. In 1980/81, operating and maintenance health expenditureswere incurred in connection with services provided by the Ministry ofHealth, other ministries, parastatals, district and rural councils,municipalities, missions, industrial and mining health facilities,voluntary organizations, and other private providers of health goodsand services (private medical practitioners, both modern andtraditional, pharmacies, etc.). Sources of finance of theseexpenditures included the Ministry of Health, other ministries,parastatals, municipalities, missions, industrial and miningenterprises, voluntary organizations other than missions, foreigndonors, insurance schemes, and private individuals. Table 11.1 belowsummarizes 1980/81 operating and maintenance expenditures by type ofservice provider and by source of finance. A more detailedexplanation of the amounts shown in the table for each source offinance then follows.

able 11.1: TOTAL aMMAXIl AND KfINrh?W E)TWflRES Ct HEf CARE
1980/81
- of FinaxneIrlustry
Ministry of Otber Munici- arl Vol. Foreign Ins. Private TItal
Service Pruviders Health Ministries Parastatals pallties Missions mies Org. Asst. Schms lIividuals Ibtal X
Mindstry of Health 57,600 500 1,900 1,700 61,700 43.5
Otber Ministries 6,000 6,000 4.2
Parastatals 1,300 4,200 5,500 3.9
District/ruralcouncils 2,700 2,700 1.9
Nkodcipalities 6,500 2,000 8,500 6.0
Missions 2,900 500 3,400 2.4
Indstry/mi6m 900 4,000 4,900 3.5
Volntaryorganizations 200 1,500 1,700 1.2
Private sector 500 24,400 22,400 47,300 33.4
Total 72,600 6,000 4,200 2,000 500 4,000 1,500 500 26,300 24,100 141,700 100.0
Total % 51.2 4.2 2.9 1.4 0.4 2.8 1.1 0.4 18.6 17.0 100.0ON
Notes:
1/ Totals may not add up due to rcunding.
2/ For the Minstry of Hea1th tie total fixds e xerded under its own hbudgt 5s Z$77,384,875.Hiever of this amnunt, Z$3,113,477 is sDre properly regarded as capital expenditure, as it camprised(i) expenxlitures on capital grants to local autborities etc.;and (ii) expeniitures on furniture andequlipent. Also an anx of Z$1,666,000 was recovered in rewnue fran fees. Tie net recurrert amixut providedby the Mirdstry was tierefore Z$72,605,398. All figures are actual, not estimates.
3/ lie detai]s of tie allocations from the Ministry of Health to cther service providers are discussed in tie text of tie
report. The exact figures are as follaos: paratatals (Z$1,284,000), district anl rural councils (Z$2,724,774), nunicipalities
(Z$6,372,948), voluntary organizations (Z$172,610), industry (Z$946,458), anl the private sector (mainly care for tie
infirm) (Z$436,014).
4/ For the irsrance schemer as a sourae of finance, it Is assmrd that the expernditures (Z$1,930,000) on the Parirenyatwa Kospital
was in effect reverae to tie gvernrent. Mie remainder of their eKperditires (including administrati-ve expeanses) is classified as obeing on the private sector.
5/ For private indlividuals as a source of finance, it is anssumed that Z$8 millimo wan spent on pharmaceuticals, Z$12 million on
traditional mndicine, and Z$2.4 million on private mEdical services.

-47- ANNEX 11Page 3 of 11
(i) Ministry of Health
3. Actual spending by MOR in 1980/81 under its own budgetamounted to Z$77,384,000. However, as explained in Note 2 to Table11.1, Z$3,113,000 of this amount should be classified as capitalexpenditures, and thus MOH's operating and maintenance expenditureswere Z$74,271,000. Moreover, an amount of Z$1,666,000 was recoveredfrom the public in revenue from service fees (shown in Table 11.1 ascontribution of private individuals to financing of MOH'sexpenditures). Hence, MOH's net financing of operating andmaintenance expenditures was Z$72,605,000. The first column in Table11.1 shows that, of this total, Z$57,600,000 went to finance MOH's ownexpenditures; Z$1,300,000 were allocated as a grant to the FamilyPlanning Association, accounting for 96.4% of the Association's budgetin that year; Z$13,200,000 were allocaterd as grants to healthfacilities operated by district and rural councils, municipalities,missions, industrial and mining concerns, and voluntary organizationsother than missions; and Z$500,000 were paid to private healthpractitioners for the care of patients referred to them by MOH.
(ii) Other Ministries
4. Some other central government ministries also provided fundsto support health services and activities. The following table liststhese ministries and departments, and attempts to provide estimates ofthe amounts of recurrent funds which they devoted to the health caresystem in 1980/81.

-48-
ANNEX 1 1Page 4 of 11
Table 11.2: HEALTH CARE AND SUPPORT ACTIVITIES OF OTHER CENTRALGOVERNMENT MINISTRIES, 1980/81
Ministry or Department Activities Funds Provided
Ministry of Agriculture Control of zoonotic Say Z$5m. (Total budgetdiseases of Department of Animal
Health is about Z$20m,and it is assumed that25% is spent for humanhealth reasons).
Ministry of Natural Water supplies (but Unknown, but possiblyResources and Water mainly for agriculture a large amount
rather than domesticuse).
Ministry of Labour Welfare of destitutes; Z$300,000and Social Services rehabilitation and
occupational health.
Ministry of School health education Relatively small amountEducation programs (very few
school health programs;no feeding programs)
Ministry of Industry Drug production policy Small amount (product-and Energy Development ion is done privately).
Ministry of Women's Support for family Relatively small amountAffairs and Community planning activitiesDevelopment
Ministry of Works Maintenance of MOH Z$400,000 (i.e. approx.(Construction) buildings 25% of maintenance vote)
Army Military health Relatively small amountservices
Source: Mission estimates

ANNEX i1-49- Page 5 of 11
5. Although it was impossible to obtain detailed recurrentexpenditure figures for many of these activities, it is estimated thatan amount of Z$6 million was provided in total by these other centralgovernment ministries for health activities (if expenditures on watersupplies are excluded). This equalled only about 7.9% of the fundsprovided by the Ministry of Health, but their contribution should atleast be acknowledged. As'in the case of the Ministry of Healthitself, they also obtained their funds from central governmentrevenues.
(iii) Parastatals.
6. Although the term "parastatals" is not entirely appropriate,there are some institutions in Zimbabwe which are established andprimarily funded by the government. For example, there is a ChildSpacing and Fertility Association (previously the Family PlanningAssociation), which in 1980/81 had a recurrent budget of Z$1,331,324.Nearly all (in fact Z$1,284,000 or 96.4x) of its income came as agrant from the Ministry of Health, however, and so these funds may beregarded as a transfer payment rather than as additional financialresources to the health sector.
7. On the other hand, the Medical School of the University ofZimbabwe received a grant of about Z$4.2 million from the Ministry ofFinance; and as these funds did not come through the Ministry ofHealth's budget, they must be added to the calculation of resourceswhich went into the health sector.
(iv) Local authorities.
8. There are three types of local authorities in Zimbabwe --district councils, rural councils, and town councils. The financingmechanism for the town council clinics before September 1980 wassomewhat different to that for the district and rural council clinics,and may be considered separately.
9. District and rural councils. Prior to September 1980 thefunds to operate the district and rural council clinics came ftompatient fees, general council revenues, and the Ministry of Healthin roughly equal proportions. With the removal of the fees for allpeople earning less than Z$150 per mDnth, however, clinic attendancesrose significantly -- and the Ministry of Health acceptedresponsibility for the full running costs. In the financial year1980/81, the Ministry of Health provided a grant to the councils ofZ$2,724,774 for this purpose. The councils ceased to be an independentsource of finance for health operating and maintenance expenditures,as can be seen from Table 11.1.
10. Town councils (municipalities). Before the new fee schedulewas introduced, revenue to operate the urban clinics was obtained fromfour sources: fees, local government rates, profits from beer sales,and a grant from the Ministry of Health. However, the Ministry ofHealth now accepts responsibility for mst operating costs; and itssubvention to the municipalities in 1980/81 was Z$6,372,948. It isestimated that in addition the municipalities provided a furtheramount of about Z$2 million raised through fees and local taxes (asshown in Table 11.1).

ANNEX 11Page 6 of 11
(v) Missions.
11. Before September 1980 the Ministry of Health paid about onethird of the operating costs of the mission facilities, but it nowaccepts full responsibility for their approved running costs; and in1980/81 it gave a subsidy of Z$2,916,979 to them. The exactadditional amount of money raised by the missions from other sourcesis unknown, but it might have been in the order of Z$500,000.
(vi) Industry and mines.
12. According to the Ministry of Health, it is thought thatindustry and mines provide about Z$4 million to operate healthservices (though a significant proportion is in effect derived fromgovernment through tax rebates). In addition the Ministry of Healthpaid Z$946,458 in 1980/81 (mainly to Wankie Colliery Hospital) forpatients for which it was responsible.
(vii) Voluntary organizations (other than missions)
13. There are many voluntary organizations active in Zimbabwe,and some of them are supported by the government. In 1980/81 theMinistry of Health provided a grant of Z$172,610 to assist with theoperating costs of some of them; but it is estimated that a furtheramount of perhaps Z$1.5 million was raised independently by thesevoluntary organizations in 1980/81. This amount includes expenditureson various nutrition programs and feeding schemes.
(viii) Foreign assistance.
14. The bulk of foreign aid is provided in the form of capitalassistance (whether or not it actually passes through the government'saccounts). However, there are certain types of non-capital aid -- forexample in the form of technical assistance, fellowships, and food ormedical supplies. It is likely that the value of such assistance mayhave been quite significant, but in view of the lack of data (and alsosome difficult valuation problems) the only estimate to be includedhere is an amount of Z$0.5 million spent in 1980/81 on nutritionprograms and feeding schemes.
(ix) Insurance schemes.
15. There are five voluntary medical insurance schemes each withover 10,000 members, and a relatively large number of other smallerones. In total the number of members of these schemes was 219,371 in1979/80 and 231,528 in 1980/81. About 80% of the members wereEuropeans, i.e. about two thirds of all Europeans were covered by oneor another of the schemes. In contrast about 20% of the members wereAfricans, representing about 0.5% of the total African population. Ofthe five largest schemes, two are operated on a commercial basis andopen to the general public, two are confined to specific industries,and one is for public and parastatal workers. In each the employer

ANNEX 11-51- Page 7 of 11
pays 50% of the contributions, with the employee paying the other50%. Not only does the government support the system financiallythrough its contributions for its own scheme (not shown separately inTable 11.1), but it also gives tax rebates for both the employers' andemployees' contributions (also not shown in Table 11.1). In additionthe premia are kept low because of the highly subsidized level ofgovernment hospital fees.
16. In 1980/81 it is estimated that an amount of about Z $26.3million was channelled into the health care system through thesemedical insurance schemes. An approximate breakdown is as follows:
Table 11.3: MEDICAL INSURANCE EXPENDITURES
(Z $'OOOs)Expenditures
General practitioners 5,550Specialists 9,630Parirenyatwa Hospital 1/ 1,930Private hospitals 950Others 2/ 2,030Dental 4,260Administration 1,950
Total 26,300
Notes: 1/ The revenue accruing to the Parirenyatwa Hospital does notgo through the government accounts.
2/ For appliances, spectacles etc. No reimbursement isallowed for drug expenditures.
(x) Private Individuals
17. It has already been pointed out that private individualspaid Z$1,666,000 to the government in the form of fees for healthservices in 1980/81. In addition they paid approximately Z$13.15million as premia for medical insurance under the insurance schemes,but this has already been considered separately. However, someindividuals who were not members of medical insurance schemes alsopaid for private medical care. Although exact data on this are notavailable, it is believed that these expenditures amounted to about10% of the amounts paid through medical insurance. Therefore,excluding the administrative costs of the insurance schemes, thoseexpenditures would have been about 10% of Z$24,350,000 or about Z$2.4million.
18. Account must also be taken of the amounts spent by privateindividuals on the purchase of drugs. In 1980/81 it is estimated thatabout Z$16 million worth of pharmaceuticals may have been consumed inZimbabwe. Of this amount approximately Z$5 million was bought by MOHhealth facilities from the government's medical stores, and about Z$1million was bought by other health providers from those stores. If itis assumed that a further amount of perhaps Z$2 million was bought

-52- ANNEX 11Page 8 of 11
directly from suppliers by government (both central and local),missions and industrial and mining hospitals, then the balance ofabout Z$8 million must have been bought by private individuals frompharmacies and private clinics. Although only rough estimates, it istherefore believed that about half of the total drug consumption mayhave been purchased privately.
19. Another most important area concerns private expenditures ontraditional medicine. These amounts are even more difficuilt toestimate, but the task is facilitated slightly by the ongoingregistration of traditional doctors in Zimbabwe. So far about 11,000have registered, and the President of the Zimbabwe NationalTraditional Healers' Association has estimated that the eventualnumber to register may be about 20,000. In addition, of course, therewill be other traditional doctors who do not register, especially ifthey are not full time or live in particularly remote areas.Nevertheless, if one makes the rather heroic assumption that the1980/81 average income (in cash and in kind) of these traditionaldoctors from their healing activities was approximately equal to theper capita GNP of the country (ie. about Z$400), then the amount spenton traditional medicine in that year would have been in the order ofZ$8 million. Given that the estimate of 20,000 traditional doctors isprobably on the low side, and that it is known that many of them areprobably relatively wealthy, it is suggested that the totalexpenditure figure might be in the range Z$8-16 million. If so, thenthe annual per capita expenditure on traditional medicine would beroughly Z$1-2 p.a. Clearly very little reliability can be placed on afigure such as this, but at least it provides a sense of the broadmagnitude of expenditures on traditidnal medicine.
(xi) Self-help.
20. Finally recognition should be given to the fact that somerecurrent health activities are already being financed throughcommunity efforts. It is indeed the intention of the Ministry ofHealth to try to encourage local communities to accept (at leasteventually) the responsibility for paying their local village healthworker. For the year 1980/81, however, no estimate was attempted ofthe value of community self-help efforts.
Capital Expenditures
21. In 1980/81, capital expenditures for health were incurred inconnection with (future) provision of services by MOH, otherministries, district and rural councils, municipalities, voluntaryorganizations, and private clinics/hospitals. Sources of finance ofthese expenditures included the central government (through theMinistry of Works and MOH), voluntary organizations, foreign donors,and insurance schemes. This is summarized in Table 11.4 below, anddetails concerning the figures shown in that table then follow(organized by source of finance).

ANNEX 1 1~53- Page 9 of 11
Table 11.4: TOTAL CAPITAL EXPENDITURES ON HEALTH CARE1980/81(Z$ '000)
- Source of Funds---------…Service Central Voluntary Foreign Insurance TotalProviders Government Organizations Assistance Schemes Total %Ministry ofHealth 5,942 5,942 42.1OtherMinistries 4,000 4,000 28.4District/RuralCouncils 1,895 1,895 13.4Municipalit-ies 144 144 1.0VoluntaryOrganizations 115 1,000 1,115 7.9Private
clinics 1,000 1,000 7.1
Total 6,201 1,000 5,895 1,000 14,096 100.0
Total % 44.0 7.1 41.8 7.1 100.0
Note: Totals may not add up due to roundingSource: MisBion estimates
(i) Central Government
22. Funds for the construction of MOH facilities appear on thevotes (Public Sector Investment Programme) of the Ministry of Works(renamed Ministry of Construction in April 1982). The Ministry ofConstruction keeps a cost estimate of each individual project andsubsequently a record of such expenditure by individual Ministries.If it is assumed that the percentage of actual to approvedexpenditures in 1980/81 was the same for MOH as for the entireMinistry of Works program, then actual capital expenditures associatedwith MOH facilities were about Z$4,983,000. This figure does notinclude the grants which MOH itself made (mainly with externalassistance) for development of health facilities operated by otherhealth providers, nor its own capital experfditures, which altogetheramounted to about Z$3,113,000 (as was pointed out in paragraph (3)above). This figure breaks down as follows:

ANNEX 11-54- Page 10 of 11
Table 11.5: MINISTRY OF HEALTH CAPITAL EXPENDITURESIN ITS RECURRENT BUDGET, 1980/81
Item Amount (Z$)
Furniture and equipment 942,600Housing in rural areas 16,738Grants to councils: infrastructure 1,894,903Grants to municipalities: infrastructure 125,878Grants to municipalities: furniture and equipment 18,421Grants to voluntary organizations: infrastructure 114,574Grants to voluntary organitations: furniture and equipment 364
3,113,477
23. Of this amount, however, some was actually financed byforeign aid. Although it is again difficult to be precise, it isthought that the main foreign-aid financed item was the capital grant(of Z$1,894,903) to the councils for the renovation/construction ofclinics in rural areas. It is possible that some of the expendituresunder the Ministry of Works' vote were also financed externally, butthis is hard to ascertain as the government's budget gives noindication of funding sources. In view of this it will here beassumed that the total amount of government finance spent on capitalhealth expenditures in 1980/81 was Z$6,201,000 (i.e. Z$4,983,000 plusZ$3,113,000 minus Z$1,895,000).
(ii) Voluntary organizations
24. In the earlier section on sources of finance for operatingand maintenance expenditures it was indicated that voluntaryorganizations were very active in 1980/81 in providing funds fornutrition programs and feeding schemes. In addition, it is estimatedthat they provided about Z$1 million to finance various capitalexpenditures.
(iii) Foreign assistance
25. At the time of independence there were widespread hopes forconsiderable amounts of foreign assistance to help both the country'srecovery and reconstruction, and also its development. However,although several donors were very anxious to expedite their aid flows,throughout 1980/81 (the first year of independence) there were somemajor problems in carrying out the plans. Indeed it was only in March1981 that the Zimcord Conference took place. Nevertheless, it isestimated that nearly Z$8 million was spent on foreign assisted healthrelated development activities in 1980/81--half of which was on waterprograms excluded from Table 11.4. It has already been indicated thatZ$1,895,000 was spent on council clinics reconstruction.
(iv) Insurance schemes
26. The final major source of development finance in 1980/81 wasthrough the medical insurance schemes. At present there are fourprivate clinics/hospitals--one (Mater Dei) in Bulawayo, two (Montaguand St. Anne's) in Salisbury, and one (surgical clinic) in Umtali.However three more (two new ones in Salisbury and an extension in

-55-
ANNEX 11Page 11 of 11
Bulawayo) have been proposed, and work on one of these (Baines AvenueClinic in Salisbury) started in 1980/81. It will have about 150 beds,and the total estimated capital cost is Z$9.5 million. In the fiscalyear 1980/81, it is estimated that maybe Z$l million was actuallyspent on it.
(v) Other sources of finance
27. The other sources of finance which were considered in theanalysis of recurrent expenditures were less important for developmentexpenditures in 1980/81. Apart from the development of water supplies(which were funded essentially from foreign aid), there do not appearto have been any major health-related development activities in theother central government ministries. This also applies to the"parastatals"; and in the case of the local authorities, theirdevelopment activities were entirely financed through the Ministry ofHealth's budget. Possibly there was a little development expenditureby the missions, and by industry and the mines, but no data areavailable on this. And finally there was probably a significantamount of self-help activities (especially in the clinicreconstruction program), but no estimate is attempted here of thevalue of this.

-56- ANNEX 12
Annex 12: INPATIENT OOSTS AND SlJBSIDIES
Table 12.1: AVERAGE COSS AND 9UBSIDIES FaR INPATIE2T CARE IN VARIXJS HLSPITALS(1979)
Total Cost Total Charges Deficit/SubsidyExpenditure Total per Patient Earnings per Patient as %
lt Patient Day Day Z$ of CostHospitals Z$ Days Z$ Z$ Z$Central:
Ardrew Flemixng2/ 8,736,103 201,179 43.42 2,440,505 12.13 31.29 72.1Harare 6,986,939 416,470 16.78 418,618 1.01 15.77 94.0Bulavayo 2,595,178 90,800 28.58 965,151 10.63 17.95 62.8Mpilo 4,804,286 430,104 15.01 331,120 1.03 13.98 93.1
District:
Banket 104,678 25,668 4.08 13,796 0.54 3.54 86.8Belinrwe 44,293 19,805 2.24 6,253 0.32 1.92 85.7Beitbridge 55,956 9,175 6.10 12,309 1.34 4.76 78.0Mrewa 73,652 30,378 2.42 19.976 0.66 1.76 72.7Pluntree 115,972 18,831 6.16 13,760 0.73 5.43 88.1Lmbvw 119,599 24,891 4.80 9,944 0.40 4.40 91.7Shabani 316,623 42,883 7.38 29,490 0.69 6.69 90.7
Rural:
IAwosi 22,888 21,156 0.92 8,726 0.35 0.57 62.0
Psychiatric:
Ingutsheni 1,752,251 275,978 6.35 49,465 0.18 6.17 97.2
Geral:
SinDia 465,260 48,528 9.55 43,328 0.89 8.66 90.7
Source: Ministry of Health.
Notes:l/ Exluding overhead costs, i.e. H.Q. affdnistratimx, staff training costs.7 This is now called the Parirenyatwa Hospital. The cost per unit in 1980/81
wa Z$54, and the cdaugm per unit Z$12.

-57- ANNEX 13
Anex 13: 1*OSTCN OF HE ED=
Table 13.1: ANNDL ESIIMS AND EXPENDIIURES CF ME MENIS CF HEALTHBY MAIN PART 1974/75-1982/83
(Z$ 000)
of widSalisby
Admnistration Mdical Care Group of rewrtiveand General Services Lmspitals Servies &earch Total
1974/75Estimte 1,104 24,911 (9,316) 2,515 340 28,870
% 3.8 86.3 (32.3) 8.7 1.2 100.0Expenditre 1,044 23,799 (8,056 2,517 349 27,710
X 3.8 85.9 (29.1) 9.1 1.3 100.01975/76
Estiimte 1,106 26,286 (8,415) 3,007 410 30,809% 3.6 85.3 (27.3) 9.8 1.3 100.0
Ependiture 1,354 25,897 (8,415) 3,079 3B9 30,719% 4.4 84.3 (27.3) 10.0 1.3 100.0
1976/77Estimate 1,614 30,388 (9,420) 3,304 463 35,769
Z 4.5 85.0 (26.3) 9.2 1.3 100.0Eexenditure 1,498 29,441 (9,102) 3,122 408 34,469
X 4.4 85.4 (26.4) 9.1 1.2 100.01977/78
Estimte 1,501 34,616 (11,461) 3,692 428 40,237% 3.7 86.2 (28.5) 9.1 1.0 100.0
Experiiture 1,215 33,399 (11,120) 3,534 414 38,562% 3.2 86.6 (28.8) 9.2 1.1 100.0
1978/79Estimte 1,449 39,749 (13,605) 4,090 542 45,829
X 3.2 86.7 (29.7) 9.0 1.1 100.0aE anditure 1,355 39,997 (14,005) 3,804 464 45,621
X 3.0 87.7 (30.7) 8.3 1.0 100.01979/80
Estimate 2,113 47,053 (16,729) 4,522 538 54,226X 3.9 86.7 (30.8) 8.3 1.0 100.0
Eyxpnditure 2,139 46,575 (16,729) 4,234 515 53,463% 4.0 87.1 (31.3) 7.9 1.0 100.0
1980/81Estimate 2,525 74,906 (21,537) 5,598 700 83,729
Z 3.0 89.5 (25.7) 6.7 0.8 100.0Eqxenditure 2,695 68,140 (21,537) 5,910 640 77,384
% 3.5 89.4 (27.8) 7.6 0.8 100.01981/82
Estimnte 3,887 95,802 (21,720)1/ 8,442 805 108,936% 3.6 87.9 (19.9) 7.8 0.7 100.0
1982/83Estiute 6,051 107,290 (15,205) 15,999 960 130,300
X 4.6 82.3 (11.7) 12.3 0.7 100.0
NDtes: i/ In tie 1981/82 fiscal year Harare HospiLtal reverted to tle Miristryof Heaith in tie accourts (i.e. it was m longer included in tie sibyertionfor tte Salisbury Group o£ bspitals).
2/ Totals may not add up dt to rotnding.

-58- ANNEX 14Page 1 of 10
Annex 14: HEALTH DEVELOPMENT PLANS, COST IMPLICATIONS ANDAFFORDABILITY
Government Proposals
1. At the time of writing of this report, the Government'sthree-year "transitional" national development plan (originally to beimplemented over the period FY81/82-FY83/84, but later pushed back byone year to the period FY82/83-FY84/85) had not been finalized. Itwas thus necessary to resort to the Zimcord Conference Documentation(March 1981), including its annex prepared by MOH and entitled "Equityin Health", plus discussions with government officials and officals ofdonor agencies active in the health sector, in order to obtain apicture of the plans for the development of the health sector over thenext few years. The mission also attempted to assess the extent towhich some of these proposals have been, or are in the process ofbeing implemented, and the amount and distribution of foreign aidalready secured or pledged for development of the health sector. Theoutcome of these efforts is an estimate (see Table 14.1 below) of thecapital needs of MOH outstanding as of mid-1982, assuming that all thehealth development projects proposed by the post-independenceGovernment would be carried out.

ANNEX 14-59- Page 2 of 10
ZflWTable 14.1: HRA D IEVELIt PLA1 AMD OUISrAIIG CAPITAL NEWS
AS CF MD-1982FinandxW Provided
or Comitted O(tstwadigUimber Ulit Cost Total Cost Amt Capital Needs
Project Ttle of hiits Z$000 Z$000 Z$00 Srce Z$000Village IHalth Workers 1,270 1,270'/ Gwt.Rurl Halth Centers 1/
Ne IEA 316 48 15,168 7,9686/ SIDA, Africen 7,2)0Deelo xt Bawk,European Dev. Bak
Upgraded (clinics upgraded 450 12 5,400 - 5,400to standard RHCs)
Rual anx District HoepitalsNMw District Hospitals 6 6,000 36,000 12,000 Govt., Said 24,000
Arabiaded 2/ 21 500 10,500 - 10.500
Strgteed 3/ 29 100 2,900 - 2,900Scools for Awdijaries (Mls, HAs) 8 700 5,600 7005/ USAAID 4,900Maternal and hild MMalth 1,011 1,0UM6/ GDVt., SE -
- ICEF, WHDNutrition 400 - 400Malaria Control n.a. n.a.Bilharzia Control 800 800Health ducatitn 900 900Mdical Store, Bulawyo 1 1,400 1,400 1,4005/ UAID -Pro1ncial Madical Stores 6 200 1,200 1,2)0 SIDA-Hintenarxce Unit, NM n.a. n.a. SID -Ibuss for Caxmity Nurses 20 12 240 240 sm -Support for District Health
Tea= 4/ 55 60 3,300 - 3,3D0Maial Hospital Efepnsion 10,000 - 10,000Upgrading of General/Provincial
tHopitals 7 / 11 28,900 4,0005/ ovt. 24,900
Total 124,989 29,789 95,200
NDtes:1/ This ass that 149 bealth centers remin to be finaned. H}ewr, it is knrwn that tie African
Dewelopmit Ftd will be c sidering a second pts to its existing prodect.
2/ pgrading of wamiler facilities into district hospitals.
3/ StrergthAng of existing district hospitals.
4/ Ihis assmes tat each team will require four 1uses (at Z$12,000 each) arii tw vehicles (at Z$6,000 each).It is possible, however, that scce allowance for tise was made by tle goverment in its estimtes for tieupgrading of district hospitals.
5/ Already spent o of mid-1982.
6/ Partially spenrt a of mid-1982.
7/ See Zimrord Co-iference Domertation, pap 109.
8/ All figures are in 1980/81 prices

-60-. ANNEX 14Page 3 of 10
2. Two general comments may be made about the Ministry ofHealth's proposals. First, there was a review of development projectsin mid-1981, but at the conclusion of this a revised programme wasfinalized. In consequence of the revision some changes were made incontent and priority, although the programme is still based strictlyupon the proposals and priorities set out in "Equity in Health" as itwas presented to Zimcord. In illustration of this it may be statedthat rural health care remains paramount and that where projects havenot yet come to fruition, e.g. the 6 new district hospitals, this isthe result of financial constraints. The first two district hospitalsare now expected to be started in the course of 1983, and funds arecurrently being sought through the Ministry of Finance, EconomicPlanning and Development to enable the remaining 4 to beginconstruction during the financial year 1983/84. Secondly, the abovecost figures should be regarded as only rough estimates at best. TheMinistry of Construction is now assuming that the annual rate ofinflation for construction is about 36%, and especially in the remoteareas building costs are rising very rapidly. As an example, theestimated cost for the upgrading of Binga District Hospital is now putat approx. Z$700,000, although the estimated unit cost assumed forupgrading existing district hospitals in "Equity in Health" was onlyZ$100,000 (the Ministry of Health, in the light of rapidly rising costis now considerably increasing its bid for funds under this heading).
Status of Proposed Projects
3. The following paragraphs deal with each of the proposedprojects, describing what is known about their current status ofimplementation.
4. Village health workers. Support has been received from SaveThe Children (Binga District), UNICEF (MCH components and trainingfunds), WHO (equipment and seminars) and the Government of Sweden(accommodation for the tutors). The government has put about Z$1.4million into the program so far. The implementation of this project.apparently is going well.
5. Rural health centers. The government is aiming to haveabout 766 rural health centers eventually. About 450 rural clinicsare now in existence, of which about 150 were restored after the warwith USAID funds. Most of the existing rural clinics need to beupgraded to convert them to the new standard RHC. For theconstruction of 316 new RECs external support has been committed bythe African Development Fund, European Development Fund, and theGovernment of Sweden. However, the number of facilities expected to beconstructed with each of these contributions has varied depending onunit cost estimates. It appears that there have been threeassessments of the funding position, as follows:

ANNEX 14-61- Page 4 of 10
Table 14.2: ASSESSMENT OF FUNDING NEEDS FOR NEW HEALTH CENTERS
First Second ThirdFunding Agency Assessment Assessment Assessemnt
African DevelopmentFund 200 82 82
European DevelopmentFund 115 115 75
Government of Sweden _ - 10
Subtotal (Funded RHCs) 315 197 167Outstanding 1 119 149
Total 316 316 316
6. There have been problems with the implementation of thisproject; and although 55 new health centers are now almost ready (ascompared to the plan to build 100 in 1981/82, the first year ofimplementation), none of them were actually in full use at the time ofthe mission. In particular there were problems with adequate watersupplies, both because there was a confusion of responsibilitiesbetween MOH and the Ministry of Water Development, and because of poorsiting of some of the facilities. However, problems of water supplyare now in the process of being solved by close liaison between MOHand the Ministry of Water Development.
7. Strengthening and development of rural and districthospitals. Of the six new district hospitals proposed, two (Mudzi anNkayi) are about to go ahead, with likely partial funding from theSaudi Arabian Government which has pledged Z$3 million for each ofthem. The balance of funds will apparently be put up by thegovernment itself (refer to para. 2 above).
8. Schools for auxiliaries. One of the proposed eight newintegrated training schools has already been virtually completed (atGwelo), with USAID financial assistance. Standard designs are beingused, but implementation of the rest of the project has been delayeddue to manpower constraints. The government has requested somefinancial support from Saudi Arabia for this project, but the amountis not known.
9. Maternal and child health. Support for the MCH program hasbeen received from UNICEF; and further assistance has been given bySIDA, WHO, Oxfam and Save the Children to the expanded program ofimmunization. In addition a child-spacing project has been submittedto USAID by the government (see Annex 2).
10. Nutrition. None of the proposed nutrition villages have yetbeen constructed. It is planned for them to be located near thevillage health worker training sites, and for them to consist ofcompounds of rondavels.

-62-ANNEX 14Page 5 of 10
11. Malaria and bilharzia controls. Little progress has yetbeen made in formulating either of these control programs.
12. Rural water supply and sanitation. There are ten componentsof this project, as follows: (i) preparation of a master plan; (ii)rehabilitation of damaged boreholes; (iii) borehole construction; (iv)dug well construction; (v) water supply for health centers; (vi)laetrine construction; (vii) training for village pump operators;(viii) training for health assistants; (ix) rural water supply,quality surveillance and geophysical borehole siting; and (x)co-operation in execution of rural water supply and sanitationprogram. Although it was not possible to discuss the implementationof these individual project components in detail, it appears thatmanpower constraints are possibly more serious than financialconstraints. For example, the engineering staff of the Ministry ofWater Development are now apparently only 38% of the pre-independencelevel. On the other hand, it is understood that financial assistancehas been offered, committed or approved by the Governments of theNetherlands, Japan, Saudi Arabia, Italy, Australia and Sweden; and bythe African Development Bank, UNICEF, UNDP and the Lutheran WorldFederation.
13. Health education. Little progress has yet been made informulating this program.
14. Rehabilitation plan. The proposal for the Ministry ofHealth to build its own rehabilitation center is again underdiscussion in view of the fact that the Ministry of Labor and SocialServices is also building one near Salisbury.
15. Medical stores. The new medical store (funded by USAID) inBulawayo is almost finished. The final construction cost is estimatedto be Z$1,4 million, as compared with an initial estimate of onlyZ$510,000.
16, Provincial medical stores. The Government of Sweden hasagreed to finance six provincial medical stores (includingconstruction, equipment and transport). The unit cost is put atZ$200,000. No building work has yet started.
17. Maintenance unit. The Government of Sweden has agreed tofinance the establishment of a maintenance unit (including equipmentand technical assistance). No building work has yet started.
18, Houses for community nurses. The Government of Sweden hasalso agreed to provide funds for the construction of these. Nobuilding work has yet started.
19. Support for district health teams. The detailedrequirements have not yet been worked out.
20. Mental hospital expansion. The expansion of IngutsheniHospital at Bulawayo has been delayed. Funds for this project areprovided in the 1982/83 budget of the Ministry of Construction, buttheir amount is unknown.

-63- ANNEX 14
Page 6 of 10
21. Upgrading of general/provincial hospitals. The government'splans for the upgrading of general/provincial hospitals are unclear.In 1981/82 approximately Z$4 million was allocated to complete suchprojects which had already been started, and there will be somecarryover of these expenditures into the 1982/83 fiscal year. Thebudget of the Ministry of Construction for the latter year includesZ$2 million for upgrading of existing hospitals, under the heading"*new works".
Consistency of Planned Projects with the PHC Approach
22. The pattern of planned capital expenditures that emerges fromTable 14.1 is largely consistent with the new orientation towards aprimary health care approach. Clearly, the last two items in thetable (which together account for about one-third of all capitalexpenditures planned) would seem to be of lower priority within thisnew scheme, and hence should be scrutinized with greater care by MOH.Alternatives to expansion of the mental hospital, in particular,should be investigated--e.g. to establish a decentralizedcommunity-based treatment program. Strengthening of thereferral/screening system at general/provincial hospitals could,likewise, substitute at least in part for expansion.
23. As of mid-1982, about Z$30 million had been already spent orcommitted to the various development projects in Table 14.1 Thus,total outstanding capital needs to carry out all projects amounted toabout Z$95 million, in 1980/81 prices. The total budget allocationfor health capital expenditures in FY82/83 (including both Ministry ofHealth and Ministry of Construction allocations) amounts to Z$21.5million, or possibly about Z$16-17 million in 1980/81 prices. Henceoutstanding capital expenditures in Table 14.1 would be equivalent tobetween five and six years of budgetary allocations at present levels.
Recurrent cost implications
24. For some of the proposed development projects it isextremely difficult to estimate their additional recurrent (i.e.,operating and maintenance) costs. Particularly important areassumptions about staffing levels, and salaries. However, in order tobe able to compare the anticipated total recurrent costs of thedevelopment program with the likely real increase in the Ministry ofHealth's recurrent budget, it is important to make some estimates(even if only very tentative) for at least the most importantcomponents of the development program. This is attempted in Table14.3 below.

-64-
ANNEX 14Page 7 of 10
Table 14.3: ESTIMATES OF RECURRENT COSTS OF MAJOR COMPONENTSOF THE HEALTH SECTOR DEVELOPMENT PROGRAM
(arising from planned capitalexpenditures outstanding as of mid-1982)
Unit Recurrent Total AnnualNumber of Costl/ Recurrent Costl/
Project Title Units Z$O0 Z$000
Rural Health CentersNew RHC 2/ 316 20 6,320Upgraded 3/ 450 5 2,250
Rural and District HospitalsNew DistrictHospitals 6 1,000 6,000Upgraded 4/ 21 100 2,100Strengthened 4, 29 20 580
Schools for Auxiliaries 4/ 7 140 980Bulawayo Medical Store 47 1 280 280Provincial MedicalStores 4/ 6 40 240
Support for DistrictHealth Teams 5/ 55 80 4,400
Mental HospitalExpansion 4/ 2,000
Upgrading of General/Provincial Hospitals 4/ 11 5,000
Total 30,150
Notes:1/ In 1981/82 prices.
2/ The estimated recurrent cost for a new health center isbased on the assumption of the following staff: 2 medicalassistants, 1 health assistant and 1 attendant.
3/ The estimated recurrent cost for an upgraded health centeris based on the assumption of the employment of oneadditional trained staff per center.
4/ This assumes that the annual additional recurrent costs are20% of the capital cost.
5/ It is assumed that there are two vehicles (each costingZ$6,000 p.a. to operate), four staff ( at an average salaryof Z$15,000), and miscellaneous expenses amounting toZ$8,000 p.a.
25. From Table 14.3 above it can be seen that the annualadditional recurrent costs of these selected components of thedevelopment program amount to about Z$30 million. Several expanding

-65- ANNEX 14Page 8 of 10
programs, moreover, are not included in Table 14.3. The recurrentcosts of the village health worker program would depend on populationcovered. If the entire rural population were to be covered bymid-1985, about 7,000 VHWs would be needed (assuming a ratio of oneVHW per 1,000 population). At the present level of remuneration,salary costs would amount to about Z$3 million per year, and drugs andsupplies are likely to amount to at least as much as salaries. Annualcosts of the VHW program would continue to increase after countrywidecoverage is reached because of increasing population. The plannedexpansion of the child spacing program would add about Z$1.5 millionper year (in 1981/82 prices) to the MOH's budget, once USAID'sassistance phases out after FY85/86. Expansion of other high-priorityprograms (malaria and bilharzia control, nutrition, health education),anticipated in the Zimcord documents, would add another about Z$2.3million per year in recurrent costs, in 1981/82 prices 1/.Summarizing all of the above estimates, it would appear that a figureof about Z$40 million could be a reasonable estimate, in 1981/82prices, of the overall addition to MOH's annual recurrent costsimplied by the sixteen development projects listed in Table 14.1, plusthe proposed child spacing project.
Affordability of the Recurrent Costs of Health Development Plans
26. It is important to consider the question of over whatperiod of time could the incremental recurrent costs associated withthe planned health capital expenditures (outstanding as of mid-1982)be absorbed into the MOH's budget. Table 14.4 below shows that if allplanned capital expenditures were to be carried out by the end ofFY86/87, and assuming that total government budget remains constant asa proportion of GDP, incremental recurrent costs could be absorbedinto the MOH's budget with only a modest increase in the proportion ofMOH's recurrent expenditure in the total government budget, providedthat GDP grows in real terms at an annual average rate of about 4-5%over the projection period (which is the current Bank's forecast).However, given the recent downward trend in MOH's budget as aproportion of total government budget, the required increase in thisproportion cannot be taken for granted. On the other hand, if GDPgrowth were to fall to a low level of 2% p.a., the required increasein MOH's recurrent budget as a percentage of total government budgetwould be larger, to a level of 6.3%.
1/ This figure was obtained by dividing the estimated recurrentcosts in "Equity in Health" for these programs by three, andadjusting the price base.

-66-ANNEX 14Page 9 of 10
Table 14.4: REJIR GpDWM IN HE B1DGET FR P1ZfCN CF WrSADIN CAFEAEND1URES AN) IrS COERATI(N
(Z$ million, 1981/82 prices)
(1) (2) (3) (4) (5) (6) (7)Total Gwt. MO1 WI Birget GIP at
Budgetl/ Biget Recurrent (2)/(1) (3)/Cl) Market Prices (1)/(6)
1980/815/ 1,353 93.5 91.0 6.9 6.7 3,8872/ 34.8
1981/821/ 1,687 108.9 98.4 6.4 5.8 4,35(?7/ 3B.8
1982/83S/5/ 1,981 116.7 103.8 5.9 5.2
1987/88X(4% GDP growth) 2,4104/ 138.46/ 5.7M87/88 (5% GP growth) 2,528t/ 138.4sJ 5.51987/88 (2% GDP growth) 2,187 138.4t/ 6.3
Noe:
I/ Excluding CoDstitutional arnd Statutory Appropriations
2/ 1980 GDP
3/ Asanirg rate of increase in corner price index (for lowr incom urban families) will be tbhe san betwen
1982/83 and 1981/82 as it wa betwen 1981/82 and 1980/81, i.e., 11.7%.
4/ Assming that total gMverrmext hidget remains cortant as a proportion of GIlP at tie 1982/83 level.
5j/ kiget etimates, not amtual exepnditures.
6/ ! reqtl ired anrual rate of growth in real terms of MI1's recurrent bidget in tie fif-year period
1982/83-1987/88 would be about 6%.
7/ 1981 GM?, provisional estimate.
27. It is likely, moreover, that the required increase in MOH'srecurrent expenditures would be somewhat larger than indicated inTable 14.4, since increasing population over the period will result in
more intensive utilization of now existing services, quiteindependently of any new additions to the public health capitalstock. Also, it is possible that salaries of MOH's staff may besubstantially raised in real terms in response to politicalpressures. These factors would result in either a lengthening of theimplementation period of present health development plans beyond1986/87, or an increase in the proportion of MOH's recurrentexpenditure in total government budget beyond what is indicated inTable 14.4. This trade-off should be explicitly taken into account byMOH in considering any prospective increases in staff salaries.
28. On the other hand, MOH may be able to curtail the growth of
selected recurrent cost items through improved expenditurecontrol. The need to take steps towards more cost-effective usage ofmedicines dispensed by public health facilities was pointed out in

-67- ANNEX 14
Page 10 of 10
para. 2.66. Certain hospital cost items may sustain some cutting.Identification of suitable opportunities for cost-cutting would begreatly facilitated by the adoption of a program budget by MOH (ifnecessary in tandem with the existing budget), which in any case wouldbe an important step towards better planning in general. It is howeverthe view of MOH that such an addition to its financial controlfunction would necessitate the incorporation of additional staff.
29. Yet another important factor to take into account indetermining what would constitute a feasible time frame forimplementation of existing health development plans is the question ofconstraints in the MOH's detailed planning capacity and inconstruction implementation capacity, as MOH attempts to increase itsannual rate of capital expenditures. To complete all healthdevelopment projects outstanding as of mid-1982 over thesubsequent five-year period would require annual health capitalexpenditures of about Z$21 million (in 1981/82 prices). This amountsto about two and a half times the corresponding actual figure forFY80/81 (Z$8.1 million in 1981/82 prices 2/). At the time of themission's visit, less than 40% of the established professional andtechnical staff posts of the Ministry of Works were filled. Localconsultants were already being used a great deal, but serious delayswere occurring in design work. There was also evidence of strains inthe construction industry's capacity, with inflation in constructioncosts estimated to have risen to 3% per mDnth. Thus it would seemthat the time frame assumed in Table 14.4 above, though apparentlyfinancially feasible, may be too optimistic in view of non-financialconstraints.
2/ This includes health capital expenditures financed out ofboth the MOH's and the Ministry of Works' budgets. ForFY81/82, the corresponding estimate was about Z$19 million(in 1981/82 prices), but actual expenditure figures are notyet available. The corresponding estimate for FY82/83 isalso about Z$19 million.

ANNEX 15-68- Page 1 of 48
Annex 15: NUTRITION
Part I: Magnitude and Nature of Malnutrition in Zimbabwel/
A. Overview
1.01 The most useful and most accessible measure of nutrition statusis nutritional anthropometry, particularly on children 6-to-36 months ofage. (Beyond that period the data become progressively less meaningfuland less nutrition-related.)2 / The anthropometric measures mostcommonly used are: (a) Weight for age -- which considers children below60% of an accepted standard as third degree malnutrition, those 60-75% assecond degree and those from 76-90% as first degree malnourished; (b)Height for age -- a good measure of long-term malnutrition; and (c)Weight for height -- an indicator of recent malnutrition. In this systemthe child is generally considered "normal" if his or her height for ageis above 90% of the standard and weight for height is above 80% of thestandard. A child is said to suffer from "acute undernutrition"(wasting) if height for age is normal but weight for height is low. Achild suffers "chronic undernutrition" (stunting) if weight for height isnormal but height for age is low. And, finally, a child is said to have"concurrent acute and chronic undernutrition" (stunting and wasting) ifboth indices are low.
1.02 Little information on nutrition conditions in rural areas wascollected before 1980 and portions of that were not made public. In1977, an unpublished confidential report to the Government concludedthat 37% of the children in Gutu Tribal Trust Land (TTL), 32% inMatshetshe (near Gwanda TTL) and 43% in a "protected village" in Chiweshesuffered from some degree of malnourished stunting (138). From 1978 datasets collected for other purposes in Gwanda and Gutu, it can be seen thata very high 11.3% of children were under 60% of the expected weight fortheir ages.
/ All bibliographical references are listed in Attachment 1 to thisannex.
2/ Although nutritional status measurements are, in theory, the truemeasure of nutritional well-being, they may be somewhat less valuablethan consumption data because generally they relate exclusively tochildren. (An exception is birthweight data--unavailable in Zimbabwefor a cross section of the population--which is a good reflection ofmaternal nutrition status.) To some extent the nutritional status ofyoung children may be a proxy for the nutritional status of thecommunity as a whole. But our ability to generalize children to thecommunity is limited by the fact that young children are relativelymore affected by infection (particularly diarrhea) and by deleteriousbelief patterns than are adults. At the same time young childrensuffer more quickly and more severely from the consequences ofmalnutrition.

ANNEX 15-69- page 2 of 48
1.03 Nearly all pre-1980 published materials reflected hospitalreports. A 1973 study of pediatric admissions to Harare Hospital foundthat severe malnutrition in the form of marasmus or kwashiorkor (whichreflect gross deficiencies of calories and/or protein) was the first,second or third diagnosis for one-third of the 2,354 children admitted.Malnutrition was the second most common reason for admission and was theleading cause of death (31%, more than double anything else). Relateddiseases in which malnutrition probably played a large role also rankedhigh (e.g., measles -- 10%, gastro enteritis -- 5%)(4). During the sameperiod, a medical school professor was reported saying that "Harareadmissions probably represent less than one-tenth of the clinicallyapparent patients with protein energy malnutrition" (114). Of 3,958people hospitalized with nutritional deficiency diseases in 1978, 17.4%died. This was double the percent of fatalities from any other diseaseexcept pneumonia (179). Nutrition problems were the direct cause forabout 5% of all hospital deaths in 1979; measles, diarrheas and othernutrition-related deaths were not included in this figure (180).
Communal Areas
1.04 Broader survey coverage began in 1980. An OXFAM study in theMtoko TTL area in the spring of 1980 found 15% of the children in awell-baby clinic with second and third degree malnutrition and 42% of thechildren in another area of the TTL at that level (61). Additional OXFAMstudies carried out in mid-year 1980 in Dande, Chiliamanzi, Ndanga, andNdowoyo TTLs found 30% of the children suffering from second or thirddegree malnutrition and 36% showing current deprivation (175). Thesestudies were either of children attending "well-baby clinics" or of thosemothers that were accessible. So soon after independence the mothers whowalked the distances to these clinics were those who felt their childrenneeded some attention. This could account for the high rates. There isno evidence to suggest that the more accessible a population (near roads,clinics, service centres) the better its nutritional status; therefore,this bias could have been significant.
1.05 The Ministry of Health, with UNICEF cooperation in September1980, measured the arm circumferences (a simpler and cruder measure thanheights for weights, but nonetheless useful) of 4,777 one-to-five yearold children in 54 districts and concluded that 29% were suffering fromsecond or third degree malnutrition. The worst cases were in Victoria,Matabeleland and the Midlands, mainly along the border areas (178).Reports from OXFAM doctors in April-June 1981 stated that 30% ofone-to-four year olds had second or third degree malnutrition at DotitoClinic, as did 33% of the children in Musengezi and 25% in Hoya andRushina.
1.06 Fifth year medical students doing field work in April 1982 inNyaderi, Musame, Mnene, Musiso and Chisumbanje areas, found that 35.5% ofchildren in under-five clinics had second or third degree malnutritionbased on weight for age and 24.5% of hospital outpatients and 66.8% ofthe inpatients could be categorized as second or third degree (96). InMberengwa District, 9% to 25% of 2,100 children measured in 17 under-fiveclinics were found to have second or third degree malnutrition (57).

ANNEX 15-70- page 3 of 48
1.07 In March/April 1982, 52 of the 80 children admitted to MneneHospital had second or third degree malnutrition and 21 of these wereadmitted with the first diagnosis of malnutrition. (In the first threemonths of the year, 138 adults and children were admitted formalnutrition; five died of kwashiorkor, two of marasmus.) A count inApril 1982 found 30 current cases of kashiorkor or marasmus in RusapeDistrict Hospital.
1.08 Although too small a sample to draw any conclusions, a May 1982survey in Gutu of 50 children found that 6% had severe (third degree)malnutrition and 16% had second degree. Severe stunting was seen in 14%of the children and moderate stunting in 40%, some of these within fivekilometers of a business center (77). A still smaller sample (of 38children) during the same period in Wedza found 8% severely and 16%moderately stunted (80).
1.09 Finally, a survey in May 1982 carried out in Bindura Districtcommunal areas (in Madziwa and Masembura) found that 18% of 428 childrenmeasured were suffering from second or third degree malnutrition and that13% were severely stunted. Seven percent were severely wasted (82).
1.10 Although certain of the above studies and reports do notdifferentiate their cases by type of community (urban, commercial farms,communal areas, mines), most relate to communal areas. The data aresketchy and scattered and collected in different forms but sufficientlycommon in conclusion to suggest that malnutrition is rife in theseareas. Nineteen of 45 doctors from health facilities, mostlyrepresenting populations of largely (but not restricted to) peasantfarmers, cited malnutrition first among the leading problems they facedin the six month-to-three year old age group. Kwashiorkor and/ormarasmus was seen as the major or a major problem in eight places. Of 94Agritex field staff surveyed in May 1982, 45 found "much" or "some"kwashiorkor or marasmus in their areas, 36 reported "little" and sixreported that there was "none."
Commercial Farms
1.11 Approximately 25% of the African population of Zimbabweconsists of farm workers and their families living on the 5,000 to 6,000large commercial farms. Earlier unquantified reports about theconditions of farm worker families indicated noticeable features ofstarvation (24) and more recent research confirms a major problem. In1981 a series of studies was undertaken that found severe conditions. Ina commercial farming area in Matabeleland, 14% of children in Beitbridgeand 20% in Nyamandhlovu were judged severely malnourished based on weightfor age (the range was from 10% in some farms to 47% on another) (79).Then, in a survey of 227 children carried out on farms in Mashonaland,Raffingora District, 24% of the children were second or third degreemalnourished and 49% showed some stunting (81). Further samples in a 30kilometer radius of Bindura city found 53.4% of the children measuredwere severely stunted and that over half had second or third degreemalnutrition based on weight for age (75).

-71- ANNEX 15page 4 of 48
Urban Areas
1.12 About 18-20% of the population live in urban areas. A smallsample taken in 1981 in a well-off area in Harare showed 8.5% of thepre-school age children had second or third degree malnutrition and thismore than doubled, to 20%, in worse off areas of Harare (153). A recentstudy in the city of Bindura, where a clinic was accessible to 94% of thefamilies and 88% of the children had "road-to-health" growth measurementcards, found less than 1% (five of 317 pre-school children) were severelymalnourished, both weight for age and stunting. An additional 11% weremoderately malnourished on both scales (83).Mines
1.13 Relatively little information is available concerning thenutrition status of the 70,000 mine workers and their families. Theearly literature makes references to mine rations being of insufficientquality to maintain the health of the African miners. The pattern is oneof a history of inadequate diets, recommendations for improvements,protests lodged by mining companies about the recommendations and littlechange over time (113).
1.14 Relatively few families live with the workers because of acuteshortages of accommodations at the mines. One study, in December 1981,was made of 626 children under six living with fathers working in twonickel mines and three gold mines in the Bindura District. The studyshowed 3% severe stunting and 12% moderate stunting and 1% severemalnutrition based on weight for age. Although over half the childrenwere to some extent stunted, the number of serious cases reflects asomewhat better picture, comparatively than commercial farm and communalareas (84).
B. How Serious the Problem?
1.15 By any measure, the available fragments of nutrition statusdata add up to a malnutrition problem of major magnitude. Table 1provides a composite of 23 of the above-mentioned surveys that usedsimilar measures. These were undertaken in different seasons (althoughit is noteworthy that the majority of surveys were undertaken Marchthrough June, when nutrition is at its best) in different areas of thecountry by different researchers with different levels of training anddifferent sampling techniques and quality controls. Therefore, the tableshould be interpreted with caution. Nonetheless, the general pattern andconsistency of the findings is striking.

-72-ANNEX 15Page 5 of 48
mm= - RX PIm , Br T Table 1
IGHI PMF AGE (X) RelGH FOR A (%) EZ LFO HEIGHT (Z)Total Total Total
- o------of * idch ch idernwrishud - id -h - Uknermrrished -- of ,d ch h- UndernurishedS]pe less than 60% less an 75X (less than 90% Less tlw 85% lss thm 90% (less thn 95% less than 70% Less hn 80% (Less thm 90%Sim of Standard of Stadard of StAard) of Standard of Stsndai of Stmard) of Stanard of Standard of Stasiard)
C01MIAL FARI ERS
1. h1tbr1 (7-8/81) 112 1/ 14 46 28 46 9 332. _ b u ( * ) 93 'r/ 20 38 32 47 9 343. Id -
(balmaDt.) (WU8 ) 227 24 36 49 66 4 174. N (1983) 223 50 68 53 64 7 16 405. (6/81) 128 38 53 43 53 23 51
T 1A1U 783 32 5D 44 58 2 12 33
6. e ' 5 nys. 418 10 29 3 8Q (12/81) 4 Mn. 174 2/ 28 5
7. EA (1281-1/82) 53 0.09 6 31 OC9 7 24 1 7 19- 3/ (10t74) 352 3
S.8 .mam --p- , )kn* (417/80) 61 15
1Al thbn 4/ 961 < I 8 31 <1 4 13 I 5 14
9. PA-1n- (12/81) 623 1 20 51 3 15 53 1 6 22
TlaL. AMS
10. ZItshetsbe(near wainda) (5/76) 155 14 32
11. ChitBngoClinic, lmde TEL (12/80) 61 36 61
12. GWy TIE (1980) Not glsn 18 5213. Qaechce PV,
mcmyo TEL (1980) Not given 0 614. 8B1na,
Ymembura, Madziwn 398 3 14 54 13 31 57 7 13 2615. lm6ga TEL (5-6/80) 184 24 4916. (liilsmnzi TIm (1980) 250 24 5417. kNimv TEL 230 3 2018. Lbda (5/82) 38 0 8 55 3 21 63 0 0 1119. Guut (5/76) 198 18 4320. Qutu (1978) 91 21 37 55 44 64 70 3 13 3321.L)a ( 6) (1978) 85 9 26 44 27 39 49 1 9 3122. Q,tu (4/82) 50 6 22 78 14 52 72 0 8 1623. Uzinxa (5-6/80) 148 30
I/ Sap lOe slu3s a -11 nmber of cd lrn mer 5 yrs.: in Bitridg 4>5 yrs; in , 9) 5 yrs.Cn only ba sepurated out In *ght for Ae argory.
2/ S11le of 4 clinics.
3/ we ed 3 gr8p of children-wry little data reprted.
4/ Used dota fro Hare and Chit,i.a (only tte 418 <5) an id .

-73-
ANNEX 15page 6 of 48
1.16 Overall, using weighted averages to reflect sample sizeswe see a picture of 21% of the under-five population with second or thirddegree malnutrition based on weight for age (see Table 2). Using aweighted Bindura figure which probably reflects a better cross sample ofthe population, 23% fall in this category. This is roughly comparable toCameroon, Lesotho and Liberia, lower than Sierra Leone at 31% and higherthan Togo at 15% and Egypt at 9%. (The number of second and third degreecases of malnutrition combined in North Africa, the Middle East and LatinAmerica is 15-20%.) Stunting is seen in 28% of Zimbabwean children (30%in the cross-community Bindura sample), considerably higher than the 9.1%in Togo, the 18% in Liberia and the 21-24% in Lesotho, Sierre Leone,Cameroon and Egypt. Wasting is found in 9% of Zimbabwean children (12%in Bindura), which generally is at least triple all of the abovecountries.
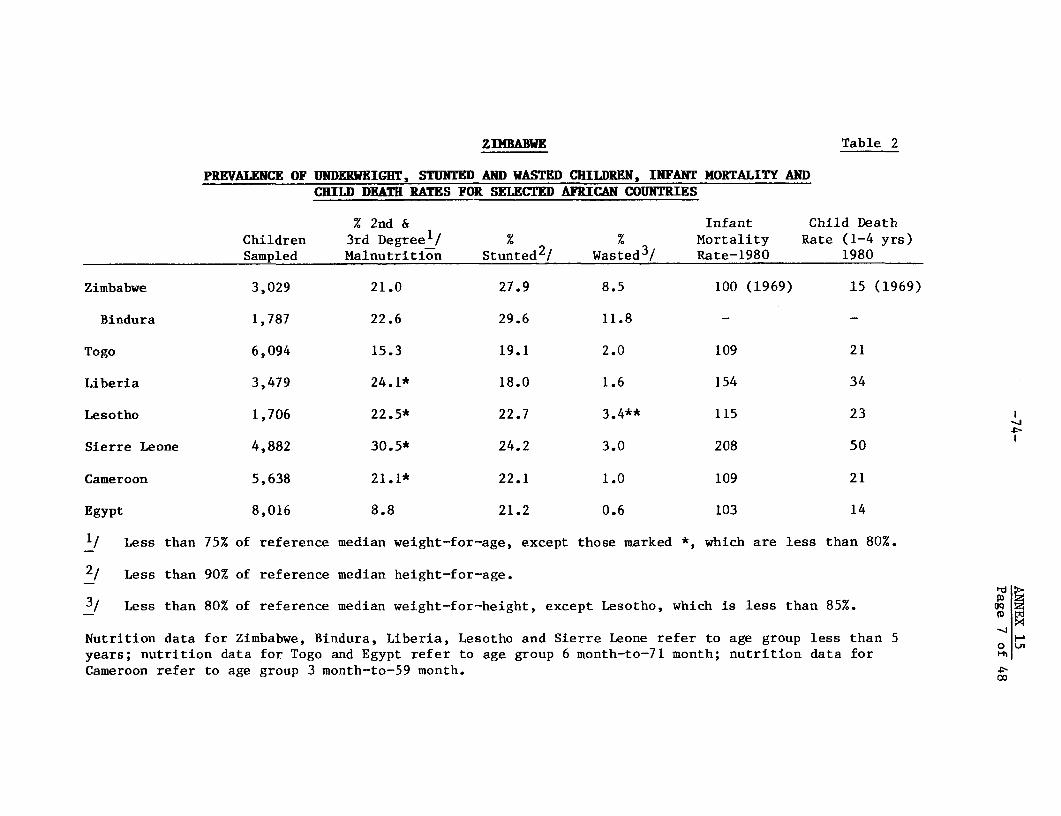
ZIDBABWE Table 2
PREVALENCE OF UNDERWEIGHT, STUNTED AND WASTED CHILDREN, INFANT MORTALITY ANDCHILD DEATH RATES FOR SELECTED AFRICAN COUNTRIES
% 2nd & Infant Child DeathChildren 3rd Degreel/ % % Mortality Rate (1-4 yrs)Sampled Malnutrition Stunted2! Wasted3! Rate-1980 1980
Zimbabwe 3,029 21.0 27.9 8.5 100 (1969) 15 (1969)
Bindura 1,787 22.6 29.6 11.8 - -
Togo 6,094 15.3 19.1 2.0 109 21
Liberia 3,479 24.1* 18.0 1.6 154 34
Lesotho 1,706 22.5* 22.7 3.4** 115 23
Sierre Leone 4,882 30.5* 24.2 3.0 208 50
Cameroon 5,638 21.1* 22.1 1.0 109 21
Egypt 8,016 8.8 21.2 0.6 103 14
1/ Less than 75% of reference median weight-for-age, except those marked *, which are less than 80%.
2/ Less than 90% of reference median height-for-age.
3/ Less than 80% of reference median weight-for-height, except Lesotho, which is less than 85%. OQ
Nutrition data for Zimbabwe, Bindura, Liberia, Lesotho and Sierre Leone refer to age group less than 5 H
years; nutrition data for Togo and Egypt refer to age group 6 month-to-71 month; nutrition data for 0
Cameroon refer to age group 3 month-to-59 month. X

ANNEX 15-75- page 8 of 48
Comparisons of Communities
1.17 Almost no comparisons have been made of the relative severityof the problem among the various communities. Based on the 1969 census,infant mortality rates, generally a good indicator of nutritionconditions, are two and a half to four times higher in rural areas thanurban. A 1975 study showed that the malnutrition problem in the TTLs wasfour-to-five times as bad as it was in urban or semi-urban populations(130). Four reports from the Mtoko area in 1980 showed that thenutrition problem among peasant farmers in communal areas can be morethan four times as great as for those living in a township (61). In a1968 study, twice as many of the 41 cases of hospitalized nutritionaldisease and 30 cases of kwashiorkor were found in children from the TTLsthan from children from commercial farms (51). However, since thepopulation of commercial farm workers is less than half that of communalareas, this would suggest that the situation may have been more severe oncommercial farms. Table 3, an aggregate by type of community, indicatesfamilies of commercial farm workers are the worst off nutritionally.One-third of the commercial farm children are below 75% of their expectedweight for height, compared to one-fourth of the children in communalareas. Similarly, stunting is found in 44% of the former; 36% of thelatter. Children from mine areas come next and the best off are urbanchildren. Serious stunting is 11 times mare prevalent among commercialfarm children than their urban counterparts. _/
1.18 The best cross comparison of the severity of the problem bytype of community can be seen from the studies in Bindura. They wereundertaken in the same District, over roughly the same recent period andlargely used the same measures. From Table 4, the same communitypattern of the severity of malnutrition appears as in the aggregatetable.
Differences by Age
1.19 The onset of malnutrition generally coincides with the start ofthe weaning period. In one relatively well-off township children gainedweight almost normally until the start of weaning at five-to-six months
3/ Little or no nutrition data is available for the 74,000 people livingon resettlement plots, or of the 8,600 families on African purchaselands. One doctor working with resettlement scheme families inBindura District reported in May 1982 no nutritional problems in thearea.

Table 3TD E CFOM91 AGT Y A TAKE
WKM FM sAGE HUM FMt AGE WE) FaT T (TiOW1 itn Total
- o f i thch b- Undmoursh1sd -of hich i- Umdrxmurlshmd %tddkh- UmhrmsulmhudS_Ie Las du 6(X lam tun 7X Omu thn 90X las Om 8 lms dm 90 as" am 95 ims dun 7(X ine dmn 8(K (Less dun got
Size of Stard of Stward of StmArd) of St_ard of Staud of Studazd) of Starad of Stard of Stadrd)
OCQtWlL FD W 783 32 50 44 58 2 12 33
11E 961 < 1* 8 31 < 1 4 13 1 5 14
lHlN3S 623 1 20 51 3 15 53 1 6 22
L D'Z uw
(A) 264 11 27 56
(B) 1,157 22 54
(C) 662 19 36 59
(D) 892 4 9 25
* 7, not 6CK
For caqxuititn of gmups, refer to Table 1 and belfw
Coral Farm Workers: 1 - 5Urban: 6,7Mines: 9TIL: (A) 18, 20, 21, 22
(B) 11, 14, 15, 16, 18, 20, 21, 22(C) 14, 18, 20, 21, 22 , (D) 14, 17, 18, 20, 21, 22 o uu

BEluA - BY TYPE (V WM= Table 4
MUM PVR HKI (X) FM (X) W= KR a1l( C)Total TOW Total
- o f ic..LrL tk2dern&w uri*e -Of dicd d - xIerm hdw vkdc h eierdriaISuwy Siple est dm 6O.1 Le tha 7 Ls than 9(s 1w tan9 L 8I M than 9( (90 s than 952 LOSs than 7 (1 LM then 8(A1 ( m 9(1
BIURA Date Size of Staxtard of St.mrd of Stanrd) af Stmxdrd of StadIhrd of Stantbrd) of Stanhrd of St.drd of StmNrd)
(XMCIAL FR WMS 12/8D-1/81 223 12.0 42.0 68.0 53.0 64.0 7.0 16.0 40.0
UDM ANA 12/8-1/82 543 0.W9 6.0 31.0 0.49 7.0 24.0 1.0 7.0 19.0
ISl3D 12/81 623 1.0 20.0 51.0 3.0 1l.0 53.0 1.0 6.0 22.0
41TIL 5/82 398 3.0 14.0 54.0 13.0 31.0 57.0 7.0 13.0 26.0
Cimedal Farm Waders: Survey carried out In 6 large fam betwm Bimhwa 2d Haiziw TIL (1omemm)Uran: Survey aried out ain wf -1za and (hipudze 'txaeup1' hin Bin wa urdm arm (Iammi)WLnes: Survey carried ca m 5 .1w InlInmurq dist-ict (Iomml)TIL: S&ver carried out in INabwa and dziv o i arm ( I)
0

ANNEX 15page 11 of 48
when they started to suffer an abnormal reduction in the rate of growth.The velocity of growth, as judged by weight gain over a fixed period, waswithin normal limits during the first three months, then fell behindslightly until six months. From six-to-nine months the children gainedbarely more than half the weight expected and substantial shortfalls ingrowth continued until 18 months when expected weight gains continued.These were of children from a relatively privileged and disease-freesituation compared to other urban townships and most rural areas (159).
1.20 Studies of children of commercial farm workers in Matabelelandfound that severe malnutrition was four times higher in a sixmonth-to-two year age group as the zero-to-six month group. And the ratethen remained relatively constant in a two-to-five year group (79). Only4% percent of children of commercial farmworkers in Mashonaland hadsecond or third degree malnutrition in their first six months, comparedto 33% in the following 18 months; this dropped to 21% between ages twoand five (81). Similarly, among the children of farm worker familiesnear Bindura, the largest percentage of severely and moderatelymalnourished children was between six months to two years for everymeasure. The survey of doctors from 45 health facilities found that inonly two of the responses was malnutrition the most important illness inthe zero-to-six month group, but was cited first in importance in 19responses in the six month-to-three year group. Kwashiorkor and marasmuswere seen as major problems in eight of the facilities in the older groupand none for the younger group.
1.21 When figures are compiled by year, nearly all studies show thatchildren are hit hardest during their second year of life. Themalnutrition seen in the second year of 2,745 children weighed inBulawayo in 1981 was nearly double that of the first year, peaked in thethird year and then started down (11). In three of the four December1981 studies in Chitungwiza and Harare, the problems of the second yearmade a marked jump over the first year (152), Other samples in Harareshowed that nearly four times as many children have severe malnutritionin the second year as the first year (153).
1.22 Malnutrition in the first year accounted for 4% of the deathsin Harare in 1980. From ages one-to-four, however, malnutritionaccounted for over 21% of all deaths (122). Of nationwide hospitaladmissions, 2.3% were attributed to nutrition deficiencies under age one,10.8% between one to four and 2.2% for the next 10 years (161).
1.23 The 33,000 school children measured in Harare in 1980 showed adecline in malnutrition with years, from 23% second and third degreemalnutrition in the first grade of school to 15% in the third grade to 9%in the seventh grade. Although there is no direct evidence, this in partcould be a reflection of a lower school drop-out rate among the betternourished. There are substantial differences in neighborhoods; themalnutrition in some areas being three times as great as in others (122).
1.24 No satisfactory studies have been carried out to make itpossible to establish a relationship between the age of the mother andthe nutritional status of the children.

-79- ANNEX 15page 12 of 48
Differences by Sex
1.25 Are boys and girls treated differently, as far as feeding? Theresult of the farm survey in Chiweshe showed there apparently is aslightly greater degree of stunting in the zero to two-year age group ofgirls compared to boys while for other measures the boys and girls wereapproximately the same (76). In Mtchabezi, boys and girls 13-and-underdid not show great differences in weight for age although boys in thiscase showed a higher prevalence of stunting (119). Girls also werebetter off at each age group up to five in both Gutu and Gwanda. InBulawayo, boys and girls had the same growth through the first two yearsbut between two and three years more girls were judged under weight thanboys (11). In the urban Bindura study, girls semed to be better off fromsix months to two years and the situation was reversed £rom two to fiveyears (83). Thus, the picture is mixed. Overall, however, these are notthe kinds of substantial differences that one finds in cultures whereboys in the early years of life are given preferential feedingtreatment. A comparison of the types and varieties of food given boysand girls in Gutu and Gwanda in 1978 shows no special attention in thefeeding of boys.
Seasonal Differences
1.26 Some periods of malnutrition are much worse than others.Reports of serious malnutrition cases by OXFAM doctors in Matibi andBondolfi for twelve months in 1981-82 found that, by far, theNovember-January period was the worst. Responses from the questionnaireto health facilities found that October through December was the periodwhen serious malnutrition was most frequently found. This coincides withthe period when food is in short supply. Nutrition status was best fromMarch to June, just after harvest. Tabulations of monthly data onchildren hospitalized due to malnutrition in Gwanda district over afourteen-year period (1963-1976) found November to be the most seriousmonth, with October second. April and May were the best months; Aprilhaving 40% of the cases of November (177). A 1975 analysis of medicalpediatric admissions to Harare Hospital found that malnutrition rosemarkedly in the agriculturally slack period (4).
1.27 The basic picture is one of chronic nutrient deprivation,intensified during seasons of reduced food availability. At that time,moderately malnourished children tend to sink into more acutemalnutrition. Although perhaps not as much so as other countries, theybecome more vulnerable to the debilitating effects of diarrhea andinfectious diseases. As for adults, the peak months for energyexpenditure in agriculture are exactly those when food supply is at itslowest (24),
C. Micronutrient Deficiencies
1.28 All of the above relates to calorie, and, to a lesser extent,protein problems; nearly all of the survey work undertaken in Zimbabwe todate has been restricted to these. Although these problems clearly are

-80- ANNEX 15page 13 of 48
the mDst important, surveys conducted in conjunction with this study alsosuggest that serious micronutrient deficiencies may be highly prevalent.Moreover, conditions predictably may deteriorate with regard to certainof the vitamin and mineral deficiencies.
Pellagra (Niacin Deficiency)
1.29 Pellagra, a nutritional disorder that is common in populationswhose diets depend heavily on maize, is characterized by cracked, scaly,peeling skin and cracked fiery lips. The patient often is confused,suffers loss of memory, insomnia, is irritable and dull. Seriousdiarrheas are common. In Zimbabwe, the highest number of pellagra casesare encountered from late August to November.
1.30 The prevalence of pellagra in Zimbabwe is not known but of 32health facilities that responded to the question, 16 reported they seepellagra "often," and 10 "aometimes" see pellagra. (Five reported they"rarely" see pellagra and only one facility reported that it never sawpellagra cases.) Of an additional 10 facilities that wereinterviewed,five found pellagra "often," four "sometimes."
1.31 A study in the 1950s of patients at Salisbury African Hospitalfound that of the 54 consecutive admissions for nutritional disease, 22were cases of pellagra (97). Another study of nutritional disorders(reported in 1971) found that 269 of 361 mostly-adult cases examined overthree years were suffering from either frank pellagra or pellagroid state(near pellagra, with some of the same symptoms) (51).
1.32 The main cause of pellagra appears to be inadequate niacin in aheavily maize-based diet. In Zimbabwe, the problem currently is beingexacerbated by the dramatically increased consumption of highly refinedmaize meal in which the niacin content is only 40% that of the village-processed product. In certain other maize-eating cultures, pellagra hasbeen inexpensively and efficiently eliminated as a public health problemthrough fortification of maize meal with niacin.
Goitre (Iodine Deficiency)
1.33 Data on prevalence of goitre is sparse. One investigation inChimanda TTL found a 35% goitre prevalence among the studied population(93), A study among Tonga. in Omay Tribal Trust Lands in the 1960s found45% of a community with goitre and, as is common elsewhere, the highestrate (77%) was among adolescent girls. The rate among 6-to-12 year oldswas 68%. A study about the same time in the Chikwaka Communial Areafound a 74% prevalence in a village population. (Twenty-six of 40 adultmales and 56 of 71 adult females had goiterous thyroid enlargement.)(36).

-81- ANNEX 15page 14 of 48
1.34 The indications from this scattered data that goitre is commonin Zimbabwe was confirmed by staffs of public health facilities. Of thehealth facilities responding to the questionnaire in May 1982, 18 sawgoitre "often," 15 'sometimes," 10 "rarely," and two "never." Staffinterviewed from an additional 10 centers reported that goitre was seen"often" in five cases, "sometimes" in three, and "rarely" in two.
1.35 The appearance of goitre is common but the consequences inZimbabwe are not clear. There is little recorded deaf-mutism orcretinism that frequently accompanies severe goitre in other cultures.Several doctors have reported that the main concern is cosmetic.
1.36 The likely cause of endemic goitre in Zimbabwe is lack ofiodine in the soil and hence in water and food (1). The only referencefound in the local literature to testing for iodine content found it tobe very low in drinking water (36).
1.37 Many countries deal with the goitre problem by iodizing thesalt supply. Currently, iodized salt is on the market in Zimbabwe butgenerally at a cost $0.01 higher than unfortified salt. This is enoughto discourage that portion of the population that most likely needs theextra iodine, given their lack of knowledge about the advantages ofiodized salt.
Vitamin A Deficiency
1.38 Less prevalent than pellagra and goitre but nonetheless notuncommon in Zimbabwe is vitamin A deficiency, which affects growth, skincondition, the severity of other nutritionally related illnesses andvision. Severe vitamin A deprivation can lead to blindness and is amajor cause of blindness in many countries. Its role in blindness inZimbabwe is not clear. A 1979 paper referred to vitamin A deficiency asa major cause of blindness among preschool children in Zimbabwe (58).However, a report for WHO in July 1981 stated that frank keratomalacia (asevere form of vitamin A deficiency, reflected in complete cornealdestruction) was uncommon according to the medical records reviewed (95).
1.39 A 1982 school health survey of 1,314 students routinelyexamined in Musami, Murewa, and Mtchabezi found eight corneal scars,reflecting a severe deficiency (96) (119). In the 1960s, a study inMatabeleland found 76 cases of xeropthalmia, a term applied to all ocularmanifestations of vitamin A deficiency. An additional 22 cases werereported of children that had either died or were unavailable forexamination. Based on this, the investigator estimated a minimum of 250cases in the area (87). An unquantified report in the late 1970s claimedthat children from Matabeleland were going blind from measles and vitaminA deficiency (20). A study of cases of nutritional disease in HarareHospital found vitamin A deficiency to be the second most importantnutrition disease at 24% (4). A larger study of mostly adult nutritionaldiseases found vitamin A deficiency to be the major problem in 7% of thecases (86).
1.40 In the above-mentioned survey of health facilities, tworeported that vitamin A deficiency is seen "often," 17 "sometimes," 19"rarely," and one "never." This ratio approximates the interviews with anadditional 10 health facilities.

-82- ANNEX 15page 15 of 48
1.41 Most cases of severe vitamin A deficiency are seen from May toDecember, the measles season in Zimbabwe. It is also the season whenmilk is less available, and when the green leaves generally are consumeddry and therefore have less vitamin A (87). The most serious cases ofvitamin A deficiency usually are related to measles, which interfereswith the uptake of the vitamin in the gut. Even though the diet mayprovide adequate vitamin A under normal conditions, it is not sufficientin times of stress (58). In fact, the severity of measles is largelydetermined by the state of nutrition at the time of the attack (5). Inthe above Matabeleland study, most of the xeropthalmia cases wereassociated with measles (the others with marasmus, kwashiorkor ordysentery) (87). The problem is almost always found among people whosediets are limited in variety. A study in 1967 of 988 childrenhospitalized in Lupana found ocular lesions from measles much more severeamong blacks with limited vitamin A intake than Europeans (35).
1.42 Rural children in Mashonaland have much higher plasma vitamin Alevels than urban children, according to a comparative study of 180 ruralchildren and 145 urban children in the Bindura area (17). Few of therural children studied were in vitamin A deficit except in isolatedinstances. This may in part reflect the availability of wild fruits andvegetables, less accessible to city children. However, with the declinein availability of wild foods, and the decline in consumption of othertraditional foods due to diet preference changes, the possibility existsfor increased vitamin A deficiencies in rural areas as well.
Iron Deficiency Anemia
1.43 Determination of iron deficiency anemia is based on biochemicalmeasurements that rarely exist in Zimbabwe other than for hospitalpatients.4 / A reading of a sampling of hospital admission charts inRusape in May 1982 found a range of hemoglobin among children from 6.1 to12.0, with the average being 9.4, a low level. Of the health facilitiessurveyed by the mission, 18 saw iron deficiency anemia "often," 17"sometimes," seven"rarely," and none "never." The relative infrequencyof cases of severe iron deficiency anemia was attributed by severaldoctors interviewed by the mission to the common use of iron pots bylow-income populations, a situation that could change with"modernization."
1.44 A study in the 1960s found that of 341 adult outpatients ofHarare Hospital, anemia was found in 29.2% of the cases; the prevalencerising with age. However, iron deficiency accounted for only 2.7% of theanemia in the case of males and 8.3% in the case of females, some of thisto a moderately severe degree. Anemia due to other causes was found in
4/ Current studies are underway by Dr. Forest in the Department ofHematology of the Medical School of the University of Zimbabwe, whois studying the hemoglobins of 300 Batonka, and Dr. Joyce Choto,Chief Dietician of the Office of Nutrition, Ministry of Health, whois studying hemoglobin levels of hospital admissions.

-83- ANNEX 15page 16 of 48
26.5% of the men and 13.5% of the women. The rest of the anemias, otherthan iron deficiency, may partly be nutrition related, but this isunlikely in that men have better diets than women in this population.More probable, it is related to cirrhosis of the liver (10).
Other Deficiencies
1.45 There probably is not much rickets (due to vitamin Ddeficiency) in Zimbabwe today because of the large amount of sunshine towhich children are exposed. But there is almost no data to substantiatethis. One study in the late 1960s included x-rays of 224 infants,without finding any rickets (68). A review of admissions at HarareHospital in the late 1960s revealed eight cases of rickets, the patientsranging in age from two to 12 years (68). By contrast, a study in the1960s in Cape Town found 17% of Bantu babies had some degree of rickets(118). Early in the century, rickets was common in Rhodesian miningareas (58) but there is no data indicating whether the problem stillexists in this community.
1.46 Similarly, scurvy (from vitamin C deficiency) was commonlyreported in the early years of the Rhodesian mining industry. In thefirst quarter of the century, 35% of the Africans working in the mines inGwanda were found to be suffering from scurvy and in 1908 13.5% of mineworkers' death were attributed to this nutritional deficiency. As lateas 1945 there were 100 serious cases among mine workers (58). Not muchscurvy is reported today in sub-Saharan Africa and there probably islittle in Zimbabwe. Of 54 hospital patients admitted for nutritiondisorders in 1954, only one "pure" scurvy was identified (97). Aninvestigation in 1976 found that the vitamin C status of a group ofAfricans was better than that of a corresponding group in Scotland (9).
1.47 Ber-ber, resulting from a lack of thiamine, apparently israrely encountered in Zimbabwe and it seems unlikely that it should occuras the thiamine content of maize is good.
1.48 Ariboflavinosis is commonly reported from diet studieselsewhere in Africa and probably exists in Zimbabwe, although no studiesare available to support this. Since riboflavin plays an important rolein many body processes, deficiency of this vitamin may perhaps beassociated with an ill-defined lowering of general health.
1.49 A majority of doctors interviewed reported a deficiency offolic acid, especially among pregnant women, but there is no dataavailable to corroborate this. It has been reported that folic aciddeficiency also is found among men in Zimbabwe (58).
1.50 Deficiencies of vitamins rarely occur singly. Deficiencies ofvitamins of the B group, vitamin C and vitamin A probably occur togetheras a multi-deficiency. Generally, the results of this multi-deficiencyare sub-clinical.

-84- ANNEX 15page 17 of 48
Part II: Causes of Malnutrition
2.01 There are no good studies available on the causes ofmalnutrition in Zimbabwe. It is possible, however, to begin to get anunderstanding of some of the more prominent influences on the problem bylooking at food availability, purchasing power (incomes in relation toprices), food consumption patterns, dietary practices, social problemsand interactions between disease and malnutrition.
A. Food Production and Availability5 /
2.02 To what extent is malnutrition in Zimbabwe a reflection of foodavailability? There is only the sketchiest of notions about therelationship of food availability and incomes and nutrition conditionsamong the poor, particularly those living in communal areas. Analysis ofdata collected in the 1980 Ministry of Health Survey suggests that infour of five provinces examined, there is a close correlation betweennutritional status and availability of food, but data gaps precludereliable judgments (178).
2.03 Overall, Zimbabwe is a food surplus nation that is notvulnerable to the international price fluctuations and changing donorpriorities that often plague most other African countries. Generally,Zimbabwe is a substantial food exporting country, a kind of granary tothe region. (After a shortfall in 1980, large exports started again withthe bumper crop in 1981. Exports of maize had dropped from $25 millionin 1978 to $7 million in 1980 but they were up to $35 million in 1981.)The major import is wheat. Domestic needs are estimated to be 205,000tons, a shortfall from local production of 20 to 25% that is made up ofimports valued at something over $10 million. Imports of other foodsin 1981 were valued at $14 million (169).
2.04 After adjusting for exports and imports, the 2,576 caloriesavailable per day per person in Zimbabwe in 1978 compared favorably tothe 2,205 calories per capita in Africa generally and the FAO target of2,394 for Zimbabwe (99). Per capita figures, however, reveal little ofunsatisfied food needs, which vary greatly by season, by region and byvulnerable segments of communities within the regions.6 /
2.05 One-quarter of the over 1,000 rural families surveyed in 1981needed to buy what was considered by most as their basic subsistencefood. In addition, over half the families had no beans at the time ofthe interview and almost three-quarters of the sample had no groundnuts(175).
5/ Food production issues are touched upon only briefly here; a study byan agricultural sector mission that visited Zimbabwe in May 1982provides more detail.
6/ Per capita estimates also are extremely sensitive to how large thepopulation is assumed to be. At present, there is considerableuncertainty about the size of Zimbabwe's population, an issue thatwill be resolved with publication next year of the new census.

-85- ANNEX 15page 18 of 48
2.06 About half of the Agritex field staff (47 of 92) queried by themission in May 1982 reported "most" families in their areas hadsufficient foods (through farming or purchase) to satisfy their needsthroughout the year and an additional eight responded "all" families intheir areas had enough. However, 33 said either "half" or "few" andthree reported "none" of the families had sufficient food. (Thirty-eightsaid food was in short supply one-to-three months, 30 said fromthree-to-six months, and nine from six-to-twelve months.) Similarresponses were received from interviews with home economics advisers.Eight of nine interviewed said there was not sufficient food, even in anaverage year, for the families they cover.
2.07 Some local observers suggest the food shortfall is a reflectionof the war and its aftermath. With three-quarters of a million urbansquatters displaced by the war, and another quarter million returningrefugees, lands had been unattended, and some 800,000 head of cattle hadbeen lost due to theft, lack of dips, and tsetse. In some areas therewas a breakdown of normal agricultural services. In addition, thepre-independence Government's policy of "protected villages" involved aquarter of a million people in 220 villages, generally miles from thefields. In some areas security fqrces destroyed crops and, in others,blockaded food supplies where guerrillas were operating.
2.08 Yet, piecing together information generally collected for otherpurposes suggests that nutrition problems among those living in theTribal Trust Lands may have been aggravated by the war, but existed longbefore the war. One confidential report to the Ministry of InternalAffairs in the early 1970s said two-thirds to three-quarters of thepeasants did not produce sufficient food for their own needs (60).Another study (P. W. Jordaan) about the same time reported that in thethree most progressive headmen's areas of Rusape District, onlytwo-thirds enough food was grown two-thirds of the time (142).
2.09 A recent farm management study in Chibi South found that 27% offarm families said that the maize they grew usually lasted them for thefull year, but 34% of the families responded that the maize never lastedfor the full year (being out of supply from August to February for somehouseholds) and 28% responded "some years" (26). Another survey, inGokwe, found over a third of the families with insufficient food (34).
2.10 A 1969 study in Gutu demonstrates the dangers of per capitafigures. On average, cultivators were able to grow 15 bags in a year tomeet their subsistence requirements in terms of grain and still sell fivebags worth some $30. However, 50% of the cultivators in the samplefailed to produce 15 bags of grain and in 1970, a year of late summerdrought, the proportion was considerably higher. Also, although stockholding was 4.2 head per family, 30% had none (85). In the areassurveyed in May 1982 by medical students, 24% of families had nolivestock. In Bikita (Mamvura), 43% had none (47). In Chibi South,those who owned cattle produced 25.7 bags of grain, retaining 14.7.Non-owners produced 9.4 bags, retaining all but one of them.

ANNEX 15-86- page 19 of 48
2.11 In short, the long-standing lack of resources amoag certaingroups to produce/obtain sufficient food rather than disruptions of thewar may be the main cause for the considerable amount of malnutrition nowseen among families of peasant farmers. The 800,000 farming families oncommunal lands grew approximately one-third of the 1.6 million tons ofmaize estimated to be produced in 1981/82 and retained about 80% of thatfor home consumption. On a daily basis, this translates to about 900calories per person. As cereals account nationally for 72% of calories(a percentage that can be expected to be still higher among low incomepopulations) and maize accounts nationally for 77% of the calories fromcereals, this means a daily caloric shortfall in communal areas of atleast 500 calories per person, unless additional calories are obtainedthrough purchases of food produced outside the communal lands.
Land
2.12 What are the main reasons for insufficient food? Lack ofresources (capital or draught power) was cited in 45% of the Agritexresponses. Drought was cited by 37%, and 18% cited land quality or landsize.
2.13 Studies on the latter that also looked at the relationshipbetween the nutrition status of 709 school children and landholdings inQue Que TTL in the 1970s found that 71% of children from families in thelowest categories of landholding were suffering from some degree ofmalnutrition, a substantially higher percentage than the next highestlandholding categories (133) (139).
2.14 A study in the late 19709 concluded that each family living incommunal areas required 27-to-250 hectares for producing adequate food,depending on the region. However, the 800,000 farming families living on16 million hectares have an average of 20 hectares per family. Thus, theaverage availability would not be adequate even on the best of lands.Moreover, the land distribution on TTLs was highly skewed; the abovestudy found that 70% had less than 15 hectares (157). Another studyfound at least 20% in Gutu were landless (85) and still another reportedthat 40% of men between 16 and 30 were without land (154).
2.15 Land carrying capacity estimates suggest that communal areasalready have a surplus population; one estimate being upward of 2.5million people (38). A 1977 study concluded TTLs could safely carry275,000 cultivators; by then there already were 675,000 (103). Anotherstudy looked at soil production potential as it related to existing foodrequirements on four TTLs. In three of the four (Gutu, Serima, Eastdale)there were deficits of 38 to 60%. Only on Chikwanda were prospectsgood. Meanwhile, because of impoverishment, and attempts to get a higherproduction from the land without benefit of fertilizer and otherpurchased inputs, land degradation is said to be "increasing at a rapidand frightening pace" (85). Ten of the health facilities surveyed listed"poor soil" as a cause of the malnutrition in their areas. Oneanalysis of the potential of communal areas for rural development -based on density of population, agro-economic conditions and proximity tourban centers and transport -- concluded that 9.4% of the land had "fair"

-87- ANNEX 15page 20 of 48
potential, 39% had "poor," 28.2% had "very poor," and 23.4% had "nil."None was rated as "good" (67).
2.16 Increasing food availability means not only increasing foodproduction; also important is the reduction of food losses. No gooddata is available on the extent of these losses, but the Minister ofAgriculture estimated they may be as high as 35-40%. Nearly two-thirdsof the families in the areas surveyed by medical students had storageproblems, primarily with rodents, ants and borers (interestingly, thosewho had some advice from extensionists had considerably less loss) andone nationwide survey found that only 18% had no storage problems. (Thehighest proportion with problems were seen in Victoria, Mashonaland andMidlands; the least in Matabaleland and Manicaland) (175). Inadequatestorage contributes to the seasonal fluctuations in food supplies, as dopoor methods of home preservation of foods. The storage of food productsfor later consumption is largely by dehydration and, therefore, thequality and shelf life of the foods are limited (88).
B. Incomes and Expenditures
2.17 Efforts to analyze root causes of malnutrition in Zimbabwe arecomplicated by the very limited availability of rural income andhousehold budget surveys. Moreover, the data on incomes is reported indifferent ways (per capita income, family income with or withoutremittances, city averages and low-income deciles) making difficultoverall assessments or comparisons. From the varied sources, however,indications are that insufficient purchasing power (considering bothincomes and prices) among large segments of the population is a principalconstraint to better nutrition.
Urban
2.18 A 1976/77 survey of lower-income urban households found anaverage monthly income of $80.92 (167). (20% of this population earned$50 a month, 60% between $51 and $110 and 20% over $111.) This comparedto a poverty datum line requirement in September 1978 of $1077/ for theaverage-sized family. (This meant that, on average, those with familiesliving in the urban areas would require an additional $36 a month tosatisfy their minimum necessary consumption needs.) (31) Some of theshortfalls in urban wages are made up with ties to communal areas -- atleast part of the year -- but they are unlikely to make up thedifference.
2.19 The families in the lower-income survey spent 49.5% of allexpenditures or $38.58 per month on food. Similarly, the urban Africanbudget surveys in Umtali in 1971 and Salisbury in 1969 showed 47% and 52%respectively for average family food expenditures (57% and 59% for thelowest income quintile). Meanwhile, the lowest quintile of the European
7/ By sector, monthly incomes in 1978 were $87 in manufacturing, $78 inrestaurant and hotel work, $68 in construction and $37 for domestics(170).

-88- ANNEX 15page 21 of 48
population, in 1975/76, spent 20% on food. About $106 or 13.8% of theexpenditures of the higher-income population as a whole went for food,compared to the 49.5%, worth $38.58, by the lower-income group. TheEuropeans spent 2.5% of total expenditures on cereal products; theAfricans 23.2% (166).
2.20 Since independence, the urban picture is considerablybrighter. The 1982 study of the Bindura urban population found anaverage monthly income of about $131 with 1.08 wage earners per household(83). This compared to a December 1980 poverty datum line of $128.
Communal Areas
2.21 No poverty datum line exists for communal areas. However, acomparison of nutrition status to average family income using 1978 Gwandadata reveals the following:
Current Nutrition Condition(Weight for Height) Annual Income of Child's Family
Normal $229.50Mild malnutrition $168.25Moderate malnutrition $114.83Severe malnutrition $51.00
2.22 Accurate data on incomes from peasant production on a nationalor regional basis is practically non-existent, but peasant incomesclearly are considerably below urban incomes. A 1978 estimate of percapita income of people in communal areas was $28 or $168 for a family ofsix (157). A year later an analysis of the composition of the incomes oncommunal lands estimated that an income of $220 a year included $27.50from sales; the rest was in the form of subsistence (116). A May-June1982 survey of 259 households in Gwanda found an average farm cash incomeof $250 ($70 from crops, $150 from stock sales and $25 from handicraftand brewing) (38).
2.23 There are significant variations in income in communal areas.Surveys of six areas in the Midlands and Mashonaland in January 1981,found income of cash and kind ranging from $80 per peasant farmer inLower Gwelo to $97 in Nharira to $164 in Chiweshe and $427 in Wedza(116). Cash earnings for 1980-81 in Chibi South averaged $105 fornon-cattle owners to $240 for owners. The latter group spent 16% of itscash income on food, compared to 25% for the former (26).
2.24 Central Statistics Office data for 1980 show that $170 millionvalue of food was produced for subsistence consumption. Divided by theestimated 800,000 communal area farm families, this would amount to avalue of $146 a year. This was supplemented by a sale of crops (of $28.9million, or $36 per family) and 5.2 million head of livestock (meaning anadditional $6.50 per family). This annual income of $188.50 wasincreased in 1981 by an estimated $44 because of the boost in marketedcrops. In short, the average annual farm income could be estimated thenat approximately $233 per year, or roughly $20 per month, per family.

ANNEX 15-89- page 22 of 48
The Role of Remittances
2.25 Although, on average, families on communal areas grow only 60%to 75% of their maize requirements, a sizeable portion of the familieshave incomes and food supplies supplemented by a member, working in themodern sector, who provides remittances.8/ In Korekore, in 1977,nearly half of the adult malc population was away from home in (orseeking) wage employment. The reason given for leaving in 95% of thecases of the migrants in one study was "a need for money" (106). The1982 survey in Gutu shows that only 27% of the families have no migrantworkers; in Gwanda 50% (62) (37). Of the latter, 34% had off-farm workelsewhere in the District, 36% were working in either Bulawayo or Harare,25% were in the army, 5% worked on commercial farms, 8% worked elsewherein Zimbabwe and 3% in South Africa or Botswana. Amounts of remittancesare influenced by the nature of the migrant's job. If he is in the cityworking in a factory or on construction, his earnings and thus hisremittances likely will be higher than if he is working on a commercialfarm or in a mine (170). A rough 1982 survey of 85 households in threeareas of Harare suggests average urban remittances from urban areas maybe upwards of $400 (112). But the average amount received by the 245families in Gwanda in 1982 was $285 (37). Overall, on average,remittances in cash and kind may be on the order of at least $250, thusdoubling the communal peasant family's income. Remittance amounts alsovary greatly, depending on the recipient. More than twice as much issent back to a wife, children and parents than when the remittance issent to parents alone (112). Currently in Murewa, remittances from headsof households average $400 compared to $145 from other family members(120).
2.26 Preliminary multiple regression analysis of the 1978 Gwanda andGutu data sets demonstrates that nutritional status improves withincreased remittances. Bringing this principle up to date (with the useof the 1982 Gutu data) suggests that a remittance per family of slightlyunder $200 will lead to a normally nourished child, that under $190 willresult in mild malnutrition and under $110 in moderate malnutrition(assuming all other independent variables at their mean values).
2.27 The report of the Commission of Inquiry into Incomes, Pricesand Conditions of Services stated that "those families which do not havemigrant workers are possibly the most disadvantaged group of farmers inthe peasant sector" (116). This group can be identified still further.The most disadvantaged are those which have migrant workers who do notsend remittances. In Gwanda and Gutu, where in 1978 78% of thehouseholds had migrant workers, 42% of them sent nothing home (116). InGwanda in 1982, 52% sent nothing home. Analysis of the 1978 Gwanda datashows that severe malnutrition is six times higher (29% to 5%) infamilies where the migrant does not send remittances compared to thosewho do. The least amount of severe malnutrition appears in thosefamilies where the father does not migrate but someone else sendsremittances.
8/ A form of "ukama," of sharing and helping others, in "mhuri" -- theextended family.

-90- ANNEX 15page 23 of 48
2.28 In Murewa, in 1982, one-third of the migrants were heads ofhouseholds (120) and a study currently being undertaken in Wedza foundthat 34% of the families have a father away (16). He remits both foodand cash, usually during his once-a-month trip home. Fourty-fivepercent of the families get remittances from someone other than thefather, and 21% are nuclear families with no outside income. A quarterof these are single women, usually old and often responsible forgrandchildren, yet with no outside income. It was found in Wedza thatthis was the segment of the population that is usually the worst off(16). Others without direct access to any earned income -- theunemployed, the number of whom is unknown but unemployment isconsiderable, and a high percent of the old, the infirm and thehandicapped and their dependents -- also are among the very needy.
Commercial Farm Workers
2.29 Wages in 1979 of 90% of the 227,000 commercial farm workerswere less than $30 per month. These were supplemented with some form ofa food ration (of differing types and sizes -- in one attitudinal study,60% of the farm workers listed inadequacy of rations as a majordissatisfaction) (106) and a small amount of land generally was providedfor production of family crops. It was unlikely that the total income ofmost farm employees -- including rations and home production -- wouldhave been higher than $540 a year or $45 a month (116).
2.30 The 1981 study of commercial farm families in Bindura Districtfound a monthly average family income from wages of $28.09 with 1.09 wageearners per family. The approximate cost of living (poverty datum line)established for the study, using local prices for an average-sized familyof five, was calculated at $92.73 per month; the gap between this and theaverage monthly income being $63.64 (75). Since then, the minimum wagefor commercial farm workers has been raised to $50 a month and thepoverty datum line for the same area as of December 1981 was re-estimatedat $99.50.9/ In the unlikely circumstance when a farm family would begiven 50% more than the $50 minimum wage, there would still be ashortfall of $25 to meet minimum requirements. In addition to the cashincome, however, there still is some payment-in-kind but apparentlyconsiderably less than before minimum wages were established. Althoughhard data does not exist, impressions from interviews both of farm ownersand commercial farm workers suggest a substantial decline and in somecases an elimination of the provision of rations. Institution of theminimum wage for commercial farm workers has in some situations also ledto longer working hours. One effect of this, according to womenextension workers and commercial farm workers interviewed, is at least insome instances less time devoted to the small plot of land -- sometimes,but not always (12) -- provided to the commercial farm worker families.
9/ From 1979 through December 1981 there was a steady increase ofconsumer prices for foods, the consumer price index for foods risingfrom 217.3 to 257.5.

-91- ANNEX 15page 24 of 48
Mine Workers
2.31 Estimates as of December 1980 were that $98 a month would berequired by the 8,000 Africans employed in the mines to meet theirminimum needs. The minimum wage has been increased to $105 per month anda recent study of mine workers in the Bindura area found that averageincome was now $126 a month, plus subsidized rent. This would indicatethat people are living at or above the poverty datum line. Mine workerfamilies spent $50 a month (or 40-43% of their income) on foods,averaging $7.36 per family member per month (84).
2.32 In addition to wages, there is sometimes a small amount of landmade available for farming. Four percent of the recent Bindura miningstudy sample said their farming was the source of food; 57% had access toan average of 0.1 acre. None of this food was sold. Also, poultry wasowned by 29% of mine worker families and over a third of them had someincome from the poultry (84).
Food Prices
2.33 Retail food prices vary significantly for some items, dependingon locale an4 the type of community served. As can be seen from Table 5,the highest prices were generally in stores in communal areas and thelowest prices in the township market and urban supermarket. The former,in part, is a reflection of transport and other distributiondifficulties. Retail prices in rural areas are as much as 36% higher formealie meal, 60% higher for margarine and 81% higher for cooking oil thanthe urban areas and it is probably because of this differential thatremittances increasingly are in the form of food rather than in cash. InGwanda now, $110 of the $285 in remittances is in the form of food (37).Recent surveys in both Harare and Wedza show that two to three times theamount of cash remittance comes in the form of, food (112) (14).

- T~~~~~~~~~~hhle 5
MML FD E
(April 22-25, 1982)
Stores Serg:
Saw Mill and Govt. Worlers,Ccammrcal Farm Peasant Farmers Peasant Farnmrs Fbrest Reserve Traders aml Urban Tow3sbip
Woxrers (ommal Area Comwal Area Ebmploye Peasant Farners Supermarket Market(Bindura) (Wedza) (Maramba) (E. HinLj!ds) (Mzera) (Haz) ( t )
Roller Nal $5.45 $6.25 $6.62 $5.17 $5.98 $1.99 $4.88(50 kg.) (20 kg)
Cooldkg Oil 1.05 1.00 1.25 1.10 .95 .69 .75(750 iL.)
Bread .25 .25 .28 .26 .25 .25 .25
Margarim .37 - .40 .35 .34 .27 .25(250 gr.)
Bron Sgar .37 - .32 .35 .34 .27 .25(1 kg.)
Lactogen - 8.50 3.67 2.62 8.70 7.10 4.50(2 kg.) (500 gr) (500 gr) (1 kg)
Nespray 5.55 4.79 4.06 2.55(1 kg.) (500 gr)
Coca Cola .16 .17 .17 .16 .16 .15 .15 O
Table Salt .17 - .16 .24 .11 .14 u I(500 gr.) (1 kg) o
Iodized Salt .18 - .17 .12 - 1,0(500 gr.)

-93- ANNEX 15page 26 of 48
Comparison of Communities
2.34 What, then, is the picture after looking at information on foodavailability, incomes and expenditures? As with nutrition statusinformation, the urban poor and, next, the mine worker families againseem to be relatively better off. By contrast, the worst off communityseems to be the commercial farm workers. Data here and observations ofthe mission confirm the Report of the Riddell Commission that "the socialconditions on some commercial farms are below an acceptable standard ofhuman decency."(116) In terms of sheer numbers, the largest group inneed is the population of communal areas. Theirs is, in large part, aland problem (quality and quantity) and related overcrowding. What isrequired to bring this group to nutritional adequacy goes beyond what canbe achieved through conventional short term nutrition interventions.
Family Size
2.35 Looming large over all of the previous discussion is the numberof mouths to be fed in a family. The multiple regression analysis of the1978 Gutu and Gwanda data sets show the larger the family on communalareas, the more malnourished the children of the family. In communalareas, per capita food availability generally is calculated based on asix person family. The figure may well be considerably higher. Averagesize among the 452 families surveyed in Gwanda in May-June 1982 was 9.7(38). In the 1978 sample, 28% of the women had six to nine livingchildren; 9% had nine to twelve. (In Gutu, 24% had lost at least twochildren and over half had lost at least one.)
2.36 The poverty datum line for commercial farm workers was based onfive members per family, as noted. For some areas this is a grossunderestimate. An unpublished survey of farm workers in the Wedza area,found that 170 farm workers were responsible for 1,694 people, i.e. adependency ratio of 10 to 1 (54). This was a similar order of magnitudeof dependency ratios of 14 families on other commercial farms whereinformal interviews were conducted. The 1982 census, to be available inearly 1983, will help clarify this.
C. Patterns of Food Consumption
2.37 Low-income urban families spend almost all of their income oneight items: mealie meal, bread, beef, milk, tea, sugar, rent, andparaffin (116). Nearly 30% of all the expenditures on food are for meat,14.5% for bread, 12.6% for mealie meal, 7.4% for sugar and 5.4% for oil,most of it groundnut or cottonseed oil. The lowest quintile from thelower-income survey spends a higher percentage on bread and a lowerpercentage on milk and meat (116) (167). An effort to establish incomeelasticities of demand for food in general in communal areas (based onthe Gwanda 1978 data set) suggests a slight increase in elasticity whenmoving from family incomes of under $50 to over $400, but it is stilllow.
2.38 Cereals account for almost three-quarters of the caloriesconsumed per capita and maize accounts for slightly over three-quarters

-94I ANNEX 15page 27 of 48
of the cereals. Less than 5% of these calories, as consumed in suchforms as mealie meal, is dietary fat. Of the remaining calories, only 4%come in the form of oils and fats, three-quarters of this from vegetableorigin. The FAO/WHO recommendations are that 15-20% of the caloriesshould be in the form of dietary fats (41). The per capita proteinintake in 1977, when livestock was more available, e.g. the dairy herdhad dropped from 129,000 in 1973 to 106,000 in 1980, was a seeminglyplentiful 74 grams compared to 55 grams in Africa as a whole. Eighteengrams were in the form of animal protein and 56 in the form of vegetableprotein. Of the latter, 88% were from cereals, more than three-quartersof that amount from maize. Maize so dominates the diet that it is alsothe leading source of other nutrients such as iron and calcium.
2.39 Other than for urban samples, food consumption surveys anddietary surveys (that record food intake either for the household as awhole or for the individual household member) have not been undertaken inZimbabwe. All available fragmentary data, however, point to sadza, athick cereal porridge, and vegetables as the primary foods, particularlyof children. In both commercial farm and mine worker families inBindura, 97% of children under age five had sadza and vegetables twicedaily. Meat was consumed less than once a week by 79% of the children offarm workers, 59% of children of mine workers and 49% of the urbanchildren. Milk, eggs and beans were never eaten by children ofcommercial farm workers in 65%, 87% and 84% of the cases respectively,compared to comparable figures of 12%, 9% and 16% in the urban population(75). The diets of women surveyed are not more varied. Of 488 womeninterviewed in Chiweshe, Matibi and Tsholotsho communal areas, 76% hadfruits less than once a week and 71% had meat or chicken less than once aweek, although it was popular in all areas as far as taste (111).
2.40 To relieve monotony, cereals are prepared in several ways:boiled mealies, roast mealies, roast mealie meal, thin porridge, andthick porridge. Sadza is made with maize, sorghum, or millets.Substantial amounts of maize also are eaten roasted or boiled as sweetcorn or green maize during the summer season and in winter whenharvested, cooked and dried on the cob. Vegetables play an importantrole in the diet, particularly in the relish (usavi), which is a kind ofvegetable stew used with sadza. Pumpkins, potatoes, especially sweetpotatoes, and tomatoes also are important to the diet. Most rural peoplegenerally like milk but the supply is variable because most milking isdone only in the summer. The milk is largely consumed sour. A lactosefermentation takes place that makes the product tasty and largelylactose-free and therefore is not likely to cause problems for thosesusceptible to lactose intolerance, as is so common in neighboringcountries (88)e10/
2.41 Breastfeeding is common and prolonged. Only 2% of the mothersin the areas surveyed by medical students in 1982 were not breastfeedingat six months and only 14% were not still nursing at the baby's first
10/ A similar milk product called Lacto is produced commercially forurban areas by the Dairy Marketing Board.

95 ANNEX 15page 28 of 48
birthday. At 19 months, 44% of the mothers were still breastfeeding.The same survey found that 45% of mothers had not given other foods bythe beginning of the baby's fifth month, 28% by the sixth month, 13% bythe seventh month, 8% by the eighth month and 2 1/2% by 12 months.
The Nutritional Effects of Modernization
2.42 Although consumption data is limited, and in rural areas isparticularly sparse, it is apparent that there has been a significantshift to a more monetized consumer economy. On communal areas thispartly reflects the shift from production of subsistence to cash crops.Among commercial farm workers, this reflects elevation of the minimumdaily wage and the accompanying decline of payment-in-kind. Althoughcommercial farm workers' wages are now at least $50 a month, it is notclear that diets are improved. (Eight of 11 home extensionistsinterviewed were of the view that more food came into the commercial farmworker's household during the era of partial payments-in-kind than withthe current higher cash incomes.) The reason most commonly given: theextra income does not always go for nutritionally-useful food, or in somecases, not for food at all. There is no direct data available to confirmthis notion although several doctors surveyed cited the use of income onsugared drinks and other junk foods as a contributing factor to thenutrition problem.11/
2.43 Indirectly there are indications that the net effect ofincreased commercialization, even with increased income, may not alwaysbe positive. In Tsholotsho communal area, for example, where landincreasingly is used for producing maize for the market, only 25% of thewomen had vegetables more than once a day, compared to 97% in Chiwesheand Matlbi where less food is marketed (111). One of the unexpectedfindings of a small sample multiple regression analysis of the 1978 Gutuand Gwanda data sets was that the value of crop sales of the 110 familiesexamined seemed to have a negative relationship with nutrition status.It is not possible to determine in either of the above cases whether thefamilies would be even worse off, nutritionally and otherwise, if theycould not sell as much as they do. (The studies do not specify the kindsand amounts of food purchased as a result of increased cash incomes.)
2.44 Mealie Meal: One of the most dramatic changes in food habits,associated with "modernization" is the increased consumption of highlyrefined mealie meal. The nutritional value of the more refined mealiemeal is not as high as the cruder processed meal. The straight-run mealcontains 4 1/2% fat, compared to 1 1/2% in the highly refined meal andthis affects caloric density, an important nutritional issue inZimbabwe. Similarly, the protein content of straight run meal is higher
11/ The only doctor working in a resettlement area who was surveyedanswered the question, "Do you think there is a nutrition problem inyour area?" with "Not yet, at least not before shops are built in theresettlement area." If the home extensionists' views referred toabove are valid, it raises the dilemma of consumer sovereignty--i.e.,that people should spend their earned resources as they wish.

-96- ANNEX 15page 29 of 48
than the more refined product, according to the old Nutrition Council(43).. There is more than twice as much iron (five mg., compared to two),nearly four times more riboflavin, more than ten times the thiamin and aquarter more calcium in the village-refined meal (176). Discussion abovepointed to the problem of pellagra, resulting from niacin deficiency.The niacin content in the village-processed product is 2 1/2 times thatof the highly refined meal.12/
2.45 The switch to the highly refined meal partly reflects tastesand partly the Government's pricing policy which made it advantageous forfarmers to sell maize to the Marketing Board and buy it back in the formof refined meal. Similarly, it sometimes was cheaper for a rural familyto buy mealie meal from town than to buy less refined food from thefarmer next door.
2.46 Given the income effect of low subsidized consumer prices ofmealie meal (and what may also be a marginal increase inproduction/income in communal areas resulting from producersubsidies--although 95% of the maize purchased in the program came fromcommercial farms) one can in the absence of hard data speculate that theswitch to refined mealie meal, on balance, could have been nutritionallypositive even though portions of the increased income went for non-fooditems and specific groups may have been directly adversely affected(e.g., rural maize milling which had been a major industry has largelydisappeared in many places as a result of the incentives to buy highlyrefined meal from heavily subsidized large millers; one estimate suggests2,000 rural mills have been closed) (14). Even though for many familiesthe switch to refined mealie meal means an increased quantity of foodconsumed, the nutrient composition of the diet no doubt has been altered.
2.47 Sorghum/millets: With the increased commercialization ofcommunal areas and the attactiveness of maize production has come a percapita decline in some areas in the production of millets and sorghum,nearly all of which is used by peasant farmers for human consumption(26). Millets and sorghum are both better nutritionally than maize(e.g., sorghum has twice the niacin as maize; millet has 25% more) andalso are more drought-resistant, the latter an important considerationfor drought-prone countries such as Zimbabwe. Whether an increase ofproduction by switching to maize more than offsets the reduction innutrient quality cannot be determined from available data.
2.48 Groundnuts: Groundnuts, traditionally an important part of theZimbabwean child's diet for both protein and caloric density, areregarded by 32 of 40 people interviewed as a less important part of thediet today than had been the case in the past. The use of dhovi(groundnut butter) in children's morning sadza is said to be less commonthan before; in some areas it is regarded as "old-fashioned." An
12/ The processing done by the village-level, power-driven hammer millsproduced a more nutritious product than the still more traditionaltechniques of pestle and mortar, grinding stones or quern andwinnowing baskets when nutrient losses were considerable (19).

-97- ANNEX 15page 30 of 48
extensive survey by the supplementary feeding program found thatone-third of the children had no groundnuts in the past year and afurther one-third ate them either once a month or once a week (175).(This ranged greatly by area; in Victoria Province 63% had not eatengroundnuts, double that of Matabeleland and more than five times thepercent in Mashonaland and Manicaland. Among commercial farm workers'children, 85% in the Bindura area never eat groundnuts) (75). For thosewho do consume groundnuts, the supply generally is available for only afew months a year (175).
2.49 Whereas groundnut production was common in earlier generations,38% of those surveyed under the supplementary feeding program now grewnone, 33% grew for sale and subsistence and 3% grew only for sale. (Theremaining 26% retained all production for home consumption.) (175) Only24.7% of urban migrants who had families in communal areas reported thatgroundnuts were grown on their farms (112). Total groundnut production inZimbabwe, most of which is grown in communal areas, had declined by 1981to 31% of what it was five years earlier. Again, as in the case ofsorghum and millets, there presumably are economic incentive factorsrelated to the decline. Available data is not adequate to sort out thenutritional trade-offs
2.50 Fruit: Other foods also now appear to be in shorter supply forthe low-income population. Although domestic demand for beef is risingat about 12% a year, almost all low-income respondents reported thatformerly they consumed more meat than they do today. Fruits, once acommon part of the Zimbabwean diet are less common. In Bindura, 76% ofthe urban population has fruit less than once a week and 6% never has it(83). Similarly, 76% of women in the Chiweshe, Matibi and Tsholotshocommunal areas had fruits less than once a week (111). Even the higherincome mine workers' families do not commonly consume fruit. The reasongiven in Bindura was that it was too expensive (84). This may reflectthe diminished supply of fruit due to the large number of trees destroyedduring the war and the trees lost due to the increasing demand forfirewood.
2.51 Bread: The "modernized" Africa also increasingly consumesbread instead of more traditional and more nutritious grain forms. InWedza, almost everyone buys bread, if only a loaf a month (16). InChiweshe, more than half the women eat bread more than once a day (111).In the survey by medical students, 54% of the respondents bought breadregularly. The lower-income urban survey found that 7.2% of totalexpenditures, and 14.5% of food expenditures went for bread (167).One reason for the increased demand for bread may be the shortage offirewood needed for traditional food preparation. Another isconvenience. Already the more highly refined and less-nutritious whitebread has largely replaced brown bread. Only 2% of bread sold to thelower-income urban population isbrown, although the lowest quintile ofthat population consumes about 2 1/2 times more brown bread than thelow-income average.
2.52 Sugar: Another nutritionally questionable change accompanyingmodernization is the increased consumption of sugar, which accounted for

-98- ANNEX 15page 31 of 48
7.4% of food expenditures in the low-income urban survey. A leadingsugar distributor reports that over the past two years there has beenmore than a two pound increase per capita in the annual consumption oflower socio-economic groups. Currently, the lower socio-economic urbangroup consumes 51 pounds a year, and the rural population 31 pounds.White sugar now constitutes more than 98% of all sugar sold, but 14% ofthe urban poor and 40% of the rural poor still consume cruder brownsugar. Generally, there is about $.05 a kilo difference in retail price.
2.53 Increased sugar consumption also results from increasedconsumption of soft drinks. Eight million cases of Coca Cola reportedlyare sold per year, 60% of them in rural areas. The company estimatesaverage adult consumption of 65 (300 ml) bottles per year at $0.17 perbottle. In Luveve, 13 bottles of soft drinks were consumed a month, bothby those with incomes under and over $300 per month (91). A 2 1/2 yearstudy of 5,376 Africans found that with an increased consumption of"Western diet" foods, dental caries began to increase (40).
2.54 Infant foods: Another example of "modernization" is theincreased consumption among the low-income population of infant formulaand, more importantly in the Zimbabwean context, commercial weaning foodsor supplements. Doctors at the health services surveyed uniformlyreported that breastfeeding is common unless, as five doctors reported,it is interrupted by another pregnancy. Some 9.5% of the mothers usedbottles in the 1982 surveys by medical students. A 1981 Health Ministrysurvey found three times as much bottle feeding in cities than incommunal areas and six times more than on commercial farms (174).
2.55 Breastfeeding appears to be almost universal among rural womenbut in the Luveve survey 37 of 68 mothers had introduced supplementsbefore three months, 20 of them with family incomes under $300. It wasreported that a "high proportion use expensive commercial preparations"(91). Pronutro was purchased regularly by 25% of the mothers interviewedin six areas. Infant formulas and weaning foods are found in allstores in all areas of the country servicing all income groups and in alloccupational communities.13/ Quantities of sale are unknown. Willardsreports they produce about 500 tons a year of Pronutro and baby cereals.Retail price of a 500 gm box of Pronutro is as high as $1.15 (April1982). Two 50 gram servings a day, each equivalent to 22 grams ofprotein and 413 calories would come to $6.90 a month or about 14% of thetotal family income of commercial farm workers.
2.56 In addition to spending increased income for food other thanbasic staples, demand with modernization has increased for non-fooditems. From 1979 to 1981, the overall retail trade value index fornon-food items went up higher than the food index. This was not the casefor the preceding eight years (169).
13/ Among the commonly seen products are Nestum, Lactogen, and Cerelac ofNestle, Pronutro of Willards, Nutresco and Instant Nutresco from theNutrition Research Company and Mahewu (a traditional corn-baseddrink) produced by Chibuku.

-99- ANNEX 15page 32 of 48
The Calorie Density Problem
2.57 While lack of sufficient food is the most important factor inthe etiology of malnutrition, it is not the only factor. The bulkinessof maize makes it difficult for a child to meet his caloric needs withouteither frequent meals or some supplementary form of caloric-dense food(e.g., foods with high fat or oil content). Dietary fats and oils, asearlier noted, are unusually low in the Zimbabwean diet. Moreover,current trends are toward more refined mealie meal, with 1% instead of4 1/2% fat, and fewer groundnuts in the diet, while the AgriculturalMinistry is pushing for greater marketing offtake of groundnuts producedby peasant farmers. There is a perceived shortage of oil among thelow-income population. Demand for edible oils rose by 46% in 1981 and afurther increase of 20% was forecast for 1982. (The 1981-82 shortfallbetween oil availability and requirements was 2,500 tgns or about 6%.)Shortages can be expected to continue into 1984 and 1985 unless majorshifts in price policy are undertaken (38).
2.58 There is no current data set available that states definitivelythat energy is the main culprit in the malnourished condition commonlyseeni in Zimbabwe. There are suggestions to this effect that emerged fromthe review of the supplementary feeding program and this is the positiontaken among those prominent in Zimbabwe's nutrition community. One canassume that the increasing flow of data from other countries pointing inthis direction probably also would be applicable to Zimbabwe. InDecember of 1981 it was found in a small sample of urban children thatnine out of 19 children had less protein consumption than theirrequirements, but 18 of the 19 had not met their energy needs. In all 19cases the extent of the energy deficiency was greater than the proteindeficiency by a considerable margin (153). With the bulkiness of theprimarily sadza diet, a small child needs five or six small meals a dayto satisfy his caloric needs. Yet 55% of the large sample surveyed inconnection with the feeding program was fed three times a day (all but 5%of these mothers thought three times was the right amount), 18% fed morethan three times and 27% fewer times (175). In the areas surveyed bymedical students, only 20% fed more than three times a day; 35% fed fewerthan three times. Roughly the same ratios emerged from the Gutu, Binduraand Wedza surveys. A 1982 small survey of 15 children in Mt. Darwinfound a direct relationship between the number of feedings andnutritional status (12).
D. "Nutritional Ignorance"
2.59 A substantial body of opinion in Zimbabwe is of the view thatmost of the malnutrition seen in the country is a result of "ignorance."(This diagnosis is similar to pre-Independence views.14/) Yet, among
14/ Former Secretary for Health, M.W. Webster, for example, was quoted assaying, "There is no doubt that under-nutrition or poor nutrition isthe biggest single cause of the remaining health problems of theAfrican population. There is also no doubt that this problem is notdue so much to the lack of food or lack of ability to procure food
but to lack of knowledge of proper feeding, particularly thefeeding of infants and children." (45)

-100- ANNEX 15page 33 of 48
the field health facilities surveyed, only 14% of the responses to thequestion "Why do you think there is a (nutrition) problem?" related toignorance of feeding practices. Our analysis of limited existing dataconfirms the field workers' perception.
2.60 Taboos exist, but not to the extent they likely would make amajor nutritional difference. Forty-one percent of the 488 womensurveyed in Chiweshi, Matibi and Tsholotsho had one food taboo and 14%had two. Two-thirds of these taboos involved some form of meat,generally restricted by the totem of the particular group. (In someinstances this means that white ants could not be eaten during the rainyseason or small mice, which are abundant after harvests). Twenty percentof the sample said they never ate eggs but it is not clear whether thisis a taboo or a question of availability (111).15/ The avoidance ofeggs appears elswhere in the literature; in one area 80% of the pooravoided eggs (91). Three doctors surveyed for this paper indicated thatpeople in their areas believed that eggs cause convulsions in smallchildren. Eggs never were eaten by 87% of commercial farm workers'children in Bindura, 72% of mine workers' children or 68% of the urbanrural children, but again it is difficult to sort out taboos fromeconomics.
2.61 More impressive is the evidence that mothers seem to understandnutrition concepts. Two-thirds of the 568 respondents in thesupplementary feeding survey prepare special drinks for their childrenwhen they have diarrhea, most commonly mahewu and salted water. Thesurvey also reflects that, by and large, mothers understand the causes ofdiarrhea and the value of breast feeding (175). Another study found that"many women seemed very conscious of the role that adequate diet playedin the well-being of their children" (94). Most mothers also have apretty good idea of the foods local nutritionists regard as mostimportant, although often wrong foods are promoted by the nutritionists(see section III). Why, then, from the women's view, the food problem?Surveys in Umfurudzi, Mtoko and Tangwena found references to "not enoughfood," "water too far," and "arduous time-consuming processing" (100).
2.62 The major information gap concerns the frequency of feeding.Of importance from data available is not only that the child was fed lessfrequently than necessary (as this could result from other demands on amothers' time) but that the mother does not appreciate the need for morefrequent meals (175). Only 44% of mothers were found by medical studentsto believe more than three feedings a day were necessary; 13% thought twoor one feeding was adequate. Also, the findings suggest thatsupplements to breast milk appear to be needed earlier than they are nowintroduced by many mothers.
2.63 Related to nutritional ignorance/education is the expectedpositive correlation elicited from all data sets where comparison can bemade of years of mother's schooling and nutrition status of theirchildren. In Gutu, for example, mothers of well-nourished children
15 A fuller list of food taboos in Zimbabwe is provided in Gelfand
(pages 188-190) (51).

-101- ANNEX 15page 34 of 48
averaged six years of schooling, compared to 3.6 years for mothers ofseverely malnourished children. (Five years of schooling generally isconsidered necessary for the retention of functional literacy.) However,years of schooling also generally correlated with higher education levelsfor the husbands and, therefore, more opportunities for higher incomes.A 1972 study in Que Que TTL showed that the education level of familyheads, independent of income, had significant positive effects onnutrition status (139).
2.64 An interesting note from a confidential report to Government in1977 was the relationship observed between church attendance of women andthe nutritional status of their children, even when holding constantother important factors, such as livestock holdings. The report, basedon a study in three TTL communities (a study regarded by some as sobiased by subjective evaluation it could be misleading), concluded thatchurch attendance was more important to nutrition status than maternaleducation, i.e., those better educated women that attended church lessfrequently had a higher percentage of children with some degree ofmalnutrition (28% compared to 9%) than lesser educated church-goers.Similarly, the non-regular church-goers had significantly higher rates ofchild mortality in their families compared to regular church-goers.Beyond, children of the Dutch Reformed Church were usually taller fortheir ages than were children of the Roman Catholic Church. Theresearcher attributed this to the higher incidence of beer drinking infamilies of the latter and the relationship he drew between beerconsumption, lower crop yields, poor diets and poor nutrition status(138).
2.65 It is difficult to discuss the malnutrition problem of Zimbabwewithout mentioning the issue of heavy beer consumption. Cheap villagebeer has long provided an important and sometimes productive bond (in thesense of community harvesting and community construction) amongvillagers. The habit, however, goes beyond social drinking gatheringsand, to some extent, probably is both a reflection of poverty as well asa contributor. No hard data exists on the number of those who drinkheavily but the impression that it is largely a male problem may bemisleading. Our interviews in three communal areas and two commercialfarms suggest approximately 30% of the women also are heavy drinkers. Arecent study in Nyanda District estimated that two-thirds of the adultpopulation weekly averaged 5.3 to 7 liters of traditional beer plus anunspecified amount of clear beer.
2.66 No data exists on trends; interviews indicate that beerdrinking traditionally has been a significant factor in the country butthat quantities consumed today are increasing. This, at least partly,reflects successful commercial marketing practices. The Annual Report ofthe City Health Department for Salisbury reported that advertisingbudgets of beer firms are "large and effective" (122). Sales of NationalBreweries' clear beer increased 95% in 1978-1979; 121% in 1979-1980; 161%in 1980-1981 and 135% in 1981-1982. Rural sales accounted for 40% of thegrowth. (Cost per bottle is $.25 and the average retail price is $.43.Some rural retail markups are as much as 160%.) The study of Bindura farmworker families found 13% of their income was spent on beer. Interviewsin the Wedza area suggest an even higher figure.

-102- ANNEX 15-- page 35 of 48
2.67 The increase in sale of clear beer in urban areas apparentlyhas not reduced the consumption of traditional beer. The market fortraditional beer is now 60% urban, compared to 25% five years ago,according to Chibuku Breweries.
2.68 Home brew contains high levels of iron but, in excess, cancontribute to siderosis and cirrhosis of the liver, commonly found in thecountry (10). In addition, there are suggestions that home-brewed beer,with its high iron content, interferes with niacin absorption.Practically every adult sufferer of pellagra admitted to the hospital isan alcoholic (58). Heavy drinking also contributes to nutrition troublesof the family in other ways; e.g., interfering with work, diversion ofmonies to beer that could better be spent for basic foods, and reducingpositive parent/child interactions. Twenty-five percent of the doctorssurveyed listed beer drinking by parents as one of the causes of childmalnutrition.
E. Social Problems
2.69 One-third of the cases of severe child malnutrition result fromsocial problems, often related to alcoholism, according to two long-timefield doctors. (Other social problems cited were imprisoned parents andlow earning power of the handicapped.) Severe cases of kwashiorkor ormarasmus, they say, may often be a form of child abuse, as seen in thewithholding of food from the child. The literature suggests thissometimes happens because parents believe the child is possessed orsomething else is wrong with the child. Serious nutrition cases alsoresult often from deserted, separated, divorced and widowed wives whohave to fend for themselves and their children. In Wedza, a higherproportion of the malnourished came from family situations of maritalinstability or divorce and, as noted above, even more so when childrenare left with grandparents with no income earning capacity. The problemsrelated to migrant labor can be a form of social problem. In the Nyafarocooperative settlement and Tangwena communal area, 19.2% of women areheads of households; in Mtoko 27.7% (100). One study shows that, otherthings being equal, the absence of the head of household had an adverseeffect on nutrition status (133). Generally, however, things are notequal. In nutrition status terms, the absence of a father is offset byhis remittances. When these are not forthcoming, however, the nutritionconsequences, as noted, are likely to be considerable. That kwashiorkoris caused in some cases by social problems was confirmed by mothersinterviewed in nutrition centers at Nyaderi in August 1981 and also by ananalysis of nutrition centers at St. Theresa's Hospital in Umvuma (149).Forty-one of the 45 health facilities surveyed agreed that socialdisruptions had an effect on nutritional status, especially (in 25responses) as reflected in kwashiorkor.
F. Interactions Between Disease and Malnutrition
2.70 Malnutrition is not exclusively associated with inadequate foodconsumption. Although production/income/expenditure/consumption datathat is available demonstrates that food intake is a major issue inZimbabwe, the nutrition status of a population often also is affected byinfections which may inhibit absorption of nutrients and often result inloss of appetite.

-103- ANNEX 15page 36 of 48
2.71 The interactive relationship of nutrition and infection is sostrong in other countries where it has been studied that it is reasonableto assume it plays some role in the Zimbabwe malnutrition problemsdiscussed above. The issue is discussed in the literature either in verygeneral terms only or with reference to very small samples of clinicaldata. Most of what is said reaffirms the familiar observations that (a)disease often precipitates borderline cases into severe malutrition andmalnutrition exacerbates the incidence and effects of disease, (b)gastroenteritis, measles, and upper respiratory diseases are among themost serious problems (as far as child nutrition is concerned), butparasitic diseases also may be widespread and debilitating, and (c) lackof adequate hygiene, sanitation, and clean water facilities reinforce thevicious circle of disease and malnutrition. Given the existing data,however, it is impossible to estimate the importance of infection in theZimbabwean context.
2.72 There are hints that the problem is not paramount here. First,Zimbabwe's infant and child mortality rates, both of which reflectinfection levels, compare relatively favorably to other sub-Saharancountries. The estimated infant mortality figure for Zimbabwe, based onthe 1969 census, is 100 per thousand, which compares favorably to presentestimated infant mortality rates of 145 for all of sub-Saharan Africa.Similarly, the one-to-four year old death rate in Zimbabwe is relativelylow for sub-Saharan Africa, 12-15 per thousand compared to 25. Nutritionconditions, meanwhile, appear worse in Zimbabwe than these same Africancountries (see Table 2). This would suggest that the infection/diseaseenvironment in Zimbabwe is better than elsewhere and that, as a result,malnourished children do not succumb as commonly as elsewhere in Africato infection. Second, although the water supply is uneven and in manyinstances bad, it still is better than in many other countries.Similarly, sanitation is more highly practiced. Third, one cannot helpbut be struck by the high premium placed on cleanliness and tidiness,even in the most impoverished circumstances in rural Zimbabwe. This isunusual in societies of this income level. All this suggests theincidence and impact of infection on nutrition status may not be as greatas elsewhere.
2.73 There is no simple answer one can give about the cause ofZimbabwe's malnutrition. Thirty-five of the doctors surveyed at healthfacilities cited some form of poverty. Twenty-four responses related toignorance, but this included ignorance of farming practices as well asignorance of feeding practices. Drought and inadequate infrastructure(including underdeveloped water supply, underdeveloped transportation,underdevloped storage, lack of adequate extension) were next at 22,followed by population pressure, 10, social causes (family disruption),nine, and high incidence of disease/poor sanitation, six. Agritex staffsurveyed cited poverty (shortage of food and income) followed by foodhabits as the main causes of malnutrition.
2.74 Even with data limitations certain conclusions at this stagecan be drawn:

-104- ANNEX 15
page 37 of 48
Despite being a substantial food surplus nation,Zimbabwe has extensive malnutrition.The problem probably is primarily a calorie ratherthan protein problem; for small children there is anadded dimension of need for caloric density.The cause of the malnutrition is some mix of poverty,nutritional ignorance and family disruption andrelated social problems.Incomes of commercial farm workers and communalarea farmers are inadequate to satisfy nutritionalneeds, even with increasing remittances. Mineworkers are better off and incomes of urban employeesappear to be sufficient.The shifts in diet accompanying modernization are notalways nutritionally advantageous. The full trade-offs of the new-food-replacing-old are not known atpresent, but of particular concern is the loss ofnutrients in highly refined mealie meal and thedecline in consumption of sorghum, millets,groundnuts and fruit.Rural women understand nutrition concepts and needsbetter than they are given credit for. The majorinformation gap relates to the number of feedings aday required for a small child on a primarily sadzadiet.Alcoholism, family separations and other socialproblems play a role, particularly in cases ofkwashiorkor and marasmus.Infection may not play as large a role inmalnutrition in Zimbabwe as in most other countries.

ANNEX 15page 38 of 48
Part IIT., P:c>. rograms
3.01 Zimbabwe has several s: Sna. address the nutritionproblem, the major categories o9 oasumer food subsidies,supplementary feeding schemiseo v1 u'ds, nutrition education andnutrition rehabilitation.
A. Consum- -.".-c5 _^ebsidies
3.02 By far the Government:r3 nutrition program -- althoughnot always perceived in that ligh '1o gYne consumer food subsidy. In1981-82, the Government spent ap .8124 million or 2.8% of GDP,on combined producer and consuTe 'S a cost more than double theprevious year.
Table 6: Budgetary Food 1 81/82 (estimated) 16/Milk _ 10.4 millionMaitz'. 5.1Beef 27.7Soya be 1.0Wheat 'o 8.5Veget t ' ' 6.2Maize 64.8
13.7 million
3.03 The portion of this att-i^'1-X Lo consumer subsidy varies bycommodity and is difficult to pete n peclisely, but about $98 millionof the total appears to be a dlr1e c--`;F, to consumers. Maize is aproducer subsidy, but maize meal l o er subsidy. In the case ofmaize meal, the Government makes egh dl fference between the $86 perton the miller is permitted to c Zl. "-' ml-e and the $137 price paid bythe miller plus the millers macis tsosting $64.8 million in thelast year. Nearly all of the $10.- > milk subsidy accrues to theconsumer; the Government's subsyid ''.t *i- is about 20%. In the case ofbeef, about half of the $28 millOo '' goes to consumers, half toproducer. The current gap bet-'ss - e price and selling price ofbeef is $.23 per kilogram. The c3-nz _e szubsidy on bread is about 44% or$.11 per loaf, leading to a $1i 1 for the year. In the caseof vegetable oil, the subsidy esems -s.gy go to the oil expressers(suggesting they are either ent!mi n ient or extremelyprofitable). Consumers of veg_t_3.s.1 -1 S-piaar to be taxed slightly tohelp cover this. (For a mors Kine lysis of who benefits fromsubsidies see (63).)
16/ The edible oils subsidy is paid' oil expressors, the flour subsidyto the millers, the dairy subsidy >e the Dairy Marketing Board, thebeef subsidy to the Cold Stcinge Cormission, and the wheat, maize andsoya bean subsidies to the C.'- ^sg Board. In the budgetthese are charged either t S' of Agriculture or theMinistry of Trade and Commar,-7' clear reason for thisdivision of specific commoStl

-106- ANNEX 15
page 39 of 48
3.04 The Government had inherited subsidies from an era whenproducer prices largely had been set in accordance with the needs ofcommercial farmers. From 1964 to 1978, 35% of net commercial farmincomes were said to come from subsidies. Concern for stability in urbanareas toward the end of the war led to the introduction of consumer foodsubsidies. At present, consumer food prices in Zimbabwe are among thelowest in Africa (116).
3.05 The major justification for blanket consumer subsidiespresumably is that the real incomes of the poor will be increased bylowering the prices of staple foods. (The gains would be less than thosefor the rich in absolute terms, but greater relative to total income.)Relatedly the subsidies should increase food consumption of the poor,both absolutely and relatively more than the rich.
3.06 The question, then, is whether the benefit to the poor istaking place and, if so, if it is taking place in an economicallyefficient manner. Analysis of the available information suggests that atleast on the surface there are some nutrition benefits to the poorresulting from the subsidy program but the benefits are modest relativeto costs. First, other than maize meal, those living in rural areas donot benefit from the subsidy (except in the case of food remittances).All of the other subsidies accrue to the urban dwellers who constitutewell under a quarter of the population. Moreover, there is a strong biaswithin the urban population. While maize meal, white bread, and milksubsidies have provided some benefit to the low-income urbanpopulation, it has been mainly the high-income urban households to whomthe beef and milk subsidy largely accrue. (14)
3.07 There are strong differences on benefits to income groups, byproduct. With maize meal, for example, $.72 of every dollar goes to thelow-income urban householder rather than the high-income households, butfor beef, of every $1.00 of subsidy only $.36 goes to the low-incomeurban household. Milk benefits the low-income urban consumer even less.For each dollar of milk subsidy only $.23 goes to the low-income urbanconsumer and virtually none goes to the rural poor. (63)
Table 7: Benefits in Urban Areas of Subsidies, 1976/77% of Total % of TotalSubsidy SubsidyAccruing to Accruing to Amount of Amount ofHigh-Income Low-Income Subsidy to Avg. Subsidy to Avg.Urban Urban High-Income Low-IncomeHouseholds Households Urban Households Urban Households
Beef 64% 36% $19.32 $10.81Milk 77% 23% 10.50 3.37Maize Meal 26% 74% 1.87 5.30White Bread 41% 59% 5.92 4.18
Source: (63) (167) (168)

-107- ANNEX 15page 40 of 48
3.08 Other inequities to the poor also may sometimes result from thesubsidies. Because beef pricing policy results in such an artificiallylow price for beef, consumers substitute beef for other products whichare close substitutes. Poultry and pig production by farmers in communalareas is undoubtedly being discouraged because of the competition withsubsidized beef (63). Moreover, as noted earlier, the manner in whichthe maize meal subsidies are provided has led to a concentration ofprocessing, so much so that over the last five years an estimated 2,000rural millers have gone out of business as they could not compete withthe heavily subsidized large millers. In summary, the main beneficiariesof producer subsidies are the large commercial farmers and the mainbeneficiaries of various consumer subsidies are generally the urban wageearners most of whom are not poor. The real poor are almost all in ruralareas (14).
3.09 The current program is not an efficient means of reaching thepoor. Both the Income/Prices and Agricultural Industries Commissionsconcluded that blanket subsidies are a haphazard and inefficient means ofachieving any objective of equity. To some extent they are having thereverse effect (7) (116). At the same time it is important to recognizethat there are large portions of the population in serious need of foodand that more carefully targeted subsidy programs designed to reach themcould have considerably greater nutritional impact than the currentprograms, even if held to a lesser cost.
3.10 At the moment there is no forum, as would be desirable, thatobjectively assesses all these issues. The nutrition consequences of foodpricing policy have not received serious attention by Government, incontrast to, and sometimes in conflict with, the attention given toissues of concern to larger producers.
B. Feeding Programs
Emergency Food Programs
3.11 Rhodesia did not have a history of extensive child feedingprograms, as existed elsewhere in the region. As things began todeteriorate in the late 1970s, however, the International Red Crossstarted a program directed to children in ten "protected villages" andtwo villages of Tonga. The ICRC claims that despite local shortages,particularly in the pre-harvest period, there had been a decrease orsteady state of malnutrition in nine of 12 places where one-to-five yearolds were fed, and in five of seven centers where six-to-nine year oldsreceived food. The ICRC attributed this to the success of the feedingprogram (18).
3.12 The new Government's first experience in providing large-scalenutrition programs came shortly after the signing of the Lancaster Houseagreement. An estimated 1.4 million people, almost one-fifth of thetotal population, had been displaced by the war. Roughly half of thesehad been moved to 200 "protected villages," nearly 20% were refugees inneighboring countries and most of the remainder had left their homes tolive with relatives or in squatter camps in towns and cities. Each of235,000 families was given enough seed and fertilizer to sow half ahectare in time before the November rains. In areas where sufficientwater already was available, 70,000 vegetable packs were distributed,

ANNEX 15page 41 of 48
each containing the requirezc-sff to reap one kilogram ofvegetables per day beginniqgi °m, 7Ktek ' -,lanting, and extending oversix months. 7 / Where animal s unavailable orinsufficient, mechanical tiIl -'-ade available. The cost wassomething on the order of $13
3.13 In addition, 7,600 t=o :f D , e given out each month to700,000 to 800,000 people at sa.-Qen 535 and 570 distributionpoints across the country at (-2d million. (In all, the refugeeprogram cost about $60 milli$= e'= was received at the outsetfrom external donors.) The was undertaken by theGovernment's Department of So'W -- and funded, at approximately$3 million per month, by the High Commission for Refugees(UNHCR). Wastage and theft , be low.
Pre-School Age Feeding Progra
3.14 In addition, a Chil d.- ,-tary Feeding Program waslaunched to protect children if -z ar old who were at risk. Atits peak, in May 1981, 100,C0 'e provided a diet made up offamiliar staples prepared in - : a1 manner. Special attentionwas given to making the rati3a u The program was regarded asboth a relief and educational 3 using locally-cultivable andaffordable foods, the parents - L1hed children were to see thenutritional value of these fcs' n their children improve. Itwas hoped that this message, ene would encourage ruralparents to grow and retain for . -- ,ing the foods promoted throughthis program, particularly g.. i - n e Cost per child per month was$1.07.
3.15 Overall direction C of the program was providedby a national working group ia <-1 , rescntatives of relevantministries and national and 1 . i,tary organizations, under theumbrella direction of the Mu -'lth Provincial committees wereorganized by the PMOH and, at level, the administrativeinfrastructure developed duria 'n -w a used to organize themeasuring of children, the es`. ",`.`,^-. of feeding points and thecooking. At the village level 3, i ay registration, preparationand feeding was performed by ',- w7 ,- of the children.
3.16 An evaluation of th .:,'5 i the program concluded thatchildren attending the supplea`.- --le, la put on weight at twice therate of better nourished childŽ.` a ildren attending 30 or moresupplementary meals gained weiI "h i times the rate of the betternourished children (175). In S3;-i,--% data limitations, it is reasonableto conclude that there was a t- :. effect on nutrition status.
3.17 Moreover, the educatin'= e5-oLzi appears to have beenconsiderable, this varying by a.^3va•ty-nine percent of the mothersreported general or specific in their children's health and
17/ Included were 12 envelopcs s-A five tins of pesticides, 40 kg.of fertilizer, garden impli =:-`. aind instructions.

-109- ANNEX 15page 42 of 48
85% of the women said they would prepare the same foods for the childrenat home.
3.18 In short, the program organizers learned from mistakes in othercountries the importance of providing foods appropriate to localcircumstances and nutritional needs. They also involved the communitiesthemselves in the program (e.g., 85% of the mothers participated), andused the program as an educational device. A large number of externalagencies participated in the program, the major of which were OXFAM, Savethe Children Fund, and the Swedish International Development Authority(SIDA).
3.19 With the 1982 drought, some continuation is likely of theChildren's Supplementary Feeding Program, which since September 1981 hasbeen taken over by MOH and funded by SIDA. In addition, a more permanent$1.1 million per year pre-school nutrition program was under preparationby the Ministry of Community Development and Women's Affairs. Over 1,000preschool centers already exist, providing some form of organized careand feeding. The expanded program would include feeding, early detectionand referral service and related nutrition education. The aim is toreduce by half malnutrition in the three-to-six age group in threeyears. As funding had not yet been agreed with the Ministry of EconomicPlanning and Development at the time of this writing, further detailswere not available.
3.20 Another proposed program being considered by MOH is thetransformation of the emergency feeding points into play centers andproduction units, where under-fives from the surrounding area would cometo be looked after by women of the community. At these play centers,health and nutrition education talks and demonstrations would be given byMinistry of Health personnel and the centers would become productionunits at which nutritious foods, particularly groundnuts, could be grownby the community for feeding of their children. Production anddistribution of the food would be communal and shared equitably among theproducers.18 /
School Feeding
3.21 School feeding programs have not been common in Zimbabwe,although in some areas a mid-morning drink (usually Nutresco Mahewu) isprovided at approximately $.01 per cup. The only evaluation of a schoolfeeding program found in the country, this between 1973 and 1976 in QueQue TTL, concluded "there can be little doubt that the school feedingscheme has had a significant influence in physical development." Thisstudy of 1,004 students in Siwundula, St. Barnabas, and Gunde found,after attempting to control for weather and successful agriculturalseasons, that 73% of the children participating in the feeding program
18/ The aim is to have 100 half-hectare plots in each province. Thesupplementary food production scheme has been pilot tested (supportcame from both OXFAM and SIDA), but the 1982 drought has had aninhibiting effect on progress.

-110- ANNEX 15page 43 of 48
grew faster than would be expected by their past performance, and thatthere had been an overall 12% improvement for children participating inthe school feeding scheme. A related study showed that the number ofchildren who benefit from the scheme depends on the severity ofmalnutrition before the feeding. In schools where the nutrition problemwas not as severe as others (i.e., where no less than 80% of the childrenwere above the tenth centile), significant improvements in the numbersbenefiting from the scheme did not result (139).
Food Aid
3.22 Being a food surplus country in most years, Rhodesia/Zimbabwehad not generally been the recipient of food aid as other countries inthe region. An exception was 1980 when 13,000 tons of food were broughtin by the World Food Program (WFP). This was sold for livestock feed;the $1.5 million proceeds were used to help finance the relief feedingprogram. The presence of the World Food Program office in Zimbabwelargely is to purchase food for distribution to neighboring countries.In the 10 months up to April 1982, for example, the World Food Programhad purchased 100,000 tons of grain worth $12 million for distribution in11 countries -- Mozambique, Tanzania and Angola being the largestrecipients.
3.23 Relatedly, currently under consideration is an ambitiousfive-year program put to EEC for 1,500 tons of skim milk powder, worth onthe order of $100 million. The milk would be sold to the Dairy MarketingBoard at world market prices and the proceeds used to build up the dairyherd that was hard hit by the war and again by the drought. Theobjective would be that, by the end of the five-year period, Zimbabwewould be self-sufficient in milk.
C. Nutrition Education
3.24 Apart from the nutrition education associated with pre-schoolfeeding programs, nutrition education in Zimbabwe is undertaken by theMinistry of Education and Culture, the Home Extension Service of theMinistry of Community Development and Women's Affairs, the Ministry ofHealth, the city Health Departments and a plethora of non-governmentorganizations, both domestic and expatriate.
3.25 Nutrition education plays a prominent role in the Ministry ofEducation's imaginative science and social studies programs, taught atvarying levels of sophistication at all grades in 4,500 schools (173).In addition to classroom presentations, the Ministry plans to mount aprogram of school gardens (to be piloted in 100 schools) that wouldinclude pre-packaged agricultural kits featuring seeds, implements andteachers' handbooks. The main constraint for gardens is water and, insome urban cases, availability of land.
3.26 The Home Extension Service has about 450 demonstrators whoreceive a three-month training course, about one-and-a-half weeks ofwhich is devoted to nutrition. These demonstrators develop and takeadvantage of a variety of field opportunities to communicate messages and

-111- ANNEX 15page 44 of 48
liaise with the Ministries of Health and Agriculture in the disseminationof nutrition-related education (mostly to women's clubs). A focus of thehome extension service is the impressive savings club movement whichprovides a basis of community participation in a variety of subjects,nutrition being among the more important. An estimated 50,000 families,represented mainly by the women in communal areas, are now participatingin this rapidly growing movement.
3.27 The Ministry of Health has been responsible for publishingnutrition education posters and currently is preparing a film. It hasalso published 29,000 copies of a breast feeding booklet, one of the moreambitious national responses to the WHO/UNESCO infant feeding code.
3.28 Much of the nutrition education from the Ministry of Health isdesigned to come from the village health worker, who has been trained inhow to use the road-to-health card and to encourage breast feeding. Thevillage health worker also receives some training from the agricultureextension service, particularly on how to plant gardens, and Isencouraged to have a garden as a community model. One-third of thehealth facilities surveyed by the mission said they were involved ingardens. Aside from its nutrition value, vegetable gardening in manyareas is the most common income-generating activity for women (94).
3.29 Recently assigned provincial nutrition officers hope tocoordinate the nutrition work already going on by the nutrition promotersof other organizations, give lectures at training centers, and coordinatework related to the supplementary feeding programs. Dieticians, workingout of the Ministry of Health, deal mainly with hospitals.
3.30 The city Health Departments also conduct nutrition educationand, in some cases, feeding sessions. In 1980, for example, 361well-baby clinics were conducted in Harare, with an attendance of 58,000people.
3.31 The Voluntary Organizations in Community Enterprise (VOICE),formerly the National Council for Social Service, works with women'sclubs in developing courses and training trainers. They report that inthe past decade they have trained 3,000 women who, in turn, affect 50,000children in pre-school groups. Commonly, children are fed mahewu forwhich parents are charged about $0.02 a day.
3.32 A substantial nutrition education program has been mounted bySilvera House, a center "which trains trainers and development promotersto combat hunger, malnutrition, oppression and injustice" (126). Sincethe nutrition program was started in 1978 by Ms. Sabina Mugabe, some30,000 people have attended 300 workshops. The training includes cookingclasses with a nutrition bent, poultry raising (in 1981, 48,000 chickswere delivered to 167 groups in nine areas), cooperative gardening (thereare now 133 groups involving 6,000 women) and play centers prepared bythe community, with a plot of land to raise groundnuts, chickens andrabbits. The 24 women trained in 1981 increases the total of SilveraHouse promoters to 54. No additional training has been provided thisyear due to funding problems. The Government supports this NGO, as doseven external agencies.

-112- ANNEX 15page 45 of 48
3.33 Zimbabwe's Freedom from Hunger Campaign, now in its 18th year,considers nutrition education the most important aspect of its work andmakes wide distribution of booklets, pamphlets and posters. Twenty-ninenutrition demonstrators who assist nurses at well-baby clinics areemployed from profits from the sale of high protein food through theclinics. In addition, the Freedom from Hunger Campaign provides $100,000a year in seeds for vegetable gardens every year and assists in thefencing of gardens. It also has helped in the building of 10 nutritioncenters for rehabilitation. These include instruction in nutrition andhygiene, as well as gardening.
3.34 The program of UNICEF, now the most active of the U.N. agenciesin nutrition in Zimbabwe, includes a heavy emphasis on nutritioneducation. In 1982, the line item for nutrition in UNICEF's budget was$95,000.
3.35 Other agencies that have been involved in nutrition education,feeding or other nutrition-related work are Christian Care, Save theChildren, OXFAM, Salvation Army, the Quaker Protein-for-the-PeopleProgram, Red Cross, the Mennonite Central Committee, Medicins sansFrontiers, Bread for the World, and the Swedish, British, Australian andDutch governments as well as other countries through the EEC and theWorld Food Program.
3.36 In sum, substantial nutrition education has taken place and istaking place in Zimbabwe and there are indications that the educationefforts have been successful in what the messages were trying to achieve(175). Unfortunately, the messages often were different and sometimescontradictory between agencies and the actions proposed ofteninappropriate for the Zimbabwean circumstances. Those mothersparticipating in the Children's Supplementary Feeding Program, forexample, when asked whether they thought the meal made a balanced diet,said there should be different foods, in addition. Most frequentlymentioned were milk, eggs and meat (by contrast, groundnuts and oil werementioned with one-third the frequency) (175). This, in part, reflectsthe thrust of nutrition education provided over the years by some of thedemonstrators. A Freedom from Hunger campaign poster seen commonly inhealth facilities in the country portrays milk, meat, eggs and commercialmilk food products (Nespray and Nestle condensed milk) as important foodsfor good nutrition. Home extensionists interviewed in April 1982 inManyika said they had been trained that children "must have milk" andthey, in turn, were encouraging low-income mothers to purchase Nespray.A large number of health workers are either ignorant about the bottlefeeding dangers or are uncertain about it, according to a 1981 survey(174). Doctors and clinics were cited by 47% bottle feeders as thesources of advice on artificial feeding measures (27).A January 1981report from St. Paul's mission Murewa on the mobile clinic work said"... Nutresco, Mahewu, skimmed milk powder and Pronutro are necessary tokeep children well fed. Milk and Pronutro are necessary for underweightbabies ... But we do not always manage to get these supplies (121)." InMay 1982, primary school teacher trainees in Masvingo who were asked toprepare nutrition posters all pictured affluent diets -- red meat, eggs,

-113- ANNEX 15page 46 of 48
milk, etc. Interviews with school students suggest that there also is aconcentration on foods of the affluent in the school curriculum. Changesare needed.
3.37 Similarly, additional attention may be merited in the use of"road-to-health" cards as an educational tool, which is one of its majorpurposes. In a 1982 evaluation at a clinic in a stable community inHarare, mothers generally did not understand the purpose of the card;rather, it was viewed as a tool for health workers. Little wascommunicated to the mothers during weighing, even in cases of nutritionrisk. The reasons: the pressure of numbers that needed to be givenattention and the orderlies involved in the weighing may not have had thenecessary education themselves. When messages were communicated to themothers, little was said about energy-rich foods and, in some cases,questionable dietary practices (e.g., the promotion of commercial infantformula and commercially processed infant foods) were being advocated.None of the mothers of children suffering from second or third degreemalnutrition was given any advice of what to do (78). A similar look ata Borrowdale clinic, a peri-urban and farming community, found that inonly eight of 30 cases was anything said to the mother after the childwas weighed (78). As education is a main point of the weighing and thecard, clearly the message is not getting through.
3.38 There is need for an understanding of what foods areappropriate (some earlier work was done on this but received limitedexposure) (139) and then a standardization and coordination of messageswould seem to deserve a high order of attention.
D. Nutrition Rehabilitation
3.39 Traditionally, the most common form of care for severemalnutrition was through hospitals and, although data are not available,this probably continues to be the case. Of 26 health facilitiesresponding to a query, 23 had nutrition rehabilitation, three of themwith over 100 patients a month. This is costly and not alwayseffective. In 1980, 41 cases of severe malnutrition were followed upfrom Bindura General Hospital. Sixteen died in the hospital and afurther four were dead on follow-up. A further case was ill again in thehospital. Of the remaining 15 children that could be located, eight wereseverely undernourished (74).
3.40 As in other countries, Zimbabwe has taken the position that itis both less costly and more useful to rehabilitate severely malnourishedchildren in so-called Nutrition Centers or, as sometimes called inZimbabwe, Nutrition Villages. The idea is that mothers would help in thecare and preparation of foods for the malnourished children and learn inthe process, thus reducing future risk. Certain of the Villages also areto be used as training centers for women running creches (121).Nutrition Villages currently constitute a sizeable portion of theMinistry of Health's expenditure for nutrition. (In 1982, $160,000 wasapproved by the Government for the establishment of new NutritionVillages.) However, there is limited data to demonstrate the

-114- ANNEX 15page 47 of 48
cost-effectiveness of this approach. Only one substantial follow-upstudy of such care was identified. An analysis of the NutritionRehabilitation Center concept in 1977 by St. Theresa's Hospital found inUmvuma that 11% of the children who had gone through the program had diedand 20% were still severely malnourished. (There was no estimate of howmany would have died without the care.) The report concluded thatmothers could relate to everything they had been told in lectures withposters, "but they did nothave gardens because they did not have water;they did not have chickens because they were too expensive and rabbitsbecause they did not have water to give them." Among the reasons citedby mothers who were readmitted to the Nutrition Center were that thefamily had no vegetables or groundnuts, the migrant husband was notsending money home, the baby had been taken off the breast because ofpregnancy, medical reasons, the mother was a mental case or an alcoholic,the child was left behind when the mother went to town to be with herhusband, and genuine poverty. The conclusion of the study was "we couldnot encourage the establishing of Nutrition Rehabilitation Centers on alarge scale as we feel that it is just another institution adjacent to amedical center. We feel that the money could be much more effectivelyused training village health workers on how to prevent malnutrition atthe village level" (149-150).19/
3.41 In short, Nutrition Centers/Villages do provide a less costlymeans than hospitals of rehabilitating malnutrition. The extent to whichthe educational/preventive dimension of the program is effective dependslargely on the cause of the nutrition problem. In those instances wherenutritional ignorance is the main cause and resources to improve thecondition are otherwise at the mother's disposal, the long-run value ofthe Nutrition Village can be considerable. By contrast, when theconstraint is basic resources or a severe social problem, it is unlikelythat the Nutrition Village can do more than solve the immediate problem.There is an unfortunate perception among some in Zimbabwe that bydevoting resources to Nutrition Villages, as is now being done, theproblem of malnutrition is being looked after. Even under a much moreambitious program than now exists, the coverage of these NutritionVillages will be modest. At any given time generally fewer than 10children are treated in a center. At the Nutrition Village at St. Paul'sin Murewa, 151 children passed through in 1981, staying an average of 13
19/ Interviews conducted with mothers of Nutrition Village patients inNyadiri in August 1981 confirmed the dilemma: "My child haskwashiorkor because I have nothing to give my children. ThisNutrition Village is helping us very much but I am sorry I won't findmilk, eggs, meat, and peanut butter when I go home, so it's going tobe the same...I have a field but I have no cattle or a plow so Ican't do anything to earn money." In another interview: "I havelearned many new things here. I didn't know how milk was boiled andI didn't know that we can put cooking cooking oil or peanut butter inporridge. But we still have a question that we won't find thesefoods at home, so how could we manage to follow these new helpingmethods."

-115- ANNEX 15
page 48 of 48
days each for an average of five children in the Village at any onetime. The malnutrition problem, of course, is much broader and morepervasive.
E. Food Technology
3.42 Most of the food science and food technology capacity in thecountry resides with the private food industry. A food science course isnow being provided in the Bio-chemistry Department at the University ofZimbabwe, in which more attention is being given to food technology as itrelates to traditional foods, instead of Western foods which largelyoccupy the food companies. Attention is being addressed to the problemof food losses through waste, pests and poor processing anddistribution. Zimbabwe is the headquarters of the SADCC Food CoordinatingSecretariat and among the projects being supported under this program byIDRC (Canada) is a sorghum milling project, being conducted with theassistance of Silvera House.
3.43 A new Food and Nutrition Association of Zimbabwe is gettingstarted with 80 members representing the food industry, the medical andacademic communities and government and international organizations. Thepurposes are to promote nutrition education, to provide a forum foridentification of problems and exchange of information, to promoteethical practices and to promote cooperation in scientific study ofnutrition-related areas.
3.44 In sum, a considerable number of nutrition-related actions arenow being undertaken in Zimbabwe both by Government and non-governmentagencies. The lack of a policy context, and of coordination, however,have limited the impact of these activities. The need for coordinationis most evident in nutrition education, where perhaps a dozen programspromote different and sometimes conflicting messages. The current heavyemphasis on Nutrition Villages may, at least in part, be misdirected.Feeding programs appear to have been successful, having learned frommistakes of other countries. The government program with potentially thegreatest impact on nutrition -- consumer food subsidies -- is notadequately geared to the needs of the truly malnourished. There iscurrently no effective focal point in government for formulating andpressing support for policy proposals that take account of the criticallinkages between production measures on the one hand and the complex ofconsumption issues on the other. Solving this problem is a prerequisitefor a rational policy to deal with malnutrition.

-116-
ATTACHMENT TO ANNEX 15Page 1 of 14
BIBLIOGRAPHY
1. Affleck, H. "Iodine Deficiency in Southern Rhodesia,"Rhodesia Agricultural Journal, Vol. 55, No. 1,January-February 1958.
2. Allaart, L. M. E. "Nutrition Education in Rhodesia," mimeo,undated (circa 1979).
3. American University Area Handbook for Southern Rhodesia, Washington,D. C., 1975.
4. Axton, J. H. M. "Analysis of Medical Paediatric Admissions, HarareHospital, 1975", The Central African Journal ofMedicine, Vol. 39, No. 9, September 1977.
5. ----- "Measles and the State of Nutrition," SouthAfrica Mediese Tydskirf, January 1979.
6. Berg, E. "Alternative Statrategies for Zimbabwe'sGrowth," Center for Research on EconomicDevelopment, University of Michigan, 1980.
7. Blackie, Malcolm Paper prepared for Commission of Inquiry into theAgricultural Industry, under the chairmanship ofProf. C. L. Charunduka, 1982 (in press).
8. Bourdillon, M. F. C. "Korekore Labour Migrants," Paper for theAssociation of Sociologists in Southern AfricaConference, Lesotho, 1973.
9. Buchanan, W. M. N. Krasner and A. C. Wicks, "Body Iron Distributionand Ascorbic Acid Status," Central African Journal ofMedicine, Vol. 22, No. 11, November 1976.
10. -- "Iron Deficiency Anemia in Rhodesian Africans,"The Central African Journal of Medicine, Vol.14, No. 1, January 1968.
11. Bulawayo, City of Annual Report of the Medical Officer ofHealth for the Year Ended June 30, 1981, October26, 1981.
12. Brown, Kent Survey data of Mount Darwin, medical studentreport for Department of Pediatrics and Child Health,University of Zimbabwe, April 1982.
13. Cairns Holdings Ltd. Annual Report, 1981.
14. Callear, Diana "Food Subsidies in Zimbabwe," St. Anthony's College,Oxford University, undated paper (circa 1981).

-117- ATTACHMENT TO ANNEX 15Page 2 of 14
15. "Special Focus - Resettlement: Zimbabwe's FirstStep," Food Policy, November 1981.
16. ----- Wedza data, work in progress.
17. Candy, E. J. and M. G. T. Pawandiwa, "Vitamin A Levels inRural and Urban African Preschool ChildrenDuring Summer Months in Rhodesia" (source anddate unknown).
18. Carlstrom, Anders "Nutritional Survey in Rhodesia - September1979-January 1980," Comite International de laCroix-Rouge, Geneva, February 26, 1980.
19. Carr, W. R. "Observations on the Nutritive Value of Tradi-tionally Ground Cereals in Southern Rhodesia,"British Journal of Nutrition, Volume 15, 1961.
20. Carver, Richard and David Sanders, "Zimbabwe's Biased HealthService," New African, Salisbury, August 1980.Also, "Malnutrition in Rhodesia," 1979.
21. Chale, Freda U. FAO Report, Duty Travel to Zimbabwe, Kenya andTanzania, January 13-February 4, 1981.
22. Chikanga, I. C., D. Paxton, R. Loewenson, and R. Laing, "TheHealth Status of Farmworker Communities inZimbabwe," The Central African Journal ofMedicine, Vol. 27, No. 5, May 1981.
23. Clarke, D. G. Agricultural and Plantation Workers in Rhodesia;A Report on Conditions of Labour andSubsistence, Mambo Press, Occasional Papers,Socio-Economic Series No. 6, 1976.
24. Cleave, John H. African Farmers: Labor Use in the Developmentof Smallholder Agriculture, Special Studies inInternational Economics and Development,Praeger, New York, 1974.
25. Colborne, L. A. "Indigenous Foods, Their Role in CombattingMalnutrition in Rhodesia," TherapeuticDietetics, Salisbury, 1975.
26. Collinson, M. and K. Billings, "A Diagnostic Survey forAdaptive Research Planning in the South ofChibi District, Victoria Province," 1982(work in progress).
27. Cooper & Lybrand Survey on Child Feeding in East and CentralAssociates Africa, Tanzania, December 10, 1981.

-118- ATTACHMENT TO ANNEX 15-118- Page 3 of 14
28. Cross, E. G. "The Tribal Trust Lands in Transition," The RhodesianScience News, Vol. 11, August 1977.
29. ----- "The Tribal Trust Lands in Transition: The NationalImplications," paper presented to the NaturalResources Board Symposium, Salisbury, June 1977.
30. ---- "Zimbabwe: Strategies for EconomicDevelopment. Agricultural Development andEquity," January 1980.
31. Cubitt, Verity S. 1979 Supplement to the Urban Poverty Datum Linein Rhodesia: A Study of the Minimum ConsumptionNeeds of Families (1974), Faculty of SocialStudies, University of Rhodesia, Salisbury,1979.
32. ---- and Roger C. Riddell, The Urban Poverty DatumLine in Rhodesia: A Study of the MinimumConsumption Needs of Families, Faculty ofSocial Studies, University of Rhodesia,Salisbury, June, 1974.
33. Danckwerts, J. P. A Socio-Economic Study of Veldt Management inthe Tribal Areas of the Victoria Province,1974, mimeo.
34. de Swardt, L. Socio-agrinomic Survey of Gukwe (work inprogress).
35. Decker, J. M. K. and E. P. MacManus, "Complications of Measles inRural African Children," Central African Journalof Medicine, Vol. 14, No. 12, 1968.
36. Dent, R. I. B. Lewis, J. D. Nelms, and A. E. Strover, "AStudy of Thyroid Disease in the Chikwaka Regionof Rhodesia," The Central African Journal ofMedicine, Vol. 14, No. 4, April 1968.
37. Doran, Martin Gwanda Field Survey, May-June 1982.
38. Economist Zimbabwe's First Five Years: Economic ProspectsIntelligence Unit, Following Independence, EIU Special Report #11,Ltd. London, November 1981.
39. DuPlessis, J. P. W. Whittman, et. al., "Effect of Enrichment of MaizeMeal with Nicotinic Acid and Riboflavin Upon theVitamin and Protein Nutritional Status of YoungSchool-going and Pre-school Children," South AfricanMedical Journal, Vol. 48, No. 39, August 1974 and"The Clinical and Biochemical Effects of Riboflavinand Nicotinamid Supplementation Upon Bantu SchoolChildren Using Maize Meal as Carrier Medium," SouthAfrican Medical Journal, Vol. 45, No. 19, May 1971.

-119- ATTACHMENT TO ANNEX 15Page 4 of 14
40. Family Health Vol. VII, A Review of Health Care in Rhodesia:Care Inc. Issues, Analyses and Recommendations, January 30,
1979 and A.O. Pugh and S.R. Chademana, "Aspects ofRural Health: Part II-Better Water Supplies," CentralAfrican Journal of Medicine, Vol. 24, No. 2, 1978
41. Food and Agricul- Zimbabwe Food and Agriculture Sector:tural Organization Country Development Brief, Technical Cooperation
Program, JCP/ZIM/6701, Rome, 1980 and Food BalanceSheets and Per Caput Food Supplies, Rome, 1980. Fordiscussion of dietary fats and oils, see Dietary Fatsand Oils in Human Nutrition, FAO Food and NutritionPaper No. 3, Rome, 1977.
42. Food and Nutrition Draft Constitution and Minutes of First AnnualAssociation General Meeting, March 6, 1982.
43. Freedom from Hunger Chairman's Report, 16th Annual Conference, Salisbury,September 19, 1980.
44. ----- Chairman's Report, October 1981.
45. ------ Food For Your Family, Foreword, 1975.
46. ----- Food For Your Family, Nutrition Council,Salisbury, Zimbabwe, 1974.
47. Froude, M. The Mamvura Area in Bikita Tribal Trust Land,Victoria Province, unpublished, undated report(circa 1970).
48. Fuglesang, Andreas Applied Communication in Developing Countries,Dag Hammarskjold Foundation, Uppsala, Sweden,1973; About Understanding, Dag HammarskjoldFoundation, Uppsala, Sweden, 1982; andCommunication with Illiterates, The NationalFood and Nutrition Commission, Lusaka, Zambia,1969.
49. Garbett, G. K. "Circulatory Migration in Rhodesia: Towards aDecision Model," in D. Parkin (ed), Town andCountry in Central and Eastern Africa, IAI,Oxford, 1975.
50. Gavaghan, Terence "Zimbabwe Problems and Prospects," paper presented tothe National Committee for the Study of InternationalAffairs, Royal Irish Academy, June 19, 1980.
51. Gelfand, Michael Diet and Tradition in an African Culture, E. &S. Livingstone, Edinburgh and London, 1971.

-120- ATTACHMENT TO ANNEX 15Page 5 of 14
52. ---- Ukama, Reflections on Shona and Western Cultures inZimbabwe, Mambo Press, 1981.
53. Gilmurray, John Roger Riddell, and David Sanders, The Struggle forHealth: From Rhodesia to Zimbabwe, CatholicInstitute for International Relations, London, 1979.
54. Grinham, S. Information on survey of dependents of farmworkers/Wedza, unpublished.
55. Gumprich, D. E. F. Notes for a Course on Shona Customs,Salisbury,G.P.S. 18448-B, undated.
56. Hampson, Joe "Health In Zimbabwe," The Tablet, May 9, 1982.
57. Hay, June and C. Stolhofer, Food and Nutrition Situation,March/April 1982, Mberengwa District.
58. Holton, C. E. "Vitamin Deficiencies in Zimbabwe, with SpecialReference to Vitamin A and Niacin," TherapeuticDietetics, Salisbury, 1979.
59. Howden, R. H. G. Food Production in Communal Areas, Report ofDepartment of Agricultural Development,September 3, 1981.
60. Hughes, A. J. B. Development in Rhodesian Tribal Areas: AnOverview, Tribal Areas of Rhodesia ResearchFoundation, 1974 also see "ExperimentalSocio-economic Survey in Gutu Tribal Trust Land,1963," CONEX, Salisbury, 1965.
61. Hunt, Sue Report of Nutritional Surveys in the Mtoko Area,April 7, 1980.
62. Jackson, Jeremy Gutu survey data, May 1982.
63. Jansen, Doris J. "Agricultural Prices and Subsidies in Zimbabwe:Benefits, Costs and Tradeoffs," draft report,April 1982.
64. Kachingwe, Ernest W. Social Welfare Services for Urban Africans inZimbabwe: The Role of Social Work Education inthe Distribution of Services, The University ofIowa, 1979.
65. Kay, George Distribution and Density of Population inRhodesia, Department of Geography, University ofHull, Series No. 12, 1972.

ATTACHMENT TO ANNEX 15Page 6 of 14
66. -- Rhodesia, Human Geography, University of LondonPress, 1970, London.
67. 'Zimbabwe's Independence: Geographical Problemsand Prospects," The Geographical Journal, Vol.147, No. 2, July, 1981.
68. Kendall, A. C. "Rickets in the Tropics ard Sub-tropics," CentralAfrican Journal of Medicine, Vol. 18, No. 3, March1972.
69. Kennan, P. B. "Extension Services to Agriculture," Paper presentedto the International Economic Resource Conference onZimbabwe, September 1980.
70. "Reasons Why Peasants Do Not Adopt Innovations,"Zimbabwe Agriculture Journal, Vol.77, No. 4,1980.
71. King, Maurice et. al., Nutrition for Developing Countries: WithSpecial Reference to the Maize, Cassava and MilletAreas of Africa, Oxford University Press, Nairobi,1972.
72. Kinsey, B. H. "Resettlement and Land Policy in Zimbabwe,Growth Equity, Trade-Offs and NationalDevelopment," April, 1982.
73. Kwofie, Kwame FAO Report, Duty Travel to Zimbabwe, March 3-6,1981.
74. Loewenson, Rene "An Evaluation of Hospital Management ofUndernutrition" (work in progress).
75. ---- "The Health Status of Farmworker Comunities inZimbabwe," Paper presented at Zimbabwe EconomicSociety Conference on Rural Development,June 6-10, 1981.
76. ---- Results of a Nutrition Survey at a ChiweshiFarm, June 25, 1981, unpublished.
77. ------ Results of the Gutu Agro-Economic/NutritionSurvey (in conjunction with Jeremy Jackson),University of Zimbabwe, April 1982.
78. ---- and K. Hakutangwi, 'Road to Health Card'Check; Results of Pilot Survey, March 1982.
79. ----- and G. Madlela, Results of the Health StatusSurveys Carried Out in the Commercial FarmingAreas of Matabeleland University of Zimbabwe,July/August 1981, unpublished.

ATTACHMENT TO ANNEX 15-122- Page 7 of 14
80. -- and A. Muuigai, Results of a Nutrition Survey Carriedout in Wedza to Supplement a Food Consumption, Socio-Economic Survey (by Diana Callear), University ofZimbabwe, May 1982.
81. Dr. Sang and T. Z. Sithole, Results of the HealthStatus Surveys Carried Out in the Commercial Farmingof Mashonaland, Raffingora District, August 1981.
82. ---- M. Tsapotsa and R. Laing, Results of a NutritionSurvey Carried out in the Bindura Area Communal(Peasant Farming Areas) in Madziwa and Masembura(work in progress).
83. ------ J. Zanza, D. Paxton, R. Laing, Results of an UrbanNutrition Survey Carried out in the Bindura UrbanArea, University of Zimbabwe (work in progress).
84. ----- S. Zengeya, A. Sena, J. Zanza and R. Laing, Resultsof a Survey into the Health Status of Mineworkers,University of Zimbabwe Medical School,December/January 1981/82 (in press).
85. Loxton, R. F. and Associates, Report on the Survey of theNatural Resources and Socio-EconomicCircumstances of Gutu District, 1974.
86. Lues, Shane Mark Thorogood, Sam Kusema, and RichardDogherty, Rural Attachment: Reports onStudents' Projects, Department of Paediatricsand Child Health, University of Zimbabwe,September/October 1981.
87. MacManus, E. P. "Xerophthalmia in Matabeleland," The CentralAfrican Journal of Medicine, Vol. 14, No. 8,August 1968.
88. Madhovi, Penias B. "Food Handling in Shona Villages of Zimbabwe,"Ecology of Food and Nutrition, Vol. 11, 1981.
89. ---- "Nutritional Needs of Rural Population Studied,"The Herald, Salisbury, October 16, 1981.
90. Martin, David and Phyllis Johnson, The Struggle for Zimbabwe,Zimbabwe Publishing House, Salisbury, 1981.
91. Mathe, S. and R. T. Mossop, Luveve Survey, undated.
92. May, Jacques M. Drinking in Harare, Institute for SocialResearch, Department of Sociology, University ofRhodesia, 1973.

ATTACHMENT TO ANNEX 15-123- Page 8 of 14
93. ------ and Donna L. McClellan, The Ecology of Malnutritionin Eastern Africa and Four Countries of WesternAfrica, Studies in Medical Geography, Vol. 9, HafnerPublishing Company, New York, 1970.
94. McCalman, Kate We Carry a Heavy Load, Report of Survey byZimbabwe Women's Bureau, December 1981.
95. Meaders, Robert Report to WHO, July 1981.
96. Miller-Cranko, A., M. Mushambi, G. Pridgeon, S. McQuade, I. Ternouth andB. Waters, A Mini Nutrition Survey of Small Areas ofZimbabwe, April 1982.
97. Miller-Cranko, John and Michael Gelfand, "A Clinical Description of theMain Nutritional Disorders Encountered in theSalisbury Native Hospital in a Series of 54Consecutive Cases Studied in 1954," The CentralAfrican Journal of Medicine, Vol. 1, No. 1, January1958.
98. Mossop, R. T. Kadoma Survey, Quest for Health, undated.
99. Moyo, E. E. "A Preliminary Application of the FAO BalanceSheet Methodology to the Zimbabwe FoodSituation," Economics and Markets Branch,Ministry of Agriculture, undated.
100. Muchena, 0. N. "Women and Work, Planning Rural Development withWomen in Mind," paper presented to ZimbabweEconomic Society Seminar, University ofZimbabwe, June 1981.
101. Muir, K. Crop Production Statistics, May 1981.
102. Mushunga, Nyasha Food Patterns and Nutrition Problems in SouthernAfrica, M.Sc. thesis, California StateUniversity, Fresno, May 1978.
103. Mutsemi, M. V. The Planning Implications of Alternative LandTenure System for Rural Development in SouthernRhodesia, dissertation for M.A. Degree,University of Nottingham, 1977.
104. Nutrition Council Annual Reports for 1953 and 1954, Department ofHealth, December 28, 1953 and December 31, 1954.
105. ----- Some Facts and Figures of Bantu NutritionSouthern Africa, undated (circa 1955).
106. Nyoni, M. J. M. Some Economic Aspects of Rural-Urban Migrationfrom Rhodesia's Tribal Trust Lands, M.Sc. thesisin agricultural economics, Wye College,University of London, May 1979.

-124- ~ATTACEMN TO AN~NEX 15-124- Page 9 of 14
107. Nziramasansa, M. "Zimbabwe: Anticipation of Economic and HumanitarianNeeds: The Agricultural Sector in Rhodesia,"Consultant Occasional Paper, No. 7, African-AmericanScholars Council, 1977.
108. OXFAM British Aid to Zimbabwe, January 30, 1981.
109. Data from periodic field reports of OXFAM doctors,1980-1981.
110. ------ Report of a Nutrition Survey Conducted in the Rural
Areas of Zimbabwe in May/June 1980.
111. Owen, F. Women's Health Survey, May 1982.
112. Patel, Diana Data on urban remittances, 1982.
113. Phimister, I. R. "African Labour Conditions and Health in the SouthernRhodesian Mining Industry, 1898-1953," The CentralAfrican Journal of Medicine, Vol. 22, No. 4, April1976.
114. Reiley, M. J. as quoted in "Protein and Energy Requirements and theEffects of Their Deficiencies," The Rhodesian ScienceNews, Vol. 9, No. 6, June 1975.
115. Riddell, Roger C. Alternatives to Poverty: From Rhodesia toZimbabwe-No. 1 Catholic Institute forInternational Relations, London, 1979.
116. - ---- Report of the Commission of Inquiry intoIncomes, Prices and Conditions of Service, underthe Chairmanship of Roger C. Riddell, June,1981.
117. ----- "Zimbabwe: Problems for the Economy," ODIReview, No. 1, 1979.
118. Robertson, F. Paper on Rickets, South African Medical Journal,Vol. 35, 1969.
119. Rugg, I., et. al., School Health Survey in Musami, Muwera andMtchabezi, 1982, mimeo.
120. Rukuni, Mandi Data on Murewa, 1982.
121. St. Paul's Report(s) on St. Paul's Hospital, Musami, Mrewa,Hospital January 2, 1981 and March 1, 1982.
122. Salisbury, City of Annual Report of City Health Department,Salisbury, 1980.
123. Sanders, David "Health, Nutrition, Food and Its Use As a Weapon inZimbabwe and Southern Africa," 1980.

-125- ATTACHMENT TO ANNEX 15Page 10 of 14
124. Saravaza, V. S. Mack C. McCoy, B. S. Dando, F. D. Jangano, "UnifiedNational Health Information System," The CentralAfrican Journal of Medicine, Vol. 28, No. 2,February 1981.
125. Save the Children Program Potential in Zimbabwe (Team Visit toFoundation (U.S.) Zimbabwe, June 27-July 11, 1981), August 1981.
126. Silveira House Annual Report, 1981.
127. ----- Nutrition and Child Care Project, Syllabus forPromoters and Coordinators.
128. --- Nutrition Department Report, January 1982.
129. ----- Wedza Nutrition, Child Care and Development, Februaryand March Report, 1982.
130. Stewart, A. M. and B. P. B. Ellis, "Anthropometry in the Assessmentof the Current Nutritional Status of SchoolChildren," The Central African Journal of Medicine,Vol. 21, No. 3, March, 1975.
131. TAICH Food Production and Agriculture. DevelopmentAssistance Abroad, American Council of VoluntaryAgencies for Foreign Service, Inc., New York,April 1981 and Development Assistance Programsof U.S. Non-profit Organizations, Zimbabwe,February 1981.
132. Thiesen, R. J. Abstracts from Research Papers, 1964-1976, March18, 1977.
133. ----- Agro-Economic Factors Relating to the Health andAcademic Achievement of Rural School Children,published by the Tribal Areas of RhodesiaResearch Foundation, Salisbury, March 1975.
134. ---- Classification of Stressed Families in theChiwundura T. T. L; Families with Children,February 4, 1978.
135. ----- Livestock in Tribal Communities, December 16,1977.
136. ----- Motivation and Extension in Tribal Communities,Institute of Social Research, University ofRhodesia, December 1978.

-126- ~~~ATTACHMENT TO ANNEX 15-126- Page 11 of 14
137. The Need for A New Approach to the Development ofConsolidated and Protected Villages, Salisbury,November 26, 1977.
138. - The Nutrition and Physical Development of Children inThree Tribal Communities of Rhodesia, November 26,1977.
139. ---- The Supplementary Feeding of School Children in ATribal Trust Land of Rhodesia, December 12, 1976.
140. Thornycroft, Peta "Beating the Child Waster: The Frontline Women," TheHerald, Zimbabwe, May 26, 1982.
141. Tickner, Vincent "Food Policy in Zimbabwe," Food Policy, August 1980.
142. The Food Problem: From Rhodesia to Zimbabwe - No. 8,Catholic Institute for International Relations,London, 1979.
143. ----- "Immediate Food Supply Problems in Zimbabwe,"Section of the Conference on Zimbabwe held atthe University of Leeds, Britain, June 21, 1980.
144. United Nations Assessment of World Food Situation, November 1974.
145. - "Opportunities for Cooperation in SouthernAfrica," March 1979.
146. U. S. Agency for "A Report to the Congress on Development NeedsInternational and Opportunities for Cooperation in SouthernDevelopment Africa," Washington, D.C., March 1979.
147. U. S. Department Food Problems and Prospects in Sub-Saharanof Agriculture Africa: The Decade of the 1980s, Washington,
D.C., 1980.
148. ---- Zimbabwe: Situation, Agricultural AttacheReport, American Embassy, Pretoria, March 3,1982.
149. Walsh, Sister "An Intensive Approach to the Problem ofPatricia Malnutrition with the Hope of Eradicating It,"
Project Reports, March and November 1977.
150. ---- "Short Presentation on Experiences in NutritionEducation," Paper presented at Symposium onNutrition Education, October 31, 1981, Instituteof Continuing Education, University of Zimbabwe(in press).

ATTACHMENT TO ANNEX 15-127- Page 12 of 14
151. Waterston, Tony "Community Desk," M. C. H. Newsletter,September-October, 1981.
152. and David Sanders, Harare and Chitungwiza NutritionSurvey data, Department of Paediatrics and ChildHealth, University of Zimbabwe.
153. ----- and R. Masanganise, Feeding Patterns in Infancy,December 1981 (work in progress).
154. Weinrich, A. K. H. African Farmers in Rhodesia, OUP, London, 1975.
155. Whitlow, J.R. "Environmental Constraints and PopulationPressures in the Tribal Areas of Zimbabwe,"Zimbabwe Agriculture Journal, Vol. 77, No. 4,1980.
156. ------ Land Utilitzation and Development Prospects in theCommunal Lands of Zimbabwe.
157. Whitsun Foundation A Strategy for Rural Development, Data Bank No. 2:The Peasant Sector, 1978.
158. Whittle, H. and E. Walker, "Goitre Survey, Omay Tribal TrustLand, Kariba District, Rhodesia," The CentralAfrican Journal of Medicine, Vol. 14, No. 3, March1968.
159. ------ A. Whittle, and A. Wicks, "The Weights of YoungAfrican Children in a Township in Rhodesia," TheCentral African Journal of Medicine, Vol.16,No. 1, January 1970.
160. World Health "Cooperation Tecnica con la Republica deOrganization Zimbabwe,"34a Asamblea Mundial de la Salud, 13
de abril de 1981.
161. World Bank Social Infrastructure and Services in Zimbabwe,Washington, D.C. 1981.
162. ------ Zimbabwe Agricultural and Rural DevelopmentSector Memorandum, February 1981, (unpublished)
163. ------ Zimbabwe Country Economic Memorandum, April 1980.
164. Zimbabwe, Govt. of "Growth With Equity," An Economic PolicyStatement, February 1981.
165. ------ Report on Development Cooperation for 1981, June1981.

-128- ATTACHMENT TO ANNEX 15Page 13 of 14
166. Zimbabwe, Govt. of European Expenditure Survey, 1978, Salisbury, 1981,Central Statistical BS/1/81/350.Office
167. - ---- Lower Income Expenditure Survey, 1976/1977 (includingthe weighting structure of the Lower Income ConsumerPrice Index), Salisbury, 1980, AD/35/80/200.
168. ------ Higher Income Expenditure Survey, 1977/1978(including the weighting structure of the LowerIncome Consumer Price Index), Salisbury, 1981,BS/1/81/340.
169. Monthly Digest of Statistics, Salisbury, March 1982.
170. ------ Supplement to Monthly Digest of Statistics,Salisbury, October 1978.
171. Zimbabwe, Govt. of Agricultural Statistics, Economics and MarketingMinistry of Agri- Branch, January 1982.culture
172. Zimbabwe, Govt. of An Inquiry into Pre-School Activities in Zimbabwe,Ministry of Education 1981.and Culture
173. ------ Social Studies Syllabus for Primary Schools,October 1980 and Environmental Science Syllabus,Environmental Science Working Party, 1980.
174. Zimbabwe, Govt. of Baby Feeding, Department of Nutrition, 1981.Ministry of Health
175. The Children's Supplementary Feeding Programmein Zimbabwe, 1982.
176. ------ Food Table, undated.
177. "Nutrition Education by Dieticians ThroughTrainees and Leaders," undated.
178. Report on the National Nutrition Survey ofZimbabwe, December 3, 1980.
179. ------ Health Profile, Health Planning Division, draft(undated); also "Morbidity and Mortality Statisticsfrom all Hospitals, Ministry of Health" (undated).

-129- ATTACHMENT TO ANNEX 15Page 14 of 14
180. Report of the Secretary of Health for the Year Ended31 December 1979, 1980.
181. Zimbabwe Medical Aid "Health Services Under the White Settler Regime inRhodesia," undated.