INFORMATION MEMORANDUM - CMA Publications
272
In respect of the offer to the public and listing of Kenya Shillings six billion (Kes.6,000,000,000) senior unsecured fixed rate notes and senior unsecured equity linked notes 14 May 2015 INFORMATION MEMORANDUM 2015
-
Upload
khangminh22 -
Category
Documents
-
view
1 -
download
0
Transcript of INFORMATION MEMORANDUM - CMA Publications

In respect of the offer to the public and listing of Kenya Shillings six billion
(Kes.6,000,000,000) senior unsecured fixed rate notes and senior
unsecured equity linked notes
14 May 2015
INFORMATION MEMORANDUM
2015

Information Memorandum
Senior Unsecured Fixed Rate Notes and Senior Unsecured Equity Linked Notes
ii
Serial Number:
Champions of Governance the second time round...We always strive to adhere to the highest corporate governance practices and consistent focus on improving our reporting systems both as a financial company and listed firm hence success in winning these awards.
www.centum.co.ke

Information Memorandum i
Senior Unsecured Fixed Rate Notes and Senior Unsecured Equity Linked Notes
Centum Investment Company Limited
Incorporated in Kenya under the Companies Act (Chapter 486, Laws of Kenya) (Registration Number C.8/67)
Information Memorandum in respect of the offer to the public and listing of Kenya Shillings six billion (Kes.6,000,000,000) senior unsecured fixed rate notes
and senior unsecured equity linked notes
14 May 2015
Information Memorandum
Senior Unsecured Fixed Rate Notes and Senior Unsecured Equity Linked Notes
ii
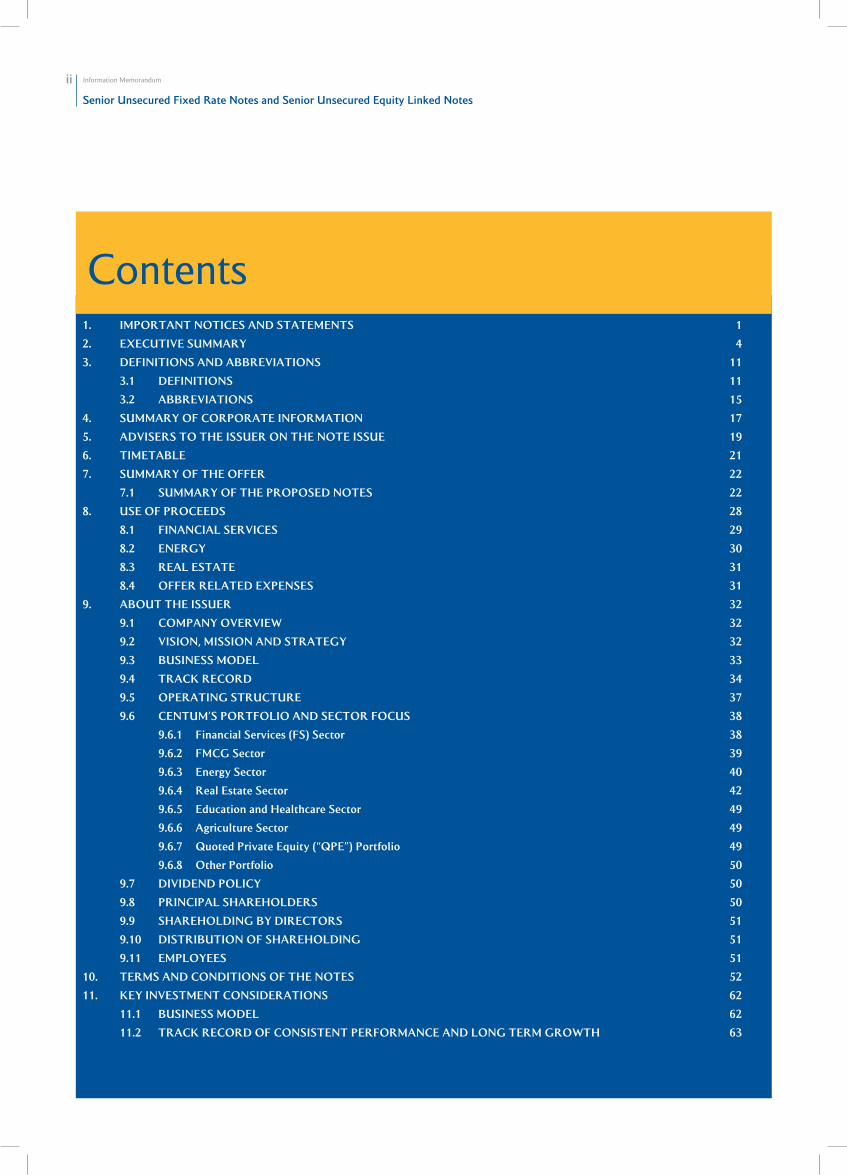
1. IMPORTANT NOTICES AND STATEMENTS 1
2. EXECUTIVE SUMMARY 4
3. DEFINITIONS AND ABBREVIATIONS 11
3.1 DEFINITIONS 11
3.2 ABBREVIATIONS 15
4. SUMMARY OF CORPORATE INFORMATION 17
5. ADVISERS TO THE ISSUER ON THE NOTE ISSUE 19
6. TIMETABLE 21
7. SUMMARY OF THE OFFER 22
7.1 SUMMARY OF THE PROPOSED NOTES 22
8. USE OF PROCEEDS 28
8.1 FINANCIAL SERVICES 29
8.2 ENERGY 30
8.3 REAL ESTATE 31
8.4 OFFER RELATED EXPENSES 31
9. ABOUT THE ISSUER 32
9.1 COMPANY OVERVIEW 32
9.2 VISION, MISSION AND STRATEGY 32
9.3 BUSINESS MODEL 33
9.4 TRACK RECORD 34
9.5 OPERATING STRUCTURE 37
9.6 CENTUM’S PORTFOLIO AND SECTOR FOCUS 38
9.6.1 Financial Services (FS) Sector 38
9.6.2 FMCG Sector 39
9.6.3 Energy Sector 40
9.6.4 Real Estate Sector 42
9.6.5 Education and Healthcare Sector 49
9.6.6 Agriculture Sector 49
9.6.7 Quoted Private Equity (“QPE”) Portfolio 49
9.6.8 Other Portfolio 50
9.7 DIVIDEND POLICY 50
9.8 PRINCIPAL SHAREHOLDERS 50
9.9 SHAREHOLDING BY DIRECTORS 51
9.10 DISTRIBUTION OF SHAREHOLDING 51
9.11 EMPLOYEES 51
10. TERMS AND CONDITIONS OF THE NOTES 52
11. KEY INVESTMENT CONSIDERATIONS 62
11.1 BUSINESS MODEL 62
11.2 TRACK RECORD OF CONSISTENT PERFORMANCE AND LONG TERM GROWTH 63
Contents

Information Memorandum iii
Senior Unsecured Fixed Rate Notes and Senior Unsecured Equity Linked Notes
11.3 UNUTILISED DEBT CARRYING CAPACITY 64
11.4 STRONG CASH FLOWS 65
11.5 A WELL-DIVERSIFIED INVESTMENT PORTFOLIO 65
11.6 STRONG CORPORATE GOVERNANCE 66
11.7 STRONG BRAND NAME 67
12. ECONOMIC OVERVIEW 68
12.1 KENYA MACRO - ECONOMIC OVERVIEW 68
12.2 UGANDA MACRO - ECONOMIC OVERVIEW 70
13. INDUSTRY OVERVIEW 73
13.1 POWER SECTOR 73
13.1.1 Overview of the East African Power Sector 73
13.1.2 Power Sector in Kenya 73
13.2 FAST MOVING CONSUMER GOODS (FMCG) SECTOR 78
13.2.1 About FMCG 78
13.2.2 Key Drivers of FMCG in Africa 78
13.3 FINANCIAL SERVICES SECTOR 82
13.3.1 Kenya Banking Sector Overview 82
13.3.2 Industry Performance 82
13.3.3 Challenges 83
13.3.4 Opportunities 83
13.3.5 Overview of Kenya Insurance Industry 84
13.3.6 Industry Performance 84
13.3.7 Kenya Insurance Market Outlook 84
13.3.8 Performance Overview 85
13.4 RECENT PRIVATE EQUITY TRANSACTIONS IN EAST AFRICA 85
13.5 THE ASSET MANAGEMENT INDUSTRY 86
13.5.1 Traditional Asset Managers 86
13.5.2 Pension Industry 86
13.5.3 Individual Retirement Benefits Schemes and Service Providers 87
13.6 REAL ESTATE INDUSTRY IN AFRICA 88
13.7 REAL ESTATE INDUSTRY IN KENYA 89
13.7.1 Property Market Segment 89
13.8 REAL ESTATE INDUSTRY IN UGANDA 90
13.8.1 Property Market Segment 90
13.8.2 Retail market 90
13.8.3 Industrial market 91
13.8.4 Residential market 91
13.9 EDUCATION SECTOR 91
13.9.1 Overview 91
13.9.2 Key Drivers for Growth of the Education Sector in Kenya 91
13.9.3 Rising disposable income 93
13.10 HEALTHCARE SECTOR 93
13.10.1 Healthcare in Africa 93
13.10.2 Healthcare in Kenya 93
13.10.3 Pharmaceutical 94
13.10.4 Private Healthcare Sector in Kenya 94
13.11 INFORMATION AND COMMUNICATIONS TECHNOLOGY(ICT) SECTOR 95
13.11.1 Industry Overview 95
13.11.2 Kenya ICT Sector 95
13.11.3 Opportunities in ICT 96

Information Memorandum
Senior Unsecured Fixed Rate Notes and Senior Unsecured Equity Linked Notes
iv
13.12 AGRICULTURAL SECTOR OVERVIEW 96
13.12.1 Agriculture in Africa 96
13.12.2 Agriculture in Kenya 97
13.12.3 Factors Driving Agriculture Business in Kenya 97
13.12.4 Opportunities 97
13.12.5 Challenges 97
13.12.6 Technology 97
14. SUMMARY OF FINANCIAL INFORMATION AND OTHER SELECTED DATA 98
14.1 AUDITORS 98
14.2 COMPANY STATEMENT OF COMPREHENSIVE INCOME 98
14.3 CONSOLIDATED STATEMENT OF FINANCIAL POSITION 99
14.4 COMPANY STATEMENT OF FINANCIAL POSITION 100
14.5 STATEMENT OF CASH FLOWS (INTERNALLY GENERATED FUNDS) 101
14.6 COMPANY STATEMENT OF TOTAL RETURN 102
14.7 PROFORMA FINANCIAL INFORMATION 103
14.7.1 Projected consolidated statement of comprehensive income 103
14.7.2 Projected company statement of comprehensive income 104
14.7.3 Projected consolidated statement of financial position 105
14.7.4 Projected company statement of financial position 106
15. RISK FACTORS AND MITIGATION MEASURES 108
15.1 INVESTMENT RISKS 108
15.1.1 Investment Decisions 108
15.2 INVESTMENT PERFORMANCE 108
15.3 INVESTMENT CONCENTRATION 108
15.4 INVESTMENT VALUATIONS AND EXIT OPPORTUNITIES 108
15.5 FINANCIAL RISKS 109
15.5.1 Liquidity risks 109
15.5.2 Interest rate risk 109
15.5.3 Inflation risk 109
15.5.4 Foreign Exchange Risk 109
15.5.5 Credit Risk 109
15.5.6 Commodity Risk 110
15.6 OPERATIONAL RISKS 110
15.7 EXTERNAL RISKS 110
15.8 REPUTATIONAL RISK 110
15.9 PROJECT RISK 110
15.10 EXECUTION RISK 111
15.11 FINANCE RISK 111
15.12 MARKET RISK 111
16. CORPORATE GOVERNANCE 112
17. LEGAL AND CORPORATE INFORMATION 121
17.1 NAME, PLACE AND DATE OF REGISTRATION 121
17.2 CAPITAL STRUCTURE 121
17.3 VOTING RIGHTS AND CONTROL 121
17.4 LISTING 121
17.5 ISSUES OF SHARES IN THE THREE YEARS IMMEDIATELY PRECEDING
THE DATE OF THIS INFORMATION MEMORANDUM 121
17.6 PRINCIPAL OBJECTS (AS CONTAINED IN THE MEMORANDUM OF ASSOCIATION) 121
17.7 PROVISIONS OF THE ARTICLES RELATING TO BORROWING 122
17.8 THE ISSUER’S SUBSIDIARIES AND ASSOCIATED COMPANIES 122

Information Memorandum v
Senior Unsecured Fixed Rate Notes and Senior Unsecured Equity Linked Notes
17.8.1 Direct Subsidiaries 122
17.8.2 Issuer’s indirect subsidiaries 122
17.8.3 Other companies that Issuer has shareholding in: 124
17.9 MATERIAL AGREEMENTS
(OTHER THAN AGREEMENTS MADE IN THE ORDINARY COURSE OF BUSINESS) 124
17.10 ONEROUS COVENANTS AND DEFAULT 125
17.11 RELATED PARTY AGREEMENTS (LOAN AGREEMENTS WITH SUBSIDIARIES, ETC
WITH DETAILS ON AMOUNTS, PURPOSE, INTEREST RATES, ETC) 125
17.12 LOAN/FINANCE AGREEMENTS 125
17.12.1 Senior Unsecured Fixed Rate Notes and Senior Equity Linked Notes 125
17.12.2 Facilities from Co-operative Bank of Kenya Limited 126
17.12.3 Facility from FirstRand Bank Limited 126
17.13 RELEVANT SUBSIDIARY LOAN/FINANCE AGREEMENTS 127
17.14 LOANS TO DIRECTORS AND SENIOR MANAGEMENT 127
17.15 LICENSES AND PERMITS 127
17.15.1 The Issuer 127
17.15.2 Subsidiaries 127
17.16 PROPERTY AND INFORMATION ON VENDORS ON MATERIALS
ASSETS ACQUIRED IN THE LAST THREE YEARS 127
17.17 PROVISIONS OF THE ARTICLES WITH RESPECT TO DIRECTORS 128
17.18 MATERIAL LITIGATION 128
17.19 OTHER DISCLOSURES 129
18. GENERAL INFORMATION 130
18.1 EXPENSES OF THE OFFER 130
18.2 DOCUMENTS AVAILABLE FOR INSPECTION 130
18.3 MINIMUM SUBSCRIPTION LEVEL 131
18.4 APPLICATION PROCEDURE 131
18.5 TRADING OF THE NOTES 131
18.6 CHANGES IN SENIOR MANAGEMENT 131
18.7 INTERRUPTIONS IN GROUP’S BUSINESS 131
18.8 MATERIAL CHANGES 131
18.9 DIRECTORS STATEMENT AS TO LIQUIDITY REQUIREMENT 131
18.10 DIRECTORS’ DECLARATION 131
19. FREQUENTLY ASKED QUESTIONS ON EQUITY LINKED NOTES 132
20. APPENDIX 135
20.1 LEGAL OPINION 135
20.2 REPORTING ACCOUNTANTS REPORT 147
20.3 FORM OF LETTER OF UNDERTAKING FOR REQUESTED ALLOCATION 258
20.4 FORM OF THE NOTE APPLICATION FORM 259

Information Memorandum
Senior Unsecured Fixed Rate Notes and Senior Unsecured Equity Linked Notes
vi
Joint Transaction Advisers
Placing Agents and Joint Sponsoring Stock-brokers
Receiving Banks
Reporting Accountants
Fiscal Agent and Registrar
Legal Advisers
Note Trustee
Information Memorandum 1
Senior Unsecured Fixed Rate Notes and Senior Unsecured Equity Linked Notes
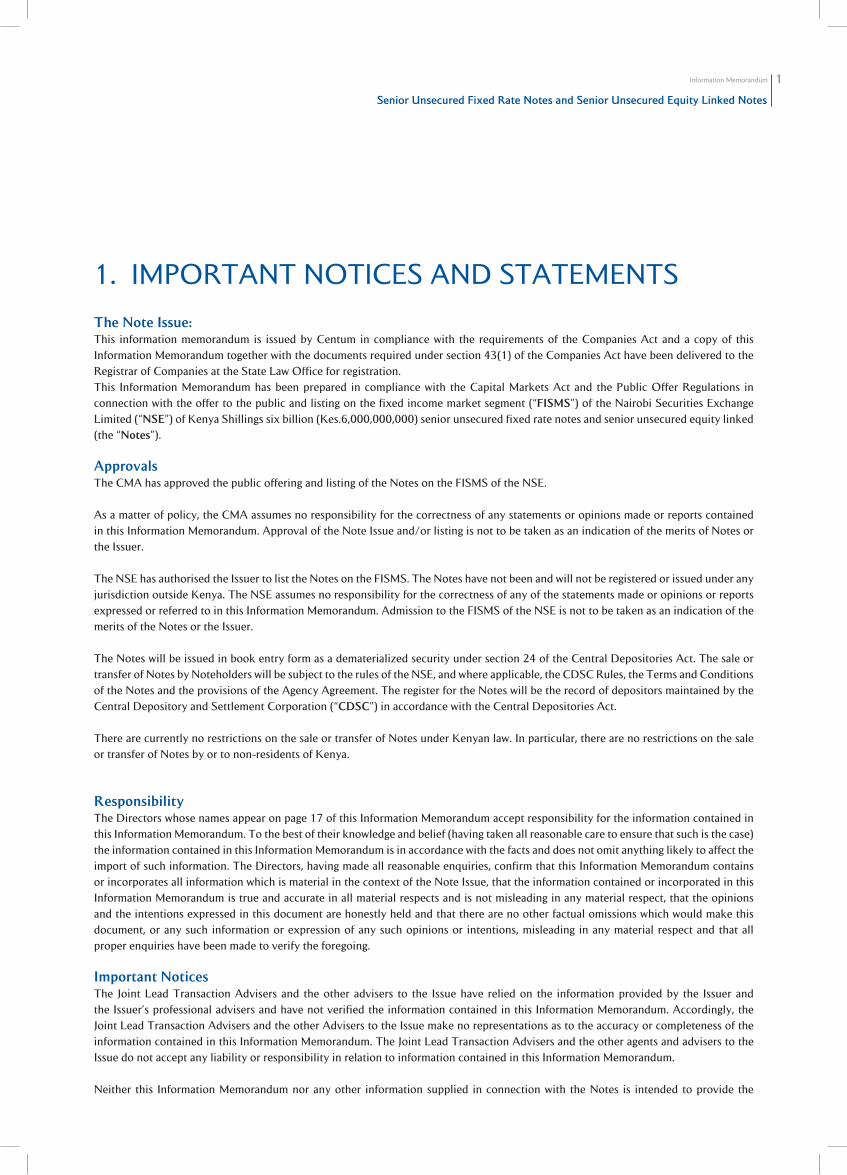
1. IMPORTANT NOTICES AND STATEMENTS
The Note Issue:This information memorandum is issued by Centum in compliance with the requirements of the Companies Act and a copy of this
Information Memorandum together with the documents required under section 43(1) of the Companies Act have been delivered to the
Registrar of Companies at the State Law Office for registration.
This Information Memorandum has been prepared in compliance with the Capital Markets Act and the Public Offer Regulations in
connection with the offer to the public and listing on the fixed income market segment (“FISMS”) of the Nairobi Securities Exchange
Limited (“NSE”) of Kenya Shillings six billion (Kes.6,000,000,000) senior unsecured fixed rate notes and senior unsecured equity linked
(the “Notes”).
ApprovalsThe CMA has approved the public offering and listing of the Notes on the FISMS of the NSE.
As a matter of policy, the CMA assumes no responsibility for the correctness of any statements or opinions made or reports contained
in this Information Memorandum. Approval of the Note Issue and/or listing is not to be taken as an indication of the merits of Notes or
the Issuer.
The NSE has authorised the Issuer to list the Notes on the FISMS. The Notes have not been and will not be registered or issued under any
jurisdiction outside Kenya. The NSE assumes no responsibility for the correctness of any of the statements made or opinions or reports
expressed or referred to in this Information Memorandum. Admission to the FISMS of the NSE is not to be taken as an indication of the
merits of the Notes or the Issuer.
The Notes will be issued in book entry form as a dematerialized security under section 24 of the Central Depositories Act. The sale or
transfer of Notes by Noteholders will be subject to the rules of the NSE, and where applicable, the CDSC Rules, the Terms and Conditions
of the Notes and the provisions of the Agency Agreement. The register for the Notes will be the record of depositors maintained by the
Central Depository and Settlement Corporation (“CDSC”) in accordance with the Central Depositories Act.
There are currently no restrictions on the sale or transfer of Notes under Kenyan law. In particular, there are no restrictions on the sale
or transfer of Notes by or to non-residents of Kenya.
ResponsibilityThe Directors whose names appear on page 17 of this Information Memorandum accept responsibility for the information contained in
this Information Memorandum. To the best of their knowledge and belief (having taken all reasonable care to ensure that such is the case)
the information contained in this Information Memorandum is in accordance with the facts and does not omit anything likely to affect the
import of such information. The Directors, having made all reasonable enquiries, confirm that this Information Memorandum contains
or incorporates all information which is material in the context of the Note Issue, that the information contained or incorporated in this
Information Memorandum is true and accurate in all material respects and is not misleading in any material respect, that the opinions
and the intentions expressed in this document are honestly held and that there are no other factual omissions which would make this
document, or any such information or expression of any such opinions or intentions, misleading in any material respect and that all
proper enquiries have been made to verify the foregoing.
Important NoticesThe Joint Lead Transaction Advisers and the other advisers to the Issue have relied on the information provided by the Issuer and
the Issuer’s professional advisers and have not verified the information contained in this Information Memorandum. Accordingly, the
Joint Lead Transaction Advisers and the other Advisers to the Issue make no representations as to the accuracy or completeness of the
information contained in this Information Memorandum. The Joint Lead Transaction Advisers and the other agents and advisers to the
Issue do not accept any liability or responsibility in relation to information contained in this Information Memorandum.
Neither this Information Memorandum nor any other information supplied in connection with the Notes is intended to provide the

Information Memorandum
Senior Unsecured Fixed Rate Notes and Senior Unsecured Equity Linked Notes
2
complete basis of any credit or other evaluation, nor should it be considered as a recommendation by the Joint Lead Transaction
Advisers or the other agents or advisers to the Issue that any recipient of this Information Memorandum or any other information
supplied in connection with this Note Issue should subscribe for or purchase the Notes. Each investor contemplating subscribing for or
purchasing the Notes should make their own independent investigation of the financial condition and affairs, and its own appraisal of
the creditworthiness of the Issuer. Investors are advised to consult their professional advisers before making an investment decision. The
attention of prospective investors is drawn to the Risk Factors set out in Section 15 of this Information Memorandum.
The delivery of this Information Memorandum does not at any time imply that the information contained herein concerning the Issuer is
correct at any time subsequent to the date hereof or that any other information supplied in connection with the Notes is correct as of any
time subsequent to the date indicated in the document containing the same.
No person has been authorized to give any information or make any representation other than those contained in this Information
Memorandum and if given or made, such information or representation should not be relied upon as having been authorized by or on
behalf of the Issuer, the Joint Lead Transaction Advisers or the other advisers and Agents to the Note Issue.
Selling RestrictionsThe Notes may not be offered or sold, directly or indirectly, and neither this document nor any other supplemental Information
Memorandum or any prospectus, form of application, advertisement, other offering material or other information relating to the Issuer or
the Notes may be issued, distributed or published in any jurisdiction, other than Kenya.
The distribution of this Information Memorandum and the offer for subscription or sale of the Notes may be restricted by law in certain
jurisdictions. Persons into whose possession this Information Memorandum or any Notes may come must first inform him or herself
about and observe any such restrictions.
Supplemental Information MemorandumThe Issuer will, for so long as any Note remains outstanding and listed on any exchange, publish a supplement to the Information
Memorandum where there has been:
(a) a material adverse change in the condition (financial or otherwise) of the Issuer; or
(b) any modification of the terms of the Note Issue which would then make the Information Memorandum inaccurate or misleading.
The Issuer shall seek the prior approval of the CMA in connection with any amendment or supplement to this Information Memorandum
and the Issuer shall, in addition, supply to the Joint Lead Transaction Advisers and other Agents and the CMA such number of copies of
such supplement to this Information Memorandum as the Joint Lead Transaction Advisers and other advisers and agents and the CMA
may reasonably require or as may be required to be provided by law. If the terms of the Issue are modified or amended in a manner
which would make this Information Memorandum, as supplemented, inaccurate or misleading, a new Information Memorandum will be
prepared by the Issuer after seeking the approval of the CMA and the NSE.
Forward Looking StatementsSome statements in this Information Memorandum may be deemed to be “forward-looking statements”. Forward-looking statements
include statements concerning the Issuer’s plans, objectives, goals, strategies and future operations and performance and the assumptions
underlying these forward-looking statements.
When used in this Information Memorandum, the words “anticipates”, “estimates”, “believes”, “intends” “plans”, “may”, “will”, “should”
and any similar expressions are used to identify forward-looking statements. The Issuer has based these forward-looking statements on the
current view of its Board of Directors with respect to future events and financial performance. These views reflect the best judgement of
the Issuer’s Board of Directors but involve uncertainties and are subject to certain risks the occurrence of which could cause actual results
to differ materially from those predicted in the Issuer’s forward-looking statements and from past results, performance or achievements.
Although the Issuer believes that the estimates and the projections reflected in its forward-looking statements are reasonable, if one or
more of the risks or uncertainties materialise or occur, including those which the Issuer has identified in this Information Memorandum,
or if any of the Issuer’s underlying assumptions prove to be incomplete or incorrect, the Issuer’s actual results of operations may vary
from those expected, estimated or projected.
These forward-looking statements apply only as at the date of this Information Memorandum. Without prejudice to any requirements
under Applicable Laws and regulations, the Issuer expressly disclaims any obligations or undertaking to disseminate after the date of
this Information Memorandum any updates or revisions to any forward-looking statements contained herein to reflect any change in its
expectations with regard thereto or any change in events, conditions or circumstances on which any forward-looking statement is based.
A prospective purchaser of the Notes should not place undue reliance on these forward-looking statements.

Information Memorandum 3
Senior Unsecured Fixed Rate Notes and Senior Unsecured Equity Linked Notes
RoundingSome numerical figures included in this Information Memorandum have been subject to rounding adjustments. Accordingly, numerical
figures shown as totals in certain figures may not be an arithmetic aggregation of the figures that preceded them.
The Issuer will provide, free of charge, to each person to whom a copy of the Information Memorandum has been delivered, upon request
of such person, a copy of any of the documents deemed to be incorporated herein by reference, unless such documents have been
modified or superseded.
Requests for such documents should be directed to:
Centum Investment Company Limited
5th Floor
International House
Mama Ngina Street
P.O. Box 10518-00100 Nairobi GPO
For the kind attention of the Company Secretary.
The information may also be obtained from the Issuer’s website: www.centum.co.ke.
Legal Adviser’s Opinion In compliance with disclosure requirement under disclosure F.08 of the Public Offer Regulations, Coulson Harney, the Legal Advisers,
have given and not withdrawn their written consent to the inclusion in this Information Memorandum of their Legal Opinion (attached
as Appendix 20.1), in the form and context in which the Legal Opinion appears and the references to their names, and have authorised
the contents of the said Legal Opinion.
Reporting Accountants’ Opinion In compliance with disclosure requirement under disclosure F.08 of the Public Offer Regulations, PricewaterhouseCoopers, the Reporting
Accountants, have given and not withdrawn their written consent to the inclusion in this Information Memorandum of their statements
(attached as Appendix 20.2), in the form and context in which their statements appear and the references to their names, and have
authorised the contents of the said statements.

Information Memorandum
Senior Unsecured Fixed Rate Notes and Senior Unsecured Equity Linked Notes
4
2. EXECUTIVE SUMMARY
Centum is one of East Africa’s largest1 quoted investment companies with total assets of Kes.36.8 billion as at 31 December 2014
and managing an additional Kes.140 billion of third party funds, through its fund management subsidiaries, Genesis Kenya Investment
Management Limited and Nabo Capital Limited.
Centum’s vision is “To be Africa’s foremost investment channel”
Centum works towards this vision by playing the role of a creator of investment grade opportunities. Within the strategy period 2014/19,
Centum will focus its development activities in eight key sectors: (i) financial services, (ii) fast moving consumer goods (“FMCG”), (iii)
real estate (iv) power (v) agriculture, (vi) education, (vii) healthcare and (viii) information communication technology (“ICT”). The
decision to focus on these sectors was informed by the size of the market, growth potential and our ability to develop and build Centum’s
capabilities in the development of investment grade assets.
Within the sectors, we look to develop opportunities of scale and attract third party investors to participate in high quality investment
grade opportunities. By way of illustration, Centum has successfully executed this strategy in the development of its Two Rivers real
estate project, which has attracted Kes.6.75 billion of equity capital and an additional Kes.7.2 billion of debt capital.
Focus on the eight sectors as highlighted below is a key theme of our 2014/19 strategy. Other themes for the strategy period are
highlighted below.
• Deliveryofmarketbeatingreturns.Inthisregardwehavesetanannualizedreturntargetof35%overthestrategyperiod
• ScaleupoftheGroupbygrowingCentum’stotalassetvaluetoKes120Billionby2019andtotalAssetsundermanagement(AUMs)
to Kes 720 Billion
• BuildingtheCentumbrandbydeliveringtopromisethroughpeoplehencedevelopingteamswithsectorexpertise
• Managementofoperatingcostsatbelow2%oftotalassets
In the following sections of the executive summary, we highlight four (4) key points:
(1) Our track record of delivery.
(2) The current Kes.6 billion issue of debt will be a component of the funding to be applied to the development of proprietary
opportunities that are in the deal pipeline that we have created;
(3) Centum has an unutilized debt carrying capacity: and
(4) Centum has strong cash flows to service the current and new debt.
2.1. Track record of delivery
2.1.1. A review of performance against our 2009/14 strategic targets.
During the strategy period 2009/14, we defined our business as an investment channel that sought to provide investors access to an
otherwise inaccessible, quality and diversified portfolio of investments. To this end we focused on five strategic objectives.
i. To deliver a return on shareholder funds consistently above market returns. Prior to this time Centum’s returns were strongly
correlated to the NSE;
ii. To scale up assets under management with a target of Kes 30 Billion by 2014 from Kes 6 Billion in 2009.
iii. ToincreaseourgeographicalfootprinttotherestofAfricawithatargetofatleast50%oftheportfoliooutsideKenya;
iv. To enhance Centum’s brand by developing processes, systems, controls and human capital to ensure the company would consistently
deliver to its promises;
v. Tomaintainportfoliocostsatbelow2.5%ofassetsundermanagement.
1Nairobi Securities Exchange Limited Market Capitalisation stock data

Information Memorandum 5
Senior Unsecured Fixed Rate Notes and Senior Unsecured Equity Linked Notes
Our performance against the above objectives is highlighted below.
i. Delivery of market beating returns
Wehaveoverthelast5years(the2009-2014strategyperiod)deliveredanaveragereturnof33%perannum.Thisperformance
representeda19%outperformancetotheNSE20ShareIndexanda19%outperformanceagainsttotheMCSIFrontierMarket
index.
ThetablesbelowhighlighttheperformanceofCentumagainsttheMCSIFrontierMarketindexinUnitedStatesDollars(USD):
The table below highlights the performance of Centum against the NSE 20 share index in Kenya Shillings (KES):

Information Memorandum
Senior Unsecured Fixed Rate Notes and Senior Unsecured Equity Linked Notes
6
The table below highlights Centum’s book value against the Market Capitalisation.
ii. Growth in assets under management
Centum’s portfolio grew by Kes. 27.8 Billion from Kes. 9 Billion in March 2010 to Kes. 36.8 Billion in December 2014. Total assets
under management stood at Kes 177 Billion in December 2014 representing a 19.5 times growth since March 2010.
iii. Geographical and asset class diversification
Duringthestrategyperiod2009/14,thediversificationtargetwastohave50%oftheportfoliooutsideofKenya.Weprogressively
increasedourexposureoutsideofKenyafromlessthan1%asatMarch2010to19%asatMarch2014.Inlinewithourmissionof
providingaccesstoinaccessibleportfolio,ourexposuretoprivateequityandrealestateincreasedfrom59%to83%atthecloseof
that period.
iv. Brand at Centum is defined as consistent delivery to promise. Throughout the 2009/14 strategy period we built capacity in the
organization through the recruitment of competent and experienced team members as well as through leadership development. As
a result of the strong team, we were able to deliver over and above our ambitious strategy targets.
v. Thecosttoassetratio(excludingthirdpartyfunds)wasmaintainedbelow2.3%withinthe2009/14strategyperiod.

Information Memorandum 7
Senior Unsecured Fixed Rate Notes and Senior Unsecured Equity Linked Notes
2.1.2. Our track record in developing investment grade assets and realizing value at significantly higher multiples
Over the last six years, Centum has had a lot of success in developing investment-grade opportunities and realizing significant return
at expanded multiples on its initial investment. Some examples are highlighted below:
Investment
Stages
Description
Deal Sourcing Centum has developed an extensive network of relationships within the region. This has enabled identification
of high-value early stage opportunities and high-potential acquisitions which have delivered significant growth
in Centum’s NAV. Examples of such investments are:
a) Amu Power – A Gulf Energy/Centum Consortium that won the award of tender to construct a 1,050MW
coal-fired power plant in Lamu, Kenya.
b) Akiira One Geothermal – Centum is part of the consortium developing Sub-Saharan Africa’s first
independent geothermal development, which when complete is expected to generate 140MW.
c) Two Rivers – A 100 acres development in Nairobi, acquired in 2010.
d) KRepBank–Acquisitionof65.7%shareholdingintheBankin2014.
e) PlatCorp –Acquisition of 35% shareholding in PlatCorpHoldings in 2012. PlatCorpHoldings is the
holdingcompanyofPlatinumCreditKenya,PlatinumCreditUgandaandPlatinumCreditTanzania.
f) GenesisKenya–Acquisitionof73.35%shareholdinginKenya’ssecondlargest2 fund manager in 2013.
Value Addition Through active execution of value creation strategies, Centum has improved the underlying performance of its
portfolio companies, which has resulted in an increase in profit attributable to Centum.
Value
Realization
Centum has been able to secure critical and well timed value realizations from its portfolio that have enhanced
return.
a) CarbacidInvestments-Acquired23%ofthecompanyin2009forUSD5Matatimewhenthecompany’s
shares had been suspended indefinitely from trading on the NSE. Centum exited in 2010 a year later at
more than 2x money back.
b) UAP-Investedintheyear2001,drovetheexpansionofthebusinessintoSouthSudan,Rwanda,DRC
andTanzania.In2012drovetheUSD50Mcapitalraisefrom3PEfundsat10xCentum’sentryvaluation.
Divested from the business in 2015 at 32x entry valuation.
c) TwoRivers–CentuminvestedUS$20Minacquiring100acresoflandinNairobiin2010.Masterplanned
securedapprovalsandattracted$75minequitycapitalatsignificantvalueuplifttoCentum’scapital.
d) RVR - Exited the underperforming asset in a secondary buyout to two PE funds in 2009, thereby recording
a gain of 4.4 times the carrying value of the investment.
2Retirement Benefits Authority Industry Performance Report, December 2013 to June 2015, published on 31 March 2015

Information Memorandum
Senior Unsecured Fixed Rate Notes and Senior Unsecured Equity Linked Notes
8
2.2. The Kes. 6,000,000,000 issue of debt will be a component of the funding applied to develop proprietary opportunities
Centum has developed a pipeline of attractive investment opportunities in the energy, financial services, real estate and agriculture
sectors. The table below highlights the deal pipeline.
Table 1: Deal Pipeline
Sector Target Companies Nature of
Investment
Description Deal value
(Kes. M)
Financial Services K-Rep Bank Limited Equity
investment*
Acquisition of majority shareholding of
K-Rep Bank and additional investment in
the Bank to increase its core capital so as
to enable the Bank to increase its ability to
attract deposits as well as increase its loans
and advances.
3,600
Energy (i) Akiira One Geothermal
Limited
(ii) Amu Power Limited
Equity
investment
Finance Centum’s equity investment in
Centum’s current opportunities in the
energy sector.
2,100
Real Estate Pearl Marina Estates Limited Equity
investment
The construction of Phase 1 of the Pearl
Marina Development commenced in March
2015. Phase 1 is estimated to cost Kes
2.75Bn. Centum intends on funding this
with60%debtand40%equity.Therefore,
the equity investment at phase 1 is Kes
1.1Bn.
1,100
Real Estate Vipingo Development
Limited
Equity
Investment
Centum is in the process of acquiring
9,646 acres of land in Vipingo at a price
of Kes. 180,000 per acre and Vipingo
Estates Limited, a subsidiary of Rea
Vipingo Plantations Limited, which
owns approximately 900 acres of land at
approximately Kes. 340 Mn.
2,100
Quoted private
equity
Centum Exotics Equity
Investment
Increase the proportion of listed
investments held by Centum.
2,000
Total 10,900
In line with Centum’s capital structure, these opportunities will be financed through a mix of internally generated funds (dividend
and interest income, as well as realizations of existing investments) and debt. This is highlighted in the table below.
Sources of funding Amount (Kes. M)
Internally generated funds (dividends, interest and investment realisations ) 4,978
Debt 5,922
Total 10,900
The debt component of funding will be through the issuance of Kenya Shillings six billion (Kes.6, 000,000,000) senior unsecured
fixed rate notes and senior unsecured equity linked notes.
The investment opportunities to be funded by the bond issue are highlighted below:
Sector Target Companies Nature of Investment % Bond proceeds
(Kes. M)
Financial Services K-Rep Bank Limited Equity investment* 60.0 3,600
Energy Akiira One Geothermal Limited
Amu Power Limited
Equity investment 35.0 2,100
Real Estate Pearl Marina Estates Limited Equity investment 3.7 221
Offer Expenses 1.3 79
Total 100 6,000
*Centum has already made a Kes. 2,355,000,000 investment in K-rep funded by a short-term facility. The proceeds from this Note
issue will be applied in refinancing the short-term facility.

Information Memorandum 9
Senior Unsecured Fixed Rate Notes and Senior Unsecured Equity Linked Notes
A. Financial services
Centumcompletedtheacquisitionof65.6%shareholdinginK-RepBankinNovember2014.Theacquisitionwasfundedthrough
abridgefacilityofUSD35Mn.Centumintendstoutilizepartoftheproceedsofthebondtowardsrefinancingthisshort-term
facility Centum further intends on increasing the capitalization of the bank and has committed to invest an additional Kes 1.2 Billion
towards this capitalization. This will allow the bank to attract higher deposits as well as enable the bank to offer more loans and
advances.
B. Energy
Centum has identified two opportunities in the energy sector.
i. Akiira One Geothermal
Akiira One Geothermal, founded in 2012, is the first private sector Greenfield geothermal private development in SSA. Centum
owns37.5%oftheequityintheprojectcompanythatisprospectingforgeothermalandwhencomplete,itwillgenerate70MW
of geothermal electricity with this being the first phase of the planned total 140MW.
ii. Amu Power
Amu Power is Special Purpose Vehicle (SPV) set up by the consortium that was awarded the tender to construct a 1050 MW
coal-fired power plant in Lamu County, Kenya. Centum is the lead project equity sponsor in the consortium.
C. Real Estate
PearlMarinaEstatesLimited(Uganda)owns385acresofprimelandsituatedbetweenEntebbeInternationalAirportandKampala
with 4km of lake frontage. The vision of Pearl Marina is to develop a premium world-class water front destination recognized in East
Africa and beyond.
Centum has commenced on Phase 1 construction of 102 villas, a gatehouse and supporting infrastructure for the Pearl Marina
project.Phase1isestimatedtocostKes.2.75Bn,whichwillbefunded40%byequityand60%bydebt.
Outcome of development of the proprietary opportunities in the pipeline
With these opportunities to be funded by the issue of additional debt, which are in addition to existing opportunities and current
investmentsthatarefundedfrominternallygeneratedfunds,Centum’sNAVissettogrowatbetween30%to35%p.a.inthecurrent
strategy period (2014-2019) and see Centum’s NAV grow to Kes.120 billion by the close of the period.
2.3. Unutilizeddebtcarryingcapacity
Centumhasarelativelylowlevelofgearing,withdebttoshareholderfundsratioat15%asat31March2015asshownbelow:
Kes. M 2010 2011 2012 2013 2014 2015
Net Debt (Total debt less cash) - 1,988 678 2,647 4,649 3,763
Gearing 16% 5% 20% 23% 15%
WiththecurrentdebtissueofKes.6billionbeingfullysubscribed,thelevelofgearingwillincreaseto31%,whichisstillrelatively
lowandwithinCentum’sexistingdebtcovenantsofaceilinggearingratioof50%.
The level of gearing at Centum excludes debt at the subsidiary company level. At subsidiary level, project specific funding at no
recourse to Centum is procured. Therefore, the value at risk for Centum in relation to the debt at subsidiary levels is limited to the
extent of Centum’s equity investment in the respective subsidiary.
2.4. Strong cash flows to service the current and new debt
Centum has strong cash flows from dividend, interest and exits from its portfolio of assets. The table below highlights the cash
generated from operations over the last six years. With our dual focus on cash return and investment value appreciation, Centum is
set to maintain healthy cash flows into the future.
Kes. M 2010 2011 2012 2013 2014 Dec 2014
Operating inflows 1,722 2,349 6,619 2,547 4,146 4,112
Operating outflows (199) (305) (309) (380) (463) (565)
Cash from Operations 1,523 2,044 6,310 2,167 3,683 3,547
Interest paid 44 148 230 344 660 391
Debt service coverage 34.61 13.81 27.43 6.30 5.58 9.07
Aminimalaverageof14%ofourcashinflowsgoestowardsservicingofoperatingexpensesatCentumInvestmentCompanyLimited.

Information Memorandum
Senior Unsecured Fixed Rate Notes and Senior Unsecured Equity Linked Notes
10
To better manage our cost structure, we have created operational subsidiaries in the following lines of business:
Business line Operational Subsidiary
Real estate - development management and project management Athena Properties Limited
Fund management of quoted securities Nabo Capital Limited
Shared Services (Finance, HR, ICT, Legal, Company Secretarial, Tax, Risk, Marketing
& Communications)
Centum Business Solutions Limited
Each of the operating subsidiaries provides services to Centum, its subsidiaries and associates companies at a fee. In addition, they have
third party clients from whom additional fees are generated. Each of the subsidiaries have revenues that exceed their cost structure,
which means that they do not add to the cost structure of Centum but rather each make a contribution to the bottom line of Centum as
they are run as separate businesses.
This therefore means that the bulk of cashflows generated from operations by Centum are available to service additional debt as well as
repay our current Kes 4.2 Bn bond in 2017.
Over the period, Centum has maintained debt service coverage way above the bond covenant of 1.5 times.
Centum is rated for credit quality by the Global Credit Rating Company (GCR). Centum received an initial rating of A- in 2012. Its
current rating is A for both short term and long term credit quality, well above the minimum investment grade rating.
Forecast debt service capacity
Given current cash flows from operations and an assumption of no growth, Centum will still be in a position to adequately service the
additional Kes.6 billion debt. This is illustrated below.
Assuming that cash from operations is at the focused Kes 3.2 Bn and an additional annual debt service of approximately Kes 800 million
from the bond raise, the debt service coverage will be 2.0 times which is within the bond covenant target.
Kes. M 2015E 2016E
Cash from Operations 8,352 2,706
Interest paid 730 1,344
Debt service coverage 11.44 2.01
Minimum debt service coverage ratio 1.5 1.5
CONCLUSION
We invite you to partner with Centum in this exciting journey of developing local institutions of scale that will attract foreign and local
investors searching for investment-grade assets in this region and will further serve to deepen our capital markets.
Information Memorandum 11
Senior Unsecured Fixed Rate Notes and Senior Unsecured Equity Linked Notes
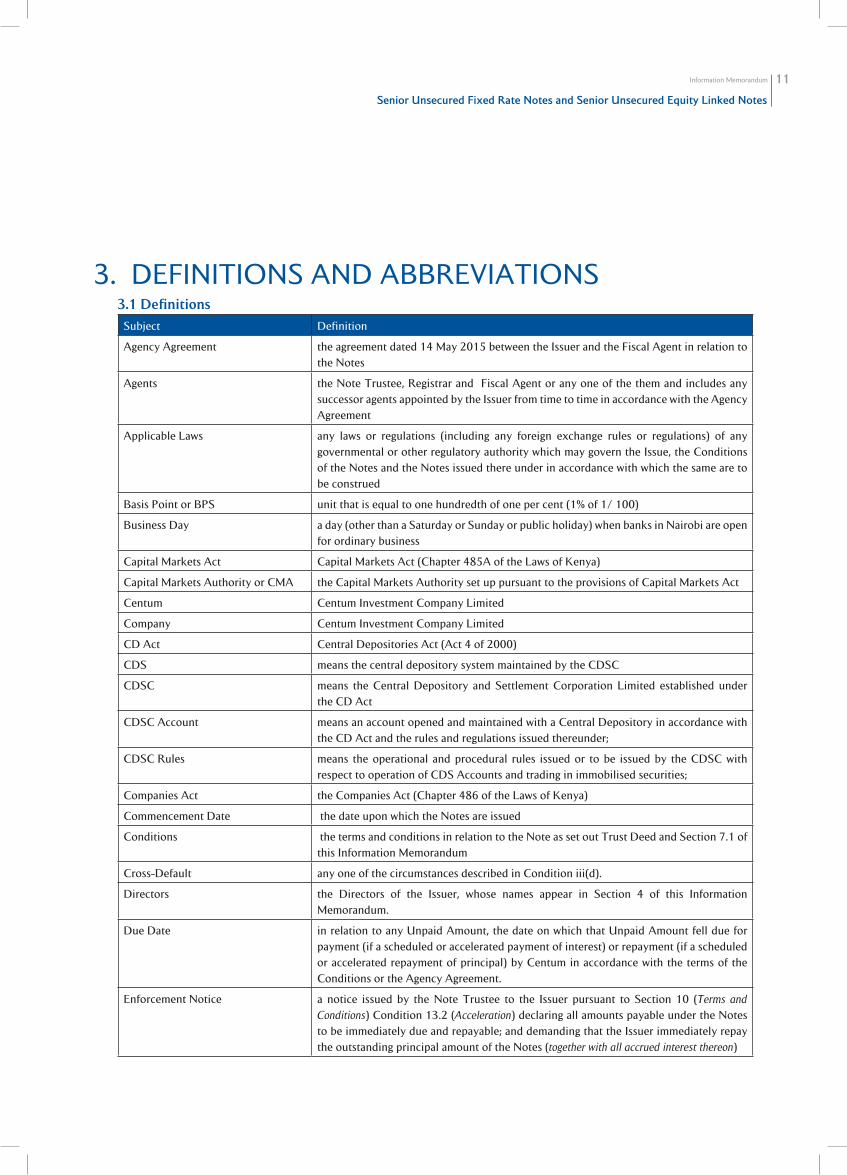
3. DEFINITIONS AND ABBREVIATIONS
Subject Definition
Agency Agreement the agreement dated 14 May 2015 between the Issuer and the Fiscal Agent in relation to
the Notes
Agents the Note Trustee, Registrar and Fiscal Agent or any one of the them and includes any
successor agents appointed by the Issuer from time to time in accordance with the Agency
Agreement
Applicable Laws any laws or regulations (including any foreign exchange rules or regulations) of any
governmental or other regulatory authority which may govern the Issue, the Conditions
of the Notes and the Notes issued there under in accordance with which the same are to
be construed
Basis Point or BPS unitthatisequaltoonehundredthofonepercent(1%of1/100)
Business Day a day (other than a Saturday or Sunday or public holiday) when banks in Nairobi are open
for ordinary business
Capital Markets Act Capital Markets Act (Chapter 485A of the Laws of Kenya)
Capital Markets Authority or CMA the Capital Markets Authority set up pursuant to the provisions of Capital Markets Act
Centum Centum Investment Company Limited
Company Centum Investment Company Limited
CD Act Central Depositories Act (Act 4 of 2000)
CDS means the central depository system maintained by the CDSC
CDSC means the Central Depository and Settlement Corporation Limited established under
the CD Act
CDSC Account means an account opened and maintained with a Central Depository in accordance with
the CD Act and the rules and regulations issued thereunder;
CDSC Rules means the operational and procedural rules issued or to be issued by the CDSC with
respect to operation of CDS Accounts and trading in immobilised securities;
Companies Act the Companies Act (Chapter 486 of the Laws of Kenya)
Commencement Date the date upon which the Notes are issued
Conditions the terms and conditions in relation to the Note as set out Trust Deed and Section 7.1 of
this Information Memorandum
Cross-Default any one of the circumstances described in Condition iii(d).
Directors the Directors of the Issuer, whose names appear in Section 4 of this Information
Memorandum.
Due Date inrelationtoanyUnpaidAmount,thedateonwhichthatUnpaidAmountfellduefor
payment (if a scheduled or accelerated payment of interest) or repayment (if a scheduled
or accelerated repayment of principal) by Centum in accordance with the terms of the
Conditions or the Agency Agreement.
Enforcement Notice a notice issued by the Note Trustee to the Issuer pursuant to Section 10 (Terms and
Conditions) Condition 13.2 (Acceleration) declaring all amounts payable under the Notes
to be immediately due and repayable; and demanding that the Issuer immediately repay
the outstanding principal amount of the Notes (together with all accrued interest thereon)
3.1 Definitions

Information Memorandum
Senior Unsecured Fixed Rate Notes and Senior Unsecured Equity Linked Notes
12
Subject Definition
Event of Default any one of the circumstances described in Section (Terms and Conditions) Condition 13.1
(Events of Default).
Extraordinary Resolution has the meaning set out in Section 10 (Terms and Conditions) Condition 16 (Meeting of
Noteholders)
Fair Value It is the amount at which the asset could be bought or sold in a current transaction between
willing parties, or transferred to an equivalent party, other than in a liquidation sale
Final Due Amount the amount due and owing from Centum under each of the Notes as determined by the
Agent on or after the Maturity Date
Final Net Asset Value the Net Asset Value, in Kenya Shillings, of Centum as reported in Centum’s Company
Statement of Financial Position as at 31st March 2020, subject to adjustments for
secondary issue of shares during the tenor of the Notes
Fiscal Agent the institution initially appointed by the Issuer pursuant to the conditions of the Agency
Agreement
Holders the Noteholders and/or the Variable Return Holders (as the case may be)
Independent Director a director who:
i. has not been employed by Centum in an executive capacity within the last five years;
ii. is not associated to an adviser or consultant to the Company or a member of
Centum’s senior management or a significant customer or supplier of Centum or
with a not-for-profit entity that receives significant contributions from Centum; or
within the last five years, has not had any business relationship with Centum (other
than service as a director) for which Centum has been required to make disclosure;
iii. has no personal service contract(s) with Centum, or a member of Centum’s senior
management;
iv. is not employed by a public listed company at which an executive officer of Centum
serves as a director;
v. is not a member of the immediate family of any person described above; or
vi. has not had any of the relationships described above with any affiliate of Centum.
Information Memorandum this Information Memorandum dated 14 May 2015
Initial Net Asset Value the Net Asset Value, in Kenya Shillings, of Centum as reported in Centum’s Statement of
Financial Position as at 31 December 2014
Insolvency Event (a) The completion of the winding-up or liquidation of Centum with it ceasing to exist;
or
(b) Any of the following which has the effect of permanently preventing the payment
or repayment by Centum of all of its liabilities under the Notes and the Agency
Agreement:
i. a war, revolution, riot or other similar event in Kenya;
ii. an earthquake, volcanic eruption, tidal wave or other act of God; or,
iii. action taken by the GoK to intervene in the business of Centum
Interest the amount of interest payable in respect of each Principal Amount of the Notes as
determined in accordance with Condition 6 (Interest) of Section 10(Terms and Conditions)
Interest Payment Date the dates which interest is payable as Condition 6 (Interest) of 10 (Terms and Conditions)
Interest Rate means13%fortheSeniorUnsecuredFixedRateNoteand12.5%fortheSeniorUnsecured
Equity Linked Note
Issue the total sums raised from the Notes
Issue and Paying Agent the Fiscal Agent
Issue Price the price at which the Notes are issued by the Issuer (being, at the election of the Issuer, at
par or at a discount to, or premium over their nominal amount as specified)
Issuer Centum Investment Company Limited
Joint Lead Arrangers or Joint Lead
Transaction Advisers
Equity Investment Bank Limited, Dyer & Blair Investment Bank Limited
Kenya The Republic of Kenya and “Kenyan” shall be construed accordingly

Information Memorandum 13
Senior Unsecured Fixed Rate Notes and Senior Unsecured Equity Linked Notes
Subject Definition
Kes or Shilling Kenya Shillings being the lawful currency of the Republic of Kenya
Late Payment Rate InterestRateplusamarginof2.0%perannum
Liabilities or Liability any loss, damage, cost, charge, claim, demand, expense, judgment, action, proceeding or
other liability whatsoever (including, without limitation, in respect of taxes, duties, levies,
imposts and other charges) and including any value added tax or similar tax charged or
chargeable in respect thereof and legal fees and expenses on a full indemnity basis
Maturity Date 8 June 2020
Month a period from and including a particular day in a calendar month to and excluding the
numerically corresponding day in the next calendar month, except that:
(a) (subject to paragraph (c) below) if the numerically corresponding day is not a
Business Day, that period shall end on the next Business Day in that calendar month
in which that period is to end if there is one, or if there is not, on the immediately
preceding Business Day;
(b) if there is no numerically corresponding day in the calendar month in which that
period is to end, that period shall end on the last Business Day in that calendar
month; and
(c) if an Interest Period begins on the last Business Day of a calendar month, that
Interest Period shall end on the last Business Day in the calendar month in which
that Interest Period is to end
NAV Net Asset Value calculated as total assets of a company less all its liabilities including loan capital and preference shares, divided by the number of outstanding shares.
NAVUpside difference between the Initial Net Asset Value and the Final Net Asset Value
Note Documents the Trust Deed and the Agency Agreement
Note Issue means the issue by the Company of medium term notes denominated in Kenya Shillings in an aggregate amount of up to Kenya Shillings six billion (Kes.6,000,000,000).
Note Trustee the person appointed to act as such in relation to the Note in pursuant to the Agency Agreement
Noteholder a person in whose name a Note is registered in the relevant Register as at the relevant date or, in the case of joint holders, the first-named thereof
Notes KenyaShillingssixbillion(Kes.6,000,000,000)13%SeniorUnsecuredFixedRateNotesand12.5%SeniorUnsecuredEquityLinkedNotesissuedpursuanttothis InformationMemorandum and the Agency Agreement.
Principal Amount the nominal amount of each Note credited in the CDSC Account in respect of that Note
Public Offer Regulations Capital Markets (Securities) (Public Offers, Listing and Disclosures) Regulations, 2002
Record Date in the case of payments of Interest or Principal, 1700 hrs Nairobi time 15 calendar days before the relevant date for payment or such other date as may be agreed between the Trustee (on behalf of the Noteholders), Centum and the relevant Agents
Redemption Price Payment at the Maturity Date for the ELN
Register means the respective official records of Noteholders and the Variable Return Holders in the CDS as maintained by the CDSC pursuant to section 25 of the CD Act;
Registrar the person appointed by the Issuer or acting as registrar pursuant to the Conditions and the Agency Agreement
Repay, Redeem and Pay shall each include both the others and cognate expressions shall be construed accordingly
Security a mortgage, charge, pledge, lien or other security interest securing any obligation of any person or any other agreement or arrangement having a similar effect
Senior Unsecured Equity Linked
Note
a Note which is issued pursuant to the Agency Agreement and this Information Memorandum whose return comprises Interest and a variable return based on the NAV UpsideasprovidedinCondition7(Computation of Variable Return) of Section 10 (Terms and Conditions)
SeniorUnsecuredFixedRateNote a Note which is issued pursuant to the Agency Agreement and this Information Memorandum whose return comprises of Interest to be calculated and paid on a fixed rate basis
Shareholder Funds a firm's total assets minus its total liabilities

Information Memorandum
Senior Unsecured Fixed Rate Notes and Senior Unsecured Equity Linked Notes
14
Subject Definition
Specified Office in relation to any Note Agent, either the office identified with its name in the Conditions or any other office notified to any relevant parties pursuant to the Agents agreement with the Issuer
Strategy Period Either of Centum’s strategy periods between years 2009-2014 and 2014-2019
Subsidiary in respect of any person, company or corporation, any other person, company or corporation who is controlled, directly or indirectly, by the first-mentioned person, company or corporation or more than half the issued share capital of which is beneficially owned, directly or indirectly, by the first-mentioned person, company or corporation. or which is a subsidiary of another subsidiary of the first-mentioned person, company or corporation and, for these purposes, a company or corporation shall be treated as being controlled by another person, company or corporation if that other company or corporation is able to direct its affairs and/or to control the composition of its board of directors or equivalent body
Successor in relation to the Agents, such other or further person, as may from time to time be appointed as an Agent
Tax any tax, levy, impost, duty or other charge or withholding of a similar nature (including any penalty or interest payable in connection with any failure to pay or any delay in paying any of the same)
Total Assets Centum’s portfolio of investments
Trust Deed the trust deed dated 14 May 2015 between Issuer and Ropat Trust Company Limited in relation to the Notes
UnpaidAmount that part of:(a) a scheduled payment of Interest under the Notes; or(b) a scheduled repayment of Principal under the Notes; or(c) a scheduled repayment of the Variable Return; or(d) any repayment of Principal by way of early redemption; or(e) the outstanding Principal Amount of the Notes (together with all interest thereon)
or outstanding Variable Return following delivery of an Enforcement Notice in accordance with the Agency Agreement, which, in each case, is not paid by Centum to the Fiscal Agent in accordance with the Agency Agreement by the applicable Due Date
US$orUSDorDollarsor$ UnitedStatesofAmericadollarsbeingthelawfulcurrencyoftheUnitedStatesofAmerica
Variable Return the variable return in relation to the equity linked component of the ELN as provided in Condition 7(Computation of Variable Return) of Section 10 (Terms and Conditions)
Variable Return Holder a person in whose name a Variable Return is registered in the relevant Register as at the relevant date or, in the case of joint holders, the first-named thereof
Written Resolution a resolution in writing signed by or on behalf of holders of Notes who for the time being are entitled to receive notice of a meeting in accordance with the provisions of the Trust Deed and who together hold not less than three-quarters in value of the principal amount of the Notes then outstanding whether contained in one document or several documents in like form, each signed by or on behalf of one

Information Memorandum 15
Senior Unsecured Fixed Rate Notes and Senior Unsecured Equity Linked Notes
Subject Definition
AUM AssetsUnderManagementwhichincludetotalassetsandthirdpartyfunds
BA Bachelors of Arts
Bcom Bachelors of Commerce
BSc Bachelors of Science
Bn or bn Billion
CAIA Chartered Alternative Investment Analyst
CAGR Compounded Annual Growth Rate
CBK Central Bank of Kenya
CFA Chartered financial Analyst
CIMA Chartered Institute of Public Finance and Accountancy
CMA Capital Markets Authority
CDS Central Depository System
CFA Chartered Financial Analyst
COD Commercial Operating Date
CPA (K) Certified Public Accountant of Kenya
CPS (K) Certified Public Secretary of Kenya
CIMA Chartered Institute of Management Accountants
EFT Electronic Funds Transfer
ELN SeniorUnsecuredEquityLinkedNote
FCCA Fellow of the Association of Chartered Certified Accountants
FMCG Fast moving consumer goods
FISM Fixed Income Securities Market Segment
FRN SeniorUnsecuredFixedRateNote
FTE Full time employee
GDP Gross Domestic Product
GoK Government of Kenya
ICDC Industrial Commercial Development Corporation
ICT Information and communications technology
IFRS international accounting standards within the meaning of the IAS Regulations 1606/2002
ICPAK Institute of Certified Public Accountants of Kenya
IMF International Monetary Fund
IRR Internal Rate of Return
JSD Doctor of Juridical Science
KenGen Kenya Electric Generating Company Limited
Km Kilometre
KPLC Kenya Power and Lighting Company Limited
LLB Bachelor of Laws
LLM Master of Laws
MA Master of Arts
MBA Master Business Administration
Mn Million
MW Megawatts
NAV Net Asset Value calculated as total assets of a company less all its liabilities including loan
capital and preference shares, divided by the number of outstanding shares.
3.2 Abbreviations

Information Memorandum
Senior Unsecured Fixed Rate Notes and Senior Unsecured Equity Linked Notes
16
Subject Definition
NAVUpside difference between the Initial Net Asset Value and the Final Net Asset Value
NSE Nairobi Securities Exchange Limited
PE Private Equity
PPP Public Private Partnership
PS Permanent Secretary
PhD Doctor of Philosophy
QPE Quoted Private Equity
RE&I Real Estate and Infrastructure
REIT Real Estate Investment Trust
RTGS Real Time Gross Settlement
sq ft Square feet
SQM or sq m Square metres
SSA Sub Sahara Africa
USA UnitedStatesofAmerica
USE UgandanSecuritiesExchangeLimited

Information Memorandum 17
Senior Unsecured Fixed Rate Notes and Senior Unsecured Equity Linked Notes
4. SUMMARY OF CORPORATE INFORMATION
Name of Issuer: Centum Investment Company Limited
Registration Number C8/67
Registered Office and Head Office International House
Mama Ngina Street
P. O. Box 10518 – 00100
Nairobi, Kenya
Tel: +254 (20) 2286000
Fax: +254 (20) 2223223
Mobile: +254 722 205339
Contact Persons James Mworia
Group Chief Executive Officer
Email: [email protected]
Risper Mukoto
Managing Director; Centum Business Solutions Limited
Email: [email protected]
Fred Murimi
Corporate Affairs Director & Company Secretary
Email: [email protected]
BOARD OF DIRECTORS OF THE COMPANY
Name Position Address
James Muguiyi Chairman
Non Executive Director
P.O. Box 10518, 00100 Nairobi, Kenya
Dr. James McFie Deputy Chairman
Independent Director
P.O. Box 10518, 00100 Nairobi, Kenya
James Mworia Chief Executive Officer
Executive Director
P.O. Box 10518, 00100 Nairobi, Kenya
Christopher Kirubi Non Executive Director P.O. Box 10518, 00100 Nairobi, Kenya
Peter Kimurwa Non Executive Director
(Alternate Director representing ICDC)
P.O. Box 10518, 00100 Nairobi, Kenya
Laila Macharia Independent Director P.O. Box 10518, 00100 Nairobi, Kenya
Margaret Byama Non Executive Director
(Alternate Director representing the PS Ministry of EA
Affairs, Commerce & Tourism)
P.O. Box 10518, 00100 Nairobi, Kenya
Imtiaz Khan Independent Director P.O. Box 10518, 00100 Nairobi, Kenya
Henry Njoroge Independent Director P.O. Box 10518, 00100 Nairobi, Kenya

Information Memorandum
Senior Unsecured Fixed Rate Notes and Senior Unsecured Equity Linked Notes
18
OTHER CORPORATE INFORMATION
Secretary Fred Murimi
Company Secretary/ Corporate Affairs Director
International House
Mama Ngina Street
P.O. Box 10518-00100
Nairobi, Kenya
Legal Advisers Coulson Harney
5th Floor, ICEA Lion Centre
West Wing
Riverside Park
Chiromo Road
P.O. Box 10643-00100
Nairobi, Kenya
Auditor PricewaterhouseCoopers
PwC Tower
Waiyaki Way/Chiromo Road
Westlands
P. O. Box 43963-00100
Nairobi, Kenya
Registrars Custody and Registrars Services Limited
6th Floor, Bruce House
Standard Street
P.O. Box 8484-00100
Nairobi, Kenya
Bankers Co-operative Bank of Kenya Limited
Co-operative Bank House
Haile Selassie Avenue
P.O. Box 48231–00100
Nairobi, Kenya
Commercial Bank of Africa Limited
International House
Mama Ngina Street
P.O. Box 30437–00100
Nairobi, Kenya

Information Memorandum 19
Senior Unsecured Fixed Rate Notes and Senior Unsecured Equity Linked Notes
Equity Investment Bank Limited
6th Floor, Equity Centre
Hospital Road
Upperhill.
P.O. Box 75104-00200
Nairobi, Kenya
Tel:+254 719 056 501
Fax: 020-2737276
Contact Person: Irungu Nyakera
Email: [email protected]
Dyer & Blair Investment Bank Limited
10th Floor, Pension Towers
Loita Street
P.O. Box 45396-00100
Nairobi, Kenya
Tel:+254 20 3240104
Fax: 020 3240 114
Contact Person: Paul M. Nyaga
Email: [email protected]
K-Rep Bank Limited
K-Rep Center
Wood Avenue,
Kilimani
P.O. Box 25363-00603 Nairobi, Nairobi
Tel: : +254 20 3906000/1-7
Contact Person: Judy Githae
Email: [email protected]
Co-operative Bank of Kenya Limited
Co-operative House
Haile Selassie
P.O. Box 48231 - 00100
Nairobi, Kenya
Tel: +254 20 3276000
Fax : +254 20 219831
Contact Person: Jacqualine Waithaka
Email: [email protected]
PricewaterhouseCoopers Limited
PwC Tower
Waiyaki Way/Chiromo Road
Westlands
P. O. Box 43963-00100
Nairobi, Kenya
Tel: +254 20 2855525
Fax: +254 20 2855001
Contact: Richard Njoroge
Email: [email protected]
Coulson Harney
5th Floor, ICEA Lion Centre, West Wing
Riverside Park
Chiromo Road
P.O. Box 10643-00100
Nairobi, Kenya
Tel: +254 20 289 9000
Fax: +254 20 2899100
Contact: Kamami Christine Mweti
Email: [email protected]
5. ADVISERS TO THE ISSUER ON THE NOTE ISSUE
Placing Agents and Joint Sponsoring Stock-brokers
Receiving Banks
Reporting Accountant Legal Adviser
Joint Lead Transaction Advisers

Information Memorandum
Senior Unsecured Fixed Rate Notes and Senior Unsecured Equity Linked Notes
20
Custody and Registrars Services Limited
6th Floor, Bruce House
Standard Street
P.O. Box 8484-00100
Nairobi, Kenya
Tel : +254 20 2230518
Fax: +254 20 2211773
Contact Person: Kerry-Anne Makatiani
Email: [email protected]
Ropat Trust Company Limited
Kenya Re Towers, off Ragati Road
P.O. Box 1243, 00100
Nairobi, Kenya
Tel: +254 20 2723322
Fax: +254 20 2723474
Contact Person: Patrick Gacheru
Email: [email protected]
Fiscal Agent and Registrar Note Trustee
Information Memorandum 21
Senior Unsecured Fixed Rate Notes and Senior Unsecured Equity Linked Notes
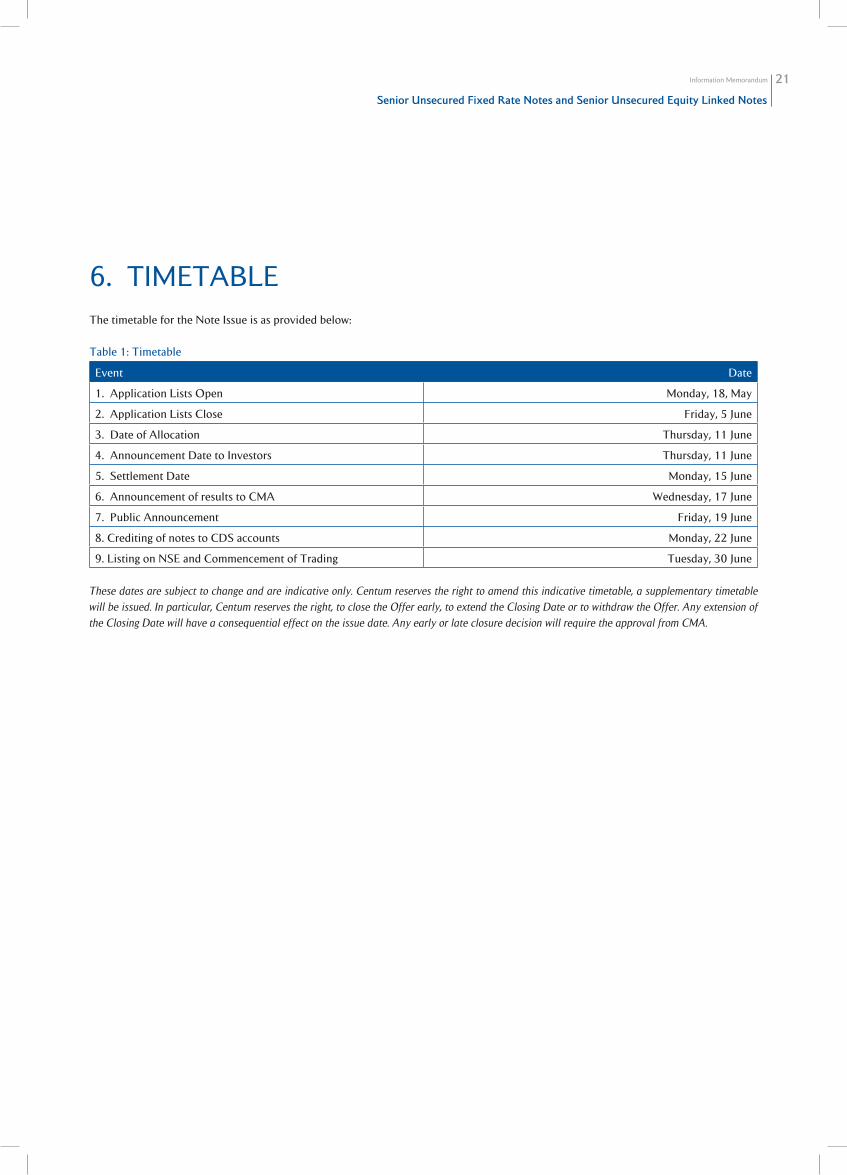
6. TIMETABLEThe timetable for the Note Issue is as provided below:
Table 1: Timetable
Event Date
1. Application Lists Open Monday, 18, May
2. Application Lists Close Friday, 5 June
3. Date of Allocation Thursday, 11 June
4. Announcement Date to Investors Thursday, 11 June
5. Settlement Date Monday, 15 June
6. Announcement of results to CMA Wednesday, 17 June
7. Public Announcement Friday, 19 June
8. Crediting of notes to CDS accounts Monday, 22 June
9. Listing on NSE and Commencement of Trading Tuesday, 30 June
These dates are subject to change and are indicative only. Centum reserves the right to amend this indicative timetable, a supplementary timetable
will be issued. In particular, Centum reserves the right, to close the Offer early, to extend the Closing Date or to withdraw the Offer. Any extension of
the Closing Date will have a consequential effect on the issue date. Any early or late closure decision will require the approval from CMA.

Information Memorandum
Senior Unsecured Fixed Rate Notes and Senior Unsecured Equity Linked Notes
22
7. SUMMARY OF THE OFFER
7.1 Summary of the Proposed Notes
The following summary does not purport to be complete and is taken from, and is qualified in its entirety by, the remainder of this
Information Memorandum. Words and expressions defined in “Description of the Notes” below shall have the same meanings in this
summary of the offering.
Table 2: Summary of the Note
1. Issuer Centum Investment Company Limited.
2. Joint Lead Transaction Advisers Dyer & Blair Investment Bank Limited
Equity Investment Bank Limited
3. Joint Sponsoring Stock Brokers
and Placing Agents
Dyer & Blair Investment Bank Limited
Equity Investment Bank Limited
4. Registrar/Fiscal Agent Custody and Registrars Services Limited
5. Note Trustee Ropat Trust Company Limited
6. Legal Adviser Coulson Harney
7. Reporting Accountant PricewaterhouseCoopers
8. Receiving Banks Co-operative Bank of Kenya Limited
K-Rep Bank Limited
9. Issue Description Up toKenyaShillings sixbillion (Kes.6,000,000,000) comprisingSeniorUnsecuredFixed
Rate Notes and Senior Unsecured Equity Linked Notes both due 8 June 2020 and the
subsequent listing of the Notes on the FISM of the NSE.
TheSeniorUnsecuredFixedRateNotesareissuedwithafixedinterestrateof13%.
TheSeniorUnsecuredEquityLinkedNotesaremadeupoftwocomponents:
a) afixedratebondof12.5%(the“12.5%Coupon”);and
b) an equity linked component (the “Variable Return”), the value of which will be determined
by the growth of the Issuer’s NAV upto a maximum of twenty five per cent (25%)
appreciationoftheInitialNAVandwhichwillearnthecouponholdersuptoten(10%)
ofthePrincipalAmountifthemaximumtwentyfivepercent(25%)NAVappreciationis
achieved.
The Variable Return will be issued and traded as units. It will be issued in the ratio of 1:1 with
respect to the Equity Linked Notes.
The Variable Return will be detachable and transferable at the option of the Noteholder in
accordance with the Conditions.
The Variable Return does not constitute a Note and its holder shall therefore not be deemed
to be a Noteholder by mere holding of the Variable Return.
10. Issuance in Series TheIssuerwillissueSeniorUnsecuredFixedRateNotesinoneseriesandSeniorUnsecured
Equity Linked Notes in another series. Within each series, the Issuer may issue Notes subject
to terms identical to those series Notes.
11. StatusofSeniorUnsecured
Fixed Rate Notes
TheSeniorUnsecuredFixedRateNotesconstituteSenior,unsubordinated,unsecuredand
unconditional obligations of the Issuer ranking paripassu among themselves and with all its
other present and future unsecured obligations (other than any secured debt obligations and
those preferred by mandatory provisions of law).

Information Memorandum 23
Senior Unsecured Fixed Rate Notes and Senior Unsecured Equity Linked Notes
12. StatusofSeniorUnsecured
Equity Linked Notes
The SeniorUnsecured Equity LinkedNotes constitute Senior unsubordinated, unsecured,
direct, and unconditional obligations of the Issuer ranking paripassu among themselves and
with all its other present and future unsecured obligations (other than any secured debt
obligations and those preferred by mandatory provisions of law).
13. Allotment of Notes A maximum of Kes 6,000,000,000 (six billion, Kenya Shillings) in Notes will be made
available for subscription.
The Issuer and the Joint Lead Arrangers will determine the allotment of Notes at their sole
discretion. Of particular note however is that FRN applications will be given preference over
ELN applications.
Centum reserves the right, whether the Issue is over-subscribed or not, to reject any
application in whole or in part and may therefore allot less than the amount applied for.
In the event that the total number of Notes subscribed for by applicants is equal to or less
than the Issue Amount, all subscriptions will be allocated in full as per the number of Notes
applied for by applicants.
Successful applicants will be notified by the Placing Agent of the amount allotted to them no
later than the date and time specified in Section 6 (Timetable).
14. Currency The Notes will be denominated in Kenya Shillings (“Kes”).
15. Issue Price The Notes will be issued on a fully paid basis at par.
16. Tenor Five years.
17. Purpose The proceeds of the Notes will be used for investments in the following sectors:
• Financialservices;
• Energy;
• RealEstate.
18. SeniorUnsecuredNotesFixed
Interest Rate
13.0%perannumpayablesemi-annuallyinarrearson100%ofeachspecifieddenomination
of the principal amount.
19. SeniorUnsecuredEquity
Linked Notes Fixed Interest
Rate
12.5%perannumpayablesemi-annuallyinarrearson100%ofeachspecifieddenomination
of principal amount.
20. Late Payment Interest Rate Theinterestrateplus2%perannum.
21. Cross Default Cross-default: any present or future indebtedness of Centum in connection with
moneys borrowed or raised exceeding in aggregate Kenya Shillings five hundred million
(Kes.500,000,000/=) (or its equivalent):
i) Is not satisfied when due, or at the end of any originally applicable grace period; or
ii) Becomes prematurely payable following delivery of an Enforcement Notice by the Note
Trustee to Centum, as the case may be, as a result of a default by Centum except to
the extent in any instance that the existence or enforceability of the relevant obligation
is being disputed in good faith by it by appropriate proceedings; or
iii) Any encumbrance over any assets of Centum or any Subsidiary of Centum becomes
enforceable.
22. Interest Payment Frequency Semi-annually in arrears.
23. Day Count Fraction Actual/364
24. Interest Commencement Date The Interest payment commencement date shall be six (6) months after the Settlement Date
25. Interest Periods Each period commencing on (and including) an interest payment date (or the interest
commencement date) and ending on (but excluding) the next, or first, interest payment date
(as the case may be).
26. Minimum success level 50%oftheaggregateissueamountfortheIssue
27. Final Maturity • ThefinalmaturityoftheSeniorUnsecuredFixedRateNoteswillbefive(5)yearsafter
the Settlement Date
• ThefinalmaturityoftheEquityLinkedNoteswillbefive(5)yearsaftertheSettlement
Date

Information Memorandum
Senior Unsecured Fixed Rate Notes and Senior Unsecured Equity Linked Notes
24
28. Redemption and Purchase Condition 9 (Redemption and purchase).
Redemption at Maturity
Unlesspreviouslyredeemedorpurchasedandcancelledasspecifiedbelow,eachNotewill
be redeemed by the Issuer at its Final Due Amount on the Maturity Date.
Redemption at the option of the Issuer
The Issuer may upon giving not less than thirty (30) and not more than sixty (60) days’
prior notice in writing to the Noteholders and the Trustee in accordance with condition 15
(Notices)toredeemallorsomeoftheSeniorUnsecuredFixedRateNotesoutstanding;
The Early Redemption Notice shall specify the date on which the redemptions is to be
effected which date shall be an Interest Repayment or Principal Repayment Day; then and
upon expiration of such notice, the Issuer shall redeem such Notes.
IftheIssuerredeemsonlysomeoftheSeniorUnsecuredFixedRateNotes,thepartial
redemption shall be of an aggregate principal amount of not less than Kenya Shillings one
billion (Kes 1,000,000,000) and integral multiple of Kenya Shillings one hundred million
(Kes 100,000,000).
SeniorUnsecuredFixedRateNotesmayonlyberedeemedafterthethirdanniversaryof
theirissuanceandatapremiumof1%(onepercent).
SeniorUnsecuredEquityLinkedNoteswillbeeligibleforearlyredemption,inwhich
case the Final NAV will be calculated based on the Issuer’s latest publicly issued financial
statements, being either half year accounts or full year accounts as the case may be.
Purchases
The Issuer may at any time purchase Notes at any price in the open market or otherwise,
subject to any approvals required from the CMA or the NSE or to any other restrictions
under applicable law. In the event of the Issuer purchasing Notes, such Notes may be held
or resold, or at the discretion of the Issuer, cancelled. All Notes which are redeemed or
purchased by or on behalf of the Issuer may be cancelled by giving notice to that effect to the
Registrar, the Fiscal Agent and the CDSC
29. Form of the Notes The Notes will be registered in the CDS Account of each Noteholder held with the CDSC in
accordance with the CD Act.
30. Denomination of the Notes The Notes will be issued in denominations of Kes 100,000 and integral multiples of Kes
100,000 in excess thereof, subject to a minimum subscription amount of Kes 1,000,000.
31. Security The Notes shall be unsecured.
32. Payment All amounts payable by the Issuer in respect of each Note or Variable Return (as the case
may be) shall be paid by EFT or RTGS transferred to the account of the Holder as set forth in
the relevant Register maintained by the Registrar, made available to the Holders or a person
nominated by the Holder and sent to the registered address of the Holder or such person.
33. Compliance The placement and transfer of the Notes shall comply with the following:
• therequirementsoftheCompaniesActwithrespecttoissuanceandsubscription;
• therequirementsoftheCMAwithrespecttoissuanceandsubscription;
• therequirementsoftheCMAandNSEwithrespecttothelistingoftheNotesonthe
NSE;
• theCMAandNSEreportingrequirementsfromtimetotime;and
• anyotherapplicableprovisionsofthelawinKenyarelatingtocompaniesanddebt
capital markets that is in existence or that may be passed before the issue of the Notes
or during the pendency of the issue of the Notes.

Information Memorandum 25
Senior Unsecured Fixed Rate Notes and Senior Unsecured Equity Linked Notes
34. Events of default Condition 13 (Events of Default)
Other than as a result of a Force Majeure Event, each of the events set out below is an Event
of Default:
(a) Non-payment: Centum fails to pay any amount due in respect of all the Notes or some
of the Notes or the Variable Return on the Due Date for payment and such default
continues for a period of seven (7) Business Days unless;
(i) the failure to pay is caused by administrative or technical error;
(ii) payment is made within three (3) Business Days thereafter; or
(iii) the failure to pay is in order to comply with any Applicable Laws or order of any
court of competent jurisdiction or in case of doubt as to the validity or applicability
of any such law, regulation or order, in accordance with advice as to such validity
or acceptability given at any time during such period by independent advisers
acceptable to the Fiscal Agent; or
(b) Breach of other obligations: Centum defaults in the performance or observance of any
of its other covenants and obligations under the Note Documents and (except where
such default is incapable of remedy) such default continues for a period of thirty (30)
Business Days following service of a notice by the Note Trustee requiring the same to
be remedied; or
(c) Misrepresentation: any representation, warranty or statement made or repeated in, or
in connection with the Agency Agreement or in any accounts, certificate, statement,
opinion or the Information Memorandum delivered by or on behalf of Centum or in
connection with the Notes or the Note Documents is incorrect to a material extent
when made or deemed to be repeated; or
(d) Cross-default: any present or future indebtedness of Centum in connection with
moneys borrowed or raised exceeding in aggregate Kenya Shillings five hundred million
(Kes.500,000,000/=) (or its equivalent):
(i) is not satisfied when due, or at the end of any originally applicable grace period; or
(ii) becomes prematurely payable following delivery of an Enforcement Notice by the
Note Trustee to Centum, as the case may be, as a result of a default by Centum
except to the extent in any instance that the existence or enforceability of the
relevant obligation is being disputed in good faith by it by appropriate proceedings;
or
(iii) any encumbrance over any assets of Centum or any Subsidiary of Centum
becomes enforceable; or
(e) Insolvency: an Insolvency Event occurs in respect of Centum; or
(f) Winding up: a petition is presented or an application is made (which is not challenged
by Centum within thirty (30) days of such petition or application) in respect of or any
order is made or a resolution is passed for or any notice is issued to convene a meeting
for the purpose of passing such resolution for the winding up or dissolution of Centum;
or
(g) Compositions: Centum stops payment or becomes unable to pay its debts within the
meaning of Section 220 of the Companies Act or any steps are taken with a view to
proposing, under any enactment or otherwise, any kind of composition, scheme of
arrangement, compromise or arrangement involving Centum and its creditors generally,
or any class of them; or

Information Memorandum
Senior Unsecured Fixed Rate Notes and Senior Unsecured Equity Linked Notes
26
(i) Legal process: a lawful distress, sequestration, execution or attachment either by virtue
of any court order, decree or process or otherwise howsoever for a sum that equal to or
exceedingthe20%(twentypercent)ofthetotalassetsofCentumisleviedorenforced
upon or issued against any part of the property and assets of Centum and which shall
not be removed or discharged within sixty (60) days of it being so levied; or
(j) Cessation of business: Centum ceases, or threatens to cease, to carry on all or a
substantial part of its business or sells or threatens to sell or otherwise disposes of or
shall threaten to sell or dispose of all or a material part of its assets (other than in the
normal course of trading it being acknowledged and agreed that Centum’s business
entails the acquisition and disposal, inter alia, shares, equity, undertakings and
businesses and such activities will not therefore constitute an Event of Default) whether
by one or a series of transactions related or not or changes the mode of conduct of its
trading in any respect so that its ability to meet its obligations under and in respect of
the Notes is materially affected; or
(k) Authorisation: any authorisation, approval, consent, license, exemption, filing,
registration or notarization or other requirement necessary to enable Centum to
comply with any of its obligations under the Note Documents or to carry on business
as presently carried on is modified (to the extent that its ability to meet its obligations
under and in respect of the Notes is materially affected), revoked or withheld or does
not remain in full force and effect and Centum is unable to obtain the same within
fourteen (14) days of such modification; revocation or extinction; or
(l) Unlawfulness: at any time it is unlawful for Centum to perform any of their respective
obligations under the Agency Agreement; or
(m) Material adverse change: any other event or series of events whether related or not,
including, without limitation, any material adverse change in the business, assets or
financialconditionofCentuminanamountequaltoorexceeding20%(twentyper
cent) of the total assets of Centum, occurs that, in the opinion of the Fiscal Agent (such
Fiscal Agent being so instructed pursuant to an Extraordinary Resolution), may affect
the ability or willingness of Centum to comply with all or any of its obligations under
the Note Documents; or
(n) Documents Void: any of the Notes is or becomes wholly or partly void, voidable or
unenforceable or is claimed to be so by Centum or the Fiscal Agent.
Acceleration
In the case of any such event as is mentioned in Condition 13.1 (Events of Default), and at
any time thereafter if any such event shall then be continuing, the Note Trustee shall if so
directed by an Extraordinary Resolution, issue an Enforcement Notice to Centum declaring
that any outstanding Notes are immediately due and payable, whereupon the same shall
become immediately due and payable together with all interest accrued thereon and all other
amounts payable under the Note Documents.
Rectification
The right to declare Notes due terminates if the situation giving cause to it has been cured
or is otherwise no longer continuing before such right is exercised and any notice or
demand issued by the Fiscal Agent in accordance with this Condition 13 (Default) shall
be of no effect.

Information Memorandum 27
Senior Unsecured Fixed Rate Notes and Senior Unsecured Equity Linked Notes
35. Taxation: All payments in respect of the Notes will be made subject to withholding or deduction for
or on account of any taxes imposed within the Republic of Kenya by the Issuer where such
taxes are applicable.
36. Listing: Approval has been given to list the Notes on the FISM of the NSE.
TheSeniorUnsecuredEquityLinkedNoteswillbelistedontheFISMandtradingwillbe
limited to qualified institutional investors.
SeparateRegisterswillbemaintainedforthe12.5%CouponandtheVariableReturn.
37. Negative Pledge: The Issuer agrees that, so long as any Notes remain outstanding, it shall not create or permit
to subsist any mortgage, charge, lien, pledge or other security interest upon or with respect
to any of its undertakings, assets or revenues to secure any future indebtedness evidenced
by notes, bonds or other securities which are or which are capable of being, at the request
of the Issuer quoted, listed or dealt in for the time being on any stock exchange or any other
similar generally recognized market for securities unless (a) the Notes are secured equally
and rateably therewith; or (b) by providing such other security or arrangement as may be
approved by Extraordinary Resolution of the Noteholders; unless the provision of any such
security is waived by an Extraordinary Resolution of the Noteholders.
38. Governing Law: The Notes will be governed by, and construed in accordance with, Kenyan Law.

Information Memorandum
Senior Unsecured Fixed Rate Notes and Senior Unsecured Equity Linked Notes
28
8. USE OF PROCEEDS
Centum has developed a pipeline of attractive investment opportunities in the energy, financial services, real estate and agriculture
sectors. The table below highlights the deal pipeline.
Table 1: Deal Pipeline
Sector Target Companies Nature of
Investment
Description Deal value
(Kes. M)
Financial
Services
K-Rep Bank Limited Equity
investment*
Acquisition of majority shareholding of
K-Rep Bank and additional investment in
the Bank to increase its core capital so as
to enable the Bank to increase its ability to
attract deposits as well as increase its loans
and advances.
3,600
Energy (i) Akiira One
Geothermal
Limited
(ii) Amu Power Limited
Equity
investment
Finance Centum’s equity investment in
Centum’s current opportunities in the energy
sector.
2,100
Real Estate Pearl Marina Estates
Limited
Equity
investment
The construction of Phase 1 of the Pearl
Marina Development commenced in March
2015. Phase 1 is estimated to cost Kes
2.75Bn. Centum intends on funding this with
60% debt and 40% equity. Therefore, the
equity investment at phase 1 is Kes 1.1Bn.
1,100
Real Estate Vipingo Development
Limited
Equity
Investment
Centum is in the process of acquiring 9,646
acres of land in Vipingo at a price of Kes.
180,000 per acre and Vipingo Estates Limited,
a subsidiary of Rea Vipingo Plantations
Limited, which owns approximately 900
acres of land at approximately Kes. 340 Mn.
2,100
Quoted
private equity
Centum Exotics Equity
Investment
Increase the proportion of listed investments
held by Centum.
2,000
Total 10,900
In line with Centum’s capital structure, these opportunities will be financed through a mix of internally generated funds (dividend and
interest income, as well as realizations of existing investments) and debt. This is highlighted in the table below.
Sources of funding Amount (Kes. M)
Internally generated funds (dividends, interest and investment realisations ) 4,978
Debt 5,922
The debt component of funding will be through the issuance of Kenya Shillings six billion (Kes.6, 000,000,000) senior unsecured fixed
rate notes and senior unsecured equity linked notes.
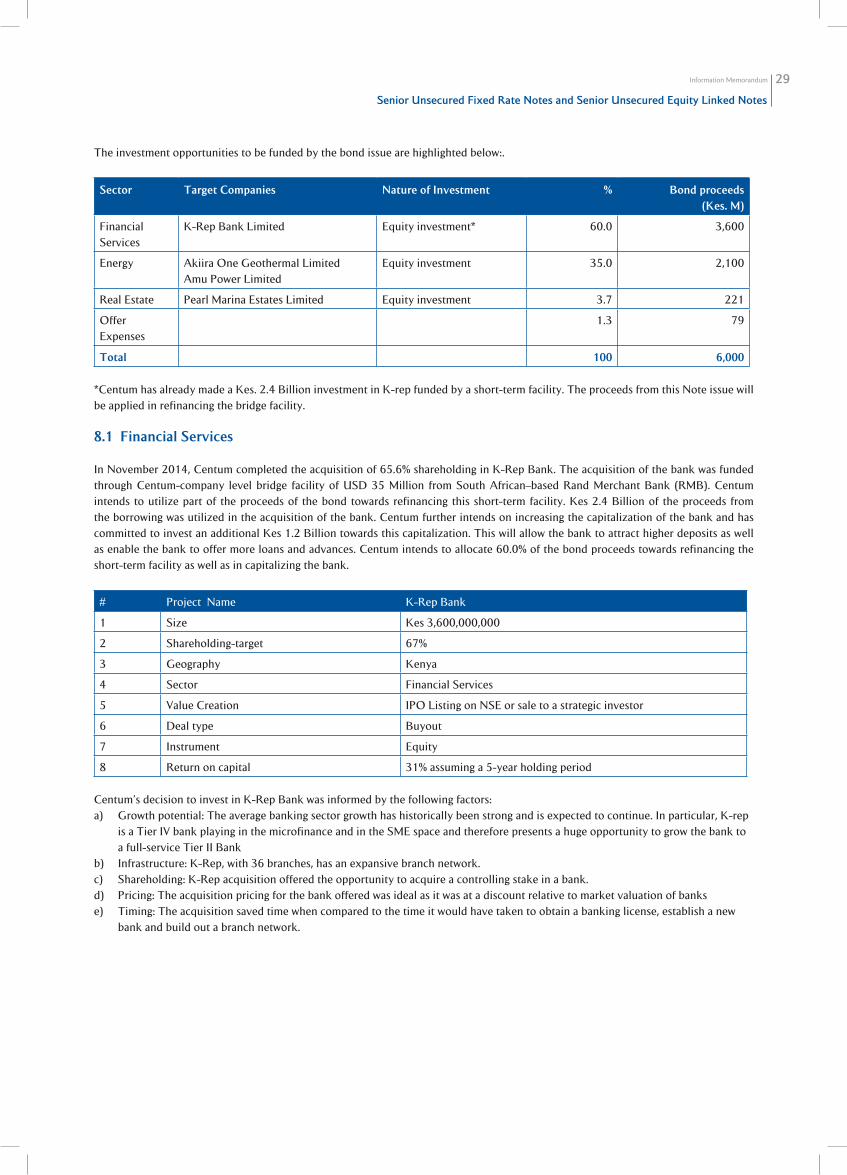
Information Memorandum 29
Senior Unsecured Fixed Rate Notes and Senior Unsecured Equity Linked Notes
The investment opportunities to be funded by the bond issue are highlighted below:.
Sector Target Companies Nature of Investment % Bond proceeds
(Kes. M)
Financial
Services
K-Rep Bank Limited Equity investment* 60.0 3,600
Energy Akiira One Geothermal Limited
Amu Power Limited
Equity investment 35.0 2,100
Real Estate Pearl Marina Estates Limited Equity investment 3.7 221
Offer
Expenses
1.3 79
Total 100 6,000
*Centum has already made a Kes. 2.4 Billion investment in K-rep funded by a short-term facility. The proceeds from this Note issue will
be applied in refinancing the bridge facility.
8.1 Financial Services
InNovember2014,Centumcompletedtheacquisitionof65.6%shareholdinginK-RepBank.Theacquisitionofthebankwasfunded
throughCentum-company level bridge facility ofUSD35Million fromSouthAfrican–basedRandMerchantBank (RMB).Centum
intends to utilize part of the proceeds of the bond towards refinancing this short-term facility. Kes 2.4 Billion of the proceeds from
the borrowing was utilized in the acquisition of the bank. Centum further intends on increasing the capitalization of the bank and has
committed to invest an additional Kes 1.2 Billion towards this capitalization. This will allow the bank to attract higher deposits as well
asenablethebanktooffermoreloansandadvances.Centumintendstoallocate60.0%ofthebondproceedstowardsrefinancingthe
short-term facility as well as in capitalizing the bank.
# Project Name K-Rep Bank
1 Size Kes 3,600,000,000
2 Shareholding-target 67%
3 Geography Kenya
4 Sector Financial Services
5 Value Creation IPO Listing on NSE or sale to a strategic investor
6 Deal type Buyout
7 Instrument Equity
8 Return on capital 31%assuminga5-yearholdingperiod
Centum’s decision to invest in K-Rep Bank was informed by the following factors:
a) Growth potential: The average banking sector growth has historically been strong and is expected to continue. In particular, K-rep
is a Tier IV bank playing in the microfinance and in the SME space and therefore presents a huge opportunity to grow the bank to
a full-service Tier II Bank
b) Infrastructure: K-Rep, with 36 branches, has an expansive branch network.
c) Shareholding: K-Rep acquisition offered the opportunity to acquire a controlling stake in a bank.
d) Pricing: The acquisition pricing for the bank offered was ideal as it was at a discount relative to market valuation of banks
e) Timing: The acquisition saved time when compared to the time it would have taken to obtain a banking license, establish a new
bank and build out a branch network.
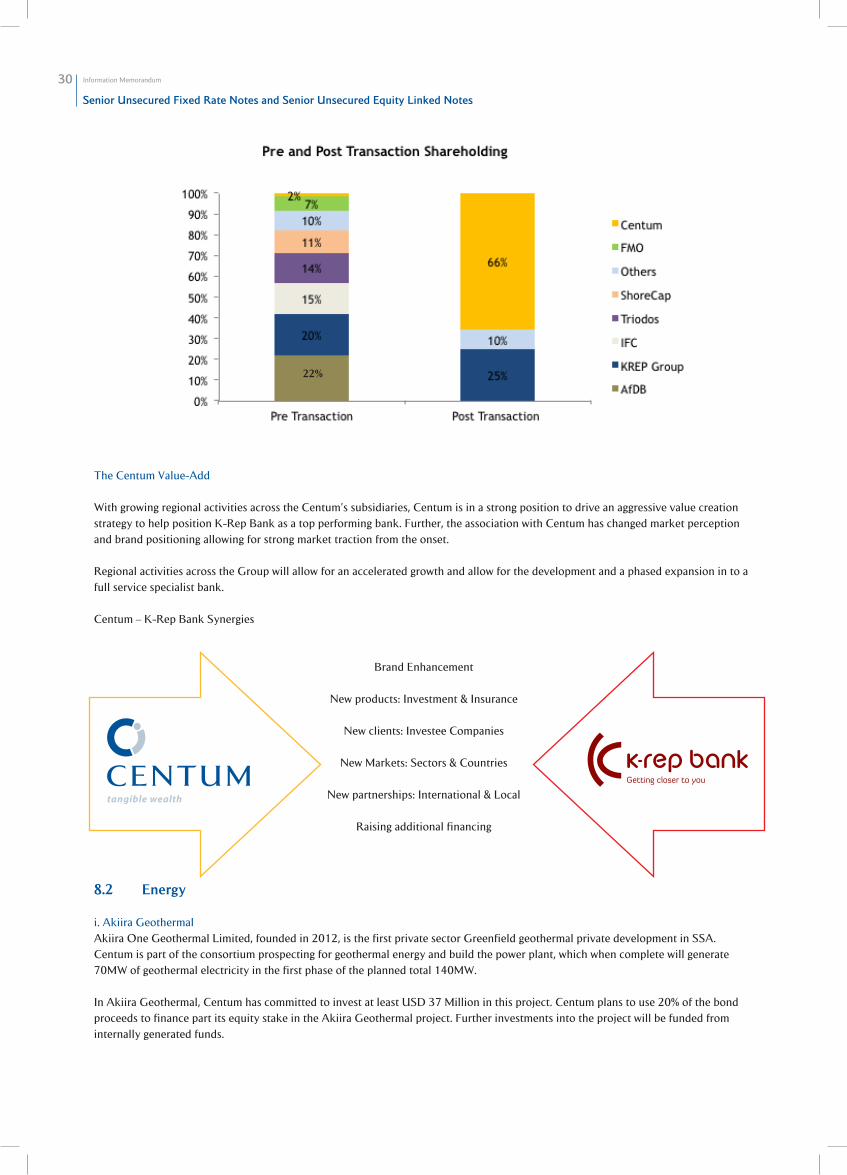
Information Memorandum
Senior Unsecured Fixed Rate Notes and Senior Unsecured Equity Linked Notes
30
The Centum Value-Add
With growing regional activities across the Centum’s subsidiaries, Centum is in a strong position to drive an aggressive value creation
strategy to help position K-Rep Bank as a top performing bank. Further, the association with Centum has changed market perception
and brand positioning allowing for strong market traction from the onset.
Regional activities across the Group will allow for an accelerated growth and allow for the development and a phased expansion in to a
full service specialist bank.
Centum – K-Rep Bank Synergies
Brand Enhancement
New products: Investment & Insurance
New clients: Investee Companies
New Markets: Sectors & Countries
New partnerships: International & Local
Raising additional financing
8.2 Energy
i. Akiira Geothermal
Akiira One Geothermal Limited, founded in 2012, is the first private sector Greenfield geothermal private development in SSA.
Centum is part of the consortium prospecting for geothermal energy and build the power plant, which when complete will generate
70MW of geothermal electricity in the first phase of the planned total 140MW.
InAkiiraGeothermal,CentumhascommittedtoinvestatleastUSD37Millioninthisproject.Centumplanstouse20%ofthebond
proceeds to finance part its equity stake in the Akiira Geothermal project. Further investments into the project will be funded from
internally generated funds.

Information Memorandum 31
Senior Unsecured Fixed Rate Notes and Senior Unsecured Equity Linked Notes
Table 4: Akiira Geothermal Development Investment Thesis
# Project Name Akiira Geothermal Development
1 Size AtleastUS$37Mn
2 Shareholding Atleast25%
3 Geography Kenya
4 Sector Energy
5 Value Creation Value uplift upon financial close after de-risking project
6 Deal type Geothermal plant
7 Instrument Equity & Debt
8 Target IRR •AttractiveUS$Returns
•BasecaseIRRabove12%
ii. Amu Power
Centum currently has a ready investment opportunity in Amu Power Limited, a Special Purpose Vehicle (SPV) set up by the
consortium that was awarded the tender to construct a 1050 MW coal-fired power plant in Lamu County, Kenya. Centum is the lead
project equity sponsor in the consortium.
InAmuPower,CentumhascommittedtoinvestatleastUSD100Millioninthisproject,or25%ofthetotalequityrequirementbythe
project.Centumplanstouse15%ofthebondproceedstofinancepartitsequitystakeintheAmuPowerproject.Furtherinvestments
into the project will be funded from internally generated funds.
Table 5: Amu Power Development Investment Thesis
# Project Name Amu Power
1 Size AtleastUS$100Mn
2 Shareholding Atleast25%
3 Geography Kenya
4 Sector Energy
5 Value Creation Value uplift upon financial close after de-risking project
6 Deal type Coal Fired Plant Construction
7 Instrument Equity & Debt
8 Target IRR •AttractiveUS$Returns
•BasecaseIRRabove12%
8.3 Real EstateIn the real estate sector, Centum’s strategy is to create new urban nodes for cities across Africa, Currently, Centum has two main real estate projects:1. Two Rivers (Kenya) -Two Rivers is a new urban node set on 100 acres of prime land 20 minutes from the current Central Business
District and in Nairobi’s diplomatic blue zone. Two Rivers is a master planned municipality with urban management, top notch infrastructure and landscaping. It seeks to fill the need for an urban node which provide residents with the opportunity to live, work and play within the city. Creating a better quality of life for the residents. The anchor development, the Two Rivers Retail, Entertainment & Lifestyle Centre, set to open in October 2015 will offer a unique blend of retail, entertainment and lifestyle facilities with 220 shops on 62,000 square metres of lettable area. This project is fully funded by both debt and equity and requires no additional funding from Centum.
2. PearlMarina(Uganda)-asatellitecityinUgandaon385acresofprimelandsituatedbetweenEntebbeInternationalAirportand Kampala with 4km of Lake Frontage. The vision of Pearl Marina is to develop a premium world-class water front destination recognized in East Africa and beyond.
Centum has commenced Phase 1 construction of 102 residential villas, a gatehouse and supporting infrastructure for the Pearl Marinaproject.Phase1isestimatedtocostKes.2.75billion,whichwillbefunded40%byequityand60%bydebt.
Centumplanstouse3.7%ofthebondproceedstofinanceitsequitystakeinPhase1developmentofthePearlMarinaproject.A
further Kes 0.7 billion will be injected from internally generated funds.
8.4 Offer Related ExpensesIn addition, proceeds of the Issue will be utilized to meet third party costs and expenses of the Issue which are calculated at approximately Kes. 79,266,000 set out in the expenses of the Issue in section 18.1 (Expenses of the offer).
Information Memorandum
Senior Unsecured Fixed Rate Notes and Senior Unsecured Equity Linked Notes
32
9. ABOUT THE ISSUER
9.1 Company Overview
Centum was established in 1967 as an affiliate of the Kenyan government-owned ICDC as a Limited Liability Company. Centum is listed
ontheNSEandcross-listedontheUSEandisnowoneofthelargest2 listed investment companies in Kenya with a market capitalisation
of Kes. 41 Bn. As at 31st December 2014, Centum’s assets under management were worth over Kes. 176.8 Bn which includes its own
assets worth Kes. 36.8 Bn and third party funds worth over Kes. 140 Bn
Centum has interests in four key sectors: financial services, fast moving consumer goods, real estate and energy. In its 2014-2019
strategy period dubbed Centum 3.0, Centum intends to invest in the following sectors as part of its strategic plan: agriculture, healthcare,
education and ICT. The sector interests are driven by Africa’s growing middle class and each sector is set to benefit from this segment.
The company’s current investment portfolio consists of over 20 investee companies which include wholly and partly owned subsidiaries,
associate companies and investments in listed securities. Through these investments, the Issuer is able to offer its shareholders access to
quality and diversified investments and generate market beating returns to its investors.
9.2 Vision, Mission and Strategy
Centum’s vision and mission are premised on Africa’s economic renaissance and its key objective is to consistently generate market
beating returns by building extraordinary enterprises throughout Africa.
Vision
“To be Africa’s foremost investment channel”.
Mission
“To create real tangible wealth by providing the channel through which investors access and build extraordinary enterprises in Africa”.
Strategic Themes
Five key strategic themes were identified for Centum 3.0 are highlighted below:
i. Return
Generate in excess of thirty five per cent (35%+) annualized return over the strategic period: In the 2009/14 strategy period, Centum’s
averageannualizedreturnonopeningNAVwas31%.Overthenextfiveyears(2014/19strategyperiod),we intendtoenhancethe
averagereturnonourportfoliotoatleast35%onopeningNAV.
ii. Focus
Focus by developing, scale and growing investment capabilities in the eight new sectors: Based on the success brought about by Centum’s
increased focus in the past strategy period, even greater focus is to be achieved by developing sector approaches to investment in 8
sectors: (i) Real estate, (ii) Financial Services, (iii) Fast Moving Consumer Goods (FMCG), (iv) education, (v) healthcare, (vi) power, (vii)
agriculture, and (viii) ICT. Within the sectors, we look to develop opportunities of scale and attract third party investors to participate in
high quality investment grade opportunities.
ScaleuptheGroupbygrowingCentum’sownassettotalvaluetoKes120Billionby2019andtotalAssetundermanagement(AUMs)
to Kes 720 Bn: Centum intends to increase its own total asset value from Kes 29 Bn to Kes 120 Bn by the end of 2019. This significant
increase will enable Centum to build opportunities of scale that can attract significant amounts of capital into future projects. Centum
furtherintendsonscalingitstotalAssetsunderManagement(AUM)fromKes147BntoKes720Bn.ThesethirdpartyfundsofKes.600
billion will be managed by its asset management subsidiaries.
2Nairobi Securities Exchange Limited Market Capitalisation stock data

Information Memorandum 33
Senior Unsecured Fixed Rate Notes and Senior Unsecured Equity Linked Notes
iii. Brand
To Build the Centum brand by delivering through people and hence develop teams with sector expertise: Centum intends to continue to
build its brand through continuous alignment of internal processes, leadership development and through the delivery of the various
projects it will undertake in the various sectors. Centum also maintains effective oversight through its board of directors.
iv. Costs
To maintain total operating costs at below 2.0% of assets under management: Centum intends to maintain operating costs below the
ceilingof2.0%oftotalassets.
9.3 Business Model
Centum’s business is to create investment grade opportunities of scale that will attract investment at significant return to initial capital.
Centum is currently focusing its development activities in several key sectors: (i) financial services, (ii) fast moving consumer goods
(FMCG), (iii) real estate and (iv) power (v) agriculture, (vi) education, (vii) healthcare and (viii) ICT. The table below highlights the route
to entry into the various sectors.
Focus Sectors
Sector Route to Entry Existing Deal Pipeline Value Realization Timing of
Investment
Financial Services Brownfield Turnaround Present Future growth fundraising 0-1 year
FMCG Franchises and Joint Ventures with
Multinational Corporations
Present Growth Capital & Direct Exit 1-3 years
Real Estate Greenfield & Joint Ventures Present Financial close & REITs 1-3 years
Energy Greenfield Present Financial Close and
securitisation
0-1 year
Agriculture Greenfield & Joint Ventures Work in Progress Project Expansion 1-3 years
Education Real Estate Play & Joint Ventures Work in Progress REITs 2-3 years
Healthcare Real Estate Play & Joint Ventures Work in Progress REITs 2-3 years
ICT Greenfield & Joint Ventures Work in Progress Project Expansion & Exits 2-3 years
As a developer and promoter, Centum realizes early-stage value by creating investment-grade opportunities for down-stream investors
as illustrated in the chart below:

Information Memorandum
Senior Unsecured Fixed Rate Notes and Senior Unsecured Equity Linked Notes
34
Centum funds these opportunities during development phase with the aim to invite financial investors after de-risking projects. The
projects funding cycle is illustrated in the chart below:
9.4 Track Record
9.4.1. A review of performance against our 2009/14 strategic targets
During the strategy period 2009/14, we defined our business as an investment channel that sought to provide investors access to an
otherwise inaccessible, quality and diversified portfolio of investments. To this end we focused on five strategic objectives.
i. To deliver a return on shareholder funds consistently above market returns. Prior to this time Centum’s returns were strongly
correlated to the NSE;
ii. To scale up assets under management with a target of Kes 30 Billion by 2014 from Kes 6 Billion in 2009.
iii. ToincreaseourgeographicalfootprinttotherestofAfricawithatargetofatleast50%oftheportfoliooutsideKenya;
iv. To enhance Centum’s brand by developing processes, systems, controls and human capital to ensure the company would consistently
deliver to its promises;
v. Tomaintainportfoliocostsatbelow2.5%ofassetsundermanagement.
Our performance against the above objectives is highlighted below.
i. Delivery of market beating returns
Wehaveoverthelast5years(the2009-2014strategyperiod)deliveredanaveragereturnof33%perannum.Thisperformance
representeda19%outperformancetotheNSE20ShareIndexanda19%outperformanceagainsttotheMCSIFrontierMarket
index.
ThetablesbelowhighlighttheperformanceofCentumagainsttheMCSIFrontierMarketindexinUnitesStatesDollars(USD):

Information Memorandum 35
Senior Unsecured Fixed Rate Notes and Senior Unsecured Equity Linked Notes
The table below highlights the performance of Centum against the NSE 20 share index in Kenya Shillings (KES):
Centum’sNetAssetValuegrewby357%fromKes.5.9BillioninApril2009toKes.26BillioninDecember2014.Thisrepresentsgrowth
oratarateof30%compoundedannually.MarketvalueofshareholderfundsgrewfromKes.5.6BninApril2009toKes.40.6Bnin
December2014representing625%growthinvaluegeneratedtoshareholders.
The table below highlights Centum’s book value against the Market Capitalisation.
iii. Geographical and asset class diversification
Duringthestrategyperiod2009/14,thediversificationtargetwastohave50%oftheportfoliooutsideofKenya.Weprogressively
increasedourexposureoutsideofKenyafromlessthan1%asatMarch2010to19%asatMarch2014.Inlinewithourmissionof
providingaccesstoinaccessibleportfolio,ourexposuretoprivateequityandrealestateincreasedfrom59%to83%atthecloseof
that period.
vi. Brand at Centum is defined as consistent delivery to promise. Throughout the 2009/14 strategy period we built capacity in the
organization through the recruitment of competent and experienced team members as well as through leadership development. As
a result of the strong team, we were able to deliver over and above our ambitious strategy targets.
vii. Thecosttoassetratio(excludingthirdpartyfunds)wasmaintainedbelow2.3%withinthe2009/14strategyperiod.
ii. Growth in assets under management
Centum’s portfolio grew by Kes. 27.8 Bn from Kes. 9 Bn in March 2010 to Kes. 36.8 Bn in December 2014. Total assets under management
stood at Kes 176 Bn in December 2014 representing a 19.5 times growth since March 2010.
AssetsUnderManagement PortfolioValue 36.8

Information Memorandum
Senior Unsecured Fixed Rate Notes and Senior Unsecured Equity Linked Notes
36
9.4.2. Over the last six years, Centum has had a lot of success in developing investment-grade opportunities and realizing significant
return at expanded multiples on its initial investment. Some examples at various stages of the investment process are highlighted
below
9.4.2.1. Deal Sourcing
Centum has developed an extensive network of relationships within the region. This has enabled identification of early stage opportunities.
Examples of such investments include:
a) Amu Power – consortium led by Centum and Gulf Energy Limited won the award of tender to construct a 1,050MW coal-fired power
plant in Lamu, Kenya
b) Akiira One Geothermal – Centum is part of the consortium developing Sub-Saharan Africa’s first independent geothermal
development, which when complete is expected to generate 140MW.
c) Two Rivers – A 100 acres development in Nairobi, acquired in 2010.
d) KRep Bank–Acquisitionof65.7%shareholdingintheBankin2014
e) PlatCorp–Acquisitionof35%shareholdinginPlatCorpHoldingsin2012.PlatCorpHoldingsistheholdingcompanyofPlatinum
CreditKenya,PlatinumCreditUgandaandPlatinumCreditTanzania.
f) Genesis Kenya–Acquisitionof73.35%shareholdinginKenya’ssecondlargest3 fund manager in 2013.
9.4.2.2. Value Addition
Through active execution of value creation strategies, Centum has improved the underlying performance of its portfolio companies.
This is highlighted in the graph below.
Examples of investments where Centum has led value addition strategies are highlighted below.
a) Almasi Bottlers Limited - In 2012/13, Centum led and completed a complex merger of the 3 bottlers which saw Centum increase
itseffectiveshareholdingfrom32%to43%.Centumisactivelyparticipatingindrivingpost-mergerintegrationaswellasdriving
distributionandscaleefficienciesandhassubsequentlyincreaseditsshareholdingto51%.
b) Nairobi Bottlers Limited (“NBL”) - In 2010, renegotiated NBL’s shared services agreement with South African Bottling Company
(“SABCO”) significantly reducing management fees and enhancing profitability
c) Kenya Wine Agencies Limited (“KWAL”) - Active participation in the privatization process that resulted in the sale of 26%
shareholding to Distell South Africa.
d) General Motors E.A. Limited – Through board participation, Centum has been instrumental in treasury oversight and in the
development of the current 5-year strategy which has resulted in an improvement in earnings and return on assets.
3Retirement Benefits Authority Industry Performance Report, December 2013 to June 2015, published on 31 March 2015
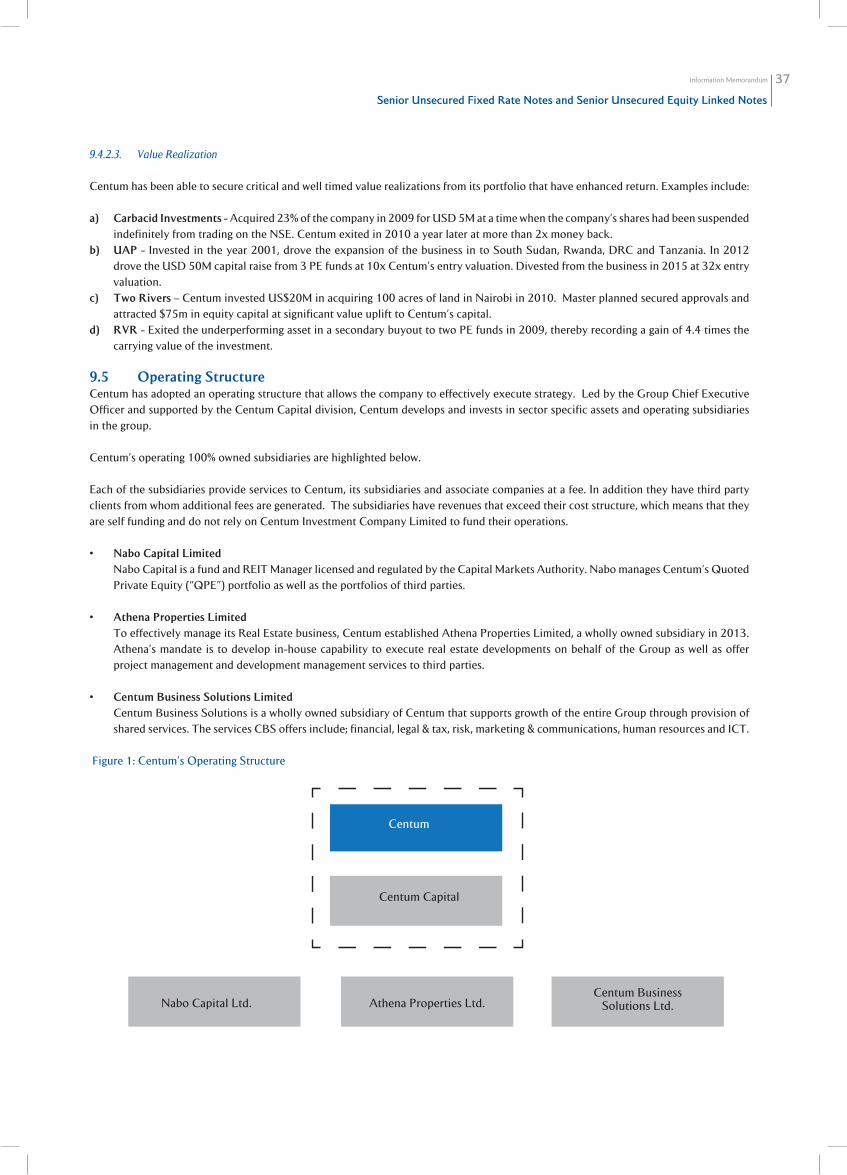
Information Memorandum 37
Senior Unsecured Fixed Rate Notes and Senior Unsecured Equity Linked Notes
9.4.2.3. Value Realization
Centum has been able to secure critical and well timed value realizations from its portfolio that have enhanced return. Examples include:
a) Carbacid Investments -Acquired23%ofthecompanyin2009forUSD5Matatimewhenthecompany’sshareshadbeensuspended
indefinitely from trading on the NSE. Centum exited in 2010 a year later at more than 2x money back.
b) UAP - Invested in the year 2001, drove the expansion of the business in to South Sudan, Rwanda, DRC and Tanzania. In 2012
drovetheUSD50Mcapitalraisefrom3PEfundsat10xCentum’sentryvaluation.Divestedfromthebusinessin2015at32xentry
valuation.
c) Two Rivers–CentuminvestedUS$20Minacquiring100acresoflandinNairobiin2010.Masterplannedsecuredapprovalsand
attracted$75minequitycapitalatsignificantvalueuplifttoCentum’scapital.
d) RVR - Exited the underperforming asset in a secondary buyout to two PE funds in 2009, thereby recording a gain of 4.4 times the
carrying value of the investment.
9.5 Operating StructureCentum has adopted an operating structure that allows the company to effectively execute strategy. Led by the Group Chief Executive
Officer and supported by the Centum Capital division, Centum develops and invests in sector specific assets and operating subsidiaries
in the group.
Centum’soperating100%ownedsubsidiariesarehighlightedbelow.
Each of the subsidiaries provide services to Centum, its subsidiaries and associate companies at a fee. In addition they have third party
clients from whom additional fees are generated. The subsidiaries have revenues that exceed their cost structure, which means that they
are self funding and do not rely on Centum Investment Company Limited to fund their operations.
• NaboCapitalLimited
Nabo Capital is a fund and REIT Manager licensed and regulated by the Capital Markets Authority. Nabo manages Centum’s Quoted
Private Equity (“QPE”) portfolio as well as the portfolios of third parties.
• AthenaPropertiesLimited
To effectively manage its Real Estate business, Centum established Athena Properties Limited, a wholly owned subsidiary in 2013.
Athena’s mandate is to develop in-house capability to execute real estate developments on behalf of the Group as well as offer
project management and development management services to third parties.
• CentumBusinessSolutionsLimited
Centum Business Solutions is a wholly owned subsidiary of Centum that supports growth of the entire Group through provision of
shared services. The services CBS offers include; financial, legal & tax, risk, marketing & communications, human resources and ICT.
Figure 1: Centum’s Operating Structure
Athena Properties Ltd.Nabo Capital Ltd.
Centum Capital
Centum
Centum BusinessSolutions Ltd.

Information Memorandum
Senior Unsecured Fixed Rate Notes and Senior Unsecured Equity Linked Notes
38
9.6 Centum’s Portfolio and Sector FocusAs at December 2014, Centum’s Portfolio Value was valued at Kes. 37.6 billion. The sector allocation of the portfolio is highlighted
below:
9.6.1 Financial Services (FS) Sector
Sector Strategy:
Centum will look for brownfield opportunities to access opportunities in the banking, insurance and asset management sectors.
Centum’s current investments in this sector are listed below in detail:
Company Description
Sector: FS
Stake:67.54%
• K-Repwasestablishedin1984tosupportNGOswithgrantsandtechnicalassistance.
• In1987,itstartedadvancingloanstotheNGOsbyestablishingamicro-creditlendingprogramand
established this as the core business and growth area.
• K-rephas36Brancheslocatedall overthecountryandoffersMicro-finance,businessand
personal banking.
Platcorp
Sector : FS
Stake:35.6%
• PlatinumCreditLimitedisaMicroFinanceCompanylicensedinKenyaundertheCompaniesActin
2002.
• PlatinumCreditisanondeposittakingMicroFinanceCompanieswithoperationsinKenya,Uganda
and Tanzania.
• PlatinumCredithasmorethan50branchesintheregion.
• Platinumpridesitselfonaswiftdisbursementofloans,allwithin24hours.
AON
Sector: FS
Stake:21.5%
• AON Kenya Insurance Brokers Ltd (AON) is a market leader offering insurance broking, risk
management, actuarial consulting, medical scheme administration and medical fund management,
life and pension’s administration, and employee benefits consulting services to medium and large
organizations in Kenya.
• AONhasalargeportfolioofcorporateclientstowhomitprovidesbrokerageservicesforcoverageof
some of the most complex risks. Aon is a service driven organization which aspires to meet the highest
standards of its clients.
Genesis
Sector: FS
Stake:73%
• Genesis Kenya was established in 1996, with the aim of providing high quality investment management
services to Kenyan institutional investors.
• GenesisKenyaisaregisteredfundandassetmanagerwithover18years’experienceintheKenyan
market and is the second2 largest Asset Manager in the country.
• Itspecializesininvestmentmanagementandpensionschemeadvisoryservicesandhasatrackrecord
of delivering superior returns to our clients.
• Servicesinclude,PensionFundManagement:Flexible,market-linkedinvestmentofferingasegregated
portfolio ideally suited to pension fund schemes.
Nabo Capital
Sector: FS
Stake:100%
• Established in2013,NaboCapital, (formerlyCentumAssetManagersLimited) is awholly owned
subsidiary of Centum.
• Itscorebusinessrevolvesaroundthemanagementoftraditionalassetclassessuchasequities,money
markets and fixed-income portfolios while traversing alternative asset classes such as real estate,
securitizations and private instruments.
• TheoperationsofNaboCapitalasafundandREITmanagerislicensedandregulatedbytheCapital
Markets Authority. In addition, it is registered under the Retirement Benefits Authority to manage
pension funds, providing ample security for our clients.
• NaboCapitalmanageswelloverUSD100million (asatSeptember2014)worthofassets inboth
internal and third party funds. For all clients, our aim is to ensure investors understand the risks they
face and tailor investment solutions to mitigate such risks.
4Retirement Benefits Authority Industry Performance Report, December 2013 to June 2015, published on 31 March 2015
Financial Services
Kes 9.1 Bn
FMCG
Kes 6.0 Bn
Energy
Kes 0.7 Bn
Others
Kes 3.4 Bn
Real Estate
Kes 12.9 Bn
Quoted Private
Equity Kes 4.7 Bn
Centum Investment Company Limited
Portfolio Value - Kes 36.8 Bn

Information Memorandum 39
Senior Unsecured Fixed Rate Notes and Senior Unsecured Equity Linked Notes
9.6.2 FMCG Sector
Africahasafastgrowingmiddleclass,withdisposableincometospendonconsumergoodsandservices.Urbanizationandincreaseduse
of technology is the biggest revolution in Africa making the consumers easier to reach and encouraging spending.
The main challenge for investors seeking entry to SSA is to obtain a better understanding of the market and its consumers, which Centum
can be well placed to add value to investors as a local partner.
Centum’s current investments in this sector are listed below:
Company Description
Almasi Beverages
Sector: FMCG
Stake:50.95%
• CentumhasinvestedinAlmasi,theholdingcompanyofthreebottlersinKenya:RiftValleyBottlers,
Mount Kenya Bottlers and Kisii Bottlers.
• RiftValleyBottlersLimitedisaCocaColabottlingcompanywhosefranchiseterritoryspansacrossthe
Rift Valley and Western provinces in Kenya.
• MountKenyaBottlersLimitedisaCocaColabottlingcompanywhosefranchiseterritoryspans
across the Central and north eastern provinces in Kenya.
• KisiiBottlersLimitedisaCocaColabottlingcompanywhosefranchiseterritoryspansacrossWestern
province.
• Ithasa29%marketshareinthecarbonateddrinksmarketsegment.
• Centumrecentlyacquiredacontrollingstakeinthecompanyin2015.
Nairobi Bottlers Limited
Sector: FMCG
Stake:27.6%
• NairobiBottlersLimitedisoneoftheCocaColafranchisesinKenya..
• ItsterritoryspansacrossthewholeofNairobiandpartsoftheCentral,EasternandRiftValleyprovinces
in Kenya.
• Ithasa48%marketshareinthecarbonateddrinksmarketsegment.
KWAL
Sector: FMCG
Stake:26.4%
• KWALwasincorporatedinMay1969withtheobjectiveofconsolidatingimportationanddistribution
of Wines and Spirits from foreign owned companies and enable indigenous Kenyans take control
the importation and distribution of Wines and Spirits in the country from hitherto foreign owned
companies.
• KenyaWineAgenciesLimitedisamanufacturer,distributorandimporterofwinesandspiritsineast
AfricawithoperationsinKenya,UgandaandRwanda.
• TheCompanywasprivatizedbytheGovernmentofKenyain2014whenICDCsold26%outofits
72%shareholdingintheCompanytoDistellGroup.
King Beverage Limited
Sector: FMCG
Stake:100%
•KingBeverageLimitedisawhollyownedsubsidiaryofCentumwithmandatetodistributepremium
beer,specifically,Carlsberg,inKenyaandUganda.
•ThereisintentiontoextendthedistributionofCarlsbergtothegreaterEastAfricaregion.King
Beverage is desirous of setting up a brewery in the short to medium term.

Information Memorandum
Senior Unsecured Fixed Rate Notes and Senior Unsecured Equity Linked Notes
40
9.6.3 Energy Sector
Sector Strategy:
The Power sectors across the region have been characterized by chronic under investment over the past two to three decades. Kenya
presentsanequityinvestmentopportunityworthUSD4.5BnderivedfromtheGovernment’spolicytoincreasegenerationcapacityby
5,000MW by 2018. Opportunities exist primarily in geothermal and coal generation.
Centum’s strategy will be to acquire independent power producer development expertise to enter the sector and deploy early capital as
a project sponsor.
Centum’s current investments in this sector are listed below in detail:
Company Description
Akiira One
Sector: Energy
• AkiiraOneGeothermal, founded in2012, is the firstprivate sectorGreenfieldgeothermalprivate
development in SSA.
• Whencomplete,itwillgenerate70MWofgeothermalelectricitywiththisbeingthefirstphaseofthe
planned total 140MW.
Amu Power
Sector: Energy
• AmuPower,aconsortiumbringingtogetherGulfEnergyLimitedandCentumissettoconstructacoal
power plant.
• Whencomplete,itwillgenerate1050MWofcoalfiredelectricity,thisbeingpartoftheGovernment
of Kenya (“GoK”) Least Cost Development Plan for power generation to bring down the cost of power
via a more stable, reliable platform.
Amu Power
Introduction
In 2013, the Government of Kenya (“GOK”) through the Ministry of Energy & Petroleum (“MEP”) held an international competitive
bidding process for the construction of a 1,050 MW coal-fired thermal power plant under the Public Private Partnership (“PPP”)
framework. The tender attracted significant international interest from over 26 reputable bidders from 7 countries. After a rigorous
evaluation process, a consortium led by Centum and Gulf Energy Limited (“GEL”) was awarded the tender to construct a 1,050 MW plant
at the Kenyan coast in Lamu County, on a 25 year Build-Own-Operate (“BOO”) concession (“the Project”).
Business Model Overview:
The project’s fundamental business model is anchored in three critical project documents:
a) Revenues-PPA:ThisagreementwillallowthePCtosellpowertotheoff-taker,inthiscaseKPLC,atapre-agreedtariffinUSD
overthe25yearPPAterm.ThetariffisalsoindexedtotheUSCPIindextoprotectagainstinflation.Itisestimatedthatoverthe
projectlife,theplantwillonaveragegeneraterevenuesofUSD575.5Mn/year.Thepre-agreedtariffhas3maincomponents(more
particularized below) which cater for the following:
i. The recovery of the fixed capital investment in the plant made by debt and equity investors.
ii. The cost of fuel of generating power plant on the basis of a pre-specified fuel consumption rate – this is treated as a direct pass-
through in the PC’s financial statements.
iii. The cost of maintaining and operating the plant.
b) Operating Costs – FSA, O&MC: These long term agreements anchor the project costs related to fuel and the operating and
maintenanceofplantequipment.Itisestimatedthatovertheprojectlife,andassumingacostofcoalUSD50/tonne,thesecosts
willaverageUSD212.6Mn/year.
c) Financing Costs & Debt Repayment – Financing Documents: These agreements provide for the cost of financing with regards to
interest and other associated hedging costs and also the terms of repayment of debt. It is estimated that over the project life, on
averageUSD33.28Mn/yearwillbepaidtotheprojectlendersinbothinterestandprincipaluntilthedebtisfullyextinguished12
years after COD.
Once the project meets its core funding obligations as described in b and c above, and as long as the project is in good financial health as
prescribed by the lenders debt covenants and distribution lock-up ratios, the remainder of the project cash flows / profits are available for
distributiontoshareholders.Priortotherepaymentofdebt,itisestimatedthatonaverageUSD101million/yearwillbepaidtoequity
shareholdersasdividends,risingtoonaverageUSD267million/yearaftertherepaymentofthedebt.
Information Memorandum 41
Senior Unsecured Fixed Rate Notes and Senior Unsecured Equity Linked Notes
Overview of Investment Returns
Figure5belowprovidesforanoverviewofaninvestorspotentialreturnprofileassumingaUSD1Minvestmentheldfortheentireproject
life of 29 years. What can be seen is that:
• Aninvestorisnotduetoearnanyreturnsoverthefirst4yearsofinvestmentduringtheplantconstructionperiodupuntilCOD.
• Thereafter,theinvestorswillearnaverageannualdividendsestimatedatUSD149,000providingforaninvestmentPayBackPeriod
(“PBP”) of 6.7 years after COD.
• Annualdividendsareexpectedtoincreasebyapproximately163%toanaverageofUSD380,000afteryear15oncetheproject
debt has been fully paid-off all project finance related debt.
• Overthe29yearprojectlife,andafterCODandinvestorisexpectedtoearn6.9TimesMoneyBack(TMB),withtheirinvestment
value on the original principal investment on average doubling every 4.2 years.
• ItisimportanttonotethattheinvestmentwillamortizeovertheProjectlifeastheProjectapproachesendofthePPAterm,and
hence the residual value of investment will be zero at the end of the PPA term.
Figure 5: Investor return profile for a USD 1M investment over the project life
The investment in this project will yield significantly better returns as compared to other available market opportunities while providing
stable returns that are not exposed to market volatility. The Issuer’s investment in Amu Power shall offer excellent diversification in its
current portfolio especially from a currency and return stability point of view. As an investor, Centum shall also enjoy an investment
instrument with a very long tenor and therefore minimize re-investment risks.
Figure 6: Illustration of return comparison against various benchmarks

Information Memorandum
Senior Unsecured Fixed Rate Notes and Senior Unsecured Equity Linked Notes
42
Funding Structure
The project is to be financed on a debt to equity ratio of 75:25. The debt will be issued on a non-recourse basis. The debt funding is
coming in as a package along with the EPC Contractor. The equity will be provided primarily by the Sponsors, GEL and Centum. Long
term debt is being sought from a consortium of banks.
9.6.4 Real Estate Sector
Sector Strategy:
Centum will focus in the development of large mixed use developments. There is demand for this type of developments and we are among
the best placed in the market to deliver. Smaller mixed use developments in very prime locations will also be considered. These projects
are less capital intensive, easier to execute and require the same skills as the large mixed use developments. Centum will be primarily
focused on the development phase but open to follow attractive opportunities along the property value chain to yield exceptional returns.
Centum’s current investments in this sector are listed below:
Company Description
Two Rivers
Sector: Real Estate
Stake:58%
• Mixedusedevelopmentwherepeoplelive,work,playsetona100acreparceloflandneighbouring
the diplomatic area of Runda, Gigiri and Limuru Road in Kenya.
• TwoRiversDevelopmentwillprovideapremiumlarge-scalemixed-usedevelopmentthatwilloffer
premium retail, commercial, residential and hospitality facilities set out in a modern urban environment.
• Anchordevelopment isTwoRiversMallwhichconsistof62,000SQMof retail spaceand22,000
SQM of office space.
• Itwillbeconstructedinphasesfullycapitalizeonthevaluecreatedbyeachphaseandwillhaveatotal
build up area of about 851,000 SQM when completed
• In2014,Centumsecuredtheequityinvestmentfromtwoinstitutionalinvestors,whoinvestedKes6.5
Billion(US$75Million)fora42%equitystakeinTwoRiversDevelopment.ConsequentlyCentum’s
shareholdinginthecompanyisnow58%.
Pearl Marina
Sector: Real Estate
Stake:100%
• PearlMarinaisamixedusedevelopmentseton385acresofpristineanduntouchedlandwith3km
lakefrontageontheGarugaPeninsularinUganda.
• Pearl Marina will provide premium tourism and residential facilities including hotels, conference
facilities, luxury apartments, villas, marinas, hospital, international school, modern office park, retail
center, a wide range of sports and recreational activities.
• The development will be constructed in phases and when complete will have a built up area of
1,400,000 SQM.
Athena Properties
Sector: Real Estate
Stake:100%
• AthenaPropertiesoffersclientsacomprehensivesolutionformixedusepropertydevelopments,from
local urban nodes to large scale new city development throughout SSA.
• ItmanagesCentum’stwoflagshiprealestateprojects(TwoRiversandPearlMarina)alongwith3rd
party developments.
Broll
Sector: Real Estate
Stake:30%
• BrollKenyawasestablishedin2013andisajointventurebetweenBrollPropertyGroup(Mauritius)
and Centum.
• ItrepresentsclientsintherapidlygrowingeconomicblockofKenya,Uganda,TanzaniaandSouth
Sudan.
• Itsservicesinclude:PropertyManagement;AssetManagement;FacilitiesandProjectManagement;
Retail Property Management; Corporate Real Estate Services; Commercial, Industrial And Investment
Broking; Research; Valuation And Advisory Services.
The Real Estate & Infrastructure business line was established in line with Centum’s central mission to offer investors access to inaccessible,
quality, and diversified investments. This business line has grown from Kes 36 Million in 2010 to Kes 12.9 billion at the end of 31
December 2014.

Information Memorandum 43
Senior Unsecured Fixed Rate Notes and Senior Unsecured Equity Linked Notes
To effectively manage its Real Estate business, Centum established Athena Properties Limited, a wholly owned subsidiary in 2013.
Athena’s mandate was to develop in-house capability to execute real estate developments on behalf of the Group as well as offer project
management and development management services to third parties. Athena has been able to recruit an experienced management team
with international experience and prides itself on having a team with over 100 years cumulative work experience in the Real Estate sector.
This remarkable team is currently managing Centum’s Two Rivers and Pearl Marina projects as well as other third party projects.
Opportunities for Centum in Real Estate
In Real Estate, Centum seeks opportunities that leverage our ability to quickly mobilise funds for investment as well as our sector
experience, thereby unlocking attractive development opportunities that will lead to the creation of new communities and address
shortages in the commercial and residential real estate markets.
Centum’s Real Estate investments are guided by the following major regional trends:
• Demographics–Itisestimatedthat40%or300millionofAfrica’spopulationliveincities.Thisnumberwillriseto800millionby
2030.Africa’spopulationisalsoyoungand60%areundertheageof25anditisexpectedthatthemajoritywillliveincitiesyetto
be conceived.
• Improving Living Standards - Africa’s economies have been growing consistently and have seen a population of 85 million
householdsearnover$5000perannum.Thisisexpectedtoriseto130millionhouseholdsbyyear2020.Locally,Kenyansare
increasinglypurchasingitemsfromformalretailers.Thishasseeninformalshoppingoutletssinkby29%whilemoderndistribution
outletshavegrownbymorethan34%.
• GrowingEconomies –Africa’sGDP is expected to almostdouble fromUSD1.6 trillion in2008 toUSD2.6 trillion in2020.
ConsumerspendingpowerwillincreasefromUSD860billionin2008toUSD1.4trillionby2020.
Centum’s successful execution of its real estate strategy in Two Rivers Development and Two Rivers Lifestyle Centre has seen Centum’s
stakeincreasefromaninitialinvestmentofKes2.3billiontoKes9.0billion,a390%increaseinvalue.InPearlMarina,thevalueof
Centum’s investment has increased through acquisition of additional land parcels in addition to obtaining various planning and physical
interventions relating to the land since acquisition.
Two Rivers
The Two Rivers property measures 100 acres and is located in the diplomatic blue zone in the Gigiri/Limuru Road area of Nairobi which
providesakeytargetmarketclosetothesubjectproperty.Thesiteisonlyabout10minutesdrivefromUnitedNationsComplex;about
20 minutes drive from Nairobi Central Business District and 30 minutes to the Jomo Kenyatta International Airport. It is bordered by
key access roads (Northern By Pass, Limuru road and the proposed North-South link road). These provide easy access to existing urban
nodes (Westlands, Lavington and Loresho) and key points like the Airport and the growing residential areas Limuru, Kiambu, Ruiru and
Thika. These factors render the site a very ideal location for the development of a mixed used commercial development. The property
has two rivers traversing through it and that is the inspiration for naming this development “Two Rivers”.
It is bordered by, and has access from, the Northern By-Pass and Limuru road, and is located within the most affluent suburbs in
KenyawithanannualspendofUSD500millionwithina50kilometreradius.ThedevelopmentissettobecomeEastAfrica’spremier
destination and address.

Information Memorandum
Senior Unsecured Fixed Rate Notes and Senior Unsecured Equity Linked Notes
44
Two Rivers Master Plan
Vision
The vision of Two Rivers Development is to develop a premium world class master planned urban address set that will be premier
regional destination and address in East Africa and beyond for a long time to come.
The development is set to be one of the most attractive and prestigious destinations in Eastern Africa that will compete economically and
culturally with other premier developments in SSA and the Middle East.
The development will create value by optimizing on the uniqueness of the site that has undulating terrain covered by a blend of indigenous
trees and is traversed by two rivers. This landscape will not only provide key attraction for visitors and residents, but also offer exceptional
recreational space, entertainment, leisure and lifestyle facilities. The site will be developed in an environmentally sustainable manner that
will seek to protect and preserve the unique physical features including the water resources and the riparian reserve.
Facilities Provided at Two Rivers
The facilities provided at Two Rivers will include:
• Retail, Entertainment and Lifestyle: A diverse and unique retail, entertainment and lifestyle mix covering a broad variety of
premium local and international brands, indoor/ outdoor activities and offering a wide selection of entertainment venues and
activities. This will be the anchor development for Two Rivers.
• Residential:Residential units will comprise of a prestigious mix of medium and high density apartments which will offer maximum
convenience, luxury and a high quality of life.
• OfficeParks:ModernofficeparkswillplaceTwoRiversas thenumberonedestination forcorporateandcreatea soughtafter
address for those working in the development.
• Hotels: Hotels will have high end rooms with modern conference facilities with a mix of short and long stay serviced apartments to
supplement the hotels.
• School: A recognized international school which will offer a recognized curriculum and a day care center.

Information Memorandum 45
Senior Unsecured Fixed Rate Notes and Senior Unsecured Equity Linked Notes
• MedicalandEmergencyServices: Health security will be provided by developing an executive medical facility affiliated to a major
recognized hospital.
• FirstWorldInfrastructure: The development will have first world infrastructure that will be managed centrally.
Two Rivers Mall
The construction of the Mall is on schedule and is set to open in October 2015.
The mall has a Gross Leasable Area (GLA) of 62,000 square meters In addition, the Centre will have 20,000 square metres of office GLA.
Two Rivers Lifestyle Centre has the following competitive advantage over other malls in the region:
a) The mall will have over 220 shops and thus will offer the public unparalleled access to a wide variety of retail outlets
b) Themallhasover40%internationaloutletsthusofferingbringingpremiuminternationaloutletstoKenya
c) Significant entertainment offering has been planned in the development which will offer interactive fountains, climbing walls,
outdoor theatres, exhibition areas, play pool, picnic sites and a jogging track.
d) The mall also offers adequate parking facilities comprising a total of 1,600 parking bays and an additional 2,000 parking bays in the
adjacent parking silo.
The strength of the above offering has been validated by the fact that the Mall is already more than half let with the anchor tenant,
Carrefour, a retail giant, opening its first and flagship store in SSA at Two Rivers Mall. Other tenants include: Chandarana Food plus,
Zucchini, Mr Price, Woolworths, Essentials, Bosini, Sandstorm, Samsonite, Adidas, Bose, Funscapes as well as variety of Local banks
including Commercial Bank of Africa.
On the Two Rivers Mall construction, the key milestones as per the project plan are:
Milestone Planned Status
Earliest tenant beneficial occupation March 2015 Done
Completion of Retail Mall October 2015 On track
Completion of construction including office towers January 2016 On track
Financing
Centum secured the equity investment from two institutional investors, AVIC and ICDC, who have invested a total Kes 6.75 Billion
(US$75Million)fora42%equitystakeinTwoRiversDevelopment.Further,wehavesecureddebtfundingofKes5.4billion(USD60
Million) in 10-year long term debt from Cooperative Bank of Kenya. As a result of this investment and debt funding, the Two Rivers
project now fully funded

Information Memorandum
Senior Unsecured Fixed Rate Notes and Senior Unsecured Equity Linked Notes
46
Pearl Marina
PearlMarina, is set on385 acres on theGarugaPeninsula on the shores of LakeVictoria inEntebbe,Uganda.The site is situated
between Entebbe international airport and Kampala, about 22 km from the airport and about 32 KM from Kampala. The property will
bedevelopedasapremiumintegratedwaterfrontdestination,resorttown,andapremierUgandatouristdestination.Thedevelopment
provides premium tourism and residential facilities including hotels, conference facilities, luxury apartments, villas, marinas, hospitals,
international schools, modern office park and a retail center.
The site enjoys beautiful views of the lake with over 3.5 kilometers of Lake Frontage. This has been the inspiration behind the Pearl
Marinaconceptandvision.ItisanideallocationforawaterfrontresorttownattractinglocalUgandans,visitingDiasporaandtourists
from all over the world.
Vision
The vision of the Pearl Marina Development is to develop a premium world class waterfront destination recognized in East Africa and
beyond. The development will to provide first world experience to locals and foreigners alike, with the advantage that there is no other
developmentofitskindplannedinUganda.
Facilities Provided at Pearl Marina
The Pearl Marina Development will incorporate:
• HotelsandMarketResorts: Hotels with high end rooms and a market resort.
• Retail,EntertainmentandLifestyle:The development will comprise a vibrant commercial square with restaurants, entertainment
arena, a retail centre covering a broad variety of premium local and international brands and a public marina with ferries, jetty for
fishing and water related leisure and lifestyle activities.
• OfficeParks: Modern office parks that will place Pearl Marina as the number one destination for those wishing to work in the
development.
• Residential: High End residential apartments and villas which will offer maximum convenience and a high quality of life.
• MedicalandEmergencyServices: Health security will be provided by developing an executive medical facility affiliated with a
major recognized hospital.
• School: A recognized International School offering internationally recognized curriculum.
• Firstworldinfrastructure: The development will have first world infrastructure that will be managed centrally.

Information Memorandum 47
Senior Unsecured Fixed Rate Notes and Senior Unsecured Equity Linked Notes
To achieve the vision stated the following master plan has been created for Pearl Marina.
Phasing Plan
Due to the size of the property the development will be done in phases. This allows for smoother financing processes as well as easier
introduction to the market.
a) Phase I:
Phase I will consist of residential houses, an international school, a hospital and a hotel.
b) Residential Component
A total of 128 residential houses will be developed in the first phase. Consisting of a mix of 72 two bedroom duplexes, 40 three bedroom
villas and 16 five bedroom villas. The 128 units will be built in clusters, each cluster containing approximately 10 houses. The clusters are
designed to provide both exclusivity and an element of community at the same time. As each cluster looks away from the other while each
house has views of both the lake and the common lawn at the center. Below is a view of phase one and the arrangement of the clusters.
The construction of the development commenced in March 2015.

Information Memorandum
Senior Unsecured Fixed Rate Notes and Senior Unsecured Equity Linked Notes
48
The houses are designed to feel light and undaunting. Pearl Marina is the hidden gem in nature that integrates the landscaped gardens
and views of the lake into the architecture. Some of the concept designs are shown below:
c) Club House
Development of a club house for the villa owners to host guests and for the public to have conference facilities;
• Theclubhousewillberunbyaninternationalhotelbrand
• PrivateSquareforprivatefunctionssuchasweddings.
• Conferencefacilities
• Swimmingpool&Spa
The resort will be operated by an international brand hotel operator.
The apartments will be offered for sale to investors and managed by the resort operator.
d) International School
Ugandahasahighdemandforgoodschools.Ugandahasalargeyoungpopulationandcoupledwitharisingmiddleclassthisinherently
creates a demand for good schools. Investors realize that Pearl Marina is a great site for a school as it provides enough space to create a
serene learning environment. In addition the development will be managed privately giving parents assurance of security.
In this regard, Centum leveraging on its strong brand is in discussions with various investors to bring an International School to the
development.Inthisweareseekingtopartnerwithaninternationalbrand.ThatwillbeattractivetotheUgandansandtheexpatriates
in the region
e) An International Hospital
AccordingtotheHealthMinistryofUganda,thehospitalscountrywidehaveonly61%ofthestaffrequired.Inadditiontothis,Uganda’s
diseaseburdenisincreasingespeciallylifestylerelatedillnesses.ThiscreatesagapforgoodhealthcareprovisioninUganda.
To this end Centum is in talks with major health care providers in the world to come into Pearl Marina on a partnership basis in an effort
torelievethisburden.TheHospitalwillprovidehealthcareservicestoUgandansatlarge.
In Phase II of the project, the following will be included in the development:
i) Office Space: set in an office park environment this will contribute to maximization of synergies of other mixed uses like retail,
hotels, serviced apartments and leisure and thus help in opening up the development as a commercial destination.
ii) Marina: the development will take advantage of the water frontage to develop a marina that will provide a variety of water activities
that will provide unique experience to residents and visitors. It will have a jetty for fishing, jet skiing, fish market, boat launching and
berthing facilities.
iii) Sporting & Recreational Activities: A wide range of activities including kids club, fitness centre, spa, tennis, cycling, tennis,
swimming, fishing, basketball, mini-soccer, and bird watching .
iv) Ferry/ boat service: A boat and ferry service is planned that will provide alternative connection between:
a. Entebbe and Pearl Marina, which is 10 km by water and
b. Between Port Bell (near Kampala) and Peal Marina, which is 26 km by water.
The objective is to reduce commuter time, enhance the quality of the experience and promote convenience
Vipingo Development Limited
Following a settlement agreement entered into between the Issuer and Rea Trading Limited, the Issuer is in the process of acquiring
9,646 acres of land in Vipingo at a price of Kes. 180,000 per acre and Vipingo Estates Limited, a subsidiary of Rea Vipingo Plantations
Limited, which owns approximately 900 acres of land at approximately Kes. 340 Mn. The total transaction prices total to approximately
Kes. 2.1Bn.

Information Memorandum 49
Senior Unsecured Fixed Rate Notes and Senior Unsecured Equity Linked Notes
9.6.5 Education and Healthcare Sector
Sector Strategy:
Critical to the success of any mixed used development is the provision of the full suite of social amenities to secure a captive catchment
to drive commercial activity and boost the attractiveness of the destination. Two of such amenities are high quality hospitals and schools.
A viable opportunity, therefore, exists to enter into the Education & Healthcare sector through synergies with our current activities in
Real Estate on mixed use developments. Critical success factor of this model is entering into joint ventures with high quality hospital and
school operators and signing long term leases with them on property to be financed and developed by Centum.
Centum’s currently does not have any investments in this sector.
9.6.6 Agriculture Sector
Sector Strategy:
Kenya has high agricultural potential with high land quality and soil resilience ratings. Varied agro-climatic conditions favour the
production of a wide range of crop and livestock.The lack of commercial investment in farming and agro-processing is a huge opportunity.
Current commercial farms are on average far smaller than world averages.
Centum will acquire agro-project development expertise to enter the agribusiness sector and deploy early capital as project sponsor.
9.6.7 Quoted Private Equity (“QPE”) Portfolio
The QPE asset class leverages on Centum’s private equity expertise to invest and create value in quoted companies that exhibit private-
equity like traits. This business line focuses on making investments in listed entities that are under-researched, illiquid, with significant
growth potential and where Centum can obtain a significant equity stake.
The second mandate of the QPE business line is to provide liquidity management for the overall portfolio. The QPE business line
provides an avenue to deploy surplus funds and is also a source of liquidity by providing collateral for borrowing or by the disposal of
marketable securities. The QPE business line also allows Centum to compare the valuations of entities in the private markets against
those of entities in public markets across the continent. This flexibility has contributed greatly to more efficient asset allocation.
In each of the last five years of the 2009-2014 Strategy Period, the QPE business line has outperformed the NSE Index by an average of
18%.Asat31December2014,theQPEbusinesslinehadKes5.02Billionofassetsundermanagement,whichrepresents13%oftotal
assets.
Year QPE Return NSE 20 Return Centum Outperformance
2010 56% 43% 13%
2011 10% -4% 14%
2012 0% -13% 13%
2013 53% 44% 9%
2014 43% 2% 41%
Dec-2014 20% 3% 17%
Geometric Average 29% 11% 18%

Information Memorandum
Senior Unsecured Fixed Rate Notes and Senior Unsecured Equity Linked Notes
50
9.6.8 Other Portfolio
Other investments within the Centum portfolio are described below:
Others
Longhorn
Sector: Publishers
Stake:31.4%
• LonghornPublisherswasincorporatedinKenyainMay1965asLongmansofKenyaawhollyowned
subsidiaryofLongmanGroupInternationaloftheUnitedKingdom.
• Longhorn Kenya Ltd. is a leading regional publisher of educational books and books for general
readership.
• Longhornrankssecondinmarketshareforbothprimaryandsecondaryleveltextbooks.
• IthassubsidiariesinUgandaandTanzaniaandisalsoexploringopportunitiesinotherAfrican
countries such as South Sudan, Rwanda and Zambia.
GMEA
Sector: Automotive
Stake:17.8%
• GeneralMotorsEastAfricaLtd,wasfoundedin1975asajointventurebetweentheGovernmentof
Kenya and General Motors Corporation.
• GMEastAfrica(GM)marketsandsellsChevrolet,OpelandIsuzuvehiclesandparts.Itlocally
assembles the Isuzu and Chevrolet vehicles.
• MajorityofGM’ssalesaredomestic.GMalsoexportstoneighboringcountriesintheCOMESAregion:
Uganda,Tanzania,Rwanda,Burundi,Zambia,Zimbabwe,MozambiqueandEthiopia.
• GMEastAfricahasover30years’experienceinthelocalassemblyandservicesindustry.
NAS Servair
Sector: FMCG
Stake:15%
• NASServairisanon-siteairportcateringfacilitysupplyingover30Internationalairlinesthatflyinto
and out of Jomo Kenyatta International Airport (JKIA) in Nairobi and Moi international Airport (MIA)
in Mombasa.
• It supplies high quality in-flight products and services and is recognized for both its professional
standards and in-depth knowledge and understanding of local and international aviation hospitality
requirements.
• NAShasclearleadershipcredentialswithinitsmarket.
Source: Centum Annual Report 2014
9.7 Dividend Policy
In 2009/2010 the Board of Directors of Centum made a decision not to recommend the payment of dividend and instead direct internally
generated funds to growing shareholder value. In the new strategy period from 2014-19, the board of directors has maintained the no
dividend policy.
9.8 Principal Shareholders
As at 31st December 2014, the top ten shareholders of Centum were as follows:
Table 8: Principal Shareholders
Shareholder No. of Shares %ofShareholding
Christopher J.Kirubi 160,023,688 24.05%
Industrial & Commercial Development Corporation 152,847,897 22.97%
CfC Stanbic Nominees Ltd A/C R48701 26,664,124 4.01%
Standard Investment Bank Standard Inv Dealing 8,438,922 1.27%
UgandaSecuritiesExchange 5,949,035 0.89%
John Kibunga Kimani 5,908,221 0.89%
CfC Stanbic Nominees Ltd A/C Nr1030685 5,643,273 0.85%
The Jubilee Insurance Company Of Kenya Limited 5,581,385 0.84%
Standard Chartered Nominees Non-Resd A/C 9537 5,425,300 0.82%
International House Limited A/C 275204 5,394,237 0.81%
Total Top Ten Shareholders 369,205,115 57.40%

Information Memorandum 51
Senior Unsecured Fixed Rate Notes and Senior Unsecured Equity Linked Notes
9.9 Shareholding by Directors
The Directors shareholding as at 31st December 2014 is as follows:
Table 9: Shareholding by Directors
Shareholder No. of Shares %ofShareholding
Christopher J. Kirubi 160,023,688 24.05%
Industrial & Commercial Development Corporation 152,847,897 22.97%
James M. Mworia 324,294 0.05%
Henry C. Njoroge 256,028 0.04%
James N. Muguiyi 46,096 0.01%
Total 313,498,003 47.11%
9.10 Distribution of Shareholding
Centum’s range of shareholding as at 31st December 2014 is as shown in the following table:
Table 10: Distribution of Shareholding
Volume Shares % Holders
1-500 2,314,393 0.35% 11,372
501-5,000 37,885,874 5.69% 18,548
5,001-10,000 24,146,416 3.63% 3,382
10,001-100,000 91,206,627 13.71% 3,686
100,001-1,000,000 91,376,857 13.73% 357
>1,000,000 418,511,547 62.89% 38
Total 665,441,714 100.00% 37,381
Table 11: Shareholder Profile
Domicile Shares % Holders
Foreign Institutions 39,475,757 5.93% 30
Foreign Individuals 1,454,589 0.22% 168
Local Institutions 276,721,400 41.58% 1,775
Local Individuals 347,789,968 52.26% 34,672
Total 665,441,714 100% 36,645
9.11 Employees
At Centum, our greatest asset and key driver behind our exception performance is our team of youthful, entrepreneurial, ambitious and
highly focused individuals. Our entrepreneurial and high performance culture is enhanced by a relatively flat organizational structure
that promotes a free flow of ideas and communication across the different levels of the organization; board, management and teams.
The standards of behaviour at Centum are guided by our core values;
• Deliverytopromise;
• Unityofpurpose;
• Partnership;and
• Investingresponsibly
We believe that every team member is a leader and focus on enhancement of leadership capacity through our leadership development
program. Our ultimate goal is to grow an adequate bench of leaders who will steer and drive the growth of the extraordinary enterprises
we create across the African continent.
Centum and its wholly owned operating subsidiaries (Nabo Capital Ltd, Athena Properties Ltd and Centum Business Solutions Ltd)
currently has a combined team of 84 members of staff.

Information Memorandum
Senior Unsecured Fixed Rate Notes and Senior Unsecured Equity Linked Notes
52
10. TERMS AND CONDITIONS OF THE NOTES
1. The Issued Notes
TheissuewithintheRepublicofKenyaofuptoKenyaShillingssixbillion(Kes6,000,000,000)constitutingSeniorUnsecuredFixed
RateNotesandSeniorUnsecuredEquityLinkedNotes,bytheIssuerwasdulyauthorizedbytheboardofdirectorsbywayofaresolution
dated 24 April 2015.
The Notes are available to the general public through subscription.
The Notes are issued with the benefit of, and are subject to the Information Memorandum, the Agency Agreement and the Trust Deed.
The statements in these Conditions include summaries of, and are subject to, the detailed provisions of the Agency Agreement and the
Trust Deed. Noteholders are deemed to have notice of all the provisions of the Agency Agreement, copies of which are available for
inspection at the Specified Offices of the Fiscal Agent in accordance with the provisions of the Agency Agreement.
The following is the text of the terms and conditions (the “Conditions”) of the Issued Notes.
2. Form, Denomination and Title
(a) Form of Notes and denominations. The Notes are issued in registered form and denominated in Kenya shillings in denominations
of Kes 100,000 each and integral multiples of Kes 100,000 thereof (the “Specified Denomination”). The Notes will be registered in
the CDSC Account of each Noteholder held with the CDSC in accordance with the CD Act.
The Variable Return in relation to the ELN is, at the option of the Noteholder, detachable from the ELN and is transferrable
in accordance with the Conditions. The Variable Return shall not therefore constitute a Note nor shall its holder be deemed a
Noteholder by mere holding of the Variable Return.
The Registrar shall maintain a Register with respect to the Notes and a separate Register with respect to the Variable Return in a
location within Kenya.
(b) Listing: Approval has been given to list the Notes on the Fixed Income Securities Market Segment of the NSE.
TheSeniorUnsecuredEquityLinkedNoteswillbelistedontheFixedIncomeSecuritiesMarketSegmentandtradingwillbelimited
to qualified institutional investors.The Issuer shall use all reasonable endeavours to maintain the listing on the official list of the NSE
of the Notes and the Variable Return or if it is unable to do so, the Issuer will, subject to the approval of the CMA and the Trustee,
provide alternative mechanisms to facilitate trading of the Notes.
(c) Title. Title to the Notes will be evidenced by means of a book-entry in the CDSC Account of a Noteholder in accordance with the
CD Act.
Title to the Variable Return will also be evidenced by means of a book-entry in the CDSC Account of a Variable Return Holder in
accordance with the CD Act.
The Issuer, the Fiscal Agent and the Registrar may (to the fullest extent permitted by Applicable Laws) deem and treat the registered
owner of any Note or Variable Return as the absolute owner thereof (whether or not the Note or Variable Return (as the case may
be) shall be overdue and notwithstanding any notice of ownership or other interest therein and neither the Issuer, nor any agent of
the Issuer, shall be affected by notice to the contrary).

Information Memorandum 53
Senior Unsecured Fixed Rate Notes and Senior Unsecured Equity Linked Notes
“Noteholder” or “Variable Return Holder” when used with respect to any Note or Variable Return (as the case may be), means the
person in whose name the Note or Variable Return (as the case may be) is registered with the CDSC for the Notes or, as the case may
be, Variable Return (or in the case of joint holders, the first-named thereof).
“Holders” means the Noteholders and/or the Variable Return Holders (as the case may be) and “Holder” shall be construed
accordingly.
(d) Transfer. A Note may be transferred in whole or in part in a Specified Denomination and title to such Notes shall pass upon the
registration of book-entry transfers in accordance with the CD Act and; subject to the detailed regulations concerning transfers of
Notes set forth in the Agency Agreement (the “Regulations”). The Regulations may be changed by the Issuer with the prior written
approval of the Registrar.
The Variable Return may be transferred in whole or in part in a Specified Denomination and title to such Variable Return shall pass
upon the registration of book-entry transfers thereof in accordance with the CD Act and subject to the Regulations. The Variable
Return Holders may from time to time trade the Variable Return subject to the CD Act and the Regulations.
(e) Registration and transfer. The transfers will be subject to such charges as may be levied by the CDSC, CMA, NSE or any other
regulatory authority or agency and market intermediary through whom the order is made.
3. Status of the Notes
The Notes constitute direct, general, unconditional, unsubordinated and, subject to the provisions of Condition 4 (Negative Pledge),
unsecured obligations of the Issuer and will at all times rank paripassu in all respects (including in priority of payment) among themselves
and with all other present and future direct, general, unconditional, unsubordinated and unsecured obligations of the Issuer, except for
any obligations that may be preferred by provisions of law that are both mandatory and of general application.
4. Negative Pledge
The Issuer agrees that, so long as any Notes remain outstanding, it shall not create or permit to subsist any mortgage, charge, lien, pledge
or other security interest upon or with respect to any of its undertakings, assets or revenues to secure any future indebtedness evidenced
by notes, bonds or other securities which are or which are capable of being, at the request of the Issuer quoted, listed or dealt in for the
time being on any securities exchange or any other similar generally recognized market for securities unless (a) the Notes are secured
equally and rateably therewith; or (b) by providing such other security or arrangement as may be approved by Extraordinary Resolution
of the Noteholders; unless the provision of any such security is waived by an Extraordinary Resolution of the Noteholders.
5. Allocation Policy
A combined maximum of Kes 6,000,000,000 (six billion Kenya Shillings) (the “Issue Amount”) in Notes will be made available for
subscription.
The Issuer and joint lead transaction advisors will determine the allotment of Notes at their sole discretion. Of particular note however is
that FRN applications will be given preference over ELN applications.
Centum reserves the right, whether the Issue is over-subscribed or not, to reject any application in whole or in part and may therefore
allot less than the amount applied for.
6. Interest
(a) Payment of interest
The Notes bear interest on their outstanding principal amount from the Commencement Date at the Interest Rate as determined
below in accordance with the Payment Interest Dates indicated in Table 12 below.
If any Interest Payment Date would otherwise fall on a day, which is not a Business Day, the next following Business Day shall
be substituted for such day, unless such Business Day falls in the next calendar month, in which case the immediately preceding
Business Day shall be substituted therefore.
The period beginning on and including the date of the issue and purchase of the Notes (the “Commencement Date”) to but excluding
the first Interest Payment Date, and each successive period from and including an Interest Payment Date to but excluding the next
Interest Payment Date is herein called an “Interest Period”. The Interest Period for each Interest Payment Date will be as follows:

Information Memorandum
Senior Unsecured Fixed Rate Notes and Senior Unsecured Equity Linked Notes
54
Table 7: Payment of Interest Dates for the ELN and FRN
Interest payment dates
1 Monday, 14 December 2015
2 Monday, 13 June 2016
3 Monday, 12 December 2016
4 Monday, 12 June 2017
5 Monday, 11 December 2017
6 Monday, 11 June 2018
7 Monday, 10 December 2018
8 Monday, 10 June 2019
9 Monday, 9 December 2019
10 Monday, 8 June 2020
(b) Accrual of interest
Interest on each Note will cease to accrue in respect of any redeemed principal, unless payment of principal on the relevant Principal
Repayment Date (as defined below) or, where applicable the due date for early redemption, is improperly withheld or refused. In
such event, each Note shall continue to bear interest in accordance with the provisions of this Condition 6 and Condition 9(b)
(Payment on Business Days and late payments) until whichever is the earlier of (i) the date on which all sums due in respect of such
Note have been paid; and (ii) five days after the date on which the full amount of monies payable has been received by the Fiscal
Agent and notice to that effect has been given to the Noteholders in accordance with Condition 15 (Notices).
(c) Calculation of the Interest Rate
TherateofinterestfromtimetotimepayableinrespectoftheNotes(the“InterestRate”)shallbe13%fortheFRNand12.5%for
the ELN.
(d) Calculation of Interest Amounts
The Fiscal Agent will as soon as practicable, but in any event no later than two Business Days prior to the date on which interest for a
particular Interest Payment Date begins to accrue (the “Interest Determination Date”), compute the amount of interest payable (the “Interest Amount”) for the relevant Interest Period.
For each Interest Payment Date, the Interest Amount shall be calculated by applying the Interest Rate to the outstanding principal amount of the Notes, multiplying such sum by the actual number of days in the relevant Interest Period divided by 364, rounding the relevant figure to the nearest Shilling (fifty cents being rounded upwards).
The computation of each Interest Amount by the Fiscal Agent shall (in the absence of manifest error) be final and binding upon all parties.
(e) Notification of Interest Rate and Interest Amounts The Fiscal Agent will cause each Interest Amount for each Interest Period and the relevant Interest Payment Date to be notified to
the Issuer and the Noteholders in accordance with the Agency Agreement and Condition 15 (Notices) as soon as possible, but in any event no later than the fourth Business Day after the Interest Determination Date.
7. Computation of Variable Return
The Equity Linked Note will in addition to the coupon payment, have a variable return (the “Variable Return”) in the event of an increase in the Issuer’s Net Asset Value (“Initial NAV”) over the life of the Notes.
Increase in NAV will be arrived at by subtracting the Initial NAV from the Final NAV. The Initial Net Asset Value is Kes 26,950,614,000 as disclosed in the reviewed financial statements for the period ended 31 December 2014. The Final NAV will be determined from (i) the Issuer’s audited financial statements as at 31 March 2020 or, (ii) in case of early redemption of the ELN, the Issuer’s latest publicly issued financial statements, being either half year accounts or full year accounts as the case may beThe formula for computing the final redemption price will be:ParValue+[ParValue*(min[max[25%*Centum’scompanyNetAssetValueChange,0],10%].
TheincreaseinNAVforpurposesofcomputingthefinalredemptionpricewillbecappedat10%ofparvalue.IntheeventthatthefinalNAV is lower than the initial NAV, the final redemption price will be at par value.

Information Memorandum 55
Senior Unsecured Fixed Rate Notes and Senior Unsecured Equity Linked Notes
Please refer to Section (5)(Frequently asked Questions).
8. Payment of Variable Return
The Issuer shall pay an amount equal to the Variable Return to each registered holder of the Variable Return (the “Variable Return
Holder”) on the Maturity Date (or such other relevant date in the case of an early redemption) as notified by the Fiscal Agent in the Final
Due Amount Notice.
9. Payments
(a) Method of payment
i. Payment to the Holder will be made according to the particulars recorded in the Register at 3.00 p.m. (Nairobi Time) on the relevant Record Date.
ii. Payments of amounts due on the final redemption of the Notes (the “Final Due Amount(s)”) will be made by the Fiscal Agent in accordance with the Agency Agreement and subject to the provisions of the CD Act to the holder of the Note thereof as appearing on the Register as at the Maturity Date.
iii. The amounts due on any prepayment of the Notes (the “Early Redemption Amounts”) will be paid to the Noteholders appearing on the Register on the applicable redemption date and in accordance with the terms of the Agency Agreement and subject to the provisions of the CD Act.
iv. Payments will be made by EFT or RTGS to a designated Kenya Shilling bank account belonging to the Holder with a bank in Kenya
which bank account details have been advised by the Holder to the Registrar in writing and are recorded in the relevant Register held
by the Registrar on the Business Day not later than the relevant due date for payment.
(b) Payments on Business Days and late payments
i. If any day for payment of any Principal or Interest in respect of any Note or the Variable Return is not a Business Day, then the Holder shall not be entitled to payment until the next Business Day or if the next Business Day falls in the following calendar month the previous Business Day, nor be entitled to any interest or other sums in respect of such postponed payment.
ii. If (otherwise than by reason of the application of paragraph (i) above) (a) any payment of principal is withheld or refused when due in respect of any Note, or (b) any Interest is not paid when due or (c) the Variable Return is not paid when due (the defaulted amounts mentioned in (a), (b) and (c) above being referred to in this Condition as “Defaulted Amounts”) then interest shall accrue on each such Defaulted Amount at the Late Payment Rate and shall be paid against presentation of a Note if the Defaulted Amount is an amount of principal, and to a person who is shown as the Holder on the relevant Record Date if the Defaulted Amount is an amount of interest or Variable Return (as the case may be).
(c) Currency of account and payment. The currency of account and for any sum due from the Issuer hereunder is the Kenya Shilling.
(d) Interpretation of principal. Any reference in these Conditions to Principal in respect of the Notes shall be deemed to include, as
applicable any premium and any other amounts, excluding interest, which may be payable by the Issuer under or in respect of the
Notes.
9.1. Redemption and Purchases
9.1.1. Redemption at Maturity Unlesspreviouslyredeemedorpurchasedandcancelledasspecifiedbelow,eachNotewillberedeemedbytheIssueratitsFinalDue
Amount on the Maturity Date.
9.1.2. Redemption at the option of the Issuer 9.1.2.1. The Issuer may upon giving not less than thirty (30) and not more than sixty (60) days’ prior notice in writing to the
Noteholders and the Trustee (the “Early Redemption Notice”) in accordance with Condition 15 (Notices) redeem all or some of the Notes outstanding;
9.1.2.2. The Early Redemption Notice shall specify the date on which the redemption is to be effected which date shall be an Interest Repayment or Principal Repayment Day; then and upon expiration of such notice, the Issuer shall redeem such Notes.
9.1.2.3. If the Issuer redeemsonly someof theSeniorUnsecuredFixedRateNotes, thepartial redemptionshallbeofanaggregate principal amount of not less than Kes 1,000,000,000 (Kenya Shillings one billion) and integral multiple of Kes 100,000,000 (Kenya Shillings one hundred million).
9.1.2.4. SeniorUnsecuredFixedRateNotesmayonly be redeemed after the third anniversary of their issuance and at apremiumof1%(onepercent).
9.1.2.5.SeniorUnsecuredEquityLinkedNoteswill beeligible for early redemption, inwhich case theFinalNAVwill becalculated based on the most recent audited financial statements (being not more than six (6) months old).

Information Memorandum
Senior Unsecured Fixed Rate Notes and Senior Unsecured Equity Linked Notes
56
9.1.3. Purchases The Issuer may at any time purchase Notes and/or the Variable Return at any price in the open market or otherwise, subject to any
approvals required. In the event of the Issuer purchasing Notes and/or the Variable Return, such Notes and/or the Variable Return (as the case may be) may be held or resold, or at the discretion of the Issuer, cancelled. All Notes and/or Variable Return which are redeemed or purchased by or on behalf of the Issuer may be cancelled by giving notice to that effect to the Registrar, the Fiscal Agent and the CDSC.
9.2. General
All Notes and/or Variable Return, which are redeemed and surrendered for cancellation will forthwith be cancelled and all Notes so
cancelled shall be forwarded to the Fiscal Agent and cannot be reissued or resold.
10. Financial Covenants
10.1. Financial definitions
In this Condition:
“Borrowings” means, at any time, the aggregate outstanding principal, capital or nominal amount (and any fixed or minimum premium
payable on prepayment or redemption) of any indebtedness of members of the Group for or in respect of:(a) moneys borrowed and debit balances at banks or other financial institutions;(b) any acceptances under any acceptance credit or bill discount facility (or dematerialised equivalent);(c) any note purchase facility or the issue of bonds (but not trade instruments), notes, debentures, loan stock or any similar instrument;(d) any Finance Lease;(e) receivables sold or discounted (other than any receivables to the extent they are sold on a non-recourse basis);(f) any counter-indemnity obligation in respect of a guarantee, bond, standby or documentary letter of credit or any other instrument
(but not, in any case, trade instruments) issued by a bank or financial institution in respect of (i) an underlying liability of an entity which is not a subsidiary of Centum which liability would fall within one of the other paragraphs of this definition or (ii) any liabilities of any subsidiary of Centum relating to any post-retirement benefit scheme;
(g) any amount raised by the issue of shares which are redeemable (other than at the option of Centum) before the Maturity Date or are otherwise classified as borrowings under IFRS;
(h) any amount of any liability under an advance or deferred purchase agreement if (i) one of the primary reasons behind the entry into the agreement is to raise finance or to finance the acquisition or construction of the asset or service in question or (ii) the agreement is in respect of the supply of assets or services and payment is due more than one hundred and eighty (180) days after the date of supply;
(i) any amount raised under any other transaction (including any forward sale or purchase agreement, sale and sale back or sale and leaseback agreement) having the commercial effect of a borrowing or otherwise classified as borrowings under IFRS; and
(j) (without double counting) the amount of any liability in respect of any guarantee or indemnity for any of the items referred to in
paragraphs (a) to (i) above.
“Cash” means, at any time, cash in hand or at bank and (in the latter case) credited to an account in the name of Centum and to which Centum is alone beneficially entitled and for so long as:(a) that cash is repayable on demand;(b) repayment of that cash is not contingent on the prior discharge of any other indebtedness of any member of the Group or of any
other person whatsoever or on the satisfaction of any other condition;(c) there is no security over that cash (except for any security for any Borrowings) constituted by a netting or set-off arrangement
entered into by members of the Group in the ordinary course of their individual banking arrangements; and
(d) the cash is freely and immediately available to be applied in repayment or prepayment of the Notes.
“Cash Equivalent Investments” means at any time any investment made by Centum in the ordinary course of business in such securities
or other instruments as Centum considers prudent.
(a) certificates of deposit maturing within one year after the relevant date of calculation;(b) any investment in marketable debt obligations issued or guaranteed by the Government of Kenya, or any other country where our
investments are domiciled or by an instrumentality or agency of any of them having an equivalent credit rating, maturing within one year after the relevant date of calculation and not convertible or exchangeable to any other security;
(c) commercial paper not convertible or exchangeable to any other security:i. for which a recognised trading market exists;ii. issued by an issuer incorporated in Kenya, Mauritius, Tanzania or any other country where its investment could be domiciled;
andiii. which matures within one year after the relevant date of calculation.
(d) in each case, to which Centum is alone beneficially entitled at that time and which is not issued or guaranteed by any subsidiary of
Centum or subject to any security.

Information Memorandum 57
Senior Unsecured Fixed Rate Notes and Senior Unsecured Equity Linked Notes
“Consolidated Net Finance Charges” means, for any Relevant Period, the aggregate amount of the accrued interest, commission, fees,
discounts, prepayment penalties or premiums and other finance payments in respect of Borrowings whether paid, payable or capitalised
by Centum in respect of that Relevant Period:
(a) including the interest element of leasing and hire purchase payments;(b) deducting any accrued interest owing to any subsidiary on any deposit or bank account.
“Consolidated Total Net Debt” means, at any time, the aggregate amount of all obligations of Centum for or in respect of Borrowings but:(a) including, in the case of Finance Leases, only the capitalised value therefore;(b) deducting the aggregate amount of freely available cash at bank and Cash Equivalent Investments held by any member of the Group
as permitted hereunder at such time and in relation to which there are no impediments (contractual or otherwise) to the ability of
a member of the Group to pay such cash at bank or the proceeds of Cash Equivalent Investments to any Company, and so that no
amount shall be included or excluded more than once.
“Internally generated funds or “IGF” means cash inflows from, dividend, interest, rent, other investment income and proceeds on
investment disposals net of operating expenses.
“Equity” means the Fair Value of the Issuer.
“Finance Lease” means any lease or hire purchase contract which would, in accordance with the IFRS, be treated as a finance or capital
lease.
“Relevant Period” means each period of twelve (12) calendar months.
10.2. Financial conditions
Centum shall ensure that:
(a) Interest coverage: The ratio of internally generated funds to finance charges in any Relevant Period is equal to or more than 1.5:1;
(b) Net debt to Equity Cover: The ratio of Consolidated Total Net Debt to Equity in respect of any Relevant Period shall not exceed 1:2.
Below is a historical representation of the Issuer’s relevant ratios:
Kes. M 2010 2011 2012 2013 2014 HY2015
Debt Service Coverage 34.61 13.81 27.43 6.3 5.58 6.9
Net Debt to Equity - 16% 5% 20% 23% 19%
10.3. Financial testing
The financial covenants set out in Condition 10 (Financial condition) shall be calculated in accordance with IFRS and tested by reference
to each of the financial statements provided that the first testing date shall occur on or after the first anniversary of the Commencement
Date.
11. Taxation
The Issuer (or the Fiscal Agent, as the case may be) will deduct withholding tax at the prescribed rate on all interest payments to
Noteholders other than any Noteholder who (a) is exempt from such deduction under the provisions of the Income Tax Act (Chapter 470
of the Laws of Kenya) and (b) has provided evidence of such exemption to the reasonable satisfaction of the Issuer.
12. Prescription
The Notes and the Variable Return will become void unless a claim is made for payment within a period of six (6) years in the case of
principal or the Variable Return (as the case be) and six (6) years in the case of interest after the Relevant Date (as defined below).
As used herein, the “Relevant Date” means the date on which such payment first becomes due, except that, if the full amount of the
moneys payable has not been duly received by the Fiscal Agent on or prior to such due date, it means the date on which, the full amount
of such moneys having been so received, notice to that effect is duly given to the Holders in accordance with Condition 15 (Notices).

Information Memorandum
Senior Unsecured Fixed Rate Notes and Senior Unsecured Equity Linked Notes
58
13. Default
13.1 Events of Default
UnlessasresultoftheoccurrenceofaForceMajeureEvent,eachoftheeventssetoutbelowisanEventofDefault:
(a) Non-payment: Centum fails to pay any amount due in respect of all the Notes or some of the Notes or the Variable Return on the
Due Date for payment and such default continues for a period of seven (7) Business Days unless:
(i) the failure to pay is caused by administrative or technical error;
(ii) payment is made within three (3) Business Days thereafter; or
(iii) the failure to pay is in order to comply with any Applicable Laws or order of any court of competent jurisdiction or in case
of doubt as to the validity or applicability of any such law, regulation or order, in accordance with advice as to such validity or
acceptability given at any time during such period by independent advisers acceptable to the Fiscal Agent; or
(b) Breach of other obligations: Centum defaults in the performance or observance of any of its other covenants and obligations under
the Note Documents and (except where such default is incapable of remedy) such default continues for a period of sixty (60)
Business Days following service of a notice by the Note Trustee requiring the same to be remedied; or
(c) Misrepresentation: any representation, warranty or statement made or repeated in, or in connection with the Agency Agreement
or in any accounts, certificate, statement, opinion or the Information Memorandum delivered by or on behalf of Centum or in
connection with the Notes or the Note Documents is incorrect to a material extent when made or deemed to be repeated; or
(d) Cross-default: any present or future indebtedness of Centum in connection with moneys borrowed or raised exceeding in aggregate
Kes.500,000,000/= (Kenya Shillings five hundred million) (or its equivalent):
i) Is not satisfied when due, or at the end of any originally applicable grace period; or
ii) Becomes prematurely payable following delivery of an Enforcement Notice by the Note Trustee to Centum, as the case may
be, as a result of a default by Centum except to the extent in any instance that the existence or enforceability of the relevant
obligation is being disputed in good faith by it by appropriate proceedings; or
iii) Any encumbrance over any assets of Centum or any Subsidiary of Centum becomes enforceable; or
(e) Insolvency: an Insolvency Event occurs in respect of Centum; or
(f) Winding up: a petition is presented or an application is made (which is not challenged by Centum within thirty (30) days of such
petition or application) in respect of or any order is made or a resolution is passed for or any notice is issued to convene a meeting
for the purpose of passing such resolution for the winding up or dissolution of Centum; or
(g) Compositions: Centum stops payment or becomes unable to pay its debts within the meaning of Section 220 of the Companies Act
or any steps are taken with a view to proposing, under any enactment or otherwise, any kind of composition, scheme of arrangement,
compromise or arrangement involving Centum and its creditors generally, or any class of them; or
(h) Appointment of receivers and managers: an encumbrancer takes possession or exercises or purports to exercise any power of sale
or if a receiver or liquidator is appointed by any court or by any other person over the property and assets of Centum; or
(i) Legal process: a lawful distress, sequestration, execution or attachment either by virtue of any court order, decree or process or
otherwisehowsoeverforasumequaltoorexceedingthe20%(twentypercent)oftheTotalAssetsofCentumisleviedorenforced
upon or issued against any part of the property and assets of Centum and which shall not be removed or discharged within sixty (60)
days of it being so levied; or
(j) Cessation of business: Centum ceases, or threatens to cease, to carry on all or a substantial part of its business or sells or threatens
to sell or otherwise disposes of or shall threaten to sell or dispose of all or a material part of its assets (other than in the normal
course of trading it being acknowledged and agreed that Centum’s business entails the acquisition and disposal, inter alia, shares,
equity, undertakings and businesses and such activities will not therefore constitute an Event of Default) whether by one or a series
of transactions related or not or changes the mode of conduct of its trading in any respect so that its ability to meet its obligations
under and in respect of the Notes is materially affected; or
(k) Authorisation: any authorisation, approval, consent, license, exemption, filing, registration or notarization or other requirement
necessary to enable Centum to comply with any of its obligations under the Note Documents or to carry on business as presently
carried on is modified (to the extent that its ability to meet its obligations under and in respect of the Notes is materially affected),
revoked or withheld or does not remain in full force and effect and Centum is unable to obtain the same within fourteen (14) days
of such modification; revocation or extinction; or

Information Memorandum 59
Senior Unsecured Fixed Rate Notes and Senior Unsecured Equity Linked Notes
(l) Unlawfulness:atanytimeitisunlawfulforCentumtoperformanyoftheirrespectiveobligationsundertheAgencyAgreement;or
(m) Material adverse change: any other event or series of events whether related or not, including, without limitation, any material
adversechangeinthebusiness,assetsorfinancialconditionofCentuminanamountequaltoorexceeding20%(twentypercent)
of the Total Assets of Centum, occurs that, in the opinion of the Fiscal Agent (such Fiscal Agent being so instructed pursuant to an
Extraordinary Resolution), may affect the ability or willingness of Centum to comply with all or any of its obligations under the Note
Documents.
13.2 Acceleration
In the case of any such event as is mentioned in Condition 13.1 (Events of Default), and at any time thereafter if any such event shall then
be continuing, the Note Trustee shall if so directed by an Extraordinary Resolution, issue an Enforcement Notice to Centum declaring
that any outstanding Notes are immediately due and payable, whereupon the same shall become immediately due and payable together
with all interest accrued thereon and all other amounts payable under the Note Documents.
13.3 Rectification
The right to declare Notes due terminates if the situation giving cause to it has been cured or is otherwise no longer continuing before
such right is exercised and any notice or demand issued by the Fiscal Agent in accordance with this Condition 13 (Default) shall be of
no effect.
14. Agents
The names of the Note Trustee, Fiscal Agent and Registrar and its initial Specified Office are set out below.
Table 8: Note Trustee, Fiscal Agent and Registrar
Party Name of Party Specified Office of Party
Note Trustee Ropat Trust Company Limited Ropat Trust Company Limited
Kenya Re Towers
off Ragati Road
P.O. Box 1243-00100
Nairobi, Kenya
Tel: +254 20 2723322
Fax: +254 20 2723474
Contact Person: Patrick Gacheru
Email: [email protected]
Fiscal Agent Custody and Registrars Services Limited Custody and Registrars Services Limited
6th Floor, Bruce House, Standard Street
P.O. Box 8484-00100
Nairobi, Kenya
Tel : +254 20 2230518
Fax: +254 20 2211773
Contact Person: Kerry-Anne Makatiani
Email :[email protected]
Registrar Custody and Registrars Services Limited Custody and Registrars Services Limited
6th Floor, Bruce House, Standard Street
P.O. Box 8484-00100
Nairobi, Kenya
Tel : +254 20 2230518
Fax: +254 20 2211773
Contact Person: Kerry-Anne Makatiani
Email :[email protected]
Information Memorandum
Senior Unsecured Fixed Rate Notes and Senior Unsecured Equity Linked Notes
60
The Issuer is entitled to amend or terminate the appointment of the Fiscal Agent or the Registrar and to appoint another fiscal agent or
registrar provided that it will at all times while any Note is outstanding maintain a fiscal agent and a registrar having a Specified Office
in Nairobi.
Any variation, termination or appointment shall only take effect (other than in the case of insolvency, when it shall be of immediate
effect) after not less than thirty (30) nor more than forty five (45) days’ prior notice thereof shall have been given to the Holders in
accordance with Condition 15 (Notices).
In acting under the Agency Agreement and in connection with the Notes, each of the Agents is acting solely as agent of the Issuer and does
not assume any obligation toward or relationship of agency or trust for or with any Holder or the owner of any interest therein.
The Trust Deed states the manner in which the appointment of Note Trustee may be amended or terminated.
15. Notices
Notices to the Holders will be deemed to be validly given if made by fax, delivered to them, or sent by registered mail or (if posted to
an overseas address) by airmail to them, or electronic mail, or posted on the Issuer’s official website or published in a newspaper with
national circulation and:
i. in the case of any communication made by fax, will be deemed to have been validly given when dispatched with a fax transmission
report showing that the entire communication was received by the intended recipient in legible form at its fax number as recorded
on the Register (to be confirmed by letter but failure to send or receive the letter of confirmation shall not invalidate the original
communication);
ii. in any other case, will be deemed to have been validly given when such communication or document is left with or, as the case may
be, ten (10) days after its being posted to the intended recipient at its address as recorded on the Register;
iii. in case of electronic transmission , the notice will be deemed to have been validly given when such electronic communication is sent
to the intended Holder;
iv. in case of a notice posted on the Issuer’s official website, the notice will be deemed to have been validly given when such notice is
so posted; or
v. in case of a notice published in a newspaper, the notice shall be deemed to have been validly given on the date of publication of the
newspaper, provided that a communication or document which is received after 5:00 p.m. on a Business Day, or on a day which is
not a full Business Day, in the place of receipt shall be deemed to be delivered on the next full Business Day in that place.
Notices given by any Holders shall be in writing and given by lodging the same with the Fiscal Agent.
16. Meetings of Noteholders; Modifications and Waiver
The Trust Deed and the Agency Agreement contain provisions for convening meetings of the Noteholders to consider any matter
affecting their interests, including, without limitation, the sanctioning by Extraordinary Resolution of a modification of the Notes or
certainprovisionsoftheTrustDeed.SuchameetingmaybeconvenedbytheIssuerorNoteholdersholdingnotlessthan20%(twenty
per cent) in nominal amount of the Notes for the time being remaining outstanding. The quorum at any such meeting for passing an
ExtraordinaryResolutionisoneormorepersonsholdingorrepresentingmorethanfifty(50%)innominalamountoftheNotesforthe
time being outstanding, or at any adjourned meeting one or more persons being or representing Noteholders whatever the nominal
amount of the Notes so held or represented, except that at any meeting the business of which includes the modification of certain
provisions of the Notes (including modifying the date of maturity of the Notes or any date for payment of interest or principal thereof,
reducing or cancelling the amount of principal or the rate of interest payable in respect of the Notes or altering the currency of payment
of the Notes), the necessary quorum for passing an Extraordinary Resolution will be one or more persons holding or representing not
less than three-quarters in nominal amount of the Notes for the time being outstanding, or at any adjourned such meeting one or more
persons holding or representing a clear majority in nominal amount of the Notes for the time being outstanding. An Extraordinary
Resolution passed at any meeting of the Noteholders must be carried by a majority of not less than three-quarters present and entitled to
vote and, if so carried, shall be binding on all the Noteholders, whether or not they are present at the meeting, and whether or not they
vote in favour. A Noteholder may appoint a proxy or representative in accordance with the provisions of the Trust Deed. The quorum for
passing any resolution (other than an Extraordinary Resolution) at a meeting of Noteholders shall be any two or more Noteholders (not
being the Issuer or any Representative of the Issuer) present in person or by proxy or representative and representing in the aggregate
more than one third of the aggregate Principal Amount of the Notes for the time being outstanding. Such resolution shall be decided by
a majority of votes of the Noteholders present and entitled to vote.

Information Memorandum 61
Senior Unsecured Fixed Rate Notes and Senior Unsecured Equity Linked Notes
The Note Trustee and the Issuer may agree, without the consent of the Noteholders, to:
i. any modification (except as mentioned above) of the Agency Agreement which is not prejudicial to the interests of the Noteholders;
or
ii. any modification of the Notes or the Agency Agreement, which is of a formal, minor or technical nature or is made to correct a
manifest error to comply with mandatory provisions of Kenyan law; or
iii. listing of the Notes on the NSE.
Any such modifications shall be binding on the Noteholders and any such modification shall be notified to the Noteholders in accordance
with the Trust Deed as soon as practicable.
17. Governing Law
The Notes, the Trust Deed and the Agency Agreement shall be governed by, and construed in accordance with, the laws of Kenya.
18. Jurisdiction
The Issuer hereby agrees, for the benefit of the Holders, (i) that any suit action or proceedings (together referred to as “Proceedings”)
arising out of or in connection with the Notes, Variable Returns or the Agency Agreement may be brought before any competent court
in the Republic of Kenya and irrevocably submits to the jurisdiction of such court; (ii) agrees that a judgment in any such Proceedings
brought in any such court shall be conclusive and binding upon it and may be enforced in the courts of any other jurisdiction; (iii) hereby
agrees that nothing contained in this condition shall limit the rights of any Holder to take Proceedings against the Issuer in any other court
of competent jurisdiction, nor shall be taking of Proceedings in one or more jurisdiction preclude the taking of proceedings in any other
jurisdiction, whether concurrently or not.
Service of any writ, judgment or other notice of legal process shall be received by the Issuer at its office in Nairobi, presently at International
House, 5th Floor, Nairobi, Kenya.
Nothing in this Condition 18 shall affect the right of any Holder to serve any writ, judgment or other notice of legal process in any manner
permitted by Applicable Law and the Issuer hereby consents to service being effected in any such manner, whether by mail or otherwise.
To the extent that the Issuer may in any jurisdiction claim for itself or its assets immunity (to the extent that such immunity may now or
hereafter exist, whether on the ground of sovereign immunity or otherwise) from suit, execution, attachment (whether in aid of execution,
before judgment or otherwise) or other legal process (whether through service or notice or otherwise), and to the extent that in any such
jurisdiction there may be attributed to itself or its assets such indemnity (whether or not claimed), the Issuer irrevocably agrees for the
benefit of the Holders not to claim, and irrevocably waives, such immunity to the full extent permitted by the laws of such jurisdiction.

Information Memorandum
Senior Unsecured Fixed Rate Notes and Senior Unsecured Equity Linked Notes
62
11. KEY INVESTMENT CONSIDERATIONS
The investment considerations below do not constitute a guarantee neither are they indicative of future returns. Potential investors are advised to
consult with their investment, legal and tax advisers to determine the suitability of an investment in the Notes, and the appropriate amount, if any,
of an investment of this nature
11.1 Business Model
Centum’s business model is to create investment grade opportunities of scale that will attract investment at significant return to initial
capital. Centum is currently focusing its development activities in several key sectors: (i) financial services, (ii) fast moving consumer
goods (FMCG), (iii) real estate and (iv) power (v) agriculture, (vi) education, (vii) healthcare and (viii) ICT.
The proceeds from the bond issue will be applied to funding these early stage opportunities and are expected to deliver significant value
to Centum at the growth phase (as illustrated below) especially given the increase in competition for the few investment grade assets
available in the region.
As a developer and promoter, Centum realizes early-stage value by creating investment-grade opportunities for down-stream investors
as illustrated in the chart below.

Information Memorandum 63
Senior Unsecured Fixed Rate Notes and Senior Unsecured Equity Linked Notes
Centum funds these opportunities during development phase with the aim to invite financial investors after de-risking projects. The
projects funding cycle is illustrated in the chart below:
11.2 Track Record of Consistent Performance and long term growth
In the period from April 2009 to 31 December 2014, we have delivered consistent performance and growth:
1. Duringtheperiod,wedeliveredanannualizedreturnof30%againstNSE20shareindexperformanceof11%,representinga19%
outperformance.

Information Memorandum
Senior Unsecured Fixed Rate Notes and Senior Unsecured Equity Linked Notes
64
2. The value of Centum’s portfolio grew by Kes 27.8 Billion from Kes 9 Billion in March 2010 to Kes 36.8 Billion in December 2014.
Total assets under management (including third party funds) stood at Kes 176Billion in December 2014, representing a 19.5 times
growth since March 2010. This is illustrated in the charts below:
Assets under Management Portfolio Value
Source: Company reports
Centum’sNetAssetValuegrewby357%fromKes.5.9BillioninApril2009toKes.26BillioninDecember2014.Thisrepresents
growthoratarateof30%compoundedannually.MarketvalueofshareholderfundsgrewfromKes.5.6BillioninApril2009toKes.
40.6BillioninDecember2014representing625%growthinvaluegeneratedtoshareholders.
Net Asset Value Growth
Source: Company reports
11.3 Unutilised debt carrying capacity
Centumhasarelativelylowlevelofgearing,withdebttoshareholderfundsratioat15%asat31March2015asshownbelow:
Kes. M 2010 2011 2012 2013 2014 2015
Net Debt (Total debt less cash) - 1,988 678 2,647 4,649 3,763
Gearing 16% 5% 20% 23% 15%
WiththecurrentdebtissueofKes.6billionbeingfullysubscribed,thelevelofgearingwillincreaseto31%,whichisstillrelativelylowandwithinCentum’sexistingdebtcovenantsofaceilinggearingratioof50%.
The level of gearing at Centum excludes debt at subsidiary company level. At subsidiary level, project specific funding at no recourse to Centum is procured. Therefore, the value at risk for Centum in relation to the debt at subsidiary levels in limited to the extent of Centum’s equity investment in the respective subsidiary.
Kes
. Bil
lio
n
36.8

Information Memorandum 65
Senior Unsecured Fixed Rate Notes and Senior Unsecured Equity Linked Notes
11.4 Strong cash flows
Centum has strong cash flows from dividend, interest and exits from its portfolio of assets. The table below highlights the cash generated from operations over the last six years. With our dual focus on cash return and investment value appreciation, Centum is set to maintain healthy cash flows into the future.
Kes. M 2010 2011 2012 2013 2014 Dec 2014
Operating inflows 1,722 2,349 6,619 2,547 4,146 4,112
Operating outflows (199) (305) (309) (380) (463) (565)
Cash from Operations 1,523 2,044 6,310 2,167 3,683 3,547
Interest paid 44 148 230 344 660 391
Debt service coverage 34.61 13.81 27.43 6.30 5.58 9.07
Aminimalaverageof14%ofourcashinflowsgoestowardsservicingofoperatingexpensesatCentumInvestmentCompanyLimited.This therefore means that the bulk of cashflows generated from operations by Centum are available to service additional debt as well as repay our current Kes 4.2Bn bond in 2017.
Over the period, Centum has maintained debt service coverage way above the bond covenant of 1.5 times.
Centum is rated for credit quality by the Global Credit Rating Company (GCR). Centum received an initial rating of A- in 2012. The Company’s current rating is A for both short term and long term credit quality, well above the minimum investment grade rating.
Diversified income streamsThe diversified nature of Centum’s portfolio helps diversify risks associated with liquidity. Centum’s investments in marketable securities were valued at Kes. 4.2Bn as at 31st December 2014. Centum expects to maintain its investments in marketable securities at approximately10-15%oftotalassetsforthemediumterm.
Forecast debt service capacity Given current cashflows from operations and an assumption of no growth, Centum will still be in a position to adequately service the additional Kes.6 billion debt. This is illustrated below.
Assuming that cash from operations is at the focused Kes 3.2 Bn and an additional annual debt service of approximately Kes 800 million
from the bond raise, the debt service coverage will be 2.0 times which is within the bond covenant target.
Kes. M 2015E 2016E
Cash from Operations 8,352 2,706
Interest paid 730 1,344
Debt service coverage 11.44 2.01
Minimum debt service coverage ratio 1.5 1.5
11.5 A well-Diversified Investment Portfolio
In its 48 year history, Centum has diversified its portfolio into different industries to help manage sector specific volatility and give its stakeholders market beating returns. In addition, through a well-managed sector diversification strategy, Centum has given its stakeholders access to a wide range of economic sectors helping to broaden participation in the economy as well as minimize the impact of market fluctuations on their portfolio returns.
As at 31 December 2014, Centum’s portfolio of Kes 36.8 billion was invested across several sectors as summarized below:-

Information Memorandum
Senior Unsecured Fixed Rate Notes and Senior Unsecured Equity Linked Notes
66
Source: Company reports
In line with its Pan African Vision , Centum continues to diversify geographically giving its stakeholders access to other geographical
markets as well as manage overall macro-economic risks. The company presently has a presence in 12 countries as summarized below:-
Egypt
Morroco
Kenya
Tanzania
Zambia
NigeriaUganda
Ivory CoastGhana
Zimbabwe
Botswana
Current Exposure
TheaboveapproachhasgivenCentumkeypresenceoutsidetheKenyanmarket.Presentlyover19%ofitsportfolioisheldoutsideKenya
representing assets in excess of Kes 5.3 billion. This has given investors access to opportunities in fast growing markets while insulating
them against the impact of country specific fluctuations.
11.6 Strong Corporate Governance
Centum’s success is anchored on the practice of world class corporate governance. The Company’s Board of Directors is committed to
ensuring that the business is run in a professional, transparent, just and equitable manner so as to protect and enhance shareholder value
whilst satisfying the interests of all other stakeholders. The principles and standards established by the Board have been developed with
close reference to guidelines on corporate governance issued by the Centre for Corporate Governance, the Capital Markets Authority for
publicly listed companies in Kenya, the Central Bank of Kenya for the banking industry and other best practices. The Board members
have a broad range of skills, expertise and experience and each brings independent judgment and valuable contribution to the business.
Centum’s success is founded on a team of young, professional and highly experienced individuals. Centum has endeavored to preserve its
entrepreneurial culture through a relatively flat organization culture that enables deliberate yet quick decision making. Centum intends
to organize itself around projects at hand rather than traditional corporate charts.

Information Memorandum 67
Senior Unsecured Fixed Rate Notes and Senior Unsecured Equity Linked Notes
The company has won the following Awards in the recent past from, inter alia, the Champions of Governance (COG) Awards by the
Institute of Certified Public Secretaries of Kenya and the Financial Reporting Excellence (FIRE) Awards by the Institute of Certified
Public Secretaries of Kenya:
In addition, Centum Group CEO, Mr James Mworia served on the Capital Market’s Steering Committee on Corporate Governance that
drafted the Kenya Corporate Governance Blue Print.
11.7 Strong Brand Name
Founded in 1967 as ICDC Investment Company Limited, Centum has grown to be one of the largest5 investment companies in East
Africa.ItislistedontheNairobiSecuritiesExchange(NSE)andcrosslistedontheUgandaSecuritiesExchange(USE).Itpresentlyhas
over36,000shareholdersspreadallovertheworldandisoneofthemostrecognizablebrands,withover93%oftheshareholdersspread
over East Africa.
Its investments are in leading companies in Africa in its quest to become Africa’s foremost investment channel. Centum is Kenya’s biggest
publicly traded investment company. It has over the years availed a quality diversified pool of assets to institutional investors, which they
would otherwise not have.
Recently,CentumwasabletoattractaUS$70millioninvestmentinitsTwoRiversprojectfromaChinesecorporationandUS$5million
from a local corporation. This investment was significant not only for Centum, but also for the country, as it is one of the foreign direct
investments (FDI) by a Chinese corporation into a private sector led enterprise. For Centum, the investment further confirmed the
company’s ability to create investment-grade assets that attract considerable investment from local and foreign sources.
5BloombergBusiness, “Centum of Kenya in Talks on Healthcare, Education Ventures”
http://www.bloomberg.com/news/articles/2014-11-26/centum-of-kenya-in-talks-on-healthcare-education-partnerships

Information Memorandum
Senior Unsecured Fixed Rate Notes and Senior Unsecured Equity Linked Notes
68
12. ECONOMIC OVERVIEW
12.1 Kenya Macro - Economic Overview
Selected Macro Economic Indicators
The table below summarizes the key macroeconomic indicators in Kenya:
Indicators 2011 2012 2013 2014 2015F
GDP(Currentprices)–USD‘Billions 34.3 40.7 45.1 51.8 59.2
Real GDP Growth 4.4% 4.6% 5.7% 5.7% 6.9%
Inflation 14.0% 9.6% 5.7% 6.9% 5.0%
Population 42.0 mn 43.2mn 44.2mn 45.3mn 46.4mn
Source: Kenya National Bureau of Statistics, IMF World Outlook Database
**KenyarebaseditsGDPfiguresin2014leadinganincreaseof25.3%
Economic Outlook
In2014,Kenya’seconomicgrowthimprovedsignificantlywithGrossDomesticProduct(GDP)growthestimatedat5.7%.Thisgrowth
has greatly been supported by infrastructure developments. According to the Kenya budget policy document 2015, Kenya’s GDP is
projectedtogrowby6.9%in2015andby7.0%overthemediumterm.Thisrobustbroadbasedgrowthwillbeunderpinnedbyimproved
performance in the agricultural, manufacturing, construction, retail, financial and insurance industries.
The main impediment to economic growth in the recent past have been the upsurge of security risks associated with terrorism attacks
which has adversely affected the output from Kenya’s Tourism industry. Other factors that may impede expected growth are drought and
the continuous fiscal expansion.
Kenya Annual GDP Growth
Source: World Bank and Kenya Budget Policy Document

Information Memorandum 69
Senior Unsecured Fixed Rate Notes and Senior Unsecured Equity Linked Notes
Inflation
Overall inflation remained largely stable through 2014 on the back of prudent monetary policies by CBK. In January 2014, inflation
stoodat7.2%risingtoayearhighof8.2%inAugustandclosingtheyearat6.0%.
Kenya Overall Inflation
Source: Kenya National Bureau of Statistics
Overallinflationdeclinedto5.5%inJanuaryandmarginallyincreasedto5.6%inFebruaryof2015.Theincreasewasaresultofincrease
infoodprices.However,inflationisrelativelylowandwellwithintheCBKmediumtermtargetofbetween2.5%and7.5%.Thelow
inflation comes on the back of low global oil prices.
Going forward, the main risk to the inflation outlook is the expected drought in some parts of the country which may result in a decline in
agricultural output prompting food imports. However, low fuel prices occasioned by the global decline in the price of crude oil is expected
to maintain downward pressure on the rate of inflation.
Interest Rates
All through 2014 and in Quarter 1 of 2015, the short term interest rates generally remained stable. This has been occasioned by high
liquidityaswellasgeneralconvergenceoftheshorttermratesinlinewiththeCentralBankRate(CBR)whichhasbeenretainedat8.5%
sinceMay2013.InthefirstweekofJanuary,the91dayT-bill,182dayT-billand364dayT-billrateswereat8.5%,10.2%and10.7%
respectivelyandclosedtheweekending18thMarch2015at8.5%,10.3%and10.6%respectively.
Interest Rates
Source: Kenya National Bureau of Statistics
Theaveragelendingratein2014was16.5%,theaverageoverdraftratewas15.5%andtheaveragedepositratewas6.6%.Asofendof
January2015theaveragedepositratewas6.5%andlendingratewas15.9%.

Information Memorandum
Senior Unsecured Fixed Rate Notes and Senior Unsecured Equity Linked Notes
70
Exchange Rates
The Kenya shilling exchange rate remained stable against major world currencies all through 2014 supported by increased remittances
from the Diaspora, IMF disbursements under the Extended Credit Facility programme and the Central Bank’s activities in the Foreign
Exchange markets.
Exchange Rates
Source: Central Bank of Kenya
Although stable, the Kenya Shilling exchange rate has demonstrated mixed performance against major international currencies through
Q1 of 2015.The Kenya shilling appreciated against both the Sterling pound and Euro to trade at Kes 137.05 and 96.77 on 12th March
2015 from Kes 141.00 and Kes 109.39 respectively in January 2015. Against the dollar, the Kenya shilling depreciated to trade at Kes
91.72 on 12th March 2015 from Kes 90.70 in January 2015.
12.2 Uganda Macro - Economic Overview
ThetablebelowsummarizesthekeymacroeconomicindicatorsinUganda
Indicators 2011 2012 2013 2014F 2015F
GDP(CurrentPrices)–USD‘Billions 18.1 21.1 23.05 25.6 27.2
Real GDP Growth 5.9% 2.8% 4.7% 6.0% 6.6%
Inflation 18.7% 14.2% 5.5% 4.3% 5.4%
Population - millions 32.9 34.1 35.4 36.6** 37.6
Source:IMFWorldEconomicOutlook,October2014,UgandaBureauofStatistics.
**actual population count in 2014 returned a figure of 34.9 million.
UgandaEconomicOutlook
TheUgandaeconomysawtheconsolidationofmacroeconomicstabilityandacontinued,albeitmodestrecoveryofeconomicactivities.
Thecountry’sGrossDomesticProduct(GDP)isestimatedtohavegrownat6.0%in2014onthebackofafiscalandmonetarypolicy
stance focused on containing inflationary pressures, while ensuring debt and exchange rate stability.
Theforecastfor2015ispositivewithGDPgrowthexpectedtobearound6.6%onthebackofsteadilyimprovingeconomicconditions.
However,theongoingconflictinSouthSudan(oneofUganda’skeytradepartners)isexpectedtonegativelyimpactexports.
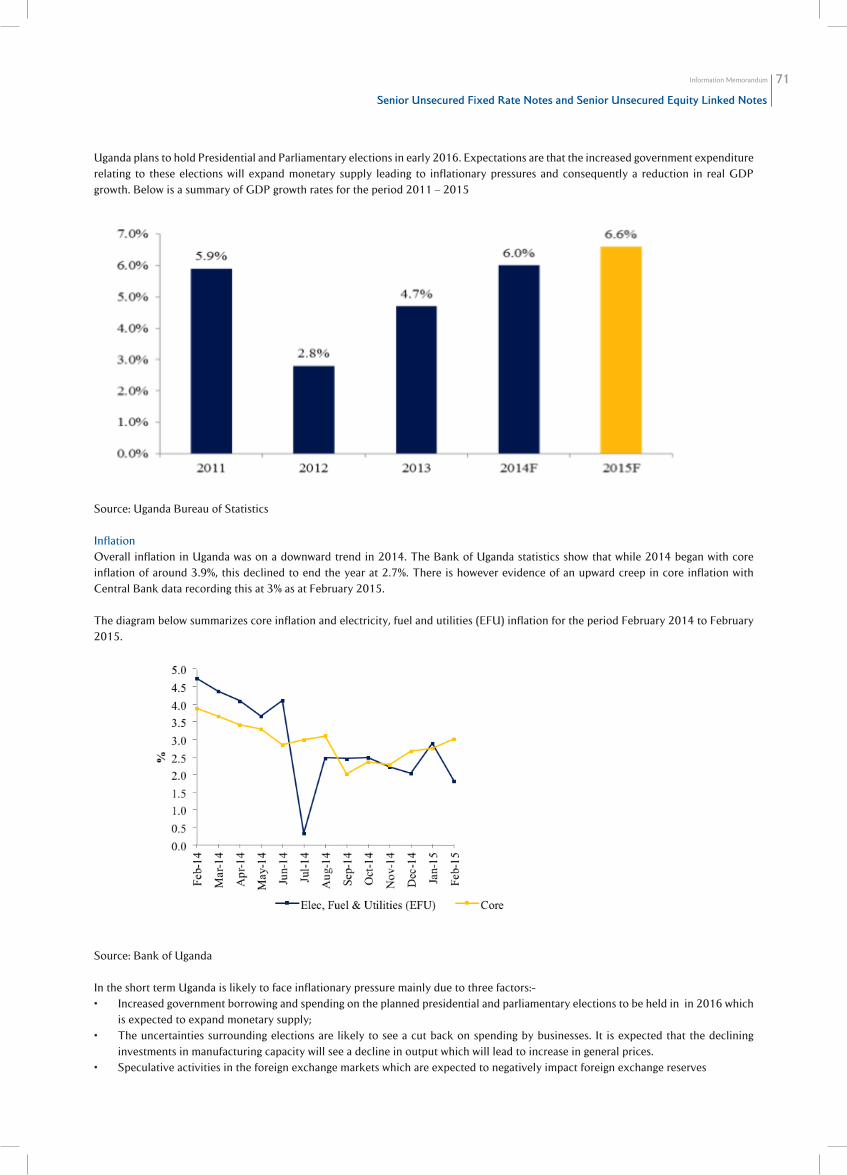
Information Memorandum 71
Senior Unsecured Fixed Rate Notes and Senior Unsecured Equity Linked Notes
UgandaplanstoholdPresidentialandParliamentaryelectionsinearly2016.Expectationsarethattheincreasedgovernmentexpenditure
relating to these elections will expand monetary supply leading to inflationary pressures and consequently a reduction in real GDP
growth. Below is a summary of GDP growth rates for the period 2011 – 2015
Source:UgandaBureauofStatistics
Inflation
OverallinflationinUgandawasonadownwardtrendin2014.TheBankofUgandastatisticsshowthatwhile2014beganwithcore
inflationofaround3.9%,thisdeclinedtoendtheyearat2.7%.Thereishoweverevidenceofanupwardcreepincoreinflationwith
CentralBankdatarecordingthisat3%asatFebruary2015.
Thediagrambelowsummarizescoreinflationandelectricity,fuelandutilities(EFU)inflationfortheperiodFebruary2014toFebruary
2015.
Source:BankofUganda
IntheshorttermUgandaislikelytofaceinflationarypressuremainlyduetothreefactors:-
• Increasedgovernmentborrowingandspendingontheplannedpresidentialandparliamentaryelectionstobeheldinin2016which
is expected to expand monetary supply;
• Theuncertaintiessurroundingelectionsarelikelytoseeacutbackonspendingbybusinesses. It isexpectedthatthedeclining
investments in manufacturing capacity will see a decline in output which will lead to increase in general prices.
• Speculativeactivitiesintheforeignexchangemarketswhichareexpectedtonegativelyimpactforeignexchangereserves

Information Memorandum
Senior Unsecured Fixed Rate Notes and Senior Unsecured Equity Linked Notes
72
Interest Rates
TheinterestrateenvironmentinUgandaremainedlargelystablein2014againstabackgroundofincreasingmarketliquidity.TheCentral
BankRate(CBR)begantheyearat11.5%butwascutto11%inJune2014whereithasremainedsince.TheTreasurybillrateshowever
showed modest increase as shown below:-
Source:BankofUganda
AStandardCharteredBankreportforecastsanincreaseintheCentralBankRatetoaround13%levelsduetoexpectedinflationary
pressure in 2015. The inflationary pressure is expected to arise out of increased government borrowing and expenditure on election
relatedactivities.ThisisinturnexpectedtofurtherincreaseUganda’straditionallyhighlendingrates.

Information Memorandum 73
Senior Unsecured Fixed Rate Notes and Senior Unsecured Equity Linked Notes
13. INDUSTRY OVERVIEW
13.1 Power Sector
Selected Macro Economic Indicators
13.1.1 Overview of the East African Power Sector
The East African governments have been actively addressing the energy problem in the region, which until recently, severely constrained
economic development. Several new projects have been initiated with the aim of increasing the region’s electricity production. In 2011,
Ethiopia’s prime minister announced that the country was working towards increasing its renewable energy output five-fold within the
next five years. State-owned Ethiopian Electric Power Corporation (EEPCo) recently announced a revised 25-yearpower-sector strategy,
aiming to boost power generating capacity to 37,000MW by 2037. A substantial amount is intended to be surplus power earmarked
for export mainly to East African countries. The vast natural resources and favourable climate could place Ethiopia at the centre of an
emerging electricity network across the region, driven largely by renewable energy.
Construction of the Lake Turkana Wind Power project in Kenya started in the first quarter of 2014. The project had been delayed for
years due to funding concerns, but it finally reached financial close in 2014. If the construction timeline is adhered to as planned, the
first 50MW of power could be generated by the first quarter of 2016, and the ramp-up to full capacity of 300MW by Q4 2016. When
completed, Lake Turkana could be the largest wind power project in Africa.
The Tanzanian government recently released a document emphasising that the domestic market will be prioritised over the export market
with regard to gas supply, and as a result, all liquefied natural gas (LNG) and other processing facilities will be located onshore. The
government also plans to facilitate the establishment of industrial parks where natural gas will be utilised. Additionally, Tanzania plans
to start exporting power in 2015 to neighbouring countries. Completion of a new gas pipeline should double the country’s electricity
generating capacity to about 3,000MW.
TheEastAfricanPowerPool aims toconnect thepowergridsof at least10countries, includingEthiopia,Kenya,Rwanda,Uganda,
Burundi, Tanzania, the DRC, Sudan, Libya and Egypt. It may also extend to northern and southern Africa.
13.1.2 Power Sector in Kenya
13.1.2.1 Structure of the Power Sector
The power sector in Kenya has been undergoing restructuring and reform since the mid-1990s, culminating with the Energy Act 2006.
UndertheEnergyAct,theMinistryofEnergyisresponsibleforformulationofpoliciesthroughwhichitprovidesanenablingenvironment
to all operators and other stakeholders in the energy sector.
As a result of the Energy Act, the Energy Regulatory Commission (ERC) was established in 2007 as an autonomous, independent energy
sector regulator with powers to formulate licensing procedures, issue licenses and permits, make recommendations on regulation (to be
implemented by the Minister of Energy), formulate, enforce and review environmental, health, safety and quality codes and standards,
set, review and adjust electricity tariffs, approve power purchase and network service contracts, investigate complaints between parties,
protect stakeholders interests and prepare an indicative national energy plan. On recent Independent Power Producers (IPPs), the ERC
has also issued a comfort letter to assist with the requirements of project finance lenders.
KenGenistheanelectricalpowergenerationcompanyinKenya,supplyingthecountrywithabout80%ofitselectricity.KenGenisa
publicly listed company and is majority-owned by the Government. KenGen provides electricity from numerous energy resources, such
as hydropower, wind, geothermal and thermal.
KPLC is a publicly listed company that transmits, distributes and retails electricity to customers throughout Kenya. KPLC is also
responsible for ensuring that there is adequate line capacity to maintain power supply and quality over the Kenyan electricity network,
covering approximately 41,486 km.

Information Memorandum
Senior Unsecured Fixed Rate Notes and Senior Unsecured Equity Linked Notes
74
Kenya Electricity Transmission Company (KETRACO) is the Kenyan national grid operator and its main business is to plan, design, build,
operate and maintain new electricity transmission lines and associated substations.
GeothermalDevelopmentCompanyLimited(GDC)isa100%stateownedspecialpurposecompanysetuptofast-trackthedevelopment
ofgeothermalresources.PartofitsmandateistoenhancegeothermalexplorationinKenya.GDChasa10-yearUS$2.6billionexploration
plan which will involve drilling 566 wells and locating 2,336MW of geothermal energy. These potential energy reserves have been located
in14“high-potential”areasandestimatesoftheirvaluearearoundUS$30billion.WhilsttheGDChasthismandateof“exploration”,it
also tenders contracts for IPPs, such as a recent expression of interest regarding the development of a power plant to process 400MW of
reserves in the Menengai field and an open tender for an 800MW geothermal plant at Bogoria- Silai. GDC will harness steam discovered
and this will be sold on to IPPs who will construct power plants to process it.
13.1.2.2 Power Generation & Supply
The Kenyan electricity market is structured as a single buyer market with KPLC, the transmission and distribution utility, buying
electricity from all generators on the basis of negotiated Power Purchase Agreements (PPAs) for onward transmission, distribution and
retail to consumers. Kenya’s energy generation market is rather liberalised, with several IPPs contributing to the national grid, a collective
installed capacity of 507MW and KenGen as the dominant market player with an installed capacity of 1,268MW.
Power generation mix
Sources Installed Capacity (MW) %Share
Hydro 797.5 44.9%
Thermal 587.5 33.1%
Geothermal 348.0 19.6%
Co-generation 21.5 1.2%
Wind 5.1 0.3%
Isolated Grid 15.0 0.8%
Total 1,774.6 100.0%
Source: KPLC 2014 Annual Report
The Ministry of Energy and Petroleum is focused on deregulating both the supply and demand in the power value chain to create a
more competitive market in the future. The Kenya government has set forth its “Vision 2030,” a programme to transform Kenya into an
industrialised middle-income country. However, Kenya has less than 2,000MW of generation capacity to serve its population of over 44
million. Kenya aims to increase generation capacity to 5,000MW by 2017 and by 15,000MW by 2030. While these are aggressive targets,
the Kenya government is focused on achieving this through:
• Sustainingastableinvestmentclimateforprivatesectorparticipationinthesector;
• Developingexpandedtransmissionanddistributionnetworkstodeliverpowertocustomers;
• Maintainingacreditworthyoff-takerinthecountry’stransmissionanddistributionutility–KPLC;
• Continuingtoenforcecost-reflectivetariffs;and
• Reducinginefficiencyinthesectortosupportmoreaffordableend-usertariffs
The planned capacity expansion drive will be largely met through the exploitation of clean energy resources such as geothermal, wind and
biomass in the medium to long-term. The country possesses over 10,000MW of undeveloped geothermal energy resources found in fields
situated in the country’s Great Rift Valley. Geothermal Development Company Ltd (GDC) intends to exploit these untapped resources
for base load power generation. If the government’s targets are realised, Kenya’s power sector is set to undergo a dramatic change in the
energy mix by 2030, with non-hydro renewables set to overtake hydro power as the dominant source of electricity.
Centum is in the process of building a 140MW geothermal power plant in Olkaria, Naivasha as part of the company’s move into the
energy sector.

Information Memorandum 75
Senior Unsecured Fixed Rate Notes and Senior Unsecured Equity Linked Notes
Projected power generation mix (2014-2017)
Source: KPLC 2014 Annual Report, MoEP
Over-dependence on hydro power generation has resulted in supply disruptions during periods of drought, with costly oil-fired sources
being used to boost output. As a result, the government aims to introduce coal, as well as gas-fired capacity, into the power generation
mix.
In 2014, the Kenya government invited bids for the construction of a 1,050MW coal power plant in Lamu County which was won by a
consortium led by Centum on a Build-Own-Operate model. Other players in the consortium included Gulf Energy and Sichuan Electric
Power Design and Consulting Company Limited (SEDC).
The government’s Vision 2030 strategy also stipulates the development of nuclear energy as a viable means of providing the much-
needed reliable and affordable electricity.
To date, over 4,000MW of projects are in progress, with most of these expected to be completed by 2016.
40 Month Government 5000+ MW Strategy (Start date: 2013)
Time in months 6 12 18 24 30 36 40 Total (MW)
Hydro 24 - - - - - - 24
Thermal 87 163 - - - - - 250
Geothermal 90 176 190 50 205 150 785 1,646
Wind - - 20 60 300 250 - 630
Coal - - - - 1,050 - 960 2,010
Natural Gas - - - 700 350 - - 1,050
Co-generation - - 18 - - - - 18
Total 201 339 228 810 1,905 400 1,745
Cumulative additions (MW) 201 540 768 1,578 3.483 3,883 5,628
Source: KPLC 2014 Annual Report
Kenya’spowersupplyhasbeengrowingatCAGRof6%overthelast5yearsmainlydrivenbyincreasedinvestoractivityinthepower
sector with IPPs playing a pivotal role, particularly in the renewable power sub-sector. Much of the growth was catalysed by the reforms
in the Energy sector through the Energy Act, 2006 which among other changes included pre-negotiated pricing and procedures for
renewable energy projects.

Information Memorandum
Senior Unsecured Fixed Rate Notes and Senior Unsecured Equity Linked Notes
76
Power Supply (GWh)
Source: KPLC 2014 Annual Report, KNBS Economic Survey
13.1.2.3 Power Transmission
In light of the power generation plans of increasing power generation by approximately ten times in approximately 14-15 years, there
needs to be a corresponding increase in transmission and distribution infrastructure to ensure government’s objectives of increasing
electrification rates at affordable prices are to be realised. In line with its mandate, Kenyan Electricity Transmission Co. Ltd (KETRACO),
has identified for implementation on a priority basis, a total of 18 projects of 1,471km of 132KV lines, 645km of 220KV lines, 608km
of 400KV lines and 686km of 500KV HVDC lines to be implemented over the next 3-4 years. The Kenya government, jointly with the
Tanzania Government, will also undertake the implementation of the 330KV transmission line between Arusha (Tanzania) and Nairobi.
Funding for this already secured. Similarly, the Kenya government in conjunction with the Ethiopian government are in the advanced
stages of implementing the 1,070km power line that will export power from Ethiopia to Kenya. The World Bank and AfDB are expected
tolendUS$684millionandUS$338millionrespectivelytowardstheproject.
13.1.2.4 Power Demand
KPLC’s key mandate is to plan for sufficient electricity generation and transmission capacity to meet demand; building and maintaining
the power distribution and transmission network and retailing of electricity to its customers. The company is currently on an expansion
programmetoextendpowerconnectivitytothemajorityofKenyanswithagoalofconnecting70%ofKenyansby2020fromthecurrent
32%.Theyhaveconnectedmorecustomersinthelast5years,thantheyhadsinceindependencewithpowerconnectionshavinggrown
byCAGRof16%since2010.
Customers connected to the grid
Source: KPLC 2014 Annual Report, KNBS Economic Survey
PowerdemandcontinuestogrowsteadilyatCAGR6%-slightlyhigherthanannualGDPgrowth-exertingpressureonpowerproducers
to ensure there is adequate increase of power supply to meet the increasing demand.
Power demand
Source: KPLC 2014 Annual Report, KNBS Economic Survey

Information Memorandum 77
Senior Unsecured Fixed Rate Notes and Senior Unsecured Equity Linked Notes
Projected power demand to the year 2030
Source: KenGen, MoEP
Nairobi remains the largest consumerofpowerby regiondue to itshugeurbanpopulationaccounting forover50%of totalpower
consumed. With devolution however, this share is expected to decrease as economic activities in the counties increase and as KPLC and
Rural Electrification Authority (REA) extend the national power grid to the rural areas.
Power consumption by region
Source: KPLC 2014 Annual Report, KNBS Economic Survey

Information Memorandum
Senior Unsecured Fixed Rate Notes and Senior Unsecured Equity Linked Notes
78
13.2 Fast Moving Consumer Goods (FMCG) Sector
13.2.1 About FMCG
FMCG are quick to package, move and sell. They include toiletries, processed food stuffs and alcohol. FMCG is a low profit margin, high
volume industry. Given their fast-paced, traceable nature, they are an excellent litmus test for assessing the state of many other variables
in the markets including transport, trade and consumer sentiment. FMCG trends allow economists to track the rise of the emerging
consumer class on the African continent, and the consumer price index (CPI) is a largely accepted statistical gauge of inflation.
Africa’sconsumer-facingindustriesareexpectedtogrowbymorethan$400millionby2020.Theeconomicgrowthacceleratedinthe
years following 2000, making it the world’s second fastest growing region after emerging Asia and equal to the Middle East. Resources
contributedlessthanathirdoftotalGDPgrowthinthe2000s,while45%ofgrowthcamefromconsumer-facingorpartiallyconsumer-
facing sectors. The African market opportunity is concentrated, with 10 of 53 countries (Algeria, Angola, Egypt, Ghana, Kenya, Morocco,
Nigeria,SouthAfrica,SudanandTunisia)accountingfor81%ofAfrica’sprivateconsumptionin20111 .
According to McKinsey & Co. GDP per capita is the single most important driver of global growth in the consumption of fast-moving
consumergoods,accountingforanaverageofaround73%oftotalgrowthacross60productcategories.Whiletheinfluenceofother
factors, such as education and local customs, varies between categories, GDP per capita dominates how much money people spend in
Africa because most markets are in the early stages of development.
The graph below shows the expected consumer spending growth in selected African countries:
Source: Euromonitor Africa Consumer Spending
As a result, Africa presents a solid opportunity for producers and retailers of FMCG but requires strategies tailored and executed market-
by-market to account for different rates of economic growth and local consumer needs and preferences. In addition, speed is very
important. Companies that can quickly establish a foothold or expand their presence will be well positioned to capture the value at stake
as the continent’s consumers increase their spending in the years to come2.
13.2.2 Key Drivers of FMCG in Africa
13.2.2.1 Market Size
FMCG retailers generally operate in a low-margin environment. As a result, the existence of a large market is crucial to the success of
these companies. Despite Africa having a population of around one billion, the continent remains relatively under-served by FMCG
companies3.
1Ventures Africa
2McKinsey & Company
3KPMG Africa

Information Memorandum 79
Senior Unsecured Fixed Rate Notes and Senior Unsecured Equity Linked Notes
The graphs below show the 10 African countries with the largest population sizes in 2013 and 20304:
Source:UnitedNationsPopulationDivision
Nigeria’s estimated population size in 2013 was roughly equal to the sum of the next two most populated nations on the continent,
Ethiopia and Egypt. On the forecast, the top two countries remain unchanged, although Nigeria is forecast to widen the gap with
Ethiopia due to the former’s fertility rate, which is projected to decline at a slower pace. For the same reason, the DRC is expected to
surpass Egypt in population numbers while Tanzania is expected to rise above South Africa, which is expected to fall from the fifth to
theeighthposition.KenyaandUgandaarealsoexpectedtomoveuptherankingsduetohighpopulationgrowthrates.
13.2.2.2 Urbanization
TheUNforecaststhatSSA’surbanizationratewillreach45.9%by2030and56.7%by2050fromjust36.3%in2010.The
urbanization rate of East Africa is much lower than the rest of SSA. In 2010, East Africa’s urbanization rate was almost 17 percentage
points lower than the second least urbanized region on the continent, namely the Francophone. East Africa’s low level of urbanization
can be ascribed to the substantial importance of subsistence agriculture in most of these countries. Central and West Africa are
expected to have higher urbanization levels than North Africa by 20255.
13.2.2.3 Market Concentration
FMCG retailers need a steady flow of consumers purchasing their products on a daily basis, so they have to operate in a local market
with a large enough size. In 2010, there were 50 urban agglomerations in Africa with a population of one million or more, of which
threehadapopulationoffivemillionormore.By2025,theUNexpectstheretobe93agglomerationsinAfricaofatleastonemillion,
of which 12 are forecast to have a population of five million or more.
13.2.2.4 Distribution Channels
It is important for FMCG to have predictable and trustworthy distribution channels, as such related industries like agricultural and
manufacturing sectors are key. This is also why many retailers opt for vertical integration, and this is particularly relevant for African
countries, where distribution channels are generally weak. The strength of local agriculture and manufacturing, the quality of transport
infrastructure, and the scope and extent of tariffs on imported goods are crucial issues in FMCG sectors.
International FMCG companies in the region commonly use one of the following two ways to distribute their products:
• DistributionthroughImporters: In this model, FMCG companies send their shipments to importers who, in turn, sell them to
distributors or wholesalers. FMCG companies play an inactive role and do not participate in any operational activities within the
destination country. All the marketing and distribution-related activities are undertaken by importers, based on mutual agreement
with FMCG companies. FMCG companies select this distribution model to minimize their risks, make short-term gains, or
understand the market and gauge market response for their products before making significant investments.
• Distributionthrough“Key”Distributors:In this model FMCG companies distribute their products to wholesalers or retailers
through one or several “key” distributors. FMCG companies play an active role in this model. They are involved in marketing,
consumer research and distribution coverage. FMCG companies opt for this model when they want to invest and develop a market
from a long-term perspective6.
4United Nations Population Division
5KPMG Africa
7Arthur D Little, FMCG Opportunities and Challenges in Africa

Information Memorandum
Senior Unsecured Fixed Rate Notes and Senior Unsecured Equity Linked Notes
80
13.2.2.5 Spending Power
Since FMCG retailers generally sell products that can be classified as necessities, income per person is a less important consideration
than for retailers of luxury or durable products. The trend in income levels is however still important in order to establish what types
of FMCG products can be offered to a specific market. In addition, over time, retailers would want to benefit from shifts in consumer
spending patterns as they move up the income chain, so a high growth market is still preferable.
Thegraphbelowillustratesthat184.8millionAfricanshaddailypercapitaexpenditureofbetweenUS$2andUS$4in2010,while
77.9millionspentbetweenUS$4andUS$107.
Source: AfDB
13.2.2.6 Buying Habits
Since FMCGs are generally similar within categories, retailers have to compete on the basis of price. In a market with fierce
competition, margins are squeezed to their minimum levels and the least efficient companies are pushed out of business. However,
companies that can convince consumers to purchase their brand name rather than that of a competitor can maintain market share
without necessarily having to offer lower prices. Key strategies in this regard are loyalty programmes, enhancing the shopping
experience, advertising, promotions, offering products in smaller packages to make them more affordable and adapting to local needs.
Convincing a consumer that your product is somehow superior to that of a competitor offering a similar product is crucial in ensuring
long-term success in a given market. A well-known example is Coca-Cola vs. PepsiCo soft drinks: the products taste similar and fulfill
the same need, but consumers generally have a very clear preference for one or the other.
13.2.2.7 FMCG Industry in Kenya
Kenyahasatotalpopulationofapproximately44million,andthemiddleclassisapproximately45%.Kenyahasatotalfoodand
beverageconsumptionofapproximatelyUS$11billionperannum,andexpectedGDPper-capitagrowthof3%(until2025).The
Kenyan FMCG market is similar to the Nigerian market in terms of consumer preferences and distribution network, except that modern
tradehasgrownfasterinKenyaduetothegrowthofthetourismsector.Moderntradecomprises10–15%oftotalretailsalesinKenya.
In addition, an increasing number of FMCG companies are setting up local manufacturing units to cater to the needs of local as well as
neighboring countries’ markets7.
13.2.2.8 Food
Kenya’s food retail sector is well developed in an African context. Foreign retailers are yet to break into the market with four local
players(Nakumatt,Tuskys,Uchumi,andNaivas)dominatingthescene.Nakumatthasthebiggestmarketshare,althoughTuskyshasa
largernumberofbranches.StoresofthesecompaniesarealsoveryprevalentinotherEastAfricancountries,especiallyUganda.
In January 2014, it was revealed that Nakumatt was looking to buy three of Shoprite’s stores in Tanzania, where Kenyan retailers still
have only a limited presence. Kenyan retailers are expected to increase the range of their product offerings over the outlook period in
7AfDB
8Arthur D Little, FMCG Opportunities and Challenges in Africa

Information Memorandum 81
Senior Unsecured Fixed Rate Notes and Senior Unsecured Equity Linked Notes
order to build market share. They will also be looking to expand further in the region, especially in countries where their presence is
still relatively limited such as Tanzania, Rwanda and South Sudan.
13.2.2.9 Beer
While still the dominant producer in Kenya, East African Breweries Limited (EABL, a subsidiary of Diageo) has seen competition
intensify in recent years from small local brewers and imports of international brands such as Heineken and SABMiller. Still, East
AfricanBreweriescontrolsaround90%oftheKenyanbeermarket,andcontinuestoexpandintotherestofEastAfrica.Aglanceatthe
company’ssubsidiariesactsasconfirmationofthis:KenyaBreweriesLimited,UgandaBreweriesLimited,SerengetiBreweriesLimited,
UnitedDistillerVentnor,CentralGlassIndustries,andEastAfricanMaltingLimited.EABLislistedontheNairobi,Uganda,andDar
es Salaam stock exchanges. The company has invested in new supply chain capacity, including a new canning line, in order to boost
production levels. East African Breweries has 26,000 local partners across the value chain, and sources 10,000 tonnes of sorghum in
Kenya (from only 400 tonnes four years ago), while two new varieties of high-yielding barley seed were recently launched9.
Although EABL clearly dominates, competition in Kenya’s beer industry has increased in recent years, as both macrobrewers and
microbrewers attempt to take advantage of naturally expanding markets. At the end of 2012, Keroche Breweries (Kenya’s only local
brewery)statedthatitplanstoraiseitsshareofthebeermarketinKenyato20%(fromaround3%then)intwoyears,andisincreasing
capacity to meet that target. This includes the construction of a brew house with an annual capacity of one million hectolitres, which is
expectedtobecompletedanestimatedcostofUS$29.4million.Apartfromboostingproductionofexistingbrands,thecompanyalso
plans to start producing other products that are not currently in its portfolio, such as stouts and non-alcoholic drinks. Keroche also
planstoexpandintoTanzania,Rwanda,andUgandaoverthemediumterm.
Centum through its subsidiary, King Beverage Limited, entered the Kenyan beer market in 2015 with the signing of a local distribution
contractwithDanishbrewer,Carlsberg.ThecontractalsogivesCentumdistributionrightsforCarlsbergproductsinUganda.
13.2.2.10 Soft Drinks
Kenya has a strong domestic soft drinks manufacturing sector. Soft drinks production increased notably during 2007 to 2009, rising by
anannualaverageof4.9%.Productionstagnatedsomewhatin2010,beforeincreasingby2.8%inthesubsequentyearandfallingagain
in 2012.
Data for 2013 indicates that production has once again increased. In fact, during the first 11 months of 2013, Kenya’s soft drinks
productionincreasedby19.1%year-on-year,whiledomesticsugarproductionroseby18.9%year-on-yearoverthesameperiod.Itis
estimated that Kenya’s soft drinks consumption increased from 306.8 million litres in 2007 to 350.7 million litres in 2011. Over this
period, per capita consumption of soft drinks rose from 8.13 litres per person per year to 8.35 litres. Per capita consumption of soft
drinks in Kenya is projected to reach 14 litres p.a. by 2030, and 30 litres by 2050.
13.2.2.11 Coca-Cola
Coca-Cola has dominated the soft drinks industry in Kenya for a number of years. Coca-Cola’s dominance may in fact have contributed
to the industry not growing at such robust levels as in some neighboring countries where there is more competition. Pepsi has tried to
re-enter the Kenyan market since 2010, and has quite a bit of lost ground to make up, having exited Kenya in the 1970s. Coca Cola has
six bottling plants in Kenya, and has been operating in the country for 65 years. Following Pepsi’s move, Coca Cola recently injected
someUS$50millionintoitsmanufacturingplantsinKenya.ConsumptionofCoca-Colaproductshasshownmoderategrowthinrecent
years, with per capita consumption of company beverage products (in units of 237 ml of a finished product) falling from 35 in 1992
to 31 in 2002, before increasing to 39 (approximately 9.2 litres) in 2012. In comparison, per capita consumption was 26 servings (6.2
litres) in Nigeria, 39 in China, and 87 (20.6 litres) in Morocco. According to Coca-Cola, it is facing rising competition from fruit juices
due to consumers becoming increasingly averse to carbonated drinks for health reasons. This also contributed to higher imports in
recent years, in turn forcing local carbonates manufacturers to cut production levels. In response, Coca-Cola recently launched its Coke
ZerobrandinKenya,aswellasitsMinuteMaidfruitjuice.Thecompanyalsocutitspricefora300mlsodafromKes25(US$0.3)
toKes23(US$0.27)inJune2012inordertoboostdemand.OtherplayersinKenya’sjuiceindustryincludeKevianKenyaandDel
Monte.
OneoftheCocaColabottlingcompaniesinKenyaisNairobiBottlersLimitedinwhichCentumhasa27.6%stake.Centumthroughits
subsidiary, Almasi Beverages Limited, also has interest in another coca-cola bottling company in Kenya. Almasi is a holding company
for 3 Coca Cola bottling companies:
• MountKenyaBottlersLimited
• RiftValleyBottlersLimited
• KisiiBottlersLimited
9A KPMG Africa
Information Memorandum
Senior Unsecured Fixed Rate Notes and Senior Unsecured Equity Linked Notes
82
13.3 Financial Services Sector
13.3.1 Kenya Banking Sector Overview
The banking sector comprised of 43 commercial banks, 1 mortgage finance company, 9 microfinance banks, 7 representative offices of
foreign banks, 94 foreign exchange bureaus, 7 money remittance providers and 2 credit reference bureaus as at 30th September 2014.
Banking industry structure
Source: Central Bank of Kenya
The Kenyan Banking Sector registered improved performance with the size of net assets standing at Kes 3.1 trillion, loans and advances
worth Kes 1.9 trillion, while the deposit base was Kes 2.3 trillion and profit before tax of Kes 104.5 billion as at 30th September 2014.
Over the same period, the number of bank customer deposit and loan accounts stood at 26.6 million and 4.0 millionrespectively.
13.3.2 Industry Performance
13.3.2.1 Asset base
The banking sector total assets stood at Kes 3.08 trillion as at September 2014. The major items on the balance sheet were loans and
advances,governmentsecuritiesandplacements,whichaccountedfor59.9%,20.5%and4.7%oftotalassetsrespectively.
13.3.2.2 Loans and Advances
The sector’s gross loans and advances grew from Kes 1.8 trillion in June 2014 to Kes1.9 trillion in September 2014, translating to a
growth of 7.3 percent. The growth was in 10 out of 11 sectors as shown in below. Tourism, Restaurants and Hotels sector registered a
decline due to higher repayments than the new loans granted during the period.
Lending to the different economic sectors as at 30 September 2014
Source: Central Bank of Kenya
Information Memorandum 83
Senior Unsecured Fixed Rate Notes and Senior Unsecured Equity Linked Notes
13.3.2.3 Deposit Liabilities
Depositswerethemajorsourceoffundingforthebankingsector,accountingfor73.1%oftotalfundingliabilities.Thedepositbase
increasedby4.7%fromKes2.2trillioninJune2014toKes2.3trillioninSeptember2014supportedbybranchexpansion,remittances
and receipts from exports. The increased use of alternative delivery channels of banking services such as agency banking model has
also contributed to increased deposits. The number of bank deposit accounts increased from 25.3 million in June 2014 to 26.6 million
inSeptember2014representingagrowthof1.3millionaccountsor5.1%
13.3.2.4 Capital and Reserves
ThebankingsectorregisteredenhancedcapitallevelsinSeptember2014withtotalcapitalincreasingby4.9%fromKes436.6billion
inJune2014toKes458.1billioninSeptember2014,whereasshareholders’fundsincreasedby6.4%fromKes459.4billioninJune
2014 to Kes 488.7 billion in September 2014. Similarly, the ratios of core and total capital to total risk-weighted assets increased from
15.0%and17.5%to15.1%and17.8%respectively.Theincreaseincapitaladequacyratiosisduetoahighergrowthincapitalbase
than the growth in total risk weighted assets during the period under review.
13.3.2.5 Assets Quality
Thestockofgrossnon-performingloans(NPLs)increasedby2.0%fromKes101.7billioninJune2014toKes103.7billionin
September2014.Thequalityofassets,measuredasaproportionofnetnon-performingloanstogrossloansimprovedfrom2.1%to
1.9%overthesameperiod.Similarly,theratioofgrossNPLstogrossloansdeclinedfrom5.7%inJune2014to5.4%inSeptember
2014. Moreover, banks have adopted enhanced appraisal standards to mitigate credit risk.
13.3.2.6 Profitability
Duringthe3rdquarterof2014,thesectorrecordedKes33.5billionpre-taxprofits,whichwasadecreaseof10.9%fromKes37.6
billion registered in the quarter ending June 2014. Total income stood at Kes 104.0 billion in the third quarter which was similar to
whatwasregisteredinthesecondquarterof2014.Thetotalexpensesincreasedby5.7%fromKes66.6billioninJune2014quarterto
Kes70.4billioninSeptember2014quarter.Onanannualbasis,theprofitabilityofthesectorincreasedby13.0%fromtheKes92.5
billion registered in September 2013 to Kes 104.5 billion in September 2014. Interest on loans and advances, fees and commissions
andgovernmentsecuritieswerethemajorsourcesofincomeaccountingfor59.2%,18.7%and15.1%oftotalincomerespectively.
Ontheotherhand,interestondeposits,staffcostsandotherexpenseswerethemaincomponentsofexpenses,accountingfor32.7%,
28.2%and24.1%respectively.
13.3.2.7 Liquidity of the Banking Sector
For the period ended 30th September 2014, average liquid assets stood at Kes 816.3billion while average liquid liabilities were worth
Kes2,180.9billion,resultingtoanaverageliquidityratioof37.4%,against38.7%registeredinJune2014,whichwaswellabovethe
minimumstatutorylimitof20.0%.
13.3.3 Challenges
13.3.3.1 Increased competition
Competition within the banking sector is becoming more aggressive both from conventional and non-conventional banking players.
Substitute products and services have emerged to a great extent in the banking industry mostly in the form of money transfer services
provided by mobile telephony companies. Consequently, this development is likely to revolutionize how the banking industry players
perform their financial intermediation services.
13.3.3.2 Money laundering
Persons who are engaged in criminal activities are seeking ways of concealing the origins of illegally generated funds. However the
government has come up with The Proceeds of Crime and Anti Money Laundering Act, 2009. The Act seeks to create a comprehensive
legislative framework to combat the offence of money laundering in Kenya and to provide for the identification, tracing, freezing,
seizure and confiscation of the proceeds of crime among other measures.
13.3.4 Opportunities
13.3.4.1 A growing SME market
The Small and Medium Enterprises (SMEs) in Kenya have developed considerably over the last ten years both in numbers and in
economic scale. This growth provides the banks with a perfect opportunity as a number of SMEs continually demand financial services.
13.3.4.2 Agency Banking
Agency Banking is a concept introduced to the banking sector by Central Bank of Kenya in 2010. This concept allows banks to offer
limited services through business outlets that are not banks and not necessarily financial services e.g. supermarkets, chemists etc. This
will enable banks to extend banking services to a wider population in areas where physical bank branches may not be viable.

Information Memorandum
Senior Unsecured Fixed Rate Notes and Senior Unsecured Equity Linked Notes
84
13.3.4.3 Technology
General technological advancement and stiff competition in the banking industry has led to major implementation of technology such
as internet banking and mobile banking applications. This has impacted positively on the industry, that is, transaction time as well as
better customer experience. Banks are increasingly using social media not only in advertising but also for receiving customer feedback.
13.3.4.4 Banking Sector Outlook
The banking sector is expected to maintain its growth momentum mainly driven by the rollout of full file credit information sharing,
regional in¬tegration initiatives, advances in information and communication tech¬nology and the introduction of the devolved
governance system in Kenya.
13.3.5 Overview of Kenya Insurance Industry
Data from the Insurance Industry regulator, the Insurance Regulatory Authority, indicates that as at December 2014, there were 49
insurance companies, 84 licensed insurance brokers and 22 Medical Insurance providers (MIPS). Other licensed insurance players
included 129 investigators, 96 motor assessors, 20 loss adjusters, 1 claims settling agent, 8 risk managers, 26 insurance surveyors and
more than 4,600 insurance agents.
13.3.6 Industry Performance
13.3.6.1 Industry Premiums
Theindustry’sinsurancepremiumsgrewby20.4%duringtheyear2014.TheannualpremiumsstoodatKes157.8billiongrowingfrom
Kes 131.0 billion. The premium income reported under life insurance business amounted to Kes 56.5 billion while general business
premiums were Kes 101.3 billion. The Kenyan insurance industry continues to be non-life business driven.
13.3.6.2 Claims experience and underwriting expenses
TheclaimsincurredundergeneralinsurancebusinesswereKes41.9billionbytheendof2014increasingby25.3%fromKes33.4
billion recorded in year 2013. Total policyholder benefits under life business amounted to Kes 17.0 billion during the same period. The
changeinclaimsexperiencewasconsistentwiththeindustrybusinessvolumeexpansion.Underwritingexpensesincludedbusiness
acquisition costs (commissions) and expenses of management. The commissions paid by the insurers during the year amounted to
Kes 9.3 billion compared to Kes 7.4 billion reported during the previous year. Management expenses amounted to Kes 30.4 billion
comparedtoKes24.4billionreportedin2013,anincreaseof24.8%.
13.3.6.3 Shareholder Funds
The increasing capitalization in the insurance industry saw common stock holders’ equity grow significantly during the year. As at 31st
December2014,theshareholders’fundsamountedtoKes122.5billionrepresentingagrowthof24.8%fromKes98.2billionasatthe
end of 2013.Stronger balance sheet position of insurance companies is likely to improve confidence in the industry with more capital
resources being available to cover losses.
13.3.6.4 Assets and Liabilities
TheinsuranceindustryassetbasewasKes426.3billionasat31stDecember2014.Thiswasagrowthof19.1%fromKes358.0billion
held as at the end of 2013. The liabilities amounted to Kes 303.8 during the same period.
13.3.6.5 Investments
The insurers held a total of Kes 352.4 billion of their assets in income generating investments as at the end of December 2014. These
hadgrownby19%duringthelasttwelvemonths.Theinvestmentsconstituted82.7%ofthetotalindustryassets.Theinvestments
underlifeinsurancebusinessamountedtoKes225.3billion(63.9%oftotalindustryinvestments)whilegeneralbusinessinvestments
wereKes127.1billion(36.1%oftotalinvestmentsfortheindustry).
13.3.7 Kenya Insurance Market Outlook
The Kenyan insurance industry’s attractiveness has been the reason for the recent entry of multinational insurance groups that are
acquiring local insurance firms to set up operations in the local market. Factors that are contributing to this interest include: the
increasing ease of doing business in Kenya, a growing middle class that is appreciating the need for insurance, and the emerging oil and
gas sector in the country.
Kenya is the focus of large scale Private Equity (PE) activity in East Africa, mostly on the back of improving infrastructure, a fairly
diversified economy compared to its regional peers, and steadily improving regulatory regime. Some notable funds operating in the
region include Centum Investments Company (formerly ICDC), which is listed on the Nairobi Securities Exchange, Catalyst Partners,
Fanisi Fund, Abraaj, Actis Fund, and Emerging Capital Partners (ECP).

Information Memorandum 85
Senior Unsecured Fixed Rate Notes and Senior Unsecured Equity Linked Notes
Kenyan companies have the most regional outlook, expanding their footprints in East Africa in sectors such as financial services, hotels,
airlines and agro business. Most of these companies look beyond being leaders in the Kenyan economy, but have broader ambitions
of tapping into new geographies to scale their products and services. This aggressive nature of Kenyan companies offers exciting
opportunities for PE firms.
Kenyaaccountedfor46%ofthetotalnumberofdealsinEasternAfricaand69%oftotalreportedvaluesin2013.Keytothiswasthe
Norway’sNorfundandAfricaInfrastructureInvestmentManager(AIIM)investmentofUS$60Mninequitytobuildawindpower
projectinKenyaworthUS$150Mn(US$90MnwillbefundedbydebtfromStandardBankGroup).
TanzaniahadthreedealsvaluedatUS$5min2013.TwolargedealswerecompletedbyCarlyleandStandardCharteredPE.Kenyan
investment firm TransCentury sold their entire stake in Tanzanian Chai Bora Ltd, a tea manufacturer, to Catalyst Principal Partners.
The deal value, however, was not disclosed.
Rwandasawasurprisingincreaseinnumberofdeals,withfivedealswithareportedvalueofUS$41.3m.Thesedealsmainlyinvolved
FusionCapital’sUS$34MninvestmentinarealestatedevelopmentprojectinKigaliandaUS$2MninvestmentinRusororo,astone
extractionminingcompany.AnotherdealwasFanisiCapital’sfirstinvestmentmadeoutsideKenya,US$2MninSopharLimited,a
pharmaceutical wholesaler.
13.3.8 Performance Overview
Kenyaaccountedfor46.0%ofthetotalnumberofdealsinEasternAfricaand69.0%ofthetotalreportedvalueassummarizedbelow:-
Sources: EMPEA
13.4 Recent Private Equity Transactions in East Africa
The table below summarizes recent PE transactions in East Africa:
No. Private Equity Fund Year Target Company Sector Region Value Deal
1 Centum 2014 K-rep Bank Financial Services Kenya O/S
2013 Almasi Beverages Food and beverage Kenya $5m
2 Pearl Capital Partners 2013 Freshco Kenya Ltd Agribusiness Kenya $600,000
2014 Eldoville Dairies Limited Food and beverage Kenya Kes 200m
2014 Meru Greens Horticulture Ltd Agribusiness Kenya Kes 210m
3 East Africa Capital Partners 2014 Wananchi Group Telecommunication Kenya n/a
4 Acumen 2014 MilikiAfya Health Kenya $600,000
2013 Sanergy Water Kenya n/a
5 Helios Investment Partners 2014 Wananchi Group Holdings Telecommunication East Africa $40.0m
6 Proparco 2014 Lake Turkana Wind Power
Project (LTWP)
Power and Energy Kenya Euros 50.0m
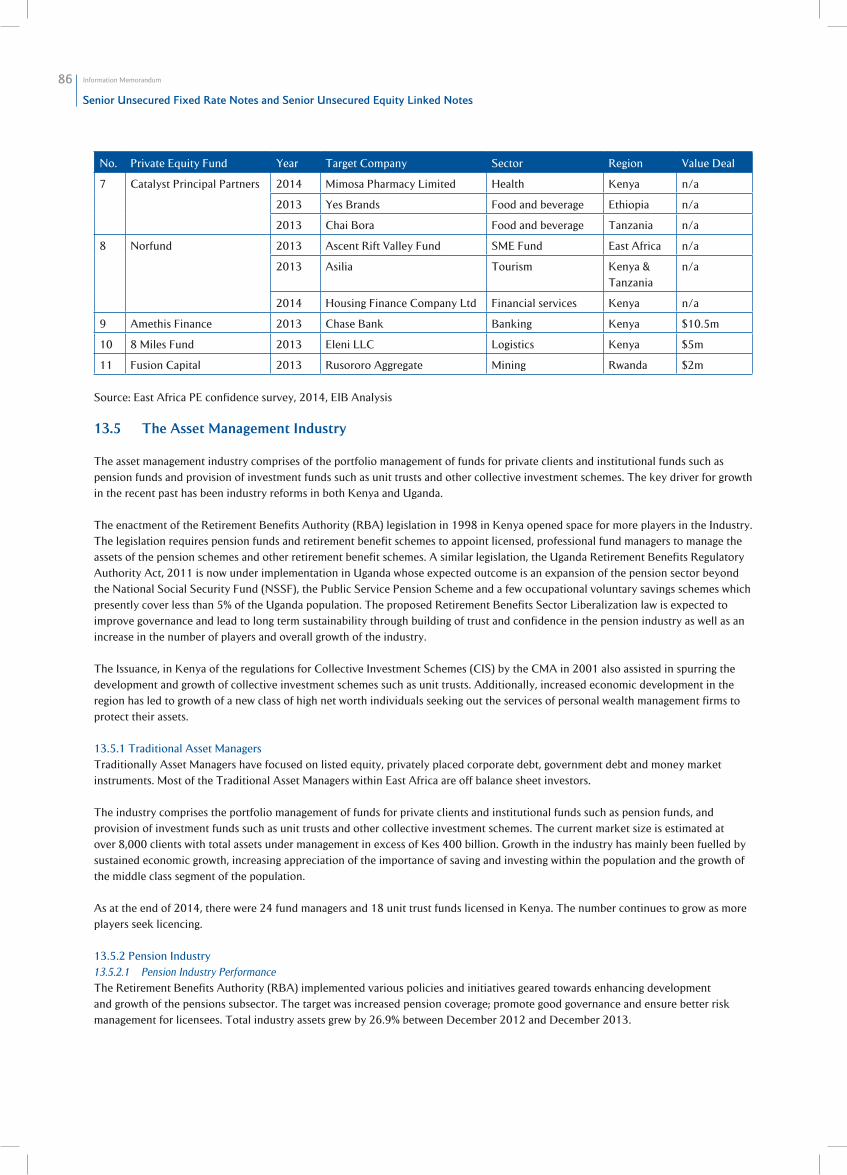
Information Memorandum
Senior Unsecured Fixed Rate Notes and Senior Unsecured Equity Linked Notes
86
No. Private Equity Fund Year Target Company Sector Region Value Deal
7 Catalyst Principal Partners 2014 Mimosa Pharmacy Limited Health Kenya n/a
2013 Yes Brands Food and beverage Ethiopia n/a
2013 Chai Bora Food and beverage Tanzania n/a
8 Norfund 2013 Ascent Rift Valley Fund SME Fund East Africa n/a
2013 Asilia Tourism Kenya &
Tanzania
n/a
2014 Housing Finance Company Ltd Financial services Kenya n/a
9 Amethis Finance 2013 Chase Bank Banking Kenya $10.5m
10 8 Miles Fund 2013 Eleni LLC Logistics Kenya $5m
11 Fusion Capital 2013 Rusororo Aggregate Mining Rwanda $2m
Source: East Africa PE confidence survey, 2014, EIB Analysis
13.5 The Asset Management Industry
The asset management industry comprises of the portfolio management of funds for private clients and institutional funds such as
pension funds and provision of investment funds such as unit trusts and other collective investment schemes. The key driver for growth
intherecentpasthasbeenindustryreformsinbothKenyaandUganda.
The enactment of the Retirement Benefits Authority (RBA) legislation in 1998 in Kenya opened space for more players in the Industry.
The legislation requires pension funds and retirement benefit schemes to appoint licensed, professional fund managers to manage the
assetsofthepensionschemesandotherretirementbenefitschemes.Asimilarlegislation,theUgandaRetirementBenefitsRegulatory
AuthorityAct,2011isnowunderimplementationinUgandawhoseexpectedoutcomeisanexpansionofthepensionsectorbeyond
the National Social Security Fund (NSSF), the Public Service Pension Scheme and a few occupational voluntary savings schemes which
presentlycoverlessthan5%oftheUgandapopulation.TheproposedRetirementBenefitsSectorLiberalizationlawisexpectedto
improve governance and lead to long term sustainability through building of trust and confidence in the pension industry as well as an
increase in the number of players and overall growth of the industry.
The Issuance, in Kenya of the regulations for Collective Investment Schemes (CIS) by the CMA in 2001 also assisted in spurring the
development and growth of collective investment schemes such as unit trusts. Additionally, increased economic development in the
region has led to growth of a new class of high net worth individuals seeking out the services of personal wealth management firms to
protect their assets.
13.5.1 Traditional Asset Managers
Traditionally Asset Managers have focused on listed equity, privately placed corporate debt, government debt and money market
instruments. Most of the Traditional Asset Managers within East Africa are off balance sheet investors.
The industry comprises the portfolio management of funds for private clients and institutional funds such as pension funds, and
provision of investment funds such as unit trusts and other collective investment schemes. The current market size is estimated at
over 8,000 clients with total assets under management in excess of Kes 400 billion. Growth in the industry has mainly been fuelled by
sustained economic growth, increasing appreciation of the importance of saving and investing within the population and the growth of
the middle class segment of the population.
As at the end of 2014, there were 24 fund managers and 18 unit trust funds licensed in Kenya. The number continues to grow as more
players seek licencing.
13.5.2 Pension Industry
13.5.2.1 Pension Industry Performance
The Retirement Benefits Authority (RBA) implemented various policies and initiatives geared towards enhancing development
and growth of the pensions subsector. The target was increased pension coverage; promote good governance and ensure better risk
managementforlicensees.Totalindustryassetsgrewby26.9%betweenDecember2012andDecember2013.

Information Memorandum 87
Senior Unsecured Fixed Rate Notes and Senior Unsecured Equity Linked Notes
Overall Industry Investment Portfolio (Kes, Billions)
Source: RBA
Actual assets grew from Kes 548.7 billion to Kes 696.7 billion in the between December 2012 and December 2013. Of the total fund
managers and insurance firms held Kes564.8 billion; National Social Security Fund (NSSF) internally administered Kes92.9 billion
and Kes39 billion of property investments directly managed by scheme trustees. In terms of portfolio allocations, fund managers
preferredGovernmentSecuritiesandQuotedSecurities,whichaccountedfor59.2%ofthetotalindustryassetsundermanagement.
Allassetclassesrecordedmarketgrowthexceptforthecashandpropertyassetclasseswhichregistereddivestitureof16.4%and1.2%,
respectively.
Allocation of Investment Assets (December 2013)
Source: RBA
13.5.3 Individual Retirement Benefits Schemes and Service Providers
Individual retirement benefits schemes membership grew steadily from 88,509 in December 2012 to 113,316 registered members in
December 2013. Total assets on the other hand grew from Kes 13.7 Billion to Kes 17.4 billion in the period under review. The growth
isattributedtothepublicawarenessundertakenbytheRBAandvariousserviceproviders.Forexample,theBlueMSME‘sJuaKali
retirement benefit scheme popularly known as - Mbao Pension Plan which caters mainly for the individuals in the informal sector grew
significantly, from 39,013 members in December 2012 to 50,057 members in December 2013. Its assets grew from Kes 39.8 million to
Kes 64.4 million during the period. Real Estate Industry

Information Memorandum
Senior Unsecured Fixed Rate Notes and Senior Unsecured Equity Linked Notes
88
13.6 Real Estate Industry in Africa
Africa’s growth over the last decade has, to a large extent, been driven by rising commodity prices. Most notably, the oil producing
nations of West Africa have benefitted greatly from soaring oil prices, while growth in Zambia has been boosted by its copper industry,
whichaccountsforaround75%ofthecountry’sexportearnings.However,thecommodityboomhasnotbeenthesoleengineof
Africa’s growth, and countries with fewer natural resources, such as Rwanda and Ethiopia, have also grown strongly in recent years.
Increased political stability, reduced trade barriers and improved governance have all been important factors aiding growth in many
countries.
TheInternationalMonetaryFundexpectsAfrica’sgrowthstorytocontinue,forecastingannualGDPgrowthof5-6%overthenextfive
years.Thisshouldnot,however,disguisethefactthatAfricastillonlyaccountsforabout4%ofglobalGDPandthatlivingstandards
remain low in much of the continent.
Forecasted GDP Growth Rates For East African Economies
Source: World Bank
The growing urbanisation of Africa has aided economic growth, by bringing large numbers of people close together, it helps to create
moreefficientlabourmarketsandbiggercustomerbases,andreducestransportcosts.AccordingtoUN-HABITATdata,theproportion
ofAfricanslivinginurbanareasgrewfrom32%in1990to40%in2010,andisexpectedtoriseto47%by2025.Manyofthelargest
cities in Africa are growing rapidly. Nairobi, Kinshasa and Dar es Salaam, for example, are expected to see population growth of over
70%by2025.Africa’smega-cities,whichincludeLagos,Cairo,LuandaandJohannesburg,areincreasinglytheenginesofitseconomic
growth.
ProportionofPopulationLivingInUrbanAreasinSSABy2050
Source:DepartmentofEconomicandSocialAffairs,UnitedNations
Africa’s city dwellers generally earn more and spend more than their rural counterparts, and the urban middle class is growing across
much of the continent. This is helping to create dynamic consumer markets and attracting overseas investors. A recent survey by
theEconomistIntelligenceUnitfoundthatinstitutionalinvestorsnowregardtheemergenceofAfrica’smiddleclassanditsgrowing
consumerism as the most attractive aspect of investing in Africa, rather than its commodities.
African retail markets are developing as the demand for consumer goods grows. In SSA, the most well developed and sophisticated
retail market by far is South Africa, with numerous large shopping centre across the country. Elsewhere, there are many countries where

Information Memorandum 89
Senior Unsecured Fixed Rate Notes and Senior Unsecured Equity Linked Notes
modern shopping malls are a relatively new phenomenon; The Palms in Lekki, Lagos, regarded as Nigeria’s first modern shopping
centre, was opened in 2006, while Accra Mall, the first of its type in Ghana, opened in 2008. Nairobi has also seen the development of
modern malls with the most notable one being the Westgate mall that was destroyed during a terrorist attack in September 2013.
Nigeria and Ghana, along with other SSA countries including Kenya, Angola and Zambia, have all seen additional shopping centres
either completed or commenced in recent years, although their scale is generally smaller than the mega-malls of South Africa and
Northern Africa. The construction of further, and larger, shopping centres can be expected, as developers seek to meet the demand for
high quality retail space from increased numbers of international retailers entering SSA markets and major South African chains such
as Shoprite and Pick n Pay pursuing expansion plans in the rest of Africa. Development activity is, however, likely to be concentrated
on the biggest and wealthiest cities. In smaller African cities and less well-off countries, small-scale local trading may continue to be the
dominant form of retail activity.
13.7 Real Estate Industry in Kenya
The real estate sector has remained vibrant and has lately been one of the key contributors to economic growth. With the introduction
of devolved governments as envisioned in the new constitution (The Constitution of Kenya, 2010), more opportunities for real estate
development as well as property values are likely to be on the rise in the medium term. Demand for land for the establishment of public
utilities and construction of housing units will also sustain increased property values.
Currently, Kenya’s annual housing deficit is estimated at 300,000 units. The country’s state run, National Housing Corporation (NHC),
estimates that the current urban housing needs are 150,000 units per year to cater for the backlog. However, it is estimated that the
currentproductionofnewhousinginurbanareasisonlyabout30,000unitsannually,ashortfallof80%.
13.7.1 Property Market Segment
13.7.1.1 Retail, Entertainment and Lifestyle market
The Kenyan retail market is diverse ranging from roadside shops to large world-class styled enclosed shopping malls. The improving
macroeconomic environment in Kenya has seen significant increase in suburban retail nodes supported by increasing consumer
spending and purchasing power.
The market has shown strong growth. New retail centers’ in the market include Galleria Mall and T-Mall (opened ±2010), Ridgeways
(2011), New Greenspan Mall (opened 2012), Thika Road Mall (2013). Furthermore, there is a host of upcoming retail malls namely:
Garden city mall (60,000 sq m), Karen (35,000 sq m), Rosslyn Riviera (13,000 sq m), Rosslyn Park (7,000sq m) and Two Rivers Mall
(82,000 sq m) currently under construction.
Kenya is set for a major retail boom with the entry of four global retail chains. Retailers such as Carrefour, Wal-Mart (represented by
its South African subsidiary, Massmart), Game Stores, Jet and Edgars plan to open retail outlets in Kenya while local formal retailers
Nakumatt,Tuskys,UchumiandNaivascontinuetoexpand.
13.7.1.2 Office market
The office market in Kenya has moved from a position of oversupply to one of stability over the last twelve months, as Nairobi
reinforces its position as the regional commercial hub of SSA. A significant proportion of the recent take-up has been due to large
corporates setting up regional headquarters in Nairobi, in preference to the traditional regional hub of Johannesburg, mainly because
of new routes opened up by Kenya Airways which enable direct flights to Central and West Africa and the increasing push to make
Nairobi both an aviation and financial hub.
The total effective demand is over 1.3 million sq ft. of office space and average effective demand of 8,000 sq ft. per requirement. In Q2
of2014markedadeclineinofficespacetakeupofGradeA&Bwitha6%dropinofficespaceabsorbedfromQ1.Themostnotable
declinewasexperiencedinNairobiUpperHillfinancialdistrictthatregistereda90%dropinQ2.Thiswasmainlyattributedtoongoing
road and infrastructure works.

Information Memorandum
Senior Unsecured Fixed Rate Notes and Senior Unsecured Equity Linked Notes
90
The table below summarizes the cost of office space in selected parts of Nairobi.
Location Avg. Prime Rental Rate per Sq Meter
Westlands $15
Upperhill $13
Kilimani $11
CBD $10
Source: Knight Frank, 2013
13.7.1.3 Residential market
The Kenyan residential market has seen significant growth over the past decade leading to a more than fourfold growth in the prices
of both land and houses. Increased demand and supply of residential units has been largely driven by economic growth, improving
purchasing power, access to mortgages, policy changes that have seen significant improvements in infrastructure and increased
remittances from diaspora.
According to the global real estate firm, Knight Frank, there is a discernible shift in demand from three and four bedroom apartments
to smaller units such as studio, one and two bedroom apartments. This is thought to be due to the former’s saturation in the market.
Market activity in the lower to middle price bracket remains positive.
13.7.1.4 Industrial market
Kenya has not traditionally experienced a high degree of speculative industrial development, with most occupiers tending to own
their property. However, this market is now beginning to emerge, particularly along the Mombasa Road in Nairobi. Rents are very low
and take-up is slow, so it will be some time before this becomes an established sector in Kenya’s property market. Some developers
are looking at purpose - built speculative logistics parks which may see a migration of light industrial occupiers from the traditional
industrial center to new locations on the periphery of Nairobi, thereby taking advantage of the new road infrastructure.
Nairobi prime rents and yields
Segment Prime rents Prime yields
Offices US$15persqmpermonth 9%
Retail US$31persqmpermonth 10%
Industrial US$4persqmpermonth 12%
Residential US$4,400permonth 6%
Source: Knight Frank, 2013
13.8 Real Estate Industry in Uganda
13.8.1 Property Market Segment
Much of Kampala’s office stock falls below international construction standards, so major companies seeking space in the capital have
fairly limited options. Good quality space is therefore at a premium and tends to be leased quickly. Currently, the biggest source of
demand for offices is from the oil, gas and telecoms sectors. In addition, recent years have seen increased interest in modern serviced
rental accommodation within a 5 km radius of Nakasero Hill, the CBD.
However, 2014 experienced increased construction activity with most of buildings expected to be completed in 2015.o a price war
that has exerted downward pressure on rental rates in Kampala. Huge exposure to debt is another major reason that is contributing to
declining rates as developers rush to have their properties occupied to ensure they have income to meet their debt obligations.
13.8.2 Retail market
The quantity and quality of retail provision is gradually improving, as domestic developers respond to rising demand from established
national and international operators who were becoming frustrated at the lack of suitable space. Two new shopping centres were
completed in Kampala in 2014, namely the Acacia Mall in Kisementi (16,192 sq m) and the Village Mall in Bugolobi (9,707 sq m).
The longer term outlook for the city’s retail sector is generally positive, on the back of continued growth in disposable incomes and
increasing consumer demand for better quality shopping facilities.
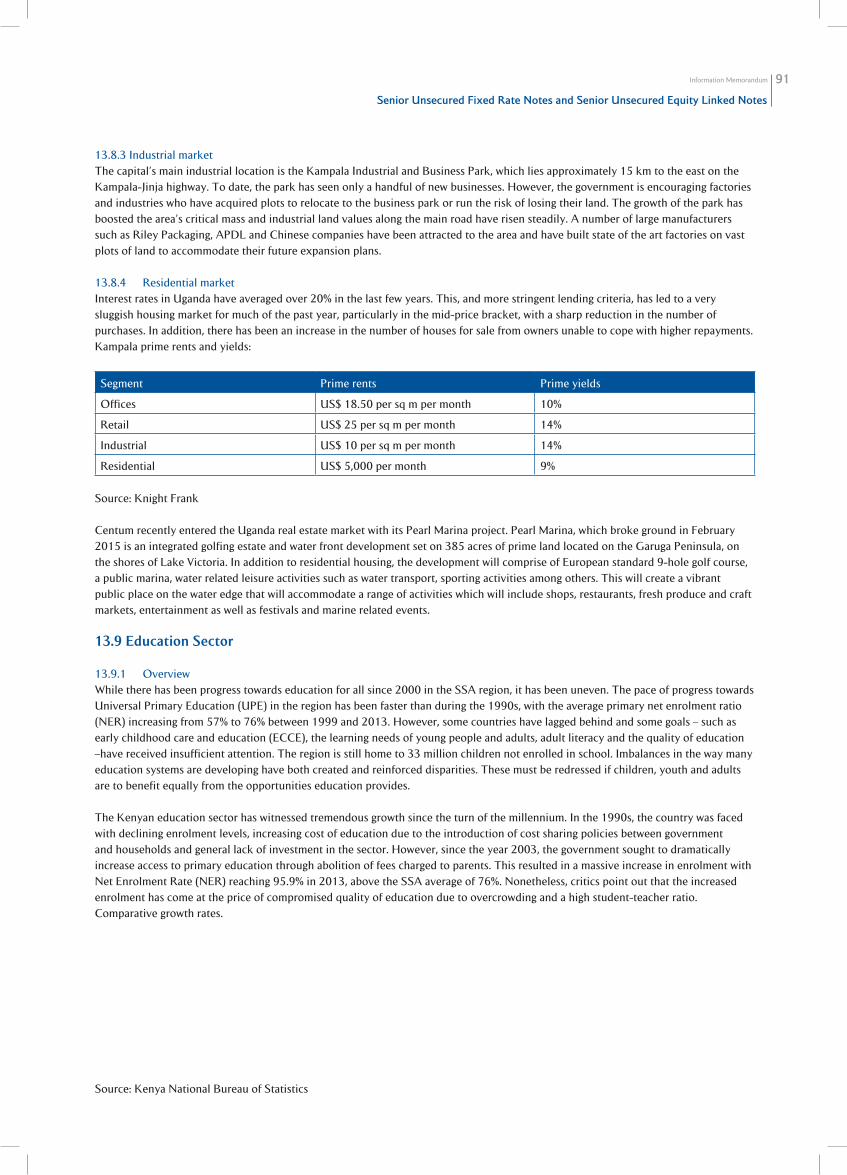
Information Memorandum 91
Senior Unsecured Fixed Rate Notes and Senior Unsecured Equity Linked Notes
13.8.3 Industrial market
The capital’s main industrial location is the Kampala Industrial and Business Park, which lies approximately 15 km to the east on the
Kampala-Jinja highway. To date, the park has seen only a handful of new businesses. However, the government is encouraging factories
and industries who have acquired plots to relocate to the business park or run the risk of losing their land. The growth of the park has
boosted the area’s critical mass and industrial land values along the main road have risen steadily. A number of large manufacturers
such as Riley Packaging, APDL and Chinese companies have been attracted to the area and have built state of the art factories on vast
plots of land to accommodate their future expansion plans.
13.8.4 Residential market
InterestratesinUgandahaveaveragedover20%inthelastfewyears.This,andmorestringentlendingcriteria,hasledtoavery
sluggish housing market for much of the past year, particularly in the mid-price bracket, with a sharp reduction in the number of
purchases. In addition, there has been an increase in the number of houses for sale from owners unable to cope with higher repayments.
Kampala prime rents and yields:
Segment Prime rents Prime yields
Offices US$18.50persqmpermonth 10%
Retail US$25persqmpermonth 14%
Industrial US$10persqmpermonth 14%
Residential US$5,000permonth 9%
Source: Knight Frank
CentumrecentlyenteredtheUgandarealestatemarketwithitsPearlMarinaproject.PearlMarina,whichbrokegroundinFebruary
2015 is an integrated golfing estate and water front development set on 385 acres of prime land located on the Garuga Peninsula, on
the shores of Lake Victoria. In addition to residential housing, the development will comprise of European standard 9-hole golf course,
a public marina, water related leisure activities such as water transport, sporting activities among others. This will create a vibrant
public place on the water edge that will accommodate a range of activities which will include shops, restaurants, fresh produce and craft
markets, entertainment as well as festivals and marine related events.
13.9 Education Sector
13.9.1 Overview
While there has been progress towards education for all since 2000 in the SSA region, it has been uneven. The pace of progress towards
UniversalPrimaryEducation(UPE)intheregionhasbeenfasterthanduringthe1990s,withtheaverageprimarynetenrolmentratio
(NER)increasingfrom57%to76%between1999and2013.However,somecountrieshavelaggedbehindandsomegoals–suchas
early childhood care and education (ECCE), the learning needs of young people and adults, adult literacy and the quality of education
–have received insufficient attention. The region is still home to 33 million children not enrolled in school. Imbalances in the way many
education systems are developing have both created and reinforced disparities. These must be redressed if children, youth and adults
are to benefit equally from the opportunities education provides.
The Kenyan education sector has witnessed tremendous growth since the turn of the millennium. In the 1990s, the country was faced
with declining enrolment levels, increasing cost of education due to the introduction of cost sharing policies between government
and households and general lack of investment in the sector. However, since the year 2003, the government sought to dramatically
increase access to primary education through abolition of fees charged to parents. This resulted in a massive increase in enrolment with
NetEnrolmentRate(NER)reaching95.9%in2013,abovetheSSAaverageof76%.Nonetheless,criticspointoutthattheincreased
enrolment has come at the price of compromised quality of education due to overcrowding and a high student-teacher ratio.
Comparative growth rates.
Source: Kenya National Bureau of Statistics

Information Memorandum
Senior Unsecured Fixed Rate Notes and Senior Unsecured Equity Linked Notes
92
13.9.2 Key Drivers for Growth of the Education Sector in Kenya
13.9.2.1 Favourable demographics
Kenya is in the middle of a demographic transition with the population growing at a much slower pace than at the time of
independence, mortality rates that are falling rapidly and declining birth rates. The country adds an estimated 1 million inhabitants per
year resulting in the need for an expanded education system to absorb the surge in student numbers.
13.9.2.2 Government intervention
Kenya’s education sector has greatly benefitted through government intervention especially since 2003 when the then President Mwai
Kibaki introduced Free Primary Education (FPE) programme. The resultant effect of this was a dramatic increase in student enrollment
at the primary school level where there was an estimated increase of 1 million new students. The abolition of school fees increased
access significantly albeit with teething problems of overcrowding and high student-teacher ratio which has led to decline in the quality
of primary school education. In 2008, the government introduced Free Day Secondary Education (FDSE) with the goal of increasing
the transition rate from primary to secondary education. By 2012, the transition rate from primary to secondary education stood at
75%upfrom46%in2002
Source: KNBS, Ministry of Education
13.9.2.3 Increased private sector participation
Kenya’s private sector has played a key role in supporting the government’s efforts for universal access to education. Many private
schools have been opened to cater for the increased numbers of student enrolled in all levels of education particularly in the urban
areas. The emergence of low cost private schools especially in low income areas has played a key role in promoting access to education
as the public schools alone cannot accommodate all the students. There is also a perception that the quality of education in private
schools is higher than public schools, a fact that is demonstrated by the better rankings private schools get in national examinations.
Source: KNBS, Ministry of Education

Information Memorandum 93
Senior Unsecured Fixed Rate Notes and Senior Unsecured Equity Linked Notes
13.9.3 Rising disposable income
In 2014, Kenya crossed the threshold to become a low-middle income economy following the rebasing its GDP figures with GDP
growing25%toUS$55.2billionandpercapitaGDPincreasingfrom$994to$1256.Thecountry’sgrowingmiddleclasshasled
to a significant increase in discretionary spending which has led to the growth of private schools as more parents prefer them over
government run schools. This in turn has resulted in the growth of an eco-system around private education which includes, training
colleges and universities, education material publishers, e-learning etc.
13.10 Healthcare Sector
13.10.1 Healthcare in Africa
Africaneedstoreassessitshealthcaresystemstoensurethattheyareviableoverthenextdecade.Unlikeotherregions,however,
Africa must carry out this restructuring while grappling with uniquely broad range of healthcare, political and economic challenges.
The continent is confronting multiple epidemiological crises simultaneously. High levels of communicable and parasitic disease are
being matched by growing rates of chronic conditions. Although the communicable diseases (malaria, tuberculosis, HIV/AIDS) are the
best known, it is the chronic conditions such as obesity and heart disease that are looming as the greater threat. These are expected to
overtake communicable diseases as Africa’s biggest health challenge by 2030.
Additionally, continued high rates of maternal and child mortality and rising rates of injuries linked to violence, particularly in urban
areas, are weighing down the system. Healthcare delivery infrastructure is insufficient; skilled healthcare workers and crucial medicines
are in short supply; and poor procurement and distribution systems are leading to unequal access to treatment10 .
The below graph shows the leading causes of deaths in the African region (2004):
Source:TheEconomistIntelligenceUnitLtd.
*The disability adjusted life year (DALY) provides a consistent and comparative description of the burden of diseases and injuries
needed to assess the comparative importance of diseases and injuries in causing premature death, loss of health and disability in
different populations.
Public spending on health is insufficient. In the absence of public health coverage, the poorest Africans have little or no access to
care. What is more, they frequently also lack access to the fundamental prerequisites of health: clean water, sanitation and adequate
nutrition.
Considering these challenges, several major reforms will be required continent-wide to ensure their viability over the long-term:
• Shiftingfocusofhealthcaredeliveryfromcuringtopreventivecare.
• Givinglocalcommunitiesmorecontroloverhealthcareresources.
• Improvingaccesstohealthcareviamobiletechnologies.
• Tighteningcontrolsovermedicines,medicaldevicesandimprovingtheirdistribution.
• Reducingrelianceoninternationalaidorganizationstofosterdevelopmentofmoredependablelocalsupplies.
• ExtendinguniversalhealthinsurancecoveragetothepoorestAfricans.
13.10.2 Healthcare in Kenya
Kenya has made great efforts in controlling diseases such as Malaria, TB, Cholera and actively fighting the HIV/AIDS pandemic.
Similar efforts have been made in controlling communicable diseases such as poliomyelitis, neonatal tetanus and measles. Kenya has
committedtospending15%ofitsnationalbudgetonhealthcareamidplanstotransformitselfintoamiddleincomenationby2030.
With public-private partnerships (PPPs) shaping the healthcare market and membership of the East African Community trading bloc
10The Economist Intelligence Unit Ltd.

Information Memorandum
Senior Unsecured Fixed Rate Notes and Senior Unsecured Equity Linked Notes
94
reducingregulatoryhurdlestoentry,KenyaisforecasttohaveaCAGRof17%through2016.Thisreflectsopportunitiesinboth
communicable diseases, such as Malaria and HIV, and NCDs which are a growing challenge in the country. The rapid increase in
Diabetes, for example, has seen the launch of a major Diabetes treatment and management pilot project sponsored by Novo Nordisk.
13.10.3 Pharmaceutical
Kenya has the most well-established pharmaceutical manufacturing industry in the region. The pharmaceutical industry consists of
three segments namely the manufacturers, distributors, and retailers. All these play a major role in supporting the country’s health
sector, which is estimated to have near 5,000 health facilities countrywide. Kenya is currently the largest producer of pharmaceutical
products in the Common Market for Eastern and Southern Africa (COMESA) region. Out of the region’s estimated 50 recognized
manufacturers, approximately 30 are based in Kenya. The industry compounds and packages medicines, repack formulated drugs, and
process bulk drugs into doses using predominantly imported active ingredients and excipients. The bulk of the locally manufactured
preparations are non-sterile over-the-counter products. The local industry has further greatly benefited from licensing agreements with
MNCs11.
13.10.4 Private Healthcare Sector in Kenya
TheprivatehealthcaremarketinKenyaisestimatedatKes27billion,or$318millionannually,contributingto22%ofallhealth
services12. In the last three years there has been rising disposable income, regulatory changes, and market developments in the
healthcare sector each having invigorated an industry increasingly dominated by the private sector. This period has seen investments
and successes in all parts of Kenya’s health sector, from health provision and insurance to pharmaceutical production. This is consistent
with research that states that Kenyan consumers spend more of their shillings on health care. At the same time, 33 million Kenyans lack
any form of basic insurance, and are treated in ill-equipped and poorly staffed facilities.
Due to the poor quality of the public sector offering, Kenyans increasingly look to the private sector for quality and value for their
money. Regardless of the specific business models, success in Kenyan private health insurance and service delivery will depend on
capital-intensivesolutions.Itisestimatedthatprivateexpenditureonhealthcarewillrange$1.8-$3.1billionby2025(depictedinthe
graph below):
Source: Open Capital Advisors
Thistranslatesintocapitalrequirementsexceeding$1billion.Investorshavenoticedrisingdemandandareturningtheirattentionto
this space through recent investments in medical insurers, medical facilities, and other Kenyan healthcare companies. The race to serve
the untapped mass market has accelerated thanks to increased innovation and investments and recent changes in the regulatory space,
including a new policy covering Medical Insurance Providers (MIPs) and general insurers13.
To serve the Kenyan mass market, private health care players require innovative business models that can supply consistent quality and
coverage at lower prices with higher volumes. Many of these emerging private sector players are Small and Medium Enterprises (SMEs)
that seek capital to grow. The expected capital needs for the private healthcare sector by 2025 are as shown in the figure:
11T IMS Health, Pharmaceutical Measurement Unit
12US AID
13Open Capital Advisors

Information Memorandum 95
Senior Unsecured Fixed Rate Notes and Senior Unsecured Equity Linked Notes
Source: Open Capital Advisors
13.11 Information and Communications Technology(ICT) Sector
13.11.1 Industry Overview
ICT has been an important driver of East Africa’s economic growth over the last 15 years. In the year 2000, East Africa (Kenya,
UgandaandTanzania)hadapproximately250,000internetusers,andaccountedfor5%ofthetotalinternetusesinthecontinent.By
theendoftheyear2014,theregionhadatotalof29millioninternetusers,accountingfor10%ofthetotalinternetusersinAfrica.
Kenyaaccountedfor74%ofthetotalinternetusersinEastAfrica.Theexponentialgrowthbeganapproximatelyin2002–2004,when
governments realized the potential impact of ICT on Economic Growth. Kenya has stood out as one of the most dominant frontier
market countries in terms of ICT growth and development.
13.11.2 Kenya ICT Sector
Kenya continues to have a marquee story when it comes to ICT growth and development. The number of Kenyans using new forms
of communication has increased rapidly in recent years, with mobile telephony providing the biggest gauge of penetration of new
technologies.Thisisevidencedbythemobilepenetrationratehitting80.5%inQ32014,accordingtothesectorstatisticsreportby
theCommunicationsAuthorityofKenya(CAK)shows.Internetpenetrationstandsat47%,wellabovetheAfricaaverageof26%.
These statistics are among the highest for any frontier market nation across the globe. Growth in the sector has been driven by a culture
of innovation, championed by ICT innovations such as the mobile money transfer service- M-Pesa - by the mobile telephone company,
Safaricom.
Kenya is also seen as an ICT hub, with a multitude of ICT conglomerates such as CISCO, SAP, Microsoft, Google, IBM, and Oracle,
establishing regional offices in Nairobi. The culture of innovation has also led to the emergence of local ICT companies, such as Seven
SeasTechonology, Cellulant, Craft Silicon, and Africaonline, which have grown to become regional powerhouses.
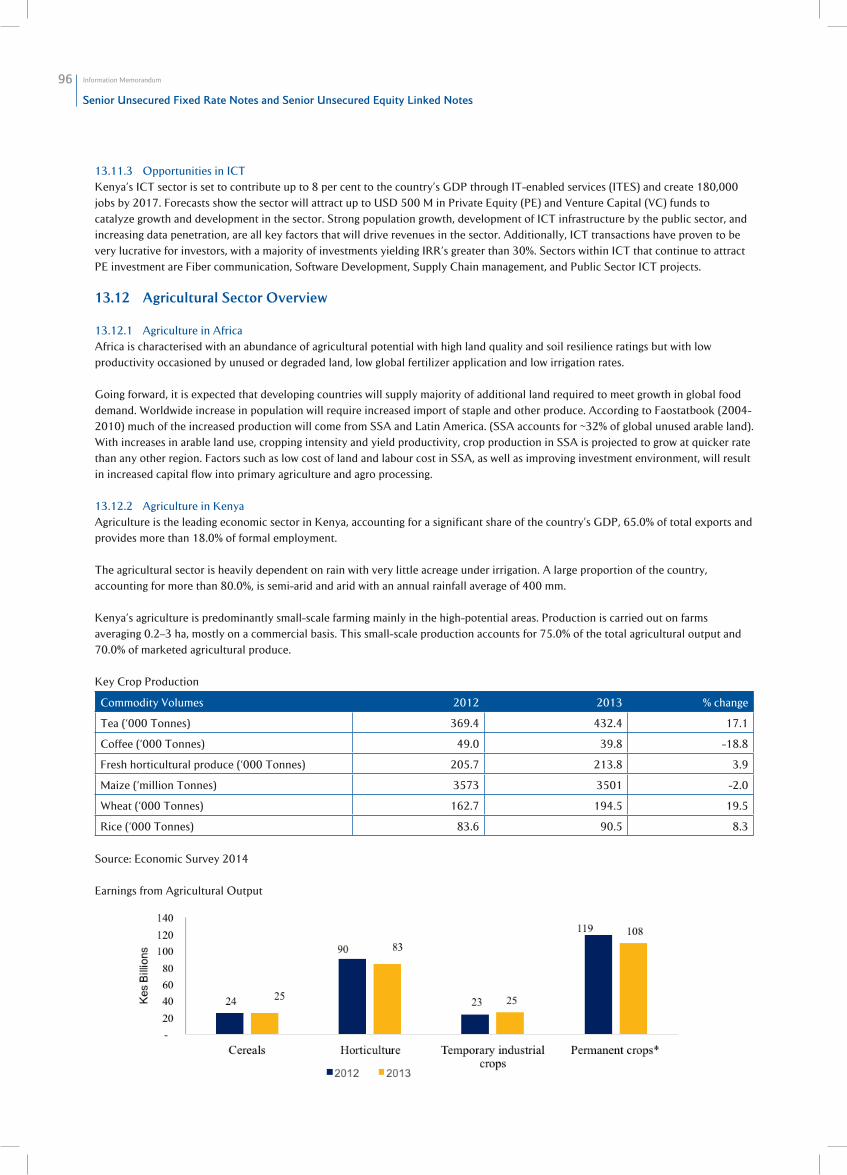
Information Memorandum
Senior Unsecured Fixed Rate Notes and Senior Unsecured Equity Linked Notes
96
13.11.3 Opportunities in ICT
Kenya’s ICT sector is set to contribute up to 8 per cent to the country’s GDP through IT-enabled services (ITES) and create 180,000
jobsby2017.ForecastsshowthesectorwillattractuptoUSD500MinPrivateEquity(PE)andVentureCapital(VC)fundsto
catalyze growth and development in the sector. Strong population growth, development of ICT infrastructure by the public sector, and
increasing data penetration, are all key factors that will drive revenues in the sector. Additionally, ICT transactions have proven to be
verylucrativeforinvestors,withamajorityofinvestmentsyieldingIRR’sgreaterthan30%.SectorswithinICTthatcontinuetoattract
PE investment are Fiber communication, Software Development, Supply Chain management, and Public Sector ICT projects.
13.12 Agricultural Sector Overview
13.12.1 Agriculture in Africa
Africa is characterised with an abundance of agricultural potential with high land quality and soil resilience ratings but with low
productivity occasioned by unused or degraded land, low global fertilizer application and low irrigation rates.
Going forward, it is expected that developing countries will supply majority of additional land required to meet growth in global food
demand. Worldwide increase in population will require increased import of staple and other produce. According to Faostatbook (2004-
2010)muchoftheincreasedproductionwillcomefromSSAandLatinAmerica.(SSAaccountsfor~32%ofglobalunusedarableland).
With increases in arable land use, cropping intensity and yield productivity, crop production in SSA is projected to grow at quicker rate
than any other region. Factors such as low cost of land and labour cost in SSA, as well as improving investment environment, will result
in increased capital flow into primary agriculture and agro processing.
13.12.2 Agriculture in Kenya
AgricultureistheleadingeconomicsectorinKenya,accountingforasignificantshareofthecountry’sGDP,65.0%oftotalexportsand
providesmorethan18.0%offormalemployment.
The agricultural sector is heavily dependent on rain with very little acreage under irrigation. A large proportion of the country,
accountingformorethan80.0%,issemi-aridandaridwithanannualrainfallaverageof400mm.
Kenya’s agriculture is predominantly small-scale farming mainly in the high-potential areas. Production is carried out on farms
averaging0.2–3ha,mostlyonacommercialbasis.Thissmall-scaleproductionaccountsfor75.0%ofthetotalagriculturaloutputand
70.0%ofmarketedagriculturalproduce.
Key Crop Production
Commodity Volumes 2012 2013 %change
Tea(‘000Tonnes) 369.4 432.4 17.1
Coffee(‘000Tonnes) 49.0 39.8 -18.8
Freshhorticulturalproduce(‘000Tonnes) 205.7 213.8 3.9
Maize(‘millionTonnes) 3573 3501 -2.0
Wheat(‘000Tonnes) 162.7 194.5 19.5
Rice(‘000Tonnes) 83.6 90.5 8.3
Source: Economic Survey 2014
Earnings from Agricultural Output
Information Memorandum 97
Senior Unsecured Fixed Rate Notes and Senior Unsecured Equity Linked Notes
Source: KNBS Economic Survey 2014
13.12.3 Factors Driving Agriculture Business in Kenya
13.12.3.1 Rapid Urbanization and increasing demand for processed foods
UptothirtypercentofKenyansliveinurbanareasandtherateofurbanizationishighat4.2%peryear.Aspeoplegetricherandmore
liveintownsandcities,thisoffersgreatbusinessopportunitiesforagricultureifwell-harnessed.Urbanconsumerswilldemandbetter
quality, packaged, processed and more diverse food products: the products of agribusiness. Recent consumption of dairy and meat
products provides evidence of this trend. This demand could create jobs, especially for young people.
13.12.3.2 High world food prices
Surging world prices have highlighted Kenya’s dependence on food imports: more than half of the country’s rice, oranges, wheat and
vegetable oils are imported. This trend is set to continue and provides plenty of reasons to support and strengthen local production
through sector support.
13.12.4 Opportunities
13.12.4.1 Gallana Irrigation Scheme
Gallana-KulaluisaUS$3bnirrigationprojectlaunchedinKenya’sCoastalregion,toincreasefoodsecurityinthecountry.The
development of the one million acre irrigation scheme will be undertaken under the public-private partnership. The Kenyan
governmentwillinvestUS$1.4bnininfrastructuredevelopmentwithUS$2.9bncomingfromtheprivatesector
13.12.5 Challenges
13.12.5.1 Infrastructure
Poor road network and other key physical infrastructure have led to high transportation costs for agricultural inputs and products. It
also leads to spoilage of perishable commodities during transportation. This causes high losses to farmers.
13.12.6 Technology
Although Kenya has a well-developed agricultural research system, use of modern science and technology in agricultural production
is still limited. Inadequate research–extension–farmer linkages to facilitate demand-driven research and increased use of improved
technologies continue to constrain efforts to increase agricultural productivity as farmers continue to use outdated and ineffective
technologies. This brings the need of extension services that can link research and the farmers.

Information Memorandum
Senior Unsecured Fixed Rate Notes and Senior Unsecured Equity Linked Notes
98
14. SUMMARY OF FINANCIAL INFORMATION AND OTHER SELECTED DATA
14.1 Auditors
As at the date of this Information Memorandum, the auditors of the Issuer were PricewaterhouseCoopers, Certified Public Accountants
located at PWC Tower, Waiyaki Way/ Chiromo Road, Westlands, P.O. Box 43963-00100, Nairobi Kenya. The auditors have audited the
Issuer’s annual accounts for the years ended 31 March 2011 to 31 March 2014.
The financial statements for the year ended 31 March 2010 were audited by Deloitte & Touche.
The last audited accounts and financial statements were in respect of the 12-month period ending 31 March 2014, whereupon the
auditors gave an unqualified audit opinion. The auditors have also carried out a limited review of the nine (9) month management
accounts up to 31 December 2014.
14.2 Company Statement of Comprehensive Income
For the Year ended 31 March 2014 2013 2012 2011 2010 Ksh’000 Ksh’000 Ksh’000 Ksh’000 Ksh’000
Income 1,988,227 1,913,776 764,460 1,684,796 1,121,464
Expenses
Administration expenses (282,580) (364,482) (136,368) (201,853) (122,154)
Other operating expenses (148,097) ( 77,649) (90,707) (89,113) (76,897)
Finance costs (461,954) (400,697) (49,979) (154,697) (46,940)
Total expenses (892,631) (842,828) (277,054) (445,663) (245,991)
Profit before tax 1,095,596 1,070,948 487,406 1,239,133 875,473
Income tax (expense)/credit (48,323) (36,850) (41,264) (1,950) 12,967
Profit for the year 1,047,273 1,034,098 446,142 1,237,183 888,440
Other Comprehensive Income
Reserves released on disposal of investment (133,208) (1,423,723) (127,243) ( 833,339) (626,700)
Fair value in subsidiaries 3,636,745 1,657,737 13,619 902,681 565,992
Fair value in associates 421,153 382,919 882,934 1,990,419 1,867,270
Fair value gain in unquoted investments 1,852,303 371,936 114,597 12,165 18,961
Fair value gain/ (Loss) in quoted investments (24,759) 428,270 (196,952) 86,192 583,711
Total other Comprehensive Income 5,752,234 1,417,139 686,955 2,158,118 2,409,234
Total Comprehensive Income 6,799,507 2,451,237 1,133,097 3,395,301 3,297,674

Information Memorandum 99
Senior Unsecured Fixed Rate Notes and Senior Unsecured Equity Linked Notes
14.3 Consolidated Statement of Financial Position
As at 31 March 2014 2013 2012 2011 2010 Ksh’000 Ksh’000 Ksh’000 Ksh’000 Ksh’000
Assets
Deferred income tax - - - 30,443 29,477
Prepaid operating lease rentals - - - - 35,940
Current income tax - - - 2,654 3,075
Investment property 10,845,392 5,456,057 3,992,754 3,525,578 -
Motor vehicle and equipment 59,954 43,999 26,467 26,813 11,347
Intangible assets 988,756 5,298 1,926 5,404 601
Investment in associates 3,900,851 3,659,198 3,614,550 3,377,305 2,948,585
Unquotedinvestments 7,569,310 4,306,221 1,427,206 1,338,664 1,251,209
Quoted investments 3,036,299 2,732,872 1,666,309 3,208,611 2,967,876
Bonds at fair value through profit or loss 1,071,046 995,313 480,000 539,188 505,371
Receivables and prepayments 1,071,947 260,825 36,079 240,140 108,849
Cash and cash equivalents 843,648 1,501,769 322,410 6,776 393,641
Total assets 29,387,203 18,961,552 11,567,701 12,301,576 8,255,971
Capital and reserves
Share capital 332,721 332,721 332,721 302,474 274,976
Share premium 589,753 589,753 589,753 589,753 589,753
Investment revaluation reserve 6,170,187 2,828,301 1,736,198 2,443,738 3,032,911
Retained earnings 12,912,168 9,891,966 7,382,570 6,223,412 3,958,527
Non-controlling interest 268,008 - - - -
Total equity 20,272,837 13,642,741 10,041,242 9,559,377 7,856,167
Liabilities
Borrowings 4,201,029 4,149,532 1,000,000 1,000,000 -
Bank overdraft 1,291,101 - - 987,980 -
Payables and accrued expenses 1,840,552 287,858 355,956 719,170 357,154
Unclaimeddividends 28,987 32,504 34,437 35,049 42,650
Current income tax 210,913 19,254 5,114 - -
Deferred income tax 1,541,784 829,663 130,952 - -
Total Liabilities 9,114,366 5,318,811 1,526,459 2,742,199 399,804
Total Equity & liabilities 29,387,203 18,961,552 11,567,701 12,301,576 8,255,971

Information Memorandum
Senior Unsecured Fixed Rate Notes and Senior Unsecured Equity Linked Notes
100
14.4 Company Statement of Financial Position
As at 31 March 2014 2013 2012 2011 2010 Ksh’000 Ksh’000 Ksh’000 Ksh’000 Ksh’000
Assets
Deferred income tax 5,317 7,354 5,150 30,539 29,477
Prepaid operating lease rentals - - - - 35,940
Current income tax - - - 832 3,044
Investment property - - - 265,000 -
Motor vehicle and equipment - 43,999 26,467 26,754 11,347
Intangible assets - 1,720 1,926 3,052 601
Investment in subsidiaries 8,159,156 3,442,759 1,784,954 1,753,506 850,163
Investment in associates 6,594,340 6,152,947 7,128,721 6,230,521 4,240,102
Unquotedinvestments 5,495,272 3,539,417 1,427,206 1,338,664 1,251,209
Quoted investments 686,348 1,088,778 1,289,540 2,422,116 2,080,599
Bonds at fair value through profit or loss - 105,560 480,000 539,188 505,371
Due from subsidiary companies 7,668,573 5,969,488 3,104,780 2,221,780 412,623
Receivables and prepayments 27,499 123,796 155,344 165,745 26,658
Cash and cash equivalents 174,932 930,896 317,340 5,903 393,168
Total assets 28,811,437 21,406,714 15,721,428 15,003,600 9,840,302
Capital and reserves
Share capital 332,721 332,721 332,721 302,474 274,976
Share premium 589,753 589,753 589,753 589,753 589,753
Investment revaluation reserve 15,962,362 10,210,128 8,792,989 8,106,034 5,947,916
Retained earnings 6,051,372 5,004,099 3,970,001 3,554,106 2,344,421
Total equity 22,936,208 16,136,701 13,685,464 12,552,367 9,157,066
Liabilities
Borrowings 4,201,029 4,149,532 1,000,000 1,987,980 -
Bank overdraft 1,291,101 - - - -
Payables and accrued expenses 204,467 230,182 134,078 144,332 356,906
Due to subsidiary companies 121,846 838,300 862,303 283,872 283,680
Unclaimeddividends 28,987 32,504 34,437 35,049 42,650
Current income tax 27,799 19,495 5,146 - -
Total Liabilities 5,875,229 5,270,013 2,035,964 2,451,233 683,236
Total Equity & liabilities 28,811,437 21,406,714 15,721,428 15,003,600 9,840,302

Information Memorandum 101
Senior Unsecured Fixed Rate Notes and Senior Unsecured Equity Linked Notes
14.5 Statement of Cash Flows (Internally Generated Funds)
As at 31 March 2014 2013 2012 2011 2010 Ksh’000 Ksh’000 Ksh’000 Ksh’000 Ksh’000
Operating Inflows:
Dividends receivable 661,481 523,715 430,892 410,222 407,957
Rent income 17 7,062 6,136 6,276 2,259
Interest receivable 225,480 222,211 45,446 77,950 6,022
Other income 307,183 (148,714) 31,172 55,099 45,551
Proceeds from disposal of investments 2,678,770 3,286,280 6,105,779 1,799,547 1,271,422
3,872,931 3,890,554 6,619,425 2,349,094 1,733,211
Operating outflows:
Operating & Administrative expenses (106,852) (297,496) (299,181) (302,784) (197,999)
Taxes paid (50,825) (25,726) (9,897) (2,591) (603)
(157,677) (323,222) (309,078) (305,375) (198,602)
Internally generated cash flows 3,715,254 3,567,332 6,310,347 2,043,719 1,534,609
Cash flows from investing activities:
Investments in equity (4,951,105) (5,095,520) (4,769,396) (4,240,959) (920,632)
Investment in motor vehicle & equipment (45,209) (27,406) (4,303) (26,944) (10,000)
(4,996,314) (5,122,926) (4,773,699) (4,267,903) (930,632)
Cash flows from financing activities:
Net proceeds from borrowings - 4,149,532 - 1,000,000 -
Dividends paid to Company’s shareholders (3,517) (1,933) (612) (1,392) (5,728)
Dividends paid to non-controlling interests (41,739) - - - -
Loan Repayment - (1,000,000) - - -
Interest paid (622,558) (400,763) (229,872) (147,914) (44,758)
(667,814) 2,746,836 (230,484) 850,694 (50,486)
Net increase/(decrease) in cash (1,948,874) 1,191,242 1,306,164 (1,373,490) 553,491
Movement in cash and cash equivalents
At start of year 1,501,769 322,410 (981,204) 393,641 (159,850)
Increase/(decrease) (1,948,874) 1,191,242 1,306,164 (1,373,490) 553,491
Exchange losses on cash equivalents (348) (11,883) (2,550) (1,355) -
At end of year (447,453) 1,501,769 322,410 (981,204) 393,641
The statement of cashflows as presented in the Accountant’s Report has been reformatted to conform to Centum Investment Company
Limited’s business model. Refer to Appendix 20.2 of the Accountant’s Report.

Information Memorandum
Senior Unsecured Fixed Rate Notes and Senior Unsecured Equity Linked Notes
102
14.6 Company Statement of Total Return
As at 31 March 2014 2013 2012 2011 2010 Ksh’000 Ksh’000 Ksh’000 Ksh’000 Ksh’000
Dividend income 1,788,646 283,468 404,347 509,797 455,548
Interest income 39,784 107,979 52,143 77,950 6,022
Other income 11,189 79,686 52,177 24,842 33,195
Realized value movements 15,401 9,360 83,913 131,091 87,735
Unrealizedvaluemovements 5,885,438 2,850,422 858,835 3,099,234 2,948,198
Gross return 7,740,458 3,330,915 1,451,415 3,842,914 3,530,698
Finance costs (461,954) (400,697) (49,979) (154,697) (46,940)
Portfolio costs (430,677) (442,131) (227,075) (290,966) (199,051)
(892,631) (842,828) (277,054) (445,663) (245,991)
Net return 6,847,827 2,488,087 1,174,361 3,397,251 3,284,707
Tax (48,323) (36,850) (41,264) (1,950) 12,967
Total return 6,799,504 2,451,237 1,133,097 3,395,301 3,297,674
Grossreturn(%) 48.0% 24.34% 11.6% 42.0% 60.3%
Totalreturn(%) 42.1% 17.91% 9.0% 37.1% 56.3%
Opening net asset value:
Portfolio value 19,307,445 14,694,418 14,462,892 9,014,620 5,930,043
Other net assets 978,788 (8,954) 77,455 142,446 99,330
Borrowings (4,149,532) (1,000,000) (1,987,980) - (169,981)
16,136,701 13,685,464 12,552,367 9,157,066 5,859,392
Closing net asset value
Portfolio value 29,371,500 19,307,445 14,694,418 14,462,892 9,014,620
Other asset/(liabilities) (943,165) 978,788 (8,954) 77,455 142,446
Borrowings (5,492,130) (4,149,532) (1,000,000) (1,987,980) -
22,936,205 16,136,701 13,685,464 12,552,367 9,157,066

Information Memorandum 103
Senior Unsecured Fixed Rate Notes and Senior Unsecured Equity Linked Notes
14.7 Proforma Financial Information
14.7.1 Projected consolidated statement of comprehensive income
At 31 March 2016 Kshs’000 DividendsfromUnquotedInvestments 378,290Dividends from Quoted Investments 248,680 Interest Income 2,716,407 Fund Management Income 691,884 Gains on disposal of Investments 1,814,593 Fair value gains on Investment Property 7,168,690 Sales Revenue 7,589,723 Rental income 462,469 Other Income 947,053 Total Income 22,017,789 Cost of sales (5,020,383) Administrative & Operating Expenses (5,165,086)Finance costs (1,856,236) Share of associate profits 386,270 Profit Before Tax 10,362,353 Tax (2,897,848) Profit After Tax 7,464,505 Other Comprehensive income 9,940,683 Total Comprehensive Income 17,405,188

Information Memorandum
Senior Unsecured Fixed Rate Notes and Senior Unsecured Equity Linked Notes
104
14.7.2 Projected company statement of comprehensive income
At 31 March 2016 Kshs’000 Dividend income 1,751,222 Interest income 158,420 Gain on disposal of investments 1,186,094Directors Fees 6,800 Income 3,102,536 Expenses Administrative & operating expenses (471,203)Finance costs (1,344,224) (1,815,428) Profit before tax 1,287,108 Income tax expense (59,645) Profit for the year 1,227,463 Other comprehensive income; net of deferred tax 8,525,373 Total comprehensive income 9,752,836

Information Memorandum 105
Senior Unsecured Fixed Rate Notes and Senior Unsecured Equity Linked Notes
14.7.3 Projected consolidated statement of financial position
At 31 March 2016 Kshs’000 Assets Investment property 38,035,316 Property, plant & equipment 4,753,078 Intangible assets 92,782 Prepaid operating lease rentals 9,513 Investment in associates 5,351,001 Unquotedinvestments 14,069,160Quoted investments 5,828,901 Equity linked note assets 7,091,037 Government securities and Bonds at fair value through profit or loss 2,331,763 Loans and advances 15,509,031 Tax recoverable 135,950 Inventories 944,336 Deferred income tax asset 88,820 Receivables and prepayments 2,909,186 Cash and cash equivalents 9,590,105 Total Assets 106,739,979 Capital and reserves Share capital 332,721 Share premium 589,753 Investment revaluation reserve 13,864,003 Retained earnings 19,615,508
Shareholders equity attributable to Equity holders of the company 34,401,986 Non-controlling interest 10,643,459
Total equity 45,045,444 Liabilities Borrowings 21,108,950 Shareholder Loans 6,834,606 Equity linked note liability 7,091,037 Customer deposits 17,089,637 Deferred income 158,838 Payables and accrued expenses 2,552,858 Dividends payable to non-controlling interests 42,863 Current income tax 287,896 Deferred income tax 6,527,850 Total liabilities 61,694,535 Total equity & liabilities 106,739,979

Information Memorandum
Senior Unsecured Fixed Rate Notes and Senior Unsecured Equity Linked Notes
106
14.7.4 Projected company statement of financial position
At 31 March 2016 Kshs’000 Assets Investment in subsidiaries 36,235,826Investment in associates 5,351,001Unquotedinvestments 10,088,959Quoted investments 345,201Other assets 7,491Cash and cash equivalents 734,546 Total Assets 52,763,024 Capital & reserves Share capital 332,721Share premium 589,753Investment revaluation reserve 27,318,735Retained earnings 11,894,835 Total equity 40,136,044 Liabilities Borrowings 10,830,000Bank overdraft 0Deferred tax 1,405,704Current income tax 59,645Payables & other liabilities 331,631 Total liabilities 12,626,980 Total equity & liabilities 52,763,024
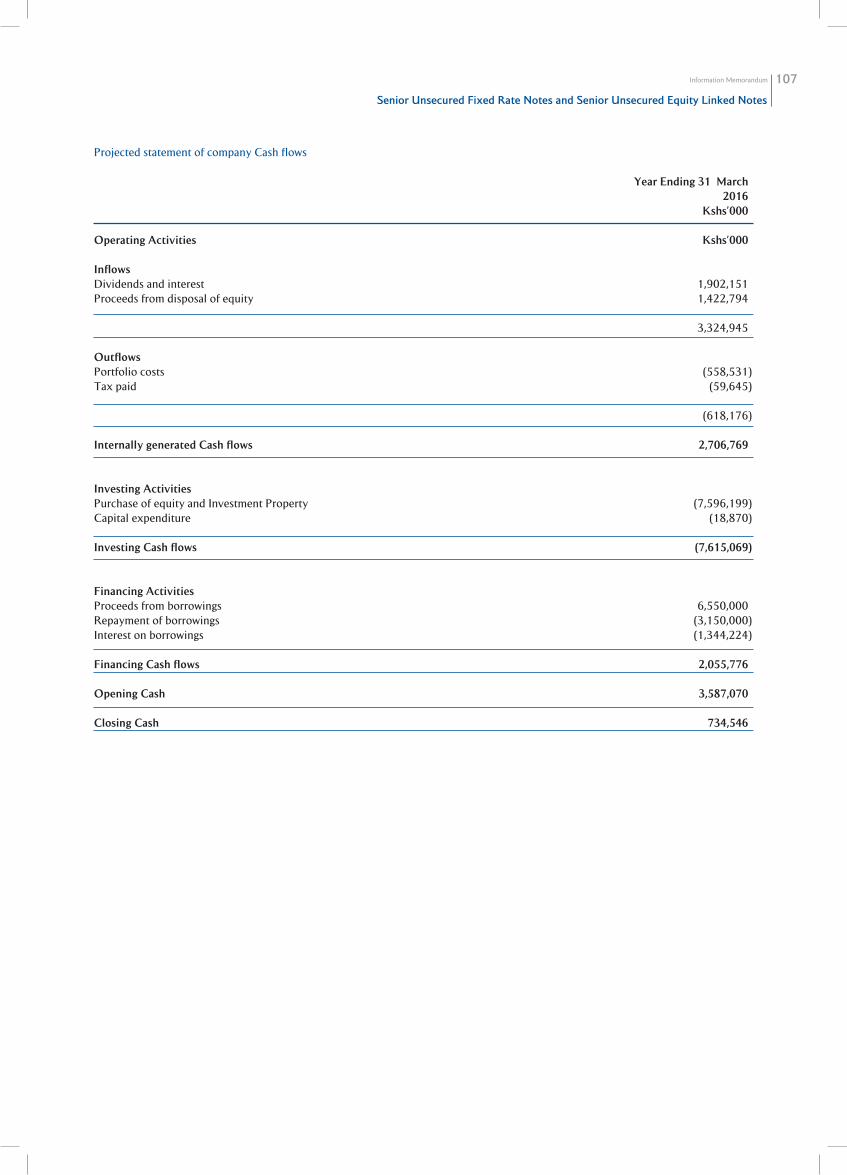
Information Memorandum 107
Senior Unsecured Fixed Rate Notes and Senior Unsecured Equity Linked Notes
Projected statement of company Cash flows
Year Ending 31 March 2016 Kshs’000 Operating Activities Kshs’000 Inflows Dividends and interest 1,902,151 Proceeds from disposal of equity 1,422,794
3,324,945 Outflows Portfolio costs (558,531)Tax paid (59,645)
(618,176) Internally generated Cash flows 2,706,769 Investing Activities Purchase of equity and Investment Property (7,596,199)Capital expenditure (18,870)
Investing Cash flows (7,615,069) Financing Activities Proceeds from borrowings 6,550,000 Repayment of borrowings (3,150,000)Interest on borrowings (1,344,224)
Financing Cash flows 2,055,776 Opening Cash 3,587,070 Closing Cash 734,546
Information Memorandum
Senior Unsecured Fixed Rate Notes and Senior Unsecured Equity Linked Notes
108
15. RISK FACTORS AND MITIGATION MEASURES
Prospective Noteholders should carefully consider the risk factors set out below before making the decision whether or not to invest in the Notes.
These are however not intended to be exhaustive
15.1 Investment Risks
15.1.1 Investment Decisions
The ability to originate deals on a proprietary basis and the pricing of assets could have a significant effect on the Issuer’s competitive
position and on the sustainability of returns.
The Issuer’s ability to originate, evaluate and execute high quality investments is dependent upon a range of factors. The most important
of these include:
• theabilitytoattractanddeveloppeoplewiththerequisiteinvestmentexperienceandculturalfit;
• organizationofteamswhosestructureismarket-adaptedandwhosecompensationisresults-oriented;and
• effectiveapplicationofcollectiveknowledgeandrelationshipstoeachinvestmentopportunity.
The Issuer’s investment appraisal process is rigorous as it includes approval by relevant managers and the Investment Committee.
15.2 Investment Performance
The performance of Centum’s portfolio is dependent upon a range of factors. These include, but are not limited to:
• thequalityoftheinitialinvestmentdecision;
• theabilityoftheinvestmenttosuccessfullyexecuteitsbusinessstrategyandgeneratepositivecashflow;and
• actualoutcomesagainstthekeyassumptionsunderlyingtheinvestmentsfinancialprojections.
Any one of these factors could have an impact on the valuation of a portfolio company and on the Issuer’s ability to make a profitable exit
from the investment within the desired timeframe.
A rigorous process is put in place for managing investments from inception through to realization. This includes regular asset reviews and,
in many cases, representation on the board of the investee companies by an Issuer investment executive. Portfolio diversification also
mitigates the risk of underperformance of any of the portfolio companies.
15.3 Investment Concentration
The Issuer invests across a range of economic sectors. Over-exposure to a particular sector could increase the impact of adverse changes
in macroeconomic or market conditions on the Issuer. An increase in the average size of investments over time could also increase the
exposure of the Issuer to the performance of a small number of large investments, albeit in different sectors.
Sectoral investment limits have been defined and the portfolio is subject to periodic reviews by the Investment Committee in order to
monitor exposure to any one sector and larger investments.
15.4 Investment valuations and exit opportunities
Private-equity holdings are valued according to private-equity and venture capital guidelines, which set out the methodology for fair
valuation. The valuation is relatively subjective and may vary from time to time.
Since valuation of the Issuer’s portfolio and opportunities for realizations depend to some extent on stock market conditions, changes in
market or macroeconomic conditions could impact the valuation of portfolio assets and the ability to exit those investments profitably
within the desired timeframe.

Information Memorandum 109
Senior Unsecured Fixed Rate Notes and Senior Unsecured Equity Linked Notes
Quoted securities are valued at market prices, thus, are subject to adverse market movements.
Valuation risks are mitigated by comprehensive reviews of the underlying investment by management every quarter. The appropriateness
of the valuation is then considered by the audit committee and the internal auditor.
The risk of fluctuation of the prices of quoted securities is mitigated by choice of defensive stocks with strong fundamentals.
15.5 Financial Risks
15.5.1 Liquidity risks
This is the risk that the Issuer will be unable to meet its financial obligations as and when they fall due. This risk may materialize due to
lack of cash reserves when required or the inability to convert assets to cash quickly and at a good price. This can result in failure to repay
Noteholders and fulfil commitments to lenders. Liquidity risk may also cause the Issuer to miss out on attractive investment opportunities
due to lack of funding.
The Issuer has adopted prudent liquidity risk management measures including:
• consistentlymaintainingsufficientcashflowstofacilitateday-to-dayrunningofCentum’soperations;
• pre-arrangedopenlinesofcreditwithitspanelofbanksinordertobridgethetimingdifferencebetweenavailableopportunitiesand
expected cash inflows;
• maintaininga‘marketablesecurities’assetclasswhichconstituteshighlyliquidavailable-for-salelistedequityanddebtsecurities;
• continuousforecastingandmonitoringtheGroup’sliquidityneedsagainstexpectedcashflowsinordertoidentifyandguardagainst
liquidity gaps.
• matchingmaturityprofilesoffinancialassetsandliabilities.
15.5.2 Interest rate risk
The Issuer from time to time temporarily holds excess cash in a variety of money-market instruments waiting to be redeployed in the next
most attractive opportunity. The interest rates on the cash deposits are fixed and agreed upon in advance. There is the risk that the value
of the Issuer’s fixed interest-bearing assets will fall due to variability in interest rates.
The Issuer also faces the risk of incurring a higher cost of borrowing on its short term borrowings which are usually floating rate based.
Interest rates on short term borrowings are usually pegged on the relevant bank’s base lending rate or prevailing Treasury Bills rates.
In the absence of material contractual liabilities, the Issuer’s exposure to interest rate risk has been minimal and only limited to its
liquidity management assets. Nevertheless, management closely monitors the interest rate environment in order to lock-in favourable
interest rates for both short term borrowings and deposits. The Issuer works with a panel of banks to ensure competitive rates.
15.5.3 Inflation risk
There is a risk that the Issuer’s portfolio holdings may decline due to unexpected changes in inflation rate. This risk may also occur when
investee companies are unable to pass on inflation costs in full to its customers due to price sensitivity.
This risk will be partially mitigated through the Real Estate and Infrastructure asset class, which is considered to provide inflation hedge
benefits as rental yields have a tendency to adjust to take into account inflation. Returns from investments in equities also provides a
good buffer for inflation.
15.5.4 Foreign Exchange Risk
This is the Issuer’s exposure to fluctuations in the foreign currency rates relating to conversion rates for valuation of overseas holdings.
This risk can also arise if the Issuer acquires a foreign subsidiary which maintains financial statements in its local currency which is
different from the reporting currency of the consolidated group.
Impact of fluctuations in exchange rates on the value of assets and investments is closely monitored through mark to market evaluations.
Hedging strategies are applied where necessary.
15.5.5 Credit Risk
This is the risk arising from a borrower’s inability to repay loans/advances as per agreed lending terms. Credit exposures for the Issuer
may arise from onward lending activities to Subsidiaries and investee companies.
The Issuer seeks a controlling stake in order to be actively involved in the management of its investee companies.

Information Memorandum
Senior Unsecured Fixed Rate Notes and Senior Unsecured Equity Linked Notes
110
15.5.6 Commodity Risk
Commodity risk refers to the uncertainties of future market values and of the size of the future income, caused by fluctuation in the prices
of commodities. This risk will be relevant with the Issuer’s participation in the Energy and Agricultural sectors.
The development of the derivatives market in Kenya will provide stability and enable prediction of commodity prices.
15.6 Operational Risks
Risk of financial loss arising from failed internal controls, people and systems. These risks are highlighted below:
• a perceived failure tomeet ethical and governanceprinciples regulatingCentum’s conduct and activitiesmay lead to a loss of
business reputation, erosion of market confidence and inability to close business deals;
• resourcing inefficiencies, especially lack of qualified investment professionals could lead to loss of competitive advantage and
intellectual edge;
• informationtechnologyfailuresandbreachescouldleadtotransactionfailures,lossofbusinessrecordsandpotentialfinancialand
legal exposures; and
• externaleventsresultingfromnaturaldisasters,crime,socialunrest,civilwarandterrorismcouldharmbothCentum’sstaffand
assets.
Operational risks have been mitigated through detailed operational procedures provided in relevant manuals supported with Business
Continuity and Disaster Recovery plans. The Issuer has a framework of core values and a code of conduct that influence its organizational
culture. An outsourced internal audit function provides independent assurance that internal controls are in check.
15.7 External Risks
These are risks that are outside of the Issuer’s control. Some of the risks are:
• politicalrisks-changestothepoliticalclimateandanynegativepoliticaleventsmayhaveadirecteffectonthevalueoftheIssuer’s
investments;
• changes in legislation, taxation, regulation and the expropriation of property including matters relating to land tenure, titles,
securities, pricing, environmental protection, trade sanctions, cancellation of licenses and agreements, social impact and repatriation
of profits can cause investment losses to the Issuer;
• crossborderinvestmentriskarisingfromdelaysinacquiringapprovalsandconsentstoundertakecrossbordertransactionsaswell
as foreign exchange fluctuations; and
• competitiverivalrywithintheinvestmentindustrycansignificantlyreducethenumberofinvestmentprospects.
The risks are largely mitigated by best business practice operations. Perils arising out of natural disasters are mitigated by Business
Continuity Planning and insurance.Risk arising from cross border investment risk ismitigated by the fact thatUganda has been a
favorable investment destination for investors compared with other East African countries. It is politically and economically stable as it
isgrowingatareasonablerate.TheUgandaSecuritiesExchangerunsonaSecuritiesCentralDepositoryplatformandaimstohavean
automatedtradingsystem.TheBankofUgandahasforeignexchangeratepoliciestocontrolthefluctuationofthecurrency.
15.8 Reputational Risk
Reputational risk is the risk of damage to Centum’s image through negative publicity, which may affect its shareholder value and its ability
to retain and generate business.
Centum’s management strives to conduct the business affairs of the company according to international best practice. Environment,
Social and Corporate Governance (ESG) are key pillars of the business operations. Additionally, the Issuer maintains compliance with
the relevant regulatory requirements.
15.9 Project Risk
The Issuer’s strategy has shifted from being a portfolio manager looking for growth capital and consolidation opportunities to become an
active promoter and developer of high quality investment grade opportunities. Project risk will be particularly prevalent in the Real Estate
and Infrastructure sectors in which the Issuer is actively operating.
Project risk has three components as explained below

Information Memorandum 111
Senior Unsecured Fixed Rate Notes and Senior Unsecured Equity Linked Notes
15.10 Execution Risk
This risk emanates from managing of various players and roles required to see the project through mainly from a planning and actual
construction perspective.
In the Real Estate Sector, the Issuer has formed Athena Properties, whose role is the development management of the current and future
real estate projects. Athena boasts of top class skill sets with international experience.
In power generation, the Issuer will rely on competent and experienced Engineering, Procurement, Construction and Maintenance
(EPCM) firms.
15.11 Finance Risk
These projects by their very nature are capital intensive as evidenced in the portfolio weighting and project highlights. Project finance is
consequently a primary concern.
The Issuer prioritizes the structuring of project funding. The objective is to optimize capital utilization by reducing weighted average cost
of capital while maximizing the equity return. Centum has used a mix of both core developer, direct equity and senior and mezzanine
debt initiatives to anchor these investments.
15.12 Market Risk
This risk refers to the timing and realization of a price for the project’s output. While the power generation projects carry a ready off take
agreement in the form of a Power Purchase Agreement (PPA) with KPLC, the Real Estate Projects would carry market risk.
The Issuer has embarked on various initiatives including off plan sales as well as engaging anchor and ancillary tenants at various stages
of the real estate developments.
An in house risk and compliance management team is actively involved in continuous and proactive risk management of emerging risks.

Information Memorandum
Senior Unsecured Fixed Rate Notes and Senior Unsecured Equity Linked Notes
112
16. CORPORATE GOVERNANCE
As a leading institutional investor and public listed company, Centum appreciates the value of strong corporate governance. The Issuer
upholds best practices in corporate governance. Centum’s culture is a reflection of the commitment of its Board to the principles of
transparency, professionalism and high performance for the benefit of our shareholders and Centum’s stakeholders.
Centum’s governance structure is as shown below:
The Board is the principal governance organ of the Issuer. The key roles of the Board are:
a) To provide leadership and direction: the Board leads the strategy development process. It has contributed to the realization of short-
term and long-term strategies for the business by ensuring adequate resourcing, target setting and following up on implementation.
b) To act as the steward of the Issuer’s resources: the Board acknowledges that the fiduciary responsibility over the assets and actions
of the Issuer lies with the Board.
c) To grow capital: the Board is actively involved in the evaluation of the Issuer’s growth agenda and steers the approval of investment
opportunities, capital allocation and divestures.
d) To oversee risk management: the Board is primarily responsible for the management of risk and ensures that business is conducted
responsibly. The internal control framework facilitates the identification and mitigation of all risks.
e) To ensure high compliance with relevant laws and regulation.
f) To ensure observance of environmental, social and governance best practices: the Board acknowledges and strives to ensure a
holistic model for value creation that covers social, economic and environmental performance.
g) To review and approve financial statements and ensure accountability to the Issuer’s shareholders and responsibility to all
stakeholders.
The BoardCentum maintains a unitary Board structure. The current Board comprises one (1) Executive Director and eight (8) Non-Executive
Directors, four of whom are Independent Directors. Therefore, almost the entire Board is made up of independent directors. In reviewing
its composition, the Board consistently seeks to ensure that its size, diversity and demographics contribute to robust decision making and
make it effective. Directors develop strategy, review the performance of management, monitor performance and ensure accountability.
The Board seeks assurance on the integrity of the financial information that the financial controls and systems of risk management are
robust and defensible.
The roles of Chairman and Managing Director/Chief Executive Officer are separate. The Chairman leads the Board while the Managing
Director and Chief Executive Officer has the direct charge of day to day business of the Issuer.
Shareholders in General meeting
Board of Directors
Management
Audit and Risk Committee
Internal Audit
Nomination and
Governance Committee
Branding Committee
Investment Committee
ICT Committee

Information Memorandum 113
Senior Unsecured Fixed Rate Notes and Senior Unsecured Equity Linked Notes
Mr. James N. MuguiyiChairman & Non Executive DirectorAge: 71 years• JoinedtheBoardinDecember,2003.• ImmediateformerGroupManagingDirectorofUAPHoldingsLimited.• HeisafellowofICPAK,amemberofCIMAandtheCharteredInstituteofPublicFinance
and Accountancy. • He isaNonExecutiveDirectorofUAP InsuranceCompanyLimited,UAP Insurance
(Uganda) Limited, UAP Insurance Sudan Limited, UAP Properties Limited, UAPFinancial Services Limited, One Network Limited, Aimsoft Kenya Limited, One Solution Limited and Mount Kenya Bottlers Limited.
Mr. James M. MworiaGroup Chief Executive Officer & Managing DirectorAge: 37 years• WasappointedChiefExecutiveOfficerofCentumInvestmentCompanyLimitedandits
subsidiaries in October, 2008.• Hehasfifteenyearsexperienceandheistherecipientofmanyregionalandinternational
awards in recognition of his outstanding business leadership. The most recent of this was the Africa Business Leader of the Year award by the Corporate Council on Africa in Washington DC.
• He is a CFA Charter holder, CPA(K), a Global Chartered Institute of ManagementAccountant,aholderofLLBfromtheUniversityofNairobiandanAdvocateoftheHighCourt of Kenya. He is a Fellow of the Archbishop Desmond Tutu African Leadership Institute.
• HeistheChairmanofK-RepBankandanon-executivedirectoroftheLewaConservancy.
Dr. James McFie (68yrs)Vice Chairman & Non Executive DirectorAge: 68 years• Dr.McFieiscurrentlytheDirectoroftheStrathmoreSchoolofAccountancy,wherehe
has served as a lecturer since 1978 and trained generations of accountants in Kenya.• Healso servesas theChairmanof theBoardofDirectorsofSasiniLimitedandasa
non-executive director of The Standard Group Limited. He has previously served as a Director of the Capital Markets Authority (Kenya) and as a Member of the Value Added Tax Tribunal of Kenya, amongst numerous other responsibilities.
• Dr.McFieholdsaPhDfromGraduateSchoolofBusiness,UniversityofStrathclyde,Glasgow,Scotland,anMA(Mathematics)degreefromBalliolCollege,OxfordUniversity,England and a BA (Mathematics) degree from Balliol College, Oxford University,England.
Mrs. Margaret M. ByamaNon Executive DirectorAge: 59 years• Mrs.ByamaistherepresentativeofthePSMinistryofTradeontheBoardsinceJanuary,
2009.• SheistheChiefFinanceOfficerintheMinistryofTradewithover20years’experience
in public financial management.• Mrs.ByamaholdsaBAfromtheUniversityofNairobiandCertificateinPublicFinancial
ManagementfromManchesterUniversity.• SheistheChairpersonoftheWildlifeClubsofKenyaandwastheimmediateformer
Chief Executive Officer of the National Humanitarian Fund for Internally Displaced Persons.
Currently, the Board of Centum is made up as explained below.

Information Memorandum
Senior Unsecured Fixed Rate Notes and Senior Unsecured Equity Linked Notes
114
Dr. Christopher KirubiNon Executive DirectorAge: 72years• Dr.KirubihasbeenaDirectorsinceDecember1997.HeservedasChairmanoftheBoard
between 1998 and 2003. He is the Chairman of Centum Investment Committee.• Awell-knownKenyanindustrialistwithinterestinfastmovingconsumergoods,mediaand
communications; Dr. Kirubi is a graduate of INSEAD and the Harvard Business School.• He was appointed a Director Harvard Business School in 2012, and also serves as the
Chairman of DHL World Wide Express Limited, Haco Industries Kenya Limited, Kiruma International Limited, International House Limited, Nairobi Bottlers Limited, Sandvik East Africa Limited and Capital FM.
• He is aNon-ExecutiveDirector of Bayer East Africa Limited andBeverage Services ofKenya Limited.
Ms. Laila MachariaNon Executive DirectorAge: 44 years• Ms.MachariajoinedtheBoardinOctober,2013.• SheistheFounderandChiefExecutiveOfficerofScionRealEstateLimited,aproperty
investment company based in Nairobi that provides financing for builders in Africa’s rapidly growing cities through its Africa Metro Property Facility.
• Lailahasvastexperiencemanagingmulti-currencyportfoliosandtransactionsintheUnitedStates of America and East Africa. While at the New York office of Clifford Chance, a global lawfirm,shecoordinatedaUS$9billionmulti-currencybondprogram.
• Prior to that, sheheaded theAfrica Initiativeat theGlobalFund forWomen in theSanFrancisco Bay Area.
• LailaiscurrentlytheViceChairman,KenyaPrivateSectorAlliance(KEPSA)andamemberof Capital Markets Tribunal. She has previously served as the Chairman, Kenya Property Developers Association.
Mr. Imtiaz KhanNon Executive DirectorAge: 46 years• Mr.KhanjoinedCentuminNovember2008andservesastheChairmanoftheAuditand
Risk Committee. He is a qualified accountant and holds a MBA with distinction from The LondonBusinessSchoolandaBcomfromtheUniversityofNairobi.
• Heisaspecialistincorporatefinanceandprivateequityinvestmentswithover20years’experience undertaking projects in 18 countries across four continents, including Brazil, Russia, India, China and South Africa which are widely regarded as some of the world’s leading emerging markets.
• He is a founding partner andExecutiveCo-Director ofCassiaCapital Partners Limited,which focuses on private equity investments in East Africa and chairs Oltepesi Properties Limited and represents Cassia Capital Partners Ltd on the board of EA-Power Limited.
Mr. Peter KimurwaNon Executive DirectorAge: 44 years• Mr.KimurwarepresentstheIndustrialCommercialandDevelopmentCorporation(ICDC)
on the Board of Centum. He has been on the Board since May 2011.• HeservesastheChairmanofTheNominationandGovernanceCommitteeandCentum
Business Solutions Limited.• HeistheExecutiveDirectoratICDCandisaspecialistinstrategyandfinancialmanagement
with extensive and varied business experience spanning over 15 years in senior positions at PricewaterhouseCoopers (PWC), British American Tobacco (BAT), BOC Kenya Limited, East African Breweries Limited (EABL) and Linksoft Communications System Limited.
• HeisaCPA(K)andholdsaMBAfromINSEADandBachelorofCommercedegreefromKenyattaUniversity.
• HerepresentsICDCasaNon-ExecutiveDirectorontheboardsofEvereadyBatteriesE.ALimited, Rift Valley Bottlers Limited, Mount Kenya Bottlers.
Mr. Henry NjorogeNon Executive DirectorAge: 46 years• Joined theBoard inOctober2005andservesas theChairmanof theCentumBranding
Committee.• HeiscurrentlyExecutiveDirectorofXtranetCommunicationsLimited.Priortothis,hewas
theManagingDirectorofOpenViewBusinessSystemsandUUNETKenyarespectively.Heworked at Telcorp and Fintech Kenya both as General Manager.
• HeisaNonExecutiveDirectorofX&RTechnologiesLimited;thesoleauthorizedXEROXdistributor and Global Equity Ventures Limited. He is also a Trustee of the Kenya Youth Business Trust, a non-profit organization which empowers youth entrepreneurs through mentorship and micro business loans.

Information Memorandum 115
Senior Unsecured Fixed Rate Notes and Senior Unsecured Equity Linked Notes
Board Structure
The complementary roles of and responsibilities of the Board and the boards of Subsidiaries are formally documented in their respective
board charters. The implementation and adoption of policies, processes or procedures across the entire Group are considered and
approved by each of the Subsidiaries.
The Board has delegated certain functions to committees with formal terms of reference which are reviewed yearly. The chairpersons of
the committees appraise the full Board of their activities on a quarterly basis through oral and/or written reports. The Board committees
are: Audit and Risk Committee, Investment Committee, Branding Committee, Nominations and Governance Committee. The ICT
Committee is currently being constituted to oversee key projects on automation of business processes for efficiency.
The details of the Committees are as summarized below:
Audit and Risk Committee
• Membership The Audit and Risk Committee (ARC) consists of four non-executive directors, the majority of who are independent directors. The
Managing Director, the Finance Manager and the lead audit partner in charge of the internal and external audit are in attendance at
meetings.
The Chairman of the ARC is an Independent Director.
• Mandate The role of the ARC is to assist the Board in discharging its duties relating to the safeguarding of assets, the operation of adequate
systems, control processes and the preparations of accurate financial statements in compliance with all applicable legal requirements and accounting standards.
Nomination and Governance Committee
• Membership
The Nomination and Governance Committee (NGC) consists of five directors who are all non-executive directors.
• Mandate
The role of the NGC is to develop and implement policies with respect to both the strategic priorities of the Board on issues of
human resources and matters of governance.
Investment Committee
• Membership
The Investment Committee (IC) is made up of six directors and includes the Group Chief Executive Officer and Managing Director
in addition to non-executive directors.
• Mandate
The key role of the IC is to review and recommend investment opportunities to ensure attractive returns on investment. The
committee provides clear guidelines on investment policies that a consistent and structured, research-based and risk sensitive
approach to value investing. The IC exercises oversight on the implementation of the investment strategy and policy of Centum.
Branding Committee
• Membership
The Branding Committee (BC) comprises of a four members being a mix of the executive and non-executive directors.
• Mandate
The role of the BC is to oversee the development of the brand of the Group ensuring consistency with the group’s strategic direction
necessary for creating tangible wealth.
Board Appointments and continuous improvement
The Nominations and Governance Committee is charged with the responsibility of appointment of Directors through a well outlined
process. Appointment of directors is geared towards bringing on board the right skill set and zeal to ensure maximum value for
shareholders. Newly appointed directors are taken through a rigorous induction program managed by the Chairman, Chief Executive
Officer and Company Secretary. The programme is aimed at imparting relevant organizational knowledge for an in-depth understanding
of the Centum culture. The induction also provides awareness for relevant policies such as disclosure of conflict of interest and obligation
to declare interests, the insider trading policy and code of ethics and business Conduct.

Information Memorandum
Senior Unsecured Fixed Rate Notes and Senior Unsecured Equity Linked Notes
116
Continuous improvement is key in ensuring the Board keeps abreast with the economic environment that Centum operates. The Issuer
ensures continuing exposure to directors on topical issues on soft skills and technical trainings to cover investment strategies and portfolio
management.
Re-election of Directors
A third of directors retire by rotation annually, and if eligible their names are submitted for re-election at the Annual General Meetings.
Also all director appointments to fill casual vacancies are subject to confirmation by shareholders at the subsequent annual general
meeting.
Evaluation of Board performance
At Centum, feedback is integral in continuous improvement for peak performance. The Board undertakes an evaluation of its performance
annually at a retreat at which candid discussions and feedback on Board performance are had. The evaluation covers among other matters:
• IndividualunderstandingoftheroleofdirectorattherespectiveCommitteeandBoardlevel;
• GeneralunderstandingoftheGroup’svision,missionandstrategy;
• PersonalinitiativeanddevelopmenttokeepabreastwithtrendsandtopicalissuesaffectingthebusinessoftheGroup;
• SkillsetofeachmemberandthematchofskillswiththeexpectationsforvalueadditiontotheGroup;
• AdequatepreparationandactiveparticipationinmeetingsattheCommitteeaswellasBoardlevel;
• AttendanceofBoardandCommitteemeetings;and
• AwarenessandadherencetoregulationsandpoliciesonCorporateGovernanceandEthics.
Company Secretary
The Company Secretary provides guidance to the Board on the duties of the directors and good governance, ensures Board and Committee
charters are kept up to date, prepares and circulate board papers, elicit responses, input, feedback for board and Board Committee
meetings, assist in drafting yearly board work plans and ensure preparation and circulation of minutes of board and committee meetings.
Remuneration of Directors
The Board remunerates directors and executives fairly and responsibly based on a compensation structure aligned with the strategy of the
company and linked to individual performance. The Shareholders at every Annual General Meeting approve the director’s remuneration.
Compliance with Laws, Rules, Codes and Standards
Compliance is an ethical imperative. Compliance with applicable laws is understood not only in terms of the obligations that they create,
but also for the rights and protection that they afford.
The Board through the guidance of the Company Secretary ensures that the Issuer complies with applicable laws and considers adherence
to non-binding rules codes and standards. Exceptions permitted in law, shortcomings and proposed changes expected are handled
ethically.
Code of Conduct
The Code of has outlined the ethical standards which the directors, employees and other stakeholders who come into contact with the
Issuer would adhere to when conducting the affairs of the Group.
The Board ensures that the Issuer’s ethics are managed effectively. Annually all directors, employees and other stakeholders renew their
written commitment to abide to the Code of Conduct. The Issuer builds and sustains an ethical corporate culture in the company through
recognition of ethical staff. The Issuer is looking into ways of measuring ethical standards.
Insider Trading Policy
Centum complies with the rules of the securities exchanges on which they are listed in respect of insider trading. The Insider Trading
policy provides the guidelines in dealing in securities by directors, officers and selected employees. Centum’s Policy and Guidelines
on Insider Trading is a reflection of the Capital Markets restrictions on transactions of the Company’s directors, employees, agents and
consultants in relation to its securities as well as the securities of other companies where it is a corporate director or insider. Such covered
persons have an open period to transact on restricted securities so as to avert any occurrence of insider trading. The open period runs
thirty days after the making of any public announcement and disclosure of all material non-public information.
Closed Period
The closed period is the time between the completion of financial results and the announcing of these results to the public. The closed
period is intended to prevent trading in a company’s shares by its insiders ahead of the public dissemination of its financial results.
In the closed period, all the investor interaction is limited to discussions on publicly available information.
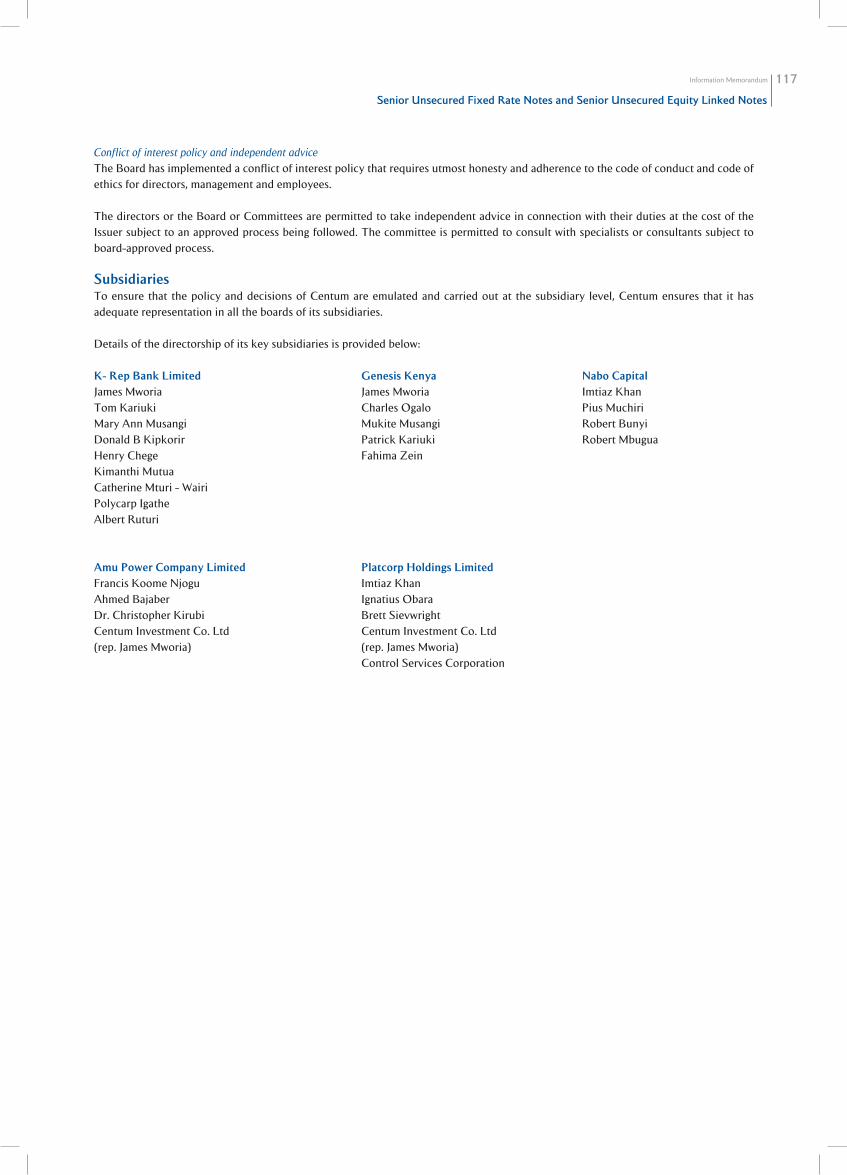
Information Memorandum 117
Senior Unsecured Fixed Rate Notes and Senior Unsecured Equity Linked Notes
Conflict of interest policy and independent advice
The Board has implemented a conflict of interest policy that requires utmost honesty and adherence to the code of conduct and code of
ethics for directors, management and employees.
The directors or the Board or Committees are permitted to take independent advice in connection with their duties at the cost of the
Issuer subject to an approved process being followed. The committee is permitted to consult with specialists or consultants subject to
board-approved process.
SubsidiariesTo ensure that the policy and decisions of Centum are emulated and carried out at the subsidiary level, Centum ensures that it has
adequate representation in all the boards of its subsidiaries.
Details of the directorship of its key subsidiaries is provided below:
K- Rep Bank Limited Genesis Kenya Nabo Capital
James Mworia James Mworia Imtiaz Khan
Tom Kariuki Charles Ogalo Pius Muchiri
Mary Ann Musangi Mukite Musangi Robert Bunyi
Donald B Kipkorir Patrick Kariuki Robert Mbugua
Henry Chege Fahima Zein
Kimanthi Mutua
Catherine Mturi - Wairi
Polycarp Igathe
Albert Ruturi
Amu Power Company Limited Platcorp Holdings Limited
Francis Koome Njogu Imtiaz Khan
Ahmed Bajaber Ignatius Obara
Dr. Christopher Kirubi Brett Sievwright
Centum Investment Co. Ltd Centum Investment Co. Ltd
(rep. James Mworia) (rep. James Mworia)
Control Services Corporation

Information Memorandum
Senior Unsecured Fixed Rate Notes and Senior Unsecured Equity Linked Notes
118
Senior ManagementCentum’s senior management is made up as explained below.
Mr. James M. MworiaGroup Chief Executive Officer & Managing DirectorAge: 37 years• Was appointed Chief Executive Officer of Centum Investment Company Limited and its
subsidiaries in October, 2008.• He has fifteen years experience and he is the recipient ofmany regional and international
awards in recognition of his outstanding business leadership. The most recent of this was the Africa Business Leader of the Year award by the Corporate Council on Africa in Washington DC.
• HeisaCFACharterholder,CPA(K),aGlobalCharteredInstituteofManagementAccountant,aholderofLLBfromtheUniversityofNairobiandanAdvocateoftheHighCourtofKenya.Heis a Fellow of the Archbishop Desmond Tutu African Leadership Institute.
• HeistheChairmanofK-RepBankandanon-executivedirectoroftheLewaConservancy.
James KaguchiaDirector Private Equity; Centum CapitalAge: 40• JoinedCentuminMarch2013havingpreviouslyworkedwithKewbergCablesinSouthAfrica
as Managing Director and Chief Executive Officer.• HeiscurrentlytheDirector;CentumCapital;thebusinessunitwithinCentumthatisresponsible
for executing the sector strategies.• HeholdsBcom(Accountingoption)fromtheKenyattaUniversity,andisaCPA(K).
Mrs. Risper MukotoManaging Director Centum Business Solutions LimitedAge: 40 years • Mrs.Mukoto is theManagingDirectorofCentumBusinessSolutions (CBS)whichprovides
non-investment related business solutions across Centum. She also serves as the Director, Finance & Operations.
• Shehasover14yearsexperienceinFinancialandoperationsmanagement,mostofwhichsheserved in various positions within Centum.
• SheisamemberofICPAKandaFellowoftheAssociationofCertifiedCharteredAccountants(FCCA).SheholdsaBAinBusinessManagementfromMoiUniversityaswellasanMBAfromtheUnitedStatesInternationalUniversity-Africa(USIU-A).
• SheisaFellowoftheArchbishopDesmondTutuAfricanLeadershipInstitute.
Mr. Fred MurimiDirector Corporate Affairs and Company SecretaryAge: 35 years• Mr.MurimiistheCorporateAffairsDirector&GroupCompanySecretary.Heactsasthe
Group’s general counsel and additionally oversees the Group’s investor relations, company secretarial and risk functions.
• Hehasover10years’experienceintheinvestmentindustry.PriortojoiningCentuminJanuary 2013, he worked with Dyer & Blair Investment Bank and later with Renaissance Capital as Vice President – Legal & Compliance.
• HeholdsaBachelorofLawsdegree(LL.B),aMasterofBusinessAdministration(MBA)degree, is a Certified Public Accountant (CPA) and as a Certified Public Secretary (CPS) and is a member of the Law Society of Kenya (LSK) and Institute of Certified Public Secretaries of Kenya (ICPSK).
• In2014,hewasawardedCertifiedSecretaryoftheYearintheChampionsofGovernanceAwards by ICPSK.
Mrs. Nelly KanjaDirector Marketing & CommunicationsAge: 41 years• Mrs.KanjajoinedCentuminMarch2015astheMarketingandCommunicationsDirector.
She has over 15 years experience in Marketing and Communication.• PriortoCentum,sheworkedforScanadandrosethroughtherankstobecometheBusiness
head of Scanad Kenya.• Mrs.KanjaholdsaMasterofBusinessAdministration(MBA)fromStrathmoreUniversityand
aBAinGovernment&PublicAdministrationfromMoiUniversity.Shealsoholdscertificatesin Public Relations Management from Kenya Institute of Management and the Marketing Society of Kenya.

Information Memorandum 119
Senior Unsecured Fixed Rate Notes and Senior Unsecured Equity Linked Notes
Nicholas Macharia Managing Director, King Beverage LimitedAge: 39 years• NicholasjoinedKingBeverageLimited(KBL)asManagingDirectorin2014.KBLiscurrently
thesoledistributorofCarlsberginKenyaandisa100%subsidiaryofCentum.• PriortojoiningKBL,NickwastheRegionalCommercialManageratWeetabixEastAfrica.He
has over 14 year’s leadership experience in the FMCG sector. He also worked at Coca Cola SabcoasCountryFinanceManagerinUganda,FinanceManager&ActingCountryManagerinMozambique and later as Country Commercial Manager in Kenya.
• NickholdsaMBAfromHertfordshireUniversityintheU.K,aDiplomainBusinessManagementfromHerriotWattUniversityandisamemberoftheAssociationofCertifiedChartered Accountants (ACCA).
Charles Orony OgaloManaging Director, Genesis Kenya Investment Management LimitedAge: 57 Years• CharlesservesGenesisKenyaastheManagingDirector,apositionhehasheldsince
joining the entity in 1996. Genesis Kenya the second largest Asset Manager in the country, specializing in investment management and pension scheme advisory services. Centum holds a73%stakeinGenesis.
• Priortotakingthisposition,heservedinkeyseniorpositionsatKCBwithhislastpostingasChief Manager, Correspondent Banking and International Trade. During his 11 years’ service with KCB, he spent four years as the first London Representative, developing business in Europe and America. He has over 15 year’s leadership experience in the banking sector and fund management.
• CharlesholdsamastersdegreeinEconomicsfromRutgersUniversityandaBachelorofArtsdegreefromStateUniversityofNewYork.
Mr. Pius MuchiriManaging Director Nabo Capital LimitedAge: 39 years• Mr.MuchiriistheManagingDirectorofNaboCapitalLimited,awhollyownedfundmanagement
subsidiary of Centum. Prior to this appointment, he served as the Investment Manager in charge of the quoted investment portfolio.
• He has over twelve (12) years investment management experience gained in various roleswithin Centum, Toyota East Africa and AAR Healthcare.
• HeisamemberofEastAfricanInvestmentProfessionalsandholdsaBcomfromtheUniversityof Nairobi. He is CPA(K) finalist and CFA.
• HeisaFellowoftheArchbishopDesmondTutuAfricanLeadershipInstitute
Mr. Chris OchiengManaging Director Athena Properties LimitedAge: 34 years• Mr.OchiengistheManagingDirectorofAthenaPropertiesLimited,thesubsidiarythat
provides real estate development and project management services to Centum and third parties.
• HeisacertifiedProjectManagementProfessional(PMP)andholdsaBachelorofScienceinCivil Engineering from Egerton University.
• PriortothisappointmentinJanuary2015,heservedastheDeputyDirectorforAthenaProperties. Previously, he worked for Lordship Group, Dubai Sports City and Hedley Engineering. He has over eight years experience in real estate development.
Managing Directors of our other subsidiaries

Information Memorandum
Senior Unsecured Fixed Rate Notes and Senior Unsecured Equity Linked Notes
120
The Management Operating Structure is highlighted below
Centum Investment Company Ltd. James Mworia; Group CEO
Centum Capital (A division of Centum)
James Kaguchia; Director & Head FMCG
Athena Properties Ltd. Chris Ochieng;
Managing Director
Nabo Capital Ltd. Pius Muchiri;
Managing Director
Centum Business Solutions Ltd. Risper Mukoto;
Managing Director
Energy Division; Job Muriuki
Financial Services Division; Francis Nasyomba
Agribusiness Division; Steve Chege
Project Delivery Director; Tim Hitchen
Architecture & Urban Planning Director;
Arthur Adeya
Project Finance; Karumba Kinyua
Product Structuring; Teresia Muthoni
Corporate Affairs Director & Group Company Secretary;
Fred Murimi
Marketing & Communications Director;
Nelly Kanja
Legal Services; Lois Gakumo
Finance Services; Gideon Maina
Risk Management Services; Charlene Kavulani
ICT Services; Steve Karechio
HR Services; Doris Ndanu

Information Memorandum 121
Senior Unsecured Fixed Rate Notes and Senior Unsecured Equity Linked Notes
17. LEGAL AND CORPORATE INFORMATION
17.1 Name, Place and Date of Registration
The Issuer was incorporated in Kenya as ICDC Investment Company Limited, a public company limited by shares on 13 April 1967
under the Companies Act (Chapter 486) with registration number C 8/67. The initial name - ICDC Investment Company Limited - was
changedto‘CentumInvestmentCompanyLimited’followingthepassingofaspecialresolutionoftheshareholdersdated21February
2008. This was effected by a Certificate of Change of Name issued by the Registrar of Companies dated the 25 February 2008, in the
name of Centum Investment Company Limited.
TheIssuerisregisteredasabranchinUgandaundertheCompaniesAct(Cap.110Section371(1)oftheLawsofUganda)(Registration
No F 2158).
The Issuer’s registered office is at 5th Floor, International House, Mama Ngina Street, Nairobi, Kenya.
17.2 Capital Structure
The Issuer’s nominal share capital is Kes 400,000,000 divided into 800,000,000 ordinary shares of Kes 0.50 cents each. The Issuer has
665,441,714 issued ordinary shares.
17.3 Voting Rights and Control
All the issued shares in the company have equal voting rights. Article 66 of the Issuer’s Articles of Association provides:
“Subject to any special terms as to voting upon which any shares may be issued or may for the time being be held, on a show of hands
every Member who (being an individual) is present in person or (being a corporation) is present by a representative duly authorized
pursuant to these Articles, shall have one vote and on a poll every Member shall have one vote for each share of which he is the holder.”
17.4 Listing
TheIssuer’ssharesarelistedontheNSEandtheUSE.
17.5 Issues of shares in the three years immediately preceding the date of this Information Memorandum
The Issuer has not issued any new shares in the three years immediately preceding the date of this Information Memorandum:
17.6 Principal objects (as contained in the Memorandum of Association)
The Issuer’s principal objects are listed below.
1) To carry on the business of an investment company, unit trust, mutual fund and to raise and borrow money by the issue of shares,
debentures, debenture stock, bonds, obligations, deposit notes and otherwise howsoever and to underwrite any such issue.
2) To invest the money so borrowed and raised and other moneys of the Issuer in the purchase or upon the security of shares, stocks,
debentures, debenture stock, bonds, mortgages, obligations and securities of any kind issued or guaranteed by any company,
corporation or undertaking existing, formed or to be formed or registered and carrying on business of whatever nature and
howsoever constituted and in shares, stocks, debentures, debenture stocks, bonds, mortgages, obligations and other securities issued
or guaranteed by any Government or by any municipal, local or other authority or body of whatever nature.
3) To acquire any such shares, stocks debentures, debenture stocks, bonds, mortgages, obligations and other securities by original
subscription, syndicate participation, tender, purchase, exchange or otherwise and to subscribe for the same either conditionally or
otherwise and to guarantee the subscription thereof.
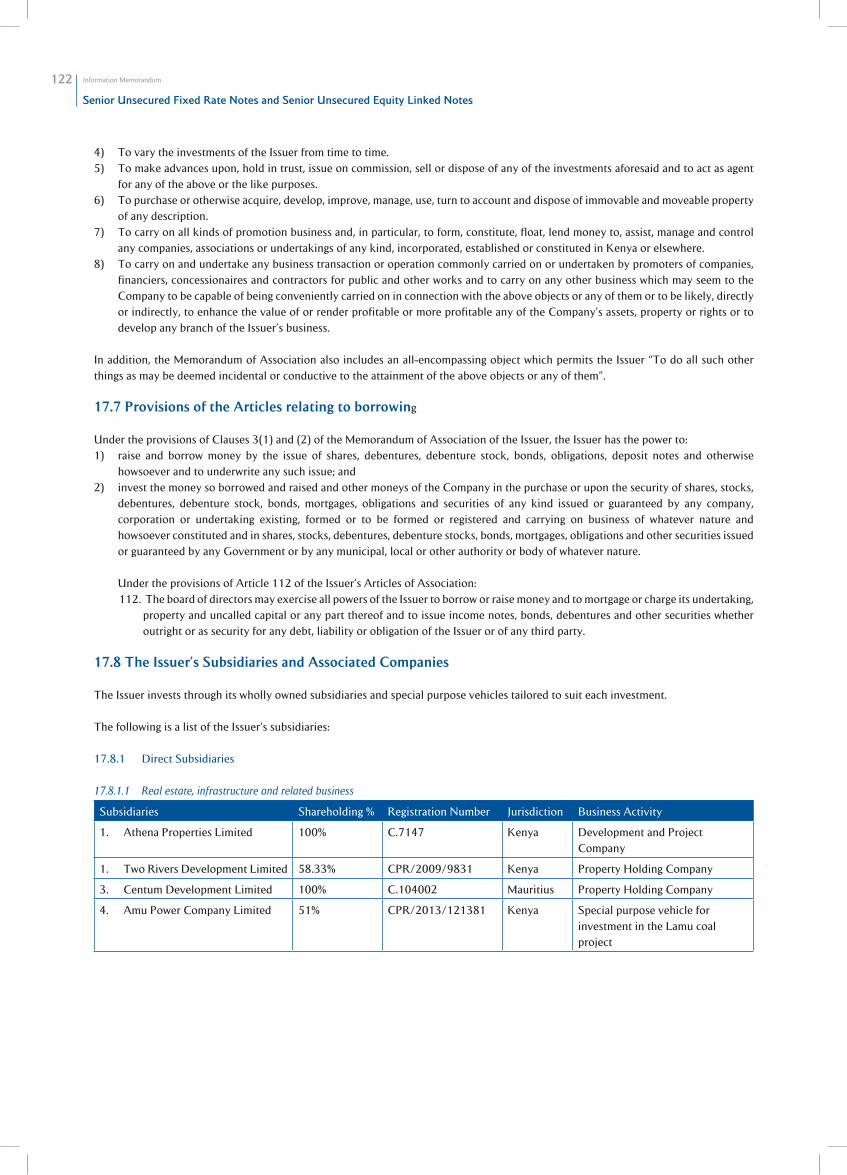
Information Memorandum
Senior Unsecured Fixed Rate Notes and Senior Unsecured Equity Linked Notes
122
4) To vary the investments of the Issuer from time to time.
5) To make advances upon, hold in trust, issue on commission, sell or dispose of any of the investments aforesaid and to act as agent
for any of the above or the like purposes.
6) To purchase or otherwise acquire, develop, improve, manage, use, turn to account and dispose of immovable and moveable property
of any description.
7) To carry on all kinds of promotion business and, in particular, to form, constitute, float, lend money to, assist, manage and control
any companies, associations or undertakings of any kind, incorporated, established or constituted in Kenya or elsewhere.
8) To carry on and undertake any business transaction or operation commonly carried on or undertaken by promoters of companies,
financiers, concessionaires and contractors for public and other works and to carry on any other business which may seem to the
Company to be capable of being conveniently carried on in connection with the above objects or any of them or to be likely, directly
or indirectly, to enhance the value of or render profitable or more profitable any of the Company’s assets, property or rights or to
develop any branch of the Issuer’s business.
In addition, the Memorandum of Association also includes an all-encompassing object which permits the Issuer “To do all such other
things as may be deemed incidental or conductive to the attainment of the above objects or any of them”.
17.7 Provisions of the Articles relating to borrowing
UndertheprovisionsofClauses3(1)and(2)oftheMemorandumofAssociationoftheIssuer,theIssuerhasthepowerto:
1) raise and borrow money by the issue of shares, debentures, debenture stock, bonds, obligations, deposit notes and otherwise
howsoever and to underwrite any such issue; and
2) invest the money so borrowed and raised and other moneys of the Company in the purchase or upon the security of shares, stocks,
debentures, debenture stock, bonds, mortgages, obligations and securities of any kind issued or guaranteed by any company,
corporation or undertaking existing, formed or to be formed or registered and carrying on business of whatever nature and
howsoever constituted and in shares, stocks, debentures, debenture stocks, bonds, mortgages, obligations and other securities issued
or guaranteed by any Government or by any municipal, local or other authority or body of whatever nature.
UndertheprovisionsofArticle112oftheIssuer’sArticlesofAssociation:
112. The board of directors may exercise all powers of the Issuer to borrow or raise money and to mortgage or charge its undertaking,
property and uncalled capital or any part thereof and to issue income notes, bonds, debentures and other securities whether
outright or as security for any debt, liability or obligation of the Issuer or of any third party.
17.8 The Issuer’s Subsidiaries and Associated Companies
The Issuer invests through its wholly owned subsidiaries and special purpose vehicles tailored to suit each investment.
The following is a list of the Issuer’s subsidiaries:
17.8.1 Direct Subsidiaries
17.8.1.1 Real estate, infrastructure and related business
Subsidiaries Shareholding% Registration Number Jurisdiction Business Activity
1. Athena Properties Limited 100% C.7147 Kenya Development and Project
Company
1. Two Rivers Development Limited 58.33% CPR/2009/9831 Kenya Property Holding Company
3. Centum Development Limited 100% C.104002 Mauritius Property Holding Company
4. Amu Power Company Limited 51% CPR/2013/121381 Kenya Special purpose vehicle for
investment in the Lamu coal
project
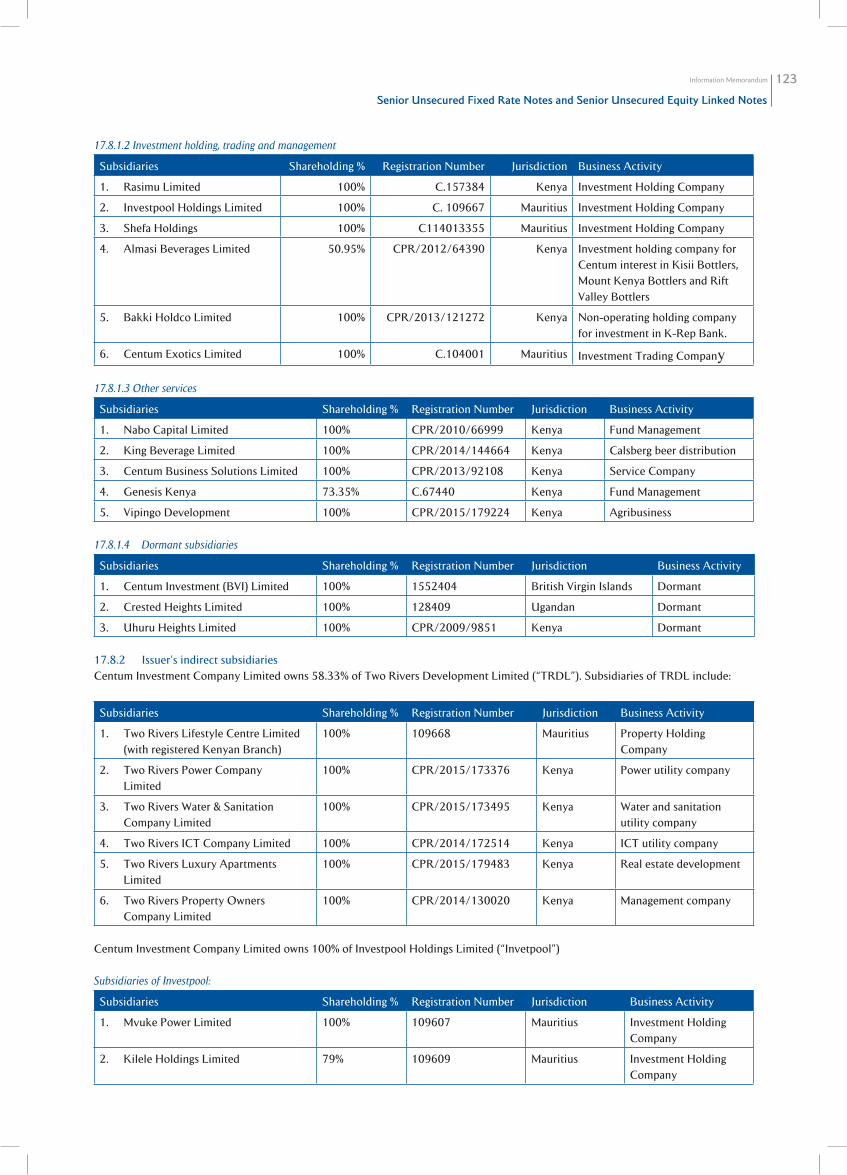
Information Memorandum 123
Senior Unsecured Fixed Rate Notes and Senior Unsecured Equity Linked Notes
17.8.1.2 Investment holding, trading and management
Subsidiaries Shareholding% Registration Number Jurisdiction Business Activity
1. Rasimu Limited 100% C.157384 Kenya Investment Holding Company
2. Investpool Holdings Limited 100% C. 109667 Mauritius Investment Holding Company
3. Shefa Holdings 100% C114013355 Mauritius Investment Holding Company
4. Almasi Beverages Limited 50.95% CPR/2012/64390 Kenya Investment holding company for
Centum interest in Kisii Bottlers,
Mount Kenya Bottlers and Rift
Valley Bottlers
5. Bakki Holdco Limited 100% CPR/2013/121272 Kenya Non-operating holding company
for investment in K-Rep Bank.
6. Centum Exotics Limited 100% C.104001 Mauritius Investment Trading Company
17.8.1.3 Other services
Subsidiaries Shareholding% Registration Number Jurisdiction Business Activity
1. Nabo Capital Limited 100% CPR/2010/66999 Kenya Fund Management
2. King Beverage Limited 100% CPR/2014/144664 Kenya Calsberg beer distribution
3. Centum Business Solutions Limited 100% CPR/2013/92108 Kenya Service Company
4. Genesis Kenya 73.35% C.67440 Kenya Fund Management
5. Vipingo Development 100% CPR/2015/179224 Kenya Agribusiness
17.8.1.4 Dormant subsidiaries
Subsidiaries Shareholding% Registration Number Jurisdiction Business Activity
1. Centum Investment (BVI) Limited 100% 1552404 British Virgin Islands Dormant
2. Crested Heights Limited 100% 128409 Ugandan Dormant
3. UhuruHeightsLimited 100% CPR/2009/9851 Kenya Dormant
17.8.2 Issuer’s indirect subsidiaries
CentumInvestmentCompanyLimitedowns58.33%ofTwoRiversDevelopmentLimited(“TRDL”).SubsidiariesofTRDLinclude:
Subsidiaries Shareholding% Registration Number Jurisdiction Business Activity
1. Two Rivers Lifestyle Centre Limited
(with registered Kenyan Branch)
100% 109668 Mauritius Property Holding
Company
2. Two Rivers Power Company
Limited
100% CPR/2015/173376 Kenya Power utility company
3. Two Rivers Water & Sanitation
Company Limited
100% CPR/2015/173495 Kenya Water and sanitation
utility company
4. Two Rivers ICT Company Limited 100% CPR/2014/172514 Kenya ICT utility company
5. Two Rivers Luxury Apartments
Limited
100% CPR/2015/179483 Kenya Real estate development
6. Two Rivers Property Owners
Company Limited
100% CPR/2014/130020 Kenya Management company
CentumInvestmentCompanyLimitedowns100%ofInvestpoolHoldingsLimited(“Invetpool”)
Subsidiaries of Investpool:
Subsidiaries Shareholding% Registration Number Jurisdiction Business Activity
1. Mvuke Power Limited 100% 109607 Mauritius Investment Holding
Company
2. Kilele Holdings Limited 79% 109609 Mauritius Investment Holding
Company
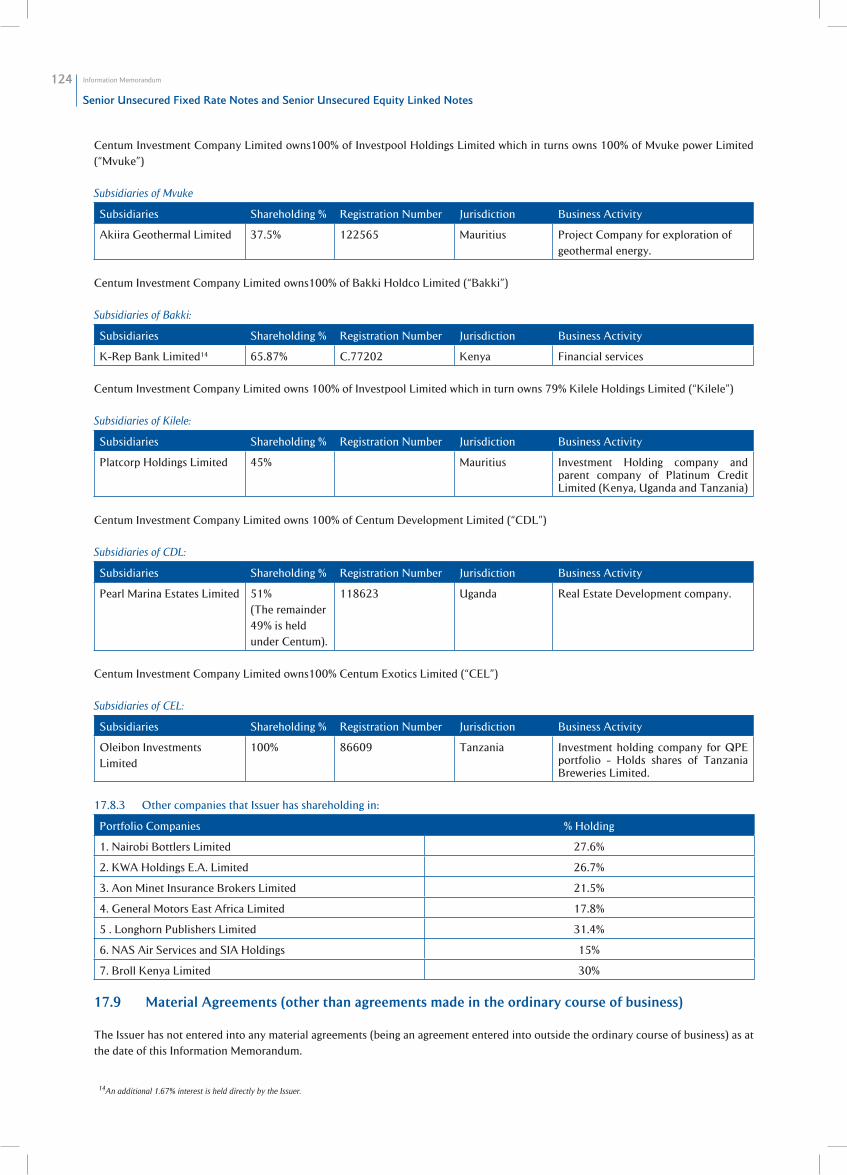
Information Memorandum
Senior Unsecured Fixed Rate Notes and Senior Unsecured Equity Linked Notes
124
CentumInvestmentCompanyLimitedowns100%ofInvestpoolHoldingsLimitedwhichinturnsowns100%ofMvukepowerLimited
(“Mvuke”)
Subsidiaries of Mvuke
Subsidiaries Shareholding% Registration Number Jurisdiction Business Activity
Akiira Geothermal Limited 37.5% 122565 Mauritius Project Company for exploration of
geothermal energy.
CentumInvestmentCompanyLimitedowns100%ofBakkiHoldcoLimited(“Bakki”)
Subsidiaries of Bakki:
Subsidiaries Shareholding% Registration Number Jurisdiction Business Activity
K-Rep Bank Limited14 65.87% C.77202 Kenya Financial services
CentumInvestmentCompanyLimitedowns100%ofInvestpoolLimitedwhichinturnowns79%KileleHoldingsLimited(“Kilele”)
Subsidiaries of Kilele:
Subsidiaries Shareholding% Registration Number Jurisdiction Business Activity
Platcorp Holdings Limited 45% Mauritius Investment Holding company and parent company of Platinum Credit Limited(Kenya,UgandaandTanzania)
CentumInvestmentCompanyLimitedowns100%ofCentumDevelopmentLimited(“CDL”)
Subsidiaries of CDL:
Subsidiaries Shareholding% Registration Number Jurisdiction Business Activity
Pearl Marina Estates Limited 51%
(The remainder
49%isheld
under Centum).
118623 Uganda Real Estate Development company.
CentumInvestmentCompanyLimitedowns100%CentumExoticsLimited(“CEL”)
Subsidiaries of CEL:
Subsidiaries Shareholding% Registration Number Jurisdiction Business Activity
Oleibon Investments
Limited
100% 86609 Tanzania Investment holding company for QPE portfolio - Holds shares of Tanzania Breweries Limited.
17.8.3 Other companies that Issuer has shareholding in:
Portfolio Companies %Holding
1. Nairobi Bottlers Limited 27.6%
2. KWA Holdings E.A. Limited 26.7%
3. Aon Minet Insurance Brokers Limited 21.5%
4. General Motors East Africa Limited 17.8%
5 . Longhorn Publishers Limited 31.4%
6. NAS Air Services and SIA Holdings 15%
7. Broll Kenya Limited 30%
17.9 Material Agreements (other than agreements made in the ordinary course of business)
The Issuer has not entered into any material agreements (being an agreement entered into outside the ordinary course of business) as at
the date of this Information Memorandum.
14An additional 1.67% interest is held directly by the Issuer.

Information Memorandum 125
Senior Unsecured Fixed Rate Notes and Senior Unsecured Equity Linked Notes
17.10 Onerous Covenants and Default
The Issuer has not entered into any agreements with third parties that contain onerous covenants as at the date of this Information
Memorandum.
The Issuer has issued several debentures in favour of Cooperative Bank as detailed in 18.12.2 below. The Issuer is not in default of any
terms of the debentures.
17.11 Related Party Agreements (loan agreements with subsidiaries, etc with details on amounts, purpose, interest rates, etc)
The Issuer has in place a transfer pricing policy created under the requirements of the Income Tax (Transfer Pricing) Rules 2006.
The schedule below shows the amounts owed to and owing from the Issuer’s subsidiaries and associate Companies.
Table 14: Related Party Agreements
March 15
Kes’000
March 14
Kes’000
DUE FROM
Centum Investment (BVI) Limited NIL 97
Pearl Marina Properties Limited NIL NIL
Two Rivers Development Limited 1,717,806 2,509,749
e-Tranzact Limited NIL 7,025
Centum Exotics Limited 1,231,375 2,009,557
Centum Development Limited 2,279,153 1,881,838
Nabo Capital Limited 355,797 363,504
Centum Business Solutions Limited NIL 29,278
Mvuke Limited 248,261 51,944
Genesis Kenya Investment Management Limited NIL 47,000
Two Rivers Lifestyle centre NIL 43
King Beverage Limited 33,909 136
UhuruHeightsLimited 5 NIL
Kilele Holdings Limited 829,310 768,402
Investpool Limited 139 NIL
Total
DUE TO NIL NIL
Athena Properties Limited NIL 117,538
Centum Development Limited NIL NIL
Rasimu Limited 6,473 1,764
UhuruHeightsLimited NIL 2,544
17.12 Loan/Finance Agreements
17.12.1 SeniorUnsecuredFixedRateNotesandSeniorEquityLinkedNotes
Centum issued notes on the basis of an information memorandum dated 23rd August 2012 and a subsequent information memorandum
dated 7 December 2012 raising an aggregate amount of Kenya Shillings four billion, one hundred and sixty seven million, nine hundred
thousand (Kes.4,167,900,000) by way of a placement and listing of unsecured fixed rate notes and unsecured equity linked notes. The
notes are currently in issue and listed on the NSE.
The Issuer has sought and obtained approval of the holders of the existing notes and the Authority for this Note Issue.

Information Memorandum
Senior Unsecured Fixed Rate Notes and Senior Unsecured Equity Linked Notes
126
17.12.2 Facilities from Co-operative Bank of Kenya Limited
(a) Centum has an overdraft and guarantee facility with Co-operative of Kenya Bank Limited. The details of these credit facilities are
detailed below:
Facility Amount Security
Overdraft/
Guarantee facility
KES 2,700,000,000 All the securities provided have the benefit of several security instruments issued by
Centum some of which overlap and act as security for other facilities.
These securities are inter alia:
• Debenture over the corporate bonds and quoted equities held at Custodial
Services Department for KES 1.2 billion dated 26 January 2010;
• FurtherdebentureoverthecorporatebondsandquotedequitiesheldatCustodial
Services Department for KES500 million dated 12 October 2010;
• 2nd further debenture over the corporate bonds and quoted equities held at
Custodial Services Department for KES 500 million dated 16 December 2011;
and
• 3rd further debenture over the corporate bonds and quoted equities held at
Custodial Services Department for KES 500 million dated 14October 2014.
17.12.3 Facility from FirstRand Bank Limited
The Issuer has a facility with FirstRand Bank Limited (the “Facility”) (acting through its Rand Merchant Bank Division acting as Agent)
(the “Bank”)forthesumUSD35,000,000.
Facility Key Terms
Parties (a) The Issuer (“Borrower”)
(b) Centum Exotics Limited; Rasimu Limited; Oleibon Investments Limited; Investpool Holdings Limited
(“Original Guarantors”)
(c) Rand Merchant Bank (“Arranger”)
(d) Rand Merchant Bank (“Original Lender”)
(e) Rand Merchant Bank (“Agent”)
(f) Rand Merchant Bank (“Security Agent”)
Principal amount US$35,000,000
Purpose Making investments and general corporate purposes
Interest Rate Marginat5.75%plusUSLIBOR(asdefined)perannum.
Default interest rate 2%perannumabovetheapplicablerate.
Security Security include:
a) Charge over shares held by the Obligors in the Charged Portfolio Companies (details of the Charge are set
out below);
b) Charge over the Custodial Accounts and Proceeds Accounts maintained by Centum Exotics Limited and
Oleibon Investment Limited with the Custodian (CfC Stanbic Bank Limited);
c) Assignment of any loans made to the Charged Portfolio Companies or other non-Obligor;
d) Custodian Agreement and Acknowledgement between the Custodian, Centum Exotics Limited and
Oleibon Investment Limited in respect of the holding of Listed Investments by the Custodian for Centum
Exotics Limited and Oleibon Investment Limited and the acknowledgement by the Custodian in favour of
the Agent.
“Charged Portfolio Companies” means the Portfolio Company whose shares are subject to security provided
(and as at the date of the Agreement include Almasi Beverages Limited and Nairobi Bottlers Limited).
Guarantees and indemnity
Centum Exotics Limited; Rasimu Limited; Oleibon Investments Limited; Investpool Holdings Limited have
guaranteed the obligations of the Borrower’s obligations in relation to the facility.
Repayment or duration
The Facility is to be repaid in full on the earlier of (a) the Maturity Date (12 months after the first utilization
date, subject to an extension of six months at the discretion of the Lenders), or (b) the date on which an
Event of Default is triggered.

Information Memorandum 127
Senior Unsecured Fixed Rate Notes and Senior Unsecured Equity Linked Notes
Facility Key Terms
Charge over Shares Charge over shares in favour of the Security Agent as trustee for the Secured Parties.
Parties a) Centum Investment Company Limited (“Chargor”); and
b) FirstRand Bank Limited acting through its Rand Merchant Bank Division (“Security Agent”)
Principal amount US$35,000,000
Purpose Security for the facility from FirstRand Bank Limited
Charged Shares Shares registered in the name of the Chargor from time to time in the capital of the Almasi Beverages Limited
and Nairobi Bottlers Limited and any entity in which any member of the Group acquires an investment after
the date of the Charge. As at the date of the Charge, the Charged Shares were:
a) 365,036,394 shares of Almasi Beverages Limited
b) 981,971 shares in Nairobi Bottlers Limited.
General Comment The proceeds of the Notes Issue will partly be utilised to refinance the above facility obtained from the
Lenders and the Lenders have consented to issue of the Notes Issue.
17.13 Relevant subsidiary loan/Finance agreements
The Issuer has provided a guarantee dated 18 December 2014 for Kes. 45,992,700 in favour of K-Rep Bank Limited (the Issuer’s
subsidiary) in connection with an asset financing facility availed by K-Rep Bank Limited to King Beverage Limited (another Subsidiary
of the Issuer).
17.14 Loans to directors and senior management
As at 31 March 2015, there were no outstanding loans to Directors or Senior Management.
17.15 Licenses and Permits
17.15.1 The Issuer
The Issuer is incorporated under the Companies Act (Chapter 486 of the Laws of Kenya). The Issuer is subject to the provisions of theCapitalMarketsAct(Chapter485AoftheLawsofKenya)andtheCapitalMarketsAuthorityAct,(Chapter84LawsofUganda)
because it is a listed company in both jurisdictions.
DuetothenatureoftheIssuer’sbusiness,theIssuerdoesnotrequirespecificlicensingbyanyregulatoryauthorityinKenyaorUganda.
The Issuer has a current single business permit issued by the City Council of Nairobi under activity code 630 – Financial Services.
17.15.2 Subsidiaries
The following subsidiaries of Centum require specific licenses under the following regulatory regimes:
No. Subsidiary and activity Licence Licence No. Regulator
1. Nabo Capital Limited Fund Manager 029 CMA
2. Nabo Capital Limited REIT Manager 076 CMA
3. Nabo Capital Limited Fund manager for retirement benefit schemes RBA/SUP/213/031 RBA
4. Genesis Kenya Investment
Management Limited
Fund Manager 25/13 CMA
5. Genesis Kenya Investment
Management Limited
Fund manager for retirement benefit schemes RBA/SUP/213/002 RBA
6. K-Rep Bank Limited Bank CBK/BSD/01/78/2015 CBK
17.16 Property and information on Vendors on materials assets acquired in the last three years
Other than disclosed in this information memorandum, the Issuer has not directly acquired the any material assets over the last three
years.

Information Memorandum
Senior Unsecured Fixed Rate Notes and Senior Unsecured Equity Linked Notes
128
17.17 Provisions of the Articles with respect to directors
Number (Article 78) Not less than 2 and not more than 9
Quorum (Article 96) The quorum necessary for the transaction of business of the Board may be fixed by the Board
and, unless so fixed at any other number, shall be two directors present either personally or by
alternate provided that one person, whether a Director or not, although duly appointed alternate
for another Director or for any number of Directors shall not constitute a Quorum.
Voting on interested matters
(Article 84 (b) and (c)
A Director who is in any way, whether directly or indirectly, interested in a contract or
arrangement or proposed contract or arrangement with the Company shall declare the nature
of his interest at the meeting if the Board at which the question of entering into the contract
or arrangement is first taken into consideration, if his interest then exits, or in any other case
at the first meeting of the Board after he becomes so interested, A general notice to the Board,
given by a Director to the effect that he is a member of a specified company or firm and is to
be regarded as interested in all transactions with such company or firm, shall be a sufficient
declaration of interest under this Article and, after such general notice, it shall not be necessary
to give any special notice relating to any subsequent transaction with such company or firm,
provided that either the notice is given at a meeting of the Board or the Director giving the same
takes reasonable steps to secure that it is brought up and read at the next board meeting after
it is given.
A Director who shall have declared his interest as aforesaid may attend, be counted in the
quorum of and vote at any meeting of the Board which may consider or pass any resolution in
respect of any contract or arrangement in which he is interested.
Remuneration (Article 81) Directors are entitled to such remuneration as shall form time to time be determined by the
Company in a general meeting and such remuneration shall be divided among the Directors
as the Board may by resolution determine or failing such determination, equally except in
such event, any Director holding office for less than a year shall only rank in such division
in proportion to the period during which he has held office during such year. The Directors
(including alternate Directors) shall also be entitled to be paid their reasonable travelling, hotel
and incidental expenses incurred while engaged on the business of the Company.
Rotation/Retirement (Article 87) The Directors to retire in every year shall be those who have been longest in office since their
last election but as between persons who became Directors on the same day, those to retire shall,
unless otherwise agreed among themselves, be determined by lot.
17.18 Material Litigation
There are no legal or arbitration proceedings (including any such proceedings which are pending or threatened of which the issuer is aware) which may have had or had in the past twelve (12) months preceding the date of this Information Memorandum a significant adverse effect on the financial position or the operations of the Group.

Information Memorandum 129
Senior Unsecured Fixed Rate Notes and Senior Unsecured Equity Linked Notes
17.19 Other Disclosures
1. The Board of Directors has passed all necessary resolutions and taken all necessary corporate actions to approve and authorise the
Issuer to issue the Notes.
2. As at the date of this Information Memorandum and for a period of at least two (2) years prior to the date of this Information
Memorandum, no director of the Issuer has-
a. had any petition under bankruptcy or insolvency in any jurisdiction pending or threatened against the director (for individuals),
or any winding-up petition pending or threatened against it (for corporate bodies);
b. had any criminal proceedings in which the director was convicted of fraud or any criminal offence, or be named subject of
pending criminal proceeding, or any other offence or action either within or outside Kenya; or
c. been the subject of any ruling of a court of competent jurisdiction or any governmental body, that permanently or temporarily
prohibits such director from acting as an investment adviser or as a director or employee of a stockbroker, dealer or any
financial institution or engaging in any type or business practice or activity.
3. At least one third of the Issuer’s board of directors are non-executive directors.
4. There was no change in Directors’ interests between the end of the Issuer’s financial year and the date of publication of this
Information Memorandum.
5. As at the date of this Information Memorandum, there are no contractual arrangements with a controlling shareholder that would
render the Issuer incapable at all times of carrying on its business independently of any controlling shareholder.
6. There has been no significant change in the Issuer’s major shareholders during the past three financial years.
7. As at the date of this Information Memorandum, none of the Issuer’s senior management employees have committed any serious
offence that may be considered inappropriate for the management of a listed company.
8. A copy of this Information Memorandum has been delivered to the Registrar of Companies.
9. The Issuer is a publicly listed company and its shares are freely transferable.
10. As at the date of this Information Memorandum, there are no arrangements, known to the Issuer the operation of which may at a
subsequent date result in a change in control of the Issuer.
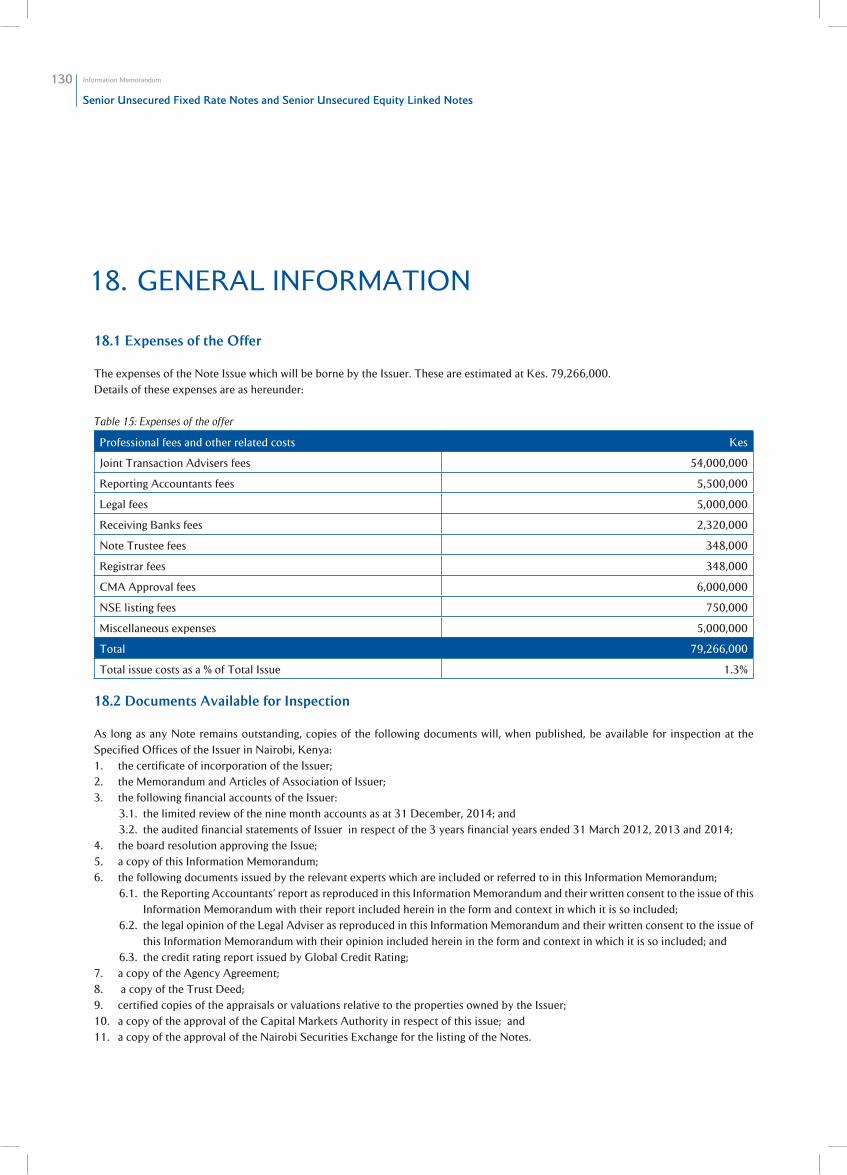
Information Memorandum
Senior Unsecured Fixed Rate Notes and Senior Unsecured Equity Linked Notes
130
18. GENERAL INFORMATION
18.1 Expenses of the Offer
The expenses of the Note Issue which will be borne by the Issuer. These are estimated at Kes. 79,266,000.
Details of these expenses are as hereunder:
Table 15: Expenses of the offer
Professional fees and other related costs Kes
Joint Transaction Advisers fees 54,000,000
Reporting Accountants fees 5,500,000
Legal fees 5,000,000
Receiving Banks fees 2,320,000
Note Trustee fees 348,000
Registrar fees 348,000
CMA Approval fees 6,000,000
NSE listing fees 750,000
Miscellaneous expenses 5,000,000
Total 79,266,000
Totalissuecostsasa%ofTotalIssue 1.3%
18.2 Documents Available for Inspection
As long as any Note remains outstanding, copies of the following documents will, when published, be available for inspection at the
Specified Offices of the Issuer in Nairobi, Kenya:
1. the certificate of incorporation of the Issuer;
2. the Memorandum and Articles of Association of Issuer;
3. the following financial accounts of the Issuer:
3.1. the limited review of the nine month accounts as at 31 December, 2014; and
3.2. the audited financial statements of Issuer in respect of the 3 years financial years ended 31 March 2012, 2013 and 2014;
4. the board resolution approving the Issue;
5. a copy of this Information Memorandum;
6. the following documents issued by the relevant experts which are included or referred to in this Information Memorandum;
6.1. the Reporting Accountants’ report as reproduced in this Information Memorandum and their written consent to the issue of this
Information Memorandum with their report included herein in the form and context in which it is so included;
6.2. the legal opinion of the Legal Adviser as reproduced in this Information Memorandum and their written consent to the issue of
this Information Memorandum with their opinion included herein in the form and context in which it is so included; and
6.3. the credit rating report issued by Global Credit Rating;
7. a copy of the Agency Agreement;
8. a copy of the Trust Deed;
9. certified copies of the appraisals or valuations relative to the properties owned by the Issuer;
10. a copy of the approval of the Capital Markets Authority in respect of this issue; and
11. a copy of the approval of the Nairobi Securities Exchange for the listing of the Notes.
Information Memorandum 131
Senior Unsecured Fixed Rate Notes and Senior Unsecured Equity Linked Notes
18.3 Minimum Subscription Level
ThedirectorsoftheIssuerhaveresolvedthattheminimumaggregateamounttoberaisedbytheissueoftheNotesisfiftypercent(50%)
of the offer amount of the Notes.
18.4 Application Procedure
Application forms for issues of Notes may be obtained from the Placing Agents. Applications must be submitted directly to the Fiscal
Agent. Successful applicants will be notified either by the Fiscal Agent on behalf of the Issuer, or by the Placing Agents on behalf of the
Issuer, of the amount of Notes allotted to them immediately after the date of allotment.
18.5 Trading of the Notes
Fiscal Agents, acting as principal or agent of the Issuer, may facilitate market trading of the Notes through purchases and/or sales of such
Notes on a best effort basis.
The transfer of a Note from a seller to a purchaser will be carried out in accordance with the transfer regulations set out in the Agency
Agreement and subject to the Conditions.
18.6 Changes in Senior Management
There are no planned or expected changes in the Issuer’s senior management during the twenty four months following this Issue.
18.7 Interruptions in Group’s Business
There have been no interruptions in the Issuer’s business, which may have or have had during the recent past (covering at least the
previous four months prior to the issuance of this Information Memorandum) a significant effect on the Issuer’s financial position.
18.8 Material Changes
Save as disclosed in this Information Memorandum, there has been no material change in the business of the Issuer in the five years up
to 31 March 2015.
18.9 Directors statement as to liquidity requirement
To the best of the knowledge and belief of the Directors (who have taken all reasonable care to ensure that such is the case) the working
capital available to the Issuer is sufficient for the Issuer’s present requirements.
18.10 Directors’ declaration
The Directors of the Issuer whose names appear on page 17 of this Information Memorandum accept responsibility for the information
contained in this document. To the best of the knowledge and belief of the Directors (who have taken all reasonable care to ensure that
such is the case), the information contained in this document is in accordance with facts and does not omit anything likely to affect the
import of such information.

Information Memorandum
Senior Unsecured Fixed Rate Notes and Senior Unsecured Equity Linked Notes
132
19. FREQUENTLY ASKED QUESTIONS ON EQUITY LINKED NOTES
Potential investors are advised to consult with their investment, legal and tax advisers to determine the suitability of an investment in the Senior
Unsecured Equity Linked Note, and the appropriate amount, if any, of an investment of this nature.
Potential investors are advised to consult with their investment, legal and tax advisers to determine the suitability of an investment in the Senior
Unsecured Equity Linked Note, and the appropriate amount, if any, of an investment of this nature.
(1) What is an “Equity Linked Note”?
An An “Equity Linked Note” is an investment product that consists of three components: (1) an undertaking based on the credit of
theIssuer,thattheNoteholderwillreceiveonmaturitynotlessthan100%oftheprincipalamountinvested;(2)couponpayment;and
(3) an investment opportunity that offers the Noteholder potential returns based on the performance of an underlying investment
that is often linked to the performance of an equity, equity index, commodity index, currency, mutual fund or hedge fund or any
other metric that can reflect the performance of the Issuer.
TheSeniorUnsecuredEquityLinkedNote is linkedtotheperformanceof theNAVofCentumona fairvaluebasis.Centum’s
unconsolidated or company statement of financial position NAV is presented on a fair value basis.
(2) What are the investment objectives of the ELN?
The primary objectives of the ELN are to provide the Noteholder with principal protection (based on the creditworthiness of Centum,
as the ELN are unsecured) and coupon payment and, if held to maturity, provide a potential return that is linked to the volatility of
Centum’s equity. The level of the equity is monitored from the Commencement Date up to and including the Final Net Asset Value
Date.
(3) Who should invest in an ELN?
You may be suited to become a Noteholder if, among other benefits, you: (1) are looking for safety of principal if held to maturity;
(2) want the safety of a definite coupon payment while at the same time want the potential to earn a return that may be greater than
what is available from a traditional fixed term deposit but with similar risks to your principal investment; and (3) want exposure to
an investment that is linked to the performance of an equity.
(4) How is the return (if any) under the ELN linked to the performance of the Equity?
The ELN has three repayment components: principal, coupon and a variable return. The variable return will be calculated and
realized based on the performance on Centum’s NAV. The variable return will be detachable from the ELN and may be transferred
in whole or in part and title to the variable return shall pass upon registration of book-entry transfers thereof in accordance with the
CD Act.
Centum’s NAV change will be calculated as follows: (Final Net Asset Value – Initial Net Asset Value)/ Initial Net Asset Value. The
Initial Net Asset Value as per the Centum’s reviewed financial statements as of 31st December 2014 is Kes 26,950,614,000 while
the Final Net Asset Value will be from (i) the Issuer’s audited financial statements as at 31 March 2020 or, (ii) in case of early
redemption of the ELN, the Issuer’s latest publicly issued financial statements, being either half year accounts or full year accounts
as the case may be.
(5) How will Final Redemption of the Equity Linked Note be computed?
FinalRedemptionwillbecomputedasParValue+[ParValue*(min[max[25%*Centum’scompanyNetAssetValueChange,0],
10%].
IntheeventCentum’sNAVappreciatesbymorethan25.0%,thiswillimply[100+100*10%],givingaRedemptionPriceofKes
110 (Redemption Price will be Kes 110).

Information Memorandum 133
Senior Unsecured Fixed Rate Notes and Senior Unsecured Equity Linked Notes
TonoteisthattheRedemptionPricewillbecappedat110%suchthatevenifCentum’sNetAssetValueappreciatesbymorethan
25%,theinvestorswillnotreceiveaRedemptionPricegreaterthan110%ofParValue.Ontheotherhand,shouldCentum’sNet
Asset Value slide to below its Initial Net Asset Value, the investors will get a Redemption Price equal to Par Value. In essence, despite
its rather involving pricing mechanism, the ELN is a principal protected instrument, that is backed by the creditworthiness of Centum
(although the Equity Linked Note is unsecured).
(6) How will the Variable Return be detachable from the ELN?
The variable return will be issued and traded as units. It will be issued in the ratio of 1:1 with respect to the Equity Linked Notes. For
example, if KSH 1 million of Equity Linked Notes are issued, there will be 1 million units of Variable Return issued.
These units can be detached and will be freely tradeable on the NSE.
(7) Will the variable return have its own register separate from the ELN register?
Yes. The variable return will have its own register with a separate ISIN and Code
(8) Will the variable return holders have the same rights as the ELN noteholders?
Yes, save for the right to attend and vote at Noteholder’s meetings.
(9) How has the Centum’s Net Asset Value performed over the past five years?
The Centum’s Net Asset Value has increased from Kes 5.96Bn in 2009 to Kes 26.95Bn as at 31 December 2014.
UsingCentum’sNetAssetValuechangecalculatedas:(FinalNetAssetValue–InitialNetAssetValue)/InitialNetAssetValue,it
translatestoareturnof352%overthe6yearperiod.
Please refer to Section 0 (10.5.Track Record of Consistent Growth) Centum’s NAV performance highlights.
(10) What is the implied per annum pre-tax Yield for the ELN?
The Implied per annum pre-tax yield gives an indication of the “annual return” that the investor will be enjoying based on the various
pointshighlightedabove.Forthepurposesofourrunningillustration,shouldCentum’sNetAssetValueappreciateby25%,the
impliedpre-taxIRRwouldbe13.95%.Itisworthnotingthatthisreturnisabovethe5-yearTreasuryyieldof11.76%(asat13th
March 2015) by 219BPS. On the other hand, if Centum’s company Net Asset Value either slips below Initial Net Asset Value or does
notchangefromNetAssetValue,theimpliedp.a.pre-taxyieldwillbeequalto12.50%,thecouponpayment.
The tables below shows by way of illustration the development in the percentage pay out in respect of the ELN dependent on the
performance of Centum’s company NAV:
Table 11: Development in Percentage Pay Out
CentumNAVChange% FinalRedemptionPrice(Cap10%) Total Returns Yield p.a
0.00% 100 163 12.50%
2.50% 101 164 12.65%
5.00% 102 165 12.80%
7.50% 103 166 12.95%
10.00% 104 167 13.09%
12.50% 105 168 13.24%
15.00% 106 169 13.38%
17.50% 107 170 13.52%
20.00% 108 171 13.67%
22.50% 109 172 13.81%
25.00% 110 173 13.95%
27.50% 110 173 13.95%
30.00% 110 173 13.95%
32.50% 110 173 13.95%
35.00% 110 173 13.95%
37.50% 110 173 13.95%
40.00% 110 173 13.95%

Information Memorandum
Senior Unsecured Fixed Rate Notes and Senior Unsecured Equity Linked Notes
134
(11) If I decide to sell my ELN, could I get less than Par Value per Note?
Yes. Prior to maturity, the ELN could trade below or above Par Value per Note in the secondary market. The price of the ELN in any
secondary market will be set by such market. See “General Information –Trading of Notes”.
(12)WhatfactorsmayaffectthetradingvalueofmySeniorUnsecuredNotesinanysecondarymarket?
The value of the ELN in a secondary market, if any, will be affected by a number of complex and inter-related factors. The effect of
any one factor may be offset or magnified by the effect of another factor. The following list, although not exhaustive, describes some
of the factors that may impact the trading value of the ELN:
• howmuchtheleveloftheNetAssetValuehasrisenorfallensincetheCommencementDate;
• whattheoutlookonCentumanditssectoris;
• thevolatilityoftheNetAssetValue;
• prevailingmarketconditions;
• lackofliquidityorlackofmarketdemandfortheELN;and
• timeremainingtoMaturityDateoftheELN.
The relationship among these factors is complex and may also be influenced by various political, economic and other factors that
can affect the trading price of the ELN in any secondary market. For a more detailed description of various risk factors affecting the
ELN, see “Risk Factors”.
(13) Will I have any voting rights as a result of owning the ELN?
No. The ELN will not entitle a Noteholder to any equity interest in Centum and a Noteholder will not be entitled to the rights and
benefits of a shareholder, including the right to receive dividends and vote at or attend meetings of shareholders.
The Noteholder will have voting rights in a meeting convened for other Noteholders.
(14) What about tax?
A Prospective Investor should consult with its, his or her own tax adviser with respect to his or her individual tax position. This
Information Memorandum is not intended to provide, nor should it be relied upon as, tax advice to any particular Prospective
Investor.
(15) How will I receive notice of significant events affecting the ELN?
If notice is required to be given to Noteholders, Centum and the Note Trustee will take reasonable steps to effect such notice to the
Noteholders in accordance with the Conditions.

Information Memorandum 135
Senior Unsecured Fixed Rate Notes and Senior Unsecured Equity Linked Notes
20. APPENDIX
20.1 Legal Opinion
Our Reference: KCM/di/6143240 Your Reference: Direct Line: +254 20 2899305 Date: 14 May 2015E-mail Address: [email protected] [email protected]
The DirectorsCentum Investment Company LimitedInternational HouseMama Ngina StreetP.O. Box 10518 – 00100 Nairobi
Dear SirsLegal opinion issued pursuant to regulation 6(3) of the Capital Markets (Securities) (Public Offers, Listing and Disclosures) Regulations 2002 in respect of the offer of unsecured medium term notes of up to Kenya Shillings six billion (KES6,000,000,000.00) by Centum Investment Company Limited
We have acted as the legal advisers to Centum Investment Company Limited (the “Issuer”) in connection with the offer to the public and subsequentlistingofKenyaShillingssixbillion(KES6,000,000,000)worthofSeniorUnsecuredFixedRateNotesandSeniorUnsecuredEquity Linked Notes due on 8 June 2020 (the “Notes”).
The Issuer is a Kenyan incorporated holding company with a number of subsidiaries owned directly by the Issuer or through other subsidiaries (collectively the “Subsidiaries” and each a “Subsidiary”) listed in Part B of Appendix 1 hereto (where the context requires the Issuer and the Subsidiaries are referred to in this opinion as the “Group”). A corporate structure of the Group is set out in Part B of Appendix 1 hereto. The information on the Group is contained, inter alia, in the Information Memorandum dated 14 May 2015 (the “Information Memorandum”) that has been prepared for the purposes of the offer of the Notes to the public.
Terms defined in the Information Memorandum have the same meanings in this opinion.
This opinion is addressed to the Issuer, and may only be relied upon for the purposes of the issue of the Notes, by (i) the Issuer, (ii) Equity Investment Bank Limited, Dyer & Blair Investment Bank Limited and Esham Park Limited in their capacity as the Transaction Advisers; and (iii) the subscribers for the Notes. It may not be relied upon by any other person or used for any other purpose.
1. Documents1.1. In arriving at the opinions expressed below, we have only examined and relied on the following documents:
1.1.1. the agency agreement (the “Agency Agreement”); and1.1.2. the trust deed (the “Trust Deed”),(collectively the “Issue Documents”).
1.2. We have also examined:1.2.1. a final proof of the Information Memorandum; and1.2.2. such other documents and made such investigation, as we have considered necessary for the purposes of giving this
opinion. (all such documents examined by us hereinafter collectively referred to as the “Examined Documents”, which
Examined Documents are listed in Part A of Appendix 2 hereto).
1.3. We have also undertaken only the searches and enquiries referred to in Part B of Appendix 2.
1.4. The opinions given in this letter are strictly limited to the matters stated in paragraph 3 (Opinions) and do not extend to any other matters. The statements in this letter do not purport to be an analysis of all the rights and obligations of the parties to the Notes and/or the Issue Documents under Kenyan law, but are merely opinions regarding the effectiveness of, and the limitations Kenyan law imposes on, the express terms of the Notes and the Issue Documents.

Information Memorandum
Senior Unsecured Fixed Rate Notes and Senior Unsecured Equity Linked Notes
136
2. Assumptions2.1. We have assumed:
2.1.1. that all the information supplied to us by the Issuer, the Transaction Advisers and by their respective officers and advisers is true, accurate and up to date;
2.1.2. the authenticity of documents submitted as originals, the conformity with the original documents of all documents submitted as copies and the authenticity of the originals of such latter documents;
2.1.3. that all signatures, stamps and seals on all documents and instruments submitted to us for the purpose of this opinion are genuine and authentic;
2.1.4. that the certified resolution of the board of directors of the Issuer as examined by us was duly passed at a properly convened meeting of duly appointed directors of the Issuer;
2.1.5. the capacity, power and authority of the parties to the Issue Documents (other than the Issuer) to enter into those documents and the due execution and delivery of the Issue Documents by such parties;
2.1.6. that the Issue Documents have been duly authorised, executed and delivered by the parties to those documents (other than the Issuer);
2.1.7. that there is no other fact, matter or document which would, or might, affect this opinion and which was not revealed by the Examined Documents, searches and enquiries made;
2.1.8. that all information contained in the Information Memorandum and all information in respect of the Issuer and the Subsidiaries supplied to us by the Issuer, its officers and advisers is true, accurate and is up to date as of the date hereof; and
2.1.9. that the Information Memorandum examined is in the final form and will be registered in that form.
2.2. With respect to matters of fact, we have relied on the representations contained in the Issue Documents and the representations of the Issuer and its officers and advisers.
2.3. This opinion is given on the basis of all documents provided to us by the Issuer in respect of the Group.
3. OpinionsBased upon and subject to the foregoing and to the qualifications set out below, we are of the following opinion.3.1. The Issuer is a public (non-private) limited liability company duly incorporated in Kenya under the Companies Act (Chapter 486
Laws of Kenya) under company number C.8/67. The Issuer’s registered office is at International House, Mama Ngina Street, P. O. Box 10518-00100, Nairobi.
3.2. TheIssuerisregisteredasabranchinUgandaundertheCompaniesAct(Cap.110Section371(1)oftheLawsofUganda)(RegistrationNo F 2158).
3.3. TheIssuerislistedontheNairobiSecuritiesExchangeandcross-listedontheUgandanSecuritiesExchange.
3.4. The existing authorized nominal share capital of the Issuer is KES 400,000,000.00 divided into 800,000,000 ordinary shares of KES 0.50 each, of which 665,441,714 ordinary shares of KES 0.50 each are in issue. The existing capital of the Issuer is in conformity with Kenyan law and has received all necessary authorizations.
3.5. All the licenses and consents required to perform the business or proposed business of the Issuer have been obtained.
3.6. The Issuer (through its subsidiaries) owns or leases all of the material assets, land and the property listed in Appendix 3 hereto, required for the purposes of the Issuer’s business and we are satisfied, after such enquiry as we deemed necessary for the purposes of this opinion, that the Issuer has good and valid title or rights to or in such property for the purposes of the business of the Issuer as carried on at the date hereof.
3.7. As at the date of this opinion and for a period of at least two (2) years prior to the date of this opinion no director of the Issuer has:3.7.1. had any petition under bankruptcy or insolvency in any jurisdiction pending or threatened against the director (for
individuals), or any winding-up petition pending or threatened against it (for corporate bodies);3.7.2. had any criminal proceedings in which the director was convicted of fraud or any criminal offence, or be named
subject of pending criminal proceeding, or any other offence or action either within or outside Kenya; or3.7.3. been the subject of any ruling of a court of competent jurisdiction or any governmental body, that permanently or
temporarily prohibits such director from acting as an investment adviser or as a director or employee of a stockbroker, dealer or any financial institution or engaging in any type or business practice or activity.
3.8. To the best of our knowledge, information and belief after due enquiry, there are no legal or arbitration proceedings (including any proceedings which are pending or threatened of which the Issuer is aware) which may have had or had in the past twelve (12) months preceding the date of this legal opinion a significant adverse effect on the financial position or the operations of the Group.
3.9. To the best of our knowledge, information and belief, and after due enquiry, there has been no material prosecution or other civil or criminal legal action in which the Issuer or any of its directors is involved;
3.10. The Issuer has the corporate capacity, power and authority to: 3.10.1. issue the Notes and enter into and deliver the Issue Documents; and3.10.2. exercise its rights and perform its obligations under the Notes and the Issue Documents.
3.11. The public offer and listing of the Notes has been duly authorised by the Board of Directors of the Issuer.
3.12. The Information Memorandum and the public offer and listing of the Notes has been approved by the Capital Markets Authority (the “CMA”) through the issue of a letter of approval dated 14 May 2015.
3.13. The listing of the Notes has been approved by the Nairobi Securities Exchange (the “NSE”) through the letter of approval dated 15 May 2015.

Information Memorandum 137
Senior Unsecured Fixed Rate Notes and Senior Unsecured Equity Linked Notes
3.14. The Notes have been prescribed as a dematerialized security under the Central Depositories Act, 2000.
3.15. The Issue Documents have been duly authorised, executed and delivered by the Issuer and are valid and legally binding upon the Issuer in accordance with their terms except as the same may be limited by bankruptcy, insolvency or other similar laws affecting creditors’ rights generally and by general principles of equity.
3.16. The Notes and the Issue Documents are in proper legal form for enforcement against the Issuer and contain no provision which is contrary to law or public policy in Kenya or, which would not for any reason be upheld by the Kenyan courts.
3.17. The issue of the Notes has been duly authorised and when issued, the Notes will constitute valid, legally binding, direct and unconditional obligations of the Issuer in accordance with their terms except as the same may be limited by bankruptcy, insolvency or other similar laws affecting creditors’ rights generally and by general principles of equity.
3.18. Neither the execution and delivery of the Issue Documents or issuance of the Notes nor the consummation of the transactions therein contemplated nor compliance with their terms and conditions will contravene:
3.18.1. any existing law, governmental rule, regulation or order of Kenya; or3.18.2. any provision of the constitutional documents of the Issuer; or3.18.3. the terms of the Examined Documents to which the Issuer is a party; or3.18.4. the terms of any loan or other credit facility granted to the Issuer.
3.19. UpontheassumptionthatpermissionisgrantedtolisttheNotesontheNSEbeforetheyareissued,nostampdutywillbepayable in Kenya in respect of the issue, or on transfers, of the Notes.
3.20. Save for (i) stamping of the Issue Documents with stamp duty (ii) registration of the Information Memorandum at the Companies Registry under section 43(1) of the Companies Act (Chapter 486 of the Laws of Kenya) and (iii) the approvals of the CMA and NSE referred to in paragraphs 3.12 and 3.13 above, there are no governmental or regulatory consents, approvals, authorisations or orders registration, filing or similar formalities required to be carried out in Kenya by the Issuer in connection with the issuance of the Notes and the performance by the Issuer of its obligations under the Issue Documents.
3.21. The Notes constitute direct, general, unconditional, unsubordinated and unsecured obligations of the Issuer and will at all times rank pari passu in all respects (including in priority of payment) among themselves and with all other present and future direct, general, unconditional, unsubordinated and unsecured obligations of the Issuer, except for any obligations that may be preferred by provisions of law that are both mandatory and of general application.
3.22.Interest(includinganycommissionordiscount)payableinrespectoftheNotesissubjecttoincometaxinKenya.Unlessthepayeeenjoys specific exemption, payments of interest are subject to withholding tax at the rates from time to time in force. At present, the applicablerateis15%.Therateofwithholdingtaxmaybelimitedbyapplicabledoubletaxationtreaties,whichmayalsopermitthepayee to obtain relief outside Kenya. The Notes do not provide for interest to be grossed up where withholding tax applies.
3.23. With effect from 1 January 2015 any capital gain which accrues on a disposal of the Notes will constitute a chargeable gain in accordance with the applicable requirements of the Eighth Schedule of the Income Tax Act (Chapter 470 of the Laws of Kenya) and may be taxable accordingly.
3.24. Except as noted below it is not necessary under Kenyan law (a) in order to enable any person to exercise or enforce its rights under any of the Issue Documents or the Notes or (b) by reason of any such person being or becoming the holder of any of the Notes or a party to the Issue Documents, or the performance by any such person of its obligations there under, that any such person should be licensed, qualified or otherwise entitled to carry on business in Kenya, nor will any such performance violate any law applicable in Kenya. Brokers, dealers and investment advisers carrying on business as such in Kenya require a license from the CMA.
3.25. No holder of the Notes and none of the parties to the Issue Documents is or will be deemed to be resident, domiciled or carrying on business in Kenya by reason only of its execution, performance or enforcement of the Notes or the Issue Documents.
3.26. The company searches carried out in relation to the Issuer and the Subsidiaries revealed that no resolution, orders or applications has been made for the winding-up of the Issuer or any Subsidiary.
3.27. Each Subsidiary is a limited liability company, duly incorporated and validly existing under the laws of the country where it was incorporated and has the power to own its assets.
3.28. The material loans and credit facilities taken by the Issuer are listed in Appendix 4 hereto respectively (the “Facilities”).
3.29. All authorisations, approvals or consents required to be obtained in connection with the Notes from any lender of the Issuer in relation to the Facilities have been obtained and no other authorisation, approval or consent is required from any lender of the Issuer in relation to the Facilities to enable the Issuer to enter into, exercise its rights or perform its obligations under Notes and the Issue Documents.
3.30. The Issuer is not entitled to claim any immunity from legal action or proceedings, execution, attachment or other legal process in Kenya.
3.31. The choice of Kenyan law to govern the Issue Documents would be recognised and upheld as a valid choice of law in any proceedings on the courts of Kenya and applied by such courts in proceedings in relation to the Issue Documents as the governing law thereof.
3.32. The submission to the jurisdiction of the Kenyan courts by the Issuer in relation to the Issue Documents is valid, legally binding and enforceable on the Issuer and would be recognised and upheld by the Kenyan courts.
Information Memorandum
Senior Unsecured Fixed Rate Notes and Senior Unsecured Equity Linked Notes
138
4. Qualifications4.1. The Issue Documents must be stamped in accordance with the Stamp Duty Act (Chapter 480 of the Laws of Kenya) within thirty
(30) days of their execution in order to be admissible in evidence in a Kenyan court. We will attend to stamping within the prescribed period.
4.2. Any provision requiring any party to pay default interest may be unenforceable in the Kenyan courts on the grounds (i) that such default interest would constitute a penalty and (ii) that penalties are not generally enforceable under common law. We consider it likely that the Kenyan courts would now follow the decision by the High Court in England in Lordsvale Finance plc v. Issuer of Zambia[1996]Q.B.752,permittingrecoverybyacreditorofdefaultinterest,suchdecisionbeingofpersuasivevalueinKenya.
4.3. If any provision of any Issue Documents is held to be illegal, invalid or unenforceable by the Kenyan courts, severance of such provision from the remaining provisions of the Issue Documents would be subject to the exercise of the discretion of the Kenyan courts.
4.4. Any provision to the effect that certain calculations or certificates will be conclusive and binding will not be effective if such calculations or certificates are fraudulent or erroneous on their face and will not prevent judicial enquiry by the Kenyan courts into the merits of any claim by an aggrieved party.
4.5. If any party is vested with any discretion or may determine a matter in its opinion, the Kenyan courts may require that such discretion be exercised reasonably or that such opinion be based on reasonable grounds.
4.6. A Kenyan court may refuse to give effect to a provision to pay the costs of another party in respect of any successful action brought against that party before a Kenyan court and the Kenyan court may not award by way of costs all of the expenditure incurred by a successful litigant in proceedings brought before that court.
4.7. Service of legal process on the Issuer by post in connection with any proceedings in the Kenyan courts would be effective only if made in accordance with the applicable court rules or with the leave of the court.
4.8. Payments between residents and non-residents of Kenya must be made through authorised banks in Kenya in accordance with the provisions of the Central Bank of Kenya Act (Chapter 491 of the Laws of Kenya).
4.9. Nothing in this opinion is to be taken as indicating that the remedy of an order for specific performance or the issue of an injunction would be available in a Kenyan court in respect of the obligations arising under any agreement since such remedies are available only at the discretion of the court. Specific performance is not usually granted and an injunction is not usually issued where damages would be an adequate alternative.
5. Effective Date5.1. This letter and the opinions given in it are governed by Kenyan law and relate only to Kenyan law as applied by the Kenyan courts
as at today’s date. We express no opinion in this letter on the laws of any other jurisdiction.
5.2. To the extent any opinion expressed in this letter and the opinions given in it relates to a future event, it is expressed on the assumption that Kenyan law will remain the same on any relevant future date as that in existence as at the date of this letter and, accordingly, no opinion is given that the future or continued performance of the obligations of any of the parties to the Notes and/or the Issue Documents or the consummation of the transactions contemplated in any of the Notes and/or the Issue Documents will not contravene Kenyan law if such law is altered.
6. Miscellaneous As legal advisers to the Issuer, we have issued and have not withdrawn our consent to the inclusion in the Information Memorandum
of this legal opinion in the form and context in which it appears.
Coulson Harney14 May 2015

Information Memorandum 139
Senior Unsecured Fixed Rate Notes and Senior Unsecured Equity Linked Notes
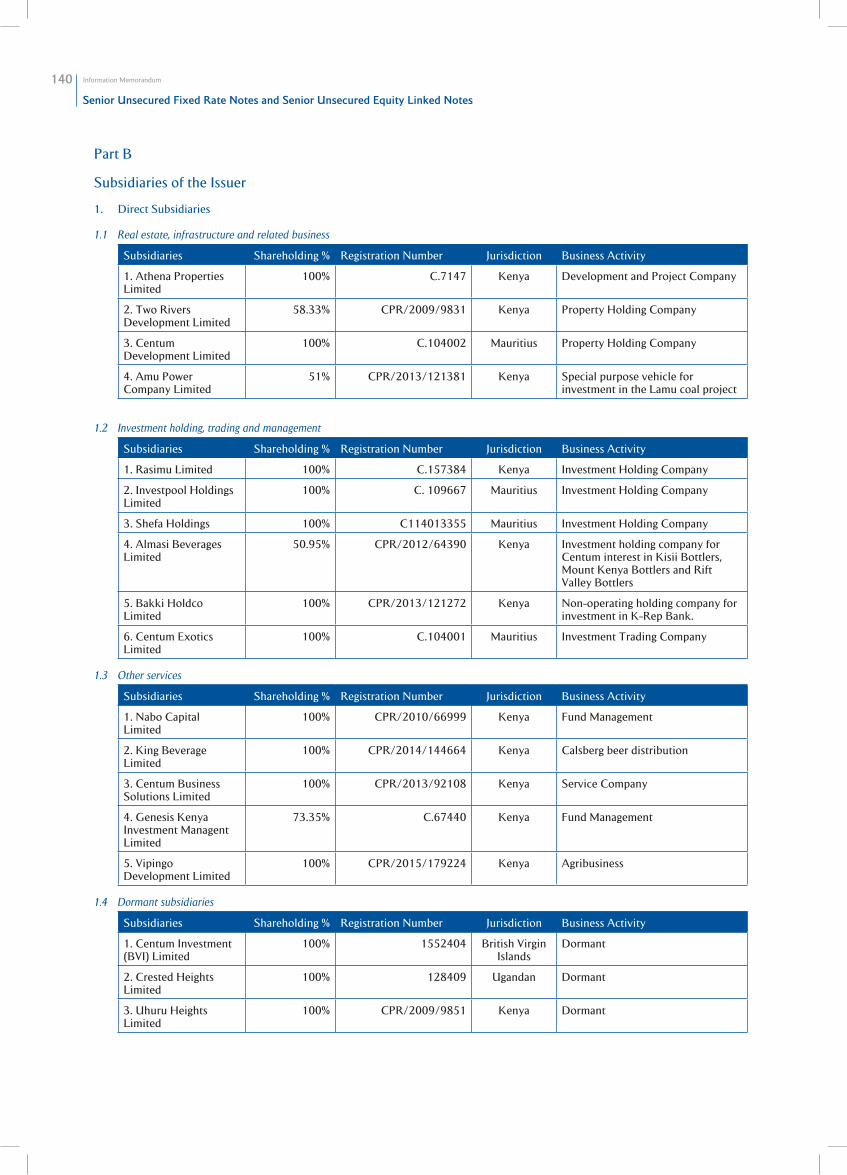
Information Memorandum
Senior Unsecured Fixed Rate Notes and Senior Unsecured Equity Linked Notes
140
Part B
Subsidiaries of the Issuer
1. Direct Subsidiaries
1.1 Real estate, infrastructure and related business
Subsidiaries Shareholding% Registration Number Jurisdiction Business Activity
1. Athena Properties Limited
100% C.7147 Kenya Development and Project Company
2. Two Rivers Development Limited
58.33% CPR/2009/9831 Kenya Property Holding Company
3. Centum Development Limited
100% C.104002 Mauritius Property Holding Company
4. Amu Power Company Limited
51% CPR/2013/121381 Kenya Special purpose vehicle for investment in the Lamu coal project
1.2 Investment holding, trading and management
Subsidiaries Shareholding% Registration Number Jurisdiction Business Activity
1. Rasimu Limited 100% C.157384 Kenya Investment Holding Company
2. Investpool Holdings Limited
100% C. 109667 Mauritius Investment Holding Company
3. Shefa Holdings 100% C114013355 Mauritius Investment Holding Company
4. Almasi Beverages Limited
50.95% CPR/2012/64390 Kenya Investment holding company for Centum interest in Kisii Bottlers, Mount Kenya Bottlers and Rift Valley Bottlers
5. Bakki Holdco Limited
100% CPR/2013/121272 Kenya Non-operating holding company for investment in K-Rep Bank.
6. Centum Exotics Limited
100% C.104001 Mauritius Investment Trading Company
1.3 Other services
Subsidiaries Shareholding% Registration Number Jurisdiction Business Activity
1. Nabo Capital Limited
100% CPR/2010/66999 Kenya Fund Management
2. King Beverage Limited
100% CPR/2014/144664 Kenya Calsberg beer distribution
3. Centum Business Solutions Limited
100% CPR/2013/92108 Kenya Service Company
4. Genesis Kenya Investment Managent Limited
73.35% C.67440 Kenya Fund Management
5. Vipingo Development Limited
100% CPR/2015/179224 Kenya Agribusiness
1.4 Dormant subsidiaries
Subsidiaries Shareholding% Registration Number Jurisdiction Business Activity
1. Centum Investment (BVI) Limited
100% 1552404 British Virgin Islands
Dormant
2. Crested Heights Limited
100% 128409 Ugandan Dormant
3.UhuruHeightsLimited
100% CPR/2009/9851 Kenya Dormant

Information Memorandum 141
Senior Unsecured Fixed Rate Notes and Senior Unsecured Equity Linked Notes
2. Issuer’s indirect subsidiaries
2.1 Centum Investment Company Limited owns 58.33% of Two Rivers Development Limited (“TRDL”) Subsidiaries of TRDL:
Subsidiaries Shareholding% Registration Number Jurisdiction Business Activity
1. Two Rivers Lifestyle Centre Limited (with registered kenyan Branch)
100% 109668 Mauritius Property Holding Company
2. Two Rivers Office Suites Limited
100% CPR/2015/179563 Kenya Real estate development related
3. Two Rivers Power Company Limited
100% CPR/2015/173376 Kenya Power utility company
4. Two Rivers Water & Sanitation Company Limited
100% CPR/2015/173495 Kenya Water and sanitation utility company
5. Two Rivers ICT Company Limited
100% CPR/2014/172514 Kenya ICT utility company
6. Two Rivers Luxury Apartments Limited
100% CPR/2015/179483 Kenya Real estate development
7. Two Rivers Property Owners Company Limited
100% CPR/2014/130020 Kenya Management company
2.2 Centum Investment Company Limited owns 100% of Investpool Holdings Limited (“Invetpool”) Subsidiaries of Investpool:
Subsidiaries Shareholding% Registration Number Jurisdiction Business Activity
1. Mvuke Power Limited
100% 109607 Mauritius Investment Holding Company
2. Kilele Holdings Limited
79% 109609 Mauritius Investment Holding Company
2.3 Centum Investment Company Limited owns100% of Investpool Holdings Limited which in turns owns 100% of Mvuke power Limited (“Mvuke”) Subsidiaries of Mvuke:
Subsidiaries Shareholding% Registration Number Jurisdiction Business Activity
Akiira Geothermal Limited
37.5% 122565 Mauritius Project Company for exploration of geothermal energy.
2.4 Centum Investment Company Limited owns100% of Bakki Holdco Limited (“Bakki”) Subsidiaries of Bakki:
Subsidiaries Shareholding% Registration Number Jurisdiction Business Activity
K-Rep Bank Limited 65.87% C.77202 British Virgin Islands
Dormant
2.5 Centum Investment Company Limited owns 100% of Investpool Limited which in turn owns 79% Kilele Holdings Limited (“Kilele”) Subsidiaries of Kilele:
Subsidiaries Shareholding% Registration Number Jurisdiction Business Activity
Platcorp Holdings Limited
45% Mauritius Investment Holding company and parent company of Platinum CreditLimited(Kenya,UgandaandTanzania)

Information Memorandum
Senior Unsecured Fixed Rate Notes and Senior Unsecured Equity Linked Notes
142
2.6 Centum Investment Company Limited owns 100% of Centum Development Limited (“CDL”) Subsidiaries of CDL:
Subsidiaries Shareholding% Registration Number Jurisdiction Business Activity
Pearl Marina Estates Limited
51%(The remainder
49%isheldunder Centum).
118623 Uganda Real Estate Development company.
2.7 Centum Investment Company Limited owns100% Centum Exotics Limited (“CEL”) Subsidiaries of CEL:
Subsidiaries Shareholding% Registration Number Jurisdiction Business Activity
Oleibon Investments Limited
100% 86609 Tanzania Investment holding company for QPE portfolio - Holds shares of Tanzania Breweries Limited.
Appendix 2
Part A
INDEXOFEXAMINEDDOCUMENTS
PROPERTY
Centum propertyi. Lease of Premises on 5th Floor in International House, L.R. No. 209/6871 dated 30th November 2007
Subsidiaries’ propertyii. Title Number Dagoretti/Riruta/3907 registered in the name of K-Rep Bankiii. Lease of Premises to Centum Business Solutions Limited on 5th Floor in International Houseiv. Lease of Premises to Nabo Capital Limited on 7th Floor in International Housev. GrantNumberI.R.144326/1(L.R.No.22/365[OriginalNumber22/360])registeredinthenameofTwoRiversDevelopment
Limitedvi. Lease in respect of a portion of property L.R. No. 22/365 (Original Number 22/360) between Two Rivers Development Limited (as
Lessor) and Two Rivers Lifestyle Limited (as Lessee) dated 7th October 2014vii. Lease in respect of Site Number 10 on a portion of Land Reference Number 22/365 (Fairview Hotel Lease)viii. Deed of Easement in respect of a portion of property L.R. No. 22/365 (Original Number 22/360) from Two Rivers Lifestyle Centre
Limited (as Grantor) to Two Rivers Development Limited (as Grantee) dated 7th October 2014ix. Lease in respect of Site Number 14 on a portion of Land Reference Number 22/365(Original Number 22/360) between Two Rivers
Development Limited (as Lessor) and Victoria at Two Rivers Limited (as Lessee) ASSETSOTHERTHANLANDANDBUILDINGSi. Asset Register for Nabo Capital Limitedii. Asset Register for Genesis Investment Management Limited – Kenya Officeiii. Asset Register for K-Rep Bank Limited
MATERIAL CONTRACTSCentum related material contractsi. Settlement Agreement between Centum Investment Company Limited and Rea Vipingo Plantations Limited and R.E.A. Trading
Limitedii. SharePurchaseAgreementinrespectof100%ofthesharecapitalofVipingoEstateLimited
FINANCE AND BORROWINGSCentum related Finance and borrowings documentsi. Audited financial statements of 2012, 2013 and 2014ii. Letter of commitment in respect of Centum’s investment in Two Rivers Development REITiii. Letter of confirmation from Centum’s finance director dated 4 May 2015iv. Facility letter between Rand Merchant Bank and Centum including: a. a charge over shares issued by Centum in favour of Rand Merchant Bankv. Facility letters of 24 October 2011, 29 May 2013, 8 October 2013 and 5 August 2014 between Co-operative Bank of Kenya
Limited (the “Co-op”) and Centum including, relating to these facilities: a. Various debentures as follows:
i. a debenture issued by Centum in favour of Co-opii. a further debenture issued by Centum in favour of Co-opiii. a second further debenture issued by Centum in favour of Co-op
iv. a third further debenture issued by Centum in favour of Co-op b. Various guarantees as follows:
v. Two (2) Guarantees from Centum Exotics Limited in favour of Co-opvi. Two (2) Guarantees from Rasimu Limited in favour of Co-op

Information Memorandum 143
Senior Unsecured Fixed Rate Notes and Senior Unsecured Equity Linked Notes
Subsidiary related Finance and borrowings documentsvi. Letter of offer between K-Rep and King Beverage Limited (related parties) including the following other documents in relation to
this facility:a. Specific Debenture by King Beverage Limited in favour of K-Rep Bank b. Deed of Guarantee and Indemnity between Centum and K-Rep Bank
vii. Guarantee issued by Co-op to Vivo Energy Kenya Limited to make payments on behalf of King Beverage Limitedviii. Financing agreement between K-Rep Bank Limited and the European Investment Bank ix. Loan agreement between K-Rep Bank Limited and Oikocredit, Ecumenical Development Co-operative Societyx. Loan/credit agreement between K-Rep Bank Limited and the Government of Kenya (through the Ministry of Finance)xi. Loan agreement between Centum Asset Managers Limited (now Nabo Capital Limited) and Platcorp Holdings Limitedxii. Term sheet for financing between Two Rivers Lifestyle Centre Limited and Co-operative Bank of Kenya Limited and the following
other documents in relation to this facility:a. Corporate Guarantee issued by Two Rivers Dvelopment Limited on behalf of Two Rivers Lifestyle Limited in favour of Co-op
Bankb. Escrow agreement between Co-operative Bank of Kenya Limited, Two Rivers Lifestyle Centre Limited and Co-operative Bankc. Deed of assignment of receivables from Two Rivers Lifestyle Centre Limited to Co-operative Bank of Kenya Limited
xiii. Charge over a portion of Land Reference Number 22/365 (Original Number 22/360).
CORPORATECentum related corporate documentsi. Confirmation letter from company secretary dated 23 April 2015ii. Certificate of Change of Name from ICDC Investment Company Limited to Centum Investment Company Limited iii. Certificate of Incorporation of ICDC Investment Company Limitediv. Resolutions amending Memorandum and Articles of Association of Centum Investment Company Limited v. Resolution for change of name from ICDC Investment Company Limited to Centum Investment Company Limitedvi. Memorandum and Articles of Association of Centum Investment Company Limited vii. Form CR12 in respect of Centum as at 18th March 2015viii. Information on Centum subsidiariesix. Centum Investee Companiesx. 2012 Annual Returns in respect of Centum and filing receiptxi. 2013 Annual Returns in respect of Centum and filing receiptxii. 2014 Annual Returns in respect of Centum and filing receiptxiii. Information on Directors provided by Centumxiv. Share Register Analysis Periodic Report for January 2015 (Centum)xv. Senior Management Profiles xvi. Form 203A in respect of appointment of Dr. Laila Macharia as Director and resignation of Maina Mwangi as Director; and filing
receiptxvii. Form 203A in respect of appointment of Fredrick Murimi Ngari as Company Secretary and resignation of Naomi Nyamongo as
Company Secretaryxviii. Form 203A in respect of the resignation of Robert Bunyi and the appointment of Dr. James Mcfie; and filing receiptxix. AGM minutes effecting appointment of Dr. Laila Macharia as Directorxx. AGM poll results effecting appointment of Dr. James McFie as Directorxxi. Minutes of the Board of the Directors reviewed ON SITE and held on the following dates:
a) Minutes of the Board of Directors’ Meeting held on 12th February 2013;b) Minutes of the Board of Directors’ Special Meeting held on 4th June 2013;c) Minutes of the Board of Directors’ Special Meeting held on 25th August 2013;d) Minutes of the Board of Directors’ Special Meeting held on 12th November 2013;e) Minutes of the Board of Directors’ Special Meeting held on 25th November 2013;f) Minutes of the Board of Directors’ Meeting held on 30th January 2014;g) Minutes of the Board of Directors’ Meeting held on 26th March 2014;h) Minutes of the Board of Directors’ Meeting held from 14th – 16th April 2014; andi) Minutes of the Board of Directors’ Special Meeting held on 19th November 2014.
Subsidiary related corporate documentsi. Memorandum and Articles of Association of Rasimu Limited ii. Resolutions amending Memorandum and Articles of Association of Rasimu Limited and filing receiptiii. Memorandum and Articles of Association of Bakki Holdco Limitediv. Memorandum and Articles of Association of Genesis Kenya Investment Management Limitedv. Memorandum and Articles of Association of Nabo Capital Limitedvi. Memorandum and Articles of Association of Two Rivers Development Limitedvii. Memorandum and Articles of Association of Athena Properties Limitedviii. Memorandum and Articles of Association of King Beverage Limitedix. 2015 Annual returns in respect of Almasi Beverages Limitedx. 2014 Annual Returns in respect of Rasimu Limited and filing receiptxi. 2014 Annual Returns in respect of Athena Properties Limited and filing receiptxii. 2014 Annual Returns in respect of Bakki Holdco Limited and filing receiptxiii. 2015 and 2014 Annual Returns in respect of Genesis Kenya Investment Management Limited and filing receiptxiv. 2014 Annual Returns in respect of King Beverage Limited and filing receiptxv. 2014 Annual Returns in respect of Nabo Capital Limited and filing receiptxvi. 2014 Annual Returns in respect of Two Rivers Development Limited and filing receiptxvii.2014AnnualReturnsinrespectofUhuruHeightsLimitedandfilingreceiptxviii. 2014 Annual Returns in respect of K-Rep Bank Limited and Filing Receipt
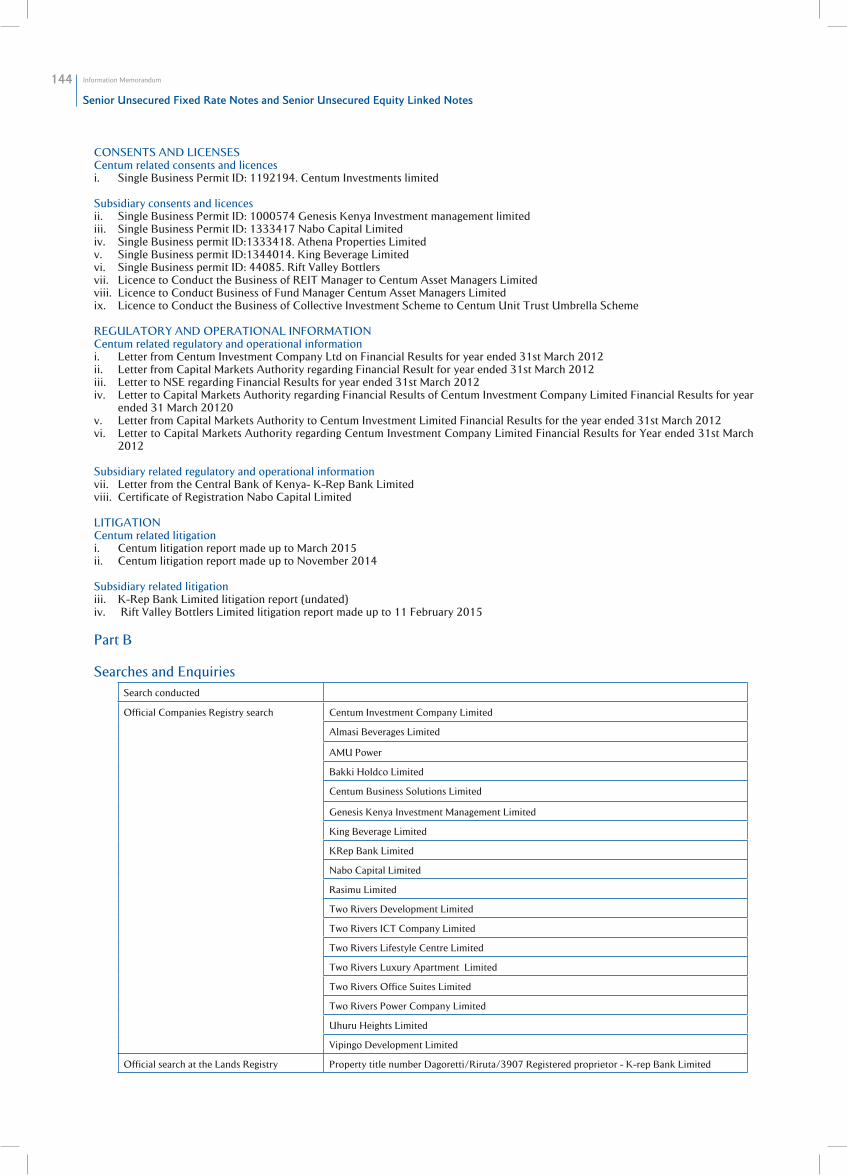
Information Memorandum
Senior Unsecured Fixed Rate Notes and Senior Unsecured Equity Linked Notes
144
CONSENTS AND LICENSESCentum related consents and licencesi. Single Business Permit ID: 1192194. Centum Investments limited
Subsidiary consents and licencesii. Single Business Permit ID: 1000574 Genesis Kenya Investment management limitediii. Single Business Permit ID: 1333417 Nabo Capital Limitediv. Single Business permit ID:1333418. Athena Properties Limitedv. Single Business permit ID:1344014. King Beverage Limitedvi. Single Business permit ID: 44085. Rift Valley Bottlersvii. Licence to Conduct the Business of REIT Manager to Centum Asset Managers Limitedviii. Licence to Conduct Business of Fund Manager Centum Asset Managers Limited ix. LicencetoConducttheBusinessofCollectiveInvestmentSchemetoCentumUnitTrustUmbrellaScheme
REGULATORYANDOPERATIONALINFORMATIONCentum related regulatory and operational informationi. Letter from Centum Investment Company Ltd on Financial Results for year ended 31st March 2012 ii. Letter from Capital Markets Authority regarding Financial Result for year ended 31st March 2012 iii. Letter to NSE regarding Financial Results for year ended 31st March 2012iv. Letter to Capital Markets Authority regarding Financial Results of Centum Investment Company Limited Financial Results for year
ended 31 March 20120v. Letter from Capital Markets Authority to Centum Investment Limited Financial Results for the year ended 31st March 2012vi. Letter to Capital Markets Authority regarding Centum Investment Company Limited Financial Results for Year ended 31st March
2012
Subsidiary related regulatory and operational informationvii. Letter from the Central Bank of Kenya- K-Rep Bank Limited viii. Certificate of Registration Nabo Capital Limited
LITIGATIONCentum related litigationi. Centum litigation report made up to March 2015ii. Centum litigation report made up to November 2014
Subsidiary related litigationiii. K-Rep Bank Limited litigation report (undated)iv. Rift Valley Bottlers Limited litigation report made up to 11 February 2015
Part B
Searches and Enquiries
Search conducted
Official Companies Registry search Centum Investment Company Limited
Almasi Beverages Limited
AMUPower
Bakki Holdco Limited
Centum Business Solutions Limited
Genesis Kenya Investment Management Limited
King Beverage Limited
KRep Bank Limited
Nabo Capital Limited
Rasimu Limited
Two Rivers Development Limited
Two Rivers ICT Company Limited
Two Rivers Lifestyle Centre Limited
Two Rivers Luxury Apartment Limited
Two Rivers Office Suites Limited
Two Rivers Power Company Limited
UhuruHeightsLimited
Vipingo Development Limited
Official search at the Lands Registry Property title number Dagoretti/Riruta/3907 Registered proprietor - K-rep Bank Limited

Information Memorandum 145
Senior Unsecured Fixed Rate Notes and Senior Unsecured Equity Linked Notes
2.6 Centum Investment Company Limited owns 100% of Centum Development Limited (“CDL”) Subsidiaries of CDL:
Subsidiaries Shareholding% Registration Number Jurisdiction Business Activity
Pearl Marina Estates Limited
51%(The remainder
49%isheldunder Centum).
118623 Uganda Real Estate Development company.
2.7 Centum Investment Company Limited owns100% Centum Exotics Limited (“CEL”) Subsidiaries of CEL:
Subsidiaries Shareholding% Registration Number Jurisdiction Business Activity
Oleibon Investments Limited
100% 86609 Tanzania Investment holding company for QPE portfolio - Holds shares of Tanzania Breweries Limited.
Appendix 3
Land and Material Assets and Property
Property known as title number Dagoretti/Riruta/3907– whose registered proprietor is K-rep Bank Limited
APPENDIX4
MATERIALBORROWINGSBYTHEISSUER
Lender Facility Purpose Term Interest Rate Security
Co-operative Bank Kenya Limited
a) Overdraft/Guarantee of KES 2,700,000,000.
(a) working capital requirements;
(b) issuance of guarantee, bid bond and performance bonds required in the ordinary course of business.
12 months from date of limit loading (renewable)
14.5%perannum
The facilities are secured by the following securities inter alia:• Debenture over the
corporate bonds and quoted equities held at Custodial Services Department for KES 1.2 billion dated 26 January 2010;
• Further debenture overthe corporate bonds and quoted equities held at Custodial Services Department for KES500 million dated 12 October 2010;
• 2nd further debentureover the corporate bonds and quoted equities held at Custodial Services Department for KES 500 million dated 16 December 2011; and
• 3rd further debentureover the corporate bonds and quoted equities held at Custodial Services Department for KES 500 million dated 14October 2014.

Information Memorandum
Senior Unsecured Fixed Rate Notes and Senior Unsecured Equity Linked Notes
146
Lender Facility Purpose Term Interest Rate Security
FirstRand Bank Limited (acting through its Rand Merchant Bank Division acting as Agent)
US$35,000,000 Making investments and general corporate purposes
12 months after the first UtilisationDate, subject to an extension of 6 months at the discretion of the Lenders
Margin at 5.75%plusUSLIBOR(asdefined) per annum
• Charge over shares heldin the Charged Portfolio Companies and other entities in which members of the Group may in future acquire an interest;
• ChargeovertheCustodialAccounts and Proceeds Accounts maintained by Centum Exotics Limited and Oleibon Investment Limited with the Custodian (CfC Stanbic Bank Limited);
• Assignment of any loansmade to the Charged Portfolio Companies or other non-Obligor;
• Custodian Agreementand Acknowledgement between the Custodian, Centum Exotics Limited and Oleibon Investment Limited in respect of the holding of Listed Investments by the Custodian for Centum Exotics Limited and Oleibon Investment Limited and the acknowledgement by the Custodian in favour of the Agent in terms acceptable to the Agent.
“Charged Portfolio Companies” means include Almasi Beverages Limited and Nairobi Bottlers Limited

Information Memorandum 147
Senior Unsecured Fixed Rate Notes and Senior Unsecured Equity Linked Notes
The DirectorsCentum Investment Company LimitedInternational HouseMama Ngina StreetP.O Box 10518-00100 Nairobi 15 May 2015
Accountant’s report – Centum Investment Company Limited
Dear Sirs
We are pleased to submit our Accountant’s Report in accordance with Section 19 of the Third Schedule of the Companies Act 486, and Part C of the Third Schedule of the Capital Markets (Securities) (Public Offers, Listing and Disclosures) Regulations, 2002 as amended in 2012 and the NSE listing requirements (hereafter referred to as “the Regulations”).
We confirm that PricewaterhouseCoopers has been the auditor of Centum Investment Company Limited (“the Company”) and its subsidiary companies (together “the Group”) and have reported on the financial statements of the Company and Group without qualification for the accounting periods ended 31 March 2014, 2013, 2012, 2011. The financial statements for the year ended 31 March 2010 were audited by Deloitte.
Responsibility of the directors
As directors of Centum Investment Company Limited (“the Company” or ‘’the Group’’), you are responsible for the InformationMemorandum to be issued on or about 15 May 2015 and for all information contained therein, and for the financial statements and information to which this Accountant’s Report relates and from which it has been prepared.
The financial information included in this report was based on the audited consolidated financial statements of the Group for the accounting periods ended 31 March 2014, 2013, 2012, 2011 and 2010.
Our responsibility
You required us to prepare and produce an Accountant’s Report to be included in the Information Memorandum to be issued to support the Notes Issue of Centum Investment Company Limited.
Our responsibility is detailed in our letter of engagement dated 3 March 2015. The objective of the engagement was to enable us to state whether, on the basis of our review procedures which do not provide all the evidence that would be required in an audit, anything has come to our attention that causes us to believe that the financial statements were not prepared, in all material respects, in accordance with International Financial Reporting Standards. Criteria and procedures used
The financial information set out in this report has been compiled in accordance with the International Standard on Related Services 4410 – Engagements to Compile Financial Statements (“ISRS 4410”) and the International Standard on Review Engagements 2410 – Review of interim financial information performed by the independent auditor of the entity conforming amendments (“ISRE 2410”).
To enable us prepare an Accountant’s Report, we carried out procedures to satisfy ourselves that the information presented in the financial statements was in accordance with Section 19 of the Third Schedule of the Companies Act 486, and Part C of the Third Schedule of the Capital Markets (Securities) (Public Offers, Listing and Disclosures) Regulations, 2002 as amended in 2012. To this end we carried out the following procedures:
• reviewedthefinancialstatementsoftheGroupforeachofthefiveyearsended31March2014,2013,2012,2011and2010forcompliance with International Financial Reporting Standards (IFRS) and consistency of application of accounting policies;
• madeenquiriesoftheGroup’smanagementwithrespecttosignificantmattersrelevanttothefinancialinformation;• reviewedotherevidencerelevanttotheGroup’sfinancialstatements;
PricewaterhouseCoopers CPA. PwC Tower, Waiyaki Way/Chiromo Road, Westlands P O Box 43963 – 00100 Nairobi, Kenya T: +254 (20)285 5000 F: +254 (20)285 5001 www.pwc.com/ke
Partners: A Eriksson K Muchiru M Mugasa F Muriu P Ngahu A Njeru R Njoroge B Okundi K Saiti R Shah
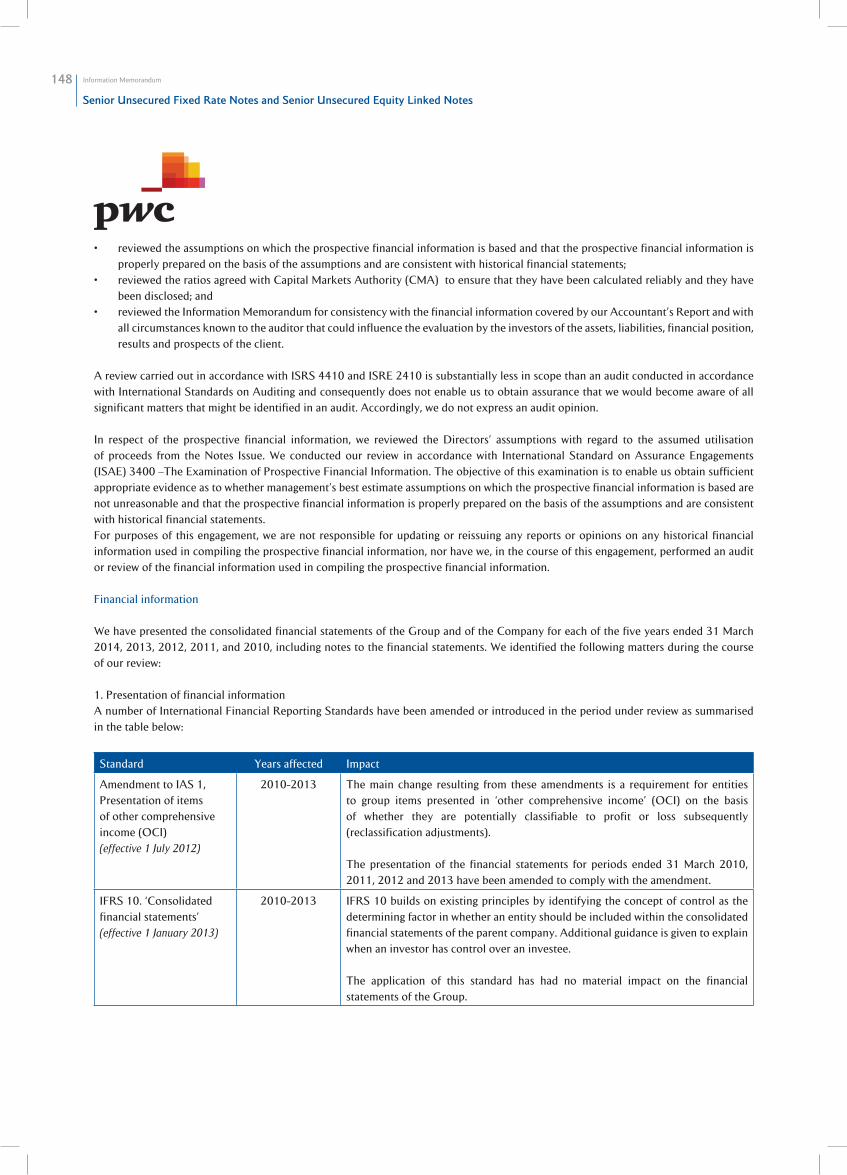
Information Memorandum
Senior Unsecured Fixed Rate Notes and Senior Unsecured Equity Linked Notes
148
• reviewedtheassumptionsonwhichtheprospectivefinancialinformationisbasedandthattheprospectivefinancialinformationis
properly prepared on the basis of the assumptions and are consistent with historical financial statements;
• reviewedtheratiosagreedwithCapitalMarketsAuthority(CMA)toensurethattheyhavebeencalculatedreliablyandtheyhave
been disclosed; and
• reviewedtheInformationMemorandumforconsistencywiththefinancialinformationcoveredbyourAccountant’sReportandwith
all circumstances known to the auditor that could influence the evaluation by the investors of the assets, liabilities, financial position,
results and prospects of the client.
A review carried out in accordance with ISRS 4410 and ISRE 2410 is substantially less in scope than an audit conducted in accordance
with International Standards on Auditing and consequently does not enable us to obtain assurance that we would become aware of all
significant matters that might be identified in an audit. Accordingly, we do not express an audit opinion.
In respect of the prospective financial information, we reviewed the Directors’ assumptions with regard to the assumed utilisation
of proceeds from the Notes Issue. We conducted our review in accordance with International Standard on Assurance Engagements
(ISAE) 3400 –The Examination of Prospective Financial Information. The objective of this examination is to enable us obtain sufficient
appropriate evidence as to whether management’s best estimate assumptions on which the prospective financial information is based are
not unreasonable and that the prospective financial information is properly prepared on the basis of the assumptions and are consistent
with historical financial statements.
For purposes of this engagement, we are not responsible for updating or reissuing any reports or opinions on any historical financial
information used in compiling the prospective financial information, nor have we, in the course of this engagement, performed an audit
or review of the financial information used in compiling the prospective financial information.
Financial information
We have presented the consolidated financial statements of the Group and of the Company for each of the five years ended 31 March
2014, 2013, 2012, 2011, and 2010, including notes to the financial statements. We identified the following matters during the course
of our review:
1. Presentation of financial information
A number of International Financial Reporting Standards have been amended or introduced in the period under review as summarised
in the table below:
Standard Years affected Impact
Amendment to IAS 1,
Presentation of items
of other comprehensive
income (OCI)
(effective 1 July 2012)
2010-2013 The main change resulting from these amendments is a requirement for entities
to group items presented in ‘other comprehensive income’ (OCI) on the basis
of whether they are potentially classifiable to profit or loss subsequently
(reclassification adjustments).
The presentation of the financial statements for periods ended 31 March 2010,
2011, 2012 and 2013 have been amended to comply with the amendment.
IFRS10.‘Consolidated
financial statements’
(effective 1 January 2013)
2010-2013 IFRS 10 builds on existing principles by identifying the concept of control as the
determining factor in whether an entity should be included within the consolidated
financial statements of the parent company. Additional guidance is given to explain
when an investor has control over an investee.
The application of this standard has had no material impact on the financial
statements of the Group.

Information Memorandum 149
Senior Unsecured Fixed Rate Notes and Senior Unsecured Equity Linked Notes
Standard Years affected Impact
IFRS12,‘Disclosureof
interests in other entities’
(effective 1 January 2013)
2010-2013 IFRS 12 sets out the required disclosures for entities reporting under IFRS 10 and
IFRS 11 and it replaced the disclosure requirements previously found in IAS 28,
‘Investments inassociates’. IFRS12requiresentitiestodisclose informationthat
helps financial statement readers to evaluate the nature, risks and financial effects
associated with the entity’s interests in subsidiaries, associates, joint arrangements
and unconsolidated structured entities.
The additional disclosures required by the standard for entities with material non-
controlling interests have been added to the financial statements for the years 2010
to 2013.
IFRS13,‘Fairvalue
measurement’
(effective 1 January 2013)
2010 -2013 The standard aims to improve consistency and reduce complexity by providing a
precise definition of fair value and a single source of fair value measurement and
disclosure requirements for use across IFRSs.
Therequirements,whicharelargelyalignedbetweenIFRSsandUSGAAP,donot
extend the use of fair value accounting but provide guidance on how it should be
applied where its use is already required or permitted by other standards within
IFRSs. The adoption of IFRS 13 has increased the extent of fair value disclosures
in the financial statements. This has no material impact on the financial statements
of the Group.
Amendments to IAS 36,
‘Impairmentofassets’on
the recoverable amount
disclosures for non-
financial assets
(effective 1 January 2013)
2010 -2013 ThisamendmentremovedcertaindisclosuresoftherecoverableamountofCGUs
which had been included in IAS 36 by the issue of IFRS 13.
The amendment has no material impact on the financial statements of the Group.
IFRS11,‘Joint
arrangements’
(effective 1 January 2013)
2010-2013 IFRS 11 focuses on the rights and obligations of the parties to the arrangement
rather than its legal form. There are two types of joint arrangements: joint
operations and joint ventures. Joint operations arise where the investors have
rights to the assets and obligations for the liabilities of an arrangement. A joint
operator accounts for its share of the assets, liabilities, revenue and expenses. Joint
ventures arise where the investors have rights to the net assets of the arrangement;
joint ventures are accounted for under the equity method. Proportional
consolidation of joint arrangements is no longer permitted.
The application of this standard has no material impact on the financial statements
of the Group.
IAS24(Revised)‘Related
party disclosures’
(effective 1 January 2011)
2010-2011 The revised standard clarifies and simplifies the definition of a related party
and removes the requirement for government-related entities to disclose details
of all transactions with the government and other government-related entities.
The revised standard requires, the subsidiaries of the Group to disclose any
transactions between itself and associates of its parent Company. The additional
disclosures required by the standard have no material impact on the financial
statements of the Group and Company.
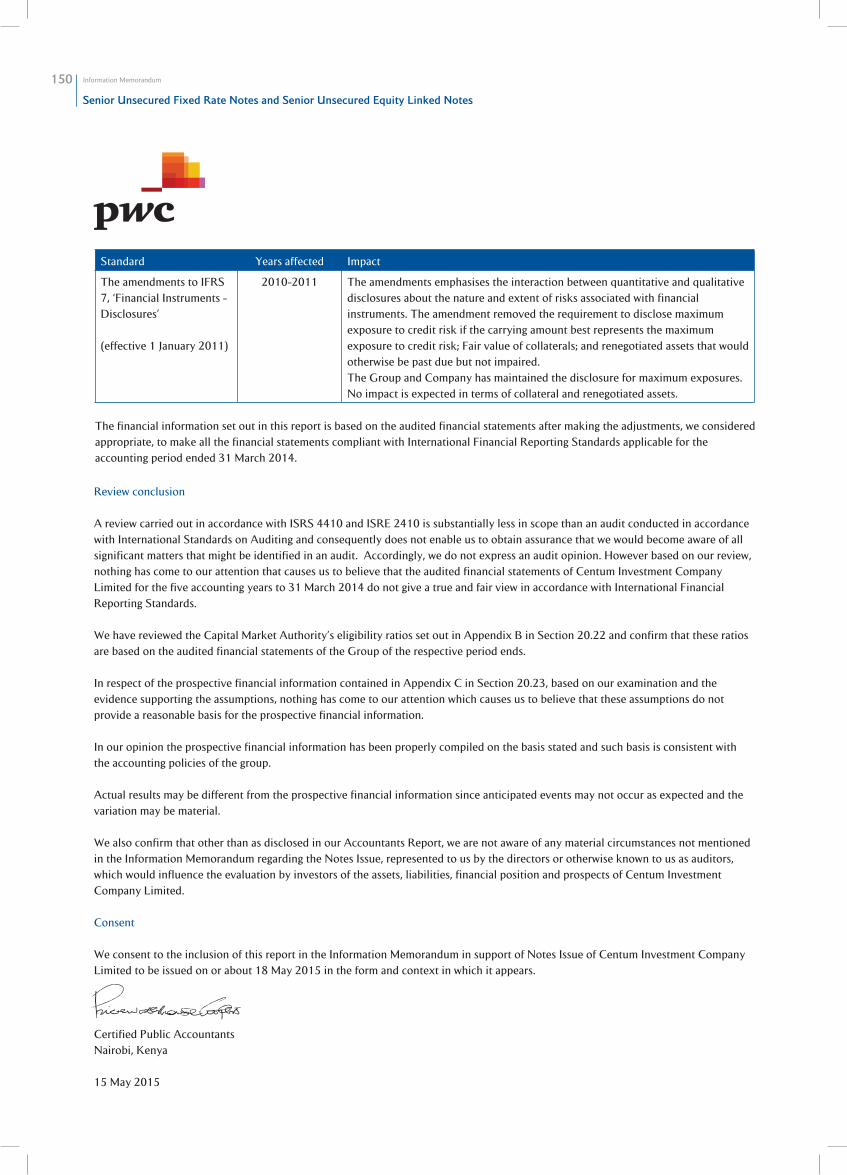
Information Memorandum
Senior Unsecured Fixed Rate Notes and Senior Unsecured Equity Linked Notes
150
Review conclusion
A review carried out in accordance with ISRS 4410 and ISRE 2410 is substantially less in scope than an audit conducted in accordance
with International Standards on Auditing and consequently does not enable us to obtain assurance that we would become aware of all
significant matters that might be identified in an audit. Accordingly, we do not express an audit opinion. However based on our review,
nothing has come to our attention that causes us to believe that the audited financial statements of Centum Investment Company
Limited for the five accounting years to 31 March 2014 do not give a true and fair view in accordance with International Financial
Reporting Standards.
We have reviewed the Capital Market Authority’s eligibility ratios set out in Appendix B in Section 20.22 and confirm that these ratios
are based on the audited financial statements of the Group of the respective period ends.
In respect of the prospective financial information contained in Appendix C in Section 20.23, based on our examination and the
evidence supporting the assumptions, nothing has come to our attention which causes us to believe that these assumptions do not
provide a reasonable basis for the prospective financial information.
In our opinion the prospective financial information has been properly compiled on the basis stated and such basis is consistent with
the accounting policies of the group.
Actual results may be different from the prospective financial information since anticipated events may not occur as expected and the
variation may be material.
We also confirm that other than as disclosed in our Accountants Report, we are not aware of any material circumstances not mentioned
in the Information Memorandum regarding the Notes Issue, represented to us by the directors or otherwise known to us as auditors,
which would influence the evaluation by investors of the assets, liabilities, financial position and prospects of Centum Investment
Company Limited.
Consent
We consent to the inclusion of this report in the Information Memorandum in support of Notes Issue of Centum Investment Company
Limited to be issued on or about 18 May 2015 in the form and context in which it appears.
Certified Public Accountants
Nairobi, Kenya
15 May 2015
Standard Years affected Impact
The amendments to IFRS
7,‘FinancialInstruments-
Disclosures’
(effective 1 January 2011)
2010-2011 The amendments emphasises the interaction between quantitative and qualitative
disclosures about the nature and extent of risks associated with financial
instruments. The amendment removed the requirement to disclose maximum
exposure to credit risk if the carrying amount best represents the maximum
exposure to credit risk; Fair value of collaterals; and renegotiated assets that would
otherwise be past due but not impaired.
The Group and Company has maintained the disclosure for maximum exposures.
No impact is expected in terms of collateral and renegotiated assets.
The financial information set out in this report is based on the audited financial statements after making the adjustments, we considered
appropriate, to make all the financial statements compliant with International Financial Reporting Standards applicable for the
accounting period ended 31 March 2014.

Information Memorandum 151
Senior Unsecured Fixed Rate Notes and Senior Unsecured Equity Linked Notes
20.2 Reporting Accountants Report
20.2 .1 Centum Five Year Financial Statements
Consolidated statement of comprehensive income
For the Year ended 31 March Notes 2014 2013 2012 2011 2010 Ksh’000 Ksh’000 Ksh’000 Ksh’000 Ksh’000 Income 6(a) 4,883,200 3,905,657 1,272,313 2,261,431 1,038,257
Expenses
Administration expenses 7(a) (575,485) (379,960) (148,094) (205,980) (122,326)
Other operating expenses 7(b) (220,341) (140,220) (121,709) (93,259) (77,988)
Finance costs 8(i) (469,355) (400,763) (229,872) (154,697) (46,940)
Total expenses (1,265,181) (920,943) (499,675) (453,936) (247,254)
Share of profit in associate companies 393,432 263,259 594,037 486,934 289,787
Profit before tax 4,011,451 3,247,973 1,366,675 2,294,429 1,080,790
Income tax (expense)/credit 10(a) (956,081) (738,577) (177,270) (2,046) 12,967
Profit for the year 3,055,370 2,509,396 1,189,405 2,292,383 1,093,757
Other Comprehensive Income
Reserves released on
disposal of investment 11 (287,772) (791,726) (562,349) (964,613) (854,626)
Share of other comprehensive
income /(loss) of associates 19(a) 32,761 41,918 (91,117) 165,053 (29,980)
Fair value gain/ (Loss) in
unquoted investments 20 2,965,632 1,018,737 114,597 12,165 18,961
Fair value gain/ (Loss) in
quoted investments 21(a) 865,064 835,057 (166,121) 199,577 1,312,022
Currency translation differences - (11,883) (2,550) (1,355) -
Total other Comprehensive Income/ (Loss) 3,575,685 1,092,103 (707,540) (589,173) 446,377
Total Comprehensive Income/ (Loss) 6,631,055 3,601,499 481,865 1,703,210 1,540,134
Earnings Per share – Basic & Diluted 12(a) Kshs 4.54 Kshs 3.77 Kshs 1.79 Kshs 3.44 Kshs1.64

Information Memorandum
Senior Unsecured Fixed Rate Notes and Senior Unsecured Equity Linked Notes
152
Company statement of comprehensive income
For the Year ended 31 March Notes 2014 2013 2012 2011 2010 Ksh’000 Ksh’000 Ksh’000 Ksh’000 Ksh’000 Income 6(b) 1,988,227 1,913,776 764,460 1,684,796 1,121,464
Expenses
Administration expenses 7(a)(ii) (282,580) (364,482) (136,368) (201,853) (122,154)
Other operating expenses 7(b) (148,097) ( 77,649) (90,707) (89,113) (76,897)
Finance costs 8(ii) (461,954) (400,697) (49,979) (154,697) (46,940)
Total expenses (892,631) (842,828) (277,054) (445,663) (245,991)
Profit before tax 1,095,596 1,070,948 487,406 1,239,133 875,473
Income tax (expense)/credit 10(a)(ii) (48,323) (36,850) (41,264) (1,950) 12,967
Profit for the year 1,047,273 1,034,098 446,142 1,237,183 888,440
Other Comprehensive Income
Reserves released on
disposal of investment 11 (133,208) (1,423,723) (127,243) ( 833,339) (626,700)
Fair value in subsidiaries 18 3,636,745 1,657,737 13,619 902,681 565,992
Fair value in associates 19(b) 421,153 382,919 882,934 1,990,419 1,867,270
Fair value gain/ (Loss) in
unquoted investments 1,852,303 371,936 114,597 12,165 18,961
Fair value gain/ (Loss) in
quoted investments 21(b) (24,759) 428,270 (196,952) 86,192 583,711
Total other Comprehensive Income/ (Loss) 5,752,234 1,417,139 686,955 2,158,118 2,409,234
Total Comprehensive Income/ (Loss) 6,799,507 2,451,237 1,133,097 3,395,301 3,297,674

Information Memorandum 153
Senior Unsecured Fixed Rate Notes and Senior Unsecured Equity Linked Notes
Consolidated statement of financial position
As at 31 March Notes 2014 2013 2012 2011 2010 Ksh’000 Ksh’000 Ksh’000 Ksh’000 Ksh’000
Assets
Deferred income tax 13(a) - - - 30,443 29,477
Prepaid operating lease rentals 14 - - - - 35,940
Current income tax 10(c) - - - 2,654 3,075
Investment property 15(a) 10,845,392 5,456,057 3,992,754 3,525,578 -
Motor vehicle and equipment 16 59,954 43,999 26,467 26,813 11,347
Intangible assets 17(a) 988,756 5,298 1,926 5,404 601
Investment in associates 19(a) 3,900,851 3,659,198 3,614,550 3,377,305 2,948,585
Unquotedinvestments 20 7,569,310 4,306,221 1,427,206 1,338,664 1,251,209
Quoted investments 21(a) 3,036,299 2,732,872 1,666,309 3,208,611 2,967,876
Bonds at fair value through profit or loss 22 1,071,046 995,313 480,000 539,188 505,371
Receivables and prepayments 24(a) 1,071,947 260,825 36,079 240,140 108,849
Cash and cash equivalents 25 843,648 1,501,769 322,410 6,776 393,641
Total assets 29,387,203 18,961,552 11,567,701 12,301,576 8,255,971
Capital and reserves
Share capital 27 332,721 332,721 332,721 302,474 274,976
Share premium 27 589,753 589,753 589,753 589,753 589,753
Investment revaluation reserve 28 6,170,187 2,828,301 1,736,198 2,443,738 3,032,911
Retained earnings 12,912,168 9,891,966 7,382,570 6,223,412 3,958,527
Non-controlling interest 268,008 - - - -
Total equity 20,272,837 13,642,741 10,041,242 9,559,377 7,856,167
Liabilities
Borrowings 26 4,201,029 4,149,532 1,000,000 1,000,000 -
Bank overdraft 25(a) 1,291,101 - - 987,980 -
Payables and accrued expenses 29 1,840,552 287,858 355,956 719,170 357,154
Unclaimeddividends 30 28,987 32,504 34,437 35,049 42,650
Current income tax 10(c) 210,913 19,254 5,114 - -
Deferred income tax 13(a) 1,541,784 829,663 130,952 - -
Total Liabilities 9,114,366 5,318,811 1,526,459 2,742,199 399,804
Total Equity & liabilities 29,387,203 18,961,552 11,567,701 12,301,576 8,255,971
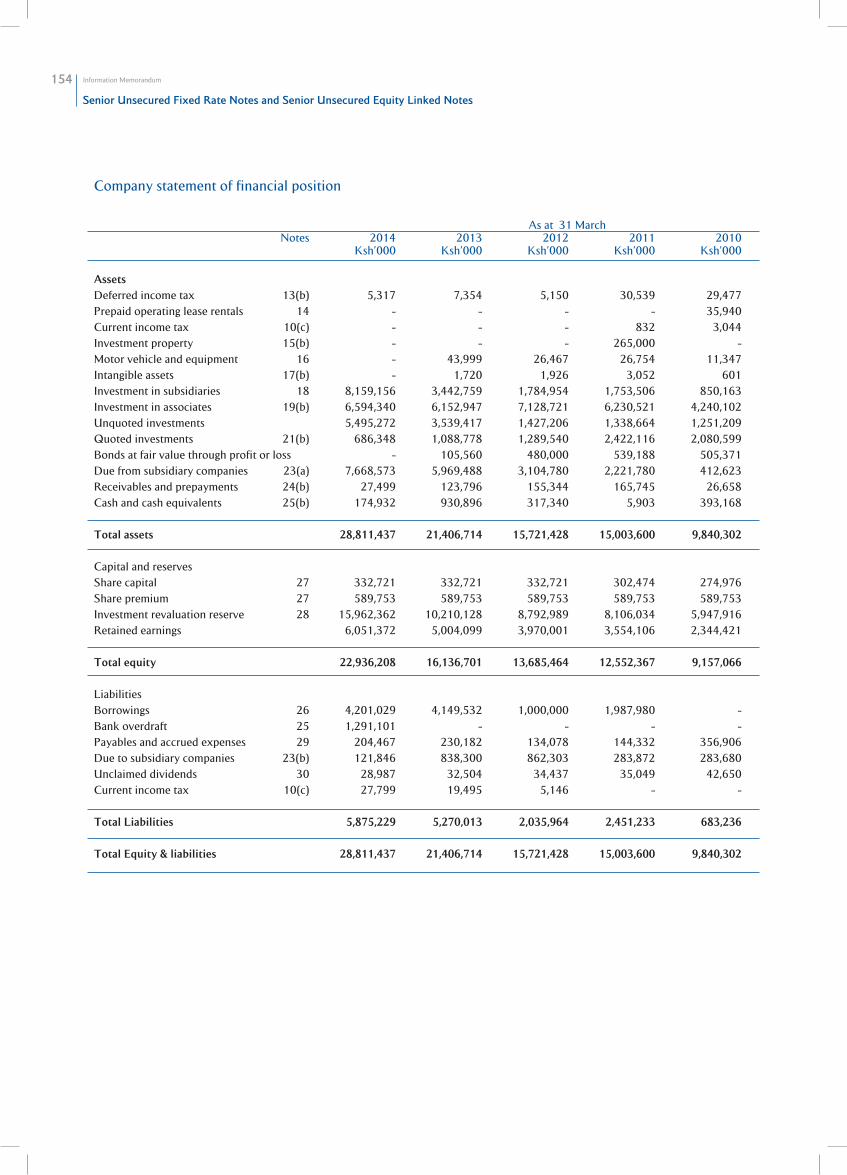
Information Memorandum
Senior Unsecured Fixed Rate Notes and Senior Unsecured Equity Linked Notes
154
Company statement of financial position
As at 31 March Notes 2014 2013 2012 2011 2010 Ksh’000 Ksh’000 Ksh’000 Ksh’000 Ksh’000
Assets
Deferred income tax 13(b) 5,317 7,354 5,150 30,539 29,477
Prepaid operating lease rentals 14 - - - - 35,940
Current income tax 10(c) - - - 832 3,044
Investment property 15(b) - - - 265,000 -
Motor vehicle and equipment 16 - 43,999 26,467 26,754 11,347
Intangible assets 17(b) - 1,720 1,926 3,052 601
Investment in subsidiaries 18 8,159,156 3,442,759 1,784,954 1,753,506 850,163
Investment in associates 19(b) 6,594,340 6,152,947 7,128,721 6,230,521 4,240,102
Unquotedinvestments 5,495,272 3,539,417 1,427,206 1,338,664 1,251,209
Quoted investments 21(b) 686,348 1,088,778 1,289,540 2,422,116 2,080,599
Bonds at fair value through profit or loss - 105,560 480,000 539,188 505,371
Due from subsidiary companies 23(a) 7,668,573 5,969,488 3,104,780 2,221,780 412,623
Receivables and prepayments 24(b) 27,499 123,796 155,344 165,745 26,658
Cash and cash equivalents 25(b) 174,932 930,896 317,340 5,903 393,168
Total assets 28,811,437 21,406,714 15,721,428 15,003,600 9,840,302
Capital and reserves
Share capital 27 332,721 332,721 332,721 302,474 274,976
Share premium 27 589,753 589,753 589,753 589,753 589,753
Investment revaluation reserve 28 15,962,362 10,210,128 8,792,989 8,106,034 5,947,916
Retained earnings 6,051,372 5,004,099 3,970,001 3,554,106 2,344,421
Total equity 22,936,208 16,136,701 13,685,464 12,552,367 9,157,066
Liabilities
Borrowings 26 4,201,029 4,149,532 1,000,000 1,987,980 -
Bank overdraft 25 1,291,101 - - - -
Payables and accrued expenses 29 204,467 230,182 134,078 144,332 356,906
Due to subsidiary companies 23(b) 121,846 838,300 862,303 283,872 283,680
Unclaimeddividends 30 28,987 32,504 34,437 35,049 42,650
Current income tax 10(c) 27,799 19,495 5,146 - -
Total Liabilities 5,875,229 5,270,013 2,035,964 2,451,233 683,236
Total Equity & liabilities 28,811,437 21,406,714 15,721,428 15,003,600 9,840,302

Consolidated Statement of changes in equity
Share Share Investment Retained Total Non- Total
Capital Premium Revaluation earnings equity controlling equity
Reserve Interest
Notes Kshs’000 Kshs’000 Kshs’000 Kshs’000 Kshs’000 Kshs’000 Kshs’000
Year ended 31 March 2014
At start of year 332,721 589,753 2,828,301 9,891,966 13,642,741 - 13,642,741
Comprehensive income
Profit for the year - - - 3,020,202 3,020,202 35,168 3,055,370
Other comprehensive income:
Reserves released on disposal of investments 11 - - (287,772) - (287,772) - (287,772)
Share of other comprehensive income of associates 19(a) - - 32,761 - 32,761 - 32,761
Fair value gain in unquoted investments - - 2,731,833 - 2,731,833 233,799 2,965,632
Fair value gain in quoted investments 21(a) - - 865,064 - 865,064 - 865,064
Currency translation differences - - - - - -
Total other comprehensive income - - 3,341,886 - 3,341,886 233,799 3,575,685
Total comprehensive income - - 3,341,886 3,020,202 6,362,088 268,967 6,631,055
Dividends paid by subsidiaries to non-controlling interest - - - - - (41,739) (41,739)
Non-controlling interest arising on business combination - - - - - 40,780 40,780
At end of year 332,721 589,753 6,170,187 12,912,168 20,004,829 268,008 20,272,837
Information Memorandum 155
Senior Unsecured Fixed Rate Notes and Senior Unsecured Equity Linked Notes

Consolidated statement of changes in equity
Share Share Investment Retained Total Total
Capital Premium Revaluation earnings equity equity
Reserve
Notes Kshs’000 Kshs’000 Kshs’000 Kshs’000 Kshs’000 Kshs’000
Year ended 31 March 2013
At start of year 332,721 589,753 1,736,198 7,382,570 10,041,242 10,041,242
Comprehensive income
Profit for the year - - - 2,509,396 2,509,396 2,509,396
Other comprehensive income:
Reserves released on disposal of investments 11 - - (791,726) - (791,726) (791,726)
Share of other comprehensive income of associates 19(a) - - 41,918 - 41,918 41,918
Fair value gain in unquoted investments 20 - - 1,018,737 - 1,018,737 1,018,737
Fair value gain in quoted investments 21(a) - - 835,057 - 835,057 835,057
Currency translation differences - - (11,883) - (11,883) (11,883)
Total other comprehensive income - - 1,092,103 - 1,092,103 1,092,103
Total comprehensive income - - 1,092,103 2,509,396 3,601,499 3,601,499
At end of year 332,721 589,753 2,828,301 9,891,966 13,642,741 13,642,741
Information Memorandum 156
Senior Unsecured Fixed Rate Notes and Senior Unsecured Equity Linked Notes

Consolidated Statement of changes in equity
Share Share Investment Retained Total Total
Capital Premium Revaluation earnings equity equity
Reserve
Notes Kshs’000 Kshs’000 Kshs’000 Kshs’000 Kshs’000 Kshs’000
Year ended 31 March 2013
At start of year 332,721 589,753 1,736,198 7,382,570 10,041,242 10,041,242
Comprehensive income
Profit for the year - - - 2,509,396 2,509,396 2,509,396
Other comprehensive income:
Reserves released on disposal of investments 11 - - (791,726) - (791,726) (791,726)
Share of other comprehensive income of associates 19(a) - - 41,918 - 41,918 41,918
Fair value gain in unquoted investments 20 - - 1,018,737 - 1,018,737 1,018,737
Fair value gain in quoted investments 21(a) - - 835,057 - 835,057 835,057
Currency translation differences - - (11,883) - (11,883) (11,883)
Total other comprehensive income - - 1,092,103 - 1,092,103 1,092,103
Total comprehensive income - - 1,092,103 2,509,396 3,601,499 3,601,499
At end of year 332,721 589,753 2,828,301 9,891,966 13,642,741 13,642,741
Information Memorandum 157
Senior Unsecured Fixed Rate Notes and Senior Unsecured Equity Linked Notes

Consolidated Statement of changes in equity
Share Share Investment Retained Total
Capital Premium Revaluation earnings equity
Reserve
Notes Kshs’000 Kshs’000 Kshs’000 Kshs’000 Kshs’000
Year ended 31 March 2012
At start of year 302,474 589,753 2,443,738 6,223,412 9,559,377
Comprehensive income
Profit for the year - - - 1,189,405 1,189,405
Other comprehensive income:
Reserves released on disposal of investments 11 - - (562,349) - (562,349)
Share of other comprehensive loss of associates 19(a) - - (91,117) - (91,117)
Fair value gain in unquoted investments 20 - - 114,597 - 114,597
Fair value loss in quoted investments 21(a) - - (166,121) - (166,121)
Currency translation differences - - (2,550) - (2,550)
Total other comprehensive loss - - (707,540) - (707,540)
Total comprehensive income - - (707,540) 1,189,405 481,865
Transactions with owners
Issue of bonus shares 27 30,247 - - (30,247) -
30,247 - - (30,247) -
At end of year 332,721 589,753 1,736,198 7,382,570 10,041,242
Information Memorandum 158
Senior Unsecured Fixed Rate Notes and Senior Unsecured Equity Linked Notes
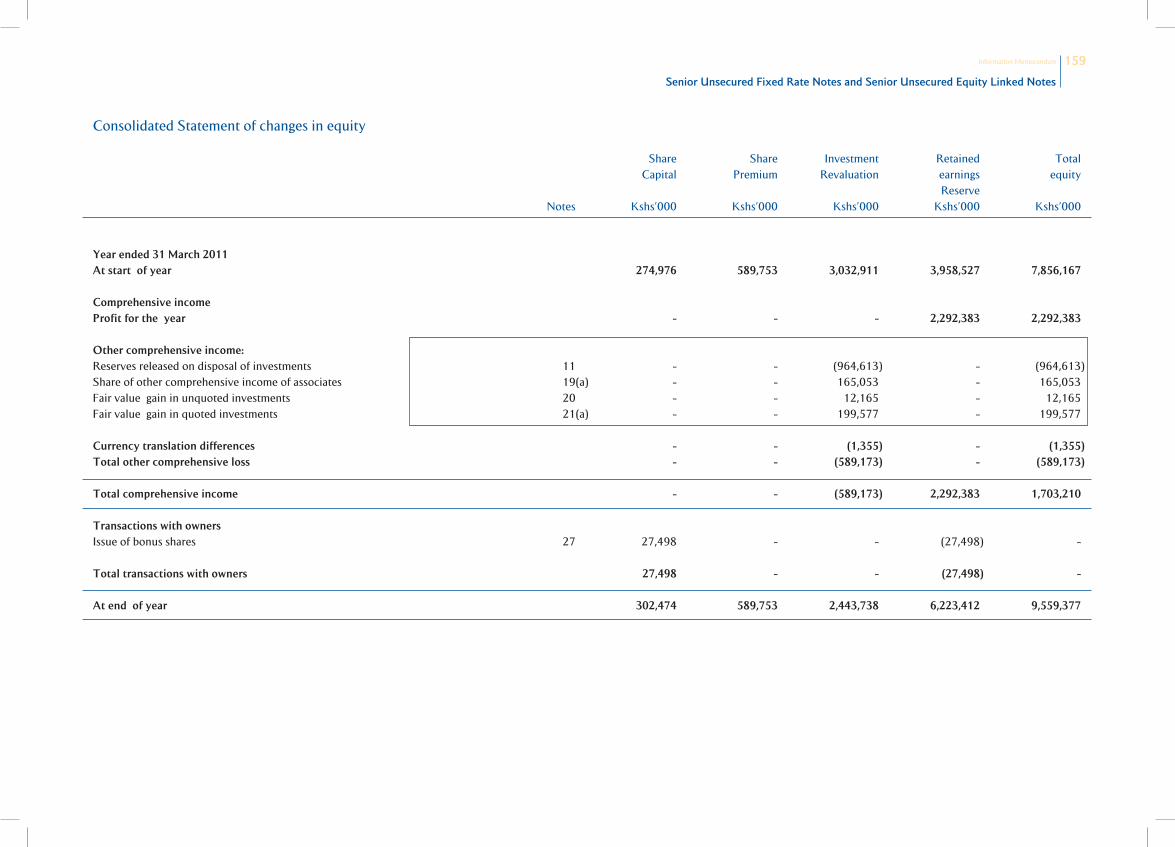
Consolidated Statement of changes in equity
Share Share Investment Retained Total
Capital Premium Revaluation earnings equity
Reserve
Notes Kshs’000 Kshs’000 Kshs’000 Kshs’000 Kshs’000
Year ended 31 March 2011
At start of year 274,976 589,753 3,032,911 3,958,527 7,856,167
Comprehensive income
Profit for the year - - - 2,292,383 2,292,383
Other comprehensive income:
Reserves released on disposal of investments 11 - - (964,613) - (964,613)
Share of other comprehensive income of associates 19(a) - - 165,053 - 165,053
Fair value gain in unquoted investments 20 - - 12,165 - 12,165
Fair value gain in quoted investments 21(a) - - 199,577 - 199,577
Currency translation differences - - (1,355) - (1,355)
Total other comprehensive loss - - (589,173) - (589,173)
Total comprehensive income - - (589,173) 2,292,383 1,703,210
Transactions with owners
Issue of bonus shares 27 27,498 - - (27,498) -
Total transactions with owners 27,498 - - (27,498) -
At end of year 302,474 589,753 2,443,738 6,223,412 9,559,377
Information Memorandum 159
Senior Unsecured Fixed Rate Notes and Senior Unsecured Equity Linked Notes

Information Memorandum 160
Senior Unsecured Fixed Rate Notes and Senior Unsecured Equity Linked Notes
Consolidated Statement of changes in equity
Share Share Investment Retained Total
Capital Premium Revaluation earnings equity
Reserve
Notes Kshs’000 Kshs’000 Kshs’000 Kshs’000 Kshs’000
Year ended 31 March 2010
At start of year 274,976 589,753 2,586,534 2,864,770 6,316,033
Comprehensive income
Profit for the year - - - 1,093,757 1,093,757
Other comprehensive income:
Reserves released on disposal of investments 11 - - (854,626) - (854,626)
Share of other comprehensive loss of associates 19(a) - - (29,980) - (29,980)
Fair value gain in unquoted investments 20 - - 18,961 - 18,961
Fair value gain in quoted investments 21(a) - - 1,312,022 - 1,312,022
Total other comprehensive income - - 446,377 - 446,377
Total comprehensive income - - 446,377 1,093,757 1,540,134
At end of year 274,976 589,753 3,032,911 3,958,527 7,856,167

Information Memorandum 161
Senior Unsecured Fixed Rate Notes and Senior Unsecured Equity Linked Notes
Company statement of changes in equity
Share Share Investment Retained Total
Capital Premium Revaluation earnings equity
Reserve
Notes Kshs’000 Kshs’000 Kshs’000 Kshs’000 Kshs’000
Year ended March 2014
At start of year 332,721 589,753 10,210,128 5,004,099 16,136,701
Comprehensive income
Profit for the year - - - 1,047,273 1,047,273
Other comprehensive income:
Reserves released on disposal of investments 11 - - (133,208) - (133,208)
Fair value gain in subsidiaries 18 - - 3,636,745 - 3,636,745
Fair value gain in associates 19 - - 421,153 - 421,153
Fair value gain in unquoted investments - - 1,852,303 - 1,852,303
Fair value loss in quoted investments 21 - - (24,759) - (24,759)
Total other comprehensive income - - 5,752,234 - 5,752,234
Total comprehensive income - - 5,752,234 1,047,273 6,799,507
At end of year 332,721 589,753 15,962,362 6,051,372 22,936,208

Information Memorandum 162
Senior Unsecured Fixed Rate Notes and Senior Unsecured Equity Linked Notes
Company statement of changes in equity
Share Share Investment Retained Total
Capital Premium Revaluation earnings equity
Reserve
Notes Kshs’000 Kshs’000 Kshs’000 Kshs’000 Kshs’000
Year ended 31 March 2013
At start of year 332,721 589,753 8,792,989 3,970,001 13,685,464
Comprehensive income
Profit for the year - - - 1,034,098 1,034,098
Other comprehensive income:
Reserves released on disposal of investments 11 - - (1,423,723) - (1,423,723)
Fair value gain in subsidiaries 18 - - 1,657,737 - 1,657,737
Fair value gain in associates 19 - - 382,919 - 382,919
Fair value gain in unquoted investments - - 371,936 - 371,936
Fair value gain in quoted investments 21 - - 428,270 - 428,270
Total other comprehensive income - - 1,417,139 - 1,417,139
Total comprehensive income - - 1,417,139 1,034,098 2,451,237
At end of year 332,721 589,753 10,210,128 5,004,099 16,136,701

Information Memorandum 163
Senior Unsecured Fixed Rate Notes and Senior Unsecured Equity Linked Notes
Company statement of changes in equity
Share Share Investment Retained Total
Capital Premium Revaluation earnings equity
Reserve
Notes Kshs’000 Kshs’000 Kshs’000 Kshs’000 Kshs’000
Year ended 31 March 2012
At start of year 302,474 589,753 8,106,034 3,554,106 12,552,367
Comprehensive income
Profit for the year - - - 446,142 446,142
Other comprehensive income:
Reserves released on disposal of investments 11 - - (127,243) - (127,243)
Fair value gain in subsidiaries 18 - - 13,619 - 13,619
Fair value gain in associates 19(b) 882,934 - 882,934
Fair value gain in unquoted investments 20 - - 114,597 - 114,597
Fair value gain loss in quoted investments 21(b) - - (196,952) - (196,952)
Total other comprehensive income - - 686,955 - 686,955
Total comprehensive income - - 686,955 446,142 1,133,097
Transactions with owners
Issue of bonus shares 27 30,247 - - (30,247) -
Total transactions with owners 30,247 - - (30,247) -
At end of year 332,721 589,753 8,792,989 3,970,001 13,685,464
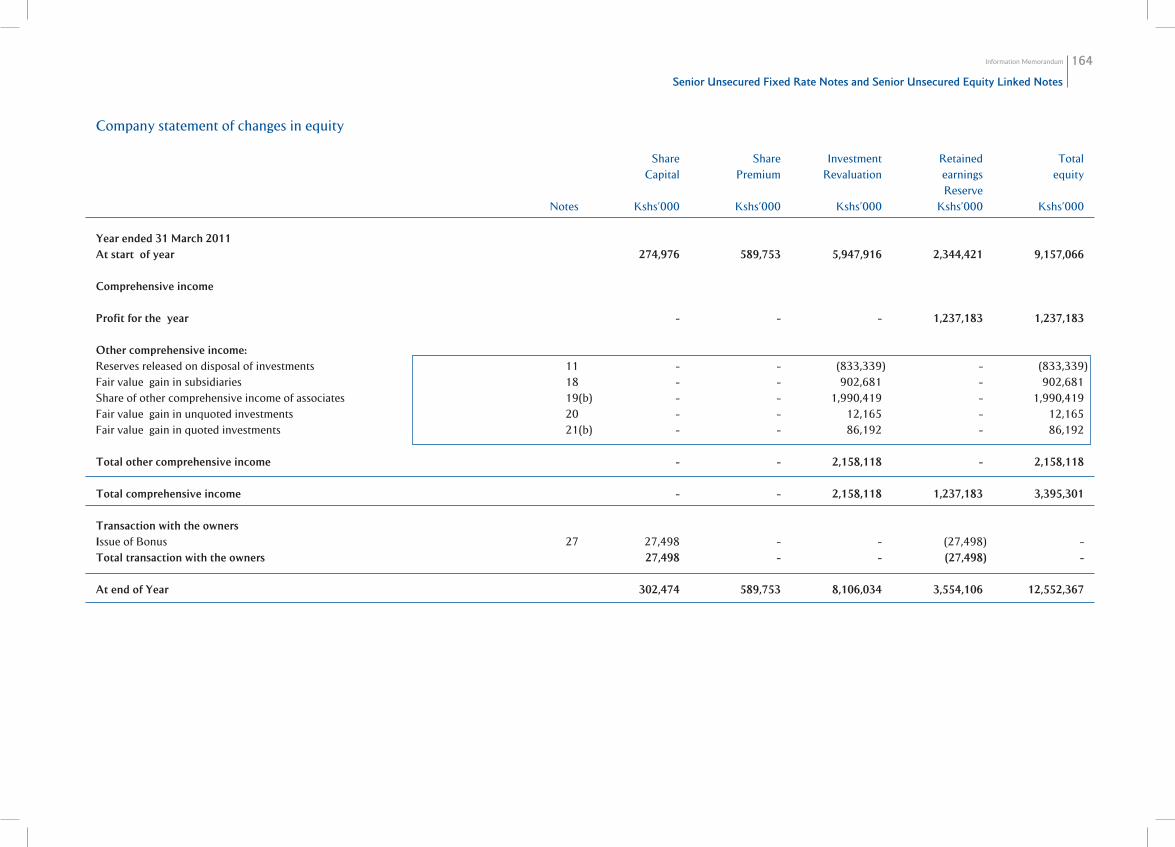
Information Memorandum 164
Senior Unsecured Fixed Rate Notes and Senior Unsecured Equity Linked Notes
Company statement of changes in equity
Share Share Investment Retained Total
Capital Premium Revaluation earnings equity
Reserve
Notes Kshs’000 Kshs’000 Kshs’000 Kshs’000 Kshs’000
Year ended 31 March 2011
At start of year 274,976 589,753 5,947,916 2,344,421 9,157,066
Comprehensive income
Profit for the year - - - 1,237,183 1,237,183
Other comprehensive income:
Reserves released on disposal of investments 11 - - (833,339) - (833,339)
Fair value gain in subsidiaries 18 - - 902,681 - 902,681
Share of other comprehensive income of associates 19(b) - - 1,990,419 - 1,990,419
Fair value gain in unquoted investments 20 - - 12,165 - 12,165
Fair value gain in quoted investments 21(b) - - 86,192 - 86,192
Total other comprehensive income - - 2,158,118 - 2,158,118
Total comprehensive income - - 2,158,118 1,237,183 3,395,301
Transaction with the owners
Issue of Bonus 27 27,498 - - (27,498) -
Total transaction with the owners 27,498 - - (27,498) -
At end of Year 302,474 589,753 8,106,034 3,554,106 12,552,367

Information Memorandum 165
Senior Unsecured Fixed Rate Notes and Senior Unsecured Equity Linked Notes
Company statement of changes in equity
Share Share Investment Retained Total
Capital Premium Revaluation earnings equity
Reserve
Notes Kshs’000 Kshs’000 Kshs’000 Kshs’000 Kshs’000
Year ended 31 March 2010
At start of year 274,976 589,753 3,538,682 1,455,981 5,859,392
Comprehensive income
Profit for the year - - - 888,440 888,440
Other comprehensive income:
Reserves released on disposal of investments 11 - - (626,700) - (626,700)
Fair value gain in subsidiaries 18 - - 565,992 - 565,992
Share of other comprehensive income of associates 19(b) - - 1,867,270 - 1,867,270
Fair value gain in unquoted investments 20 - - 18,961 - 18,961
Fair value gain in quoted investments 21(b) - - 583,711 - 583,711
Total other comprehensive income - - 2,409,234 - 2,409,234
Total comprehensive income - - 2,409,234 888,440 3,297,674
At end of year 274,976 589,753 5,947,916 2,344,421 9,157,066

Information Memorandum 166
Senior Unsecured Fixed Rate Notes and Senior Unsecured Equity Linked Notes
Consolidated statement of financial position
For the year ended 31 March Notes 2014 2013 2012 2011 2010 Ksh’000 Ksh’000 Ksh’000 Ksh’000 Ksh’000
Cash flows from operating activities
Cash (used in)/generated from
operations 31 953,706 (251,761) (216,890) 183,949 290,188
Interest paid 8(a) (660,082) (343,576) (179,243) (147,914) (44,758)
Income tax paid 10(c) (50,825) (25,726) (9,897) (2,591) (603)
Dividends received from associates 19(a) 204,780 217,072 280,941 223,267 197,214
Net cash (used in)/generated
from operating activities 447,579 (403,991) (125,089) 256,711 442,041
Cash flows from investing activities
Purchase of investment property 15(a) (2,111,258) (128,671) (111,016) (2,485,417) -
Purchases of motor vehicles
and equipment 16 (26,915) (22,594) (4,156) (21,330) (9,403)
Proceeds from disposal of motor
vehicle and equipment - - 112 257 -
Purchases of intangible assets 17(a) (18,294) (4,812) (259) (5,871) (597)
Acquisition of interest in subsidiary (1,079,453) - - - -
Acquisition of subsidiary,
net of cash acquired 128,436 - - - -
Purchase of shares in associates 19(a) (20,240) (1,784,911) (15,266) - (45)
Purchase of unquoted equity investments 20 (337,123) (837,929) (85,240) (382,433) (79,743)
Purchase of quoted equity investments 21(a) (631,068) (1,112,066) (364,097) (1,670,399) (636,416)
Purchase of corporate bonds 22 (934,052) (947,663) (3,879,824) - (505,371)
Proceeds from disposal of
unquoted investments 20 39,666 1,367,306 111,295 307,143 265,147
Proceeds from disposal of
quoted investments 11 1,913,339 974,577 1,691,927 1,629,241 1,083,606
Proceeds on disposal of treasury
and corporate bonds 11 725,765 529,397 4,088,389 - -
Proceeds from disposal of investment property - 415,000 - - -
Net cash generated from/(used in)
investing activities (2,351,197) (1,552,366) 1,431,865 (2,628,809) 117,178
Cash flows from financing activities
Net proceeds from borrowings 4,149,532 - 1,000,000 -
Dividends paid to Company’s shareholders 30 (3,517) (1,933) (612) (1,392) (5,728)
Dividends paid to non-controlling interests (41,739)
Loan repayment - (1,000,000)
Net cash (used in)/generated from
financing activities (45,256) 3,147,599 (612) 998,608 (5,728)
Net increase/(decrease) in cash
and cash equivalents (1,948,874) 1,191,242 1,306,164 (1,373,490) 553,491
Movement in cash and cash equivalents
At start of year 1,501,769 322,410 (981,204) 393,641 (159,850)
Increase/(decrease) (1,948,874) 1,191,242 1,306,164 (1,373,490) 553,491
Exchange losses on cash and
cash equivalents (348) (11,883) (2,550) (1,355) -
At end of year 25 (447,453) 1,501,769 322,410 (981,204) 393,641

Information Memorandum 167
Senior Unsecured Fixed Rate Notes and Senior Unsecured Equity Linked Notes
Notes
1 General informations
Centum Investment Company Limited is incorporated in Kenya under the Kenyan Companies Act as a public limited liability
Company and is domiciled in Kenya. The Company’s shares are listed on the Nairobi Securities Exchange. The address of its
registered office is:
International House
5th Floor, Mama Ngina Street
P.O Box 10518 – 00100
Nairobi.
The Company has sixteen subsidiaries. Details of the business of the subsidiaries are highlighted in note 18 of the financial
statements.
For Kenyan Companies Act reporting purposes, the balance sheet is represented by the statement of financial position and the profit
and loss account by the statement of comprehensive income, in these financial statements.
2 Summary of significant accounting policies
The principal accounting policies applied in the preparation of these financial statements are set out below. These policies have been
consistently applied to all the years presented, unless otherwise stated.
(a) Basis of preparation
The financial statements are prepared in compliance with International Financial Reporting Standards (IFRS). The financial statements
have been prepared under the historical cost convention, as modified by the revaluation of investment properties, available for sale
financial assets and assets at fair value through profit or loss. The financial statements are presented in Kenyan Shillings (Kshs),
rounded to the nearest thousand.
The preparation of financial statements in conformity with IFRS requires the use of certain critical accounting estimates. It also
requires management to exercise its judgement in the process of applying the Group’s accounting policies. The areas involving
a higher degree of judgement or complexity, or where assumptions and estimates are significant to the financial statements, are
disclosed in Note 3.
Changes in accounting policy and disclosures
(i) New and amended standards adopted by the Company and the Group
The following new standards and amendments to standards are mandatory for the first time for the financial year beginning 1 April
2013:
Amendment to IAS1, ‘PresentationofFinancialStatements’ regardingother comprehensive income is effective for accounting
period beginning on or after 1 July 2012. The main change resulting from these amendments is a requirement for entities to group
itemspresentedin‘othercomprehensiveincome’(OCI)onthebasisofwhethertheyarepotentiallyreclassifiabletoprofitorloss
subsequently (reclassification adjustments). The amendments do not address which items are presented in OCI. The application of
the amendments has mainly impacted the presentation of the primary statements.
IAS 27 (revised 2012) includes the requirements relating to separate financial statements following the issue of IFRS 10, 11 and
12. The standard has been renamed and now deals solely with separate financial statements. The amended standard does not have
any significant impact on the Company as the existing guidance and disclosure requirements for separate financial statements are
unchanged.
IAS 28 (revised 2012) includes the requirements for associates and joint ventures that have to be equity accounted following the
issue of IFRS 11. IAS 28 is renamed and the scope exception for venture capital organisations, or mutual funds, unit trusts and
similar entities, including investment-linked insurance funds has been eliminated and has been characterised as a measurement
exemption from the requirement to measure investments in associates and joint ventures using the equity method. The revised
standard does not have any significant impact on the Company

Information Memorandum
Senior Unsecured Fixed Rate Notes and Senior Unsecured Equity Linked Notes
168
Notes (continued)
2 Summary of significant accounting policies (continued)
(a) Basis of preparation (continued)
Changes in accounting policy and disclosures (continued)
IFRS 10, Consolidated financial statements’, builds on existing principles by identifying the concept of control as the determining
factor in whether an entity should be included within the consolidated financial statements of the parent. The standard provides
additional guidance to assist in the determination of control where this is difficult to assess. The adoption of IFRS 10 did not have a
significant impact on the Company.
IFRS12,‘Disclosuresofinterestsinotherentities’,includesthedisclosurerequirementsforallformsofinterestsinotherentities,
including joint arrangements, associates, special purpose vehicles and other off balance sheet vehicles. With the adoption of IFRS
12 increased disclosures have been made in respect of the subsidiaries and associates in the financial statements.
IFRS13,‘Fairvaluemeasurement’aimstoimproveconsistencyandreducecomplexitybyprovidingaprecisedefinitionoffairvalue
and a single source of fair value measurement and disclosure requirements for use across IFRSs. The adoption of IFRS 13 increased
disclosures around fair value in the financial statements.
There are no other IFRSs or IFRIC interpretations that are effective for the first time for the financial year beginning 1 April 2013
that would be expected to have a material impact on the Company.
(ii) New standards and interpretations that are not yet effective and have not been early adopted
A number of new standards and amendments to standards and interpretations are effective for annual periods beginning after 1
January 2013, and have not been applied in preparing these financial statements. None of these is expected to have a significant
effect on the financial statements of the Company, except the following set out below:
IFRS9,‘Financialinstruments’,addressestheclassification,measurementandrecognitionoffinancialassetsandfinancialliabilities.
Issued in November 2009 and October 2010, it replaces the parts of IAS 39 that relate to the classification and measurement of
financial instruments. IFRS 9 requires financial assets to be classified into two measurement categories: those measured as at fair
value and those measured at amortised cost. The determination is made at initial recognition. The classification depends on the
entity’s business model for managing its financial instruments and the contractual cash flow characteristics of the instrument. For
financial liabilities, the standard retains most of the IAS 39 requirements.
The main change is that, in cases where the fair value option is taken for financial liabilities, the part of a fair value change due
to an entity’s own credit risk is recorded in other comprehensive income rather than the income statement, unless this creates an
accounting mismatch. The directors are yet to assess IFRS 9’s full impact and intend to adopt IFRS 9 no later than the accounting
period beginning 1 April. The directors will also consider the impact of the remaining phases of IFRS 9 when completed by the IASB.
IFRS10(Amendment),‘Consolidatedfinancialstatements’(effective1January2014)definesaninvestmententityandintroduces
an exception from consolidation. This will particularly benefit private equity funds, as those that qualify will fair value all of their
investments, including those that are controlled. The amendment to IFRS 10 was also accompanied by amendments to IFRS 12
and IAS 27. The directors are yet to assess the impact of the amendment and intend to adopt it no later than the accounting period
beginning 1 April 2014.
There are no other IFRSs or IFRIC interpretations that are not yet effective that would be expected to have a material impact on the
Company.

Information Memorandum 169
Senior Unsecured Fixed Rate Notes and Senior Unsecured Equity Linked Notes
Notes (continued)
2 Summary of significant accounting policies (continued) (b) Consolidation
(i) Subsidiaries
Subsidiaries are all entities (including special purpose entities) over which the Group has the power to govern the financial and
operating policies generally accompanying a shareholding of more than one half of the voting rights. The existence and effect
of potential voting rights that are currently exercisable or convertible are considered when assessing whether the Group controls
anotherentity.TheGroupalsoassessesexistenceofcontrolwhereitdoesnothavemorethan50%ofthevotingpowerbutisable
to govern the financial and operating policies by virtue of de-facto control.
De-facto control may arise in circumstances where the size of the Group’s voting rights relative to the size and dispersion of holdings
of other shareholders give the Group the power to govern the financial and operating policies, etc.
Subsidiaries are fully consolidated from the date on which control is transferred to the Group. They are de-consolidated from the
date the control ceases.
The Group applies the acquisition method of accounting to account for business combinations. The consideration transferred for the
acquisition of a subsidiary is the fair values of the assets transferred, the liabilities incurred to the former owners of the acquiree and
the equity interests issued by the Group. The consideration transferred includes the fair value of any asset or liability resulting from
a contingent consideration arrangement. Identifiable assets acquired and liabilities and contingent liabilities assumed in a business
combination are measured initially at their fair values at the acquisition date. The Group recognises any non-controlling interest in
the acquiree on an acquisition-by-acquisition basis, either at fair value or at the non-controlling interest’s proportionate share of the
recognised amounts of acquiree’s identifiable net assets.
Acquisition-related costs are expensed as incurred.
If the business combination is achieved in stages, the acquisition date carrying value of the acquirer’s previously held equity interest
in the acquiree is remeasured to fair value at the acquisition date; any gains or losses arising from such remeasurement are recognised
in profit or loss.
Any contingent consideration to be transferred by the Group is recognised at fair value at the acquisition date. Subsequent changes
to the fair value of the contingent consideration that is deemed to be an asset or liability is recognised in accordance with IAS 39
either in profit or loss or as a change to other comprehensive income. Contingent consideration that is classified as equity is not
remeasured, and its subsequent settlement is accounted for within equity.
Goodwill is initially measured as the excess of the aggregate of the consideration transferred and the fair value of non-controlling
interest over the net identifiable assets acquired and liabilities assumed. If this consideration is lower than the fair value of the net
assets of the subsidiary acquired, the difference is recognised in profit or loss.
Inter-company transactions, balances, income and expenses on transactions between group companies are eliminated. Profits and
losses resulting from intercompany transactions that are recognised in assets are also eliminated. Accounting policies of subsidiaries
have been changed where necessary to ensure consistency with the policies adopted by the Group.
(ii) Changes in ownership interests in subsidiaries without change of control
Transactions with non-controlling interests that do not result in loss of control are accounted for as equity transactions – that is,
as transactions with the owners in their capacity as owners. The difference between fair value of any consideration paid and the
relevant share acquired of the carrying value of net assets of the subsidiary is recorded in equity. Gains or losses on disposals to
non-controlling interests are also recorded in equity.

Information Memorandum
Senior Unsecured Fixed Rate Notes and Senior Unsecured Equity Linked Notes
170
Notes (continued)
2 Summary of significant accounting policies (continued) (b) Consolidation
(iii) Disposal of subsidiaries
When the Group ceases to have control, any retained interest in the entity is remeasured to its fair value at the date when control is
lost, with the change in carrying amount recognised in profit or loss. The fair value is the initial carrying amount for the purposes of
subsequently accounting for the retained interest as an associate, joint venture or financial asset. In addition, any amounts previously
recognised in other comprehensive income in respect of that entity are accounted for as if the Group had directly disposed of the
related assets or liabilities. This may mean that amounts previously recognised in other comprehensive income are reclassified to
profit or loss.
(iv) Associates
Investments in associates are accounted for by the equity method of accounting. These are undertakings in which the group has
between20%and50%ofthevotingrightsandoverwhichthegroupexercisessignificantinfluencebutwhichitdoesnotcontrol.
Undertheequitymethod,investmentsinassociatesarecarriedintheconsolidatedstatementoffinancialpositionatcostplusshare
of subsequent profits and other comprehensive income less any impairment in the value of individual investments. Losses of an
associate in excess of the group’s interest in that associate are recognised only to the extent that the group has incurred legal or
constructive obligations or made payments on behalf of the associate. A listing of the Group’s associates is shown in note 19.
Any excess of the cost of acquisition over the Group’s share of the net fair value of the identifiable assets, liabilities and contingent
liabilities of the associate recognised at the date of acquisition is recognised as goodwill. The goodwill is included within the carrying
amount of the investment and is assessed for impairment as part of that investment. Any excess of the group’s share of the net fair
value of the identifiable assets, liabilities and contingent liabilities over the cost of acquisition, after reassessment, is recognised
immediately in profit or loss.
Investments in associates are accounted for as available-for-sale financial assets in the separate financial statements of the Company
(and are stated at fair value).They are initially measured at fair value plus transaction costs. Subsequently, they are measured at fair
value with gains and losses arising from changes in fair value recognised in other comprehensive income and accumulated in the
investments revaluation reserve.
Where a significant amount of new investment into a Company has been made within the financial year, the price at which the
investment was made is considered the fair value unless there has been a significant change in conditions since the transaction took
place. For all other investments, the earnings multiple method is employed. This method, which draws on market based measures
of risk and return, involves the application of an earnings multiple to the earnings of the business being valued in order to derive a
value for the business.
The earnings multiple that is applied is derived from comparable companies or transactions with similar prospects from a return and
growth perspective. Where fair value cannot be reliably measured, the unquoted investment is carried at cost.
The difference between valuation and cost is recognised in other comprehensive income and accumulated in the investment
revaluation reserve. Where valuation is below cost, the difference between valuation and cost is charged to profit or loss if, in the
opinion of the directors, the reduction in value is not considered temporary. Where the investment is disposed of, the cumulative
gain or loss previously accumulated in the investments revaluation reserve is reclassified to profit or loss.

Information Memorandum 171
Senior Unsecured Fixed Rate Notes and Senior Unsecured Equity Linked Notes
Notes (continued)
2 Summary of significant accounting policies (continued) (c) Functional currency and translation of foreign currencies
(i) Functional and presentation currency
Items included in the financial statements of each of the Group’s entities are measured using the currency of the primary economic
environmentinwhichtheentityoperates(‘thefunctionalcurrency’).Theconsolidatedfinancialstatementsarepresentedin‘Kenyan
Shillings (Kshs), which is the Group’s presentation currency.
(ii) Transactions and balances
Foreign currency transactions are translated into the functional currency using exchange rates prevailing at the dates of the
transactions or valuation where items are re-measured. Foreign exchange gains and losses resulting from the settlement of such
transactions and from the translation at year-end exchange rates of monetary assets and liabilities denominated in foreign currencies
are recognised in profit or loss.
Foreign exchange gains and losses that relate to borrowings and cash and cash equivalents are presented in profit or loss within
‘financeincomeorcost’.Allotherforeignexchangegainsandlossesarepresentedinprofitorlosswithin‘otherincome’or‘other
expenses’.
Translation differences related to changes in amortised cost are recognised in profit or loss, and other changes in carrying amount
are recognised in other comprehensive income.
Translation differences on non-monetary financial assets and liabilities, such as equities held at fair value through profit or loss, are
recognised in profit or loss as part of the fair value gain or loss. Translation differences on non-monetary financial assets, such as
equities classified as available-for-sale financial assets, are included in other comprehensive income.
(iii) Group companies
The results and financial position of all the Group entities (none of which has the currency of a hyperinflationary economy) that have
a functional currency different from the presentation currency are translated into the presentation currency as follows:
(i) assets and liabilities for each statement of financial position presented are translated at the closing rate at the end of the
reporting period;
(ii) income and expenses for each income statement amount are translated at average exchange rates (unless this average is not a
reasonable approximation of the cumulative effect of the rates prevailing on the transaction dates, in which case income and
expenses are translated at the dates of the transactions); and
(iii) all resulting exchange differences are recognised in other comprehensive income.
Goodwill and fair value adjustments arising on the acquisition of a foreign entity are treated as assets and liabilities of the foreign
entity and translated at the closing rate. Exchange differences arising are recognised in equity.
(d) Segment reporting
IFRS 8 requires operating segments to be identified on the basis of internal reports about components of the group that are regularly
reviewed by the chief operating decision maker in order to allocate resources to the segments and to assess their performance.
The group organises its activity by business lines and these are defined as the Group’s reportable segments. The three business lines
are; Private Equity, Quoted Equity and Real Estate & Infrastructure. Performance is reviewed from a total return perspective.

Information Memorandum
Senior Unsecured Fixed Rate Notes and Senior Unsecured Equity Linked Notes
172
Notes (continued)
2 Summary of significant accounting policies (continued)
(e) Revenue recognition
Revenue comprises the fair value of the consideration received or receivable for the sale of services in the ordinary course of the
Group’s activities.
The Group recognises revenue when the amount of revenue can be reliably measured, it is probable that future economic benefits
will flow to the Group and when specific criteria have been met for each of the Group’s activities as described below.
Revenue is recognised as follows:
(i) Dividend income from investments is recognised when the shareholders’ rights to receive payment have been established.
(ii) Interest income is accrued on a time basis, by reference to the principal outstanding and the interest rate applicable.
(iii) Provision of services are recognised in the period in which the services are rendered, by reference to completion of the specific
transaction assessed on the basis of the actual service provided as a percentage of the total services to be provided.
(iv) Rental income is recognised as income in the period in which it is earned. All investment income is stated net of investment
expenses.
(f) Investment property
Buildings, or part of a building, (freehold or held under a finance lease) and land (freehold or held under an operating lease) held for
long term rental yields and/or capital appreciation and are not occupied by the Group are classified as investment property under
non-current assets. Investment property is carried at fair value, representing open market value determined annually by external
valuers. Properties under construction and development sites with projected use as Investment properties are valued at projected
fair values taking into account current market conditions. Changes in fair values are included in investment income in the income
statement.
(g) Motor vehicle and equipment
Motor vehicle and equipment are stated at cost less depreciation and any accumulated impairment losses.
Depreciation is calculated to write off the cost of the motor vehicle and equipment in equal annual instalments over their estimated
useful lives.
The annual rates in use are:
Motorvehicleandmotorcycles 20%
Furniture,fittingsandofficeequipment 10%
Computers 33.3%
(h) Intangible assets
(i) Goodwill
Goodwill represents the excess of the cost of an acquisition over the fair value of the Group’s share of the net identifiable assets
of the acquired subsidiary/associate at the date of acquisition. Goodwill on acquisitions of subsidiaries is included in intangible
assets. Goodwill on acquisitions of associates is included in investments in associates. Goodwill on subsidiaries is tested annually
for impairment and carried at cost less accumulated impairment losses. Impairment losses on goodwill are not reversed. Gains and
losses on disposal of an entity include the carrying amount of goodwill relating to the entity sold.
Goodwill is allocated to cash-generating units for the purpose of impairment testing. The allocation is made to those cash-generating
units or groups of cash-generating units that are expected to benefit from the business combination in which the goodwill arose
identified according to operating segment.

Information Memorandum 173
Senior Unsecured Fixed Rate Notes and Senior Unsecured Equity Linked Notes
Notes (continued)
2 Summary of significant accounting policies (continued)
(h) Intangible assets (continued)
(ii) Computer software
Costs incurred on computer software are initially accounted for at cost as intangible assets and subsequently at cost less any
accumulated amortisation and accumulated impairment losses. Amortisation is calculated on the straight line basis over the estimated
useful lives not exceeding a period of 3 years.
(i) Financial assets
Classification
The Group classifies its financial assets in the following categories: loans and receivables and available-for-sale financial assets. The
classification depends on the purpose for which the financial assets were acquired. The directors determine the classification of
financial assets at initial recognition.
(i) Loans and receivables
Loans and receivables are non-derivative financial assets with fixed or determinable payments that are not quoted in an active
market. They are included in current assets, except for maturities greater than 12 months after the end of the reporting period. These
are classified as non-current assets and are carried at amortised cost.
(ii) Available-for-sale financial assets
Available-for-sale financial assets are non-derivative financial assets and are included in non-current assets unless the investment
matures or the directors intend to dispose of the investments within 12 months of the end of the reporting period.
(iii) Financial assets at fair value through profit or loss
This category comprises two sub-categories: financial assets classified as held for trading, and financial assets designated by the
Group as at fair value through profit or loss upon initial recognition.
A financial asset is classified as held for trading if it is acquired or incurred principally for the purpose of selling or repurchasing
it in the near term or if it is part of a portfolio of identified financial instruments that are managed together and for which there is
evidence of a recent actual pattern of short-term profit-taking.
Derivatives are also categorised as held for trading unless they are designated and effective as hedging instruments. All derivatives
are carried as assets when fair value is positive and as liabilities when fair value is negative.
The Group designates certain financial assets upon initial recognition as at fair value through profit or loss (fair value option). This
designation cannot subsequently be changed and can only be applied when the following conditions are met:
• theapplicationofthefairvalueoptionreducesoreliminatesanaccountingmismatchthatwouldotherwiseariseor
• thefinancialassetsarepartofaportfoliooffinancialinstrumentswhichisriskmanagedandreportedtoseniormanagementon
a fair value basis or
• thefinancialassetsconsistsofdebthostandanembeddedderivativesthatmustbeseparated.
Financial assets at fair value through profit or loss are carried at fair value. Purchases and sales of financial assets at fair value through
profit or loss are recognized on trade-date, the date on which the Group commits to purchase or sell the asset. Fair value changes
relating to financial assets designated at fair value through profit or loss are recognized in the statement of profit or loss in the year
in which they arise.
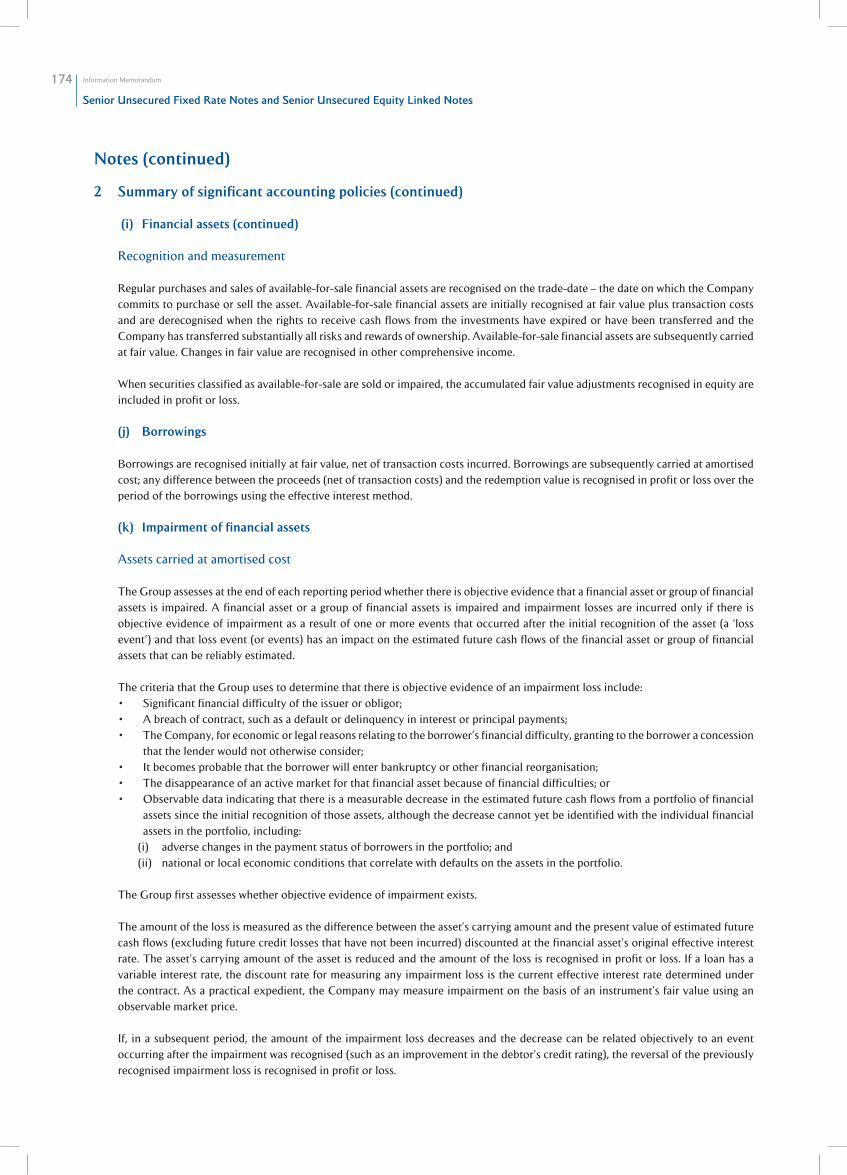
Information Memorandum
Senior Unsecured Fixed Rate Notes and Senior Unsecured Equity Linked Notes
174
Notes (continued)
2 Summary of significant accounting policies (continued)
(i) Financial assets (continued)
Recognition and measurement
Regular purchases and sales of available-for-sale financial assets are recognised on the trade-date – the date on which the Company
commits to purchase or sell the asset. Available-for-sale financial assets are initially recognised at fair value plus transaction costs
and are derecognised when the rights to receive cash flows from the investments have expired or have been transferred and the
Company has transferred substantially all risks and rewards of ownership. Available-for-sale financial assets are subsequently carried
at fair value. Changes in fair value are recognised in other comprehensive income.
When securities classified as available-for-sale are sold or impaired, the accumulated fair value adjustments recognised in equity are
included in profit or loss.
(j) Borrowings
Borrowings are recognised initially at fair value, net of transaction costs incurred. Borrowings are subsequently carried at amortised
cost; any difference between the proceeds (net of transaction costs) and the redemption value is recognised in profit or loss over the
period of the borrowings using the effective interest method.
(k) Impairment of financial assets
Assets carried at amortised cost
The Group assesses at the end of each reporting period whether there is objective evidence that a financial asset or group of financial
assets is impaired. A financial asset or a group of financial assets is impaired and impairment losses are incurred only if there is
objectiveevidenceofimpairmentasaresultofoneormoreeventsthatoccurredaftertheinitialrecognitionoftheasset(a‘loss
event’) and that loss event (or events) has an impact on the estimated future cash flows of the financial asset or group of financial
assets that can be reliably estimated.
The criteria that the Group uses to determine that there is objective evidence of an impairment loss include:
• Significantfinancialdifficultyoftheissuerorobligor;
• Abreachofcontract,suchasadefaultordelinquencyininterestorprincipalpayments;
• TheCompany,foreconomicorlegalreasonsrelatingtotheborrower’sfinancialdifficulty,grantingtotheborroweraconcession
that the lender would not otherwise consider;
• Itbecomesprobablethattheborrowerwillenterbankruptcyorotherfinancialreorganisation;
• Thedisappearanceofanactivemarketforthatfinancialassetbecauseoffinancialdifficulties;or
• Observabledataindicatingthatthereisameasurabledecreaseintheestimatedfuturecashflowsfromaportfoliooffinancial
assets since the initial recognition of those assets, although the decrease cannot yet be identified with the individual financial
assets in the portfolio, including:
(i) adverse changes in the payment status of borrowers in the portfolio; and
(ii) national or local economic conditions that correlate with defaults on the assets in the portfolio.
The Group first assesses whether objective evidence of impairment exists.
The amount of the loss is measured as the difference between the asset’s carrying amount and the present value of estimated future
cash flows (excluding future credit losses that have not been incurred) discounted at the financial asset’s original effective interest
rate. The asset’s carrying amount of the asset is reduced and the amount of the loss is recognised in profit or loss. If a loan has a
variable interest rate, the discount rate for measuring any impairment loss is the current effective interest rate determined under
the contract. As a practical expedient, the Company may measure impairment on the basis of an instrument’s fair value using an
observable market price.
If, in a subsequent period, the amount of the impairment loss decreases and the decrease can be related objectively to an event
occurring after the impairment was recognised (such as an improvement in the debtor’s credit rating), the reversal of the previously
recognised impairment loss is recognised in profit or loss.

Information Memorandum 175
Senior Unsecured Fixed Rate Notes and Senior Unsecured Equity Linked Notes
Notes (continued)
2 Summary of significant accounting policies (continued)
(k) Impairment of financial assets
Assets classified as available-for-sale
The Group assesses at the end of each reporting period whether there is objective evidence that a financial asset or a group of
financial assets is impaired. In the case of equity investments classified as available-for-sale, a significant or prolonged decline in the
fair value of the security below its cost is also evidence that the assets are impaired. If any such evidence exists for available-for-sale
financial assets, the cumulative loss – measured as the difference between the acquisition cost and the current fair value, less any
impairment loss on that financial asset previously recognised in profit or loss – is removed from equity and recognised in profit or
loss. Impairment losses recognised in profit or loss on equity instruments are not reversed through profit or loss.
(l) Borrowing costs
General and specific borrowing costs directly attributable to the acquisition, construction or production of qualifying assets, which
are assets that necessarily take a substantial period of time to get ready for their intended use or sale, are added to the cost of those
assets, until such time as the assets are substantially ready for their intended use or sale.
Investment income earned on the temporary investment of specific borrowings pending their expenditure on qualifying assets is
deducted from the borrowing costs eligible for capitalisation.
All other borrowing costs are recognised in profit or loss in the period in which they are incurred.
(m) Accounting for leases
Leases are classified as finance leases whenever the terms of the lease transfer substantially all the risks and rewards of ownership to
the lessee. All other leases are classified as operating leases.
Rental income from operating leases is recognised on a straight-line basis over the terms of the relevant leases.
Rentals payable under operating leases are charged to the profit or loss on a straight-line basis over the term of the relevant lease.
(n) Receivables
Receivables are amounts due from investments in the ordinary course of business. If collection is expected in one year or less (or in
the normal operating cycle of the business if longer), they are a classified as current assets. If not, they are presented as non-current
assets.
Receivables are recognised initially at fair value and subsequently recognised at amortised cost, less any provision for impairment.
(o) Payables
Trade payables are obligations to pay for goods or services that have been acquired in the ordinary course of business from suppliers.
Accounts payable are classified as current liabilities if payment is due within one year or less (or in the normal operating cycle of the
business if longer). If not, they are presented as non-current liabilities.
Trade payables are recognised initially at fair value and subsequently at amortised cost using the effective interest method.
(p) Share capital
Ordinary sharesare classifiedas ‘share capital’ inequity.Anypremiumreceivedoverandabove theparvalueof the shares is
classifiedas‘sharepremium’inequity.

Information Memorandum
Senior Unsecured Fixed Rate Notes and Senior Unsecured Equity Linked Notes
176
Notes (continued)
2 Summary of significant accounting policies (continued) (q) Cash and cash equivalents
Cash and cash equivalents includes cash in hand, deposits held at call with banks, other short-term highly liquid investments with
original maturities of three months or less, net of bank overdrafts.
(r) Dividend distribution
Dividends payable to the Company’s shareholders are recognised as a liability in the Group’s financial statements in the period in
which the dividends are approved by the Company’s shareholders. Proposed dividends are shown as a separate component of equity
until declared.
(s) Provisions
Provisions are recognised when: the Group has a present legal or constructive obligation as a result of past events; it is probable
that an outflow of resources will be required to settle the obligation; and the amount has been reliably estimated. Provisions are not
recognised for future operating losses.
Provisions are measured at the present value of the expenditures expected to be required to settle the obligation using a pre-tax
rate that reflects current market assessments of the time value of money and the risks specific to the obligation. The increase in the
provision due to passage of time is recognised as interest expense.
(t) Employee benefits
(i) Retirement benefit obligations
The Group operates a defined contribution pension scheme. The assets of the scheme are held in a separate trustee administered
fund. The scheme is administered by independent fund managers and is funded by contributions from both the employer and the
employees.
The Group also contributes to the statutory National Social Security Fund. This is a defined contribution pension scheme registered
under the National Social Security Act. The Group’s obligations under the scheme are limited to specific obligations legislated from
time to time and are currently limited to a maximum of Shs 200 per month per employee.
The Group contributions in respect of retirement benefit schemes are charged to profit or loss in the year to which they relate.
(ii) Performance Bonus
The Group has in place a performance bonus scheme. The scheme rewards employees of the Group based on achievement of certain
set benchmarks of business success.
The Group’s performance bonus scheme is designed to enable achievement of consistent business growth that is tied to the increase
in shareholder wealth, which is a primary business objective.
Atargetof15%annualincreaseinopeningshareholderfundshasbeenset(hurdlerate).
Employees only qualify for the bonus after achievement of this percentage increase in shareholder wealth.
Actual award of the bonus is in three equal instalments over a period of three years. The annual payment is on condition that
shareholder wealth is maintained at the same level or increased. Should there be a drop in shareholder wealth, payment will not
be made and will be deferred until the year when shareholder wealth is restored. Should an employee leave employment of the
Company before payment is due, he/she will forfeit payment. The amount payable is accrued over the period to the payment of each
instalment.
TheperformancebonusforemployeesofAthenaLimitediscomputedat30%ofprofitaftertax.

Information Memorandum 177
Senior Unsecured Fixed Rate Notes and Senior Unsecured Equity Linked Notes
Notes (continued)
2 Summary of significant accounting policies (continued)
(t) Employee benefits (continued)
(iii) Other entitlements
The estimated monetary liability for employees’ accrued annual leave entitlement at the reporting date is recognised as an expense
accrual.
(u) Impairment of non-financial assets
Assets that have an indefinite useful life are not subject to amortisation and are tested annually for impairment. Assets that are subject
to amortisation are reviewed for impairment whenever events or changes in circumstances indicate that the carrying amount may
not be recoverable. An impairment loss is recognised for the amount by which the asset’s carrying amount exceeds its recoverable
amount. The recoverable amount is the higher of an asset’s fair value less costs to sell and value in use.
For the purposes of assessing impairment, assets are Grouped at the lowest levels for which there are separately identifiable cash
flows (cash-generating units). Non-financial assets other than goodwill that suffered impairment are reviewed for possible reversal
of the impairment at each reporting date.
(v) Current and deferred income tax
The tax expense for the period comprises current and deferred income tax. Tax is recognised in the profit or loss except to the extent
that it relates to items recognised in other comprehensive income or directly in equity. In this case, the tax is also recognised in other
comprehensive income or directly in equity respectively.
The current income tax charge is calculated on the basis of the tax enacted or substantively enacted at the reporting date.
Management periodically evaluates positions taken in tax returns with respect to situations in which applicable tax regulation
is subject to interpretation. It establishes provisions where appropriate on the basis of amounts expected to be paid to the tax
authorities.
Deferred income tax is recognised, using the liability method, on temporary differences arising between the tax bases of assets and
liabilities and their carrying values in the financial statements. However, if the deferred tax liabilities are not recognised if they arise
from the initial recognition of goodwill; deferred income tax is not accounted for if it arises from initial recognition of an asset or
liability in a transaction other than a business combination that at the time of the transaction affects neither accounting nor taxable
profit or loss. Deferred income tax is determined using tax rates and laws that have been enacted or substantively enacted at the
reporting date and are expected to apply when the related deferred income tax liability is settled.
Deferred income tax assets are recognised only to the extent that it is probable that future taxable profits will be available against
which the temporary differences can be utilised.
Deferred income tax is provided on temporary differences arising on investments in subsidiaries and associates, except where the
timing of the reversal of the temporary difference is controlled by the Group and it is probable that the temporary difference will not
reverse in the foreseeable future.
Deferred income tax assets and liabilities are offset when there is a legally enforceable right to offset current tax assets against
current tax liabilities and when the deferred income taxes assets and liabilities relate to income taxes levied by the same taxation
authority on either the same taxable entity or different taxable entities where there is an intention to settle the balances on a net
basis.
(w) Comparatives
Where necessary, comparative figures have been adjusted to conform with changes in presentation in the current year.

Information Memorandum
Senior Unsecured Fixed Rate Notes and Senior Unsecured Equity Linked Notes
178
Notes (continued)
3 Critical accounting estimates and judgements
In the process of applying the Group’s accounting policies, management has made estimates and assumptions that affect the reported
amounts of assets and liabilities within the next financial year. Estimates and judgements are continually evaluated and are based
on historical experience and other factors, including expectations of future events that are believed to be reasonable under the
circumstances. The key areas of judgement in applying the entities accounting policies are dealt with below:
Impairment losses
At the end of each reporting period, the group reviews the carrying amounts of its financial assets to determine whether there is
any indication that those assets have suffered an impairment loss. A financial asset or a group of financial assets is impaired and
impairment losses are incurred if there is objective evidence of impairment as a result of one or more events that occurred after the
initialrecognitionoftheasset(a‘lossevent’)andthatthelosseventhasanimpactontheestimatedfuturecashflowsofthefinancial
asset or group of financial assets that can be reliably estimated. If any such indication exists, the recoverable amount of the asset is
estimated in order to determine the extent of the impairment loss. Where it is not possible to estimate the recoverable amount of an
individual asset, the group estimates the recoverable amount of the cash generating unit to which the asset belongs.
Valuation of unquoted investments
For equity instruments for which no active market exists, the group uses the price of a recent investment or the earnings multiple to
estimate the fair value of these investments. Management uses estimates based historical data relating to earnings of the investee
Company and other market based multiples in arriving at the fair value. The primary assumption in employing the earnings multiple
method is that the market has assigned an appropriate value to the benchmark Company. The methodology and assumptions used
for arriving at the market based multiples are reviewed and compared with other methodologies to ensure there are no material
variances.
Income taxes
The Group is subject to income taxes in various jurisdictions. Significant judgement is required in determining the Group’s provision
for income taxes. There are many transactions and calculations for which the ultimate tax determination is uncertain during the
ordinary course of business. The Group recognises liabilities for anticipated tax audit issues based on estimates of whether additional
taxes will be due. Where the final tax outcome of these matters is different from the amounts that were initially recorded, such
differences will impact the income tax and deferred tax provisions in the period in which such determination is made.
4 Financial risk management
a) Market risks
Market risk is the risk arising from changes in market prices, such as interest rate, equity prices, and foreign exchange rates which
will affect the Group’s income or the value of its holdings of financial instruments. The objective of market risk management is to
manage and control market risk exposures within acceptable parameters, while optimising the return.
(i) Interest rate risk
The Group is exposed to interest rate risk as it borrows funds at floating interest rates in the form of short term loans (overdrafts)
and also holds cash deposits with financial institutions. The interest rates on the cash deposits are fixed and agreed upon in advance
while interest rates on overdrafts are pegged to the bank’s base lending rate or prevailing Treasury Bills rates.
Management closely monitors the interest rate trends to minimise the potential adverse impact of interest rate changes. Deposits are
placed at fixed interest rates and management is therefore able to plan for the resulting income. For the facilities with variable rates,
the Company is in regular contact with the lenders in a bid to obtain the best available rates.
As at 31 March 2014, Group and Company held deposits of Kshs 224,017,580 and Kshs 108, 850,547 respectively (Both Group
and Company 2013: Kshs 902,499,873, 2012:Ksh 310,000,000, 2011: Ksh: Nil, 2010: Ksh 345,000,000) and had unutilised bank
credit facilities of Kshs 708,898,947 (2013: Kshs 1,200,000,000, 2012: Kshs 1,200,000,000, 2011: Kshs 212,020,000, 2010:
Ksh1,700,000,000).

Information Memorandum 179
Senior Unsecured Fixed Rate Notes and Senior Unsecured Equity Linked Notes
Notes (continued)
4 Financial risk management (continued)
a) Market risks (continued)
(i) Interest rate risk (continued)
Asat31March2014,a5%increase/decreaseoftheannualinterestratewouldhaveresultedinanincrease/decreaseinpre-tax
profit and equity of Kshs 43,161,899 and Kshs 31,126,650 (2013: Kshs 45,124,993, 2012:Ksh 8,572,000, 2011: Ksh 7,323,000,
2010: Kshs 20,895,000) for both Group and Company resulting from interest paid on deposits.
The Group has invested in corporate bonds with fixed interest rate which is not affected by interest rate fluctuations.
(ii) Price risk
The Group’s private equity holdings are valued according to the International Private Equity and Venture Capital guidelines,
which set out the valuation methodology for fair valuation. Valuation is relatively subjective and may change from time to time.
In addition the valuation is also affected by the volatility of the stock prices since the Group uses the earnings multiple method
which entails the use of the share prices of similar/comparable quoted companies among other components. Valuation risks are
mitigated by comprehensive quarterly reviews of the underlying investments by management every quarter. The appropriateness of
the investment valuations are then considered by the Audit and Risk committee.
Quoted equity are valued at their market prices. These values are subject to frequent variations and adverse market movements.
This risk is mitigated by choice of defensive stocks with low price volatility, and weekly monitoring of the value changes.
At31March2014,ifthepricesattheNairobiSecuritiesExchangeandotherexchangeshadappreciated/depreciatedby5%with
all other variables held constant, the impact on the Group comprehensive income and revaluation reserves would have been Kshs
172,701,438 (2013: Kshs 186,409,000, 2012: Kshs 107,315,000 ,2011 : Kshs 527,602,000, 2010: Kshs 184,839,000) higher/
lower.
At31March2013,ifthepricesattheNairobiSecuritiesExchangeandotherexchangeshadappreciated/depreciatedby5%with
all other variables held constant, the impact on the Company comprehensive income and equity would have been Kshs 34,317,377
(2013: Kshs 59,717,000, 2012: Kshs 88,477,000, 2011:Ksh 488,277,000, 2010: Kshs 140,470,000) higher/lower.
(iii) Investment holding period risk
87% (2013: 81%, 2012: 60%, 2011: 60%, 2010:60%) of theGroup andCompany’s investments are not traded on any formal
exchange. Disposal of these investments is constrained in many instances by pre-emptive rights, shareholder agreements and the
absence of willing trade buyers or an active secondary market. The timing of realised proceeds on disposal may pose a risk to the
Group.
The Group/Company mitigates this risk by seeking influence in the investee company’s operations through large shareholding or
board representation. The Group/Company also seeks compensation for this risk through high return hurdles during the investment
appraisal and laying emphasis on dividend generating potential.
However, the Group and Company have got no fixed time horizon for its investments, and does not enforce exit options on
investments as it believes current practice makes it easier to acquire attractive investments.
(iv) Concentration risk
81% (2013: 80%, 2012:87%, 2011 :83%, 2010 :95%) of theGroup’s assets are located inKenyawith over 13% (2013: 12%,
2012:11%,2011:15%,2010:5%)inthewiderEastAfricanRegionand5%(2013:8%,2012:2%,2011:2%,2010:Nil)outsideEast
Africa.
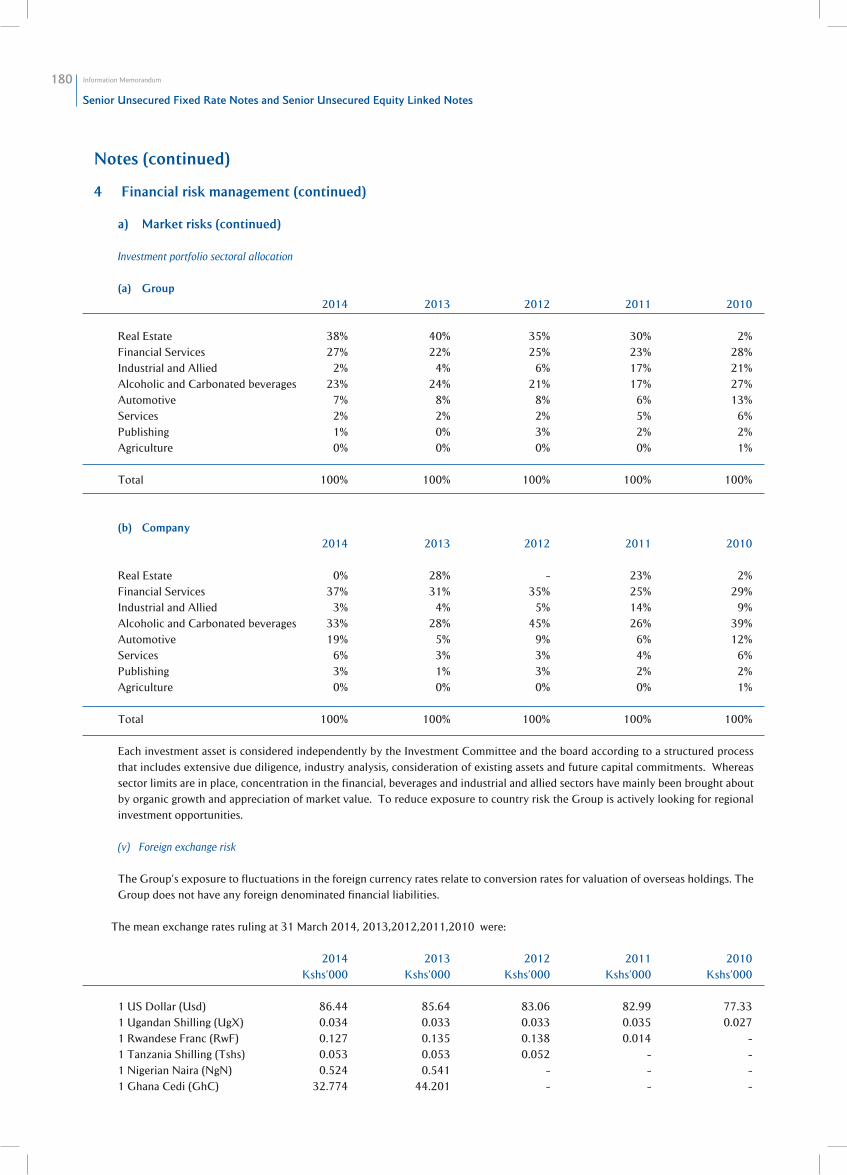
Information Memorandum
Senior Unsecured Fixed Rate Notes and Senior Unsecured Equity Linked Notes
180
Notes (continued)
4 Financial risk management (continued)
a) Market risks (continued)
Investment portfolio sectoral allocation
(a) Group
2014 2013 2012 2011 2010
RealEstate 38% 40% 35% 30% 2%
FinancialServices 27% 22% 25% 23% 28%
IndustrialandAllied 2% 4% 6% 17% 21%
AlcoholicandCarbonatedbeverages 23% 24% 21% 17% 27%
Automotive 7% 8% 8% 6% 13%
Services 2% 2% 2% 5% 6%
Publishing 1% 0% 3% 2% 2%
Agriculture 0% 0% 0% 0% 1%
Total 100% 100% 100% 100% 100%
(b) Company
2014 2013 2012 2011 2010
RealEstate 0% 28% - 23% 2%
FinancialServices 37% 31% 35% 25% 29%
IndustrialandAllied 3% 4% 5% 14% 9%
AlcoholicandCarbonatedbeverages 33% 28% 45% 26% 39%
Automotive 19% 5% 9% 6% 12%
Services 6% 3% 3% 4% 6%
Publishing 3% 1% 3% 2% 2%
Agriculture 0% 0% 0% 0% 1%
Total 100% 100% 100% 100% 100%
Each investment asset is considered independently by the Investment Committee and the board according to a structured process
that includes extensive due diligence, industry analysis, consideration of existing assets and future capital commitments. Whereas
sector limits are in place, concentration in the financial, beverages and industrial and allied sectors have mainly been brought about
by organic growth and appreciation of market value. To reduce exposure to country risk the Group is actively looking for regional
investment opportunities.
(v) Foreign exchange risk
The Group’s exposure to fluctuations in the foreign currency rates relate to conversion rates for valuation of overseas holdings. The
Group does not have any foreign denominated financial liabilities.
The mean exchange rates ruling at 31 March 2014, 2013,2012,2011,2010 were:
2014 2013 2012 2011 2010
Kshs’000 Kshs’000 Kshs’000 Kshs’000 Kshs’000
1USDollar(Usd) 86.44 85.64 83.06 82.99 77.33
1UgandanShilling(UgX) 0.034 0.033 0.033 0.035 0.027
1 Rwandese Franc (RwF) 0.127 0.135 0.138 0.014 -
1 Tanzania Shilling (Tshs) 0.053 0.053 0.052 - -
1 Nigerian Naira (NgN) 0.524 0.541 - - -
1 Ghana Cedi (GhC) 32.774 44.201 - - -

Information Memorandum 181
Senior Unsecured Fixed Rate Notes and Senior Unsecured Equity Linked Notes
Notes (continued)
4 Financial risk management (continued)
a) Market risks (continued)
(v) Foreign exchange risk (continued)
Below is a summary of the financial assets denominated in foreign currencies at their carrying amounts:
(i) Group
2014 2013 2012 2011 2010
Kshs’000 Kshs’000 Kshs’000 Kshs’000 Kshs’000
Quotedinvestments(UgX) 30,527 13,118 10,048 5,158 2,350
Quoted investments (RwF) 221,993 212,984 87,506 47,516 -
Quoted investments (Tshs) 1,135,104 540,161 99,074 - -
Quoted investments (GhC) 686,234 1,137,169 - - -
Quoted investments (NgN) 90,961 127,577 - - -
InvestmentinFunds(Usd) 497,028 336,532 227,555 264,754 58,967
Investmentproperty(Usd) 2,663,576 1,671,821 1,672,146 1,690,481 -
Prepayments - - - 9,966
Cashandequivalents(Usd) 227,903 30,436 146 3,259 -
5,553,326 4,069,798 2,096,475 2,021,134 61,317
(ii) Company
2014 2013 2012 2011 2010
Kshs’000 Kshs’000 Kshs’000 Kshs’000 Kshs’000
Quotedinvestments(UgX) 30,527 10,882 10,048 5,158 2,350
Quoted investments (RwF) 221,993 212,984 87,506 47,516 -
Quoted investments (Tshs) - - - - -
Quoted investments (GhC) - - - - -
Quoted investments (NgN) - - - - -
InvestmentinFunds(Usd) 497,028 336,532 227,555 264,754 58,967
Investmentproperty(Usd) - - - - -
Prepayments - - 9,966
Cashandequivalents(Usd) - 30,436 129 3,060 -
749,548 590,834 325,238 330,454 61,317
If all other variables were held constant, at 31 March 2014, the impact on values and reserves of the Shilling weakening or
strengtheningby5%againsttheabovecurrencieswouldhavebeenasbelow;
(i) Group
2014 2013 2012 2011 2010
Kshs’000 Kshs’000 Kshs’00 Kshs’000 Kshs’000
1USDollar(Usd) 169,425 101,939 94,992 96,889 2,948
1UgandanShilling(UgX) 1,526 655 502 258 118
1 Rwandese Franc (RwF) 11,100 10,649 4,375 2,376 -
1 Tanzanian Shilling (Tshs) 56,775 27,008 4,954 - -
1 Nigerian Naira (NgN) 4,548 6,378 - - -
1 Ghanian Cedi (GhC) 34,312 56,858 - - -
277,686 203,487 104,823 99,523 3,066

Information Memorandum
Senior Unsecured Fixed Rate Notes and Senior Unsecured Equity Linked Notes
182
Notes (continued)
4 Financial risk management (continued)
a) Market risks (continued)
(v) Foreign exchange risk (continued)
(ii) Company
2014 2013 2012 2011 2010
Kshs’000 Kshs’000 Kshs’00 Kshs’000 Kshs’000
1USDollar(Usd) 24,851 101,939 11,384 13,889 2,948
1UgandanShilling(UgX) 1,526 544 502 258 118
1 Rwandese Franc (RwF) 11,100 10,649 4,375 2,376 -
1 Tanzanian Shilling (Tshs) - - - - -
1 Nigerian Naira (NgN) - - - - -
1 Ghanian Cedi (GhC) - - - - -
37,477 113,132 16,261 16,523 3,066
(b) Liquidity risks
This is the risk that the Group will encounter difficulties in meeting its financial commitments from its financial liabilities. Prudent
liquidity riskmanagement includesmaintaining sufficient cash tomeet its obligations.Ultimate responsibility for liquidity risk
management rests with the board of directors, which has built an appropriate liquidity risk management framework for the
management of the Group’s short, medium and long term funding and liquidity management requirements. The Group manages
liquidity risk by maintaining adequate reserves, banking facilities and by continuously monitoring forecast and actual cash flows and
matching the maturity profiles of financial assets and liabilities.
Liquidity risk also relates to the risk that the Group would miss out attractive investment opportunities due to lack of funding. This
risk is mitigated by the fact that the available for sale quoted investments can be converted to cash when funds are required. The
risk is also minimised by use of annually renewable credit facilities.
Asat31March2014,over21%(2013:over28%,2012:over17%,2011:over30%,2010:over30%)oftheGroupsassetswere
held in assets that are quickly convertible to cash. The Group also had Kshs 708,848,947 (2013: Kshs 1,200,000,000, 2012: Kshs
1,200,000,000, 2011: Kshs 212,020,000, 2010: Kshs 1,700,000,000) unutilised credit facility.
The net liquid assets of the Group and Company as at 31 March 2013 as highlighted below.
2014 2013 2012 2011 2010
Kshs’000 Kshs’000 Kshs’000 Kshs’000 Kshs’000
Assets
Quoted investments 3,036,299 2,732,872 1,666,309 3,208,611 2,967,876
Corporate bonds 1,071,046 995,313 480,000 539,188 505,371
Due from subsidiary companies - - - - -
Receivables 1,071,947 260,825 19,565 230,174 108,849
Deposits 224,018 902,500 310,000 - 345,000
Cash 619,630 599,269 12,410 6,776 48,641
Cash and cash equivalents 6,022,940 5,490,779 2,488,284 3,984,749 3,975,737
Liabilities
Payables and accruals 1,840,552 287,858 355,956 719,170 357,154
Due to subsidiary companies - - - - -
Unclaimeddividends 28,987 32,504 34,437 35,049 42,650
Overdraft 1,291,101 - - - -
Borrowings 4,201,029 4,149,532 1,000,000 1,987,980 -
7,361,669 4,469,894 1,390,393 2,742,199 399,804
Net liquid assets (1,338,729) 1,020,885 1,097,891 1,242,550 3,575,933
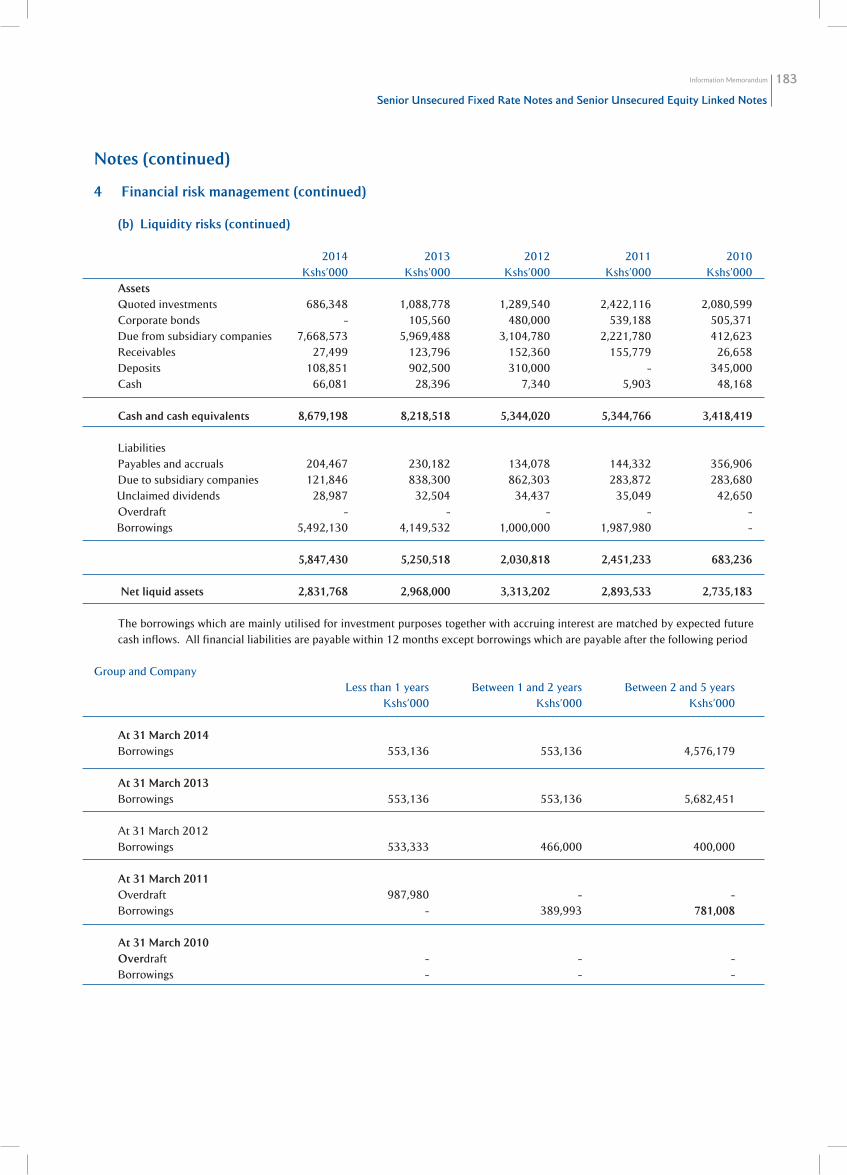
Information Memorandum 183
Senior Unsecured Fixed Rate Notes and Senior Unsecured Equity Linked Notes
Notes (continued)
4 Financial risk management (continued)
(b) Liquidity risks (continued)
2014 2013 2012 2011 2010
Kshs’000 Kshs’000 Kshs’000 Kshs’000 Kshs’000
Assets
Quoted investments 686,348 1,088,778 1,289,540 2,422,116 2,080,599
Corporate bonds - 105,560 480,000 539,188 505,371
Due from subsidiary companies 7,668,573 5,969,488 3,104,780 2,221,780 412,623
Receivables 27,499 123,796 152,360 155,779 26,658
Deposits 108,851 902,500 310,000 - 345,000
Cash 66,081 28,396 7,340 5,903 48,168
Cash and cash equivalents 8,679,198 8,218,518 5,344,020 5,344,766 3,418,419
Liabilities
Payables and accruals 204,467 230,182 134,078 144,332 356,906
Due to subsidiary companies 121,846 838,300 862,303 283,872 283,680
Unclaimeddividends 28,987 32,504 34,437 35,049 42,650
Overdraft - - - - -
Borrowings 5,492,130 4,149,532 1,000,000 1,987,980 -
5,847,430 5,250,518 2,030,818 2,451,233 683,236
Net liquid assets 2,831,768 2,968,000 3,313,202 2,893,533 2,735,183
The borrowings which are mainly utilised for investment purposes together with accruing interest are matched by expected future
cash inflows. All financial liabilities are payable within 12 months except borrowings which are payable after the following period
Group and Company
Less than 1 years Between 1 and 2 years Between 2 and 5 years
Kshs’000 Kshs’000 Kshs’000
At 31 March 2014
Borrowings 553,136 553,136 4,576,179
At 31 March 2013
Borrowings 553,136 553,136 5,682,451
At 31 March 2012
Borrowings 533,333 466,000 400,000
At 31 March 2011
Overdraft 987,980 - -
Borrowings - 389,993 781,008
At 31 March 2010
Overdraft - - -
Borrowings - - -
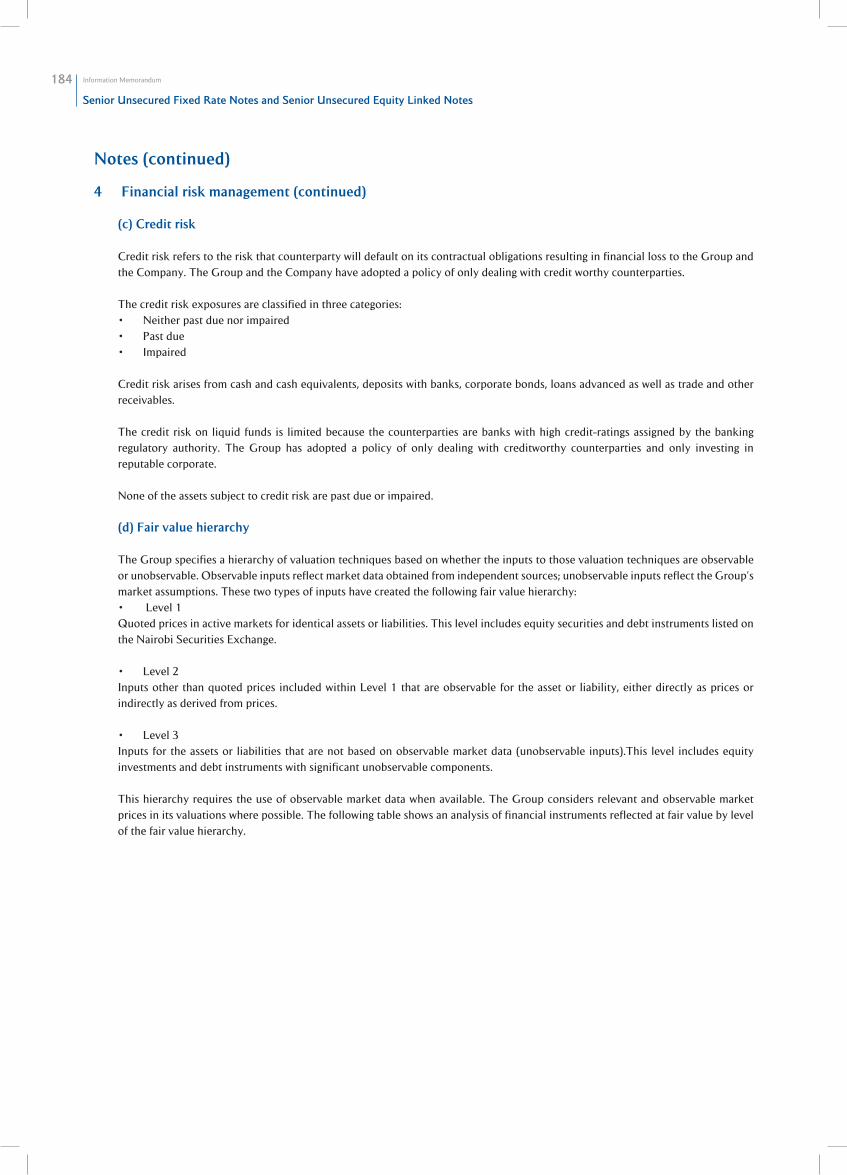
Information Memorandum
Senior Unsecured Fixed Rate Notes and Senior Unsecured Equity Linked Notes
184
Notes (continued)
4 Financial risk management (continued)
(c) Credit risk
Credit risk refers to the risk that counterparty will default on its contractual obligations resulting in financial loss to the Group and
the Company. The Group and the Company have adopted a policy of only dealing with credit worthy counterparties.
The credit risk exposures are classified in three categories:
• Neitherpastduenorimpaired
• Pastdue
• Impaired
Credit risk arises from cash and cash equivalents, deposits with banks, corporate bonds, loans advanced as well as trade and other
receivables.
The credit risk on liquid funds is limited because the counterparties are banks with high credit-ratings assigned by the banking
regulatory authority. The Group has adopted a policy of only dealing with creditworthy counterparties and only investing in
reputable corporate.
None of the assets subject to credit risk are past due or impaired.
(d) Fair value hierarchy
The Group specifies a hierarchy of valuation techniques based on whether the inputs to those valuation techniques are observable
or unobservable. Observable inputs reflect market data obtained from independent sources; unobservable inputs reflect the Group’s
market assumptions. These two types of inputs have created the following fair value hierarchy:
• Level1
Quoted prices in active markets for identical assets or liabilities. This level includes equity securities and debt instruments listed on
the Nairobi Securities Exchange.
• Level2
Inputs other than quoted prices included within Level 1 that are observable for the asset or liability, either directly as prices or
indirectly as derived from prices.
• Level3
Inputs for the assets or liabilities that are not based on observable market data (unobservable inputs).This level includes equity
investments and debt instruments with significant unobservable components.
This hierarchy requires the use of observable market data when available. The Group considers relevant and observable market
prices in its valuations where possible. The following table shows an analysis of financial instruments reflected at fair value by level
of the fair value hierarchy.

Information Memorandum 185
Senior Unsecured Fixed Rate Notes and Senior Unsecured Equity Linked Notes
Notes (continued)
4 Financial risk management (continued)
(d) Fair value hierarchy (continued)
Group Level 1 Level 2 Level 3 Total
Note Kshs’000 Kshs’000 Kshs’000 Kshs’000
31 March 2014
Financial assets:
Unquotedequityinstruments 20 - - 7,569,310 7,569,310
Quoted equity instruments 21 3,036,299 - - 3,036,299
Corporate bonds 22 1,071,046 - - 1,071,046
31 March 2013
Financial assets:
Unquotedequityinstruments 20 - - 4,306,221 4,306,221
Quoted equity instruments 21 2,732,872 - - 2,732,872
Corporate bonds 22 995,313 - - 995,313
31 March 2012
Financial assets:
Unquotedequityinstruments - - 1,427,206 1,427,206
Quoted equity instruments 1,666,309 - - 1,666,309
Corporate bonds 480,000 - - 480,000
31 March 2011
Financial assets:
Unquotedequityinstruments - - 1,338,664 1,338,664
Quoted equity instruments 3,208,611 - - 3,208,611
Corporate bonds 539,188 - - 539,188
31 March 2010
Financial assets:
Unquotedequityinstruments - - 1,251,209 1,251,209
Quoted equity instruments 2,967,876 - - 2,967,876
Corporate bonds 505,371 - - 505,371
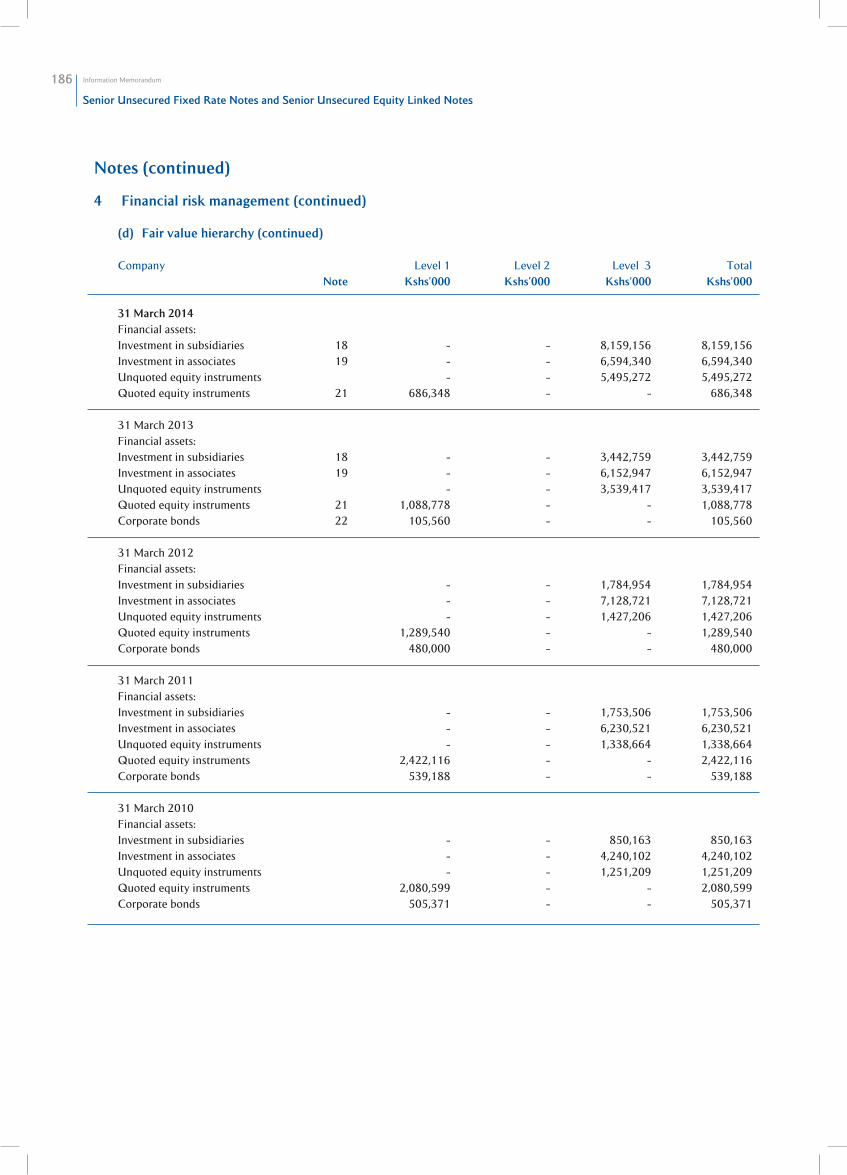
Information Memorandum
Senior Unsecured Fixed Rate Notes and Senior Unsecured Equity Linked Notes
186
Notes (continued)
4 Financial risk management (continued)
(d) Fair value hierarchy (continued)
Company Level 1 Level 2 Level 3 Total
Note Kshs’000 Kshs’000 Kshs’000 Kshs’000
31 March 2014
Financial assets:
Investment in subsidiaries 18 - - 8,159,156 8,159,156
Investment in associates 19 - - 6,594,340 6,594,340
Unquotedequityinstruments - - 5,495,272 5,495,272
Quoted equity instruments 21 686,348 - - 686,348
31 March 2013
Financial assets:
Investment in subsidiaries 18 - - 3,442,759 3,442,759
Investment in associates 19 - - 6,152,947 6,152,947
Unquotedequityinstruments - - 3,539,417 3,539,417
Quoted equity instruments 21 1,088,778 - - 1,088,778
Corporate bonds 22 105,560 - - 105,560
31 March 2012
Financial assets:
Investment in subsidiaries - - 1,784,954 1,784,954
Investment in associates - - 7,128,721 7,128,721
Unquotedequityinstruments - - 1,427,206 1,427,206
Quoted equity instruments 1,289,540 - - 1,289,540
Corporate bonds 480,000 - - 480,000
31 March 2011
Financial assets:
Investment in subsidiaries - - 1,753,506 1,753,506
Investment in associates - - 6,230,521 6,230,521
Unquotedequityinstruments - - 1,338,664 1,338,664
Quoted equity instruments 2,422,116 - - 2,422,116
Corporate bonds 539,188 - - 539,188
31 March 2010
Financial assets:
Investment in subsidiaries - - 850,163 850,163
Investment in associates - - 4,240,102 4,240,102
Unquotedequityinstruments - - 1,251,209 1,251,209
Quoted equity instruments 2,080,599 - - 2,080,599
Corporate bonds 505,371 - - 505,371

Information Memorandum 187
Senior Unsecured Fixed Rate Notes and Senior Unsecured Equity Linked Notes
Notes (continued)
4 Financial risk management (continued)
(d) Fair value hierarchy (continued)
There were no transfers into or out of level 3 in 2014, 2013,2012, 2011 and 2010.
The following is a movement of financial assets classified under level 3.
(I) Group
2014 2013 2012 2011 2010
Kshs’000 Kshs’000 Kshs’000 Kshs’000 Kshs’000
At start of year 4,306,221 1,427,206 1,338,664 1,251,209 1,212,828
Additions 337,124 837,929 85,240 382,433 79,743
Disposals (39,666) (8,063) (111,295) (307,143) (60,323)
Transfer from associates - 1,030,412 - - -
Fair value gains/(loss) 2,965,631 1,018,737 114,597 12,165 18,961
At end of year 7,569,310 4,306,221 1,427,206 1,338,664 1,251,209
Total gains on level 3 financial
assets held at the end of the
year as recognised in other
comprehensive income 2,965,631 1,018,737 114,597 12,165 18,961
(i) Company
At start of year 13,129,466 10,340,881 9,322,691 6,341,474 3,869,678
Additions 1,243,110 1,856,104 118,697 382,433 79,896
Disposals (39,666) (1,474,454) (111,657) (186,142) (60,323)
Transfer from associates - - - - -
Fair value gains/(loss) 5,866,222 2,406,935 1,011,150 2,784,926 2,452,223
At end of year 20,199,132 13,129,466 10,340,881 9,322,691 6,341,474
Total gains on level 3 financial
assets held at the end of the
year as recognised in other
comprehensive income 5,860,663 2,406,935 1,011,150 2,784,926 2,452,223
Financial assets under level 3 are valued using earnings multiples that are based on the market prices of comparable entities. If the
marketpricesofthecomparableentitieslistedontheNairobiSecuritiesExchangeappreciated/(depreciated)by5%,thefairvalues
of the financial assets under level 3 would change by the following.
(a) Group
2014 2013 2012 2011 2010
Kshs’000 Kshs’000 Kshs’000 Kshs’000 Kshs’000
5%changemarketvalue 44,905 16,576 49,533 42,474 50,238
(b) Company
5%changemarketvalue 113,673 383,745 356,436 341,113 212,005
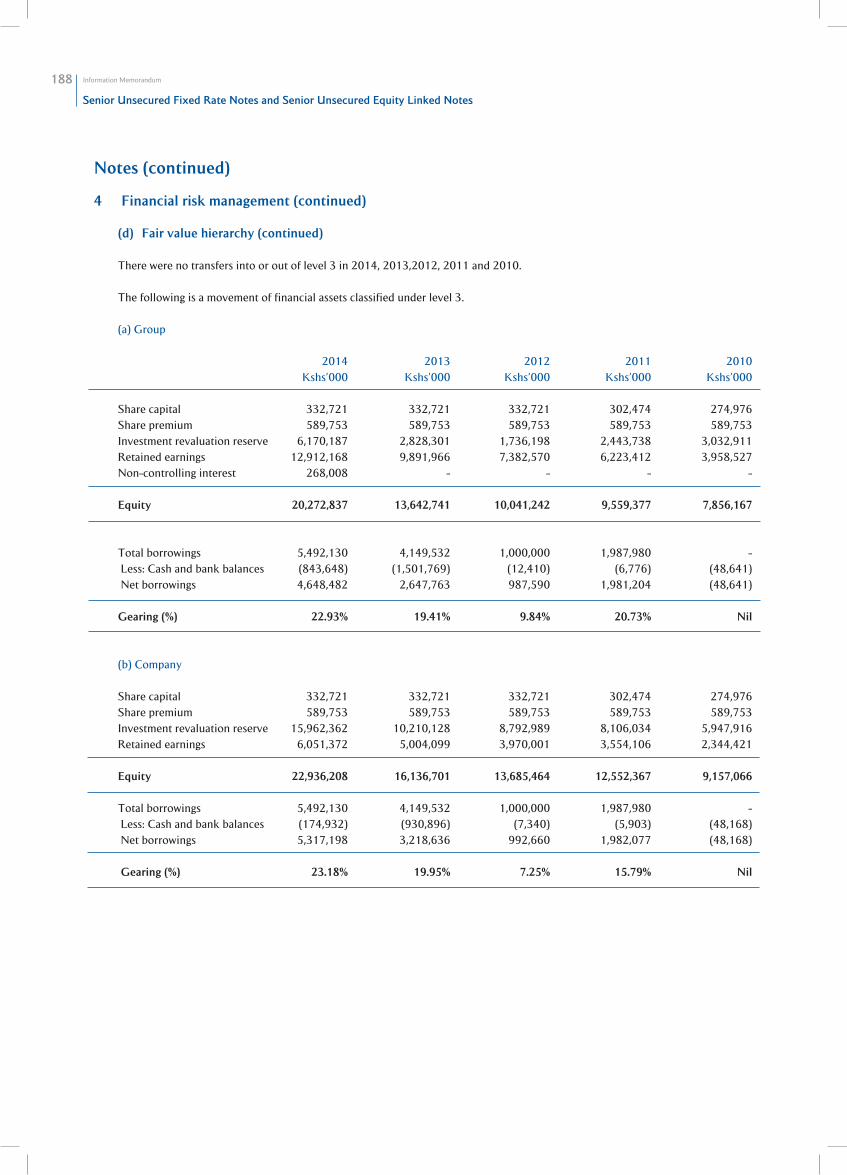
Information Memorandum
Senior Unsecured Fixed Rate Notes and Senior Unsecured Equity Linked Notes
188
Notes (continued)
4 Financial risk management (continued)
(d) Fair value hierarchy (continued)
There were no transfers into or out of level 3 in 2014, 2013,2012, 2011 and 2010.
The following is a movement of financial assets classified under level 3.
(a) Group
2014 2013 2012 2011 2010
Kshs’000 Kshs’000 Kshs’000 Kshs’000 Kshs’000
Share capital 332,721 332,721 332,721 302,474 274,976
Share premium 589,753 589,753 589,753 589,753 589,753
Investment revaluation reserve 6,170,187 2,828,301 1,736,198 2,443,738 3,032,911
Retained earnings 12,912,168 9,891,966 7,382,570 6,223,412 3,958,527
Non-controlling interest 268,008 - - - -
Equity 20,272,837 13,642,741 10,041,242 9,559,377 7,856,167
Total borrowings 5,492,130 4,149,532 1,000,000 1,987,980 -
Less: Cash and bank balances (843,648) (1,501,769) (12,410) (6,776) (48,641)
Net borrowings 4,648,482 2,647,763 987,590 1,981,204 (48,641)
Gearing (%) 22.93% 19.41% 9.84% 20.73% Nil
(b) Company
Share capital 332,721 332,721 332,721 302,474 274,976
Share premium 589,753 589,753 589,753 589,753 589,753
Investment revaluation reserve 15,962,362 10,210,128 8,792,989 8,106,034 5,947,916
Retained earnings 6,051,372 5,004,099 3,970,001 3,554,106 2,344,421
Equity 22,936,208 16,136,701 13,685,464 12,552,367 9,157,066
Total borrowings 5,492,130 4,149,532 1,000,000 1,987,980 -
Less: Cash and bank balances (174,932) (930,896) (7,340) (5,903) (48,168)
Net borrowings 5,317,198 3,218,636 992,660 1,982,077 (48,168)
Gearing (%) 23.18% 19.95% 7.25% 15.79% Nil

Information Memorandum 189
Senior Unsecured Fixed Rate Notes and Senior Unsecured Equity Linked Notes
Notes (continued)
5 Segment information
The Group’s chief operating decision maker is the executive management committee. The Group organises its activity by business
lines and these are defined as the Group’s reportable segments under IFRS 8, Operating Segments. The three business lines are;
Private Equity, Quoted Equity and Real Estate & Infrastructure. Performance is reviewed from a total return perspective.
Total return
Total return is the total value created in the period which includes cash value as well as unrealised movements in the portfolio. Total
return is calculated as the gross portfolio return less portfolio and funding costs. Total return is expressed in absolute amount or as
a percentage of opening portfolio value in the period.
Gross portfolio return
Gross portfolio return is equivalent to “revenue” for the purposes of IAS 1. It represents the overall increase in net assets from the
investment portfolio. Gross return is analysed into the following components:
Portfolio income
Portfolio Income is that portion of income that is directly related to the return from individual investments. It is recognised to the
extent that it is probable that there will be economic
benefit and the income can be reliably measured. Portfolio income includes; dividend income, interest income, rental income as well
as fee income.
• Dividendincome from investment in associates is included as portfolio income.
For the Group dividend income, the equity method of accounting is not applied and as such dividends received from associate
investments are incorporated.
• Realisedprofitsonthedisposalofinvestmentsare the difference between the fair value of the consideration received less any
directly attributable costs, on the sale of equity, and its carrying value at the start of the accounting period.
Although the net realised gains are similar to those in the statement of comprehensive income (SCI), the disclosure differs
under the Group’s segment reporting.
In the SCI, the difference between the sales proceeds and cost of the investments are accounted for in the income statement,
while the difference between the gains and the opening fair value is then disclosed under other comprehensive income as
reserves released on disposal of investments.
• Unrealisedprofitsontherevaluationofinvestments are the movement in the carrying value of investments between the start and
end of the accounting year.
UndertheGroup’ssegmentreporting,thereisnodifferentiationbetweenfairvaluethroughprofitorlossandfairvaluethrough
other comprehensive income. All value movements are passed through the statement of total return.
Portfolio costs
Portfolio costs include all expenses, operating and administrative incurred in the furtherance of investment activity during the
accounting period.
Portfolio value
Portfolio value includes the carrying value of equity investments as well as marketable securities.
The segment information provided to the executive management committee for the reportable segments for the year ended 31
March 2014 is as below.
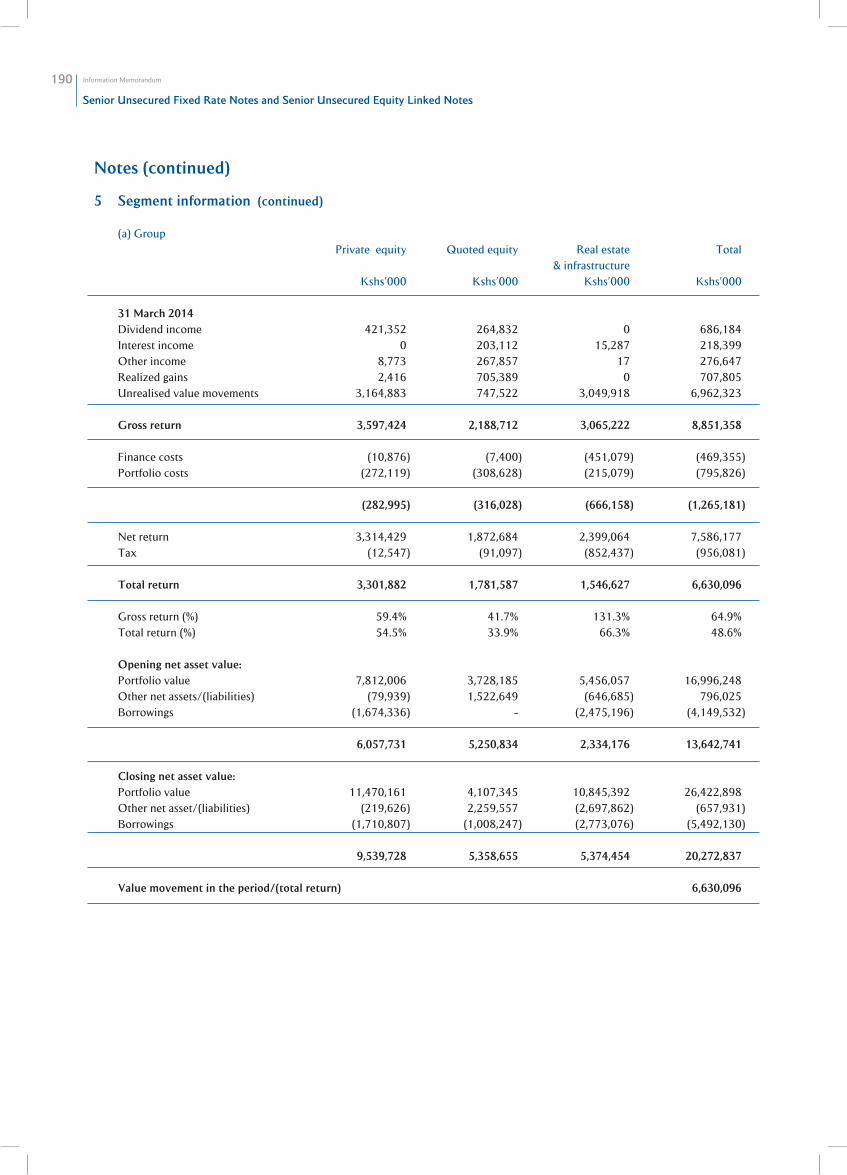
Information Memorandum
Senior Unsecured Fixed Rate Notes and Senior Unsecured Equity Linked Notes
190
Notes (continued)
5 Segment information (continued)
(a) Group
Private equity Quoted equity Real estate Total
& infrastructure
Kshs’000 Kshs’000 Kshs’000 Kshs’000
31 March 2014
Dividend income 421,352 264,832 0 686,184
Interest income 0 203,112 15,287 218,399
Other income 8,773 267,857 17 276,647
Realized gains 2,416 705,389 0 707,805
Unrealisedvaluemovements 3,164,883 747,522 3,049,918 6,962,323
Gross return 3,597,424 2,188,712 3,065,222 8,851,358
Finance costs (10,876) (7,400) (451,079) (469,355)
Portfolio costs (272,119) (308,628) (215,079) (795,826)
(282,995) (316,028) (666,158) (1,265,181)
Net return 3,314,429 1,872,684 2,399,064 7,586,177
Tax (12,547) (91,097) (852,437) (956,081)
Total return 3,301,882 1,781,587 1,546,627 6,630,096
Grossreturn(%) 59.4% 41.7% 131.3% 64.9%
Totalreturn(%) 54.5% 33.9% 66.3% 48.6%
Opening net asset value:
Portfolio value 7,812,006 3,728,185 5,456,057 16,996,248
Other net assets/(liabilities) (79,939) 1,522,649 (646,685) 796,025
Borrowings (1,674,336) - (2,475,196) (4,149,532)
6,057,731 5,250,834 2,334,176 13,642,741
Closing net asset value:
Portfolio value 11,470,161 4,107,345 10,845,392 26,422,898
Other net asset/(liabilities) (219,626) 2,259,557 (2,697,862) (657,931)
Borrowings (1,710,807) (1,008,247) (2,773,076) (5,492,130)
9,539,728 5,358,655 5,374,454 20,272,837
Value movement in the period/(total return) 6,630,096

Information Memorandum 191
Senior Unsecured Fixed Rate Notes and Senior Unsecured Equity Linked Notes
Notes (continued)
5 Segment information (continued)
(b) Group
Private equity Quoted equity Real estate Total
& infrastructure
Kshs’000 Kshs’000 Kshs’000 Kshs’000
31 March 2013
Dividend income 239,700 144,224 - 383,924
Interest income - 222,680 - 222,680
Other income 7,361 70,327 7,062 84,750
Realized gains 565,240 142,951 145,000 853,191
Unrealisedvaluemovements 1,240,546 883,178 1,592,750 3,716,474
Gross return 2,052,847 1,463,360 1,744,812 5,261,019
Finance costs (212,537) (90,859) (97,367) (400,763)
Portfolio costs (177,895) (105,243) (237,042) (520,180)
(390,432) (196,102) (334,409) (920,943)
Net return 1,662,415 1,267,258 1,410,403 4,340,076
Tax (448) (36,972) (701,157) (738,577)
Total return 1,661,967 1,230,286 709,246 3,601,499
Grossreturn(%) 41.35% 59.15% 67.05% 52.39%
Totalreturn(%) 33.48% 49.72% 27.25% 35.87%
Opening net asset value:
Portfolio value 5,041,756 2,146,309 3,992,754 11,180,819
Other net assets/(liabilities) (76,965) 327,880 (390,492) (139,577)
Borrowings - - (1,000,000) (1,000,000)
4,964,791 2,474,189 2,602,262 10,041,242
Closing net asset value:
Portfolio value 7,812,006 3,728,185 5,456,057 16,996,248
Other net asset/(liabilities) (79,939) 1,522,649 (646,685) 796,025
Borrowings (1,674,336) - (2,475,196) (4,149,532)
6,057,731 5,250,834 2,334,176 13,642,741
Value movement in the period/(total return) 3,601,499

Information Memorandum
Senior Unsecured Fixed Rate Notes and Senior Unsecured Equity Linked Notes
192
Notes (continued)
5 Segment information (continued)
(c) Group
Private equity Quoted equity Real estate Total
& infrastructure
Kshs’000 Kshs’000 Kshs’000 Kshs’000
31 March 2012
Dividend income 324,678 90,271 - 414,949
Interest income - 52,143 - 52,143
Other income 50,774 - 6,135 56,909
Realized gains - 56,389 - 56,389
Unrealisedvaluemovements 346,294 (121,484) 353,610 578,420
Gross return 721,746 77,319 359,745 1,158,810
Finance costs - (49,979) (179,893) (229,872)
Portfolio costs (108,287) (67,557) (93,959) (269,803)
(108,287) (117,536) (273,852) (499,675)
Net return 613,459 (40,217) 85,893 659,135
Tax (18,340) (12,937) (145,993) (177,270)
Total return 595,119 (53,154) (60,100) 481,865
Grossreturn(%) 15.5% 2.0% 38.0% 12.1%
Totalreturn(%) 12.7% (1.3%) (6.3%) 5.0%
Opening net asset value:
Portfolio value 4,715,969 3,723,790 3,525,578 11,965,337
Other net assets/(liabilities) (47,038) 219,996 (590,938) (417,980)
Borrowings - - (1,987,980) (1,987,980
4,668,931 3,943,786 946,660 9,559,377
Closing net asset value:
Portfolio value 5,041,756 2,146,309 3,992,754 11,180,819
Other net asset/(liabilities) (76,965) 327,880 (390,492) (139,577)
Borrowings - - (1,000,000) (1,000,000)
4,964,791 2,474,189 2,602,262 10,041,242
Value movement in the period/(total return) 481,865

Information Memorandum 193
Senior Unsecured Fixed Rate Notes and Senior Unsecured Equity Linked Notes
Notes (continued)
5 Segment information (continued)
(d) Group
Private equity Quoted equity Real estate Total
& infrastructure
Kshs’000 Kshs’000 Kshs’000 Kshs’000
31 March 2011
Dividend income 419,430 109,996 - 529,426
Interest income - 77,950 - 77,950
Other income 14,220 8,575 6,276 29,071
Realized gains 121,001 34,132 - 155,133
Unrealisedvaluemovements 189,493 175,253 1,002,866 1,367,612
Gross return 744,144 405,906 1,009,142 2,159,192
Finance costs - - (154,697) (154,697)
Portfolio costs (171,306) (84,324) (43,609) (299,239)
(171,306) (84,324) (198,306) (453,936)
Net return 572,838 321,582 810,836 1,705,256
Tax (545) (1,582) 81 (2,046)
Total return 572,293 320,000 810,917 1,703,210
Grossreturn(%) 17.4% 11.5% 2,757.4% 27.5%
Totalreturn(%) 13.4% 9.0% 2,215.0% 21.7%
Opening net asset value:
Portfolio value 4,199,795 3,473,247 35,940 7,708,982
Other net assets 76,751 69,777 657 147,185
4,276,546 3,543,024 36,597 7,856,167
Closing net asset value:
Portfolio value 4,715,969 3,723,790 3,525,578 11,965,337
Other net asset/(liabilities) (47,038) 219,996 (590,938) (417,980)
Borrowings - - (1,987,980) (1,987,980)
4,668,931 3,943,786 946,660 9,559,377
Value movement in the period/(total return) 1,703,210

Information Memorandum
Senior Unsecured Fixed Rate Notes and Senior Unsecured Equity Linked Notes
194
Notes (continued)
5 Segment information (continued)
(e) Group
Private equity Quoted equity Real estate Total
& infrastructure
Kshs’000 Kshs’000 Kshs’000 Kshs’000
31 March 2010
Dividend income 247,527 45,839 - 293,366
Interest income - 6,022 - 6,022
Other income 21,711 9,699 2,910 34,320
Realised gains 201,998 113,663 - 315,661
Unrealisedvaluemovements 128,691 996,361 - 1,125,052
Gross return 599,927 1,171,584 2,910 1,774,421
Finance costs (28,761) (17,036) (1,143) (46,940)
Portfolio costs (119,289) (64,757) (16,268) (200,314)
(148,050) (81,793) (17,411) (247,254)
Net return 451,877 1,089,791 (14,501) 1,527,167
Tax 496 11,010 1,461 12,967
Total return 452,373 1,100,801 (13,040) 1,540,134
Grossreturn(%) 14.9% 51.8% 8.1% 28.1%
Totalreturn(%) 11.3% 48.7% (36.4%) 24.4%
Opening net asset value:
Portfolio value 4,101,600 2,305,043 36,560 6,443,203
Other net assets 27,253 16,315 243 43,811
Borrowings (108,206) (60,810) (965) (169,981)
4,020,647 2,260,548 35,838 6,316,033
Closing net asset value:
Portfolio value 4,199,795 3,473,247 35,940 7,708,982
Other net asset 76,751 69,777 657 147,185
Borrowings - - - -
4,276,546 3,543,024 36,597 7,856,167
Value movement in the period/(total return) 1,540,134

Information Memorandum 195
Senior Unsecured Fixed Rate Notes and Senior Unsecured Equity Linked Notes
Notes (continued)
5 Segment information (continued)
(f) Company
Private equity Quoted equity Real estate Total
& infrastructure
Kshs’000 Kshs’000 Kshs’000 Kshs’000
31 March 2014
Dividend income 519,352 1,218,294 51,000 1,788,646
Interest income - 39,784 - 39,784
Other income 11,189 - - 11,189
Realized value movements - 15,401 - 15,401
Unrealizedvaluemovements 3,395,076 479,834 2,010,528 5,885,438
Gross return 3,925,617 1,753,313 2,061,528 7,740,458
Finance costs (10,876) - (451,078) (461,954)
Portfolio costs (282,819) (70,903) (76,955) (430,677)
(293,695) (70,903) (528,033) (892,631)
Net return 3,631,922 1,682,410 1,533,495 6,847,827
Tax (8,880) (38,770) (673) (48,323)
Total return 3,623,042 1,643,640 1,532,822 6,799,504
Grossreturn(%) 45.1% 35.2% 84.1% 48.0%
Totalreturn(%) 41.6% 33.0% 62.6% 42.1%
Opening net asset value:
Portfolio value 10,459,172 3,748,424 5,099,849 19,307,445
Other net assets (79,939) 1,233,009 (174,282) 978,788
Borrowings (1,674,336) - (2,475,196) (4,149,532)
8,704,897 4,981,433 2,450,371 16,136,701
Closing net asset value
Portfolio value 14,060,848 5,024,502 10,286,150 29,371,500
Other asset/(liabilities) (91,608) 1,213,962 (2,065,519) (943,165)
Borrowings (1,710,807) (1,008,247) (2,773,076) (5,492,130)
12,258,433 5,230,217 5,447,555 22,936,205
Value movement in the period/(total return) 6,799,504

Information Memorandum
Senior Unsecured Fixed Rate Notes and Senior Unsecured Equity Linked Notes
196
Notes (continued)
5 Segment information (continued)
(g) Company
Private equity Quoted equity Real estate Total
& infrastructure
Kshs’000 Kshs’000 Kshs’000 Kshs’000
31 March 2013
Dividend income 239,700 43,768 - 283,468
Interest income - 107,979 - 107,979
Other income 9,623 70,063 - 79,686
Realized value movements (107,147) 116,507 - 9,360
Unrealizedvaluemovements 754,853 1,128,302 967,267 2,850,422
Gross return 897,029 1,466,619 967,267 3,330,915
Finance costs (212,537) (90,859) (97,301) (400,697)
Portfolio costs (177,892) (104,023) (160,216) (442,131)
(390,429) (194,882) (257,517) (842,828)
Net return 506,600 1,271,737 709,750 2,488,087
Tax (448) (36,842) 440 (36,850)
Total return 506,152 1,234,895 710,190 2,451,237
Grossreturn(%) 10.42% 59.29% 37.16% 24.34%
Totalreturn(%) 5.88% 49.92% 27.29% 17.91%
Opening net asset value:
Portfolio value 8,555,814 2,145,791 3,992,813 14,694,418
Other net assets 53,246 327,938 (390,138) (8,954)
Borrowings - - (1,000,000) (1,000,000)
8,609,060 2,473,729 2,602,675 13,685,464
Closing net asset value
Portfolio value 10,459,172 3,748,424 5,099,849 19,307,445
Other asset/(liabilities) (79,939) 1,233,009 (174,282) 978,788
Borrowings (1,674,336) - (2,475,196) (4,149,532)
8,704,897 4,981,433 2,450,371 16,136,701
Value movement in the period/(total return) 2,451,237

Information Memorandum 197
Senior Unsecured Fixed Rate Notes and Senior Unsecured Equity Linked Notes
Notes (continued)
5 Segment information (continued)
(h) Company
Private equity Quoted equity Real estate Total
& infrastructure
Kshs’000 Kshs’000 Kshs’000 Kshs’000
31 March 2012
Dividend income 324,678 79,669 - 404,347
Interest income - 44,740 7,403 52,143
Other income 50,179 - 1,998 52,177
Realized value movements - 83,913 - 83,913
Unrealizedvaluemovements 992,246 (152,936) 19,525 858,835
Gross return 1,367,103 55,386 28,926 1,451,415
Finance costs - (49,979) - (49,979)
Portfolio costs (103,907) (53,026) (70,142) (227,075)
(103,907) (103,005) (70,142) (277,054)
Net return 1,263,196 (47,619) (41,216) 1,174,361
Tax (18,281) (18,155) (4,828) (41,264)
Total return 1,244,915 (65,774) (46,044) 1,133,097
Grossreturn(%) 17.8% 1.4% 3.1% 11.6%
Totalreturn(%) 16.2% (1.7%) (4.9%) 9.0%
Opening net asset value:
Portfolio value 7,571,499 3,939,975 2,951,418 14,462,892
Other net assets 90,419 4,039 (17,003) 77,455
Borrowings - - (1,987,980) (1,987,980)
7,661,918 3,944,014 946,435 12,552,367
Closing net asset value
Portfolio value 8,555,814 2,145,791 3,992,813 14,694,418
Other asset/(liabilities) 53,246 327,938 (390,138) (8,954)
Borrowings - - (1,000,000) (1,000,000)
8,609,060 2,473,729 2,602,675 13,685,464
Value movement in the period/(total return) 1,133,097

Information Memorandum
Senior Unsecured Fixed Rate Notes and Senior Unsecured Equity Linked Notes
198
Notes (continued)
5 Segment information (continued)
(i) Company
Private equity Quoted equity Real estate Total
& infrastructure
Kshs’000 Kshs’000 Kshs’000 Kshs’000
31 March 2011
Dividend income 421,106 88,691 - 509,797
Interest income - 77,950 - 77,950
Other income 11,708 8,575 4,559 24,842
Realized gains 121,001 10,090 - 131,091
Unrealisedvaluemovements 1,879,642 220,564 999,028 3,099,234
Gross return 2,433,457 405,870 1,003,587 3,842,914
Finance costs - - (154,697) (154,697)
Portfolio costs (164,916) (84,286) (41,764) (290,966)
(164,916) (84,286) (196,461) (445,663)
Net return 2,268,541 321,584 807,126 3,397,251
Tax (545) (1,486) 81 (1,950)
Total return 2,267,996 320,098 807,207 3,395,301
Grossreturn(%) 43.4% 11.5% 2,777% 42.0%
Totalreturn(%) 40.5% 9.1% 2,234% 37.1%
Opening net asset value:
Portfolio value 5,491,311 3,487,361 35,948 9,014,620
Other net assets 110,903 31,358 185 142,446
Closing net asset value 5,602,214 3,518,719 36,133 9,157,066
Portfolio value 7,571,499 3,939,975 2,951,418 14,462,892
Other asset/(liabilities) 90,419 4,039 (17,003) 77,455
Borrowings - - (1,987,980) (1,987,980)
7,661,918 3,944,014 946,435 12,552,367
Value movement in the period/(total return) 3,395,301

Information Memorandum 199
Senior Unsecured Fixed Rate Notes and Senior Unsecured Equity Linked Notes
Notes (continued)
5 Segment information (continued)
(j) Company
Private equity Quoted equity Real estate Total
& infrastructure
Kshs’000 Kshs’000 Kshs’000 Kshs’000
31 March 2010
Dividend income 409,708 45,840 - 455,548
Interest income - 6,022 - 6,022
Other income 18,924 9,975 4,296 33,195
Realized gains - 87,735 - 87,735
Unrealizedvaluemovements 1,886,230 1,061,968 - 2,948,198
Gross return 2,314,862 1,211,540 4,296 3,530,698
Finance costs (28,761) (17,036) (1,143) (46,940)
Portfolio costs (118,543) (64,364) (16,144) (199,051)
(147,304) (81,400) (17,287) (245,991)
Net return 2,167,558 1,130,140 (12,991) 3,284,707
Tax 496 11,010 1,461 12,967
Total return 2,168,054 1,141,150 (11,530) 3,297,674
Grossreturn(%) 65.3% 53.2% 11.9% 60.3%
Totalreturn(%) 61.1% 50.1% (31.9%) 56.3%
Opening net asset value:
Portfolio value 3,588,440 2,305,043 36,560 5,930,043
Other net assets 60,105 38,609 616 99,330
Borrowings (102,860) (66,073) (1,048) (169,981)
3,545,685 2,277,579 36,128 5,859,392
Closing net asset value
Portfolio value 5,491,311 3,487,361 35,948 9,014,620
Other net assets 110,903 31,358 185 142,446
5,602,214 3,518,719 36,133 9,157,066
Value movement in the period/(total return) 3,297,674

Information Memorandum
Senior Unsecured Fixed Rate Notes and Senior Unsecured Equity Linked Notes
200
Notes (continued)
5 Segment information (continued)
(k) Reconciliation of total return to profit after tax for the year
Group
2014 2013 2012 2011 2010
Kshs’000 Kshs’000 Kshs’000 Kshs’000 Kshs’000
Total return as per internal
reporting 6,630,096 3,601,499 481,865 1,703,210 1,540,134
Adjustments for:
Share of associate earnings 393,432 263,259 594,037 486,934 289,787
Share of other comprehensive
income of associates 32,761 41,918 (91,117) 165,053 (29,980)
Associate dividend income (225,983) (217,072) (280,941) (223,267) (150,077)
Unrealisedvaluemovementsnet
of dividend relating to associates (199,251) (88,105) (206,713) (428,720) (109,730)
Additions in the year - - (15,266) - -
Total comprehensive income 6,631,055 3,601,499 481,865 1,703,210 1,540,134
Other comprehensive income (3,575,685) (1,092,103) 707,540 589,173 (446,377)
Profit for the year 3,055,370 2,509,396 1,189,405 2,292,383 1,093,757
(d) Reconciliation of Gross return to profit after tax for the year
Gross return as per
internal reporting 8,851,358 5,261,019 1,158,811 2,159,192 1,774,421
Adjustments for:
Associate dividend income (225,983) (217,072) (271,223) (353,658) (150,077)
Unrealisedvaluemovementsnet
of dividend relating to associates (199,251) (88,105) (216,432) (298,330) (109,730)
Additions in the year - - (15,266) - -
Items dealt with on other
comprehensive income in
the financial statements:
Reserves released on
disposal of investments 287,772 791,726 562,349 964,613 854,626
Fair value gain in quoted
securities (865,064) (835,057) (114,597) (12,164) (18,961)
Fair value gain in unquoted
securities (2,965,632) (1,018,737) 166,121 (199,577) (1,312,022)
Currency translation differences - 11,883 2,550 1,355 -
Total income for the year 4,883,200 3,905,657 1,272,313 2,261,431 1,038,257

Information Memorandum 201
Senior Unsecured Fixed Rate Notes and Senior Unsecured Equity Linked Notes
Notes (continued)
5 Segment information (continued)
(l) Other segment reporting disclosures
Private Quoted Real estate Total
equity equity & infrastructure
Group Kshs’000 Kshs’000 Kshs’000 Kshs’000
31 March 2014
Depreciation and amortisation 6,113 1,589 5,304 13,006
Motor vehicle and equipment 27,902 7,171 24,882 59,955
Intangible assets 9,687 970,334 8,735 988,756
Additions to motor vehicle and equipment 10,409 2,706 9,479 22,594
Additions to intangible assets - 985,504 - 985,504
31 March 2013
Depreciation and amortisation 1,600 1,280 3,622 6,502
Motor vehicle and equipment 11,000 8,800 24,199 43,999
Intangible assets 430 344 4,523 5,297
Additions to motor vehicle and equipment 5,648 4,519 12,427 22,594
Additions to intangible assets 283 226 4,303 4,812
31 March 2012
Depreciation and amortisation 1,153 1,922 2,748 5,823
Motor vehicle and equipment 5,762 9,452 11,343 26,557
Intangible assets 413 688 825 1,926
Additions to motor vehicle and equipment 891 1,484 1,781 4,156
Additions to intangible assets 55 92 112 259
31 March 2011
Depreciation and amortisation 2,114 987 767 3,868
Motor vehicle and equipment 13,971 7,224 5,618 26,813
Intangible assets 3,939 824 641 5,404
Additions to motor vehicle and equipment 11,123 5,742 4,465 21,330
Additions to intangible assets 4,281 894 696 5,871
31 March 2010
Depreciation and amortisation 1,138 723 7 1,868
Motor vehicle and equipment 6,912 4,390 45 11,347
Intangible assets 366 233 2 601
Additions to motor vehicle and equipment 5,728 3,638 37 9,403
Additions to intangible assets 364 231 2 597

Information Memorandum
Senior Unsecured Fixed Rate Notes and Senior Unsecured Equity Linked Notes
202
Notes (continued)
5 Segment information (continued)
(M) Other segment reporting disclosures
Private Quoted Real estate Total
equity equity & infrastructure
Company Kshs’000 Kshs’000 Kshs’000 Kshs’000
31 March 2014
Depreciation and amortisation - - - -
Motor vehicle and equipment - - - -
Intangible assets - - - -
Additions to motor vehicle and equipment - - - -
Additions to intangible assets - - - -
31 March 2013
Depreciation and amortisation 1,600 1,280 3,520 6,400
Motor vehicle and equipment 11,000 8,800 24,199 43,999
Intangible assets 430 344 946 1,720
Additions to motor vehicle and equipment 5,648 4,519 12,427 22,594
Additions to intangible assets 283 226 623 1,132
31 March 2012
Depreciation and amortisation 1,153 1,922 2,322 5,397
Motor vehicle and equipment 5,672 9,452 11,343 26,467
Intangible assets 413 688 825 1,926
Additions to motor vehicle and equipment 891 1,484 1,781 4,156
Additions to intangible assets 55 92 112 259
31 March 2011
Depreciation and amortisation 1,901 987 767 3,655
Motor vehicle and equipment 13,912 7,224 5,618 26,754
Intangible assets 1,587 824 641 3,052
Additions to motor vehicle and equipment 11,058 5,742 4,465 21,265
Additions to intangible assets 1,722 894 696 3,312
31 March 2010
Depreciation and amortisation 1,138 723 7 1,868
Motor vehicle and equipment 6,912 4,390 45 11,347
Intangible assets 366 233 2 601
Additions to motor vehicle and equipment 5,728 3,638 37 9,403
Additions to intangible assets 364 231 2 597

Information Memorandum 203
Senior Unsecured Fixed Rate Notes and Senior Unsecured Equity Linked Notes
Notes (continued)
5 Segment information (continued)
(n) Analysis of income by geographical segments is below
2014 2013 2012 2011 2010
(i) Group Kshs’000 Kshs’000 Kshs’000 Kshs’000 Kshs’000
Kenya 3,459,999 3,662,561 1,292,486 1,838,960 998,438
Uganda 437,979 (59,246) (26,282) 421,676 -
Tanzania 716,848 57,411 - - -
Others 268,374 244,931 6,109 795 39,819
4,883,200 3,905,657 1,272,313 2,261,431 1,038,257
(ii) Company
Kenya 1,983,114 1,912,459 757,704 1,672,516 919,465
Uganda 72 1,103 647 - -
Tanzania - - - - -
Others 5,041 214 6,109 12,280 201,999
1,988,227 1,913,776 764,460 1,684,796 1,121,464
Non-current assets by country
(i) Group
Kenya
Investment property 8,181,816 3,753,800 2,307,581 1,865,800 35,940
Motor vehicles and equipment 59,954 (43,999) 26,467 26,813 11,347
Intangible assets 988,756 5,297 1,926 5,404 601
Outside Kenya
Investment property 2,663,576 1,702,257 1,685,172 1,659,778 -
Motor vehicles and equipment - - - - -
(ii) Company
Kenya
Investment property - - - 265,000 35,940
Motor vehicles and equipment - 43,999 26,467 26,467 11,347
Intangible assets 967,210 1,720 1,926 3,052 601
Outside Kenya
Investment property - - - - -
Motor vehicles and equipment - - - - -

Information Memorandum
Senior Unsecured Fixed Rate Notes and Senior Unsecured Equity Linked Notes
204
Notes (continued)
6 Income
(a) Group
Total investment income Notes 2014 2013 2012 2011 2010 Ksh’000 Ksh’000 Ksh’000 Ksh’000 Ksh’000
Dividend income 460,201 300,557 143,725 175,768 143,289
Rent income 17 7,062 6,136 6,276 2,259
Interest income 218,399 222,680 52,143 77,950 6,022
Fund management income 266,673 - - - -
Gain on disposal of investments 11 993,161 1,495,955 618,738 964,613 854,626
Gain on disposal of investment property - 145,000 - - -
Unrealisedgainsoninvestmentproperty 15 3,049,918 1,604,632 356,160 1,004,221 -
Unrealised(loss)/gainsoncorporatebond 22 (117,309) 48,122 44,637 9,808 -
Write back of long outstanding dividend - - - 6,209 25,485
Other income 12,140 81,649 50,774 16,586 6,873
4,883,200 3,905,657 1,272,313 2,261,431 1,038,554
Income from financial assets:
Available for sale financial assets 1,680,535 2,019,192 821,907 1,223,906 1,009,275
At fair value through profit & loss (117,309) 48,122 400,797 9,808 -
1,563,226 2,067,314 1,227,704 1,233,714 1,009,275
Investment income earned
on non-financial assets 3,319,974 1,838,343 49,609 1,027,717 28,982
4,883,200 3,905,657 1,272,313 2,261,431 1,038,257
Dividend income
Subsidiaries - - - - 39,819
Associates - 28,742 - - -
Unquotedinvestments 319,845 127,591 53,454 65,772 57,631
Quoted investments 140,356 144,224 90,271 109,996 45,839
460,201 300,557 143,725 175,768 143,289

Information Memorandum 205
Senior Unsecured Fixed Rate Notes and Senior Unsecured Equity Linked Notes
Notes (continued)
6 Income (continued)
(b) Company
Total investment income Notes 2014 2013 2012 2011 2010 Ksh’000 Ksh’000 Ksh’000 Ksh’000 Ksh’000
Dividend income 1,788,646 283,468 404,347 509,797 455,547
Rent income - - 1,998 4,559 1,134
Interest income 39,784 107,979 52,143 77,950 6,022
Fund management income - - - - -
Gain on disposal of investments 148,609 1,433,074 211,156 833,339 626,700
Gain on disposal of investment property - - - - -
Unrealisedgainsoninvestmentproperty15 - - - 229,060 -
Unrealised(loss)/gainsoncorporatebond 161 9,560 44,637 9,808 -
Write back of long outstanding dividend - - - 6,209 25,485
Other income 11,027 79,695 50,179 14,074 6,576
1,988,227 1,913,776 764,460 1,684,796 1,121,464
Income from financial assets:
Available for sale financial assets 1,977,039 1,824,521 674,947 1,426,659 1,093,607
At fair value through profit & loss 161 9,560 44,637 9,808 -
1,977,200 1,834,081 719,584 1,436,467 1,093,607
Investment income earned
on non-financial assets 11,027 79,695 44,876 248,329 27,857
1,988,227 1,913,776 764,460 1,684,796 1,121,464
Dividend income
Subsidiaries 1,343,720 - 271,223 353,658 150,077
Associates 225,983 112,109 - 1,676 201,999
Unquotedinvestments 195,369 127,591 53,455 65,772 57,632
Quoted investments 23,574 43,768 79,669 88,691 45,839
1,788,646 283,468 404,347 509,797 455,547

Information Memorandum
Senior Unsecured Fixed Rate Notes and Senior Unsecured Equity Linked Notes
206
Notes (continued)
7 Expenses by nature
(a) Administrative
Notes 2014 2013 2012 2011 2010 (i) Group Ksh’000 Ksh’000 Ksh’000 Ksh’000 Ksh’000
Staff costs (Note 9) 513,525 335,333 104,393 177,521 106,778
Directors’ fees and expenses 12,891 14,129 13,928 8,461 4,430
Audit fees 5,177 4,822 4,194 2,805 2,020
Office rent & service charge 9,550 6,410 4,077 4,322 3,850
Depreciation & amortisation 11,008 6,502 5,818 3,868 1,868
Other administrative costs 23,334 12,764 15,684 9,003 3,380
575,485 379,960 148,094 205,980 122,326
(i) Company
Staff costs (Note 9) 245,590 327,637 102,548 177,206 106,778
Directors’ fees and expenses 11,921 14,129 13,928 8,461 4,430
Audit fees 3,540 3,744 3,092 2,805 2,020
Office rent & service charge 3,498 6,410 4,070 4,322 3,850
Depreciation & amortisation - 6,400 5,381 3,655 1,868
Other administrative costs 18,031 6,162 7,349 5,404 3,208
282,580 364,482 136,368 201,853 122,154
(a) Operating expenses
(i) Group
AGM & annual report printing 14,369 11,935 24,072 17,740 17,809
Business development costs 40,277 29,445 27,198 16,270 6,066
Capital raising costs - - 3,361 13,948 10,039
Legal and consultancy costs 80,154 66,487 - - -
Advertising & PR costs 18,539 8,624 6,754 8,167 11,556
Share registration costs 3,410 3,453 3,391 5,886 4,089
Listing expenses 6,113 4,042 4,729 3,937 2,397
Other costs 57,479 16,234 52,204 27,311 26,032
220,341 140,220 121,709 93,259 77,988
(ii) Company
AGM & annual report printing 14,369 11,935 24,072 17,740 17,809
Business development costs 31,402 29,445 27,198 16,270 6,066
Capital raising costs - - 3,361 13,948 10,039
Legal and consultancy costs 42,864 10,136 - - -
Advertising & PR costs 10,523 6,871 5,933 8,167 11,556
Share registration costs 3,410 3,453 3,391 5,886 4,089
Listing expenses 5,716 3,991 4,686 3,937 2,397
Other costs 39,813 11,818 22,066 23,165 24,941
148,097 77,649 90,707 89,113 76,897

Information Memorandum 207
Senior Unsecured Fixed Rate Notes and Senior Unsecured Equity Linked Notes
Notes (continued)
8 Finance costs
Notes 2014 2013 2012 2011 2010 (i) Group Ksh’000 Ksh’000 Ksh’000 Ksh’000 Ksh’000
Interest on borrowings 660,082 343,576 179,243 147,914 44,758
Commitment fees 12,986 5,240 - 6,277 1,500
Forex loss 6,558 450 50,629 506 682
Bond related expenses 17,888 51,497 - - -
697,514 400,763 229,872 154,697 46,940
Less: amounts capitalised
on qualifying assets 15 (228,159) - - - -
469,355 400,763 229,872 154,697 46,940
(i) Company
Interest on borrowings 431,897 343,543 - 147,914 44,758
Commitment fees 9,899 5,240 - 6,277 1,500
Forex loss 2,270 417 49,979 506 682
Bond related expenses 17,888 51,497 - - -
461,954 400,697 49,979 154,697 46,940
9 Employee benefits expense
(i) Group
Salaries 191,102 108,615 72,234 68,056 48,641
Performance bonus accrual 299,400 200,294 14,249 92,842 46,942
Retirement benefit scheme
contributions 4,579 6,390 4,947 4,579 3,103
National Social Security
Fund contributions (NSSF) 91 67 105 91 17
Movement in leave pay provision (789) 1,886 (789) 1,290 1,615
494,383 317,252 90,746 166,858 100,318
Staff medical expenses 8,405 7,301 2,685 1,766 1,980
Other staff welfare costs 10,737 10,780 10,962 8,897 4,480
513,525 335,333 104,393 177,521 106,778
(ii) Company
Salaries 85,492 100,919 70,389 67,741 48,641
Performance bonus accrual 144,652 200,294 14,249 92,842 46,942
Retirement benefit scheme
contributions 4,579 6,390 4,947 4,579 3,103
National Social Security
Fund contributions (NSSF) 91 67 105 91 17
Movement in leave pay provision (789) 1,886 (789) 1,290 1,615
234,025 309,556 88,901 166,543 100,318
Staff medical expenses 3,289 7,301 2,685 1,766 1,980
Other staff welfare costs 8,276 10,780 10,962 8,897 4,480
245,590 327,637 102,548 177,206 106,778

Information Memorandum
Senior Unsecured Fixed Rate Notes and Senior Unsecured Equity Linked Notes
208
Notes (continued)
10 (a) Income tax expense
2014 2013 2012 2011 2010 (i) Group Ksh’000 Ksh’000 Ksh’000 Ksh’000 Ksh’000
Current income tax 240,084 39,866 15,875 3,012 3,115
Prior year tax - - - - 45
Deferred income tax (Note 13) 715,997 479,186 28,602 (3,188) (16,173)
Underprovisionofdeferredincome
tax liability in prior year (Note 13) - 219,525 132,793 2,222 46
956,081 738,577 177,270 2,046 (12,967)
(i) Company
Current income tax 46,286 39,054 15,875 3,012 3,115
Prior year tax - - - - 45
Deferred income tax 2,037 (2,204) 25,389 (3,284) (16,173)
Underprovisionofdeferredincome
tax liability in prior year (Note 13) - - - 2,222 46
48,323 36,850 41,264 1,950 (12,967)
10 (b) Reconciliation of taxation charge to expected tax based on accounting profit:
(i) Group
Accounting profit before taxation 4,011,451 3,247,973 1,366,675 2,294,429 1,080,790
Taxattheapplicablerateof30% 1,203,436 974,392 410,002 688,329 324,237
Tax effect of income not taxable (1,315,721) (961,178) (461,020) (816,061) (387,247)
Tax effect of expenses not deductible for tax 1,068,366 505,838 95,495 127,556 49,952
Prior year current tax under(over) provision - - - - 45
Prior year deferred tax under provision - 219,525 132,793 2,222 46
956,081 738,577 177,270 2,046 (12,967)
(ii) Company
Accounting profit before taxation 1,095,597 1,070,948 487,406 1,239,133 875,473
Taxattheapplicablerateof30% 328,679 321,284 146,222 371,740 262,642
Tax effect of income not taxable (648,984) (520,002) (200,453) (499,568) (325,652)
Tax effect of expenses not deductible for tax 368,628 235,568 95,495 127,556 49,952
Prior year current tax under(over) provision - - - - 45
Prior year deferred tax under provision - - - 2,222 46
48,323 36,850 41,264 1,950 (12,967)

Information Memorandum 209
Senior Unsecured Fixed Rate Notes and Senior Unsecured Equity Linked Notes
Notes (continued)
10 (a) Taxation payable/(recoverable)
2014 2013 2012 2011 2010 (i) Group Ksh’000 Ksh’000 Ksh’000 Ksh’000 Ksh’000
At start of year 19,254 5,114 (2,654) (3,075) (5,632)
Tax payable on acquisition of subsidiary 2,400 - - - -
Charge for the year 240,084 39,866 15,875 3,012 3,160
Current income tax receivable written off - - 1,790 - -
Payments during the year (50,825) (25,726) (9,897) (2,591) (603)
At end of year 210,913 19,254 5,114 (2,654) (3,075)
(i) Company
At start of year 19,495 5,146 (832) (3,044) (5,601)
Charge for the year 46,286 39,054 15,875 3,012 3,160
Payments during the year (37,982) (24,705) (9,897) (800) (603)
At end of year 27,799 19,495 5,146 (832) (3,044)
11 Gains on disposal of investments GROUP COMPANY
Gain on Gain on
Cost Proceeds disposal Cost Proceeds disposal
Note Kshs’000 Kshs’000 Kshs’000 Kshs’000 Kshs’000 Kshs’000
31 March 2014
Quoted investments 21 904,933 1,913,339 1,008,406 244,463 392,917 148,454
Unquotedinvestments 20 39,666 39,666 - 39,666 39,666 -
Treasury bonds 22 741,010 725,765 (15,245) 105,721 105,560 (161)
1,685,609 2,678,770 993,161 389,850 538,143 148,293
Reserves released on disposal
Quoted investments 21 - - 287,772 - - 133,208
Gain during the year - - 705,389 - - 15,085
- - 993,161 - - 148,293
31 March 2013
Quoted investments 699,047 974,577 275,530 496,317 708,966 212,649
Unquotedinvestments 8,063 8,063 - 8,063 8,063 -
Associates 187,743 1,359,243 1,171,500 187,743 1,359,243 1,171,500
Treasury bonds 480,472 529,397 48,925 480,472 529,397 48,925
1,375,325 2,871,280 1,495,955 1,172,595 2,605,669 1,433,074
Reserves released on disposal
- Quoted investments - - 181,513 - - 145,075
- Associates - - 610,213 - - 1,278,648
- 791,726 - - 1,423,723
Gain during the year - - 704,229 - - 9,351
- - 1,495,955 - - 1,433,074

Information Memorandum
Senior Unsecured Fixed Rate Notes and Senior Unsecured Equity Linked Notes
210
Notes (continued)
11 Gains on disposal of investments (continued) GROUP COMPANY
Gain on Gain on
Cost Proceeds disposal Cost Proceeds disposal
Note Kshs’000 Kshs’000 Kshs’000 Kshs’000 Kshs’000 Kshs’000
31 March 2012
Quoted investments 1,177,929 1,691,927 513,998 889,731 1,019,819 130,088
Unquotedinvestments 111,295 111,295 - 111,295 111,295 -
Treasury bonds 3,444,461 3,562,111 117,650 2,793,645 2,887,623 93,978
Treasury bonds 539,188 526,278 (12,910) 539,188 526,278 (12,910)
5,272,873 5,891,611 618,738 4,333,859 4,545,015 211,156
Reserves released on disposal - - 562,349 - - 127,243
Gain during the year - - 56,389 - - 83,913
- - 618,738 - - 211,156
31 March 2011
Quoted investments 942,346 1,629,241 686,895 859,453 1,415,074 555,621
Unquotedinvestments 29,425 307,143 277,718 29,425 307,143 277,718
971,771 1,936,384 964,613 888,878 1,722,217 833,339
31 March 2010
Quoted investments 430,979 1,083,606 652,627 399,076 1,025,776 626,700
Unquotedinvestments 63,148 265,147 201,999 - - -
494,127 1,348,753 854,626 399,076 1,025,776 626,700
12 Earnings per share
Basic earnings per share are calculated by dividing the profit attributable to equity holders of the Company by the weighted average
number of ordinary shares in outstanding during the year.
2014 2013 2012 2011 2010 Ksh’000 Ksh’000 Ksh’000 Ksh’000 Ksh’000
Profit attributable to equity
holders of the Company 3,020,202 2,509,396 1,189,405 2,292,383 1,093,757
Weighted average number of
ordinary shares in issue (thousands) 665,442 665,442 665,442 665,442 665,442
Basic earnings per share (Kshs) 4.54 3.77 1.79 3.44 1.64
At the Annual General Meeting held on 23 September 2011, the shareholder approved a bonus issue of one ordinary share for every
ten shares held by utilisation of revenue reserves.
Also, at the Annual General Meeting held on 24 September 2010, the shareholder approved a bonus issue of one ordinary share for
every ten shares held by utilisation of revenue reserves.

Information Memorandum 211
Senior Unsecured Fixed Rate Notes and Senior Unsecured Equity Linked Notes
Notes (continued)
13 Deferred income tax
Deferredincometaxiscalculatedusingtheenactedincometaxrateof30%.Themovementonthedeferredincometaxaccountis
as follows:
2014 2013 2012 2011 2010(a) Group Ksh’000 Ksh’000 Ksh’000 Ksh’000 Ksh’000
At start of year (829,663) (130,952) 30,443 29,477 13,350
(Charge)/ credit to Profit/Loss (Note 10) (715,997) (698,711) (161,395) 966 16,127
Current year deferred tax (715,997) (479,186) (28,602) 3,188 16,173
Underprovisionofdeferredtaxin
prior year - (219,525) (132,793) (2,222) (46)
Acquisition of subsidiary 3,876 - - -
At end of year (1,541,784) (829,663) (130,952) 30,443 29,477
(b) Company
At start of year 7,354 5,150 30,539 29,477 13,350
(Charge)/ credit to Profit/Loss (2,037) 2,204 (25,389) 1,062 16,127
Current year deferred tax (2,037) 2,204 25,389) 3,284 16,173
Underprovisionofdeferredtaxin
prior year - - - (2,222) (46)
At end of year 5,317 7,354 5,150 30,539 29,477
Deferred income tax is calculated on all temporary differences under the liability method using the currently enacted tax rate of
30%.Thedeferredtaxasset/(liability)isattributabletothefollowingitems:
2014 2013 2012 2011 2010(c) Group Ksh’000 Ksh’000 Ksh’000 Ksh’000 Ksh’000
Tax losses 122,121 - - 2,256 2,127
Performance bonus provision 84,781 6,423 5,037 27,852 14,083
General provision for doubtful debt - - - - 12,121
Exchange differences - - - - 181
Leave pay provision 1,582 124 89 387 831
Accelerated capital allowances 307 54 24 (52) 134
Other provisions 1,226 - - - -
Fair value gain on investment property (1,751,801) (836,264) (136,102) - -
(1,541,784) (829,663) (130,952) 30,443 29,477
(d) Company
Tax losses - - - 2,256 2,127
Performance bonus provision 3,814 6,423 5,037 27,852 14,083
General provision for doubtful debt - - - - 12,121
Exchange differences - - - - 181
Leave pay provision 85 124 89 387 831
Accelerated capital allowances - 54 24 (52) 134
Other provisions 1,418 753 - - -
Fair value gain on investment property - - (136,102) - -
5,317 7,354 (130,952) 30,443 29,477

Information Memorandum
Senior Unsecured Fixed Rate Notes and Senior Unsecured Equity Linked Notes
212
Notes (continued)
14 Prepaid Operating lease rentals
Group &Company 2014 2013 2012 2011 2010 Ksh’000 Ksh’000 Ksh’000 Ksh’000 Ksh’000
Cost
At start of Year - - - 59,487 59,487
Transfer to Investment property - - - (59,487) -
At end of year - - - - 59,487
Amortisation
Amortisation charge at start of year - - - 23,547 22,927
Charge for the year - - - - 620
Transfer to Investment property - - - (23,547) -
Amortisation charge at end of year - - - - 23,547
Net book value - - - - 35,940
In 2011, land which was previously held as an operating lease was transferred to investment property and reported at fair value in
line with the requirement of IAS 40 as the group now holds the land for the purposes of development of an investment property
(Note 15)
15 Investment property
2014 2013 2012 2011 2010(a) Group Ksh’000 Ksh’000 Ksh’000 Ksh’000 Ksh’000
At start of year
Valuation 5,456,057 3,992,754 3,525,578 - -
Transfer from operating lease rental - - - 35,940 -
Additions 2,111,258 128,671 111,016 2,485,417 -
Capitalized borrowing costs 228,159 - - - -
Transfer out/disposals - (270,000) - - -
Fair value gains 3,049,918 1,604,632 356,160 1,004,221 -
At end of year 10,845,392 5,456,057 3,992,754 3,525,578 -
(a) Company
At start of year
Valuation - - 265,000 - -
Transfer from operating lease rental - - - 35,940 -
Additions - - - - -
Transfer out/disposals - - (265,000) - -
Fair value gains - - - 229,060 -
At end of year - - - 265,000 -
Capitalized borrowing costs relate to interest costs incurred during the development phase of Two Rivers Development Limited. An
averagecostofdebtof10%(2013:Nil)wasusedasabasisforcapitalization.
The fair value model has been applied for the investment property. The Company commissioned an independent qualified valuer to
determine the fair value of the investment property as at 31 March 2014 on the basis of open market value. The open market value
of all properties was determined using recent market prices.

Information Memorandum 213
Senior Unsecured Fixed Rate Notes and Senior Unsecured Equity Linked Notes
Notes (continued)
16 Motor vehicle and equipment
Group Company Ksh’000 Ksh’000
At 1 April 2009 Cost 11,235 11,235Accumulated depreciation (7,807) (7,807)
Net book amount 3,428 3,428
Year ended 31 March 2010 Opening net book amount 3,428 3,428Additions 9,403 9,403Disposals (1,008) (1,008)Depreciation charge (1,426) (1,426)Elimination on disposal 950 950
Closing net book amount 11,347 11,347
At 31 March 2010 Cost 19,630 19,630Accumulated depreciation (8,283) (8,283)
Net book amount 11,347 11,347
Year ended 31 March 2011 Opening net book amount 11,347 11,347Additions 21,330 21,265Disposals (cost) (5,933)) (5,933)Depreciation charge (2,800) (2,794)Disposals (accumulated depreciation) 2,869 2,869
Closing net book amount 26,813 26,754
At 31 March 2011 Cost 35,027 34,963Accumulated depreciation (8,214) (8,209)
Net book amount 26,813 26,754
Year ended 31 March 2012 Opening net book amount 26,813 26,754Additions 4,156 4,156Disposals (cost) (1,689) (1,625)Depreciation charge (4,012) (4,012)Disposals (accumulated depreciation) 1,199 1,194
Closing net book amount 26,467 26,467
At 31 March 2012 Cost 37,494 37,494Accumulated depreciation (11,027) (11,027)
Net book amount 26,467 26,467
Year ended 31 March 2013 Opening net book amount 26,467 26,467Additions 22,594 22,594Depreciation charge (5,062) (5,062)
Closing net book amount 43,999 43,999 At 31 March 2013 Cost 60,088 60,088Accumulated depreciation (16,089) (16,089)
Net book amount 43,999 43,999

Information Memorandum
Senior Unsecured Fixed Rate Notes and Senior Unsecured Equity Linked Notes
214
Notes (continued)
16 Motor vehicle and equipment (continued) Group Company Ksh’000 Ksh’000
Year ended 31 March 2014 Opening net book amount 43,999 43,999Additions 26,915 -Transfer - (43,999)Depreciation charge (10,960) -
Closing net book amount 59,954 - At 31 March 2014 Cost 87,003 -Accumulated depreciation (27,049) - Net book amount 59,954 -
17 Intangible assets 2014 2013 2012 2011 2010(a) Group Ksh’000 Ksh’000 Ksh’000 Ksh’000 Ksh’000
Cost
At start of year 9,353 4,541 6,841 1,908 1,311
Additions 18,294 4,812 259 5,871 597
On acquisition of subsidiary-Goodwill 967,210 - - - -
Transfer to subsidiary/Disposal - - (2,559) (938) -
At end of year 994,857 9,353 4,541 6,841 1,908
Amortisation
At start of year 4,055 2,615 1,437 1,307 865
Charge for the year 2,046 1,440 1,811 1,068 442
Transfer to subsidiary/ Disposal - - (633) (938) -
At end of year 6,101 4,055 2,615 1,437 1,307
Net book value 988,756 5,298 1,926 5,404 601
(a) Company
Cost At start of year 5,673 4,541 4,282 1,908 1,311Additions - 1,132 259 3,312 597Transfer to subsidiary/Disposal (5,673) - - (938) -
At end of year - 5,673 4,541 4,282 1,908 Amortisation At start of year 3,953 2,615 1,230 1,307 865Charge for the year - 1,338 1,385 861 442Transfer to subsidiary/Disposal (3,953) - - (938) -At end of year - 3,953 2,615 1,230 1,307
Net book value - 1,720 1,926 3,052 601
Thegoodwill recognised represents theexcessof the considerationpaid for theacquisitionof73.35%stake inGenesisKenyaInvestment management Limited over the fair value of the acquired identifiable assets and liabilities (see note 33).
Given the proximity of the year end to the acquisition of the business at 1 December 2013, the fair values determined at that date were relied upon to support the carrying value of the goodwill recognised. The carrying amount of the goodwill is reviewed annually
on the basis of forecast profits of the cash generating assets.

Information Memorandum 215
Senior Unsecured Fixed Rate Notes and Senior Unsecured Equity Linked Notes
Company statement of changes in equity
COMPANY COST FAIRVALUE
Ownership 01.04.13 Additions Disposals 31.03.14 31.03.14 31.03.13 31.03.12 31.01.11 31.03.10
% Shs’000 Shs’000 Shs’000 Shs’000 Shs’000 Shs’000
Athena Properties Limited 100 114,735 - - 114,735 357,966 276,160 284,002 284,063 284,063
Rasimu Limited 100 100 - - 100 701,495 634,384 613,271 700,746 566,092
Centum BVI Limited 100 8 - - 8 (97) (97) (97) 8 8
Pearl Marina Estates Limited 100 - - - - - - - 417,839 -
Two Rivers Development Limited 100 100 - - 100 3,142,604 1,513,539 576,196 352,663 -
UhuruHeightsLimited 100 100 - - 100 159,564 149,213 1,960 27 -
eTransact Limited 100 100 - - 100 (7,025) (7,024) (7,021) (1,840) -
Centum Exotics Limited 100 100 - - 100 1,111,564 756,111 87,388 - -
Centum Development Limited 100 91 - - 91 391,872 102,204 211,690 - -
Centum Asset Managers Limited 100 18,000 - - 18,000 100,332 18,201 17,565 - -
Kilele Holdings Limited 79 68 - - 68 1,113,444 68 - - -
Genesis Kenya Investment Management Limited 73 - 1,079,452 - 1,079,453 1,079,454 - - - -
Mvuke Limited 100 - - - - (20) - - - -
Centum Shared Services Limited 100 - 100 - 100 8,182 - - - -
Two Rivers Lifestyle Centre Limited 100 - 100 - 100 (43) - - - -
King Beverage Limited 100 - - - - (136) - - - -
133,402 1,079,652 - 1,213,055 8,159,156 3,442,759 1,784,954 1,753,506 850,163
Subsidiary Country of Incorporation Principal activity
Athena Properties Limited Kenya The principal activity of Athena Properties Limited is the management, ownership and development of property for rental purposes. During the year, the Company had no property but was actively prospecting for opportunities.
Rasimu Limited Kenya Incorporated in July 2008 and principal activity is engagement in investment activities. The subsidiary has invested in Carbacid Investment Company Limited.
Centum BVI Limited British Virgin Islands Incorporated in October 2009 and principal activity is engagement in infrastructure investments.
Pearl Marina Estates Limited* Uganda Incorporated in September 2010 and principal activity is engagement in real estate investments. The subsidiary has invested in 345acresoflandinEntebbeUganda.
Two Rivers Development Limited Kenya Formerly known as Runda Closeburn Estates Limited incorporated in September 2010 and principal activity is engagement in real estate investments.
Notes (continued)
18 Investment in subsidiaries

Information Memorandum 216
Senior Unsecured Fixed Rate Notes and Senior Unsecured Equity Linked Notes
Information Memorandum 216
Senior Unsecured Fixed Rate Notes and Senior Unsecured Equity Linked Notes
Subsidiary Country of Incorporation Principal activity
eTransact Limited Kenya Incorporated in October 2010 and was engaged in mobile phone software advancement.
Centum Exotics Limited Mauritius Incorporated in July 2011 and the principal activity is engagement investment in quoted private equity investments.
Centum Development Limited Mauritius Incorporated in July 2011 and the principal activity is engagement in real estate.
Centum Asset Managers Limited Kenya Incorporated in February 2012 and the principal activity is engagement in fund management.
UhuruHeightsLimited Kenya Incorporated in July 2010 and the principal activity is engagement in real estate investments
Oleibon Investment Limited* Tanzania Incorporated in October 2011 and the principal activity is to engage in investment in quoted private equity investments.
Kilele Holdings Limited Mauritius Incorporated in December 2012 and the principal activity is engagement in private equity investments
Centum Shared Services Limited Kenya Incorporated in July 2013 and the principal activity is to provide business solutions to Centum and its subsidiaries
Mvuke Ltd Mauritius Incorporated in December 2013 as a special purpose vehicle to explore Geothermal opportunities In Africa.
Genesis Kenya Investment Management Limited
Kenya Thecompanyacquired73.17%shareholdinginGenesisKenyaInvestmentManagementLimitedon1December2013andtheprincipal activity is to provide fund management services.
Two Rivers Lifestyle Centre Limited*
Mauritius Incorporated in 2013 and the principal activity is engagement in the management, ownership and development of property for rental purposes.
King Beverage Limited Kenya Incorporated in 2014 and the principal activity is engagement in the importation, distribution and sale of alcoholic beverages.
*These subsidiaries are indirectly owned by Centum Investment Company Limited. Pearl Marina is a subsidiary of Centum Development Limited (Mauritius), Oleibon Investment Limited is a Subsidiary
of Centum Exotics Limited (Mauritius) while Two Rivers Lifestyle Centre Limited is a subsidiary of Two Rivers Development Limited.
Notes (continued)
18 Investment in subsidiaries (continued)

Information Memorandum 217
Senior Unsecured Fixed Rate Notes and Senior Unsecured Equity Linked Notes
Notes (continued)
18 Investment in subsidiaries (continued)
2014 2013 2012 2011 2010Fair value movement – Company Ksh’000 Ksh’000 Ksh’000 Ksh’000 Ksh’000
Opening valuation of subsidiaries 3,442,759 1,784,954 1,753,506 850,163 284,063
Additions 1,079,652 68 18,191 662 108
Disposals* - - (362) - -
Fair value gain in subsidiaries 3,636,745 1,657,737 13,619 902,681 565,992
Closing valuation of subsidiaries 8,159,156 3,442,759 1,784,954 1,753,506 850,163
*During the period, Centum’s investment in Pearl Marina Estates Limited was transferred to its subsidiary Company; Centum
Development Limited.
Summarised financial information for each subsidiary that has non-controlling interests that are material to the group are set out
below.
Kilele Limited Genesis Kenya
2014 2013 2014 2013
Shs’000 Shs’000 Shs’000 Shs’000
Income 124,476 - 114,359 -
Profit after tax 124,228 - 34,072 -
Total comprehensive income 1,237,556 - 34,072 -
Total assets 1,943,883 - 222,972 -
Total liabilities (829,635) - (88,169) -
Net assets 1,114,248 - 134,803 -
Genesis Kenya Investment Management Limited and Centum Asset Managers Limited have a different financial reporting period
end from that of the Group; of 31 December. These subsidiaries, which are registered fund management companies, are regulated by
the Capital Markets Authority and have a statutory year end of 31 December. The financial performance of the Group has however
been prepared using financial statements of these subsidiaries for a period that corresponds with the reporting period of the Group.
Investments in subsidiaries are classified as non-current assets.

Information Memorandum
Senior Unsecured Fixed Rate Notes and Senior Unsecured Equity Linked Notes
218
Notes (continued)
19 Investment in associates
2014 2013 2012 2011 2010(a) Group Ksh’000 Ksh’000 Ksh’000 Ksh’000 Ksh’000
At start of year 3,659,198 3,614,550 3,377,305 2,948,585 2,885,947
Share of profits after taxation 393,432 263,259 594,037 486,934 289,787
Share of other comprehensive income 32,761 41,918 (91,117) 165,053 (29,980)
Dividends received (204,780) (217,072) (280,941) (223,267) (197,214)
Acquisitions during the year 20,240 1,784,911 15,266 - 45
Transfer to unquoted investment (Note 20) - (1,030,412) - - -
Disposals at cost - (187,743) - - -
Reserves released on disposal (Note 11) - (610,213) - - -
At end of year 3,900,851 3,659,198 3,614,550 3,377,305 2,948,585
(a) Company
At start of year 6,152,947 7,128,721 6,230,521 4,240,102 2,372,787
Fair value gain 421,153 382,919 882,934 1,990,419 1,867,270
Acquisitions during the year 20,240 1,784,911 15,266 - 45
Transfer to unquoted investment - (1,677,213) - - -
Disposals at cost - (187,743) - - -
Reserves released on disposal (Note 11) - (1,278,648) - - -
At end of year 6,594,340 6,152,947 7,128,721 6,230,521 4,240,102
Associates are accounted for under the equity method in the Group’s financial statements. Under the equity method, investments
in associates are carried in the consolidated statement of financial position at cost plus share of subsequent profits and other
comprehensive income less any impairment in the value of individual investments.
Associates are held at fair value in the Company’s separate financial statements.
The associates held at year end are as follows;
2014 2013 2012 2011 2010 Country Interest Interest Interest Interest Interest held% held% held% held% held%
AON Minet Insurance
Brokers Limited Kenya 21.50 21.50 21.50 21.50 21.50
KWAL Holdings Limited Kenya 26.43 26.43 26.43 26.43 26.43
Nairobi Bottlers Limited Kenya 27.62 27.62 27.62 27.62 27.62
Longhorn Publishers Limited Kenya 35.00 35.00 35.00 35.00 35.00
UAPFinancialServicesLimited Uganda 29.00 29.00 29 - -
Almasi Limited Kenya 43.00 42.00 - - -
Mount Kenya Bottlers limited Kenya - - 27.80 27.80 27.80
Rift valley Bottlers limited Kenya - - 43.99 43.99 43.99
UAPHoldingsLimited Kenya - - 24.23 24.23 24.23
Kisii Bottlers Limited Kenya - - 23.89 23.89 23.89

Information Memorandum 219
Senior Unsecured Fixed Rate Notes and Senior Unsecured Equity Linked Notes
Notes (continued)
19 Investment in associates (continued)
2014 2013 2012 2011 2010 Ksh’000 Ksh’000 Ksh’000 Ksh’000 Ksh’000
Total assets 22,001,478 19,346,321 30,709,119 27,041,191 22,750,223
Total liabilities (11,467,297) (9,686,130) (17,276,117) (14,598,074) (12,371,340)
Net assets 10,534,181 9,660,191 13,433,002 12,443,117 10,378,883
Total revenue 23,385,784 21,125,799 26,565,307 22,426,120 17,483,461
Total profit for the year 1,358,278 1,311,505 1,633,250 2,582,613 1,110,356
20 Unquoted investments
Group & Company 2014 2013 2012 2011 2010 Ksh’000 Ksh’000 Ksh’000 Ksh’000 Ksh’000
Opening valuation 4,306,221 1,427,206 1,338,664 1,251,209 1,212,828
Movements in the year:
Additions 337,123 837,929 85,240 382,433 79,743
Disposals (39,666) (8,063) (111,295) (29,425) (60,323)
Transfer in from associates (Note 19) - 1,030,412 - - -
Released on disposal - - - (277,718) -
Fair value gain /(loss) 2,965,632 1,018,737 114,597 12,165 18,961
3,263,089 2,879,015 88,542 87,455 38,381
Closing valuation 7,569,310 4,306,221 1,427,206 1,338,664 1,251,209
Unquoted investments are classified as non-current assets.
21 Quoted investments
2014 2013 2012 2011 2010(a) Group Ksh’000 Ksh’000 Ksh’000 Ksh’000 Ksh’000
Opening valuation 2,732,872 1,666,309 3,208,611 2,967,876 2,305,043
Movements in the year:
Additions 631,068 1,112,066 364,097 1,670,399 636,416
Disposals (904,933) (699,047) (1,177,929) (942,346) (430,979)
Reserves released on disposal (287,772) (181,513) (562,349) (686,895) (854,626)
Fair value gain/(loss) 865,064 835,057 (166,121) 199,577 1,312,022
303,427 1,066,563 (1,542,302) 240,735 662,833
Closing valuation 3,036,299 2,732,872 1,666,309 3,208,611 2,967,876

Information Memorandum
Senior Unsecured Fixed Rate Notes and Senior Unsecured Equity Linked Notes
220
Notes (continued)
21 Quoted investments (continued)
2014 2013 2012 2011 2010(b) Company Ksh’000 Ksh’000 Ksh’000 Ksh’000 Ksh’000
Opening valuation 1,088,778 1,289,540 2,422,116 2,080,599 2,305,043
Movements in the year:
Additions - 12,361 81,350 1,670,399 217,620
Disposals (244,463) (496,318) (889,731) (859,453) (399,075)
Reserves released on disposal (133,208) (145,075) (127,243) (555,621) (626,700)
Fair value gain/(loss) (24,759) 428,270 (196,952) 86,192 583,711
(402,430) (200,762) (1,132,576) 341,517 (224,444)
Closing valuation 686,348 1,088,778 1,289,540 2,422,116 2,080,599
Quoted investments are classified as non-current assets.
22 Corporate bonds at fair value through profit or loss
Group & Company 2014 2013 2012 2011 2010 Ksh’000 Ksh’000 Ksh’000 Ksh’000 Ksh’000
Opening valuation 995,313 480,000 539,188 505,371 -
Movements in the year;
Additions 934,052 947,663 3,879,824 - 505,371
Disposals (741,010) (480,472) (3,983,649) - -
Interest receivable - - - 24,009 -
Fair value (loss)/gain (117,309) 48,122 44,637 9,808 -
75,733 515,313 (59,188) 33,817 505,371
Closing valuation 1,071,046 995,313 480,000 539,188 505,371
Corporate bonds are classified as non current assets.
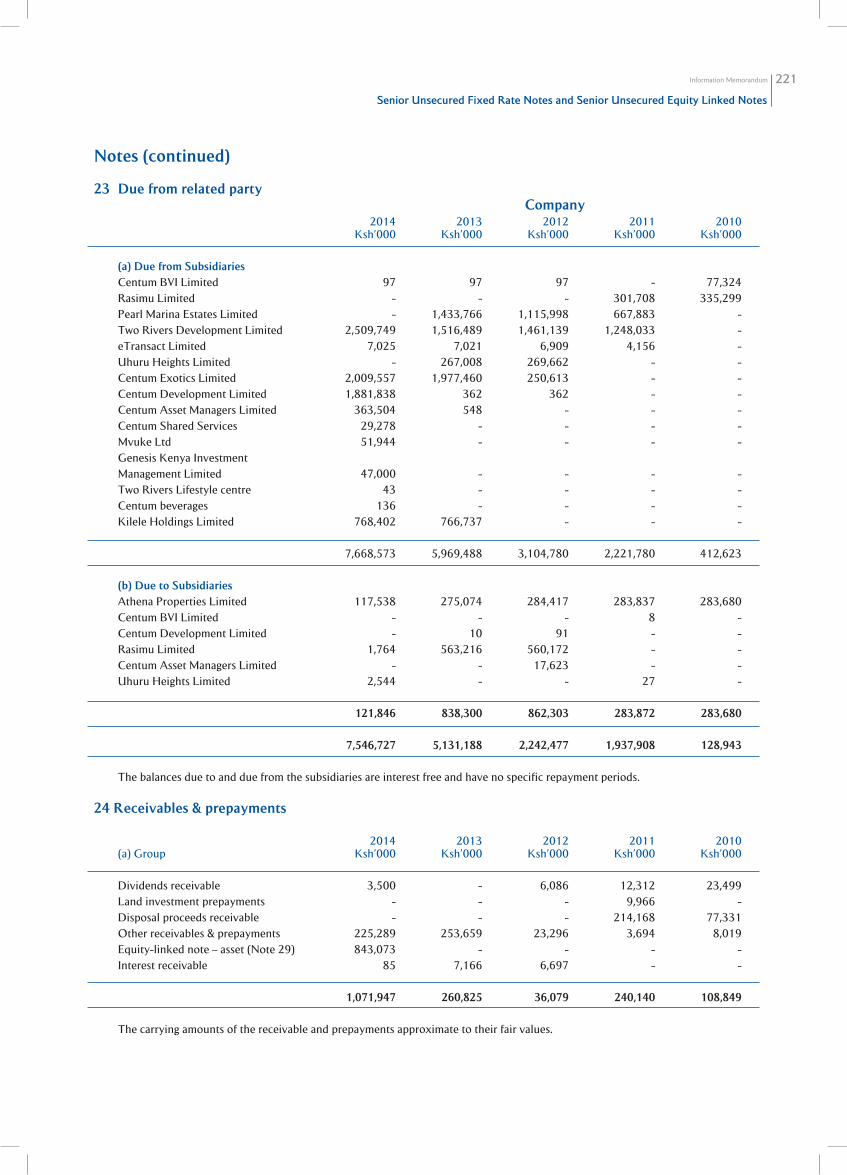
Information Memorandum 221
Senior Unsecured Fixed Rate Notes and Senior Unsecured Equity Linked Notes
Notes (continued)
23 Due from related party Company
2014 2013 2012 2011 2010 Ksh’000 Ksh’000 Ksh’000 Ksh’000 Ksh’000
(a) Due from Subsidiaries
Centum BVI Limited 97 97 97 - 77,324
Rasimu Limited - - - 301,708 335,299
Pearl Marina Estates Limited - 1,433,766 1,115,998 667,883 -
Two Rivers Development Limited 2,509,749 1,516,489 1,461,139 1,248,033 -
eTransact Limited 7,025 7,021 6,909 4,156 -
UhuruHeightsLimited - 267,008 269,662 - -
Centum Exotics Limited 2,009,557 1,977,460 250,613 - -
Centum Development Limited 1,881,838 362 362 - -
Centum Asset Managers Limited 363,504 548 - - -
Centum Shared Services 29,278 - - - -
Mvuke Ltd 51,944 - - - -
Genesis Kenya Investment
Management Limited 47,000 - - - -
Two Rivers Lifestyle centre 43 - - - -
Centum beverages 136 - - - -
Kilele Holdings Limited 768,402 766,737 - - -
7,668,573 5,969,488 3,104,780 2,221,780 412,623
(b) Due to Subsidiaries
Athena Properties Limited 117,538 275,074 284,417 283,837 283,680
Centum BVI Limited - - - 8 -
Centum Development Limited - 10 91 - -
Rasimu Limited 1,764 563,216 560,172 - -
Centum Asset Managers Limited - - 17,623 - -
UhuruHeightsLimited 2,544 - - 27 -
121,846 838,300 862,303 283,872 283,680
7,546,727 5,131,188 2,242,477 1,937,908 128,943
The balances due to and due from the subsidiaries are interest free and have no specific repayment periods.
24 Receivables & prepayments
2014 2013 2012 2011 2010(a) Group Ksh’000 Ksh’000 Ksh’000 Ksh’000 Ksh’000
Dividends receivable 3,500 - 6,086 12,312 23,499
Land investment prepayments - - - 9,966 -
Disposal proceeds receivable - - - 214,168 77,331
Other receivables & prepayments 225,289 253,659 23,296 3,694 8,019
Equity-linked note – asset (Note 29) 843,073 - - - -
Interest receivable 85 7,166 6,697 - -
1,071,947 260,825 36,079 240,140 108,849
The carrying amounts of the receivable and prepayments approximate to their fair values.

Information Memorandum
Senior Unsecured Fixed Rate Notes and Senior Unsecured Equity Linked Notes
222
Notes (continued)
24 Receivables & prepayments (continued)
2014 2013 2012 2011 2010(b) Company Ksh’000 Ksh’000 Ksh’000 Ksh’000 Ksh’000
Dividends receivable 24,493 - 136,141 152,084 18,676
Land investment prepayments - 39,966 15 9,966 -
Other receivables & prepayments 85 76,664 12,491 3,695 7,982
Interest receivable 2,921 7,166 6,697 - -
27,499 123,796 155,344 165,745 26,658
The carrying amounts of the receivable and prepayments approximate to their fair values.
25 Cash and cash equivalents
For the purpose of the statement of cash flows cash and cash equivalents comprise;
2014 2013 2012 2011 2010(a) Group Ksh’000 Ksh’000 Ksh’000 Ksh’000 Ksh’000
Call deposits (maturing within 90 days) 224,018 902,500 310,000 - 345,000
Bank balances 619,630 599,269 12,410 6,776 48,641
Bank overdraft (1,291,101) - - (987,980) -
(447,453) 1,501,769 322,410 (981,204) 393,641
(a) Company
Call deposits (maturing within 90 days) 108,851 902,500 310,000 - 345,000
Bank balances 66,081 28,396 7,340 5,903 48,168
Bank overdraft (1,291,101) - - (987,980) -
(1,116,169) 930,896 317,340 (982,077) 393,168
At 31 March 2014 the Group had undrawn committed borrowing facilities amounting to Kshs 708,899,000 (2013: Kshs
1,200,000,000, 2012: Kshs 1,200,000,000, 2011: kshs 212,020,000, 2010: Kshs 1,700,000,000). The effective interest rate for
thebankoverdraftis14.5%(2013:20%,2012:22%,2011:9,5%,2010:10.53%).
The overdraft facility is secured by a floating charge over all the listed Kenya securities.

Information Memorandum 223
Senior Unsecured Fixed Rate Notes and Senior Unsecured Equity Linked Notes
Notes (continued)
26 Borrowings Group & Company
2014 2013 2012 2011 2010 Ksh’000 Ksh’000 Ksh’000 Ksh’000 Ksh’000
The borrowings are made up as follows:
Bank loan and overdraft
At start of year - 1,000,000 1,987,980 1,987,980 -
Repayment during the year - (1,000,000) (987,980) - -
At end of year - - 1,000,000 1,987,980 -
Corporate bond
At start of year 4,149,532 - - - -
Issue during the year - 4,167,900 - - -
Accrued additional interest on
Equity linked note 37,524 37,524 - - -
Amortization of bond related expenses 13,973 (55,892) - - -
- - -
At end of year 4,201,029 4,149,532 - - -
Total borrowings 4,201,029 4,149,532 1,000,000 1,987,980 -
The company successfully issued a 5 year bond in 2012 and raised Kshs 4,167,900,000. This comprised of fixed rate notes of KShs
2,917,530,000ataninterestrateof13.5%andequitylinkednoteofShs1,250,370,000at12.75%withamaximumupsideof15%
on the Company’s net asset value as at 31 March 2012.
27 Share capital & Premium
Year ended 31 March 2014 Year ended 31 March 2013
Group and Company Number Ordinary Share Number Ordinary Share
of shares shares Premium of shares shares Premium
(in thousands) Kshs’000 Kshs’000 Kshs’000 Kshs’000 Kshs’000
At start and end of year 665,442 332,721 589,753 665,442 332,721 589,753
Year ended 31 March 2012 Year ended 31 March 2011
At start of year 604,947 302,474 589,753 549,952 274,976 589,753
Issue of shares-bonus 60,494 30,247 - 54,995 27,498 -
At end of year 665,441 332,721 - 604,947 302,474 589,753
Year ended 31 March 2010
At start and end of year 549,952 274,976 589,753
The total authorised number of ordinary shares is 800,000,000 with a par value of Kshs 0.50 per share 665,441,714 shares (2013:
665,441,714 shares, 2012:665,441,714 shares, 2011:604,947,013, 2010:549,951,830 shares) are issued and fully paid up.
At the Annual General meeting held on 23 September 2011, the shareholder approved a bonus issue of one ordinary share for every
ten shares held by utilisation of revenue reserves. As result, 60,494,701 bonus shares were issued on 2012 and 54,995,183 bonus
shares were issued on 2011

Information Memorandum
Senior Unsecured Fixed Rate Notes and Senior Unsecured Equity Linked Notes
224
Notes (continued)
29 Reserves
(a) Investment revaluation reserve
The investment revaluation reserve arises on the revaluation of available-for-sale financial assets. Where a revalued financial asset
is sold, the portion of the reserve that relates to that financial asset, and is effectively realised, is reduced from the investment
revaluation reserve and is recognised in profit or loss. Where a revalued financial asset is impaired, the portion of the reserve that
relates to that financial asset is recognised in profit or loss.
(b) Retained earnings
The retained earnings represent amounts available to the shareholders of the Group. Retained earnings are utilised to finance
business activity.
30 Payables and accruals
2014 2013 2012 2011 2010(a) Group Ksh’000 Ksh’000 Ksh’000 Ksh’000 Ksh’000
Sundry payables and accruals 525,274 83,506 13,398 13,935 7,654
Equity-linked note – liability 843,073 - - - -
Settlements in respect of investments 33,653 - 284,280 608,199 300,943
Leave pay provision 7,234 4,059 2,173 4,194 1,615
Performance bonus provision 431,318 200,293 56,105 92,842 46,942
1,840,552 287,858 355,956 719,170 357,154
(a) Company
Sundry payables and accruals (14,881) 25,830 12,296 13,644 7,406
Settlements in respect of investments 33,653 - 63,504 33,652 300,943
Leave pay provision 4,194 4,059 2,173 4,194 1,615
Performance bonus provision 181,501 200,293 56,105 92,842 46,942
204,467 230,182 134,078 144,332 356,906
The carrying amounts of the payables approximate to their fair values.
Centum Exotics Limited successfully issued a 5 year equity-linked note in 2014 and raised Kshs 843,073,578. The carrying value
of the equity-linked note is linked to the fair value of an underlying asset held under receivables (Note 24).
30 Unclaimed dividends
Group and Company
2014 2013 2012 2011 2010 Ksh’000 Ksh’000 Ksh’000 Ksh’000 Ksh’000
At the beginning of the year 32,504 34,437 35,049 42,650 73,863
Dividend paid (3,517) (1,933) (612) (1,392) (5,728)
Write back of long outstanding dividends - - - (6,209) (25,485)
At the end of the year 28,987 32,504 34,437 35,049 42,650
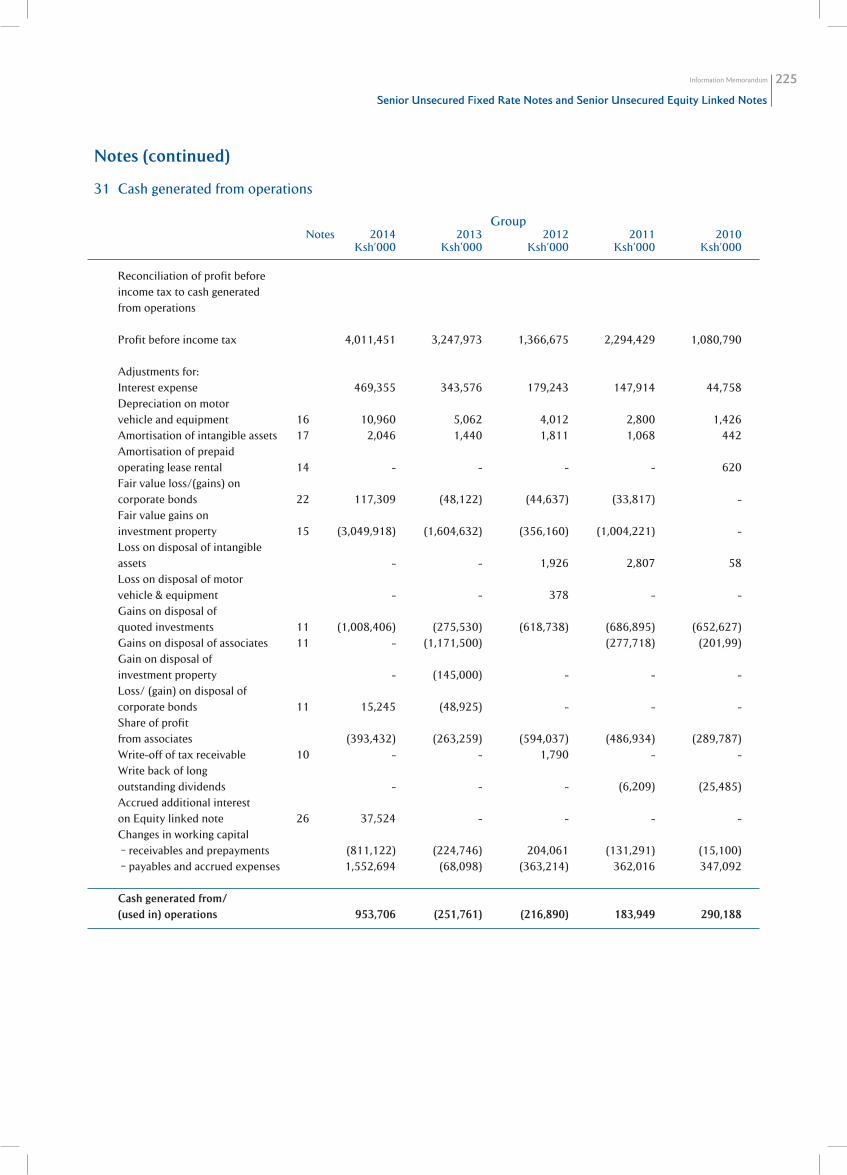
Information Memorandum 225
Senior Unsecured Fixed Rate Notes and Senior Unsecured Equity Linked Notes
Notes (continued)
31 Cash generated from operations
Group Notes 2014 2013 2012 2011 2010 Ksh’000 Ksh’000 Ksh’000 Ksh’000 Ksh’000
Reconciliation of profit before
income tax to cash generated
from operations
Profit before income tax 4,011,451 3,247,973 1,366,675 2,294,429 1,080,790
Adjustments for:
Interest expense 469,355 343,576 179,243 147,914 44,758
Depreciation on motor
vehicle and equipment 16 10,960 5,062 4,012 2,800 1,426
Amortisation of intangible assets 17 2,046 1,440 1,811 1,068 442
Amortisation of prepaid
operating lease rental 14 - - - - 620
Fair value loss/(gains) on
corporate bonds 22 117,309 (48,122) (44,637) (33,817) -
Fair value gains on
investment property 15 (3,049,918) (1,604,632) (356,160) (1,004,221) -
Loss on disposal of intangible
assets - - 1,926 2,807 58
Loss on disposal of motor
vehicle & equipment - - 378 - -
Gains on disposal of
quoted investments 11 (1,008,406) (275,530) (618,738) (686,895) (652,627)
Gains on disposal of associates 11 - (1,171,500) (277,718) (201,99)
Gain on disposal of
investment property - (145,000) - - -
Loss/ (gain) on disposal of
corporate bonds 11 15,245 (48,925) - - -
Share of profit
from associates (393,432) (263,259) (594,037) (486,934) (289,787)
Write-off of tax receivable 10 - - 1,790 - -
Write back of long
outstanding dividends - - - (6,209) (25,485)
Accrued additional interest
on Equity linked note 26 37,524 - - - -
Changes in working capital
−receivablesandprepayments (811,122) (224,746) 204,061 (131,291) (15,100)
−payablesandaccruedexpenses 1,552,694 (68,098) (363,214) 362,016 347,092
Cash generated from/
(used in) operations 953,706 (251,761) (216,890) 183,949 290,188

Information Memorandum
Senior Unsecured Fixed Rate Notes and Senior Unsecured Equity Linked Notes
226
Notes (continued)
32 Related party transactions
The Group transacts with companies related to it by virtue of common shareholding and also by virtue of common directors.
The following transactions were carried out with related parties:
Group and Company
2014 2013 2012 2011 2010(i) Related party transactions Ksh’000 Ksh’000 Ksh’000 Ksh’000 Ksh’000
Office rent (paid to entity controlled
by a director) 10,697 7,184 3,648 3,945 3,153
Insurance premiums (paid to an associate) 13,810 8,222 2,435 2,804 3,970
24,507 15,406 6,083 6,749 7,123
(ii) Key management compensation
Key management includes executive directors and members of senior management. The compensation paid or payable to key
management for employee services is shown below:
Group and Company
2014 2013 2012 2011 2010 Ksh’000 Ksh’000 Ksh’000 Ksh’000 Ksh’000
Salaries 86,717 59,576 45,301 41,227 33,124
Performance bonus 96,975 105,357 14,932 65,625 39,375
Retirement benefit scheme contribution 4,680 3,859 3,196 3,092 2,485
188,372 168,792 63,429 109,944 74,984
(iii) Directors’ remuneration
Fees for services as a non-executive director 12,891 14,129 13,928 8,461 4,430
Other included in key management
compensation above 84,991 82,130 37,985 36,701 18,576
97,882 96,259 51,913 45,162 23,006
(iv) Outstanding related party balances
Performance bonus 155,955 173,264 14,932 65,625 39,375
- - - 5,717 -
155,955 173,264 14,932 71,342 39,375

Information Memorandum 227
Senior Unsecured Fixed Rate Notes and Senior Unsecured Equity Linked Notes
Notes (continued)
33 Commitments
(i) Capital commitments Capital expenditure contracted for at the reporting date but not recognised in the financial statements is as follows:
2014 2013 2012 2011 2010 Ksh’000 Ksh’000 Ksh’000 Ksh’000 Ksh’000
Equipment - 823 823 823 15,000
(ii) Operating lease commitments
At the end of the reporting year, the Group had outstanding lease commitments under lease obligations which fall due as follows;
Group and Company
2014 2013 2012 2011 2010 Ksh’000 Ksh’000 Ksh’000 Ksh’000 Ksh’000
Within one year 2,334 3,648 3,648 3,648 3,648
Within the second to fourth years inclusive 2,651 1,671 5,319 8,967 9,423
4,985 5,319 8,967 12,615 13,071

Information Memorandum
Senior Unsecured Fixed Rate Notes and Senior Unsecured Equity Linked Notes
228
Notes (continued)
34 Financial instruments by category
(a) Financial assets
2014 2013 2012 2011 2010(a) Group Ksh’000 Ksh’000 Ksh’000 Ksh’000 Ksh’000
At fair value through profit or loss 1,071,046 995,313 480,000 539,188 505,371
Loans and receivables 1,815,488 1,762,594 358,489 246,916 502,310
Available for sale 10,605,609 7,039,093 3,093,515 4,547,275 4,219,085
13,492,143 9,797,000 3,932,004 5,333,379 5,226,766
Fair value through profit or loss
Corporate bonds 1,071,046 995,313 480,000 539,188 505,371
Loans and receivables:
Receivables 1,032,748 260,825 36,079 240,140 108,849
Deposits 224,018 902,500 310,000 - 345,000
Cash and cash equivalents 558,722 599,269 12,710 6,776 48,461
1,815,488 1,762,594 358,789 246,916 502,310
Available for sale:
Unquotedinvestments 7,569,310 4,306,221 1,427,206 1,338,664 1,251,209
Quoted investments 3,036,299 2,732,872 1,666,309 3,208,611 2,967,876
10,605,609 7,039,093 3,093,515 4,547,275 4,219,085
(b) Company
At fair value through profit or loss - 105,560 480,000 539,188 505,371
Loans and receivables 7,882,235 7,024,180 3,577,464 2,393,428 419,826
Available for sale 20,885,480 14,277,901 11,633,647 11,744,807 8,422,073
28,767,715 21,407,641 15,691,111 14,677,423 9,347,270
Fair value through profit or loss
Corporate bonds - 105,560 480,000 539,188 505,371
Loans and receivables:
Receivables 27,499 123,796 155,344 165,745 26,658
Deposits 108,851 902,500 310,000 - 345,000
Cash and cash equivalents 66,081 28,396 7,340 5,903 48,168
Due from subsidiary Companies 7,679,804 5,969,488 3,104,780 2,221,780 412,623
7,882,235 7,024,180 3,577,464 2,393,428 832,449
Available for sale:
Investment in subsidiaries 8,109,520 3,442,759 1,784,954 1,753,506 850,163
Investment in associates 6,594,340 6,152,947 7,128,721 6,230,521 4,240,102
Unquotedinvestments 5,495,272 3,593,417 1,427,206 1,338,664 1,251,209
Quoted investments 686,348 1,088,778 1,289,540 2,422,116 2,080,599
20,885,480 14,227,901 11,630,421 11,744,807 8,422,073
(b) Financial liabilities
All the Group’s financial liabilities are measured at amortised cost. The carrying value of the Group’s and the Company’s financial
liabilities at the end of 2014, 2013, 2012, 2011 and 2010 is shown on note 4(b).

Information Memorandum 229
Senior Unsecured Fixed Rate Notes and Senior Unsecured Equity Linked Notes
APPENDIX
20.2.2 Financial ratios
2014 2013 2012
1 Earnings before interest and taxes interest cover (times) 9.55 9.10 6.95
2 Fundsfromoperationstototaldebt(%) 77 139 422
3 Freecashflowtototaldebt(%) 76 137 422
4 Totalfreecashflowtoshorttermobligation(%) 350 - -
5 Netprofitmargin(%) 63 64 93
6 Posttaxreturn(beforefinancingoncapitalemployed)(%) 16 20 13
7 Longtermdebttocapitalemployed(%) 19 18 13
8 Totaldebttoequity(%) 28 22 15
20.2.3 Proforma financial information
Projected consolidated statement of comprehensive income
31 March 2016 Kshs’000 DividendsfromUnquotedInvestments 378,290Dividends from Quoted Investments 248,680 Interest Income 2,716,407 Fund Management Income 691,884 Gains on disposal of Investments 1,814,593 Fair value gains on Investment Property 7,168,690 Sales Revenue 7,589,723 Rental income 462,469 Other Income 947,053 Total Income 22,017,789 Cost of sales (5,020,383)Administrative & Operating Expenses (5,165,087)Finance costs (1,856,236)Share of associate profits 386,270 Profit Before Tax 10,362,353 Tax (2,897,848) Profit After Tax 7,464,505 Other Comprehensive income 9,940,683 Total Comprehensive Income 17,405,188
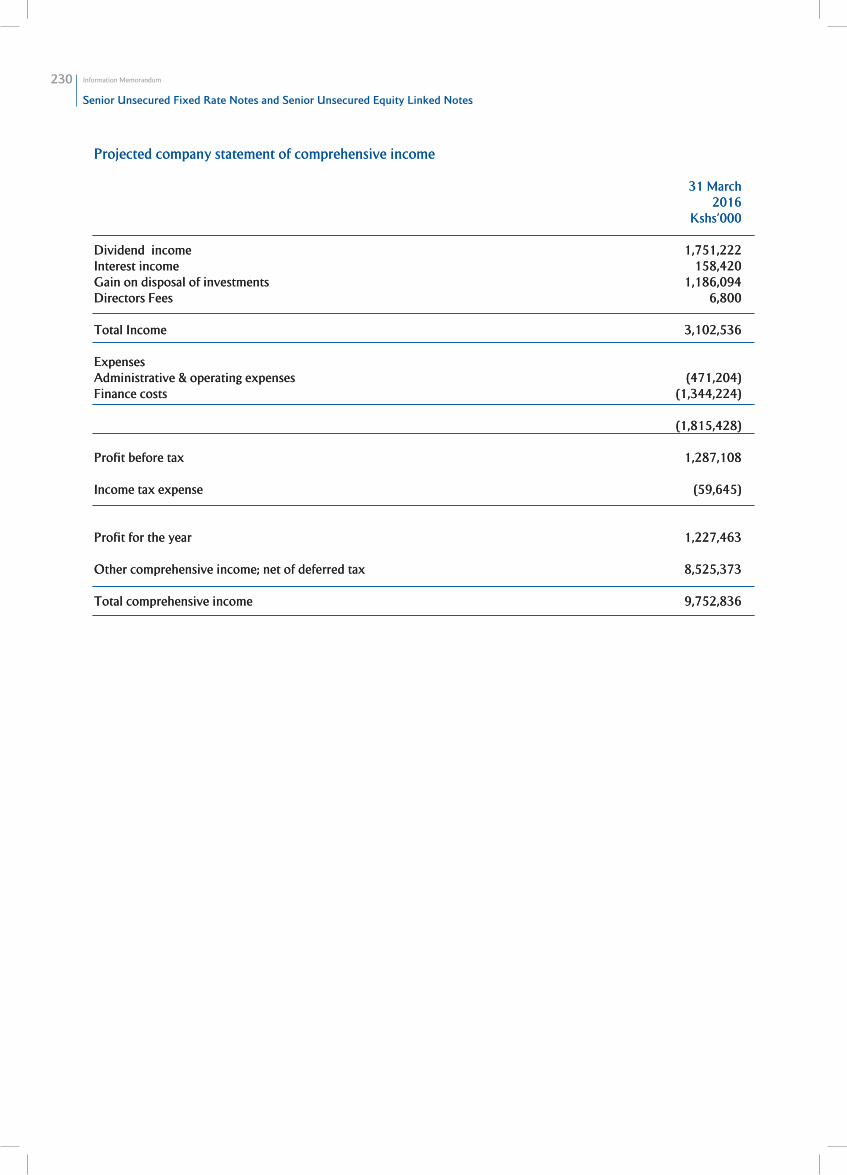
Information Memorandum
Senior Unsecured Fixed Rate Notes and Senior Unsecured Equity Linked Notes
230
Projected company statement of comprehensive income
31 March 2016 Kshs’000 Dividend income 1,751,222 Interest income 158,420 Gain on disposal of investments 1,186,094Directors Fees 6,800 Total Income 3,102,536 Expenses Administrative & operating expenses (471,204)Finance costs (1,344,224) (1,815,428) Profit before tax 1,287,108 Income tax expense (59,645) Profit for the year 1,227,463 Other comprehensive income; net of deferred tax 8,525,373 Total comprehensive income 9,752,836

Information Memorandum 231
Senior Unsecured Fixed Rate Notes and Senior Unsecured Equity Linked Notes
Projected company statement of comprehensive income
at 31 March 2016 Kshs’000 Assets Investment property 38,035,316 Property, plant & equipment 4,753,078 Intangible assets 92,782 Prepaid operating lease rentals 9,513 Investment in associates 5,351,001 Unquotedinvestments 14,069,160Quoted investments 5,828,901 Equity linked note assets 7,091,037 Government securities and Bonds at fair value through profit or loss 2,331,763 Loans and advances 15,509,031 Tax recoverable 135,950 Inventories 944,336 Deferred income tax asset 88,820 Receivables and prepayments 2,909,186 Cash and cash equivalents 9,590,105 Total Assets 106,739,979 Capital and reserves Share capital 332,721 Share premium 589,753 Investment revaluation reserve 13,864,003 Retained earnings 19,615,508 Shareholders equity attributable to Equity holders of the company 34,401,985 Non-controlling interest 10,643,459
Total equity 45,045,444 Liabilities Borrowings 21,108,950 Shareholder Loans 6,834,606 Equity linked note liability 7,091,037 Customer deposits 17,089,637 Deferred income 158,838 Payables and accrued expenses 2,552,858 Dividends payable to non-controlling interests 42,863 Current income tax 287,896 Deferred income tax 6,527,850 Total liabilities 61,694,535
Total equity & liabilities 106,739,979
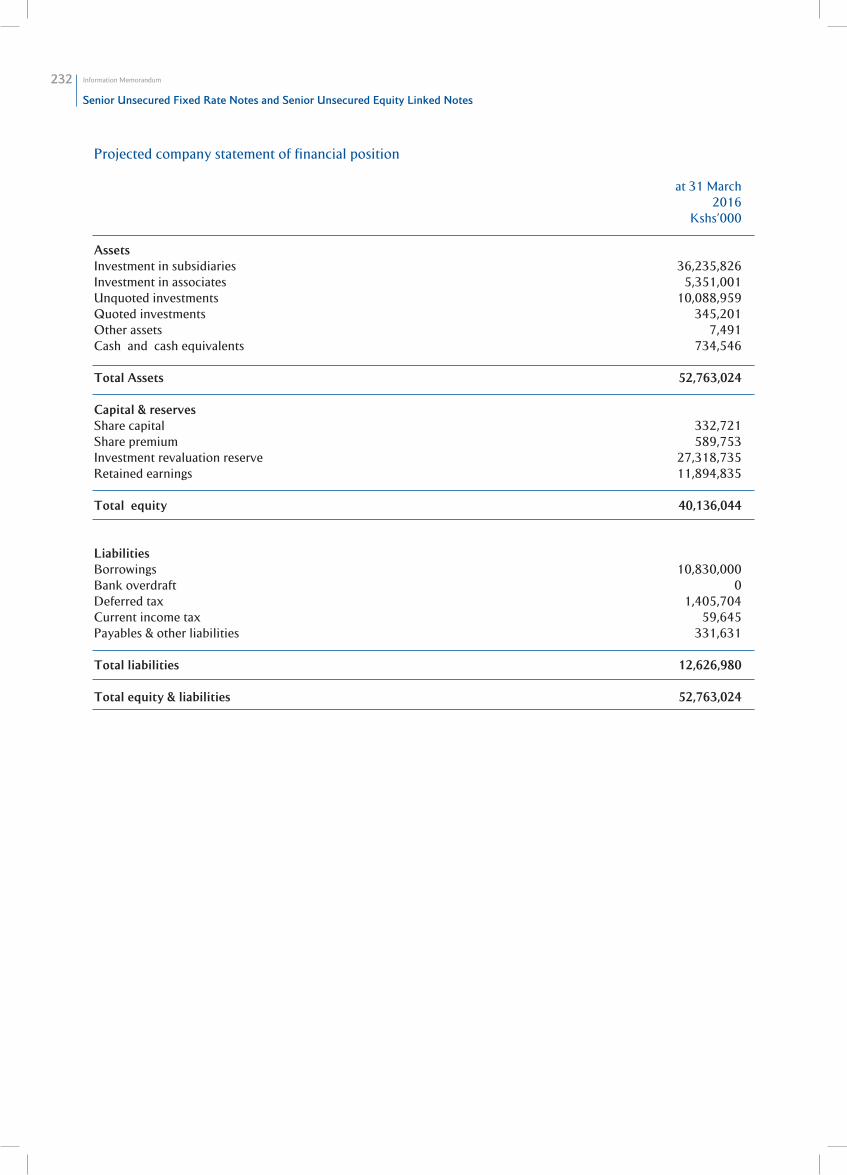
Information Memorandum
Senior Unsecured Fixed Rate Notes and Senior Unsecured Equity Linked Notes
232
Projected company statement of financial position
at 31 March 2016 Kshs’000 Assets Investment in subsidiaries 36,235,826Investment in associates 5,351,001Unquotedinvestments 10,088,959Quoted investments 345,201Other assets 7,491Cash and cash equivalents 734,546 Total Assets 52,763,024 Capital & reserves Share capital 332,721Share premium 589,753Investment revaluation reserve 27,318,735Retained earnings 11,894,835 Total equity 40,136,044 Liabilities Borrowings 10,830,000Bank overdraft 0Deferred tax 1,405,704Current income tax 59,645Payables & other liabilities 331,631 Total liabilities 12,626,980 Total equity & liabilities 52,763,024

Information Memorandum 233
Senior Unsecured Fixed Rate Notes and Senior Unsecured Equity Linked Notes
Projected statement of consolidated cash flowss
Year Ending 31 March 2016 Kshs’000 Operating Activities Cash from generated from operations (1,063,293)Tax paid (472,029) Internally generated Cash flows (1,535,322) Investing Activities Purchase of equity and Investment Property (15,565,795)Proceeds from disposal of equity 2,044,494 Capital expenditure (1,418,870)Dividends to non-controlling interests (18,655)
Investing Cash flows (14,958,826) Financing Activities Proceeds from borrowings 15,019,763 Repayment of borrowings (3,150,000)Issue of capital to non-controlling interests 7,327,000 Interest on borrowings (1,856,236)
Financing Cash flows 17,340,526 Opening Cash 8,743,726 Closing Cash 9,590,105

Information Memorandum
Senior Unsecured Fixed Rate Notes and Senior Unsecured Equity Linked Notes
234
1. USEOFPROCEEDS
The funds received from the bond issue are targeted to be used by Centum Investment Company Limited in the following areas:
Sector Target Company Nature of Investment % Bond proceeds (KShs. M)
Financial Services K-Rep Bank Limited Equity investment 60.0 3,600
Energy Akiira One Geothermal LimitedAmu Power Limited
Equity investment 35.0 2,100
Real Estate Pearl Marina Estates Limited
Equity investment 3.7 222
Offer Expenses 1.3 78
Total 100 6000
2. ASSUMPTIONS
i. Incomefromdividendsandinterestforlegacyinvestmentsareexpectedtogrowby2%,whilethecashyieldfromnewinvestmentsisexpectedat18%forprivateequityinvestmentsand5%forquotedequityinvestments.
ii. Exits in the year are expected to realize Kshs 1,666 million. The resultant proceeds of Kshs 3,426 Bn will be re-invested in other opportunities in FMCG, Agriculture and Power.
iii. Aconservativeunrealisedvalueappreciationof20%ontheportfoliohasbeenassumed.iv. Operatingandadministrativecostsareexpectedtogrowby10%duringtheyearv. Projected consolidated financial statements include the financial performance and financial position of Almasi
Beverages Limited and K-Rep Bank Limited. vi. Thirdpartyassetsundermanagement(AUMs)areassumedtogrowby15%duringtheyear.vii. Investmentpropertyisassumedtogrowby25%duringtheyearonthebasisoftheplannedinvestmentsinTwoRivers
and Pearl Marina.viii.SalesrevenueforAlmasiBeveragesLimitedisassumedtogrowby13%basedonhistoricalsalesvolumegrowth.ix. Credit impairment is assumed to grow at the same rate as the K – Rep Bank loan book.x. Thecosttoincomeratioisassumedtobe67%basedonK–RepBank’sprioryearaverages.xi. Theloantodepositratioisassumedtobe91%basedonK–RepBank’sprioryearaverages.

Information Memorandum 235
Senior Unsecured Fixed Rate Notes and Senior Unsecured Equity Linked Notes
The Directors
Centum Investment Company Limited
International House
5th Floor
Nairobi
15 May 2015
Report on the Interim financial statements for 9 Months ended 31 December 2014
Dear Sirs
We have reviewed the accompanying financial statements of Centum Investment Company Limited, which comprise the consolidated
statement of financial position at 31 December 2014, and the consolidated statements of comprehensive income, changes in equity and
cash flows for the 9 months then ended, together with the statement of financial position of the company standing alone at 31 December
2014 and the statements of comprehensive income and changes in equity of the company for the period then ended.
Management’s Responsibility for the Interim financial statements
Management is responsible for the preparation and fair presentation of these financial statements in accordance with the International
Financial Reporting Standards, and for such internal control as management determines is necessary to enable the preparation of financial
statements that are free from material misstatement, whether due to fraud or error.
Our Responsibility
Our responsibility is to express a conclusion on the accompanying financial statements. We conducted our review in accordance with
International Standard on Review Engagements ISRE 2410 – Review of Financial Information Performed by the Auditor (“ISRE 2410”).
ISRE 2410 requires us to conclude whether anything has come to our attention that causes us to believe that the financial statements,
taken as a whole, are not prepared in all material respects in accordance with the applicable financial reporting framework. This standard
also requires us to comply with relevant ethical requirements.
A review of financial statements in accordance with ISRE 2410 is a limited assurance engagement. The practitioner performs procedures,
primarily consisting of making inquiries of management and others within the entity, as appropriate, and applying analytical procedures,
and evaluates the evidence obtained.
The procedures performed in a review are substantially less than those performed in an audit conducted in accordance with International
Standards on Auditing. Accordingly, we do not express an audit opinion on these financial statements.
Conclusion
Based on our review, nothing has come to our attention that causes us to believe that these financial statements do not present fairly, in all
material respects, the financial position of Centum Investment Company Limited as at 31 December 2014, and its financial performance
and cash flows for the 9 months then ended, in accordance with International Accounting Standard 34 - Interim Financial Reporting.
Other matters
The corresponding figures covering the 9 month period ended 31 December 2013 were not subjected to the same review.
Certified Public Accountants
Nairobi, Kenya
15 May 2015
PricewaterhouseCoopers CPA. PwC Tower, Waiyaki Way/Chiromo Road, Westlands P O Box 43963 – 00100 Nairobi, Kenya T: +254 (20)285 5000 F: +254 (20)285 5001 www.pwc.com/ke
Partners: A Eriksson K Muchiru M Mugasa F Muriu P Ngahu A Njeru R Njoroge B Okundi K Saiti R Shah

Information Memorandum
Senior Unsecured Fixed Rate Notes and Senior Unsecured Equity Linked Notes
236
Consolidated statement of comprehensive income
Notes 9 month period ended 31 December
2014 2013
Kshs’000 Kshs’000
Income 4 2,416,516 1,238,591
Expenses
Administrative expenses (650,138) (223,357)
Operating expenses (257,680) (115,098)
Finance costs (541,801) (451,677)
(1,449,619) (790,132)
Share of profits of associate companies 377,693 351,870
Profit before tax 1,344,590 800,329
Income tax expense 5 (78,024) (158,662)
Profit for the year 1,266,566 641,667
Attributable to:
Equity holders of the company 1,199,535 641,667
Non-controlling interest 67,031 -
1,266,566 641,667
Other comprehensive income
Reserves released on disposal of investments (717,025) (217,963)
Share of other comprehensive income of associates - 119,674
Fair value gain in unquoted investments 2,495,591 502,948
Fair value gain in quoted investments 499,101 1,375,736
Currency translation differences 173,795 502
Deferred tax on fair value gains on investments (438,529) -
Total other comprehensive income 2,012,933 1,780,897
Total comprehensive income 3,279,499 2,422,564
Attributable to:
Equity holders of the company 3,148,978 2,422,564
Non-controlling interest 130,521 -
3,279,499 2,422,564
Earnings per share 6 1.80 0.96

Information Memorandum 237
Senior Unsecured Fixed Rate Notes and Senior Unsecured Equity Linked Notes
Consolidated statement of comprehensive income
Notes 9 month period ended 31 December
2014 2013
Kshs’000 Kshs’000
Income 4 1,440,738 1,074,890
Expenses
Administrative expenses (123,595) (192,764)
Operating expenses (236,158) (89,467)
Finance costs (501,893) (448,106)
(861,648) (730,337)
Profit before income tax 579,090 344,553
Income tax expense 5 39,120 (13,587)
Profit for the year 618,210 330,966
Other comprehensive income for the year
Reserves released on disposal of investments (304,404) (96,662)
Fair value gain in subsidiaries 600,303 1,531,863
Fair value gain in associates 782,644 46,986
Fair value gain in unquoted investments 2,218,728 502,948
Fair value gain in quoted investments 537 (53,816)
Deferred tax on fair value gains on investments (802,943) -
Total other comprehensive income 2,494,865 1,931,319
Total comprehensive income 3,113,075 2,262,285

Information Memorandum
Senior Unsecured Fixed Rate Notes and Senior Unsecured Equity Linked Notes
238
Consolidated statement of financial position
Notes At 31 Dec At 31 Mar
2014 2013
Kshs’000 Kshs’000
Assets
Investment property 7 12,002,511 10,845,392
Motor vehicle and equipment 451,914 59,954
Intangible assets 1,947,560 988,756
Investment in associates 4,232,222 3,900,851
Unquotedinvestments 8 10,753,578 7,569,310
Quoted investments 2,791,001 3,036,299
Equity linked note assets 9 9,591,922 843,073
Government securities and Bonds at
fair value through profit or loss 2,335,978 1,071,046
Loans and advances 10 10,453,714 -
Tax recoverable 236,389 -
Inventories 23,418 -
Deferred income tax 131,024 210,017
Receivables and prepayments 542,234 228,874
Cash and cash equivalents 11 4,830,012 843,648
60,323,477 29,597,220
Capital and reserves
Share capital 12 332,721 332,721
Share premium 589,753 589,753
Investment revaluation reserve 8,119,632 6,170,187
Retained earnings 14,111,701 12,912,168
Non-controlling interest 1,151,197 268,008
Total equity 24,305,004 20,272,837
Liabilities
Long term borrowings 13 8,544,400 4,201,029
Bank overdraft 11 2,114,197 1,291,101
Equity linked note liability 9 9,591,922 843,073
Customer deposits 14 12,065,178 -
Payables and accrued expenses 1,485,006 997,479
Unclaimed dividends 66,483 28,987
Current income tax 16,254 210,913
Deferred income tax 2,184,453 1,751,801
36,018,473 9,324,383
60,323,477 29,597,220

Information Memorandum 239
Senior Unsecured Fixed Rate Notes and Senior Unsecured Equity Linked Notes
Company statement of financial position
Notes At 31 Dec At 31 Mar
2014 2013
Kshs’000 Kshs’000
Assets
Deferred income tax asset - 5,317
Intangible assets 4,189 -
Investment in subsidiaries 11,114,848 8,159,156
Investment in associates 7,527,045 6,594,340
Unquotedinvestments 8 7,354,804 5,495,272
Quoted investments 345,201 686,348
Tax recoverable 30,420 -
Due from subsidiaries 9,813,355 7,668,573
Receivables and prepayments 7,491 27,499
Cash and cash equivalents 11 576,734 174,932
36,774,087 28,811,437
Capital and reserves
Share capital 12 332,721 332,721
Share premium 589,753 589,753
Investment revaluation reserve 18,457,227 15,962,362
Retained earnings 6,669,582 6,051,372
Total equity 26,049,283 22,936,208
Non-current liabilities
Long-term borrowings 13 7,552,193 4,201,029
Bank overdraft 11 2,114,197 1,291,101
Payables and accruals 193,347 204,467
Due to Subsidiary 7,483 121,846
Unclaimeddividends 66,483 28,987
Current Income tax - 27,799
Deferred income tax 791,101 -
10,724,804 5,875,229
36,774,087 28,811,437

Information Memorandum
Senior Unsecured Fixed Rate Notes and Senior Unsecured Equity Linked Notes
240
Company statement of financial position
Share Share Investment Retained Non- Total
capital premium revaluation earnings controlling equity
reserve interest
Kshs’000 Kshs’000 Kshs’000 Kshs’000 Kshs’000 Kshs’000
Period ended 31 December 2014
At 1 April 2014 332,721 589,753 6,170,189 12,912,166 268,008 20,272,837
Comprehensive income
Profit for the period - - - 1,199,535 67,031 1,266,566
Other comprehensive income - - 1,949,443 - 63,490 2,012,933
Non-controlling interest on
acquisition of subsidiary - - - - 752,668 752,668
At 31 December 2014 332,721 589,753 8,119,632 14,111,701 1,151,197 24,305,004
Period ended 31 December 2013
At 1 April 2013 332,721 589,753 2,828,301 9,891,966 - 13,642,741
Comprehensive income
Profit for the period - - - 641,667 - 641,667
Other comprehensive income - - 1,780,897 - - 1,780,897
At 31 December 2013 332,721 589,753 4,609,198 10,533,633 - 16,065,305
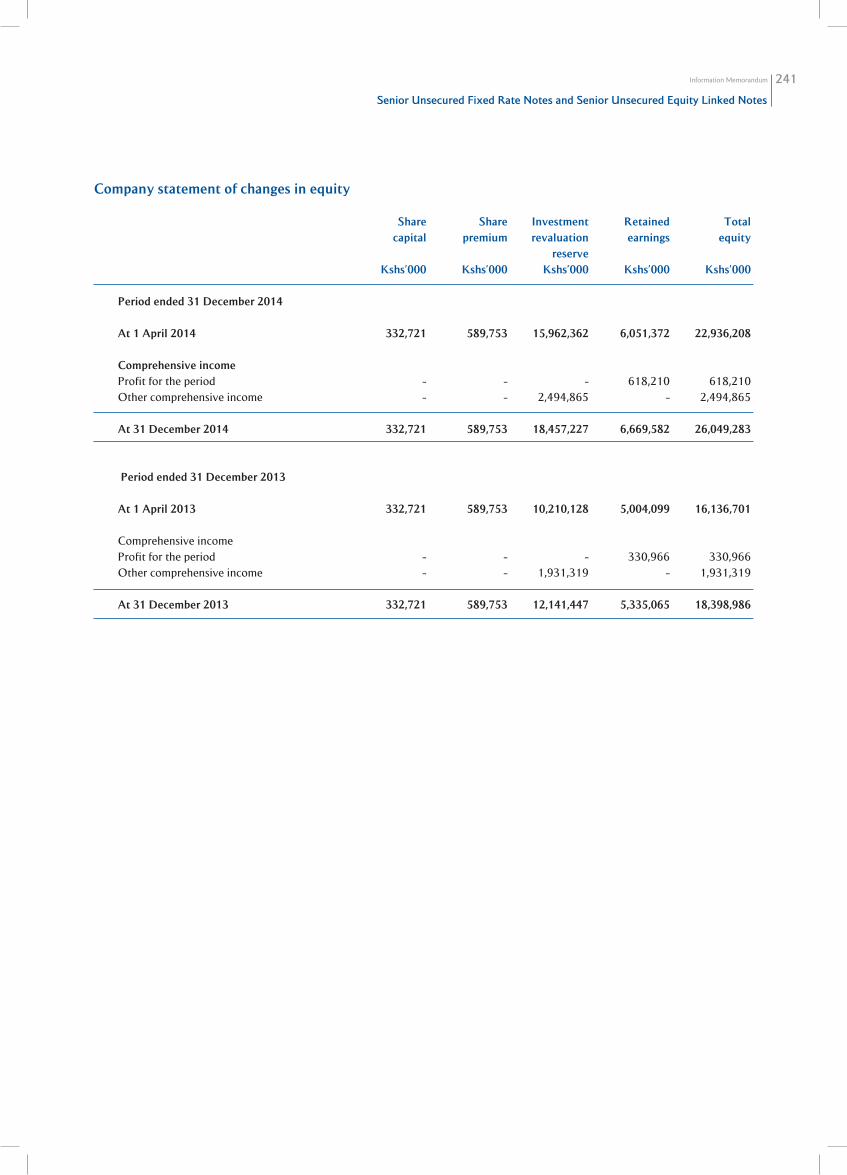
Information Memorandum 241
Senior Unsecured Fixed Rate Notes and Senior Unsecured Equity Linked Notes
Company statement of changes in equity
Share Share Investment Retained Total
capital premium revaluation earnings equity
reserve
Kshs’000 Kshs’000 Kshs’000 Kshs’000 Kshs’000
Period ended 31 December 2014
At 1 April 2014 332,721 589,753 15,962,362 6,051,372 22,936,208
Comprehensive income
Profit for the period - - - 618,210 618,210
Other comprehensive income - - 2,494,865 - 2,494,865
At 31 December 2014 332,721 589,753 18,457,227 6,669,582 26,049,283
Period ended 31 December 2013
At 1 April 2013 332,721 589,753 10,210,128 5,004,099 16,136,701
Comprehensive income
Profit for the period - - - 330,966 330,966
Other comprehensive income - - 1,931,319 - 1,931,319
At 31 December 2013 332,721 589,753 12,141,447 5,335,065 18,398,986

Information Memorandum
Senior Unsecured Fixed Rate Notes and Senior Unsecured Equity Linked Notes
242
Consolidated statement of cash flows
Notes Dec Dec
2014 2013
Kshs’000 Kshs’000
Cash generated from operations 1,210,573 474,185
Interest paid (548,833) (434,265)
Taxation paid 10(c) (367,307) (50,625)
Dividends received from associated companies 294,389 124,003
Net cash generated from operating activities 588,822 113,298
CASH FLOWS FROM INVESTING ACTIVITIES
Purchase of investment property (990,887) (1,063,087)
Purchase of equipment (87,815) (62,005)
Proceeds on disposal of equipment - 49,296
Acquisition of interest in subsidiary (2,355,028) -
Acquisition of subsidiary, net of cash acquired 2,173,485 -
Purchase of intangible assets (6,075) (7,517)
Purchase of shares in associates (177,867) (19,396)
Purchase of unquoted equity investments (1,148,827) (119,635)
Purchase of quoted equity investments (762,954) (752,095)
Purchase of corporate bonds - (377,726)
Proceeds on disposal of unquoted investments 596,325 36,084
Proceeds on disposal of quoted investments 2,211,485 920,202
Proceeds on disposal of bonds - 105,721
Proceeds of shares in associates 50,188 -
Net cash used in investing activities (497,970) (1,290,158)
CASH FLOWS FROM FINANCING ACTIVITIES
Proceeds from borrowings 3,151,463 -
Dividends paid to non-controlling interests (71,331) -
Repayment of loans (7,716) -
3,072,416 -
Net increase/(decrease) in cash and cash equivalents 3,163,268 (1,176,860)
MOVEMENT IN CASH AND CASH EQUIVALENTS
At start of year (447,453) 1,501,769
Net increase/(decrease) in cash and cash equivalents 3,163,268 (1,176,860)
At end of period 2,715,815 324,909
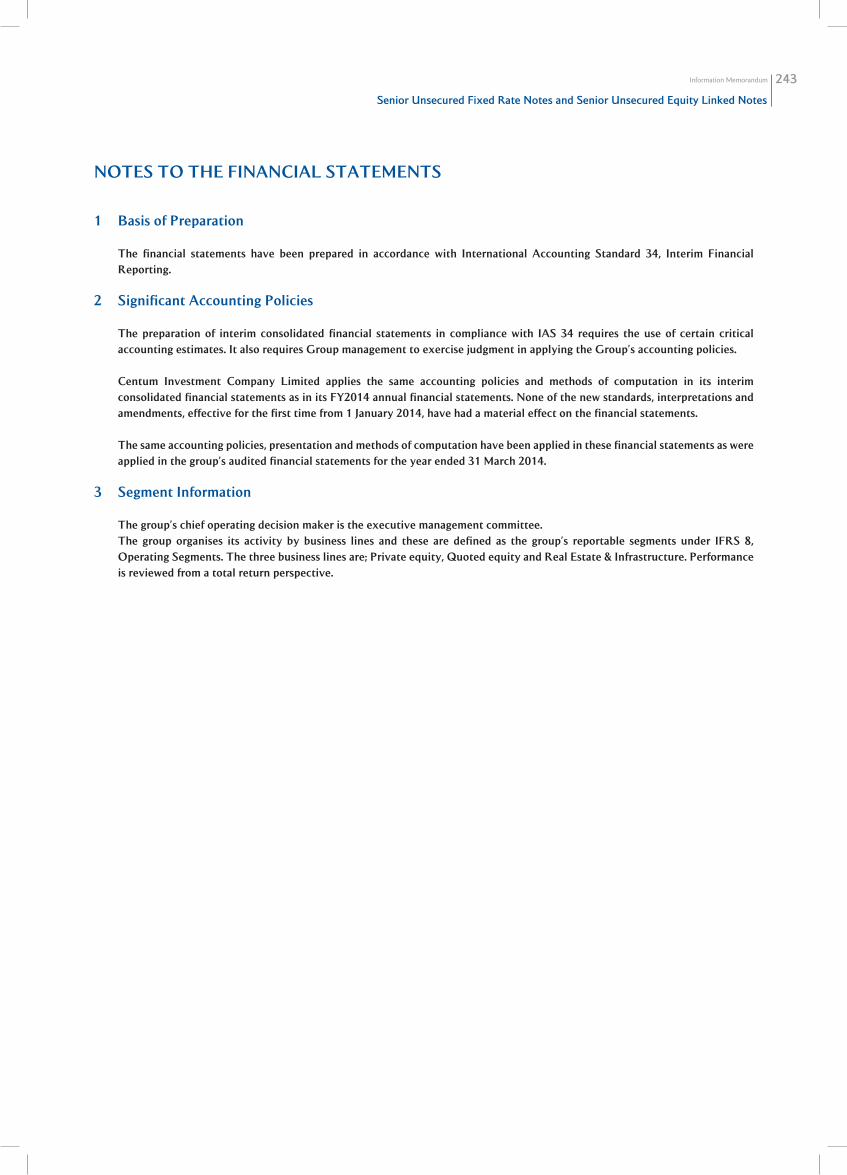
Information Memorandum 243
Senior Unsecured Fixed Rate Notes and Senior Unsecured Equity Linked Notes
NOTES TO THE FINANCIAL STATEMENTS
1 Basis of Preparation
The financial statements have been prepared in accordance with International Accounting Standard 34, Interim Financial
Reporting.
2 Significant Accounting Policies
The preparation of interim consolidated financial statements in compliance with IAS 34 requires the use of certain critical
accounting estimates. It also requires Group management to exercise judgment in applying the Group’s accounting policies.
Centum Investment Company Limited applies the same accounting policies and methods of computation in its interim
consolidated financial statements as in its FY2014 annual financial statements. None of the new standards, interpretations and
amendments, effective for the first time from 1 January 2014, have had a material effect on the financial statements.
The same accounting policies, presentation and methods of computation have been applied in these financial statements as were
applied in the group’s audited financial statements for the year ended 31 March 2014.
3 Segment Information
The group’s chief operating decision maker is the executive management committee.
The group organises its activity by business lines and these are defined as the group’s reportable segments under IFRS 8,
Operating Segments. The three business lines are; Private equity, Quoted equity and Real Estate & Infrastructure. Performance
is reviewed from a total return perspective.

Information Memorandum
Senior Unsecured Fixed Rate Notes and Senior Unsecured Equity Linked Notes
244
NOTES TO THE FINANCIAL STATEMENTS (continued)
3 Segment Information (continued)
(a) Group Private Quoted Real estate Total
equity equity & infrastructure
31 December 2014 Kshs’000 Kshs’000 Kshs’000 Kshs’000
Dividend income 671,847 119,159 - 791,006
Interest income 185,550 139,646 - 325,196
Fund management fees - 402,053 - 402,053
Other income (56,170) 3,556 - (52,614)
Realized gains 117,624 434,128 - 551,752
Unrealisedvaluemovements 2,646,034 460,804 121,440 3,228,278
Gross return 3,564,885 1,559,346 121,440 5,245,671
Finance costs (501,652) (7,606) (32,543) (541,801)
Portfolio costs (415,138) (403,739) (88,942) (907,819)
Net return 2,648,095 1,148,001 (45) 3,796,051
Tax (353,069) (150,665) (12,818) (516,552)
Total return 2,295,026 997,336 (12,863) 3,279,499
Grossreturn(%) 37.37% 29.10% 2.26% 25.88%
Totalreturn(%) 24.06% 18.61% (0.24%) 16.18%
Opening net asset value:
Portfolio value 11,470,161 4,107,345 10,845,392 26,422,898
Other net asset/(liabilities) (219,626) 2,259,557 (2,697,862) (657,931)
Borrowings (1,710,807) (1,008,247) (2,773,076) (5,492,130)
9,539,728 5,358,655 5,374,454 20,272,837
Closing net asset value:
Portfolio value 14,294,352 3,692,560 13,144,998 31,131,910
Other net asset/(liabilities) 378,064 1,792,833 1,660,794 3,831,691
Borrowings (5,343,624) (1,837,810) (3,477,163) (10,658,597)
9,328,792 3,647,584 11,328,629 24,305,004
Gross value movement in the period 4,032,167
Less: Non-controlling interest on acquisition of subsidiary (752,668)
Net value movement in the period/(total return) 3,279,499
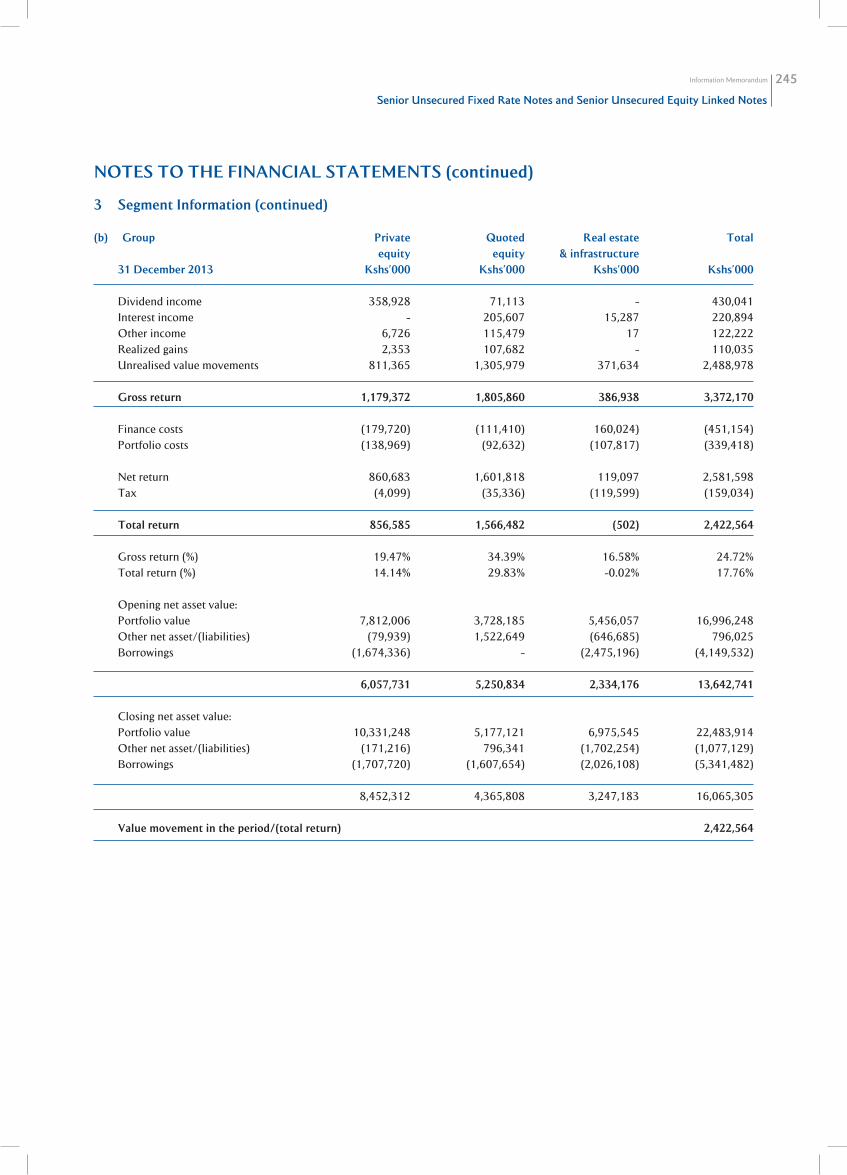
Information Memorandum 245
Senior Unsecured Fixed Rate Notes and Senior Unsecured Equity Linked Notes
NOTES TO THE FINANCIAL STATEMENTS (continued)
3 Segment Information (continued)
(b) Group Private Quoted Real estate Total
equity equity & infrastructure
31 December 2013 Kshs’000 Kshs’000 Kshs’000 Kshs’000
Dividend income 358,928 71,113 - 430,041
Interest income - 205,607 15,287 220,894
Other income 6,726 115,479 17 122,222
Realized gains 2,353 107,682 - 110,035
Unrealisedvaluemovements 811,365 1,305,979 371,634 2,488,978
Gross return 1,179,372 1,805,860 386,938 3,372,170
Finance costs (179,720) (111,410) 160,024) (451,154)
Portfolio costs (138,969) (92,632) (107,817) (339,418)
Net return 860,683 1,601,818 119,097 2,581,598
Tax (4,099) (35,336) (119,599) (159,034)
Total return 856,585 1,566,482 (502) 2,422,564
Grossreturn(%) 19.47% 34.39% 16.58% 24.72%
Totalreturn(%) 14.14% 29.83% -0.02% 17.76%
Opening net asset value:
Portfolio value 7,812,006 3,728,185 5,456,057 16,996,248
Other net asset/(liabilities) (79,939) 1,522,649 (646,685) 796,025
Borrowings (1,674,336) - (2,475,196) (4,149,532)
6,057,731 5,250,834 2,334,176 13,642,741
Closing net asset value:
Portfolio value 10,331,248 5,177,121 6,975,545 22,483,914
Other net asset/(liabilities) (171,216) 796,341 (1,702,254) (1,077,129)
Borrowings (1,707,720) (1,607,654) (2,026,108) (5,341,482)
8,452,312 4,365,808 3,247,183 16,065,305
Value movement in the period/(total return) 2,422,564

Information Memorandum
Senior Unsecured Fixed Rate Notes and Senior Unsecured Equity Linked Notes
246
NOTES TO THE FINANCIAL STATEMENTS (continued)
3 Segment Information (continued)
(c) Company Private Quoted Real estate Total
equity equity & infrastructure
31 December 2014 Kshs’000 Kshs’000 Kshs’000 Kshs’000
Dividend income 611,946 532,275 - 1,144,221
Interest income - 22,457 - 22,457
Other income 6,791 - - 6,791
Realized gains 23,677 (60,813) - (37,136)
Unrealisedvaluemovements 3,056,710 512,856 32,647 3,602,213
Gross return 3,699,124 1,006,775 32,647 4,738,546
Finance costs (304,962) (196,931) - (501,893)
Portfolio costs (242,528) (53,378) (63,848) (359,753)
Net return 3,151,634 756,466 (31,201) 3,876,899
Tax (416,505) (77,948) (269,371) (763,824)
Total return 2,735,129 678,518 (300,572) 3,113,075
Gross return (%) 30.18% 19.25% 0.60% 20.66%
Total return (%) 22.31% 12.97% (5.52%) 13.57%
Opening net asset value:
Portfolio value 14,060,848 5,024,502 10,286,150 29,371,500
Other net assets (91,608) 1,213,962 (2,065,519) (943,165)
Borrowings (1,710,807) (1,008,247) (2,773,076) (5,492,130)
12,258,433 5,230,217 5,447,555 22,936,205
Closing net asset value:
Portfolio value 19,877,121 4,742,973 11,485,966 36,106,060
Other net assets (766,030) 491,430 (315,486) (590,085)
Borrowings (5,343,624) (1,837,810) (2,285,258) (9,466,692)
13,767,467 3,396,593 8,885,222 26,049,283
Value movement in the period/(total return) 3,113,075

Information Memorandum 247
Senior Unsecured Fixed Rate Notes and Senior Unsecured Equity Linked Notes
NOTES TO THE FINANCIAL STATEMENTS (continued)
3 Segment Information (continued)
(d) Company Private Quoted Real estate Total
equity equity & infrastructure
31 December 2013 Kshs’000 Kshs’000 Kshs’000 Kshs’000
Dividend income 456,928 472,315 - 929,243
Interest income - 39,784 - 39,784
Other income 9,079 - - 9,079
Realized gains - 122 - 122
Unrealisedvaluemovements 549,483 1,240,301 238,198 2,027,982
Gross return 1,015,490 1,752,522 238,198 3,006,210
Finance costs (179,720) (108,362) (160,024) (448,106)
Portfolio costs (137,455) (60,652) (84,125) (282,232)
Net return 698,315 1,583,507 (5,952) 2,275,872
Tax (4,098) (7,387) (2,099) (13,584)
Total return 694,217 1,576,120 (8,051) 2,262,286
Grossreturn(%) 11.67% 35.18% 9.72% 18.63%
Totalreturn(%) 7.98% 31.64% -0.33% 14.02%
Opening net asset value:
Portfolio value 10,459,168 3,748,424 5,099,849 19,307,441
Other net assets (79,939) 1,233,009 (174,281) 978,789
Borrowings (1,674,336) - (2,475,196) (4,149,532)
8,704,893 4,981,433 2,450,372 16,136,698
Closing net asset value:
Portfolio value 11,243,116 6,626,032 6,957,542 24,826,691
Other net assets (98,790) 264,378 (1,251,818) (1,086,231)
Borrowings (1,707,720) (1,607,654) (2,026,108) (5,341,481)
9,436,606 5,282,756 3,679,616 18,398,978
Value movement in the period/(total return) 2,262,280

Information Memorandum
Senior Unsecured Fixed Rate Notes and Senior Unsecured Equity Linked Notes
248
NOTES TO THE FINANCIAL STATEMENTS (continued)
3 Segment Information (continued)
GROUP
31 December
2014 2013
Ksh 000 Ksh 000
(e) Reconcilliation of total return to profit for the year
Total return as per internal reporting 3,279,499 2,422,564
Adjustment for
share of associate earnings 377,693 351,870
Share of other comprehensive income of associates - 119,675
Associate dividend income (273,401) (190,483)
Unrealisedvaluemovementsnetofdividendrelatingtoassociates (104,292) (281,061)
Total comprehensive income 3,279,499 2,422,564
Other comprehensive income (2,012,933) (1,780,897)
Profit for the year 1,266,566 641,667
4 Income
(a) Total investment income
GROUP COMPANY
2014 2013 2014 2013
Kshs’000 Kshs’000 Kshs’000 Kshs’000
Dividend income 517,606 266,102 1,144,221 929,243
Interest income 325,075 220,894 22,457 39,784
Fund management fees 402,053 - - -
Gain on disposal of investments 1,267,865 325,645 267,268 96,784
Unrealisedgains/(losses)onrevaluationof
property & bond portfolio (38,298) 301,375 - -
Directors Fees 6,792 6,726 6,792 6,726
Other income (64,577) 117,849 - 2,353
2,416,516 1,238,591 1,440,738 1,074,890
(a)Dividendincome GROUP COMPANY
2014 2013 2014 2013
Kshs’000 Kshs’000 Kshs’000 Kshs’000
Associates - - 519,015 548,380
Subsidiary - - 273,401 163,559
Unquotedinvestments 398,447 195,369 338,545 195,369
Quoted investments 119,159 70,733 13,260 21,935
517,606 266,102 1,144,221 929,243

Information Memorandum 249
Senior Unsecured Fixed Rate Notes and Senior Unsecured Equity Linked Notes
NOTES TO THE FINANCIAL STATEMENTS (continued)
5 Current and deferred income tax
The interimperiod taxcharge isbasedon theestimatedaverageannualeffective income tax rateof30% (9monthsended31
December2013:30%)onthetaxablerevenuestreams.
Deferred tax on fair value gains is based on5% capital gains tax recently reintroduced in the FinanceAct 2014.The amount
recognised as at 31 December 2014 is the deferred tax on cumulative unrealised gains or losses on investments.
6 Earnings per share 31 December
2014 2013
Kshs’000 Kshs’000
Profit attributable to equity holders of the Company 1,199,535 641,667
Weighted average number of ordinary shares in issue(thousands) 665,442 665,442
Basic earnings per share (Kshs) 1.80 0.96
Basic earnings per share are calculated by dividing the profit attributable to equity holders of the Company by the weighted average
number of ordinary shares in outstanding during the year.
7 Investment property GROUP
Dec 2014 Mar 2014
Shs’000 Shs’000
At start of year 10,845,392 5,456,057
Additions 990,887 2,111,258
Capitalized borrowing costs 206,733 228,159
Fair value gains - 3,108,376
Translation differences (40,501) (58,458)
At end of year 12,002,511 10,845,392
The Company commissions an independent valuer to determine the fair value of investment property as at 31 March every year.
The last valuation for the investment property was carried out as at 31 March 2014. No fair value gains have been recognised as at
31 December 2014 and the next valuation will be carried out as at 31 March 2015. Translation differences above relate to foreign
exchange revaluation gains and losses on investment property as at the end of the period.
8 Unquoted investments GROUPCOMPANY
Dec 2014 Mar 2014 Dec 2014 Mar 2014
Kshs’000 Kshs’000 Kshs’000 Kshs’000
Opening valuation 7,569,310 4,306,221 5,495,272 3,539,417
Movements in the period:
Additions 1,148,827 337,123 51,533 143,218
Disposals (320,117) (39,666) (320,117) (39,666)
Reserves released on disposal of investments (90,613) - (90,613) -
Fair value gain 2,495,591 2,965,632 2,218,729 1,852,303
3,233,688 3,263,089 1,859,532 1,955,855
Closing valuation 10,802,998 7,569,310 7,354,804 5,495,272
Unquotedinvestmentsareclassifiedasnon-currentassets
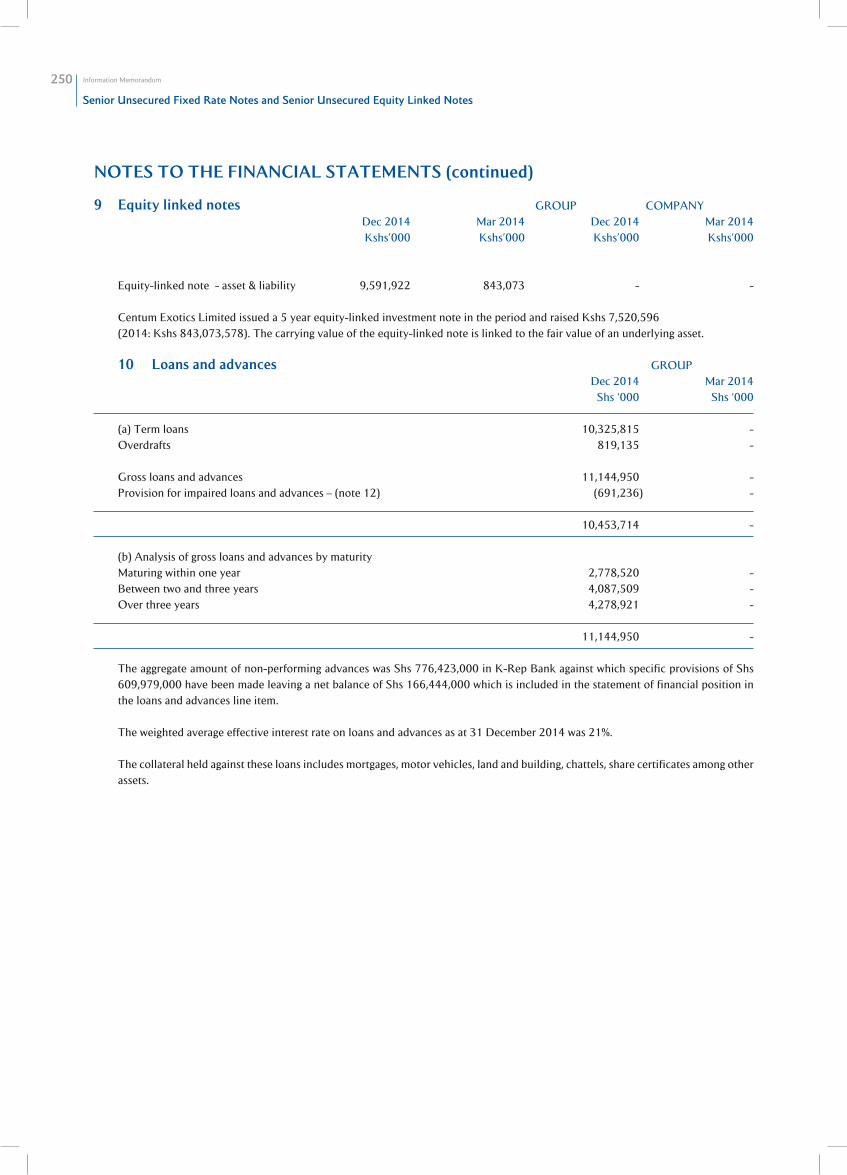
Information Memorandum
Senior Unsecured Fixed Rate Notes and Senior Unsecured Equity Linked Notes
250
NOTES TO THE FINANCIAL STATEMENTS (continued)
9 Equity linked notes GROUPCOMPANY
Dec 2014 Mar 2014 Dec 2014 Mar 2014
Kshs’000 Kshs’000 Kshs’000 Kshs’000
Equity-linked note - asset & liability 9,591,922 843,073 - -
Centum Exotics Limited issued a 5 year equity-linked investment note in the period and raised Kshs 7,520,596
(2014: Kshs 843,073,578). The carrying value of the equity-linked note is linked to the fair value of an underlying asset.
10 Loans and advances GROUP
Dec 2014 Mar 2014
Shs‘000 Shs‘000
(a) Term loans 10,325,815 -
Overdrafts 819,135 -
Gross loans and advances 11,144,950 -
Provision for impaired loans and advances – (note 12) (691,236) -
10,453,714 -
(b) Analysis of gross loans and advances by maturity
Maturing within one year 2,778,520 -
Between two and three years 4,087,509 -
Over three years 4,278,921 -
11,144,950 -
The aggregate amount of non-performing advances was Shs 776,423,000 in K-Rep Bank against which specific provisions of Shs
609,979,000 have been made leaving a net balance of Shs 166,444,000 which is included in the statement of financial position in
the loans and advances line item.
Theweightedaverageeffectiveinterestrateonloansandadvancesasat31December2014was21%.
The collateral held against these loans includes mortgages, motor vehicles, land and building, chattels, share certificates among other
assets.

Information Memorandum 251
Senior Unsecured Fixed Rate Notes and Senior Unsecured Equity Linked Notes
NOTES TO THE FINANCIAL STATEMENTS (continued)
11 Cash and cash equivalents
For the purpose of the statement of cash flows cash and cash equivalents comprise;
GROUPCOMPANY
Dec 2014 Mar 2014 Dec 2014 Mar 2014
Kshs’000 Kshs’000 Kshs’000 Kshs’000
Call deposits (maturing within 90 days) 2,015,588 224,018 112,476 108,851
Bank balances 2,814,424 619,630 464,258 66,081
4,830,012 843,648 576,734 174,932
Bank overdraft (2,114,197) (1,291,101) (2,114,197) (1,291,101)
2,715,815 (447,453) (1,537,463) (1,116,169)
At 31 December 2014 the Group had undrawn committed borrowing facilities amounting to Kshs 85,803,000 (Mar 2014: Kshs
708,899,000).Theeffectiveinterestrateforthebankoverdraftis14.5%(2014:14.5%).
The overdraft facility is secured by a floating charge over all the listed Kenya securities.
12 Share capital
The total authorised number of ordinary shares is 800,000,000 with a par value of Kshs 0.50 per share. 665,441,714 (2014:
665,441,714) are issued and fully paid up.
13 Borrowings GROUPCOMPANY
Dec 2014 Mar 2014 Dec 2014 Mar 2014
Kshs’000 Kshs’000 Kshs’000 Kshs’000
The borrowings are made up as follows:
Bank loan
At start of year - - - -
Proceeds from bank loans 3,151,463 - 3,151,463 -
Borrowings, on acquisition of subsidiary 999,923 - - -
Repayment during the period (7,716) - - -
Accrued interest 22,794 - 22,794
At end of year 4,166,464 - 3,174,257 -
Corporate bond
At start of year 4,201,029 4,149,532 4,201,029 4,149,532
Issue during the year - - - -
Accrued additional interest on Equity linked note 28,143 37,524 28,143 37,524
Accrued interest 138,284 - 138,284 -
Amortization of bond related expenses 10,480 13,973 10,480 13,973
At end of year 4,377,936 4,201,029 4,377,936 4,201,029
Total borrowings 8,544,400 4,201,029 7,552,193 4,201,029
The company successfully issued a 5 year bond in 2012 and raised Kshs 4,167,900,000. This comprised of fixed rate notes of KShs
2,917,530,000ataninterestrateof13.5%andequitylinkednoteofShs1,250,370,000at12.75%withamaximumupsideof15%
on the Company’s net asset value as at 31 March 2012.

Information Memorandum
Senior Unsecured Fixed Rate Notes and Senior Unsecured Equity Linked Notes
252
NOTES TO THE FINANCIAL STATEMENTS (continued)
14 Customer Deposits GROUP
Dec 2014 Mar 2014
Shs‘000 Shs‘000
Call and fixed deposits 6,664,424 -
Current and demand accounts 2,822,360 -
Savings accounts - micro savers 2,360,145 -
- other 218,249 -
12,065,178 -
Analysis of customer deposits by maturity:
Payable within one year 9,300,835 -
Between one year and three years 2,764,343 -
12,065,178 -
Includedin‘Customerdeposits’weredepositsofShs559,584,000thathavebeenpledgedtotheBankbythecustomersassecurities
for loans and advances.
The weighted average effective interest rate on interest bearing customer deposits for the period ended 31 December 2014 was 6.79
%.Theweightedaverageinterestrateonthedepositsfortheperiodended31December2014was8.86%.
15 Contingencies and commitments
There have been no significant changes in contingent liabilities and commitments since March 31 2014.

Information Memorandum 253
Senior Unsecured Fixed Rate Notes and Senior Unsecured Equity Linked Notes
NOTES TO THE FINANCIAL STATEMENTS (continued)
16 Business Combinations
On1December2014,theGroupobtainedcontrolofK-RepBankLimited,alicencedbankinginstitutionbyacquiring65.6%ofthe
shares and voting interests in the company.
The following table summarises the consideration paid for K-Rep Bank Limited, the fair value of assets acquired, liabilities assumed
and the non-controlling interest at the acquisition date.
Kshs’000
Cash consideration paid 2,355,028
Fair value of previous equity interests 59,707
Total Consideration 2,414,735
Fair value of assets acquired (see below) (2,318,754)
Non-controlling interest at acquisition 752,667
Goodwill – included in intangible assets 848,648
Total assets
Cash and cash equivalents 2,173,485
Government securities 1,828,383
Net Loans & advances to customers 10,312,847
Property & equipment 406,837
Deferred tax assets 39,380
Other assets 172,646
14,933,578
Total liabilities
Customer deposits (11,297,701)
Borrowed funds (999,923)
Taxation (38,345)
Total liabilities (278,855)
(12,614,824)
Total net assets acquired during the year 2,318,754
Non-controlling interest at acquisition 752,668
Majority interest at acquisition 1,566,086
Total net assets acquired during the year 2,318,754

Information Memorandum
Senior Unsecured Fixed Rate Notes and Senior Unsecured Equity Linked Notes
254
NOTES TO THE FINANCIAL STATEMENTS (continued)
17 Events occurring after the reporting period
On 8 January 2015, the company announced that it has entered into an agreement with a member of the Old Mutual Group for the
saleofCentum’s13.75%shareholdinginUAPHoldingsLimited.ThetransactionwascompletedinFebruary2015.
On8December2014,thecompanyannounceditsintentiontoacquireanadditional3%shareholdinginAlmasiBeveragesLimited
bringing its shareholding to 50.95% of the share capital in the company. Following regulatory approvals, the acquisition was
completed in March 2015.
On 27 March 2015, the company announced its intention to acquire 9,646 acres of land in Vipingo at a price of KES 180,000 per
acre and also acquire Vipingo Estates Limited, a subsidiary of Rea Vipingo Plantations Limited, which owns approximately 900 acres
of land at a price of approximately Kes.340 million. The transaction price totals to approximately KES 2.1 billion.

Information Memorandum 255
Senior Unsecured Fixed Rate Notes and Senior Unsecured Equity Linked Notes
20.4FormofLetterofUndertakingforrequestedAllocation
The Directors
Centum Investment Company Limited
International Life House
Mama Ngina Street
P. O. Box 10518-00100
Nairobi
Kenya
Date:
Dear Sirs
UNDERTAKING IN RESPECT OF PAYMENT ON ALLOCATION OF NOTES TO [name of QII]
WHEREAS[nameof investor](“the Investor”) has applied for Notes (Fixed Rate (delete as appropriate) and/or Equity Linked Note
(FixedRate)worthKes[]inCentumInvestmentCompanyLimited(Centum)beingofferedbyyouforsubscriptionassetoutinthe
InformationMemorandumdated[](Capitalisedtermsusedinthisletterofundertakingshallhavethemeaningandinterpretationgiven
to such terms in the Information Memorandum).
NOW at the request of the Investor and in consideration of Centum allotting to the Investor on the conditions set forth in Condition 5
(Allocation Policy) of the Information Memorandum as well as in AND in consideration of Centum allotting to the Investor Notes worth
Kesxxx that we have applied for or such lesser amount as you shall in your absolute discretion determine, we hereby undertake to pay
you without delay or argument and without the need to prove, forthwith upon your first written notice specifying how much has been
provisionally allotted to the Investor, such sum requested not exceeding Kesxxx.
Should such payment not be made within two Business Days following the deemed service of such notice then Centum shall be entitled
without further notice to either: treat the Investor’s application as having been repudiated and cancel the provisional allotment to it and
re-allocate the provisionally allotted Notes on such terms and conditions as it shall think fit without prejudice to any rights to damages
for such repudiation or; to allow us further time for payment on such terms and conditions as it shall think fit in which event we shall pay
late payment interest on all sums outstanding at the Late Payment Rate calculated on daily balances and compounded monthly.
Any notice to be served on us shall be in writing and shall be deemed to have been properly served on us if delivered by hand or sent by
fax or e-mail to us at the address specified in the Note Application Form.
Any notice shall be deemed to have been received, if delivered by hand, at the time of delivery or, if sent by fax, on the completion of
transmission or if by email receipt of a confirmed delivery notice.
This undertaking shall be governed and construed in accordance with the laws of Kenya and we irrevocably submit to the non exclusive
jurisdiction of the Courts of Kenya. If we are not a Kenyan entity or citizen and in addition to any other permitted means of service, we
hereby irrevocably appoint the agent submitting our Application for the offered Notes as our agent for the receipt of any legal process.
INWITNESSWHEREOFTHISLETTEROFUNDERTAKINGHASBEENEXECUTEDBYUSTHIS
________ DAY OF ______________ 2015.
Signed By:
1) Name ___________________________________________________ Signature_____________________ Title ________________________
2) Name ___________________________________________________ Signature_____________________ Title _________________________
Note:TheLetterofUndertakingshallbeexecutedbytheInvestoranddeliveredtotheJointLeadArrangerssimultaneouslywiththe
duly completed Note Application Form.

Information Memorandum
Senior Unsecured Fixed Rate Notes and Senior Unsecured Equity Linked Notes
256
Centum Investment Company Limited
Incorporated in Kenya under the Companies Act (Cap 486, Laws of Kenya) Reg. No C. 8/67
NOTE APPLICATION FORMInrespectoftheuptoKenyaShillingssixbillion(Kes.6,000,000,000)13%SeniorUnsecuredFixedRateNotesand12.5%SeniorUnse-
cured Equity Linked Notes
Offer opens at 9.00 am on the 18 May 2015 and
Closes at 5.00 pm on the 5 June 2015
Please refer to the Information Memorandum and the instructions in the Application Form before completing this form.
The Board of Directors shall reject any application in whole or in apart if the instructions as set out in the Information Memorandum and
the Application Form are not complied with.
APPLICANT’S STATEMENT
By signing the Application Form overleaf, I /We the applicant(s) herein state that:-
I/We hereby apply to purchase
SENIORUNSECUREDFIXEDRATENOTES SENIORUNSECUREDEQUITYLINKEDNOTES
Please tick the appropriate box for the type of Note being applied for
of the Notes (the “Notes”) to be issued by Centum (“the Issuer’) and for the amounts specified in Section C of this application form upon the
termsandconditionssetoutinthisapplicationformandTrustDeed(the‘TrustDeed”)dated14May2015betweenRopatTrustCompany
(the‘NoteTrustee’)andtheIssuer.I/WeauthorizeCustody&RegistrarsServicesLimited(the“Registrar”)toentermy/ournameontheReg-
ister of Noteholders of the Notes that may be allotted to me/us and to register my/our address as given in Section H of this application form.
By signing this application form I/We represent and warrant that I/we have the necessary authority and power to purchase and hold the Notes
in accordance with this application form and have taken all necessary corporate actions to approve such purchase and to authorize the person
signing this application form to bind me/us in accordance to the terms thereof.
Serial No:
SPECIMEN

Information Memorandum 257
Senior Unsecured Fixed Rate Notes and Senior Unsecured Equity Linked Notes
A: (i) APPLICANT POOL: (Tick as applicable)
Applicant type: Retail Qualified Institutional Investor Corporate Other
Residence: Resident Non Resident Citizenship: Kenyan East African Foreigner
B: (i) PRIMARY APPLICANT DETAILS: (Name as per National ID / Passport) Surname (Last Name)
First Name and Other Names
Passport Number/ID Number/Alien ID Number Country of Issue
(ii) JOINT APPLICANT 1 DETAILS: (Names as per National ID / Passport) Surname (Last Name)
First Name and Other Names
Passport Number/ID Number/Alien ID Number Country of Issue
(iii) JOINT APPLICANT 2 DETAILS: (Names as per National ID / Passport) Surname (Last Name)
First Name and Other Names
Passport Number/ID Number/Alien ID Number Country of Issue
(iv)QUALIFIEDINSTITUTIONALINVESTOR/CORPORATE:(Name as per Certificate of Registration / Incorporation) Name
Registration/Incorporation No. Country of Registration/Incorporation
Qualified Institutional Investors are Fund Managers, Authorized Depositories and Investment Banks licensed under the Capital Markets Act and Insurance Companies who manage life funds and licensed by the Insurance Regulatory Authority
For Nominee Applicants Only:Account Name/Number
C: VALUE OF NOTES APPLIED FOR: Minimum Amount of Kshs.1,000,000; Additional Amount in Multiples of Kshs.100,000
SENIOR UNSECURED FIXED RATE NOTES AMOUNT IN WORDS (SENIOR UNSECURED FIXED RATE NOTES)
SPECIMEN

Information Memorandum
Senior Unsecured Fixed Rate Notes and Senior Unsecured Equity Linked Notes
258
GPS (Please tick If applicable)
Funds Transfer Reference Number.
SENIOR UNSECURED EQUITY LINKED NOTES AMOUNT IN WORDS (SENIOR UNSECURED EQUITY LINKED NOTES)
D: Please credit my/our CDSC Account as detailed below to the extent of the Notes are allotted:
PARTICIPANT’S CDSC ACCOUNT NO:
E: PAYMENT DETAILS:NameofBank NameofBranch(e.g.MOIAVENUE)
Bank code Amount of Payment
F: WHERE PURCHASE IS FINANCED/GUARANTEED (Optional) – Attach financing/ guarantee letter from bank
Tick if applicable
Bank Code
G: REFUND / INTEREST PAYMENT AND PRINCIPAL REDEMPTION:Electronic Fund Transfer OnlyNameofBank NameofBranch(e.g.MOIAVENUE)
Bank code Name of Account Holder
Branch Code Account Number
H: FULL MAILING ADDRESS AND CONTACT DETAILS FOR ALL APPLICANTS:
P.O. Box Postal Code Street Address (If Applicable)
Telephone Number Mobile Number
City/Town Email Address
SPECIMEN

Information Memorandum 259
Senior Unsecured Fixed Rate Notes and Senior Unsecured Equity Linked Notes
I: SIGNATURES:Signature 1 Signature 2 Company Seal
J: FOR OFFICIAL USE ONLY: Authorized Placement Agent Stamp Name of Agent representative
Signature
GENERAL INSTRUCTIONS ON COMPLETING THE APPLICATION FORM
Please note that Application Forms received by the Authorized Placement Agent after the Closing Date will be rejected..
Part A Tick the appropriate investor pool whether Retail, or Qualified Institutional Investor (QII).Tick appropriate residence and
citizenship status.
Part B Fill in the names as per the National ID/Passport Number. Trusts that have not been incorporated, a partnership or a deceased’s
estate cannot be used. Trustees of unincorporated trusts, individual partners or executors may apply for Notes in their own
name(s).
Part C Fill in the value of Notes being applied for. All Notes shall be mailed to the address provided in Section F of this application form.
Part D Please provide the details of the method of payment as requested. Banker’s cheques payments should accompany this Application
Form. Personal cheques will not be accepted. Kindly indicate the full bank code as requested. The bank code is the 5 digit number
found on the top right hand corner of your cheque, just under the date field, and above the amount field.
Part E Where the purchase is financed, applicants must attach financing letter from the bank indicating the financing bank and the
Authorised Placement Agent; and the original attached to this Application Form.. For guaranteed applications, please attach letter
of guarantee from the bank to the Application Form.
Part F Fill in your current mailing address, telephone number, mobile telephone number and email address.
Part G For refunds (if any), interest payment and principal redemptions fill in your bank details i.e. name of bank, branch, bank code and
correct account number. Refunds will be payable only via Electronic Funds Transfer (EFT). Any rejected EFTs will be defaulted to
cheques and sent to Authorised Placement Agents for your collection.
Part H QII applications must be signed by Authorised Signatories and the company seal appended in the space provided. Applicants
signing by thumbprint must have the thumbprint witnessed next to it, and the witness should provide his/her full names and
identification number in the space provided.
Part I This section is reserved for the official use of the Authorised Placement Agent and the Receiving Agent.
Part J This section is to be torn off and safely retained by the applicant after the Authorised Placement Agent has date-stamped in the
space provided.
Part K This section is to be torn off and safely retained by the applicant after the Authorised Placement Agent has date-stamped in the
space provided.
Please note that Application Forms received by the Authorized Placement Agent after the Closing Date will be rejected.
Date (DD / MM / YYYY)
SPECIMEN

Information Memorandum
Senior Unsecured Fixed Rate Notes and Senior Unsecured Equity Linked Notes
260
This completed form should be forwarded by hand to the Arrangers or Placing Agents at the following address:
• Applicationlistswillcloseat5:00pmon5June2015
• Allalterationsonthisformmustbeauthenticatedbyfullsignature.Allapplicationsmustbemadewithoutanyconditionsstatedby
applicants.
• Undernocircumstanceswhatsoevermaythenameoftheapplicantbechangedanditthisisdonethentheapplicationformwillbe
invalid.
• ApplicationsaremadesubjecttotheprovisionsoftheInformationMemorandumwithwhichthisformisattached
• ApplicationsareirrevocableandmaynotbewithdrawnoramendedwithoutthewrittenconsentoftheIssuer.
• Individualapplicantsmustbe18yearsofageorolder.
1. Allotment procedure
• ThebaseofallotmentwillbedeterminedbytheIssuerandtheArrangerandwillbecommunicatedbytheIssuertotheCapitalMarkets
Authority.
• Therightisreservedtoacceptorrejectanyapplicationinwholeorinpart.
2. Settlement , Payment of the purchase price for the notes may be made:
• Bybanktransfer/remittanceofthefundsforcreditoftheIssuer’saccountbelow:suchapplicationandoriginaltransferconfirmationslip
to reach the Authorized Placement Agent not later than 5:00 pm on 5 June 2015 for Retail Investors
• Bybanktransfer/remittanceofthefundsforcreditoftheIssuer’saccountbelow:notlaterthan3:00pmon15June2015forInstitu-
tional Investors
3. Delivery of Notes
• TheNoteswillbemailedtoeachsuccessfulapplicantagainstclearedfunds.Notemporarydocumentsoftitlewillbeissued.
4. General
• AnyacceptanceofanapplicationfortheNotesshallbegovernedandconstructedinaccordancewiththeKenyanLaw
Equity Investment Bank Limited
6th Floor, Equity Centre
Hospital Road
Upperhill.
P.O. Box 75104-00200
Nairobi, Kenya
Tel:+254 719 056 501
Attention: Irungu Nyakera
E-mail:[email protected]
OR Dyer & Blair Investment Bank Limited
10th Floor, Pension Towers
Loita Street
P.O. Box 45396-00100
Nairobi, Kenya
Tel:+254 20 3240104
Fax: +254 0 20 3240114
Attention: Paul M Nyaga or Cynthia Mbaru
E-mail: [email protected]
Account Name Centum Investment Bond 2015
Bank Co-operative Bank Kenya Ltd
Branch Hilton
Account Number KES A/c 01150579192000
USDA/c02150579192000
Account Name CENTUMINVESTMENTCOMPANYLIMITEDBOND
ACCOUNT
Bank K-Rep Bank Limited
Branch Kenyatta Avenue Branch
Account Number KES-01003020034472
USD-01003020034482
OR
SPECIMEN
Information Memorandum 261
Senior Unsecured Fixed Rate Notes and Senior Unsecured Equity Linked Notes
Part J – Application Acknowledgement Receipt – for applicant to retain
APA Stamp &
Date
This Acknowledgement Receipt is evidence of an application released to the selected Authorized Placement
Agent. It should be kept secure and must be produced when making an enquiry regarding the application
refunds via EFT. This receipt is NOT evidence of an application received by the Receiving Agent. Thank
you for investing in the Centum Investment Company Limited Notes Offer
Serial No
SPECIMEN

NOTES
Information Memorandum iii
Senior Unsecured Fixed Rate Notes and Senior Unsecured Equity Linked Notes
Champions of Governance the second time round...We always strive to adhere to the highest corporate governance practices and consistent focus on improving our reporting systems both as a financial company and listed firm hence success in winning these awards.
www.centum.co.ke

Information Memorandum iv
Senior Unsecured Fixed Rate Notes and Senior Unsecured Equity Linked Notes
Centum Investment Company LimitedInternational House5th Floor, Mama Ngina StreetPO Box 10518-00100Nairobi, Kenya.
Tel: +254 20 2286000 / 316303 Mob: +254 722 205339Fax: +254 20 2223223Email: [email protected]: www.centum.co.ke