Technical Memorandum 85031 _
278
Technical Memorandum 85031
-
Upload
khangminh22 -
Category
Documents
-
view
3 -
download
0
Transcript of Technical Memorandum 85031 _
Technical Memorandum 85031 _t
1983022079
OR;G_NALPAGE ISOF POOR QUALITY
APPROVAL SHEET4
1t
Title of Thesis: A Stady of the Temporal and SpectralCharacteristics of Gamma Ray Bursts
/ . t
Name of Candidate; Jay Preston Norris• Doctor of Philosophy, 1983
Donat G. Wentzel
Professor
ii Astronomy Program
• .r"
Bonnard J. Teegarden- ,"
:i Astrophysicist; NASA Goddard Space Flight Center
z
Date Approved: _/,/2 ?//7
1983022079-002
f "7
OF POOR QUALITY
CURRICULUM VITAE
Name: Jay Preston Norris.
Permanent address: 8718 Manchester Road, Silver Spring, M_ryland 20901.
Degree and date to be conferred: Ph.D., 1983.
Date of birth:
Place of birth:
Secondary education: High Point High School, Beltsville,Maryland, 1967.
Collegiate institutions attended Dates Degree Date of Degree
University of Maryland 1967-1970
University of Arizona 1971-1974 B.S. 1973
University of Maryland 1977-1983 M.S. 1979
Ph.D. 1983
Major: Astronomy.
Minor: Physics.
Professional publications:
Norris, J. P., Bell, R. A., Butler, D. S., and Demlng, L. D., "The
Metallicity of M67", 1980, Bull. Am_ Astr. Soc., 12, 458.
Norris, J. P., Cline, T. L.0 and Teegardeu, B. J., "Search for TimeVaria=ions in the 511-KeV Flux by ISEE-3 Gamma-Ray Spectrometer",
1982, in Gamma Ray Transients and Related Astrophysical Phenomena,AlP Conference Proceedings No. 77, (New York: ALP), 163.
Desai, U. D., Norris, J. P., Cline, T. L., Dennis, B. R., and
Frost, K. J., "Gamma-Kay _urst High Time Resolution SpectralObservations made with the Solar Mmxlmum .Mission', i_th
, International Conference on Cosmic Rays Conference, India.
Presentations at scientific meetings:
! Norris, J. P., Cllne, T. L., and Teegarden, B. J., "Gamma-Ray BurstTemporal Studies made with ISEE-3", Spring 1983 APS Meeting,Baltimore.
1983022079-003
OF POut, QJAclT¥
Professional positions held: i
Research Assistant, Univ. of Az., 5/72-4/75. iTeaching Assistant, Unlv. of Md., 8/77-5/79.Instructor, Maryland College of Arts and Design, 3/79-5/79.Instructor, Univ. of Md., 9/79-12/79. 2Research Assistant, Goddard Space Flight Center, 5/79-4/83•NAS/NRC Associate at Naval Research Laboratory, to commence 9/83.
A
1983022079-004
ABSTIVLCT OF FOOR Q_;_,LIFY
Title of Dissertation: A Study of the Temporal and Spectral
Characteristics of Gamma Ray Bursts ! ,
Jay Preston Norris, Doctor of Philosophy, 1983
Dissertation directed by: Donat G. Wentzel,
Professor, Astronomy
Bonnard J. Teegarden ]
Astrophysicist, NASA/GSFC
I
Gamma-ray burst data obtained from the ISEE-3 Gamma-Ray Burst !
Spectrometer and the Solar Maximum Mission's Hard X-Ray Burst
Spectrometer (HXRBS) have been analy_ed to yield information on burst
temporal and spectral characteristics.
A Monte Carlo approach was used to simulate the HXRBS response to
candidate spectral models. Energy-loss spectra of those bursts
determined to be within the detector fleld-of-vlew were deconvolved to
produce incident photon spectra, At energies above about i00 keV, the _ !
spectra are well fit by exponential forms. At lower energies, 30 keV to _
60 keV, depressions below the model continua are apparent in some burst4
spectra. The depressions are not instrumental or data-reductlon
• artifacts, but rather are an intrinsic property of the spectra, Both
the depressions and the continua evolve on a time scale as short as _I/4 '_
second.
The event selection criterion of the ISEE-3 experiment is based on
the time to accumulate a preset number of photons rather than the photon
1983022079-005
i
OF PO0;_ ="" _'_ i
count per unit time and is consequently Independent of event duration ! :
for a given burst intensity, unlike most conventional systems. As a
result, a significantly greater percentage cf fast, narrow events ha_e
been detected. The ratio of count rates from two ISEE-3 detectors
indicates that bursts with durations _ one second have much softer
spectra than longer bursts. These short bursts probably require a
distinct mechanism to explain their occurrence. A few events exhibit
temporal prcflles with possible periodic structure.
The burst sources may be neutron stars with typical rotation
periods greater than tens of seconds. Since burst durations are
comparable to or less than such time scales, detectable periodicity due
to source rotation should be infrequent, In agreement with observations.
If burst sources are within a few hundred parsecs, as implied by the
uniform distribution of locallzatlons in galactic latitude and
longitude, the emitting region is probably optically thin. The low-
energy depressions are probably not absorption features. Rather, the
appearance of depressions may be the result of integrating spectra for
intervals longer than the time scale of a rapidly evolving cutoff in the
synchrotron spectrum.
#
1983022079-006
i i'
A STUDY OF THE TE:'R_ORALAND SPECTRAL CHARACTERISTICS
OF GAI_fl'_ARAY BURSTS
by
Jay Preston Norrls
Dissertation submitted to the Faculty of the Graduate Schoolof the University of _ryland in partial fulfillment
of the requirements for the degree ofDoctor of Philosophy
1983 i
1983022079-007
iTo my parents
I
! ?
_-_
1983022079-008
ACKNOWLEDGE I_NTS
I would llke to express my sincere thanks to everyone who has in
some way helped to make this thesis a reality, but the list is quite
long. Among the principals to whom I owe my appreciation for supportingt
me are the followlng: Dr. Donat Nentzel, my advisor at the University of
Maryland, for his expert guidance and proper sense of llterary writing;
Dr. Bonnard Teegarden, my advisor at Goddard, for introducing me co 8
gamma-ray astronomy, for the opportunity to tackle the problem and for
his advise on many topics; the Solar Maximum Mission investigators, Dr. 1
Brian Dennis and Dr. Larry Orwlg for access to the HXRBS spectral data ._i
and many discussions; Dr. Thomas L. Cllne, who arranged the opportunity
to analy_e the HXRBS gamma-ray burst data and for many enjoyable
discussions, not aX1 of which pertained to astrophysics; Dr. Upendra
Vesal, for day-to-day advise and countless insights into the mysteries
of gamma-ray bursts - without his suggestl)ns many ideas would not have
occurred to me; Dr. Upendra Desai and Dr. Grazlella Pizzlchlnl, who i
collaborated with me in the digitization of the KONUS spectra; Dr. Bill
Paclesas and Dr. Jack Tueller for always answering my queqtlons; Jenny
Jacques, for her creative computer programming necessary for graphics
manipulations and many of the illustrations; and Andrew Szymkowlak, .
whose expertise helped evaporate many computer problems.:i
I must also thank my friends for their support throughout the
years, especially Luther Hartshorn, Connie Ninn, and Nancy Brewrlnk, who
also did the proof reading, and the graduate students at Goddard and i '!
Maryland. And flnally I must thank my parents Dorothy and Bill Brooks, ! =
who made many things possible, i
iII
2
1983022079-009
TABLE OF CONTENTS
Page IACKNOWLEDOE_NTS .......................... II
LIST OF TABLES ........................... vii
LIST OF FIGURES .......................... ix
CHAPTER I: INTRODUCTION ...................... 1
A. Province of Gamma-Ray Astronomy ............. 1
i. Early History ...................... 2
il. Recent Observational Discoveries ............ 3
ja, Diffuse Emission ................... 3
i b. Point Sources ..................... 4, i! ili. Experimental Considerations ............... 6
{ B Gamma-Ray Bursts 9• eoeQ@Qseeeeeoeoeoeoeooo •
i Temporal Characteristics I0• oooo•osoosooesQo_ i
; ii. Spectral Characteristics ................. 12 :
ili, Szarches For Gamma-Ray Bursts at Other Frequencies . . . 16
iv. Constraints on Gamma-Ray Burs_ Sources ......... 20 i
C, Gamma-Ray Burst Models and Astrophysics ........... 23
i Radiations Mechanisms 24• _elo oeoeooooeoeol
iI Gamma-Ray B Sce arl 25• urst n os . . . , . . . , • • • _ • • • •
D Present Work 29 .• •_eooeooeeeooooe•lls•se•o
CHAPTER II: INSTRUL_NTATION .................... 35
A• Genera_ Remarks ....................... 35
6. The _SEE-3 Detectors .................... 35
I. The Germanium De_ector ................. 36
, li. .The Cesium Iodide Detecto_ .............. 39
Ill, Data Collectlon and Modes of Opera_ion ......... 40
t
i ill i'
1983022079-010
Page
iv. Sensitivity ....................... 42
C. The Hard X-Ray Burst Spectrometer .............. 43
i. Detector System ..................... 4,_
if. Data Collection ..................... 46
D. The KONUS Experlment .................... 47
CHAPTER Ill: }_THODS OF ANALYSIS ................. 58
A. Introduction ......................... 58
B. Time History Reduction ................... 58I
i _. Energy Spectra Reduction .................. 60!!
D. Computation of Detector Response Metrix ........... 62• I. Monte Carlo Code .................... 62
ii. Verlflcatlon of Code Accuracy .............. 65I! Ill. SimuIatlon of HXRBS ................... 66
, E. Spectral Fitting Program .................. 69
F. Confirmation of the Accuracy of the Method ......... 75-i
C. Dependence of Detected Spectra on Incldent Angle ...... 75
H. Effect of Detector Dead Layer Thickness on Model Fits .... 78l
CHAPTER IV: ISEE-3 TI_, HISTORY ANALYSIS ............. 91
A. 0utlln¢ ........................... 91
B. Temporal Analysis ...................... 92
i. Classical Bursts .................... 92
a. Compact Bursts .................... 94
b. Extended Bursts .................... 97
ii. Splke-llke Bursts .................... I00
C. Discussion ......................... 108
iv
1983022079-011
?
Page
CHAPTER V: HXRBS SPECTRAL ANALYSIS ................ 137
A. Introduction ........................ 137
B. Determination of Events in Detector Field-of-View ...... 139
C. HXRBS Ti_e Histories .................... 140
D. Description of Spectral Analysis .............. 142
E. Spectral Analysis of Three Events .............. 145
i. Burst Spectral Evolution ................ 149
a. 19 APR 80 Event .................... 150
b. 21APR 80 Event .................... 151
c. Ol MAR gl Event .................... 152
i if. Spectral Features .................... 152
a. 19 APR 80 Event .................... 155
b. 21APR 80 Event ..................... 157
F. Discussion ........................ 158
CHAPTER VI: INTERPRETATION OF RESULTS ............... 204
A. Spike-like Bursts ...................... 205
i. l_pllcatlons of Temporal Characteristics ........ 205
a. Rise Time and Duration ............... 205
b. Per_odlclty ...................... 205
c. Repetition ...................... 206
II. Intrinsic Luminosity .................. 207
ill. Models for Splke-llke Bursts .............. 209
a. Improbable :_dels ................... 209
b. Models Involving Neutro1_-Star Glitches ........ 211
B. Classical Bursts ...................... 213
_ i. Implications of Temporal Characteristics ........ 213
_ I
1983022079-012
Page
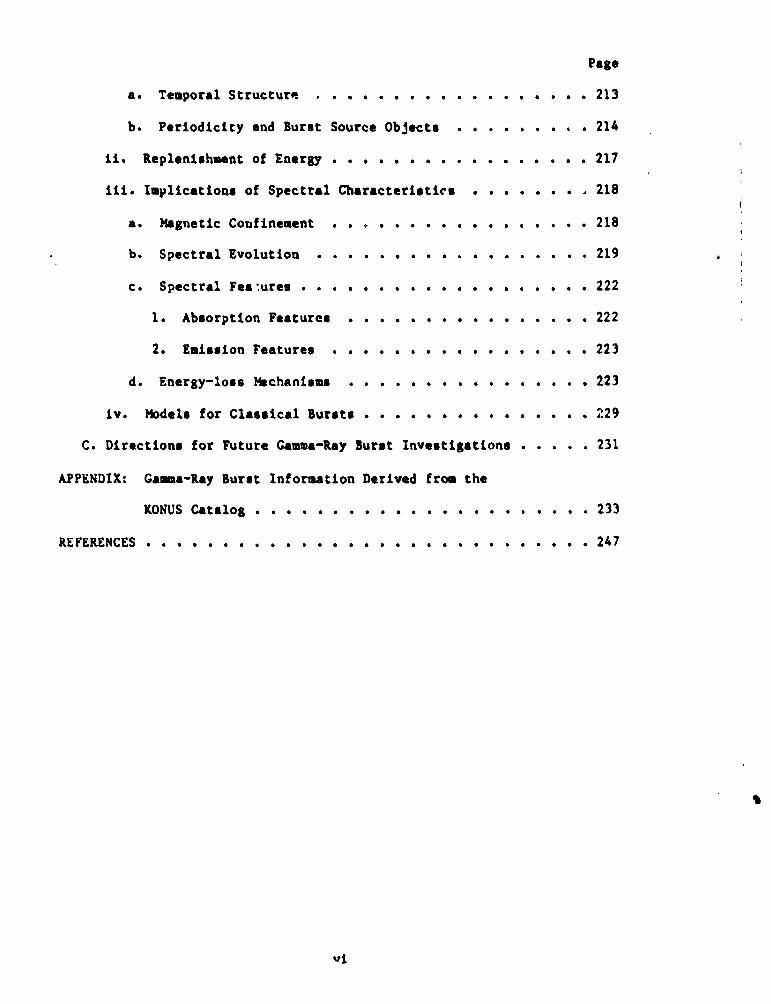
8. Temporal Structure .................. 213
b. Periodicity and Burst Source Objects ......... 214
tl. geplenlsh_nt of Energy ................. 217
ili. Implications of Spectral Characteristics ........ 218
a. Maguetlc Conflneaent ................. 218
b. Spectral Evolutlou .................. 219
c. Spectral Fea:ures ................... 222
1. Absorption Features ................ 222
2. £slssion Features ................. 223
d Energy-lose _echantea8 223• eeeeeeeeoeeeoeeo
iv. Models for Classlcal Sursts ............... 229
C. Directions for Future Gamma-Ray Burst Investigations ..... 231
APPENDIX: Gauna-Kay Surer Xnforutlon Derived froe theF
KONUS Catalog ...................... 233
REFERENCES ............................. 247
1983022079-013
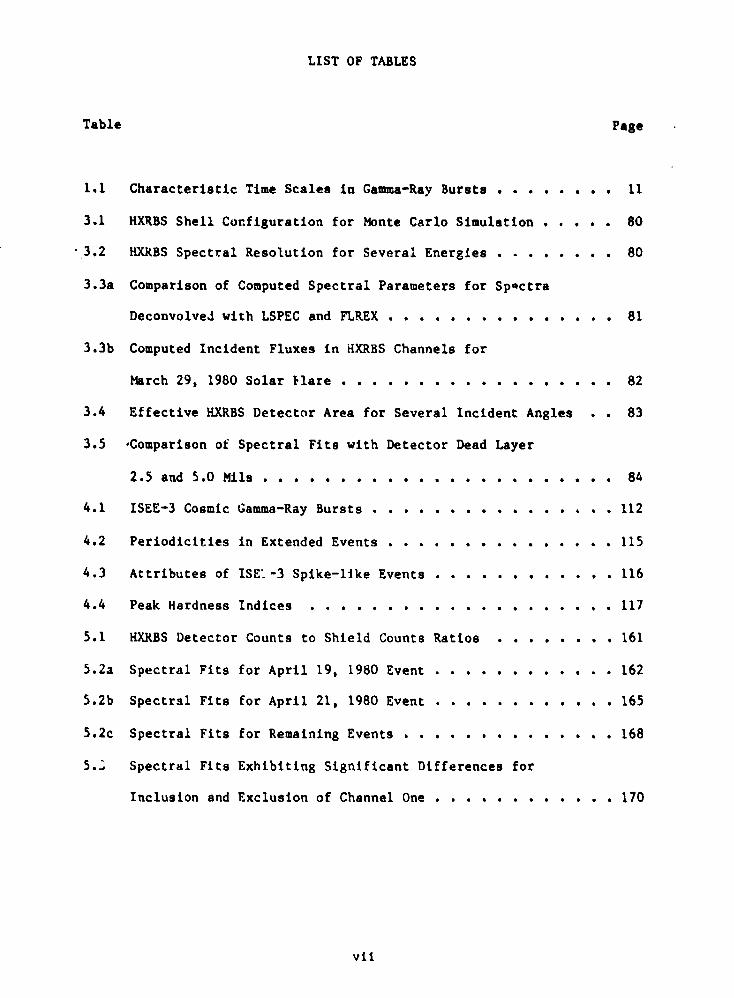
LIST OF TABLES 1
]Table Page
I,I Characteristic Tlme Scales in Gamma-Ray Bursts ........ 11 !
3,1 HXRBS Shell Configuration for Monte Carlo Simulation ..... 80
"3.2 HXgBS Spectral Resolution for Several Energies ........ 80
3.3a Comparison of Computed Spectral Parameters for SpQctra !
DeconvolveJ with LSPEC and FLREX ............... 81
3.3b Computed Incident Fluxes in HXRBS Channels for
March 29, 1980 Solar _lare .................. 82
3.4 Effective HXRBS Detector Area for Several Incident Angles . . 83
3.5 ,Comparison of Spectral Fits wlth Detector Dead Layer !
2.5 and 5.0 Mils ....................... 84
4.1 ISEE-3 Cosmic Gamma-Ray Bursts ................ 112
4.2 Periodicities in Extended Events ............... 115
4.3 Attributes of ISEI-3 Spike-llke Events ............ 116
4.4 Peak Hardness Indices .................... 117
5.1 HXKBS Detector Counts to Shield Counts Ratios ........ 161
5.2a Spectral Fits for April 19, 1980 Event ............ 162
5,2b Spectral Fits for April 21, 1980 Event ............ 165!
5,2c Spectral Fits for Remaining Events .............. 168
5._ Spectral Fits Exhibiting Significant Differences for
Inclusion and Exclusion of Channel One ............ 170
vii
I
1983022079-014
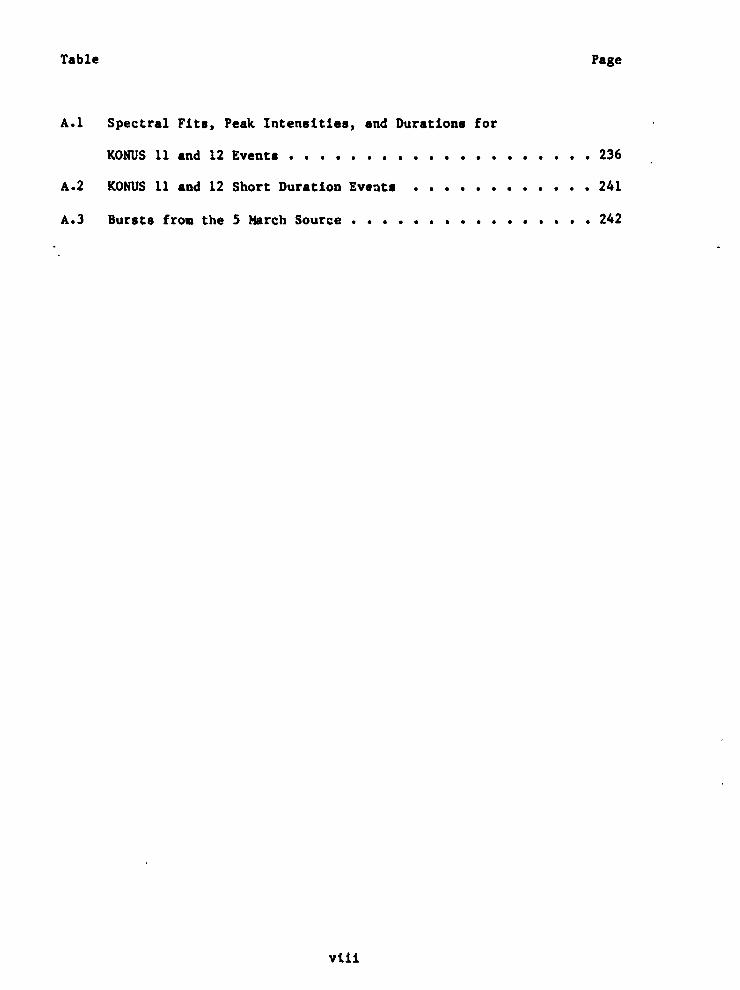
Table Page
A.I Spectral Fits, Peak Intensities, and DurationB for
KONUS 11 and 12 Events .................... 236
A.2 KONUS 11 and 12 Short Duration Events ............ 241
A.3 Bursts from the 5 March Source ................ 242
t /
L
vtii
:_,L
1983022079-015
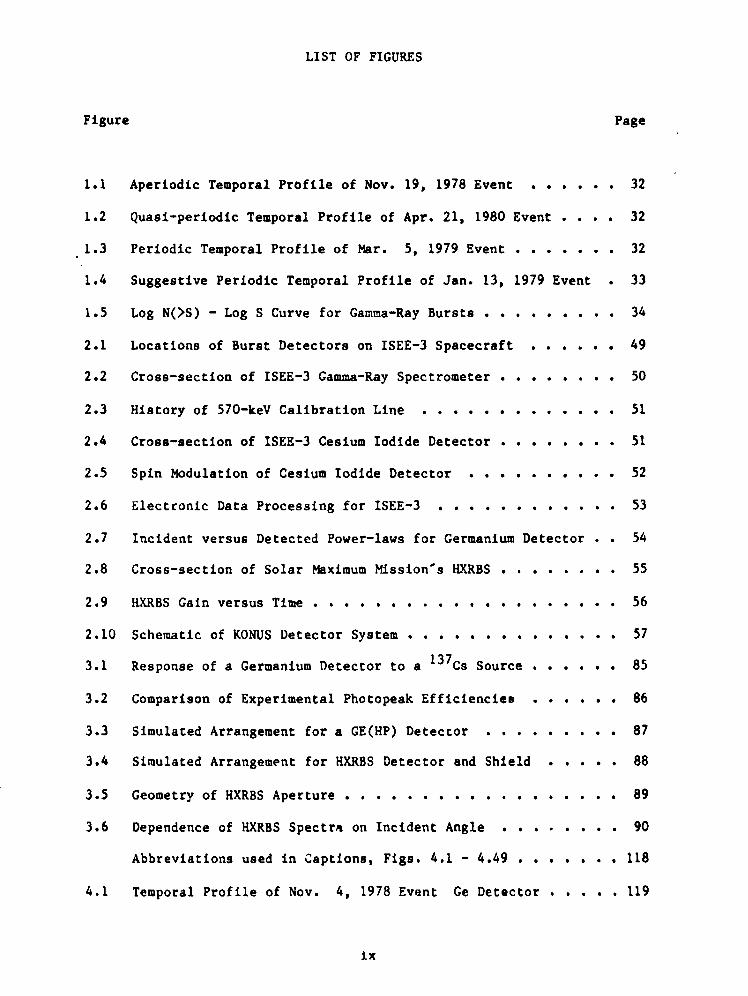
LIST OF FIGURES
Figure Page
1.1 Aperiodlc Temporal Profile of Nov. 19, 1978 Event ...... 32
1.2 Quasi-periodic Temporal Profile of Apr. 21, 1980 Event .... 32
1.3 Periodic Temporal Profile of Mar. 5, 1979 Event ....... 32
1.4 Suggestive Periodic Temporal Profile of Jan. 13, 1979 Event . 33
1.5 Log N(>S) - Log S Curve for Gamma-Ray Bursts ......... 34
2.1 Locations of Burst Detectors on ISEE-3 Spacecraft ...... 49
2.2 Cross-sectlon of ISEE-3 Gamma-Ray Spectrometer ........ 50
2.3 History of 570-keV Callbration Line ............. 51
2.4 Cross-sectlon of ISEE-3 Cesium Iodide Detector ........ 51
2.5 Spin Modulation of Cesium Iodide Detector .......... 52 ;
2.6 Electronic Data Processing for ISEE-3 ............ 53
2.7 Incident versus Detected Power-laws for Germanium Detector • • 54
2.8 Cross-section of Solar Maximum Mission's HXRBS ........ 55
?
2.9 fDL_BS Gain versus Time .................... 56
2.10 Schematic of KONUS Detector System .............. 57
: 3.1 Response of a Germanium Detector to a 137Cs Source ...... 85
3.2 Comparison of Experimental Photopeak Efficlencies ...... 86
3.3 Simulated Arrangement for a GE(HP) Detector ......... 87
3.4 Simulated Arrangement for HXRBS Detector and Shield ..... 88
_ 3.5 Geometry of HXRBS Aperture .................. 89 i
3.6 Dependence of HXRBS Spectra on Incident Angle ........ 90
iI Abbreviations used in Captions, Figs. 4.1 - 4.49 ....... 1184.1 Temporal Profile of Nov. 4, 1978 Event Ge Detector ..... 119
i -1
ix _
1983022079-016
Figure Pese
4.2 Temporal Profile of Nov. 4, 1978 Event, CsZ Detector .... 119
4.3 Temporal Profile of Nov. 19, 1978 Event, CsI Detector .... 120
4.4 Temporal Profile of Nov. 19, 1978 Event, Ge Detector ..... 120
4.5 Temporal Profile of Jan. 13, 1979 _veut, Ge Detector ..... 120
4.6 Temporal Profile of Mar. 7, 1979 Event, CsI Detector .... 121
4.7 Temporal Proflie of Her. 7, 1979 Event, Ge Detector ..... 121
4.8 Ratio of 1SEE-3 Detector Count Rates, )_ar. 7, 1979 Event . . 121
4.9 Temporal Profile of Feb. 13, 1980 Event, CsI Detector .... 122
4.10 Temporal Profile of Feb. 13, 1980 Event, Ge Detector ..... 122
4.11 Ratio of ISE£-3 Detector Count Rates, Feb. 13, 1980 Event . . 122
4.12 Temporal Profile of Nov. $, 1979 Event, Ge Detector ..... 123
4.13 Temporal Profile of Apr. 17, 1980 Event, CsI Detector .... 123
4.14 Temporal Profile of Apr. 17, 1980 Event, Ge Detector ..... 123
4.15 Temporal Profile of June 2, 1980 Event, CeI Detector .... 124
4.16 Temporal Profile of June 2, 1978 Event, Ce Detector ..... 124
4.17 Ratio of ISEE-3 Detector Count Rates, June 2, 1980 Event . . 124
4.18 Temporal Prof£1e of July 23, 1980 Event, Csl Detector .... 125
4.19 Temporal Profile of July 23, 1980 Event, Ge Detector ..... 125
4.20 Ratio of ISEE-3 Detector Count Rates, July 23, 1980 Event . . 125
4.21 Temporal Profile of AuS. 1, 1980 Event, CsI Detector .... 126
4.22 Temporal Profile of Aug. 1, 1980 Event, Ge Detector ..... 126
4.23 Ratio of 1SEE-3 Detector Count Rates, Aug. 1, 1980 Event . . 126 t
4.24 Temporal Profile of Sep. 30, 1981 Event, CsI Detector .... 127
4.25 Temporal Profile of Sep. 30, 1981 Event, Ge Detector ..... 127
4.26 TeQporal Profile of Apr. 18, 1979 Event, CeI Detector .... 128
X
1983022079-017
Figure Page
¼
4.27 Temporal Profile of Apr. 18, 1979 Event, Ce Detector ..... 128i
4.28 Temporal Profll_ of Mar. 20, 1982 Event, CsI Detector .... 129
4.29 Temporal Profile of Mar. 20, 1982 Event, Ge Detector .... 129
4.30 Expanded Temporal Profile of Mar. 20, 1982 Event, CsI Detector 129
4.3_ Temporal Profile of Sep. 26, 1981 Event, HXRBS Shield .... 130
4.32 Temporal Profile of Sep. 26, 1981 Event, Csl Detector .... 130
4.33 Temporal Profile of Sep. 26, 1981 Event, Ge Detector ..... 130
4.34 Temporal Profile of Mar. 5, 1979 Event, Csl Detector .... 131
4.35 Temporal Profile of Initial Spike Mar. 5, 1979 Event .... 131
4.36 Temporal Profile of Mar. 15, 1979 Event, Ge Detector ..... 132
4.37 Temporal Profile of May 12, 1979 Event, Ge Detector ..... 132
4.38 Temporal Profile of Mar. 22, 1980 Event, Ge Detector ..... 132
4.39 Tem\_ral Profile of Aug. 6, 1980 Event, Csl Detector .... 133
4.40 Temporal Profile of Aug. 6, 1980 Event, Ge Detector ..... 133
4.41 Temporal Profile of Aug. 6, 1980 Event, I[XRBS S1_[eld .... 133
4.42 Temporal Profile of Dec. 5, 1980 Event, Csl Detector .... 134
4.43 Temporal Profile of Dec. 5, 1980 Event, Ge Detecto_ ..... 134
4.44 _*_poral Profile of Dee. 5, 1980 Event, HXRBS Shield .... 134
4 45 Temporal Profile of Dec. 31, 1981 Event, Csl Detector .... 135
4.46 Temporal Profile of Dec. 31, 1981 Event, Ge Detector ..... 135
4.47 Temporal Profile of May 8, 1982 Event, Ge Detector ..... 136 I
4.48 Temporal Profile of May 19, 1982 Eyelet, CsI Detector .... 136
_.49 Temporal Profile of May 19, _982 Event, Ge Detector ..... 136
5.1 HXRBS Shleld-lnfluenced PHA Spectrum for Sep. 26, 1981 Event 171
xl
1983022079-018
Fisure Pass
A_brevistions used in Captions, FIBs. 5.28 - 5.22 ...... 172
, 5.2a Int_rv81s A throuah E for Apr. 19, 1980 Event, H]OtBS ..... 173
5.2b :volutlon of Critical Energy for Intervals in Fig. 5.2a . . . 173
5.3s I_tervals PSI through VL2 for Apr. 19, 1980 Event, HXRBS . . . 174
5.3b Evolution of Critical Energy for Intervals in Fi8. 5.3a . . . 174
5.4 Temporal Profile of Channels I - 5, Apr. 19, 1980 Event . . . 175
5.5 Temporal Profile of Channels 6 - 10, Apr. 19, 1980 Event . . . 175
5.6 Temporal Profile of Channels I0 - 15, Apr. 19, 1980 Event . . 175
5.7 Temporal Profile of Apr. 19, 1980 Event, HXRBS Shield .... 176
5.8 Temporal Profile of Apr. 19, 1980 Event, Csl Detector .... 176
5.9 Temporal Profile of Apr. 19, 1980 Event, Ge Detector ..... 176
5.108 Intervals A throuah C for Apr. 21, 1980 Event, HX_BS ..... 177
5.10b Evoluclon of Critical Energy for Intervals in Fi8. 5.10a . . . 177
5.11e Intervals RSI through VL2 for Apr. 21, 1980 Event, tIXltSS . . . 178
5.11b £volutlon of Critical Energy for Intervals in FI8. 5.11a . . . 178
5.12 Temporal Profile of Ch_nnel# I - 5, Apr. 21, 1980 Event . . . 179
5.13 Temporal Profile of Channels 6 - i0, Apr. 21, 1980 Event . . . 179
5.14 Temporal Profile of Channels I0 - 15, Apt. 21, 1980 Event . . 179
5.15 Temporal Profile of Mar. 7, 1980 Event, HXRBS ........ 180
5.16 Temporal Profile of Nov. 19, 1980 Event, HXRBS ........ 180
5.17 Intervals RSI end DCI for Mar. I, 1981 Event, HXRBS ..... 180
5.18 Temporal Proflle of Channels I - 5, M_r. I, 1981 Event . . . 181
5.19 Temporal Profile of Channels 6 - I0, Mar. l, 1981 Event . • . 181
5.20 TetuporalProfile of Chan_els I0 - 15, Mar. I, 1981 Event . . 181
5.21 Temporal Profile of Mar. 17, 1981 Event, HXRBS ........ 182
xil
1983022079-019
Figure Page
f
5.22 Temporal Profile of Jun, 5, 1981 Event, HXRBS ........ 182
5.23 Total Event PHA Spectra for Mar. i t 1981, Apr. 19, 1980,a
and Apr. 21, 1980 ...................... 183
5.24 TTB, ITS, and PLE Fits for Interval VL2 of Apr. 19, 1980 . . . 184
"5.25 PLE and TTS Fits for Interval RS2 of Apr. 19, 1980 ...... 185
5.26 PEA Spectra for Intervals A through E of Apr. 19, 1980 .... 186
5.27a PEA Spectra for Intervals RSI, DCI, and VLI of Apr. 19, 1980 187
5.27b PEA Spectra for Intervals RS2, DC2, and VL2 of Apr. 19, 1980 188 I4
5.28a TTS Fits for Intervals A, B, and C of Apr. 19, 1980 ..... 189
5.28b TTS Fits for Intervals D and E of Apr. 19, 1980 ....... 190
5.29a TTS Fits for Intervals RSI, DCI, and VLI of Apr. 19, 1980 . . 191'
5.29b TTS Fits for Intervals RS2, DC2, and VL2 of Apr. 19, 1980 . . 192 :
5.30 PEA Spectra for Intervals A, B, and C of Apr. 21, 1980 .... 193
5.31a PEA Spectra for Intervals RSI, DCI, and VLI of Apr. 21, 1980 194
_i 5.31b PHA Spectra for Intervals RS2, DC2, and VL2 of Apr. 21, 1980 195 ,
5.32a TTS Fits with Absorption Lines for Intervals A, B, and C
of Apr. 21, 1980 ....................... 196
5.32b TTS Fits with Extrapolated Continua for Intervals A, B, and C
of Apr. 21, 1980 ....................... 197j 5.33a TTS Fits for Intervals RSI and DCI of Apr. 21, 1980 ..... 198
5.33b TTS Fits for Intervals RS2 and DC2 of Apr. 21, 1980 ..... 199
5.33c TTS Fits for Intervals VLI and VL2 of Apr. 21_ 1980 ..... 200
5.34 PHA Spectra for Intervals RSI and DCI of Mar. i, 1980 .... 201
5.35 TTS Fits for Intervals RSI and DCI of Mar. I, 1980 ..... 202
xiii
1983022079-020
Figure Page
5.36 Simulation of Spectral Artifact Created by Tl_e Averaging
Of Evolving Synchrotron Spectrum ............... 203
A.1 Plot in Galactic Coordinates of Gamaa-Ray Bursts with
Unique Localizattous ..................... 243
A.2 Number of Gamma-Ray Bursts versus Galactic Latitude ..... 244
A.3 Number of Gamma-Ray Bursts versus Galactic Longitude ..... 245
A.4 Histogram of Thermal Synchrotrou Fits for KONUS Spectra . . . 246
xtv
1983022079-021
•° •
CHAPTER I
INTRODUCTION
A. Province of Gamma-Ray Astronomy
The study of gamma-ray (y-ray) astronomy is motivated by the direct
connection between y-rays and hlgh-energy astrophysical processes.
Mechanisms such as gravitational collapse, acc-etion onto compact
objects, explosive processes, hlgh-energy particle acceleration,
nucleosynchesls, and matter-antlmatter annihilation all produce x-rays.
The usual demarcation between hard X-rays and low-energy y-rays is
105 eV. y-rays from celestial objects have been detected at energies
as high as i0II eV (Flchtel and Trombka 1982). The llst of identified
y-ray sources includes the sun, the moon, neutron stars, the
interstellar medium, the galactic center, and activ_ galactic nuclei,
y-rays have been predicted from black holes and from the newly
synthesized radioactive species produced In supernovae explosions.
Cosmic y-rays can be produced by a number of physical processes.
Cosmlc-ray electrons interacting with matter can produce bremsstrahltutg
radiation. Cosmic rays can also inverse Compton scatter with starlight
photuns producing y-rays. Cosmlc-ray - matter interactions can produce
T° mesons which decay into two y-rays with energy 68 MeV in the rest
frame. These processes contribute to the diffuse galactic plane
emission from about i0 keV to 103 _V. Line raGiatlon from nuclear
transitions ( _ tO key to several MeV) and positron-electron
annihilation radiation has been observed from solar flares (Chupp et al.
1[915; Chupp et at. 1981), and is predicted to be observable from the
interstellar medium (Ramaty, Kozlovsky, and Lingenfelter 1979).
Ji
!
1983022079-022
2
Annihilation radiation has also been detecte_ from the galactic center
region (Rlegler et al. 1981) and possibly from y-ray burst sources
(Kszets et al. 1981e). The continuum spectrum of Y-ray bursts is
probably dominated by synchrotron radiation produced by - 109 K plasma
interacting with very strong magnetic fields, _ 1012 G.
Synchrotron and inverse Compton radiation from highly relativistic
• electrons are probably responsible for the emission from the nuclei of
active galaxies. On a cosmological scale, the diffuse extragalactic
y-ray background may be due to the superposltlon of emission from active
galaxies from distant epochs (Bignaml et al. 1979), or alternatively,
may be the remnant of matter-antimatter annihilation radiation at the
boundaries of primordial superclusters (Brown and Stecker 1979).
i. Early History
In most flelds of astronomy the tendency has been for _bservatlons
to precede theory. In the adolescent discipline of Y-ray astronomy,
however, the reverse usually has been true. t_hile y-ray detection
techniques lagged, theory of astrophysical y-ray production
progressed. In particular, most theoretical developments relevant to
high energy astrophysics of the Interstellar medium were expounded
before confirming observations were made. Feeuberg and Primakoff (1948)
discussed the effect of Compton scattering of low energy photons off
0high energy electrons. Hayakawa (1952) discussed the production of
mesons, which decay into Y-rays, via the interaction of cosmic rays and
Interstellar _as. Hutchinson (1952) considered bremastrahlung radiation
from cosmic electrons. Morrison (1958) addressed several y-ray
processes applicable in astrophysical settings.
i
1983022079-023
3
In one of the first y-ray observations of a celestial object,
Haymes et al. (1968) extended the previously known power-law spectrum of
the Crab Nebula to _ 500 keV. In the first detection of an
astrophysical y-ray line, Johnson, Harnden, and Haymes (1972) reported
the observation of an emission feature at an energy of _ 0.5 MeV from
the direction of the galactic center. Jscobson et al. (1975) reported a
y-ray transient which lasted for abuut 20 min. Spectral lines at
energies of 0.41, 1.79, 2.:2, and 5.95 MeV were detected during the
event. The first three were interpreted as the annihilation llne and
the deuterium formation llne redshlfted by a factor of 0.24, and the
unshifted deuterium llne, respectively. The 5.95 MeV feature is near
the energy of an excited state of 160 ((.12 MeV). No other (non-solar)
y-ray transients of such long duration have since been observed.
i
Ii. Recent Observational Discoveries
a. Diffuse Emission
At energies greater than a few MeV, the intergalactic medium is
practically transparent; the total absorption for a path length through
the universe is about I%. Similarly, the galactic disk is
transparent. Hence, the structure of the galaxy again becomes
dlscernable in "_-rays as it is at radio frequencies. Recently, the
galactic plane has been well mapped at high _-ray energies (Hartman
: et al. 1979; Mayer-Hass_lwander et al. 1980). The region 50° > lIl >
310° along the galactic plane is much more intense in high-energy y-rays
than would be expected if only atomic hydrogen were present in the innerJ
galaxy. The excess is consistent with a higher proportion of molecular _
hydrogen in the inner 5 kpc (see Gordon and Burton 1976). Even when im
,it _ °_"
1983022079-024
j,
4
spiral structure and radial density dependences are included in galactic
models, an enhanced coRmic-ray flux_ relative to the local flux, is
probably required in order to reproduce the excess y-ray flux in the
inner region. Large scale features famLllar in the radio and optlcal
pictures, such as Gould's belt, the 8alactlc disk wa_p, and
concentrations in directions tangent to spiral arms, appear in the y-ray
picture as well (Fichtel and Trombka 1981).
In the energy regime 100 keY to 100 MeV a diffuse radiation is
observed which is not galactic in origin. A correlation of galactic
21 cm radiation with high energy y-rays as a function of latitude shows
that the y-ray intensity is nonzero for 21 cm radiation extrapolated to
zero column density (Flchtel et al. 1978). Also, the differential
spectral shJ_pe of the diffuse radiation above I NeV (dN/dE - E-3) is
much steeper than the galactic plane emission (dN/dE a E-I'7). Among
the several possible explanatlons for the extragalactLc radiation are
matter/anti_atter annihilation in the context of a baryon symetric big
bang (Brown and Stecker 1979), and active galaxies (Bignami et al.
1979). The angular resolutlon of present observations is not good
enough to distinguish between the predictions of various theories.
b. Point Sources
The sparse localized extragalactic y-ray detections attest to the
problems (not all of which are technological) in orbiting sufflclently
sensttive instrument payloads. Some bright active galax es have been
detected: the radioactive galaxy Cen A; the Seyfert galaxy, NGC 4151;
and the quasar 3C273.
1983022079-025
5
_I Beyond the solar system, the first _ J,<tic compact object detectedw
I a_ , energies was the Crab pulsar _Br:':_ing et al. 1971). Over awide ravge in the X-ray/y-ray spectr_ _04 to I0 II eV) the pulsed
+
._ emis_ from the Crab is described _ _ power law, dN/dE - I.O*E -2"I
,_ photons cm-2s-lkeV -I (Fichtel _n/ :'_':-_ka1981). The total emission
_d_ is a fact,_ ,_: _en higher than the pulsed emission(nebular plu_ p,:1 _ _
at 10 keV, however the pulse_ ealssion dominates above I0 MeV. Vela
X-l, a binary X-ray pulsar, haz also been detected at y-ray energies.
Several other persistent localized sources have been detected by
the SAS-2 and COS-B satellites, including notably the strong source !
designated by its coordinates (l,b) II = 195 +5. For many such sources
detected at energies greater than I00 HeY (with positional uncertainties i,
2°), no counterparts are evident in other portions of the spectrum
(Fichtel et al. 1975; Masnou et al. 1977).
Evidence for a time-varying localized source of annihilation
radiation near the galactic center has been presented (Riegler et al.
1981). Refined 511-keV observations, when combined with galactic center
results obtained in the radio and infrared regions of the spectrum ;
(Riegler and Blandford 1982) should help determine the nature of
procesfes at word in the core of the galaxy.
The active sun la also a source of y-rays, Tb_ first observatlon_
of y-ray spectral lines were _ade by the OSO-7 satelllte in 1972 during
two large solar flares. The transitory spectral features included: a
511-keV annihilation line, a 2.2-_v line due to deuterium for_tlon,t
and less statistically significant, 4.4-_V and 6.1-_V lines from
collisionally excited 12C and 160, respectively (Chupp et el. 1975).
Recently, the Solar Maximum _ission (SMM), a satellite incorporating
1983022079-026
o..
.z
coordinated solar instruments operating in the UV, X-ray, and Y-_ay
portions of the spectrum, has conflrmed the presence of these features
in solar f_are spectra (Forrest et el. 1980; Chupp e¢ el. 1981).
Ill. Experlaental Considerations
The measurement of y-ray spectra is accomplished by detection of
"energy lost by the incident photon within _he mass of the detector.
When an Indlvldual y-ray interacts, the photon energy is transferred to
charged partlcles. In an Ideal detector, the total charge produced
would be collected and analyzed and would be proportlonal to the energy
of the Incldent y-ray photon. In reality not all photons encount_rlng
the detector _nteract, and for those which interact, the total energy of
the photon may not be deposited in the detector.
The probabillty of absorption of a photon by a given _nteractlon
process is exponentially dependent on the path length, x, traversed
within the detector uterlal, I(x)/l 0 - • -_x, where u the absorption
coefficient depends on energy and materla1. A photon may Interact by
o'_e or more of three charge-produclng prc:es_es. Photoelectrlc
absorption, prlnclpally in the K she11, is the dominant mode of
tnteractlon below _ _00 keV. The X-ray produced by the ensuing K-shell
fluorescence then may also interact via the photoelectrlc effect in
hlgher shells. The photoelectrlc absorption coefficient ts proportional
to Za with a _ 4 to 5 (Z - nuclear charge). Photoelectric absorption
falls sharply with energy, Between _ 100 keV and several HeV Cospton
scattering is the predominant interaction process. Compton scattering
Is proportional to the electron density and therefore to Z. The
scattered pho_cn, degraded In energy, then has a hlgher probability of
i
1983022079-027
• 7 ivia the photoelectric effect. Above 2meC2, electron-interacting
positron pair production becomes energetically possible. The cross
section for this process, proportional to Z2, rises sharply, overtakes
the falling Compton interaction at _ I0 MeV, and flattens at higher !
energies. The positron may annihilate with an electron to produce two
511-key photons which may then interact in the detector via the other
}
processes.
At low to medium energies ( _ I0 keV to _ I0 MeV), two types of
detectors are widely employed. Crystal scintillator detectors, usually
NaI or CsI doped with TI, convert electron-hole pairs produced in the
_-ray interaction into light. The light is collected and amplified by
photomultlpller tubes (PMT's) and th_ resultant signal is registered by
an ana_og-to-dlgltal converter. Several factors determine the energy
resolution of scintillator detectors: the intrinsic _nergy required to
produce an electron-hole pair in the crystal material, the detector
size, light collection technique, and PMT conversion statistics.
Typical good energy resolution [AE(FWHM)/E] is _ I0% at _ 1MeV.
High purity Ge [Ge(HP)] detectors are replacing scintillators in
ii some applications. Narrow astrophyslcal y-ray lln_s (Ramaty, Kozlovsky,and Lingenfelter 1978) _hich may be observable with future instruments
require resolution on the order of I% or better. Ge(HP) detectors
afford the resolution necessary to detect these lines. Two principal
factors contribute to the improvement over the resoluclon of
scintillators: (l) the required energy to produce an electron-hole pair
in Ge is about 3 eV, compared to 300 eV required to make a photo-
electron in a Pbfr, and (2) the charge is collected directly obviating
the use of Pbff's. A high voltage is applied to the electrodes on the Ge "
1983022079-028
8
crystal to collect the charge. The use of Ce(HP) (1 part impurity in
1013 ) reduces the effect of trapping centers on the Nobility of the
charge carriers. To achieve optimum signal-to-noise, Ge(HP) must be
cooled to liquid nitrogen temperatures. Currently, single Ge crystals
are smaller than scintillators. _ltiple C,e detector configurations are
necessary to achieve sensitivities comparable to those of scintillator
detectors.
y-rays with energies of a few hundred keV may penetrate several cm
of high Z material before being absorbed. In order to obtain
directional information, detectors must be co111mated with thick active
or passive absorbing material. An active co111mator configuration,
composed of sclutillator crystals operated in anticolncldence with the
detector, allows rejection of detector events which alsn interact within
i the collimator.
I Above about 10 NeV, pair production is the dominant interaction
mode. Spark chambers exploit the fact that the pair continues inii approximately the same direction as the incident y-ray. A detector is
4r_ typically constructed of several stacked grids of wires interleaved with
thin high-Z plates. The plates serve two purposes: (i) to provide a
medium in which the y-ray annihilates, and (2) to measure the Coulomb4:i
scattering of the pair to obtain the incident y-ray energy. The paths
of the electron and positron are traced through the three dimensionalt
; lattice to also yield the direction of the incident y-ray (Fichtel and
: Trombka 1981).g
As is well known, the earth's atmosphere severely attenuatesI
frequencies above _ 1016 Hz. Also, low celestlal Y-ray fluxes and high
ambient charged particle flux combined with scattered y-radiatlon from
I
z i
1983022079-029
I
9
the earth's atmosphere (albedo) lead to a low signal-to-background
ratio. This renders y-ray observations generally very difficult, even
at the top of the earth's atmosphere. In fact most y-ray data are now
derived from earth-orbiting or heliocentric satellites. Sometimes
observing stations with large detector systems are carried aloft by
_alloon. Such experiments float at _ 25,000 feet for about 1 day.
Pointed balloon observations can achieve significantly better
sensitivity than smaller satellite experiments.
For comprehensive treatises on the experimental situation, the
reader is referred to two excellent texts, Adams and Dams (1970) and
Fichtel and Trombka (1981). The detectors which provided the y-ray
burst data for this work are discussed i: chapter II. _
B Gamma-Ray Bursts
i In 1969 several short bursts of low energy y-radlatlon werei
I detected by the Vela 4 and 5 satellites (Klebesadel, Strong, and Olsen
1973). The Velas were intended to monitor the earth's surface and
nearby space for violations of the 1963 Nuclear Test Ban Treaty. The
nearly simultaneous recording of similar temporal structure by two or
more Velas for a given burst insured that it was not an artifact of the
detection systems. The Vela satellite sensors give quasi-
omnidirectional coverage. In order to determine approximate burst
directions, the differences in wavefront arrival times for pairs of b
satellites were analyzed ("triangulation"), The first source location
error boxes were typically several degrees in extent, which sufficed to
exclude the sun and planets as sources.
i
1983022079-030
10
Succeeding generations of spacecraft have flown more sophisticated
electronics and detectors, some tailored specifically for y-ray burst
detection. Many of thtse sensors were designed to record bursts with
absolute timing precision to several milliseconds. Helios-B carried the
first y-ray burst sensor into solar orbit establishing a much longer
baseline for triangulation than previous earth-orbiting satellites had
-provided (Cline and Desat ;976). In 1979 as many as 12 spacecraft with
baselines extending up to _ 1000 light-seconds were operating in a burst
detection network. A few of the triangulated source location error
boxes which resulted from the network are as small as a few square
arcminutes. With the exception of the u_ique 5 MAR 79 event (see Cline
1980), no particularly outstanding radio, optical, or X-ray source
(however, see section iii) has been found within or adjacent to the
smaller error boxes (Laros et al. 1980; Cline et al. 1979a; 1979b;
1981).
Without associations with known objects, the nature of y-ray bursts
remains uncertain. However, their temporal and spectral characteristics
appear to limit possible sources to compact stellar objects, most likely
neutron stars within the _alaxy. The galactic hypothesis is reinforced
by the constraints implied by the distribution in galactic coordinates
and the frequency of occurrence versus size relatlon (log[N(>S)] -$
log[S]). Th_se attributes of y-ray bursts are outlined below.
i. Temporal Characteristics
The temporal profiles ("time histories") of y-ray bursts are
usually characterized by apparently stochastically distributed pulses.
The pulses have an explosive appearance with rapid rises and equally
1983022079-031
ii
: sharp decays. When observed with very good time resolution, individual i •
: pulses manifest rapidly varying substructure on time scales down to t_e
instrumental resolution limit (typically 10"s of ms). The peaks of i
bright bursts are one to three orders of magnitude above the _-ray
background. Sometimes the intensity falls to the background level
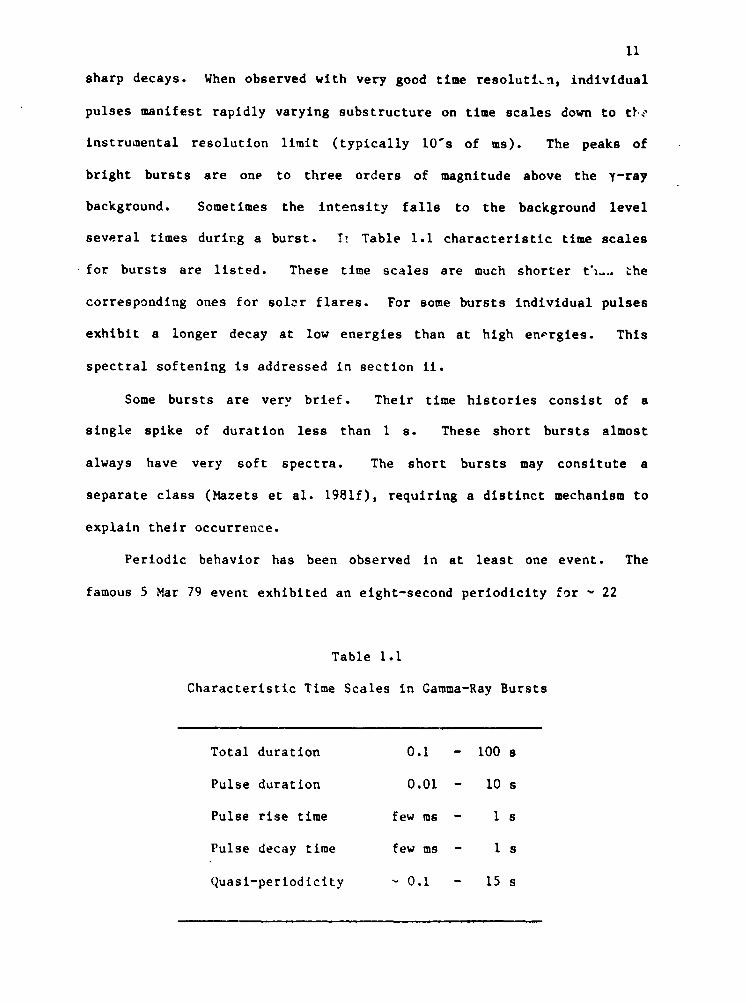
: several times during a burst. I_ Table i.i characteristic time scales i
for bursts are listed. These time scales are much shorter t_,., the
corresponding ones for soler flares. For some bursts individual pulses
exhibit a longer decay at low energies than at high energies. This
z
spectral softening is addressed in section li. !
Some bursts are very brief. Their time histories consist of a
single spike of duration less than 1 s. These short bursts almost
always have very soft spectra. The short bursts may consltute a
separate class (Mazets et al. 1981f), requiring a distinct mechanism to
explain their occurrence.
Periodic behavior has been observed in at least one event. The
famous 5 Mar 79 event exhibited an elght-second periodicity for _ 22
i
Table i.I
Characteristic Time Scales in Gamma-Ray Bursts
i Total duration 0.I - i00 s
_| Pulse duration 0.01 - i0 s
iI Pulse rise time few ms - i s
'! Pulse decay time few ms - 1 s
Quasi-perlodlclty _ 0.I - 15 s|
1983022079-032
12
cycles (Cltne 1980). Another burst. 29 Oct 77, has been interpreted as
displaying a 4,2 s period modula_ttng an exponential decay (Wood et al.
1981 ). There have been o:nvr observed bursts with possible
periodicities not 1.1sting long enough for their periodicity to tm
definitely established (Losnikov and Kusnetsov 1982). Sometimes what
may be periodic structure is dubioul because the time history drops to
background level tor a few (apparent) pulse periods, Examples of
aperiodic, qua.-,i-perlodic, and peri,_dle time histories are t11ustrated
in Figures 1.1 - 1.4.
i] it. Spectral Characterlsttcs
The I_ 6 and 7 satellites provided the first y-ray burst spectral
data. Spectra integrated in tim@ over an entire event were consistent
with an exponential with characteristic energy 150 keV, an0 a power law
tail above 400 keV to _ 2 MeV with a photon index "- -2.5 (Cltne et al.
1973; Cline and Desai 1975). An equally good fit to ths early burst
data vas obtained with two power laws with indices -I.O and -2,5, the
spcctral break occurring at 200 to 300 keV (Cllne and t_sat i_76).
tater experiments, some utlli#lntl detectors with improved
sensitivity, have shown that burst spectra not only vary during a given
event (Nakano, Imhof, and Reagan 1970; Trombka et al. 1974; Mettger et
al. i974; _heaton et al. 1973; Tee•arden and Cline 1980; Dennis et al.
1981) but also vary from event to event. The most lmpressiw evidence
for this ts contained within the KONUS catalog (Naset# et al. 198la; b;
! and c - hereafter referred to as the KONUS catalog). "/or KONIIS eventsi,t _vhich were intense enough to allow t tree _equences of _pect ra to hei
1983022079-033
13
individual pulses appear hardest with subsequent softening. There is a
tendency for intense portions of a burst to exhibit harder spectra.
Some bursts do not dlsplay any significant spectral evolution. Mazets !
and cotnvestigaLors find that the spectra may be represented by a
thermal bremsstrahlung form throughout the burst evolution (Mazets et!
al. 1981d).
In contrast, for several events detected by the S_ y-rayJ
spectrometer (Share et al. 1981) the event-averaged spectra from _ 300 ._
keV to i - 8 MeV have the appearance of power-laws. The publlshed
count-rate spectra are uncorrected for the instrumental response.
Although TTB appears to provide a good fit to the data it is not
likely to be the actual emission mechanism. The arguments against it
are as follows: First, if the KONUS features at - 50 keV are due to
cyclotron absorption, the line formation occurs in a region with
magnetic field strength _ 4 x 10¹² G, i.e., a region approximately the
size of a neutron star. For the spectrum to remain optically thin to
Compton scattering requires z < i. This constraint, combined with thecs
emissivity for TTB (see eq. 3.5), the observed fluxes and the Implled
size of the source region, yields distances _ I0 pc, probably an
inadmissably short range to contain the burst sources (Fenimore et al.
1982a). Second, representation of the continuum as TTB is suspect in
itself. Bussard and Lamb (1982) derived a required source are_. and
depth in the ratio >,03:1 if the spectrum is generated by TTB. They
remark that this geometry may be realized in thin sheets or filaments if
the sources are not too distant (_ I00 pc).
The ISEE-3 gamma-ray spectrometer was the first high-purity
germanium high spectral resolution detector flown for astrophysical
i.
1983022079-034
14
observations. One of the first y-ray bursts detected (19 NOV 78) with
~
this instrument was found to have emission lines in its spectrum. The
lines appear at energies of _ 420 key and 740 keY. They have been
Interpretated as the 511 key electron-positron annihilation llne and the
847 keV llne caused by the first excited state of iron, both redshlfted
by _ 20Z (Teegarden and Cline 1980). The redshifted annihilation llne
(at _ 420 kev) also has been observed in the spectra of several bursts
by the KONUS experiment (Mazets et al. 1981e). There are no other
likely candidate astrophysical y-ray lines with rest energy _ 420 keV.
If the features are in fact due to annihilation radiation, it is an
exciting discovery for stellar astrophysics. The percentage redshift
for radiation emitted at the surface of a neutron star observed at
infinity is approximately 2OZ. High spectral resolution detectors with
increased sensitivity would be able to measure the position of this line
more accurately; the corresponding redshift would directly yield the
ratio of mass to radius of the neu ton star.
In addition, the KONUS experiment has recorded bursts with
absorption features (and in one case an emission feature) at energies
30 to 70 keY in the spectra of several bursts ()_azets et al. 1981e).
These features have been interpreted as "cyclotron" resonance lines.
Cyclotron features have been observed in the spectra of the persistent
t! source Her X-I and other X-ray pulsars (Trumper et al. 1978; Tueller eti
t
i al. 1981; Wheaton et al. 1979; Pravdo et al. 1979). The requirement of
i very high magnetic fields ( _ 1012 G) for the production of cyclotron
resonance features at these energies strengthens the case for neutron
stars as the burst source objects. Usually the absorption feature
evolves or disappears as the burst progresses (Nazets et al. 1981e),
1983022079-035
i however, bursts have been recorded which exhibit persistent "cyclotron"!
'I absorption features. A broad tlme-varying absorption feature was
_I observed by SMM's HXRBS in the spectrum of the 19 APR 80 burst (Dennis
_! et al. 1981). The burst lasted only about 4 s during which time the
absorption feature and the spectrum as a whole continuously evolved.
This event is analyzed in detail in Chapter V. Recently, another
detection of a low-energy absorption feature in a y-ray burst was
reported (Gruber and Hueter 1982). The spectrum was accumulated over
the i0 s duration of the event.
Fenimore et al. (1982a) have suggested that the KONUS low-energy
features may be instrumental artifacts. Klrk and Trumpet (1982) note
several reasons why this is probably not the case: the central energies
of the features vary from burst to burst ( _ 30 to 70 keV); the spectra
evolve wlth the feature usually disappearing at later stages; two
spacecraft detect essentially the same spectra; and, most bursts do _ot
display any features, only smooth continua.
It is also possible that several-second spectral accumulations
obscure spectral evolution and/or produce Illusory detail. For example,
the 19 Nov 78 event spectra reported by Mazets et al. (1981a), for the
initial 4 s, and by Teegarden and Cllne (1980), for the Initial part of
the event (_ 3 s), exhibit continuous form down to _ 20 keV and _ I00
keV, the respective lower channel limits. Both also display emission
features, the KONU$ spectrum displaying a broad 300 - 800-keV feature
! with an equivalent width about ten times that of the narrower 420-keV
ISEE-3 feature (an adjacent, spectrally resolved feature at _bout 740
keV was also observed by ISEE-3, see above). However, the first two
sequential _ 1 s spectra for the same event reported by Vedrenne (1981)
1983022079-036
16
exhibit low-energy turnovers at _ 350 to 450 keV. In subsequent
intervals D the spectra "unfold", becoming montonically decreaslng with
energy. In this event the longer spectral accumulations may have
produced the apparent broad emission feature near 400 keY. A spectrum
with shape similar to the initial 4 s accumulatlon of Nazets et al.°s
Figure 67 can be obtained by summing the spectra A, B, C of Vedrenne's
• Figure 5, corresponding to approximately the same time interval. The
implications of the possibility of evolution of lo_--energy turnovers may
extend to the absorption features as well. This problem Is addressed in
chapter VI.
Another potentially interesting form of spectral behavior was
observed during the 19 APE 80 event. For _ I0 s before and _ 3 m after
this event, Sl_'s y-ray spectrometer detected soft emission (I0 to 15
keV). Share et al. (1981) have suggested that the origin of this soft
component may be solar.
Woosley (1982) predicts observable X-ray emission on a time scale
of minutes subsequent to a y-ray burst caused by helium detonation on a
neutron star. Steady-state X-ray emission due to interstellar accretion
onto neutron stars is also a consequence of this model. However, on the
basis of X-ray observations by HEAO-2 (Helfand et al._ 1980) some
variations on th_ thermonuclear model for y-ray bursts may be ruled out
unless the source objects are more than I kpc distant (Ventura 1982).
%
ill. Searches For y-ray Bursts st Other Frequencies
Bursts have been detected at energies as lov as _ 5 keV (Metzger et
al. t974). Recently, a few bursts with spectra extending up to _ 25 HeV
were detected by the Gamma Ray Spectrometer experiment on SY_ (Share et
1983022079-037
17
el. 1983). There have been buret searches conducted in other reslons of
the spectrum. Lack of detections may rule out some burst models.
During a few Vela events, for which source locallzations were
performed, the relevant regions of the sky were coincldentally
photographed by the Prairie Network (Grindlay et al. ]974), whose
purpose is to assist in the recovery of meteorites. None of the gem-
ray bursts were detected, setting upper limits which preclude buret
spectra with indices a > 2 (g "_ photon ca-2s'lkeV "1) continuing into the
optical realms. Grlndlay et el. remark that this spectral constraint
implies the hard X-ray to optical flux ratio Is >100. This would appear
to eliminate scaled-up solar flare type y-ray buret models, for which
the predicted flu_ ratio is < 1 (Stecker and Frost 1973).
The I ° x 2 _ error box for 5 MAR 79 lles Inslde N49, a supernova
remnant In the Large Nagellanic Cloud at s distance of 55 kpc (Cline
1981). Observatlons with the HEAO-2 Einstein Observatory found no point
source of X-rays within the remnant (Helfaed and Long 1979). From the
flux upper licit, a transient to steady-state X-ray ratio ) 109 Is}
derived, independent of distance. A nearby galactic neutron star
; accrettnB interstellar matter is probably ruled out as the source since
steady--state X-rays would be observable. The greet distance of the LMC
would require a luLtnoslty of _ 5 x 1044 ergs s -1 for 5 MAR. Indeed, if
_-ray burst sources were extragalactic , and If the 5 _R luminosity were
representatlve of most bursts, the Isotroplc burst dlstrlbutlon (see •
section Iv below) would indicate that N49 is a reletively close
source. The vast majority of burs_s would ori$1nate in the nearby
galaxles and their luminosities would be _ 1031 erss s"I. It seems more
Ifeasible to consider 5 _ as representative of a separate phenomenon,
J
I
1983022079-038
18
albeit exceptionally powerful. In fact, Pelion (1981) presented a
convincing statistical argument in favor of the 5 }_R - N4_ association,
and also arsued for the validity and sufficiency of convective transport
for liberating - 1044 erg in 0.I • from a neutron star atmosphere.
There is an interestin8 piece of evidence that classlcal y-ray
bursts have optical and/or X-ray counterparts. On one plate in a series
taken in 1928 (Harvard Patrol Plates), a transient image appear• vlthin
the 8" x 1.5" error box of the brisht burst 19 NOV 78 (Sheerer 1981).
Densltoaeter •cans indicate that the image Ls not an artifect of the
imaging system. Comparison with stellar iaages on the same plate, which
are slightly trailed, imply the duration of light that caused the imase
was significantly shorter than the total exposure tins. A possible
persistent optical counterpart to the 19 NOV 78 burst whlcL Is varlable
( _ 23rd meg) has been identified (Sheerer 1961; 198_}. Also, a
persistent X-ray source whose position coincides with the 1928 opel•el
image has been found by the HEAO-2 Einstein Observatory. The implled
recurrence tins ( - 50 yr), ratio of opti_al to X-ray luainosities, and
optlcel variability are interpreted as k_ing ccnslstent with episodic
accretion onto a neutron star at a distance of _ I kpc (Grindlay et el.
1982).
There is further evidence for sources repeatin$ on a time scale of
days to sonths. Fol_owin6 the $ MAR79 event, three events occurred (6
_, h APR_ 24 _L) vhlch were coarsely localised by the IU)NUS
expsrinsnt (Pluses ec el. 1981f). Then four events have error bone
which are sutually consistent with one source. Disresardiv$ the
relatively, low-amplitude oscillatin 8 portion of the $ I_R event, all
four event duratLons were _ I s. The spectra were unulally loft
1983022079-039
!.|
19
compared to the spectra of "classical" y-ray bursts (longer duration
events displaying complex temporal profiles). Thermal _remsstrahlung
flts with kT _ 35 key were obtained for all four events. The trial
fluence ratlob (450:6.5:0.7:0.6) aud Intervals between eveuts (14 hr, 29
d, 20 d) suggest a relaxation mechanism.
!The KOh-0S Venera 11 and 12 sensor_ ceased operation In January
1980. A second pair of KONUSburst experiments was launched on Venera _
13 and 14 in November 1981. Eight more fast events, which can be i!
grouped into two 3- and 5- event series, wlth fluences, spectra, and ]
intervals between occurrence slmilar to the three events following 5
_A, were detected by KO_S 13 and 14 (see Table A.3). The Intersectlon
of the twelve _ 10° x 0.03 ° locallzations is consistent wleh the 5
source position reported by Cllne et el. (1982). Several other fast,
spike-llke events were detected by KONUS 13 and 14 (_tzets, private
communication). This apparently separate class of repeating, spike-
llke, soft _-ray burst_ is discussed in chapters IV and VI.
Another series of events (24 _, 25 MAR, 2? _ 7q) detected by
the KONUSexperiment have error boxes consistent wlth a slngle-source. !
The event durations and spectra ar_ very similar to the 5 MARseries.
A posterlorl searches of data records for coinciding bursts at
radio frequencies have been conducted with negative results (Baird et
al. 1975; 1976; Ciapl et el. 1979). Upper llmits to fluxes of _ I0 -12
to 10-13 er8 cm-2s-IMHz -I imply that less than I0 -6 - 10-10 of an
esti_ted 1039 - 1041 ergs/burst (Fishman's luelnoslty estlumte, 1978)
is esltted st microwave frequencies. This argues against etellsr flare
mechanisms since in these models _-ray and radio emission are expected i
to be associated (Stecker and Frost 1973; Bat and Rauty 1976). i
1983022079-040
20
Searches for coincident burs_s at energies > 10 GeV were also being
perforued during the Vela period (O'Brten and Porter, 1976; Bhat et •1.,
1979; Fegan et al., 1979). All produced negative results. Not onlyI
were one-source loc•llza_ions for several Vela events undetected (Fegan
et al.), but no bursts of g•nma radi•tlon of short dur•tlon (> 10 as, <
I s) have ever been observed during several years of monitoring at GeV
energies. If one •ssuues a burst energy spect ".,m above bOO Ke'F
proportlonal to E-2"5, a large burst (- 10-A erg cm-2) is about two
orders o_ magnitude too small to be detected at energies greater than
I GeV by any of _he above mentioned experlunts. Hence, the upper
llmlts constrain only those uodels which predict bursts st thosem
energies (e.g. evaporating prlmordlal black holes) and not tr•dltlon•le
gamma-ray bursts.
Iv. Constraints on y-ray Burst Sources
An luport•nt c_netralnt on burst sources is the maxla_uu 81_. of the
eulttlng region luplled by the short te_porzl varlatlons observed In the
tl_e histories. Statletlc•11y slgnlflc•nt flux v•ri•tlons are typlcally
observed _o be as short •8 the Inst_uuental llmlts. The shortest flux
variations so far observed (T _ 5 us) Imply •n eultti_S region t _ cT
1500 kiloueters. The e=Ittlng region say t'_ a small area (hot spot) of
the total surface of the -.,rce..-
Photons with energies above several HeY have been observed In y-ray •
bursts. According to an argument by Schaidt (1978), lack of • cutoff in
burst spectra above - I Ne_: requires the source to remain optically thin
to YY pair production; i.e., the photon density must not exceed •
critical value. The upper limit on source sizes therefore 11uits _he
~ .
1983022079-041
21\
luminosity L = 4_d2F (d = distance, F = observed flux) and hence the
distance. Schmldt calculated a limiting distance of _ 2 kpc for fluxes
10-4 erg cm-2 assuming an emlttlng region _ 104 km. This argument Is
not conclusive. The impllcstlons of palr production In d_nse photon
fields may represent more a limitation on the details of burst evolution
and therefore spectral shape than on source size. In fact, Hertertch
(1974) noted that yy pair production would be followed by _airg
annihilation, anticipating the observation of annihilation radiation In
gamma-ray bursts. In addition, there are of course other viable
mechanisms for pair production. Also, Schmldt's argument may bel
mitigated by a radiative transfer argument presented by Katz (1982)
which proposes that annihilation radiation may escape from a plasma
:[ optically thick to yy palr production through angle and frequency!i windo" _.
I The frequency of occurrence versus size distribution, log[N(>S)] -
r 'log[S], distinguishes, in principle, between geometrical distributions
of sources. An isotroplc and homogeneous three dimensional distribution
is reflected in an N _ S"_ law wlth a = 1.5. An homogeneous planar
distribution results in a = 1.0. Hence, the log[N(>S)] - log[S]
relation may be used to distinguish between halo and disk source
distributions. Flshman (1979) computed an array of variations on th¢|
isotropic, homogeneous case using a V_nte Carlo code. Realistic
parameters are incorporated including burst distribution scale heights
for galactocentric coordinates z and r, spiral arm structure and
termination of the distributions at a galactocentric radius of 15 kpc.
Jennings (1982) incorporated intrinsic luminosity distributions in disk
and halo models.
1983022079-042
22
In Figure 1.5 meet observations are plotted for comparison with
repreBentative dllk and halo models (Jenntngs 1982). In fact, since one
does not kn a priori if there is a range in burst luminosities, the
present observations on]y constrain the burlt aourcei to s galactic
distribution. Further eenlitlve observations ere required at low
fluencem in order for i log[N(>S)] - log[S] analysis to distinguish
between ., high luminosity halo popul,,tion or low luminosity disk
population.
: The KONUS experiment, flown on the Veneras II and 12, was capable
of source localization to within a few degrees. The Vela and IHP
satellites and the Venera KONUS experiment combined account for about 85
coarse source localitatlons. A plot in galactic coordi:,ates of all
uniquely localized y-ray bursts is illustrated in Figure A.Io There
does not appear to be a concentration of sources toward8 ,he region of
the galactic center. An excess of sources near b II - 15 ° is evident.
In Figure A.2 a histogram of ein(b ll) versus number of sources (unique
localizationa) makes this more apparent. In fact this excess may be
attributable to s nonuniformity in the KONUS directional sensitivity
(Lares et el. 1982). The consequent lsotroplc distribution may be the
result ot at least two possible galactic configurations: 1) present
instruments sample nearby burst sources from a low-luminosity disk-
shaped population (sensitivity limited), or 2) the instruments see aI
large portion of a high-luminosity halo population. If the second
posslbl llty were the came, a center/ant lcenter bias should be
|
apparent. In Figur_ A.3 a histogram of bursts in longitude Is shown' no
centar excess is observed. Hence the observed bursts are probably
produced by sources within tl_e g,_l.scttc disk.
l I
1983022079-043
-i
23 i
The phenomenon most similar to the y-ray burst is the X-ray
burst. X-ray bursts exhibit durations of seconds to minutes, which
suggests a relationship to _-ray bursts. However, the X-ray bursts !
(kewln and Joss 1981) and y-ray bursts are definitely not associated
Indtvldually or as a class. X-ray bursts tend to be repeaters and in :
some cases are identified with persistent X-ray sources and/or blue
stellar objects. Currently, y-ray bursts, other than the splke-llke
class of bursts exemplified by the 5 MAR 79 event, are not known to
repeat nor do positive identifications of any kind exist presently. The
X-ray bursters cluster around the galactic center with b II _ 35 ° . The
_-ray burst distribution appears tsotroplc. _-rsy bursts exhibit much
harder spectra than do X-ray bursts (Lewin and Joss 1981; Wheaton et al.
1973; Trombka et el. 1974). Blackbody fits with temperatures of a few
keV are found for X-ray bursters (Swank 1977; 8offman 1977) whereas
. characteristic energies for gamma-ray bursts are _ 150 keY. A
comparison of total X-ray burst flux to total _-ray burst flux. for a
typical _-ray burst extrapolated to soft X-ray energies (Evans et el.
197b), shows X-ray bursts to be too faint by a factor of I00 to be the
same phenomenon _s _-ray bursts. Even if the two kinds of bursts
originate from similar objects, the condlctons of burst generation or
occurrence must be quite different.
C. Gamma-Ray Burst _bdels and Astrophysics
It is important to distinguish between the cause(s) of _-ray bursts
; and the ensuing observable event. While it is possible to Iml Jve
i ', _detector spectral resolution and seasitivity and thereby derive more
i information from burst observations, determining the cause of bursts
1 1i
1983022079-044
24
from these observations may be dlfflcult. This inherent difflculty is
reflected in the variety of speculatlons advanced to explaln y-ray burst
characteristics. Part of the problem is the present state of knowledge
": of neutron star physics. On the other handp intense magnetic andI
gravitational fields at the surface of neutron stars may camouflage
i otherwise observable characteristics which to certai_ burstare 8peclflc
!-_ scenarios.l
.l1I
J i Radiation Mechanlsms!!
: The y-ray burst phenomenon has been part of the motivation for
recent theoretical developments in astrophyslcal hlgh-energy plasmas.
The familiar problem of radiative transfer becomes rather complex in the
context of strongly magnetized neutron stars.
The spectral fits assuming thin thermal bremsstrahlung published in
the KONUS catalog did not incorporate a gaunt factor. Gould (1980) has
published relativistic corrections (appllcable at 107 to 109 K) to the
bremsstrahlung gaunt factor. Inclusion of the gaunt factor
significantly increases the spectral temperatures of blazers et al.
(1981d). The deduced higher temperatares exascerbate the discrepancy
with the low temperatures implied by the narrow widths of the cyclotron
absorptlon lines.
Several authors have pointed out that synchrotron emissivity
exceeds bremsstrahlung emissivity in a magnetic field of _ 1012 G if the
electrm, density is less than 1031 -3cm (Gould 1982; Lamb 1982; Liang
1982). Recently, Petroslan (1981) d !red a slmple expression for the
synchrotron emissivity of a thermal distribution of electrons (kT
A, ,
1983022079-045
v
25 _!
met2). Ltang (1982) has successfully utilized this function to fit4 _
_-ray burst spectra from the KONUS catalog and from other experiments.
The appearance of absorption features in X-ray pulsar spectra (Kirk i
and Trumper 1982) and possibly both absorption and emission features in
T-ray burst spectra has spurred development of self-conslstent radiative
transfer theory of strongly magnetized neutron stars (Meszaros, Nagel, i
and Ventura 1980; Nagel 1981). The effects of hot plasmas and strong
magnetic fields on annihilation spectra have also recently been
developed. For the 5 .MAR 79 burst, the very high luminosity and
interpretation of the emission feature as redshifted annihilation
radiation constrain the temperature of the annihilation region. The
observed widths of the 400 to 450 keV features would require that the
pairs are cooled by synchrotron emission to _ 3 x 10⁸ K before
annihilating (Ramaty and Meszaros 1981).
Fenlmore et al. (1982b; c) have proposed a radiative transfer
mechanism for _-ray bursts which does not require a strong magnetic
field. An X-ray burst is inverse Compton scattered by an overlying hot
plasma of mildly relativistic temperature to produce the observed y-ray
spectrum. The origin of the suspended hot plasma is unspecified.
The time-dependent Compton problem has been studied by Gullbert,
Fabian, and Ross (1982). Their model spectra, which can be described by
quasi-power-laws with exponential-tails, are similar to the Monte Carlo
results of Pozdnyakov, Sobol and Syunyaev (1977). The time-dependent
treatment indicates that, because of cooling, Wien peaks in the spectra
are not produced even for large optical depths.
r
1983022079-046
26
ii. Gauma-Ray Burst Scenarios
The minimum requirements for plauslble burst models (Ruderemn 1975)
would appear to be the following: I) source objects within a few x i00
pc, 2) total energy release E _ I037(d/I00 pc) 2 ergs, 3) characteristic
photon energies _ 150 keV (with spectra continuing in some cases to _ i0
MeV), and 4) fast temporal variations. The characteristic dynamic and
cooling time scales near the surfaces of a neutron star are faster than
observed temporal variations. Consequently, a common problem of neutron
star models is explainlt_g the total event durations of several
seconds. In addition to Ruderman's requisites, Lamb (1982) emphasizes
the implication of optical depth. If the emission region is optically
thin, energy regeneration or matter replenishment during the event is
necessary. Also, Lamb reminds us that event durations and
(bremsstrahluug) spectral temperatures both have dynamic ranges greater
than 103 . These large variations in fundamental attributes may indicate
that more than one mechanism is responsible for generating y-ray
bursts. Additional constraints must be met by models proposed to
explain the 5 _R 79 burst, since this source repeats on a time scale of
1 day to mouths.
Ruderman's (1975) review of _-ray burst models lists many
combinations of high-energy producing processes occurring on or near
stellar objects.
The interpretation of features in burst spectra as cyclotron and
annihilation lines has narrowed attention to scenarios involving neutron
stars. These can be grouped into several generic classes: thermonuclear
explosions (Woosley and Taam 19_6; Tsygan 1980; Woosley 1982), episodic
accretion of gaseous matter (Lamb, Lamb, and Pines 1973), accretion of
1983022079-047
!27
asteroids or comets (Newman and Cox 1980; Van Buren 1981; Colgate and
Petschek 1981), neutron star quakes or g11tches (Pacinl and Ruderman
1974; Tsygan 1975; Fabian, Icke and Prlngle 1975), and magnetic
instabilities in pulsar magnetospheres (Paclnl and Ruderman 1974). A
major motivation for many later models has been the modelling of
impulsive bursts llke 5 MAR 79. I shall describe the main attributes of
two represeutative models.
The thermonuclear model (Woosley 1982) involves the accretion (
I0-13 Mo yr-I km-2) and steady burning of 1020 to 1022 g km-2 of
hydrogen into helium. A strong magnetic field ( _ 1012 G) focuses the ' :
accretion flow onto the polar caps and restrains th_ accreted material
from diffusing across field lines above and below the surface. A
detonation wave or convective deflagration front propagates across the
helium lake fusing the matter up to 56NI and releasing 1038 to 1040 erg
km -2 in a _-ray burst. The model differs from thermonuclear X-ray burst
models in that helium is the fuel rather than hydrogen and that the
total energy released is much greater. The duration depends upon the
mechanism of propagation: about 0.I ms for a detonation wave or lO's of
seconds for convective deflagratlon. Recurrence times, which depend on
variations in model parameters, range from less than a year
(deflagration model) to _ 103 years (detonation model). This model
predicts an observable steady-state X-ray source resulting from the
accretion flow (these two models are discussed in chapter V1 in |
connection with short and long duration bursts).
Ventura (1982) maintains that, because Woosley neglects both
cooling through the neutron star and the effect of magnetic opacity, the
I required temperature for CNO-medtated burning of hydrogen is nott
I
1983022079-048
28
achieved. Furthermore, Ventura points out that IPC X-ray observations
(Helfand et al. 1980) of y-ray burst error boxes have yielded results
inconsistent with Woosley's models unless sources are at distances _ 1
kpc. Ventura postulates a binary system evolutionary sequence in which
a low-luminosity (originally 0.1 No) companion star, presently
undetectable (d _ 300 pc), slows the neutron star rotation by mass
"exchange. The system eventually becomes unbound. The advantages of
this scenario are that more efficient gaseous accretion is possible due
to slower rotation (typical pulsar rotation rates result in the
magnetosphere repelling accretlng matter at the Alfven surface,
lllarlonov and Syunyaev 1975), and normal stellar space veloclties are
envisaged (as opposed to runaway supernova-generated pulsar
velocities). The slower interstellar accretion rates result in
unobservable X-ray sources and much longer recurrence times.
The asteroid-accreting neutron star model of Colgate and Petschek
(1981) is intended to explain the 5 Mar 79 event. In this scenario a
solid body of _ 1018 gm impacts on a strongly magnetic neutron star.
The body is initially elongated and ehen tidally broken up in its fall
toward the neutron star. The magnetic field compresses the material in
longitude and allows expansion in latitude so that upon impact the cross
section is _ I cm x few km. The ensuing collision is predicted to
result in an observable turbulent plume interaction. The impluslve peak
and subsequent _ 3 mln oscillation phase of the 5 Mar 79 burst both
require the radiating plasma to be magnetically entrained. Without a
strong magnetic field, the accreted material would expand and cool and
no y-ray burst would be produced. The total energy released, _ 1038
1983022079-049
!29 I °
Iergs, places the source at a distance of only I00 pc, rather than at 55 _
kpc in the LMC.
The probablllty of asteroid capture by high-veloclty neutron st_rs
is probably insufficient to explain the observed frequency of y-ray
bursts. However, the capture cross-sectlon is significantly increased
for stars possessing _ 1012 G fields (Van Buren 1981). Ventura's (1982)
•arrangement (see above) would increase the probability of capture of
asteroids or comets whose orbits are perturbed by the companion star.
D. Present Work
y-ray burst spectra from Sb_s Hard X-Ray Burst Spectrometer
(HXRBS) and time histories from the ISEE-3 Teegarden experiment were
made available to the author, The instrumentation for these experiments
is described in chapter II and the methods of analysis are presented in
chapter Ill.
In chapter IV the ISEE-3 time histories are analyzed. From the
ratios of the count rates of two ISEE-3 detectors with dlfferent energy
thresholds it was possible to calculate hardness indices as a function
of time for some events. A tendency for some bursts to exhibit hard-to-
soft spectral evolution was found.
The tlme histories were examined for periodicities. A few ISEE-3°,
bursts with relatively long durations exhibit possibly periodic
%structure. It has been suggested that the reason periodicities are
infrequently observed in burst time histories is th,_ most burst$
durations are shorter than the source rotation periods (Wood et al.t
1981).
!1
1983022079-050
i 3O
: The ISEE-3 data base contains a much larger fraction of short
duration (6 I s) splke-llke events than do previous experiments.
Estimates of the spectral hardness of these events were obtained by
calculating the ratios of the peak counting rates of the two ISEE-3
detectors. These events are similar temporally and spectrally to the
very intense 5 HAR 79 burst and other KONUS splke-llke bursts.
Probability analysis and comparison of ISEE-3"s unique burst triggering
mechanism with conventional experiments (KONUS) indicates that the
ISEE-3 data base more accurately represents the true proportion ofi!
i spike-llke bursts ( _ 33%) than do previous experiments.
!
i In chapter V the HXRBS spectral analysis is presented. Only events
!which were observed close enough to the center of the detector field-of-
view for the shleld-processed contribution to be negligible were
analyzed i- detail. Three relatively large events meL this criterion,
the bu, sta of 19 APR BO, 21APR 80, and 01 MAR 81. In the April events,
' depressions below an exponential model continuum are evident at snergies
40 to 60 keV.
Three spectral forms are found to fit the data equally
satisfactorily in some cases: thin thermal bremsstrahlung, thin thermal
synchrotron, and power-law with exponential tail. Determination of the
correct radiative mechanism(s) cannot be made from the fitting analysis
alone with existing observations.
For the thermal bremsstrahlung and thermal synchrotron models,
inclusion of broad low-energy absorption lines is required for some
spectral intervals in order to adequately fit the low-energy portions of
the spectra.
1983022079-051
31 !For the 19 APR 80 event ( _ 4 s duration), both the continuum and
the low-energy depression evolve on a time scale _i/4s. The event as a
whole exhibits hard-to-soft evolution. A tendency for the rising
i•portion of pulses to be spectrally harder than the decaying portions is
found. The 21 APR 80 event ( _ 20 s duration) exhibits soft-to-hard
evolution. The low-energy depres_[on persists throughout the event.
In chapter VIa self-consistent interpretation of the results of i
this work combined with the discoveries of previous investigations is
attempted. From the available evidence, it is concluded that the
sources of spike-like and the longer "classical" y-ray bursts are
probably slowly rotating neutron stars located at distances of a few
hundred parsecs. However, the burst mechanisms for the two classes of
bursts probably differ. Thermal synchrotron radiation is shown to be
the most self-consistent and viable energy-loss process for _-ray
bursts.
The reality of absorption features is examined. The possibility of
explaining these features as artifacts of spectral evolution due to I)
low-energy synchrotron cutoffs, or 2) source self-absorption is
discussed. If the burst sources are within a few hundred parsecs, then
the source region is optically thin, and the low-energy features may be
the result of accumulating spectra for intervals longer than the time
scale of rapidly evolving low-energy cutoffs.
The most extensive y-ray burst data base available is the published
results from the KONUS experiment. Event durations and peak Intensltes
were measured from the KONU$ catalog. Also, thermal bremsstrahlung and
thermal synchrotron models were f_t to the spectral data. These data
are assembled in Appendix [ for reference In the main text.
1983022079-052
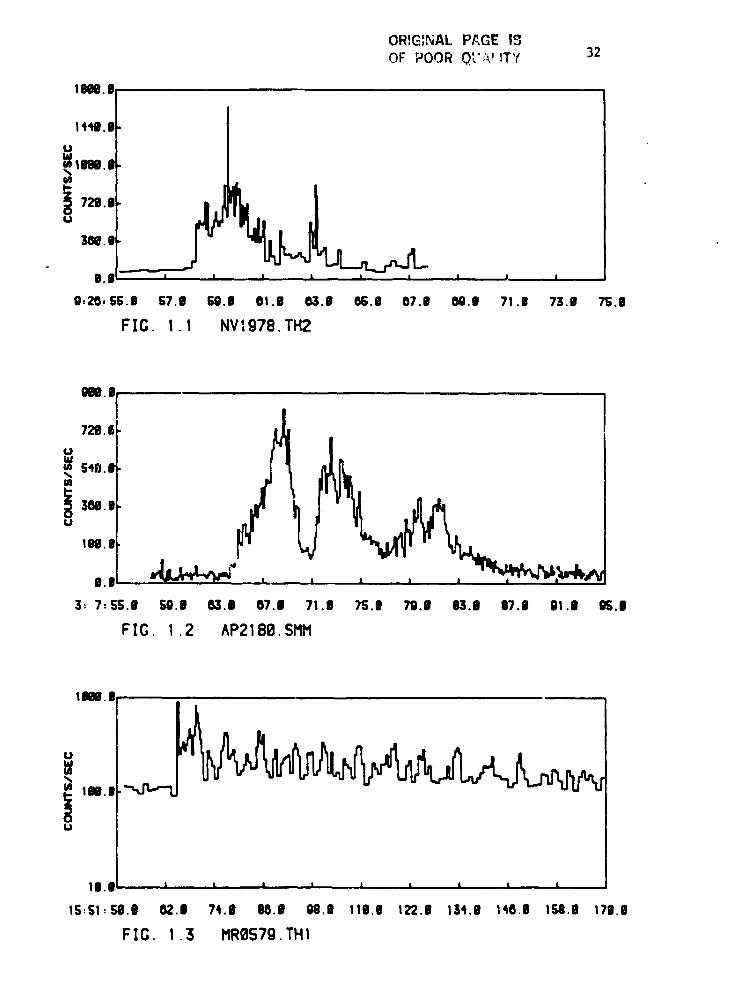
ORZG:NAL PAGE IgOF _JOORQt';d !TY 32
10m. ¢!
1440.ll_
_ IIW.IIN
_IW.|
il.il i i i i , i i i p i
0,20, Sg.il G7.9 ig.I 01.il 03.il OG.il 07.0 OG.II 71.il 73.0 7g.O
FIG. 1 . 1 NV1978. TH2
OW.O
72B.1_
_ S4fJ. |
! 300.1
i 100.0
3: 7: SS,il 50.| 03.0 07.l 71.0 7'S.O 79.| 03.| 07.0 OI .O OS.O
F I G. 1 .2 ^P2180. SMH
Im.|
,, i lOO.II[.-"_.; tO.O i L I i i i I i I15:St:SO.O 62.0 74.0 OO.il 98.0 110.8 122.0 134,ij 146.0 158.9 170.0
F !C. 1 . 3 HRgS7g . TH1
t
1983022079-053
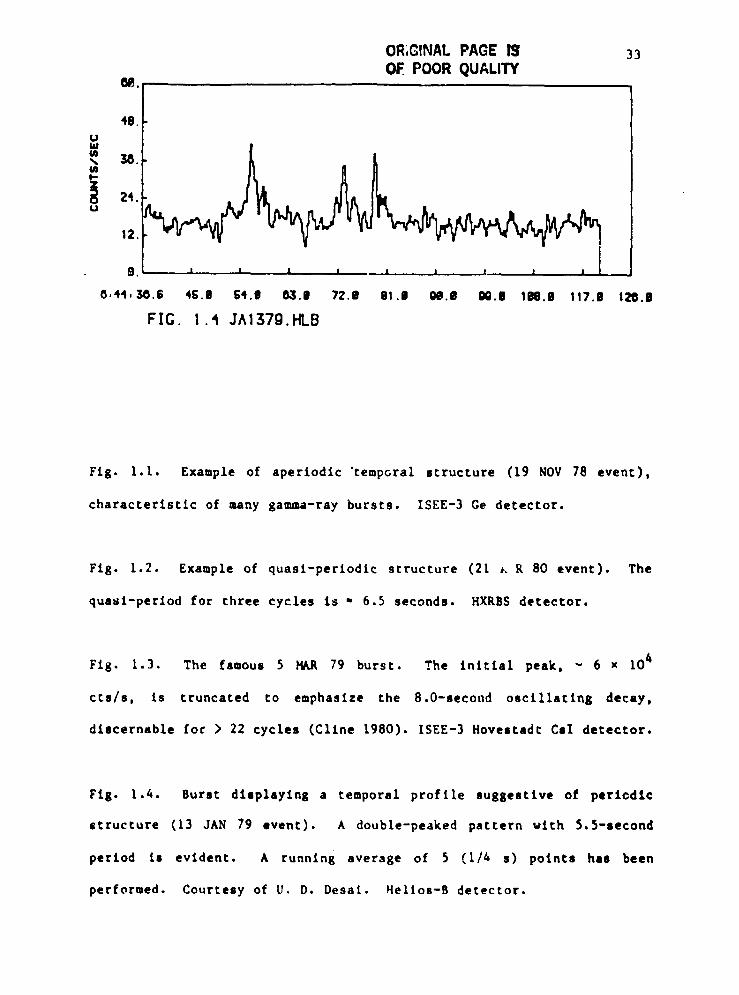
OR;GINALPAGE IS 33OF POOR QUALITY
e_.
48
211
_ 12. I " I i8.L ! I I i A l I I _ |
0,44,30.6 45.8 G4.1I 03.8 72.0 81.8 00.8 00.8 108.8 117.8 120.1
FIG 1 4 JA137g. HLB
Fig. 1.1. Example of aperiodic 'tempGral structure (19 NOV 78 event),
characteristic of many gamma-ray bursts. ISEE-3 Ge detector.
Fig. 1.2. Example of quasi-periodic structure (21 ,, g 80 event). The
quasi-period for three cycles is = 6.5 seconds. HXRBS detector.
Fig. 1.3. The famoua 5 MAR 79 burst. The initial peak, - 6 x 10⁴
cts/s, is truncated to emphasize the 8.0-second oscillating decay,
discernable for > 22 cycles (Cltne 1980). ISEE-3 HovestadC CsI detector.
Fig. 1.4. Burst dlsplaylng a temporal profile suggestive of pericdlc
structure (13 JAN 79 event). A double-peaked pattern with 5.5-second
period is evident. A running average of 5 (1/4 s) points hal been
performed. Courtesy of U, D. Desai. Helios-B detector.
1983022079-054
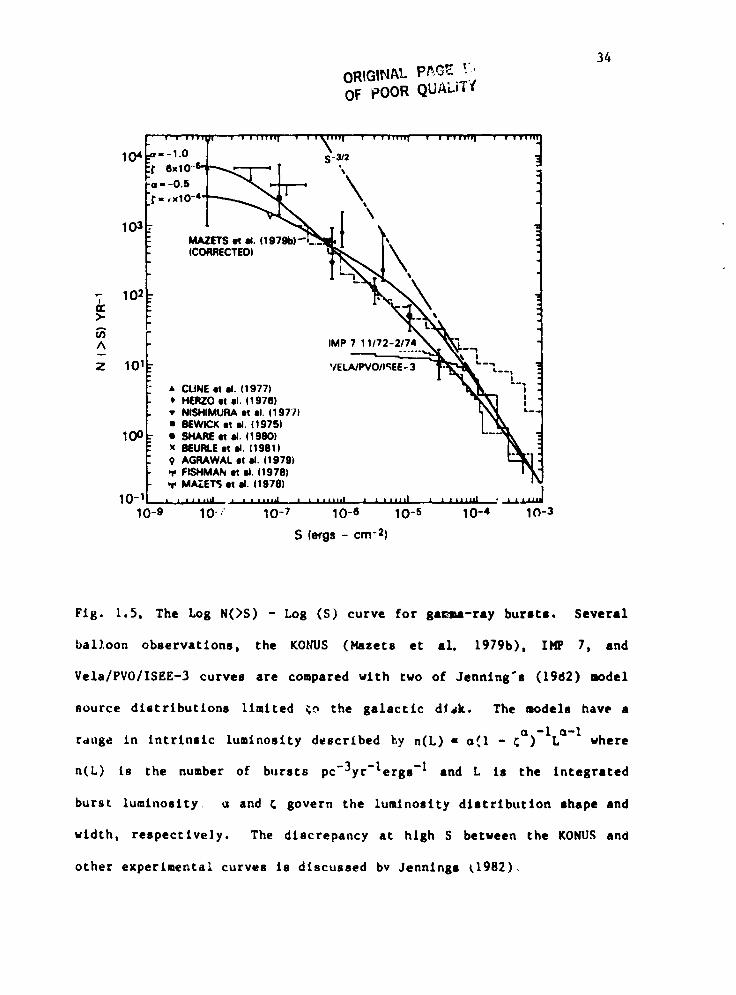
34
ORIG|_IAL P/_G,_ UOF POOR QUALiT/'
104 - 1.0 S-_/2
_=,=-O.6\,x10-4"
\MAZETS et el. 11979t(CORRECTED)
-_ 102>-
03A IMP 7 11172-2174v IZ 101 VELAIPVOII(;EE_3 L._.,Q'--_t
L-,• CLINE et el (1977)0 HERZO et el (1976)• NISHIMURA et el (1971)• BEWICK st =l (1975)
10 0 • SHARE et el. (1900)x BEURLE•t el (1981)9 AGRAWAL •t al (1979)
FISHMAN et el. (1978)'r MAZETS et I_. (1978) t
10-1 = ,,.,,,_ j ...... ., ........ = • =,,,,,I , ,,,,,.l ',..LL,=.._10-9 10" :" 10 -7 10-6 10-5 10-4 10-3
S (ergs - ca-2)
Fig. 1.5. The Log N(>S) - Log (S) curve for samBa-ray bursts. Several
balloon observations, the KONUS (Hazers et al. 1979b), IHP 7, and
Vela/PVO/1SEE-3 curves are compared with two of Jenntng's (19d2) model
source distributions limited to the galactic df_k. The models have a
ra.ge in intrinsic luminosity described _y n(L) • a_l - _a)-lLa-I where
n(L) is the number of bi:rsts pc-3yr-lergs -I and L is the integratedi
burst luminosity. _ and E govern the luminosity distribution shape and
width, respectively. The discrepancy at high 5 between the KONUS and
other experimental curves is discussed by Jennings t1982),
L
1983022079-055
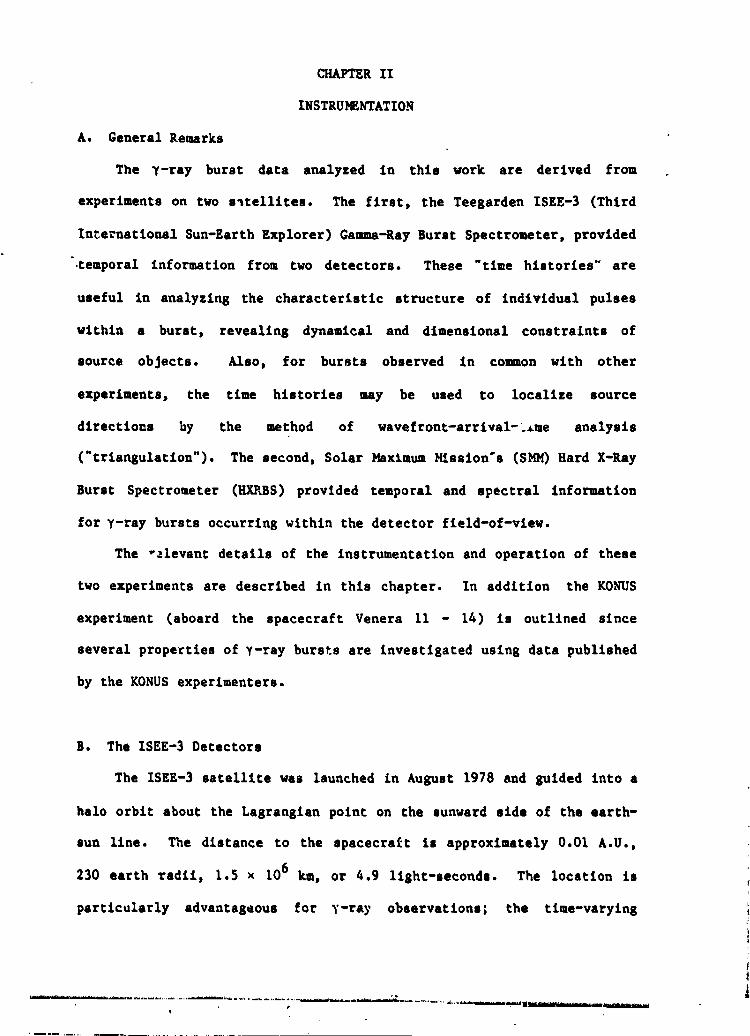
, 1:l CHAPTER II
_f INSTRUMEFrATION
'| A. General Remerks
experiments on two s_tellites. The first, the Teegarden ISEE-3 (Third
.International Sun-Earth Explorer) Gamma-Ray Burst Spectrometer, provided 1 :•temporal information from two detectors. These "time histories _ are
useful in analyzing the characteristic structure of individual pulses {
within a burst, revealing dynamical and dimensional constraints of
source objects. Also, for bursts observed in common with other
experiments, the time histories may be used to localize source
I directions by the method of wavefront-arrival-;_me analysis
_:' ('triangulation'). The second, Solar Haxtmum b_sston°s (SMM) Hard X-Ray
Burst Spectrometer (HX/_BS) provided temporal and spectral information
for y-ray bursts occurring within the detector field-of-view.
.i+ The -_levant details of the instrumentation and operation of theseI
two experiments are described in this chapter. In addition the KONUS :
! experiment (aboard the spacecraft Venera 11 - 14) is outlined since _
_ several properties of y-ray bursts are investigated using data published
by the KONUS experimenters.
'L. i
B. The ISEE-3 Detectors !
The ISEE-3 satellite was launched in August 1978 and guided Into a }
halo orbit about the Lagrangian point on the sunward side o_ the earth-
sun line. The distance to the spacecraft is approximately 0.01 A.U.,
230 earth radii, 1.5 x 10⁶ km, or 4.9 light-seconds. The location is _
particularly advantageous for _-ray observations; the time-varying
?
i
II
1983022079-056
36
exposure to trapped pertlcle radletlon wi_hln the magnetosphere and the
earth-•lbedo problem are completely •voided. The light-travel time to
thc earth affords y-ray buret localization In conjunction with e•rth-
_rbltlng ot•tlone with •ccur•clee - (6t/_.9) r•diane, where At (s) is
the finest temporal feature of high statistical weight within the
burst. The spacecraft Is spln-st•bllzed vlth • period of about 3 s.
The spin axle is aligned vlth the ecllptlc poles.
The Teegarden experiment (Teesarden et el. 1978) is a "piggyback"
to the Hovestadt Low-energy Charged Particle experiment. The intended
purpose of the y-ray burst experiment was to search for narrow y-ray
lines in y-ray bursts. For two events spectral information was recorded
(Teegarden and Cline 1980). Subsequently, an electronic malfunction
rendered the spectral memory inoperative. The time history memorles
were unaffected.
Primarily, three detectors contributed to the Teegarden
experiment. One high-purity Ce and one CeI scintillator detector
continue to operate. A second CeI detector, the shield for a particle
detector experiment, was found to be too sensitive to charged
particles. Due to the detector°e large effective area, single high-
energy particles very frequently impinged on the detector. The
resulting light scintillations were large enough to frequently trigger
the burst recordin 8 electronics, simulating true epiks-Ilke events. The
detector was therefore not used in collection of data. •
i. The Germanlum Detector
The C_ spectrometer Is recessed within the lower body of the
spacecraft (Figure 2.1). Its axis Is approximately aligned with the
1983022079-057
L
ORIGIHAL "'"..... -'OF POOR QUALITY
37
spacecraft spln axis. The detector is housed within two nested
radlatlveiy-cooled stages (Fl_ure 2.2). The cooler stages were designed
so that as the detector progressed to thermal _qulllbrlum, the inner and
outer stages separated leaving the inner stage and sensor thermally
isolated from the spacecraft. The o_ter stage is conically shaped to
define a 126° (thermal) fleld-of-vlew for the inner stage. The field-
: of-view does not contain the sun, earth, or any significant portion of
the spacecraft. The inner stage was predicted to reach an equilibrium
temperature of i00 K whereas the actual cperatlng temperature is about
130 K.
The spectrometer was the first hlgh resolution Ge detector
dedicated Lo astrophysical observations to be flown on a satellite. The
crystal Is relatively small compared to scintillators. However, in
pr[nclple, the use of hlgh-purlty germanium (i part In 1013 impurities)
permits the attainment of unprecedented energy resolution at y-ray
energies ( _ 3 keV at I HeV). The detector crystal is p-type co-axlal
hlgh-purity germanium, 4 cm diameter x 3 cm depth, wlth an active volume
of 33 cm3. The crystal possesses a dead layer of approximately uniform
thickness, 0.7 mm, (cf. Figure 3.3, Chapter III). The dead layer is
necessary to make electrical contact to the crystal, y-rays with
energies less than _ 70 keV interact within this outermost portion of
the crystal, and are not detected. An electric field bias applied toe
_i _ the crystal does not pervade the dead layer; hence, the charged
photolonlzatlon by-products of the y-ray interaction are not collected
from the dead layer. The lower and upper energy thresholds for analysis
of an energy deposition eyelet are adjustable by command. The thresholds
.................IIIIIln...........................Iii....................................,........................_._....................................................................,A
Ii p
1983022079-058
, OF POOR QL::,: _Y 38
< for the Ge detector have been - 105 keV and - 6.5 MeV, respectively,J
+, during most of the lifetime of the experiment.
+ Although the ISEE-3 spectral information is no longer transmitted,
it is of general interest to note the history of the detector energy
resolution. In section B.ili of this chapter the background and trigger
modes of operation are described. In the background mode, pulse height
"analysis (PHA) data were collected in order to obtain upper limits on
the variability of the cosmic 511-key flux (Norris, Cline, and Teegerden
1982). To measure the llne flux it was necessary to know both the
channel/energy (gain) relationship and energy resolution as a function
of time. An onboard 207BI source provided two calibration lines at 570
and 1064 keV. In a plot of the width of the 570 keV line versus time
(Figure 2.3), significant deterioration of the resolution is seen to
have occurred in the first 600 days of operation. The 570 keV llne
broadened from an initial _ 8 keV to _ 50 keV (the predicted operating
temperature, and corresponding optimum resolution of 3.5 keV, were never
reached). The relative magnitudes of the gain and resolution changes
observed are consistent with • decreasing charge collection efficiency,
evidently caused by detector radiation damage from high-energy charged
part'cles and f_st neutrons.
The position and alignment of the Ge detector make it particularly
sui_aDle for recording y-ray burst time histories on a spinning
platform. At energies greater than 100 keV, the effect of spin
mo_uletlon is negligible for bursts arriving from the southern ecliptic
hemisphere; the cooler stages and spacecraft well into which the
spectrometer is recessed are virtually transparent (Figure 2.1). For
i
qt _ I" m _+ -+_+,+,,q .++ q__,+g, mllq_T.,.,_,_llqpMl _ .... _.+ ......... +.+ ..... +-_L---., .... +.-. _++._+._j_.+R,.-_, ._ _
198:3022079-059
i! OF POORQU,,=,Ii_ arrival dlrec_i_ns from the northern ecliptic hemisphere the spacecraft 1
;_ mass attentuates the burst flux significantly. _
_I For a detailed treatment of y-ray detection systems, see Applied I
Gamma-Ray Spectrometry (Adams and Dams 1970). For a complete j
j description of radiations interacting with matter the reader is referred i
to Nuclei and Particles (Segre 1977). In Chapter III th_ details of ;
"simulating the geometrical configuration and physics of the Ge and HXRBS i
detectors by the Monte Carlo technique are discussed.
li. The Cesium Iodide Detector
_. The operational CsI detector was designed and incorporated into the
spacecraft by the collaborating Max Planck Institute (MPI) group. The
i=! 3.65 cm diameter x 1.98 cm depth crystal (Figure ?.4) is viewed by a PMT
(photomultipller tube). The PMT collects the scint_llatlon light from
, by-products of the y-ray interaction in the crystal. The MPI
bursts. The energy resolution of scintillators is much worse than that
of high-purity Ge detectors (AE/E at I00 keV is typically 0.15 - 0.18
for a small crystal).
I The low and high energy thresholds for the CsI detector are _ 70
keY and _ 1 MeV, respectively. The CsI detector is therefore sensitive
to the hard X-ray photons from 70 to 105 keV to which the Ce electronlcs!
do not respond. Since the y-ray background and solar flare spectra are
essentially monotonically decreasing with energy, the CsI detector sees
higher statistical fluctuations than the Ge datector, y-ray bursts
manifest significant portions of their energy in photons harder than I00
keV. Also, as mentioned before, scintillators are senslti,_ to high-
1983022079-060
40
energy charged particles. For these reasons, the Ge detector was
finally selected as the one which would provide the least false triggers
due to statistical fluctuations In the y-ray background, or "burst
simulations" caused by charged particles.
The CsI detector Is located on the periphery of the spinning
spacecraft (Figure 2.1). The hard X-ray photons to which it Is most
.sensitive are nearly completely absorbed by the spacecraft mass when
incident from > 90 ° (azimuth) from the detector fleld-of-vlew. Bence,
the CsI tlme histories are spln-modulaeed. In Figure 2.5 the fracelonal
transmission versus phase Is plotted for a typical solar hard X-ray
burst (Feb. 8, 1980). Thirteen cycles of the relatlvely constant-rate
event were normalized relative to the most intense cycle and summed to
produce the modulation curve. Each cycle displayed qualitatively
similar features. The "slde-lobe" peaks at 90 ° end 270 ° ere due to
effective holes in the arrangement of adjacent masses at the periphery
of the spacecraft. The modulation limits the usefulness of CsI time
histories to essentially demarcating the onset and cessation of a burst
if indeed the burst is longer than a spin cycle.
Since the two detectors have different lo_r-energy thresholds, the
ratio of Ge-detector to CsI-decector count rates (during unmodulated
portions of the spin cycle) provides a relative measure of spectral
hardness of ISEE-3 events.
t11. Data Collection and Nodes of Operation
Since the experiment was allocated a very low data transmtssiots
race (1.5 bits s'l), and the burst information is stored in a 100
....t._._ "_
I
1983022079-061
T
41
kilobit memory, the tlme to transmit the time history memory contents to
the ground is apvroximately ten hours.
Each detector event is PHA'ed by a 4096 channel analog-to-dlgltal
converter (ADC) and tlme-tagged by vernlered clock counters. That is,
individual events within sets of nine are labelled with a tlme-offset
from a long term clock. This method reduces the number of bits
• necessary to record the time of an event. The absolute time of each
event is determined by adding the indivldual offset to the long term
clock; the clock time is then related to UTC. The total PHA count rate
Is registered by counting the clock pulses necessary for an event
counter to overflow. The clock frequency (FT) and event overflow values
(N) are command adjustable by factors of 2 within limits. The most
often used frequency has been 1024 Hz with an overflo_ count of 32. A
small clrculatlng memory records the event information.
The trigger clrcult is an adjustable clock pulse counter. When the
current accumulation of clock pulses per N events is less than the
trigger value (TR), that is, when
Event Rate ) N(FT/TR) = N/At, (2.1)
a trigger occurs. The clrculating memory freezes, preserving the time
history interval immediately prior to the trigger. Slmultaneously,
recording of burst information is transferred to the larger static •
memory. A schematic of the data flow is shown in Figure 2.6.
During the mission the trigger value had usually been set at 95
clock pulses which for N = 32 corresponds to a trigger threshold of 345
cts/s. The false trigger rate due to statistical fluctuations isI
1983022079-062
42
extremely sensitive to the trlgger setting. In July 1981 I noticed
that, assuming Polsson s,:atlstlcs, a false trigger due to statlstlcal
fluctuations would occur on the average once In _ 25 years for TR =
95. A new value for TR of 128 (rate = 256 cts/s) was calculated to glve
an acceptable false trlgger rate of once per month. Since the threshold
was lowered, a few events have been detected which otherwise would not
have triggered the experiment.
The Instrument also records the Ge low and hlgh threshold rates as
well as the Csl low threshold rate. These rates glve a measure of the
y-ray background.
In the absence of a burst trigger, the experiment operates In the
background mode, PHA'Ing about 1 photon of 550 incident on the Ge
detector. A small buffer (36 events) fills up very quickly, _cceedlng
events are lgnored, and the background buffer ls emptied Into the
telemetry stream periodically. The background PHA data transmission was
unaffected by the failure of the burst spectral memory. Background data
continued to be transmitted regularly until July 1981 at which tlme new
satellites began to preempt receiving time.
iv. Sensitivity
From September 1978 to July 1982 the GE detector triggered on 24
-Iy-ray bursts, or about 6 y-ray bursts yr . This relatively low
tdetection rate is a consequence of the small detector area. The
instantaneous flux required to trigger may be roughly calculsted by
assuming an incident two power law photon spectrum for s typlcal y-ray
burst: = E-I'5 for E < 200 keV and = E-2"5 for E > 200 keV. From Honte
Carlo s_mulations it was determined that incident photon po_er laws are
......... w-,,--e,-w,-,--- .................................... -, .......... ,',:-_--_,'e'". "_qmw_m'mm_'''_" "_ _ - _ ._."'"" '' -_f _"- -
1983022079-063
!
i
43 itransformed into detector count spectra that are also power laws with j
the shift in spectral index rottghly constant (Figure 2.7). Utillzlng !
the simulation tranformations and a Ge detector cross section of 12.5
cm2, one obtains a required instantaneous flux of about 1.2 x 10 -5 erg
cm-2s -I for a detector trigger threshold of 256 cts s"I.
"C. The Hard X-Ray Burst Spectrometer i
The RXRbS experiment (Orwlg, Frost, and Dennis 1979) was flown on
Solar Maximum Mission, a coordinated satellite designed to investigate
solar phenomena during the recent maximum in the sun's activity. The
/
S_ is in a nearly circular earth orbit at an altitude of 530 km with a
period of 95 minutes and inclination to the earth's equator of 28.5°.
The RXRBS°s primary objective is to study solar X-ray flare events
in the energy regime 20 keV to i HeV with significantly better absolute
time resolution (as short as I ms) than prevlously achieved. The
experiment makes continuous measurements of th_ energy-loss spectrum of
detector events with a time resolution of 12B ms. The instrument is
ideal for observing the hard X-ray/low-energy y-ray portion of y-ray
burst spectra.
i. Detector System
The I-IXRBS sensitive elements consist of a central disk-shaped
Csl(Na) crystal and a surrounding can-shaped Csl(Na) antl-colncldence
shield (Figure 2.8). Fifteen-channel energy spectra are obtained from
the central detector. The shield is designed as a collimator for
viewing the sun. It strongly attentuates the photon and charged
particle fluxes from d_rectlons other than the 40° FNIIM solar
=' vr
1983022079-064
i: 44.J
aperture. Also, the shield is operated in antlcolncldence with the
detector so that only events which are seen in the detector, but not
also in the shield, are PHA'ed and included in the detector count
., rate. The shield and detector are each viewed by four P_T'a. An
additional charged-partlcle detector monitors the particle flux and
- averts damage to the PHT's during periods of high flux (e.g., during
"passage through the South Atlantic Anomaly) by temporarily turning off
the PMThigh voltage.J
• The detector dimensions are 4.67 cm radius x 0.635 cm depth, the
sensitive area, 68.6 cm2. A detector dead layer of thickness _ 0.13 mm
and 0.14 g ca -2 of aluminum above the detector reduce the efficiency of
photon detection for energies below 30 keV. The aluminum absorbing ':
material serves to attentuate the large flux of soft X-rays which would '
otherwise cause pulse pile-up effects. Details of the detector response
are developed in Chapter III.
Pre-launch measurements of the energy resolution indicated 30Z F_n4ML
at 122 keV whereas the operational resolution is found to be described
by the relation F_n4M - 1.76(E'75), with E and FWHMin keV (Orwig,
private comm.). The actual in-flight resolution is _ 53Z at 122 keV.
The degradation in resoluti = is probably the result of some degree of
decoupling of the PHr assembly from the detector crystal.
For flares which exceed count rates of - 104 cts s -I, corrections
to the spectra must be applied to account for pulse pile-up effects.
Pulse pile-up refers to counts spilling into a higher energy channel
from a lower energy channel when the count rate is high enough that
randomly coincident small pulses add together and masquerade as large
pulses. The spectrum is thereby distorted. So far, the largest _-ray
1983022079-065
45
burst seen in the HXRBS fleld-of-vlew briefly attained a count rate of
3000 cts s -1. _-ray bursts have slgnlflcantly harder spectra than solar
flares; hence for _-ray bursts the counts are distributed towards higher
channels than for flares. Consequently, pulse pile-up is not forseen as
a problem for 7-ray bursts.
The shield dimensions are 4.92 cm inner radius, 8.09 cm outer
.radius x 24.75 ca length, with a bottom thickness of 3.17 ca. The
shield operates at a lower discriminator threshold of about 200 keV.
All events which exceed the 200 keV shleld threshold and which also
interact in the detector are vetoed. The 200 keV threshold is not
sharply defined sln_e the efficiency of the PMT's llght collection is a
function of the region of interaction of the incident photon. The P_'s
are positioned at the top of the shield (Figure 2.8); hence the
effective threshold for antlcolncldence is lowest for incident
directions near the field-of-vlew.
In-flight detector gain calibration is achieved by monitoring the
59.6 key X-ray line from an 241Am source. The source decays by emitting
a 5 MeV alpha particle and a 60 keV X-ray. The alpha particle is
captured within a plastic scintillator button which is viewed by a
PMT. A coincidence between the 5 _V light pulse and a detector event
(the 60 key X-ray) generates a calibration tag for the event. In Figure
2.9 the history of the gain over the mission's first 800 days is
plotted. The scatter is attributable to the difficult task of fitting a
8aussian line to the small number of points ( _ 3) comprising the line
in the calibration spectrum. During a short period (March 1981) the
experiment was in a low gain state with the highest channel _ 1.3 MeV.
The 511-keV annihilation line was measured at that time and its positionI
L -'"
1983022079-066
46
was in good agreement with the gain relationship computed from the 241Aa
source (Orvig, private comm.). Two 241Am sources are used in an
identical manner to calibrate the shleZd threshold level. Integral
spectra with increasing low thresholds are acculmlated in adjacent time
periods; these spectra are differenced to generate a differential
calibration spectrum for the shield_
It is estimated that y-ray bursts with fluxes _ 10-8 erg cm-2 s"1
shouZd be detectabZe with the HXRBS, However, only for those bursts
which directly illuminate the detector, i.e. near or within the 40°
FWHMfield-of-view, are spectra obtained which are not substantially
contaminated by the shield-processed contribution. A 60° fulZ-width-
quarter-maximum field-of-view is approximsteZy 1/24 of the sky. With a
50% duty cycle (the SH_ views the earth at night), about 1 y ray burst
in 40 is seen in the detector FWQHfield-of-view,
li. Data Collection
The HXRBScontinuously monitors the hard X-ray fZux received in the
central detector with a time resolution of 128 me. The shield count
rate is accumulated every 64 ms. The experiment live time ( _ 95%) is
obtained by counting 500 kHz clock pulses during periods when the
detector is cepable of registering an event. Detector spectra are
PHA'ed by a 15 channel ADC. In princlple, spectra are produceable at
the time resoZution of the experiment. The current and most often used
gain state for the 15 channel ADC corresponds to the energy regime 30 to
550 keY.
A 32768-byte memory can store time history information vlth a
resolution as fine as I ms. This memory is used to study fast X-ray
1983022079-067
47
solar phenomena. At night the memory wy be set to trigger on shield
rate increases in order to record any y-ray bursts which may occur.
Five data rates are aiso recorded on a longer time scale (16 s).
These are I) total PHA counts, 2) counts in channel 2, a sensitive \
indicator for solar flares, 3) counts above the detector lower
threshold, 4) shield counts, and 5) counts in the charged particle
"detEctor.
i
D. The KONUS Experiment
The Leningrad group has flown the very successful KONUS y-ray b,_rst
experiment on four Venera spacecraft (11 - 14). The spacecraft were
launched in pairs, Venera II and 12 iv September 1978, and Venera 13 and
14 in Nnvember 1981. The K)NUS experiments were responslble for the
-Iprodigious detection rate of - 150 y-ray bursts yr . Almost half of
the events were crudely localized (uncertainties _ 5 ° ) by a method which
uses the detectors on only one spacecraft. With the events detected by
this experiment the size spectrum has been extended to fluences _ I0 -7
-2erg cm and the distribution of sources has assumed a nearly isotropic
appearance.
From the large number of y-ray bursts detected by the KONUS
experiment a separate class of bursts has been defined with
characteristic durations < 1 s and significantly softer spectra than
classical T-ray bursts. Also, _ 450 key emission features and 30 to 70
keY features, interpreted as cyclotron absorption lines, hsvc been
observed in the KONUS spectra.
The KONUS detector system is designed to have qussi-omnldlrcctional
resvonse (Mazets and Golenetskli t98[). Six large NaI(TI) crystals,
4
1983022079-068
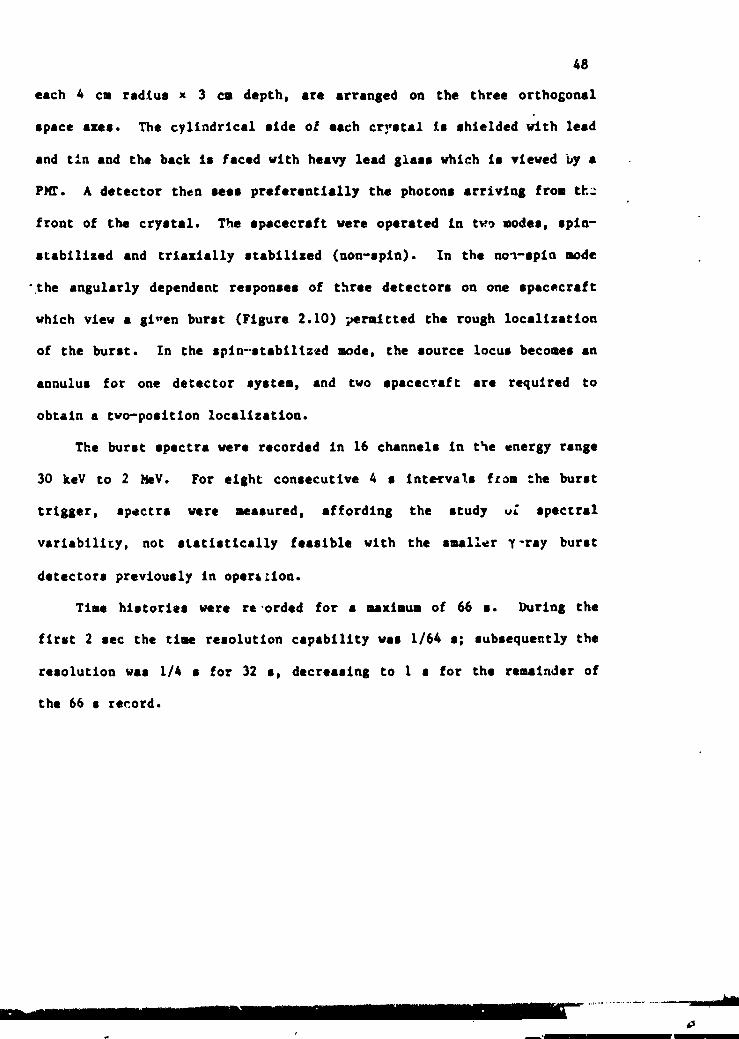
48
each 4 cm radlu• x 3 cm depth_ ere arranged on the three orthoGonsl
• pace axe•. The cyllndrlcal •Ida o[ each cry•tel i• •hlelded wlth lead
and t_n and the back i• faced with heavy lead gla•• vhlch is vleved Dy a
P_fr. A detector then •ca• preferentlaIly the photon• arriving from th;
front of the cry•tel. The •pacecraft were operated tn tw_ mode•, •pin-
• tabillzad and trlaxlally •tabillzed (non-•pln). In the no_-•pln mode
"the angularly dependent re•port•e• of three detector• on one •pacmcraft
which view a Siren bur•t (Figure 2.10) _raltted the rough locallzatlon
of the bur•t. In the •pln-•tsbiltzed mode, the •ource torn• become• an
annulu• for one detector •y•tem, and two •pacecraft ere required to
obtain a two-po•Itlon localization.
The bur•t spectra were recorded in 16 channel• in the energy range
30 key to 2 NeV. For eight con•ecutlve 4 • Inte_val• f_om the burst
trigger, spectra were ma•ured, affording the study v_ spectral
variability, not •tetlatlcally feasible with the •seller y-ray burst
detectors previously in opers_ion.
Time histories were ra,orded for a mxlaum of 66 0. During the
first 2 sac the time re•olutlon capabillty we• 1/64 •; •ubsequently the
resolution was I/4 • for 32 •, decrea•Ing to I • for the reminder of
the 66 • record.
-- iilii .............................. II ................. I ..........i...................................
1983022079-069
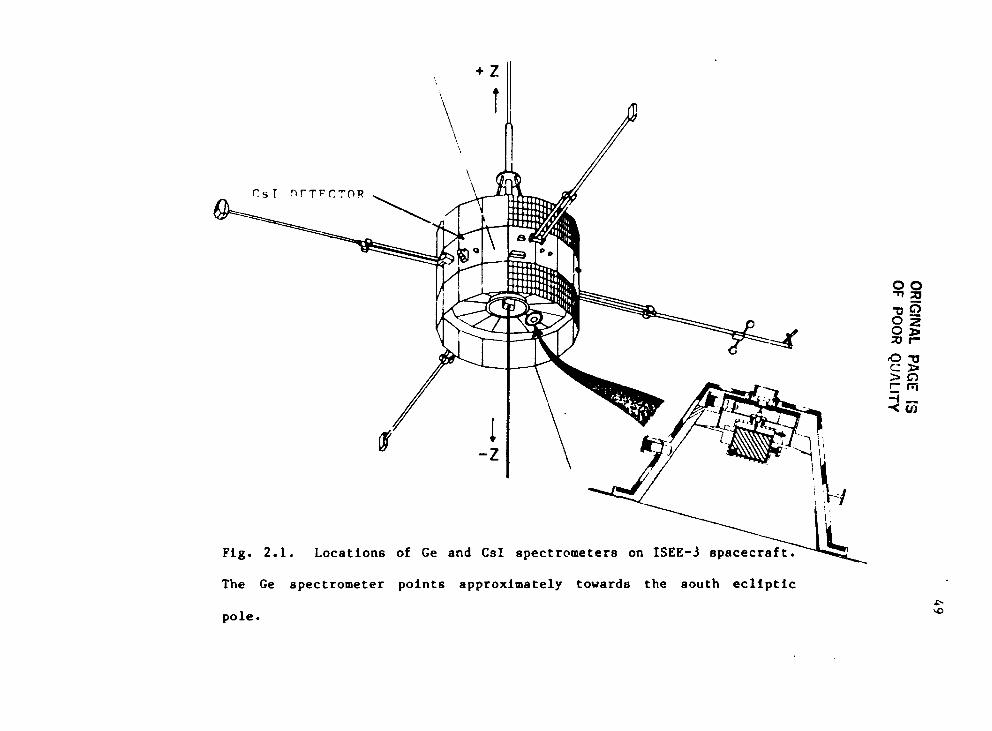
1983022079-070
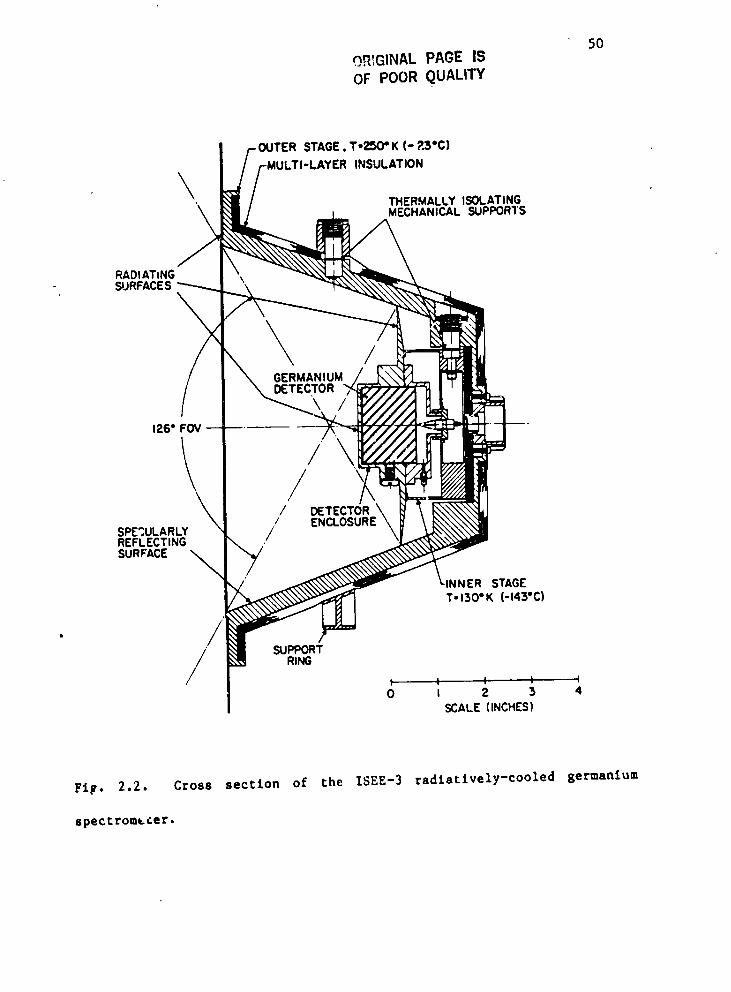
5OO_IGINAL PAGE ISOF POOR QUALITY
STAGE.T'2:50" K (- ?.3*C)INSULATION
\THERMALLYISOLATINGMECHANICALSUPPORTS
RADIATINGSURFACES "
GERMANIUMDETECTOR
126" FOV
// ,
/ DETECTOR/ ENCLOSURE
SPE';ULARLY /REFLECTING
SURFACEINNER STAGET- 130°K (-143"C)
/ SUPPORTRING
t t _- t (0 I 2 3 4
SCALE(INCHES)
FIF. 2.2. Cross section of the ISEE-3 radlattvely-cooled germanium
: spectromLcer,
1983022079-071
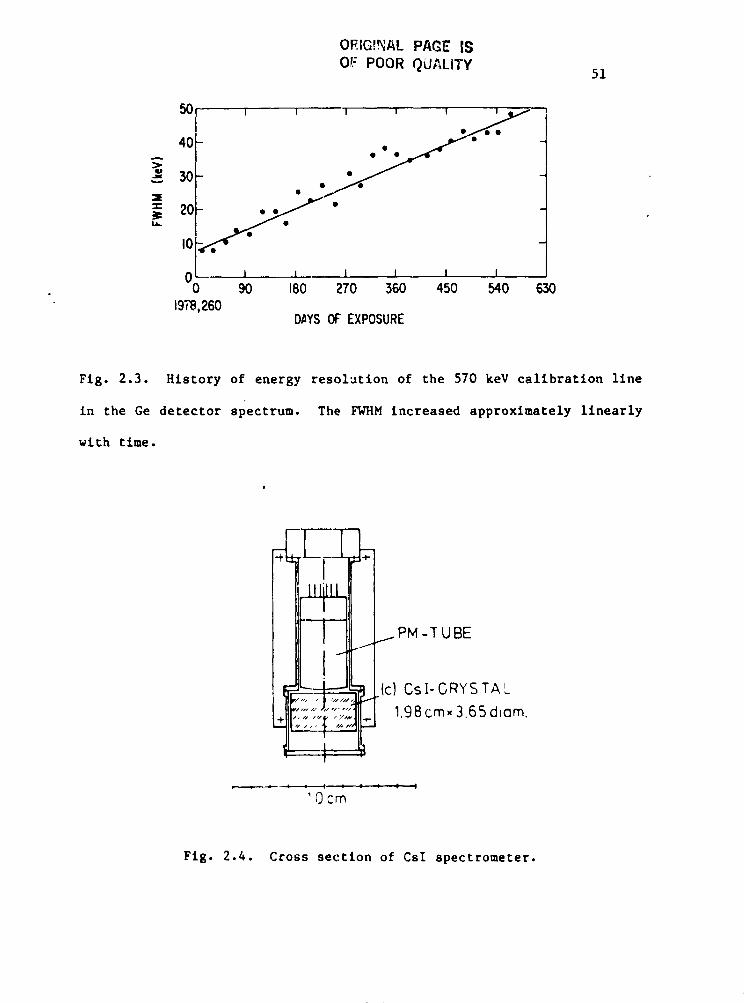
r
O_IG!NAL PAGE IS '_
Of= POOR QUALITY 51 ;,
_.°I ..30b "/
0L_. 1 I 1 I I I0 90 180 270 360 450 540 630
19_,260D_,YSOFEXPOSURE
Fig. 2.3. History of energy resolution of the 570 keV calibration line"r
in the Ge detector spectrum. The FWHM increased approximately linearly
with time.
' PM -TUBE
- Ui _",',,,.:t,;'/,'; (c) CsI-CRYSTAL
__ 1.98crn. 3.65 d_om.1a
'Ocrn
Fig. 2.4. Cross section of CsI spectrometer.
1983022079-072
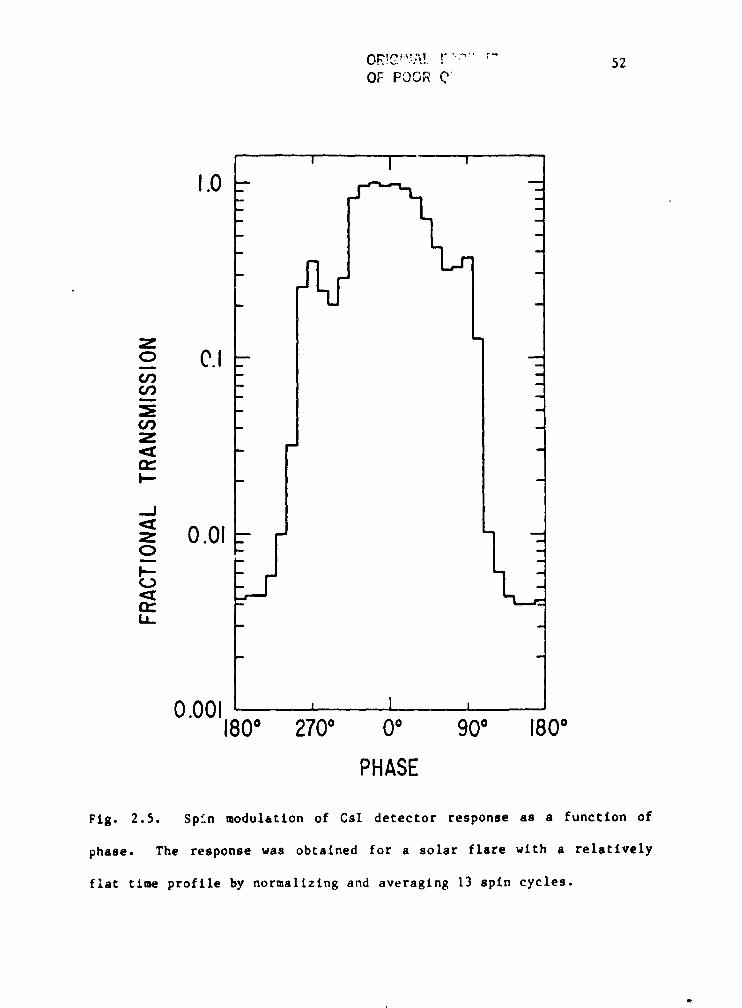
OR!C:'!'.'.':%[F":"'"_- 52OF POOR Q"
' I '
,0- -- 1_ -
Z
_o O.I- =m
-
Z,,:I:
._J
z u.ul-
(1::: -
0.001 , ! ,180° 2700 0° 900 180o
PHASE
Fig. 2.5. Spin modulation of CsI detector response as a function of
phase. The response was obtained for a solar flare with a relatively
flat time profile by normalizing and averaging 13 spln cycles.
1983022079-073
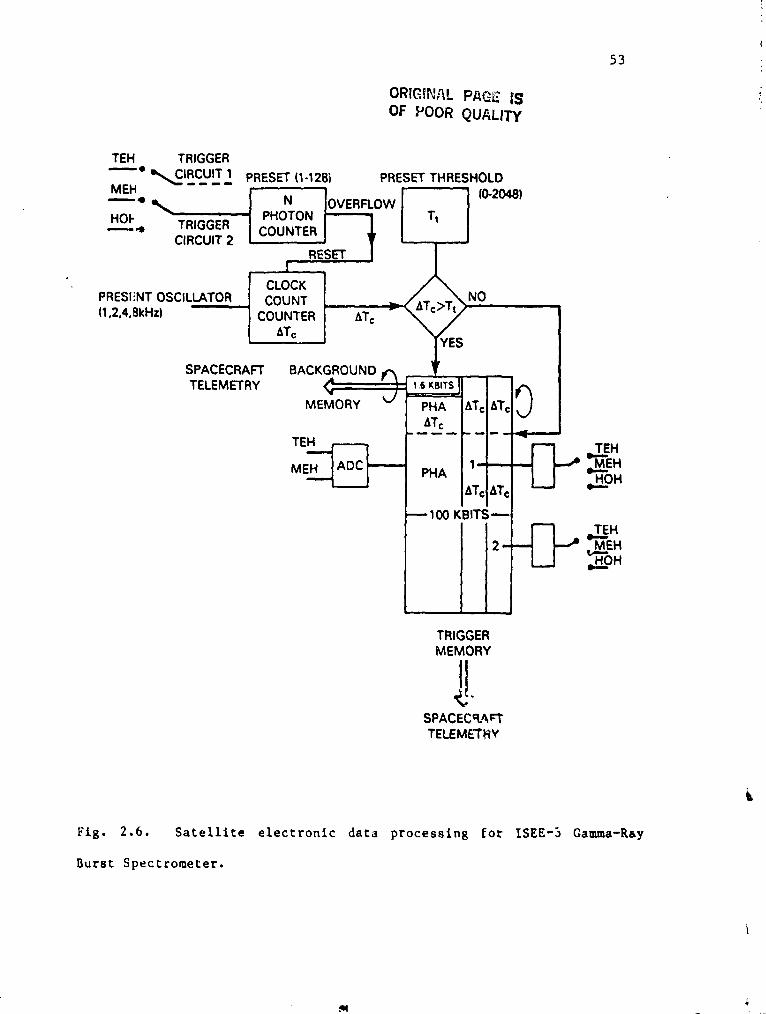
53
ORIGINAL PAGE |9OF POOR QUALITY "
TEH TRIGGER_e CIRCUIT 1.... PRESET(1-128t PRESETTHRESHOLD
M__H."_TR,GGER_--N- IO_ERFLOWI I,I0-20_)PHOTON Tt I
- iI i
CLOCK _T_>_NOPRESENTOSCILLATOR COUNT _,,(1.2,4.BkHz) COUNTER &:rc
&To '
_ESSPACECRAFT BACKGROUND =r_ _,
MEMORY v I PHA &Tc &T¢
ATc --
_"_'EHME_ PHA 1 __.OH&Tc &Tc
i
100 KBITS
2-_ ,,._.MEH,,.__HOH
TRIGGERMEMORY
SPACECOJ_I:'TTELEMETRY
Fig. 2,6. Satellite electronic data processing for ISEE-3 Gamma-R&y
Burst Spectrometer.
1983022079-074
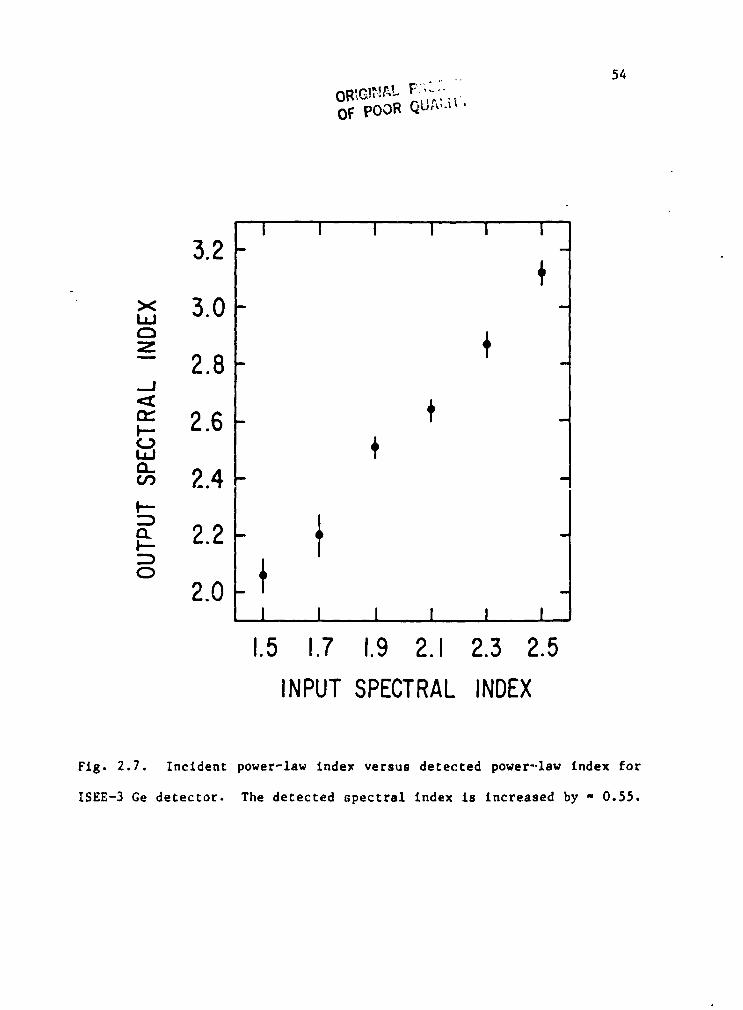
54
] OR.'.C-.],",!P-LF.-....._IP' "" "l
i Oi:poOR Qu,_,._l
i
I I I I I I3.2-
!
x ,,,,-_.n- -C}
- 2.8- -
'J_,_ _: 2.6 - -O_m ..__,.,_- -i--
a 2.2-I--:Z)
° +2.0- -1 I ! I I I
1.5 1.7 1.9 2.1 2.3 2.5
INPUTSPECTRALINDEX
1
: Fig. 2.7. Incident power-law index versus detected power-law index for
': ISEE-3 Ge detector. The detected spectral Index is increased by - 0.55.i
J
iII
I
1983022079-075
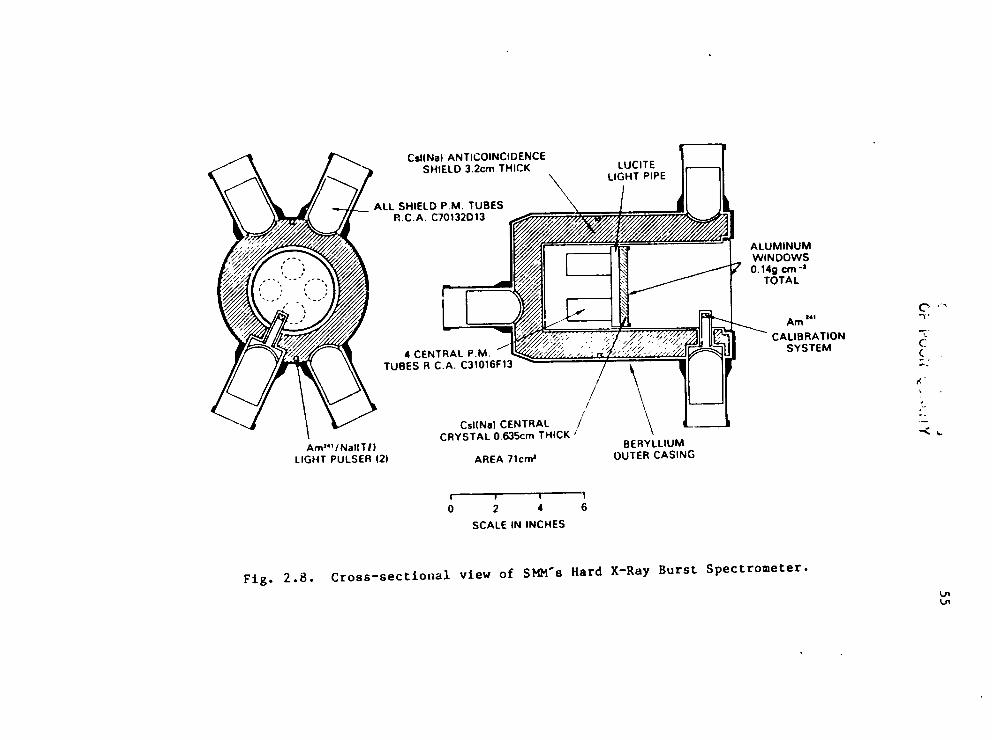
•55
1983022079-076
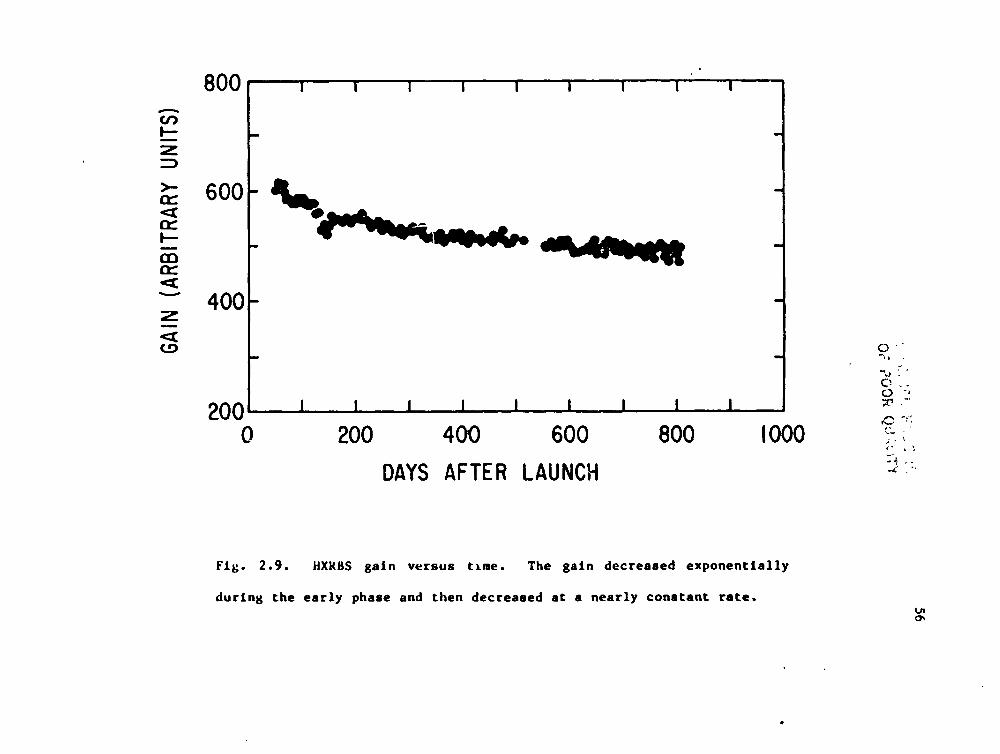
-.(S
ilNn
_,_V_J.IE
]_V)N
IV9
i
"L|
1983022079-077
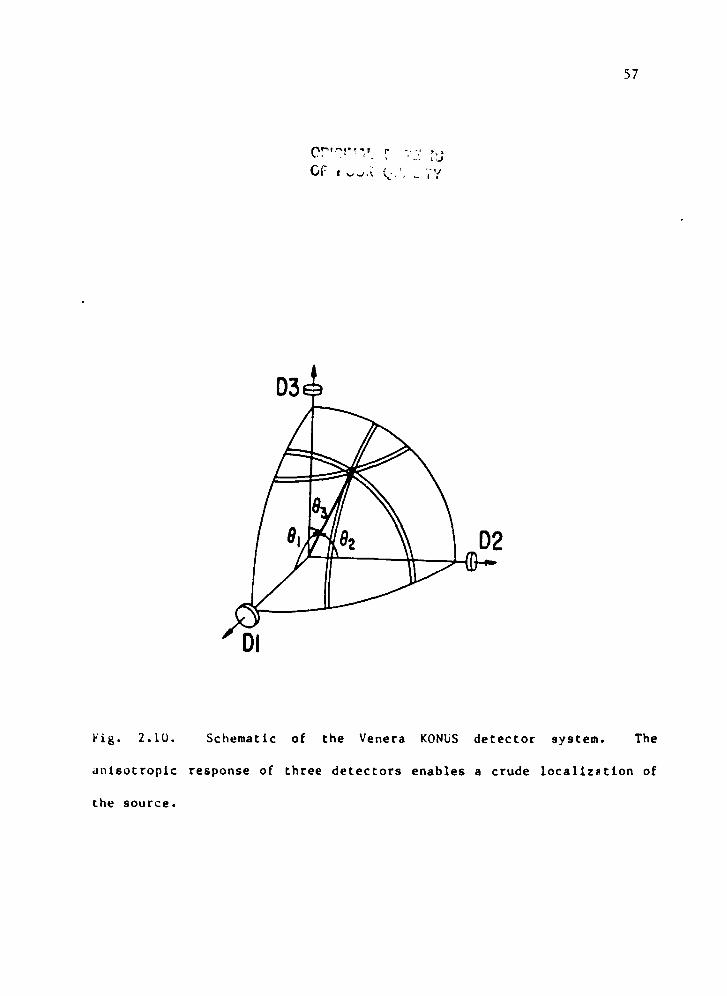
57
Fig. 2.10. Schematic of the Venera KONUS detector system. The
anlsotroptc response of three detectors enables a crude localtzstlon of
the source.
1983022079-078
CHAPTER III
METHODS OF ANALYSIS
A. Introduction
The y-ray burst data used for analysis In the present study are the
count rates within the upper and lower energy thresholds as a function
of time (time histories), available from ISEE-3 and SMM satellites, and
detector count rates within fifteen energy channels (energy spectra),
available from the SMM detector. Reduction of the temporal information
to time histories is a straightforward task. The deconvolutlon of
detector count-rate spectra into incident photon spectra is considerably
more complicated. This process involves several detailed steps,
sometimes Iteratlve. Moreover, the derived incident spectrum is not
unamblgiously unlque_ a fact which will become apparent when the
procedure is described at some length. I describe first toe temporal
analysis and then the method of spectral analysls.
B. Time History Reduction
The computer program package which extracts ISEE-3 y-ray burst
temporal information from the data stream and reduces the information to
recognizable count rates and associated times was created by the
Computer Science Corporation for the Low Energy CaNNa-Ray Group at
Godd.rd Space Flight Center (LEGG/GSFC). The program procedure is amply
described in Chryssa Kouveliotou's Ph.D. thesis (1981). In connection
with temporal information processing, the primary interest is in the
: accuracy of absolute timing for the purpose of triangulating y-ray burst
i source positions in conjunction with data from other spacecraft. The
i initial timing information and satellite positions received for ISEE-3
1983022079-079
t
I 59t
analysis were based on predicted orbital parameters. These predictions
r were thought to be sufficiently different from the true values tot
enlarge the potentially arcminute-sized source error boxes. Therefore,]
the experimenters requested that accurate ex post facto positions and
associated times be published by the ISEE-3 satelllte command after the
burst data are received. It was found that the total error introduced
by using the predicted orbital data rather than the ex post facto data
is much less than the I millisecond resolution limit of the Teegarden
experiment for recording of the temporal information.
The ISEE-3 time histories are produced on an IBM 360/3081. The
time history produced from the raw time interval data is not entirely
chronological due to the order of data in the small pre-trigger
circulating memory. Also, a typical y-ray burst lasts 1 to 60 seconds
whereas the memory contains _ I0 minutes of rate data. I reordered the
IBM-produced time histories chronologically and trimmed the time
histories to include some y-ray background data before and after the
event. For convenience of manipulation and display, the time histories
were then transferred to a PDP 11/70 with a graphics facility.
The SMM time histories are extracted from a nearly continuous
temporal record which fs produced in real time with no complications of
timing predictions. The software procedure is completely described in
an tIXRBS in-house manual entitled "Flare Analysis Procedure User's
Guide" (FLREX). Candidate y-ray bursts are located in the time records
by examination of the five coarse count rates (see chapter II). These#
records are routlnely searched by HXRBS experimenters for solar
flares. Events exhibiting very hard spectra and short dvratlons
(compared to solar flares) usually prove to be y-ray bursts, Eometlmes,
1983022079-080
P 60
information from other y-ray burst experiments provided to the LEGG/GSFC
either confirmed a burst or lead to its discovery in SMMrecords.
For y-ray bursts the duration of the transient is so short that the
background rate is constant for all practical purposes. The background
does vary from event to event however. A background rate was computed
for each event by averaging several rate values In short intervals
: before the onset of a burst and after its subsidence.
C. Energy Spectra Reduction
As with all detector systems which record electroaag,,etic
radiation, the obsecved y-ray energy spectrum is the convolJtton of the
incident energy-loss spectrum with the instrumental response. At
optical frequencie the intensity of detected radiation as a function
of energy, D(v), is related to the incident radiation, I(v), by an
efficiency factor ¢(v);
0(v) - e(v)z(v). (3.1)
Photons incident at an energy hv are either detected at hv or are lost
by the system. At y-ray energies the situatton is more complicated.
For X-ray energies up to _ I00 keV. photoelectric absorption in the
detector crystal !s the pr, domlnant interaction, the efficiency
decreasing with energy. Above the hard X-ray regime, _ 100 keY, Compton
scattering of incident photons to lower energie_ becomes a slgniftcant
effect. Figure 3.1 illustrates the respons_ of s Ge crystal to ani
t incident monoeaergetic beam of photons with energy 662 keY, revealing a t
t Compton continuum at energies below the photopesk incident energy. For
t
-----'- j
1983022079-081
OR_r: ,_L ...... . i_0_" pOOR QUALITY
61
2photons with energies greater than 2m c another interaction channele
, opens_ pair production. Moreover, incident photons may first scatter in
material surrounding the detector and subsequently deposit only a
fraction cf their initial energy in the detector crystal. It is evident
that th_ relation between detected and incident spectra at y-ray
energies must be represented _y a response matrix:
D(v') = ¢(v',v)I(v). (3.2)
For configurations other than the simpliest detector geometries,
analytic functions of the detector response may be greatly improved by
Monte Carlo calculations. For the present analysis s Monte Carlo
approach was utilized to create the detector response matrix.
Generally it is not possible to find a unique inverse matrix,
¢l(v,v'), and thereby perform the multiplicatlon
I(v) - ¢I(v,v')D(v') , (3.3)
completing the task of spectral deconvolution. Instead one is compelled
to select trial incident spectra, multiply these by the detector
response matrix and compare the "detected trial spectrum" with the
data, _he quantlcative comparison is accomplished by a program which
seeks the minimum chisquare parameter for a family of test models by
iterating the multtplicatlon procedure while adJustlng trial incident
spectral values.
The construction of the detector response matrix by the Monte Carlo
method and the spectral fitting program will be described in turn,
1983022079-082
62
D. Computation of Detector Response _trix
t. Monte Carlo Code
In 1979 the LEGG/GSFC received from the Gamma-Ray Group at UCSD a
Monte Carlo code designed to simulate the response of detection systems
to gam_i radiation. The program has survived in approxlm_tely the
initial form except for a few corrections and adaptatlouz. All of the
physical data used it, ehe program as well as the correctness of all
geometrical expr_sslons and techniques have been verified or reco_ed.
Some of the basic kin,matical sections have also been verified. To my
know_edge no errors re_sln in the program.
, The cletector-radlatlon Interaction slmul_tlon can be divided into]
o five elements: I) geometry and composition of the Jetectlon system, 2}I
geometry of the beam, 3) incident spectral characteristics, 4) physical
Int_ractlons, and _) detected spectrum. The simulation proceeds
precisely _a one might visu_ze the relevant interactions as dep_ct#d
in text)..-_ ._",-_ngs. The simulation consists in rep]acing the beam
geometry, incident spectrum, and quantum mechanical prohabilltles of
kinematical processes with appropriately chosen random number
dlstrlbutlons. If the simulations are sufflclently ace,,rate and s large
number of Incident ph6to_s are tracked through the system, the detected!
; spectrum will reflect the physical situation it is intended to
represent. The operation and use of the Monte Carlo program and tests
whlch confirm its accurate correspondence with experimental results are
decrlbed below.
The program allows one to define up tc seventeen material or vacuul
shells. Each shell Ls composed of a single suostance such _s ._siu_
iodlde. The geometry Is restricted to cylindrical symmetry such that
!L
1983022079-083
L;
63
r_{ the (i+l)th shell encloses tl,e Ith shell. A few slight deformations
from the real detector system geometry are usually necesssry to comply
;!with this restriction. It is permissible to have tops, sides or bottomsof shells with i_Lfini_eGimal thickness. Hence, two contiguous,
consecutively numbered disks of equal radii are interpreted by thet
! program as the (i+i)th disk enclosing ith disk. around the side and on
"the top or bottom, with an infinitesimal layer. Presently, the program
Jis coded for the more frequently encountered detector materials and
,i absorbers: Nal, Csl, Ge, AI, Pb, Fe_ Be, Sn, plastic scintillator, air,
=i and vaccum. Also, subtances of organic composition that are sometimes
i used must be replaced with equal grammage, nearly equal Z materials.m
Thus, the simulation can be made quantltatlvel; acceptable.lI The incident photon beam geometry can be plane parallel, point
source, _c !sotropic. For the plane parallel case, applicable for a
_ sou_2e a_ infinity, the beam impinges on the system at a specified angle
8 with respect to the cylindrical axis of symmetry. For the point
source case, appropriate to simulating an experimental situation with a
nearby radioactive source, the beam is a cone of half angle _ arriving
at _he detector system from a point (r,z). An Isotropic beam
illuminates the system from all azimuthal angles between the specified
polar angles 8 1 and 8 2 . If 81 - 0, 8 2 = _/2, the beam is truly 4w
Isotropically incident. This case would be utilized to simulate an|
isotrnpic background. For the plane parallel or Isotroplc cases, one
specifies a target shell, the shell which is to be illuminated uniformly
per projected area according to the selected beam geometry. The target!
shell ,my be designated to be an luterlor shell of smaller area (i.e.,
the detector shell) than the outermost shell in order to economize on
1983022079-084
:i 64
photons. To include the effects of sc&ttering from outer shells, the
outermost shell should be the target shell. The direction of each
photon is determined by one or more uniformly distributed random numbers
I which are arguments of the specific integrated angular/projected-area
!i distribution of each beam case.i"L
i The distribution in energy of incident photons can be specified to
ibe either monoenergetic or power-law. By combining several program
runs, any distribution can be built up.
Once a photon is simulated, the program propagates it through the
detector system shells until it interacts vla the photoelectric effect,
Compton scattering, or pair production processes or until it is lost out
of the system. The interaction length for each of these processes#
within the various material shells characterizes the exponential
distribution for penetration. Again a random number i:; employed to
create the distribution. Upon interaction, the photon's by-products,
electrons, positrons, and degraded photons, are followed through the
system. The propagation and accounting Is continued until the nth
generation photon is entirely absorbed or is loCt and until all by-
products have deposited all their energies within the shells or _.ave
escaped the system. The chase then begln_ anew with another Incident
photon.
The detected spectrum is a histogram of total energy deposited perL
incident event in shells labelled "detector". The physical detector
resolution can be convolved into the final binning, as a gaussian
i distribution, thus simulating photomultlpller characteristics,!
iassoclar,d electronic processing, and/or charge collection efficiency.
II Also, shells which represent active shields, that is, scintillators used
1983022079-085
65
to collimate the system and reduce baekground counts, may have low level
thresholds specified. For photons which scatter in an active shield and
deposit energy greater than the threshold value, the event would be
rejected if it also interacted within a detector shell.
ii. Verification of Code Accuracy
Two initial tests of the Monte Carlo program were performed to
insure validity of results derived from its use. First, I simulated
experimental tests pezformed with a Ge(Li) detector as described in
Seyfarth et el. (1972). Thls article reported efflc_encles of
"photopeak" absorption of Incident monoenergetlc radiations. The
photopeak energy is the energy of the incident radiation. The Monte
Carlo simulations and Seyfarth's results are in very good agreement
(Figure 3.2).
Second, I performed experimental runs with monoenergetlc radiations
incident on a high-purity germanium crystal encased in a cryostat with a
few cm of material (mainly aluminum and steel) forming the base of the
detector holder. The significance of the base plate material is that
some photons backscattered (_ 180°) from the steel plate and were
detected by the crystal. The usual Compton scattering of photons within
the crystal, the backscattered spectrum and the photopeak were recorded
with a multichannel analyzer. The experimental configuration was then%
/ simulated as closely as possible (Figure 3.3). The Compton end
backscatter Compton continua were adequately reproduced by the Monte
Carlo program (Figure 3.1). The slight discrepancy between the
experimental and simulated continua in the backscatter region may be
L
1983022079-086
p
66
attributed to an imprecise knowledge of the thicknesses and distribution
of materials within the sealed cryostat.
_ ill. Simulation of HXRBS
A primary consideration in computing the detector response is
economy of time and cost; it is not feasible to construct a detector
_atrlx for several angles of incidence relative to the system axis of
symmetry. Section G describes the use of the Monte Carlo progra_ to
determine the effect of angle of incidence on detected spectra. For the
response metrlx construction the beam direction was chosen parallel to
the axis of symmetry. A second consideration of economy was forgone
since it appeared that accuracy might have been sacrificed at lower
energies; it was decided to illuminate the entire detector system,
including the shield, an area three times the detector area. This was
deemed necessary since some higher energy photons scatter in the shield
near the aperture and continue approximately in the forward direction
toward the detector. Since thele is a negligible amount of spacecraft
material near the instrument 3perture and since the shield severely
attenuates radiation from directions other than the detector fleld-of-
view, the spacecraft was not included in the simulation.
To create the response matrix, 85 energies, forming a colum_
vector, were provided to the program. These energies were
logarithmically spaced from 20 keV to I MeV. The log spacing factor was
chosen to cover adequately the flr_t SMM detector channel, only 4.5 keV
wide, and at the same _Ime not over-represent the high energy
, channels. With the resultant spacing there are _ I0 input channe_ for
each detector channel at low energies (below I00 keY). There are at
Lr ,
198:3022079-087
67
least four input channels per detector channel at the higher energies.
With this choice, an incident spectrum to be multiplied by the response
matrix will be sufficiently continuously transformed by the matrix. In
particular, the discontinuous effect of the CsI K absorption edges,
at =33 and 36 keY, is properly accounted for since the input binning
is much finer than the detector channels at low energies. The input
.energies extend up to 1 MeV in order to include the contribution of
Compton scattered photons at _ 1 MeV energies into the SMM detector
energy regime.
For a Monte Carlo approach, the matrix smoothness is also
determined by statistics; a sufficient number of counts must be
accumulated in each output column vector of the matrix to represent the
detector response accurately. The detector efficiency at low energies
is of order unity. The more penetrating _-rays with energy _ 500 keV
are detecLed by the relatively thin crystal wiLh only about 5%
efficiency. To accumulate a large number a counts in each output bin,
25,000 photons were fired for the monoenergetlc inputs from 20 keV to
200 keV. Above 200 keV, the number of incident photons was increased
quasi-exponentially to 500,000 for the highest input energy ( - 1
• Hey). The resulting matrix, without any smoothing, produces a
representation of the detected spectrum which is estimated to be
accura_e to better than 3% in each detector channel (see section F
below). %
Th,_ Monte Carlo output spectrum for each monoenergetlc input is a
column vector in the eCficlency response matrix. This is evidently
correct since , if said column _ector were normalized by dividing by the
total number of incident photons (and all other column vectors set to
1983022079-088
68
zero), then multiplication of the matrix and the original monoenergetic
incident spectrum w_uld yield Just the simulated Monte Carlo output
" spectrum for that monoenergetic Input energy. The full norrmlized
matrix then represents th_ detector response to any spectrum exter_ing
up to 1 MeV. The detector response to photons above 1 MeV is i
negligiole. The output spacing is linear with 5 keV intervals Crom 20
keV to 590 keY, covering the HXRBS energy regime. The conversion of
output channels to HXRBS detector channels Is described in section D
below.
The simulated detector configuration is presented in Table 3.1 and
illustrated schematically in Figure 3.4. Necessarily, low Z materials
other than those which the pregram accommodates have been replaced with
aluminum which has ao atomic number comparable to such materials. The
overall configuration of tne detector system was very _early exactly
reproduced in the simulations.
The antlcoincldence shield low-level threshold was specified to be
200 keV in the program, an _stlmate of the true value. In fact, the
physical shield threshold may change with tlme. Also, the 200 keV
estimate Is a value applicable to photons impinging on the shield near
the aperture where the PM tubes are strategically positioned to collect
the scintillation light (see Figure 2.8).
The thickness of the dead layer on the front surface of the
detector crystal is uncertain by a factor of two. The extreme
estimates, 0.00635 and 0.0127 cm ( 2.5 and 5.0 mils), were used to4
create two response matrices. If the lower value were in fact the true ,:
value, the use of a thicker dead layer in the _k)nre Carlo program would _
have the eff-ct of absorbing more low energy (25 to 70 keV) photons from
1983022079-089
69
the incident beam, with a consequent overcorrection. Therefore, any
depression in the true spectral continuum at these low energies would
tend to be deaccentuated. Since such depressions are evident in the
deconvolved data, the reason for simulating t_o thicknesses becomes \
clear; perhaps the depression could be made to disappear with the use of
the thicker layer. It was found that effect on the spectrum due to the
.uncertainty in the dead layer thickness is small compared to the
depressions present in some of the spectra (see section IIbelow).
The detector resolution is a function of energy. The resolution is
approximately represented by the functional form
FWHM(detector) = 1.76E 0"75 (3.4)
with FWHM and E in keY (Dennis, private comm.). The shield resolution
is assumed to be twice that of the detector at all energies. The
relatively poor resolution has the effect of significantly smoothing the
detector response matrix column vectors; any spectral features presentiI in incident spectra would therefore be shallower and broader afterfI multiplication by the matrix. In fact, _t low energies ( _ 50 keY) the
instrumental resolution is approximately the width of one detector
channel, about 30 keY. There is ,1o possibility of distinguishing
features of much smaller width. Table 3.2 lists the FWHM cesolutlon for |
the detector and shield for several energies.
E. Spectral Flttlng Program
As stated in section C, it is generally not true that one spectral
function is found whlcn best fits the data; several different functional
1983022079-090
i
70c
forms may give approximately equivalent fits. The investigator must
• consider what physical processes and conditions are the probable origin
of the observed detected spectrum, given all constraints and Inlerences
avallable. These problems are examined in Chapter VI in an attempt to
determine the energy-loss mechanlsm(s) operating in y-ray bursts.
Presently I describe the method of (nonunlque) deconvoluLion of detected
spectra.
A particularly sultable and convenient specr I fitting program,
LSPEC, has been developed by the X-Ray Group (LHEA/GSFC). This program
utilizes a modification of the CURFIT routine of Bevlngton (1969).
Two basic adaptations were made for the purpose of deconvolvlng the
SMM spectra. First, it was necessary to modify LSPEC to accommodate the
HXRBS response matrix. Also, the 114 output bins (20 - 590 keV) of the
D(v') column vector had to be apportioned to the 15 HXRBS detector
channels. Since the detector channel edges change with time, the
program performed an interpolation between output bins and detector
channels for each y-ray burst eveut. Where the counts in one output bin
were to be divided between two detector channels, a linear interpolation
in energy space was computed.
Second, candidate spectral models were added to the program. The
existing program already included several spectral models: one- or two-
temperature black body or thermal bremsstrahlung; exponential; power-law
with exponential tail; and one- or two- (broken) power laws, The
program also has the capabillty of including gausslan absorption and
emission lines in the model spectrum, For y-ray bursts an exponenttal r_
form ha_ been recognized as providing a good representation of the data
_ (Cllne, Desal, Klebesadel and Strong 1973). A physical mechanism which
1983022079-091
ORIGINALPAGE IS tOF POORQUALITY 71
exhibits approximately exponential energy dependence is thermal
bremsstrahlung (TB). Previously, investigators have neglected to
+incorporate Gaunt factors appropriate to seml-relatlvlstic electron
temperatures In TB models (Gilman et al., 1980; Mszets et al. 1981d).
The existing X-ray TB model in LSPEC (Qulgg, 1968) included a Gaunt
factor useful only up to X-ray energies. Since the HXRBS spectra extend
up to _ 500 keV, it was decided to use the recent relativistic
corrections calculated by Gould (1980). In Gould's expression, the
correction factor includes I) the relativistic expression for a thermal
electron velocity distribution; 2) relativistic and spln corrections to
the electron-lon cross section, f(a); 3) an electron-electron
bremsstrahlung term, _(a); 4) a first order Born approximation
correction, %(a). The resulting expression for the TB emmlsslvlty in
photon space is (there were several errors In the original paper)
dN E 2/2, ne ,_, "
Lan m¢
z (3.5)_Z3n
+ 2¢2 (_z2nZ)# (a)¢ (_-_kT)}Z
216 2with 0(¢) " _43 {7} a3A2cn e(_Z2nz)g{-_ } e'aKo(a)
1 Kl(a)
z f(a) =Z_-a+_tKl(a) 14.63e -a
,-)- + +¢(a) = _I¢2 + /(_a)}erfc /(2a).- e-all2
e'a{Kl(a) - Ko(a)}
i
1983022079-092
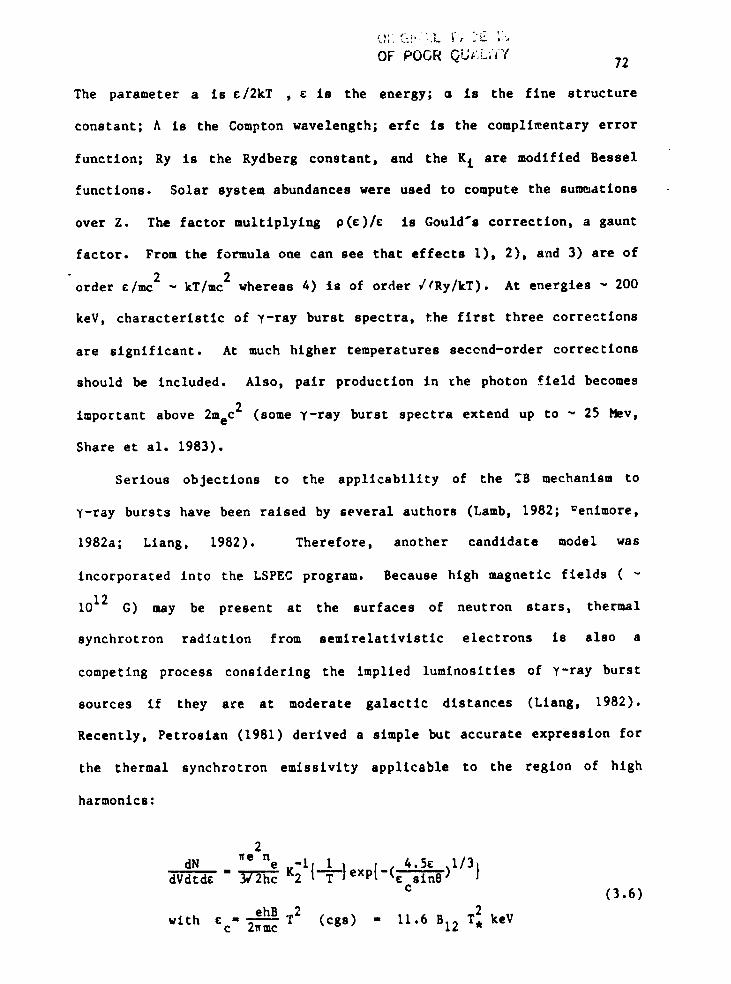
>
72
The parameter a is ¢/2kT , c is the energy; a is the fine structure
constant; A is the Compton wavelength; eric is the complimentary error
function; Ry is the Rydberg constant, and the Ki are modified Bessel
functions. Solar system abundances were used to compute the sum_ations
over Z. The factor multlplylng p(c)/¢ is Gould's correction, a gaunt
factor. From the formula one can see that effects I), 2), and 3) are of
order c/mc 2 _ kT/mc 2 whereas 4) is of order JqRy/kT). At energies _ 200
: keV, characteristic of y-ray burst spectra, the first three corrections
are significant. At much higher temperatures second-order corrections
should be included. Also, pair production in the photon field becomes
important above 2mec2 (some y-ray burst spectra extend up to - 25 Mew,
Share et al. 1983).
Serious objections to the applicability of the _B mechanism to
y-ray bursts have been raised by several authors (Lamb, 1982; =enlmore,
1982a; Liang, 1982). Therefore, another candidate model was
incorporated into the LSPEC program. Because high magnetic flelds (
1012 G) may be present at the surfaces of neutron stars, thermal
synchrotron radiation from semlrelativistic electrons is also a
competing process considering the implied luminosities of y-ray burst
sources if they are at moderate galactic distances (Liang, 1982).
RecentlyD Petroslan (1981) derived a simple but accurate expression for
the thermal synchrotron emissivity applicable to the region of high
harmonics:
2
dn _e ne -I I . 4.5¢ .I/3,dVdtd¢ _c 12 {T}exp{= -re slnB ) )
c (3.6)•h_.._B 2
T2 (cgs) = 11.6 B12 T, keVw_th e n
c 2_mc
h
1983022079-093
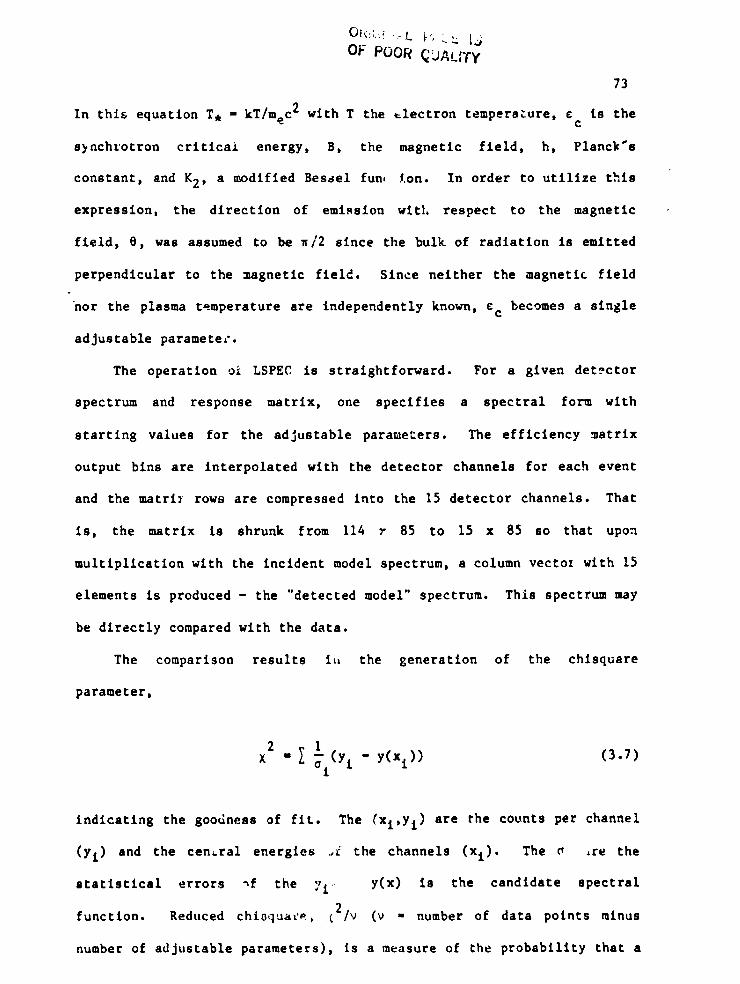
OF POOR _AL_Ty
73,i
In this equation T, = kT/meC2 with T the _lectron temperature, ¢ Is thec
s_nchrotron critical energy, B, the magnetic field, h, Planck's
constant, end K2, a modified Bes_el fun, ion. In order to utilize this
expression, the direction of emission wltl. respect to the magnetic
field, 0, was assumed to be 7/2 since the bulk of radiation is emitted
perpendicular to the magnetic field. Since neither the magnetic field
nor the plasma temperature are independently known, ¢c becomes a single
i adjustable parameter.I
The operation ol LSPEC is straightforward. For a given detector
ispectrum and response matrix, one specifies a spectral form with
starting values for the adjustable parameters. The efficiency matrix
output bins are interpolated with the detector channels for each event
II and the matri_ rows are compressed into the 15 detector channels. Thatis, the matrix is shrunk from 114 r 85 to 15 x 85 so that upon
multiplication with the incident model spectrum, a column vector with 15
elements is produced - the "detected model" spectrum. This spectrum may
be directly compared with the data.
_[ The comparison results i, the generation of the chlsquare
parameter,i
2 1
x = Y i(yl- y(xl)) (3.7)t
indicating the goodness of fit. The (xi,Y i) are the counts per channel
| (yi) and the central energies .,i the channels (xi). The o _re the
staClstlcal errors _f the yl, y(x) Is the candidate spectral \
function. Reduced chlsquat'e, 42/_ (_ = number of data points minust
number of adjustable parameters), is a measure of the probability that a
i
1983022079-094
i' 74!
random set of n data points w£11 yleld a X2/V larger than that obtainedIi
i with the actual data. This Is tabulated in referencesprobability many_4I
(see e.g., Bevlngton, 1969).I
Generally a X2/V _ 1 reflects an acceptable fit to the data points
by the candidate function. To obtain a good fit the program adjusts the
variable parameters of the model function. The adjustments are
determined by taking derivatives with respect tc the parameters in X2
space and incrementing the parameters, seeking a X2 minimum. If X2 is
not converging sufficiently fast, the program automatically switches to
a linear grid search method of incrementing parameters. In this modes
2without the benefit of a derivative. X sometimes diverges if the
pro@ram initially increments a parameter in the wron$ direction.
Usually, however, X2 converges quickly. If X2 is dive.glng, one must
enter better estimates for the model func ion parameters. Each time the
program adjusts the parameters, a new incident _pectrum is calculated
based on the parameters" values, and the spectrum is multiplied by the
response matrix to generate a new detected model spectrum for comparison
with the data.
The ratios b:" channel of detL ted model spectrum to incident model
spectrum are called the channel efficiencles. The detector count
spectrum divided by the channel efficiencles yields the deconvolved
incide_lt spectrum. Since the channel efficiencies are a function of Lhe
model spectrum (and of the detector matrix), the deconvolved spectrum is
also a function of the model spectrum. This point will be elaborated in
Chapter V especially u_th respect to the effect of including absorption
_eatures in the model spertrum.
1983022079-095
75
F. Confirmation of the Accuracy of the Method
To insure that the changes implemented in LSPEC were correctly made
and that the response matrix indeed represented the detcctor-radlatlon
intsractlon, comparisons of LSPEC runs and SMM's FLREX runs were made.
For the TB model the FLREX uses a function _ E-l*4*exp(-(E-50.)/k_).
The E-1"4 factor incorporates a zeroeth-order-approxlmatlon Gaunt
factor. This function was included in LSPEC and several HXRBS y-ray
burst spectra were deconvolved using both programs. The resulting
spectral temperatures, associated errors, normalization co-elSie _. _ts,
ard X2 parameters are presented in Table 3.3. The remarkably good
agreement is an indication that both (independent) programs have
represented the detector response very accurately, or that both are
colncldently in error. The fits were performed only on the higher
channels s_ce at the lower energies the spectra departed significantly
from a simple TB model. To confirm agreement between the programs at
lower energies, a solar flare exhibiting a TB form was also fit using
both programs. For the solar flare, the FLREX and LSPEC agreement was
very good in all 15 channels. The results of the solar flare fit are
also shown in Table 3.3.
G. Dependence of Detected Spectra on Incident Angle
It is not known a priori where, or if, a gamma-ray burst is
observed in the HXRBS fleld-of-vlew. The unknown incident angle
introduces an additional degree o{ freedom into the deconvolu_ion
procedure. That is, to self-consistently deconvolve detected spectra,
one must use a response matrix ,_._ch is generated with the incident beam
impinging on the detector system at the same angle the burst arrived at
_t A
1983022079-096
76
the physical system. As stated above in section C, it i," not
economically feasible to compute response matrices at s_ve:ql angles. _
In _rder to determine what fraction of the flux reaches the
detector as a function of incident angle (8), the aperture and detector
crystal can be viewed as seen oy a parallel beam and the ratio of
unahadoved to total area calculated. The geometry shouu in Figure 3.5
depicts what fraction of the detector is unshadoved as a function of
3. Table 3.4 lists the projected, unshadov_d a.ee, in the lo,;-energy
limit for several _ ,ues of 0. The effective area IncrJases _ith energy
sluice higher energy photons can _enetrate greater lengths of _he shield
material near the aperture. The path length through the shield as seen
from _he detector In,teases quickly vlth increasing 6. Th,:: effective
_rea for nonzero B _as _stlmated to be only a few pe-cent laL&er at
energies _ 200 keV th_n at 20 keV.
Fortunately, several spacecraft detecte_ the 19 APR 80 burst and
its direction of arrival _as triangulated. The source _'as determined to
be - 18 ° flom the sun (the sun is :he HXP_S center of _.o.v). The
shleld-to-dete_tor counts ratio foc the 19 &PR event serves to eo_abllsh
the relative orientation of burst arL:val d_rectlons wlth respect to the
HXRBS center of f.o.v. Events which h_ve larger (_maller_ ratios than
that of 19 APR are assumed to arrive at lesser (greater) angles than
18 o . .;
The effects of nonzero angles of incidence with respect to the
HXRBS syamatry axis were In'estlgsted using the Hont_ Carlo program.
Spectra vlth a power-law dependen<e - E-I.O with incident b_am angles
0 °, 20 ° , 30 °, and 45 ° were fired at the same HXRBS configuration as
aescrlbed In section C. ^ hard spectrum was chosen in order to maxlmi_e
1983022079-097
77
the effect of high-energy Compton scattered photons, y-ray burst
spectra are conside_.bly harder than solar flare spectra which do not
appear to deviate from simple functional forms at lower energies as
burst spectra sometimes do. The resulting detected spectra are
•liustrated in Figure 3.6. The spectra have been normalized to agree in
the high _.ergy region (where the spectrum is less affected by shield
"a_orption) with the 0° incident spectrum. At nonzero angles of
incidence the forward part of the shield intercepts some fraction of the
beam. The shadowing of the detector necessitated the normalization. It
is the spectral shape we are concerned about, however. At an Incident
angle of 20°j one-half of the beam is intercepted by the shield (the
H_M). At angles greater than 44°, the beam is entirely intercepted by
the shield; the beam must penetrate the shield to reach the detector.
The effect of the shleld-procegsed contribution on the total detector
spectrum can be understood as follows. First, that part of the beam
which passes through the shield is attenuated by a factor _ 225 to _ 90
for energies 25 keV to I00 keV, but only by a factor of _ 2 in the
highest HXRBS channel. Hence, if a substantial fraction (_ i/3) of the
beam is not intercepted by the shield_ the total detected spectrum at
low energies will not be signiflcantly altered by the shleld-processed
contribution. Second, some photons with energies _ 200 keV will Compton
scatter in the shield and be detected at lower energies resulting in a
slight building up of the lower portion of the spectrum. As with _he
matrix construction runs, the veto threshold was set at 200 keV for
these runs. The program tabulates those events which passed through the
i
shield and would have been detected had the veto threshold not been
set. This "non-contribution" for the 45° run is also plotted to show
1983022079-098
78
the effect of the shield threshold; a significant fraction of the
scattered photons, compared to the number detected for the 45 ° spectrum,
are in fact vetoed by the shield. It was concluded that, for bursts
with incident angles up to _ 20 ° from the center of the fleld-of-view,
the spectral shape is not significantly altered. For incident angles
30 °, the admixture of shield processed flux has begun to influence the
shape of the spectrum, creating a depression relatlve to the 0 ° incident
spectrum. At 50 keV, the 30 ° spectrum is about 25% below the 0 °
spectrum. This is to be compared to the _ 20% effect at _ 50 keV
resulting from halvlng the dead layer (section H below), and to the
50% depression below model contlnus at 30 to 70 keV for some HXRBS
spectra (see Chapter V).
H. Effect of Detector Dead Layer Thlckneas on Model Fits
The problem of the uncertainty of the detector dead layer thickness
Ii was mentioned in section D.lii. Essentially, the dead layer
preferentially absorbs low energy photons, flattening the detected
spectrum iv the lowest channels. Iv Table 3.5 fits of thermal
bremsstrahl,mg continuum plus absorption llne for several spectral
intervals are listed for two dead layer thicknesses. The spectra
selected for this comparison exhibit absorption features or depressions
below the continuum in the energy range _ 30 to 70 keV (except the 29
MAR 80 solar flare). For the thick dead layer, lower values of kT
(i.e. steeper cG_itlnua) and lower co-efficients (C2) for the absorption
line equivalent widths were fit to the data than for the thin dead
layer. The fractional change in the equivalent widths is small, rangingi
: from 5% to 21Z. The same effect is evident when the continuum is
i
1983022079-099
I
79t
thermal synchrotron radiation. It is emphasized that since the thicker
dead layer was used to create the detector response matrix for the HXRBS
analysls, the strengths of the 1or-energy depressions observed in some
spectra are certainly not overestimated due to the dead layer effect.
I
1983022079-100
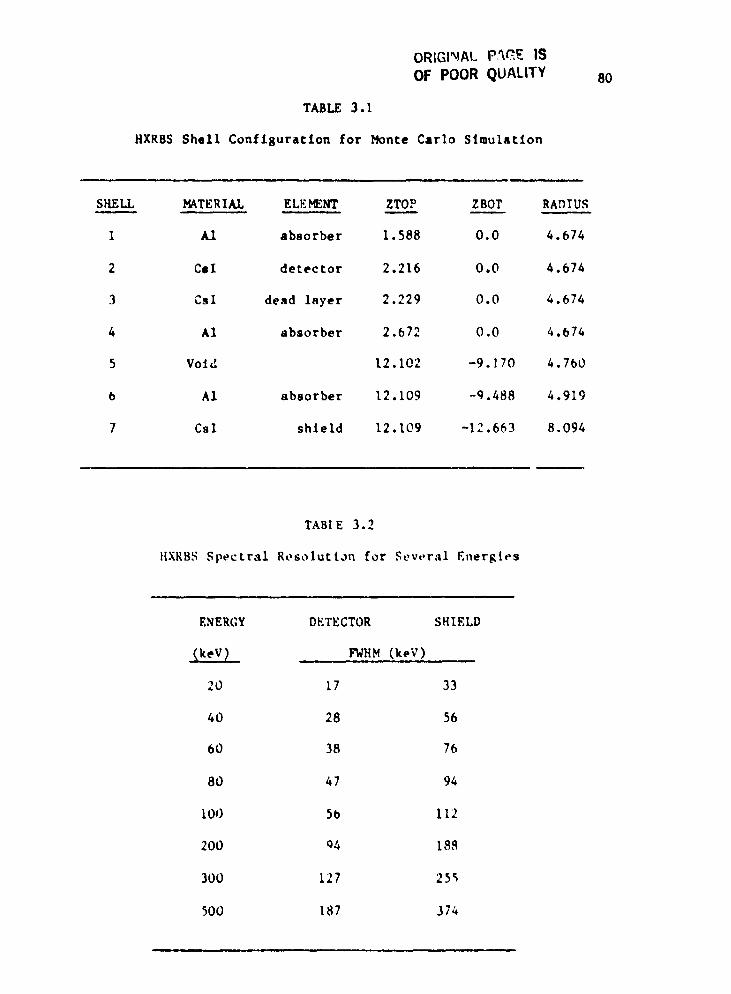
ORIGINAL P,%GE ISOF POOR QUALITY 80
TABLE 3.1
HXRBS Shell Configuration for Monte Carlo Simulation
SHELL MATERIAL ELEMENT ZTOP ZBOT RADIUS
1 A1 absorber 1.588 0.0 4.674
2 CaI detector 2.216 0.0 4.674
3 CsI dead layer 2.229 0.0 4.674
4 A1 absorber 2.672 0.0 4.674
5 Void 12.102 -9.170 4.760
b A1 absorber 12.109 -9.488 4.919
7 Csl shield 12.109 -12.663 8.094
TAM E 3.2
HXRBS Spectral Resolution for Several Energies
ENERGY DETECTOR SHIELD
(key) FWHM(keY)
20 17 33
40 28 56
60 38 76
80 47 94 •
I00 50 112
200 O4 18_
300 127 25_
500 187 374
1983022079-101
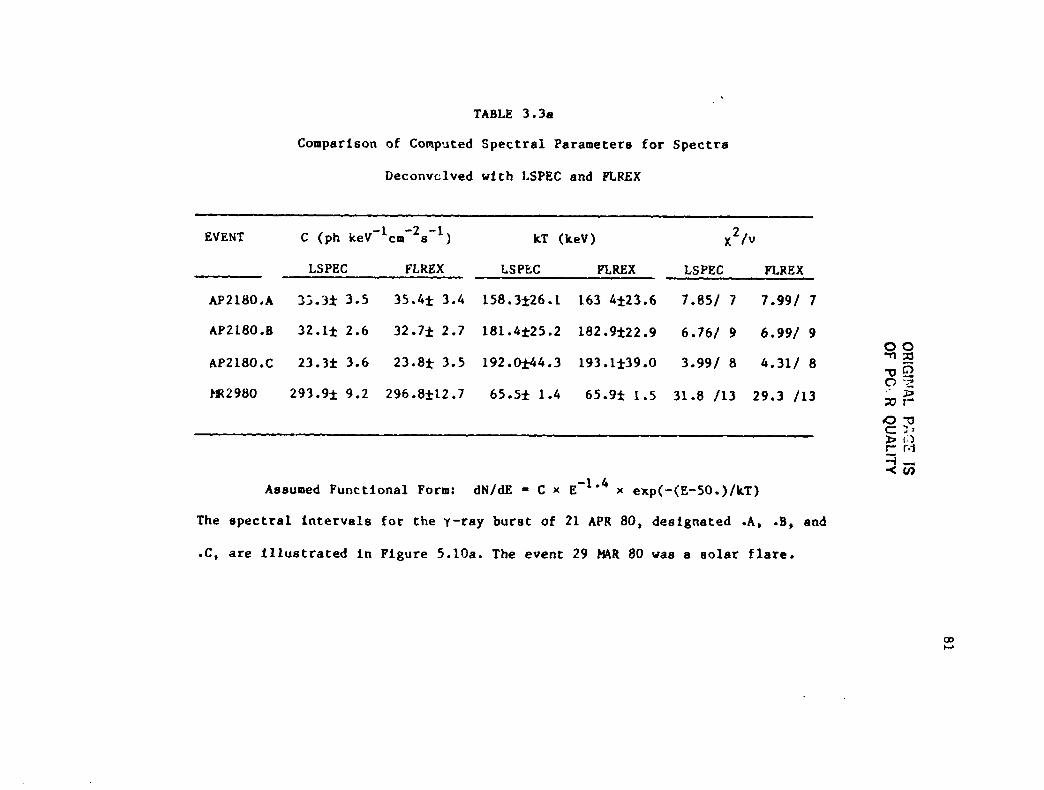
TABLE 3.3a
Comparison of Comp-~ted Spectral Parameters for Spectra
Deconvclved vi t h I.SPEC and PLREX
EVENT C (ph ke~-lcrn-*s^l) kT (Lev) X 2 /V
LSPEC FLREX LSPEC PLREX LSPEC FLREX
AP21SO.A 35.32 3.5 35.4f 3.4 158.3f26.1 163 4223.6 1.851 7 7.99/ 7
Assumed Functional Form: dN/dE = C x E -1.4 x exp(-(E-SO.)/kT)
The specttal intervals for the y-ray burst of 21 APR 80, designeted .A, .B, and
. C , are i l lustrated i n Figure 5.10a. The e v e n t 29 HAR 80 was a solar f lare .
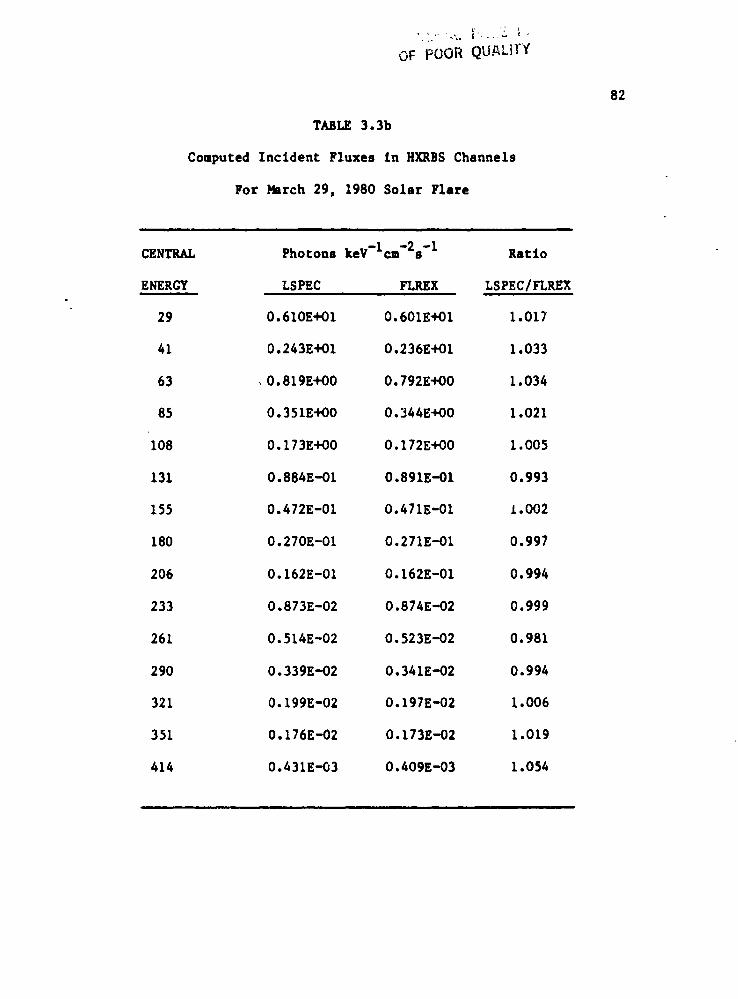
OF POOR QUALITY
82
TABLE 3.3b
Computed Incident Fluxes in HXRBSChannels
For March 29, 1980 Solar Flare
• i J
CENTRAL Photons keV-lcm-2s -1 Ratio
ENERG'Y LSPEC FLKEX LSPEC/ FLREXi
29 0.610E+O 1 0.601E+O 1 1. O17
41 0,243E+O1 0.236E+O1 1• 033
63 ,0.819E+O0 0.792E+OO 1.O34
85 0.351E+OO 0.344E+OO 1.021
108 0.173E+00 0.172E+O0 1.005
131 0.884E-01 0.891E-01 0.993
155 0.472E-01 0.471E-01 1.O02
180 0.270E-01 0.271E-01 0.997
206 0.162E-01 0.162E-01 0.994
233 0.873E-O2 0.874E-O2 0.999
261 0.514E-02 0.523E-O2 0.981
290 0.339E-O2 0.341E-02 0.994
321 0.199E-02 0.197E-02 1.006i
351 0.176E-02 0.173E-02 1.019
414 0.431E-03 0.409E-03 1.054
1983022079-103
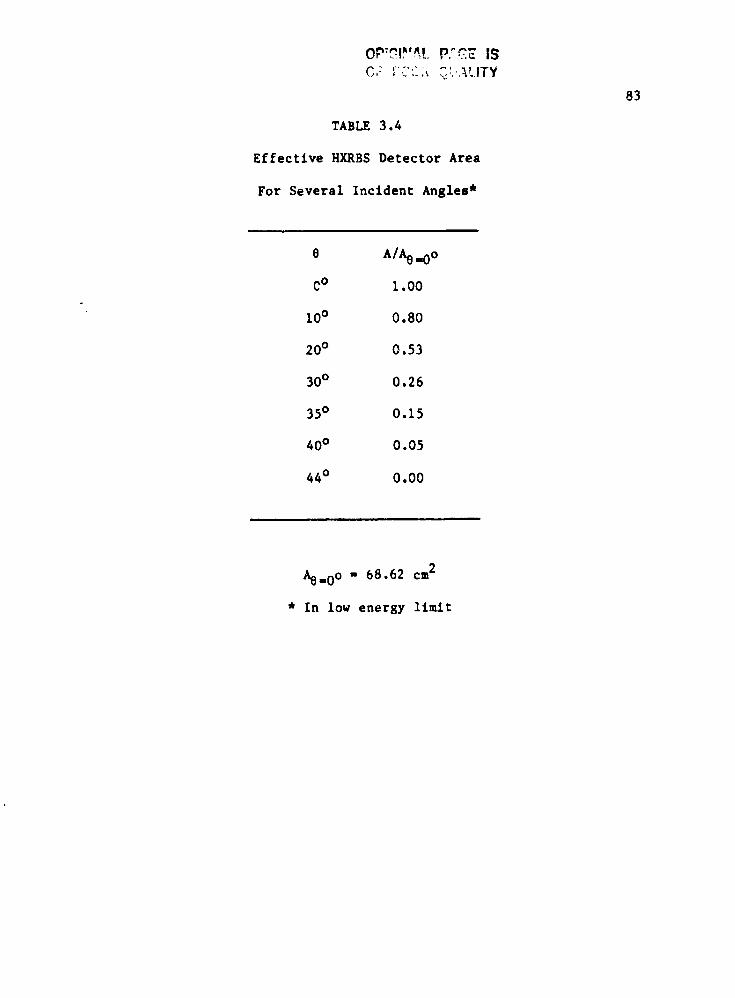
<
83
TABLE 3.4
Effective HXRBSDetector Area
For Several Incident Angles*
e A/%.oO
C° 1.00
I0° 0.80
20° 0.53
30° 0.26
35° 0.15
40° 0.05
44° 0.00
Ae=0o = 68.62 cm2
* In low energy limit
. i
1983022079-104
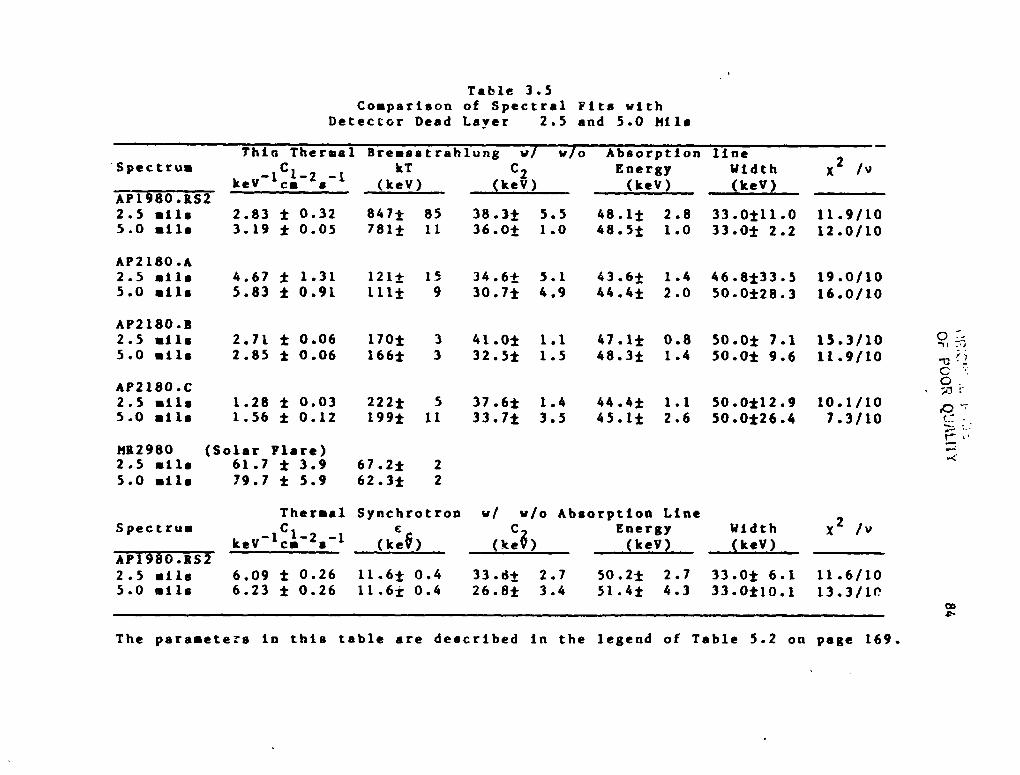
..J
1983022079-105
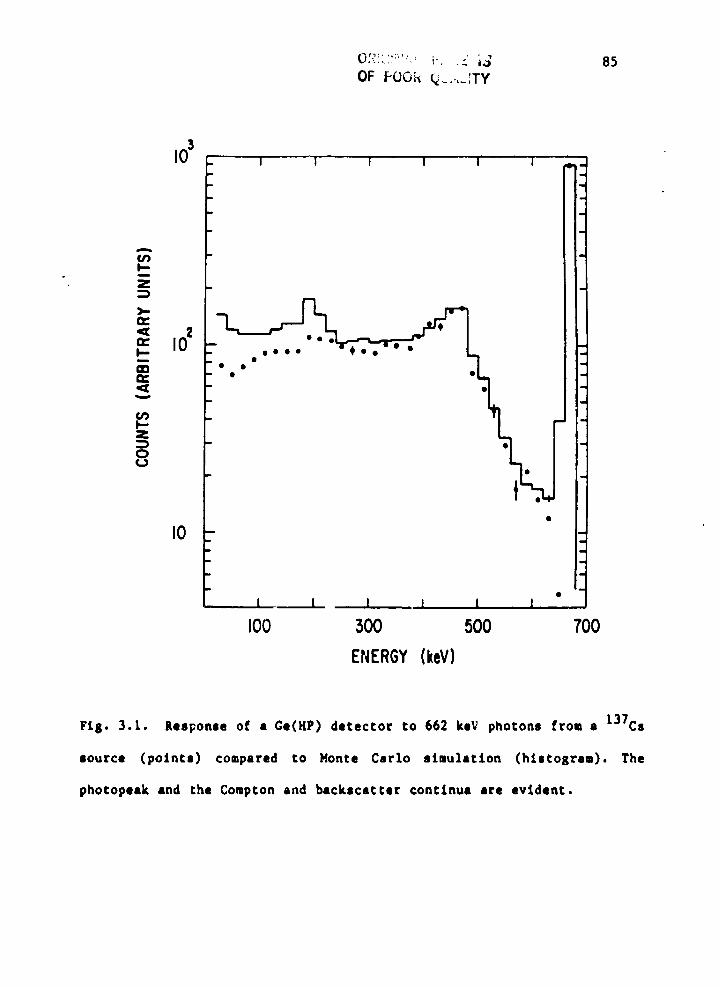
I03 . , _ , , ,
i-
8
e
o
• I I I I I I
I00 300 500 700
ENERGY(keV)
Ft$. 3.1. ResFonse of a Ge(HP) detector to 662 key photons from a 137Cs
source (points) compared to Monte Carlo simulation (histogram). The
photopeek and the Compton and backscetter ¢ontlnue ere evident.
i
]98:3022079-]06
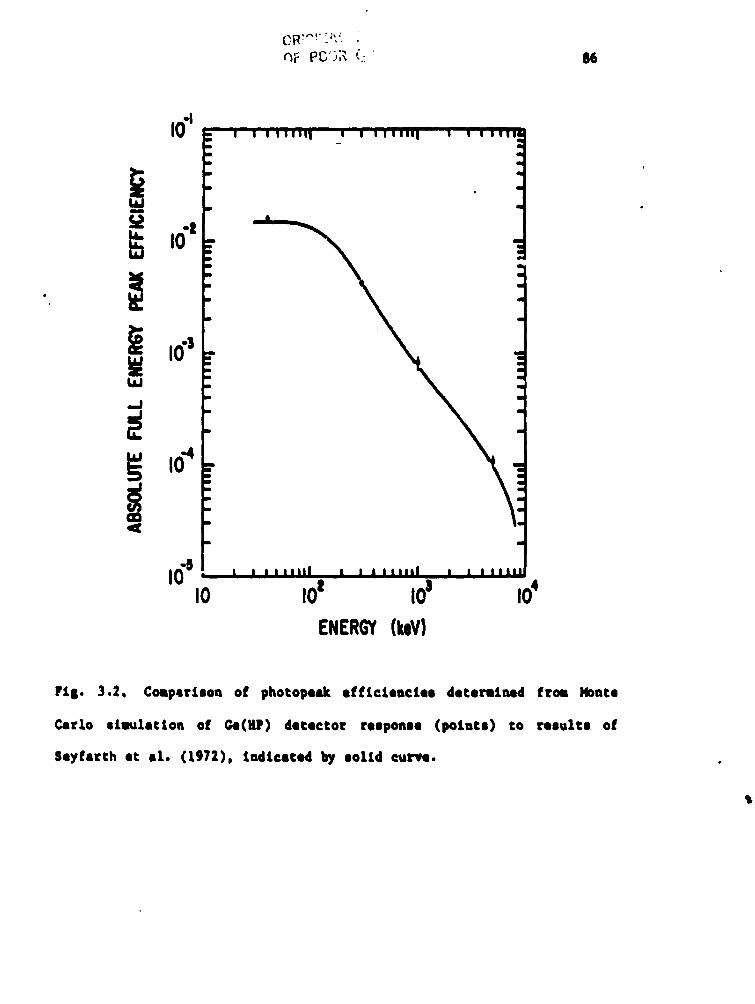
\
OF PG');_. {.: 86
I0"| -, ,,,,,h! ,' '''"u ' ""''"iql
I
qI
• p
I0_ _
16° . ,ao Io' Io' Io"ENERGY(keY)
FL8. 3.2, Coep_rLJou of photopeak efftcLencLee determ/ned frou 14onte
Carlo sLlmlatlon of Ge(BP) detector reeponea (potutl) co reeulcl of
Sey_arch It 82. (1972), indicated by eoltd curve.
1983022079-107
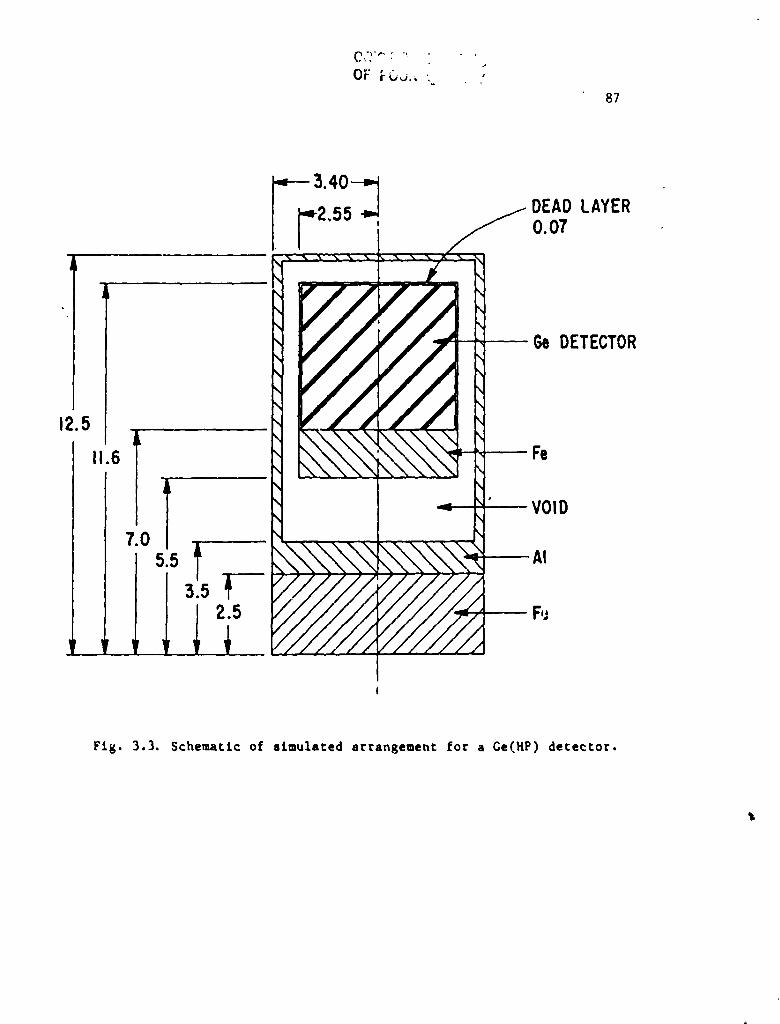
-,--3.40-_
r2.55 i DEADLAYER0.07
, ///_, 4- -- GeDETECTOR
12.5
' i Fe11.6 _.____.._____-
_,,,,_ _ VOID
\
,o _ _x\\'_
Fig. 3.3. Schematic of slmulated arrangement for a Ce(HP) detector.
A
1983022079-108
_f
ORIGI{';ALPAGE IS
OF POOR QUALITY 88
AI WINDOW(6)
A_(4)
II
ICsI DETECTOR(2) ANDDEADLAYER(3)
VOID (b)
AI(6)
CsI SHIELD (7)
Fig. 3.4. Schematic of simulated arranseaent for Hard X-Ray Burst
Spectroueter detector and ahleld.
1983022079-109
SIllELD INNER DETECTORRADIUS-R2 RADIUS-Rl
FOR r >R2-R_AEFF=( Ai+A2) cose = ( _ RiZ+_,R_- rR2sin_}cos@
Fig. 3.5. Geometry of H_RBS aperture. 0 is the angle of incidence
relatlve to the instrument optlcal axis. r - h x tan(0), vnere h is the
dts.ance from aperture to detector, 9.9 cm.
1983022079-110
ORIGINAL PAGE IS
OF POOR QUALITY 90
'"lU3 L , "r" ', , • ,,,i , , , 1 , ,ll g
j i
w • m
o'1I.--g::D
n.."<¢g:E
k- _ sm
--I0"- * * -nn
i
I--z -::) _0
-I-0"0"• _'20'o 0,30'
.16{; ,.45' o"45',VETOED10 , J J , , J,,l J J _ , , If,
10 102 103ENERGY (keY)
Fig. 3.6. Honte Carlo simulation o_ dependence of HXRBSdetected spectra
on angle of incidence for 0 - 0", 20", 30", and 45". The errors for B -
20" and 30° are comparable to chose shown for e - 0°. The shield-vetoed
spectr,-sfor the 45" run Is also illustrated.
198302207g-111
CHAPTER IV
ISEE-3 TIME HISTORY ANALYSIS
A. Outline
The time histories (T.H.) of y-ray bursts detected by ISEE-3 and
their analysis are presented in this chapter. The T.H.'s can be
classified into three broad categories. The very narrow ( _ 0.i s)
spike-like events, compact events (several seconds), exhibiting multiple
pulse structures, and the longer lasting (> 30 s) extended events are
discussed separately. In some of the extended bursts, the T.H.'s
exhibit apparently periodic structure.
Even though no spectral data were available from the ISEE-3
detectors, it was possible to obtain a measure of the ;,ature and
evolution of the spectrum of a burst from the ratio of instantaneous
counting rates of two detectors with different energy thresholds
(Ethr). The ratio of the Ge (Ethr _ 125 keV) to the CsI (Ethr _ 70 keY)
counting rates integrated over equal time intervals was calculated [or
this purpoae. A tendency for the bursts to exhibit hard-to-soft
spectral evolution was found.
The ratio of Ge-to-Csl peak detector counts Indicates that the
: splke-llke bursts are softer spectrally than compact bursts, confirming
the KONUS result (Mazets et al. 1981f).
The ISEE-3 data base contains a much larger fraction of splke-like
bursts than does any previous experiment. It is argued that the ISEE-3
data more correctly represents the true proportion of spike-llke bursts.
tq
....-'_-"',=mW
1983022079-112
92
B. Temporal Analysis
A chronological listing of all the ISEE-3 events with time of
occurrence, detector identification, appropriate parameter constants,
and confirmation by other spacecraft Is presented in Table 4.1.
As elaborated in chapter If, ISEE-3 employed a unique method for
triggering on and recording transient events. The rate data are
inversely proportlonal to the number of clock counts with frequency FT
necessary for the phcton counter to overflow. Hence, the relative error .
associated with each accumulation interval is constant and proportional
to 4_/N (N - photon counter setting).
Two peculiar effects result from the technique for photon
accumulation. First, more intense intervals are recorded with higher
time precision tha_ less intense intervals. Second, _II events which
achieve an instantaneous rate equal to or above the threshold are
detected. In contrast, most experlment trigger criteria require a set
level of integrated counts above background in a given time Interval;
hence, among bursts with equal peak flux near a given limit of
sensitivity, longer duration events are preferentially detected.
In section I, the longer duration (compact and extended -
"classical") bursts detected by ISEE-3 are discussed. A relatlvely
large fraction of the total number of events, compared to other
experiments, are short duration (_ I s) bursts. These events, which
probably constitute a separate class, are discussed in section 11.
i. Classical Bursts
The T.H.'s of all classical type ISEE-3 bursts are illustrated In
Figures 4.1 through 4.32, a total of 15 event_. For most evevts both
1983022079-113
f
i
93
the CsI (THI) and Ge (TH2) detector T.H.'s were recovered. Both are
illustrated if available. Figure 4.31 is the HXRBS shield T.H. of the
event 26 SEP 81, one of at least five events observed in common by both
experiments. THE 19 APR 80 and 02 JUN 80 bursts, also of the classical
type, were detected by both ISEE-3 and the HXRBS. The 19 APR 80 burst
is extensively discussed in chapter V. The 02 JUN 80 burst was only
-marginally discernable in the HXRBS shield rate data and therefore the
shield T.H. is not illustrated. In addition, two splke-llke ISEE-3
events were seen in the HXRBS shield (see section ii),
Quite often, gaps in the ISEE-3 T.H. data occurred, sometimes
during interesting portions of events. The gaps have been filled in
with a rate of I0 ors/s, significantly below the background level of 60
to I00 cts/s, to indicate interJacent Intervals with no data. •
Occasionally, the T.H. will begin or end in the middle of the event. In
these cases nothing is plovted in the intervals with no data.
The CsI T.H.'s are severely modulated due to the location cf the
detector on the spinning spacecraft (3 s spin period) and the detector's
sensitivity to soft y-ray photons which are strongly absorbed by the
spacecraft material if not incident directly upon the detector. For
I approximately 25% of each cycle, however_ the view is 80% or more
il transparent (see Figure 2.5). A particularly good illustration of the
effect of _odulatlon is seen in Figure 4.9, the CsI T.H. for the long
event 13 FEB 80. The Ge T.H. (Figure 4.10) does not show significant
modulation. The lack of Ge detector modulation is attributable to its
open view locatlcn close to the spacecraft spin axis_ orientation along >
the spin axis, and sensitivity to hard y-ray photons which penetrate :
surrounding material without significant attenuation, i
1983022079-114
94
Note that the CsI detector photon counter setting (N) was 64 and
128 for the 07 NAR 79 and 13 FEB 80 bursts, respectively, rather than
the usual value of 32 (sea Table 4.1). The effect of higher counter
settings is reflected in the smoother CsI temporal pro_lles and smaller
statistical errors in these two cases.
a. Compact Bursts
Classical y-ray burst T.H.'s exhibit complex behavior with usually
more than one main structure, or pulse. Each pulse can be seen to
conslst of several subpulses if observed with sufficiently fast time
resolution. Upon inspection, one finds that many bursts approach
intervals of local maximum intensity gradually, with small pulses
generally building to larger pulses. Examples of such behavior are
displayed in events 04 NOV 78 (Figures 4.1 & 4.2), 07 _ 79 (Figures
4.b & 4.7), 05 NOV 79 (Figure 4.12), 17 APR 80 (Figures 4.13 6 _,t_), 02
JUN 80 (Figures 4.15 & 4.16), 23 JUL 80 (Figures 4.18 & 4.19), 0l AUG 81
(Figures 4.21 _ 4.22) and 30 SEP 81 (Figures 4.24 & 4.25). The
durations of the main portions of these events, excluding small
precursors and subeldint_ pulses, which exist in some cases, are 12 s, 20
s, )10 _ and <25 s (long data gap at end of 05 NOV 79), 15 s, 14 s, 3 s,
12 s, and 10 e, respectively. These events may be characterized as
compact with protiles usually contained within one or more closely
spaced quasi-triangular envelopes.
The events 19 NOV 78 (Figures 4.3 & 4.4), also compact, and 13 FEB
80 (Figures 4.9 & 4.10) rise more abruptly from the background level.
Still in both cases, short ( _ 0.2 s) but significant rises directly
precede the first large pulses. The 19 NOV 78 event is the famous burst
1983022079-115
95 '
whose small (5 attain 2) error box contains an X-ray source (Cllne et el.
1981; Grlndley et al. 1982) The X-ray box is consistent with the
positio_, of an optical stellar flare image discovered on a 1928 plate
(Schaefer 1981).
i For some of the classical type bursts it was possible to compute
hardness indices from ratios of the Ge-to-Csl detector count rates as a
function of time, and thereby investigate the burst spectral evolution
qualitatively. Two criteria were required in order to construct the
ratio for a burst. First, only bursts qualified for which the Hovestadt !
Csl and Ge detectors operated; the Meyer CsI detector produced data
which were too noisy to be of value for such calculations (see Table 4.1
for operational detectors during each event). The second requirement
was that the Csl T,H. continue for a sufficient period during which the
unmodulated intervals were unambiguously discernable. These criteria
obtained for five events: 07 M&R 79, 13 FEB 80, 02 JUN 80, 23 JUL 80,
and Ol AUG 80. Hardness indices were computed only for intervals
modulated no more than 20% by summing counts above oackground within
equal intervals for the CsI and Ge T.H.'s and taking the Ge:Csl ratio.
The sampling then necessarily occurs with the spln period of 3 s and
with a duty cycle of 25%.
The hardness index versus time Is Illustrated in the figure
following the pair of T.H.'s for an event. The index is plotted only
for those intervals during which both averaged detector rates are
significantly above the background level. Sometimes the most intenser
phases in the Ge T.H. occur during the Csl modulated phase, leaving In
question the value of the index for interesting intervals.
1983022079-116
96
In all five events for which the hardness index was computed,
marked spectral evolution occurs, sometimes from one integration
interval to the next (3 s separations). One may expect spectral
hardness to vary on time scales comparable to large intensity
fluctuations, which are sometimes much faster than the 3 s spin cycle.
In fact, some burst spectra from the SIGNE experiment do exhibit
evolution on time scales of a few x I0 ms (Barat et al. 1983a).
The 07 MAR 79 burst (Figure 4.8) exhibits the hardest spectral
intervals in the middle of the burst with softest spectra in the initial
and final Intervals. The harder intervals are correlated with the most
intense portions of the burst. The same correlation is seen in the 02
JUN 80 (Figure 4.17) burst. For this burst, two sequences of hard
indices correlated with intense intervals evolving t_ softer indices
occur. For the O1 AUG 81 burst (Figure 4.23) the hardness index remains
practically constant during the event except for the last interval which
is softer than the preceding ones. For the 23 JUL 80 burst (Figure 4.2)
the intervals for which the hardness index was computed evolve towards
softer spectra. However, in this event, two short pulses in the Ge T.H.
occur during modulated portions of the CsI T.H. The common feature in
these four bursts is soft emission in the final stage of the event.
The 13 FEB 80 burst has a unique temporal profile. Although this
burst is classified as extended, it has the appearance of two lone
compact events separated by about 15 s (total duration _ 70 s). The %
hardness index (F_gure 4.11) vsrles in an apparently random manner with
no correlation with intensity. This burst dlsplsys a wealth of
significant fast temporal variations. Perhaps the I s integrations for
the hardness index obscure a finer pattern of evolution in this case.
1983022079-117
97
For comparison, many KONUS events for which several spectra were
recorded display a pattern of inltlelly hard with subsequent evolution
to softer spectra. This pattern sometimes repeated during a burst with
the later occurring hard Interval_ correlated with intense phases of the
burst (Mazets, et al. 1981d), thus resembllng the 02 JUN 80 and 23 JUL •
80 events.
+
b. Extended Bursts
In addition to 13 FEB 80, three more ISEE-3 events are ca_egorlzed
as extended. The events of 18 APR 79 (Figures 4.26 & 4.27), 20 K_R 82
(Figures 4.28, 4.29 & 4.30), and 26 SEP 81 (Figures 4.31, 4.32 & 4.33)
are similar in other respects. All three display a predominant pulse of
width (FNHM) _ i to 3 s (26 SEP 81 displays two such major pulses).
Small precursor pulses occur 19 s (18 APR), 54 s (20 MAR), and 34 s (26
SEP) before the predominant pulse. Additlonal pulses occur between
precursor and predominant pulse in each case. The common pattern is
increasing intensity with succeeding pulses.
For comparison, about two-thlrds of the events in the KONUS catalog
have T.H.'s of the compact variety, whereas about 20Z of the KONUS
events may be categorized as extended, dlsplaylng longer duration
T.H.*s. Occasionally interruptions up to 30 or 40 s between main burst
strt_tures are observed in KONU$ events, during which the count rate is
virtually background level. +
The T.H.*s of these extended bursts exhibit structures which
suggest periodicity. In _.he 18 APR 79 (Figures 4.26 & 4.27) T.H., the
small precu, sor at about 50.5 s, and the centrolds of the larger pulses
at 60.4 s and 70.3 s are separated by 9.9 s. In 20 FLLR 82 (Figurest
1983022079-I18
4.28, 4.29 & 4.30) pulses at 47.0 s, 83.0 s, and 101.0 s would form a
series with a period of 18.0 s save for the missing member at 65 s. And
in 26 SEP 81 (Figures 4.31, 4.32 & 4.33), precursor centroid at about
22.3 s and maln pulses at 39.0 s and 55.7 s (ISEE-3 times) are separated
by 16.7 s. At 29.5 s a small but significant peak appears which
is - 155 ° out of phase wlth the other features.
Also in 26 SEP 81, the two main pulses in the unmodulated HY_BS
shield and Oe T.H.'s are both double-peaked. The Inltlal peaks In the
first double-peaked pulse from the two T.H.'s have nearly the same
separation as do the corresponding peaks in the second double-peaked
pulse. The interval between the conjugate peaks forming each double
peak is in each case _ 0.6 s, about 0.035 of the apparent pulse
period. A similar periodic double-peaked pattern is apparent in the 13
JAN 79 event (a member of the series Is missing In this case; see
Helios-B T.H. in Figure 1.3, the ISEE-3 T.H. has a 16 s gap during the
initial portion of the burst).
Two other bt_rsts, 05 MAR79 (Cllne 1980) and 29 OCT 77 (Wood et al.
1981) exhibit damped stnusotdal structure. In contrast, the three
extended bursts discussed here exhibit pulses which are narrow compared
to the separations. Only three or four apparent periods are dlscernable
above background level (compared to 22 cycles for 05 MAR79 and 6 cycles
for 29 OCT 77). In order to specify conservatively and appropriately
the uncertainty in the proposed periods (_P/P), the ratios of half-width
of widest pulse (at about zero amplitude) to apparent period were
calculated. In order to determine a more formal uncertainty, one would
assume a fanctionsl form for a modulation envelope (e.g. sinusoidal)
1983022079-119
99
and perform a fit to the data. However, the exact modulation form is
camouflaged by the intrinsic burst temporal evolution.
Wood et al. (1981) show there exists a theoretical minimum to the iI
accuracy with which a period Nay be specified for finite event
durations. In analogy to the uncertaluty principle, the theoreticalt
minimum &P/P increases as the burst duration decreases, i
i
6w x D _ 1 (4.1) 1
with _ = 21/P and D - event duration. In Table 4.2 the theoretical
minimum achievable and observed &P/P are listed for each event. The
observed ratios are _ 1 to 3 times the theoretccal minimum achievable
accuracy. Hence, this method for determining [&P/P]obs yields values
consistent with the limitation (4.1). The best period determination is
for the 26 SEP 81 burst, [&P/P]obs _ [&P/P]theo = 0.08, for which the
event duration is 37 s.
The apparent periods manifested in the extended events discussed
above and 05 MAR 79 and 13 JAN 79 are of the same order of magnitude,
ranging only over a factor of three: 5.5 s, 8.0 s, 9.9 s, 16.7 s, 18.0
s. Twenty percent of the bursts detected by ISEE-3 (27% percent of the
"classlcal" type) show some evidence of periodicity. Several KONUS
bursts show evidence for qaasi-perlodic or periodic structure (Loznlkov
and Kuznetsov 1982).
The hardness indices, where produceable, of the three extended
events that show evidence of periodicity, are softer than the maximum
spectral hardness attained by the compact bursts and the other extended
1burst 13 FEB 80 (see Table 4.4). In the 20 MAR 82 burst, the precursor
1983022079-120
100
pulses at 47 s and 83 s have hardness indices _ 0.2 and _ 0.3,
respectively. These peaks appear to be (un)modulated to the same degree
as the main pulse, being _n spin phase with it. There is a data gap in
the last, largest pulse. For the portion of this pulse observed by both
detectors the hardness index is about 0.4. In the 26 SEP 81 event, spin
modulation appears to have reduced the CsI T.H. precursor pulse end
first main pulse (cf. HXRBS shield T.H.). The last pulse has a
hardness index of about 0.3. For the 18 APR 79 burst only part of the :
last pulse was seen by both detectors; the hardness index is _ 0.6.
li. Splke-llke Bursts
Out of twenty-four events detected by ISEE-3 from September 78 to
May 82, nine may be characterized as eplke-llke with durations less than
one second (Figures 4.34 through 4.49), fast rise times, and usually no
dlscernable substructure other than an exponentlal decay. The 05 K_R 79
bur_t is included in this category for two reasons: 1) the elght-second
oscillation would not have been discernable had the intensity of the
initial splke-llke pulse been comparable to classical burst peak
intensities, and 2) the spectrum of the initial pulse is much softer
than classical burst spectra. Splke-llke burst spectra tend to be
characteristically soft (_Sazets et al. 1981f, and Table A.2)
Six out of nine of the splke-llke bursts have been confirmed to be
of cosmic origin by other spacecra/t. For the remaining three, 15 K_.R J
79, 12 At_Y 79, and 08 AKR 82, the Csl T.H. was not recovered nor were
I the events detected by another spacecraft. The Ge detecto¢, which didlI
record these bursts, is not sensitive to charged particles which
slmulate splke-llke bursts in Csl sclntallator detectors. The n_xt few
tb
1983022079-121
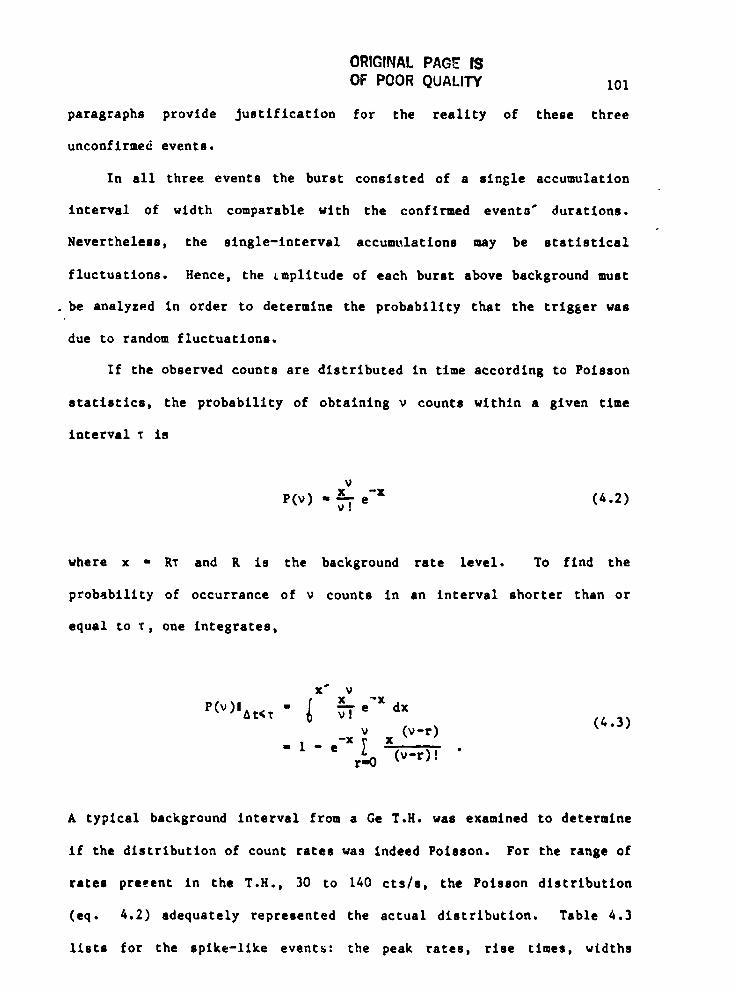
ORIGINAL PAGE IS ;-OF POOR QUALITY 101
paragraphs provide Justification for the reallty of these three
unconflrme_ events.
In all three events the burst consisted of a slngle accumulatlon
Interval of width comparable with the confirmed events" duratlons.
Nevertheless, the single-Interval accumulations may be statistical
fluctuations, Hence, the tmplitude of each burst above background must
• be analyzed In order to determine the probability that the trigger was
due to random flucCuations.
If the observed counts are distributed in time according to Polsson
statistics, the probability of obtaining v counts within a given time
interval T Is
VX --X
P(v) - _T • (4.2) ,
where x = R_ and R is the background rate level. To flnd the
probability of occurrance of v counts in an Interval shorter than or
equal to T, one integrates,
X_ V
P(v)IAt_T • dxv (v-r) (4.3)
--X X
- I - • _ (v-r)t "r-O
t
A typical background interval from a Ge T.H. was examined to determine
If the distribution of count rates was _ndeed Poisson. For the range of
rates pre__ent In the T.H., 30 to 140 cts/s, the Poisson distribution
(eq. 4.2) adequately represented the actual distribution. Table 4.3
lists for the spike-like events: the peak rates, rise times, widths5
it
1983022079-122
_:E_GINAL PAGE IS
_'_ POOR QUALITY 102
(Fl_iM arc .._, full width at about zero amp!_-_:,_7, background level•,
probabilit£_ of events being •tati•tlcal f_ _.uatlont; and expected
intervals between fluctuations equal to or _er than the peak rate•
observed. _ is determined by the for_u_ :_k Rate - v/x (in all case•
v = 32), and the ex:_ecced inte:'.'_ t_ obtained from eq. 4.3
using T = T/P(v)IAt_T . From the tables one sees that a •tati•tlcal
fluctuatlon as large or larger tha_ the 08 SAY 82 peak is expected once
per two years. The other two unconfirmed events have peaks which are
expected to be equalled or exceeded by background fluctuations once
within six or more lifetime• of the experiment. Therefore, for purposes
of further dlscus•Ion, the reality of the (unconfirmed) 15 SAR 79 and 12
SAY 79 burst• will be assumed.
The rise time• and widths were determined from the CsI T.H. if it
was recovered since it has the better statistic•. Otherwise the Ge T.H.
was used. The width• _easured from the C•I T.H.*•, when available,
agzee with the Ge T.H. widths. Characteri•tlc rise time• are tens of
• 3. The range in width• (FNHM) of the •plke-llke bursts is _ 0.05 • to
0.36 • with an average of 0.15 • (Table 4.3). In four events, 05 MAR
79, 22 MAR 80, 31 DEC 81, and 19 _Y 82, short decay• are present. In
the C•I T.H. for 06 AUG 80 a build up and decay are present. The total
event durations range from 0.2 • to _ I s.
A qualification is necessary concerning measurement of short
tdurations with finite statistics from the XSEE-3 T.H.'s. Since the
count rate data are generated by countln8 clock pulse• necessary for N
photons to be detected, for a given detector area the observed width is
a function of N, the burst intensity, and the intrinsic burst width.
1.ower N, higher intensity or larger area resu1: in recording the burst
1983022079-123
L
103
with better time resolution (and, of course, lower N results in worse
statistics). Hence, the observed FW_M and rise times are probably
somewhat larger than the i_trinslc widths, especially for the events In
which the burst is recorded in only one or two time Intervals.
For comparison, the FWHM and _WZA for the short duration, so_t
spec_ • KONUS events are listed in Table A.2. The KONUS experiment
records the initial stage of a burst with 1/64 s (16 ms) time
resolution. The rise time is usually faster than the 16 ms time
resolution (Mazets et al. 1981f). The average width is 0.09 . Becuuse
of the qualification on ISEE-3 resolution mentioned above, the KONUS
average width, 40% lower than the ISEE-3 meanj is probably more
representative of intrinsic burst widths. For the KONUS soft, spike-
llke bursts, a decay is usually o_served with characteristic duration _
0.1 s to 0.3 s. Hence, taking into account the ISEE-3 qualification on
resolution, the temporal characteristics of ISEE-3 and KONUS spike-like
events are comparable.i
Both T.H.'s were recovered for five ISEE-3 splke-like events. For
four of these bursts the ratio Ge:CsI peak covnts above background was
calculated to produce peak hardness indices (see Table 4.4). In the
re_aining case, (05 DEC 80), the Csl T.H. peak is obviously diminished
by spin modulation. The hardness index for 05 MAR 79 is 0.49. This
serves as a fiducial for spike-llke e_ents; the spectrum of the 05 MAR
intense initial spike is very soft (kT _ 45 keV for a thermal
bremsstrahlung fit without gaunt factor, see Table A.1 for comparison
with other KONUS spectra) compared to classical burst spectra. Tht 05
MAR index is very well determined since its ratio was calculated using
the several accumulation intervals comprlsing the high intensity peak.
1983022079-124
104 <
The 05 MaR CaI T.H. Is not modulated Mince the triangulated source
direction is very close to the south ecliptic pole, the satellite spin
aXiS.
The three other spike-llke events (Table 4.4) have peak hardness
indices comparable to or softer than that for 05 MAR. The values range
from 0.45 to 0.22. Note however, the errors are considerably larger
tha_ for 05 MAR. The peak hardness indices for spike-like events should
be considered upper bounds since only one-fourth of the CsI T.H. is 80%
or more unmodulated; the CsI peaks may have been reduced by modulation.
i For comparison, the maximum values of the hardness index for the
compact and extended bursts are also listed in Table 4.4. The index is
typlcall7 _ 1.0, indicative of the hard spectra which compact bursts
attain. For a few additional compact events, for example 30 $EP 81, it
is noc clear where the modulation occurs in the CsI T.H. and hence
hardness indices were not calculated. However, in these cases the
overall burst hardness appears comparable to the compact burst indices
which were computed. The three extended events with evidence of
periodicity also exhibit hardiiess indices significantly less than
compact bursts. A possible explanation for this behavior is introduced
in section C.
In summary, the ISEE-3 spike-like events for which peak hardness
ratios are produceable prove to be similar spectrally _o tl.e KONUS
splke-llke events. Nearly all short duration KONUS events haw very
dolt apectra (Table A.2).
Compared to other T-ray burst experiments, the Teegarden ISEE-3
experiment has detected a very large petcentage of spike-like events,
33%. In particular, for the KONUS experiment, the corresponti_ng
1983022079-125
?S
06 POOR QUALITY 105
percentage is 8%. The figure is based on KONUS events for which spectra
are available. All short duration (<i s) bursts with thermal
bremsstrahlung fits of kT < 50 keV are included (i0 out of 124).
Although the ISEE-3 experiment is one of the least sensitive y-ray '
burst detectors, the ISEE-3 data set is probably more representative of
the true proportion of spike-llke events. To show that this is the
case, one must first examine the burst trlg_er mechanisms for both
experiments. The ISEE-3 trigger has already been demcrlbed; if N
photons are counted by the experiment within a preselected number of
clock pulses (TH) with frequency FT, the trigger threshold (NxFT/TH) is
exceeded and burst recording is begun. All bur_ts which deliver an
instantaneous count rate equal to or greater than the trigger threshold
are detected. Thus, if burst spectra were not correlated with
durations, sources with equal instantaneous flux _ould be sampled
without bias for duration.
The KONUS Lrlgger mecLqnism is representative of con_=tttlonal
experiments. Counts are integrated by two rate meters with effective
time constants of 0.3 s and 1.5 s and compared to a background ratemeter
with a 30 s time constant. A _ 6 sigma rise above the background
initiates recording of the burst (Mazets et al. 1979). In Figure 3 of
_zets et al. (1979), the estimated threshold sensitivity of the KONUS
experiment, assuming square burst shapes, is plotted versus duration.
According to this graph, threshold fluences required to trigger the
recording apparatus for bursts of duration 0.I s, 1 s, and I0 s are 1.6
x 10`-7, A 3 _ 10-7 , and 2.6 x i_ -6 erg cm -2• , corresponding to (average)
fluxes of 1.6 x i0-b, 4.3 x 10⁻⁷ , and 2,6 x 10⁻⁷ erg cm-2s -1,
1983022079-126
ORiGInAL P/LCE _COF PG_ QUAL_{ :
106
respectively. Hence, long bursts are detected at lower flux levels than
short bursts.
The difference in thresholds translates into a difference in
detection llmlts for sources of luminosity L and distance d. The ratio
of threshold fluxes for 0.1 s (spike-llke) and 10 s (compact) bursts is
FO.I LO.I d10 2" _ {d_ } " 6.2 (4.4)
FIO L I0 O. I
If the assumption is made that the luminosities of t_e two types of
bursts are comparable, the ratio of volumes sampled is
dlo 3
{d0.1} " 15. (4.5)
Another implied assumption is that the two source distributions are
isotroplc and homogeneous out to the distance inferred by thresholds of
sensitivity and assumed luminosities, i.e., galactic structure is not a
factor. Given the present understanding of y-ray bursts, these
assumptions are interdependent and not completely Justifiable, and are
made only for the purpose of illustrating the dependence of KONUS
threshold sensitivity on dulation and therefore on flux. However, the
nearly isotropic distribution of burst localizations (Figure A.1)
suggests Isotropy of sources, indicating that observations are presently
limited by experiment sensitivities rather than by the galactic source
distribution geometry.
I
1983022079-127
I 0" FOOi_ _:J/',L_TY _,:| 107
_j At the least, relation 4.4 obtains for the KONUS e_periment,
:i whereas
F0"I- i (4.6)
i FIO\
W"_ for the ISEE-3 experiment (ignoring spectral differences between
.classical and spike-like bursts). Hence, the ISEE-3 data set represents
, the proportion of spike-like events without the complication of an
additional duratlon-dependent sensitivity factor (besides the unknown
factors, source distributions, and ratio of characteristic
luminosities).
! The ISEE-3 sample is considerably smaller than the KONUS catalog.
Therefore, one must question, is the percentage of spike-like events
detected by ISEE-3 actually significantly greater than the KON_S spike-
llke percentage? The binomial distribution is appropriate for the small
sample of ISEE-3 events. Assume the KONUS sample is truly
representative of the parent populations of splke-llke and classical
bursts; the probability of occurrance of a splke--like event is then p -
i0/[24 - 0.08. The probability of observing x or more splke-l_ke events
from a sample of n is
nn!
" Pb ('x'n'p) " [ i_(n-i)' pi(l-p)n-i (4.7)i=x
The probsbiitty of observing eight or more spike-like events out of
twenty-four Is 4 x lO-4. If only the six confirmed ISEE-3 sptke-iike
events are considered, the probability is still only 1 x i0-2. These
low probabilities and the argument presented above concerning trigger
1983022079-128
log
criteria are strong evidence thst previous burst experiments have under-
represented the true proportion of splke-llke bursts.
C. Discussion
The phenomenologlcal dlvtslon into two classes of bursts, one with
soft spectra, short duratxonl, and one with hard spectra and longer
durations, is not clear cut. Two short duration KONUS events have
th_Tm_l bremsstrahlun 8 temperatures above 50 keV, the events of 06 APR
7_ and 13 JUN 79. The 06 APR 79 event has an unusually hard spectrum
even for classical type bursts. There is an inconsistency in the
spectra reported for the 13 JUN 79 event by the KONUS and SIGNE
investigators. The KONUS spectrum exhibits a temperature of _ 87 keV
{Table A.2), whereas the SIGNE Gpectrum is _ 660 keV (Beret et el.
i983b). The difference in the reported spertra may bt _ttributed to a
possible anisotropic response of the KONUS detector system. This is
suggested by a correlation of Veners spacecraft positions with burst
localizations, spectral hardness, and fluence (Laros et el. I_82).
Nevertheless, the solitary short pulses and soft spectra of most
splke-like bursts compared to the protracted multlple-pulse proiiles and
hard spectra of compact bursts suggest that fundamentally different
physical mechanisms are operating in the two categories of bursts. This
is suggested by Figure A.4, a histogram of the thermal synchrotron fits
for the KONUS spectra listed in Table A.l (multiple spectra for • given
event in some cases). There is a definite separate peak at c c _ 0.6 (c c
is the critical energy, which characterlees the spectral hardness in the
thermal synchrotron model; see chapter V). This peak is accounted for
_ntirely by the spectra of splke-llke events and the spectra of l,_ter
ir _ I
] 983022079-] 29
109
stages of classlcal bursts The classlcal bursts tend to soften as the1
: event progresses. Seven of these spectra are from the two repeating
�sources,the 5 MAR 79 source and BI900 +14, discovered by the KONUS
I Investigators (Mazets et al. 1981f).r
: The sparse number of localizations for spike-like bursts are
: insufficient to form a picture of a source distribution (see Figure A.1)
which might differ from that of classical bursts.
Extended burst and compact burst profiles differ in two respects:
1) extended bursts are longer with gaps of duration comparable to or
longer than major pulse structures, and 2) structure suggestive ot
(quasi-) periodicity is evident mostly in extended bursts. However,
extended and comoact bursts are probably produced by the same kind of
process. In the following discussion, a scenario is outlined to explain
the dearth of observed periodicities in burstc. This possibility is
expanded in chapter VI in a general disc_,sston of burst characteristics.
The apparent observed periodicities in bursts are longer _han radio
pulsar periods (cutoff period _ I s, Manchester and Taylor 1977) but
comparable to the shorter periods (_ 10 s) of X-ray binary pulsars
(White 1982). Wood et al. (1981) have shown that the convolution of a
period distribution like that of X-ray binary pulsars (peaked at several
tens of seconds) with the distribution of y-ray bursL durations (peaked
at about 10 s) yields a small fraction of detect_ble y-ray bursts wtth
periodicities, consistent with existing y-ray burst observations.
Then if y-ray bursts come from objects with a period distribution
like that of the X-ray pulsars, the geometry and degree of beaming of
radiation and the peciod modulate individual source temporal profiles.
For example, consider the 13 FEB 80 extended burst (Figures 4.9 &
1983022079-130
t
110
4.10). The temporal profile may be explalned by invoking an emission
region covering approximately half of the star; the region rotates into
view twice before the burst subsides.
The compact bursts may come from the more slowly rotating objects
corresponding to the upper end of a period distribution llke that of
X-ray pulsars. The burst is observed when, during a burst episode, the
emission region rotates into view. Yet no rotation period is detected
because the period is longer than the event duration.
The three extended bursts with long gaps, presumably due to
rotation, and narrow pulses, due to beaming, have softer spectral
indices than the compact bursts and 13 FEB 80. The KONUS observations
indicate that the hardest portions of bursts usually come in the initial
phases; when hard intervals do recur during a burst, their durations are
relatively short. It may be that during the long gaps in the extended
bursts discussed here, the hard portions of these bursts were missed
while the source was beaming in another direction.
The X-ray binary pulsar hypothesis requires a scenario which placeq
the y-ray burst source objects at _ few x I00 pc but renders the _=eady-
state X-ray accretion undetectable (see chapter I). However, detected
X-ray binary pulsars are concentrated at several kpc distances at low
galactlc latitudes towards the galactic center, whereas y-ray burst
Iocalizationa appear Isotropically distributed. To explain t_e
difference, Ventura (1982) has postulated a sequence in which a binary
system consisting of a rapidly rotating neutron star and initially 0.i
Ho companion evolve through mass exchange. The neutron star's rotation
is slowed by accretion torque and the system may eventually become
I
1983022079-131
L
iii
unbound. The resulting y-ray burst system may lle at a distance of
300 pc and X-rays from low accretion rates remain undetected.
r Alternatively, and with less contrivance, the y-ray burst sources
! may be old extinguished radio pulsars with rotation periods greater than
I _ 5 s, or there may be neutron stars which are born with long periods.
The galactic scale height for radio pulsars, determined from
observations, is _ 230 pc (Manchester and Taylor 1977) or _ 380 pc
"(Gailly et al° 1979). The scale height for "dead" pulsars, given the
estimated z velocity of 150 km s -I (Manchester and Taylor), is then
somewhat larger. If these are the _-ray burst sources, then accretion2
from a companion star and interstellar accretion are improbable
explanations of y-ray bursts.
1983022079-132
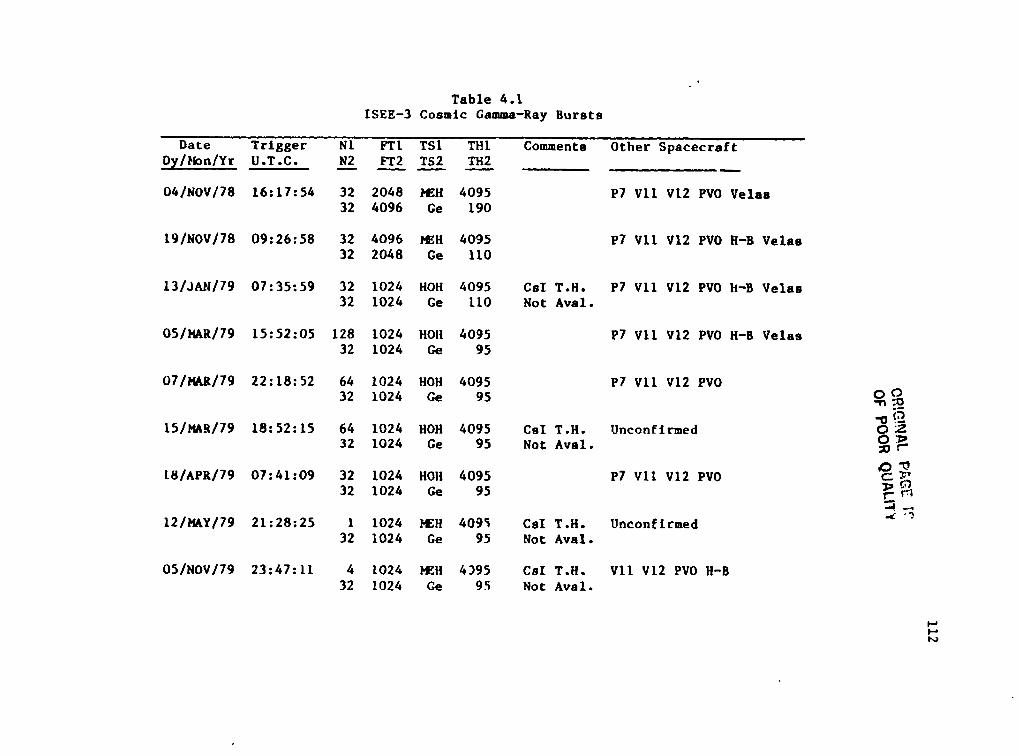
Table 4.1 ISEE-3 Cosmic Gamma-Ray Burste
Date Trigger N1 FTl TS1 THl Comments Other Spacecraft Dy/Fbn/Yr U.T.C. N2 IT2 TS2 TH2 - -- - -
P7 Vl1 V12 PVO Velae
P7 V11 V12 PVO H-B Velas
13/3AtJ/79 07:35:59 32 1024 HOH 4095 CeI T.H. P7 V11 V12 PVO h-B Velae 32 1024 Ge 110 Not Aval.
05/MAR/79 15:52:05 128 1024 HOH 4095 32 1024 Ge 95
07/MR/79 22:18:52 64 1024 HOH 4095 32 1024 Ce 9 5
P7 V11 V12 PVO H-B Velas
P7 v11 v12 PVO
15/HAB/79 18:52:15 64 1024 HOH 4095 CsI T.H. Unconfirmed 32 1024 Ce 95 Not Aval.
L8/APR/79 07:41:09 32 1024 HOH 4095 32 1024 Ce 95
P7 v11 V12 PVO
12/UAY/79 21:28:25 1 1024 M H 4095 CaI T.H. Unconfirmed 32 1024 Ge 95 NotAval.
05/NOV/79 23:47:11 4 1024 W H 4395 CeI T.H. V11 V12 PVO H-B 32 1024 Ge 95 NotAval.
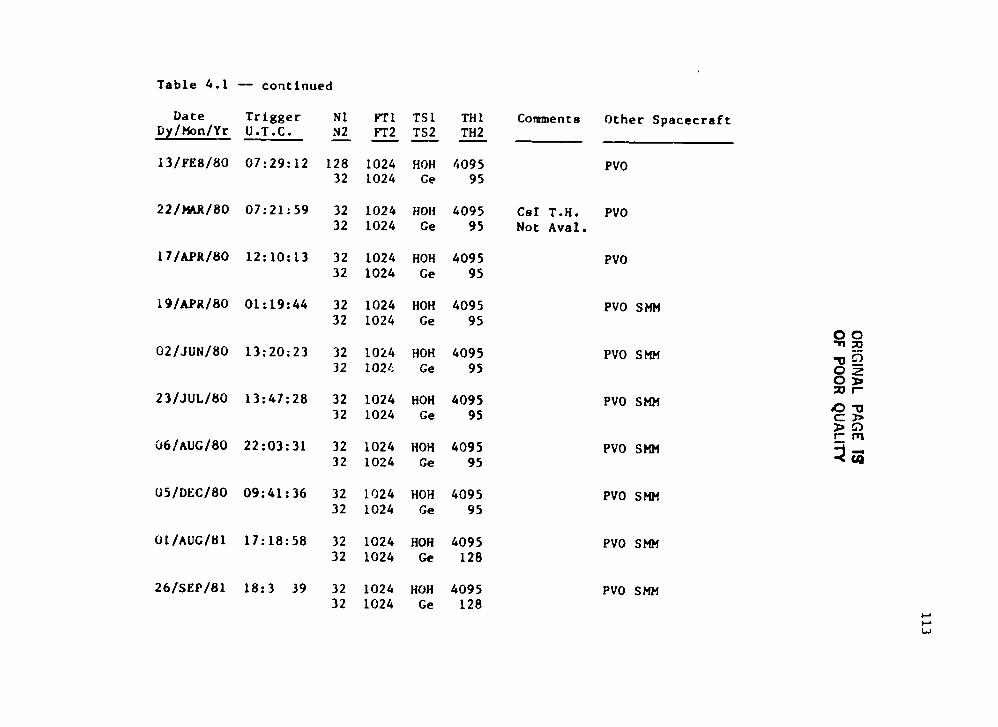
113
OR
IGINAL
PAG
EIS
OF
POOR
QUA
LITY
4.JW
_Ur.o
oo
oo
oo
oo
o
®._
Et
i
1983022079-134
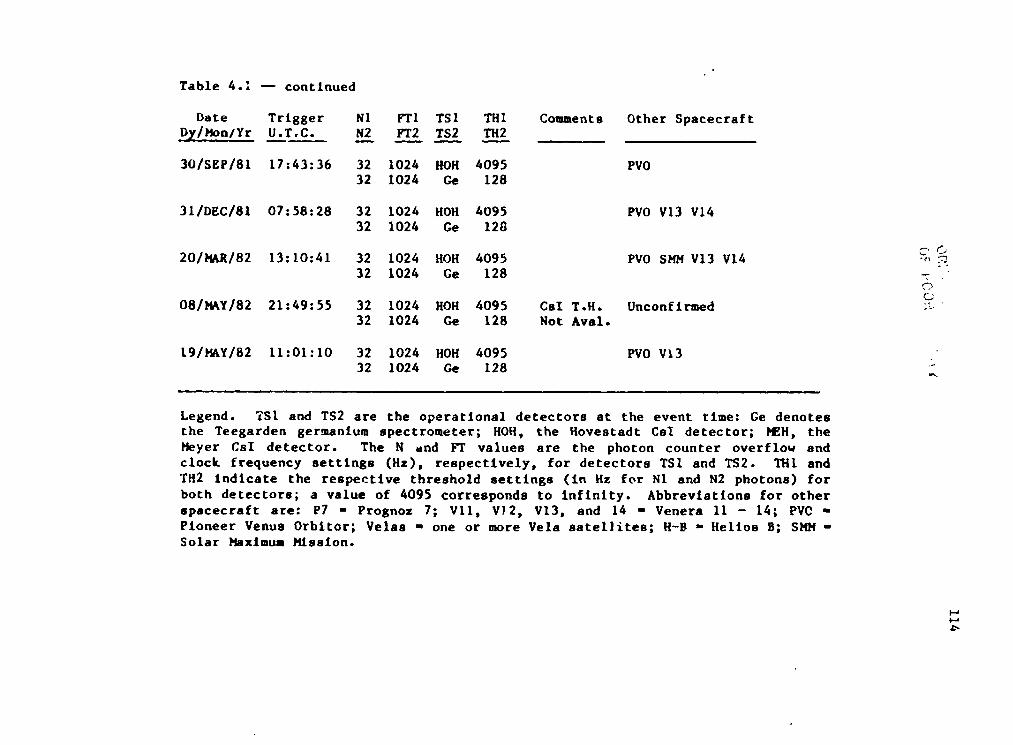
Table 4.: - contlnued Date
Dy/Hon/Yr Trigger N1 U-TeC. -- N2 -
THl Coaments Other Spacecraft TH2 -
HOH Ge
PVO
PVO V13 V14 HOH Ce
HOH Ce
PVO SHn V13 V14
HOH Ce
4095 CsI T.H. Unconfirmed 1 2 8 Not Aval.
PVO V13 HOH Ce
Legend. ?S1 and TS2 are the operational detectors at the event time: Ge denotes the Teegarden germanium spectrometer; HOH, the Hovestadt CeI detector; M H , the tfeyer CsI detector. The N and values are the photon counter overflow and clock frequency eettings (Hz), reepectively, for detectors TS1 and TS2. THl and TH2 indicate the respective threshold settings (in Hz for N1 and N2 photons) for both detectors; a value of 4095 corresponds to infinity. Abbreviations for other spacecraft are: P7 = Prognoz 7; Vll, V12, V13, and 14 = Venera 11 - 1 4 ; PVC = Pioneer Venue Orbitor; Vela8 - one or more Vela satellitee; H-B = Helioe B; SMM = Solar Heximum Hiseion.
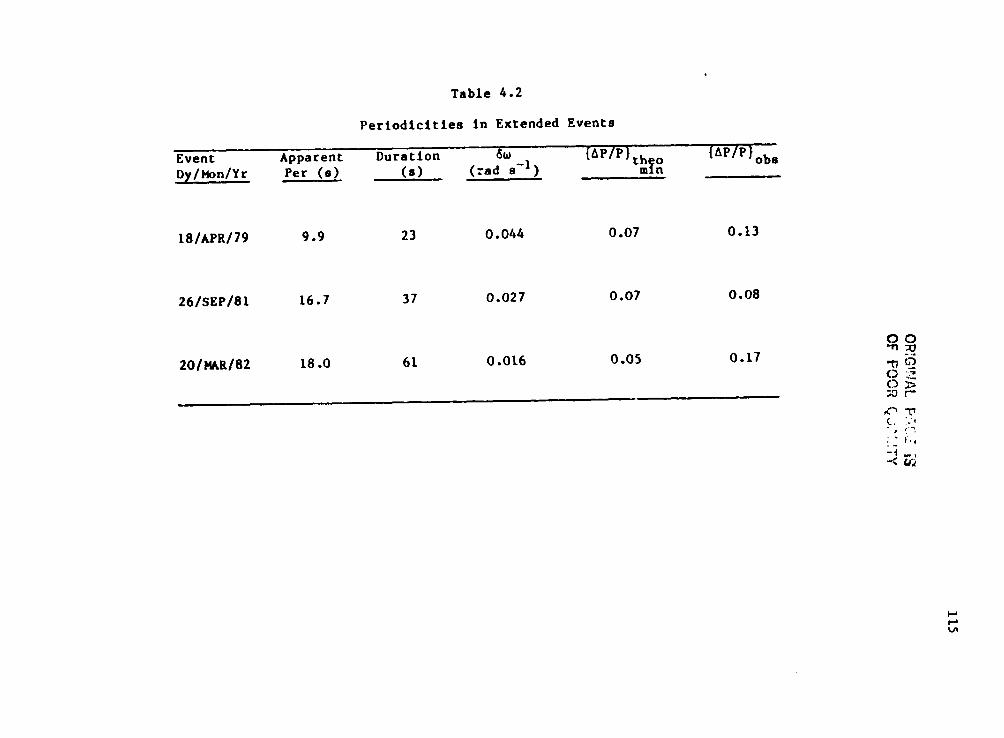
115
OR',GVr.JALF._t,E
i_
hi'l,
OF
P....RC_b."..'.TY
,A
1983022079-136
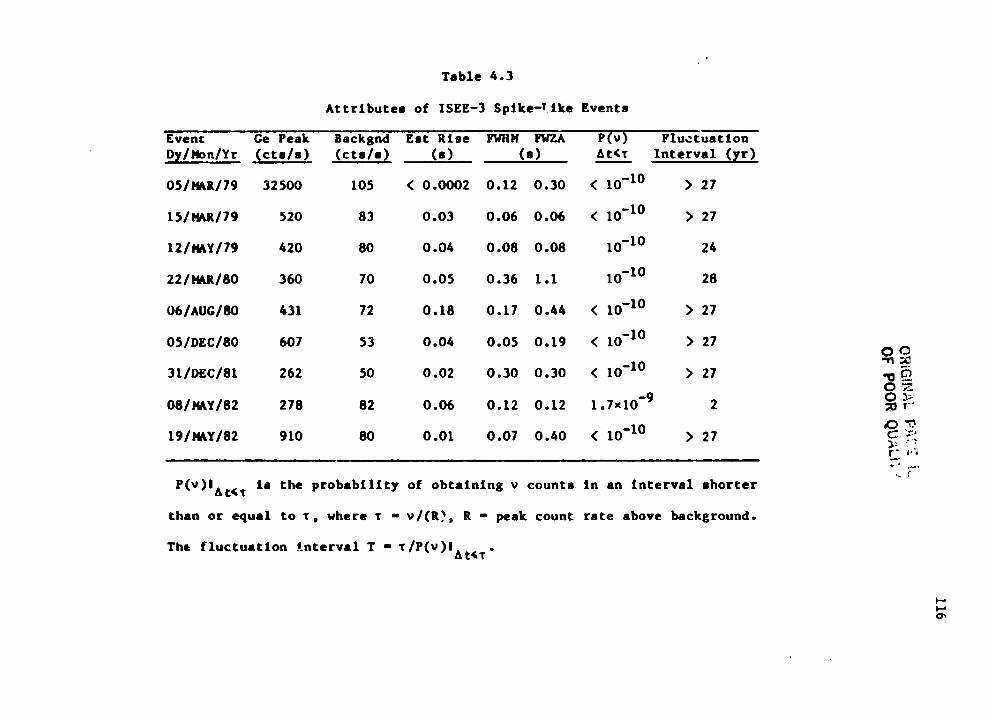
116
ORiGtlq'ALPA':.';.
i,_
OF
PO
ORQU,_U,;/
1983022079-137
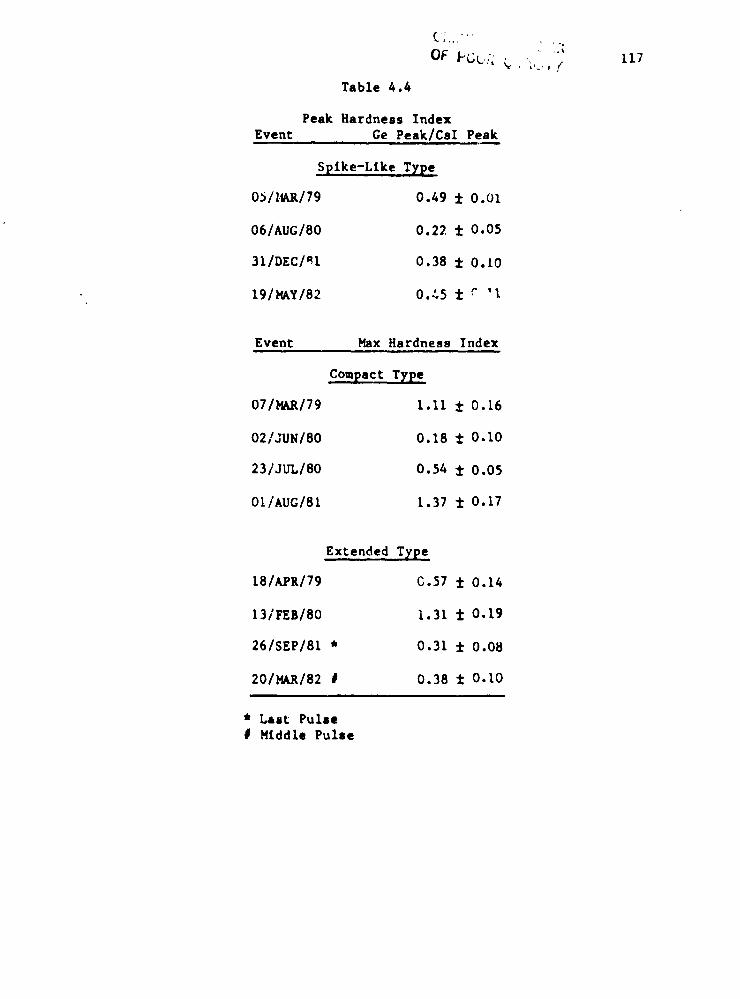
!
OF PCL:;_. ,I 117 I
Table 4.4
Peak Hardness Index , :Event Ge Peak/Csl Peak _
Spike-Llke Type
0_/_t_/79 0.49 ± 0.01
06/AUG/80 0.22 ± 0.05
31/DEC/_I 0.38 ± 0.10
19/MAY/82 0.45 ± c 'l
Event Max Hardness Tndex
Compact Typ _
07/M&R/79 1.11 ± 0.16
02/JUN/80 0.18 ± 0.I0
23/JUL/80 0.54 ± 0.05
Of/AUG/81 1.37 t 0.17
Extended Type
18/APR/79 C.37 ± 0.14
131_S/80 1.31 ± 0.19 1
26/SEP/81 * 0.31 ± 0.08
20/MAR/82 # 0.38 ± 0.I0
* Lair Pulse# Middle Pulse
A
1983022079-138
118
Figures 4.1 - 4.49. Time histories of ISEE-3 gamma-ray bursts.
the time axis refers to Coordinated Unlverssl Time. The suffixes to the
event na_es represent the following:
! TH1 - CsI time histories.!
i TH2 - Ge time histories
i SHD - HXRBS shield time histories for events observed in common
i with ISEE-3/
RAT - ratio of detector counts, Ge/Csl, for the 80Z or more
unmodulated portions of the Cs[ time histories.
The shield plots have been shifted ± _ 4.5 s (llsht travel time,
[SEE-3 - SMM) to line up with the ISEE-3 plots.
The HXRBS shield accumulation interval is 64 as.
-r _
I
1983022079-139
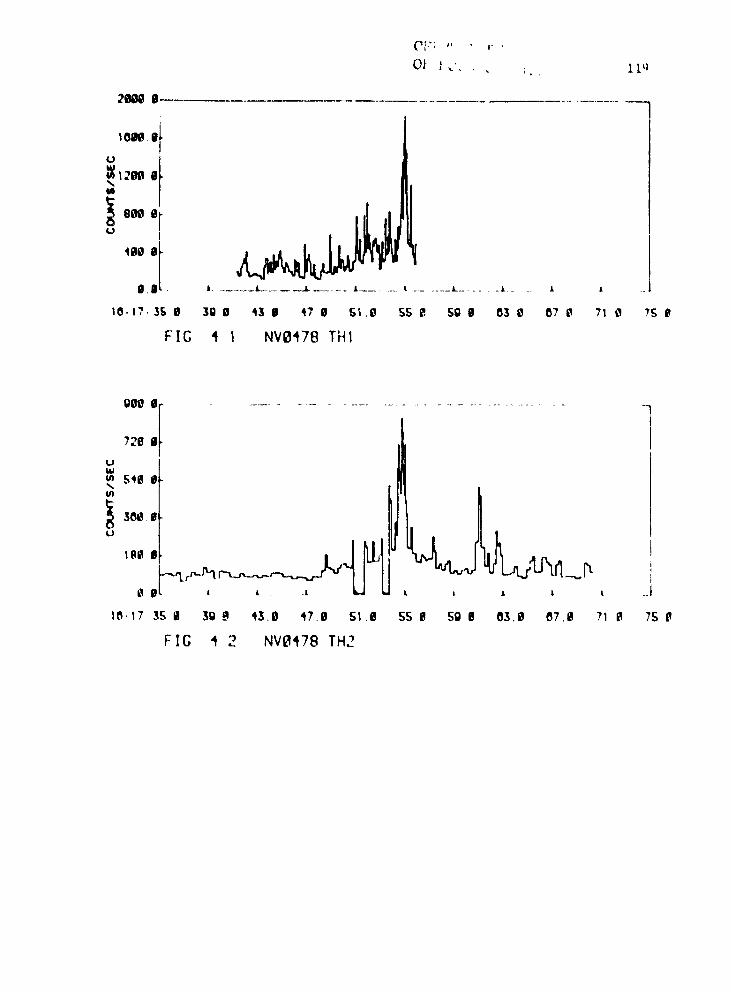
kT:; " r _
", 01" _ _', _. . I L_ ! °
7 1i'
_om,e i "o I
i ,8m_O _
il.I J......... L ..... -._ ..... • ....... i ....... L........ l.._ _ , _.
tO, 17, 3g 0 30 0 43 il 47 0 g'_.iP 55 e 50 8 05 iP 0"7 _l 71 0 75 L_ iFIG 4 1 NY9478 THI _,
?2
glPO II, ...........................................
721_ il
UW
30¢, IPU
¢ L L _ .l • , l l L ..
10'17, 3S 0 3U 9 43.0 47.0 St.iB $5 [_ SO 0 03.i_ 07,QI 71 ia 75 _1
FIG 'I 2 NVe478 TH2
a
1983022079-140
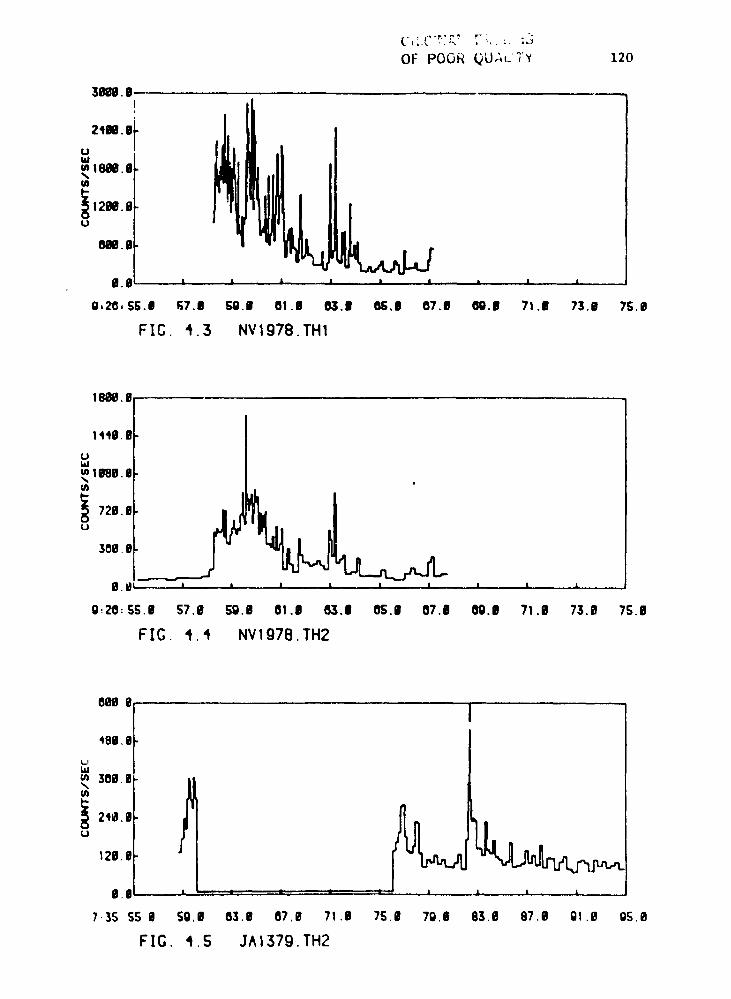
:, OF POOR _LI/,L'T¥ 120
31_III.II_I
u241I.ililld
w
12N.0-
01_.0.
II.0 ' ' ' ' ' ' • ' •
0,2_, SS.II l;7.g ._9.I 01.I 03.9 88.11 07.B OO.l 71 .II 73.11 75.0
FIC. 4.3 Nvlg78.THI
16m.
1410.
uIAI1090
°
B,_l A l • l I A • i l
0,20: S5.1J 57.0 59.B 01.II 63.1 OS.I 07.0 00.II 71.0 73,0 75.0
FIG. 4.4 NV1978.TH2
0N
400.
w30g.
g. Oi L -- ,_ -- ...: -" - = L_ l •
7.3S 55 0 5O.il 03.1J 07.0 71.0 75.IJ 79.1I 63.i9 67.0 01.0 OS.O
FI6. 1,S JAI379.TH2
1983022079-141
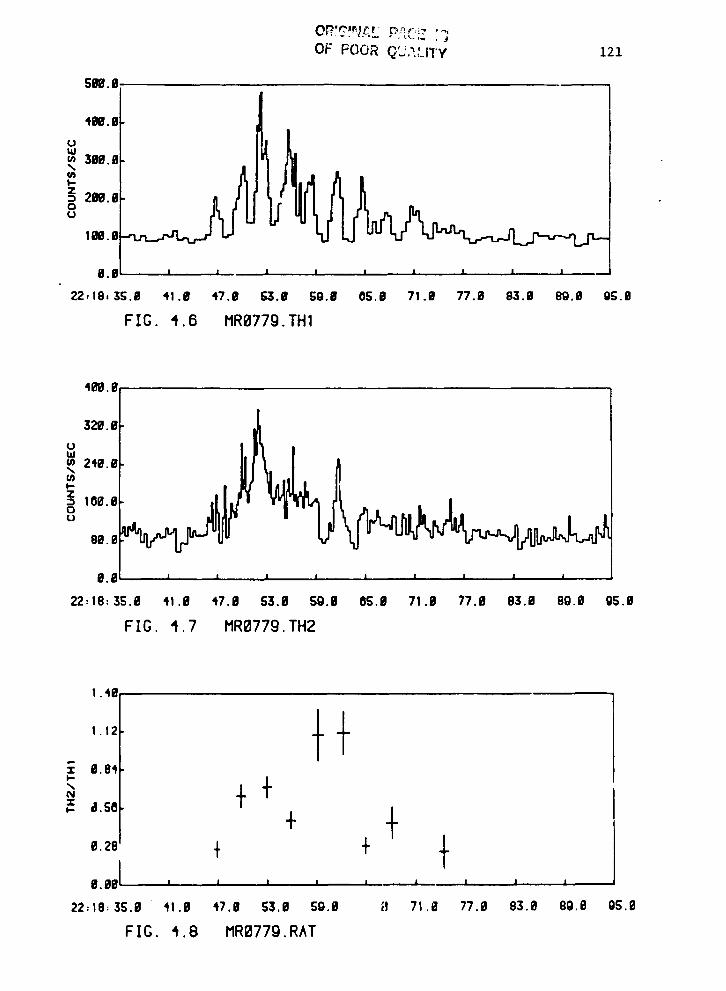
OF POOR (_'..,',_LITY 121
599.0
4ele.R
!,uw
= 21W.60u
IoR.e "I _
B.il i _ i a i J i l J __
22,18, 35.6 41 .R 47.R r_.if 59.1l 05.0 71.8 77.R 83.R 8Q.8 05.0
FIG. 4.O MR0779.THI i '
401_,8 i
329. B
uw(n 248.R
i-z-, 108.8o(..I
88.6
22: 18:35.8 41.0 47.0 53.0 SO.B OS.R 71 .R 77.R 83.0 8{}.9 O5.R
FIG. 4.7 MRO779.TH2
1.48
1.12 _ +8.84
'- +- +Z
o,28 JrI /
e 88[ , , , , , , , , ,22: 18:35.0 41.8 47.0 53.0 59.8 ;I 71.0 77.0 83.0 89.8 OS,O
FIG. 4.8 MR8779. R^T
1983022079-142
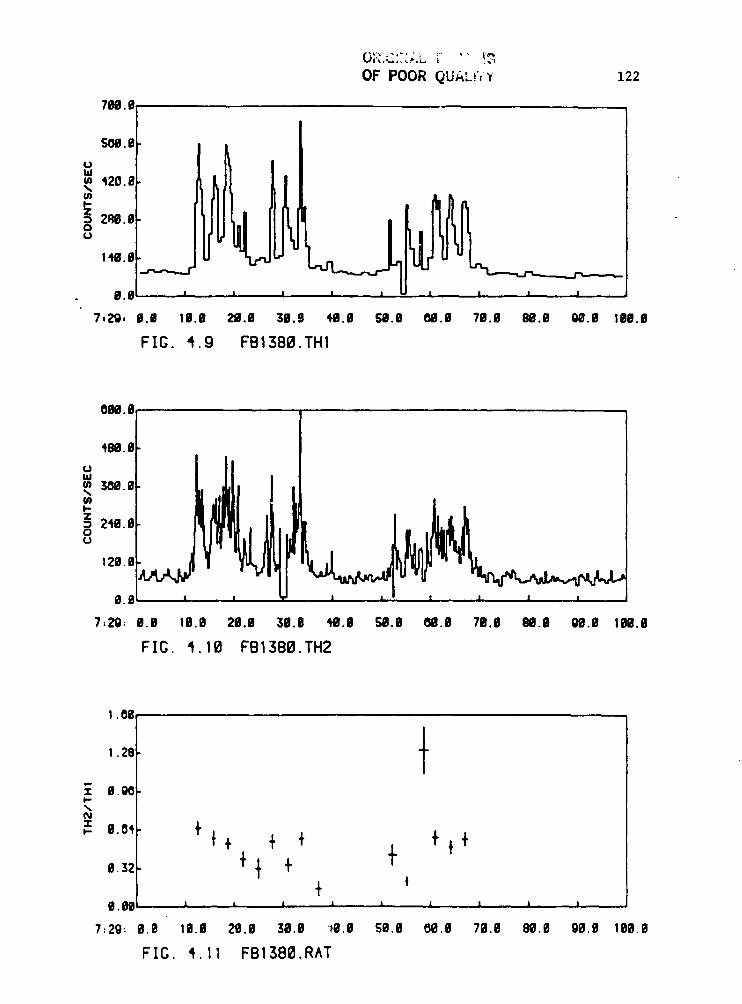
; /
OF POOR QUAL!iY 122
70g.O,
SOO,eUtd
...42oi• U
il.il I i .i I
7,29, I.I I1.1 211,1 31.1 4i!.i SI.I! all.i 71.I 811,11 fig.I llil.I
FIG. 4.g FBI 3BO.TH1
ON. 0,
u 480. etwin 36g. i%
I-Z
240.6
°(.) !29.
_ . i I i
7:_: i#.e lO.O 2_.I 3B.O 4e.I Sg.i# Og.I 70.i# M.I 09.0 1g.e
FIG. 4.10 FB1389.TH2
I.8_
!. 281
I,,,-
NI
,- eo, t.t+ �+�¸�+032 °Jr
�*
7:29: il.il 111.tt 20.0 38.6 19.tl 511.1t 80.tl 7g.9 Oe.il g9.0 lEO.It
FIG. 4.11 FB1386.RAT
t
1983022079-143
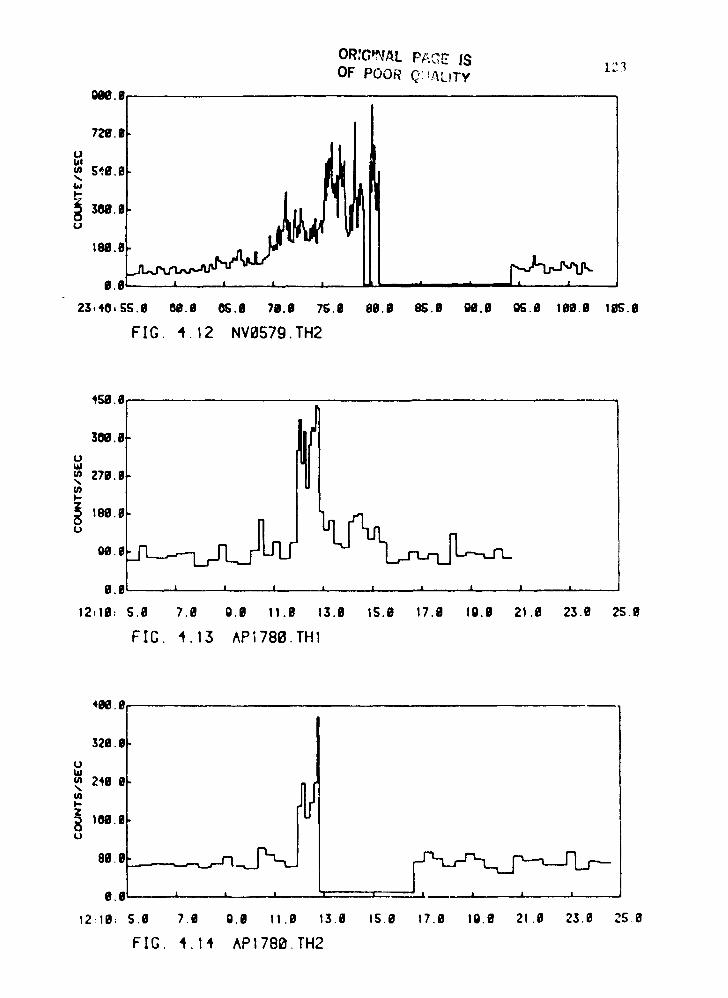
!|
OR'OP_L PACE 18 I::3 _OF POOR QItALITY
_.II
7211.II
Ui
• I | '1 |B eL l . , " •
23,40, 5S.O 08.1g 0G.I 7B.il ?S.i_ 81B.l_ 85.0 H,ID 05.1_ 1H.I! li_S.0
FIG. 4.12 NVO57g. TH2
4_.e
uJu360.il, Icn 271.%U)
00 A i i i i i
12:10: S.O 7.9 g.0 11.0 13.0 IS.t} 17.1g Ig.il 21.I_ 23.0 25.0
FIC. 4.13 API780.THI
40e.9
320. g
uwm 240 tl
: SI011. B
eee _O.O A , i _ L
12:10_ S.8 "7.0 O.0 11.9 t3.@ IS,O 17.O 10.O 21.6 2_.0 25,0
FIG, 4.14 API786.TH2
I
1983022079-144
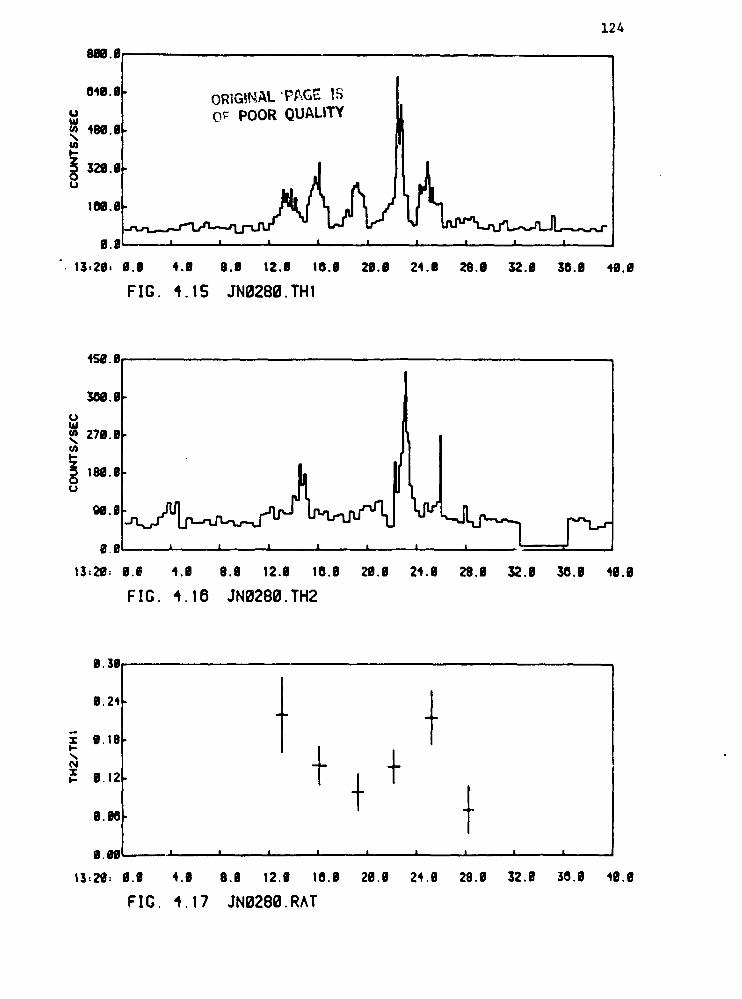
.'
124
""I1 040.il ORIGINAL "_'_GE |,_J u o_ POOR QUALITYt ==4u.e_ -
U
i IM.O
_ g.O i i , ' = • , . .= . , J !
13,20, 0.8 4.1 8.iJ 12.0 IO.iJ 2g.iJ 24.8 28.0 32.0 30.0 4O.g
FIG. 4.15 JNg280.THI
4_. O_
308.8 IU
_ 27g-| t
t3,29: g.e 4.8 9.8 12.0 la.O 20.0 24.0 29.8 32.6 30.8 40.0
FIG. 4.16 JNO286.TH2
O.38
0.24 t _"o.teI,,-,
- + +NZt,- 0.12
il.Og _,i i i i i i i i ,, ,
13,29, 0.0 4.0 8.0 12.0 10.8 20,0 24.9 28.9 32.8 30.0 40.0
FIG. 4.17 JNO280.RAT
i
1983022079-145
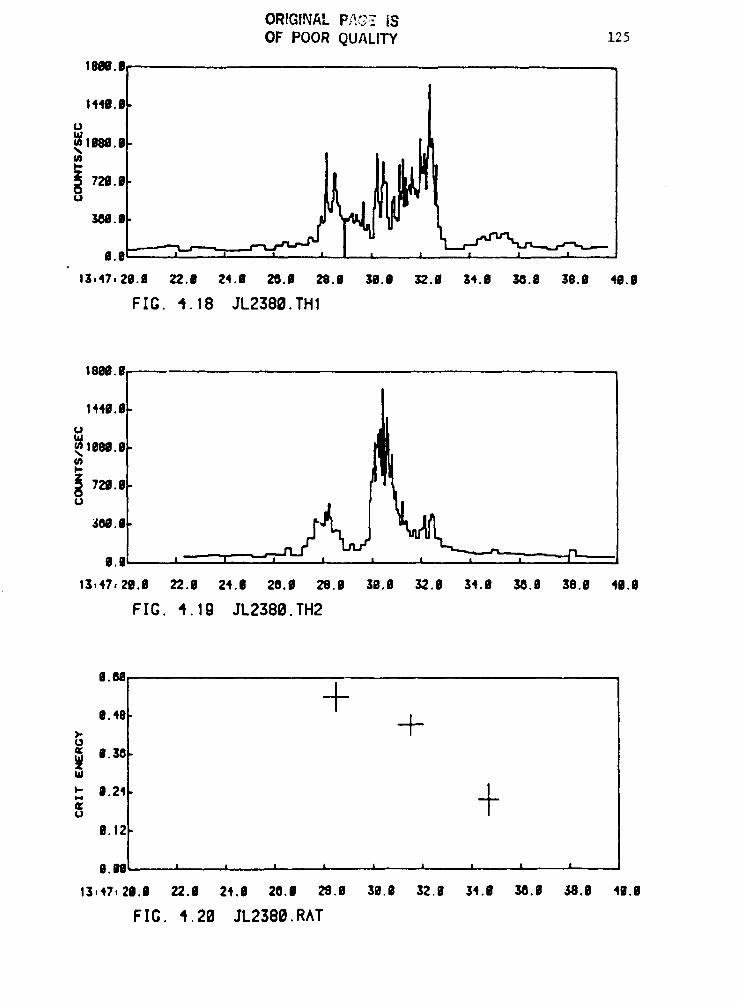
ORIGINAL P::_'_: iS _OF POOR QUALITY 125
!8N. IIi
u 144|'III
=.
7_.m
11111.8
11.8
13,47, 21D.f 22.11 24.11 20.11 213.1 38.| 32.| 34.B 30.8 3e.II 41m.8
FIG. 4.18 JL2380.TH1
1880.0
144ii.g
u
_ leW.il
_lOi3.II ._'g.O ' ,,,
13=47, 2g.II 22.11 24.11 20.11 29.1m 30.0 32.0 34.11 30.0 38.1_ 40.0
FIG;. 4.1g JL2380.TH2
II.IW
0.49 +,. +_ 0.30w
I- il.24 |1-0¢(,.,p
9.12
a. |g ' A ! I l i _ l • = =
13,47, 20.1 22.0 24.1 20.1 29.g 30.0 32.6 34.0 30.1 ,38.0 46.1
FIG. 4.20 JL2380.R^T
=l
1983022079-146
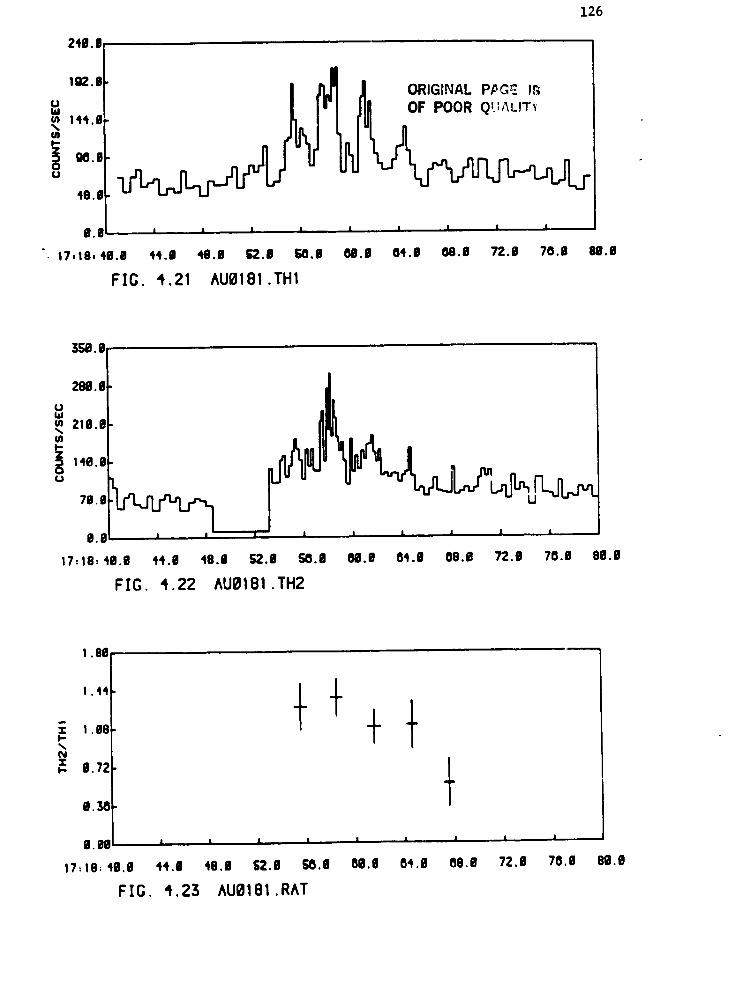
_.f
126
2'lO,|
102.0
] ORIGINAL PPG_ _U
40.6
jill I I I ,, a i s A i i ..
ii 17,18, 4g.O 44.8 48.| _.il 60.8 M.g 04.B 08.D 72.g 70.8 88.8i FIG. 4.21 AUI_181.TH1
&Sl9.il
208,|f,.,)W
Zlae
70.0 _8.6 , A i. I i L
17:16:40.8 44.g 49.8 S2.il SO.il 00.iD 04.il 08.e 72.11 70.B 88.B
FIG. 4.22 AUg181.TH2
1.88
t ,ee +I.-
N
_ 0.72
0.30
iJ.H i i ' i i i i i ,
': 17:18: 411,9 44.| #9.| S2.1l SO.0 08,9 04.9 08.1_ 72.0 70,9 80.0
FIG. 4.23 AUgt81.RAT
!
• r ,
1983022079-147
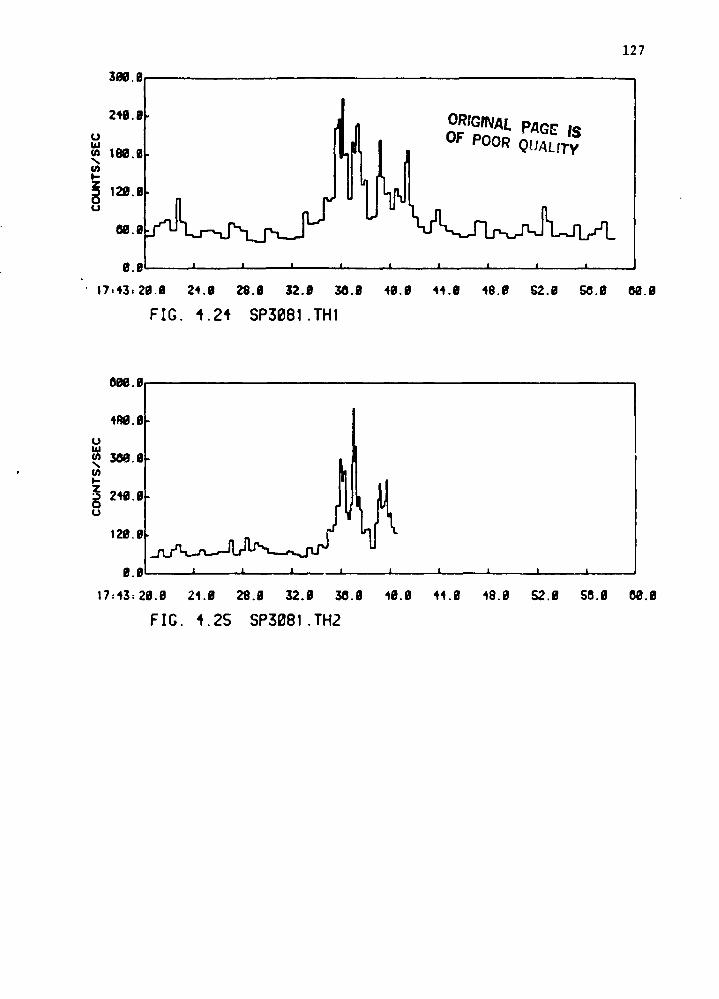
127
3N.0
z4e.e OR/GII_/AL PAGE IS
_au_wu"IN.O _ _OF POOR QUALITY
_ I_.0U
0.8 _ i i i .L i i i i
17,43, 2g.O 24.11 28.0 32.11 3_.0 4e.il 44.ii 48.I_ G2..B F_.O 00.0
FIG. 4.24 SP3681.TH1
ON. g
4M.O
UW
' i 2'lg.ll
121_.0
0.9 _ i i i i i _ m A_
17;43:20.0 24.0 2'0.6 :_r_,.il 30.0 40.0 44.11 48.9 $2.6 50.9 Oe.O
FIG. 4.25 SP3881.TH2
1983022079-148
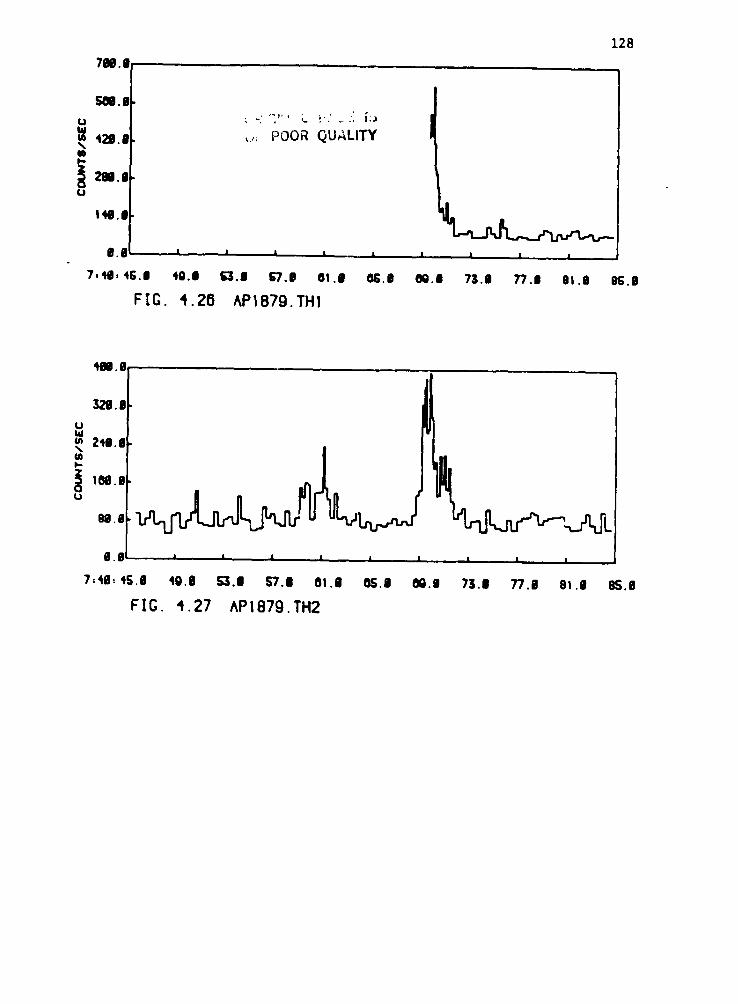
128
7m.|
|'_ 420. ,,: POOR QUALITY
0. J E | l __ • | | | , J
7,'HI, 4G,| 40.0 I;3,| b'7.| Ot.0 OG.O 00.0 73.0 77.0 8t .0 OG.O
FIG. 4.26 AP1879.THI
_.8
_0.0U
_n 240.
_ 1_.U
N.O'
7,40, 45.0 40.0 53.0 S7.0 Ot .8 05.0 _.0 73.0 77.0 el .0 8S.O
FIG. 4.27 ^PI87g.TH2
i
1983022079-149
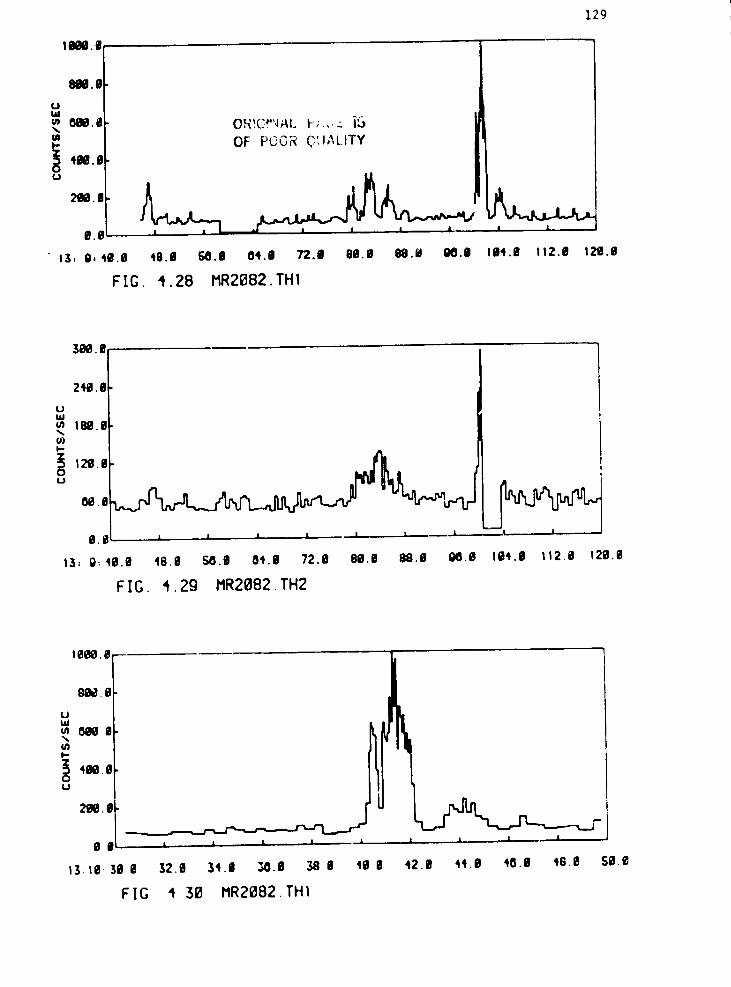
1129
leee.m
8gg.o
Ulal
i OF POOR C,:I,%LITY4m.|
_.8 _B.O "
13, O, 40.8 48.11 60.11 04.11 72.11 88.11 O:O.ltl 00.11 104.11 112.11 120.0
FIG. 't.28 MR2682.TH1
3ee.11
u 245J.11 Iw
',.w1619.11 I
U o0.1_( i I i I I l _ i t _ 1
13, 0;411.11 46,11 50.11 84.11 72.11 80.0 09.8 0_.1t 1514.11t12.11 120.8
FIG. 4.29 MR2082.TH2
I ilele.8
6ee.il
411e.9u %
2ee,|0 | A I L . L & A I, I
|3:18' 3118 32.11 34.11 ,_0.11 38 II 40 8 42.11 44.0 40.11 46.0 SO.t_
FIG 4 36 MR21182.THI
1983022079-150
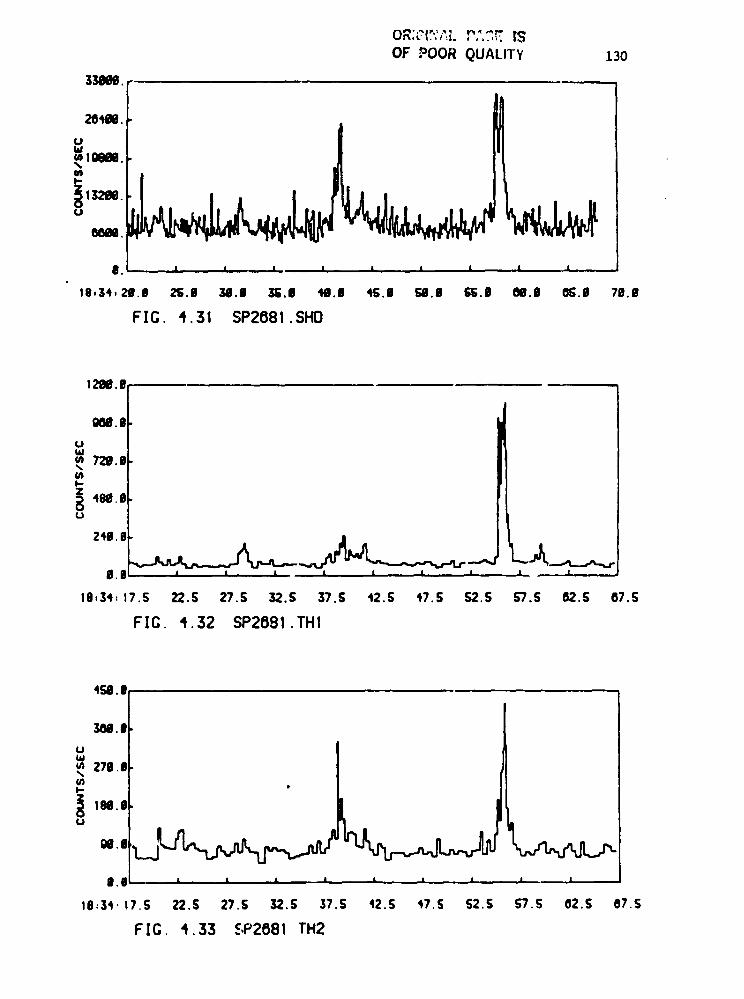
OF POORQUALITY 1303_.
2f14m.UId
8. " ' • ' I I --
18,34, 2f.m 2S.| 341.1 31;.| 'W.I 4G.| F_.| GG.| _.8 0_.| 78.8
FIG. 4.31 SP2681.SHD
12fl_.8
UW
729.8g_
_ 4N.J
18,34, 17.5 22.5 27.5 32.S 37.S 42.S 47.S 52.5 b'/. S 82..S 07.g
FIG. 4.32 SP2681.THI
4_. i I
3aO.llj
UW_ 278,ffl ,
_ I_.l
8. |_ i i i A
10"34" IT.S 22.S 27.5 32.S 37.S 42.S 47.S 52.5 $7.5 02.5 07.5
FIG. 4.33 ,¢,P2(_81TH2
i ,J
1983022079-151
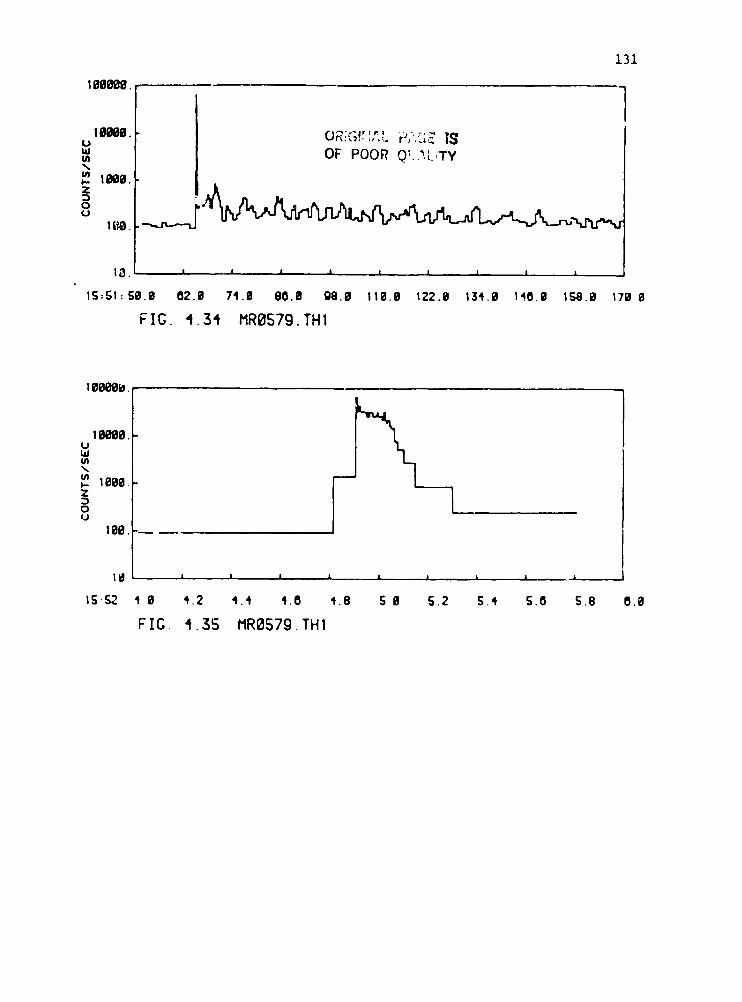
!
131
I00_9.
|_. i A, i A I l i i i
IS,S1:50.0 02.0 74.0 80.0 08.8 I10.0 122.8 134.0 140.0 158.0 170 0
FIG. 4.34 MRO57g.TH1
IOOO91o
u 10000 __L
LdUI
" L__I IPOO
o
log,
|_ , i i i i i i i i
1S.$2 4 6 4.2 4.4 4.0 4.8 S @ S.2 S.4 S.@ 5.6 0.6
FIG. 4.35 MROS79.TH1
1983022079-152
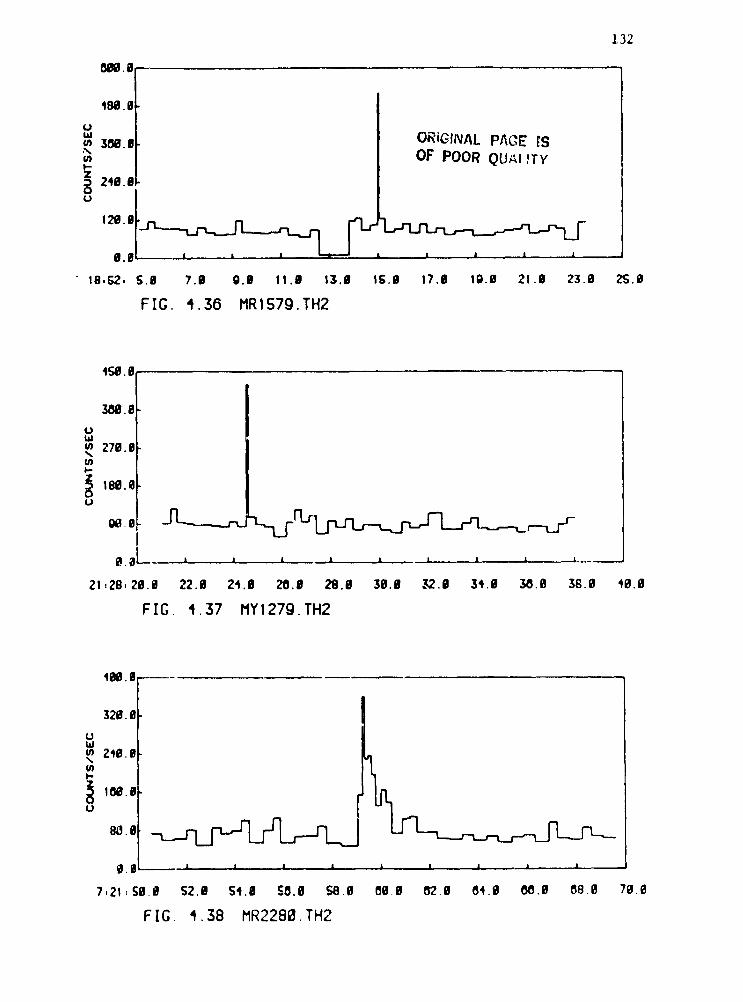
132
480.8u
'" ORIGINAL PAOE ISu) 300.6OF POOR Qua! rTY
240.n
12_.
I
18,g2, g.8 7.A g.O II.g I$.g IG.B 17.11 IQ.0 21.B 23.0 2_.0
FIG. 4.30 MR1579.TH2
4_.eIi
_.8 ¸
uw
278.g%
186.9u
9,a - A , A ,A L , i J i _ ....
21,28,29.0 22.g 24.0 20._ 28.0 30.g 32.0 34.0 30.0 38.0 49.0
FIG. 4.37 MYI279.TH2
49e.8
32_. 9
WZ49.0
i
813.e _
A ,,, I , L i i i i _ •
, 7,21 59.9 52.0 $4.0 S0.0 S.O.O 0e.8 02.0 04.0 0,0.0 08.0 78.0
' FIG. 4.38 I'IR228B.TH2
1983022079-153
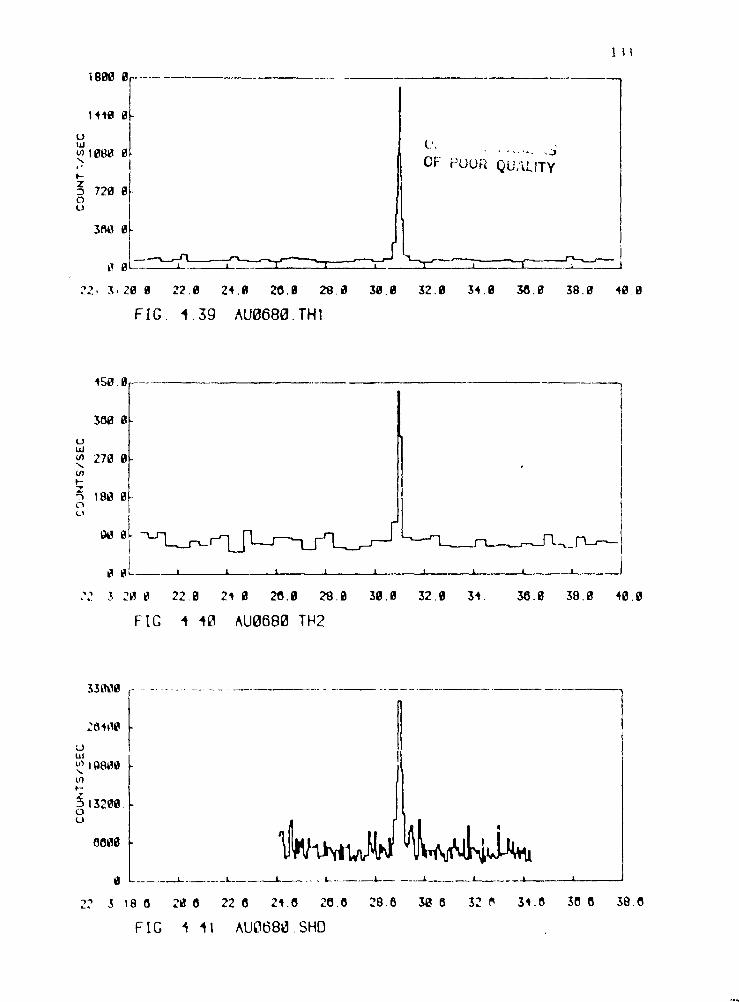
.I!
t
f88_ 8
1448 _[/
,._eB_e/ OF I_UL}RQUALITYz 721_ 80
° l3_8
"_ 3,20 8 22.0 24'.8 20.0 2'B.i_ 38.0 32.B 34, 0 _.8 38.B 4B.O
FIG. 4.Sg ,'_UO680.THl
458.9
388 8
(_)W
278 8",., °{/)l--Z
1880 !o 1el !
Q_o __r-l____ _-_l_-__j__ _
:2 3 2_ 9 22.8 2't 8 20.9 20.6 38.9 32.9 34. 36.0 38.8 46.9
FIG 4 4A ^U0680TH2
33B_B ..............
2_4,19
L.IL*|
u_1g8_9
Z13209.
0
°0800
...... J- ....... k ..... ...J..... L- ..... _ .... 4_.... _..... 4--__-.- •
22 3 18 0 2_ 0 22 0 2e.0 20.0 28.0 38 8 32 _ 34.0 38 0 38.0
FIG 4 41 ^UB681_.SHD
1983022079-154
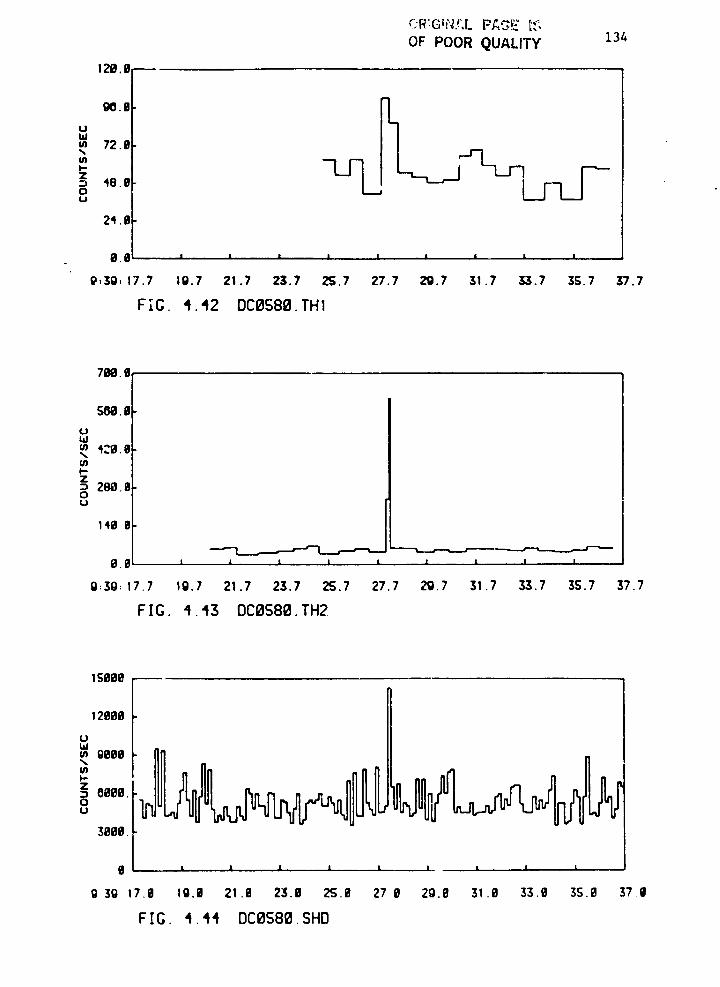
134OF POOR QUALITY
u) 72.0%(/)I..-Z
48.00(,.)
24 .a
8._ I I I I I I l I I
g,3g, 17.7 10.7 21.7 23.7 2S.7 27.7 29.7 31.7 33.7 2;5.7 37.7
FIG. 4.42 DCOS81_.THI
799.9
508.II¢3Wm 4Z8. gU)I--Z::, 280. il0(.1
140 0
0._ i i , i i i i i l
g:3g: 17.7 19.7 21.7 23.7 2S.7 27.7 213.7 31.7 33.7 35.7 37.7
FIG. 4.43 0COS80.TH2
IS898
12696
(,3W
6 e f
oU
3809.
il i l I i I i_ i i t
g 39 17.0 lO.O 21 .O 23.0 2S.O 27 O 20.8 31.0 33.0 3S.0 37.g
FIG. 4.44 OCOS86.SHD
1983022079-155
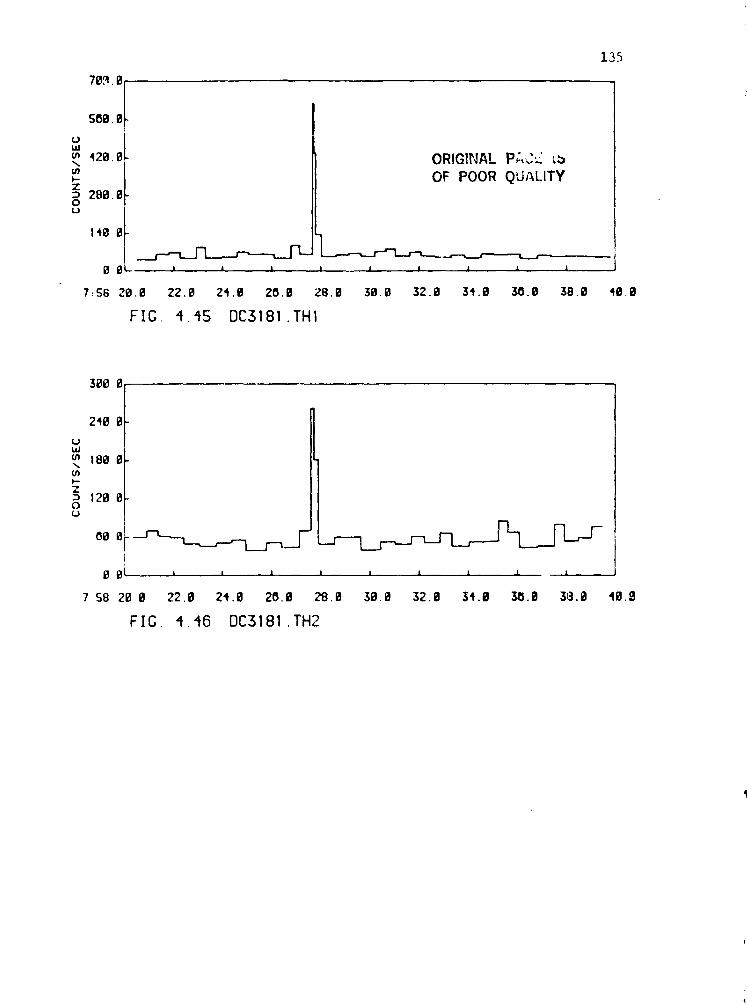
135
7_. e
SOe. B
0UJ
u_ 420.0 ORIGINAL p,T,.-_;:_Ul
,- OF POOR QUALITYz
280.0oU
140 0
0 0 .,, L l . I i i _. I •
7:58 20,0 22,0 24.0 20.0 28.0 30.0 32.0 34.0 30.0 38.0 40.0
FIG. 4.4S DC3181.TH1
3_)0 0
240 0
UW
(n 1800(,/')I'-z
1200o(..,)
I/
90i _ , . A , i l , J. .L
i 7 $8 20 0 22.9 24.9 20.0 28.0 30,0 32.0 34.0 3_.0 313,0 49.9
FIG. 4.48 DC3181.TH2
h
1983022079-156
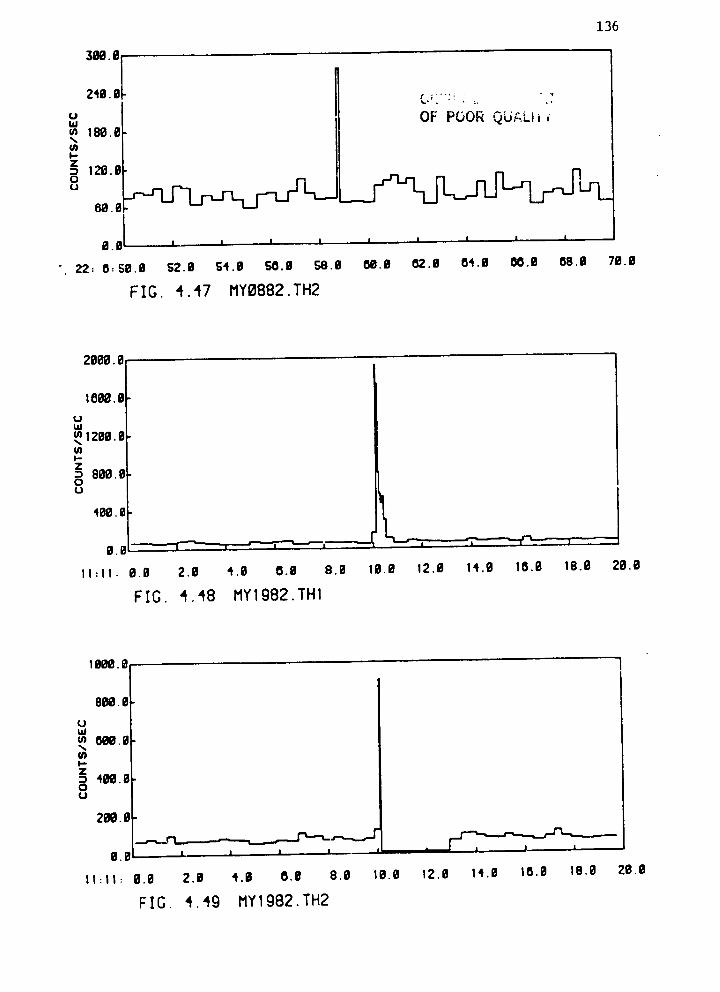
136
240. L__.... ! , ,(,,)u OF POORQU._Lli _m 100.9
120.8
61_.0
0.6 I ,,, I I
22." 0." go.o 52.0 g4.0 _.il £,8.0 00.0 82..0 04.0 00.0 08.g 70.0
FIG. 4.47 MYO882.TH2
2800.8
1800.9uwm 1200. Ot--Z
600.8, ,,
°° t400.6
O.ol---'-"_-'_ , _--I ---'-"-r"--"-_i T-- _ ,.,. ,
I1:11: 0.9 2.8 4.9 0.8 8.9 10.0 12.0 14.9 10,0 18.0 28.0
FIG. 4.48 MY1982.TH1
1000.0
800.8(.,,Pwm 000.8
U
200.9
-,-,--,-L_ --- ._._,__r'---.-.,-,-._,_0.0, i _ , _ _ ,
11:11: B.8 2.D 4.B 0.0 8.0 18.0 12.0 14.0 1a,0 18.0 20.0
FIG 4.49 MY1982.TH2
i:
1983022079-157
CHAPTER V
HXRBS SPECTRAL ANALYSIS
A. Introduction
In this chapter the y-ray burst PHA spectra from the HXRBS
experiment are analyzed to derive the photon energy spectra. The source
photon spectrum for a given observed PHA spectrum is not unique, but
depends on the form of the assumed incident model. The response of the
shleld-colllmated detector of the HXRBS is dependent upon the burst
arrival direction with respect to the collimator aperture. Detailed
discussion of the photon energy spectra is presented only for those
events whose direction of arrival fell within the detector field-of-view
(f.o.v.). A significant feature of this experiment is the very fine
time ( = 1/8 s ) resolution which enabled the study of burst spectral
evolution.
The energy spectra of some events within the detector f.o.v, reveal
features or depressions at energies below i00 keV which are
statistically significant (see cha_ter I, section D_ chapter III
sections G and H). The energy range and strength of these features vat
with time for a given event. The time variability as well as the _ute
Carlo simulation of the detector response has established the intrinsic
character of the features, ruling out the possibility that they are
instrumental or data-reductlon spectral artifacts.
Three candidate models relevant to possible physical mechanisms
generating the y-ray bursts were used to fit the spectral data. Thin
thermal bremsstrahlung (TTB), thin thermal synchrotron (TTS), with and
without absorption features, and power-law with exponential cutoff (PLE)
1983022079-158
138
were considered. The power-law portion of the PIE model was adequate to
fit the low-energy channels, supplanting the inclusion of absorption
features. In many cases equally good fits were obtained for a given
spectrum with more than one model. A simple power-law model was also
considered. However, this model did not provide an acceptable fit to
any of the HXRBS spectra.
Evaluation of those model fits which could explain the nature of
the low-energy depressions has been emphasized. During some portions of
the events of 19 APR 80 and 21 APR 80, a significant depression below a
TTB or TTS continuum at low energies results if only the channels above
I00 keV are fit. In these cases, if a TTB or TTS fit is attempted to
all channels, the reduced chlsquare parameter, X2/V , is relatively
large, indicating a poor fit. Inclusion of a broad absorption feature
at _ 40 to 60 keV facilitates fitting both the depression and the higher
channels; the continuum parameters are free to adjust to fit the high
channels, and a significantly better fit is attained. In one case only,
for an interval in the 19 APR 80 event, a "narrow" absorption line is
Lequlred to fit the data (see section E.li).
The success of a particular model in giving a good fit to the data
does not imply its validity. This is evident since for most of the
spectra analyzed, all three models give, on the average, comparable and
acceptable chlsquares. Similarly, the success of an absorption line in
the TTB and TT$ models for fitting the low-energy channels does not
imply an intrinsic spectral llne. Ocher explanations for the
depressions, _uch as averaging of rapidly time-varying spectra with low-
energy turnowrs may also satlfactorily explain the observations. In
chapter Vl, these alternative possibilities are discussed in detail and
1983022079-159
139
it is concluded chat the depressions are probably due to temporal
averaging rather than absorption lines.
B. Determination of Events in Detector Field-of-View
In chapter Ill it was shown that the spectra of bursts observed
within 20° of the HXRBS center of f.o.v, are not significantly altered
by the shield-processed contribution (see Figure 3.6). The 19 APR 80
event is the only one for which a source direction was independently
established by triangulation with detectors on various spacecraft. The
direction of this event was determined to be _ 18° from the sun, the
HXRBS center of f.o.v. (Fenlmore et al. 1982b). [In the case of the
April 21, 1980 event, timing information from the Pioneer Venus Orbiter
indicates I) that the direction of arrival is not inconsistent with
being within the f.o.v., and 2) that the event is non-solar (Klebesadel,
private comm.).]
The 19 APR 80 detector-to-shleld ccunts ratio thus serves to
establish the relative orientation of source direction with respect to
the f.o.v, of the detector. Events which have detector-to-shield count
ratios equal to or greater than that of 19 APR 80 are considered to be
within 20° of the HXRBS center of f.o.v. In Table 5.1, HXRB$ events
which were discernable in the detector are listed with average counts
above background for both the detector and shleld, the associated
•_ errors, and the ratio of detector-to-shield average counts. The error
for shield counts was always the dominant contribution to the total
error. The shield data is very noisy; hence the shield background level
for any given interval has a large associated error.
t
1983022079-160
OF POOR QUAL¢_"Y 140
Five events out of the thirteen in Table 5.1 have detector-to-
shield ratios comparable to or greater than that of 19 APR 80,
indicating the positions are within 20° of the center of f.o.v.: 07 MAR
80, 21 APR 80, Ol MAR 81, 17 MAR 81. The 05 JUN 80 event is borderline,
considering the size of the error. The remaining events have very low
ratios, indicating that the events were not observed in the f.o.v. The
fraction of events in the f.o.v, is much larger than the ratio of solid
angle of the detector FWHM to 41 ( _ 1:33). This is explained by the
method used to search for solar flares and bursts; the detector rate
data is usually examined rather than the shield data.
In Figure 5.1 the detector PHA spectrum of a burst observed through
the shield (26 SEP 81) is illustrated to show the effect of preferential
absorption of low energy photons by the shield (cf. Figure 3.6, 45°
spectrum).
C. HXRBS Time Histories
Time histories of events observed in th_ central detector are
illustrated in Figures 5.2 to 5.22. The smallest accumulation interval
is 128 ms except in the cases of events with low intensity, 05 JUN 81
(512 ms) and 07 MAR 80 (1.024 s). Note the ordinate Is plotted in
ccs/s. Hence, for events with accumulation interval of 128 ms, the
actual number of counts per interval is = i/8 of the value plotted. The%
time hLstorles of these HXRBS events are all of the classical type.
For three of these events, sufficient counts were obtained to
warrant dividing the bursts into several intervals for the purpose of
studying the spectral evolution of the burst (see section E below).
1983022079-161
•:, ORIGINALPAGE _:'
!t OFPoorQUAL, I
'I Figures 5.2a and 5.3a show two reasonable groupings of intervals
i for spectral analysis for the event of 19 APR 80. Intervals containing
the onset, peaks, and subsidence of the burst are shown in Figure
5.2a. The rising and decaying portions of two peaks and valleys in
i are separated in Figure 5.3a. The gross division into risingbetween
and decaying intervals ignores any faster time variations.l
, Figures 5.4, 5.5 and 5.6 show the low energy (26 to I00 keV),
medium energy (i00 to 210 keY), and high energy (210 to 460 keY) photon
time histories with the same interval divlslc_s as Ghown in Figure
5.3. The 19 APR 80 event was also recorded by the ISEE-3 detectors and
the shield detector of the HXRBS experiment. Figures 5.7, 5.8, and 5.9
Jhow the time histories of the shield, the Csl (ISEE-3) detector and the
Ge (ISEE-3) detector, respectively. The 19 APR 80 event exhibits three
closely spaced peaks at low energy (Figure 5.4; see also the shield
T.H., Figure 5.7). The ISEE-3 Csl detector does not reveal the true
time history because of the spin modulation. The Ge detector, with a
higher energy th_oshold than the HXRBS detector, does not show three
distinct peaks. A smaller pulse appears at 50.5 s in the SMM data in
all channels. The FWHM of the most intense pulse is narrower in the
higher channels than in the ower channels. Also, the onset of this
pulse (labeled RS2/DC2) appears to begin earlier (in the VLI interval)
in the medium and high energy bands than in the low energy band (see
Figures 5.4, 5.5, and 5.6).
Figures 5.10a and 5.11a illustrate the groups of intervals for the
21 APR 80 event. The same two prescriptions for dividing the time
history were used for 21 APR 80, i.e., division into peaks and into
rising and decaying portions of peaks. Low, medium, and high channel
i
1983022079-162
ft r_ _IAI_
142OF POOR QUALIi'Y
accumulatlons for the 21 APR 80 event are 111ustrsted in Flgures 5.12,
5.13, and 5.14, respectively. The splkler appearance in the higher
channels could be accounted for by the statistics of low counts, or the
pulses could be intrlnslcally narrower at hlgh energy.
The appearance of three equally spaced peaks in the 21APR 80 event
may be due to source rotation ( _ 6.5 s period), or interruption of the
burst process.
Figures 5.17 through 5.20 show the temporal profile for the 01 MAR
81 event. The errors for the high channel T.H. are relatlvely large.
The two _ I s rising and decaying Intervals for this event each appear
to be composed of two to three pulses.
The T.H.'s of four additional HXRBS events are illustrated in
Figures 5.15, 5.16, 5.21, and 5.22. The 19 NOV 80 and 07 MAR 80 bursts
were too weak to divide into intervals for spectral analysis; only their
total event spectra were analyzed. The 07 MAR 80 event duration (Figure
5.15) was unusually long, _ I mLn.
The relatlvely intense event of 17 _ 31 (Figure 5.21) occurred
when the HXRBS was in a low gain state (i.e., high keY/channel).
Consequently, the spectral data extend up to _ 1.3 HeV, beyond the upper
channels of the computed response matrix. Therefore, the spectral data
for this event was not analyzed in the present study.
The 05 JUN 80 burst (Figure 5.22) was very weak. The poor
statistics precluded performing a meaningful analysis.
D. Description of 3pectral Analysls
Three candidate spectral models were used to fit the data: thin
thermal bremmstrahlung (Gould, 1980), thin thermal synchrotron
1983022079-163
ORIG'_AL PAGi lS 143OF PCOR QUALITY
(Petroslan, 1981), and power-law with exponential cutoff. The latter
represents the spectrum resulting from an incident Planckian epectrum
Compton-scattered by a weakly-relativlstlc Maxwelllan distribution of
electrons (Pozdnyakov, Sobol: and Syunyaev, 1977; Gu41bert, Fabian, and
Ross, 1982). For the TTB and TTS models, 3ausslan absorption lines were
included in the incident model for those spectra exhibiting significant
"depression below the model continuum.
The model parameter values for the best fits to the spectral data
are assembled in Table 5.2. The table is divided Into parts a, b aI_d c
corresponding to the events of 19 APR 80, 21 APR 80, and all the
remaining events, respectively. Within each subtable, the three n_del
fits for the several time intervals of each event are presented. In the
case of the TTB and TTS models, the fits wlth and without a low-energy
absorption llne are givenj if in fact the Inclusion of a llne
significantly improved the mathematical fit. In Table 5.2, for the TTB
and ..S models there are two parameters for the continuum and an
additional three parameters for an absorption line. The coefficient CI,
in units of photons cm-2s-lkeV -I, gives the continuum normalization of
the fit. For TTB the second continuum parameter Is the temperatare T in
keV (see eq. 3.5). For ITS this parameter Is the critical energy c inC
keV corresponding to the critical frequency v = ¢ /h ;C C
eh8 2 2¢c "--2,m c T, - Ii.6 key BI2T, , (5.1)
e
(see eq. 3.6) where T, " kTe/mec2. The TTB temperature or the TTS
critical energy provide a measure of the spectral hardness.
1983022079-164
OR|GIHAL _L_E !_
OF pOOR QUALITY 144For model fits with = $auasian absorption llne, the continuum is
multiplied by the £_ctor
C2- I -(27_;-_exp{-(e-Eo)_/2o 2] (5.2)Fabs(E)
ahere C2 is the flue equivalent wldth, E0 Is the central energy of the
"llne, and the FWHM- 2.36_, all expressed in keV.
For the PIE model there are four p_rameters: CI, the continuum
normalization; a, the slope of the power-law portion of the curve; Ecut,
the energy at which the power-law portion stops and the exponential tall
begins; and Ether, the characteristic energy of the exponentlal tail.
The mathematical form of the PIE model Is constructed so that the power-
law and exponential portions agree at Ecut:
ci{ E } E <Ec.tE - E (5.3)
Ci{ E_ x exp( cutcut E ) } E > Ecutchar
In the far right column of Table 5.2, the chtsquare per degrees of
freedom, X2/v , is listed for each fit. A value of X2/V _ I indicates
an acceptable flt for a glven model.
TTB was the first radiation process aussested to explain the burst
exponential spectral shapes (Hazers et el. 1979a; Gilman et el. 1_80).
When relativistic corrections are included in the TTB expression (eq.
3.5), a range In temperatures {tom _ i?0 keV to _ 3 MeV is required to
fit the spectra (Table 5.2).
Arguments are presented tn chapter VI which show that, of the three
radiation proctsses represented by the models, thermal synchrotron
|L ":
1983022079-165
OR;GI_AL P,_C:S {SOF POOR QUALITY 145
radiation is the most self-consistent and feaslb!e radla_lon process for
-I13y-ray bursts. The exponent in eq. 3.6 is proportlonal co c ,
whereas the exponent in eq. 3.5 depends on _/kT in the zeroetb
approximation. Hence, bursts with a wider varlation in spectral
hardness can be fit with the TTS model than with the TTB model. If one
fixes B _ 1012 G in eq. 5.1 (see chapter VI for arguments that B _ 5
I0 II G), then a much narrower range In temperatures results for the TTS
model than for the TTB model. The ¢ values listed in 1.ble 5.2c
translate into a range In temperatures of _ 170 keV to 800 keV for B
1012 G.
E. Spectral Analysis of Three Events
The spectra for the three events analyzed in detail, 19 APR 80, 21
APR 80, and Ol MAR 81, are Illustrated in Figures 5.23 to 5.35. The
spectra are of two types: detector energy-loss (PEA) spectra and
deconvolved (model-dependent) photon spectra.\
In the PHA spectra, the data points are plotted as crosses which
represent the associated statistical errors and the channe_ widths. In
the photon spectra, the deconvolved (model-dependent) data points as
well as the candidate mo_el cur_e are plotted. The spectral fitting
program, which computes the deconvolved spectra, Is described In chapter
_II, section E.
In Figure 5.23 the PHA spectra integrated over the entire events
(total e_ent spectra) are lllus_rated for the three events. When a TTS
or TTB model .is fit to the channels above _ I00 keV, the lower energy!
channels fall below the model continuum. Since the exponential shape of i
burst spectra _s observed to continue up to _ 2 _V (Mazets et al.
IA,
r
1983022079-166
,/
i
\
OF POOR QU_L,k_ t46
!981d), far above the highest HXRBS channel, _ 500 keY, it is
appropriate to con_Ider the higher channels as defining the spectral
hardness of an event. From inspection of Figure 5.23 one can see the
high energy portions of the total event spectra indicate that 19 APR 80
and Ol MAR 81 exhibit comparable spectral hardness, while 21APR 80 is
significantly softer./
Some PRA spectra _f y-ray bursts (including that of the 19 APR 80
event) from the SMM's Gamma Ray Spectrometer (GRS) experiment (Share et
al. 1982) have a power-law shape for energies above the HXRBS energy
range ( > 500 keV). These observations are not necessarily inconsistent
with an exponential shape at high energies for two reasons: I) the GRS
spectra are not corrected for the instrumental responee, and 2) they are
event-averaged spectra. Rowever, the GRS observations do indicate that.
some _-ray bursts exhlb_t very hard spectra that extend to !0"s of Men
(Share et al. 19_3).
The low-energy depressions or absorption features, for example in
the 19 APR 80 event, tend to flatten the spectra a= low energies, making
them appear harder than they would if more channels above 500 keV were
present.
As described in section C, the spectral data for each of these
three events were divided into intervals corresponding to structures in
the temporal profiles. For almost all of the intervals, the three
models gave equally good mathematical fits. Visually, the three models
for a given interval vary in the closeness of the fit from channel to
channel. However, the overall appearance for the three cases are
usually quite similar. This is evident in Figure 5.24 where the photon
spectra for the three models are illustrated for the time Interval
i
1983022079-167
4
i! OF POOR QUALITY 147API980.VL2 (spectrum of first valley in 19 APR 80 temporal profile, see,}
:i Figure 5.3). No absorption llne was included in the TTS or TTB model.!
i The reduced chisquares for the three fits are comparable, _ 0.6 to0.7. The same similar visible appearance for the three model fits is
i evident for all intervals for which an absorption feature was not!
included. When an absorption line is included in the TTS or TTB model
-spectrum, the appearance of these fits with the llne are significantly
different than for the PLE model. This is best illustrated in Figure
5.25, where the PLE and TTS models _re shown again for the interval
API980.RS2 (second rising interval of 19 APR 80, see Figure 5.3). This
is the best example of the incapability of the TTS (or TTB) model to fit
the spectra of some intervals without the inclusion of an absorption
line at low energies. The TTS fit (without a line) to the upper ten
channels is else illustrated to show that, indeed, the departure of the
observed spectrum from the TTS fit at low energies is not due to the
assumption of an absorption line in the model.
To spare the reader viewing three times as many graphs as
necessary, only the photon spectra for the TTS fits are illustrated for
the rest of the intervals. However, it is emphasized that the PLE model
without an absorption line does afford an equally acceptable fit to all
channels in most cases where the TTS or TTB models require a llne.
In Figures 5.26 and 5.27 for the 19 APR 80 event, and Figures 5.30
and 5.31 for the 21 APR 80 event, the PHA spectra are illustrated for
the two methods of dividing the temporal profiles. The A through E
series (19 APR 80) of Figure 3.26 and the A through C series (21APR 80)
of Figure 5.30 are the spectra of the whole peaks in the temporal
profiles. For 19 APE 80, A is the spectrum of the onset sad E is the
1983022079-168
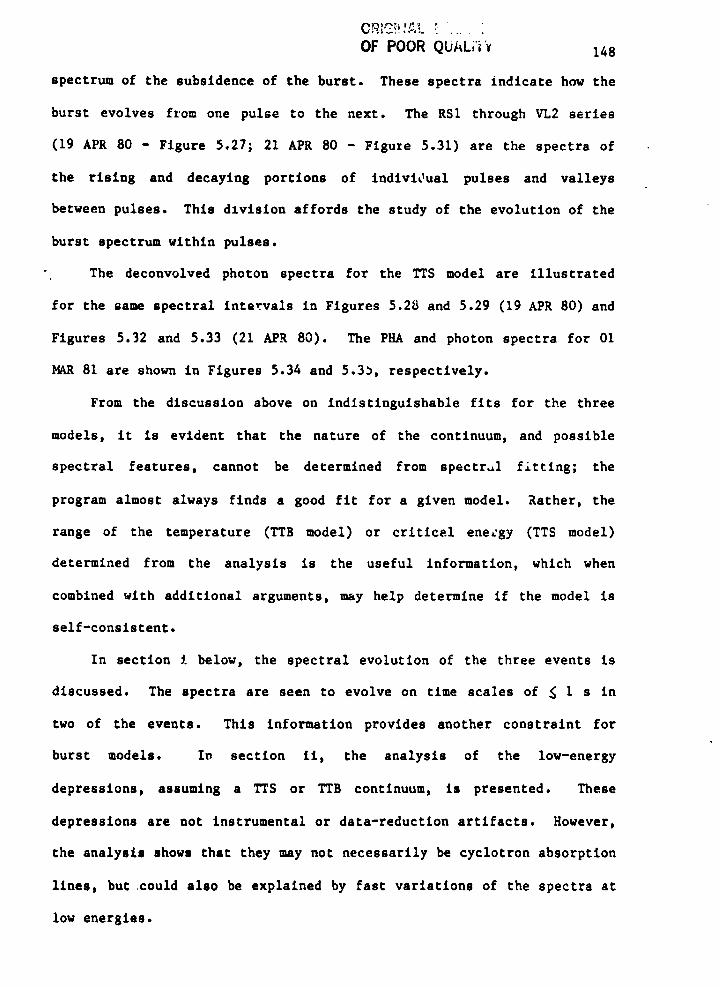
OF POOR QUALi'i_ 14S
spectrum of the subsidence of the burst. These spectra indicate how the
burst evolves from one pulse to the next, The RS1 through VL2 series
(19 APR 80 - Figure 5.27; 21APR 80 - Figuze 5.31) are the spectra of
the rising and decaying portions of indiviCual pulses and valleys
between pulses. This division affords the study of the evolution of the
burst spectrum within pulses.
The deconvolved photon spectra for the TTS model are illustrated
for the same spectral intervals in Figures 5.28 and 5.29 (19 APR 80) and
Figures 5.32 and 5.33 (21APR 80). The PHA and photon spectra for 01
MAR81 are shown in Figures 5.34 and 5.3_, respectively.
From the discussion above on indistinguishable fits for the three
models, it is evident that the nature of the continuum, and possible
spectral features, cannot be determined from spectr_l fltttng; the
program almost always finds a good fit for a given model. Rather, the
range of the temperature (TTB model) or critical energy (TTS model)
determined from the analysis is the useful information, which when
combined with additional arguments, may help determine if the model is
self-consistent.
In section i below, the spectral evolution of the three events is
discussed. The spectra are seen to evolve on time scales of _ 1 s in
two of the events. This information provides another constraint for
burst models. Iv section ii, the analysis of the low-energy
depressions, assuming a TTS or TTB continuum, is presented. These
depressions are not instrumental or data-reductlon artifacts. However,
the analysis shows that they may not necessarily be cyclotron absorption
lines, but could also be explained by fast variations of the spectra at
low energies.
1983022079-169
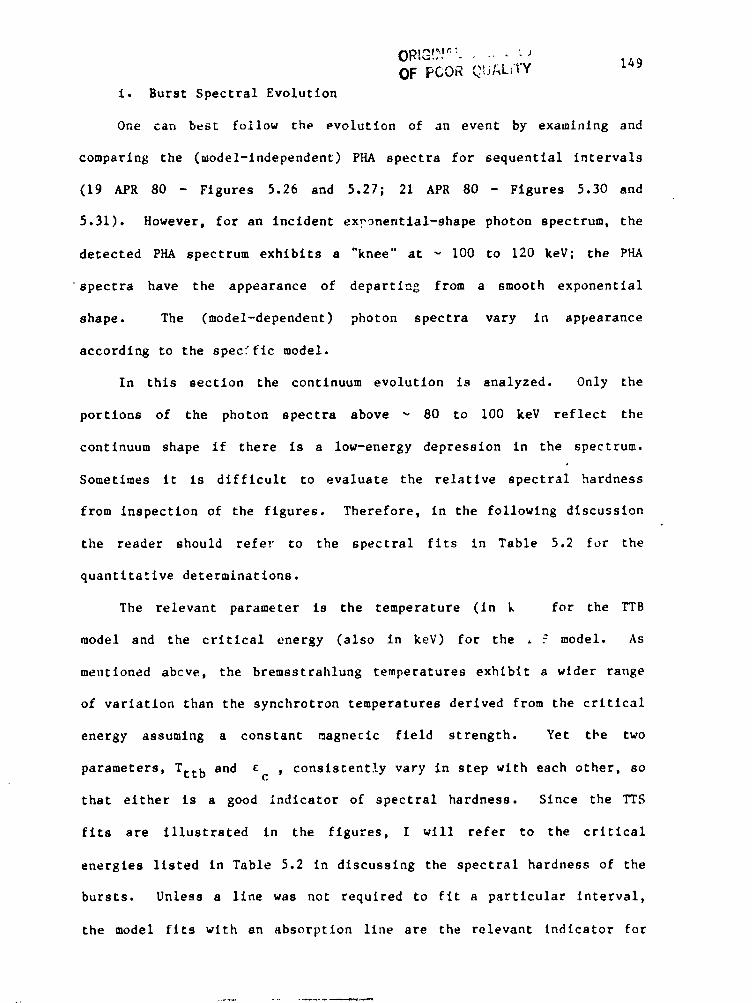
I,_ 1 _
_' _ "i'Y 149OF PCOR _Jl_t,
i. Burst Spectral Evolution
One can best follow the pvoiutlon of an event by examlnlng and
comparing the (model-lndependent) PHA spectra for sequential intervals
(19 APR 80 - Figures 5.26 and 5.27; 21 APR 80 - Figures 5.30 and
5.31). However, for an incident exponential-shape photon spectrum, the
detected PHA spectrum exhibits a "knee" at _ I00 to 120 keV; the PHA
spectra have the appearance of departing from a smooth exponential
shape. The (model-dependent) photon spectra vary in appearance
according to the specfflc model.
In this section the continuum evolution is analyzed. Only the
portions of the photon spectra above _ 80 to i00 keY reflect the
continuum shape if there is a low-energy depression in the spectrum.
Sometimes it is difficult to evaluate the relative spectral hardness
from inspection of the figures. Therefore, in the followlng discussion
the reader should refer to the spectral fits in Table 5.2 for the
quantitative determinations.
The relevant parameter is the temperature (in k for the TTB
model and the critical energy (also in keV) for the • _ model. As
mentioned abcve, the bremsstrahlung temperatures exhibit a wider range
of variation than the synchrotron temperatures derived from the critical
energy assuming a constant magneclc field strength. Yet the two
parameters, Tttb and c , consistently vary in step wlth each other, soc
that either is a good Indicator of spectral hardness. Since the TTS
fits are illustrated in the figures, I will refer to the critical
energies listed in Table 5.2 in discussing the spectral hardness of the
bursts. Unless a llne was not required to fit a particular interval,
the model fits with an absorption llne are the relevant indicator for
I 4
1983022079-170
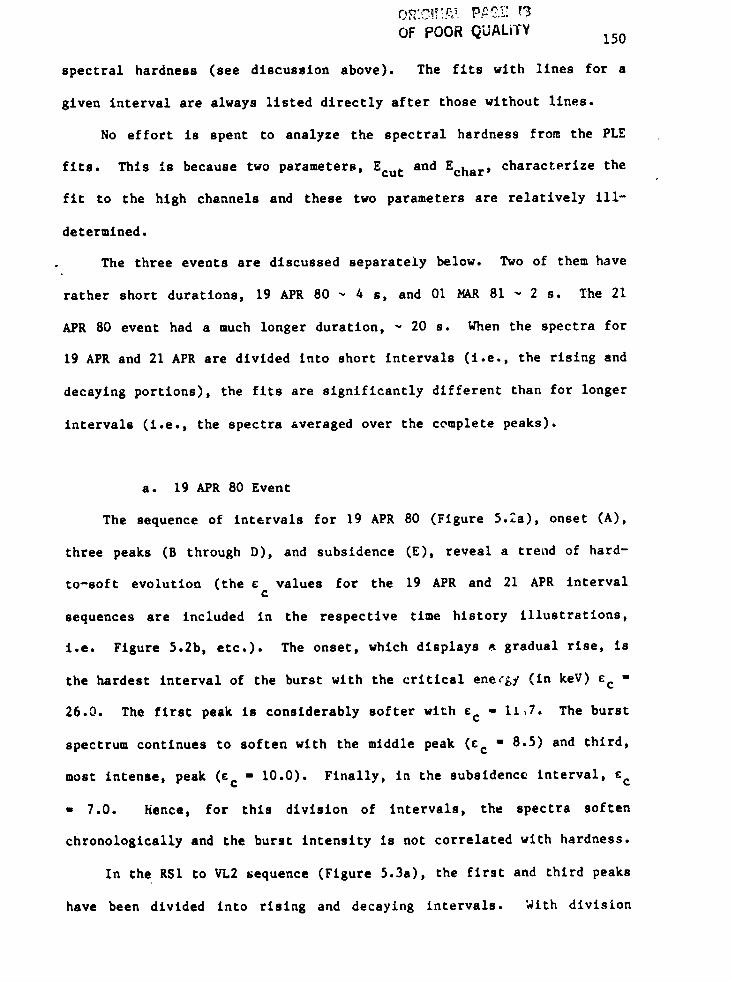
OF POOR QUALITY 150
spectral hardness (see discussion above). The fits wlth llnes for a
given interval are always listed dlrectly after those without lines.
No effort is spent to analyze the spectral hardness from the PLE
fits. This is because two parameters, Ecu t and Echar , characterize the
fit to the high channels and these two parameters are relatlvely Ill-
determined.
The three events are discussed separately below. Two of them have
rather short durations, 19 APR 80 _ 4 s, and 01 MAR 81 _ 2 s. The 21
APR 80 event had a much longer duration, _ 20 s. When the spectra for
19 APR and 21APR are divided into short Intervals (i.e., the rising and
decaying portions), the fits are significantly different than for longer
intervals (i.e., the spectra averaged over the complete peaks).
a. 19 APR 80 Event
The sequence of intervals for 19 APR 80 (Figure 5.2a), onset (A),
three peaks (B through D), and subsidence (E), reveal a trend of hard-
to-soft evolution (the ¢ values for the 19 APR and 21 APR intervalc
sequences are included in the respective time history illustrations,
i.e. Figure 5.2b, etc.). The onset, which displays _ gradual rise, is
the hardest interval of the burst with the critical ene,'gl (in keV) Ec =
26.0. The first peak is considerably softer wlth ¢c " It,7. The burst
spectrum continues to soften with the mlddle peak (¢c = 8.5) and third,
most intense, peak (¢c = 10.O). Finally, in the subsidence interval, ¢c
= 7.0. Hence, for this division of intervals, the spectra soften
chronologically and the burst intensity is not correlated with hardness.
In the RSI to Vh2 sequence (Figure 5.3a), the first and third peaks
have been divided into rising and decaying intervals. With division
1983022079-171
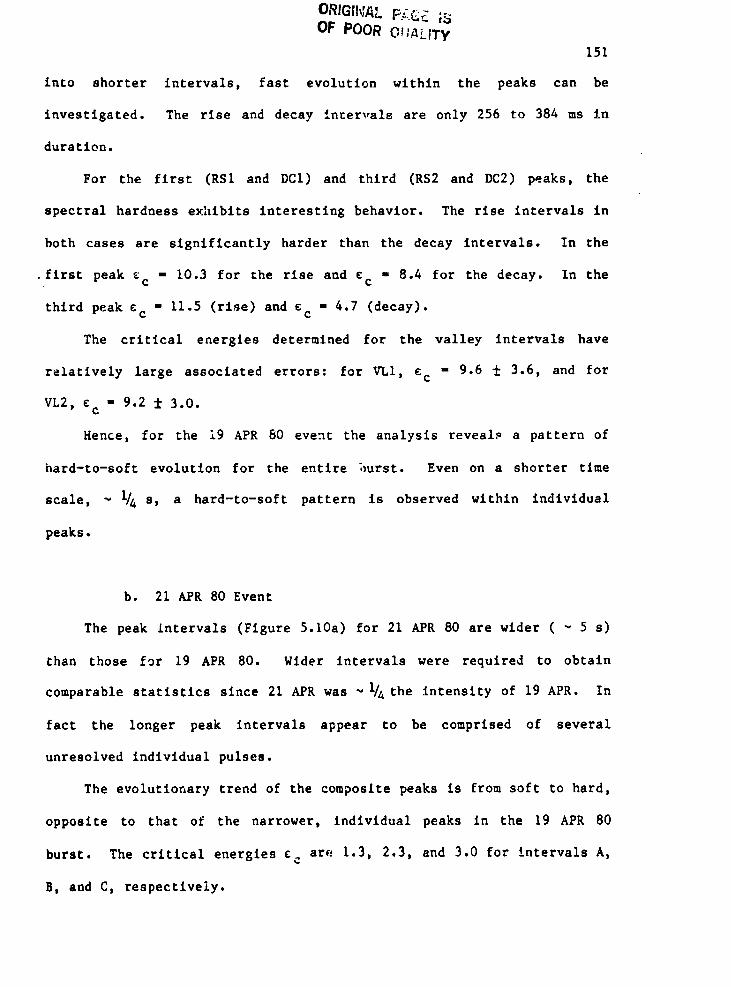
ORIGII_AL p_._£ _OF POOR O_LITF
151
into shorter intervals, fast evolution within the peaks can be
investigated. The rlse and decay !n=ervals are only 256 to 384 ms in
duration.
For the first (RSI and DC1) and third (RS2 and DC2) peaks, the
spectral hardness exhibits interesting behavior. The rise intervals in
both cases are significantly harder than the decay intervals. In the
first peak _c " 10.3 for =he rise and Ec - 8.4 for the decay. In the
third peak ¢c = 11.5 (rise) and Ec - 4.7 (decay).
The critical energies determined for the valley intervals have
relatively large associated errors: for VLI, cc - 9.6 ± 3.6, and for
8
VL2, ¢c 9.2 ± 3.0.
Hence, for the 19 APR 80 event the analysis reveal_ a pattern of
hard-to-soft evolution for the entire burst. Even on a shorter time
scale, _ 1/4 s, a hard-to-soft pattern is observed within individual
peaks.
b. 21APR 80 Event
The peak intervals (Figure 5.10a) for 21 APR 80 are wider ( _ 5 s)
than those for 19 APR 80. Wider intervals were required to obtain
comparable statistics since 21APR was _I/4the intensity of 19 APR. In
fact the longer peak intervals appear to be comprised of several
unresolved individual pulses.%
The evolutionary trend of the composlte peaks is from soft to hard,
opposite to that of the narrower, individual peaks in the 19 APR 80
burst. The critical energies ¢c are 1.3, 2.3, and 3.0 for intervals A,
B, and C, respectively.
1983022079-172
O_G_I'_L pACE ISOF pOOR QUAUI Y 152
When 21APR 80 is divided into "rise" and "decay" intervals (Figure
5.11a), the Interval durations range from - 1 s to 2.8 s, longer than
the durations ( - 0.6 s) of the whole peaks in the 19 APR 80 burst. The
rise and decay intervals still have the appearance of composite
pulses. The ¢c values for these Intervals do not reveal any spectral
evolution from rise to decay portions. In the first peak, c c = 1.4
-(rise) and 1.5 (decay), and in the second peak ¢c " 2.3 for both rise
and decay. If the burst spectrum evolved significantly on a time scale
comparable to the short ( I/4 to 1/2 s) pulses within the spectral
intervals, then the ¢c determinations reflect the averages of spectral
variations.
c. 01 _ 81 Event
The duration of the 01 PAR 81 event Is about 2.7 s. Tnls burst has
also been divided into rise and decay Intervals, 1.4 s and 1.3 s,
respectively. Again, these intervals are not strictly rises or decays
since within both intervals two or three individual pulses are
apparent. However, because of the relatively low Intensity of the
burst, it was not divided into shorter Intervals.
For the total event spectrum, a value for ¢c of 13.5 was
obtained. The values of ¢c for the rise (11.9 ± 2.61 and decay (14.5 ±
2.41 differ only sllghtly from each other.
il. Spectral Features
In several of the spectral intervals the lower channels depart from
an exponential shape, giving the appearance of a depression or broad
absorption feature. 0nly spectra were analyzed for which the event
i
i
1983022079-173
..o
OR!G_L PnCZ ISOF POOR QDALITY 153
direction of arrival was close enough to the detector center of f.o.v.
for the shield-processed contribution to be insignificant. Also,
careful attention was given to the Monte Carlo simulation of the HXRBS
detector system. Therefore, the depressions are probably not
instrumental or data-reductlon artifacts, but are intrinsic to the burst
spectra.
The option of absorption lines was included In the TTS and TTB
models in order to obtain an acceptable fit to some of these spectra.
However, two considerations indicate that the depressions are not
necessarily absorption features.
First, in all but one case (the spectrum of the third, most intense
peek of the 19 APR 80 event), the spectral fitting program tended to fit
broad lines with FWHM _ 50 keY. In most cases the program would have
fit lines of FWHM _ 60 to 70 keV. An upper limit to the width of 50 keV
was set in the program because widths greater than that energy were
deemed unphysical. The effect of limiting the llne width on the other
parameters of the fit and on X2/V was insignificant. By increasing the
width of the absorption llne the program was creating broad shallow
features, attempting to fit a flat "shelf" to the lower energy portions
of the spectra. This Is evident in the PLE model flts also. Absorption
lines were not necessary in this model because the flat power-law part
[ of the model readily flt the low-energy "shelf".l
i |
Second, in practically all HXRBS solar flare spectra, which are
il otherwise well fit by either a pure TTB or pure power-law form, channelone is (artificially) high (Larry Orwlg, private communication). The
, reason for this instrumental effect is not clear, although it is
possibly connected to the fact that channel one is only _ 4.5 keY wide
I
i
1983022079-174
OF POOR QUALII _154
whereas the remaining channels are _ 30 keV wide (channel 15 is _ i00
keV wide). If channel one were plotted at lower (correct) values, the
depressions in some of the spectra might have more the appearance of
low-energy turnovers rather than an absorption feature or flattening of
the spectrum,
If channel one were as wide as the other low--ener_y channels it
.would be expected to dominate the spectral fits. Channel one would have
th_ smallest errors since the spectra are _onotonlcally decreasing.
However, channel one is only about i/7 as wide as the other channels,
and in factm the errors are larger than those for the other low-energy
channels.
To determine the effect of channel one on the fits, the analysis
was performed on the spectra with channel one excluded. The values for
the fit parameters and the X2/V parameter, with and without c%annel one,
were nearly uniformly equivalent. For the TTS and TTB models, the
computed parameter values were significantly different for only three
spectra. A comparison of the 14 and 15 channel TTS fits is shown in
Table 5.3 for the three cases. Only for the interval API980.DC2 was a
substantial difference found. The llne energies were determined to be
46 keV (15 ch) and 55 keV (14 ch). The reason for the lower llne energy
in the 15 channel case is that channel one was low rather than high (see
Figure 5.27b); the program attempted a broad llne fit over the energy
range of channels one through three (see Figure 5.29b). I_ the other
two cases, intervals C and RS1 of 21 APE 80, the same effect is
apparent, although not as pronounced. Channel one is somewhat lower
than it is for the other intervals of 21 APR 80 (see Figures 5.30 and
5.31a), and the program fit slightly higher line energies when channel
| I I
1983022079-175
OF POOR _._:TY 155
one was excluded. In all three cases the program flt somewhat softer
continuum parameters (kT and c ) since the spectrum appears higher atc
low energies when the low point, channel one, is excluded. For the PLE
model, all the parameter values for the 14- and 15- channel spectral
fits agreed to within the computed errors for every spectrum. Hence, in
general, the problem of the calibration of channel one did not
"significantly affect the analysis and interpretation of the low-energy
portion of the spectra.
Whereas the depressions can be fit by broad absorption lines, this
does not imply that there are absorption features in the burst
spectra. The depressions may be the high end of low-energy turnovers.
The low end where the spectrum is actually turned over would then be
below the HXRBS spectral range. Another possibility is that the
depressions are the result of Integrating the burst spectrum over
intervals of rapid spectral evolution. From the discussion above on
continuum evolution, it was concluded that spectral variations are
present on time scales _ 1 s. Examination of the 19 APR 80 and 21APR
80 events reveals that evolution of the depressions occurs on short time
scales also.
a. 19 APR 80 Event
There is a consplcuous evolution of the low-energy portion of the
spectrum of the 19 APR 80 event, which can be seen in the PHA spectra,
Figures 5.26 and 5.27. However, because of the characteristic shape of
the detected spectra, with a "knee" at _ i00 to 120 keY, It is difficult .-.
to visually appreciate from the PHA spectra the degree of departure of
the low-energy portion from a TTS or TTB shape. This effect Is more
1983022079176
....".....'"- _ ...... 156OF PbOR _UAL.II_{
easily seen in the IZlustratlons of the photon spectra, Figures 5.28 and
5.29. In these figures the models with absorption llnes are shown. The
same fits (i.e. same contlnuum) without llnes are extrapolated to low
energies to show the departure from the model continuum.
For the spectra of the first (Intervals B, RSI and DCl) and thtr_
(Intervals D, RS2 and DC2) peaks, the best-fit mode] included an
.absorption line. A significant improvement in X2/_ is obtained for
these intervals for models with _tnes comparec to tl_ose without lines
(see Table 5.2a). The improvement is most impressive for the D and RS2
(rise of D) Intervals. For Lhe D interval X2/v decreases from- 3.6 to@
0.6 (TTB) or = 1.7 to 0.9 (TTS). For the RS2 Interval X'/_ decreases
from - 3.2 to 1.2 (TT,B) or - 1.8 to 1.3 (TTS). Generally, the TTS model
contlnuum provided a closer fit to the low-energy channels thRn did the
TTB continuum. Hence, the i_provement in X2/_ when a line :as included
was not as marked in the TTS fits.
The D and RS2 intervals are the only ones for which the program
tended to fit "narrow" llnes. For these Intervals the line width tended
to decrease to _ 10 keV. However, as the wldths decreased below _ 30
keY, the changes in X2/_ and the other parameters of the fit were
insignificant. Therefore, a lower llmit for the width, 33 keV equal to
the Instrumental resolutlon at 50 keV, was set in the program.
The program also gave better fits for models with llnes for
Interval DC2 and the intervals comprising the first peak. However, the
Improvement in X2/v over the models wlthout lines was not as significant
in t[me_e cases.
The central llne energies determined by the program were model
dependent, ranging from _ 35 to 55 keV for the TTB fits, and from _ 42
1983022079-177
O,_.......
G7 I OLR r" ,'._G. ,L, l {157
to 70 keV for the TTS fits. For a given intervai the TTS line energies
were always 5 to 10 key higher than the 1"rB energies. Since the
detector resolution _t 50 keV is 33 keV and the F_IM of the lines was
usually _ 50 keV, the evidence for the position of the depression
changing is marginal.
In conclusion, there are three important aspects of the spectral
-behavior at low energies for this event. First, the depressions evolve
on a time scale _ I s. Second, the _epressions appear only in the
spectra of the first and third peaks, and are most proml,_ent in the
rising portions of the peaks. Third, a "narrow" line is determined for
the spectrum of the third, most intense peak.
b. 21APR 80 Event
From Table 5.2b one can see from the X2/V values that the peak
intervals A, B, and C of the 21APR 80 event are better fit by a TTB or
TTS model with line than a model without. Thls can also be seen in the
photon spectra (Figure 5.32).
When the first two peaks are _tvlded in rising and decaying
intervals and valleys (Figure 5.33), the depressions appear most
significant in the rising intervals and VL2 (Figure 5.33a, b, and c).
This is reflected in the substa, tial improvement in X2/V when a line i_
included in the fits for these intervals: 4.2 to 2.0 for RSI; 5.7 to 2.7
for RS2; and 1.0 to 0.3 for VL2.
The presence of the depressions in ell thre_ peaks, over a duration
of _ 15 s, is contrary to most observations of the KONU$ experiment
(Mazets et al. 1981e). Low-energy depressions or absorption features
were observed in the KONUS spectra usually only in the first 4 s
1983022079-178
OF FGb_ _,L_ 158
interval of the burst. Infrequently, the depressions persisted for
three or four 4 s intervals.
Since the 21 APR burst exhibited a hlgher detector-to-shleld ratio
than the 19 APR burst, 0.38 compared to 0.10 (Table 5.1), It is very
unlikely that the 21 APR detector spectrum was signlficently
contaminated by the shleld-processed flux. Hence, the departure oF the
"spectrum from a 1"rB or TTS continuum is probably an intrinsic feature of
the burst spectrum in this case.
F. Discussion
In summary, several points emerge from the spectral analysis.
Significant spectral evolution occurs on time scales _ I/2 s in some
events. The 19 A_R 80 burst exhlblts hard-to-soft evolution within two
_I/2s wide peaks. The 21 AFR 80 burst, vhen the peahs are decomposed
into shorter intervals, also exhibits significan_ evolution on a time
scale _ 2 s.
Fast evolution of the depressions is observed in the 19 APR 80
event. Rapid continuum evolution and (apparent) evolvln8 low-energy
turnovers or absorption features at energies as high as 200 to 300 keV
aze also seen on time scales of tens of ms to 250 ms in some spectra
from the SIGh'E experiment (Beret eC el. 1983a; Beret 1983).
T_ • _ov-energy depressions evident in some spectral intervals are
Intrinbic to the burst spectrum, but are not necessarily absorption
features. Averasln$ of _apidly-varying spectra with low-energy
turnovers nay create the appearance of absorption features. An example
of such a spectral artifact is illustrated in Figure 5.36. Two
slsulated spectra with different £ "s and the sum of these spectra areC
1983022079-179
J
OR'_'_, p_-•_._ '_ _ -
OF POOR
159
ilotted. The turnover energlea, due to the synchrotron cutoff
[ehB/(2_mc)= 11.6 BI2 keV], and the ¢ s correspond to magnetic fieldc
strengths of 4.4 x 10¹² G and 1.4 x 10¹² G and plasma temperatuces of
200 keV and ,00 keV, respectively. The turnover ( _ 16 keV) in the
softer spectrum is below the lowest channe] plotted. The sum of these
two spectra gives the appearance of an absorption feature at _ 40 keV.
In fact many KONUS spectra (Mazets et al. 1981e) which are claimed
to display absorption f_atures merely depart from a 1"rB continuum in the
lowest one or two energy channels; the continuum is higher than the
t feature only on the high energy side.
If the features are due to averaging of _pectra with rapidly time-
varying cutoffs, the cutoff energy, proportional to the magnetic field
strength, is not necessarily correlated with the critical eI.-rgy, which
depends upon the _dditional parameter, the temperature (see eq. 5.1).
There is a _-', in the KCNUS data for bursts with absorption
lines to exhibit t,,_ spectra, from Tabl= A.I the mean value for ¢ for
cthe KONUS spectra is 4.1 keV [excluding six values above 20.0 keV which
imply T, > 1 if BI2 - I; Petrosian's expression (1981) for the
synchrotron emissivity, eq. 3,6, is not valid for kT _ 511 keV] This
value is 4.4 keV if the spike-like bursts with soft spectra are
excludes. The mode of the ¢ distribution is much lower, about 2.0 keVc
(Figure A.4). For the spectra which exhibit a depression or absorption
feature (indicated by # i_ the table), the mean value for ¢ is _uchc
Eigher, about 7.0, excluding values above 20.0 from the average. The
KONUS spectra exhibit the tendency to soften as the bucst progresses
(Mazets et al. 1981d), aL_d absorption features a_ observed usually only
during the first 4 s, and only in about 20% of the events (Mazets et al.
1983022079-180
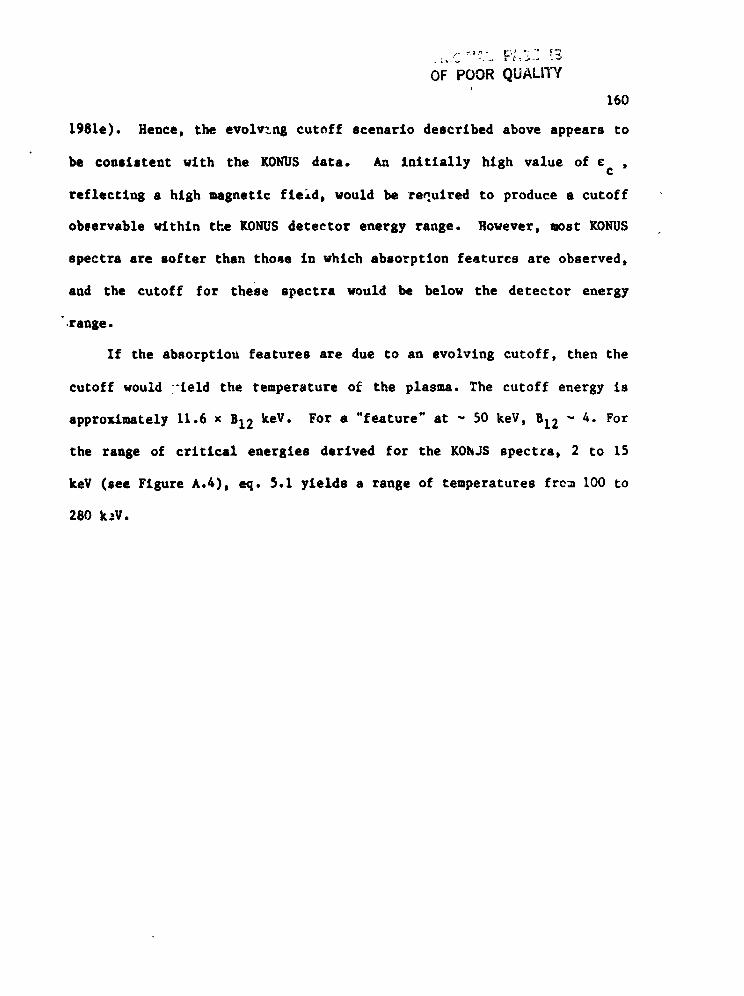
4
OF POOR QUALITY
": 160
1981e). Hence, the evolving cutoff scenario described above appears to
be consistent with the KONUS data. An Initially high value of ¢ ,C
reflecting a high magnetic ftekd, would be required to produce a cutoff
observable within the KONUSdetector energy range. However, _8t I_NUS
spectra are softer than tho_e in which absorption features are observed,
and the cutoff for these spectra would be below the detector energyo
.range.
If the absorptlou features are due to an evolving cutoff, then the)
cutoff would :'teld the temperature of the plasma. The cutoff energy is
approxi_tely 11.6 x B12 keY. For a "feature" at - 50 keY, B12 - 4. For
the range of critical energies derived for the lOhJS spectra, 2 to 15
key (see Figure A.4), eq. 5.1 yields a range of temperatures fre_ 100 to
280 k_V.
t
i
1.
!-
11l
i:
1983022079-181
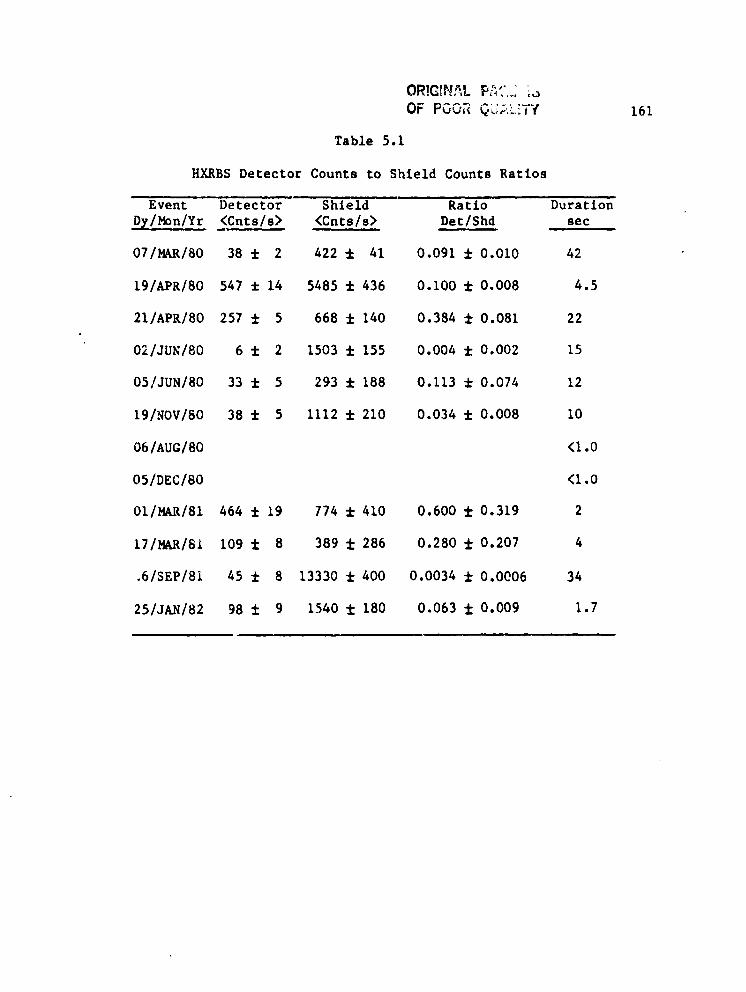
!L
OF PGO_ Q:S,::_iTY 161
Table 5.1
: HXRBS Detector Counts to Shield Counts Ratios
; Event Detector Shield Ratio Duration
D_v/Mon/Yr <Cnts/s> <Cnts/s> Det/Shd sec
07/MAR/80 38 ± 2 422 _ 41 0.091 _ 0.010 42
19/APR/80 547 ± 14 5485 _ 436 0.i00 ± 0.008 4.5
21/APR/80 257 ± 5 668 ± 140 0.384 f 0.081 22
02/JUN/80 6 f 2 1503 f 155 0.004 ± 0.002 15
05/JUN/80 33 ± 5 293 i 188 0.113 ± 0.074 12
19/NOV/80 38 ± 5 1112 ± 210 0.034 ± 0.008 i0
061AUGIS0 <I.0
05/DEC/80 <I.0
OI/MAR/81 464 ± 19 774 ± 410 0.600 ± 0.319 2
17/MAR/6i 109 ± 8 389 ± 286 0.280 f 0.207 4
.6/SEP/8i 45 f 8 13330 f 400 0.0034 ± 0.0006 34i
[ 25/JAN/82 98 ± 9 1540 ± 180 0.063 ± 0.009 1.7!
I
I
1983022079-182
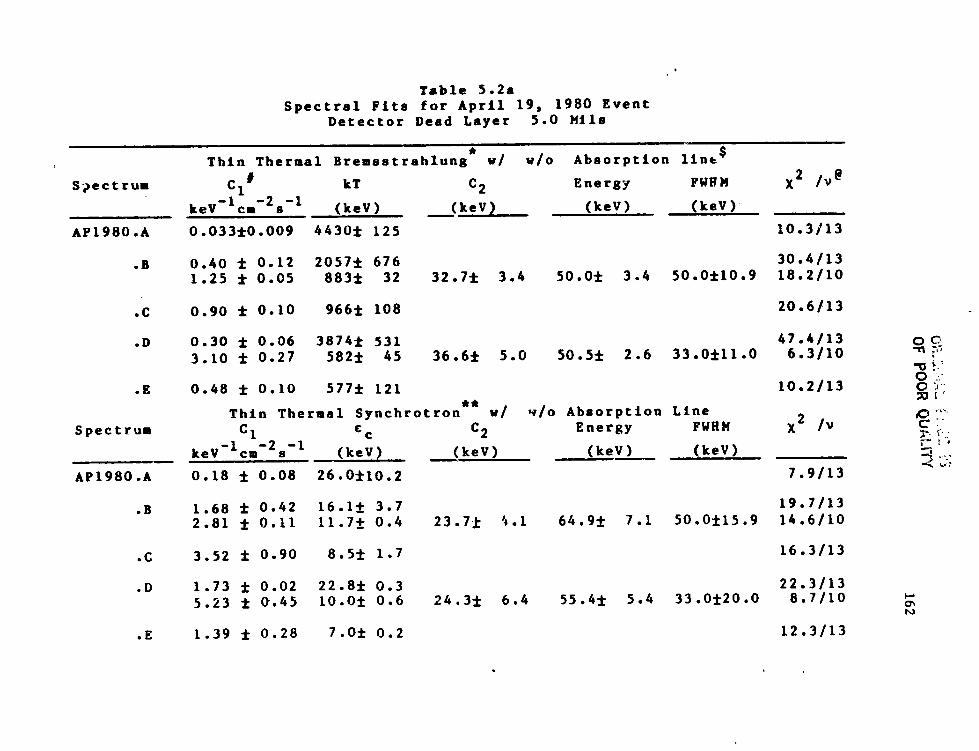
:OFP
OORQUALIT¥
162
Id0
_0
fJO
_U
O_
w,1:
_n,<
i'
1983022079-183
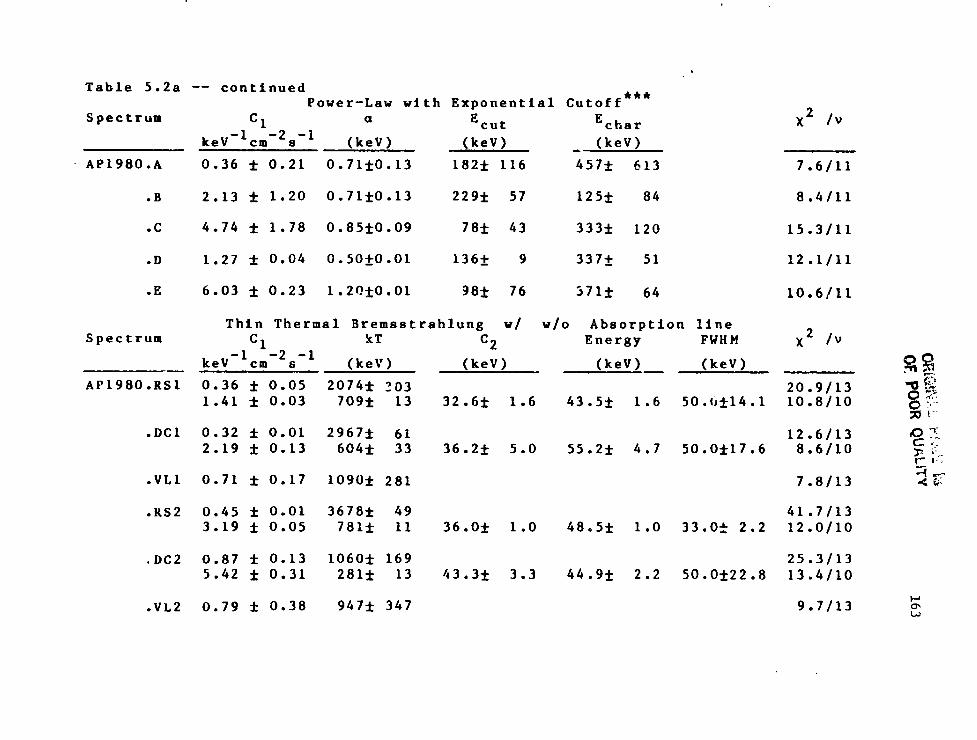
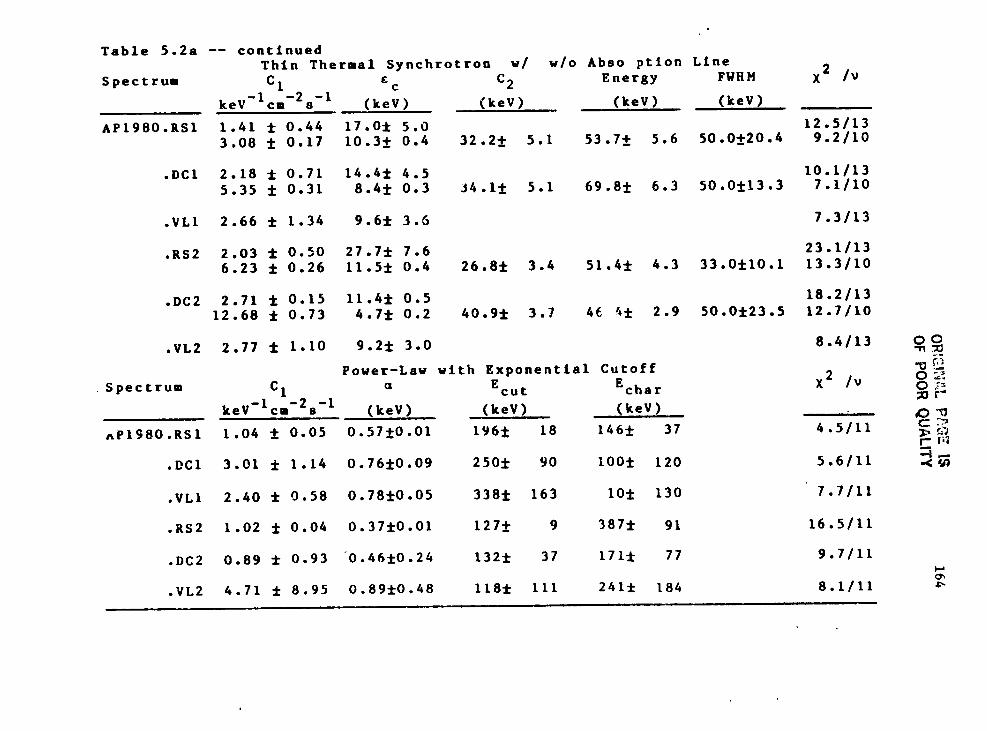
I_.i_,;i"8-'_L-
:OF
POORQUALITY
1983022079-185
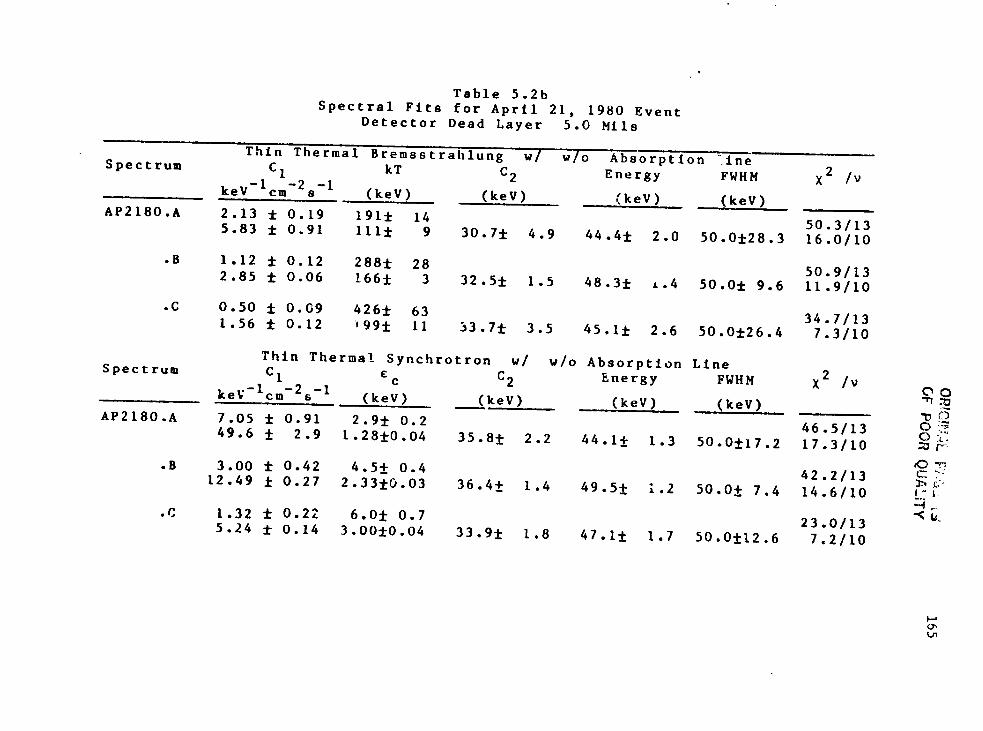
!,
+
J/
_L
+
1983022079-186
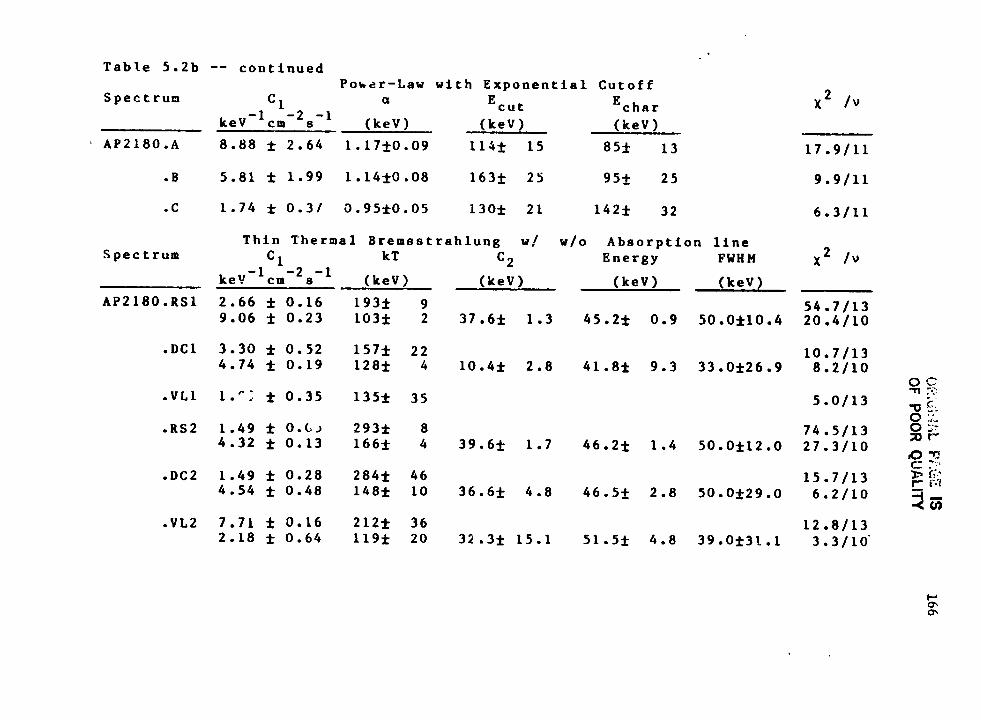
0,'_,_-'_,
,L
166
OFPOORQUALITY
I
i,
1983022079-187
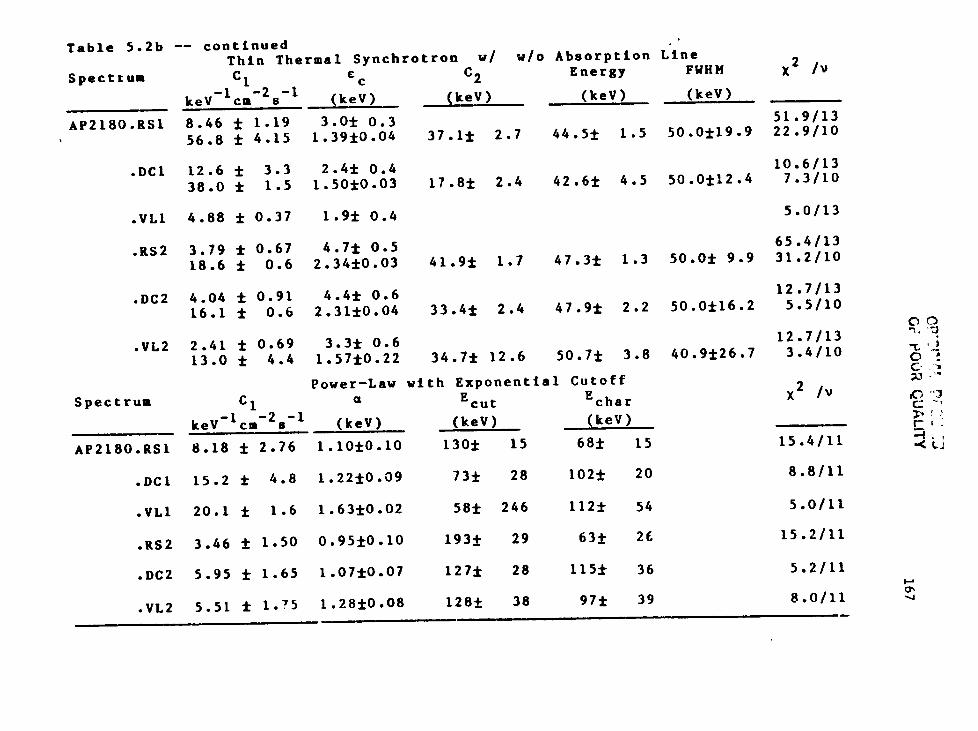
0_.-,-,,,_-r
......3
G_:P
OO
R(_UALITY
167
t
1983022079-188
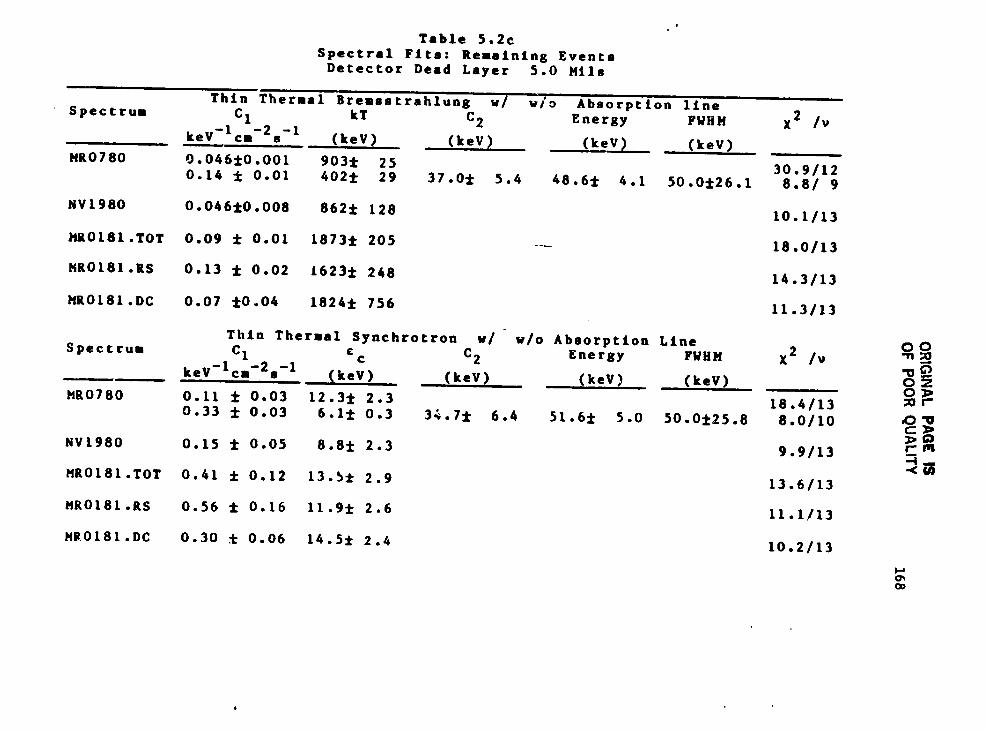
Z\
ORIGINALPA
GEIS
OFPO
ORQUALITY
168
Ii;
-"u:el
-H::
el+l
7.,_.Ul
oe_
allo
"_"_1
_ge
I_
__
•,II_
el
4.0
_•
-H
•_
I=,,uI
o=
_•.:
I:"1
"
I,.,•
i_._el
-H.H
u
__
|_
__
<P_
"-+_
I¢+'__',')
I_,',,o.o.
•_
°°,,
_l..
•".
_•
'__°
oo
•_
...'.1°°o
oo
o._
._;o
.1+,.,.,+,+,..++.
,....+++++++++I_-
I,,¢+
__
I"+m,,_
r_o-
__
__
_o
I•
•.
o..
._!*"_
I,,.
ooo
oo
c_en
••
._.
t"_I
ooo
oo
o
-_
==
-®
®®
®®
.-,_+.
:•
o-o
oo
I,,
,
1983022079-189
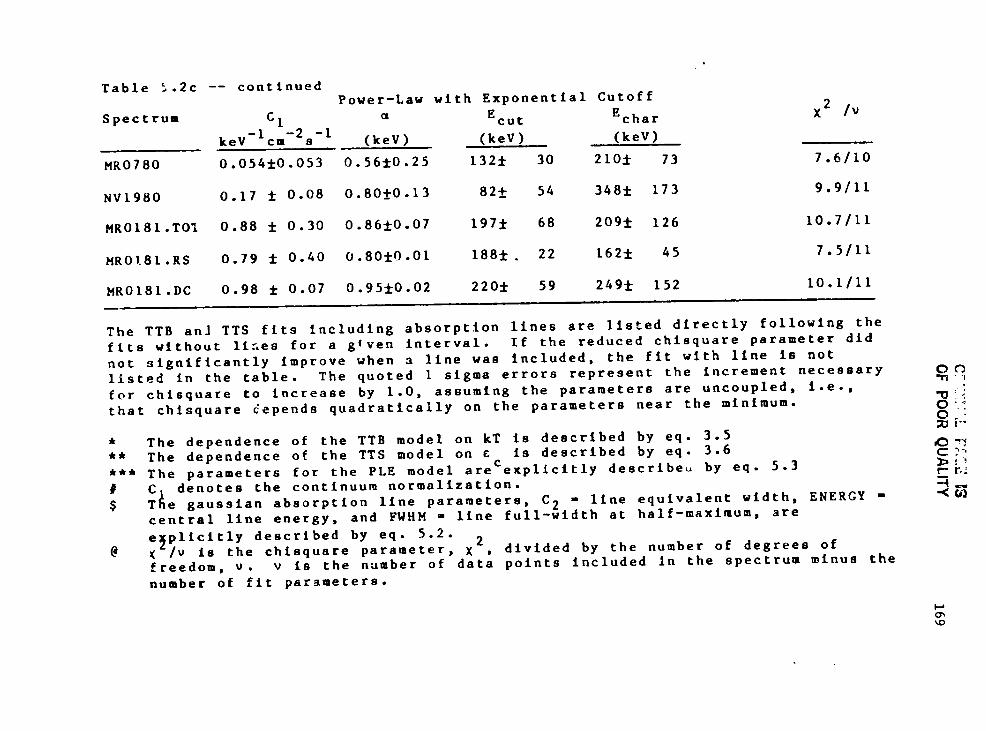
,_,T,_
•,7_,
_t',,
hlC._
.....L
,-.-'.__.13
ilOFP
OO
RQ
UALITY
169
C,,I
••
••
•C::Iw
_,,_Q
;Q
;r,z:
,_G
Xr,.,
O_
0r,,.
O-,'*
@0
U•
ZO*,-i
o¢u
_w
_',,'-_
Bw
:_
*a;
a;B
-D
,,G
BI:_,,,,,,w
*,,,-I
*(U
O
",--i
_),-_
I.,o
._.¢•
__,
•u
__:
_¢::
••
_¢::_._
0
I_c7'*,-_
.=,.-i
_l._.=
°u
-is-H
-1.4-H
4-1m
me
mm
mm
m
)<,..10
00
C_.
0_)
*.,_
EB
0G
_*
BQ
;I
_)_
u'_0
_...1'
0.,-,
I..,s.,
Q;
__,
GI.,
_.G:_
m
]
r
1983022079-190
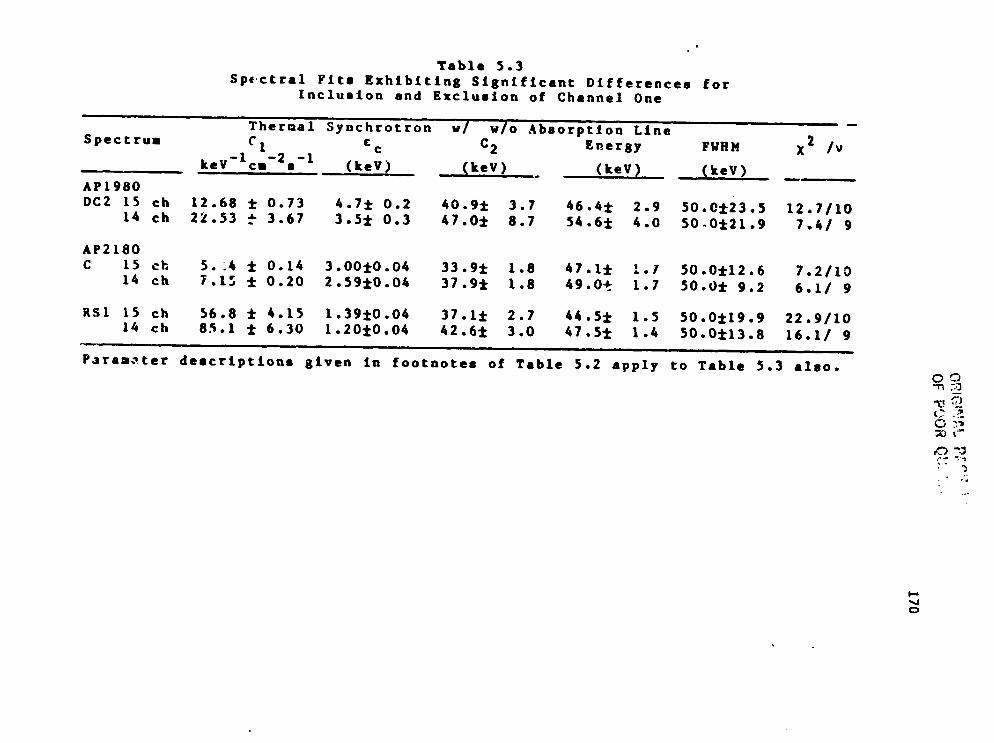
1983022079-191
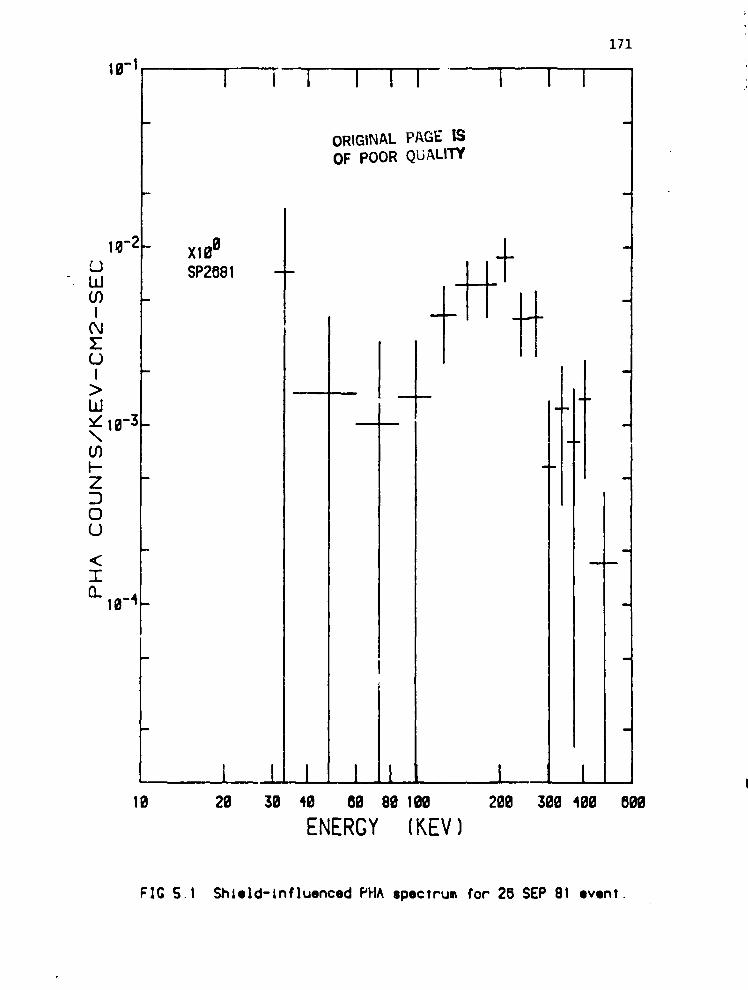
1,T
171
16-1 1 i I I 1 ! ! I Im 1
ORIGINALPAGEISOF POOR QUALITY
10-2 - XI69 " 'SP2881 :-Ld
CO -I "
(xj
° _J_ I -JI ->
uJ 't_ 16-3 ....
!-,-
Z)0(_)
_ --19-4
[ I i i I i I L19 26 36 49 69 80 106 266 366 466 890
ENERGY (KEV)
FIG S.l Shield-influenced PHAspeclrum for 26 SEP81 evenT.
i
1983022079-192
' i
a,,,:.'._;_.'L pF.,'?,F.IS
OF pOOR QUALITY 172
Flsures 5.2a - 5.22. Time hlstorles of SI_ Suma-rmy bursts,
The tim axls refers to Coordinated Unlversal T1ae. The suffixes to she
event names represent the follovins:
SMM- HXRBS detector tiae histories
Slid - _RBS shield tlae histories
£VI, EV2 -ttue sequences for critical energy, ¢c
LCH - time histories for lovest five channels
M_l - rise histories for interue6tate five channels
HCH - tl_e histories for hishest five channels
131 - ISEE-3 CsI its.. history
TH2 - ISEE-3 Ge time history
l
1983022079-193
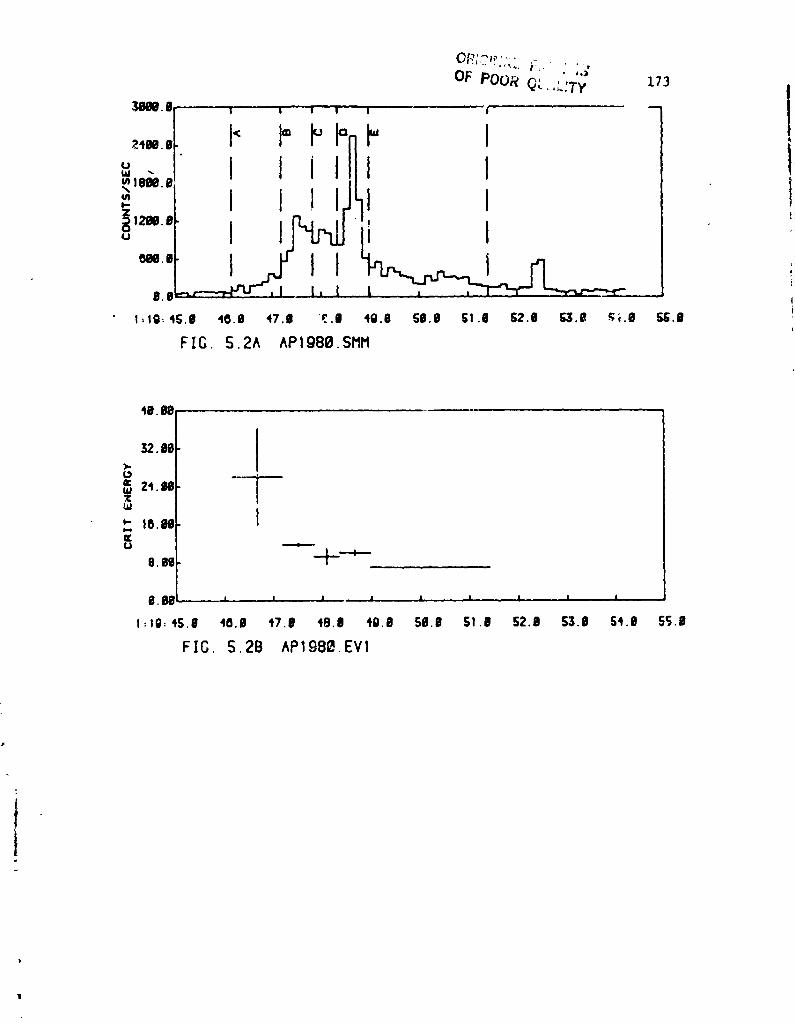
: OF POOR Q_., ,.'-..'TY ].73
30BOil _ _ " i l i _ "-]
_1_._
- , , ,,jt,l 1• !6.6 ,
e
i
0.0
1_10: 4S.B 40.0 47.| "r.| 4Q.O _;0.0 f;I .0 g2.0 C=3.8 gi.O _i;.f
FIG. S.2A APIgSO.SMM
40.90
B.BB , 1 ._ i , ,t , A.. J. . i _ J
I: tO: 45.0 10.il 't7.1 48.0 40.0 SIJ.iJ St .I 52.0 55.0 54.9 SS.iI
F[G. S.2B ^P198_.EV1
1983022079-194
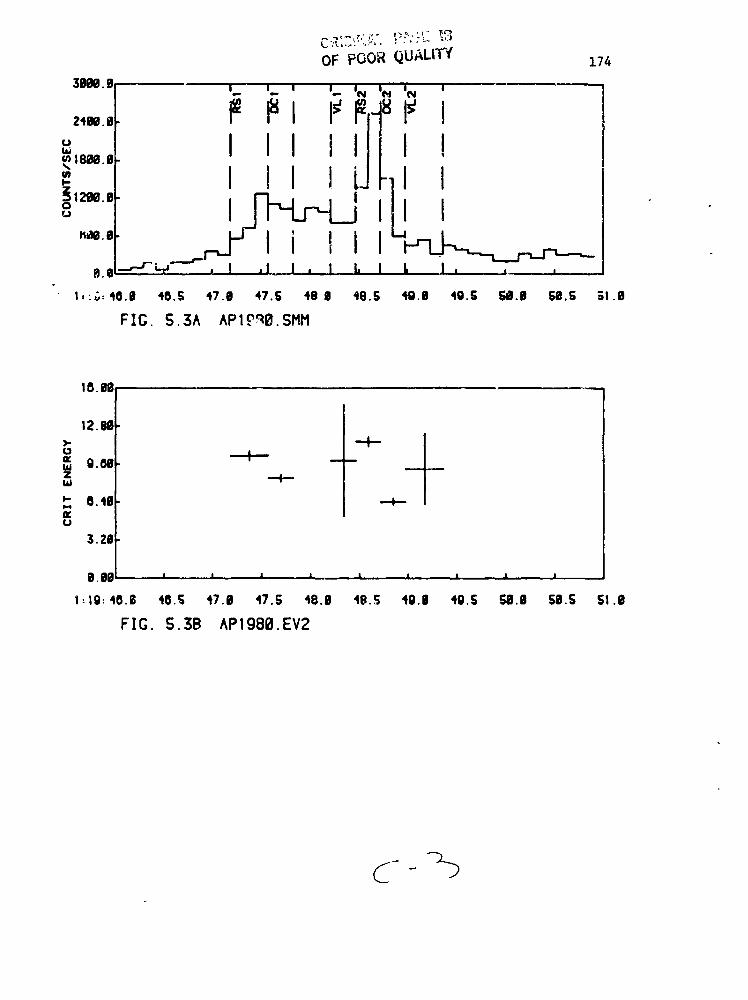
OF pGORQUALITY 174 •
3Me.O '. L ' J. iN I_ le_ ,
_,m. I I I i I !. o_,_.,t I J I ! J I
e.el.-,-rL_ --'- , I ,I 1 , I ....i. I I, t , , ,1, '.;; 40.0 40.5 47.0 47.G 48 0 48.5 40.0 40.S SlD.9 $e.S E1.8
FIG. S.3A Ap10qB.SHH
18.H
12,80>- -'4-,. 0.Mzwi- 9.40 --,4,,,-u
3.20
O.N I A i I _ i I I i
1: tO: 40.1G 40,cJ 47.0 47.5 49.0 49.5 4g,| 40.5 50.B SO.5 SI .0
F!G. S.3B ^P1980.EV2
.
1983022079-195
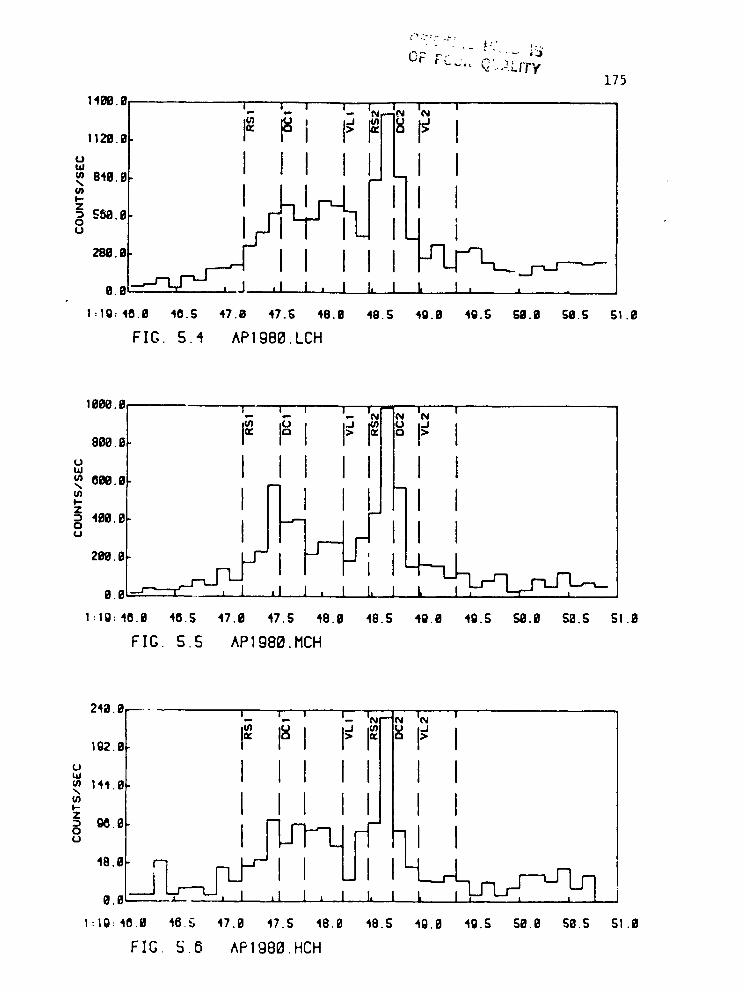
i
ii o__,._;......_" "" (J.'..,_LfTy: 175
_ ,
1129.1_
° I I I I I Iz
U
e.a , , h ! k I, , ,
I :19: 40.8 40.S 47.8 47._ 48.g 48.S 49.8 49.S 58.8 5g.S 51.8
FIG. 5.4 API980.LCH
leee.e ;- ' ' '- '_-_ IN i._ I: 10_1Ie ° !"_ iI I I I I I_ ow.e
-_ I I I I Iz
498.Boo I I
299.e; e.e 1 , I h i _,
1:1G: 40.B 40.S 47.0 47.S 48.8 48.5 4Q.8 49.5 SlB.i_ $8.S SI.B
FIG. S.S APIO80.MCH
2421.1g_- i_ i i i 1N--N iN I
,_. I= I_1 I"_I= :_I"_ I
'"" I I I I I
°48g.• _
I:19: 46.i_ 48,,_ 47.8 47.S 48.8 48.S 4Q.8 4Q.S 58.8 SB.S SI.0
FIG. 5.6 API980.HCH
1983022079-196
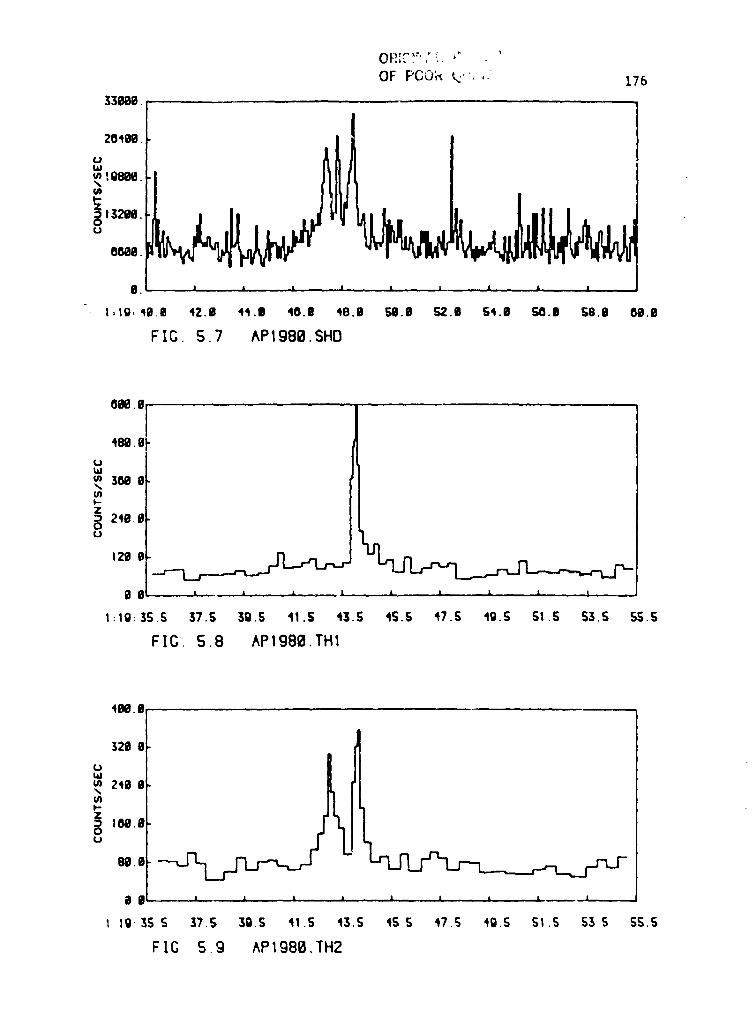
OF POOR k". ,- 17633e80.
204N.
uw_*1061N.In
8. I • I l i 1 JL JL. _l
I ,I0, 40.0 42.B 44.| 40.11 40.B SO.If _.B $4.0 _.0 $8.0 _.0
F If3.S. 7 AP1988. SHD
4_.e
uILl
3880
Z
0
129 0
0 m L . I ,| ' , _ , A •_ q ,,
1:19: 3S.S 37.5 39.S 41.S 43.S 4S.5 47.5 49.S 51.S $3.S SS.S
FIG. S.8 API980. TH1
4M.e
320 g
wm 246 e
,e!• I
_J L L, . . I, • • , I /_ I J
I 19 3S S 37.S 30.5 41.5 43.S 4S S 47.S 40.S SI .S $3 S SS.S
FIC S,9 AP1981_, TH2
1983022079-197
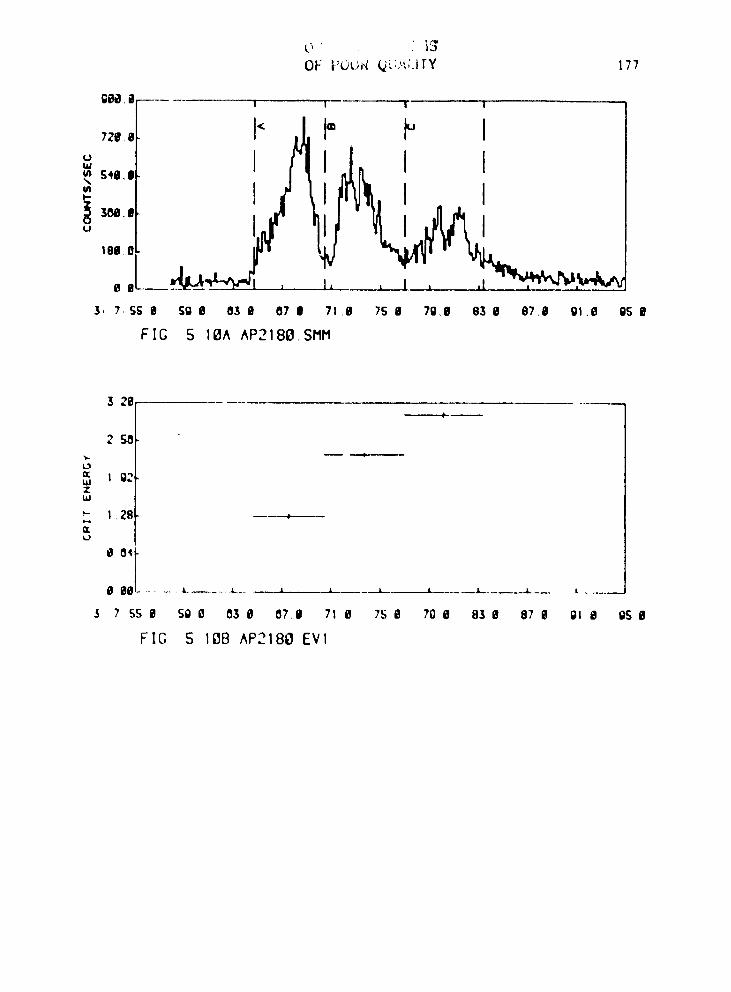
1
OF ;_C)L;_ _:_:/._,;.trY 177 i _'
_ I jR I I54a
i I_. I IU
185
8 .....
$, 7, SS 0 SQ 0 83 il 87,1 71,8 75 8 79,8 83 0 187_8 91.0 ero il
FIG S 10A AP2180.SMM
3 2g4
2 SO
o: I 02WZbJ
_" 1,28 _---+_
_J
$ 7 SS 8 SO O 03 8 07.8 71 8 75 8 70 8 83 8 87 8 el 8 gS 8
g IG S 10B AP218{} EVI
1983022079-198
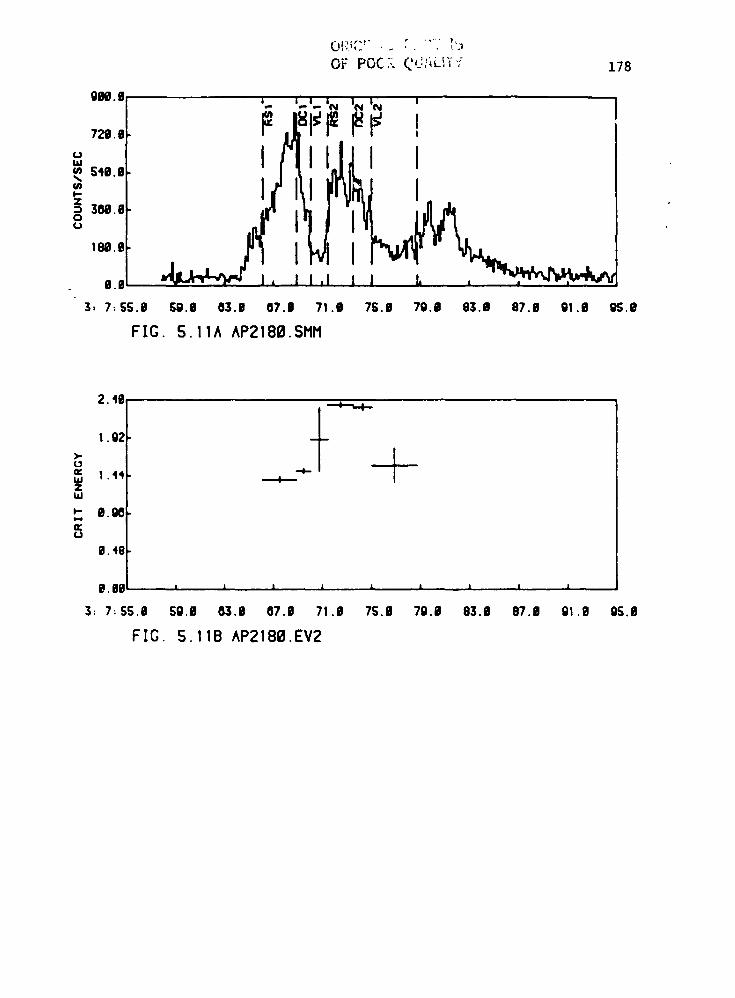
J
_'_i_ l i i__i IN IN IIM i.° i l$1 I_ $48.
),-Z_ 30g.00u ,
I_.B
8.03, 7, 55.8 SO.8 03.8 07.0 71 .I 78.8 70.8 83.0 87.8 01 .B 05.8
FIG. S. 1I^ AP2180. SI'IM
2.18I
I. 02
_._loe,, 1.44U,J ,4zI,l,J
t- 8.gOu
il.4g
0.00 i i i i i i ¢ i i
3: 7:$5.8 50.0 83.0 a7.0 71.0 75.0 70.0 03.0 07.0 01.0 05.8
FIG. 5.11B ^P2180.EV2
1983022079-199
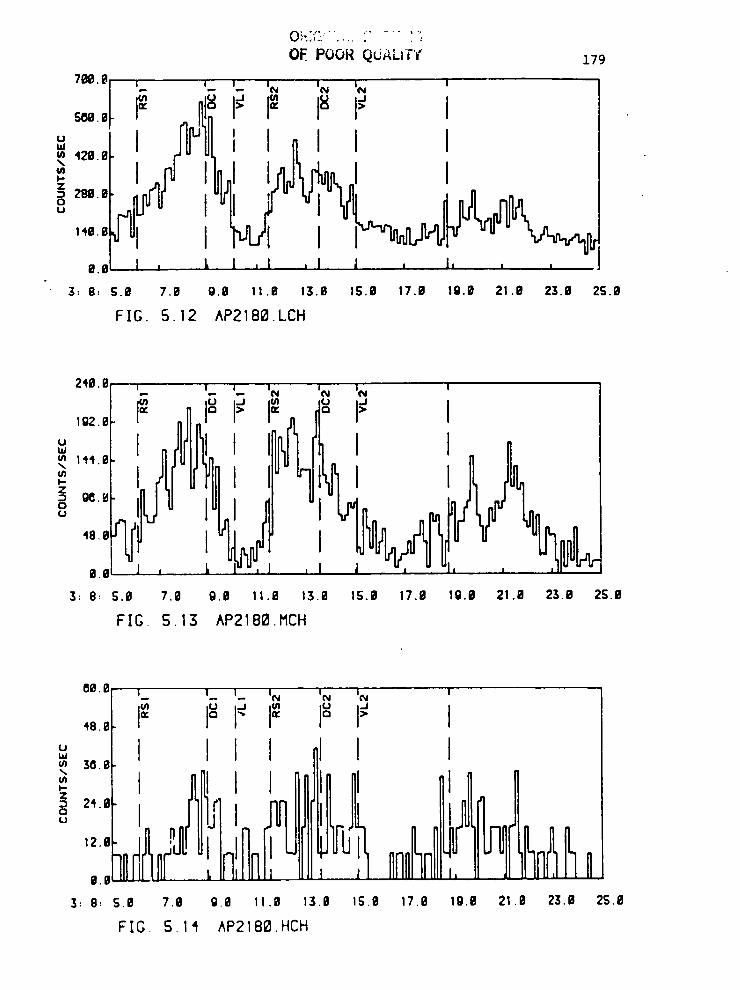
' -/-, • " ,_ -_," _ _ -/
OF POOR QU_L_T_¢ 179
700. _1 i_ - '- '(,,I 'N 'iN I
_., I_ '_"I_ I_ I>_ io I r ;I,Ii I" I I I_.I'L_, I IUPI,,,-z U" -U0U
140.8 I
o.e I , L 1 ,I ,I 1 , I, , ,3; 8; g.i_ 7.0 O.l} 11.0 13.0 15.1i 17.11 19.11 21.0 23.0 25.0
FIG. 5.12 AP2186.LCH
248.g i w i. tN iN iN t
,_., I_,.,o I I I_ 1440
_" " I IZ:3 9e.UIo iU ,
., r I r_w I I_o o , I, l",l , I3: O: 5.9 7.0 9.e !1.0 13.0 15.0 17.0 10.0 :)1.0 23.9 25.0
FIG 5.13 AP2186 MCH
80.0 - i_ w I IN i_ iN t
,,, I_ 1_ I_ I_ I_ I>_ II I I I I I
_ 30. B
.. n[ ,. nFIG. S.14 AP2180.HCH
1983022079-200
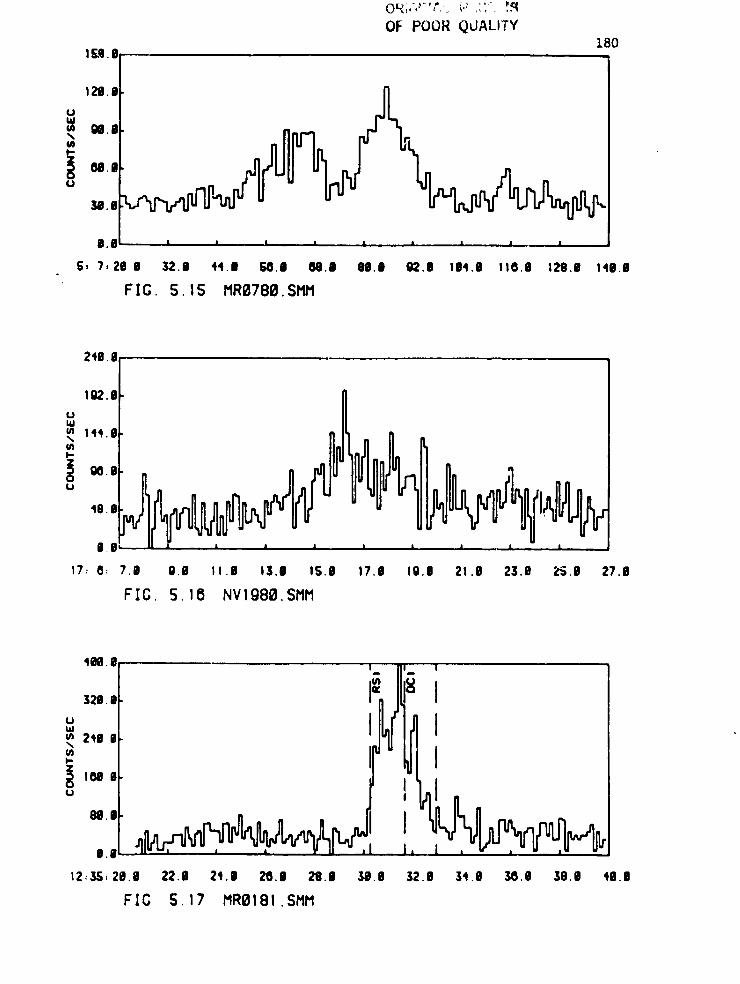
OF POOR QUALITY180
I_9.1
120.iI
i 811.|u
30.0
|.B', i i i i , A A i i •
S, 7,20.1 32.0 44.1 SO.I OO.I O0.1 92.I 114.0 ItO.I 120.0 140.1
FIG. 5.15 MROT86.SMM
._ 240.II[
/°"I 119. I i
|.0 • ' i i I i l ,
17: O: 7.0 O.O I1.0 I].l 15.0 17.0 IO.I 21.0 2$.0 2S.0 27.|
FIC. 5.15 NV1986.SMM
_ ]211,
° ,w2't0
" I
M.I
e.8 I
t2,35, 20.0 22.0 24.0 20.I 20.0 30.0 32.e 34.0 ]O.O 30.0 IO.I
FIG S.17 MROIBI.SMM
1983022079-201
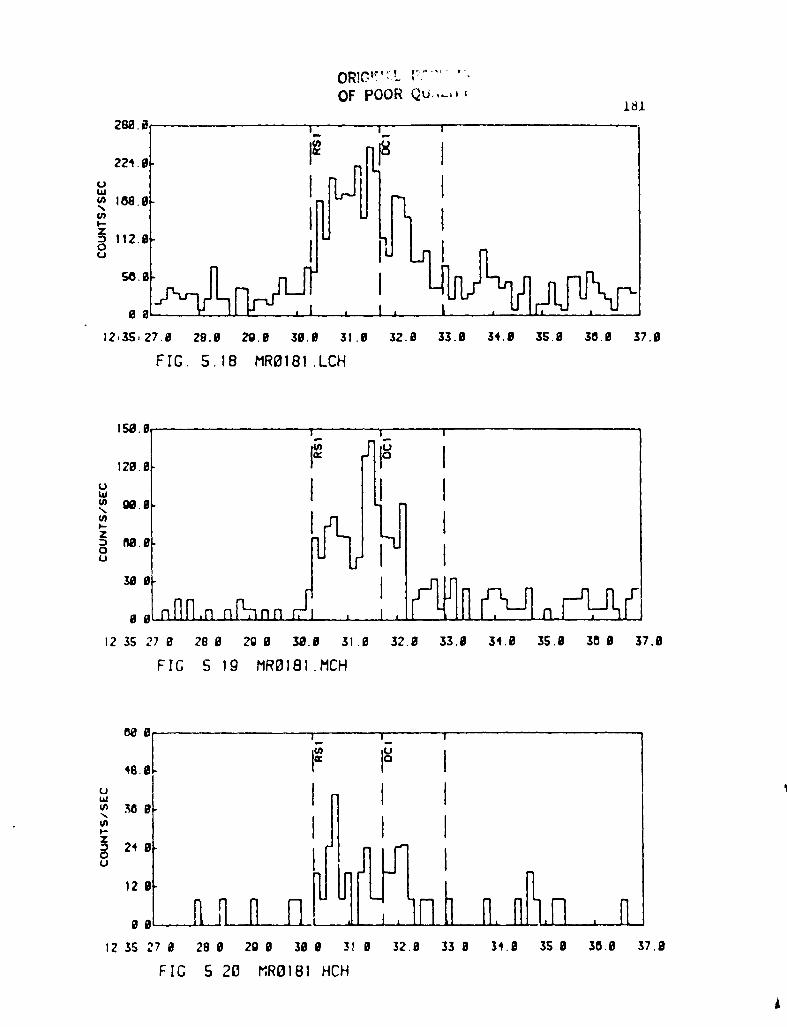
OF POOR Qu,,,-,'," 181; 2B_.B i i 1
- I§ I
_ 12,.T,,..5,27.0 28.0 2'0.0 3O.i_ 31 .O Z2.O 33.0 34._ 35.9 30.0 37._
i FIG. 5.18 MR0181.LCH!
° Iw
z 1
uo ', I _ l
FIG 5 19 MRBI81.t'ICH
,,.,L I_ I_ I
,_° : I I 'Z
0° I12,0
,,___ID_IFI I1, F1 il. .Fi . [l12 35 27 9 28 9 20 9 30 0 !_ 6 32.9 33 9 3't.9 35.9 38.9 37.0
FIG 5 20 MROI81 HCH
i
1983022079-202
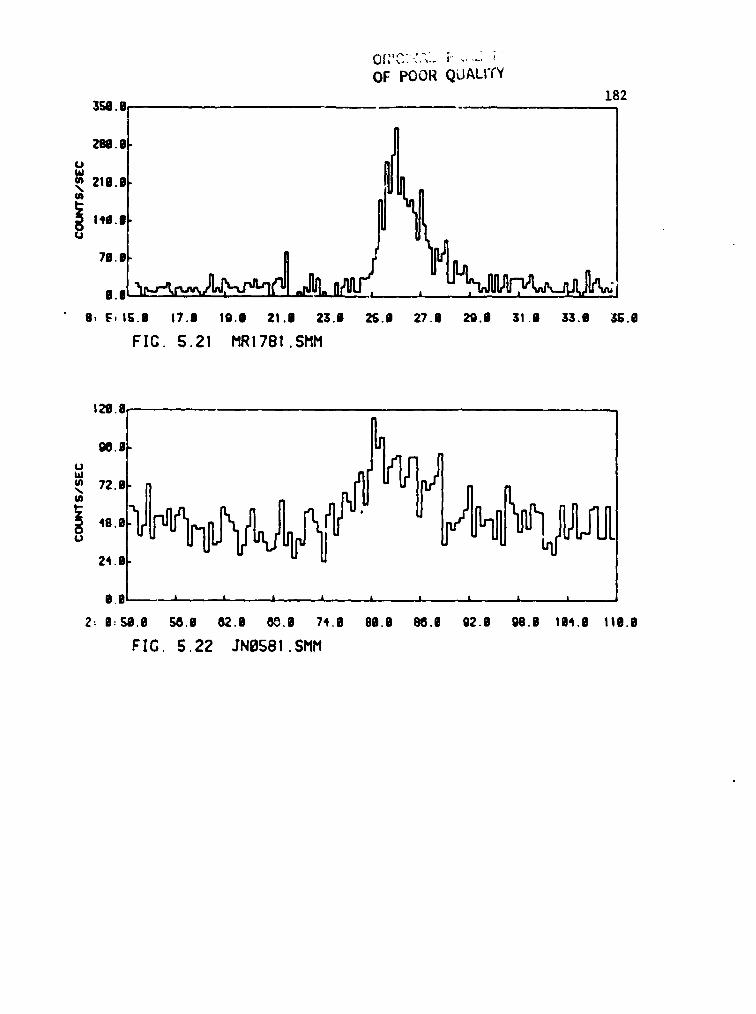
Oft= %_ -..... i '_' i
OF POOR QUALITY182
350.=
ZOO.|
i 2tO.O
• ! 1la.ll
|.|
O, f, lg.| 17.1 lO.| ZI .| 23.$ ZS.I 27.| 20.0 31.O 33.1 35.0
FIG. 5.21 MR1781.SMM
120.0
00.6
_ 72.|P
": _ 46.mu
24.|
0,0 , i , I , I A L J , i L L
2: O:SO.O 50.D 02.0 00.0 74.0 80.0 O0,O 02.0 00.| 104,0 110.|
FIG. 5.22 JNOSSI.SMM
=iI
1983022079-203
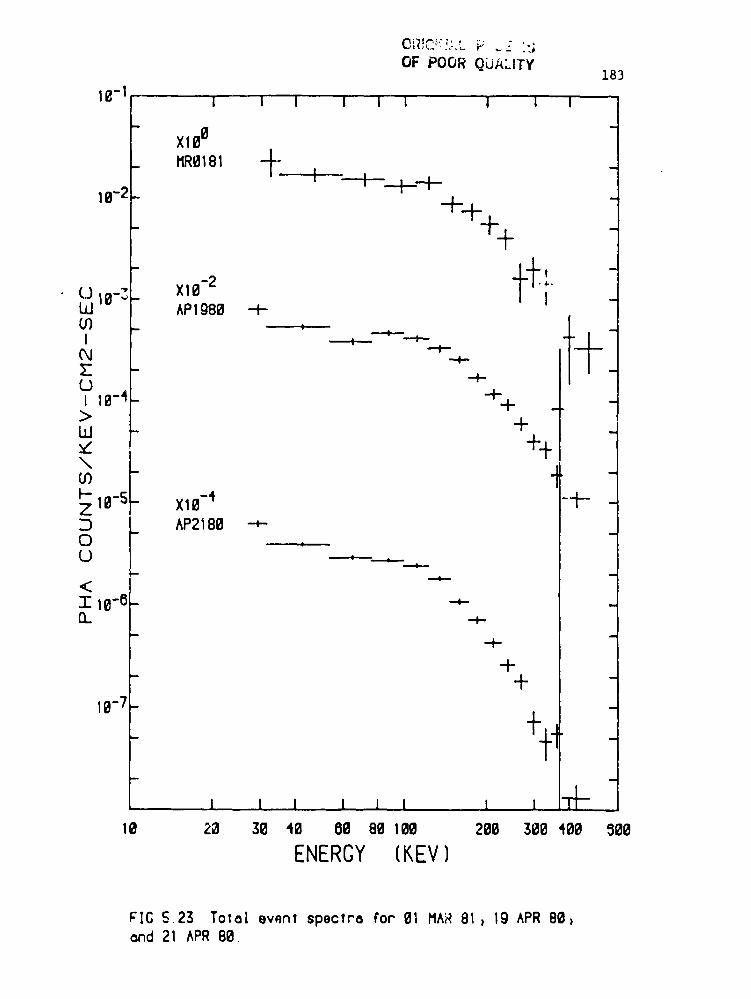
OF POOR QUALITY183
1_-1 i ...... I I I ' i I i ' i t
XII_6
MRQ181 f-. !I i
,e-2- 4-_�,.
L3 16-_ - X10-2W ^P1g89 -4- IlO _ ° _ I .
It16-4-
/
I "_--!- ->
/
LLI - -t- _
_D "_ -
_- _-4 --t--Z I0-5 IID _. ^P2186 -_-OO ----"---.--,--
_- 16-6 -_- _n ___
-4-+
- .__ -
16-7-
_ _/
I I I l I I t t TI-
I0 2_ 30 40 80 eo I00 200 300 400 _00
ENERCY(KEV)
FIC 5.23 Total evon; spectra for" 01 MAR81, lg APR88,and 21 ^PR 88,
1983022079-204
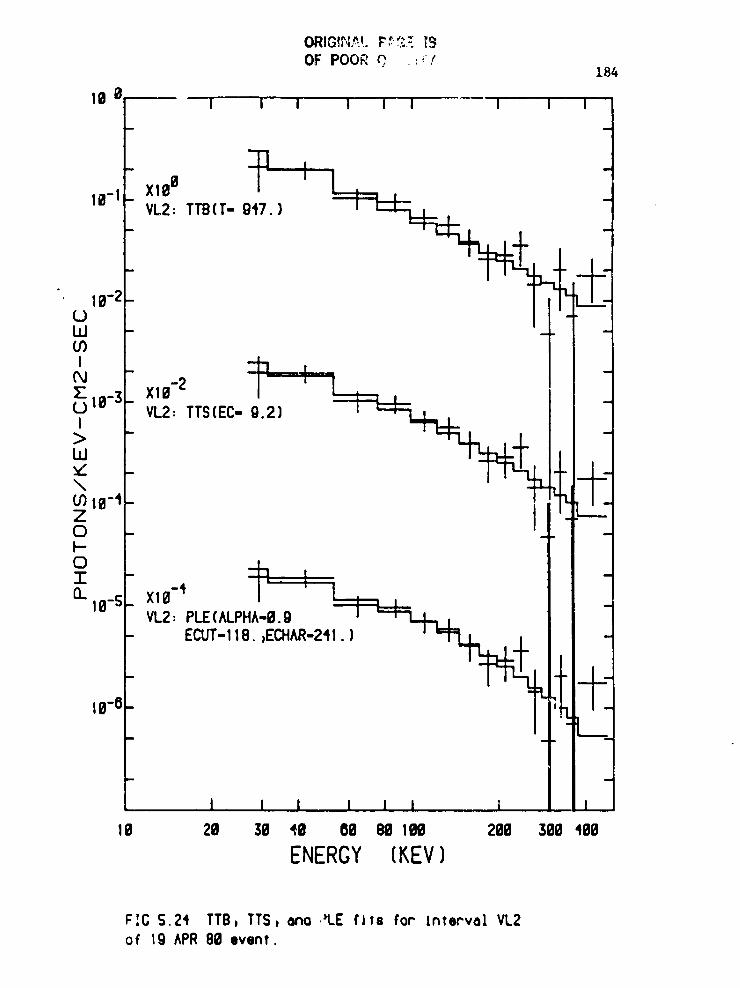
FIG S.24 TTB, TTS_ one .'LE fiT== for" [nterve! VL2: of 19 APR80 evenT.
.I J
1983022079-205
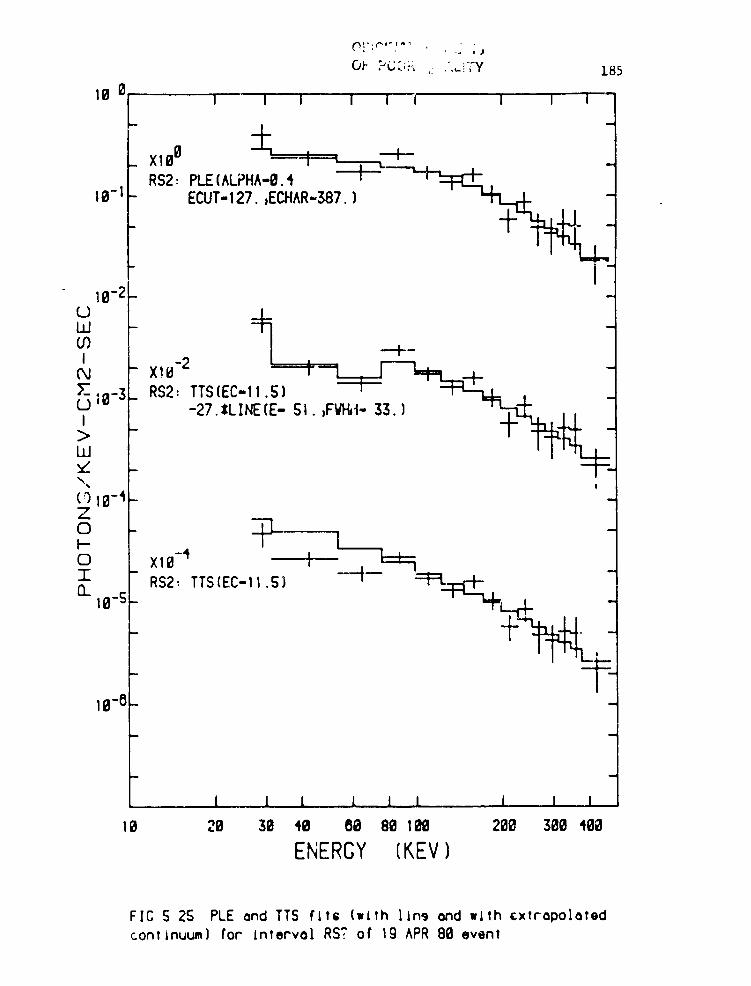
O_- FCC;i;_.:.'._-!TY 185
6 'IIB I I I I I I I I -
RS2:PLE(^LPHA-9.4 ' _,
1B- 1 ECUT-127. _ECHAR-387.) __,-L.-t
18-2
-2 .RS2" TTS(EC 11 S) ' _, I
!10-3,,,' " -27 %LINEiE" $1 " )FVt'_i" 33" ) ___jz_t"%*, i
(010-4-Zo - -zJ
I
o xt0-4 ! --I=:_=F_
- RS2" TTS(EC-11.S} i _, __.___I-,
10-S-
16-6 -
m
m !
, I I ,1 l I I I I I16 29 36 40 86 86 199 266 360 46_
ENERGY(KEV)
FIG 5 25 PLE end TTS fits (with llns end with cxtr'apolatedcontinuum) for IntervoiRS? of Ig ^PR B6 event
41
1983022079-206
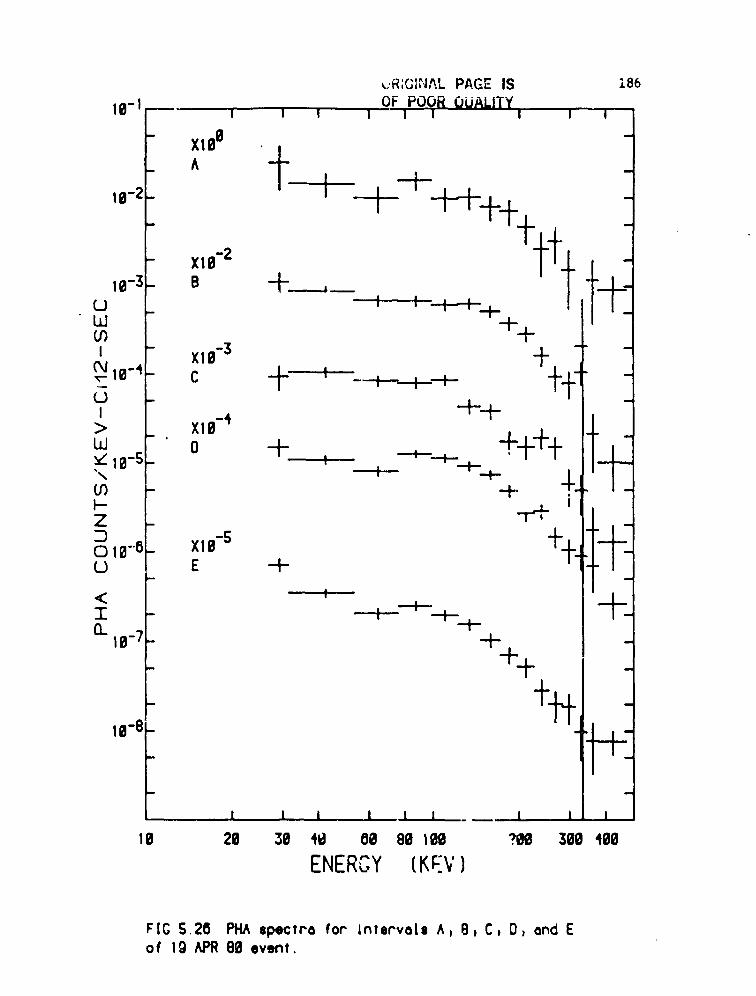
' ,,:R;Gt_'_IALPAGE IS 186,k
OF POOROuALITYIO-I i m I i ] i i i i
- Xlgg
.f- A _
I_t_-f-
- Xle-2
1e-3- B -I"----_.,__ "_I--_ : ! -..t-.-t-_1- _O
I.d ++
I - XIB-3 ..t_+.t__ -Ie-4- C I- I ___(.Ja -4-4- -
LLI> - XlO-4' "_- -_- l-"_o + +_+_10-5 _ t --t----t-- '
,\ f --t--_f_ /LO _ _ .-i
m
u _ E --t-< ! .--I--T - ---f---'-4--'- 4- -
-4-_e -7- --t- -
10-8 _
I "/1 1 I I l l 1 t 1Ig 2g 3g 'ld 80 8g log ?Og 300 40g
ENERGY(KEV]
FIG S.2_ PHAmpecfra for lnvervals A_ B, C, 0, and Eof lg _ 8e event.
1983022079-207
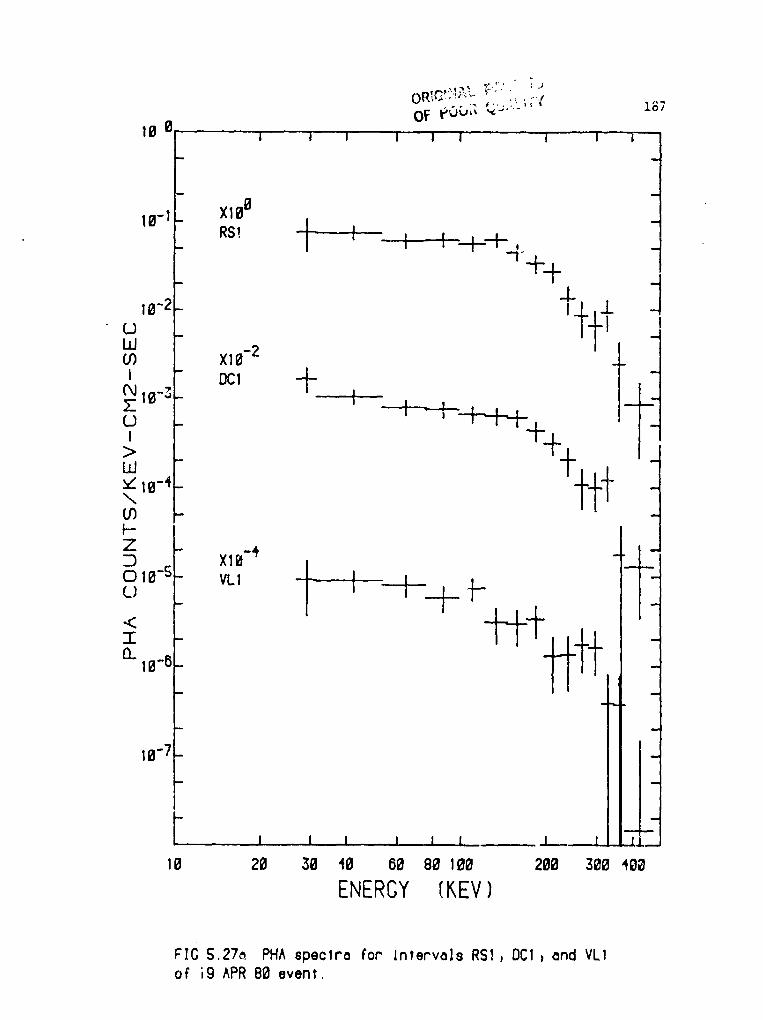
I
I
I- -- '" 187
100 I ' I I I I i I i" I '.
I
19- - X169RS! 1 - '
10-2 "_'_I_I-I-0 I
CO X10-2 l !?!
I - DC1 -I--cJlo-3- Iz --5---+-_+.+%(..I _
'>16-4_
\i 03 -
I--
Z _ VL10-4 ?-
! C} 10-S- IC) _ @
<
0_ 16_6_
i u
1'_ 19-7 - I
_L:I I, I .I I I I z Ii
10 20 30 40 80 80 100 200 300 460
ENERGY (_,EV)
FIG S.27_, PHA spectra for IntervalsRS], DCI_ and VLI, of i9 ^PR BOevent,
' I[ .
1983022079-208
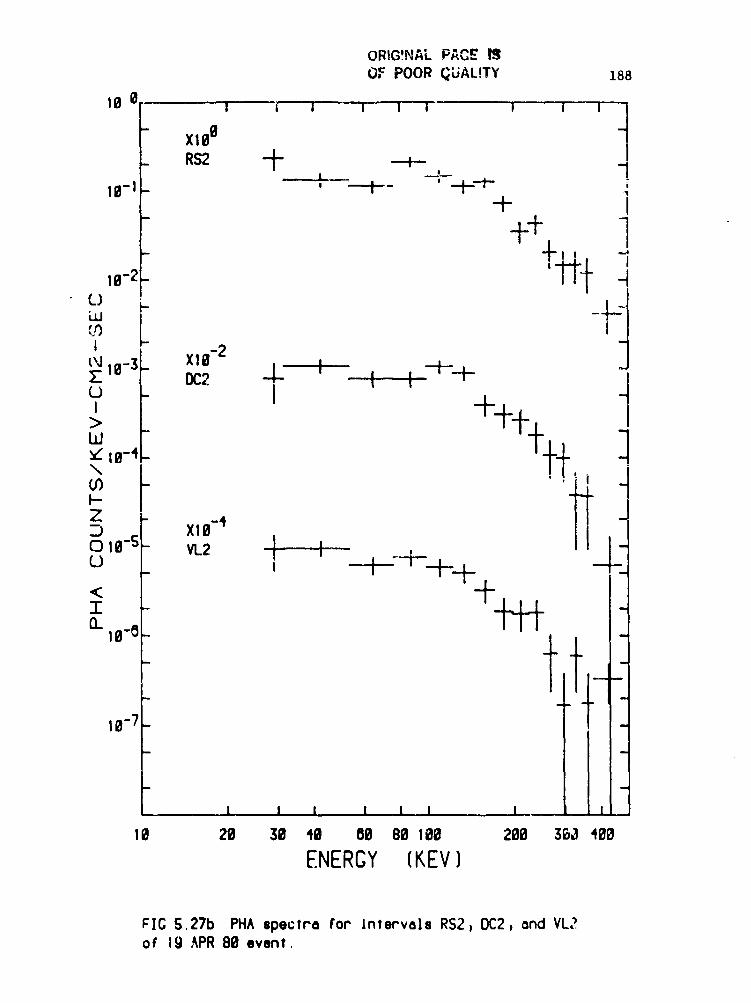
: ORIG!NAL PACE IS ;,L.: OF POOR (_UAL!TY 188
100 I _ i i i i J' " i l '
- 1199_ RS2 4-, ---+.- _
-I , f ' -I --_
Ie_2- i-_-r]L -t(..,)LU - -4 -z
I 16-3 _- 6-2 -- I" -_-'--,_ i,',,l Xlz oc2 4- , , '-l-U - j I i _
, ++,jr,, "LU10-4 - -i--_- -
F-
Z 6_4Xlo le-s VL2 J I ,. u , _+_--r-__ _ .
T - _ -
! Q- 19_0_ Ill
t I
!i--9- 7 -" -,-
- ]-I I I i ! I i .... i l "
19 29 36 49 09 89 liD6 299 3_a 466-i ENERCY(KEV)It
_j FIG S.27b PHAspectra for Intervals RS2, OC2, ond VL2f of 19 APR80 event.:1
i
1983022079-209
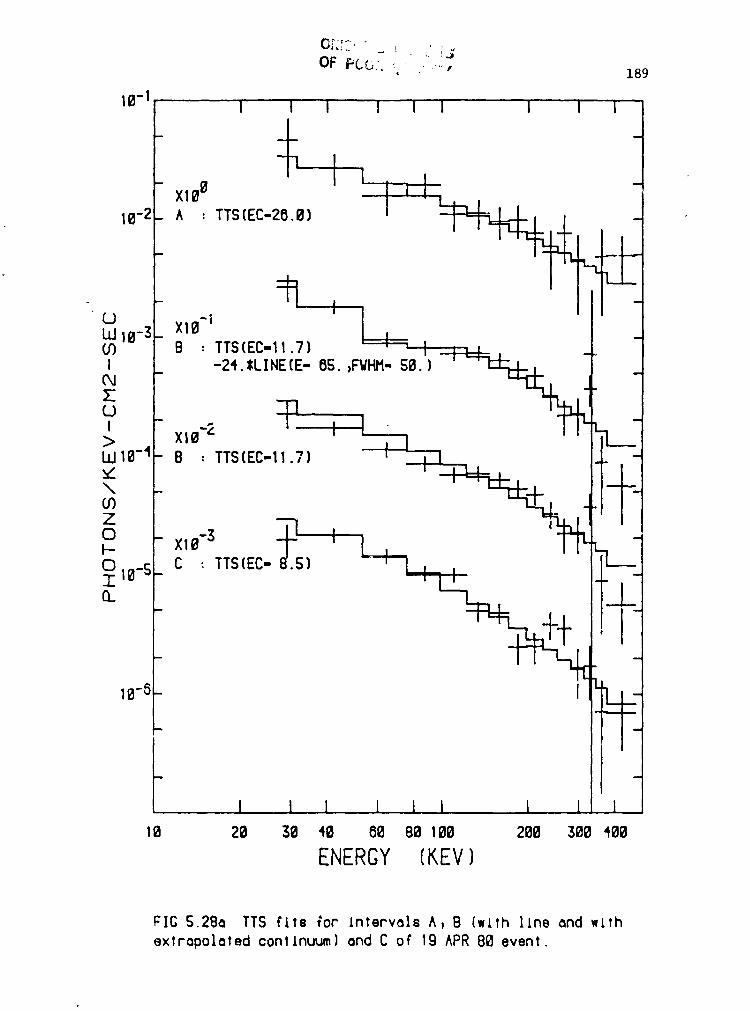
OF P_,• 189
"--" 10-1; I ! I' l I I 1 I I/
! .
X106 . )
;:_!_ 10-2 10: i TTS(EC.2_;i L_,e-3 L=I=_ i
; Y ,,-2 IL 7 , 71"
1e_S C : TTS(EC ) ! In
10-8
I
I I 1 1 1 I 1 I 1
10 20 30 40 60 80 100 200 300 400
ENEROY (KEV)
FIG 5.28a TTS fire _or intervalsA, B (with line and withextrapolated continuum) and C of' 19 APR 86 event.
-j,
1983022079-210
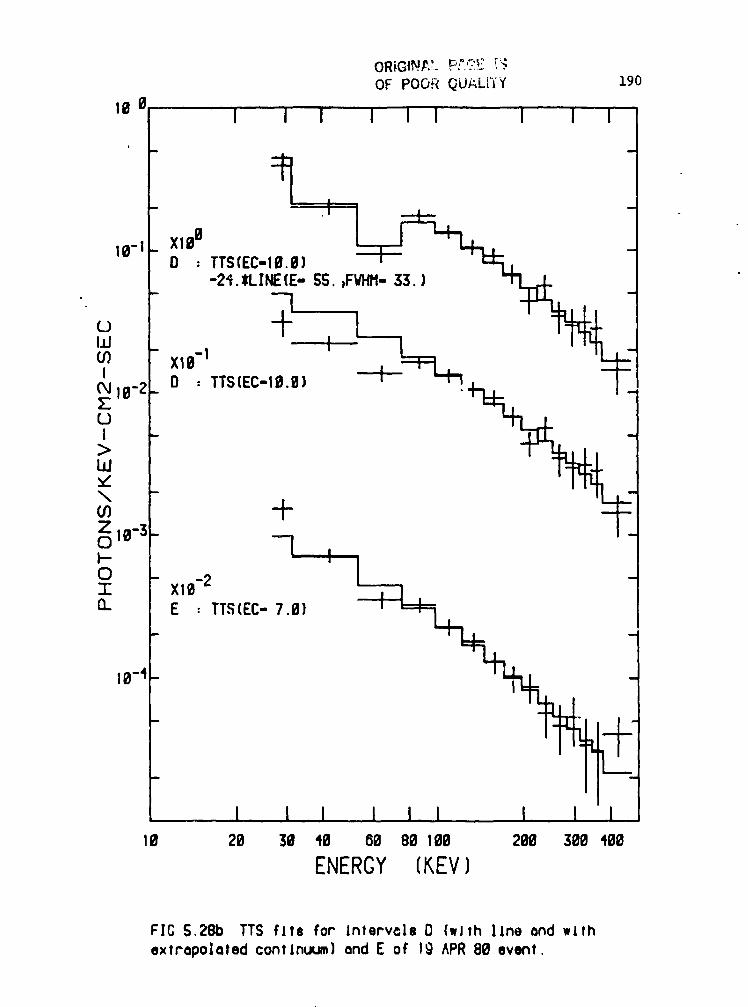
OF PO0._ QLIALFi°Y 190L
; 1B B I I I I I I I I I
XlltB10-1 -D • TTS(EC-I_.G)
-21.SLINE(E"SS.DF_M"33. )
03 XlO-1I
lO_2__ O = TTS(EC-19.9)0I>Ld
\ -
' z'°-3- 7 ,
"- '1 t0 - 9_2
T Xt(3.. E : TTS(EC-7.9)
m
I0-4-
. I l ,, i .,1 I 1 I 1 1i
IO 20 3@ 40 60 80 lOB 200 300 400
ENERGY (KEY}
FIG S.2Bb TTS flfs for Interv¢]sD [wlth 11ne and wlth
extropo]atedcontinuum)and E of 19 APR 80 event.
I-
1983022079-211

" I
i
- 16-_ _
i
II
': I,_.. 1
19 29 36 49 69 09 109 299 396 499
ENERGY (_EV)
FIG S.29a TTS file for InlervaisRSIj DCI I,llh lines endwilh extrapolatedconllnuo)and VLI for 19 APR 80 event
198.3099A7_cI_919
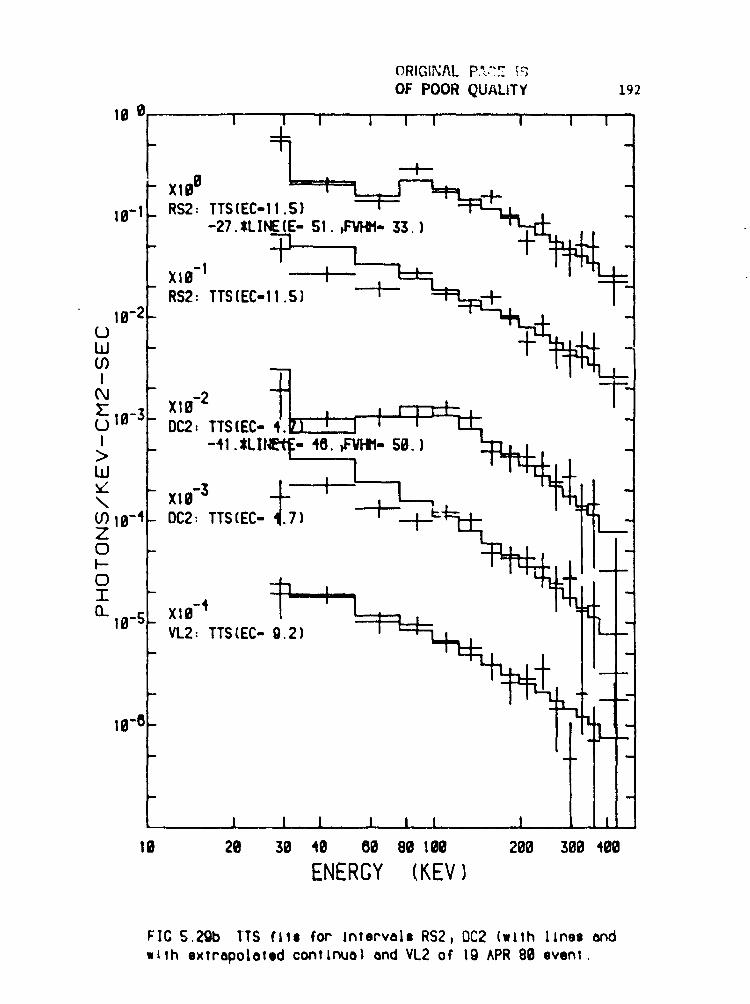
w
1 I 1,. I i I I L itI0 20 39 49 86 80 100 260 360 460
ENERGY(KEV)
FIG s.2gb ITS fll= for InTervals RS2, 0C2 (wlth lines _ndwith exlrspoleled conllnua] ond VL2 of Ig APR 80 event,
1983022079-213
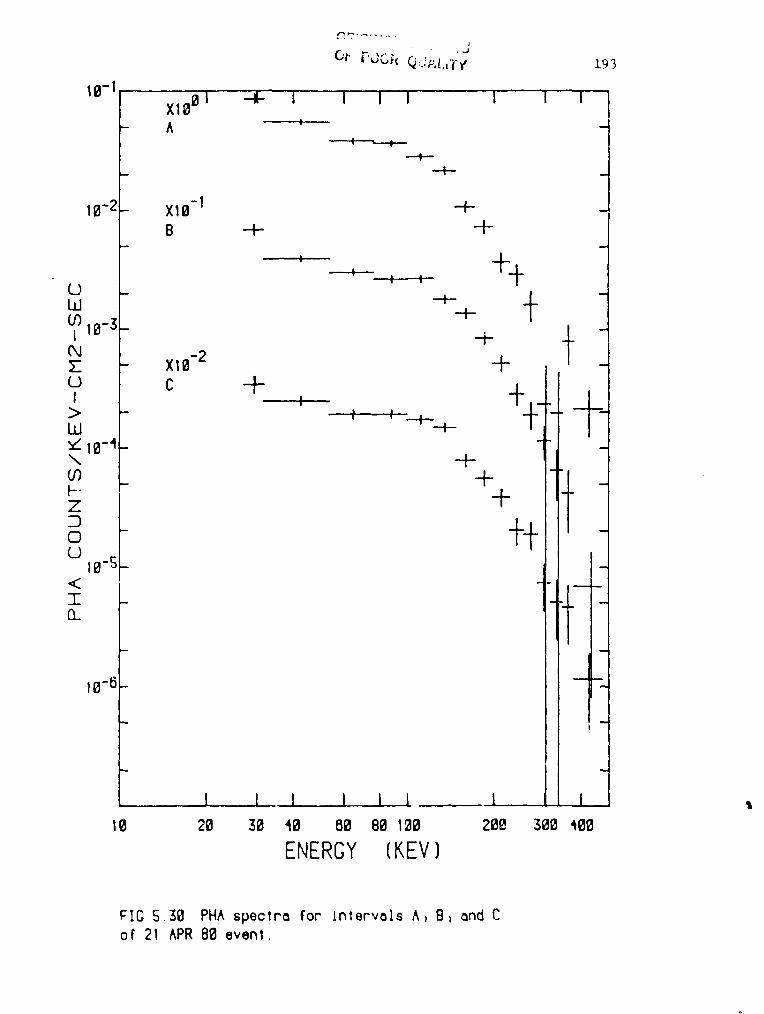
,+
.Ji_,_,_(Q:f/_:_..]f_, 193
16-1 X10{3I .-d,- 1 ' i '"1 I I i .....1- A "'"
--+--
1D-2__ X19-1 .-f.-- _B --t-- -4-
, ++U _W -4- _ -O3 "-4- /1 16-3-
tN -2
o c + +W> - ! I +-'l- +If ",,/10-4_\ -+- j
- + 'I io"t"(310_5I - J., -
IT
I t t I I I I I _,10 26 36 46 08 86 1_6 20e 3{30 '_0{3
ENERGY (KEV)
FIG 5,30 PHA speclra for InlervalsA, 8, and Col 21 APR 86 evenl,
1983022079-214
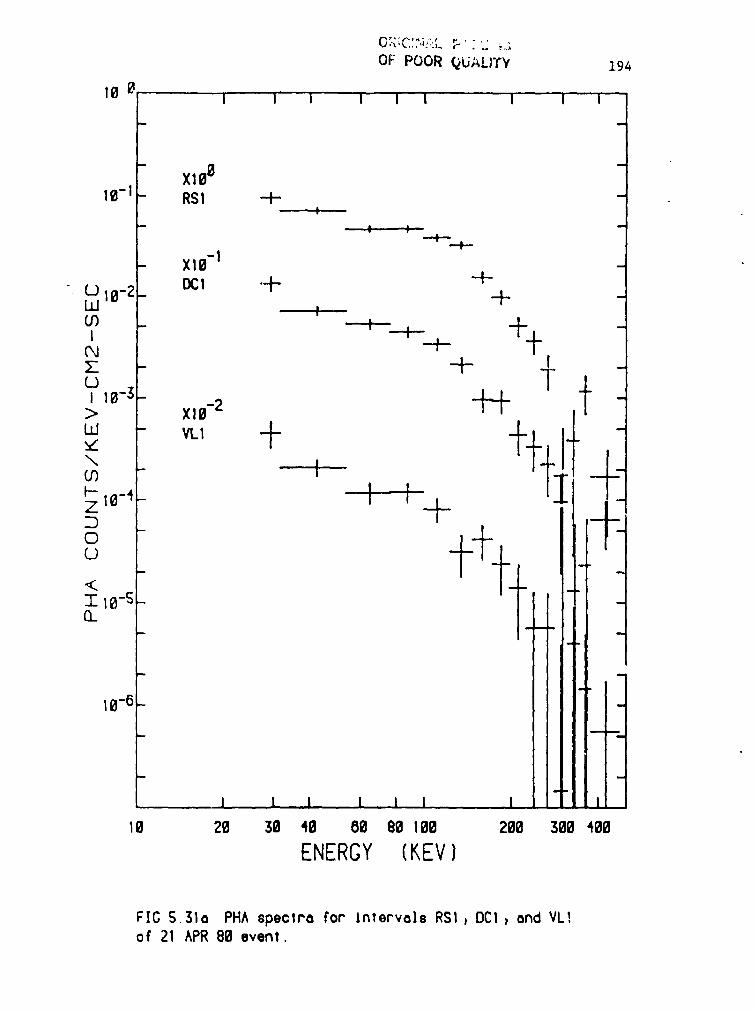
...... " F": "OF POOR QU#,LIT¥ 194
10 _1 I I' I I I I I -I I
u
1 t i , I I, i i16 26 36 40 80 eO 160 266 366 466
ENERGY (KEV)
FIG S.31a PHA spectrafor IntervalsRSI_ OCl, and VL!of 21APR OO event.
1983022079-215
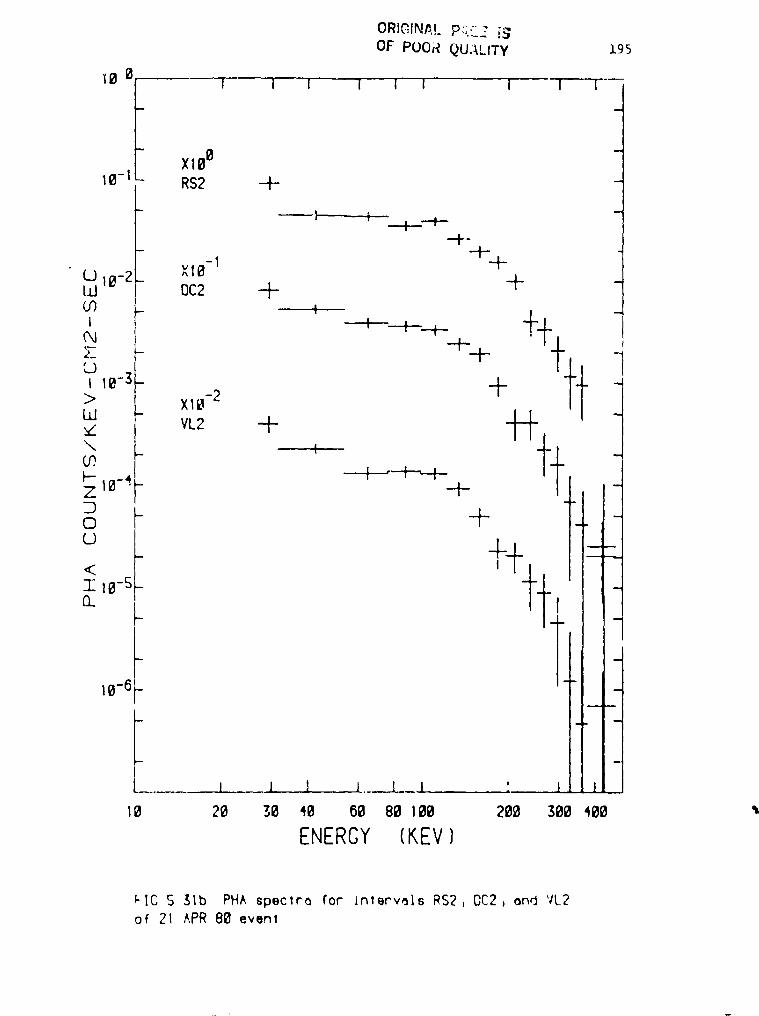
IllI
ORI_INA!. P,',.C.Z __OF" POOR QUALITY 195
I0 0 1-- I i ! I I i i I'--
Xl0o10- I _ RS2 -4-
- _1 i __t___.4_,, --I"-
:: - - 1 "It'--t-" _ 10_2 _ XlOt.u oc2 -t-- +
03 _ t _
I -----4--__.1._._1.- ++
_ -+-_p fit -
)- _
I 10-3- -I- ..4> XlO-2ILl - .4_.4_ -
CO.\'z" ! VL2 + _ I I f_[_Z 1°-4 + -I
0 - T -i
U i_ f __<I 10-S-n
I I
t -10-6
I I l I ____L_ I ,', I lJ.
10 20 30 40 50 80 100 20_ 300 400
ENERGY (KEV
P|C S 31b PHA speclrm for Inlerv_Is RS2, DE2, and VL2of 21 APR 80 event
IF,-
1983022079-216
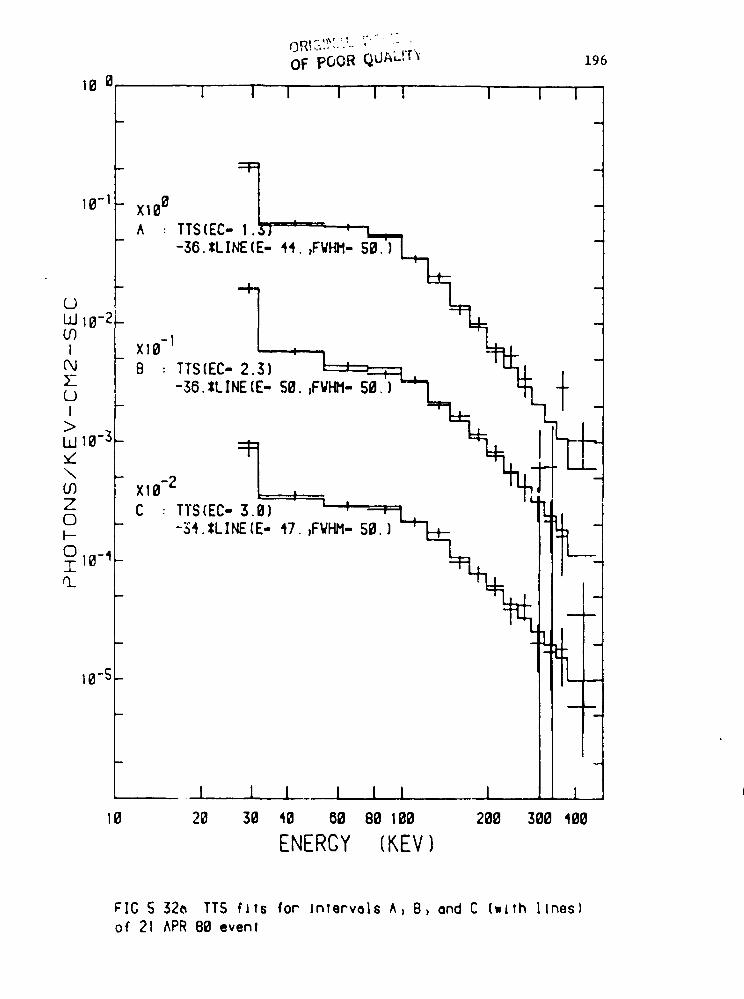
FIC S 32_ TTS fLts for lntervols ^) B_ ond C (wiTh lines)
jl| of 21 APR 80 even!I
1983022079-217
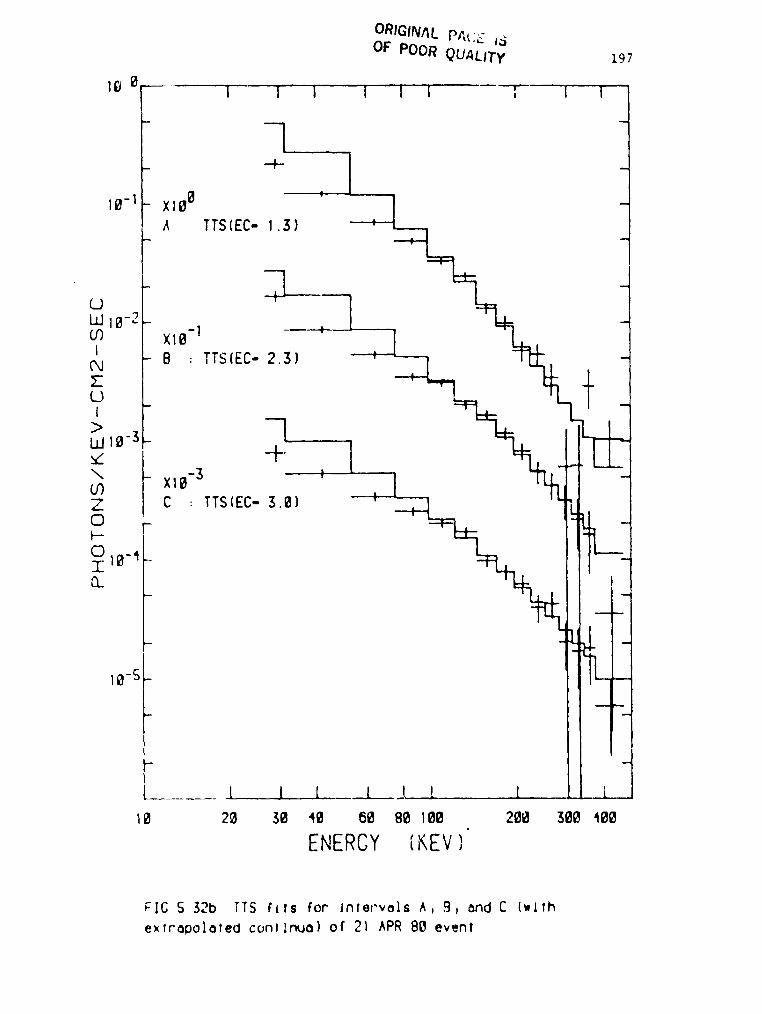
zIG S 32b TTS fits for Intervals ^, ,_, and C Iwithe_Irapoloted toni!hUe) of 21 ^PR 80 ev_,nt
1983022079-218
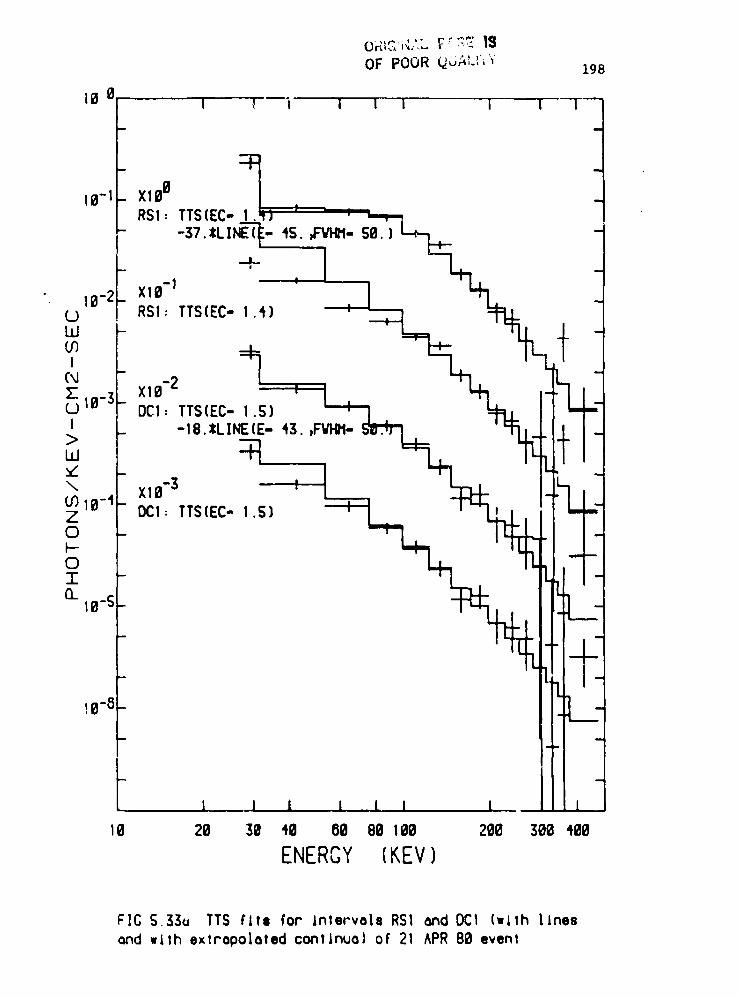
OF POOR _,.;ALI_',198
I 1 I I 1 I I' I'- 1 "m a
10-1_ X10B .RS1. TTS(EC 1.
1(10-110-2 . _ 1. _
L_ RSI: TTS[EC 1.41
: _ _,_°_ . ' ._ -I _ t0-3- -18.*LIN_E- 43.,
OCt: TTS(EC 1.5]
2
O_10_S-
11I-10_0. • _
'1l
i II
t - '; l 1 I I l I [ 110 20 30 40 60 60 100 200 300 400
ENERGY(KEV)
FIg 5.33u TTS FIts for intervals RSI end 0CI (wlth linesend with extrapolated conllnua) of 21 ^PR 80 event
)
1983022079-219
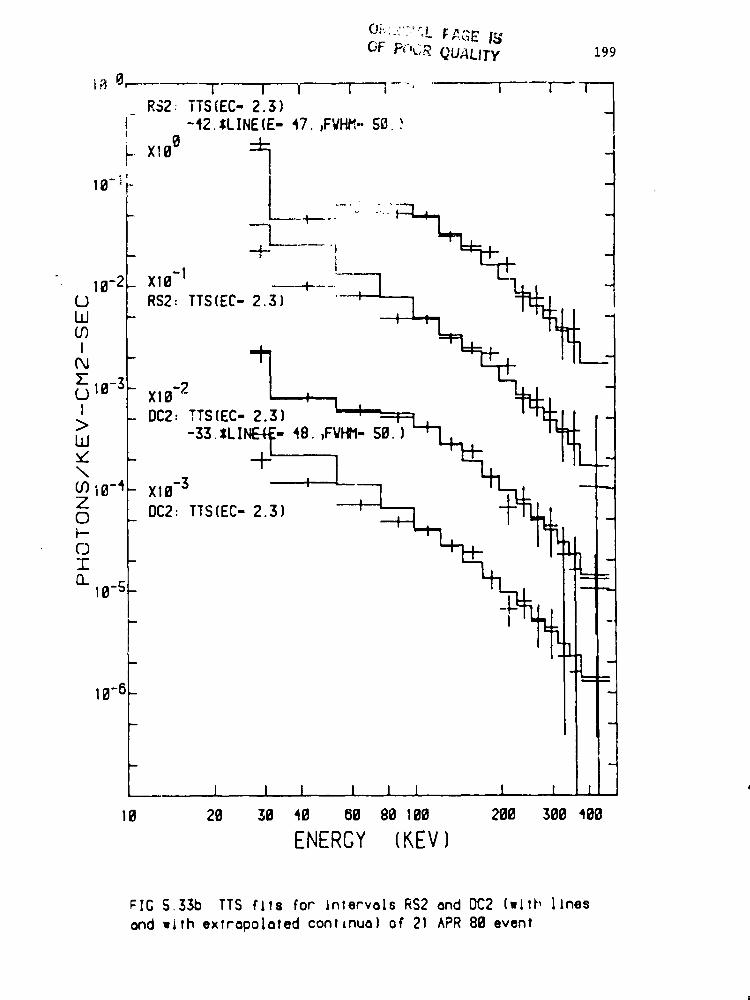
GF P_JC.D.QUALITy 199
i I I I _ I I--T-RY2: TTS(EC- 2.3)
I -12._LINE(E-47._FVH_-SO.:I
L. XlO0 --l
10-_i..
- _ "i
10-2 X10⁻¹ !.___0 RS2: TTS(EC-2.3}LLJ -
i__-'_ -
_- 0-3- -2(_)I XIOI DC2" TTS(EC-2.3}
--33.ILINC_E" 48. ,FVHM- $0. }ILl /
\v" . -t-' [zC010-4- XlO-3 !0 _ DC2: TTS(EC- 2.3)F-0
CI.10_S-
10-0_
ii
l I I I 1 I I l
!0 20 30 40 60 80 100 200 300 400
ENERGY (KEV)
;IC S.33b TTS flts for JnlervelsRS2 end OC2 [with lines
ond with exlropo|otedconlAnuo}of 21APR BB event
A
1983022079-220
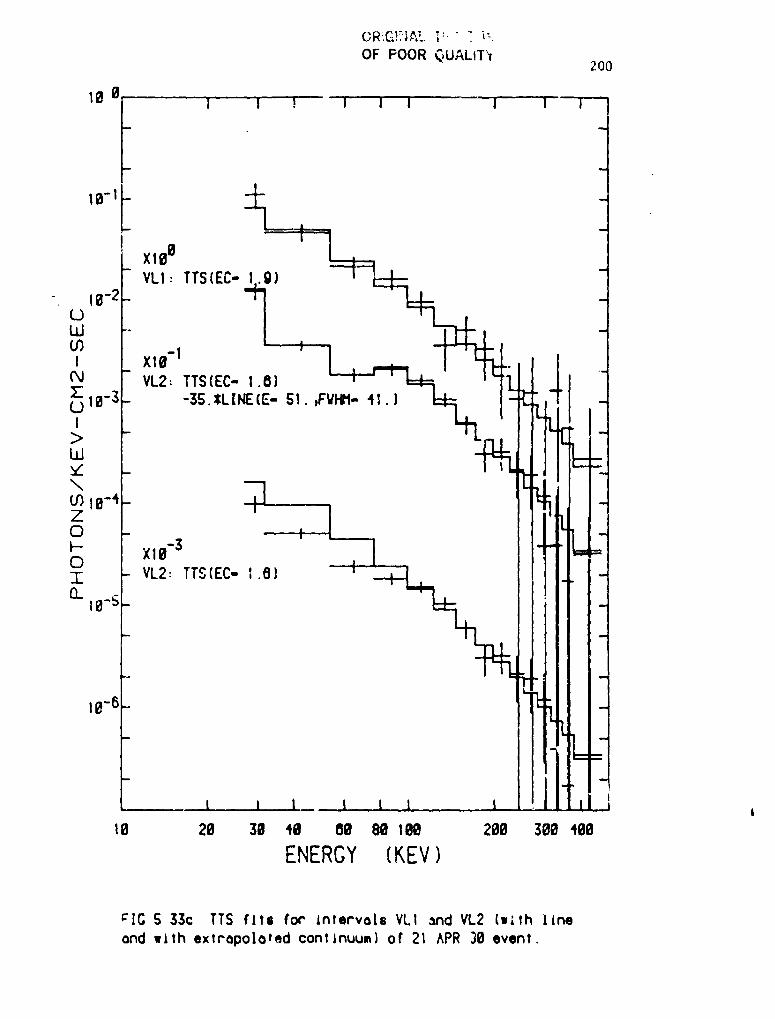
" cIG S 33c TTS fits for Interval8VLI and VL2 {w;th line
and wllh extropoloted continuum)of 21 ^PR 30 event.
1983022079-221
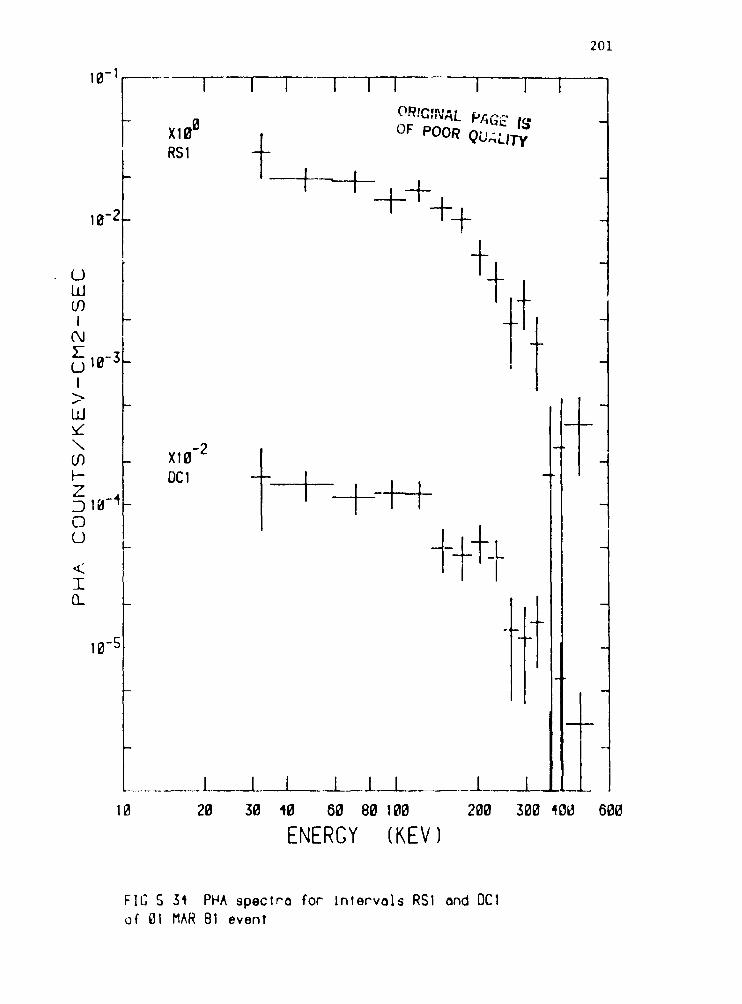
FIg S 34 PH^ speclra for InlervalsRSI and OClol 01 MAR 81 evenl
(
1983022079-222
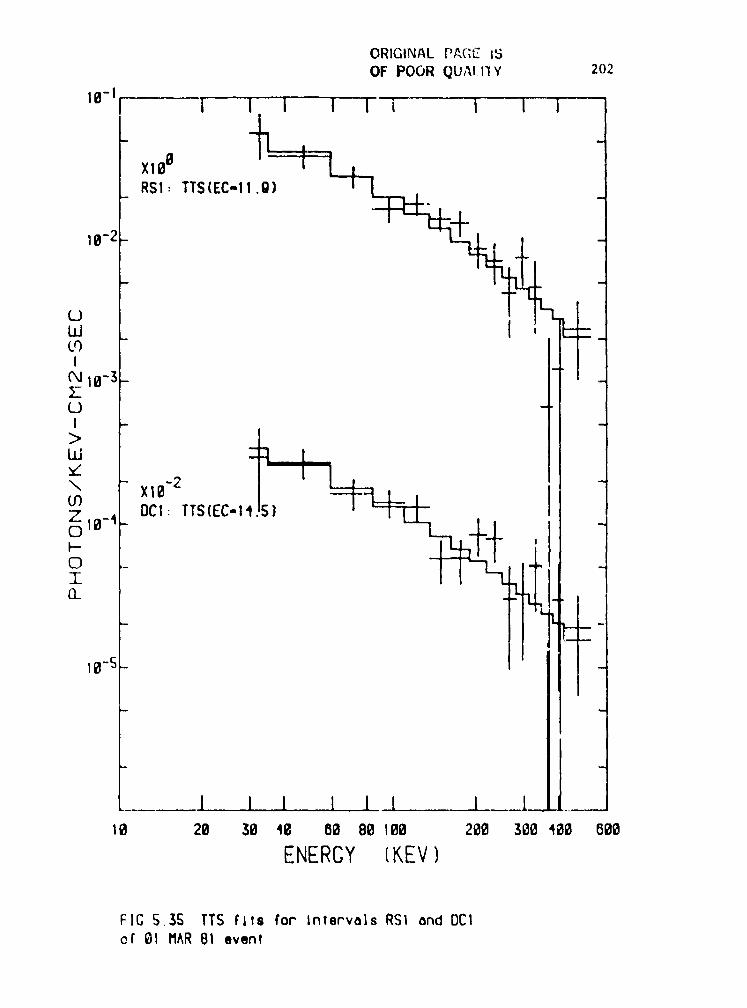
ORIGINAL P_.(;EIb_OF POOR f_UAI.IIY 202
I°-I I I I .... i i I I I I
- -XlO9 I---'
_ RSI, TTSIEC-11.O)
10-2-
W _ ICO ", I
_ 10_3_ i _I2.(D -
m i" 1\ - X16-2CO DCI" TTS(EC-I . }Z0 10-4- L..., -l.-,J -
(D _ _ _Ta_ ._-k
I18-S_ , _
II
jI I I , I ,I _I ,I I ._I0 29 30 41_ 80 86 100 200 300 400 000
ENERGY [KEV)
FIG S.3S TTS fll$ for IntervalsRSI and DCIof 01 MAR 81 event
i
1983022079-223
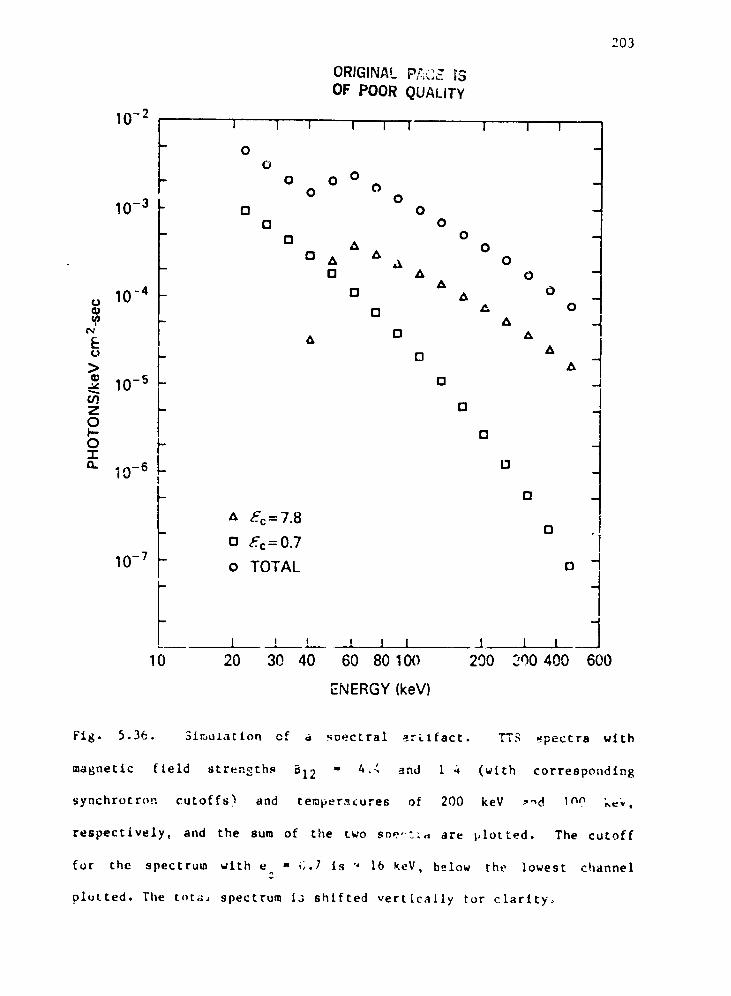
203
ORIGINAL pf._,,_.ISOF POOR QUALITY
10-2 / I I I I J I I I I0
00 0 0
0 0 0"-IU-3 O O -
O OO
O A O
0 A Z_ A O- O A 0 -
A
o 10-4 El A 0 _(_ 0 A O? A _
Eo _. 0 A _
L A
>_ O-S aZ 0 _0I- 00 _- -In
i0_ 6 . 13 _
w.- 0"1 --
a Ec=7.8. 13
a _:c= 0.710-7 - o TOTAL o -
I -2-' t 1 I I J I !10 20 30 40 60 80100 200 200 400 600
ENERGY (keY)
' Fig. 5.36. Slmulation of a soectral artifact. TTS _pectra with
ii magnetic field strength_ El2 - 40_ and I 4 (with correspondingI
synchrotron cutoffs) and temperncures of 200 keY -_d Inn k=,.
i respectively, and the sum of the two Shed':,, are [,lot ted. The cutoff
for the spectrum with e = 6.1 is ', 16 keV, below the lowest channel
,i plotted. The tota, spectrum 1_ shifted vertLcally tor clarity,tt
4
1983022079-224
Chapter VI OF VC_f_ "" ......
INTERPRETATION OF RESULTS
It is now generally believed that neutron stars are the sources of
_-ray bursts. Several arguments to be presented in this chapter support
this conclusion. Recent observatlono suggest that spike-llke bursts and
"classical" bursts are generated by different processes. Yet for both
classes of bursts the evidence favors a distance of a few hundred
parsecs for most souree_ The Rcurces are most likely old neutron stars
whose rotation periods are longer than the average burst duration. The
observed (quasi-) periodicities may be due to source rotation. This
would explain why periodic structure £s observed in only a small
percentage of burst temporal profiles.
Interpretation of the burst spectra as thin thermal :ynchrotron
radiation is consistent with all observed and deduced parameters. Low-
energy features observed in some spectra are probably not cyclotron
resonance lines. If, indeed, the sources are within a few hundced
parsecs, the source is optically thin. Then, the features may be due to
spectral averaging of a rapidly time-varying low-energy synchrotron
,' Cutoff.
Evidence for the neutron star hy_othesls will be presented
separately for both classes of bursts. The implications of observable4
propertles of bursts are discussed in the context of current neutron
star models.
r
t
i
1983022079-225
205
A. Splke-llke Bursts OF POC_ _: T¥
i. Impllcatlous of Temporal Characteristics
a. Rise Time and Duration
The typtc_l temporal structure of spike-like bursts gives important
clues to the nature of the burst mechanism. The most remarkable
property of the burst temporal profiles is the fast else time, less than
a few × I0 ms. Only upper limits to the rise times have been obtained
by the KONUS experiment in most cases (_zets et al. 1981f). From the
ISEE-3 experlment the rise time of the 5 MAR 79 superburst w_s
determined to be < 0.25 ms. This Is comparable to the radial
oscillatory period of a neutron star (Van Horn 1980) and also comparable
to the onset time for the neutron star thermonuclear runaway detonation
model (Woosley 1982).
The profiles of spike-llke bursts are further characterized by
relatively smooth decays of duration _ a few tenths of a second.
b. Periodicity
The double-peaked elght-second oscillating decay phase of the 5 MAR
79 burst suggests a neutron star with nonaligned magnetic and rotational
axes. Neutron stars in X-ray binary systems exhibit periods in the
range tens of ms to _ 103 s (White 1982) and old extinguished radio
pulsars probably continue to slow their rotation past Lhe observed
pulsar cutoff of _ 5 s.
Also, a suggestive 22 ms periodicity is apparent during the initial
intense spike of the 5 MAR 79 burst (Barat et al. 1983b). The
7
fundamental tcrslonal (toroidal) oscillation mode of a neutron star is
predicted to be _ 20 ms (Van Horn 1980).
1983022079-226
ORIGINAL PAGE IS 206 4OF POOR QUALITY
c. Repetition
Thirty-three percent of the bursts in the ISEE-3 sample are spike-
llke with soft spectra. This is a much larger percentage than detected
by previous experiments. However, the KONUSexperiment (Veneras 11. 12,
13, and 14) has now detected twelve spike-llke bursts whose localization
arcs (a few arcmlnutes wide) all Intersect at the famous 5 PAR 79 burst
• error box (Hazers 1983). The fluences of these follow-up bursts are all
down by factors 10-2 to 10-3 from the 5 PAR fluence. The intervals
between bursts from this source, during periods of observation, range
from 13 hr to 67 dy. At least one other repeating spike-like burst
source with comparable re urrence intervals was detected during the
Venera 11 and 12 period, and several other spike-like bursts have been
detected whose localizations are forthcoming (Hazeta, private comm.).
Classical burst sources can be inferred to have repetition times _ 1 yr
from the KO_YS results (Ha=eta et el. 1981a; b) Hence, whereas jpike-
like bursts are more prevalent than previous evidence indicated, we can
conclude Chat the repeating spike-like burst sources are sparse compared
to classical burst sources.
In Table A.3 the events and intervening intervals for the 5 MAR79
source are listed. Two similar event sequences are apparent beginning i
, with the 5 HAg 79 event and with the 23a APR 82 event. The intervals
between first and second events in the two series are about 14 and 13_ :
hr, respectively, with subsequent intervals longer (18 to 39 dy). The
23a APR 82 sequence exhibits strictly monotonically increasing
intervals. A third sequence with monotonically incrsssing intervals
starts with the event on 01 DEC 81. The Venera 13 and 14 spacecraft
were launched about November 15, 1981; hence, it is not known tf the
i
1983022079-227
'_:.... 207
OF POOR QG&LI'Tyseries commenced before that time.
The aeries of KONUS splke-llke bursts, 24 M_R_ 25 MAR, 27 MAR 79,
having locallzatlons cohsistent with a slngle source (designated B1900
+14, _zets et al. 1981f), is another example of increasing burst
Intervals (I0 hrj 32.5 hr). This trend of incroaslng intervals between
bursts is suggestive of a relaxation process.
The short time scale for repetition of the burst process, several
hours to tens of days, probably excludes so_e models specifically
proposed to explain splke-llke bursts (see section ill).
II. Intrinsic Luminosity
Since locallzatlons have been determined for only two spike-like
burst sources, their source distribution on the celestial sphere is
unknown. The possible association of the 5 MAR 79 burst with thp
supernova remnant N49 in the LMC leads to questions concerning the
galactic or extragalactic origin of spike-like bursts in general and
their intrinsic luminosity function. Presently, the 5 MAR burst is
unique among all spike-like bursts in that the 5 bP_Rfluence, 4.5 x 10⁻⁴
; erg cm-2, was 102 to 103 times greater than most other splke-llke
bursts. It is interesting that a splke-like burst with a soft spectrum
observed by KONUS, 30 SEP 79, exhibited an intensity one-third that of 5
MAR. Unfortunately, only one detector on Venera II observed the ew_t
and its direction was not establlshed (Mazets, et al. 1981f). N_%
evidence of an oscillating decay wao observed.
Splke-like bursts from other sources deliver fluences comparable to
those of the 5 _t_R follow-up bursts, _ I0-7 to 5 x I0-6 erg cm-2. The
spectra of most short duration (_ 0.5 s) bursts are 8 ft, I(ph cm-2s -I
mT=..,_ _ ..
1983022079-228
OF POOR QUALITY208
keV -I) = E-lexp(-E/_30 keV), compared to classlcal burst spectra (see
Table A.I). If one makes the simplest assumption that the burst
mechanisms for the 5 MAR source and other spike-llke bursts are
generically similar, and most are galactic, then either the 5 MAR source
produces bursts scaled up by a factor _ (55 kpcl_ 500 pc) 2 _ 104 (by
107 for events like 5 MAR 79 itself), or the 5 MAR source is not
".associated with the supernova remnant in the LMC.
Our galaxy and M31 compose more than 90% of the mass of the local
group; it is very unlikely that splke-like burst sources are located
Just in nearby satellite galaxies and not in our own galaxy. However,
the splke-llke sources could be in nearby clusters of galaxies. The
ratio of most splke-llke burst fluxes to the 5 MAR flux (in the LMC),
10-2 to 10-3, is comparable to the Inverse-square atten,:atlon factor (55
kpc/ _ 103 kpc) 2 if the splke-like sources are at extragalactic
..idistances; hence, the smaller splke-llke bursts would be as energetic as
5 MAR itself.
One observation is contrary to this possibility. The other
repeating (soft spectra, splke-llke) source, B1900 +14 (Mazets et al.
1981f), produced three bursts in two days with fluences _ 10-2 to 10-3
that of 5 MAR. If a core phase transition, a rare and possibly singular
event in the lifetime of a neutron star, is the mechanism for 5 MAR -
llke bursts (see section lll.b bel_w), the 5 MAR burst and bursts from%
BIgo0 +14 were probably caused by different mechanisms.
It remains to explain the _ 103 range in luminosity for the 5 MAR
source. It is possible that the flux from splke-like bursts is beamed
in a narrow angular pattern. The dynamic range in fluences observed
from the 5 MAR source would then be a consequence of the rotating
1983022079-229
ORIGI_AL PAG_ 15; OF POOR Q{IALITY
20g
source. If this is the case, other sources should also be observed to
produce large bursts infrequently. A1ternatlvely, the follow-up bursts
from the 5 MAR source may be small readjustments of the crust subsequent
to a core phase transition.
tit. Models for Spike-llke Bursts
a. Improbable Models
Quasi-steady accretion onto a neutron star in a binary system as
the energy source for spike-llke bursts (and for classical bursts as
w?ll) appears to be ruled out for several reasons. Most physically
expected variations on accretlng neutron stars have been observed,
leaving hardly any room for modification of the theme for y-ray
bursts. X-ray binary pulsars with high and low mass companions and with
large ranges in orbital periods, eccentrlcitless and inferre_ magnetic
field strengths have been detected (White 1982). Type I X-ray bursters
(Lewin 1982), believed to be powered by thermonuclear hydrogen
explosions, manifest observable properties quite different than those of
f-ray bursts (howevers see Woosley's thermonuclear model below). X-ray
burst rise times, a few _enths of a second, are comparable to the total
event durations of spike-like y-ray bursts. X-ray burst characteristic
: temperatures are an order of magnitude smaller than those of spike-llke
y-ray bursts. Type I and II bursters exhlblt persistent X-ray emission
due to accreting matters while the smallest ( _ few arcmln 2) y-ray burst
source boxes contain only weak background X-ray sources or none at all
(Cline 1981; Hurley I982).
Three classes of neutron star y-ray burst models have been proposed
which may be capable of producing splke-llke bursts: thermonuclear
A
1983022079-230
_.f ",
OF POORQUALITY 210
helium e_ploslons (Woosley 1982), accretion of asteroids (Renan and Cox
1980; Van Buren 1981; Colgate and Petschek 1981), and structural changes
in the neutron star - crustquakes or "glitches" (Fabian, Icke, and
Frtngle 1976; Pactnl and Ruderman 1974), and phase transitions (Raauaty
et al. 1980).
In Woosley's (1982) y-ray burst model II (see chapter I, section
• C.ii), detonation of a 1 ka radius helium lake (1022 _n) on a neutron
stac euagnettc polar cap, produces theoretical bursts with characteristic
energies, rise times, and durations comparable to those of the observed
spike-like bursts. A strong magnetic field of _ few x 1012 G is
required to channel the accretl_ auatertal onto the small polar region
where stable hydrogen burning via the CNO-cycle eventually builds to a
critical helium euass. Ventura (1982) concluded that the required
temperature for the CNO-medlated burning is not achieved _hen cooling
through the body of the neutron star and the effects of magnetic opacity
are included in the calculations. Rowever, the deciding factor which
appears to exclude this model as the explanation for the observed spike-
like bursts Is the uodel's repetition rate, 240 yr. This is clearly too
long to explain the bursts which come from the two established repeating
sources.
Models invoking neutron star - asteroid collisions (Colgate a,
Petschek 1981) predict spike-like bursts but with vecy low repetition
rates. Even wtt_ an increased cross-section due to magnetic drag, Van t
Buren (1981) estluuates such encounters would occur every _ 106 yr per
neutron star, still inadequate to account for the repect_ng spike-like
bursts. If the burst distribution is limited to the galactic disk, with
neut.'on star density of 0.03 pc -3 (Lamb, Lamb, and Pines 1973), within
1983022079-231
OF PO0_ QUALITY 211
a •phere of r•dlus 400 pc, only about 8 events per year would be
generated.
b. 8odelm Involving Neutron-Star Glitches
It is possible that structural changes in neutron stars produce
y-ray burst,. According to pulsar Rodels (_anchester and Taylor 1977),
"a• radiation processes extract rotational energy from the star, the
decrease In centrifugal force results in a building up of sires• in the
solid cru•t. Perlcdlcally_ the stress exceeds the strength of the
crust, the stellar oblateness decreases, the moment of inertia (I)
decreases as the crust suddenly adJu,ts - a •carquake and a "glitch"
occur. Since the magnetic field Is anchored In the crust, the quake
perturbs the nuagneto•phere near the surface, inducing large electric
fields capable of accelerating particles to relativistic energies and
producing a y-ray burst.
Alternatively, the sudden expulsion of plasma from the
ugnetosphere and contraction of re_alnlng plain in reaction ray torque
the neutron scar to produce a glitch (Ruder_an 1972).
I Glitches are inferred from pulsar period discontinuities which have
:i been observed co recur on tlme scales of • few years in the Crab pulsar
(6 - A_/_ - AI/I _ 10 -8 ) and the Vela pulsar (6 _ 10-6). Smaller
glitches with 6 _ I0 -I0 have been observed In other pulsars (Manchester
and Taylor 1974). t
For a glitch resulting from crustal adjustment with 6 - 10 "10,
Paclnl and Ruder_n (1974) estimate a lower limit to the total energy
released to be 6(B_/41)(4w/])r_ ) 10 ]4 ergs, where BO Is the surface
magnetic field and rO is the neutron star radius. For a magnetospheric
A
1983022079-232
ORIGINAL PAG_ |_,, OF POOR QUALITY-' 212
2 2 is the rotations]glitch, the energy releese is _ 8Hr_ro t , where _rot
angular velocity. In the latter case for 8 _ 10-10 , r 0 - 10 km, N = 1
_; No, and Prot = 6 s, thlD avallable energy is 4 x 1035 ergs. To acco,Jnt
for the small splke-llke bursts ( - 10 -7 erg ca-2), If IZ of thls enlrgy
:i Is radlated as y-rays, the required distances of the sources would be
30 pc. Wlth a space density for neutron stars of _ 0.03 pc -3 (Lamb et
".al. 1973), only a smum11portion of - 103 old neutron stars in the solar
neighborhood would be requtrs_ to generate the observed spike-like
bursts. To match the observed burst frequency, uost of these are
normally qulet. A repetlt_on interval of days to _ 1 - 2 months may
conceivably obtain for sources only during partlcular epochs. The
increasing Intervals between bursts for these sovrces may be naturally
explained by a relaxation mechsnln In which burst intervals are
approximately proportlonal to resldual crustal stress.
y-ray bursts were not observed at the times of major 811tches in
the Vela and Crab pulsars, although burst sensors were operating at the
tl_e of two of these events (Brecher 1982). At the distances of the
Crab (2 kpc, _ - 10-8 ) and Vela (0.5 kpc, 6 - !0-6), the _urste should
have been de;scrod If the total glltch energy (see below) were converted
Into y-rays and radiated lee roplcally. Rowever, they need not have
been detected If they were beamed or represent _ IZ of the total energy.
In the case of the 5 K_ 79 source, if the source Is In the LNC,
the superburst may have had a more catastrophlc origin. Ramaty st al.
(1980) suggest an Internal phase transition and the resultlng releame of
gravltatlonal energy as the cause of the 5 _ 79 event. In thls model
i he energy Is transported to the surface by vtbrstlon_ of the neutron
t star which are damped by quadrupola gravitational radiation (DetweilerI
1983022079-233
ORIGINAL PAC_ ;SOF POOR QUALITY 213
1978) in _ 0.15 s, in agreement with the duration of the intense
spike. The energy source of the oscillating decay phase say be radial
vibrations which are damped by the _- process (Langer and Camelon 1969)
on a time scale of _ 50 s. Since the bulk of the energy was delivered
in the spike rat_er than the decay phase, the nonradlal modes are
required to be preferrentially excited, presumably by an asymmetric
. event. The smaller (down by factors of 10-2 to 10 -3 ) follow-up bursts
would be reorderlngs of the star as the mass distribution seeks
equillbrtua.
B. Classical Bursts
The collective evidence suggests that the sources of classical
y-ray bursts are also neutron stars. _owever, the burst durations of
several to 10"s of seconds, complex temporal profiles, characteristic
energies of a few x 100 keY, and repetition on time eca_e| > 1 yr
indicate that classical bursts are generated by a mechanism dlsttnct
i from that which produces splke-llke bursts.i
i. Implications of Temporal Characteristics
a. Temporal Structure
The fast rise times and widths of substructure in pulses (Table
i 1.1) imply formation in sources with radius less than a few x lC 1 km.
i The burst rime scales are much shorter than those for most solar flares
-_I and the implied burst energies, if observed burst sources are _ few xP
• I00 pc distant, are _ lO I0 larger than solar flare energies (Ruderman
I_75).
1983022079-234
ORIGINAL F: _..
OF POOR _U;,L:,214
The high energy densities deduced from such large luminosities and
short tlue scales may require %ntense gravltatlonal end/or s_,_netlc
fields. These considerations point to compact objects as the burst
sources.
Burst durations of several seconds end multiple pulses appear to
require a process unllke the "one-shot" mechanism operating In spike-
"llke bursts.
b. Periodicity and Burst Source Objects
The case for periodicity in classical burst temporal profiles Is
not clearly establlshed. Several bursts have been shown to exhibit
quasl-perlodic, or possibly periodic, structure for the range of periods
searched, 0.I to 4.0 s (Loznlkov and Kuznetsov 1983). Hany bursts iF
the KONUScatalog exhibit quasl-periodlc structur_ on a tie scale of _
5 to 15 s.
True periodic b_navlor due to • rotating source =By be cemou'laged
by spetleA fllckerings. Alternat¢vely, quasi-perlodlcity =By reflect
character•silt time scales of fundamental processes in bursts. A ch_rd
posslbiltty is chat random distribution of pulses could account for the
appearance of periodicity, given the small percentage (I to 3 %) of
bursts displaying convincing or even suggestive periodic structure.
A few classical bursts have been observed In vhich strictly
periodic structure is dlscernable: 29 OCT 77, 4.2 s period (Wood et el.
1981); 13 JAN 79, 5.5 s period, although twt claimed by the authors
(Hazers st el. 1981a, see •l_o Figure 1.3); and three ISEK-3 evsnt¢ _Ith
suggestive periodic intervals of 9.9 s, 16.7 s, end 18.0 s (ch_ce=
ZV). Only two to six apparent periods ere present in any o_ these
1983022079-235
:I ...... J
Oi- J"O"d_ Q,:V_Li]Y215
bursts. The only Irrefutable evldence of strlctly per'.odlc behavior is
"I for the spike-like burxt of 5 MAR 79 (> 22 cycles, 8 s period).
: The time scale for the observed quasl-perlodlc and periodic
structure in _-ray bursts Is comparable to the rotation pericds (_ 5 s)
of extinct pulsars. That periodic structure is rare in bursts may be
accounted for by burst durations and old neutron star rotationl
periods. The convolution of the burst duration distribution and
:[ rotation period dlstril_ution yields a small percentage ( _ 1 to 3 Z) _f
| observable periods, according to Wood etal. (1981). In their analysis,i
i they used the distribution of rotation periods among X-ray binary
pulsars; however the distribution (unknown) of old neutron stars
probably would give a similar result.
For completeness consider the most likely alternative, namely that
very young neutron stars are the burst sources. Recently formed neutron
stars ma, be more "glitch"- or quake- active (Brecher 1982). If this is
the case and glitches do produce bursts, young neutron stars vould be
better but'at candidates than old ones. In Brecher's scenario then, the
rotational periods are few x IO me (e.g., the 22 ms suggestive periodic
structure in the initial spike of the 5 MAR 79 event, Barat et al.
1983b), and the free precessional periods ar_ _ 10 s.
The precessional angular velocity fl is determined by theP
rotational angular velocity _3 ' and the principle moments of inertia,
13 and I l - 12,
2T.3 - l_. 15 _3
s_ _ _ - __ - c_3 (6.1)p I L 3 tonGO 3
where c is the stellar obtateuesa (Manchester and Taylor 1977). For a
i
1983022079-236
C_:C'IJ\L :
OF POOR _,. "t:,216 _,
star with a fast spinning ( _ 33 ms), solid core (low mass, M _ 3.5
,_o), ¢ is _ 3 x lO-4. If solld core neutron stars retain their
/_ )2 ,oblateness at bl h, then ¢ is increased by the factoc (Uinlt pres
and may be as high as 10-3 for the Crab pulsar (Baym and Pines 1971). A
pcecessional period of _ ii0 s or 33 s is expected for the second
fastest pulsar (the Crab, M " 0.5 Ms) if ¢ _ 3 x 10⁻⁴ or lO-3,
-3respectively. Since the precessional period decreases as u3 , neutron
stars with Prot _ 15 as would have Pprec _ I0 s, comparable to the
observed several-secor.d apparent periodicities in 3-ray bursts. [For a
liquid core (high ma,ss M _ I Mo) star, ¢ is a factor 10-2 to 10-3
smaller than for a low mass star (Pines, Shaham, and Ru3erman 1972).]
i llowever, several lines of observational evidence are inconsistent
with _-ray _.=rsts from radio pulsars. First, precesslonal periods in
pulsars have been searched for but not found (for example, Groth
'.975). The newly discovered 1.6 ms rulsar offers the best promise of
detecting a short precessional period (Pprec should be _ O.Ol s); none
I has been reported yet (Backer et al. 1982). The forces which tend to
change the relative alignment of rotational, symmetry, and magnetic axe._
are not well understood (Goldreich 1970; _anchester and Taylor lq77');
t
perhaps alignment is attained shortly after formation. Second, withinI
the handful of arcmin-sized y-ray burst error boxes, no pulsars are
found, vulsars have been detected out ro several kpc, whereas _he
_tnearly isotropic distribution of observed bursts indicates the burst
sources are probably located within the galactic disk. Third, -- few x
lO ms periodicities have not been reported in bursts except for the 5
MAR 79 burst.
I
1983022079-237
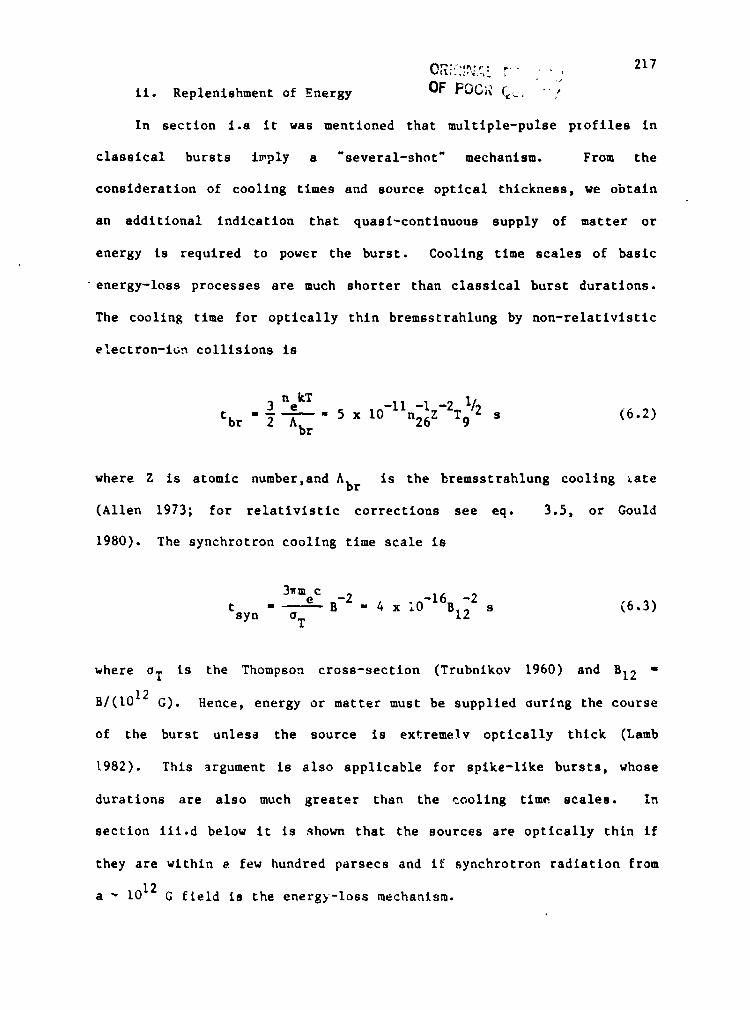
217
ii. Replenishment of Energy OF FOG_ _.. ',
t In section i.a it was mentioned that multlple-pulse pzofiles in
: classical bursts i_ply a "several-shot" mechanism. From the
consideration of cooling times and source optical thickness, we obtain
an additional indication that quasi-continuous supply of matter or
energy ts required to power the burst. Cooling time scales of basic
"energy-loss processes are much shorter than classical burst durations.
" The cooling time for optically thin bremsstrahlun 8 by non-relativlstic
electron-ion collisions is
3 n kT -11 -1 -2 1/2
tbr = 2 Abre = 5 x 10 n26Z T 9 s (6.2)
where Z is atomic number,and Abr is the bremsstrahlung cooling _ate
(Allen 1973; for relativistic corrections see eq. 3.5, or Gould
1980). The synchrotron cooling time scale is
3winc
=_e B-2 - 4 x 10-1681; 2 s (6.3)tsyn oT
where oT is the Thompson cross-sectlon (Trubnikov 1960) and BI2 -
B/(t012 G). Hence, energy or matter must be supplied aurlng the course
of the burst unless the source is extremely optically thick (Lamb
1982). This argument is also applicable for spike-llke bursts, whose
durations are also much greater than the cooling time scales. In
section iii.d below it is shown that the sources are optically thin if
they are within a few hundred parsecs and if synchrotron radiation from
a _ 1012G field is the energy-loss mechanism.
J
1983022079-238
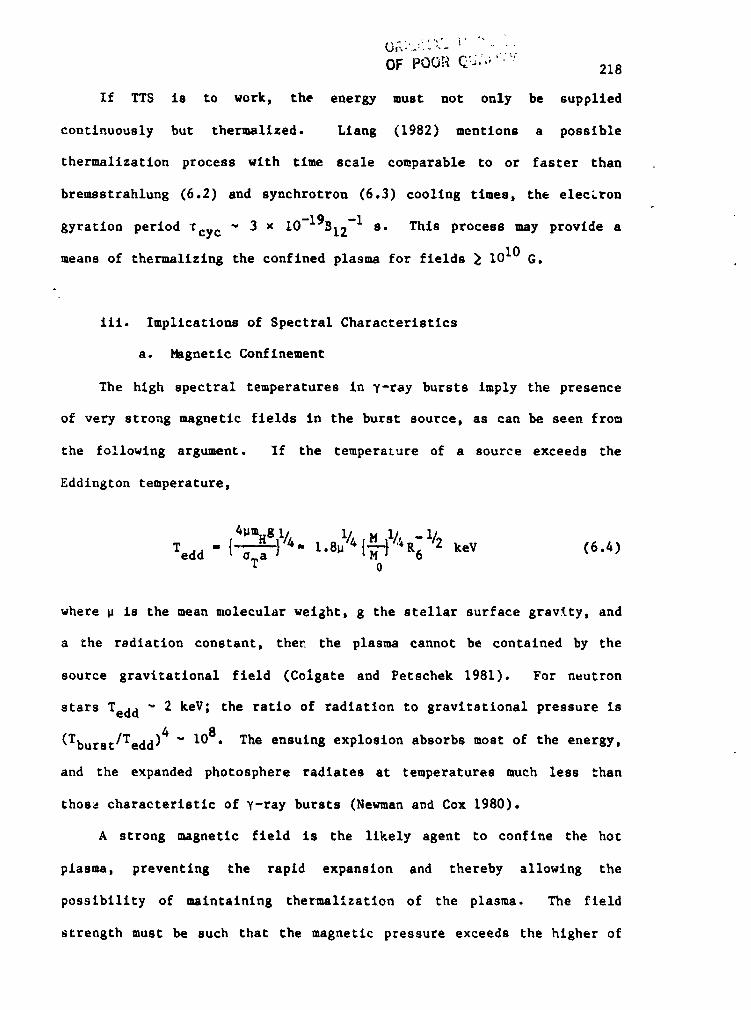
OF POOR _:_.%_""'_ 218
If TTS is to work, the energy must not only be supplied
continuously but thermallzed. Llang (1982) mentions a possible
thermalizatlon process with time scale comparable to or faster than
bremsstrahlung (6.2) and synchrotron (6.3) cooling times, the elecLron
10-19B12 ' ._gyration period Tcy c _ 3 x -i s. This process may provide a
means of thermalizing the confined plasma for fields _ I0I0 G.
iii. Implications of Spectral Characteristics
a. Fagnetic Confinement
The high spectral temperatures in _-ray bursts imply the presence
of very strong magnetic fields in the burst source, as can be seen from
the following argument. If the temperature of a source exceeds the
Eddington temperature,
where _ is the mean molecular wel_ht, g the stellar surface gravity, and
a the radiation constant, thec the plasma cannot be contained by the
source gravitational field (Colgate and Petschek 1981). For neutron
stars Ted d _ 2 keV; the ratio of radiation to gravitational pressure is
(Tburst/Tedd)4 - 108 . The ensuing explosion absorbs most of the energy,
and the expanded photosphere radiates at temperatures much less _han
thos_ characteristic of _-ray bursts (Newman add Cox 1980)o ,_
A strong magnetic field Is the likely agent to confine the hot
plasma, preventing the rapid expansion and thereby allowing the
possibility of maintaining thermalization of the plasma. The field
strength must be such that the magnetic pressure exceeds the higher of
_L
1983022079-239
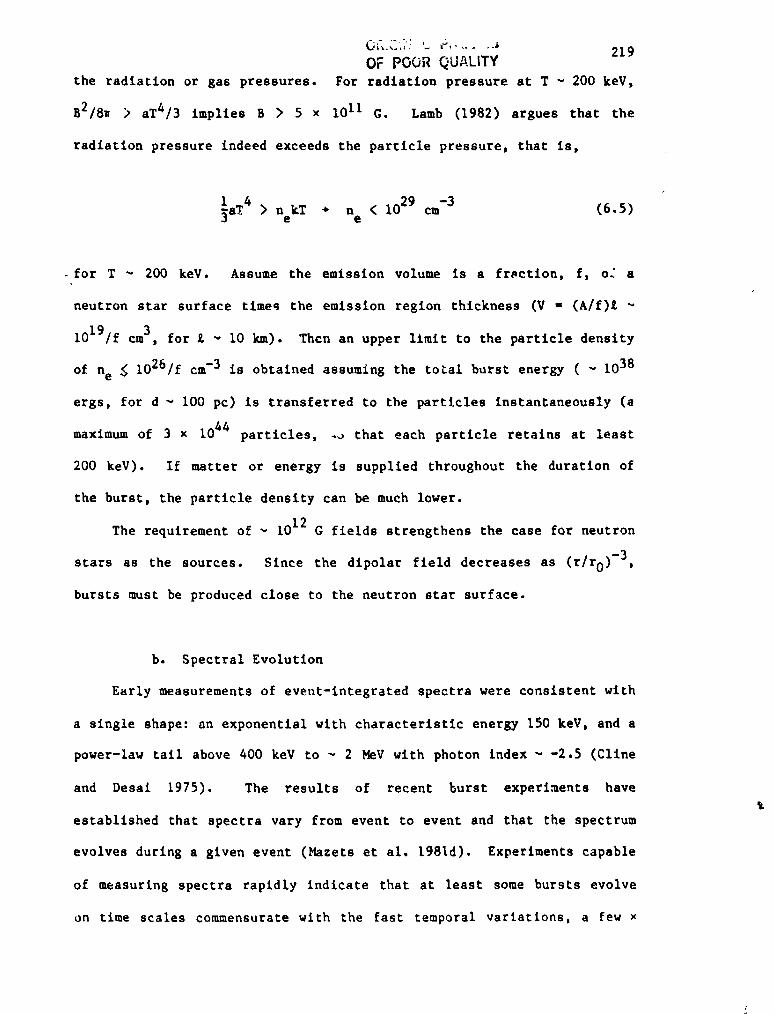
.4
219: OF POOR QUALITY -.
the radiation or gas pressures, For radiation pressure at T _ 200 keV, _T
= B2/8_ > aT4/3 implies B > 5 x I0II G. Lamb (1982) argues that the
radiation pressure indeed exceeds the particle pressure, that is,
1 4_aT > n kT + n < 1029
_3
: cm (6.5)• " ..,I e e
t
for T _ 200 keY. Assume the emission volume is a fr_ctlon, f, of a
neutron star surface times the emission region thickness (V = (A/f)_
1019/f cm3, for £ _ I0 km). Thcn an upper limit to the particle density
of ne _ 1026/f cm-3 is obtained assuming the total burst energy ( - 1038
ergs, for d _ I00 pc) is transferred to the particles Instantaneously (a
maximum of 3 x 1044 particles, .o that each particle retains at least
200 keY). If matter or energy is supplied throughout the duration of
the burst, the particle density can be much lower.
The requirement of _ 1012 G fields strengthens the case for neutron
stars as the sources. Since the dipolar field decreases as (r/to)-3,
bursts must be produced close to the neutron star surface.
b. Spectral Evolution
Early measurements of event-integrated spectra were consistent with
a single shape: an exponential with characteristic energy 150 keV, and a
power-law tail above 400 keV to _ 2 MeV with photon index _ -2.5 (Cllne
and Desal 1975). The results of recent burst experiments have
established that spectra vary from event to event and that the spectrum
evolves during a given event (Mazets et al. 1981d). Experiments capable
of measuring spectra rapidly indicate that at least some bursts evolve
on time scales commensurate with the fast temporal variations, a few x
1983022079-240
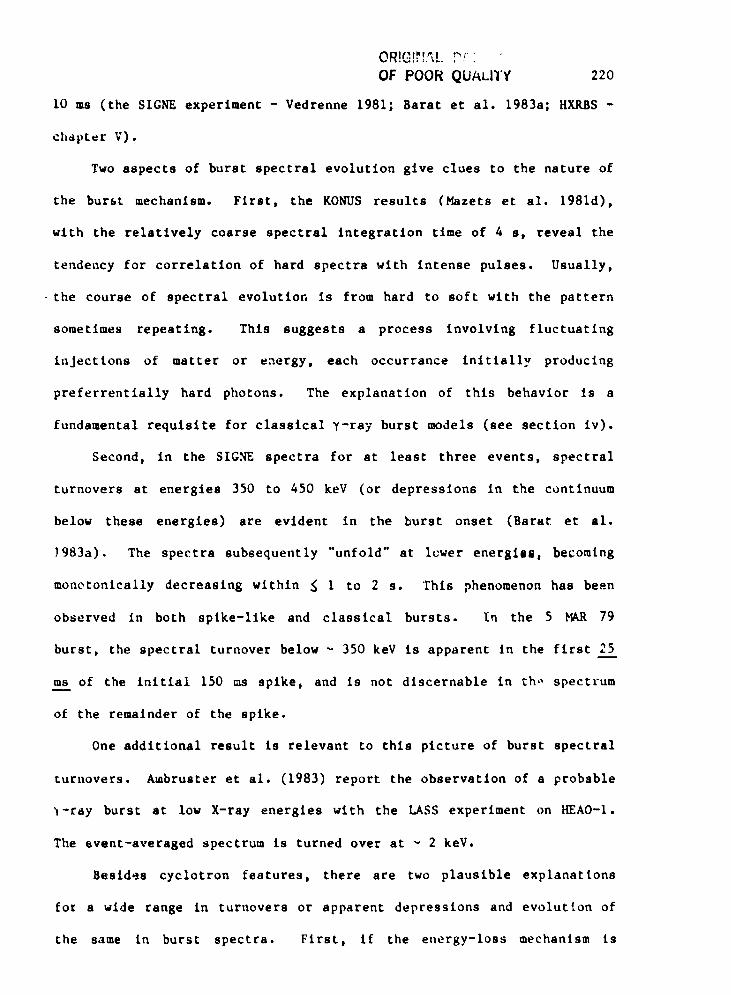
OR!G!_!AL ?/:OF POOR QUALITY 220
10 ms (the SIGNE experiment - Vedrenne 1981; Barat et al. 1983a; HXRBS -
chapter V).
Two aspects of burst spectral evolution give clues to the nature of
the burst mechanism. First, the KO_JS results (Mazets et al. 1981d),
with the relatively coarse spectral integration time of 4 s, reveal the
tendency for correlation of hard spectra with Intense pulses. Usually,
the course of spectral evolution is from hard to soft with the pattern
sometimes repeating. This suggests a process involving fluctuating
injections of matter or energy, each occurrance Initially producing
preferrentially hard photons. The explanation of this behavior is a
fundamental requisite for classical T-ray burst models (see section iv).
Second, In the SIG._ spectra for at least three events, spectral
turnovers at energies 350 to 450 keY (or depressions in the continuum
below these energies) are evident in the burst onset (Barat et al.
J983a). The spectra subsequently "unfold" at lewer energies, becoming
monotonically decreasing within _ 1 to 2 s. This phenomenon has been
observed In both spike-like and classical bursts. In the 5 MAR 79
burst, the spectral turnover below _ 350 keV is apparent in the first 25
ms of the initial 150 ms spike, and is not dtscernable in th_ spectrum
of the remainder of the spike.
One additional result Is relevant to this picture of burst spectral
turnovers. Ambruster et al. (1983) report the observation of a probable t
_-ray burst at low X-ray energies with the LASS experiment on HEAO-1.
The event-averaged spectrum is turned over at _ 2 keY.
besides cyclotron features, there are two plausible explanations
foz a wide range in turnovers or apparent depressions and evolution of
the same In burst spectra. First, If the energy-loss mechanism is
i
1983022079-241
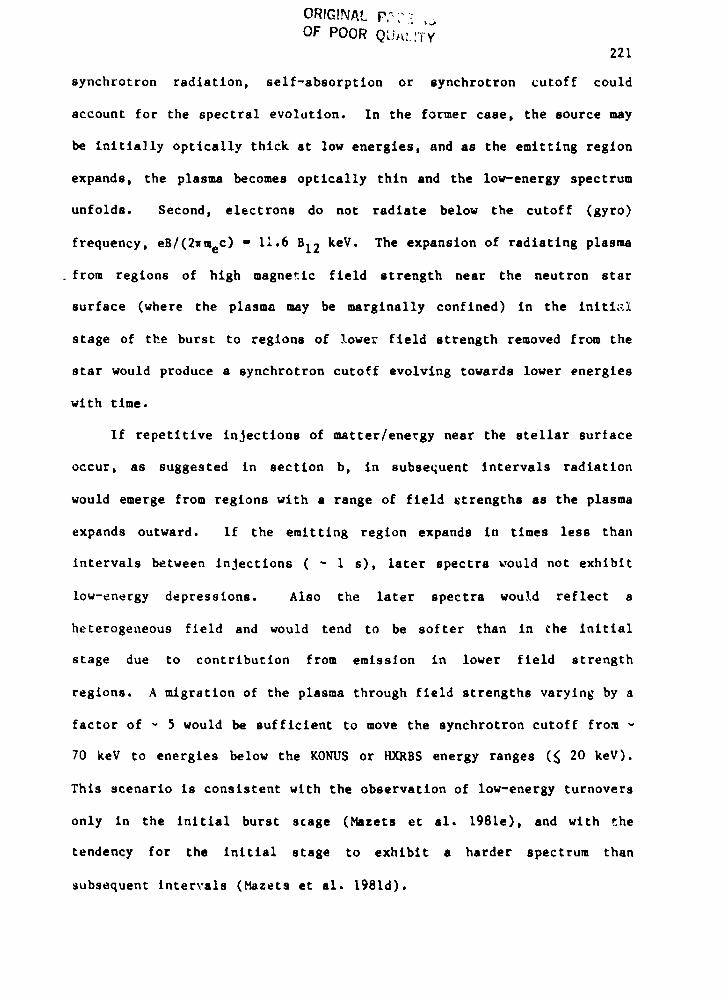
ORIGINAL p# _"i_ ,_OF POOR QU_t. ITY
221¢
synchrotron radiation, self-absorption or synchrotron cutoff could
account for the spectral evoletton. In the former case, the source may
be initta]ly optically thick at low energies, and as the emitting region
expands, the plasma becomes optically thin and the lo_-energy spectrum
unfolds. Second, electrons do not radiate below the cutoff (gyro)
frequency, eS/(21meC) = 11.6 B12 keV. The expansion of radiating plasma
from regions of high magnetic field strength near the neutron star
surface (where the plasm_ may be marginally confined) in the initial
stage of the burst to regions of lower field strength removed from the
! star would produce a synchrotron cutoff evolving towards lower energies
with time.
If repetitive injections of matter/energy near the stellar surface
i occur, as suggested in section b, in subsequent intervals radiation
i would emerge from regions with a range of field _trengths as the plasmaE
expands outward. If the emitting region expands in times less than
intervals between injections ( _ I s), later spectra _ould not exhibit
low-energy depressions. Also the later spectra would reflect a
heterogeneous field and would tend to be softer than in the initial
stage due to contribution from emission in lower fleld strength
regions. A migration of the plasma through field strengths varying by a
factor of _ 5 would be sufficient to move the synchrotron cutoff from
70 keV to energies below the KONUS or HXRBS energy ranges (_ 20 keV).
This scenario is consistent with the observation of low-energy turnovers
only in the initial burst stage (Mazets et al. 1981e), and with the
tendency for the initial stage to exhibit a harder spectrum than
subsequent intervals (Mazets et sl. t981d).
id,
1983022079-242
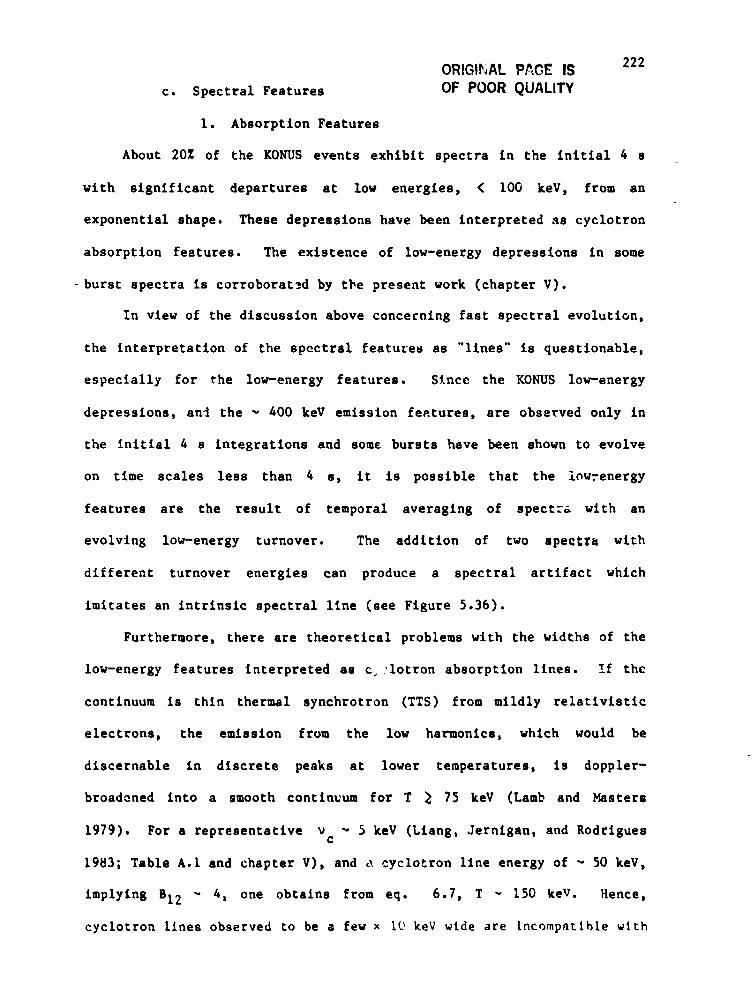
ORIGIhAL PACE IS 222
: c. Spectral Features OF POOR QUALITY
I. Absorption Features
About 20Z of the KONUS events exhibit spectra in the initial 4 s
with significant departures at low energles, < i00 keVD from an
, exponentlal shape. These depressions have been interpreted as cyclotron
absorption features. The existence of low-energy depressions In some
-burst spectra is corroborated by the present work (chapter V).
In view of the discussion above concecnlng fast spectral evolution,
the Interpretation of the spectral features as "lines" is questionable,
especially for the low-energy features. Since the KONUS low-energy
depressions, and the _ 400 keV emission features, are observed only in
the initial 4 s integrations and some bursts have been shown to evolve
on tlme scales less than 4 s, It Is possible that the iowrenergy
features are the result of temporal averaging of spect:_ with an
evolving low-energy turnover. The addition of two spectra with
different turnover energies can produce a spectral artifact which
imitates an intrinsic spectral llne (see Figure 5.36).
Furthermore, there are theoretical problems wlth the widths of the
low-energy features Interpreted as c_lotron absorption llnes. _f the
continuum is thin thermal synchrotron (TTS) from mlldly relativistic
electronsp the emission from the low harmonlcsj which would be
dlscernable in discrete peaks at lower temperaturesD Is doppler-
broadoned into a smooth continuum for T _ 75 keV (Lamb and Hasters
1979). For a representatlve v _ _ keV (Llang, Jernlgan, and godrlguesc
1983; Table A.I and chapter V)D and _ cyclotron llne energy of _ 50 keV_r
implying BI2 _ 4, one obtains Erom eq. 6.7, T _ 150 keY. Rence,
cyclotron llnes observed to be a few x 1_ keV wide are incompatible with
1983022079-243
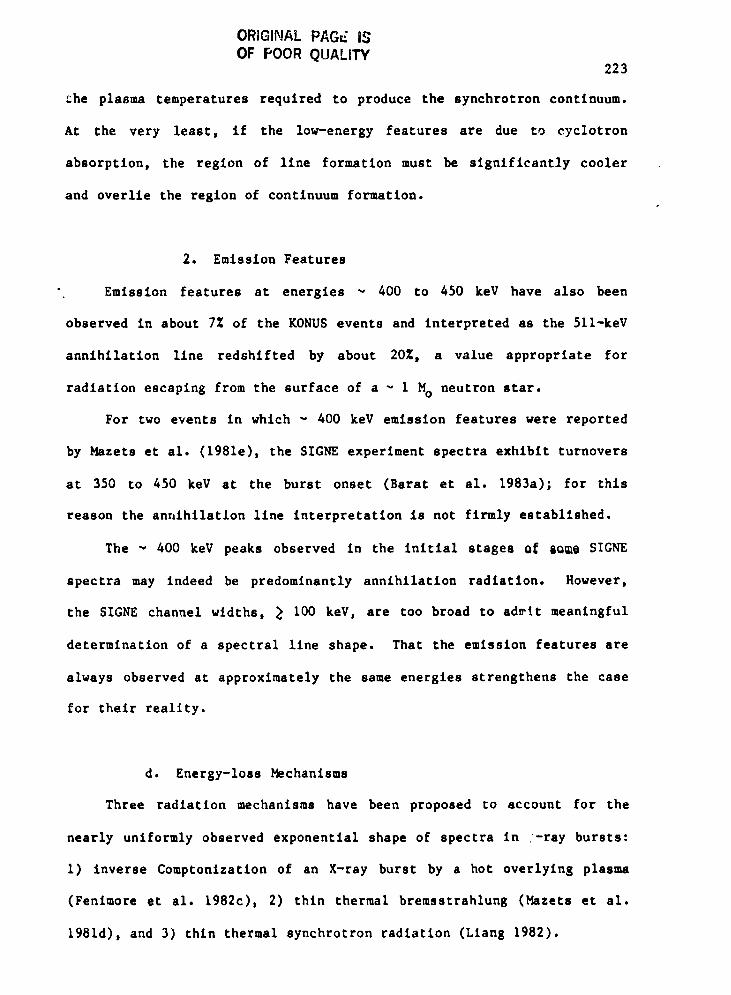
ORIGINAL PAGE iSOF POOR QUALITY
223
_he plasma temperatures required to produce the synchrotron continuum.
At the very least, if the low-energy features are due to cyclotron
absorption, the region of llne formation must be significantly cooler
and overlie the region of continuum formation.
2. Emission Features
Emission features at energies _ 400 to 450 key have also been
observed in about 7% of the KONUS events and interpreted as the 511-keV
annihilation llne redshlfted by about 20Z, a value appropriate for
radiation escaping from the surface of a _ I Mo neutron star.
For two events in which _ 400 keV emission features were reported
by Mazets et al. (1981e), the SIGNE experiment spectra exhibit turnovers
at 350 to 450 keV at the burst onset (Barat et al. 1983a); for this
reason the annlhilatlon llne interpretation is not firmly established.
The _ 400 keY peaks observed in the Inltial stages Of 80_e SIGNE
spectra may indeed be predominantly annihilation radiation. However,
the SIGNE channel widths, _ 100 keV, are too broad to admit meanlngful
determination of a spectral llne shape. That the emission features are
always observed ac approximately the same energies strengthens the case
for their reality.
d. Energy-loss Mechanisms%
Three radiation mechanisms have been proposed to account for the
nearly uniformly observed exponentlal shape of spectra in -ray bursts:
I) inverse Comptonlzation of an X-ray burst by a hot overlying plasma
(Fenlmore et al. 1982c), 2) thin thermal bremsstrahlung (Mazets et al.
1981d), and 3) thin thermal synchrotron radiation (Liang 1982).
1983022079-244
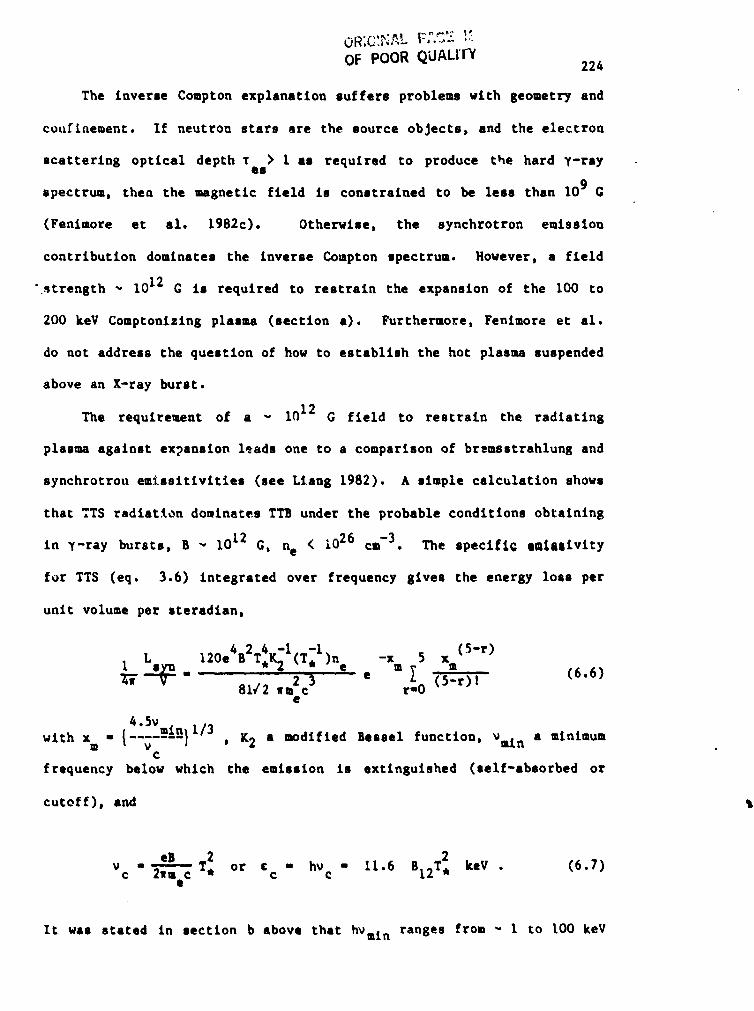
OR;G'.P_L F,. .....
OF POOR QUALITY 224
The inverse Compton explanation suffers problems with geometry and
couftnement. If neutron stars are the source objects, and the electron
scattering optical depth T > I am required to produce the hard y-rayas
spectrum, then the magnetic fleld is constrained to be less than 109 G
(Fenlmore et al. 1982c). Otherwise, the synchrotron emission
contribution dominates the inverse Compton spectrum. However, a fleld
"strength _ 1012 G is required to restrain the expansion of the 100 to
200 key Comptonlzlng plasma (section a). Furthermore, Fenlmore et al.
do sot address the question of how to establlsh the hot plasma suspended
above an X-ray burst.
The requirement of a - 1012 G field to restrain the radlatln8
plasma asalnst expansion leads one to a comparison of br_msstrahlun8 and
synchrotrou emlssltivlties (see Liang 1982). A simple calculation shows
that TTS radiation dominates TTB under the probable conditions obtaining
in y-ray bursts, 8 _ 1012 G, n e < i026 cm -3. The speclftc lala|Ivlty
for TTS (eq. 3.6) tntesrated over frequency $1ves the energy loss per
unlt volume per steradlan,
L 120e4B2T4,I_l(T;l)ne -x 5 x (5-r)m m
-_" 81/2 wm c r-O2 3 • Z (6.6).... (-5-r)le
wlth x - {4"Sv"(n} I/3m v , K2 a modified Bessel function, va.tn a minimumC
frequency below which the emission is extinguished (self-absorbed or
cutoff), and t
vc eB 2 2" 2wm c T, or ¢c " hvc - 11.6 B12T , keV . (6.7)e
It was stated in section b above that hvmt n ranges from - 1 to 100 keV
1983022079-245
(
II
ORICq_'q,...P";J_ iS "
OF POORQIJALJTy 225 I
in scme bursts. However, after the onset of the bursts wlth evidence of
low-energy turnovers, and for the majority of bursts, the spectra
continue smoothly down to the lowest detector channel (Hazers et el.
1981e), and therefore hVml n _ 20 keV. Regardless, since x_ a Vmln 1/3,
over the probable energy range of Vmln, the product of the exponentlal
and summation in (6.6) is of order unity. Then (6.6) may be written
B 2 4K-I -lv (T: l) erg s . (6.8)Lsy. 10lOne 12 T* 2
The TTB luminosity Is given by Gould (1980). The ratio of synchrotron
to bremsstrahlun8 luminosity is
L--= .^31 -1 2 3/2 -1ts 6 x xu ne BI2T , K2 (T.I). (6.9)
Lib
Assuming T _ 300 keY, BI2 _ I, synchrotron dominates bremsstrahlung for
ne _ 3 x 1031 cm-3. This condition would clearly be fulfilled even If
the burst energy were deposited instantaneously rather than continuously
durln8 the burst (cf., section lll.a).
Therefore, in the following discussion thermal synchrotron is
assumed to be the energy-loss process. Also, the source objects are
assumed to be • subset of old neutron stars which retain magnetic fields
lO 12 G. This argument parallels that of Liens (1982) with the
alteration that the source objects are assumed to be within the galactic
disk, rather than in the galactic halo. The galactic disk hypothesis Is
more consistent wlth the observed, nearly isotroplc distribution of
bursts end especially the lack of a galactic center/enclcenter bias.
From the burst luminosities implied by a dlsk source distribution, It is
1983022079-246
OF POOR QUALITY226
shown below that the low-energy turnovers or depressions observed In
some bursts are probebly not due to self-•bsorptlon, • po4slblllty
suggested by Liang, Instead, since the _ources wouZd be optlcally thin
if loc_ted vlchln a few hundred parsecs, the remaining natural and
consistent explanatlon is the 1o_r-energy cutnff in the synchrotron
spectrum.
The optical depth for synchrotron self-absorptlon is
_2t
Tsyn(_)= a_t- -P--_c _ ta(_) (6.10)g m
where a is the absorption coefficient, _ is the emission region
thickness, _ is the electron plasma frequency end _ = 2wv , vg =P g g
electron gyrofrequency. The summation Is over the contrlbutlon_ from
the m h•rmonlcs. The sp_clflc emi:_slvlty is
2
.1_,(_).. {_} l_°2k'-'-E-T_,s,32, Xm*m(_') (6._)
for a uniform magnetic field (Bekefl 1966). Combining these two
equations ylelds an expression in terms of the turnover frequency due to
self-absorptlon, Vmln, belou whlch the source _s optlcally thick,
8w3c2t Jw 2t
Xsyn w _, inT, mln
where •gain. T, = kTe/mec 2. Upon substituting for the Ipeciflc
emissivity J_ (3.6) and rearranging, one obtains the condition for an
optlcally thin source.
A
1983022079-247
OR;GINAL P_GE IS
OF POOR QUALITY 227 i!X
3,/2aeVmtnT, e m K2(T;1)ne£ _ 2
2_e (6.13)x
1.9 x lO19Vmin(keV)T,12(T,1 ) • a ca-2 .
Combining this with the expression for the synchrotron luminosity (6.8)
yields the luminosity given an observed self-absorptlon turnover at
- VNI n ,
5 X ('5-r)
Lthin _ 2 x 1029A B12Vain(keV ) T5 _ aTTTrr=O (6.14)
t037A(k 2) 2c xm -I" 1.4 x Vmin(keV ) v (keY) T, • erg s .
We may argue that _he source Is optically thin if Lob s is less than
eq. 6.14. The parameter values in thla expression will be estimated
conservatively to give a low but realistlc value for Lthin. Aasuae A =
i km2, an area comparable to the size of a neutron star's =assert ¢ polar
cap. Since the depressions are observed only in sol bursts In the
initial stage (Nazets et al. 1981e), estimate vat n to be below the
low, st detector channel, _ 25 key (KONUS, HXRBS). Then for some bursts
1 keY _ v t n < 10 keY and 1 _< xa_< 2 . Choosing a representative
value for v c of _ 5 key one finds T, _ .66 for BI2 _ 1. UsIn 8 these
values, the burst source is optically thin if Lob s _ 6 x 1038 to 1040
t -1er_ s .
Now estimate the observed luminosity liberally, the only assumption
being a galactic disk burst population. For a bright burst with average
flux F _ 3 x 10⁻⁵ erg ca-2s "1, burst duration _ 10 s, the fluence 18 _ 3
x l0 -4 erg ca -2, placing it at the upper end of the lOE(N>S) - log(S)
o(H/pc 3 -(Z/Zo )m ;curve. For _OIL galactic populations ) • Ooexp{ }
i
1983022079-248
ORIGINAL PP,GE iSOF POOR QUALITY 228
with l._ < m < 1.7 (Guiber. +, Lequeux, and Viallefond 1978). For radio
pulsars ¢0 is 230 pc (Manchester and Taylor 1977) or 380 pc (Gailly
Lequeux, and Masnou 1978). For this nalculatlon assume d _ 400 pc.
Such a burst woul_ then be at the hlgh end of an intrinsic lumlnosity
distribution. Then
Lobs = Awd2F _ 6 _ 1038 erg s -1 < Lthln , (6.15)
indicating that the sources are optically thin at _ 1 key for galactic4
disk distances end that the turnovers are not due to self-absorption.
For the observed low-energy depressions at _ 70 keV to be due to
synchrotron ,elf-absorption, some sourco= would have to be located at
distances _ 4 kpc (as Liang suggests). This would require old
extinguished pulsars _th velocity components perpendicular to the
galactic plane of 150 km s-1 (Manchester and Taylor 1977) to retaini
1012 G fields for _ 2 x 10⁷ yr, a duration comparable to or greater than
the predicted time scale for decay of the crustal field (Flowers and
Ruder-_an 1977). Furthermore, a galactic center/snticenter _tas should
oe observed if most sour_em were at halo distances.
Assume then, that the burs_ sourcu are located _Ithin a fewI
hundred pc and Lobs _ !.5 x 1038 t:g s"I. From (6.12), using T, _ .66,
B12 _ 1, one finds new _ & x 1028 . The volume of the emitting region
must be some fraction of the neutron star surface times a characteristic
depth. For a plausible lower limit on V (upper limlt on ne) , assume an
area A - I ka2 and a depth t _ & ka. This value for _ alloy for some
expansion of the plasma outward through the dipole field to be
1983022079-249
ORIGINAL F_%GE LSOF POOR QUALITY
229
consistent with the observed varlatlon;3 In the low-energy turnovers.
Then V _ 4 x 1015 cm3 -3, yielding ne _ 1013 cm .
The optical depths for electron scatter_.ng and cyclotron
absorption, assuming £ _ 10 km and n e _ 1013 cm-3 are
-6Tea " ne°-'t1" 7 x I0 .___,(fi.1&_
w2& _/ -3 -i .i/_ 13&(km) 6.17)_cyc" __ m--_c2T*) 2, 5 x I0 BI2T 9 e, (C
where T9 = Te/(109 K) and ne,13 = ne/(lol3 cm-3) (Lamb 1982). For BI2
1 and T, _ .66 (T9 _ 4), Tcy c is _ 2 x 10⁻² • Since u_-'=r the above
assumptions, the source will be optically thin, and the synchrotron
cooling time (eq. 6.3) is very much shorter than burst durations,
e_ergy st matter must be continuously supplied during the burst.
iv. Models for Classical Bursts
Models for classical bursts must differ from splke-llke burstg
!
'_ models in a_ least three aspects: I) event duration _ few x I0 s, 2)
spectral energies _ few x I00 keY, and 3) recurrance times _ 1 yr.
± Also, it appears that a "several-shot" or extcnded process is necessary
to produce multiple pulses (section i.a) and repeating hard-to-soft
spectral evolution (section ill.b) observed in some bursts, %
Asteroid accretion scenarios appear to ue ruled out for classical
bursts on the basis of the insufficient total event rate ( _ 8 yr-l,
section A.lil). Furthermore, the asteroid collision model does not
appear capable of producing an extended duration burst.
1983022079-250
OR!CINAL PAO_ IS _
OF POOR QUALITY
230 ,
A variation on the thermonuclear model (Woosley 1982) appears Lo
account for some of the observed properties of classical bursts. In
1020 1012Woc_ley's Model I, _ gm of accretlng hydrogen, focussed by a _
G field onto the magnetic polar cap of a neutron star, Is steadily
converted to helium via the CRO cycle. Upon accumulation of a critical
mass, the convective deflagration burning of an uneven dlsrrlbuttou of
fuel sites mlght, according to Woosley, reproduce the durations and!
chaotic temporal structure observed In classical bursts. The mode!
predicts a recurrence ra:e _ 0.4 yr, somewhat lower than the (unfJrm)
i lower !im_C t_piied by available observations (KO_S catalog). The
burst generates 1038 ergs In T-rays, which for a source distance of
• --2
, 400 pc, delivers a fiuencc _ 10 -6 erg cm , in agreement with observed
fluences. Bnwever, prellmtnsty calculations indicate =hat the
characteristic photon energies produced _re an order of _agnt_ade lower
than that of classlcal burst energies. Further, the _ck of X-ray
detections again presents a difficulty. For Model I, an accretion cate
of 4 x 10 -13 M° yr -1 is required to sustain the tempersture at which the
CNO-medlated hydrogen burning occurs (see also chaplet I concernla_
viability of tht_ process, or Ventura lq82). For this accretion rate, a
steady-state X-ray source should be visible for a source distance < 500
pc (Ventura 1982), but the lack of detections (Helfand et al. 1980;
Cline 1981; Hurley 1982) for vev_ral burst error boxes requires source
distances > I kpc. For such distances, the model is at odds with the
lack of a galactic center/anticenter bias in _ne (1,b) II distribution.
Fleeting episodes of accretion onto neutron stars (Lamb_ Lamb, and
Pinna 1973) may reproduce the observed properties of classical bursts
and avoid the problem of a steady-state X-ray source. In this scenario,
1983022079-251
ORIG"PUrL I_,I_'" r_
:i OF POOR QUALITY 231
the burst Is powered by Lh_ _ I00_ conversion of gravitational energy?
' into radiation. A flare from a companion star delivers _ 1016 to 1017
gna onto one area of the neutron star. Vari_tlons in flare ejection
;< velocity and geometry may account for the range an classical burst
durations. No specific predictions concerning spectral energies are ,
made by the authors; however with free-fall energies of _ I00 Mev per
nucleon, the necessary energy is available to produce hard burst
spectra. Estimates of the density of neutron stars in binary systems
with companions capable of producing ouc_ flares would require
recurrence intervals _ t6 yr. Since, the companion is quiescent between
flares, no steady-state X-ray source is predicted.
7C. n_ ._-.r. .ions for Future Gala-Ray Burst Investigations
complete understanding of _-ray bursts _walts development of much
more sophisticated and dedicated observational tools. SaCallltes with
the level of integrated experiments comparable to the SSH are necessary
for burst investigations. Efforts in several directions will help to
solve the mysteries of _-ray bursts.
The first priority should b,. to re-establish an interplanetary
network of several burst sensors, such as the one which operated in
1978-79. Detectors with better sensitivity and faster temporal
resolution would produce sub-arcmin-sized source localizations. X-ray
or optical associations would provide conclusive burst source
identifications.
Improved detector systems with wider spectral coverage (_ 1 key to
50 HeV), higher sensitivity, faster spectral l_tegratlon times, and
finer energy resolution are required to obta[_ the necessary quality
ii
"1983022079-252
ORIGINAL PAGE IS; OF POOR QuA[ fTv 232
spectra In order to study burst processes. The information derived from
these experiments should determine the true nature of features observed
In some burst spectra. Perhaps additional discoveries such as narrow
spectral lines will be made.
Continuous surveillance of the 5 M_R 79 source should be
established In the optical, X-ray, and y-ray energy bands to determine!
"I) the event size spectrum from this source, 2) the recurrence
Intervals, and 3) the spectrum over a wlda frequency range.
In the very near future, the reduction of KONUS 13 and 14 data
should provide an Improved picture of the y-ray burst distribution in
galactic latitude and longitude. If a tendency for lower fluence events
at low latitudes emerges, the galactic disk hypothesis will be!
strengthened. With the addition of _ 100 more events by KONUS 13 and
14, perhaps some truely periodic temporal structure in classical bursts j:|
will be seen.
i
tt0
". j
1983022079-253
i_A
Z
}
_, ORIGINAL PAGE ISOF POOR QUALITYAPb_NDIX
Gamma-Ray Burst Information Derived from th? KONUS Catalog
The KONUS catalog (Mazets et al. 1981a; b; c) coutalns the largest
sample of y-ray bursts with spectra and temporal profiles of any
experiment to date. The KONUS experiment, carried on the Venera 11 and
12 spacecraft, recorded bursts from September 1978 to January 1980. The
experiment is described in chapter If.
The peak intensities (cts/ I/4s) and durations of the KONUS bursts
were measured directly from temporal profiles.
The KONUS spectra, including error bars, were digitized using a
Tektronlcs 4081 Graphics Tablet. The digitized errors were increased by
5%. This measure was performed since I) the manual digitization
technique may have produced occassloaal shifts in the apparent values,
and 2) the published graphs were sometimes obvlously distorted by the
reproduction process. An adaptation of the LSPEC spectral fitting
program, described in chapter III, was used to fit the digitized
spectra. The program was modified to circumvent the detector matrix
multiplication since the publlshed spectra were already corrected for
the detector response (Mazets, private comm.).I
! Two spectral models were used to fit the KONUS spectra: i) the sameJ
model employed by Mazets et al. (1981d), = E-lexp(-EIT) , representing a
• tthin thermal bremsstrahlung (TTB) model without a gaunt factor, and 2)
the thin thermal synchrotron (TTS) model described by eq. 3.6. Fitting
deconvolved spectra with a model other than the one used in the actual
deconvolutlon is not a strictly correct procedure. However, the TTS
form does approximate that of the TTB, and therefore 'he detector
1983022079-254
OF POOR QUALITY234
responses to the two models are quantitatively slml]ar. In fact, the
TTS model almost always provided as good or better a fit to th_ data as
did the TTB model. The TTB temperatures derived by this procedure
compared very well with the temperatures published for some KONUS
spectra (Mazets et el. 1981d; 1981e).
In Table A.I spectral fits for the two models (see Figure A.4 for
histogram of ¢c values), the peak intensities, and durations are
assembled. For TTB, the continuum parameter is the temperature, T. For
TTS, this parameter is the critical energy, ¢ . The chisquaredc
parameter and the number of degrees of freedom are also listed for both
model fits. Occasslonally, two events occurred on the same day. The
first event is subscripted .AI, the second .BI . If more :han one 4 s
spectrum was published for an event, each spectrum was fit. For the
third spectrum of the second event on November 4, 1978, the designation
is NVO478.B3. In some spectra there are apparent absorption or emission
features, indicated by a # or *, respectively, following the event
designation. When lines were included in the models, better fits were
obtained for these spectra; the fits with lines are therefure included
in the table. The continuum parameters only are listed (for the line
energies, etc., see Hazets et al. 1981e).
In Table A.2 the short duration bursts (_ I s) detected by KONUS
experiment on Venera II and 12 are listed (extracted from Table A.I).
The spectra of these bursts are usually much softer than the spectra of%
classical y-ray bursts, as can be seen from a comparison of the thermal
bremsstrahlun8 temperatures in Tables A.I and A.2. Table A.3 lists the
events detected by the KONUS experiments on Venera II and 12, and Venera
13 and 14 which have localizations consistent with the 5 MAR 79 source
1983022079-255
I
OR!CI_!AL PAG_ I_OF POOR QUALITY
235
(llazete, private comm.). The events are arranged in groups to suggest a
trend of increasing intervals between events. The Venera i1 and 12
spacecraft ceased recording bursts in January 1980 and the Venera I3 and
14 spacecraft became operatlonal iu November 1981.
The directions of sixty bursts were uniquely trlangulated by the
KONUSexperiment. One-position localizations have been determined for a
-few additional bursts by Strong, Klebesadel, and 01son (1974) and Hurley
(private comm.). These 67 unique localizations are plotted in galactic
coordinates in Figure A.I. R1stogram of the number of positions versus
sin (b II) and t 11 are illustrated in Figures A.2 and A.3, respectively.
1983022079-256
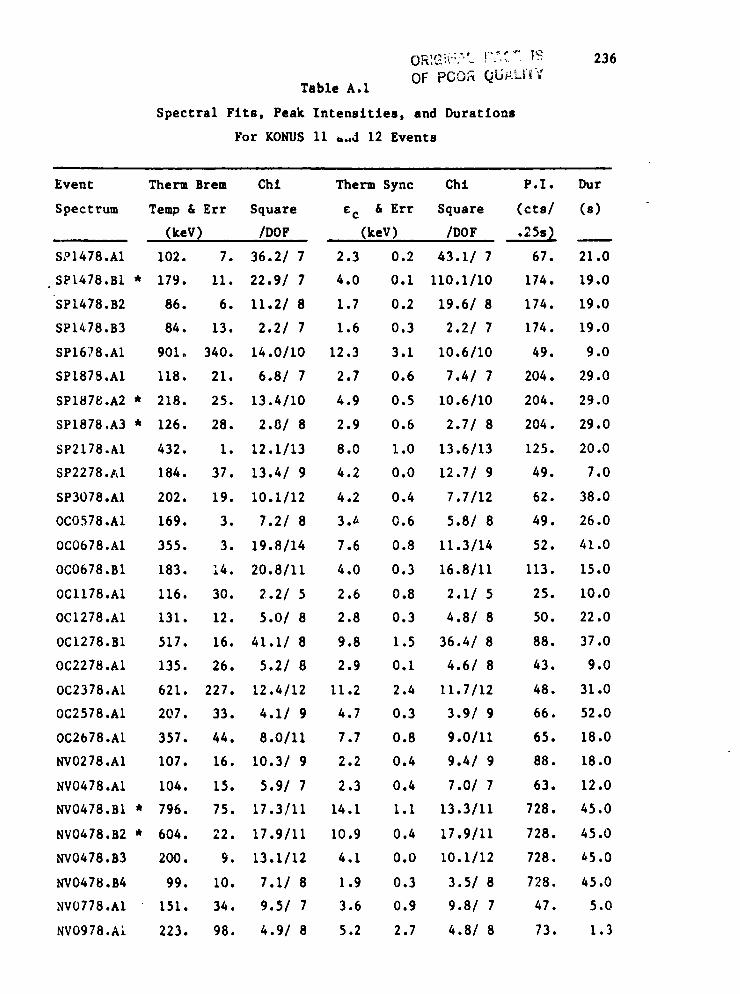
OR',GI{'i;"'..!".',-'.._i_ 236
OF PCO_ QU_L[II",'Table A.1
Spectral Flts, Peak IntensltlesD and Durations
For KONUS 11 _.,d 12 Events
Event Therm Brem Chl Therm Sync Chl P.I. Dur
Spectrum Temp & Err Square ¢c & Err Square (cts/ (s)
(keV_ /DOF (keY) /DOF .25s_ __
S?1478.A1 102. 7. 36.2/ 7 2.3 0.2 43.1/ 7 67. 21.0
5P1478.B1 * 179. 11. 22.9/ 7 4.0 0.1 110.1/10 174. 19.0
SPI478.B2 86. 6. 11.2/ 8 1.7 0.2 19.6/ 8 174. 19.0
SP1478.B3 84. 13. 2.2/ 7 1.6 0.3 2.2/ 7 174. 19.0
SP1678.A1 901. 340. 14.0/10 12.3 3.1 10.6/10 49. 9.0
SP1878.A1 118. 21. 6.8/ 7 2.7 0.6 7.4/ 7 204. 29.0
SP1878.A2 * 218. 25. 13.4/10 4.9 0.5 10.6/10 204. 29.0
SP1878,A3 * 126. 28. 2.8/ 8 2.9 0.6 2.7/ 8 204. 29.0
SP2178.AI 432. I. 12.1/13 8.0 1.0 13.6/13 125. 20.0
SP2278.A1 184. 37. 13.4/ 9 4.2 0.0 12.7/ 9 49. 7.0
SP3078.A1 202. 19. 10.1/12 4.2 0.4 7.7/12 62. 38.0
0C0578.A1 169. 3. 7.2/ 8 3._ 0.6 5.8/ 8 49. 26.0
0C0678.AI 355. 3. 19.8/14 7.6 0.8 11.3/14 52. 41.0
0C0678.BI 183. 14. 20.8/11 4.0 0.3 16.8/ii 113. 15.0
0Cl178.A1 116. 30. 2.2/ 5 2.6 0.8 2.1/ 5 25. 10.0
0C1278.AI 131. 12. 5.0/ 8 2.8 0.3 4.8/ 8 50. 22.0
0C1278.B1 517. 16. 41.1/ 8 9.8 1.5 36.4/ 8 88. 37.0
0C2278.AI 135. 26. 5.2/ 8 2.9 0.I 4.6/ 8 43. 9.0
0C2378.A1 621. 227. 12.4/12 11.2 2.4 11.7/12 48. 31.0
0C2578.A1 207. 33. 4.1/ 9 4.7 0.3 3.9/ 9 66. 52.0
0C2678.A1 357. 44. 8.0/11 7.7 0.8 9.0/11 65. 18.0
NV0278.A1 107. 16. 10.3/ 9 2.2 0.4 9.4/ 9 88. 18.0
NV0478.AI 104. 15. 5.9/ 7 2.3 0.4 7.0/ 7 63. 12.0
NVO478.BI * 796. 75. 17.3/11 14.1 1.1 13.3/11 728. 45.0
NV0478.82 * 604. 22. 17.9/11 10.9 0.4 17.9/II 728. 45.0
NV0478.83 200. 9. 13.1/12 4.1 0.0 10.I/12 728. 45.0
NV0478.84 99. 10. 7.1/ 8 1.9 0.3 3.5/ 8 728. 45.0
NVO778.AI 151. 34. 9.5/ 7 3.6 0.9 9.8/ 7 47. 5.0
NVO978.Al 223. 98. 4.9/ 8 5.2 2.7 4.8/ 8 73. 1.3
i
1983022079-257
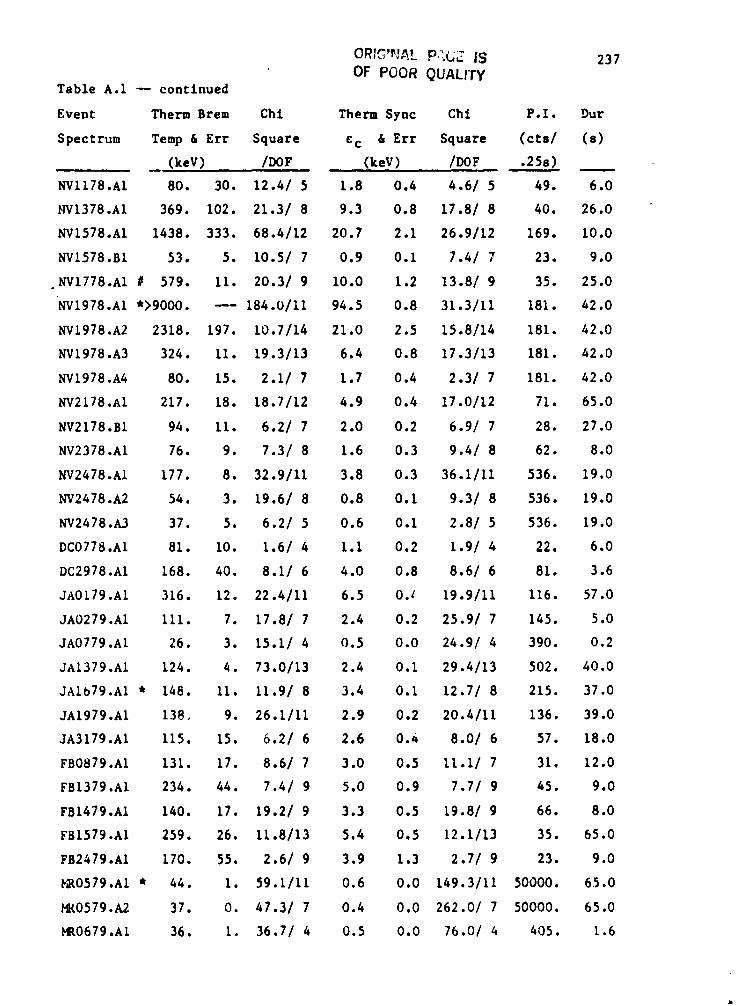
OF POOR QUALITYTable A.1 -- continued
Event Therm Brem Chi Therm Sync Chi P.I. Dur
Spectrum Temp & Err Square c c & Err Square (cts/ (s)
(keY) /DOF (keY) /DOF .25e)
NV1178.AI 80. 30. 12.41 5 1.8 0.4 4.61 5 49. 6.0
NVI378.AI 369. 102. 21.3/ 8 9.3 0.8 17.8/ 8 40. 26.0
NVI578.AI 1438. 333. 68.4/12 20.7 2.1 26.9/12 169. i0.0
NVI578.BI 53. 5. 10.5/ 7 0.9 0.I 7.4/ 7 23. 9.0
.NVI778.AI # 579. II. 20.3/ 9 I0.0 1.2 13.8/ 9 35. 25.0
NVI978.A1 *>9000. --- 184.0/11 94.5 0.8 31.3/11 181. 42.0
NVI978.A2 2318. 197. 10.7/14 21.0 2.5 15.8/14 181. 42.0
NVI978.A3 324. ii. 19.3/13 6.4 0.8 17.3/13 181. 42.0
NVI978.A4 80. 15. 2.1/ 7 1.7 0.4 2.3/ 7 181. 42.0
NV2178.AI 217. 18. 18.7/12 4.9 0.4 17.0/12 71. 65.0
NV2178.BI 94. II. 6.2/ 7 2.0 0.2 6.9/ 7 28. 27.0
NV2378.A1 76. 9. 7.3/ 8 1.6 0.3 9.4/ 8 62. 8.0
NV2478.AZ 177. 8. 32.9/11 3.8 0.3 36.1/11 536. 19.0
NV2478.A2 54. 3. 19.6/ 8 0.8 0.I 9.3/ 8 536. 19.0
NV2478.A3 37. 5. 6.2/ 5 0.6 0.i 2.8/ 5 536. 19.0
DC0778.AI 81. I0. 1.6/ 4 1.I 0.2 1.9/ 4 22, 6.0
DC2978.A1 168. 40. 8.1/ 6 4.0 0.8 8.6/ 6 81. 3.6
JA0179.AI 316. 12. 22.4/11 6.5 0./ 19.9/11 116. 57.0
JA0279.AI III. 7. 17.8/ 7 2.4 0.2 25.9/ 7 145. 5.0
JA0779.AI 26. 3. 15.1/ 4 0.5 0.0 24.9/ 4 390. 0.2
JAt379.AI 124. 4. 73.0/13 2.4 0.i 29.4/13 502. 40.0
JAIO79.AI * 148. 11. 11.9/ 8 3.4 0.1 12.7/ 8 215. 37.0
JAI979.AI 138 9. 26.1/II 2.9 0.2 20.4/II 136. 39.0
JA3179.AT 115. 15. 6.2/ 6 2.6 0.4 8.0/ 6 57. 18.0
FB0879.AI 131. 17. 8.61 7 3.0 0.5 11.II 7 31. 12.0
FBI379.AI 234. 44. 7.4/ 9 5.0 0.9 7.7/ 9 45. 9.0 %
FBI479.A1 140. 17. 19.2/ 9 3.3 0.5 19.8/ 9 66. 8.0
FBI579.AI 259. 26. 11.8/13 5.4 0.5 12.1/13 35. 65.0
FB2479.AI 170. 55. 2.6/ 9 3.9 1.3 2.7/ 9 23. 9.0
_0579.AI * 44. I. 59.1/11 0.6 0.0 149.3/11 50000. 65.0
_t0579.A2 37. 0. 47.3/ 7 0.4 0.0 262.0/ 7 50000. 65.0
HR0679.A1 36. 1. 36.7/ 4 0.5 0.0 76.0/ 4 405. 1.6
1983022079-258
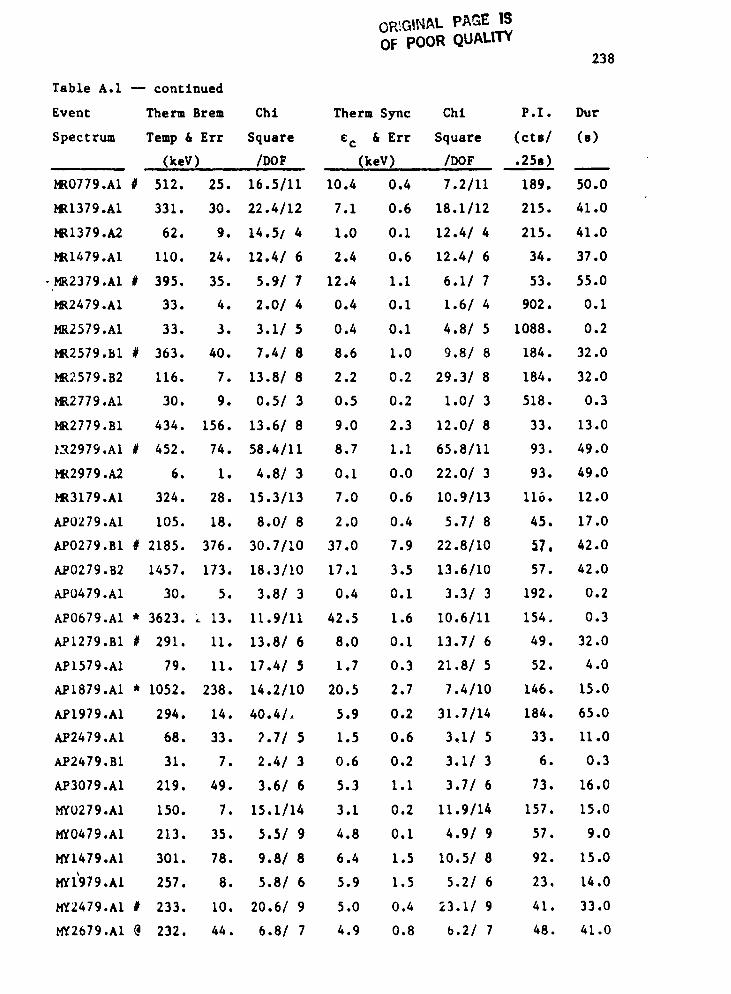
oR!GIHAL PAGE IS
OF POOR QUALII_238
TabZe A.Z -- continued
Event Therm Bre= Chl Therm Sync Chi P.I. I)ur
Spectrum Temp & Err Square ¢c & Err Square (cts/ (s)
(keY) /DOF (keY) /DOF .25s)
t_0779.A1 # 512. 25. 16.5/11 10.4 0.4 7.2/11 189, 50.0
HR1379.A1 331. 30. 22.4/12 7.1 0.6 18.1/12 215. 41.0
MRI379.A2 62. 9. 14.51'4 1.0 0.i 12.4/ 4 215. 41.0
MRI479.AI ii0. 24. 12.4/ 6 2.4 0.6 12.4/ 6 34. 37.0
-PR2379.AI # 395. 35. 5.9/ 7 12.4 I.I 6.1/ 7 53. 55.0
1_2479.A1 33. 4. 2.O/ 4 0.4 O.1 1.6/ 4 902. 0.1
PRZ379.AI 33. 3. 3.1/ 5 0.4 0.I 4.8/ 5 1088. 0.2
MR2579.B1 # 363. 40. 7.4/ 8 8.6 1.0 9.8/ 8 184. 32.0
/'ft2579.B2 116. 7. 13.8/ 8 2.2 0.2 29.3/ 8 184. 32.0
t.E2779.A1 30. 9. 0.5/ 3 0.5 0.2 1.0/ 3 518. 0.3
PR2779.B1 434. 156. 13.6/ 8 9.0 2.3 12.0/ 8 33. 13.O
}X2979.A1 # 452. 74. 58.4/11 8.7 1.1 65.8/11 93. 49.0
MR2979.A2 6. 1. 4.8/ 3 0.1 0,0 22.0/ 3 93. 49.0
HR3179.A1 324. 28. 15.3/13 7.0 0.6 10.9/13 116. 12.0
APO279.AI 105. 18. 8.0/ 8 2.0 0.4 5.7/ 8 45. 17.0
AFO279.B1 # 2185. 376. 30.7/10 37.0 7.9 22.8/10 _7, 42.0
APO279.B2 1457. 173. 18.3/10 17.1 3.5 13.6/10 57. 42.0
APO479.A1 30. 5. 3.8/ 3 0.4 0.1 3.3/ 3 192. 0.2
AP0679.AI * 3623. _ 13. 11.9/11 42.5 1.6 10.6/11 154. 0.3
AP1279.B1 # 291. 11. 13.8/ 8 8.0 0.1 13.7/ 6 49. 32.0
API579.AI 79. 11. 17.4/ 5 1.7 0.3 21.8/ 5 52. 4.0
API879.AI * 1052. 238. 14.2/10 20.5 2.7 7.4/10 146. 15.0
API979.AI 294, 14. 40.4/_ 5.9 0.2 31.7/14 184. 65.0
AP2479.A1 68. 33. 2.7/ 5 1.5 0.6 3,1/ 5 33. 11.0
AP2479.B1 31. 7. 2.4/ 3 0.6 0.2 3.1/ 3 6. 0.3
AP3079.A1 219. 49. 3.6/ 6 5.3 1.1 3.7/ 6 73. 16.0
MY0279.AI 150. 7. 15.1/14 3.1 0.2 11.9/14 157. 15.0
HY0479.AI 213. 35. 5.5/ 9 4.8 0.I 4.9/ 9 57. 9.0
HYt479.A1 301. 78. 9.8/ 8 6.4 1.5 10.5/ 8 92. 15.0
MYI'979.AI 257. 8. 5.8/ 6 5.9 1.5 5.2/ 6 23. 14.0
HY2479.At # 233. 10. 20.6/ 9 5.0 0.4 23.1/ 9 41. 33.0
HY2679.A1 @ 232. 44. 6.8/ 7 4.9 0.8 b.2/ 7 48. 41.0
1983022079-259
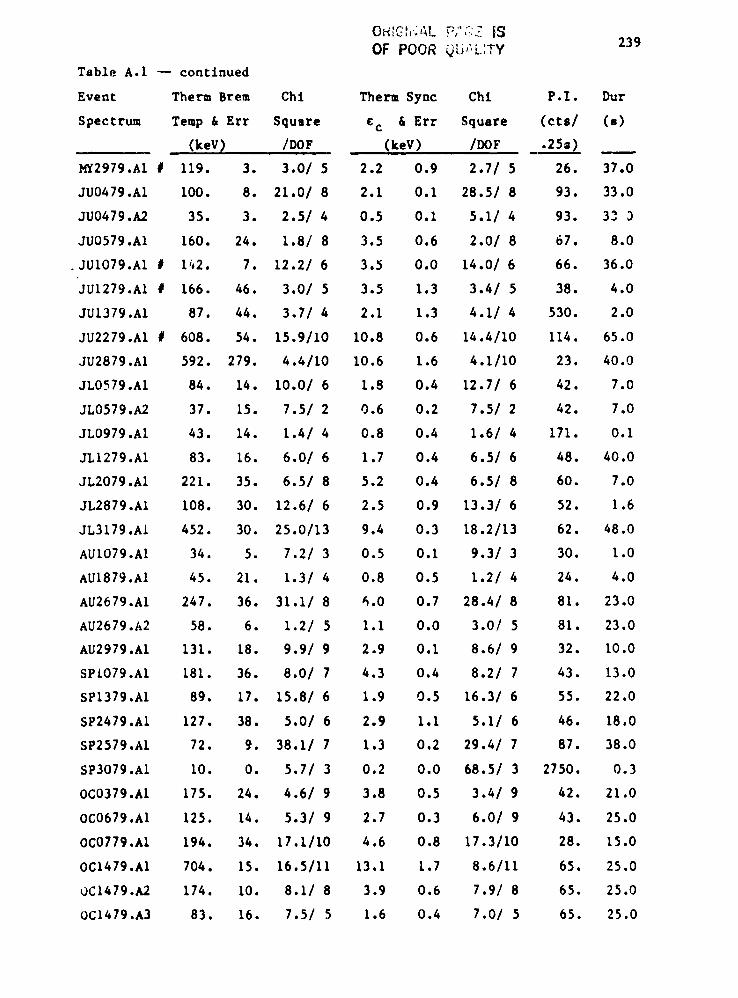
!
J
' OF POOR _UgL;'TY 239
i Table A.I -- continued
Event Therm Brem Chl Therm Sync Chi P.I. Dur?
.i Spectrum Temp & Err Square ¢c & Err Square (cts/ (s)
i (keV) /DOF (keV) /DOF .25a)MY2979.AI # 119. 3. 3.0/ 5 2.2 0.9 2.7/ 5 26. 37.0
I JU0479.A1 100. 8. 21.0/ 8 2.1 0.1 28.5/ 8 93. 33.0! JUO479.A2 35. 3. 2.5/ 4 0.5 0.I 5.1/ 4 93. 33 3
i' ,UOSZ9.AI 160.24olo8/8 3.5 0.6 200/8 67. 8.0
JUI079.AI # 142. 7. 12.2/ 6 3.5 0.0 14.0/ 6 66. 36.0
JUL279.At # 166. 46. 3.0/ 5 3.5 1.3 3.41 5 38. 4.0
JU1379.AI 87. 44. 3.7/ 4 2.1 1.3 4.1/ 4 530. 2.0
I JU2279.AI # 608. 54. 15.9110 10.8 0.6 14.4110 114. 65.0
JU2879.AI 592. 279. 4.4110 10.6 1.6 4.1/10 23. 40.0
JLO579.AI 84. 14. I0.0/ 6 1.8 0.4 12.7/ 6 42. 7.0
JLO579.A2 37. 15. 7.5/ 2 0.6 0.2 7.5/ 2 42. 7.0
JLO979.AI 43. 14. 1.41 4 0.8 0.4 1.6/ 4 171. 0.I
SLI279.AI 83. 16. 6.0/ 6 1.7 0.4 6.5/ 6 48. 40.0
JL2079.A1 221. 35. 6.5/ 8 5.2 0.4 6.5/ 8 60. 7.0
JL2879.A1 108. 30. 12.6/ 6 2.5 0.9 13.3/ 6 52. 1.6
JL3179,AL 452. 30. 25.0/13 9.4 0.3 18.2/13 62. 48.0
AUI079.AI 34. 5. 7.2/ 3 0.5 0.I 9.3/ 3 30. 1.0
AUI879.AI 45. 21. 1.3/ 4 0.8 0.5 1.2/ 4 24. 4.0
AU2679.AI 247. 36. 31.1/ 8 6.0 0.7 28.4/ 8 81. 23.0
AU2679.A2 58. 6. 1.2/ 5 I.I 0.0 3.0/ 5 81. 23.0I
I, AU2979.A1 131. 18. 9.9/ 9 2.9 0.1 8.6/ 9 32. 10.0SP/OF9.A1 181. 36. 8.0/ 7 4.3 0.4 8.2/ 7 43. 13.0
SPI379.AI 89. 17. 15.8/ 6 1.9 0.5 16.3/ 6 55. 22.0
SP2479.AZ 127. 38. 5.0/ 6 2.9 1.1 5.1/ 6 46. 18.0
SP2579.AI 72. 9. 38.1/ 7 1.3 0.2 29.4/ 7 87. 38.0
SP3079.A1 10. 0. 5.7/ 3 0.2 0.0 68.5/ 3 2750. 0.3
0C0379.A1 175. 24. 4.6/ 9 3.8 0.5 3.4/ 9 42. 21.0 t
0C0679.A1 125. 14. 5.3/ 9 2.7 0.3 6.0/ 9 43. 25.0
0C0779.A1 194. 34. 17.1/10 4.6 0.8 17.3/10 28. 15.0
0C1479.AI 704. 15. 16.5/11 13.1 1.7 8.6/11 65. 25.0
0C1479.A2 174. 10. 8.1/ 8 3.9 0.6 7.9/ 8 65. 25.0
OC1479.A3 83. 16. 7.5/ 5 1.6 0.4 7.0/ 5 65. 25.0
1983022079-260
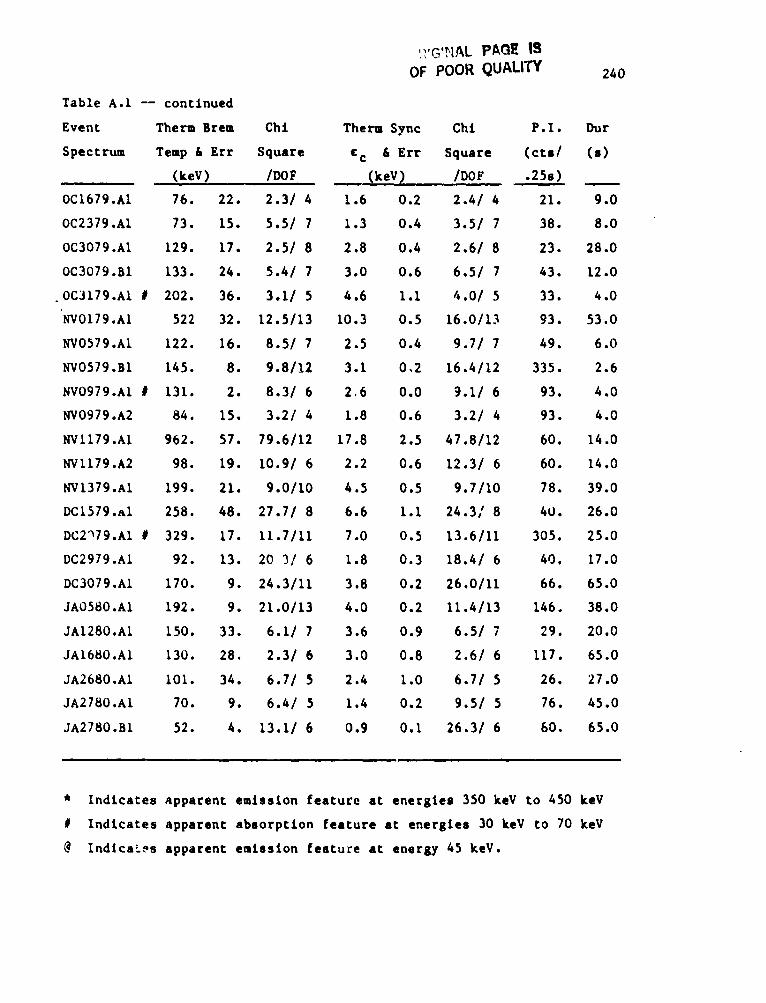
_G_HAL PAQ_ IS
OF POOR QUALITY 240
Table A.I -- continued
Event Therm Brem Cht Therm Sync Cht P.I. Dur
Spectrum Temp & Err Square ¢c & Err Square (cts/ (s)
.. (keY) /DOF (keV_ , L /DOF .25s)
0C1679.AI 76. 22. 2.3/ 4 1.6 0.2 2.4/ 4 21. 9.0
OC2379.A1 73. 15. 5.5/ 7 1.3 0.4 3.5/ 7 38. 8.0
OC3079.A1 129. 17. 2.5/ 8 2.8 0.4 2,6/ 8 23. 28.0
OC3079.B1 133. 24. 5.4/ 7 3.0 0.6 6,5/ 7 43. 12.0
0C3179.A1 # 202. 36. 3.1/ 5 4.6 1.1 4.0/ 5 33. 4.0
NVO179.A1 522 32. 12.5/13 10.3 0.5 16.0/13 93. 53.0
NVO579.A1 122. 16. 8.5/ 7 2.5 0.4 9.7/ 7 49. 6.0
NV0579.B1 145. 8. 9.8/12 3.1 0,2 16.4/12 335. 2.6
NVO979.A1 # 131. 2. 8.3/ 6 2.6 0.0 9.1/ 6 93. 4.0
NVO979.A2 84. 15. 3.2/ 4 1.8 0.6 3.2/ 4 93. 4.0
NVI179.A1 962. 57. 79.6/12 17.8 2.5 47.8/12 60. 14.0
NVl179.A2 98. 19. 10.9/ 6 2.2 0.6 12.3/ 6 60. 14.0
NV1379.A1 199. 21. 9.0/10 4.5 0.5 9.7/IO 78. 39.0
DC1579.A1 258. 48. 27.7/ 8 6.6 1.1 24.3/ 8 40. 26.0
DC2_79.A1 # 329. 17. 11.7/11 7.0 0.5 13.6/11 305. 25.0
DC2979.A1 92. 13. 20 3/ 6 1.8 0.3 18.4/ 6 40. 17.0
DC3079.AI 170. 9. 24.3/11 3.8 0.2 26.0/11 66. 65.0
JAO580.AI 192. 9. 21.0/13 4.0 0.2 11.4/13 146. 38.0
JA1280.A1 150. 33. 6.1/ 7 3.6 0.9 6.5/ 7 29. 20.0
JAI680.AI 130. 28. 2.3/ 6 3.0 0.8 2.6/ 6 117. 65.0
JA2680.AI 101. 34. 6.7/ 5 2.4 1.0 6.7/ 5 26. 27.0
JA2780.A1 70. 9. 6.4/ 5 1.4 0.2 9.5/ 5 76. 45.0
JA2780.81 52. 4. 13.1/ 6 0.9 0.1 26.3/ 6 60. 65.0
....... _ | , ,
* Indicates apparent emission feature at energies 350 keY to 450 keY
# Indicates apparent absorption feature at energies 30 keY to 70 keY
@ Indlca_s apparent emission feature at energy 45 keY.
1983022079-261
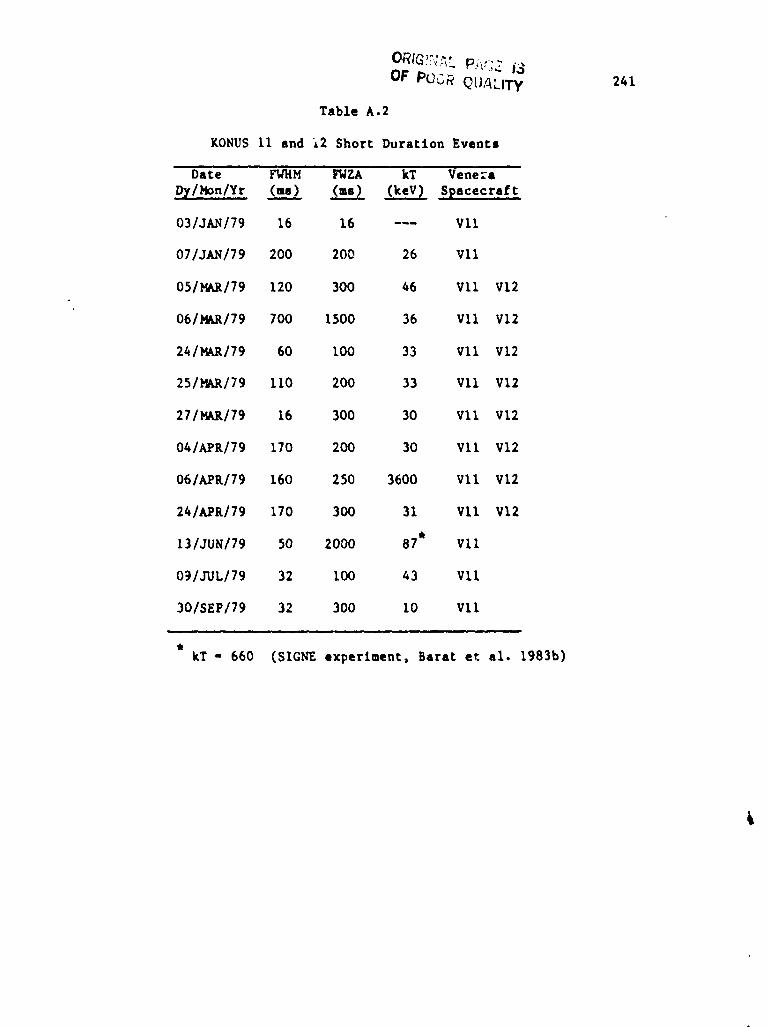
OF POCR QUALITY 241
Table A.2
KONUS 11 and i2 Short Duratlon EventJ
Date F_M FWZA kT Vene_a
D_/Hon/Yr (ms___) (ms__._) _ Spacecraft
03/JAN/70 16 16 --- Vll
07/JAN/79 200 200 26 Vll
05/PAR/79 120 300 46 VII V12
06/Hi_/79 700 1500 36 Vll V12
24/HAR/79 60 i00 33 Vll V12
25/HAR/79 Ii0 200 33 Vll V12
27/HA_/79 16 300 30 VII VI2
04/APR/79 170 200 30 Vll V12
06/APR/79 160 250 3600 Vll VI2
24/APR/79 170 300 31 Vll V12
13/JUN/79 50 2000 87* VII
09/JUL/79 32 i00 43 Vll
30/SEP/79 32 300 10 Vll
kT - 660 (SIGNE experiment, Barat et al. 1983b)
,,
J
1983022079-262
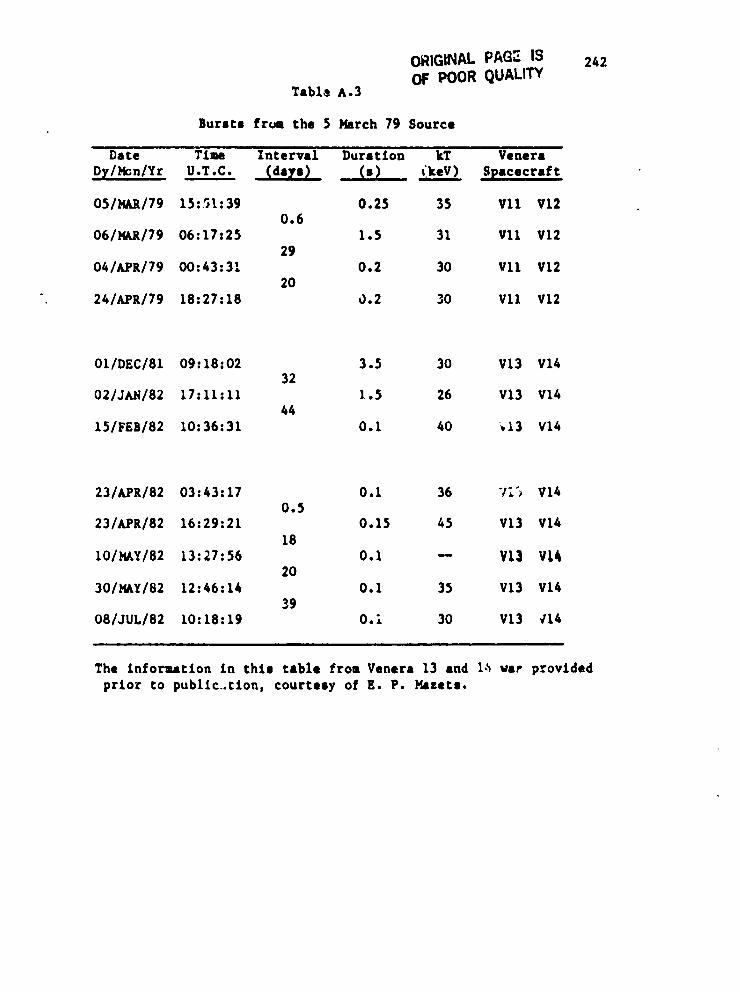
ORIGINAL PAGE IS 242OF POOR QUALITY
Tabla A.3
Bursts from Che $ March 79 Source
DaCe Time Interval Duration kT VeneraD_/Hcn/Yr U.T.C. (days) _s_ t_keV) Spacecraft
05/M_R/79 15:51:39 0.25 35 V11 V120.6
06/HAR/79 06:17:25 1.5 31 Vll V1229
04/APR/79 00:43:31 0.2 30 Vll V1220
24/APR/79 18:27:18 0.2 30 Vll V12
OI/DEC/81 09:18:02 3.5 30 V13 V1432
02/JAN/82 17:11:11 1.5 26 V13 V1444
15/FEB/82 10:36:31 0.1 40 _13 V14
; 23/APR/82 03:43:17 0.1 36 7;'> V140.5
23/APR/82 16:29:21 0.15 45 V13 V1418
10/HAY/82 13:27:55 0.1 m V13 V_.420
30/HA¥182 12:46:14 0.1 35 V13 V1439
08/JUL/82 10:18:19 0.; 30 V13 ,r14m,
The Informatlon in thls table from Venera 13 and I,_ va_ providedprior to publlc.clon, courtesy of E. P. Hazers.
1983022079-263
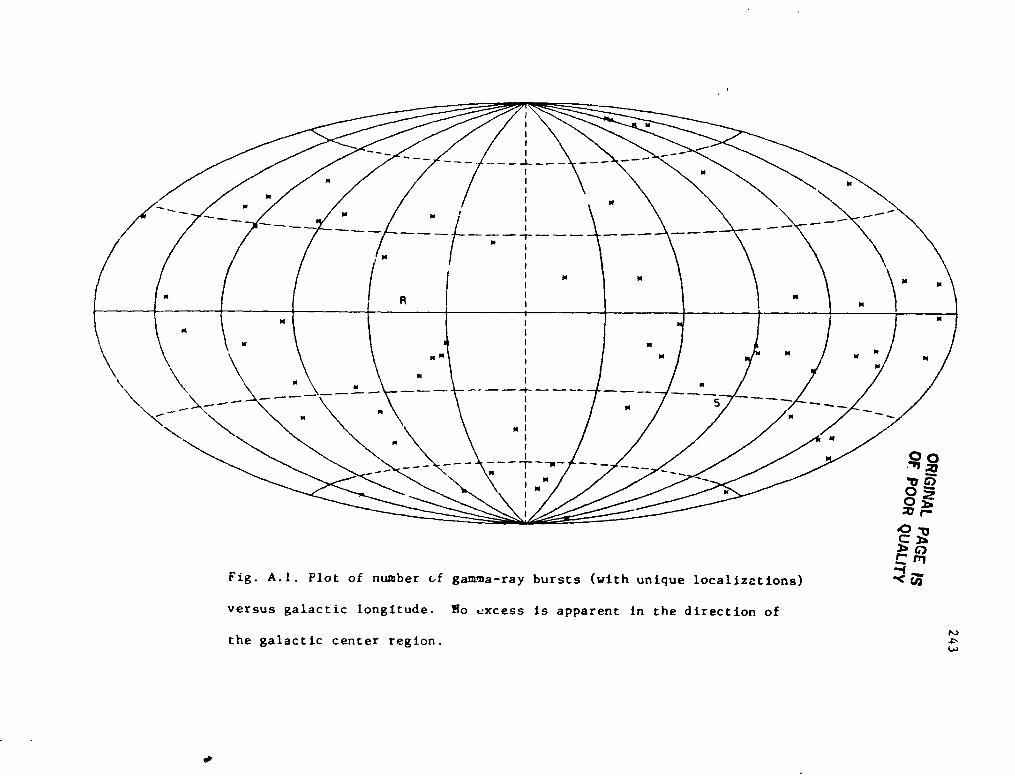
++
1983022079-264
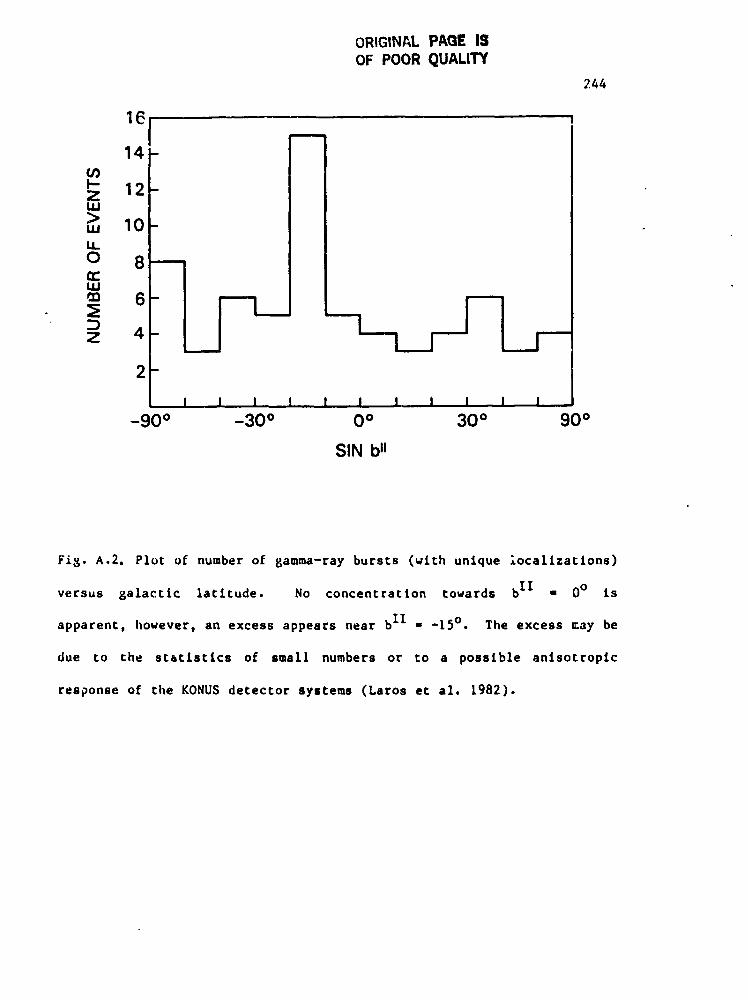
ORIGINALPA(3EIS !OF POORQUALITY
244
16_m=.=
14-(/)_- 12-ZUJ
,,, 10-I1.
2-
I 1 I ! I I I I 1 I I
-90 ° -30 ° 0o 30 ° 90 °SIN b=l
Fig. A.2o Plot of number of gamma-ray bursts (with unique iocalizattons)k
versus galactic latitude. No concentration towards bII = 0° is
apparent, however, an excess appears near bII - -15 °. The excess may be
due to the sta¢istics of small numbers or to a possible anisotroptc
response of the KONUS detector sysCems (Laros et al, 1982).
i .-
1983022079-265
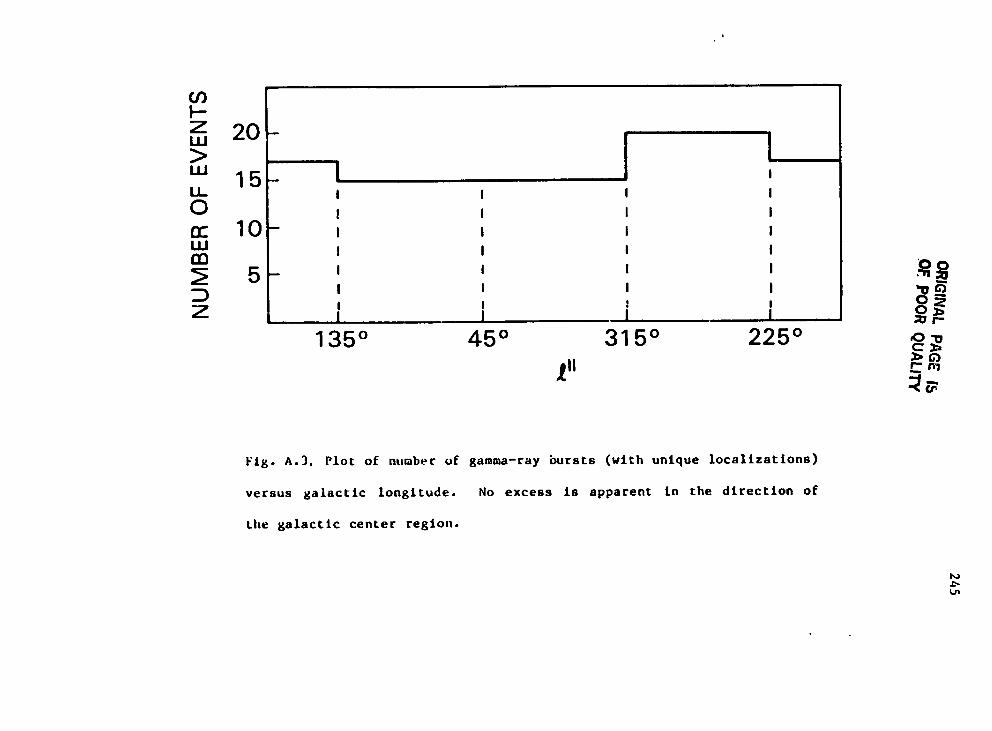
j
245
'_ORIGINALPA
GEIS
i6OF.PO
ORQUALITY
J_
0
CM
_-
_N
u
0
.1=
0_
_3
m
l,J
.QflW
_U
_X
0_S
__
o_
Z
__
_0
0_
0o
_,"
e4_
u
0I._
0I..0
-'_'
-"
•$1N
3A3
-I0_I381A
II7N"
1983022079-266
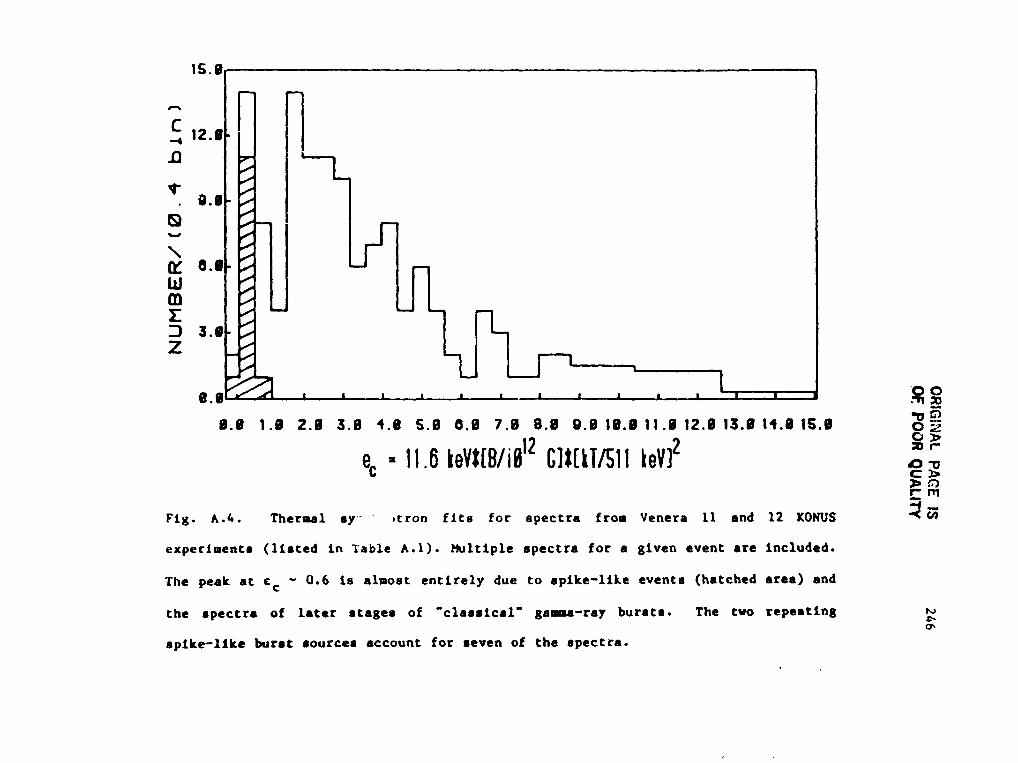
ORIGINALPAC
.EIS
246PO
ORQUALITY
1983022079-267
P_FERENCES _"_
Adams, F., and Dams, R. 1970, App!ied gamma_Ray Spectrometry, (New York: #
Pergamon Press).
A11en, C. W. 1973, As_rophyslcal Quantities, (London: Athlone Press).
Ambruster, C., Wood, K. S., Neeklns, J. F., Yentls, D. J., Smathers, H.
N., Byram, E. T., Chubb, T. A., and Friedman, H. 1983, preprlnt.
Backer, O. C., Kulkarni, S. R., Heiles, C., Davis, M. M., and Goss, W.
M. 1982, Nature, 300, 615.
Bai, T., and Ramaty, R. 1976, Solar Physics, 49, 343.
Baird, G. A., Delaney, T. J., Lawless, B. G., Griffiths, D. J.,
Shakeshaft, J. R., Drever, R. W. P., Meikle W. P. S., Jelley, J.
V., Charman, W. N., and Spencer, R. E. 1975 Ap. J. (Letters), _196,
Lll.
Baird, G. A., _eikle, W. P. S., Jelley, J. V., Palumbo, G. C. C., and
Partridge, R. B. 1976, Astrophys. Space Sci., _ 69.
Barat, C. 1983_ preprint.
+-Barat, C., et al. 1983a, Workshop on e e Pairs in Astrophysics, held at
Goddard Space Flight Center NASA.
Bara¢, C., et al. 1983b, preprint.
ii Baym, G., and Pines, D. 1971, Ann. Physics, 66, 816.
r Bekefi, G. 1966, Radiation Processes in Plasmas, (New York: Niley).
• Bevington, P. g. 1969, Data Reduction and Error Anslysis for the t _,
Physical Sciences (New York: McGraw Hill)
Bewick, A., Cce, M. J., Mills, J. S., and Quenby J. J. 1975, Nature,
258, 686.
1983022079-268
ORIGINAL PAGE IS._ OF POOR QUALITY
248
Bhat, P. N., Gopalakrishnanm N. V., Guptam S. K., Ramana Murthy, P. _.,%
Srukantan, B. V., and Tonwar, S. C. 1979, 16th lnt'nl Conf. on
:i Cosmic RaTs , Conf. Papers, 1__ 216.
Btgnaml, G. F., Fichtel, C. E., Hartman, R. C., and Thompson, D. J.
1979, Ap. J., 23_2 649.
Brecher, K. 1982, in Gamma Ray Tranatents and Related Astrophysical
Phenomena, AlP Conference Proceedings No. 71, (New York: AIP),
293.
Brown, R. W., and Stecker, F. W. 1979, Ph_. Rev. Letters, 43, 315.
Browning, R., Ramsden, D., and Wright, P. J. 1971, Nature_ 23._2 99.
Bussard, R. W., and Lamb, F. K. 1982, in Gamma Ray Transients and
Related Astrophysical Phenomena, AIP Conference Proceedings No.
77, (New York: AIP), 189.
Carter, J., Dean, A. J., Manchada, k. K., and Ramsden, D. 1976, Nature,
26_2 370.
. 1977, Nature, 266, 751.
Chupp, E. L., Forrest, D. J., and Suri, A. N. 1975, in Solar Gamma-_ X- _
and EUX Radiation, IAU Symp. 68, ed. S. R. Kane, (Dordrecht:
Reldel), 341.
Chupp, E. L. 1981, Ap. J. (Letters_, 244, LI71.
Ciapl, A., Inzanl, P., and Sironl, G. 1979, 16th Int'nl Conf. on Cosmic, , , | , ,
Rays, Coal. Papers, 1_, 209.
Cline, T. L. 1980, C?mments..on Astrophys., 9_, #I, 13.
C1ine, T. L. 1981, Ann. N. Y. Acad. Sol., 375, 314.
Cline, T. L., Desal, U. D., Klebesadel, R. W., and Strong, I. B. 1973,
Letters), 18__.55,L1.
" Cline, T. L., and Desai, U. D. 1975, AP. J. (Letters), 196, L43.
m_ ..............
1983022079-269
_ ORIGINAL PAGE IS,-_ OF POOR 0UALITY 249
Cllne, T. L., and Desal, U. D. 1976, Astrophys. Space Sci., 42, 17. .,4
Cline, T. L., and Schmidt, W. K. H. 1977, Nature, 266, 749.
Cline, T. L., Desai, U. D., Schmidt, W. K. H., and Teegarden, B. J.
1977, Nature, 266, 694.
Cline, T. L., Desai, U. D., Plzzichinni, _., Spizzichtno, A., Trainor,
J. H., Klebesadel, R. W., and Helmken, H. 1979a, Ap. J. (Letters),
232, L1.
Cline, T. L., et al. 1979b, Ap. J. (Letters), 229, L47.
Cline, T. L., et al. 1981, Ap. J. (Letters), 246, L133.
Cline, T. L., et al. 1982, Ap. J. (Letters), 255, L45.
Colgate, S. A., and Petschek, A. G. 1981, Ap. J., _ 771.
; Dennis, B. R., Frost, K. J., Kipllnger, A. L., Orwlg, L. E., Desal,
U. D., and Cllne, T. L. 1982, in Gamma Ra_ Transients and Related
Astrophysical Phenomena, AIP Conference Proceedings No. 77, (New
York: AIP), 153.
Detweiler, S. L. 1975, Ap. J., 19_7, 203.
Evans. W. D., Bellan, R. D., and Connors, J. P. 1976, AP. J-, 207___,L91.
Fabian, A. C., Icke, V., and Prtngle, J. E. 1976, Astrophys. Space Sci.,
42__, 77.
Feenberg, E., and Primakoff, H. 1948, Phys. Rev., 73, 449.
Fegan, D. J., McBreen, B., and O'Sullivan, C. T. 1979, 16th Int'nZ Conf.
on Cosmic Ra_s, Conf. Papers 1_, 254.
Felton, J. E. 1981, 17th Int'nl Conf. on Cosmic Rays, Conf. Pap,_rs, 52.
Fenimore, E. E., Laros, J. G., Klebesadel, R. W., Stockda]e, R. E., and
Kane, S. R. 1982a, in Gamma Ra_ Transients and Related
Astrophysical Phenomena, AIP Conference Proceedings No. 77, (New
York: ALP), 201.
1983022079-270
:L
' ORIGINAL PAG_ |_OF POOR QUALITY :,
250
Fentmore, V. E., Klebesadel, R. W., and Laros, J. G. 1982b, Proc. XXIV
COSPARMeeting, Ottawa, Canada.
Fenimore, E. E., Klebesadel, R. Wo, Laros, .1. Go, Stockdale, R. g., and
gAne, S. g. 1982c, Nature, 297, 665.
Flchtel, C. E., Hartman, R. C., Kniffen, D. A., Thompson, D. J.,
: Bignami, G. F., Ogelman, N., Ozel, M. E., and Tumor, R. 1975, Ap.
J..__, 198...__163.
Fichtel, C. E., Simpson, G.A., and Thompson, D. J. 1978, Ap. J., 222,
833.
Flchtel, C. E., and Trombka, J.l. 1981, Gamma Ray As_roph_slcs: New
Insight into the Universe, (Washington: NASA SP-.4S3).
Fishman, G. J. 1979, Ap. J., 23_3 851.i
Ftshman, G. J., _egan, C. A., Watts, J. W. Jr., and Derickson, J. H.
1978, Ap. J. (Letters), 223.._.,L13.
FlCwers, E. G., and Ruderman, N. A. 1977, Ap. J., 21___5,302.
"i Forres_, D. J., Chupp, E. L., Ryan, J. N., Reppln, C., Rieger, E.,
Kanbach, G., Plnkan, K. Share, G H., and Kinzer, R. 1980, Bull.
Am. Astr. Sot., 12._.,890.
Gallly, J. L., Lequeux, J., and Mssnou, J. L. 1978, Astron. As_rophys.,
70.,_L15.
Gllman, D., Metzger, A. E., Parker, R. H., Evans, L., and Trombka, J. I.
1980, AV. J., 236_..._,951.
Goldreich, P. 1970, Ap. J., 160, LII.
Gordon, M. A., and Burton, W. B. 1976, AP" J', 208, 346.
Gould, g. J. 1980, Ap. J., 238, 1026.
1
1983022079-271
ORIGINAL PAGE ISOF POOR QUALITY 251
Gould, R. J. 1982, in Gamma.Ra_ Transients and Related.Astrophysical
phenomena, AIP Conference Proceedings No. 77t (New York: AIP),
169.
Orlndlay, J. g., Wright, E. L., and McCrosky, R. E. 1974, Ap. J.
(Letters), 192, Ll13.
Grindlay, J. E., et al. 1982, Nature, 300, 730.
•Groth, E. J. 1975, Ap. J. S_pp., 29, 453.
Gruber, D. E., and Hueter, G. J. 1982, in Accretln_ Neutron Stars, eds.
W. Brlnkman and J. Trumpet, MPE Report 177, 213.
Guilbert, P. W., Fabian, A. C., and Ross, R. R. 1982, N. N. R. A. S.,
199.___,763.
Hartman, R. C., Kntffen, D. A., Thompson, D. J., and Ozel, M. E. 1979,
Ap. J., 230, 597.
Hayakawa, S. 1952, Pro_. Theor. Phys., 8_, 571.
Haymes, R. C., Ellis, D. V., Ftshman, G. J., Kurfess, J. D., and Tucker,
W. H. 1968, Ap. J. (Letters), 151, L9.
! Helfand, D. J., and Long, K. S. 1979, Nature, 28_2 589.
Helfand, D. J., Chanan, G., and Novtck, R. 1980, Nature, 283, 337.
Herterlch, K. 1974, Nature, 25_0 311.
Hoffman, J. A., Lewin, W. H. G., and Doty, J. 1977, M. N. R. A. S., 179,
57.
_urley, K. 1982, in Gamma Ray Transients and Related Astrophysical
Phenomena, AlP Conference Proceedings No. 77, (New York: ALP), 85.
Hutchinson, G. W. 1952, Phil. Mag., 43, 847.
Illarlonov, A. F., and Syunyaev, R. A. 1975, Astr. Ap._,39, 185.
• Jacobson, A. S., Ling, J. C., Mahoney, W. A., and Wlllet, J. B. 1978, In
Gamma Ray Spectroscopy in Astrophysics, NASA TM79bI9, 228.
i
1983022079-272
ORIGINAL PAGE I=OF POOR QUALITY
Jennings, M. C. 1982, Ap. J., _ 110.
Johnson, W. N., Harden, F. R., and Haymes, R. C. 1972, Ap. 3., 172, L1.
Johnson, W. N., Kurfess, 3. D., and Bleach, R. V. 1976, As_ro_hys. Space
Sci__..._.,42, 35.
Katz, J. I. 1982, Ap. J., 260..._,371.
Kirk, J. G., and Trumpet, J. 1982, in Acczetion Driven Stellar X-Ra_
Sourcesp eds. W. H. O. Lewin and E. P. J. v.d. Heuvel, (Cambridge
University Press).
Klebesadel, R. W., private communication.
Klebesadel, R. W., Strong, I. B., and Olson, R. A. 1973, Ap. J.
(Letters), 182, L85o
Kouveliotou, C. 1981, Ph.D. Thesis, Technical University of Munich.
Lamb, D. Q. 1982, in Gamma Ra_ Transients and Related Astrophysical
Phenomena, AIP Conference Proceedings No. 77, (New York= AIP),
249.
Lamb, D. Q., and _sttrs, A. R. 1979, Ap. J. (Letters), 23__4,L117.
Langer, W. D., and Cameron, A. G. W. 1969, Astrophys. Spate Scl., 5,
213.
Laros, J. G., et al. 1981, Ap. 3. (Letters),245, L63.
Laros, J. G.. Evans, W. D., Fenlaore, E. E., and Klebesadel, R. W. 1982,
Astroph_s. Space .Set., 88, 243.
Lewin, W. H. G.= and Joss, P. C. 1981, Space Sci. RED:, 28__,3.
Liang, E. P. 1982, Natur.e,299, 321. %
Liang, g. P., Jernigan, T., and Rodrigues, R. 1982, preprint.
Loznikov, V. M., and Kuznetsov, A. V. 1982, A. F. Ioffe Institute Report
743, Leningrad.
Manchester, R. N., and Taylor, J. H. 1974, Ap. J.(Letters), 191, 163.
1983022079-273
ORIGrNAL PAGE IS
OF I=OOR QUALITy 253 _.IHanchester, R• N•, and Taylor, J. H. t977, Pulsars, (San Francisco:
o jW. H. Freeman).
_asnou, J. L•, etal. 1977, in Recent Advances in Astronomy, ESA SP-124,
33.
Mayer-gasselwander, H• A., etal. 1980, Ann• N. Y. Acad• Sci•, 336, 211.
Mazets, E• P. 1983, Workshop on e+e- Pairs in Astrophysics, held st
Goddard Space Flight Center NASA•
Hazers, E. P•, private communication.
_azets, E. P., Golenetskll, S. V•, Ilylnskil, V. N•, Panov, V. N.,
Aptekar, R• L., Guryan, Yu• A•, Sokolov, I. A., Sokolova, Z• Ya.,
and Kharltonova, T• V. 1979a, Pis'ma v Astronometcheskll Zhurnal,
5_., 163.
Mazets, E• P., Golenetskit, S• V., Aptekar, R. L., Ilyinskii, V. N., and
Panov, V. N• 1979b, Soviet Astr• Letters, 4, 188.
_tazets, E. P., and Golenetskll, S. V. 1981, Astroph_s. SpacQ, Solo, __75,
47.
Mazets, E. P., Golenetskll, S. V., llyinsklI, V. N., Panov, V. N.,
Aptekar, R. L., Guryan, Yu. A., Proskura, H. P., Sokolov, I. A.,
Sokolova, Z. Ya., and Kharltonova, T. V., Dyatchkov, A. V.,
Khave.mon, N. G. 1981a, Astroph_s. Space Sci•, _ 3•
• 1981b, Astroph_s. Space. Scl., 80, 85.
• 1981c, A. F. Iof_e Institute Report 712, Leningrad.
_azets, E. P., Golenetskll, S. V., llylnskll, V. N., Guryan, ¥u. A.,
Aptekar, R. L., Panov, V. N., Sokolov, I. A., Sokolova, Z. Ya.,
and Kharltonova, T. V. 1981d, A. F. loffe Institute Report 719,
Leningrad.
1983022079-274
oRIGI_AL I.';;.OF pOOR QU,\ -v
254
Haze,s, E. P., Golenetekli, 3. V., Aptekar, R. L., Guryan, Yu. A.,
Ilylnskli, S. V. 1981e, Nature, 290, 378.
Haze,s, E. P., Golenetskll, S. V., Guryan, Yu. A., and I1ylnskll, V. N.
1981f, A. I. Ioffe Institute Report 738, Leningrad.
Heszaros, P., Nagel, W., and Venture, J. 1980, Ap J., _ 1066.
Metzger, A. E., Parker, R. H., Gilman, D., Peterson, L. E., end Trombka,
J. I. 1974, Ap. J. (Letters), 194.._jLI9.
Morrisou, P. 1958, Nuovo Clme.nto., 7., 858.
Nagel, W. 1981, _p. J., 251___,278.
Nakano, G. H., Imhof, W. L., end Reagan, J. B. 1976, Astrophys. Sp&ce
Sci., 42, 49.
Newman, H. J,, and Cox, A. N. 1980, Ap. J., .--..242'319.
Nlshlmura, J., et el. 1977, 151h Int'nl Conf. on Cosmic R_s, Conf.
Papers, 1_., 179.
Norris, J. P., Cllne, T. L., and Teegarden, B. J. 1982 in Gem Ray
Transients and Related Astroph_slcal Phenomena, AIP Conference
Proceedings No. 77, (New York: AIP), 163.
O'_rlen, S., and Porter, N. A. 1976, Astroph_s Space Sci., 42, 73.
orwi8, L., private communications.
Orwis, L., Frost, K. J., and Dennis, B. R. 1980, Solar Ph_slcs, 65, 25.
Pacinl, F., and Ruderman, H. 1974, Nat_:¶, _ 399.
Petrosian, V. 1981, A_)._.J., 251, 727. %
Pines, D., Shaham, J., and Ruderman, H. 1972, Nat. Phys. Sci., _ 83.
Pozdnyakov, L. A., Sobol, I. M., and Syunyaev, R. A. 1977, Soy. Astron.,
21.., 708.
Pravdo, S, H,, Eusmard, R, W,, and White, N. E, 1979, H, N. R" A, S._,
188...._,5.
1983022079-275
255
ORIGINAL PAGE ISQutgs, C. 1968, Phys. Flulds, ll.j 461. OF POOR QUALITY
Ramaty, K., Bouazzola, S., Cltne, T. t., Kanzanas, D., and F_szaros, P.
1980, Nature, 287_, 122.
I
i Ramaty, R., Kozlovsky, B., and Llngenfelter, R. E. 1979, A__. 3. Supp.,i
40:487Rlegler, G. R., Ling, J. C., _khoney, W. A., Wheaton, W. A., Wlllet, J.
B., Jacobson, A. S., and Prince, T. A. 1981, Ap. J. (Letters),
34, LI3.gtegler, G. R., and Slandford, g. D. (eds.) 1982, The Galactic Center,
(New York: AIP).
Rudermar, H. 1972, Ann. Rev. Astr. and Ap., 10, 427.
Ruderman, N. 1975, Ann. N. Y. Acad. Sci., 262..__,645.
Shaefer, S. 1981, Nature, 294, 722.
Sheerer, B., and Kicker, G. 1983, Nature, 302, 43.
Schmldt, W. K. H. 1978, Nature, 27_i, 525.
Segre, E. 1977, Nuclei and Particles, (New York: Benjamin).
Seyfarth, H., Hassan, A. H., Hrastnlk, B., Gottel, P., and Delan8, W.
1972, Nucl. Instr. and Meth., I05...._,301.
Share, G. H., Kurfess, J. D., Dee, S., Chupp, E. L., Ryan, I. N.,
Forrest, D. J., Lanlgan, l., Rieger, E., Kanbach, G., and Reppin,
C. 1982 in Gamma P_._ Transients and Related Astroph_y.sical
" Phenomena, AIP Conference Proceedings No. 77 (New York: AIP), 45.
1983, preprint.
Stecker, F. W., and Frost, _. J. 1973, Nature Phys. Sci:, 245, 70.
Stron8, I. B., Klebesadel, R.W., and Olson, R. A. 1974, Ap. J.
(Letters), 18_88, LI.
Swank, J. H. et al. 1977, Ap. J. (Letters), 212, L73. i
1983022079-276
ORIGINAL PAQ[ ISOF POOR QUALITY
256
!
Takakur_, T• i967, Solar PhTslcs, I, 304•
Teegarden, B. J., Porreca, G•, Stilwell, D•, Desai, U• D•, Cline, T• L•,
and Hovestadt, D. 1978, in Gamma Ray Spectroscopy in Astrophysics,
NASA TMi9619. 516.
Teegarden, B• J•, and Cline, T• L• 1980, Ap• J• _;etters),236, L67•
Trombka, J, I•, Eller, E• L•, Schmadebeck, R. L•, Adler, I•, Metzger, A•
"E., Gi]4an, D., Gorensteln, P., and 8Jorkholm, P. 1974, Ap. J.
Letter ), L27•Trubnlkov, B. A. 1960, dlssertatlon, (Moscow: USAEC Technical
Information Service AEC-tr-4073) _
Trumpet, J., Pletsch, W., Repplo, C., VoLes, W., Staubert, R., and
Kendzlorra,. E• 1978, Ap• J_ (Letters), _ LI05.
Tsygan, A. I. 1975, Ascr. Ap•, 4.__, 21•
Tsygen, A. I. 1980, AJtr. Ap., .8_, 224.
Tueller, J. '_."_, T•, Packages, W•, Teegarden, B•, 8odeC, D•, _z
Durouchoux, _ , 'Iaaeurv. ' and Haynes, R• 1981, 17th In_'nl• .. .,o,
Conf. on Cosmic Pays, Conf. ?ape_s I., 9S. l_
Van Buren, D. 1981, Ap. J., _ 297.
Van Horn, H. H. 1980, A_n__J.., 23__6, 899.
Vedrenna, G. 19ql, Phil• Trans. R. S?c. Loud• A, _ 645.
Venture, J. 1982, praprlni:.
Wheaton, ;ha. A., Ulmer, _. P_. _tty, W. A., Datlove, D. W., Elcan, N.
J., Paterson, L. E., klebesadal, R. _., Strong, i. B., Cllne, T.
L., Deut, U. D. 1973, Ap. J. _Letters_ 185, L57.
Wheaton, Wm. A., st el. 1979, N._atura, 2b__, 240.
Mhlte, R. S., Long, J. L., JeunXnss_ M. C., Zanrosso, E., and Zych A. _.
1979, 16th Int'nl Conf. _n Cosmic Ra_s, Conf. Papers, -.I" :i;
1983022079-277
ORIGfNAL PAGE ISOF POOR QUALI'I'y 257
White, N. 1982, in Accretln_ Neutron Stars, eds. W. Brlnkman and J.
Trumpet, MPE Report 177, £9.
Wood, K. S., Byram, E. T., Chubb, T. A., Friedman, H., Meeklns, J. F.,
Share, G. H., and Yentls, D. J. 1981, Ap. J., _ 632.
Woosley, S. E. 1982,1n Gamma Ray Transients and Related Astroph_slcal
Phenomena, AIP Conference Proceedings No. 77 (New York: AIP)p 273.
"Woosley, S. E., and Taam, R. E. 1976, Nature, 263____,101.
YamagamI, T., Nlshlmura, J., Oda, M.D Ogawara, Y., FuJll, M., Tawara,
Y., Yoslmorl, Y., Murakamlj _., and Mlyamoto, S. 1979, 16th Int'nl1
Conf. on Cos,_ c Rays, Conf. Papers l_.t248.
j
1983022079-278