, NAS_ TECHNICAL NASATMX-62,334 MEMORANDUM
143
r r , NAS_ TECHNICAL NASATM X-62,334 MEMORANDUM 1- -?
-
Upload
khangminh22 -
Category
Documents
-
view
1 -
download
0
Transcript of , NAS_ TECHNICAL NASATMX-62,334 MEMORANDUM
rr
, NAS_ TECHNICAL NASATM X-62,334
MEMORANDUM1-
-?
SYMBOLS -
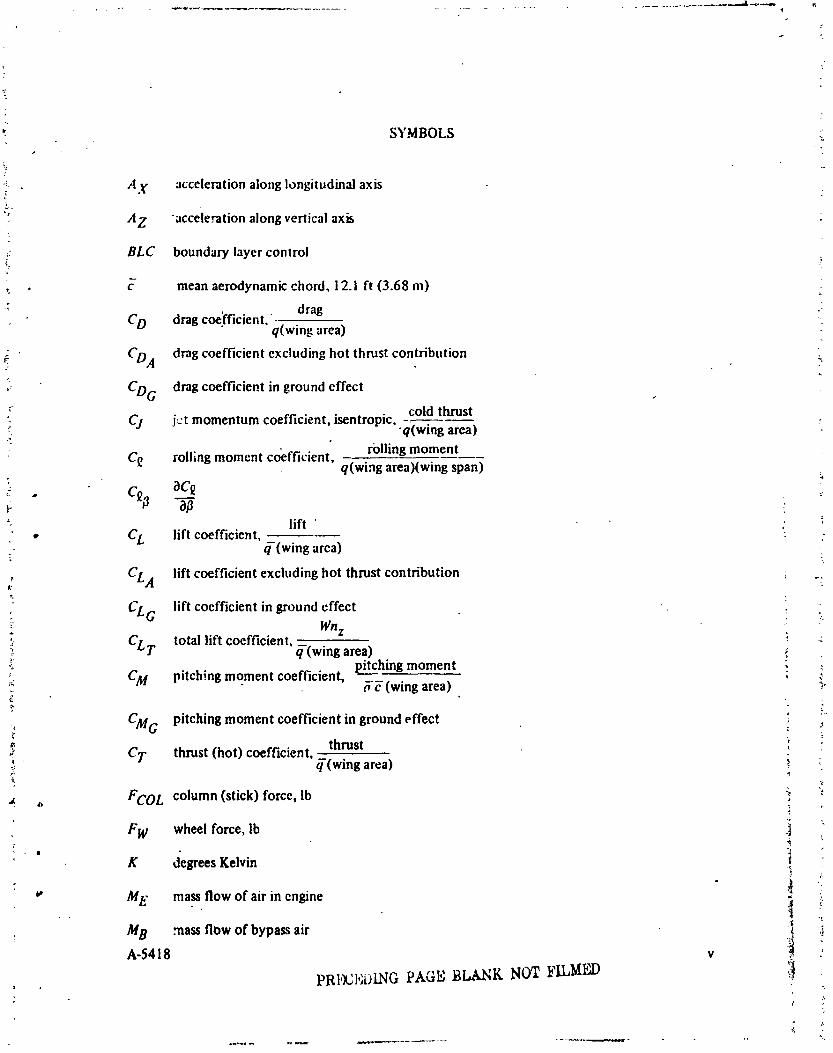
A X acceleration along longitudinal axisL
A Z acceleration along vertical axis
BLC boundary layer control< :'
. c mean aerodynamic chord, 12.1 ft (3.68 m)[ .-
CO dragcoe'.fficient.q(widng:rea)
CDA drag coefficient excluding hot thrust contribution
" CDG drag coefficient in ground effectcold thrust
"-< Cj jet momentum coefficient, isentropic, "q(wing area)
C_/ rolling moment coefficient, rolling momentq(wing area)(wing span)
,=. . C_fl aC___ :,¢ aftlift '
• CL lift coefficient,_-(wing area) -
CLA lift coefficient excluding hot thrust contribution ; ..
•:: CLG lift coefficient in ground effect . ._ :..Wnz
?_ CLT total lift coefficient, q(wing area) _<. pitching moment :
,_ CM pitching moment coefficient, b-F(wing area) ' !"7
, CMG pitching moment coefficient in ground effect :thrust
;'_ CT thrust (hot) coefficient, _-(wing area) ;, ;?
,) FCOL column (stick) force, lb
• FW wheel force, ib ii "
K degrees Kelvin .I
" ME mass flow of air in engine 1 ;'
MB mass flow of bypass air :_
A-54 ! 8 v :_
, PRI,_CI,;DINGPAGE BLANK NOT FILMED _i?
¢
1974014524-002

Ntf high pressure engir e rotor speed, rpmP
nz vertical load factor
" q- free-stream dynamic I.."essure, i/2 pV 2 , Ib/ft2 i
P period of oscillati¢,-l, sec
'" PI engine inlet pressure, psi
_: PT engine bypass air total pressure, psi
• • yawing rate, rad/sec
rpm revolution per minute
SAS Stability Augmentation System
t time, sec
T_ 12 time to I/2 amplitude, sec
7"2 time to double amplitude, secg
T_ engine inlet temperature, °K •
V velocity, ft/sec or knots I
VE equivalent air speed (EAS), knots
_ VS sink rate, ft/sec
VFR visadl flight rules
:. VSS Variable Stability System3
W weight, lb
_'F angle of attack of fuselage, positive nose up, deg i-
: IS angle of sideslip, positive nose left, deg
/"
_/ flight path angle, positive up, dei; [
l6A1L aileron deflection, positive T.E. down, deg
6CH choke deflection, positive T.E. up, deg t
l,; vi -s41s !-
: i
1974014524-003

. 6COL control column deflection in pitch, positive air, deg
_: 6c elevator deflection, positive T.E. down, deg
5/ flap deflection, positive T.E. down, deg
-- 6p rudder pedal deflection, positive left forward, in.
6sp spoiler deflection, positive T.E. up, deg
? 6w control wheel deflection, positive clockwise, deg
0 pitch angle, positive nose up, deg2
,: _ braking coefficient
_i v nozzle deflection, positive down from full aft. relative to fuselage datum line. deg
,2
.' _ damping ratio
_" p ambient air density, sl.ugs/ft3
_ rA apparent roll mode time constant
¢, roll angle, positive right wing down, deg
;_ _ roll angle after ! sec, deg¢,
_,i g, yaw angle, positive nose right, deg
_. wn natural frequency, rad/sec
i
l ' A-5418 vii
1974014524-004

1_ A FLIGHT INVES]'IGATtON OF THE STOL CHARACTERISTICS OF
" AN AUGMENTED JET FLAP STOL RESEARCH AIRCRAFT
Hervey C. Quigley and Robert C. Innis
Ames Research Center
_ and7
Seth Grossmith.: Ministry. of Transport, Canada?
; INTRODUCTION
Several powered lift concepts are being studied by NASA for'po_ible future use on fan jetSTOL transport airplanes. The augmented jet flap or augmentor.wing concept has been recognizedby both government (ref. 1) and industry (refs. 2-4) as one of the promising concepts for furtherresearch and development.
, A cooperative NASA/Canadian Government research program on the augmented jet flap con-cept began in 1965. The program included analysis and small-scale static and wind-tunnel tests(ref. 5): large-scale tests in the Ames 40- by 80-Ft Wind Tunnel (refs. 6-8) conducted by NASA in
" cooperation with the Canadian Defense Research Board using a de Havilland built model: andNASA design feasibility and simulator studies. Research progress by early 1970 warranted develop-ment of a proof-of-concept aircraft to test the jet STOL principle in flight. The U.S. and Canadiangovernments entered into an international agreement whereby the NASA and the Canadian Depart-ment of Industry Ty.ade and Commerce (DITC) would modify a de Havilland C-8A Buffalo to anattgmented jet flap STOL research aircraft. The DITC contracted with the de Havilland Aircraft ofCanada, Ltd., and their subcontractor Rolls Royce of Canada, Ltd., to provide and modify the jetengines and modify the nacelles. The NASA contracted with The Boeing Company to modify theaircraft, provide the augmented jet flap system, install the propulsion system, and perform the
_ initial flight tests. Reference 9 summarizes the contractor development program and describes theaugmented jet flap STOL research aircraft.
F
"_ The C-8A Buffalo aircraft was chosen on the basis of a design feasibility study, which showedthat with required aircraft modifications, the primary research objective could be achieved at a
reasonable cost and within an acceptable time span. In addition, considerable design data were_ available from extensive testing in the Ames 40- by 80-Ft Wind Tunnel of a large-scale model having_. a wing planform similar to the C-8A (refs. 6-8). (Simulation inputs to the development of the; aircraft are discussed in refs. i 0-12.)
• The first flight of the aircraft was made on May 1, 1972, at Seattle, Washington. The initiali, airworthiness flight test program was conducted by The Boeing Company (ref. 13). During theset_. ,, ,tests the aircraft was flown within a flight envelope of from 50 to 180 knots and at load factors_;._2. sufficient to demonstrate that the aircraft flight loads were within design and the airplane flutter_ fi:ee. The aircraft was delivered to NASA on July 31, 19'72.
'.',_- A-S418
1974014524-005
2
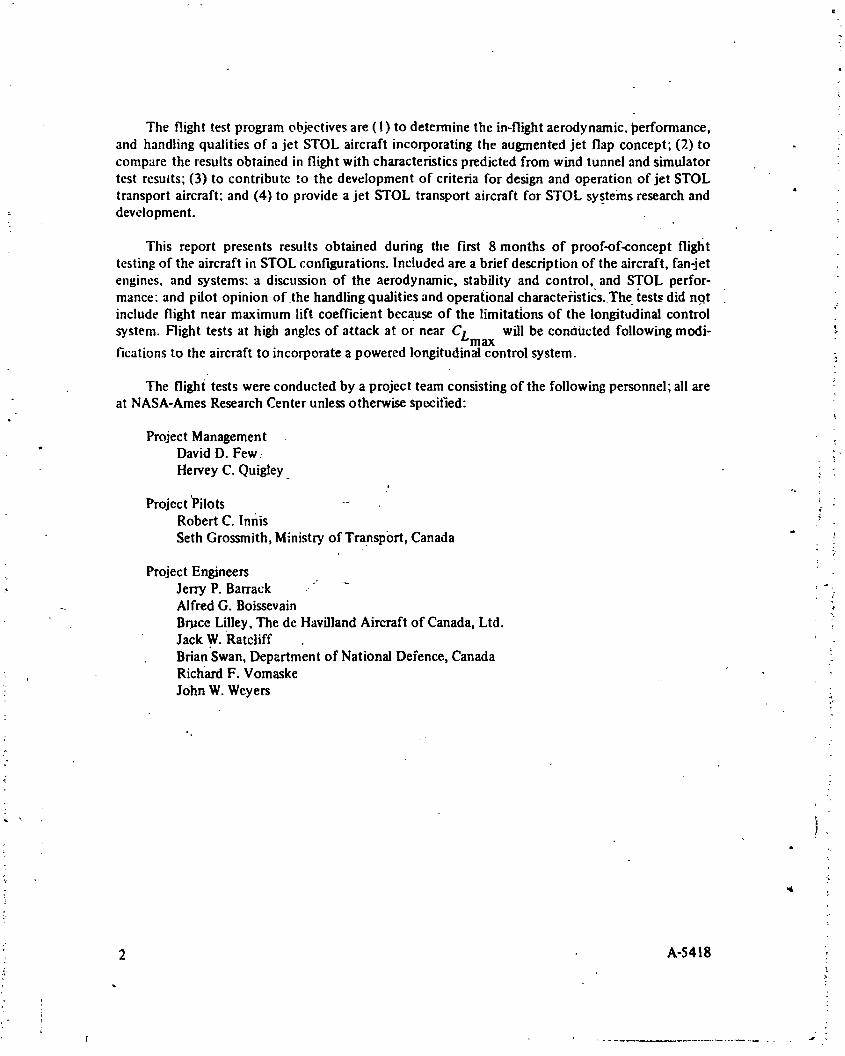
The flight test program objectives are (!) to determine the in-flight aerodynamic, performance,and handling qualities of a jet STOL aircraft incorporating the augmented jet flap concept; (2) to - ;compare the results obtained in flight with characteristics predicted from wind tunnel and simulatortest results; (3) to contribute to the development of criteria for design and operation of jet STOL
transport aircraft; and (4) to provide a jet STOL transport aircraft for STOL systems research and °development.
This report presents results obtained during the first 8 months of proof-of-concept fliglattesting of the aircraft in STOL configurations. Included are a brief description of the aircraft, fan-jetengines, and systems: a discussion of the aerodynamic, stability and control, and STOL perfor-mance: and pilot opinion of.the handling qualities and operational charactei-istics.The tests did ng.tinclude flight near maximum lift coefficient beca.use of the limitations of the longitudinal control
system, night tests at high angles of attack at or near CLmax will be conaucted following modi- '-fications to the aircraft to incorporate a powered longitudinal control system.
The flighf tests were conducted by a project team consisting of the following personnel; all areat NASA-Ames Research Center unless otherwise spocified:
Project Management" David D. Few:
Hervey C. Quigley.
Project 'Pilots --Robert C. lnnis _
Seth Grossmith, Ministry of Transport, Canada ° , :
Project EngineersJerry P. Barrack .." _"_.
- Alfred G. Boissevain
Br_ce L!!ley, The de Havilland Aircraft of Canada, Ltd. _"Jack W. RatcliffBrian Swan, Dep_.rtment of National Defence, Canada _
i Richard F. Vomaske
" John W. Weyers
°,
; Nt
: 2 A-S418 :
1974014524-006

-5
¢
,, THE RESEARCH AIRCRAFT _.B
_ L
: The research aircraft is a highly modified de Havilland C-8A Buffalo military turboprop trans- :_- port. Its high wing and high "T" tail made it especially suitable for application of a powered lift" system. The landing and takeoff configurations of the aircraft are shown in figure !. Table 1 lists
, the geometric and mass cl_aracteristics of the aircraft. Figure 2 is a three-view drawing of the :aircraft. Special features of the aircraft are describiM briefly below; a more complete description is
: presented in reference 9.
I , , ?• x
•! , Engine
_ • ,. Two Rolls Royce SI6_y MK 801-SF split flow engines, one mounted in each of two nacelles i:- ' (fig. 2), provide the thrust for the aircraft as well as the air for the augmentation system. The engine .
is mounted to the same nacelle structure as used for the T-64 installation in the original C-gA. The _.MK 801-SF engine (fig. 3) is a hybrid engine of 0.6 bypass ratio, which was assembled from several
_ engines by Rolls Royce. It consists of a Spey MK 51 !-8 core, a Spey MK 512 low pressure corn- :
'_ presser, a Spey MK 555-15 high pressure compressor external gearbox, Avon MK 101 low pressure "dump valves, a new bypass air duct, a Pegasus MK 5 trouser piece, and new vectorable conical
_ nozzles.-Existing engihe hardware was used to the extent possible to reduce development time, risk, 'and"costs. -The resulting engine represents a very useful research tool, but is not necessarily an ._.
_- optimum configuration for future augmenter wing aircraft. A more detailed description of the_: engine and a discussion of its development is provided in reference 14.
_ The low pressure compressor for the engine has five stages, the first and fifth being made of
titanium with mid-span snubbers to make the compressor more tolerant of inlet flow distortions
_ and deviations from the nominal compressor working line. Its maximum pressure ratio is 2.5. _, _.
The engine bypass air is collected and di.scharged through two 13-in.-diameter (0.3 m) ducts -_located at the top of the engine (fig. 4); it is distributed to the augmenter fuselage and aileron .
_!i nozzles by the air distribution system discussed below.
ii The flow from the hot section of the engine is discharged into a slightly strengthened Pegasus ,;trouser piece and out .through two conical nozzles. The trouser piece was originally designed for a _ *_
much larger engine, and a "colander plate" (fig. 3) between the turbine and the trouser piece allows _ ,
I proper matching of the compressors and turbines without the fear of possible disturbances in the
trouser piece or nozzle affecting'engine operation. The colander plate _s a l-in. steel plate with ; ';400 one-inch-diameter (2.54 cm) holes, 36 of which are plugged to accommodate the engine dis- _ }charge flow area requirement. The conical nozzles can be vectored by means of a Hawker Siddeley i _nozzle control system from 00 to 98* down relative to the engine centerline (6* to 104" relative to ), "_,
the fuselage waterline) to provide flight path control and increase experimental versatility. The !, nozzle vector angle control handles, one for each engine, are located in the cockpit overhead _ -.
console adjacent to the throttles within easy reach of the,,pilot. "!i *_:
" The Spey MK 801-SF engine, operating parameters are shown in figure 5. The bypass (cold,_ _
thrust shown is isentropic cold thrust at the engine offtake. _ ._
A-54 ! 8 3 I
1974014524-007

Air Distribution Systemq
The air distribution system directs the engine bypass air to tile upper and lower augmenter
nozzles, to the fuselage boundary layer blowing nozzles, and to the aileron blowing i_ozzles (figs.,6 • iand 7). A crossover ducting system is used'so that approximately 64 percent of the bypass massflow of each engine is dueted to the augmenter and aileron nozzles on the opposite wing and to halfof the fuselage boundary-layer blowing nozzles,, while the remaining 36 percent of the bypass massflow is ducted aft to the augmenter nozzles on the same side of the aircraft as the engine. The airdistribution systems for each &lgine are completely separate, but identical. This unique arrangement .,
_ provides for engine-out operation without large rolling or yawing moments. ,
; The mass flow from the inboard offtake port (36 percent of the total mass flow)-of eachengine is ducted aft in the nacelle to a tee in the lower (inner) augmenter nozzle assembly. This
• duct from the engine aft to the lower augmenter_nozzle duct contains a calibrated flow measuring -.k
station. ' ,
._. The mass flow from the outboard offtake duct (64 percent of the total mass flow) of each
engine i_ directed through a 14-in.-diameter (0.35 m) duct along the front spar of the wing and -,across the interior of the fuselage to the upper (outer) augmenter nozzle duct at the rear spar of the
opposite wing. A calibrated mass flow measuring station is located in the straight section of the ductalong the wing front spar. A 6-in.-diameter (0.15 m) duct is tapped into the fuselage crosso,6i duct
; to provide air for the fuselage boundaryqayer blowing nozzles. Of the 64 percent of the engine massflow carried by the crossover ducting system, approximately 7.1 percent is used for fuselage blow-ing, 44 percent by the upper augmenter nozzles, and the remaining 12.9 percent by the aileronboundary-layer control nozzles (fig" 7).
The design duct Math number of the air distribution system was 0.3 to prevent excessive flowlosses. ,The resulting bypass air flow losses are summarized in figure 8. For the purposes of thisrep6rt, all bypass (hrust levels are defined as the isentropic thrust that would be obtained for fi:lly
expanded flow based on the pressure r temperature, and mass flow measurements just downstreamof the engine offtakes.
At takeoff, the mass flow through the air distribution system is 79 lb/sec per engine at 270* F• and a pressure ratio of 2.5. The installation thrust losses due to pressure drops in the supply ducts
to the flaps are about 4 percent of the fan thrust. An additianal thrust loss of about 7 percentoccurs through the high aspect ratio nozzles and the flap ducts. Addition_d.information on ductlosses are provided in reference 9.
:: _ Augmented Jet Flap
:. Figure 9 is a sketch of the general arrangement of the augmented jet flap and its raajor', components. The flap geometry is basically the same as that of the large-scale model tested in the .
; , Ames 40- by 80-Ft Wind Tunnel (ref. 7). The flaps have constant chord and are made in four equalspanwise segments, two on each side of the aircraft. I'o reduce the overall cost of the modification .-
!_ .-program, the flap assembly was ,_ot designed to retract into the streamlined airfoil contour as would, . . .be required for high speed flight.
' t
4 A-5418
r' i "_
1974014524-008

The entire augmenter flap assembly, including the augmenter nozzle duct, is supported on%
• " beafns external to the wing that attach to the front and rear spars. This arrangement permits"_:_ accurate alignment of the flap and nozzle assembly and minimizes the effects of wing deflection.
=_- The flaps are deflected by hydraulic linear actuators mounted e:._ernal to the wing. The_ miuimum(flaps up) angle is 5.6 ° and the maximum flap angle is 72°.._,
_;_ The ducts that supply the ai_ to the flaps are mounted just aft of the rear spars and provide airr
¢_ independently from each engine. The inner duct air is ._upplied from the engine on the same side of
the aircraft as the engine, while the Outer duct is supplied from the engine on the opposite side. • ,'
._'_ The flap itself is made up of twc surfaces, eac.h of which has slots for added air flow and--_. boundary-layer confrol. As the flap deflects, the h_take door on the top st,,rface also deflects>-": - (fig. 10) to allow .a smoother outside air entry into the flap system and to re_,ardflow separation)_:. from the upper surface of the shroud. Note also that the flap system pivots about a poirit within the_... Coanda leading edge portion of the lower surface so that the ejected air from the nozzles is tangent
to the surface of the Coanda as the flrp deflects. Static tests of a 0.7-scale model (ref. 15)showed
_ that the location of this tangency point relative to the eflux centerline was of critical importance
i_ for obtaining the maximum augmentation ratio. Also, the optimum Coanda surface position for_., each flap deflection is at a different location. The location chosen for the aircraft represents a._ compromise that favors a flap deflection of 45°. The sensitivity of performance to physical posi-
._'_ tioning of the flap components resulted in a design of relatively rigid structure to minimize, deformation
_ " Fixed leading edge slats were installed to help maintain airflow over the wingat the high values "
_ of circulation obtained during poweredqift operation.
_. _ .. Flight Control System
_ _ Several modifications _c;re macle to the basic C-8A Buffalo flight control system. In the
_ cockpit (fig. 1I), the Control wheel was _eplaced with a wheel instrumented to read out lateral andlongitudinal control forces• The only other change in the cockpit flight controls was the addition ofan electrical lateral and pitch trim switch, which the pilot could control with his left thumb and theco-pilot with his right thumb; the manual trim was retained.
The longitudinal cotitrol system is the basic C-gA Buffalo manual spring tab s_,stem modifiedto reduce the stick forces for "one hand" pilot operation. The .static stick force variation with"
control column position is shown in figure 12. The dynamic force characteristic of a spring tab 1system requires an initial "force to deflect the tab that is momentarily higher than the static force 4characteristics. As discussed later, these force characteristics along with mass balance forces at low
speeds were found to be undesirable.
,The directional control system consists of a two-panel rudder, the aft panel being hinged to the
trailing edge of the forward panel and geared t9 it with a 2:1 deflection ratio. The rudder is fully•' powered through an irreversible dual hydraulic actuator controlled by cables from the pedals. The
or:ly modification to the.basic Buffalo directional control system was the addition of a Stability4'
• A-5418 5 _;
L
q9740 q4524-009
!
Augmentation System (SAS) actuator mechanically summed in series with pilot inputs. The rudderpedal Iorce and gearing are shown in figurt. 13.
The lateral control system is completely new. Three separate surfaces are used to produce therequired rolling moments: ailerons with boundary-layer control, spoilers in.front of the ailerons,and an augmentor choke. Figure ! 4 shows the position and function of each element. The ailerons
: are mechanically programmed to droop as a function of the flap deflection as shown in figure 15(a).Full droop is 35° and is reached at flap deflection of about 70° . The differential aileron deflection
• : from the droop position is -+17°. Blowing boundary-layer control is used on the aileron to increasei the effectiveness elf both the aileron and spoiler. The augmentor chokes are designed to control the_. lift of the. augmented jet flap system by changing the exit of the augmentor. Full lateral control
. reduces the exit area as a function of flap deflection to a maximum of 55 percent on the downgoingwing (fig. 15(b)). The chokes function much the same as spoilers on a conventional airplane.Although there are augmentor chokes in eachOf the four sections of the flap, only the chokes in theoutboard section of each wing are used for lateral control. All four chokes are activated on thegrotmd after landing for lift dump.
The three lateral control surfaces are programmed to give nearly linear effecti')eness withcontrol wheel deflection (fig. 16(a)). The aileron and spoiler operate from 0° wheel deflection, and
the augmentor choke is phased in at 17° control wheel deflection. Thespoilers are fully deflected at48° wheel deflection.
- Lateral control wheel forces are low (fig ! 6(b)) and are produced by a simple spring system.The lateral control surfaces are activated by a central dual hydraulic power actuator, located on therear spar, which, drives the ailerons through a cable system. The central lateral power actuator also
dt4ves spoiler2 and augmentor choke control valves through a second cable. The spoiler _rd chokeactuators are on different hydraulic systems.
Stability Augmehtation System
_ Two indepe:ldent stability augmentation systems, one for the lateral and one for the direc-tional aircraft axis are provided. Each system offers the pilot two modes of SAS operation: normalmode having fixed gains for near optimum characteristics and a variable stability mode with gainadjustment. The normal mode is used for basic STOL operations, atld the variable stability mode isused for changes in gain setting in handling-qualities testing.
, The SAS actuators are positioned by closedqoop servos and summed in series with the pilot's-_' control system. The SAS electronics is single channel, and relies on limited rate and displacement;' ' authi_rity fox' safety,. The wheel lateral rate limit is 50*/see while the displacement authority is
_ limited to :1:20" (27 percent) equivalent wheel displacement. The maximum directional rate is25°/see of rudder travel, and displacement is limited to ±50 (20 percent) of forerudder deflection.
The lateral SAS in the normal mode performs the following functions: "
I. Spiral stability augmentation, using yaw f_edback to the lateral controls. ,,
2. Roll damping augmentation, usin_ roll rate feedback to the lateral controls. "
6 A-5418S
l
1974014524-010

r
, . • .
3. Lateral control quickening, using wheel position feed forward (-+3° maximum) to the lateral: controls.
• The directional SA S in the normal mode perform'the following functions:'
1. Turn coordination, using roll rate and roll attitude feedback to the rudder.
2. Dutch roll damping, using yaw rate and roll attitude feedback to the rudder.
Norrr._l mode gains (fig. 17) are programmed with flap position and are automatically switched ,_off above 100 knots. Figure 17(c) is the schematic for the lateral control aileron quickener, whichdoubles the lateral control geat;;'_g for the first three degrees of control wheel travel to improve the -"_
_! control characteristics near zero deflection.
_" _ ,.
"_:_i Data Acquisition System ,
_,. An onboard data acquisition system gathers data on about 95 parameters measured during all_ ground and flight testing. A pulse code modulated (PCM) digital system records the data on :
magnetic tape. Recorded flight test data include stability and control, SAS signals, engine perfor-
_._ mance, augmenter performance, and guidance information. Each channel is sampled 100 times per ::
, second. The PCM word length is 10bits. The system's 14-track tape recorder has a capacity of_ about 50 min recordi_ g time per reel of tap& To allow data gathering during flights that exceed _ _;_ 50 min duration, the p_:ot may start and stop the recorder at will. _
I The I_M data. is processed on a Sigma-7 digita.l computer programmed with the desired ;calculations for determining such parameters as engine lhrust, lift and drag coefficients, flight path
" angle, and corrected airspeed. _ "'d'
_? The onboard data acquisition system also.includes a recording oscil!ggraph, which is used for i i_" additional recording requirements when the available number of PCM channels are exceeded. The "_
oscillograph also has a much higher (to 5000 Hz) frequency response used foi: recording suchparameters as loads and vibration. .,
FLIGHT TEST PROCEDURE _!
The flight tests were initiated from Moffett Field and flown in test areas in the vicinity of _ _
Moffett Fteld and at the Crows Landing Naval Auxiliary Landing Facility. The flights were made by _project pilots from NASA, the Canadian Ministry of Transport, The de Havilland Aircraft of _tCanada. and The Boeing Company. J i
••The flight tests included the following general categories: calibration, aerodynamics, stability _ _'.
_!_ and control, performance, and operational and handling qualities.
t
, p
A-5418 , 7
] 974014524-0] ]

q
.. Calibration Tests :_
The airspeed and static pressure position errors were determined by a "pacer" helicoptertowing a calibrated "trailing airspeed bomb." Flap angles for these calibration flights were 5.6 °,30 °, 50°, and 65°. in general, the engine power was that required for level fhght with nozzles at "
_. minimum deflection (~ 60). For some of the 30 ° flap tests, the power was held fixed at 96 percent :rpm and nozzle vectored between 50* and 80 ° to maintain level flight over the test speed range.
_' Tests were also conducted with 65° flaps, 94 percent rpm, and varied nozzle deflection over the :"speed range of 60 to 75 knots. The test altitude was between 3000 and 5000 ft (900 and 1500 m), _
_ and gross weight varied between 37,000 and44,000 lb (16,800 and 20,000 kg). _o
The angle-of-attack position error calibrations were made in conjunction with the aerodynam- :i': ics tests described later. In general, the angle of attack was determined by the difference betwee
_.irplane attitude and flight path. The airplane attitude was determined from the pitch attitude gyroand the longitudinal aceelerbmeter. Flight path was determined from rate of change of altitude and ,._'airplane airspeed.
The position error data derived in these tests.for airspeed, altitude, and angle of attack ispresented in the appendix. :
C
' Aerodynamic Tests .,
The airplane aerodynamics tests were conducted by flying in unaccelerated flight for about '_:10 sec, holding angle of attack steady at the various test conditions. Extensive tests were performed - ::in wing_-level flight, while efforts at turning flight ("wind-up turns") testing were sharply limited by
pilot difficulty in establishing steady conditiom. Recorded test data were used in determirdng lift,drag, thrust, and control characteristics. Aerodynamics tests !ncluded the following configu_'ations: ' :
and conditions: gross weights, 37,C30 to 45,000 Ib (16,800 to 20,400 kg); flaps, 5.6 °, 30% 40 °,' 50 °, 65°, 72°; altitude, sea le', .o 10,000 ft (3000 m); engine power, 89 to 100 percent rpm
including single engine; engine '_° to 104"; and angle of attack, .-to to 18".
, !
,_ Stability and Control Tests
Stability and control testing may be separated into two categories, lateral-directional and
Iongltudin,d. Some stability and control test data were gathered during aerodynamics and calibra-tion testing. Test configurations were generally cruise (5.6 ° flaps) at 150 knots, landing approach(65* flaps) at about 65 knots, and takeoff (30 ° ".aps) at about 80 knots. Power for level flight was :_used for the cruise and landing approach testing, while maximum continuous power was used for )
the takeoff tests. Engine-out testmg was conducted using takeoff power on one engine and idle on: the other.
Stability and control tests were performed to determine the following: control systems char- ' " _
acteristics, control power; static stability; dynamic stability; acceleration characteristics; and trim ,ch_nges. ., ',
<.,L
", 8 A-5418
1974014524-012

Longitudinal test maneuvers included the following: trim change with speed (two and oneengine): trim change with power and with nozzle delaection; elevator steps, reversals, ana d,'ublets;
.:, rapid pitch attitude changes; wind-up turns; engine power lever step,_:engine nozzle lever steps; trim_,: change with flap deflection; phugoid; and trim change in ground effect.
_ Lateral-di, ectional test maneuvers included the following, with VSS _nd S, iS both on andoff:
' lateral control steps and reversals; directional control steps and reversals; Dutch-roll; spiral stab!lity:rapid bank angle changes; and trim change with speed, one engine operating.
P
L
!_, Tests were also conducted to determine the effects of partial hydraulic failure on lateral!_ control and _a SAS operation. The lateral control augrnentor chokes and the spoilers were deacti-!_ " vated separate.y t,_ te_*,their effect on control power: The directional and lateral control channels
i_ of the SAS were deactivated separately, again to determine their effect on stability and control.9,
Performance
i" The STOL take-off climb, transition, approach, landing, waveoff, and simulated slngle-engine_ performance characteristics were measured and evaluatec, by the project pilots. A Pulse Codedf: Optical Landing Aid (PCOLA) was used by the pilots for guidance on the approaches. A Fairchild_ Analyzer Camera was used for redundant measurements or takeoff and landing performance.
_ Operational _nd Handling Qualities I
i_' ' ' Operational and handling-qualities testing was conducted in conjunction ,v'th the other tests. _?_'_ In addition, STOL landing, transition, takeoff, and waveoff operation, and ground effect testing i
_!_ were conducted as part of the evaluation of operational and handling-qualities characteristics, t._- Single-eng'ne landing approaches and takeoffs were also cohducted.
_,_ _ FLIGHT TEST RESULTS AND DISCUSSION
_*,
_ The results of the flight investigatton of the STOL characteristics of the augmented jet flap
" STOL research aircraft are discussed under five general categories: (1)aerodynamics, (2)stabhityand control, (3)handling qualities, (4)performance and c_,',rational characteristics, and (S)engine-out control and performance.
Aircraft Aerodynamics '_
The aerodynamics characteristics for the au_rnented jet flap aircraft, like those of conventit_nal
aircraft, are functions of flap deflection ;.nd of angle of attack. Unique to the augmented jet flapaircraft, however, are the additional parameters of cold (fan or bypass) engine thrust, of the
, augmented jet flap nozzles, hot (primary) engine thrust, and hot thrust vector angle. These effectsare discussed here, together with the landing and takeoff operational envelopes that result from the
A-5418 9
l
1974014524-013

,_ ._ . _ . _ __ ., . . r._ • ._ _ _ _ _ o_ *-4 L.. _'_ -'_ .I ,._ -'Z _ _ . r., _
aerodynamic characteristics of the augmented jet flap aircraft, and the effect of the ground prox- [
imity on the aircraft aerodynamics. . " -!
The aerodynamic garameter_ - lift,'drag, jet momentum, thrust coefficients, and angle ofattack - can be comptlteM from flight-measured quantities. It is difficult to derive generalized lift
_ and drag curves from individual data points, however, because the jet momentum and thrust
coef_cients(C._an_CT)varywitheach_ightp_intasairspeedand`atm_sphericc_iti_nscha_ge_ i
i Consequently, the lift and drag cu,-vespresented are for varying values of Cj and C T.
_ Effects of airplane confq_umtion on aerodynamic characteristics- The effect of flap deflection
; on aerclynamic characteristics is shown in figure 18 for flap angles of 5.6° (flaps up), 30° (takeoff), "_ ;_ and 65° (landing). The engine nozzle angle for these data was about 150, the engine rpm was
_ 94 percent (6f-- 5.6 ° and 30 °) and 95 percent (6f = 65°), and the altitude varied between 2400: and 9400 ft (730 and 2900 m). The data are shown as a function of aerodynamic lift coefficient_"
_ CLA, which is defined as the fotal trimmed lift coefficient minus the hot thrust (CT) contribution.Similarly, the drag coefficient includes the thrust of the augmented jet flap but not the hot thrust.
_ The flight data were obtained during trimmed steady-state flight at selected airspeeds resulting in
_ _ the CT and Cj variation being neady identical for each"flap setting shown. The Cj,values in• _ figure 18 are lower than those used in STOL landings. Because of the method for obtaining these
- data,-the Cj increases with decreasing airspeed (increasing angle of attack), which results.in a larger_ .CL than would be produced by a change in angle of attack alone - that is, with constant Cj. ?
The effect of engine rpn: on the aircraft _erodynamics is show_ in figure ! 9 for a P.apdeflec-t_n of 67°. At a given angle of attack, a.n/increase in engine rpm results in an increase in Cj . ,
_ resulting in a large increase in CLA andsome increase in CD. Also, the lift curve slope increases withincreasingengi.'nerpm.
_ The effect 'of engine nozzle deflection on the to:-4 CLT and aerodynamic CLA of the airplanefo_-a_67° fl_p angle is shown in figure 20. Although the Cj and CT variations are not the same for
the nozzle an_es shown; a large change in total CLT occurs when the nozzles are deflected. Becal_se
_-_, . the. C./was not matched for_all nozzle deflections, theeffe_t of nozzle deflection on CLA cannot be,, readily determined from thi._ figure.. However, prelimina-y flight test data suggest that the larger
nozzle deflections may cause some reduction in aerodynan'ic lift or increase in drag, or both.
_ Landing and takeoff aerodynamic characteristics- Flight-derived aerodynamic characteristics, -.engine thrust, geometrical characteristics, and the downwash (ref. 16) were used in the trim algo-
l* rithm of reference i 7 to compute, the typical takeoff and landing aerodynamic characteristicsshown in f_ure21 for a sea4evel standard day at constant engine rpm. The curves shown in this
'_ figure represent the change in aerodynamic parameters produced by varying airspeed in l-g flightonly. These curves were derived from flight te_t data shown in figures ! 8-20. For the landing
- configuration (_ = 65°), 92 and 95 percent engine speed (N_).characteristics are shown since the. engine power usually varied between these two values on a :-7.5 ° approach path (_). The character- ,
istics shown for the takeoff conf'qguration(_f= 30°) rep_nt conditions for near minimum take-
,. off distance using takeoff power (99 percent NH). _ t
.;
/10 A-5418
1974014524-014

',..
" _ Landing operational envelope- Landing operational envelopes computed for various configura--= tions for a sea-level standard day are shown in figure.s22 through 27. These computations followed:'_ the same mathematical model as those for the lift and drag curves discussed above. Figure 22 i
• __ shows the effect of engine rpm on the landing operational envelope (_f-- 65 °) at a gross weight of :"__ " , 40,000 lb (18,000 kg), and for the nozzles deflected 90 ° relative to the fuselage waterline. At a
nominal STOL approach condition of 60 knots and _, = -7.5 °, a ~ 3° and N H ~ 94 percent. At_= these conditions, the flight path angle is changed by about, 0.3 ° per percent change in N H._ ,Therefore, large chan_es in N H are required for large changes in 7- Ffght path control methods are _ . _:
: discussed further in the section on performance and operational characteristics. •
The effect of nozzle angle on the landing operational envelope is shown in figure 23 for
r_ Sf = 65 °, gross weight of 40,000 Ib (18_000 kg), and N H = 94 percent. For the nominal approachcondition of 1' = -7.5 ° and a speed of 60 knots, the angle of attack and nozzle angle are about 3°
and 85°, respeetivol_. The nozzle is a very effective means of controlling flight path angle. :.
i The computed variations in aircraft flight path angle with airspeed shown in figures 22 and 23
are based on a mathematical model of the airplane. For verification purposes, the_e data were __ compared with specific flight test points. Flight test data on flight path angle are compared in- figure 24 with the computed performance of the airplane at the same gross weight, flap angle, !_
"_ altitude, airspeed, engine rpm, and ambient temperature. The solid symbols"in the figure are flighttest points, and the open symbols at the same airspeed are the computed values. With the nozzles at ::
-" 12°, the flight test and computed values of'l_ show very good agreement. With the nozzles deflectedto about 90°, the measured fligi_t test value for 7 is perhaps a little below the computed value,
. indicating that there may be a nozzle interference effect. This effect will be investigated further infuture flight tests. (For the most part, however, the data shown good agreement.)
Takeoff and climb operational envelopes- The takeoff operational envelope for the airplanewas computed using the mathematical model of the airplane discussed earlier. The effect of enginerpm on the airplane flight path angle for a wing flap angle of 30°, engine nozzles at 6° (fully up),and sea-level standard day is shown in figure 25 for gross weights of 40,000 and 45,000 lb (18,200and 20.500 kg?. At full takeoff power, the airplane has the capability of climbing at angles of about12° at 45,000 lb (20,500 kg) and 16° at 40,000 ib (18,200 kg). The airplane retains significantclimb performance even at reduced power setting.
The effect of engine rpm on the climb operational envelope at a wing flap _ngle of 5.6 ° (fullyretracted) for a sea4evel standard day at 40,000 and-45,000 lb (I 8,200 and 20,500 kg) grdss weightis shown in figure 26. With the 5.6 ° flap angle, the airplane has about 2° to 3° greater climb angle
capability a_ the engine power .settings shown than with the flaps at 30°, even at a greater airspeed.
Figure 27 shows flight path angles computed from a mathematical model of the aircraft forspecific flight test data points compared with measured flight test flight path angle at flap angles of30c' and 5.6 ° The measured values for flight path angle were about 1° greater than the computed
• values for 30° flap angle. But at 5.60 flap angle, the measured values of flight path angle were aboutI° less than the-computed values.
" Ground effect- The ground effect with the airplane in the landing configuration (dr= 65°)
shows a marked decrease in drag, a nosedown pitching moment, and a slight increase in lift as the !
i -A-5418 ! I l_
i!
1974014524-015

|
airplane descends to ground level. Figure 28 shows the effect of ground proximity on the lift, drag,and pitching moment coefficients obtained from several landings in which the airplane descended - |slowly to touchdown. The discrete data points shown were derived from test da:a (assumed quasi- i
steady_tate) collected with flaps 65°, CLA = 2.3 and 3.0, and engine nozzles deflected between , :50°'and 80°. Separate flight conditions were used for determining lift, drag, and pitching moments
ground effects. The engine power varied between 93 and 96 percent NH, depending on flight !i;7conditions and gross weight. Figure 28 also presents fairings (CLA = 2.65) based on a least-squares |_,.fit to the entire data for four runs using a regression parameter identification technique. The data [_show good agreement between the two data methods. With the airplane flying at ground level
(CLA = 2.65), the drag is about 60 percent and lift 105 percent of the basic values. The nosedown•pitching moment at ground level for the same conditions is equivalent to about 8° of elevator
' deflection (ACM=-0.3). The values of CLT shown are based on a nominal flight condition of65 knots, 65° nozzle deflection, and 94.5 percent engine rpm. There is evidence that the ground
effect varies as a function of CLA. The parameter identification processing of the test data indicated
the following changes of ground effect with CLA at ground level:
:Ac£dc'A) = -o.12ACLA
|
W°G/CDa) = -o.05 "ACLA [i
Acmo
! ACLA = -0.30
The exponential dee_y of the ground effect with increasing altitude (h) is expressed by e"kh.The theoretical value for the scale height (k) is approximately 0.06 based on the aspect ratio(ref. 18). Parameter identification processing _ielded a scale height value near the theoretical value
for CLG, and approximately 0.07 for CDG and for ACMG.
_rcrafl Stability and Control
Longitudinal control- The longitudinal control system used for these tests was the I_asicBuffalo spring tab system modified to reduce the control forces. During the initial flight tests, thepilots found that the longitudinal control dynamic feel chracteristics were unsatisfactory, and themaximum control that could be obtained at STOL airspeeds with reasonable forces was only about
+ !0° to -! 7° elevator deflection (6e), although the full travel of the elevator is + 15° to -25 °. (Thisproblem is distained in more detail in ref. 10. For subsequent testing, the elevator control rystem _was modified to a fully powered system. Data discussed here, however, pertain to the original springtab system.) The staticforcevariationwith deflectionisshown in f'qlure12. "
12 : A-5418
1974014524-016

,. Elevator control power was assessed in longitudinal control reversal maneuvers. A typicalcontrol reversal at 65 knots is shown in figure 29. The variation of pitch angular acceleration withelevator angle at various speeds for 65°. 30°, and 5.6 ° flaps is given in figure 30, and maximum
t• pitch rates achieved in the reversal maneuvers are shovm in figure 31.
Initial pitch sensitivity (pitch acceleration per unit deflection, O/_c,shown in fig. 30) is about0.097 cad/see2/in, at 65 to 69knots, 0.088 at 60 to 64 knots, and 0.076 at 57 to 59 knots, in pilotopinion, the sensitivity was satisfactory.
>
. The maximum control power could not be assessed, of course, because of the limitation onachieving maximum conh'ol.- The pilots found that normal STOL takeoffs and landings could be
" achieved with the available elevator control. The data indicate that a maximum control power of, about 0.5 rad/sec 2 was available at takeoff rotation and landing approach speeds of 60 to 65 knots.
.Elevator deflections as high as -18 ° (about 15° above trim) were used in some takeoffs and flares,., but the pilots did not report a large increase in force or other limitations due to thecQntfol system
in any of these maneuvers. It is not known whether knowledge of restricted elevator deflection, influenced pilot use of the control. The airplane was restricted from conducting stalls because of the:. dynamic feel characteristics and low control power at very low airspeed resulting from the reduced
elevator deflection with low forces.
Longitudinal static stability- The stick-fixed static longitudinal characteristics of the aircraftwere obtained by flying steady ! g trim Conditions and measuring elevator deflection. Tests were
"!. conducted at flap settings of 70°, 65°, 50°, 30 °, and 5.6 ° with varioufpower settings over a range i:_ - of nozzle positions. The. center of gravity (CG) varied between 28.9 and 30.7 percent of the meani :" aerodynamic chord, and test weights ranged from 35,800 to 46,6001b (16,300 to 21,200kg).¢
_ Variation of CG position with weight is shown in figure 32.
Figures 33, 34, and 35 illustrate typical variations of elevator deflection with flap deflection,nozzle position, and power setting respectively. These data correspond to the aerodynamic datagiven in figures 18, ! 9, and 20. Figure 33 presents measured elevator-to-trim values. For these flight
conditions, ! g trim is achieved with elevator deflections of less than 4° for the range of airspeedstested. Larger up elevator deflections were-required with lower flap angles. Maximum trim elevatorused was about -7 ° with flaps up., No attempt was made to determine elevator for minimum -.
"airspeed because of the hazard of approaching stall conditions. .... _
Static longitudinal stability levels were found to be low, as expected. Elevator required to trimat a given airspeed is given in figures 33 to 35; variations in stick force, elevator deflection, and an_eof attack with airspeed are given in figures 36 and 37 for the flap angles of 67°, 32°, and 5.6 °. With " :flaps up, both stick-fixed and stick-free stability are positive. At 30° and 65 ° flap ddflectionstick-fixed stability is positive except at 3peeds below about 65 knots where stability tends tobecome neutral. Stick-free stability (stick force required to change airspeed) at constant _ower isnonexistent at both 30° and 65 ° flap deflections. At 30 ° flaps and speeds below about 80 knots and
i at 65° flaps below 60 knots, stability even becomes slightly negative although the for_e variation is _ 'within the friction band. At 70 ° flap deflection, stick-free stability deteriorated further, becoming ". " !i
negative throughout the landing approach speed range. The low 19ngitudinal stability and "spongy" I
elevator response at low speeds, combined with.poor sticl_-cent_'ng capability (large friction band), imade it difficult for pilots to maintain both pitch attitude and airspeed during landing approaches. _,
A-5418 ! 3
i _ 4r _.. _-
.... i
1974014524-017

-, .J
Longitudinal dynamic stability'- :l'hc dynamic longitudinal s'ho:-t period stability character-istics were approximated by analyzing the response of the aircraft to control pulses and step inputs. "Figure 38 is a typical time history of an elevator step at 62 knots. The data illustrate the lowshort-period stability of the aircraft at this _speed. Pitch rate is almost constant for the approxi- ,mately 3.0 sec while the controls are held fixed, and the pitch rate response of the airplane to thecontrol input appears to be almost first order with a tim_-c0nstatrt of about 0.5 sec. Figure 39 is a
•- time history of a phugoid oscillation from a trimmed condition of 65 knots with the nozzle: deflected 77". Aircraft short-period and phugoid characteristics are summarized in table 2 for_ several configurations.
L_ The pilots were not satisfied with the short-period dynamic characteristics of the aircraft .-_.:: _ because, of the high pilot workoad to control pitch attitude and flight path angle at airspeeds below /, . ,
65 to 70 knots. Approaches _under visual flight rules (VFR) were performed without difficulty in_- winds as high as 30 knots with gusts to 45 knots because the low stability results in only small
_. low-frequency disturbance; under such conditions, however, the pilot workload increased.
[ Longitudinal maneuvering characteristics- This section covers the vertical and longitudinalacceleration- responses of the aircraft to control inputs used for flight path and airspeed control.
_ . Three controls are available to the pilot_in this propulsive lift aircraft to achieve these responses:_" .. (!) changes of angle of attack with elevator control, (2) changes in engine thrust with the throttles,,- ?
and (3) changes in hot thrust vector angles with nozzle control levers. All three of these controls_ affect the lift, drag, and pitching moment of the aircraft.
'l /
, The aircraft exhibited stable maneuvering characteristics at constant speed, thrust, and nozzle -_
angle. Figure 40 compares predicted values from reference 19 with maneuve.ring .data, .which are , " :J _ '_ 4
/ given in terms of angle of attack, elevator position, and stick" force per g vacation with airspeedobtained from wind-up turns and pitch attitude steps. Specific d.ata points are presented in _ig-
ures 4 ! and42 for the landing and takeoff configurations, respectively. Elevator-per-g is close to thepredicted value based on.the wind-up turn data with high values of between 25° and 30° per g at : *,airspeeds bet'_veen 60 and 65 knots. Figure 41 shows that'at 67° flap deflection stick force per g isclose to p.edicted values up to 1.1 g, above which'it falls below the predicted value. At 30 ° flaps,
, the stick force per g is well below the predicted level. These data were obtained with ,the spring-tabelevator control system. In the fully powered elevator contr91 system installed subsequently, the ,
forces are a function of airspeed and elevator deflection from trim. ./ ;: _
Load factor per unit angle of attack becomes'quite Idly as airspeed _ reduced (fig. 40). The: measured value of 1.6 g/rad at 63 knots, which is representative of a landis.., appr(>achcondition, is . i
close to the prechcted value; a meamred point at 100 knots is about 4 g/rad. _ i• i
_e
Th_ _riation of vertical acceleration with changes in angle of attack obtained during pitchattitude changes are presented in figure 43. The date shows that for an airspeed of 63 knots, the !!
sk,peof the variation of &orF with g is about the same as that obtained in wind-up turns-for negative
¢md low positive values of Aa F. At values of AC_F above 6°, however, very little if any"in.creitsein "- .,_ load factor is achieved with increased angle of attack. A maximum load f_ctor of only 0.14 is -, _ :._ ; available at 63 knots with the pitch attitude changes used in these tests. At 68 knots,, the maximum _
_ i " ,talue of load factor is 0.23 and the curve again flattens at about A¢_F = 6°. At 98 knots, the '" _:
t _ " variation of _ with A_F is quite linear to a An: value of 0,4 g. r
_4 -' . A-5418
/" , ')
] 974014524-0] 8

./
, Figure 44 shows time histories +of 5° and 10° pitch r:tiitude changes at a trim speed of
63 kn_ots. Note that as attitude is "increasedthe airspeed decre_es such that the peak value ofi" , vertical acceleration does not occur at the peak value of angle of _*,tackfor the 10° case, which_ accounts for the flattening cf the variation of Anz with _UzF in figure 43. With attitude changes of :5 5°, acceleration follows angle of attack more closely and airspeed changes are much smaller and do "_
_. 5/ not affect the peak load factor. Figure 45 p_esents similar time history data for negative attitude._ ch: lges_ The response of the airplane with pitch attitude changes is typica' of operation on the back: side of the thrust required curve.
_ Figure 46.shows aircraft response to nozzle rotation downward from the aft position, with thepilot controlling elevator to_hold angle of attack nearly constant. Th_ effect is somewhat similar to
_: a decrease of power in?c-conventional aircraft because the main effect of vectoring thrust on the_T ,-flight characteristics is in the'd_g direction. When the nozzle is moved from lull aft to normal to._" the flight path on the appi'oach, the lift change is only about 20 percent of the weight of the ;i_ airplane. Air_eed decreases quickly as the thrust vector is rotated from aft to vertical position, then _f_ - increases as the aircraft pitches down and rate of sh,k increases, excitingthe phugoid. The new trim :
_ speed is lower than initial trim. If attitude were held constant, angle of attack would incre_e and " J_ speed would further decrease. An initial increase in positive vertical acceleration would accompany '
a more rapid down nozzle deflection. The effect of rotating nozzles from the forward to aftposition is shown in figure 47. The aircraft sinks'momentarily, about -0.1 g, as the lifting force due "_ : "..
_; to thrust is removea,--then pitches up, increases speed, and climbs. With exception of the initial! " --.in/creased sink rate due to the lift changes, the response is similar to a power increase in a conven- :. _
, tional aircraft. Figur,,"48 illustrates similar effe_.ts for smaller changes in nozzle position. _ -:
- _: Forward rotation of nozzles proved effective as a means of decreasing speed and fligllt path .for : !
I glide.slope interceptign. Once cn the approach, modulation of the nozzles in the range 70° to 90* , _ ._J: provided a very effective airspeed control, taking the place of conventional throttles. The initial_ tendeucy for the aircraft to sink on aft vectoring of the nozzles, however, restricted their use as a_" means of controlling flare in proximity to the ground, and the pilots preferred to revert to throttle
_ and elevator control for touchdown. Caution was also requited in vectoring nozzles aft on low i '__ altitude waveoffs to avoid sinking, although it was subsequently found that increasing pitch'attitude _
as nozzles moved aft effectively countered the problem. • , '
\ _" i"_; Aircraft response to change:, in throttle setting is convehtional in cruise configuration with i
nozzles aft, but is unconventional, as expected, in landing configuration with flaps and nozzles !down. Figures 49 and 50 illustrate response to a step increase' and a step decrease in power, ;respectively, in the landing configuration. The "pilot is con'trolling elevator to maintain constant _ ._pitch attitude. Increasing thrust produces a lifting force instead of an axial force causing the aircraft !to heave upward. Figure 49 shows a peak of 0.11 g for a step from"about 92.5 to 98.5 percent r.vm.The data show no increase in longitudinal acceleration A X. Flightpath shallows initially, but thesubsequent decrease in sp_d tends to ,wash'out the change in flight path angle. Similarly, the . i _short-term effect of reducing power (fig. 50) witli attitude held constant is a decrease in load factor i
" ' and a steepened flight path angle; but as speed increases the flight path tends to shallow. With thrust _• _,
as primary flight path control this,.adverse speed-path coupling made it necessary for pilots to _. continually monitor both attitude andthrustto achievedesiredcorrectionsin flight path andspeed. I :
Where required flight path corrections were large, pilots had to revert to nozzle modulation, or to a _ ;combination of nozzle and thrust control to achieve the desired response. _ +,
A-5418 15 + +
)
1974014524-019

Laieral and directional control- Lateral control power was measured by conducting lateral
control reversals..The wheel was appfied in one direction and then rapidly reversed and held in the • "opposite direction with" rudder pedal neutral. Maximum acceleration was measured as roll ratepassed through zero. A typical reversal at 65 ° flaps with SAS off is presented in figure 5 ! aridwith
SASon in figure 52. Results are compared Withpredictions (ref. 19).in figure 53.
In the approach configuiation (flaps65°),. at approximately 40,O001b (18,200 kg) gross: weight, maximum roll acceler.ttion available is about 0.67 rad/sec 2 at 69 knots, slightly above the_- predicted value andrepresenting a rolling moment coefficient of about 0.16. Extrapolating the data,
_i " and assuming control power varies with dynamic pressure, we find that control power at 60 knots is i _about 0.51, well in excess of the design criterion of 0.4 rad/sec 2 . t :
: The contributions of aileron, spoiler, and choke to the rolling _homent are illustrated in-! figure 54. Data are shown for SAS on and off conditions. SAS had some effect on maximum _i control power because of the control deflections due to SAS. For the maximum control condition .-
, ! shown in figure 54, ailerons alone produce about 35 percent of the moment, the spoilers produce�27percent, and the choke about 38 percent. Lateral control sensitivity (roll acceleration per unit *:
wheel displacement) is about 0.1 ! rad/sec 2/in., compared to predictions of about 0.095. The sensi- \i tivity was considered satisfactory by the pilots.
Figure 55 presents roll acceleration data measured at a gross weight of 45,000 lb, flaps 65°. :;: Maximum acceleration available is about 0.53 rad/sec 2 at 69 knots at this higher weight because of
' the increased inertia with fuel in the wings.
In_figures 51 and 52, it can be seen that with SAS on or off at STOL airspeeds, yaw accelera- " _ :tion due to lateral control deflection is very small.
Figure 56 presents roll acceleration data Torthe 30° and 5.6 ° flap deflection configurations atgross weights of 44,000 to 45,000 lb (20,000 to 20,500 kg). With 30° flaps, maximum rolling _
acceleration at 78 knots is about 0.53 rad/sec 2 , representing a rolling moment coefficient (CR) of _about 0.14, which allowing for the higher weight is above the predicted value. With flaps up, the
measured maximum rolling acceleration of 1.27 rad/sec2 at 166 knots (C£ = 0.075) is-milch higher _than predicted, due in part to the flap deflection at nominal flaps up being 5.6 ° instead of 0°, andbecause the predictions did not consider the lower surface of the chokes acting as ailerons.
Maximum roll rates achieved in the wheel reversal maneuvers, flaps 65 ° , are given in figure 57for SAS_on and off conditions at about 40,000 lb gross weight. Maximum rate available, SAS on, isabove 23°/sec at 70 knots. Minimum Criterionat 60 knots is 20°/sec.
Maximum control surface rates achieved in reversal maneuvers were: , ,
8w ;_ 200°/sec ,_
8AxL> 5o°/ C ., .6.sp 120°Isec
• • +i
, 6CH _ 95percent/sec " ., .
Full lateral control from neutral position can be achieved in less than 0.5 sec. _ :
16 A-5418:_.
J
1974014524-020

,= ,. • . _
k ."
[
Directional control power was evaluated by conducting rudder reversals with wheel at neu[ral.
z Maximum yaw acceleration was measured as yaw rate passed through zero. Results for 65 ° and 30°flap conditions with SAS on and off are presented in figure 58. A typical directional reversal with,_: . SAS off is shown in figure 59 and with SAS on in figure 60. At 65° flaps and an airspeed of
_. 70 knots, a yaw acceleration of 0.3 rad/sec 2 was measured at 70 percent rudder deflection equi-_ valent to 0.22 rad/sec 2 when extrapolated to 60 knots. This is higher than the predicted value ofabout 0.26 tad/see 2 at 70 knots with maximum 25° rudder defle_ction and is well above the crite-
rion of 0.15 rad/sec specified for a_lequate maneuvering at 60 knots. At 33° flaps and 80 knots, a_" yawing acceleration of 0.33 rad/sec 2 was achieved at 70 percent rudder. It is expected that at•_ " rudder deflections above 70 percent, the acceleration curve bends over fairly quickly as shown by :
_, the dotted lines in figure 58. During the reversal maneuver, yaw acceleration tends to reach maxi-, mum before the rudder has had sufficient time to come to its commanded pbsition because tile rate /_i_ is building up rapidly. At 70 _nots, maximum rate of rudder movement appears to be .,bout 38°/see _5, with full pedal input. Roll acceleration due to directional control, SAS o,1, is sniall (fig. 60). • _.
, Maximum yaw rates achieved during reversal maneuvers are shown in figure 61 At 65" flaps :
_ and 69 knots, a maximum rate of 12.5°/see was measured with SAS off, and about 13°/see with •',_ SAS on. In both cases, controls were removed before maximum rates were achieved.
_" Lateral directional static stability-, Thesestability characteristic_ were assessed by performingsteady sideslip maneuvers. Test results are'pre_sented for takeoff, approach, and cruise configura-
_ tions in figures 62 through 66. The 'aircraft exhibits positive stability about botl', lateral and direc- •: tional axis for all configurations tested.
i " Figures 62 and 63 present data for the 65 ° flap condition. Figure 62 shows variation of rudder. deflection, wheel deflection, bank angle, and elevator position with sideslip; figure 63 shows the
i' same data as a function of rudder angle and indicates a positive'dihedral effect. The data fall within•_:
the range of as predicted bv wind tunnel tests, correlating better with C£_ = -0.004 than with
%=0. %tt-
_ Rudder and wheel deflections are reasonably linear with sideslip angles out to ±15 °. At65 flaps and 65 knots, sideslip prbduced by !0 ° rudder is about 22 percent less than the predicted
value, indicating a higher directional stability than predicted for large sideslip angles. At speedsbelow 90knots, the .aircraft exhibited a low amplitude directional snaking characteristic I(3 = :1:1- 2*) indicating that near 3 = 0* directional stiffness may be very low. Attempts to docu-
tment any nonlinearities were not successful. About half available rudder and less than half availablewheel throw are required to achieve 15° 3 at 65 to 70 knots. (Note that abo_,; 100 knots sideslip islimited due to tail loads.) In STOL configurations, 15° of sideslip is achieved with bank angles of
about 5°, indicating low net sideforces. Ratios of bank angle to sideslip angle in steady-state ]sideslips, _/_, were approximately i as follows: [
., 65 d 65 93 0.25 : |30 6 75 90 0.30
o
•5.6 6 120 PFLF 0.655.6 6 .150 PFLF " 0.85
A-S'418 '!7
t,/
i " ;y
1974014524-021

The iow_'/O at landing approach speeds below 65 knots results in very little lateral acceleration A.
with sides,ip. The absence of the lateral acceleration cue requires the pilot to use the sidesli_ ' :indicator in the cockpit much more as speed is reduced to maintain low sideslip angles. The low i,directional stability aggravates this problem. . •
" Longitudinal trim change with sideslip is small for all configurations, requiring less than 1°-:elevator deflection with flaps at 65 ° and less than 6° elevator deflection with flaps up and at 30 °.
Lateral directional dynamic stability- Lateral directional characteristics were evaluated at flap" settings of 65 °, 30°, and 5.6 ° with SAS both on and off (SAS is automatically off above
100 knots), and with combinations of roll and yaw SAS on separately in the landing configuration.: " .: Dutch-foil characteristics are summarized in figure 67 and table 3: roll daml/iiag characteristics are: shown in figures 68 and 69.. "
.-. At the landing approach flap deflection of 65 °. the Dutch-roll damping with SAS off is quite! low with a damping ratio between 0.1 and 0.2. The Dutch-roll period is about 6 see/cycle and is• close to the predicted value at 70 knots. Measured period is slightly less than predicted at 75 to
90 knots indicating a trend toward greater directional stiffness than predicted at the higher speeds., A typical Dutch-roll, SAS off, is shown in figure 70. The oscillation is primarily a yawing motion: with I¢1/L81amplitude ratio about i .0. With SAS on, Dutch-roll damping ratio increases to about "'_ 0.3. A typical SAS on time history is "shownin figure 71. The SAS on period is about 7 sec and is
less than predicted. With roll axis SAS off and yaw axis SAS on it was difficult to obtain Dutch-rolldata because the ;iircraft exhibited a marked tendency to "roll off" with controls fixed; therefore,table 3 does not show Dutch-roll data for this case. The roll axis SAS off has little effect on theDutch roll; with. roll axis S,IS on and yaw axis S.AS off, Dutch-roll characteristics were similar tothe all SAS off case.
As noted in the discussion of static stability, a residual directional sn_-ki/lgcharacteristic was, common at speeds below 90 knots even with basic SAS on. Pilots found this characteristic objec-
tionable. By using the VSS,/J-damping was doubled, increasing the Dutch-roll damping ratio toabout 0.45 (fig. 67). The higher damping markedly improved the pilots' opinion of the directionalcharacteristics at landing approach speeds.
" Time histories showing the aircraft spiral mode with flaps at 67° deflection and nozzles at 15°
: SAS off and on, are shown in figure 72. Spiral stability with SAS off at 65 ° flaps, nozzles up, isanstable as expected with time to double amplitude of about 6 sec at 60 to 75 knots. With nozzle
L angle increased to 90 °, time to double amplitude appears to increase slightly. Precise spiral behavior,;, with SAS off was not always discernible due to small lateral offsets and atmospheric perturbations,
• With only yaw SAS on, spiral mode was similar to the SAS off condition with a tendency to divergemore rapidly, Ta being 4 to 6 sec. With only the roll SAS on, spiral stability is positive. Times to
i' half an_plitude of 7 to !0 sec were noted at 69 knots. With all SAS on, spiral stability at 65° flaps is.: neutral to slightly positive. Increasing nozzle a-gle to 9b° appears again to give a small increase in
stability. Measurement of precise times to converge with SAS on was difficult due to nonlinearities,, introduced by SAS inputs and/or atmospheric turbulence.
• _ The roll damping at 65 ° flaps with SAS off is low with an apparent roll mode time constant; O"A) of about !.0 fsec as determin_.d from roll reversal maneuvers (fig. 68). SAS o_ time constant is_ approximately 0.45 sec. The pilots considered the roll damping with SA,.q on satisfactory.
18 A-5418 :_
¢
1974014524-022

"4
With takeoff flaps at 30°, Dutch-roll damping, SAS off, is low at 100 knots, but with SAS on,damping increases to a satisfactory level of about 0.3 i at 79 knots. SAS off period at 100 knots isabout 4.5 sec and SAS on period at 79 knots is about 6.4 sec. The spiral mode is unstable with SAS
• off (7"2 _ 8 sec at 78 knots), and shows neutral to positive stability with SAS on. The apparent rollmode tinle constant is about 1.0 sec (fig. 69) and is apparently about the same SAS on or off.
_ In cruise configuration, Dutch-roll characteristics are satisfactory with damping and period_ close to predicted levels. Spiral mode is neutral to positive, and apparent roll mode time constant is
about 0.8 sec at 134 knots and 0.7 sec at 166knots, both near predicted values.2 _
Turn entry coordination- Turn entries were conducted at 65_, 30°_ and 5.6 ° flal_s to evaluateaircraft latera! control and turn entry characteristics. -Tests were carried out with SAS both on and
' off, and with VSS system in operation with several roll-rate-to-rudder gains. Turn coordination
! [._ characteristics, Aj3/A_ venus airspeed, are summarized in figure 73. With SAS on, the aircraft
exhibits satisfactory turn coordination characteristics. With SAS off, response in turn entries _._: degrades markedly as airspeed is reduced below 80 knots due to adverse sideslip, giving A_/A¢ ratios _,_: above the maximum level of 0.3 generally considered acceptable, reference 20. !:_
'_ With 65° flap deflection at 65-75 knots, SAS off, _/AO ratios are between 0.4 and 0.6. Thetime history" of a turn entry at 68 knots (fig. 74) shows the large adverse sideslip generated on [initiation of the tu.rnentry. Yaw rate lags roll rate by about _ sec. The large sideslip with bank angle _
ii " and the lag between bank angle and turn rate greatly increase the pilot's workload when maneuver-ing laterally during low speed approaches without SAS. With SAS on, turn coordination is much
ii improved as shown in figure 74. Yaw rate now follows roll rate with a small lag, and adverse sideslip_ is reduced. The SAS reduces A_/A¢_ ratios to a value of about 0.3, which the pilots considered_ satisfactory. The stability augmentation improves the turn coordination by deflecting the rudder
proportional to roll rate. Adverse yaw due to lateral control is negligible in both examples.
/
At 30° flaps with gAS off, some difficulty was encountered in setting up initial steady-state_ .,conditions, with _ varying + !° about a steady bias of approximately -2 °. The A_/A_ ratio data in
_ figure 73, therefore, showed scatter with an average value of about 0.37 at 77 knots. No adverse_ _ yaw due to lateral control deflection was evident, but yaw rate lagged roll rate by 1 to 2 sec due tot_ adverse sideslip, giving unsatisfactory turn coordination overall. With SAS on, adverse sideslip and
yaw rate lag were reduced and turn coordination was considered satisfactory.
t In the flaps up configuration (with SAg automatically off above 100 knots), _/A¢ has a valueof about 0.1 at 165 knots and 0.13 at 135 knots, in flaps up turn entries, no adverse sideslip was
• -evident and yaw rate followed roll rate without lag, indicating satisfactory turn coordination.
Aircraft Handling Qualitieseh. :.,
• The aircraft handling qualities evaluated in° the flight test program are discussed in bothqualitative and quantitative terms. The quantitative values are compared tOestablished criteria.
, Longitudinal stability and control- The longitudinal stability and control characteristics of thei aircraft during STOL operations were considered marginal by the pilots. Once the proper
A-5418 19
1974014524-023

. procedures had been determined, the pilots had no problems accomplishing VFR STOL takeoffs,
- transitions, approaches, or landings, but they considered the workload high.
The primary approach path control is accomplished by use of either engine thrust or thrustJ_ vector changes combined with the elevator. Large glide path corrections or low frequency response
that give essentially direct drag or thrust control are best accomplished by means of engine nozzle, vectoring, while small (high frequency) corrections are most easily made by thrust variation (essen-
tially direct lift control). Ti_e elevator response in flight path control for STOL approach(3, = -7.5 °) condition (65 ° flaps, 65 knots) is summarized in table 4 along with criteria from various
, references. The pilots found that in addition to the sluggish load factor response, the pitch controlsensitivity (0/6 c) is marginal (0.08). The nosedown pitching moment in ground effect effectively
_ reduces the pitch control sensitivity below a satisfactory level. .
i The elevator control system characteristics are considered marginal at airspeeds under about: 65 knots. The decreased elevator damping, dynamic 'force characteristics, and excessive column
: forces for elevator d.eflections greater than about 14° from trim that reduced the usable controlautnority were all objectionable at the lower airspeeds. The effect of elevator overbalance on
/ stability, at speeds less than 60 knots that resulted in reduced control forces was also objectionable.At zero stick force, the elevator mass balance produces full trailing edge up elevator at speeds up to
= about 30 knots. These undesirable characteristi:cs(ref. 13) are associated with the spring tab controlsystem and mass balance; the spring tab control system subsequently was replaced with a fullypowered hydraulic control system. The elevator system characteristics at the 65 knot approachspeed and referenced criteria are summarized in table 5.
7
; The engine speed control is unsatisfactory when used for flight path control because the thrustlevel to control handle gearing in the approach is too sensitive and has hysteresis. One inch ofhandle movement gives a change of 475 rpm (AT/W = 0.10 where W = 38,000 lb) at the approach
_ ' power setting. Hysteresis of -+1/3 in. in the engine speed control system.was also quite objection-able, especially with the high sensitivity. Engine acceleration and deceleration times in the nom_al
': operating range are considered acceptable for control on a STOL ,_pproach, but the spooldown time.)
after the throttle is retarded on touchdown is too long. The engi_._ nozzle control sensitivity apdeffectiveness was satisfactory. Use of the nozzles during flare was avoided because of the initial liftloss and the probability of hot gas reingestion on the ground _,t large nozzle deflections. If the
nozzles are used to control flight path at constant speed, a concu_ent change in pitch attitude must: accompany any sizable nozzle angle change. Control of flight path by means of engine thrust
requires little or no accompanying attitude change.
_: The longitudinal stability is satisfactory over the normal operating envelope except in theSTOL approach speed region below about 65 knots. The static longitudinal stability becomes neu-
_ tral and unstable as speed is reduced. The neutra_ to unstable slope of flight path with decreasing: velocity is objectionable and increases the pilots workload on the apl:roach. Characteristics of the_:: longitudinal stability and criteria are summarized in table 6 for the 65 knot :pproach case.
Lateral-directional stab',lity and control- The lateral-directional stability and control charac-• teristics are satisfactory over the operational speed range with $A8 in the normal mode except for
an objectionable low amplitude directional snaking at landing approach speeds and unsatisfactoq,:: lateral control forces. With SAS off in the landing approach (65 knots 65 ° flaps), turn
'f
20 A-54 ! 8
_1 i I
I
1974014524-024

.i
.. coordination, Dutch-roll damping, roll damping, and spiral damping are unsatisfactory, as discussedin the previous section• With the variable SAS (VSS) programmed to increase the "Beta-dot"damping, the objectional snaking was reduced to a satisfactory level. The lateral control breakout
_ force wasabout 5 Ib (2.3 kg) ]with friction forccs of about +-1.5 lb (+-0.7 kg)l and because of the:, low force gradient [ 10 Ib (4.5 kg) at maximum wheel deflection], the breakout felt like a r*rong
detente and was objectionable. A modification to correct this condition will be evaluated during
_. the next test period.
':._ Characteristics of the lateral and directional control systems and criteria are presented in : ,
table 7. The lateral control pow .r and sensitivity are satisfactory. Although large wt.eel deflections .
i. are required for maximum roll control 90 percent of the effectiveness is achieved at aboutpower,
,:_ 60° wheel deflection at STOL sp-.eds (fig. 54). The configuration of the lateral control system may ,be varied by selectively shutting off power to the spoilers and chokes. Tests were conducted with ; _the spoilers and chokes inoperative only in the landing approach configuration. In the landingapproach_ the lateral control power is satisfactory with all control surfaces operating; with either _
_. the spoiler or choke surfaces inoperatiye, however, it is unsatisfactory because of the low sensitivity
with spoiler off and nonlfnearity with' the choke.off. Th.e low control power and sensitivity withi both spoiler and choke off make the aircraft unacceptable for STOL ope.ration. The control power_. and sensitivity for the various lateral control configor_tions are given below for the landing _..i approach 165 knots, gross weight 38,000 to 40,000 Ib (,.,,800 to 18,200 kg)]. The lateral control_ "quickener" (fig. 17), which is operational when SAS is on, was not specifically evaluated in flight; :
however, pilots did not comment on any noticeable reduction of control sensitivity or dead band :
when flying with the SAS turned off. ,_
¢'law, ]:max (aw < 40o)
rad/sec_ rad/sec 2/deg....... ,l,L
All su_aces operating 0.67 0.0129Spoilers inoperative .47 .0075
Chokes inoperative .40 { .0129 (8w < 17°).0088 (6w > 17°) "-Spoilersand chokes inoperative .22 .0037
, The directional control power is considered satisfactory for all flight conditions including• crosswind landings when the crosswind component is as great as 20 knots.
t
The lateral and direct.ional control power characteristics with referenced criteria are sum- " _"marizcd in table 8 for the landing approachand takeoff conditions.The maximum sideslip(_ max)given in the table isbasedon a tail stall tendencyat largesideslipangles.The deHavillandCompany ,.has some evidence of vertical stabilizer and rudder stall between 20° and 25* sideslip.
" The lateral.dhce.tionaldynamic stability is satisfactorywith norrn_!SAS for all flight condi- itions except for the Ioa amplitudesnakingmotiofi, which isexperien_:edwith theSAS operatingin
• w,,,,oo or0.mi.,. iitude is low with changes t,r yaw angle of only 2° or Increasing the Dutch-roll'damping ratio•from 0.30 to 0.45 did not elimi:la.t¢ the tendency but reduced it to a level that the pilot considered
A-5418 21 '
]9740]4524-025

\
satisfactory. With SAS off, the Dutch-roll dcar_, roll damping, spiral damping, and turn coordi-nation :¢unsatisfactory in the landing approach _:_d takeoff. The lateral-directiov-J dv:Lamic char-act,_ristics for the landing approach and takec.ff _,:;,",normal SAS are summarize,. :n tabl*. 9 with
, criteria from various references.
' Airc,_ft Performance ,:,'._ ')perational Characteristics
; This section discusses the perf.or_a.n,'.: and operational characteristics of the research air-_ craft in the STOL takeoff and landin_ !,iJ_e of eperation. Cruise and conventional takecff and: landing data are given in reference 13. T,,c preliminary STOL takeoff and landing pefformeace data
• are summarized in table 10.? ,
Takeoff- The nominal takeoff configuration is with a flap deflection of,30°, ailerons drooped= 17"- and the nozzles full aft. Takeoff procedure is to advance the throttles to a speed of 93 to; 96 percent with the brakes locked, release the brakes, and add power to the takeoff engine speed of
99 percent. Takeoffs were conventional for an aircraft with a thrust/weight ratio of 0.4 to 0.5_ except that events, occurred more rapidly during the takeoff maneuver. The elevator has sufficient
control power to 'start rotation at about 60 knots. Back stick is held until liftoff, at about 75 knots,and 8° angle of attack, when the control is ea_d forward tct maintain a constant angle of attackuntil climb rate and velocity are both established. Both directional and lateral control areacceptable.
:!, A time history from brake release of a typical takeoff is-shown in' figlJre 75 for a low gross .: weight of 39,220 lb (17,800 kg). The distance traveled, S, is calculated from the measured velocity.
(The wind conditions were calm.) Full thrust is achieved about 1 see after brake release. Rotationwas initiated at 65 knots, 7 sec after start. Liftoff occurred 8 _ec after start at a velocity of 73 knots
- and 510 ft (155 m) after start; 820 ft (249 m) and 10.4 see after start, the aircraft cleared 35 ft: (10 m). An angle of attack of 8° was reached just at liftoff and held until full climb rate was
established. Figure 76 is a Fairchild Analyzer Camera sequential photograph of another takeoff. Inthis no-wind takeoff, the flight path angle gradually increased up to 20* at about a 300-ft (90-m)altitude. The previous figure showed a steady climb rate of about 19" by the time a 60-ft (18-m)
altitude was reached. , "'
Figure 76"gives some indication or"the nose-high attitude of the aircraft during the climbout.An angle of attack of 2° and a climb angle of 19" pl,._'csthe aircraft pitch attitude at 21" above thehorizon.
_ A compilation of several takeoffs in figure 77 shows the effect of takeoff weight on the:_ distance _equired to clear 35 ft (10 m). These data were corrected for wind conditions but not_. temperature. Large variations in performance are present, as expected, but an upper boundary ie
* fairly well defined. The data show that the performance is about as predicted (ref. ! 0). During these:: tests no attempt was made to determine, the Optimum flap deflection for minimum takeoff perfor- -
_ mance; 30° flap deflection was chosen as nominal takeoff flap deflection for engine considerations. _,"t
• Except for the rapid rotation necessary for these takeoffs and the poor visibility over the nose !
of the aircraft during the initial climb, the pilots considered the takeoffs comfortable, with little
, change in control techniques required fQrSTOL operation. \
22 A-5418 i
] 974014524-026
J
i('limb and transition to cruise- Although the angle of attack during climb with takeoff flap is .__
low, from i° to 5°, the flight path angle of up to about 20 ° contributes si_;nificantly to a very steep _.inose-up attitude during climb. Visibility over the nose was greatly restricted. Directional and lateral 1
. controls, remained acceptable, and no problems wet:e experienced during turbulent and gusty condi- _ :tions. Figure 78 shows the measured values of takeoff climb gradient for several flights that had istabilized conditions. The climb values computed from aerodynamics data shown previously in .figure 25 are included for comparison, but it should be noted that tile flag:,,_data shown were taken ! :under nonstandard conditions, between 4C° and 50° F, an'd have .not bee_: corrected for this l-temp6rature difference. In general, the agreement is good, with the measured climb angle bei_ I _
: slightly higher. ,_ i i_, 1_- Transition to cruise or flaps up climb configuration is straightforward as the flaps are retracted I '_,3 " i :
_. from the takeoff and initial climb deflection of 30 ° to full up. Some flights were'made with the !,,;_ a,atomatic trim-flap interconnect removed with no significant change in handling qualities or pilot t __ workload. Part of this is due to the low static margin and the very light control forces of the .r elevator i_:its present configuration.
Transition and landing approach- Pilot evaluation of approaches and landings with 55°, 65 °,
w"_ and 72° flap d_,flections indicated that a flap deflection of 65 ° is near optimum fo: the aircraft on i'__
_" -7.5 ° approaches. An increase in flap deflection to 72° results in very little lift increase. "l,i_Transition to the approach configuration of 65° flap deflection and nozzle angle of 80° was
docile, and can be accomplished in either level flight or by decelerating on the approach. Speed isreduced front cruise (150 to 160 kn,ots) to flap extend speeds (table 1) by either reduction of power
, or downward rotation of the nozzles, Both methods are satisfactory, as is a combination of the two. !_ Although attitude transients occur during the configuration changes, no excessive control inputs are
required, trim is adequate, and pilot workload is not excessive.
•:_ An experimental glidepath indication called a Pulse Coded Optical Landing Aid (PCOLA) was-" _ used that identified for the pilot the scheduled glideslope and indicated angular distance f,om the
_, optimum slope. The PCOLA is an optical device located next to the runway and provides ._vari_iblepulse width, indicative of devi,,tion from establishe41 glide slope. The pilots ':ansidered it useftl! andsimple to interpret.
F
The technique that evolved was to slow to 90 knots while on a high base leg, with flaps at 30°_ and nozzles full aft. Fla,-s were then lowered to 65 ° just prior to or while intercepting the -7.5 °
_. ., glideslope. A speed of about 90 knots was maintained at an angle of attack of about +2 ° b:,_-_' adjusting power. Speed was reduced at an altitude of about 800 ft (240 m) speed by moving the ]
|_ nozzles down as required while increasing power to about 93 percent and maintaining the estab-
lished glideslol_ with nozzle deflection ..t angle of attack of 2*. Deceleration to 60 to 65 knots wasusually completed at about 500ft (150m)and the remainder of the approach was flown atconstant airspeed. The use of nozzle angle modulation (vectored thrust) at constant thrust has
. proven satisfactory for small or large glidepath corrections. With nozzles, #idepath angle changescan be made with little citange in angle of attack or airspeed (fig. 23). With nozzle fixed at 80*, theuse of thrust for glidepath control is also a satisfactory technique orovided large glidepath correc-tions are not necessary. This technique permits small glidepath changes with nearly constant airsp'eedand attitude, but angle of attack changes (fig. 22). An increase in power on approach at constantangle of attack _decreases both the rate of descent and speed. "1he use t,f thrus alone to correct for
• IA-5418 23
"19740"14524-027
°
large_idepath angle changes is not adequate because of the airspeed changes, and it usually is neces-sary to revertto nozzle angle modulation. The pilots' consensus was that the transition and approachhad to be tightly controlled to keep the workload acceptable. Correction for large excursions from
• nominal values of airspeed and/or ghdepath raised the pilot workload to an unacceptable levelbecause of the difficulty in controlling both airspeed and glidepath angle.
Most of the approaches to a landing werc made at a nominal -7.5 _' flight path angle using thePCOLA for guidance. Figure 79 shows a time history of such a landing approach starting at analtitude of about 200 ft (60 m). Although the trace shows a gradual increase in angle of attackstarting between 5 and 6 se_ before touchdown, flare initiation as used in the following discussion is
/ taken as the time at which a _harp change appears in the elevator position, in this case almost 3 sec: before touchdown. An an altitude of a little over 100 ft (30 m) there appears to be a gradual
decrease in glideslope and a small decrease in velocity.
• o •
The vanaUon of approach speeds with gross weight is shown in figure 80 and is representative!of observed speeds between about 200-ft (60-m) altitude and the flare height for a series of
: appro _ches on a nominal -7.5 ° glidepath. Changes in the minimum observed approach speed with; gross weight were such that lift coefficient remains approximately constant. The pilots considered: the ability to make a precise flare the limiting factor in choosing the minimum approach speed. The: angle-of-attack margin or the airspeed margin from the stall were not limiting factors. The angle-of-
attack margin on the approach was over 15° and was 10° to 12° in the flare. Since the load factorresponse to angle-of-attack changes (nz/a) is an important factor t'orcontrol in the fla, e appropriate
• values of nz/a are shown in the figure. The band depicts the minimum approach speed for accept- -zble flight path control in th_ landing flare. When landing flares from flight paths of -7.5 ° wereexecuted bel'ow this speed, the change in flight path that could be produced in a reasonable time byrite change in attitude was insufficient to arrest the sink rate to values less than about 5 ft/sec(I.5 m/sec). _;
La,nding- Landings are best accomplished by leaving the nozzles at about 80° and flying thelast ! 00 ft (30 m) with elevator and throttle control• The sink rate is arrested by attitude change,and power is usually reduced for the actual touchdown. The point at which flare .isinitiated must bepicked precisely for a good landing. There is a strong feeling that the nose wheel is going to hit firstif flare is delayed, and the_e is a tendency to float if flare is accomplished too soon. The typicalflare angle-of-attack change from a -7.5 ° approach path was 10° with vertical acceleration levels! .2 g or less. The load factor response time is also in_portant. The longer it takes to attain th- loadfactor the slower the flare. Based on the vertical response shown in figures 43 and 44 an accelera-tion response time constant (nz), of approximately 1.5 sec is estimated to be typical of this airplanewhen allowing for control transport and response lages. Reference 2 ! indicates a rnz of 1.5 sec isabout the maximum acceptable.
Figure 8 ! shows the change in sink rate during the flare maneuver from pitch up to touchdownfor a number of landings and the predicted changes in sink rate for given average values of normalload factor nz, although the actual variation in nz with time is more nearly triangular than rectangu-lar. The si0k rate at touchdown is shown in figure 82. Only a few landings were made at sink rate_IFeater than 4 ft/sec, and these were considered to be exceptionally "firm" by the pilots.
_ Crosswind landings presented no difficulties. The rudder was very powerful and allowed pre-I cise decrabbing just before touchdown. Pitch control was considered sluggish at low speeds and
: i contributes to the lack of precise attitude control durin8 the flare and landing phases of theI
/, | 24 A-5418
!-
,a
1974014524-028
Z
¢
_ approach. Experience built some confidence, but the elevator cent,el lacks the crisp, precise char- [
: _ acteristics of the lateral control system, t;" - I
_ _L" " Minimum ground roll landing tests were not conducted because of the poor brake feel system, iInitial attempts to conduct rapid decelerations on the ground resulted in flat spots on the tires due I
; _'_. to brake grab and a danger of blowing out a tire. Installation of an improved braking system with t_= anti-skid control is planned. Figure 83 shows the estimated landing distance over 35 ft (!0 m), ,_: which is felt to be representative of the performance that can be obtained with the present braking I
system: the landing distance also shows a curve for a braking coefficient of 0.38, which is an t
_" estimate of the performance possible with the anti-skid system. • " i
:. t- Waveoff- Waveoffs were accomplished easily, but the unique ground rules of this aircraft
required nonstandard actions. The procedure developed is to increase engine speed to 99 percent, !irotate the nozzles aft, concurrently increasing the pitch attitude, and then gradually decrehse theflap deflection as speed increases. The thrust must be increased In'st because the transient effects of _
changing nozzle position are opposite to the steady-state effects. Deflection of the nozzles aft to _
: _ achieve more longitudinal acceleration decreases the lift. A concurrent increase in engine speed or• _ angle of attack is therefore necessary to compensate for the momentary loss in lift as well as to-_ _: arrest the sink rate for the waveoff, i4
_ Engine-Out Control and Performance
; _. Single engine failures were simulated in the test program on approaches and takeoffs by" _ abruptly _tarding one engine to flight idle. The relatively long deceleration time (18 to 25 sec)" [. peculiar to the engines caused a very moderate onset of any out of trim conditions.
L
.' !. Engine fa;.lure on takeoff-- Figure 84 is a time history of a simulated engine failure on takeoff_ at an aircraft weight of 41,000 lb (18,600 kg) with flaps at 33° and the nozzles vectored aft. The
right-hand engine was cut at rotation speed, and the left engine remained at 99.9 percent rpm.
Recovery requires less than 20° wheel deflection and less than 10° ruidder deflect:. Similarn. i
._- control inputs were used in recovery from another simulated failure conducted just aftdf liftoff at aweight of 44,400 Ib (20,200 kg) and a speed of 88 knots. In general, pilots described aircraft
, behavior during the simulated failures as "very docile wRh. little corrective control required," andconsidered recovery from the simulated failures to be no more demanding than for some conven-tional twin-engine aircraft.
At 30° flaps and approximately takeoff thrust, single-engine climb gradients were low aspredicted. Measured climb gradients for several takeoff weights and flap settings are shown in J"
figure 85, along with a predicted value for 45,000 lb (20,500 kg) gross weight. At 44,400 lb i(20,200 kg) and flaps at 32°, the best single-engine rate of climb achieved was about 200 ft/min(60 m/see) at 88 knots. The operating engine was at 99.5 percent rpm and the other at flight idle.For an emergency condition, the engine can be increased to about 103 percent rpm, which wouldincrease the climb angle about one-half a degree.
Engine failure on approach- Single engine failures were simulated on nominal -7.5 ° landing" approaches at altitudes between 550 and 800 ft (167 and 243 m). Flaps were at 70°, nozzles were
vectored vertically, and airspeed at engine cut was about 70 knots. All simulated failures were
A-54 !8 25
_, . |t
1974014524-029
"r
C
•= followed by a waveoff with power restored at 1130-to 200-ft (30- to 60-m) altitude. No actual single
engim: landings were made. The _ime histories in figure 86 show a "'failure" from 95 percent N H "approach power setting. Recovery. wa- accomplished by first increasing power on the good engine,then rotating nozzles aft (recovery technique A). Figure 87 show_ a simulated failure from 95 per-
,., centNil inwhichnozzlesarefirstvectoredaft,thenpowerincre_:don thegoodengine(recovery+ technique B).+:J- t
in the illustration of technique A (fig. 86). cutting the left engine increases rate of sink from950 ft]min to 1450 ft/min (200 m/min to 440 m/min) as total vertical force is decreased andairspeed tends to increase. Elevator is applied, pitching the aircraft nose up, and power is increased
i_ on the good engine to arrest sink rate. As nozzles are ve¢:c:ed aft, with airspeed at 65 knots, sink, rate further increases to 1800 ft/min (550 m/min) until th_ aft vectored thrust causes speed to
+ increase, producing positive g and a decrease in sink rate. About 20 sec are required to bring the rateof de_cnt to zero. Nozzles arc then modulated to reestablish speed and regain the flight path.
+ Laterally, cutting the left engine rolls the aircraft about 4° to the I_ft due"to the .asymmetric hot_. thn_st moment (partLdly offset by an opposite moment from asymmetric .distribution of cold: +, thrust). An increase in right-.hand engine power contributes further to the left moment, which is
corrected by application of ! 0° to 20 ° right wheel input. As nozz.*esare now vectored aft, the roll -: _ mome,+t becomes a yawing moment requiring 8° of right rudder to counteract sideslip, and the: l
' wheel deflection is reduced to level the wings. Although control inputs are small and easily accom-plished, considerable coordination of control is required throughout the recovery procedure. In agenuine emergency with rapid asymmetric thrust loss, pilot workload would be high.
in the illustration of techniqae B (fig. 87), sink rate increases rapidly from about 850 ft/min to1400ft!min and airspeed increases as the right-hand engine is cut and nozzles are vectored aft. Pitchattitude is increased and thrust on the opposite engine is advanced to takeoff power to arrest sink
_+ rate. As speed increases, the flight path shallows. Laterally and directionally the recovery procedure" involves primarily rudder input. As the engine is cut and nozzles are vectored aft, the+momentary - ....: roll moment becomes a yaw moment, which is corrected with about 5°of left rudder. As power ol_-++
the good engine is increased, a further 5° of rudder is applied in the_ame dii-ectio0. Technique B is,.
+,, simpler than A in that reversa! of wh_l position is avoided, but in a genuine e4nergency thisprocedure may tend to give a larger initial increase in sink rate due to an initial decrease in Hft asnozzles are vectored aft prior to an increase in power:Single-engine climb:, with flaps at 65° or
: above were not possible with any technique except at the very low gross weights,
Waveoff from single-engine approaches required only vectoring the thrust aft, increasing air-' . speed, and retracting the flaps. The _ontrol and performance were then similar to the engine-out_ •'takeoff case. These recovery examples are not necessarily optimum for minimizing altitude loss or+
+ for reestablishing the approach flight path, but they do illustrate the primary control inputs used to,_ recover from an engine loss. "
+
..- __+- ;
: 26 A-5418
1974014524-030

!
t
REFERENCES :!
. !. Bradford H. Wick and Richard A. K_hn, "Turbofan STOL Research at NASA." Astronautics and .AeJona,,fics_
vol. 9, no:.5, May 1971.
./ 2. D,C. Whittley. "The Augmentor _ng: A New Means of Engine Airframe Integration for STi_U'AJrcraft." _ "_-, AIAA paper no. 64-574 presented at Fourth ICAS Conference, Paris, 1964.
3. J.E. Middlebrook, H. C. Tinney, an_ D. C. Whit:ley, "The Evolutionary Development and Current Status ofthe Augmentor Wing Concept." Paper 700812 presented at SAE National Aeronautics and Space En_neering
and Manufa_tbring Meeting, Los Angeles, October i 970. - •__ 4. G.S. Kelley and R. P. Gerend, "Propuluon Systems for Commercial STOL Air_raft." AIAA paper no. 71.746.AIAA/SAE 7th propuhion Joint Specialist Conference, Salt Lake Chy, June 1971. _
5. D.C. Whittle),, "The Augmentor Wing Research Program: Past, Present, and Future." AIAA paper no. 6.7-741 ,_ - •
Tenth A_,_)_-American Aeronautical Conference, L_s Angeles, October 1967. .._ .. ,
6. D.G. Koenig, V. R. Coniglia, and J, P. Morelli, "Aerodynamic Characteristics'of a Large Scale Model with an _•_i
Unswept Wing and Augmented Jet Flap." NASA TN 1_4610, 1968. -..
7. A.M. Cook and T. N. Aiken, "Low Speed AerodynamifCharacteri_ics of a Large Scale STOL'-Transport
Model with an Augmented Jet Flap." NASA TM X-62,017, ! 97 !. _ , .
8. M.D. Falarski and D. G. Koenig, "Aerodynamic Characteristics of a Large-Scale Model with aSwf, pt Wing and
'Augmented Jc" glap." NASA TM.X-62,029, 1971. "-
9. R H. Ashleman atld H. Skavdahl, _'The DeVelopment 6:f an Augmentor Wing Jet STOL Research Aircraft, (Modified C-gA), vol. !. SummarY, NASA CR:! 14503, 1972.
i0. H.C. Quigley, S. R. M. Sinclair, T. C. Nark, and J. V. O'Keefe, "A Progress Report on the Development ofan
Augmentor Wimg'Jet STOL Research Aircraft." SAE Paper 710757, National Aeronautic and Space E_gineer- ,
ing and Manufacturing Meeting, Los Angeles, September L971. ' - 1,b
1I. R E. Spitzer, P.C. Rumsey,and !:1.rC. Quigley, "Use of tl_e FlightSimulatorin the Designof a STOLResearchAircraft."AIAAPaper'72-762,August1972.
-t2. R.C. lnnh andS. B. Andenon_"_omparisonof SimulatorandFlightResultson AugmentorWingJetSTOL: ,_ Reu!arcllAircraft."NASASP-3_0,Paper2!. 1972.
•_ 13. H. Skavdaldand D. H. Patten.on, "The Developmento_m AugmentorWingJet STOL ResearchAircraft(ModifiedC-gA),vol. !1.Analym of Contractor'sFlnghtT_t, August1972.
14. "John A-_o_nway,"The Developmentof an IntegralPropulsionSystemforJetSTOLFlightResearch."Paper,• presentedat AGARDPropukionattdEnergeticsPanelMeetingon V/STOLPropulsion,September1973.
15. D.L. I-larkonen,C. F. Wintermeyer,and F. L. Wright,'_tatic Testsof a 0.7 ScaleAugmentorWingFlapfor• the ModifiedC-gAAirplane- TestResultsand Analysis."NASACR-114315,1971.
16. B. Cleveland,RichardF. and S. R. M.Sinclair, Jet ResearchVomaske, **Augmengor Wing STOL' A_rrraftDigitalSimulationModel."NASATM X-62,149_1972.
A-5418 27
*°
1974014524-031
• iL
: o
°
17. Susan E. Post, "'Computer Pregrams for Estimation of STOL Takeoff, Handling, and Static Perfmmance." i1 NASA TMX-62,217, 1972. / _!.
, " };18. H.E. Hoemer,,_'Fluid-DynamicDrag." Publishedby the author, 1965. :: :,I -- _c
-,-_ 19. R.E. Spitzer, "Predicted Flight Characteristicsof the Augmentor W'mgJet STOL ResearchAircraft." NASA "
CR-114463, 1972. " _,/
20. R.G. Inn/s, C. A. Holzhauaer, and H. C. Quisley, "Airworthiness Comiderations for STOL Aircraft." NA2,A *- !_.- TN !)-5594, 1970. i_
21. Anon.: "V/SfOL Handling-QuahtiesCriteria," AGARD Report no. 577, DecA_mber1970. _. ~ " t__t
22. R.L. Allison, "Design EvaluationCriteriafor CommercialSTOLTrenspon_.'" NASA.CR-! taa54:1972, it ". - |
_ 23. Anon,: "Military Specification - Flying Qualities of Piloted Ai_plaqe,." MIL-F-8785B(ASG)_August 1969.
24. Anon.: '*Tentative Airworthiness Standards for Powei_ Lift Transpor.tCategor_-Aircraft.'__ XX, FederalAviation Administration, August 1970.
- |
, 25. Anon.: "l_tary Specification - Flying Qualities of Piloted V/STOL Aircraft." MIL-F-83300, December I,
i "... 1970. " _.
! 26. P.M. Condit, L. G. Kinbrel, and R. G. Root, "lnflight and Ground-Based Simulation of HandlingQualities of . i-Very LargeAirplanesin Landing Approach." NASACI_-635, 1966. ['
I
/
_ t
t
I
28 A-54 !8 :
t_
J
1974014524-032

3:
r_
!
/
APPENDIX
• FLIGHT TEST AIRSPEED, ALTITUDE, AND ANGLE OF ATrACK CORRECTION
The nose boom airspeed and altitude position error corrections are presented in figure 88 for5.6 °, 30°, and 65 ° flaps. The parameter (AP/qi) is the ratio of the measured static pressure error
(_) :o the uncorrected impact pre-_ure (qi). The parameter.,CLa"is the trim lift coefficient of theaircraft,based on indicated airspeed.
The angle of attack calibration is presented in figure 89, also for flap deflections of 5.6 °, 30 °,
and 65°. In this figure, ¢/is the measured or vane deflection (indicated angle of attack) referenced
I to the rose boom measuring station, and ¢F is the corrected angle of attack referenced to the _
/ fuselage centerline. ..
" 2
7 _
iI
t
A-:;418 29
1,!
1974014524-033
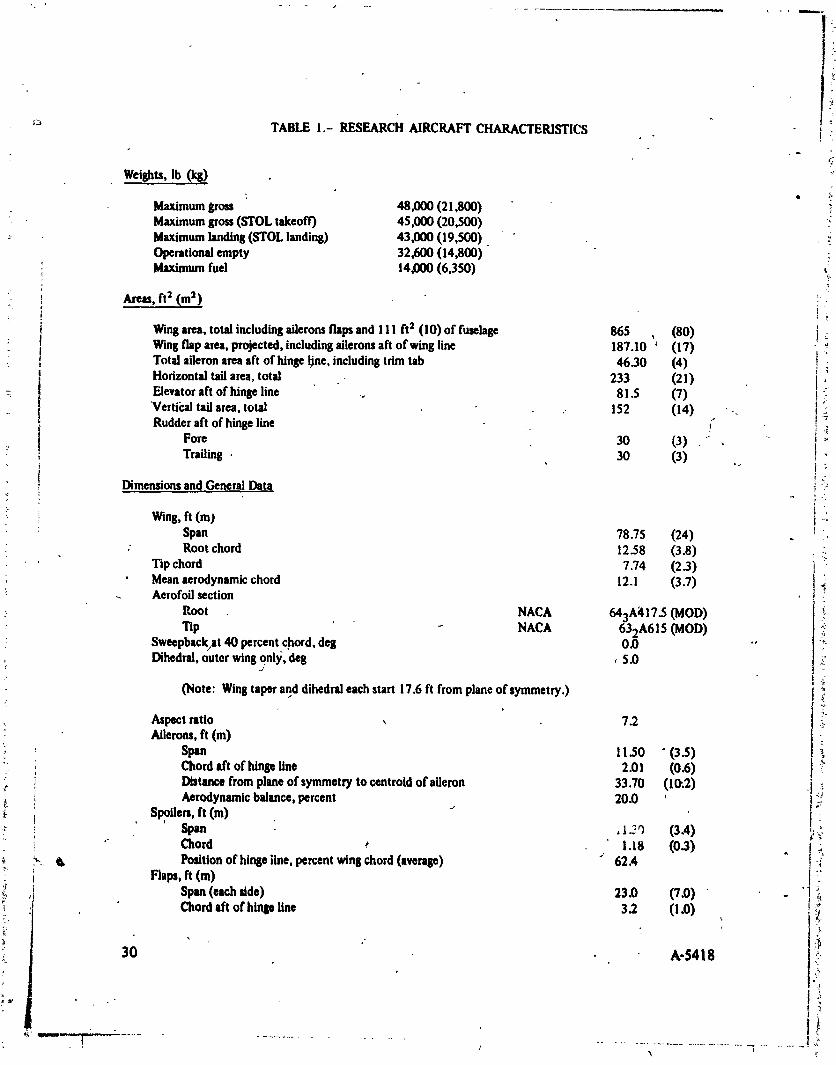
_ TABLE I.- RESEARCH AIRCRAFT CHARACTERISTICS
Weights, lb (ks)
Maximum gross 48,000 (21,800)Maximumgross (STOL takeoff) 45,000 (20,500)
Maximumlanding(STOL landing) 43,000 (19,500).Operational empty 32,600 (14,800)Maximum fuel 14,000 (6,350)
"_ Areas, ft I (ml)
Wingarea, total including ailerons flaps and 111 ft1 (I 0) of fuselage 865 (80)Wing flaparea, projected, includingailerons aft of wing line 187.10 (17) " "Total aileronarea aft of hinge line, including trim tab 46.30 (4) , -Horizontal tail area,total .- 233 (21)
Elevatoraft of hinge line 8 ! .5 (7) _:"Verticaltail area, total .. 152 (14) " .
< Rudder aft of hinge line s" -t
Fore 30 (3) . " , -_
Trailing • 30 (3) ... ;
Dimensions and GeneralData ?.o J
Wing, ft (m) ,
Span 7835 (24): Root chord 12-58 (3.8)
Tip chord 7.74 (2.3) "
Meanaerodynamic chord 12.1 (3.7)Aerofoil section
:, Root NACA 643Air 17.5 (MOD): Tip - NACA 632A615 (MOD), Sweepback_at40 percent chord, deg 0_) "'
, Dihedral,outer wing only, de8 .-5.0
(Note: Wingtaper and dihedraleach start 17.6 ft from plane of symmetry.) _.
Aspect ratio , 7.2; Ailerons, ft (m)" Span 11__0 "(3.5)
Chord aft of hinge line 2.01 (0.6) _"/ Distance from plane of symmetry to cemtroidof aileron 33.70 (IO,2)
Aerodynamic balance, percent 20.0 ', Sl_llen, ft (m) _ |t"i
:_- Span , i 2 q (3.4) _;_." Chord _ i.18 (0.t) . °_
I_. _ Position of hinge line, percent wing chord (average) • 62.4
Flaps, ft (m) lSpan (each lide) 23.0 (7.0) . "!Chord aft of hinge line 3 2 (! .0) !
30 A-$418
t
......................_ -............. i ,?
1974014524-034
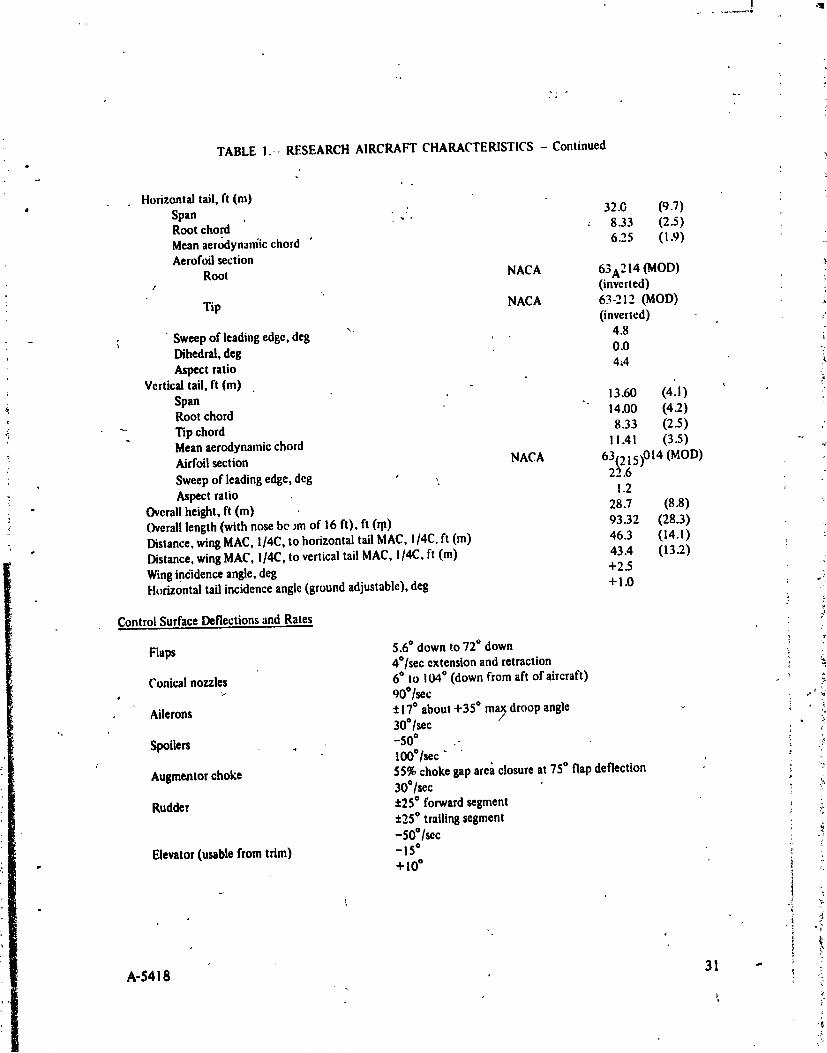
.4: . ..
TABLE I.-- RESEARCH AIRCRAFT CHARACTERISTICS - Continued
Horizontal tail, ft (m)
Span : 32.0 (9.7)Root chord _ 8.33 (2.5)Meanaer_lynaniic chord " 6.25 (I .9)Aerofoil section
Root NACA 63A214 (MOD)t (inverted)
Tip NACA 63-212 (MOD)(inverted)
- ; " Sweep of leadingedge, deg " 4.8Dihedral,deg 0.0 =.Aspect ratio 4_4
Vertical tail, ft (m)
Span -. 13.60 (4.1) '_Root chord 14.00 (4.2)
Tip chord 8.33 (2.5)Meanaerodynamic chord ! 1.41 (3.5) --
:: Airfoil section NACA 63f21 014 (MOD)
" Sweep of leadingedge, deg , ,. 2_.6 5).: Aspect ratio ! .2
Overallheight, ft (m) 28.7 (8.8)Overalllength (with nose be _mof 16 ft), ft (rp) 93.32 (28.3)
, Distance, wing MAC, I/4C, to horizontal tail MAC, I/4C, ft (m) 46.3 (14. !)Distance, wing MAC, I/4C, to vertical tail MAC, i/4C, ft (m) 43.4 (13.2)
Wingincidence angle, deg +2.5Htnizontal tail incidence angle (ground adjustable), deg + ! .0 !
ControlSurfaceDeflectionsandRates , :,
Flaps 5.6° downt.o72° down : :'4°/see extension and retraction ,
Conical nozzles 6° to 104° (down from aft of aircraft) _ ;. > O0*/sec ,
Ailerons ±i7 ° about +35* ma_ droop angle • _.. 30*/see •
Spoilers _ -50° "" i', 100°/see "
Augmentor choke 55% choke gap area closure at 75° flap deflection _-30°lsec _,
Rudder ±25° forward segment :±25° trailing segment _:
-50°IsecElevator (usable from trim) - 15° _
" "FI0° °
A-5418 , 31 .-
1974014524-035
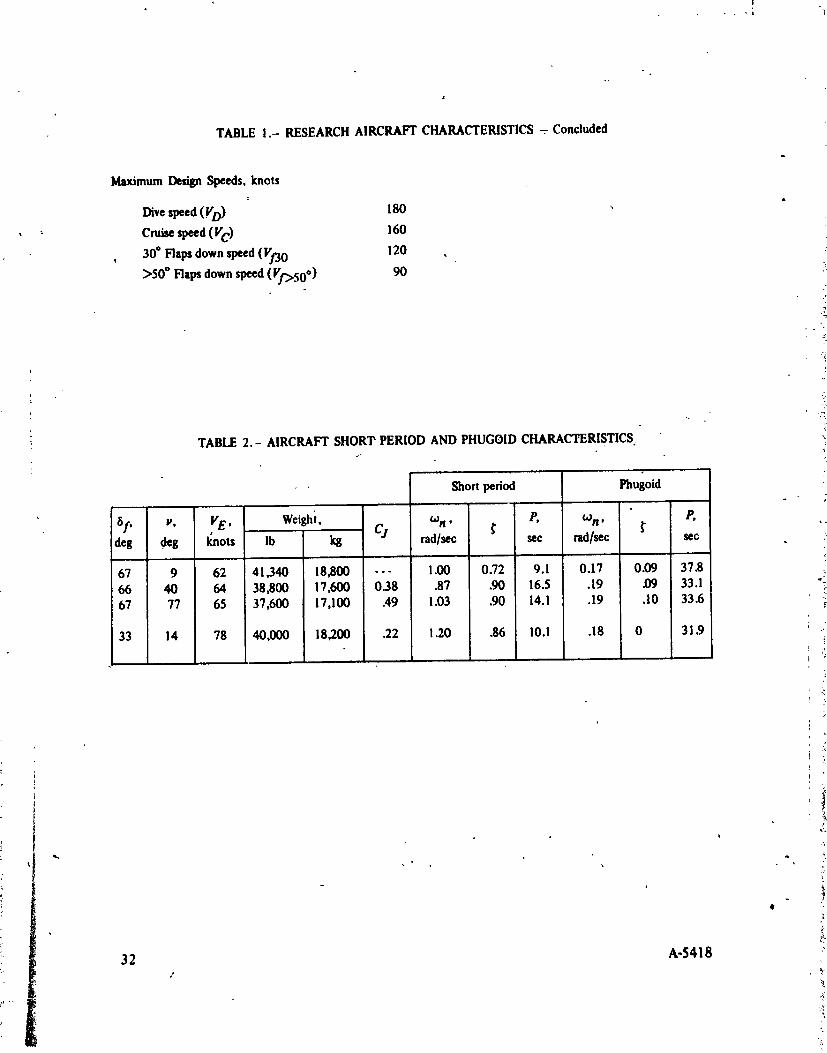
I
j
TABLE I.- RESEARCH AIRCRAFT CHARACTERISTICS - Concluded
Maximum Design Speeds, knots
,a
Dive speed (FD) 180 ,
, cm_ speed(re) !60, 30° Flaps down speed (F_ 0 120
>50 ° Flaps down speed (Ff_50o) 90
TABLE 2.- AIRCRAFT SHORT PERIOD AND PHUGOID CHARACTERISTICS̀
Short period Phugoid
8f, U, FE , Weighi, wn' P' COn' P'deg deg I_nots 'Ib kg Cj rad/sec _" _"sec rad/sec seo
67 9 62 41,340 18,800 -- - 1.00 0.72 9.1 0.17 0.09 37.866 40 64 38,800 17,600 0.38 .87 .90 16.5 .19 .09 33.167 77 65 37,600 17,100 .49 1.03 .90 14.1 .19 .10 33.6
33 14 78 40,000 18,200 .22 1.20 .86 10.l .18 0 31.9
/
f
32 A-5418
1974014524-036


i;l
io• TABLE 4.-ELEVATOR RESPONSE AND FLIGHT PATH CONTROL FOR THE _
STOL APPROACHCONDITION. • _'
(
AWJSRA Criterion (ref.) 11
Elevatorcontrol power l!(FcoI -- 40 lbs), rad/sec2 0.33, -0.34 > 0.05 toO.20 i21)
Pitch control sensitivity
(0/6c), rad/sec_/inch 0.08 > 0.08 to 0.12 (21)
• Stick force perg, lb/g 30 < 20 to 40, >3 (21)• t.
Effective vertical speed
crossover time (t_), sec 0.9 _ 0.8 (22)
Load factor response time
constant (rnz), sec ~1.5 _ 1.5 (21)
Load factor per unit control
deflection (nz/6col), g/inch 0.15 ~ O.! (22) - i_
Load factor perunit angle of t
! attack (nzla), g/rad 1.5 _ > 2.3 (23) " _"
Flare control load factor, g > !.1-1 .! 5 > 1.20 (22)
Pitch angle after !sec,
.t deg (Fco ! se40#) 2.2° > 2 to 4 (21)
-/
TABLE 5.-ELEVATOR SYSTEM CHA_CTERISTICS AT STOL APPROACH SPEED. ..
AWJSRA Criterion(ref.)
Elevator deflection from
trim@40# Fco1, de8 -13, +!4 -
Control column deflection, th.' +7.5, -5 > ±4, < ±6.5 (21)
Elevator to column - ,:
gemn8, deg/ln. 3.0 -
, Force gradient(/_ e<l 0°) lb/in. 4.8 _>2, < 5 (21) "
i Column force at TEU
;, ! maximum uuble 8 e, ib 40 _ 75 (24)
34 A-5418
• . ......................... • ........ I =)
1974014524-0:38

TABLE 6.-,LONGITUDINAL STABILITY CHARACTERISTICS AT" ;TOL APPROACH SPEED.
• AWJSRA Criterion(ref.)
Stick-fixed stability
• (A6e/AV), deg/knot 0. I > 0 (24)
Stick.free stability
" (AFc/AF), Ib/knot 0 > 0 (24)
Change of flight path with_,elocity(AT/AV). de,knot" 0 <_0.06 (23)
Short-periodnatural frequency
(ton), rad/sec 0.9 > 0.47 (25) iiL
Short-period damping ratio (_') 1.2 > i.06 (25) :°
Phugoid natural frequency
(top), rad/sec 0.2 - /,
Phugoiddamping ratio (_') 0.1 > 0 (25)
Changeof 0 with velocity• (AO/tXlO,deg/knot , -0.8 < 0 (22)
| ,,,
'7
s
• 1¢
• ?• 3
A-5418 _5
f
_" _.... -'_ ....... _...... I i_J_ i ",j
1974014524-039

TABLE 7.- LATERAL AND DIRECTIONAL CONTROL CHARACTERISTICS.
AWJSRA Criterion(ref.)3t
Lateral
Control wheel travelat max 0, deg ± 77 . "± 60 (20)
Control travel, in. (m) + 11.2 (± 0.3) -
Breakoutforce, lb (kg) ± 5 (+ 2.3) 1/2 to 4 (25) .
Force gradient (_w < 20°)' Ib/in. (kg/m) 0.8 1 to 3 (21)
Maximumforce at max. 0, lb (kg) ' 10 (4.5) < 20 (20) •
Control response (full control), sec 0.3 < 0.3 sec. for 63%_max (21)
Directional I
Rudderpedal travel, in. (n) ' ± 3.9 (:_0.1) 2.5 to 4.5 (21) _"
Force gradient(± 25 percentRudder pedal), ib/in. (kg/m) 45 (800) 10 to 35 (21)
Maximumforce, lb (kg) 98 (44.5) < 130 (24)
Control response (full
control), sec 0.7 < 0.3 for 63% _max (21)
p-
tI'
¢-
t •
, !
36 A.or418 , Ii
t
1974014524-040
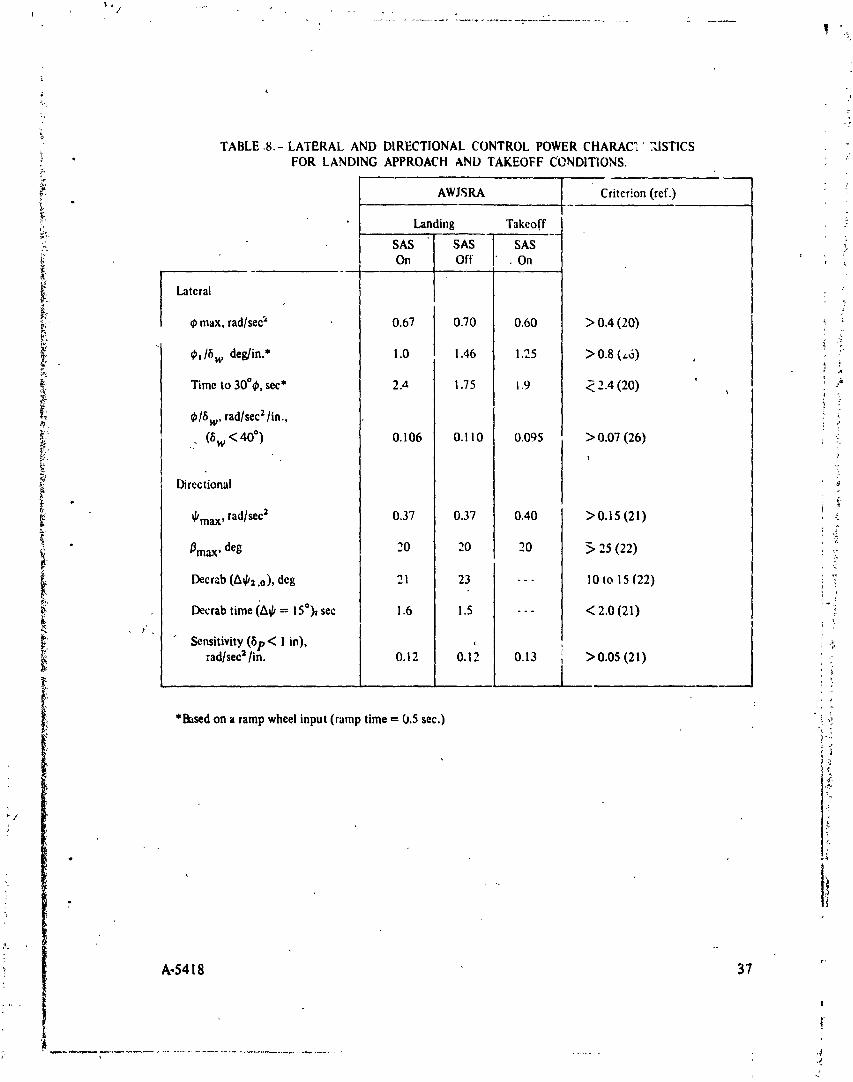
_J/
• !
TABLE.8.-LATERAL AND DIRECTIONAL CONTROL POWER CHARAC'_' ._iSTICS" FOR LANDING APPROACH AND TAKEOFF C@NDITIONS. ;
AWJSRA Criterion (ref.) ;-
'_" landing Takeoff
:< SAS SAS SAS _.
_ On Off , On_ Latcral
_ #)max, rad/sec:' 0.67 0.70 0.60 > 0,4 (20) .:'
• Ct/Sw deg]in.* i.0 1.46 1.25 >0.8 (,_6) , , _
Time to 30°_, sec* 2.4 i.75 1.9 _, 2.4 (20) ' ,_
1
_ ¢/6 w, rad/sec2/in., _:_7 (5w <40 °) 0.106 0.1 I0 0.095 >0.07 (26) _
-7
Directional? ° _
_[ ¢,max, rad/sec2 0.37 0.37 0.40 >0.15 (21) _.
_ _max, deg 20 20 20 >. 25 (22) _2',2
I Decrab (A_2.o), deg 21 23 --- 10 to 15 (22) _-'": Decrab time (A_ = I 5°), sec 1.6 1.5 --- < 2.0 (2 I) " i
_i Sensitivity (Sp< ! in), , ¢.
rad/se¢2/in. 0.12 0.12 0.13 >0.05 (21) --
*Basedon a rampwheel input (ramp time = 0.5 sec.) ., _i_
i/
A-5418 37
I
1974014524-041

._ TAELE 9.-LATERAL-DIRECIIONAL DYNAMIC CHARACTERISTICS FOIt "LANDING A_EROACH AND TAKEOFF CONDITIONS.
; AWJSRA Criterion (re£) 'r_
Landing Takeoff
-, Dutch roll damping_(Od),I/set: 0.30* 0.16 0.36 > 0.087 (20)
;: Dutch-roB " 0.98 !.06 -I.06 > 0.523 (20)-- frequency(_d)' i/see -.
Roll timeconstant0rR),sec 0.45 " i.1 1.0 < 1.4(23)
_i Spiraltimeconstant'_ (rs). sec _O -0.Z Z "-0 >--o.o35 (20)
; Turn coordination (_1_) 0.25 0.65 0.15 < 0.3 (20)-
Dihedraleffect (d&w/d_') i.2 1.2 !.4 > 0 (21)
Dihedraleffect (Fwi_max), lb 8 8 8 < 10 (21) -i
-, wine Dutch-roll dampingparameter(g'C_d)is increasedto 0.45.with the VSS engaged in the landing_: approachconfiguration.
?
£
/
i'
I
ifi
38 A-$418, - . - i
t¢ e_k
1974014524-042
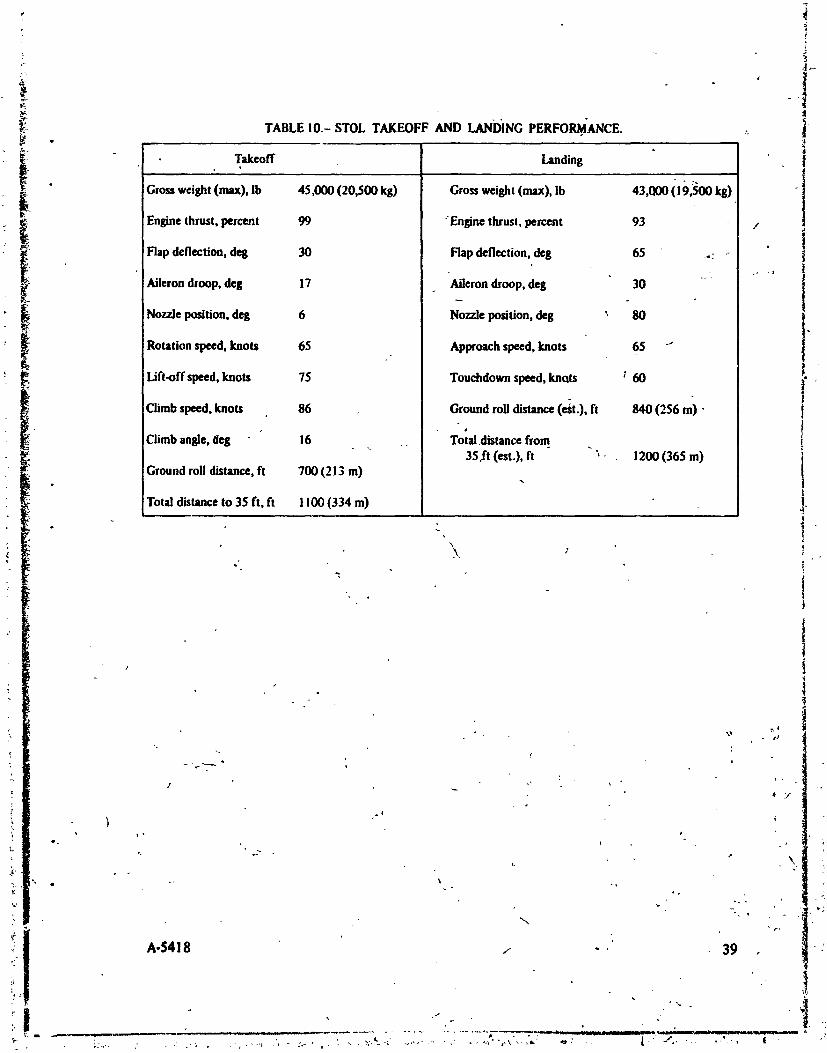
TABLE 10.- STOL TAKEOFF AND LANDING PERFORI_J'ANCE. :- i
i Takeoff Landing
Gross weight (max). lb 45,000 (20,500 kg) Gross weight (max), Ib 43,000 (19.500 kg)
Engine thrust, percent 99 'Engine thrust, percent 93 /
Flap deflection, deg 30 Flap deflection, deg 65 4: '- j ,t
Aileron droop, deg 17 Ailerondroop, deg 30 "-
Nozzle position, deg 6 Nozzle position, deg x 80
Rotation speed, knots 65 . Approachspeed, knots 65 -"
Lift-off speed, knots 75 Touchdown speed, knots t 60
Climb speed, knots 86 Ground rob distance (e_t.), ft 840 (256 m) • ,
• * t
Climbangle, deg 16 .. Total.distance from . t35ft (est.), ft '- 1200 (365 m)
Ground roll distance, ft 700 (213 m)
LTotal distance to 35 It, ft I 100 (334 m)
x
/
,_|#7
4 O
,y ." ,
1 'e. • f _
• °,°
_ q
A'5418 / "• 39 ,I
1974014524-043
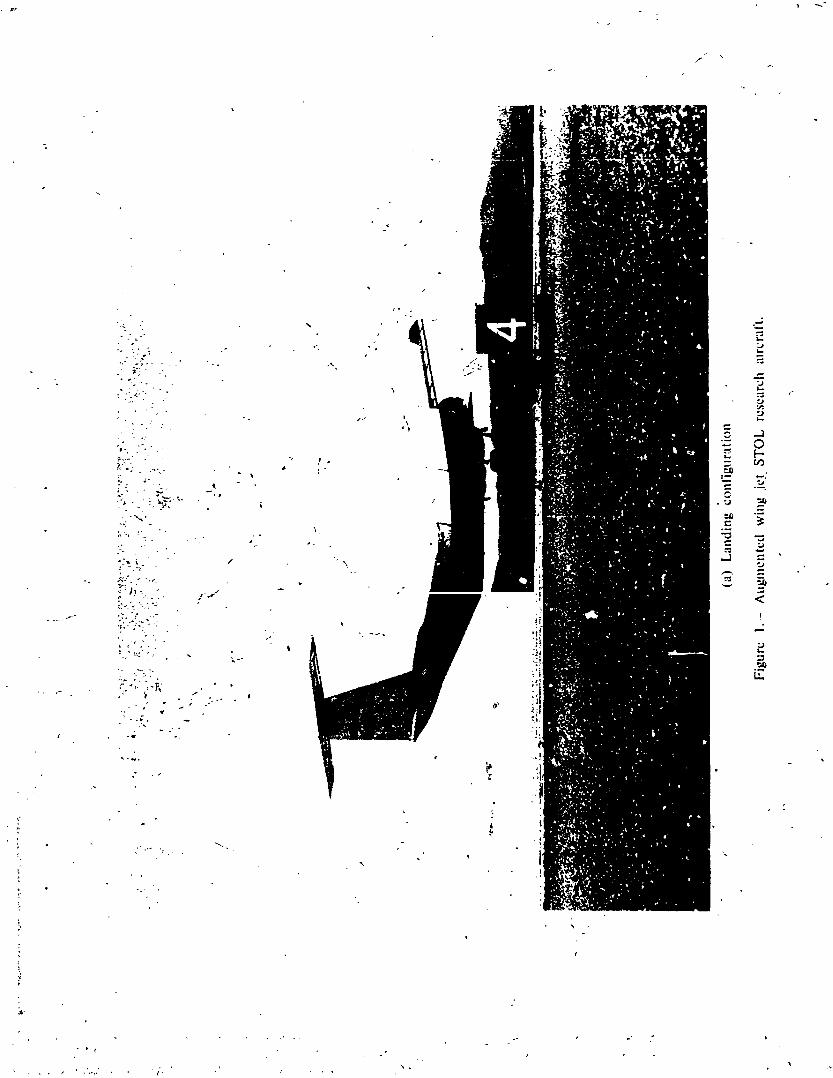
s
. °

1974014524-045


.=
• Bypass air Conical nozzles_. cross duct
g
: _ _' X Bypass air_ Main Rear' _ engine mount mount assy rear duct ,
1
_ _ ,°
Firewall Firewall
Airbleed exit Nozzle : ?! engine bypass actuator _
Figure 4. - Nacelle installation. ! •
1974014524-048

; Z
8 -- -1 ........ _ -
I I ' 4
t OUJ
:-, ...... / ,! / •" = . .... i
"": I1_ I"| 1 / I
- 1201 , • ,O / _ ;.
' "x 4 ..... -7 ...........i....... ::-_ JD
• " (fOil I= 2 .... Y ---I- b :
L i t L
; 2GO r_. ...... 1r ....... ._ _°_]_ -.._ ,
•1_ ,co J J' ' '
_ *;-'t 12
.. .
-. . II _
_"'; 080 600 620 640 660 680 700 720 740 _:'_
• 4_ I _: NTI , (rpm/,/_) " :
(a) Primary mass flow and gro= (ho_ J:-:_st. i
Ft&ur_ S.- Nominal SPEY 801-SF engin_ operatlnl parameters.
1974014524-049

I
Ib
C. I , _ f_... o 20 - ,: ' ,'1 i
:L Z ' ! d ,
' _ =10- i_ ! i ; ....it) t J .
: _. (_ , _ ! .
_• _i = { , :" 0-0 i I I , . , I
; ' L _"
• _ i _ __._C I - " _......... ,
_-; .j = ' -:_0 , , i, i _ I i i ;;;_
_o--N-- i I * i _;=3@ I ' i : : _
:
#1 _eo_oo_o _4o_6oseo_oo_o _4oNH/q_l, (rpm/qr;K") ,.,
(b) Bypass(cold) thrust, L.P. compressorpressurerati-o,.andbypassmassflow,
Figure 5.- Concluded.¢
1974014524-050
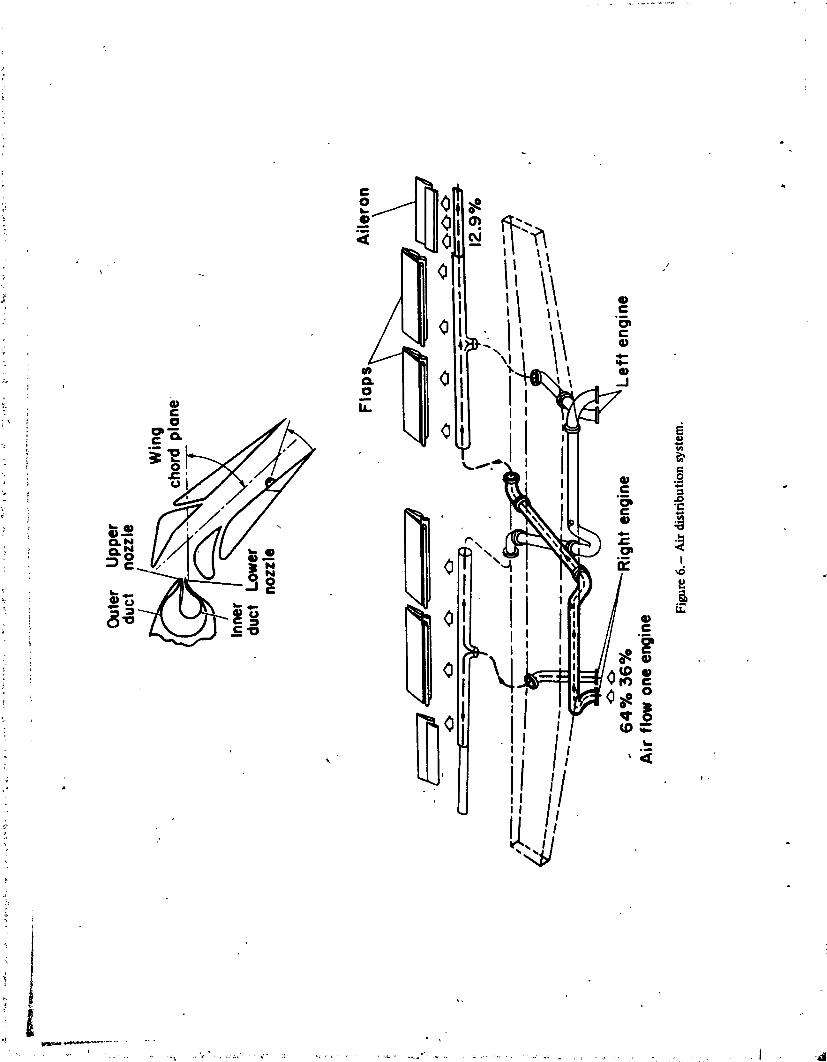
|...... ' • t d
1974014524-051

Crossduct\ _Fuselage BLC nozzles: il p---k---._lr qr_......J_ ,!
II " "_._.11 m!st ...... I I_s II
- - Lower nozzle\ jill _J:',,_\_= "L": L:: .. ..... __.:,,.\,..,__ === ----m_m=L _ ,.--
• Upper nozzie/ Aile/ronBLC nozzles
: R H Engine
i_ _,T_O 0 L.H. EngineA
o _ " ' Crossduct.,,_,_ _. . _._
: _- _ 50 ' , ': L__' ;) I_IL • , -
_ _ _ ,_ - _- _ "'- _' '_Upper nozzle
=_= ,_-- -___ _, ... ___ ...------"Lowe nozzle_i i ; i !F" , I
o Aoo': " i 1 i: _
I _ ___.--.,_-_-- __.i.__-,_._- : ler n n zzles
- i. 'm 0 i i I 1 I'i', 88 90 92 94 96 I00 102
.... High pressure engine rotor speed, %NH .I
Figure 7.- Bypass flow distribution.
L ,,
1974014524-052
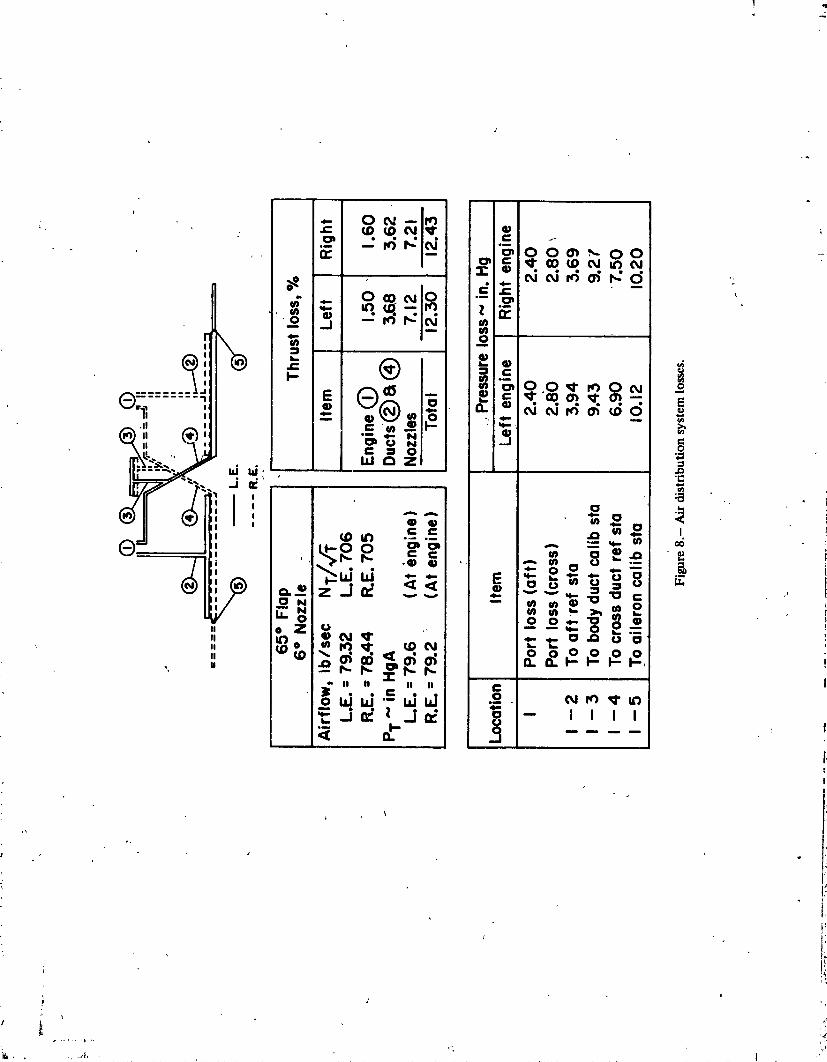
Ii,i
!
• ..... o - -
1974014524-053
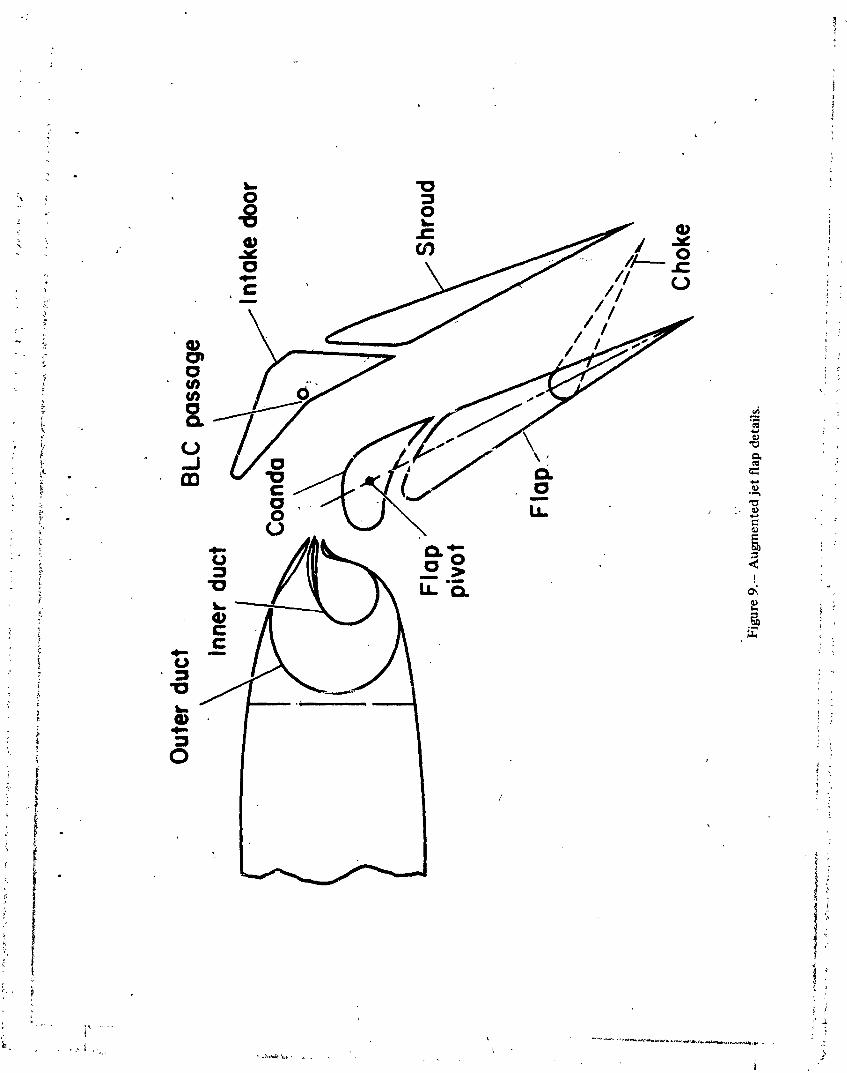
s.. "0", _ • 0 :3" >. 0 0
, _ . .__/_ //__o
t
r :
t, 7
,i
" i
]9740]4524-054

t - 1.
1974014524-056

I
1974014524-057
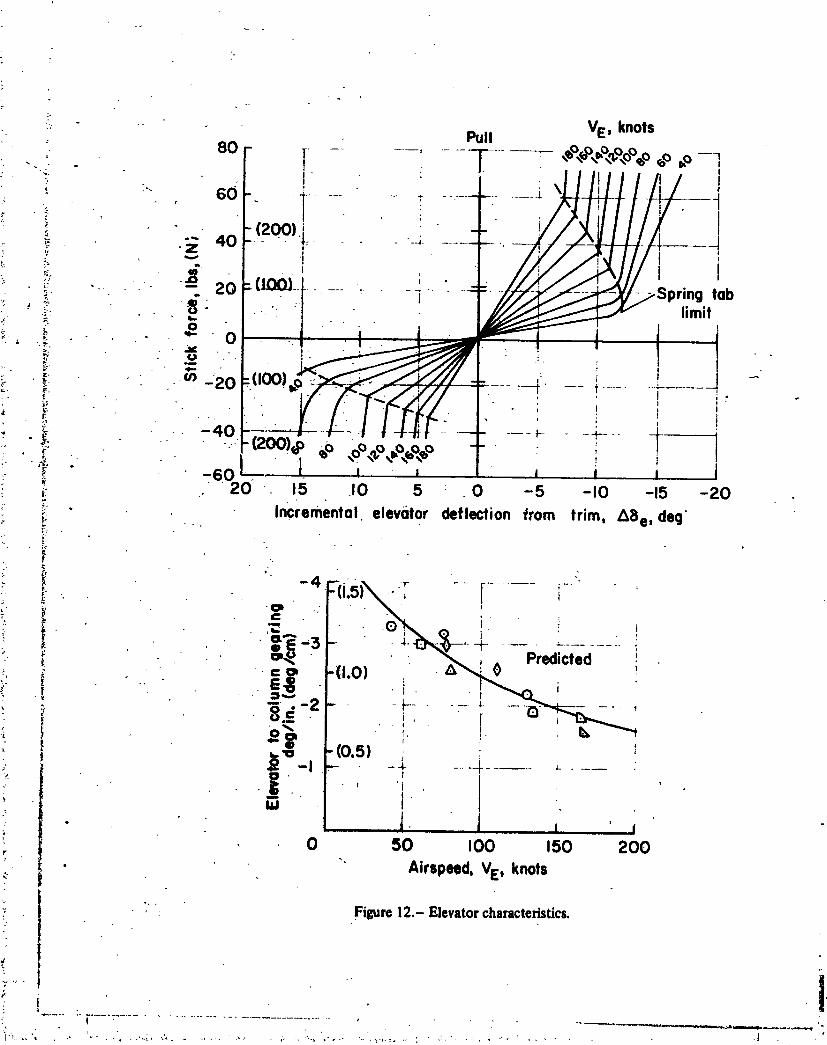
i-
1974014524-058

{
30 F
o, 20= --t "
e ' ! 7: f
= 0 i0 i j +
1 1m -20 .... ,.....; I I!
-30 i ... I I . :-4 -3 -2 -I 0 I 2 '3 4 inches
I I I I l lcm) .++
i+ -I0 -5 ... 0 _ I0 +• : ' Pedal position,inches cm) ._:- Ib . ++
+, +
• (")'+°F+] + + +"--I +---i I+
[ L ' : " ; 1
,,oo 8or i , i i-i _ 11+ / ; I '/ /" Z I _:
i "L_ I _ 1 >-T ' ' 1 :
_ -4oo_- P'T I i i Ii i. . i +-iZo-ZSlaO-_S-0o -s o s _o 15 2o 25 /l
Rudder angle, deg ;
:i [ Figure13.- Directionalcontrol characteristics,pedalforceand gearing. ,2-, J -. .__ '4
K Ii i ,"
) i ' 'fI
• ' + P+':,,im_--'m'_r+ "+.... ; - -, ' IP + ,. ++ + ,, + ,_ +
1974014524-059


f
50 , .
,, 030
•_ 2o ........ t •J' _ ' ;
_ 0---- I i i .......... t• (a) Aileron droop program - "
-' 60 ----_-. _ r.....;...._
40 .... !--;- ........ :___o :,
__- .
x 1
, i
1 L ": _ i k - , i .0 20 ' 40 60 80
" Flop position,_, deg. ; (b).Maximum choke deflection program _
Fillu_ 15.-Lateral control deflection. •
1974014524-061
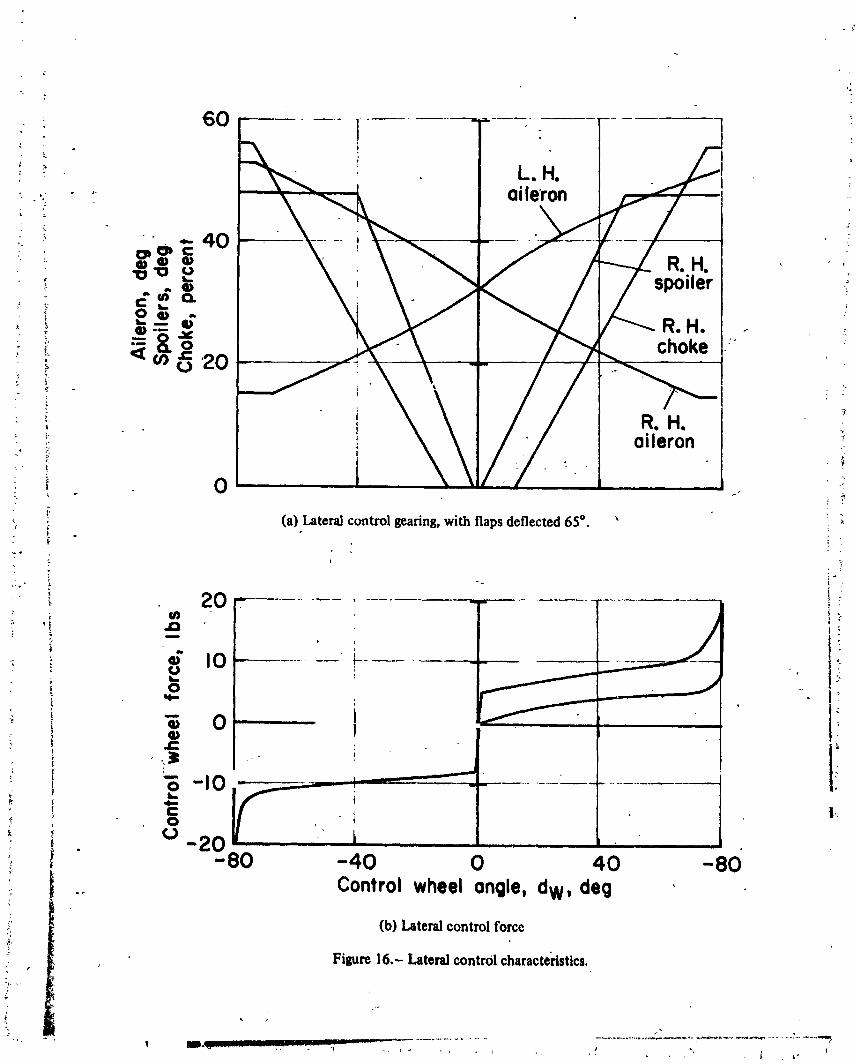
?
60 T "i.
i _ L.H. taileron
' 4O%
_e R.H. "_. . _ spoiler :
• _ -_ R.H._ _ choke :; o '20e i •
; ' t R.H. :" _ ' aileron _
_ _ 0 , "
(a) Lateral control gearing, with flaps deflected 65 °. ' 1
,2.- i °_
2o- T { A :'!j , :.
" _ _ I,
0 ..... :0-40
.. Control wheel angle, dw, de
(b) Lateral control force
Figure 16.- Lateral control characteristics.r
1974014524-062

E -o e
"-° _
.; ,_ o , :_ o-tt, _?. o o ,,_
: -_ ea
,. -= 4 _ ' -
; 0::: I >;"Io i•
!
1974014524-063
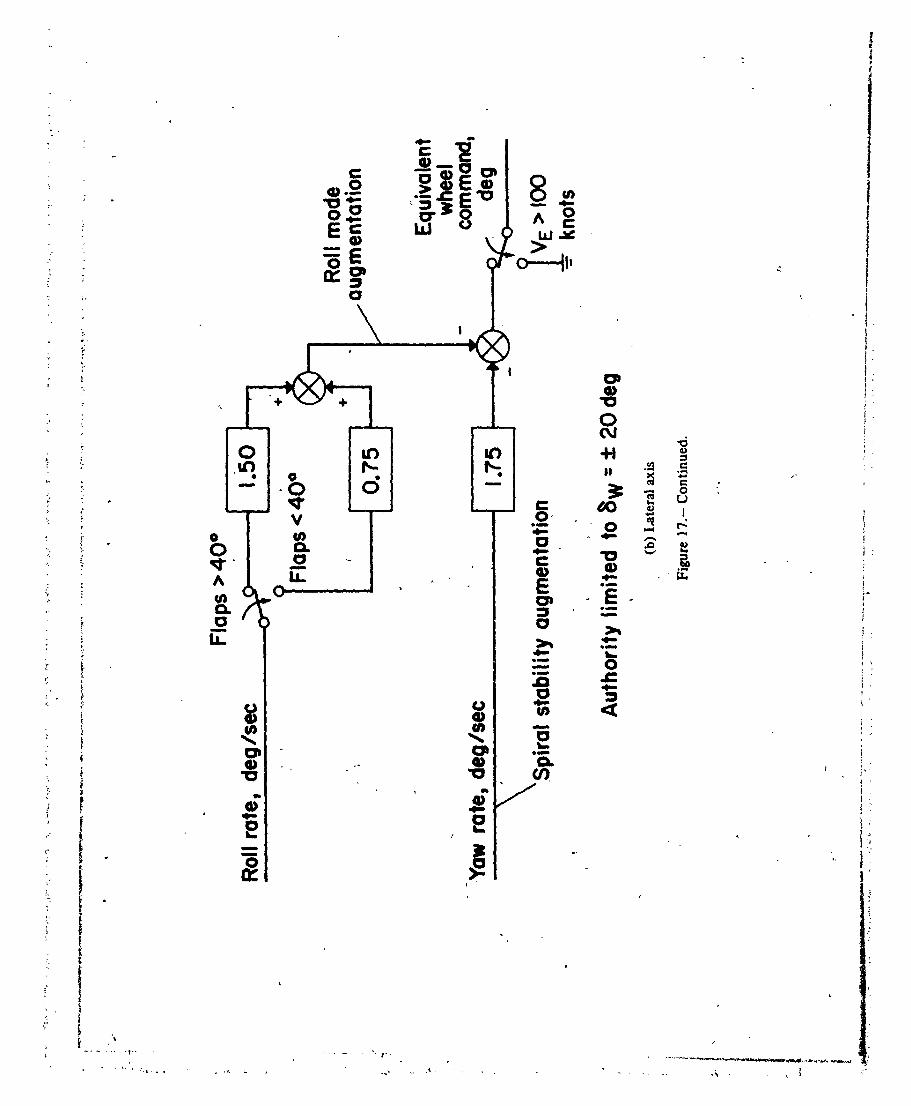
!
1974014524-064

I
!
I
] 9740] 4524-065


4
_- 80 0
e=8 88 _.o
i [4 uo o -_
• I1_ _'_ .... - .....L
1974014524-067

, i--_-_°-_- -_--I__
_, _. _, -_ "._Z
%ill: • ....... _ ..... ,--- £0
888 :N _
_ ooo _ °
: _- 0 ---cO =' _ coOdNOd : "....... ,_ __ _
I-" - -_ .... CO"0_ _=; --I_OD -I _ "
u) 013<I I \ ._.,• I ............-'' ..i....c:) °
.J .J _,0 ¢.)
t
i ] . .
1974014524-068

t
lg74014524-o6g

t
wL°
o •
4' .....
1974014524-070

go
o_ _°°
¢}
, 0 _._1" 0 _ _- co c_ ¢p 0 _"
I I I I _i o
, _Bop 'X-'elBUD q_od lqB!l..I
I
!
1974014524-071

:' 4)
: 00000
1all II - _;. _. . -°o.bo oo . ._, _: ;: :_ _ooooo , _
E;_g_ ® ® _o :000oo _ "ooooo o
• _l_'3('Dt"O 8
' ooooo o _ _'_:. : 00000 ' - . _/
- rO_l. rr),q, ro -,_ . =_
'_ D---I "
: : _ooo- _,,
" 0 0000 E8 =0 0000 _1_ _ 8
,; m m _ _--_ -_-_;_;; gilliE) _ 0--_> _.=__oo °_ - o8o0
_o -:o .!,g,8 =
" _ _ " _ o _ _0 _ _o o$:: ' ' " T T o_ v
I ', fE!e _ • •, 6ep ',/,.'el6i_o qlod lq6!l-I "
, (/):0 <1 13 _ O _ !?
). iI
t
k _1
1974014524-072

.L
>
1974014524-073


5 _" t .... :\
]9740]4524-075
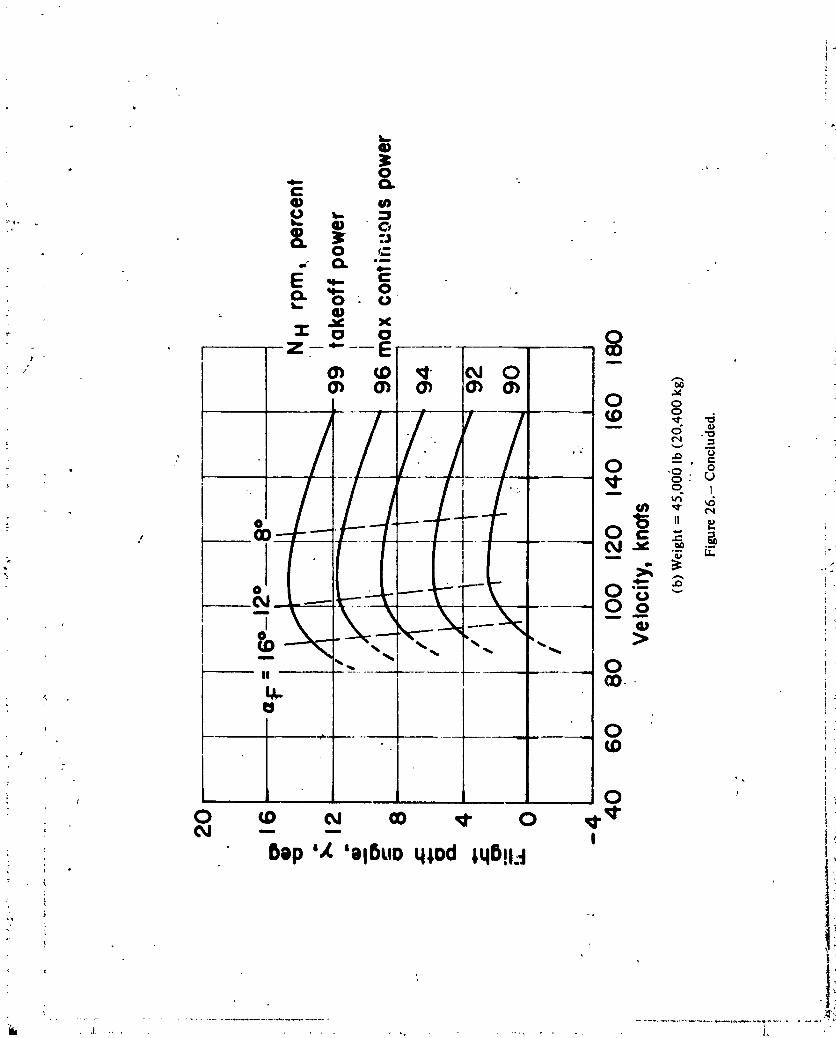
J
w
_ . •
: - - __ i.
0
0 _ _ _) _ 0(_I -- -- I
Bep'I 'DI6UO qlod lqB!l.t
19740] 4524-076
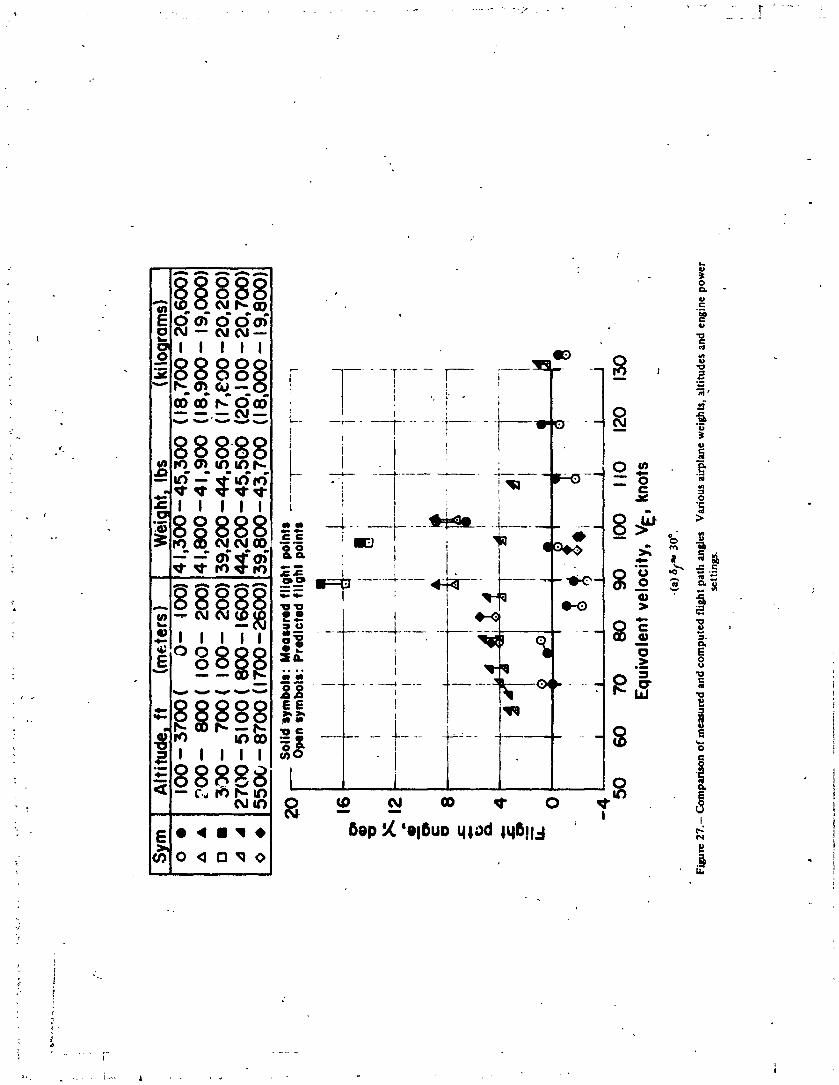
OO'1000_ < .- ,,_M -- (M (M--
:- _ __OC)8.._..._O : -7..... _ ...... V---'-i ---_-__. _-] _ _ _'=
_- _.,,'),o .. , o "i ", _11 I I I ..... 8 _ _i i ,_ _.
*_'_ -
-_l llil " _ _. 'ii ........ "_ooooo
" I I
E • _I I _ • hip ',Z.'el_UOqiod lqBll-I_, 09 0 ,0 13'q O _ .
?
_ ---
' r
_', i ..... l + "'
1974014'524-077
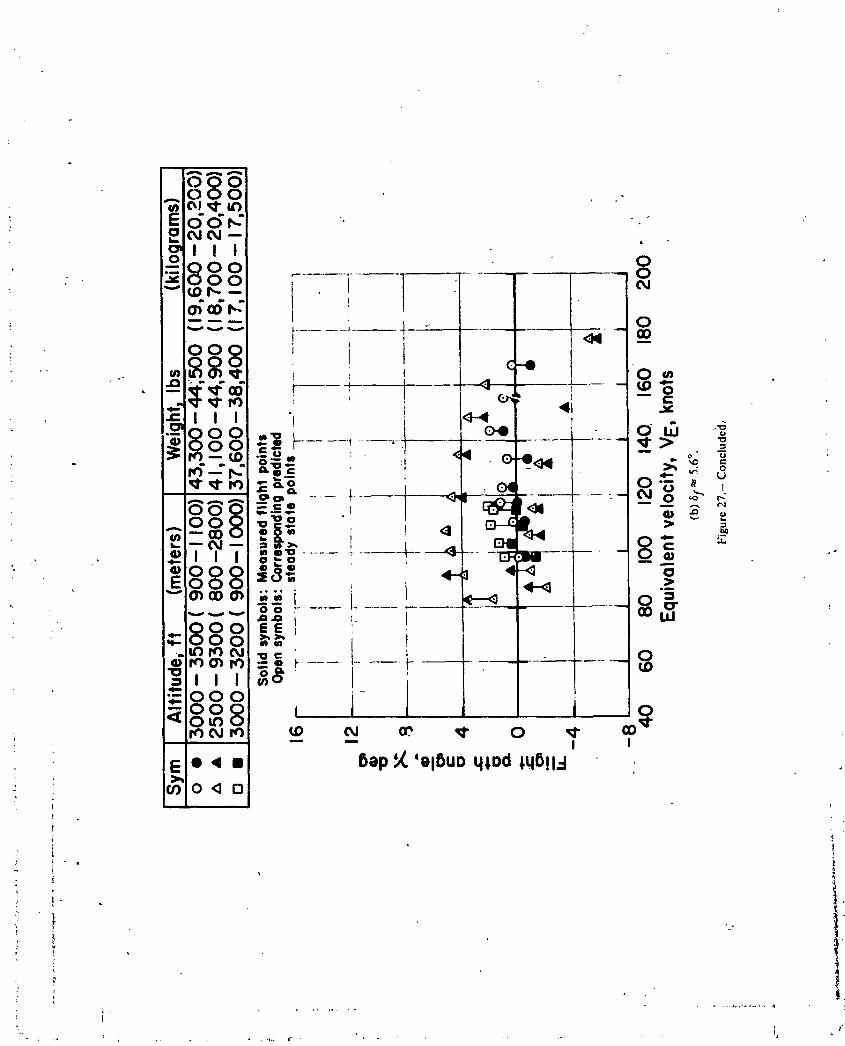
,+Jmh A _
080ooi i i
- oo 1 _ o_:8oo • omc0_ i I -I
ooo '-- -+'- - - -_-- o0• _.m.° , = i o_.
" . "__,,+.,.)'',+:co . -i !, <::_, ., - __ o
=_.o ++• ,.0,.-.,,.,+._..... ++__ +p,_++-+ .... :___p) ,.++o _.-=+-" -. +
oo __ i _,I o-_ _ ":= i+->, I E)'II..,+ ++- -+---<+-._.:=- ..... 8 _. , .,..e!l I I o...,.o 0,)
o.,®0.,_+++_i I "_ ._ o_++" _- _ _ -I----';- -I®''-' +• BB_ _-++
°,.,Nooo..: 5 F__t++_ooo - j__oo i I l Ii0_ I
-- -- I I
• _ E • 4 • Oep '_. 'elOUO qlod lqO!l..-I ,
i
.++
J
-: i
]9740]4524-078
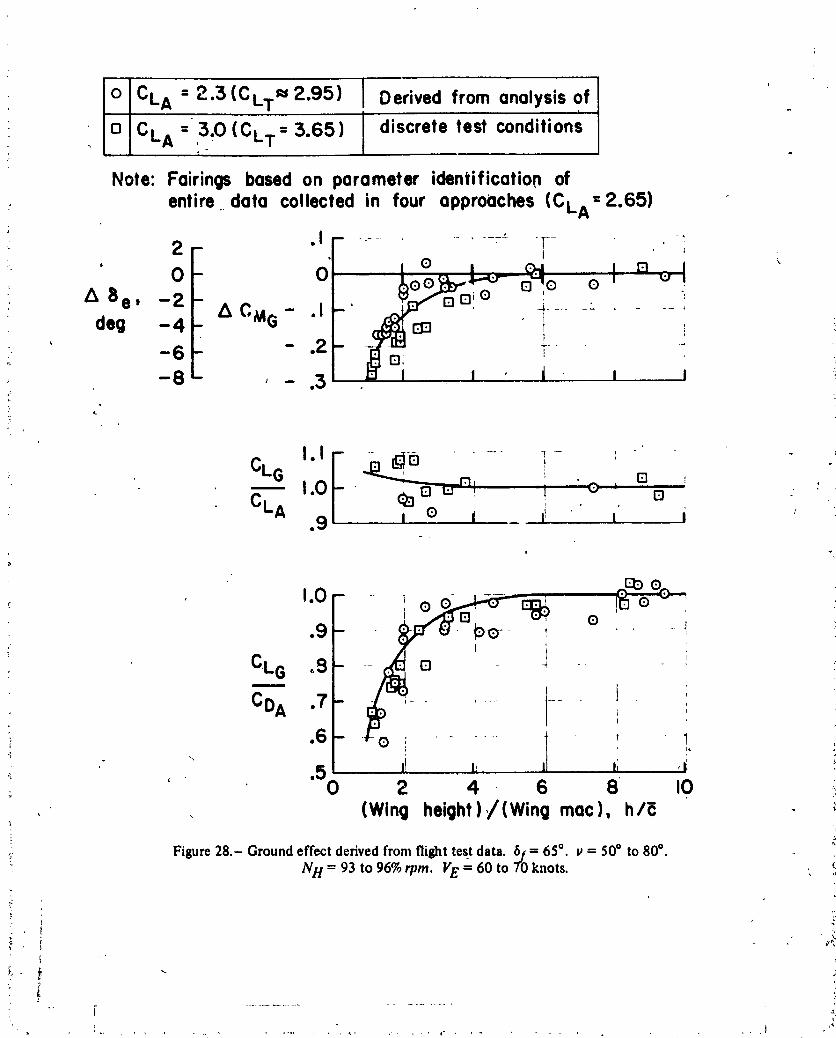
: o CLA = 2.3 (CLT=U2.95) Derived from analysis ofr
, O CLA 3:O(CLT= 3.65) discrete test conditions"
Note: Fairin_ based on parameter i_ntification of
, entire data collected in four approaches (CLA 2.651
; 2 - "IF " " ......... _" " r l• t
A'Se O- O' °_u _" " o_oC_ o I m _- '
• , -z _c_ - .l i ......" --
deg -4 G i' -6 .2 i
-8 .3 i i I
:_ CLG !
CLA ? r i.9 o i i ,, i ' "i
60
CoA .7 1- !,_ ':
i " .50 , I_ ,I ,, ,_ :; ' 2 , 4 .6 8 IO ::
, (Wing helght),/(Wmg mac), hie
• Figure 28.- Ground effect derived from flight test data. 61= 65 °. v = 50° to 80°.Nil = 93 to 96% rpra, VE = 60 to 70 knots. ,, ":
• t
!
1974014524-079


+i (,w,I
"" I_^ I ._ cn IV} " O:r(/} L • -
• _-" _ lip _ {:: --fa'}9.,
.^ 0 0 O .,,.., w C:: C i.. _
• _\ ' _"1" 0') "rJ _. (.Oooooo oo ] _ + ®
__I_o_ o _ ' _'_. !' _ s
' + \ <-°° !• - (3 "_
, ,
88888 8 _ _ _..- _a,.._o_ _ _ _ . : _ _ '
._,-_r_-_-_ ,.,__ _ oL
i +' ':° _. _ _. ,
++_ ...-,'Z_ ,o_,,, .,, _ ' I _ I
E>,0 Q O* <3 _ P,- _:)l)s/pol '0-," (/):O B _, "
t
i
", +
v
>
t',
'i
i j ,;+",, +, ,, , , , .... ,,_.... +
1974014524-081

........T--_ i
' _ _ _--_-- _ • '_ _ _,
o_ , j ,¢ T _ __,., it) _ • .."_ '
oooooo _ :,....Y,. ' _ o - -_N_-o _._ ___ _--C7 _- E _ T "_
0088 g_ I I o_ ._i a
. _ _! !....... o--_, I
.=__,,',_,,',_ _ ............-_.... __
It /
,, _ co • _ =es/Bep 'O o_,m,qo_!d"' •
" l
1, _
1974014524-082
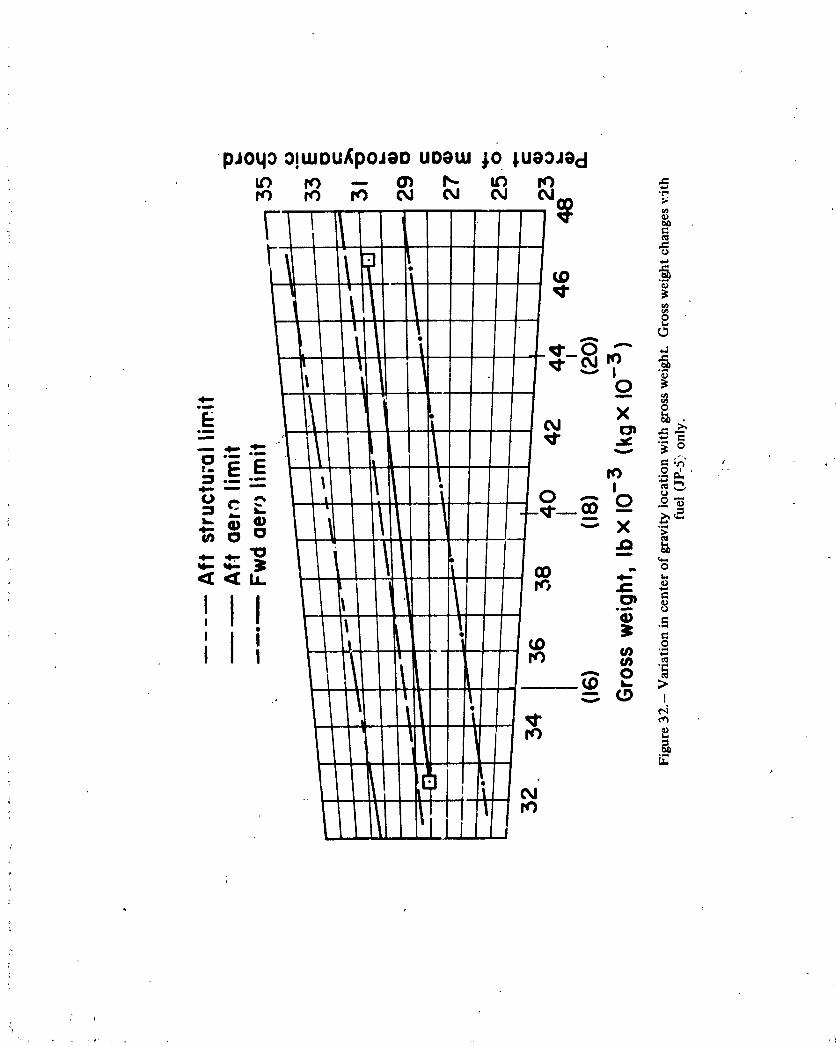
1974014524-083
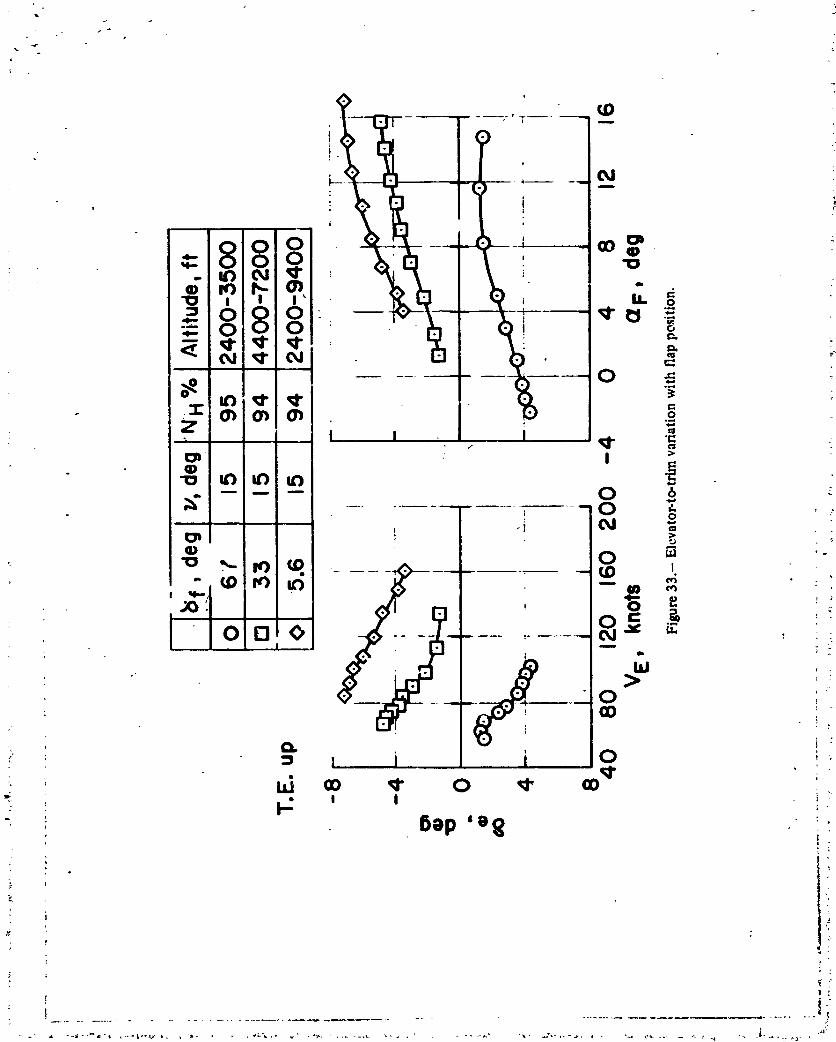

q
1974014524-085

o
=oooo• - 0d le) 0d -
oo
• , 0
, cO _ _' N 0 N _1" _0 _0 _1"
_: . I I i I ' Ii
1974014524-086

A
0 0
o I I o
_'=" /i- >uJ .. :II II II ,,
j i ° ,, .
"°1 L|| _
, ' 8ep ' o -,: N N
: (N) .'sql "I°°_-I
q ,-', .... _ .................. I j
1
1974014524-087

a,¢ O
8 -- !-T-T-:- _- _ I-'-_°i _:
_' _°° ! °co,.,_....,,r;N_N C ;
\II II II
.!
I' o__- _4
• 8-t _t-t o
.t
• i , t "l
__iJi i/o :-01.")01.") 0 ¢,,()_(I)_0 __I- 0,_I-_I"
n _ m
Z I = = ?_. ,
' i _-',
(N) ql'o
1974014524-088

il .... I 'Ii:-:.i.,,::!!:if:.?.I,.- I} _/Qo il :If _ " .:
! lli::i iiiiii,!, o o----o o -u_ o -- o _' uuO_" o ouuouu ' _o_ _ -
T r,- w o4 _,: 0 0 -- _ _• I
--. "-'_ CZ)* "10 ._-o . .- _
1974014524-089
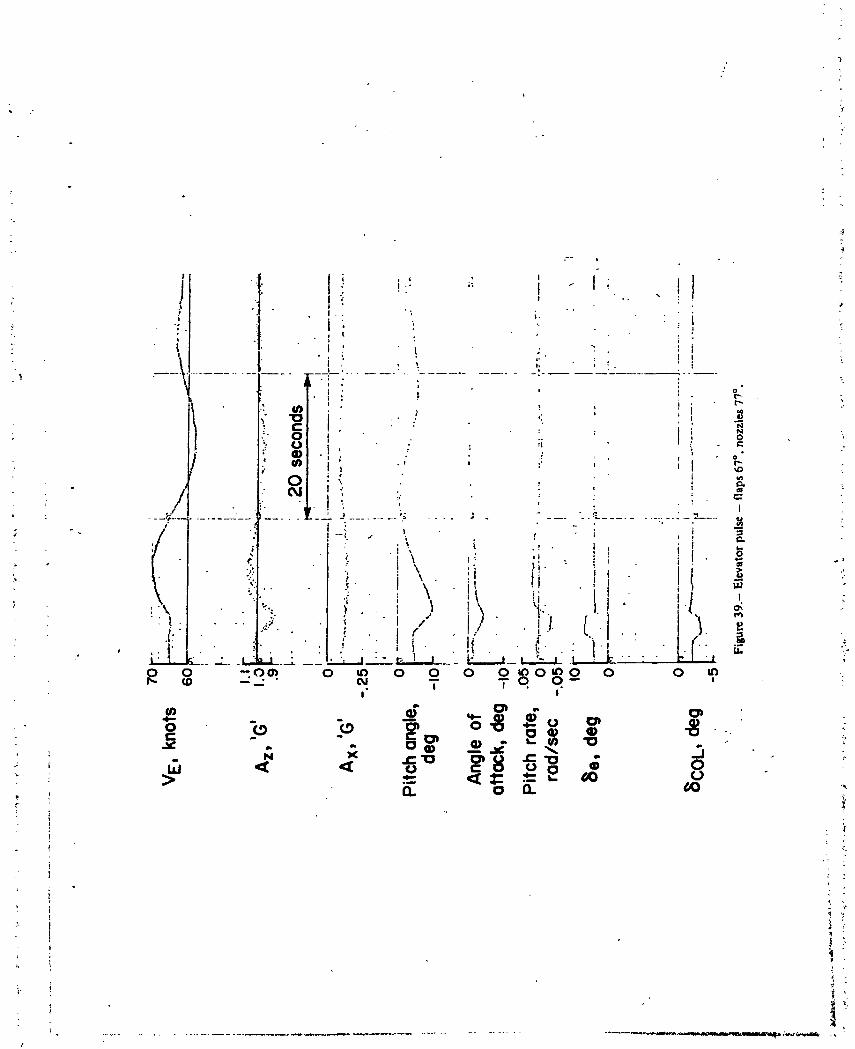
,"
4
4
I
• _ .. .., _. "i : i
A, " !
I) ! , 1 _;
•- I_ : N;- c . i
D :' ! I
o ., , :1 ¢ . i
• - _ i.......... _ ;: .... I _- ........ ....... .................. _
: .I , "'
_.. , .,.. I _ ,- ,, , t _ .,
f , ., ,
• k " . :._J " t_ ! _J ._'_' _ I, _ 1_ -:!
o o -o_ o _ o o o o _o_o o o ,_---" ,. T TO 0-. :
L
[
, ?
,' £
]9740]4524-090

8f,: Sym deg Weight,Ibs (kilogran_s)..:I.%C.G.MacTe_t
0 _T 43,800 (_9._x))30.3 wi_-u,n 67 var -var --- /18 step
; A 67 39,000 : (17,700) 29.5 /18 step0 32 41,000.; (18,600) 29.8 Wind-up!_ 33 41,400' (18,800) 29.8 /18 step
..
-50 - T.E. up ---1 ! ......_
_ <]1<]
b.I i ' "-'-'---i
w
,.. _ 80 Pull -T...........
"_ _ _z°°)_/I J Predicted_ I I
.o,_" = 0<]<3
.- ,2r I-4o,ooo,b(,8,2opk¢_--)
z=o_8 ..............3_ I=' l J _,<_'_"_'5,'O001b'(20,400kg)
.o¢=
__°oF _I 1 i i 1 i60 80 I00 120 140 160 180
: VE, knots :
I:igur¢,+0.- Maneuveringstabilitysummary,'._
1974014524-091

T.E. up.
20 _ GW=43.800 Ib
i Q,_,, (I9,900 kg)j C.G.=30.0 % mac
=. ,_'f Predicted
o., 1 t,?
- pull
-I0 --i lf_ ",t
-- _ O_ " '
(N):_' 20
80- I /
, . //
• _ 40 - I0 , _
, o- or" ,, , i ,_1.2 1.4 1.6 1.8
_ _', , Normal loadfactor nz 'GOs '
' FiBur¢ 41.- Wind-up turn, flaps 67°, 77 knots. !
' i
1974014524-092

GW: 41,O00 Ibs(18,6OOkg)
20 ...... CG = 29.8 % MAC iu= 7 deg _
• i
..-o I0 : •
®E , , .
0
T.E. up '_'
-20 i
L
l
J
--0 t ,
Pull "i
30 ........... 1" ]"
I •
• IN) i . i /4IOO _ / ':
20 -- -_._ -- --_
o 50o in -- -,u.
/ .I
.8 I,O 1.2 1.4 1.6 1.8Normol Iood factor, Nz, g
: Figure 42.- Wind-up turn, flaps 32% 100 knots. _._
).
1974014524-09:3

1974014524-094

7
' LT
l
A
] 9740] 4524-095

t
/
. . ) •
', -k.. C .0
l _ s_ i '°1 :° " i " •
• ' "i" 1 "
: .. , ., ,I II
" _ , lit _.i ' ! i" i ' 'll ; {i : , tl < )7L I _" I'i
.., t . "1_ .l i _ ... t_ l " "' _),, , j" i' _,,_b ,! I 0 v_
,l ',,. I ___ I .."'t,. " _, ii")
>. _0 i) ' ,, ,," ' "-o i ' " -
II _, , o. . _ _ _, I;- , ii_ I I , , :l" I"f I' L I , • .'t,. ,0 0 _0 0 el QO 0 0 _ 0 _0 0 0 0 0 0 0 0T W _ -- T "-- , I T
. 0 (P _ _}
"_- g'_ ,i <,o o' X, '_ .u -,.
}
1974014524-096

I# ,,
I /..... i-T----.....
J 'i • V "
• I , _,_ 'I " I
" I," _ _. _2I .o
• . . ..... r
------. ..... (,i ...........:'...... 4:--_,_o.] .. _ ,,• • N
i ._, : 0I e_
• " I " i
• " : . . ' |i._ '..., . .,. -,. _..__, ° , , ' L J--.:..-_.,__.:L.,__ZL._'
o o o g o-® _- 90 _.o,-;8 o
_. :,. ,
?
1974014524-097

!
1974014524-098


' 1
1974014524-100

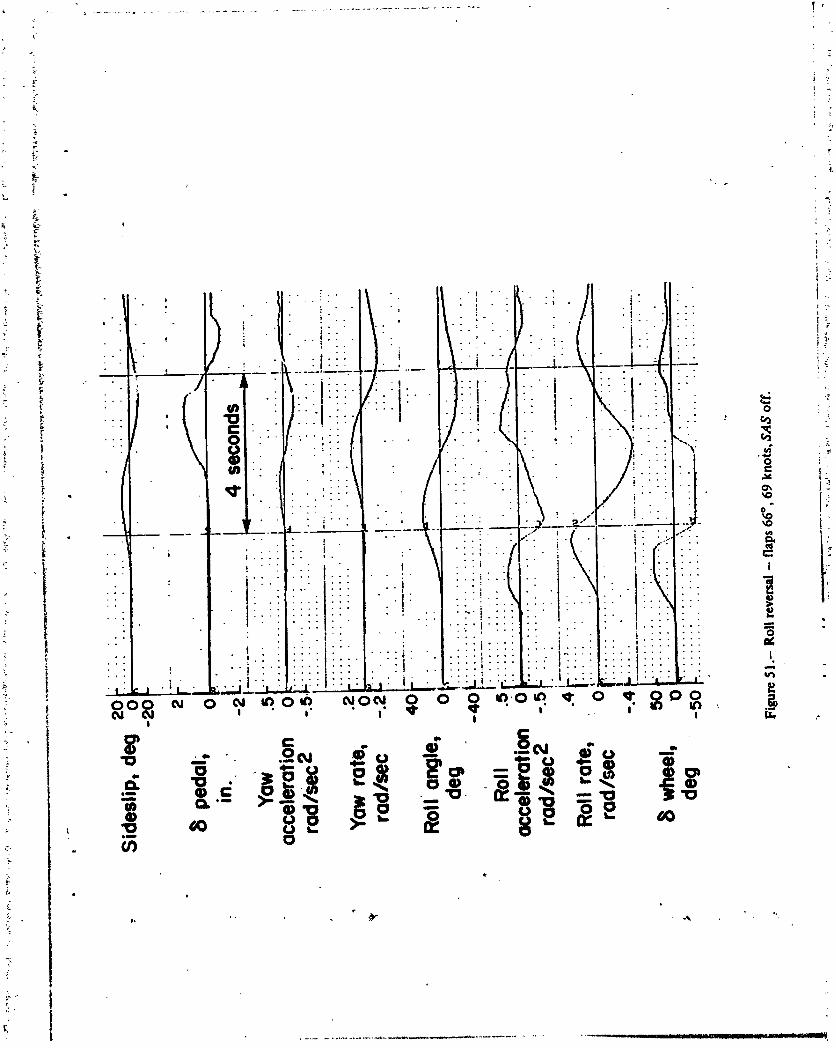
1974014524-102
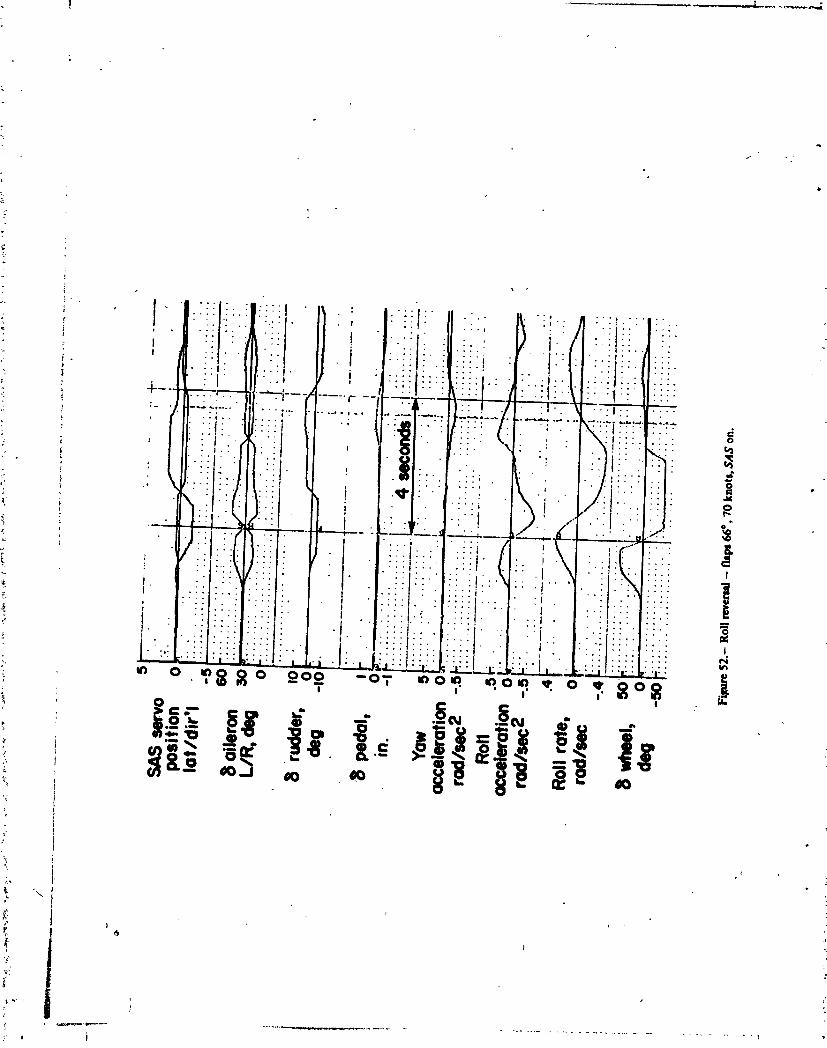
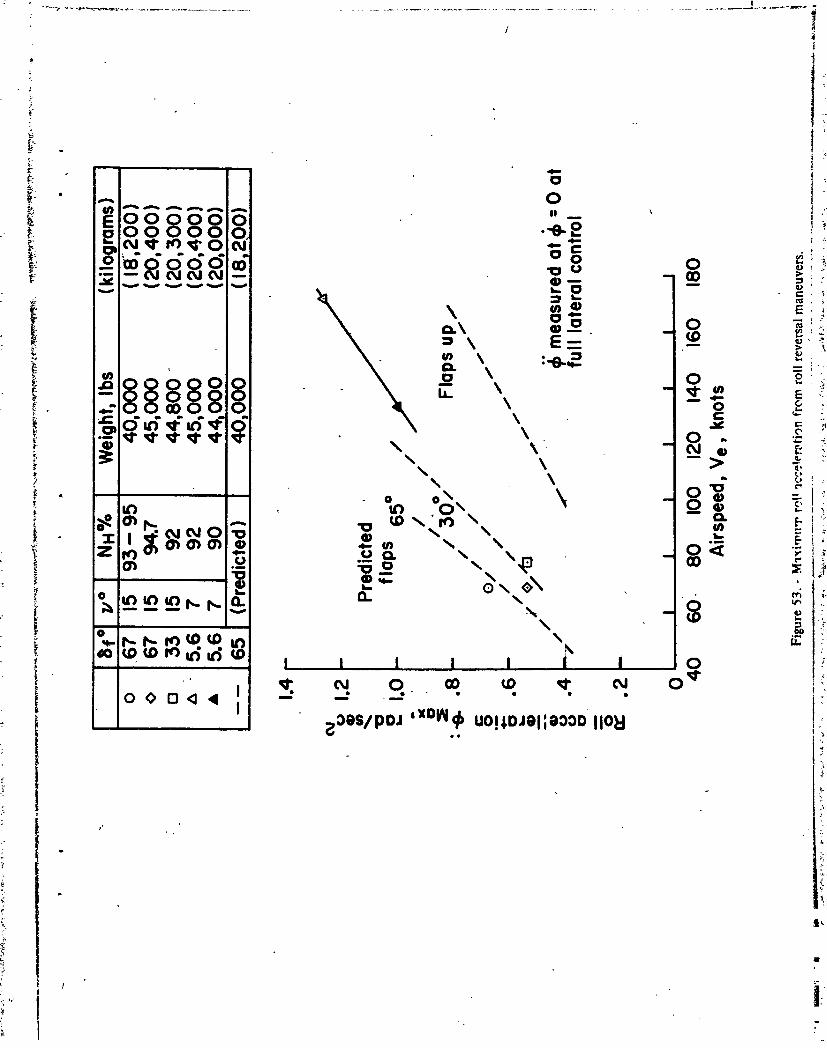
i
• ,t
{
_ -
_ " 0
, _ W,. _ "_
I 04,. E
o o,_ _ E :.G
\\ N0 _"\ \ > _:
w-_i \ i.Z
' e_) I I I I I l i 0
o o n<l _I I '_, ed co _ ,_" ed 0
I i_Oo$1POJ ,xoNqb uo!IoJollO000 liON'' ' io
1974014524-104
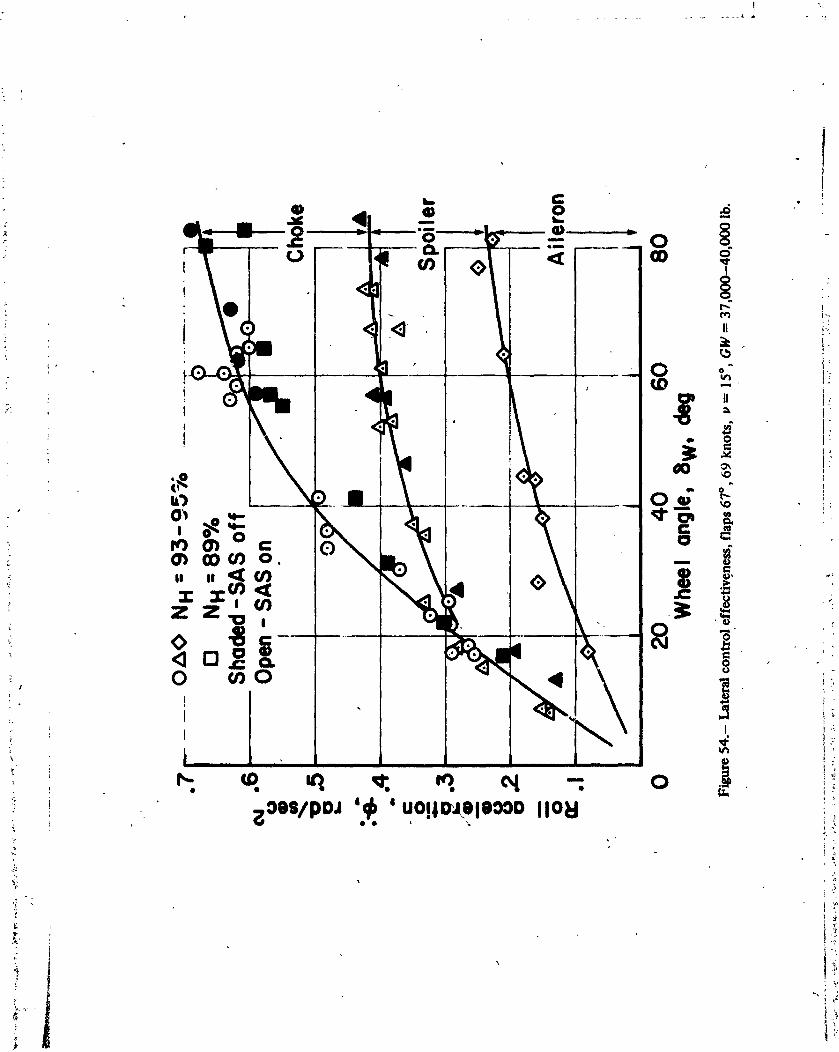
• _ J= O.
b .......
V_
_i_ ;_:)e$/pDJ' 'UO!lO_OleOOOI10 _d _
°
'. 5'
1974014524-105

1974014524-106
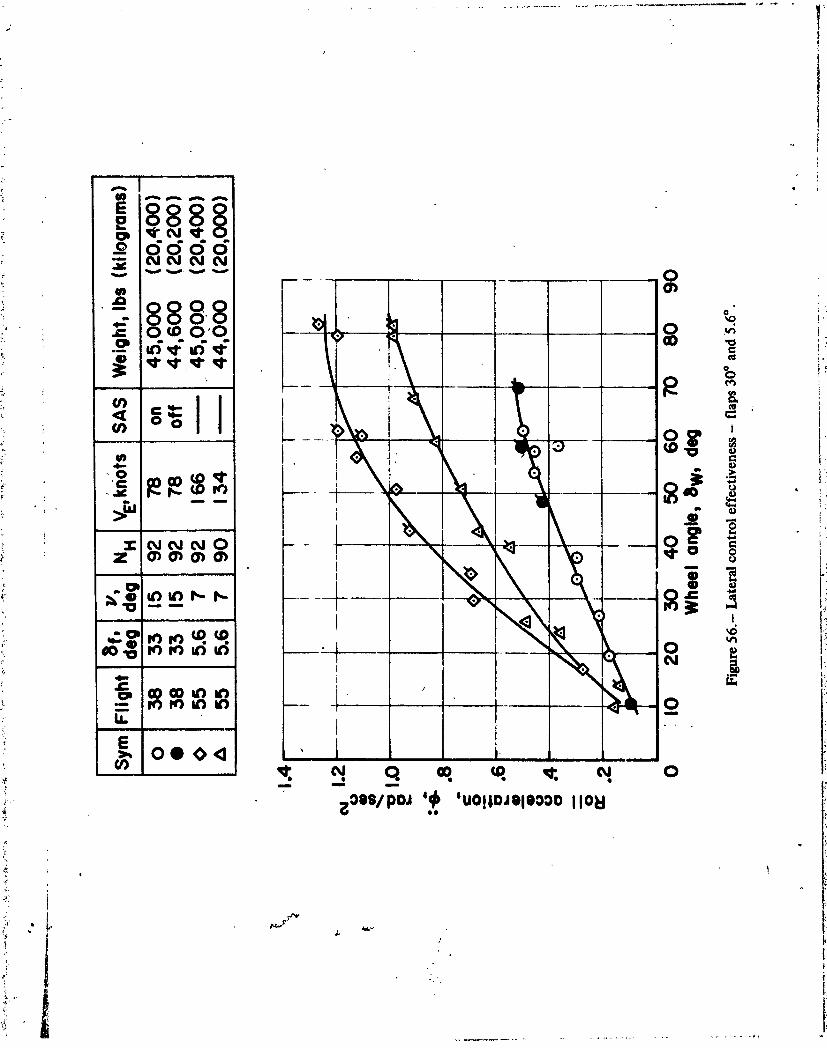
.-I
_o 0000i oJN N 0J
o
._ - 0000
:_ u) Oo ii
z o_mo_m 8
• ill
E i_ _'. _ q _. _. _.. _ o
" ;_oos/po_'_ 'uo_o_olOOOoIIO_1ee
i t
1974014524-107

0 U_ 0 U_ 0 u_ 01,0 I',0 Owl 0,.I -.. .....
OeS/pOJ '(_ 'OIDJ liON
+-
........... ,.+.I
1974014524-108
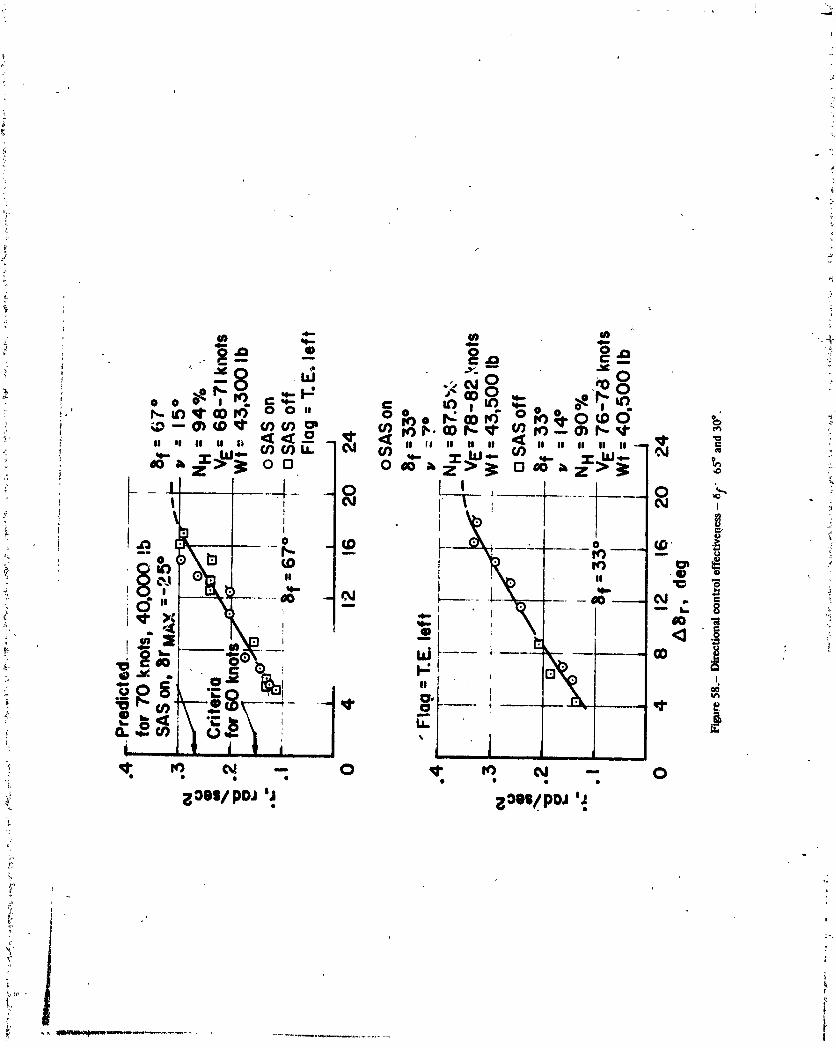
i " -_R ,_; ._c_O /08 _i • o _';-_. c_ r- • _'
.. _ _ _,_l" _ _ too I_.._rO __,_-0_0 _
_ _ ,, ,, ,, ,, ,, _--_ ,,,, ,, ,, ,, _,,,, ,, ,, ,,-_.: i _ -t--W*- uJ ul u.. _ -r bJ.,-- u_ _-. -r-JA_.,-
i -
!o, ____ _',- L'_:_ io'" [_ ...." - - . - "- _-,: _
_'_ zr_ ..IK . i ' . L- V__ I
_ u'.-,,.,,-t"r--e_r-----_.- ---n_ o, '9"
_ I !
{ ;_on/pm ' ;_oe_/poJ'
_o
1974014524-109
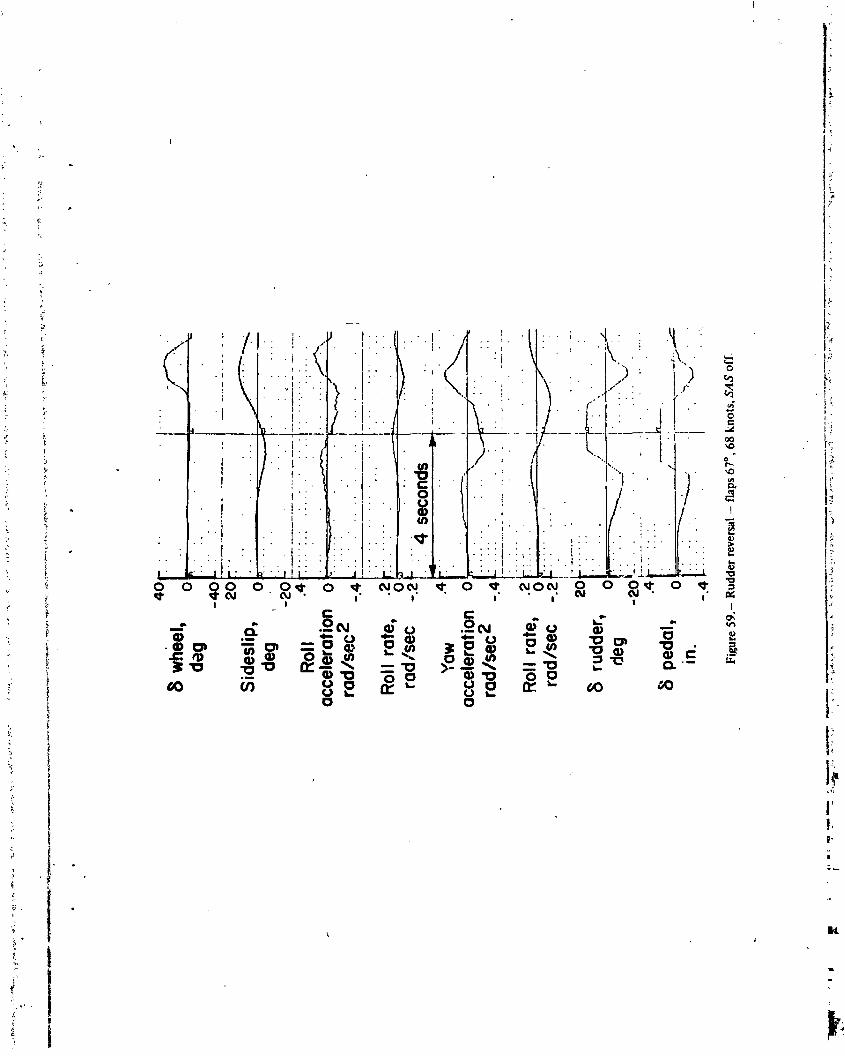
1974014524-110
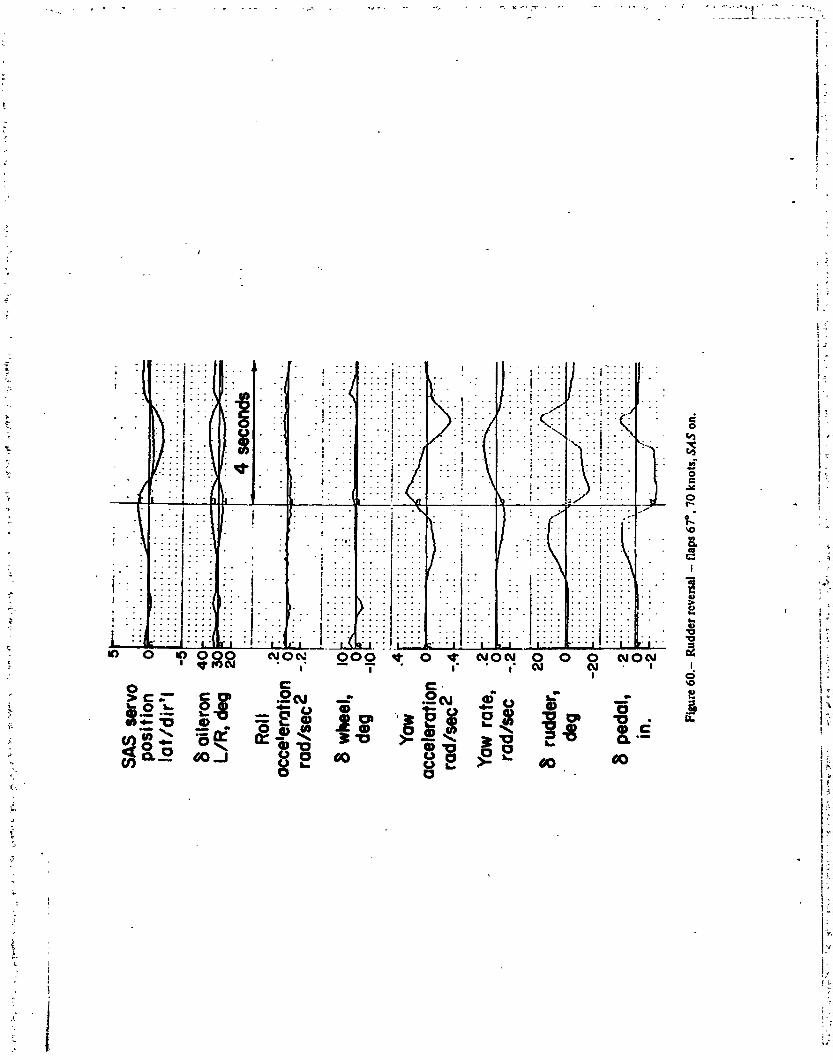
i
........... o.
t
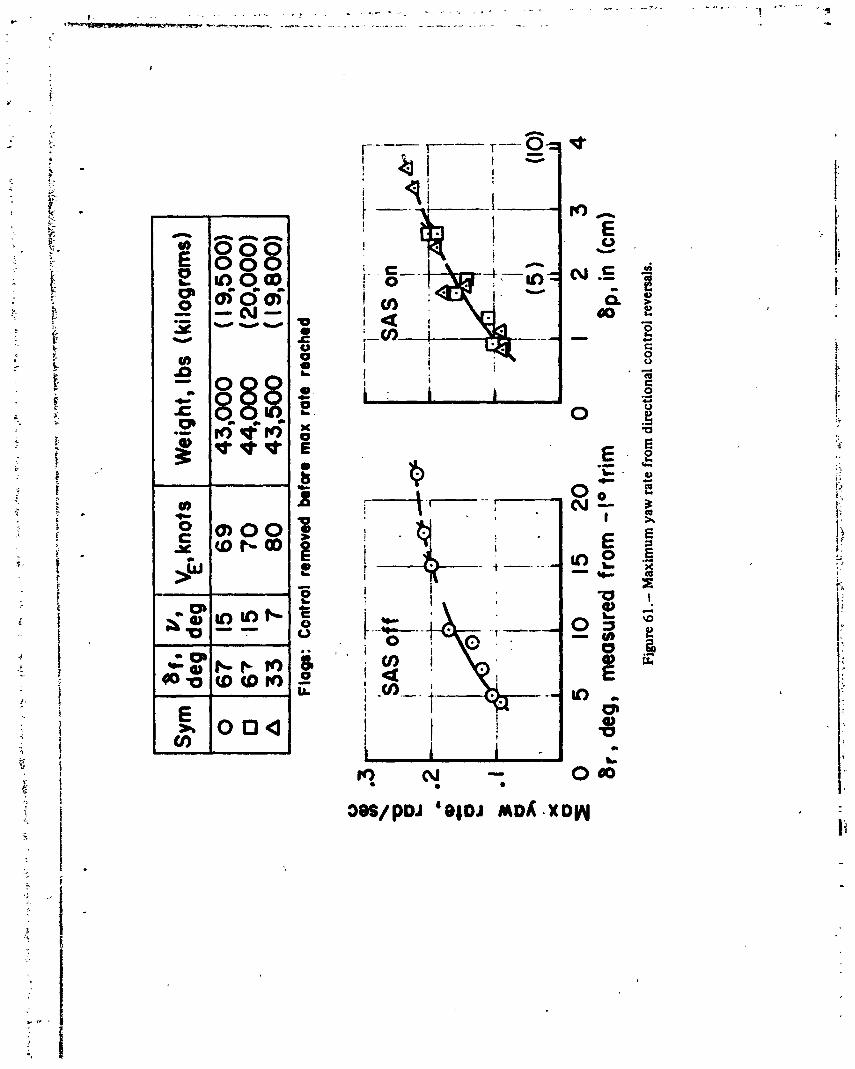
I
" _ oo I.. _ l
..... '-2_ • b
" [ oa<_ I |
" li
J,
(
?
1974014524-112

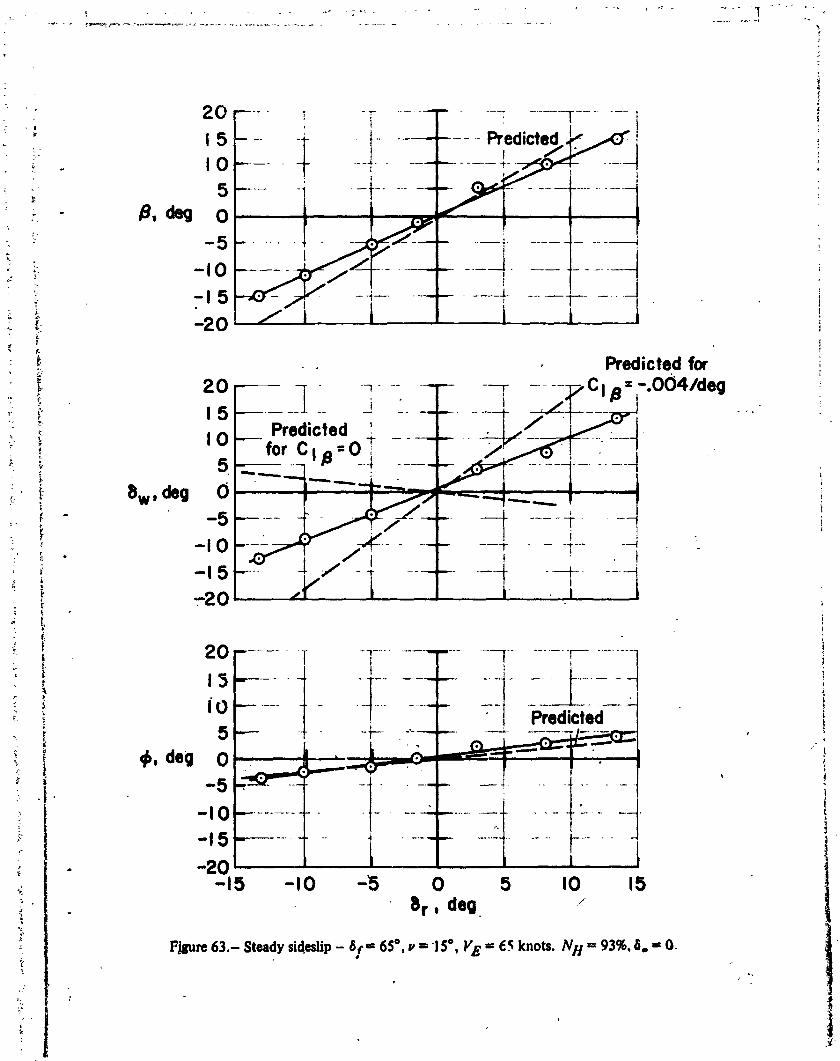
!
" 20 r--- ! _ ___ edict
L !
_. Predictedfor• O0: _ • • _. --..- --_, .....7'cl "_'" 4/deO
- I i • .... -
._ _
'i; ' 20--......_ 4
" _ _, de_ 05_.__ 1• -I0 ..........
- -20 "--"--- /; 5 -|0 -5 0 5" - _r, de_l":" ,=93%,_- = O.
",
_, Figure63.-SteadysKl.eslip- 6f= 6S°'v= 15=,lie= 6._knots,NH
'i i 1974014524

I
r
It !
!
I-
" " _ I _ --i, llr)
", _ 0 . l s
_ 1 O'V.
, .... .+--'. _-!-,-" ,--- -" ", 'i' _
"1r-l--" 3- ' I• [ i#l
:I I - , ____ It) ._
0 0 0 0 0 0 u_ 0 u_ O" 0 0 m O'm 0 _ 0 w'iT .__- T_? -- Tili -- ' --,, • -,.
' E- ,oll _._
I
r "_"
5, 1
)
, li}+
t '
]9740]4524-]]5
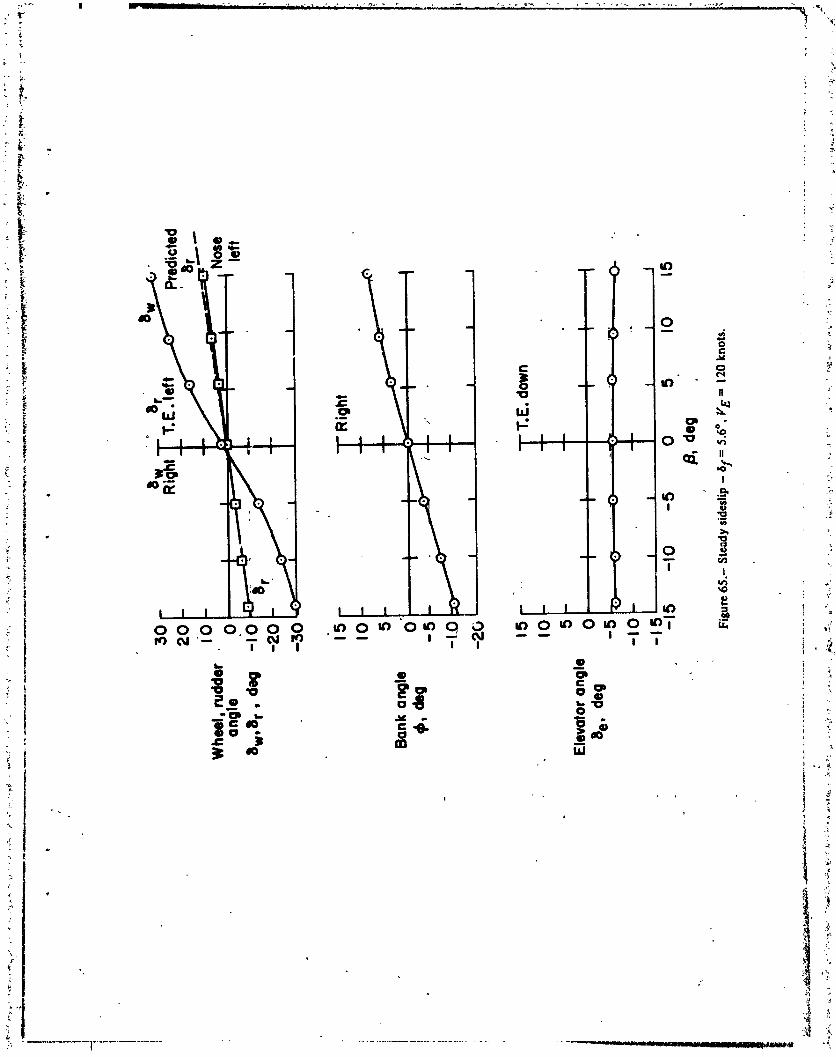
1974014524-116

!
• -I|
/4-
:.:'.
.- \
, .1
: 1!
1974014524-117

_. I
_, Sym 9 Weight, Ibs (kiloqrorns) SAS |l:
,- _. o l e_ I,O 137,ooo-40,ooo(,e,eoo)-(ie,a_o)off Ii_ • I6i 1,7 J 38,600 (,7,500) on i• I61 I,O j 39,._KX) (m,,O0) yesn I ¢ l eel 40,400 (m,_mo) off • ii_
_ I S'_I S'ZI 4,,ooo (re.coo) off. J3Z I 15 J 44,800 (20,300) offe i SZl 9 I 40,000 (,8,200) off _
: I 33 I 15 ! 43,800 (19,900) on" I s I " i 44,000 (20,000) --'_' I 6 I,II I 39,700 (180000) --
t5 --"'..... i..........".......-T-- :Predicted, SAS on • I ' .J;._
. j..... * , _i!__
= ,o -!-; ' ---,t! !,:
Predicted, Sb,S off
tOk . i , i.. i I
<,
.5 ............. _ l _.
.4 i @ _ ............... ,,
;'_ .... i.....W ...........i ---T -, --I
' F:¢m 019 i SAS off prediction, _ i _.
,.,,.,,,_-"_ASoffprediction, ' T• "-u.w.e/oeg 60 knots • tiI
Io , , .... _ i i I ,,," 40 60 80 I00 120 140 160 180
Airspeed, VE, knotsf
" Figure 67..-- Dutch roll characteristicssummary.
1974014524-118

Sym_f' VEdeg• • 67 69
lib 67 70 '&A 67 70-77• 67 69
, I_ .67 70 ....
:, 5 0 68 70 1 " 1 ' _
il I "Wt - 37- 41,O00:bS 116,800-18,600) i• " " n I ; I -_..
_I sASon _
'_ = • • "
:-e. <> ' ;
: _ SASoff _ _:
"_" O l ( I
._, ."
: Wt • 45 300 Ibm120,400 kg)
/ ql_ .- .i
_ 2 ............. ----_--
_ : BI•,, Ol Ol SAS on _
• ,
i!_ I ; " "_-, ' 0 20 : 40 60 80 :2;_: 19Wheel, dig /
._. ' Figure68.- Rolldampin8charactofistic_- flaps65°. ',
]9740]4524-]]9

i
: Wt'= 44,200-45,200 Ib" (20, I00- 20,500 kg)
_: =5.6 °
e_
i• In _ .__ e® 0 ._ i66 knOts_ (1.A=0.68 sec)
_ ! ,_ -- :]fn [] E] _r_ ('rA= 0.7-( 134 knotsI 0.83sec)• _ I ....
i °
L ,te
! 2- l I8f = 3Y Wt =44,900 Ib 124,000 kg)
78 knots
• I - l, SASoff _ z_ i (IrA= l.Osec)SAS on
ii, ii , • , ql I
0 20 40 60 80 I00
8 Wheel, deg
Figure 69.- Roll dampingcharacteristics- flaps33°, 5.6°.
1974014524-120


L_
1974014524-122
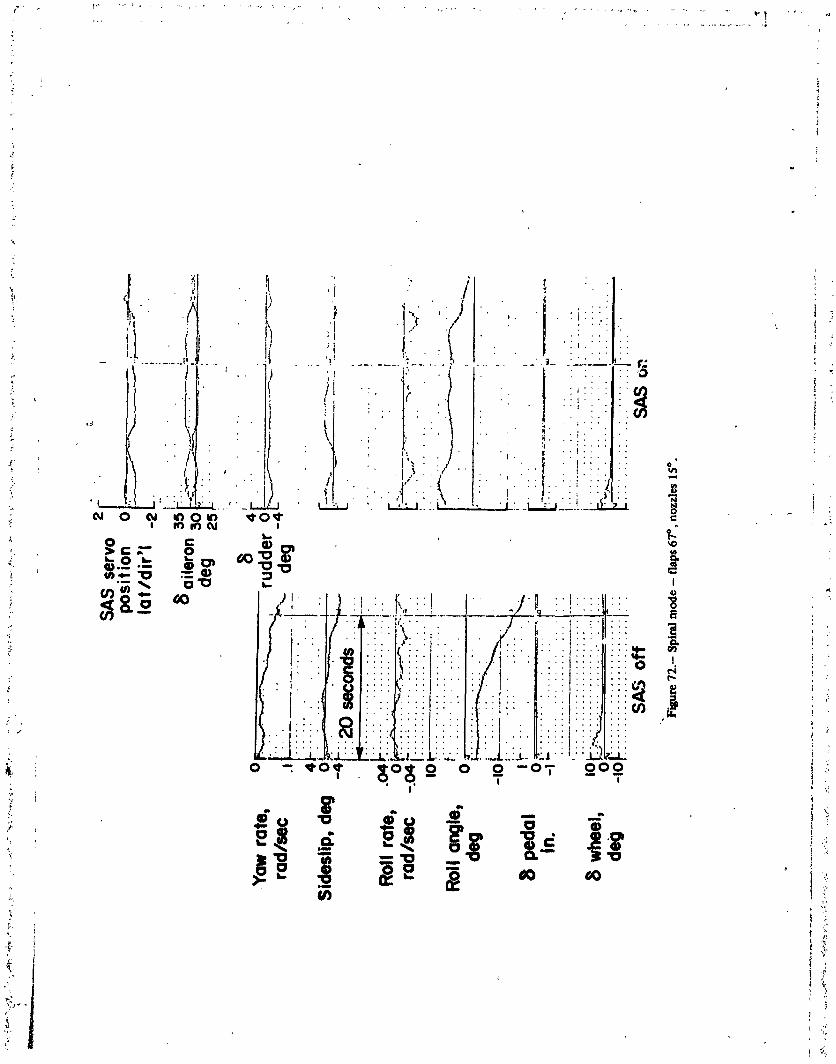
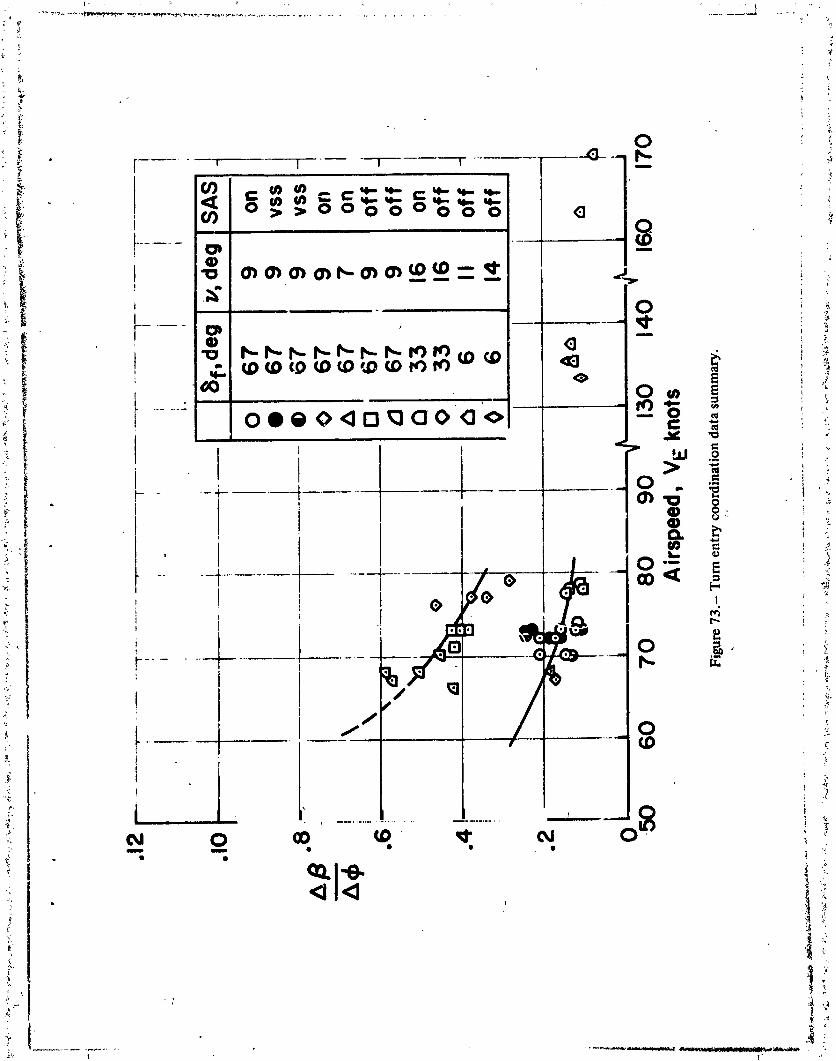
t
Y
i U) >>o o ooo 41 ._
= = -
2-
ed 0 m _0. _" _ O. "umnu_ i • • q_ "i"
°,
.,_
]9740]4524-]24

_ ..... :.:i -i --T !- _ i : ' • -I- :::I- F::'I" _ I" • I., " " " " ',' " I.: ' ::I
"I i...... I............... I....- , ..... I I - , _ 0 - I ...... C
....... , ..... I ............. 0".- . . ." ' " _'" I. : .:']. : . _ -: "
. . . °i ......... i
• . ::::.!_:.
, i::-_!:lii::i : ._. "-i-!i-... i: " Ci : i-il _
• -_..= _ -• m-..- o-E , _, ! I' ._" ° -" _12:__i_iL• , [.... l_z_ { ; II I._:::, '
.!. . . , • • ..... :_.-:.,.- _ _
' ' I"".d ":"-,,l""q"' -_:IN_" :/ " "" :: " I -?I: ::- ":" --. I':::
0 _ --.0--. _ 0 0 0 0 0 _ 0 0 0 0' ' 0 ql" - • i') _
_" _ " _"" _ _a "1o -___ .'=3 ,_ 'o_ o o_ o_I _. _o, _o, .
I-: _, _,,i 0,'-- =_ ._-_l _ __ ,_,,,_ _i,, %,,_ ,
I:
¢0
t
1974014524-125
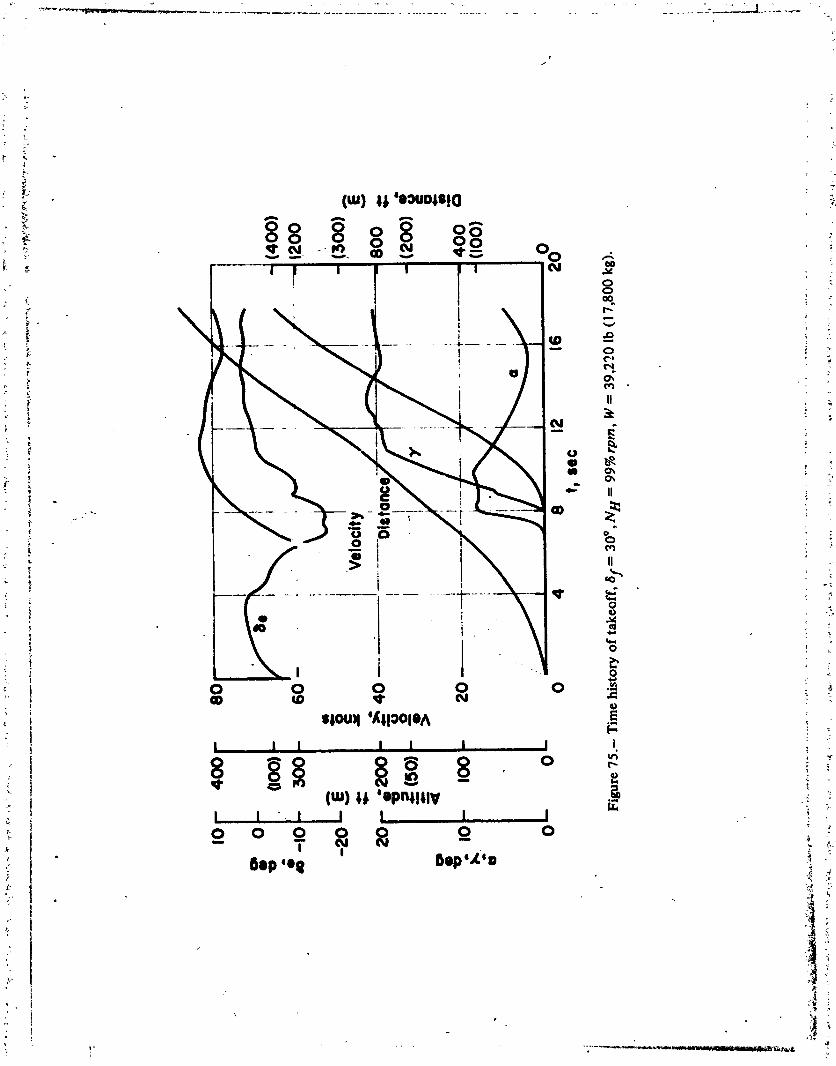
/


l
A
0_ o-O_. _ ._ ....... , -_-_ 0 ,
_t O )
i
(r ; :t . 0 ."
•
E)% ' i iV)
, o
_" ;- -; .... : 0 0 _
| ®
:" O] ...._ _ oo: --- , _ 0 _ _)
: i 0 I m =,' . f,_
•. I , II I, i I ._ m 00
(£_OIx 5_11'£_Olx ql 'iqBlo_ I;oJo.=!V
°
lg74014524-128

4 - _ •
lip
"0 ( .
" _.,16 .....i o
a. • 45,G00 Ib'-__120,600 kg):
0 .
24-1
Q _•_ O_
_ 0 0
()_, _._ - , .
0 o
C '
o ..... Fi; :,'00,,lll,l0a,
=,- ......
o,= 40 000 Ib
" h ......... t
118,000 kg)
0 "] . roll
76 ' 80 84 88 92 96", VEknots '
Filum78.- Takeoff,
I,
1974014524-129
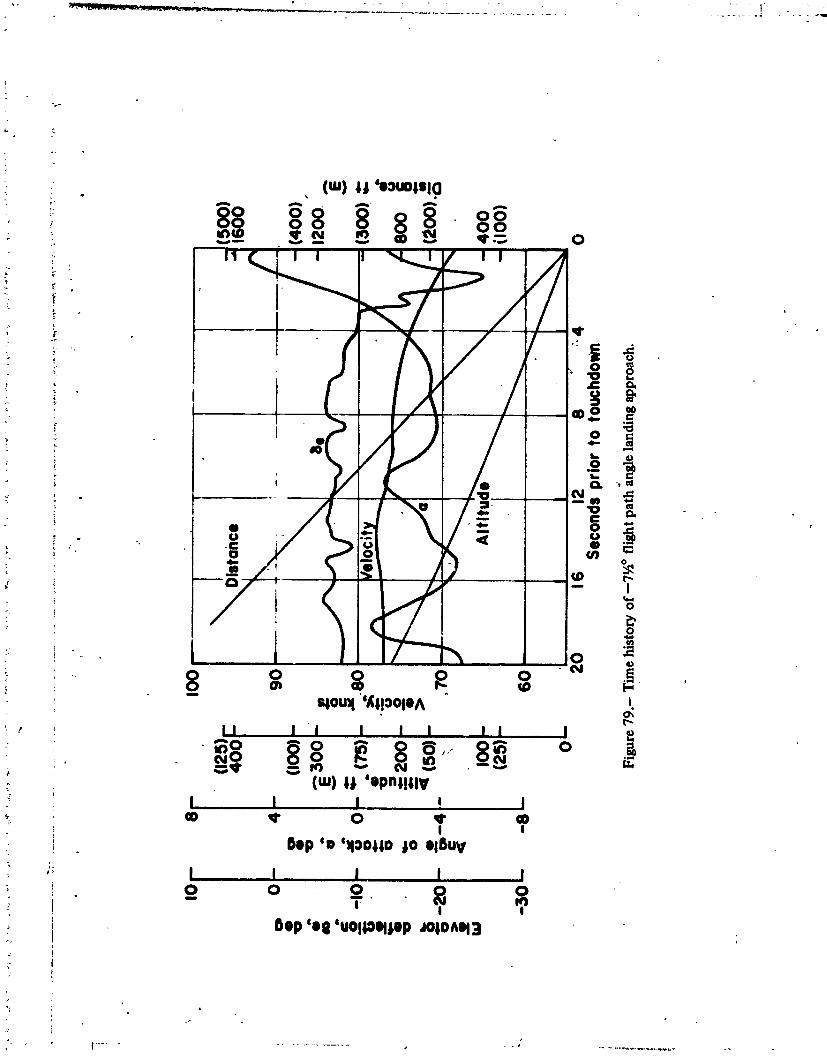
.i
_- (m) i_ 'e:)uoislO
f
, i1' i i i I I / t I A
g z
,Q :)"/ 0
_ 8 o o e o - ._I
qOU:1%(llOOleA• (.,,,,.
',: II t I J I I I I I
. (m) l_ 'epn;lll¥: I I I ! I
CO _1" 0 _1" @I I
" i 6op 'o ':lOOlloto Ol6UV:i" I I Ii I l
o o o __' I I
60p'o_ 'UOll_qtop_olo^q3 .
i
1974014524-130
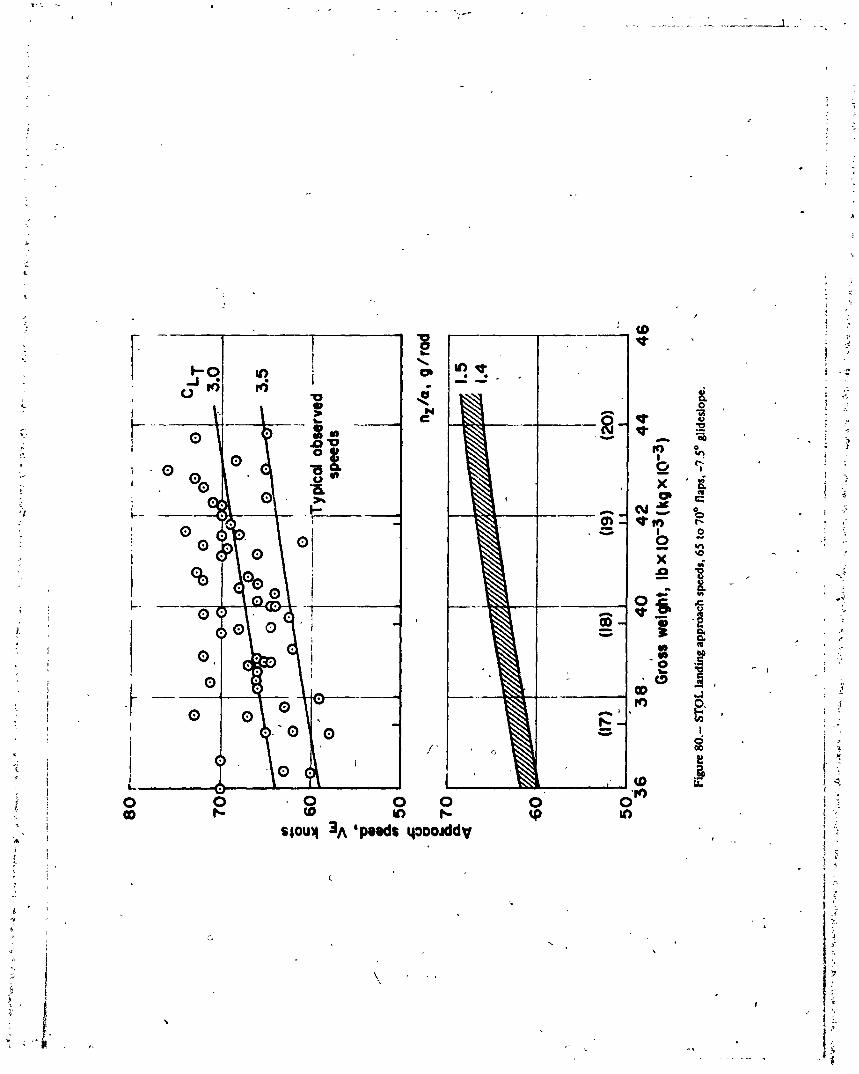

C
£Li.
14 -_ ...........;,- - [
. I.0d I'1 -
-_ Average e/
: f / /
_ , / /gi" '" • D
_, ,- .. / /-,, Io........ -7 ....... _ ....-/: I o /
,o I eel• _ / ,.:: = .8 - , , -/---
# ,I o / ."
_. -, -'_ 6-- -p o----m -m-i .c_ /
,: _ I go._. I _1 .I_ - / /.' c 4- -.- -Qo
"= I Io
v _
//. // o
m_ J
'0 ......................._=-_2 4-" 6 i 8 _I _
t, sec _..Figure 81,. Changein sink rate during flare maneuver,
" \l:
,4/ i
1974014524-132

i
D ° r_
• ::. i
i "
, I
o_o|o 8'
., GO
Q •
t '_I" 0 Lo
• (_os/uJ) '_OSl_I i'uMopq_no__o e_oJ_lu!S !
i
1974014524-133

/
7
,o, :., :Lt
\\U
I'_ :r
- GO "_
\ - _
\ ' _ °
I-' I_ _ "'!
.......__..... 0 _
8 8 8 8 _ _0 0 0 0 i_ _ _'
i ol .il l - ....' o o i ol io_ _ _"0 0 0 0 '_ _
(w) 11'eouols!p5u!puo-I i
il ;-I /
:1
i! "
]9740]4524-]:34

T
!
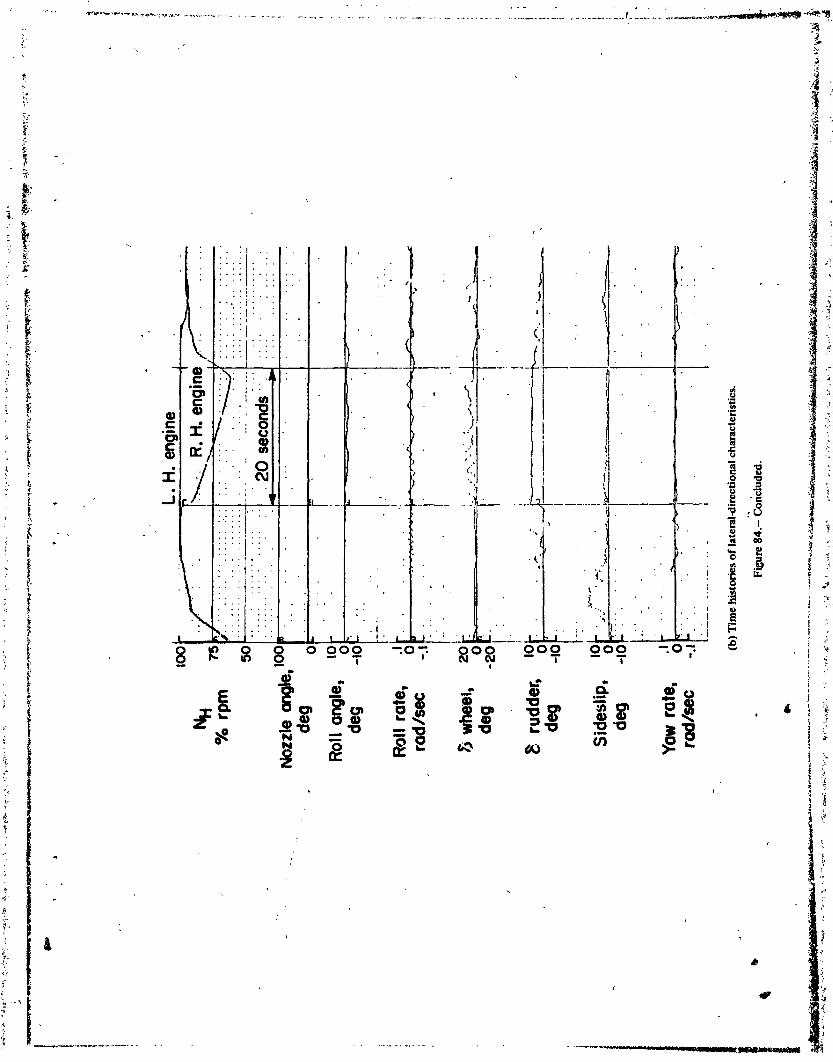
1974014524-136

"i 1 .... ' ''_
-!
!!
o
°.
!
1974014524-137


#-

1974014524-141

1974014524-142
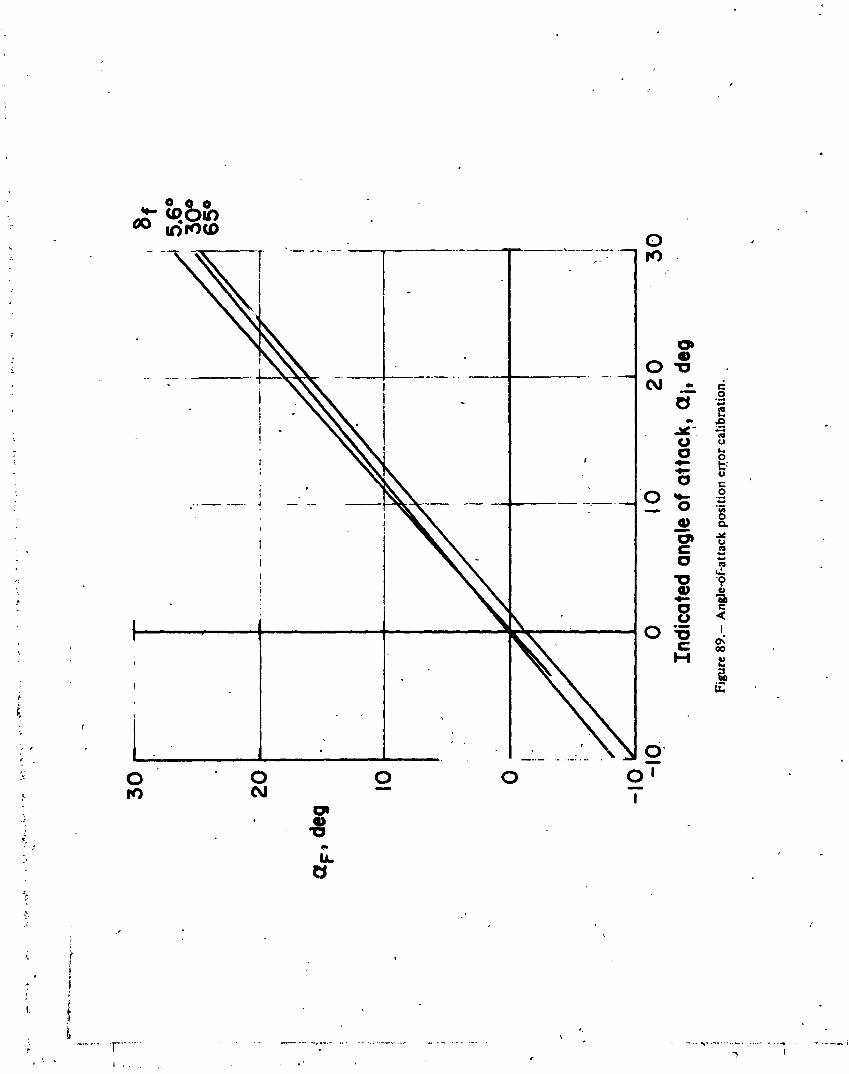
it