Turkey Country Economic Memorandum
351
February 23, 2006 Document of the World Bank Report No. 33549-TR Turkey Country Economic Memorandum (In Two Volumes) Volume II: Expanded Report Poverty Reduction and Economic Management Unit Europe and Central Asia Region Promoting Sustained Growth and Convergence with the European Union Public Disclosure Authorized Public Disclosure Authorized Public Disclosure Authorized Public Disclosure Authorized Public Disclosure Authorized Public Disclosure Authorized Public Disclosure Authorized Public Disclosure Authorized
-
Upload
khangminh22 -
Category
Documents
-
view
1 -
download
0
Transcript of Turkey Country Economic Memorandum

February 23, 2006
Document of the World Bank
Report No. 33549-TR
TurkeyCountry Economic Memorandum
(In Two Volumes) Volume II: Expanded Report
Poverty Reduction and Economic Management UnitEurope and Central Asia Region
Report N
o. 33549-TRTurkey C
ountry Economic M
emorandum
Volume II
Promoting Sustained Growth and Convergence withthe European Union
Pub
lic D
iscl
osur
e A
utho
rized
Pub
lic D
iscl
osur
e A
utho
rized
Pub
lic D
iscl
osur
e A
utho
rized
Pub
lic D
iscl
osur
e A
utho
rized
Pub
lic D
iscl
osur
e A
utho
rized
Pub
lic D
iscl
osur
e A
utho
rized
Pub
lic D
iscl
osur
e A
utho
rized
Pub
lic D
iscl
osur
e A
utho
rized

CONTENTS
PART A . POLICY AND INSTITUIONAL FRAMEWORK FOR CONVERGENCE WITH THE EUROPE UNION .............................. 1
CHAPTER 1 . UNLOCKING TURKEY’S POTENTIAL FOR GROWTH AND PREPARING FOR EU ACCESSION ...................... 3 A . FROM CRISIS TO STABILITY-STRONG ECONOMIC PERFORMANCE POWERED BY
FAR-REACHING POLICY REFORMS ........................................................................................ 4 ....................... 4 ..................... 10
ENGINES OF LONG TERM GROWTH IN TURKEY ................................................................ 12 B . 1 . Turkey’s growth dynamics in international comparison ....................................................... 12 B.2. Growth Decomposition: Labor Productivity and Employment Ratios .................................. 14 B.3. Sources of Labor Productivity Growth ................................................................................. 19
TRADE PERFORMANCE AND CHANGING PATTERNS OF SPECIALIZATION ON THE WAY TO THE INTERNAL EU MARKET ................................................... ............. 26
THE SIMULTANEOUS CHALLENGE OF FASTER GROWTH AND REGIONAL CONVERGENCE ......................................................................................................................... 31
THE CHALLENGE OF PROMOTING FAST CONVERGENCE WITH THE EU ..................... 34 E . 1 . The speed of convergence will depend on the pace of structural reform .............................. 34 E.2. Savings-Investment Balances and the Sustainability of High Growth E.3. Convergence Scenarios for Turkey ............................................... POLICY COORDINATION FOR ENHANCED GROWTH AND MANAGEMENT OF EU ACCESSION: THE ACQUIS AND BEYOND ............................................................................. 47 F . 1 Policy prioritization during EU accession .............................................................................. 47 F.2. Policy coordination on the way to the EU ............................................................................. 50
A.l. A strong recovery has taken hold since 2002 .... A.2. The macroeconomic policy framework has bee
B .
C .
D .
E .
F .
CHAPTER 2 . PUBLIC FINANCE MANAGEMENT ON THE WAY TO THE EU .......................................................................................... 55 A .
B .
C .
D .
E .
QUALITY OF FISCAL ADJUSTMENT AND THE SIZE OF GOVERNMENT IN TURKEY ..................................................................................................................................... 55 A.l. Patterns of Fiscal Consolidation in 1999-2004 ..................................................................... 55 A.2. Expenditure allocations in international comparison ............................................................ 64
HORIZONTAL ISSUES IN PUBLIC EXPENDITURE REFORM .............................................. 71 B . 1 . Public sector pay and employment ........................................................................................ 71 B.2. The Public Investment Program ............................................................................................ 77
STRUCTURE OFFISCAL REVENUES AND OPTIONS FOR TAX POLICY REFORM ......... 82 C . 1 . Reform Priorities for the Personal Income C.2. Reform Priorities for the Corporate Income Tax ... C.3. Tax Expenditures ......................................... DEBT SUSTAINABILITY ............................................. ........................ .................. 89 D.l. Recent Developments in Public Debt Man D.2. Projected Debt Dynamics ..................................................................................................... 94 D.3. Analysis of Risks ......................................... .................................... .................... 96
OPTIONS FOR REFORM ............................................................................................................ 99
i

PART B: STRUCTURAL POLICIES . IMPROVING THE FUNCTIONING OF KEY MARKETS AND EFFICIENCY OF PRODUCTION FACTORS ............................................................... 101
CHAPTER 3 . PRODUCT-MARKET REGULATIONS TO IMPROVE THE INVESTMENT CLIMATE .................................. 103 A . PRODUCT MARKET REGULATIONS . AN AREA IN NEED OF REFORM ........................ 103
B . ADMINISTRATIVE BARRIERS ................................................................................... B. l . Firms’ Entry. Operation and Exit ........................................................................................ 108 B.2. Resolving Commercial Disputes ......................................................................................... 112
...................................................................................................................... 115
D . BARRIERS TO TRADE ................................................................................. ................ 117
E . COMPETITION POLICY .......................................................................................................... 119
F . COMPLEMENTARY MEASURES TO IMPROVE ATTRACTIVENESS TOFDI ................. 121
G . CONCLUSIONS ......................................................................................................................... 122
CHAPTER 4 . EXPANDING EMPLOYMENT . THE LABOR MARKET REFORM AGENDA ....................................................... 125 A . EMPLOYMENT AND EU ACCESSION ................................................................................... 126
A . 1 . General Employment Issues ............................................................................................... 127 A.2. Compliance with EU Directives ........ .............................................. 129
TURKEY’S EMPLOYMENT PERFORMANCE IN A EUROPEAN AND INTERNATIONAL CONTEXT .................................................................................................................................. 129 B.1. Working Age Population ..................................................................................................... 129 B.2. Underpinnings of Turkey’s Employment Performance ...................................................... 131 B.3. Employment in the Informal Economy ............................................................................... 137
LABOR MARKET POLICIES AND THEIR EMPLOYMENT IMPACTS ..................... C . 1 Payroll Taxes ........................................................................................................................ 139 C.2. Employment Protection Legislation .................................................................................... 142 C.3. Unemployment Insurance ................................................................................................... 147 C.4. Active Labor Market Programs ........................................................................................... 150
D . CONCLUSIONS AND RECOMMENDATIONS .................................. 151
B .
C .
CHAPTER 5 . FINANCIAL SECTOR DEVELOPMENT .............. 153 A . B . THE BANKING SECTOR .. ........................................................
OVERVIEW OF THE FINANCIAL SECTOR ISSUES IN TURKEY ....................................... 154
B . 1 . Performance ................ B.2. Key Remaining Issues in Banking Sector Reform .............................................................. 165
DEVELOPING INSTITUTIONAL INFRASTRUCTURE FOR THE CREDIT MARKET ....... 167 C.1. Corporate Transparency and Audit Information ................................................................. 167 C.2. The Mortgage Market ......................................................................................................... 170
.................................................
C .
D . E .
THE INSURANCE SECTOR ..................................................................................................... 171
SUMMARY OF REFORM NEEDS ........................................................................................... 173
CHAPTER 6 . FOSTERING TECHNOLOGY ADOPTION. INNOVATION. AND SKILLS .......................................................... 175 A . PROMOTING TECHNOLOGY ADOPTION AND INNOVATION AT THE FIRM LEVEL .. 176
11

A.3. Links Between Firms And Research Institutions ................................................................ 187 ...................................... 189 A.4. Policy Recommendations .....................................................
B . QUALITY STANDARDS ........................... ................................................................. 194
C . LABOR SKILLS ......................................................................................................................... 196
D . CONCLUSIONS ................................................................................... ................................. 203
CHAPTER 7 . INFRASTRUCTURE SERVICES FOR IMPROVED COMPETITIVENESS ....................................................................... 205 A .
B .
C .
D .
INFORMATION AND COMMUNICATION TECHNOLOGIES ............................................. 206 A . 1 . The Stakes .............................. .............................................. 206 A.2. ICT Performance in Turkey ..... .............................................. 207
....................................................................... 209 .............................................. 210
....................................................................... 213
LINKING Up WITH TRANS-EUROPEAN NETWORKS ........................................................ 214
A.3. Broadband - The New Imperative ..... A.4. I s Turkey Ready? ...................................................... A.5 . Policy and Action Guidelines ..
B. l . Overview of the Transport Sector ....................................................................................... 215 B.2. The National Road Sector ................................................................................................... 218 B.3. The Railway Sector ............................................................................................................. 221 B.4. THE PORT SECTOR ......................................................................................................... 222
........................................... 224 B.5. The Maritime Transport Sector ......................................... B.6. Air Transport and Airports Sectors ..................... ....................................... ...... 224
ENERGY ..................... ........................................................................................................ 226 C . 1 . Electricity ............. ........................................................................................................ 226 (2.2. Gas ...................................................................................................................................... 230
COMMON REFORM DIRECTIONS .............................................................
PART C: PROMOTING INCLUSIVE GROWTH ......................... 235
CHAPTER 8 . AGRICULTURE AND RURAL DEVELOPMENT ON THE WAY TO THE EUROPEAN UNION ............................... 237 A . ALIGNMENT WITH THE EU COMMON AGRICULTURAL POLICY (CAP) ..................... 238
A . 1 . Support to Agriculture in Turkey and EU and Impact of Alignment .......................... A.2. Impact of Alignment with CAP - General Equilibrium Modeling ..................................... 242
PROMOTING RURAL DEVELOPMENT AND ITS EU ALIGNMENT ................................. 246 B . 1 .Comparable International Experiences and Options ............................................................ 246 B.2. Rural Development Investment Patterns ............................................................................. 247 B.3. Diversification of Rural Development with Structural Funds ............................................. 252 B.4. Needed Changes to Institutional Arrangements for Structural Fund Programs .................. 256 B.5. Recommendations for Building SF and CAP Implementation Capacity ............................ 263
B .
CHAPTER 9 . ENHANCING POLICIES FOR SOCIAL COHESION 265 A . B .
SOCIAL ASSISTANCE AND SOCIAL SERVICES ................................................................. 265
MANAGING THE HEALTH CARE SYSTEM .......................................................... B . 1 . Status of Health Care System Reform .................................................................. B.2. Health Expenditures. 1999-2005 .......................................................................... B.3. Projected Trends in Health Expenditures ............................................................. B.4. Short-and medium-term measures to contain cost escalation ............................................. 276
C . CONCLUSIONS .......................................................................... ................. .......... 280
... 111

ANNEXES
Annexes Chapter 1 Annexes Chapter 2 Annexes Chapter 4 Annexes Chapter 6 Annexes Chapter 8 Annexes Chapter 9
LIST OF FIGURES
Figure 1.1 Figure 1.2 Figure 1.3 Figure 1.4 Figure 1.5
Figure 1.6 Figure 1.7 Figure 1.8 Figure 1.9 Figure 1.10 Figure 1.1 1 Figure 1.12 Figure 1.13 Figure 1.14 Figure 1.15 Figure 1.16 Figure 1.17 Figure 1.18 Figure 1.19 Figure 1.20 Figure 1.21 Figure 2.1
Figure 2.2 Figure 2.3 Figure 2.4 Figure 2.5
Figure 2.6
Figure 2.7
Figure 2.8 Figure 2.9 Figure 2.10 Figure 2.1 1 Figure 2.12 Figure 2.13 Figure 2.14 Figure 2.15
Annual GNP growth High growth episodes Inflation Per capita income growth rate Volatility, growth, and investment 1970-2003: Turkey in international comparison Annual average growth in labor productivity Annual average per capita GDP growth and its decomposition Annual average per capita GDP growth and i t s decomposition, 1993-2003 elasticity o f employment to output growth Average schooling in working age population Trade flows in percent o f GDP Exports o f services by category
283 296 304 305 317 326
004 004 005 013 014
016 016 017 018 020 02 1 022
Technology content’ o f Turkish trade with the EU in 1993-2003 (in percent) 027 Shares and dynamics o f total networks’ exports in 1995-2003 Regional income distribution GDP by sectors in regions Per capita income growth by percentiles Per capita income convergence high performing countries Per capita income convergence new EU member countries Saving-investment gap vis-8-vis high growth economies Actual and predicted savings ratios Fiscal balances and primary expenditures and revenues the general Government (1 999-2004; in % of GDP) General Government revenue in % o f GDP vs per capita GDP in PPP General Government expenditure as % of GDP Compensation o f general Government employees (2003-04; in % o f GDP General Government wage bill in percent o f Primary Public Expenditure (2004)62 Expenditure by economic category: Current transfers Turkey (2004) and 63comparators (2003), in % o f GDP General Government expenditure on social benefits and social transfers (as a % of GDP) Consolidated general Government gross fixed capital formation Functional allocation o f general Government expenditures Public expenditure on education vs. average years of schooling Personnel expenditures in percent o f GDP (1 999-2004) Composition of wage bill by function (in percent of total wage bill; 2004 Employment in the public sector (1997-2004) Employment and average wage cost in the public sector Wage bill in consolidated budget agencies -- actual and alternative scenario (1 999-2004; in % o f GDP
029 03 1 033 033 036 037 038 040 056
063 064 065
065
065
065 066 067 068 07 1 072 07 3 074
075
i v

Figure 2.16
Figure 2.17
Figure 2.18 Figure 2.19 Figure 2.20 Figure 2.21 Figure 2.22 Figure 3.1 Figure 3.2 Figure 3.3 Figure 3.4 Figure 3.5 Figure 4.1
Figure 4.2
Figure 4.3
Figure 4.4 Figure 4.5 Figure 4.6
Figure 4.7 Figure 4.8
Figure 4.9
Figure 4.10 Figure 5.1 Figure 5.2 Figure 5.3 Figure 5.4 Figure 5.5 Figure 5.6 Figure 5.7 Figure 5.8 Figure 5.9 Figure 5.10 Figure 5.1 1 Figure 5.12 Figure 5.13 Figure 5.14 Figure 5.15 Figure 5.16 Figure 6.1 Figure 6.2 Figure 6.3 Figure 6.4 Figure 6.5 Figure 6.6 Figure 6.7 Figure 6.8 Figure 6.9
Compensations, rewards, allowances, and overtime pay in percent o f total personnel expenditures of consolidated budget agencies (1997-2004) Public investment - institutional breakdown o f annual investments (2003), in 9% of GDP Gross capital formation by function General government revenue components as % of GDP EMBI+ spreads: Jan 2001- Aug 2005 Breakdown of domestic debt Downside scenario assumptions and projected debt/GNP ratios Foreign direct investment Labor productivity by sector SMEs’ share o f employment and GDP Turkey’s performance on key PMR indicators Administrative barriers, selected indicators, 2003 Turkey’s labor force participation rates in international context, persons aged 15-64 years, 2004 GDP and employment growth, Turkey and selection o f countries, 1990s to latest year GDP per capita (PPP) and agricultural share of total employment, Turkey and selected middle-income countries, 2003 Real wages and unit labor costs in private manufacturing, 1988-2004 Percent o f labor force and wage bill reported for tax purposes, Turkey’s EPL Rating compared to other OECD and European countries, 2004 Turkey’s severance rules compared to other countries Average actual weekly working hours in manufacturing, Turkey in an international context, most recent year Changes in sales ($US) and in employment over previous year, sample o f formal-sector firms, 2000-2002 Value of the UI Fund reserves, U IS IM (various simulations), 2003-2022 Bank DepositdGDP, 2004 Bank Credit to private sector/GDP, 2004 Distribution of banking sector assets ISE listed equity Market capitalization, 2004 ISE equity turnover Ratio Equity market turnover ratio, 2004 Corporate bonds, value of outstanding bonds Mutual funds, portfolio value Mutual funds, aggregate asset composition, 2004 Asset composition - state banks and private banks Loan and deposit dollarization Finance to private sector, 2004 Housing loans Non-life insurance premiums, 2003 L i f e insurance premiums, 2003 Capital goods importhnvestment Foreign direct investment Foreign direct investment: correlation with income Interest of Turkish firms in absorbing new technologies Acquisition o f new technologies via FDI Royalty and license fee payments: trends Royalty and license fee payments: level o f development Licensing as a means of acquiring new technologies Gross expenditures on R&D, trends and composition: Turkey.
076
077 079 082 093 093 097 105 105 106 107 110
131
133
135 135 138
143 144
145
146 149 156 156 157 157 157 158 158 159 160 160 161 164 168 170 172 172 178 179 179 180 180 181 181 181 182
V

Figure 6.10
Figure 6.1 1 Figure 6.12 Figure 6.13
Figure 6.14 Figure 6.15 Figure 6.16 Figure 6.17 Figure 6.18 Figure 6.19 Figure 6.20 Figure 6.21 Figure 6.22 Figure 6.23 Figure 7.1 Figure 7.2 Figure 7.3 Figure 7.4 Figure 7.5 Figure 8.1 Figure 8.2 Figure 8.3 Figure 8.4 Figure 9.1 Figure 9.2 Figure 9.3 Figure 9.4 Figure 9.5
Gross expenditures on R&D, total and composition: international comparison, 2001-2003, most recent data available Privately-financed R&D and level of development. Government-financed R&D and level o f development R&D expenditure o f foreign affiliates as percentage o f total private R&D, 2000-2002 (most recent year for which data i s available) Patent applications (national patent office). Patent applications (national patent office) and level o f development University-industry research collaboration I S 0 certifications per US$lOO million o f industry value added, 2003. Average years of schooling of adults (aged 15 and over), 2000. Average years of schooling and level o f development, 2000. Acquisition o f s k i l l s in mathematics and science. Acquisition of s k i l l s in reading literacy. Distribution o f students by PISA proficiency level in Turkey and EU, 2003 Quality o f math and science education. Availability o f digital subscriber l ines in OECD Countries Turkey freight and passenger modal split, 2002 Condition o f the national road network between 1993 and 2003 Fatalities in road motor vehicle accidents (Fatalities per 10,000 vehicles) Turkey - Comparison of industrial prices with OECD average Rural recurrent and Investment expenditures b y region 2002 (US$ Million) Total rural investments by region Per capita annual rural investments 2002 (US$) Rural investments in percent o f agricultural GDP, 2002 Health expenditure and GNI per capita Turkey and comparator countries GNI per capita and expected years spent in poor health Trends in health expenditures, 1999-2004 Real increase in health expenditures Real increase in pharmaceutical expenditures
LIST OF TABLES
Table 1.1 Table 1.2 Table 1.3 Table 1.4 Table 1.5 Table 1.6 Table 1.7
Table 1.8
Table 1.9
Table 1.10
Table 1.11
Table 1.12 Table 1.13 Table 1.14 Table 2.1
Table 2.2
Components o f real GDP growth Trade and current account balance FDI commitments in 2005 and expected cash flow in 2005-06 Sources o f labor productivity growth in Turkey, 1973-2003 Investment GDP ratios Sectoral contributions to labor productivity growth in Turkey, (1973-2003) Contributions to labor productivity growth in industry and services
Turkey in the world trade regional perspective in 1993,1996 and 2003 (1973-2003 in 96) Share o f slulled labor and capital intensive products in total exports o f EU candidate countries and EU-8 in 1996 and 2003 (in percent) Total automobile and ICT network trade and share o f Pan-European free trade area in 1995,2000 and 2003 (in mill ion o f US dollars and percent) Income shares o f population groups by level of province per capita income (in percent of total GDP). I C T / GDP ratio Income gaps to EU average and speed of convergence Negotiation o f the acquis4xperience from the new EU members Institutional breakdown o f consolidated general Government primary Balance Fiscal consolidation in Turkey, 1999-2004 and sub-periods
182 183 183
183 185 185 188 195 197 197 198 198 200 202 210 218 219 219 229 248 249 250 250 269 270 272 272 273
005 006 009 019 020 024 025
026
028
028
032 037 046 049
058 06 1
v i

Table 2.3
Table 2.4 Table 2.5 Table 2.6 Table 2.7
Table 2.8 Table 2.9 Table 2.10 Table 2.1 1 Table 3.1 Table 3.2 Table 4.1
Table 4.2
Table 4.3 Table 4.4
Table 5.1 Table 5.2 Table 6.1 Table 6.2 Table 7.1 Table 7.2 Table 7.3
Table 7.4 Table 8.1 Table 8.2 Table 8.3 Table 8.4 Table 8.5
Table 8.6
Table 9.1
Table 9.2 Table 9.3
List of Boxes
B o x 1.1 B o x 1.2 B o x 1.3 B o x 1.4 B o x 1.5 B o x 1.6 B o x 1.7
Box2.1
B o x 2.2
Personnel expenditures b y government function and level o f general Government (2004; in percent). Total employment in Turkey’s public sector ( l ) , September 2004 Public sector Investment, 1996-2005 Annual investment spending (% o f GNP Breakdown o f public sector debt stock as defined by Turlush Treasury, 2001 vs 2004 Composition o f the change in debt/GNP, 1999-2004 Baseline debt projections public debt forecasts (in % o f GNP Projected composition o f the change in Debt/GNP, 2005-2008 External financing requirements and sources 2003-2008 Entry and exit, Turkey and comparator countries, 2004 Contract enforcement Employment rates in 2004 relative to the Lisbon targets, Turkey, EU members, and Bulgaria and Romania Unit labor costs, manufacturing and total economy, Turkey compared to EU members and Bulgaria and Romania, most recent year Non-registration o f employed labor force in social security, 2004 Comparing average tax wedges1 in Turkey with European countries b y family type and wage Level, 2004 Structure o f the financial sector Structure o f the Turkish banhng system Patents granted per mi l l ion population Tertiary education indicators: stock and f low Infrastructure and doing business Network readiness index rank 2004105 Network readiness index for Turkey: significant differences between rankings and variables Turkey - Breakdown o f generation b y ownership (2004) Indicators o f support to agriculture Turkey and EU (1986-2004) Change in value o f production wi th price alignment wi th EU CAP Change in supported value o f production after full EU C A P alignment Comparable country data Correlations o f per capita agricultural GDP and per capita rural spending Correlations o f rural literacy levels and per capita rural spending b y expenditure type and correlation Economic classification o f total public health expenditures (as a share o f GNP Uti l izat ion o f health services (2003 or latest available year) Number o f hospital beds and utilization
Growth decomposition Drivers o f total factor productivity growth in Turkey Income convergence Speed o f convergence H o w negotiations were conducted with the new member states Summary o f structures for managing EU affairs in selected countries Impact assessment o f adjustment in the area o f health and safety at work on enterprises in Slovenia 054 Conversion between SOP definition o f CGG primary surplus to IMF’s program definition o f public sector primary surplus 057 Turkish pension system - The need for a reform 059
072 073 07 8 079
090 092 095 095 099 109 113
132
136 137
141 155 162 184 20 1 206 21 1
21 1 23 1 238 240 241 246
25 1
252
272 275 277
015 022 035 045 048 052
v i i

Box 2.3 068 Box 2.4 070 Box 2.5 The wage bill in rural agencies budget 072 Box 2.6 090 Box 6.1 Designing matching programs for private R&D investments 192 Box 8.1 Experiences from EU countries with regional aid 253 Box 8.2 263
Education reform on the way to the EU- Fiscal impact The quality o f fiscal adjustment and economic performance
ESA 95 Definition of the change in general Government gross debt
Key role o f EU CAP Paying Agency and accreditation requirements
... V l l l

ACKNOWLEDGMENTS
This report was prepared by a core team composed o f Mediha Agar, Michel Audige, Gordon Betcherman, Steen Byskov, Mukesh Chawla, Michael Edwards, Indira Konjhodzic, Mark Lundell, Marialisa Motta, Zafer Mustafaoglu, Kamer Karakurum-Ozdemir, and Aristomene Varoudakis (Task Team Leader).
Significant contributions were provided by: Gokhan Akinci; Enrique Blanco Armas, Nina Budina; Sirin Elci (consultant); John Innes; Bart Kaminski (consultant), Rughvir K Khemani, Robin Horn, Ranjit Lamech, Gareth Locksley; Koshy Mathai (IMF); Ebru Ocek (consultant); Marc Reichel (consultant), Selin Sayek (consultant); Sumter Lee Travers; Dominique Van Der Mensbrugghe, Charles Vuylsteke (consultant), and Sweder van Wijnbergen (consultant).
Contributions were also received by: Cecilia Briceno-Garmendia; Ferhat Emil (consultant); Edgardo Favaro; Isabel Sanchez Garcia; Vinod K. Goel; Itzhak Goldberg, Ufuk Guven, Mizuho Kida; Brian Levy; Richard Messick, Georgine Ann-Marie Newman-Alawode, Panagiota Panopoulou, Taras Pushak, Anita Schwarz.
Research assistance was provided by: Faruk Baykal, Mehmet Gorpe, Thomas Haven; Antoneta Stavreska, Victor Sulla; Olga Vybornaia, Omer Yalvac, and Izzet Yildiz.
Peer reviewers were: Kyle Peters and Carlos Silva Jauregui. Guidance was provided by Cheryl Gray (Sector Director), Pradeep Mitra (Chief Economist, E C A Region), and Felipe Jaramillo (sector manager).
External reviewers were: Daniel Gros, Director, Center for European Policy Studies, Brussels; and. Jorge Braga de Macedo, Professor, Nova University o f Lisbon, former Minister o f Finance and Member o f Portuguese Parliament, former President of the OECD Development Center.
Comments were provided by: Ismail Arslan, Enis Baris, Rodrigo Chaves, Franz Kaps, Ali Mansoor, Fernando Montes-Negret, Samuel Otoo, Mathew Verghis, and Deborah Wetzel. Valuable comments were also received from Lorenzo Giorgianni (IMF); Peter Grasmann, Dirk Verbeken, Alain Deckers, Catherine Combette, Kerstin Rosenow, (EU Commission); Rauf Gonenc and Anne-Marie Brook (OECD). Administrative support by: Lalani Dammika Somasundaram and Aikaterina Stefanova
Valuable support from the counterpart team, organized by the Undersecretariat of the Treasury, i s gratefully acknowledged, and especially from the services o f the State Planning Organization, which provided information on many parts o f the study. Comments from the counterpart team were received on a first draft o f the summary report


PART A. POLICY AND INSTITUIONAL FRAMEWORK FOR CONVERGENCE WITH THE EUROPE UNION
1

2

CHAPTER 1. UNLOCKING TURKEY’S POTENTIAL FOR GROWTH AND PREPARING FOR EU ACCESSION
1.1 Commitment of the Government to sound economic policies since 2001 has placed the Turkish economy in a good position to embark on a sustained path of faster economic growth. Turkey has significantly improved i t s macroeconomic situation through a determined implementation o f the reform program. Important progress has been achieved in reducing inflation and real interest rates, improving public finances, restructuring the financial sector, improving the business environment, and reforming the public sector. In particular, strong fiscal discipline helped lower inflationary expectations and improve debt sustainability. Thus, stability has been restored, predictability has improved and market confidence has increased. The new Stand-By arrangement with the IMF and the ongoing process o f European Union (EU) accession i s expected to provide an anchor for the continuation o f the reform process in the years ahead, and contribute to increasing Turkey’s growth potential and improving convergence prospects to the EU average income level.
1.2 Sustained fast growth could be the virtuous outcome, and the precondition, for Turkey’s EU accession. The strong recovery after the 2001 crisis has improved confidence and eased the burden o f reforms to the society which in turn facilitated a consensus about their merits. Sustained high growth rates could further strengthen the consensus on these reform efforts. The EU accession can provide a strong anchor for the continuation o f the reforms as well as helping high growth rates; while at the same time sustained high growth rates would enhance prospects for Turkey’s eventual membership by accelerating income convergence between Turkey and the EU. This chapter looks into Turkey’s prospects for achieving faster growth during a sustained period o f time, so as to start closing the income gap with the EU-25 average and addresses overachieving policy coordination issues for EU accession. The first section evaluates the recent developments in key economic variables as well as the macroeconomic policy framework. The second section compares Turkey’s long term growth performance relative to other countries. This section also analyses the main factors affecting labor productivity, total factor productivity and labor utilization in Turkey. Section three analyzes in more detail Turkey’s trade performance-a powerful driver o f productivity improvement and growth. The fourth section discusses how the challenge o f accelerating growth i s intertwined with the challenge of reducing regional disparities. The fifth section analyses the relative growth performance o f Turkey with the EU countries and, building on the findings o f previous sections, evaluates scenarios for sustained income convergence for Turkey. The last section discusses reform sequencing, including the agenda that goes beyond the acquis, and overarching issues in policy coordination for EU accession.
3

A. FROM CRISIS TO STABILITY-STRONG ECONOMIC PERFORMANCE POWERED BY FAR-REACHING POLICY REFORMS
-GNP II _ b x * 1950-2000=4.8
A.l. A strong recovery has taken hold since 2002
D Annual ’ 3-years Moving Average
1.3 The recovery in the Turkish economy has been remarkable. Following the record contraction o f GDP in 2001, the Turkish economy rebounded very strongly and was one o f the fastest growing economies in the world in 2004. The annual growth rate averaged 8 percent during 2002-2004, considerably exceeding past performance (Figure 1.1). Turkey has managed to grow above 6 percent on average in three consecutive years many times over the last 55 years (Figure 1.2). However, the average growth rate over the last three years was the second highest since 1950. Per capita income growth, at an average of 6.3 percent during 2002-2004, significantly exceeded past trends and was strong enough to help Turkey achieve some convergence with higher income countries. The economy continued to grow strongly in 2005, albeit at a slower pace close to potential. Growth o f GDP reached 5.5 percent in the f i rs t three quarters o f 2005 compared to the same period in 2004. The official estimate o f 5 percent growth rate for the whole year seems well in reach.
Figure: 1. 1 Annual GNP Growth Figure: 1.2 High Growth Episodes
Annual Growth Rate GNP Growth Rate
12 0 9 0 6 0 3 0 0 0
-3 0
2002-2004 = 7 9 %
1.4 The recovery was mainly driven by the private sector. A noticeable change from the past during this period was that the strong growth mainly came from the private sector, while public sector consumption and investment expenditures shrank due to tight fiscal policies. The growth was mainly driven by private consumption, investment and exports on the demand side (Table 1.1). Domestic demand grew faster than real GDP in 2003-2004, causing a broadening o f the current account deficit (see below), and this trend did not change much in the first three quarters o f 2005, though consumption slowed down considerably and was aligned with real GDP growth. Strong investment activity brought about a significant increase in domestic demand since 2002. On the supply side, industry, trade, transportation and communication sectors have mainly contributed to growth.
4
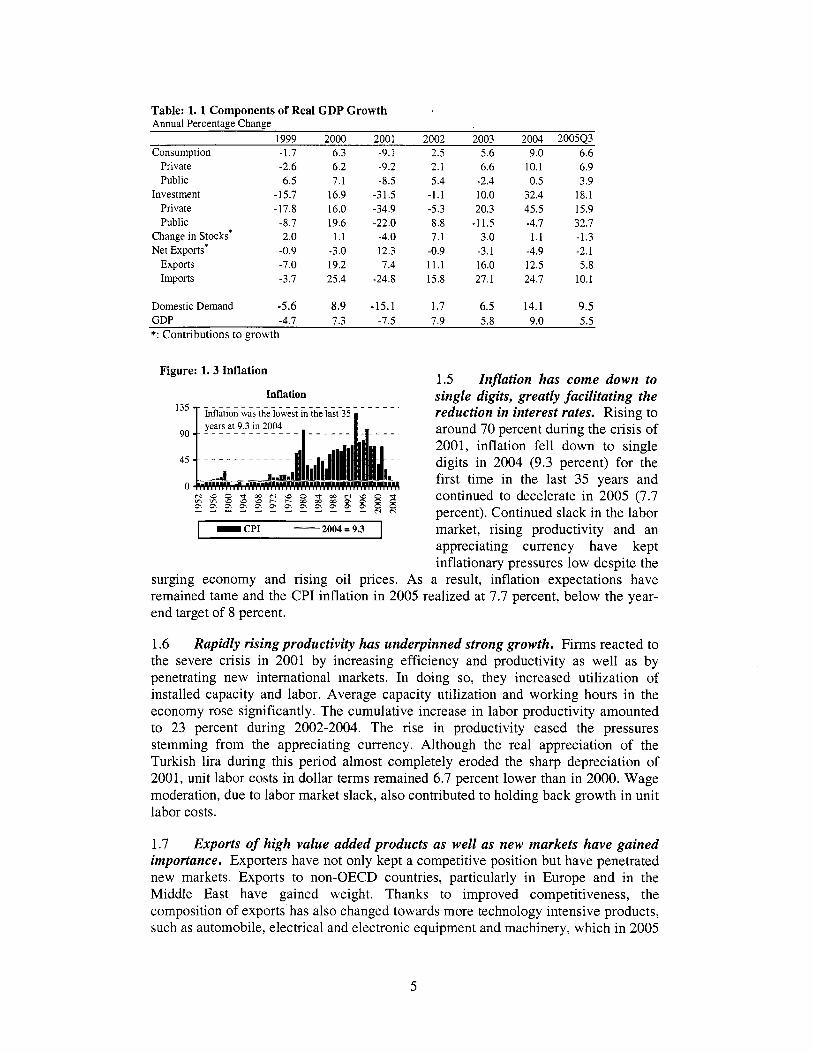
Table: 1. 1 Components of Real GDP Growth Annual Percentage Change
Consumption 1999 2000 2001 2002 2003 2004 200543
Private Public
Investment Private Public
Change in Stocks' Net Exports*
Exports Imports
- CPI ' ' 2004=9.3
-1.7 6.3 -9.1 2.5 5.6 9.0 6.6 -2.6 6.2 -9.2 2.1 6.6 10.1 6.9 6.5 1.1 -8.5 5.4 -2.4 0.5 3.9
-15.1 16.9 -31.5 -1.1 10.0 32.4 18.1 -17.8 16.0 -34.9 -5.3 20.3 45.5 15.9 -8.1 19.6 -22.0 8.8 -11.5 -4.1 32.1 2.0 1.1 -4.0 7.1 3.0 1.1 -1.3
-0.9 -3.0 12.3 -0.9 -3.1 -4.9 -2.1 -7.0 19.2 7.4 11.1 16.0 12.5 5.8 -3.7 25.4 -24.8 15.8 27.1 24.7 10.1
market, rising productivity and an
Domestic Demand -5.6 8.9 -15.1 1.7 6.5 14.1 9.5 GDP -4.1 7.3 -7.5 1.9 5.8 9.0 5.5 *: Contributions to growth
1.6 Rapidly rising productivity has underpinned strong growth. Firms reacted to the severe crisis in 2001 by increasing efficiency and productivity as wel l as by penetrating new international markets. In doing so, they increased utilization o f installed capacity and labor. Average capacity utilization and working hours in the economy rose significantly. The cumulative increase in labor productivity amounted to 23 percent during 2002-2004. The rise in productivity eased the pressures stemming from the appreciating currency. Although the real appreciation o f the Turkish lira during this period almost completely eroded the sharp depreciation o f 2001, unit labor costs in dollar terms remained 6.7 percent lower than in 2000. Wage moderation, due to labor market slack, also contributed to holding back growth in unit labor costs.
1.7 Exports of high value added products as well as new markets have gained importance. Exporters have not only kept a competitive position but have penetrated new markets. Exports to non-OECD countries, particularly in Europe and in the Middle East have gained weight. Thanks to improved competitiveness, the composition o f exports has also changed towards more technology intensive products, such as automobile, electrical and electronic equipment and machinery, which in 2005
5

represented 30 percent o f total exports, up from 21 percent in 2000. This bodes well for the sustainability o f the growth in exports. Underlying trends in Turkey’s trade are examined in more detail in section C. The appreciation o f the euro against the dollar may have also benefited Turkey’s exporters by supporting their profit margins. The majority of Turkish exports are euro-denominated while imported raw materials are mostly USD-denominated.’ Therefore, the appreciation o f Euro against the USD by almost 40 percent during the period o f 2002-2004 must have eased substantially the pressures on competitiveness originating from the appreciation of the Turkish lira.
Table: 1.2 Trade and Current Account Balance (Million Dollars)
1999 2000 2001 2002 2003 2004 2005 Exports (by ISIC) 26,587 27,775 31,334 36,059 47,253 63,167 73,122
Textile and Clothing Machinery, Electric-Electronic and Vehicles
Machinery and Equipment Electric-Electronic Vehicles
Imports (by BEC) Capital Goods Intermediate Goods Consumption Goods Memo: energy imports *
Exports / Imports Ratio %
Trade Balance Trade Balance as a percentage of GDP
Exports of Services Transportation Tourism Others
Imports of Services Transportation Tourism Others
Current Account Balance
9,828 10,031 10,341 12,148 14,995 17,338 18,637 5,120 5,853 7,262 8,881 12,802 18,585 21,870 1,272 1,439 1,617 2,117 3,159 3,965 4,915 1,463 1,787 2,041 2,632 3,168 4,459 5,076 2,386 2,627 3,605 4,132 6,474 10,161 11,879
40,671 54,503 41,399 51,554 69,340 97,540 116,048 8,727 11,365 6,940 8,400 11,326 17,397 20,236
26,854 36,010 30,301 37,656 49,735 67,549 81,320 4,820 6,928 3,813 4,898 7,813 12,100 13,926 5,375 9,529 8,339 9,204 11,575 14,407 21,164
65.4 51.0 75.7 69.9 68.1 64.8 63.0
.14,084 -26,728 -10,065 -15,495 -22,087 -34,373 -42,926 -7.6 -13.4 -6.9 -8.4 -9.2 -11.4
16,800 20,364 16,030 14,783 19,025 22,928 25,854 2,900 2,955 2,854 2,795 2,184 3,267 4,016 5,203 7,636 8,090 8,479 13,203 15,888 18,152 8,697 9,773 5,086 3,509 3,638 3,773 3,686
9,313 8,996 6,900 6,904 8,520 10,144 11,850 2,101 2,463 2,021 1,934 2,707 4,331 5,313 1,471 1,713 1,738 1,880 2,113 2,524 2,872 5,741 4,820 3,141 3,090 3,700 3,289 3,665
-1,344 -9,819 3,390 -1,524 -8,036 -15,604 -22,852 Current Account Balance as a percentage of GDP -0.7 -4.9 2.3 -0.8 -3.4 -5.2
*: SITC Rev. 3, code which includes 32: coal, coke and briquettes; 33: petroleum, petroleum products and related materials; 34: gas, natural and manufactured; 35: electric current.
1.8 The current account deficit has also widened. The real appreciation o f the l ira and the strong recovery o f the domestic demand led to widening trade and current account deficits in early 2004. The Turkish government was fairly quick in introducing measures to slow down consumption and consumer goods imports at the end o f May 2004.* Those measures were effective in reducing imports o f consumer goods, particularly automobiles, but the current account continued to widen albeit to a lesser extent than what i t would have been if the government had not taken any
Berument and Dincer (2005), Denomination Composition o f Trade and Trade Balance: Evidence
The measures included curbs on expansion of consumer credit by the state banks, reduction in tax from Turkey, Applied Economics, vo1.35.
credits for automobile purchases and raising taxes on consumer credit.
6

measure. The current account deficit amounted to 5.2 percent o f GDP in 2004 and continues to remain a major cause o f concern as it i s projected to increase to 6 percent o f GDP in 2005. Although the demand for imported automobiles has weakened significantly, the trade deficit in 2005 increased by 24.9 percent compared to 2004 and reached 42.9 bi l l ion dollars, mainly due to large increases in the imports o f raw materials, particularly o f energy related products as a reflection o f high o i l prices. The increase in the imported energy bill accounts for almost 1.5 percentage points o f the projected current account deficit in proportion to GDP during 2005. The export coverage o f imports declined from around 69 percent in January 2005 to around 62 percent in December 2005.
1.9 With generally favorable conditions in international capital markets, Turkey had no difficulty in financing the large current account deficit and foreign reserves rose in 2004 and 2005. However, a significant part o f these flows continue to be short-term capital. Foreign investment in the stock exchange market, purchases o f government bonds by non-residents in domestic markets and short term credit usage by banks (largely trade credits and inter-bank credits), increased substantially starting from mid-2003. About 53 percent o f total net inflows (excluding IMF credits and official reserves) were in the form o f short-term flows in 2004 and this ratio decreased to 41 percent in 2005. The official reserves o f the Central Bank rose from around 19 bi l l ion dollars in 2001 to 36 bi l l ion at the end o f 2004 and 50.5 bi l l ion at the end o f 2005. The official reserves stood at 4.4 months o f imports in 2004 and 5.2 months of imports in 2005. The same ratio was 4.9 months in 2000 and 5.4 months in 2001.
1.10 The large external current account deficit i s of concern for the sustainability of fast growth. Although a high energy bill has inflated further the current account deficit in 2005, the continuing strong growth o f domestic demand, and in particular o f investment in the face o f s t i l l weak domestic savings, underpins existing current account tensions. With strong fiscal consolidation achieved so far and a flexible exchange rate regime in place, Turkey i s in a much better position to face current account imbalances than in the past. However, as strong growth o f domestic demand i s l ikely to characterize a fast-growth scenario in the years ahead (see section E.3), r isks are also l ikely to persist. As further explained in chapter 2 (see section D.3), a sudden depreciation o f the exchange rate-which might be triggered by capital f low reversals in the face o f large current account deficits, insufficient amounts o f FDI, and rising international interest rates-remains a source o f vulnerability. Because o f the s t i l l large foreign-exchange linked component o f the public debt, and the increase in real interest rates that a significant depreciation o f the exchange rate may entail, the currently declining path o f the debt to GNP ratio could be interrupted. Such developments would not be consistent with sustained, fast medium-term growth.
1.1 1 for both macroeconomic and structural policies.
Preserving current account sustainability raises a simultaneous challenge
On the macroeconomic front, i t i s important that fiscal discipline be continuously maintained through a high primary budget surplus to ensure needed mobilization o f domestic savings for the financing o f investment. Moreover, a sufficiently tight fiscal stance would be needed to support monetary policy in the context o f the upcoming introduction o f explicit inflation targeting (see next section). Without support from fiscal policy in forestalling domestic demand pressures, monetary policy would have to rely
7

on high short-term real interest rates to keep disinflation on track, with the risk o f further appreciating the currency and damaging the external balance as well as increasing the cost o f borrowing in domestic markets for the Treasury. On the other hand, managing monetary policy with a view to achieving a more competitive exchange rate would not be an option consistent wi th pursuing a strategy o f inflation targeting and would risk undermining the credibility o f disinflation.
On the structural front, strengthening the investment climate, by complementary reforms further analyzed in chapters 3,4, 5 and 7, i s not only a condition for higher private investment and faster growth, but also for attracting foreign savings in the form o f foreign direct investment and thus for ensuring the sustainability o f growth. Better mobilization o f domestic savings w i l l be also needed-partly through sustaining the fiscal consolidation effort, and partly through greater mobilization o f domestic private savings. Empirical analysis, based on a panel o f 70 countries, including Turkey, suggests that fiscal policy, growth, financial sector development, and demographics are key factors that affect private savings (see section E.2). Continuing liberalization o f product and service markets, through early alignment with the EU acquis and further strengthening o f competition policy, would enable competitive cost reductions, especially in non traded services, which would accelerate the reduction o f inflation. This would possibly allow a policy m ix wi th an easier monetary policy stance, and would thus prevent currency appreciation induced by persistently high interest rates.
1.12 Bolstering the traditionally low levels of long term financing including foreign direct investment will improve the structure of capital flows and help preserve current account sustainability. FDI has picked up significantly in 2005. FDI in 2004 amounted to US$2.8 billion, and reached $9.6 bi l l ion (2.6 percent o f GDP), based on transactions realized during the year. On a commitment basis, FDI i s estimated at more than USD 19 b i l l ion in 2005, o f which the great majority (72 percent) i s related to privatization operations and sales o f SDIF assets (Table 1.3). FDI related to acquisitions in the private sector accounts for the rest o f commitments. On a cash-flow basis, however, FDI originating from private sector acquisitions accounts for the majority o f expected inflows in 2005 (USD 5.2 bi l l ion out o f U S D 9 bi l l ion total-Table 1.3), consistent wi th an increasing appetite for Turkish companies and a significant rise in foreign interest in the Turkish banking sector. Moreover, 2005 represents a milestone in the history o f privatization in Turkey. The Privatization Agency completed the ever biggest privatization, for Turk Telekom on July 1, raising US$ 6.6 bi l l ion for a sale o f 55 percent shares o f the ~ o m p a n y . ~ The total amount o f privatization deals in 2005 i s expected to yield close to US$ 26 bi l l ion (not including sales by the SDIF, see Table 1.3), although some o f the sales are s t i l l in the legal process. B y comparison, only US$ 9.4 bi l l ion o f privatization deals were realized in the whole period 1986-2004. All these developments signal a strong confidence in the Turkish economy and confirm the government's commitment to the privatization program. Continuing efforts o f privatization w i l l help reduce public debt and, combined with greater greenfield FDI, w i l l be particularly helpful in financing the
The total amount wil l be paid in five annual installments and only an amount of 1.3 billion dollars was received in 2005. The strong privatization progress continued with big ticket items, such as the state refinery TUPRAS and the steel company Eregli Demir Celik.
8

widening current account deficit-especially in a context where short-term capital flows to emerging market economies may dry up with increasing interest rates in international capital markets.
Completed Privatization Tenders of which FDI
Sale Price Cash Payment profile (commitment based) 2005 2006
25.63 6.86 4.50 9.78 3.45 1.11
Assest Sales by SDIF of which FDI
Total FDI
5.96 1.66 4.00 4.30 0.30 4.00
19.39 8.96 5.21
Acquisitions in the Private Sector of which FDI
7.86 7.76 0.10 5.31 5.21 0.10
1.13 The impressive economic growth did not reduce unemployment. Despite the strong growth performance for the three consecutive years in a row, unemployment remained high at 10.3 percent in 2004, declining only marginally from 10.5 in 2003. In urban areas, unemployment rate stayed at around 13 percent while unemployment o f educated youth remained at around 25 percent. Although employment increased by 3 percent in 2004 and the rate o f increases in agriculture, industry and construction sectors were significant, the increase in employment was just enough to cover the 2 percent increase in the working age population and 0.4 percentage point increase in the labor force participation ratio. Unemployment being realized at 10.1 percent, showed only slight declines in the f i rs t three quarters o f 2005, compared to 10.4 percent in the same periods o f 2004. Given the strong labor force growth and the potential for an increase in participation rates, Turkey needs to grow at very high rates even just to keep unemployment from rising.
1.14 The “jobs deficit” presents a particular challenge on the road towards EU accession. The European Council meeting in Lisbon in 2000 adopted an employment rate target o f 70 percent to be met by 2010. With a s t i l l fast growing population and an employment rate o f only 46 percent, Turkey w i l l have to generate about 10 mil l ion jobs in 6 years to reach the current EU average employment rate in 2010, and would have to generate an additional 14 mi l l ion jobs to reach the Lisbon target employment rate. Under current trends o f GDP and employment growth, only around 2 mil l ion jobs w i l l be created by 2010. The targets for female employment rate and employment for workers over 55 are even more diff icult because women and older workers are particularly l ikely not to be employed in Turkey. The magnitude o f the jobs deficit suggests that immediate action i s needed (see below and also chapter 4).
9

A.2. The macroeconomic policy framework has been considerably strengthened
1.15 The policy mix has been effective in strengthening confience in the economy. The policy m ix followed since 2002, based on tight fiscal and monetary policies and a flexible exchange rate regime, has proven to be expansionary as i t increased confidence in the markets and reduced risk premium on Treasury-bill interest rates. Ambitious structural reforms in financial markets, key infrastructure services, product markets and public sector as well as collaboration with the Wor ld Bank and the IMF have led to a radical improvement in policy framework and institutional set up, which boosted productivity and growth. The increased focus on the alignment with the EU acquis further strengthened the macroeconomic environment. In addition, the decision to start accession negotiations with Turkey by the European Council4 in December 2004, followed by the effective start o f negotiations on October 3 2005, and the signing o f a new Stand-By arrangement with the IMF’ in early 2005 have created twin anchors for economic policies in the years ahead. Nevertheless, a strong implementation o f the reforms i s necessary to maintain current high growth rates in the medium term.
1.16 Post crisis monetary policy focused on price stability under a floating exchange rate regime. The Central Bank o f the Republic o f Turkey (CBRT) gained independence in 2001 and price stability was set as i t s primary objective. The currency peg regime implemented in 2000 as an anchor o f the stabilization program lost i t s credibility during the crisis and therefore a floating exchange rate regime was adopted. In this context, the exchange rate was set free to be determined by supply and demand conditions in the market. The advantage o f the floating exchange rate regime was that i t allowed the Central Bank to focus on price stability and freed it from the constraint o f following many targets at the same time. However, the Central Bank occasionally intervenes in the foreign exchange market to dampen what are deemed to be excessive fluctuations in the exchange rate. The Central Bank intervenes directly in the markets by buyingkell ing foreign currency from time to time and holds currency buying auctions.
1.17 Confience in the consistency of the policy framework with sustained disinflation was gradually strengthened. Monetary policy followed a path o f implicit inflation targeting since 2002, facilitated by a resolute effort at fiscal consolidation that eased fiscal dominance over the conduct o f monetary policy. The CBRT mainly concentrated on disinflation and used short term interest rates as a policy tool in guiding inflationary expectations. This monetary framework was also backed by establishing targets for monetary aggregates. Credit growth has been particularly strong in the last two years, and the process o f reverse currency substitution has continued with foreign currency deposits fall ing to 40 percent o f total deposits from 55 percent in 2001. Interest rates on Treasury bills continued to fall, particularly after December 2004. The recently achieved macroeconomic stability and strong fiscal performance have helped build confidence in the economy, which in turn decreased
The European Council took a decision during the December 17, 2004 Summit to start negotiation talks with Turkey on October 3, 2005.
Turkey signeia new Stand-By agreement with the IMF in May 2005, covering the period of 2005- 2008.
10

the risk premium attached to Treasury’s cost o f borrowing (see chapter 2, section D.3, on public debt management).
1.18 The upcoming introduction of explicit inflation targeting has the potential to deliver superior results. The CBRT w i l l be operating an explicit inflation targeting regime as o f January 2006. Evidence from developing countries suggests that adoption o f inflation targeting delivers better results in terms o f lower and more stable inflation, as well as lower volatility o f the nominal exchange rate and real interest rates (IMF, 2005). Although the fiscal position before the adoption o f inflation targeting does not seem to affect the ability o f inflation targeting to deliver lower and more stable inflation relative to other strategies, i t i s also true that most countries that have successfully moved to inflation targeting had made progress in fiscal consolidation with the aim o f easing potentially destabilizing policy inconsistencies.
1.19 Fiscal consolidation has laid the groundwork for explicit inflation targeting in Turkey, as policy inconsistency is the main risk of failure in inflation targeting regimes. The traditional problem faced by inflation targeting regimes i s a fiscal stance that i s too expansionary to be compatible with stable debt-output ratios and low inflation. Inflation targeting may become a source o f instability if higher real interest rates, which may be necessary to achieve the targets, trigger concerns o f broadening fiscal imbalances and possibly default, thus entailing devaluation and higher inflation as a consequence. Such concerns could arise through the impact o f higher interest rates on default risk premia.6 Analysis has shown that the early period o f the recent stabilization attempts (1999 and 2000) in Turkey was characterized by inconsistencies between fiscal policy parameters, levels o f public debt on the one hand and inflation targets on the other. Although vulnerabilities remain-as further explained below and in chapter 2-the basic settings o f macroeconomic policy have been brought in line with each other in 2004. I f at least the primary surpluses o f 2004/2005 can be maintained, policy inconsistency w i l l not be an issue for switching f rom implicit to explicit inflation targeting.
1.20 Reasonable flexibility in the implementation of inflation targeting would be appropriate. Flexibil i ty seems to be the preferred option in the implementation o f inflation targeting, until the fiscal program i s more f irmly established and external imbalances are reduced.’ According to the implementation framework o f inflation targeting announced by the CBRT, the approach adopted allows for reasonable flexibility, by attaching an uncertainty band o f plus or minus 2 percentage points around the headline CPI program target. Additional options may involve using an inflation target zone based on inflation forecasts over a longer time period (for example, 18 months to two years). Moreover, setting an appropriate core inflation target may help avoid reacting to excess volatility in case o f recurrent supply-side shocks, in view o f existing tensions in world energy markets. Although targeting the “headline” CPI has merits in terms o f simplicity and communication, this could be coupled with an appropriate target range for “core” inflation forecasts. Developing
Blanchard (2004) and van Wijnbergen and Budina (2005),
’ For example, raising interest rates in the face o f a temporary increase in inflation induced by exchange rate adjustment to current account imbalances may be counterproductive if i t were to trigger debt sustainability concerns that may further add to interest rate tensions.
11

strong forecasting capacity for inflation over the medium term would be a pre- condition for successful implementation o f a flexible targeting approach.
1.21 Strong fiscal performance has been the cornerstone of the economic programs implemented since 2000. As further explained in chapter 2, following the cr is is in 2001, there has been an outstanding improvement in the public sector primary balance, which moved to a surplus o f 7 percent o f GNP by 2004 from a deficit of 1.6 percent in 1999. The fiscal performance showed no deterioration in 2005 with the consolidated budget primary surplus amounting to 132 percent o f the target for the whole year at the end o f 2005. The success in achieving the targeted primary surpluses has driven the market expectations and played a key role in the establishment o f macroeconomic stability.
1.22 Resilience to shocks increased as public debt to GNP ratio declined. As a result o f strong fiscal adjustment, but also helped by exchange rate appreciation, the net public debt to GNP ratio fel l by 27 percentage points from i t s eak at 91 percent in 2001 to 64 percent in 2004 and to a projected 60 percent in 2005 (total public debt declined from 108 percent to 77 percent between 2001 and 2004 on a gross basis). With increasing capital inflows and growing appetite for the Turkish government’s paper, the Treasury had no problem in servicing the debt, while the average maturity o f new debt increased to 15 months in 2004 and 27 months in 2005 f rom under 10 months in 2003. Nevertheless, as further explained in section Chapter 2, risks continue to exist, albeit to a lesser extent, as the current level o f debt i s s t i l l high, i t s maturity i s s t i l l relatively short and vulnerability to interest rate and foreign currency shocks i s not negligible despite the increasing share o f f ixed rate debt in the total.
P
1.23 Improving the quality o f fiscal adjustment i s an important challenge for ensuring i t s sustainability and making room for growth-enhancing expenditures and lower taxes. As further explained in chapter 2, much o f the burden o f fiscal adjustment following the crisis in 2001 has been borne by increasing revenues, while primary spending as a ratio o f GNP has remained broadly at 1999 levels. Taking into account that interest expenditures and public sector borrowing requirement are s t i l l high, an improvement in the quality o f fiscal adjustment would boost growth and, by enhancing market confidence, lower interest rates which would allow a more rapid decline in the ratio o f public debt to GNP. The patterns o f fiscal adjustment and expenditure allocations in international comparison are examined in more detail in chapter 2.
B. ENGINES OF LONG TERM GROWTH IN TURKEY
B.l. Turkey’s growth dynamics in international comparison
1.24 High and chronic inflation, large public deficits, frequent current account crisis, rising debt and high volatility characterized the Turkish economy for long periods in the past. The Turkish economy has been going through important structural reforms since the beginning o f 1980s and important steps have been taken
The government’s latest estimate for 2005 i s 56.9 percent.
12

to create a competitive and open economy in parallel to developments in other parts o f the world. Despite the increasing liberalization o f the economy, the 1990s were characterized by volatile growth, high and sustained inflation, continuing public deficits and high real interest rates. Macroeconomic instability hindered the functioning o f markets by undermining confidence, heightening uncertainty, and raising concerns about the sustainability o f macroeconomic policies.
1*25 Chronic has Figure: 1.4 Per Capita Income Growth Rate prevented Turkey from
potential. The Turkish 6 0
cloud of vulnerability and earlier attempts to stabilize the economy fel l short, so that high growth has never been sustained for long. As a result, long-term growth has been relatively slow, with average annual per capita income - growth in 1970-2003 at two percent-well below the emerging market economies o f East Asia, which grew by 4.3 percent (excluding China), and closer to growth seen in Latin American countries. Growth was much healthier in the 1980s, boosted by a far-reaching program o f economic reforms, while severe macroeconomic instability in the 1990s was reflected in slower growth (Figure 1.4). Transition economies in Eastern and Central Europe that joined the EU in 2004 have witnessed much stronger growth than Turkey in the period o f 1993-2003.
8 0 realizing its full growth Averrgc GmwUI R8lc 01 Per Crpltr h c o m (1971 2W3 m
economy has operated under a E11971 1980 .I981 1990 0 1 9 9 1 2W3
3 0
2 0
O 0
I O
1.26 Volatility has been high in international comparison. Over 1971-2003, the coefficient o f variation o f annual per capita GDP growth was 2.2 in Turkey, compared to less than one in East Asia. Volati l i ty has been exacerbated in the 1990s: The country plunged into three contractions in the last 10 years (1994, 1999, and 2001), wi th per capita GDP shrinking by more than 7 percent in each episode (-13, -7.5, and - 14.5 percent, respectively). Volati l i ty has been associated with high and persistent inflation, as in other countries where growth has been volatile. The average inflation rate for the last 30 years was 52 percent, increasing to 72 percent in the 1990s.
1.27 Volatility is generally associated with lower investment and slower growth. Evidence across countries, over 1971-2003, suggests that higher volatility, as measured by the coefficient o f variation in per capita GDP growth, was associated wi th lower long-run growth (figure 1.5a). A main driver for lower growth seems to have been the negative association o f volatility wi th average investment ratios (figure 1.5b). There are a number of reasons why volatility in key macroeconomic variables such as the terms o f trade, inflation and real exchange rate, may lead to lower investment. Volatility heightens uncertainty, hence lowering the risk-adjusted returns on investment. Volatility also increases bank exposure to credit risks, so that banks are more inclined to supply short-term credit, at the expense o f long-term financing. This potentially raises the cost o f financing o f long-term productive investment. High risks o f financial intermediation also increase the level o f collateral required by banks,
13

thus hampering access to finance b y small and medium enterprises. International experience suggests that prudent fiscal policies help insulate the economy from external shocks, while strong prudential regulation o f banks also greatly helps cushion the impact o f volatility, by preventing the accumulation o f bad loans as a result o f structural transformation and external shocks. In Turkey, prior to 2001, lack o f durable fiscal adjustment and weak supervision o f the banking system have exacerbated macroeconomic volatility and i t s negative impact on growth.
Figure: 1.5 Volatility, growth, and investment 1970-2003: Turkey in international comparison
I 10 f c 5 - 1
1.28 I n Turkey, volatility has affected both productive efficiency and investment. The effect that lack o f sustainability o f economic policies may have had on economic performance has been investigated by estimating a time-varying conditional variance for the output growth (Annex 1.1).9 The estimated conditional variance o f output has been tested as an explanatory variable both in a growth equation and in the regressions for TFP, investment, employment and real exchange rate. The results indicate that higher output volatility adversely affects growth. Higher output volatility i s also detrimental to both TFP growth and investment in proportion to GDP. In other words, higher volatility exerts a significantly negative impact on potential growth. Volatility of output also leads to real depreciation in the exchange rate, which might be triggered by increased uncertainty and resulting capital outflows. However, no significant effect has been found for employment.
B.2. Growth Decomposition: Labor Productivity and Employment Ratios
1.29 Lack of convergence across countries, or the differences in per capita income growth rates, can be explained by differences in average labor productivity and labor utilization rates. I t i s generally predicted that lower-income countries can grow faster than r ich countries, and therefore eventually converge to the rich countries. However, cross country evidence i s mixed and despite their low per capita income compared to high income countries, many countries do not s t i l l grow fast
The conditional variability has been taken as an indicator of the sustainability o f economic policies. In other words, the lower the conditional variability of the output, the higher i s the sustainability of policies.
14

enough to achieve convergence.” Sources o f differences in growth o f GDP per capita can be better understood by breaking GDP growth down into contributions o f labor utilization and labor productivity (Box 1.1). The advantage o f breaking down the growth rate into labor utilization and labor productivity i s that i t facilitates measuring contributions o f each component to growth and comparing across countries to understand where Turkey i s lagging behind. I t also allows to assess how much Turkey benefited from the so called demographic opportunity window, that i s from the increasing working population in the total population.
Box: 1.1 Growth Decomposition
Per capita income can be divided into three components:
- apl, *err * wapr, Y Y L WAC L=’L -... N, L, WAP, N,
Where, Y i s real income, N i s total population, L i s total employment, WAP i s working age population, apl i s average productivity o f labor, er i s employment ratio, wapr i s working age population as a ratio o f total population and t i s time subscript. Similarly, the growth in per capita income can be decomposed as:
-=--- y , alp, err wapr, where y i s per capita income. yt-1 alp,-1 er1-I wapc-1
lo OECD in i t s study “Going for Growth (2005)” shows that GDP per capita rose relative to that in the United States in over half o f i t s member countries since 1993: English-speaking and Nordic countries, as well as Central European countries, Greece, Korea and Spain. The countries that grew fastest relative to the United States are mainly those where GDP per capita remains comparatively low (Hungary, Korea, Poland and Slovakia) with a notable exception o f Ireland. In contrast, the gap in GDP per capita has either remained unchanged or widened in several continental European countries over the same period (Austria, Belgium, France, Germany, Italy and Switzerland) as well as in Japan. The most disappointing performance over the past decade in the OECD area has been registered in Mexico and Turkey, which combined the weakest (after Switzerland) growth rate and the lowest levels o f GDP per capita.
15

1.30 Labor productivity growth slowed particularly in the 1990s and Turkey fell behind many East European countries. The average growth in labor productivity in Turkey slowed to around 1.5 percent in the 1990s, mainly due to a series o f crisis followed by sharp contractions in economic activity. Many East European countries (the new EU
Figure: 1.6 Annual Average Growth in Labor Productivity
1993-2003 Period
members) performed much better than Turkey during the same period, after pursuing ambitious reforms to liberalize their markets and reform their institutions (Figure 1.6).
1.3 1 Low employment generation and declining employment ratios slowed per capita income growth despite a significant advantage of demographic changes. Turkey had a relatively higher increase in i t s population compared to many countries as well as in i t s working-age population. Known as the demographic opportunity window, the rising working age population should have allowed for higher per capita income growth if ' Turkey had been successful in generating higher employment. However, low employment generation combined with rapidly rising population during the period o f 1980-2003 led to significant declines in the employment ratio. While average labor productivity and working age population to total population ratio increased by 2.8 percent and 0.7 percent on an annual basis respectively, the employment ratio declined by 1.4 percent per year during the period o f 1980-2003. Poor performance in employment generation has put Turkey behind many fast growing countries.
16

1.32 Countries that experienced high per capita income growth also recorded an increase in labor utilization. All countries, except Thailand, in our sample that had higher per capita income growth rate than Turkey also increased their labor utilization during the period o f 1980-2003. Turkey was one o f the few countries that experienced a substantial decline in labor utilization in the sample of 33 countries (Figure 1.7). The situation further worsened in the 1990s as growth stagnated and Turkey witnessed deterioration in i t s per capita income growth (Figure 1.8).
U I OALP OEMP KIWORK OGDP P CAP I
1.33 The overall employment intensity of growth has been low partly due to the structural diversification of the economy out of agriculture and partly because employment generation in services has been weak. As further explained in chapter 4, the employment elasticity o f growth in Turkey has been a mere 0.27 during 1972- 2000, at the low end o f comparator countries. One o f the key factors i s l ikely to have been the high starting employment share o f agriculture-at 53 percent in 1980. Between 1980 and 2003 agriculture shed 1.25 mi l l ion workers, while industry and services created 1.6 and 5.1 mi l l ion jobs. However, net job creation o f 5.4 mi l l ion was far less than the large increase in working age population o f 2 1.6 mi l l ion during the same period, leading to falling employment ratios over time. In industry, the employment elasticity to growth has been low relative to other middle-income countries that have similar production and cost structures, such as Brazi l and Mexico, indicating some missed employment generation potential (Figure 1.9).
17
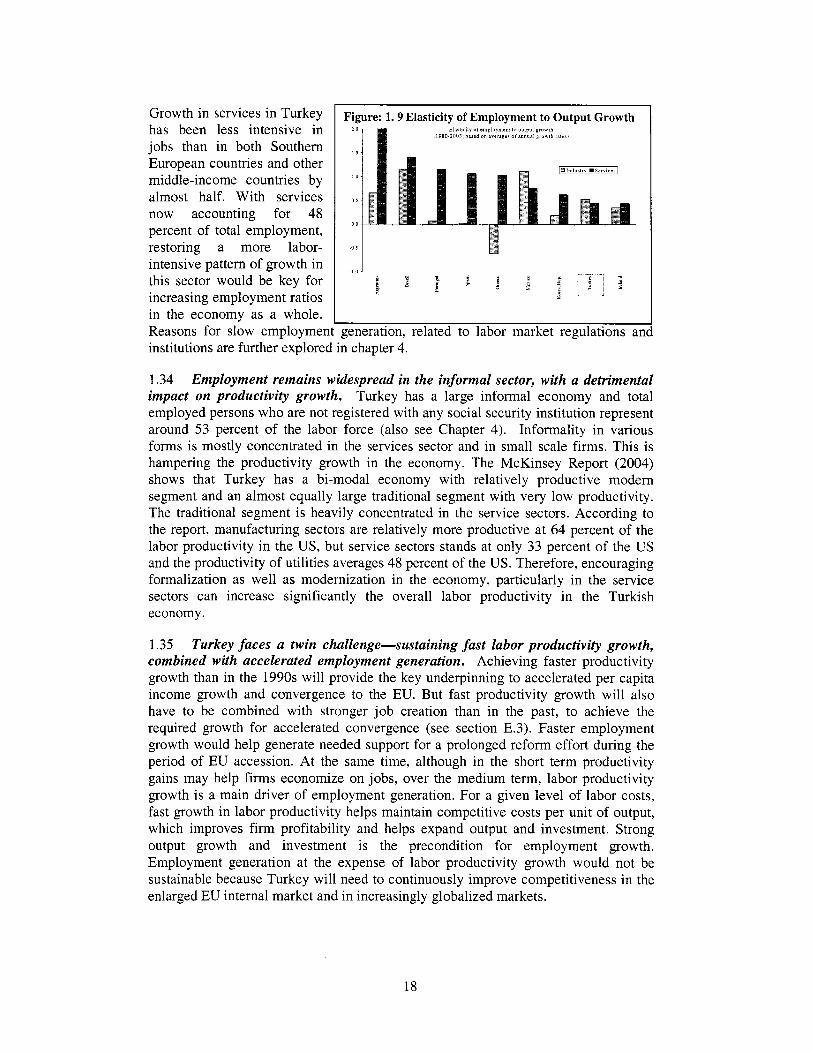
Growth in services in Turkey has been less intensive in jobs than in both Southern
middle-income countries by almost half. With services now accounting for 48 percent o f total employment, restoring a more labor- intensive pattern o f growth in this sector would be key for increasing employment ratios in the economy as a whole.
European countries and other
1.34 Employment remains widespread in the informal sector, with a detrimental impact on productivity growth. Turkey has a large informal economy and total employed persons who are not registered with any social security institution represent around 53 percent o f the labor force (also see Chapter 4). Informality in various forms i s mostly concentrated in the services sector and in small scale f i rms. This i s hampering the productivity growth in the economy. The McKinsey Report (2004) shows that Turkey has a bi-modal economy with relatively productive modem segment and an almost equally large traditional segment with very low productivity. The traditional segment i s heavily concentrated in the service sectors. According to the report, manufacturing sectors are relatively more productive at 64 percent o f the labor productivity in the US, but service sectors stands at only 33 percent o f the U S and the productivity o f utilities averages 48 percent o f the US. Therefore, encouraging formalization as well as modernization in the economy, particularly in the service sectors can increase significantly the overall labor productivity in the Turkish economy.
Figure: 1 . 9 Elasticity of Employment to Output Growth Elastlcny 0 1 cmplo\m~nl l o ~ u t p u l p m w f h
1980 2003 bnrcd on sveirecr 0 1 m n ~ i l eravlh m l c ) 2 0
, J
I o
o J
IESlnduriiv .Scrvirc,I
0 "
O J
; z a s i j ] 4 J i
1.35 Turkey faces a twin challenge-sustaining fast labor productivity growth, combined with accelerated employment generation. Achieving faster productivity growth than in the 1990s w i l l provide the key underpinning to accelerated per capita income growth and convergence to the EU. But fast productivity growth wi l l also have to be combined with stronger job creation than in the past, to achieve the required growth for accelerated convergence (see section E.3). Faster employment growth would help generate needed support for a prolonged reform effort during the period o f EU accession. At the same time, although in the short term productivity gains may help f i rms economize on jobs, over the medium term, labor productivity growth i s a main driver of employment generation. For a given level o f labor costs, fast growth in labor productivity helps maintain competitive costs per unit o f output, which improves firm profitability and helps expand output and investment. Strong output growth and investment i s the precondition for employment growth. Employment generation at the expense of labor productivity growth would not be sustainable because Turkey w i l l need to continuously improve competitiveness in the enlarged EU internal market and in increasingly globalized markets.
18

B.3. Sources of Labor Productivity Growth
(a) Total Factor Productivity, Capital, and Education
1.36 Drivers of labor productivity growth have varied over time depending on the policy regime. Contributions to measured labor productivity growth have been broken down into three components: (i) capital deepening (increases in the capital-to-labor ratio); (ii) human capital accumulation; and, (iii) total factor productivity growth. An estimated production function for the economy as a whole has provided the background for these calculations, with the exercise also conducted for the three main sectors o f economic activity (Annex 1.2). There i s a noticeable difference between the sources of growth in the years o f import substitution, during the 1970s, and after trade liberalization in the 1980s. In the high protection environment o f the 1970s, productivity growth was driven by fast capital accumulation, despite low production efficiency, as evidenced by the negative Total Factor Productivity growth. Patterns reversed in the 1980s, with much faster labor productivity growth driven by a surge in TFP growth, which more than offset slower capital accumulation. As documented earlier (Figure 1.6), the onset o f macroeconomic instability in the 1990s has been associated with slower labor productivity growth. I t i s worth noting that the decrease in labor productivity growth (1.2 percentage points) during the 1990s i s ful ly accounted for by slower TFP growth (1.3 percentage points-see Table 1.4).
Table: 1.4 Sources of labor productivity Growth in Turkey, 1973-2003 Growth in labor Contribution Contribution of Contribution of productivity of capital Human capital TFP growth
deepening" 1973-1980 1.89 2.15 0.36 -0.62 1981-1990 3.13 0.80 0.52 1.81 1991-2003 1.93 . 1.04 0.37 0.52 Source: own calculation
1.37 Investment in Turkey is not low but lagging behind fast growing countries. The investment to GDP ratio i s not low in Turkey on average compared to many countries. Throughout the 1990s, investment averaged around 24 percent o f GDP and this was slightly higher than the OECD average o f 22 percent but well above the EU average o f 20 percent. However, fast growing Asian countries had investment to GDP ratios at around 35 percent (Table 1.5).
I' Capital stock data i s taken from Cihan, Saygili and Yurtoglu (2005).
19

Table: 1.5 Investment GDP Ratios Percent of GDP
1991-1995 1996-2000 2001-2004 New EU Members 20.4 24.4 22.2
Cohesion Countries 22.0 23.2 25.1
Candidate Countries 22.7 22.6 17.5 Turkey 23.7 23.7 16.3
Asia 4 (I) Latin 3
35.7 34.1 36.0 18.8 19.5 18.6
OECD 21.7 21.5 20.3 EU15 20.5 20.0 19.5 "I: China, South Korea, Malaysia, Singapore, Thailand "I: Argentina, Brazil, Mexico
1.38 Improving educational Figure: 1.10 Average Schooling in Working Age attainment has contributed to Population productivity growth but human capital indicators still remain below fast-growing comparators. Turkey has one o f the lowest average schooling in the working age population among a group o f comparator countries (Figure 1.10). The low level o f education among the working age population i s a
Average of schoohg in working-age population 2.0 1
ource: World Bank, World Development Indicators ~ ~~~
significant obstacle for increasing productivity as well as attracting FDI.
1.39 The pace of TFP growth in Turkey has been slower than in fast growing countries. Over the long run (1973-2003), Turkey achieved an average TFP growth of 0.6 percent per year. The long run average growth rate o f TFP was comparable to that o f slow-growing developing regions, such as Latin America or the Middle East. However, TFP growth has been much slower than in East Asia (less China) or South Asia where growth has been much faster.12 Achieving much faster TFP growth would be a prerequisite for faster convergence to the EU average per capita income during accession.
1.40 Stronger TFP growth is the key to sustained growth and accelerated convergence in the years ahead. There i s certainly room for faster labor productivity growth to be fuelled by increasing investment ratios, in view o f Turkey's gap compared to other fast growing economies. Improved educational attainment w i l l also contribute to stronger growth-especially as well-educated younger generations w i l l be entering the labor force in the years ahead. However, there i s a limit to the contribution o f these two factors to growth. A stronger investment effort may lead to
'* Bosworth and Collins (2003) estimates TIT growth rates as 0.2 percent for Latin American countries, 0.5 percent for Middle East countries, 1.0 percent for South Asian countries and 1.0 percent for East Asian (excluding China) countries.
20

external current account pressures, unless higher domestic or foreign (non debt creating) savings are available to ensure financing. Improved educational attainment w i l l contribute only slowly to productivity growth. Stronger TFP growth w i l l thus be the prerequisite for accelerated growth in the future, as also suggested by the experience o f other new EU members that have embarked on steep convergence paths (especially Hungary, Poland, and S l~ven ia) . ’~ Fast TFP growth w i l l also be a condition for a sustained stronger investment effort, complementing the beneficial impact o f the expected improvement in the investment climate as the EU accession process w i l l be unfolding in the years ahead.
1.41 Enhanced macroeconomic stability, continuing trade expansion, and financial sector deepening are key requirements for stronger TFP growth. Empirical evidence reviewed previously suggests that macroeconomic instability has been associated with slower TFP growth in the past. Consolidating and further strengthening the sound macroeconomic foundations laid out over the past three years w i l l thus be an overarching factor for faster TFP growth. Moreover, empirical evidence from Turkey points to two additional pillars for a strong TFP performance (Box 1.2): (i) Increased trade openness, as measured by trade flows over GDP, i s found to be significantly associated with stronger TFP growth; (ii) greater financial depth, as measured by the broad money supply as a ratio to GDP, i s also positively associated with TFP growth. Even though evidence based on macroeconomic time series i s not strong enough for Turkey, there i s significant international evidence that FDI inflows and R&D investment by local f i r m s contribute to TFP growth.14
1.42 evidence suggests that a lo percent
Strong trade performance has been an engine of TFP growth. Empirical Firmre: 1.11 Trade Flows in percent of GDP
increase in Turkey’s trade flows as a ratio to GDP leads to a 1.2 percent increase in the level o f TFP over the long run (Box 1.2). Moreover, the potential impact o f trade openness on TFP may be underestimated based on past performance. Macroeconomic instability, a distorted investment
Trade k w r in pwent of GDP (average m 2oM-03) 220.0 I
climate, and inefficient trade-related services are factors that may have l imited the “quality” o f Turkey’s trade in the past, by discouraging export-oriented foreign direct investment. Turkey’s trade openness, as measured by the sum o f exports and imports over GDP, sharply increased between 1993 and 2003, from 33 to 59 percent. Greater trade openness was supported by the Customs Union with the EU and simultaneous multilateral (MFW) and regional liberalization, as a result o f which Turkey’s average applied tariff rates and non-tariff barriers on industrial imports were dramatically reduced (see chapter 3, section D). Trade openness s t i l l remains below that in most new EU members and some other emerging economies (Figure 1.11). However, Turkey ranks high in terms o f trade in goods, in particular when country-specific characteristics are taken into account. According to a recent Wor ld Bank study on
l3 Doyle Peter, Kuijs Louis. And Guorong Jiang (2001), Real Convergence to the EU Income Levels: central Europe from 1990 to the long term, IMF Working Papers 2001/146. l4 The small amounts o f both R&D and FDI in Turkey and the presence o f considerable volatility in macroeconomic time series make i t diff icult to establish a strong empirical impact.
21

E C A trade developments, Turkey’s trade in goods relative to GDP in 2003 was around 30 percent higher than that implied by the size o f i t s population, distance to major markets and GDP per capita in comparison to other countries (World Bank 2005). The improvement in the composition o f Turkey’s trade towards higher value- added and technology-intensive goods has also been a factor o f greater impact o f trade on productivity growth, as further examined in section C below.
have increased from 9 percent of GDP in 1991-93 to 22.3 percent in 2001-03, while during the same period exports o f services have increased from 5.8 to 9 percent of GDP. Turkey’s overall export performance in services i s good by emerging economies’ standards, but
Exports of sewices by category (average m 2002-03, m percent of GDP) 60
5 o
4 o
3 0
2 0
lo
0 0 Travel Servlces lnsurance and Commumcatlons Transport services
fnancial servres computer, etc
I Table: Granger Causality Tests
H.,: Openness does not Granger cause productivity
H.,: Productivity does not Granger cause Openness
Lag 1* 14.1OU Lag 1* 0.42
Lag 2 7.12“ Lag 2 0.12
Lag 3 4.57“ Lag 3 0.81
22

Lag 4 3.09b
I&: M2/GDP does not Granger cause productivity
7.08”
Lag 4
Lag 1
Lag 2* 4.89“ Lag 2*
1.82
H,,: Productivity does not Granger cause M2/GDP
0.89
1.20 I Lag 3 3.91“ Lag 3 1.18
Lag 4 3.12” Lag 4 0.92
a, b, c indicates significance at 1%, 5% and 10% level respectively. *: Optimal lag choice according to AIC with in a VAR specification.
Similarly, the results show that the null hypothesis of “financial depth does not Granger cause productivity” can be rejected at 1 percent significance level. However, i t i s not possible to reject the null hypothesis of “productivity does not Granger cause financial depth”. In other words, results indicate that while financial depth Granger cause productivity, the reverse i s not true.
Granger causality tests strongly indicate that openness and financial depth affect productivity, though they do not show the direction of the relation. In order to see how openness and financial depth affect productivity, the equation below i s estimated;
In(TFP) = 0.09+ 0.03” ln(openness) + 0.05* ln(M 2/ GDP) + 0.77* ln(TFP-,) - 0.1 1” Dummy
RZ = 0.86, Jarque-Bera Normality test: 2.59, ARCH-LM(1): 0.14, Serial Correlation LM(1): 0.57 Sample: 1972-2003, t-ratios are given in parenthesis, Openness = (exports + imports)/GDP. In our estimates we observe that trade openness and financial development indeed positively affects TFP. I t has also been observed that lagged values of TFP also account for the present value of TFP while economic recessions display a negative effect on it. The Dummy variable traces the effects of 1994, 1999, and 2001 crises.
(0.79) (2.59) (2.17) (7.67) (-9.42)
1.44 I n services there is still considerable unrealized potential for exports. There i s thus considerable room for stronger growth o f exports in these other categories o f services that make an important contribution to exports o f comparable EU members. In view o f Turkey’s favorable geographical position, the potential seems particularly strong in transport, where new EU members have also posted a strong performance. As further explained in chapter 6, this would call for better integration into Pan- European transport networks supported by early alignment with the EU acquis in this area. Improvement o f productivity growth in services-which has been lagging behind as further discussed below-would be a key underpinning o f better competitiveness and export performance.
1.45 Increasing level of financial development will enhance productivity and ensure smooth financing of productive investment. As further explained in chapter 5, Turkey has now a stronger banking system and better financial markets but s t i l l needs to increase financial depth. The financial sector provides a good payments system and mobilizes savings efficiently, but s t i l l lags behind in allocating efficiently credit to the private sector. In particular, bank credits to the private sector as a ratio o f GDP i s quite low and far below the EU averages, while the non-bank financial institutions sector remains small.
(b). Sector contributions to labor productivity growth
23

1.46 Analysis of sector contributions to economy-wide labor productivity growth reveals that services have been losing momentum. Further to the functional analysis o f sources o f labor productivity growth, analysis by sectors can also shed light to existing bottlenecks and prospects for stronger growth. Sectoral contributions to economy-wide labor productivity growth during the three distinct sub-periods identified above are shown in Table 1.6.15 Relative contributions o f services and industry to labor productivity growth are not out o f l ine with the range seen in OECD countries16. Because o f slow productivity growth and a declining share in total employment, the contribution o f agnculture has been negligible over time. Most importantly, the contribution o f services to economy-wide labor productivity growth has been losing momentum despite the increasing share o f services in total employment-from 26 percent in 1972 to 48 percent in 2003. Thus, industry contributed more than services to the increase in productivity growth in 1981-90 compared to 1973-80. Moreover, for a comparable rate o f overall productivity growth in 1973-80 and the 1991-03, and despite a much higher employment share in the latter period, services contributed less to productivity growth, with a relative increase in the contribution o f industry. Note that in this breakdown, the contribution o f sectors also depends on the relative size o f each sector in the economy. Despite increasing size o f services in the economy, i t s contribution, when adjusted for i t s size, shows a declining trend. This pattern suggests a slowing trend o f labor productivity growth in the services sector compared to industry, and i s further investigated below.
Table: 1.6 Sectoral contributions to labor productivity growth in Turkey, (1973-2003 in %)I7
Total Industry Services Agriculture Economy
1973-80 1.96 0.65 1.49 -0.15 1981-90 3.21 1.29 2.03 -0.11 1991-03 2.17 0.88 1.33 -0.03
1.47 Labor productivity in industry has benefited from sustained efficiency gains. Estimations o f contributions to productivity growth in industry and services confirm that the improvement in economy-wide TFP growth during the 1980s spread over to both industry and services (Table 1.7). However, trade liberalization and companion reforms had a much stronger impact on industry, where efficiency gains and TFP growth became the single most important factor o f labor productivity growth. Trade liberalization during the 1980s and the customs union with the EU in force since 1996, both l imited the state support to industry and permanently lowered high customs barriers. Domestic manufactures faced stronger competition from imports that seems to have triggered efficiency gains.
l5 Contributions reflect both differences in sectoral productivity growth and changes in sector shares in total employment. Contributions are calculated according to the formula:
AYr f ~ r - 1 = (A( ) + A( y,"Ay) + A( y;Ay ))/ yr-, , where yi stand for sectoral productivities and 3,' for shares in total employment. Slight differences in economy-wide growth rates in Table 1.4 compared to Table 1.3 are due to the calculation o f logarithmic growth rates in the latter. l6 Growth in Services (2005), OECD, Ministerial Level Meeting. l7 Capital stock data i s taken from Cihan, Saygili and Yurtoglu (2005).
24

Table: 1.7 Contributions to labor productivity growth in Industry and Services, (1973-2003 in %)
Labor TFP contribution of productivity growth' capital growth deepening Industry
1973- 1980 1 .o -2.5 3.6 1981-1990 4.7 4.6 0.1 199 1-2003 1.5 2.0 -0.4
Services 1973-1980 0.1 -0.7 0.8 1981-1990 2.0 1.4 0.7 199 1-2003 0.3 -0.5 0.8 (*) Contrary to the estimates reported in table 1.3, TFP growth in these calculations includes the contribution of human capital accumulation since the latter i s not estimated separately in the sector production functions.
1.48 Labor productivity growth in services has turned almost stagnant, owing to low efficiency and negative Total Factor Productivity growth. During the 1990s TFP, growth lost momentum in both services and industry. Recurrent balance-of- payments crises are l ikely to have been detrimental to efficiency, as suggested by the findings on the impact o f volatility on TFP growth. Frequent devaluation o f Turkish lira made imported inputs expensive and domestic producers faced rising costs o f imported intermediate goods that may have impeded TFP growth. However, the decline o f TFP growth was more dramatic in services, where i t became negative and accounts for the entire slowdown in productivity growth in that sector. Slow liberalization in some key trade-related services during the 1990s (Transport, ICT) may have contributed to slow TFP growth. Moreover, as noted earlier, the high level o f informality in services i s holding back overall efficiency and TFP growth.'*
1.49 Improving TFP performance in services would be a key underpinning of faster growth in the years ahead. With services now accounting for 57 percent o f GDP (in constant prices) and 48 percent o f total employment, i t would be very difficult for Turkey to accelerate growth for the economy as a whole without a concomitant acceleration o f TFP growth in services. Alignment with the EU Acquis on freedom to provide services would greatly contribute to better efficiency, but complementary reforms would also need to be considered. O f course, services cover a very heterogeneous set o f f i rms, from large utilities and financial companies to small retailers and low-productivity informal economy service providers. Reform requirements are, therefore, very different for the various segments o f the services sector. However, some cross-cutting initiatives, further examined in the following chapters, would facilitate efficiency gains across the sector. These include:
0 Further regulatory reforms to open services market to competition-by reducing the degree o f public ownership in competitive segments, such as air transport; addressing anticompetitive practices in professional services; and further reducing barriers to entrepreneurship; More widespread use o f I C T in services has the potential to contribute to better TFP growth in the future. I t w i l l thus be important to remove any
0
l8 See McKinsey (2004).
25

obstacles to seizing the benefits o f I C T for services, by continuing to encourage effective competition in I C T infrastructure and network services.
0 Constant adaptation o f education and training policies to changing requirements for new ski l ls , because, especially in services, human resources are key to strong performance. Reform o f labor market policies and regulations with a view to facilitating employment creation and adjustment in services where more flexible forms o f work may be appropriate while promoting formalization.
0
1993 1996 2000 2003 Exports Imports Exports Imports Exports Imports Exports Imports
(in percent of world trade) Turkey 0.4 0.8 0.4 0.8 0.4 0.8 0.6 0.9 EU-8 1.7 1.3 2.1 1.6 2.3 1.9 3.0 2.6
Roman ia0 .13 0.18 0.14 0.22 0.15 0.19 0.22 0.31 Bulgaria 0.10 0.14 0.08 0.09 0.07 0.09 0.09 0.14
1.50 A smother transition of labor from agriculture to other sectors can support productivity. Reallocation o f labor from low productive sectors such as agriculture to high productive sectors such as industry and services can contribute significantly to overall productivity in an economy. Such productivity gains due to reallocation of factors across sectors would be more important in the case o f Turkey since i t s t i l l has a large employment in agriculture. The calculation o f productivity gains due to labor reallocation shows a highly fluctuating structure in the 1990s. Although the average gain was considerable, the fluctuating structure points out to a need for better managing the transition of labor from agriculture to other sectors. The fluctuating structure could also be due to many crises in the Turkish economy throughout the 1990s since the agriculture acts l ike a buffer to absorb shocks in the labor market. Nevertheless, the labor in agriculture i s low skilled and requires training as well as support for finding jobs in other sectors. Therefore, the government should invest in skill upgrading o f the labor moving out o f agriculture and consider active labor market policies for smoothing out such fluctuations.
Change in percent 1993-2003 2000-2003 Exports Imports Exports Imports
52 15 SO 13 78 96 30 37 -2 53 37 S I
SO 62 75 44
C. TRADE PERFORMANCE AND CHANGING PATTERNS OF SPECIALIZATION ON THE WAY TO THE INTERNAL EU MARKET
1.5 1 Turkey’s trade integration into global markets for goods has significantly expanded over the last two decades. This was mainly the result o f expanding exports in the second half o f the 1980s and in the 2000s. Turkey’s share in world imports remained relatively unchanged in 1990-2003 at around 0.8 percent, although i t displayed an upward trend in 2000-2003. I t s share in world exports, however, increased rather dramatically, from 0.4 percent in 2000 to 0.6 percent in 2003, faster than that o f EU-8. Only Romania, one o f the top export performers among Pan- European economies during that period, matched Turkey’s record. This was in a marked contrast to the developments in the 1990s when Turkey exports growth simply kept with the pace o f the growth o f world exports (Table 1.8).
1.52 The level of processing in Turkey’s trade has been increasing. First, the shares o f traditional inputs in Turkey’s exports fel l from 30 percent in 1990 to 24
26

percent in 1995 and 13 percent in 2002-03. Second, exports o f capital and transportation equipment and automobile parts have dramatically expanded while their imports have kept up wi th the overall growth o f total imports. Third, the expansion in exports o f more processed goods took place in highly demanding and competitive Pan-European markets. Traditional industrial inputs accounted for a larger share in rest o f the world oriented exports (15 percent) than in pan-European exports (1 1 percent).
1.53 Other indicators also point to growing technological sophistication in Turkish exports. The most visible change in Turkey’s EU-oriented exports has been a dramatic shift away from low tech, unskilled labor intensive operations towards medium and high technology products (Figure 1.13). Although low technology and unskilled labor intensive products together with resource-based
Figure: 1.13 Technology content’ of Turkish trade with the EU in 1993-2003 (in Dement)
Technology Content of Trade I 1 0 0 0 1
80 0 600 400 20 0 0 0
1990 1995 1996 1997 1998 1999 2000 2001 2002 2003
I I q o r t s : low tech products --+ Expons: low tech products
0 Irpons: mdium to high tech f Expons: mdiutn to high tech
Source: Computations based on EU25 data from UN COMTRADE Statistics
products s t i l l accounted in 2003 for more than half o f Turkish exports to Pan- European preferential partners, i f past growth rates continue until 2005, the value o f exports o f medium and high technology products w i l l exceed that o f low tech and unskilled labor intensive products by the end o f 2005. Furthermore, the growth in exports o f these products was not the result o f expanding EU import demand for these products but was primarily due to stronger competitiveness o f Turkish suppliers. They increased their share in EU external imports o f these products from 0.6 percent in 1995 to 0.9 percent in 2000 and 2.1 percent in 2003.
1.54 Exports of goods with higher content of cdpital and skilled labor have been expanding faster than those of products intensive in traditional inputs and unskilled labor. The aggregate share o f skilled labor and capital intensive products in Turkish total exports increased 14 percentage points from 29 percent in 1996 to 43 percent in 2003. Skilled-labor and capital-intensive exports as a share o f Turkey’s total exports i s now comparable to that o f EU-8 before the start o f their accession process in 1996 (Table 1.9). The share o f skilled-labor products in total exports i s now higher than that o f EU acceding and candidate countries. Major levers o f the increasing share in both cases have been skilled labor and capital intensive products manufactured in operations characterized by medium to high technology. I f the average rates o f export growth recorded in 2000-03 were sustained, the aggregate share o f skilled labor and capital intensive products in total exports would exceed the fifty-percent threshold in 2007.
27

Table: 1. 9 Share of skilled labor and capital intensive products in total exports of EU candidate countries and EU-8 in 1996 and 2003 (in percent)
11 996 12003
Turkey Bulgaria Croatia Romania EU-8 (simple average) Memorandum: SEE-3 (simple average)
Share in total Of which: Share in total Of which, exports skilled labor exports skilled labor 29 20 43 32 45 28 34 15 32 8 37 11 38 18 37 18 47 24 56 28
21 10 24 15
1.55 The shift towards exports embodying higher levels of technology and using skilled labor has been facilitated by the entry of Turkish-basedfirms into ‘producer- driven’ networks. The value o f aggregate exports o f parts and components from ‘producer-driven’ networks rose from US$ 2.1 bi l l ion in 2000 to 8.2 bi l l ion in 2003. Participation in automotive and information communication technology networks, which are capital- and skilled-labor-intensive industries, has been the main driver o f this improvement (Table 1.10). Together with Hungary, Czech Republic, Slovak Republic, Slovenia, Estonia and Poland, Turkey-with the share o f ‘producer-driven’ networks in exports o f manufactures, excluding chemicals, exceeding 20 percent in 2003 and double-digit growth rates-has been identified in a recent Wor ld Bank study (World Bank 2005) as one o f the seven “High Performers” among European and Central Asian countries. Turkey’s share o f 22.5 percent puts i t on a par with Slovenia in ‘producer-driven’ network trade. At the same time, although ‘buyer-driven’ chains, mainly textiles and clothing, s t i l l dominate ‘producer-driven’ chains, their importance declined (Figure 1.14). The share o f ‘buyer-driven’ chains, which dominate more traditional exports such as textiles and clothing, footwear and furniture, fe l l from 90 percent in 1996 to 40 percent.
Network exports: parts and final products ($ million) Share of Pan-European area Exports of final products (US$ million) Share of Pan-European area
Imports of parts as percent of network exports Share of Pan-European area in network imports of parts
Table: 1.10 Total automobile and ICT network trade and share of Pan-Eurovean free trade
Automobile Network ICT Network 954 2,125 6,201 255 1,008 1,980 60.9 66.3 73.6 83.4 83.2 89.3 439 1,041 4,062 239 944 1,888 55.5 66.4 77.0 85.5 86.9 91.1 80.8 71.4 80.5 60 63.5 64.4 135 135 57 253 174 100
area in 1995,2000 and 2003 (in million of US dollars and percent) I 1995 2000 2003 I 1995 2000 2003 I
28

1.56 Turkish f i r m s operate within global networks organized around multinational corporations based mainly in the EU. Firms from automobile networks sent almost three-quarters o f their total exports to Pan-European countries in 2003 and imported 80 percent o f parts and other automotive products from these countries (Table 1.9). I C T producers’ reliance on Pan-European networks i s even higher regarding exports and relatively low in purchases o f parts. The surge in automotive exports raised their share in EU external imports from 2.9 percent in 2000 to 7 percent in 2003. The surge in ICT exports resulted in
Figure: 1.14 Shares and dynamics of total networks’ exports in 1995-2003
I Dvnarncs of Networks’ ExDorts 100 0 300
75 0 225
50 0 150
25 0 75 0 0 0
1995 19% 1997 1998 1999 2Mx) 2031 2002 2003
= Buyer-Dnven Networks EI! Producer-Dnven Networks - - Buyer-Dnven Networks (vaiue 2ooo=100) -+- Producer-Dnven Networks (value 2ooo=lOo
Source. Computations based on data from UN COMTRADE database.
an increase in their share in EU imports o f these products from 0.7 percent in 2001 to 1.1 percent in 2002.
1.57 The shift towards products requiring more capital, better-trained labor force and more sophisticated technologies and participation in international ‘producer- driven’ networks has important consequences.
Industries intensive in skilled labor and capital tend to be more productive. I t seems that the growth of exports in these sectors has boosted labor productivity and output growth. In contrast, exports o f natural resource-based products that involve little processing do not have the similar effect on productivity and growth. Consolidating this improving trend in the quality o f trade w i l l further boost Turkey’s potential for growth in the years ahead. The shift away from products embodying natural resources and unskilled labor competitive in global markets augurs well for future sustainability o f exports. This w i l l greatly contribute to preserving the sustainability o f external balances as the economy continues to grow in the future. At the same time, growth o f exports in industries intensive in skilled labor and capital fosters growth in wages. The growth o f exports in these sectors has helped improve l iving standards. However, high wages in higher technology sectors lead also to higher wages in services (especially in nontradables) and unskilled labor-intensive sectors, such as textiles and footwear. Given the growing competition from low-wage countries in Asia and elsewhere, these exports may not be sustainable over a longer term. Improving formal labor market flexibility would facilitate structural adjustment in exporting industry according to changing competitive advantages, and also help align wage cost increases with differing productivity growth trends across sectors. Capital and skilled labor intensive products are less sensitive to changes in labor cost. Sustainability o f their exports hinges critically on availability o f high quality human capital to avoid bottlenecks from the supply side. I t also depends on f i r m s ’ absorptive capacity o f new technologies, which i s affected
29

by the overall regulatory framework in product markets.
1.58 With the right framework in place, increasing trade openness could further boost growth in the years ahead. In view o f Turkey’s favorable geographical position and the performance o f most other new EU members, there i s potential for further increasing both the economy’s trade openness and the “quality o f trade”. The challenge for policy makers i s to sustain this healthy transformation reflecting Turkey’s relative competitive strengths. The process o f integration in the EU internal market and early adoption o f the EU acquis on freedom o f trade in goods and services i s expected to further reinforce Turkey’s trade performance. However, this process should be supported by complementary reforms, aimed at promoting alignment with EU product standards, while improving the efficiency and reducing the cost o f trade- related infrastructure services (transport, ICT, energy). Early alignment with the EU acquis in these areas would thus merit particular attention, as further analyzed in chapters 4 and 6.
30

D. THE SIMULTANEOUS CHALLENGE OF FASTER GROWTH AND REGIONAL CONVERGENCE
large. Per capita income in the 10 richest provinces (in 1987 prices) was 2.1 times higher than the national average in 2000, up from 1.9 times in 1987 (Figure 1.15). At the same time, per capita income in the 10 poorest provinces was 31 percent o f the national average, down from 36 percent in 1987.
1.59 Regional development is an important policy challenge particularly in Turkey. Balanced regional development i s an important policy challenge on i t s own. Large regional disparities in development bring about a range o f risks, f rom uncontrolled migration and socio-economic pressures in urban centers, to environmental issues. The issue i s of particular relevance for Turkey for a number o f reasons: (i) regional income disparities are broader in Turkey compared wi th new EU members and accedindcandidate countries; (ii) as further explained below, despite migration, past trends reveal absence o f convergence in regional per capita income; (iii) because o f persistence divergence o f regional growth, faster growth o f backward regions would contribute to faster growth o f the economy as a whole; (iv) Turkey w i l l benefit from significant amounts o f “pre accession funds” during EU accession, and the challenge w i l l be to make best possible use o f these financing instruments to promote regional development. This section assesses regional growth trends in Turkey during 1987-2000 without, however, attempting an evaluation o f policies and institutions for regional development. I t i s important that this broader task be undertaken in a future study.
Figure 1 X Ram of GDP per capita in 10 proumes wlm lowest and kghest GDP per capita m me M b O M l average and coefficiem of
vanabon of per capita GDP (1 987-2000)
0 5 2
1 5 0
0 00 0 48 k m r n a - ~ m ~ m a ~ m r n
+- Richest 10 proumes
& y d g g g g g l l g Z $ - Poorest 10 proumes + Coefficiem of variabon
1.61 Disparities in province per capita income have persisted over time. Trends in the coefficient o f variation (ratio o f standard deviation to mean) o f per capita GDP across provinces provide a more accurate indication as to the persistence o f regional disparities over time. The coefficient o f variation has remained broadly unchanged to around 0.51 from 1987 to 1994, and has increased to 0.55 in 1995-2000, confirming
31

that far from declining, regional income gaps have increased. However, i t i s worth noting that, owing to the creation o f new administrative jurisdictions over time, the number of provinces has increased from 67 in 1987 to 81 in 2000. This, coupled with frequent alteration o f administrative division, may somewhat affect disparity measures o f province per capita income over time. To address this issue, regional disparities were also examined from a perspective o f GDP accruing to population groups by income level o f their home provinces. The time trend o f this indicator can reveal if parts o f population l iving in poorer provinces (regardless o f changes in administrative divisions) are catching up with groups that l ive in richer regions.
1.62 The share of income accruing to the 25 percent of the population living in the poorest provinces has failed to increase. Table 1.10 summarizes average proportions of GDP accruing to 5 population groups.” Typically the lower 10 percent (25 percent) o f population l iving in the poorest provinces shared in only 3 percent (1 1 percent) o f GDP, while the upper 25 percent o f population, l iv ing in the richest provinces, shared in more than 40 percent o f national income. In addition to this significant disparity, the trend in income shares seems to have been unchanged for the lower 25 percent o f population during 1987-2000. B y contrast, the shares o f income accruing to the lower-middle and upper-middle quartiles o f population (25-50 and 50- 75 percent) have increased, at the expense o f the top 25 percent o f population l iving in the richest provinces. Although the income share o f the upper 50 percent o f the population to the lower 50 percent (according to home province per capita income) has been slightly declining, the Gini coefficient, which i s more sensitive to disparities across smaller population groups, suggests a trend o f increasing inequality over time (Table 1.11).
Table: 1.11 Income shares of population groups by level of province per capita income (in percent of total GDP).
Population shares by increasing order of 1987-1988 1989-1991 1992-1994 1995-1997 1998-2000 province per capita income
0-10% 3.0 2.9 3.1 2.9 3.1
Share of GDP accruing to each population group
IO-25% 25-50% 50-75% 75-100% Total
8.3 8.1 8.0 8.2 1.7 18.2 19.1 19.4 18.8 20.2 24.7 29.0 24.7 27.6 28.2 46.0 40.9 44.8 42.6 40.8 100.0 100.0 100.0 100.0 100.0
income share of upper 50% to lower 50% 2.41 2.32 2.28 2.35 2.23 Gini coefficient 0.275 0.279 0.282 0.299 0.298 Source: World Bank staff, based on SPO data
l9 To create these groups, provinces were ranked from poorest to richest according to GDP per capita. Then shares of GDP were calculated by respective population proportions.
32

1.63 Zndustrial activity has been the main contributor to high regional incomes. Figure 1.16 further describes sources o f income by population groups according to the per capita income o f their home province (following the same classification as in Table 1.10). I t i s noticeable that industry generates a share o f income at
Figure: 1.16 GDP by sectors in Regions GDP Brcaldow by S c c i a
IW,? W% 80%
60% sow 40% 30%
10% 0%
70%
20%
par wi th services for the upper 25 percent o f the population l iving in the richest provinces. Agriculture generates a proportion o f income much higher than the national average for the 50 percent o f the population l iving in the poorer provinces. A decrease in the income share of agriculture was common for al l groups, in keeping with the declining trend seen nationwide. Diversification o f economic activity out o f agriculture was stronger in the upper-middle 25 percent o f the population that has seen the largest increase in i t s share in national income (Table 1.10 and Figure 1.16). B y contrast, the share o f agriculture in the income o f the lowest 10 percent o f population l iving in the poorest provinces was only slightly reduced, from 39 percent in 1987-89 to 33 percent in 1998-2000.
1.64 Regional income disparities have persisted despite Figure: 1. 17 Per Capita Income Growth by Percentiles extensive internal migration. As in other countries, regional differences in per capita income levels have given rise to internal migration. Thus, population in the poorest 16 (25 percent) o f the 67 provinces existing in 1987 was almost stagnant from 1987 to 2000, growing by only 0.2 percent per year.20 In general,
Grawlh rdss o f provinces by income level (1990-2WO) I
Poorsrl 114 of Poor 114 of R i h 114 o f Rbhcrt 114 of N a b w I pmvirer pmkcei p r o h a p r o r i r r i
Provinces ranked by ZWO GDP per capka
population growth was faster in provinces with higher income, and population grew at the fastest pace in the upper 17 provinces by income level (Figure 1.17). Persistence-indeed, the slight increase-of regional disparities in per capita income in the face o f steady migration f rom poor to r ich provinces means that GDP grew much faster in rich than in poor regions. Indeed, in 1987-2000, GDP grew by 3.9 percent per year on average in the richest group o f provinces, compared to around 2.1 percent in the upper- and lower-middle groups, and only 1.4 percent in the poorest group. Significant differences in GDP growth across regions suggests that promoting regional growth convergence i s also relevant for growth o f the economy as a whole. Faster income growth in the poorer provinces would boost overall growth and help accelerate convergence with the EU.
*' As mentioned above, the number of provinces has increased from 67 in 1987 to 81 in 2000. Omitting the new provinces from th i s comparative analysis of population and GDP growth over time involves a "loss" equivalent to 1.1 percent of GDP and 1.8 percent of total population in 1990, increasing to 3.9 percent of GDP and 5.5 percent of population in 2000. The size of the omitted information i s not significant to affect the main findings.
33

1.65 Addressing the challenge of persistent regional disparities would call for an assessment of regional development policies and institutions. The Government has been implementing various programs to address regional disparities, through tax incentives and subsidies and public expenditure programs targeted on backward regions. For example, public investment (out o f the central government budget) as a percentage o f GDP has been on average during 1990-2000 3.5 times higher in the ten poorest regions compared to the ten richest ones. However, in view o f the persistence of regional disparities despite extensive migration, a comprehensive assessment o f the effectiveness o f these interventions would be warranted. Issues that deserve particular attention include: (i) How to develop a coherent and efficient institutional mechanism for regional policy, to make the best use o f the available and potential structural EU funds. (ii) What are the existing instruments for promoting regional development, how effective they are, and what influences their effectiveness. As part o f the EU accession process, Turkey w i l l need to establish policy frameworks, as well as management, control, monitoring and evaluation mechanisms for regional development. Chapter 8 reviews issues in strengthening policy coherence for rural development policies as part o f the alignment process with the EU acquis. A more comprehensive analysis o f institutions and policies should be planned as the EU accession process unfolds.
E. THE CHALLENGE OF PROMOTING FAST CONVERGENCE WITH THE EU
1.66 The challenge during the EU accession process is to achieve a rapid convergence to average EU per capita income. The EU accession negotiations have started on October 3, 2005 but are not expected to be completed soon and 2015 i s often said to be the most l ikely date for membership. Although Turkey has the advantage o f having custom union with the EU for a decade and considerable alignment with the EU Acquis in some of the negotiation chapters, there are significant per capita income differences between Turkey and the EU member countries and closing this gap w i l l be one o f the important challenges during the next ten years.
E.l. The speed of convergence will depend on the pace of structural reform
1.67 Convergence is not spontaneous and depends on many factors-especially on the quality of policies and institutions. The failure o f many low income countries to achieve convergence with the high income countries have led to development o f a large literature on the conditions o f income convergence (see Box 1.3). The studies have both theoretically and empirically showed that the per capita income convergence i s neither spontaneous nor automatic. Many economic policies such as taxation, provision o f infrastructure services, market regulations as well as institutional setups and demographics can affect the accumulation or quality o f factors of production and, therefore, per capita income growth.
1.68 The EU accession can provide opportunities to Turkey for speeding up its convergence with the EU. The neoclassical growth theory assumes that, among others, the factors of production are freely mobile and this mobil ity together wi th
34

trade in goods and services act as a convergence mechanism. Adoption o f similar economic policies within the EU can further strengthen convergence. Therefore, a deeper economic integration into the EU single market can promote growth by improving mobilization o f production factors and investment efforts in physical and human capital; by facilitating a faster absorption o f technologies and accelerated productivity growth; and by improving the overall policy framework. Lagging countries are often short o f capital as well as know-how and foreign direct investment from more advanced countries can be an important source for the diffusion o f new technologies. Further integration with the EU can increase convergence as capital moves from capital abundant advanced countries to Turkey to take advantage o f higher returns in the latter. However, faster growth presumes that there exists a well functioning legal, administrative and physical infrastructure and a stable macroeconomic and political environment. Also the experience o f cohesion countries suggests that benefits o f EU integration are not guaranteed and they are contingent on the quality of the policy framework as well as the reform momentum.21
Box: 1.3 Income Convergence
The standard neoclassical growth models suggest that r ich countries grow slower than poor countries and therefore income levels of different countries would converge overtime. Known as the absolute convergence hypothesis, this prediction relies on the assumptions that production technologies are identical and exogenous among the countries and returns to capital diminishes as the stock o f capital increases in an economy'. However, absolute convergence hypothesis finds litt le support in the literature2 and therefore convergence i s not automatic or spontaneous.
One major argument against absolute convergence hypothesis i s that init ial conditions of the countries are not the same and countries have different saving-investment rates, population growths, fiscal or monetary policies, production technologies and tastes. The l i s t o f differences relevant to growth can be extended to include political and macroeconomic stability and financial deepness but the basic idea i s that initial conditions can lead to disparities in growth rates. For example, richer countries with higher saving rates and better human capital can grow faster than poor countries with lower saving rates and inferior human capital stock. Taking these points into account i s known as the conditional convergence hypothesis in the literature and i t suggests that the convergence relation s t i l l holds once the differences in endowments or environments are accounted. In other words, convergence holds among countries with s im i la r endowments. Studies in empirical literature provides some support for conditional convergence and shows that differences in per capita growth rates relate systematically to a set o f quantifiable variables3. These variables usually include international openness, government consumption, rule o f law, democracy, investment to GDP ratio, human capital accumulation and fertility rates.
In neoclassical growth models, the long run per capita income growth rate depends on the exogenous technological progress. However, Romer (1986), Lucas (1988) and Grossman and Helpman (1991) have argued that growth may not slow down in rich countries because returns to investment broadly defined to include human capital do not necessarily diminish or technological advances resulting from R&D can make technological progress endogenous. Known as endogenous growth models, this line o f research opened a substantial role for government policies to influence long run growth. In these models, long term growth rate depends on variables such as taxation, rule o f law, provision o f infrastructure services, protection o f intellectual property rights, regulations o f international trade, financial markets and other areas in the economy.
2' Reflecting such differences, EU accession did not have an automatic and equal impact across countries. For example, Ireland's convergence with EU accelerated only in the 1990s, 20 years after entry, while Greece's income gap widened in the 1980s, during the f i rst decade o f EU accession. B y contrast, reflecting steady modernization efforts, Spain and Portugal experienced investment booms upon accession in 1986, and benefited from accelerated convergence to the EU-see also more detailed analysis below.
35

' For an extensive discussion o f the issue see, Solow, R. (1956) A Contribution to the Theory o f Economic Growth, Quarterly Journal o f Economics, p.65-94, and Barro, R. and Sala-I Martin, X. (1995). Economic Growth. New York, McGraw-Hill
Fuente, A. (1997). The empirics o f growth and Convergence: A Selective Review, Journal o f Economic Dynamics and Control, p. 23-73. Barro, R. and Sala-I Martin, X. (2003). Economic Growth (Second Edition). MIT Press.
Barro and Sala-i-Martin (1995.2003) show that convergence occurs when environments are similar and differences in per capita income growth rates are large across countries but can be explained by a set of quantifiable variables.
135% -
1.69 Turkey failed to achieve convergence over the past decades while other countries succeeded. Turkey did not show any convergence to the EU15 income levels over the past three decades. Per capita income in Turkey relative to the EU15 has hovered at around 25 percent since 1975. On the other hand, cohesion countries as well as some fast growing Asian countries achieved significant levels o f per capita income convergence vis-&vis the EU15 countries. The case o f Ireland and South Korea are worth noticing. South Korea started from almost the same level or even less than Turkey in 1975 and converged to a level o f 67 percent o f the EU15. Ireland started from a level o f 57 and astonishingly reached a level o f 141, almost tripling i t s per capita income relative to the EU15.
Irelan Jl
1 5 % ! , , , , , , , 1 1 1 , , , , , , , , , , , , , , , , , , m r - m - m m r - m - m m r - m - m r - r - r - m m m m m m m m m m o o 2 2 2 f El El f f 2 . 2 f E: El N 0 0 N
1.70 The Eastern European transition countries that joined the EU in 2004 have also achieved significant convergence. The new EU member countries have achieved substantial convergence with the EU15 since 1995, within a considerably short time period o f a decade. The continuous strong efforts in Eastern European countries to liberalize their markets and the steps taken to align their institutions with the EU15 countries have facilitated a rapid convergence.
36

Figure: 1. 19 Per Capita Income Convergence New EU Member Countries
1.71 Creating a knowledge- Table: 1. 12 I C T / GDP Ratio based economy should be a
1.9 4.5 5.3 main policy goal in the long run. Turkey can benefit from deeper integration with the EU Cohesion Countries 2.1 3.4 3.0
1.1 2.2 2.5 and thereby from foreign Candidate Countries
exDosure to trade and foreign
Information & Communication Technologies 1991-1995 1996-2000 2001-2004
technologies brought by Turkey 1.1 2.1 2.1 "
Asia 4 (I) direct investment. Migration o f skilled labor, involvement in
Latin (2)
6.2 8.3 9.8 1.3 2.5 2.7
joint R&D activities or academic OECD 1.7 2.6 2.5 cooperation can further support 2.2 3.2 3.1
technology transfers. However, (2): Argentina, Brazil, Mexico
international experience shows that diffusion o f such technologies into the domestic markets i s not always automatic. Existence o f a well educated labor supply or a stock o f human capital in general i s important in the transfer o f foreign technologies. R&D activities can further strengthen adaptation o f such technologies. This requires Turkey to increase i t s expenditures on education, improve i t s quality o f education at al l levels, put more emphasis on job mismatch and arrange i t s curriculum accordingly to promote supply o f skilled labor force needed by the growing modern sectors in the economy and finally to promote R&D activities to foster creation o f new technologies as well as adaptation o f foreign ones.
'I): China, South Korea, Malaysia, Singapore, Thailand
1.72 Level of competition as well as regulations in the product markets can affect diffusion of technologies. Benefits f rom FDI and technology spillovers usually depend on appropriateness o f local conditions. Such conditions include the level o f competition in the economy and the degree of product market regulations among
37

others. The OECD has heavily invested in identifying the degree o f product market regulations in i t s member countries and effects of such regulations on growth and income convergence.22 The empirical results from the OECD studies indicate a negative direct effect o f product market regulations on productivity. Moreover, if the interaction o f regulation with the technology gap i s also considered, the results point to an even stronger indirect effect via the slower adoption o f existing technologies. Strict regulations seem to have a particularly detrimental effect on productivity the further a country i s from the technology frontier, possibly because they reduce the scope for knowledge spillovers. According to the OECD estimates o f product market regulation^^^, Turkey has s t i l l strictly regulated product markets. Issues in reducing rigidities in product markets in order to boost productivity and facilitate technological advances in the economy are examined in chapter 3.
E.2. Savings-Investment Balances and the Sustainability of High Growth
1.73 Convergence with Europe in terms of per capita income will depend on how well the economy can escape out of the boom-and-bust cycle of the past. A high investment rate i s a necessary condition for long term accelerated growth, as well as healthy TFP growth. But sufficient domestic savings w i l l also be needed to ensure financing o f high investment levels. Experience from past boom-and-bust episodes suggests that Turkey does not generate enough domestic savings to finance the level o f investment needed for fast growth and sustained convergence. Higher investment has been too often l imited by savings shortages that triggered an increase in the external current account deficit, leading eventually to a balance o f payments crisis.
1.74 Preserving external current account sustainability in a context of strong expected growth will be a key challenge for Turkey in the years ahead. In the absence of sufficient domestic savings, greater investment w i l l be reflected into a larger current account deficit. Financing o f a large current account could pose r isks for external debt sustainability, unless non debt-creating foreign savings are available in the form o f foreign direct investment. Enhanced macroeconomic stability, a stronger investment climate, and the prospect o f EU accession should all work in this direction. Indeed, strengthening the investment climate i s not only a precondition for higher private investment and faster growth, but also for attracting foreign savings in the form o f foreign direct investment and thus for ensuring the sustainability o f growth. However,
22 The Sources of Economic Growth in OECD Countries (2003) and Going for Growth (2005), OECD, Paris. 23 Paul Conway, VCronique Janod, Giuseppe Nicoletti (2005). Product Market Regulation in OECD Countries: 1998 TO 2003, ECO/WKI? (2005)6. OECD.
38

hedging existing r isks would call for a better mobilization of domestic savings- partly through a sustained fiscal consolidation effort and partly through greater mobilization o f private savings. The analysis in this section examines the determinants o f private savings and prospects over the medium term.
1.75 I n the past, Turkey has seen an increasing trend of private savings that mainly served to finance an increasing public sector borrowing requirement. Over the 1980s private savings in Turkey had remained lower than in other fast growing economies (Figure l.20).24 However, the trend has been on the upside, and private savings ratios in Turkey have been surpassing savings ratios in comparator countries since the early 1990s. But Figure 1.20 also illustrates that increasing private savings have mainly served to finance rising budget deficits, rather than higher levels o f investment. The ensuing unsustainable current account imbalances have put a brake on growth.
1.76 Empirical analysis across countries suggests that, fiscal policy, growth, financial sector development, and demographics are key factors that affect private savings. Empirical analysis o f the determinants o f private savings ratios was based on a panel o f 70 countries, including Turkey, ranging from developing to industrial economies. Detailed results are presented in Annex 1.3.25 In line with existing evidence, i t i s found that, due to “Ricardian equivalence”, public and private savings partly offset each other: For every percentage point reduction in budget surplus, private saving w i l l increase on impact by an approximate half percentage point. Consequently, national savings rate w i l l decrease by a half percentage point. However, in the long run the offsetting effect i s almost complete, wi th the change in the private savings ratio increasing up to 90 percent o f the change in the budget surplus. In accordance with existing evidence, both income level and income growth have positive effect on private saving. An increase in income per capita by 10 percent raises the private saving rate by 0.7 percentage points. Similarly to the effect o f increasing income, a jump in growth rate by 2.5 percent w i l l increase the saving rate by 1 percentage point. Increasing financial sector depth, approximated by a larger money supply-to-GDP ratio, has a small yet positive influence on private saving. B y contrast, relaxation of credit constraints, through an increase in credit to private sector, i s expected to lower private savings. Finally, demographic variables negatively affect private saving. A 5 percent increase in urbanization; an 11 percent increase in young age dependency; or a 2 percent increase in o ld age dependency lowers private saving by 1 percentage point o f GDP.
24 Comparator countries are Chile, Ireland, Korea, Malaysia, Mauritius, Portugal, Singapore, Spain and Thailand. These countries are selected on the basis of their performances, marked by high growth and high savings. 25 The empirical estimations follow the methodology developed by Loayza, N., Lopez, H., Schmidt- Hebbel, K. and Serven, L. 2000. “What Drives Private Saving Across the World?” The Review of Economics and Statistics 82(2): 165-18 1.
39

1.77 Macroeconomic stability and sustained growth are key preconditions for better mobilization of domestic savings. With increasing public savings, private saving in Turkey i s predicted to fall in the years ahead. However, as the predicted decline in private savings i s smaller than the increase in Dublic savings. domestic
0.15
saving w i l l increase, creating some room for the financing o f increased private investment. However, although higher public savings, through “Ricardian equivalence” may restrain private savings in the future, maintaining fiscal discipline would have a much more favorable effect on private savings by ensuring macroeconomic stability-a precondition for faster
Figure 1 21 Actual and predicted savlrgs ratios
A+--*
0.25 -
0.2 - k-c-W“ Domestic savings
growth and rising per capita incomes. These would be two key factors boosting the private savings rate in the future, as in other fast-growing comparators-especially in a high-growth scenario that would lead to faster convergence with the EU (see below).26
1.78 Structural factors will exert mutually compensating effects on private savings. Easing financing constraints, as a result o f greater financial intermediation in a more stable economic environment, are l ikely to reduce private savings in the future. However, increased financial sector depth and diversification o f financial instruments for savings would work in the opposite direction. Overall, demographic variables are anticipated to exert a neutral effect on the savings rate. As young population .of the last decade are joining the working age population, the young age dependency i s moving downwards and expected to boost the savings ratio. On the other hand, the o ld dependency ratio shows a slow upward movement, potentially reducing private savings.
1.79 I n a conducive environment underpinned by continuing fiscal discipline, private savings could increase in tandem with fast income growth, generating the necessary financial resources for investment. Overall, as a result o f these trends, private savings are predicted to decline and become aligned with domestic savings as of 2008, and begin moving together in an upward direction thereafter. Domestic savings are projected to increase from an estimated 22 percent o f GDP in 2005 to around 28 percent by 2015 (Figure 1.21). The predicted increase in the savings ratio would match the projected increase in the investment ratio under the high-case growth scenario (6 percentage points o f GDP-see below). With domestic savings projected to increase in step with investment in the base-case scenario pressures on the current account deficit would subside. The projected decline in the public sector deficit in the years ahead-as a result o f continuing fiscal discipline and lower interest payments on public debt-is a key pre-condition in this scenario. If the decline in the public sector
26 The projection i s based on a 6 percent growth per year over 2006-2015-in-between the baseline and high-case growth scenarios discussed bellow-and a balanced budget after 2008. Similarly, the recent sharp declines in inflation rate with ongoing efforts to keep i t low w i l l eventually remove distortions that boosted precautionary savings in the past. Even though this may seem like a drawback, a more stable economy w i l l boost investment, so that i t s indirect effect through stronger growth w i l l sufficiently compensate for the decline.
40

deficit failed to materialize, growth in domestic savings would fai l to match the increase in domestic investment, and the current account deficit would increase to unsustainable levels-inconsistent with stable growth. I t i s thus important that fiscal discipline be preserved by maintaining a high primary budget surplus in the years ahead. Despite the projected decline in public debt as a proportion to GDP (see chapter 2), the fiscal room from lower interest payments on the public debt should not be used for increasing spending or lowering taxes until conditions for current account sustainability have been secured.
E.3. Convergence Scenarios for Turkey
1.80 Turkey is now in a better position to break free from the past stop and go growth cycles and achieve convergence with the EU. The recent consolidation o f the fiscal balances, the reduction in inflation, the improvements in macroeconomic stability and the wide ranging structural reforms put Turkey in a better position to take advantage o f the EU accession process and accelerate growth on a sustained basis. Favorable demographic trends w i l l increase the share o f working-age population in total population-contrary to EU 15 members and most new members-allowing Turkey to grow more rapidly. Turkey can also rely for faster growth on the absorption o f sizeable underutilized labor+specially from agriculture and among working-age women who do not participate in the labor force-into an expanding, high productivity modem sector. Modernization o f the large informal sector, which provides jobs to about half o f the labor force, can also significantly promote growth, given the large productivity gaps between formal and informal segments in all activity sectors. Turkey can also take advantage o f better mobilization o f investment- especially through higher F D I , which s t i l l remains well below levels seen in other emerging market economies. This w i l l further enhance Turkey’s trade performance, which-as discussed above-has constituted a powerful factor o f productivity improvement and i s crucial for the sustainability o f growth. H o w much and how quickly Turkey can actually benefit from EU integration w i l l depend on how much efforts Turkey w i l l put in continuing to implement reforms as wel l as extending the scope of structural reforms.
1.81 There could be a broad range of possible convergence outcomes. Turkey can achieve different levels o f convergence under different economic policies or structural reforms. Neither convergence i s automatic nor the EU accession negotiations are uniquely structured to ensure convergence. The experience o f the past shows that convergence among the EU member countries i s common but not a unique outcome. Similarly, accession negotiations can take many different shapes and every country had i t s own way. Also, in the case o f Turkey, the negotiations are expected to take longer. Therefore, one has to consider a broad range o f possibilities for how much and how quickly Turkey can achieve in converging wi th the EU. These have been summarized in three main growth scenarios analyzed below. The assumptions concerning the underpinning sources o f growth in each scenario are la id out in annex
1.82 Turkey can secure considerable per capita income convergence with the EU25 countries by implementing sound economic policies backed by structural
41

reforms. The fact that Turkey could not achieve convergence with the EU countries in the past clearly shows that Turkey has to break away from the instabilities and inefficiencies o f the past. Convergence over a sustained period o f time requires sound economic policies and broad-ranging reforms in many areas of the economy. Assuming that Turkey continues to implement current sound macroeconomic policies envisaged in the latest IMF Stand-By arrangement and Pre-Accession Economic Program of the government, secure strong fiscal balances and consolidate the structural reforms initiated so far, potential GDP could grow at a rate o f around 5 percent under a base case scenario. This would generate some convergence with the EU25 countries.
1.83 Turkey can do more by implementing more ambitious and mutually reinforcing structural reforms. The path o f accession negotiations i s not unique and so are i t s outcomes. Turkey can have different preferences and strategies for the accession negotiations. Differences in preferences or strategies may result from many considerations, but from the perspective o f sustaining a high economic growth, the strategy should prioritize growth enhancing and mutually reinforcing structural reforms starting from the early phases in the negotiation period. Assuming that Turkey broadens the scope o f structural reforms in a number o f priority areas further reviewed in the following chapters-including labor markets, public sector governance and public service delivery, corporate governance and commercial judiciary; reinforces the implementation o f the reforms; supports productivity enhancing and technology creating activities such as research and development, FDI inflows and competition in the product and factor markets particularly in the services sector; and preserves macroeconomic stability-potential GDP could grow at rates around 6-7 percent under the high case scenario. This would allow Turkey to close a substantial amount o f the per capita income gap vis-&vis the EU25 countries over a 10-year period.
1.84 However, failure to consolidate reforms and take advantage of opportunities opened by EU accession could perpetuate historical trends of slow growth. Turkey has been reforming i t s economy since 1980s and past experience in Turkey, as well as in other countries, show that the governments can easily fal l into reform fatigue and the reform process might be suspended. Moreover, the accession negotiations are expected to continue for a long time and can have ups and downs during the process. Despite strong improvements and the resilience o f the Turkish economy to shocks, the existing high public debt as well as i t s structure and the widening current account deficit can magnify the effects o f such ups and downs. Under such circumstances, characterizing a low case scenario, Turkey may barely achieve a growth rate o f between 3.5-4 percent, compatible with the past trend but away from generating any income convergence.
1.85 I n the base case scenario, it is assumed that the recent achievements in the Turkish economy and further integration with the E U can enhance productivity, employment generation and investment compared to past trends. The growth o f GDP in the past has been mainly driven by the increase in the capital stock with low contributions from productivity and employment. However, the recent reforms generated outstanding increases in total productivity, in parallel with relatively slow employment creation. Total factor productivity grew by 6.6 percent on average
42

annually during 2002-2004 in comparison to 1.1 percent during 1972-2000.27 In the base case scenario, i t i s assumed that the increase in total factor productivity would slow down since a part o f i t came from the restructuring in the economy in the wake o f the slump, but i t s t i l l would remain at a higher rate than in the past due to better macro stability, structural reforms initiated since 2001 and continuing alignment with the EU acquis throughout the accession period. Continuous improvement in Turkey’s trade integration with the EU single market and the quality o f trade wil l be strong drivers o f TFP growth as established in the previous sections. Therefore, total factor productivity i s projected to grow by 2 percent annually during the period o f 2005- 2015. Similarly, i t i s assumed that the current low investment to GDP ratios would recover and reach an average o f 24.6 percent o f GDP during the negotiation periods as Turkey attracts more funds for greenfield investment and improves the business environment and financing conditions for domestic investment. Employment generation i s also assumed to accelerate to 2 percent annually as Turkey reforms i t s labor market. As a result, real GDP growth i s estimated to be slightly above 5 percent under the base case scenario. With a population increase declining gradually from 1.5 in 2005 to 1 percent in 2015, this would generate a per capita real income increase o f around 4 percent, which i s almost double what Turkey achieved during the last three decades.
1.86 Growth in the EU25 countries is estimated to reach the potential level of 2.5 percent by 2006 and stay at this level thereafter. Growth in the EU25 countries i s estimated to be around 2 percent in 2005 and 2006 by the EU Commission. Over the long run, the OECD has recently forecasted that the potential growth rate for the EU15 countries would be around 2 percent until, 2020. The European Central Bank (ECB) has also recently estimated potential output growth rates for the euro area around 2 percent or close to 2 percent.28 Combined with the higher potential growth in the new member countries, i t i s assumed that the EU25 countries would grow by 2.5 percent annually during 2006-201 5. With almost stagnant population in these countries, per capita income i s projected to grow by around 2.4 percent per year.
1.87 Turkey can achieve only a limited convergence in per capita GDP under the base case scenario. I t i s estimated that the per capita income in Turkey would increase from 29.1 percent o f the EU25 in 2004 to 34.2 percent o f the EU25 by 2015, giving rise to some but not substantial convergence.
1.88 For a better convergence outcome, Turkey would have to aim for an ambitious reform program. Under the high case scenario, i t i s assumed that with ambitious and wide-ranging reforms, Turkey can sustain higher total factor productivity increases o f around 2.5 percent (see Annex 1.4). Employment generation may also further accelerate to around 3 percent, thanks to strong TFP growth and higher investment, provided that non wage costs are kept competitive and al l existing bottlenecks to job creation in the formal labor market are removed (see chapter 4). The investment ratio could further increase as Turkey attracts more FDI. An investment to GDP ratio o f around 25.7 percent would be feasible under the high case scenario. This would allow GDP growth rates close to 7 percent and per capita GDP
’’ The TFP growth rate i s different from the figures provided in Table 1.3 since human capital i s not included as a factor in the production function. 28 Albert0 Musso and Thomas Westermann (2005), Assessing Potential Output Growth in the Euro Area, ECB Occasional Papers No. 22.
43

growth rates o f around 5.5 percent. Keeping the same assumptions for the EU25 countries, Turkey can achieve significant amount o f income convergence. Per capita income in Turkey would increase from 29.1 percent o f the EU25 in 2004 to 40.4 percent of the EU25 by 2015.
1.89 However, if Turkey fails to capitalize on reform opportunities opened by EU accession, the convergence path would be a mere reflection of the past. The low case scenario can be seen as an extrapolation o f past trends. If Turkey falls into reform fatigue or negotiations stalls temporarily for any reason so that implementation o f reforms slows down, then growth in the production factors would be much slower than in the base- or the high-case scenarios. I t i s assumed that the factors o f production increase at rates compatible with the past trends in the low-case scenario. TFP growth i s estimated to be somewhat above the past trends due to achieved stability and structural reforms and forecasted around 1.5 percent. Employment generation i s also estimated to be lower at around 1.3 percent. Similarly, investment to GDP ratio i s estimated to be at 24 percent. This would allow for Turkey to grow at around 4 percent, with per capita income growing at around 3 percent. However, with per capita income growing at around 2.4 percent in the EU25 countries, Turkey would achieve almost no convergence. The per capita income in Turkey would merely increase from 29.1 percent o f the EU25 in 2004 to 30.1 percent o f the EU25 by 2015. In this low-case scenario the economy would remain fragile, so that growth blips due to volatility from domestic policies or external factors could easily bring the economy even to a lower end-point by 2015.
1.90 The analysis presented above abstracts from any price or exchange rate movements but variations in the purchasing powers of currencies are also relevant for convergence. For the sake o f clarity, the above discussions were based on real GDP growth rates at constant Purchasing Power Parities (PPP) o f 2003. However, both the cohesion countries and particularly the new member countries experienced significant appreciations in their currencies. The amount o f cumulative real appreciation averaged around 60 percent for the 8 new member countries for the period o f 1995-2004.29 Therefore, prospects for changes in PPP rates are also relevant in order to complete the convergence picture.
1.9 1 Income convergence could be accelerated by productivity-driven real exchange rate appreciation during the accession period. Healthy productivity increases, especially in the traded goods sectors, under the base- and high-case scenarios would be expected to lead to real exchange rate appreciation during accession.30 However, i t would be very diff icult to forecast how much exactly the
29 The real exchange rates are taken from the Eurostat and defined vis-&vis the 12 trading partners. 30 Fast-growing open economies typically experience fast productivity and wage growth in the traded goods sector owing to catch-up with the productivity level o f higher-income trade partners. This i s very l ikely to happen during Turkey’s integration in the single EU market. To keep up with more rapidly rising labor costs, prices in the non-traded goods sector (mostly non-traded services and construction), where productivity growth i s slower, need to r i se faster than in the traded goods sector. This i s reflected into real exchange rate appreciation, with the real exchange rate approximately measured as the relative price of non-traded to traded goods (the Balassa-Samuelson hypothesis). The increase in the relative price of non-traded goods prevents profitability from fall ing in that sector and i s also reflected in higher overall consumer price inflation. Along with real exchange rate appreciation, lower-income countries can thus be expected to experience higher-than-average CPI inflation, mirrored by more rapidly increasing prices in services, owing to catching up of productivity in industry and other traded goods sectors. Balassa, Bela, (1964), “The Purchasing Power Parity Doctrine: A reappraisal,” Journal of
44

real exchange rate would appreciate vis-A-vis the EU25 countries. Nevertheless, for the sake o f the analysis, i t i s assumed that the real exchange rate could appreciate by 2 percent annually under the high case scenario and by 1 percent under the base case scenario. N o appreciation i s foreseen under the low case scenario as this would not be very l ikely outcome due to low productivity increases. Projected appreciations are much lower than trends seen in new EU members since the start of their accession process. Under the base case scenario, per capita income relative to EU25 would reach 38.1 percent by 2015 with 1 percent annual real appreciation compared to 34.2 percent with no real appreciation. Under the high case scenario, the per capita income would reach 50.1 percent with 2 percent annual real appreciation compared to 40.4 percent with no appreciation.
1.92 However, real appreciations can be sustainable only to the extent they are
would ensure that real exchange rate appreciation remains consistent with maintaining competitiveness and preserving external current account sustainability. I f the real appreciations are not supported by productivity increases, then current account would widen sooner
Productivity Productivity gains
or later and the situation would not be sustainable but on the contrary could even
in Of large alignments in the exchange rates.
1.93 The experiences of the European countries show that the above results are
the new member Countries achieved significant levels o f convergence speeds.
feasible* Both the cohesion countries and
Box lS4: ‘peed Of ‘Onvergenee Starting from neoclassical growth models and
Douglas, the production function can be written as; = A K ~ L i - a or as in intensive form with y=y/L and I<=m. With labor augmenting technological progress and assumption about how capital and labor augments over time, the per capita income can be written as’;
assuming that the production technology i s Cobb-
b g [ y ( t ) l = ( 1 - e - 8 ‘ ) ~ g ( y * ) + e - P ’ ~ g [ Y ( 0 ) l Where P is the speed Of t stands for time, y(o) i s the starting value o f y and y* i s the level to be converged in the steady state. The time t for which log[y(t)] i s half way between log[y(O)] and log(y*) satisfies the condition e-Pt = 112. Therefore the half l i fe i s log(2)/P or 0.69/P.
Second Edition, p.58. The MIT Press. 1: See Barr0 and Sala-i-Mmin (2003), Economc Growth,
Political Economy, Vol. 72, No.6, pp.584-589. and Samuelson, Paul, (1964), “Theoretical Notes on Trade Problems,” Review of Economics and Statistics, Vol. 46, No. 2, pp. 145-154.
45

Table: 1. 13 Income gaps to EU average and speed of Convergence 1995 2003
New EU Members
Czech Republic Estonia Hungary Latvia Lithuania Poland Slovak Republic Slovenia
1975 1981 1986 1995 2003
p = Speed Convergence
~. . . _. ._
Per capita income in % of EU15 average with constant 2000 PPP
rates p = Speed of Convergence 57.7 61.1 1.1 32.8 50.5 3.8 45.7 54.4 2.2 25.3 38.3 2.4 30.9 43.7 2.5 35.6 42.5 1.4 43.2 50.4 1.7 61.3 71.5 3.8
Cohesion Countries (with constant 2000 PPP rates) Per capita income in % of EU15 average with constant 2000 PPP rates Greece Ireland Portugal SDain
57.8 80.8
59.6 73.0 64.7 74.5 141.0 67.7 83.6
of -1.2', -4.22, 4.03 -na 1.3 2.9
Base Case High Case Low Case
Turkey (Per capita income in % of EU25 average with constant 2003 PPP rates) 2004 2015 p = Speed of Convergence 29.1 34.2 0.8 29.1 40.4 1.5 29.1 30.1 0.1 The number of years required for Turkey to close half of the income gap would be 86 years under the base-case and 46 years under the high-case scenarios
Base Case High Case Low Case
29.1 50.1 2.6 29.1 30.1 0.1 The number of years required for Turkey to close half of the income gap would be 69 years under the base-case and 27 years under the high-case scenarios
Source: World Bank Staff I: 1981-2003 ': 1981-1995 3: 1995-2003
46

F. POLICY COORDINATION FOR ENHANCED GROWTH AND MANAGEMENT OF EU ACCESSION: THE ACQUIS AND BEYOND
F.l Policy prioritization during EU accession
1.94 Turkey could take advantage of the EU accession process as an anchor for reform and macroeconomic stability Some o f the challenges facing Turkey are long- term in nature, but because the reform agenda i s complex, the efforts have to begin early on. Other challenges, especially related to the quality o f the business environment, could be met over the medium term by strong efforts to align early on with the EU Acquis. I t i s in Turkey’s interest to place particular emphasis during the accession period on the many areas where the alignment to the Acquis can strongly contribute to reinforcing the economic management framework. In areas where the EU Acquis i s less complementary wi th economic management, or compliance costs are significant (such as, for example, in harmonization o f environmental regulations), reforms could be delayed until an advanced stage o f the accession process i s reached and faster, sustained growth has taken hold.
1.95 -but it is also important that the broader reform agenda-beyond alignment with the Acquis-be appropriately prioritized. Despite their different time dimensions due to the policies and institutions that need to be changed, many reform areas are highly complementary and mutually r e i n f ~ r c i n g . ~ ~ Reform areas where policy complementarities are strongest should be prioritized, to maximize the benefits from the reform process and avoid the pitfalls o f a piecemeal approach. In addition, to take advantage o f policy complementarities, reforms that go beyond the EU Acquis, yet are important underpinnings o f Turkey’s medium-term growth prospects and broadening o f social inclusion, should become prominent in the reform agenda. The cost o f reforms (fiscal and social) should also be appropriately factored in the prioritization o f the agenda as the social consensus to reform would need to be maintained over a long time. Structural reforms with low fiscal cost, and public finance reforms that create needed fiscal space for more costly initiatives in the future, would merit to be prioritized.
1.96 The experience of the new EU members could provide useful insights on the prioritization of reforms to successfully manage the accession process. The amount o f time spent for negotiating each o f the 29 Acquis chapters, and the selection o f chapters to begin with, was not uniformly distributed among EU acceding countries (see Box 1.5 on the structure o f the negotiation process). Moreover, the whole process took longer in some countries than in others.32 For the purposes o f the analysis, negotiation o f the EU
31 For example: reforms o f product market regulations to strengthen the investment climate may not yield full benefits in terms o f job creation unless complemented by reforms to improve labor market flexibility; reforms to ensure financial sustainability o f the pension system usually underpin initiatives to reduce the non wage costs of labor, which in turn helps combat informality and further strengthen the viability of the social security system. For further analysis see J. Braga de Macedo and J. Oliveira Martins, (2005). 32 The analysis i s based on the timetable for the negotiation o f the Acquis chapters b y the Czech Republic, Estonia, Hungary, Poland, Slovenia, Latvia, Lithuania, and Slovakia. The first five countries started
47

Acquis chapters has been categorized into “up-front”, “medium term”, and “defemed’, based on the average length o f time between the opening o f EU accession negotiations and the closing o f each chapter-as a percent o f the length o f the negotiation period for each new EU member (Table 1.14, based on individual country data reported in Annex 1.5). Differences in the negotiation pattern o f the various chapters could partly reflect the approach adopted by the parties, and partly difficulties inherent in the respective policy areas. In addition, some chapters require more financing efforts for alignment than others. I t must be underscored that the observed pattern does not necessarily reflect any strategically optimal prioritization in terms o f economic or other type o f return to the adjustment.
Box 1.5: How negotiations were conducted with the new member states
First step was the screening of legislation for each chapter, carried out at the meetings o f national experts and experts f rom the European Commission, or in writing. The screening was conducted for each negotiating chapter in two stages. The purpose o f multilateral screenings was to inform all candidate- countries about the whole acquis in individual chapters - the Commission’s experts presented the acquis and its implementation in practice. The purpose o f bilateral screenings was to examine in greater detail the existing degree o f harmonization o f candidates’ legislation with the acquis. The experts from a candidate- country presented the existing legislation and put substantive solutions forward and, together with the experts from the Commission, identified the areas o f non-compliance. The screening results are a document agreed between both sides.
Based on the screenings and an assessment o f the actual capacity to implement the acquis, the working group, a member of the negotiating team, with the support from external experts and independent institutions, prepared a draft negotiating position. In some countries, such as Slovenia, the draft was presented to non-governmental organizations for their eventual comments. The proposed negotiating position was prepared, depending on a country practice, in co-operation with the editing group o f the negotiating team, and then put into the Government procedure. Since the proposed negotiating position was also a proposal for the conclusion o f an international treaty i t had to be discussed and adopted by the Government. Thereafter, the proposal was usually discussed by the relevant bodies o f the national parliament. Subsequently, the English translation o f the negotiating position was submitted to the European Council (the Council), and the copy provided to the Commission.
The European Commission wrote down i t s position in the Draft Common Position of the EU, for submission to the Council. On the basis of that position, the Enlargement Working Group operating within the Council prepared the Common Position of the EU which was then discussed at the Conference on Accession. I t set out the position o f the Council (Le. all the Member States) concerning the negotiating position o f a candidate-country and invited i t to provide some additional clarifications with respect to individual issues.
The formal part of negotiations on individual negotiating chapters was conducted in the Intergovernmental Conferences on Accession at the Deputies Level (heads o f the negotiating teams o f candidate-countries); and in the Intergovernmental Conferences on Accession at the Ministerial Level (foreign ministers of candidate-countries).
A t these Conferences, the Committee o f Permanent Representatives (COREPER) o f the Council and a candidate-country discussed the negotiating positions on both sides, brought their positions on the substance o f individual negotiating chapters into line and - provided there are no outstanding issues regarding a given chapter - established that negotiations on that chapter might be temporarily closed. Since
negotiations in March 1998, while the last three in February 2000. Negotiations were completed for all countries by December 2002.
48

the principle that “nothing i s agreed until everything i s agreed” applied to negotiations, the temporarily closed chapters could have still been reopened by the conference on accession.
The negotiating positions of each candidate-country had to be adopted unanimously by all Member States, forming the basis for drafting o f the Accession Treaty. The Accession Treaty incorporates the results o f negotiations: concerning harmonization o f legislation with the Agreements o f the European Union with third countries; harmonization o f legislation with the acquis; transitional periods; derogations; technical adaptations; and other measures.
The Council and the European Parliament have to give consent to the accession o f a new country. The Accession Treaty has to be signed and ratified by all Member States and the candidate-country involved.
Source: Office for European Integration, Republic o f Slovenia.
Telecommunications Energy Up-front Small and medium-sized
Social policy and employment Freedom to provide services Free movement o f capital Financial control Customs union Freedom o f movement for persons Environment
enterprises Science and research Education and training Statistics Industrial policy Consumers and health
Common foreign and protection
security policy Financial and budgetary provisions
Economic and monetary union External relations Fisheries Free movement o f goods Culture and audio-visual policy
Company law
Competition policy Taxation Transport policy Justice and home affairs Regional policy and coordination of
Agriculture structural instruments
1.97 However, Turkey’s priorities for accession will be affected by different starting conditions, country-specific factors, and the need to ensure effective compliance with the EU Acquis. Turkey i s in a different position than the new member countries when they started negotiations, because a Custom Union with the EU has been in place since 1996; a longer relation wi th the EU has been effective since the 1960s, while the economy i s not facing the challenges o f the transition to the market that new EU members were s t i l l facing in the mid-1990s. Turkey has already achieved significant alignment in some chapters, so that under normal circumstances negotiation o f these chapters could be quickly completed. However, Turkey can s t i l l draw lessons f rom the recent accession experience of the new member countries. In addition, some chapters involve economic, political or technical difficulties and there fore are l ikely to stay at the negotiation table longer irrespective o f the level of current alignment. In the case o f Turkey, the negotiation pattern w i l l also be influenced by the need to demonstrate effective compliance with the Acquis before each chapter could be declared closed.
49

F.2. Pol icy coordination on the way to the EU
1.98 Strengthening policy coordination is a precondition for successfully managing a multi-faceted reform agenda during EU accession. Managing the process of EU accession and ensuring effective compliance with the Acquis w i l l critically hinge on the quality o f pol icy coordination across various parts o f the public administration. Because implementation of the Acquis w i l l be a prerequisite for EU accession, strengthening vertical and horizontal coordination, within and across line ministries and agencies and between sectors at local level, would deserve special attention. The challenge i s even taller because Turkey needs to pursue the broader development agenda for growth and social inclusion in parallel with the EU accession agenda.
1.99 Management of the EU accession process necessitates the creation of inter- ministerial structures to coordinate cross cutting issues and to act as a counterbalance to the fragmentation of policy making. Moreover, the accession countries are expected to establish ‘a mechanism for collective ministerial strategic supervision, inter-ministerial working arrangements with the capacity and authority to co-ordinate EU integration work internally and externally, and to monitor progress, and administrative unit or units to support those coordinating arrangements, and adequate European integration capacity in ministries’ .33
1.100 Turkey has made good progress in establishing such arrangements, but complementary steps would be needed. Initiatives taken so far include: setting up the coordinating body for EU affairs (European Union General Secretariat), EU Units in public institutions, and the Internal Coordination and Harmonization Committee (for legal approximation with the EU acquis), as well as the framework for the EU financial assistance, comprising the National Aid Coordinator, National Fund and National Authorizing Officer, Financial Coordination Committee, Joint Monitoring Committee, and Central Finance and Contracts Units. However, the scope o f work o f the Internal Coordination and Harmonization committee and o f the Financial Coordination Committee do not seem to cover the management o f cross-cutting pol icy issues, and the coordination between the policy making, legal approximation, and the planning and monitoring o f enforcement. Directions for complementary action would involve:
i) 8ht Development Plan,
Harmonizing national plans and programs, as envisaged by the Art icle 357 o f the
ii) Strengthening the link between the planning o f National Plan for the Adoption of the Acquis (NPAA) measures with the planning of budget, based on an all-encompassing strategy for entry into the EU and the dynamics of a cost-benefit and impact analysis of EU membership, and
33 Sigma Baselines, OECD, October 1999. The baselines, prepared upon the request of the European Commission, provide a basis for conducting assessment of c iv i l service, external audit, financial control, public expenditure management systems, policy-making and co-ordination machinery and public procurement management systems.
50

iii) Defining the appropriate coordination system.
1.101 Overlapping and fragmented competences would complicate the accession process. The capacity o f the government to drive through the EU-related, but also other reforms, i s influenced by the horizontal division o f tasks and responsibilities. A situation o f overlapping and fragmented competences i s observed in some rather important policy areas such as economic policy, environmental policy, trade related issues, energy or transport. Moreover, the combination of fragmented competences and o f weak horizontal coordination has resulted in a number o f national plans and programs which are not harmonized. This i s indirectly reflected in what appears to be a certain lack o f clarity regarding the selection o f investment projects to be proposed for EU funding and included in investment programs.
1.102 Defining the appropriate coordination system involves assigning roles and responsibilities, but also deciding whether to opt for more or less formalized system. The general trend across countries seems to be to position the system close to the centre o f the government (see Box 1.6), and to establish regular structures as compared to ad hoc arrangements. The experience o f the new member states suggests the critical importance o f horizontal coordination at inter-ministerial level for managing EU-related activities. This i s particularly true for the negotiations, as any unresolved differences are almost certain to come to the surface when commitments to irrevocable national positions have to be made. The lesson learnt i s also that establishing a top political committee for European Integration helps in expediting the decision making process, and reduces the risk o f overloading the Cabinet with issues that may be competently dealt b y such committee. For instance, Lithuania established the Governmental European Integration Commission (GEIC). I t s work was less restricted by the government coordination procedures, mandating that proposed new regulations presented to the Cabinet be coordinated with the interested institutions. Although i t would appear that the GEIC would not be an effective coordinator due to i t s broad composition and the principle o f ministerial autonomy, i t used the above advantage and was able to accept important EU related documents, resolve the problems o f coordination between ministries and make decisions which obligated the separate institutions to implement certain important assignments for integration into the EU.34
34 Lithuania’s administrative and political adaptation to the European Union. Vital is Nakrosis.
5 1

P M Office Special EU SecretariaVOffic e P M Office Special EUhtemat iona l Unit
EU Cabinet Sub-committee H igh Level Inter-ministerial Committee
i for Managing EU Affairs in Selected Countries Finland I Hungary I Slovenia I Estonia I Czech I Slovakia I Poland I Ireland Greece
No No
Yes No
Yes No
Yes No
1.103 The start of the accession negotiations will call for strong efforts of line ministries in. Turkey to organize internal coordination of the preparation of position papers, but also of all other EU related activities. Internal coordination and control o f EU-related issues has proved to be a challenge in every accession country, largely because o f barriers to exchange o f information that followed from the vertical structures of ministries. Based on experience from other EU accession countries, an option could be to assign the role of coordinating the preparations o f the position papers to the Strategy Development Boards, which are planned to be established in line ministries, under the draft Law on Public Administration. Their work may be assisted by the EU units, which need to be ful ly integrated in the daily routine. o f ministries, including policy development processes. Additionally, i t would seem o f advantage to establish a core group o f senior officials, responsible for coordinating and monitoring al l other accession related activities, and reporting on those to the head o f administration.
1.104 Ensuring sectoral coordination at local level is equally important. The OECD SIGMA report from 2002 points towards weak co-ordination between ministries and agencies at local level. Apparently, there i s a significant degree o f overlapping between inspection and enforcement services, such as in the area o f environment and physical planning. This i s an area calling for urgent attention, not least because the issue of enforcement w i l l be at the heart o f the negotiations but also because the Government plans to grant greater policy implementation competences to sub-national levels o f government. I t would be advisable to develop the strategy for reducing the overlapping between inspection and enforcement services at local level and promoting their coordination.
1.105 Efforts should be deployed towards improving the procedural efficiency of policy processes - The technical aspects o f how policy proposals and draft laws move through the government influence the overall procedural efficiency o f the policy processes. Yet, the procedural framework in Turkey does not provide formal guidance regarding time within which certain stages of the policy-making process are to be
52

completed. Specifically, the Principles on Preparation o f Laws, Decrees Having Force o f Law, Regulation and Draft By-Laws do not formally specify timeframe for intra-agency consultation process. The current practice i s for a proponent ministry to specify the deadline for receiving comments, and that could be subject to negotiations and there i s no formal mechanism for ensuring that opinions are provided within the given time. That creates opportunities for procedural delays, and could be a significant bottleneck as the number o f changes to be implemented increases.
1.106 -in particular at the level of line ministries and agencies. In Turkey, the speed o f action o f central government agencies i s in part influenced by their large size. Large ministries and agencies are more complex and have stronger needs to ensure coordination and control, which may lead to procedural delays. I t i s advisable to explore options for reducing such delays in ministries and agencies. The first step would be to establish how the work gets done, focusing on processes for developing pol icy across ministry, and i t s implementation, monitoring and evaluation. That would help in sorting out components o f ‘reasonable’ procedural delay versus ‘excessive’ or ‘unreasonable’ delays. The next step would be for the heads o f central agencies and their respective teams to develop an action plan for eliminating or minimizing those ‘excessive’ or ‘unreasonable’ delays, with clearly specified tasks and responsibilities at the agency level and the timetable for completing necessary actions. Providing strong commitment o f the government and the heads o f administrations, i t i s possible to achieve improvements in a relatively short period o f time.
1.107 Strong control of new regulations for consistency with EU acquis i s important for successfully managing the accession process. Control o f new regulations i s needed for ensuring correct alignment wi th the acquis, which i s one o f the factors that w i l l influence the pace o f the negotiations. Further, poor quality o f regulations does not help improve the business environment. Consistency control w i l l be significantly enhanced if there i s one single unit entrusted with coordination. In Turkey, however, such responsibility i s actually fragmented.
1.108 Impact assessment mechanism is instrumental for improving the quality of policy-making, ultimately facilitating strategic policy coordination. As other accession countries, Turkey i s also expected to start developing a mechanism for impact assessment (budgetary, economic, social and environmental impact, and efficiency and practicability in implementati~n)’~. Such mechanism helps to improve the quality o f policy-making by assessing the impact that a particular policy option may have on the budget or on other policy areas. For al l these reasons, Turkey i s strongly encouraged to introduce the impact assessment mechanisms, starting with the development o f a standardized format or guideline for the preparation o f budgetary impact assessment, and making that exercise a mandatory part o f the quality control o f new laws and regulations. In addition, there i s an urgent need to organize and provide training in impact assessment to those that w i l l be involved in preparing the position papers for the purposes o f the accession negotiations. The preparation for negotiations includes assessing the implications o f different policy options before determining national negotiating objectives, strategies and tactics (Box
35 The SIGMA baselines include the mechanism for impact assessment of policy options.
53
1.7). T h i s requires people sk i l led in impact assessment, such as in impact assessments technique, such as social impact assessment, budgetary impact assessment, and environmental impact assessment.
Box 1.7: Impact assessment of adjustment in the area of Health and Safety at Work on enterprises in Slovenia
The Republic o f Slovenia must implement 33 EU directives together with amendments in the field of health and safety at work. A t the bilateral screening o f legislation's harmonization with the acquis, i t had been established that requirements arising from EU directives relating to work with physical, chemical and biological agents wi l l be difficult to meet, which i s why research on the impacts o f the approximation o f directives in Slovenian legislation was carried out. The research sought to establish: (a) consequences o f implementing these directives for employees and jobs, (b) the time period required for enterprises to be capable o f adjusting to EU directives, and (c) costs o f harmonization.
The research was based on special questionnaires devised by the Office o f the Republic o f Slovenia for Safety and Health at Work. The questionnaires were divided in two areas: noise, chemical and biological agents, taking into account the basic requirements of EU directives in this field. Workshops organized by the Chamber o f Commerce and Industry o f Slovenia were intended to present the problem to organizations concerned. The entire project was carried out under the auspices of the Institute o f Economic Research, which also prepared an overview o f the situation in this area in the form o f tables. In order to ensure the participation o f enterprises in the research, summaries o f individual directives were prepared and discussions on the most important requirements were organized at workshops. During the period o f making the research, professional advice was available to enterprises covering both technical requirements and economic aspects o f introducing new requirements and changes, particularly in verifying economic cost assessments. The largest number o f problems was found by the research in members o f the Association o f Employers in Slovenia's Small Businesses Sector (GIZ). These enterprises responded poorly owing to weak staff and other capacities, which i s why technical and economic advisory work for these enterprises was most intensive.
Source: Office for European Integration. Republic o f Slovenia.
54

CHAPTER 2. PUBLIC FINANCE MANAGEMENT ON THE WAY TO THE EU
2.1 Zmproving the quality of fiscal adjustment is a key challenge. The Turkish economy in the 1990s has been characterized by persistent fiscal imbalances and fiscal dominance, a pattern that has contributed to growth volatility, chronic inflation, and continuous macroeconomic instability. As high public sector borrowing requirements became unsustainable and structural problems mounted up, it became inevitable for Turkey to embark on an ambitious reform program aiming at macroeconomic stability and fundamental restructuring o f the economy following the 2001 financial crisis. The analysis in this chapter focuses on the quality and sustainability o f the strong fiscal adjustment, since maintaining hard-won macroeconomic stability i s a pre-requisite for promoting faster growth on a sustained basis, as discussed in the previous chapter. At the same time, Turkey would need to achieve efficiency gains in public expenditures, by determining the low value programs that should be retrenched, in order to make appropriate room in the budget for growth-enhancing public expenditures and lower taxes. The first section reviews the patterns o f fiscal adjustment since 1999 and benchmarks public expenditure allocations in international comparison. Section two examines horizontal issues in , public expenditure reform-which are relevant for expenditure savings across al l functional areas-focusing on personnel compensation and the investment program. The third section examines tax reform options, wi th particular emphasis on the personal and corporate income taxes. Section four provides an assessment o f debt dynamics and sustainability in the face o f surrounding r isks. Finally, section five provides a summary o f reform options for further strengthening the fiscal framework and creating fiscal space for growth-enhancing expenditures and lower taxes.
A. QUALITY OF FISCAL ADJUSTMENT AND THE SIZE OF GOVERNMENT IN TURKEY
A.l. Patterns of Fiscal Consolidation in 1999-2004
2.2 Turkey has gone through an impressive fiscal adjustment during 1999-2004. In the aftermath o f the 2000 and 2001 crises, Turkey had to generate a sizeable primary surplus to reduce i t s public debt stock. Turkey’s fiscal position improved dramatically between 1999 and 2004, as reflected in the improvements in the primary balance o f the Consolidated General Government (CGG), f rom a negligible primary surplus o f 0.5
55

percent o f GDP in 1999 to a surplus of 5.9 percent in 2004 (Figure 2.1).36 (See Box 2.1 for the conversion from the SPO-based consolidated general government primary surplus to IMF program definition o f public sector primary surplus). The CGG borrowing requirement decreased by 7.1 percentage points o f GDP between 1999 and 2004, driven by the increase in the primary surplus and the gradual decline o f interest payments on public debt. Turkey’s public sector-comprising the consolidated general government plus the State Owned Enterprises (S0Es)-achieved even a bigger fiscal consolidation in 1999-2004, f rom a primary deficit o f 1.6 percent o f GDP in 1999 to a primary surplus o f 6.9 percent in 2004.37 Fiscal adjustment at the CGG level was mainly driven by a substantial tax effort achieved from 1999 to 2001 and maintained thereafter (Figure 2.1). Primary expenditures have been reduced more gradually, f rom 33.9 percent o f GDP in 2001 to 32.7 percent in 2004. In 2004 primary expenditures in percent of GDP s t i l l remained marginally above their level in 2000.
2.3 Reflecting a sound fiscal framework, interest payments on public debt have declined significantly. Strong fiscal adjustment helped Turkey reduce i t s net public debt to GDP ratio to 63.5 percent in 2004 from 90.5 percent in 2001. Declining debt ratios and lower interest rates-thanks to receding inflation and stronger confidence in the ability o f the Government to res tore macroeconomic stability- have led to sharp declines in interest payments on public debt: Interest payments, which had peaked at 25.4 percent of GDP in 2001, up from 14.6 percent in
Figure 2.1: Fiscal balances and primary expenditures and revenues of the General Government (1999-2004; in % of GDP)
10 r l ~ A
1999 2 0 0 0 2 0 0 1 2 0 0 2 2 0 0 3 2 0 0 4
40
3 9
3 8
37
3 6
35
3 4
33
3 2
3 1
Fiscal Balance - Prlmry Suiplus +Primary Rsvenues (right BXIE) -PrimaryExpenditurcr (right a x s )
1999, declined to 13.5-percent o f GDP in 2004. However, interest payments s t i l l represented the equivalent of 41 percent o f total primary expenditures o f CGG in 2004.
36 While Annex 2.1 presents detailed data sources and methodology, i t should be noted that the definition of general government used in this report includes the (i) consolidated budget, (ii) social security institutions (SSI), (iii) a subset o f budgetary and extra budgetary funds (EBFs), (iv) local administrations, and (v) off- budget revolving funds created by public entities. The analysis does not include the revenues and expenditures o f the Central Bank and other public depository institutions, 45 non-financial state economic enterprises (SOEs), nine regulatory and supervisory agencies, and 45 out o f a total o f 50 special budget institutions listed in the Public Financial Management and Control Law (PFh4C). Special budget institutions refer to 50 public entities established as affiliated or related to a ministry to provide certain public services. These special budget institutions receive revenues and are authorized to spend them. The analysis includes the net subsidies and transfers between these institutions and the consolidated budget. 37 The IMF’s Stand-By Arrangement (SBA) program target o f 6.5 percent o f GNP primary surplus for 2005-2007, includes primary surplus o f a subset o f SOEs together with the general government. The primary surplus data for the SOEs provided in Table 2.1 are from IMF staff reports.
56

Box 2.1. Conversion between SPO definition of CGG primary surplus to IMF’s program definition of public sector primary surplus:
The backbone o f the Government’s Stand-By Arrangements (SBA) with the IMF has been continued and strong fiscal discipline monitored through program definition of the public sector primary balance. A detailed definition o f the program primary surplus methodology can be found in the Fiscal Targets annex o f the April 2005 SBA with Turkey.
The objective o f the IMF methodology i s not to monitor the consolidated public sector revenues and expenditures according to Government Financial Statistics (GFS) definition and the underlying primary surplus, but rather to focus on the fiscal balance measured through the primary surplus. Moreover, the program definition also does not account the revenues and expenditures that are not o f continues and regular nature.
In order to reach the program definition of the public sector primary surplus the following adjustments should be made to the SPO definition o f the primary surplus.
Table: Public Sector Primary Surplus; conversion from the SPO to the IMF Program definition (% of GDP) 1999 2000 2001 2002 2003 2004 Primary Surplus (SPO definition of General Governn 0.5 4.9 5.8 4.0 5.1 5.9
Adjustments on revenues (-) CB profit (-) Transfer of special revenues (-) Dividend revenues from state banks (+) Tax arrears interest (-) Revaluation difference (+) Support Price Stabilization Fund repayment (+) Interest revenues of the SSIs
Adjustments on Expenditures (-) Retirement bonus (+) Mandatory savings (-) Expenditures due to privatization activities (+) Privatization Fund net lending (+) Defense Fund net lending (+) Mass Housing Fund net lending (+) Interest expenditures of SSIs (-) Risk Account
0.1 0.2 0.3 1.1 0.0 0.1 0.3
0.1 0.5 0.0 0.0
0.0 0.0 0.0 0.0 0.0 0.0 0.1 0.0 0.0 0.0
0.1 0.7 0.5 0.0 0.0 0.0 0.0 0.0 0.0 0.1 0.1 0. I 0.1 0.1 0.0
(0.0) (0.0) 0.1 0.0 (0.0) (0.0) 0.0 (0.0) 0.1 0.1 0.0
0.3 0.1
Program adjusted general government primary surph (0.4) 4.1 5.0 2.9 5.3 5.7 SOEs primary surplus (program definition) (2.1) (1.5) 0.1 1.1 0.7 1.1 Program adjusted public sector primary surplus (2.5) 2.6 5.1 4.1 6.0 6.8 Note: Plus and minus signs reflects additions and substractrions from the related revenues and expenditures categori
2.4 At the same time, fiscal transparency and accountability have considerably improved. Turkey has aligned, to a great extent, i t s legislation o f public procurement, financial management and financial control wi th international standards. A public procurement agency and an office for debt and risk management have been established; most o f the extra budgetary funds have been integrated into the budget; the duty losses o f state banks have been accounted in a more transparent manner while generation o f new duty losses without an appropriation in the budget have been legally prohibited. More
57

importantly, a new Public Financial Management and Control Law (PFMC) has been enacted as o f December 2003. The PFMC Law aims at establishing a public financial management and control system compatible with international standards and EU norms. I t extends the scope o f the budget; provides budgetary unity, increase effectiveness, fiscal transparency, and accountability during the process o f preparation and implementations of budgets; ensures transparency in financial management; and restores the balance between authorizations and responsibilities in the spending process by establishing an efficient accountability mechanism. Therefore, a more transparent and close management o f the fiscal stance i s now achieved and quasi-fiscal activities are much harder to undertake.
2.5 Consolidated budget (CB) and extra budgetary funds (EBFs) contributed most to fiscal adjustment at the General Government level. The consolidated budget (Central Government budget, accounting for 61 percent o f CGG expenditures in 2004) b y i tse l f created a fiscal adjustment o f more than 5 percentage point o f GDP (Table 2.1). With the primary surplus o f 9.1 percent o f GDP, the CB more than doubled i t s primary surplus compared to 1999. Controlling the extensive off-budget activities of the past by eliminating the earmarked revenue system through the closure of numerous Extra- budgetary Funds (EBFs) contributed to fiscal consolidation. Abolishment o f all budgetary funds, with the exception o f Support Price Stabilization Fund (DFIF), and al l but five extra budgetary Funds (Social Solidarity Fund, Defense Fund, Promotion Fund, SDIF, Privatization Fund) improved the fiscal discipline and brought the deficit of the EBFs close to zero in 2004.38
Table 2.1: Institutional breakdown of Consolidated General Government Primary Balance ~
(% of GDP) Consolidated Budget SSIS Local Administrations Revolving funds EBFs UI
Total Primary Surplus Memo Item:
1999 3.8
-3.0 0.3 0.0
-0.6 0.0 0.5
2000 2001 2002 2003 2004 6.2 6.2 6.6 8.8 9.1
-1.9 -2.6 -3.1 -3.8 -3.8 0.5 0.7 0.1 -0.3 0.0 0.1 0.1 0.2 0.3 0.4
0.3 0.6 0.3 0.3 0.4 4.9 5.8 4.0 5.1 5.9
-0.3 0.8 -0.2 -0.2 -0.2
SOEs -2.1 -1.5 0.1 1.1 0.7 1.1 Source: World Bank staf f calculations based on SPO data
2.6 Fiscal adjustment has been im eded by a growing social security deficit, which reached 3.8percent of GDP in 20M3'The fiscal situation would have been much better if Turkey had managed to contain the social security deficit after the 1999 reform. The
38 The number of EBFs has been reduced in 2000 and 2001, and the related earmarked revenue system was abolished in 2004. 39 The deficit of the social security institutions does not include payments made on behalf o f the consolidated budget since those expenditures are treated as part of the consolidated budget expenditures. Therefore the deficit o f 3.8 percent o f GDP i s consistent with the more commonly used definition, (including payments made on behalf o f the consolidated budget) which corresponds to 4.5 percent o f GNP in 2004.
58

overall deficit o f the SSIs increased from 1.9 percent o f GDP in 2000 to 3.8 percent in 2004. The deficit may further grow to above 4.1 percent o f GDP in 2005. Given the favorable demographic profile o f Turkey, the currently high deficits pose a bigger challenge in the long run considering that the number of elderly w i l l start to increase as the demographic shift starts to k ick in. The projected deficit o f the system i s expected to reach 6.7 percent o f GDP in the long term, under a no-reform scenario (see B o x 2.2).
2.7 Social security reform currently under way will help contain the deficits over the long term, but more ambitious steps will be needed to ensure financial sustainability with lowerpayroll taxes. With the help o f reform currently planned by the Government, the pension system deficit i s expected to decline by 1 percent below the baseline projection o f “no reform” by 2020. However, the beneficial impact o f these measures i s expected to be rather limited over the medium run, thus creating little fiscal space for growth-enhancing expenditures. Moreover, long-run financial sustainability w i l l be secured under a high level o f payroll taxes by international standards. Indeed, as further explained in chapter 4, high social security contributions, combined with other income taxes, create a high “tax wedge” on labor income in Turkey, which i s an impediment to j ob creation in the formal labor market. More ambitious reforms would be needed to generate medium-term savings and also create room for a reduction in payroll taxes in the future (see Box 2.2).
Box 2.2. Turkish Pension System - The Need for a Reform
The social security system in Turkey started to incur deficits in early 90s. Gradually increasing, the required transfers from the budget became a major fiscal problem by the late 90s. Increased public transfers to the social security system have been crowding out investments in other sectors l ike education, health or infrastructure. The fiscal deficits‘ have been mainly due to low retirement age, the weak link between benefits and contributions and the inefficiencies in the system that led to low coverage and compliance. Recognizing the deficits were unsustainable, the Government planned a two phase reform the first phase of which included the parametric redesign o f the social security system to respond to the most urgent need of reducing fiscal deficits. The objectives o f the second phase were improving the efficiency, coverage and compliance and introduction o f voluntary private pensions.
1999 reform was partial and did notprove to be effective. As a result o f the parametric changes introduced with the Social Security Reform Law legislated in 1999, the social security deficits accounting for 3.75% of GNP in 1999 decreased to 2.57% o f G k P in 2000. E security system started to deteriorate, mainly due to the economic crisis in 2001 that led to revenue reduction and because o f the fact that Emekli Sandigi (ES, social security system for civi l servants) was excluded from the 1999 parametric reform. Also ad-hoc increases in benefits above the inflation in 2003 and 2004, several amnesties for contribution arrears and the inability to implement the planned administrative reforms highly contributed to the increase in deficits, which, by 2004, reached 4.5% of GNP and i s projected to be at about the same level in 2005.
)wever, from 200i, the fiscal balances o f the social Figure 1. Fiscal Balance of the Pension System
0.0%
-1.0%
-2.0%
-3.0%
-4.0%
-5.0%
-6.0%
-7.0%
a c1
8
The Turkish pension system is a large fiscal drain. Main reasons for this are: (i) high number o f young pensioners due to the transition period until 2034 when the minimum retirement age o f 58/60 w i l l kick-in: (ii) higher period for collection o f benefits than the contribution periods; (iii) high replacement rates
59

compared to ILO target; (iv) underreporting of earnings and (v) fragmented structure of social security institutions.
Continued commitment to overhaul of the social security system is key for achieving long-term sustainability. The new social security reform package initiated b y the government envisages separating pensions, health and social assistance functions and unification o f the social security institutions for increased efficiency and transparency. While the draft legislation on the pensions and health components are in the Parliament and are expected to be enacted in the first quarter o f 2006, the complementary institutional law and the social assistance law are still under preparation. On the pension front’, the reform introduces parametric changes including the retirement age, replacement rate, valorization rate and pension indexation. The reform also introduces a state contribution o f 5 percent, which i s expected to put on the government an additional burden o f about 0.1 percent o f GDP starting in 2040. A significant improvement included in the draft law i s that Emekli Sandigi contributions w i l l be based on the total remuneration (as opposed to the existing base o f only salaries). In addition, Bag-Kur income steps w i l l be removed and contributors w i l l be allowed to declare their own earnings level. With the help o f the reform, the pension deficit i s expected to decline by 1 percent below the baseline projection o f “no reform” by 2012 and reach a balanced position by 2045. (Figure 1)
Generating significant medium-term savings and reducing payroll taxes would require additional steps. On current reform plans, medium-term savings w i l l be rather limited, while payroll taxes w i l l remain high, hampering activity in the formal sector and depriving the pension system from significant revenues. Further reducing the generosity o f the PAYGO pension system wi l l be required to generate needed savings in the medium term. Options may include, for example: raising the retirement age immediately; paying no pensions for those under the age of 58/60; phasing out indexation o f current pensions to inflation. Additional options may involve broadening the tax base to generate needed fiscal space for lower social security contributions by taxing pension benefits above a threshold, or removing the deductibility o f pension contributions from taxable income. I t should be noted that some measures, such as increasing the retirement age immediately, would face legal obstacles, and could be implemented only gradually for current employees.
’ For a discussion o f the health sector issues and reform, see chapter 9.
2.8 The primary balance of State-Owned Enterprises has significantly improved since 1999. The SOEs covered under the IMF program have been generating a deficit o f 2.1 percent o f GDP in 1999 but their fiscal situation improved substantially, generating a surplus o f 1.1 percent of GDP in 2004 (Table 2.1).40 This improvement was mainly generated by a close to 2 percentage points o f GDP reduction in their investment expenditures, and 1 percentage point cut in their personnel compensation (see sections B. l and B.2 below). The personnel retrenchment o f the SOEs has been supported by the PFPSAL program o f the Wor ld Bank.
2.9 With the privatization of profitable SOEs, like Turk Telekom and Tupras, the contribution of the SOEs to the public sector primary surplus will decrease, but foregone revenues may be offset from other sources. These SOEs were also helping the fiscal position of the consolidated budget through their net transfer to the budget. In 2004, the net transfer from the SOEs to the budget was YTL 1.4 bi l l ion or 0.3 percent o f GDP. 41 Revenue losses for the consolidated budget w i l l be mitigated b y corporate tax receipts from privatized SOEs. International experience suggests that additional tax receipts may
40 The number o f SOEs covered in the program was eight in 1999, and this number increased to 26 in 2004. 41 Turk Telekom’s contribution to the budget has been secured for the year 2005 even if the privatization of 55% i s completed in this year.
60

offset foregone fiscal revenues from profitable SOEs as a result o f growing business activity in liberalized sectors. In addition, wi th privatization revenues used to pay down public debt, there w i l l be room for expenditure savings as a result o f lower interest payments on the public debt stock.
(differences between two periods as % of GDP) 1999-2004 1999-2001 2001-2004
2.10 Fiscal adjustment at the general government level was mainly revenue-driven in 1999-2001. As shown in Figure 2.1 and Tables 2.1 and 2.2, the effort o f fiscal consolidation until 2001 reflects predominantly an increase in general government revenues, excluding SSI, and an improvement in the primary balance o f the SOEs-the latter up until 2002.42 During 1999-2001 primary revenues increased by 5.2 percentage points o f GDP, driven by an increase in indirect taxes of 3.2 percentage points o f GDP (Table 2.2). By contrast, primary expenditure o f the general government remained almost constant in percent o f GDP.
Memo: 2002-2004
2.11 I n 2001-04 fiscal .consolidation was also supported by reductions in primary general government expenditures. In 2001-2004 the pattern of fiscal adjustment has somewhat changed with respect to 1999-2001. Total primary expenditures were reduced by an estimated 1.2 percentage points o f GDP. This was mainly driven by reduced investment spending (1.3 percentage points o f GDP), which was needed to offset the increasing deficit o f the SSIs (Table 2.1). By contrast, compensation o f personnel, which accounts for 31 percent o f primary CGG expenditures, has been constant as a share o f GDP since 2001, and has even edged upwards when measured over 2002-2004 (Table 2.2). The reasons for the apparent rigidity in the wage bill are further examined in section B.l below. General government tax revenues decreased by 2.1 percentage points o f GDP over 2001-2004. However, measured f rom 2002 onwards, the tax burden continued to increase by 1.4 percentage points o f GDP, owing to further increases in indirect taxes, estimated at 1.7 percentage points o f GDP.
Total Revenues 5.7 6.2 -0.5 Primary Revenues 4.8 5.9 -1.1
1.4 1.2
Taxes 21 Direct Indirect Wealth
Non-Tax Revenues Factor Incomes
Social Funds Interest revenues
1.8 -2.4 4.0 0.2 0.2 2.1 0.9 1.6
3.9 0.7 3.2 0.0
-0.2 1.5 0.3 1 .o
-2.1 -3.2 0.9 0.2 0.3 0.6 0.6 0.6
1.4 -0.5 1.7 0.2
-0.4 -0.5 0.2 0.9
42 Although tax revenues in percent o f GDP have peaked in 2001, for the whole 1999-2004 period, this partly reflects the sharp drop in GDP in this crisis year. For this same reason, expenditure items appear also artificially inflated in 2001 when measured in percent o f GDP. To account for this distortion, a different breakdown, using 2002 as reference year, i s also shown in Table 2.2.
61

Current Expenditures -0.1 -0.2 0.1 of which personnel -0.5 -0.5 -0.1
Investment Expenditures -1.0 0.3 -1.3 Transfer Expenditures -0.6 11.3 -11.9
Current Transfers 0.0 11.4 -11.4 o f which interest
payments -1.1 10.8 -12.0 Capital Transfers -0.6 -0.1 -0.5
Net Lending
Total Expenditures -0.6 0.5 -1.2 Primary Expenditures -0.6 0.5 -1.2
Borrowing Requirement -7.1 4.3 -11.4 Primary Surplus 5.4 5.3 0.1
0.0 0.3
-1.2 -4.2 -3.9
-0.7 -0.7
-6.6 1.9
-4.7 -0.3
2.12 Overall, fiscal consolidation came primarily from the revenue side, with heavy reliance on indirect taxes, although initiatives have been taken to improve the quality and limit the growth of spending. Despite the partial shift in the adjustment pattern since 2002, Turkey's focus for achieving fiscal consolidation has been on revenue-increasing measures rather than expenditure rationalization. From 1999 to 2004, 90 percent o f the 5.4 percentage points o f GDP increase in the CGG primary surplus came f rom revenue- increasing measures-specially f rom higher indirect taxes. Indirect tax revenues increased from 11.7 percent o f GDP in 1999 to 15.7 percent o f GDP in 2004. In contrast to primary revenues, non-interest expenditures reflect no major changes during the period, with expenditures for personnel, goods and services and current transfers largely unaffected by fiscal consolidation. Primary expenditures hovered at around 33 percent o f GDP, reflecting no major expenditure rationalization. I t should be noted, however, that initiatives have been taken to prevent wasting in expenditures, improve spending quality, and set expenditure priorities-for example, annual budget ceilings are set to recruitments in the public sector (with priority to education, health care, and justice), while non-priority investment projects have been excluded from the investment program. Although more steps are needed, as further explained below, these measures have supported a better control o f expenditure growth than in the past.
62

2.13 Fiscal revenues have increased to levels comparable to EU countries and much higher than in emerging market economies. In most EU cohesion countries and new EU members the tax burden has remained constant, or has even decreased in percentage of GDP, as a result of initiatives to contain the increase in the size of Government (Figure 2.2). But contrary to this trend, and as a result o f the pattern of fiscal adjustment since
_ _ 50 -
b 4 0 -
s
H 3 0 - a 20 z
10 -
1999, fiscal revenues in Turkey stood at 40 percent o f GDP in 2004, a level that i s now similar to EU countries. The increase in the fiscal burden in 1999-2004 was the largest among the comparator countries-similar only to Brazil. With a fiscal burden higher than in other emerging economies, further increases in tax rates would risk hindering competitiveness, bolstering informality, and eventually compromising growth.
Figure 2.2: General Government Revenue In % of GDP vs per capita GDP in PPP
0 4 0 5,000 10,000 15.000 20,000 25,000 30,000 35,000 40,000
GDP per capita, PPP
There is, however, considerable room for broadening the tax bases, as further explained in section 2.3 below. Initiatives in the years ahead should focus on two goals: (i) In the short term, promoting tax rationalization, with the aim o f reducing the distortions associated with a given level of the tax burden and broadening the tax bases; (ii) Over the medium term, making fiscal room for lower taxes, by taking advantage o f the reduction in the debt ratio and pursuing public expenditure reforms aimed at containing expenditure pressures.
63

A.2. Expenditure allocations in international comparison
2.14 Turkey's primary expenditures are still at the low end of EU countries but much higher than in other emerging economies. Turkey's public expenditure allocations have been benchmarked against a set o f countries comprising cohesion EU countries, new EU members, and emerging market economies. Reflecting s t i l l high interest payments on public debt, total expenditures o f the Consolidated General Government (CGG) are among the highest o f the comparison group (Figure 2.3). However, at 32.7 percent o f GDP in 2004, primary expenditure i s much lower, and compares favorably with the average size o f government seen in cohesion countries o f the EU and new EU members-although Turkey's primary expenditure in percent o f GDP i s at par with Ireland's and higher than Romania's. The size o f government i s nevertheless much higher than in other comparable emerging economies in East Asia, Latin America, and Southern Africa. Primary expenditure in the comparison group o f emerging economies (excluding Mexico where available data do not capture properly spending b y subnational governments) represented 23 percent o f GDP in 2003, about ten percentage points o f GDP lower than in Turkey. As primary expenditure was only
Figure 2 3 General Government Expenditure as 56 of GDP
6 0 /
50
40
30
20
10
0
marginally reduced in percent o f GDP between 1999 and 2004, Turkey's relative position remained pretty much stable within the benchmark group.
(a) Public expenditure by economic category43
2.15 The Government wage bill is high compared to other emerging economies and some new EU members. At 10 per cent o f GDP in 2004, Turkey's expenditure on wages and salaries at the level o f the General Government i s relatively high. I t i s s t i l l lower than in Southern EU countries (Greece, Portugal, Spain) or in some new EU members wi th a tradition o f bloated public service (Poland, Hungary-see Figure 2.4). However, personnel compensation i s significantly higher than in other fast-growing emerging economies (Chile, Korea, Malaysia, Thailand) or in some new and acceding EU countries
43 This section briefly examines, in international comparison, Turkey's expenditures for personnel compensation, current transfers, and public investment at the CGG level. These three categories comprised the bulk (75.4 percent) of primary CGG expenditures in 2004, or the equivalent o f 24.6 percent o f GDP. Remaining primary expenditures (the equivalent o f 8 percent o f GDP) are allocated for purchases o f goods and services (7.3 percent o f GDP) and capital transfers. The bulk o f purchases o f goods and services are allocated to health (3.8 percent o f GDP) and Defense, Public order and safety (1.8 percent o f GDP combined). A detailed cross-classification (Le., economic and functional) o f CGG expenditures i s provided in Annex 2.1.
64

that have streamlined the public sector (Czech Republic, Bulgaria, Romania). At 30 percent o f total General Government primary expenditure in 2004, up f rom 28.6 percent in 2000, the wage bill represents a large fraction o f public spending b y international comparison (Figure 2.5). This imparts rigidity in the budget at a time when more fiscal space i s needed.
Fgure2.4. Compensalionol General Cdvernment employees (2003-04: in %of GDP) I
I 14
12
10
8
4
6
2
0
Figure 2.5: General Government Wage Bill in percent of Primary Public Eqendidture (2004)
. . . . . . - . ._ .. . . . ._ .. ... . .. . - . . . . . . . . - . . . .. . .
2.16 Expenditures for current transfers, mainly comprising social benefits, are oversized by international standards, in view of Turkey's favorable demographics. At 11.7 percent o f GDP in 2004, expenditure on current transfers i s lower than in most EU comparator countries (15 percent and up, with the exception o f Ireland), but higher than emerging market economies such as Chile, Korea and Malasia (Figure 2.6). Current transfers in their majority (8.5 percent o f GDP) are for social protection, so that spending in this category i s better analyzed in the context o f the age distribution o f population. Given that Turkey has a very young population and the lowest o ld age dependency ratio among a selected group o f comparators, i t s social protection expenditures are oversized by international comparison (Figure 2.7). In addition, the proportion o f Turkey's population aged 65 and over to the labor force w i l l increase by 10 percentage points between 2000 and 2020, according to OECD projection^.^^ Therefore, despite the current favorable demographic situation, in the future, Turkey i s l ikely to face an upward pressure on social spending in order to expand the social safety net.
FIgumZ.7 G a m a Government Expsnditur~on Social BaMftOand SOcIdTmnef~m(as %of GDP)
Y*. Old hgc Oepndenw Ratio
Figure 2.6: Expenditure by Economic Categofy: Current tranders -Turkey ( m 4 ) and Comparators (2003), in %01 GDP
251 -
15 -
- 10 -
5 -
n. I.
I I 2s"l
mi. M I L
44 OECD Factbook 2005 -ISBN 92-64-01869-7 - 0 OECD 2005. See Section "Population and migration - demographic trends - ageing societies".
65

2.17 Turkey’s domestic investment level is close to the average of comparator countries. Despite significant downsizing since 2001, public investment remains comparable to levels seen in other EU members, and higher than in other emerging economies (with the exception o f Malaysia and Korea-see Figure 2.8). Although infrastructure gaps in Turkey may be larger than in cohesion countries or in some new EU members, careful consideration should be given to increasing the size o f the PIP based on sound costhenefit assessment o f investment projects. The large portfolio o f frozen projects suggests that the PIP has been
Figure 2 8 Consolidated General Government Gross Fimd Capltal Formation- Turkey (2004) and cumparators (2003), in % of GDP
~~ - .
oversized in the past, including projects o f questionable priority. Issues in the management o f the public investment program are reviewed in section B.2.
66

(b) Public expenditure by Government function
functional classification in 2006 and
2.18 Implementation of functional classification of expenditures is very recent in Turkey. Turkey initiated the GFS 2001 consistent functional classification for the consolidated budget institutions in 2004, and central government budget and SSIs are
Figwe 2 9 Fvctional albcalion of germrat government experdtures .. Twkey (2004) arc comparators (2W3) In% of GDP
local government budgets in 2007. There have been some partial efforts to estimate the functional classification o f social sector expenditure^.^^ The cross functional and economic classification for 2003 and 2004 used in this study i s a first attempt to estimate the general government functional expenditures, and draws On Ongoing by the World Bank for a public dit^^^
l2
IO
4
Gen Pub Defenseand Economr Environment tbwingand HeaHh Recrealon, Edmatlon Soclai Sewices PUblCorder anairs protectan commmw culture and protection
and safety amennes relgion
2.19 Expenditure for the provision of public goods (general public services, defense, public order and safety) is relatively high in international comparison. Spending levels in general public services and in defense and public order and safety are oversized b y 0.8 and 1.2 percentage points o f GDP respectively wi th respect to comparators.
2.20 Expenditure on economic affairs (comprising mainly investment in infrastructure and various subsidies) i s broadly in line with average levels in comparator countries. As already mentioned, this mainly reflects drastic downsizing o f the investment budget and continuing reform o f subsidies to agriculture since 1999.
2.21 Expenditure on health care is relatively high in international comparison. At 5.9 percent o f GDP in 2004 (including Hospital Revolving Funds), CGG expenditure on health care i s 2.2 percentage points o f GDP higher than in the average o f comparator countries. Public expenditure on health care depends o f course on many factors, such as the structure of the health care system, demographics, and per capita GDP. Further
45 General Government social expenditures first initiated under the P E R 2001 study of the World Bank. The coverage has been expanded under the PFPSAL program. 46 Comparators include: Russia, Portugal, Greece, Czech Republic, Spain, Ireland, S. Africa, Romania, Malasia, Mexico, Thailand, Brazil, and Chile. Turkey’s size of government, as measured by primary expenditure in percent of GDP (32.6 percent in 2004), was broadly comparable to the average of these countries (30 percent of GDP in 2003).
67

analysis i s provided in chapter 9. Turkey’s favorable demographics should work towards containing health care spending for the elder relative to comparators. The high level o f health care spending may conceal inefficiencies and provide room for expenditure savings. A cross-country examination o f per capita health care spending (both by the public sector and including out-of-pocket, private expenditures) in relation to per capita GDP also corroborates this point (see Chapter 9).
2.22 Expenditure on education is in line with comparators but educational attainment remains weak. Turkey spends more on education than other emerging economies with similar educational attainment, such as for example Brazil. Public expenditure on education in percent o f GDP i s similar to other EU countries and comparable to emerging economies, but educational attainment in Turkey i s s t i l l lagging behind with respect to these comparators (Figure 2.10).47
2.23 Increases in education expenditures should go in tandem with improved efficiency of spending. As in other countries experiencing educational gaps (Portugal, South Africa, Malaysia), public expenditure on education would need to increase in the future to promote the closing o f these gaps (also see B o x 2.3). This would be a pre- requisite for faster long-term growth (chapter 1). However, in view o f current levels o f public spending, existing educational gaps also suggest some potential for efficiency improvements. Reforming the curricula at al l levels; better targeting o f public schooling efforts to groups really in need; better management o f
Figure 2.10. Pubic Expendidlure on Education vs Average Years 01 Schooling
I _ . M A L I
I ‘
‘ I 0 1 2 3 4 5 6 7 8 9 1(
Yeais of Schooling
teacher’s wage bill; could be examples o f areas where efficiency gains could generate resources for new investments.
Box 2.3 Education Reform on the way to the EU - Fiscal Impact Improving the quality of education and promoting access and equity are key challenges for convergence. One o f Turkey’s biggest challenges in preparing for EU membership and European integration i s to ensure that i t provides high-quality education for all o f i t s young citizens in order to close the gap between the country’s level o f educational attainment in comparison with EU standards. Improving the quality o f the human capital stock i s crucial in promoting faster per capita income convergence through increased productivity and competitiveness. Although Turkey made significant progress with a program o f education reforms beginning in 1997 that expanded the length o f compulsory schooling from five to eight years and boosted enrolment in and completion o f basic education, recent international assessments of learning achievement show that the majority o f Turkey’s primary and secondary school students perform considerably below the performance o f their European counterparts, and Turkey graduates significantly fewer students from secondary schools and higher education when compared to European countries. Although education i s not under-funded as a percentage of GDP, efficiency and effectiveness i s low. Turkey w i l l need to build on the success of its 1997 education reform by better concentrating the sector’s
47 Public expenditure on education should be assessed in a broader framework, also comprising private expenditure, as they complement each other. See box 2.3 and Education Sector Study - ESS 2005.
68

significant tinancial, human, and material resources on ensuring the enrollment, attendance and completion o f basic education for al l students, upgrading the quality o f learning, increasing secondary school enrollment and completion rates, and improving students’ transition from schooling to employment. The ratio o f total spending on education (including private as well as public spending) to GDP was 7 percent as o f 2002 (the latest year for which data are available). This level o f spending, which well exceeds the OECD average o f 5.2 percent, i s only surpassed by education spending in the United States and Denmark. Nonetheless, as reported in a recent World Bank study (Education Sector Study - ESS 200548), these resources are not providing the kind of results that Turkey needs for effective convergence with European standards. The majority o f Turkish students perform at or below the bottom rung o f OECD’s six-point learning proficiency scale as measured by i t s Program for International Student Assessment. The inability o f Turkey’s schools to provide knowledge and competencies to al l students appears to derive in part from the structure o f the system, which i s driven by selection exams, not results-based accountability. Increased expenditure pressures in the near future seem to be due to three factors: (i) postponement o f the expenditures, including public investments in education and maintenance o f the existing capital stock, during the recent years o f fiscal adjustment; (ii) the rapid growth of the school-age population; (iii) the need to improve educational results in order to narrow the human capital gap in comparison with the EU. ESS research finds that among the recommended policy options for education reform, expanding access to early childhood education and using information and communication technology to integrate new curriculum into classroom practice have high estimated cost impacts, particularly due to additional investment requirements. In addition, estimates suggest for example, that solely the construction o f new classrooms that w i l l be required to reduce the number of students per class to 30 in primary education in 2006 i s at 0.2 percent o f GNP. Public resources may need to be boosted. The development o f a coherent national education strategy, guided by the broader national strategy o f educational development stated in the eighth five-year development plan, w i l l be crucial in promoting effective resource allocation. The policies required to achieve the strategic objectives in the emerging strategy are expected to have fiscal consequences. In order to expand access to education, promote equity in access to education, improve the quality o f education (with the ultimate goal o f increasing the employability o f young graduates), Turkey needs to devote sufficient public resources to education while at the same time improve the distribution and efficiency o f available resources. The government could also make more efficient use o f the massive funding provided by private sources. Private funding could contribute enormously to Turkey’s ability to provide educational services to all citizens as i t reduces the burden on the public budget, allowing the government to redeploy scarce public resources towards children from less well-off families. In Turkey, most private funding goes to universities (35 percent of total private expenditures), wealthier families subsidizing the education o f their children who are enrolled in public primary (32 percent) and public secondary (15 percent) schools, and private tutoring to prepare for secondary and higher education entrance and selection examinations (1 1.4 percent). Government should consider ways o f leveraging these private resources to help improve public education for those who cannot afford to pay out-of-pocket.
2.24 Expenditure on social protection is high by international comparison in view of Turkey’s favorable demographics. As noted earlier, although Turkey’s expenditure in percent of GDP i s on par with the average of comparator countries, favorable demographics suggest considerable room for savings through more ambitious pension reform.
2.25 Expenditure on environmental protection is comparatively low and may need to increase on the way to the EU. Alignment with the EU Acquis on environmental protection wil l place a burden on public expenditure for control of air pollution, quality of water supply, wastewater and waste management. Although considerable uncertainty
48 Forthcoming, following final review by the Government for dissemination.
69

surrounds the cost estimates o f necessary investments, i t should be noted that costs of meeting the Acquis requirements w i l l also depend on policy choices and reforms in infrastructure services, while there i s considerable room for participation o f the private sector (see A. Markandya, 2005).
2.26 Downsizing low-value expenditure programs, to make room for growth- enhancing expenditures and lower taxes, would deserve particular attention in the years ahead. Turkey has accomplished a remarkable effort o f fiscal consolidation since 1999 but ensuring a high-quality fiscal adjustment w i l l be a key challenge on the way to the EU. This i s important for a number o f reasons: (i) international experience suggests that the quality of fiscal adjustment i s a key factor for sustainability and i s closely associated with stronger growth performance (Box 2.4); (ii) expenditure pressures are l ikely to be felt over the medium term, either as a result o f past policy commitments- such as in education and access to universal health insurance, or owing to a s t i l l pending reform agenda (such as in the pension system or in c iv i l service pay); (iii) infrastructure investment may need to increase in less developed regions, given the persistence o f regional disparities reviewed in the previous chapter, while maintenance needs to be up scaled (see below); (iv) Government w i l l have to make room in later stages o f EU accession for expenditures in areas, such as environmental protection, where harmonization with the EU Acquis i s cost ly-even though the cost w i l l be, to some extent, offset by EU pre-accession funds; (v) c iv i l service pay for highly qualified personnel may also need to increase to support the EU accession process.
Box 2.4: The quality of fiscal adjustment and economic p e r f ~ r m a n c e ~ ~
There i s evidence, especially from OECD countries, that fiscal consolidations that have relied primarily on tax increases and cuts in public investment have not been sustainable because higher tax revenues sooner or later boosted expenditures, while maintenance and expenditures on backbone infrastructure could not be postponed forever. By contrast, fiscal consolidations underpinned by structural public expenditures cuts- by downsizing public employment and the wage bill and cutting back transfers-have had more lasting effects because they tackled the main types o f expenditures that show a strong upward drift. Countries that implemented sustained fiscal adjustments enjoyed fast growth over the medium term because measures perceived as lasting have led to strong reductions in real interest rates that stimulated investment. Moreover, such measures may have been perceived as implying a reduction in the future tax burden, thus generating positive wealth effects, while also reducing precautionary savings by resolving uncertainties about the future course of fiscal policy.
2.27 Trade offs in expenditure allocations would need to be considered to meet Turkey’s development challenges. As public expenditures are already high compared to other emerging economies and some new EU members there i s little room for Turkey to further increase expenditure in order to meet pressing development challenges. Expenditure should also be contained in order to make room for lower taxes in the long run while preserving a sound fiscal framework. Policy would thus need to focus on trade-
49 Sources: A. Alesina and R. Peroti, “Fiscal Adjustments in OECD Countries: Composition and Macroeconomic Effects”, IMF Staff Papers, 1997; A. Alesina and S. Ardagna, “Tales o f Fiscal Adjustment”, Economic Policy, 1998; R. Peroti, “Fiscal Consolidation in Europe: Composition Matters”, American Economic Review, 1996.
70

offs in expenditure allocations, possibly by reducing spending in functional areas where i t appears to be oversized in international comparison (such as general public services and defense, public order and safety). At the same time, reforms should be implemented with the aim o f improving the efficiency o f expenditure programs in areas where expenditure pressures are being felt-such as health care, education, social protection (see chapter 9 for options in cost containment in health care). Horizontal reforms, focused on the modernization o f c iv i l service pay and employment system and the rationalization o f the investment program, would also help contain pressures on the wage bill and investment spending and thus better control public expenditure across functional areas. These are brief ly reviewed below.
These shares have remained stable over
B. HORIZONTAL ISSUES IN PUBLIC EXPENDITURE REFORM
1999 2000 2001 2002 2003 2004
3 Consolidated bxiget W SSls 0 Local administrations 0 Revolving Funds I EBFs 11
B.l. Public sector pay and employment
2.28 The Government wage bill has been bypassed by fiscal consolidation. Since 1999 total compensation for General Government employees has hovered at around 10 percent o f GDP, growing from 9.5 percent to 10 percent between 2000 and 2004 (Figure 2.11).50 The lion's share o f personnel expenditures, about 80 percent, i s incurred by consolidated budget agencies. Local administrations and revolving funds account for 9 and 7 percent of total personnel expenditure.
Figure2.11: Personnel eqenditures in percent of GDP (1999-2004) 1 .. .. . . . . ._ _._ . . _. . . . . . . . . . . . . . .. .. . .. . . . . - . . . . . _- .. -. . .
time.
2.29 Personnel expenditures are concentrated on education, security, and health care. These three functional categories absorbed more than two-thirds o f the wage bill in 2004 (Table 2.3).51 The fourth major category o f personnel expenditure i s in economic affairs, accounting for the provision o f infrastructure services, rural development, and services to agriculture. The share o f this functional category in total personnel expenditure i s equal to that o f Public order and safety and higher than Defense. Provision o f general public services i s the fifth largest category o f personnel spending for the General Government as a whole. I t i s relatively oversized at the level o f local administrations, representing the largest component o f their wage bill.
50 Steep increases in the wage bill in 1999 and 2001 reflect the sharp drop in GDP in these two crisis years. 5 ' Personnel expenditure in education and security i s incurred by the consolidated budget, but more than half of the wage bi l l for health care i s borne by Revolving Funds and Social Security Institutions.
71

Table 2.3 : Personnel expenditures by government function and level of General Government
Consolidated Social Security Local Revolving Total budget Institutions administrations Funds
(2004; in percent).
General Public Services 7.9 0.1 2.4 0.1 10.4 Defense 10.1 ... 10.2 Public Order and Safety 12.7 0.8 ... 13.5 Economic Affairs 10.5 ... 1.6 1.1 13.2 Environmental Protection 0.1 0.5 ... 0.7 Housing and Community Amenities . . . 1.7 ... 1.8 Health 7.7 3.0 0.6 5.3 16.4 Recreation, Culture and Religion 2.5 ... 0.6 ... 3.1 Education 27.6 1 .o 0.5 29.1 Social Protection 0.3 0.9 0.3 ... 1.5 Total 79.6 3.9 9.4 7.0 100.0
Source: World Bank staff
2.30 The wage bill in economic affairs and security is oversized by international comparison. The functional breakdown o f General Government personnel compensation in Turkey was compared to the average o f seven other new EU members, cohesion countries, and emerging economies for which similar information i s available: Czech Republic, Greece, Ireland, Mexico, Portugal, Spain, and South Africa. The share o f personnel compensation in security spending (Defense and Public Order and safety combined) i s somewhat above the average o f comparators (Figure 2.12). In particular, the share o f personnel expenditures on economic affairs i s twice as high. An example o f oversized wage bill with possible room for savings i s that o f the rural agencies budget (Box 2.5).
Figure 2.12 Composilon of Wage Bill by Furclon (in percent of Total Wage Bill;2004)
40 35 30 25 20 15 10 5 0
General public Defense & Economic Health Education, Sccial services Public Order Affairs, Culture, pcotecSon
Environmental Religion & Protection Housing
Box 2.5. The wage bill in rural agencies budget The rural consolidated non-transfer budget i s dominated by recurrent expenditures leaving limited funds for investment. Budget allocations for recurrent expenditures (excluding agricultural transfers) in 1999-2004 have been on average close to 70 percent o f the rural consolidated budget. As much as 90 percent of recurrent spending o f rural agencies i s allocated for salaries alone. Therefore, there i s limited funding (only 2-3 percent o f recurrent budget) for logistical and operational spending, which i s extremely vital for effective service delivery. There i s room for fiscal savings in rationalizing the personnel in rural agencies. Most pressing issues are: (i) State Hydraulic Works(DS1) turned approximately 90 percent o f the management o f irrigation schemes to Waters Users Associations, but cut only 10 percent o f i t s work force and s t i l l continues to allocate 25-30 percent o f i t s budget for personnel; (ii) Ministry o f Agriculture and Rural Affairs (MARA) budget i s soaked up by personnel expenditures (70-75 percent o f total budget) which could be tackled by for example, contracting out mainly extension activities while reducing such personnel, and (iii) GDRS budget was also largely taken up by wages (75 percent o f total), and after i t s closure in March 2005, the overstaffing problem has been passed on to Ministry o f Agriculture and Rural Affairs and the Special Provincial Administrations.
72

Figure 2 13 Employment in the Public sector (1 997-2004) 1,920,000
2.3 1 Public sector employment has been significantly downsized, mostly in State Economic Enterprises. Total public sector employment (excluding Revolving Funds)
1,860,000 Consolidated
~ 350000 1 / budget agencies was 2,460,740 in 2004-about 10 percent o f the economically active population. Three / - -
1,840,000
1,820,000
1,800,000
~ !%,$I +--k-ie2-7--;F h ~ 1 quarters of public sector employees are in consolidated budget agencies. Civ i l servants comprise the bulk o f public employment,
and State banks-represent about 22 percent, and contracted personnel only 5 percent o f total (Table 2.4).52 Overall, there has been a decreasing tendency in employment of all categories o f public sector employees. Sector-wise, employment in consolidated budget agencies increased until 2000, and then shrank by 4.5 percent up until 2004 (Figure 2.13). The most significant employment downsizing has occurred in state economic enterprises, o f around 30 percent from 1997 to 2004. Employment in municipalities has remained pretty much stable. However, a significant change in the composition o f municipal employment has occurred, with the share of temporary workers increasing to 45 percent o f total in 2004, f rom 25 percent in 1995.
while public workers+oncentrated in SEES 1997 1998 1999 2000 2001 2002 2003 2004
Table 2.4: Total employment in Turkey’s public sector (l), September 2004 Civil servants Contracted Workers Total % of Total
Personnel Public Sector Consolidated 1,620,341 17,182 184,62 1 1,822,144 74.0 budget Municipalities 92,487 2,178 106,700 201,365 8.2
administrations Social Security 74,391 349 3,728 78,468 3.2 institutions State economic 7,880 106,670 209,6 14 324,264 13.2 enterprises, State banks 58 29 29,639 29,726 1.2 Total 1,799,08 1 126,495 534,892 2,460,740 Percent of total 73.1 5.1 21.7 100
Special provincial 3,924 87 762 4,773 0.2
(1): Excluding Revolving Funds and Extra budgetary Funds Source: Ministry o f Finance
2.32 Civilian public sector employment i s not exceptionally high by international standards. Using only central government employment data (consolidated budget agencies for Turkey), and excluding the functions o f defense and public order and safety, public sector employment in Turkey amounted to 2.2 percent o f population in 1999. This
52 Civil servants are defined as those public employees carrying out public services o f a primary and continuous nature. They enjoy constitutional protections which effectively provide a lifetime job guarantee. Contracted personnel in theory are employed to fill temporary needs (typically unfilled civi l service positions), and are hired on one-year, renewable contracts. In practice, Turkey’s courts have ruled that they enjoy all benefits and protections o f c iv i l servants. Public workers have a contract but do not occupy a c iv i l service position. They do not enjoy the same job protections as the other categories but, unlike c iv i l servants, they are both allowed collective bargaining and have a right to strike.
73

i s somewhat above the scale o f public employment in other emerging economies such as Chile, Korea, and Mexico. However, i t i s below the figures seen in other Eastern European and Central Asian countries-including new EU members (Figure 2.14a). Excessive employment in the public sector does not thus seem to be the main reason for the relatively large wage bill by international comparison.
2
2 5
1 5
1
0 5
0
Figure 2.14: Employment and average wage cost in the public sector
3 1 -.... ..-.... ___ -.
2.3 2.2
Figure 2 14a Central Government employment (excluding Defense and security) in percent of population - 1999
0.7 -- 0.68 -- 066 -- 0.64 -- 0.62 -- 0.6 -- 0.58 -- 0.56 -- 0.54 -- 0.52 r 0.5
1 Russia Bulgaria Poland Romnia Turkey Chile Korea Mace 1
Figure 2 14b Average persoml compensation incentral government as a rabotopercapitaGDP (1997-2000forallcountnes ard2001-04forTurkey)
. . . 1 3 5 T 3 0 I
I I 2 5
2 0 1 5
1 0
0 5
0 0
I
Public sector employment i s not oversized.. .
2.8 --(left axis) 2.7 -- Average compensa6on/
w n agricultural GDP per employee (right a is)
2.6 2.5
-- --
... and has been growing faster than per capita income..
2.33 Average compensation of Central
... but average compensation i s high by international standards.. .
Figure 2 14d Average COmpeWabOn in consolidated budget agemies and CPI iflation (1998-2004, inpercent)
90 ,..T .\ n Averaae compensation T 15
c -16 1998 1999 2000 2001 2002 2003 2004
... because nominal compensation increases have by far exceeded inflation
Government employees is high by international comparison and has grown fast in recent years. High average compensation has been the main factor driving up the wage bill and largely accounts for differences with comparator countries. Indeed, the average wage in consolidated budget agencies in Turkey was in 1997-2000 2.6 times higher than per capita GDP. This ratio was the second highest among the group o f comparators for which similar data are available (Figure 2.14b). At the same time, since 2000, average compensation in consolidated budget agencies has grown faster than various measures o f per capita income for the economy as a whole. Average compensation has thus increased to 2.9 times of per capita GDP in 2001-2004 (Figure 2 . 1 4 ~ ) . ~ ~ Measured as a percentage o f
53 In this calculation, per capita GDP and compensation are measured in constant 1987 prices. A similar picture emerges from nominal GDP and compensation figures, w i th the rat io of average wage to per capita GDP increasing f rom 2.8 in 2000 t o 3.4 in 2004.
74

GDP per worker in the non agricultural sector, average compensation has followed a very similar path, increasing from 54 percent in 1997 to 68 percent in 2004. Fast growth in average compensation has occurred despite the government's pol icy o f restricting nominal compensation in the public sector so as not to exceed the annual change in the CPI. Further to large, offsetting fluctuations in 1999-2001, real average compensation surged by more than 6 percent in 2002 and by close to 10 percent in 2003 and 2004, as nominal increases by far surpassed CPI inflation (Figure 2.14d).
remained constant at i t s average level in
budget agencies would have fallen to around 1999-2000, the wage bill o f consolidated
7.6 percent o f GDP in 2004-that is, about 1 percentage point lower than i t s actual level
Figure2 15 Wage bill inconsolidated budgetagewies-actualard aHerMbvesceMrio(i999-2004,in0/~ofGDP)
9 5 __.________-_________ _. __ . _-__.
9 - \\ Actual 8 5 %\ *
0 9% ..---
-... '\\ \\ p /+-- ---_1...__
*-%
75
increases in the public sector would thus create significant scope for savings in the
I Constant rabo of average wage to pc GDP at 1999R000 level

2.35 The compensation system is dominated by a multitude of side benefits. In 2004, about 32 percent o f personnel compensation in consolidated budget agencies was
40 38.- 36 34 32 30 28 26 24 22 20
composed o f various allowances, compensations, and rewards on top o f the basic salary of employees. Moreover, overtime pay represented 6.5 percent o f total compensation. While wages are calculated on a transparent basis (driven by a combination of grade and years in service), allowances and overtime pay seem complicated, seemingly offering substantial opportunities for discretion. Allowances and other rewards
- - 8 *---A
- - --
-. 5 \.----
-- --
-- rewards, 3 -- --
Compensabons,
allowances
-. --
-- 2
-- 1
7 r o --
have been somewhat reduced in 2003 and 2004, by about 4 percentage points o f total pay (Figure 2.16).’Overtime pay has been on an upward trend since 1997, but has been stabilized in the past two years. Overtime pay (0.5 percent o f GDP) i s a more expensive form o f compensation in the c iv i l service and would need to be reduced more aggressively to contain pressures on the wage bill. This would cal l for an appropriate redefinition o f basic c iv i l service obligations.
2.36 Many allowances are exempt from the income tax. Examples include “horizontal” allowances, such as those for representation; foreign service; housing; university allowance; or allowance for .knowledge o f foreign language. Several allowances for specific duties and overtime payments are also exempt f rom the income tax. Although a precise breakdown o f the amount o f non taxable allowances i s not available, in view o f the substantial size o f allowances and overtime pay (3.3 percent o f GDP for consolidated budget agencies), their cost in terms o f foregone tax revenue i s l ikely to be significant. Assuming that 70 percent o f allowances and overtime pay are non taxable, and based on a 20 percent effective marginal tax rate, foregone tax revenue could be around 0.5 percent of GDP.
2.37 Sizable side benefits reduce transparency and may be distorting incentives in the civil service compensation system. The share o f allowances i s disproportionately large for the highest grades. For the highest grade o f c iv i l servants, wages (including basic seniority and indicator salary plus side payment) account for only 15 percent of total compensation. For the lowest grade, wages typically account for about 75 percent o f compensation. The exceedingly high role o f allowances among the highest grades i s cause for concern for transparency and incentives in the c iv i l service, and warrants further analysis. Moreover, as allowances represent a much larger share o f income for higher-grade civ i l servants, exemptions f rom the income tax are detrimental to vertical taxpayer equity. One plausible hypothesis i s that these more discretionary forms of pay are the means via which Turkey achieves de facto decompression o f what i s otherwise an excessively compressed set o f pay differentials between more and less skilled c iv i l servants. But further detailed analysis o f opportunities for modernizing the ru les governing civ i l service pay-and any related opportunities for budgetary savings-is warranted.
76

2.38 Towards performance-oriented pay and civil service reform. The Government i s considering plans for c iv i l service reform to address some o f the deficiencies o f the existing system. The reform aims to reduce the complexity o f the system, improve transparency and incentives in the c iv i l system, and remove horizontal and vertical inequities arising from non taxable allowances. Achieving decompression in compensation scales w i l l have to be an important part o f c iv i l service pay reform.54 Without decompression, taxation o f allowances would reduce pay differentials and may have unintended effects on incentives. At the same time, decompression o f earnings would be necessary to respond to the need to attract highly qualified c iv i l servants to support the EU negotiation and accession process. Civ i l service reform would also need to address issues related to the deployment o f a number o f public employees to the special provincial administration as a result o f the recent reform. The majority o f those employees are s t i l l associated with the consolidated budget in terms o f their status and wages, even though centrally determined compensation i s often not directly related to their performance, and does not reflect differences in regional l iv ing standards.
B.2. The Public Investment Program
2.39 Public Investment was cut significantly as part of the fiscal adjustment efforts during 2001-2004. Total public investment level (inclusive o f local administrations and SOEs investment), stood at 4.7 percent o f GNP in 2004, down from 6.8 percent in 2000 (Figure 2.17). In 2001-2002, fiscal adjustment fe l l primarily on public investment by SEEs while investment by the consolidated budget increased. In 2003-2004 however, the cut was predominantly from the investment budgets o f both the consolidated budget agencies and SEEs.
Qure 2.17. Public Investment - Institutional Breakdown of AMwI Investments . _ ~ _ _
7 6
E 5 < ;4 1'-3
2 1 0
1999 2000 2001 2002 2003 2004 2005
1 QCons Budget .SEES ProvuK-e Bank 0 Lmal Adm
I Revohmg Funds 0 SE Sec Adm W Funds
2.40 priority projects.
I n the past the investment program seems to have been overloaded with low- Unclear criteria and processing rules had resulted in many more
j4 Adequate data does not exist to assess the compression o f wage scales in civ i l service in international comparison. While the distribution o f wages can be assessed by grade for basic pay, similar information i s not available for allowances and other side benefits.
77

projects being “pushed” into the PIP than there i s funding for. As a result, the stock o f approved but unfinished projects grew to an average o f more than 5,000 during the latter half o f the 1990’s, and the average completion time increased to about 10 years. Many projects received “trace” allocations, i.e. amounts nowhere near enough to implement the project, but assigned merely to keep it in the PIP. While in 2001, one-third o f the projects wi th trace allocations were in the health sector, agriculture and education and other social sectors also had a sizeable share in the stock of these “inactive” projects”. Similarly, many projects had stayed in the program, and remained unfinished, for 30 years or longer.
2.41 Rationalization of the PIP in 2001 has been quite effective, In 2001, the government initiated a rationalization process, with support f rom the Bank, in order to allocate the reduced amounts o f appropriation and improve the average project completion time (Table 2.5). The SPO rationalized the investment portfolio by eliminating about 1000 projects in the 2001 program consisting mostly o f transport, energy and agriculture projects and by reducing the number o f multi-year projects. In addition, the program included new feasibility studies for some projects. As a result the total cost o f projects in the PIP was reduced and average completion time was cut by 32 percent.
2.42 Rationalization efforts continued in 2002-2005. The total number o f projects declined from 5239 in 2001 to 2627 in 2005. While the average completion times (based on actual annual investment spending) are higher in 2003 and 2004, this reflected more the decline in the budgetary allocation, than the composition o f the portfolio. Energy and transportation investments were hit the hardest, since joint ly they constitute about 40-50 percent o f total public sector investments.
Table2.5: Public Sector Investment, 1996-2005 I/ (current prices, trillion TL)
Actual Actual Investment Average Time of Average Time of New Projects Number Total
Investment 21 (in Z of GNP) Completion 31 Completion 51 Projects Projects Total Multiyear
of Value of
1997 5332 16,597 1,298 4.4 10.7 8.1 1428 577 1998 5556 34,084 2,378 4.4 10.4 9.3 1,574 714
4.7 10.2 9.9 1,186 305 1999 5458 57,126 3,649 8.7 1,176 249 2000 5321 86,219 6,183 4.9 9.2
7,570 4.3 12.5 11.8 1,234 286 2001 41 5047 142,919 2002 4414 166,797 12,223 4.4 8.5 7.2 1,066 128
2.9 7.6 9.7 1,032 134 2003 3851 187,110 10,386 2004 3555 196,113 11,625 2.7 8.1 8.6 1,079 149 2003 2627 206,684 15,875 3.3 6.6 985 137
1/ Excludes local adnlinistrations. 21 2004 figure i s provisional. 2GQ5 figure i s program projection.
3/ Average time of conqletion i s calculated as the annun1 of tinlc requued to finish up the remaining stock completely,
assuming that no other projects me taken into the investment program in t k following years and an appropriation and
expenditure is nude of the nugnitude of the current year level.
41 Includes supplementary budget allocation o f n 280 trillion and TL 555 tril l ion from Law 3418 revenues.
51 Based on actual investnlcnt.
78

2.43 The brunt of adjustment was borne by investment in infrastructure. Table 2.6 gives the annual investment spending for public sector excluding local administrations for the period 1999-2005. The annual allocations for infrastructure investment came down f rom above 3 percent of GNP in 1999-2000 to below 2 percent in 2004. This was the main source o f adjustment in public investment program, although education investments also declined. As a result o f adjustment, trace allocation projects accounted on average for about 10 percent o f total value o f projects in 2003-04, a significant rise f rom the 1999-2000 average o f only 3 percent.
TabIe2.6. Annual Investment Spending (% of GNP) I /
1999 2000 2001 2002 2003 2004 20052/
Economic Infrastructure 3.1 3.4 2.6 3.2 1.8 1.7 1.9 Water Resources-Irrigation 0.3 0.4 0.3 0.4 0.2 0.2 0.1 Energy 0.9 0.9 0.8 1.3 0.7 0.5 0.6 Transport and Communication 1.7 1.8 1.2 1.2 0.6 0.9 1.1 Drinkable Water,Sanitation 0.3 0.3 0.3 0.2 0.2 0.1 0.2
Social Infrastructure 0.9 0.8 0.9 0.6 0.7 0.5 0.7 Education 0.7 0.6 0.7 0.4 0.5 0.4 0.4 Health 0.2 0.2 0.3 0.2 0.2 0.2 0.2
Economic Sector 0.3 0.4 0.4 0.3 0.2 0.3 0.5 Others 0.3 0.4 0.3 0.3 0.2 0.2 0.2 TOTAL 4.6 4.9 4.3 4.4 2.9 2.7 3.3 1/ Excluding local administrations 2/ Budget allocation. Source: SPO
2.44 Public investment is geared more towards general public services, public order and safety and infrastructure, but may need to further increase in education. The composition of CGG gross fixed capital formation by function reveals that public investment allocations in Turkey differ somewhat f rom the group o f comparators (Figure 2.18).55 As a percentage o f GDP, public investment in Turkey exceeds the average o f comparators for the provision o f public goods (general public services, defense and public order and safety) and infrastructure services (included in economic affairs). I t also marginally exceeds that o f comparators in education.
1.6
1.4
1.2
1.0
0.8
0.6
0.4
0.2
0.0
Figure 2.18: Gross Capital Formation by Function-Turkey (2004) and comparators (2003). in % of GDP
_ _
BAverage of 11 comparators OTurkey 110
0 49
General public Economic affairs Housing and Edwation Other swial services, Defense, community
Public order and amenities, Environmental
protection safety
sectors
55 Due to limited data availability on functional breakdown o f investment spending, only the following countries have been included in the sample: Ireland, the Netherlands, Greece, Spain, Portugal, Sweden, Finland, Czech Republic, Belgium, Austria, South Africa.
79

However, in view o f the need to rapidly fill Turkey’s gap in educational attainment, public investment allocations in education may need to be significantly enhanced, by reconsidering priorities in the public investment program in areas that may be s t i l l oversized. Investment for environmental protection remains negligible and may need to increase soon to levels comparable with benchmark countries (Figure 2.18).
2.45 The apparently large share of infrastructure investment mirrors what is observed in other countries. The share o f annual investment spending for infrastructure in total investment spending (slightly above 60 percent in 2003-04) i s similar to those in comparator countries. I t i s very similar to what was observed for infrastructure public investment in Latin America countries particularly during the 1980s, before the introduction o f major private participation in infrastructure services but - most importantly - before major fiscal adjustments were ~ n d e r t a k e n . ~ ~ The private sector could be more actively involved in the financing o f infrastructure in Turkey, wi th careful design o f Government commitments to private operators to minimize the risk o f contingent liabilities.
2.46 Appropriate allocations for operation and maintenance of public capital need to be ensured. This i s an important requirement not only for improving the quality o f services, but also for restricting the cost o f the projects. Whilst the investment budget i s under SPO oversight, maintenance expenditures below a certain threshold, as defined in annual budget laws, are recorded in the current budget, in the “purchases o f goods and services” line. Total maintenance expenditures including this l ine item, declined from 0.4 percent of GNP in 2000-2001 to 0.2 percent in 2003-0457. Appropriation for maintenance expenditures declined particularly for transportation sector as well as for education and health sectors. Such reductions in O&M expenses should be avoided since they are not sustainable while they reduce the contribution o f public capital to efficiency and
2.47 Inappropriate maintenance and accelerated decay of capital goods may unduly burden the investment program in the future. The existing structure of budget preparation-with separate guidelines for current and investment expenditures-poses a risk o f misallocation o f resources. Agencies may not necessarily strategically allocate resources between investing in new assets and maintenance o f existing assets. The
56 That was the case o f Argentina, Brazil and Bolivia. For details, refer to Easterly and Serven (2003). 57 The total maintenance expenditure i s estimated as the sum of the small amounts o f expenditure recorded in the recurrent budget and the expenditure that i s part o f the investment budget. There i s a potential drawback for using the latter series. I t i s obtained by extracting from the investment program database those projects having as part o f i t s title or characteristics, words like maintenance, repair, renovation. However, other projects that do involve a maintenance component are not picked up b y this method if the names or characteristics specified in the database do not involve the relevant words. General Directorate of State Highways i s reported to have many projects involving maintenance work. As more reliable and refined data becomes available, the data could be updated. ’* Evidence of lower than expected capacity utilization and shorter than planed economic l i f e o f some projects points to problematic maintenance, especially in the road network, where indicators o f physical condition point to deteriorating quality-see chapter 7 (Figure 7.3). However, the relative roles o f inadequate budget allocations and lack of appropriate incentives/culture for maintenance seems difficult to establish.
80

importance of timely maintenance i s more prominent in the infrastructure sector and thus proper accounting o f the actual amounts spent for maintenance i s needed. For example, for a road wi th a 20-year life, GD o f State Highways (KGM) research shows that if maintenance i s not done at the end o f the 12th year, the road would start deteriorating at a rate 8 times faster than in the f i rs t years o f i t s lifetime. This, in practical terms, means that i f the cost o f capital i s the same for maintenance as i t i s for investing in new roads, undertaking investment for rebuilding an existing road i s up to 2.5 times more expensive than providing timely maintenance.
2.48 The quality of infrastructure needs to be improved. While the size o f the investment portfol io in infrastructure sector may not be l ow with respect to selected comparators, the existing quality i s perceived to be poor b y investors. This reflects gaps in infrastructure that w i l l need to be f i l led in the future, but may also reflect inadequate maintenance and inefficient operation. Chapter 7 further elaborates on these issues- especially regulatory reform in infrastructure services that can play a significant part in improving efficiency. As the total value o f infrastructure projects in the investment program adds up to over 80 percent o f total public investment i t deserves particular attention, especially because future growth w i l l depend on the quality o f Turkey’s infrastructure.
2.49 Expenditure pressures in investment will only rise further as alignment with the EU accelerates. Although the government recognizes these infrastructure needs and further states in the Preliminary National Development Plan that improving infrastructure services i s not only a strategic priority unto itself but also a key element for achieving sustainable growth and better quality o f life, much needs to be done towards faster convergence with EU. When additional investment requirements are taken in to account, for example for alignment wi th the environmental acquis, effectiveness o f investment spending and better project selection and monitoring w i l l be even more urgently needed. In the 2005 annual investment program guidelines, the government has committed to further reducing the average completion time, which i s one o f the available indicators o f the quality o f the PIP, from an estimated 6.6 years in 2005 to 5 years in 2006, an almost 25 percent reduction. The reduction in completion times alone does not certainly ensure the rationalization o f the PIP. Structural measures are bound to complement the rationalization o f the investment stock, by enhancing management o f the public investments.
2.50 There are several potential measures towards reaching a more effective investment program. In the recent past, volatility o f annual investment allocations has hampered implementation in line with strategic priorities, total costs and average completion times o f projects. A prerequisite to achieve stable and foreseeable annual allocations i s macroeconomic stability and sustained fiscal discipline. This i s needed to better link the resource allocation process and actual investment needs. In addition, in order to close the quality gap in infrastructure described above, and improve the quality o f i t s investments, Turkey further needs to (i) effectively utilize the newly introduced medium-term expenditure framework; (ii) as part o f the ongoing introduction of performance based budgeting, strengthen the consistency o f investment and recurrent
81
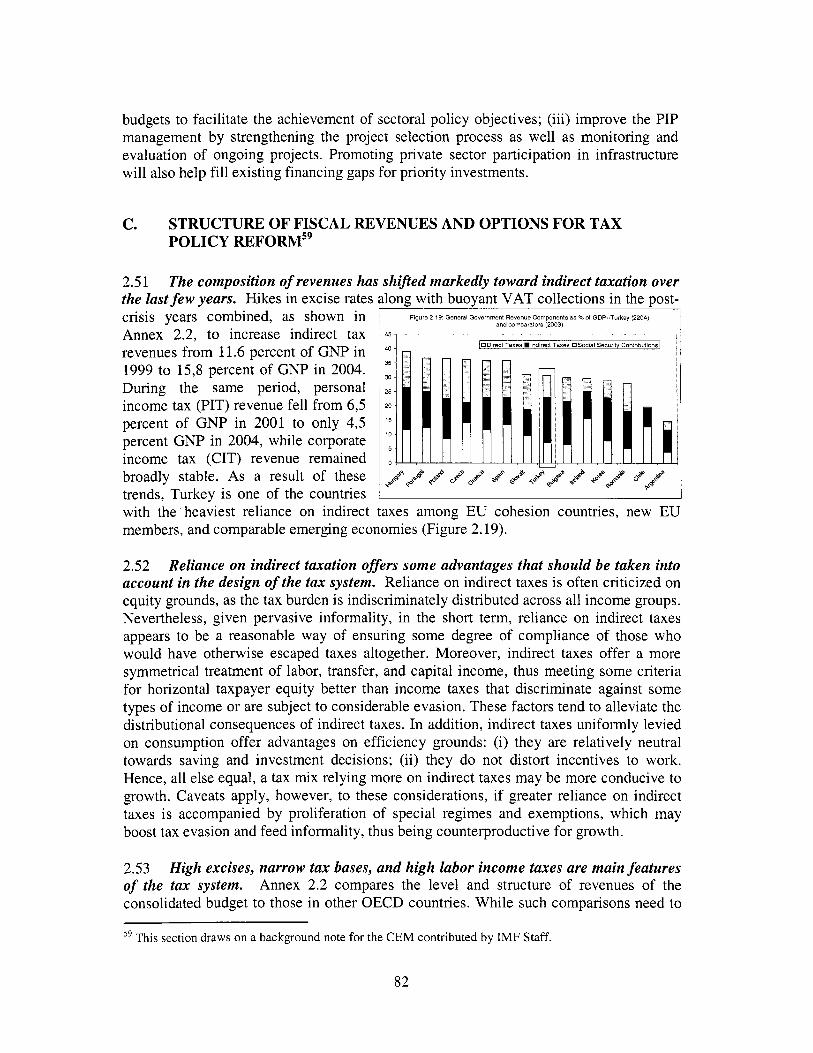
budgets to facilitate the achievement o f sectoral policy objectives; (iii) improve the PIP management by strengthening the project selection process as well as monitoring and evaluation o f ongoing projects. Promoting private sector participation in infrastructure w i l l also help fill existing financing gaps for priority investments.
C. STRUCTURE OF FISCAL REVENUES AND OPTIONS FOR TAX POLICY REFORMs9
crisis years combined, as shown in Annex 2.2, to increase indirect tax revenues f rom 11.6 percent o f GNP in 1999 to 15,8 percent of GNP in 2004. During the same period, personal income tax (PIT) revenue f e l l f rom 6,5 percent o f GNP in 2001 to only 4,5 percent GNP in 2004, while corporate income tax (CIT) revenue remained broadly stable. As a result o f these trends, Turkey i s one o f the countries with the ' heaviest reliance on indirect
2.5 1 The composition of revenues has shifted markedly toward indirect taxation over the last few years. Hikes in excise rates along with buoyant VAT collections in the post-
Figure 2 19 General Oovernmenl Revenue Components ss % 01 GDP-Turkey (2204) and comparators (2003)
. .
[ODirecl Taxes Indirect Taxes OSooial Security Contributions [
35
30
25
20
15
10
5
0
taxes among EU cohesion countries, new EU - members, and comparable emerging economies (Figure 2.19).
2.52 Reliance on indirect taxation offers some advantages that should be taken into account in the design of the tax system. Reliance on indirect taxes i s often criticized on equity grounds, as the tax burden is indiscriminately distributed across al l income groups. Nevertheless, given pervasive informality, in the short term, reliance on indirect taxes appears to be a reasonable way o f ensuring some degree o f compliance o f those who would have otherwise escaped taxes altogether. Moreover, indirect taxes offer a more symmetrical treatment o f labor, transfer, and capital income, thus meeting some criteria for horizontal taxpayer equity better than income taxes that discriminate against some types o f income or are subject to considerable evasion. These factors tend to alleviate the distributional consequences o f indirect taxes. In addition, indirect taxes uniformly levied on consumption offer advantages on efficiency grounds: (i) they are relatively neutral towards saving and investment decisions; (ii) they do not distort incentives to work. Hence, al l else equal, a tax m i x relying more on indirect taxes may be more conducive to growth. Caveats apply, however, to these considerations, if greater reliance on indirect taxes i s accompanied by proliferation o f special regimes and exemptions, which may boost tax evasion and feed informality, thus being counterproductive for growth.
2.53 High excises, narrow tax bases, and high labor income taxes are main features of the tax system. Annex 2.2 compares the level and structure o f revenues o f the consolidated budget to those in other OECD countries. Whi le such comparisons need to
59 This section draws on a background note for the CEM contributed by IMF Staff.
82

be interpreted with care, three features o f the tax structure in Turkey are especially noteworthy:
0 A very heavy reliance on excises, which account for nearly one-third o f a l l tax receipts and raise at least twice as much, relative to GDP, as in any other country in the sample.60 Heavy reliance on excises i s o f concern as i t may encourage activity in the informal sector, which would further undermine the tax bases and impede efficiency for the economy as a whole. Reducing this high level o f excise taxation does not appear, however, to be seen as a priority: the 2005 budget included several excise increases (of which only the increase in Special Consumption Tax was implemented during the year) in order to attain the primary surplus target while meeting spending needs.
0 Low receipts from, and reliance on, income taxation. Although the PIT yield in percent o f GDP i s significantly lower than the OECD average, the top marginal rate was a substantial 40 percent in 2005 for non-wage earners (planned to be reduced to 35 percent in 2006). One reason for this pattern may be the existence o f a large informal sector. Similarly, Corporate Income Tax (CIT) revenues are somewhat lower than the OECD average, despite the fact that the C I T rate in 2004 was a substantial 33 percent (though reduced in 2005 to 30 percent). This indicates that the base o f the tax i s narrow, owing to substantial tax expenditures as further discussed below.
A high tax wedge on labor income. When the PIT, employer and employee social security contributions, and the stamp duty on wages are combined, total payments to the government out o f labor income can approach 43 percent o f the gross wage for some workers (see chapter 4). Indeed, according to the OECD’s Taxing Wages study, Turkey emerges as the country wi th the highest labor tax wedge for the married “average production worker” with a non-working spouse and two children. The implications o f high labor income taxation for employment generation are further discussed in chapter 4.
2.54 Reducing the burden of indirect taxes would call for careful study and long- tern design. Although the balance between direct and indirect taxation in Turkey i s considerably out o f line with that in comparator countries, options are l imi ted in the short to medium term because revenue cuts in one area must-given the continued macroeconomic need to achieve large primary surpluses-be offset by gains in another. I f excises and VAT collections are cut, then income taxes w i l l l ikely need to be raised. However, such a substitution o f direct for indirect taxes would not be advisable in view o f the above-mentioned considerations regarding the efficiency benefits o f indirect taxes and their equity-improving incidence when significant informality i s present, as in the case o f Turkey. Appropriate fiscal space for lower indirect taxation w i l l thus have to be created over the long term. Fiscal space could come f rom three main sources: (i) Continuous fiscal discipline to reduce the level o f the debt ratio and create room for a
6o This appears to mainly reflect high rates on ‘traditional’ excisable goods: around half i s from petroleum products alone-indeed, at ‘about $8/gallon, pump prices for gasoline are about the highest in Europe. In addition, the taxes on “luxury goods” raise revenue o f about 0.1 percent o f GDP.
83

lower primary surplus in percent o f GDP; (ii) better control of primary expenditures in low-value programs; (iii) tax base broadening and reduction in the size o f the informal sector. The analysis that follows presents options for income tax reform with the aim o f improving efficiency and broadening the tax base. Eventually, these initiatives w i l l also facilitate a shift in the balance o f the tax burden between direct and indirect taxation.
2.55 The tax landscape is changing fast. The authorities are currently in the process of reviewing and rewriting each o f their major tax laws, also fol lowing commitments taken in the last Stand-By Arrangement with the IMF. The authorities eliminated stamp duties on financial transactions in 2004, and in April 2005 announced their intention to eliminate the two remaining financial intermediation taxes-the Banking and Insurance Transaction Tax (BITT) in 2006 and Resource Utilization Support Fund (RUSF) within the program period. A new regime for capital income taxation w i l l subject interest and capital gains, including on previously exempt government securities, to final withholding at 15 percent. This w i l l move Turkey closer to an explicit “dual income tax” (DIT) model o f the sort employed in the Nordic countries. Labor w i l l remain subject to progressive taxation, while capital income w i l l be subject to a flat and relatively modest rate-in recognition o f the futility o f trying to tax a highly mobile base l ike capital.
2.56 The 2006 budget and drafl legislation to amend the existing PIT and CZT laws incorporate significant reforms of the Corporate Income Tax and the Personal Income Tax. They include: (i) a reduction of the CIT rate f rom 30 to 20 percent, with a parallel elimination o f the Investment Tax Allowance (ITA); and, (ii) a reduction o f the top personal income tax rate f rom 40 to 35 percent for non-wage earners, accompanied by a reduction in the number o f tax brackets from 5 to 4 and a unification o f the tax regimes for wage and non-wage income.61 As a result o f tax base broadening, due to the elimination o f the ITA, ongoing tax administration reforms, and broader strengthening o f the CIT code (regarding, for example, transfer pricing and thin capitalization), the Government does not expect a significant impact o f these measures on C I T collections, and stands ready to take offsetting expenditure measures i f necessary to keep the primary surplus on target. The C I T tax reforms have the potential to promote investment on a sound basis and stimulate j o b creation, especially in the formal sector. The PIT reform w i l l improve the efficiency o f the tax system, as the dual tax system for wages and non wage income created complication and incentives for income recharacterization, and was unduly generous to highly paid wage earners. Unifying the rate schedules i s consistent with movement towards a Dual Income Tax system. PIT and C I T reforms could be complemented with measures outlined below.
C.l. Reform Priorities for the Personal Income T a x
2.57 Turkey operates a system where taxpayers may claim tax credit for certain kinds o f expenditures (such as
The consumption credit (CC) has outlived its purposes.
‘’ By the new reform, i t i s also planned to reduce the lowest tax rate for income components other than wages from 20 percent to 15. The highest and the lowest tax rates on wages w i l l be maintained at 35 percent and 15 percent respectively, thus effectively unifying the two tax schedules.
84

certain types o f food, health, education, rent, and clothing) on the basis o f receipts issued by enterprises liable for the VAT. Different rules for the calculation o f the tax credit apply to different types o f taxpayers (wage earners, non-wage incomes, pensioners). The purpose o f the CC i s twofold: to strengthen VAT compliance, and to support the consumption o f certain goods l ikely to be o f particular importance in the budgets o f the less well-off. I t seems doubtful that the CC has greatly strengthened the VAT. Tax auditors typically do not actively use the submitted receipts to audit VAT compliance, while the system creates an incentive to issue false invoices, posing further difficulties for tax administration. The CC also imposes additional and unusual costs o f compliance on employers-not only in collecting invoices but, perhaps even more burdensome, in adjusting withholding-and requires that taxpayers go to the trouble of storing invoices for many small purchases.
2.58 The equity rationale for the credit is also questionable: i t does not favor the less well-off but rather i t favors all those who buy the particular commodities for which the credit i s available. Those who gain most, in terms o f a reduced PIT bill, are those with the highest level o f consumption-who w i l l tend to be the better off.
2.59 involve:
0
0
There are better alternatives to the consumption credit. The two main options
A standard deduction (or allowance, or threshold), meaning some f ixed monetary amount that i s deducted from income before calculating tax liability; A (non-refundable) credit, meaning some f ixed monetary amount by which al l taxpayers’ liability schedule would be reduced (with no refund paid when f inal tax so calculated i s negative).
A key feature o f both approaches i s that they exclude some minimum level o f income from PIT, as against the current system in Turkey, which subjects the very f i r s t l i ra of income to taxation. In this sense, both are more pro-poor than the CC.62
2.60 Turkey’s P I T is unusual in providing no explicit tax reduction for dependents. In Turkey the PIT i s levied on a personal basis. Most PITS provide an explicit tax reduction for those with dependent spouse and children, on the equity argument that their presence reduces ability to pay. Turkey, unlike most other countries, does not offer any general deduction or credit for dependents, although a tax credit exists for some categories o f workers. As a result, the tax wedge for the married “average production worker” wi th a non-working spouse and two children i s amongst the highest in the OECD zone.
2.61 Elimination of the consumption credit should go in tandem with the introduction of some explicit reduction for spouse and children. The question arises as to whether the additional credit for the spouse should be available only i f the spouse does not work. On equity grounds, one could argue that this should be the case. On efficiency grounds, however, withdrawal o f the additional credit would imply an undesirable
62 For a given progressive rate schedule, a deduction i s worth more to those facing a higher marginal rate, whereas a credit has the same value to all. For this reason, a credit i s generally regarded as more progressive than a deduction.
85

disincentive for secondary workers to enter the labor market-since the net income gained by doing so would be reduced by withdrawal o f the credit, making part-time work, in particular, potentially much less attractive. This would be unwelcome given Turkey’s very low labor force participation by women.
2.62 The tax treatment of pensions, a key aspect of any income tax, is extremely generous in Turkey. Social security contributions for o ld age (disability, and death), charged at different rates for different schemes, are fully deductible against PIT, up to caps that also appear to vary across schemes. Public pensions are PIT-exempt and pensioners also qualify for the C C scheme described above.63 Most countries treat pension saving in a way more generous than income taxation. The most common form o f treatment in OECD countries i s the so called “expenditure tax treatment” (EET), with contributions deductible but pensions-including any lump sum at retirement-fully taxed. In Turkey, however, not only are contributions deductible, at least up to some cap, but the return i s also exempted from tax. This goes beyond a standard exemption-it i s a substantial subsidy. In the case of private pensions in particular, it i s highly questionable why fiscal revenues should be foregone in order to encourage private pensions, to the benefit mainly o f the better off.
C.2. Reform Priorities for the Corporate Income Tax
2.63 Before the recent reform, the Corporate Income Tax rate was relatively high and the tax base was unduly narrow. At 30 percent, the statutory C I T rate in Turkey was quite high compared to levels in most new EU members. The ordinary depreciation allowances in Turkey do not stand out f rom those offered by other countries. But when accounting for the 40 percent ITA, the overall level o f allowances was quite generous in Turkey. Tax evasion from the sizeable informal economy, but also generous tax allowances, help explain why the ratio o f C I T revenue i s relatively modest in Turkey, despite the relatively high statutory tax rate.
2.64 0
The reduction in the CIT rate will bring about multiple benefits: I t w i l l align Turkey’s corporate tax regime with that o f new EU members, thus increasing Turkey’s attractiveness to FDI. A low and uniform “headline” C I T rate w i l l be attractive to investors seeking simplicity and stability. I t w i l l level the playing field, mitigating differences in effective tax rates across different assets, modes of finance, and levels o f firm profitability. Elimination o f the ITA, although i t could slightly reduce overall investment, since effective tax rates and the cost of capital could rise somewhat, i t would also eliminate low-yielding investments that are profitable for the private sector only
0
0
63 Regarding private pensions, which are a small but potentially important part of the market: (i) contributions are deductible subject to caps; (ii) with the reform o f capital income taxation on January 1, 2006 private pension funds wi l l be exempt; (iii) at retirement, if payments have been made for 10 years and the retirement age reached, 25 percent of the lump sum payment i s exempt, and the rest subject to a final 5 percent withholding tax.
86

because o f heavy tax subsidies. The reform w i l l therefore l ikely improve economic efficiency and boost Total Factor Productivity growth. Related to the previous point, the reform could eliminate current inducements to overly capital intensive methods of production and thus help promote employment generation. The cut in the statutory tax rate w i l l have the beneficial effect o f reducing the incentive for companies to shift taxable income out o f Turkey via transfer pricing and thin capitalization, just as i t would reduce the incentive for income-shifting f rom taxable to tax-exempt companies operating within Turkey.
0
0
2.65 Turkey has provided various tax incentives since the mid-1960s. There i s little sign that these have had much effect, as regional disparities remain unabated (chapter 1) and investment in targeted activities, such as R&D, remains below levels seen in comparators. The efficiency o f incentives may also have been hindered by pervasive macroeconomic instability in the past. The system has undergone considerable rationalization, but there are s t i l l incentives for investments in specific sectors or regions, described in Annex 2.3. A reduction in the statutory C I T rate w i l l reduce the need for (and effectiveness of) special incentives, while securing revenue in the face o f such a reduction would cal l for measures to widen the corporate tax base, not to reduce it. Policy should take advantage o f the l ikely presence o f instruments better targeted on the underlying objective for C I T incentives: supporting regional development, for example, by spending measures to improve infrastructure and the quality o f the workforce. Moreover, survey evidence stresses the importance that foreign investors, in particular, place on stability and predictability o f tax rules, as opposed to the availability o f incentives. Before sinking their funds in a long-term investment, they want to be sure o f how i t w i l l be taxed; and they are averse to the risk that competitors, entering the market later, w i l l benefit f rom incentives unavailable at the time o f their own investment. The form and extent o f permissible incentives i s in any event constrained by Turkey’s obligations to the WTO, OECD, and, prospectively, the EU regulations on state aid (see chapter 3).
Regional and sectoral incentives should be avoided.
2.66 Dividends should be incorporated into new regime for capital income taxation. Dividends are subject to withholding PIT at 10 percent. For those who file, half o f the dividend i s included in taxable income, with the tax withheld credited against the ultimate liability. Turkey thus applies a system o f double taxation o f dividends, since the underlying profit has already been taxed at the C I T rate. Towards the a im o f leveling the playing f ield for business activity, i t would be desirable to eliminate the double taxation o f dividends currently in place. This would put finance by new equity, so important to young f i rms, on an even footing wi th finance by retained earnings, which i s the typical source o f equity finance for older and more well-established firms.64 A f i rs t step in
64 Retained earnings are subject only to corporate income taxation. They entail an increase in company capitalization and since capital gains on long-term shareholdings are tax exempt, there i s virtually no double taxation of investment financed by retained earnings. On equity grounds, i t can be argued that eliminating the taxation o f dividend income accruing to shareholders would be detrimental to horizontal taxpayer equity. However, if double taxation o f dividends boosts capital gains by encouraging reinvestment o f earnings, i t also affects taxpayer equity to the extent capital gains accrue to wealthier taxpayers and are less taxed than personal income. In Turkey capital gains are untaxed.
87

dividend tax reform would be include dividends in the base for the new harmonized capital income tax to be launched in 2006, subjecting them to the same final flat 15 percent withholding tax as w i l l apply to interest income and certain capital gains.
2.67 Double taxation of dividends should be progressively phased out. For the longer term, Turkey might consider moving towards a more consistent Dual Income Tax, with the corporate income tax rate aligned with the capital income tax rate. I t would then seem natural to fully eliminate the double taxation o f dividends to achieve full tax neutrality between debt and equity finance. One way o f doing so would be to simply exempt dividend income, since the underlying profit has already been taxed at a C IT rate equal to the capital income tax rate. Thus dividends would be treated in parallel with (long-term) capital gains on shares, which are also exempt, eliminating the tax bias in favor o f retentions. Exempting dividends from tax would require, however, an effective broad- based corporation tax to ensure that the underlying profi t i s indeed taxed at the corporate level.
C.3. Tax Expenditures
2.68 Turkey has a complex and extensive range of tax provisions that could be classiJied as tax expenditures.65 There are some 290 tax provisions which are set forth in the laws and regulations pertaining to the PIT, CIT, Value Added Tax and Special Consumption Tax. Out of these 290 tax provisions, 186 provisions are potentially eligible as tax expenditures, defined as revenues foregone in the form o f tax incentives and other tax concessions.66 The most significant ones could be grouped in seven categories: (1) Free Zones; (2) Investment Incentives; ( 3 ) Financial instruments; (4) Regional employment incentives; (5) Agricultural sector support; (6) Social insurance and pension contributions; and (7) Assistance to low-income and disadvantaged persons. These categories are not exhaustive and sometimes overlap.
2.69 Establishing an adequate tax expenditure framework would promote fiscal accountability and transparency. Tax expenditures are a concern from the standpoint o f fiscal accountability and the transparency o f governance in tax expenditures. Establishing a tax expenditure framework to report these expenditures w i l l help bring the level o f scrutiny o f tax expenditure closer to that o f direct (cash) government expenditures, which i s desirable because tax expenditures have the near equivalent impact on public deficits. In Turkey, some tax expenditures are o f potentially broad scope, while multiple tax expenditures, which were created for a single objective, sometimes overlap. A systematic evaluation o f the effectiveness and efficiency in using these fiscal resources has yet to be completed, because o f gaps in the framework to estimate and to evaluate these tax expenditures. However, the Government i s undertalung steps towards better transparency
65 This section i s based on a recent Bank study on tax expenditures in Turkey, which w i l l be discussed more extensively in the upcoming PER. 66 See definitions in: OECD, “Best practice Guidelines-Off Budget and Tax expenditures”, Public Governance and territorial development Directorate, M a y 2004, Paris.
88

o f tax expenditures, as mandated by the PFMC law.67 The estimated potential cost o f tax expenditures in the 2006 budget i s YTL 8.3 bi l l ion (equivalent to 6.9 percent o f total primary expenditure). This estimation i s very preliminary as the coverage o f the eligible provisions in the tax code i s s t i l l partial, while i t also includes the cost o f the ITA that w i l l be phased out. Benefits o f establishing a comprehensive tax expenditure framework would include: (a) coordinating and monitoring the authorization procedures; (b) managing the estimates and projections o f costs o f tax expenditures; (c) evaluating the cost-benefit o f tax expenditures; (d) providing analyses and proposals to policymakers for prioritizing budget allocation (such as trade-offs between direct expenditures and tax expenditures); and (e) publishing the regulations, authorization procedures, beneficiaries, and analytical reports relating tax expenditures activities, to enhance transparency and better governance.
D. DEBT SUSTAINABILITY
D.l. Recent Developments in Public Debt Management
2.70 Debt dynamics considerably improved in the post-2001 period. Since the peak o f the crisis in 2001, when the net debt to GNP ratio was at the historical high o f 90.5, debt ratios have been falling steadily. As o f end-2004 the ratio had come down to 63.5 percent o f GNP, o f which 46 percentage points o f GNP was domestic debt (Table 2.7). Gross debt, as defined by the Turkish Treasury, which differs f rom the EU definition, declined from the record 2001 level o f 108 percent to 77 percent o f GNP in 2004. While the net debt-to-GNP figures are the most commonly used definition, the Maastricht criterion o f public debt i s defined in gross terms. Box 2.6 provides the latest estimates reported to the EU under fiscal notification required for al l candidate countries and describes the methodology used in these calculations. Turkey would benefit f rom further improving the implementation o f ESA 95 methodology in measuring and reporting public debt and deficit figures to promote tractability o f these figures towards meeting the Maastricht criteria.
15’ A list o f the tax expenditures for the four main categories o f taxes (CIT, PIT, VAT, SCT) was attached to the budget for the first time together with their projected amounts for the 2006-2008 period.
89

Total Public Sector Net Debt (I-II-III-IV) Net External Debt Stock Net Domestic Debt Stock
Table 2.7: Breakdown of Public Sector Debt Stock as defined by Turkish Treasury, 2001 vs 2004
(% of GNP) 2001 2004 63.5 % 17.5% 45.9%
1- Total Public Sector Debt Stock (Gross) A-Domestic Debt Central Government Rest of the Public Sector
B- External Debt Central Government Rest of the Public Sector
II- Central Bank Net Assets Net Foreign Assets Other Asset and Obligations (Net)
III- Public Sector Deposits Central Government Rest of the Public Sector
IV-Unemployment Insurance Fund Net Assets
Source: Treasury
90.5% 37.8% 52.8%
107.5% 71.1% 69.2%
1.9%
36.4% 31.6% 4.8%
12.9% -1.3% 14.3%
2.8% 0.7% 2.1%
1.2%
77.4% 54.5% 52.3%
2.2%
22.9% 21.5%
1.4%
6.5% 5.4% 1.1%
4.4% 2.4% 1.9%
3.1%
Box 2.6: ESA 95 Definition of the Change in General Government Gross Debt*
Starting in 2001, all candidate countries have been required to submit annual fiscal notifications to the European Commission as part o f the pre-accession fiscal surveillance procedure. The fiscal notification consists o f reports on the government deficit and debt levels in accordance with the EU legal and methodological principles. ESA 95 accounting and definitional requirements used for the fiscal surveillance o f EU member states are taken into account in calculations, to the extent possible. In effect, the aim for the candidate country notification tables i s to reconcile the national budget and the balance used in EU fiscal surveillance.
The debt level in a given year i s calculated by adding to previous year’s debt stock the change in general government consolidated gross debt. The change in gross debt i s in turn, derived as illustrated in the attached table, starting from net borrowingllending o f general government.
Calculation of the change in general government gross debt I. Net borrowindlending o f general government 11. Net acquisition offinancial assets
Currency and deposits Securities other than shares Loans Shares and other equity Other financial assets
Ill. Adjustments IV. Statistical Discrepancies V. Change in general government consolidated gross debt (I+II+III+IV)
The transposition from the national budget concept o f “net borrowingllending” into ESA95 requires a number of adjustments, including;
90

(9 the treatment of financial transactions - main change i s due to the appropriations for guarantee payment and expected privatization revenues
( i i ) the accounting of accrued receivables and payables such as revenues and interest payments (iii) institutional coverage - refers to adding the net borrowingllending o f other central
government bodies, namely extra-budgetary funds and revolving funds (iv) adjustments for other transactions - for example, the transfers related to the duty losses o f
state banks. Following these adjustments, central government net lendinglborrowing in ESA 95 standards i s reached. Adding to this balance the local government and social security institutions net borrowingllending, net borrowingllending o f general government (item I in the table) can be calculated.
(% o f GDP) Gross Debt
The biggest item in the “Net acquisition o f financial assets” category i s the loans to the Savings Deposit and Insurance Fund, especially in 2001 and 2003 figures. This i s the result of massive bank recapitalization-both state banks and private banks taken over by SDIF and more recently the cost o f additional loans to SDIF to cover the losses due to the failure o f Imar Bank. The “Adjustments” accounts for the changes in the value o f existing assets and loans, or foreign exchange fluctuations. Statistical discrepancies arise from the difference between financial and capital accounts.
200 1 2002 2003 2004 2005 (planned) 105.2 94.3 87.2 80.1 77.2
Source: The methodological explanation in this box draws on the European Commission Enlargement Papers No:25, August 2005 on “2005 fiscal notifications of acceding and candidate countries: overview and assessment” by DG for Economic and Financial Affairs.
2.7 1 Improved fundamentals have been the major drivers of the reduction in the debt ratio. While in the initial years o f reform fol lowing the 2001 crisis, the adjustment came mostly f rom inflation and the exchange rate movement, by 2004, economic growth and fiscal adjustment have started to dominate (Table 2.Q6’ An estimated two thirds o f the debt reduction (the total reduction due to al l items listed in Table 2.8 that counteract the interest payments) i s attributable to high growth and primary surplus in 2004. The reduction in the borrowing cost as reflected in the reduced interest payments as a share o f GNP and lengthening o f domestic borrowing maturities clearly played an important role in the reduction o f debt ratio. In 2001 and 2003, the most significant debt creating i tem was the issuance of recapitalization bonds for state banks and the SDIF banks. Although financial sector restructuring was wel l underway by 2003, the failure o f a medium sized private bank (Imar Bank) in mid-2003 was a setback. The estimated burden on the Treasury through payments to individual depositors was 1.9 percent o f GNP.
This analysis follows the methodology used in Turkey C E M (2003).
91

Table 2.8 Composition of the change in Debt/GNP, 1999-2004 I / 2001 2002 2003 2004
TOTAL debt 90.5 78.5 70.4 63.5
Change in debt 33.4 -12.0 -8.2 -6.9
Interest payments 21.8 16.7 15.9 11.9
Primary balance 5.1 4.1 6.1 6.8 Growth effect -3.9 4.6 3.6 5.8 Inflation effect 13.2 9.4 5.5 3.2 Revaluation effect -12.6 10.0 11.9 3.0 Seigniorage 1.1 1 .o 1.2 1.2 Other items (sum o f below) -18.1 -1.6 -1.8 -0.1
Privatization 1.9 0.3 0.1 0.4 Cost o f financial sector bailc -20.0 -1.9 -1.9 -0.5
Errors and discrepancy -3.5 -1.3 2.4 1.0 Source: Official data and own calculations. I/ With the exception of interest rates, items with a positive sign reduce the debt-to GNP ratio, while those with a negative sign increase it.
2.72 Cost of borrowing has been declining. The maturity of borrowing from domestic markets lengthened to almost 28 months in 2005, from 9 months in 2002 and about 15 months in 2004, while the cost of borrowing declined sharply, from 63 percent in 2002 to 46 percent in 2003 and 25 percent in 2004 and further to 16 percent in 2005.69 The fal l in the rates i s expected to continue in the next few years, albeit at a slower rate. In 2005, the parameters of domestic borrowing continue to improved further. The domestic debt rollover ratio came down from 93 percent in 2003 to 88 percent in 2004 and 89 percent in 2005, and i s expected to fal l to 77 percent in 2006. External borrowing indicators also improved, JP Morgan’s EMBI+ spread for Turkey fe l l below the overall EMBI+ index (Figure 2.20) starting at the end of 2003, although the gap narrowed in mid-2005. Increased creditworthiness of Turkish sovereign bonds and newly achieved stability of the domestic currency led to an increased appetite for lira-denominated bonds. Several international institutions, including IBRD, issued YTL denominated bonds in 2005. In the first quarter of 2005, the total issuance amounted to YTL3.9 billion.
2.73 The composition of public debt has also improved significantly as the foreign exchange and interest rate exposure of Turkey declined. The FX-linked part of the consolidated budget domestic debt stock, including floating rate notes, shrank from 42 percent in 2001 to below 20 percent in 2004 (Figure 2.21) of which almost half was in
69 Average interest rate on new domestic borrowing weighted by the amount o f issuance. The real cost of domestic borrowing, calculated by deflating the nominal rate by the inflation expectations for the next 12- months, dropped from about 30 percent in 2002-03 to about 14 percent in 2004 and further to about 9 percent in mid-2005.
92

floating rate.70'71 This was accompanied by an increase in the fixed-rate TL debt, reaching, at end-2004, 42 percent o f total domestic debt. As a result, the share o f total foreign exchange linked consolidated budget debt (including external debt) in total declined to 41.5 percent at end-2004 from 58 percent at end-2002.
50 46 0
!? 40 ROO -
6M) -
403-
30
5 20
I O
0 I O " ' ' ' " " " ' " ' " " " " " I " ' ' " ' " " "" " ' " " " ' " " I / I 2001 2004 J- A- J- 0- I. A- J- 0- I. A. J- 0- 1. A- J- 0- J- A- J- 01 01 01 01 02 02 02 02 03 03 03 03 04 01 01 01 05 OS 05 i 1 112 FX-unked W Floating rate (TL) 0 Flxed rate (TL)
~
2.74 Non-marketable debt stock is slowly phased out. The share o f non-cash debt in the total domestic debt stock fel l from 52 percent in 2001 to 26 percent in 2004. The decline reflects the maturing o f the non-marketable Treasury bonds that were issued for recapitalization o f the state banks and SDIF banks. However, this also represents increased vulnerability to market conditions since more debt i s now held by the market.
2.75 Debt management practices progressed considerably. The enactment of the law on Public Finance and Debt Management in March 2002 was a milestone in Turkey's move towards prudent debt and risk management. The law and the follow-up secondary regulations established the basis for a more effective management o f the government liability portfolio. A high-level Debt Management Committee was established to formulate policies for borrowing and debt management. The Middle Office (Deputy General Directorate within Treasury that i s in charge o f risk management) acts as the secretariat for the committee. The unit became fully operational at the beginning o f 2004 and continues to build capacity supported by the Bank. The middle office has been conducting public debt analysis and monitoring fiscal risks. As required by the relevant legislation, i t reports to the senior management and the Turlush Grand National Assembly as well as to the general public including lenders and investors, particularly through the quarterly public debt management reports, which has been a significant improvement in transparency o f liability management. The introduction o f quantitative benchmarks for direct debt (for instance, on the maturity and composition o f the debt) facilitated better analysis o f refinancing, currency and interest rate r isks.
2.76 The guarantee issuance mechanism has also been improved. The scope o f the limit imposed on Treasury guarantees since 1998, was extended to cover Build-Operate and BuiId-Operate-Transfer projects through the Public Finance and Debt Management
70 Consolidated budget domestic debt stock constituted, at end-2004,96 percent of the total public sector domestic debt stock.
The fixed vs. floating rate breakdown for FX-linked debt i s not available for 2001.
93

Law and risk-sharing was introduced by a communiqui that set a 95 percent guarantee ceiling. A r isk account was created to finance the obligations arising f rom guarantees. The revenues o f the risk account consist of a budgetary allocation along with the loan fees, guarantee fees, repayments made by institutions and interest earned on the balance o f the account.
2.77 Contingent liabilities continue to decline. Treasury guaranteed external debt stock came down to $5.2 bi l l ion (1.7 percent o f GNP) at end-2004 f rom $6.1 bi l l ion (4.2 percent) in 2001. This represented a decline in the share o f guaranteed debt in total external debt from above 5 percent to about 3 percent. As a result o f the improved debt and risk management practices and the overall improvement in the economy, the amounts o f guaranteed debt undertaken by the Treasury was also cut down to 0.1 percent in 2004, from a peak o f 0.9 percent o f GNP in 2001, while collections f rom receivables increased in 2004 and 2005. Treasury guaranteed debt stock decreased by about 30 percent f rom 2001 to mid-2005. The risk inherent in the energy projects did not materialize and there was no payment from the risk account for these projects.
D.2. Projected Debt Dynamics
2.78 Debt-to-GNP ratio is projected to decline further. In a base-case scenario, sound macroeconomic fundamentals w i l l lead to a further reduction in the debt ratio over the medium term.72 Table 2.9 below presents the debt projections for 2005-2008 based on a set o f macro projections broadly consistent wi th the government’s medium-tern program supported by an IMF stand-by. In the next three years, the primary surplus target i s kept at 6.5 percent o f GNP indicating the commitment to maintain the fiscal adjustment path and also to forestall pressures on the external current account (see chapter 1). The CPI inflation and nominal interest rate are expected to continue to decline, albeit at a slower pace. The model assumes about an annual 0.5 percentage points decline in the real interest rate during this period, reaching 8 percent in 2008, while the real exchange rate stays relatively stable. Following the strong growth performance in 2002-2004, growth rates are expected to stabilize at 5 percent, closer to the potential growth rate under the base-line scenario examined in chapter 1. As a result, in this baseline estimation, the net debt-to-GNP level continues to decline, falling below 60 percent in 2005 (74.5 percent in gross terms) and further below 50 percent in 2008 (60.2 percent in gross terms).
’’ In this exercise, IMF definition of the primary surplus and debt figures are used.
94

Table 2.9 Baseline Debt Projections
Domestic Debt Stock Domestic Interest Payments 2/ Dom Debt Amortization PSBR 31
Public Debt Forecasts (in % of GNP)
38.0 52.8 46.2 48.3 46.0 43.9 42.7 40.4 37.1 14.9 23.0 15.9 14.8 11.7 8.6 6.2 5.5 5.1 12.9 23.2 24.6 24.1 28.0 27.4 23.8 21.2 17.7 13.2 16.7 12.6 9.8 5.1 3.4 2.0 0.8 -0.2
CPI Inflation (%, DecDec) Real Interest Rate 11 Depreciation (DedDec)
GNP growth rate (%) Primary Balance (% of GNT’)
REER (DecDec)
39.0 68.5 29.7 18.4 9.3 8.0 5.0 4.0 4.0 -9.5 35.5 30.3 30.2 14.2 9.5 9.0 8.5 8.0 24.4 114.3 13.5 -14.6 -3.8 5.5 2.5 1.4 1.4
6.3 -9.5 7.9 5.9 9.9 5.0 5.0 5.0 5 .O 2.6 5.1 4.1 6.1 6.8 6.5 6.5 6.5 6.5
13.7 -23.6 10.9 34.6 10.4 -0.6 -0.5 -0.4 -0.4
TOTAL debt 59.9 56.7 52.8 48.0
Change in debt -3.5 -3.2 -4.0 -4.8
Interest payments 9.9 8.6 7.4 6.3
Primary balance 6.5 6.5 6.5 6.5 Growth effect 2.8 2.7 2.6 2.4 Inflation effect 2.8 1.7 1.4 1.3 Revaluation effect 0.7 0.6 0.6 0.5
Other items (privatization) 0.4 0.4 0.4 0.4 Seigniorage 1.3 0.9 1 .o 1.1
Errors and discrepancy 1.0 1.1 1.1 1.1
Source: Official data and own calculations.
73 The reduction in debt-to-GNP ratio seems to be getting bigger after 2006; however, this reflects the increased relative contribution of the primary surplus (since primary surplus target i s kept at 6.5 percent o f GNP) to debt reduction.
95

D.3. Analysis of Risks
2.80 Debt levels are still high with respect to EU members and candidates. In 2004, Turkey’s significantly reduced gross debt level, at 80 percent, as defined in ESA 95, was much higher than all o f the new member states (EU-10) which are below the 60 percent threshold and the EU-15 average.74 In addition, although much improved debt dynamics and sound fiscal performance have contributed to mitigating r isks in the last few years, the Maastricht criteria may not be strong enough to ensure a sound fiscal framework in the face o f Turkey’s vulnerabilities: First, the sustainability of a given debt-to-GDP ratio depends not only on i t s level, but also on the composition of the public debt portfolio, in particular with regard to maturity. Despite recent improvements, the average maturity o f Turkey’s public debt remains much lower compared to EU-8, and especially EU-15 countries, making refinancing more challenging, but also posing important liquidity r isks that should be hedged by a lower debt ratio. Second, Turkey’s public debt ratio remains higher than in other comparable emerging economies, with a similar or slightly higher sovereign debt ranking. On average, the debt-to-GDP ratio o f these comparators i s below the Maastricht benchmark.75
2.81 A sensitivity analysis of public debt dynamics demonstrates the central role of credible policies that maintain a robust fiscal framework in building confidence. Despite recent improvements, the level and structure o f Turkey’s public debt s t i l l represent important challenges for debt management. The short average maturity o f domestic debt leads to high monthly rollover requirements. Foreign exchange exposure i s another important risk. To illustrate the potential r isks for debt sustainability, a downside scenario can be formulated where the political w i l l to continue the fiscal program falters and the primary surplus undershoots the 2005 target by 1 percentage point in 2005 and does not exceed 3 percent o f GNP in 2006-08 (Figure 2.22). As a result, real interest rates could be in the 20 percent range, i.e., wel l above the projected program path. Growth performance i s expected to weaken under the burden o f high real interest rates, with the growth rate falling to 3 percent per year. A reversal in the strong growth pattern and deterioration in the public debt dynamics could lead to capital account outflows and exchange rate instability which would exacerbate the impact on the debt burden. Under these hypothetical conditions, the public debt burden could begin to rise and the currently declining path o f the debt to GNP ratio could be interrupted.
74 In 2004, gross public debt in proportion to GDP was, on average, 31.3 percent in EU-8 and 64.7 percent in EU- 15-although significant disparities persist within the EU-15 group. 75 Comparators include (by increasing S&P’s sovereign debt rating): Brazil, Philippines, Ukraine, South Africa, Thailand, Tunisia, Mexico, Kazakhstan, Russian Federation, Egypt, India, Morocco, and Colombia. On average, the public debt-to-GDP ratio of these countries was 46.1 percent in 2003.
96

Figure 2.22 Downside scenario assumptions and projected debt/GNP ratios
Real Interest Rate
25
2005 2006 2007 2008
@baseline mdownside 1
GNP Growth Rate
2005 2006 2007 2008
1 Q baseline R downside I
Primary Balance(% of GNP) Total Debt Stock(% of GNP)
7 6 5 4 60
40 3 2 1 20
0 0 2005 2006 2007 2008 2005 2006 2007 2008
0 baseline Edownside 1 Qbaseline Rdownstde I
2.82 A sudden depreciation of the exchange rate remains a major source of risk. The vulnerability o f public debt to exchange rate can be demonstrated by an illustrative simulation. A 20 percent depreciated nominal exchange rate (compared to the baseline) would imply a 4 percent increase in the 2005 net public debt-to-GNP level. The actual impact i s l ikely to be even higher taking into account the increase in the overall borrowing cost that wi l l result f rom an environment wi th higher inflation, higher financing requirement and associated weak credibility. In order to measure Turkey’s exposure to a potential foreign exchange shock, either triggered by a sudden loss o f confidence in the domestic markets or an external event, total external debt needs to be consolidated with the FX-l inked part o f the domestic debt.76 This amount, which can be referred to as Turkey’s total FX-l inked debt, stood at 63 percent o f GNP at end-2004. Although this i s substantially lower than the 2002 level o f close to 87 percent, i t s t i l l remains high.
2.83 Turkey faces an externalfinancing challenge over the medium-term. The r isks relate to both the magnitude and the composition o f external financing. Annual financing requirement increased from U S $ 3 9 bi l l ion in 2001 to US$62 bi l l ion in 2004 as a result o f
76 The level o f external debt at $160 bi l l ion at the end o f first quarter o f 2005 consists mostly o f long-term debt (80 percent of total). The share o f public external debt declined from 66 percentin 2002 to 54 percent by September 2005, as the share o f private sector debt increased from 34 to 46 percent during the same period.
97

the widening current account deficit and the amortization o f short-term trade credits. Assuming that imports w i l l stay at high levels as a result o f strong growth, trade credit i s expected to continue increasing, putting pressure on the gross financing requirement for 2006-08 (Table 2.1 1). Turkey needs to generate enough medium and long term capital inf lows to: (a) finance an annual current account deficit o f close to $22-23 bi l l ion in 2005-06 and somewhat lower levels in 2007-08 (assuming subsiding pressures on the current account); (b) service sizeable long-term loan repayments despite recent easing out o f repayments to the Ih4F; and, (c) keep the short-term debt inf lows at prudent levels. A potential mitigating factor i s better prospects for attracting much higher levels o f FDI than the 2004 realization o f 0.9 percent o f GNP7’, given Turkey’s location, size, and expected EU accession. The improving level o f Central Bank gross reserves could provide some additional cushion in case o f a severe external shock. Looking forward, the extent to which Turkey w i l l be able to attract much higher levels o f foreign, non-debt creating savings in the form o f FDI w i l l remain an important determinant for the success o f the economic program.
2.84 To sum up, debt dynamics have considerably improved but vulnerabilities still remain and should be managed carefully. The relatively appreciated real exchange rate and large current account deficit constitute a potential risk Turkey w i l l need to cope with throughout the EU accession process. EU accession negotiations may boost capital inflows, providing relief f rom balance-of-payments pressures but also contributing to some real exchange rate appreciation. However, Turkey might also be exposed to capital flow reversals, in case the EU accession process were to occasionally stumble, wi th potentially destabilizing effects on the exchange rate, interest rates, debt dynamics, and the overall macroeconomic framework. Preserving a tight fiscal stance as needed to accelerate the reduction o f the debt ratio and forestall current account pressures, and using projected large privatization proceeds to further reduce public debt, would be the best course to mitigate surrounding r i sks while malung needed fiscal room for growth- enhancing expenditures and lower taxes.
77 The table reflects the estimates at the time the analysis was carried out. However, the recently announced balance of payments statistics showed that 2005 net FDI inf low amounted to $8.6 billion.
98

Table 2.11 Turkey: External Financing Requirements and Sources, 2003 -2008 (billion $)
Gross financing requirements
Current account deficit (excl. of f ic ia l transfers) Amortization o n debt securities
Med ium and long-term debt amortization o/w Public Sector
Public sector 11 Private sector Deposit money banks
Short-term debt amortization Public sector (net)l/ Trade credits 21 Banks and other private (net)
Available financing
Foreign direct investment (net) Portfolio flows
Public sector Deposit money banks Private sector (net)
Public sector 1/ Private sector Deposit money banks
Med ium and long-term debt financing
Short-term trade credits, currency and deposits Off ic ia l transfers Other 3/ Net reserves (+/- = decreasehncrease)
Accumulation o f gross reserves IMF (net)
Purchases
Actual 2003 47.4
8.3 3.9
15.0 3.2 10.4 1.4
20.1 0.0 22.4 -2.3
47.4
1.2 7.9 5.3 0.0 2.6 14.1 0.7 12.0 1.4
23.0 0.3 5.0 -4.1 -4.0 -0.1 1.7
-1.7
2004 62.2
15.9 3.8
14.7 3.2 10.4 1.1
27.8 0.0 31.4 -3.6
62.2
1.9 13.2 5.8 0.0 7.5 20.7 1.7
15.5 3.4
27.6 0.3 2.8 -4.3 -0.8 -3.5 1.2 -4.7
Estimate 2005 75.8
21.9 3.6
17.5 4.1 11.7 1.7
32.8 0.0 35.2 -2.4
75.8
3.7 14.5 6.0 0.0 8.5
25.7 2.7 16.5 6.5 37.4 0.6 5.3
-11.4 -7.1 -4.3 3.3
2006 79.7
22.8 2.8
18.7 3.9 12.8 2.0 35.4 0.0 38.5 -3.1
79.7
8.2 13.4 5.5 0.0 7.9 25.5 3.2 16.8 5.6
41.1 0.8 0.0 -9.3 -5 .O -4.3 3.3
Projection 2007 84.0
21.4 3.7
19.6 3.4 14.0 2.2 39.3 0.0
41.4 -2.0
84.0
5.3 10.3 5.5 0.0 4.8 26.1 3.0 16.9 6.3
42.6 0.6 0.0 -0.9 2.1 -3.0 2.5
2008 87.0
20.6 3.7
20.6 3.3 15.0 2.4
42.2 0.0
44.2 -2.0
87.0
4.0 10.7 5.8 0.0 4.9 26.6 2.1 17.6 6.8
45.3 0.6 0.0 -0.2 1.6
-1.8 0.8
Repurchases ... -7.6 -7.6 -5.5 -2.7 Source: CBT, IMF and WB estimates.
1/ General government and Central Bank of Turkey. 2/ Series reflects gross flows o f short term trade credits, and stocks o f credits to the banking sector. 3/ Errors and omissions. 4/ Interest plus medium- and long-term debt repayments as percent o f current account receipts (excluding official transfers).
E. OPTIONS FOR REFORM
2.85 Hedging risks for debt sustainability and making fiscal room for growth- enhancing expenditures and lower taxes is the main policy challenge. The challenge for the government i s to enhance the quality o f fiscal adjustment to meet multiple goals: (i) achieving a continuing reduction in the debt ratio; (ii) making room for growth- enhancing expenditures; and (iii) laying the groundwork for lower taxes to promote
99

growth and reduce existing distortions. Meeting this challenge would call for a three- pronged approach:
Promote structural reforms in public expenditures (horizontal or sectoral) that would free up resources over the medium term, which would be reallocated from low-value to high-value and growth-promoting programs; Promote tax reforms with the aim o f broadening the tax bases and rationalizing the tax system, which would also create some medium-term room for lowering the tax rates.
0 In the long term, use the fiscal space that w i l l be created through the reduction o f the debt ratio and associated lower interest payments on public debt to lower the tax burden-onditional on external current account sustainability. Using this fiscal space to increase expenditures may be a missed opportunity for growth- promoting tax reform. I t may also be counterproductive, as Turkey’s public expenditure at the General Government level is already above levels seen in other fast-growing emerging economies.
0
0
100

PART B: STRUCTURAL POLICIES - IMPROVING THE FUNCTIONING OF KEY MARKETS AND EFFICIENCY OF PRODUCTION FACTORS
101

102

CHAPTER 3. PRODUCT-MARKET REGULATIONS TO IMPROVE THE INVESTMENT CLIMATE”
A. PRODUCT MARKET REGULATIONS - AN AREA IN NEED OF REFORM
3.1 Improving product market regulations (PMRs) would strengthen the investment climate, in turn fostering productivity and sustainable economic growth. Product market regulations - including administrative barriers, barriers to trade, state control and competition - together wi th elements addressed in other chapters o f this report (such as macroeconomic stability, access to infrastructure, access to finance and the adequate functioning o f labor markets) are critical determinants o f productivity and investment, which can unleash private sector potential, help f i r m s grow, generate new opportunities for employment, and reduce i n f ~ r m a l i t y . ~ ~ Box 3.1 presents a brief summary of key findings from international evidence on the links between PMRs and growth.
3.2 Several features of the Turkish economy indicate that PMRs have an important role to play in promoting investment and productivity. These include: (a) l ow FDI- though the boom observed in 2005 may signal better outcomes in the future, (b) the dual structure o f the economy, which comprises a few modem and dynamic f i r m s together with a segment o f laggards, (c) limited contributions to the country’s value added by Small and Medium Enterprises (SMEs), and (d) high informality.
3.3 Until 2005 FDZ has remained low, especially for green-field investment (Figure 3.1). Init ial econometric evidence shows that key determinants o f FDI include large market size, openness to foreign trade and institutional quality, including control o f corruption, administrative barriers and contract enforcement.*’ Improving these elements i s important for increasing on a sustained basis Turkey’s capacity to attract FDI, which would in turn improve competition in the local market, facilitate integration with the global economy, bring in new technologies, and generate new employment.
3.4 Sector productivity is highly uneven. While some Turlush sectors are highly modem and productive (labor productivity o f the apparel and automotive industries are
78 The findings o f this chapter w i l l be further explored through - and complemented by - the results o f an Investment Climate Study (ICs) based on a survey o f 1,300 Turkish firms and 200 hotels, which the World Bank and EPRI are jointly preparing. The I C s w i l l be completed in the spring o f 2006.
79 World Development Report (World Bank, 2005).
See S. Sayek “FDI in Turkey: The Investment Climate and EU Effects” (background paper prepared for the CEM, 2005). The econometric analysis i s based on empirical modeling o f FDI determinants for Central and Eastern European countries and the cohesion countries, as well as Turkey. The analysis uses data covering 1992-2003, and the model i s estimated using panel estimation techniques.
103

estimated at more than 80 percent o f U S levels, for example'') others (such as the electricity, retail and dairy sectors) have strikingly low productivity, hampered by lack o f competition (electricity), or presence o f traditional (often small- and medium-size) players -see Figure 3.2.
3.5 Turlush S M E s (roughly defined as f i r m s with fewer than 250 employees) constitute 6 1 percent o f total employment in Turkey, but contribute only 26.5 percent to the economy's value added, significantly less than SMEs in comparator countries - see Figure 3.3.82 Figures from the Turkish Foreign Investor Association indicate that Turlush SMEs' contributions to investment and exports are about 7 percent and 8 percent respectively, versus 36 percent and 20 percent in South Korea, for e~arnple. '~ SMEs' l ow contribution to economic activity i s related to scarce market competition, barriers to entry, operation and exit, together with lack o f integration wi th larger f i r m s (except in a few specific sectors).84
The contribution of SMEs to the economy is unbalanced.
3.6 The informal sector i s oversized. B y some estimates, the informal sector in Turkey produces 31 percent o f GNI, more than in most comparator countries, and absorbs as much as 51 percent o f the labor force (also see chapter 4).85 High informality has a significant impact on the government's fiscal revenues, competition levels, and the overall productivity o f the Turkish private sector. The high level o f informality i s also related to the disincentives f i r m s face when operating in the formal market, including administrative barriers.
" Productivity i s defined as output per worker (McKinsey).
The Turkish State Planning Organization (SPO) reports that Turkish S M E s constitute 99.8 percent o f total enterprises and 76.7 percent o f total employment (SME Strategy and Action Plan, 2004, page 8). The differences between these numbers and those reported in the text are due to different definitions o f SMEs and formal employment, as well as on the different years o f the analysis.
83 YASED (mimeo, 2003).
" Other factors include SMEs' low use o f advanced technologies and quality standards and the lack of a skilled labor force (see the chapter on Innovation, Technology and Skills).
85 OECD, Economic Survey of Turkey (Paris, 2004).
104

Box 3.1: Theory and Evidence on the links between Product M a r k e t Regulations and Growth
Improvements in Product Market Regulations foster productivity growth through three channels: (i) by reducing market power and monopolistic pricing behavior, shifting production f rom less productive to more productive firms, and thereby increasing efficiency (allocative efficiency); (ii) by improving utilization o f inputs - that is, labor and capital - in individual firms (productive efficiency); and (iii) by creating an incentive to innovate and thereby raising total factor productivity (dynamic efficiency). While the first two effects are one-time gains, the third effect i s persistent over time and l ikely to be more important in the long run.
Evidence on the allocative efficiency channel i s strong. Negative association between market openness and profitability was first shown by Bain (1951) for the American manufacturing industry, and the findings have been confirmed by many others. Based in part on the OECD PMR indicators, Grif f i th and Harrison (2004) showed that improvements in the product market regulatory regime (broadly defined to include, for instance, state ownership in the enterprise sector) have a negative impact on economic rents, thus empirically supporting the allocative efficiency channel. Improvements in productive efficiency within firms appear to be more important than production shifts from less productive to more productive firms, although both effects are found - see for instance Barnes et al. (2001). Nicoletti and Scarpetta (2003) found that regulations promoting competition and private sector governance boost productivity. They also found that lowering entry barriers promotes productivity, and o f particular interest for Turkey, that the further a country i s from the technology leader, the greater i s the impact o f lowering barriers to entry. More broadly, competitive product markets have been shown to have a positive impact on both per capita GDP and employment (Blanchard and Giavazzi, 2003). Research has also found that the higher entry costs and lower degree o f turnover in Europe compared to the US are an important factor in explaining Europe’s weaker growth performance over the past decade (Aghion and Howitt, 2005).86 According to Aghion and Howitt, the fact that competition policy in the EU has placed relatively more emphasis on competition among incumbent firms than entry may explain, to some extent, that exit and turnover are more important in the US than Europe. Thus, 12 percent o f the largest US firms by market capitalization at the end o f the 1990s had been founded less than twenty years before, against only 4 percent in Europe. Emphasizing policies that facilitate business entry would deserve particular attention, especially as the EU acquis i s less elaborate in this area.
Figure 3.1: Foreign direct investment Figure 3.2: Labor productivity by sector
7
6
5 - E 4 L
3
2
1
0 EMU Chile Hungary Poland Romania @ 1990-1994 0 1995-1999 0 2000-2003
- - - Apparel
Autoparts
Steel
Telecom-Wireline Telemm-Wireless x Cement
E? Diury j 9 Reiidenual consVUcuon
Retail b d n g Elecmcity generation
- Coniect,onery
FMCG retail
Electncq Vnnm und distr
0 20 40 60 80 100 120 W Actual Labor Productivity
Note: EMU denotes European Monetary Union countries. Source: World Bank, WDI.
Source: McKinsey Global Institute (2004).
86 “Appropriate Growth Policy: A Unifying Framework”, Mimeo, Harvard University, August 2005.
105

Figure 3.3: SMEs’ share o f employment and GDP
57 ’ O 61 /
37 34
Turkey Slobak Italy Poland Bulgaria Romania Republic
0 Share of formal employment (percent) Share of GDP (percent)
Source: Ayyagari, Beck & Demirguc-Kunt (2003) Note: SMEs asfirms with fewer than 250 employees.
3.7 Zmproving Turkey’s mixed performance on PMRs is critical for EU accession and facilitating rapid and sustained growth. Surveys by the OECD convey a sense of Turkey’s mixed performance on PMRs - see Figure 3.4.87 While barriers to trade and competition policy have improved significantly in the past few years, administrative barriers and state control remain significant constraints on investment and productivity. The EU Progress Report also highlights the need for Turkey to improve several aspects o f i t s PMRs, including: (a) registration procedures and costs o f establishing a business (Acquis Chapter 20 on Enterprise and Industrial Policy); (b) state aid wi th a distortive effect on competition (Chapter 8 on competition policy); (c) technical trade barriers (Chapter 1 on free movement o f goods), which are overdue to be addressed under the Customs Union agreement; and (d) restrictions on foreign ownership (Chapter 4 on free movement o f capital). The sections below analyze Turkey’s performance on key PMR factors and provide policy recommendations for improvement.
87 OECD PMR database (2005). The OECD developed a methodology to evaluate countries’ PMR performance based on surveys across member countries covering more than 800 data points. Current data reflect 1998 and 2003 and are available for 30 countries of which 6 (including Turkey) are considered emerging markets. The survey covers a wide range o f topics that are important for the efficient functioning of product and service markets, such as state ownership and control over businesses (for instance, price controls), regulatory burdens and licensing, legal barriers constraining competition in certain sectors, the antitrust regime, and barriers to international trade and investment. The data points are weighted and combined into indicators at different levels o f aggregation, allowing countries to evaluate their overall PMR regime as well as its components, all the way down to the 800+ specific data points.
106

Figure 3.4: Turkey’s performance on key PMR indicators
2 Adnunistrauve State control Bamers to trade Barriers to regulauon and investment COmpehhOn
Turkey 0 Emerging market average 0 High income average
-
Source: OECD database on PMR, 2005.
Note:
9
9
Administrative renulation refers to administrative burdens placed on firms, such as licensing and permits required to open, operate and close a business. State Control refers to public ownership and other state involvement in the business sector, such as provision of state aid, price control and command and control regulations. Barriers to trade and investment refers to tariffs and restrictions on foreign ownership, including regulatory practices against foreign firms. Barriers to Competition refers to sector exemptions from antitrust legislation and regulatory limits on competition in specific sectors.
9
9
B. ADMINISTRATIVE BARRIERS
3.8 Reducing administrative barriers would strengthen Turkey’s business environment, increase investment levels and facilitate alignment with EU requirements on enterprise and industrial policy. Streamlined registration, operation and closure procedures encourage entrepreneurs to open new f i r m s and banks to move capital to the most productive uses, in turn fostering (local and foreign) investment, competition and productivity. Effective resolution o f commercial disputes also ensures that f i r m s interact smoothly, reducing inefficiencies and costs. Simplified procedures and contract enforcement also help reduce informality and facilitate S M E growth. As indicated by the evaluation o f Turkey’s compliance with Acquis requirements in the 2005 EU Progress Report, while the Government has made some progress to reduce administrative and business judiciary hurdles, several procedures are s t i l l an impediment for business operation and should be reduced.88
See 2005 Turkey EU Progress Report, Chapter 20, page 98.
107
B.l. Firms’ Entry, Operation and Exits9
3.9 Turkey has significantly reduced the time for business registration, but the cost i s still high. Business registration in Turkey has been simplified since 2003, when a modern investment law was implemented and additional legislation affecting registration procedures was adopted.” Legislative changes have been coupled wi th administrative changes, including: (a) transformation o f the regional offices o f the Chamber of Commerce into hubs responsible for communicating firm registrations to other institutions (such as the Treasury, the Statistical Institute and the Tax Administration), reducing the time that entrepreneurs spend visiting various agencies; (b) full computerization o f the Chambers’ entry archives; (c) elimination o f superfluous steps (e.g., registration with the Ministry o f Industry and Commerce); and (d) equal treatment for foreign investors, who can now open a business in Turkey without approval f rom the Treasury and regardless o f the f i rm ’s assets (the minimum threshold o f US$50,000 has been eliminated). According to the 2006 Doing Business report, starting a firm in Turkey now takes only 9 days, one o f the shortest times among comparator countries (see Table 3.1), below the OECD average and close to EU best practice. The Turkish Government indicates that starting a fim takes even less time (only about two days)”. However registration cost i s s t i l l high at Turlush L i ra 1,600 (US$l,000),92 equivalent to 28 percent o f GNI per capita, versus 5 percent o f GNI in Romania, for example, and 8 percent on average for OECD countries. The main reasons for Turkey’s high startup costs are fees for notarizing the company’s articles and accounting books (US$250) and fees related to the trade registry (US$750), both well above the administrative costs that notaries and the trade registry incur for these procedures.
89 For a more detailed discussion, see M. Reichel, “Administrative Barriers” (prepared as a background paper for the Investment Climate Study, 2005)
The Law on Amendments on Turkish Commercial Code No. 4884, Tax Procedural Law, Stamp Tax Law, Labor Act and Securities Law, all o f which were adopted on June 17,2003, as well as the Communique Concerning the Principles of Procedures for the Establishment and Amendments in Articles of Associations of Joint Stock Companies and Limited Liability Companies (Domestic Trade 2003/3). 9’ Indicated by the General Directorate of Foreign Investment, Undersecretariat of Treasury. The World Bank wil l revise the procedures and times needed to set up a business included in the Doing Business report in order to ensure consistency between the two analyses.
92 Doing Business (World Bank, 2006). The figure refers to a Limited Liability Company.
108

Table 3.1. Entry and Exit, Turkey and comparator countries, 2004. Starting a Business Closing a business in case of bankruptcy
Time cost Time Recovery rate (days) (% GNI per capita) (years) (cents on 1 US$)
Turkey 9 28 5.9 7.2 International best practice 2 (Australia) 0 (Denmark) 0.4 (Ireland) 92.6 (Japan) EU best practice 5 (Denmark) 0 (Denmark) 0.4 (Ireland) 91.0 (Norway)
China 48 14 2.4 31.5 Croatia 49 13 3.1 28.4 Poland 31 22 1.4 64.0
Romania 11 5 4.6 17.5 Slovak Rep. 25 5 4.8 38.6 Spain 47 17 1 .o 77.8 Thailand 33 6 2.7 43.9 Source: World Bank, Doing Business Report, 2006. Note: Data refers to the countries’ most populous cities.
Bulgaria 32 10 3.3 33.5
Portugal 54 13 2.0 74.7
3.10 Changes to exit procedures are currently underway. Closing a company in Turkey can be initiated by the owner and the managing director if the company i s insolvent. The closing i s formalized and supervised by a judge o f the commercial court. Rights and obligations o f the two parties (owner and creditors) are set in the bankruptcy law. According to the most recent Wor ld Bank data, closing a business in Turkey i s s t i l l very difficult - the insolvency procedures take about 6 years, and the recovery rate i s extremely low at 7 percent. However, these statistics do not yet reflect reforms o f the bankruptcy law that were undertaken in 2003 and 2004, aimed at strengthening creditors’ rights, streamlining court processes and enforcement, and ensuring compliance with EU requirements. Unfortunately, i t i s too early to estimate the effect o f these legislative changes, particularly since the courts are currently processing a backlog that was built up over many years with a slow, inadequate system and i s s t i l l clogging the pipeline.
3.1 1 Licensing procedures increase f i r m s ’ start up times and operating costs. Firms often need licenses to become fully operational after registering, as wel l as to remain in business. Licensing obligations put a considerable burden on both the private sector (in terms o f time, human and financial resources) and the public agencies responsible for granting licenses and carrying out inspections. To obtain a license, a firm must collect and prepare documents, gather information, and fill out applications, which often must be submitted in person. I t must also pay license fees and, at times, procure costly professional assistance f rom lawyers or consultants. Licenses must also be monitored and renewed in time to avoid negative consequences. During the duration o f the license, random and routine inspections are often carried out, requiring the license holder to assist inspectors, explain issues and submit documents, in turn increasing f i rms’ costs and decreasing productivity.
3.12 Licensing remains a major bottleneck for doing business in Turkey. Some administrative procedures to operate a business have been simplified during the past year, for instance permits required to open and set up a work place, specific permits required in the mining sector and, to a lesser extent, the food processing industry, and the procedures for certificating tourism establishments have been streamlined. However, licenses and
109

regulations are s t i l l the most cumbersome procedure in Turkey -see Figure 3.5. Factors that complicate the licensing process in Turkey include:
a. An excessive number o f licenses required from f i rms, coupled with an excessive number o f agencies involved in granting them. Mandatory licenses are also often required, even for purposes beyond health, safety and environmental protection. The excessive number of licenses i s coupled with an excessive number o f agencies involved in the licensing process, such as (among others) Chambers o f Commerce, the Ministries o f Environment and Health, Fire Departments, the State Hydraulic Works Department, and the State Railways Administration. The excessive number o f agencies involved significantly complicates and convolutes f i rms ’ start up and operating procedures.
b. The unclear role o f the municipalities. In most countries, municipalities are responsible for ensuring that f i rms ’ locations comply with urban plans, fire and other safety-related issues. In Turkey, on the other hand, municipalities are often responsible for examining other authorities’ approvals in several areas93 (e.g., urban planning, safety, health and environment). This increases bureaucratic costs for the f i r m s and results in an unclear and often discretionary decision-making process.
Figure 3.5: Administrative barriers, selected indicators, 2003
I H Turkey 0 Emerging market average 0 High income average 1
Source: OECD database on PMR, 2005.
3.13 A partial licensing reform is currently underway. The licensing system i s currently being revised, with a bill in Parliament establishing a centralized system that w i l l create “one-stop-facilities” for licensing at the municipality Under the reform, the municipality w i l l obtain all the inputs necessary to grant a license internally, after the applicant submits the application. The reform should be evaluated, as international experience shows that mandatory one stop facilities often add another bureaucratic step to -rather than helping speeding up-the process.
93 For a l l firms located within municipal boundaries.
94 Draft Law on Regional Agents.
110

3.1 4 Administrative procedures should be further streamlined, with a specific focus on reducing cost of entry and simplifying licensing processes. Progress on simplifying exit procedures should also be closely monitored.
Key measures to improve the registration process include:
Reducing start up costs, by reviewing current fees and ensuring closer alignment with the effective costs incurred by the notaries and the trade registry, and possibly by making notarization a service offered by the Trade Registry.
Establishing an integrated registration system that includes a unif ied business number for both registration and taxation, making the information exchange between these two agencies more efficient.
Establishing an integrated registration and licensing system. The existing exchange o f information between the Chambers o f Commerce and the tax authorities could serve as a model for further integration with the municipalities.
Ensuring that the ongoing review of the Turlush commercial code covers compliance with EU disclosure requirements for company registration.
Introducing an online registration service to streamline business registration in all parts o f the country. This w i l l in turn require updating the software in the municipalities and ensuring recognition o f electronic signatures.
Key measures to reduce the time and costs of licensing, both for general and for sector- specific licenses, include:
Continuing the ongoing effort by the Undersecretariat o f Treasury to create an inventory o f existing licenses, which w i l l allow identifying overlapping and duplicating requirements, documentations and approvals, in turn laying the ground for streamlining the existing licensing process.
Re-assessing the proposal to introduce a one-stop facility to acquire a license. As mentioned above, international experience shows that this may further complicate the licensing procedure b y adding another layer o f bureaucracy.
Assigning each licensing task to a specialized authority, wi th municipalities concentrating on urban planning, construction requirements and specific safety issues only. The licensing systems o f best practice countries (e.g., Germany) should be taken as a reference for carrying out these reforms.
Developing less burdensome ways to regulate businesses, including using mandatory licenses as ultima ratio only (i.e., for health, safety and environmental standards) and, whenever possible, replacing licensing with a system o f inspections or reporting requirements coupled with an effective enforcement system (fines and penalties).
Further policy options to improve exit procedures should be reviewed after evaluating the results o f the ongoing bankruptcy reform, since recent interviews with several judges from commercial courts indicate that considerable streamlining o f exit procedures i s
111

expected95 - estimates of about six months for completing a bankruptcy case appear to be a realistic forecast among the experts.
B.2. Resolving Commercial Disputes
3.13 Improving efficiency and transparency of the commercial judiciary increases predictability of the business environment in which firms operate, in turn increasing investments and reducing business costs. Better performing courts increase f i rms ’ willingness to contract with new customers and suppliers, and increase f i rms ’ efficiency. As Wor ld Development Report ’05 showed, when courts perform better, f i r m s invest more and enjoy greater access to credit. Court inefficiencies, on the other hand, reduce the potential for investment and increase transaction costs, particularly for SMEs, which incur proportionally higher costs when involving the judiciary in resolving a business dispute. Court inefficiencies are also often exacerbated by lack o f confidence in the impartiality and quality o f the commercial courts and by the risk o f corruption.
3.14 Resolution mechanisms for commercial disputes have improved in Turkey. Since 2000 Turkish authorities and the Turkish judiciary have taken important steps to speed the resolution o f commercial disputes. Fol lowing the necessary constitutional changes, the legislature approved in 2001 a new statute governing arbitration proceedings when one disputant i s not Turkish. Reflecting best practice, the parties are now free to choose where the arbitration w i l l be held and what procedures w i l l control it. The courts’ ability to intervene in the proceeding or second guess the arbiter’s award i s sharply l imited too, again in accordance with international norms, and a 2004 court decision made i t clear that the law applies regardless o f when the contract was made or the dispute arose. Measures aimed at improving the overall efficiency o f the judiciary are also beginning to produce results. The judicial holiday was cut f rom 45 to 36 days in 2004. The first stage o f the National Judicial Network Project (UYAP), automating the central units of the Ministry o f Justice, i s complete, and f ield units are now being linked to the center. Establishment o f Intermediate Appeal Courts i s underway and, fol lowing the changes in the Criminal Code and Criminal Procedure Code, the Civ i l Procedure Code i s being revised to enable c iv i l courts to operate more effectively and efficiently. All courts and prosecutors have been supplied with computers and received initial training in their use.
3.15 The impact of these and other reforms are reflected in Turkey’s key indicators on contract enforcement. B y and large Turkish courts compare well with those o f E U 8 and accession countries, with days and procedures needed to complete a simple debt case lower than the average across the EU8 and those in Bulgaria and Romania (Table 3.2). Turkey’s figures also do not compare particularly unfavorably with the 225 days and 19 procedures that are the norm in the high income OECD.
95 Estimates indicate that ongoing reforms should lead to completion of a bankruptcy case in six months.
112

Table 3.2. Contract Enforcement Days to Number o f Cost as percentage o f Country enforce a contract procedures overdue debt
Turkey 330 22 12.5% International and 27 (Tunisia) 11 (Australia) 4.2% (Norway) EU best practice 48 (Netherlands) 14 (Greece) Bulgaria 440 34 14.0% Romania 335 43 12.4% EU8 450 27 10.8% OECD 225 19 10.6%
.Source: World Bank, Doing Business Report, 2006.
3.16 However, the cost of litigation, backlogs in the commercial courts and enforcement proceedings has room for improvement. The cost o f litigation i s s t i l l relatively high in Turkey, at 12.5 percent of the amount owed - see Table 3.2. By one estimate, a person paid the minimum wage must work 6.1 days to pay for one hour o f oral advice and 10.7 days to have a lease reviewed. Two additional areas o f concern include backlogs in the commercial courts (Asliye Ticaret) and enforcement proceedings without judgments (ilamsiz takip). Data from the Ministry o f Justice web site shows that during 2002 and 2003 Asliye Ticaret received roughly 95,000 cases per year, yet decided only half that number each year. The average time to decide a case i s 417 days, without counting time for appeals. Times to disposition across all chambers of the Court o f Cassation (Yargitay) are also on the rise.96 The data also show difficulties with enforcement proceedings without judgments (ilamsiz takip). At the beginning o f 2003, some 7.4 mil l ion actions were pending, and while just over 3 mi l l ion were resolved, leaving 4.4 mi l l ion unresolved at the close of the year. Although more recent data are not yet available, the Turkish Ministry o f Justice indicates that several initiatives in the meantime have improved the efficiency of the system. Further improvements are underway. For instance, a commission i s currently studying the draft law on Uncontroversial Jurisdiction and Alternative Dispute Resolution Methods wi th the objective o f allowing for faster and simpler trials wi th minimum expenses as wel l as increased use o f methods such as late performance, peace and conciliation. Whi le recognizing that recent improvements are not reflected in the data, the magnitude of the figures suggests that this procedure i s being abused. Private banks and others who lend against collateral report that i t can take as long as six months to foreclose on moveable property and even longer on real estate.
3.17 Turkey needs to continue reforming its commercial and civil justice systems to trim the time and cost required to resolve disputes. Key measures to improve resolution mechanisms include:
9 Adopting a case management system and associated alternative dispute resolution mechanisms. Case management includes the entire set o f actions a court takes to monitor and control the progress o f cases, f rom initiation through trial or other initial disposition to the completion o f al l post-disposition matters. Time standards are set,
96 In the 1 lth chamber, which hears commercial cases, processing time rose from 152 days in 2002 to 202 days in 2003, the latest year for which data i s available.
113

judges monitor the progress o f each case, and their success in meeting the standards serves as a key measure o f their performance. As litigants and their attorneys realize that they cannot avoid resolution through delay, their incentive to resolve cases through mediation or other forms of alternative dispute resolution increases. The combined effect i s thus to reduce both delays and the caseload.
P Reforming the system for choosing experts. Turkish judges routinely call on university professors and even lawyers to decide cases by hiring them to submit expert reports on issues in dispute in a case. The result i s greater cost and often more delay. One way to streamline proceedings and cut costs i s reduce the use o f experts in c iv i l litigation. In the United Kingdom, France, and the United States, reforms covering when to use experts, how to select and compensate them, and the weight the experts’ opinions are entitled to receive have all been recently proposed or enacted. The commission now reviewing the expert law should review these reforms and see how they can be adapted to the Turkish setting.
P Applying to domestic arbitrations the same rules that govern international arbitrations. When both parties to a dispute are Turkish, an arbitration proceeding i s governed b y the Turkish Code o f Civ i l Procedure. The code and the decisions interpreting i t do not give the parties as much autonomy as the 2001 international arbitration law, nor do they as effectively limit the courts’ right to interfere wi th the proceedings or second-guess an award. There i s no reason why domestic arbitrations should be treated differently than international ones, and according to them the same treatment w i l l encourage more litigants to choose arbitration over a lawsuit.
9 Providing competitive restraints on fees for legal professionals. Some reports suggest that litigants are discouraged from turning to domestic arbitration, let alone litigation, because legal fees are very high. Lawyers’ fees are set by the bar association and are widely considered to be quite high. B y one estimate, a person paid the minimum wage must work 6.1 days to pay for one hour o f oral advice and 10.7 days to have a lease reviewed. Supra-competitive legal fees can be a drag on the entire legal system, discouraging f i r m s and citizens alike f rom seelung legal advice or pursuing legal remedies. As part o f i t s effort to make the European Union more competitive, the Commission has launched an initiative to bring the fees for lawyers, notaries, and other liberal professions more in line wi th those that would be charged in a competitive market. In April 2004, the Competition Authority and Competition Board ruled that the setting o f prices by professional bodies was anticompetitive. This decision should be ful ly implemented and other measures considered to ensure Turkish policy respecting legal services conforms to the Commission’s initiative.
> Evaluating the courts’ caseload to observe the principle of proportionality. As the courts in many OECD countries began to tackle the problems o f delay and cost the Turkish courts now face, their leaders considered whether, given existing resource constraints and alternatives, their caseloads and the procedures for dealing wi th their cases were appropriate. In the United Kmgdom the Woolf reforms introduced the principle that the resources devoted to a case must be proportionate to the value, importance, and complexity o f the dispute. In c iv i l law jurisdictions, these considerations translated into a rethinking o f the automatic right to appeal by way of a complete rehearing. In Ontario and New Zealand, i t led to replacing the system o f
114

court-adjudicated liability wi th social insurance schemes. In every case, such reforms were initiated by a searching analysis o f the courts’ caseload and the costs it imposed on the parties and society as a whole.
c. STATE AID^'
3.18 Monitoring - and eliminating distorting - state aid is required by the EU and is essential to guaranteeing a level playing field among firms, in turn increasing competition, innovation and productivity. State aid refers to government policies that are “a form of state support to promote a certain economic activity and discriminate between beneficiaries and non-beneficiaries.” The term “discriminate” i s essential to the identification o f state aid, which covers not only subsidies and tax exemptions, but also, for instance, equity participations by the government and exclusive rights granted to certain f i rms. State aid can be classified as either horizontal or vertical. Horizontal aid i s aimed at broad development objectives, such as S M E growth, R&D, environmental protection, employment and training. In contrast, vertical aid targets specific sectors or individual firms. Since the launch o f the Lisbon Strategy in 2000, the EU has focused on reducing overall state aid and on shifting the aid towards horizontal objectives in all member and candidate countries, because vertical aid i s not compatible with the EU Acquis. In addition to ensuring compliance with EU requirements, monitoring and reducing state aid levels the playing field among f i rms, ensure that the market economy works efficiently and thereby fosters lower prices, efficiency, innovation and growth.
3.19 State aid in Turkey lacks sufficient monitorable disclosure. Turkey has made init ial efforts to improve monitoring o f State Aid, including preparation o f a bill on the monitoring and audit o f government assistance. However -and in contrast to the EU, including the new member countries-Turkey does not systematically monitor i t s state aid98. This may have a deterring effect on FDI and contestability in domestic markets in general. State Aid i s granted by several institutions, including the Undersecretariats o f Treasury and Foreign Trade, Ministry o f Finance (Revenue Administration), Ministry o f Industry and Trade, Ministry o f Culture and Turism, KOSGEB, Turk Eximbank, and TUBITAK.
3.20 Although Turkey has made progress towards horizontal objectives, there is need for applying formal procedures for monitoring and control as to State Aid’s potentially distortive effect or compatibility with the Acquis. Vertical aid, targeting specific beneficiaries, sectors or products, includes support to state banks and other state-owned enterprises, public service institutions, including agriculture, fisheries, cultural Financial transfers to SOEs are intended loss-making companies. These transfers
a n d specific provisions for certain sectors, activities, and (most aspects of) transport.
to cover investment and operating deficits o f are estimated at around YTL 2.4 bi l l ion in
97 This report does not specifically address the issue o f privatization, which w i l l be covered in the Investment Climate Study and in subsequent CEMs. 98 The European Commission’s 2005 Progress Report notes that Turkey has not yet fulfil led its obligation under the Customs Union to establish a state aid monitoring authority and to align and ensure full transparency o f i t s existing and new state aid schemes.
115

200599. On the positive side, privatizations picked up substantially in 2005 and thereby contributed to reducing the scope o f state aid.
3.21 A broad array of instruments is being used. Examples o f instruments used are grants; state guarantees; exemptions from customs duties; exemptions f rom VAT, energy support through reduced electricity tariffs; credit allocations from the budget; and free land allocation. Energy support through electricity consumption subsidies granted to f i r m s established in less developed areas are likely to be distorting as they constitute operating aid. These subsidies are considered by the Government as a means to promote employment generation in less-developed areas as they are linked to the level o f firm employment.’00 Under state aid rules in general investment aid would be considered to be eligible as non distorting intervention. Aid to the ongoing production would be compatible with competition rules only in exceptional circumstances and under tight restrictions . 3.22 Turkey has committed to implementing reforms of the state aid regime to bring it in line with the Acquis since 1996, when the final phase of the Customs Union became effective, but it has not yet complied with the Customs Union requirements. Under the Acquis, an advantage conferred by the State i s regarded as state aid if it i s granted by a Member State or through State resources, i t distorts or threatens to distort competition, i t favors certain undertakings or the production o f certain goods, and i t affects trade between Member States. The Customs Union requirements include making Turkish State Aid legislation compatible with the EU Acquis, as well as noti fying the E C o f al l aid schemes in force and o f any individual aid to be granted that would be notifiable were Turkey a Member State. Turkey has yet to fulfill these commitments. The State Planning Organization, which i s responsible for drafting the legislation, has submitted draft state aid control legislation to the Prime Minister’s office. The screening required by the EU state aid regime”’ as to the compatibility o f instruments used with the EU acquis has been initiated.
3.23 State aid reforms in Turkey should include legislative and policy changes, institutional development, and the introduction of a regime for Services of General Economic Interest (SGEZ). First, Turkey needs to adopt state aid control legislation aligned with EU directives. Second, a state aid monitoring agency must be set up with adequate capacity to effectively monitor and supervise state aid. As indicated by the 2005 EU Progress Report, no developments can be reported with regard to either the adoption o f state aid legislation or the establishment o f an operationally independent state aid monitoring authority. Third, distorting or state aid that i s not in compliance with the Acquis should be properly identified and eliminated. Turkey w i l l be under pressure to
99 Presentation by the Republic o f Turkey on State Aid for the screening meeting o f Chapter 8, 1-2 December 2005. loo To be eligible for energy support, companies operating in less-developed areas should employ at least 30 workers (10 workers in agricultural activities). Energy support ranges from 20 to 40 percent of energy cost (50 percent for companies in industrial zones) depending on the number o f company employees. lo’ The EC Treaty provides that State Aid i s illegal unless there is : (a) prior E C approval; or (b) an exemption given by the E C or the Council. A general exception to the above i s de minimis aid. However, de minimis support i s required to be closely monitored. The Treaty also contains four key “distortion tests” to ascertain if a measure i s State Aid, namely: economic advantage for the recipient, selectivity to certain beneficiaries, distortion of competition, and effect on trade between Member States.
116

demonstrate a strong start to enforcement wel l ahead o f accession, because alignment wi th EU directives i s considered a complement o f the Customs Union. Fourth, the state aid reform package should include the transfer o f state enterprises to a regime o f “Services o f General Economic Interest” as defined by the EU (possible sectors include electricity, water and broadcasting) while state enterprises outside such a regime w i l l not be eligible for state aid. Minimum requirements for eligibility under the SGEI regime include the following: (a) the public services obligations must be clearly defined; (b) the parameters on the basis o f which public services compensation w i l l be paid must be established in advance; (c) all elements o f compensation must be documented; and (d) an analysis o f the costs must be prepared on a comparative competitive basis. I f this option i s used, Turkey must establish an SGEI regime in accordance with EU requirements.
D. BARRIERS TO TRADE
3.24 Decreases in tariff barriers and in the incidence and pervasiveness of non- tariff barriers have greatly improved the contestability of markets for industrial goods in Turkey. In the past few years, Turkey has significantly reduced tariff and non-tariff barriers for industrial goods, and improved the quality o f services facilitating trade, including customs. Turkey’s performance in some essential areas o f trade facilitation, such as customs environment, i s no different f rom that o f new EU members.
3.25 Thanks to the implementation of the Customs Union, Turkey has one of the lowest levels of MFN tariff protection among economies at a similar level of economic development. As a result o f simultaneous multilateral (MFN) and regional liberalization, Turkey’s average applied tariff rates on industrial imports f rom non-preferential partners fe l l f rom an average o f 26.7 percent in 1994 to 4.3 percent in 2003. The average tariff rate on industrial imports f rom the EU was 22 percent in 1994, and the tariff rate for industrial products zeroed fol lowing the implementation o f the C U D in 1996. Last but not least, by virtue o f the CUD, Turkey’s tariff commitments under the WTO agreements have been considerably extended and bound rates lowered to EU levels.
3.26 Competitive conditions in Turkish markets have also substantially improved as a result of progress in transitioning to the EU technical standards regime and establishing a competition infrastructure, with most components already in place. The progress achieved in alignment with the EU system o f technical standards (see Chapter 6) has increased the competitiveness o f Turkish products not only in the EU and European Economic Area, but also in other wor ld markets because simultaneously meeting domestic and international standards reduces costs. Similarly, on the import side, there has been significant improvement in market access with the ‘hassle’ cost o f meeting technical requirements going down thanks to Turkey’s adopting CE marking and reducing the number of mandatory technical standards. The Competition Infrastructure has also improved significantly and i s now characterized by a satisfactory antitrust legal framework and an efficient Competition Authority (see section 3.D.).
117

3.27 Liberalization in conditions of access to Turkish markets has demonstrated the capacity of Turkish firms to withstand competitive pressures from imports and to compete successfully in global markets. Despite strong competition from imports, industrial sectors have recorded strong growth, while export expansion has intensified. Moreover, as further explained in chapter 1, in some sectors, producers have shifted successfully to more value added and skilled labor intensive lines o f production. In a nutshell, liberalization of foreign trade complemented by the progress achieved in establishing - in line with the Acquis - an enabling environment to support investment and employment creation in new activities has produced tangible results.
3.28 While overall barriers to trade have decreased significantly, the use of antidumping measures has also intensified. While one would expect that, with the passage o f time, the demand for measures limiting competition f rom imports would fall, this has not happened so far. Turkey ranked seventh in the world after India, US, EU, Argentina, South Africa and Canada on the total number o f antidumping measures implemented in 1995-2004. Although Turkey’s imports are around sixteen times lower than those o f the EU, the number o f antidumping investigations (54) over the period 2002-2004 was close to that by the EU (57). The major sectors where antidumping measures have been initiated are textiles (fibers and fabrics), iron, steel and metal products, and plastics and rubber. Since these are mostly intermediate products, higher import costs might have impeded resources moving to higher stages of processing in some sectors where they are used as inputs. The Government considers this situation as reflecting the increased unfair trade practices by certain countries and existing differences and vulnerabilities in the structure o f the Turkish economy compared to the EU.
3.29 High frequency of antidumping investigations ending with implementation of antidumping measures calls for the review of institutional and procedural arrangements. Although subject to multilateral WTO disciplines, antidumping mechanisms are susceptible to bureaucratic abuse and capture by private industrial interests. Among the top 15 worldwide users o f antidumping mechanisms, Turkey shares the first position with Mexico in terms o f the percentage o f initiations resulting in the imposition o f antidumping measures. For both, 87 percent o f initiations ended up with a positive finding of dumping. Australia was at the bottom, wi th 31 percent o f investigations resulting in dumping measures. Australia also has antidumping processes acknowledged as best international practice. The Australian Industries Assistance Commission i s regarded as the best designed institution to handle antidumping cases. I t i s an independent institution responsible for evaluating and monitoring the economic effects o f proposed and subsequently implemented trade measures on competition (concentration and market structure) and national welfare, tahng into account both consumers’ and producers’ interests. The Australian experience could serve as a useful example in reviewing the functioning o f the two boards in charge with antidumping in Turkey.
3.30 Although the resort to antidumping measures was an infrequent occurrence in Turkish-EU commercial interaction, there are reasons to expedite its removal from the box of policy tools available to CUD signatories. The EU record o f the use of antidumping measures against former candidate countries suggests that preferential arrangements including the C U D do not fend o f f a country’s exporters f rom the punitive reach o f antidumping duties. There are justifiable fears that EU antidumping measures
118

may strike any time, destroying successful exports f rom Turkey. Turkish producers are particularly vulnerable to EU “contingent protection” as long as the EU competition and state aid Acquis i s not satisfactorily transposed into Turkish legislation and practice. Implementation and effective enforcement o f the competition, state aid control, and other relevant parts o f the Acquis related to the internal market w i l l allow suspension o f application o f trade defense measures in the Customs Union between Turkey and the EU, and a progressive alignment towards a common anti-dumping pol icy wi th the EU before accession.
E. COMPETITION POLICY lo2
3.3 1 An effective competition policy encompasses instruments that address government economic and regulatory policies, as well as restrictive private sector business practices that significantly distort the competitive process, thereby undermining the efficient functioning of markets and consumer welfare. Against the background o f a concentrated industrial sector and a history o f state owned enterprises in the productive sector, there i s ample scope for dominant players to undermine effective competition in Turkey. In 2005, the process o f privatizing state owned enterprises was significantly accelerated thus improving the scope for effective competition. The Turkish Competition Authority i s charged with the responsibility o f administering competition or antitrust law (No.4054). I t not only investigates complaints and market situations giving rise to anticompetitive behavior and industry structures, but also engages in advocating pro-competition public policies. B y protecting and promoting competition, f i r m s are encouraged to reduce costs, increase their productivity, expand output, innovate, and offer a greater choice and quality o f products and services at lower prices.
3.32 Turkey’s antitrust regime is in line with international best practice, but several sectors of the economy remain highly concentrated. Turkey rates favorably relative to i t s comparators on “barriers to competition” (see Figure 3.5 above) mostly reflecting a very high rating on i t s antitrust regime. A more thorough a s s e ~ s m e n t ’ ~ ~ confirms that indeed the antitrust regime i s wel l functioning in Turkey, while at the same time indicating that sectoral policies tend to undermine effective competition in several areas. This i s due to a combination of: s t i l l large portfolio o f state owned enterprises despite the recent acceleration in the privatization process, legal barriers to entry in sectors such as ‘electricity, gas, water, and telecom; exclusive rights historically given to individual f i r m s ; low levels of credit to the private sector despite recent credit growth to the corporate sector; and other investment climate barriers to effective competition. Consistent with this assessment, the EU emphasizes the need for Turkey to make “major efforts concerning alignment in the adjustment o f state monopolies and companies having exclusive and special rights . 3, 104
lo* For more information on Competition Policy and the Competition Agency in Turkey, including activities, cases reviewed and decisions made, see R.K. Khemani, “Competitiveness, Investment Climate and Role of Competition Policy in Turkey” (Foreign Investment Advisory Services (FIAS), World Bank, 2005) ‘03 R.K. Khemani, Op. Cit. lo4 Turkey EU 2005 Progress Report. Op. Cit.
119
3.33 The legal framework for antitrust is comprehensive and aligned with EU requirements. Turkey established an independent Competition Authority and Competition Board to implement a new competition law in 1997. The competition law addresses issues such as agreements on price f ixing and bid-rigging, abuse o f dominant position (AOD), and mergers and acquisitions (M&A) and joint ventures (JVs), which could potentially distort competition. The law i s considered to be closely aligned with EU requirements, as well as with the broader objective o f ensuring effective product market competition. lo5
3.34 The Turkish Competition Authority is efficiently implementing the antitrust law. The Competition Authority i s widely viewed as an effectively managed government body that i s implementing the law efficiently and well. OECD noted in 2004 that the agency had gained a reputation as “one o f Turkey’s most effective and best administered agencies”, and a recent World Bank assessment concurs with this view.lo6 The authority i s reasonably wel l funded and has qualified staff. The appointment process for the board has safeguards against capture by influential groups and appears to be independent of undue influence.
3.35 The Competition Authority is also successfully exercising its competition advocacy role. The Competition Law provides for the Competition Authority to engage in competition advocacy by reviewing and commenting on public policy, regulatory decisions and institutional arrangements unnecessarily limiting competition. As part o f i t s advocacy role, the authority issued 25 such opinions in 2004 and 33 in the f i r s t three quarters o f 2005. The opinions covered policies in sectors such as energy, telecommunication, broadcasting, the press, banking, tobacco, sugar, transportation, and insurance. Such opinions are particularly useful in sectors where state owned or controlled monopolies remain prevalent and in sectors with one or a few dominating f i rms. As Turkey i s emerging from a legacy o f state intervention, i t i s expected that such advocacy, combined with opening the foreign trade and investment regime, wi l l prove instrumental in reinvigorating competition in the Turlush business sector.
3.36 Further strengthening competition in Turkey requires enhancing the antitrust regime as well as expanding the Competition Authority’s engagement in competition advocacy.
Suggested reforms to further improve the antitrust regime include:
0
0
Eliminating legal uncertainty and speeding up the adjudication o f cases under appeal; Reducing reliance on adjudication by expanding the Competition Authority’s use o f consent orders and business advisory opinions and improving i t s communication on fines and remedies for anti-competitive behavior to the business community; and
0 Reducing compliance burdens for small f i r m s by establishing de minimis principles for exempting agreements involving only small companies.
I O 5 R.K. Khemani, Op. Cit.
I O 6 2005 Turkey EU Progress Report, Op. Cit., page 68 ; and R.K. Khemani, Op. Cit.
120

0 Initiate an enhanced program o f compliance and information dissemination to foster greater understanding o f the competition law-policy and reduce unnecessary litigation.
Suggested reforms to further strengthen the Competition Agency’s advocacy role include:
0 Clearly delineating the roles, responsibilities and powers o f the Competition Authority and sector-specific regulatory bodies on competition matters (as wel l as on monitoring o f state aid), especially in the telecommunication, electricity and transportation sectors - by expanding and clarifying the competition advisory role o f the Competition Authority, the scope and impact o f i t s efforts wi l l be improved; and Safeguard competition in sectors where state enterprises are being privatized. Developing a framework to encourage competition in the markets being served b y SOEs would be most important, as competitive bidding for SOEs does not mean there w i l l necessary be competition in the market post privatization. Indicating a plan for SOEs or sectors being considered for privatization, available for advance consultation and with input from the Competition Authority, would help take into account existing competition concerns.
F. COMPLEMENTARY MEASURES TO IMPROVE ATTRACTIVENESS TO FDI
3.31 An improved legal framework to increase FDZ attraction, coupled with macroeconomic and political stability, and positive signals for EU accession, are expected to increase FDZ inflows to Turkey. Turkey’s extremely l ow FDI levels (see chapter 1) are l ikely to improve in the next few years, thanks to (a) a new Foreign Direct Investment Law (2003) that has established a liberal FDI regime in line with international best practice by eliminating additional permits and procedures that were originally required to foreign investors and by streamlining the foreign investment process, (b) improved macroeconomic stability, (c) progress in EU accession discussions and (d) expected microeconomic investment climate reforms.
3.38 However, specific additional measures are required to improve FDZ attraction through FDZ promotion and foreign investment policy advocacy. Further reforms to improve the FDI regime include ensuring implementation o f existing FDI legislation and reducing FDI restrictions in some sectors, including c iv i l aviation, maritime transport, radio and TV broadcasting, while restrictions to foreign ownership in the telecommunications and mining sectors were removed in 2004.’07 Ensuring effective investment promotion i s also essential. The General Directorate o f Foreign Investment within the Undersecretariat o f Treasury i s currently the main Turlush authority responsible for FDI promotion. Before the 2003 reform, the Undersecretariat’s main task was to approve and administer the FDI inflow. Since FDI approval was abolished in
lo’ 2005 Turkey EU Progress Report, Op. Cit.
121

2003, the responsibilities o f the Undersecretary have been centered on coordination o f the private sector development reform program to improve the country’s investment climate. The Undersecretariat’s results in attracting F D I should be evaluated against international best practice and follow up measures taken to ensure that the Agency operates effectively. As part o f a public body, the current Investment Promotion Agency (IPA) currently lacks funds o f i t s own, has little experience with the core functions o f investment promotion, and i s not exclusively dedicated to promoting FDI.
3.39 IPA to operate effectively. General reference criteria for an effective IPA include:
International experience indicates that several aspects need to be in place for an
A clear strategy and sufficient independence from the Government Policy advocacy on foreign investment as a key mandate Staff wi th advanced s lu l l s and staffing policies. One o f the most important elements of a ‘successful IPA i s hiring o f skil led marketing professionals who understand how business people think. Given the private sector demand for these professionals, regular c iv i l service salaries are not sufficiently competitive to attract such slulled people to government service. Private sector involvement in key decisions. Working closely wi th the private sector enables an IPA to identify constraints that investors face and help them overcome these constraints. Sufficient initial budget and adequate financing to ensure long-term sustainability, which i s usually provided by the government. Mandate to provide the government with continuous and reliable feedback about potential difficulties or shortcomings in the policy, legal and administrative framework related to FDI.
G. CONCLUSIONS
3.40 This chapter has made the case that improving product market regulations in Turkey would strengthen the investment climate and thereby increase productivity, generate employment, and help Turkey achieve sustained, long-term economic growth. Although Turkey has made progress on improving product market regulations in recent years, there i s s t i l l much to be done, particularly in reducing start up costs and licensing procedures, streamlining the resolution o f commercial disputes, monitoring and eliminating state aid with a distortive effect on competition, refraining from the use o f antidumping measures, enhancing the antitrust regime and advocacy for competition, and attracting more FDI through promotion o f foreign investment. Table A1 summarizes short- and medium-term recommendations for product market regulations and the investment climate. As in other areas, continued progress requires firm commitments from and cooperation between the Turkish government and the private sector. The rewards, however, are great - strengthening the investment climate by optimizing product market regulations w i l l not only help Turkey align itself to the Acquis and other EU recommendations, i t w i l l also enhance competition and raise productivity. As part o f
122

a comprehensive strategy, these changes w i l l help Turkey achieve consistent economic growth over the long term and ultimately result in social welfare improvements.
123

124

CHAPTER 4. EXPANDING EMPLOYMENT - THE LABOR MARKET REFORM AGENDA
4.1 Labor market performance is a concern as Turkey prepares for EU Accession. Employment grew by less than 1% on an annual basis over the past decade. The employment rate in 2004 was 46%, well below any EU member country and far f rom the Lisbon target for 2010 o f 70%. The unemployment rate was 10.6% in 2004 and this does not capture the substantial underemployment in the large informal sector.lo8 As noted in chapter 1, low employment generation and declining employment ratios have slowed per capita income growth in the past, so that increasing labor utilization w i l l be a key factor for stronger growth and accelerated convergence with the EU in the years ahead. Moreover, in a context o f free labor mobility, existing EU member countries w i l l be more at ease with Turkey's candidacy if Turkey i s creating jobs for i t s citizens and does not have a large pool o f unemployed workers whose best work options are elsewhere in Europe.
4.2 Job creation will remain a high-priority issue through the accession period. The working-age population w i l l increase by over 800,000 annually between 2005 and 2015. Moreover, i t i s reasonable to expect an increase in the labor force participation o f women, currently at 27%, one o f the lowest rates in the world. The ongoing structural shift out o f agriculture w i l l continue to add new workers to the urban labor force. And creating opportunities for the increasingly well-educated youth - a group that now has very high unemployment rates - w i l l only add to the task. However, while al l o f these are challenges, they also present opportunities to increase the productive capacity o f the Turkish economy.
4.3 The ability to create jobs will be critical if Turkey is to converge to EU living standards. However, this convergence w i l l not happen simply through the creation o f low-productivity jobs. The process must be based on increases in productivity through better allocation o f resources including labor, technological change, and a more skilled workforce. This w i l l establish the conditions for the creation o f good jobs and higher wages while promoting competitiveness in view o f Turkey's deeper integration into EU and world markets.
'Os This i s the OECD-standardized unemployment rate, which covers the working age population (15-64 years o f age). SIS typically reports employment data for those 15 years and older which results in slightly different numbers. For example, the SIS unemployment rate for 2004 was 10.3%. In this chapter, we generally use the 15-64 year definition where possible in order to provide international comparability. In some cases, however, only figures for the 15+ year population are available.
125

4.4 The challenge for decision-makers will be to further establish and implement a policy framework that supports a development path focusing on job creation with productivity growth. Certainly, essential elements in such a framework rest outside the labor market, including the macroeconomic environment and the investment climate. However, a number o f critical factors fal l within the labor market, including regulation, labor institutions, active and passive programs, labor costs, and workforce development. These are the issues that provide the focus for this chapter.
4.5 Turkey entered the new century with labor market policies and institutions that were not suitable for an open, private-sector led economy; however, in the last few years, policy-makers have responded by introducing some important modernizing reforms. These include a new Labor Code and an unemployment insurance system. But further reforms are s t i l l needed to support job creation, enhance productivity growth, better protect workers, and broaden inclusion in the labor market.’” These reforms, coupled with continued economic growth, should result in an increasingly favorable climate for j o b creation and wage growth as Turkey moves through the accession period.
4.6 While the labor market reform agenda goes well beyond the Acquis, Turkey must also implement a number of specific legal and institutional changes to meet EU requirements. In i t s 2005 progress report, the European Commission has recognized the advances that Turkey has made in the area o f labor law but has noted a number of shortcomings that s t i l l exist. In general, the issues highlighted by the Commission (e.g., worker representation, chi ld labor, enforcement) represent important reforms for achieving a more efficient and equitable labor market. However, some o f the regulatory changes that w i l l need to be made w i l l be costly for f i r m s , at least in the short-run. As a consequence, how they are implemented, including the timing, w i l l be very important to minimize any possible negative impact on the job creation objective.
4.7 The next section summarizes the current situation with respect to EU accession and employment. Section B presents a statistical review of Turkey’s labor market performance, benchmarking i t against EU members and also brief ly addresses the issue of informal employment which i s an important feature o f the Turkish labor market. Section C addresses labor market policies that are relevant for meeting the Lisbon employment targets, for accelerating growth, creating higher-productivity, higher-wage jobs, and for helping Turkey’s workers to adjust to a more dynamic economic environment. The section looks at two aspects o f labor market pol icy - payroll taxes and employment protection - that are constraining j ob creation, especially in the formal sector. A reform agenda i s presented including a more effective unemployment insurance system and better s k i l l s training and active labor market programs. Finally, conclusions and recommendations are presented in Section D.
A. EMPLOYMENT AND EU ACCESSION
lo9 Detailed analysis on many o f the reform proposals included in this chapter was carried out by the World Bank in i t s recent study o f the labor market in Turkey. See World Bank (2005).
126

4.8 Turkey is still far from meeting the EU employment targets. The EU agreed at Lisbon in 2000 (with additions at Stockholm in 2001) to the fol lowing targets for 2010: an overall employment rate o f 70% (intermediate target o f 67% in 2005); a female employment rate o f 60% (57% in 2005); and a 50% employment rate for older workers (aged 55-64). As i s explained in the next section, neither Turkey nor most o f the existing EU members are on track to meet these targets. These targets are part o f the European Employment Strategy that also sets guidelines for member countries in the areas o f social protection for workers and inclusion and equity in the labor market."' As well, members must implement legislation and regulations in a number o f areas related to employment in order to comply with the directives that are part o f the Acquis.
4.9 As part of the EU accession process Turkey i s now engaged in drawing up a national action plan to implement the European Employment Strategy guidelines. Turkey, wi th ISKUR as the coordinating agency, began this process wi th the completion o f a background study (ISKUR 2003) which provided a comprehensive analysis o f the labor market. The next step, currently underway, i s the preparation o f a joint assessment paper to identify what needs to be done to prepare for accession and to fulfill EU requirements. The Government and the European Commission expect this paper w i l l be finalized in early 2006. Fol lowing the joint assessment paper, the national action plan for employment w i l l be formulated. The EU wi l l provide support to the Government to implement this plan through an instrument for pre-accession and a capacity-building roadmap. In fact, EU assistance i s already being provided through project financing to build capacity on active labor market programs, chi ld labor, social dialogue, and occupational health and safety.
A.1. General Employment Issues
The European Commission has identified areas where further reforms are required to implement the European Employment Strategy guidelines.' "
4.10 Less restrictive worker representation and collective bargaining. This i s probably the single most important accession issue in the labor market area. Turkey's legal arrangements and practices are too restrictive to meet EU standards, which are based on ILO conventions. The European Commission expects reforms to both public sector and private sector industrial relations legislation. The Law on Public Employees' Trade Union (Law 4688) limits the rights o f public employees to organize and does not include the right to collective bargaining. In the private sector, the Collective Labor Agreements, Strikes, and Lockouts Act (Law 2822) imposes dual criteria on workers' organizations to qualify as the authorized bargaining agent - they must represent at least 50% o f the employees in the workplace and at least 10% o f the total workforce in the
'lo For the latest guidelines, adopted in July 2005, see http://europa.eu.int/comm/empl(~~ment social/employinent stratezy/proD 200Yeuide 2005 en.pdf I" See European Commission (2005).
127

relevant industry.’ l2 In these (and some other respects) Turkey’s legislation does not comply with two o f the I L O core conventions - No. 87 on Freedom o f Association and Protection of the Right to Organize and No. 98 on the Right to Organize and to Bargain Collectively.’
4.11 Stronger social dialogue. The Commission has called on Turkey to strengthen social dialogue, establishing a culture o f bipartite dialogue (i.e., an improved framework for collective bargaining, as noted above) in the private sector and making tripartite dialogue more meaningful. I t has recommended that the predominant position o f the Government’s representatives on the tripartite Economic and Social Council be amended.
4.12 Efforts against child labor. Turkey has adopted the I L O Convention on the Worst Forms o f Chi ld Labor and had made legislative progress in the area, including increasing the compulsory schooling age to 15 years. According to the ILO, the number o f working children has decreased. However, the rights to education, especially for girls, and the issue o f street children remain serious in some regions. As well, Turkey has not yet accepted some articles o f the European Social Charter related to children’s rights to social and economic protection.
4.13 Promoting equal treatment/anti-discrimination. The new Labor Code and implementing regulations address a number o f issues relating to equal treatment and non- discrimination and, in terms o f gender, an equal rights constitutional amendment was adopted by Parliament in 2004. However, there are a s t i l l a number o f EU directives where alignment i s s t i l l required to meet equal treatment standards.
4.14 Better implementation and enforcement. The Commission report emphasizes that Turkey faces a major challenge to ful ly implement and enforce i t s labor laws on the ground. The need to further strengthen administrative capacity i s explicitly noted. The report also refers to the exclusion o f certain sectors and categories o f businesses f rom the coverage o f the Labor Code.
4.15 I t is important that the reform process continue in all of these areas. Reducing and eventually eliminating chi ld labor and discrimination w i l l have positive economic as wel l as social benefits. Reforms to the collective bargaining legislation w i l l align Turkey with the ILO core conventions and broaden the choices workers have for effective representation in the workplace. Finally, as the Bank’s recent labor market study concluded, strengthening the capacity to effectively enforce labor legislation i s an important element in an overall strategy to reduce informality.
‘I2 There are 28 industries (or “economic activities”) defined under the Trade Unions Act (Law 2821). The primary sector (agriculture, forestry, hunting, and fishing) i s exempt from this requirement. ‘I3 Although its legislation does not comply, Turkey has ratified these conventions, as well as all o f the other ILO core conventions. On various occasions, the ILO supervisory body has noted the non-conformity of Turkey’s legislation with Conventions 87 and 98 and has recommended that the Government take remedial steps to properly implement the conventions. For the latest observations o f the ILO, see http://www.ilo.oir/ilolex/rrbe/ceacr2~~5 .htm.
128

A.2. Compliance with EU Directives
4.16 With the 2003 Labor Code, Turkey has brought its labor legislation into closer conformity with the Acquis directives; however, further reforms are still needed. These directives bind member states to the relevant objectives but leave national authorities to work out the means to be used. Accession candidates negotiate how directives w i l l be met, including the transitional period required. The new Labor Code has more closely aligned Turkey’s laws to EU directives regarding fixed-term work, part-time work, protection o f employees in the event o f insolvency, and the protection o f young people at work (Taymaz and Ozler 2005). However, further reforms w i l l be needed to ful ly conform to directives regarding organization o f working time, some aspects of fixed-term work, employees’ rights in the event o f transfers, information for employees, and consultation and employee representation (see Annex Table A).’ l4
4.17 Turkey’s negotiations with the EU should recognize that, in certain cases, needed changes could require a long transition period. Some o f the reforms that are s t i l l outstanding w i l l be costly, at least in the short-run. For example, the EU directive on the organization o f working time states that each worker i s entitled to four weeks o f paid leave annually. Under the Labor Code, only employees with tenure o f at least six years are entitled to this amount o f leave. Meeting the EU standard may be socially desirable but, given the cost structure o f Turkey’s economy, i t would create disincentives for j ob creation and for labor law compliance. In some other cases, getting agreement f rom the social partners on the objectives o f directives, on means for compliance, and on implementation w i l l be difficult. Reforming the dual criteria for authorized bargaining representation i s a case in point.
B. TURKEY’S EMPLOYMENT PERFORMANCE IN A EUROPEAN AND INTERNATIONAL CONTEXT
4.18 This section provides an overview of Turkey’s employment performance. Trends over the past 15 years are presented and compared with EU members, distinguishing between the new members (EU-10) and pre-2004 members (EU-15), Bulgaria and Romania, and a selection o f comparable middle-income countries.’ l5
B.1. Working Age Population
4.19 Turkey already has a larger working-age population than any current member of the EU. Moreover, i t i s s t i l l in a phase o f population growth in this age category while most EU members are aging rapidly. As a result, by 2015 Turkey’s working age
‘14 In principle, countries can conform with directives through laws, regulations, administrative procedures, or bipartite agreements. According to Taymaz and Ozler (2005), Turkey has relied on the new labor law rather than through non-legislative means. Note that the review by Taymaz and Ozler (2005) focuses on employment directives narrowly defined and does not address related issues such as discrimination, mobility o f workers, and health and safety. ‘15 The middle-income countries have been selected on their basis o f their similarity with Turkey in terms o f size, GDP per capita, and GDP growth performance.
129

population wi l l be larger than that in the 10 new Accession countries combined and i t would represent 18.3% o f the total working age population in the EU.
4.20 This situation has a number of implications, both positive and negative. First, there are opportunities. With a dependency ratio that w i l l continue to decline for another two decades, Turkey has the possibility o f benefiting from what has been called the “demographic gift” - i.e., a population structure that i s weighted towards potentially productive, independent age groups. This could be a benefit for potential growth and the mobilization of domestic savings for growth financing (see chapter 1). Moreover, in a region where other countries are facing increases in their dependency ratios because o f aging, Turkey can offer an important source o f labor.
4.21 On the other hand, the productive potential of Turkey’s large and growing working-age population will only be realized if adequate employment opportunities are created. Between 2005 and 2015, the number o f people in the 15-64 year age category i s projected to increase from 47.8 mil l ion to 56.2 million. This means that the potential workforce w i l l increase by 840,000 annually during this period. Even at the currently low labor force participation rate o f about 40% for the 15-24 year age group (where the new entrants w i l l come from), about 335,000 new jobs would need to be created just to address this new labor supply. I f Turkey were to achieve the EU-15 participation rate o f 48% for this age group, the annual job target for new entrants would rise to over 400,000.
4.22 While in an optimistic scenario of strong job creation, Turkey could provide a useful (and selective) source of labor for an aging Europe, the context would be quite different ifjob creation is slow and unable to accommodate the supply of new entrants into the Turkish labor market. In that event, the prospect o f labor flows out o f Turkey seelung work in Europe because o f scarce opportunities at home may raise concerns in existing EU members. The extent o f this concern would presumably depend on the labor mobility conditions that were to apply to Turkey’s accession, as wel l as the labor market situation in existing EU countries.
4.23 Labor force participation has been declining. The participation rate for the 15-64 year age group fel l f rom 59.4 in 1990 to 51.5 in 2004. This i s a long-term trend, linked to broader structural shifts - Le., the transformation o f agriculture away from small-family farming characterized b y very high participation, and to the rural-to-urban structural shift where labor force participation has been more selective.’16 A temporary shift in the composition o f labor force may also have affected the labor force participation rate, as low-skilled rural workers age and are replaced by better-educated urbanized workers who face tighter employment conditions. Overall participation has fallen for both men (about 7 points) and for women (about 9 points). However, the female decline i s especially notable, given the very low starting point.
4.24 Participation rates are very low by European and international standards. Turkey’s participation rate in 2004 was about 20 and 14 points below the EU-15 and EU-
‘16 Between 1990 and 2003, rural labor force participation rates for persons aged 15-64 declined by 11.5 percentage points, while urban participation rates decreased by 3.2 percentage points.
130

10 means, respectively (Figure 4.1). I t i s also below Bulgaria, Romania, and non- European middle-income comparator countries. These comparisons show that the l ow aggregate rate for Turkey i s due to the very low female rates that are between 16 and 36 points below the comparator countries.
Figure 4.1: Turkey’s labor force participation rates in international context, persons aged 15-64 years, 2004
Total
0 Men
0 Womer
Turkey N - 1 5 N - 1 0 Bulgaria Romania Mexico South Thailand Malaysia Africa
Source OECD E m p l o y m t Otilook2005, Eurostat, 110 LABORSTA
EU-15 and EU-10 figures are weighted averages of countries included. Rates for Thailand include al l persons 15 years and over. Participation rate for Thailand (2003) and Malaysia (2000).
B.2. Underpinnings of Turkey’s Employment Performance
4.25 Employment rates have been falling and are well below the Lisbon standards. The employment rate for those between 15-64 years declined from 54.5 in 1990 to 46.1 in 2004. Huge differences exist between men and women, wi th employment rates o f 67.9 and 24.3, respectively. As Table 4.1 indicates, the EU members, as a group, are not on track to meet the Lisbon targets. In all cases, Turkey i s even further behind. I t should be noted that the EU itself does not rank particularly highly in terms o f employment when compared to a number o f other OECD and middle-income countries.”’
4.26 Turkey’s relatively poor employment rates reflect very low employment among women and older workers. The female and older worker targets were included in the Lisbon guidelines because the EU correctly noted that improved performance for these groups was essential if the overall employment target i s to be met. In fact, the two special targets for women and older workers represent the dominant reasons why Turkey lags so
In 2004, 10 OECD countries had employment rates above 70%. Six of these are outside the EU (Canada, Iceland, New Zealand, Norway, Switzerland, and the US.) while four are in the EU (Denmark, Netherlands, Sweden, and the UK) .
131

far behind the 70% overall standard. Without major improvements in the participation and employment rates o f these groups, this target w i l l remain far above Turkey’s actual performance.
Table 4.1: Employment rates in 2004 relative to the Lisbon targets, Turkey, EU members, and Bulgaria and Romania
Employment rate
2004
Overall employment Female employment Older workers
( 15-64 years) (15-64 years) (55-64 years)
2010 70% 2010 67% ’ 2010 55%
2005 67 % 2005 57%
Turkey
EU- 15
EU- 10
46.1 24.3 33.1
64.8 57.0 42.5
56.0 50.2 32.3
Source: OECD Employment Outlook 2005, Eurostat.
Bulgaria
Romania
4.27 Turkey’s low and declining employment rates have occurred despite relatively strong output growth. Over the 1995-2004 period, annual real GDP grew, on average, b y 3.5%; however, average annual employment growth during these years was only 0.6%. Turkey has not translated output growth into j ob creation as wel l as most other countries. Compared to EU countries and selected emerging market economies, Turkey f i t s into the middle range in terms of GDP growth over the past decade but it has had the lowest rate of employment growth (Figure 4.2).
54.2 50.6 32.5
57.7 52.1 36.9
132

Figure 4.2: GDP and employment growth, Turkey and selection of countries, 1990s D latest year
3.5 ' 3.0 2 5 2.5 E
E 1.5
m
g 2.0 - P
- m
S m
2 1.0
g 0.5 E !j 0.0 a 0.0 1 .o 2.0 3.0 4.0 5.0 6.0 7.0
Average annual GDP growth
Period covered i s Turkey (1995-2004), Malaysia and Mexico (1996-2003), EU-15 (1993-2004), Spain (1990-2004), Greece (1991-2004), Thailand (1990-2003).
Source: World Development Indicators, Eurostat, ILO
4.28 A number of factors potentially come into play to explain Turkey's low job creation, relative to its GDP growth. Some o f these are outside the labor market while others are more directly related to labor market policies, institutions, and practices. W e w i l l briefly address the possible factors outside the labor market here, while leaving the labor market-specific factors to the remaining sections o f the chapter.
(a) Structural change
4.29 Aggregate employment levels have been affected by the shift out of agriculture and into industry and services.''* Between 1980 and 2004, employment in agriculture fel l in absolute terms b y over 1.6 mi l l ion and i t s share o f total employment declined from 50% to 34%. Services are now the major source o f employment. Because o f agriculture's large starting share and i t s high labor intensity, however, the relatively fast growth o f the other sectors has not been sufficient to generate strong overall employment growth.
4.30 Future job creation will be primarily in services. Analysis undertaken in the Bank's labor market study showed that employment growth in services has been slower in Turkey than in comparator countries both because o f relatively slow growth in services
These factors are addressed in more detail in the Bank's labor market study (forthcoming, following final review by the Government for dissemination).
133

output and a relatively l ow employment elasticity in that sector. For Turkey’s j ob creation record to improve, services w i l l need to be the source o f more employment.
4.31 This job creation challenge in services will be heightened in the future since continued declines in agricultural employment are a certainty. Even with the structural shifts out o f agriculture over the past quarter-century, the transition has actually been quite slow when Turkey’s trends are considered in an international perspective. Figure 4.3, which depicts the negative relationship across countries between employment in agriculture and GDP per capita, shows that Turkey’s employment in the sector i s quite a bit higher than would be expected given its level o f development. I f Turkey was on the trendline, there would be 2.1 mil l ion fewer jobs in agriculture than i s currently the case. With the elimination o f agricultural subsidies, and further adoption o f technologies to compete in global markets, the shift o f employment out o f agriculture can be expected to accelerate.
(b) Macroeconomic trends
4.32 Although Turkey’s history of economic volatility has depressed output, it has not been a factor in explaining the country’s low employment elasticity of growth. Analysis undertaken for the Bank’s labor market study finds no statistical evidence that Turkey’s crises have had a significant persistent effect on employment levels. Adjustment in the labor market primarily happens through wage declines and increases in agricultural employment. Figure 4.4 shows how real wages fel l substantially during the 1994 and 2001 crises. In 2001, agricultural employment increased b y 320,000 before returning to i t s long-run pattern o f decline. There are surprisingly few layoffs in the formal sector and, as we argue later in this chapter, this i s due, at least to some degree, to how employers respond to the constraints o f labor market regulation. Whi le employment growth may not have been directly affected b y the crises for these reasons, output volatility over time has adversely affected both total factor productivity growth and the investment ratio, as indicated by empirical evidence reviewed in chapter 1. This has had a negative impact on GDP growth and the overall trajectory for employment generation.
134
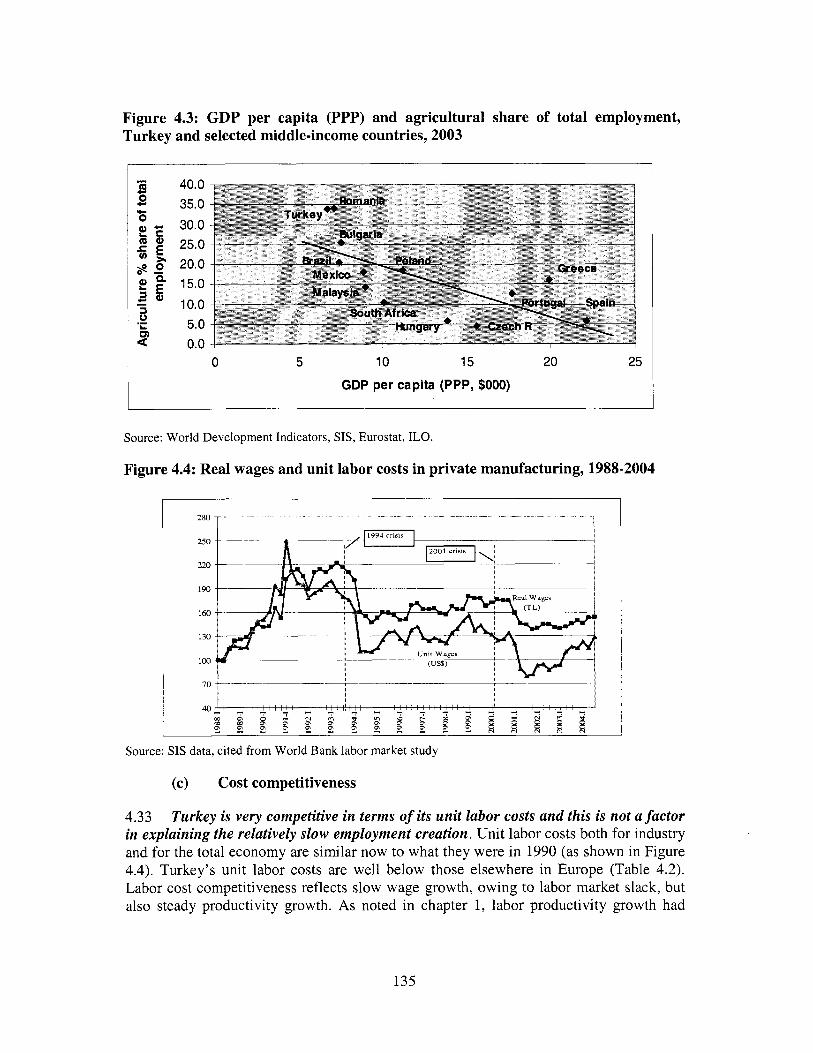
Figure 4.3: GDP per capita (PPP) and agricultural share of total employment, Turkey and selected middle-income countries, 2003
40.0 35.0 30.0 25.0 20.0 15.0 10.0 5.0 0.0
0 5 10 15 20 25
GDP per capita (PPP, $000) 1 I
Source: World Development Indicators, SIS, Eurostat, ILO.
Figure 4.4: Real wages and unit labor costs in private manufacturing, 1988-2004
I 70t-------- -I ,
Source: SIS data, cited from World Bank labor market study
(c) Cost competitiveness
4.33 Turkey is very competitive in terms of its unit labor costs and this i s not a factor in explaining the relatively slow employment creation. Unit labor costs both for industry and for the total economy are similar now to what they were in 1990 (as shown in Figure 4.4). Turkey's unit labor costs are well below those elsewhere in Europe (Table 4.2). Labor cost competitiveness reflects slow wage growth, owing to labor market slack, but also steady productivity growth. As noted in chapter 1, labor productivity growth had
135
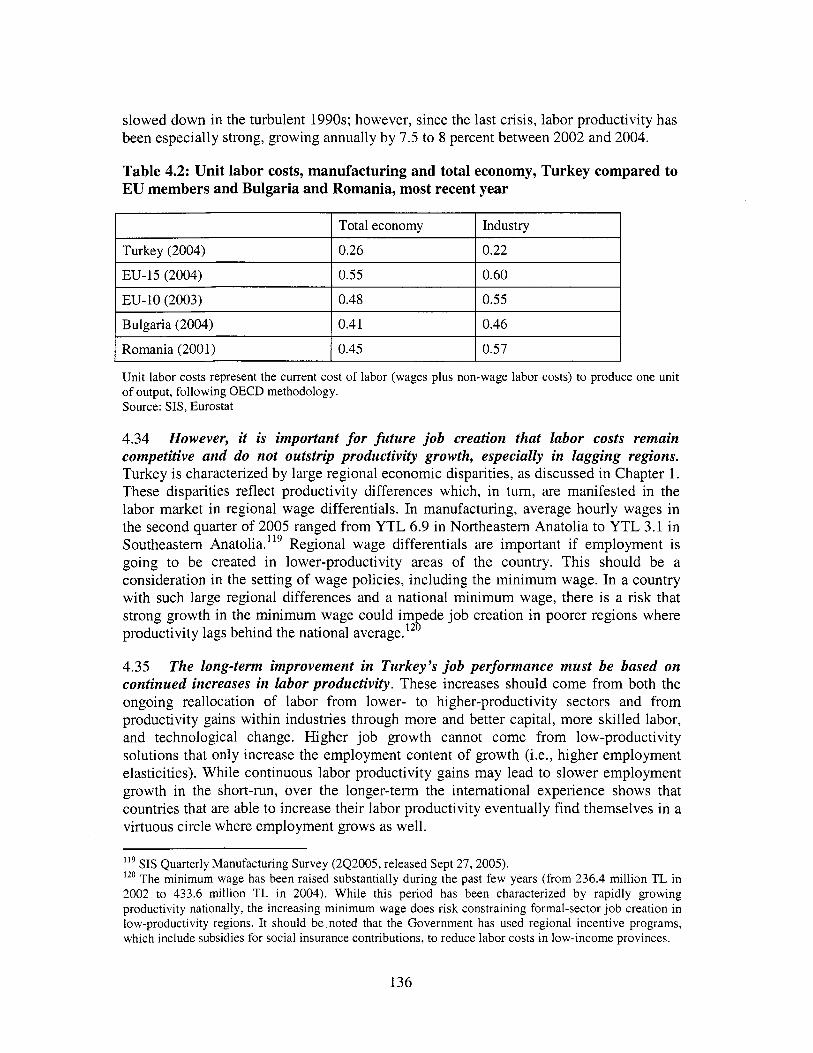
slowed down in the turbulent 1990s; however, since the last crisis, labor productivity has been especially strong, growing annually b y 7.5 to 8 percent between 2002 and 2004.
Turkey (2004)
Table 4.2: Unit labor costs, manufacturing and total economy, Turkey compared to EU members and Bulgaria and Romania, most recent year
Total economy Industry
0.26 0.22
EU-10 (2003)
Bulgaria (2004)
I EU-15 (2004) I 0.55 I 0.60
0.48 0.55
0.41 0.46
1 Romania (2001) 1 0.45 I 0.57
Unit labor costs represent the current cost of labor (wages plus non-wage labor costs) to produce one unit of output, following OECD methodology. Source: SIS, Eurostat
4.34 However, it is important for future job creation that labor costs remain competitive and do not outstrip productivity growth, especially in lagging regions. Turkey i s characterized by large regional economic disparities, as discussed in Chapter 1. These disparities reflect productivity differences which, in turn, are manifested in the labor market in regional wage differentials. In manufacturing, average hourly wages in the second quarter o f 2005 ranged from YTL 6.9 in Northeastern Anatolia to YTL 3.1 in Southeastern Anatolia.”’ Regional wage differentials are important if employment i s going to be created in lower-productivity areas o f the country. This should be a consideration in the setting of wage policies, including the minimum wage. In a country wi th such large regional differences and a national minimum wage, there i s a risk that strong growth in the minimum wage could im ede job creation in poorer regions where productivity lags behind the national average. 1 8 4.35 The long-term improvement in Turkey’s job performance must be based on continued increases in labor productivity. These increases should come f rom both the ongoing reallocation o f labor f rom lower- to higher-productivity sectors and from productivity gains within industries through more and better capital, more s l l l e d labor, and technological change. Higher j ob growth cannot come from low-productivity solutions that only increase the employment content of growth (i.e., higher employment elasticities). While continuous labor productivity gains may lead to slower employment growth in the short-run, over the longer-term the international experience shows that countries that are able to increase their labor productivity eventually find themselves in a virtuous circle where employment grows as well.
SIS Quarterly Manufacturing Survey (2Q2005, released Sept 27,2005). The minimum wage has been raised substantially during the past few years (from 236.4 mil l ion TL in
2002 to 433.6 million T L in 2004). While this period has been characterized by rapidly growing productivity nationally, the increasing minimum wage does risk constraining formal-sector job creation in low-productivity regions. I t should be noted that the Government has used regional incentive programs, which include subsidies for social insurance contributions, to reduce labor costs in low-income provinces.
136

B.3. Employment in the Informal Economy
All workers
4.36 Informal employment is an important feature of the Turkish labor market. The exact size o f the informal labor market depends on the definition and data used (see Box 4.1). The most straightforward definition i s based on whether the j ob i s registered with one o f the social security institutions. According to the HLFS estimates on social security registration, 53% o f the employed labor force was unregistered in 2004 (Table 4.3).
% of total employment
100 53
% not registered
Table 4.3: Non-registration of employed labor force in social security, 2004
Location
Urban 54 36
Rural
Activity
46 73
Non-agriculture
Agriculture
66 34
34 90
Employment status
Regular employee 43 21
137
Casual employee
Employer
8 91
5 24
Self-employed
Unpaid family worker
25 65
20 97

4.37 The high share of informal employment partly reflects the structure of the economy. As we have already noted, a large proportion o f the workforce i s s t i l l engaged in rural activities, primarily in agriculture. This i s a sector that i s not amenable to formal institutions, including social security. ’*’ In 2004, 90% o f employees in agriculture, fishing, and forestry were unregistered.
the sector’ as it is measured by the underreporting o f employment and the wage bill by f i r m s who otherwise f i le for tax purposes and, thus, belong to the formal sector o f the economy. However, the estimates are robust as they rely on a large sample o f f i r m s across all economic sectors. Even b y this partial measure, informality in Turkey i s significantly higher
4.38 While informalization is significantly lower in non-agricultural sectors, it is still substantial and does not appear to be declining. In 2004, 34% o f employees in non- agricultural industries were unregistered. Among regular employees, where one would expect near-universal coverage, 21 % were unregistered. Informal urban employment i s increasing more rapidly than formal work: between 1995 and 2003, non-agricultural employment grew by 25% while unregistered employment expanded b y 45%. The highest concentrations o f urban informal employment are in industries where institutions are weak and the state i s not involved much (e.g., construction and transportation).
Figure45 PercernofhborfoiceanJwagebillreportedfortaxpwposes 2004 120
80
EO
40
2o
Lat Est Lit Cro Hun poi CE Tw
4.40 The informal economy is an important generator of jobs and provides a safety net for workers. However, it is a low-cost, low-productivity sector with wages that are substantially below those in the formal sector. Registered paid employees receive net wages that are 1.7 times higher than unregistered employees (Kenar and Levent 2005). When social security contributions are taken into account, the labor-cost gap rises substantially. Certainly, the wage differential reflects differences in the s k i l l levels o f the formal- and informal-sector workforces. The probability o f working in the informal sector decreases as the level o f education rises; only 1.4% o f those with post-secondary degrees are employed in the informal sector (Kenar and Levent 2005). However, even
*” Unlike many countries, Turkey has a social security program for the self-employed, including in agriculture (Bag Kur). However, coverage i s inherently difficult and Bag Kur’s membership i s less than 2.5 mil l ion which represents only a small proportion o f the potential membership.
138

when education and other potential determinants o f earnings are controlled for, wages are significantly higher for workers in the formal sector. Kenar and Levent (2005) estimate that the (adjusted) formal-sector wage premium i s about 18%. This i s largely due to the higher productivity o f labor in formal sector f i rms, estimated on average to be three times higher than in f i r m s in the informal sector (McKinsey, 2004). Because of this gap in productivity performance, the dual structure o f the Turkish economy also drives down overall productivity growth and thus limits the potential for j ob creation in the economy as a whole.
C. LABOR MARKET POLICIES AND THEIR EMPLOYMENT IMPACTS
4.41 The slow employment growth and high informality documented in the last section raise questions about the extent to which labor market policies and institutions may be contributing factors. Particular attention has been paid to whether payroll taxes are too high and whether labor market regulation i s too rigid.
C.l Payroll Taxes
4.42 Payroll taxes are levied on employees and employers toJnance social insurance programs, with a combined contribution rate on gross earnings of between 36.5%-42%. Employees contribute 15% -- 9% for pensions, 5% for sickness, and 1% for unemployment. Employers contribute 21.5% to 27%, depending on industry - 11% for pensions, 7% for sickness and maternity, 2% for unemployment, and 1.5-7.0% for work injury (rates vary b y industry).
4.43 From an international perspective, Turkey’s mandatory payroll taxes are relatively high. Vroman and Brusentsev (2005) have assembled contribution rates for 150 countries, according to income level and geographic region. For the 59 middle-income countries included in their study, they find an average payroll tax rate (employer plus employee) o f 25.0%, well below the rate o f 37.5% they compute for Turkey. The payroll tax rate for Turkey i s higher than rates in all regions, except Central and Eastern Europe (46.5 %).
4.44 Comparative analysis across European countries indicates that the tax burden in Turkey is especially high in the case of workers with children, especially earning low wages. This analysis i s based on calculations o f the “tax wedge” which i s defined as income taxes and combined (employer-employee) social security contributions, minus cash benefits, as a percentage o f total labor compensation. Since Turkey provides consumption tax credits, we have also made calculations o f the tax wedge accounting for these credits. Note that payroll taxes account for about 70% o f Turkey’s overall labor taxes. Table 4.4 compares the tax wedge in Turkey with the EU-15 countries and a selection o f EU-10 countries (i.e., OECD members) for workers at different earnings levels and with different family characteristics. Turkey’s relative position varies, depending on family status and earning levels. This i s because, unlike most European countries, Turkey does not levy lower effective tax rates (especially through income taxes) on families with children and on l ow earners. In the cases o f single individuals and
139

married couples wi th no children at or above the average production wage, Turkey’s tax burden i s in the middle ranks in Europe. But for families and singles with children, Turkey’s taxes on labor are among the highest. This i s especially the case for low-wage workers wi th children where Turkey has the highest tax wedge o f al l o f the European OECD countries.
4.45 A high tax wedge on labor income hampers job creation in the formal sector, although more solid evidence is needed to confidently assess the expected impact of reforms. The employment effects o f a high tax wedge depend on (i) the incidence o f the tax - i.e., who actually pays the taxes - and, thus, i t s effect on total labor costs; and (ii) the elasticity o f labor demand - i.e., what happens to employment as labor costs change. 122 There has been very l i t t le quantitative analysis on these issues in Turkey and the international research offers only rough insights. Studies in middle-income countries provide a wide range o f estimates on tax incidence; for example, research in Lat in America suggests that anywhere from 20-70% o f the employer’s social security contributions are passed on to the worker through reduced wages. The lower bound estimate would suggest that high payroll taxes have a substantial effect on labor costs while the upper bound estimate would imply a much smaller impact. In terms o f labor demand elasticities, estimates from international research suggest that the l ikely range i s between 0.3 and 0.5 (i.e., a 10% increase in the cost o f labor would cause a decrease in employment o f between 3 and 5%).123 Depending on the actual incidence and elasticity in Turkey, these estimates suggest that a 10% decrease in payroll taxes (i.e., 3-4 percentage points) would result in an employment increase somewhere between 1-4%.124 However, this range is suggestive only and empirical analysis i s needed to estimate both the labor tax incidence and the elasticity o f labor demand.’25
12’ Note that a high tax wedge can also create incentives for employees to work informally because o f the difference between their gross wage and their take-home pay. This effect may be particularly evident where workers have low expectations that national insurance systems and other social services w i l l deliver benefits in the future. Research by the World Bank, especially in Latin America, has demonstrated that worker choice plays some role in informality (e.g., see Maloney and Cunningham 2001). 123 This range i s based on the literature review in Vroman and Brusentsev (2005). They present these estimates with some caution, because o f the lack o f empirical evidence from middle-income countries. A more recent study o f EU-8 countries (World Bank, EU-8 Quarterly Economic Report, April 2005, Part 11) finds a higher elasticity o f employment to changes in the tax wedge, between 050 .8 , suggesting a strong negative impact o f the tax wedge on employment. There is, however, some possibility of bias in these estimates relying on macro data, although i t i s not clear in which direction any bias might go. 124 The high-end estimate i s based on an assumed employee incidence rate o f 20% (i.e., employer actually pays 80% of taxes) and a labor demand elasticity o f 0.5; thus, with a 10% tax cut, total labor costs would be reduced by 8% and this would translate into a 4% employment gain. The low-end estimate i s based on the other ends o f the incidence and elasticity ranges indicated in the text - i.e., 70% and 0.3. 125 I t should be noted that the World Bank has requested data from the Government to undertake an analysis o f the effects o f payroll taxes on employment and informality.
140

Table 4.4: Comparing Average Tax Wedges' in Turkey with European countries by Family Type and Wage Level, 2004
Family type Single Single Married - _ _ N o Ehildren 2 children 2 children
Wage level ' 67 100 167 67 67 100-0 100-33 44-0
Turkey tax wedge 41.8 42.7 44.4 41.8 42.7 42.2 42.2 41.3 (%), OECD methodology Number o f EU- 15 3 8 8 0 0 0 3 countries with higher tax wedge
countries3 with higher tax wedge
(%), with consumption tax credit Number o f EU- 15 5 9 9 0 1 1 3 countries with higher tax wedge Number o f "EU-4" 3 4 4 0 0 1 2 countries3 with higher tax wedge
1. Income tax plus employee and employer contributions less cash benefits; consumption tax credits added for Turkey. 2. As percent o f average production wage. In married family types, wage level for each adult. 3. Includes EU-IO countries that are also OECD members -- Czech Republic, Hungary, Poland, and Slovak Republic. Source: OECD (2004), with calculations by IMF and World Bank staff
Number o f "EU-4" 2 3 3 0 0 0 1
Turkey tax wedge 39.0 40.0 41.5 39.0 38.3 38.7 39.2 35.3
4.46 I n the absence of broader reforms, currently there is little scope for major reductions in payroll taxes because of the fiscal position of the social security funds. Subject to feasibility in view o f broader fiscal policy considerations, taxes for unemployment insurance could be decreased without threatening the integrity o f the Unemployment Insurance (UI) Fund, as discussed below. However, since this represents a minor part o f overall social security contributions, any employment gains would be relatively small. The strategy should be to successfully implement social security reforms to put the overall system on better financial footing which would allow for deeper tax cuts in the future. In the meantime, institutional reforms to improve tax collection and reduce non-compliance would be useful.
4.47 Reducing payroll taxes, when feasible, and strengthening tax collection and inspection would bring more workers into the formal social protection system. As was discussed previously, Turkey has a high ercentage o f the non-agricultural workforce that i s outside the social security system."' To the extent that social security reforms
lZ6 The non-registration figures discussed earlier actually understate the lack o f coverage because registration i s often only partial due to the underreporting o f wages; for about 50% o f employees enrolled in SSK, wages as reported by employers are at the minimum insurable level.
141

eventually put the system on a sound financial footing and taxes can be reduced, incentives for formalization w i l l improve. In the meantime, institutional reforms to improve tax collection and improve enforcement would be useful in bringing more workers into the formal social protection system. At present, the Ministry o f Labor and Social Security and the Social Security Institution do not have the resources or the capacity to adequately address non-compliance.
C.2. Employment Protection L e g i ~ l a t i o n ’ ~ ~
4.48 Employment protection legislation (EPL) provides job security for covered workers but it can also have unintended consequences by discouraging job creation, especially in theformal sector. EPL covers the kinds o f contracts permitted and the rules and procedures for terminating workers, including the severance obligations o f employers. Research has found that strong employment protection rules can have unintended labor market impacts, increasing informality, somewhat reducing participation and employment rates, and increasing unemployment duration. Women and youth are disproportionately affected because they are underrepresented among the “insiders” who benefit from the j ob security rules. The challenge for policy-makers i s to find an appropriate balance between flexibility and security in employment protection legislation.
4.49 Turkey’s employment protection rules are very restrictive by international standards. One widely used measure i s the OECD index that calculates strictness o f EPL according to 18 indicators o f employment protection in three areas: dismissal regulations for permanent or regular workers; regulations regarding flexible work forms; and regulations governing collective dismissals.’28 The most recently published scores take into account Turkey’s 2003 Labor Code (OECD 2004). The 2004 OECD scores indicate that Turkey, along with Portugal, had the most restrictive EPL among member countries. Figure 4.6 summarizes the results, benchmarlung Turkey against groups o f OECD c o u n t r i e ~ . ’ ~ ~ Turkey’s high score i s primarily due to i t s rules concerning flexible work contracting (temporary and fixed-term employment) which are the most restrictive in the OECD.I3’
12’ For more detail on the analysis summarized here, see the World Bank labor market study, Chapter 4. 12* For details on the methodology, see OECD (2004, Annex 2.A1).
Note that the figure also includes two EU-10 countries, Estonia and Slovenia, that are not part o f the OECD. These scores were calculated by Riboud, Sanchez-Paramo, and Silva-Jauregi (2002). I 3 O The 2003 Labor Code did create a legal framework for flexible employment forms and put these on the same legal footing as full-time, indeterminate employment. However, the Code did not remove the restrictions on using these work forms. N o legal provision exists for temporary agency work; Mexico i s the only other OECD country where this i s the case. Only Turkey and Greece restrict fixed-term contracts to situations where the nature of the assignment has an end date (such as seasonal work, specific project, replacing temporarily absent workers). Other OECD countries allow for at least some fixed-term employment, even where the work i s not inherently o f a limited duration.
142

Figure 4.6: Turkey’s EPL Rating compared to other OECD and European countries, 2004
I I I I I I
Turkey 3.3u 1 I I I I I I
Southern Eur.
Continental Eur
Nordic Eur.
New EU
2.98
0 0.5 1 1.5 2 2.5 3 3.5
Source: OECD (2004, Table 2.A2.4); Riboud, Sanchez-Paramo, and Silva-Jauregi (2002); and calculations by World Bank.
4.50 Severance pay is the other aspect of employment protection where Turkey’s rules stand out. Severance payments are much more generous than i s typically the case in other middle-income countries, or in Europe and the rest o f the OECD (Figure 4.7).131 The Government committed to reform in the 2003 Labor Code, specifically in the form o f introducing a severance pay fund. However, to this point, this has not been implemented because o f a lack o f consensus on the part o f social partners and the Government about the details o f the proposed fund.’32 The previous severance arrangements (under the 1971 Labor Code) prevail in the meantime.
13’ Regular workers are eligible for severance payments after one year o f service in the event o f resignation for just cause, dismissal initiated by the employer for reasons other than worker misconduct, and qualification for old-age pension. The payment i s set at a level equal to one month of pay (at last gross daily wage rate) for each year o f service. A ceiling i s placed on the amount a worker can receive. This ceiling i s established as the annual amount o f the retirement bonus of the highest state official subject to the Civ i l Servants Act. 13’ Studies on severance pay reform, including the establishment o f severance fund, are being continued.
143

Figure 4.7: Turkey's severance rules compared to other countries (a) Minimum months o f employment required for eligibility
I 1
Turkey Upper-middle ECA region OECD income
I 1 1 1
(b) Multiples o f monthly wages paid in severance at selected lengths o f service
I
Source: Holzmann, Iyer, and Vodopivec (2003)
4.5 1 Job security rules, including both flexible contracting and severance payments, should be brought closer into line with norms in Europe and in other middle-income countries. As noted above, while these protections do benefit covered workers, the international evidence suggests that they come at a price - constraining formalization, a less dynamic labor market with lower employment, and exclusion o f vulnerable groups from the formal labor market. If the j ob security rules are changed, i t i s important to introduce reforms both to open up opportunities for flexible contracts and to reduce severance costs for regular workers. Many countries (e.g., Spain) tried to move only on the former, avoidin the latter because of the political difficulties associated with reducing ~everance."~ In these cases, however, the result has tended to be expansion o f temporary and fixed-term employment at the expense o f regular employment which had
133 Spain eventually followed these initial reforms with a second round that increased the attractiveness o f permanent contracts for employers.
144

become relatively more costly. This unbalanced pattern o f j ob creation wi l l typically persist until reforms are extended to change severance pay for regular terminations.
4.52 Employers use various strategies to avoid entering into the obligations associated with EPL and payroll tax compliance. The most common strategy i s simply to operate informally, not registering workers and keeping below the sightlines of workplace inspectors.
4.53 Employers tend to respond to increased labor demand by lengthening hours of existing workers rather than hiring new ones. Workers in Turkey report actual hours that are among the highest in the world - certainly far beyond European countries and even longer than in East Asian countries that are known to have long work weeks (Figure 4.8). As Turkey came out o f the 2001 crisis, increased demand for labor was met by increases in average hours; in 2002 and 2003, average weekly working time in manufacturing rose by 0.5 and 0.3 hours, respectively.
Figure 4.8: Average actual weekly working hours in manufacturing, Turkey in an international context, most recent year
60 50 40 30
20 10 0
1. Estimates are for 2003 for Turkey and Japan, 2001 for Korea and Thailand, and 2004 for the rest. Source: Eurostat, ILO
4.54 Formal-sector employers are reluctant to hire new workers because of possible separation costs in the future, as well as other obligations. An analysis of a sample o f large f i r m s during and after the most recent crisis illustrates how formal sector employers maintain very stable employment levels even in the face of very unstable business conditions. This analysis i s based on employment and financial information from 101 publicly-traded f i r m s over the 2000-2002 period. 34 The research provides evidence that f i r m s did not lay o f f workers in significant numbers during the downturn and then did
134 This sample was drawn from the Worldscope database and includes al l firms that provided full reporting on employment, capital, and sales for 2000,2001, and 2002. Of the 101 firms, 70 were in industry and 31 in services. Because of their size and financial status as publicly-traded, these firms would represent the most formal segment of the Turkish private sector. For details on the Worldscope database, see http://WWw.thornson.corn/comnion/view brand overview.isu?section=financial&body include=/financial/ brand ~verviews~~orldscoue Fundamentals&Daee mode=full&subsection=null&secondurv=null&subnav =~rodaz&tertiary=null~product name=Wiorldscoi>e Fundamentals
145

very l i t t le hiring when business conditions improved again. As Figure 4.9 shows, despite extremely large changes in sales over this three-year period, the median firm employment level remained nearly flat. Calculations o f employment elasticities on sales yield very small estimates of between 0.0 and 0.15.
Figure 4.9: Changes in sales ($US) and in employment over previous year, sample of formal-sector firms, 2000-2002
I 50 40 30 20 10 0
-1 0 -20 -30 -40 -50
2000 2001 2002
Source: Calculations by World Bank staf f based on Worldscope data
4.55 The strategies that employers use to minimize the costs of Turkey’s legal framework are not always economically efficient and they constrain job creation, especially in the formal sector. At the same time, they leave a large share o f the labor force without access to formal instruments of social protection.
4.56 Better outcomes would result from more flexible job security rules that encourage employment creation in the formal sector. This would involve reforms to bring Turkey more in line with comparator countries in Europe and elsewhere in terms of
, severance pay requirements and flexible contracting. Increasing flexibility through the reforms suggested in this report does not need to jeopardize the protection of the basic rights o f workers. International experience suggests that women and young people would especially benefit in terms of increased access to formal employment.
4.57 At the same time, the labor force would be more effectively protected by a stronger safety net with wider coverage and better opportunities for skills development. The key elements would be an improved unemployment insurance system, capacity to implement cost-effective active labor market programs, and a high-quality training system.
4.58 This strategy of making Turkey’s EPL more flexible while strengthening the safety net and skills development can be seen as shifing protection from jobs to workers. This transition i s necessary i f Turkey’s labor market i s going to have the flexibility to benefit from the opportunities o f ongoing economic liberalization, to
146
provide full access to a diverse population, and to offer workers the tools to enhance their employability and to manage the inevitable adjustments.
c.3. Unemployment ~nsurance’~~
4.59 The Unemployment Insurance system has been providing benefits payments since 2002. The legal framework for the system follows the standard OECD model. I t i s mandatory, covering al l industries and occupations (except public administration and the self-employed); benefits are available for those involuntarily laid-off in registered f i rms; benefit levels are earnings-related; entitlement duration i s tied to previous employment history; and benefits are financed by employer, worker, and government contributions. One important deviation f rom the OECD model i s a simplified monitoring of continuing eligibility. This i s primarily dictated b y the large informal sector and l imi ted capacity o f employment offices to monitor the current status o f recipients, including their j ob search b e h a ~ i 0 r . l ~ ~
4.60 I n its short history, Turkey’s UZ system has actually provided benefits to relatively few unemployed workers. The most recent figures indicate that there are slightly less than 100,000 recipients, representing about 4% o f al l unemployed workers. Although it would be expected that a new system would expand only gradually, the growth in the number o f recipients has been slow when compared wi th other countries that have introduced unemployment in~urance.’~’ Additional reforms w i l l be required for broader coverage.
4.61 Zf the UZprogram is to evolve into a broadly-based source ofprotection, reforms will be needed to improve compliance, to ease eligibility requirements, and to improve protection offered through higher benefits. These reforms would complement reductions in severance payments, as discussed earlier. The compliance issue around social security in general has already been raised. In the case o f UI, there i s an additional issue - j o b separations being reported as voluntary (primarily to avoid severance) with the consequence that many unemployed workers are ineligible for unemployment benefits.
4.62 Eligibility requirements are quite restrictive and easing them would increase the number of unemployed workers who could qualify for benefits. Currently, workers need to have worked in covered employment continuously for 120 days preceding the termination o f employment, and for 600 days in the preceding three-year period. This condition i s particularly strict, when compared with OECD countries and with the
135 This sub-section i s based on World Bank (2005) and underlying analysis f rom Vodopivec (2004), updated in 2005. 136 The Unemployment Insurance fund i s also used to finance short-time compensation and a Wage Guarantee Fund. The former provides for UI payments to “top up” wages o f workers who have hours reduced because o f reduced labor demand. The latter provides partial payment o f wages to workers who are employed by firms unable to pay their wages because o f liquidation or some other reason. 13’ In other developing countries that have recently introduced UI, coverage rates are significantly higher. For example, Korea’s UI system provides benefits to about 15% o f all unemployed workers. Based on the experience o f middle-income countries, Turkey should expect that coverage rates should be in the 2550% range when the system matures.
147

transition countries. The Government has recently proposed that the eligibility requirements be amended to 120 days (not necessarily continuous) over the ast year and 450 days over the preceding three-year period. In i t s Labor Market stud$38, the Bank recommended a reduction in eligibility requirements to 12 months o f covered employment over the preceding 24 month period.
4.63 Higher benefit levels would be another way to increase the coverage of the plan as well as improve the degree of protection offered to the unemployed. Benefits are now set at 50% o f net earnings (from average o f previous 4 months). The ceiling for benefits i s the net wage of the official minimum wage for workers below 16 years o f age. The Government i s currently considering a proposal to raise the ceiling to double the minimum wage. The Bank has recommended in i t s Labor Market study that the maximum benefit be de-linked from the minimum wage since, in some instances, the setting o f minimum wages may not reflect market conditions. The specific recommendation was to establish a target benefit ceiling tied to the average private sector wage. Implementing this recommendation w i l l require a sound statistical basis for calculating this average private sector wage.
4.64 The Bank has also recommended that the UZ contribution rate be reduced from the current 4% to 2%. While the employment impact o f this reduction would be modest, i t would provide some alleviation to the high payroll taxes to fund social security.
4.65 The Government is in a position to consider liberalizing changes to the UZ system given the strong financial position of the Fund. Because o f l ow liabilities and very high rates o f return, the Fund has a surplus o f over 15 bi l l ion YTL (over $11 billion). The Bank’s Unemployment Insurance Simulation Model (UISIM) was used to assess the impacts o f different macroeconomic and parametric reform scenarios on the UI system and the performance o f the Fund. 139 The “combined reform” simulation includes the eligibility, benefit, and contribution rate changes indicated above, plus increasing spending on ALMPs to reach a level o f 0.2% o f GDP by 2009. This reform simulation was also run under an “economic shock” scenario where the economy slows and then contracts between 2007-2010. Figure 4.10 shows that the combined reforms could be financed without any jeopardy to the sustainability o f the UI Fund. This conclusion holds
13’ Forthcoming, following final review by the Government for dissemination. 13’ This model predicts (Le., projects) outcomes for key financial and other system variables based on input data regarding contributors, beneficiaries, and rules of the system, as well as macroeconomic and labor force variables. The simulations include a base scenario and a set o f alternative scenarios to capture the effects o f possible changes to key parameters and changes in macroeconomic conditions. Simulations are run out to 2022. The base case simulation assumes that key parameters o f the system remain as they were in April 2004. As for macroeconomic parameters, the base scenario assumes the real yearly interest rates (the rate applied to the UI reserve fund) o f 8.0% in 2003, declining by 0.5% yearly until it reaches an equilibrium rate o f 4.0% in 2011. Under the low-interest rate scenario, interest rates are set at 2.)% from 2006 to the end o f the simulation period. Note that inflation i s dealt with implicitly, as the model works with real values o f financial variables. Under the base case, real GDP i s assumed to grow at a 5% rate during the simulated period. Real wage growth i s assumed to be 5.8% in 2005, then gradually declines to reach an equilibrium range o f 3.0-3.2% by 2013. The macroeconomic assumptions are the same as those used by the World Bank for i t s more recent pension and health insurance model simulations Further details on the model are available in Vodopivec (2004) and World Bank (2005).
148

even when the reforms are combined with the economic shock or when interest rates have been reduced significantly.
Figure 4.10: Value of the UI Fund reserves, U I S I M (various simulations), 2003-2022 Base case
50 000
10,000
0
0 2003 2004 2005 2006 2007 2008 2009 2010 2011 2012 2013 2014 2015 2016 2017 2018 2019 2020 2021 2022
Year
+Turkey - Base --Turkey - Shock +Turkey. Easing of eligibility * Turkey - Reduction of contributions --Turkey. Combined reform 8' Turkey. Combined reform + shock
Low interest case
40 OW
5.000
0 2003 2004 2005 2006 2007 2008 2009 2010 2071 2012 2013 2014 2015 2016 2017 2018 2019 2020 2027 x)22
Year
-Turkey - Base --Turkey. Shock +Turkey ~ Easing of ellgtbllity --Turkey. Reduction of contnbuttons -Turkey -Combined reform Turkey - Combined reform + 6hOCk
4.66 Reforming UZ along the lines indicated above would improve the coverage of the system and its capacity to provide income protection to unemployed workers. When this support i s combined with cost-effective ALMPs (discussed below), unemployed and otherwise vulnerable workers w i l l be able to more effectively manage labor market r isks.
149

4.67 However, as the UZ fund is a component of the government's primary fiscal position, reforms should be planned subject to broader fiscal feasibility. Appropriate fiscal space should be made for broader coverage o f social safety nets by structural fiscal reforms aimed at downsizing low-value programs and broadening the tax bases, as discussed in chapter 2.
4.68 Zn the future, policy-makers may want to consider a more far-reaching reform that goes beyond the modification of existing UZ parameters and more fundamentally changes the architecture of income support for unemployed workers. This would involve transforming and integrating the existing severance and UI systems into fully- funded individual accounts to provide income support to workers who have lost their jobs. This type of reform has been implemented in some countries, especially in Latin America. Whi le many design issues would have to be worked out, individual unemployment savings accounts have the potential to efficiently protect workers while solving some of the employment and compliance-related concerns discussed in this section.
C.4. Active Labor Market Programs
4.69 Income protection needs to be selectively complemented by cost-effective active labor market programs (ALMPs) for unemployed and otherwise vulnerable workers. The demand for ALMPs should grow during the accession period, wi th the labor adjustment that can expected because o f increasing trade, privatization, and the restructuring o f agriculture.
4.70 Currently, Turkey has little capacity to support workers through employment services or other ALMPs. Overall spending i s not available but i t seems probable that Turkey invests less in ALMPs than other middle-income OECD countries which roughly spend between 0.2-0.7% o f GDP (OECD 2005). The bulk o f spending on ALMPs i s financed b y World Bank and EU projects. The EU has implemented a technical assistance program, primarily to enhance the capacity o f ISKUR, the national employment agency created in 2000.'40 Private employment agencies do not yet play an important role. These agencies were authorized for the f i rs t time in 2003 although they cannot provide the full range o f employment and training services. According to the latest figures (February 2006), just over 100 have been licensed.
4.71 The international experience shows that ALMPs have a mzked record and building capacity in this area must be done selectively and strategically. Scientific evaluations indicate that many ALMPs do not help participants find work or improve earnings and, where impacts are positive, they are sometimes outweighed by program costs.'41 Program design and the context in which the program operates matter a great deal and well-designed and implemented interventions can improve the functioning o f the labor market and assist targeted workers to find jobs. A recent review by the OECD (2005) has reinforced earlier conclusions b y that organization and b y the Wor ld Bank that
This program includes policy development and improving ISKUR's operational performance; a grant scheme to finance ALMPs; and construction o f provincial employment offices. 14' For a review of the evaluation evidence, see Betcherman, Olivas, and Dar (2004).
150

j o b search assistance can have positive impacts at relatively low cost. The record on more expensive interventions l ike job training i s less favorable but the OECD’s updated assessment suggests that the impact o f these programs may be positive over the longer term even if n o positive effects are evident in the short run.
4.72 The international experience is clear in showing that successful ALMP strategies are based on rigorous performance monitoring and evaluation and allocation of resources to programs and service deliverers that demonstrate positive outcomes. The foundation should be a network o f public employment offices, directing clients to service deliverers that meet performance standards. There i s now considerable institutional variation within the OECD in terms o f how this strategy i s implemented, ranging f rom conventional models to more radical innovations in Australia and Netherlands, for example, where a “quasi-market” for ALMPs have been established. Turkey should consider the full range o f options as it builds capacity in this area. In any event, allocation o f resources should be based on evaluation evidence and directed towards programs and services that demonstrate cost effectiveness. Increases in resources for ALMPs should only be made as the institutional capacity o f ISKUR to design and implement them develops.
D. CONCLUSIONS AND RECOMMENDATIONS
4.73 Recent initiatives, including the 2003 Labor Code, have brought Turkey’s labor market framework into closer alignment with E U requirements. However, more changes w i l l s t i l l be needed to ful ly comply wi th the Acquis. These generally represent useful reforms for achieving a more efficient and equitable labor market but some o f the reforms w i l l require careful design and implementation in order not to work against the j o b creation objective. Moreover, Turkey’s negotiations wi th the EU should recognize that some o f these could require a long transition period, either because they w i l l be costly or because i t w i l l be difficult to get agreement f rom the social partners.
4.74 There is also a broader labor market reform agenda to create the conditions for full employment, higher quality and productivity, and social cohesion and inclusion. The principle underlying the reforms should be to shift protection from jobs to workers. This w i l l involve making labor market regulation more flexible while strengthening the support workers receive through unemployment insurance, active labor market programs, and sk i l l s development. Table 4.5 prioritizes the reform agenda needed to comply with the Acquis and to pursue the targets set b y the European Employment Strategy.
151

152

CHAPTER 5. FINANCIAL SECTOR DEVELOPMENT
5.1 Turkey’s financial sector is repositioning itself to better facilitate growth of the private sector, as the financial sector’s development was impeded by past macroeconomic instability and fiscal deficits, crowding out credit generation to the private sector. As a result, the sector today i s smaller than i t s potential size and performing below i t s potential in terms o f prudently allocating credit in the economy. Increasing credit to the private sector w i l l not only facilitate capital accumulation, leading to growth and better labor productivity, but it w i l l also improve the allocation o f capital leading to TFP growth.
5.2 Turkey’s financial sector provides a good payment system and has efficiently mobilized savings, but the mobilized funds have historically not been supporting private sector investments and have instead been largely invested in a small number of firms and in Government securities. Therefore, i t has neither allocated capital to the private sector efficiently, nor has i t diversified r i s k s for i t s investors.
5.3 The EU accession process is a positive force for change as the acquis outlines a number of sound standards for financial sector supervision and standards for corporate governance and transparency. EU aims to create an open market for financial services and wel l as to create a level playing f ield b y applying consistent governance and supervisory systems across member states. Thus, the acquis lays out standards for supervision o f financial institution and governance that w i l l guide near term financial sector reforms in Turkey.
5.4 Turkey’s commitment to EU accession is also stimulating financial sector development through its positive impact on investor confidence. EU accession establishes a medium-term policy anchor, which creates trust among international investors that Turkey i s on a convergence path with EU. As noted in chapter 1, interest rates have been declining, and international investors have been financing the current account deficit wi th capital inf lows at decreasing interest rates. In February o f 2005, the Government successfully marketed a 5-year bond with a yield lower than the 1 year T bill, and international issuers have followed with f ixed coupon bond issues with maturities of as much as 10 years. These are positive forces for the development o f access to credit and in particular medium- and long-term credit products in local currency.
5.5 The World Bank has supported the recovery and development of the banking sector since the financial crisis of 2000/2001 most importantly through a series of adjustment loans, PFPSAL 1-111. Between 1997 and 2002,20 banks were taken over b y the SDIF, and al l but one have been liquidated, merged or sold. In addition, Imarbank
153

was liquidated due to bankruptcy in 2003. Moreover, Cbris Kredi Bank was voluntarily liquidated without any burden to the public. The bank supervisory system has been strengthened, and three large deposit talung public banks have been operationally restructured and recapitalized. In tandem with the economic recovery, the banking sector i s now evolving f rom a mechanism for funding Government borrowing needs to a sector that intermediates finance for the private sector.
5.6 While substantial progress has been achieved since the financial crisis of 1999- 2001, financial sector reform remains an unfinished agenda. As Turkey continues on i t s path o f economic and financial stability, the key challenge i s to strengthen the prudential framework and to create institutions that w i l l facilitate sound and efficient expansion o f credit to the private sector, which in turn w i l l foster competitiveness, growth and employment in the private sector. The three large state banks, which required fiscal outlay o f U S $ 22 bi l l ion in the aftermath o f the financial crisis, are yet to be sold to private investors. The supervisory frameworks are s t i l l in the process o f building capacity while adapting to EU and Base1 I1 requirements. The credit markets, which to a great extent remained dormant during the time o f economic volatility, need institutional support in the areas o f auditing and accounting, credit information system, collateral regime, enforcement o f contracts, as well as more sector specific reforms, for instance in the mortgage market. While such institutional underpinnings merited little attention during the time o f economic volatility and therefore remain ill developed, they now offer great potential for developing a sound financial sector. A sound regulatory system, a sound accounting and auditing system, a good credit information infrastructure, a good collateral registry and regime, contract enforcement and an effective judiciary w i l l be the foundations for a sound and efficient financial sector.
5.7 The next section provides an overview o f the status o f Turkey’s financial sector followed b y sections that review challenges and identify reform needs in: the banking sector, the credit market, the mortgage market, and the insurance sector. The last section provides an overview o f policy objectives and policy recommendations combining the broader financial development agenda with the EU accession perspective.
A. OVERVIEW OF THE FINANCIAL SECTOR ISSUES IN TURKEY
5.8 The banking sector is the largest and most important part of the Turkish financial sector, and other financial institutions are mostly owned or otherwise affiliated with the major commercial banks. In addition, the public equity market has grown since the late ei hties to a substantial size, while the non-bank financial institutions (NBFI) sect^!^^ remains small, and the NBFIs are generally owned b y or otherwise affiliated with the major banks. The Government debt market, including a rep0 market, i s large and liquid with significant participation from domestic banks, foreign investors, domestic mutual funds, pension funds and insurance f i rms. The corporate bond
142 The sector includes mutual funds, pension funds, insurance, leasing, factoring, asset management and consumer finance firms.
154

market, in contrast, i s virtually non-existent. Table 5.1 provides an overview o f assets o f sub-sectors o f the financial sector in Turkey.
5.9 Savings mobilization of the financial sector in Turkey is good compared to other emerging markets, helped by the high returns offered on relatively low risk T- bills throughout the 9O’ies. As discussed in Chapter 1, improved savings mobilization w i l l be a critical factor for sustainable economic growth. Bank deposit mobilization amounted to 42 percent o f GDP in 2004, which i s in line with other non-Asian emerging markets (see Figure 5.1). The banking sector dominates savings mobilization wi th US$ 166 bi l l ion worth o f deposits in October 2005. The other notable vehicle for mobilizing funds i s mutual funds amounting to about U S $ 14 bi l l ion at the end o f 2004. Mutual funds grew rapidly in the years fol lowing the financial crisis as an alternative to time deposits. The mutual funds are predominantly money market funds that hold Government securities and reverse repos, and the mutual fund certificates are very liquid.
Table 5.1: Structure of the Financial Sector’43
Share o f Share o f Number 2004 Mill. YTL Mill. US$ sector GNP o f entities
Banks 306,452 228,781 63.9 71.4 50 State banks Private banks
Non-life insurance L i fe insurance and pension firms Reinsurance
Insurance and pension /1
Leasing companies /2 Factoring companies /3 Brokerage firms Investment trusts (net asset value)
Mutual funds Portfolio management firms Special finance houses Stock market capitalization
Of which real estate investment trusts
114,917 85,791 24.0 26.8 6 191,535 142,990 39.9 44.7 44
8,124 5,817 1.7 1.9 61 3,677 2,633 0.8 0.9 35 3,893 2,787 0.8 0.9 24
554 397 0.1 0.1 2 4,227 3,027 0.9 1 .o 82 2,019 1,446 0.4 0.5 110 1,131 810 0.2 0.3 117 1,183 847 0.2 0.3 32 1,179 844 0.2 0.3 9
19,622 14,050 4.1 4.6 244 na na na na 21
3,878 2,895 0.8 0.9 5 131,672 98,299 27.5 31 na
Total 479,486 356,815 100 112 73 1 Sources: Treasury, ISE, and Banks Association. /1 Consolidated for insurance, re-insurance and pension fund companies. Pension includes only the private pension funds. Emeklilik Sandigis are reportedly significant. /2 Data reflect March 2004 /3 Data reflect 2002. Asset data are not available for 2004, but according to Factor Chain International, volume in US$ terms doubled between 2002 and 2004 suggesting that factoring assets
5.10 I n terms of credit generation to the private sector, Turkey’s financial sector performs poorly (see Figure 5.Y) . Despite rapid bank (mostly retail) credit growth in
143 As o f October 2005, total assets o f the banking sector were US$268 bi l l ion o f which state banks accounted for US$ 86 billion.
155

2003 and 2004, credit to the private sector s t i l l amounts to less than 20 percent o f GDP. Other specialized institutions account for a combined 9 percent of finance to the private sector, while the traded corporate bond market i s virtually non-existent. Facilitating improved access to credit thus remains a critical challenge for Turkey.
Figure 5.1: Bank DepositdGDP, 2004
: / g 80
E 60 2
40
20
n
-
Source: IFS and Staff Calculations
Figure 5.2: Bank Credit to Private Sector/GDP, 2004
I20 11047
100
80 E 2 6 0 2
40
20
0
Source: IFS and Staff Calculations
5.11 Consumer credit has grown rapidly in tandem with the macroeconomic improvements, but credit to SMEs remains problematic. Figure 5.3 shows how the banking sector assets were directed towards claims on the public sector (mostly in the form of Government bonds and bills) throughout the late 90'ies. In contrast, loans to private firms have remained at a low level throughout the period. In the recent period after 2001, credit to consumers has grown very rapidly and much o f i t has been in the form o f credit cards and more recently housing loans. Credits to f i rms, however, remain at about the same level in real terms as 10 years ago. Other than for the top t ier f i r m s , firm credit generation represents the area where the banking system has substantial room for improvement. As o f October 2004, just 418 f i r m s accounted for more than half o f total credit to f i rms, confirming that S M E s have poor access to finance.
In most banks and in most countries, loan to deposit ratios are below one, but occasionally such as in the case of Malaysia, credits exceeds deposits and are funded with borrowings, issued securities, equity and other non-deposit liabilities.
156

I Figure 5.3: Distribution of Banking Sector Assets
20
0 S g 2 g c E g 8 g g g $ W
2 2 r % H 2 2 w 8 : i 8 i 8 8 i i $ 8 i 0
Source: CBT. Note: Loans to state owned enterprises are included in claims on public sector.
5.12 The capital market has two well development components: the equity market and the Government bills and bonds market. The capitalization of listed firms amounts to US$98 billion or 33 percent of GDP with 296firms (see Figure 5.4 and 5.5). The equity market has been growing steadily in terms o f listed f irms, while the market capitalization has been more erratic over the same period reflecting mostly the volatility in pricing o f equity.
Figure 5.4: ISE Listed Equity Figure 5.5: Market Capitalization, 2004 70 1 T I
I I
Source: WDI. Source: WDI and LDB.
5.13 The equity market provides an important source of financing for large enterprises and an essential alternative to bank (or debt) financing, but it has not reached its potential. Although the capitalization o f listed f i rms amounts to US$98 billion, the value o f l isted equities amount to only US$25 billion. The difference i s made up by stock, which has never been floated on the exchange, thus financial intermediation provided b y the exchange i s only US$25 billion. This suggests that the exchange s t i l l has great potential o f increased intermediation i f informational asymmetries, corporate governance and other institutional impediments can be overcome.
157
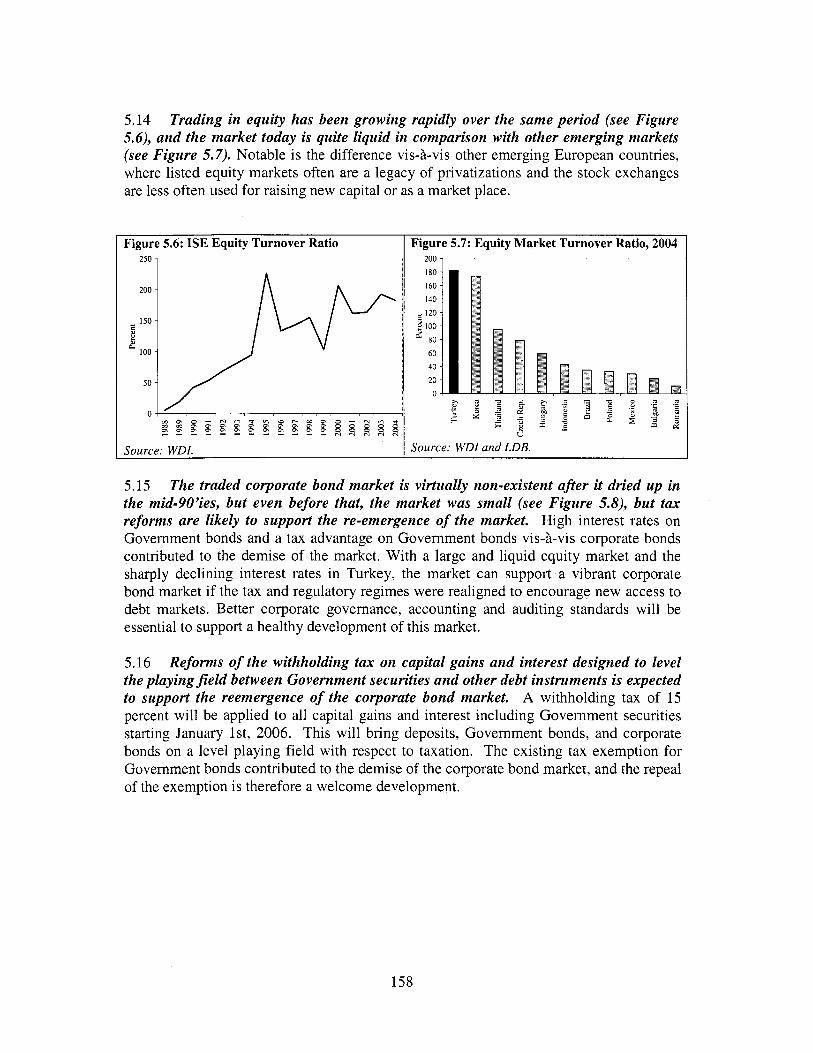
5.14 Trading in equity has been growing rapidly over the same period (see Figure 5.6), and the market today is quite liquid in comparison with other emerging markets (see Figure 5.7). Notable i s the difference vis-a-vis other emerging European countries, where listed equity markets often are a legacy o f privatizations and the stock exchanges are less often used for raising new capital or as a market place.
Figure 5.6: I S E Equity Turnover Ratio Figure 5.7: Equity M a r k e t Turnover Ratio, 2004 250 1
Source: WDI. I Source: W D I and LDB. I
5.15 The traded corporate bond market i s virtually non-existent after it dried up in the mid-90’ies, but even before that, the market was small (see Figure 5.8), but tax reforms are likely to support the re-emergence of the market. High interest rates on Government bonds and a tax advantage on Government bonds vis-&vis corporate bonds contributed to the demise o f the market. With a large and liquid equity market and the sharply declining interest rates in Turkey, the market can support a vibrant corporate bond market if the tax and regulatory regimes were realigned to encourage new access to debt markets. Better corporate governance, accounting and auditing standards w i l l be essential to support a healthy development o f this market.
5.16 Reforms of the withholding tax on capital gains and interest designed to level the playingfield between Government securities and other debt instruments i s expected to support the reemergence of the corporate bond market. A withholding tax o f 15 percent w i l l be applied to all capital gains and interest including Government securities starting January l s t , 2006. This w i l l bring deposits, Government bonds, and corporate bonds on a level playing f ield with respect to taxation. The existing tax exemption for Government bonds contributed to the demise of the corporate bond market, and the repeal of the exemption i s therefore a welcome development.
158
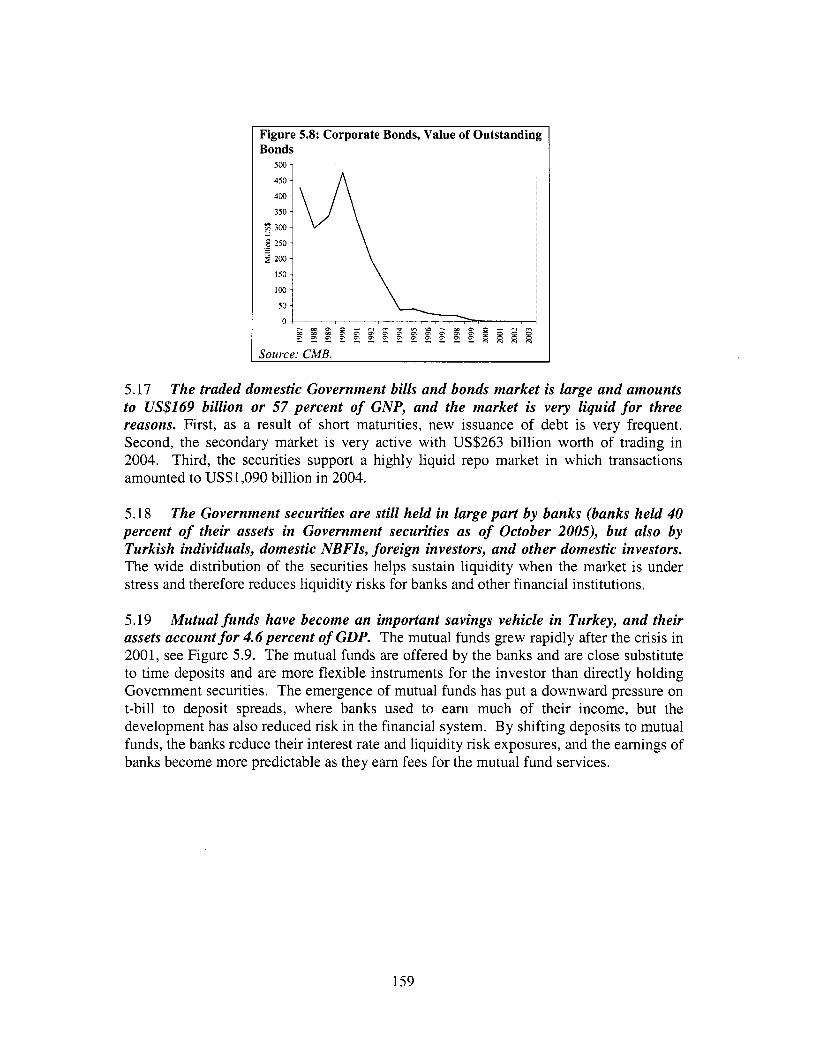
Figure 5.8: Corporate Bonds, Value of Outstanding Bonds
450 A
ij 200 \
Source: CMB.
5.17 The traded domestic Government bills and bonds market i s large and amounts to US$169 billion or 57 percent of GNP, and the market i s very liquid for three reasons. First, as a result of short maturities, new issuance of debt i s very frequent. Second, the secondary market i s very active with US$263 billion worth of trading in 2004. Third, the securities support a highly liquid rep0 market in which transactions amounted to US$1,090 billion in 2004.
5.18 The Government securities are s t i l l held in large part by banks (banks held 40 percent of their assets in Government securities as of October 2005), but also by Turkish individuals, domestic NBFZs, foreign investors, and other domestic investors. The wide distribution of the securities helps sustain liquidity when the market i s under stress and therefore reduces liquidity risks for banks and other financial institutions.
5.19 Mutual funds have become an important savings vehicle in Turkey, and their assets account for 4.6percent of GDP. The mutual funds grew rapidly after the crisis in 2001, see Figure 5.9. The mutual funds are offered by the banks and are close substitute to time deposits and are more flexible instruments for the investor than directly holding Government securities. The emergence of mutual funds has put a downward pressure on t-bill to deposit spreads, where banks used to earn much of their income, but the development has also reduced risk in the financial system. By shifting deposits to mutual funds, the banks reduce their interest rate and liquidity risk exposures, and the earnings of banks become more predictable as they earn fees for the mutual fund services.
159

Figure 5.9: Mutual Funds, Portfolio Value
, Source: CMB.
20 7
18 -
16 -
14 -
v1 1 2 - a g I O -
z 8 -
ar
.- -
Source: CMB.
Figure 5.10: Mutual Funds, Aggregate Asset Composition, 2004
Government bills and bonds
3%
the funds are not very active in the equity markets (see Figure 5.10), but with the large assets size they have the potential to become important sophisticated investors in the equity market. The assets o f the mutual funds are 95 percent in Government securities or reverse repo. Reverse rep0 are loans secured wi th Government securities, so the credit risk and yields closely resemble those o f T-bills, but reverse repos on average have shorter maturities and are more liquid (as mentioned above, rep0 transactions amounted to US$1,090 bi l l ion in 2004). Only 2 percent or US$ 400 mi l l ion are invested in equity, and thus the mutual funds are not important equity market investors. However, as the governance, auditing and accounting standards for listed f i rms improve, the mutual funds with large assets could become sophisticated investors in private sector securities.
5.21 Looking forward, the two key potential risks to the financial sector are: (i) sharp increases in international interest rates, which will likely be combined with capital outflows from emerging markets; and, (ii) a loss of political commitment to the key policy anchors: the ZMF program145 and the EU accession, which could affect, inter alia, the pending reforms in the state bank and/or regulatory spheres. The financial markets' confidence in the Turkish economy i s based on a trust in a continued reform oriented policy that w i l l insure fiscal sustainability and financial stability. A loss of confidence would lead to increases in interest rates, a depreciation o f the currency, and a slow down in the real economy, al l o f which wil l negatively impact the banking sector. While the financial sector i s viewed as being significantly more robust than in the run up to the 2000/2001 crisis, i t i s clear that r isks to the sector remain
145 A three-year IMF program was signed in April of 2005.
160

B. THE BANKING SECTOR
.B.l. Performance
5.22 Banks in Turkey are in the process of transforming their business models towards better assessing credit risk and providing value added services for their clients (see Figure 5.11). The private banks are further along in this process, while the state banks remain heavily invested in Government securities. Although the banks are generally handling the transition well, several issues remain. State ownership in the sector remains very large with 34 percent o f assets, the privately owned banks are mostly parts o f large financial industrial conglomerates, and foreign ownership remains small. The SDIF i s s t i l l faced with finalizing the resolution o f assets f rom banks that failed after the financial crisis. In addition, the supervisory regime i s faced with the evolving challenges o f adjusting to EU and Base1 I1 standards, especially towards consolidated supervision, and building capacity in the supervisory institutions remains a crucial medium-term endeavor.
Figure 5.11: Asset Composition - State Banks and Private Banks
l000C
15% j n
8 3
P 50% - - 0
E 5,
25 R
0% 2004 2003 2002 2004 2003 2002
Pnvate Banks Statc Banks
Source: BRSA.
5.23 Recent positive developments in the banking sector are closely related to Turkey’s strong economic performance. A sound fiscal and macroeconomic framework and a successful disinflation program that has helped reduce nominal as wel l as real interest rates. In addition, l ow international interest rates and capital inf lows have more recently supported both the macroeconomic stabilization and the positive developments in the banking sector. Syndicated loans and securitization loans f rom abroad amounted to US$15 bi l l ion in November 2005.
161
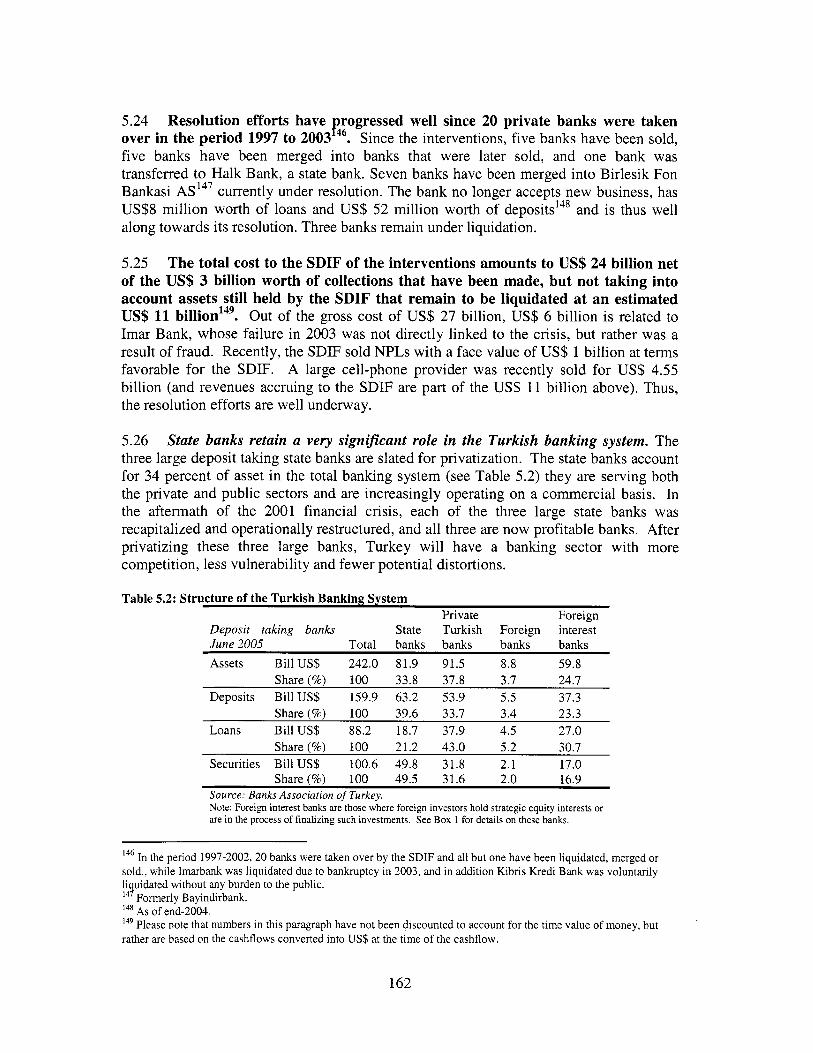
5.24 Resolution efforts have rogressed well since 20 private banks were taken over in the period 1997 to 2003p46. Since the interventions, five banks have been sold, five banks have been merged into banks that were later sold, and one bank was transferred to Halk Bank, a state bank. Seven banks have been merged into Birlesik Fon Bankasi AS'47 currently under resolution. The bank no longer accepts new business, has US$8 mi l l ion worth of loans and US$ 52 mi l l ion worth o f deposits'48 and i s thus well along towards i t s resolution. Three banks remain under liquidation.
5.25 The total cost to the SDIF of the interventions amounts to US$ 24 billion net of the US$ 3 billion worth of collections that have been made, but not taking into account assets st i l l held by the S D I F that remain to be liquidated at an estimated US$ 11 billion'49. Out o f the gross cost o f US$ 27 billion, US$ 6 bi l l ion i s related to Imar Bank, whose failure in 2003 was not directly linked to the crisis, but rather was a result o f fraud. Recently, the SDIF sold NPLs wi th a face value o f US$ 1 bi l l ion at terms favorable for the SDIF. A large cell-phone provider was recently sold for U S $ 4.55 bi l l ion (and revenues accruing to the SDIF are part o f the US$ 11 bi l l ion above). Thus, the resolution efforts are well underway.
5.26 State banks retain a very significant role in the Turkish banking system. The three large deposit talung state banks are slated for privatization. The state banks account for 34 percent o f asset in the total banking system (see Table 5.2) they are serving both the private and public sectors and are increasingly operating on a commercial basis. In the aftermath of the 2001 financial crisis, each o f the three large state banks was recapitalized and operationally restructured, and al l three are now profitable banks. After privatizing these three large banks, Turkey w i l l have a banlung sector wi th more competition, less vulnerability and fewer potential distortions.
Table 5.2: Structure of the Turkish Banking System Private Foreign
Deposit taking banks State Turkish Foreign interest June 2005 Total banks banks banks banks
Assets B i l lUS$ 242.0 81.9 91.5 8.8 59.8 Share(%) 100 33.8 37.8 3.7 24.7
Deposits Bill US$ 159.9 63.2 53.9 5.5 37.3 Share(%) 100 39.6 33.7 3.4 23.3
Loans Bill US$ 88.2 18.7 37.9 4.5 27.0 Share(%) 100 21.2 43.0 5.2 30.7
Securities Bill US$ 100.6 49.8 31.8 2.1 17.0 Share(%) 100 49.5 31.6 2.0 16.9
Source: Banks Association of Turkey. Note: Foreign interest banks are those where foreign investors hold strategic equity interests or are in the process of f inal iz ing such investments. See Box 1 for details on these banks.
'46 In the period 1997-2002,20 banks were taken over by the SDIF and al l but one have been liquidated, merged or sold., while Imarbank was liquidated due to bankruptcy in 2003, and in addition Kibris Kredi Bank was voluntarily liquidated without any burden to the public. 14' Formerly Bayindirbank. 14* As of end-2004. 149 Please note that numbers in this paragraph have not been discounted to account for the time value of money, but rather are based on the cashflows converted into US$ at the time of the cashflow.
162

5.27 I n addition to the three large deposit taking state banks, there are three non- deposit taking state banks that are not of systemic importance, but their poor efficiency is a concern. The banks are pursuing policy objectives to a much greater extent than the deposit taking state banks. The largest among them, EXIM Bank (US$3.1 bi l l ion in assets), i s a key export promotion agency and provides credit, guarantee and insurance services to exporters. I l ler Bank (US$2.5 bi l l ion in assets) i s a municipal development bank providing investment financing for sub-national Governments. The Development Bank o f Turkey (US$0.4 bi l l ion in assets) i s a small project finance bank that extends credit to the private sector in activities that are politically targeted for development, and the tourism sector dominates the bank’s loan book.
5.28 Almost all the major private banks are affiliated with large financial and/or industrial conglomerates through their shareholders. Related lending remains prevalent, as reported direct and indirect loans to shareholders amount to as much as 15 percent of capital in the Turkish banlung system. In addition, almost al l major banks have subsidiary or otherwise affiliated financial institutions such as l i fe and non-life insurance firms, leasing f i rms , factoring f i rms, investment banks, and asset management companies. This presents governance and supervisory problems, because financial reporting i s often incomplete without a consolidated group reporting requirement in place. Whi le the reporting requirements for banks in Turkey do require the preparation o f financial statements for the consolidated group, importantly, the consolidation does not include non-financial f i r m s . In addition, the ultimate parent o f groups that include banks i s not required to present consolidated financial statements. Thus, consolidated supervision o f the financial groups i s incomplete and vulnerabilities are opaque, as affiliated f i r m s have a comparative advantage over non-affiliated f i r m s in accessing credit f rom affiliated banks. However, these issues are being addressed b y the new Banlung Law enacted in 2005 and i t s secondary legislation under preparation. The new banking sector legal framework i s closely in l ine wi th the EU standards. Provisions under the new law include; lending to entities affiliated with the bank i s l imited to 20 percent o f equity and the bank’s board may extend that limit to 25 percent under certain condition, which are in line with EU directives.
5.29 Dollarization i s strong but declining with 38 percent of deposits and 20 percent of loans in foreign currency’50 (see Figure 5.12). While it i s straightforward for the banks to hedge the direct exchange rate exposure by rebalancing their marketable securities portfolios, the domestic loan dollarization exposes the unhedged borrowers to exchange rate risk. Consumer loans are predominantly in local currency, while about one third o f loans to f i r m s are in foreign currency. Loan dollarization has subsided rapidly since Turkey emerged from the financial crisis. However, long term financing in local currency remains scarce and lending remains mostly short term as a result.
Data in this paragraph reflect June 2005 using the central bank as the source. The BRSA reports different numbers: 40 of deposits in foreign currency and 32 percent o f loans in foreign currency as of June 2005.
163

Figure 5.12: Loan and Deposit Dollarization
loo 1
l "I % : b n . . . . . . H g $ g g $ 8 8 8 " " " s a 5 B B d - Deposit dollarization -Loan dollarization
Source: CBT.
5.30 The structure of the Turkish banking sector is changing as domestic banks are seeking partnership with or divesting shares and control to foreign investors. Since December 2004 when Turkey got a date for starting accession talks wi th the EU, foreign investor interest in the Turkish banking sector has strengthened, and several deals have been made or are in the making with foreign investors (Box 5.1). Those Turkish banks account for 24 percent o f total Turkish banking sector assets or 39 percent o f assets o f the private banks, so the development i s very significant. Foreign investors bring in new capital, lower cost o f financing, and new risk management technologies, thus improving access to finance for Turkish f i r m s b y driving down costs and enhancing the competitiveness o f the sector. Finally, they improve the safety o f the Turkish banking system, since the parent companies are generally large, sound institutions. In addition to the ownership interests, international lenders are extended syndicated and securitization loans to Turkish banks in the amount o f US$14.6 billion, which also contribute to the development o f the sector. The continuance o f foreign investment in the banking sector depends critically on political developments such as the continued commitment to the IMF economic program and to reforms for EU accession.
Box 5.1: Foreign Strategic Investments in the Turkish Banking System 0
0
0
0
0
TEB, BNP Paribas bought 50 percent o f the holding company for the bank Koc Bank, Unicredito bought 50 percent of the holding company for the bank Sekerbank, Rabobank acquired a 5 1 percent stake Yapi ve Kredi Bank, the KocKJnicredito partnership bought a 57.4 percent stake in the bank. Disbank, i s acquired by Fortis, which took an 89.3 percent stake in the company Garanti Bank, strategic owner, Dogus Group, sold about half o f i t s shares, 25.5 percent o f the tntsl stock. to GE Consumer Finance.
5.31 I n their efforts to collect deposits, Turkish banks have developed advanced banking services including an extensive A T M network, Internet banking, mobile phone banking, and a vibrant credit/debit card market. The credit card market has 27 mi l l ion credit cards and outstanding credit amounting to US$ 10.2 billions or 3.4 percent o f GDP, and transaction volume amounting to US$ 46 bi l l ion in 2004. The credit card market i s based on a highly scalable business model where credit assessments are done based on
164

scoring models wi th simple inputs, and where fixed investments such as IT infrastructure and reach are important competitive parameters. Therefore, i t i s not surprising that the market i s dominated b y a small number o f large banks, and that the market has taken o f f so rapidly. In addition to the 27 mi l l ion credit cards, there are 43 mi l l ion debit cards, so the total number o f cards about equals the population o f Turkeyl'l.
5.32 Shortcomings in the information infrastructure are becoming important impediments for credit generation to SMEs. As real interest rates are declining and economic and financial stability i s taking root, the market potential for lending to S M E s i s booming. However, the institutional underpinnings for developing the market have been largely neglected in the past while the former instable macroeconomic environment inhibited the growth of this market. Auditing and accounting, collateral regime, and credit information systems are now becoming critical to facilitate lending b y ensuring improved transparency o f S M E s creditworthiness as well by improving their willingness to pay.
5.33 Developing the banking sector encompasses complementary reforms of state banks, the supervisory framework, and strengthening the institutional underpinnings for developing credit to firms. The World Bank has been supporting these reform efforts through a series o f adjustment loans and other activities and continues to stay involved. Issues pertaining to developing the credit markets are addressed in a specific section below.
B.2. Key Remaining Issues in Banking Sector Reform
5.34 Privatization of three large deposit taking state banks remains a top priority. In the aftermath o f the crisis, fiscal restructuring cost o f the state banks was US$ 22 bi l l ion (equivalent to 15 percent o f 2001 GDP). The banks underwent early governance and operational restructuring and are now more efficient, transparent and saleable. The prospects for a successful privatization have improved with the stabilization o f the economic environment and increasing interest in Turkish banks among strategic investor. At the same time, foreign investments in Turkish banks are making the business environment for banks more competitive, thus creating new challenges for the state banks. In order to be attractive for investors, the banks must prove that they have good potential for medium term profitability by improving their ability to respond to the changing economic and competitive environment.
5.35 Vakif Bank is further along with its privatization process than the two other deposit taking state banks. Vaki f Bank launched an IPO o f D - s h a r e ~ ' ~ ~ in November 2005, and the divestment of Halk Bank and Ziraat Bank i s slated to follow. Public offerings o f shares as well as block sales remain open options for divestment, and investment advisors, which are yet to be hired, w i l l guide the Government's choice based on market conditions and other considerations. Privatizing the banks w i l l foster increased
''I While recognizing that one cardholder may have multiple cards, the penetration i s still great. 152 Vakif Bank now has four classes o f shares, and D-shares have limited voting rights.
165

competition, create a level playing f ield in the sector, and reduce uncertainty for investors in Turkey’s banking sector.
5.36 The financial sector is still taxed with transaction taxes that are distorting financial intermediation. The Banking and Insurance Transaction Tax (BITT) and the Resource Utilization Support Fund (RUSF) transaction tax are currently applied to credits and insurance premiums and have contributed more than 0.5 percent o f GDP to fiscal revenues. For the banks, the tax base i s interest paid by private borrowers leading to an increased loan-to-deposit interest rate spread and creating an impediment to developing access to credit for the private sector. The Government should consider abandoning the transaction-based taxes. At the same time, i t would be advisable to reassess the tax system for the financial sector to make sure that tax neutrality prevails and distortions are minimized.
5.37 Further strengthening of the banking supervisory and regulatory regime is required not only to ensure the sound development of the sector, but also to adapt the regime to the evolving requirements under EU and Basel ZZ. A sound regulatory and supervisory framework twinned with an effective consumer protection regime inst i l ls confidence in the financial sectors among users and investors. In addition to supervision, resolution o f assets from failed banks remains an unfinished agenda. The prudential and resolution responsibilities are shared by the BRSA, which i s in charge o f regulation and supervision, and the SDIF, which i s in charge o f bank resolution, asset resolution and deposit insurance. The separate but complementary sets o f responsibilities ensure better management o f the r isks inherent in a financial sector. A new banking law passed in October 2005 frames the reforms o f the two institutions.
5.38 F o r the BRSA, the drivers of reform are alignment with the EU acquis, the adoption of Basel ZZ and risk-based supervision, implementation of the new banking law, and the continued need to improve the supervisory capacity of the institution. The revision o f the regulatory and supervisory framework requires in part new processes and ski l ls , which in many areas are yet to be developed, and in part management o f r isks in the transition process. The BRSA i s in the process o f finalizing i t s strategic plan, which inter alia would strengthen i t s processes and capacity. Key actions are related to:
Developing and drafting regulations supporting the implementation o f the new banking law Implementing Basel I1 and risk based supervision Developing information systems at the BRSA to support effective implementation o f the new supervisory regime Training staff in accordance with the new roles and responsibilities Effectively implement consolidated supervision in the financial sector
0
0
0
As a near term priority, the BRSA should ensure proper supervision o f the rapidly expanding credit market, since poor credit quality may go unnoticed while credit i s expanding.
5.39 The S D Z F is facing an institutional challenge as it changes its strategic focus from its asset resolution function to a deposit insurance and bank intervention and
166

resolution function. The SDIF i s in the process or realizing asset recoveries o f more than US$5 billions, and this effort dominates i t s near term objectives. The institution has developed a business plan laying out necessary reforms such as downsizing staff as the asset resolution process draws to an end and reorganization o f the institution. Some critical issues remain to be addressed, such as strengthening the bank resolution and deposit insurance functions. Thus, extensive reforms remain to be undertaken in order to ensure that the SDIF performs i t s role in an efficient and effective manner.
5.40 The SDZF, the BRSA, and the CBT, which are all tasked with aspects of financial stability, in accord with the new Baning law, are to develop formal and robust rules and procedures for cooperation, information sharing and coordination. The cooperation and coordination among the three agencies i s a critical prerequisite for developing and maintaining a successful supervisory and regulatory framework.
C. DEVELOPING INSTITUTIONAL INFRASTRUCTURE FOR THE CREDIT MARKET
C.l. Corporate Transparency and Audit Information
5.41 The credit market in Turkey is in need of improvement, and supporting the development of access to credit requires, inter alia, improving the institutional underpinnings of the credit market. Credit to S M E s has been identified as particularly problematic while the consumer segment has taken o f f very rapidly. Policies should be designed to ensure that credit i s allocated efficiently to those f i r m s that can best leverage their capital, as well as to avoid excessive r isks building up in the financial system. Developing a sound credit market requires a good m i x of: i) accounting and auditing standards, ii) additional informational infrastructure in the form o f credit bureaus, iii) sound collateral regime, iv) effective contract enforcement, and v) a taxation regime that provides a level playing f ield across different means o f financing. Contract enforcement i s addressed in Chapter 3 (Product Market Regulations and Investment Climate) o f this report, and taxation i s addressed in Chapter 2 (Public Finance). The mortgage market i s unique in nature and has a very large potential in Turkey and i s addressed in a separate section below.
5.42 Banks dominate the credit market, but leasing, factoring, consumer finance and specialized finance institutions are important components of the market (Figure 5.13). The composition o f the credit market confirms that access to credit for S M E s i s poor, since the bank credit has been concentrated with few f i rms, and leasing and factoring volumes remain small. Recent evidence suggests that financial intermediaries are now focusing on expanding their business with SMEs.
167

Figure 5.13: Finance to Private Sector, 2004 Deposit taking Investment and ::- development
Sources: CBT, CMB, BRSA, Turkish Treasury, and staff calculations. Note: Equity held by Investment and development banks are double counted. *As o f 2002
5.43 Enhancing transparency and governance through reform in the areas of private sector accounting and auditing is needed to not only support credit market development, but also to develop the corporate bond and public equity markets. Corporate governance remains problematic in Turkey, where many listed companies are part o f family owned conglomerates, creating the potential for distorted transfer prices and share dilutions. In the absence o f reliable financial reporting on SMEs, lending decisions have been primarily based on other sources o f information and collateral.
5.44 Harmonization with the acquis of the Turkish Commercial Code with respect to accounting and auditing regulations presents an opportunity modernize the system. Short-term priorities include defining appropriate standard setting bodies, defining the scope o f statutory audits, and outlining the requirements for publication o f financial statements for public interest entities. In the ac uis, there are relevant directives related to corporate sector accounting and auditing’”, wi th additional directives related to entities such as banks (Banking Accounts Directive (1986), insurance companies (Insurance Accounts Directive (1991), and listed companies (Regulation (EC) No 1606/2002)).
5.45 The accounting and auditing framework for SMEs should be designed to provide useful information while avoiding onerous and overly costly requirements. The acquis provides the option to subject S M E s to a simplified framework for both accounting and auditing and utilizing such exemptions would be helpful in Turkey.
153 Fourth EU Company Law Directive (1978): Annual accounts o f companies with limited liability, Seventh EU Company Law Directive (1983): Consolidated accounts of companies with limited liability, and the new Eighth EU Company Law Directive (to be adopted in late 2005): Statutory Audits.
168

5.46 I n tandem and expanding to the medium term horizon, some members of the auditing profession will need to be re-tooled in order to be able to perform independent financial statement audits according to International Standards on Auditing, set by the International Auditing and Assurance Standards Board (IAA SB). Currently, auditing in Turkey i s predominantly driven by tax reporting, which i s required for al l f i rms, while auditing under IFRS remains a l imited activity. Retooling the audit profession entails education and training, possible introduction o f a specific designation for individuals authorized to perform audits according to International Standards on Auditing (ISA), and the formation o f an independent public oversight body to regulate professionals and the professional body(ies) responsible for audits based on ISA.
5.47 I n addition to firms’ financial accounts, the credit information in Turkey encompasses four important sources: KKB (a private credit bureau); TOBB on-line corporate registry; the Court of Enforcement and Commercial Court of First Instance records; and, a Central Bank public credit registry. KKB i s owned by several banks and i s a well functioning consumer credit bureau, which recently started collecting data on f i r m s as well. KKB ambitiously plans to have 2 mi l l ion f i r m s included in the database by end 2005. I f KKB succeeds even partially, i t wi l l be an important source o f information for Turkish credit institutions. The TOBB registry includes basic information on more than 650,000 f i rms . The historical information i s s t i l l in the process o f being brought on-line, and the free and easy availability o f this information makes i t a useful source for creditors o f SMEs. The Court o f Enforcement and Commercial Court o f First Instance records relate to c iv i l cases for breach o f contract, non-payment and bankruptcy. The information i s in the process o f being made available on-line, but access rights are restricted to lawyers wi th a relevant need to access the information. Lastly, the Central Bank maintains a credit registry for banks, which includes information on returned checks.
5.48 I n the area of credit information, private sector efforts are underway to improve information on SMEs, but complementary efforts can improve access to credit information for lenders as well as to protect borrowers and creditor alike from abuse. Options for such complementary reforms include:
0 Establish a law for credit reporting that provides a basis for creditors to share information and provides specific consumer rights and a regulatory framework for enforcement o f the law
0 Establish the necessary regulatory and supervisory framework for credit reporting in l ine with relevant EU directives.
0 Pass legislation to make the central bank data available to the credit reporting system - in particular information related to returned checks
0 Reduce the role o f notaries in the registry process to ease the f low o f information Also, refer to Chapter 3 o f this report for a discussion o f contract enforcement and the necessary reforms.
5.49 The regime for movable collateral includes three principal security devices: i ) security interest in registered property supported by a registry for motor vehicles, ships, and airplanes, ii) mortgage against the f irm including all the property of the f irm
169

whether fixed or movable, and iii) mortgage, which may include fixtures, i.e. movable property that has become fixed to the b~ilding'~'. The mentioned property registry for vehicles appears to be working well and supports a large volume o f collateral. One problem in the collateral regime i s unclear priority o f the three systems, which yields uncertainty and inefficiency. In order to develop a good movable collateral regime, two significant initiatives should be given priority:
0
0
Impediments in the legal framework should be clarified and addressed An effective filing system covering all types o f movable collateral should be implemented
C.2. The Mortgage Market
5.50 The mortgage market in Turkey has formerly been suppressed by the high and volatile interest rates, which precluded the long term finance needed to stimulate the sound development of the mortgage market. However, those market conditions have now changed and thereby created a great potential for the market. Mortgage loans in Turkey amounted to less than 1 percent o f GDP at the end o f 2004, which i s a fraction o f the levels in Asian emerging markets, and less than in the new EU member countries.
5.5 1 The mortgage market is poised for strong growth, and it has taken off from its small base since 2003. As the economy i s stabilizing, and interest rates are declining, and loan maturities are growing, the prospects for this market are formidable, and the near explosive growth o f housing loans in the first half o f 2005 confirm an optimistic outlook for the market (see Figure 5.14). Banks are extending maturities and lowering rates for the mortgage loans, and in October 2005, Ziraat Bank offered a 10 year fixed local currency mortgage loan for a monthly interest rate o f 1.19 percent (equivalent to 15.3 percent p.a.). The loans, however, lead to significant interest rate risk and mortgage securities are not yet developed to fund the banks' lending and hedge the interest rate risk.
Figure 5.14: Housing Loans
2000 2001 2002 2003 2004 Iuly2005
Source: CBT. Note: Data reflect consumer loans for housing deflated bv CPI.
154 Examples o f the latter include elevators, escalators, air conditioners, furnaces, commercial interiors, generators and ovens.
170

5.52 Legislation and a sound regulatory regime is needed to foster the further development of the primary mortgage market as well as establishing a secondary market for mortgage securities and thereby to mitigate risks in the banking sector. Efforts led by the Turkish Capital Markets Board (CMB) and supported b y a $400.000 FIRST Initiative grant’55 are aiming to strengthen the primary market and to develop a secondary market for mortgage securities. A draft new mortgage law has been submitted to parliament, and through the successful implementation o f regulatory reform and continued decline in long term local currency interest rates, the market i s poised for very strong growth.
In the primary market, the reform areas include: 0
0
0
0
0
Reducing the time needed to foreclose mortgages Regulating o f the appraisal profession to ensure effective valuation o f properties Al lowing variable interest rates (with some restrictions) on mortgage loans Regulating and ensuring effective consumer protection in part b y improving information provided to the borrower Ensuring proper eligibility for mortgage loans to be included in the cover pool o f mortgage covered bonds and mortgage backed securities; for instance mortgages on unauthorized houses shall not be eligible.
In the secondary market, the reform areas include: 0 Establishing supervisory and regulatory framework including drafting regulations
for the mortgage market, which must be done joint ly by the banking regulator, the BRSA, and the securities market regulator, the C M B Defining and regulating mortgage covered bonds and other mortgage securities appropriately and in a way that does not restrict origination o f mortgage loans to banks only
0 Addressing taxation issues related to intermediation, interest income from mortgage securities, and interest expenses related to housing loans
0
The successful implementation o f the reforms w i l l require a multi year effort and ensure that the market reaches i t s potential in a sound manner.
D. THE INSURANCE SECTOR
5.53 The insurance sector in Turkey is poorly developed, and insurance premiums in 2003 amounted to just 1.1 percent of GDPls6 for the non-life segment and 0.3 percent for the life segment (See Figures 5.15 and 5.16 for comparisons). The sector includes 35 non-life providers including two large international insurers, AXA and AIG and 24 l i f e insurance and pension funds providers and employed more than 11,000 people in 2002. The insurance companies are mostly affiliated with major banks.
”’ The project i s named “Turkey: Secondary Mortgage Market Development” and was approved in October 2004.
1.25 percent of GDP in 2004.
171

5.54 The poorly developed non-life insurance industry is partly related to the poor development of the credit market. For instance, as the mortgage market develops, the demand for housing insurance w i l l grow, and enforcement o f mandatory coverage for Motor Third Party Liabi l i ty (MTPL) w i l l increase demand for insurance products.
Figure 5.15: Non-Life Insurance Premiums, 2003 3
8 2
2 $ 1
; -
0
g $ j p $ g g a r Y a * " 9 g $ 2 z ' a 2 = -
3 0 v1
g $ k 2 8 2 2
Source: Swiss Re, Sigma, World Insurance in 2003.
Figure 5.16: Life Insurance Premiums, 2003 3
B 2
g I $ 1 iJ
0
$ g $ 5 x 2 p ; i p g z e u i 2 = x $ e 2 U P 6 2 F s r "
0 v1
Source: Swiss Re, Sigma, World Insurance in 2003.
5.55 Due to the small size of the sector, the supervisory and regulatory regime for insurance has received insufficient attention and needs substantial revision in order to meet EU requirements. Regulation and off-site supervision are done b y the General Directorate of Insurance (GDI), and on-site supervision i s done b y the Insurance Supervisory Board (ISB). Both are hosted in the Turkish Treasury and are thus less independent than for instance the BRSA, the C M B or the CBT.
5.56 Supervision and regulation of the insurance industry needs significant improvement. Important issues include: 0 A new framework law for insurance aiming to modernize the regulatory and
supervisory framework and to bring i t in line wi th EU and international standards i s urgently needed and has been under preparation for more than a decade After passage o f the framework law, the supervisory authority w i l l be challenged with producing the supporting legislation and secondary regulations necessary to ensure effective implementation o f the framework The independence o f the ISB and the GDI and the possible establishment o f a single entity for insurance supervision and regulation
0
0
5.57 EU is poised to play an active role in improving the insurance supervisory framework. Insurance supervision and regulation has been highlighted b y EU's progress report for Turkey as an area in need o f substantial improvement.
172

E. SUMMARY OF REFORM NEEDS
5.58 A solid financial sector reform agenda will contribute to the sound development, to expanding access to credit for the private sector, and thereby fostering private sector growth and economic prosperio. A sound financial sector will help sustain the confidence of international investors that underlie the continued strong macroeconomic performance. The three large state banks are yet to be sold to private investors. The banking and insurance supervisory frameworks are s t i l l in the process o f building capacity while adapting to the EU directives and in the case o f banks, Base1 I1 requirements. The credit markets need institutional support in the areas o f auditing and accounting, credit information system, collateral regime, as well as more sector specific reforms, for instance in the mortgage market. By pursuing such reforms, Turkey has the prospects for a vibrant financial sector that w i l l provide a key pillar for more broadly developing the private sector by allocating credit in a more sound and efficient manner.
A multi-pronged agenda w i l l help the financial sector reach i t s potential, and the reforms entail :
Privatizing three large deposit taking state banks Strengthening banking supervision by adopting and implementing supplementary regulations to support the new banking law, build capacity both in terms o f new technology and training o f staff Strengthening insurance supervision and regulation by adopting a new framework law and supporting legislation, and addressing the independence and capacity o f the supervisor and regulator Fostering the sound development of the mortgage market by addressing development issues in the primary market thereby encouraging the future development o f secondary market, and by setting up supervisory systems for the secondary market ins t i tuti ons. Adapt auditing and accounting standards to the acquis while ensuring adequate exemptions for S M E s to avoid excessive costs Establishing law and regulatory framework for credit reporting Abandoning the transaction-based taxes, while reassessing the financial sector tax system to make sure that tax neutrality prevails and distortions are minimized. Introducing a legal framework and effective filing system for movable collateral
173

174
CHAPTER 6. FOSTERING TECHNOLOGY ADOPTION, INNOVATION, AND S K I L L S
6.1 Productivity differences between countries and between firms within countries are affected by differences in levels of innovation, access to and capacity to adapt technology, use of quality standards, and the availability of a highly skilled labor force. A significant body o f international theoretical and empirical evidence demonstrates links between technology, innovation and s k i l l s (the knowledge factors) and total factor productivity (TFP) and economic g r 0 ~ t h . l ~ ~ The knowledge factors are also essential for attracting higher levels o f Foreign Direct Investment (FDI). As cheap labor becomes less relevant to attracting FDI, availability o f technologically advanced local suppliers and a highly slul led labor force become more important for influencing the location decisions o f multinational companies (MNCs). Acknowledging the importance o f the knowledge factors as drivers for productivity and growth, governments in recent years have tried to devise ways to foster technology absorption, increase innovation, encourage use of quality standards and improve the s k i l l s o f the labor force. For Turkey, this i s o f the utmost importance, considering the need to ensure sustained fast long-term growth through increased TFP and FDI.
6.2 Harnessing the knowledge factors is a central element of the European Commission’s policies and strategies to improve E U (and candidate) countries’ competitiveness and growth. The E C has placed knowledge at the core o f i t s economic policy objectives b y issuing a Green Paper on Innovation in 1995 and b y setting “make the European Union the most competitive and dynamic knowledge-based economy b y 2010” as one o f i t s key objectives at the 2000 Lisbon Council Summit. (See Annex 6.1 for a review o f EU knowledge strategies and programs released since 1984.) Turkey has been a full associate member o f EU Research and Development Framework Programs since the creation o f FP6 in 2002. FP6 aims to contribute to the creation of a “European Research Area” (ERA) and promote research activities in support o f implementing EU innovation policies and strategies. The 2003 Innovation Communication identified for the f i rst time specific challenges that candidate countries need to address in the knowledge areas in order to improve the performance o f the enlarged EU, including improving countries’ institutional capacity to foster innovation, embedding innovation in several policy areas and strengthening the role o f the private sector in innovation.
15’ For a detailed discussion of the impact of technology, innovation and sk i l l s on productivity, see Chapter One of Closing the Gap in Education and Technology (World Bank, 2003).
175

6.3 While the Acquis does not dedicate a specific chapter to the knowledge variables, several of i t s sections include requirements related to knowledge improvements with which Turkey will have to comply. Key sections o f the Acquis that cover issues that are related to, or that can influence, the knowledge factors include: Chapter 25 on Science and Research, which addresses institutional issues and countries’ capacity to use EU funds for innovation; Chapter 6 on Company Law, which addresses issues related to protection o f Intellectual Property Rights; and Chapters 1 and 4 on Free Movements of Goods and Capital (respectively), affecting technology adoption and quality standards. Other EU documents complement Acquis requirements by providing broader recommendations to improve Turkey’s performance in the knowledge areas.
6.4 The objective of this chapter is to highlight critical issues related to technology adoption, innovation, quality standards and skills in Turkey by conducting a diagnostic of the country’s performance in these areas and providing policy recommendations. This chapter comprises three sections. The first section focuses on technology adoption and innovation. The second section looks at quality standards and the Turkish National Quality System, and the third section provides an overview o f Turkey’s labor sk i l l s , with a focus on the specific needs o f the private sector to improve i t s ability to adopt technology and innovate. For each topic, the chapter provides a diagnostic o f the country’s performance and provides policy recommendations, both to meet Acquis requirements and - more broadly - to improve the country’s productivity and sustainable long term growth.
6.5 The analysis in this chapter is based on the premise that both the private and the public sector have essential roles to play in developing and managing the knowledge factors. The reason lies in market failures related to the knowledge factors, which have been well documented in existing research:’58 (a) knowledge i s non- appropriable because i t i s a quasi-public good - that is, the knowledge developed by one individual or firm can easily be transferred to another; (b) knowledge generates specific positive externalities and spillovers; (c) investments in innovation are long-term and risky, which implies that private f i r m s are unlikely to undertake them alone; (d) the process o f innovation involves bringing various actors together and i s subject to coordination failures and free rider behaviors; and (e) diffusion o f knowledge i s not appropriable. Thus, while adopting new technologies and improving productivity i s ultimately the responsibility o f f i r m s , governments have important roles to play. This chapter dedicates specific attention to the interplay between the public and private sectors and focuses on the need to strengthen the government’s capacity to catalyze knowledge development.
A. PROMOTING TECHNOLOGY ADOPTION AND INNOVATION AT THE FIRM LEVEL
6.6 Technology adoption and innovation are intertwined. Development of new technologies i s mostly the prerogative o f f i r m s and institutions in high-income, scientifically- and technologically-advanced countries (often referred to as “core
”* World Bank, Closing the Gap, page 134.
176

innovators”). 159 Most low- and middle-income countries, on the other hand, innovate mostly by absorbing existing technologies.16’ However, the links between technology absorption and innovation are often blurred, wi th local innovation being an essential requirement to successfully absorb technologies and, equally importantly, to adapt them to the local needs.’61 Focusing on both dimensions i s particularly important for a country l ike Turkey, which i s growing rapidly, i s very much in need o f local innovation to adapt technology to local needs, and could strive to become a “core innovator” in areas in which i t has comparative advantages. The sections below analyze key determinants o f technology adoption, innovation and collaboration between research institutions and f i r m s (an essential condition to improve both technology adoption and innovation) in Turkey and provide policy recommendations to improve Turkey’s performance in these areas.
A.l. Technology Adoption
6.7 The three main avenues for acquiring technology in an open economy are importing capital goods, FDZ and licensing. Turkey’s relatively low levels of capital goods import is a first indicator of the country’s limited access to foreign technology. The importance o f trade, FDI and licensing as drivers o f technology absorption has been emphasized b y endogenous growth theory. 162 Capital goods often embed technologies and productive applications that increase the stock of capital as wel l as i t s marginal prod~ct iv i ty . ’~ ’ At the end of 2004, imports o f capital goods in Turkey were low, at 26 percent o f total investment, about one third o f the proportion in Bulgaria and one fourth of that in Thailand (Figure 6.1). Direct import o f capital goods embedding foreign technologies i s an unexploited means that Turkish f i r m s could use to tap into global knowledge, as demonstrated by the East Asian countries, for which importing of technologies through capital goods has been a key means for productivity improvements.
159 On the concept o f core innovators and for a more detailed discussion o f creating versus absorbing new technologies, see the World Economic Forum (WEF) Global Competitiveness Report (World Economic Forum, 2000 and following years), in particular, the section by M. Porter and S. Stern in the 2003-2004 Global Competitiveness Report, pages 91-1 11. The WEF defines “core innovators” as countries that have more than 15 U S utility patents registered per annum per mil l ion population and “non-core innovators” as all other countries.
160 See, among others, S. Lall, “Technology Absorption: An Overview” (presented at The World Bank Istanbul Knowledge Economy Forum, April 2005).
16’ See Cohen and Levinthal “On the importance o f R&D for technology absorption” in Absorptive Capacity: A New Perspective on Learning and Innovation (1989). See also World Bank, Poland and the Knowledge Economy (2004), and World Bank, Concept Note for a Regional Study on Access to Finance and Innovation in East European and Central Asia Countries (2004).
See Romer (1996, 1990), Lucas (1988), Grossman & Helpman (1990) and World Bank, Closing the Gap.
163 On the importance of imports o f capital goods, see Eaton et al. (2000).
177

Figure 6.1: Capital goods importhnvestment
- e ,J ,s z w P B z 6 % E 8 $ g 8 u 2 2 f 2 2 2 f f 2
-Turkey +Bulgaria *Chile +Poland +Romania +Thailand
Source: World Bank Live Database, 2005.
6.8 Direct investment from foreign firms is a second means of acquiring ahvanced technology from abroad. Zn Turkey, FDZ has been chronically low but prospects are improving after the rebound observed in 2005. While worldwide FDI has increased by a factor of 12 in the last 15 years, FDI in Turkey has remained compressed since the mid- 1990s, to less than 1 percent of GDP, compared with more than 3 percent in China, almost 7 percent in Bulgaria, and 10 percent in Hungary, for example (Figure 6.2). Although, as explained in chapter 1, FDI has boomed in 2005, to an estimated 2.6 percent of GDP, it is significantly lower than what would be expected considering the country’s income level (see Figure 6.3). Several factors have l imited FDI in Turkey, in particular weak investment climate conditions-including related to macroeconomic and political instability-and specific legal and institutional constraint^.'^^ Some o f these constraints have been mitigated, and FDI i s expected to grow in the coming years. This w i l l increase non-debt creating capital inflows to Turkey, improve competition in the local market, and facilitate the country’s integration wi th the global economy as well as technology absorption. 165
See Chapter One, The Product Market Regulations Chapter and S. Sayek, “FDI in Turkey: The ,164
Investment Climate and EU Effects,” background paper (2005).
‘65 Evidence about the impact o f FDI on technology absorption i s mixed. In some countries, FDI has been instrumental in increasing technology absorption among local firms, while in other countries multinationals (MNCs) have not created linkages with local firms, continuing to do business with their foreign affiliates. Key factors that have to be in place for local firms to integrate with local-foreign supply chains and take advantage o f the opportunities offered by MNCs include a technically skilled and highly educated labor force and local firms’ capacity to use advanced technology.
178

Figure 6.2: Foreign direct investment
8 -
Gross
180 1981 1992 1993 l 9 9 l 1995 19% 1997 18% 19% 20W ZOO1 ZW2 2903
I Chle 3 EMU --Hunglmi Pdand R m a n i a -i-Tu*ey 1
SlrlqapOre
FDI (%of GDP), Zm3
EQtonia
H w g w . 4.
Note: E M U - European Monetary Union countries. Source: WDI, 2005.
6.9 Interviews with leading Turkish business executives and entrepreneurs confirm that, while Turkish f i r m s are eager to absorb technology, FDZ is not yet a vehicle for acquiring it. Among all comparator countries, Turkey has the widest disparity between f i r m s ’ recognition o f their readiness to absorb advanced technology and FDI contribution as a source o f technological development - see Figures 6.4 and 6.5. This i s probably due to the low current levels of FDI and concentration in sectors that are not technologically intensive (e.g., real estate, retail). On a more positive note, Turkey has experienced the positive effects o f FDI in a few sectors, both in terms o f growth and exports and in terms o f spill-over effects on the local economy. In the automotive industry, for example, MNCs play a major role. They entered the Turkish market by merging with large local companies (e.g., Ford-Otosan, resulting f rom the merger o f Ford and the local Koc group) and created strong links with several local small- and medium-size enterprises (SMEs), leading to an accumulation o f know-how and the development o f local technological capacities. 166
166 Interview with Ford-Otosan (February, 2005) and Sirin Elci, “Innovation and Technology Absorption in Turkey”, 2005.
179

Figure 6.4: Interest of Turkish firms in absorbing new technologies
Figure 6.5: Acquisition of new technologies via FDI
6 7
Note: Companies in your country are ... ... 1 = aggressively absorbing new technologies .. , 7 = not interested in absorbing new technologies
Source: World Economic Forum (WEF), 2004-2005.
Note: Foreign direct investment in your country ... ... I = brings little new technology ... 7 = is an important source of new technology
Source: WEF, 2004-2005.
6.10 The third avenue for absorbing foreign technology - licensing - i s also somewhat weak in Turkey. Licensing involves the contractual transfer o f technology between f i rms . I t provides knowledge in a more accessible manner than FDI, and for this reason has been favored b y several countries around the world, including Japan, Brazil, India and Mexico. Royalties and license fee payments in Turkey are about US$2 per capita - see Figure 6.6. This i s broadly consistent with the country's level o f development, although Turkey i s below the regression l ine in Figure 6.7. However, other European comparator and Latin American countries are more aggressively tapping into the pool o f global knowledge and over perform compared to their development level. As a comparison, per capita royalties and license fee payments in Poland, Slovakia and Chile are about ten times those o f Turkey. Hungary i s even more advanced, wi th per capita royalties and license fees o f US$40. East Asian countries had Turkey's current levels o f licensing in 1985 (US$2.7 per capita regional average). In 2002, the average per capita licensing for Korea, Thailand and Malaysia was US$42, with Korea reaching US$75. While aggregate values are low in Turkey, the country has had some success at licensing in manufacturing. Licensing agreements - particularly in automotive, automotive spare parts, and white goods sectors - have led to an accumulation o f know-how and the development of local technological c a p a c i t i e ~ . ' ~ ~ Indeed, Turkish business executives and leading entrepreneurs consider licensing as a much more common means o f acquiring technology than FDI - compare Figure 6.8 wi th Figure 6.5. Perceptions are far more optimistic than the real numbers indicate. At the same time, they do suggest that licensing i s wel l known in Turkey and that i t holds promise as a means to acquire technology in the future.
16' Companies like Arcelik, Temsa and Tofas are good examples in this respect (interview with Arcelik, February, 2005). See also Sirin Elci, Op. Cit.
180

Figure 6.6: Royalty and license fee payments: trends
Figure 6.7: Royalty and license fee payments: level of development
5 0
4 5
4 0
3 5
3 0
1990 1991 1992 1993 1994 1995 1998 1997 1998 1999 2000 2001 2002 200
I-- Chlle -- EMU Hunpav Poland - Slovak R ~ w b l i c +Turkey]
I
Note: E M U - European Monetary Union countries.
Source: World Bank, WDI.
Log p r caplta ODP. PPP, 2W3
Figure 6.8: Licensing as a means of acquiring new technologies 5.5 1
I I
Note: Licensing in your country ... ... 1 = brings l itt le new technology ... 7 = is an important source of new technology
Source: WEF, 2004-2005
A.2. Innovation
(a) Comparative Performance
6.11 Investment in R&D has improved in Turkey, and so has the share of R&D financed by the private sector, a key determinant of productivity. Without an adequate volume of R&D expenditures a country will most likely not ascend the technological ladder.I6* With gross expenditures in R&D (GERD) equaling 0.66 percent of GDP at the end of 2002, Turkey i s in the middle of the GERD ranlung compared to OECD countries taken as a reference (Figures 6.9 and 6.10). Turkey almost doubled i t s GERD during the
World Bank, Closing the Gap.
181

past decade, which (both public and private) i s now slightly above that o f countries with similar level o f development (Figures 6.11 and 6.12). The latest budget allocation for R&D also confirms that the government i s moving in the right direction - funds allocated f rom the 2005 (and 2006) budgets are much higher than in al l previous years. However, and notwithstanding recent initiatives to increase institutional capacity - including the creation o f the Turkish Research Area (TARAL) which has as one o f i t s key objectives that o f increasing institutional capacity for innovation and supporting public-private cooperation in this area-more effort are needed to ensure that Turkey has coherent programs and capacity to utilize these resources effectively. Despite a strong increase in private R&D during the past decade, firm-financed GERD in Turkey was still low at 41 percent o f the total in 2002 (versus 52 percent in the Czech Republic and 60 percent in China, for example). R&D performed by enterprises affiliated with foreign companies is also very low - see Figure 6.13. Key objectives for the future w i l l be increasing private R&D investment and ensuring productive use o f public R&D by improving collaboration between the public and private sectors. Suggested measures to achieve these goals w i l l be discussed in Section A.4.
Figure 6.9: Gross expenditures on R&D, trends and composition: Turkey.
0 1 O 2 I 1994 1995 1995 1997 1998 1999 2000 2001 20M
10 Induslryfinanced GERD 10 Government-hnanced GERD ;.GERD flnanced by other nstonaiard foreign sourceoi
Source: OECD, Main Science and Technology Indicators database, 2005.
Figure 6.10: Gross expenditures on R&D, total and composition: international comparison, 2001-2003, most recent data available*
2 5
2 0
b 8 1 5 - i
1 0
0 5
- 1 3 1 107
Note: data are,from 2003 for all countries but Mexico (2001) and Turkey and Portugal (2002).
Source: OECD, Main Science and Technology Indicators database, 2005.
182

Figure 6.11: Privately-financed R&D and level of development.
Israel 3 5 1 1 2 -
c 1 0 - 0 -
3 0
isye1
smgapOie : . .
Romania . 3 8 3 9 4 0 4 1 4 2 4 3 4 4 4 5 4 8
Log GDP pi cspllc. 2033 (PPP. curl)nl U S )
3 8 3 9 4 0 4 1 4 2 4 3 4 4 4 5 4 6 ~ o g GDP per capna, 2003 (PPP, EWMI uss)
Source: OECD, Main Science and Technology Indicators database, 2005.
Figure 6.13: R&D expenditure of foreign affiliates as percentage of total private R&D, 2000-2002 (most recent year for which data i s available)
2 90 ,
Poland SIouak8a Ponugal Spwn Cmch Hungap~ Republic
Note: 2002 data for Poland, Czech Republic and Slovakia, 2001 data,for Portugal and Spain, 2000 data for Turkey and 1998 data for Hungary.
Source: OECD, Main Science and Technology Indicators, Volume 2005, Release 01.
6.12 The number of patents filed by Turkish innovators in the US is aligned with that of several comparators, but patents granted to Turkish inventors by the EU are limited and the number of patents registered locally is extremely low. Patents are relevant for technological development because they protect inventions wi th industrial a p p 1 i ~ a b i l i t y . l ~ ~ While investment in R&D i s an input to innovation, the number of patents registered by the residents of a country i s a key output o f the innovation process and can be considered as an indicator of the success of R&D expenditures. Table 6.1 includes the number o f patents registered by residents o f Turkey in the United States,
169 Patent applications are for exclusive rights to an invention - a product or process that provides a new way of doing something or offers a new technical solution to a problem. A patent provides protection to the owner o f the invention for a limited period, generally 20 years.
183

Europe and Turkey.17’ Turkey far underperforms al l comparators (except Mexico) in filing patent applications at home. Turkish patent numbers are not growing and are low given the country’s level of development (Figures 6.14 and 6.15). Turlush inventors also f i le few patents with the European Patent Office - fewer than a l l European countries except Romania.’71 The picture improves only when looking at patents granted by the United States to Turkish inventors - about as many as granted to inventors in Poland, although Bulgarians and Slovakians receive over twice that number - see Table 6.1.
Table 6.1: Patents granted per million population
US utility patents European Patent Office National patent granted per million applications, per million applications, per million population, 2003 population, 2004 population, 2002
China 0.2 0.3 31.5 Philippines Romania Poland Thailand Turkey Brazil Chile Mexico Bulgaria Slovakia Portugal Malaysia Czech Republic Hungary
0.3 0.3 0.4 0.4 0.4 0.7 0.7 0.8 1.1 1.1 1.2 2
3.9 7.3
0.0 0.5 2.4 0.1 0.9 0.5 0.6 0.2 2.0 2.2 5.0 1.3 8.2 9.3
N A 68.2 60.8 NA 7.9 37.4 N A 6.2 38.9 51.3 17.8 NA 59.6 94.7
Note: Population data used to calculate the EPO applications is for 2003 from the WDI
Source: US patents, USPTO; EP Patents, European Patent OfJice Annual Report 2004; National Patent, WDI, 2005.
6.13 Progress has been made to improve protection of Intellectual Property Rights in Turkey, but further effort is needed to ensure compliance with the Acquis. Intellectual property rights give the inventors or innovating firm the right to temporarily exclude others from using the new ideas commercially, improving innovation and (in turn) technology adoption. IPR protection requires clear rules to ensure that inventors can
”O The advantage of measuring patents registered in the U S i s that i t i s o f similar “quality” (within a given technology field) across countries. The shortcoming o f this measure i s that i t reflects, in part, the expected likelihood that inventors o f a given country w i l l sell their product in the U.S., and may therefore be contaminated by trade and other flows across countries. Moreover, the relatively high cost may further discourage inventors from lower income countries from registering a patent in the U.S.
’” Countries outside the European area are not ideal comparators in this case, as they are less likely to file patent applications with the European Patent Office.
184

appropriate the benefits o f their research, together with implementation agencies that are able to ensure enforcement o f the IPR rules. Weak enforcement o f IPRs and regulatory gaps with respect to international standards (see below) seem to be at the origin o f the underperformance regarding especially national patent applications. During the past few years, several legislative changes to improve IPR protection have been introduced in Turkey, including changes to the law on trademark protection to ensure compliance with other Turkish laws and EU requirements, as well as the introduction o f decrees related to protection o f pharmaceutical and medical processes and products and biotechnological inventions. The Turkish Patent Institute (TPE) has also strengthened i t s capacity and modernized processes in order to improve i t s services, including process automation, various IPR promotion campaigns and training programs, and the creation o f an Industrial Property Campus building in Ankara, hosting specialized IPR courts. Despite recent progress, more effort i s needed to ensure full compliance with Acquis requirements and the creation o f a comprehensive legal and implementation IPR framework, which i s in turn an important condition to foster productive innovation in Turkey. Specific suggestions are included in section A.4.
Figure 6.14: Patent applications (national patent office).
Figure 6.15: Patent applications (national patent office) and level of development.
E '"1
0 0 3 0 3 2 3 4 3 6 3 8 4 0 4 2 4 4 4 6 4 8
Log pi capita GDP, PPP. 2002
1996 1997 1998 1999 M O O Mol 2CO2
[-EMU -c Hungary Poland Romanid Slovakia Spain +Turkey1
1:: "Y , . ,
Source: World Bank, World Development Indicators; U.S. Patent and Trademark OfJice.
(b) Finance For Innovation
6.14 Several tax incentive schemes aim to encourage investment in R&D in Turkey. However, their impact on innovation and their fiscal implications are unclear. Turkey has four fiscal schemes to promote R&D:
Decree on Tax Postponement to Support R&D (1986) 0 Support for R&D Investment (1986) 0 Law o f Technology Development Zones (2001) 0 R&D Tax Exemption (2005)
Turhsh f i rms do not find tax postponement or support for R&D investment incentives beneficial and therefore do not use these schemes. The incentives provided b y the Technology Development Zone and R&D Tax Exemption Laws are very generous. They
185

include deduction o f 40 percent o f R&D expenditures from taxable corporate income, in addition to the ordinary Investment Tax Allowance (deduction o f 40 percent o f investment expenditures) for all f i r m s and exemption from CIT for software development and R&D activities, as well as PIT-exemption for salaries o f R&D personnel until the end of 2013 for f i r m s located in Technology Development Zones. The incentives provided under the Technology Development Law have fuelled high start up rates for technoparks in the past few years. However, the recently approved Tax Exemption legislation provides even more appealing incentives, which are l ikely to reduce future requests to locate in technoparks. These four schemes should be evaluated to assess their impact on innovation, fiscal impact and consistency with the Acquis.
6.15 Public and public-private matching grants and soft loans schemes also aim at promoting private R&D and innovation. Matching grants to promote private R&D are offered by TUBITAK-TIDEB under the “State Support for R&D Program” financed b y the Treasury. TUBITAK-TIDEB provides up to 60 percent o f the f i r m ’ s total project budget to finance R&D-related expenses for personnel, materials, equipment, travel, consultancy and patenting. Reimbursable (soft) loans are provided by the Technology Development Foundation o f Turkey (TTGV) with resources from the Undersecretary o f Foreign Trade (also under the “State Support for R&D Program”) and the Wor ld Bank (under the Industrial Technology Project). Finally, the Small and Medium-Size Industry Development Organization (KOSGEB) provides a m ix o f grants and soft loans for R&D projects b y S M E s located in TEKMERs (under the “Technology Research and Development Support” program). As further explained below, existing matching grants and loans programs should also be assessed systematically in tandem with fiscal incentives.
6.16 Venture capital and other private means to finance start up are almost non existent in Turkey. There are only four V C funds in Turkey’72 and the total percentage of V C investment over GDP i s close to nil. T o help develop the V C industry, the Turkish Capital Market Board (SPK) modified the venture capital legislation in 2004.’73 The new law introduced two types o f Venture Capital Investment Trusts (VCITs): (1) those only entitled to sell their shares to accredited investors such as banks, intermediary institutions, insurance companies and long-term pension funds, and (2) those that can sell their shares to the public without limitations. In addition, the minimum capital requirement for both types o f funds was decreased and other unfavorable conditions, such as requirements for a Turkish majority among V C I T board members, were abandoned. Despite the recent legislative improvements, both supply and demand factors s t i l l limit the V C industry in Turkey. As explained in Chapter 5, these factors are, indeed, more generic as they impede the development o f private capital markets more broadly.
0 Key factors hindering V C development on the supply side include: the instability o f the macro environment until very recently, low FDI levels until 2005, immature
17’ Vakif Girisim (a subsidiary of Vakif Bank), I s Girisim (owned by I s Bank, TSKB and TTGV), TurkVan Ventures (Advent, IFC, TTGV and others) and KOBI Girisim (owned by TOBB, Halk Bank and KOSGEB). An additional fund i s currently being established by FIBA Holding. Sirin Elci, 2005, Op. Cit.
173 See Communique Serial: VI, N. 16 “Amending the CommuniquC Regarding the Principles about Venture Capital Investment Trusts”.
186

pension funds and insurance markets that make fundraising difficult, the small size and l imited liquidity o f the capital market (the market capitalization o f Turkey’s stock exchange i s US$68 billion, versus US$14.2 trill ion in the United States and US$726 bi l l ion in Spain, for example’74), insufficient exit mechanisms that make IPOs rare in Turkey, and lack o f l imited rights for, and protection of, minority shareholders.
Key factors hindering VC development on the demand side are the cultural and managerial practices o f Turkish f i r m s and entrepreneurs, which negatively affect the quality and quantity o f deals. These include traditional family ownership and management, weak corporate structures, confidentiality concerns o f entrepreneurs who are reluctant to share ideas, ownership and control, and f i rms ’ accounting practices (e.g., different accounting books kept for different purposes l ike taxation, banking and management), which make company valuation difficult. The impact o f these factors i s exacerbated b y the low levels o f awareness o f venture capital investments and the l imited capabilities o f f i rms and entrepreneurs to transform their ideas into business plans.
0
A.3. Links Between Firms And Research Institutions
6.17 Creating links between firms, universities and research centers is essential to focus research on productive purposes and stimulate technology adoption and innovation at the f i rm level. University / research center / industry collaboration comes in many forms, including mobil i ty o f researchers and students, jo int or contract research projects, licensing, consulting, training, formal and informal networks, and ~ p i n - 0 f f s . l ~ ~ According to the WEF survey, university / industry research collaboration i s low in Turkey compared to most EU and East Asian countries, although i t i s higher than in Romania, Bulgaria and Hungary. Leading Turkish executives and entrepreneurs also consider scientific institutions to be o f low quality, below those o f al l other comparators - see Figure 6.16. Whi le these data are based on qualitative surveys and should therefore be taken with caution, they do point to the need to conduct an in-depth assessment o f the quality o f Turkish research institutions and the constraints that limit collaboration between f i r m s and the scientific world. Indeed, Figure 6.16 shows a high level o f collaboration between f i r m s and universities and a l ow gap between collaboration and quality o f scientific institutions in all East Asian countries and in the comparator European countries that have made deliberate efforts to become more technologically advanced (e.g., Spain, Slovakia). The perceptions o f Turkish executives and entrepreneurs are also confirmed by other surveys. Reports evaluating the results o f the World Bank Industrial Technology Project (ITP)’76 confirmed that “most o f the f i r m s in
174 World Bank, Doing Business in 2005, based on Standard & Poor’s (2004).
175 Sirin Elci, “Innovation and Technology Absorption in Turkey”, 2005, Op. Cit.
176 The WB ITP Project (1999-2006) was designed to assist in the harmonization o f Turkish technology infrastructure with European Customs Union standards and assist firms in upgrading their technological capabilities in order to improve the competitiveness of the Turkish real sector, in both domestic and foreign markets. For a description of the project and i t s results, see the project documents at: http://www . worldbank.org.tr/external/default/main?pagePK=6402722 1 &piPK=64027220&theSitePK=36 1 7 12&menuPK=36 1744&Projectid=P009073
187

Turkish manufacturing industries do not collaborate with any research center or university in Turkey or abroad to acquire knowledge or develop new techn~logies. ” ’~~
Figure 6.16: University-industry research collaboration
6.18 Several factors hinder collaboration between firms and research institutions in Turkey. First, communication between research institutions and f i r m s i s limited. One o f the main reasons for this i s the l imited availability o f intermediaries (such as technology transfer offices, technology parks, and university-industry technology centers) to facilitate exchanges between the industry and research communities. Second, universities do not have the right incentives to collaborate wi th f i rms. Academicians who provide services to f i r m s outside o f Technology Development Zones must transfer to universities 70 percent o f their income and are not allowed to start their own bus ine~ses . ’~~ Third, f i r m s perceive the quality o f Turkish scientific institutions as quite low, which limits their interest in collaborating with local researchers. Finally, cultural differences are an issue. Traditional business culture i s reflected in Turkish f i r m s ’ claim that mature technologies are sufficient for their needs.’79 Firms’ overemphasis on confidentiality, academicians’ missing deadlines, and differences between the priorities o f both sides are also stumbling blocks in Turkey.
6.19 Recent measures to increase the number of intermediaries include the Law on Technology Development Zones and the establishment of government-funded university/industry research centers. Despite these efforts, the gaps between the scientific and industry communities are still large. Besides providing fiscal incentives for companies located in specific areas, the 2001 “Law on Technology Development Zones” stimulates collaboration between private f i r m s and research centers or universities by supporting the creation o f technoparks. The law includes incentives for f i r m s located in technoparks to hire university researchers (who do not have to transfer to their universities any income generated by working for f i r m s in the technoparks) as well as
177 E. Taymaz “Monitoring and Evaluation of the Industrial Technology Project, Second Report” (2003) and S. La11 and E. Taymaz “Monitoring and Evaluation of the World Bank Turkey Industrial Technology Project, Third Report” (2004). 17* Sirin Elci, “Innovation and Technology Absorption in Turkey”, 2005, Op. Cit. I7’S. La11 and E. Taymaz, 2003, Op Cit.
188

giving researchers the opportunity to start companies in the parks. Since the Technology Development Law passed, several universities and research centers have established technoparks. Private firms have also been responsive, mainly due to tax incentives offered in the parks. As a result, there are 17 technoparks in Turkey, more than half o f which are under construction. Other programs aimed at improving collaboration between f i r m s and universities or research centers include TUBITAK-TIDEB'S University- Industry Joint Research Centers (USAMs) and KOSGEB's Technology Development Centers (TEKMERs), which specifically target SMEs. There are 6 USAMs and 14 TEKh4ERs throughout Turkey. In 2005, TUBITAK also initiated a National Public Research Program aimed at encouraging public agencies to establish partnerships wi th industry and academia, as well as an Industry Liaison Office in cooperation wi th the Chamber o f Commerce (TOBB), aimed at training some o f TOBB's staff to act as intermediaries between industry and TUBITAK.18' Despite the recent increase in technoparks, USAMs and TEKMERs and more recent initiatives, the Turlush innovation infrastructure i s not sufficient to jumpstart university-firm collaboration throughout the country. Before scaling up, i t i s important that the outcomes o f existing and new programs be evaluated by external experts on the basis o f international best practices.
A.4. Policy Recommendations
6.20 This section includes key policy recommendations to improve innovation at the firm level. I t does not include specific suggestions to improve technology adoption through increased imports o f capital goods, FDI and licensing. Measures to improve technology adoption (which require general improvements to the country's overall investment climate) are addressed in other chapters o f this report (Chapter 1 regarding a macroeconomic environment conducive to stability and growth, and Chapter 3 on Product Market Regulations). Recommendations to improve innovation at the firm level are grouped below under three items: (a) improving the overall policy framework and infrastructure for innovation, (b) increasing access to finance for innovation and (c) improving the institutional effectiveness o f the Turkish National Innovation System (NIS).
(a) Improving The Policy Framework And The Infrastructure For Innovation
6.21 Policy and legal changes are needed to improve the environment for firm-level innovation and strengthen collaboration between researchers and firms, including extending to all universities incentives currently granted only to technoparks. University researchers, excluding students, can benefit f rom their own research in Turkey.18' That is, the academician who invents something i s the owner of the related IPR and has the right to commercial revenues from patents that hidher research generates. While this policy i s satisfactory, additional measures are needed to: (a) extend the benefits currently provided to researchers working in technoparks to al l universities, that i s , eliminate the rule requiring academicians working for firms outside o f
TUBITAK's observations and contributions to the CEM, October 2005.
''' Decree-Law No. 551, Article 41, April 1995.
189

technoparks to transfer 70 percent o f the income they receive to their universities; (b) provide students with the same patenting rights as researchers, because they may contribute to increasing productive innovation and patent levels in Turkey; and (c) create patent cost sharing schemes between inventors, universities and government, and introduce clear rules about IPR ownership among researchers, research institutions and private f i rms .
6.22 The IPR legislation should be reviewed and IPR enforcement strengthened. As mentioned in section II.B, Turkey has improved i t s IPR regime. However, as also indicated by the EU evaluation o f alignment with the Acquis Chapter Six on Company Law, the country needs to make further progress both on IPR legislation and on IPR enforcement.
ZPR Legislation. Changes in the final legislation should be revised in collaboration with international experts and relevant stakeholders to ensure that the law meets EU and international rules and requirements.
ZPR Enforcement. Suggested measures to improve IPR enforcement include:
0 Increasing the independence o f the Turkish Patent Institute (TPE) and improving * i t s staff‘s capacity and experience on IPR-related issues, on both registration and
protection. In the past few years, the TPE has been supported by the World Bank’s ITP Project, which has financed several initiatives to improve i t s effectiveness. 182 Additional staff has also been hired fol lowing changes to TPE’s law in 2003. The ITP project evaluation shows that TPE’s capacity, costs, paperwork and time needed to provide services have improved significantly since program i n ~ e p t i 0 n . I ~ ~ TPE has particularly improved the average registration periods in trademarks, patents and industrial designs. More effort in this direction i s needed to further improve TPE’s effectiveness. Establishing an independent board dealing wi th appeals to the decisions taken by the TPE on registration o f industrial property rights would also be important. The board should be composed o f neutral experts and have a role in between the current board o f re-evaluation and examination and the courts.
0 Increasing the number o f IPR courts and training programs for judges and prosecutors to ensure that they are able to address the high number o f IPR infringement cases. Development o f standard manuals, implementation guidelines and training to improve IPR understanding and specialization among prosecutors, judges, and police and customs officers i s also needed.
18* The World Bank ITP program supports activities necessary to bring the Turkish IPR system into conformance with the European Customs Union requirements. Specific initiatives financed under this project include: (a) technical assistance and training o f TPE staff, (b) reorganization o f the TPE’s staff workflow, (c) construction o f a new building for expansion and upgrading o f current activities, (d) IPR awareness campaigns for consumers, industry, R&D managers and technical staff and academicians, (d) dedicated information centers easily accessible to customers, and (e) training o f judicial officials on IPR.
lg3 I t i s important to note that, in 2004, TUBITAK also established an IPR department that provides help desk services for patent and trademark applications, and also organizes training for TUBITAK researchers, affiliate institutions and firms receiving TUBITAK’s financial assistance.
190

0 Limiting piracy and counterfeiting by applying sanctions and improving border controls fol lowing the E C Directive on enforcement o f intellectual property rights. This, in turn, requires strengthening the administrative capacity o f all agencies involved with piracy control, as wel l as improving coordination and cooperation among enforcement and administrative bodies such as customs, the police, the judiciary, TPE and the Ministry o f Culture and Tourism.
6.23 Increasing the number and quality of intermediaries to improve communication and collaboration among firms, universities and research centers in Turkey. Existing innovation intermediaries (i.e., technoparks, USAMs, TEKMERs and more recent initiatives such as the Industry Liaison Officers) should be systematically evaluated so that only successful approaches w i l l be replicated on a broader scale.'84 TUBITAK has recently started promoting public-private collaboration b y requiring public agencies to establish consortia wi th universities and private f i r m s in order to be eligible for funding, and by providing technical assistance and seed funds to young entrepreneurs. Successful international programs stimulating public-private collaboration that could serve as a useful benchmark include the MAGNET program in Israel, TEKES in Finland and ATP in the US. The Spanish model o f private-public Technology Innovation Centers (Centros de Znnovacione Tecnologicas, or CITES) may prove particularly beneficial for promoting technology adoption among Turkish SMEs.
(b) Increasing Access to Finance for Innovation
6.24 The results of existing financing programs to promote private R&D and business start up (i.e., fiscal incentives, matching grants and reimbursable loans) should be evaluated using best-practice international criteria. The results o f the four fiscal incentives schemes described previously should be evaluated, to assess their effectiveness, fiscal impact and consistency with the Acquis. I t i s also important to emphasize that fiscal incentives do not benefit SMEs, which do not have sufficient profits to use the tax benefits and usually do not record R&D expenses separately on their financial statements, making them ineligible for these incentives. Thus, alternatives to fiscal incentives should be preferred for stimulating private R&D and innovation, particularly for SMEs. In addition, all existing matching grant and loan programs should periodically be assessed against criteria based on international best practice (e.g., the SPREAD program in India and, for matching grants, the experiences o f Israel and Finland). The experiences o f Finland, Israel, Malaysia, Hong Kong and (more recently) Mexico and Chile'85, show that well-designed participatory matching grants for R&D projects and consortia o f academics and f i rms, if properly designed, can be beneficial in enhancing R&D investment b y firms and promoting the commercialization of
lX4 The Ministry o f Industry and Trade i s developing a monitoring and evaluation (M&E) system to assess the results o f existing technoparks. The M&E system should be designed on the basis of international best
"' These include the TEKES Program in Finland, the Magnet Program in ISRAEL, the Small Entrepreneur Research Assistance Program (SERAP) in Hong Kong, the Industrial Technical Assistance Fund (ITAF) in Malaysia, and programs supported by the World Bank through Science and Technology Projects in Chile and Mexico. See Philips (2000) and Batra and Mahmood (2003) for an overall evaluation of the benefits and shortcomings o f matching grant programs supporting technology and innovation.
ractices.
191

innovations generated in academic centers. (Box 6.1). Both TUBITAK and KOSGEB have started evaluating the results o f their matching grants programs. External reviews could add value to the internal assessments by providing inputs based on lessons learned f rom international best practices. Finally, an overall support framework should be designed so as to: (a) assess and reduce as needed overlap among providers; (b) replicate schemes with the highest impact on innovation; (c) increase the level o f collaboration between some o f these institutions and the funding Ministries - both TTGV and KOSGEB have recently experienced funding problems due to some issues with the Undersecretariat of Foreign Trade and the Ministry of Finance; and (d) reduce administrative hurdles in all financing programs, which beneficiary f i r m s say are a major drawback - citing especially implementing agencies’ burdensome bureaucratic procedures, delays in payments caused both by late transfers o f funds from the Government and inefficient processes at the implementing agencies, and the risk averse fund allocation approach taken by al l institutions. TUBITAK has recently introduced simplified procedures in i t s TIDEB program, including advanced payment options in R&D financing schemes’86. I t also plans to introduce accelerated application and appraisal processes to facilitate access to R&D grants. The results o f TUBITAK’s and other agencies’ recent efforts to streamline processes should be evaluated and complemented by similar initiatives aimed at streamlining administrative hurdles throughout the financial process.
Source: Goldberg, I., World Bank 2005
lx6 Starting in 2006, under the Industrial R&D Grant Program, TUBITAK and the Under Secretary o f Foreign Trade wi l l grant up to 10% down payment to SMEs or large firms requesting funds for projects belonging to national priority areas.
192

6.25 Increasing access to finance for innovative start up will also require policies to support development of the venture capital (VC) industry. Development o f the venture capital industry requires further reforms to improve the business environment (see Chapters 1 and 3) and promote innovation (e.g., improving IPR protection). These measures should be coupled with further revisions to the VC legislation and capital market reforms to increase the liquidity o f the stock market (see Chapter 5).
(c) Improving the Effectiveness of the Turkish National Innovation System
6.26 Improving the effectiveness of the Turkish National Innovation System is important for aligning with EU policies and promoting innovation and technology absorption. A National Innovation System i s a network o f public and private institutions interacting in a concerted way to create and adopt technologies, together wi th the policies and strategies that regulate and influence technology adoption and generation. While Turkey’s N IS comprises several institutions covering al l relevant aspects o f science, technology and innovation policies (see Annex 6.2) some key measures are needed to improve i t s effectiveness, in turn increasing technology adoption, innovation and productivity. These include:
(a) Reviewing the institutional structure and capacity o f the Scientific and Technological Research Council o f Turkey (TUBITAK) to ensure alignment wi th international best practices. A new law addressing these issues b y introducing changes in TUBITAK’s mission and organizational structure based on lessons learned from other countries has been drafted. An external review o f the law i s needed to ensure that the proposed actions are aligned wi th international best practices, and lead to improve effectiveness o f both TUBITAK and the Turkish NIS. Clarifying TUBITAK’s role in Turkey’s NIS i s also important. Currently, TUBITAK i s both secretary o f the Supreme Council o f Science and Technology (BTYK), and monitoring and implementing agency for science, technology and innovation support programs. International best practice suggests separating these functions. Finally, i t i s important to complement ongoing internal assessments o f TUBITAK’s programs and affiliate institutions (e.g., TUBITAK-TIDEM, and UME), which have been recently upgraded and are in the process o f further expansion, wi th external evaluations. The evaluations should focus on outputs and outcomes (e.g., increased innovation, technology adoption and productivity at the firm level) rather than inputs (e.g., number o f projects financed, amounts disbursed).
Broadening coverage o f the Turkish NIS. Given the size o f the country and the economic, social and geographical diversity o f i t s regions, a fully centralized N IS i s a significant barrier to addressing local challenges. Local strategies and institutions should be established to ensure that all regions are reached.
Adopting an innovation strategy that places productive innovation at the heart o f all economic, and social development (including science and technology) policies, by strengthening the role o f the business sector in the innovation process and by broadening the definition of innovation to include non-technological
(b)
(c)
193

improvements (e.g., organizational and process changes). While Turkey has developed several strategic plans to support innovation, they have mainly been centered on R&D and science policies. The main science and technology objectives adopted by BTYK in September 2004 are: (a) increasing the demand for R&D, (b) increasing the number and quality o f scientists and vocational and technical staff, and (c) raising gross expenditures in research and development (GERD) as a percentage o f GDP.18’ While these objectives are relevant, the strategy would benefit from a clearer focus on productive innovation and technology adoption at the firm level and from a stronger emphasis on output (rather than input) measures. Some measures in the Vision 2023 document and BTYK’s strategic documents point in this direction, for example: developing s k i l l s and technologies to improve productivity in specific industries, supporting the creation o f science- and technology-based innovative f i rms, and improving venture capital legislation and revolving fund regulation (see Box 1). Further emphasis on these objectives and a clear focus on implementation are essential to comply with EU suggestions and ensure that the resources the government has allocated to science, technology and innovation are used effectively and result in increased productivity in the Turkish economy.
B. QUALITY STANDARDS
6.27 Improving use of quality certification is important to increase Turkish firms’ exports and facilitate integration between local and foreign firms. B y complying with international quality standards, Turkish f i r m s can be recognized as reliable partners for foreign f i rms . The Turkish f i r m s could then more easily sell their products abroad, either as inputs to local or foreign f i r m s ’ production processes or directly to final customers. The use o f quality standards also lays the foundation to promote technology adoption and innovation at the firm level. While the use o f quality standards has increased in Turkey during recent years, quality certification i s s t i l l less common among Turkish f i r m s than among f i rms in most comparator countries - see Figure 6.17. Romania and Bulgaria, for example, have twice as many ISO-certified f i r m s by industry value added as in Turkey.”* Increasing the use o f quality certification at the firm level requires that several conditions be in place, including: a well functioning National Quality Certification System (NQCS), comprehensive quality legislation and regulations, and a sufficient number o f accreditation and certification institutions.
18’ The specific targets to be reached by 2010 to approach the EU objectives set in Barcelona are: increasing the share o f GERD/GDP to 2 percent (from 0.66 percent in 2002) and the number of full-time equivalent R&D personnel to 40,000 (from 28,964 in 2002) while increasing the number of vocational and technical staff proportionally. The centrality o f these objectives i s confirmed b y BTYK’s Science and Technology Strategies Implementation Plan for the period 2005-2010, approved in March 2005.
188 Although figures on Turkish firms’ use o f industry- and product’ specific quality standards (which are often more relevant than I S 0 certifications, particularly for supply chain development) are not available, we can assume that I S 0 certifications are a good proxy for the use o f quality standards and the importance that firms attribute to certification.
194

Figure 6.17: I S 0 certifications per US$lOO million of industry value added, 2003.
~ 35 1 31 30
25
20
15
10
5
0
Gto$* 5Q8 G+8 ,$' o++& .\.."' 90\a P GO4 9
Sources: ISO, 2005 (for I S 0 certipcations) and WDl, 2005 (for industry value added).
6.28 Turkey has gone a long way towards establishing a modern, market-based quality standards regime compatible with relevant sections of the A c q ~ i s . ' ~ ~ Turkey has already replaced almost al l national technical standards with EU and international standards. I t has also significantly reduced (by 60 percent) the number o f mandatory standards applied to imports, from about 650 to 261. This reduction brings Turkey close to have an EU-compatible control mechanism (EU Regulation 339/93) on imports f rom third countries.190 Turkey has a well functioning NQCS in place, comprising the Turkish Standard Institute (TSE), an accreditation agency (TmKAK) and a National Metrology Institute (UME). TmKAK i s a full member o f the European Cooperation for Accreditation. Whi le TmKAK has not yet been internationally recognized, i t i s expected that i t w i l l soon meet al l requirements for signing multilateral agreements wi th the European Cooperation for Accreditation (EA), which w i l l in turn ensure that i t s accreditations o f Turkish conformity assessment bodies (89191 in 2005) and their conduct conformity assessments w i l l be recognized b y EU countries. The National Metrology Institute already offers reliable measurement traceability, which i s needed for the proper functioning o f the Turkish quality infrastructure. The transposition o f harmonized European legislation into Turlush national legislation, as the first necessary step on the way towards full implementation o f the legislation, i s now nearing i ts completion. Public authorities are now at the stage o f implementation of the transposed legislation. This requires, among other things, the establishment o f a sound functioning market surveillance system with improved administrative and technical infrastructure.
6.29 Notwithstanding recent progress, policy and institutional changes are still needed to further improve Turkey's National Quality System and foster adoption of quality standards at thefirm level. First, i t i s in Turkey's interest to recognize tests and standards for products originating in countries with which the EU has signed mutual
B. Kaminski, 2005, Technical Standards Regime and Trade, Background Note. I9O The list o f those mandatory standards was revised and published as an Annex o f the Communique on Standardization of Foreign Trade (Official Gazette 26040 of December 2005). 19' http://www.turtak.org.tr/eng/acredited.htm
195

recognition agreements (MRAs), ’~~ It i s also in Turkey’s interest to obtain similar recognition for i t s products from the same countries. This would reduce the cost o f imports by increasing competitive pressures on preferential (i.e., free trade agreement) exporters to Turkey and Turkey’s quality standards. Second, i t i s important to complete the process leading to TmKAK’s international recognition. Third, some sector specific legislation should be aligned with the Acquis requirements (including legislation for pharmaceuticals, cosmetics and chemicals), and food safety and foodstuff legislation should be adopted. Fourth, TSE’s responsibilities and functions should be compared with those o f similar institutions operating in other countries. International best practice indicates that private sector institutions are often best placed to provide certification and testing services. TSE’s standard development, certification and testing functions are now clearly separated both administratively and financially, to avoid conflicts o f interest. I t would be useful to assess whether the separation o f these three functions within TSE i s effective or whether i t would be preferable to outsource certification and testing services to the private sector. Fifth, the government should encourage creation of private secondary metrology facilities to ensure national coverage. Finally, i t i s essential to increase Turkish labs’ and f i rms ’ requests for accreditation and certification. Matching grants have proven successful at raising awareness o f encouraging adoption o f quality standards in several countries.
C. LABOR SKILLS
6.30 Advanced labor skills are essential complements of technology and innovation and fundamental determinants of productivity and income gaps across countries. Productivity gaps can be thought o f as having two components, s k i l l s gaps and technology gaps, which must be closed simultaneously in order to maximize TFP.’93 Countries and f i r m s that are more innovative and open to technology adoption require a more educated and skilled labor force. Likewise, a more educated and skilled labor force i s essential for innovation and technology adoption. An educated and skilled labor force includes university graduates, able technical workers and, more broadly, flexible workers who are able and wil l ing to learn and apply their s k i l l s productively. What workers need most in today’s rapidly changing world, rather than knowledge o f specific techniques that can quickly become obsolete, are the abilities to solve problems and to continue to learn. This section provides an overview o f the main challenges to enhance the sk i l l s o f the labor force in Turkey. I t starts wi th a description o f educational attainment in the Turkish adult population and then provides an assessment o f theflow o f skilled workers, together wi th an overview o f the quality o f the s k i l l s obtained at various levels o f education.
6.31 The stock of educational attainment among the Turkish population is low. Turkey has made substantial gains in educational level o f i t s population, having increased the enrollment o f 7-14 year-olds from 80 percent to 90 percent in just eight years and
19’ These countries include Australia, Canada, Israel, Japan, New Zealand, Switzerland and the United States. 193 World Bank, Closing the Gap.
196

introduced programs to improve quality and reduce the disparities in school attainment. Nonetheless, the country faces some significant challenges. Adults in Turkey average only 5.3 years of schooling, less than in all comparator countries (except Brazil) and below the expected value given Turkey's level o f development - see Figures 6.18 and 6.19.194 On average, Turkish adults have 4 fewer years o f education than their Polish, Hungarian or Slovakian counterparts, while educational attainment i s similar to that of Finland's in 1960. Increasing the average stock of education i s essential to ensure that Turkey can absorb and adapt global knowledge and technologies. Whi le current educational attainment i s the result o f past investments in education, enrollment rates reflect current investments and indicate how the stock o f education w i l l evolve. T o better assess these trends, the sections below analyze enrollment rates at the primary, secondary and tertiary levels, as well as the quality o f the education provided. Overall, as noted in Chapter 2, current expenditures (both public and private) are high in international comparison, but considerable room for improvement in efficiency seems to exist as educational outcomes remain below comparator countries.195
Y '
Figure 6.18: Average years of schooling of adults (aged 15 and over), 2000.
Figure 6.19: Average years of schooling and level of development, 2000.
I 1 2 1
2 0 4
194 Mean years of educational attainment in Turkey i s likely to be somewhat higher in 2005 as a consequence of the enactment in 1997 of the eight-year compulsory education law. 195 The World Bank Education Sector Study (2005) reports that Turkey spends approximately 7 percent of i t s GDP (combining private and public sources) on education, which i s well above most EU and comparator countries.
196 Law No. 4306
197

to 90 percent in 2003. However, international assessments o f primary school students'97 show that Turkish pupils are learning substantially less than children in EU member states in the core areas o f mathematics, science, and reading literacy. On the TIMSS study o f mathematics, Turkish students performed almost one standard deviation below EU children - sees Figure 6.20. In the TIMSS primary school science assessment, the average Turkish student's performance i s at the lower quartile benchmark, while the mean achievement o f EU children i s at the top quartile. O n the PIRLS assessment o f reading literacy, Turkish students also performed, on average, one standard deviation below EU students. Critical learning shortcomings o f Turlush children include the ability to apply mathematical understanding to relatively complex situations, to recognize and state relationships between events that they have read in a story, and to solve problems by making inferences based on a variety o f information provided b y texts, tables, maps, diagrams and images. These capacities are essential foundations to develop knowledgeable and flexible workers able to apply problem solving s k i l l s to different contexts and learn continuously. The Government hopes to address these quality constraints by means o f a comprehensive program o f curriculum modernization that i t launched in 2004 to improve teaching and learning across all o f the core subject areas.
Figure 6.20: Acquisition of skills in mathematics and science.
560
640
520
500
480
4Eu
44c
420
I 400 Membr Stale NW Members Candldalsr
EMBER STATES
Figure 6.21: Acquisition of skills in reading literacy.
Source: World Bank, Education Sector Study, 2005'98.
6.32 Expanding enrollments and improving quality of secondary education are Turkey's critical challenges. Less than 50 percent o f the 20-24 year o ld young adults have a secondary education diploma in Turkey, which i s wel l below the EU target o f 85 percent. Turkey's success in implementing i t s eight year compulsory education program has contributed substantially to increasing enrollment in secondary education, but the challenge o f closing the gap remains quite substantial. Results f rom the 2003 OECD Program for International Student Assessment (PISA) show that Turkish students
INFOR
LIT
iuntry
19' The Trends in International Mathematics and Science Study (TIMSS) and the Progress in International Reading Literacy Study (PIRLS) are carried out by the International Education Association in partnership with participating countries, including Turkey. They measure cognitive development and skill acquisition among fourth and eighth grade students (respectively half-way through and at the completion o f primary schooling). 19* Forthcoming, following final review by Government for dissemination.
198

perform we l l below their OECD counterparts (although a small percentage perform at world-class standards). PISA uses a six-level scale o f mathematics-quantitative proficiency, where “1” represents the absolute minimal level of proficiency and “6” represents high-level, complex problem-solving and mathematical reasoning ability. More than hal f o f Turkey’s 15-year-old students (55 percent) were unable to perform above level “1 ,” whereas the average proportion in OECD countries (including Turkey) was less than 21 percent ~ see Figure 6.22. Similar results were found in all mathematics s k i l l areas, from geometry and algebra to statistics and computation, as wel l as in reading and science.
6.33 Turkey’s secondary vocational schools - which have very low enrollment rates despite the government efforts to increase them - also do not provide Turkish youth with skills that can be readily applied in the labor market. Evidence from PISA indicates that vocational graduates in Turkey are not prepared for employment. Wor ld Bank research also shows that vocational graduates are not significantly more l ikely to be employed after high school than general secondary graduates who do not continue to tertiary e d ~ c a t i 0 n . l ~ ~ Vocational school graduates, the vast majority of whom are unable to qualify for university entrance, have the opportunity to enroll directly in post- secondary vocational institutions (MYOs) without an examination. Nonetheless, many o f these institutions are o f inadequate quality and do not provide adequate value in terms of s k i l l development and preparation for employment (see paragraph 6.35, below). In addition, fewer than half o f employed vocational high school graduates report having jobs that use the vocational s k i l l s they actually learned in This i s because many o f the secondary vocational/technical school programs are out o f step wi th the needs o f the modernizing economy. Some o f the vocational programs are s t i l l directed to girls with instruction in traditional homemaking s k i l l s such as embroidery, knitting, food preparation, and childcare. Even as computer science i s being introduced into girls’ vocational education programs, i t i s difficult to see how they can prepare young women for a real profession in a modern labor market, or help them become catalysts of technological change and innovation within f i r m s .
‘99 World Bank, Education Sector Study, 2005. The finding i s derived from an analysis of Household Labor Force Surveys (HLFS) of the State Institute of Statistics for 2003.
*O0 World Bank, Education Sector Study, 2005. The finding i s derived from the 1997 household survey, the only survey that included a module on the acquisition of workforce skills.
199
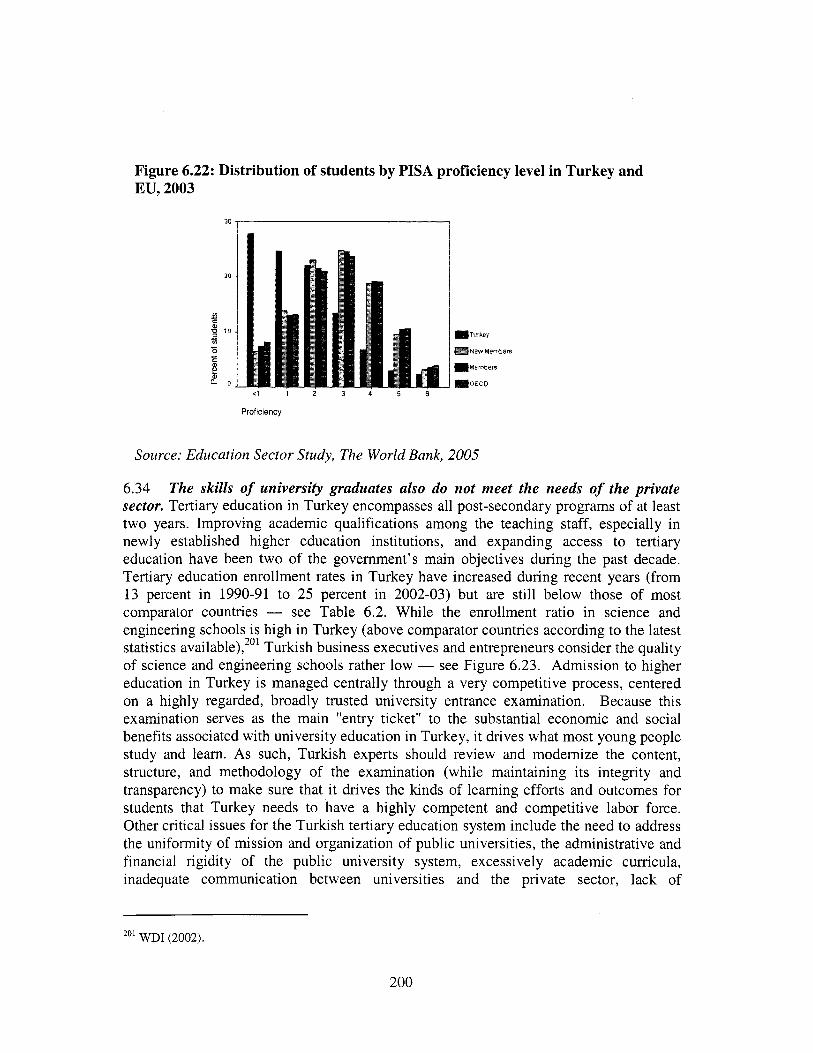
Figure 6.22: Distribution of students by PISA proficiency level in Turkey and EU, 2003
30
=Turkey
NUW Melltbats
Member6
OECD cl 1 2 3 4 5 6
Proficiency
Source: Education Sector Study, The World Bank, 2005
6.34 The skills of university graduates also do not meet the needs of the private sector. Tertiary education in Turkey encompasses all post-secondary programs o f at least two years. Improving academic qualifications among the teaching staff, especially in newly established higher education institutions, and expanding access to tertiary education have been two o f the government's main objectives during the past decade. Tertiary education enrollment rates in Turkey have increased during recent years (from 13 percent in 1990-91 to 25 percent in 2002-03) but are s t i l l below those o f most comparator countries - see Table 6.2. While the enrollment ratio in science and engineering schools i s high in Turkey (above comparator countries according to the latest statistics available),201 Turkish business executives and entrepreneurs consider the quality o f science and engineering schools rather low - see Figure 6.23. Admission to higher education in Turkey i s managed centrally through a very competitive process, centered on a highly regarded, broadly trusted university entrance examination. Because this examination serves as the main "entry ticket" to the substantial economic and social benefits associated with university education in Turkey, i t drives what most young people study and learn. As such, Turkish experts should review and modernize the content, structure, and methodology o f the examination (while maintaining i t s integrity and transparency) to make sure that i t drives the kinds o f learning efforts and outcomes for students that Turkey needs to have a highly competent and competitive labor force. Other critical issues for the Turkish tertiary education system include the need to address the uniformity o f mission and organization o f public universities, the administrative and financial rigidity o f the public university system, excessively academic curricula, inadequate communication between universities and the private sector, lack of
'01 WDI (2002).
200

specialized technical or professionally oriented undergraduate degrees (such as universities of applied science in Germany or the former polytechnics in the UK), and lack o f an adequate system o f regional colleges that can provide good capillary education. Employers in Turkey, l ike their international peers, are increasingly concerned about problem solving, creativity, confidence and communication s k i l l s than about specific technical sk i l l s . However, academics seem reluctant to accept input from f i r m s in determining what and how they teach (with the important exception o f a handful of institutions, including private (foundation) institutions, which are beginning to take account o f labor market needs). Partially as a result o f these issues, there i s a relatively high level o f unemployment among new university graduates.202
Table 6.2: Tertiary Education Indicators: Stock and Flow Tertiary education Tertiary school (% o f 25-64 year enrollment
olds) (% gross) 2002-2003 Brazi l 18 Turkey Portugal China Thailand Malaysia Mexico Spain Chile Philippines Hungary Slovalua Poland Bulgaria Romania
8.9 9.4
24.4
14.1 10.8 12.2 21.1 10.0
25 53 13 37 27 21 59 42 31 44 32 60 38 30
Source: Population with Tertiary Education-EUROSTAT Labor Force Survey, as reported in the Trendchart Innovation Policy in Europe, Innovation Scoreboard 2003.
202 The level of unemployment i s higher among young university graduates than for recent secondary school graduates..
20 1

Figure 6.23: Quality of math and science education. 6
5 5 4 H 5 e 4 5
$ 3 5
P s 0 4
- - 3 L. - a 2 5
2
.""J.." &e4 *ab ,-.,.:,.p,,.. ,d**$@~fl*,d8eq$* @ r " B .? 5 p. p.08 0 J
9 9.'
Note Math and science education in your country's schools. . I =lags far behind most other countries . 7=is among the best in the world).
Source. WEF, 2004-2005
6.35 Post-secondary vocational education is also of poor quality and out of sync with the needs of the private sector. Employers in Turkey face even greater shortages o f mid- tier, technician level workers than o f university graduates. Well-prepared technician level workers are essential to facilitate technology absorption and adaptation, as wel l as (to a lesser extent) innovation. Thus, qualified post-secondary vocational institutions (MYOs), or technically oriented programs in undergraduate schools, are much needed in Turkey. Unfortunately, Turkish MYOs suffer from historic underinvestment, neglect and a poor image. Many students and employers consider most MYOs as undesirable, and many o f the universities that are responsible for them neglect them.*03 These circumstances have led to a downward quality spiral, with l ow staff morale, less prepared students, and a tarnished image among employers. The fact that the MYOs are associated with universities, but are relegated to a second-class status in the system, also prevents them from evolving into strong alternatives to universities, restricts their ability to innovate, and diminishes them in the eyes o f students and the public.
6.36 Improving the skills of the labor force and ensuring that they match the needs of the private sector will require rethinking the education system at all levels. First, i t i s essential to improve the quality o f education both at the primary and secondary levels, to ensure that students acquire the foundations that are needed to continue learning at later stages and key problem solving s k i l l s that w i l l allow them to be conduits o f change at all stages o f their careers. Second, reforms are needed to encourage higher education institutions to develop differential missions and strategies, with a different balance o f effort across the functions o f teaching, research and service provision. Third, the curricula o f universities should be revised to reduce their academic thrust and ensure that they better match the needs o f the private sector. Improvement o f university-firm communication i s essential to reach this aim. Fourth, the Turkish education system should be reformed to avoid systematically assigning students into a specific education track from a very early age. The existing tracking system reduces learning opportunities through a series o f selection examinations that tend to separate students by achievement
*03 An indicator o f the quality challenge for MYOs i s that, according to Government figures, 25 percent o f their places remain unfilled, despite the opportunity o f open enrollment for vocational education graduates.
202

and place them into schools that then exacerbate their learning differences and career outcomes. Currently, each step of the education selection process in Turkey leaves fewer and fewer students to benefit from high-quality education. Fifth, there i s a need to consolidate and refocus post-secondary technical institutions with their own budgets and missions, while maintaining the academic link to universities. Turkey should also consider ways o f using i t s funding o f postsecondary education to upgrade MYOs into technical colleges or polytechnic institutions that can grant two- to four-year degrees in a broad variety of areas so as to more flexibly provide high end technical s k i l l s to graduates in line wi th labor market demands. Finally, more emphasis should be given to cultivating lifelong learning systems for continuously upgrading human capital and to promoting continuing vocational training. This can be accomplished b y providing incentives to f i rms , both to hire technical personnel and to provide relevant training.
D. CONCLUSIONS
6.37 This chapter has emphasized that improving Turkey’s performance on the knowledge factors - technology, innovation, quality and skills - is a critical part of increasing total factor productivity and ultimately achieving Turkey’s goal of sustainable, long-term economic growth. Despite some recent improvements and successes, Turkey lags behind comparator countries on many indicators in these areas, including importing capital goods, FDI and licensing (for technology absorption), R&D, patents, access to finance and university/firm collaboration (for innovation), use o f quality standards by firms, and the stock o f educational attainment and f low o f skilled workers (for labor sk i l ls ) . Table 6.3 includes a summary o f short- and medium-term recommendations to improve Turkey’s performance in the knowledge areas. A firm commitment by both the Turkish Government and the Turkish private sector to make progress on access to and use o f the knowledge factors w i l l not only allow Turkey to meet the requirements o f the Acquis and other EU recommendations, but also ensure that the country develops the capability to generate and manage technological change and innovation, as well as create a better alignment between workers’ s k i l l s and the needs o f the private sector, in turn reaping the social benefits o f increased productivity and consistent economic growth.
203

204

CHAPTER 7. INFRASTRUCTURE SERVICES FOR IMPROVED COMPETITIVENESS
7.1 I n key infrastructure service areas, Turkey has already made substantial progress in designing the changes to legal and regulatory structures needed to meet EU acquis requirements. While much implementation work remains, Turkey recognizes that the combination o f internal market liberalization and effective integration with international markets offers efficiency gains that w i l l increase competitiveness and employment This chapter o f the C E M focuses on the nexus between EU accession and growth in three infrastructure sectors - Information and Communications Technology (ICT), transport, and energy. Within these sectors, the Government has choices to make in regard to phasing and timing of the changes needed to meet acquis obligations. This chapter offers guidance from Bank and international experience.
7.2 Transport and communications contribute approximately 15 percent o f Turkey’s GDP. The importance o f these services reflects both internal demand and Turkey’s geopolitical position as a link between Europe and Asia. Energy services contribute an additional 3.5 percent of GDP. These services are critical components o f the business environment and can play an important role in attracting investment and improving the overall competitiveness o f the Turkish economy. Each o f these services offers the potential for substantial efficiency gains through structural changes - typically already underway - and regulatory strengthening.
Infrastructure services are an important driver of growth.
7.3 Although Turkey is relatively well endowed with infrastructure compared to other emerging economies, it falls short of OECD and EU standards. Businesses are burdened by costly, low quality backbone infrastructure services, as reflected in Table 7.1, below. In particular, the cost o f telecommunication services and energy remains among the highest in the OECD area,2o5 while quality i s among the worst not only in the OECD, but also in comparison to new entrants to the EU. The dominant transport mode - road -- suffers f rom localized congestion and deteriorating road quality. While daunting, Table 7.1 does show progress in telecommunications over the past three years and substantial progress in electricity services. Gains in both areas reflect initial outcomes from recent reform efforts and suggest that much can be gained through more
*04 Embodied in the Turkish National Programme for the Adoption o f the Acquis. *05 OECD, Economic Survey of Turkey, Paris, 2004.
205

efficient, user financed, operations. The largest transformational challenge i s moving from monopolistic state entities providing services toward the mix of private and state that characterizes efficient higher income economies. Of course, the infrastructure implications of meeting all acquis requirements go well beyond those discussed in this chapter. In particular, the environmental dimension, wi th i t s very large financial costs, wi l l be dealt with in a later CEM.
Turkey
EU-8
Table 7.1 Infrastructure and Doing Business Percentage of Firms that see infrastructure service provision as a problem doing business
2002 22.5 31.6 19.3 2005 20.4 23.1 21.3 2002 11.5 11.4 12.3
I Telecommunications I Electricity I Transportation
A. INFORMATION AND COMMUNICATION TECHNOLOGIES
A.l. The Stakes
1.4 ICT are a general purpose set of technologies, applied across all activities with no sector untouched. I C T accounts for 8% o f EU GDP, 6% o f employment and 50% o f EU productivity growth between 1995 and 2000. A UN Task Force observed: “The global I C T sector i s extremely dynamic and transformational; there i s virtually no status
and “ICT are rapidly emerging as a vital factor in economic and social development to facilitate innovative and scalable solutions for achieving major development objectives”. These observations apply to Turkey - irrespective o f the date o f EU accession - as a participant in the global economy. Ensuring the widespread diffusion of I C T in Turkey i s an unavoidable challenge, one made more difficult by the need to provide access in farming and rural communities, but a challenge where the process o f EU accession w i l l provide considerable value added in i t s own right.
7.5 ICT is largely the responsibility of the private sector, nevertheless the government of Turkey still has a significant leadership role to play in policy development and implementation. The government sets the business climate for ICT investments. The electronic communications acquis i s part o f the story. Other actions are also required and the challenge i s sufficiently broad that one proposal i s to appoint a cabinet level e-minister wi th responsibility for coordinating the response to the I C T challenge.
1.6 The electronic communications acquis communautaire is evolving. The 2002 version w i l l be reviewed in 2006. B y the time of Turkey’s accession the target w i l l have
206 http://w.~vw.itu.~nt/M.sis/tffni/final-~epo~.p~f this observation also implies that whatever data i s presented here i s certainly out of date.
206

moved again. The acquis i s an element o f the target which includes a set o f supporting legal instruments related to data protection, privacy, e-security, e-signature and a panoply o f initiatives related to the application o f I C T in such activities as e-government, health, learning, work, business, mobility, transport, content and inclusion. The EU has placed great emphasis on the Information Society (IS) in economic growth and social inclusion. The importance o f I C T as the enabler o f the IS was enshrined in the Lisbon Strategy which represents Europe’s response to the challenge o f accelerating growth and job creation largely in the ‘knowledge based economy’. The associated actions form a considerable component o f the target.
7.7 To promote ZCT the European Commission has developed a series of projects: e-Europe, e-Europe 2005 and now the i2010 program together wi th initiatives to reinvigorate the Lisbon Strategy. Turkey, as a candidate, participated in the e-Europe. Each project set higher benchmarks and standards for I C T diffusion and a more competitive environment. The current emphasis i s broadband and i t s supporting framework. Each new benchmark moves the target for Turkey
A.2. ICT Performance in Turkey
7.8 Turkey faces the ZCT development challenge with some advantages. The telecommunications regulatory authority (TK) though encumbered by a dated and much amended telecommunications law (no. 406 o f 1924) assumed the role o f issuing licenses in 2001 and has since, January 2004, overseen the full liberalization o f the sector. The competition authority (RK), armed wi th an EU reflective competition law, which needs to be updated2”, has also been very active in supervising the market and i t s 2004 Annual Report demonstrates the pro-competition role i t played in the preparation o f the privatization o f Turk Telecom. Whi le TK and RK need more professional staff, and their decisions are subject to lengthy appeals procedures, the Turlush market performs well and by implication the policy malung institutions appear to be functioning well. Tariffs w i l l fal l as competition intensifies. Equally, the SPO has been expanding i t s capacity on the e-agenda through the e-transformation o f Turkey program and the e-Turkey portal has developed into a r ich source o f information.
7.9 The successful privatization of Turk Telecom will allow it to play a more active role in the promotion and diffusion of ZCT. As a private business it wi l l be more responsive to market needs. The EU accession process w i l l further develop these strengths as Turkey implements the relevant acquis, enhances, refines and implements i t s e-strategy and generally converges to EU benchmarks. But convergence wi l l necessitate an acceleration of developments. However, post-privatization both TK and RK w i l l need to be more vigilant regarding the progress o f liberalization in order to ensure that the full benefits o f competition in the sector materialize. A private Turk Telekom retains considerable market power over bottleneck facilities essential to the development of competition.
*07 See OECD Review http://www.rekabet.gov.tl./intrel.htrnl
207

7.10 Turkey currently lags member states, peers and competitors in some dimensions of ZCT. I t s relative position i s we l l documented in the f ina l report o f the e-Europe + project and elsewhere. There are nearly 50 million telecommunications customers in Turkey with more than hal f being mobile subscribers. In telecommunications Turkey performs adequately in the 13 (10 accession and 3 candidate) countries. But gaps start to appear when the internet, PCs per 100 population or PCs per 100 elementary school children are examined. The most striking gap relates to broadband.
7.1 1 Turkey’s IT equipment manufacturing capabil ity i s “modest”; software i s largely imported; ICT imports substantially exceed exports; the share o f ICT in GDP i s around 2.5% compared with 8 to 10% in the EU and average spending per person on ICT i s around $40 compared to $500 in Western Europe and $1,200 in the USA. ICT Intensity (defined as ICT Markets/GDP) and Trade in ICT Goods and Services in Turkey are amongst the lowest in the OECD, there i s n o Turkish representative in the l i s t of the 250 top ICT f i rms.
7.12 In this context, the l o w ICT Intensity in Turkey, evidenced by the l o w per capita spending on ICT, raises questions for the competitiveness o f Turkish businesses. Only the widespread diffusion and application of ICT can remedy this potential threat t o Turkish businesses in the global economy (Box 7.1).
Box 7.1. Microeconomic Impact of ICT development
ICT i s not a substitute for good management but the combination o f the two has a direct and positive impact on performance at the firm level. This holds for individual firms even in declining industries. The OECD identifieszo8 the role o f ICT in helping firms gain market share and in organizational change at firm level and, with some caveats, summarizes the findings o f various studies as:
ICT use has a positive impact on firm performance, productivity and wages, and i s associated with plant expansion Computer networks are particularly important; they allow f i r m s to outsource activities, work closely with customers and suppliers, and better integrate activities in the value and supply chains, with positive effects on productivity. Organizational change i s a key to benefiting from ICT investment and i s closely linked to the need for skilled human resources Adoption o f advanced ICT increases with the size o f f i r m s and plants e.g. large f i r m s are more likely to use a combination o f network technologies and broadband and to use the technologies to redesign and integrate information and communication flows within the firm, whereas small f i r m s tend only to use the Internet for marketing purposes. The benefits o f ICT may only emerge over time, as f i r m s need to adapt their s k i l l s and organization.
Ibid page 59.
208

A.3. Broadband - The New Imperative
7.13 I n July 2005, the European Commission issued a landmark document on the digital divide and broad band access.2o9 Broadband has 2 major attributes - i t can carry huge quantities data at very high speeds. Postal and courier services can deliver huge quantities o f data but they fai l the speed test. The expansion o f broadband i s closely related to the growing importance o f the “knowledge economy” which recognizes the growing knowledge intensity and declining material components o f goods and service and the associated contributions of knowledge creation and innovation. The Lisbon Strategy seeks to locate the EU economy f irmly within the knowledge content orbit since these sectors provide the greatest prospects for economic growth, j o b creation, wel l remunerated employment, increasing returns and expanding markets.
7.14 The role of broadband in this paradigm is to facilitate, very rapidly, the functions related to knowledge creation, management, applications, control, distribution, capture and manipulation. Broadband i s becoming a new essential infrastructure for businesses and government. Whi le transport infrastructure handles material products, broadband manages the knowledge components o f final and intermediate products and process. Broadband i s frequently the means o f the ‘digital delivery’ o f many services. As economies become increasingly service and knowledge based the importance o f electronic highways increases. These highways are an imperative for a modem economy.
7.15 The European Commission stated210 “The advent o f broadband communications i s radically changing the Internet and i t i s essential for investment in Europe to continue if i t i s not to be left behind.” Turkey lags badly as illustrated by Figure 7.1211. Although Turkey shows a doubling o f lines f rom 2003 to 2004, the distance behind the comparators remains striking.
Broadband gaps present a particular challenge in Turkey.
*09 httR://eulopa.eu.int/information society/eeurope/i20 1 O/digital dividehndex en.htm 210 httR://eul.oDa.eu.int/information societv/eeurope/2005/doc/all aboudacte sector en.pdf 211 http://www.oecd.or~r/document/23/0,2310,en 2649 34223 33987543 1 1 1 1 .OO.html
209

Figure 7.1 -Availability of digital subscriber lines in OECD Countries %
100 IB 2003 (Actual coverage, %) A 2004 (Rojected coverage, %)
80
60
40
20
0
7.16 The level of broadband access has spatial consequences. The Commission’s digital divide document addresses the need for actions to ensure the widespread availability o f broadband for both economic and social reasons. The spatial issue w i l l be a particular challenge for Turkey since currently broadband access i s highly localized.
7.17 The EU’s determination to achieve full broadband coverage is backed by funding. For example the European Commission has produced guidelines for the use o f EU Structural Funds (ERDF) for investment in broadband infrastructure.212 These matching funds are available throughout the EU in rural and remote areas where broadband i s not “financially viable”. The new “Competitiveness and Innovation Programme” o f April 2005, envisages more than € 800 mi l l ion specifically for an “ICT Policy Support Programme” in the context o f €4.2 bi l l ion package to re-launch the Lisbon Strategy. Such EU funds are available to member states. EU financial support offers member states, but not yet Turkey, the opportunity to more quickly reach full coverage
A.4. I s Turkey Ready?
7.18 ZCT diffusion is closely associated with competitiveness. I t i s a component of the World Economic Forum’s (WEF) “Global Competitiveness Index”.213 In order to monitor developments the WEF produces a complex set o f indices to measure a country’s “e- readiness” or “network readiness index” (NRI). The NRI represent the overall ranking o f a country within a group o f 104 countries. Table 7.1 compares the NRI of Turkey with some o f i t s neighbors, peers and competitors. Some o f the results are encouraging.
212 http://europa.eu.i nt/cotnm/renional policv/sources/docofficiworkin~doc/tele~~~ni en.pdf 213 htt~://www.weforum.orrz/Bdf/Gcr/Coml,osition of Growth Conipetitiveness Index Turkey i s ranked 66’ out of 104 http:/ /Lvww.weforum.or~~~f/Cicr/Gro~~/th Coml3etitiveness Index 2003 Comparisons
210

Table 7.1 Network Readiness Index Rank 2004/05
Index Sub-component
I
Rank Index Rank Index Rank Sub-Component Sub-component
7.19 Turkey holds a roughly median position regarding network readiness. While Turkey i s behind Estonia, Slovenia and the Slovak Republic i t i s ahead o f some EU member states and candidates. The highest ranked EU member i s Finland at 3rd place. A deeper analysis o f the sub-indices for a country can provide insights for the appropriate application o f policy interventions and clarify the respective roles o f the public and private sectors.
1 Environment I 57
Variable Rank +/- 10
Availability o f Scientists 42 & Engineers Availability o f Venture 84 Capital Quality o f Scientific Research 70
7.20 Attention shouldfocus on most critical gaps. The overall NRI has 3 major sub- components: environment (of ICT), readiness, and usage. Each o f these sub-components i s comprised o f numerous variables (Table 7.2). In the table below the overall sub- component ranlung i s listed together wi th any variable in the sub-component whose ranking differs b y 10 places (plus or minus) from the sub-component ranking. Turkey ranks 49'h overall for I C T usage but in the usage sub component, Turkey i s ranked lSt in the proportion o f households wi th TV - consequently this variable i s included in the table.
Readiness I 60 Usage I 49 Variable Variable
Rank +/- 10 Rank +/- 10 Quality o f Public Educational 81 payphones 77 system Quality o f Television Public schools 70 sets 1
Buyer Broadband-DSL dynamism 37 Internet 59
Institutes I Subscribers Subsidies for I Firm level R&D I 37 I Telephone I 4 I Foreign technology I 33
I Residential I Prevalence o f
21 1

Intellectual property protection
The following comments concentrate on those areas where improvement i s needed.
80
7.2 1 ZaEnvironment This sub-component refers to the overall enabling environment for the I C T sector. Two sets o f related variables that stand out are:
0 Availability of venture capital and ease o f access to loans; Administrative burden, laws relating to ICT, intellectual property protection
Both sets require government attention. The f i rs t relates to initiatives to promote the development o f financial markets and innovation (dealt with in chapters 5 and 6). The second set refers to the legal, regulatory and business environment o f ICT. The effective transposition of the electronic communications acquis w i l l produce positive results for this component, indeed strengthening the enabling environment o f I C T wil l bring benefits regardless o f progress in the Accession process more broadly. Turkey has a good ranking for “effectiveness o f law making” so the transposition should not prove to be difficult.
7.22 Readiness. This sub-component examines the supply side, take up potential, and possible stimulants o f I C T development. “Buyer dynamism” i s strong in Turkey and the diffusion o f I C T i s supported by the low costs o f telephone usage.214 I t i s possible to group the variables as follows:
Quality o f educational system, quality o f public schools, availability o f training services
Government prioritization of I C T and Government procurement o f I C T
0
0 Business Investment in R&D 0
7.23 The educational issues for technology adoption are addressed in chapter 6. The private sector has prime responsibility for the l ow business R&D ranking. As with the venture capital ranking, macroeconomic conditions could play a significant role. The government should also examine, within the EU parameters, i t s R&D incentives schemes and the whole R&D nexus o f universities, science, research and commercialization. R&D i s a particular worrying concern for the EU (see chapter 6). The low rank for government I C T procurement does not reflect recent government commitments to rapid expansion of
214 I t i s conceivable these costs w i l l increase when Turk Telecom sets i t s tariffs more independently and more closely relates investment and tariff decisions.
212

internet access, particularly for schools. As the single biggest buyer o f I C T i t s practices have important ramifications for the whole I C T sector.
7.24 fol lowing groups o f variables are considered:
Usage. The third sub-component measures how I C T are currently used. The
0
0 Broadband-DSL internet subscribers 0
Firm level technology absorption, prevalence o f foreign technology licensing
Government success in I C T promotion, government on-line services
7.25 At the firm level, ZCT usage is satisfactory as firms absorb and license foreign technology. The broadband ranking confirms previous observations. With the liberalization o f the electronic communications market and the privatization o f TT, the private sector w i l l play an increasing role. The role for the government w i l l be to stimulate demand for broadband. As yet, the performance o f the government i s mixed since Turkey ranks wel l in terms o f on-line services but poorly in terms o f promoting the I C T sector. Finally, discriminatory taxes also possibly burden the development o f the mobile segment-a key underpinning o f the I C T sector. In response, the Ministry o f Finance i s now reviewing sector tax policy.
AS. Policy and Action Guidelines
7.26 The first priority is the transposition and effective implementation of the acquis for electronic communications well before E U accession thereby providing the regulatory and business climate for increased investment in I C T to enhance the competitiveness o f Turkish businesses. The reasons for early implementation are that i t takes time for companies to absorb and adjust their organization to ICT, so early implementation w i l l give companies more time to adjust. The U N ’ s Economic and Social Council stresses the importance o f the type o f enabling environment found in the acquis observing: “The creation o f an enabling environment for ICT-driven development relies on establishing a legal and policy framework that encourages investment, innovation and entrepreneurship . . . [the environment consists of] a set o f public policies that operates at several levels: (a) the development o f national strategies at the macro-policy level, which favor the development and deployment o f I C T in pursuit o f social and economic development goals; (b) economic strategies that involve the design, development and implementation o f effective policies in areas such as telecommunications policy and regulation, spectrum management and electronic commerce; and (c) accurate measurement and benchmarking, in order to assess the effectiveness o f the implementation o f policy objectives in relation to development goals and targets.” Other actions are also required of the government.
7.27 The government could usefully re-examine its own performance across all levels of the ZCT deployment model. T o send clear signals to the market and private investors, a renewed statement o f Turkey’s I C T macro-policy may be required (level (a)). The statement may include the objectives o f the government regarding the e-agenda,
213

social inclusion (especially regarding farming and rural areas) and broadband and the role that government w i l l play in these developments, re-establishing i t s I C T priorities.
7.28 The government has made great progress in telecoms policy and regulation, but could beneficially examine its role in promoting and procuring ICT. I t i s quite possible that government demand for I C T services (from health to education to general administration) could pull private suppliers into under-served locations in Turkey. This entails a wider analysis o f the government’s role o f I C T buyer and user and assessing the extent to which the government can outsource the supply o f services by competitive tender to the private sector. The government could both foster more intense competition in and encourage the aggregation o f demand for certain goods and services to bring about lower prices. This may be very important for the household sector where PC penetration i s l ow and a more affordable approach i s required. Broadband w i l l be deployed slowly without the widespread diffusion o f PCs. The same holds true for relevant content. Though i t i s beyond the scope o f this chapter, some serious consideration must be given the R&D nexus. In undertaking these actions the Turkish authorities could draw on EU experience and work closely wi th EU counterparts. T o support these initiatives i t w i l l be necessary to establish monitoring and evaluation (M&E) schemes to measure progress and the fulfillment o f objectives and reporting regularly. The establishment o f benchmarks and M&E w i l l allow for the continuous refinement o f pol icy actions and instruments.
7.29 Most EU members have a specific “e” minister with a cabinet level position. The electronic South- Eastern Europe (eSEE) program, in which Turkey participated required the establishment of a cabinet level body in charge o f I S promotion and development, to ensure that “IS issues are brought to the highest policy malung levels” and to ensure “e-modernization o f the public sector i s at the core o f the national information society policies . Turkey could also consider a similar model, including with a cabinet-level responsibility for coordinating the implementation o f i t s I C T policy.
Coordination in the Government’s e-policy is key for success.
7, 215
B. LINKING UP WITH TRANS-EUROPEAN NETWORKS
7.30 Turkey’s future growth will depend on the quality of i t s infrastructure. Raising the efficiency o f Turkey’s transport sector w i l l contribute to economic growth, environmental sustainability and poverty alleviation. This would help Turkey’s competitiveness by lowering logistics costs. I t would also increase the access o f rural and urban populations to basic services, markets and jobs, and reduce the high human and economic costs o f traffic accidents. Mobil izing private investments and managerial know-how in this effort w i l l also help reduce the sector’s current onerous deficits.
215
2 14
7.31 EU Accession. As a result o f the official launching o f the negotiations between the EU and Turkey, the detailed examination o f the regulatory framework i s expected to begin shortly. One significant element of the adoption o f the EU Acquis i s the requirement that the government separate out social services f rom commercial services, which wil l have a special significance for TCDD, the National Railway Administration.
7.32 EU Progress Report October 2004. Regarding the transport sector, the latest EU Progress Report concludes as follows: “Some progress could be recorded in all transport modes, excepted air transport, but overall alignment remains l imited and al l modes present problematic issues. Concerning in particular maritime transport, the detention rate remains much higher than the EU average, and Turkey remains in the black l i s t o f the secretariat o f the Paris Memorandum o f Understanding (MOU) on Port State controls. Transposition o f the Acquis should take place in parallel with adherence to international agreements. The staff and capacity o f the Ministry of Transport needs to be strengthened substantially.” An update of the progress made since 2004 w i l l be available b y the end o f this year 2005, and i t should be noted that significant progress has been observed in the quality o f Turkish-flagged vessels complying with Paris MOU requirements.
7.33 EU Acquis for the Transport Sector in Turkey. In terms o f regulating the road transport market, two new pieces o f national legislation (Road Transport Law and Road Transport Regulation) entered into force, elaborated in accordance wi th EU legislation concerning access to the market and profession. The fol lowing actions w i l l need to be initiated as part of the Revised Accession Partnership short-medium term action plan: (i) alignment on road transport legislation (road safety as wel l as social, fiscal and technical rules), railways and air transport (particularly air safety and air traffic management); (ii) ensure effective implementation and enforcement o f transport legislation, particularly as regards maritime safety, road transport as well as air transport; (iii) complete alignment with EU maritime legislation in safety and non-safety areas; improve maritime safety, in particular improve the performance of maritime safety administrative institutions, firstly, as a flag State, and then as a port State, and guarantee their independence; (iv) implement a programme o f adaptation o f the Turkish transport fleet, particularly maritime and road transport to Community technical norms; and (v) adopt a program with a view to identifying main transport infrastructure needs in Turkey and related transport-network projects, in coherence with the European Community TEN-transport guidelines.
B.l. Overview of the Transport Sector
7.34 Transport is vital for the economic development and integration of Turkey. Transport (with communications) i s the 3‘d largest contributor to GDP, amounting to 15 percent in 2003 after Industry (excl. construction) and trade. This level o f contribution to GDP i s more than twice than that o f western European countries (Germany’s contribution being 5.2 percent, Denmark’s being 7 percent). Increasing the efficiency o f the transport sector i s a priority both because o f the enabling role the sector can play in the economy and the integration o f the country with the EU. Turkey i s a large country, with an area about that o f France and UK combined, and population and activities widely spread. For instance, Ankara i s over 400 km from any o f i t s nearest ports, Le., Samsun, Istanbul, and
215

Mersin. Turkey i s also the natural land transport bridge between Europe and the Middle East. Again, the distances are long, 1,750 km from the Bulgarian border to Iran and 1,900 km to Iraq. Problems o f distance are increased by the mountainous terrain and harsh winter conditions in most o f Anatolia. Hence the improvement in the transport infrastructure i s a major challenging priority for the overall development o f the economy.
7.35 The Turkish Government recognizes these infrastructure needs and further states in the Preliminary National Development Plan that improving infrastructure services i s not only a strategic priority unto i tse l f but also a key element for achieving sustainable growth and better quality o f life. However, as explained in chapter 2, the main medium-term priority in Turkey has recently been, the macroeconomic stabilization of the country. In this context, infrastructure spending cuts have been part o f a broader structural reform program that also includes concrete steps to achieve fiscal and macroeconomic targets, reduce the role o f the public sector in the economy, and assess both the government role in infrastructure (particularly regarding limiting the exposure to contingent liabilities) and the problem o f quasi-fiscal costs. I t lays out a plan to phase out subsidies to goods and services, eliminate extra-budgetary funds and ful ly budget for “duty losses”.
7.36 National Transport Strategy. A National Transport Strategy prepared b y specialized consultants and the Istanbul Technical Institute i s in the process o f being approved by the Government. In addition, a Transport Infrastructure Network Assessment (TINA) study i s currently carried out by the General Directorate o f Highways (KGM), with a view to identifying main transport infrastructure needs in Turkey and related transport-network projects, in coherence wi th the European Community TEN-transport guidelines. As detailed below, a shift i s needed between the various modes o f transport, especially for the transport o f freight which should be gradually rebalanced from the road to the railways. Due to the steady increase o f containerized cargo, intermodal transport systems should also be promoted to improve the connections between the various modes o f transport, e.g., improved railway linkage to ports.
7.37 Transport Sector Organization. There are two main institutions responsible for the transport sector at the central government level, the Ministry o f Public Works and Settlements (MOPWS) and the Ministry o f Transport (MOT). The MOPWS, through the KGM, i s responsible for the development and maintenance o f state and provincial roads and motonvays. The MOT i s responsible for developing the infrastructure o f rail, maritime and air transport modes; the regulation o f transport operations in the various modes and the supervision o f State Economic Enterprises (SEE) in the transport sector, except for the pipelines which are under the Ministry o f Energy. The Turkey State Railways (TCDD) i s responsible for the operation o f the railways and the major ports in the country, while the Airport Agency (DHMI) operates the civi l ian airports. Turlush Airlines (THY), still owned by the State, has been placed on the l i s t o f the SOEs to be privatized in the short-medium term. Finally, the construction and maintenance of rural roads has been decentralized to local authorities since the abolition earlier this year of the General Directorate o f Rural Services (GDRS) o f the Ministry o f Agriculture.
216

7.38 Regulatory Framework. The regulatory framework for the transport sector comprises o f one general law on the duties o f the Ministry o f Transportation and a series o f laws specific to the sub-sectors, especially the Law on the Organization and Duties o f the Ministry o f Transport, No. 3348, April 9, 1987. The Tariffs and Trade Department under the Ministry of Transport i s in charge o f regulating the prices charged for transport and communication services. Where deemed appropriate, the tariffs would be subject to approval and monitoring b y this department.
7.39 Planning units within the modal agencies and SEES are responsible for identifying and proposing capital investments and operating budgets. They provide the technical, economic and, in the case o f SEES, financial feasibility studies for investment projects. The State Planning Organization (SPO) has the responsibility for reviewing the agencies' investment proposals and establishing the medium-term as well as the annual investment programs. The SPO's in- house capability could be further improved to integrate subsectoral demands into a comprehensive intermodal investment plan through an annual budgeting exercise guided by a clearly defined government investment strategy providing broad guidelines based on economic considerations.
Capital investments and operating budget.
7.40 Negative impact of recent economic crises on the sector. Although the Government needs a coherent investment strategy, excessively centralized control o f all operational aspects o f agencies and enterprises involved in infrastructure sectors can affect efficiency. These controls now extend from investment and financing decisions to purely operational decisions such as tariffs, revenue requirements and staffing. Investment decisions are taken on an annual basis, even for multiyear projects that can be systematically delayed as a consequence. Infrastructure entities suffer f rom a lack o f autonomy over their operations and resources, and often lack the incentives to improve their way o f worlung. As further explained below, operation and maintenance expenditures would deserve special attention.
7.41 Transport Infrastructure. The backbone o f Turkey's transport system consists of the 380,000 km of roads (63,372 km o f state and provincial roads and motorways, and 317,000 km o f rural roads) and to a lesser extent the 10,948 km o f rai l network; o f which 8,257 km i s currently being operated as a single line. Surrounded by seas on three sides and with a coastline of 8,300 km, Turkey has some 80 ports and 100 coastal facilities, ranging from open roadsteads to small jetties. Airports (22 state airports, 13 o f them international) and pipelines (1,200 km) complete the transport infrastructure.
7.42 Transport demand in Turkey has grown significantly over the pastfive decades. Overall, demand has grown at an annual rate of nearly 8% since 1950. Annual demand growth rates have fared at an average o f 7.6% for road transport; about 2% for rai l transport, 5% for water transport, and over 16% for air transport. Unfortunately, the pattern in the change in the supply o f infrastructure i s not clearly matched by the change in the demand for transport observed in each mode. Road vehicle registrations have risen in the last decade, most significantly in terms of automobiles, wi th a more modest growth
217

in the number o f buses and trucks. These have outpaced road construction with the consequence that vehicle densities are high b y international standards especially in the Western part o f the country, around major urban areas. Increasing traffic congestion results in a high level o f road fatalities (see below).
7.43 Modal split and dominance of the road sector. Based on data f rom 2002, the share o f freight transportation (in volume) i s as follows: (i) road transport 91.9%; (ii) railway transport 4.4%; (iii) marine transport 3.5%; and (iv) air transport 0.2%. Regarding transport of passengers, the modal share i s as follows: (i) road transport i s 96.1%; and (ii) railway transport 2.3%; (iii) marine transport 0.5%; and (iv) air transport 1.1%. Since 1990, air transport infrastructure has shown the biggest growth o f any o f the modes, but, partly reflecting geography, and partly owing to market forces, the transport system in Turkey relies essentially on road transportation. (see figure 7.2). One clear message f rom analytical work to date i s that a shift i s needed between the various modes o f transport, especially for the transport o f freight which should be gradually - but steadily - transferred from the road to the railways. Due to the steady increase o f containerized cargo, internodal transport systems should also be promoted to improve the connections between the various modes of transport, e.g., improved railway linkage to ports.
Figure 7.2: Turkey Freight and Passenger Modal Split, 2002
FrdgM Transportation M odd Split on Market Shares as of 2002
UHghways IRa lways OSeaTransport OAirlines
Passenger Transportation Modal Split on Market Shares as of 2002
3 % W o
UHghways ORalways USeaTransport OAirlines
Source: KGM (2003), TCDD (2003)
B.2. The National Road Sector
7.44 Quality of the National Road network. Parts of the state and provincial road system are old and have weak pavements, leading to high road maintenance and vehicle operating costs, especially in the case o f vehicle overloading. The quality i s also poor in some sections. As a result o f a shortage o f funds to finance road maintenance and rehabilitation, the overall condition o f the road network i s progressively deteriorating as a result o f deferred maintenance and rehabilitation works. Indeed, whilst the surface condition o f the state road network in 1993 was rated 80% good, 15% fair and 5% poor, the situation deteriorated during the past decade. In particular, the situation o f the
218

secondary roads i s alarming with more than 70% in poor condition, as wel l as for the motonvays, where a 40% rate o f poor condition in unacceptable by any standards. The figure 3 below illustrates the change in overall quality o f the Turkish Road network.
Figure 7.3: Condition of the National road network between 1993 and 2003
Condition of the National Road network in 1993
80.0%
Condition of the National Road network in 2003
It4 19.4%
Source: KGM
7.45 Road Safety level far below EU average. Although road safety has improved during the last decade, road accidents remain a serious socio-economic problem in Turkey. In 2003, about 250,000 accidents were reported by police, o f which there were 3,966 deaths and 117,268 injuries216. From 1993 to 2003, the number o f accidents had been growing at an average 2% per year, in l ine wi th the growth rate o f freight traffic expressed tons-kilometers (2.5%). Whi le the number o f fatalities has been drastically reduced, the number o f injuries has been increasing at about 1.3% per year. The reduction of fatalities results from the introduction o f air bags and seat belts in cars. However, the current fatality rate in Turkey (8 fatalities/10,000 vehicles) i s s t i l l about four times the average o f the European Community (2 fatalities/10,000 vehicles). (see figure 7.4).
Figure 7.4: vehicles)
Fatalities in Road Motor Vehicle Accidents (Fatalities per 10,000
. . 12 10 8 6 4 2 0
Bosnia Croatia Latvia Lithuania Moldova Russia Serbia Turkey EU 15 Avg
Source: Roads in ECA - World Bank 2004 Unpublished working paper.
*I6 These are the data collected during the accidents. Later results ( in hospitals and later) are not followed, considered. Therefore the figures shown understate reality.
219
7.46 Road maintenance backlog. Due to a significant maintenance backlog, the present state o f the network i s wel l below an appropriate standard. Approximately 52 percent o f the roads in Turkey are in good and fair condition compared to 95 percent or more in most large western European countries. The economic detriment caused by the poor condition o f the road network, in particular for secondary roads, i s l ikely to be acute.
7.47 Need for an overall reassessment of road maintenance policy. The Government o f Turkey should evaluate present levels of maintenance expenditure to determine the economic benefits that w i l l result, and also consider whether further economic benefits could be generated through a reallocation o f spending. The Government should also consider the introduction o f some form o f incentive scheme for National Road Administration (KGM) such that i t i s financially rewarded or punished depending on i t s performance in maintaining the road network. Ideally, this incentive scheme would relate to the actual outputs of the road network, perhaps using the grading system currently employed. Basing the incentive scheme on the amount o f spending, as i s the practice in the U.K., i s l ikely to lead to an inefficient use o f resources.
7.48 National Road Administration (KGM). KGM i s a fair ly effective organization aiming at gradually increasing i t s efficiency in road management. As many other public agencies in Turkey, KGM i s striving to reduce overstaffing. In 2005, KGM employed about 20,000 staff, of which 4,000 are technical and administrative staff and 16,000 laborers. Over the past ten years, the number o f technical and administrative staff have been stable, (mainly to attend the operation and maintenance of an expanding motorway system) while the number o f laborers has fallen dramatically, especially temporary labor. The reduction in the labor force has been accompanied b y an increase in construction works by contract. KGM, in line with Government’s policy directives, i s committed to continue the gradual downsizing o f KGM’s labor force and the shift to contracted works.
7.49 Road Financing. Given Turkey’s apparent difficulty to protect budgetary funds for road development and maintenance, the Government needs to put in place an adequate mechanism to secure road financing in the short term. Tol l ing major roads and motorways would allow operating and investment decisions to be based more on road users’ willingness-to-pay, thus providing a closer link to the demand for the service. Taking into consideration the high level of traffic observed along some itineraries, options for Public Private Partnership schemes for financing and/or operating and maintaining specific itineraries seem promising, although so far n o such scheme has been developed in Turkey.
7.50 Road charges. Turkey has a developed system o f road charges: an excise tax on all motor vehicles ranging from 10 to 45 percent o f the selling price o f the vehicle; an annual motor vehicle tax for cars and motorcycles based on engine power and age o f the vehicle; a capital transfer tax; motorway tolls which vary according to number o f axles, height and in some cases weight; and fuel charges. The EU publication ‘Fair Payment for Infrastructure Use’ advocates that charges for infrastructure should reflect the marginal social cost o f use. Users should be charged for the costs, both internal and external, they
220

impose at the point o f use, when costs include operating costs, infrastructure damage costs, congestion and scarcity costs, environmental costs and accident costs. The benefits o f introducing such principles are to internalize the external costs associated with road transport in order to prevent excessive use o f the mode and to provide fair competition across the different modes to the benefit o f potential transporters.
7.51 Road pricing policy. There are two issues that need to be considered when analyzing Turkey’s road pricing policies in relation to these principles: the structure and the level o f road charges. In terms o f the structure o f charges, i t would appear that Turkey i s already wel l on the way to creating a system in accordance with the principles set out by the EU. Nevertheless, there are some changes to the present structure o f i t s road- charging pol icy that Turkey could consider: re-examining the scope o f the principle o f to l l charging on i t s motonvays and road network; and greater differentiation and sophistication could be introduced into the to l l charging system. In terms o f the level o f charges, the Ministry o f Transport should undertake a detailed study o f the costs associated wi th use o f the Turkish road network. The latest study looking at the external costs o f road transport suggested that, while cars were more than fully covering their external costs (by 135 percent), trucks and semi-trailers were only covering 25 percent o f their costs.
B.3. The Railway Sector
7.52 National Railway Administration (TCDD). At present, the rai l industry in Turkey i s dominated by TCDD, a vertically integrated, state-owned company responsible for both infrastructure provision and the supply o f both freight and passenger services. The issues concerning the rai l sector relate to two main areas: the provision of infrastructure and the restructuring o f the sector. In Turkey, the plans for rai l infrastructure development are decided by DLH. The Government has decided to restructure i t s transport system and particularly the role o f the railway. Despite the shrinking share o f the rai l market, i t would not be either politically acceptable or economically sound to consider the closing o f the railways as some social and economic needs cannot be fulfil led b y other transport modes, e.g., dry and liquid bulk, containerized traffic and urban transport services in already highly congested cities.
7.53 TCDD, the Turkish State Railways operates the national railway, the seven largest ports, and manufactures and repairs locomotives, wagons, passenger coaches, as wel l as sleepers and switches. Created as a result o f the nationalization o f the railways in 1924, TCDD was set up as a State Economic Enterprise (SEE) in 1953. As a State owned enterprise, TCDD has the monopoly of any railways related activities. Yet, i t i s currently the largest money loser among Turkey’s public sector enterprises: in 2004, T C D D lost US$780 mil l ion (US$470 mi l l ion including subsidies).
7.54 Railway network and activities. T C D D i s responsible for operating and maintaining a 10,948 km long railway network, of which 8,257 km i s currently being
22 1

operated as a single line. Besides the ports, the railway related activity i s the largest element o f TCDD, Le., about 85 percent o f TCDD total operating costs but slightly less than 50% o f i t s operating revenues in 2004, resulting from a cross-subsidization from the ports.
7.55 Budget support to the Railways. During the period 1993-2004, the railway cost the Government about US$9 billion, averaging about US$750 mi l l ion a year. In 2004, total support from public finance to cover losses as wel l as capital investment amounted to US$1,023 million, or 0.4 percent o f GDP. The value o f budget support together with uncovered losses expressed as a share o f GDP i s broadly comparable wi th other railways in middle-income countries in Europe217. Although the highly profitable port related activities are cross-subsidizing T C D D revenues, i t s operating revenue does not cover the cost o f i t s staff. The staff totals about 39,000 o f which about 9,000 are employed at ports and non-core affiliated companies.
7.56 Railway Sector Institutional Reform. The Government i s clearly committed to change the TCDD -- both structure and technology -- to cope better wi th the competition in the global market and to increase the share o f ra i l in the transport sector. More specifically, a Letter o f Sector Development Policy includes unequivocal commitment for an in-depth reform o f the T C D D with the preparation o f two new Laws: (i) a Railway Law providing a new legal framework for railway activity consistent with EU directives; and (ii) a TCDD Law supporting the reorganization o f the national railway company. The restructuring includes essentially the separation and eventually the privatization o f the affiliated companies and o f the ports operations, the reshaping o f the labor force and the reduction in redundant staff.
7.57 Restructuring of the TCDD. To support the decision taken by the Government to reform the Railway sector, a detailed T C D D Business Plan has been prepared wi th the assistance o f specialized consultants. The T C D D Business Plan for the period 2005-2010 was approved b y the Board o f Directors o f the T C D D on March 23, 2005. The main objectives o f the Business Plan aim to: (i) improve i t s financial situation; (ii) establish a more client oriented structure; (iii) increase railway competitiveness and market share; (iv) integrate the national network into the European and Asian network; and (v) provide an equitable, secure and economic service for the users. The satisfactory implementation o f the Business Plan i s an integral part o f the Railway Restructuring project financed by the World Bank.
B.4. THE PORT SECTOR
Croatian Railways (1.3% of GDP), Romanian Railways (0.7%), Bulgarian Railways (0.6%), Poland 217
(0.4%).
222

7.58 Port Sector in Turkey: Five ports handle the bulk o f the country's sea freight. Istanbul (Haydarpasa) i s the most important port, followed by Mersin, Izmir, Iskanderun, and Derince. There are also many small ports along the country's extensive coastline; coastal shipping i s substantial, particularly o f such bulk commodities as coal and i ron ore. Cargo handling i s slow and storage limited, however. The main o i l terminals near Iskenderun handle both domestic and Iraqi crude. T C D D i s managing the seven most important ports which are currently being privatized except Haydarpasa port.
7.59 Port Privatization. At the end o f 2004, the High Privatization Council, annnounced that the Bandirma, Izmir, Samsun, Derince, Mersin, Iskenderun ports, currently under the T C D D ownership and operation would be included in the privatization program. The Council announced that these ports would be privatized under a transfer o f operating rights (TOR) scheme or any other appropriate method, except for the lease andor sale o f assetts. The decision envisaged that the privatization would be completed in 12 months and the ports would be managed by T C D D until they are privatized. T C D D would be involved in the post-privatization monitoring o f investor's performance, especially in terms o f maintenance, repair and other liabilities with respect to the assets. The revenues arising f rom the privatization would be transferred to the Treasury, who would in turn transfer the funds to the TCDD.
7.60 Privatization principles. The privatization process o f the ports has been initiated, starting with the port o f Mersin, to be followed shortly with the port o f Iskanderun and the port o f Izmir. The privatization process o f the Turlush ports i s based on the fol lowing key principles: (i) operational rights to operate the port w i l l be awarded to a single operator for a duration o f 36 years; (ii) the port asset property remains public; (iii) the selected operator w i l l not be allowed to bid for any other port; (iv) port tariffs w i l l remain aligned with the current T C D D tariffs during three years, the operator being free to set i t s tariffs thereafter; (v) the operator w i l l have to invest in the development o f the port to accommodate traffic increases up to 2010; and (vi) the T C D D staff currently employed in the port w i l l be reverted to TCDD. The prequalification o f the bidders w i l l be made essentially on their financial capacity and the contract awarded to the biggest one time fixed fee to be paid upfront.
7.61 Key issues related to the ongoing port privatization process. As a result o f the discussions with the Privatization Administration, the fol lowing points need to be taken into account before completing the privatization process : (i) the current process i s l ikely to result in a transfer o f a public monopoly to a private monopoly, wi th no institution yet in place to ensure a proper regulation o f the sector; (ii) it i s not yet clear on how the port tariffs policy w i l l be implemented after the three year tariffs freeze imposed on the single operator; and (iii) the technical documents to be used for the transaction should be made explicit on: (a) technical criteria to be imposed to the operator, including quantified minimum operational performance; (b) the nature of the investment program imposed to the future single operator; (c) the relevance to revert the current T C D D staff employed in the port to the loss-making TCDD; and (iv) conditions to avoid risk abuse o f monopoly position.
223

7.62 Creation of a National Port Authority: The Undersecretary for Maritime Affairs i s now acting as the National Port Authority with the power to: (i) regulate port tariffs; (ii) ensure security and safety within the Turkish ports; and (iii) manage the Harbor Masters’ functions and responsibilities. The Undersecretary o f Maritime Affairs has been involved in the design o f the privatization process and i s currently working on the setting up o f individual Port Authorities in each o f the Turkish ports. Particular attention should be given to the establishment o f an adequate regulatory framework before awarding the concessions of the ports to private operators. This i s one of the key lessons learned from the past experience o f the port privatization process which took place in Latin America during the past decade, which currently faces serious problems.
B.5. The Maritime Transport Sector
7.63 Maritime Transport. Except for national cabotage services, the maritime transport sector in Turkey i s fu l ly liberalized with significant progress recently observed in the quality o f the vessels under Turkish flag to increasingly comply wi th Paris Memorandum o f Understanding (MOU) requirements. The steady decline o f the detention rate of Turkish vessels in European ports demonstrates the progress made so far. In order to implement the International Maritime Organization’s State Port Control obligations, 160 experts are now deployed in the Turkish ports to control the quality o f the vessels, with a global control rate o f 30% for foreign vessels and 100% for national vessels. Regarding national cabotage services, the government has included i t s intention to liberalize national cabotage in the EU accession National Program, after EU membership.
7.64 Financial incentives to promote maritime transport. In order to support national maritime transport, the special consumption tax (OTV) on fuels was not collected in 2004, providing TL 190 tr i l l ion relief to operators. Turlush Marit ime Lines (TDI), the operator o f domestic and international ferry and passenger services, and the Istanbul Fast Ferries Company (DO), owned by the municipality o f Istanbul, were able to cut their fees. The TDI cuts ranged from 9 to 32% and the ID0 cuts were in the 25 to 42 % range. Both companies recorded increase in passenger and car traffic in 2003. As o f August 2003, the port tariffs were cut b y almost 50%, in an attempt to enhance the competitiveness of the ports. A discount o f 75% was introduced in cabotage fees.
B.6. Air Transport and Airports Sectors
7.65 The General Directorate of Civil Aviation, under the Ministry o f Transportation, i s the agency tasked with developing c iv i l aviation rules, licensing air transport personnel, authorization o f all aviation activities, the coordination o f navigation services, monitoring o f the implementation o f international agreements, the examination o f air transport-related accidents, the auditing o f all c iv i l aviation systems and determining the
224

contents o f c iv i l aviation training programs. The General Directorate o f C iv i l Aviation has been restructured in order to enhance air transport safety and to enable i t to effectively perform the duties assigned to it by law. A draft law on this issue i s under preparation and i s expected to be sent to the parliament in 2005.
7.66 General Directorate of State Airports (DHMZ) i s in charge o f airport operations, provision o f airport services, air traffic control, setting up and operation o f the navigation systems and the associated facilities. DHMI operates 34 out o f the 68 airports in Turkey. The remaining airports are those with special status, those used by the Turkish Aeronautical Association (THK), the military airports used by c iv i l aviation entities under special protocols, military airports and joint military-civilian airports.
7.67 Turkish Airlines (THY) i s the predominant provider o f passenger and freight services in Turkey’s air transport sector. Turlush Airlines was established in 1933, as a department o f the Ministry o f Defense as the State Airlines Administration and in 1935, i t was assigned to the Ministry o f Public Works. In 1938, this entity was renamed the General Directorate o f State Airlines. From 1939 onward, i t operated as a department o f the Ministry o f Transportation. In 1955, i t was restructured as a private corporation to be managed and operated under private law. From then on, i t operated as Turkish Airlines. In 1984, Turkish Airlines was classified as a State Economic Enterprise and in 1990; i t was included in the l i s t o f the State Economic Enterprises to be privatize. The Turkish Airlines Corporation was then transferred to the jurisdiction o f the Privatization Administration in 1994.
7.68 Liberalization of domestic air transport. The recent opening o f domestic air transportation to competition was followed b y the emergence o f several private carriers. These carriers provide cheap transport options in certain high-volume routes such as Istanbul to Ankara, Bodrum, Trabzon, etc, with ticket prices reportedly around two thirds cheaper than THY. In 2004, the special transaction tax (ozel islem vergisi) and education support fund share (egitime katki payi) were eliminated from the airplane ticket prices.
7.69 An increase in the total number of airline passengers was recorded in 2004, both for THY and for private airlines. In 2004 a 57% increase was observed in the number o f domestic air passengers, reaching almost 14.5 million, f rom just over 9 mi l l ion passengers in 2003. Private airlines carried 3.7 mi l l ion passengers. The number o f international air passengers increased by 20.8% in 2004. In 2004, THY load factors exceeded 70% for the first time in company history and the increased travel figures also helped the company financials. I t reported YTL 110 mi l l ion in profits before taxes. In addition to the increase in passenger numbers, the air fleet also grew in 2004. There was a similar picture in the air freight business, where the number o f freight planes increased from 5 in 2003 to 12 in February 2005.
7.70 As for airports, there are currently several ongoing projects for the maintenance and upgrading of in the Istanbul, Ankara, Zmir, Antalya and Dalaman airports, along with modernization of several airports and the construction of new airports. Following a tender process initiated by DHMI in 2004, a new international and
225

national terminal for Ankara Esenboga Airport w i l l result f rom a Build-Operate-Transfer (BOT) model, similar to the ongoing one in Istanbul International Airport.218 Another important BOT project i s Antalya Airport international lines terminal building and i t s complements. Tenders have also been realized for the construction o f a new international terminal building o f Adnan Menderes and Dalaman airports.
C. ENERGY
C.l. Electricity
7.7 1 Comprehensive reform program in electricity. The Government has embarked upon a comprehensive reform and restructuring program o f the electricity sector over the last 5 years, with a view to creating a liberalized, efficient and economic sector consistent wi th the principles o f the Acquis on energy. Turkey i s signatory to the Athens Memorandum, 2003 - the Memorandum o f Understanding on the Regional Energy Market in South East Europe and i t s Integration into the European Union Internal Energy Market. While the other regional members signed the Energy Community Treaty in October 2005, Turkey i s currently in discussion with the European Community on some aspects o f the Treaty, before i t considers signing the Treaty. Turkey however, remains committed to implementing the Acquis as demonstrated by the progress so far on i t s ambitious and complex reform program in energy - progress on implementing the reform program has been uneven, and this i s discussed in subsequent sections o f this chapter.
7.72 Reform legislation and independent regulation. Turkey i s in compliance wi th the legislative requirements o f the Athens Memorandum. In February 2001, Turkey enacted the Electricity Market Law219 which i s in line wi th the EU Electricity Directive. In order to implement the provisions o f the Law, and to be consistent wi th EU requirements on energy, Turkey has also prepared a strategy paper220 which lays down the timelines for these activities221. Pursuant to the law, Turkey has set up an independent regulatory authority, the Energy Market Regulatory Authority (EMRA) wi th jurisdiction over electricity, petroleum and gas. EMRA has powers over licensing, tari f f setting and customer service issues. The Law also mandates the restructuring o f the generation and distribution sectors, and introduction o f competition and privatization o f distribution.
7.73 Preparation for privatization of electricity distribution. The distribution sector has accordingly been restructured into separate companies in preparation for their
218 The Istanbul Ataturk airport’s BOT project consisted of an international terminal building and complements with a total cost of US$ 400 million. ’ 1 9 Electricity Market Law -Law No. 4628 ’*’ The High Planning Council approved the Electricity Sector Reform and Privatization Strategy Paper in March 2004. ”’ The Bank has assisted the reform process through its ongoing loans, as well as through the mobilization of Trust Fund and PPIAF grants for supporting the conceptualization and implementation of the reform program.
226

privatization starting late-2005. In accordance with this organizational framework, the distribution sector has been restructured into 21 separate companies. One company, named Kayseri ve Civari Elektrik A.S. i s privately owned, with the remaining 20 companies owned b y wholly owned affiliates o f TEDAS, the Government-owned distribution corporation. TEDAS suffers f rom high technical and commercial losses, and also has problems accruing and promptly collecting electricity bills. TEDAS has not been able to finance periodic maintenance o f the system as a result o f which parts o f the system are unreliable and suffer from low voltages and poor quality o f supply. The Government attempted to privatize the distribution business over the previous decade, but did not meet wi th success. Due to perceived constitutional restrictions to a sale o f the electricity distribution assets, the Government adopted a concession-type approach, which however met with severe legal challenges. As a result, most o f these contracts were cancelled. The Government i s attempting to privatize the distribution business again, using a modified Transfer-Of-Operating-Rights (TOOR) approach where the operator w i l l have full control over the assets (though ownership w i l l rest wi th TEDAS) and over new investment, and w i l l be provided with a multi-year regulatory framework to ensure certainty in the tariff profile. In 2004, the TEDAS companies were transferred to the program o f the Privatization Administration in preparation for their phased privatization.
7.74 Private participation in electricity generation. The generation sector i s also in the process o f being restructured into separate companies with different portfolios o f generating plants. The Government intends to privatize these portfolios in phases over the medium term to enable competition and to reduce chances o f abuse o f market power. In order to ensure supply security, the Government has endeavored to attract private investment into generation through various means. In 2005, nearly 54.5% o f Turkey’s total annual electricity generation o f about 160 TWh (Turkey’s total installed capacity in 2005 was 38,819 MW) was produced by plants owned by the private sector (refer to Table 7.3 below). The private sector operates about 41.8% o f installed generating capacity. About 10.5% of total generation i s produced by auto-producers as a result o f the gradual opening up o f the electricity industry, and about 34% i s produced under Build-Operate-Own (BOO) and Build-Operate-Transfer (BOT) schemes. An additional 2.5% o f generation comes from capacity that i s operated under public-private partnerships where existing Government-owned plants are operated by the private sector under Transfer-Of-Operating-Rights (TOOR) arrangements. Whi le these investments have brought in significant generating capacity, the Government has had to provide guarantees and long-term offtake contracts, and some o f the capacity has turned out to be very expensive. A number of the contracts were challenged legally and subsequently cancelled, leading to arbitration cases, some of which have resulted in further liabilities for the Government.
227

1 Ownership E U A S + EUAS Affiliates Other Public (Generation Companies Under Privatization Program)
% Share in Generation 41.5%
4.04%
7.75 Renewable sources are an important source o f energy in Turkey. Apart f rom hydro, Turkey also has potential for geothermal and wind energy. The Government has recently approved a new law supporting renewable ener y, the Law on the Utilization o f Renewable Energy Resources in Electricity Generation22g. The Law aims to protect the environment through reduced greenhouse gas emissions and conservation of renewable energy resource areas. I t also seeks to promote renewable energy by providing incentives in terms of prices and o f f take agreements during the transition until the sector can attract investments on i t s own merit. Subsequent to the Law being approved, there has been an increase in private sector interest in renewable energy, especially in hydro power.
Renewable energy.
Total Public Sector Build-Operate-Own (BOO) Build Operate Transfer (BOT) Auto-producers Transfer o f Operating Rights (TOOR) Contracts Other private ownership Mobi le Power Plants Total Private Sector
7.76 Turkey has opened up the retail market, and currently consumers up to 7.7GWh of demand are considered eligible, i.e., they can choose their electricity supplier. Current market opening i s estimated at around 30% o f the total Turkish electricity market, with a significant number o f consumers either producing electricity for their own consumption, or buying from a supplier other than the incumbent distribution company operating in the same region. Turkey aims to achieve the ambitious target of complete market opening b y 201 1.
Market opening in electricity.
45.5% 25.7 % 8.5 % 10.7 % 2.5 %
6.56 % 0.53% 54.5%
7.77 Introduction of a competitive market in electricity. Before making the electricity market ful ly competitive, Turkey i s in the process of implementing a transitional balancing market which i s being tested at this stage. The market w i l l consist of a bilateral contracts market complemented b y a balancing and settlement system. A separate ancillary services arrangement w i l l also be put in place. TEIAS, the transmission company, i s the independent system operator and wil l also be the market
222 Law on the Utilization of Renewable Energy Resources in Electricity Generation - Law No. 5346 enacted in May 2005.
228

operator. During the transition period, big generators w i l l submit their schedules and upward/downward regulation offers on a “day-ahead” basis. The market operator w i l l calculate hourly system marginal prices f rom merit order o f upwarddownward regulation offers. At a later date, a day-ahead market where all wholesale market participants, including demand-side participants, can submit buyhell offers and “spot” price determined at the intersection o f supply and demand curves w i l l be instituted. The market, once i t i s functional, i s expected to provide the necessary price signals for potential new generation based on the demand characteristics o f various consumer groups in bilateral contracts.
7.78 Retail electricity prices are relatively high in Turkey, at approximately US$O.O92/kwh (excluding VAT) for households and US$O.O87/kwh for industrial consumers. Refer to Figure 2 below for a comparison o f industrial prices wi th OECD averages. Generally, retail prices for industrial consumers are higher than OECD average, whereas retail prices for households are moderate compared to OECD average. Turkey currently has implici t cross-subsidies between regions and also for certain sub- categories o f consumers. The Government i s contemplating putting in place a transition period - through the use o f a tariff equalization methodology for reducing cross-subsidies and graduating to cost-reflective tariffs over the medium term.
Figure 7.5: Turkey - Comparison of Industrial Prices with OECD average
Electricity prices.
8 0.050
I Years
P
Source: IEA, Energy Prices and Taxes
7.79 Security of electricity supply and the regional market. Turkey i s the dominant power producer and consumer in South East Europe. Electricity demand i s growing at 6- 7% per annum, and additional generation capacity w i l l be required beyond 2009-2010 under most demand (and supply) scenarios made by the Ministry o f Energy and Natural Resources. Security o f electricity supply i s a key government concern. The Government i s exploring alternatives for adding significant amounts o f capacity in order to meet the probable shortage o f supply in the medium term. However, given that the electricity market i s in transition towards a competitive one, and given that the Government does
229

not want to take on further liabilities with regard to new generation facilities. The Bank and Government are beginning work on exploring options for obtaining additional generating capacity in the current situation - a competitive market in transition and delays in privatization o f distribution. With the exception o f Turkey, by late 2004, all South East Europe power systems were synchronously interconnected. After establishment o f necessary transmission lines, Turkey i s planning to become synchronously interconnected with all South East Europe power systems. The two existing 400 kV transmission lines between Turkey and Bulgaria would allow full integration of Turkey b y the end o f 2006. In addition to these lines a new 400kV line between Turkey and Greece i s now under construction, o f which expected commissioning time i s 2007. Turkey i s not a member o f the Union for the Coordination o f Transmission o f Electricity in Europe (UCTE), which i s the association o f transmission system operators in continental Europe but would l ike to join. Turkey’s interconnection with U C T E i s expected to contribute to the security o f supply both in the South East Europe region and in Turkey through electricity trade. Detailed technical studies in this regard have been initiated in coordination wi th UCTE. Turkey i s undertaking key investments required to enable joining UCTE such as upgrading load dispatch and system control abilities, implementing market management software and constructing cross-boundary interconnections.
7.80 Areas requiring further attention. While Turkey has implemented a number o f the requirements o f the EU and has in some cases achieved more than i s required under the directives, i t s overall alignment with the EU directives remains uneven across different areas o f energy policy. The Government has , not allowed retail tariff increases over the past three years, choosing instead to increase the use o f hydro generation owing to low cost o f production. Government agencies and offices, notably municipalities, do not pay on time or adequately for their electricity consumption, leading to a further cash flow problem in the electricity sector - the Government i s endeavoring to introduce new legislation to curb this problem. I t i s also hoped that wi th privatization o f distribution, this problem o f non-payment w i l l reduce - privatization itself i s delayed however, and i t w i l l take time to privatize the entire distribution network. There are delays in implementing the balancing market as well, although this i s not unexpected in a market which i s faced with complex issues such as high system losses and poor collection efficiency even as i t i s transitioning from a state-owned monopoly to a competitive and increasingly privately owned and operated system.
C.2. Gas
7.81 Natural gas market legislation. The national government has addressed the gas sector challenge through a 2001 Natural Gas Market and subsequent secondary legislation, which requires the natural gas sector to be restructured into a competitive market over the medium term. Again, current legislation i s in compliance wi th the EU Natural Gas directive. The Law sets a very ambitious target for the transition to competition, requiring BOTAS - the Government-owned monopoly transmission system
223 Natural Gas Market L a w - L a w No. 4646
230

operator, importer and wholesaler - to reduce i t s role in gas imports and wholesaling to 20% o f each market b y 2009. The Bank’s recent policy note on the sector224 analyzes progress in implementing the law and highlights measures needed to achieve the objectives o f the Government in the sector over the medium term. The policy note highlights the importance o f moving to competitive gas wholesaling wi th in Turkey. The note also states that i t may not be feasible to transfer BOTAS gas contracts to other licensees given that suppliers may not agree to such a transfer, advocating instead that BOTAS’ monopoly over imports and wholesale be gradually reduced through gas volume release programs. This i s already an accepted approach in EU countries for introducing wholesale competition.
Electricity Generation Residential/Commercial Other Total
7.82 Gas demand and supply. Gas has grown rapidly as a percentage of total primary energy supply in the past decade, now reaching 23%, which however i s s t i l l lower than in EU and OECD countries. Turkey’s total natural gas demand i s currently estimated at 25 bcm, and has grown very rapidly at about 10% per annum over the last few years. This growth i s expected to sustain in the medium term primarily due to increasing urbanization, increased dependence on natural gas for heating and increased use o f natural gas in electricity generation (refer to Table 7.4 below). Turkey does not have natural gas reserves and imports i t s supply primarily from Russia through two pipelines, one through Bulgaria and one under the Black Sea. Other major suppliers are Iran, and Algeria and Nigeria (in the form o f LNG). Turkey i s also expecting delivery o f natural gas to start f rom Azerbaijan in late 2006.
(est) 2.6 3.8 9.7 13.0 15.4 21.4 0.1 1 .o 2.8 4.4 5.9 9.6 0.7 2.0 2.1 4.7 5.6 13.1 3.4 6.8 14.6 22.1 26.9 44.1
Table 7.4: Turkey - Natural Gas Demand (bcm) I Year I1990 I 1995 I2000 I 2004 12005 I2010
7.83 Zntroduction of competition in wholesale supply. Until recently, BOTAS was also responsible for gas distribution and sale to retail consumers. Pursuant to the Law however, BOTAS has sold i t s existing distribution businesses to private investors. The Government i s also working towards removing the monopoly of BOTAS over imports and wholesaling, through the contract/ volume release program mentioned above. The contract/ volume release program aims to transfer 16 bcm o f the total gas consumption o f 25 bcm (about 64%) to independent importers/ wholesalers. This process was started in November 2004, and has been delayed due to amendments in the Law in June 2005 - the date for the tenders has been postponed to November 30, 2005. 35 companies are said to have applied to EMRA for import licenses, which i s a prequalification requirement in
224 World Bank: Turkey: Gas Sector Strategy Note, Report No. 30030-TR, September 2004
23 1

order to participate in the tender. BOTAS i s currently also in the final stages o f separating i ts transmission, storage and natural gas sales businesses into separate accounting entities, in preparation for eventual unbundling. Even though the timeframe for competition envisaged in the Law i s ambitious, over the medium to long term, it i s anticipated that BOTAS w i l l remain as a gas transmission company and gas system operator, no longer having monopoly over imports and wholesaling. Contract release tenders have been realized on November 30,2005. Bids are currently being evaluated.
7.84 Private investment in natural gas distribution. Turkey has moved speedily on the introduction of private investment in gas distribution networks. Due to gasification o f cities over the last few years, household penetration rates have risen rapidly and are now around 22%. Unt i l recently, only 5 cities had gas distribution systems. During the last two years, EMRA has awarded licenses to private investors for building and operating greenfield gas distribution systems in an additional 31 cities. While i t is st i l l early to comment on the outcome o f these privatizations since investments have not yet begun f lowing in significant volumes, 20 o f these cities are reported to have started the use o f natural gas, and i t i s expected that with the gasification and interconnection o f these cities, natural gas demand w i l l r ise sharply in the short to medium term.
7.85 Turkey’s role in the European gas market. Turkey, due to i ts unique geographical location, i s well-placed to be a major natural gas transit country into mainland Europe. Turkey i s currently proceeding towards construction o f large pipelines reaching into countries in continental Europe, and in addition to the growing domestic demand for natural gas, this role for Turkey as a transit country i s l ikely to drive the economics o f the natural gas market in the medium term. Turkey currently has long-term contracts for supplies significantly larger than i t s current domestic demand, and i t i s unlikely that in the foreseeable future, the demand w i l l cross available supply. These supply contracts except for the Azerbaijan contract, however, do not currently allow re- export o f gas out o f Turkey.
7.86 Natural gas pricing. Natural gas prices in Turkey are regulated b y EMRA. EMRA sets a price cap for wholesale, storage, transportation and retail sale, and historically, BOTAS has priced itself below the cap, partially on account o f larger politico-social considerations. BOTAS has however, been able to recover i t s costs wi th these tariffs, and has been able to invest in developing the entire gas transmission system in the country. On the other hand, the implemented retail prices are generally determined at cap by private f i r m s .
7.87 The above text documents progress in energy sector reform that has received positive mention in the EC’s 2005 Progress Report225. Going forward, implementation w i l l be as great a challenge as further transposition of the Acquis. In particular. Regulatory support for cost reflective tariffs, improved payment discipline b y government agencies, and implementation o f the electricity balancing market need particular attention.
Priority interventions.
225 Turkey 2005 Progress Report - European Commission - Brussels, November 9,2005 SEC (2005) 1426
232

D. COMMON REFORM DIRECTIONS
7.88 The long run gains offered by liberalization of infrastructure services offset the costs, but do require thoughtful timing and legislative action to realize. The sectors discussed above share the qualities o f high cost relative to comparator countries, and relatively l o w efficiency. The combination, while daunting, does mean that unlike many countries, Turkey has the potential to lower the cost o f services while increasing quality and coverage. The means to achieve this - market liberalization to capture the benefits o f competition - are embodied in the relevant acquis chapters, so Turkey’s on-going efforts to achieve that goal are consistent both with growth strategy and accession requirements. Furthermore, the needed actions typically have a low economic cost and offer fiscal relief. However, institutional reform comes with other costs that have slowed implementation. These include shifts in relative power among actors in the sector, with government agencies or state economic enterprises yielding power to more independent private entities (or state entities operating on commercial terms). The use o f tariff policy as a social instrument w i l l need to be altered in favor o f explicit budgetary provision for social support. Finally, although the EU Acquis and practices allow for financial transactions and other practices through the “services o f general economic interest” under well-defined conditions, the government’s flexibility in the use o f Treasury shares, duty losses, and other ad hoc financial transactions with state economic enterprises should continue to be curtailed.
233

234

PART C: PROMOTING INCLUSIVE GROWTH
235

236

CHAPTER 8. AGRICULTURE AND RURAL DEVELOPMENT ON THE WAY TO THE EUROPEAN UNION
8.1 Despite a projected beneficial impact of EU accession on agricultural production and trade, agriculture’s one third share in total employment is likely to decrease in the future, as a result of structural reform and alignment with CAP. As Turkey s t i l l heavily protects i t s agriculture and foods sectors, a reduction in protection would tend to hurt agriculture as a result o f EU accession. However, simulations o f long- term impact suggest that the increase in market access into the EU could generate a significant increase in demand that would support significant growth of the agricultural and food sectors in Turkey. However, the high share o f employment in agriculture i s l ikely to decrease in the future, as i t has happened in other countries that have liberalized agriculture, while the structural changes in production required to boost competitiveness and take advantage o f the new environment w i l l also put pressure on rural labor markets. Consequently, one o f the key rural development concerns would be whether economic activities in rural areas w i l l be able to absorb labor force leaving the agricultural sector.
8.2 The dual challenges will be to support adjustment to structural changes in agriculture and promote rural development off-arm more widely. Strengthening policy coherence w i l l be particularly prominent in the process of EU accession. Particular emphasis w i l l be placed on coherence o f instruments and policy objectives between the agricultural and rural development policy, and o f their respective institutional and implementation arrangements, as explained by the recent changes in CAP.226 The accession process also implies the EU alignment o f Turkey’s national rural development policy and objectives.
8.3 The next section reviews Turkey’s overall support to agriculture in comparison to the EU and lays out the policy challenges for alignment with CAP during the accession period. I t then provides an analysis o f the long-run impact o f EU accession on agriculture-including the multiplier impact on the economy-based on a general equilibrium model simulation. In the third section the chapter addresses rural development and i t s EU alignment by analyzing the recent patterns of investments in agricultural and rural development, exploring options for diversification of economic activities in rural areas and examining the experience of selected EU member states in
226 The reformed CAP consists of two pillars, with the rural development representing the 2nd pillar. The 1st pillar concentrates on providing a basic income support to farmers, while the 2nd pillar supports agriculture as a provider o f public goods in its environmental and rural functions and rural areas in their development. See: http:/lww \ .europa.eu. 11it/scadplii~/lerz/en/s04002. htm.
237

implementing Structural Fund programs in rural areas, and outlining the key EU requirements regarding institutional and implementation arrangements for these Structural Fund programs.
A. ALIGNMENT WITH THE EU COMMON AGRICULTURAL POLICY (CAP)
A.l. Support to Agriculture in Turkey and EU and Impact of Alignment
8.4 The level of support granted by Turkey to the agricultural sector, measured by the Producer Support Estimate (PSE) and the Nominal Assistance Coefficient (NAC) rose substantially through the late 1980’s and 1990’s. 227 Despite serious efforts to move away f rom high market support with the substitution o f most budgetary subsidies for agricultural outputs and inputs by a Direct Income Support program (DIS, a uniform, non-distorting per hectare income transfer), Turkey has not stemmed the rise o f price differentials between farm gate and world reference prices (as measured b y the Nominal Protection Coefficient, NPC). In essence, continually high import tariffs on agricultural commodities and non-trade barriers have kept agricultural prices high, with the aggregate level o f such distortion in 2004 (30 percent) being at roughly the same level as that o f the EU-25 (29 percent-Table 8.1). The effect o f this has been an increased burden mainly on consumers: the Consumer Subsidy Estimate for Turkey (CSE, -22 percent228 in 2004) i s relatively high and again roughly on par with the CSE for the EU-25 (which has been decreasing over the past few years).229
’” PSE: Ratio between the annual monetary value o f gross transfers from consumers and taxpayers to agricultural producers, arising from measures that support agriculture, regardless o f their nature, to the value o f gross farm receipts valued at farm gate prices including budgetary support;
NAC: Ratio between the annual monetary value o f gross transfers from consumers and taxpayers to agricultural producers, arising from measures that support agriculture, regardless o f their nature, to the value o f gross farm receipts valued at world market prices, without budgetary support; ”* This i s interpreted as the fact that 22% o f consumers’ food expenditures are a subsidy paid to agricultural producers. ’” Non tariff barriers have been particularly distorting in the case o f beef imports. Official beef imports have largely ceased owing to import restrictions imposed by the government in 1996 on the account o f mad cow disease. However, domestic beef production i s not enough to meet demand for beef. On the other hand, a considerable cattle import has been made illegally (an estimated 1 mil l ion cattle in 2001), which i s also o f concern for public health. Owing to these illegal imports, beef prices do not increase as much as would be expected-farm prices are 18 percent higher than that o f world reference prices in 2004. Instead of banning legal beef imports, more targeted measures could be considered-such as improving the established system o f cattle registration and traceability. In addition, the high cost o f feed due to high import tariffs on maize and interventions o f TMO could be adjusted to allow livestock farmers to access to lower cost as well as better livestock suitable feed crops, such as soybeans.
23 8

Table 8.1. Indicators of Support to Agriculture Turkey and EU (1986-2004)
Turkey Total Support Estimate (TSE)/GDP (%) 3.94 4.40 4.16 4.91 4.12 Percent Producer Support Estimate (PSE) (%) 16 25 20 29 27
1986-88 2002-04 2002 2003 2004
Percent Consumer Support Estimate (CSE) (%) -16 -22 -17 -26 -22 General Services Support Estimate (GSSE) /TSE (%) 9.7 10.8 26.5 7.7 3.5 Nominal Protection Coefficient (NPC) 1.17 1.28 1.20 1.36 1.30 Nominal Assistance Coefficient (NAC) 1.20 1.34 1.26 1.40 1.36 European Union Total Support Estimate (TSE)/GDP 2.82 1.24 1.20 1.26 1.20 Percent Producer Support Estimate (PSE) 41 34 34 36 33 Percent Consumer Support Estimate (CSE) -38 -2 1 -21 -22 -20 General Services Support Estimate (GSSE) /TSE 9.1 8.2 8.5 7.5 8.5 Nominal Protection Coefficient (NPC) 1.80 1.32 1.31 1.34 1.29 Nominal Assistance Coefficient (NAC) 1.71 1.52 1.52 1.56 1.49 Source: OECD (2005)
8.5 However, the overall level of support captured by the NAC (including both market support and additional support provided by direct payments and other programs), has been and continues to be about 10-15 percent below that of the EU. Turkey’s N A C has oscillated in the range o f 1.3 over the past few years, while that o f the EU has been steady in the range o f 1.5. Combined wi th the above discussion on the trends o f NPCs, the clear conclusion i s that EU support to agriculture i s higher than that o f Turkey almost exclusively due to higher support extended through non-market subsidy instruments. In addition, support in Turkey for general services, such as research and development, extension and marketing, has been quite volatile wi th considerable decline in 2004. Fortunately, the recent Agricultural Sector Strategy targets an increase to a 5 percent share for research and development in the total budgetary support for agriculture. Since success o f alignment efforts with EU w i l l largely depend on upgraded support to farmers on advice on cropping patterns, access to new technologies and better marketing, increased support for general services in agriculture w i l l be quite important for Turkey.
8.6 Producer farm gate and world reference price differentials measured by the NPC are higher for many commodities in Turkey than those of the EU25. Although producer prices for sugar beet, poultry and sheep are not being supported as much as those in the EU-25, the prices o f wheat, barley, maize, sunflower, potatoes, grapes, milk and beef are being supported at levels higher than those in the EU (Table 8.2).
8.7 Keeping the supply levels constant, alignment with the current levels of agricultural prices in the EU-25 would directly impact the value of several products. A simple (static) simulation based on NPC ratios o f 2004 show what would be the effect on production values in Turkey o f alignment wi th the current levels o f agricultural prices in the EU-25 (Table 8.2). The biggest reductions in price and in value o f production would be seen for potatoes, grapes, sunflower, maize and barley. Beef, milk and wheat would have price reductions as well; whereas prices for sugar beet, poultry and sheep would have to be increased. I t i s important to note that these price reductions would positively affect consumers’ welfare as food expenditures would decline.
239
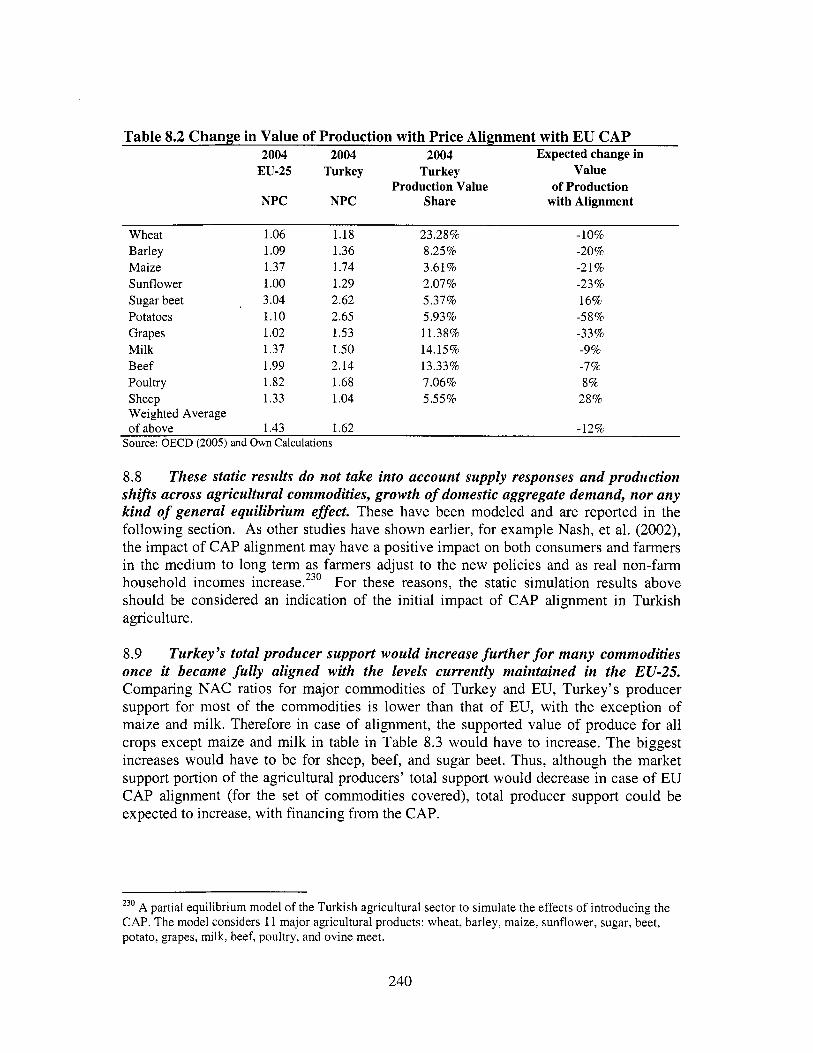
Table 8.2 Change in Value of Production with Price Alignment with EU CAP 2004 2004 2004 Expected change in
EU-25 Turkey Turkey Value
NPC NPC Share with Alignment Production Value of Production
Wheat 1.06 1.18 23.28% -10% Barley 1.09 1.36 8.25% -20% Maize 1.37 1.74 3.61% -21% Sunflower 1 .oo 1.29 2.07% -23% Sugar beet 3.04 2.62 5.37% 16% Potatoes 1.10 2.65 5.93% -58%
Milk 1.37 1 S O 14.15% -9% Beef 1.99 2.14 13.33% -7%
Sheep 1.33 1.04 5.55% 28% Weighted Average o f above 1.43 1.62 -12%
Grapes 1.02 1.53 11.38% -33%
Poultry 1.82 1.68 7.06% 8%
Source: OECD (2005) and Own Calculations
8.8 These static results do not take into account supply responses and production shifts across agricultural commodities, growth of domestic aggregate demand, nor any kind of general equilibrium effect. These have been modeled and are reported in the fol lowing section. As other studies have shown earlier, for example Nash, et al. (2002), the impact o f CAP alignment may have a positive impact on both consumers and farmers in the medium to long term as farmers adjust to the new policies and as real non-farm household incomes increase.230 For these reasons, the static simulation results above should be considered an indication o f the init ial impact o f CAP alignment in Turkish agriculture.
8.9 Turkey’s total producer support would increase further for many commodities once it became fully aligned with the levels currently maintained in the EU-25. Comparing N A C ratios for major commodities of Turkey and EU, Turkey’s producer support for most o f the commodities i s lower than that of EU, with the exception o f maize and milk. Therefore in case o f alignment, the supported value of produce for all crops except maize and milk in table in Table 8.3 would have to increase. The biggest increases would have to be for sheep, beef, and sugar beet. Thus, although the market support portion o f the agricultural producers’ total support would decrease in case o f EU C A P alignment (for the set o f commodities covered), total producer support could be expected to increase, with financing from the CAP.
230 A partial equilibrium model o f the Turkish agricultural sector to simulate the effects o f introducing the CAP. The model considers 11 major agricultural products: wheat, barley, maize, sunflower, sugar, beet, potato, grapes, milk, beef, poultry, and ovine meet.
240

Table 8.3 Change in Supported Value of Production after Full EU CAP Alignment 2004 EU-25 2004 Turkey Change in Supported
N A C N A C Value of Production with Alignment
Wheat 1.64 1.46 12% Barley 1.85 1.60 15% Maize 1.75 1.87 -6% Sunflower 1.59 1.49 7% Sugar beet 3.24 2.76 17% Mi lk 1.44 1.53 -6% Beef 3.12 2.15 45 % Poultry 1.94 1.68 15%
Weighted average of above 1.96 1.69 17%
Sheep 2.09 1.04 101%
Source: OECD (2005) and Own Calculations
8.10 However, because the structure of CAP keeps evolving, it is uncertain that upon accession overall support for Turkish agriculture could in reality increase. In the years ahead, the share o f CAP budgetary transfers in total support i s unlikely to be growing by enough to fully offset the expected decline in EU agricultural trade protection. In addition, the CAP budgetary support to be received by producers in new EU members i s l ikely to be phased in over long periods, with flexibility for the domestic budgets o f Member States to “top-up” CAP transfers.
8.1 1 Moreover, this full alignment is either unlikely or expected to take a long period to be phased in after accession, if the current experience of recent EU accession countries is a good guide. First, the levels o f NACs in the EU w i l l l ikely continue i t s slow decline over the next ten to fifteen years, wi th NPCs falling further and the share o f non-market transfers in total support growing but not by enough to fully offset the fa l l in NPCs. Secondly, the CAP non-market support levels received b y agricultural producers in the EU-15 are higher than those in the recent 10 accession countries. The level o f support to agricultural producers in the latter group are being phased in f rom 2005-2012 (financed mainly by the CAP budget wi th some flexibility for the domestic budgets o f Member States to “top-up” these levels). Thus, Turkish agricultural producers would l ikely face a phase-in period as well.
8.12 Turkish agricultural policy during the pre-accession period will need to focus on gradual reduction of tarzffs with continued reform of budget support. Market support for a number o f commodities has to decrease in general through tariff reduction i f such support i s to converge to EU levels prior to accession and avoid any sharp falls in prices and initial contractions in agricultural income (as have been recently the case in Hungary). At the same time, government budget support for agriculture should be more focused on non-market distorting instruments. This should take the form o f maintaining the Direct Income Support (DIS) Program and expanding support for general services and the other non-distorting programs which Turkey i s introducing through i t s draft Framework Agricultural Law. This i s discussed in greater detail below.
24 1

8.13 Adjustment of Turkish agriculture to reductions in tariff protection could be facilitated by further improving market access for Turkish exports to the EU. EU imports o f a l l agricultural products originating f rom Turkey are tariff free i f the value o f consignment i s below a pre-set entry price. For four different kinds o f fruit and nine vegetables, however, this suspension o f the ad valorem tariff i s l imited to certain calendar periods ranging from 3-8 months depending on the type o f the product. Removing such seasonal restrictions would facilitate adjustment towards more dynamic products where Turkey has a comparative advantage.231
A.2. Impact of Alignment with CAP - General Equilibrium Modeling
8.14 The economic impacts of Turkey’s potential accession to the EU has been analyzed using the World Bank’s global general equilibrium model calibrated to the GTAP dataset (release 6.0) with supplemental information on Turkey’s domestic protection. For modeling purposes, the process o f Turkey’s accession i s decomposed in four parts: 1) the EU eliminates i t s tariffs on Turkey’s exports; 2) Turkey eliminates i t s tariffs on EU’s exports; 3) Turkey aligns i t s external tariff to the EU’s external tariffs; and 4) wi th funding from CAP, Turkey aligns i t s domestic support wi th the EU’s. As Turkey s t i l l heavily protects i t s agriculture and foods sectors, a reduction in protection would tend to hurt agriculture. However, the increase in market access into the EU generates a significant demand pull that leads to an expansion o f the agricultural and food sectors in Turkey. The fiscal impact o f alignment o f domestic support with the EU, combined with the loss in tariff revenues would amount to net savings, estimated at 0.9 percent o f GDP (see below).
(a) Current Status and Accession Policy Implications-model calibration for EU and Turkey in 2004
8.15 For the EU, the data is sourced from the GTAP database (release 6.0)’ which has a 2001 base year. The protection measures are updated to their 2004 levels wi th a pre-simulation shock. The pre-simulation shock incorporates known policy changes. In the case o f the EU, this largely reflects expansion to the 10 new members.232 Turkey’s protection has been introduced through an exogenous change to the init ial database to reflect the levels o f protection reported b y the Turhsh authorities.233 The GTAP data reflects preferences and i t s aggregates are import-weighted.
231 Also some tariff rate quotas, at zero or reduced rates, exist for EU imports originating from Turkey with the full MFN tariff or the specific tariff component only applied for above-quota imports. Turkey in general has managed to fill the quotas over the last years, but in many cases the quotas cannot be completely used owing to inability to meet food safety requirements. 232 For other economies, i t also includes the final phase-in o f the Uruguay Round agreement including removal o f the textile and clothing quotas and China’s W T O accession commitments. 233 The initial database i s adjusted using the model itself, but with parameters value set so as to minimize deviations from initial values subject to the exogenously inserted actual protection levels.
242

8.16 Tariffs. Table 1 in Annex 8.3 shows the various tariffs structures. For the EU, init ial (i.e. 2004) tariffs are given for Turkey, all other exporters and the weighted average (excluding intra-EU trade). The post-accession tariffs are only given for the weighted world average since all o f the tariffs on Turkey’s exports are eliminated. Average tariffs barely move, reflecting the relatively low share o f Turkey’s exports into the EU with high tariffs. The average tariff on merchandise trade drops f rom 3.4 percent to 3.3 percent. This small decline i s virtually true across all sectors, wi th only a somewhat more important reduction in vegetable oils and fats (2.8 percentage points).
8.17 Table 1 in Annex 8.3 also provides the initial 2004 tariffs for Turkish imports from the EU and from other exporters, as well as the total. Under the model simulation, Turkey eliminates tariffs on imports from the EU and aligns i t s tariffs with those of the EU. The accession agreement would drop the average tariff on merchandise trade f rom 3.6 percent to only 0.9 percent. For non-EU exporters, the weighted average tariff drops from 5.4 percent to only 1.9 percent, well below EU’s average tariff.234 This reflects the regional composition of Turkey’s imports relative to the EU. The large change for Turkey i s in the agriculture and foods sectors. The average agricultural tari f f declines to 6.0 percent, from 44.2 percent, and to 6.2 percent from 29.4 percent for processed foods. The reductions in manufacturing are less significant on average.
8.18 Domestic support. Domestic support i s split into four components, plus export subsidies. The four components include production subsidies, payments to capital and land, and input subsidies (e.g. energy and chemicals). Table 2 in Annex 8.3 summarizes the key numbers for Turkey - pre- and post-accession. The average output subsidy would increase by 1.3 percentage points to 5.3 percent on average.235 The only significant output subsidy in the pre-accession period i s in o i l seeds, about 24 percent and i s more or less lined up with the EU level o f support. Post-accession, the only major change i s in cotton, where the rate jumps from a negligible 2 percent to 20 percent. This generates a significant jump in the cost o f production subsidies, virtually all o f i t attributable to cotton where CAP payments post-accession total nearly U S $ l billion.
8.19 Capital payments also increase sharply, in dollar terms from under $100 million to around US$I billion.236 The largest increase in percentage point terms i s for the beef and sheep sector reflected in an increase in payment o f over $400 million. Other sectors with large payments include dairy, cotton and f ru i ts and vegetables. Turkey’s land payments, on the other hand, tend to be somewhat more generous than the EU’s on average, and support in percentage terms would decline f rom 56 percent to 51 percent, albeit with a small increase for the government budget due to higher wheat payments.
234 Aggregate tariffs won’t line up between the EU and Turkey because o f aggregation weights. Even in the same sector tariffs won’t line up because the structure o f EU’s preferences w i l l lead to different aggregation weights if Turkey and the EU are sourcing from different regions. 235 The average subsidy rate (Le. across sectors) w i l l depend on whether base or post-simulation levels are used as aggregation weights. Herein, we use post-simulation levels as aggregation weights but this biases the average upward since clearly output w i l l go up in sectors where the subsidy rises. Using base year levels, the output subsidy barely moves. 236 Capital payments are largely head payments to cattle (including milking cows) but also include other subsidies.
243

Input subsidies in Turkey are zero initially. I f they are l ined up with the EU’s level, costs would jump to nearly $450 mi l l ion and the average input subsidy would amount to about 6.1 percent. Finally, the average export subsidy would increase f rom 1.7 percent to 5.0 percent (using actual weights), between pre- and post-accession levels, though export subsidies on exports to the EU would be eliminated. The budgetary implications are relatively small compared to the other measures with an increase to $144 mi l l ion from an initial level o f $33 million.
(b) Accession Impacts on Agriculture and Food sectors
8.20 The model focuses mainly on the agricultural and food sectors, where distortions are highest, except perhaps in services. The impact assessment i s based on the Wor ld Bank’s global general equilibrium (GE) model known as LINKAGE.237 The model i s run in i t s comparative static version, i.e. with no dynamic aspects and results should be viewed as long-term changes to the steady-state assuming n o change in the stock o f factors (labor, capital and land) and productivity. The data base (as mentioned above) has been modified to reflect the level o f support in Turkey in 2004.238
8.21 Accession would support growth in the output of agriculture and food. The two aggregate sectors combined would see a slight rise in their share o f total value added to 15.0 percent f rom an initial value o f 14.3 percent (Table 3 in Annex 8.3), wi th an average output increase o f around 15 percent. Within agriculture, the biggest shift i s in cotton, with output increasing by 63 percent and i t s share in agricultural value added increasing from 7.4 percent to 11.4 percent. Other large percent increases in output occur for beef and mutton and rice, although the latter star ts f rom a very small base. This sector i s aided by capital (or head) payments that helps overcome i t s non-competitive cost structure. Sharp declines occur in other meats and other crops (essentially nuts). Vegetable oils and fats see a huge increase in the processed food sectors both relative to the sector’s initial level as well as with respect to i t s share in food production.
8.22 Net exports of agricultural and food products are projected to increase. The total increase in exports o f these goods i s $4.5 billion, wi th net exports increasing b y $1.8 billion. Although imports rise substantially because o f the large decrease in tariffs, better access to EU agricultural markets boosts exports relatively more. Exports of vegetable oils represent the largest increase in exports-all o f i t to the EU, with significant increases in cotton and dairy products in value terms. The change in imports i s more widely spread out across sectors though with sizeable increases for ‘other manufacturing’, fossil fuels, and poultry. With regard to the impact o f EU accession on overall trade, imports are up $7.6 billion, only about 1/3 sourced f rom the EU (Table 4 in Annex 8.3). Though Turkey i s providing preferential access to EU exporters, i t i s also opening up i t s markets to other exporters by aligning their tariffs wi th the EU. Moreover, the agricultural payments f rom the EU generate income effects and some real exchange
237 See van der Mensbrugghe (2005) for more details. 238 Prior to Turkey’s accession simulation, a “pre-simulation” i s run that incorporates known policy commitments-final implementation of the Uruguay Round including the elimination of textile and clothing quotas, EU’s expansion to EU25 and China’s WTO accession commitments.
244

appreciation that boost net imports o f industrial goods and services-especially f rom non-EU countries. Exports increase b y $3.2 billion, with virtually all o f the new exports to the EU itself.239 I t should be noted that the simulated increase in total net imports i s not l ikely to impact the capital account. The change in total net imports w i l l more or less match the increase in payments f rom the EU to pay for the entire domestic support budget in agriculture and food. The payments total around $4.8 bi l l ion and net exports decline by $4.4.
8.23 The overall real income gain is $8.1 billion for the Turkish economy, representing an increase of some 6.5 percent-under the assumption that the EU finances the entire domestic support budget. Accession has no measurable impact outside o f Turkey, including in the EU (a near zero decrease o f $4.8 bi l l ion or a loss o f 0.1 percent in real income). In terms o f macro aggregates, private consumption increases by 6.7 percent, and there i s a more sizeable increase o f 7.8 percent in real investment reflecting an increase in savings. Exports increase by .8 percent and imports increase by 18 percent.
8.24 Net fiscal savings are expected. Domestic support-including the export subsidies-would increase from base levels o f $2.2 bi l l ion to $4.7 billion. Upon EU accession, and barring any transitional clauses or possible limitations mentioned in the previous section, domestic support to agriculture wi l l be funded from C A P in the form o f a large current account transfer. Tari f f revenues, on the other hand, would drop f rom an initial level of $1.3 bi l l ion to $0.5 billion. Overall, this translates into an increase in net saving o f $1.3 billion, or 0.9 percent o f GDP.240 In the model simulations, this fiscal closure replaces the net change in fiscal position by a lump sum transfer to households.
8.25 I n conclusion, EU accession would boost agricultural output and could help realize fiscal savings, although structural changes in production will be needed. Turkey’s structure o f tariffs and domestic protection i s similar to many other OECD countries, i.e. i t i s heavily skewed towards protecting agriculture and food. Whi le the average merchandise tariff i s only around 3.5 percent (trade weighted), in agriculture i t i s 44percent (higher than the EU’s 13 percent), and 29percent in processed food (compared with 15 percent in the EU). The post-accession tariffs rates in agriculture and food would drop to around 6 percent, much lower than in the EU (due to the composition of i t s imports). Despite this drop in border protection, agricultural output would increase as the increase in market access to the EU outweighs the average loss in protection. However, accession would mean a relative shift towards agricultural and food output, from where i t i s today, also reflected in the export structure. Lining up domestic protection with the EU wi l l also make room for fiscal savings, estimated at 0.9 percent o f GDP in 2001, and support from the EU would amount to 3.3 percent relative to GDP.
239 Turkey’s exporters can benefit from new market access into the EU, but they lose some competitiveness in other markets as the real exchange rate rises in part a result o f the outside budgetary support. 240 Before accession, the government cost o f support i s $2.2 bi l l ion (domestic support) offset by $1.3 bi l l ion in tariff revenue for a total net cost o f $0.8 bi l l ion (with rounding error). With accession, the cost o f domestic support jumps to $4.8 billion, but this i s completely paid for through budgetary support from the EU. Tariff revenues drop to $0.5 billion, hence the budget position i s $0.5 billion. The change in the net position i s therefore $1.3 billion (0.5 - (-0.8)).
245

8.26 First, the sectoral shifts within agriculture are based on a high degree o f factor mobility across sectors. The actual extent to which Turkish farmers can switch across crops-for example f rom other crops towards cotton-may limit the gains from accession. Second, the gains are being measured against a relatively static policy environment. The model has used ‘static’ protection rates and does not attempt to predict the evolution o f protection over time. For example, should the EU open further i t s market to non-EU countries (e.g., in i t s everything-but- arms initiative, where sugar i s expected to enter duty- and quota-free by the end o f the decade), the impacts o f Turkey’s accession could be altered. Lastly, the usual caveats regarding the model’s assumptions apply here-closure rules, perfect competition and returns to scale, no productivity impacts, etc.
Several caveats apply on the conclusions.
B. PROMOTING RURAL DEVELOPMENT AND ITS EU ALIGNMENT
B.1.Comparable International Experiences and Options
8.27 As agriculture is the largest sector in many developing countries, and majority of poor live in rural areas, government spending for rural areas and agriculture plays an important role (Table 8.4). A number o f studies on this spending have found that i t contributed substantially to agricultural production and poverty reduction. Agricultural research and development spending i s the most crucial to growth in agriculture, while spending on irrigation, education and roads also contributes strongly to growth and poverty reduction (Fan, Shenaaen; Rao, Neetha. 2003, “Public Spending in Developing Countries” (Discussion Paper) Washington, D.C.: International Food Policy Research Institute).
Table 8.4. Comparable Country Data
Country Rural Population Rural GDP Share Agricultural GDP National GDP Per Capita Share Share (Atlas) US$
India 72% 28% 23% 460 China 63% 24% 15% 890 Brazil* 49% 11% 6% 3,070 Mexico” 38% 24% 4% 5,530 Turkey 35-40% 30-35 % 13 % 2,530 Poland 36% 29% 5% 4,230 *Rural GDP shares for Brazil and Mexico are “expanded agricultural.” figures including food and processed products. Source: World Bank “Turkey Policy and Investment Priorities for Agricultural and Rural Development”, February 2005, Annex 2.
8.28 As agricultural employment declines, Turkey needs to develop off farm income and employment opportunities in rural areas not only to increase economic growth in these areas but also to moderate the pace of rural-urban migration to a more manageable level. Turkey s t i l l has a considerable share o f rural population, although i t
246

holds one o f the lowest shares compared to several developing countries. This sizeable rural population generates pressure on urban areas as a means to rapid migration f rom rural to urban parts o f the country leading to all sorts of problems in urban cities over the last decades. Despite the projected overall positive impact o f EU accession on agricultural production and trade, agriculture’s one third share in total employment i s l ikely to decrease in the future, as a result o f structural reform and alignment wi th CAP. Therefore, the industrial and service sectors particularly need to expand further in rural areas, as they have in Poland over the 1990s, while at the same time agricultural productivity has to increase further by adapting to the recent global advances in agricultural technical efficiency.
8.29 I n this regard, government expenditures on agricultural research and extension, as well as infrastructural investments including roads and irrigation has to expand further. However, another World Bank study (February 2005) found out that greater emphasis in the future should be given to participatory approaches in determining service priorities, to private sector involvement in and financing o f service provision, and expansion o f the role o f cooperatives, producers union, and other types o f farmers organizations. This leads to gaining greater co-financing by beneficiaries to infrastructure and other rural investment programs, which may be a sizeable future source o f increased investment in the rural sector.
8.30 Another essential improvement for rural expenditures, as pointed out by the investment patterns analysis below, is to adequately prioritize the regional as well as “by project” investment needs. Dormant projects have to be eliminated from the investment program and projects that are close to completion must be given priority. For poverty alleviation purposes, less developed provinces mainly in regions o f East Anatolia, South East and Black Sea should benefit a lot more from the government expenditures
B.2. Rural Development Investment Patterns
8.31 following agencies:
The analysis in this section includes consolidated budget241 allocations for the
a) Ministry o f Agriculture and Rural Affairs (MARA) - agricultural extension, research, animal and crop protection services;
b) Ministry o f Environment and Forestry (MOEF) - forestry and environment protection;
c) General Directorate o f Rural Services (GDRS) - village roads, on farm small irrigation and drainage works;
d) State Hydraulic Works (DSI) - budget related to only large scale water resources for irrigation;
e) Turkish Electricity Distribution Company (TEDAS) - budget related to only rural electricity distribution and village networks; and,
f) General Directorate of Roads (GDR) - budget related to only road construction and maintenance o f provincial roads (roads connecting provinces).
24’ Figures do not include regional spending by special provincial administrations and municipalities.
247

8.32 Based on the figures from these agencies, the total regional rural spending appears to be concentrated in the Southeast region basically due to Southeast Anatolia Project (GAP). On the other hand, more developed regions such as Marmara, Aegean and Mediterranean account for the least amounts for rural spending. Analysis o f regional rural spending2j2 from the consolidated budget in 2002 shows that the largest expenditure i s made in Southeast Anatolia region (approximately US$475 million) followed by Black Sea (US$ 412 million), then Central Anatolia (US$ 368 million) and East Anatolia (US$ 338 million). The Aegean, Mediterranean and Marmara regions receive the lowest budget allocations with US$ 247 million, US$ 236 million, and US$ 228 million, respectively (Figures 8.1 and 8.2).
Figure 8.1. Rural Recurrent and Investment Expenditures by Region 2002 (US$ Million)
500.0
400.0
300.0
200.0
100.0
Source: MARA, DSI, GDRS, MOEF, TEDAS and GD Roads.
242 Rural spending includes regional current and investment expenditures of MARA, MOEF D S I and GDRS. For TEDAS and GD Rural Roads, only regional investment amounts were available. Owing to GDRS accounting practices, spending amount includes direct expenditures and excludes indirect expenditures.
24 8

Marmara, 9.0%
Mediterranean ,
East Anatol ia, entral Anatolia,
Black Sea, 15.2%
Source: MARA, DSI, GDRS, MOEF, TEDAS and GD Roads.
8.33 Per capita investment spending in rural areas in US dollars reveals that the average investment spending per rural population is quite low (US$47), and there are differences among regions. The Southeast region receives US$93, and Central Anatolia receives only U S $ 3 2 for rural investments per capita. (Figure 8.3). Among rural agencies GDRS243 accounts for the highest total regional spending (40 percent) for rural roads and on farm water works but spending i s largely for current expenditures (55 percent) rather than investments (24 percent) in 2002. D S I follows GDRS in terms o f total spending among agencies (36 percent). D S I also makes the highest investment spending with 62 percent o f total investment spending among other rural agencies. MARA’s share o f rural regional spending i s only 14 percent but i t s recurrent regional spending i s the second highest with 25 percent. TEDAS accounts for 7 percent o f rural investments whereas GD Roads and MOEF accounts for only 3 percent o f rural investments (see Annex 8.2 Table 1).
~~
243 GDRS was abolished at the beginning o f 2005 and its 2005 budget as well as staff i s allocated primarily to SPAs. This can be considered as a start for the decentralization efforts o f the government. However, due to uncertainties about work plans o f SPAs as well as lack o f necessary regulatory revisions, which would for example allow SPAs spend investment amounts funded by foreign loans, difficulties emerged in carrying out GDRS’s responsibilities.
249
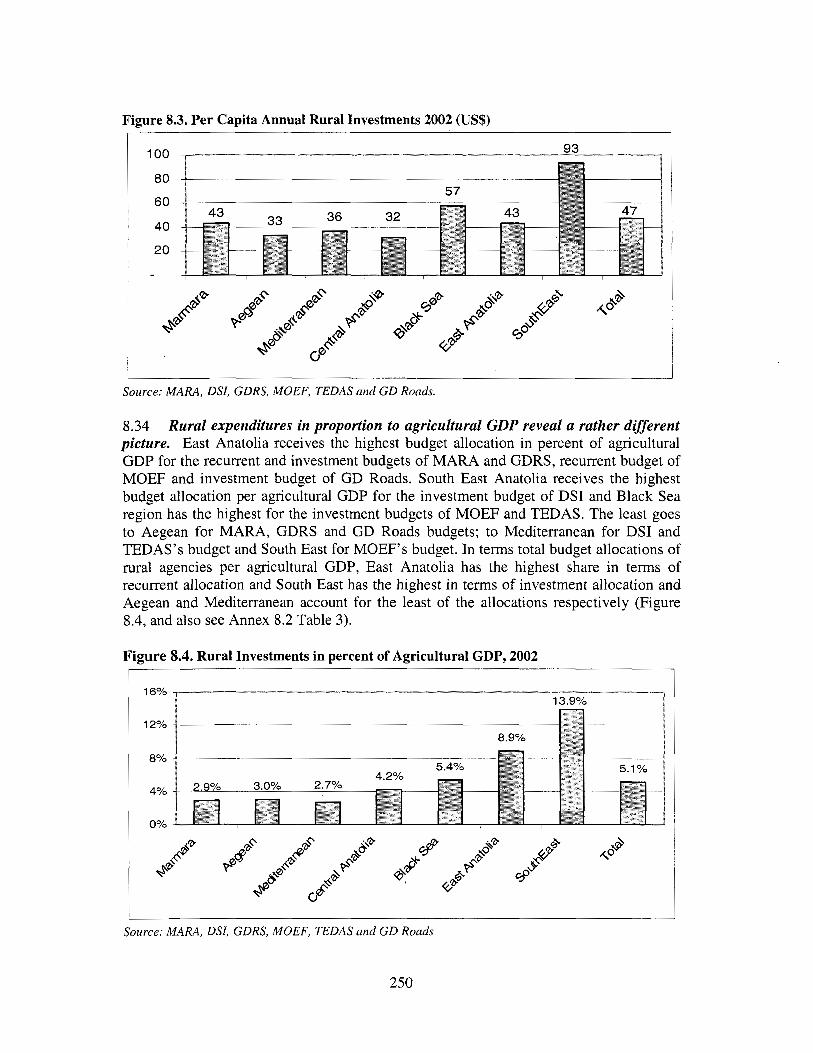
Figure 8.3. Per Capita Annual Rural Investments 2002 (US$)
100
80
60
40
20
Source: MARA, DSI, GDRS, MOEF, TEDAS and GD Roads.
8.34 Rural expenditures in proportion to agricultural GDP reveal a rather different picture. East Anatolia receives the highest budget allocation in percent o f agricultural GDP for the recurrent and investment budgets o f MARA and GDRS, recurrent budget o f MOEF and investment budget o f GD Roads. South East Anatolia receives the highest budget allocation per agricultural GDP for the investment budget of D S I and Black Sea region has the highest for the investment budgets o f MOEF and TEDAS. The least goes to Aegean for MARA, GDRS and GD Roads budgets; to Mediterranean for D S I and TEDAS's budget and South East for MOEF's budget. In terms total budget allocations o f rural agencies per agricultural GDP, East Anatolia has the highest share in terms o f recurrent allocation and South East has the highest in terms o f investment allocation and Aegean and Mediterranean account for the least of the allocations respectively (Figure 8.4, and also see Annex 8.2 Table 3).
Figure 8.4. Rural Investments in percent of Agricultural GDP, 2002
12%
8%
4%
0%
I
Source: MARA, DSI, GDRS, MOEF, TEDAS arid GD Roads
250

8.35 Although spending figures by seven regions seem to demonstrate that rural spending is higher in general in less developed regions, calculations made at the provincial level point to the opposite. Correlations between Per capita agricultural GDP and per capita rural spending by 81 provinces show positive correlations (average 0.60) meaning more spending i s made in provinces where per capita agricultural GDP i s higher (Table 8.5). Correlations between rural illiteracy levels and per capita rural spending also show that for all o f the agencies with the exception of DSI, there i s a negative correlation between the two; i.e. agencies’ rural per capita spending i s lower in provinces where rural illiteracy levels are high. Only D S I has a positive correlation meaning D S I rural per capita investments i s higher in areas where there i s higher illiteracy levels.
Expenditure Type Correlation MARA Recurrent* 0.64 MARA Investment* 0.50 MOEF Recurrent* MOEF Investment DSI Investment*** GDRS Roads*
0.3 1 0.5 1 0.35 0.39
GDRS Water* TEDAS Investment* Total*
8.36 Rural spending amounts at the provincial level tend to reveal that rural investments may need to be realigned to reflect the regional priorities of the government-with the exception of GAP investments.244 However, i t i s also important to note that the analysis does not include regional budgets o f SPAS and municipalities and also investments for education, health and housing in rural areas are lef t out and inclusion of these budgets may alter the results.
0.80 0.69 0.60
244Priority development provinces are determined by the decisions of the Council of Ministers on the Implementation, Coordination and Monitoring of the Annual Programs issued each year. The latest program (2005) selected 49 provinces out of 81 provinces as priority provinces that are located mostly in the East, South East and Black Sea regions and which have in general the lowest per capita income.
25 1

Expenditure Type Correlation MARA Recurrent** -0.43 MARA Investment** -0.36 MOEF Recurrent* -0.38 MOEF Investment* -0.5 1 DSI Investment** 0.45 GDRS Roads -0.23 GDRS Water** * TEDAS Investment* * * Total
B.3. Diversification of Rural Development with Structural Funds
-0.25 -0.42 0.09
8.37 There are large regional discrepancies in Europe both between countries and between regions of countries stemming from low mobility of economic agents.245 In order to reduce these regional inequalities, the European Union (EU) has been allocating a large portion o f i t s budget for regional aid. The Structural Funds and the Cohesion Fund currently represent one third o f the EU budget (in 2000-2006, 213 bi l l ion Euros). They represent f rom 1.5 percent to 3.5 percent o f the GDPs for countries such as Greece, Portugal, Ireland and Spain and 6-15 percent o f these investments are financed out o f EU sources.
(a) Instrument for Pre-Accession for Rural Development ( IPARD)
8.38 The Instrument for Pre- Accession (IPA) envisaged to be implemented within the years 2007-2013 has a component which covers matters o f rural development (known as The IPARD serves as the framework for supporting sustainable agricultural and rural development in EU applicant countries during the pre-accession period. I t aims to solve problems affecting the long-term adjustment o f the agricultural sector and rural areas, to help implement the Community acquis in matters o f the common agricultural policy (CAP) and related policies. In 2007-2013, the EU is planning to allocate in excess o f Euro 1 bi l l ion per year under IPARD for al l candidate countries including Turkey.
Pre-accession aid has been operating since 1994.
8.39 main areas of priority actions.
Support for agriculture and rural development focuses in particular on two
245 This i s not a case for some other developed countries such as U S due to high labor mobility. 246 Before 2007 called SAPARD.
252

a) Priority 1 - Contributing to the sustainable adaptation o f the agricultural sector and the implementation o f the acquis communautaire concerning the common agricultural policy and related policies: i) Investments in farms to restructure and upgrade to the EU standards; ii) Supporting setting up o f producer groups; iii) Investments in processing and marketing o f agriculture and fishery products to
restructure and upgrade to the EU standards; iv) Agricultural production methods designed to protect environment and maintain the
countryside (at pi lot level);
b) Priority 2 - Contributing to the sustainable development o f the rural areas: v) Improvement and development o f rural infrastructure;
vi) Development and diversification of rural economic activities; vii) Preparation o f rural communities to conceive and implement local rural
development strategies and integrated rural development strategies through local private-public partnerships (at pi lot level);
viii) Improvement o f training and technical assistance for the above mentioned priorities and measures, including studies to assist with the preparation and monitoring o f the Rural Development program and information and publicity campaigns.
Box 8.1 - Experiences from EU Countries with regional aid
There i s no one route to economic development and the effect o f structural funds has been different in each recipient region. Southern Italy as well as Greece has not seen satisfactory convergence as a result of to regional aid. However, Ireland, Portugal and Finland’s experiences have been much positive as they have followed different industrial strategies. I t i s also important to point out that convergence has been generally at the national level driven by the growth poles, with lower growth in other parts o f the countries, widening regional disparities. There i s a trade o f f between economic efficiency and redistributive objectives and policies in general give the priority to efficiency goal.
Ireland: Ireland particularly experienced a boom in the 1980s due to single market that created FDI from Europe as well as investment funds from US’S boom. A t the same time, structural funds more than doubled in 1990s compared to 1980s. EU support accounted for 10 percent o f investments in Ireland. Ireland had favorable characteristics for investments such as low tax rates as well as English speaking environment. However, i t also had unfavorable characteristics in terms o f l ow levels o f human capital (educational attainment), poor physical infrastructure (transportation, telecommunication and energy) and poor research and development. Therefore, these areas have been the ones that attracted the biggest share o f structural funds. In 1994-1999 budget period, 36 percent o f structural funds were allocated to physical infrastructure, 28 percent was allocated to human resources, 26 percent to productiodinvestment aid to private sector and 10 percent to income support. Ireland also selected the right strategic areas for the structural funds that were very much inline with the demand o f the high tech industries. For example, tertiary education that focused on natural sciences, agriculture and engineering as well as university degrees grew considerably.
Source: Funck Bernard and Pizzati Lodovico, “European Integration, Regional Policy, and Growth”, The World Bank 2003.
Poland and Hunearv: Before accession, both Poland and Hungary had large economic disparities among regions, and both needed to improve infrastructure and generate non-agricultural employment. In Poland, where 28 percent o f the labor force was in agriculture EU was eager to see accelerated efforts to move some labor out o f agriculture. The EU provided substantial pre-accession funds to address these shortcomings, and even more money came after accession through “Structural Funds”
253

and rural development assistance. However, the EU was concerned about a lack o f coordination in developing and implementing rural policies: neither Poland nor Hungary had the administrative capacity at the regional level to administer these funds. The EU had rejected several o f Poland’s proposals for use o f pre-accession funds, contending that the proposals were not well developed. Commission reports complained that in Hungary, nine different ministries are involved in rural policy. Nevertheless, successful implementations were achieved in the field of rural development through multi-sectoral integrated plans. Investments were made mainly in the fields o f infrastructure (such as drainage, drinking water, highways, etc.), non-agricultural income generating activities and health and education.
Source: USDA Economic Research Service, “Agriculture in Poland and Hungary Preparing for EU Accession” Agricultural Outlook, December 1999 http://www. ers. usda.gov/publications/AgOutlooWDecl999/ao267h.pdf
8.40 The decentralized management of the SAPARDHPARD financial instrument is unique. Subject to ex-post checks, all responsibility for managing the funds i s devolved from the Commission to the beneficiary country once the conferral o f management o f an implementing and paying agency i s decided on b y the European Commission and the rural development plan prepared by the beneficiary country i s adopted by the Commission. This system has a positive impact on the absorption capacity o f the rural development funds after accession. This acquired experience i s an excellent way to prepare the future Member States for the implementation and management o f the acquis concerning the CAP and rural development policies. This experience w i l l also contribute to Structural Fund and Cohesion Fund management.
(b) Turkey’s Current Rural Development Activities and Accession Plans
8.41 The Pre-Accession Economic Program (PEP) prepared and submitted by Turkey in 2003 to the European Commission sets out key objectives of rural development policy: to increase competitiveness in rural areas, to ensure economic and social development by increasing income levels and off-farm activities, to widen training and participatory organizations and to protect the environment. T o be eligible to access IPARD funds to pursue these objectives, Turkey needs to complete three activities: elaborate a rural development strategy, formulate an IPARD plan, and set up a rural development agency.
8.42 Rural development strategy: A framework for rural development projects has to be developed b y identifying priorities and measures for the sectors and ensuring harmonization with the EU’s rural development policies. Efforts are under way to draw up the strategy, and the strategy is expected to be finalized soon. (The National Rural Development Strategy was apparently signed by the Turkish Prime Minister on January 26,2006.)
8.43 ZPARDplan: This i s to be a multi-year programming document which i s based on the rural development strategy. The IPARD plan lays out the m i x o f prioritized activities drawn from the l i s t of measures eligible for support.
8.44 Rural Development Agency (Paying and Implementation): As payments under IPARD are to take place in a fu l ly decentralized system (ex-ante controls), the new
254

agency with al l i t s branches has to be set up and proceed through a lengthy accreditation process. The agency can delegate some o f i t s responsibilities to Special Provincial Administrations (SPAs, o f which there are 81). In this process, Turkey should initially target a l imited number o f areas (and a similarly l imited number o f measures) for developing a functioning administrative structure, and then accelerate the process to improve the system subsequently in more challenging rural areas. In order to simplify and ease the accreditation process, Turkey i s apparently considering to establish the new agency init ial ly without local branches.
8.45 Turkey needs to increase the capacity of SPAs to identi&, plan and execute agricultural and food sector investment programs. Turkey also has to rapidly develop key acquis related food safety and regulatory functions such as phyto-sanitary inspection and control, livestock and dairy inventorization and traceability, agro-chemical control and organic certification, so that investments needed to comply wi th food safety measures can be made eligible for the pre-accession funds.
8.46 For regional development (both of rural and urban areas), a Preliminary National Development Plan (PNDP) was drawn up for implementation in 2004-2006. The plan i s intended to formulate a national economic and social cohesion pol icy in order to reduce regional disparities and to create an operational infrastructure allowing an efficient use o f pre-accession financial assistance received f rom the EU and allocation o f post-accession structural funds. Regional development programs supported by pre- accession financial assistance received from the EU w i l l be launched in 12 N U T S I1 regions, which have been designated as priority areas in terms o f socio-economic development indicators, under the PNDP. The State Planning Organization i s coordinating several projects under this program.247
(c) Conclusions
8.47 While the agricultural sector plays a key role in rural development, support for non-farming activities in the services and industry sectors should be given particular attention, as has been the case recently in Poland and Hungary. Maximum attention should be given to cooperation between agencies (e.g., ministries) since rural development i s multi-dimensional and covers various sectors. Examples o f convergence in countries that heavily used structural funds have also shown that investment strategies need to be determined b y careful analysis o f regional specificities, bottlenecks and potential competitive advantages.
8.48 One important conclusion from country examples is that regional policies should be primarily focused on promoting efficiency, with measures ensuring maximum diffusion of growth across regions. Also a number o f studies have found that regional funding o f essential infrastructure (transport, communication, power, water,
247 Eastern Anatolia Development Program (Euro 45 Million), Southeastern Anatolia Project Regional Development Program (Euro 47 Million), 3 integrated regional development projects in 3 Nuts 2 regions in East, Black Sea and Central Anatolia Region (Euros 52.3 Million), Turkey-Bulgaria Cross Border Program (Euros 19.5 Million) and also Greece-Turkey program i s being planned (Euro 19.4 Million).
25 5

education) i s more effective than subsidies allocated to small businesses. As for the institutional arrangements, structural funds should be integrated into the government’s overall strategy and public resource management process.
8.49 Taking advantage of structural funds will be a significant challenge. The availability o f sufficient beneficiary contributions (at least 25-50 percent) for rural development programs linked to structural funds can be a very important obstacle for investments in rural areas. Increasing access to finance in rural areas wil l key for increased use o f such funds. Steps to increase the capacity o f SPAS to identify, plan and execute agricultural and food sector investment programs are also needed.
B.4. Needed Changes to Institutional Arrangements for Structural Fund Programs
8.50 I n pursuing alignment with the EU in the rural sector, including conformity with agricultural acquis, the Common Agricultural Policy, and the Fisheries Policy of the EU, the Ministry of A riculture and Rural Affairs (MARA) will need to undergo significant restructuring . This w i l l be done in a context o f the Government o f Turkey’s pol icy for decentralization o f service delivery. Turkey’s alignment wi th the EU w i l l require MARA to fulfill a number o f basic conditions/programs. Turkey i s wel l aware o f these conditions and they include, but are not l imited to:
25
a) A farmer registration program and integrated administration and control system; b) A farm accountancy data network ( a tool for measuring farmers’ incomes); c) A subsidy pol icy and MARA Payment Agency responsible for i t s management; d) An animal numbering system, init ial ly for cattle but eventually for al l livestock; e) A proper sanitary and phytosanitary food law and food safety system and
comprehensive adoption o f HACCP management in food production systems; f) Veterinary epidemiology and plan protection systems including drug, pesticide
and heavy metals residue testing, reporting and feedback systems; g) A sound environmental policy and the promotion/adoption o f EUREPGAP (Good
Agricultural Practices) principles and practices; h) Adoption o f the EU Common Seed catalogue; and, i) Translation and adoption o f key sections o f “acquis communautaire”.
8.5 1 will impact on MARA. These include, but are not l imited to:
The proposed law on Public Sector Reform has a number of characteristics that
j) The separation o f policy f rom delivery; k) MARA’s primary role and responsibilities w i l l include development o f
i) A broad ranging agriculture and rural development policy framework; ii) A comprehensive regulatory framework and rulesh-equirements for
implementation; iii) Crop and livestock protection systems;
248 The focus on the restructuring needs o f the MARA i s not meant to imply that other government organizations do not have an important role in rural development efforts. However, the elaboration o f restructuring measures for the other government organizations involved in aspects o f rural development, e.g DSI, GDRS, MOEF, TEDAS and GD Roads, and others i s beyond the scope o f this current analysis and w i l l be taken up in the subsequent module o f the CEM series.
256

iv) Implementation monitoring; 1) Responsibility and funding for implementation and service delivery w i l l be
directed closer to the target beneficiaries at the provincial and local level; m) Participation o f stakeholders and the private sector in development and delivery
o f agricultural services.
8.52 The recent EU enlargement process has produced key lessons which can inform the restructuring process. First, the GOT should make sufficient investment in administrative and human infrastructure in advance to cope with the immediate demands o f pre-accession funding and post-accession responsibilities. Secondly, application o f EU food quality standards through adjustments to food safety, environmental and other standards should begin in the early stages o f the accession process. This i s because EU health and safety standards w i l l need to be implemented progressively, to allow food- processors and farmers time to adjust following a well defined and credible timetable for specified adjustments.
(a) Current Structure and Operational Modality
8.53 M A R A is currently structured on service function and operational lines. Corporate functions o f financial, personnel and information administration and management are all discharged from the centre. Legal, inspection and Research, Planning and Coordination (APK) services are also discharged from central “Advisory and Supervisory Units”. Three “Attached Organizations” and three “Relevant Organizations” (State Owned Enterprises) including 38 state farms report to MARA. At the centre General Directorates are based on the core functions o f
a) Education and extension services and registration o f cooperatives (TEDGEM); b) Crop and livestock development (TUGEM); c) Plant and animal regulatory function, e.g, quarantine, border protection (KKGM); d) Agricultural research (TAGEM)
8.54 Apart from the agricultural research institutes, this functional oriented structure is more or less replicated in each of eight-one Provincial Directorates and in offices in each agricultural district. Overall, MARA has approximately 38,000 staff. Technical staff at the provincial level are MARA employees and service delivery i s essentially based on a projecthask oriented model. Funds for implementation are usually tied to projects/tasks and in this way nationally important programs, such as those undertaken by the General Directorate o f Protection and Control (KKGM) are seen to have the potential to be applied reasonably uniformly across Turkey. This model i s suitable for a Ministry where regulation i s a major function as the relationship between the centre and the provinces i s linked through authority and budget support and the operational mode i s top-down and based on a process o f command/control. I t i s less suitable for rural development programs where a participative approach to provincial/district priorities and service delivery i s a strategic goal.
257

(b) Organization Structure Models, Issues and Options
8.55 The EU and international approach to institutional reform in ministries involved in agriculture and rural development has a number of key underpinnings:
The central government role i s moving towards agencies that develop the policy and regulatory framework and procedures to contract, monitor and evaluate implementation; Pol icy i s separated from delivery; Public and private sector service delivery agencies are able to access public funds in an open, transparent and contestable basis; Transparency i s managed through establishing governance structures that represent the major stakeholders; Service delivery i s increasing managed through a transactional process o f service delivery contracts; and, The role and contribution to funding o f the private sector in agriculture and rural development i s encouraged through an inclusive and participative approach to planning and implementation.
A brief review of some long standing and recent EU member states shows that while there i s lack of uniformity within EU member states, there is some degree of commonality in the functions performed. This review suggests that the organizational structure for a ministry involved in agricultural and rural development could take the following generic form at the political level.
a) A Corporate Support Services Directorate, including sections/divisions o f i) Finance ii) Human resource management iii) Legal matters iv) Statistics and payments v) Information technology, and
vi) Public relations and communications.
b) Policy and/or Regulatory Directorates, including, but not l imited to: i) Food Safety ii) Fisheries iii) Rural Development iv) Plant Products v) Animal Products
vi) Foreign Relations & EU Coordination
8.57 I n this configuration, .the importance of food safety policy in the MARA structure will need to be accentuated, with clear procedures o f food control “from stable to table” and effective cooperation and coordination between different services and control institutions w i l l have to be laid out. To improve coordination generally and to clarify responsibilities, i t would be recommended to base activities on main service units (i.e., Directorates General, Departments) instead of related organizations and affiliated organizations as i s currently the case.
258

8.58 At the service delivery level there is even less uniformity in the EU. For research and extension some member states have established National Departments o f Agriculture or Agricultural Development wi th a network o f regional offices. Others have decentralized although in most cases research i s coordinated as a national function while extension i s driven by provincial or district needs. Sometimes the research and extension functions are combined within one department and sometimes separated. Some member states have separated plant research and extension from livestock research and extension. Regulatory services are sometimes managed from the centre through a regional network and in other cases are delivered by independent authorities that report to monitored and are monitored b y the central agency
8.59
a)
b)
There are three main service delivery options that could be considered.
Owner-Operated. This i s close to the current situation. I t requires establishment and maintenance o f a regional or provincial network o f staff. L ine control o f staff i s often seen as a strength that assists the delivery o f national projects and programs. Flexibility to respond to stakeholder needs at the local level i s often compromised b y the need to deliver national priority programs and the development o f demand driven services i s often not wel l advanced. The funding mechanism i s generally through budget appropriation and in many cases expenditure often occurs in areas for which i t was not intended. Management o f performance i s often based on expectation rather than inspection and i s invariably weak due to the diversion o f funding from i t s original purpose. This option would l ikely not support the government’s requirement for decentralization o f services and a participative approach to service delivery.
Outsourcing. Where public or private sector agencies andor individuals are contracted to deliver specific services. This system encourages the development o f a range o f national and local institutions with specific expertise. Outsourcing i s generally effective in reducing the diversion o f funds from their intended purpose. Often many o f the service delivery institutions act as autonomous or semi- autonomous agencies. Outsourcing i s one way o f managing and coordinating funds from different public and private sector organizations and a range o f funding mechanisms can be employed to assist stakeholders to more effectively determine the service needs and service providers. T o work effectively outsourcing requires: i) Establishment o f effective and stakeholder representative governance
structures at the national and local level as appropriate. ii) Identification o f national and local priorities for service delivery and ensuring
that public (and preferably private sector) funds are directed to priori ty areas. iii) Establishment o f operational guidelines to ensure that service needs are
clearly specified, that selection o f service providers i s criterion-based and that service provider contracts are awarded in an open and contestable manner.
iv) Development o f service delivery specifications, contract negotiation and contract (including finance) management s k i l l s within the management
259

agency. Given Turkey’s the size and diversity o f service requirements the issue o f regionalization o f contract management w i l l need to be resolved.
v) Monitoring and evaluation o f contract implementation i s often managed by a combination o f self-assessment and independent audit o f achievement o f agreed service standards.
8.60 A combination of Owner-Operated and Outsourcing. Many EU agriculture and rural development ministries employ both owner-operator and outsourcing service delivery systems. What works best depends on the establishment and maturity o f autonomous or semi-autonomous and private sector agencies. During the change process many countries establish transitional organizations/institutions and progressively move from owner-operator to outsourcing systems o f service delivery. For example a number o f EU countries have established Food Safety Authorities. Many o f these operate independently but are responsible to Agriculture (or in some cases Health) Ministries. Turkey may not yet be ready for this but may consider that it would be desirable in the medium term.
(c) Institutional Challenges of EU Agricultural and Rural Development Policies
8.61 Zn the pre-accession period, adjustment of the institutional structure of the ministries responsible for agriculture and rural development in the new EU Member States was indispensable. Institutional adjustment facilitated a close cooperation wi th the EU in a number o f areas.
8.62 Ensuring an efficient and competent dialog with EU Commission Directorate General for Agriculture (DG Agri). In light o f the cooperation wi th the EU i t was indispensable for these ministries to cover the same range o f activity that DG Agri covers. Therefore, to ensure good coordination wi th the DG Agri, Turkey w i l l need to adjust the structure o f MARA to be more in line wi th the structure o f DG Agri, taking into account the roles o f government organizations (other than MARA) involved in rural development. Given MARA’s current restructuring process, the current time i s the best opportunity to effect this adjustment.
8.63 Responding to the urgent requirement for an adaptation of the administration structure for pre-accession support from the EU budget (ZPARD). In view o f building an adequate absorption capacity for pre-accession support for rural areas available through the IPARD, a new IPARD department w i l l need to be created at MARA. After adjustment o f MARA’s internal structure and creation o f the IPARD department, a Paying Agency w i l l have to be set up and accredited (discussed below).
8.64 New challenges related to food safety. In accordance with the national food safety strategy (approved by GOT in 2000), al l responsibilities wi th regard to Food Safety and Control were delegated to MARA after publishing o f Food Law No 5179 in 2004. Instead o f Ministry o f Health, MARA i s responsible to coordinate the Food Safety Policy and i s the only competent authority to supply food safety. Since MARA’s Department o f Food Safety develops and coordinates policies in the areas o f veterinary
260

and phytosanitary issues, this Department must now establish a staged strategy for implementing a food safety policy which i s complaint with EU requirements.
8.65 Need to prepare for accession negotiations. Perhaps, the biggest challenge for MARA w i l l be the preparation and efficient use o f available human resources. The Agricultural Planning and Research Department (APK)249 currently bears an excessive burden for agricultural policy analysis, though i t confers wi th and contracts work out to the Agricultural Economics Research Institute and Turkish universities. I t lacks a capacity to sufficiently. monitor developments in foreign markets, and i t also has difficulty in attracting a larger group o f qualified staff, partially as a result o f specialists being subject to the MARA wide pay scales. By giving institutions similar to the APK an independent status and the ability to pay significantly higher remuneration, a number o f CEE governments have created stronger capacity250 to perform analysis and strategy development on the request of their ministries o f agriculture. This would address a current weakness that MARA i s bound to see intensify over the next few years as the needs grows for accurate information and complex analyses o f pol icy options and negotiating positions. The first priority o f a strengthened APK should be to establish working groups (including ministerial and other experts from scientific and research institutes cooperating wi th MARA) that reflect the structure o f the DG Agri and o f the agricultural policy sub-chapters for future negotiations.
8.66 Demand for improvement of the efficiency of administration activities in view of a quick increase of tasks, but with modest accompanying increase of financial and human resources. Taking into account the high demand for improvement o f the efficiency o f the administration o f agricultural and rural development policies, MARA needs to target a special training program to management staff o f the ministry and o f the institutions and agencies cooperating wi th the ministry. This should focus on courses on EU institutions and legislation, on Common Agriculture Policy principles, and on linguistic courses o f English (and potentially French) at different levels. Long term training in economics and agricultural policy (including one-year post graduated study abroad) should be proposed to the best candidates (with a detailed selection based on competency level and linguistic sk i l l s ) . For financing those important human resources investments, MARA should request EU financial support to a large extent to supplement i t s own budgetary resources.251
8.67 Establishment of Paying Agencies. As noted previously, one o f the key steps in the preparing for EU accession in the agricultural and rural sector wi l l be the establishment o f EU-style Paying Agencies. One Paying Agency w i l l need to be responsible for market measures (Pillar I o f the Common Agricultural Policy, CAP): intervention, export subsidies, trade mechanisms, and management o f quotas). A second
249 Planning and Research Departments (APK) in all public institutions have been restructured as Strategy Development Departments by law no.5436 issued in the official gazette on December 24,2005. 250 For example, in Poland the Government setup the Agricultural Policy Analysis Un i t (SAEPR) under the independent Foundation for Assistance Programs for Agriculture (FAPA), and due to this arrangement i t was possible to pay higher salaries to the staff working more efficiently than average in the Ministry o f Agriculture and Rural Development. 251 Through the successor program to the MEDA program.
26 1

Paying Agency w i l l be responsible for Rural Development Programs (Pillar I1 o f CAP) and direct payments. The process o f setting up o f Paying Agencies should be based on close cooperation with similar institutions from EU Member States. In this regard, the EU offers such possibilities for cooperation for Turkey in the framework o f “twining projects”. In the pre-accession period, the Paying Agency for Market Measures would be expected to gradually take over responsibility for handling Turkey’s existing agricultural market support programs and the Direct Income Support Program. (Despite the fact that full C A P compliance w i l l occur only in the long run with full EU membership, the integration of market support programs under a Paying Agency for Market Measures i s needed in the medium-term to ensure greater coherence and timeliness of implementation across the existing market support measures). The Pillar II Paying Agency would handle the other more investment-promoting programs under the agricultural and rural transfer budget.
8.68 The process of setting up appropriate Paying Agencies is complex and difJiult and should be well prepared and planned in a detailed manner. For every stage o f the process, a comprehensive and realistic plan and schedule should be elaborated. The deadlines for completing every elements o f restructuring plan should be established and adhered to. Prior to embarking on this process, the GOT needs to consider whether to set up a unified single Paying Agency or Paying Agencies for each C A P Pillar separately. Current Member States’ practice i s not a decisive factor on this issue since there i s no unique model o f paying agencies in the EU. In the majority o f Member States there i s a single paying agency for all above mentioned measures (e.g., Austria, Ireland, Sweden, Lithuania), but there are also cases o f two agencies (e.g., Poland, Portugal, Netherlands) or several agencies (e.g., France252, Germany253).
8.69 Establishing one Paying Agency for rural development and market measures has several advantages. First, i t has lower costs compared to the model wi th two or more paying agencies due to a fewer number o f offices, directors and management staff, and other personnel, as wel l as lower operational costs. Second, there i s no need for establishment o f a Coordinating Body as required for two or more agencies (see Box 2 below). Lastly, i t allows for better coordination and cooperation o f a l l units responsible for setting up and running Integrated Administration and Control System (IACS), Animal Identification System and others.
8.70 Since the Paying Agency for each of the CAP Pillars is a complex institution one its own, attempting to set up a single Paying Agency for both CAP Pillars increases the complexity of properly establishing Paying Agency tasks and implementation procedures. This multiplies the risk o f not achieving EU accreditation in a timely manner. This risk i s further heightened b y the dimension o f Turkey: a dispersed territory, with a large number of farmers, and with highly diversified needs in different rural areas. The associated opportunity costs would be high given the urgent need for gaining access to EU financial support for the implementation o f rural development pol icy in Turkey.
252 For different products: milk - ONILAI, cereals- ONIC, etc. 253 For different regions
262

Box 8.2 - Key role of EU C A P Paying Agency and accreditation requirements The framework for control o f expenditure under the CAP i s set out in Council Regulations and can be summarized as follows. Primary responsibility for checking and controlling CAP expenditure has i s given to the Member States, which must 'accredit' agencies as having met standards for authorizing, paying and accounting for payments.
The Commission i s responsible for managing the EU budget and must verify the conditions under which payments and checks have been made as part o f an annual 'clearance o f accounts' procedure. Expenditure by Member States i s reimbursed only when the necessary compliance with EU rules has been established. Financial corrections ('disallowance') are made when this i s not the case.
Strict control and accounting measures, including the establishment o f certain control bodies and procedures, were introduced in October 1996. The Competent Authority i s responsible for the granting, maintaining and, if necessary, withdrawing accreditation o f Paying Agencies. The Minister responsible for agriculture (or the Minister responsible for finance) i s appointed the Competent Authority for these purposes in EU Member States. The Minister, through a Management Board, also exercises the functions o f the Co-ordinciting Body, which i s responsible for bringing together and supplying information to the Commission and for promoting the harmonized application o f Community rules between Paying Agencies in a country where there i s more than one Paying Agency. The Certifying Body, which must be independent from the Paying Agencies and Co-ordinating Body, has the function o f conducting an audit and certifying accounts annually and o f confirming whether scheme controls are adequate. This i s a prerequisite to decisions by the Commission on the clearance o f Paying Agencies' annual accounts.
Accreditation o f Paying Agencies i s effectively reviewed annually as part o f the certification and clearance o f the EAGGF accounts. The Certifying Body may identify 'major' shortcomings in controls which generally result in the Competent Authority having to issue directions requiring the Paying Agencies concerned to take corrective actions by set deadlines. Failure to take action by agreed deadlines can lead to a Paying Agency's accreditation being downgraded from full to provisional status or to withdrawal o f accredited status altogether, with responsibility for scheme management and payments being transferred to another Paying Agency.
8.71 I n order to reduce the risk of delay in the process of building Paying Agency capacities, it is recommended that Turkey adopt an option of two Paying Agencies. If i t selects this approach, MARA w i l l need to pay special attention to effective establishment, updating and functioning o f the Integrated Administrative Control System (IACS), which links the two C A P Pillars. A well functioning IACS w i l l lower the r i sks of malfunctioning and delay and partially compensate for the higher costs o f building and functioning o f two Paying Agencies.
B.5. Recommendations for Building SF and CAP Implementation Capacity
8.72 To create absorptive capacity for structural fund programs and align agricultural sector regulations and policies to EU CAP requirements, adjustment of the institutional structure of MARA will be needed. Initiatives should address a number o f challenges:
a) The need to ensure an efficient and competent dialog with DG Agri and with other EU institutions, and Member States
b) Urgent requirements for an adaptation of the administration structure for pre- accession support f rom the EU budget for rural areas;
263

c) New challenges related to food safety; d) Technical preparation for accession negotiations; and, e) The demand for improvement o f the efficiency o f administration activities in view
o f a quick increase o f tasks, but with limited accompanying increase o f financial and human resources.
8.73 in the adjustment process would be to:
I n the short-term, the main priorities which the GOT and MARA should focus on
Elaborate a consistent Strategy o f Rural Development; Adjust MARA structure254 so that i t covers the same range o f activity which DG Agri covers; Commence the expansion of investment in the development o f MARA’s human resources; Decentralize agricultural administration; Set up two EU-style Paying Agencies - one for market measures (including direct payments) and a separate one for measures akin to CAP Pillar I1 programs; Establish priorities and detailed timetable for gradual implementation o f overall Common Agricultural Policy (Pillar I and 11) and food safety policy. Set up a Rural development Agency (IPARD Agency) and national accreditation b y competent authority and conferral o f management decision by EU.
I n the medium term, the main priorities should be to: Adjust and enlarge the responsibility o f MARA and the Pillar I Paying Agency for market measures to the management o f CAP measures; Expand the responsibility o f the Pillar I1 Paying Agency to include all the investment-promoting programs under the MARA transfer budget; Focus on the full implementation o f food safety policy; and, Gradually implement C A P measures according to the established priorities of
Turkey. Expand the function o f IPARD Agency for more challenging rural areas and measures and include al l the investment-promoting programs under the MARA transfer budget. Convert the IPARD Agency into an EU-style paying agency after accession.
254 In the light o f CEE experience, i s important to stress that MARA’s new structure should be simple and transparent. Every unit (e.g. department, office, section) should be set on the base o f detailed terms o f reference. To avoid, overlapping o f activities and to improve coordination, a specific terms o f reference should be elaborated for every, individual staff member o f MARA.
264

CHAPTER 9. ENHANCING POLICIES FOR SOCIAL COHESION
9.1 Ensuring sustained and inclusive growth is an important challenge for Turkey in view of the existing important social and regional gaps and the potential for the EU accession process to create “winners”, but also some “losers”. Although reform i s underway to define a more systematic approach to start closing the existing gaps, an integrated strategy w i l l need to be formulated with a strong dimension on policies for social cohesion. The capacity o f the social security system to contribute/strengthen social cohesion i s impaired by several factors: i t does not cover the entire population; i t lacks financial stability, with the largest share o f funds going to pensions; the presence of a large informal sector; and administrative and management problems which have adverse effects on the effectiveness in the delivery o f services. This chapter provides analytical underpinnings in the key areas o f social inclusion and health care, wi th emphasis on policies to improve efficiency and ensure financial sustainability.
A. SOCIAL ASSISTANCE AND SOCIAL SERVICES
9.2 Despite there being relatively few Acquis Communautaire requirements in social inclusion, maintaining a policy framework which facilitates the inclusion o f all groups in society in economic and social progress irrespective o f their ethnicity, religion, gender, handicap, or sexual orientation i s a major element of meeting the Copenhagen criteria. Continuing to meet the Copenhagen criteria i s itself a pre-requisite to keeping the entire accession negotiation process on track. This requires that the entire legal framework o f the country should enshrine equal rights for al l citizens irrespective o f these social variables, throughout the constitution itself and the entire body o f legislation. More than this i t i s expected that in many cases specific legislation would be required to address the specific needs o f such groups accompanied where necessary by active programs to offset any disadvantages these groups might experience. Such programs and policies are expected to be embodied in the Joint Inclusion Memorandum (JIM) which all candidate countries prepare and which Turkey i s currently working under the leadership o f the Ministry o f Labor & Social Security (MOLSS).Thus far, Turkey has made notable progress in two areas related to social inclusion and the attainment o f the Copenhagen criteria, through: strengthening the social safety-net and programs directly targeted towards the disadvantaged and vulnerable. Despite this, further progress i s required in the following areas:
265

9.3 Legal Framework. Priority one i s to ensure that the constitutional amendments and other pieces o f legislation that enshrine this progress in social inclusion are implemented ful ly and consistently, throughout the lifetime o f the accession process and beyond. Priority two i s to review gaps in the legislative framework regarding social inclusion and to deal wi th them in a timely manner.
9.4 Social Znclusion Programs. A wide range o f policies and programs can have an important positive impact upon social inclusion and cohesion. Notable amongst these are basic and secondary education policies (discussed in chapter 6) which extend high quality education at an affordable price to the entire citizenry, the strengthening o f the social safety-net under the General Directorate o f Social Assistance and Solidarity (SYDGM) and i t s 931 foundations covering the entire country and in the near future the introduction of UHI, as discussed earlier in this chapter.
9.5 Education. Substantial progress has been made over the last 5 years in basic education in terms o f extending the coverage of basic and secondary education, with net enrollment rates increasing from 95% to 98%. Male/female ratios, have improved across the education spectrum and in the case o f grades l t o 5 have essentially reached parity. However, there i s a problem o f increased female school drop-outs in the grades from 6-8 especially in rural areas in eastern Turkey where parents are less l ikely to send their girls out of the village. This effect i s even more ronounced within secondary education, where currently the male/female ratio i s 1.33.25’The good news i s that the ratio has been improving.256 With the Conditional Cash Transfer (CCT), carried out by SYDGM and Back to School campaigns (supported by the Ministry o f National Education and UNICEF) further progress i s anticipated.
9.6 Zt is in tertiary education where issues of access and social inclusion are more pronounced. Obstacles for youth coming from lower income families become magnified at this level because (i) by definition a student must complete al l 8 years o f primary education and secondary education before even attempting the university entrance examination (OSS) and (ii) in order to do well in the OSS i t has become “de rigueur” for students to receive intensive preparation from private exam-cramming schools or dershanes. In particular, lower income families are less able to pay for dershanes and thus their children are placed at a disadvantage in terms o f university entrance.
9.7 Going beyond gender issues in education discussed above, whilst Turkey has made good progress in addressing some gender inequities, and both primary and secondary school enrollment rates are converging for the two genders, there i s s t i l l more to be done in terms o f promoting and supporting female employment, reducing the pay gap and in general integrating women as full equal partners in society. Two key elements are important here - lower s k i l l levels for women due to their historically lower
Gender.
255 Ministry o f National Education data for the 2004-2005 school year. 256 Between the 1998-1999 and the 2004-2005 school year, the ratio of boys to girls enrolled in general secondary education decreased, whereas in vocational secondary education, the ratio remained unchanged.
266

participation in education and training programs, a situation which i s being rectified for younger cohorts o f women and girls and secondly access to chi ld care. A frequently mentioned reason given by women in qualitative assessments o f reasons for non- participation in the labor market i s the absence o f adequate and affordable chi ld care. Finding low-cost, community -based solutions to this problem i s an important challenge for the greater social inclusion o f women and enhanced labor participation rates.
9.8 Social Services. A wide range o f agencies including municipalities, the Social Services & Chi ld Protection Organization (SHCEK), the SYDGM, municipalities and NGOs are providing social services. Unfortunately there i s no integrating framework, and both problems o f duplication and inadequate service provision occur, despite the best intentions o f the involved agencies to prevent this. Moreover, robust evaluations o f the cost-effectiveness o f such services, and even beneficiary assessments are few and far between. There i s a need to develop an integrated social pol icy under one lead ministry, improve the monitoring and evaluation o f social services, and then expand cost-effective services to underserved population groups, although it would be more than appropriate for the S Y D G M to remain as an executing agency outside o f this umbrella pol icy ministry. These issues w i l l be given prominence under the J IM and the demand for such services i s expected to grow rapidly now that over 70% o f Turkey’s population i s urban, and the process o f the ageing o f the population takes hold as Turkey i s passing through the demographic transition. Transferring the experience o f positive and cost-effective solutions for the provision o f social services f rom the EU i s something to be strongly encouraged.
9.9 Conditional cash transfer (CCT). Turkey i s the first country in the E C A region to introduce a CCT program (modeled on the successful programs in Brazi l and Mexico) to address the demand side constraints for the uptake o f basic health and education services b y the very poorest in society. The C C T i s targeted towards the poorest 6% o f children (with the benefit paid to the mothers) which helps families to maintain the poorest children in school (ages 6-18, with increased payments for girls) and obtain adequate preventive health services, including immunization and check-ups for children. This program covers the entire country and i s already reaching 1.9 mi l l ion children wi th payments varying f rom YTL 17 per month for children under 6, to up to YTL39 per month for secondary school girls. I t i s administered by the SYDGM. The proxy means test for this program was updated in 2005 based upon the 2003 HICES. The proxy means test for the CCT w i l l be systematically updated based upon the latest HICES, and in this manner strengthened so that i t can be used for the determination o f eligibility for other government programs (such as UHI premia paid for b y the state) b y adjusting the cut-off point accordingly. Given i t very tight targeting, this program not only represents a low- cost (and thus affordable) social safety-net for Turkey, but i s designed to invoke positive impacts in terms o f school attendance and health care behavior for the poorest. A rigorous impact evaluation o f the CCT i s underway.
9.10 Youth policy. With youth aged under 30 accounting for 50% o f the total population, youth are a particularly important population group to target as they represent nothing less than the future social and human capital o f the country. I t i s urgent to give
267

more attention to the issues o f youth empowerment and inclusion, together with specific programs .to overcome barriers to youth employment (youth unemployment i s 2.5 times the national average). Inter alia, this process would be enhanced through the development o f a national youth policy and providing significantly more resources to youth programs. The EU, UN and World Bank are all expanding their efforts and programs targeted to youth.
9.11 Poverty monitoring. Turkey has made strong progress on monitoring poverty wi th annual household income and consumption expenditure surveys (HICES) having been undertaken by the State Institute o f Statistics (DIE) since 2002 onwards with Bank support. The EU itself favors a different approach to poverty measurement, which i s essentially a relative poverty measure and based upon income. Although Turkey w i l l have to report data on this basis to the EU, the current poverty monitoring mechanism should be maintained in parallel as i t provides important pol icy information relevant to important social inclusion and poverty reduction programs such as the CCT and UHI.
B. MANAGING THE HEALTH CARE SYSTEM
B.l. Status of Health Care System Reform
9.12 Turkey spends around 6.7 percent of its Gross National Income (GNI) on health, of which public expenditures account for about 70 percent. Per capita expenditure i s relatively higher than in countries with similar income levels (Figure 9.1).257 Health expenditures relative to GNI are higher than in Romania, Russia, Mexico and Chile (all between 5.8 and 6.3 percent of GNI in 2003) but much lower than Ireland, Spain, Czech Republic, Portugal and Brazil (all between 7.0 and 9.3 percent o f GNI). However, the public-private financing m i x in Turkey i s more l i ke Spain, Portugal and Ireland.258 Social health insurance - offered by SSK, BagKur and Emekl i Sandigi - accounts for almost 66 percent o f al l public expenditures on health, equivalent to about 12,875 trill ion liras in 2004, while the balance (6,582 tr i l l ion liras in 2004) comes from the central government budget. A l ittle over 53 percent o f all public expenditures on health take place on care provided b y hospitals, followed by 30 percent on the provision of pharmaceuticals and medical goods and 8.5 percent on outpatient care.259
*j7 Comparator countries include Brazil, Chile, Czech, Greece, Ireland, Malaysia, Mexico, Portugal, Romania, Russia, South Africa, Spain and Thailand. *j* Public expenditures on health consist of expenditures incurred by the Ministry o f Health, General Directorate o f Coastal Health Services, Universities, Social Solidarity Fund, other Ministries and agencies, local governments, state enterprises, c iv i l servants, and social security institutions: Sosyal Sigortalar Kurumu (SSK), Emekli Sandigi and Bag-Kur. Private expenditures on health consist of out-of-pocket treatment and pharmaceutical expenditures incurred by individuals and households, and b y companies and individuals contributing to private insurance schemes.
*j9 Source: World Bank calculations, based on MOF/MOWMOLSS data, reorganized and presented in the NHA2000 format
268

percent more health care per capita relative to the bottom two quintiles.
2000 z n $ 1500 I 4 5 'a 1000 ::a W 5 500
0 5000 10000 15000 20000 25000 GNI Per Capita
9.14 Turkey faces an unacceptably high burden of ill health and ranks far behind most middle-income countries in terms of the health status of its people. The reasons for such low outcomes are many and varied. There are gaps in nutrition, housing, access to clean water and satisfactory sanitation, and education, especially o f girls and women - all o f which are widely recognized to be powerful determinants o f good health - that adversely affect health status. On the financing side, besides the fact that there are multiple problems with mobilization o f resources, the available resources are not allocated efficiently and equitably. A significant proportion o f the population has little or no financial protection, and despite support f rom special funds and programs l ike the Social Assistance Fund and the Green Card, in practice the disadvantaged groups are not targeted effectively.
9.15 A number of distortions hamper the efficiency of the health care system. There are multiple payers for same or similar services, and the institution o f revolving funds - which allow health providers to accept user charges and account for them outside the budgetary f low o f funds - introduces a variety o f perverse incentives for providers and further constrains access to health services for consumers. Public provision o f health i s characterized by poor incentives for managers and providers alike, leaving them open and vulnerable to alternative sources o f income to augment their meager salaries. L i ke financing, the delivery o f health care i s also fragmented, and there i s little continuity in the different levels o f care. Clinical effectiveness of existing medical interventions and treatment protocols i s not always tested and attention to quality and effectiveness o f care i s uneven. The private sector i s growing, but i t s full potential i s not fu l ly realized and their role and responsibilities not adequately defined. The present situation, therefore, i s one in which the health system fails to reach the poor and vulnerable sections o f society
269

and the health status o f the population i s well below that o f countries o f comparable income. By al l accounts, the health sector in Turkey i s under-performing in achieving health outcomes (Figure 9.2).
12 -
10 -
8 -
5 5
2
0 7
BR - =--- 4.---
-
Comparator countries include Brazil, Chile, Czech, Greece, Ireland, Malaysia, Mexico, Portugal, Romania, Russia, South Africa, Spain and Thailand. Source: IMF World Economic Outlook database; WHO Statistical Information System Reproduced from Mitra: Towards Sustainable Social Sector Expenditures in the New Member States of the European Union - Keynote Presentation, Chatham House, London, June 22-23,2005)
9.16 To address the challenges facing the health sector, the Government embarked upon systemic and comprehensive reforms in the last couple of years. Key elements o f the proposed reforms that aim at improving equity and access to health services are the introduction o f universal health insurance and the creation o f a health insurance fund that would integrate al l functions and premium collections related to health in the existing insurance agencies such as SSK, BagKur and Emekl i Sandigi. The health insurance fund would combine al l financial flows o f fund in the health sector, including budgetary support to MOH (except for public health care activities), financial outlays for the existing Green Card program, and health expenditures o f c iv i l servants. Based on the principles o f solidarity and risk pooling, all citizens o f the country are proposed to be covered under universal health insurance, wi th the state making premium contributions on behalf o f the indigent and others unable to do so on their own behalf. 260 The responsible agency for setting up the universal health insurance system and fund i s the Ministry o f Labor and Social Security (MOLSS).261
9.17 The first and most fundamental challenge that the health sector reform in Turkey needs to address is that of providing adequate financial protection for health
260 The position at the time o f writing i s that Pension and UHI Bill has been cleared by the Health Commission of the National Assembly and i s before the Planning and Budget Committee. 261 The bill on the institutional restructuring o f the social security system i s before the Planning and Budget Committee of the National Assembly.
270

care to the entire population. The present system o f insurance leaves many without any coverage, and with inadequate coverage for many who are nominally covered. Additionally, there are many who enjoy multiple sources o f coverage, either by design or by circumstances. There i s also little doubt that the different health insurances being offered through SSK, Bagkur and Emekli Sandigi, and the coverage provided to c iv i l servants and welfare programs l ike the Green Card should - in the interest of efficiency, risk-pooling and consolidation o f financing - be combined into one compulsory universal health insurance system.
9.18 With better access to health care services, ensuring financial sustainability of the system i s becoming a key issue. At the same time, the extension o f health insurance to the entire population w i l l lead to higher levels o f public expenditure on health. The reason i s that the state w i l l have to bear the health insurance expenditures o f those hitherto uninsured, but also that changes in utilization o f health services by the already insured may occur as they adjust to new boundaries o f coverage, and the utilization patterns o f the newly insured. In order for the system to be fiscally sustainable, therefore, the introduction o f universal health insurance needs to be accompanied by system-wide efficiency changes that w i l l bring about a downward pressure on health costs and compensate for the additional expenditures associated with extending financial protection to all segments o f the population. The proposed introduction o f universal health insurance has already triggered a number o f reform measures in the health sector in Turkey, and the emphasis at this point needs to be not only on sustaining this momentum and extending i t to other areas not included so far, but increasingly on ensuring that the desired access and efficiency outcomes are achieved without any increase in public expenditures on health.
B.2. Health Expenditures, 1999-2005
9.19 Health care expenditures are on an upward trend. As a share o f GNP, total public expenditures on health have increased from 3.77 percent in 1999 to 5.33 percent in 2004 (Table 9.1). The share o f personnel expenditures on health have increased during this period f rom 1.23 percent to 1.47 percent o f GNP, while the share o f investments has fallen from 0.27 percent to 0.19 percent o f GNP. The share of general government expenditures excluding social security funds has fallen f rom 47 percent o f total public expenditures on health in 1999 to 34 percent in 2004, while the share o f social security funds has increased f rom 53 percent to 66 percent during this period (Annex 9.2, Table 1). Health expenditures on SSK and Green Card beneficiaries show the largest increase in 2005 relative to previous years and in comparison to other financing agents (Figure 9.3). Adjusted for inflation, real expenditures on health in 2005 for c iv i l servants, BagKur and ES actually fal l in 2005 relative to 2004 (Figure 9.4). Real expenditures on SSK and Green Card show a rise in real terms. Overall, real expenditures on health are projected to decrease b y around 2 percent in 2005 relative to 2004, wi th increases in real expenditures for SSK and Green Card beneficiaries being cancelled out by decreases in real expenditures in the rest o f the health sector.
27 1

Table 9.1: Economic Classification of Total Public Health Expenditures (as a share
Personnel Other Current
Investment Transfers Total Exp.
I 1999 I 2000 I 2001 I 2002 1 2003 1 2004 Current I 2.65 I 2.49 I 2.98 I 3.12 I 3.26 I 3.72
1.23 1.19 1.48 1.29 1.44 1.47 1.42 1.30 1.50 1.83 1.82 2.24 0.27 0.40 0.37 0.36 0.19 0.19 0.85 0.84 1.01 1.15 1.44 1.42 3.77 3.73 4.36 4.64 4.88 5.33
~
Figure 9.3: Trends in Health Expenditures, 1999-2005 9000
v) 7200
5 5400 .- - .- -
3600 0 0 1800
0 1998 1999 2000 2001 2002 2003 2004 2005
I+ civil Servants + SSK Emekli Sandiai ~ Bag Kur +Green Card I Source: MOH, National Health Accounts (for 1999, 2000); updated author calculations for other years using MOWMOF/SSK/BWES data sources
Figure 9.4: Real Increase in Health Expenditures (percent, year on year)
1999 2000 2001 2002 2003 2004 2005 +Civil Servants d)- SSK Emekli Sandigi -I + - Bag Kur 31t Green Card +TOTAL
Source: MOH, National Health Accounts (for 1999,2000); updated author calculations for other years using MOWMOF/SSWBWES data sources
9.20 Expenditures on pharmaceuticals are volatile but have been growing faster than average health expenditures. Total real expenditures on pharmaceuticals are projected to increase by 2 percent in 2005. Over 2000-2005, expenditures on pharmaceuticals grew also faster than total expenditures, at an estimated 11.3 percent per
272

year, against 9.6 percent for total expenditures. Expenditures on pharmaceuticals are also the most volatile component o f health care spending, particularly by Green card holders (Figure 9.5). In 2005, real expenditures on pharmaceuticals increased by 61 percent for Green Card holders followed by 33 percent for SSK beneficiaries and fal l ing for others.
Figure 9.5: Real increase in Pharmaceutical Expenditures (percent, year on year)
1999 2000 2001 2002 2003 2004 2005
+Civil Servants + SSK Emekli Sandigi Bag Kur --31t Green Card +TOTAL
Source: MOH, National Health Accounts (for 1999, 2000); updated author calculations for other years using MOWMOWSSWBWES data sources
B.3. Projected Trends in Health Expenditures
9.21 Before attempting to project health expenditures in the short and medium terms, i t i s necessary to better understand the reasons for the observed increase in health expenditures. As the data presented above shows, almost al l the increase i s explained b y expenditures on pharmaceuticals and on Green Card holders.
Expenditures on Pharmaceuticals
9.22 in expenditure on pharmaceuticals. The more important o f these are:
A series of events starling from February 2004 help explain the observed trends
a
a
a
a
a
a
a
a
a
a
Feb 2004 - Reference pricing introduced March 2004 - VAT on prescribed drugs reduced b y 8 percentage points December 2004 - Protocol signed with suppliers o f drugs results in a discount between 7.5% and 14% in the price o f drugs Jan 2005(a) - Discount of 8% negotiated on non-prescription drugs Jan 2005(b) - Prescription drugs extended to Green Card holders as part of their benefit package Feb 2005(a) - SSK enrollees allowed to obtain drugs f rom private pharmacies Feb 2005(b) - Positive drug l i s t introduced Feb 2005(c) - SSK hospitals transferred and pharmacies closed May 2005 - Green Card holders required to make copayments, l ike others June 2005 - A further reduction of 8.83% obtained in drug pricing following the fal l in the Euro.
27 3

9.23 These measures have had mixed results, as was expected. Some (those o f March 2004, December 2004, January 2005a, and June 2005) resulted in a fa l l in price o f drugs, some (May 2005) resulted in a fall in consumption of drugs, while others (January 2005b, and February 2005a) resulted in increase in consumption o f drugs. The net result i s that the price o f drugs has, on average, fallen, but the quantity procured has increased significantly, particularly following the inclusion o f drugs in the benefit package o f Green Card holders and by easing the restrictions on SSK enrollees b y allowing them to obtain drugs from private pharmacies. In effect, therefore, changes in pharmaceutical policies in the last year or so have resulted in new access for the 10+ mi l l ion Green Card holders and improved access for the 25+ mi l l ion SSK enrollees. This has significantly outweighed the gains realized through reductions negotiated in prices.
Green Card Holders 9.24 The increase in health expenditures of Green card holders i s almost entirely explained b y the increase in public reimbursement for drugs consumed. In effect, changes in pharmaceutical policies have resulted in a shift in health expenditures f rom out-of- pocket to public funding.
SSK Enrollees 9.25 The increase in health expenditures by SSK is, however, only partially explained by the changes in pharmaceutical policies mentioned above. With the transfer o f SSK hospitals, MOH has begun billing SSK for services provided to i t s enrollees, and SSK does not appear to have any w o r l n g system o f claims management and control. At present, payments f rom SSK to M O H are ad-hoc and dictated by transfers f rom MOF to MOH via SSK. I t i s unclear whether the invoices submitted by MOH do not accurately reflect the services provided or whether they actually reflect an increase in utilization o f services b y SSK enrollees following the significant reduction o f waiting time in MOH hospitals compared to the former SSK hospitals. In any case, the fact that BagKur and ES are better able to manage the process o f settlement o f claims i s an indication o f the great need for developing and strengthening the processes, procedures and controls needed to dispose o f claims and invoices that are submitted by MOH.
At the same time, M O H has introduced a type o f fee-for-service in M O H hospitals, which has significantly changed the incentives facing physicians in these hospitals. There are widespread concerns that this has led to supplier-induced demand and an increase in production, provision and utilization o f health services. Whi le some o f this may wel l be serving some pent-up demand, i t i s also generating new health expenditures in the system.
Projecting Future Expenditures 9.26 Health care costs of Green Card holders were expected to increase following the introduction of UHZ, but a bulk o f this increase has already taken place even before the introduction of UHI with the introduction o f a large number o f Green Cards effectively extending health insurance protection to almost al l the poor. In other words, policy decisions taken deliberately or otherwise before the introduction o f UHI have started extending de-facto health insurance to most o f the poor population. Bulk o f the increase
274

in health expenditures in the future i s l ikely to come when the presently uninsured non- poor take up UHI when i t i s introduced and as utilization of health services in Turkey increases to levels similar to other European countries (Table 9.2).262
Austria Denmark Germanv
Table 9.2: Utilization of Health Services (2003 or latest available vear)
31.2 6.7"" 19.7 6.2""
23.8" ...
I In-patient care admissions per 100 I Outpatient contacts per person I
Netherlands Portugal Sweden
Czech
Latvia Lithuania Poland
Hungary
9.27"" 5.6" 11.6" 3.8" 15.4 2.8
21.8 15.0 25.0 12.2 20.5 4.8 23.5 6.6 17.5" 5.6"
Slovakia Slovenia
18.5 13.0 16.9 6.9
Turkey
EU EU-10
8.1 2.6"
18.5" 6.6" 19.5 8.4
I Romania I 24.9 I 5.6 I
9.27 A significant increase in health expenditures is expected in the years ahead. Expenditure projections are based on the fol lowing assumptions: (i) most of the increase in costs due to the poor joining UHI has already taken place; (ii) only 10% o f the presently non-poor uninsured w i l l j o in UHI in 2007, increasing to 15% in 2008, 20% in 2009 and so on; (iii) inflation rate w i l l remain at 6.8% year-on-year f rom 2006 to 2011; (iv) 10% of the country's population w i l l be covered by family medicine in 2007, increasing to 15% in 2008, 20% in 2009, 30% in 2010, 40% in 2011 and so on; (v) outpatient visits w i l l increase to 2.7 per person per year in 2009; and (vi) hospital occupancy rates w i l l increase to 67% in 2006, 70% in 2008 and 72% in 201 1. On these assumptions, preliminary calculations show that health expenditures w i l l increase by 5%
262 Note that the Turkish population has a much lower median age and lower percentage o f the population above 65 years and that these figures are not standardized or adjusted for age.
275

in 2006, 18% in 2007, the year that UHI w i l l be introduced, and around 15% thereafter.263
B.4. Short-and medium-term measures to contain cost escalation
(a) Managing Pharmaceutical Expenditures
9.28 Drugs deserve particular attention as they are perhaps the single largest cost driver in almost all healthcare systems, and have been the most dynamically growing element in overall costs of healthcare services in recent years. According to new data released by OECD, spending on pharmaceuticals across OECD countries has increased by an average o f 32 percent in real terms since 1998, reaching more than U S $450 bi l l ion in 2003. Growth in drug spending has outpaced total health expenditure in most OECD countries, and Turkey i s no exception. Expenditure on pharmaceutical products constitutes a significant proportion o f total expenditures on health in Turkey, accounting for almost half o f al l SSK, Emekli Sandigi and Bagkur spending on health. While pharmaceutical prices have increased broadly in line with general inflation, there has been a much larger change in consumption levels, including subtle changes in consumption in favor o f newer and more expensive One o f the reasons why Turkey spends a huge amount on drugs and pharmaceutical products i s that most o f the insured population i s insensitive to pharmaceutical prices, wi th out-of-pocket payments for medicines constituting between 10 and 20 percent o f total medicine bill o f the insured.265
9.29 I n addition to price controls, managing consumption of pharmaceuticals is critical in order to contain expenditures on drugs. Many countries have successfully adopted demand-side measures o f controlling consumption, and cost-sharing has proved to be the most effective such measure.266 The consumption o f pharmaceutical products
263 At the same time, revenues are also expected to increase, particularly because o f the presently non-poor joining UHI and making insurance contributions. Revenue projections have been not been carried out at this time.
264 Between the years 2000 and 2001, for example, the proportion o f drugs consumed priced at half million T L or less decreased slightly from 34 percent to 30 percent, while the proportion o f drugs consumed priced at 2 million T L or more increased from 34 percent to 47 percent. 265 Indeed, the high percentage o f pharmaceutical expenditures in terms o f overall health expenditures i s as much a reflection o f low overall expenditures on health as i t i s o f high expenditures on drugs. 266 In the Netherlands, for example, the introduction of co-payments on prescribed pharmaceuticals (a fixed amount per prescription) led to substantial decrease in the total number o f prescriptions. In Germany, drug cost-containment measures take the form o f cost-sharing, prescription limitations, reference prices and the pharmaceutical spending cap that makes physicians’ associations liable for any overspending with no upper limit. These measures led to substantive decreases in pharmaceutical expenditures for social health insurance, mainly attributable to price reductions, changes in physicians’ prescribing behavior resulting in a reduced number o f prescriptions by 1 1.2 percent and increased prescriptions for generics. The French government imposes a fine on pharmaceutical companies if pharmaceutical expenditures surpass budget ceilings either due to price or quantity increases.
276

among the insured i s actually not low by international standards, and there i s a strong scope for cost containment i f indiscriminate consumption can be curbed.
Czech Hungarv
(b) Consolidating hospitals and improving efficiency
629.7 8.4 74.1 592.7 6.7 77.2
9.30 Prior to the recent merger o f MOH and SSK hospitals, public hospitals in Turkey were owned and run by MOH, SSK as well as the University, and there was a lot of fragmentation and variation in their performance and efficiency levels. A large number o f hospitals were - and continue to be - substantially underutilized, and huge variations s t i l l exist in hospital occupancy rates among provinces, ranging from a very low 20 percent in Tunceli province to a respectable 82 percent in Karabuk province. Overall, bed occupancy rate in Turkey i s 62 percent, and compares unfavorably wi th other European countries (Table 5).
There is ample room for improving hospital efficiency.
Latvia Lithuania Poland Slovakia Slovenia
545.3 ... ... 581.4 7.9 73.6 466"" ... ... 638.6 8.5 64.8 401.0 6.1 68.1
Romania Turkey
451.8 ... ... 228.6 5.6 61.9
9.3 1 Consolidation of hospitals and greater management autonomy could contribute to efficiency gains. Many MOH hospitals are too small in size to allow for efficient operation and provision o f care, and have significantly lower utilization rates compared to SSK and University hospitals. In addition, hospital managers enjoy very limited administrative and financial autonomy, and have very few incentives to adopt efficiency-
277
enhancing measures. The proposed introduction o f universal health insurance provides a good opportunity to further strengthen the gains from the merger o f MOH and SSK hospitals under MOH ownership and management, and while some gains in efficiency can be brought about simply by consolidating and reducing the number o f hospital beds in many provinces, further gains wi l l come about only by improving efficiency in the use o f hospital resources and overall management and accountability. The separation o f provision and financing provides an opportunity to introduce innovative methods in management o f health facilities, which can be achieved b y granting financial and administrative autonomy to public hospitals. The introduction o f hospital autonomy w i l l require appropriate legislation that w i l l allow for public assets to be managed outside the direct purview o f the government, and related laws and regulation would need to be amended in order to facilitate the transformation o f M O H and S S K facilities to autonomous bodies. This process has started, but i t . i s essential that momentum i s maintained during the transition phase.
9.32 The harmonization of hospital management and payment after the transfer of all SSK hospitals to MOH is continuing. However, there i s a risk that the delay in the establishment o f UHI w i l l lead to interim financing arrangements (such as global budget agreements), which would rely on currently high levels o f hospital costs. By internalizing the existing inefficiency, this would effectively undermine the gains f rom the consolidation and provider-purchaser split. Such interim arrangements should be avoided and hospital and pharmaceutical expenditures need to be closely tracked during the interim period until UHI i s introduced.
(c) Strengthening delivery of health services
9.33 The introduction of universal health insurance also provides an opportunity to initiate measures to improve delivery of health services. This process has also started with the piloting o f the family medicine system, which i s aimed at shifting the emphasis from treatment o f the sick to health promotion and prevention o f illness. The family medicine system w i l l bring the physician and family members into closer and more personal contact, enabling the physician to play an important role in the family’s health and prevention o f illness. Under the family medicine system, simple and routine diagnostic services and consultations could be provided under a single-window and common illnesses could be treated across a broad spectrum o f medicine domains, including internal medicine, gynecology and pediatrics. Family medicine places special emphasis on continuity o f care and on quality o f health services, and integrates preventive health services with basic health services and provides the full package under one window. The family medicine system has the potential for the strengthening o f the patient referral system as
267 At the time o f writing, the family medicine pilot in Duzce has already made significant headway, with training o f over 100 family doctors completed and over two-thirds of the 300,000 population of Duzce registered with family physicians.
27 8

(d) Reforms in provider payment mechanisms
9.34 The transformation of the health sector through the introduction of universal health insurance also provides an opportunity to bring about changes in provider payment systems and introduce incentives for physicians to provide quality care at lowest costs. Some o f these changes are already being planned, and a system o f paying family physicians on the basis o f capitation i s being worked out. Physicians paid on the basis o f a capitation fee per enrollee receive a fixed amount per enrollee regardless o f the type and extent o f treatment sought. Physicians participating in this scheme bear most r isks o f treating a patient, and therefore are l ikely to be conservative in the amount o f health care they provide. Such a system would need to be extended to cover al l outpatient care as family medicine i s scaled up from the Duzce pilot.
9.35 Likewise, and perhaps more importantly, prospective payment mechanisms introduced at the hospital level would provide incentives to hospitals to contain costs. Prospective payment mechanisms rely on the fact that services associated with a particular treatment are reasonably predictable and can be bundled into a group to which a monetary value can be attached. The hospital then gets reimbursed according to a pre- fixed rate per bundle. Such payment mechanisms do not encourage excessive use, since the hospital can conceivably make a profit (or a surplus) by being careful about inputs and hospital lengths o f stay. One o f the most widely-known prospective payment systems i s the Diagnosis Related Group, or DRG. Developed to classify treatments according to the resource costs o f i t s treatment, DRGs employ a complete and consistent coding system o f patient-level information obtained from medical records to establish and cost bundles o f appropriate inputs for one or more diagnosis-based treatment. Typically requiring about 10-20 data items per discharge over a few years, the DRG system provides a valuable tool not only for reimbursing hospitals but also for overall planning and resource management.268 T o be certain, a DRG-based system by itself w i l l not necessarily promote efficient use o f resources. Hospital care providers and managers need the flexibility and tools to actively manage their resources and redirect their use, which w i l l ensure that cost-savings in treatment o f one case are passed through the entire system.
268 Case-mix systems l ike DRGs may take 2-3 years to establish, even though the discharge items required are not overwhelming. The billing system currently used in the hospital system does not collect all the relevant information that would be required to prepare DRGs, but this data-gap can be filled. Specific data elements for DRGs include, besides age, gender, and discharge status o f the patient, the principal diagnosis at the time the patient i s admitted and then discharged; up to 8 secondary diagnoses and up to 6 procedures performed during the hospital stay and reported by the hospital using the International Classification of Diseases, 10th Edition (ICD-10) system. A number of cases may be classified to only one DRG, regardless o f the number o f conditions treated or services provided. Reimbursements based on DRGs represent the average cost of treating cases having similar clinical patterns and costs. In any case, note that having a DRG system for reimbursement purposes which does not necessarily lead to efficiency gains (such as in the US), and having i t as a basis to estimate costs and subsequently global budget allocations, as in most European countries, i s more likely to lead efficiency gains.
279

(e) Containing outpatient care provided by hospitals
9.36 A large number of outpatient services in Turkey are provided in hospitals, accounting for almost 43 percent of total costs of outpatient services. Outpatient services provided in hospitals cost significantly more than outpatient services provided in outpatient clinics, and i t i s imperative that the introduction o f universal health insurance and family medicine be accompanied by a significant reduction in number o f outpatient visits in hospitals that are paid out o f the health insurance fund. This can be managed by establishing clear and transparent rules restricting reimbursement b y the health fund o f outpatient treatment carried out in hospitals.
C. CONCLUSIONS
9.37 The expansion of UHI will increase public expenditures on health but a number of policy options can help prevent cost escalation without necessarily impacting on access to health care and undermining equity. These measures should aim at reducing pharmaceutical expenditures which currently account for 34.6% o f total public expenditures on health. In the medium and longer term, however, cost containment w i l l have to rely on building the system hierarchy by full expansion o f family medicine as gate-keeper, reforming the patient referral system to streamline hospital-based outpatient care, and finally introduce payment mechanisms for providers which wil l replace the current performance-based payment o f hospital physicians with one which w i l l discourage unnecessary use o f physician and diagnostic services and introduce incentives to remain within budget. In addition, some supply-side measures such as overseeing the deployment of healthcare technologies and accreditation and licensing o f health facilities and professionals, res ectively wi th a view to overall sectoral needs would also result in efficiency gains.26'Turkey could also spend more on Public Health in general and health promotion and disease prevention in particular, for long-term benefits and cost savings.270 For these measures to be implemented effectively there should be a strict separation o f providers f rom the purchaser(s) o f services, as predicated in Government's Health Transformation Program.
While all o f the above measures are critical to ensure improvements in access, equity and efficiency, i t i s critical that utmost attention i s paid to the sequencing o f the above reforms so that the process i s seamless and does not lose effectiveness and credibility in the process o f i t s implementation.
269 For instance, there are more MRI Units (3.0) in Turkey per 1 mil l ion population than there are in France (2.8), Hungary (2.8), Czech Republic (2.4) and Greece (2.3), Poland (1.0) or Mexico (0.2). Similarly, There are more CT Scanners in Turkey (7.3 per million population) than there are in Hungary (6.9), Poland (6.3), the UK (5.8) and Mexico (1.5). Source: OECD Health Data, 2005). 270 In 2000, Turkey spent 2.4% of i t s total expenditures on public health and prevention, less than OECD average of 2.9 (2003), and compared with Canada @%), Netherlands (5.5%) Hungary (5%), USA (3.9%), or Czech Republic (2.9%) (Source: OECD Health Data, 2005).
280

ANNEXES
28 1

282

ANNEXES Chapter 1
Annex 1.1 Policy Sustainability and the Macroeconomic Performance
The relationship between growth volatility and growth i s an old and important issue, both from a theoretical and an empirical standpoint. Observing the high volatility, especially in developing countries in the recent decade led the economists to focus on the issue.
Although the relationship between the average output growth rate and i t s volatility attracts strong attention among macroeconomists, there has been no theoretical consensus on the relationship between growth rates and output variability. One l ine o f argument suggests that deviations o f output f rom i t s long run level are temporary. In other words, there i s n o relation between output growth rate and output variability. Fore example, some business cycle models argue that deviations o f output f rom i t s natural rate are due to price level misperceptions which are triggered by monetary shocks and therefore are independent of the factors affecting the natural rate o f output growth such as s k i l l s and technology (Friedman, 1968). A second line o f argument dates back to Keynes (1936) and suggests that the relationship can be negative. Large output fluctuations increase the r i sks on returns to investment and higher r isks perception reduces the demand for investment and therefore output growth rate. A third line o f argument suggests that the relationship can be positive. One theory i s that higher uncertainty increases savings (Sandmo, 1970) and, as Solow (1956) neo-classical model predicts, higher savings leads to higher growth rates. Another theory i s that agents choose to invest in riskier technologies only if the growth rates are higher enough to compensate for the associated greater r isks (Black, 1997).
Given that there emerges no conclusive result from the theoretical studies, we investigate not only the effect o f output variability on output growth rate but also on factors o f production in order to identify transmission channels.
The Model
We use output variability as a proxy for the sustainability o f economic policies and measure output variability b y the conditional variance o f output growth.
The growth variable i s captured with an AR process. I t i s plausible that growth rate i s also affected b y growth variability. In order to account this we include the conditional variance of 6, as h, here.
E , I L - 2 r - 1 - ( 0 , h i ) (2 ) where Et has a zero mean and a time varying conditional variance o f h, to capture the riskhariability o f growth
,In order to model the time varying variance, Engle (1982) introduces the Autoregressive Conditional Heteroscedastic (ARCH) model o f order (4) as:
283

Bollerslev (1986) generalized the A R C H model o f Engle (1982) by including lagged values o f the conditional variance ht as an explanatory variable to the variance equation. In other words G A R C H (p,q) specification he introduces is:
where the coefficients a), a1jS and a2js are non-negative and E: i s covariance stationary (i.e. Zalj + Ca2j~ l ) .
Nelson (1991) proposed the following model for conditional variance by letting E, = &vi , where vt i s i id with zero mean and unit variance.
This model i s referred as E-GARCH model. I f O, i s greater than 1, Nelson’s model implies that a deviation o f I vi-j I from i t s expected value causes the variance to be larger than otherwise, an effect similar to the idea behind G A R C H specification.
The 6 parameter allows this effect to be asymmetric. I f 6=0, then a positive surprise has the same effect on volatility as a negative surprise magnitude. I f Oc6c1, a positive surprise increases volatility less than a negative surprise. I f 6>1, a positive surprise actually reduces volatility while a negative surprise increases volatility.
Nelson (1991)’s specification models the logarithm o f the conditional variance rather than conditional variance, which gives us some advantages. One o f the advantages o f E- G A R C H model i s that the variance i tse l f (h,) w i l l be positive regardless o f whether O, coefficients are positive or negative. Thus, no restrictions need to be imposed for the estimation in contrast to the G A R C H model. This makes numerical optimization simpler and allows a more flexible class o f possible dynamics models o f the variance (Hamilton, 1994 pp.668-9). Moreover, as mentioned in the previous paragraph, this specification allows measuring asymmetry through the leverage effect.
The E-GARCH model can be estimated by maximum likelihood b y specifying a density for vt. Nelson proposed using the generalized error distribution, normalized to have zero mean and unit variance for the distribution function o f the error term:
where r(.) i s the gamma distribution, i s a constant given by
2 ( - 2 1 D ) r (1 / D ) a = [ r ( 3 / D )
284
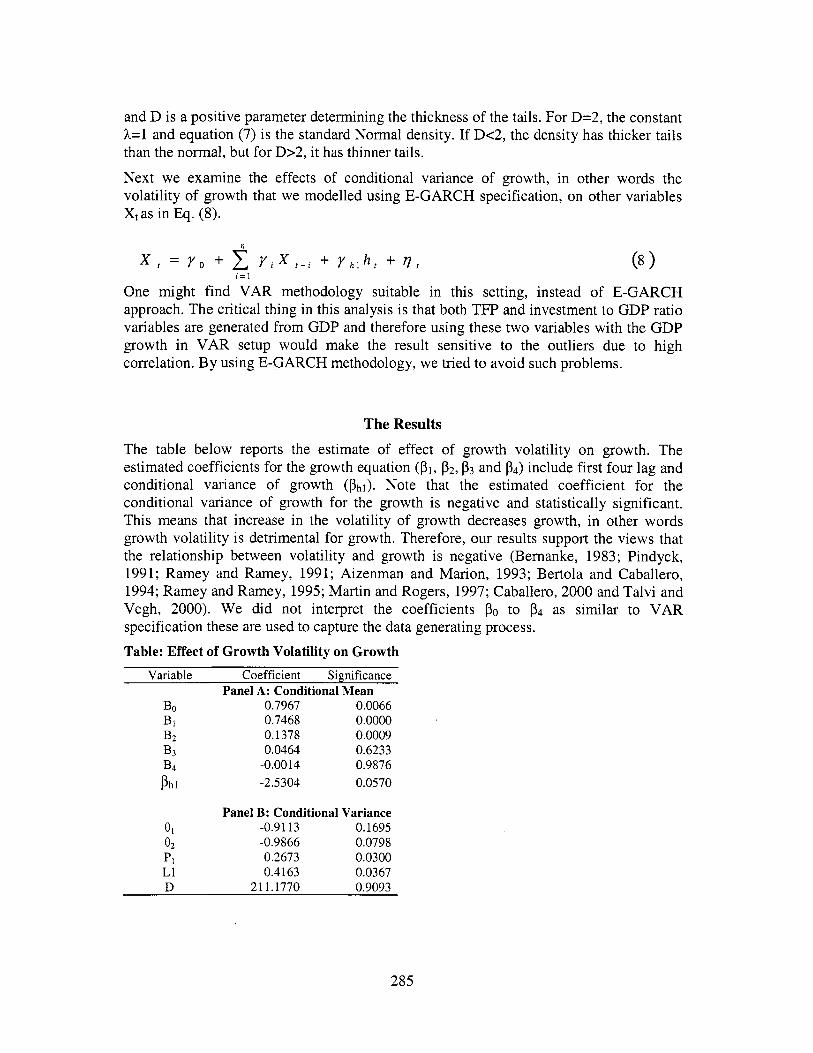
and D i s a positive parameter determining the thickness o f the tails. For D=2, the constant h=l and equation (7) i s the standard Normal density. I f D<2, the density has thicker tails than the normal, but for D>2, i t has thinner tails.
Next we examine the effects o f conditional variance o f growth, in other words the volatility of growth that we modelled using E-GARCH specification, on other variables Xt as
X
One
in Eq. (8).
i = l
might find VAR methodology suitable
(8 ) in this setting, instead o f E - G A R C H
approach. The critical thing in this analysis i s that both TF'P and investment to GDP ratio variables are generated from GDP and therefore using these two variables with the GDP growth in VAR setup would make the result sensitive to the outliers due to high correlation. By using E-GARCH methodology, we tried to avoid such problems.
The Results The table below reports the estimate o f effect o f growth volatility on growth. The estimated coefficients for the growth equation (PI, P2, P 3 and P4) include first four lag and conditional variance of growth (Phi). Note that the estimated coefficient for the conditional variance o f growth for the growth i s negative and statistically significant. This means that increase in the volatility o f growth decreases growth, in other words growth volatility i s detrimental for growth. Therefore, our results support the views that the relationship between volatility and growth i s negative (Bernanke, 1983; Pindyck, 1991; Ramey and Ramey, 1991; Aizenman and Marion, 1993; Bertola and Caballero, 1994; Ramey and Ramey, 1995; Mart in and Rogers, 1997; Caballero, 2000 and Talvi and Vegh, 2000). W e did not interpret the coefficients PO to P4 as similar to VAR specification these are used to capture the data generating process. Table: Effect of Growth Volatility on Growth
Variable Coefficient Significance
BO 0.7967 0.0066 B1 0.7468 0.0000 B2 0.1378 0.0009 B3 0.0464 0.6233 J34 -0.0014 0.9876 Phl -2.5304 0.0570
Panel A: Conditional Mean
Panel B: Conditional Variance 81 -0.9 1 13 0.1695 (32 -0.9866 0.0798 P1 0.2673 0.0300 L 1 0.4163 0.0367 D 21 1.1770 0.9093
285

Column I o f the next table below reports the estimates between GDP growth and TFP. The estimated coefficients for the growth equation (PI, p 2 and p3) include first 3 lags o f growth and conditional variance o f growth (Phi). Note that the estimated coefficient for the conditional variance of growth for the growth i s negative and statistically significant. This means that increase in the volatility o f growth decreases growth, in other words growth volatility i s detrimental for growth. As in the previous case, we did not interpret the coefficients PO to p3 as similar to VAR specification these are used to capture the data generating process.
286

Table: Effect of Growth Volatility on TFP, Investment, Exchange Rate and Employment* ~ ~~~
I I1 I11 I V
Panel A: Conditional Mean Growth Growth Growth Growth Growth
S O 1 SO75 2.4974 2.0717 2.0832
PI
P 2
P3
P4
Phl
YO
Y l
Y 2
Y 3
Yhl
(0.00) 0.1364 (0.00)
-0.1272 (0.10)
-0.1475 (0.06)
-0.05 11 (0.00)
TFP 0.0858 (0.00) 0.8413 (0.00)
-0.0434 (0.00)
-0.0005 (0.00)
(0.00) 0.0342 (0.75)
(0.14) -0.1214 (0.02)
-0.1787 (0.00)
(0.00)
Investment 1.3751 (0.00) 0.9299 (0.00)
-0.163 1
-0.1410
-0.0261 (0.04)
(0.00) 0.0876 (0.00)
-0.0029 (0.97)
-0.1002 (0.00)
-0.1138 (0.00)
Depreciation 3.7734 (0.00) 0.0027
(0.9700) -0.1532 (0.05)
-0.2332 (0.00)
-0.2349 (0.00)
(0.00) 0.0296 (0.73)
(0.52) -0.0493
-0.1087 (0.00)
Employment 0.2186 (0.10)
-0.0233 (0.83)
(0.92) -0.0145
0.0138 (0.25)
Panel B: Conditional Variance
0.9089 1.3398 1.3421 1.9107 (0.00) (0.00) (0.00) (0.00)
(0.00) (0.18) (0.00) (0.28) -0.0487 0.3627 -0.0570 0.2688 (0.01) (0.03) (0.00) (0.05) 0.0379 0.6687 0.3821 0.5605 (0.57) (0.02) (0.00) (0.00)
1.0432 0.6556 0.7444 0.1564 (0.00) (0.02) (0.00) (0.00) 0.0268 -0.1300 1 1.2403 -0.0994 (0.00) (0.74) (0.00) (0.81)
0.5225 0.1913 0.3924 -0.1 144
0.0001 1.3750 39.1383 2.4540 (0.00) (0.00) (0.00) (0.00)
* P-values are reported in parentheses under the corresponding estimated coefficients.
The next set of coefficients for the TFP i s reported. yo i s for the constant term for the TFP specification. The coefficients y1 to y3 are for the first 3 lags o f TFP and yhl i s the estimated coefficient for the conditional variance o f growth in the TFP specification. The estimated coefficient for yhl i s negative and statistically significant. Therefore, uncertainty in growth decreases the TFP which i s consistent with the theory supporting
287

the negative relationship between volatility and growth suggesting TFP as the transmission mechanism (see Mart in and Rogers, 1997; and Talvi and Vegh, 2000). However, the coefficient o f volatility in the TFP equation i s significant but very small and this suggests that the effect o f volatility on TFP i s small.
Next, we reported the estimated coefficient o f conditional variance specification. The estimated coefficient for the lag value o f logarithmic conditional variance (PI) i s positive and statistically significant. Observing coefficient o f less than 1 satisfies the non- explosiveness condition o f conditional variance (Hamilton, 1994).
The second column o f the Table i s for the analysis on the relationship between growth and investment. The first equation i s for explaining growth. Phl i s the conditional variance o f growth and i t i s a statistically significant explanatory variable for the growth estimation. The coefficient i s negative implying that growth volatility decreases growth (this i s parallel wi th the first column).
The next equation in Column 2 i s for investment and includes a constant term, first lag of investment and the output volatility with coefficients yo, y1 and yhl respectively. The coefficient for lag investment i s significant and positive, which means that higher investment this period implies higher investment next period. This i s due to persistency o f investment. On the other hand, yhl i s significantly negative, Le. output volatility decreases investment, suggesting that output volatility i s decreasing output via investment supporting the irreversible investment argument o f Bernanke, 1983 and Pindyck, 1991 and the empirical study b y Aizenman and Marion (1999).
In Column 3, a rarely discussed issue in the literature, the relation between output volatility and exchange rate appreciation, i s discussed. The growth equation i s in the first part o f the column where PO i s for the constant and to p 3 are the coefficients o f the lagged values of growth. The coefficient phi, which i s significantly negative, shows the explanatory power o f the output volatility in the growth equation.
The appreciation equation in column 3 i s formed by i t s lags and the growth volatility. The coefficient o f growth volatility yhl i s negative in a statistically significant manner. Therefore, we suggest that growth volatility increases exchange rate depreciation in Turkey.
Finally, the last column o f the Table i s for examining the effects o f output volatility on employment. The growth equation i s estimated and the explanatory variables are a constant term, two lags o f growth and the volatility o f growth (Their coefficients are Po, pl, p 2 and Phl respectively). The output volatility decreases output significantly, as in the other estimations.
Output volatility has a positive coefficient in the employment equation (yhl). This result supports the Schumpeterian view that output volatility increases output because o f the creative destruction. However, the coefficient i s not significant in our estimations. The discussion behind this view i s that all the idea i s related to the developed countries. Since the recent discussion i s about a developing country, Turkey, i t would be expected that the theory would not hold. Moreover, some o f the discussions suggest human capital as a transmission mechanism but the employment data we use in the estimates would not carry the same characteristics.
288

Annex 1.2 Estimating sources of labor productivity growth in Turkey
The source of TFP growth in Turkey i s analyzed by estimating a Cobb-Douglass production function with constant returns to scale of the form: Y = AKa(L* H)l-a. The reason for employing this type of a production function in our analysis i s that it represents a rich set of technology choices in terms of substitutability and complementarity of inputs that producers have and thus i t i s the widely used formulation in the literature of growth theory.
In this specification we use augmented labor (L*H) together with capital stock (K) and Solow residual (A) as Total Factor Productivity. We relate human capital (H) to average years of schooling (S) and assume a seven percent return each year, thus H = (1.07)'. Human capital i s assumed to have i t s effect on output growth via affecting labor. This way we can account for the interaction between labor and education in our model of TFP growth.*'l The results of the estimation for the entire economy and three sub-sectors are given below:
Economy: Zn(Y / L) = 0.33" ln(K / L) + 0.67" ln(H) - 0.07" Dummy, R2 = 0.97, DW = 0.75
(3.65) (3.76) (-4.19)
Agriculture: Zn(Y,,, / Lngr) = 1.2 + 0.45" ln(K,,, / L,,,) - 0.20" Dummy, R2 = 0.87, DW = 1.04
(19.29) (13.72) (-0.88)
Industry: Zn(yi,, / Lind) = 0.72+ 0.57*1n(Kind / Lind) - 0.03" Dummy, R2 = 0.10, DW = 0.05
(0.50) (1.83) (-0.28)
Services: Zn(Y,,, /Lser) = 1.99+0.31*ln(K,,,/L,,,)-0.06*Dummy,R2 =0.83,DW =0.88
(17.21) (11.69) (-3.89)
Sample: 1972-2003 and t-ratios are in parenthesis.
27' Many studies in growth theory indicated that Human capital expressed alone in the production function yields insignificant estimates together with a negative sign. e.g. Caselli et al. (1996), Islam (1995).
289
Annex 1.3 Panel Study on Determinants of Private Saving Behavior
Empirically, panel techniques have been utilized to obtain robust estimation results. Our sample consists of a large number o f countries, which range from developing to industrial economies. Countries with GDP per capita below US$ 1,700 in 2002 are excluded in order to get a more comparable pool o f countries. Overall, the panel i s comprised o f 70 countries and spans the years 1980 to 2002 with a total o f 1160 observations. Evidence from previous works suggests an endogenous relationship between savings and growth. Parallel to the work o f Loayza and et a1.272 instrumental variables were used to correct for this simultaneity. Country heterogeneity i s taken into account by adopting fixed- effects approach.
Fol lowing existing literature, regressors include two income-related variables: the GDP per capita and the rate o f growth o f GDP per capita. The expected sign o f income effect on savings i s positive as all previous studies support this hypothesis. As for the growth rate of income, there are two conflicting views: l i fe cycle approach and permanent income hypothesis. According to the former, aggregate savings should increase through an increase in the savings o f active workers, whereas, the latter suggests savings w i l l fal l in anticipation of higher income in future. Terms o f trade captures the transitory component o f income fluctuation. Hence, i t s sign should be positive as income gains (losses) resulting from positive (negative) terms-of-trade shocks should be saved (dissaved). The demographic variables are urbanization, young age and old age dependencies. Income o f urban population generally fluctuates much less than that o f the rural population, who tend to save more as a precaution. Young and old population dissave against future and previously accumulated earnings respectively. Money stock in the economy i s a common variable used as a proxy for financial depth with an expected positive sign. Credit constraint i s an important factor in determining private savings and i s measured b y domestic credit f low to private sector. The higher the credit f low i s the lower savings are. More recently in the work o f Loayza and et al. the dynamic nature o f saving was captured using the lagged private saving rate on the basis that i t has long-term effects. Due to Ricardian equivalence, public saving and private savings should fully offset each other. However, the regression w i l l determine the degree o f this negative correlation. The macroeconomic stability o f the economy i s measured by inflation rate. Reflecting heightened uncertainty, private savings tend to rise in more unstable economies signaled by higher inflation rates. Obviously, this i s not meant to say that high inflation i s good for savings. High inflation distorts relative prices while the associated macroeconomic instability weakens the investment climate. This leads to slower GDP growth that i s detrimental to private savings.
272 Loayza, N., Lopez, H., Schmidt-Hebbel, K. and Serven, L. 2000. “What Drives Private Saving Across the World?” The Review o f Economics and Statistics 82(2): 165- 18 1.
290

Regression Results
Wald test that all slope coejicients = 0 F
F F test that al l fixed effects = 0 R-squared within 0.5789 Number of observations 1160
Number of countries 70
0.0000 4.16 Prob > F 0.0000
72301.15 Prob > F
Table 1 reports the results on the private saving rate regression on the full sample. Remarkably, all the dependent variables are significant in explaining private saving behavior. Moreover, the regression produced a within R-squared o f 0.58, indicating a good fit for our sample.
29 I

As the F igure be low illustrates, the model predicts pr ivate saving reasonably w e l l for Turkey. On this basis, future behavior of pr ivate saving has been simulated using projections of determinant variables.
Figure 3. Goodness of Fit for Turkey 1
Years
Private Saving - - Fitted Private Saving
292
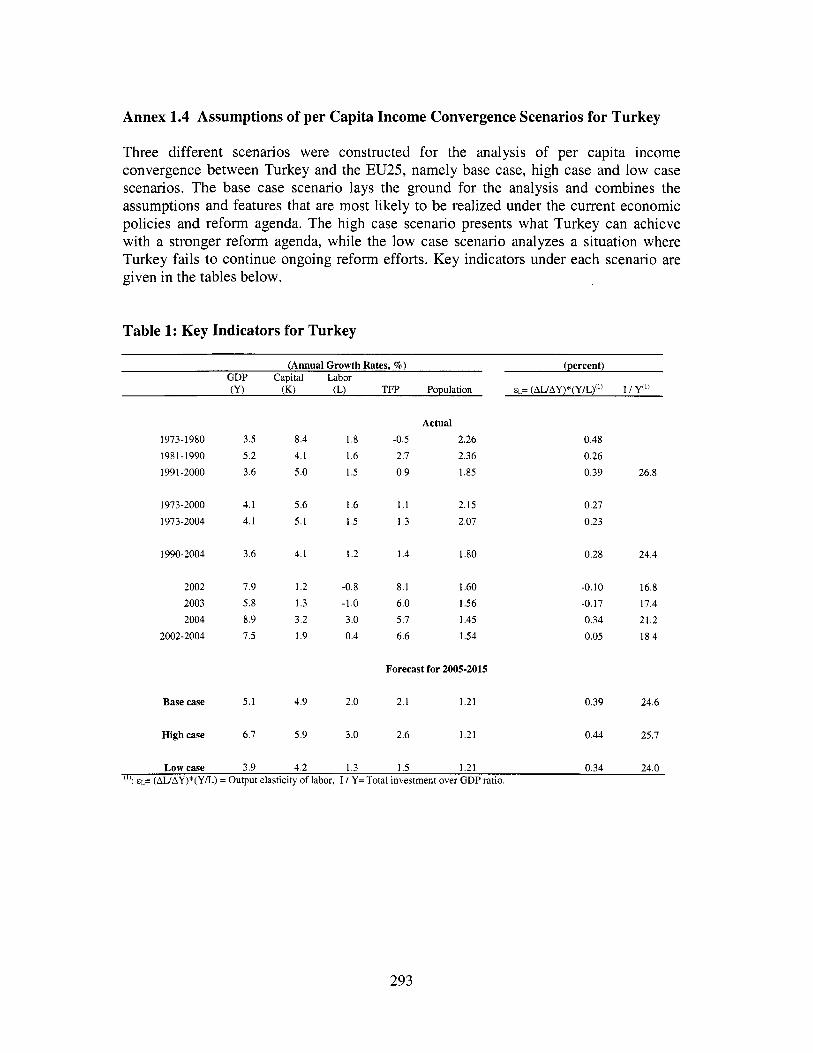
Annex 1.4 Assumptions of per Capita Income Convergence Scenarios for Turkey
Three different scenarios were constructed for the analysis o f per capita income convergence between Turkey and the EU25, namely base case, high case and low case scenarios. The base case scenario lays the ground for the analysis and combines the assumptions and features that are most l ikely to be realized under the current economic policies and reform agenda. The high case scenario presents what Turkey can achieve with a stronger reform agenda, while the l ow case scenario analyzes a situation where Turkey fails to continue ongoing reform efforts. K e y indicators under each scenario are given in the tables below.
Table 1: Key Indicators for Turkey
(Annual Growth Rates, 70) (percent) GDP Capital Labor 0) (K) (L) TFP Population EL= (AUAY)*(Y/L)(~) I / Y(')
1973-1 980 3.5 8.4 1.8 198 1 - 1990 5.2 4.1 1.6 1991-2000 3.6 5.0 1.5
1973-2000 4.1 5.6 1.6 1973-2004 4.1 5.1 1.5
1990-2004 3.6 4.1 1.2
2002 7.9 1.2 -0.8 2003 5.8 1.3 -1.0 2004 8.9 3.2 3.0
2002-2004 7.5 1.9 0.4
Base case 5.1 4.9 2.0
High case 6.7 5.9 3.0
Actual -0.5 2.26 2.7 2.36 0.9 1.85
1.1 2.15
1.3 2.07
1.4 1.80
8.1 1.60 6.0 1.56 5.7 1.45 6.6 1.54
Forecast for 2005-2015
2.1 1.21
2.6 1.21
0.48 0.26 0.39 26.8
0.27 0.23
0.28 24.4
-0.10 16.8 -0.17 17.4 0.34 21.2 0.05 18.4
0.39 24.6
0.44 25.7
Low case 3.9 4.2 1.3 1.5 1.21 0.34 24.0 (I): E ~ = (AUAY)*(Y/L) = Output elasticity of labor, I / Y= Total investment over GDP ratio.
293
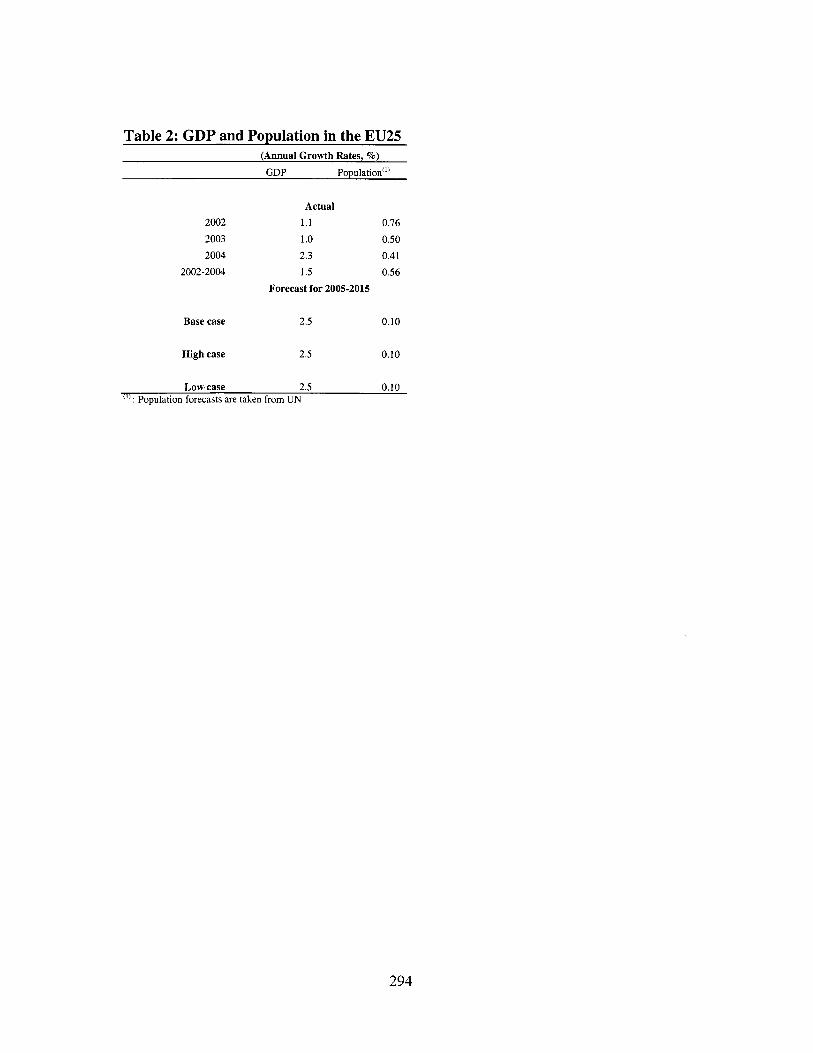
Table 2: GDP and Pomlation in the EU25 (Annual Growth Rates, %)
GDP Population"'
Actual 2002 1.1 2003 1 .o 2004 2.3
2002-2004 1.5 Forecast for 2005-2015
Base case 2.5
High case 2.5
0.76 0.50 0.41 0.56
0.10
0.10
Low case 2.5 0.10 (I) : Population forecasts are taken from UN
294

Annex 1.5: Duration of EU Acquis chapter negotiations for new EU members
Table 1: N u m b e r o f M o n t h s for Negotiations u
Czeck Estonia Hungary Latvia Lithuania Poland Slovakia Slovenia Republic
Smal l and medium-sized enterprises
Science and research
Education and training Fisheries
Statistics Telecommunications
Consumers and health protection
Industrial policy Free movement of goods
Economic and monetary union Common foreign and security policy
Custom union External relations Freedom to provide services
Company law Free movement of capital
Social policy and employment Culture and audio-visual policy Environment Freedom of movement for persons
Energy Financial control
Taxation Justice and home affairs Regional policy and coordination of structural instruments Competition policy Agriculture Transport policy Financial and budgetary provisions
8 8 8 13 13 13 14 15 21 21 25 21 21 36 36 38 38 39 39 43 43 43 45 45
49 55 5 1 5 1 5 1
8 8 8
25 14 13 14 13 33 21 25 48 25 36 25 26 31 32 39 48 52 36 51 48
51 44
5 1 48 57
8 8 8 14 13 13 14 13 36 21 25 38 31 35 36 38 32 36 39 39 31 21 39 44
52 5 1 5 1 45
3 3
3 20 3
26 8 8
13 9 3
20 9 13 15 15 16 13 21 16 22 21
28 28
28 9
34 22 34
3 3 3 16 3 13 13 8 15 13 3
21 8 16 15 13 13 13 16 9
28 22 25 26
28 9 34 22 74
8 8 8
51 13 14 14 14 36 21
25 36 20 32 45 48 36 33 43 45 43 2 1 48 52
55 5 1 5 1 51 57
3 3 3 8 3 15 8 8 13 13 3 15 3 15 15 14 15 9
22 16 20 21 25 28
29 34 34 26
8 8 8 14 13 13 14 13 36 21 25 43 3 1 32 25 36 33 38 36 45 36 21 45 45
52 44 57 45
295

ANNEXES Chapter 2
Annex 2.1 Data and Methodology for Consolidated General Government Classification of Expenditures
1. Economic Classification:
1. In this analysis, the State Planning Organization (SPO) data produced for the Pre- Accession Economic Program (PEP) has been used for the consolidated budget, social security institutions, local administrations, revolving funds, extra-budgetary funds and unemployment insurance fund. With the implementation o f the PFMC law in 2006, the institutional coverage w i l l be changed to be more in line with the international definitions and to increase the scope o f the general government institutions, however, since the last year covered in this study i s 2004, the terminology used here and the coverage are s t i l l not consistent with the PFMC law.
2. The SPO i s the only public institution which estimates the size o f the general government for Turkey. In generating consolidated general government data the SPO i s following the GFS manual. The IMF i s another source for the general government data in Turkey. However, the purpose o f their data i s not to measure the overall size o f the revenues and expenditures o f the general government, but to monitor the performance criteria set in terms o f the primary surplus o f the public sector. 213
3. The definition o f general government used in this report includes: consolidated budget (CB), local administrations, revolving funds, social security institutions (SSI), Revolving Funds and a common subset o f budgetary and extra budgetary funds (EBFs)
a. Consolidated Budget Institutions: All o f the general and annex budget institutions. As o f 2004 the total number o f the institutions was 98.
b. Local Administrations: 3225 municipalities, 8 1 special provincial administrations, I l le r Bank, 16 water and sewerage companies o f metropolitan municipalities and 10 natural gas and public transportation companies .
c. Revolving finds: 1,450 (in 2004) enterprises established under the consolidated budget institutions and TRT (Turkish Radio and Television), DG o f Dormitory and Student Credits, National Lottery and AOC (Ataturk Forestry Farm).
d. Social Security Institutions: SSK, BagKur, Emekli Sandigi and Unemployment Insurance Funds. The UI was included into the balance since year 2000.
273 For the comparison and methodological differences, please see an internal discussion note on the “Estimation of the Size o f the Government in Turkey”, prepared by R. Chaves and M. Agar, October 2004.
296

e. Extra Budgetary Funds: The total number o f the funds included in the general government balance decreased from 12 in 1999 to 4 in 2004.
4. I t should also be noted that the analysis does not include the expenditures o f the Central Bank and other public depository institutions, 45 non-financial state economic enterprises (SOEs), nine regulatory and supervisory agencies, and 45 out o f a total o f 50 special budget institutions listed in the Public Financial Management and Control Law (PFMC).274 The analysis includes the net subsidies and transfers between these institutions and the consolidated budget.
5. adjustments were made to their general government data for the fol lowing reasons;
Although the SPO i s in general in line with the GFS methodology three
0 To eliminate the double counting:
a. Invoiced payments which are social assistance type o f payments made by the Emekli Sandigi through transfers from the consolidated budget were deducted from the social security institutions balance.
b. Spending on common retirement f rom BagKur has been netted o f in the SSK balance because the same amount o f spending i s already reported in the BagKur’s expenditures.
0 To transfer cash -based accounting into accrual accounting;
c. Interest payments realized in 2001 but reported in 2002 were deducted from 2002 expenditures and added to 2001.
0 Moreover, in order to be in l ine wi th the primary surplus definition o f the GFS 2001 manual, interest revenues o f the institutions were deducted. In their current definition o f primary surplus, the SPO has been deducting only the interest expenditures but not interest revenues.
274 Special budget institutions refer to 50 public entities established as affiliated or related to a ministry to provide certain public services. These special budget institutions receive revenues and are authorized to spend them. The complete l i s t of these institutions i s presented in the Public Financial Management and Control Law.
297

2. Functional Classification:
7. In this study a cross classification o f general government expenditures -- functional vs economic -- for 2003 and 2004 by combining the expenditures o f the institutional coverage defined in the economic classification was used. Regulatory and Supervisory Institutions and some o f the special budget institutions which were recently brought under the definition o f general government by law 5018 were not included because o f the data problem.
8. Main data sources for the study are as follows. 0
0
0 SSK, Bagkur, Emekli Sandigi 0
SPO economic classification o f the general government data Ministry o f Finance, consolidated budget and revolving funds
High Audit Board (YDK) on the accounts o f SSK, Bagkur and TRT (Turkish Radio and Television Board ) , AOC ( Ataturk’s Farm) , General Directorate o f Credit and Dormitories.
IMF fiscal tables o f M a y 2005 Ministry o f Internal Affairs, General Directorate o f Local Authorities
0 National Lottery Directorate 0
0
9. As a general principle the GFS consolidation methodology has been used while producing the functional classification o f the general government. A detailed analysis on the methodology and assumptions for producing the cross classification i s available in Ferhat Emil, 2005, Turkey-Economic and Functional Classification o f General Government Expenditures, Draft background analysis note for the CEM. Table 1 below shows the first result o f this study. The work i s being refined for the upcoming Public Expenditure Review.
298

r .I
E/ ' m C
~
6 0 C
Y L 0 n 2
a,
rc 0
5
0 .- E z 8 e, a, 5 5 '5 5 E Y
Y
Y
a, s r, c N

Annex 2.2 Structure of Tax Revenues in Turkey-Recent Trends and International Comparison
Table A.2.2: Revenues and Expenditures of the General Government, 1999-2004 '/
(% of GDP) 1999 2000 2001 2002 2003 2004
Taxes Direct Indirect Wealth
Non-Tax Revenues Factor Incomes
Interest revenues Social Funds
21.8 9.7
11.7 0.4 2.6 4.8 0.7 5.3
24.4 9.7
14.3 0.4 3 .O 4.9 0.8 5.8
25.6 10.4 14.9 0.3 2.5 6.3 1.1 6.4
22.2 7.8
14.0 0.4 3.1 7.4 1.4 6.1
23.6 7.6
15.1 0.9 3 .O 6.4 1.3 6.6
23.6 7.3
15.7 0.6 2.8 6.9 1.6 7.0
Total Revenues 34.5 38.1 40.7 38.8 39.6 40.2 -Privatization 0.1 1.5 0.9 0.2 0.1 0.4
300

Table A.2.3. Revenue Breakdown for OECD Countries
General Government (in percent of GDP)
Australia Austria Belgium Canada Czech Republic Denmark Finland France Germany Greece Hungary Iceland Ireland Italy Japan Korea Luxembourg Mexico Netherlands New Zealand Norway Poland Port u g a 1 Slovak Republic Spain Sweden Switzerland United Kingdom United States
Turkey (2004) OECD average:
PIT CIT Taxes Income Taxes & ss Tax ...
43.0 45.2 33.6 36.5 48.7 44.8 43.4 40.3 36.1 39.1
29.6 42.6
...
...
... 41.9
38.7
43.4 36.6 36.9 31.2 35.8 50.2
36.1 25.5
...
...
...
... 28.3 30.6 28.6 21.3 47.1 32.6 26.8 22.8 23.2 26.4
25.0 29.8
...
...
... 30.2
24.2
33.4 22.5 25.1 18.8 23.0 35.8
28.9 18.5
...
...
...
... 12.9 16.5 15.6 9.6
28.8 17.5 10.3 10.3 8.3 9.3
11.9 13.2
...
...
... 15.3
10.1
19.3 6.3 9.1 7.0
10.2 18.1
13.2 10.8
...
...
...
... 10.4 13.4
4.9 26.0 14.0 8.1
4.9 7.1
7.0 10.8
...
...
...
...
...
...
... 6.9
11.2 4.1 5.9 3.4 6.9
16.0
10.4 8.9
...
...
..* 2.3 3.0
4.7 2.8 3.5 2.2
3.3 2.2
3.8 2.3
...
...
...
...
...
...
... 3.2
4.3 2.2 3.2 2.8 3.3 2.1
2.8 2.0
...
...
... 9.5
12.2 11.8 8.4
17.8 14.0 14.2 7.7
11.9 13.2 16.8 9.1
11.7
6.7 9.2
10.7
14.4 12.8 14.8 9.3
10.3 17.1
10.5 10.0
...
...
...
...
... 2.7 2.2 0.3 2.5 4.0 4.3 2.5 2.6 3.2 3.3
2.0 2.5
...
...
... 0.0
1.3
1.7 3.9 3.3
2.6 3.3
3.5 1.6
...
...
...
...
... 0.0 0.3 0.2 1.3
0.0 0.0 0.7 0.0 1.1
1.4 0.0
...
...
...
... 4.8
1.3
0.1 1 .o 0.2 1.4 0.0 0.0
0.0 0.2
...
...
...
... 14.7 14.6 4.9
15.2 1.7
12.2 16.6 17.5 12.9 12.7
4.6 12.9
...
...
... 11.7
14.5
9.9 14.1 11.8 12.4 12.8 14.4
7.3 7.0
...
...
...
... ... 6.8 4.6 2.2 8.0 7.0 0.3 6.8 39.1 27.4 12.9 9.5 2.9 11.8 2.5 0.7 11.7
Source: OECD; and Turkish authorities.
30 1

Annex 2.3 Specific business incentives in Turkey
Turkey has provided various tax incentives since the mid-1960s:
The f i rs t tax incentive package for economic development was introduced in 1964. I t included an investment allowance, postponement o f import duty on machinery and equipment, an allowance for accelerated depreciation, a longer loss carry forward period, and a lump-sum tax rebate on exports. Many o f these benefits were granted on a discretionary basis by the State Planning Organization, which issued investment certificates. In the early 1980s other export-oriented tax incentives were introduced. These included export subsidies in the form o f input tax rebates, a tax exemption on export credits, and a 20 percent deduction from corporate earnings on exports o f manufactured and agricultural products and from the foreign currency proceeds o f freight and tourism services. In the 1980s, the central bank granted generous lump-sum tax rebates to exports on the provision o f evidence that export earnings were transferred to Turkish banks. This subsidy induced fraudulent and overstated export claims, and the system was phased out in 1989. In 1988, the authorities established a five-year tax holiday (ten years in the poorest regions) from both corporate and personal income taxes for investments in educational, health, and sports facilities. The 1995 investment incentives decree reintroduced a subsidized credit program but only for investments in research and development, environmental protection, regional handicrafts and small and medium-size industries. Specific regional-based incentives were provided f rom 1998 to the end o f 2002: an exemption from employers’ social security contributions in respect o f newly created jobs and 5-year regional corporate income tax holiday. By 2000, ITAs were available at differentiated rates f rom 100 to 200 percent, but wi th a 15 percent withholding tax to claw back some o f the revenue. By 2003, Turkey offered two main types o f tax incentive: (1) The 40 percent investment tax allowance, which i s s t i l l in effect; (2) Extensive tax benefits in the FTZ, which are currently as described in Box 4.2. Regional incentives were again offered in 2004 and expanded in 2005.
Currently, there are incentives for investment and business activity in specific regions, sectors or activities:
Software development and R&D activities in the technological development zones (established by the Council o f Ministers) are exempt f rom ClT, and the salaries o f R&D personnel in these companies are PIT-exempt, until the end o f 2013.
e Under the new Law 5084 (which succeeds L a w 4324) companies establishing themselves before the end o f 2008 in regions with a per-capita income below 1,500 U S D are granted free land and energy subsidies. I f they operate within an organized industrial zone, they may retain the tax withheld on their wage bill to the tax office for five years. Companies outside an industrial zone retain 80 percent o f withheld wage taxes. (In calculating the taxes to be
302

withheld, i t i s assumed that all employees are paid the official minimum wage). For the same five-year period, the Treasury pays the employer’s social security contribution.
0 This scheme was extended to an additional 13 provinces, and made more generous, in 2005: f i r m s o f at least 30 employees, which add at least 10 new jobs, attract SSK, PIT subsidies for ‘one new and two old’ employees. An additional energy subsidy free land i s also available.
0 Companies established in the former Turkish free-trade zones (now called customs free zones) before 6 February 2004 are exempt f rom C I T until expiry o f their license to operate. The wages and salaries o f these companies are PIT-exempt until the end o f 2008, and their transactions are exempt from all other taxes, duties and fees until then. New entrants may also enjoy C I T exemption until EU accession. Regardless o f the expiry date of the original license, profits from the sale o f goods produced in the zones can be exempt f rom tax only while Turkey remains outside the EU.
0 Business income derived operating ships registered with the Turkish International Shipping Registry i s exempt from CIT (including on capital gains from the transfer o f such ships) and PIT withholding. The wages o f those working on such ships are PIT-exempt.
0 Companies investing in ‘cultural activities’ (constructing and operating museums, cinemas, theatres, or cultural centres, and so are free land and subsidized energy. For the first three years, they may retain half the income tax withheld from their wage bill), and for the next seven years they may retain 25 percent. Moreover, for 10 years the, Treasury pays the employer’s social security tax for these companies. T o qualify for these benefits, f i r m s have to obtain a ‘cultural investment document’ f rom the Ministry o f Tourism and Culture.
Several incentives have been removed for new investments, but grandfathered for old:
0 Operators o f the organized industrial zones who received their licenses before 6 February 2004 are exempt from C I T until their license expires, and from PIT until the end o f 2008.
0 Companies established infirst priority regions between the start o f 1998 and the end o f 2000 and employing more than 10 employees are granted a five-year exemption from C I T and a subsequent reduction o f CIT until the end o f 2007. Until then, the employer’s social security contribution i s paid b y the Treasury.
303

ANNEXES Chapter 4
Annex Table A 4.1: Labor Code (Law 4857) compliance with EU employment directives
Conforms EU directive
Does not conform
Organization o f working t ime
Norma l work week Minimum res t t ime Shi f t work N igh t work
Definit ion o f fixed-term
Fixed-term workers w o r k
r ights
Definit ion o f fixed-time
N o shift f r o m full-time to work
part-t ime without consent Part-t ime workers r ights
Definit ion o f collective
Informat ion and
Procedure
redundancy
consultation
Framework agreement o n fixed-term work
Max imum week t ime Minimum annual
Patterns o f work
Informat iodtraining
leave
Framework agreement o n par t - time work
Employees’ r ights Employers’ liabilities
Collective redundancies
Informat ion and consultation
Employees’ r ights in the event o f transfers
Protection o f employees in the event o f insolvency
Protection o f young people at work
~
Information fo r employees
Consultation and employee representation Source: Taymaz and
I
Claims Guarantees Coverage
Definit ion o f “young” Employers’ obligations
Time l imits Enforcement * l z l e r (2005)
No t well-defined o r st i l l some differences
Definit ion o f “comparable permanent worker” Abuse o f successive contracts
Definit ion o f “comparable full- t ime worker” In fo rmat iod t ra in ing
Informat ion content
Informat ion content Coverage Procedures
304
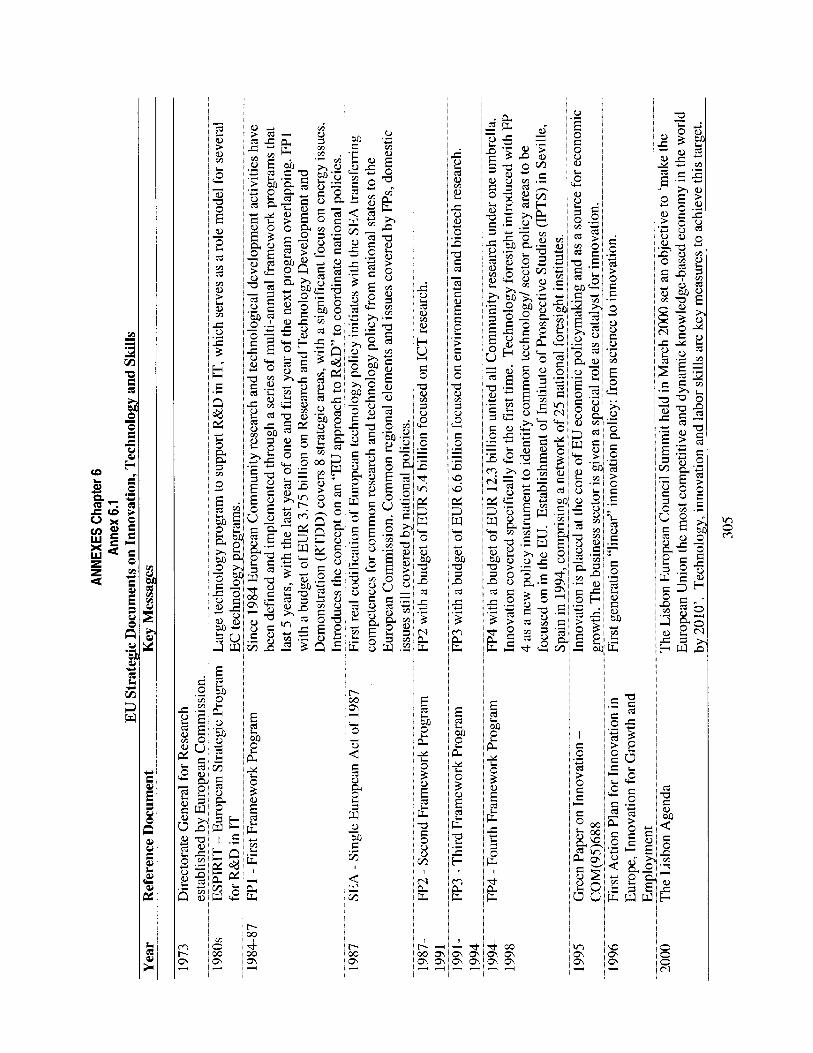
"i 0 m
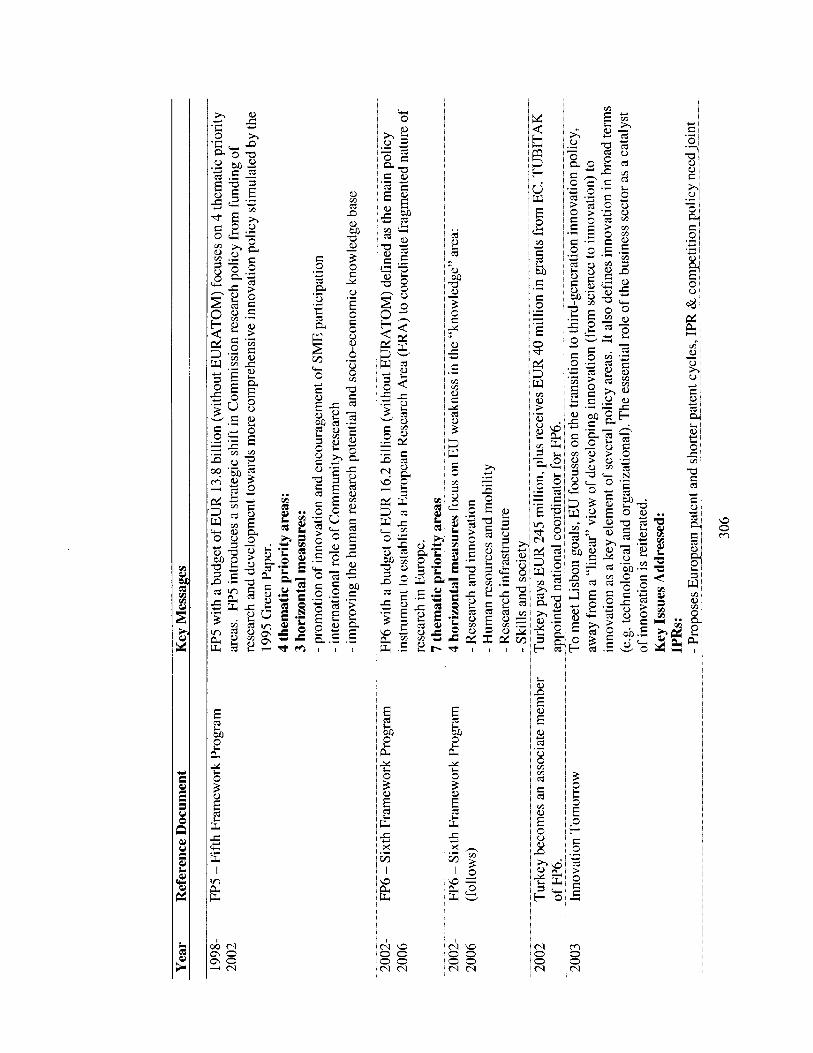
g E E + c 0 cd > 0 E c
.- Y
H
m 0 8
\D 0 m

c .* Y
E E E 3
>
E .-
e c
.C U
3
z m m c 0
v) U
3 a c .C
? c 0 e

Annex 6.2 Key Actors of the Turkey National Innovation System
The two main institutions of the Turlush N I S are the Supreme Council of Science and Technology (BTYK) and the Scientific and Technological Research Council of Turkey (TUBITAK). BTYK i s the highest-level science and technology policy making and coordination body. I t i s chaired by the Prime Minister. BTYK i s responsible for approving the policies proposed by TUBITAK, for identifying the responsible bodies and coordinators for each policy measure, and for following up and coordinating implementation of policy actions. TUBITAK i s the secretary of BTYK and the implementing agency for science, technology and innovation support programs. I t comprises institutions carrying out research in several areas, provides grants for industrial R&D and supports creation of university-industry research programs. Other relevant N I S institutions include the State Planning Organization (SPO), the Technology Development Foundation of Turkey (TTGV), and various Ministries. Figure 1 shows the organizational framework o f the Turlush NIS, and Box 1 provides a summary description of the specific functions of each institution comprising the NIS.
Figure 1: The Turkish National Innovation System
I President of the Republic 1
BTYK: Supreme Council of Science and Technology YPK: High Planning Council P-KKK: Money-Credit and Coordination Council YOK: Higher Education Council MoE: Ministry of Education MoIT: Ministry of Industry and Trade DTM: Undersecretariat of Foreign Trade HM: Undersecretariat of Treasury DPT: State Planning Organization TPE: Turkish Patent Institute KOSGEB : Small and Medium Industry Development Organization TSE: Turkish Standards Institute TURKAK: Turkish Accreditation Agency TUBA: Turkish Academy of Science TUBITAK: Scientific and Technological Council of Turkey TUDEB: Technology Monitoring and Assessment Directorate of TUBITAK TTGV: Technology Development Foundation of Turkey M A M Marmara Research Centre of TUBITAK UME: National Metrology Institute of TUBITAK
308

RIs: Research Institutes HIES: Higher Education Institutes
Source: European Trend Chart on Innovation, Annual Innovation Policy for Turkey, September 2003-August 2004.
309

Box 1: Key Actors of the Turkish National Innovation System
The Supreme Council of Science and Technology (BTYK): the highest level science and technology pol icy making and co-ordination body in Turkey. I t s responsibilities include approval o f the policies proposed by the Scientific and Technical Research Council o f Turkey (TUBITAK) and o f the policies’ implementation plan. I t i s chaired by the Prime Minister and comprises al l relevant Min is t r ies.
The Scientific and Technological Research Council of Turkey (TUBITAK): an autonomous body affiliated to the Prime Ministry, TUBITAK i s responsible for the formulation o f Turkey’s science and technology policy as the secretary o f BTYK. I t i s also the implementing agency for science, technology and innovation support programs. Finally, i t i s the National Coordination Office for Turkey in the EU Sixth Framework Programme. The following institutions are connected to TUBITAK:
Marmara Research Center (TUBITAK-MAM)”: the largest contract research center in the country. I t carries out research in several areas, including materials, ICT, energy & environment, food technology, and earth & marine sciences. MAM also runs a technopark and a technology free zone.
National Metrology Institute (TUBITAK- UME): responsible for measurement, training, consultancy, information dissemination and infrastructure support.
Technology Monitoring and Assessment Directorate (TUBITAK-TIDEB) *: provides grants for industrial R&D and has supported creation o f six university-industry research centers program (USAMs). They include: Ceramics (at Anadolu University), Textile (Ege University), Biomedical Technologies (Hacettepe University), and advanced manufacturing (METU-OSTIM Organized Industrial Zone). USAMs promote universityhndustry and inter- firm collaboration for innovation.
State Planning Organization (DPT): responsible for the preparation and implementation o f Turkey Five-Year Development Plans, which include innovation policy items for the purposes of budget allocations (assigned through i t s Co-ordination Council, P-KKK).
Under-Secretariat of Treasury (HM) and Under-Secretariat of Foreign Trade (DTM): involved in the formulation o f innovation policies. DTM also provides funds to the “Implementing Agencies” (TUBITAK-TIDEB and the Technology Development Foundation o f Turkey, TTGV) for supporting R&D and innovation activities o f industry - based on the decree o f P-KKK.
310

Continuation of Box 1: Key Actors of the Turkish National Innovation System
Ministry of Zndustry and Trade (MoZT): responsible for the determination of the objectives for the Turkish industrial policy, the assignment o f technoparks (or 'technology development zones') and the establishment o f Organized Industrial Zones. The fol lowing institutions are connected to Mo IT :
Turkish Patent Znstitute (TPE): responsible for industrial and intellectual property rights, and for informing and guiding the industrialists, R&D institutes and individuals on IPR- related issues. Turkish Accreditation Agency (TURKAK): responsible for accrediting organizations and ensuring that these organizations operate in accordance with national and international standards. Turkish Standards Institute (TSE): responsible for standards preparation, product certification and testing. Small and Medium Size Industry Development Organization (KOSGEB)": autonomous public body supporting small and medium enterprises (SMEs). I t finances 14 incubators (Technology Development Centers, TEKMERs) in cooperation with technical universities and industrial chambers.
Note: * indicates implementing agencies that have the explicit objective of facilitating collaboration between industry and research institutions.
Source: Summary based on Elci, S. (2005), op. cit.
311

Box 1 (follows): Key Actors of the Turkish National Innovation System
Ministry of Finance (MoF): responsible for the implementation o f the R&D tax postponement and tax exemption schemes and the tax exemptions provided to the companies located in technoparks.
Ministry of National Education (MoNE) and the Higher Education Council (YOK): the key players in the NIS for development of the human capital for innovation. They design and implement the education and training policies and coordinate pol icy implementation.
Turkish Academy of Science (TUBA): I t i s affiliated to the Prime Minister, and i t i s mainly engaged in co-operation wi th the academia and supporting academic research.
State Institute of Statistics (DIE): connected to one o f the State Ministers and responsible for providing statistical information related to R&D, innovation and industry.
Technology Development Foundation of Turkey (TTGV) *: a not-for-profit foundation financing technology development projects, technoparks, and start-up funds. I t i s financed by HM from resources o f international donors (e.g., the World Bank) and DTM.
Innovation intermediaries that support collaboration between industry and research institutions, in addition to the (*) organizations included above:
Innovation Relay Centers (IRC-Ege and IRC-Anatolia): established with E C funds from the Sixth Framework Program to foster international technology transfer activities.
Associations and Chambers o f Commerce:
P The Union of Chambers of Commerce and Industry (TOBB): a hub o f a network o f industrial and commercial chambers and non-governmental organizations which facilitates the f lows in the NIS.
9 Chambers of industry and commerce located in several regions around the country. They have important roles as intermediaries. Only a few o f them are active on innovation related issues, such as the Istanbul Chamber o f Industry and Mersin Chamber o f Industry and Trade.
P Turkish Industrialists ’ and Businessmen’s Association (TUSIAD), responsible for granting awards for innovation and for organizing Technology Awards and Congress with TTGV and TUBITAK. awareness and facilitating information flows between the public and private sectors.
3 12

9 The Technology Management Association (TYD) which aims at creating a culture o f innovation and innovation-based entrepreneurship among school children and teachers in cooperation wi th private sector companies, NGOs and academia.
9 Other remarkable non-governmental organizations with mediating role in innovation related issues include the Foreign Investors Association (YASED), the Economic Development Foundation (ZKV) and sectoral bodies such as the ICT Foundation of Turkey (TBV), Informatics Association of Turkey (TBD) and the Automotive Manufacturers Association Of Turkey (OSD). They all carry out activities for raising awareness and facilitating information flows between the public and private sectors.
Technology parks and incubators. There are 17 technoparks established by universities and research centers under the ‘Law o f Technology Development Regions’ and a few incubators set up by private companies (e.g., Ericsson, Koc Holding, and Siemens). The Cyberpark established by the Bilkent University with financing from the Wor ld Bank’s ITP program- includes an incubator set up joint ly with KOSGEB i s the f i rs t incubator founded through private-public partnership.
Note: * indicates implementing agencies that have the explicit objective of facilitating collaboration between industry and research institutions.
Source: Summary based on Elci, S. (2005), op. cit.
313

Annex 6.3 Strategic Objectives related to science, technology and innovation
BTYK’ s Science and Technology Strategies Implementation Plan for the period 2005- 2010 (approved in March ‘05). The Science and Technology Policies Action Plan i s a strategic framework for actions to be undertaken by several S&T institutions between 2005 and 2010. I t consists o f actions defined under seven strategic objectives that are in l ine wi th the main objectives, basic principles and major targets o f the National S&T Strategy. The seven strategic objectives are:
. . .
Increasing awareness on science and technology (S&T) and developing an S&T culture Increasing and developing S&T human resources Supporting result oriented and qualified research Increasing the effectiveness o f S&T management Enhancing the science and technology performance o f private f i r m s Developing research environment and infrastructure Increasing the effectiveness o f national and international networks
In a meeting held in March 2005, BTYK appointed TUBITAK as the institution which wil l monitor and coordinate the implementation o f the S&T Plan. TUBITAK has carried out a survey o f key participants to increase awareness on the plan and assess the current situation in the areas identified above.
Vision 2023 Project, objectives to be implemented by TUBITAK between 2005 and 2010:
1.
2. 3. 4.
5. 6. 7. 8. 9.
Developing knowledge-intensive products wi th high added value and becoming a global design and production center for consumer goods. Becoming competitive in agricultural production. Developing competencies in development o f space and defense technologies. Developing competencies in flexible manufacturing-flexible automation processes and technologies. Gaining s lu l l s for clean production. Gaining s k i l l s for developing material technologies. Developing competencies in the field o f health and l i fe sciences. Gaining s l u l l s for developing modern and safe transportation systems. Ensuring food safety and reliability.
10. Gain ing skills for healthy and modern urbanization and establishing required
1 1. Developing competencies in energy technologies. 12. Gaining sk i l l s for the productive use o f natural resources. 13. Developing competencies in environmental technologies. 14. Strengthening the technological infrastructure for transition to the information
infrastructure.
society.
Eight priorities for competency building:
1. Information and Communication Technologies 2. Biotechnology and Genetic Technologies
3 14

3. Material Technologies 4. Nanotechnology 5. Design Technologies 6. Mechatronics 7 . Production Processes and Technologies 8. Energy and Environmental Technologies
315

Summary o f complementary objectives included in The Eight Five-Year Development Plan (2000-200.5); The Preliminary National Development Plan; Industrial Policy for Turkey; and SME Strategy and Action Plan.
Ful ly establishing and efficiently operating the National Innovation System (NIS). Completing legal and institutional arrangements for the smooth functioning o f the N IS Supporting scientific and technological developments to ensure Turkey’s transition to a knowledge economy, including: increasing state supports for R&D, enhancing physical, human and legislative infrastructure for innovation, encouraging establishment o f technoparks and promoting growth o f venture capital. Making the Intellectual Property Rights regime fully operational, and raising public awareness on IPR. Encouraging improvement o f university-industry collaboration by establishing technological support and development centers, technoparks and technology institutes. Increasing innovative capabilities o f enterprises through training and international co-operation.
Source: Summary based on Elci, S. (2005), op. cit.
316

ANNEXES Chapter 8
Annex 8.1: Model-based simulations of impact of EU accession on agriculture and food sectors
Table A 8.1: Pre- and post-accession tariffs for the EU and Turkey with respect to trading partners (tariffs in percent)
European Union-25 2004 Post
Turkey Other Total Total
Merchandise trade 1.2 3.4 3.4 3.3 Agriculture &food 5.7 14.1 13.8 13.6
Agriculture 2.8 13.6 13.1 12.9 Rice 98.4 91.6 91.7 91.5
Other crops 0.5 2.8 2.7 2.7 Beef and sheep 1.2 6.2 6.1 6.1 Other livestock 2.2 1.2 1.2 1.2
Processed foods 12.1 14.7 14.6 14.4
Fossil fuels 0.5 0.2 0.2 0.2 Textile & wearing apparel 0.2 7.0 6.7 6.7
Textile 0.3 6.5 6.0 6.0 Wearinp anoarel 0.1 7.9 7.5 7.5
Turkey 2004 Post-accession
EU Other Total Other Total
1.9 5.4 3.5 1.8 0.9 47.2 35.2 39.0 8.8 6.1 68.7 36.8 44.2 7.8 6.0 34.0 34.0 34.0 85.6 83.5
39.7 39.7 39.7 3.6 3.1 135.0 135.0 135.0 1.7 0.2 135.0 135.0 135.0 0.8 0.4 27.5 31.1 29.4 11.5 6.2
0.0 0.1 0.1 0.2 0.2 0.2 9.3 3.8 5.7 2.3 0.2 8.7 3.8 5.6 2.4 0.2 11.1 3.0 6.6 1.7 0.2 12.8 4.9 5.8 2.1
0.2 4.1 1.3 1.7 0.5 0.5 8.2 5.5 0.7 0.4 0.2 8.6 1.0 5.7 0.6 0.3 1.7 0.8 1.1 0.4
Other manufacturing 2.8 2.8 2.8 2.7 0.1 2.7 1.1 1.9 0.7 Source: GTAP release 6.0 and CEPII.
317
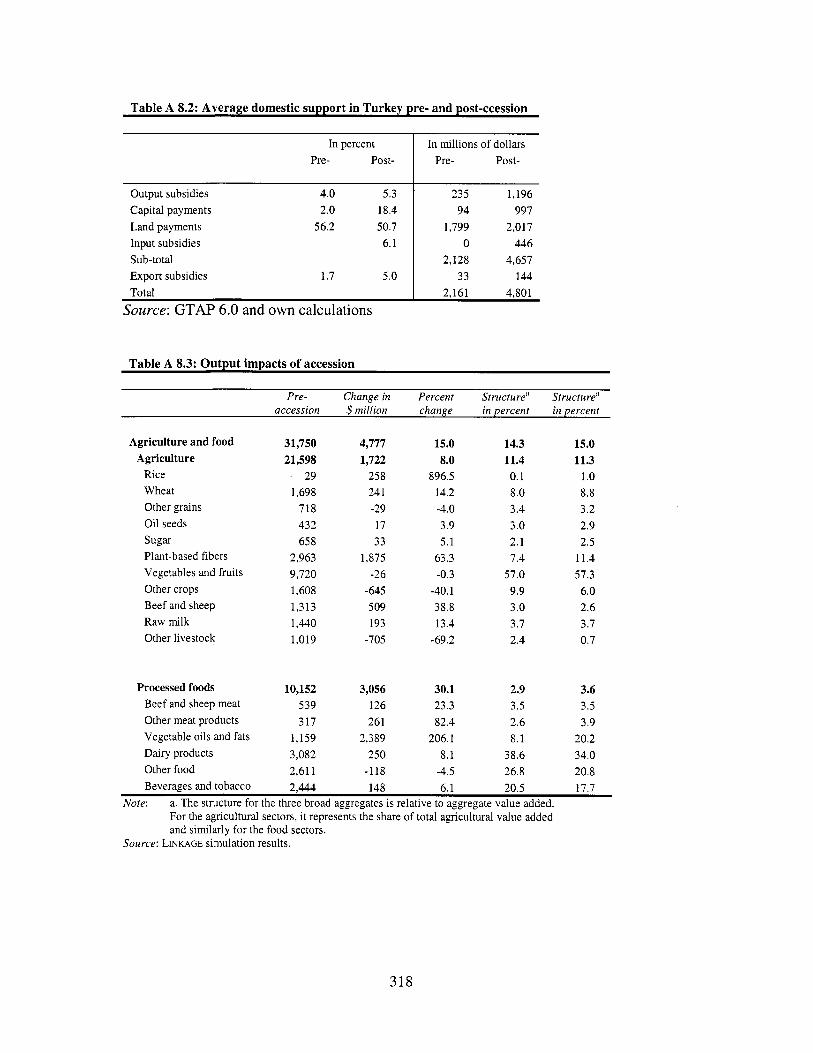
Table A 8.2: Average domestic support in Turkey pre- and post-ccession
In percent Pre- Post-
In millions of dollars Pre- Post-
Output subsidies 4.0 5.3 Capital payments 2.0 18.4 Land payments 56.2 50.7 Input subsidies 6.1
Export subsidies 1.7 5.0 Total
Sub-total
Source: GTAP 6.0 and own calculations
Table A 8.3: OutDut imDacts of accession
~~
235 1,196 94 997
1,799 2,017 0 446
2,128 4,657 33 144
2,161 4,801
Pre- Change in Percent Structure" Structure" accession $ million change in percent in percent
Agriculture and food Agriculture
Rice Wheat Other grains Oil seeds
Plant-based fibers Vegetables and f ru i ts Other crops Beef and sheep Raw milk Other livestock
sugar
Processed foods Beef and sheep meat Other meat products Vegetable oils and fats Dairy products Other food
31,750 21,598
1,698 718 432 65 8
2,963 9,720 1,608 1,313 1,440 1,019
29
10,152 539 317
1,159 3,082 2,611
4,777 1,722
258 24 1 -29 17 33
1,875 -26
-645 509 193
-705
3,056 126 261
2,389 250
-118
15.0 8.0
896.5 14.2 -4.0 3.9 5.1
63.3 -0.3
-40.1 38.8 13.4
-69.2
30.1 23.3 82.4
206.1 8.1
-4.5
14.3 11.4 0.1 8.0 3.4 3 .O 2.1 7.4
57.0 9.9 3.0 3.7 2.4
2.9 3.5 2.6 8.1
38.6 26.8
15.0 11.3
1 .o 8.8 3.2 2.9 2.5
11.4 57.3
6.0 2.6 3.7 0.7
3.6 3.5 3.9
20.2 34.0 20.8
Beverages and tobacco 2,444 148 6.1 20.5 17.7 Note: a. The structure for the three broad aggregates i s relative to aggregate value added.
For the agricultural sectors, i t represents the share of total agricultural value added and similarly for the food sectors.
Source: LINKAGE simulation results.
318
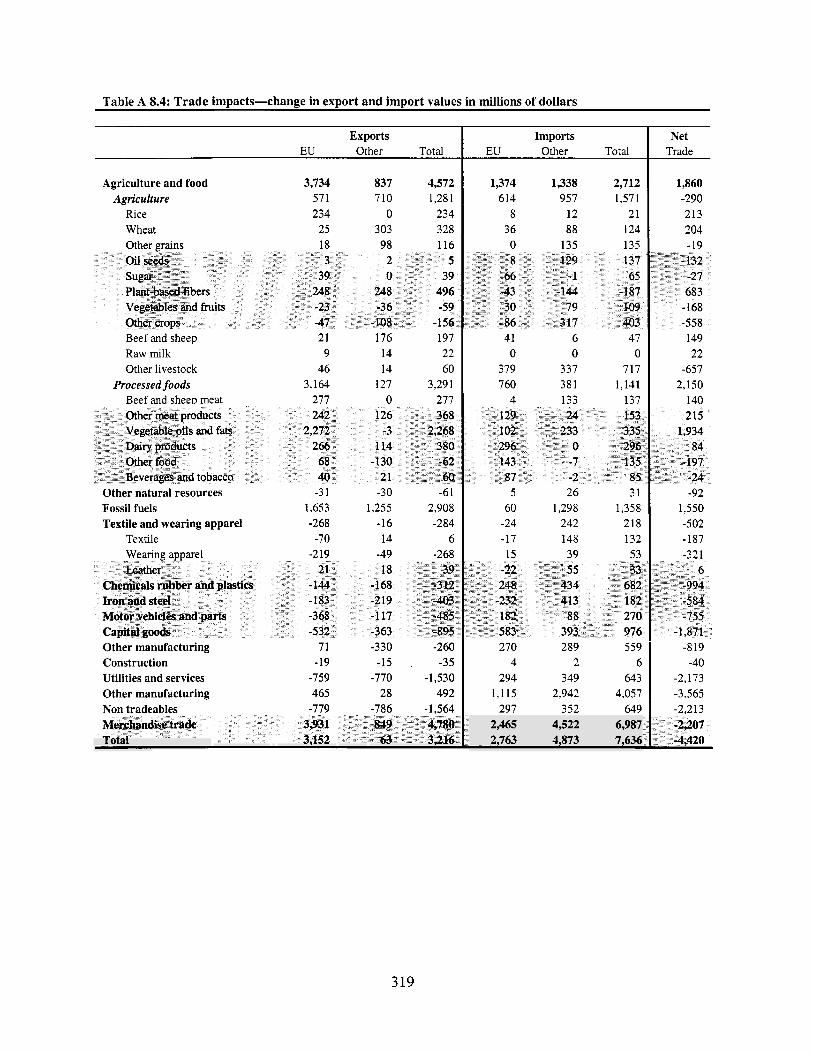
Table A 8.4: Trade impacts-change in export and import values in millions of dollars
Exports EU Other Total
Agriculture and food Agriculture
Rice Wheat
3,734 837 4,572 571 710 1,28 1 234 0 234
25 303 328 Other grains 18 98 116 Oil seeds 3 2 5 sugar 39 0 39 Plant-based fibers 248 248 496 Vegetables and fruits -23 -36 -59 Other crops -47 -108 -156 Beef and sheep 21 176 197 Raw milk 9 14 22 Other livestock 46 14 60
Processed foods 3,164 127 3,291 Beef and sheeD meat 277 0 277 Other meat products 242 126 368 Vegetable oils and fats 2,272 -3 2,268 Dairy products 266 114 380 Other food 68 -130 -62 Beverages and tobacco 40 21 60
Other natural resources -3 1 -30 -61 Fossil fuels 1,653 1,255 2,908
Textile -70 14 6 Textile and wearing apparel -268 -16 -284
Wearing apparel -219 -49 -268 Leather 21 18 39
Chemicals rubber and plastics - 144 -168 -312 Iron and steel -183 -219 -403 Motor vehicles and parts -368 -1 17 -485 Capital goods -532 -363 -895 Other manufacturing Construction Utilities and services Other manufacturing Non tradeables
71 -330 -260 -19 -15 -35
-759 -770 -1,530 465 28 492
-779 -786 -1.564 Merchandise trade 3,931 849 4,780 Total 3,152 63 3,216
Imports EU Other Total
1,374 1,338 2,712 614 957 1,571
8 12 21 36 88 124
41 6 47 0 0 0
379 337 717 760 381 1,141
4 133 137 129 24 153 102 233 335 296 0 296 143 -7 135 87 -2 85 5 26 31
60 1,298 1,358 -24 242 218 -17 148 132 15 39 53
-22 55 33 248 434 682
-232 413 182 182 88 270 583 393 976 270 289 559
4 2 6 294 349 643
1,115 2,942 4,057 297 352 649
2,465 4,522 6,987 2,763 1,873 7,636
Net Trade
1,860
213 204
-290
-19
22 -657
2,150 140
-92 1,550 -502 -187 -321
-819 -40
-2,173 -3,565
3 19

Annex 8.2-Regional Spending By Agency
1. Regional spending for each agency i s diverse due to many reasons including location o f natural resources (forests in the case o f MOEF and water resources in the case o f DSI) as well as sizeable ongoing projects. However there are problems with prioritizing the projects where there i s very l imited available funding. DSI allocates i t s agricultural spending based on ongoing irrigation projects in 26 different areas. However, funding amounts are insufficient to complete the current projects and there i s no clear plan for prioritization o f project implementation. Therefore, many areas that are in urgent need wait for a long time to receive enough funding to be completed. With current levels o f investment allocation276 and without inclusion o f any new projects, i t would take 35 years to finish all DSI’s on-going.
2. In 2002, DSI allocates 39 percent o f i t s investment budget in the Southeast region and as much as 28 percent i s distributed in Urfa province alone. Almost al l o f these investments are made under the GAP s t i l l there are problems with GAP due to insufficient funding; i.e. in order to complete the investment program fully by the planned year o f 2010 the current size of investment allocations have to be increased considerably. Apart from that, Mediterranean region receives the lowest allocation f rom DSI budget wi th only 5 percent.
3. Unlike DSI, MARA spends the lowest share o f both recurrent and investment budget in the Southeast region (9 percent each); whereas, the highest share o f recurrent and investment budgets are used in Central Anatolia (19 percent and 18 percent respectively. GDRS’s spending (direct recurrent and investment costs) i s concentrated in the Black Sea region (24 percent) and the least amount i s utilized in the Aegean region (10 percent). MOEF also distributes i t s highest recurrent and investment budgets in the Black Sea region (21 percent and 22 percent respectively) and lowest budgets in the Southeast region (6 percent and 4 percent respectively). Tedas and GD Roads are similar to MOEF and spend the highest portion o f investment budget in the Black Sea region (29 percent and 33 percent respectively). Tedas spends the least in the Southeast region (7 percent) and GD Roads spends the least in the Aegean region (5 percent). (Annex 2 Table 2)
4. Rural Expenditures per rural population shows that MARA utilizes the highest amounts in Mediterranean and the least in South East Anatolia; D S I allocates the highest again in South East and the least in Mediterranean; GDRS spends the highest amounts in Black Sea and lowest amounts in Aegean; M O E F spend the highest recurrent in Black Sea and highest investment in Mediterranean and the lowest amounts in South East; TEDAS and GD roads makes the highest investments per rural population in Black Sea and the lowest in South East and Aegean respectively. The biggest total recurrent spending per rural population i s made in Black Sea and the biggest investment per rural population i s made in South East regions. The lowest ratio for recurrent budget i s spent in Aegean and for investment i s spent in Central Anatolia. (Annex 2, Table 4 and Chart 3).
276 World Bank “Turkey Policy and Investment Priorities for Agricultural and Rural Development”, February 2005. 277 GAP accounted for approximately 15 percent of rural budget expenditures (excluding energy) in 2002. Through 2001, 10.8 quadrillion T L had been spent for GAP. (Ibid, Annex 2.)
3 20

r: r: 8
?
".
9 *. m
2
r N
Lo
m t m
:
8
m m m t
m m.
-. 8 :
" t
r- (0
s a.
(4 W
N
7
5 F (4 $
L E 1 a E -
2
s m.
a. r r
v 0
In b. m 2
N 0 m t m $
* m.
t 0
:
b w t
". 8 W
m N. m m : m F N N.
w 0. m -. m
- a C -
v) x P
N
N 8
3 (u m

7 7 T 7

g
g 8
E 2
T 0
8 8 8 0 3 0 0 3 m m c o 0 4 4
0
0

0 0 0 7 e m
w c u o m e
b m w cum
m c u b cucu
b w m cum
w m c u m e

B I-
$ $ $ $ $ $ $
z c r b o O N ' O v) c o r d 5 a 0 v)

ANNEXES Chapter 9
1999 2000 2001 2002 2003
Annex 9.2 Data Tables
1.1 1. General General exc Govt Social
Sec. Funds
3,047,000 . 1,432,340 5,190,130 2,308,090 7,022,381 2,937,265 11,743,273 4,497,469 15,787,575 5,056,720
Table 1 : Total Health Expenditures, by Financing Agents, 1999-2004 (billion liras)
I
OTHER TOTAL
480 432 -48 -10.10 6,780 7,099 319 4.71
2004 I 19,526,730 1 6,582,478 Source: MOH, National Heal MOWMOF/SSWB WES data sources
~
ES I PHARMA I 1,590 I 1,525 I -65 I -4.07 I OTHER I 143 I 126 I -17 I -11.96
Accounts (for 1999, 2000); updated author calculations for other years using
Bag-Kur
TOTAL 2,810 2,783 -27 -0.97
HEALTH 1,501 1,297 -204 -13.57 PHARMA 2,160 2,058 -102 -4.72 OTHER 253 268 15 5.78 TOTAL 3,914 3,623 -291 -7.43
I HEALTH I 1,077 I 1,132 I 55 I 5.08 I
Green Card HEALTH 850 902 52 6.14 PHARMA 300 779 479 159.63 TOTAL 1,150 1,681 53 1 46.18
HEALTH 8,428 7,563 -865 -10.27 TOTAL 1 PHARMA I 7.665 1 8.745 I 1.080 I i 4 . n ~ I
I OTHER I 876 I 825 I -51 I -5.82 I TOTAL I 16,969 I 17,133 1 164 I 0.96
326

Sources: (1) Budget (CS):January-November figures are taken from GD of Public Accounts of MoF. December i s estimated to be the average of August-November. (2) S S K : January-November taken from SSK. December i s an estimate. (3) ES : Taken from ES. January-September realization. October-November provisional. December i s estimated to be the average of August-November. (4) B K : January-November taken from BK. December i s an estimate. (5) Green Card: "Total" figures are taken from GD of Public Accounts of MoF. December i s estimated to be the average of Aug-Nov. Last three months for "Health" and "Pharma" are estimates.
327

Billion TL I 1998 I 1999 I 2000 I 2001 I 2002 I 2003 1 2004 I 2005
328
TOTAL HEALTH 22.1 28.9 4.0 9.8 12.9 19.4 9.7 -4.9 PHARMA 45.3 18.6 20.5 14.3 18.0 10.6 2.7 1.9 OTHER 11.3 3.9 -0.7 20.3 0.5 9.2 13.5 -7.6 TOTAL 31.3 22.2 11.4 12.6 14.8 14.2 6.3 -1.7

REFERENCES
Aghion, P. and P. Howitt. 2005. "Appropriate Growth Policy: A Unifying Framework", Harvard University Working Paper.
Aizenman, Joshua and N. Marion. 1993. "Policy Uncertainty, Persistence and Growth", Review of International Economics, Blackwell Publishing, vol. 1(2), pages 145-63
Aizenman, Joshua and N. Marion. 1999. "Volatility and Investment: Interpreting Evidence from Developing Countries", Economica, London School o f Economics and Political Science, vol. 66(262), pages 157-79
Alesina A. and R. Peroti. 1997. "Fiscal Adjustments in OECD Countries: Composition and Macroeconomic Effects", IMF Staff Papers.
Alesina A. and S. Ardagna. 1998. "Tales o f Fiscal Adjustment", Economic Policy, 1998.
Andrew B. Bernard & Jonathan Eaton & J. Bradford Jenson & Samuel Kortum. 2000. "Plants and Productivity in International Trade", NBER Working Papers 7688. National Bureau o f Economic Research.
Bain, J. 195 1. "Relation o f Profit Rate to Industry Concentration: American Manufacturing", Journal of Industrial Economics 65:293-324.
Balassa, Bela. 1964. "The Purchasing Power Parity Doctrine: A reappraisal", Journal of Political Economy, Vol. 72, No.6, pp.584-589.
Barnes, M. J. Haskel and M. Maliranta. 2002. "The Sources o f Productivity Growth: Micro-Level Evidence for the OECD", Mimeo.
Barro, R. and X. Sala-I Martin. 1995. Economic Growth. New York, McGraw-Hil l
Barro, R. and X. Sala-I Martin. 2003. Economic Growth (Second Edition). MIT Press.
Batra, Geeta and Syed Mahmood. 2003. "Direct Support to Private Firms: Evidence on Effectiveness", World Bank Policy Research Working Paper 3 170.
Bernanke, Ben S. 1983. "Non-Monetary Effects o f the Financial Crisis in the Propagation o f the Great Depression", NBER Working Papers 1054. National Bureau o f Economic Research, Inc.
Bertola, G. and R. Caballero. 1994. "Irreversibility and Aggregate Investment", Review of Economic Studies, Blackwell Publishing, vol. 61 (2), pages 223-46.
Berument H. and N. Dincer. 2005. "Denomination Composition o f Trade and Trade Balance: Evidence from Turkey", Applied Economics, ~01.35.
329

Betcherman, Gordon, Karina Olivas and Amit Dar. 2004. "Impacts of Active Labor Market Programs: New Evidence from Evaluations with Particular Attention to Developing and Transition Countries", Social Protection Discussion Paper Series Number 0402. The World Bank, Washington, DC.
Black, F. 1987. "Business Cycles and Equilirium", Cambridge, MA: Blackwell.
Blanchard, Olivier J & Giavazzi, Francesco. 2003. "Improving the SGP through a Proper Accounting of Public Investment", CEPR Discussion Papers 4220, C.E.P.R. Discussion Papers.
Blanchard, Oliver. 2004. "Fiscal Dominance and Inflation Targeting: Lessons from Brazil", NBER Working Papers 10389, National Bureau of Economic Research.
Bollerslev, T. 1986. "Generalized Autoregressive Conditional Heteroskedasticity", Journal of Econometrics, 37, 307-327.
Bosworth, B., and S. Collins. 2003. "The Empirics of Growth: An Update", Mimeo, Brookings Institution, Washington D.C.
Braga de Macedo, J. and J. Oliveira Martins 2005. "Growth, Reform indicators and Policy complementarities", presented at the 2005 LACEA Conference, Paris
Caselli, F., G. Esquivel, and F. Lefort. 1996. "Reopening the Convergence Debate: A New Look at Cross Country Growth Empirics", Journal of Economic Growth, 1, 3,
89 363-
Cihan C., S. Saygili and H. Yurtoglu. 2005. "Turkiye Ekonomisinde Sermaye Birikimi Verimlilik ve Buyume: 1972-2003", The Turkish State Planning Organization No:2686
Cohen, W. M. and D. A. Levinthal. 1989. "Absorptive Capacity: A New Perspective on Learning and Innovation", Administrative Science Quarterly 35: 128- 152.
Conway P., V. Janod and G. Nicoletti. 2005. Product Market Regulation in OECD Countries: 1998 to 2003, ECOWKP (2005)6. Organization for Economic Co- operation and Development, Paris.
Cunningham, Wendy and William F. Maloney. 2000. "Measuring Vulnerability: Who Suffered in the 1995 Mexican Crisis", IBRD Mimeo, World Bank
Doyle P., K. Louis. and G. Jiang. 2001. "Real Convergence to the EU Income Levels: central Europe from 1990 to the long term", IMF Working Papers 2001/146.
i.
Easterly W. and L. Serven. 2004. The Limits of Stabilization: Infrastructure and Fiscal Adjustment in Latin America, Stanford University Press.
Elc i Sirin. 2005. "Innovation and Technology Absorption in Turkey". Background paper for CEM and Investment Climate Study.
330

Engle, R.F. 1982. "Autoregressive Conditional Heteroskedasticity with Estimates o f the Variance of U.K. Inflation", Econometrica. 50: 987-1008.
European Commission. 2005. 2005 Regular Report on Turkey's Progress Towards Accession. European Commission, Brussels.
European Trend Chart on Innovation. 2004. Annual Innovation Policy for Turkey, September 2003-August 2004. European Commission, Brussels.
Fan S. and N. Rao. 2003. "Public Spending in Developing Countries", Discussion Paper. International Food Policy Research Institute, Washington, D.C.
Friedman, James, 1968. "An Experimental Research in Oligopoly", Cowles Foundation Discussion Papers 246, Cowles Foundation, Yale University
Fuente, A. 1997. "The empirics o f growth and Convergence: A Selective Review", Journal of Economic Dynamics and Control, p. 23-73.
Funck B. and P. Lodovico. 2003. European Integration, Regional Policy, and Growth. The Wor ld Bank, Washington, DC.
George Evans & Seppo Honkapohja & Paul Romer. 1996. "Growth Cycles", NBER Working Papers 5659, National Bureau o f Economic Research.
Griffith, R. and R. Harrison. 2004. "The link between product market reform and macro-economic performance", European Economy: Economic Papers No. 209, Brussels.
Grossman, G.M. ve E. Helpman. 1990. "Comparative Advantage and Long-Run Growth", American Economic Review 80:4,796-815.
Grossman, G. and Helpman, E. 1991. Innovation and Growth in the World Economy, M.I.T. Press, 199 1.
Hamilton, James D. 1994a. Time Series Analysis. Princeton University Press
Holzmann, Robert, Kripa Iyer and Mi lan Vodopivec. 2003. "Severance Pay Programs around the World: Rationale, Status, and Reforms", The World Bank, Mimeo. The World Bank, Washington, DC.
EA.. The Trends in International Mathematics and Science Study (TIMSS). International Education Association, Amsterdam.
E A . The Progress in International Reading Literacy Study (PIRLS). International Education Association, Amsterdam.
ISKUR. 2003. Background Study on Labor Market and Employment in Turkey. ISKUR. Ankara
33 1

Islam, N. 1995. "Growth Empirics: A Panel Data Approach", Quarterly Journal of Economics, 110,4, 1127-70.
IMF. 2005. World Economic Outlook, Chapter IV. International Monetary Fund, Washington, DC.
Jonathan Eaton & Samuel Kortum. 2001. "Trade in Capital Goods", NBER Working Papers 8070. National Bureau of Economic Research.
Kaminski B. 2005. "Turkey: Technical Standards Regime and Trade", Background Note for the CEM, 2005. The World Bank, Washington, DC.
Kenar N. and H. Levent. 2005. "Informal Economy in Turkey". Background paper for the CEM, 2005.
Keynes, J. M.1936. The General Theory of Employment, Interest, and Money. paperback edition: New York: Harcourt Brace & World, Inc. 1965.
Khemani R.K. 2005. "Competitiveness, Investment Climate and Role of Competition Policy in Turkey", Foreign Investment Advisory Services (FIAS), The World Bank, Washington, DC.
La11 S. and E. Taymaz. 2003. "Monitoring and Evaluation of the Industrial Technology Project, Second Report", Interim Report. Oxford and Ankara
La11 S. and E. Taymaz. 2004. "Monitoring and Evaluation of the Industrial Technology Project, Third Report", Interim Report. Oxford and Ankara
La11 S. 2005. "Technology Absorption: An Overview", presentation at The World Bank Istanbul Knowledge Economy Forum.
Levine, R., N. Loayza, and T. Beck. 2000. "Financial Intermediation and Growth: Causality and Causes", Journal of Monetary Economics, 46, 1,31-77
Loayza N., H. Lopez, K. Schmidt-Hebbel and L. Serven. 2000. "What Drives Private Saving Across the World? ", The Review of Economics and Statistics 82(2):165-181.
Lucas, R.E. 1988. "On the Mechanics of Economic Development", Journal of Monetary Economics 22, 3-42.
Luis A. Rivera-Batiz & Paul M. Romer. 1990. "Economic Integration and Endogenous Growth", NBER Working Papers 3528. National Bureau of Economic Research.
Markandya, A. 2005. "Turkey on the Path of to the Accession" p. 295 - 309 in "Turkey. Economic Reforms & Accession to the European Union", copublication of the World Bank and the Centre for Economic Policy Research
Martin, P. and C.A. Rogers, 1997. "Stabilisation policy, learning-by-doing and economic growth". Oxford Economic Papers, 49, 152-166.
332

McKinsey Report. 2004. Turkey: Making the Productivity and Growth Breakthrough. McKinsey Global Institute
Mitra K. Pradeep.2005: "Towards Sustainable Social Sector Expenditures in the New Member States of the European Union", The World Bank Presentation, London, June 2005.
Musso A. and T. Westermann. 2005. "Assessing Potential Output Growth in the Euro Area", ECB Occasional Papers No. 22.
Nelson, Daniel B. 1991. "Conditional Heteroskedasticity in Asset Returns: A New Approach", Econometrica, 59, 347-370.
OECD. 1999. Sigma Baselines: October 1999. Organization for Economic Co- operation and Development, Paris.
OECD. 2003. The Sources of Economic Growth in OECD Countries. Organization for Economic Co-operation and Development, Paris.
OECD. 2004. Best practice Guidelines-Off Budget and Tax expenditures. Public Governance and Territorial Development Directorate, Paris.
OECD. 2004. Economic Survey of Turkey. Organization for Economic Co-operation and Development, Paris.
OECD. 2005. Going for Growth. Organization for Economic Co-operation and Development, Paris.
OECD. 2005. Growth in Services (Ministerial Level Meeting). Organization for Economic Co-operation and Development, Paris.
OECD. 2005. Peer Review of Turkey's Competition Law and Policy. Organization for Economic Co-operation and Development, Paris.
OECD. 2005. PMR database. Organization for Economic Co-operation and Development, Paris.
Peroti R. 1996. "Fiscal Consolidation in Europe: Composition Matters 'I, American Economic Review.
Pindyck, R. 199 1. "Irreversibility, uncertainty, and investment", Journal of Economic Literature 29, 11 10-1 148.
Ramey, G. and V. Ramey. 1991. "Technology Commitment and the Cost of Economic Fluctuations", NBER Working Papers 3755, National Bureau of Economic Research, Inc
Ramey, G. and V. Ramey. 1995. "Cross-Country Evidence on the Link Between Volatility and Growth" American Economic Review, 85, 5, 1138-1 151.
333

Reichel M. 2005. "Administrative Barriers", Background paper for the Investment Climate Study 2005. The World Bank, Washington, DC.
Riboud, Sanchez-Paramo, and Silva-Jauregi 2002. "Does Eurosclerosis Matter?: Institutional Reform and Labor Market Performance in Central and Eastern Europe", World Bank Technical Paper. The Wor ld Bank, Washington, DC.
Ricardo J. Caballero. 2000. "Macroeconomic Volatility in Latin America: A View and Three Case Studies", NBER Working Papers 7782, National Bureau o f Economic Research, Inc.
Romer, Paul. 1986. "Increasing Returns and Long Run Growth", Journal of Political Economy 94: 1002-37.
Romer, Paul. 1996. "Why, indeed, in America? Theory, History, and the Origins o f Modem Economic Growth", NBER Working Papers 5443. National Bureau of Economic Research.
Samuelson, Paul. 1964. "Theoretical Notes on Trade Problems", Review of Economics and Statistics, Vol. 46, No. 2, pp. 145-154.
Sandmo, A. 1970. "The Effects o f Uncertainty on Saving Decisions", Review of Economic Studies, 37(3), 353-360.
Sayek, Selin. 2005. "FDI in Turkey: The Investment Climate and EU Effects", Background paper for the CEM, 2005.
Scarpetta, Stefan0 & Nicoletti, Giuseppe. 2003. "Regulation, productivity, and growth: OECD evidence," Policy Research Working Paper Series 2944, The Wor ld Bank.
Solow, R. 1956. "A Contribution to the Theory o f Economic Growth", Quarterly Journal of Economics, 70, 1, 65-94.
SPO. 2004. SME Strategy and Action Plan, 2004. Organization, Ankara.
The Turkish State Planning
Talvi, E. and C. VCgh. 2000. "Tax Base Variability and Procyclical Fiscal Policy", NBER Working Paper no. 7499.
Taymaz E. and S. Ozler. 2005. "Labor Market Policies and EU Accession: Problems and Prospects for Turkey", Working Papers 0405, ERC - Economic Research Center.
The Government o f Turkey. 2005. Presentation by the Republic of Turkey on State Aid for the screening meeting of Chapter 8, The Government of Turkey, Ankara.
The Government of Turkey. Turkish National Programme for the Adoption of the Acquis, The Government o f Turkey, Ankara.
334

TURKSTAT. 2003. Household Labor Force Surveys (HLFS). Turkish Statistical Institute. Ankara
TURKSTAT. 2005. Quarterly Manufacturing Survey (2Q2005). Turkish Statistical Institute, Ankara
UNDP. 2003. National Information Society Policies. United National Development Programme Regional Service Center, Slovakia.
USDA Economic Research Service. 1999. Agriculture in Poland and Hungary Preparing for EU Accession. Agricultural Outlook. United States Department of Agriculture, Washington, DC.
Van der Mensbrugghe D.; W. Martin and K. Anderson. 2005. "Distortions to world trade: impacts on agricultural markets and farm incomes", The World Bank, Policy Research Working Paper Series: 3736.
Vodopivec Milan. 2004. "Income Support Systems for the Unemployed: Issues and Options", The World Bank, Washington, DC.
Vroman W. and V. Brusentsev. 2005. Unemployment Compensation : A Comparative Analysis . WE Upjohn Institute for.
WEF. 2004. The Global Competitiveness Report. The World Economic Forum, Geneva.
WEF. Global Competitiveness Report (2000 and following years). The World Economic Forum,Geneva.
Wijnbergen V. and N. Budina.2005. " I s Turkey Ready for Inflation Targeting?", Background paper for CEM, 2005.
World Bank. 2003. One of Closing the Gap in Education and Technology. The World Bank, Washington, DC.
World Bank. 2003. Turkey CEM: Towards Macroeconomic Stability and Sustained Growth. The World Bank, Washington, DC.
World Bank. 2004. Concept Note for a Regional Study on Access to Finance and Innovation in East European and Central Asia Countries. The World Bank, Washington, DC.
World Bank. 2004. Doing Business in 2005: Removing Obstacles to Growth. The World Bank, Washington, DC.
World Bank. 2064. Poland and the Knowledge Economy. The World Bank, Washington, DC.
World Bank. 2004. Turkey: Gas Sector Strategy Note. The World Bank, Washington, DC.
335

World Bank. 2005. Doing Business in 2006: Creating Jobs. The World Bank, Washington, DC.
World Bank. 2005. EU-8 Quarterly Economic Report. The World Bank, Washington, DC .
World Bank. 2005. From Disinflation to Reintegration Europe and Central Asia In International Trade. The World Bank, Washington, DC.
World Bank. 2005. The World Bank Education Sector Study. The World Bank, Washington, DC.
World Bank. 2005. Turkey Labor Market Study. The World Bank, Washington, DC.
World Bank. 2005. Turkey Policy and Investment Priorities for Agricultural and Rural Development. The World Bank, Washington, DC.
World Bank. 2005. World Development Report 2005. The World Bank, Washington, DC.
World Bank. World Development Indicators. The World Bank, Washington, DC.
World Bank. Industrial Technology Project (1999-2006). The World Bank, Washington, DC.
WSIS. 2004. The Report of the Task Force on Financial Mechanisms for ICT for Development. The World Summit on Information Society, Geneva.
YASED. 2003. Mimeo. The Foreign Investors Association of Turkey, Ankara
336

MAP SECTION
337


TTuzuzGGööllüü
HoyranHoyranGGööllüü
BaysehirBaysehirGGööllüü
AksehirAksehirGGööllüü
Prut
ÇÇoorruuhh
MMuurraatt
KKuurraa
FFiirraatt
SSaakkaarryyaa
DDeevvrreezz
KKiizziill
CCeekkeerreekk
KKiizzii
ll
SSeeyyhh
aann
GGöökkssuu
CCeeyyhhaann
KKeellkkiitt
KKuuzzeeyy AAnnaaddoolluu DDaaggllaarr ii
TToorrooss DDaaggllaarr iiKaramanKaraman
KonyaKonya
AksarayAksaray
NigdeNigde
NevsehirNevsehir KayseriKayseri
MalatyaMalatya
AdiyamanAdiyaman
ElazigElazig
TTunceliunceli
ErzincanErzincan
BingBingööllMusMus
BitlisBitlis
DiyarbakirDiyarbakir BatmanBatman SiirSiirtt
SirSirnaknakMardinMardin
HakkariHakkari
VVanan
AgriAgriIgdirIgdir
ErzurumErzurum
KarsKars
ArArtvintvin
RizeRize
GGüümmüüshaneshane¸̧BayburBayburtt
GiresunGiresun
TTokatokat
SivasSivas
AmasyaAmasya
KastamonouKastamonou
ÇÇankiriankiri
KarabKarabüükk
BoluBoluSakarSakaryaya(Adapazari)(Adapazari)
KocaeliKocaeli(Izmit)(Izmit)
BilecikBilecik
EskisehirEskisehir
KKüütahyatahya
BursaBursa
YYalovaalova
IstanbulIstanbulTTekirdagekirdag
EdirEdirneneKirklareliKirklareli
ÇÇanakkaleanakkale
BalikesirBalikesir
ManisaManisaIzmirIzmir UsakUsak
AAydinydin
DenizliDenizliBurdurBurdur
IsparIspartata
AfyonAfyon
AntalyaAntalya
MuglaMugla
KirikkaleKirikkale
ÇÇorumorum
YYozgatozgat
KirsehirKirsehir
AdanaAdana
OsmaniyeOsmaniye
KahramanKahraman Maras Maras
GaziantepGaziantep
KilisKilis
SanliurSanliurfafa
ArdahanArdahan
ANKARAANKARA
AArraass
DDüüzcezce
SYRIAN ARABREPUBLIC
IRAQ
ARMENIA
GEORGIA
BULGARIARUSSIAN FEDERATION
AZER-BAIJAN
AZER.
To Batumi
To Kirovakan
ToMaku
ToSalmas
ToOroumieh
ToDahukTo Damir
KabuTo
Al Hasakah
ToAleppo
ToBurgasTo
Kurdzhali
Kuzey Anadolu Daglar i
To ros Daglar iKaraman
Konya
Aksaray
Nigde
Nevsehir Kayseri
Malatya
Adiyaman
Elazig
Tunceli
Erzincan
BingölMus
Bitlis
Diyarbakir Batman Siirt
SirnakMardin
Hakkari
Van
AgriIgdir
Erzurum
Kars
Artvin
RizeTrabzon
Gümüshane¸Bayburt
Giresun
Ordu
Tokat
Sivas
Amasya
Samsun
Sinop
Kastamonou
Çankiri
Karabük
BartinZonguldak
Bolu
Düzce
Sakarya(Adapazari)
Kocaeli(Izmit)
Bilecik
Eskisehir
Kütahya
Bursa
Yalova
IstanbulTekirdag
EdirneKirklareli
Çanakkale
Balikesir
ManisaIzmir Usak
Aydin
DenizliBurdur
Isparta
Afyon
Antalya
Mugla
Kirikkale
Çorum
Yozgat
Kirsehir
Icel(Mersin)
Adana
Hatay (Antakya)
Osmaniye
Kahraman Maras
Gaziantep
Kilis
Sanliurfa
Ardahan
ANKARA
SYRIAN ARABREPUBLIC
IRAQ
ISLAMICREP. OFIRAN
ARMENIA
GEORGIA
BULGARIARUSSIAN FEDERATION
AZER-BAIJAN
AZER.
GRE
ECE
GREECE
TuzGölü
HoyranGölü
BaysehirGölü
AksehirGölü
Lake Van
Çoruh
Murat
Kura
Aras
Firat
Tigris
Euphrates
Sakarya
Devrez
Kizil
Cekerek
Kizi
l
Seyh
an
Göksu
Ceyhan
Kelkit
B lack Sea
Medi terranean Sea
Sea ofMarmara
Gulf ofAntalya
Bosporus
Dardanelles
To Batumi
To Kirovakan
ToMaku
ToSalmas
ToOroumieh
ToDahukTo Damir
KabuTo
Al Hasakah
ToAleppo
To Ladhiqiyah
ToBurgasTo
Kurdzhali
ToKomatini
Kuzey Anadolu Daglar i
To ros Daglar i
Mt. Ararat(5166 m)
26°E 28°E 30°E 32°E 34°E 36°E 38°E
42°E 44°E30°E28°E 32°E 34°E
36°N
38°N
40°N
42°N
40°N
42°N
TURKEY
This map was produced by the Map Design Unit of The World Bank. The boundaries, colors, denominations and any other informationshown on this map do not imply, on the part of The World BankGroup, any judgment on the legal status of any territory, or anyendorsement or acceptance of such boundaries.
0 50 150100
0 50 100 150 Miles
200 Kilometers
IBRD 33501
JAN
UA
RY 2005
TURKEYPROVINCE CAPITALS*
NATIONAL CAPITAL
RIVERS
MAIN ROADS
RAILROADS
PROVINCE BOUNDARIES*
INTERNATIONAL BOUNDARIES
*Province names are the same as their capitals.