MAURITANIA - Country Economic Memorandum
104
MAURITANIA Country Economic Memorandum: Accelerating Growth Through Diversification and Productive Cities Public Disclosure Authorized Public Disclosure Authorized Public Disclosure Authorized Public Disclosure Authorized
-
Upload
khangminh22 -
Category
Documents
-
view
1 -
download
0
Transcript of MAURITANIA - Country Economic Memorandum

MAURITANIACountry Economic Memorandum: Accelerating Growth Through Diversification and Productive Cities
Pub
lic D
iscl
osur
e A
utho
rized
Pub
lic D
iscl
osur
e A
utho
rized
Pub
lic D
iscl
osur
e A
utho
rized
Pub
lic D
iscl
osur
e A
utho
rized

© 2020 The World Bank
1818 H Street NW, Washington DC 20433
Telephone: 202-473-1000; Internet: www.worldbank.org
Some rights reserved
This work is a product of the staff of The World Bank. The findings, interpretations, and conclusions expressed in this work do not
necessarily reflect the views of the Executive Directors of The World Bank or the governments they represent. The World Bank does not
guarantee the accuracy of the data included in this work. The boundaries, colors, denominations, and other information shown on any map
in this work do not imply any judgment on the part of The World Bank concerning the legal status of any territory or the endorsement or
acceptance of such boundaries.
Rights and Permissions
The material in this work is subject to copyright. Because the World Bank encourages dissemination of its knowledge, this work may be
reproduced, in whole or in part, for noncommercial purposes as long as full attribution to this work is given.
Attribution—Please cite the work as follows: “World Bank. 2020. Mauritania Country Economic Memorandum: Accelerating Growth
Through Diversification and Productive Cities © World Bank.” All queries on rights and licenses, including subsidiary rights, should be
addressed to World Bank Publications, The World Bank Group, 1818 H Street NW, Washington, DC 20433, USA; fax: 202-522-2625;
e-mail: [email protected].

MAURITANIACountry Economic Memorandum: Accelerating Growth Through Diversification and Productive Cities
May 2020
MAURITANIA: Country Economic Memorandumii
Abbreviations vii
Acknowledgements ix
Executive summary xi
1. Introduction 1
2. Understanding Mauritania’s growth story 52.1. Growth history 5
2.2. Weak foundations for growth and structural transformation 7
2.2.1. Over-reliance on extractives 8
2.2.2. A missing link between urbanization and growth 11
3. The need to diversify the Mauritanian economy 153.1. Why diversification matters to Mauritania? 15
3.1.1. Diversification is a top priority for Mauritania’s development process 15
3.1.2. Mauritania has struggled to diversify exports away from extractives 17
3.2. What are the opportunities for diversification? 20
3.2.1. Focus on products with emerging comparative advantage 20
3.2.2. Export quality upgrading 22
3.2.3. New export opportunities based on established patterns 23
3.2.4. Further develop exports of transport services 24
3.3. Constraints to agricultural productivity 25
3.3.1. Human capital 25
3.3.2. Access to Finance 26
3.3.3. Value chains and Markets 27
3.3.4. Public spending 29
3.3.5. Governance 29
3.3.6. Land 30
3.4. Is Mauritania’s current diversification ecosystem adequate? 31
3.4.1. Rigid exchange-rate policy and underdeveloped banking sector 31
3.4.2. Despite recent improvements, the business environment remains challenging 31
Contents

MAURITANIA: Country Economic Memorandum iii
3.4.3. High tariffs and trade restrictions compound a challenging business environment 35
3.4.4. Absence of preferential trade agreements 36
3.4.5. Poor infrastructure and connectivity increase trade costs 37
3.4.6. Weak human capital 39
4. The missing link between urbanization and growth 414.1. Introduction 41
4.2. Understanding the urbanization landscape in Mauritania 42
4.2.1. Urbanization and its Drivers 42
4.2.2. Spatial Inequality in Welfare and Access to Services: a Driver for Migration? 46
4.3. Unpacking the linkages between urbanization and growth 47
4.4. Is Nouakchott lifting its weight as an urban agglomeration? 52
4.4.1. Absence of effective land management and urban planning has resulted in urban sprawl 55
4.4.2. Low population densities, disconnected neighborhoods, and financing constraints make infrastructure
and services costly 56
4.4.3. Inadequate institutional capacities also hamper other urban services 58
4.4.4. Nouakchott’s low wage premium 59
4.4.5. Low education 60
4.4.6. Climate change challenges 60
5. The way forward for a more sustainable and resilient growth path 635.1. Promote a more market-oriented economy 63
5.1.1. Adopt an export-prone trade policy 63
5.1.2. Improve the business environment and promote local entrepreneurship 65
5.2. Enhance production factors 65
5.2.1. Boost education and skills 65
5.2.2. Improve infrastructure and connect cities 67
5.2.3. Make land use more efficient 68
5.3. Strengthen governance and improve urban planning 69
5.4. Better manage natural resources and adopt a more market-based exchange rate 70
Appendices 73I. Data limitations 74
II. Growth accounting: production function 75
III. The diversification-growth nexus: evidence from the literature 76
IV. Definitions of export/trade concepts 77
V. Wage premium analysis 78
VI. Oaxaca Decomposition Analysis 79
VII. Lessons from Peru’s successful growth experience 80
References 82

MAURITANIA: Country Economic Memorandumiv
List of FiguresFigure 1: The poverty rate declined rapidly over time in Mauritania… 2
Figure 2: …, but the country’s development level did not improve relative to other countries 2
Figure 3: Between 1992 and 2018, GDP growth in Mauritania was almost equal to the SSA average, … 6
Figure 4: … but it was very volatile with a standard deviation of 4.5 percent 6
Figure 5: Mauritania’s growth path can be decomposed into three main periods that were characterized
by natural resources, climatic hazards, and political instability 6
Figure 6: Extractives, transport and communication, and agriculture were the main drivers of growth 7
Figure 7: The product space in Mauritania remained almost the same between 2000 (left) and 2017 (right) 8
Figure 8: Mauritania lags its peers on economic complexity 8
Figure 9: The standard Solow decomposition shows that physical capital was the driver of growth… 9
Figure 10: …, but this masks the major growth effect of natural resource extraction in the past two decades 9
Figure 11: About 80 percent of per capita wealth growth in Mauritania was driven by natural capital 10
Figure 12: In contrast, Mauritania suffered from limited human capital accumulation 10
Figure 13: Agricultural growth in Mauritania stemmed from labor and livestock accumulation 10
Figure 14: Despite some improvement in recent years, Mauritania still lag its peers on agricultural TFP 10
Figure 15: The rapid urbanization in Mauritania was not accompanied by parallel increases in GDP per capita,
in contrast to the relationship in its peers 11
Figure 16: The percentage of urban population living in slums is very high in Mauritania 11
Figure 17: Between 2004 and 2014, labor moved from agriculture to sectors with low and declining productivity 12
Figure 18: Despite the oil and mining boom, Mauritania did not experience a structural transformation 12
Figure 19: The share of firms operating in non-traded sectors in Nouakchott is high 13
Figure 20: Mauritania remains highly dependent on extractives 16
Figure 21: GDP growth more than halved after 2014, positioning Mauritania as a backslider in SSA 16
Figure 22: Economic diversification is clearly highlighted in the SCAPP as a key driver for growth 17
Figure 23: Wilayas with more natural resources are more economically complex in terms of labor force 17
Figure 24: Mauritania’s export structure remains largely dependent on extractives and fish 18
Figure 25: Although export destinations are more diversified overall, … 18
Figure 26: … exports of main products are concentrated in few destinations 18
Figure 27: Mauritania’s export growth was largely driven by the “intensive margin” 19
Figure 28: FDI inflows in Mauritania are very high, … 19
Figure 29: … but are destined to extractives 19
Figure 30: In Mauritania, the number of products with an RCA is small … 20
Figure 31: … and did not increase over time 20
Figure 32: Fish products offer more opportunities for quality upgrading, … 22
Figure 33: …especially high value-added products like fresh/chilled fish, fish fillets, and dried fish 22
Figure 34: More than half of Mauritanians working in the agriculture sector are illiterate… 26
Figure 35: … and the ratio of workers who receive agricultural payment with limited schooling is high 26
Figure 36: Public spending on agricultural research… 26
Figure 37: … and the skill level of researchers have dropped in Mauritania compared to comparators 26
Figure 38: Access to finance in rural areas declined in Mauritania, in contrast to the rising trend in peer countries 27
Figure 39: Most Mauritanians still rely on cash to receive agricultural payments 27
Figure 40: Mauritania exports lower added-value hides and skins’ products than Senegal and Cote d’Ivoire 28
Figure 41: Public spending on agriculture in Mauritania is very low and declined in recent years… 29
Figure 42: … due to the large cut in subsidies 29

MAURITANIA: Country Economic Memorandum v
Figure 43: The REER was on an appreciating trend 32
Figure 44: NPLs in Mauritania are very high compared to SSA 32
Figure 45: The business environment in Mauritania improved compared to its peers in recent years 34
Figure 46: However, it remains below the country’s income potential because of … 34
Figure 47: … financing constraints, … 34
Figure 48: … limited competition, … 34
Figure 49: … poor electricity infrastructure, … 35
Figure 50: … and lack of skilled labor 35
Figure 51: Mauritania’s import tariffs are high 37
Figure 52: Mauritania is second to last in the world on the prevalence of NTMs 37
Figure 53: Mauritania performs poorly in terms of trade logistics 38
Figure 54: Despite declining over time, trade costs in Mauritania remain elevated 38
Figure 55: Mauritania’s territory is characterized by low population density 42
Figure 56: Half of the urban population in Mauritania resides in the capital Nouakchott … 43
Figure 57: … while 37 percent reside in towns below 10 thousand inhabitants 43
Figure 58: Nouakchott’s population nearly doubled over the past two decades, driven mostly by migration 43
Figure 59: The main cities to which individuals migrated are Nouakchott and Nouadhibou and the mining areas 44
Figure 60: Young males are the most likely to migrate... 44
Figure 61: … with Nouakchott being the main migration destination 44
Figure 62: A continuation of previous migration patterns will heavily influence the regional composition population 45
Figure 63: The difference between rural and urban welfare is sizeable ... 46
Figure 64: … and is more pronounced in the South that has the largest headcount poverty ratio 46
Figure 65: Urbanized communes have better access to… 47
Figure 66: … electricity… 47
Figure 67: … piped water… 47
Figure 68:… and sanitation systems 47
Figure 69: Communes in the south of Mauritania are largely dependant on framing and herding 48
Figure 70: Regions in the South of Mauritania were affected by a food crisis in 2018 48
Figure 71: Urban agglomerations in Mauritania are among the least dense in Africa 49
Figure 72: Many localities, especially in the South, show low economic activity and do not emit light 49
Figure 73: Urban agglomerations in Mauritania are very distant from each other 49
Figure 74: About half of Mauritania’s territory has no or limited connections to within country market towns 49
Figure 75: The spatial price variation for Charcoal (panel A) and Milk concentrate (panel B) points to high
transport costs 50
Figure 76: The quantity and … 51
Figure 77: … quality of roads in Mauritania are poor 51
Figure 78: Social cohesion in Mauritania is very low when compared to other countries in the world 52
Figure 79: Between 1977 and 2018, Nouakchott’s population grew by a factor of ten 53
Figure 80: Nouakchott’s contribution to the economy is lower than what is expected given its population 53
Figure 81: Nouakchott’s urban footprint expanded 30-fold between 1964 and 2016 54
Figure 82: Leapfrogging in Nouakchott increased dramatically since 2000 55
Figure 83: Low-rise buildings dominate the housing structure in Nouakchott 55
Figure 84: Nouakchott has a very low and flat population density gradient compared to Dakar 57
Figure 85: Access to piped water is low declines with distance to the CBD … 57
Figure 86: … as does access to the internet within household 57
MAURITANIA: Country Economic Memorandumvi
Figure 87: The cost of financing in Mauritania is the highest compared to peer countries 58
Figure 88: Nouakchott has an advantage in wage differentials over other Mauritanian regions, except
with Tiris Zemmour, Inchiri, and Nouaddhbiou 59
Figure 89: While access to schools seems spatially secured, it is low in Nouakchott 60
Figure 90: In Nouakchott, emigrants are better educated than those that they leave behind, but immigrants
seem less educated compared to the original population 61
Figure 91: Boosting human capital would yield economic gains … 66
Figure 92: … and reduce the percentage of Mauritanians living under 1.9$ per day 66
List of TablesTable 1: Summary of recommendations that could help Mauritania achieve a sustainable growth path xv
Table 2: Mauritania has a consolidated revealed comparative advantage in mineral and fish products and a strong
potential for creating a consolidated comparative advantage in some animal and mineral related products 21
Table 3: Industries in the nearby product space of Mauritania’s current capabilities include animal, vegetable,
fish and copper-related products 23
Table 4: Mauritania has an increasing (decreasing) RCA in sea transport (travel and ICT) services 24
Table 5: Among major cities, Rosso is the city where cars roll at the slowest pace when travelling from/to Nouakchott 39
Table 6: Administratively, Mauritania is divided into 13 regions, each with its own capital 42
Table 7: In 2015, 90 percent of the urban population (other than Noukachott and Nouadhibou) lived in cities that
were more than 200 km away from the next larger city 51
Table 8: Younger migrants to Nouakchott are less educated than older cohorts 61
Table 9: Wage gap estimation between Nouakchott and other urban areas. 78
List of BoxesBox 1: Description of CEM 2.0 analytical framework 3
Box 2: Few large firms dominate key markets 33
Box 3: Future population will grow rapidly and be largely concentrated in Nouakchott if past migration
trends continue 45
Box 4: One-stop shops facilitated trade in Laos and Zambia 64
Box 5: Successful experiences of land management in SSA countries 68

MAURITANIA: Country Economic Memorandum vii
ACFTA African Continental Free Trade Area
AMU Arab Maghreb Union
BCM Banque Centrale de la Mauritanie
CBD Center of Business District
CBM Central Bank of Mauritania
CAGR Compound Annual Growth Rate
CEM Country Economic Memorandum
CPF Country Partnership Framework
DB Doing Business
ECOWAS Economic Community of West African
States
ECI Economic Complexity Index
EPCV Enquête Permanente sur les Conditions
de Vie des Ménages
EU European Union
FDI Foreign Direct Investment
GCI Global Competitiveness Index
GoM Government of Mauritania
GTA Grant Tortue Ahmenyim
GDP Gross Domestic Product
IMF International Monetary Fund
JICA Japan International Cooperation Agency
LFS Labor Force Survey
LCSI Liner Connectivity Shipping Index
LPI Logistics Performance Index
CNERV National Livestock and Veterinary
Research Centre
ONS National Office of Statistics
NFHR National Fund for Hydrocarbon Revenues
NQI National Quality Infrastructure
NTMs Non-Tariff Measures
ONS Office National de la Statistique
OECD Organisation for Economic Co-operation
and Development
PIP Public Investment Program
RGPH Recensement Général de la Population et
de l’Habitat
RCA Revealed Comparative Advantage
RUN Urban Region of Nouakchott
SMCP Société Mauritanienne de
Commercialisation du Poisson
SCAPP Strategie Nationale De Croissance Aceleree
et de Prosperite Partage
SSA Sub-Saharan Africa
ToT Terms of Trade
TFP Total Factor Productivity
USDA United States Department of Agriculture
WBL Women, Business and the Law
WB World Bank
WDI World Development Indicators
WTO World Trade Organization
Abbreviations


MAURITANIA: Country Economic Memorandum ix
This Country Economic Memorandum (CEM) was prepared by a multisectoral World Bank team led by Samer Matta (Economist) based on three background papers prepared as part of the CEM 2.0 process. Chapters 1 and 2 were written by Samer Matta, with contributions from Fiseha Haile Gebregziabher (Economist). Chapter 3 was prepared by Guillermo Arenas (Trade Economist), with contributions from Samer Matta, Nabil Chaherli (Lead Agriculture Economist), Hadramy Oubeid (Public Sector Specialist), Brahim Sall (Senior Rural Development Specialist), Daniel Gerber (Senior Agriculture Economist), and Lilian Yves Yvon Puech (Senior Livestock Specialist). Chapter 4 was written by Kirsten Hommann (Senior Urban Economist) and Moritz Meyer (Poverty Economist), with contributions from Farouk Banna (Senior Urban Sanitation Specialist), Thomas Gertin (Consultant), Alexandra Le Courtois (Urban Specialist), Katie McWilliams (Geographer), Anirudh Rajashkar (Consultant), and Benjamin Stewart (Geographer). All the above team members contributed to chapter 5. Isolina Rossi (Consultant), and Melanie Laloum (Consultant) conducted various analyses in different parts of the report. The team also acknowledges overall contributions from Cristina Navarrete Moreno (Private Sector Specialist) and Andre Teyssier (Senior Land Administration Specialist).
The report was prepared under the overall guidance of Nathan Belete (Country Director), Laurent Msellati (Country Manager), and Lars Christian Moller (Practice Manager). Administrative support from Micky Ananth, Theresa Bampoe, and Maimouna Toure is greatly acknowledged.
The report greatly benefited from two workshops (in October 2018 and February 2019) and interactions with Mauritanian stakeholders, including management and staff of: Ministère de l’Economie et de l’Industrie (MEI), Banque Central de Mauritanie (BCM), Centre Mauritanien d’Analyse de Politiques (CMAP), Office National de la Statistique (ONS), Ministère de l’Habitat, de l’Urbanisme et de l’Aménagement du Territoire (MHUAT), la Région de Nouakchott, l’Union Nationale du Patronat Mauritanien (UNPM), Féderation Mauritanienne de l’Agriculture (FMA), and la Fédération Mauritanienne de l’Élevage (FME), among others.
The team would also like to thank Johan Mistiaen (Program Leader), Christine Richaud (Lead Economist), Aghassi Mkrtchyan (Senior Economist), Somik Lall (Lead Urban Economist), and Jose Reyes (Senior Economist) for their helpful comments.
The analysis is based on information and data available as of December 2019.
This report would not have been finalized without the generous financial assistance from the Umbrella Facility for Trade Trust Fund.
Acknowledgements


MAURITANIA: Country Economic Memorandum xi
he Mauritanian economy is at an important crossroad. Despite significant increases in its
natural resource wealth, economic development
in Mauritania remains weak. The over-reliance on natural
resources has left the economy undiversified with growth,
exports, and fiscal revenues all dependent on extractives.
Responding to the 2015 commodity price shock, the
authorities implemented a strong fiscal consolidation
program that restored macroeconomic stability and
steered the economy onto a recovery path. The new
administration—appointed following the election in mid-
2019—now has the challenge and opportunity to map
out a more sustainable development model and steer
the economy onto a path of accelerated and equitable
economic growth for the rapidly growing population.
The objective of this report is to support policy makers in Mauritania in their reform efforts to accelerate growth as outlined in the National Development Plan (SCAPP). It attempts to answer the following questions: (i) Why
Mauritania could not diversify its economy in the past and
what are the opportunities to do so in the future? (ii) What
are the reasons behind the weak link between urbanization
and growth, and is Nouakchott lifting its weight as an
urban agglomeration? (iii) Which policy actions could help
build those pathways? By answering these questions,
the report aims to contribute to the economic discussion
and provide policy recommendations for the choices that
Mauritania is facing to accelerate growth and improve the
living standards of its population.
The report is organized around five chapters. Chapter 1
starts with a brief introduction. Chapter 2 analyzes the key
characteristics of Mauritania’s past growth performance.
Chapter 3 evaluates the current and future potential for
economic and export diversification. Chapter 4 examines
the challenges that are preventing urbanization from
contributing to growth, with a focus on Nouakchott.
Chapter 5 concludes by proposing a menu of policy
recommendations that could help Mauritania achieve
faster and more sustainable economic growth. The main
messages are summarized below.
Executive Summary
T

MAURITANIA: Country Economic Memorandumxii
Weak foundations of past growth
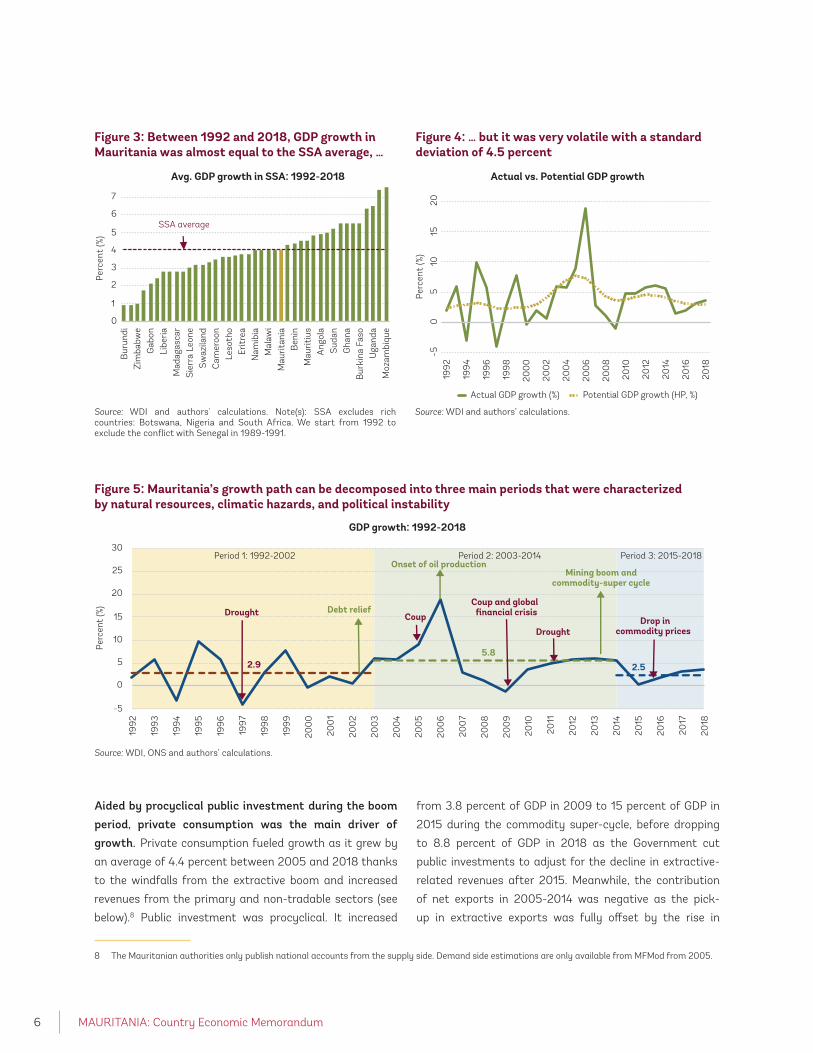
Between 1992 and 2018, economic growth was moderate but highly cyclical. During this period, GDP
growth in Mauritania averaged 4 percent, a rate almost
equal to the SSA average. However, due to the rapid increase
in population, growth was lower in per capita terms. As
a result, the gap in real GDP per capita between the SSA
average and Mauritania has widened, reaching USD 306 in
2018. The growth path also displayed cyclical fluctuations,
reflecting the country’s vulnerabilities to natural resource,
climate, and political shocks.
Growth and wealth accumulation were largely driven by natural resource extraction. The extractive sector made
the biggest contribution to GDP growth, driven by the oil
discovery in mid-2000s and the onset of gold and copper
extraction in the late 2000s and early 2010s. The surge in
natural resources was also behind the 64.7 percent rise in
real wealth per capita between 1995 to 2014.
However, the extractive windfalls were not efficiently invested to boost competitiveness in non-extractive sectors. Mauritania did not leverage its natural capital to
invest in its weak human capital. With a Human Capital
Index of 0.35 (150 out of 157 countries) in 2017, the average
Mauritanian child born today will only reach 35 percent of
his productivity potential endowment, thus hindering future
productivity and growth. Mauritania also suffers from large
infrastructure gaps that are inherited from colonial times,
but also from mismanagement of large public investment
projects that did not yield the expected returns.
The Mauritanian economy suffers from an unchanged and unsophisticated export basket. The export structure
has changed little between 2000 and 2017 and is still
dominated by products requiring little complexity in
processing, namely extractives and low value-added
fishing products. Not only Mauritania failed to diversify its
exports, but its productive capabilities are weak compared
to peer countries. This could slow long-term per capita
growth, particularly if the current population growth trend
continues.
Another manifestation of Mauritania’s weak growth foundations is the missing link between urbanization and economic growth. Mauritania is one of the most
urbanized countries in SSA as 52.8 percent of its 4.2 million
population lived in urban areas in 2017, compared to a 39.5
percent average in SSA. Urbanization has usually gone
hand in hand with sustained GDP growth, but this was not
the case in Mauritania. This missing link manifests itself
through the large percentage of individuals living in urban
slums (about 80 percent in 2014).
Given the importance of diversification and a well-managed urbanization to Mauritania’s development, the rest of the report focuses on these two topics. While acknowledging that Mauritania may face
additional challenges to growth such as human capital
and private sector development, this report is not
designed to be exhaustive. Rather it tries to provide policy
recommendations with a focused approach.
The need to diversify the Mauritanian economy
The lack of diversification hurts the Mauritanian economy. In 1997, mining and fish products accounted
for 97.6 percent of merchandise exports, with almost no
manufacturing exports. Two decades later, this picture
has not changed much as both sectors accounted for 98.1
percent of total exports in 2017. The lack of diversification
not only resulted in limited job creation, but it also exposed
the economy to external vulnerabilities. This was evident
after the fall in commodity prices in 2014 when GDP growth
more than halved from 5.5 percent in 2011-2014 to 2.5
percent in 2015-2018.
Commodity-dependence and a small and disconnected internal market are major reasons for product and market diversification. Extractive industries are unable
to absorb the rapid demographic boom because they are
highly capital-intensive. The Mauritanian economy also
suffers from a small and disconnected domestic market
that limits its ability to attract private investments. Hence,
unless the country diversifies its export basket and expand

MAURITANIA: Country Economic Memorandum xiii
its market reach, strong reliance on commodity-based
exports will keep the economy underperforming, except for
periods of booming commodity prices.
Agriculture (hereinafter defined as crops, fish, and livestock) is the only non-extractive sector in which Mauritania has a clear comparative advantage and has the potential to develop new export opportunities. At the same time, a significant percentage of households
in this sector are poor. Therefore, developing this sector
could promote economic diversification and accelerate
poverty reduction. Yet, this goal would not be feasible with
a lackluster productivity that faces numerous challenges
including insufficient government spending, poor and even
deteriorating human capital, land issues, and governance
weaknesses.
Structural constraints impair Mauritania from expanding its production base and diversifying its economy away from natural resources. The real exchange
rate is overvalued due to limited exchange flexibility and
ineffective monetary policy. This is coupled by financial
vulnerabilities that undermine economic diversification.
In addition to large financial constraints, the business
environment is impaired by limited competition, low skilled
labor, and poor electricity infrastructure. The challenging
business environment is compounded by high import
tariffs which shield domestic producers from international
competition and impede access to cheap imported inputs.
Beyond tariffs, the prevalence of non-tariff measures
(NTMs) and the absence of clear procedures hinder trade.
The lack of preferential trade agreements further reduces
trade connectivity. Finally, large infrastructure and logistic
gaps coupled with limited connectivity increase trade costs.
The missing link between urbanization and growth
Productive cities could drive diversification through agglomeration effects, that is the clustering of firms and individuals in an environment that promotes scale and specialization. Scale can be achieved by producing a
lot of the same product, thereby reducing the fix cost per
unit of production. Specialization occurs when workers
concentrate on doing a few narrowly defined tasks and in
that process accumulate specialized skills that increase
productivity. Scale and specialization interact and are
stimulated by the proximity that successful cities provide
to connect producers and consumers.
The rapid population urban growth in Mauritania was driven by migration and a high fertility rate. In 2017,
the country’s urban population reached about 2.3 million
or about 52.8 percent of the total population. Mauritania’s
fertility rate is among the highest in the world at about
5.1 births per woman. In addition to the high fertility
rate, migration drove population dynamics, particularly
in Nouakchott which now accounts for half of the urban
population. If past migration trends continue, Nouakchott’s
population would grow disproportionally faster than the rest
of the country, potentially leading to further congestion.
Even though Mauritania has made positive strides in reducing spatial inequality in the past, the welfare gap between rural and urban areas remains large. Between
2008 and 2014 rural poverty declined, driven by a robust
growth in median income of rural households. In contrast,
urban areas registered fewer gains in poverty reduction
and Nouakchott witnessed an increase in poverty as it
did not absorb poor migrants into high productive sectors.
This led to some convergence between rural and urban
poverty rates. Yet, welfare differences between rural and
urban communes remain sizeable and poverty rates remain
highest in the South where the population is highly reliant
on agriculture.
Mauritania did not benefit from the economic dividends of urbanization due to low density, large distances, and acute divisions. Urban agglomerations in Mauritania
are among the least densely populated in Africa, meaning
that few cities are sufficiently large to create market
potential or generate economies of scale. In addition,
urban centers are distant from each other because of
geography and disconnected from other urban regions in
neighboring countries due to hard borders. They also face
acute divisions due to inadequate infrastructure, low levels
of social cohesion, and limited trade linkages. These

MAURITANIA: Country Economic Memorandumxiv
challenges limit the benefits of agglomeration economies,
thus undermining long-term growth.
Several factors have rendered Nouakchott a consumption city that is not serving as an engine of economic growth. Nouakchott’s contribution to the economy is below
its potential given its population size. This stems from the
mismanagement of extractives which rendered Nouakchott
a consumption city that urbanized without acquiring
the industrial sectors that are typically associated with
productive cities. Unplanned expansion, deficiencies in
connectivity, weak governance, and financing constraints
have all undermined agglomeration economies and made
it costly to connect workers and firms. Meanwhile, the low
skill base, owing to low educational outcomes of the city’s
original population coupled with the influx of less educated
immigrants and the outflow of more educated emigrants
has failed to invigorate the private sector.
Like other capitals on the West African coastline, Nouakchott is exposed to important climate risks that threaten its sustainability. Given that a large part
of Nouakchott is located below sea level (42.9 percent),
climate change places vulnerable communities at risk from
sea-level rise, more frequent and intense flooding, and
extreme weather events. These topographic challenges are
aggravated by uncontrolled infrastructure building and
inadequate drainage systems.
The way forward for a more sustainable and resilient growth path
While there is no universal recipe for success, Mauritania could orient its diversification strategy toward improving the quality of exported fish, exporting new products, and expanding its market reach: In particular,
Mauritania should:
• Export more volume of products in which it has a
consolidated and emerging comparative advantage,
including: fish products, leather and animal hides,
Arabic gum, malt, and minerals products.
• Improve the quality of high-value added fish products
like fish fillets, fresh/chilled fish, and dried fish. The
financial gains of upgrading the quality and increasing
the exported quantities of these products would be high
given that Mauritania is far behind on the corresponding
quality frontier.
• Pilot and develop new products in which Mauritania can
gain a comparative advantage based on its existing
capabilities. These include sheep’s or lamb’s wool, live
animals, copper alloys, and ores and concentrates.
• Develop the North-South road corridor that is crucial to
support diversification in primary sectors.
• Expand its market reach by strengthening ties with
West African countries.
A package of policies could help Mauritania achieve the proposed diversification strategy and leverage the urban dividends. In particular, this report proposes policy
recommendations that can be implemented in the short,
medium, and long-term. The policy agenda, summarized in
Table 1, is anchored around four interlinked dimensions:
• Promote a more-market oriented economy;
• Enhance production factors;
• Improve planning and strengthen institutions;
• Better manage natural resources and adopt a more
market-based exchange rate policy.

MAURITANIA: Country Economic Memorandum xv
Table 1: Summary of recommendations that could help Mauritania achieve a sustainable growth path
Objective Proposed recommendation(s) Time horizon*
1) Promote a more market-oriented economy
Develop an export-oriented trade policy
Submit a “statement of implementation” to notify WTO members about relevant laws regarding trade procedures
ST
Appoint a trade facilitation enquiry point ST
Agree on a common external tariff with ECOWAS ST
Submit a schedule of tariff concessions and negotiate tariff reductions for key export products under AfCTA
MT
Eliminate non-transparent import taxes MT
Coordinate with Morocco and Senegal to further develop the Tangier-Nouakchott-Dakar trade corridor
LT
Improve the business environment and promote local entrepreneurship
Implement the 2019-2020 reform program to strengthen access to finance and monetary policy mechanisms
ST
Establish a well-coordinated institutional architecture for startup and entrepreneurship
ST
Remove anti-competitive procedures and policies MT
Advocate for legal reforms to encourage women’s participation MT
Study the possibility of joining OHADA LT
2) Enhance production factors
Boost education and skills
Strengthen teacher management and professional development of teachers MT
Review curricula of schools MT
Develop a school-based management system MT
Encourage education of girls LT
Improve infrastructure and connect cities
Finalize the rehabilitation of the Nouakchott-Rosso road and enlarge it in a later stage
ST
Design a framework for prioritizing infrastructure and service development based on demand
MT
Expand and improve road networks, sidewalks and pedestrian equipment in Nouakchott
MT
Maximize land use
Develop a centralized and digitized land registry ST
Streamline land registration procedures ST
Strengthen and decentralize the public land administration MT

MAURITANIA: Country Economic Memorandumxvi
Table 1: Continues
Objective Proposed recommendation(s) Time horizon*
3) Strengthen governance and improve planning
Strengthen governance
Develop a National Quality Infrastructure (NQI) MT
Increase and re-orient Government spending in agriculture toward productive factors
MT
Allocate appropriate finance on a population-based formula to local governments
MT
Improve urban planning
Develop and implement master plans for different urban cities ST
In Nouakchott, introduce appropriate zoning laws that differentiate and connect residential, industrial and office zones
ST
Intensify efforts to build large-scale drainage facilities, particularly in Nouakchott
ST
Protect the coastal dune of Nouakchott from illegal activities ST
Study the possibility of prohibiting construction in areas at high risk of flooding and rising groundwater
MT
Impose a tax on land MT
4) Better manage natural resources and adopt a more market-based exchange rate policy
Strengthen management of natural resources
Increase transparency by clarifying the operational rules of the NFHR and conduct yearly audits
ST
Design an effective rule-based fiscal strategy to manage natural resources MT
Strengthen capacity in the areas of medium-term budget planning, revenue forecasting and fiscal risk analysis
LT
Adopt a more flexible exchange rate
Review the calculation of the daily reference exchange rate ST
Establish an FX auction budget and interbank market MT
Introduce FX auctions in a competitive official market LT
Source: Authors’ elaboration. Note: * ST means short-term, MT means medium-term, and LT means long-term.

MAURITANIA: Country Economic Memorandum 1
auritania is a sparsely populated and arid country that is one of the least developed in the world. Geographically, Mauritania links
the Arab Maghreb and western Sub-Saharan Africa (SSA).
It is characterized by a very low population density of 4.3
people per square kilometers, which is significantly lower
than the 44.9 average in SSA. While the poverty rate
declined over time (Figure 1), Mauritania remains one of the
least developed countries in the world (Figure 2), ranking
159th out 189 countries on the HDI index in 2017.
In 2015-2018, economic activity receded as the authorities addressed the underlying macro-economic imbalances resulting from the over-reliance on extractives. Rather than leveraging the potential of the
extractive boom for productive investment and fiscal
resilience, ineffective management of extractive revenues
has left Mauritania vulnerable to Terms of Trade (ToT)
shocks. As the commodity-price shock in 2014-2015
negatively impacted domestic resources, the Government
embarked on a fiscal consolidation program, including a
1 Société Nationale Industrielle et Minière (SNIM).
significant cut in public investment. This was coupled with
a severe contraction in the extractive sector (11.6 percent
in 2017-2018) stemming from mismanagement and
operational problems at the public mining utility.1
As macroeconomic stability was regained, the Mauritanian economy is today at a significant juncture to shift to a more inclusive and sustainable growth path. The challenge for the new administration that took
office in mid-2019 is to lay the foundations for a new growth
model that promotes economic diversification through
policies that boost productivity in non-extractive sectors
and improve the management of current and expected
natural resources. The structural transformation to a less
resource-dependent and state-driven economy would not
be possible without well-functioning and interconnected
cities that cater to the needs of a young and rapidly
growing population.
This Country Economic Memorandum (CEM) examines Mauritania’s principal challenges and opportunities
Chapter 1
Introduction
M

MAURITANIA: Country Economic Memorandum2
to achieve a more balanced and sustainable growth through economic diversification and sustained urbanization. This choice has been motivated by the
results of the country scan diagnostic which is an integral
part of the new CEM 2.0 analytical framework (Box 1). In
addition, the Government’s development plan (SCAPP,
2016-2030)2 and the World Bank’s Country Partnership
Framework (CPF, 2018)3 both stressed the importance of
diversifying the economy and developing growth-enhancing
cities. The CEM format is not designed to be exhaustive,
and Mauritania may face additional challenges to growth
which are outside of the scope of the report. It should be
also noted that several empirical questions pertaining to
urbanization and diversification were not tackled due to
data scarcity (appendix I).
Across this study, the performance of Mauritania on different economic aspects will be benchmarked to three groups of countries. The first group, referred to as regional
peers, includes the Sub-Saharan African (SSA) average and
Algeria, Tunisia, and Morocco as neighboring Arab countries.
These have been used as comparators in recent studies
(World Bank, 2017b, 2018b). A data-driven approach is
2 The National Development Plan of Mauritania is called: Strategie Nationale De Croissance Aceleree et de Prosperite Partage (SCAPP): 2016-2030.3 World Bank 2018. “Mauritania - Country partnership framework for the period of FY18-FY23 (English)”, Washington D.C.4 See World Bank (2019f) for details about the methodology.
then used to identify structural and aspirational peers.4
Structural peers are defined as countries that currently have
similar structural characteristics and economic features
as Mauritania, while aspirational peers are countries that
were able to grow much faster than Mauritania over time,
despite having had similar initial economic and structural
conditions. In sum, this methodology results in the selection
of Benin, Nicaragua, and Senegal as structural peers, and
Laos, Moldova, and Zambia as aspirational peers.
The remainder of this study is organized as follows. Chapter 2 describes the main macro-economic trends
and analyzes the key characteristics of Mauritania’s past
growth performance. Chapter 3 evaluates Mauritania’s
current and future potential for economic and export
diversification, while chapter 4 examines the challenges
that are preventing urbanization from contributing to
national economic growth, with a focus on Nouakchott.
Finally, chapter 5 concludes by proposing a set of policy
recommendations which could help Mauritania achieve a
more resilient and sustainable growth path.
Figure 1: The poverty rate declined rapidly over time in Mauritania…
Figure 2: …, but the country’s development level did not improve relative to other countries
Source: World Bank (2017b). Source: Human Development Reports. Note: Distance to last represents how far Mauritania’s ranking is from the worst ranking.
51
46,744,5
33
20
25
30
35
40
45
50
55
2000 2004 2008 2014
Perc
ent
(%)
Official poverty rates (national poverty line) HDI rank: 2005−2017
025
5075
100
125
150
175
200
Ran
k
200
5
200
6
200
7
200
8
200
9
2010
2011
2012
2013
2014
2015
2016
2017
Mauritania’s rank Total number of countries Distance to last

MAURITANIA: Country Economic Memorandum 3
Box 1: Description of CEM 2.0 analytical framework
The CEM 2.0 approach proposes innovations in the process and substance of growth analyses. In terms of substance,
the CEM 2.0 proposes a simple analytical framework organized around 20 guiding questions: 10 questions at the macro
level and 10 questions at the micro level. This is combined with 2 overall questions regarding the choice of period of
analysis and peer countries. The macro questions are designed to encourage the employment of the most common growth
diagnostic tools and decomposition techniques. The micro questions are designed around the framework proposed by
Syverson (2011). In terms of process, a key innovation is the close involvement of national counterparts (government and
private sector) in the design stage and the identification of modules.
In the Mauritanian content, this CEM 2.0 approach was adopted to conduct consultations with various Mauritanian stakeholders. The workshop was held at the World Bank office in Nouakchott on October 11, 2018 with representatives
from key Mauritanian stakeholders. These included the Ministry of Economy and Finance (MEF), the Ministry of Habitat,
Urbanism and Landscape Planning (MHUAT), the Ministry of Commerce, Industry and Tourism (MCIT), the Central Bank
of Mauritania (BCM), the Office of National Statistics (ONS), the Federation Mauritanienne de l’agriculture, the Centre
Mauritanien d’Analyse de Politiques (CMAP), and the Union Nationale du Patronat.
Based on the country scan presentation, participants agreed that urbanization and diversification – with a focus on agriculture – merit in-depth analysis as part of this study. The workshop was structured into three main parts.
First, the team introduced the overall objective of this study and explained the procedure that will be adopted to complete
it. Second, it presented the country scan and engaged in fruitful discussions with the participants about the data sources
used, the methodologies adopted, and the interpretation of results. Third, the workshop concluded with a consensus
among participants that a more structured urbanization and a diversified economy (with a focus on agriculture) are key to
achieve a sustainable growth in Mauritania.


MAURITANIA: Country Economic Memorandum 5
2.1. Growth history
etween 1992-2018, economic growth was moderate, but highly cyclical.5 GDP growth
averaged 4 percent during this period, a rate
almost equal to the SSA average (Figure 3). However, due
to the rapid increase in population, growth was lower in per
capita terms and, as a result, the gap in real GDP per capita
between the SSA average and Mauritania has widened from
USD 227 in 1992 to USD 306 in 2018. The growth path also
displayed cyclical fluctuations (Figure 4), largely reflecting
peaks (related to natural resource discoveries) and troughs
(related to weather and political instability).
Structural break analysis suggests that Mauritania’s growth history can be divided into three periods (Figure 5).6 Following the conflict with Senegal in 1989, output grew
by an average of 2.9 percent per year between 1992 and
5 We start from 1992 because Mauritania had a conflict with Senegal in 1989-1991.6 Econometric tests identified 2004 as a structural break, which represents the onset of investment in the oil industry. The year 2015 marks the end of the commodity super cycle and was identified through visual inspection as econometric tests could not be applied due to the small number of observations.7 The Chinguetti oil field was decommissioned in early 2018 after production plummeted rapidly to about 3,000 bopd in 2017.
2003, at par with SSA’s average. Despite relative political
stability, droughts during this first period depressed
growth. The second period, from 2004 to 2014, was
characterized by an initial major positive shock represented
by the onset of oil production in 2006 with a brief peak of
75,000 barrels of oil per day (bpd) during that year. This
growth acceleration was, however, not sustained due to
technical difficulties in oil extraction,7 political instability
and internal conflicts, and the severe drought in 2011 that
largely impacted the primary sector. Yet, this period ended
on a high, with growth averaging about 5.8 percent in 2012-
2014, owing to the mining boom and the commodity super-
cycle. In the third period, spanning 2015 to the present,
economic activity receded as it endured the fiscal and
economic effects of low commodity prices, aggravated by
droughts and regional insecurity. Although it remains below
the pre-2014 shock levels, GDP growth started to recover
in 2018.
Chapter 2
Understanding Mauritania’s growth story
B
MAURITANIA: Country Economic Memorandum6
Aided by procyclical public investment during the boom period, private consumption was the main driver of growth. Private consumption fueled growth as it grew by
an average of 4.4 percent between 2005 and 2018 thanks
to the windfalls from the extractive boom and increased
revenues from the primary and non-tradable sectors (see
below).8 Public investment was procyclical. It increased
8 The Mauritanian authorities only publish national accounts from the supply side. Demand side estimations are only available from MFMod from 2005.
from 3.8 percent of GDP in 2009 to 15 percent of GDP in
2015 during the commodity super-cycle, before dropping
to 8.8 percent of GDP in 2018 as the Government cut
public investments to adjust for the decline in extractive-
related revenues after 2015. Meanwhile, the contribution
of net exports in 2005-2014 was negative as the pick-
up in extractive exports was fully offset by the rise in
Figure 3: Between 1992 and 2018, GDP growth in Mauritania was almost equal to the SSA average, …
Figure 4: … but it was very volatile with a standard deviation of 4.5 percent
Avg. GDP growth in SSA: 1992-2018 Actual vs. Potential GDP growth
0
1
2
3
4
5
6
7
Bur
undi
Zim
babw
eG
abon
Libe
riaM
adag
asca
rS
ierr
a Le
one
Sw
azila
ndC
amer
oon
Leso
tho
Erit
rea
Nam
ibia
Mal
awi
Mau
ritan
iaB
enin
Mau
ritiu
sA
ngol
aS
udan
Gha
naB
urki
na F
aso
Uga
nda
Moz
ambi
que
Perc
ent
(%)
SSA average
Source: WDI and authors' calculations. Note(s): SSA excludes rich countries: Botswana, Nigeria and South Africa. We start from 1992 to exclude the conflict with Senegal in 1989-1991.
Source: WDI and authors’ calculations.
−50
510
1520
Perc
ent
(%)
1992
1994
1996
1998
200
0
200
2
200
4
200
6
200
8
2010
2012
2014
2016
2018
Actual GDP growth (%) Potential GDP growth (HP, %)
Source: WDI, ONS and authors’ calculations.
Figure 5: Mauritania’s growth path can be decomposed into three main periods that were characterized by natural resources, climatic hazards, and political instability
2.95.8
2.5
-5
0
5
10
15
20
25
30
1992
1993
1994
1995
1996
1997
1998
1999
200
0
200
1
200
2
200
3
200
4
200
5
200
6
200
7
200
8
200
9
2010
2011
2012
2013
2014
2015
2016
2017
2018
Perc
ent
(%)
GDP growth: 1992-2018
Period 1: 1992-2002 Period 2: 2003-2014 Period 3: 2015-2018
CoupCoup and global
financial crisis
Drought
DroughtDrop in
commodity prices
Onset of oil production
Debt relief
Mining boom and commodity-super cycle

MAURITANIA: Country Economic Memorandum 7
infrastructure imports related to the Public Investment
Program (PIP) and the construction of new mining fields. It
turned slightly positive in 2015-2017 due to lower import-
related investments and higher fishing exports.
On the supply side, the traditional sectoral drivers of growth remained the same over the different periods. The extractive sector made the biggest contribution to GDP
growth due to oil discovery in mid-2000s and the onset of
gold and copper extraction in late 2000s and early 2010s,
respectively (Figure 6). Driven by the production boom in
extractives, the commodity super-cycle, and the PIP, non-
tradable sectors (construction, retail, and public services)
grew by a combined 6 percent per year. The agro-pastoral
sector (also referred to in this study as simply agriculture)
remains a pillar of the Mauritanian economy as it accounts
for about 30 percent of employment and a significant
percentage of its households are poor. However, the 3.3
percent average growth of this sector in 1999-2018 was
very volatile with a standard deviation of 4 percent. This
high volatility was driven by climatic hazards as reflected
by the positive (0.4) correlation between rainfall variability
and agricultural GDP.
The unchanged and unsophisticated structure of the Mauritanian economy is also reflected in the composition of exports. The product space shows that
9 Appendix III defines the Product Space concept.
the export structure has changed little between 2000
and 2017 and is still dominated by low complex products,
namely extractives and low-complex fishing products
(Figure 8).9 Not only Mauritania failed to diversify its
exports, but its productive capabilities, as proxied by the
Economic Complexity Index (ECI), are weak compared to
peer countries (Figure 9). This could hold back long-term
growth, which according to the Hidalgo and Haussman
(2009) model, is projected at 2.8 percent per year up to
2027, that is -0.1 percent per capita terms assuming the
current population growth trend continues.
2.2. Weak foundations for growth and structural transformation
Mauritania’s growth model suffers from an overreliance and mismanagement of natural resources and an incomplete urbanization that have hindered structural transformation. Rather than leveraging its natural
resources in productive investments into physical and
human capital and fiscal resilience, ineffective management
of extractive revenues has left Mauritania vulnerable to
commodity price shocks and ultimately contributed to
the economic deceleration post-2015. Meanwhile, rapid
urban population growth without spatial densification of
people and firms has deprived Mauritania of significant
Source: ONS, BCM, and authors’ calculations. Note: National Accounts are only available since 1998.
Figure 6: Extractives, transport and communication, and agriculture were the main drivers of growth
Decomposition of GDP growth (supply side)
-1
0
1
2
3
4
5
6
1999-2003 2004-2014 2015-2018
Perc
ent
(%)
Agriculture and Herding
Fisheries
Extractives
Manufacturing
Construction
Tansport and telecom
Commerce
Other services
Government
Net Taxes
GDP

MAURITANIA: Country Economic Memorandum8
benefits and growth dividends from economies of scale and
structural transformation.
2.2.1. Over-reliance on extractives
Growth in Mauritania was largely driven by natural resource extraction. The standard Solow decomposition
shows that capital accumulation, rather than productivity
10 See appendix II for details about the methodology of adding natural capital as an addition factor of production.
improvements, was the major driver of past growth per
worker (Figure 9). However, since Mauritania is abundant
in natural resources, it is important to capture the
contribution of natural resources. When doing so using
the model developed by Calderón and Cantú (2019),10
natural capital becomes, by far, the major contributor to
growth per worker (Figure 10). This reflects the onset of
production in oil (in 2006), copper (in 2007), and gold (in
Source: Atlas of Economic Complexity; Center for Development of Harvard University.
Figure 8: Mauritania lags its peers on economic complexity Economic complexity
−1.5
−1−0
.50
0.5
Inde
x
NicaraguaMoroccoMoldovaMauritaniaLaosAlgeria SSA Senegal Tunisia Zambia
1995−2003 2004−2014 2015−2017
Figure 7: The product space in Mauritania remained almost the same between 2000 (left) and 2017 (right)
Source: Atlas of Economic Complexity; Center for Development of Harvard University.

MAURITANIA: Country Economic Memorandum 9
2012). Meanwhile, the TFP contribution is reduced sharply
with the inclusion of natural capital, a result that is in line
with the one found by Calderón and Cantú (2019) for other
SSA resource-rich countries. In simple terms, these findings
imply that Mauritania mismanaged its resource discoveries.
Natural resources were also the major driver of wealth accumulation over the past two decades. Real wealth
per capita rose nearly 64.7 percent from 1995 to 2014,
increasing from US$ 17,843 to US$29,380. Mauritania’s
wealth accumulation was dominated by an increase in
non-renewable natural resources (Figure 11). This stemmed
from the onset of oil production in 2006 and the extraction
of gold and iron mines in early 2010s. In fact, Mauritania
moved from being ranked as the 11th country in the world
with the highest wealth stock of metals and minerals
per capita in 1995 (2nd in SSA behind Zimbabwe) to the
position 6th in 2014 (1st in SSA), only behind Australia,
Chile, Suriname, Mongolia and Peru.
However, Mauritania did not leverage its natural capital to strengthen its weak human capital that is key to
11 In this report, we use the broader definition of agriculture which includes fishing and livestock.12 For more details about the USDA methodology, kindly refer to (Fuglie and Rada, 2013). The data can be accessed using the following link: https://www.ers.usda.gov/data-products/international-agricultural-productivity.aspx
boost productivity. Human capital per capita grew by
2 percent per annum (CAGR) between 1995 and 2014,
a rate lower than in most peer countries. With a Human
Capital Index of 0.35 (150 out of 157 countries), the average
Mauritanian child born today will only reach 35 percent of
his/her productivity potential. The weak human capital,
which hinders future productivity, reflects a general
education system which is not providing foundational skills
for most children, with problems in low enrollment, weak
retention and poor learning outcomes especially at the
basic level (World Bank, 2019h).
The economywide lack of productivity growth is also observed in agriculture which is critical to reduce poverty.11 Using the growth-accounting methodology
developed by the United States Department of Agriculture
(USDA),12 we find that agricultural growth in Mauritania
has been largely resource-led rather than productivity-led
between 1992 and 2015 (Figure 13). Over this period, more
than 70 percent of agricultural growth stemmed from
intensive use of inputs (labor and livestock accumulation),
in contrast to only 20 percent from productivity
Figure 9: The standard Solow decomposition shows that physical capital was the driver of growth…
Figure 10: …, but this masks the major growth effect of natural resource extraction in the past two decades
Decomposition of growth per worker(Standard Solow)
Decomposition of growth per worker(Standard Solow including natural capital)
-8
-6
-4
-2
0
2
4
6
8
10
1995-2017 1995-2003 2004-2014 2015-2017
Perc
ent
(%)
Physical capital Human capitalTotal Factor Productivity Output per labor
-25
-20
-15
-10
-5
0
5
10
15
20
25
1995-2017 1995-2003 2004-2014 2015-2017
Perc
ent
(%)
Physical capital Human capitalNatural ressource capital Total Factor Productivity
Output per labor
Source: PWT 9.1, the Changing Wealth of Nations (2018) and authors’ calculations.
Source: PWT 9.1, the Changing Wealth of Nations (2018) and authors’ calculations.

MAURITANIA: Country Economic Memorandum10
improvements. Agricultural productivity in Mauritania was
low compared to peer countries, even lagging behind the
Sahel average (Figure 14). However, this productivity gap
has slightly narrowed since early 2010s thanks to public
subsidies for rice production and the launch of a large-scale
pro-poor irrigation program in the Senegal River Valley.
2.2.1. A missing link between urbanization and growth
Mauritania has been urbanizing rapidly in the last decades, but the country failed to reap the benefits usually associated with urban growth. Mauritania
Figure 11: About 80 percent of per capita wealth growth in Mauritania was driven by natural capital
Figure 12: In contrast, Mauritania suffered from limited human capital accumulation
Decomposition of wealth growthper capita: 1995-2014
Per capita human capital growthper year (1995-2014; CAGR)
Source: The Changing Wealth of Nations (2018) and authors’ calculations. Source: The Changing Wealth of Nations (2018) and authors’ calculations.
-80
-40
0
40
80
120
160
Produced capitalNatural capital - renewable Natural capital - nonrenewableHuman capital Net foreign assets Total wealth
0
1
2
3
4
5
Sen
egal
Sen
egal
Mau
ritan
iaMau
ritan
ia
Mor
occo
Mor
occo
Tuni
sia
Tuni
sia
Nic
arag
uaNic
arag
ua
Mol
dova
Mol
dova
Laos
Laos
Zam
bia
Zam
bia
Perc
ent
(%)
Perc
ent
(%)
Figure 13: Agricultural growth in Mauritania stemmed from labor and livestock accumulation
Figure 14: Despite some improvement in recent years, Mauritania still lag its peers on agricultural TFP
Decomposition of agircultural growth Agricultural TFP index
Perc
ent
(%)
1992
=10
0
Source: USDA ERS and authors’ calculations. Source: USDA ERS and authors’ calculations.
-3
-2
-1
0
1
2
3
4
5
1992
2015
1992
1995
1996
200
0
200
120
05
200
620
10
2011
2015
TFP Land expansion (extensification)Labor Capital input Intermediate input
MauritaniaMoldova
ZambiaNicaraguaBenin SSA, Sahel (excl. Mrt)
LaosSenegal
Agricultural output
60
80
100
120
140
160
180
200
1992
1994
1996
1998
200
0
200
2
200
4
200
6
200
8
2010
2012
2014

MAURITANIA: Country Economic Memorandum 11
was one of the most urbanized countries in SSA in 1990,
even more so nowadays as 52.8 percent of its 4.2 million
population lived in urban areas in 2017 compared to 39.5
percent in SSA (WDI, 2019).13 Urbanization has usually
gone hand in hand with GDP growth and no country has
reached middle income status without becoming at least
50 percent urbanized (Spence et al, 2009). The power of
cities to drive growth stems from agglomeration effects
the clustering of firms and individuals in an environment
that promotes scale and specialization (Hommann and
Lall, 2019). Population densities bring workers closer
to jobs, increasing workers’ opportunities and fueling
their productivity. However, cities in Mauritania did not
generate agglomeration economies as evident by the rapid
urbanization that was not associated with parallel increases
in GDP per capita, in contrast to the relationship in peer
countries (Figure 15). Urbanization without commensurate
planning and regulation of investments in infrastructure
has resulted in almost 80 percent of the urban population
residing in slums (Figure 16).
13 Noting that ONS estimates the urbanization rate to be 49.8 percent in 2016, this report relies on data from WDI to ensure consistency when comparing Mauritania with other countries in the world. In particular, WDI uses the UN methodology which defines urban centers as localities with 5,000 inhabitants or more and/or administrative centers of departments (moughataa).
Although the share of employment in the primary sector has declined since the mid-2000s, labor has been mostly absorbed by low productivity construction and services. Most West African countries experienced
some structural shift from low-productivity agriculture to
higher productivity sectors including manufacturing and
services (Haile, 2018). This was not the case in Mauritania
as, between 2004 and 2014, labor shifted from agriculture
toward non-tradable sectors such as construction, retail,
and government services in which productivity declined
over time (Figure 17). These sectors have also been among
the least productive, with even lower productivity than
agriculture. This result is corroborated by the Shapley
decomposition which shows that within sector gains
– largely reflecting the surge in the value added of the
capital-intensive extractive sector – drove economic
growth, while inter-sectoral labor shifts reduced growth
(Figure 18). In sum, Mauritania urbanized without structural
transformation toward higher productivity sectors.
Figure 15: The rapid urbanization in Mauritania was not accompanied by parallel increases in GDP per capita, in contrast to the relationship in its peers
Figure 16: The percentage of urban population living in slums is very high in Mauritania
Urbanization vs. real GDP per capita: 2007−2017 Population living in slums (% of urban population): 2014
Urb
an p
opul
atio
n (%
of
tota
l)
Source: USDA ERS and authors’ calculations. Source: USDA ERS and authors’ calculations.
8.013.1
31.4
39.4
54.060.5 61.5
79.9
020
406
08
0Pe
rcen
t (%
)
Tuni
sia
Mor
occo
Laos
Sen
egal
Zam
bia
SSA
Ben
in
Mau
ritan
ia
Aspirational peers Neighboring Arab countries Structural peers
3040
506
070
1000 2000 3000 4000 5000
GDP per capita (constant 2010 US$)
Benin Senegal Nicaragua Laos ZambiaAlgeria Morocco Tunisia SSA Mauritania

MAURITANIA: Country Economic Memorandum12
Three factors explain the reverse structural transformation. First, the extractive boom fueled an
ambitious public investment program (PIP) that translated
into an increase in the share of employment in construction
from 4 percent in 2004 to 5.9 percent in 2014. Second, the
Government used the oil-related revenues to significantly
expand the public sector workforce which rose from 8.8
percent of total employment in 2004 to 11.6 percent in 2008.
This was reflected by the 123 percent surge in the public sector
wage bill between 2006 and 2007. Third, labor moved from
rural-agriculture to the less productive urban-related sectors
that are dominated by informality and limited value added.
The reallocation of labor to lower productivity sectors reflects spatial poverty dynamics. The poverty rate in the
agriculture and livestock sectors in rural areas decreased by
respectively 13.5 and 13.2 percentage points (pp) between
2008 and 2014. In contrast, in urban centers the poverty
rate in the retail sector decreased by only 3 pp and even
increased by 4 pp in the construction sector. These trends
indicate that urban centers were not able to absorb poor
households into high productive sectors, rendering living
conditions in cities, particularly Nouakchott, worse off.
The absence of a structural change and the movement of workers into non-tradable sectors prevents
the creation of a more complex and specialized economy. Driven by favorable terms of trade, domestic
non-tradable sectors, such as construction, public
administration, utilities and transport, have expanded
with a combined growth rate of almost 9.3 percent a
year in 1999-2018. Dependency on domestic demand –
as non-tradable sectors are by definition – will cap the
potential of economies of scale and therefore efficiency
improvements. Among the firms registered in Nouakchott,
44 percent are producing goods and services that are not
traded internationally (Figure 19). While Nouakchott is
no different from other African cities, the proportion of
non-tradable goods and services is still much higher in
Nouakchott than in cities of all East and South Asia and
most of those sampled in Latin America.
Given the importance of diversification and a well-managed urbanization to Mauritania’s development, the rest of the report focuses on these two topics. While
acknowledging that productivity growth within sectors
(particularly agriculture) and structural transformation
across sectors requires a number of important ingredients,
the remainder of this report focuses on the underpinnings of
economic diversification and a well-managed urbanization.
Maintaining a clear focus and depth of analysis on these
areas is a core value added of this report.
Figure 17: Between 2004 and 2014, labor moved from agriculture to sectors with low and declining productivity
Figure 18: Despite the oil and mining boom, Mauritania did not experience a structural transformation
Correlation between sector productivity and change inemployment shares (2004-2014)
Shapley decomposition (2004-2014)
Log
(sec
tora
l pro
duct
ivit
y/to
tal p
rodu
ctiv
ity)
Source: ONS and authors’ calculation. Note(s): The size of a circle represents the relative labor size of each sector in 2004. The red line represents fitted values.
Source: ONS and authors’ calculation.
Agriculture
Fisheries
Mining
Manufacturing
Construction
Transp. & Comm.
Commerce
Public Sector
Other Services
-1,5
-1,0
-0,5
0,0
0,5
1,0
1,5
2,0
2,5
-15 -10 -5 0 5 10 15
Change in employment share (percentage points)-2 -1 0 1 2 3 4
Structural change-Static
Structural change-Dynamic
Within-sector
Demographic effect
Employment rate
percent (%)

MAURITANIA: Country Economic Memorandum 13
Source: Adapted from Lall and Venables (2018).
Figure 19: The share of firms operating in non-traded sectors in Nouakchott is high
Share of firms in internationally traded and non-traded sectors
Perc
ent
(%)
0
20
40
60
80
100
Chi
ttag
ong
Del
hi
She
nzhe
n C
ity
Dha
ka
Zhen
gzho
u C
ity
Ban
gkok
Yang
on
Lim
a
Bue
nos
Aire
s
Bog
ota
Med
ellin
Cor
doba
Asu
ncio
n
La P
az
Cai
ro
Am
man
Bei
rut
Tuni
s
Har
are
Lusa
ka
Mom
basa
Nig
er
Lago
s
Kin
shas
a
Add
is A
baba
Dak
ar
Nai
robi
Nou
akch
ott
Acc
ra
Bam
ako
Kig
ali
Kam
pala
Dar
Es
Sal
aam
Gab
oron
e
Luan
da
EAP & SA LAC MNA AFR
Tradables Non-tradables


MAURITANIA: Country Economic Memorandum 15
his chapter explores the opportunities for Mauritania to diversify its economy. It is organized
as follows. Section 3.1 explains why diversification
matters for Mauritania. Section 3.2 examines what are
the opportunities for economic and export diversification.
Section 3.3 analyses the key constraints preventing
agriculture from playing its strategic role in enabling
a dynamic growth environment. Section 3.4 concludes
by evaluating the diversification ecosystem. Policy
recommendations are presented in chapter 5.
3.1. Why diversification matters to Mauritania?
3.1.1. Diversification is a top priority for Mauritania’s development process
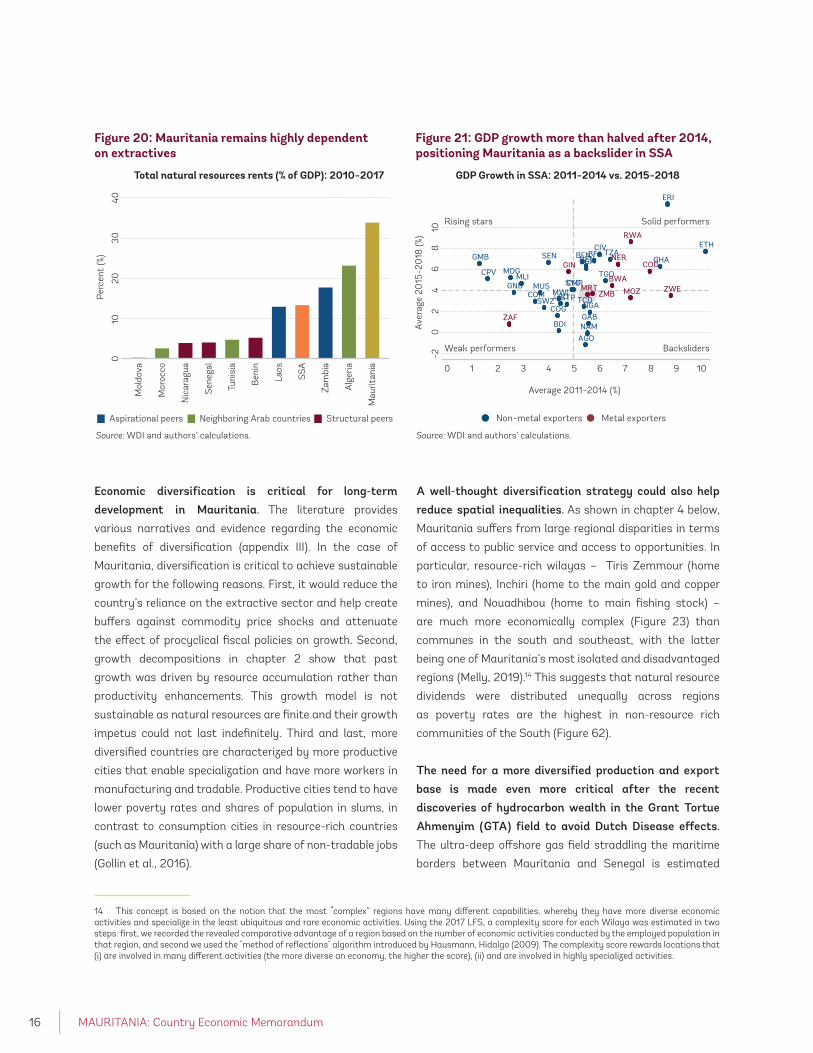
The lack of diversification hurts the Mauritanian economy. The country ranked 8th in the world in terms of
natural resource dependence, outclassing all of its peers,
many of which are resource-rich (Figure 20). However, the
management of extractive rents did little to encourage
economic diversification and support private sector-led
job creation (World Bank, 2019c). The country’s policy
framework was not supportive of growth in competitive
labor-intensive sectors, while natural resources were not
used to invest in productive sectors (see chapter 2). The lack
of diversification not only resulted in limited job creation,
but it also exposed the economy to external vulnerability.
This manifested itself after the end of the commodity
super cycle in 2014 when GDP growth more than halved
from 5.5 percent in 2011-2014 to 2.5 percent in 2015-2018,
positioning Mauritania as a backslider in SSA (Figure 21).
As a result, diversifying the economy is a key strategic area of the country’s development plan. The SCAPP for
the period 2016-2030, is articulated around three strategic
levers: (i) promoting robust, sustainable and inclusive
growth; (ii) developing human capital and access to basic
social services; and (iii) strengthening governance in all
sectors. Economic diversification is clearly highlighted as a
key channel through which Mauritania can support the first
pillar (Figure 22).
Chapter 3
The need to diversify the Mauritanian economy
T
MAURITANIA: Country Economic Memorandum16
Economic diversification is critical for long-term development in Mauritania. The literature provides
various narratives and evidence regarding the economic
benefits of diversification (appendix III). In the case of
Mauritania, diversification is critical to achieve sustainable
growth for the following reasons. First, it would reduce the
country’s reliance on the extractive sector and help create
buffers against commodity price shocks and attenuate
the effect of procyclical fiscal policies on growth. Second,
growth decompositions in chapter 2 show that past
growth was driven by resource accumulation rather than
productivity enhancements. This growth model is not
sustainable as natural resources are finite and their growth
impetus could not last indefinitely. Third and last, more
diversified countries are characterized by more productive
cities that enable specialization and have more workers in
manufacturing and tradable. Productive cities tend to have
lower poverty rates and shares of population in slums, in
contrast to consumption cities in resource-rich countries
(such as Mauritania) with a large share of non-tradable jobs
(Gollin et al., 2016).
14 This concept is based on the notion that the most “complex” regions have many different capabilities, whereby they have more diverse economic activities and specialize in the least ubiquitous and rare economic activities. Using the 2017 LFS, a complexity score for each Wilaya was estimated in two steps: first, we recorded the revealed comparative advantage of a region based on the number of economic activities conducted by the employed population in that region, and second we used the "method of reflections" algorithm introduced by Hausmann, Hidalgo (2009). The complexity score rewards locations that (i) are involved in many different activities (the more diverse an economy, the higher the score), (ii) and are involved in highly specialized activities.
A well-thought diversification strategy could also help reduce spatial inequalities. As shown in chapter 4 below,
Mauritania suffers from large regional disparities in terms
of access to public service and access to opportunities. In
particular, resource-rich wilayas – Tiris Zemmour (home
to iron mines), Inchiri (home to the main gold and copper
mines), and Nouadhibou (home to main fishing stock) –
are much more economically complex (Figure 23) than
communes in the south and southeast, with the latter
being one of Mauritania’s most isolated and disadvantaged
regions (Melly, 2019).14 This suggests that natural resource
dividends were distributed unequally across regions
as poverty rates are the highest in non-resource rich
communities of the South (Figure 62).
The need for a more diversified production and export base is made even more critical after the recent discoveries of hydrocarbon wealth in the Grant Tortue Ahmenyim (GTA) field to avoid Dutch Disease effects. The ultra-deep offshore gas field straddling the maritime
borders between Mauritania and Senegal is estimated
Figure 20: Mauritania remains highly dependent on extractives
Figure 21: GDP growth more than halved after 2014, positioning Mauritania as a backslider in SSA
Total natural resources rents (% of GDP): 2010−2017 GDP Growth in SSA: 2011−2014 vs. 2015−2018
Perc
ent
(%)
Source: WDI and authors’ calculations. Source: WDI and authors’ calculations.
010
2030
40
Mol
dova
Mor
occo
Nic
arag
ua
Sen
egal
Tuni
sia
Ben
in
Laos
SSA
Zam
bia
Alg
eria
Mau
ritan
ia
Aspirational peers Neighboring Arab countries Structural peers
AGO
BENBFA
BDI
CMRCPV
TCDCOM
COG
CIV
ERI
ETH
GAB
GMB GHA
GNB
KEN
LSO
MDG
MWI
MLIMUS
NAM
NGASTP
SEN
SYC
SWZ
TZA
TGO
UGA
BWA
CODGIN
MRT MOZ
NER
RWA
ZAF
ZMBZWE
Solid performersRising stars
Weak performers Backsliders
−20
24
68
10
Ave
rage
20
15−2
018
(%)
0 1 2 3 4 5 6 7 8 9 10
Average 2011−2014 (%)
Non−metal exporters Metal exporters

MAURITANIA: Country Economic Memorandum 17
to hold between 15-25 trillion cubic feet of gas and a
productive life of 25 years and could start producing
in 2022. If managed well, this development could yield
significant benefits to Mauritania. But, for this to happen
and avoid past Dutch Disease effects,15 the country needs
to strengthen its current framework for natural resource
management (World Bank, 2019c).
3.1.2. Mauritania has struggled to diversify exports away from extractives
Mauritania’s exports of goods remain heavily concentrated on extractives and fish products with no significant exports of manufactured products. In
1997, mining and fish products accounted for 97.6 percent
of merchandise exports, with almost no manufacturing
exports. Two decades later, this picture has not changed
much as both sectors accounted for 98.1 percent of total
exports in 2017 (Figure 24). The only difference over this
period is that the extractives sector (light yellow) is now
15 The extractives boom in 2007-2015 has lifted Mauritania into the ranks of lower-middle-income countries and contributed to reducing poverty by a remarkable 11.5 percentage points. Despite these achievements, the boom left a legacy of Dutch disease effects. High commodity prices prompted a rapid surge in foreign direct investments further increasing demand for non-tradeable services like construction, transport and commerce at the expense of job-creating sectors like manufacturing. Coupled with ineffective monetary policies, this has led to an appreciation of the real exchange rate, eroding the country’s competitiveness and impeding its diversification efforts. Growth remained moderate averaging 3.5 percent over this period, and limited progress was made in human development outcomes despite large infrastructure investments in education and health. The boom years were also accompanied by a pro-cyclical fiscal policy that resulted in a rapid expansion of public debt and a high risk of debt distress rating.
Source: Authors’ based on SCAPP.
Figure 22: Economic diversification is clearly highlighted in the SCAPP as a key driver for growth
A. Promote robust, sustainableand inclusive growthLevers B. Develop human capital and
access to basic social servicesC. Strengthen all dimensions
of governance
Strategicareas
1. Promote more diversified growth of lead sectors2. Promotion of the private sector and improvement of business practices3. Strengthening of infrastructure to support growth
1. Increasing access to and raising the quality of education and vocational training2. Improving access to health care3. Employment for all and promotion of youth, culture and sport 4. Increasing resilience of the most vulnerable
1. Political governance, social cohesion, peace and security2. Consolidation of the rule of law, human rights and justice 3. Making the most of the demographic dividend
Figure 23: Wilayas with more natural resources are more economically complex in terms of labor force
Source: LFS (2017) and authors’ calculations.

MAURITANIA: Country Economic Memorandum18
more diversified after the country discovered and started
to export oil (in 2006), copper (in 2007), and gold (in 2012).
Mauritania is likely to remain dependent on exports of
extractives and fish products given the wealth of its natural
resources (Figure 11). However, the country will need to do
much more to add value before exporting, and to diversify
where possible, in order to generate more jobs.
In terms of market destination, most exports of goods go to China and the European Union (EU) with limited exports to Africa. The EU has traditionally been the main
export market, accounting for as much as 70 percent of
exports in 2002. The EU’s share has, however, declined
in favor of China after 2005, leading to an almost parity
between the two destinations in recent years (Figure 25).
While China is the main export market for iron and copper,
the EU is a large export market for Mauritanian fish, gold,
and iron (Figure 26). Meanwhile, Mauritanian exports to
Africa, have been limited and accounted for less than 20
percent of total exports over the last two decades, even
dropping to 15 percent in 2017. African countries remain
important destinations for non-mineral exports, mainly fish
Figure 24: Mauritania’s export structure remains largely dependent on extractives and fish
Composition of Mauritania's Exports: 1997 Composition of Mauritania's Exports: 2017
Source: UN-COMTRADE and authors’ calculations.
2.4
55.0 42.5
Other Fish Iron Other Fish Gold Iron Copper Oil
1.9
45.1
12.2
29.0
8.82.9
Figure 25: Although export destinations are more diversified overall, …
Figure 26: … exports of main products are concentrated in few destinations
Share of exports by destination (% total) GDP Growth in SSA: 2011−2014 vs. 2015−2018
Perc
ent
(%)
Source: UN-COMTRADE, IMF BOPS and authors’ calculations. Source: UN-COMTRADE, IMF BOPS and authors’ calculations.
00
Fish
Gold
Iron
Cooper
Oil
20 40 60 80 100
20
40
60
80
199
719
98
199
920
00
200
120
02
200
320
04
200
520
06
200
720
08
200
920
1020
1120
1220
1320
1420
1520
1620
17
Africa China Europe Japan ROW USA Africa China Europe Japan ROW USA

MAURITANIA: Country Economic Memorandum 19
but also animal hides and leather, textiles, and agricultural
products.
Merchandise export growth was mostly driven by the “intensive margin”. Figure 27 shows the decomposition
of export growth between 1997-2003, 2004-2014, and
2015-2017 into four categories based on whether the
export products or destinations were already established
16 Figure 1 in Amurgo-pacheco and Pierola (2008) illustrates the four different classifications of export growth. In particular, the intensive margin of trade refers to the exports of “old products to old markets”, while the extensive margin refers to exports of “old products to new markets”, “new products to old markets”, or “new products to new markets”.
at the start of the period (“old” products and markets) or
were introduced at the end of the period (“new” products
and markets).16 During most of the last two decades, export
growth was driven almost entirely by increases in sales
of old products to old partners (the so-called “intensive
margin”), except for 2004-2014 in which new mineral
products (oil, gold, copper) were introduced to the export
basket.
Source: UN-COMTRADE and authors’ calculations.
Figure 27: Mauritania’s export growth was largely driven by the “intensive margin”
Export growth decomposition
Perc
ent
(%)
-20
0
20
40
60
80
100
120
1997-2003 2004-2014 2015-2017
Old products to old markets Old products to new markets New products to old markets New products to new markets
Figure 28: FDI inflows in Mauritania are very high, … Figure 29: … but are destined to extractives
FDI, net inflows (% of GDP) FDI inflows in Mauritania by sector
Perc
ent
(%)
Source: WDI and authors’ calculations. Source: BCM and authors’ calculations.
0
10
20
30
200
7
200
8
200
9
2010
2011
2012
2013
2014
2015
2016
2017
Mauritania Benin NicaraguaSenegal Lao PDR Moldova
Zambia AlgeriaMorocco Tunisia
0
200
400
600
800
1.000
1.200
1.400
1.600
200
7
200
8
200
9
2010
2011
2012
2013
2014
2015
2016
2017
US
$ b
illio
n
Non-extractive Oil Gold Copper

MAURITANIA: Country Economic Memorandum20
Foreign Direct Investment (FDI) did not support diversification toward non-extractives. Empirical evidence
shows that FDI can underpin diversification efforts through
transfer of technology and knowledge (including modern
managerial and business practices), access to international
markets and financing (Amighini abd Sanfilippo, 2014;
Nicet-chenaf and Rougier, 2011). Compared to its peers,
Mauritania has attracted a significant amount of FDI over
the past decade (Figure 28), but extractive industries were
the main destination of these inflows (Figure 29). FDI into
non-extractive sectors accounted for less than ten percent
of total FDI, with most investment projects going into non-
tradable sectors like construction and retail.
3.2. What are the opportunities for diversification?
Diversification strategies can take many forms ranging from focusing on products with emerging comparative advantage, adding value to existing exports, and developing new products and services. This section uses
several standard trade analytical measures like revealed
comparative advantage, export quality, and product space
analysis to inform a diversification strategy.17 In sum, the
different analyses suggest that processed fish, leather and
17 See appendix IV for the definitions of the different trade concepts used in this study.
animal hides, coper derivatives, and transport services
emerge as important options for Mauritania to diversify
its exports. Increasing the quality and adding value to
current export products – specially fish – will also help
diversification.
3.2.1. Focus on products with emerging comparative advantage
Mauritania has struggled to increase the number of products with a Revealed Comparative Advantage (RCA). Except Algeria, Mauritania has the lowest number of
products with an RCA among its comparators (Figure 30).
What is more worrisome is that the number of products
with an RCA did not increase significantly over time and
fluctuated between 15 and 22 products between 2000
and 2017 (Figure 31), suggesting that Mauritania could
not create new products with a comparative advantage.
In comparison, the number of products with an RCA
significantly increased in countries that managed to
diversify their exports such as Laos (from 43 in 2000 to 73
in 2017) and Tunisia (from 104 in 2000 to 131 2017).
Few minerals and fish products with consolidated revealed comparative advantage constitute the core of the export basket. Among the 21 products in which
Figure 30: In Mauritania, the number of products with an RCA is small …
Figure 31: … and did not increase over time
Number of products with RCA (2017) Mauritania: Number of products with RCA
Num
ber
Num
ber
Source: UN-COMTRADE and authors’ calculations. Source: UN-COMTRADE and authors’ calculations.
0
20
40
60
80
100
120
140
DZA
MR
T
BEN ZIM
SEN NIC
LAO
MA
R
MD
A
TU
N
0
5
10
15
20
25
30
35
40
2000 2002 2004 2006 2008 2010 2012 2014 2016

MAURITANIA: Country Economic Memorandum 21
Mauritania had a comparative advantage in 2017, there is
a core group of seven products – all fish and iron products
– that exhibited revealed comparative advantage in every
year over the 2000-2017 period (highlighted in red in Table
2). Exports of these products usually averaged over US$
100 million per year and can be considered as products
with consolidated RCA. Two products introduced over
the last two decades, copper (in 2007) and gold (in 2012),
showed revealed comparative advantage every year since
their exports started and now have exports over US$ 200
million per year, hence can also be considered as products
with consolidated RCA.
Table 2: Mauritania has a consolidated revealed comparative advantage in mineral and fish products and a strong potential for creating a consolidated comparative advantage in some animal and mineral related products
SITC 4 Product Name Avg. exports 2016-17
(US$ thou.)
RCA in 2017
Number of years with RCA>1
(2000-2017)
341 Fish, fresh(live/dead) or chilled 88,653 21.1 18
342 Fish, frozen (excluding fillets) 405,303 115.6 18
350 Fish, dried, salted or in brine; smoked 1,338 1.4 18
360 Crustaceans and mollusks, fresh, chilled 160,621 4.1 18
814 Fish flours and meals 133,191 163 18
2815 Iron ore and concentrates, not agglomerated 657,035 48.4 18
2816 Iron ore agglomerates (sinters, pellets) 11,699 8.3 18
2922 Shellac, seed lac, stick lac, resins 470 4.2 14
4111 Fats and oils of fish 23,178 105.1 13
344 Fish fillets, frozen 3,515 1.6 12
2871 Copper ores & concentrates 232,905 25.9 12
6115 Sheep and lamb skin leather 352 2.5 11
2117 Sheep & lamb skins without the wool 317 9.4 10
9710 Gold, non-monetary 278,833 6.8 6
482 Malt, roasted or not 2,126 3.8 3
2732 Gypsum, plasters, limestone flux & ca 2,001 5 3
2785 Quartz, mica, felspar, fluorspar 818 4.4 3
2111 Bovine & equine hides 141 5.1 1
5623 Mineral or chemical fertilizers 2,349 1.2 1
6581 Sacks and bags of textile materials 167 2.7 1
6582 Tarpaulins, sails, awnings, sun blinds 3,551 8.4 1
Source: Authors elaboration with data from UN-COMTRADE. Note: An RCA>1 indicates that Mauritania has a revealed comparative advantage in the related product.

MAURITANIA: Country Economic Memorandum22
Processed fish, leather and animal hides, Arabic gum, malt, and non-metallic minerals are products with emerging RCA that could be targeted for increasing diversification. Some products gained revealed
comparative advantage over the last two decades, but
exports failed to increase significantly and usually stand at
less than US$ 5 million per year on average (see products
highlighted in blue in Table 2). The list of products with
emerging but unconsolidated comparative advantage
include: processed fish products like fish oil (SITC 4111) and
frozen fish fillets (344), sheep skins and leather (SITC 6115
and SITC 2117), malt (SITC 482), arabic gum (SITC 2922),
gypsum (SITC 2732), and quartz (SITC 2785).
3.2.2. Export quality upgrading
Building on comparative advantages, improving the quality of existing products can raise productivity and hasten structural transformation (Henn et al., 2017). Export quality upgrading offers another avenue
for diversification, but the upgrading potential varies
with the length of a product’s quality ladder. Products
with long quality ladders – i.e. a significant difference
between the prices obtained in world markets – hold the
most potential for quality upgrading. Figure 32 shows
that the differences between the maximum and average
prices (normalized to one) for iron and copper are small
compared to the price differences for fish products. This
means that if Mauritania were able to increase the quality
of its mineral exports, the payoff in terms of obtaining
higher prices in international markets would be small.
In contrast, improving the quality of fish exports, could
result in higher prices as the maximum prices paid in
international markets are between 3 to 6 times higher
than the average world price.
Quality upgrading could complement export diversification since Mauritania is close to the quality frontier on low complex fish products, while far behind on high complex fish products. Mauritanian exports of
frozen fish and molluscs accounted for 86 percent of all
fish products in 2016-2017. These products are of relatively
high quality, as proxied by the average price obtained on
these exports as a fraction of the world’s highest prices
(Figure 33). This means that the country already has the
capabilities required to compete in terms of quality in these
products and fulfill high standards in developed markets.
Yet, these two products are the least sophisticated along
the fishing value chain and their potential for further quality
increases are somewhat limited given that they are very
close to the world’s quality frontier. On the other hand,
Mauritania’s exports of high-value added fish products like
fish fillets, fresh/chilled fish, and dried fish are of low quality
and very small (see upper left side of Figure 33), indicating
that the country still has significant room to improve the
quality of these products.
Figure 32: Fish products offer more opportunities for quality upgrading, …
Figure 33: …especially high value-added products like fresh/chilled fish, fish fillets, and dried fish
Quality ladder length Mauritania fish exports: quality vs. complexity
Rel
ativ
e un
it v
alue
s (W
orld
ave
rage
= 1
)
Source: UN-COMTRADE and authors’ calculations. Source: UN-COMTRADE, Observatory of Economic Complexity, and authors’ calculations. Note: The size of a circle represents the export value in 2016-2017.
0
1
2
3
4
5
6
Iron ore Copper ore Frozenmackerel
Frozensardines
Fresh orchilled fish
Fish, salted, dry
Fish, fresh, or chilled
Fish filletFish frozen
Crustaceans and molluscs
-2
-1,9
-1,8
-1,7
-1,6
-1,5
-1,4
-1,3
-1,2
-1,1
-1
0,3 0,4 0,5 0,6 0,7 0,8 0,9 1,0
Prod
uct
com
plex
ity
inde
x
Quality proxied by Relative Unit Values (World's best quality = 1)

MAURITANIA: Country Economic Memorandum 23
3.2.3. New export opportunities based on established patterns
Established export patterns provide a natural basis for export diversification. The capabilities needed to
develop a revealed comparative advantage in exports can
be redeployed to similar export products that are nearby
in the product space. We focus on products where the
development of a comparative advantage would seem
most feasible. Such feasibility is based on the proximity
of these products to the current network of products that
Mauritania is already exporting.
The concept of “density” is used to determine the feasibility of developing new export industries and product upgrade options. This metric is a measure of
proximity which allows to determine the relation of a
potential new product to a country’s existing capability
stock (i.e. the goods that a country already exports with
a high RCA). In essence, it captures the feasibility for a
country to make a new product. The underlying idea is
that the process of accumulating productive knowledge is
not random, but rather dependent on existing capabilities.
Hence, a country can easily develop a new product if it
already possesses all or most of the capabilities required
for production. In simple terms, it is easier for a country
to move from producing chairs to producing couches than
from chairs to cars.
Key industry and product clusters that appear promising for Mauritania to develop include animal meat and leather, processed fish products, vegetable products, and copper derivatives. Table 3 shows the main exports
products into which Mauritania can more easily develop
Table 3: Industries in the nearby product space of Mauritania’s current capabilities include animal, vegetable, fish and copper-related products
SITC4 Product name density PRODY Avg. exports2016-17
Path
2879 Ores & concentrates of other non-ferrous metals 0.059 5,688 23 -5.3
9410 Animals,live,n.e.s., 0.055 9,882 3 -0.4
2927 Cut flowers and foliage 0.055 6,250 3 1.1
2681 Sheep's or lambs' wool, greasy or fleece-washed 0.052 25,091 0 0
371 Fish,prepared or preserved,n.e.s. including caviar 0.05 7,059 680 -1.8
2225 Sesame (sesamum)seeds 0.05 1,448 0 3.8
6673 Oth.precious & semi-precious stones,unwork.cut etc 0.049 8,139 906 9.8
3330 Petrol.oils & crude oils obt.from bitumin.minerals 0.049 13,305 169,100 -12.9
2713 Natural calcium phosphat.,natur.aluminium c.phos. 0.048 5,738 0 -10.9
2631 Cotton (other than linters),not carded or combed 0.048 4,210 0 -12.4
2114 Goat & kid skins, raw (fresh,salted,dried,pickled) 0.048 25,613 0 -100
112 Meat of sheep and goats, fresh, chilled or frozen 0.047 19,009 0 2.2
2929 Other materials of vegetable origin, n.e.s. 0.047 10,467 0 0
579 Fruit,fresh or dried, n.e.s. 0.047 9,200 6,667 6.2
542 Beans,peas,lentils & other leguminous vegetables 0.047 3,685 0 5.2
6899 Base metals,n.e.s.and cermets,unwrought 0.046 10,597 0 -3.9
2116 Sheep & lamb skins with wool on,raw 0.046 12.874 0 -13.4
6821 Copper and copper alloys, refined or not,unwrought 0.044 7,364 0 -3.9
2919 Other materials of animal origin, n.e.s 0.043 16,287 0 -0.1
Source: UN-COMTRADE and authors’ calculassions.

MAURITANIA: Country Economic Memorandum24
revealed comparative advantage based on its existing
capabilities. Four major options to target new products for
export diversification emerge from the analysis:
• Preserve or build comparative advantages in animal
products, including live animals, sheep and goat meat,
sheep’s wool, sheep and goat hides and leather;
• Increase exports of vegetable products, including fresh
or dried fruits;
• Develop exports of prepared or preserved fish products;
• Deepen specialization in the copper value chain by
developing exports of copper alloys.
3.2.4. Further develop exports of transport services
Service exports are small in Mauritania, but there are opportunities to build on the recent improvements in sea transport services and develop ICT and tourism sectors. The sea transport industry has made important
strides both in its share of Mauritania’s service exports
and in its revealed comparative advantage (Table 4). The
industry has grown faster than the global average and
presents an opportunity to expand Mauritania’s service
sector, which is still small compared to product exports
(services contributed to 11.5 percent of total exports in
2017). Looking beyond sea transport, Mauritania has
a comparative advantage in tourism and ICT services.
However, with export volumes declining rapidly, it will be
important for Mauritania to strengthen these sectors. The
ICT sector in particular is a key input for trade integration,
private sector development, public service delivery, and
overall growth.
Developing the North-South road corridor for transport services exports is crucial to support diversification in the agriculture, livestock and fishing sectors highlighted above. While Mauritania does not currently
have a comparative advantage in road transport,
the development of this industry is crucial to support
diversification in agriculture and fishing. The North-South
road corridor (Tangiers-Nouakchott-Dakar corridor) along
the Mauritanian coast is one of the only viable and active
transport routes between North Africa and SSA (WTO,
2018). Traffic appears to have grown since 2011, reaching
over 1,000 trucks per month that are either destined for
Mauritania or in transit to Mali or Senegal (World Bank,
2016a). This corridor has potential for further development
to become an export route, in particular from agricultural
zones in the south and for the fishing hub in Nouadhibou.
With the objective of establishing a second North-South
corridor, Mauritania opened its first border crossing with
Table 4: Mauritania has an increasing (decreasing) RCA in sea transport (travel and ICT) services
SITC Export value (US$ million) Export RCA
2012 2013 2014 2015 2016 2017 2012 2013 2014 2015 2016 2017
Transport (sea) 6 20 28 27 20 55 0.5 1.4 1.3 1.7 1.3 5.9
Transport (other) 2 10 7 5 13 1 0.1 0.5 0.2 0.2 0.6 0.1
Travel 48 41 37 29 30 22 13.7 9.0 5.3 5.6 5.1 6.7
Insurance and pension services
3 2 3 2 3 2 0.3 0.2 0.1 0.1 0.2 0.2
Telecommunicatios 27 20 17 16 14 15 19.6 11.2 6.7 7.8 6.2 11.6
Other business services
41 74 164 124 144 37 0.3 0.4 0.6 0.6 0.6 0.3
Total Commercial services
127 167 256 203 224 132
Source: IMF BPM6 and author’s calculations.

MAURITANIA: Country Economic Memorandum 25
Algeria in August 2018. However, trade benefits are likely
to be small as this region was declared a military zone by
Mauritanian authorities in 2017 because it was affected
by terrorist activities of alQaida in the Islamic Maghreb, a
jihadi group which remains a threat to the security in the
region.
3.3. Constraints to agricultural productivity
The agriculture sector can play its role as the main driver of economic diversification only if its productivity is boosted. As suggested in section 3.2, agriculture is
the only non-extractive sector which Mauritania has a
clear comparative advantage and has the potential to
develop new export opportunities. At the same time, a
significant percentage of households in this sector are poor.
Therefore, developing this sector could promote economic
diversification and accelerate poverty reduction. Yet, this
goal would not be feasible with a lackluster productivity
(Figure 14) that faces numerous challenges.
This section examines the reasons behind the limited agriculture productivity growth in Mauritania. It relies on
the literature which identified the following determinants
of agricultural productivity growth: human capital, access
to finance, infrastructure, developed markets, adequate
and quality spending, good governance, and access to land
(Block, 2014; Fuglie and Rada, 2013; Mandemaker et al.,
2011).
3.3.1. Human capital
The low level of human capital is a major obstacle to agricultural productivity. According to the 2013 census,
more than half of individuals working in the sector are
illiterate (Figure 34). The 2017 Financial Inclusion survey
corroborates these results and shows that more than
60 percent of individuals who received an agricultural
payment did not attain more than primary education.
This compares less favorably to peer countries (Figure
18 Agricultural Research intensity is defined as public spending on R&D in agriculture as a ratio of agricultural GDP.19 CNRADA: Centre national de recherche agronomique et de développement agricole; ONARDEL: Office national de recherche et de développement de l’élevage.
35). The high illiteracy rate makes transformation of the
agricultural sector a challenge because it impedes the
farmers’ and herders’ ability to learn new techniques and
adopt productivity-enhancing technologies, especially in a
context where support services are limited.
Public spending on agricultural Research and Development (R&D) has dropped in recent years.18 Among all types
of agricultural expenditures, spending on R&D is argued
to be the most important factor to growth in agricultural
production (Goyal and Nash, 2017). In Mauritania, however,
this has been neglected by the Government in recent years
as public spending on agricultural R&D dropped from 0.7
percent of agricultural GDP in 2001-2005 to 0.5 percent in
2010-2014 (Figure 35), with half of this investment being
dedicated to fishing. Wiebe et al. (2017) estimate that this
R&D intensity rate is less than half of what Mauritania
should invest in agricultural research given the country’s
economic conditions.
The drop in research intensity was associated with a deterioration in the skill level of researchers. The
percentage of PhD-qualified agricultural researchers –
who are fundamental to the conception, execution, and
management of high-quality research – declined over time
in Mauritania and fell behind the SSA average in 2012-
2016 (Figure 37). The two main publicly-funded agricultural
research centers (CNRADA and ONARDEL)19 simply no
longer have the required personnel to conduct high-
quality research, because they were not able to recruit or
retain researchers due to lack of incentives. For instance,
CNRADA’s higher-level staff, working on research and
development, are engineers without PhD and represent only
3 out of its 116 total staff (World Bank, 2019a). Moreover,
the Institut Supérieur d'Enseignement Technologique
(ISET) is the only institution in Mauritania that educates
and trains agricultural researchers. It graduates only 15-
20 students per year, which is insufficient to fill the large
skills gap. All these capacity constraints are a major reason
for the extremely low number of new agricultural products
produced in Mauritania compared to other West African
countries (IFPRI, 2018).

MAURITANIA: Country Economic Memorandum26
3.3.2. Access to Finance
Access to finance in the agriculture sector is extremely limited. While crops and livestock represent more than 25
percent of GDP, the two sub-sectors accounted for less
than 1 percent of total credit in 2010-2016. Commercial
banks usually shy away from lending to the agriculture
sector because the sector is highly volatile and subject to
systemic climatic risks. Moreover, agricultural households
usually often lack collateral readily convertible into liquid
assets and do not maintain financial records. For instance,
the percentage of individuals with financial accounts in
rural areas – where more than 80 percent of agricultural
households reside – remains extremely modest and even
declined between 2011 and 2017, in stark contrast to the
increasing trend observed across peers (Figure 38). As a
Figure 34: More than half of Mauritanians working in the agriculture sector are illiterate…
Figure 35: … and the ratio of workers who receive agricultural payment with limited schooling is high
Highest education of indiduals workingin agriculture (Percent, %)
Education of indiduals who recievedagri payments (%, 2017)
Perc
ent
(%)
Source: RGPH 2013 and authors’ calculations. Source: Global Findex database and authors’ calculations.
53.1
29.6
11.6
4.10.6 0.1 0.10
1020
3040
50
Higher technical None Prim. school QuranicSec. school Sec. technical University
9.8 81.3 8.9
40.5 54.3 5.2
52.9 35.3 11.8
58.1 38.6 3.3
61.2 35.1 3.7
65.2 29.5 5.3
66.7 31.7 1.6
0 20 40 60 80 100
Moldova
Zambia
Nicaragua
Benin
Mauritania
Laos
Senegal
Primary or less Secondary Tertiary or more
Figure 36: Public spending on agricultural research… Figure 37: … and the skill level of researchers have dropped in Mauritania compared to comparators
Agricultural research intensity Percent of Agricultural Researchers with a PhD
Perc
ent
(%)
Perc
ent
(%)
Source: ASTI database and authors’ calculations. Source: ASTI database and authors’ calculations.
0.3
0.6
0.9
1.2
SSA SSAMauritania MauritaniaSenegal SenegalBenin BeninZambia Zambia
025
5075
Avg: 2001−2005 Avg: 2012−2016Avg: 2001−2005 Avg: 2012−2016
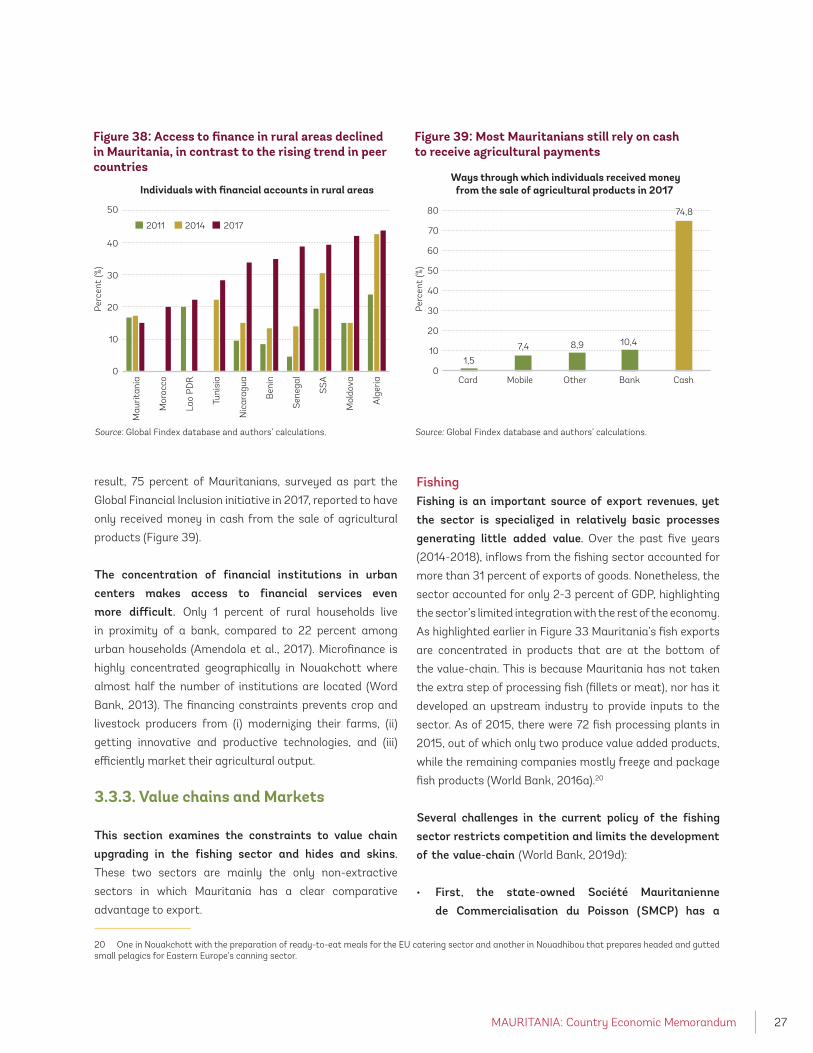
MAURITANIA: Country Economic Memorandum 27
result, 75 percent of Mauritanians, surveyed as part the
Global Financial Inclusion initiative in 2017, reported to have
only received money in cash from the sale of agricultural
products (Figure 39).
The concentration of financial institutions in urban centers makes access to financial services even more difficult. Only 1 percent of rural households live
in proximity of a bank, compared to 22 percent among
urban households (Amendola et al., 2017). Microfinance is
highly concentrated geographically in Nouakchott where
almost half the number of institutions are located (Word
Bank, 2013). The financing constraints prevents crop and
livestock producers from (i) modernizing their farms, (ii)
getting innovative and productive technologies, and (iii)
efficiently market their agricultural output.
3.3.3. Value chains and Markets
This section examines the constraints to value chain upgrading in the fishing sector and hides and skins. These two sectors are mainly the only non-extractive
sectors in which Mauritania has a clear comparative
advantage to export.
20 One in Nouakchott with the preparation of ready-to-eat meals for the EU catering sector and another in Nouadhibou that prepares headed and gutted small pelagics for Eastern Europe’s canning sector.
FishingFishing is an important source of export revenues, yet the sector is specialized in relatively basic processes generating little added value. Over the past five years
(2014-2018), inflows from the fishing sector accounted for
more than 31 percent of exports of goods. Nonetheless, the
sector accounted for only 2-3 percent of GDP, highlighting
the sector’s limited integration with the rest of the economy.
As highlighted earlier in Figure 33 Mauritania’s fish exports
are concentrated in products that are at the bottom of
the value-chain. This is because Mauritania has not taken
the extra step of processing fish (fillets or meat), nor has it
developed an upstream industry to provide inputs to the
sector. As of 2015, there were 72 fish processing plants in
2015, out of which only two produce value added products,
while the remaining companies mostly freeze and package
fish products (World Bank, 2016a).20
Several challenges in the current policy of the fishing sector restricts competition and limits the development of the value-chain (World Bank, 2019d):
• First, the state-owned Société Mauritanienne de Commercialisation du Poisson (SMCP) has a
Figure 38: Access to finance in rural areas declined in Mauritania, in contrast to the rising trend in peer countries
Figure 39: Most Mauritanians still rely on cash to receive agricultural payments
Individuals with financial accounts in rural areasWays through which individuals received money
from the sale of agricultural products in 2017
Perc
ent
(%)
Perc
ent
(%)
Source: Global Findex database and authors’ calculations. Source: Global Findex database and authors’ calculations.
0
10
20
30
40
50
Mau
ritan
ia
Mor
occo
Lao
PDR
Tuni
sia
Nic
arag
ua
Ben
in
Sen
egal
SSA
Mol
dova
Alg
eria
2011 2014 2017
1,5
7,4 8,9 10,4
74,8
0
10
20
30
40
50
60
70
80
Card Mobile Other Bank Cash

MAURITANIA: Country Economic Memorandum28
monopoly over fish exports. Since the mid-80s,
SCMP is mandated to regulate and sell frozen fish
products on behalf of producers at the reference prices
set by SMCP’s price Commission. This price-setting
mechanism disincentives firms to compete based on
quality, because setting minimum export prices that
might not always reflect the market dynamics could
hinder lower-cost suppliers from gaining market share
by developing cost-saving production techniques.
• Second, the price-setting mechanism may act as a focal point for collusion between fish exporters. The mechanism of export prices is determined by
SMCP’s committee, which is formed from three public
sector representatives and seven private sector
representatives, all appointed by the Minister of
Fisheries for a (renewable) three-year mandate. The
commission can make decisions based on a two-third
majority, meaning that private sector players can
self-regulate and protect themselves if they all collude
together. This bears the risk of facilitating cartel-like
behavior, thus damaging market entry and competition.
Hides and skinsDespite having a clear comparative advantage, exports of hides and skins are low and of poor quality.
Mauritania’s exports of leather and animal skins were only
US$ 8.8 million (or 0.5 percent of total exports) in 2016.
In addition, these exports were of low added-value when
compared to exports in peer countries (Figure 40).
The main obstacles to the development of the value chain in the sector are the absence of local tannery and large informality (World Bank, 2016a). Although
global demand for hides and skins is expected to
increase, only the smallest of the four tanneries operates
at half capacity. Operators cite poor quality of hides, due
to inadequate skinning and limited tanning capacities,
and lack of revolving funds as major obstacles. Another
challenge is the large informality. Most skins of small
ruminants are informally exported in raw to Senegal
and Mali, while cattle and camel hides are burned on
wheels and exported to Ghana and Nigeria for human
consumption. This happens because Ghanaian and
Nigerian buyers offer prices twice as high as those
that local tanneries can offer (i.e. UM 4,000 instead of
UM 2,000 for cattle hide). As a result, it is estimated
that about 75-80 percent of skins is being informally
exported with no significant value-added in Mauritania.
Environmental pollution and the limited skills of the
workforce are additional constraints that impede the
development of this value chain.
Figure 40: Mauritania exports lower added-value hides and skins’ products than Senegal and Cote d’Ivoire
Decomposition of hides and skins exports (2016)
Source: Atlas of Economic Complexity, the Observatory of Economic Complexity and authors’ calculations. Note: the complexity of exported goods is defined by the Product Complexity Index. Goods with higher values are judged to be more complex. For instance, in the hides and skins sector raw sheep skin (waste and scrap metal) are the least (most) complex products.
0 20 40 60 80 100
Mauritania
Senegal
Cote d'Ivoire
Percent (%)
Raw Sheep Skin with Wool
Miscellaneous Hides and Skins
Raw Sheep Skin Without Wool
Raw Calf Skins
Raw Hides of Bovine and Equine
Raw Hides of Bovine and Equine
Waste and scrap metal of iron or steel
Least complex product Most complex product

MAURITANIA: Country Economic Memorandum 29
3.3.4. Public spending
Government spending on agriculture has declined and is insufficient to achieve agriculture transformation. The share of public expenditures on agriculture as part
of total government expenditures has declined from 4.2
percent in 2013 to 3.0 percent in 2018. This decrease
widens the spending gap between Mauritania and its
regional agriculture-based comparators which were able to
significantly increase agriculture spending and reach the 10
percent goal set by the 2003 Maputo Agreement (Figure
41).21
The overall reduction in agriculture spending was driven by a large drop in subsidies which, however, was not offset by an increase in productive spending. The
emphasis placed on subsidies in 2011-2013 – to support
rice production and respond to the 2011 drought – has been
reduced as the share of subsidies out of total agriculture
spending dropped from 29.3 percent in 2013 to 5.7 percent
in 2018 (Figure 42). This is a good policy since subsidies
mostly benefitted input providers and larger producers
(World Bank, 2016b). However, the generated savings
were not re-oriented to increase investment spending that
21 This target was reaffirmed in the Malabo Declaration in 2014 (Goyal and Nash, 2017).
remained almost unchanged, nor R&D spending which
decreased (see Figure 36 above).
Agricultural resources are also very centralized. Public
expenditures in the sector are carried out at the central level
in Nouakchott as less than 5 percent are geographically
decentralized. In addition, more than 80 percent of the
sector's staff are in central administrations and most of the
staff in decentralized services are in regional capitals. This
concentration of resources limits the ability of field services
to be operational and provide the necessary services to
farmers and herders (World Bank, 2016b).
3.3.5. Governance
The state actors and agencies involved in the sector are overwhelmed and unorganized. Many public bodies
are involved in the sector and significant problems
are common regarding mandates and responsibilities,
sometimes with competing roles and confusion between
policy management aspects and operational coordination.
For instance, the Ministry of Rural Development has,
without the Minister's office, more than 40 administrative
structures and more than 10 public institutions under its
Figure 41: Public spending on agriculture in Mauritania is very low and declined in recent years…
Figure 42: … due to the large cut in subsidies
Government spending on agriculture(% total public expenditures)
Decomposition of agriculture spending inMauritania (% total public expenditures)
Perc
ent
(%)
Perc
ent
(%)
Source: MEF and authors’ calculations. Source: MEF and authors’ calculations.
0
2
4
6
8
10
12
14
2013 2014 2015 2016 2017
Mauritania SenegalBenin Mali
Maputo agreement
0
1
2
3
4
5
2013 2014 2015 2016 2017 2018
Wages Goods and services Transfers and subsidiesInvestments Total Agriculture spending

MAURITANIA: Country Economic Memorandum30
supervision. This organizational chart shows organizational
links that are not strong to implement ambitious policies.
Management capacities of human and physical capital are weak, posing significant challenges to the development of the sector. Previous staff assessments
show a top-heavy public administration that is dominated
by managerial rather than operational staff (World Bank,
2016b). Insufficient separation of technical and managerial
functions is another challenge that results in inefficiencies
and affects the quality of service delivery. The shortcomings
in the management of agricultural staff are coupled with
weaknesses in the management of public investments
that are more focused on means than results (World
Bank, 2016b). The sector does not have an expenditure
planning tool (such as an MTEF), which partly explains
the deterioration of hydro-agricultural facilities and the
significant gap in storage infrastructure in production
areas. Finally, the processes of selecting and developing
projects remain very weak.
Monitoring and evaluation in the agricultural sector is very important, and its management must be based on factual data and evidence. The production and access to
quality and complete data/statistics is a major problem for
building policies on real evidence. The planning processes
in the sector at the central level are totally disconnected
from the field and its challenges as there is a gap between
project design and implementation. Moreover, production
objectives are not sufficiently based on factual evidence.
Livestock data are the source of much controversy and
production and harvest statistics depend on rather dubious
surveys of the sector's added value.
3.3.6. Land
The longstanding land issue in Mauritania reflects the country’s limited agricultural transformation. This issue
should be at the core of any agricultural development
policy and key to support economic diversification. In rural
areas, secure access to land as a productive resource is
essential for farmers' livelihoods. Land ownership is also
important for investment in urban areas where economic
22 This ordinance is considered as the foundation of the new Mauritanian land policy and constitutes the legal framework currently in force.
agents need physical space for processing, storage and
marketing activities. While the scarcity of statistics on land
administration prevents the development of an objective
picture of the situation, Mauritania's land tenure situation
is very particular and one of the most complex in the region
(World Bank, 2019e).
The legal and institutional framework for land in Mauritania has been dictated by history. It was the
outcome of different influences stemming from traditional
forms of land access, religious principles, and the colonial
era. The effects of the droughts in the 1970s, food crisis
risks, and conflicts between livestock breeders and
farmers over decreased agricultural and pastoral resources
led lawmakers to draft a new land tenure legislation:
Ordinance No. 83-127 of June 5, 1983.22 This ordinance
was intended to develop irrigation projects on fallow land,
and to reinforce the official abolition of slavery in 1981
with provisions designed to facilitate land access for the
Haratins. Its objective were to (i) consider all land as the
assumed property of the State, (ii) abolish the traditional
land tenure system and its various forms of sharecropping,
and (iii) facilitate access to individual private property.
Land availability in rural areas is not problematic, but its allocation is given that the 1983 ordinance was not founded on consultations with local communities. The 1983 was inspired by the principles
driving the development policy of many African nations
at the time and was based on a belief that policies
communicated through simple legislation would be able
to challenge the foundations of societies. Therefore, this
ordinance was drafted without consultation with local
communities, leading to social tensions that prevented
its application. For instance, the administrative circular of
1985 authorized the administration to issue concessions
for fallow lands (that the administrative authorities
considered to be “dead”) by derogating from the principle
of development and of the purge of rights prior to the
concession. Many land allotments took place without
consideration of existing rights (World Bank, 2019e). At
that time, the haste in the issuing of concessions by simple
administrative authorization that benefitted new private

MAURITANIA: Country Economic Memorandum 31
owners fueled political tensions in the Senegal River Valley
and contributed to the events of 1989.
Despite several attempts to improve the land situation, sensitivities over this issue persist. On the one hand, the
Government intends to promote a modernized agriculture
and considers public investments in irrigation for the benefit
of all Mauritanians no matter of the ethnic identity. On the
other hand, communities want to maintain local land rights
on exploited or undeveloped lands to preserve farmland for
their members in the future. The communities living in the
valley can be still traumatized by the 1989 events and the
related abusive land allocation and react strongly to what
they consider as dispossession.
An evaluation is needed to assess the actions of land offices in rural areas. The establishment of land offices in
the four Wilayas of the Senegal River Valley Wilayas (Trarza,
Brakna, Gorgol, Guidimaka) is one of the Government’s
major actions aiming to improve land management in
rural areas. The land offices were created at the beginning
of the 1990s following the 1989 events. They allowed the
regularization of some concessions granted under the
1985 derogation system23 and at the beginning of the
regularization process in several developed areas. Despite
some positive results obtained, the sustainability of these
offices, initially supported by the international community,
raises questions (World Bank, 2019e). Only the Rosso land
office is still in operation today, whereas the Kaédi, Boghé
and Sélibaby land offices have been closed due to a lack of
personnel and insufficient financial and technical resources.
3.4. Is Mauritania’s current diversification ecosystem adequate?
The diversification ecosystem in Mauritania suffers from several obstacles. An appreciated exchange rate,
symptomatic of Dutch disease, eroded Mauritania’s
competitiveness and impeded its diversification efforts.
The business environment is not favorable to attract FDI,
despite steady progress since 2015. This is compounded
by relatively high tariffs and the prevalence of non-tariff
23 In particular, Circular No. 20 of August 5, 1985 allowed administrative authorities to allot land without sufficient attention to pre-existing land rights.
barriers. The lack of trade agreements, coupled with the poor
quality of infrastructure, hinders the inflow of goods within
the country and hampers trade with neighboring countries.
3.4.1. Rigid exchange-rate policy and underdeveloped banking sector
A fair-valued Real Exchange Rate (RER) is essential for economic diversification and private sector development, particularly in resource-rich countries. The
existing economic literature suggests that maintaining the
RER close to its equilibrium level is a necessary condition
for sustained growth (Cottani et al., 1990; Rodrik, 2008).
Countries that avoided overvaluation have been associated
with substantial export diversification (Elbadawi et al.
2012). Currency overvaluation, particularly in resource-
rich countries, exacerbates the distortions in the relative
price of tradable and non-tradable goods, and amplifies the
inefficiency in the allocation of production factors across
sectors by implicitly imposing a tax on export-oriented
sectors while subsidizing imports. This reduces prospects
for new sources of growth. In addition to being more suitable
for export diversification, exchange rate flexibility tends to
help resource-rich countries better manage commodity
price fluctuations and support macro stability (Peterson
Institute, 2007).
In Mauritania, the real exchange rate is still overvalued, impeding the country’s diversification efforts. As
shown earlier, the commodity-price boom and the surge
in extractives-related FDI in 2012-2014 increased demand
for non-tradeable services at the expense of job-creating
sectors like manufacturing. Coupled with ineffective
monetary policies and limited exchange flexibility, this has
led to an RER appreciation (Figure 43). Faced with depleting
foreign reserves following the ToT shock in 2014-2015, BCM
was pushed to abandon the fixed peg to the U.S. dollar, thus
inducing a 4.9 percent depreciation of the RER in 2016. Yet,
the RER started to appreciate again in 2017 and was still
overvalued by 4-13 percent in 2018 because BCM continue
to adopt a crawl-like peg with minimal deprecation (IMF,
2019). This overvaluation impairs the competitiveness of
the economy and hinders diversification efforts.

MAURITANIA: Country Economic Memorandum32
Financial vulnerabilities also present risks to growth and economic diversification. Despite improvements
ongoing efforts to write-off old debt, non-performing loans
(NPLs) remain of the highest in SSA (Figure 44). This was
also accompanied by 4.2 and 5.1 percentage point drops
in the provisioning rate and the liquid-to-total assets ratio,
respectively in 2018. These indicators reflect structural
vulnerabilities in the sector linked to a narrow deposits
base, low rates of access to finance (see below) and high
credit concentration as 54 percent of the credit market in
2014 was dominated by four firms (World Bank, 2019d).
BCM started to address some of these constraints with IMF support. In July 2018, Mauritania has adopted
a new banking law that boosts the BCM’s independence
and strengthens the crisis management mechanism by
establishing a new framework for bank resolution and
depositor protection. The law also expands BCM’s scope
of supervision to include insurance companies and the
“Caisse des Dépôts et de Développement” (CDD). To reduce
transactions costs and promote financial inclusion, the
BCM is also developing automated payment tools and
mobile banking instruments. The BCM also issued a new
directive in November 2018 aimed at combatting money
laundering and terrorism financing. As a consequence, 700
illegal money transfer service providers were closed by
March 2019.
3.4.2. Despite recent improvements, the business environment remains challenging
Notwithstanding important business reforms implemented by the Government since 2015, Mauritania faces several issues that need to be addressed so that the business environment becomes favorable to private sector development. Thanks to the 17 reforms
implemented by the authorities between 2015 and 2019,
Mauritania improved by 28 positions in the last four years
on the Doing Business (DB) Index, reaching the 148th rank
out of 190 countries in 2018 (Figure 45). Yet, the business
environment remains below its potential considering the
country’s income level (Figure 46) due to several structural
issues (World Bank, 2019f):
• Financing constraints: Over the past few years, lack
of credit has been consistently cited by businesses
as the most problematic obstacle for doing business
(Figure 47). In fact, Mauritania is one of the least
financially inclusive countries in the world, with the
percentage of people with an account in a financial
institution declining from 22.8 percent in 2014 to 20.8
percent in 2017, in contrast to the rising global trend
globally. These trends reflect the low participation of
Mauritanians in the financial system, which constraints
private sector development.
Figure 43: The REER is on an appreciating trend Figure 44: NPLs in Mauritania are very high
REER Gross NPLs to total loans in SSA: 2017
(REE
R=2
012
)
Perc
ent
(%)
Source: IMF and authors’ calculations. Source: WDI and IMF.
96
98
100
102
104
106
108
110
2012 2013 2014 2015 2016 2017 20180
5
10
15
20
25
30
Equ.
Gui
nea
Cha
dA
ngol
aC
AR
Mau
ritan
iaG
hana
Ben
inN
iger
Nig
eria
Bur
undi
Con
goZa
mbi
aTa
nzan
iaC
amer
oon
Gui
nea
Ken
yaG
abon
Bur
kina
Fas
oM
alaw
iS
waz
iland
Mad
agas
car
Rw
anda
Gam
bia
Mau
ritiu
sU
gand
aB
otsw
ana
Leso
tho
Sou
th A
fric
aN
amib
ia
SSA

MAURITANIA: Country Economic Memorandum 33
• Limited competition: Competition is very limited
(Figure 48) due to strong oligopolistic tendencies in
private markets that are dominated by well-connected
companies, and the significance presence of state-
owned companies (Box 2). Some reforms have recently
taken place in this area, for example on conditions of
access to public procurement, but much remains to be
done. In particular, SMEs' access to public procurement
markets remains low or non-existent, with most
contracts being awarded to large, well-connected
family groups.
• Poor electricity: The reliability and affordable provision
of energy is considered a key product market into the
competitiveness of firms. Despite the 50 percent rise in
electricity production between 2015 and 2018 thanks
to the Government’s efforts, Mauritania has high cost
and poor quality of electricity compared to its peers
(Figure 49). This is due to the low generation capacities
and high operating costs of power generation, operated
by a single state-owned company.
• Lack of skilled labor: The Mauritanian workforce is less
educated than in most peers (Figure 50). Many workers
have little or no education and very few companies offer
formal training to their employees. In addition, the supply
of training programs in technical and vocational schools
remains limited, representing less than 10 percent of all
post-basic education enrolments. These skills shortages
create serious problems for business development.
Box 2: Few large firms dominate key markets
Enhanced competition could further promote a healthy investment climate in Mauritania and significantly contribute to private sector development and diversification. Efforts to shift toward higher-value-added activities and encourage
economic diversification in the future will be a function of the intensity of domestic competition. Promoting domestic
competition can ultimately prevent sectoral misallocation between tradeable and non-tradeable sectors. Furthermore,
competition policy reforms can benefit the poorest households and improve income distribution and help reduce poverty.
Around nine large industrial and commercial groups dominate key markets in Mauritania. A handful of large family-
owned groups control trade in imported food products (e.g., rice and cereal), construction, hotel and restaurant services,
and the banking sector in a country where the imports of goods and services represented 63 percent of GDP in 2018. Out
of these nine groups, three participate in at least eight sectors, while another two operate in six sectors (figure 22 of World
Bank 2018b). Furthermore, seven of the nine identified groups are active in the banking sector, allowing them to ensure
access to credit for their own enterprises. This may strengthen the market power of large groups and potentially crowd out
smaller firms given that the large financing constraints in Mauritania. In the banking sector, the concentration ratio of the
lending market of the four largest banks was 54 percent in 2014.
Informal ties between the Government and the private sector may provide well-connected businessmen with rent-seeking opportunities. In addition to regular functions of a government with regard to the market, such as taxation and
regulation, the Government also participates in the market as a supplier (e.g. of electricity, water, gas) and as a buyer, for
example of sugar, powdered milk and vegetable oils, primarily through SOEs. In some cases, the Government can act as a
supplier and a buyer in the same market, for example when supplying cement through the SOE SNIM (Société Nationale
Industrielle et Minière) to government construction projects.
Source: World Bank, 2018b.

MAURITANIA: Country Economic Memorandum34
The entrepreneurship ecosystem is also primitive and not conducive to transformational entrepreneurs (World
Bank, 2019i). The literature shows a significant effect of
entrepreneurship towards economic growth (Wennekers
and Thurik, 1999; Wong, 2005). Entrepreneurship
represents hope to many young Mauritanians who
perceive fewer and fewer opportunities in the public
sector and traditional rural sectors. Responding to a
survey conducted jointly by the World Bank and CMAP
in 2016, 77 percent of young Mauritanians expressed
strong motivation to launch their own business, yet
just one in five felt “fully ready” to embark on their
entrepreneurial adventure. This is partially due to the
challenging business environment in which these aspiring
entrepreneurs are operating. The Global Entrepreneurship
Index, which measures how conducive ecosystem are to
Figure 45: The business environment in Mauritania improved compared to its peers in recent years
Figure 46: However, it remains below the country’s income potential because of …
Evolution of DB ranking DB 2015-2019 Ease of Doing Business vs. Real GDP per capita: 2018
Ran
king
Ease
of
Doi
ng B
usin
ess
Source: ASTI database and authors’ calculations. Source: ASTI database and authors’ calculations.
40
60
80
100
120
140
160
180
Mau
ritan
ie
Alg
érie
Mar
oc
Tuni
sie
Bén
in
Nic
arag
ua
Sén
égal
Laos
Mol
davi
e
DB2019 DB2015
Real GDP per capita (log)
2040
60
80
100
3 3.5
MRT
4 4.5 5
Figure 47: … financing constraints, … Figure 48: … limited competition, …
Most problematic obstacle for doing business Extent of Market Dominance vs. Real GDP per capita (2018)
Perc
ent
of r
espo
nses
(%)
Sco
re (1
−7)
Source: GCI, WDI, and authors’ calculations. Source: GCI, WDI, and authors’ calculations.
Real GDP per capita (log)
0
20
40
60
80
100
2013 2014 2015 2016 2017
Access to financing CorruptionTax rates InflationGovernment bureaucracy Policy instabilityInadequate infrastructure Inadequately educated workforcePoor work ethic Government instability/coupsForeign currency regulations Tax regulationsRestrictive labor regulations Insufficient capacity to innovateCrime and theft Poor public health
MRT
BEN
NIC
SEN
23
45
6
3 3.5 4 4.5 5
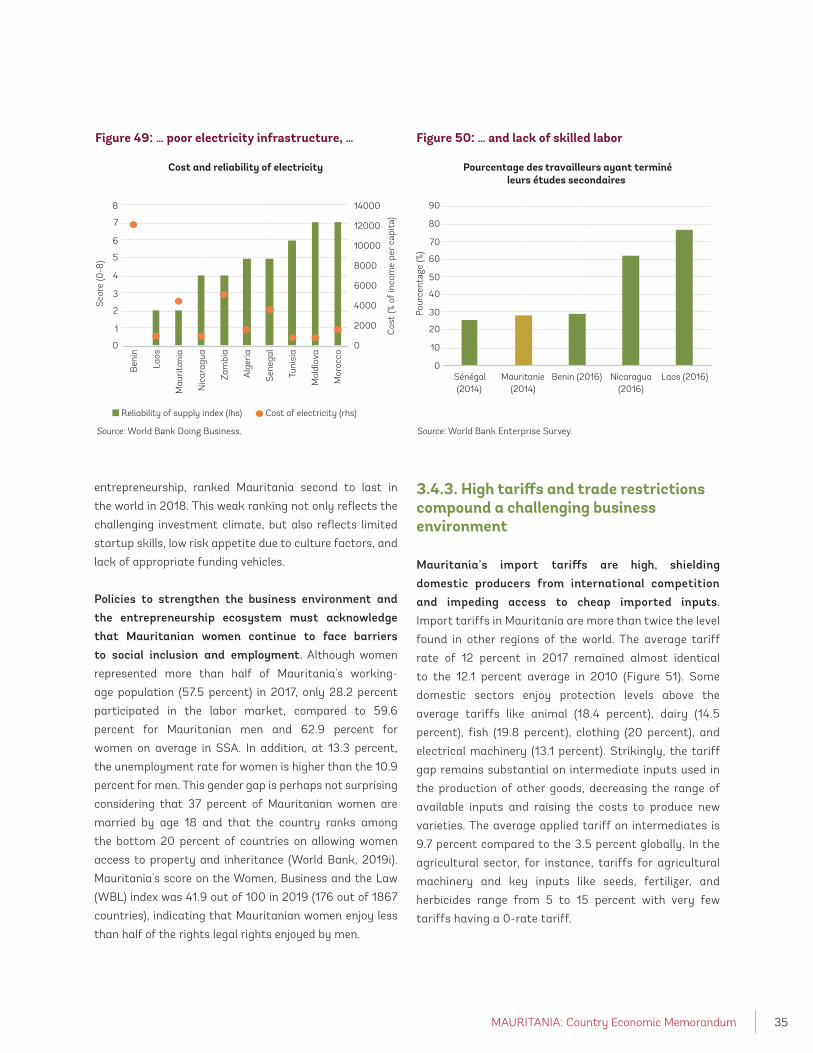
MAURITANIA: Country Economic Memorandum 35
entrepreneurship, ranked Mauritania second to last in
the world in 2018. This weak ranking not only reflects the
challenging investment climate, but also reflects limited
startup skills, low risk appetite due to culture factors, and
lack of appropriate funding vehicles.
Policies to strengthen the business environment and the entrepreneurship ecosystem must acknowledge that Mauritanian women continue to face barriers to social inclusion and employment. Although women
represented more than half of Mauritania's working-
age population (57.5 percent) in 2017, only 28.2 percent
participated in the labor market, compared to 59.6
percent for Mauritanian men and 62.9 percent for
women on average in SSA. In addition, at 13.3 percent,
the unemployment rate for women is higher than the 10.9
percent for men. This gender gap is perhaps not surprising
considering that 37 percent of Mauritanian women are
married by age 18 and that the country ranks among
the bottom 20 percent of countries on allowing women
access to property and inheritance (World Bank, 2019i).
Mauritania's score on the Women, Business and the Law
(WBL) index was 41.9 out of 100 in 2019 (176 out of 1867
countries), indicating that Mauritanian women enjoy less
than half of the rights legal rights enjoyed by men.
3.4.3. High tariffs and trade restrictions compound a challenging business environment
Mauritania’s import tariffs are high, shielding domestic producers from international competition and impeding access to cheap imported inputs. Import tariffs in Mauritania are more than twice the level
found in other regions of the world. The average tariff
rate of 12 percent in 2017 remained almost identical
to the 12.1 percent average in 2010 (Figure 51). Some
domestic sectors enjoy protection levels above the
average tariffs like animal (18.4 percent), dairy (14.5
percent), fish (19.8 percent), clothing (20 percent), and
electrical machinery (13.1 percent). Strikingly, the tariff
gap remains substantial on intermediate inputs used in
the production of other goods, decreasing the range of
available inputs and raising the costs to produce new
varieties. The average applied tariff on intermediates is
9.7 percent compared to the 3.5 percent globally. In the
agricultural sector, for instance, tariffs for agricultural
machinery and key inputs like seeds, fertilizer, and
herbicides range from 5 to 15 percent with very few
tariffs having a 0-rate tariff.
Figure 49: … poor electricity infrastructure, … Figure 50: … and lack of skilled labor
Cost and reliability of electricity Pourcentage des travailleurs ayant terminéleurs études secondaires
Sco
re (0
-8)
Pour
cent
age
(%)
Source: World Bank Doing Business. Source: World Bank Enterprise Survey.
0
2000
4000
6000
8000
10000
12000
14000
0
1
2
3
4
5
6
7
8
Ben
in
Laos
Mau
ritan
ia
Nic
arag
ua
Zam
bia
Alg
eria
Sen
egal
Tuni
sia
Mol
dlov
a
Mor
occo
Cos
t (%
of
inco
me
per
capi
ta)
Reliability of supply index (lhs) Cost of electricity (rhs)
0
10
20
30
40
50
60
70
80
90
Sénégal(2014)
Mauritanie(2014)
Benin (2016) Nicaragua(2016)
Laos (2016)

MAURITANIA: Country Economic Memorandum36
Beyond tariffs, the prevalence of non-tariff measures (NTMs) and the absence of clear procedures hinder trade.24 According to the Global Competitiveness Index
(GCI), Mauritania is second to last in the world on the
prevalence of NTMs (Figure 52). The country has experienced
difficulties in implementing its legislation relating to the
standardization, certification and accreditation process
(WTO, 2018). Despite the adoption of a law in 2010, the
regulatory framework for trade processes remains weak in
the absence of implementing decrees. There is also a lack
of equipment, human resources, and funding for testing
laboratory and conformity control infrastructure. Moreover,
sanitary and phytosanitary control is characterized by the
presence of different services without any real coordination
among institutions. (WTO 2018). The lack of transparency
in NTMs is reflected in the fact that, by August 2019,
Mauritania has not made yet any notification under
Article 15.2 of the WTO’s Technical Barriers to Trade (TBT)
agreement and did not appoint a national enquiry point for
questions related to TBTs in the country.25
Non-transparent taxes increase protection for certain industries. Consumption taxes applicable only
at importation constitute hidden tariffs that increase the
protection of selected industries. These taxes are levied
on specific products like tea, sugar, meat, diary, cement,
and concrete reinforcing bars, and are usually revised
upwards during the fiscal year. For instance, a 20 percent
consumption tax on imported mineral water was created
in 2015 and was subsequently raised to 50 percent in 2016
and 80 percent in 2018. Similar increases have happened
with consumption taxes on imported poultry meat and
edible offal, yoghurt, sweetened dairy products, and pasta.
3.4.4. Absence of preferential trade agreements
Mauritania is one of the few countries that is not a full member of a preferential trade agreement. Although
Mauritania was a founding member of the Economic
24 NTMs are policy measures other than tariffs that can affect trade. This include core measures such as quantity and price controls (e.g., quotas, prohibitions, discretionary import licenses, and para-tariffs), as well as standards and technical regulations (e.g., sanitary and phytosanitary measures and technical barriers to trade).25 The TBT aims to ensure that technical regulations, standards, and assessment procedures are non-discriminatory and do not create unnecessary obstacles to trade: https://www.wto.org/english/tratop_e/tbt_e/tbt_e.htm26 The Arab Maghreb Union was established in 1989 with the aim to establish a free-trade area between Algeria, Libya, Mauritania, Morocco, and Tunisia. No meeting of the AMU’s presidency council took place since the last one in 1994 in Tunisia.
Community of West African States (ECOWAS), it left
the 16-nation body in 2000 to concentrate its efforts in
the Arab Maghreb Union (AMU).26 However, the AMU is
not effectively operational and none of its conventions
are currently being implemented. AMU’s failure to achieve
tangible progress on many of its goals results from political
disagreements between its members, particularly due to
differences between Algeria and Morocco over Western
Sahara (Allouche, 2019). Faced with relative stagnation
of AMU, Mauritania has negotiated re-entry and signed
an Association Agreement with ECOWAS in 2017. The
Agreement granted Mauritania an associate state
status, under which it participates in the ECOWAS trade
liberalization scheme and was due to apply ECOWAS’s
common external tariff (CET) and promote the free
movement of people, goods, and investments starting
January 2019. However, none of the arrangements have
been implemented as of August 2019 due to ongoing
discussions regarding the strategy to operationalize
the agreement. According to Mauritanian officials, the
agreement should enter into force in January 2020.
Mauritania has signed and ratified the African Continental Free Trade Area (AfCFTA), but its implementation needs to be defined. AfCFTA, which
will create an African-wide free trade area over the next
decade, aims to eliminate tariffs on most intra-regional
trade in goods, eliminate NTMs, reduce restrictions
on trade in services, and harmonize policies related to
investment, intellectual property, and competition. It has
the potential to deepen regional integration and drive
economic diversification, attract FDI, and heighten regional
connectivity. The agreement came into force on May 30,
2019 after The Gambia became the 22nd country to ratify it
and entered its operational phase on July 7, 2019. However,
critical parts of the agreement are yet to be finalized
before countries start trading under the AfCFTA on July 1,
2020, including on schedules of tariff concessions, services
commitments, and policies around investment, intellectual
property, and competition. Negotiations for protocols under

MAURITANIA: Country Economic Memorandum 37
phase II which include protocols on intellectual property,
rights, investment, and competition policy are all still
outstanding. Most of these remaining issues are scheduled
to be concluded and adopted by 2021.
Mauritanian exports benefit from tariff preferences in developed countries that can be revoked unilaterally. Exports to the United States enjoyed duty-free and quota-
free access under the African Growth and Opportunity
Act (AGOA) until Mauritania was declared ineligible in
January 2019 due to human right concerns as cited by
the US administration. The country had previously lost
AGOA eligible status following the coup d'état in August
2008 but recovered in 2010. Mauritanian exports to the
European Union benefit from tariff-free treatment under
the Everything But Arms (EBA) initiative. However, once
Mauritania graduates the status of least developed
country (LDC), it risks losing free access to EU market
without a free trade agreement. One of the benefits of the
Association Agreement with ECOWAS is that the country
can assure further free access to EU market as part of
the ECOWAS Economic Partnership Agreement (EPA),
which is yet to be implemented as Nigeria still has not
signed it.27
27 https://trade.ec.europa.eu/doclib/docs/2009/september/tradoc_144912.pdf
3.4.5. Poor infrastructure and connectivity increase trade costs
The logistics competency of Mauritania further re-affirms its weak trade facilitation environment. Despite
the recent efforts made by the authorities to strengthen
logistics and road services, the trade and transport
infrastructure remains insufficient (WTO, 2018). As
shown in Figure 52, Mauritania performs relatively poorly
compared to its peers on key elements of the World Bank’s
Logistics Performance Index (LPI) such as the efficiency of
customs and border management clearance, the quality of
trade and transport infrastructure, the ease of arranging
competitively priced shipments, and the competence and
quality of logistics services (trucking, forwarding, and
customs brokerage).
The poor road infrastructure coupled with geographical constraints, mean that trade costs are elevated. Despite
declining over time, aggregate trade costs of Mauritania
remain the highest among peer countries (Figure 53). While
this partially relates to the insular nature of the country
(such as the large distances) for which policymakers have
little direct leverage on, trade costs are elevated due to
Figure 51: Mauritania’s import tariffs are high Figure 52: Mauritania is second to last in the world on the prevalence of NTMs
Applied MFN duty rates by product (2010 vs. 2017) Extent of Market Dominance vs. Real GDP per capita (2018)
Perc
ent
(%)
Sco
re (1
−7)
Source: WTO (2018). Note: the numbers correspond to: 1. Agriculture, 2. Animal products, 3. Dairy products, 4. Fruit, vegetables, 5. Coffee, tea, 6. Cereals, 7. Oil sseds, 8. Sugar, 9. Beverages, 10. Cotton, 11. Other agri products, 12. Non-agri products, 13. Fish products, 14. Metals and minerals, 15. Chemical, 16. Wood, paper, 17. Textiles, 18. Clothing, 19. Leather, footwear, 20. Non-electrical machinery, 21. Electrical machinery, 22. Transport equipment, 23. Other manufactured articles, 24. Petroleum
Source: Source: GCI 2018 and authors’ calculations.
0
5
10
15
20
25
1 2 3 4 5 6 7 8 9 10 11 12 13 14 15 16 17 18 19 20 21 22 23 24
2010 2017 Avg (2010) Avg (2017)
MRT
BENNIC
SEN
34
56
3 3.5 4 4.5 5
Real GDP per capita (log)

MAURITANIA: Country Economic Memorandum38
poor domestic connectivity which stems from poor logistic
services and infrastructure.28
The lack of quality roads particularly affects agricultural production areas in the south, which remain isolated from the main economic and export centers. Even important agricultural production centers, such as
Rosso, get disconnected at the start of the rainy season.
The situation is bad enough that fruits and vegetables
production enterprises, which used to export to Europe, have
suffered because products could not reach airport facilities
in Nouakchott on time for shipping, or got damaged along
the bumpy, muddy road (World Bank, 2019a). In fact, the
speed at which an average vehicle reaches Nouakchott is
by far the lowest from Rosso compared to the other main
cities in Mauritania (Table 5). This suggests that the quality
of the Rosso-Nouakchott corridor needs upgrading since
it links the agricultural production center to the main
demand and export destination. Nevertheless, things are
slowly improving thanks to the support of the World Bank
and the EU who financed the rehabilitation of large parts
of this road.
28 The trade cost measure captures two main categories: The first entails bilateral factors of separation between the exporter and the importer, more dependent on exogenous factors than particular policy choices such as geographical distance. The second includes endogenous trade costs, which measure the ‘thicknesses of two countries’ borders and includes logistics performance, trade facilitation bottlenecks, such as border control and transit systems, and international connectivity, as the existence of regular maritime, air shipments (Arvis et al., 2013).
Low maritime connectivity continues to undermine the access of Mauritania to global markets. In contrast
to Morocco which improved its global ranking on the
Liner Connectivity Shipping Index (LCSI) from 79th in
2006 to 22nd in 2019, Mauritania’s position on the LCSI
deteriorated from 112th in 2006 to 116th in 2019. Despite
the expansion of the port capacity in Nouakchott from
three to seven berths in 2014, the rapid growth of imports
means that ships often wait for a long time to unload their
cargoes. The construction of a container terminal and an oil
jetty agreed as part of PPP in end-2018 would help expand
the port’s capacity in the future. In addition to capacity
issues, the most recent Trade Policy Review by the WTO
(2018) points to several institutional issues that affect the
functioning of the port. These include the multiplicity of
supervisory authorities which undermine the management
of port affairs, the uncontrolled liberalization of transport
auxiliaries, and the non-existence of a legal framework for
coordination that would facilitate the passage of goods
through the ports.
Figure 53: Mauritania performs poorly in terms of trade logistics
Figure 54: Despite declining over time, trade costs in Mauritania remain elevated
Components of Logistic Performance Index (2018) Measures of Trade costs to the US
Sco
re (0
-5)
Perc
enta
ge c
hang
e in
tra
de c
ost
(20
05-
2014
)
Source: LPI and authors’ calculcations. Source: UNESCAP – World Bank Trade Costs database and authors’ calculations.
2
2.2
2.4
2.6
2.8
3
Mauritania Structural peersAspirational peers Neighboring Arab countries
Mauritania
Benin
Nicaragua
Senegal
Lao PDR
Moldova
ZambiaAlgeria
Morocco
Tunisia
-50
-40
-30
-20
-10
0
10
50 100 150 200 250 300
Trade cost (2014)
Customs Infra-structure
International shipments
Logisticsquality
Trackingand tracing
Timeliness

MAURITANIA: Country Economic Memorandum 39
3.4.6. Weak human capital
Despite sustained investment over a long period of time, Mauritania has not yet achieved universal access to primary education. While the Gross Enrollment Rate
in primary education has been over 100 percent over the
last decade, the Net Enrolment Rate (NER) of the primary
education age-group (6-11 years) has remained under 75
percent, well below the average of SSA and Arab countries
(World Bank, 2019b). Based on the MICS 201529 survey
data, more than 236,000 children aged 6-15 years (24
percent of total age-group) were out-of-school. Two out of
three were among the youngest (6-9 years old) signaling
late-entry, and 46 percent have never been to school. While
the primary education retention rate increased from 51.3
percent in 2000/2001 to 69 percent in 2016/2017, one
third of primary school students drop-out before the end of
the cycle with important regional disparities.4
Learning outcomes are poor. At the national level, the
education system is failing to provide foundational skills
that are critical to enable social and geographic mobility. In
2017, only a quarter of grade 6 students scored above 50
percent on the end-of-primary-school national exam, while
29 UNICEF 2016 – Multiple Indicators Cluster Survey – Mauritania 2015
only 1.7 percent of grade 4 students in public schools could
read a simple eight-word sentence in French and about
37 percent could not add two single-digit numbers (World
Bank, 2018c).
Table 5: Among major cities, Rosso is the city where cars roll at the slowest pace when travelling from/to Nouakchott
Route to Nouakchott Time (hours) Distance (km) Km per hour
Nouadhibou 5h 51 480 87.1
Atar 5h 28 439 83.1
Kaedi 5h 52 415 75.2
Guerou 7h 35 547 74.4
Zoueiratt 10h 51 767 73.0
Kiffa 8h 28 603 72.8
Aioun El Atrouss 11h 23 814 72.5
Nema 15h 12 1,089 72.0
Selibabi 9h 27 645 69.6
Rosso 3h 34 205 61.4
Source: Google maps accessed on February 15, 2019 at 18:00 pm local time.


MAURITANIA: Country Economic Memorandum 41
4.1. Introduction
hen cities function well, they are engines of economic growth and prosperity. Urban
densities connect workers better to jobs and
bring people physically closer, facilitating the exchange of
ideas and innovations, fueling productivity, and reducing
the cost of infrastructure and services (Lall et al., 2017).
Functioning cities support the structural transformation of
an economy: no country has reached middle income status
without urbanizing (Spence et al., 2009). Today, African
cities present themselves to investors as crowded, costly
and fragmented (Lall and Venables, 2018). Mauritania’s
case, as will be shown below, is not so different and faces
additional challenges arising from its geography (low
population density and large distance from major markets)
and its economic structure that is heavily reliant on natural
resource exports. Although the latter challenge will not be
further explored here, empirical evidence shows that the
linkages between urbanization and growth in manufacturing
and services is weaker among resource exporting countries
versus non-resource exporting countries (Gollin et al., 2016).
Mauritania’s geography and settlement pattern make urban centers distant from each other. Mauritania’s
cities and towns are sprawling and suffer from low
population density, undermining the agglomeration
benefits to be reaped from moving closer. Because of
the vast terrain, urban areas in Mauritania are also
distant from each other and further divided due to poor
infrastructure and cultural differences. The larger cities
are also disconnected from urban areas in neighboring
countries due to trade restrictions and hard borders.
For instance, the agricultural-based Southern region
is disconnected from economic opportunities on the
Senegalese side by the Senegal river that forms a natural
border between the two countries. These challenges limit
access to markets, thus undermining growth through
specialization and diversification.
More than 50 percent of Mauritania’s urban population reside in Nouakchott, though living conditions and economic opportunities underwhelm. Although it is
the most diversified region, Nouakchott is not home
Chapter 4
The missing link between urbanization and growth
W

MAURITANIA: Country Economic Memorandum42
to productive firms or more complex manufacturing
processes (see chapter 3). Plagued by sprawling and
disconnected neighborhoods, the capital’s infrastructure
remains inadequate, thus stifling better services and
improved connectivity for Nouakchott’s residents and
reducing two important benefits associated with density:
improved connectivity and better services (Hommann
and Lall, 2019). It is estimated that about 80 percent of
Nouakchott’s urban population live in slums, lacking either
adequate housing, infrastructure, tenure or a combination
of these.
This chapter aims to examine the urbanization pattern of Mauritania and explains the challenges that are preventing urbanization from contributing to growth as expected. The rest of this chapter is organized as
follows. Section 4.2 studies the urbanization patterns
and the drivers of urbanization in Mauritania. Section
4.3 analyzes the challenges that prevented urbanization
from contributing to growth as expected. Section 4.4
concludes by discussing the role of Nouakchott as a driver
of economic prosperity. Policy recommendations are
presented in chapter 5.
4.2. Understanding the urbanization landscape in Mauritania
4.2.1. Urbanization and its Drivers
Mauritania’s population of 4.2 million is distributed across a vast territory of about 1 million square kilometers with four distinct ecological zones (Figure 55). The desert-like Saharan zone – comprising the regions
of Tiris Zemmour in the North, Adrar in the middle, and
Hodh Ech Chargui in the East – covers about two thirds
of Mauritania’s territory, but is home to only 15 percent of
its population. The Sahelian zone extends from Boutilimit
in the South Western part of Mauritania to Nema in the
East and from the Saharan zone to about 30 kilometers
North off the Senegalese river. This zone is characterized by
vast steppe and savanna grasslands that form the natural
home of Mauritania’s goat and sheep herders. Further
South stretches the only real fertile zone of Mauritania, the
Senegalese River Valley, that supplies most of the country’s
agricultural production. Lastly, the Coastal zone extends
754 kilometers along the Atlantic coast and comprises
mostly of dunes. Nouakchott (the capital) and Nouadhibou
Figure 55: Mauritania’s territory is characterized by low population density
Source: Adapted from World Bank (2019).
Table 6: Administratively, Mauritania is divided into 13 regions, each with its own capital
Wilaya Capital
Adrar Atar
Assaba Kiffa
Brakna Aleg
Dakhlet Nouadhibou Nouadhibou
Gorgol Kaedi
Guidimaka Selibaby
Hodg Ech Chargui Nema
Hodg El Gharbi Aioun el Atrouss
Inchiri Akjoujt
Nouakchott Nouakchott
Tagant Tidhikja
Tiris Zemmour Zouerat
Trarza Rosso
Source: Google maps accessed on February 15, 2019 at 18:00 pm local time.

MAURITANIA: Country Economic Memorandum 43
are the most important cities in that zone. Mauritania’s
geography and climate determines its settlement pattern,
and climate change has contributed to the expansion of
the Saharan zone at the expense of the more fertile zones
North of the Senegalese river and border.
Despite Mauritania’s low population density across much of its territory, the country maintains administrative presence over its geographic area. Administratively,
the country is divided into 13 regions (wilayas), each with
a regional capital that act as a hub for economic activity
(Table 6). Regions are further divided into departments
(moughataas) that are subdivided into communes that
represent the lowest administrative level within the
government system. In turn, each commune has a “main
town” with an elected mayor responsible for all localities
within the commune. The main town is the center for basic
services, like hospitals and schooling, and commerce.
Given terrain and geography, half of Mauritania’s urban population is concentrated in Nouakchott and about a third resides in small and scattered settlements in the South. In 2017, the country’s urban population reached
about 2.3 million or about 53 percent of the total population
(Figure 56). After Nouakchott with 1.2 million inhabitants,
the next largest city is Nouadhibou in the North with 120
thousand, followed by the town of Kiffa in the South with
50 thousand (Figure 57). At the tail end of the distribution
are almost 60 urban areas that have an average population
of only 10 thousand inhabitants and account for about a
third of the total urban population.
Even though some of the small towns in the South are growing rapidly, there is limited evidence of what drives urban population growth. Among towns with more than 20
thousand inhabitants, Aïoun el Atrous, located on the road
between Kiffa and Nema, experienced the fastest growth
Figure 56: Half of the urban population in Mauritania resides in the capital Nouakchott …
Figure 57: … while 37 percent reside in towns below 10 thousand inhabitants
Urban population in Mauritania Population distribution per city size
Mill
ions
Perc
ent
(%)
Source: WDI and authors’ calculations. Source: Citypopulation.de and authors’ calculations.
Other urban areas Nouackhott 2000 2013
0,0
0,5
1,0
1,5
2,0
2,5
196
0
196
3
196
6
196
9
1972
1975
1978
198
1
198
4
198
7
1990
1993
1996
1999
200
2
200
5
200
8
2011
2014
2017
0.03.6
9.4
21.6
62.3
0.2 3.1 2.57.7
1115.9
62.7
0
10
20
30
40
50
60
70
below1.5k
1.5k to 5k
5k to 10k
10k to50k
50k to100k
above100k
Figure 58: Nouakchott’s population nearly doubled over the past two decades, driven mostly by migration
Population by main cities
0 200 400 600 800 1.000
NémaGuerou
Aïoun El…Atar
SélibabiRosso
Zoueirat
KaédiMbera*
Kiffa
NouadhibouNouakchott
Number of individuals (thousands)
2013 2000

MAURITANIA: Country Economic Memorandum44
of 6 percent between 2000 and 2013 (Figure 58). While
several of these small towns (i.e. Guerou, Kiffa, Sélibabi)
reported population growth rates higher than Nouakchott,
their impact on overall urbanization is low given the small
size of these settlements. What drives the population
growth – migration or natural growth -- in specific towns
is less understood.
30 Mauritanie : Enquête par Grappes à Indicateurs Multiples (MICS) 2015 : http://www.ons.mr/images/mics/MICS5_rapport.pdf31
Migration, coupled with a high fertility rate, fueled rapid population urban growth, particularly in Nouakchott and Nouadhibou. Mauritania’s fertility rate
is among the highest in the world at about 5.1 births per
woman,3031and higher in rural (6.1 births per woman) than
in urban areas (4.3 births per woman). In addition to the
high fertility rate, data from the 2013 census shows
Figure 59: The main cities to which individuals migrated are Nouakchott and Nouadhibou and the mining areas
Distribution of individuals per wilaya according to their length of residence
Source: RGPH 2013 and authors’ calculations.
0
10
20
30
40
50
60
70
80
90
100
Perc
ent
< 1 year
Giudimaka Gorgol Assaba Tagant Hodh Gharbi Brakna Hodh EchCharghui
Trarza Adrar TirisZemmour
Nouakchott Inchiri DakhlettNouadibou
1-4 years 5-9 years 10+ years since birth missing
Figure 60: Young males are the most likely to migrate...
Figure 61: … with Nouakchott being the main migration destination
Probability to migrate per age and wilya Destination of migrants per age
Perc
ent
(%)
Perc
ent
(%)
Source: Authors’ calculations based on Dupriez and Spielauer (2017). Source: Authors’ calculations based on Dupriez and Spielauer (2017).
0
2
46
8
1012
(min
,5)
[5,10
)[1
0,15
)[1
5,20
)[2
0,2
5)[2
5,30
)[3
0,3
5)[3
5,40
)[4
0,4
5)[4
5,50
)[5
0,5
5)[5
5,6
0)
[60
,max
)
(min
,5)
[5,10
)[1
0,15
)[1
5,20
)[2
0,2
5)[2
5,30
)[3
0,3
5)[3
5,40
)[4
0,4
5)[4
5,50
)[5
0,5
5)[5
5,6
0)
[60
,max
)
Female Male
Adrar Tagant TrarzaAssaba Brakna GorgolInchiri Dakhlett Nouadibou Tirs - EzemourHodh Gharby Hodh Charghy GuidimaghaNouakchott
0
0,2
0,4
0,6
0,8
1
Hodh Charg
hy
Hodh Gharb
y
Assaba
Gorgol
Brakna
Trarza
Adrar
Dakhlett N
ouadibou
Tagant
Guidimagha
Tirs -
Ezem
ourInch
iri
Nouakchott
(min,5)[5,10)
[10,15)[15,20)[20,25)[25,30)[30,35)[35,40)[40,45)
[45,50)[50,55)[55,60)[60,max)

MAURITANIA: Country Economic Memorandum 45
that migration fueled population growth, particularly in
Nouakchott and Nouadhibou, where 50 and 55 percent
of their respective residents report being born in another
wilaya (Figure 59). This confirms a high level of migration
into these two most urbanized wilayas. Other regions
with higher migration status – but lower population
numbers – include Inchiri (50 percent) in the North East
of Nouakchott with gold and copper mines near the town
of Akjoujt, and Tiris Zemmour (56 percent) with iron
mines in Zoueirat. While the census provides information
of movements between wilayas in the temporal intervals,
it does not record whether a person arrived from a rural
or an urban area, nor does it show the intra-wilaya
movement of population. At national level, about one
quarter of the population have moved to another wilaya
since birth.
Box 3: Future population will grow rapidly and be largely concentrated in Nouakchott if past migration trends continue
Mauritania’s population is projected to grow from 4.2 million in 2018 to almost 12 million in 2065 (Spielauer and Dupriez, 2017). This projection is consistent with previous dynamics between 1977 and 2013 when the total population
in the country increased from 1.4 to 3.4 million. Population growth will be driven by fertility and migration, with the latter
heavily influencing the regional composition of the population across wilayas if previous patterns of international and
national migration continue in the future (Figure 62).31 Considering migration trends observed between 2000 and 2013, it
is expected that Nouakchott would grow disproportionally faster due to a large number of migrants arriving in the capital
city. Despite lower fertility rates in urban areas including Nouakchott, its population will increase from 1.2 million in 2018
to almost 6.5 million people in 2065.
Continued rapid population growth in Nouakchott may lead to congestion and increases the risks posed by climate change. Already delinquent on the provision of basic infrastructure services and economic assets, Nouakchott risks
falling behind further, unless appropriate urban planning and land use regulation guide the investments into housing and
infrastructure within the city. As outlined in section 4.4.6 below, existing threats posed by climate change will expose the
city further, unless accompanied by commensurate investments into climate resilience.
31. Population projections are based on a dynamic micro-simulation model, which account for a broad variety of individual characteristics, model realistic life-courses and their diversity, and support the modeling of interactions between people.
Projected total population - migration scenarios
Source: Authors’ calculations based on Dupriez and Spielauer (2017).
0
2.000.000
4.000.000
6.000.000
8.000.000
10.000.000
12.000.000
2015
2020
2025
2030
2035
2040
2045
2050
2055
206
0
206
5
2015
2020
2025
2030
2035
2040
2045
2050
2055
206
0
206
5
2015
2020
2025
2030
2035
2040
2045
2050
2055
206
0
206
5
NO MIGRATION INTERNAL MIGRATION ONLY INTERNAL AND INTERNATIONALMIGRATION
Nouakchott Inchiri Tirs-Ezemour Guidimagha TagantDakhlett-Nouadibou Adrar Trarza Brakna Gorgol
Assaba Hodh-GharbyHodh-Charghy

MAURITANIA: Country Economic Memorandum46
Among the migrant population, migration is mainly oriented towards Nouakchott and it is mainly young men who migrate. Men are about twice as likely to migrate
compared to women and the probability to migrate peaks
around the age of 20 to 25 (Figure 60). Among wilayas,
Nouakchott is by far the preferred migration destination as
it attracts about 70 percent of total migrants (Figure 61).
This is because most jobs (34 percent, LFS 2017) are found
in the capital. If these past migration trends continue,
Nouakchott’s population would grow disproportionally
faster than the rest of the country (Box 3), likely leading
to congestion that could undermine its growth prospects
further, and exposing the future generations to the threats
imposed by climate change (see section 4.4.6).
4.2.2. Spatial Inequality in Welfare and Access to Services: a Driver for Migration?
Even though Mauritania has made positive strides in reducing spatial inequality over the past decade, welfare and living conditions are still very different between rural and urban areas. Between 2008 and 2014 rural poverty
was declining behind the backdrop of more favorable terms
of trade for commodities, which favored rural households
by generating higher farm income (World Bank 2017b, p.9).
During the same period, however, urban areas registered
fewer gains in poverty reduction and Nouakchott witnessed
an increase in poverty likely driven by the arrival of poorer
households. This led to some convergence of poverty rates
between rural and urban areas (World Bank, 2017b). Still,
welfare differences between rural and urban communes
remain sizeable (Figure 63) and poverty headcount ratios
remain highest in the populated South where population is
highly reliant on agriculture (Figure 64).
The pattern of access to public services mirrors the poverty rates across communes. As expected,
urban communes, particularly those in Nouakchott and
Nouadhibou, are doing better in terms of access to public
infrastructure and services, such as electricity, piped water,
and sanitation compared to more rural communes (Figure
65 to Figure 68). More urbanized yet poorer communes
in the South – such as Kiffa, Guerou, Kaedi and Aioun el
Atrouss – are doing better too, especially compared to their
neighboring communes with rural characteristics. For these
rural communes, the combination of lack of economies of
scale, relatively higher cost of service provision and poverty
explain the very low access to services.
The overlap between dependency on agriculture, poverty, and lack of infrastructure services is concerning when
Figure 63: The difference between rural and urban welfare is sizeable ...
Figure 64: … and is more pronounced in the South that has the largest headcount poverty ratio
0
01.
0e-
06
2.0
e-0
63.
0e-
06
4.0
e-0
65.
0e-
06
200000 400000 600000 800000 1000000
Rural areas Urban areas
Per capita/adult equilavent food & no-food consuption expenditure (annual)
Distribution of household welfare in Mauritania
Den
sity
Source: EPCV 2014 and authors’ calculations. Source: Poverty Map for Mauritania, based on EPCV 2014 and RGPH 2013.

MAURITANIA: Country Economic Memorandum 47
Figure 65: Urbanized communes have better access to…
Figure 66: … electricity…
Percent of Population Urban Percent of Population with Access to Electricity
Figure 67: … piped water… Figure 68:… and sanitation systems
Source: RGPH 2013 and authors' calculations.
Percent of Population with Access to Piped Water Percent of Population with Access to Sewage or Septic
considering the likely negative impact of climate change. In Southern communes, the share of farmers
and herders in the total workforce is very high (Figure 69).
Agriculture dependence coincides with high poverty and
deficiency of public services and infrastructure. Climate
change will add stress to these communes that are already
prone to food security crises (Figure 70) and is likely to push
people in even greater numbers to the larger urban centers
(Henderson et al., 2017).
4.3. Unpacking the linkages between urbanization and growth
Empirical evidence suggests that successful cities enable firms to increase workers’ productivity through scale and specialization. Scale can be achieved by
producing a lot of one product or through technologies,
thereby reducing the fix cost per unit of production.

MAURITANIA: Country Economic Memorandum48
Producing at scale requires access to a large market, so that
producers can sell to consumers at low transaction costs
– either locally or exporting internationally. Specialization
occurs when workers concentrate on doing a few narrowly
defined tasks and in that process accumulate specialized
skills that increase productivity (Collier and Jones, 2015).
Scale and specialization interact and are stimulated by
the proximity between producers and consumers. The
abundance of complementary skills of specialized workers
encourage diversification of products as firms compete for
the market share.
When consumers, producers and workers cluster in proximity, they spur competition and enable scale and specialization that bring agglomeration benefits in form of higher productivity. To generate proximity,
either the physical distance needs to be reduced or
overcome by investing into connective infrastructure and
transportation services. Therefore, productivity generated
through scale and specialization, can only be reaped if
connectivity between workers, producers and consumers
is fostered through density and efficient transport options.
Many African cities are fragmented and disconnected
(Lall and Venables 2017) and therefore fail to reap these
agglomeration benefits.
It is therefore through the lens of density, distance, and division that growth opportunities can be usefully assessed spatially in a country or city. The “3Ds”
framework first emerged in the World Bank’s (2009)
World Development Report, when location-based growth
opportunities and related policies were analyzed in the
context of population densities, lagging regions (distance)
and hard borders (division). The framework allows to
identify the constraints that impede growth and propose
remedies to remove these constraints (Wang et al., 2018).
In Mauritania, the small size of urban settlements – apart from Nouakchott and Nouadhibou – means that few towns are sufficiently large to create market potential or generate economies of scale. The low
density shown earlier at the national level is also an issue
at the urban level. The average density among urban
agglomerations in Mauritania is 3,162 inhabitant/km2 in
2015, one the lowest densities in Africa (Figure 71). It is thus
not surprising that nightlight data – often used to depict
economic activity, population or a combination of both –
detects only Nouakchott, Nouadhibou and the mining area
around Fderik and Zoueirat as emitting lights, but without
substantial growth between 1996 and 2010, these being
the latest years of comparable nightlight data (Figure 72).
Figure 69: Communes in the south of Mauritania are largely dependant on framing and herding
Figure 70: Regions in the South of Mauritania were affected by a food crisis in 2018
Source: RGPH 2013 and authors' calculations. Source: http://fews.net/west-africa/mauritania.

MAURITANIA: Country Economic Memorandum 49
In addition to low density, distances between urban regions are vast, leaving large parts of the country disconnected. The average distance between urban
agglomerations in Mauritania is 107 km, the third longest in
Africa (Figure 73). When visualizing access to marketplaces
across Mauritania’s territory (and assuming thick borders
to its neighboring countries), one can see that half of
the country is disconnected (Figure 74). Lack of market
accessibility mostly coincides with little to no populations,
such as in the North Eastern part of the country. However,
the South Eastern border to Senegal has also inaccessible
areas (highlighted in purple) where population settlements
are disconnected from other towns in Mauritania due to
non-existing roads.
Large distances and high cost of transportation limit the integration of product and labor markets. Figure
75 shows prices for charcoal and milk concentrate for
Figure 71: Urban agglomerations in Mauritania are among the least dense in Africa
Figure 72: Many localities, especially in the South, show low economic activity and do not emit light
Source: Africapolis and authors’calculations.Source: National Oceanic and Atmospheric Administration and authors’ calculations.
0
2
4
6
8
10
12
SWZ
BW
AN
AM
TUN
MR
TZA
FM
WI
TZA
ZWE
DZA
CM
RC
OG
UG
AG
INC
PVS
EN SLE
CO
DS
OM
NG
AM
AR
BEN
SS
DC
IVTC
D
Average density in urban agglomerations (persons/km2)
Figure 73: Urban agglomerations in Mauritania are very distant from each other
Figure 74: About half of Mauritania’s territory has no or limited connections to within country market towns
Source: Africapolis. Source: Open Street Map (OSM), Africapolis and Authors’ calculations.
Average distance between urban agglomerations in Africa
0
20
40
60
80
100
120
140
160
Nam
ibia
Mau
ritan
ia
CA
R
Con
go
Zam
bia
Ang
ola
Gui
nea
Gui
nea-
biss
au
Nig
er
Zim
babw
e
Sou
th S
udan
Sie
rra
Leon
e
DR
C
Alg
eria
Sou
th A
fric
a
Bur
undi
Ben
in
Sao
Tom
e an
d…
Egyp
t

MAURITANIA: Country Economic Memorandum50
different Moughataas in Mauritania. These prices are
systematically linked to patterns of production but also
point towards high transport costs. For instance, prices for
charcoal (Panel A) are relatively lower for the South-West
of the country, which reflects the abundance of wood as
input for production. In the North and East of the country,
charcoal is imported and significantly higher prices signal
high cost of transportation. Milk concentrate (Panel B) is
normally imported through Nouakchott or comes from
Mali, and spatial patterns suggest that distance matters.
It is likely that high transport costs undermine domestic
and international market integration.
Even when considering larger agglomerations in neighboring countries, Mauritania’s towns are far from other towns. In Mauritania, the average distance
to the nearest larger city was about 335 km in 2015
(Table 7), compared to 128 km, 264 km, 270 km, and 271
km in neighboring Senegal, Morocco, Mali and Algeria,
respectively. These large distances increase transportation
cost, thus reducing possible spillover benefits that could be
reaped from a more tightly knitted network of cities. While
Nouakchott has a geographically central location in the
country, it is however distant from any other significant
growth pole. Towns in the South, like Rosso or Kiffa, could
perhaps play an important role to bridge the distance
to Saint Louis in Senegal or Bamako in Mali, or likewise
Nouadhibou or Atar to connect to the North.
Acute divisions between settlements also prevail due to poor road infrastructure. Division is characterized by
the shortage of effective transportation which adversely
affects the travel time between cities and countries.
Adequate roads are also important for the development of
rural areas as they provide cheap access to both markets
for agricultural output and for modern inputs (Jacoby,
2000). Despite the increase in investments, the quantity
and quality of roads in Mauritania are extremely low as the
country ranked last in SSA on both measures (Figure 76 and
Figure 77). Poor road conditions also increase transportation
costs, which adversely affect firm growth (Dinh and Clarke,
2012). In Mauritania 45.9 percent of firms surveyed as part
the World Bank Enterprise Survey considered transport
as major constraint to their operations, compared to 26
percent in SSA. The dearth of transnational highways and
railways thwart mobility and trade and undermine the
generation of economies of scale.
In addition to physical barriers, social barriers inhibit economic integration. In a general setting, acute social
divisions inhibit growth as they encourage rent-seeking
behavior, lead to market distortions, and mismanagement
Figure 75: The spatial price variation for Charcoal (panel A) and Milk concentrate (panel B) points to high transport costs
Source: World Bank staff calculations based on EPCV 2014. Note: Results show percentage variation in nominal prices after controlling for observable characteristics. Red (blue) regions show higher (lower) prices relative to Nouakchott.
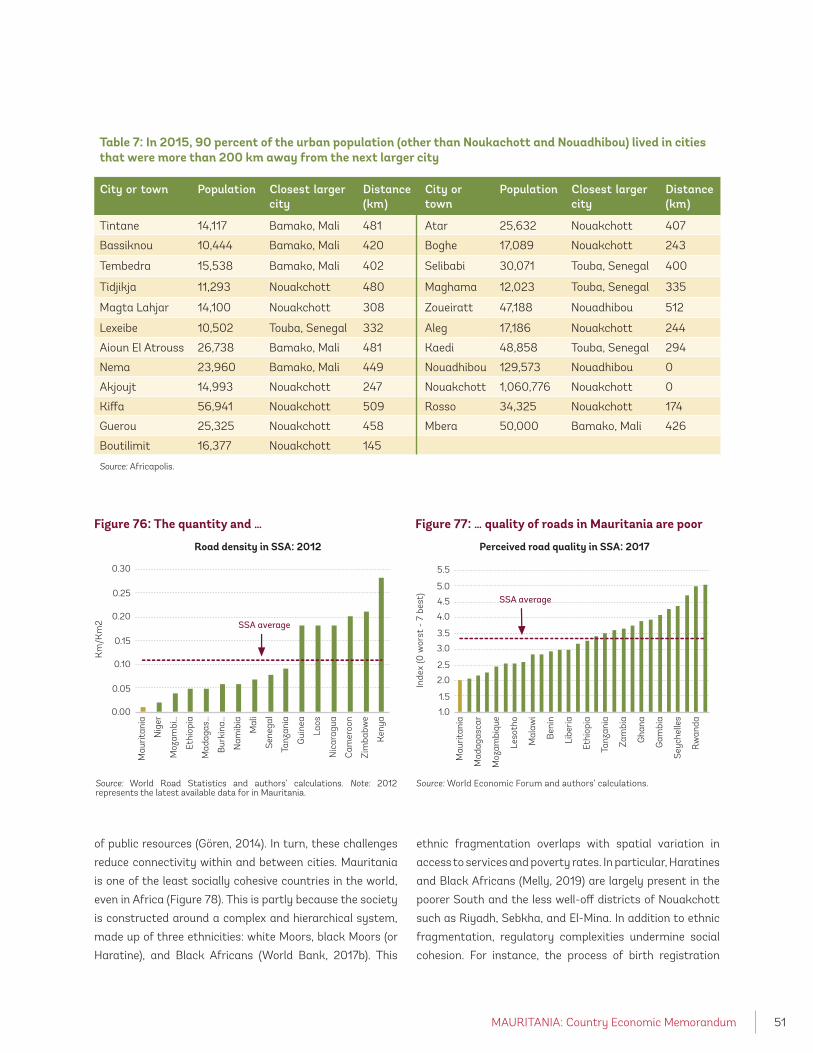
MAURITANIA: Country Economic Memorandum 51
of public resources (Gören, 2014). In turn, these challenges
reduce connectivity within and between cities. Mauritania
is one of the least socially cohesive countries in the world,
even in Africa (Figure 78). This is partly because the society
is constructed around a complex and hierarchical system,
made up of three ethnicities: white Moors, black Moors (or
Haratine), and Black Africans (World Bank, 2017b). This
ethnic fragmentation overlaps with spatial variation in
access to services and poverty rates. In particular, Haratines
and Black Africans (Melly, 2019) are largely present in the
poorer South and the less well-off districts of Nouakchott
such as Riyadh, Sebkha, and El-Mina. In addition to ethnic
fragmentation, regulatory complexities undermine social
cohesion. For instance, the process of birth registration
Figure 76: The quantity and … Figure 77: … quality of roads in Mauritania are poor
Road density in SSA: 2012 Perceived road quality in SSA: 2017
Km
/Km
2
Inde
x (0
wor
st -
7 b
est)
Source: World Road Statistics and authors’ calculations. Note: 2012 represents the latest available data for in Mauritania.
Source: World Economic Forum and authors’ calculations.
0.00
0.05
0.10
0.15
0.20
0.25
0.30
Mau
ritan
ia
Nig
er
Moz
ambi
…
Ethi
opia
Mad
agas
…
Bur
kina
…
Nam
ibia
Mal
i
Sen
egal
Tanz
ania
Gui
nea
Laos
Nic
arag
ua
Cam
eroo
n
Zim
babw
e
Ken
ya
SSA average
1.0
1.5
2.0
2.5
3.0
3.5
4.0
4.5
5.0
5.5
Mau
ritan
ia
Mad
agas
car
Moz
ambi
que
Leso
tho
Mal
awi
Ben
in
Libe
ria
Ethi
opia
Tanz
ania
Zam
bia
Gha
na
Gam
bia
Sey
chel
les
Rw
anda
SSA average
Table 7: In 2015, 90 percent of the urban population (other than Noukachott and Nouadhibou) lived in cities that were more than 200 km away from the next larger city
City or town Population Closest larger city
Distance (km)
City or town
Population Closest larger city
Distance (km)
Tintane 14,117 Bamako, Mali 481 Atar 25,632 Nouakchott 407
Bassiknou 10,444 Bamako, Mali 420 Boghe 17,089 Nouakchott 243
Tembedra 15,538 Bamako, Mali 402 Selibabi 30,071 Touba, Senegal 400
Tidjikja 11,293 Nouakchott 480 Maghama 12,023 Touba, Senegal 335
Magta Lahjar 14,100 Nouakchott 308 Zoueiratt 47,188 Nouadhibou 512
Lexeibe 10,502 Touba, Senegal 332 Aleg 17,186 Nouakchott 244
Aioun El Atrouss 26,738 Bamako, Mali 481 Kaedi 48,858 Touba, Senegal 294
Nema 23,960 Bamako, Mali 449 Nouadhibou 129,573 Nouadhibou 0
Akjoujt 14,993 Nouakchott 247 Nouakchott 1,060,776 Nouakchott 0
Kiffa 56,941 Nouakchott 509 Rosso 34,325 Nouakchott 174
Guerou 25,325 Nouakchott 458 Mbera 50,000 Bamako, Mali 426
Boutilimit 16,377 Nouakchott 145
Source: Africapolis.

MAURITANIA: Country Economic Memorandum52
is complicated and expensive, making it inaccessible for
a large part of the population. According to the United
Nations Children’s Fund, only 66 percent of under-5-year-
olds are registered. Lack of identification makes it difficult
for individuals to obtain formal employment and get access
to basic services such as education and healthcare. Women
are also marginalized as highlighted in section 3.4.1.
Lack of spatial integration through trade linkages generates further division and reduces Mauritania’s economic potential. Not a member of the Economic
Community of West African States (ECOWAS) and further
distant to the European Union countries – even though a
recent signatory to a regional EU economic partnership
agreement32 – Mauritania is neither belonging fully to
the club of North African nor SSA countries (see chapter
3 above). Apart from terrain and distance, the rigidity of
geopolitical boundaries impede trade and discourage the
continuity of urban areas and urban corridors which could
otherwise be developed into lucrative trade hubs.
32 http://trade.ec.europa.eu/doclib/press/index.cfm?id=191133 Nouakchott is divided into 9 moughataas – Arafat, Dar Naim, El Mina, Ksar, Riyadh, Sebkha, Teyarett, Toujounine, and Tevragh Zeina – of which Arafat had the largest population in 2013 (176 thousand) followed by the fast-growing areas of Dar Naim and Toujounine with both around 144 thousand in 2013(JICA, 2018). 34 Another ongoing study entitled “From rural towns to cities: Critical path to capture the economic potential of South Mauritania” is examining the urban potential of southern cities.
4.4. Is Nouakchott lifting its weight as an urban agglomeration?
Since Nouakchott is the only agglomeration of any significant size, this section examines the city’s performance as an engine of growth for Mauritania’s economy. The focus on Nouakchott is motivated by three
factors. First, it is the only city of any significant size in the
country, i.e. dominant city in a low market potential area
(OECD, 2017). Second, the wilaya of Nouakchott is the only
one that is classified entirely as urban.33 This enables use of
data that is only statistically representative at wilaya level.
Third, Nouakchott remains the country’s main interface for
international trade through its port facility which receives
most of Mauritania's imports (WTO, 2018).34
Nouakchott experienced one of the fastest population growth in Africa since it was chosen in 1958 as the capital of the then soon to be independent Mauritania. Back then, Nouakchott was a fishing village of about two
Figure 78: Social cohesion in Mauritania is very low when compared to other countries in the world
Source: Author calculations based on the Social Cohesion Index developed by Foa (2011).
(8,10](6,8](4,6][2,4]No data

MAURITANIA: Country Economic Memorandum 53
thousand inhabitants (Choplin and Dessie, 2017). In the
decades that followed – and accelerated by a series of
droughts since the beginning of the 1970s – Nouakchott’s
population grew exponentially from 135 thousand in 1977
to almost 1.2 million in 2018 (Figure 79).
Rising revenues from resource extraction accelerated income growth that translated into a higher public sector wage bill, a public investment program and a surge in consumption imports. As shown in section 2.2.1 above,
natural resource extraction, coupled with the commodity
super-cycle, raised income per capita in Mauritania in
the past. This resource-boom led to a surge in food and
manufacturing imports which rose from 27.1 percent of
GDP in 2006 to 38.7 percent of GDP in 2014, and created
opportunities in the import and domestic trade sectors.
Public consumption became another driver of economic
growth, when the Government increased the wage scale by
123 percent following the onset of oil production in 2006
and launched the PIP in 2009.
The resource boom rendered Nouakchott a consumption city that is not serving as an engine of economic growth as it shifted labor away from the manufacturing sector into non-tradable sectors. The increase in consumption
imports, coupled with the higher public sector wage bill
and the boom in the construction sector distorted the
labor market, inducing new migrants to find employment
opportunities in non-tradable and low-productive
sectors such as retail, construction, transport and public
administration. Combined, these sectors accounted for
about 50 percent of jobs in Nouakchott in 2017. As a result,
Nouakchott represents a “consumption city” as defined by
Gollin et al. (2017) as it urbanized without acquiring the
industrial sectors that are typically associated with the
development of productive cities.
Several factors prevented Nouakchott from evolving into a production city that could support economic diversification. Compared to capital cities in peer
countries, Nouakchott’s contribution to the national
economy is below its potential considering its population
size (Figure 80). Rapid and unplanned expansion,
deficiencies in connectivity, weak governance, the lack
of population density and access to finance have all
undermined agglomeration economies and made it costly
to connect people, workers, and firms within the city.
Meanwhile, the low skill base, owing to low educational
attainment outcomes of Nouakchott’s original population
coupled with the influx of less educated immigrants and
the outflow of highly educated emigrants has failed to
invigorate the private sector.
Figure 79: Between 1977 and 2018, Nouakchott’s population grew by a factor of ten
Figure 80: Nouakchott’s contribution to the economy is lower than what is expected given its population
Popuation per Wilaya Population vs GDP at the city level (2015)
Mill
ions
Cit
y le
vel G
DP
(% o
f tot
al)
Source: ONS, Citypopulation.de and authors’ calculations. Source: Oxford Economics, WDI and authors’ calculations.
0,1
0,4
0,6
1,01,2
0,0
0,5
1,0
1,5
2,0
2,5
3,0
3,5
4,0
1977 1988 2000 2013 2018
Inchiri Tiris Zemmour AdrarTagant Dakhlet Nouadhibou TrarzaGuidimaka Hodg El Gharbi BraknaGorgol Assaba Hodg Ech CharguiNouakchott
LusakaTunis
DakarManagua
Casablanca
Chisnau
NouakchottBamako
Vientiane
Cotonou
Algiers
5
15
25
35
45
7 12 17 22
city population (% of total)

MAURITANIA: Country Economic Memorandum54
Figure 81: Nouakchott's urban footprint expanded 30-fold between 1964 and 2016
Source: Author calculations based on the Social Cohesion Index developed by Foa (2011).
1958 1964 1980
1989 1995 2000
2008 2012 2017

MAURITANIA: Country Economic Memorandum 55
4.4.1. Absence of effective land management and urban planning has resulted in urban sprawl
Since the city’s inception, population growth has not been guided by urban planning and land use regulation. Nouakchott’s urban footprint, which is visualized in Figure
81, expanded from only 5 square kilometer (km2) in 1965
to 150 km2 in 2016 (CILSS, 2016). Rather than prioritizing
the development of land within or near the city core (infill
development), thereby increasing density and using prime
land more efficiently, Nouakchott’s urban expansion,
especially since 2000, took more the form of leapfrog
development, meaning the development of land that is
disconnected from currently developed areas (Figure 82).
Some of the leapfrog development is called “Kebbe” and
“Gazra” and are associated with often illegal occupation
of land. Many of these areas are characterized by informal
housing, poor infrastructure and services (roads, access
to water, and basic services) as well as poor integration
into the urban environment (World Bank, 2019e). Such
development increases the costs of providing future public
services and connecting roads.
While partly attributable to local preference, inefficient land use is mostly a symptom of a dysfunctional land
35 A household survey conducted by JICA 2018 showed that 87 percent of the sampled population in Nouakchott preferred to live in a single house.
management system. Clearly, local preferences for single
family housing and larger plots prevail in the Mauritanian
culture.35 92 percent of buildings in Nouakchott are
composed of only 1 or 2 floors (Figure 83). Still, and despite
attempts to improve current land administration in recent
years, Mauritania’s land administration system suffers from
complex formalities to land registration, lack of capacity
and financial resources, and dispersion of records and
responsibilities across different institutions. As per a 2010
decree, the Directorate General of State Land and Property
(DGDPE) at the Ministry of Finance has the responsibility of
processing and formalization of land rights. However, this
administration has only has 84 employees, or one agent
per 30,000 inhabitants (World Bank, 2019e). In contrast,
Namibia – whose geographical characteristics are similar
to those of Mauritania – has a land administration staff of
455 agents (or one agent per 4,600 inhabitants).
Emerging inconsistencies are the result of poor management, fraud and transactions being not recorded officially, undermining further the credibility and the functioning of land record systems (World Bank, 2019e). As of 2018, only 30 thousand deeds
were officially issued by the DGDPE since the creation of
Nouakchott. The absence of official deeds is confirmed by
the household survey implemented by JICA in 2018: none
Figure 82: Leapfrogging in Nouakchott increased dramatically since 2000
Figure 83: Low-rise buildings dominate the housing structure in Nouakchott
Source: Lall and Venables (2017). Source: JICA 2018 and authors’ calculations.
Share of new leapfrog fragments out of new fragments in African capitals Distribution of buildings in Nouakchott
0
10
20
30
40
50
60
Win
dhoe
kN
iam
eyC
onak
ryA
ddis
Suk
uta
Abu
jaB
ulaw
ayo
Toub
aD
akar
Oua
gado
ugou
Lago
sK
ano
Nai
robi
Lusa
kaA
ccra
Nou
akch
ott
Kig
ali
Kam
pala
Nya
laM
aput
oB
amak
o
Perc
ent
(%)
1990-2000 2000-2010
1 Floor; 39,5%2 Floors; 39,9%
3-6 Floors; 8,0% 7+ Floors; 0,2%
Ground floor; 12,4%
MAURITANIA: Country Economic Memorandum56
of the 10 thousand households interviewed in Nouakchott
had a real title; 32 percent had an occupancy permit, which
is sufficient to build a home on public land; 8 percent had
a provisional occupancy right, and the vast majority of 60
percent had no document at all (JICA, 2018).
Nouakchott’s experience in upgrading informal settlements has been mixed at best, thwarted by lack of strategy and political economy considerations. As
highlighted above, Nouakchott experienced rapid growth
since its inception, much of it was unplanned. This has
increased pressure and competition for land, causing
land prices to skyrocket. At the same time and in order
to accommodate the growing population, the state has
distributed free land, most of the time not considering the
impact on urbanization and not taking into account existing
plans. For instance, after 2008, the state conducted
resettlement operations that aimed at reducing urban
poverty and improve living conditions in poor neighborhoods
of Dar Naïm, Arafat, and Toujounine. However, this objective
was not met because the Government simultaneously
distributed 20,000 plots of land in the southern peripheries
for resettled households (named as Tarhil area) without
preparing the necessary infrastructure (water, electricity,
roads, etc.) that are needed to ensure decent living
conditions. In addition to being unplanned, some of these
resettlement initiatives were driven by political motives to
guarantee stability of the political regime as many of the
slums were home to opposition groups that were not in
favor of the Government at that time (Choplin, 2014).
Lack of land registration also undermines planning and tax collection. The absence of land title leads to a shortfall
in collected taxes and undermines the role of the state
in controlling speculation and the proliferation of illegal
occupations. The lack of well-documented studies and the
scarcity of data make it difficult to establish a clear picture
of the taxation system in Nouakchott. According to JICA
(2018), there is an annual tax on constructed buildings
and a residential tax, however there is no land tax and the
official land price registration system has not been applied.
36 Authors’ computation using EPCV2014. Although these figures need to be interpreted with the caveat that households reporting access to piped water may not be connected to formal utility water but have a makeshift connection to a well. 37 The airport area accounted for 66 percent of the road network.
4.4.2. Low population densities, disconnected neighborhoods, and financing constraints make infrastructure and services costly
Inefficient land use leads to low population densities that are not conducive to agglomeration economies. Nouakchott’s population density gradient is lower and
flatter compared to neighboring Dakar for instance
(Figure 84). The population density in Nouakchott’s center
measures about 50 persons per hectare, just around one
sixth of that in central Dakar. Low density and urban
sprawl carry economic consequences. First, they lengthen
the average distance to jobs and services, leading to
fragmented labor markets and more difficult access to
hospitals and schools. Second, they increase the per capita
cost to provide infrastructure such as roads, electricity,
sewage, and drinking water.
Low population density undermines access to various types of infrastructure and services in Nouakchott. In
2014 (latest available household survey), access to internet
was insignificant in both Nouakchott (8 percent) and other
urban areas (2 percent), averaging only 3 percent for the
entire country (2014, EPCV). While access to electricity was
far higher in Nouakchott (82 percent) compared to other
urban areas (66 percent), the access to piped water was
only 40 percent in Nouakchott, significantly lower than the
78 percent average reported across other urban areas.36
Low access to services worsens further as households
move away from the Center of Business District (CBD)
assumed here to be the Presidential Palace (Figure 85 and
Figure 86). The interaction of density and services has
been analyzed by Gollin et al. (2017) who demonstrate how
service outcomes improve with rising population densities.
Nouakchott is also under equipped in roads that have poor quality. Outside of the airport area,37 paved roads
represented only 3.4 percent of the territorial surface in
2017 (JICA, 2018). Putting this into the regional context,
the coverage of paved roads was 386 meters per 1,000

MAURITANIA: Country Economic Memorandum 57
Figure 84: Nouakchott has a very low and flat population density gradient compared to Dakar
Source: Authors’ computation based on Worldpop 2015 for Nouakchott and Landscan 2014 for Dakar.
Nouakchott Dakar
Pers
ons/
hect
are
00 10 20 30
km
40 50 60
100
50
150
200
250
300
350
400
Pers
ons/
hect
are
00 10 20 30
km
40 50 60
100
50
150
200
250
300
350
400
inhabitants in Nouakchott in 2017 compared to the 467
in neighboring Dakar (latest available data). The reliability
of the road network is further impeded due to the absence
of an appropriate drainage system which contributes to
inundations during the rainy season.
Beside the dearth of and bad quality of roads, urban mobility is constrained by limited access to walkable space and an almost inexistent public transport system. Large distances between neighborhoods undermine
exchange of ideas and discourages workers to participate
in labor markets that are beyond their reach. This is further
exacerbated by the lack of affordable transportation
system. Similar to other African cities, walking is the main
mode of transportation in Nouakchott, accounting for 58
percent of all transportation. However, the absence of, or
poorly maintained and crowded, sidewalks makes walking
unsafe and inconvenient. And yet, walkability is assessed as
being low: more than 70 percent of households expressed
their discontent about walking conditions in the city (JICA,
Figure 85: Access to piped water is low declines with distance to the CBD …
Figure 86: … as does access to the internet within household
Source: ECPV 2014 and authors’ calculations. Source: ECPV 2014 and authors’ calculations.
Sha
re o
f HH
s w
ith
pipe
d w
ater
(%)
0
10
20
30
40
50
60
0−2 km
2−3 km
3−4 km
4−5 km
5−6 km
6−8 km
8−15 km
Distance from CBD (Presidential Palace) in km Distance from CBD (Presidential Palace) in km
Bottom 40% Bottom 40% − best fitAverage Average − best fit
Bottom 40% Bottom 40% − best fitAverage Average − best fit
0
10
20
30
Sha
re o
f HH
s w
ith
inte
rnet
(%)
0−2 km
2−3 km
3−4 km
4−5 km
5−6 km
6−8 km
8−15 km

MAURITANIA: Country Economic Memorandum58
2018). Taxis were the second mean of transport (27.3
percent) followed by cars (10.5 percent) and public buses (3.3
percent). The low usage of public transportation is associated
with lack of reliable timetable and service (JICA, 2018).
High cost of borrowing and lack of collateral aggravate urbanization challenges in Nouakchott. As highlighted in
section 3.4.1, limited access to finance is a major constraint
to the development of the private sector and the overall
growth of the country. This is due to unfavorable lending
rates that are too high compared to those in peer countries
(Figure 87), and a low-quality collateral system that is a
serious obstacle for getting loans. While BCM is working
on developing an eligible collateral framework and reducing
the cost of financing,38 the lack of affordable financing
undermines urbanization patterns in Nouakchott because
it precludes private sector developers from constructing
higher-density, multifamily lodgings close to activity centers.
4.4.3. Inadequate institutional capacities also hamper other urban services
Poor waste management is another result of inadequate institutional capacity, posing serious health and hygiene problems for the population in Nouakchott. In
38 In efforts to render the policy rate more effective in influencing commercial interest rates and encourage commercial banks to conduct refinancing operations, BCM reduced in November 2018, for the first time in a decade, its policy interest rate from 9 to 6.5 percent. The lower rate reflects better the market dynamics especially that of Treasury Bills (TBs). Moreover, BCM defined in March 2018 a new collateral framework so that banks participate in the new lending and deposit facilities. To date, however, this framework is not yet operational.
2007, the Urban Development Agency that was responsible
for Urban Community of Nouakchott – reconfigured as
the Urban Region of Nouakchott (RUN) in 2018 – signed a
ten-year contract with a private company to clean the city
and collect and dispose household waste from the city to
a landfill site located 30 km south-east of the city center.
While anecdotal evidence suggests that this has improved
the quality of service, it significantly increased Government
arrears since the authorities did not properly anticipate the
associated cost owed to the private company. The resulting
arrears coupled with a deterioration in relations with the
company led the Government to abruptly terminate the
contract in May 2014. Since then, waste management
in the capital passed by several institutional changes,
reflecting the lack of clear planning. Currently, the RUN is
in charge of waste collection over all Nouakchott.
Two main challenges limit the ability of RUN to manage waste properly. The first is that of financing given that
RUN resources are limited. The second is operational as
RUN's human resources are not enough and do not have
the necessary skills to efficiently manage waste. In this
context, there is a need to involve the private sector in
specific activities (pre-collection, collection, and transport)
that have high economic returns.
Figure 87: The cost of financing in Mauritania is the highest compared to peer countries
Source: WDI.
Average lending rate
Perc
ent
(%)
0
5
10
15
20
25
2010 2017
SenegalBeninAlgeriaMoldovaNicaraguaZambiaMauritania

MAURITANIA: Country Economic Memorandum 59
4.4.4. Nouakchott’s low wage premium
Inefficient land use, weak management, and low connectivity make urban living costly. All of the above
suggests that connecting people to services and jobs is
more expensive in Nouakchott due to its urban form. Apart
from transportation cost, households in African cities are
estimated to pay, on average, 77 percent more for housing
and 26 percent more for food than households in other cities
at comparable levels of economic development (Nakamura
et al., 2016). In turn, this may result in higher urban wages
that are not driven by productivity gains, but higher urban
costs that are passed on to consumers and reduce firm
level competitiveness. In the context of Mauritania, a wage
regression analysis and an Oaxaca-Blinder decomposition
are used to examine wage differentials across cities.
Nouakchott’s nominal wage premium against other urban areas is eroded when considering real wages. Following Jones et al. (Jones et al., 2017) regression
analyses show that nominal wages in Nouakchott are
about 25-38 percent higher than in rural areas and 2-6
percent higher than in other urban areas (see appendix V for
detailed regression results).39 However, when considering
real wages,40 Nouakchott’s advantage over other urban
areas is eliminated. In fact, a reversed real wage premium
39 Nouakchott’s wage premium ranges reflect results from depending regression specifications.40 Conversion of nominal to real wages was carried out by applying the regional deflators used in the poverty analysis using ECPV2014.
of 1-5 percent is observed between Nouakchott and the
other urban areas, suggesting that higher nominal wages
are necessary to offset the high living costs.
Wage disparities in the country are driven by higher wages paid by the mining sector that attracts better educated workers. The Oaxaca-Blinder Decomposition
(OBD) is used to decompose the spatial wage difference
–here between the various wilayas and Noukachott – into
differences attributed to (i) endowment levels such as
educational attainment and labor market participation,
and (ii) differences in the returns to endowments (see
appendix VI for details about the methodology). As
expected, higher wages are paid, on average and all
things being equal, to workers in the mining sector (~50
percent), workers with higher education (~40-85 percent)
and male workers (~60-80 percent). Decomposing the
wage gap shows further that some spatial sorting may
drive endowment levels in Tiris Zemmour and Inchiri to be
higher than in Nouakchott (Figure 88). The opposite effect
can be seen in Nouadhibou, which is house to SNIM’s
headquarters and includes the largest fishing port: wages
(i.e. the return to endowment) are higher in Nouadhibou
than in Nouakchott at given endowment, despite lower
endowment (education, age, gender, marital status)
compared to Nouakchott.
Figure 88: Nouakchott has an advantage in wage differentials over other Mauritanian regions, except with Tiris Zemmour, Inchiri, and Nouaddhbiou
Source: LFS 2017 and authors’ calculations. Note: wage gap=endowment + return to endowment + interaction term, the latter is not shown here.
Wage gap relative to Noukchott
Perc
ent
(%)
-60-40
-20
020
4060
80
100120
140
DakhletNouadhibou
TirisZemmour
Trarza HodhEl Charghi
Inchiri HodhEl Gharbi
Adrar Tagant Assaba Brakna Gorgol Guidimagha
Endowment Returns to endowment Wage gap
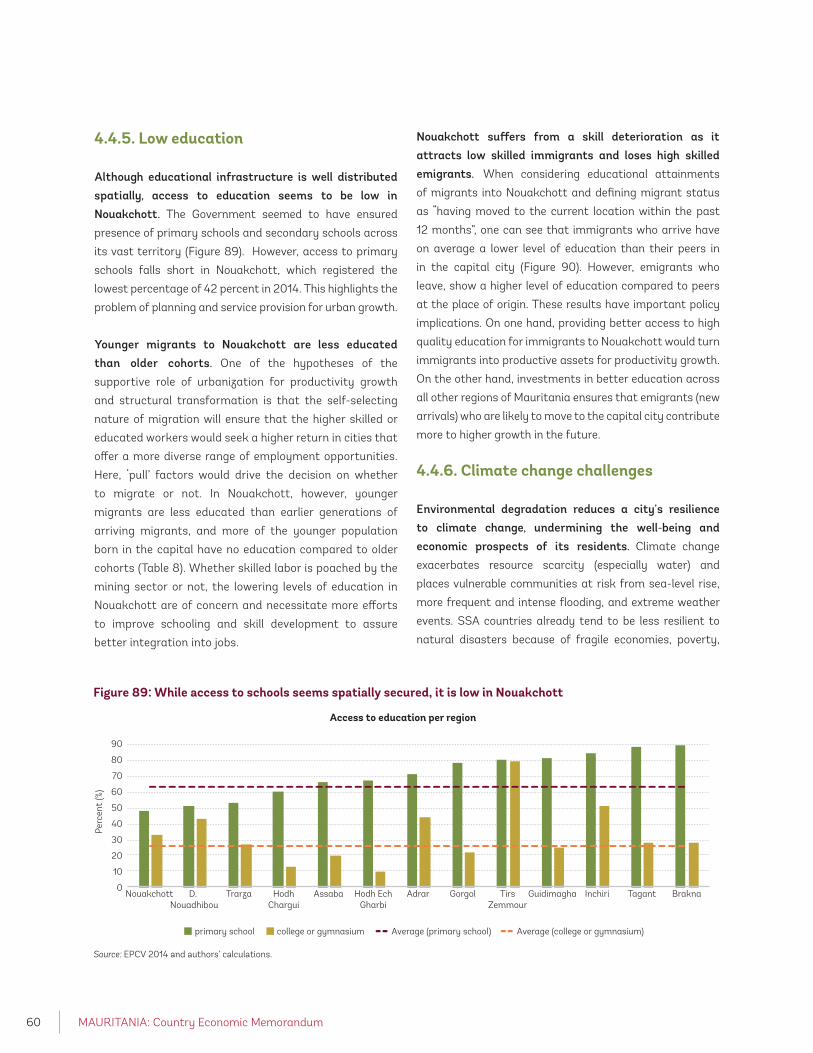
MAURITANIA: Country Economic Memorandum60
4.4.5. Low education
Although educational infrastructure is well distributed spatially, access to education seems to be low in Nouakchott. The Government seemed to have ensured
presence of primary schools and secondary schools across
its vast territory (Figure 89). However, access to primary
schools falls short in Nouakchott, which registered the
lowest percentage of 42 percent in 2014. This highlights the
problem of planning and service provision for urban growth.
Younger migrants to Nouakchott are less educated than older cohorts. One of the hypotheses of the
supportive role of urbanization for productivity growth
and structural transformation is that the self-selecting
nature of migration will ensure that the higher skilled or
educated workers would seek a higher return in cities that
offer a more diverse range of employment opportunities.
Here, ‘pull’ factors would drive the decision on whether
to migrate or not. In Nouakchott, however, younger
migrants are less educated than earlier generations of
arriving migrants, and more of the younger population
born in the capital have no education compared to older
cohorts (Table 8). Whether skilled labor is poached by the
mining sector or not, the lowering levels of education in
Nouakchott are of concern and necessitate more efforts
to improve schooling and skill development to assure
better integration into jobs.
Nouakchott suffers from a skill deterioration as it attracts low skilled immigrants and loses high skilled emigrants. When considering educational attainments
of migrants into Nouakchott and defining migrant status
as “having moved to the current location within the past
12 months”, one can see that immigrants who arrive have
on average a lower level of education than their peers in
in the capital city (Figure 90). However, emigrants who
leave, show a higher level of education compared to peers
at the place of origin. These results have important policy
implications. On one hand, providing better access to high
quality education for immigrants to Nouakchott would turn
immigrants into productive assets for productivity growth.
On the other hand, investments in better education across
all other regions of Mauritania ensures that emigrants (new
arrivals) who are likely to move to the capital city contribute
more to higher growth in the future.
4.4.6. Climate change challenges
Environmental degradation reduces a city’s resilience to climate change, undermining the well-being and economic prospects of its residents. Climate change
exacerbates resource scarcity (especially water) and
places vulnerable communities at risk from sea-level rise,
more frequent and intense flooding, and extreme weather
events. SSA countries already tend to be less resilient to
natural disasters because of fragile economies, poverty,
Figure 89: While access to schools seems spatially secured, it is low in Nouakchott
Source: EPCV 2014 and authors’ calculations.
Access to education per region
Perc
ent
(%)
0
10
20
30
40
50
60
70
80
90
primary school college or gymnasium Average (primary school) Average (college or gymnasium)
Nouakchott D. Nouadhibou
Trarza HodhChargui
Assaba Hodh EchGharbi
Adrar Gorgol TirsZemmour
Guidimagha Inchiri Tagant Brakna

MAURITANIA: Country Economic Memorandum 61
lack of risk awareness, and a lack of coping capacity in
urban communities (Hommann and Lall, 2019). The loss of
wetlands and increasing desertification in urban areas can
increase the risk of flooding.
Like other capitals on the West African coast, Nouakchott’s geography and geology exposes the city to important climate risks that threaten its sustainability. In particular, a large part of Nouakchott (42.9 percent) is
located below sea level (JICA, 2018). The urban blocks of the
city that are largely underwater include the Airport Front
East (26.9 percent), the Airport Zone (55.3 percent), and the
Northern East (77 percent). In these areas, floods can cause
considerable damage. In fact, the main natural disasters
in Nouakchott are flooding due to marine incursions
and stagnation of inland waters. As a natural protection
against marine incursion, the city is characterized by a 3 to
5-metre coastal dune. However, in recent years, there has
been a significant reduction in the level of sand dunes due
to the illegal and informal use of the sand for construction
purposes and the increase of car traffic on the beach and
on the dunes.
Uncontrolled infrastructure building and inadequate drainage systems aggravate the city’s topographic challenges. The poorly planned port infrastructure has
Figure 90: In Nouakchott, emigrants are better educated than those that they leave behind, but immigrants seem less educated compared to the original population
Source: RGPH 2013 and authors’ calculations.
Education level of non-movers, immigrants and emigrants accross wilayas
Perc
ent
(%)
0
20
40
60
80
100
Not
mov
ing
pop
Im
mig
rant
s
Em
igra
nts
Not
mov
ing
pop
Im
mig
rant
s
Em
igra
nts
Not
mov
ing
pop
Im
mig
rant
s
Em
igra
nts
Not
mov
ing
pop
Im
mig
rant
s
Em
igra
nts
Not
mov
ing
pop
Im
mig
rant
s
Em
igra
nts
Not
mov
ing
pop
Im
mig
rant
s
Em
igra
nts
Not
mov
ing
pop
Im
mig
rant
s
Em
igra
nts
Not
mov
ing
pop
Im
mig
rant
s
Em
igra
nts
Not
mov
ing
pop
Im
mig
rant
s
Em
igra
nts
Not
mov
ing
pop
Im
mig
rant
s
Em
igra
nts
Not
mov
ing
pop
Im
mig
rant
s
Em
igra
nts
Not
mov
ing
pop
Im
mig
rant
s
Em
igra
nts
Not
mov
ing
pop
Im
mig
rant
s
Em
igra
nts
HodhCharghy
HodhGharby Assaba Gorgol Brakna Trarza Adrar
D.Nouadibou Tagant Guidimagha
TirisZemour Inchiri Nouakchott
Not moving pop immigrants emigrants
Table 8: Younger migrants to Nouakchott are less educated than older cohorts
Time of residence in Nouakchott
Cohort of 25-35 years old
Cohort of 45-55 years old
No education
Prim. Educ. or less
More than prim. Educ.
No education
Prim. Educ. or less
More than prim. Educ.
1 year 66 19 15 60 19 21
1-4 years 58 20 22 51 19 30
5-9 years 46 28 26 44 24 32
10+ years 42 26 32 45 18 38
Born in Nouakchott 68 17 15 52 23 25
Source: RGPH 2013 and authors’ calculations.

MAURITANIA: Country Economic Memorandum62
dramatically altered the flow of sediments along the coast
leading to substantial erosion in the city’s south. This was
coupled with unplanned expansion in coastal zones that
are prone to floods and where the population density and
poverty rates are the highest: Sebkha, El-Mina, and Tevragh
Zeina. In addition to the unplanned expansion, the drainage
system is not able to accommodate extreme weather
events, particularly in urban slums.41 This is because the
sewerage network only covers 38 km, or only 5 percent
of the city area (JICA, 2018). Even this tiny network does
not always function well because of lack of maintenance,
aging, and the pollution of the groundwater stemming from
wastewater that is not sanitized. As a result, wastewater
appears on the ground surface during periods of high rain,
causing public health problems, and disturbing the normal
economic activity.
41 For in 2013, more than 500 houses were destroyed and 8 people died when heavy rain trigger massive flooding in Nouakchott.

MAURITANIA: Country Economic Memorandum 63
s shown above, Mauritania has failed to reap benefits from its rapid urbanization process and did not manage to diversify its economy. While
some of the underlying reasons are beyond Mauritania’s
control – like the geographic conditions common to other
countries in the Sahel region – other underpinning factors
are home grown and could be tackled through critical
decisions. Lessons learnt from Peru are but one example
of potential ways for a small and resource-rich country
like Mauritania to grow rapidly and become an upper-
middle country (see Appendix VII for details about the Peru
experience).
While there is no blue-print for accelerating growth, a package of policies could help Mauritania leverage the potential benefits of urbanization and foster economic diversification. This chapter proposes a policy agenda
anchored in four interlinked dimensions that support
the SCAPP’s overall objective of boosting growth (Table 1
provides a summary of these policies):
• Promote a more-market oriented economy;
• Enhance production factors;
• Strengthen governance and improve urban planning;
• Better manage natural resources.
5.1. Promote a more market-oriented economy
5.1.1. Adopt an export-prone trade policy
Trade policy reforms should aim at reducing tariffs, eliminate non-transparent import taxes, and adhere to international standards on trade barriers. Mauritania
needs to reduce its tariffs on intermediate and capital
goods to improve access to cheap imported inputs
and increase domestic firms’ competitiveness. This is
particularly important in the case of livestock and fishing,
given the importance of these sectors for future growth.
The elimination of non-transparent import taxes and NTMs
that protect specific sectors will also help level the playing
field and increase competition in the domestic market.
Furthermore, it is important to notify the WTO about
trade procedures and how they conform to (or differ from)
international standards as per the TBT agreement. This
Chapter 5
The way forward for a more sustainable and resilient growth path
A

MAURITANIA: Country Economic Memorandum64
should be accompanied by appointing a trade facilitation
enquiry point that would deal with queries from other WTO
Members and the public on trade facilitation issues.
The establishment and launch of an online trade and investment portal in November 2018 is a step in the right direction. In November 2018, the Government
launched, in partnership with UNCTAD and the International
Chamber of Commerce the “iGuide Mauritania”, which is
a one-stop shop that provides key information on trade
and investment in Mauritania: tariffs, standards, technical
requirements, tax system, investor rights, and costs.42
While it is still early to evaluate the impact of this policy,
the experiences of Laos and Zambia indicate that one-stop
shops facilitate trade (Box 4). 43
Given its cultural and economic history, Mauritania could strengthen its ties with West African countries without abandoning its existing links with the Maghreb countries. Until now, the differences in tariffs and trade
rules between Mauritania and ECOWAS have incentivized
informal trade, smuggling and corruption, which can be
revenue sources for terrorists (Melly, 2019). Integration into
42 https://www.theiguides.org/public-docs/guides/mauritanie43 OECD (2011). Aid-for-Trade Case Story – Zambia. Full report is available at: https://www.oecd.org/aidfortrade/47379298.pdf
ECOWAS’s economic space, through agreeing on a common
external tariff as part of the association agreement signed
in 2017, will harmonize Mauritania’s tariff regime with West
African countries, reducing the costs and delays entailed
in formal cross-border trade. This could boost exports of
livestock and fish, and strengthen the role of Nouakchott as
a gateway port for landlocked Mali and even Burkina Faso.
Local authorities should carefully study and develop strategies to implement AfCFTA in the future. Although
intra-Africa trade will be expanded thanks to AfCFTA, it is
notable that there are no automatic country benefits and
each country will be required to develop suitable strategies
and policies to leverage on the benefits that will accrue
from the expanded markets. In the short term, Mauritania
will need to prepare an offer of tariff commitments (i.e. a
timeline for eliminating tariffs for different products) and
identify actual or potential export products for which to
negotiate accelerated tariff reductions in other members’
markets. In the medium term, there is a need to assess
existing regulatory constraints to trade in services and
investment to be negotiated in the AfCFTA.
Box 4: One-stop shops facilitated trade in Laos and Zambia
Laos favored trade across borders by implementing a Trade Facilitation Strategy and launching the Trade Information Portal (LTIP) in 2012. The latter enabled firms to cut down the number of trips needed to get information
on trade transactions and regulations. These measures improved the regulatory environment, increased transparency, and
consequently helped ameliorate Lao’s ranking on the World Bank’s Doing Business Indicator from 171 (out of 183) in 2011
to 154 (out of 190) in 2019. Moreover, the LTIP has helped the country accede the WTO and fulfill the commitments of the
Association of Southeast Asian Nations (ASEAN).
From its end, Zambia enacted the One-Stop Border Control Act in 2009 to reduce border costs and facilitate trade. This act enabled the country to sign bilateral agreements with other countries with which it wants to establish a One-Stop
Border Posts (OSBP). One of the first agreements signed was with Zimbabwe, where the Chirundu Border Post was opened
in 2009. The establishment of this border-post increased the efficiency and capacity to effectively handle larger volumes
of traffic, thus facilitated trade and increased government revenues (OECD, 2011) 43.

MAURITANIA: Country Economic Memorandum 65
5.1.2. Improve the business environment and promote local entrepreneurship
For Mauritania to reap the benefits from urbanization and diversify its economy, it needs to make its business environment more conducive to private investors. Investments into public services will be essential to enhance
people's productivity, but higher growth in urban areas will
ultimately also be a function of better jobs to absorb these
new talents. This necessitates a vibrant private sector.
The Government is encouraged to continue implementing the 2019-2020 reform roadmap (World Bank, 2019f). This roadmap is built around four pillars: (i) simplify and
enhance the transparency of administrative procedures;
(ii) simplify taxation and promote access to credit; (iii)
modernize commercial justice and improve the resolution
of commercial disputes; (iv) and improve consultation and
communication.
Beyond the current reform agenda, the authorities need to strengthen competition through the adoption of pro-competitive policies. To do so, the Government should
encourage pro-competitive regulations in order to open
markets and remove anti-competitive sectoral regulations,
promote a level playing field and ensure competitive
neutrality, and strengthen the effectiveness of competition
policy by eliminating implicit cartels that increase input
costs and reduce access to a wider variety of products
Mauritania could study the possibility of joining the Organisation for the Harmonisation of Business Law in Africa (OHADA). Such membership would facilitate
trade with other members of the organization as well as
international investors operating in these countries. It would
also enable Mauritania to benefit from modern regulations,
inspired by international best practices. Finally, it would
make it possible to call on OHADA’s bodies to provide
training for judges and judicial staff. Senegal and Mali are
already members of OHADA while Morocco is evaluating
the possibility of joining the organization.
44 Article 247 of the Law No. 2004-017 of the labor code prohibits women from performing work exceeding their strength or work likely to harm their health, physical integrity or morals. Section 166 of the same law prohibits women from working in the same sectors as men, including factories, mines and construction sites.45 The Long-Term Growth Model developed by Devadas and Pennings (2018) is used to simulate the effects of an improvement in human capital levels
Local authorities should also support and promote entrepreneurship. The Government needs to move from
policy promises to implement specific actions that will
support entrepreneurship development. As a start, it would
be important to establish a well-coordinated institutional
architecture for startup and entrepreneurship related
policies. This should be followed by setting a startup status
that would have an appropriate legal and fiscal framework
to encourage startups.
Legal barriers to women’s participation in the economy must be removed. In particular, Mauritania could adopt
reforms guaranteeing equal pay for work and prohibit and
punish sexual harassment (World Bank, 2019f).44 While it is
essential to ensure health and safety at work, protection
must be guaranteed for all workers, regardless of their
sex. In addition to guaranteeing equal pay, it is important
to prohibit all forms of gender-based discrimination by
granting women equal property rights and inheritance
as men. The country could also equalize the mandatory
retirement age for men and women.
5.2. Enhance production factors
5.2.1. Boost education and skills
In addition to improving physical connectivity, it is also very important to improve human capital. While the
country statistics show a relatively high access to primary
schools, the quality of education is poor, leaving pupils with
low arithmetic, reading and writing capabilities. Moreover,
and as discussed above, there is an increasing population
with no finalized primary education. At the macro level,
simulation results using the Long-Term Growth Model
(LTGM) developed by Devadas and Pennings (2018) show
that Mauritania could significantly boost economic activity
and accelerate poverty reduction if it raises its human
capital to the level of its aspirational peers (Figure 91 and
Figure 92).45

MAURITANIA: Country Economic Memorandum66
To ameliorate educational outcomes, the quality of teaching should be improved. It is important to gradually
improve the quality of teaching and learning at both
primary and secondary levels. This can be attained through
strengthening teacher management and professional
development to improve the quality of the stock of
teachers, instituting a strategic staffing mechanism to
keep bad teachers out of the classrooms, and reviewing
critical learning content of primary school curricula and
deliver teaching and learning materials to schools (World
Bank, 2019b).
There is also a need to strengthen the governance and management of the education sector. Authorities
should improve the delivery of education services through
better allocation of resources and enhanced school-
based management which is found to help increase
school participation and reduce students and teachers’
absenteeism (Burns et al., 2011). In particular, it addresses
a fundamental failure of service delivery by providing
better information and a stronger voice to the client
(pupils, parents, and communities) so that she can hold
on the paths of GDP growth per capita and the poverty ratio. The baseline (or Scenario 1) is based on the following assumptions: in 2019-2021 the economy is assumed to maintain the steady recovery, driven by strong activity in the primary sector, reforms in the financial sector and better management of investment; in 2022-2023 growth would accelerate further thanks to the onset of gas and oil production; post-2023 growth will benefit by the numerous reforms in the business environment and investment management. In addition to the baseline, we consider a second scenario in which human capital in Mauritania growth similarly to the path of its aspirational peers.
the provider (teachers, school directors, school governance
structures) more accountable. As in other sectors of the
Mauritanian economy, the Government should also instill
a culture of monitoring and evaluation that would allow to
track progress and evaluate the efficiency of its policies.
The education of girls should be encouraged. Girls
educational outcomes are solid determinants for fertility
and participation in the workforce. Mauritania’s urban
fertility rate is with 4.3 higher than the SSA country average
(Bouquier and Shoemaker, 2018) and a key determinant,
in addition to migration, of urban population growth.
Integrating young women into the workforce postpones
their child bearing, reduces urban pressures, and allows
the country to reap its demographic dividend from a young
work force. It is thus of utmost importance to bring girls to
school and understand their lack of attendance -- whether
cultural, due to absence of sanitation services, co-ed or
other.
Given the importance of agriculture in the Mauritanian economy, efforts should be made to strengthen the
Figure 91: Boosting human capital would yield economic gains …
Figure 92: … and reduce the percentage of Mauritanians living under 1.9$ per day
Source: Authors’ calculations. Source: Authors’ calculations.
% of
pop
ulat
ion
US
$ 20
10
0
5
10
15
20
25
30
2018
2020
2022
2024
2026
2028
2030
2032
2034
2036
2038
2040
1: Baseline 2: Baseline + ( ) HC 1: Baseline 2: Baseline + ( ) HC
1200
1400
1600
1800
2000
2200
2400
2600
2018
2020
2022
2024
2026
2028
2030
2032
2034
2036
2038
2040
Poverty headcount ratio at $1.90 a day (2011 PPP) Real GDP per capita

MAURITANIA: Country Economic Memorandum 67
research environment and upskill the agricultural workforce. In support of economic diversification, research
should be focused on raising the quality of fishing and
livestock-related products, thus supporting poverty
reduction and economic diversification. Investment in
developing, attracting and retaining human capacity
will need to be prioritized to fill the current gaps in the
workforce. This should be complemented by mechanisms
to deploy staff regionally, instead of nationally. It would be
also important to strengthen relationships and affiliation
with regional and international centers.
5.2.2. Improve infrastructure and connect cities
Mauritania cannot change the vast geographical distances between its towns and cities, but it can reduce the time it takes to overcome these distances. Reducing physical divisions within its territory could
spur more economic opportunities especially in the more
populous and poorer Southern communes. In that spirit,
the rehabilitation of the 200-km Nouakchott-Rosso
road started in early 2010s would reduce transport
costs, generate market activity, and strengthen the
links between farmers in the agricultural South to local
consumption markets, such as Nouakchott, hence
support diversification. However, as of August 2019, the
construction works were not completed due to issues
with one of the contractors that delayed the finalization
of this project. Therefore, it is critical to rapidly finish the
ongoing rehabilitation work, and in a later stage enlarge
the road to allow for more traffic circulation. This road
is also is an integral part of the Tangier-Nouakchott-
Rosso-Dakar corridor linking Tangier (in Morocco) to
Dakar (in Senegal). Thus, its completion would help
Mauritania play its natural role as a link between North
African and West African countries and facilitate trade
with its neighboring countries. The planned bridge
over the Senegalese river in Rosso would also increase
connectivity and foster trade.
Apart from reducing distance and division between cities, infrastructure improvements need to be prioritized based on a population factor. Countries
frequently adopt a strategy to ensure equality in their
territorial development, and Mauritania’s case is no
different, partly driven by security needs especially in its
less populated regions. However, investment needs in
more populous areas, especially in the urban communes
in the South, are needed to modernize these small-town
economies, connect them better to their surrounding
villages, and provide better access to electricity to enable
commercial agriculture and spur the economic growth.
Investments outside Nouakchott will reduce pressure for
further migration, which already today leads to significant
congestion in the capital city, while not realizing the gains
from agglomeration.
While all urban communes need better infrastructure, the cost of not improving and organizing Nouakchott’s infrastructure is even higher. As outlined above,
Nouakchott is by far the largest city, but is delivering below
expectations. One reason is that road infrastructures are
scarce and limited, restraining mobility. Infrastructure
investments were not able to keep pace with its rapid
urban population growth, leaving some peripheral and poor
regions largely disconnected from the center that accounts
for most jobs. Thus, it is important to continue expanding
the paved road network to increase accessibility of the
population to transport services and opportunities. These
expansions also provide opportunities for labor intensive
jobs suited for low-skilled local workforce as experienced
in other SSA countries. In the Democratic Republic of
Congo, Gabon or Côte d’Ivoire, employment of low-skilled
people is highly encouraged in urban slum upgrading
projects to foster community participation, and enhance
and social and economic inclusion (World Bank, 2019g).
Tasks usually consist of tertiary road upgrading which rely
on labor-intensive construction techniques (fabrication of
interlocking pavers). Expanding sidewalks would increase
walkability and improve pedestrian safety in a metropolitan
area where walking remains the first mean of transport for
the population and notably the poor.
Improving physical infrastructure in Nouakchott should be accompanied by a well-studied transport plan that is connected to other plans. In addition to ameliorating the
road network, improving the city’s connectivity, should be
based on an urban mobility plan that is a pre-requisite to
identify the actual transportation needs and capabilities.

MAURITANIA: Country Economic Memorandum68
This should be followed by efforts to better organize the
public transport system and support pilot operations to
identify routes that could be profitable enough to attract
private sector operators. Effective coordination among
different plans is fundamental to ensure the effectiveness
of planning and the efficiency of investments.
5.2.3. Make land use more efficient
Securing land rights in rural areas is key to bolster agriculture productivity. This can be achieved in two ways.
First, through the restructuring of institutions responsible
for land tenure and the use of modern tools and simplified
Box 5: Successful experiences of land management in SSA countries
Improving land registries• Rwanda’s comprehensive land-tenure reform has shown successes. Over 2005-12 it implemented a program to issue
land titles based on photomapping technology at a cost of less than $10 per parcel.
• Tanzania surveyed all communal land and registered 60 percent of them at a cost of $500 per village. Ghana and
Mozambique have begun to follow Tanzania’s example.
• Ethiopia issued certificates for 20 million parcels of land at less than $1 per parcel and mapped them onto a cadastral
index map at less than $5 per parcel in 2003-05.
Streamlining registration procedures• In 2009, Kenya adopted a new land policy that strives to streamline land administration processes by reducing the
stamp duty from 25 to 5 percent of the principal amount; by providing VAT exemptions for developments with more
than 20 low cost units; and by reducing the tax on mortgages from 0.2 to 0.1 percent.
• The introduction of Lesotho’s Land Administration Authority in 2012 has significantly improved land registration in the
country by reducing wait times and improving application turnaround. It also has gained general support from land-
holding communities.
• Computerizing land records and registration systems helped significantly cut the number of days to transfer property
for Ghana (169 to 34) and Uganda (227 to 48).
Improving tenure security• In 2012, Namibia passed the Flexible Land Tenure Act, which allowed communities to obtain blocks of multiple plots and
a “starter title” that grants perpetual occupancy and transfer rights. This Act is aimed at the 30 percent of Namibian
residents that live in informal settlements (CAHF, 2013). Residents were able to also apply for full, ‘’mortgageable’’ land
titles. Upon receipt of title, the communities were responsible for upgrading the site infrastructure. The legislation has
been regarded as innovative in its methodology of recognition of incremental tenure and building.
• In 2011, Senegal passed a new Land Tenure Act under which those with temporary occupancy permits in urban areas
can convert the permits into permanent title deeds at no cost. Improved tenure security further helps increase housing
investment and improvement, access to housing finance, and the activity of the land market.
• Kenya, Lesotho, and Tanzania were utilizing bulk surveying and land use planning approaches to regularize tenure in
slums.
Source: World Bank (2019g).

MAURITANIA: Country Economic Memorandum 69
procedures to ensure the accuracy of land information.
Second, through the formal recognition of existing rights
through low-cost, easily accessible, and participatory
processes implemented by local land commissions and a
local land service. Third, and more importantly, there is a
need to clarify the distribution of State land and private
land, which can only be developed within the framework
of consultation between different stakeholders based on
actual circumstances on the ground.
Strengthening land management is a pre-requisite to sound urban planning. As outlined comprehensively in
the Mauritania Land Sector Review (2019), various steps
– from simplified land registration procedures and aligning
responsibilities to fewer institutional actors, including
eventual decentralization to municipalities, to implementing
and recording electronically existing registration
instruments – need to be implemented to improve current
land administration. Without these steps, land transactions
will remain unmonitored and uncontrolled, leading to land
use that is illegal or in non-adherence to master plans or
building standards. Successful and simple experiences
in land management from other African countries are
presented in Box 5.
5.3. Strengthen governance and improve urban planning
Agriculture will not drive the development and diversification agenda in Mauritania unless the governance of the sector is improved. This includes
increasing and re-orienting Government spending in
agriculture toward productive factors. After winding
down the current subsidy system, there is a need to
increase public spending on agriculture, particularly on
irrigated infrastructure. Priority should also be given to
investing in agricultural technologies and agricultural
research centers. The reallocation of public funds to R&D,
technology promotion and adoption, and education could
also significantly help increases yields and production
efficiency. In 2012, for instance, Moldova moved away from
a focus on machinery to smart subsidies that promote new
technologies in the agricultural value-chain. This has helped
increase yields and production effiency (World Bank, 2015).
It is important to develop a National Quality Infrastructure (NQI) system to provide quality assurances in accordance with the country’s current and near-future needs. The lack of a laboratory for the
control and certification of animal products (besides fish)
and the outdated sanitary legislation since 1960 are a big
handicap for exports of meat, hides, skins and leather,
where Mauritania has definite comparative advantages.
The National Livestock and Veterinary Research Centre
(CNERV) could include such a laboratory but lacks the
human and financial resources for doing so (WTO 2018).
Hence, the authorities could design a legal framework to
support the establishment of NQI system.
Ameliorating agriculture, particularly livestock, related statistics is critical for a better understanding of agricultural performance and its connection to the rest of the economy. It is very important to strengthen human
skills and design plans with concrete targets and defined
monitoring mechanisms to track the progress in the sector.
Improvements in agricultural data collection and processing
can be done using ICT technologies along with adequate
estimation methodologies. It is also imperative to conduct,
as a matter of urgency, a General Livestock Census (GCE)
to accurately measure the size of the livestock sector and
its integration with the rest of the economy.
Mauritania should improve urban planning by developing and implementing city master plans. Master plans play
a key role as they lay out the city’s spatial structure
along with definitions of land uses and city expansion. In
particular, they help local authorities in (i) examining the
current stage of the city’s development, (ii) setting out
the directions of change for the future, and (iii) identifying
the priority areas to focus on. A critical next step would be
to implement the Master Plan for Nouakchott that was
developed with support from JICA. Simultaneously, other
Mauritanian cities and towns need to start preparation of
master plans, so they too can lead rather than follow the
development of infrastructure and housing. These plans
also constitute a formidable opportunity to engage with
citizens and understand the constraints that they face.
This is paramount to ensuring that plans are effective and
can be enforced.

MAURITANIA: Country Economic Memorandum70
Climate change mitigation measures should be at the heart of future urban planning. Mitigating climate risks
requires innovative, open, and dynamic data collection
and mapping processes that support management of
urban growth and disaster risk. In addition, the authorities
should study the possibility of prohibiting construction
in areas at high risk of flooding and rising groundwater.
This should be accompanied by intensified efforts to (i)
build large-scale drainage facilities and (ii) strengthen the
coastal dune and protect it from illegal activities.
Moving from a low density and sprawling city to one that is compact and connected requires however more than effective urban planning. Incentive-based
regulation, including penalty taxation for vacant land as
to encourage compactness and discourage speculation,
would entail defining building standards – including
minimum heights and land to building ratios – that will
increase housing supply. However, multi-family units are
usually beyond the means of single owners and typically
built by developers, who need to access long-term
finance from commercial banks which remains limited as
highlighted above.
Coordination among different stakeholders is paramount. Coordination between the central
Government and local communities is critical for urban
development. If transport investment decisions are
not taken in close coordination with land planning,
Mauritanian cities will continue to grow into forms that
inhibit their development and livability for decades.
Coordinated land use and infrastructure planning involves
bringing together decisions of infrastructure investments
with the development of productive and other logistical
infrastructure, as well as accompanying investments in
connectivity with flood protection investments and efforts
to enhance structural drainage to increase resilience.
By bringing together the different pieces of the puzzle,
coordination has the potential for enhancing the efficiency
of urban cities.
46 MPIH stands for Modified Permanent Income Hypothesis and FSF refers to Fiscal Sustainability Framework.
5.4. Better manage natural resources and adopt a more market-based exchange rate
Given previous failures, Mauritania needs to effectively manage natural resource revenues to support diversification. International experience shows that in
commodity-exporting countries a sound fiscal framework
is designed based on a simple and clear fiscal rule that
has an appropriate target and some degree of flexibility
when unexpected economic shocks occur (Richaud et al.,
2019). A key challenge in developing such a framework is
to reconcile long-term strategic development objectives
with the need to manage the short-term volatility and
uncertainty of resource revenues. A recent World Bank
(2019c) study assesses different approaches to the
management of resource revenues in Mauritania in
general, and the expected gas ressources starting 2022
in particular. Given that Mauritania has infrastructure and
human capital shoratges, the paper aruges that adopting
a capital front-loading rule (an MPIH or FSF),46 with a
clear visibility of the share of the resources to be invested
upfront, could be important to ground the management of
ressource revenues into a sustainable and equitable inter-
generational framework.
The introduction of a rule-based fiscal framework will require strengthening fiscal institutions. Strong
institutions are necessary to withstand the political pressure
to consume resource wealth either for short-term political
gains, or worse for misappropriation by special groups.
Their role is to guarantee that natural resource wealth is
reinvested into productive assets. Indeed, international
experience indicates that countries experience more
productive investment and higher growth when institutions
reaffirm the rule of law, ensure government accountability,
and help control corruption (Lange et al., 2018).
Specifically, the Government needs to implement various institutional reforms to design and implement an effective fiscal framework. It should lay the basis for
an effective medium-term economic and fiscal framework
by investing in capacity building in the Ministry of Finance

MAURITANIA: Country Economic Memorandum 71
(MoF) in the areas of medium-term budget planning,
revenue forecasting, and fiscal risk analysis. Key actions
also include ensuring political, administrative, and financial
support to execute the recently adopted organic budget law
(LOLF 2018), which introduced a medium-term expenditure
framework (MTEF). It could be also relevant to consider
the creation of a fiscal council that can validate the fiscal
projections feeding into future fiscal rules and fiscal
frameworks. Such entity will have to be truly independent
and have technical capacity staff for it to succeed in its
mandate.
Building on existing mechanisms, it would be important to transform the National Fund for Hydrocarbon Resources (NFHR) to an institution that caters for the development needs of current and future generations. The NFHR National was originally set-up to
be an intergenerational equity fund. However, because of
weak public financial management and a cautious asset
management strategy the NFHR was used instead as a
macro stability instrument to close the budget financing
gap (World Bank, 2019c). Moreover, yearly audits were not
undertaken despite adequate provisions in the law. Given
these bottlenecks, there is a need to clarify operational
rules in the law to reduce policy discretion, strengthen the
governance framework by conducting and publishing yearly
audits, and embrace a more active investment strategy
with the objective of diversifying the external investment
portfolio and increasing the returns on those assets.
In addition to better managing its natural resources, the exchange rate policy should be more market oriented. In that context, it is important to reform the official
foreign exchange market to achieve a market-determined
exchange rate as this would help the authorities respond
to exogenous shocks and improve competitiveness of the
domestic economy. In the short-run, BCM is encouraged
to review the calculation of the daily published reference
exchange rate to reflect the weighted average of
transactions on the official market. Later, a monthly FX
auction budget and interbank market should be established
(IMF, 2019). In the longer run, there is a need to introduce
auctions in a competitive official market and discontinue
daily FX interventions.


Appendices

MAURITANIA: Country Economic Memorandum74
Data gaps prevented the team from conducting several empirical analyses, including:
• Firm-level analysis: Currently, the Mauritanian
authorities do not gather complete information
about firms and SMEs. Nouakchott's One-Stop Shop
for Business Creation and Nouadhibou Free Zone
One-Stop Shop provide some statistics on firms’
creation; however, they do not include details on firms’
performance. Moreover, companies do not respect
their legal obligation to file their financial statements
in the commercial register. The World Bank conducted
an Enterprise Survey (ES) in 2014 which provides
useful data on the constraints that affect businesses.
Unfortunately, the ES only includes 150 firms with at
least five employees covering only Nouakchott and
Nouadhibou. In addition, it does not provide granular
and enough data on firm-level dynamics (firm survival,
productivity, production factors, etc.), which limit its
usefulness to conduct rigorous firm-level analyses.
• Detailed migration analysis: This report suggests
that migration had a profound impact on population
dynamics and shaped the process of urbanization,
especially in Nouakchott. However, the 2013 census
only reports the location of birth by Wilaya and
the length of residence in that locality in different
temporal intervals. Without clear understanding of
arrivals and exits by locality, it is difficult to ascertain
whether population growth is driven by migration or
by natural population growth. Unless there is a change
to the census questionnaire, this will remain a topic of
uncertainty.
• Transportation costs: The report argues that the
weak link between urbanization and economic growth
in Mauritania, is partly explained by high transportation
cost within and across urban centers. There is suggestive
evidence on high cost of transportation arising from
large distances and limited density (in urban areas),
but more granular statistics on quality of roads, use of
different modes of transportation and cost of transport
would be needed to inform policies focused on improving
transportation. Apart from cost, transportation modes
are not asked in the household survey, which means one
cannot estimate demand for transportation services or
constraints to their affordability from existing data.
• Land values and implications for housing development projects: The scarcity of statistical
land data accentuate the difficulties of establishing
an exhaustive, up-to-date and objective overview of
the sector. For instance, this lack of data makes it
impossible to empirically explore changing land values
in the process of rapid urbanization in Nouakchott
and its implications for urban land management
and administration in the city. In the future, a
comprehensive land registry would make it possible to
centralize information within the same land information
system to ensure the management data. This should
be associated by surveys to quantify land and house
prices in different regions of Nouakchott.
• Analysis of livestock potential: Livestock production
statistics are obsolete. Estimates of livestock trends,
are not very accurate because animal population is
calculated (not empirically estimated) by applying a
constant growth rate to some historical guestimate
base. Mauritania has never carried a livestock census,
and instead reports animal populations on the basis of
colonial tax records on herders, vaccination drives, and
ad-hoc animal biometrics calibration surveys that lack
statistical validity.
• Road inventory. Distance and accessibility have been
estimated using Open Street Map, which is assuming
full navigable roads with speeds at permissible levels.
If road quality is however uneven or roads are closed
during flooding, these disruptions to trade and
connectivity are not captured without a better road
inventory.
• Public spending. There is no data on transfers or public
spending on localized services and education that would
allow an assessment of the efficiency of such spending.
Appendix I: Data limitations

MAURITANIA: Country Economic Memorandum 75
Growth accounting analysis decomposes the growth in
GDP as the weighted average of the growth of factors of
production (labor and capital) and Total Factor Productivity
(TFP) growth. The latter is usually interpreted as a
measure of technological change. However, in resource rich
countries, the contribution of TFP growth might be over-
estimated since this measure is effectively a “residual” that
incorporates the contribution of natural resources, among
other things. Hence, in the case of Mauritania, it is important
to disentangle the contribution of natural resources from
TFP growth to avoid misleading conclusions.
Production function: standard
The standard Cobb-Douglas production function (known
also as the Solow decomposition) that illustrates the
relationship between output (or real GDP) and the various
factors of production is (Hall and Jones, 1999):
(PF.1)
where Yt is the country’s real GDP, Kt is the aggregate
capital stock, and hL represents the “quality adjusted” labor
force —that is, the total workforce (L) multiplied by the
quality of human capital (h). Furthermore, α represents the
share capital in the economy, and A represents the Solow
residual which is interpreted as TFP or the efficiency with
which factors of production are used.
To estimate TFP growth, the production function in
equation (PF.1) is expressed in per-worker terms as
(PF.2)
Considering that x̂ =log(xt) - log(xt-1) and re-arranging
equation (PF.2), TFP growth can be calculated as:
(PF.3)
Production function: accounting for natural resources
To account for natural capital, we use the following
augmented production function recently introduced by
Monge-Naranjo et al. (2019):
(PF.4)
In equation (PF.4) Tt represents the non-produced capital
(natural resources), and α(1-y) is the natural resource share
in GDP. This canbe proxied as the ratio of natural resource
rents to GDP from the World Bank’s WDI. In this context,
TFP growth becomes:
(PF.5)
Appendix II: Growth accounting: production function

MAURITANIA: Country Economic Memorandum76
Economic diversification brings economic benefits. First, by increasing the complexity of the production base,
diversification boosts domestic and per-capita income.
According to structural models, (Chenery, 1979; Syrquin,
1988), as countries grow richer their production structure
becomes more complex and the share of industrial output
increases. At the empirical level, studies show a U-shaped
relationship between economic concentration and per-
capita income: countries tend to initially diversify economic
activity and at later stages in the development process
they start specializing again (Imbs and Wacziarg, 2003).
Diversification also strengthens resilience to external shocks and improves macro-stability. This is particularly
true for commodity producers which tend to have a highly
concentrated export base. In countries at early stages
of development, like Mauritania, export concentration
in primary commodities increases external vulnerability
and may confine them into low-growth sectors (Prebisch,
1959). Ghosh and Ostry (1994) and Jansen (2004) argue
that diversification makes countries less vulnerable to term
of trade shocks, which in turn stabilizes export earnings
and supports economic growth in the long term. This
was reflected in the growth downturn in many resource-
rich countries following the end of the recent commodity
cycle. In fact, 60 percent of SSA’s commodity exporters
experienced a drop in growth above 2 percentage points in
the three years following the end of the commodity cycle
(2015-2017).47
The positive impact of diversification on growth is linked to the composition of a country’s export base. Studies
have shown that economic growth is not only driven by a
country’s comparative advantage, but also by diversifying
the product base into high-value products (Hausmann and
Klinger, 2006; Hausmann and Rodrik, 2003). Hausmann et
al. (2007)further identify a positive relationship between
47 GDP growth rates calculated between 2015 and 2017 and compared to growth rates between 2012 and 2014.
growth and the income of countries to which they export,
suggesting that countries could increase growth by tapping
into rich export markets.
Another area relates to the role of innovation in export diversification. Endogenous growth models emphasize
the role of “learning by doing” in the manufacturing sector
as a driver of growth. In this context, a higher export
diversification can bring knowledge spillovers to other
sectors or industries (Gutierrez de Pineres and Ferrantino,
2000). At a theoretical level, countries can produce “inside-
the-frontier” (or goods that are already produced) or
“on-the-frontier” (innovations, or products not produced
elsewhere). Klinger and Lederman (2006) examine the
relationship between innovation and export diversification.
They find that developing countries that are in the
diversifying stage are characterized by a larger number of
“inside-the-frontier” discoveries. On the contrary, along the
line of the U-shape pattern finding of advanced countries
that are concentrating their exports (Imbs and Wacziarg,
2003) show a higher level of “on-the-frontier” innovations.
Appendix III: The diversification-growth nexus: evidence from the literature

MAURITANIA: Country Economic Memorandum 77
Appendix IV: Definitions of export/trade concepts
Concept Definition and Use Cases
Revealed Comparative Advantage (RCA)
Revealed Comparative Advantage calculates the relative advantage or disadvantage of a country in a certain class of goods or services as evidenced by trade flows (Balassa 1963).
Economic Complexity Index (ECI)
Economic Complexity Index is an extension of the sophistication measure and suggests that the large income gaps between rich and poor nations are an expression of the vast differences in productive knowledge amassed by different nations. The ECI, developed by Hausmann et al (2011), approximates the productive knowledge in a country and helps explain differences in the level of income of countries.
Export Quality (EQ) Export Quality measures the export quality by using unit value adjusted for differences in production costs and for the selection bias stemming from relative distance (Spatafora et al. 2014).
Export Density (ED) Export Density measures the relatedness of a potential new industry to the goods that a country already exports competitively. It varies from 0 to 1, with higher values indicating that the country has achieved comparative advantage in many nearby products, and therefore should be more likely to export that good in the future. Hausmann and Klinger (2006) show that this measure of density is indeed highly significant in predicting how a country’s productive structure will shift over time: countries are much more likely to move to products that have a higher density, meaning they are closer to their current production capabilities.
Product Space (PS) The Product Space approach presents a variety of statistical measures that facilitate an understanding why a country that exports a certain set of products was able to diversify in another set of new exports. The changes in the RCA are governed by the pattern of relatedness of products at the global level (Hidalgo et al. 2007). As countries change their export mix, there is a strong tendency to move towards goods that are more closely related to ones already being produced rather than to goods that are less closely related.
The initial step in building a network representation of product relatedness (proximities) involved first generating a network framework using the maximum spanning trees (MST) algorithm for all the product nodes. The network exhibits heterogeneity and a core-periphery structure: the core of the network consists of metal products, machinery, and chemicals, whereas the periphery is formed by fishing, tropical, and cereal agriculture. On the left side of the network, there is a strong outlying cluster formed by garments and another belonging to textiles. At the bottom of the network, there exists a large electronics cluster, and at its right mining, forest, and paper products (Hidalgo et al. 2014). Generally, the core (or center) of the product space indicates a higher path or link to variety of other products, hence higher likelihood of broad-based diversification.
Source: World Bank (2017a, 2018a)

MAURITANIA: Country Economic Memorandum78
Table 9 below represents the estimation results of the wage gap analysis between Nouakchott and other urban areas
(relative to rural areas) when accounting for nominal (orange columns) and real (green columns).
Appendix V: Wage premium analysis
Table 9: Wage gap estimation between Nouakchott and other urban areas.
log of nominal wages log of real wages
(1) (2) (1) (2)
urban_type = 1, Urban outside Nouakchott 0.353*** 0.188** 0.350*** 0.186**
urban_type = 2, Nouakchott 0.375*** 0.250*** 0.297*** 0.172**
isic_cat = 2, Mining & quarrying 0.531*** 0.524***isic_cat = 7, Wholesale & retail trade 0.346*** 0.345***isic_cat = 8, Transportation & storage 0.430*** 0.430***isic_cat = 9, Accomodation & food services 0.470** 0.468**isic_cat = 10, Information & communication 0.376* 0.377*isic_cat = 12, Real estate activities 0.439* 0.436*Professional category = 3, Employi ou ouvrier qualifii -0.376*** -0.376***Professional category = 4, Manoeuvre -0.597*** -0.593***Professional category = 5, Employi de maison ou domestiques -0.446*** -0.443***Professional category = 6, Patron,Employeur(utilisant une maison d'oeuvre payante)
0.494** 0.501**
Professional category = 7, Travailleur pour compte propre (sans employis salariis)
-0.520*** -0.513***
Professional category = 10, Aide familial -1.672*** -1.668***Type of organization = 2, Etablissement public ` caracthre administratif
0.336** 0.336**
Type of organization = 3, Entreprise non financihre sous contrtle publique
0.319* 0.314*
Type of organization = 7, Coopirative, association ou ONG cherchant un binifice
-1.182** -1.177**
Sexe 0.660*** 0.607*** 0.659*** 0.608***Age 0.074*** 0.056*** 0.074*** 0.056***age#c.age -0.001*** -0.001*** -0.001*** -0.001***Etat Matrimonial = 2, Marii(e) 0,0101 0,0208 0,0114 0,0216Etat Matrimonial = 3, Divorsi(e) -0,0339 0,002 -0,033 0,00251Etat Matrimonial = 4, Veuf(ve) -0,25 -0,142 -0,251 -0,143Educational attainment = 2, Secondaire 0.317*** 0.136* 0.316*** 0.135*Educational attainment = 3, Supirieur 0.869*** 0.410*** 0.867*** 0.408***Educational attainment = 4, Coranique -0.257*** -0.181** -0.254*** -0.179**Niveau d'etude = 5, Mahadra 0,195 0,0902 0,194 0,0883Niveau d'etude = 6, Technique et professionnel 0.804*** 0.411*** 0.794*** 0.406***log_hours_worked 0.117* 0,105 0.117* 0,106Constant 7.682*** 8.649*** 7.710*** 8.674***Observations 3.155 3.153 3.155 3.153R-squared 0,239 0,319 0,232 0,312
Source: LFS 2017 and authors’ calculations. Notes: Robust standard errors were used, for clarity, they were omitted but are available upon request. ***, **, and * denote statistical significance at the 10, 5 and 1 percent level, respectively. Reporting only significant coefficients for ISIC categories, professional category and type of organization.

MAURITANIA: Country Economic Memorandum 79
The Oaxaca-Blinder Decomposition referred to as BOD
(Blinder, 1973; Oaxaca, 1973) is used to examine spatial
differences in wages across Mauritanian regions. Apart
from estimating the wage gap, it decomposes spatial
differences of wage levels into (i) differences attributed
to endowment, such as educational attainment, gender,
marital status and age and (ii) the returns to a given
endowment in that particular location. Moreover, and
similar to a wage regression, controls for type of employer
and industry of occupation have been applied. The BOD
reveals whether wage differences across regions are driven
by differences in endowment versus differences in returns
(to endowment). It suggests that for an individual with
given endowment, it could be beneficial to move to another
location, provided this endowment is higher remunerated
there, hence explaining potential ex-ante reasons for
migration decisions.
The decomposition is obtained by estimating equation
(BOD.1) for both the country’s metropolitan leading region
and all other regions:
(BOD.1)
where yi is the log of the nominal wage ratio in region i, the
main city (indexed by A) or else (indexed by B), and xi is a
set of characteristics mentioned above. After estimating
equation BOD.1 using OLS, the average wage gap can be
expressed follows:
(BOD.2)
Mathematically, equation BOD.2 can be rewritten as:
(BOD.3)
48 See Blinder (1973), Oaxaca (1973), and Jann (Jann, 2008).
If the locally inclined people are the worse-off and we
consider the normal returns to be , the last term of equation
BOD.3 can be dropped48 and we end-up with:
(BOD.4)
In equation BOD.4, the first part measures
the effect of the differential in endowments while the
second captures the differential in returns to
endowments.
The estimation of welfare gaps based on the OLS version
of the Blinder-Oaxaca decomposition focuses on mean
effects. The effect of the covariates is limited to an average
effect that remains constant across the wage distribution.
However, the effect of each covariate might in fact vary
across the welfare distribution. While it is beyond the focus
of this study, one can use quantile regression to extend
the decomposition of characteristics and returns effects
across the wage distribution.
Appendix VI: Oaxaca Decomposition Analysis

MAURITANIA: Country Economic Memorandum80
Peru and Mauritania had similar economic structures in the late eighties, but Peru became an upper-middle income country. In 1988-1990, both countries were close
to the low-income threshold and were heavily dependent on
natural resources (particularly mining). During this period,
natural resources rents accounted for about 10 percent
of GDP, with mining exports accounting more than 40
percent of merchandise exports. Despite a similar economic
structure, Peru transitioned to an upper-middle income
country with a GNI per capita that was almost six times
bigger than that of Mauritania in 2017.
To mitigate its dependency on mining products, Peru successfully diversified its exports structure by upgrading its agriculture sector. Between 1998 and 2017,
the share of agricultural exports surged as a percentage
of both non-traditional exports49 and total exports. In
addition, Peru diversified its agriculture exports which were
in 2017 dominated by 6 crops (grapes, asparagus, avocado,
mango, blueberries and coffee), compared to only 2 crops
(coffee and asparagus) in 2000. As non-traditional exports
surged, Peru’s agricultural productivity increased steadily.
The development of the agriculture sector was driven by
several policies since the early nineties, including:
• Land markets and irrigation policies: In early 1990s,
the Government introduced a series of changes to the
constitution to develop the private sector. In particular,
it removed restrictions to private ownership of lands,
liberalized land markets, and incentivized private land
acquisition in the Costa region. In 1994, the Government
created the Commission for the Promotion of Private
Investments to promote the privatization of public
firms and assets. The Government also used PPPs to
finance several irrigation projects.50
49 Non-traditional agriculture exports exclude coffee, sugar and cotton50 Olmos (2004), Majes-Siguas (2010) and Chavimochic (2013).
• Tax policy: The Agriculture Sector Promotion Law
granted a series of tax incentives and tax reductions
for agro-exporters. Firms in this sector benefitted
from a corporate tax rate of 15 percent, compared to
29.5 percent for other sectors; VAT exemptions; and
VAT drawback mechanism for exported products.
Investment related to irrigation also benefited from
additional tax exemptions.
• Trade policy: Peru signed several bilateral and trade
liberalization agreements in the 2000s, leading to
significant tariff reductions on agricultural products. As
a result, the weighted average tariffs for vegetables was
significantly reduced from 17 percent in 2000 to only
0.1 percent in 2017. This is particularly relevant as Peru
implemented its free trade agreement with USA (2008)
and China (2010).
• Sanitary and phytosanitary compliance agency: In
1992, the Government of Peru created the SENASA, a
public/private agency responsible for the compliance
with sanitary and phytosanitary requirements. SENASA
certifies shipment and supports the private sector to
enter into new markets, such as North America and
Europe
• Logistics: As a result of the liberalization process
launched in early 1990s, the Government removed
restrictions and procedures constraining the aviation
sector, allowing free pricing for passengers and freight
transport. It also eliminated the monopoly of CORPAC
in the provision of services related to air transport, such
as merchandise storage and cargo handling. Although
port infrastructures remain broadly underused and
inefficient, maritime transport accelerated in mid
2000s thanks to bilateral and multilateral free-trade
Appendix VII: Lessons from Peru’s successful growth experience

MAURITANIA: Country Economic Memorandum 81
agreements. Indeed, the liner shipping connectivity
index surged from 14.8 in 2004 to 37.8 in 2016,
suggesting higher integration to international trade.
In addition to developing its exports structure Peru used mining revenues to build fiscal buffers and foment investment at the sub-national level. During the
commodity boom cycle, Peru took advantage of increasing
mining fiscal revenues to finance its stabilization fund,
which aims at mitigating fiscal instability and enhancing
investment in infrastructure at the subnational level.
As fiscal revenues are dependent on commodity prices, Peru’s stabilization fund heavily benefitted from the boom of commodity prices in 2000s. Over the past 20
years, revenues from mining and hydrocarbons accounted
on average for 15 percent of total tax revenues. Peru
established a fiscal stabilization fund (FSF) in 1999 to
accumulate funds during boom periods with the aim of
using them in recessions or natural disasters. The FSF is
financed by tax resources, 10 percent of the sales of public
assets for privatization, and 10 percent of concessional
fees. As tax mining revenues surged in the mid-2000s due
to higher commodity prices, the stabilization fund climbed
from USD100 million (0.2 percent of GDP) in 2000 to 6.4
billion (3.3 percent of GDP) 2016.
The FSF helped Peru to cope with decreasing mining revenue and natural disasters. As per the Law of Fiscal
Prudence and Transparency,51 the FSF should be used: (i) in
case of national emergency or international crisis that could
seriously affect the economy; (ii) when there is evidence
that real GDP is declining or could decline next fiscal year;
and (iii) when current revenues financed by tax collection
are expected to decline in the current fiscal year by more
than 0.3 percent of GDP, compared to the average of the
last 3 years. In addition, if the FSF is more than 4 percent
of GDP, the government can used additional savings to
reduce public debt. In 2015, the Government withdrew USD
1.2 billion (0.6 percent of GDP) from the FSF in a context
of decreasing fiscal revenues and economic deceleration
caused by declining commodity prices. The funds were used
as a countercyclical fiscal policy to ensure the financing of
51 Law 27245, 1999
budgeted public spending, in a context of decreasing fiscal
revenues. Similarly, the Government used USD 1.7 billion
(0.8 percent of GDP) in 2017 to finance public spending
related to the reconstruction of damaged infrastructure in
the regions affected the floods created by el Niño.
Mining revenues are earmarked to investment projects at the sub-national levels, resulting into a significant increase of investment over the past 20 years. 80
percent of mining-revenue transfers are earmarked to
investment projects while the rest should be used to
cover maintenance spending for infrastructure. Resource-
revenue sharing transfers are distributed according to
their point of origin. For example, over 75 percent of canon
mining-revenue transfers go to local governments while
regional governments and universities receive 25 percent.
Moreover, district municipalities receive more than 50
percent of resource-revenue transfers in each region where
an extractive industry is located. Investment from sub-
national governments in education and culture and health
& sanitation steadily surged from 0.1 to 1.3 percent of GDP
between 2005 and 2017. Similarly, investment in transport
expanded from 0.1 to 0.6 percent of GDP.

MAURITANIA: Country Economic Memorandum82
Allouche, Y. (2019). Regional Power Rivalry and the Failure of the Arab Maghreb Union. Ottawa.
Amendola, A., Boccia, M., Mele, G., & Sensini, L. (2017). An Assessment of the Access to Credit-Welfare Nexus : Evidence from Mauritania. International Journal of Business and Management, 12(9), 77–93. https://doi.org/10.5539/ijbm.v12n9p77
Amighini, A., & Sanfilippo, M. (2014). Impact of South – South FDI and Trade on the Export Upgrading of African Economies. World Development, 64(September 2013), 1–17. https://doi.org/10.1016/j.worlddev.2014.05.021
Amurgo-pacheco, A., & Pierola, M. D. (2008). Patterns of Export Diversification in Developing Countries: Intensive and Extensive Margins. Washington D.C.
Arvis, J., Duval, Y., Sheperd, B., & Utoktham, C. (2013). Trade Costs in the Developing World. Washington D.C.
Blinder, A. (1973). Wage Discrimination : Reduced Form and Structural Estimates. Reources, The Journal of Human, 8(4), 436–455.
Block, S. A. (2014). The post-independence decline and rise of crop productivity in sub-Saharan Africa: Measurement and explanations. Oxford Economic Papers, 66(2), 373–396. https://doi.org/10.1093/oep/gpt010
Burns, B., Filmer, D., & Patrinos, H. (2011). Making Schools Work: New Evidence on Accountability Reforms. Washington D.C: World Bank.
Calderón, C., & Cantú, C. (2019). Trade Integration and Growth Evidence from Sub-Saharan Africa. Washington D.C.
Chenery, H. (1979). Structural Change and Development Policy. New York: Oxford University Press.
Choplin, A. (2014). Post-Politics and Subaltern (De)Mobilization in an African City. Nouakchott. Journal of Asian and African Studies, 1–18. https://doi.org/10.1177/0021909614548238
Choplin, A., & Dessie, E. (2017). Titling the desert: Land formalization and tenure (in) security in Nouakchott (Mauritania ). Habitat International, 64, 49–58. https://doi.org/10.1016/j.habitatint.2017.04.003
CILSS. (2016). Landscapes of West Africa - A Window on A Changing World. Garretson, SD 57030, United States.
Cottani, J., Cavallo, D., & Shahbaz, K. (1990). Real Exchange Rate Behavior and Economic Performance in LDCs. Economic Development and Cultural Change, 39(1), 61–76.
Dinh, H., & Clarke, G. (2012). Performance of Manufacturing Firms in Africa: An Empirical Analysis. Washington D.C.: The World Bank.
Elbadawi, I. A., Kaltani, L., & Soto, R. (2012). Aid , Real Exchange Rate Misalignment , and Economic Growth in Sub-Saharan Africa. World Development, 40(4), 681–700. https://doi.org/10.1016/j.worlddev.2011.09.012
Foa, R. (2011). The Economic Rationale for Social Cohesion – The Cross-Country Evidence.
Fuglie, K. O., & Rada, N. E. (2013). Resources, Policies, and Agricultural Productivity in Sub-Saharan Africa (Economic Research Report No. 145).
Ghosh, A. R., & Ostry, J. D. (1994). Export Instability and the External Balance in Developing Countries. IMF Staff Papers, 41(2), 214–235.
Gollin, D., Jedwab, R., & Vollrath, D. (2016). Urbanization with and without industrialization. Journal of Economic Growth, 21, 35–70. https://doi.org/10.1007/s10887-015-9121-4
Gollin, D., Kirchberger, M., & Lagakos, D. (2017). In Search of a Spatial Equilibrium in the Developing World. Cambridge.
Gören, E. (2014). How Ethnic Diversity Affects Economic Growth. World Development, 59, 275–297. https://doi.org/10.1016/j.worlddev.2014.01.012
Goyal, A., & Nash, J. (2017). Reaping Richer Returns: Public Spending Priorities for African Agriculture Productivity Growth. Washington D.C.: World Bank.
Gutierrez de Pineres, S., & Ferrantino, M. (2000). Export Dynamics and Economic Growth in Latin America A Comparative Perspective. London: Routledge.
Haile, F. (2018). Structural Change in West Africa A Tale of Gain and Loss. Washington D.C.
Hall, R. E., & Jones, C. I. (1999). Why Do Some Countries Produce So Much More Output Per Worker Than Others? A. The Quarterly Journal of Economics, 114(1), 83–116. https://doi.org/10.1162/003355399555954
Hausmann, R., Hwang, J., & Rodrik, D. (2007). What you export matters. Journal of Economic Growth, 12, 1–25. https://doi.org/10.1007/s10887-006-9009-4
Hausmann, R., & Klinger, B. (2006). Structural Transformation and Patterns of Comparative Advantage in the Product Space.
Hausmann, R., & Rodrik, D. (2003). Economic development as self-discovery. Journal of Development Economics, 72, 603–633. https://doi.org/10.1016/S0304-3878(03)00124-X
Henderson, J. V., Storeygard, A., & Deichmann, U. (2017). Has climate change driven urbanization in Africa? Journal of Development Economics, 124, 60–82. https://doi.org/10.1016/j.jdeveco.2016.09.001
References

MAURITANIA: Country Economic Memorandum 83
Henn, C., Papageorgiou, C., Romero, J., & Sapatafor, N. (2017). Export Quality in Advanced and Developing Economies Evidence from a New Data Set. Washington D.C.
Hidalgo, A., & Hausmann, R. (2009). The building blocks of economic complexity. Proceedings of the National Academy of Sciences, 106(26), 10570–10575.
Hommann, K., & Lall, S. (2019). A Road Map for Sub-Saharan Africa Which Way to Livable and Productive Cities ? Washington D.C.: World Bank.
IFPRI. (2018). Fiche d’information sur les indicateurs de la R&D agricole Mauritanie. Retrieved from http://ebrary.ifpri.org/utils/getfile/collection/p15738coll2/id/133115/filename/133332.pdf
Imbs, J., & Wacziarg, R. (2003). Stages of Diversification. The American Economic Review, 93(1), 63–86.
IMF. (2019). slamic Republic of Mauritania: Third Review Under the Extended Credit Facility Arrangement. Washington D.C.
Jacoby, H. G. (2000). Access to Markets and the Benefits of Rural Roads. The Economic Journal, 110, 713–737.
Jann, B. (2008). A Stata implementation of the Blinder-Oaxaca decomposition. The Stata Journal, 8(4), 453–479.
Jansen, M. (2004). Income volatility in small and developing economies: export concentration matters. WTO Discussion Paper, No. 3.
JICA. (2018). Le Projet d’Elaboration du Schéma Directeur d’Aménagement et d’Urbanisme de la Ville de Nouakchott.
Jones, P., Aoust, O. D., & Bernard, L. (2017). The Urban Wage Premium in Africa. In S. Johnson-Lans (Ed.), Wage Inequality in Africa (pp. 33–53). Palgrave Macmillan, Cham. https://doi.org/https://doi.org/10.1007/978-3-319-51565-6_3
Klinger, B., & Lederman, D. (2006). Diversification, Innovation, and Imitation inside the Global Technological Frontier.
Lall, S., Henderson, V., & Venables, A. (2017). World, Africa’s Cities: Opening Doors to the. Washington D.C: World Bank.
Lange, G., Wodon, Q., & Carey, K. (2018). The Changing Wealth of Nations 2018 Building a Sustainable. Washington D.C.: World Bank.
Mandemaker, M., Bakker, M., & Stoorvogel, J. (2011). The Role of Governance in Agricultural Expansion and Intensification : a Global Study of Arabl Agriculture. Ecology and Society, 16(2).
Melly, P. (2019). Mauritania’s Unfolding Landscape Elections , Hydrocarbons and Socio-Economic Change. London.
Monge-naranjo, A., Sánchez, J. M., & Santaeulàlia-Llopis, R. (2019). Natural Resources and Global Misallocation. American Economic Journal: Macroeconomics, 11(2), 79–126.
Nakamura, S., Harati, R., Lall, S., Dikhanov, Y., Hamadeh, N., Olivier, W., … Yamanaka, M. (2016). Is Living in African Cities Expensive ? Washington D.C.
Nicet-chenaf, D., & Rougier, E. (2011). New exports matter : Discoveries, foreign direct investment and growth, an empirical assessment for Middle East and North African countries. The Journal of International Trade & Economic Development, 20(4), 507–533. https://doi.org/10.1080/09638190903045557
Oaxaca, R. (1973). Male-Female Wage Differentials in Urban Labor Markets Author. International Economic Review, 14(3), 693–709.
OECD. (2017). Cross-border Co-operation and Policy Networks in West Africa. West African Studies. Paris. https://doi.org/http://dx.doi.org/10.1787/9789264265875-en
Prebisch, R. (1959). Commercial Policy in the Underdeveloped Countries. The American Economic Review, 49(2), 251–273.
Richaud, C., Essl, S., Galego, A., Samer, M., & Ayivodji, F. (2019). Fiscal Vulnerabilities in Commodity Exporting Countries and the Role of Fiscal Policy (MTI Discussion Maper No. 15). Washington D.C.
Rodrik, D. (2008). The Real Exchange Rate and Economic Growth. Brookings Papers on Economic Activities, (2), 365–412.
Spence, M., Annez, P., & Buckley, R. (2009). Urbanization and Growth. Washington D.C: World Bank.
Spielauer, M., & Dupriez, O. (2017). Dynamic Microsimulation for Population Projections in Developing Countries : A Portable Application with a Country Case Study ( DYNAMIS-POP-MRT ). Torino.
Syrquin, M. (1988). Patterns of Structural Change. Handbook of Development Economics (Vol. 1). Amsterdam: Elsevier Science Publishers.
Wang, Y., Wu, D., Wang, M., Zhou, L., & Ding, J. (2018). Density, Distance, and Division: Rural Poverty in a Developing-Country Context. Growth and Change, 49(3), 473–489. https://doi.org/10.1111/grow.12250
Wennekers, S., & Thurik, R. (1999). Linking Entrepreneurship and Economic Growth. Small Business Economics, 13, 27–55.
Wiebe, K., Stads, G., Beintema, N., Brooks, K., Cenacchi, N., Dunston, S., … Thomas, T. (2017). West African Agriculture for Jobs , Nutrition , Growth , and Climate Resilience.
Wong, P. K., Ho, Y. P., & Autio, E. (2005). Entrepreneurship , Innovation and Economic Growth : Evidence from GEM data. Small Business Economics, 24, 335–350. https://doi.org/10.1007/s11187-005-2000-1
Word Bank. (2013). 2013-2017, Mauritania Financial Sector Development Strategy and Actiona Plan. Washington D.C.
World Bank. (2009). World Development Report: Reshaping Economic Geography. Washington D.C.

MAURITANIA: Country Economic Memorandum84
World Bank. (2015). Moldova: Public Expenditure Review on Agriculture. Washington D.C.
World Bank. (2016a). Islamic Republic of Mauritania: Diagnostic Trade Integration Study (DTIS) Update. Washington D.C.
World Bank. (2016b). Islamic Republic of Mauritania PER: Surfing the wave - public spending during the commodity super-cycle and beyond. Washington D.C.
World Bank. (2017a). Niger: Fostering Growth under Adverse Shocks with Diversification. Washington D.C.
World Bank. (2017b). Turning Challenges Into Opportunities for Ending Poverty and Promoting Shared Prosperity:Mauritania Systematic Country Diagnostic. Washington D.C.
World Bank. (2018a). Angola Country Economic Memorandum: Towards Economic Diversification. Washington D.C.
World Bank. (2018b). Rapport sur la situation economique en Mauritanie: Vers une consolidation budgétaire qui améliore la gestion des investissements publics et fortifie les filets sociaux. Washington D.C.
World Bank. (2018c). Service Delivery Indicators: Mauritania survey. Forthcoming.
World Bank. (2019a). Agro-pastoral livelihood development project. Forthcoming.
World Bank. (2019b). Education Support Project. Washington D.C.
World Bank. (2019c). Macroeconomic Management of Gas Revenues in Mauritania, forthcoming. Washington D.C.
World Bank. (2019d). Mauritania: A Policy Note on The Role of Competition Policy for A Diversified Economy. Washington D.C.
World Bank. (2019e). Mauritania Land Sector Review. Washington D.C.
World Bank. (2019f). Rapport sur la sitation Economique en Mauritanie: Améliorer le climat des affaires pour favoriser le développement du secteur privé. Washington D.C.
World Bank. (2019g). Republic of Guinea: Planning, Connecting, Financing in Conakry. Washington D.C.
World Bank. (2019h). The First Competition and Skills Development Policy Financing, forthcoming. Washington D.C.
World Bank. (2019i). The Untapped Potential of Mauritania’s Entrepreneurial Ecosystem Lessons from the Entrepreneur’s Marathon. Washington D.C.
WTO. (2018). Mauritania: Trade Policy Review (Vol. WT/TPR/S/3). Geneva.