An experimental investigation into the effect of hydrodynamic cavitation on diesel
41
1 An Experimental Investigation into the Effect of Hydrodynamic Cavitation on Diesel * R.D. Lockett, M. Jeshani Department of Mechanical Engineering & Aeronautics, School of Engineering & Mathematical Sciences, The City University, Northampton Square, London EC1V 0HB, United Kingdom Abstract Samples of commercial diesel were subjected to forty hours of intense cavitation flow across a diesel injector in a specially designed high-pressure recirculation flow rig. In the high pressure part of the rig, diesel samples were compressed to 550 bar using a continuous flow high pressure pump. In the low pressure part of the rig, the diesel samples were maintained at 70 o C using a temperature control system in conjunction with a heat exchanger. A portion of the recirculating diesel was passed through an optically accessible cell. Changes to the optical absorption properties of the diesel over time were identified by the continuous measurement of spectral attenuation coefficient of the diesel at 405 nm by means of a simple optical arrangement. Identical diesel samples were maintained at 70 o C for forty hours in a heated water bath, in order to distinguish the effects of hydrodynamic cavitation and temperature on the cavitated diesel samples. The commercial diesel samples subjected to high pressure cavitation flow and water bath heating revealed a response to the flow and temperature history that was identified by an
Transcript of An experimental investigation into the effect of hydrodynamic cavitation on diesel
1
An Experimental Investigation into the Effect of Hydrodynamic Cavitation on Diesel
*R.D. Lockett, M. Jeshani
Department of Mechanical Engineering & Aeronautics, School of Engineering &
Mathematical Sciences, The City University, Northampton Square, London EC1V 0HB,
United Kingdom
Abstract
Samples of commercial diesel were subjected to forty hours of intense cavitation flow across
a diesel injector in a specially designed high-pressure recirculation flow rig. In the high
pressure part of the rig, diesel samples were compressed to 550 bar using a continuous flow
high pressure pump. In the low pressure part of the rig, the diesel samples were maintained
at 70 oC using a temperature control system in conjunction with a heat exchanger.
A portion of the recirculating diesel was passed through an optically accessible cell. Changes
to the optical absorption properties of the diesel over time were identified by the continuous
measurement of spectral attenuation coefficient of the diesel at 405 nm by means of a simple
optical arrangement. Identical diesel samples were maintained at 70 oC for forty hours in a
heated water bath, in order to distinguish the effects of hydrodynamic cavitation and
temperature on the cavitated diesel samples.
The commercial diesel samples subjected to high pressure cavitation flow and water bath
heating revealed a response to the flow and temperature history that was identified by an

2
increase in the optical absorptivity of the cavitated and heated samples. The contribution of
cavitation flow and temperature to the variation in spectral absorptivity was identified. It was
concluded that the increases observed in the spectral attenuation coefficients of the cavitated
commercial diesels were caused by the cavitation affecting the aromatics in the commercial
diesel samples.
* Corresponding Author: Email: [email protected]
Tel. 44 (0)207 040 8812
Fax. 44 (0)207 040 8655

3
1. Introduction
Modern common rail direct injection diesel engines operate through the injection of high
pressure liquid diesel fuel through magnetic solenoid actuated injectors directly into the
engine cylinders. The diesel fuel is supplied to the injectors at high pressure from a common
fuel storage container, termed the common rail. When the fuel is supplied to the injectors, a
proportion is injected into the engine, and the balance is returned to the fuel tank. If the
engine is operated at low/part load, the rail pressure may be as low as 600 bar, and up to 40 %
of the high pressure diesel supplied to the common rail and the injectors may be returned to
the fuel tank via the fuel return pipes in the pump, common rail, and injectors [1]. However,
when the engine is operated at high load, and depending on the engine, pump and common
rail selected, the rail pressure may attain pressures of 1,400 bar to 1,800 bar. At these high
load operating conditions, approximately 70 % to 80 % of the diesel supplied to the common
rail and the injectors is injected into the engine, with the remainder being returned to the fuel
tank [1].
The consequence of returning a significant fraction of the fuel supplied to the injectors back
to the tank is that the proportion of diesel fuel subjected to repeated high pressure pumping is
a substantial fraction of the original volume. This implies that a significant proportion of the
diesel fuel has been re-circulated through the high pressure pump and rail more than once
prior to admission to the engine.
Deposits have been observed to develop at the entrance to, and inside the nozzle holes in
modern mini-sac multi-hole diesel injectors [2, 3]. Indeed, deposits along the needle and on
the needle seat have also been discovered [4]. These deposits are likely to have an impact on
4
the internal flow and the external atomisation of the fuel jets emanating from the nozzle holes
[5, 6].
Deposits at the exit of the injector nozzle holes may be formed through the partial oxidation
and/or pyrolysis of liquid diesel located on the outer surface of the injector body, coming into
contact with hot combustion gases originating in the cylinder [7, 8]. The mechanisms for
deposit formation inside the nozzle holes, on the needle seat and along the needle are
presently unknown.
Cavitation flow is believed to occur in high pressure diesel nozzles during diesel fuel
injection, to significantly affect the structure and atomisation of the fuel jets emanating from
the nozzles and entering the engine cylinders [9, 10]. Cavitation occurs when the diesel
passes through or over a restriction, causing a large local pressure gradient and/or shear stress
in the fluid. If the pressure gradient or shear stress in the fluid causes the local pressure to
drop to less than the saturated vapour pressure at the local temperature, then the liquid may
begin to boil locally, forming local pockets of diesel fuel vapour [11]. Cavitation is also
thought to be capable of altering injector surfaces though local hydro-erosion and hydro-
grinding [12]. In extreme circumstances, cavitation may cause injector failure [13]. It has
been observed directly in a number of diesel fuel injection experiments [14 - 16].
There has been some speculation relating to cavitation flow in diesel common rail pumps in
the automotive industry [17, 18]. Whether it occurs, and its extent, is presently unknown.
However, the diesel fuel injection equipment (FIE) industry trend is to maintain an increase
in common rail pressures. Indeed, Bosch has developed a 2,500 bar common rail fuel
5
injection system [19], while both Denso and Delphi Diesel Systems have reported the
development of 3,000 bar common rail diesel fuel injection systems [20, 21].
The industry trend towards larger common rail pressures may begin to affect the diesel fuel
subjected to such extreme conditions, during pumping, storage and in flow. This may occur
through pyrolysis and/or intense cavitation flow, causing chemical re-arrangement and
decomposition. This may, in turn, lead to deposit formation and ultimately, to equipment
failure.
The effect of cavitation on alkanes was first investigated by Suslick et al. [22]. They
employed high intensity ultrasound on alkane solutions, and discovered primary products of
hydrogen, methane, acetylene, and smaller 1-alkenes. They suggested that the reactions in
the system bore strong similarities to high temperature pyrolysis, and concluded that the
principal sono-chemical process responsible was C-C bond cleavage with secondary
abstractions and re-arrangements. This was considered to be the consequence of high
temperature regions developing in the solution as a result of cavitation bubble collapse.
The corresponding effects of ultrasound cavitation in diesel has been investigated by Price et
al. [23, 24]. They employed high intensity ultrasound to irradiate a diesel fuel sample, and
observed the decomposition of saturated alkanes, and identified sonically promoted
polymerization reactions that led to aromatics forming insoluble sediments (gums), similar to
those reported by Pedley et al. [25] and Kalitchin et al. [26] as a result of the long term
storage of diesel.
6
These observations in ultra-sound cavitation raise the question of whether similar effects
occur, and are observable in hydrodynamic cavitation. Furthermore, it is necessary to
discover whether high pressure diesel common rail fuel injection equipment produce
hydrodynamic cavitation internally, and whether any such cavitation induces sono-chemistry
effects on the diesel fuel, resulting in deposit formation, similar to that reported earlier.
It was therefore considered necessary to investigate the conditions that exist in high pressure
pumping systems, and their effect on the physical and chemical stability of the diesel fuel
(through an analysis of the variation of the physical and chemical properties and composition
of the fuel).
The aim of this work was to establish whether hydrodynamic cavitation introduced alterations
to the diesel that could be identified using a simple measurement technique. This led to the
design and manufacture of a high pressure, continuous re-circulation, cavitation flow rig that
produced intense hydrodynamic cavitation flow continuously, involving a moderate volume
of re-circulating diesel. A simple measurement technique for the identification and
determination of change in composition and rate of change of composition of the diesel
sample was required to be developed. It was thought that an alteration to the composition of
the diesel would be optically identifiable, through a change in the spectroscopic properties of
the diesel sample. This led to the development of a simple optical absorption measurement
system, intended to determine any changes in the spectral absorptivity of the diesel sample as
a result of compositional change arising out of hydrodynamically induced diesel sono-
chemistry.
7
A water bath was employed in order to separate out the combined effects of cavitation and
the release of internal compression energy during the diesel flow through the diesel nozzle
into the receiver. This was in order to identify and separate out the effects of temperature and
cavitation on the diesel samples.
A number of commercial and non-commercial diesel samples were subjected to continuous
cavitation flow and exposure to the hot water bath in the course of the experimental work
reported here. The results obtained from four commercial diesel samples are reported and
discussed in this paper, together with the results obtained from a model diesel sample. The
four commercial diesel samples discussed here consisted of two newly bought samples, and
two samples that had been stored in a diesel storage tank for a year. The model diesel sample
tested was comprised of a paraffin blend, containing zero aromatics.
2. Experimental Equipment
2.1 The High Pressure, Continuous Re-Circulation, Cavitation Flow Rig
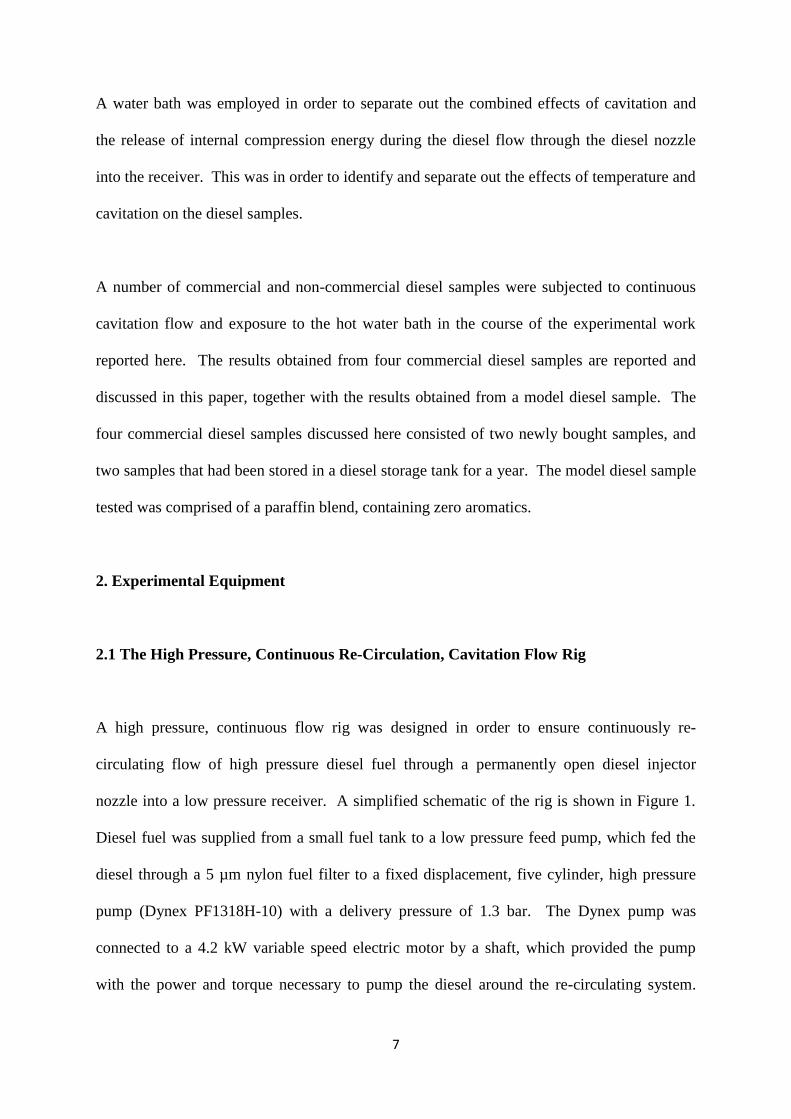
A high pressure, continuous flow rig was designed in order to ensure continuously re-
circulating flow of high pressure diesel fuel through a permanently open diesel injector
nozzle into a low pressure receiver. A simplified schematic of the rig is shown in Figure 1.
Diesel fuel was supplied from a small fuel tank to a low pressure feed pump, which fed the
diesel through a 5 µm nylon fuel filter to a fixed displacement, five cylinder, high pressure
pump (Dynex PF1318H-10) with a delivery pressure of 1.3 bar. The Dynex pump was
connected to a 4.2 kW variable speed electric motor by a shaft, which provided the pump
with the power and torque necessary to pump the diesel around the re-circulating system.
8
The Dynex pump had a case volume of 150 cm3, and was capable of providing flow rates of
up to 3.80 l/min, at pressures of up to 630 bar, when driven by the motor at 1,800 rpm. The
diesel pressure in the high pressure tubing was measured using a conventional pressure
gauge.
Figure 1: Schematic of Continuous, High Pressure, Cavitation Flow Rig
The Dynex pump continuously supplied high pressure diesel (preset to 550 bar ± 10 bar) to a
permanently open 0.22 mm diameter five-hole asymmetric diesel nozzle (Bosch diesel nozzle
Part Number DSLA148P591 with needle removed). The diesel injector nozzle released the
diesel fuel into a 1.0 litre receiving cylinder maintained at atmospheric pressure. The
continuous re-circulation of fuel through the high pressure pump and diesel nozzle caused the

9
temperature of the diesel to rise to dangerous levels. Consequently, a temperature control
system was installed in order to maintain the temperature of the diesel in the re-circulating
flow rig at a safe value. The temperature control system utilised control thermocouples, a
commercial temperature controller, and a heat exchanger. The control thermocouple was
attached to the high pressure tubing upstream of the open diesel injector, and communicated
the pre-expansion diesel temperature to the temperature control system. The temperature
control system controlled the temperature of the diesel by controlling the water supply to a
compact, helical, rectangular plate counterflow heat exchanger, located immediately
downstream of the receiver. Once the diesel had passed through the heat exchanger, it was
returned to the fuel tank. The minimum volume of diesel to be re-circulated in the cavitation
flow rig was 3.5 litres.
A safety pressure relief valve providing an over-pressure fuel return to the tank was installed
between the high pressure pump and the diesel injector in order to relieve the pump and
tubing of over-pressure conditions and/or high pressure surges. The pressure relief valve was
manually set to relieve the diesel in the high pressure tubing at 630 bar and above.
2.2 The Optical Absorption Measurement System
The objective here was the development of a simple, sensitive experimental technique, to be
used for the determination of the change in composition of the diesel samples subjected to re-
circulating cavitation flow in the high pressure rig.
This consideration led to the hypothesis that a change in the composition of the diesel sample
would lead to a corresponding change in the spectral absorptivity of the diesel, through the
10
destruction of optically active molecular species comprising the diesel, and the formation of
new optically active molecular species. The long term cavitation in the high pressure flow rig
might also result in the formation of particulates, which would produce a corresponding
increase in the spectral absorptivity of the diesel samples.
2.2.1 The Optically Accessible Cell
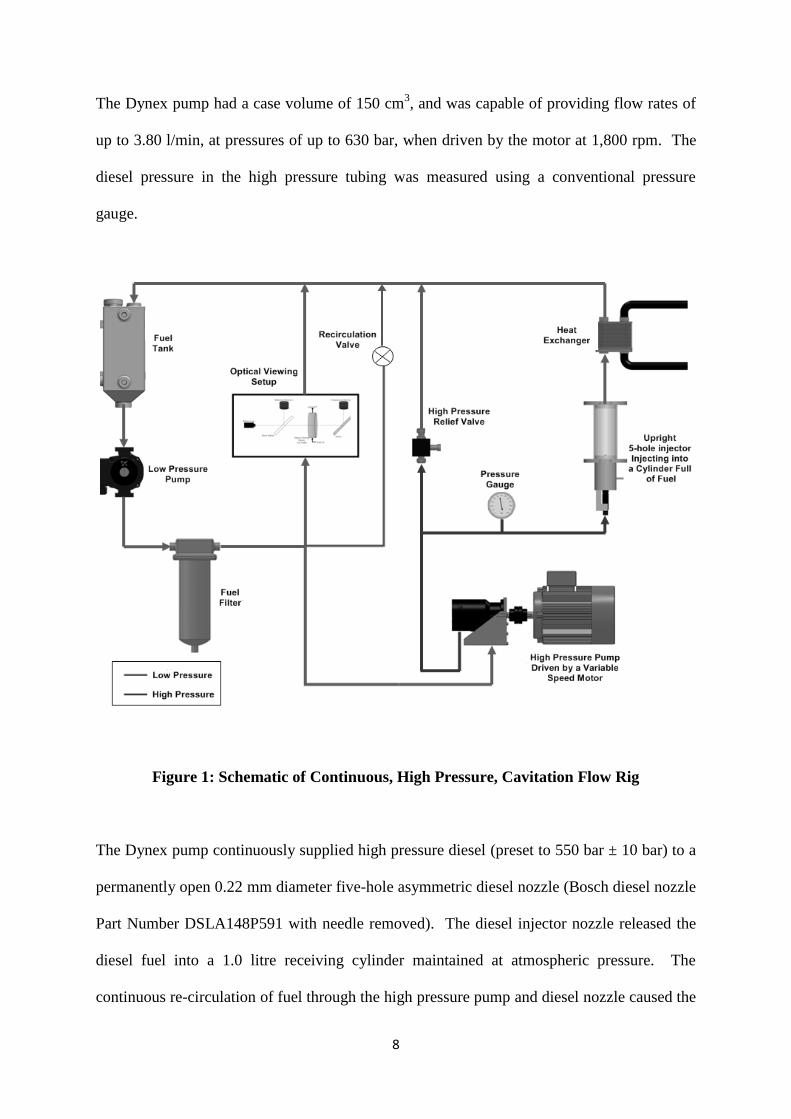
Continuous sampling of a fraction of the re-circulating diesel was undertaken, by connecting
a sampling tube to the main diesel fuel tube connecting the fuel filter to the suction port of the
high pressure Dynex pump. The sampling tube continuously supplied a small flow of diesel
to an optically accessible cell, and then returned it from the cell, back to the fuel tank. A
schematic of the optically accessible cell in shown in Figure 2.
Fused Silica Windows
on Both Sides
1cm Width of Fuel Sealed
Between the Fused Silica
Windows
Fuel IN from the
Bottom
Figure 2: Schematic of Optically Accessible Cell
11
The optically accessible cell consisted of a short hollow stainless steel cylinder 20 mm wide,
80 mm diameter with a wall thickness of 30 mm. A 5 mm deep, 40.1 mm diameter recess
was bored into both ends of the cylinder, providing the space for 40 mm diameter windows.
Six M6 bolt holes were symmetrically placed on the outer faces of the main cylinder near the
outer edges, and threaded. Two stainless-steel cylindrical disc end plates containing six M6
size bolt holes were manufactured in order to locate, hold and seal the fused silica windows
in place, using four polypropylene gaskets to protect and seal the windows. 5mm thick, 40
mm diameter uv grade fused silica windows were then located and sealed against the gaskets,
which were located against the recessed flanges of the main body of the cell. The windows
were clamped to the cell by screwing down the end-plates using M6 bolts, forming a sealed
volume in the centre of the cell.
Fuel access ports on opposite sides of the cylinder were radially drilled through the cylinder
wall, providing flow access into the central volume. Flexible braided hoses transported the
sampled diesel from the rig to the port at the bottom of the optically accessible cell. The
diesel then flowed up the port, filling the 1 cm wide, 4 cm diameter cylindrical space in the
cell, before flowing upwards into the return hose, returning the sampled diesel back to the
fuel tank.
2.2.2 The Laser Measurement System
A 405 nm laser beam (originating from a World Star Tech. 405 nm diode laser ) was directed
through a 0.03 OD neutral density filter (50 mm x 50 mm uv grade fused silica glass sheet)
placed at a 45o angle to the incident beam, before being passed through the optically
accessible cell containing the sampled diesel flowing from the rig and back to the fuel tank.

12
The fraction of the beam reflected from the angled neutral density filter was directed onto a
Laserpoint laser power detector in order to obtain a reference laser power. The main laser
beam passing through the optically accessible cell was attenuated as a result of optical
absorption and scattering from the 1 cm wide diesel fuel sample flowing through the cell, and
scattering from the two fused silica windows. The attenuated beam leaving the cell was then
directed onto a mirror, which reflected the beam onto a second Laserpoint laser power
detector. Figure 3 shows the assembly of the laser, neutral density filter, optically accessible
cell, mirror and laser power meters.
405nm Laser
Aluminium
Mirror Optical Viewing
Cylinder
1cm Width
Reference Detector 1 Transmission Detector 2
Beam Splitter
Fuel OUT
Fuel IN
5.5cm
6cm 11.9cm 3.3cm 12cm
Figure 3: Optical Layout for Laser Absorption Measurement in Diesel
Both of the Laserpoint laser power detectors utilized a USB interface to record the measured
laser power on a computer using PC-Link software. The control program provided the user
with the ability to calibrate the power detectors under different lighting conditions prior to
measurement. The software provided a 10 x gain function in order to increase the sensitivity
13
of the detectors, making them capable of determining laser power from 10 µW to 200 mW in
discrete intervals of 10 µW.
2.3 The Water Bath
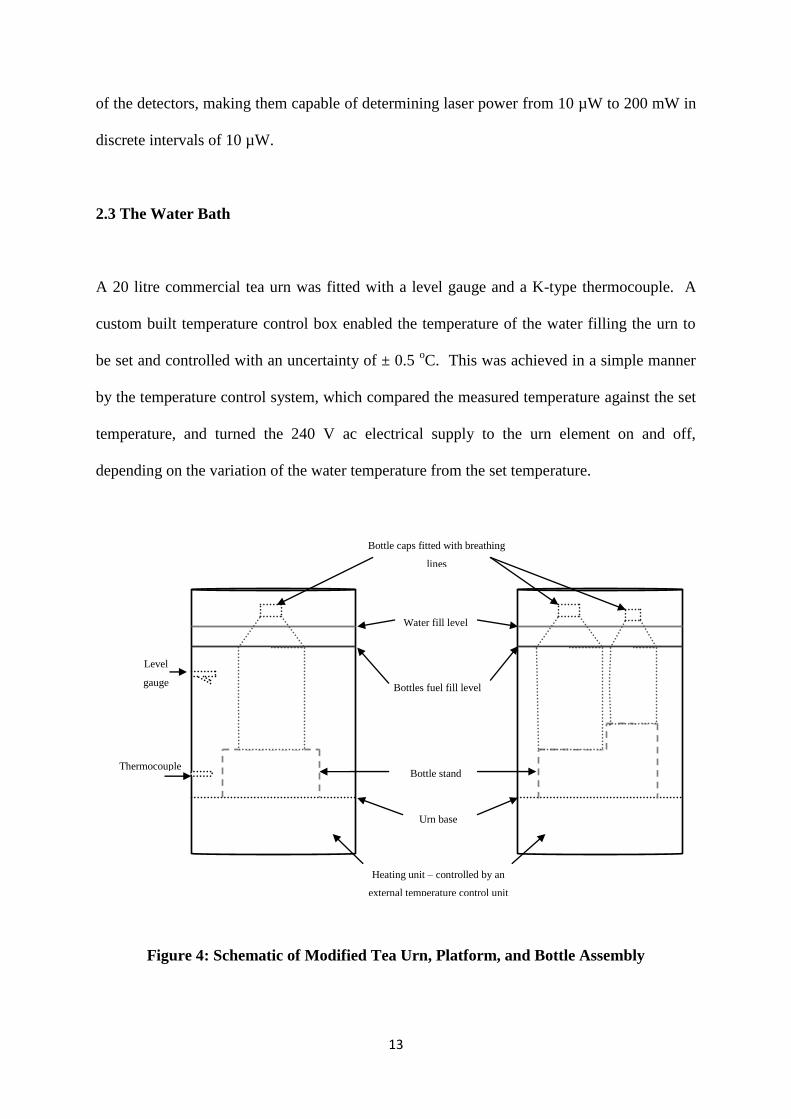
A 20 litre commercial tea urn was fitted with a level gauge and a K-type thermocouple. A
custom built temperature control box enabled the temperature of the water filling the urn to
be set and controlled with an uncertainty of ± 0.5 oC. This was achieved in a simple manner
by the temperature control system, which compared the measured temperature against the set
temperature, and turned the 240 V ac electrical supply to the urn element on and off,
depending on the variation of the water temperature from the set temperature.
Bottle caps fitted with breathing
lines
Water fill level
Bottles fuel fill level
Bottle stand
Urn base
Heating unit – controlled by an
external temperature control unit
Level
gauge
Thermocouple
Figure 4: Schematic of Modified Tea Urn, Platform, and Bottle Assembly
14
Bottle platform stands were manufactured in order to place a 2.5 litre laboratory glass bottle
and a 1 litre laboratory glass bottle in the urn, in order for the diesel samples in the bottles to
be fully immersed in the water, but with the bottle tops and caps maintained above the water
line. The bottle caps were drilled and fitted with breathing ports and tubing, which facilitated
pressure equalization and ventilation during immersion in the water bath. Figure 4 shows the
urn and platform stand assembly.
3. Experimental Method
3.1 Re-Circulation Flow Tests in the High Pressure Cavitation Rig
Before a new fuel test, the high pressure flow rig was flushed twice with 3.5 litres of 95 %
grade hexadecane (supplied by Alfa-Aesar), followed by filling the system with 3.7 litres of
the diesel sample that was to be tested. The flushing process consisted of filling the fuel tank
slowly with the flushing liquid while the low pressure feed-pump was being run. Once the
receiving cylinder began to receive flushing liquid from the diesel nozzle (indicating that the
lower part of the system was filled with liquid), the high pressure pump was started, and
driven by the motor to produce a pressure of 300 bar. This served to fill the receiving
cylinder and the heat exchanger, before returning to the main fuel tank. Once the
components were filled, the flushing liquid was circulated around the system at 300 bar and
50 oC for approximately one hour.
Between successive tests and flushes the system was drained. Four drain valves were used to
drain the rig of diesel or flushing liquid. The first drain valve was attached to the base of the
filter housing, and was employed to drain the tank, low pressure pump, filter, and a fraction
15
of the high pressure pump. Approximately 2.2 litre of liquid was drained from the first drain
valve. The second drain valve was located at the base of the receiving cylinder, which was
employed to drain the receiving cylinder and the heat exchanger. Bottle nitrogen was
employed to provide back pressure to the heat exchanger in order to ensure that the heat
exchanger was fully drained. Approximately 0.5 litres of liquid was drained from the second
drainage point. Liquid was then drained from the high pressure exit near the diesel nozzle,
and from the low pressure entry to the high pressure pump. Approximately 0.4 litres of liquid
was drained from these two points. Therefore for each fill of 3.5 litres of diesel or
hexadecane flushing liquid, approximately 3.2 litres was able to be drained. This left
approximately 300 ml in the system in the form of residual volume from the previous test or
flush. A full test cycle consisting of two flushes and a new test fuel fill resulted in a test
cycle to test cycle contamination of the order of 0.1 %.
Once the rig was filled with approximately 3.7 litres of a new test fuel (using the procedure
specified earlier), it was circulated around the rig for approximately 30 minutes at low
pressure. During this delay the laser power detectors were calibrated for the local light level.
A 200 ml pre-test sample was then drawn off from the filter drain valve, providing a
reference pre-test sample for later chemical analysis.
The pre-injection temperature was initially set to 55 oC. The low pressure pump was then
turned back on, allowing the remaining 3.5 litre test diesel sample in the rig to circulate at
low pressure. The laser was turned on, and allowed to settle, before a laser power reading
was taken from both detectors. The high pressure pump was then turned on, and the motor
speed and the pressure upstream of the diesel nozzle slowly increased to 550 bar. The
continuous release of the compression energy during diesel flow through the nozzle into the

16
receiver resulted in a temperature rise. Once the temperature reached 55 oC, one full
temperature cycle was allowed, before setting the temperature control point to its test value of
70 oC. The temperature continued to rise until the set point was achieved, at which time the
temperature control system began supplying cold water to the heat exchanger, maintaining
the diesel pre-injection temperature at 70 oC ± 2
oC.
The diesel test sample was circulated around the system for ten hours per day, for four
successive days, for a total of forty hours cavitation test time. During the cavitation flow
tests, the laser detectors were sampling the reference and transmitted laser power with a
sampling rate of 1 Hz. The computer control software computed a one minute average of the
discrete reference and transmitted laser power measurements, and then wrote the one minute
laser power averages to a text file for later analysis. The one minute laser power averages for
the reference and transmitted beams were recorded continuously over the ten hour cavitation
test period. At the end of the ten hour period the electric motor and pump were slowed down
to a stop, and the diesel test sample allowed to cool. The following day the standard run
procedure was repeated, and this was undertaken for four successive days.
Four commercial diesel samples and one model diesel sample were subjected to forty hours
continuous cavitation and water bath heating tests. Two of the four commercial diesel fuel
samples were stored, and then tested within three months of purchase. The other two
commercial samples were stored for between twelve and fifteen months prior to testing. The
model diesel sample was comprised of a blend of C12 to C19 paraffins.

17
3.2 Water Bath Tests
Before the diesel samples were immersed in the hot water bath, pre-bath laser transmission
tests were undertaken. The cavitation flow rig was filled with the diesel sample to be tested,
and circulated around the system and through the optically accessible cell at ambient
temperature using the low pressure pump. The diode laser was turned on, and the beams
directed onto the reference detector, and through the optical cell, and onto the transmission
detector. The reference laser power and transmitted laser power incident on the detectors
were recorded for approximately 15 minutes circulation time.
Two types of water bath tests were then undertaken. The first test involved an attempt to
reproduce the temperature history achieved in the cavitation flow tests. 3.5 litre of fresh
diesel fuel sample were immersed in water, maintained at 70 oC, for ten hours per day for
four days. The second test involved the immersion of fresh 3.5 litre diesel samples in water
at 70 oC for a continuous, uninterrupted period of forty hours.
After the hot water immersion tests were complete, the cavitation flow rig was filled with the
post-immersion diesel samples, and circulated around the rig and through the optically
accessible cell at ambient temperature. Reference and transmitted laser power was again
recorded, in the same manner as identified earlier. The diode laser was turned on, and the
beams directed onto the reference detector via the neutral density filter, and through the
optical cell, and onto the transmission detector. The reference laser power and transmitted
laser power incident on the detectors were recorded for approximately 15 minutes circulation
time.
18
3.3 Analysis and Calibration of the Laser Detection System
3.3.1 Analysis of the Spectral Attenuation Coefficient
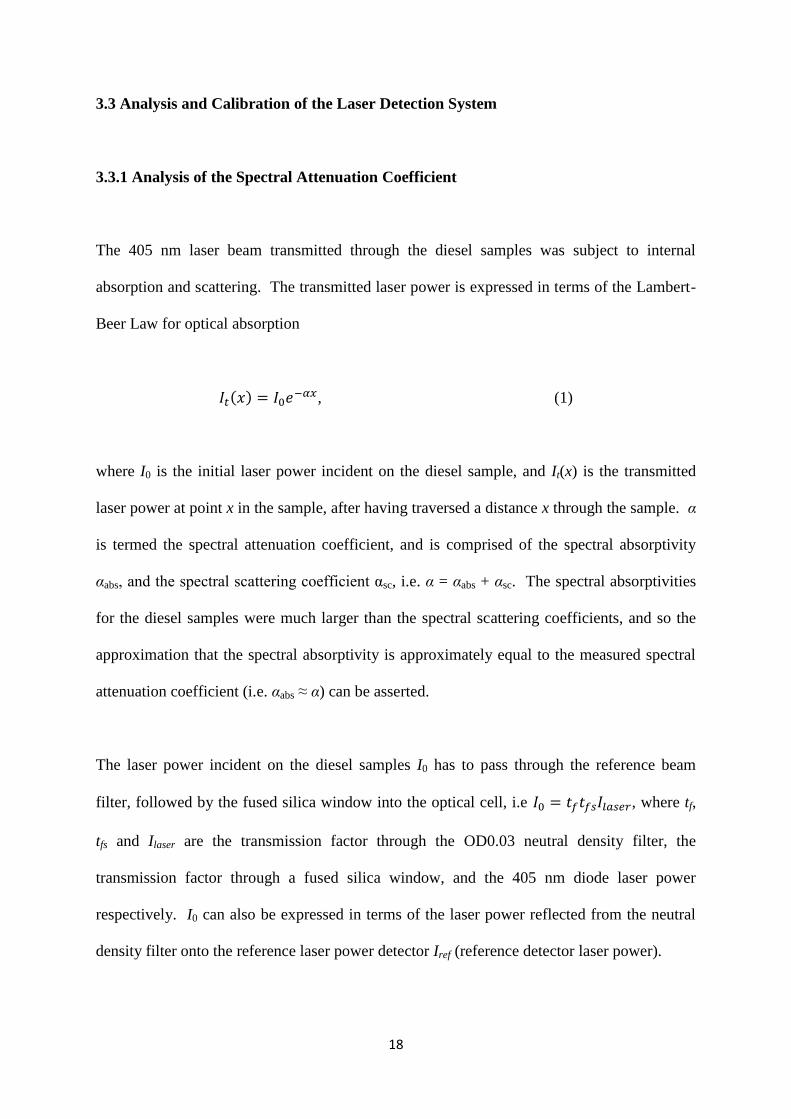
The 405 nm laser beam transmitted through the diesel samples was subject to internal
absorption and scattering. The transmitted laser power is expressed in terms of the Lambert-
Beer Law for optical absorption
, (1)
where I0 is the initial laser power incident on the diesel sample, and It(x) is the transmitted
laser power at point x in the sample, after having traversed a distance x through the sample. α
is termed the spectral attenuation coefficient, and is comprised of the spectral absorptivity
αabs, and the spectral scattering coefficient αsc, i.e. α = αabs + αsc. The spectral absorptivities
for the diesel samples were much larger than the spectral scattering coefficients, and so the
approximation that the spectral absorptivity is approximately equal to the measured spectral
attenuation coefficient (i.e. αabs ≈ α) can be asserted.
The laser power incident on the diesel samples I0 has to pass through the reference beam
filter, followed by the fused silica window into the optical cell, i.e , where tf,
tfs and Ilaser are the transmission factor through the OD0.03 neutral density filter, the
transmission factor through a fused silica window, and the 405 nm diode laser power
respectively. I0 can also be expressed in terms of the laser power reflected from the neutral
density filter onto the reference laser power detector Iref (reference detector laser power).

19
(2)
where tfs is as before, and rf is the reflectivity of the OD0.03 neutral density filter, being used
as a beam-splitter.
The laser power exiting the diesel samples pass through a fused silica window before being
reflected from a 45o angled mirror onto the transmission laser power detector. The laser
power measured with the detector is denoted by IP, and is related to the laser power exiting
the diesel sample in the optical cell It by
, (3)
where tfs is the transmission coefficient for the exit fused silica window (as defined above),
and rm is the reflectivity of the final mirror. The time-dependent spectral attenuation
coefficient is then derived from equation (1) to be
(4),
where l is the optical path length of the laser through the diesel in the optical cell. The optical
path length in the cell was measured to be 1.03 cm ± 0.01 cm.

20
3.3.2 Calibration of the Optical Absorption System
Each optical element affecting the laser detection system was independently investigated and
calibrated. The calibration of the system began with the direct measurement of the un-
attenuated diode laser beam power by directing the diode laser beam directly onto the
transmission power meter. Average power measurements of the un-attenuated laser beam
were obtained, and stored on the pc.
Reference Detector Reference Detector
Transmission Detector Transmission Detector
Figure 5: Optical Layout for the Calibration of the Beam-splitter
The first optical element to be investigated was the OD 0.03 fused silica neutral density (ND)
filter placed at a 45o angle to the incident laser beam. The optical arrangement is shown in
Figure 5 below. During the cavitation flow experiment, it was employed to reflect
approximately 10% of the incident diode laser beam towards the reference laser power meter,
while allowing the balance of the beam to pass through the filter towards the optically
accessible cell. A number of neutral density filters were employed to attenuate the beam
originating from the diode laser, and were located between the diode laser and the angled
neutral density filter.

21
Nine average reflected beam power measurements were obtained from the reflected beam
falling on the reference power meter (denoted by Iref) and transmitted beam power
measurements were obtained from the transmitted beam falling on the transmission power
meter (denoted by IT2), for three different attenuations (four including the origin). The graph
is shown in Figure 6. A linear plot of IT2 as a function of Iref including the origin produced
the proportional relationship , with a linear correlation coefficient of R2 =
0.9982. A comparison between the values of IT2 derived from the proportional relationship
with the measured values produced a mean relative error of 0.8 %. This means that the
neutral density filter reflected 0.099 ± 0.001 of the incident laser power onto the reference
detector.
Figure 6: Graph of Transmitted Laser Power (mW) as a Function of Reflected Laser
Power (mW)
y = 9.0306x R² = 0.9982
0.0
2.0
4.0
6.0
8.0
10.0
12.0
14.0
16.0
18.0
0 0.5 1 1.5 2
I T2 (
mW
)
IR (mW)
IR v IT2 Linear (IR v IT2)

22
The second set of optical elements to be calibrated were the fused silica windows that were
employed to provide optical access to the diesel samples and to seal the optical cell. The
optical transmission through the fused silica windows had to be calibrated with a transparent
fluid flowing though the optical cell during the calibration measurements, with the
transparent fluid having a refractive index matching those of the diesel samples. This was in
order to calibrate the effect of the laser passing from the entrance fused silica window into the
diesel sample, to be followed by the laser exiting the diesel, and entering the exit fused silica
window.
Signal Test 1
Signal Test 3
Signal Test 2
Signal Test 4
Signal Test 5 Signal Test 6
Figure 7: Optical Layout for the Measurement of Transmission through Fused Silica
Windows

23
A C12 to C19 paraffin blend was employed as a model diesel in order to calibrate the optical
transmission of the laser through the fused silica windows sealing the optically accessible
cell. The paraffin blend was almost transparent to the diode laser light at 405 nm. Figure 7
shows a schematic of the experimental arrangement necessary to calibrate the transmission
through the fused silica windows.
Signal Test 1
Signal Test 3
Signal Test 2
Signal Test 4
Signal Test 5 Signal Test 6
Figure 8: Optical Layout for the Measurement of Reflectivity of Final Mirror
The transmission through the fused silica windows were measured using Signal Test Setup 3
and Signal Test Setup 6 in Figure 7. The beam power transmitted through the fused silica
windows were compared with the beam power incident directly on the transmission detector.
The transmission through the fused silica windows and the transparent paraffin blend model
diesel was determined to be 0.94 ± 0.01.
24
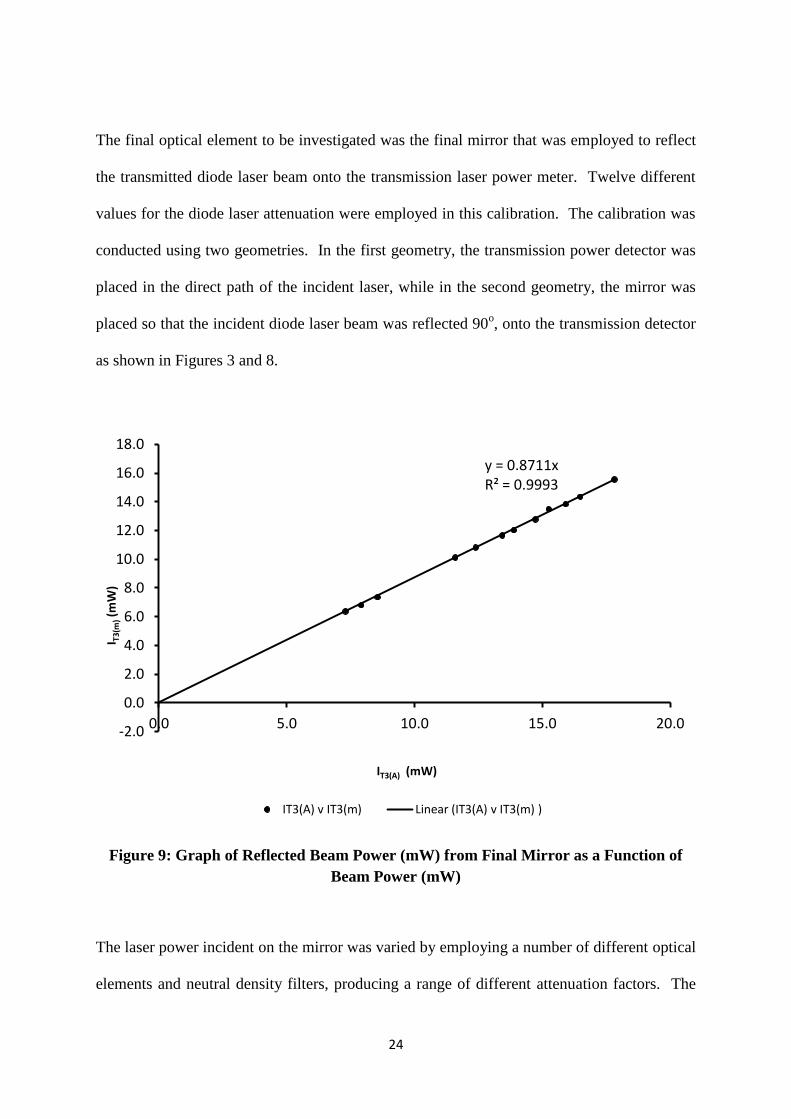
The final optical element to be investigated was the final mirror that was employed to reflect
the transmitted diode laser beam onto the transmission laser power meter. Twelve different
values for the diode laser attenuation were employed in this calibration. The calibration was
conducted using two geometries. In the first geometry, the transmission power detector was
placed in the direct path of the incident laser, while in the second geometry, the mirror was
placed so that the incident diode laser beam was reflected 90o, onto the transmission detector
as shown in Figures 3 and 8.
Figure 9: Graph of Reflected Beam Power (mW) from Final Mirror as a Function of
Beam Power (mW)
The laser power incident on the mirror was varied by employing a number of different optical
elements and neutral density filters, producing a range of different attenuation factors. The
y = 0.8711x R² = 0.9993
-2.0
0.0
2.0
4.0
6.0
8.0
10.0
12.0
14.0
16.0
18.0
0.0 5.0 10.0 15.0 20.0
I T3
(m) (
mW
)
IT3(A) (mW)
IT3(A) v IT3(m) Linear (IT3(A) v IT3(m) )

25
graph of reflected laser power as a function of incident laser power is shown in Figure 9. The
final mirror was determined to reflect 0.871 ± 0.007 of the incident laser power.
4. Data Analysis
The one-minute averaged laser power measurements for the diesel samples that were
subjected to cavitation flow tests were converted to fifteen-minute averages. The continuous
fifteen-minute averaged laser transmission power data, were ratioed against the synchronous
reference laser power data, producing normalised transmission power data that were
independent of power fluctuations in the source 405 nm diode laser.
0
1
2
3
4
5
6
7
8
9
10
0 5 10 15 20 25 30 35 40
No
rmal
ised
Las
er P
ow
er (N
o u
nit
s)
Cavitation Time (hours)
Fresh Commercial Diesel A
Fresh Commercial Diesel B
Aged Commercial Diesel C
Aged Commercial Diesel D
Model Diesel E
Figure 10: Normalised Transmitted Laser Power as a Function of Cavitation Time
(hours) for Three Commercial Diesel Samples and a Paraffin-based Model Diesel.

26
Figure 10 shows a graph of five normalised transmission laser power to reference laser power
profiles as a function of time during the forty hour cavitation test period. The five profiles
are identified as fresh commercial diesel samples A and B, aged commercial diesel samples C
and D, and the paraffinic rich model diesel sample E. Model diesel E is a blend of C12 to C19
paraffins, which is transparent to the 405 nm laser light. Commercial diesel samples A, B, C
and D begin with different attenuation coefficients, which is why the normalised values at the
beginning of the cavitation tests are different.
The time-dependent reflection and transmission laser power measurement data were then
employed to determine the time-dependent spectral attenuation coefficients for the four
commercial diesel samples, together with the samples subjected to immersion in the hot water
bath. These were derived using Equation (4).
5. Results
Figure 10 shows a graph of the normalised laser power transmitted through the optical cell
containing a 1.1 cm thick layer of commercial or model diesel flowing upward through the
cell, as a function of cavitation time (hours) for the forty hour period of the test. The initial
attenuation coefficient was different for the five diesel fuel samples. The paraffin based
model diesel was almost transparent to the incident laser light at 405 nm. In addition, the
model diesel attenuation coefficient was observed to remain unchanged over the forty hour
period of the cavitation flow test.
The relative variation in laser transmission through the respective diesel samples as a
function of cavitation test time were determined by normalising the transmission profiles with

27
the corresponding transmission laser power at the beginning of the cavitation tests. These
normalised transmission laser power profiles are shown in Figure 11.
0
0.2
0.4
0.6
0.8
1
1.2
0 5 10 15 20 25 30 35 40
Self
-no
rmal
ise
d T
ran
smit
ted
Las
er
Po
we
r (N
o u
nit
s)
Cavitation Time (hours)
Fresh Commercial Diesel A
Fresh Commercial Diesel B
Aged Commercial Diesel C
Aged Commercial Diesel D
Model Diesel E
Figure 11: Self-normalised Transmitted Laser Power as a Function of Cavitation Time
(hours) for Three Commercial Diesel Samples and a Paraffin-based Model Diesel.
The time-dependent variation in the spectral attenuation coefficients of the five diesel
samples was determined using Equation (4). The results for the five samples were plotted
together on the same graph, which is presented in Figure 12.
Figures 13 to 15 show the attenuation coefficients derived from the two fresh commercial
diesel samples and one of the two aged diesel samples, plotted together with the attenuation
coefficients derived before and after forty hours immersion in the hot water bath.
28
0.0
0.2
0.4
0.6
0.8
1.0
1.2
1.4
1.6
1.8
2.0
2.2
2.4
0 5 10 15 20 25 30 35 40
Spe
ctra
l Att
en
uat
ion
Co
eff
icie
nt
(cm
-1)
Cavitation Time (hours)
Fresh Commercial Diesel A
Fresh Commercial Diesel B
Aged Commercial Diesel C
Aged Commercial Diesel D
Model Diesel E
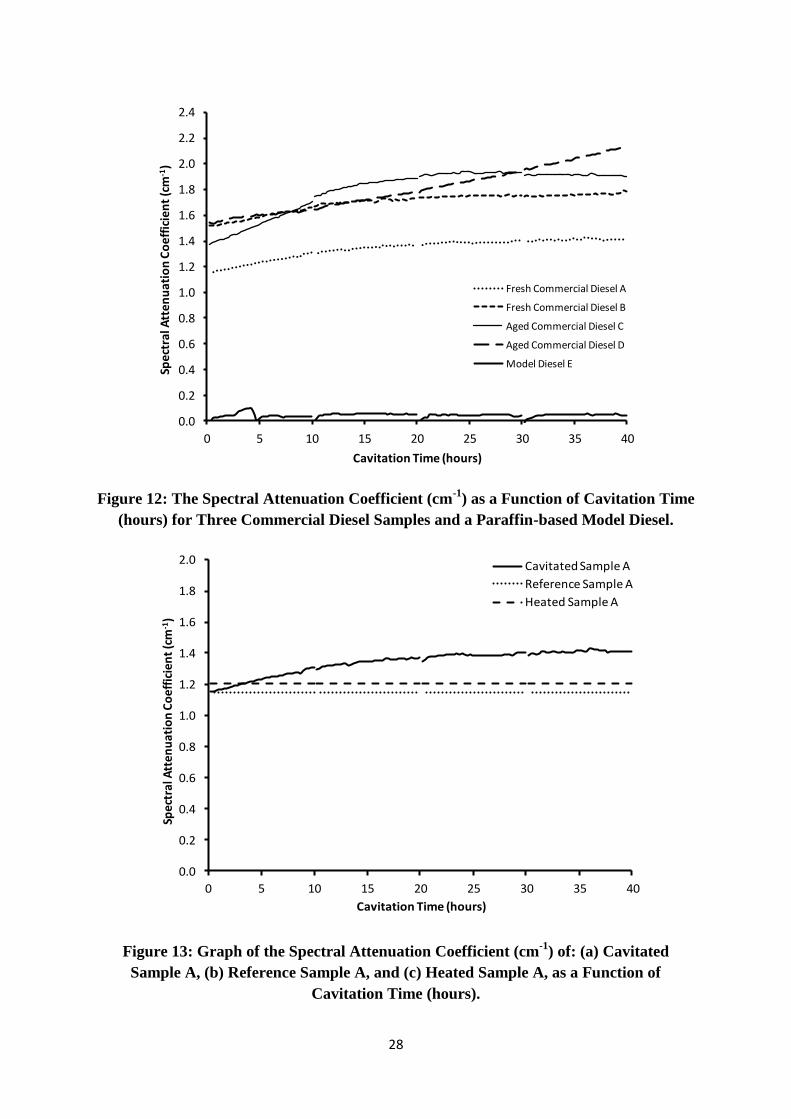
Figure 12: The Spectral Attenuation Coefficient (cm-1
) as a Function of Cavitation Time
(hours) for Three Commercial Diesel Samples and a Paraffin-based Model Diesel.
0.0
0.2
0.4
0.6
0.8
1.0
1.2
1.4
1.6
1.8
2.0
0 5 10 15 20 25 30 35 40
Spec
tral
Att
enu
atio
n C
oef
fici
ent
(cm
-1)
Cavitation Time (hours)
Cavitated Sample A
Reference Sample A
Heated Sample A
Figure 13: Graph of the Spectral Attenuation Coefficient (cm-1
) of: (a) Cavitated
Sample A, (b) Reference Sample A, and (c) Heated Sample A, as a Function of
Cavitation Time (hours).

29
0.0
0.2
0.4
0.6
0.8
1.0
1.2
1.4
1.6
1.8
2.0
0 5 10 15 20 25 30 35 40
Spe
ctra
l Att
en
ua
tio
n C
oe
ffic
ien
t (c
m-1
)
Cavitation Time (hours)
Cavitated Sample B
Reference Sample B
Heated Sample B
Figure 14: Graph of the Spectral Attenuation Coefficient (cm-1
) of: (a) Cavitated
Sample B, (b) Reference Sample B, and (c) Heated Sample B, as a Function of
Cavitation Time (hours).
0.0
0.2
0.4
0.6
0.8
1.0
1.2
1.4
1.6
1.8
2.0
0 5 10 15 20 25 30 35 40
Spe
ctra
l Att
en
ua
tio
n C
oe
ffic
ien
t (c
m-1
)
Cavitation Time (hours)
Cavitated Sample C
Reference Sample C
Heated Sample C
Figure 15: Graph of the Spectral Attenuation Coefficient (cm-1
) of: (a) Cavitated
Sample C, (b) Reference Sample C, and (c) Heated Sample C, as a Function of
Cavitation Time (hours).
30
6. Discussion
Figure 10 shows the transmitted laser power normalised by the reference laser power for two
fresh commercial diesel samples, and two aged commercial diesel samples, together with a
paraffin-blend model diesel, plotted against the cavitation time that the samples were
subjected to. The paraffin blend model diesel is almost transparent to the 405 nm laser light,
and shows negligible change in absorption over the forty hour cavitation period. In contrast
to this, all of the commercial diesel samples produce a decrease in normalised laser
transmission power with time during the cavitation.
The scale of the decrease in normalised transmission power can be observed in Figure 11,
which shows the relative change in normalised laser transmission power through the four
commercial diesel samples and the paraffin-blend model diesel sample. The paraffin-blend
model diesel produces very little change in the normalised transmitted laser power over the
forty hour cavitation period. By contrast, the two fresh commercial diesel samples produce a
very similar relative decrease in normalised transmitted laser power, decreasing
approximately 22 % from the initial value over the forty hour period. The aged samples were
observed to produce an even greater decrease in transmitted laser power, decreasing
approximately 40% from the initial value after the forty hour cavitation period. It is
important to note however, that the aged samples produced very different laser transmission
histories. Aged diesel sample C produced a profile which decreased rapidly after cavitation
began, and levelled out in the middle to late period. In contrast, aged diesel sample D
produced a linearly decreasing transmission profile.

31
Equation (4) was employed to calculate the spectral attenuation coefficients for all of the
diesel samples as a function of the cavitation time. The results of these calculations are
shown in Figure 12. The paraffin-blend model diesel was revealed to have an unchanged 405
nm spectral attenuation coefficient of 0.05 cm-1
± 0.03 cm-1
during the cavitation period.
Fresh commercial diesel A began with an initial 405 nm spectral attenuation coefficient of
1.15 cm-1
± 0.01 cm-1
, increasing to 1.42 cm-1
± 0.01 cm-1
at the end of the forty hour
cavitation period. Fresh commercial diesel sample B began with an initial spectral
attenuation coefficient of 1.52 cm-1
± 0.01 cm-1
, increasing to 1.79 cm-1
± 0.01 cm-1
over the
forty hour cavitation period. Aged commercial diesel samples C and D began with initial
spectral attenuation coefficients of 1.38 cm-1
± 0.01 cm-1
and 1.53 cm-1
± 0.01 cm-1
respectively, increasing to 1.90 cm-1
± 0.01 cm-1
and 2.13 cm-1
± 0.01 cm-1
respectively over
the forty hour cavitation period.
Three of the four commercial samples (fresh samples A and B, and aged sample C) were
subjected to discontinuous heating in a modified water urn at 70 oC ± 1
oC for forty hours,
mimicking the forty hour cavitation period. This was done in order to separate out the effects
of temperature and cavitation flow in changing the spectral absorption coefficients over the
forty hour cavitation period.
Figure 13 shows the graph of the variation of spectral attenuation coefficient with cavitation
time for fresh diesel sample A, together with the corresponding spectral attenuation
coefficients for sample A obtained before and after forty hours discontinuous immersion in
the water bath. The discontinuous immersion of sample A in the water bath for forty hours
produces a 4.5 % change in the spectral attenuation coefficient, compared with the 24 %
increase that occurred as a result of the forty hours cavitation flow. This means that the

32
cavitation flow is responsible for a 19.5 % increase in the spectral attenuation coefficient over
the forty hour cavitation period.
Figure 14 shows the graph of the variation of spectral attenuation coefficient with cavitation
time for fresh diesel sample B, together with the corresponding spectral attenuation
coefficients for sample B obtained before and after forty hours discontinuous immersion in
the water bath. The discontinuous immersion of sample B in the water bath for forty hours
produces a 10.5 % change in the spectral attenuation coefficient, compared with the 19 %
increase that occurred as a result of the forty hours cavitation flow. This means that the
cavitation flow is responsible for an 8.5 % increase in the spectral attenuation coefficient over
the forty hour cavitation period. A comparison of the respective effects of the immersion of
fresh diesel samples A and B in the water bath shows that temperature produced a more
significant change in the spectral attenuation coefficient for sample B relative to sample A.
Figure 15 shows the graph of the variation of spectral attenuation coefficient with cavitation
time for aged diesel sample C, together with the corresponding spectral attenuation
coefficients for sample C obtained before and after forty hours discontinuous immersion in
the water bath. The discontinuous immersion of sample C in the water bath for forty hours
produces a 0.8 % change in the spectral attenuation coefficient, compared with the 40.5 %
increase that occurred as a result of the forty hours cavitation flow. This means that the
cavitation flow is responsible for a 40 % increase in the spectral attenuation coefficient over
the forty hour cavitation period. It appears that the immersion of aged diesel sample C in the
water bath had very little effect on the spectral attenuation coefficient.
33
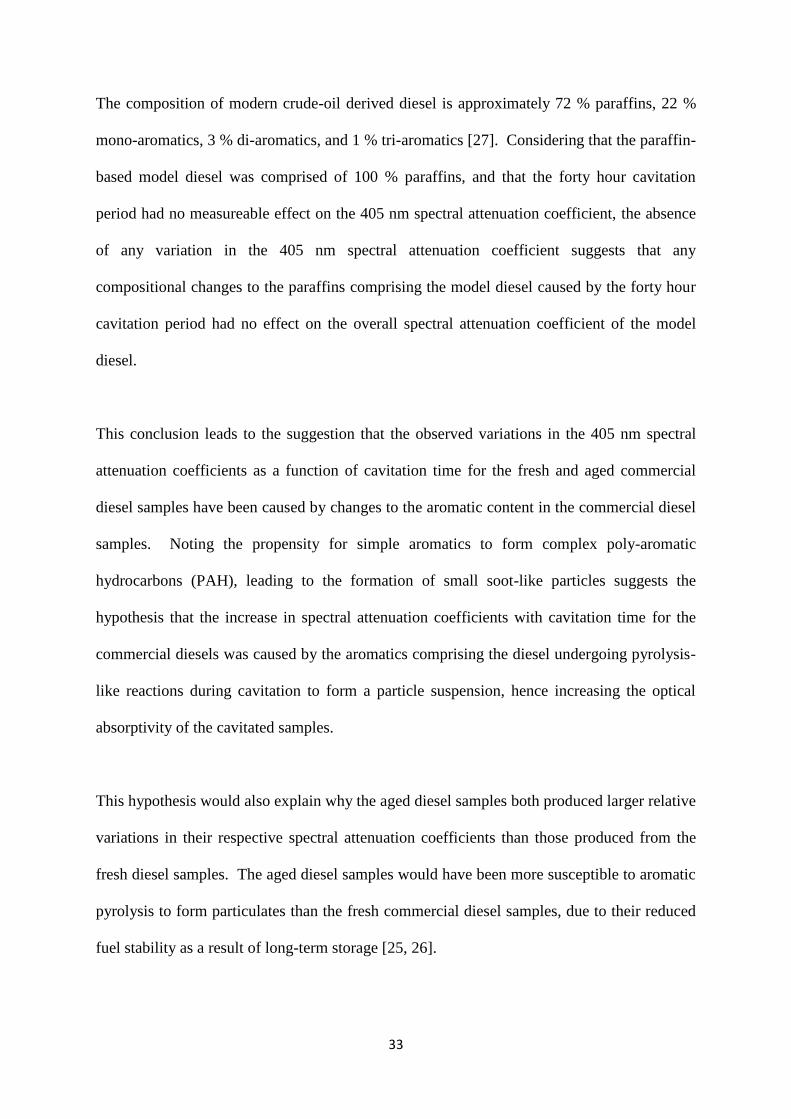
The composition of modern crude-oil derived diesel is approximately 72 % paraffins, 22 %
mono-aromatics, 3 % di-aromatics, and 1 % tri-aromatics [27]. Considering that the paraffin-
based model diesel was comprised of 100 % paraffins, and that the forty hour cavitation
period had no measureable effect on the 405 nm spectral attenuation coefficient, the absence
of any variation in the 405 nm spectral attenuation coefficient suggests that any
compositional changes to the paraffins comprising the model diesel caused by the forty hour
cavitation period had no effect on the overall spectral attenuation coefficient of the model
diesel.
This conclusion leads to the suggestion that the observed variations in the 405 nm spectral
attenuation coefficients as a function of cavitation time for the fresh and aged commercial
diesel samples have been caused by changes to the aromatic content in the commercial diesel
samples. Noting the propensity for simple aromatics to form complex poly-aromatic
hydrocarbons (PAH), leading to the formation of small soot-like particles suggests the
hypothesis that the increase in spectral attenuation coefficients with cavitation time for the
commercial diesels was caused by the aromatics comprising the diesel undergoing pyrolysis-
like reactions during cavitation to form a particle suspension, hence increasing the optical
absorptivity of the cavitated samples.
This hypothesis would also explain why the aged diesel samples both produced larger relative
variations in their respective spectral attenuation coefficients than those produced from the
fresh diesel samples. The aged diesel samples would have been more susceptible to aromatic
pyrolysis to form particulates than the fresh commercial diesel samples, due to their reduced
fuel stability as a result of long-term storage [25, 26].

34
A note of caution in necessary. The increases in spectral attenuation coefficients are common
to all of the commercial diesel fuel samples subjected to cavitation flow. However, all of the
commercial diesel fuel samples tested will have contained an unknown concentration and
composition of additives, surfactants and detergents (normally less than 1% vol/vol), which
would have had an unpredictable effect on the spectral attenuation coefficients of the tested
diesel fuel samples. However, the consistent increase in spectral attenuation coefficients
common to all of the samples tested suggests that sono-chemical alterations to the fuel
components common to the commercial diesel samples were responsible. These common
fuel components present in all of the commercial diesel samples were dominated by the
mono-aromatics.
7. Conclusion
A novel recirculation, continuous cavitation flow rig has been designed and manufactured in
order to test the stability of diesel fuels to high pressure cavitation flow. The change in
composition and/or stability of the fuel was determined through the continuous measurement
of the spectral attenuation coefficient of the cavitated diesel samples at 405 nm as a function
of the cavitation time.
A commercial tea urn was modified in order to immerse diesel samples in heated water, in
order to mimic the temperature history of the diesel samples in the cavitation flow rig. This
was done in order to separate the effect of temperature from the effect of cavitation on the
diesel samples.

35
Five diesel samples were tested in the cavitation flow rig and immersion in the water bath.
These samples consisted of two fresh commercial diesels that were subjected to cavitation
flow testing within three months of purchase, two aged commercial diesel samples that were
stored in a fuel store for twelve to fifteen months, and then subjected to cavitation flow
testing and immersion in the water bath, and a model diesel comprised of a C12 to C19 paraffin
blend.
The model diesel produced almost no variation in spectral attenuation coefficient, and hence
almost no variation in spectral absorptivity during and after the forty hours cavitation period.
This suggests that any variation that occurred in the composition of the model diesel sample
during cavitation had negligible effect on the spectral absorptivity of the model diesel sample.
In contrast, the fresh commercial diesel samples were observed to undergo a continuous
increase in spectral attenuation coefficient (spectral absorptivity) during cavitation flow,
leading to a 20 % to 25 % increase in spectral absorptivity over forty hours. The aged
commercial diesel samples were observed to undergo an even greater increase in spectral
absorptivity during the cavitation period, leading to a 40 % to 50 % increase in spectral
absorptivity after forty hours cavitation.
Approximately 80 % of the increase in the spectral absorptivity of fresh commercial diesel
sample A was attributed to the effect of cavitation, and the balance (20 %) was attributed to
the effect of temperature. In contrast, approximately 45% of the increase in spectral
absorptivity of fresh commercial diesel sample B was attributed to the effect of cavitation,
and the balance (55 %) was attributed to the effect of temperature. Approximately 99 % of

36
the increase in spectral absorptivity of aged commercial diesel sample C was attributed to the
effect of cavitation, and the balance (1 %) attributed to the effect of temperature.
A comparison of the composition of the model diesel, together with the absence of variation
in spectral absorptivity during cavitation, with the composition of the commercial diesels and
the consistent increase in spectral absorptivity of these samples during cavitation, leads to the
conclusion that the cavitation is affecting the aromatics in the commercial diesels. It is likely
that the aromatics are undergoing pyrolysis-like reactions during cavitation to form complex
poly-aromatic hydrocarbons (PAHs), and even small particles in suspension. This hypothesis
would explain the relative increase in spectral absorptivity of the aged diesel samples (C and
D) when compared with the fresh commercial diesel samples (A and B), in terms of the
reduced chemical stability of the aged samples when compared with the fresh samples.
37
References
1. R.D. Lockett, M. Jeshani, to be published (2013).
2. G. Lepperhof, M. Houben, Mechanisms of Deposit Formation in Internal Combustion
Engines and Heat Exchangers, SAE Technical Paper 931032 (1993) doi:10.4271/931032.
3. J. Tang, S. Pischinger, M. Lamping, T. Korfer, M. Tutur, D. Tomazic, Coking Phenomena
in Nozzle Orifices of DI-Diesel Engines, SAE International Journal of Fuels and Lubricants
2:1 (2009) 259 - 272. doi:10:4271/2009-01-0837.
4. J. Ullman, M. Geduldig, H. Stutzenberger, R. Caprotti, G. Balfour, Investigation into the
Formation and Prevention of Internal Diesel Injector Deposits, SAE Technical Paper 2008-
01-0926 (2008).
5. S. Pehan, M.S. Jerman, M. Kegl, B. Kegl, Biodiesel influence on tribology characteristics
of a diesel engine, Fuel 88:6 (2009) 970 - 979.
6. R. Caprotti, A. Breakspear, O. Graupner, T. Klaua, O. Kohnen, Diesel Injector Deposits
Potential in Future Fuelling Systems, SAE Technical Paper 2006-01-3359 (2006).
7. Y.M. Arafin, T. Furuhata, M. Saito, M. Arai, Diesel and bio-diesel fuel deposits on a hot
surface, Fuel 87: 8-9 (2008) 1601 - 1609.

38
8. Y.M. Arafin, M. Arai, The effect of hot surface temperature on diesel fuel deposit
formation, Fuel 89:5 (2010) 934 - 942.
9. C. Soteriou, R. Andrews, M. Smith, Direct injection diesel sprays and the effect of
cavitation and hydraulic flip on atomization, SAE paper 950080 (1995).
10. F. Payri, V. Bermudez, R. Payri, F.J. Salvador, The influence of cavitation on the internal
flow and the spray characteristics in diesel injection nozzles. Fuel 83 (2004) 419 – 431.
11. A. Andriotis, M. Gavaises, C. Arcoumanis, Vortex flow and cavitation in diesel injector
nozzles, J Fluid Mech 610 (2008) 195–215.
12. Badock C, Wirth R, Tropea C. The influence of hydro grinding on cavitation inside a
diesel injection nozzle and primary break-up under unsteady pressure conditions. In:
Proceedings of the ILASS-EUROPE. Toulouse, France; 1999.
13. A. Osman, Failure of a diesel engine injector nozzle by cavitation damage, Engineering
Failure Analysis 13:7 (2006) 1126 – 1133.
14. H. Roth, M. Gavaises, C. Arcoumanis, Cavitation initiation, its development, and link
with flow turbulence in diesel injector nozzles. SAE paper 2002-01-0214 (2002).
15. H. Roth, Experimental and computational investigation of cavitation in diesel injector
nozzles, PhD thesis, Imperial College, London, UK, (2004).

39
16. R.D. Lockett, L. Liverani, D. Thaker, M. Jeshani, N.P. Tait, The characterisation of diesel
nozzle flow using high speed imaging of elastic light scattering, in press, Fuel (2012)
http://dx.doi.org/10.1016/j.fuel.2012.10.065.
17. Y. He, Z. Zhao, J. Liu, H. Du, M.Li, Y. Zong, Two-phase flow of liquid-gas in diesel fuel
inection system and their effect on engine performances, Journal of Thermal Sciences 10:3,
(2001) 223 - 227.
18. R. Price, D. Doyle, Private Communication, Shell Global Solutions (2012).
19. Diesel Systems: Common Rail Systems CRSN3 with 2,000 to 2,500 bar, Robert Bosch
GmbH Diesel Systems, http://www.bosch-
kraftfahrzeugtechnik.de/media/db_application/downloads/pdf/antrieb/en_3/DS_Sheet_CRSN
3_with_2_000_to_2_500_bar_20120730~3.pdf
20. Y. Shinohara, K. Takeuchi, O.E. Herrmann, H.J. Laumen, 3000 bar Common Rail
System, MTZ Worldwide Magazine 72:1, ISSN 2192-9114, Springer Automotive Media
(2011) 4 - 9. DOI: 10.1365/s38313-011-0002-8
21. M. Graham, N. Keeler, J. Kewley, Ultra-high pressure common rail systems, IMechE
Conf. Injection Systems for IC Engines, London, ISBN 9781843345619 (2009) 231 - 243.
22. K.S. Suslick, J.J. Gawienowski, P.F. Schubert, H.H. Wang, Alkane sonochemistry, J.
Phys. Chem. 87: 13 (1983) 2299 - 2301.

40
23. G.J. Price, M. McCollom, The effect of high-intensity ultrasound on diesel fuels,
Ultrasonics Sonochemistry 2: 2 (1995) S67 - S70.
24. G.J. Price, M. McCollom, Use of high-intensity ultrasound as a potential test method for
diesel fuel stability, Fuel 74: 9 (1995) 1394 - 1397.
25. J.F. Pedley, R.W. Wiley, R.A. Hancock, Storage stability of petroleum-derived diesel fuel
3: Identification of compounds involved in sediment formation, Fuel 67:8 (1988) 1124 -
1130.
26. Z.D. Kalitchin, S.K. Ivanov, M.I. Boneva, P.T. Georgiev, A. Ivanov, K. Kanariev,
Chemical stability of diesel fuels and sediment formation therein: 1. Evaluation of the
chemical stability of diesel fuels by following the kinetics of sediment formation, Fuel 71: 4
(1992) 437 - 442.
27. J. Erwin, Assay of Diesel Fuel Components Properties and Performance, Symposium on
Processing and Product Selectivity of Synthetic Fuels, Division of Fuel Chemistry, American
Chemical Society, Washington DC, USA, 23 - 28 August, 1992.
Acknowledgements
The authors would like to acknowledge Shell Global Solutions for partial financial support
for this work. They would also like to thank Mr G. Clow, and Mr. J. Ford for their technical
support and assistance.

41
Table 1: Comparison of Beam Power with and without Final Mirror Using Three Beam
Splitters
Signal
Test
No.
Splitter 1 Splitter 2 Splitter 3
Actual
Setup Test
Results-
IT3(m) (y)
No Mirror
Setup Test
Results-IT3(A)
(x)
Actual
Setup Test
Results-
IT3(m) (y)
No Mirror
Setup Test
Results-IT3(A)
(x)
Actual
Setup Test
Results-
IT3(m) (y)
No Mirror
Setup Test
Results-
IT3(A) (x)
1
12.0195
13.8875 10.112 11.59 6.3705 7.297
2
13.4955 15.25619048 - - - -
3
15.553125 17.817 - - - -
4
13.8395 15.911 11.651 13.4285 7.3605 8.551
5
12.775 14.7245 10.8075 12.3945 6.8095 7.9055
6
14.354 16.4795 - - - -