
Influence of porosity on mechanical properties and in vivo response of Ti6Al4V implants
Upload
independentCategory
view
1download
0
March 2010, published 22, doi: 10.1098/rsta.2010.0003368 2010 Phil. Trans. R. Soc. A
Narendra B. Dahotre, Sameer R. Paital, Anoop N. Samant and Claus Daniel
4V for bioapplication−6Al−microtextures on Ti Wetting behaviour of laser synthetic surface
Referencesl.html#ref-list-1http://rsta.royalsocietypublishing.org/content/368/1917/1863.ful
This article cites 40 articles
Subject collections
(171 articles)materials science (49 articles)computational biology
(145 articles)biomedical engineering collectionsArticles on similar topics can be found in the following
Email alerting service herein the box at the top right-hand corner of the article or click Receive free email alerts when new articles cite this article - sign up
http://rsta.royalsocietypublishing.org/subscriptions go to: Phil. Trans. R. Soc. ATo subscribe to
on March 12, 2014rsta.royalsocietypublishing.orgDownloaded from on March 12, 2014rsta.royalsocietypublishing.orgDownloaded from

Phil. Trans. R. Soc. A (2010) 368, 1863–1889doi:10.1098/rsta.2010.0003
Wetting behaviour of laser synthetic surfacemicrotextures on Ti–6Al–4V for bioapplication
BY NARENDRA B. DAHOTRE1,2,*, SAMEER R. PAITAL1,2, ANOOP N.SAMANT1,2 AND CLAUS DANIEL2,3
1Laboratory for Laser Materials Synthesis and Fabrication, and 2Departmentof Materials Science and Engineering, University of Tennessee, Knoxville,
TN 37996, USA3Materials Science and Technology Division, Oak Ridge National Laboratory,
Oak Ridge, TN 37831, USA
Wettability at the surface of an implant material plays a key role in its success asit modulates the protein adsorption and thereby influences cell attachment and tissueintegration at the interface. Hence, surface engineering of implantable materials toenhance wettability to physiological fluid under in vivo conditions is an area of activeresearch. In light of this, in the present work, laser-based optical interference anddirect melting techniques were used to develop synthetic microtextures on Ti–6Al–4Valloys, and their effects on wettability were studied systematically. Improved wettabilityto simulated body fluid and distilled water was observed for Ca–P coatings obtainedby direct melting technique. This superior wettability was attributed to both theappropriate surface chemistry and the three-dimensional surface features obtained usingthis technique. To assert a better control on surface texture and wettability, a three-dimensional thermal model based on COMSOL’s multiphysics was employed to predictthe features obtained by laser melting technique. The effect of physical texture andwetting on biocompatibility of laser-processed Ca–P coatings was evaluated in thepreliminary efforts on culturing of mouse MC3T3-E1 osteoblast cells.
Keywords: interference patterning; direct melting; wettability; thermal modelling;simulated body fluid
1. Introduction
When an implant material is placed inside a human body, among the plethoraof events that take place, the first and the foremost one is the wetting of theimplant material by the physiological fluids. This further controls the adsorptionof proteins, followed by attachment of cells to the implant surface. Hence, thesurface wettability is considered to be an important criterion that can dictate thebiocompatibility of the implant material. The three most important factors thataffect the wettability of a surface are its chemical composition, microstructuraltopography and surface charge.
*Author for correspondence ([email protected]).
One contribution of 14 to a Theme Issue ‘Advanced processing of biomaterials’.
This journal is © 2010 The Royal Society1863
on March 12, 2014rsta.royalsocietypublishing.orgDownloaded from

1864 N. B. Dahotre et al.
Keeping this in mind, several research groups have studied the interaction ofdifferent types of cultured cells or blood proteins with various solid substrateshaving different wettabilities to correlate the relationship between surfacewettability and cell or blood compatibility (Yuehuei & Richard 1998; Joneset al. 2000; Wei et al. 2007). Wei et al. (2007) modelled the surfaces ofhexamethyldisiloxane to different degrees of wettability and thereby studiedtheir effects on cell attachment, cell proliferation and cell morphology. Plasmapolymerization followed by O2 plasma treatment was used to modify the surfaceof hexamethyldisiloxane. The authors concluded that, with an increase in O2plasma treatment duration, there was a decrease in the contact angle of distilledwater and an increase in attachment of L929 cells on these surfaces. Such animprovement in biocompatibility was attributed to the introduction of morehydrophilic (−COOH) groups and a decrease in hydrophobic groups such as−CH3 on the surface.
Adsorption of a protein to the surface of an implant material also modulatesthe surface roughness and thereby the wettability and cell adhesion. Fibronectin,a well-known extracellular matrix and cell-adhesive protein, was coated on Tisurfaces, and its effect on cell compatibility was studied by various researchers(Schneider & Burridge 1994; Sauberlich et al. 1999; Scheideler et al. 2003).Coating of Ti with this extracellular matrix protein enhanced the focal adhesionand spreading of osteoblast and gingival fibroblast on these surfaces (Schneider &Burridge 1994; Sauberlich et al. 1999; Scheideler et al. 2003). This in vivo-derivedcell-adhesive protein gets adsorbed to the surfaces of the endosseous implants,as they are exposed to the patient’s blood during surgery (Rupp et al. 2004).The osteoblast precursors then adhere to these proteins and thereby providea matrix for cell adhesion through integrin-mediated mechanisms. Apart frominfluencing the wetting behaviour on the cellular level, biological responses suchas orientation and migration of cells and the cellular production of organizedcytoskeletal arrangements are also directly influenced by the surface topography(Flemming et al. 1999). Hence, it is well established that surface roughness playsan important role in determining successful osseointegration of Ti implants.
Until now, most surface modification techniques are aimed at achieving theappropriate surface chemistry and surface topography for enhanced bone-to-implant fixation and increased biomechanical interlocking with bone (Pilliar1998; Cooper 2000; Perrin et al. 2002). There are only a few reports dealingwith the initial interactions of these surfaces with the simulated body fluid(SBF) in terms of the wetting perspective (Hao et al. 2004, 2005; Lawrenceet al. 2005; Paital & Dahotre 2009). However, recent reports on wettingbehaviour of various types of morphologically textured surfaces have increasedour understanding of which requirements a surface topography has to fulfil toinduce a specific hydrophilicity or hydrophobicity during contact with a liquidphase (Bico et al. 2001, 2002; Palasantzas & De Hosson 2001; Ishino et al. 2004;Ma et al. 2005, 2007; Sheng et al. 2007; Bhusan et al. 2009; Yong & Zhang 2009).Hence, in the present work, attempts are being made to better understand thesefindings by conducting wetting experiments on defined surface morphologies andpredicting the wetting behaviour based on theoretical thermodynamic models onarbitrarily structured surfaces. Laser-based optical interference patterning anddirect melting techniques were employed to generate the surface morphologieson Ti–6Al–4V at two different length scales. Furthermore, a three-dimensional
Phil. Trans. R. Soc. A (2010)
on March 12, 2014rsta.royalsocietypublishing.orgDownloaded from

Wetting of laser microtextures 1865
inputfibre
beamsplitter
beamexpandingtelescope
mirror
mirror
mirror
surfacepattern
b
Figure 1. Schematic of a laser interferometer set-up (Engleman et al. 2005).
thermal model based on COMSOL’s multiphysics was developed to predict theevolution of surface features, thereby asserting a better control on the laserprocessing parameters for tunable wettability. A preliminary, mouse MC3T3-E1osteoblast cell culture study on Ca–P laser-coated Ti–6Al–4V was conducted toobserve the effects of surface texture and wettability.
2. Laser microtexturing
(a) Interference patterning
The samples were surface treated using a linear polarized third harmonic of aQ-switched Nd:YAG laser (Coherent Infinity, Santa Clara, CA, USA). In thistechnique, the primary laser beam was split into two coherent sub-beams thatwere guided using an optical system to produce interference at the sample surface.This allows the creation of periodic surface textures at length scales ranging frommicro to nano in a single-step process. A detailed schematic set-up of the processis illustrated in figure 1 (Engleman et al. 2005). The area irradiated by the laserbeam was approximately 0.5024 cm2. The geometry of the pattern depends onthe wavelength and the angles between the beams. The two interfering laserbeams create a sinusoidal intensity distribution with high- and low-intensitylines. The distance w between the high-intensity spots (periodicity) can be variedwith the angle (b) between the beams as per the following Bragg’s equation(Daniel et al. 2003, 2005; Engleman et al. 2005; Lasagni et al. 2006, 2007):
w = p
2 sin(b/2). (2.1)
Phil. Trans. R. Soc. A (2010)
on March 12, 2014rsta.royalsocietypublishing.orgDownloaded from

1866 N. B. Dahotre et al.
Table 1. Laser and material parameters used for the study.
direct writing interference patterning
laser parameterswavelength of laser beam (nm) 1064 355pulse width 0.5 ms 2.5 nspulse energy (J) 4 —pulse repetition rate (Hz) 20 10laser power (W) 156, 131.2, 124, 80 3.82, 2.64, 1.82laser scan speed (cm min−1) 36, 48, 78, 102 —laser fluence 1887, 1415, 871,
666 J cm−2760.35, 525.47,
362.26 mJ cm−2
focus position 0.8 mm above thesample surface
at focus
laser spot diameter on the surface (mm) 900 8000number of pulses for groove-like patterns — 5number of pulses for pillar-like patterns — 10pulse shape rectangular —
material parametersdensity of precursor (Ca–P tribasic) 3156 kg m−3 (Dyshlovenko et al. 2004)density of substrate (Ti–6Al–4V) 4420 kg m−3 (Boivineau et al. 2006)melting point of precursor
(Ca–P tribasic)1843 K (Dyshlovenko et al. 2004)
melting point of substrate (Ti–6Al–4V) 1800 K (Boivineau et al. 2006)activation energy for Ti–6Al–4V 126 kJ mol−1 (Dabhade et al. 2007)viscocity of precursor (Ca–P tribasic) 6.8 mPas (Li et al. 2007)surface tension precursor (Ca–P tribasic) 28 mN m−1 (Li et al. 2007)latent heat of melting of precursor
(Ca–P tribasic)49.9 kJ mol−1 (Dyshlovenko et al. 2004)
latent heat of melting of substrate(Ti–6Al–4V)
290 kJ mol−1 (Boivineau et al. 2006)
In the present work, the patterns were obtained by varying the laser power.The pillar-like patterns were synthesized in a two-step process, in which thesample periodicity w was kept constant at 2.5 mm. Two different surface textures,i.e. groove- and pillar-like, were rotated 90 prior to the second irradiation.The processing parameters employed in laser interference patterning are listedin table 1.
(b) Direct writing
In the direct writing technique, the samples were scanned using a 400 W averagepower, JK701 model, pulsed Nd:YAG laser to obtain a metallurgical bondingbetween the precursor and the substrate material. The laser was equipped witha fibre-optic beam delivery system to transfer the laser beam from the laserhead to the material. The control panel for the laser allows control of the pulse
Phil. Trans. R. Soc. A (2010)
on March 12, 2014rsta.royalsocietypublishing.orgDownloaded from

Wetting of laser microtextures 1867
fibre-optic cable
gas shielding
lens assembly
laser-induced plasma
textured coating
CNC work station CNC controlmonitor to viewthe work
sample
TV cameralaser controlpanel
laser head
coating precursor deposit
Figure 2. Schematic of the pulsed Nd:YAG laser system used for the coating process (Paitalet al. 2009).
height, pulse width, pulse repetition rate and pulse shape. The lens assembly isequipped with a 120 mm focal length convex lens, which gives a spot diameter ofapproximately 240 mm at focus. The focused spot is kept at approximately 0.8 mmabove the surface of the sample so as to have a spot size of approximately 900 mmon the surface. A schematic set-up of the laser system is shown in figure 2 (Paitalet al. 2009). The processing parameters used for the above process are listed intable 1. From the table, it can be observed that only the linear scan speed wasvaried (36, 48, 78 and 102 cm min−1), keeping the rest of the parameters constant.This linear scan speed can be related to the spot overlap (sx) by the followingequation (Paital & Dahotre 2009):
sx = 1 − V2fR
, (2.2)
where V is the laser scan speed, f the pulse repetition rate and R the beamradius. Hence, four different samples with spot overlap varying as 65, 55, 28 and5.5 per cent were obtained.
(c) Pre- and post-laser treatment surface preparation and characterization
Substrate coupons of Ti–6Al–4V (100 × 50 × 3 mm) were cut from rolledsheets using an abrasive cutter. For interference patterning, the cut couponswere prepared by polishing with emery papers of different grits ranging from200 to 1000 mm in succession, followed by disc polishing with colloidal silicaof 0.3 and 0.05 mm to get a mirror-finished surface. For sample processing bythe direct melting technique, substrate coupons of Ti–6Al–4V (100 × 50 × 3 mm)
Phil. Trans. R. Soc. A (2010)
on March 12, 2014rsta.royalsocietypublishing.orgDownloaded from

1868 N. B. Dahotre et al.
were prepared for coating by initially polishing using a 30 mm grit silicon carbideemery paper, followed by rinsing with acetone. Calcium phosphate tribasic(Ca5(OH)(PO4)3) powder obtained from Fisher Scientific was taken as theprecursor material. This precursor powder had a spherical morphology with aunimodal distribution in the range of 10–30 mm. The precursor was mixed in awater-based organic solvent LISI W 15853 obtained from Warren Paint and ColorCompany (Nashville, TN, USA). The mixed slurry was then sprayed onto the pre-heated (approx. 50 C) substrate coupons using an air-pressurized spray gun. Thesprayed coupons were air-dried to remove the moisture, and a uniform thicknessof 40 mm was maintained for all pre-coating deposits.
Surface roughness of the laser-treated samples was measured using a whitelight interferometer. Contact angles on the surface-modified Ti–6Al–4V andTi–6Al–4V control (Ra) with distilled water and SBF were measured by a staticsessile drop technique. The SBF solution was prepared by mixing reagent gradechemicals in the following order: NaCl (8.026 g), NaHCO3 (0.352 g), KCl (0.225 g),K2HPO4·3H2O (0.230 g), MgCl2·6H2O (0.311 g), CaCl2 (0.293 g) and Na2SO4(0.072 g) in distilled water (700 ml). The fluid was then buffered to pH = 7.4at 37 C with tri-hydroxymethyl-aminomethane (6.063 g) and hydrochloric acid(40 ml). A liquid droplet of volume 3 ml (droplet diameter of 2 mm) was placedon the thoroughly cleaned sample by a hypodermic syringe, and the advancingcontact angle was taken as a measure of wettability. The test was conducted atroom temperature, and a minimum of 10 contact angle readings were taken oneach sample to minimize errors in the measurement. Further, the measurementwas based on the patented half-angle method (US Patent no. 5268733), whicheliminates the errors associated with the arbitrary tangential alignment.
For cell culture studies, mouse pre-osteoblast cell line MC3T3-E1 cells(subclone 14, American Type Culture Collection (ATCC)) were seeded on thesurfaces of UV-sterilized samples placed in 24-well culture plates at a densityof 1.25 × 10⁵ cells cm−2. The cells were cultured in a minimum essential medium(MEM) (Invitrogen, USA) supplemented with 10 per cent foetal bovine serum(Thermo Scientific) and 1 per cent penicillin/streptomycin (Invitrogen) at 37 Cunder 5 per cent CO2 in air in a humidified incubator.
For cell morphology analysis using SEM, cells cultured on the sample were fixedwith 3 per cent glutaraldehyde in 0.1 M cacodylate for 1 h and rinsed three timeswith phosphate-buffered saline (PBS). The sample was further processed in 2 percent osmium tetroxide in 0.1 M cacodylate for 1 h, dehydrated with a series ofincreasing concentrations of ethanol (25, 50, 70, 95 and 100%), critical point driedand sputter-coated with gold for SEM observation. For immunocytochemicalstaining of the actin filament, the cells cultured on the sample were fixed with 4per cent paraformaldehyde (Sigma-Aldrich) in 1x PBS for 30 min at 4 C. Afterwashing with PBS, the sample was permeabilized with 0.1 per cent Triton X-100 (Fisher Scientific) in 1x PBS for 5 min, blocked with 1 per cent bovineserum albumin (Sigma-Aldrich) for 30 min and stained with 2 per cent Alexa594 conjugated Phalloidin (Invitrogen) fluorescent dye for 1 h. Cell nuclei werecounterstained with 0.1 per cent 4′,6-diamidino-2-phenylindole (Chemicon) in 1xPBS for 5 min. The sample was then washed three times with 0.05 per centTween-20 (Sigma) in 1x PBS before and after the staining steps. All the stainingprocedures were carried out at room temperature. High-resolution fluorescenceimages were captured using an upright fluorescence microscope (Nikon).
Phil. Trans. R. Soc. A (2010)
on March 12, 2014rsta.royalsocietypublishing.orgDownloaded from
Wetting of laser microtextures 1869
3. Computational model for predicting effects of laser parameterson surface morphology
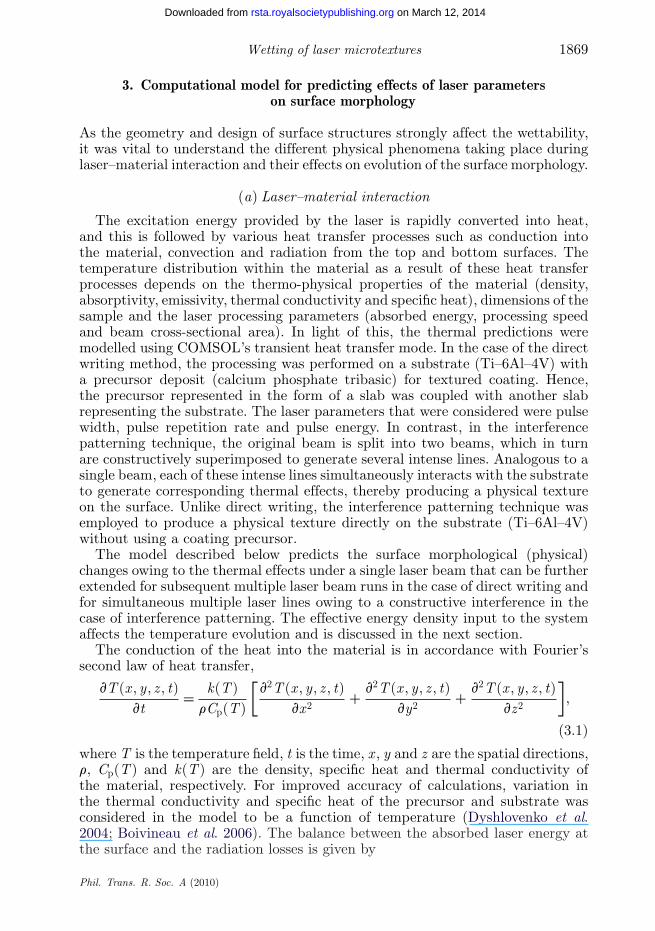
As the geometry and design of surface structures strongly affect the wettability,it was vital to understand the different physical phenomena taking place duringlaser–material interaction and their effects on evolution of the surface morphology.
(a) Laser–material interaction
The excitation energy provided by the laser is rapidly converted into heat,and this is followed by various heat transfer processes such as conduction intothe material, convection and radiation from the top and bottom surfaces. Thetemperature distribution within the material as a result of these heat transferprocesses depends on the thermo-physical properties of the material (density,absorptivity, emissivity, thermal conductivity and specific heat), dimensions of thesample and the laser processing parameters (absorbed energy, processing speedand beam cross-sectional area). In light of this, the thermal predictions weremodelled using COMSOL’s transient heat transfer mode. In the case of the directwriting method, the processing was performed on a substrate (Ti–6Al–4V) witha precursor deposit (calcium phosphate tribasic) for textured coating. Hence,the precursor represented in the form of a slab was coupled with another slabrepresenting the substrate. The laser parameters that were considered were pulsewidth, pulse repetition rate and pulse energy. In contrast, in the interferencepatterning technique, the original beam is split into two beams, which in turnare constructively superimposed to generate several intense lines. Analogous to asingle beam, each of these intense lines simultaneously interacts with the substrateto generate corresponding thermal effects, thereby producing a physical textureon the surface. Unlike direct writing, the interference patterning technique wasemployed to produce a physical texture directly on the substrate (Ti–6Al–4V)without using a coating precursor.
The model described below predicts the surface morphological (physical)changes owing to the thermal effects under a single laser beam that can be furtherextended for subsequent multiple laser beam runs in the case of direct writing andfor simultaneous multiple laser lines owing to a constructive interference in thecase of interference patterning. The effective energy density input to the systemaffects the temperature evolution and is discussed in the next section.
The conduction of the heat into the material is in accordance with Fourier’ssecond law of heat transfer,
vT (x , y, z , t)vt
= k(T )rCp(T )
[v2T (x , y, z , t)
vx2+ v2T (x , y, z , t)
vy2+ v2T (x , y, z , t)
vz2
],
(3.1)
where T is the temperature field, t is the time, x , y and z are the spatial directions,r, Cp(T ) and k(T ) are the density, specific heat and thermal conductivity ofthe material, respectively. For improved accuracy of calculations, variation inthe thermal conductivity and specific heat of the precursor and substrate wasconsidered in the model to be a function of temperature (Dyshlovenko et al.2004; Boivineau et al. 2006). The balance between the absorbed laser energy atthe surface and the radiation losses is given by
Phil. Trans. R. Soc. A (2010)
on March 12, 2014rsta.royalsocietypublishing.orgDownloaded from
1870 N. B. Dahotre et al.
− k(T )(
vT (x , y, 0, t)vx
+ vT (x , y, 0, t)vy
+ vT (x , y, 0, t)vz
)
= daP − 3s(T (x , y, 0, t)4 − T 40 ), d = 1 if 0 ≤ t ≤ tp and d = 0 if t > tp,
(3.2)
where P is the effective incident peak power density discussed in the next section,a is the absorptivity of the material (0.1; Guillot-Noël et al. 1996), 3 is theemissivity of thermal radiation, To is the ambient temperature (300 K), tp is theon-time for the laser discussed in the next section and s is the Stefan–Boltzmannconstant (5.67 × 10⁻⁸ W m−2 K−4). The term d takes a value of 1 when time t isless than laser on-time tp and it is 0 when time t exceeds laser on-time. Thus,the value of d depends on time t and ensures that the energy is input to themodel only when the laser is on and cuts off the energy supply when the laser isswitched off. The convection taking place is
− k(T )(
vT (x , y, H , t)vx
+ vT (x , y, H , t)vy
+ vT (x , y, H , t)vz
)
= h(T )(T (x , y, H , t) − T0), (3.3)
where H is the thickness of the sample being processed and h(T ) is thetemperature-dependent heat transfer coefficient (Incropera & Dewitt 1985).
(b) Effective incident peak power density
While scanning the material surface, several laser tracks are laid subsequently(direct writing technique) or simultaneously (interference patterning), and thelength of a single track is equal to the distance between the centre of the first pulseand the centre of the last pulse. Furthermore, it is assumed that the morphologycorresponding to an area equal to a single beam spot would be repeated for theentire length of the track. Within a single track, the overlap (sx) between adjacentpulses is given by equation (2.2). The distance b travelled by the beam betweentwo adjacent pulses is given by
b = 2R(1 − sx). (3.4)
As the laser beam moves with a constant velocity V , multiple laser pulses willbe required to process an area equal to the beam spot diameter (2R), as shownin figure 3, and the number of pulses N required to process this area is given by(Samant 2009):
N = 2Rb
. (3.5)
The corresponding overlap of each pulse over the spot area is given by
spulse = 2R − (n − 1)b2R
, (3.6)
where n is the number of the pulse ranging from 1 to N , b is the distance travelledby the laser beam between consecutive pulses and R is the beam radius. The val-ues of sx and N would depend on the beam radius and the laser scanning speed.
Phil. Trans. R. Soc. A (2010)
on March 12, 2014rsta.royalsocietypublishing.orgDownloaded from
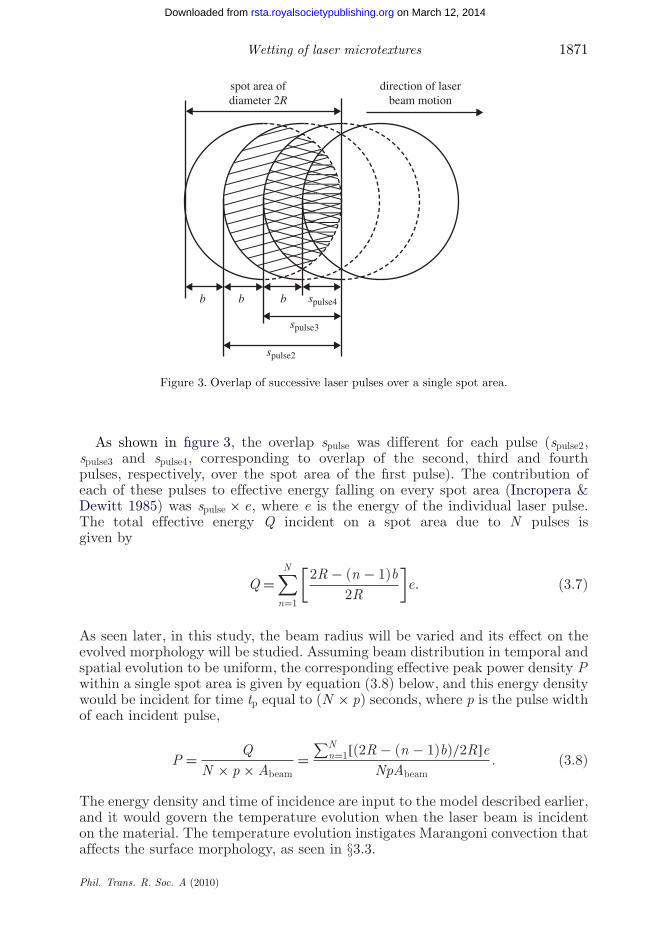
Wetting of laser microtextures 1871
spot area ofdiameter 2R
direction of laserbeam motion
b b b spulse4
spulse3
spulse2
Figure 3. Overlap of successive laser pulses over a single spot area.
As shown in figure 3, the overlap spulse was different for each pulse (spulse2,spulse3 and spulse4, corresponding to overlap of the second, third and fourthpulses, respectively, over the spot area of the first pulse). The contribution ofeach of these pulses to effective energy falling on every spot area (Incropera &Dewitt 1985) was spulse × e, where e is the energy of the individual laser pulse.The total effective energy Q incident on a spot area due to N pulses isgiven by
Q =N∑
n=1
[2R − (n − 1)b
2R
]e. (3.7)
As seen later, in this study, the beam radius will be varied and its effect on theevolved morphology will be studied. Assuming beam distribution in temporal andspatial evolution to be uniform, the corresponding effective peak power density Pwithin a single spot area is given by equation (3.8) below, and this energy densitywould be incident for time tp equal to (N × p) seconds, where p is the pulse widthof each incident pulse,
P = QN × p × Abeam
=∑N
n=1[(2R − (n − 1)b)/2R]eNpAbeam
. (3.8)
The energy density and time of incidence are input to the model described earlier,and it would govern the temperature evolution when the laser beam is incidenton the material. The temperature evolution instigates Marangoni convection thataffects the surface morphology, as seen in §3.3.
Phil. Trans. R. Soc. A (2010)
on March 12, 2014rsta.royalsocietypublishing.orgDownloaded from
1872 N. B. Dahotre et al.
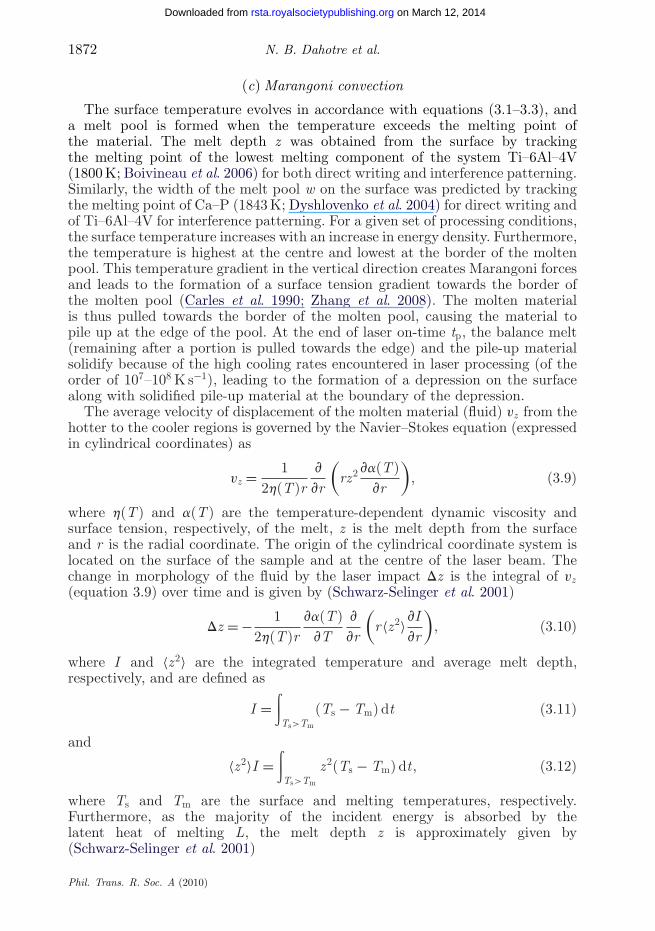
(c) Marangoni convection
The surface temperature evolves in accordance with equations (3.1–3.3), anda melt pool is formed when the temperature exceeds the melting point ofthe material. The melt depth z was obtained from the surface by trackingthe melting point of the lowest melting component of the system Ti–6Al–4V(1800 K; Boivineau et al. 2006) for both direct writing and interference patterning.Similarly, the width of the melt pool w on the surface was predicted by trackingthe melting point of Ca–P (1843 K; Dyshlovenko et al. 2004) for direct writing andof Ti–6Al–4V for interference patterning. For a given set of processing conditions,the surface temperature increases with an increase in energy density. Furthermore,the temperature is highest at the centre and lowest at the border of the moltenpool. This temperature gradient in the vertical direction creates Marangoni forcesand leads to the formation of a surface tension gradient towards the border ofthe molten pool (Carles et al. 1990; Zhang et al. 2008). The molten materialis thus pulled towards the border of the molten pool, causing the material topile up at the edge of the pool. At the end of laser on-time tp, the balance melt(remaining after a portion is pulled towards the edge) and the pile-up materialsolidify because of the high cooling rates encountered in laser processing (of theorder of 107–108 K s−1), leading to the formation of a depression on the surfacealong with solidified pile-up material at the boundary of the depression.
The average velocity of displacement of the molten material (fluid) vz from thehotter to the cooler regions is governed by the Navier–Stokes equation (expressedin cylindrical coordinates) as
vz = 12h(T )r
v
vr
(rz2 va(T )
vr
), (3.9)
where h(T ) and a(T ) are the temperature-dependent dynamic viscosity andsurface tension, respectively, of the melt, z is the melt depth from the surfaceand r is the radial coordinate. The origin of the cylindrical coordinate system islocated on the surface of the sample and at the centre of the laser beam. Thechange in morphology of the fluid by the laser impact Dz is the integral of vz(equation 3.9) over time and is given by (Schwarz-Selinger et al. 2001)
Dz = − 12h(T )r
va(T )vT
v
vr
(r〈z2〉vI
vr
), (3.10)
where I and 〈z2〉 are the integrated temperature and average melt depth,respectively, and are defined as
I =∫Ts>Tm
(Ts − Tm) dt (3.11)
and
〈z2〉I =∫Ts>Tm
z2(Ts − Tm) dt, (3.12)
where Ts and Tm are the surface and melting temperatures, respectively.Furthermore, as the majority of the incident energy is absorbed by thelatent heat of melting L, the melt depth z is approximately given by(Schwarz-Selinger et al. 2001)
Phil. Trans. R. Soc. A (2010)
on March 12, 2014rsta.royalsocietypublishing.orgDownloaded from

Wetting of laser microtextures 1873
z ∼ a(Q − Qth)AbeamL
, (3.13)
where L is the latent heat of melting and Qth is the threshold energy requiredfor melting, which is obtained by iterating the thermal model for differentabsorptivity values and selecting that value of incident energy for which thetemperature at the surface is just equal to the melting point of the precursorcalcium phosphate tribasic (1843 K; Dyshlovenko et al. 2004) or substrateTi–6Al–4V (1800 K; Boivineau et al. 2006). Also, the temperature evolution ismainly governed by the melt depth and the thermal conductivity of the material,and the integrated temperature is given by
I ∼ a(Q − Qth)zAbeamk(T )
. (3.14)
Replacing differentials of r in equation (3.10) by the laser beam radius R, theevolution of morphology Dz is given by (Schwarz-Selinger et al. 2001)
Dz = a4 va(T )vT
(Q − Qth)4
A4beamh(T )L3k(T )R2
. (3.15)
As in the case of direct writing, the melt composed of both the precursor and thesubstrate, and the law of mixtures was used to determine the properties of themelt such as latent heat of melting, dynamic viscosity and surface tension ofthe melt based on the percentage contribution of the precursor and the substrateto the melt. In contrast, for interference patterning, in the absence of coatingprecursor, the properties of only Ti–6Al–4V are considered. When the melt depthz was greater than 40 mm, it was assumed that the entire precursor melted and theremaining depth (z − 40) mm of the melt pool was contributed by the substrate.The dynamic viscosity of the substrate was assumed to be the same as Ti andwas given by (Dabhade et al. 2007)
h = 0.49 exp(
Qh
RgT
)MPa s, (3.16)
where Rg is the gas constant and Qh is the activation energy. The variation ofthe surface tension of the substrate as a function of temperature was given by(Schneider et al. 2002)
a = 1.389 ± 0.09 − 9.017 × 10⁻⁴ ± 5.64 × 10⁻⁵(T − 1933 K ) N m−1. (3.17)
In general, the different steps involved in the evolution of the surface topographyfor an area equal to the spot diameter as a result of the above-mentioned effectsare illustrated in figure 4.
The values of the laser beam radius were varied from 150 to 450 mm typicallyused in the present work, and the temperature evolution was predicted using theabove-described model (equations 3.1–3.17). Furthermore, as mentioned earlier,the width of the melt pool w was also predicted by tracking the melting point ofcalcium phosphate tribasic for direct writing and of Ti–6Al–4V for interferencepatterning on the surface, and a correlation with the beam radius R was obtained.A relation of w = R, w = 1.1R and w = 2R was obtained for the beam radii of 150,300 and 450 mm, respectively, and the corresponding evolution of morphology is
Phil. Trans. R. Soc. A (2010)
on March 12, 2014rsta.royalsocietypublishing.orgDownloaded from

1874 N. B. Dahotre et al.
incident laser beam
melt pool
(a) (b) (c)
coupon coupon coupon
incident laser beam
melt pool
direction of flowpile up
solidified depression andpile up
t2t1 t3
Figure 4. Different steps involved in the evolution of the surface morphology at various times(t1 < t2 < t3) for a single laser beam.
–450
(a) (b) (c)6 6
1
–4 –4
4
–8
–12
–16
–9
–14
2
–2
–6
–10
–14
–300 –150 1500 0 0
r (µm)
z (µm
)
z (µm
)
z (µm
)
r (µm) r (µm)
300 450 –450 –300 –150 150 300 450 –450 –300 –150 150 300 450
Figure 5. Surface evolution for laser beam radii of (a) 450 mm, (b) 300 mm and (c) 150 mm.
shown in figure 5. In this study, the capillary effects were neglected as they arenot dominant when the thickness of coatings and/or the melt depth is of theorder of a few microns (Schüssler et al. 1992).
As mentioned earlier, the process of formation of a depression and associatedpile-up corresponding to an area equal to spot diameter repeats itself forsuccessive laser runs and the sinusoidal morphology evolves as shown in figure 6,where w is the wavelength (width of depression or width of melt pool) and Ais the amplitude (distance between the centre-line passing through the profileand the highest point on the surface). The amplitude A is representative of andproportional to the depth of depression or depth of melt pool. A flow chartrepresenting the evolution of the surface topography starting with the laserprocessing conditions and material properties is shown in figure 7.
Since the invasion or the wetting behaviour of a liquid on a solid surfacedepends on the surface design and the above-mentioned geometrical parameters,an understanding of or the estimation of such parameters owing to laser–materialinteraction will provide a strong base for tuning wettability. Assuming a constantspot size, it can be realized from equation (3.15) that, with increasing effectiveinput laser energy, the depth or the height of the features (depression) can beincreased for a possible hydrophobic surface because of air entrapment. On thecontrary, for improved wettability and desirable cell compatibility, the samplesmust be processed within the regime of lower effective laser energy.
Phil. Trans. R. Soc. A (2010)
on March 12, 2014rsta.royalsocietypublishing.orgDownloaded from

Wetting of laser microtextures 1875
laser beam
surface
coupon
0A
w
direction of laserbeam motion
Figure 6. Combination of profiles generated by successive pulses defining the width w andamplitude A.
laser surface texturing
effective input energy density
temperature evolution
melting Marangoni convection
surface morphology:width w, amplitude A
(a) laser processing conditions:input energy, laser processing speed, pulse width,
repetition rate, pulse energy, beam cross-sectional area(b) dimensions and properties of coating and substrate
Figure 7. Flow chart illustrating the method to predict surface morphology starting with laserprocessing parameters and material geometry and properties.
4. The effects of surface morphology on wettability
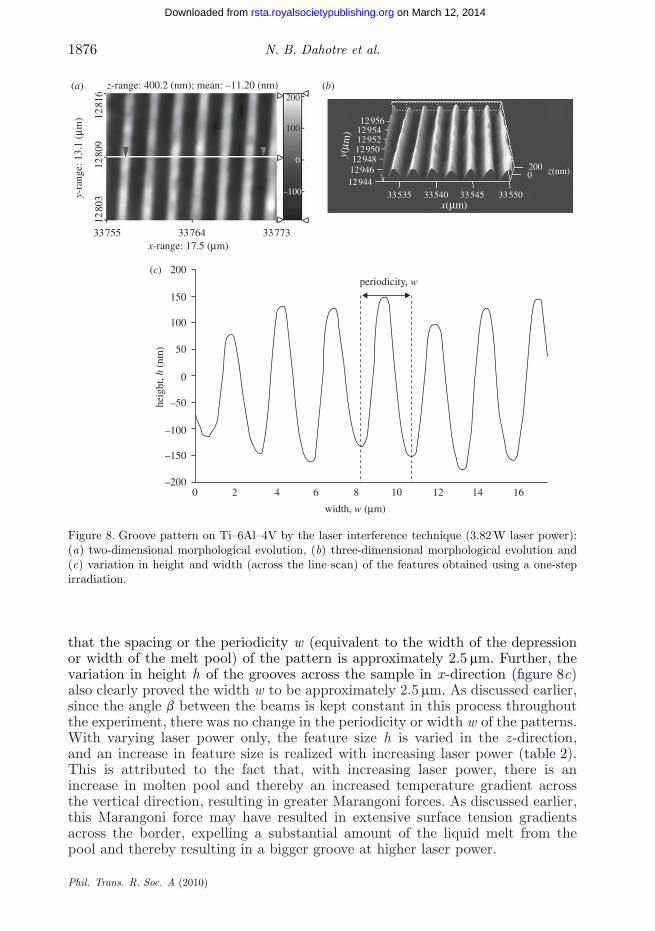
Using the laser-based optical interference technique, textured surfaces withgroove- and pillar-like features were obtained on the flat Ti–6Al–4V sample byvarying the laser power. The two- and three-dimensional morphological evolutionof the groove-like features obtained using a one-step irradiation under a laserpower of 3.82 W is presented in figure 8a,b, respectively. From figure 8a,b (two-and three-dimensional morphological evolution, respectively), it can be observed
Phil. Trans. R. Soc. A (2010)
on March 12, 2014rsta.royalsocietypublishing.orgDownloaded from
1876 N. B. Dahotre et al.
z-range: 400.2 (nm); mean: –11.20 (nm)y-
rang
e: 1
3.1
(µm
)
y(µm
)
x(µm)
x-range: 17.5 (µm)
12 8
1612
809
12 8
03
33 755
200(c)
(b)(a)
150
100
50
heig
ht, h
(nm
)
width, w (µm)
periodicity, w
0
–50
–100
–150
–2000 2 4 6 8 10 12 14 16
33 764 33 773
200
100
0
12 95612 95412 95212 950
12 94812 94612 944
33 535 33 540 33 545 33 550
200 z(nm)0
–100
Figure 8. Groove pattern on Ti–6Al–4V by the laser interference technique (3.82 W laser power):(a) two-dimensional morphological evolution, (b) three-dimensional morphological evolution and(c) variation in height and width (across the line scan) of the features obtained using a one-stepirradiation.
that the spacing or the periodicity w (equivalent to the width of the depressionor width of the melt pool) of the pattern is approximately 2.5 mm. Further, thevariation in height h of the grooves across the sample in x-direction (figure 8c)also clearly proved the width w to be approximately 2.5 mm. As discussed earlier,since the angle b between the beams is kept constant in this process throughoutthe experiment, there was no change in the periodicity or width w of the patterns.With varying laser power only, the feature size h is varied in the z-direction,and an increase in feature size is realized with increasing laser power (table 2).This is attributed to the fact that, with increasing laser power, there is anincrease in molten pool and thereby an increased temperature gradient acrossthe vertical direction, resulting in greater Marangoni forces. As discussed earlier,this Marangoni force may have resulted in extensive surface tension gradientsacross the border, expelling a substantial amount of the liquid melt from thepool and thereby resulting in a bigger groove at higher laser power.
Phil. Trans. R. Soc. A (2010)
on March 12, 2014rsta.royalsocietypublishing.orgDownloaded from

Wetting of laser microtextures 1877
Table 2. Process power and corresponding height of the groove/pillar pattern and contact anglerelated to interference-patterned samples.
apparent contact angle, q∗ ()laser fluence
sample (mJ cm−2) height, h (nm) distilled water SBF
groove pattern on 760.35 208.08 ± 0.08 78.55 ± 0.45 67.4 ± 0.60Ti–6Al–4V 525.47 71.35 ± 0.02 73.45 ± 0.55 64.2 ± 0.80
362.26 68.08 ± 0.02 70.7 ± 0.30 60.2 ± 0.80
pillar pattern on 760.35 77.65 ± 1.07 78.45 ± 0.55 66.8 ± 0.20Ti–6Al–4V 525.47 44.14 ± 1.04 77.45 ± 0.55 66.6 ± 0.40
362.26 36.68 ± 1.03 77.9 ± 0.10 67.1 ± 0.90
chemical angle, q ()
distilled water SBFTi–6Al–4V control — — 67.98 ± 0.02 59.2 ± 0.80
In order to generate pillar-like features, the sample once irradiated was rotated90 and irradiated again with five pulses. Hence, it was a two-step process,with the effective number of pulses being doubled compared with the groove-likefeatures. The two- and three-dimensional morphological evolution of the pillar-like features obtained under a laser power of 3.82 W is presented in figure 9a,b,respectively. From a line scan across the sample (figure 9c), it was observedthat the width d at full-width-half-maxima (FWHM) and the periodicity wof the pillars were approximately 1.04 and 2.5 mm, respectively. Again, theperiodicity is dependent on the angle b between the beams. Therefore, in thepillar patterns also, the only physical feature that was varied with varyinglaser power was the height h of the pillars. It was observed that there is anincrease in the pillar height h with increasing laser power (table 2) as perearlier discussion.
Contact angle measurements on both the groove and pillar patterns wereconducted using distilled water and SBF. Selected images of the droplet shadowon the goniometer are presented in figure 10. It can be observed that the distilledwater droplet (figure 10a–c corresponding to flat, groove-patterned and pillar-patterned Ti–6Al–4V, respectively) subtended a higher contact angle than theSBF droplet (figure 10d–f corresponding to flat, groove-patterned and pillar-patterned Ti–6Al–4V, respectively). The chemical angle or the Young angle qobtained on the flat Ti–6Al–4V averaged around 67.98 for distilled water and59.2 for SBF (table 2). Furthermore, it was observed that there was a decreasein the apparent contact angle q∗ (using SBF and distilled water) with decreasinglaser power for the groove-like patterns; however, no such distinct trend wasobserved for the pillar patterns. This disparity is mostly due to their geometricalstructure (groove and pillar features) and can be justified based on the Cassie andBaxter model. According to the Cassie and Baxter model, the apparent contactangle q∗ on a surface with chemical patch work or rough features entrapped withair is given as (Ishino et al. 2004)
Phil. Trans. R. Soc. A (2010)
on March 12, 2014rsta.royalsocietypublishing.orgDownloaded from

1878 N. B. Dahotre et al.
z-range: 354.5 (nm); mean: 9.469 (nm)y-
rang
e: 2
0.5
(µm
)
10 8
6410
854
10 8
44(a)
200
100
0
–100
(b)
(c)
y(µm
)
10 870
10 865
10 860
10 855
–26 710 –26 700 –26 690
200 z(nm)0
x(µm)
x-range: 24.9 (µm)–26 723 –26 711 –26 698
100
80
60
40
20heig
ht, h
(nm
)
0
–20
–40
width, w (µm)
0 2 4 6 8 10 12 14 16 18
periodicity, wwidth, d
FWHM
Figure 9. Pillar pattern on Ti–6Al–4V by the laser interference technique (3.82 W laser power):(a) two-dimensional morphological evolution, (b) three-dimensional morphological evolution and(c) variation in height and width at FWHM (across the line scan) of the features obtained usinga two-step irradiation.
cos q∗ = f1 cos q1 + f2 cos q2, (4.1)
where f1 and f2 represent the surface area fraction of the liquid in contact with thesolid and air, respectively, and q1 and q2 represent their corresponding contactangles. Hence, according to their model, when a liquid drop is placed on acomposite surface with solid and air patches in it, the liquid does not followthe surface contours and sits upon the composite surface as it is pushed by theair. As the grooves in the groove pattern are bridged by a certain amount ofmaterial, air entrapment within them is more feasible. Also, with increasing laserpower, there is an increase in the height h of the grooves (width w of the groovesis constant) and thereby an increased volume of trapped air pockets resultedin an increase in apparent contact angle q∗. In contrast, for the pillar patterns,there is an open volume within the pillars, and hence air entrapment may not
Phil. Trans. R. Soc. A (2010)
on March 12, 2014rsta.royalsocietypublishing.orgDownloaded from

Wetting of laser microtextures 1879
(a)
(b)
(c)
(d )
(e)
( f )
Figure 10. Light optical images of the distilled water droplet shadow on (a) flat Ti–6Al–4V,(b) groove-patterned Ti–6Al–4V and (c) pillar-patterned Ti–6Al–4V and those of the SBFdroplet shadow on (d) flat Ti–6Al–4V, (e) groove-patterned Ti–6Al–4V and (f ) pillar-patternedTi–6Al–4V.
be possible. Further, as there is not much variation in the height h of the pillars(width d and periodicity w of the pillars being constant) with increasing laserpower, their roughness factor Rf = 1 + 2(h/d) (the ratio of the solid area to itsprojected area as explained later) did not vary much, and, hence, a noticeablechange in the apparent contact angle could not be expected.
Also from the droplet shadow images (figure 10) and from table 2, it canbe seen that there is an increase in the apparent contact angle q∗ for theinterference-patterned samples compared with the chemical angle obtained on theflat sample. Therefore, the presence of groove and pillar features obtained usingthe laser interference technique with the present set of processing parameters
Phil. Trans. R. Soc. A (2010)
on March 12, 2014rsta.royalsocietypublishing.orgDownloaded from
1880 N. B. Dahotre et al.
(table 1) resulted in tuning the surface towards a less hydrophilic behaviour. Thisreduced wettability on the patterned samples can further be explained with thethermodynamic models as discussed below.
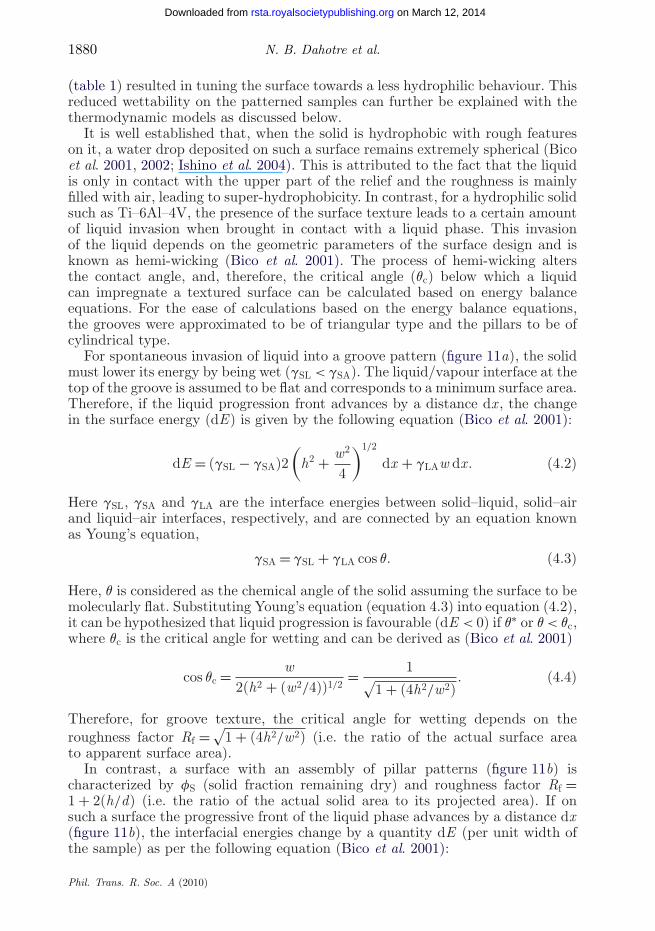
It is well established that, when the solid is hydrophobic with rough featureson it, a water drop deposited on such a surface remains extremely spherical (Bicoet al. 2001, 2002; Ishino et al. 2004). This is attributed to the fact that the liquidis only in contact with the upper part of the relief and the roughness is mainlyfilled with air, leading to super-hydrophobicity. In contrast, for a hydrophilic solidsuch as Ti–6Al–4V, the presence of the surface texture leads to a certain amountof liquid invasion when brought in contact with a liquid phase. This invasionof the liquid depends on the geometric parameters of the surface design and isknown as hemi-wicking (Bico et al. 2001). The process of hemi-wicking altersthe contact angle, and, therefore, the critical angle (qc) below which a liquidcan impregnate a textured surface can be calculated based on energy balanceequations. For the ease of calculations based on the energy balance equations,the grooves were approximated to be of triangular type and the pillars to be ofcylindrical type.
For spontaneous invasion of liquid into a groove pattern (figure 11a), the solidmust lower its energy by being wet (gSL < gSA). The liquid/vapour interface at thetop of the groove is assumed to be flat and corresponds to a minimum surface area.Therefore, if the liquid progression front advances by a distance dx , the changein the surface energy (dE) is given by the following equation (Bico et al. 2001):
dE = (gSL − gSA)2(
h2 + w2
4
)1/2
dx + gLAw dx . (4.2)
Here gSL, gSA and gLA are the interface energies between solid–liquid, solid–airand liquid–air interfaces, respectively, and are connected by an equation knownas Young’s equation,
gSA = gSL + gLA cos q. (4.3)
Here, q is considered as the chemical angle of the solid assuming the surface to bemolecularly flat. Substituting Young’s equation (equation 4.3) into equation (4.2),it can be hypothesized that liquid progression is favourable (dE < 0) if q∗ or q < qc,where qc is the critical angle for wetting and can be derived as (Bico et al. 2001)
cos qc = w2(h2 + (w2/4))1/2
= 1√1 + (4h2/w2)
. (4.4)
Therefore, for groove texture, the critical angle for wetting depends on theroughness factor Rf = √
1 + (4h2/w2) (i.e. the ratio of the actual surface areato apparent surface area).
In contrast, a surface with an assembly of pillar patterns (figure 11b) ischaracterized by fS (solid fraction remaining dry) and roughness factor Rf =1 + 2(h/d) (i.e. the ratio of the actual solid area to its projected area). If onsuch a surface the progressive front of the liquid phase advances by a distance dx(figure 11b), the interfacial energies change by a quantity dE (per unit width ofthe sample) as per the following equation (Bico et al. 2001):
Phil. Trans. R. Soc. A (2010)
on March 12, 2014rsta.royalsocietypublishing.orgDownloaded from
Wetting of laser microtextures 1881
dx
dx
w
w
d
h
h
solid
unwettedsurface
wettedsurface
liquid
(a)
(b)
liquid
solid
Figure 11. Schematic illustration of liquid invasion into (a) a groove pattern and (b) a pillar pattern.
dE = (gSL − gSA)(Rf − fS) dx + gLA(1 − fS) dx . (4.5)
The first term on the right-hand side of the above equation is related to thereplacement of a dry solid by a wet one and is proportional to the factor (Rf–fS).The second term is related to the creation of a liquid/vapour interface and isproportional to (1 − fS). The liquid progression is favourable if dE is negativeand by introducing Young’s equation gives the condition for wetting on such asurface as (Bico et al. 2001)
q∗ or q < qc with cos qc = 1 − fs
Rf − fs. (4.6)
Therefore, the liquid invasion on the microtextured solids can be tuned byeffectively modifying the structures.
Using the above relationships and experimentally measured geometricalparameters (w, h and d) of the features obtained using laser-based opticalinterference patterning technique, the roughness factor Rf was calculated for bothgroove and pillar patterns and plotted as a function of laser power (figure 12a). Itcan be observed (figure 12a) that there is a slight increase in Rf with increasinglaser power for both the groove and pillar patterns, and Rf is higher for the pillarpattern than for the groove pattern. This increased value of roughness factor(Rf > 1) for the pillar pattern is attributed to reduced width d of the featuresas a result of the two-step processing involved in this technique. Further, the
Phil. Trans. R. Soc. A (2010)
on March 12, 2014rsta.royalsocietypublishing.orgDownloaded from

1882 N. B. Dahotre et al.
1.4(a)
(b)
1.3
1.2
roug
hnes
s fa
ctor
, Rf
criti
cal w
ettin
g an
gle,
θc
1.1
1.0
0.9
60
50
40
30
20
10
0
350 450 550
laser fluence (mJ cm–2)
650 750
groove pattern
groove pattern
pillar pattern
pillar pattern
Figure 12. (a) Variation in roughness factor Rf and (b) critical wetting angle qc with laser fluencefor interference-patterned samples.
critical wetting angle (qc) based on equations (4.4) and (4.6) was calculated forthe groove and pillar patterns, respectively, and plotted as a function of laserpower (figure 12b). Here, for the pillar patterns, the liquid is assumed to seep intothe interpillar region with the top of pillars remaining dry, and therefore, fS (solidfraction remaining dry) is calculated from the geometry of the pillars (figure 11b).It can be observed (figure 12b) that there is an increase in the critical wettingangle (qc) with increasing laser power for both the patterns, and the values ofthe critical wetting angle (ranging from 3 to 48) are subsequently smaller thanthe chemical or the Young angles (q) obtained using both distilled water andSBF (table 2). As a result, the condition for wetting (q∗ or q < qc) is not satisfiedin both the cases (pillar and groove), and, hence, the liquid dewets on both thepatterns owing to an increase in apparent contact angle (q∗).
Keeping the above results in mind and understanding the limitations associatedwith the laser-based optical interference patterning technique in generatingsuitable surface features under a set of processing conditions employed in thepresent work, a modified technique based on laser direct writing was adopted.Here, to improve wettability, not only surface morphology but also surfacechemistry was altered by directly melting calcium phosphate tribasic coatingon Ti–6Al–4V substrate. Although in these coated samples diverse surfacemorphologies were generated within a set of laser processing parameters employedin the present work, no chemical phase variations were realized (Paital & Dahotre2009). Hence, the wettability was observed as variation in the surface morphology.
Phil. Trans. R. Soc. A (2010)
on March 12, 2014rsta.royalsocietypublishing.orgDownloaded from

Wetting of laser microtextures 1883
(a) (b)
(c) (d )
Figure 13. Low-magnification optical microscopic images of the surfaces of the coatings obtainedat laser scan speed of: (a) 36 cm min−1, (b) 48 cm min−1, (c) 78 cm min−1 and (d) 102 cm min−1
(Paital & Dahotre 2009). Scale bar, (a–d) 500 mm.
Low-magnification optical microscopic images (figure 13) of the surfaces ofsamples coated using the laser direct writing technique clearly demonstrate theeffect of varying laser scan speed on the texture evolution. The laser scan speedinfluences the input energy density (table 1) and the laser spot overlap. Thesetwo parameters in turn greatly influence the surface morphology or the textureevolution in the coating. As seen in figure 13, each pulse of a laser produces asolidified crater with a defined boundary and a flat region at the centre. Hence,as the laser scan speed is increased, the laser spot (crater) overlap is decreasedas per equation (2.2), which in turn modifies the crater area as well as thesurface texture. Also with increasing laser scan speed, the input energy density(fluence) decreased and resulted in reduced surface melting or less thermal effectat the surface. Thus, variation of laser processing parameters produced variablethermodynamic conditions, resulting in the creation of different physical surfacetextures (figure 13).
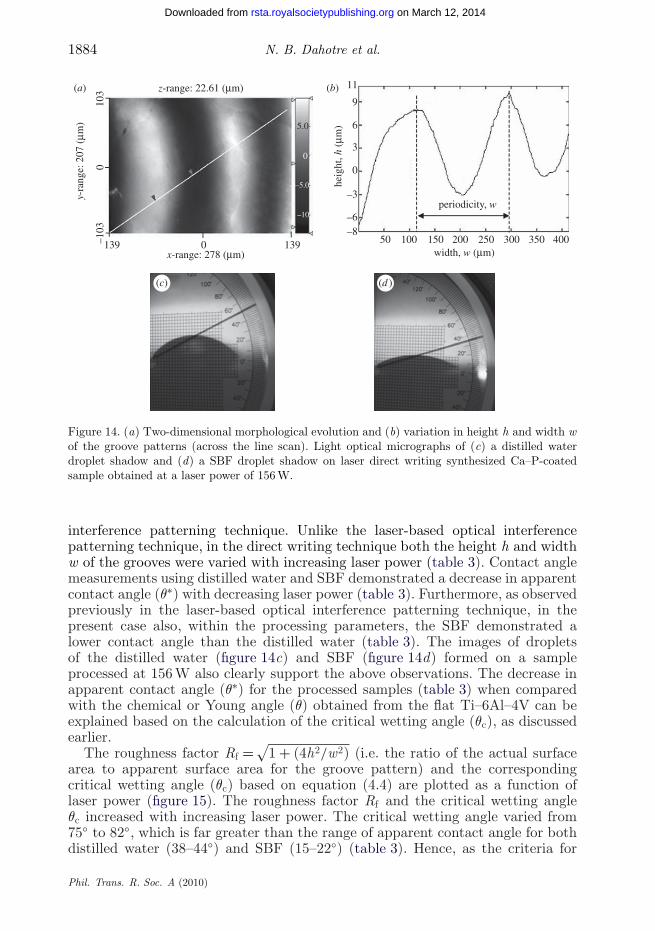
The two-dimensional morphological evolution (figure 14a) and the variationin height h of the features across a line scan (figure 14b) were obtained usingthe white light interferometer. It can be observed (figure 14a,b) that the featureswere similar to those of a groove-like pattern and are of higher length scales whencompared with the similar type features obtained using the laser-based optical
Phil. Trans. R. Soc. A (2010)
on March 12, 2014rsta.royalsocietypublishing.orgDownloaded from
1884 N. B. Dahotre et al.
y-ra
nge:
207
(µm
)z-range: 22.61 (µm)
x-range: 278 (µm)
103
0–1
03
139 139
11
9
6
3
0
–3
–6–8
50 100 150 200 250 300 350 4000
5.0
0
–5.0
–10periodicity, w
width, w (µm)
heig
ht, h
(µm
)
(a) (b)
(c) (d )
Figure 14. (a) Two-dimensional morphological evolution and (b) variation in height h and width wof the groove patterns (across the line scan). Light optical micrographs of (c) a distilled waterdroplet shadow and (d) a SBF droplet shadow on laser direct writing synthesized Ca–P-coatedsample obtained at a laser power of 156 W.
interference patterning technique. Unlike the laser-based optical interferencepatterning technique, in the direct writing technique both the height h and widthw of the grooves were varied with increasing laser power (table 3). Contact anglemeasurements using distilled water and SBF demonstrated a decrease in apparentcontact angle (q∗) with decreasing laser power (table 3). Furthermore, as observedpreviously in the laser-based optical interference patterning technique, in thepresent case also, within the processing parameters, the SBF demonstrated alower contact angle than the distilled water (table 3). The images of dropletsof the distilled water (figure 14c) and SBF (figure 14d) formed on a sampleprocessed at 156 W also clearly support the above observations. The decrease inapparent contact angle (q∗) for the processed samples (table 3) when comparedwith the chemical or Young angle (q) obtained from the flat Ti–6Al–4V can beexplained based on the calculation of the critical wetting angle (qc), as discussedearlier.
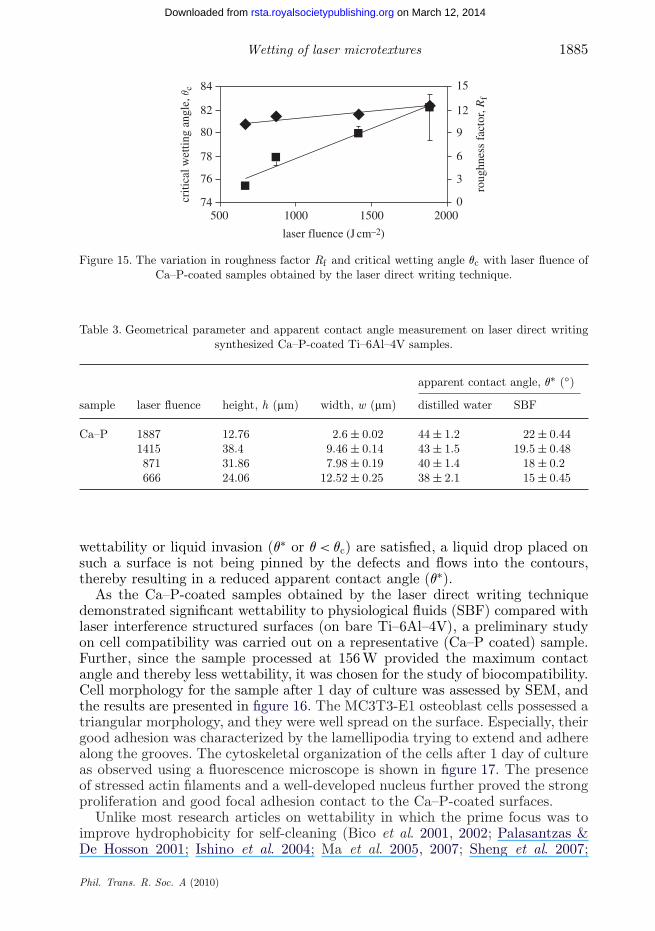
The roughness factor Rf = √1 + (4h2/w2) (i.e. the ratio of the actual surface
area to apparent surface area for the groove pattern) and the correspondingcritical wetting angle (qc) based on equation (4.4) are plotted as a function oflaser power (figure 15). The roughness factor Rf and the critical wetting angleqc increased with increasing laser power. The critical wetting angle varied from75 to 82, which is far greater than the range of apparent contact angle for bothdistilled water (38–44) and SBF (15–22) (table 3). Hence, as the criteria for
Phil. Trans. R. Soc. A (2010)
on March 12, 2014rsta.royalsocietypublishing.orgDownloaded from
Wetting of laser microtextures 1885
84
82
80
78
76
74criti
cal w
ettin
g an
gle,
θc
roug
hnes
s fa
ctor
, Rf
500 1000
laser fluence (J cm–2)
1500 20000
3
6
9
12
15
Figure 15. The variation in roughness factor Rf and critical wetting angle qc with laser fluence ofCa–P-coated samples obtained by the laser direct writing technique.
Table 3. Geometrical parameter and apparent contact angle measurement on laser direct writingsynthesized Ca–P-coated Ti–6Al–4V samples.
apparent contact angle, q∗ ()
sample laser fluence height, h (mm) width, w (mm) distilled water SBF
Ca–P 1887 12.76 2.6 ± 0.02 44 ± 1.2 22 ± 0.441415 38.4 9.46 ± 0.14 43 ± 1.5 19.5 ± 0.48871 31.86 7.98 ± 0.19 40 ± 1.4 18 ± 0.2666 24.06 12.52 ± 0.25 38 ± 2.1 15 ± 0.45
wettability or liquid invasion (q∗ or q < qc) are satisfied, a liquid drop placed onsuch a surface is not being pinned by the defects and flows into the contours,thereby resulting in a reduced apparent contact angle (q∗).
As the Ca–P-coated samples obtained by the laser direct writing techniquedemonstrated significant wettability to physiological fluids (SBF) compared withlaser interference structured surfaces (on bare Ti–6Al–4V), a preliminary studyon cell compatibility was carried out on a representative (Ca–P coated) sample.Further, since the sample processed at 156 W provided the maximum contactangle and thereby less wettability, it was chosen for the study of biocompatibility.Cell morphology for the sample after 1 day of culture was assessed by SEM, andthe results are presented in figure 16. The MC3T3-E1 osteoblast cells possessed atriangular morphology, and they were well spread on the surface. Especially, theirgood adhesion was characterized by the lamellipodia trying to extend and adherealong the grooves. The cytoskeletal organization of the cells after 1 day of cultureas observed using a fluorescence microscope is shown in figure 17. The presenceof stressed actin filaments and a well-developed nucleus further proved the strongproliferation and good focal adhesion contact to the Ca–P-coated surfaces.
Unlike most research articles on wettability in which the prime focus was toimprove hydrophobicity for self-cleaning (Bico et al. 2001, 2002; Palasantzas &De Hosson 2001; Ishino et al. 2004; Ma et al. 2005, 2007; Sheng et al. 2007;
Phil. Trans. R. Soc. A (2010)
on March 12, 2014rsta.royalsocietypublishing.orgDownloaded from

1886 N. B. Dahotre et al.
100 µm 10 µm
Figure 16. SEM micrographs revealing the morphology of the MC3T3-E1 osteoblast cells followingculture for 1 day on a laser direct writing synthesized Ca–P-coated sample obtained at a laserpower of 156 W.
Figure 17. Fluorescent micrographs for cytoskeleton assessment of adherent MC3T3-E1 osteoblastcells after culture for 1 day on a laser direct writing synthesized Ca–P-coated sample obtained ata laser power of 156 W. Scale bar, 100 mm.
Bhusan et al. 2009; Yong & Zhang 2009), the above study was mostly focusedon improving the wettability or hydrophilicity for load-bearing implants. Sinceimplant materials when placed inside a human body come in contact with thephysiological fluids, which then further governs the protein interaction followed bycell attachment and tissue integration at the interface, an improved hydrophilicbehaviour was considered ideal for such surfaces. As the wettability or the contactbehaviour of a liquid can be tuned by the surface morphology or surface textures,the techniques such as laser-based optical interference patterning and directwriting can be instrumental in creating the surface textures at different lengthscales on the Ti–6Al–4V surface. Furthermore, these techniques in integrationwith the computational model approach and fundamental understanding ofinvolved physical phenomena can be important to control surface textureparameters such as width, height and periodicity in tuning the wettabilityfor improved biocompatibility. Apart from load-bearing implant applications,the above understanding can also be used to design surfaces for corrosionprevention, self-cleaning (water repellent), energy conversion and conservation,biomimetics, etc.
Phil. Trans. R. Soc. A (2010)
on March 12, 2014rsta.royalsocietypublishing.orgDownloaded from
Wetting of laser microtextures 1887
5. Conclusions
A systematic study based on the laser-based surface modification techniqueto improve the wettability of the load-bearing implant alloys (Ti–6Al–4V) tophysiological fluids is demonstrated. The surfaces were characterized based onthe roughness factor and the apparent contact angle measurements. The grooveand pillar patterns obtained using the interference patterning technique resultedin an increase in apparent contact angle. Such an increase was attributed to thedecrease in the critical wetting angle as a result of the pinning effect created bythe sharp grooves on the liquid drop. Owing to the limitations associated withthe laser-based optical interference patterning technique in getting appropriatesurface features, a modified technique based on laser-based direct writing wasadopted. Here, to improve the wettability, both the surface morphology and thesurface chemistry were altered by directly melting calcium phosphate tribasicon Ti–6Al–4V substrate. The groove features obtained using the direct writingtechnique demonstrated a significant decrease in the apparent contact angle.This improved wettability is concluded as a result of the increase in the criticalwetting angle. The well-organized morphological evolution and the spreadingof the MC3T3-E1 osteoblast cells after culture for 1 day on a representativeCa–P-coated sample further proved its biocompatibility.
The authors acknowledge the help from Sudarshan Phani in white light interferometry-basedsurface measurements. The authors also highly acknowledge the support and help fromDr Wei He and Zheng Cao in conducting cell culture measurements. A part of this researchhas been performed at Oak Ridge National Laboratory, managed by UT-Battelle, LLC, for theUS Department of Energy under contract DE-AC05-00OR22725 and has been sponsored bythe Industrial Technologies Program for the Office of Energy Efficiency and Renewable Energy.
References
Bhusan, B., Jung, Y. C. & Koch, K. 2009 Micro-, nano- and hierarchical structures forsuperhydrophobicity, self-cleaning and low adhesion. Phil. Trans. R. Soc. A 367, 1631–1672.(doi:10.1098/rsta.2009.0014)
Bico, J., Tordeux, C. & Quéré, D. 2001 Rough wetting. Electrophys. Lett. 55, 214–220.(doi:10.1209/epl/i2001-00402-x)
Bico, J., Thiele, U. & Quéré, D. 2002 Wetting of textured surfaces. Colloid Surf. A Physiochem.Eng. Aspects 206, 41–46. (doi:10.1016/S0927-7757(02)00061-4)
Boivineau, M., Cagran, C., Doytier, D., Eyraud, V., Nadal, M.-H., Wilthan, B. & Pottlacher,G. 2006 Thermophysical properties of solid and liquid Ti–6Al–4V (TA6V) alloy. Int. J.Thermophys. 27, 507–529. (doi:10.1007/s10765-005-0001-6)
Carles, P., Troian, S. M., Cazabat, A. M. & Heslot, F. 1990 Hydrodynamic fingering instability ofdriven wetting films: hindrance by diffusion. J. Phys. Condens. Mater. 2, 477–482. (doi:10.1088/0953-8984/2/S/076)
Cooper, L. F. 2000 A role of surface topography in creating and maintaining bone at titaniumendosseous implants. J. Prosthet. Dent. 84, 522–534. (doi:10.1067/mpr.2000.111966)
Dabhade, V. V., Rama Mohan, T. R. & Ramakrishnan, P. 2007 Viscous flow during sinteringof attrition milled nanocrystalline titanium powders. Mater. Res. Bull. 42, 1262–1268.(doi:10.1016/j.materresbull.2006.10.008)
Daniel, C., Mucklich, F. & Liu, Z. 2003 Periodical micro-nano-structuring of metallic surfacesby interfering laser beams. Appl. Surf. Sci. 208–209, 317–321. (doi:10.1016/S0169-4332(02)01381-8)
Phil. Trans. R. Soc. A (2010)
on March 12, 2014rsta.royalsocietypublishing.orgDownloaded from
1888 N. B. Dahotre et al.
Daniel, C., Balk, T. J., Wubben, T. & Mucklich, F. 2005 Bio-mimetic scaling of mechanicalbehavior of thin films, coatings, and surfaces by laser interference metallurgy. Adv. Eng. Mater.7, 823–826. (doi:10.1002/adem.200500110)
Dyshlovenko, S., Pateyron, B., Pawlowski, L. & Murano, D. 2004 Numerical simulation ofhydroxyapatite powder behavior in plasma jet. Surf. Coat. Technol. 179, 110–117. (doi:10.1016/S0257-8972(03)00799-0)
Engleman, P. G., Kurella, A., Samant, A., Blue, C. A. & Dahotre, N. B. 2005 The applicationof laser-induced multi-scale surface texturing. JOM J. Miner. Metal Mater. Soc. 57, 46–50.(doi:10.1007/s11837-005-0182-2)
Flemming, R. G., Murphy, C. J., Abrams, G. A., Goodman, S. L. & Nealey, P. F. 1999 Effectsof synthetic micro- and nano-structured surfaces on cell behavior. Biomaterials 20, 573–588.(doi:10.1016/S0142-9612(98)00209-9)
Guillot-Noël, O., Gomez-San Roman, R., Perrière, J., Hermann, J., Craciun, V., Boulmer-Leborgne,C. & Barboux, P. 1996 Growth of apatite films by laser ablation: reduction of the droplet arealdensity. J. Appl. Phys. 80, 1803–1808. (doi:10.1063/1.362991)
Hao, L., Lawrence, J., Phua, Y. F., Chian, K. S., Lim, G. C. & Zheng, H. Y. 2004 Enhanced humanosteoblast cell adhesion and proliferation on 316L stainless steel by means of CO2 laser surfacetreatment. J. Biomed. Mater. Res. B Appl. Biomater. 73B, 148–156. (doi:10.1002/jbm.b.30194)
Hao, L., Lawrence, J. & Li, L. 2005 Manipulation of the osteoblast response to a Ti–6Al–4V titanium alloy using a high power diode laser. Appl. Surf. Sci. 247, 602–606.(doi:10.1016/j.apsusc.2005.01.165)
Incropera, F. P. & Dewitt, D. P. 1985 Fundamentals of heat and mass transfer, 2nd edn. New York,NY: Wiley.
Ishino, C., Okumura, K. & Quéré, D. 2004 Wetting transitions on rough surfaces. Electrophys. Lett.68, 419–425. (doi:10.1209/epl/i2004-10206-6)
Jones, M. I., McColl, I. R., Grant, D. M., Parker, K. G. & Parker, T. L. 2000 Proteinadsorption and platelet attachment and activation, on TiN, TiC, and DLC coatings on titaniumfor cardiovascular applications. J. Biomed. Mater. Res. 52, 413–421. (doi:10.1002/1097-4636(200011)52:2%3C413::AID-JBM23%3E3.0.CO;2-U)
Lasagni, A., Nejati, M., Clasen, R. & Mucklich, F. 2006 Periodical surface structuring of metals bylaser interference metallurgy as a new fabrication method of textured solar selective absorbers.Adv. Eng. Mater. 8, 580–584. (doi:10.1002/adem.200500261)
Lasagni, A., Holzapfel, C., Weirich, T. & Mucklich, F. 2007 Laser interference metallurgy: a newmethod for periodic surface microstructure design on multilayered metallic thin films. Appl.Surf. Sci. 253, 8070–8074. (doi:10.1016/j.apsusc.2007.02.092)
Lawrence, J., Hao, L. & Chew, H. R. 2005 On the correlation between Nd:YAG laser-inducedwettability characteristics modification and osteoblast cell bioactivity on a titanium alloy. Surf.Coat. Technol. 200, 5581–5589. (doi:10.1016/j.surfcoat.2005.07.107)
Li, X., Huang, J., Ahmad, Z. & Edirisinghe, M. 2007 Electrohydrodynamic coating of metal withnano-sized hydroxyapatite. Biomed. Mater. Eng. 17, 335–346.
Ma, M., Mao, Y., Gupta, M., Gleason, K. K. & Rutledge, G. C. 2005 Superhydrophobic fabricsproduced by electrospinning and chemical vapor deposition. Macromolecules 38, 9742–9748.(doi:10.1021/ma0511189)
Ma, M., Gupta, M., Li, Z., Zhai, L., Gleason, K. K., Cohen, R. E., Rubner, M. F. & Rutledge, G. C.2007 Decorated electrospun fibers exhibiting superhydrophobicity. Adv. Mater. 19, 255–259.(doi:10.1002/adma.200601449)
Paital, S. R. & Dahotre, N. B. 2009 Wettability and kinetics of hydroxyapatiteprecipitation on a laser-textured Ca–P bioceramic coating. Acta Biomater. 5, 2763–2772.(doi:10.1016/j.actbio.2009.03.004)
Paital, S. R., Balani, K., Agarwal, A. & Dahotre, N. B. 2009 Fabrication and evaluation of apulse laser-induced Ca–P coating on a Ti alloy for bioapplication. Biomed. Mater. 4, 1–10.(doi:10.1088/1748-6041/4/1/015009)
Palasantzas, G. & De Hosson, J. Th. M. 2001 Wetting on rough surfaces. Acta Mater. 49, 3533–3538.(doi:10.1016/S1359-6454(01)00238-5)
Phil. Trans. R. Soc. A (2010)
on March 12, 2014rsta.royalsocietypublishing.orgDownloaded from

Wetting of laser microtextures 1889
Perrin, D., Szmukler-Moncler, S., Echikou, C., Pointaire, P. & Bernard, J. P. 2002 Bone responseto alteration of surface topography and surface composition of sandblasted and acid (SLA)implants. Clin. Oral. Implant Res. 13, 465–469. (doi:10.1034/j.1600-0501.2002.130504.x)
Pilliar, R. M. 1998 Overview of surface variability of metallic endosseous dental implants:textured and porous surface-structured designs. Implant Dent. 7, 305–314. (doi:10.1097/00008505-199807040-00009)
Rupp, F., Scheideler, F., Rehbein, D., Axmann, D. & Geis-Gerstorfer, J. 2004 Roughness induceddynamic changes of wettability of acid etched titanium implant modifications. Biomaterials 25,1429–1438. (doi:10.1016/j.biomaterials.2003.08.015)
Samant, A. N. 2009 Laser machining of structural ceramics: computational and experimentalanalysis. Doctoral dissertation, The University of Tennessee, Knoxville, TN.
Sauberlich, S., Klee, D., Richter, E. J., Hocker, H. & Spiekermann, H. 1999 Cell culture tests forassessing the tolerance of soft tissue to variously modified titanium surfaces. Clin. Oral. ImplantRes. 10, 379–393. (doi:10.1034/j.1600-0501.1999.100505.x)
Scheideler, L., Geis-Gerstorfer, J., Kern, D., Pfeiffer, F., Rupp, F., Weber, H. & Wolburg, H. 2003Investigation of cell reactions to microstructured implant surfaces. Mater. Eng. C 23, 455–459.
Schneider, G. & Burridge, K. 1994 Formation of focal adhesions by osteoblasts adhering to differentsubstrata. Exp. Cell. Res. 214, 264–269. (doi:10.1006/excr.1994.1257)
Schneider, S., Egry, I. & Seyhan, I. 2002 Measurement of the surface tension of undercooledliquid Ti90Al6V4 by the oscillating drop technique. Int. J. Thermophys. 23, 1241–1248.(doi:10.1023/A:1019896321431)
Schüssler, A., Steen, P. H. & Ehrhard, P. 1992 Laser surface treatment dominated by buoyancyflows. J. Appl. Phys. 71, 1972–1975. (doi:10.1063/1.351161)
Schwarz-Selinger, T., Cahill, D. G., Chen, S.-C., Moon, S.-J. & Grigoropoulos, C. P. 2001Micron-scale modifications of Si surface morphology by pulsed-laser texturing. Phys. Rev. B64, 155 323. (doi:10.1103/PhysRevB.64.155323)
Sheng, Y. J., Jiang, S. & Tsao, H. K. 2007 Effects of geometrical characteristics of surface roughnesson droplet wetting. J. Chem. Phys. 127, 234 704. (doi:10.1063/1.2804425)
Wei, J., Yoshinari, M., Takemoto, S., Hattori, M., Kawada, E., Liu, B. & Oda, Y. 2007 Adhesion ofmouse fibroblasts on hexamethyldisiloxane surfaces with wide range of wettability. J. Biomed.Mater. Res. B Appl. Biomater. 81, 66–75. (doi:10.1002/jbm.b.30638)
Yong, X. & Zhang, L. T. 2009 Nanoscale wetting on groove-patterned surfaces. Langmuir 25,5045–5053. (doi:10.1021/la804025h)
Yuehuei, H. An. & Richard, J. F. 1998 Concise review of mechanics of bacterial adhesionto biomaterial surfaces. J. Biomed. Mater. Res. Appl. Biomater. 43, 338–348. (doi:10.1002/(SICI)1097-4636(199823)43:3%3C338::AID-JBM16%3E3.0.CO;2-B)
Zhang, Z., Zhou, H., Ren, L., Tong, X., Shan, H. & Li, X. 2008 Surface morphology of laser tracksused for forming the non-smooth biomimetic unit of 3Cr2W8V steel under different processingparameters. Appl. Surf. Sci. 254, 2548–2555. (doi:10.1016/j.apsusc.2007.09.102)
Phil. Trans. R. Soc. A (2010)
on March 12, 2014rsta.royalsocietypublishing.orgDownloaded from
Copyright © 2022 FDOKUMEN