The effects of wetting and drying on soil physical properties
344
ITAITE INSTITUTE e5. to.8> LIBRARY THE EFFECTS OF hIETTING AND DRYING ON SOIL PHYSICAL PROPBRTIES A thesis submitted by !üANI HADI UTOMO Ir. (Agricultural Engineer) Brawijaya tlniversity (Indonesia) to The University of Adelaide for the degree of Doctor of Philosophy Department of Soil Science, Ïlaite Agricultural Research Institute, The University of Adel.aide. December 1980.
-
Upload
khangminh22 -
Category
Documents
-
view
0 -
download
0
Transcript of The effects of wetting and drying on soil physical properties
ITAITE INSTITUTEe5. to.8>
LIBRARY
THE EFFECTS OF hIETTING AND DRYING
ON SOIL PHYSICAL PROPBRTIES
A thesis submitted by
!üANI HADI UTOMO
Ir. (Agricultural Engineer)
Brawijaya tlniversity (Indonesia)
to
The University of Adelaide
for the degree of
Doctor of Philosophy
Department of Soil Science,
Ïlaite Agricultural Research Institute,
The University of Adel.aide.
December 1980.

].
TABLE OF CONTENTS
LIST OF TABLES
LIST OF FIGURES
LÏST OF PLATES
SUMMARY
DECLARATION
ACKNOüILEDGEMENTS
SECTION 1 - INTRODUCTION
SBCTTON 2 - REVIEhI OF LITERATURE
2.1 The physical agents responsible for aggregateformation and stability2.1.1 Assessment of aggregate stability2.1.2 hletting and drying cycl-e-s2.1.3 Freezing and thawing cycles2,1.4 Tillage
2.2 Strength of a cohesive soilShear strengthCompressive slrengthTensile strengthPenetration resistance
SECTÏON 3 THIXOTROPIC HARDENÏNG
Effect of ageing on the strength of remoulded soils3.1.1 Introduction3.1.2 Materials and Methods
SoilsRemouldingMeasurement of soil strength
3.1.3 Results and DiscussionEffect of water content on soil strengthEffect of ageing on soil strengthPore size distribuLionCompression resistance
3.2 Effect of chemical treatment on thixotropic behaviour3.2,1 Introduction3.2.2 Materials and Methods
Chemical treatmentMeasurement of thixotropic hardeningMea-surement of a-ggregate ten-sile strengthCompression resj-stance test
3.2.3 Results and DiscussionThixotropic hardeni-ngAggregate tensile strengthCompression resistance
P-eeg.
iv
ix
xiii
xlv
xix
xx
1
5
56
11
1720
2.2.12.2.22.2.32.2.4
2224374352
3
59
59596464646566666B7982
B4B4868687e78BB8BB
919B
3.3 Conclusions 100

SECTION 4 EFFECT OF WETTING AND DRYING CYCLES ON FORMATION
AND hIATER STABILITY OF SOIL AGGREGATES
4.1 Introduction
4.2 Mat.erials and MethodsSoiIsAggregate formationAggregate water stabilitY
Resul-ts and DiscussionAggregate formationAggregate water stabilltY
a
IT
Page
103
103
103103104105
4.3
4.4 Conclusions 113
SECTION 5 EFFECT 0F V'IETTING AND DRYING 0N SOIL STRENGTH 115
106106110
5.1
5.2
5.3
SECTION 6
Effect of wetting and drying cycles on soil5.1.1 Introduction5.1.2 Materials and Methods
SoilsRemoulded aggregatesSoi-I coresPenetrati-on resistanceField clods and aggregates
5.1.3 Results and Di.scussionTensile strength of soil aggregates
coresEffecf of wetting and drYing on the
of remoulded soilsField clods and aggregatesEffect of ageing on the strength of
weakened by wetting and drYingTemperature cycling
Soil frlability5.2.1 Introduction5.2.2 Materials and Methocls
Effect of soil water contentüIettÍng and drying
. Freezing and thawing5.2.3 Results and Discussion
Effect of soil water contentEffect of wetting and drYi.ngEffect of freezing and thawing
Conclusions
EFFECT OF NATURAL I,'IETTING AND DRYING ON THE
PROPERTIES OF TILLED SOILS
Soil !'later Behaviour6.1.1 Introduction
strength
and soil
strength
soils
115115117117118119120120121
121
123129
131132
134134137137137138139139142144
145
149
6.1 149149

tt1
Page
6.1 .2 Materials and MethodsSoil water content fluctuation in tilled
and untilled soilsEffect of fillage system on soil water
behaviourResul.ts and DiscussionSoil wa.ter conbent fluctuationsInfluence of meteorological factors on soil
drying
153
153
154155155
162
172172174176176180
187187189189190190190199
6.1 .3
6.2 Tilth MellowingIntroductionMateri-als and MethodsResults and DiscussionClod strengthClod size distribution
6.3 Tensile strength and aggregate water stability6.3.1 trntroduction6.3.2 Materials and Methods
Tensile strengthAggregate water stability
6.3.3 Results and DlscussionTensile strengthAggregate water stability
6.4
6 .2.16.2.26.2.3
Effect of agei-ng on the wat.er stabllity and compressionresistance of aggregates disturbed by til.lage 204
6.4.1 Introduction 2046.4.2 Materials and Methods 2066.4.3 Results and Discussion 207
Aggregate water stability 207Compression resistance 208
6.5 Conclusions 214
sEcTroN 7. - GENERAL DISCUSSION AND CONCLUSIONS 216
7.1 Introduction
7.2 Discussion and Conclusions
7.3 Suggestions for further works
BÏBLIOGRAPHY
216
217
226
228
APPENDIX 250

].V.
Tableññuor
3.1
3.2
3.3a
3.3b
3. 3c
3.3d
3.4
3.5
3.6
3.7
3.8
3.9
3.10
List of Tables
Ti.tle
Compositions and Atterberg limits of the soils usedin the experiment
Values of A and a parameters of equat,ion (3.3), andthe strength at the plastic limits, Q^ '1.0, for thefreshly remoulded Urrbrae, Strathalbyñr Mortlock and!'laco soils, and the field clods coll-ected from theUrrbrae soil.
pa-ej.
Effect of ageing on the penet.ration resistance'of remoulded Urrbrae soil.
Effect of ageing on the penetration resistancetof remoulded Strathalbyn soil.
Effect of ageing on the penetration resj-stance'of remoulded Mortl-ock soil.
Effect of ageing on the penetration resistance,of remoulded Waco soil.
Values of B and b parameters of equation (3.8) 'the strengths at 12 and 20% waLer contents, 8-
0 20, of remoulded Urrbrae soil. as infl-uencetlcBemiáar treatments.
Qpt
64
6T
70
71
72
74
83
90
95
96
69
8p'
Qp'
Effect of organic matter oxidation and sterilizationon the strength of remoulded Urrbrae soil.
Effect of ageing on the tensile strength of remouldedaggregates of Urrbrae soil-.
Values of D¡r D-, and m parameters of equation (3.7)resultÍng fñom öompression tests on remoufded Urrbraesoil aged for different times.
Qpt
and12 andby
80
B9
Effect of ageing on the penet.ration resistance ofremoulded Urrbrae soif as inffuenced by chemicaltreatments.
Effect of phosphoric acid and calcium sulphateapplication on particle -size distributj-on ofUrrbrae 1oam.
Values of K and k parameters of equation (3.11)of Urrbrae loam as influenced by chemica1treatments.
Values of Do, D*, and m parameters of equation(3.7) resutting'"from compression tests on becls ofaggregates of 2.0 - 4.0 mm diameter of Urrbrae loamas influenced by chemical treatment.
3.11
99

v
TabIeñffi6ãr
4,1
5.1
5.2
5.3
5.4
5.5
5.6
5.7
5.8
5.9
5. 10
5.11
5.12
Title
Effect of 2 cycles of wetting and drying on theformation of water stable aggregates of 0.25 -2.0 mm diameter.
The tensile strength of remoulded soils asinfluenced by the method of measurement.
Effect of different potentials in wetting anddrying cycle(s) on the tensile sirength ofremoulded soil aggregates.
Effect of one wetting and drying cycle on thetensile strength of remoulded soil- cores.
Effect of one cycle of wetting and drying on theresistance of the soil-s to probe penetration.
Effect of wetting method of a wetting and dryingcycle on the tensile strength of remouldedaggregates of Urrbrae soil.
Effect of one cycle of wetting and drying ontensile strength of aged aggregates.
Effect of one cycle of wetting and drying onclod strength, as shou¡n by the proportion ofaggregates < 4.0 mm produced by the drop shattertest, of the Urrbrae til.Ied soil.
Effect of one cycle of wetting and drying on thetensile strength of aggregates from non-tilledsoil-.
Effect of one cycle of wetting and drying on thetensile strength of aggregates from tilledUrrbrae soil.
Page
107
122
124
124
125
127
128
130
130
131
Effect of ageing on the tensile strength of soilaggregates which have been weakened by one cycl-eof wettlng (-l t<pa) and drying (-100 kPa). 132
Effect of temperature cycles on the tensilestrength of natural and artificial aggregates ofUrqbrae soil.. 134
Effect of water content on the values of parametersof K and k of equation (5.7) and on the strengthsof 10 mm diameter aggregates, of1O. 140
Effect of wetting (-1 t<pa) and drying (-100 kPa) onthe values of parameters of K and k of equation(5.7), and on the tensil-e strength or .1, of remouldedUrrbrae aggregates of diameter d (mm1.- 143
5.13

Tableñffi6ãr
5.14
5.15
6.1
6.2
6.3
6.4
6.5
6.6
6.7
6.8
6.9
6. 10
6.11
Title
Effect of wetting and drying cycles on the valuesof parameters of K and k of equation (5.7), andon the tensile strength, o- ,, of remouldedMortlock aggregates of diarüeËer (mm).
Effect of freezi.ng and thawing cycles on thevalues of parameters K and k of equation ß-7),and on the tensile strength, oTtnr of 10 mm
diameter aggregates of remoul.dèd"Urrbrae soiL.
Values of B and the b parameters and coefflcientof determination of equation (6.7) obtainedfrom the tilled (TL) and non-tilled (NTL)plots.
Values B and b paramet.ers, and coefficient ofdetermi-nation of equation (6.7) found from0-5 cm and 5-10 cm layer of the tilled pì-ot.
The mean soil water content as influenced bytillage system.
The coefficient of correl-ation (r) and covariance(cov) obtained from the re]ationship betweenthe soil. drying with pan evaporation.
Correl-ati-on matrix of observed variabl-es for the1978 experiment 1.
Path coefficient of observed variables upondrying rate from tilled and non-tilled plots( 1978-1 ).
Correlation matrix of observed variables forthe 1978 experiment 2.
Path coefficient of observed variables upondrying rate from tilled and non-tillect plot(1978-2).
Correlation matrix of observed bariables forLhe 1979 experiment.
Path coefficient of observed variables upondrying rate from til1ed and non-tilIed plot(1979).
Effect of cumulative wetting and drying (X A Vü)
on clod strength of Urrbrae soil, as shourn bythe size rlistribulion of the clods produced bythe drop shatter test.
VaJues of C and c parameters and coefficientof determination (12) or equatj.on (6.'15) asinfl-uenced by webting and drying (X A I/ü).
vi.Page
143
145
156
161
162
163
166
167
168
169
170
171
177
6.12
179

TabIeffi6ãr
6,13
6 .14
6.15
6 .16
6.17
6. 1B
6. 19
6.20
6.21
6.22
6.23
6.24
6.25
6.26
TitIe
The values of the parameters A, ar and ar ofequation (6.13) for the Urrbrae 1978 experiment'
The values of the parameters A, a, and at ofequation (6.13) (Urrbrae, 1979).
The values of the parameters A, a, and att ofequation (6.16) for the Strathalbyn experiment'
Effect of natural wetting and drying (as shown
by X A !,1 after tillage ) on clod size distributionin a tilled soil (Urrbrae - 1978)
'
Mean tensile strength of aggregates of 4.0 ' 6.7mm diameter collecte'd from the tilled and non-tilled Urrbrae plots (40 days after tillage).
Mean tensile strength of aggregates col-lecledfrom the tilled plots at Condobol-in.
The tensile strength of the aggregates fromO - 5 and ! - 10 cm laYers of tilled andO - 10 cm layer of non-tilted Urrbrae plots(21 days after tillage).
The val-ues of parameters of L, I and lr ofequations ß.zz) and (6.23).
Aggregate water stability of Mortlock soil asj-nfl-uenced by dif ferent tillage treatments.
Soil organic matter content of Mortlock soil asinfluenced by different tillage systems.
The values of parameters of D¡, D* and m ofequation rc.28) resulting rroå'co$pression testson beds of aggregates of Urrbrae soj-I aged fordifferent periods of time since disturbance bytillage.
Page
vr1
181
183
184
185
191
191
193
200
203
Effect of wetting and drying (t ^
I¡I) on the mean
tensile strength of aggregates from tilled (0 - 5
and 5 - 10 cm layers) and non-tilled Urrbrae plots. 195
Effect of wetting and drying (time afLer billage)on the mean tensi.l-e strength of aggregates fromthe tilled (O - ! and 5 - 10 cm layer) andnon-tilled Strathalbyn ptots. 195
The values of parameters of A, a, and ar ofequation (6.20) and (6.21) obtained from theUmbrae and Strathatbyn experiments. 197
Mean tensile strengths of aggregates of Mortl-ocksoil as influenced by different tillage treatments. 199
202
6.27
209
TableF-rer
6.28
6.29
TitIe Page
viii
212
212
The values of parameters D"r D.r, Dr,, and ,r., ofequation rc.29) resulting from-comþressiotl"tests Q9.4 kPa stress) on beds of aggregatesof the Urrbrae soil aged for different times.
The val.ues of parameters D. Dl, Drrr .n9 .n ofequation rc.29) resutting from-comþressioti"tests Q9.4 kPa stress) on beds of aggregatesof the Strathalbyn soil aged for differenttimes.

Figurenumber
2.1
2.2
2.3
2.4
2,5
2.6
3.1
3.2
3.3
3.4
3.5
3. 6a
3.6b
3.7a
3.7b
3.8
l_x
LIST OF FIGURES
TitIe
Scheme for determining class numbers of aggregates(Emerson, 1967).
Pictorial representation of yield in: (a) perpectlyplastic material, (b) work-hardening materials.
Representation of shear strength of a cohesive soilin Mohrrs clrcle.
Principle stress space showing principal stresses attime of failure (redrarnr from Yong and !'iarkentin, 1975).
Potential contributions of various bonding mechanismto soil strength (redravm from IngJ-es, 1962).
Streamlines and contours of equal particle speed indry sand (redrawn from Dexter and Tanner, 1972).
Energy di-stance curves for dilute suspensions ofclispersed, flocculated and lhixotropic materj-als(redrawn from l'[itcheJ-1, 1960 )
Effecl of water content (S) on soil packing density(D) and on soil penetratiôn" resistance (Op).
Effect of ageing on the resistance of remoul-ded soil-sto probe penetration (Op).
Effect of ageing on matric water potential of Urrbraeand I'laco soils.
Effect of water content t$-lratj-o of Urrbrae, Sfrathalbynafter '12 days of aeging.
on thixotropic strength, Mortlock and lrlaco soils
Effect of ageing on water characteristics ofStrathalbyn soi1.
Effect of ageing on water characteristics ofMortlock soil.
Effect of ageing on pore slze distribution ofStrathalbyn soii ( /= 1.4g).
Effect of ageing cn pore size distribution ofMort]ock soil ( / = 1.44).
Effect of ageing on the resistance of Urrbrae soilto compression.
Effect of chemical treatment on packing density (D)
and penetrati.on resistance (8^) of Urrbrae loam asinfl.uenced by water content. '
3.9

3. 10
3.11
3.12
3. 13
3.14
3.15
3. 16
3,17
4.1
4.2
4.3a
4.3b
4.4
4.5
5.1
5.2
x
Effect of chemical- treatment on age strength ratio ofUrrbrae l-oam after 6 days of ageing, as influenced bywater content.
Effect of ageing on the tensile strength of remouldedchemically treated Urrbrae loam, as infl-uenced by watercontent.
Effect of chemical treatment on the tensile strengthof natural aggregates of Urrbrae loam.
Mohr faiture envelope of the control, phosphoric acidand calcium sulphate treated Urrbrae loam at 0 day aged.
Mohr failure envefope of the control, phosphoric acidand calcium sulphate treated Urrbrae loam at 6 days aged.
Effect of ageing on the resistance to probe penetrationof CaSO. treated Urrbrae l-oam.
+
Effect of chemical treatment on the 1og aggregate tensilestrength - volume relationship of. Urrbrae l-oam.
Effect of chemical- treatment on the compression resistanceof beds of aggregates of Urrbrae loam, as shourn by stress-packing density relationship.
lletting rate as influenced by the initial matric potentialand the matric potential to which the soil is wetted.
Effect of wetting and drying cycles on aggregateformation in initially nonaggregated soils.
Effect of one wetting and drying cycle on watercharacteristics of Strathalbyn soil.
Effect of one wetting and drying cycle on pore sizedistribution of StraLhalbyn soi1.
Effect of onstability of2.0 - 4.0 mm
e webting and dryihg cycle on waterso1I aggregates with initi-al- diameter
Effect of wetting and drying cycles on water stabilityof soil aggregates with initial diameter of 2.0 - 4.0 mm,
as influenced by sterilization.
Effect of wetting and drying cycles on the tensilestrength of remoufded aggregates of Urrbrae loam.
Effect of wetting and drying cycles on the tensilestrength of remoufded (non aged) aggregates ofStrathalbyn soil.
Effect of matric water potential on the log aggregatetensile strength-volume relationship of Urrbrae loam.
5.3
5.4
5.5
6.1
6.2
b.J
6.4
6.5
6.6
6.7
6.8
6.9
6.10
6.11
6.12
6. 13
XT
Effect of matric water potenti-al on the 1og aggregatetensil-e strength-volume relationship of Strathalbynsoil.
Effect of wetting and drying cycles on the 1og aggregatetensile strength-vol-ume rel-ationship of Urrbrae loam.
SoiI water content fluctuations of til-Ied and nontilledplots (1978, exp. 1).
Soil water content fluctuations of titled and nontilledplots (1978, exp. 2).
SoiI water content fluctuations of tilled and nontilledplots (1979 exp. ).
Cumulative wetting and drying, X A I/,1, (as a function oftime, L, after tillage) of tilled and nontj-lled plots( 1978, eXp. 1 ) .
Cumulative wetting and drying, t A !tl, (as a function oftime, L, after tillage) of tilled and nontilled plots( 1978, €xp. 2),
Cumulative wetting and drying, X A lJ, (as a function oftime, L, after tillage) of titled and nontilled plotst1979 exp. ).
Soil water content fluctuations of 0 - 5 and 5 - 10 cm
layers of a tilled plct.
Cumulative wetting and drying, I A !ü, (as a function oftime, L, after tiltage) of 0 - 5 and 5 - 10 cm layersof a tilled plot.
Path diagram of the effect of meteorological factorsand initial soil- water content on drying rate fromtilled and nontilled plots (1978, êxP. 1).
Path diagram of the effect of.meteorological factorsand initiat soj-l water content on drying rate fromtilled and nontilled plots (1978r êXP.2).
Path diagram of the effect of meteorological factorsand initial soil water content on drying rate fromtilIed and nontitled plots (1979 exp. ).
Effect of wet.ling and drying (X A l,f) on clod strength(as shov¡:i by the proportion of fractj-on smaller than4.0 mm diameter resulting from the drop shatter test)for Urrbrae soil.
Effect of wetting and drying (X A ir'i) on the relationshipbetween l-ogn^E and the M!'lD of aggregates resu1ting fromthe drop stråYter test on Urrbrae soil.
Effect of wetting and drying (r ^
l'I) on the slzedistribution of cl-ods produced by the second implementpass (Urrbnae - 1978).
6.14

6.15
6 .16
6 .17
6. 18
6.19
6.20
6.21
6.22
6.23
6.24
6,25
6.26
6.27
xL1.
Effect of wetting and drying (r ^
\¡r) on the proporbionof clods small-er or larger than diameter, ô, producedby the second implement pass (Urrbrae' 1978) '
Effect of wetting and drying (X ^
W) on the sizedistribution of clods produced by the second implementpass (Urrbrae - 1979).
Effect of wetting and drying (t ^
lü) on the proportionof clods larger or smaller than diameter, ô, producedby the s".onã implement pass (Urrbrae - 1979) '
Effect of wetting and drying (as shov¡n by time aftertillage) on the size distribution of clods producedby thé second impJ-ement pass (Strathal-byn)'
Effect of wetting and drying (as shov¡r by time aftertillage) on the proportion of clods smaller or largerthan ãiameter, ô, produced by the second implementpass (StrathalbYn).
Effect of wetting and drying (t A !'l) on tensile strengthof the aggregates from tilled plot of Urrbrae loam'
Effect of wetting and drying (as shown by time, t, aftertillage) on tensil-e strength of aggregates from tilledplots of StrathalbYn soi1.
Effect of wetting and drying (x ^
hl) on the water stabilityof the aggregates from tilled Urrbrae soil-'
Effect of wetting and drying (as shor^¡n by time, t, aftertillage) on the water stability of the aggregates fromtilled StralhalbYn soil.
Effect of a.geing since disturbance on the stability ofaggregates of Urrbrae loam.
Effect of ageing on the resistance of beds of disturbedaggregates Lo compression (Urrbrae soil).
Effect of ageing on the resistance of beds of disturbedaggregates to compression (Urrbrae soil)
Effect of ageing on the resi-stance of beds of disturbedaggregates to compression (Strathalbyn soil).

PIateÑilm-rer
3.1
3.2
3.3
3.4
5.1
6.1
xra]-.
LIST OF PLATES
TitIe
Measurement of soil strength with a laboratorypenetromeler.
Measurement of matric waber potential with a soiltensiometer.
Measurement of soil shear strength in a trixialcelI.
Soil deformations resulting from triaxial testsafter ageing for 5 daYs.a. Control (10% sbrain, o. = 100 kPa)b. H^PO, treated (10% strãin, oa = 100 kPa)c. cåsof treated (20% strain, ol = 1OO kPa)
Micro-cracks in remoulded soil aggregates formedby wetting and drying (mag¡rification of B times) '
The development of cracks in a cl-od of Urrbraeloam in the fietd observed by time-lapse photography:a. Initial stage of crack formationb. Cracks have alreadY been formedc. Some cracks closed after wetting.

XIV.
SUI,[,IARY
physical factors responsibl-e for aggregate formation and stability'
and methods for assessing aggregate wat,er sfability are reviewed' The
natural factors responsible for developing and controlling soil strength'
which is defined as l,he ability of a soil to withstand an applied stress,
and methods of soil strength measurement are also reviewed.
ThÍxotropic hardening
This topic does not really fall within the subject title of this
thesis. However, this study is a precursor to the studies of the effects
of wetting and drying cycles because it is necessary to be able to avoid
any confounding effects of thixotropic hardening, especial-ty with
remoulded and disturbed soil samples.
It is found that some agricultural top soils exhibit appreciable
thixotropic behaviour at soil water contents close to that at which
tillage is usually performed. This is shor,¡n by increases in the strength
(shear strength, tensile strength, penetration resistance, and compression
resistance) with ageing at constant water content.
The water content at which maximum thixotropic strength regain
occurs is influenced by the clay mineral content of the soil. For soil
containing kaolinite, the maximum thixotropic strength regain occurs at
a water contenl at about or below the ptastjc limit. For soil containing
illite and montmorillonite (no kaolinite) this maxÍmum value occurs at
the water conbent between the liquid and plastic limits.
Effect of wetting and drY ing on aggregate formation and stabilitY
planes of weakness (cracks) formecl by unequal- swelling and shrinkage
resulting flrom uneveu wetting and drying provide the initiaf faces of

XV
soil aggregates in an initialty unaggregated soil. Tt was found that
wetting and drying to wat,er matrlc pot.ential of -1 kPa and -100 kPa,
and of -1 kpa and 60oC oven dried resulted in the greatest aggregalion
(> 0.25 mm) .
For aggregated soil too, wetting and drying influences aggregate
water stability. Providing there is an extra energy source for
microbial acti-vity (such as in aggregates disturbed by tillage), wetting
and drying first increases the proporlion of water stable aggregates
> 0.5 mm to a maximum value. Further wetting and drying then decreases
aggregate water stability. ülhen there is no extra energy sources'
wetting and dryì-ng steadity decreases aggregate water stability.
Effect of wettins and drying on soil strength
' I'letti-ng and drying may influenc.e the strength of a soiI.
Providing the stresses set up by unequal swelling and shrinkage are
able to create cracks, wetting and drylng decreases the tensile strength
of remoulded aggregates and of the aggregates disturbed by tillage. For
larger aggregates (clods) the decrease in the strength was shorn¡n by the
fact that with the same amount appJ-i-ed energy (by the drop shatter test
or by a second implement pass) greater soil- break up occuryed.
Since soj-l wetting and drying in the field are usually from one
side only, the formation of cracks in larger aggregates occurs much
more readity than in smaller aggregates. As a consequence, the decrease
in the strength i-n larger aggregates occurs much more rapidly than that
in the smaller aggregates. This phenomenon led to the development of a
method for measuring so11 friabiJ-ity.
Soil friability is defined as the tendency of an unconfined soj-l
mass to break up and to crumble under applied stress into smaller
XVI
mechanically stabte soil aggregaLes. A measure of soil fri-ability
!ías developed from the theory of the brittle fracture theory of soil
aggregates. Friability üfas obtainec from the sIope, k, of plots of
the tog aggregate tensile strength, oT, against the log aggregate
volume, V:
Io8"o, = K-k
Values of friabilitY ranged from
(mechanicalIY unstable )
This measure can be used to
tillage can produce the greatest
useful in explaining the results
a very interesti-ng future in the
loE V.
k < O.O5 (not friable) to k > 0.40
predict the water content at which
soil crumbling. The method is also
of some earlier workers, and may have
study of soil physical properties.
Application of soil conditioners
phosphoric acid addition decreases the tensile strength of remoulded
and natural aggregates, but increases the penetration resistance of
remoulded soil. As a consequence of the decrease of aggregate tensile
strength, phosphoric acid application decreases the resistance of beds
of these aggregates to compression. Phosphoric acid is also found to
increase soil friabilitY.
Calcium sulphate addition increases the tensile strength of
remoulded and natural aggregates, but decreases the penetrati-on
resistance of remoulded soil. ThiS increase in aggregate tensile
strength results in increases in the resistance of beds of these
aggregates to comPression
XVI]-
Effecb of tillage on soil water behaviour
The amplitude of natural soil water content flucutations (wettlng
and drying) j.n the tilted layer of a til-led soil is greater than that
at the same depth in an untilled soil. Under South Australian condit,ions,
the cumul-ative wetting and drying in the tilled soil (0 - 10 cm depth)
until 20 days afLer tillage was greater by a factor of 1.7 - 2.0 than
that in untilled soil-. For the 0 - 3 cm layer, these values ranged
from 3.1 - 5.6 depending on the tillage syslem.
Meteorological f'actors influence the rate of drying from a soll
when soil water conlent is high enough to provide the evaporative demand.
t'lhen soil- water content is low (for the Urrbrae soil, lower than about
1O%), the rate of drying is mainly controlled by soil water content.
Agricultural implications
Cracks are formed by natural wetting and drying. These make the
soil weaker, and at the same time provide initial faces of soil
aggregates. This could have some significance in soil management
practice. By increasing the amptitude of wetting and drying, by for
example stubble management, it is likeIy that the soil can be tilled
more esily and can resul-t in a finer Lilth.
Tillage increases the amplitude of wetting and drying, the strength
of the clods'produced by tillage decreases with wetting and drying, and
at the same time aggregation is promoted by wetting and drylng. If is
therefore suggested that delaying a second implement pass for several
days after a first implement pass, can enable soil to be til-led with
minimum energy and cost to produce a fine seed bed. In addition, with
decreasing clod strength it is possibl-e to reduce t he number of
,.1

xvt].t.
irnplement passes so that compaction dan¡age can be minj-mized. Compaction
damage might also be reduced as a result of the increase in the tensile
Strength (with a deJ-ay of the second implement pass), and hence
compression resistance, of aggregates in the deeper part of the tilled
layer.
Thixotropic hardening of top soil may influence seed germination
and crop growth, either directly through the increase in strength or
indirectly through its effect on soil water behaviour'
It is suggested that phosphoric acid should be used in soils of
high aggregate tensile strength, because besides increasing aggregate
water stabitity it also reduces aggregate tensile slrength and increases
friability. Calcium sulphate, on the other hand, should be used in
soils of low aggregate tenslle strength, so that besides increasing
aggregate water stability, the resistance of the soil to compression
can be i-ncreased.
xl-x.
DECLARATION
This thesis contains no material which has been
accepted for the award of any other degree or diploma
in any university. To the besL of authorrs knowledge
and belief, this thesis contains no material previously
published or written by another person, except r¿here
due reference is made in the text of the thesis.
!'Iani H. Utomo
December, 1980.
XX
ACKNOüILEDGEMENTS
I would like to express my sincere gratitude to Dr. A.R' Dexter'
Senior Lecturer in Soil Science, and to Dr. J.M. Oades, Reader in
Soil Science and the Chairman of the Department, for their guidance
and helpful discussion during supervision of this project'
My thanks also go to the Dean of Agricultural Faculty of Brawijaya
University and the Rector of Brawijaya University l^/ho gave me permission
to leave my duties so that I could undertake this project.
The assistance of David Hein and Terry Sherwin with several of the
experiments j-s gratefully acknowledged.
Dr. I,ü.1¡1. Emerson of CSIRO Divislon of Soil-s assisted with the
consolidometer test.
M. Ahmed helped with the ATP determination.
Dr. J.S. Hewitt assisted in the development of theory accounting
for errors resulting from a random measurement (appendix).
The assistance of Biometry section staff, especially Dr. P.
Baghurst and T. llancock, is gratefully acknowledged'
The thesis Ìüas typed by Joan Howe. Joy l,lillis helped with the
preparation of the figures.
I was sponsored by Australian Covernment through the AVCC-AAUCS
scholarship.
At tast, but not l-east, my deep gratitude go to my wife, Titiek'
and my sons, Iwan and Dodi, for their continuous support, understanding
and encouragement.

WAITE INSTITUTE
LIEIìARY
SECTTON 1. INTRODUCTION
SoiI, which is defined as lhe loose top layer of the earth' is
virtually the sole source of manrs sustenance because it supports the
planbs and animals which provide food, fiber, and shelter. Throughout
the ages man has primariJ-y been an exploiter of the soil and j-ts resources
without much regard for its conservation or long-term management. Soil-
is a non-renewable resources, and it has often fall-en into decline and
in many places eventually disappeared.
It is now, although rather late, essential for us to learn how to
manage the soil correctly. hlith increasing population and its consequent
demands, h¡e are being forced to make the soil as productive as possibJ-e
whilst at the same time preventing it from being depleted further. To
attain these objectives, soil management systems must be developed which
allow the production of food crops at minimum cost, and which ab the same
time, minimize soil deterioration caused by unnecessary removal of plant
nutrients, erosion, and compaction.
Much work has now been done to study and to attempt to find the
optimum methods for managing a soil. These include tillage, minimum or
zero til1age, cropping system, crop residue management, and the use of
chemical conditi-oners. History has proved that while we have been
successful in our attempts bo increase crop yield per unit area on good
soi1, we have fallen behlnd in our attempts to maintain the condition of
the soil, One of the reasons for this is pnobably the lack of i.nformaticn
on the effects of different soil management systems on soif physical
properties. !'lhere there is information, it is often shoi^rn separately'
and very little effort has been made to integrate the data with other
knowledge or to relate it to soil management practice.

2
The concept behind the project described in this thesis was bhat
any work done to a soil- which modifies its condition would be like1y to
influence the physical properties of lhe soil. The changes in these
physical properlies might have some significance in the management of
the soil by enabling a reduction in the input cost of the work and/or by
reducing the rate of soil deterioration in crop production.
The first aspect considered was the influence of changes in soil
waler content and soil- temperature fluctuations resulting from soil
management practices (such as tillage or crop residue management) on
other physical properties of the soil, In the case of an increase in
these fluctuations (especialty of soil water content), there might be
formation of cracks 1n the soil. Such cracks would enable the soil to
be more easily broken by the mechanicat impact of tillage implements.
If this vùere so, the input energy and cost involved in the preparation
of seed beds could be reduced. In addition, with decreasing soil
strength due to crack formation, it might be possible to reduce the
numben of implement passes, and hence reduce the compaction caused by
the vehicle wheels.
Any change in soit water content fluctuation might also have some \
significant effect in the formation and stabil-ization of soil- aggregates.
If this suggestion l¡Jere correct, then soil aggregale management, and
thus also some soil- erosion contro], could be achieved by modifying the
soil water content fluctuation regime.
The second aspect considered was the possibility of j-ncreasing soil
strength with time after the soil is broken up by tillage. It is well
known, especially in the field of civil engineering, that disturbing or
remoulding a soil results in a decrease in its strength, and allowing
this soil to rest at constant water content can resuft in the recovery

3
of alt or part of the strength. Since tillage and/or other soil
disturbance usual-Iy involves some shearing and remoulding, then alJ-owing
this soil to rest for several days may increase the strength of this
disturbed soil. In the case of an increase in the soil water content
fluctuation, which mostly occurs in the top layer of the disturbed
soi1, such increases in strength may not occur. Any increase would be
expected to occur mainly in the deeper layers where soil water content
fluctuations are much smalfer. Any increase ln strength in these layers
could reduce the susceptibility of the soil to compaction damage.
In the past, chemical soil conditioners for agricufture have usually
been studied in terms of their effects on the water stability of soil
aggregates. It was thought that the use of chemical soil conditioners
might affect other physicat properties of the soil, especially strength.
If this were true, it might be worthwhile to increase or decrease, which
ever is necessary, soil strength with the conditioners in order to obtain
an additional benefit from soil conditioner application.
To study these suggestions, a series of laboratory and field
experiments were carried out and the results are discussed in this
thesis. The laboratory experiments were aimed to investigate: effects
of ageing at constant water content on the strength of remoulded
agricultural top soil; influences of chemical treabments on strength
changes with ageing; effects of wetting and drying cycles on the
formation and water stability of soil aggregates; and effects ofI
wetting and drying cycles and temperature cycJ-ing on soil strength. i
Field experiments were carried out to test the results of the
Iaboratory experiments under natural conditions, and in particular to
determine: the extent to which tillage modifies soil water content
fluctuations; consequences of these modifications on the physical-

4
properties of clods and aggregates in the tilled layer, especially
clod and aggregate strengbh and aggregate water stability; and effects
of ageing at constant water content on the water stability and the
resistance to compression of aggregate beds of aggregates disturbed by
tillage. In these experiments, the importance of.meteorological factors
in determining soil drying Ís also considered.
It is expected that the results of these investigations could
ultimately lead to the development of improved systems of management of
surface soil based on physical and environmental principles.
5
SECTION 2. REVIE!.I OF LITERATURE
2.1 The physical agents responsible for aggregate formation and stability
SoiI structure has been defj.ned as the arrangement of individual
mechanical sepanates, soil aggregates which are formed by aggregation of
smaller mechanical fractions, and accompanied pore space into a centain
structural pattern (Baver, Gardner, and Gardner, 1972). In tillage
practice, the term clod and aggregate are used to describe the aggregation
of small soj-l fractions into lårger structural units. In this thesis, the
term clod is used to describe a structural arrangement with dimensions of
several cm, and the term aggregate is used to describe that with dimensions
of up to several mm.
Considerabl-e attention has been given to the study of soil structure,
and excell-ent reviews have been pubJ-ished by Martin et af. (1955),
Marshall (1962), Harnis, Chesters andAllen (1966), and more recently by
Sequi (1978). Most of these reviews, however, are centered on the rol-e
of chemical and biological- processes in the development and stabilization
of soil aggregates. Retatively litt1e attention, except by Harris et a7.
(1966), has been given to the rofe of physical agents either in the
formation or stabilizaLion of soil aggregates.
The term physical agents used in this thesis includes the action of
weather, especially wetting and drying cycles and freezing and thal+ing
cycles, and mechani-cal- action as produced by tillage. Before discussing
the r,ole of these agents in the formation and stabilization of soil
aggregates, it is wcrthwhile to discuss the assessment of aggregate
stability.

6
2.1.1 Assessment of aggregate stability
The stability of soi-l aggregates in water is the main interest in
studying the physical- properties of soil. I,ùater stable aggregates are
necessary to maintain soil- aeration and water conductivit,y to provide a
favourable condition for growing crops. The existence of water stable
aggregates is also important in erosion control.
l¡'lhen a dry soil aggregate is immersed in water, it ma¡'breakdovm
into smaller soil fragments. Several processes may be involved in this
phenomenon, namely ( 1 ) decrease in the cohesion due to weakening of
cementing bonds, (2) unequal sweJ-ling of the soil- mass, (3) internal
pressure originating from entrapped air. The importance of these factors
i-n causing aggregate breakdown will be discussed further in section 2.1.2.
The most widely used method to assess aggregate water stability is
probably the v¡et sieving method developed by Yoder (f936), which is
actually the modification of Tiulin's (1933) method. Several
modifications have been proposed to improve the reliability and
reproducibility of this method. An excelÌent discussion and bibliography
on this subject has been published by Kemper and Koch (1966). In
principle, the measurement of aggregate water stability by this method
can be described as follows.
A given amount and size of soil- aggregates are put onto sieve or a
series of sieves with a given opening size. The sieve(s)' with the
aggregates on it(them), are immersed in water for a given timer then
shaken up and down in water at certain speed and for a standard time.
Aggregates which are left on each sieve after wet sieving are oven
dried, and then weighed.
7
The result can be expressed as the percentage of the j-nitial total
weight remaining in aggregates J-arger than any given diameter, such as
0.10 mm (Baver and Rhoades, 1932), 0.25 nm (McHenry and Russell, 1943;
trüillis, 1955), 0.5 mm (Bryant, Bendj-xen and Slater, 1948)' and even
3.0 mm (Low, 1954), or in mean weight diameter (M!,lD) or geometric mean
diameter (Gl',lD) of the aggregates l-eft in the sieves after wet síeving.
To calculate the mean weight diameter (MVrlD), van Bavel (1949) plotted
accumul.ated frequency which was obtained by summing the percentage (by
weight) of aggregates retained at any given size, against the upper limit
of separalion. The M!,lD was obtained by calcul-ating the area over the
curve. This can be done either directly by counting the area (of -small
unit graph paper), or by using a planimeter on the curve. Cornfield
(195':) pointed out that although this method was very useful, it was
ti.me consuming. To overcome this problem, Youker and McGuinness (1957)
pi"oposed a simple regression method. The cumulative percent (by weighl)
was ptotted against fhe size of sj-eve opening. Unlike van Bavel (1949)'
however, the plotted points were joined by straight lines. The area
above the straight lines were calculated by two methods, i.e. (1) by
counting this area as done by van Bavel (1949), and (2) by accumulating
the products of multiplication of the cfass mid points and the percent
retained. A least square regression line was computed from these
measurements and resulted in
.Y = 0.876x-0.079 Q.1)
where T is the mean weight dì-ameter, and x is a constant which is obtained
by summing the muJ-tiplication product of mean sieve size and percent
retained. This method has been successfu]-ly used in tillage experiments
by Bateman, Naik and Yoerger (1965) and Bushan and Ghildyal (1971, 1972).
The use of geonetric mean diameter (GMD) in studying the water
stabiliby of soil aggregates vras developed by Mazurak (1950). To obtain

B
GMD, the weight of aggregates in a given size fraction was multipl-ied
by the l-ogaribhm of the mean diameter of that fraction. The sum of
these products for all size fra.ctions were divided by the total weight
of soil sample. Logsdail and Vüebber (1959) used this method of
presentation in a study of the effects of freezing and thawing on
aggregate water stabiJ-ity of Haldiman clay.
The most important factors in the wet sieving method are the
pretreatment of the sample, and the mechanical operation of the machine,
such as the frequency, amplituäe, and time of sieving. A lot of workers
have recognized the importance of standardizalion of the wet si-eving
method (e.g. Russel-l , 1971). A standard method, however, has not yet
been establ-ished. Each workers chooses his or¡¡n interest according to
the nalure of the soil and the objective of the study. Because of this'
it is necessary to describe sample pretreatment and mechanical operati-on
of the machine in presenting the results of such a test.
Ib has been found that the results of wet sieving are influenced by
the initial size of soil aggregates (t'loodburn, 1944; Low, 1954), the
initial water content of soil aggregates (Low, 1954; Panabokke and Quirk'
1957), method or rate of wetting (Emerson and Grundy, 1954; Panabokke
and Quirk, 1957 ), method of aggregate storing (Evans, 1948; Hoffman'
19T6), temperature of water in which wet sieving is done (!,loodburn ' 1944;
Low, 1954), the time (season) of soil sampling (Sl-ater and Hopp,1951;
Stefanson , 1971), and of course the mechanical- operation of the machine.
The surface soil structure under natural conditions is subject to
the impact of falling nain drops. !,lith this idea, McCaJ-Ia (1942)
deveJ-oped the method of aggregate water stabiliby determination based on
the amount of energy necessary to destroy soil aggregates. Drops of water
approximately 4 mm in diarneter fall-ing from 0.5 m height from a buretl,e

9
at the same rate, vJere allowed to strike moist soil aggregates of 4 mm
diameter resti-ng on a 1 mm sieve. The kinetic energy, E, was cal-culated
from
E 0.5 m v2 (2.2)
and v is the terminal velocitY.where m is the mass of the waLert
In a later study, McCalIa (1944) used the number of drops instead
of the kinelic energy. He found that a water drop height of 0.3 m
height (v = 2.5 m/sec.) and a soil aggregate size of 0.15 g were
satisfactory for studies of peårian loess sub-soil- and Marshall sÍ ì [y
clay loam top soil.
Smlth and Cernuda ( 1951 ) noticed that most soils of Puerto Rico
are clays and often tend to break into rather distinct aggregates of
Somewhat similar size. They, therefore, suggested that the water drop
test developed by McCaIla (1942; 1944) would be suitable to assess the
water stabiJ-ity of soil aggregates of these soifs. It was found that
1.0 e aggregates, a drop size of 1.0 mI from 0.6 m height (v = 3.35
m/sec. ), and an applicatlon rate of 1 drop per second were suitable for
these soi1s.
Pereira (1955) considered that the problem in the water drop test
was to obtain very small but representative samples from fields which
are mostly nonhomogenous. To overcome this problem, he used a rainfa.ll
simulator instcad of single water drops, and soil cores, instead of
single soil aggregates. The use of rainfal-I simulatons, especially to
study run off and soil erosion, has lately been received much attention
(Meyer and McCune, 1958; Mazurak and Mosher, 1970; Grierson and Oades,
1977).

10.
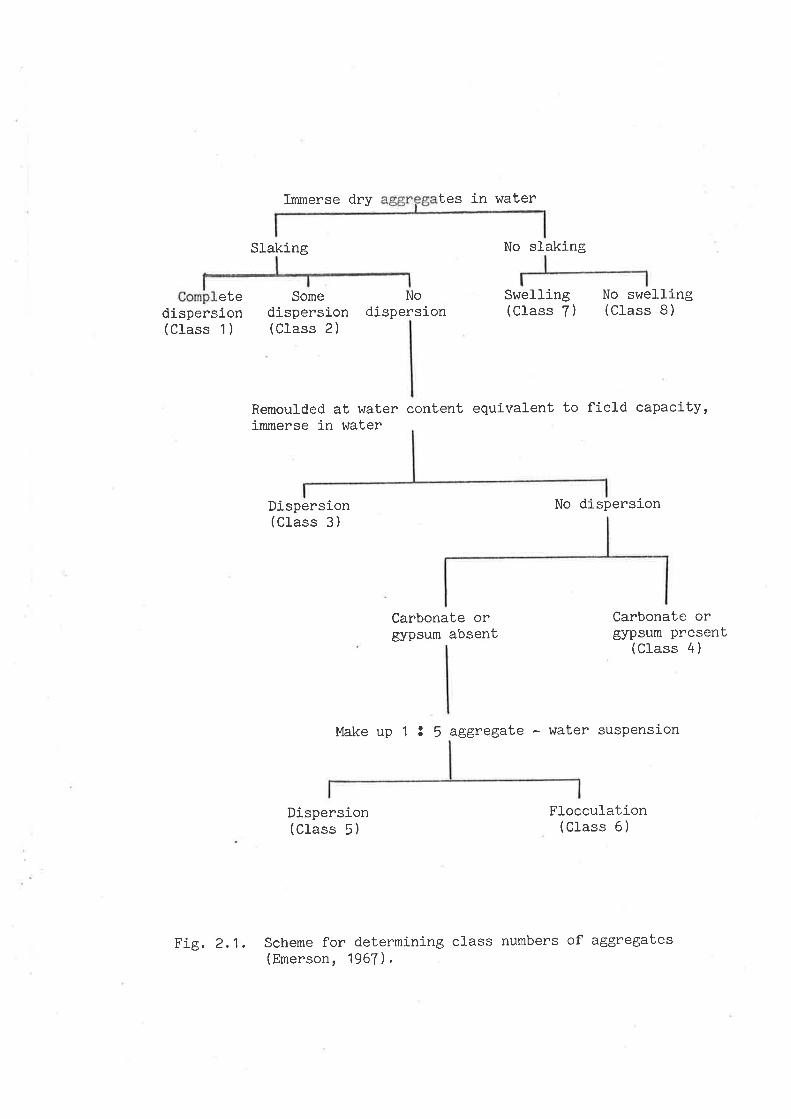
Emerson (1967 ) developed a water coherence test for use in
assessing the stabj-lity of soils for earth dam construction. Thus
this method is mainly applied to sub-soils, and is based on the
swelling, slaking, and dispersion behaviour of soil aggregates when
immersed in water. To do this, soil aggregates are immersed in
distilled waler, and according to their behaviour, the aggregates are
cLassified inLo eight classes (Figure ?.1).
Loveday and PyIe (1973) modified the Emerson dispersion test as
part of a study of soit hydraulic conductivity. The Emerson dispersion
test has also been successfully used by Greenland, Rimmer and Payne
(1gT:_) to determine the structural- stability of top soil-s of English
and lrlelsh soils. This method has been found to be very useful in
assessing drainage problems in these soils.
Low (jg54) and others (Rovira and Greacen, 1957; Richardson, 1976)
used dispersion ratio as an index of aggregate water stabilit'y. The
dispersion ratio is defj-ned as the ratio of percent silt plus clay obtained
after weak dispersion to that obtained after complete dispersion during
mechanical analysis. Rovira and Greacen (1957 ) used the weak dlspersion
method developed by MarshalÌ (1956). This method consisted of measuring
with a plummet balance the amounts of material smaller than 50 pm aften
successive periods of end-over-end shaking. A suspension of about 20 g
of soil in 1 I of water was used.
The change in permeability due to leaching with dilute salt sofution
has been proposed by Emerson (1954; 1955) as a measure of aggregate water
stability. The method consisted of replacing all other exchangeable ions
of 20 g of natural- air dry 1 - 2 mm soiJ- aggregates with sodiumr and then
measuring the decrease in the permeability of the aggregate bed when
brought into equilibnium with successiveJ-y more dilute sol-utions of sodj-um
ïmmerse dry tes i-n water
etedispersion(Class 1 )
Slaking
Somedispersion(Class 2)
Nodispersion
No slaking
Swel-ling(C1ass 7)
No swelling(Class B)
Remoulded at water content equivalent to field capacity'immerse in water
Dispersion(Class 3)
No dispersion
Carbonate orgypsum absent
Carbonate orgypsum present
(Class 4)
Dispersion(Class 5)
Make up 1 ! 5 aggregate - water suspension
Flocculation(Class 6)
Fig. 2.1. Scheme for determining class numbers of aggregates(Emerson, 1967).
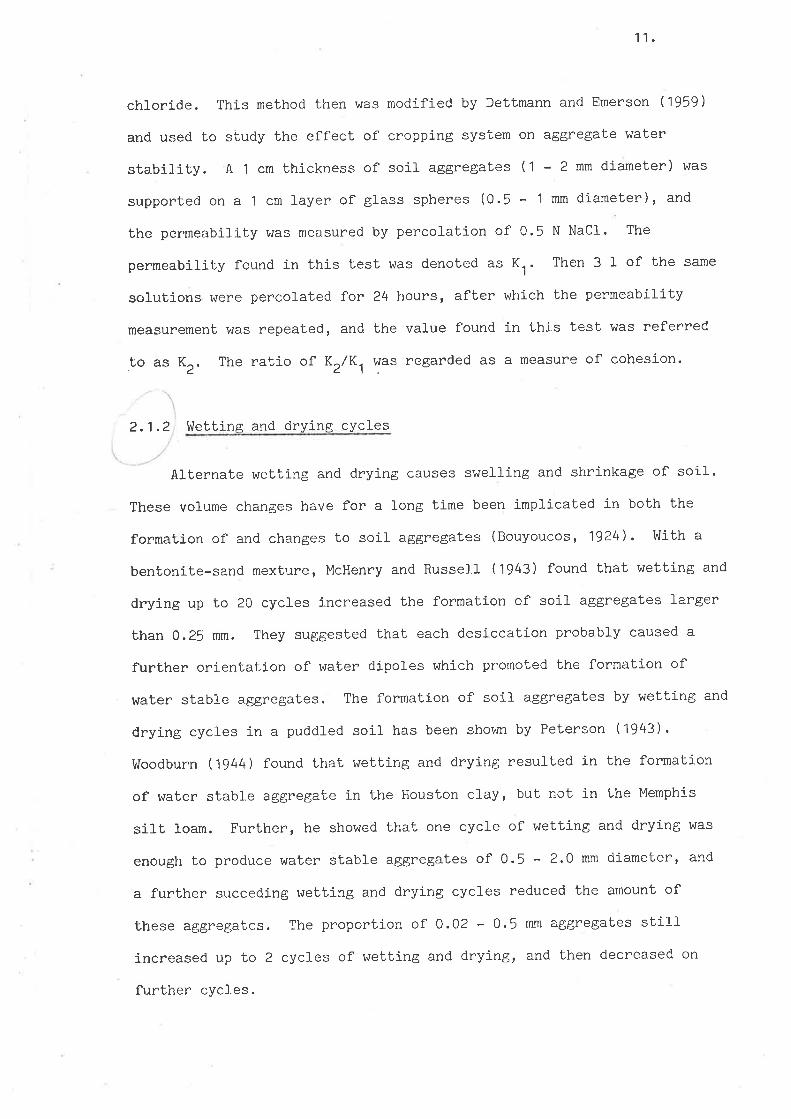
11.
chloride. This method then was modified by Dettmann and Emerson (1959)
and used to study the effect of cropping system on aggregate water
stability. A 1 cm thickness of soir aggregates (l - 2 mm diameter) was
supported on a 1 cm layer of glass spheres (0.5 - 'l mm diameter), and
the permeability hlas measured by percolation of 0.5 N NaCI. The
permeability found in this test was denoted as K.,. Then 3 1 of the same
solutions 1¡ere percol-ated f or 24 hours, after which the permeability
measurement was repeated, and the value found in this test was referred
to as Kr. The ratio of Kr/K, !¡as regarded as a measure of cohesion.
2.'t.2 hlettine and drying cycles
Alternate wetting and drying causes swel-ling and shrinkage of soil.
These volume changes have for a long time been implicated in both the
formation of and changes to soil aggregates (Bouyoucos, 1924). !'lith a
bentonite-sand mexture, McHenry and Russell (1943) found that wetting and
drying up to 20 cycles increased the formation cf soil aggregates J-arger
than 0.25 mm. They suggested that each desiccation probably caused a
further orientation of water dipoles which promobed the formation of
water stable a.ggregates. The formation of soil- aggregates by wetting and
drying cycles in a puddled soil. has been shov¡n by Peterson (1943).
!ùoodburn (1944) found that wetting and drying resulted in the formation
of water stable aggregate in the Houston clay, but not in the Memphis
silt loam. Further, he showed that one cycle of wetting and drying was
enough to produce water stable aggregates of 0.5 ' 2.0 mm diameter, and
a further succeding wetting and drying cycles reduced the amount of
these aggregates. The proportion of 0.02 - 0.5 mm aggregates still
increased up to 2 cycles of wetting and drying, and then decreased on
further cycles.

12.
Vthite (1966; 1967 ) has suggested that the main agent for stnucture
development in sub-soils is expansion and contraction due to alternate
wetting and drying. In studying the aggregation of allophane soi1s,
Kubota (1972) found that drying resuJ-ted in aggregation of some silt
'and clay particles. He, thenefore, suggested that drying might be the
main agent responsible for aggregate formation in these soi1s. lrletling
and dnying cycles were used by Coughlan and Fox (1977 ) to produce soil
aggregates. They considered that aggregation was complete when the bulk
.density of dry aggregates did not change appreciably with further wetting
and drying cycles.
Cracks which develop during drying have been suggested to constitute
the inibial faces of soil aggregates (White, 1966). As the thickness of
water 1ayer surrounding particles becomes reduced, individual sand, silt,
and clay particles are brought close together. If interparticle water
films ane lost, a soil changes from semi plastic mass to a brj-ttle
material which can readily break dov¡n into aggregates. Baver eX al-.
(1gT2) consi-dered that the dehydration of a soit mass cannol be uniform,
especially if the drying process is rapid. Consequently, unequal stresses
and stralns arise throughout the mass of the soil, and this, as suggested
by !,lhit.e (1966)' can result in aggregate formation.
lrùett"ing of the shrunken soil produces swelling which closes the
cracks. This crack closure associated with swelling can cause stresses
to develop in the boundary zones between soil layers of different water
content (White , 1966). This process can lead to the initiation of soil
aggregate formation.
It is common knowledge that wetting a dny clod can result in the
breakdov¡n of the clod into finer soil aggregates. There are two
processes whjch govern the break-dorvn of these cl-ods, these are:
I

13.
( 1 ) unequal swel-l-ing due to rapid intake of waler producing fracture
and fragmentation, and (2) compression of entrapped air due to water
entry into the soil pores.
The breakdovm of clods due to swelling is significant only when the
soil contains clay minerals which exhibit appreciable swelling behaviour.
Emerson (1954) and Emerson and Grundy (1954) found that the breakdovrn on
wetting of clods from some British soils is due to the dispersion of the
clay in the clods. For these soils, in which lhe clays are effectively
calcium saturated, the breakdounr resulting from swelling is neglì-gible.
Det,tmann (1958) wetfed pure c1ays, and concluded that entrapped air is
neither necessary nor imporlant factor in slaking of dry clods, and that
slaking is always associated wj th rapì-d intercrystalllne swelling of the
c1ay. If swelling r^/as suppressed or occurred slowly through, for example
wetting from the vapour phase, slaking did not occur. SIow swelling
gives time for readjustment of the internal geometry of the clays. As a
result, slow swel-Iing produces dislocation, but not complete disruption.
The extent to which a clod wil-1 breakdov¡n on wetting is determined
by the balance of the dri-ving forces for the entry of water and cohesive
forces that hold particles togelher (lrlinterkorn, 1942). As water moves
into the soi], the affinity of the soil surfaces for water lncreases.
If it exceeds the cohesive forces, soil aggregates lose their cohesion,
and cementing bonds are destroyed. A mathematical representation for
this condition has been given by Henin (1938). It is
rC + Ct < 2A (2.3)
where r is the largest capiJ-lary in the soil, C is the apparent cohesj-on
of the soil, C., is the cohesion of water, and A is the affinity of the
soil fon water.
14.
Quirk (1950) noticed that soil aggregates with diameter of 2 - 5 mm
did not breakdov¡n into units smaller than 0.25 nn appreciably untiJ- the
matric potentiat of the soil water at the time of wetting exceeded the
potential of -5 MPa. The effect of water content at time of wetting on
aggregate disruption has been received considerabJe attention (Cernuda,
Smith and Vicente-Chandler, 1954:. Panabokke and Quirk, 1957).. It has
been found that there is a certain water content at which soi.l aggregates
do not slake appreciabJ-y upon wetting. The result of Panabokke and
Suirk (1957 ) showed that fon the Urrbrae fine sandy l-oam the minimum
slaking occurred when the initial matric water potential of the aggregatcs
was about -'lO kPa.
Aggregate water content at time of wetting influences the development
of internal slaking through it.s effect on the amount of air avail-abl-e for
trapping, and through its effect on the rate of water entry. It has been
found that slaking of soil aggregates i-ncreases with increasing rate of
wetting (Emerson and Grundy, 1954).
Te1fair, Garner, and Miars (1957 ) found that wetting and drying a
soil produced a platy structure with cracks usually running horizontally.
lrlhite (1966) proposed a cl-assification for sub-soil structures formed
mainly by wetting and drying cycles as ft[ows: ( 1 ) faces of blocky
peds, Q) faces of prisms, (3) faces of columns, (4) faces of parallelep.i-pedt
(5) faces of granules, and (6) faces of peds. Van de Graff (1978) studied
the aggregal.ion process based on the concept of externally lnduced
oriented stress regime caused by uneven shrinking and swelling. He found
lhat the stresses developed during rapid drying produced smaller peds
than those developed during slow drying. Low rate of wetting and drying
produced smal-fer stresses giving betlen possibllities for stress relaxation.
Consequently, wi.th lower rates, there was less intensive cracking, and
hence the aggregates produced were larger.

15.
The breakdown of dry clods when they are wetted is well known.
How wettÌng and drying cycles affect aggregate water stability, however,
is sfitl debatable. !üillis (1955) studied the effect of wetting and
drying on the water stability of soil aggregates treated with HPAN (a
sodium salt of hydrolyzed polyacrilolnitrite) and SC-50 (a water soluble
sodium siliconate CHrSi(OH)rONa). Using the wet sieving method he found
that excepb for the Edina silty clay loam (untreated and SC-50 treated),
untreated Ida silt loam, untreated Shelby loam, the cycles of wetting
and drying decreased aggregate water stability, as shourn by the
percentage of aggregates larger than 0.25 (m diameter. For those above
mentioned treatments, a single wetting and drying cycle increased
aggregate stability, but further wetting and drying cycles decreased
aggregate water stability. A decrease in aggregate water stability'
as shou¡n by the proportion of aggregate larger than 0.5 mm dj-ameter
obtained by the wet sieving method developed b)'Bryant et af. (1948),
due to webting and drying cycles has al.so been found by Soulides and
Allison (1961) on the Codorus silt loam, Elliot silt loam, Chester
sandy loam, and Fargo silty clay loam.
Rovira and Greacen (1957) and Tisdall, Crockroft and Uren (1978)
used dispersion lest to stucly the effect of wetting and drying cycles
on aggregate water stability. Rovira and Greacen (1957 ) used
disaggregation, which was defined as the ratio of % par|icles smaller
than 50 ym obtained by the weak dispersion of Marshall (1956) to that
of obtained by mechanical analysis, and Tisdall, Cockroft and Uren
(1gTB) preferred the percentage of particles smal-Ier than 20 pm obtained
by Bì-ackmore (1956) mebhod, which was defined as 7" slaking, to show bhe
effect of wetLing and drying cycles on aggregate water stability. It
was found in these two works that aggregate water stability decneased
with wetting and drying cycles, as shourn by the increase in disaggregation
16.
(Rovira and Greacen, 1957), or by the increase in % slaking (Tisdall
et a7., 1978).
Tisdalt et al-. (1978) explained the decrease in aggregate water
stability of a soil subjected to wetting and drying cycles in terms of
microorganism activity. They suggested thab wetting and drying cycles
restrict microbial activity, so that bonds destroyed during wetting and
drying can nol be replaced. To test this suggestion, they wetted and
dried a sterllized soil and found that the decrease in aggregate water
stability of sterj-llzed soil- was much greater than that of unsterilized
soiI.
Sillanpaaandlrlebber (1961) and Richardson (1976) found a contrary
result to that mentioned above. Using I^Iet sÍeving' Silanpaa and hlebber
(1961) found that wetting and drying up to 5 cycfes increased the mean
weight diameter of aggregates with the initial size of 2.0 - 3.0 mm
and of the crushed aggregates (< 0.25 mn diameter), but did not infl-uence
the MI¡'ID of original aggregates with the initial diameter of < 0.25 mm.
The clay content of these aggregates was 36.3%, 35.6% and 29.3% for
2.0 - 3.0 mm oniginal aggregates, crushed aggregates, and < 0.25 mm
original aggregates respectively.
Richardson (1976) employed a dispersion test (Middleton, 1930) to
study the effect of artificial weathering on the structural stability of
the Holland fine sandy l-oam of Lincolnshì-re, England (18% clay and 15%
silt). The result was given in terms of I'dispersion ratiorr which was
calculated from the amount of sj.It and clay obtained as a percentage of
the total sill and clay 1n a sample of oniginal untreated soil which
had been completely dispersed with a '10% calgon sofution and destruction
of the organic mabter with hydrogen peroxide. He found that after 3
cycles of wetting and drying the water stability of aggregates of the
cycled soil was higher than that of non-cycled soil. To study the micro
II
17.
structure at the surface of aggregates he took scanning eLectron
micrographs. The most striking difference between treatments was that
the finer particles in the cycled soil had been oriented parall-e1 to
each other to much greater degree than in non-cycled soil.
Hofman (1976) found that the instability of soil aggregates sieved
immediately after sampling was higher than that obbained when the soil
was first air dried and then rewetted to its original water content or
to field capacity. He suggested bhat this was probably due to changes
in the organisation of the soil constituents, such as a more stable
orientation of the clay particles, variation in the distribuLion of
organic matter, orland modification of the physical structure of the
organic matter, such as a change of surface area of this coloidal
material as has been suggested by Nevo and Hagin (1966).
2.1.3 Freezing and thawj-ng cycles
The formation of ice crystals and their subsequent melting in a soil
caused by alternabe freezing and thawing can assist the development of
soil aggregates. t'later expands on freeztng by about 9% (volumetric),
and results in the enlargement ofl soil pores with a consequent loosening
effect upon the soil. During this process water migrates from around the
clay particles to fhe growing ice crystals which creates loca1
dehydration. The combination of ice crystal pressure and dehydration
provldes an initial condition for aggregate formation. Corte (1962)
and others (e.g. Nonrish and Rausell-Co1om, 1962, Anderson and Hoekstra,
1965) have suggested that as water is drawn from suspension and frozen,
aggregal"ion occurs as a combination of the migration of particles in
the front of ice-liquid interface, and the removal of interlamefar water
from the c1ay.
18.
The structure formed by freezing and thawing cycles depends on
the soil type, rate of freezing and thawing, and the water content at
the time of freezing (Baver et a7.,1972). Russel-l (1950) has cÒncluded
that freezing and thawing improves the structure of clay soils with high
organic matter content, but adversely affects silty soil-s with fow
organic matter content. This is in consistent with CeraLzki (1956)
who found that freezing coarse-textured soils produced a homogenous mass
with no obvious difference in its micnoscopic structure. lrlhen fine
grained soj-ls were frozen, ice,crysbalized in layers within the soil-
materials, and resulted in the formation of the so-call-edItfrost structuretr.
Bisal and Nielsen (1964) observed that a clay soil was more finely
aggregated after frost action, and was thus more susceptible to wind
erosion. A clay Loam was less erosive, and no change occurred in a
sandy soil.
The aggregating effect of frost is related inverseJ-y to the rate of
freezing (Harris et a7., 1966). SIow freezing results in the formation
of large ice crystal-s and large stabl-e aggregates. Rapid freezing causes
the formation of many small ice crystals and smaller aggregates. Rowell
and Dillon (1972) studied the effect of freezing on aggregation based on
migration of clay particJ-es. They found that a freezing rate of 10 mm
per hour did not move ffoccul-ated c1ay, but moved dispersed clay up to
7 mm before it became trapped j-n the ice with released air. Further,
they observed that freezing and thawing of clay suspension at > 10-2M
CaCI, produced aggnegates in the form of fl-ocs of about 1 mm diameter.
At < tO-2¡l CaCLr, aggregates were produced in the form of fl-akes, often
with curled edges becoming more blocky with decreasing concentration,
and their size increased from about 0.1 mm lo 1.0 mm diameter.
Aggregation may be improved if the soil at time of freezing is not
too wet (Russell-, 1950). lühen the soil is very wet, freezing and thawing

19.
even may destroy the previously existing aggregates. Benoit (1973)
found that the formation of > O.05 mm diameter water stable aggregates
from an initially unaggregated soil was greater by a factor of 1.10
and 1.26 (for rapÍd and slow freezing) than that in the untreated soil
when maf,ric waLer potential at time of freezing b¡as about -50kPa. When
the water content at the time of freezi-ng corresponded to the maximum
waler holding capacity, the proportions formed were only 0.92 and 1.10
(for rapid and slow freezing) of those in untreated soil.
In studying the effect of fneezing and thawing cycJ-es on aggnegate
stabillty of Haldiman clay, Logsdail and Webber (1959) found that the
water stabj-lity of aggregates from a continuous corn plot is not influenced
by freezing and thawing cycles. For this phenomenon, they suggested that
the initial 1eve1 of aggregation in this soil had attained a value whj-ch
was nol significantl-y affected by alternately freezing and thawing. This
suggestion agrees with the finding of Slater and Hopp (1949) that soiÌs
of good quality (a high val-ue of initial aggregate water stability)
suffered a larger reduction in aggregate water stability than soils of
poor qua11ty.
f,lillj-s (1955) studied the effect of freezing and thawing cycÌes on
aggregate water stability of soils treaied with chemical-s. Except for
Edina silty clay loam and Lagonda clay loam treated with SC-50, aggregate
water stability decreased with freezing and thawing cycles. For these
two treated soils, aggrcgate water sbability was increased by 1 cycle
of freezing and thawing, but was decreased by funther freezing and
thawing cycles. An increase in MllD of crushed aggregates due to freezing
and thawing cycles has been foundbySillanpaa and !'lebber (1961). For the
natural- aggnegates, they found that freezing and thawing decreased the
MI¡ID of aggregates wi.th initial diameter of 2 - 4 mm, but did not influence
the MI¡,ID of aggregabes with initial diameter of < 0 -25 fim.

20
The importance of initial size of aggregates in determining the
final effect of freezing and thawing has aLso been stressed by Hinman
and Bisal- (1968) and Benoit (1973). Benoit (1973) found that freezing
and thawing of aggregates wibh initial diameter < 0.8 mm increased the
pnopontion of water stable aggregates > 0.5 mm. !,lhen the initial diameter
hras > 1.2 mm, howeven, freezing and thawing cycles greatly reduced the
proportion of water stable aggnegates larger than 0.5 mm.
Richardson (1976) studied the effect of freezing and thawing cycles
on aggregation of puddled fine sandy loam of Holland, Lincolnshire,
England. He found that after only 3 cycles of freezing and thawing'
aggregation reached a maximum val-ue which was slightly greater than
unpuddled soil. He, therefore, suggested that the structure of severely
damaged fine sandy Ìoam could be restored by al-ternate freezing and thawing.
2.1.4 Tillage
During tillage soil structure is modified by the implement through
shearing, compressing, and i-nverting the furrow s1ice. AÌthough tillage
is not capable ofl forming water stable aggregates (Rogowski and Kirkham'
1962), it at l-east, initiates the formation of soil aggregates, so that
stabilization by other mechanisms can p"o."uO. This initiation might
resul-t from the separation of aggregates which atready exist in the soi1,
or/and which have been formed by other processes, such as wetting and
drying, freezing and thawing, and even the mechanical action of soil-
flora and fauna. Tillage can have a high efficiency if it makes use
the existing pl-anes of weakness, such as cracks, in the soil.
The size dj-stribution of aggregales produced by tillage is influenced
by the properties of the soi-l-, the conditj-on of the soil at the time of
tllJ-age, and the performance of the till age implement. It is wef I knotn¡n
thaL the effect of tillage on soil- structure is a function of soil water

content
tillage
and may
tillage
instead
21.
at time of tillage (Russell, 1938; Vershinin , 1959) . lrlhen
is performed in a very wet soil, it cannot produce a good tilth'
even destroy the previ-ously existing aggregates. Likewise when
is performed in a dry soiI, excessively large clods are produced
of small stable aggregates.
The effect of water content at tj-me of tillage on soil structure
produced has been extensively studied (Lyl-es and Woodruff, 1962; Bushan
and Ghildyal, 1972; Ojeniyi and Dexter, 1979a). In general-, it has been
found that the optimum water content for tillage is'around the plastic
Iimit (0jeniyi and Dexter, 1979a).
The optimum water content for tillage is influenced by the pressure
exerted by the tillage implements, and the speed of tillage (Vershinin,
1959). The hlgher the pressure exented by tillage implement, the lower
is the optimum water content for tì-Ilage. This is in agreement with
Russell's (1938) suggestion that the more intensive the tillage, the
lower is the optimum water content at which tillage can be performed.
Swanson, Hanna and De Roo (1955) found that excessive tillage (at hieh
water content) broke dovm the aggregates larger than 2 mm, and decreased
aggregate water stabitity. Rovira and Greacen (1957 ) simulated tillage
in the laboratory, and found that disaggregation j-ncreased with increasitlg
tillage intensity and water content at time of t,illage.
The influence of implement shape on soil structure produced by
tillage has been studied by GiI] and McCreery (1960) and others (Bushan
and Ghildyal, 1971; 1972; Ojeniyi, 1978). It has been found that a
moul-dboard plough produces ì-argen clods than a disc pJ-ough (Gill and
McCreery, 1960) and than a cul-tivaton (BushanandGhildyal, 1971). For
Urrbrae fine sandy loarn, Ojeniyi (1978) has shou¡n that a mouldboard
'plough produces a smal1er proportion of small aggregates than a
scarifier or rotary cul"tivator. This diffenence may in part be a
22.
consequence of differences in the radii of curvature of the implements
used. It has been found that fhe M!'iD of clods produced by tillage
increases with increasing the radius of curvature of the implements
(Bushan and Ghildyal, 1971; 1972).
2.2 Strength of the cohesive soil
Soil strength is defined as the ability or capacity of a soil- to
resist or endure an applied stress (Gilf and Vanden Berg, 1967). In
addition, since strength is not evident without strain, soil strength
might be defined as the capacity of a soj-l to withstand deformation or
strain. Soil strength may be described in terms of the parameters of
stress-strain equations, or be evaluating the parameters in yield
conditions.
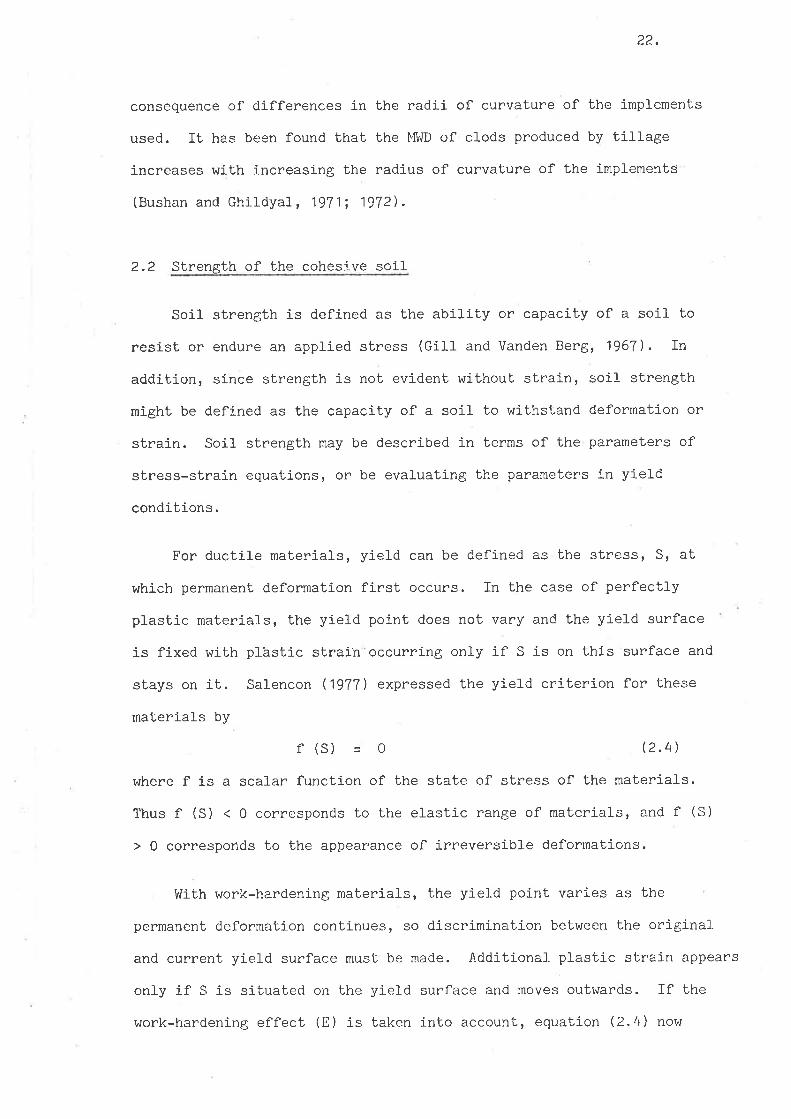
For ductile materials, yield can be defined as the stress, S, at
whi-ch permanent deformalion first occurs. In the case of perfectly
plastic materials, the yield point does not vary and the yield surface
is fixed with ptästic straih occurring only if S is on this surface and
stays on it. Salencon (1977 ) expressed the yield criterion for these
malerials by
f (s) - 0 (2.4)
where f is a scalar function of the state of stress of the materíal-s.
Thus f (S) < O corresponds to the elastic range of materials, and f (S)
> 0 corresponds to the appearance of irreversible def'ormations.
lrlith work-hardening material-s, the yield point varies as the
permanent deformation continues, so discrimination between the original
and current yield surface must be made. Additional plastic strain appears
only if S is situatecl on the yiel-d surface and moves outwards. If the
work-hardening effect (E) is taken into account, equation (2.4) now

23.
becomes
f (s,E) 0 Q.5)
A pictorial representation of yieJ-d in ductice materials is given
in Figure 2.2.
In brittte (as distinct from plastic) materials, fail-ure occuns as
or just after the yield stress, S, is reached. In these materi-als, onl-y
a very little plastic behaviour is exhibited.
In nature, soiJ.s can be fôund as near-liquid materialsr ductiJ-e
materiafs, or bri-ttle materlals. The applicatipn of the term rryi-eldrt,
therefore, is very complex and often leads to confusion and misunderstanding.
Because of this, Yong and ülarkentin (1975) suggested that the term yield
and failure could not be applied indiscriminately to soil-s.
In the pasb, especially in the field of civil- engineering, research
in soil mechanics has been centered on the shear strength of a soil.
Consequently, failure is usualfy defined as shear failure. Nev¡rnark (1960)
defined failure in a cohesive soil as the condition at the beglnning of
the loss of shearing resistance or at a relatively advanced state in the
loss of shearing resistance. It is now realj-zed that shear strength is
not the only important strength property of soil. Kezdi (1979) has
point,ed oul the importance of tensile strength in many problems of earth
statics associated with a cohesive soil. From the agricufture viewpoint,
Bateman et aL. (1965) recognised that in Lillage, soil fail-s in shear,
compression, tension, and abrasion. Barley and Greacen (1967 ) suggested
3 types of failune produced by plants, namely (1) tensile failure, (2)
shear without compression, and (3) shear with compression.
The intent of this review i s to discuss Lhe natural factors which
'contribube to the development of, and/or which infl-uence the strength of

Ssa
B
A
Ecco
Fig. 2.2. Pictorial representation of yield in(a) perfectly plastic materj-al,(b) work-hardening maberials.
O - A = elastic region (reversible deformation).A = yield point, when S t So, irreversible deformation
occurs.

24.
a soi-I. The mathematical treatment of soil strength, therefore, is not
treated in detail. In addition, factors which are considered to be
non-natural factors, such as rate of strain, rate and time of loading
etc., are not discussed in this review. The influence of these factors
on soil strength can be found efsewhere in soil mechanics text books
(e.g. Lambe and inihiLman, 1969; Yong and lrrarkentin, 1975; Mitche11, 1976).
2.2,1 Shear strength
Fail-ure by shear is identified by the occurrence of failure plane(s)
in the direction of greater shear stress and always between this dÍrection
and the direction of the compressive stress (Yong and hlarkentin, 1975).
This type of failure can be seen perfectly in brittle materials. Since
a soil may also have a brlttle property, this type of failure can also
occur in soil, especially when the soil is dry. lfhen soil water content
is high enough, the soil may not fracture, but the diameter of the
specimen under test gradually increases with increasing applied stress.
The increase in diameter is a permanent deformation, and the level- of
stress causing this deformation, therefore, can be referred to as a
measure of shear strength.
The first theory of shear failure was developed by Coulomb Ln 1776t
and is knor^¡n as rrthe maximum shear theoryrr (Yong and ülankenti-n, 1975).
In this theory, it is suggested that failure occurs when the maximum shear
stress reaches some critical va1ue. The maximum shear stress theory was
extended by Navier, and then by Mohr who considered that fail-ure by both
yielding and fracture can be expnessed as a functional rel-ationship
between the normal and shear stresses on the failure plane:
fN
rf o (2.6)
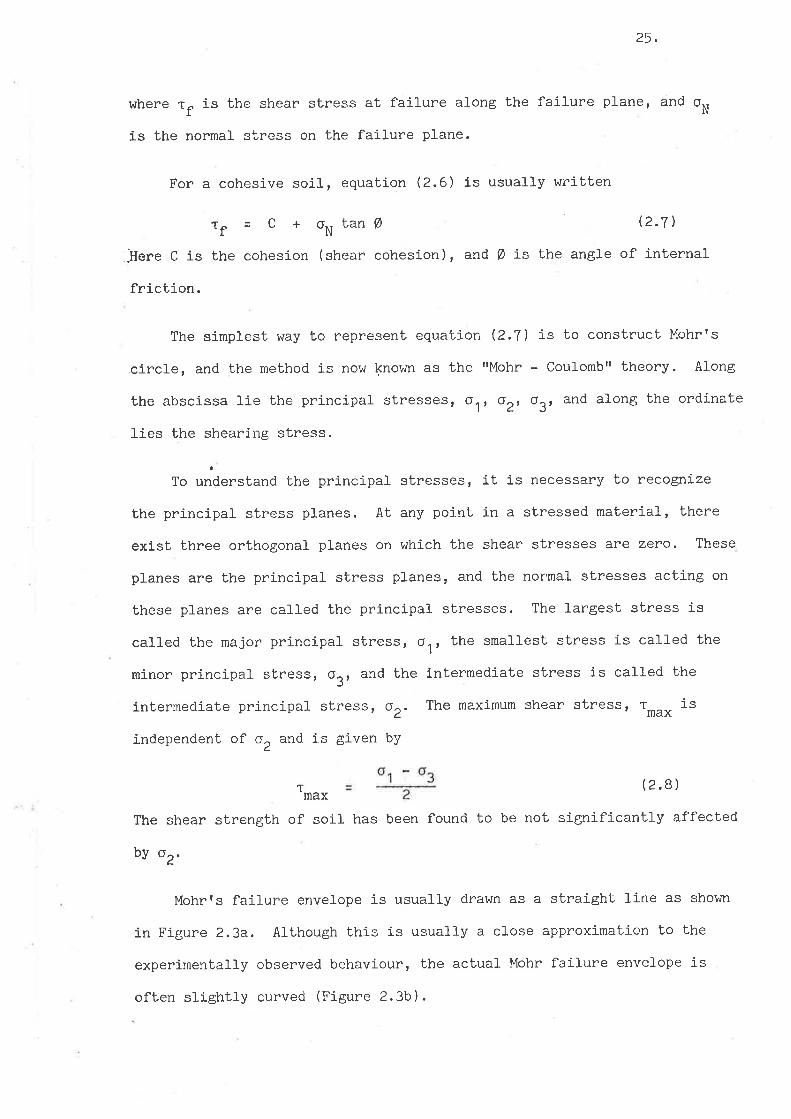
25.
where t, is the shear stress at faj-lure along the failure pIane, and o,
is the normal stress on the failure p1ane.
For a cohesive soil, equation (2.6)
Tf = C + ortanØ
-Uere C is the cohesion (shear cohesion),
friction.
is usuaLly wribten
(z'l )
and Ø is the angle of internal
(2.8 )
The simplest way to represent equation Q.7) is to construct Mohrrs
.circl-e, and the method is now knou¡n as thettMohr - Coul-ombrttheory. Along
the abscissa lie the prlncipal stresses, o1, aZ, 03, and along the ordinate
Iies the shearing stress.
a
To understand the principal stresses, it 1s necessary to recognize
the principal stress planes. At any point in a stressed material, there
exlst three orthogonal planes on which the shear stresses are zeY'o. These
planes are the principal stress planes, and the normal stresses acting on
these planes are cal-led the principal stresses. The largest stress is
called the major principal stress, al, the smal,lest stress is called the
minor principat stress, a3, and the intermediate stress is ca1led t'he
inlermediate principal stress, O2. The maximum shear stress, Trn"* i"
independent of o, and is given bY
Tmax
The shear strength of soil has been found to be nol significantly affected
by o2'
Mohrfs failure envelope is usually drawn as a straight line as shown
in Figure 2.3a. AlLhough this is usually a- close approxì-mation to the
experimentally observed behaviour, the actual Mohr failure envel-ope is
often slightly curved (Figure 2.3b).

2.3a.
Tslrearstress
a-d-+
5002.3b.
T(Pa)
300
-1
cË cLt Principal (r
Cf (Pa)
stress circle
(l
Representation of shear strength of a cohesive soj-l inMohrrs Circle,a. a common (si.mplified) method.b, actual Mohrrs failure envelope obtained from the
Parafield Loam (Farrell et a7., 1967 ).
Fie. ¿.3.
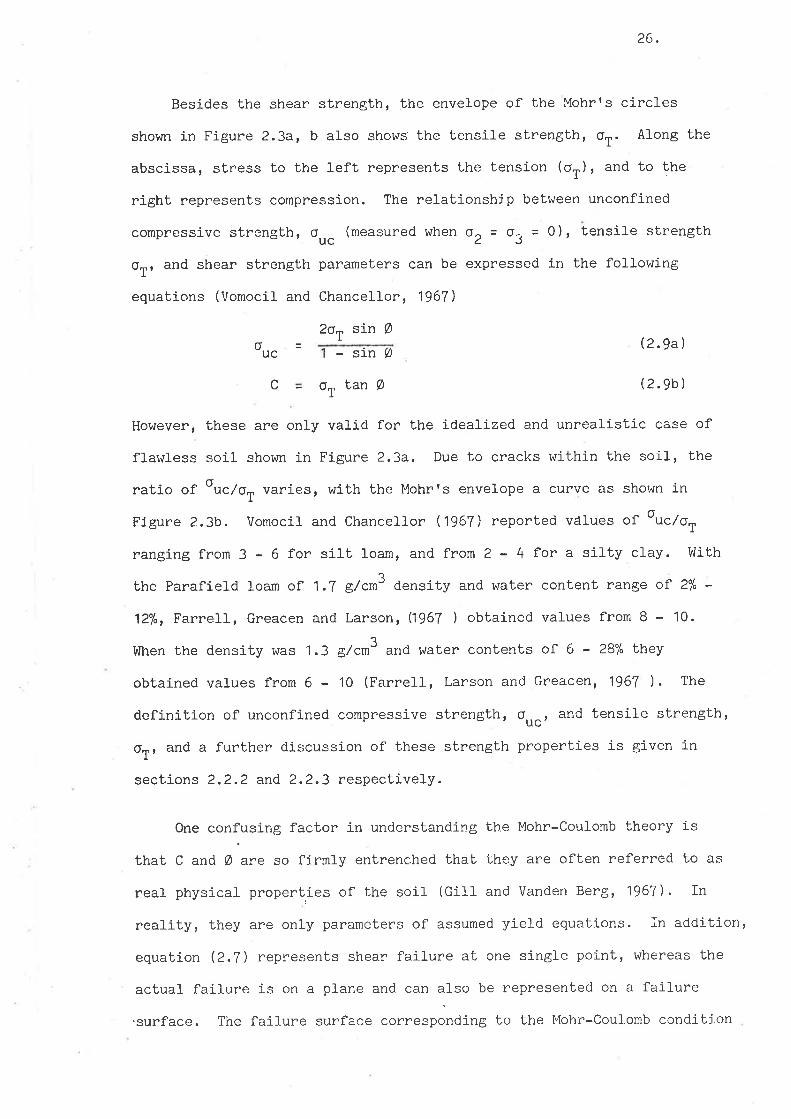
26.
Besides the shear strenglh, the envelope of the Mohrrs circles
shown in Figure 2.3a, b also shows the tensile strength, oT. Along the
abscissa, stress to the left represents the tension (or) r and to the
right represents compression. The relationship between unconfined
compressive strength, or" (measured when o, = 03 = 0), tensile strength
oT, and shear strength parameters can be expressed in the following
equations (Vomocil- and Chancellor, 1967)
2o, sin Ø
ouc(2.9a)
(2. gb )c o
-sinØLan Ø
T
However, these are only valid for the idealized and unrealisbic case of
flawless soil shor,m in Figure 2.3a. Due t,o cracks within the soil, the
ratio of ouclo, varies, with the Mohr's envelope a curve as shown j-n
Figure 2.3b. Vomocil- and Chancell-or (1967) reported vâlues of ouc/o,
ranging from 3 - 6 for sill loam, and from 2 - 4 for a silty clay. !,lith
the Parafield loam of 1.7 g/cm3 density and water content range of 2% '
12%, FarreJ-l, Greacen and Larson, (1967 ) obtained values from B - 10.
tlhen the density was 1.3 g/cm3 and water contents of 6 - 28% Lney
obtained val-ues from 6 - 10 (Farrell, Larson and Greacen, 1967 ). The
definition of unconfined compressive strength, ouc, and tensile strength'
orr and a further dlscussion of these strength properties is given in
sections 2,2.2 and 2.2.3 respectively.
One confusi-ng factor in understanding the Mohr-Coulomb f,heory is
that C and Ø are so firmty entrenched that they are often refered to as
real physical properties of the soil (GiIf and Vanden Berg, 1967). In
reality, they are only parameters of assumed yield equations. In addibion,
equation Q.7) represents shear failure at one single point, whereas the
actual failure is on a plane and can also be represented on a failure
.surface. The faiLure surface "o""u"Oonding
to the Mohr-Coulomb condition
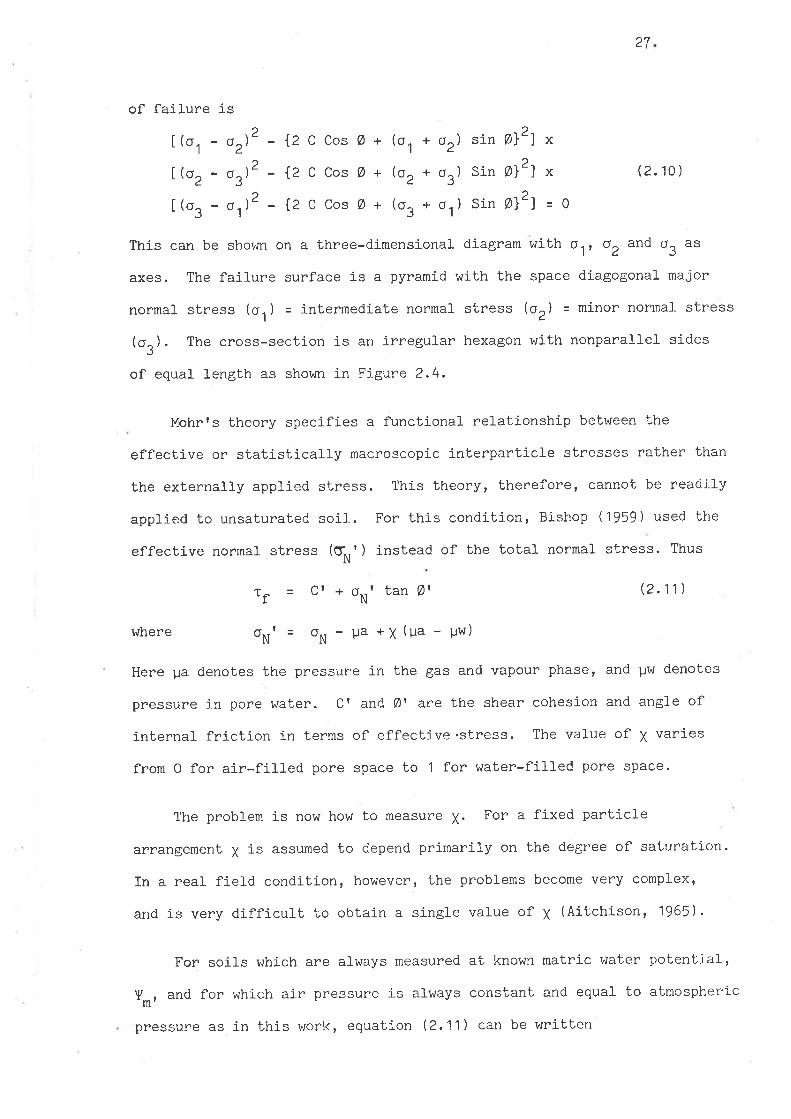
¿l
of failure isa
[(o,, - o)'- {, c cos Ø + (o, + or) si-n Ø}2] x
l r'r- o=)' - {2 c cos Ø + Gr+ or) sin ø}21 x (2.10)
)[(o, - oì' - {2 c cos Ø + (o, + o.,) si-n ø}2] = O
This can be shov¡n on a three-dimensional diagram with O.'r O, and oi3 as
axes. The failure surface is a pyramid with the space diagogonal major
normal stress (o.,) = i-ntermediate normaL stress ß) = minor normal stress
(or). The cross-section is an irregular hexagon with nonparallel sides
of equal- length as shourn in Figure 2.4.
Mohrrs theory specifies a functional rel-ationship between the
effective or statistically macroscopic interparticle stresses rather than
the externally applied stress. This theory, therefore, cannot be readily
applied to unsaturat,ed soil. For this condition, Bishop (1959) used the
effective normal- stress (CfNt ) instead of the total normal stress. Thus
Tf = Cr * oNt Lan Øt (2.11)
where oNt = oN-Ua+X(Ua-Us¡)
Here pa denotes the pressure in the gas and vapour phase, and pw denotes
pressure in pore water. Cr anr) Ør are the shear cohesion and angle of
internal friction in terms of effective .stress. The value of X varies
from O for air-f1]1ed pore space to 1 for water-fill-ed pore space.
The problem is now how to measure X. For a fixed particle
arrangement X is assumed to depend primarily on the degree of saturation.
In a real field condition, however, the problems become very complex,
and is very difficult to obtain a single value of ¡ (Aitchison, 1965).
For soils which are always measured at knov¿n matric water potential '
Vr, and for which air pressure is aÌways constant and equal to atmospherI-c
pressure as in this work, equation Q.11) can be written
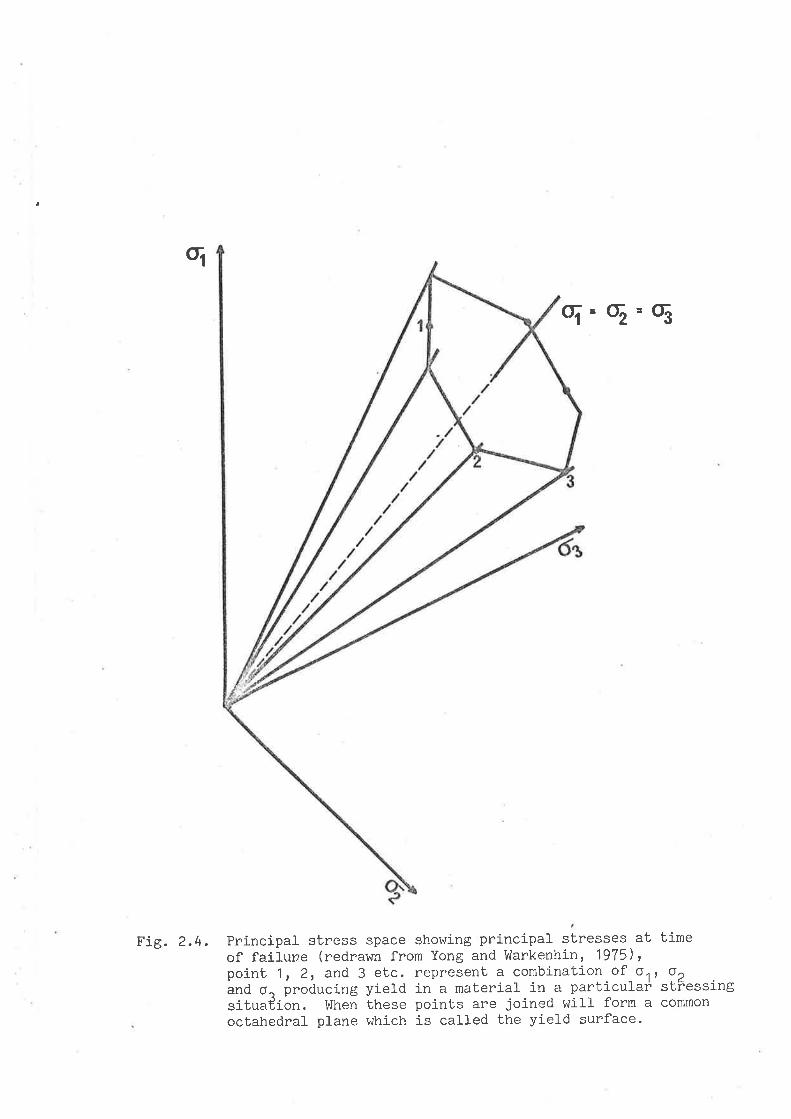
(rl
Oi= C2=Ag
principal stress space showing principal stresses at timeof failure (redrawc from Yong and ülarkenhin, 1975),point 1, 2, and 3 etc. represent a combination of o,' r o2and O. producing yield in a material 1n a particular stFessingsituaÊion. tr¡lhen these points are joined will form a common
octahedral plane which is cal-Ied the yield surface.
Fig. 2.4.

28
, rf = Cr + (o* - XYr) Lan Ø' (2.12)
As soil dries from saturationr ¡ decreases from 1 to 0, and Y* decreases
from 0 to --. Hence (-XYm) is positive and goes to a rnaximum at
potential somewhere around Ym = -10 kPa.
!ùilliams and Shaykewich (1970) rel-ated the value of X to the matri-c
water potential. They found that at a matric water potential of about
-100 kPar { was about 0.4 and 0.1 for the Gretna clay and the !ùellwood
loam respectively. hlhen the matric water potential was about -1 MPa,
the corresponding values of ¡ were 0.1 and 0.0.
Lambe (1960) interpreted shear strength in terms of interparticle
forces. He suggested that there were severaf forces acting between
particles, namely (1) Fr, force where contact is mineral - mineral;
(2) F"t force where contact is air - mlneral; (3) F"t force where
contact is water - mineral or water - water; (r) Rr: electrical repulsi.on
between particJ-es; and (5) Ar: el-ectrical attraction between particles.
Ï'Iith these forces, he proposecl an equation
oN=o'4.*P"4"*uAw+R-A (2'13)
where ot is the effecti-ve stress between minerals derived from and
associated with F*i A* is the unit conta'ct area for mineral- - mineral-;
P^ and A^ are the unit pressure and unit area directly associated withaaF^; U and A-- are the pore water pressure and unit area directly associateda''wwith F*i R and  represent unit el-ectrical forces of repulsion and
attraction respectively.
It is, however, very difficult, if not impossib}e to measure all the
components listed above. To o.iu".o.u this difficulty, Yong and V,larkentin
(1975) simplified equation Q.13) into
oN
for saturated soil-.
or+U+(R-A) Q.14)
29
Equation (2.7) and (2.11) show that the factors responsible for
the shear strength of a cohesive soil are the frictional resistance
and the shear cohesion. Lambe (1960) divided the shear strength
component into three basic components. These are, ( 1 ) cohesi-on , (2')
dilatant, and (3) friction. However, it is not possibl-e to adequately
separate and study the contributions of these components.
The friction angle used in equations (2.7) and (2.11) which is
often refered to as ühe physicaJ- component of shear strength arises
prì-marily from the resistance to nelative movemenL of sliding of one
particle on another, and to interl-ocking between particles. Rosenqvist
(1959 ) divided the interlocking phenomemon into ( 1 ) microscopic inter-
locking resulting from surface roughness of particles which results j-n
smal-I movement of particf es normat to the failure plane, and Q)
macroscopic interlocking of particles requiring appreciable movement ..
of particfes normal to the failure plane, and hence resulting in an
increase in volume pri.or to failure. According to Rowe (1962) tfre
frictional resistance arises from sliding of grains in contact,
resistance to volume change, grain rearrangement, and graÍn crushing.
The value of frictional- resistance can be described by using the
angle of internaì- friction, or by using tfr" co"fficient of friction (f)
which is equal Lo Lan Ø. in this thesis, the first method is used.
It has been found that frictional- resistance can exist between
granular materials, such as quartz, feldspar, and calcite, as well as
in between sheet minerals, such as mica. Some factors that have been
found to infl-uence the magnitude of the frictional resistance are
particle size, water content, surface roughness, and packing of the
particles.

30
The effect of particle size on friction angle has been studied
by Rowe (1962) who showed that the angle of internal friction decreased
with incneasing particle sj.ze. Coarse silt had a friction angle of 3Oo,
whereas fine, medium, and coarse sand had a friction angle of 2Bo , 25o,
and 22o respectively. It seems bhat the larger particles are able to
ro11 more easily than the smaller particles, perhaps as a result of
their centre of gravity being further away from the pJ-ane of shear
(Lambe and !'lhilman, 1969). Consequently, the friction angle will be
smaller as the size of particles are larger. ülhen these materials are
mixed with clay, however, the opposite effect has been observed.
Kenney (1967 ) found that both in clay - quarLz mixture and in natural
soils the friction angl-e decreased with increasing clay content.
Further, he found that with the same clay mineral content, the friction
angle of soil containing hydrosmica was greater than that containing
montmorillonite. The friction angle of Se1nes soil containing about
50% hydrosmica was about 30o. For Vayont soil containing about 50%
montorilLonite, the friction angle was only about 1Oo.
The effect of water content on the friction angle of grain mineral
differs from that of sheet minerals (Horn and Deere , 1962) . lnlater acts
as an antilubricant when it is applied to the surface of grain mineralst
and as a lubnicant when it is applied to the surface of sheet mineral-s.
Horn and Deere (1962) found that oven-dried quarLz from !'liscotlsln had a
friction angle of about 90. !{hen this quarlz \^¡as oven dried and then
air equiliUrateO, the friction angle was about the same as it was in the
oven dried condition. !,lhen it was saturated, however, the friction angle
increased to about 15o. For sheet mi-nerals, Horn and Deere (1962) showecl
that the friclion angJ-e of muscovite was abouL ?2o, 1Bo, and 1 20 for
oven-dried, oven-dnied air equilibrated, and saturated conditions
respectively. Panwar and Siemens (1972) measured the friction angle of

3',1 .
Drummer silty clay ì-oam with clay content of 31%, plastic limj-t of 31%
and liquj-d limit of 5B%, and found that the friction angle decreased
with increasing waten content from W = 16% Lo W = 25%, above 25% a
further increase in water content did not infl-uence the friction ang1e.
It has been found Lhat frictj-on angle increases with increasing
surface roughness (Horn and Deere, 1962), Surface roughness had rncre
inffuence on the friction angJ.e of quartz under oven drj-ed or oven-
dried air equilibrated conditions than it had under saturated condition.
Based on this resul-t, Horn and Deere (1962) suggested that the anti-
lubricating action of water diminished rapidJ-y as the surface becomes
rougher. A simifar resuÌt has been found by Bromwel] (1966).
The influence of packing density on the friction angle can be
explained from inLerlocking, and is hence a dilation phetromenon. As
discussed previously, the frictional nesistance of a soil is made up
of the frictional resistance of g""i-n= on contact, particle rearraÌlgerreri--,
grain crushing, and dilation. At high porosity (thus high void ratio),
the frictiona1 resistance arises from sl-iding between grains on1y. As
the void ratio decreases, in addition to the work required bo move
particles relative to one another, frictional resistance also arises
from the work required for particJ-e """"".ng"ment
and/or diÌatj-on. The
void ratio at which fail-ure occurs at a constant volume, thus at which
no work is required to produce dilatation is called the I'critical void
ratio". This critical void ratio is obtained at }arge strains and
corresponds to thettresidualtrrather than the ttpeakrrsoj-l shear sir"eirgth"
Thus angles of internal friction angle measured from plots of residutal
strength against normal stress are independent of initial- soil- packing
density or void ratio. It has been found that for a packing of mediurn*
fine sand with maximum unl-oaded porosiLy of 46%, this critical void
ratio corresponds to a porosity of abouí 42% (Rolve, 1962).

'))
The more clense is the soil, the greater is the expansion which
tends to Lake place during shear. Thus more energy (hence more force
and a higher friction angle) must be expended to shear the soil. This
is in good agreement with the resuÌt of Panwar and Siemens (1972) which
showed that at 20% water content the friction angle at (peak) failure
of the Drummer silty clay was about 25o, 35o, and 40o for bulk densities
of 1.2; i.3 and 1.4 g/cc respectiveJ-y.
Rowe (1962) found that the friction angle of medium sand increased
with decreasing void ratio. At a void ratio of 42% the friction angle
was about 3Oo, and when the void ratio of this packing was 387" and 34%,
the friction angle was 34o and 40o respectively.
Frictional resistance may some times be considered as a physico-
chemical phenomencn (Yong and lrlarkentin, 1975). Because particle
surfaces are not absolutely smooth, when two particles are brought into
contact each other under stress, the contact point will deform
elastically or plastically to an amount sufficient to sustain the
applied effective stress. The close proximity of contacting areas
resufts in adhesion due to electricaf forces of attraction. The
adhesive forces contribute to shear resistence, and must be overcome
if sliding between contracting particles is to occur.
Shear cohesi-on may be interpreted as the shear strength aL zero
normal stress. Again, it must be remembered that the shear cohesion
value in equations Q.7) and Q.11) is only an analytical parameber.
This must not be confused wibh the property of true cohesion, or inter-
particle cohesion. As discussed previously, the anal-ytical parameter
of shear cohesion is obtained from laboratory tests coupled with
application of a failure on strengLh theory. Cohesion as a property of
.a soil- is considered further when discussing tensile strengLh in section
2,2.3.

33
As discussed previously, the shear sl,rength of a cohesj.ve soil is
made up of the frictional resistance and shear cohesion. Any factor
influencing these parameters, therefore, will influence the shear
strength of the soil. The influence of soil- water content on shear
strength has been investigated by many workers (Greacen, 1960; Tornrner,
1961; 1974; McCormack and Vlilding, 1979). Greacen (1960) found that
with the same normal stress, the shear strength of saturated soil was
lower than that of unsaturated soil. Towner (1961) suggested that
internal soil water potential is equivalent to an external- forces of
the opposite sign. In a later study with 17 ADAS standard texture soils,
Tov¡ner (1974) found that shear strength i-ncreased linearly with
increasi-ng water content. Usi.ng the Canfield (Aquic Fraguidalfs: fine
Ioamy, mixed, mesic) and Geeburg (Aquic Hapludalfs: fi-ne, illitic, mesic)
soils with water content range of 15% - 3O%, McCormack and V'iilding (1979)
descnibed the decnease in the shear strength with increasing water
content with a curvilinier refationship.
Shear sbrength increased with increasing plastic limit and
ptasLicity index (Hampton, Yoder and Burr, 1962). Towner (1974 ) related
shear strength to soil texture, and found that the shear strength of sandy
loam soil- was much lower than that of Ioam or clay soil-. McConmack and
ûrlilding (1979) showed that shear strength is positively correl-ated wi1"h
coarse clay (1 - 2 Um), and negative]y correl-ated with fine clay
(< O.0B ¡rm) content. Further, they showed that shean strength was
positi.vely correlated to bhe total cÌay content.
It can be expected from Lambers (1960) theory (equation 2,13) Lhat
soils with the same amount clay content may have different shear strengths.
The shear strength of sodium montmorillonite is greater than that of
calcium montmoril-lonite (lriarkentin and Yong, 1962). Sodium montmorill.onite
is a highly swelling clay, thus Ít has a high interparticle repulsion'

34
According to equation Q.13) and Q.14) tfiis wilL result in a hj-gh
normal stness provided that expansion is prevented. Calcium
montmorillonite, on the other hand, swells by a much smaller amount.
Consequently the repul-sion forces, and hence the normal stress is
smal1er.
A decrease in shear strength with decreasing interparticle repulsion
can be explained by a model in which strength arises from the force
required to readjust particles to form a failure plane (ltlarkentin and
Yong, 1962). This readjustment is restricted by interparticle repulsion.
Any decrease in interparticle repulsion, therefore, allows an easj-er
particJ-e readjustment, andhence, can result in a decrease in shear strength.
Warkentin and Yong (1962) have shourn that the shear strengths of
sodium and calcium montmorillonite decrease with increasing void ratio.
McCormackandWilding(1979)usedbulkdensityinsteadofvoid.ratio,
and found that shear strength decreased with decreasj-ng bulk density.
AII present measuremenLs of shear strength attempl to evaluate the
two parameters C and Ø, Kept in mind, however, these are parameters of
the mathematica] representing of shear strength only. Physically' these
two para.meters are not separate or unique entities and so are not true
physical properties. Until a different model is proposed, the measurement
of shear strength wil-I centre around evaluating shear cohesion and
frictional- resistance (GilI and Vanden Berg, 1967).
The oldest and simplest device to measure shear strength is that
cal-led the 'rdirect shear apparatus'r. It was used by Coulomb in 1776
(Lambe and Whitman, 1969), and is stj.lI widely used. Severaf types of
direct shear apparatus have been developed. These incl-ude that used for
in situ measurement, such as rttorsional shear boxrf described by GoJ-lis.'
George and LJ_oyd (1978) to measure shear sLrengths of seed-beds.

35.
In all direct shear apparatus, the normal and tangential- (shear)
forces are measured as well as the relabive movement of the apparatus
with respect to the soil. The normal and shean forces dj-vided by the
appropriate failure area gives the required stresses. Movement is
generally expr'essed in term of strain. By plotting the shear stress
against the straÍn, the shear strength (the shear stress at, fallure)
can be determined. lrlhen there is a peak value in this relationship,
failure j-s assumed to occur al this value, and when there is no peak
value, failure is assumed to occur when the curve attains its limiting
maximum (plateau) level. The shear strength parameters C and Ø can bc
found from a series of shear measurements at different level-s of nonmal-
stress for a given soil condition. The shear stress at failure t,' 1s
plotted against the associated normal stress, on. The slope of this
curve represents the coefficient of internal friction, Lan Ø, and the
value of shear cohesion, C, can be found by extrapolating the curve to
zero normal stress (equation 2.7],.
Another common device to measure shear strength is the rrtriaxial
celltt. The name of tri-axial device indicates that the stresses can be
controlled along three axis. In reality, however, this is not the case,
because most tests are done with the two lateral- (intermediate and minor)
princi-pal stresses the same (o, = or¡. An excellent discussion on the
measurement of soil strength wlth the triaxial cell has been published
by Bishop and Henkel (1967). In this test, a cylindrical- soil specimen
is first subjected to confining pressure, o"r which equally stresses all
surfaces of the specimen. Then the axlal stress is increased, Ao.r until
the specimen fail-s. As discussed previously, fail-ure is judged to have
occurued either when clear fracture is evident, or when the diamet.er of
the specimen increases. Since there are no shearing stresses on the
sides of the cylindrical specimen, the axial- stress, o" + Ao., is the

36.
maior principal stress (o.,, ), and the confining stress, ac, the
minor (and intermediate) principaf stress (oa). To obtai-n the stnength
parameters, C and Ø, a series of tests with different confining pressures
are done. The resulting principal stresses are plotted on the absisca
of the Mohr diagram, and circl-es with radii R = (o1
; ot)
are drau¡n. The
coefficient of friction, Lan Ø, is obtained by drawing tangent or envelope
of these circles, and the shear cohesion value, C, can be oblained either
by extrapoJ-ating this line to the zero normal stress, or from (Yong and
l,Iarkenti-n, 1975)
R =CcosØ+ sin Ø Q.15)
The device called the tfdrop cone penetrometertr which in the past has
been widely used by Swedish geotechnicians (Hansbo, 1957), is now again
receÍved much atlention (Totrner, 1973; Campbell, 1975). A commercial
drop cone penetremeter, which consists of a penetrometer of 3Oo t 1o
cone angle and 35 mm length with the mass of 80.0 g, has been buii-t by
the Laboratorie central des Ponts et Chauses, Paris (Campbe1.I, 1975;
1976) .
To measure shear strength, first the cone is adjusted to just touch
the surface of the specimen. It is then rel-eased, and its penetration
depth is measured after it has come to rest. Hansbo (1957 ) has given a
rel-ationship between the depth of penetration, h (mm), and the undrained
shear strength, 'r, (N/m2), as
Q. 16)
where M (g) is the weight of penetrometer and shaft, and k is an adjustable
parameter.
Towner (1973) has shown that the val-ue of k is infl-uenced by soiJ-
type, especially the lexture of the soi1. A cJ-ay soil has value of
M
3kTu

37
3 sil-t l-oam, sandy loam,
2.4 x 10³, 1.0 x 10⁴,
k=7.9Xi0 and a cÌay loam, silty clay laom,
loamy fine sand soils ahve k val-ues of 5.4 X 10³,
6.9 X 10³, 1.6 x 10⁴, and 1.2 x lO4 respectively.
The drop cone penetrometer has the additional advantage that, besides
shear strength, it can al-so be used to measure Atterberg limits as has
been done by Sheerwood and Ry]ey (19T0) and others (Campbell, 1975;
1976; Campbell, Stafford and Blackwell, 1980; MuJ-Iins and Fraser, 1980).
2.2.2 Compressive strength
Compression can be considered as the change in volume of a soi-l- uncier
applied stress. Failure by compression, therefore, might be defined as
the state of stress at incipient vol-ume change (Gi1l- and Vanden Berg,
1967). The compressive strength discussed here must be differentiated
from unconfined compressive strength or the compressive strength
obtained from shear strength measurement which is discussed by Lambe
and lfhitman, 1969 ) .
The unconfined compressive strength is obtained from shear strength
measurement with 6r= a, = O. In this test the unconfined compressive
sfrength, ouc, is equal to the major prlncipal stress at fail-ure
(Vomocil and Chancel-lor, 1967), and the shear cohesi.on can be cal-culated
by Panwar and Siemens, 1972)
c Ø
2))o /(2 Lanuc(i+ (2.17 )
Dexter and Tanner (1974) differenliated compressi-on into
consolidatj.on and compaction. Vrlhen deformation occurs with the expulsion
of air compaction is said to occur, and when it occurs with the expulsion
of water, consolidation is said to occur.

3B
To describe the compressive strength defined above, it requires
the stress and volume strain relationship. Bekker (1969) related pJ.ate
sÍnkage, Z, to applied stress, S, with the equation
a m (2.18)
where k" is a cohesive modulus of deformation, k, is a frictional modulus,
b is the smaller dimension of the loading area, and m is an adjustable
parameter. The parameter" kc, k, and m have been used in studies of the
sinkage and performance of wheels and tyres.
This equation, however, does not relate stress and volume changes
directly. It has been widely assumed that the major principal stress
is reÌated to volume strain. This concept has been examined by Vanden
Berg, Buchele and Malvern (1958) and Harris, Buchele and Malvern (1964).
Neither was able to support or reject this concept. Despite the
extensive work which have been done since Gi1] and Vanden Berg (1967)
developed the idea of compressive strength discussed above (e.g.
Vomocil and Chancellor, 1967; BaileyandVanden Berg, 1968; BaiIey,1971;
Aref, Chancellor and Niel-sen, 1975), it seems that no satisfÍed stress -
volume strain relationship has been developed. Consequently, simplifyi.ng
assumptions are usually made.
Since compression can occur both with and wj.thout shear (Baver
et a7., 1972), it is very difficult to differentiate between failure by
shear and fa1J-ure by compression. The fail-ure by compression and by shear
can be considered as two separate phenomenon only when the behaviour
can be adequately described. Even so, shear and compressive failure
must have a common basis, because in both ca-ses, the same kinds of
inter-part,icle bonds must be broken, and in both cases the same parLicles
have t,o rearrange themselves.
uØk
c+
bz

39.
It has been suggested that in a wet aggregated soil, compression
occurs as a result of plastic deformation (Day and Holmgren, 1952i
McMurdie and Day, 1958; Davis, Dexter and Tanner, 1973). Plastic
deformation occurs when the applied stness overcomes the shear strengl,h
of the soil. In a dry aggregated soil, compression occurs as a resul-t
of aggregate rupture (Dexter, 1975; Kezdi, 1979), and it has been shown
elsewhere that aggregate rupture occurs when the applied stress is
capable of ovencoming the tensile strength of the aggregates. Any
factor which influences the shear and tensiJ-e strength of a dry aggregated
soiI, therefore, will influence its compressive strength. In addition,
since compression occurs when there is a decrease in the volume of
volds (Kezdi, 1979), packing of soil particles shoul-d also j-nfl-uence the
compressive strength.
Because of the difficulty in defining the stress at which fai1ure
occurs, the compressive strength (as defined above) is usually not
represented in terms of strength, bul is represented as the resistance
of the soil to compressi-on. This can be shornnr by the changes in the
vol-ume of the soil, void ratio, bulk density, or packing density.
In discussing the work of some earl-ier workers, Harris (1971)
showed that both the rate and total- changes in bulk density for the
Decatur siJ-ty cl-ay loam, due to applied, slress was greater than thaL
for the Loyd clay soil-. Further, he showed that when clay, silty loam,
and sandy loam soifs were compacted at air dry equilibrium, there was
no difference in the changes in bulk density. Ii'lhen the soils were
compacted at a higher water content, however, the compressive strength
of the clay soil was greater than thab of the sandy loam soil. This was
shown by the fact that the changes in bulk density of the clay soil- were
smaÌIer than those of the sandy foam. At water content of B%, the change
40.
in bulk density of the clay soil was 0.17 e/cn3, whereas the change
in bulk density of the sandy l-oam was 0.45 g/cn3.
The difference in the compressive strength for different soil types
may result from the difference in particle size distributions, cJ-ay
content and clay type, cation type and cation concentration. Harris
(1971) has suggested that the change in void ratio with appJ-ied stress
is greater for a poorly graded soil than for a well graded soil-. !üell
graded soil contains both coarse and fine grained particles. The
number of particle contacts and the area of contact for any one particle,
therfore, will be larger. Hence the resistance to shear induced motj.on
in such a soil will be greater than that in a poorly graded soil-.
The type of clay mineral determines the forces of attraction
and repulsion and therefore also the soil structure. A soil
containing sodium montmorillonite (which is a highly-swelÌing mineral)
has a rand.om structure. with kaolinite, on the other hand, the
structure is flocculated. Here "floccul-ation" implies a close
aggregation of particles without any specific orientation,
whereas "random" implies an aggregation in random orientation
but not in cl-ose contact (see Yong a¡rd Vflarkentin, L975, p.83).
Craford. (f964) and Yong and !ùarkentin (1966) have shown that, at
first, the change in void. ratio with applied stress in a marine clay
with an initial floccufated stn¡cture is very small, and Iower than
that in a remoulded clay with a random structure. VÍhen the
structure has broken at a kind of "threshold" stress, the void
ratio changes with further increases in applied stress are very
large, a¡rd are greater than tho6e in clays with random structure.
The attract,ion and repulsion forces in a soil- are also infl-uenced
by the dominant type of cation present. The compressibilj-ty of kaolinite

41.
has been found to decrease according to the order of Li > Na > K > Ca ) Ba,
and for bentonite the order is Li > Na > Ca > K (Sa]ás and Seratosa, 1953).
Chancell-or and Schmidt (1962) evaluated the effect of initial bulk
density on compressive strength in terms of k" and k, in equation (2.18) '
and found bhat both for the YoIo loam and Greenfield sandy loam the
value of k" and k, increase with increasing initial bulk density. This
shows that the greater is the initial bulk density, the greater is the
compressive strength.
Compressive strengbh decreases with increasing water content dourn
to a minimum value, and then increases with further increases in water
content (Nichols, and Baver, 1930; Raghavan et a7., 1976). This minimum
vafue usuaJ-J-y exists within the plastic range. Harris (1971) has shourn
that with an initial bulk density of 1. 4 g/cn3 and an applied stress of
about 138 kPa, the bulk density of sandy loam soil aL B% water content
is about 1.9 g/cm3. l,lhen the water content is 1 .5%, the bulk density is2
only 1 .5 g/cmt. The decrease in compressive strength with increasing
water content has also been found by Vomocj-I and Chancellor (1967 ) and
Dexter and Tanner (1973a). Dexter and Tanner (1973a) found that the
increase in packing density (defined as the volume of the soil occupied
by solid particles) with applied uniaxi-al sbress in a soil with 33% plastic
limit and 54% Iiquid limit is greater aL 25.3% water content than that at
16.5% or 6.7% waLer content.
A common assumption j-n the method used to measure compressive
strength is that the major principal stress, a1, is the factor controlling
the change in vol-ume. TÌ'ie soil- is usuafl-y confined in a suitable
container, such as a cylindrical consofidometer cell, then uniaxi-al- stress
is applied to an exposed surface. The apptied axial stress is considered
to be the major principal stress. Unfortunately, Lhe frictional

42
characteristics of soil causes non-uniform stress distribution, and in
a narrov,r compression cyli-nder arching may occur. To eliminate this effect,
Koo1en (1974) used the mean vertical stress, ov, instead of the total-
applied stress, and used the equation
there o, and oO
respectively.
or, =0.5(or+oo) Q,19)
are the stress on the top and on the base of container
Another factor which may infJ-uence the result of this test is the
friction resislance of the container wall-s. To minimise this effect,
Koolen (1974) estabtished an equation to relate the dimensions of the
container to the applì-ed stress
ob (d/h) - 2k tan ô(ffi{ ] Q.20)ot
where d and h are the diameter and height of the sample, k is an adjustabJ-e
parameter, and tan ô is the coefficient of sliding fraction between the
soil and the container wall material.
hrith this equation, Koolen (1974) suggested that bo obtain meaningful
resul-ts, the value of d/h shoul-d not be less than 2.
Compression tests may also be done in a triaxial cell as has been
done by BaileyandVanden Berg (1968) and Bailey (1971); Dexter and Tanner
(1973a) ernployed the principle of the triaxial apparatus. They prepared
cylindrical samples of two sizes: 102 X 102 mm and 38 X 38 mm. The
side of the soil sample was encfosed with a rubber membrane which was
attached to the metal end plates by O-ring seals. Between the l-ower ends
of the sample and the bottom metal end plate, a porous disc was located.
The confining fluid around the sealed soil was water. Hydrostatlc
pressure was applied (o,l = o, = o,), and the change in the vo]-ume of the
43.
sample r^ras determined by measuring the vofume of the fluid exuded from
the bottom of the sample through the porous disc. The restlfts were found
to be independent of sample size.
2.2,3 Tensil-e strength
Soil is considered bo fail by tension when separatJ-on occurs. The
tensile strength of a soil may be defined as the state of stress at which
incipient separation occurs. Gill and Vanden Berg (1967 ) discussed the
difficulty in expressing tension failure in precise terms because of the
porosity of the soll. The problem is to specify the area over which the
force acts, because total area of a soil is made up of air, solid materiafr
and water area. For simplicity, the total area of the soil is usually
used.
Tensile strength is usual-Iy considered to be a measure of cohesion.
hlhen a soil fail-s in tension, only cohesive forces contribute to the
resistance, and thus, at least in principle, it is not subjected to
frictional effects (Ingles, 1962), However, this tensile cohesion is not
the same as the shear cohesj,on in equations (2.7 and (2.11). To
differentiate cohesion measured by tension from the rrshear cohesionrt,
this type of cohesion is cal-l-ed I'interparticle cohesion" in this bhesis.
Tensile strength, oT, i-s on the abscissa and shear cohesion, C, 1s on the
ordinate in Figure 2,3 a, b.
Several factors are responsible for the development of soil tensile
strength under field condition-s. Haines (1925) suggested that, cohesion
was made up of (1) true cohesion, and (2) induced or temporary cohesion
due to the surface tension of water films' Lambe (1960) identified
several types of true cohesion, na.mely ( 1 ) fl-occulation cohesi-on, Q) H
and K bonding cohesion, and (3) cementation. Mitchell (1976) suggested
44.
that the true cohesion might result from ( 1 ) cementation, Q) el-ectt"o-'
static-electromagnetic attraction, (3) primary valence boncling, and
(4) adhesion. The induced on apparent cohesion does not depend on
interparticle cementation or bonding, and it may develop from ( 1 )
capillary stress, and (2) apparent mechanical forces'
Cementation between particles can be developed by carbonate,
silica, aluminium and iron oxide, and organic materiafs. These
materials may be derived from the soil minerals themsefves as a resul-t
of weathering processes, or they may be taken from solution. Particl-e
cementation is aided by drying (Lambe, 1960). Not only does drying
bring the adjacent particles cl-ose enough together to permit cemenLing'
but drying also tends to precipitate soluble cementing niateriafs from
the pore water. Ib has been found that drying tends to resuJt in the
production of ferric oxides which are relatively actj-ve cementing agents.
Ingles (1962) suggested thaf the strength of cementing bonds mus'u
be a function of ( 1 ) the cohesive strength of the cement and/or the
substrates itsetf, (2) the adhesive strength of the cement which is
essentially of covalent or ionic bondi-ng, and (3) the area of cement
substrate interface. From this reasoning, he developed the equation
n (2.21)oT P nx1
m
A.I
Here, P is the bond strength per contact zone, m is the mean coordination
number of a grain, X A, is the total surface area of tne ith grain, n is
the number of grains per-unib cross section of faj-l-ure plane, and e is
the void rati-o.
Electromagnetic attraction originates from Van der lolalls forces.
These forces are significant only at separation dlstance fess than 1000

45.
Ao (Ingl-es , 1962) , and vary inverseJ-y as the fourth pohrer of the
separation distance (Mitchell, 1976). The tensile strength arisi-ng
from Van der Walls forces for two equal spheres of diameter, d, and
separation distance, h, can be computed from
Am Q.22)oT=24ndh 2 (1 + e)
fngJ-es (1962) suggested that an appreciable tensile strength can be
developed by this mechani-sm only for d < 0.26 pm, that is only for fine
montmoril-lonitic clays, and for separation distance h < 1OO0 Ao. hlith
these limitations it is like1y that the tensile strength arising from
Van der \,rlalls is insignificant in most real soil"s.
The net charge on the pl-ane surface of cJ-ay particles differs from
that ab the edges. The net electrostatic force resulting from this
edge/face interaction is attractive. Ing1es (1962) computed the tensile
strength arisi-ng from this force as
oT (v (2.23)
where (Vl - V) is bhe potenti-al difference of the surfaces, H is the
separation distance, and k is a constant.
lrlhen a fl-uid wets a particulate medium, it is drawn preferentialJ-y
into the finest capillaries geometrically availabl-e to it. Provided that
3 phases are maintained in the system, a considerable force may be required
to separate the particles. An attempt t,ò develop a mathematical- expression
for the cohesion arising from capillary forces was made by Haines (1925;
1927). The Hainesrs formufae has been discussed by Fisher (1926) and
has been applied to study the capilJ-ary action in plate shape partì-cles
by Nichols (1931). In a l-ater discusslon, Ingles (1962) computed the
tensil-e strength arising from capillary forces from
k v;2 n2
46.
mnT Ir1r ) Aj+Cj Sin (0+V) (2.24)oT n
\.
1
2(1 + e) A.].
!'lhere A- is the planar projected area of the liquid-substrate interface'J
T is the surface tensi-on of tiquJ.dr r.' and ?Z ane the larger and smaffer
radii of curvature of the liquid/ai'r interface respectively, 0 if the
contact angle between liquid and sol-id, and t | - Vl is the mean angle
of inclination with respect to the applied stress of all tangents to the
wetted perimeter.
The potential contributions of various sources of strength
discussed above to tensil-e strength of non-cemented soils are shoi^¡n
in Figure 2.5.
Tschebotarioff, Ward, and De Philippe (1953) found that, the tensife
strength of montmorillonit,ic clays was greater that that of kaolinitic
clays. Further, they showed that with increasing addition of sand
particles tensile strength increased to a maximum and then decreased.
Vomocil- and Chancellor (1967 ) investigated the tensile strength of Yolo
sil-t loam QO.3% plastic limit and 33.1% liquid limit), Yolo silty c]-ay
Q1.6% plastic limit and 47.1% liquid limj-t), and Col-umbia silt loam (non
plastic soil). They found that the tensile strength of Col-umbia silt
loam was much lower than that of Yolo silt foam or Yol.o silt clay. This
difference probably arises from the difference in the content of clays
whj.ch act as cementing materials. The clay content of Columbia silt
loam is only 5.3%, whereas those of Yolo silt Loam and YoIo silty clay
are 16.6% and 41,4% respectively. It is interesting to compare the
tensile strength of Yolo silt loam and Yolo silty clay. At low r"ater
content, the tensile stnength of Yolo sil-t loam was greater than that of
Yolo silty clay. At high vrater content, however, the tensil-e strength

6.x1 clays .-+ silts and sands
rú(LI
o)o.h
_9U,
.ot-
6
6.9Ç
cementation bYdePosition
!I.É t E m q9t EBJE lG E¡.F3 ES
øoaoeocaooaêceoeooco0aac
svcsFßüsr,
@eeeøcoeoooo
o@()
CEooeooêce€oo€a
66
o
o
o
Ð
o
-4
o Gooooacoaocaoccoooooo oGeo6oeoocoooooooo
o
e
c
'102
o
@
o
oo
c
o
o
e
€
@
6
ô
o
o
ê
o
o
@
6
€
o
e
@
o
o
o
t@
tÐ
ø
€
o
rt
o
6(¿
G
o
e
o('
o
6
o
o
e
o
o
€
o
o
e
e
6
6@
10' 10 105
x
Particle diameter (¡nrn)
Potential contributions of various boncli-ng mechanism
to soil- strength (redrawn from Ingles, 1962) '
Õ
€e
€
o
6
o
6
e
6
ê
@
o
o
€
ô
6
€
6
@
€
o
o
@
@
Õ
g
çc
€
o
o
ø
@
o
o
FÍg. 2.5
47
of Yolo sitt loam was not diffenent from, or even slightly lower than,
that of Yolo silty cl-ay.
Dowdy and Larson (1971 ) studied the effect of'cation type on the
tensile strength of montmorillonite, and found that the tensil-e strength
of iron montmorill-onite was much greater than that of potassium
montmorill-onite. A high strength of iron montmorill-onite was actually
not to be expected, because iron clay is a highly flocculated clay, and
hence, larger domains wi-th a reduced area of interdomain contact within
a given cross section mighf be'expected. Consequently, l,he tensil-e
strength should be l-ow. For this resuft, Dowdy and Larson (1971) reasoned
that during cation saturation, smafl- quantities of hydrous iron oxides
were formed which served as a cementing agent at the foad-bearing areas
of contact. This imparted a greater st,rength to the iron clay than
expected.
Vomocil and r,{aldron (1962) studied effects of water content on the
tensile strength of unsaturated glass bead systems. Dowdy and Larson
(1970; 1971) found that t,he tensil-e strength of montmorill-onite decreased
with increasing water content. The effect of water content on tensife
strength has also been sludied by Farrell, Greacen and Larson (1967a)
and Vomocil and Chancellor (1967).
The tensile strength of Parafiel-d l-oam (a red-brou¡n earth) containing
12% cLay decreases from about 90 kPa, at about 47" water to about 10 kPa'
at about 12% waLer content (Farrerl et a7., 1967). rn studying the
tensiLe strength of Yolo silt l-oam, Yolo sitty clay, and Columbia silt
Ioam, Vomocil and Chanceflor (1967 ) found that for Yolo silt l-oam ancl
Yolo silty clay, the tensile strength decreased with increasing water
content. For Col-umbia silt l-oam, however, t,here was refativeJ-y IitL1e
influence of water content in the range they used.

4B
Quirk and Panabokke (1962) found that the tensile strength of
natural aggregates collected from virgin Urrbrae soil (2.7% organic
matter) was greater than that of natural aggregates collected from
cultivated Urrbrae soil (1.3% organic matter). The tensile strength
of remoulded cores made from these soils, however., ü¡as not much different.
They, therefore, suggested that the di-fference in the tensile strength
of the natural aggregates from these two soils was not due to organic
matter content per se, but rather due to the disposition of organic
matter in the soil matrix. Rogowski and Kj.nkham (1976) found Lhat the
natural- aggregates of Storden (15.1% clay and 0.99 organic matter content),
t'lebster (31.4% clay and 3.26% organic matter content), and Luton (52%
clay and 2.96% organic matter content) soils in the air dry condition'
had tensiJ-e strengths of about 139, 338 and 1016 kPa respectiveÌy. !'lhen
they were equitibrated at -1500 kPa potentì-al, the corresponding tensile
strengths were abouí 27, 23 and 59 kPa.
In addition to the factors discussed previously, the tensile strength
of a soil can be reduced by the occurrence of flaws or cracks. The
tensile strength of an ideal isotropic material exhibiting no plastic
deformation and containing cracks of length 2.Q,, can be calcul-ated by the
well knovm Grlffithrs (1921) equation
oT (2.. E _y.)29"
(2.25a)
and oT (2Ey) Q.25b)n 0 (1-v)¿
for plane stress and plane strain conditions respectively. Here E is
the Youngrs modulus, v is the Poisson's ratio, and y is the surface
energy of the material.
The influence of cracks on tensife strength has been discussed
elsewhere (e.g.Ing1es and Lafeber, 1966;1967), and a statistical theory
49.
of brittle fracture for -soiI aggregates has been developed by
Braunack, Hewitt and Dexter (1979).
Braunack (1979) tried to reÌate the tensile strength of soil
aggregates to crack J-ength per unit area as observed on thin, impregnated
sections. He, however, did not find any significant relalionship. To
account for this, he reasoned that probably there were invisibl-e cracks
which influenced the tensil-e strength, but which coul-d not be used in
calculating the regression.
To measure tensile strength of a soil, Hardy (1925), GiIl (1959),
and Hendrick and Vanden Berg (1961 ) employed tension directly upon
columns of soil by pulling at the ends. Metcalf and Frydman (1962) and
Ingles and Frydman (1963) called this method therrdirect tensile stressrt
measurement. An indirect tension test call-ed the rrBrazil-ianil test which
was developed to measure the strength of concrete (Carneiro and Barchelos,
1953) has been used to measure the tensile strength of undj-sturbed soil
cores by Kirkham, De Boodt and De Lenher (1959) and of remoulded soil
cores by Metcalf and Frydman (1962) and Ingles and Frydman (1963). Tn
this method, cylindnical- soil cores are compressed while 1yi-ng on their
side between parallel plates until a tensile fail-ure occurs. The
tensil-e strength, oT, is calculated from
2Fîil Q.26)
where F is th-e force required to fracbure the sample, I is the length of
the sample, and d is the sample diameter.
Vomocil-, I¡laldron and Chancellon (1961) modified the centrifuge method
deveJ-oped by Haefeli (1951) to measure the tensj-Ie streneth. They
preferred this method because, according to their suggestion, the condition
of the sample measured by this mei.hod is simifar to the field condition in
oT

50.
agronomic practice. A block of soil is placed in a centrifuge afl,er
which the speed is increased until faiLure occurs. At fail-ure, the
force i-s calculated from
2F = mo-P Q,2T)
here, m is the mass of the sanple, o is angular velocityr and r is the
radius to the center of the mass.
Vomocil et al. ( 1961 ) have shovm that this method is applicable
over a range of water contents from oven dry to that corresponding to
approximateJ-y -30 kPa matric water potential. This method has been
successfully used by Vomocil and Chancelloe (1967 ) to study the tensile
strength of some agricultural soils.
In addition to be a measure of the strength of the bulk soil, tensil-e
strength measurement has been found to be very useful- to evaluate the
tensile strength of soil clods or aggregates (Martinson and Olmstead,
1949i Dexter, 1975; Rogowski and Kirkham, 1976). The measurement of soil
clods or aggregates is often necessary because the strength of a soil- that
has been broken up (by til-lage) is not longer homogenous. Dexter (1975)
determined aggregate tensile strength by crushing the aggregate between
parallel plates. The tensile strength, oT, was calculated from
o- = kl/d2 (2.28)I
where F is the force required to fracture the aggregate, d is aggregate
diameter, and'k is a parameter, the exact value of which can be determined
by measurement or by theoreLical- stress analysis.
Dexter (1975) used a value of k = 0.576. Rogowski and Kirkham
(1976) suggested that the value k of 0.821 might be better than
k = 0,576.

51.
Besides the tensile strength, several methods have been proposed
to measure the strength of soil clocls. Marshall and Quj-rk (1950) used
the |tdrop shatter testt', which has been widely used to measure the
strength of coals (ASTM, 1946). This method is then used by Lyles and
t'loodruff (1961) and Bateman et al-. (1965) to study the energy required to
pulverize a soil in tillage practice. A mathematical analysis of this
method has been developed by Ingles (1963).
To determine clod strength by the drop shatter test, a clod is
'dropped from a given height, and then the size distribution of the
resulting aggregates is measured by sieving. The resul-t can be simply
presented by the refationship between the input energy and the mean
weight diameter of the resulting aggregates. The input energy i-s
calculated from the produce of the mass of the clod, the height of drop'
and the acceleration of gravitY.
Fountaine, Brown and Payne (1956) developed a method to measure the
shear strength of soil- clods. The clod was coated with wax to prevent
it drying, and then cemented at one end into a mould with a quick drying
plaster. Then torque was applied to a miniature shear box (which had been
pressed into the clod) unlil fracture occurred. The shear strength is
given by
3Tg
zr¡13
where T^ is the tonque to cause shear, and r is the radius of the shearq
box. A simllar method was used by Barrey (1964) in a study of the shear
strength of clods of a red bromr earth in South Australia.
Clod strength has also been measured with a laboratory penetrometer
by Campbetl (1977). He showed that this method is sufficiently sensilive
a.nd reproducibte to be useful- to the sbudy of the strength of clods which
are often lifted in potato harvesting.
rf Q.29)
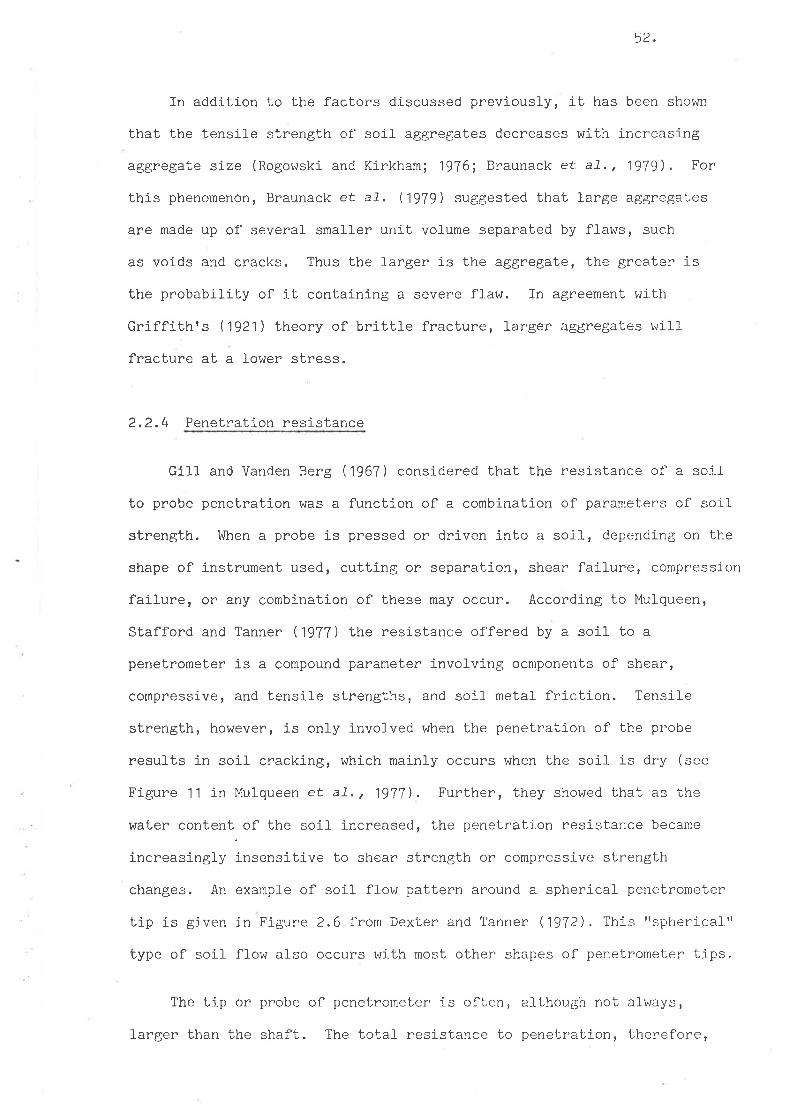
52.
In addition to the factors dj-scussed previously, it has been shou¡n
that the tensile strength of soil- aggregates decreases with increasing
aggregate size (Rogowski and Kirkham; 1976; Braunack et a7., 1979). For
this phenomenÒn, Bnaunack et af. (1979) suggested that large aggregates
are made up of several smaller unit volume separated by flaws, such
as voids and cracks. Thus the Ìarger is the aggnegate, the gneater is
the probability of it containing a severe flaw. In agreement with
Griffithrs (1921) theory of brittle fracture, larger aggregaLes will
fracture at a lower stress.
2,2.4 Penetration resistance
Gill and Vanden Berg (1967 ) considered that the resistance of a so-i-l-
to probe penetration r.ras a function of a combination of paranreters of soil
strength. !{hen a pnobe is pressed or driven into a soil-, depending on the
shape of i-nstrument used, cutLing or separation, shear fail-ure, cornpressiotr
failure, or any combination of these may occur. According to Mu1queen,
Stafford and Tanner (1977 ) the resistance offered by a soil to a
penetrometer is a compound parameter i-nvol-ving ocmponents of shear,
compressive, and tensile strengths, and soil- metal- friction. Tensil-e
strength, however, is only invofved when the penetration of the probe
resufts in soil cracking, which mainly occurs when the soil is dry (see
Figure 11 in Mulqueen et a7., 1977). Further, they showed that as the
water content. of the soif increased, the penetration resistance became
increasingly insensitive bo shear strength or compressive strength
changes. An example of soil flow pattern around a spherical penetrometer
tip is given in Figure 2.6 from Dexter and Tanner (1972), This 'rspherical.'l
type of soil- flow also occurs with most. other shapes of penetrometer tips.
The tip or pnobe of penetrometer is often, although not always,
larger than the shaft. The total resistance to penel,ration, therefore,
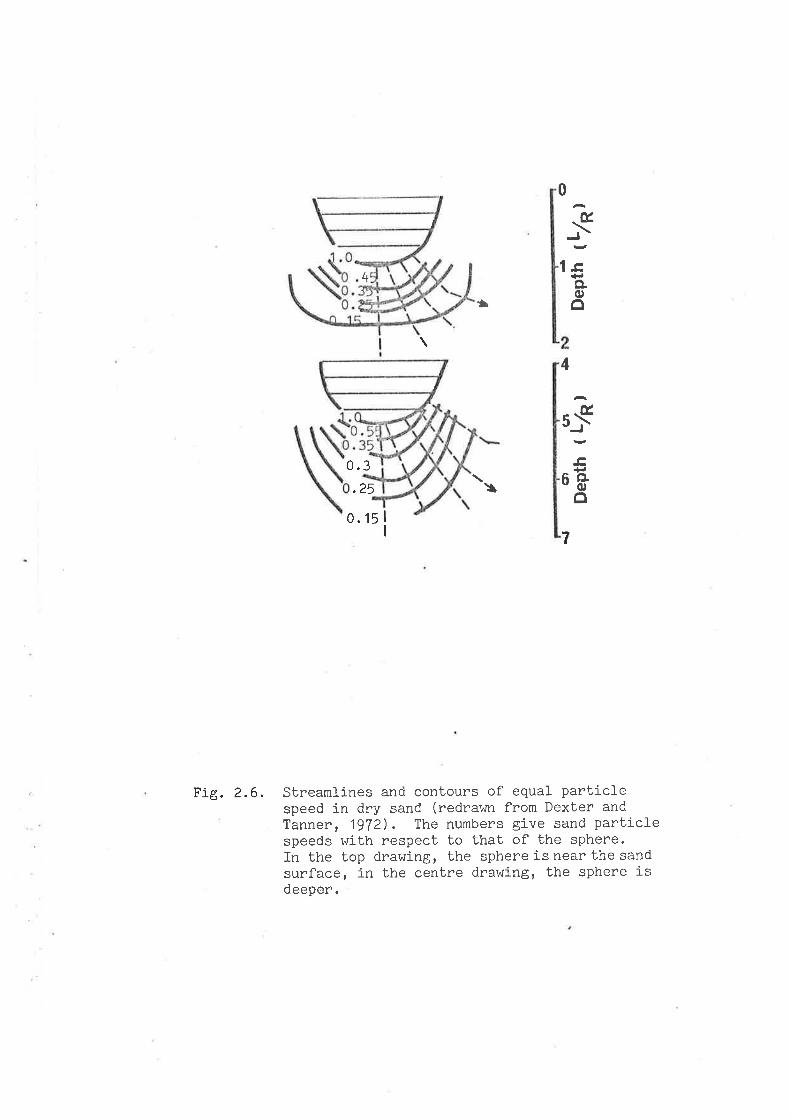
\ /
0
4
É,ì
ooo
1
ù
's6Ë0
\4
0.3.25
0.15 |
I
Streamlines and contours of equal particlespeed in dry sand (redrav¡r from Dexter andTanner, 1972). The numbers give sand particlespeeds with respect to thab of the sphere.In the top drawing, the sphereisnearthesandsurface, in the centre drawing, the sphere isdeeper.
ìl
7
Fig. 2.6.
)t
/
53
reflects bhe soil- conditions near the tip. The nesults are usually
expressed as the force or pressure resisting probe penetration at any
given depth. Knight and Freitag (1962) and others (e.9. lrlismer and
Luth, 1974; Voorhees and lrlalker, 1977) used the rrcone indexrr for the
force per unit projected area of a conical probe of 30o total included-
angle and 323 mrn2 m"*imum projected area. In this thesis, the term
ttpenetration resistancetr, Qp, will be used for the smaller probe used
here, and is calcul-ated from
no = 4 F /tt d2 (2.30 )
Here, F is the force required to push the probe, and d is the probe
diameter.
l^lith a probe of 1.5 mm diameter and 600 tip angle, Barley, Farrell
and Greacen (1965) found that the penetration resistance offered by a
soil in both confined and unconfined cores of 3.6 cm diameter and 2.0 cm
height increased with increasing penetration depth up to 5 mm. For
confined cores, a further increase in penetra.lion depth was not foll-owed
by any change in the penetration resistance, and for unconfined core,
due to crack formation, the penetration nesistance decreased rapidly with
increasing penetration depth. Dexter and Tanner (1973b) found that
with increasing penetration depth, the force required to push the
penetromeler increased towards a maximum llmiting value, and could be
descnibed adequately by the equatlon
F = A+Be-k(L/R) (2.31)
where A, B, and k are adjustabl-e parameters, and L/R is the dimensionless
depth of penetration measured in spere radii. They found that the force
is nearly constant when the penetration depth had reached the val-ue of
L/R = 4,
54.
Following Nishida's (1961) approach, Farrell and Greacen (1966)
developed a mathematical analysis of probe penetration in a compressible
soil-. Assuming that the principal stresses in the soil adjacent to the
probe are the radial and tangential- stresses, a?a.nd ot", required to
form a spherical cavity, then the normal- stress, oN on the basal
surface of the probe 1s given by
oN = å (or" * ot") * å (o""- or") Cos Y Q.32al
and
tan ô = (o"" - ot") sin v/, o* (2.32b)
where
R/ora A (1 + sinØ) (
A (1 - si-nØ) (
4si-nØ
4sinØ
(1 + sin Ø)
(1 + sin Ø)R/
r)
r)
+B
+Bota
Here, Ø is the angle of soil intennal friction, ô is the angle of
soil/metal friction, Y is the direction of the principal stresses, R is
the radius of the sphere of the plastic zone, r is any radial distance
from the point of the probe, and A and B are arbitrary constants to be
determined.
The penetration resistance is then,
0p oN (1 + tan ô cot o ) (2.33)
where o, is the included semi angle of the probe point.
As a mea-sure of soil strength, penetrometer resistance has been
found to tre very useful in many scientific diciplines. Stone and lnlilliarns
(1939) used a penetrometer to predict the draft force of ploughs in
various soil- conditions. Knight and Freitag (1962) and others (e.9. !'Jisrner
and Luth , 1974; Voorhees and l¡lalker, 1977) related penetraLion resistance
to trafficability. Penetrometers have been used by many wokers to study

trtr
effects of soiÌ strength on the growLh of pl-ant roots (e.9. Banley
et aL. , 1965, TayJ-or, Roberson and Parker, 1966; Dextenr 1978). An
exceflent review of this subject has been pubJ-ished by Barley and
Greacen (1967 ) .
The penetrometer discussed here must be cìifferentialed from the
tfdrop cone penetrometerr discussed in section 2.2.1. The simplest type
of penetrometer is that calÌed the trstatic penetrometerr'. To measure
soil strength, the penetromeber is just pushed to any given depth, atld
the strength of the soil. is usually recorded as the cone index or
penetration resistance as discussed previously.
To obtain a contj-nuous reading with depth, several types of
recording penetrometer have been developed (e.9. Hanks and Harknesst
1956; Bar1ey et a7., 1965; Dexter and Tanner, l)l3b; Prather, Hendrick
and Schafer, 1970; Anderson et a7., 1980). The root simulation
penetrometer assembled by Barley et aL' (1965) consisted of a penetrometer
probe and shaft driven by an el-ectric motor. The force ü/as measured with
small proving ring equipped with electrical resistance strains gauges.
Each gauge r¡¡as calibrated by dead load tests. Force I^Ias recorded as a
function of depth of penetration with a milivolt recorder. This was
essential-ly the penetrometer used in the work described in this thesis.
However, here the force v\¡as measured by an electronic digital balance
(Mettler model PC 4400), which gave greater accuracy and repeatabì-Iity.
A hand held recording penetrometer developed by Anderson et al-.
(1980) call-ed the "Sol-id state penetrometerrr is capable of measuring
force up to 500 t 5N. The force is measured with strain gauge
transducer, and the depth is measured by an accurate optical- system.
This penetrometer can be equipped with a programmabl-e calculator which
enables the accumulation of data up to 20 strokes per plot. 0n

56.
interogation, the calcufator displays for each depth: the mean cone
Índex, the standard deviatiotr, and the number of -strokes record.ed at
that depth.
The rate of penetration, probe diameter, and the angle of
penetrometer tip have been found to be among the flactors influencing
penebration resistance. Cockroft, Barley and Greacen (1969) found Lhat
the resistance of a soil to probe penetration r^ras inversely rel-ated to
the rate of penetration. hlith a probe of 2 mm diameter and 600 included
angle, they found that the penetrabion resistance of remoulded B horizon
Urrbrae soil ,64,9% clay) were 1900' 1720, 1510' and 1040 kPa when the
probe was pushed downward at the rate of 0.175 mm/hr, 1.75 mm/hr, 10 mm/hr,
and 60 mm/hr respectively. V,lith a 20 mm diameter spheres, Dexter and
Tanner (1973b) found that on clay (62% ctay and 24% silt), clay with
chalk (46% cl.ay and 30% silt), and loam with peat (26% clay and 36% silt)
soils, the maximum limiti-ng force increased linearJ-y with increasing
penetration rate from O to 1000 mm/hr. For sandy l-oam soil- ( 10% clay
and 1B% silt), the maximum limiting force decreased exponentially as
the rate of penetration increased.
Using steel- spheres with a penetration rate of 20 mm/sec, Dexter
and Tanner (1973b) found thab the maximum limiting force varied as the
square of the sphere radius:
F = a+br? (2.34)
This has the implication that the pressure
o =?n + Þ Q.35)P 'fir'?¿ 1T
tends to infinity as the probe radius tends Lo zero. t{ith relieved,
conical probes of 30o semi-angle, Gooderham (1g73) found that the
penetration resistance of 1 mm dian:eter probe was 35-74"/" larger than
that of 2 mm diameter probe"
57.
Mulqueen et al-. (1977) investigated the effect of probe angle on the
maxj-mum limiting force. They used the NIAE recording soil penetrometer
which was equipped with two probes, i.e. (1) a blunt probe consistlng of
a hardened steel spheres of radius 10.0 mm, and (2) a sharp probe
consisting of a hardened steel 3Oo right circular. cone with base radius
of 10.1 mm. They found that in the non plastic state and at low bulk
density, the limiting force on the blunt sphere was significantly higher
than that in the sharp cone. This difference becoming non-significant as
the bulk density and/or the water content of the soil increased.
The effect of probe material- on the maximum limiting force has been
investigated by Dexter and Tanner (1973b). They measured the force
acting on 20 mm diameter spheres having surface of steel, poJ-ytetra-
fluorethylene (PTFE), and 0.7 mm diameter sand grains. It was found that
the average maximum limiting forces for clay, clay with chalk, loam with
peat, and sandy loam soils }üere 182,.193, and 212 N for PTFE' steel, and
sand covered respecti-vely. In terms of the angle of soil/metal friction,
ô, they obtained equations
F = 146 +BOtanôN (2.36)
at, 100 mm/sec. penetration rate, and
F = 14g +76tanôN Q.3T)
aL 20 mm/sec. penetration rate.
It has been found that the resistance of a soil to probe penetration
is influenced by soiì- texture, bulk density, and soi-1 water content
(Taylor et a7. , 1966; Mirreh and Ketcheson' 1972i Becher, 1978; Byrd
and Cashel, 1980). Taylor et aL' (1966) have shown that at a bulk
density of 1.55 e/cn3 and matric water potential of -33 kPa, Miles loamy
fine sand (9% cLay) has a penetration resistance of about 800 kPa, whereas
Columbia]-oam(19%clay)hasapenet,rationresistanceofaboutlBkPa.

58.
Byrd and Cassel-l- (1980) found no simple rel-ationship between percentage
of sand and cone index. At a matric water potential of -6 kPa, cone
index vaLues increased with increasing sand content. At a matric water
potential of -33 kPa, cone index values increased as percentage sand
increased from 66.6% Lo 75.4%, decreased from 75.4% Lo 79.2%, and then
again increased fron 79.2% Lo 92.2%.
The resistance of a soil to probe penetration decreases with
increasing water conlent (Taylor et a7., 1966; Mirreh and Ketcheson'
1972), and with decreasing soil bulk density (Taylor et a7., 1966). At
-33 kPa matric water potential, the penetration resistance of Columbia
si-1t l-oam is about 1800' 9OO' and 700 kPa for bulk densities of 1'55
g/ccr 1.35 e/cc, and 1.25 respectively (Taylor et a7.,1966). Mirreh
and Ketcheson (1972) found that at Iow bulk density the increase j-n
matric water potential, first (up to -400 kPa) increased the penetration
resistance, then a further increased in matric water potential decreased
the penetration resistance. At high bulk density, increasing matric water
potential increased the penetnation resistance sharply without any
subsequent decrease in penetration resistance. The decrease in
penetration resistance with increasing soil water content has also been
shovm by Becher (1978) and Byrd and Cassel-l (1980).
lrlibh a 1 . 5 rnrn diameter probe, Becher ( 1978 ) found that the
penetration resistance of soil cores prepared from Pel-osols r vlas
negatively correlated with onganic matter content. Based on this result,
he suggested that to provide a good medium for root growth it w¿s
necessany to maintain or increase organic matter to reduce penetration
resistance in Pelosofs.

59
SECTION 3
THIXOTROP]C HARDENING
3.1 Effect of age inE on the streneth of remoulded soifs
3.1.1 Introduction
Remoulding an undistunbed soiì-, except for a soil- that has been
overconsolidated, usually results in a l-oss of part of its strength.
This phenomenon was first observed in some Norwegian and Canadian cl-ays
which are kncwn as rrsen,sitivett or rrquicktr c]ays. Rosenqvist (1952)
has observed that the shear strength of a soiL which is initially in
excess of ]0 - 20 kPa may be reduced to less than 0.1% of this value by
remoulding. The ratio of undisturbed strength to the remoul-ded strength
is known as the rrsensì-tivityrr (Terzaghi, 1944).
According to Terzaghi (1941) tne close approach of parlicfes as a
result of squeezing out of viscous absorbed water from points of contact
Ieads to high attraction fonces. lrlhen this soil Ís remoulded, the
interparticle contacts breakdor^¡n, and adsorbed water fills in around the
old contacts with a consequent decrease in strength. Some workers
(l,¡interkorn and Tschebotarioff , 1947; Yasutomi and Sudo, 1966; Smal-Iey,
1978) suggested that the decrease in strength of undisturbed soil with
remoulding is due to the breakdoum of the connecting l-inks and cementing
bonds between particles. In addltion to these processes' Mitchell
(1960) has postulated that the lower strength of a remoulded soil is
due to the change in the energy status of the system resul.ting from
particle rearrangement.
I,,lhen remoulded soil is all-owed to rest at constant rvaten content,
a part or all of the strength may be regained. Skempton and Northey
(1952) proposed the term trpartly thixotropicrr for the first phenomenon'

60.
and tþurely thixotropictt for the second phenomenon. The term thixotropy
was first used by Freundl-ich (1935) to describe isothermal- gel-so}-gel
transformations in colloid súspensions induced by shearing atrd subsequent
rest. Burgers and Scott-Blair (1948) defined thixotrophy as a process
of softening caused by remoulding followed by a gradual retunn to the
original strength when the material is allowed to rest. An extensive
discussion of thixotrophy in colloid systern was given by Price-Jones
(1952).
The phenomenon of strength regain in a soil- is time dependent.
Mitchell (1960), therefore, defined thlxotrophy as an isothermal'
reversible, time dependent process occurring unden conditions of constant
composition and volume, whereby a material stiffens whil-e at rest, and
softens or liquifies when remoulded.
It is necessary to point out that not all strength regain in aged
soil resul-ts fnom thixotropi.c processes. Mitchell (19To) suggesieci
that thixotropic hardening contributes to the strength regain up to the
sensitivity of B. Beyond this value, another mechanism, such as the
formation of permanent cementing bonds (Bjerrum and Lo, 1962), must
exist. Because of this, some workers (Yasutomi and Sudo, 1966; Smalley'
1978) preferred to use the term "age harãeningttinstead of thixofropic
hardening.
It seems lhat Moretto (1948) was the first scientist to stucÌy in
detail the strength regain of remoulding clays resul-ting from ageitrg al,
constant water content. He rejected a common theory which assigned most
of the differences in the strength between undisturbed and remoulded
clays to an i-rreversibl-e loss of structure. A simil-ar conclusi-on was
obtained by Skempbon and Northey (1952) in studying the processes invc1ve<
in causing the sensitivity in some clays. Seed and Chan (1957), l"litchel-]

61.
(1960) and Gray and Kashmeery (1971) have presented excellent discussions
on thixotropy in compacted soil-s.
Blake and Gitman (1970) and Arya and Blake (1972) studied thixotropic
processes from the point of view of aggregate water stabiJ-ity. Ib has
been found that ageing increases the water stabiJ-ity of newly forrned
synthetic aggregates (Blake and Gilman, 1970), and of the aggregates
formed by plough shearing of field soil- and by particfe coalascence
around water drops (Arya and Blake, 1972). These workers suggested that
this phenomenon is analogous to a thixotroplc soJ--gel transformation and
to an increase in the strength of remoulded soil- with ageing.
Thixotropy is related to the bal-ance of forces acting between
particles, and therefore, it is influenced by the magnitude of attraction
and repulsion forces (Freundl-ich, 1935). This concept has been widely
supported by many workers, incl-uding Lambe (1953). Mitchell (1960)
illustrated this concept as shown in Figure 3.1. The ordinate of this
curve represents the energy (positive if repulsion and negative if
atbraction) necessary to bring particJ-es fnom an infinite spacing to any
given spacing along the abcissa. Curve A represents a stable suspension
which exhibits neither fl-occufatlon non thixotropy because of the energy
barrier preventing close approach of pa.tictes. Curve B represents a
condition where particles will spontaneously agglomerate and settfe out.
The energy minimum indicated on curve C represents the spacing of the
particles in a thixotropic ge1. Any movetnenL, such as caused by shaking
or shearing, which tends to change the panticle spacing causes an
increase in energy of repuJ-sion leading Lo a more fluid conditíon.
An intenesting approach to the description of the thixotropic
process is to consider the changes in the water energy stabus of the
system. Croney and Coleman (1954) and others (Day and Ripple, 1966;

III
Close parl-icle approach prevented by
energy barnier - parLicles disperse
tttt-1oÉ.
EUrt
õ(,aú
bc:ðcD
þ¡¡¡
+
0particþs
B. Enengy decreases asparticle approach -particles flocculate
*E+.,LHP
Curve fon thixotroPicmaterial - sPacing ofpartlcles at resl -remoulding movesparLicles awaY frommininrum - increase irlenergy causes decreasesin strengLh
Fig. 3,1. Energy distance curves for dilute suspensions ofdi-spersed,flocculatedandthixotropicmaterials(redrar^m from Mitchell , 1960 ) .
III

62.
Schweikle, B1ake and Arya, 1974 ) found that shearing or remoul-ding a soil
result in a less negative matric water potential. I¡lhen the soil is then
allowed to rest, t,he matric water potential- becoming more negative.
Mitchell (1960) interpreted these data in terms of cohe-sion forces. He
pointed out that shearing decreased cohesion forces as shown by the
decrease in the viscosity of the system, and allowing the gel to rest
resulted in an increase in the cohesion forces. This was shov¡n by the
fact that the gel viscosity changes to its initial viscous state as the
potential was restored. This approach has also been treated by
Yasutomi and Sudo (1966).
Trollope and Chan (1960) suggested that thixotropic strength regain
in compacted soil j-s due to changes in disposition of the col-loidal
particles within bhe soil mass. The hypothesis of structural changes
with ageing which cause thixotropic strength regain has also been put
forwarded by Mitchell (1960), Yasutomi and Sudo (1966) and Gray and
Kashmeery (1971). Mitchell (1960) suggested that when a thixotropic soi]
is remoulded or compacted, a part of the externall-y-apptied shearing
energy is utilized to disperse the pl-aty cJ-ay particl-es into uniform,
parallel arrangement. Thus at this stage, the external applied energy
assists the repuì-sive forces between particles resul-ting from doubfe
layer interaction in producing a dispersed system, with a consequent low
strength. As soon as shearing ceases, the external appJ-ied stress, which
was assisting repulsive forces, drops Lo zero. Thus the net repulsive
forces decrease, and now the attractive forces exceecl the repulsive
forces for the particular arnangement of particles and distribution of
water. As a consequence, the structure attempts to adjust itself inbo a
new relative l-ower energy condition, which resul.ts in an increase in the
strength. This concept is consistent with the j-deas of Croney and
Col-eman (1954), Day and RippJ-e (1966), Yasutomi and Sudo (1966), and

63
Schweikle et al-. (1974) discussed previously. Gray and Kashnteery (1971)
tried to freeze the microstructure of a thixot.ropic soil at various
ageing times by impregnating some of their samples with carbol^iax, and
then analysing them by X-ray diffraction. However, they coul-dnrt
differentiate between X-ray diffactograms of compacted clay samples at
time zero and one month l-ater.
According to Mitchell (1960), a soil will exhibit thixotropic
behaviour it meets the following conditions: ( 1 ) the net interparticJ-e
force bal-ance is such that bhe'soil will flocculate if given a chance,
and (2) the fl-occulation tendency rnust not be so strong that it cannot
be overcome by mechanical action, such as shearing or remoulding the soj-Ì.
This second condition is consistent with the result of Furukawa and
Kawaguchi (1969) who found that thixotropic behaviour was found only in
soils containing aggregates of low to moderate stability, and not in well
stabilized soils containing cementing materiafs or hì-gh organic matter
content.
As discussed previously the formation of cementing bonds with ageing
may also make a significant contribution in increasing the strength of
aged soil. The partial conversion of hydrogen montmorillonite to
aluminium forms has been found by Mathers, hleed and Col-eman (1955).
Martin (1958) has shown that after ageing for 1OO days at 70oC, lithium
kaolinite changes to al-uminium kaolinite. These processes, however,
al-ter the condition of the system, so this hardening process cannot be
classifj-ed as thixotropy according to the definition of l'fitchell (1960).
In this thesis, the interest is not onJ-y in the strength regain
resulting from thixotropic hardening, but in all processes leading to an
increase in the strength of aged, remoulded soiÌ. The term rrthixotropic
hardeningttis used if the condition of the system meets Mitchellrs (1960)
criteria, otherwise the broader term rrage hardeningrr is used.

64
3,1 .2 MateriaLs and l.{ethods
Soils
The soils used were three sandy l-oams from South AusLral-ia, and a
clay soil from Queensland. The South Australia soils were colLected
from the Urrbrae fine sandy loam, from the Charlick experimental station
at Strathalbyn, and from the Mortlock experimental- statj-on. All these
fields belong to the lnlaite Institute. The Queensland soil is the lrlaco
soil from Jondaryan.
The Urrbrae and Mortl-ock soils are red brown earths, and the
Strathalbyn soil is a shal-lower red brown earth typical of a lower
rainfall area (Stace et a7., 1968). The Waco soil is a sel-f-mulching
montmorillonit,e bÌack earth mainl-y derived from tertiary basal_t
(Coughlan, Fox and Hughes, 1973). Some properties of these soil-s are
given in Table 3.1.
Table 3.1. Compositions and Atterberg limits of the soil-s used in
the expenlment.
Soilsite <20 pm
(%)<2 um
(%)
claymineral
Plasticl1mit
(%t
Liquidlimit
(%)
Proportion of oven drv soil-org. matber
(%)
Urrbrae 49 17
Mortlock 46
Strathalbyn 36 12
lr'laco 74
1.7
17.5 3.6
i11itekaolinite
iIIitekaol-inite
19.5 26.5
23.9 36.5
B7
2.8 il1iteactinolite
17 .9 30
1.9 montmoril-l-onite 54 B6
Remoulding
Samples from the A horigon of those soifs were passed through a 'l mrn
sieve, then remoulded wiLh deionized water at several water contents froni

65.
slightly below the plastic limits up to nearly the liquid limits.
Remoulding vlas done with a l-aboratory knife until- the soils were as
homogeneous as possible. These remoulded soiÌs were allowed to
equilibrate overnight, then again remoulded for about 2 minutes and
pressed in plastic containers of 24 mn dj-ameter and 24 mm height.
The strengths of 2 - 3 cores of each soil- at each water content
ÌÂIere measured immediately (0 day sample). The remainders, in their
containers, tlere wrapped in thin plastic sheeting and aluminium foil,
then stored in a constant temperature room for later testj-ng.
Measurement of soil strength
Soil strength was measured with a motor driven laboratory
penetrometer. The probe had a diameter of 1.003 mm, a total ti-p angle
of 600, and penetrated dou¡nward at a.ra.te of 3 mm min-1. The force
requi-red to penetrate the soil was measured with an electronic digital-
balance Metller type PC 4400 (P1ate 3.1).
Three measurements were done on each core,'thus there were 6 - 9
measurements at each water content for each soi1. The measurement was
done to a deplh of 5 mm. This was based'on the finding of Dexter and
Tanner (1973) which showed that the timiting maximum penetration force
attains a constant value for depths of penetration L/R greater than four
times the probe size. The strength was calcul-ated as the resistance to
probe penetration, 8Or using equation
op 4 F/ d2 (3.1)
Ît
where F is lhe
diameter.
force required to penetrate the sample, and d is the probe

Plate 3.1. Measurement of soif strength with a laborat,ory
penetrometer.
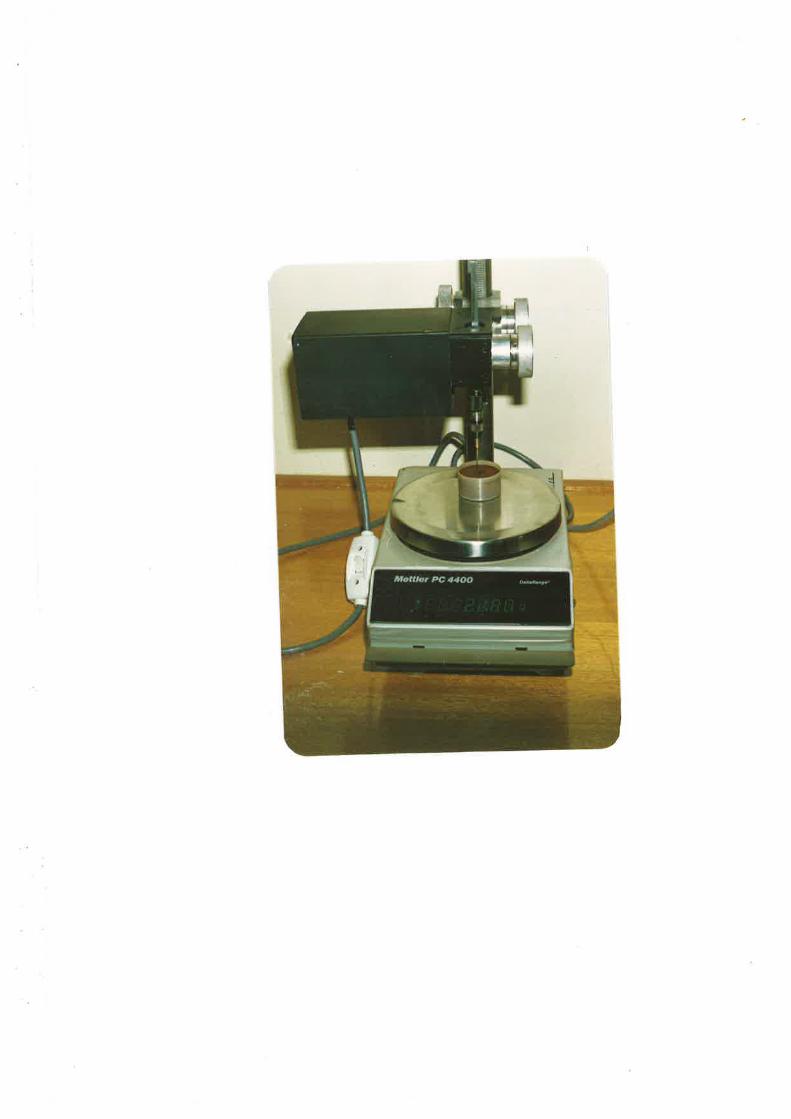

66.
Each time after testing, the sample was remoulded, pressed back
into container and its strength was measured. When this remoul-ded
strength was equal to that of remoulded sample at time of preparing
the specimen (O Oay sample), the strength increase could be considered
as a thixotropic hardening. Any change in this remoul-ded strength would
indicate some permanent alterati-on, such as the formation of permanent
cementing bonds. !'lhen this occurs, the term lhixotnopy cannot be
applied.
To test whether there was any change in soil water content, each
time after measurement of the strength, the water content of the sample
was determined. i,'lhen there r^ras a significant change in water content,
the result was discarded.
3.1.3 Results and Discussion
Effect of water content on soil strength
The effect of water content at remoulding on packing density and
soil strength is gì-ven in Fi-gure 3.2. Packing density, D, was defined
as the volume proportion of the soil which is occupied by solid particJ-es,
D ß.2)
here, / and /^ aru bhe dry bulk density of the soil and the density of
the solid (mineral-) particles respectively.
Figure 3.2 shows that unlike packing density, which increases with
increasing water content up to a maximum value and then decreases on
further wat,er content increases, the penetration resistance decreases
steadily with increasing water content. Over the range of water conLent
used, the logarithm of the soil strength is an approximately l-inear
function of soil- water content (here expressed as a proportion of pl-arstic

67.
limit, PL)
loE O"ep A-a( l,I
E (3.3 )
The val-ue of adjustable parameters A and a, together with the
strength at the plastic l-imit, Qp 1.0, are given in Table 3.2. For
comparison, the value of parameters A and a, and nO ,.0 of Urrbrae
field clods are al-so given in Table 3.2 and Figure 3.2. These vafues
were obtained by testing the penetration resistance of clods of about
I - 12 cm diameter which were coltected approximately 6 months after
tillage. These clods were wetted slow1y by capillary action and then
dried in sintered funnels or pressure plate apparatus to obtain a range
of water contents. Six strength measurements were made on each of
6 - 12 clods as described before.
The penetration resistance of these clods cannot strictly be
considered as the strength of undistunbed soil. However, these results'
at least, provide good evidence that the strength of freshJ-y remoulded
soil is much lower, at the same water content, than that of clods which
have been exposed to weathering action for about 6 months.
Table 3.2. Values of A and a parameters of equation (3.3), and the
strength at the plastic limits, 8O 1.0, for the freshly
remoulded Urrbnae, Strathalbyn, Mortl-ock and V'laco soi1s,
and the field clods collected from the Urrbrae soil.
Soil A d.2r no , .0 (kPa )
Urrbrae remoulded
Urrbrae field clods
Strathalbyn
Mortlock
tr{aco
14.75
12.16
11.88
13.86
11.81
9.42
4.77
4.65
7 .37
4,32
0.97
0.90
0.97
0.99
0.98
206 .4
1619.7
'1380. 2
663.5
1790 .1

où6
o 0'4
0.2
A
2.t0.7
Fie. 3.2.
A
E.0
{ 6{r
Jctoå r.oI
1.3 161{wPL
Effect of v¡ater content t$l on soil packing clensity(D) and on soil penetrati5h resistance (0p) '
g: Urrbrae remoulded i '1 urrbrae field crods;ttz Strathalbyn; É: Mortl-ocki à: !'laco'
B
oE
o ID
o
c
68.
Effect of ageing on soif strength
Ageing of the remoul-ded Urrbrae, Strathalbyn, Mortlock and I'laco
soils resulted in an increase in the resistance of the soil to probe
penetration (Table 3.3). ft was observed that the strengths of the
samples remoufded after ageing were about the same as that of the 0 day
sample. In addition, as shown in Table 3.3, the change in water content
and packing density of the sample was negligible. Thus the criterion
of the sysbem met Mitchellrs (1960) criterion for a thixotropic process,
and hence the mechanism of strength regain which occurred in this
experiment could be described as a thixotropic hardening. The effect of
ageing up to 30 days on the strength of the Urrbrae, Strathalbyn and hlaco
soils is given in Figure 3.3.
To test the truth of the above suggestj-on a further experiment was
designed to eliminate other processes which may contribute the strength
increase with ageing. In the fottowing experiment, the formation of
cementing bonds caused by organic matter and microbial actj-vity was
minimized. This was done by destroying organic matter and sterilizing
the Urrbrae soi1.
Oxidation was done with hydrogen pe¡oxide (Robinson, 1922), and
stenilization was done by mixing the soil with sodium azide and mercuric
chloride, 0,5 mg of NaN, and 0.5 mg of HeCl, per gram of soil- (Tisdal-I
et a7.,1978). The ATP test (Jenkinson and Oadesr 1979) showed that
there r^¡as no conl,amination in steril-ized sampJ-es.
Ageing of both oxidized and sterilized soil-s resulted in strength
increases as shou¡n in Table 3.4. However, the strength of oxidized and
steril-ized soil-s, especial-Iy for the non-aged sample (0 day sample), is
much l-ower than that of untreated soil. Quirk and Panabokke (1962)
showed that the crushing strength of natural aggregates from a virgin
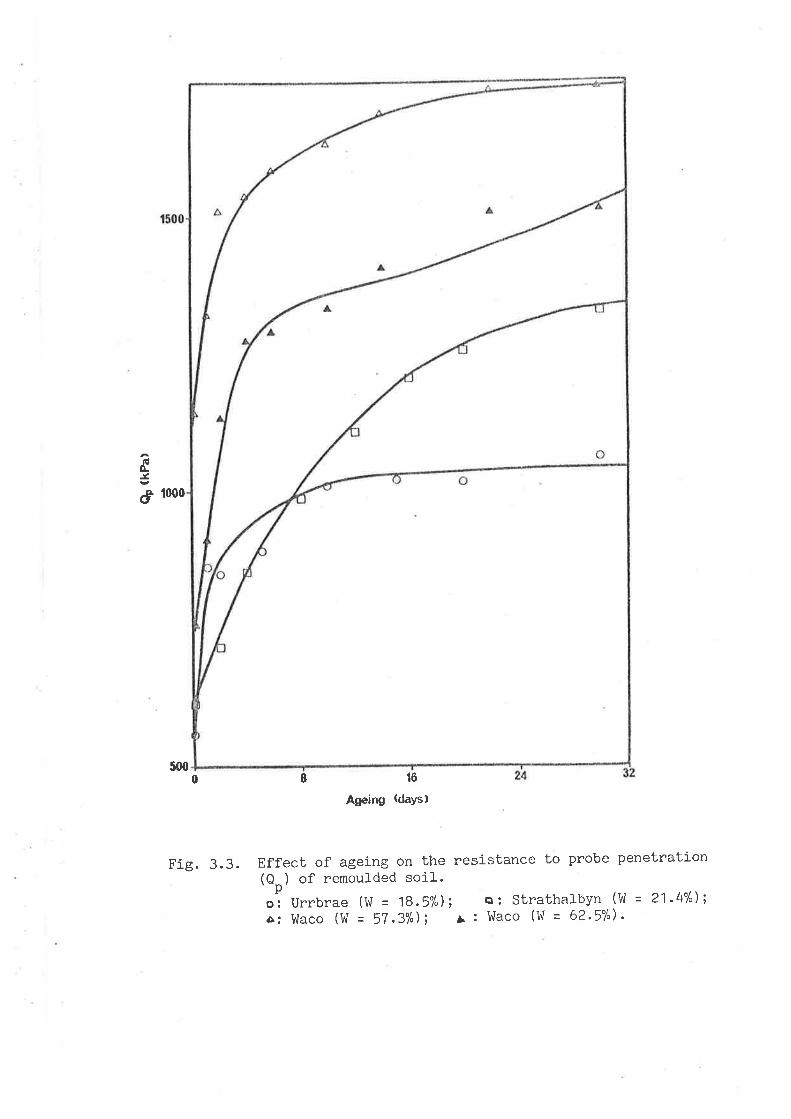
t000
filo-t
t
5000
Fie.3.3.
16
ASeir¡S (days)I
Effect of ageing on the resistance to probe penetrat.ion(A ) of remoufded soil.' p'oì Urrbrae (!rI = 18.57"); È: Strathalbyn (1¡ = 21'I+%);a: !,laco (W = 57.:%); ¡. : !'laco (W = 62.5%) '
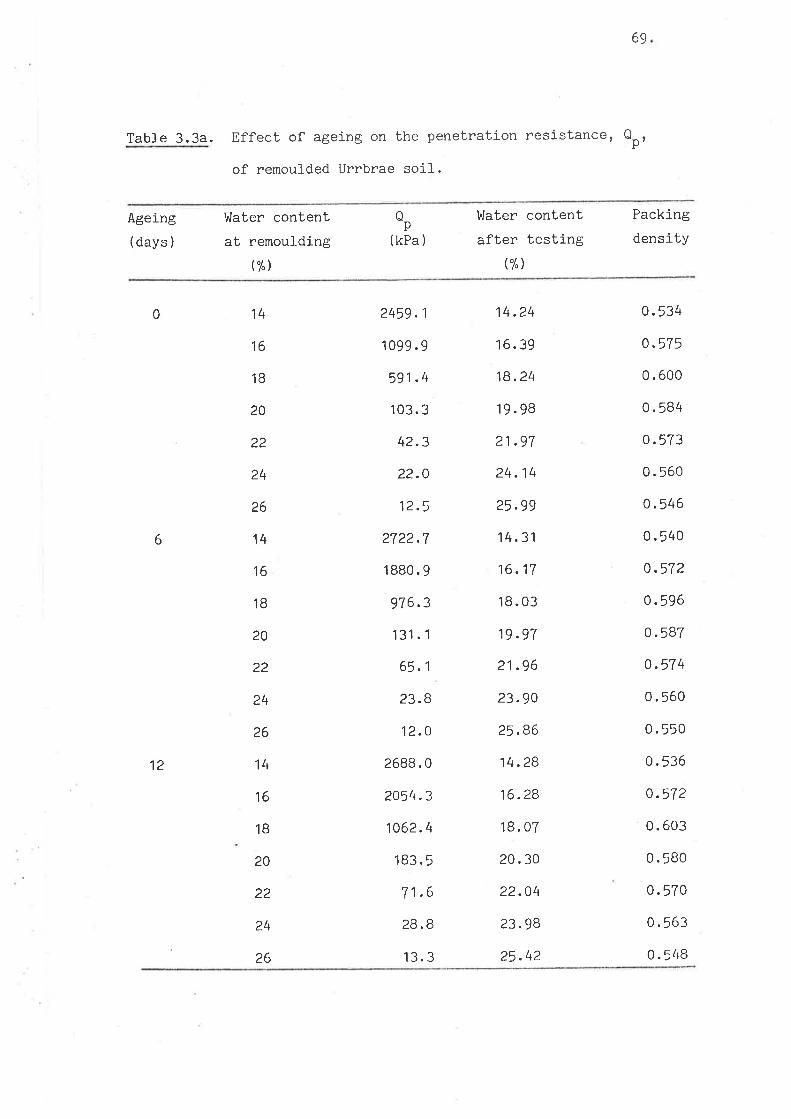
Table 3.3a.
69
Effect of ageing on the penetration resistance' Qpt
of remoulded Urrbrae soil-.
Ageing( days )
I¡'later content
at remoulding(%)
op(kPa )
ülater content
after testing(%)
Packing
density
0
12
14
16
1B
20
22
24
26
14
16
18
20
22
24
26
14
16
1B
20
22
24
26
2459 .1
1 099 .9
591.4
103. 3
42.3
22.0
12.5
2722.7
1880.9
976.3
131.1
65.1
23.8
12.O
2688.0
2054.3
1062.4
183. 5
71.6
28,B
13. 3
14.24
16. 39
18.24
19.98
21.97
24 .14
,tr oo
14.31
16 .17
18. 03
19.97
21.96
23.90
25.86
14.28
16.28
18. 07
20. 30
22.04
23.98
25.42
0.534
0.575
0.600
0. 584
o.573
0.560
o.546
0.540
o.572
0.596
0.587
0.574
0. 560
0.550
0.536
0.572
0. 603
0.580
0.570
0.563
0.548
6
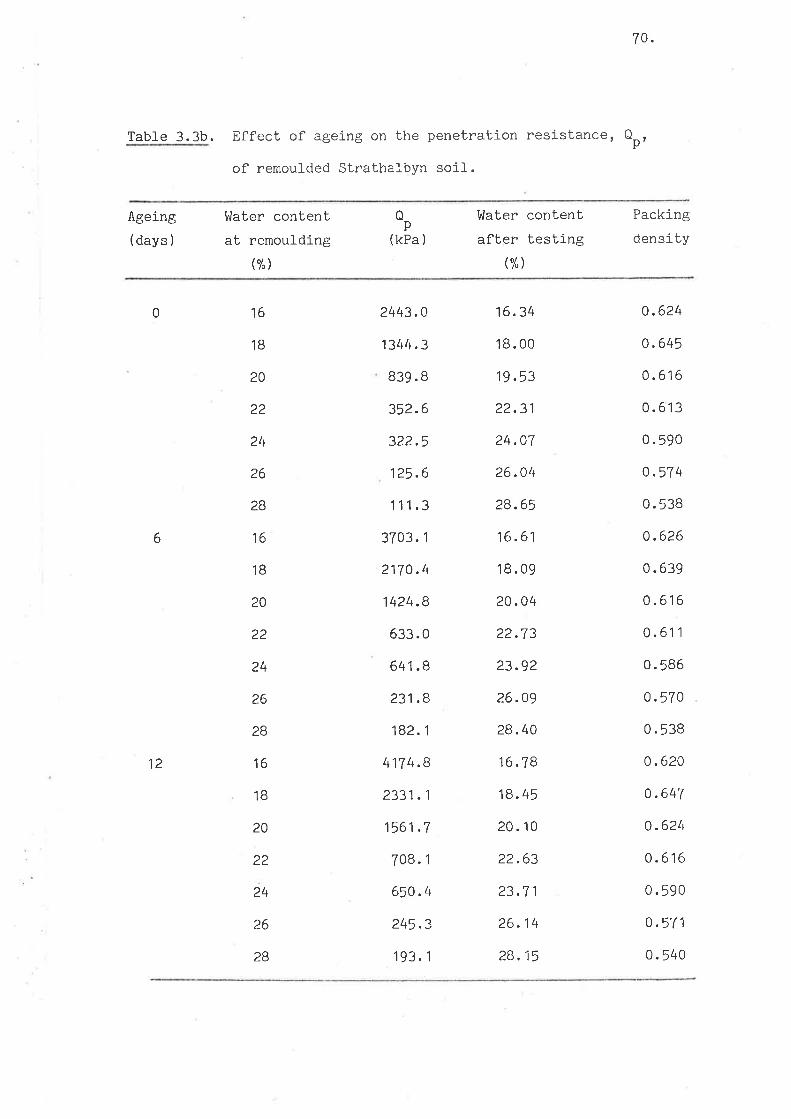
Table 3.3b.
74.
ptEffect of ageing on the penetration resistance' O
of remoulded Strathalbyn soil-.
Ageing( days )
Water contentat remoulding
(%)
0p
(kPa )
t'later content
after testing("/")
Packing
density
0
12
16
1B
20
22
24
26
28
16
1B
20
22
24
26
28
16
1B
20
22
24
26
28
2443.0
1344.3
839. B
352.6
322.5
125.6
111.3
3703.1
2170.4
1424.8
ó33.0
641.8
231.8
182.1
417 4.8
2331 .1
1561.7
708. 1
650.4
245.3
193.1
16.34
18.00
19.53
22.31
24,07
26.04
28.65
16 .61
18.09
20.04
22.73
23.92
26.09
28.40
16. 78
18.45
20.10
22.63
23.7 1
26.14
28,15
0.624
0.645
0.616
0. 613
0.590
0.574
0.538
0.626
0.639
0.616
0.611
0.586
0.570
0.538
0.620
0.647
0.62t¡
0.616
0.590
0.571
0. 540
6

Table 3.3c.
71.
Effect of ageing on the penetration resistance' Qp,
of remoulded Montlock soil.
Ageing(days )
hlater contentat remoulding
g")
op
(kPa )
I'later content
after testing$l
Packing
density
0
12
16
19
22
26
29
32
16
19
22
26
29
32
16
19
22
26
29
32
4967.o
3828.1
836.7
245.9
99.9
58. 6
5722.1
4307.2
996.\
275.7
110.6
65.3
5821.6
5382.1
1426.9
469 .1
143.6
90. 1
16.95
19 .45
22.67
26.28
30.33
32.04
16.45
19.62
22.48
26.04
29.96
32.24
16.76
19.51
22.35
26.00
30.13
31 . gB
0.543
0.585
0.573
0.548
0.524
0.513
0.548
0.583
0.576
0.551
0. 530
0.516
0.547
0. 586
0.577
0.552
0.528
0.514
3
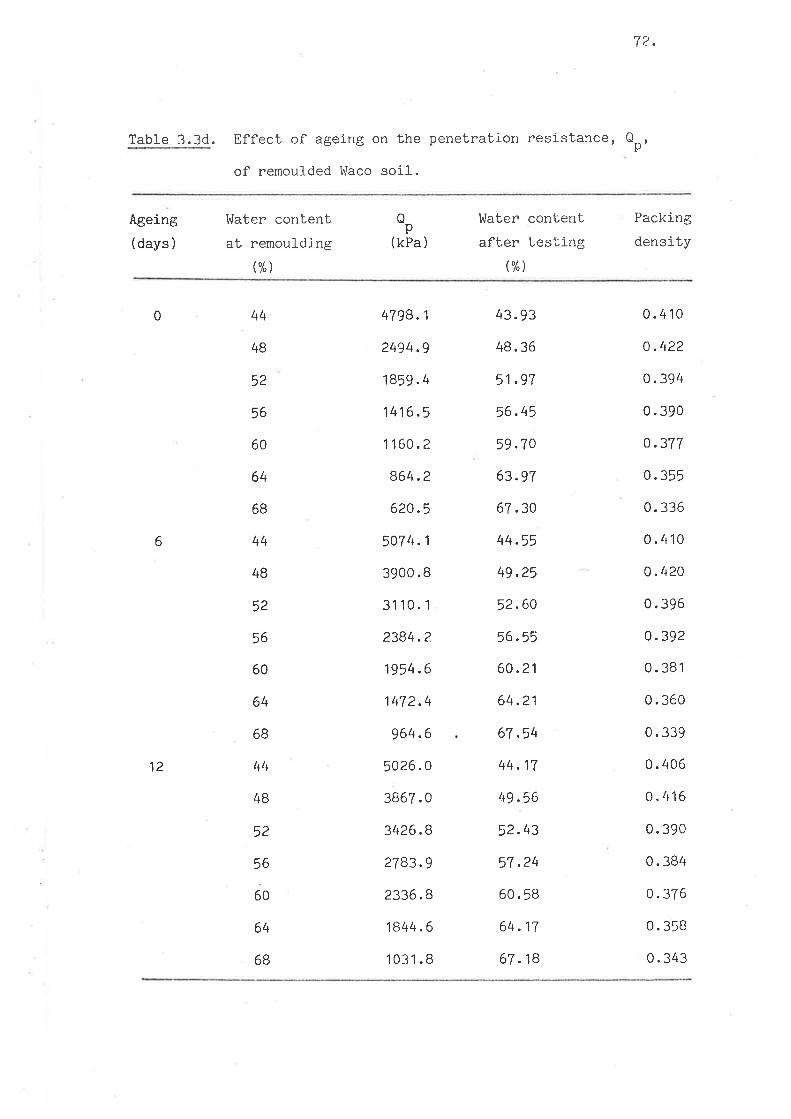
72.
Table 3.3d. Effect of ageing on the penetration resj-stance'
of remoul-ded !'laco soil.
Qp'
Ageing( days )
l¡rlater content
at nemoulding(%)
Op(kPa)
t'later contentafter testing
(%)
Packing
density
0
12
44
48
52
56
60
64
68
44
48
52
56
60
64
6B
44
4B
52
56
60
64
6B
4798.1
2494,9
1859.4
1416.5
1160.2
864.2
620.5
507 4.1
3900. B
31 10. 1
2384.2
1954.6
1472.4
964.6
5026.0
3867.0
3426.8
2783.9
2336.8
1844.6
1031 . B
43.93
48.36
51.97
56.45
59.70
63.97
67.30
44.55
49.25
52.60
56.55
60.21
64.21
67.54
44 .17
49.56
52.43
57 .24
60.58
64 .17
67.18
0.410
0.422
0.394
0.390
0.377
0.355
0. 336
0.410
0.420
0.396
0.392
0.381
0. 360
0. 339
0.406
0.416
0.390
0.384
0.376
0. 358
0. 343
6

73.
pJ-ot of the Urrbrae soil- (2.7% organic matter content) is greater than
that of aggregates from a cultivated plot (1.3% organic matter conLeni-)
over the range of water content they used. The crushing strength of
remoufded cores pnepared from these soils, however, I^Iere almost identical.
For this phenomenon, they reasoned that the differences in strength of
the field aggregates coufd not be attributed to soil organic matter
content as such but rather to the disposition of the organic matten in
the soil. Becher (1978) found that the penetration resistance of soil
cores from Pelosols decreased with increasing organic matter content over
a range of v¡ater matric potential of -5 to -40 kPa. For natural-
aggregates, at water potentials l-ess negative than -4 kPa the penetration
j-ncreased with increasing organi-c matter content, whereas in drier soil-s
the increase in organic matter content did,not give a consistent effect.
The resul-ts in Table 3.4 cannot be compared directly with those of these
earlier works, because here the organic matter content of oxidized
sample was practically zero, whereas in the samples of either Suirk and
Panabokke (1962) or Becher ( 1978) all the soj-l samples contained some
organic matter.
Evidence of thixotropic behaviour in the absence of organic mai.ter
has aÌso been found by Blake and Gilman (1970). They, however, did noL
investi-gate the thixotropic process in terms of strength, but preferred
aggregate water stability. They showed that bhe increase in wal,er
stability of newly formed aggregates v{as independent of organic matter.
Abrukova (1971) found that in thick chernozem soils, tlrixotropic
behaviour was absent in the sample from the top 10 cm layer which contains
high organic matter, but occurred in the sample from B0 - 90 cm and
150 - 160 cm layers. However, it is likely Lhat other important f'actors,
besi-des organic matter, would have differed over bhis range of dept-|¡s.

74.
Table 3.4. Effect of organic matter oxidation and steril-ization on
the strengLh of remoul-ded Urrbrae soil.
t(Ageing( days )
!'later content(%)
0 (kPa )p
control oxidised steril-ised
0
15
17
20
22
17
20
22
17
20
22
1T
20
22
17
20
22
1T
20
22
757.7
136. 3
48. 1
1 300 .8
1BB. 6
64.5
1348.2
218.4
64.0
1523.9
218.2
64.7
1618 .4
221.6
74.2
1627 .3
220.2
68.2
345.0
55.5
5.9
626.8
78.1
8.4
798.2
81 .5
12.8
874.0
87.4
15.3
1487.9
108. 5
20.3
1546.0
180. 1
28.3
329.5
110.0
5.1
560.8
148. B
7.9
562.0
156.3
8.0
629.5
176. B
7.2
624.4
182.0
7.7
660. 6
187.:
7.3
1
2
4
I
l(The water contents of the samples were not these exact values butwere close to these values. For simplicity, however, this methodof presentation is used.

.f t-
Schweikle et af. (1974) found that even in the absence of microbial
activity, there vras a change in matric water potential with ageing (matrj-c
water potential becoming more negative). They concluded that thixotropic
behaviour was independent of microorganisms.
As discussed previously, thixotropic behaviour is related to the
changes in the energy status of the system. Thus, if bhe strength regairr
found in this experiment was a thixotropic process, as suggested, ageing
shoul-d infl-uence soil- matric water potential. To study this, an
experiment on the effect of ageing on matric water potential was carried
out.
Samples of Urrbrae and üiaco soils b¡ere remoulded at about 20% and
65% water content respectively. For the I¡'laco soil, remoulding was done
with and without steril-i-zation. After allowing the soils to equilibrate
overnight, the soil-s were again remoulded and pressed in plastic
containers of 40 mm diameter and 65 mm heighb. A tensiometer was itrsert.ed
into the soil through the middle of the container J-id, and the hole on
the lid hras covered with Silastic RTV sealant to make it air tight (Plate
3.2). The cores were then stored in a constant temperature room (2OoC).
Two sampJ-es were prepared for each treatment.
The resul-t (Figure 3.4) shows that ageing of the remoul-ded Urrbrae
and lrlaco soils results in a more negative vafue of matric water polential-,
and subsequent remoufding makes the matric waben potential less negative "
This shows that remoulding the Urrbrae and V'laco soil-s, at the water
content used, resufts 1n a high relalive free energy condition, and
subsequent rest decreases the free energy of the system which leads to an
increase in the strength. A similar resuft has been shomr by Croney and
Coleman (1954), Day ancl Rippte (1966) and Schweikle et af. (1974).
Bodman and Day (1943), and Campbell (1952) on the other hand, found that

Plate 3.2. Measurement of matric water potentiai- with
a soil tensiometer.


a
^
C
III
o
.¿$6
III
IIII
= 64'0E I. 6¡l'61
{.0
3.0
0
1.0
2-
tqo-
È,o+,oÊLq,
fiú
B
.9Lrd
E
20 230 15
Ageing (da¡rs)t050
Effect of ageing on matric water potential of urrbrae (o ) , and !,raco unsterirized (o ) '
ãnd Waco sterilized (") soils'Fis.3.4.
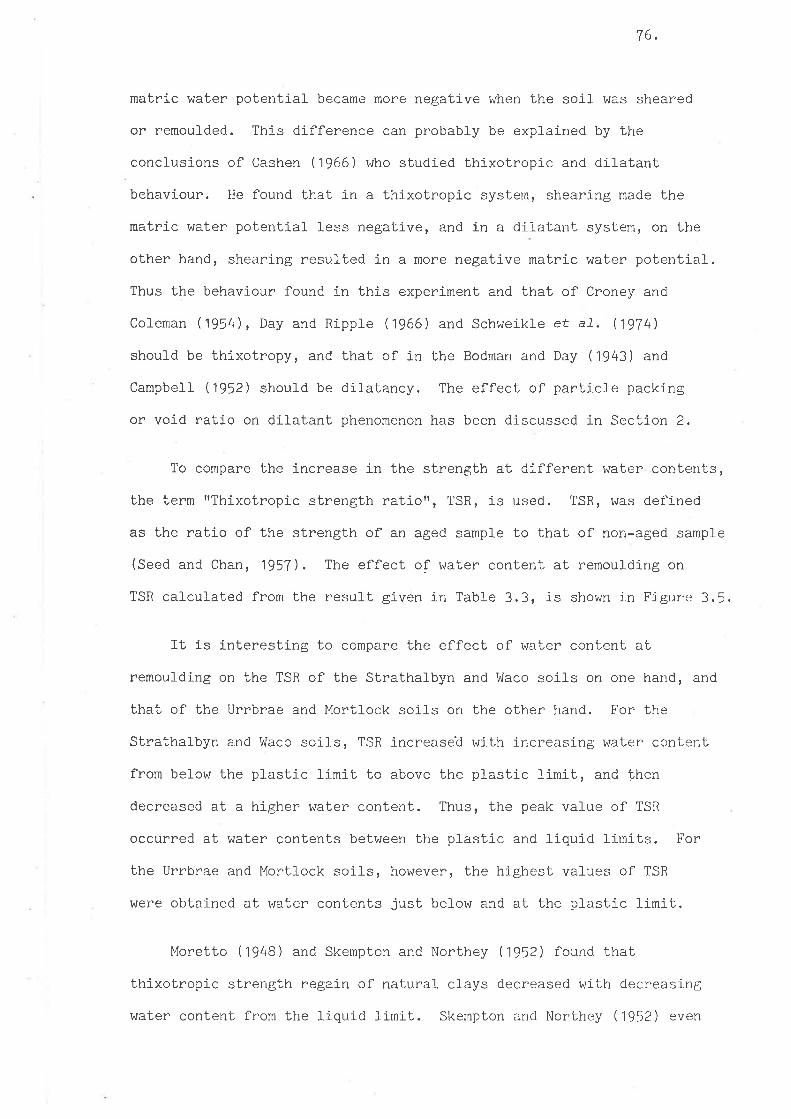
76.
matric water potential became more negative when the soil was sheared
or remoulded. This difference can probably be expJ-ained by the
conclusions of Cashen (1966) who studied thixotropic and dilatant
behaviour. He found that in a thixotropic syst.em, shearing made the
matric water pot,ential less negative, and in a dilatant system, on the
other hand, shearing resulted j-n a more negative matric water potential.
Thus the behaviour found in this experiment and that of Croney and
Coleman (1954), Day and Ripple (1966) and Schweikle et aL. (1974)
should be thj-xotropyr and that of in the Bodman and Day (1943) and
CampbelJ- (1952) should be diJ-atancy. The effecb of particle packing
or void ratio on dil-atant phenomenon has been discussed in Section 2.
To compare the increase in the strength at different water content s,
the term rrThixotropic strength ratiotr, TSR, is used. TSR, r^ras defined
as the ratio of the strength of an aged sampl-e to that of non-aged sample
(Seed and Chan, 1957). The effect of water content at remoul-ding on
TSR calculated from the result given in Table 3.3, is shown in Figure 3.5.
It is interesting to compare the effect of water content at
remoufding on the TSR of the Strathalbyn and V'laco soil-s on one hand, and
that of the Urrbrae and Mortlock soils on the other hand. For the
Strathalbyn and lirlaco soils, TSR increased with increasing water content
from below the plastic limit to above the pJ-astic limit, and then
decreased at a higher water content. Thus, the peak value of TSR
occurred at water contents between the pJ-astic and liquid limits. For
the Urrbrae and Mortlock soils, however, the highest vafues of TSR
were obtained at water contents just beJ-ow and at the pJ-astic limit.
Moretto (1948) and Skempton and Northey (1952) found that
thixot,ropic strength regain of naLural clays decreased with decreasing
water content from the liquld limit. Skempton and Northey (1952) even
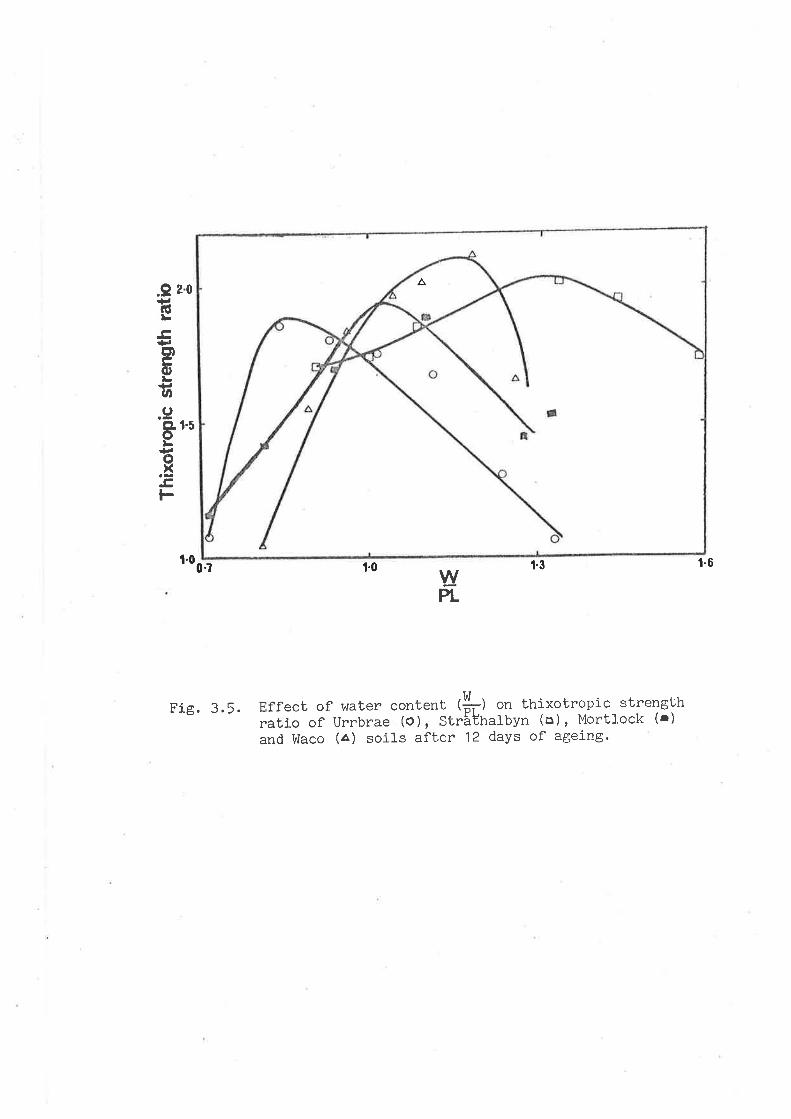
^.9 2.0+.tÌl¡¡
+JPoL{.,o.98t'uL{..oxl-
1.0 1.60.7 t.0 1.3
wPL
Fie. 3.5. Effect of water content thl on thixotropic strengthratio of Urrbrae (o), Stråthalbyn (u), Mortlock (r)and lüaco (a) soils after 12 days of ageing'
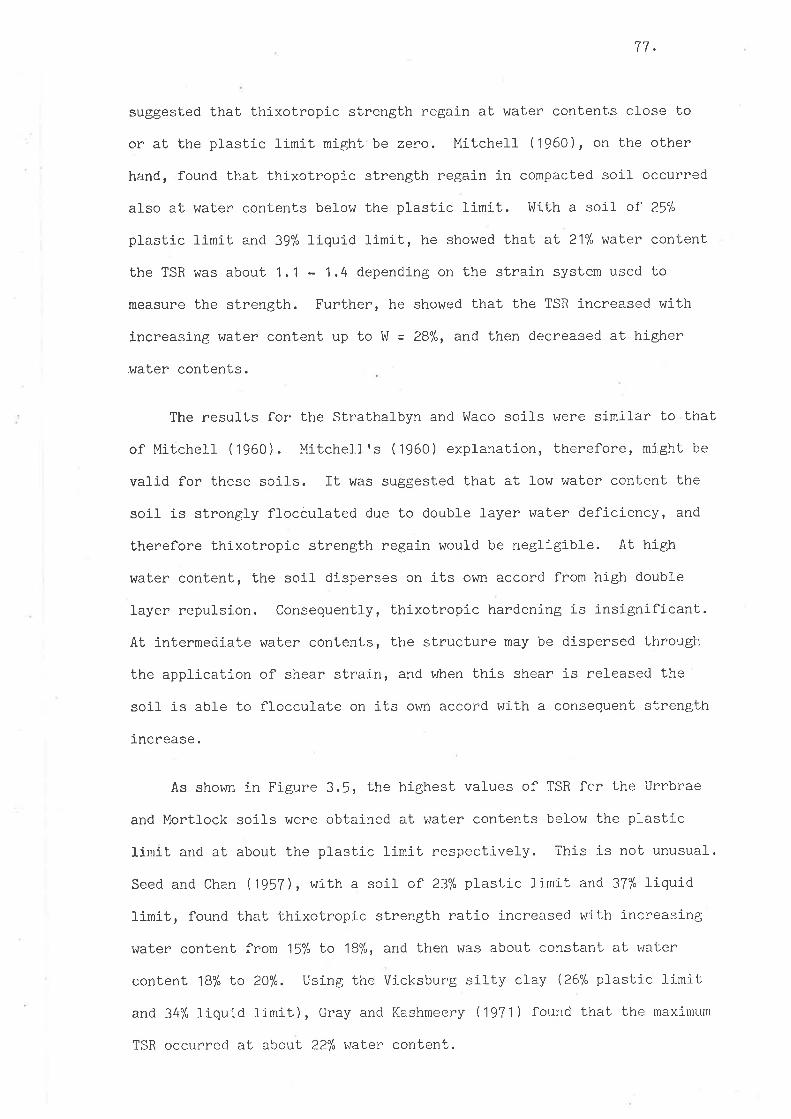
77.
suggested that thixotropic strength regain at wat,er contents cfose to
or ab the plastic limit might be zero. Mitchelt (1960), on t'he other
hand, found that thixotropic strength regain in compacted soil occurred
also at water contents beÌow the plastic limit. Wi.th a soil- of 25%
plastic limit and 39% liquid limit, he showed that aL 21% water content
the TSR was about 1.1 - 1.4 depending on the strain system used to
measure the strength. Further, he showed that the TSR increased with
increasing water content up to W = 2B%, and then decreased at higher
.waten contents.
The resul-ts for the Strathalbyn and llaco soils were simil-ar to thab
of Mitchell (1960). Mitchell's (1960) explanation, therefore, might be
valid for these soils. It was suggested that at l-ow water content the
soil is strongly flocculated due to doubl-e layer water deficiency, and
therefore thixotropic strength regain would be negligible. At high
water content, the soil disperses on its own accord from high double
layer repulsion. Consequently, thixotropic hardening is insignificant.
At intermediate water contents, the structure may be dispersed through
the application of shear strain, and when this shear is released the
soil- is able to flocculate on its own accord with a consequent strength
increase.
As shown in Figure 3.5, the highest values of TSR for the Urrbrae
and Mortl-ock soils were obtained at water contents below the plastic
limit and at about the pJ-astic limit respectiveJ-y. This is not unusual-.
Seed and Chan (1957 ), with a soil of 23% plastic limit and 37% liquid
limit, found thal thixotropic strength ratio increased with increasing
water content from 15% Lo 1B%, and then was about constant at water
content 18% lo 20"ft. Using the Vicksburg silty clay (26% plastic limit
and 34% Iiquid limit), Gray and Kashmeery (1971 ) found that. the maxitlum
TSR occurred at about 22% waLer content.
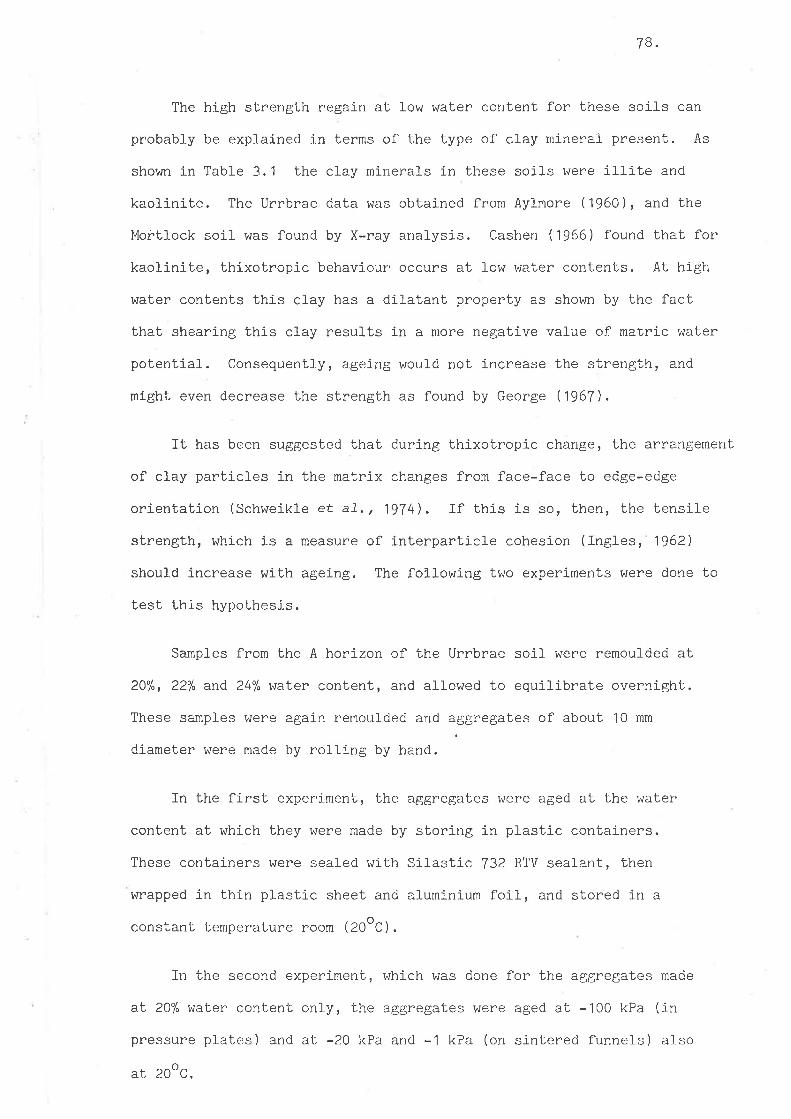
78.
The high strength regain at low water content for these soil-s can
probabJ-y be expl-ained in terms of the type of cJ-ay mineral present. As
shown in Table 3.1 the clay minerals in these soils were il-l-ite and
kaol-inite. The Urrbrae data was obtained from Aylmore (1960), and the
Mortlock soil was found by X-ray analysis. Cashen (1966) found that for
kaolinite, thixotropic behavj-our occurs at fow water contents. At high
water contents this cJ-ay has a dilatant property as shown by the fact
that shearing this clay results in a more negative val-ue of matric water
potential. Consequently, ageing woul-d not increase the strength, and
might even decrease the strength as found by George (1967).
It has been suggested that during thixotropic change, the arrangement
of clay particles in the matrix changes from face-face to edge-edge
orientation (Schweikle et al-.,1974). If thls is so, then, the tensile
strength, which is a measure of interparticle cohesion (IngJ-es, 1962)
should increase wilh ageing. The following two experiments were done to
test this hypothesis.
Samples from the A horizon of the Urrbrae soif were remoulded at
20%, 22% and 24% waLer content, and allowed to equilibrate overnight.
These samples were agai-n remoulded and aggregates of about 10 mm
diameber were made by rolJ-1ng by hand.
In the first experiment, the aggregates were aged at the water
content at which they were made by storing in plastic containers.
These contai-ners r^rere seal-ed with Sil-asLic 732 RTV seal-ant, then
wrapped in thin plastic sheet and aluminium foil-, and stored in a
constant temperature room (eOoC).
In the second experiment, which was done for the aggregates made
aL 20% water contenL only, the aggregates were aged aL -100 kPa (in
pressure plates) and aL -20 }<Pa and -1 kPa (on sintered funnels) afso
at 2OoC.

79.
Prior to the measurement of strength, all treatments of experiments
1 and 2 were dried to the pot,ential of -100 kPa on pressure plaLes for
2 days. The strengLhs of 16 aggregates of each treatment were measured
by crushing the aggregates individual-Iy between fJ-at paralleJ- plates
until fracture occurred (Rogowski, 1964; Dexten, 1975). The tensile
strength, oT, was calculated from
oT = 0.576 F/dz (3.4)
where F is the force required to crush the aggregates, and d is the
aggregate diameter
ln the second experiment, the water contents at remoufding and at
ageing wene not the same, and in both experiments the water contents at
remoulding and at the measurement of strength were not the same. The
term thixotropic hardening, therefore, is not really applicable. The
more suitabf e term is rrage hardeningrr.
The results in Table 3.5 show that the tensife strength of remoulded
aggregates increased with ageing. A significant incnease in tensil-e
strength occurred only at 20% and 22% waLer content (for the first
experiment) and at -100 kPa and -20 kPa potential ageing (for i,he second
experiment). This was in good agneement wÍth the result given in Figure
3.5 which shows that the strength regain with ageing for the Urrbrae
soil occurred mainJ-y at low water content.
Pore Size distribution
It was shorn¡n in Figure 3.4 that ageing remoul-ded soil-s at constant
water content resulted in a more negative vafue of matric water potential'
Packing density, on the other hand, did not change appreciabl-y wiLh
ageing (Table 3.3). These phenomena indicate that with ageing, t'here
must be a change in pore size distribution rather than total porosii,y.
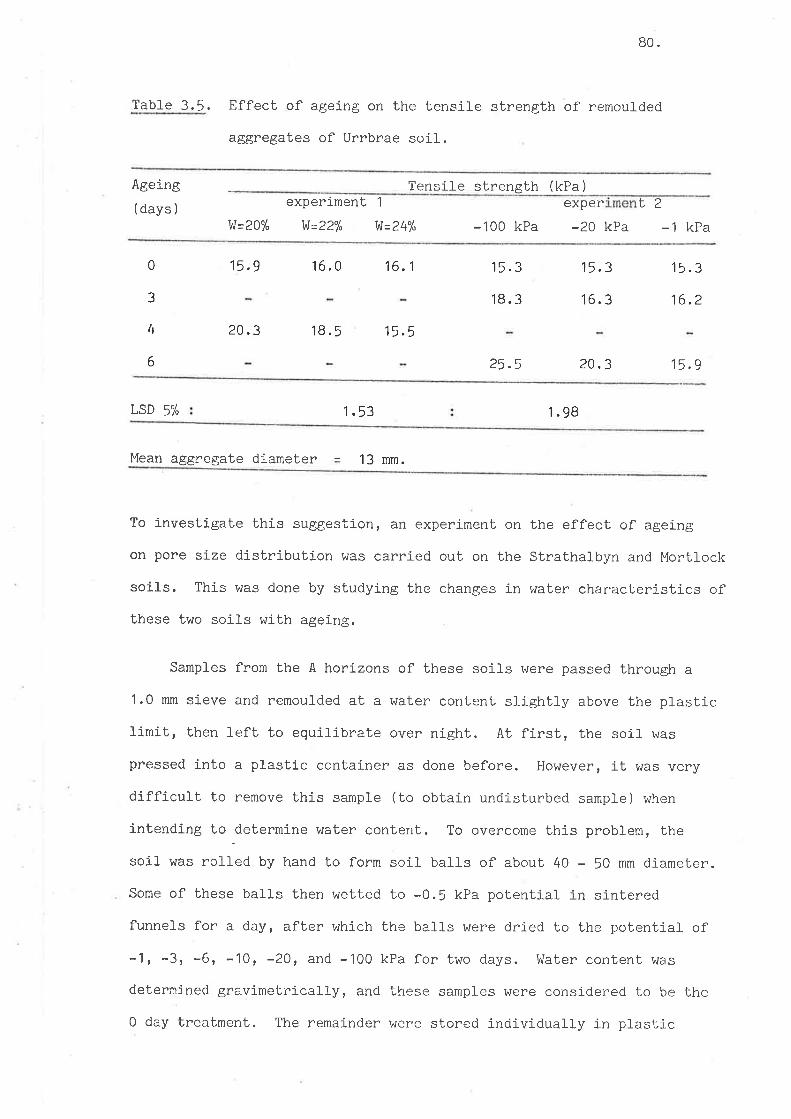
Table 3.5.
80.
Effect of ageing on the ten-sile strength of remoulded
aggregates of Urrbrae soil-.
Tensil-e strength (kPa)Ageing
( days )experiment 1
W=22% t¡tr=24%
exper L2-100 kPa -20 kPa -1 kPat¡tr=20%
0
3
4
6
15.9 16. 0 16.1 15.3
18.3
25.5
15.3
16. 3
15. 3
16.2
20.3 18.5 15.5
20.3 15.9
LSD 5% 1 .53 1 .98
Mean aggregate díameter 13 mm.
To investigate this suggestion, an experiment on the effect of ageing
on pore size distrlbution was carried out on the Strathalbyn and Mortlock
soils. This was done by studying the changes in water characteristics of
these two soil-s wilh ageing.
Samples from the A horizons of these soils r^¡ere passed through a
1.0 mm sieve and remoulded at a water content sJ-ightly above the pJ-astic
Ilmit, then l-eft to equilibrate over night. At first, the soil was
pressed into a plastic container as done before. However, it was very
difficult to remove this sample (to obtain undisturbed sampl-e) when
intendlng to.determine water content. To overcome this problem, fhe
soj-I was rolled by hand to form soil balls of about 40 - 50 mm dia-meter.
Some of these balls then wetted to -0.5 kPa pot,ential in sintered
funnels for a day, after which the balls were dried to the potentiat of
-1, -3, -6, -10, -20, and -100 kPa for two days. V,later content was
determined gravimetricali-y, and these samples r^rere considered to be the
0 day treatment. The remainder were stored j-ndividuaì_l.y in pJ_astic

81.
containers, and then \,frapped in thin plastic sheeÈ and aluminium foil,
and stored in a constant temperature room (2OoC) for later testing' Four
replicates were done for each level of matric potential for each period of
ageing. This level of replication did not affow statisticaf tests for
significance of observed differences to be done '
The results (Figures 3.6 and 3.7) show that ageing remoulded soils
resul-ts in the disappearance of smal-I soil pores and the creation of
larger pores. This finding is consistent with the hypothesis of
Schweikle et al-. (19741, It has been suggested that when soil- is remoulded,
there is face-face arangement of the clay particles in the matrix. In
such a system, small pores are dominant. As the soil ages, the clay
arrangement changes to edge-edge and/or edge-face orientation v'rith a
consequent l-oss of small pores and creation of larger pores.
The size of these pores can be calculated by the well known Jurin
equation (Sills, Aylmore and Quirk, 1973)
P -2Tcoscl¿ (3.5)ð
hrhere, P is the applied pressure (here the water matric potential-), T
is the surface tension of water (72.75 mJm-2),o, is the contact angle
of the water with the soil (here assumed to be zero),
particle separation or pore diameter.
and ô is the
To calcul-ate pore size distribution, the gravimetric water content
(I¡l) was transformed into volumetrj-c wat.er content' (0 ) by
o = f wtP (3.6)'s '-'tInJ
where f" ana f, ^ru the bulk densi-ties of the soil and water respectively.
The results are given Ín Figures 3.6b and 3.7b,
From Figure 3.7b, it can be seen that ageing the remoufded
Strathalbyn soil for 3 days resulted ín the disappearance of pores smafler
than 2.8 Um, and in creatj.on of pores larger Lhan 2.8 Um. For the l'lortl-ock

1-0
ftlo,l
*JIJ
002 w (?.t
0.0 0 2-0Loss õ (¡im)
Fig. 3.6a. Effect of ageÍng on water characteristlcs ofStrathalbyn soi,J.,
. À: 0 daYi o: 3 daYsi o: 6 daYs.
drOVtttC)
ä
Et¡tooÀ
Fig. 3.6b. Effect of ageinStrathalbyn soi
a: 0 day;
n pore size dlstributlon off= 1.49).
3 days.
gor(tr¡

Gô-E 1'0
2.0
0.
*I
aIJ
20 24w (%,
8ootoVqtô)LI.9
-8
oÀ
30 2.01.0
Logrõ ( gm)
Fig. 3,Ta. Effect of ageing on water characteristics of Mortlocksoil.O= 0 daY; a= 3 daYs'
Fig. 3.7b. Effect of ageing on pore size distribution of Mortlocksoil ( p= 1.44) .
o= 0dayi a=3days.

B2
soil (Figure 3.7b) 3 days ageing resulted in the disappearance of
pores smaller than 4.7 Um, and in the creation of pores J-arger than
4.7 um.
Compression resistance
Little attentj-on has been given to the effects of ageing on soif
compressive strength. As discussed in section 2, this strength is defined
as the ability of a soil to resist a volume change caused by applied
stress. Hence this stnength is of great interest to agricultural
engineers, because it is a measure of the resistance of a soil to
compaction damage. Berger and Gnaedinger (1949), with the Grand
Forks and Crookstone c1ays, found that the compression behaviour
of samples tested 6 months after remoul-ding v'ras not different from that
of the 0 day sample. Mitchell (1960), on the othen hand, found that with
the same appi-ied stress, aged soil compresses less than the non-aged
sample. This was shown by the fact that with the same appli-ed stress,
the void ratio of the 12 days aged sample was larger than that of the
non-aged sample.
The effect of ageing on compression resistance l¡Ías investigated on
Urrbrae fine sandy J-oam. Soil- from the A horizon vJas passed through 1 mm
sieve, and then remoulded aL 17% water content. The soil was left to
equilibrate overnight, and was again remoul-ded and compacted in a standard
consolidometer cel-l (75 mm diameter, and 14 mm height) to a packing density
of 0,672. Compression resistance I^Ias measured at 0, 11 3, and 6 days
after sample prepanation. The test was done in a standard consolidometer
with uniaxial sLresses of 0; 4.9; 9.8; 19.6; 29.4 and 49.1 kPa
respectively, with 60 minutes loading time at each l-evel of stress.

B3
To prevent water loss, for the 1, 3 and 6 days aged samples, the
consolidometer ceÌl, with the soil inside, was stored in a plastic
container, sealed with silastic 732 RTV sealant, then wrapped in thin
plastic sheet and aluminium foil and stored in a constant lemperature
room (2OoC). Two samples urere prepared for each period of ageing.
Packing density was plotted against the applied stress, and this
data was fitted to the equation
exp (-s/m)DS =D^-DIM
where D, is the packing density at stress S, Df
density, and D, and m are adjustable parameters
(3.7)
is the final packing
to be determi-ned.
The result shows that ageing results in a decrease in the val-ues of
D^ and D and an increase in m (Table 3.6). The small value DoÎ'mrindicates that with the same applied stress, the aged samples cömpress
less than the non-aged samples. A làrge value of m indicates that the
increase in packing density with increasing applied stress in aged samples
occurred more slowly than in non-aged samples (Figrue 3.8). Thus ageing
increases the resislance of the soil to compression.
lab1e 3.1. Val-ues of Drr D*, and m parameters of equation (3.7) resulting
from compression tests on ""o,o,rtded
Urrbrae soil. aged for
different times.
Ageing( days )
D f m (kPa)Dm
0 0.747(r 0.006)
o .712(r 0.003)
0.714(r 0.003)
0 .704( r 0.000 )
0.072( r 0.008 )
0.039( r 0.003 )
0.032(r 0.000)
8,34(t 3.00)
10.91(t 3.38 )
1'1.81(r 0.74 )
1
3
6
0.041(r 0.003)
15.04(t 4.06)

0.?5
0.70
o+.t¡G
sEleï(,d
0.0¡0
Fig.3.B.
40 30r0 20 30
Uniaxla! stress (kPa)
Effect of ageing on the resislance of Urrbrae soil-
to compression. The continuou" t'f1":.^1":.:::" "teouation (3.7), and the measurements are given by:
tðl- o o.v; (q) 1 daY; (a) 6 days'

84.
As discussed in section 2, compression and shear failune have
some common basis in that in both cases interparticle bonds have to be
broken. AIso, in shear and compression failure, the same particles must
rearrange themselves. Since ageing increases shear strength, it is
resonabl-e that this results in an increase in the compression resislance.
3.2 Effect of chemical treatment on thixotnopic behaviour
3.2.1 Introduction
!,lhen discussing the use of chemical soil conditioners, almost al-I
agriculturists think about aggregate water stability. The references'
in this subject can be found el-sewhere, these include the symposia held
by the International Soi-l Science Society (SSSA, 1975; De Boodt and
Gabrielsr 19T6; Emerson, Bond ancl Dexter, 1978). References on the
effect of soÍI conditioners on soil mechanical properties, on the other
hand, are very scarce. Thùs sub¡ect, especially the effects of cement
and l-i-me on soil mechanical properties, has been mainJ.y the interest
of civil engineers.
Braunack and Dexter (1978) showed that the resistance to compression
of beds of aggregates is a function of the tensile strengths of the
individual aggregates. Ib was found that compression resistance
increased with increasing aggregate tensile strength. Therefore, it is
useful to consider the effects of soil conditioners on soil strength as
well as on aggregate water stability. It will be more val-uable ift
besides increasing aggregate wa1,er stability, the soiÌ condil,ioners used
also increase or decrease (which ever is desired) the strength of the
soi1.
In the past, from the soil strength poinL of view, the use of soil
conditioners has been usually related to crust strength (Jamison, 1954;

B5
Allison andMoore,1956; Pugh, Vomocil and Nielsen, 1960). To study this'
these workers measured strength by the modulus of rupture test devel-oped
by Carnes (1934) and Richards (1953). They found that the modulus of
rupture coul-d be decreased by the application of soil condit'ioners.
!,iilliams, Greenland and Quirk (1967 ) suggested that the modulus of
rupture test did not normally reflect the strength of particle-polymer-
particle bonds, but rather lndicated that small stabilized aggregates
were not easily remoulded to form a sample with the mechanical strength
of the original stabilized material prior to crushing. This idea is
consistent with thixotropic phenomenon discussed previously. Further
lüilliams et al. (1967 ) hypothesized that soil conditioners, especially
organic polymers, would in general- tend to increase the strength of
particle bonds in soils, and hence increase the bulk strength of the
soil provided the adsorption of polymers takes place in such a way tha1"
the polymer molecules are able to form bonds between the majority of
soil particl-es. This hypothesis is supported by their resul.t v¡hich shows
that the tensile strength of soil treated with poly (vinyI alcohol) or
PVA is greater than that of untreated soil. An increase in the tensile
strength of a soil. treated with PVA and hydrous iron oxide has also
been found by Dowdy (1975).
Ingles (1970) measured the unconfined compressive strength of
chemically treated soi-l- after it was aged for a year, and found that
barium hydroxyde and calcium hydroxyde increased soil- strength, vrhereas
phosphorì-c acid and acetj-.c acid decreased soil strength. Chisci, Lorenzi
and Piccolo ( 1978) found a decrease in soil cohesion, measured using the
Casagrande method, with the application of glotal (a mixture of ferric
oxide and acid). Further, they for-tnd that the application of this
conditioner also decreased the resistance of the field soiÌ to probe
penetration.

B6
The object of the work described here was to study the effect of
some chemical treatments on thixotropic behaviour and on soil strength.
If there were different responses to different chemicaf treatments, then
this phenomenon shoul-d be considered in determining the type of chemical
used. In soils consisting of aggregates with low tensil-e strength, and
thus a low compression resistance, it woul-d be better if the chemicals
used lncreased both aggregate water stability and aggregate tensile
strength. In soils contaj.ning aggregates of high tensile strength' on
the other hand, the chemical used should not increase the tensile
strength, but just increase aggregate water stabit-ity. If necessary,
conditioners which reduce aggregate strength coul-d be used so that pJ-ant
root elongation is not mechanÍcalIy impeded.
3.2,2 Materials and Methods
Chemical treatment
The soil used was Urrbrae fine sandy loam, and the chemicals were
orthophosphoric acid (H3P04) and calcium sulphate (CaSOO.?HZO),
The phosphoric acid tneatment was done by remouldlng the soiJ-
samples with 0.1 M; 0.2 M; and 0.5 M phosphoric acid solution (35 mll'100
g soil), and then allowing them to rest and dry at ambient temperature
for 6 weeks to allow the reaction to proceed and any soil- aggregation to
develop.
The calcium sulphate treatment was done by remoulding the soil with
35 ml CaSOO solution/1OO g soil. The amount of CaSOO in the solution
was such that it was equal to application naLes of 1%, 2%, and 5%
respectively. After allowing the reactj-on to take place for a week,
the samples urere l-eached with distill-ed water to remove any sodium ì.n
the solution. A flame test was done to tesL the existence of sodiurn in
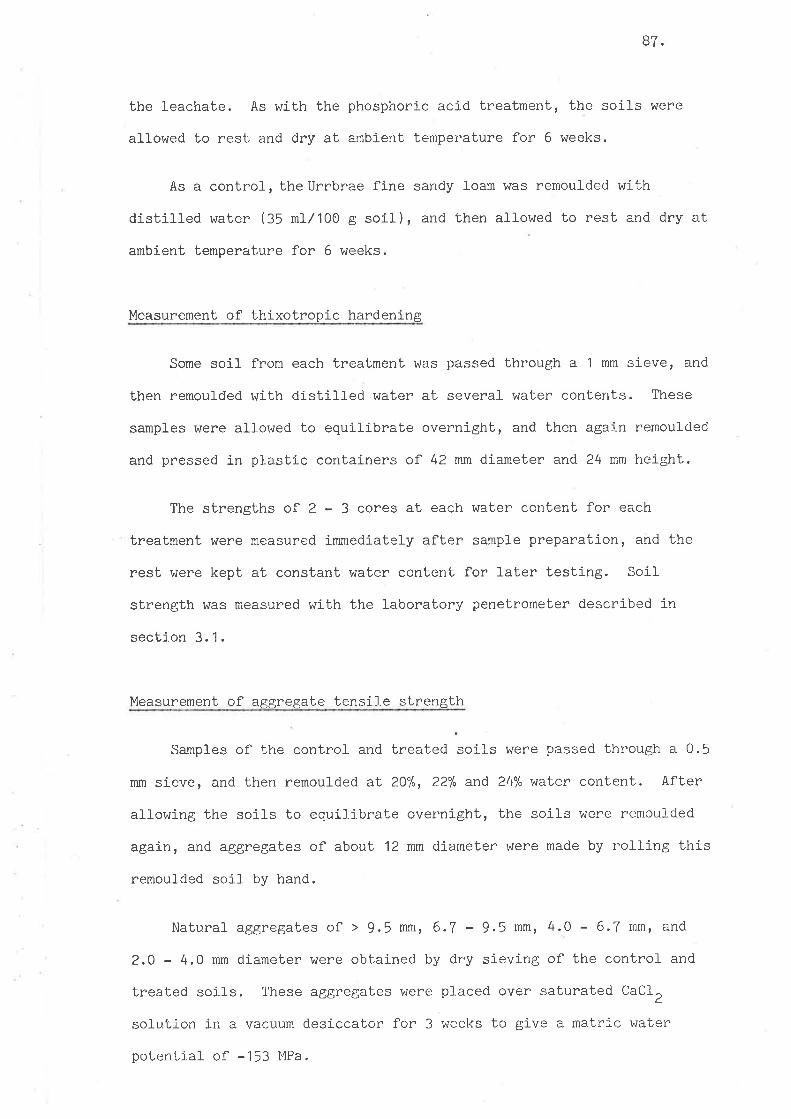
87.
the leachate. As with the phosphorj-c acid treatment, the soil-s were
al-lowed to rest and dry at ambient temperature for 6 weeks.
As a control, the Urcbrae fine sandy loam hlas remoulded with
distilled water (35 nr1-/100 g soil), and then allowed to rest and dry at
ambient Lemperature for 6 weeks.
Measurement of thixotropic hardening
Some soil from each treatment ü/as passed through a 1 mm sieve, and
then remoulded with distilled water at several wa.ter contents. These
samples were allowed to equilibrabe overnight, and then again remoulded
and pressed in plastic containers of 42 mm diameter and 24 mm height.
The strengbhs of 2 - 3 cores at each water content for each
treatment were measured immediately after sample preparation, and the
rest were kept at constant water content for l-ater testing. Soil
strength vJas measured with the laboratory penetrometer described in
section 3.1.
Measurement of aggregate tensil-e strength
Samples of the control and treated soils were passed through a 0.5
mm sieve, and then remoulded aL 20%, 22% and 24% waLer content. After
allowing the soils to equilibrate overnight, the soils were remoulded
again, and aggregates of about 12 mm diameter were made by rolJ-ing this
remoulded soil by hand.
Natural aggregates of > 9.5 mmr 6.7 - 9.5 mm, 4.0 - 6.7 mm, and
2.0 - 4.0 mm diameter were obtained b5' dry sieving of the control- and
treated soj.l-s. These aggregates Í¡ere placed over saturated CaCL,
sol-ution in a vacuum desiccaLor for 3 weeks to give a matric water
pot.ential of -153 MPa.
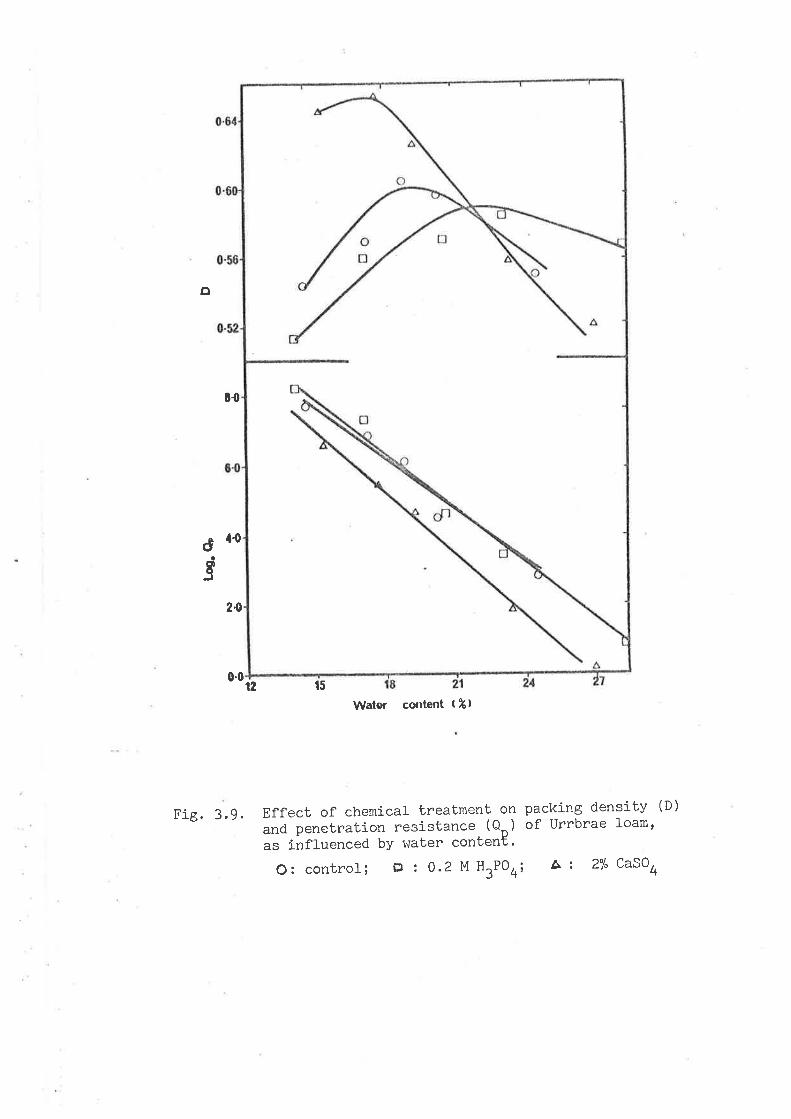
o
û{
Fie,3.9.
Wator cotttent t %t
ôl{
E
24
0.0t512
Effect of chemical- treatment on packing density (D)
and penetration resistance (8o) of Urrbrae loamt
as influenced bY water content'
O: control; I z O.2M H3PO4; A z 2% CaSOO

88.
Tensile strength was determined by crushing the aggregates between
flat parallel plates as described in section 3. 1 .
Compression resi-stance test
Bed of aggregates were made from 2.O - 4.0 mm natural- aggregates
(after equil.ibnating them oven saturated CaCL, solution) in a standard
consolidometer cell. The compression best was done with a standard
consoLidometer with uniaxial sLresses of 0; 9.8; 19.6; 29.4; 39,2i
52.2 and 66.1 kPa re-spectively; as described in section 3.1.
3.2.3 Results and Discussion
Thixotropic hardening
Effects of phosphoric aci-d and calcium sulphate appJ-ication on
packing density and on the resistance of the soil to probe penetration
are shourn in Figure 3.9. At low water content, phosphoric acid
decreased packing density, whereas calcium sulphate increased packing
density. At high wafer content, on the other hand, the opposi*"e effect
occurred.
Figure 3.7 also shows that the increase in packing densi-ty due to
calcium sulphate application is not followed by an increase in the
penetration resistance, but even decreases the penel,ration resistance.
The addition of phosphoric acld, on the other hand, although decreasing
packing density, results in an increase in the resistance of l,he soil- to
probe penetration. The increase in penetration resistance disappears at
high water content (W > 25%).
The variation in penetration reslstance with water content bottr for
the treated and control soils was fitted to equati-on (3.3). By rep]-acing
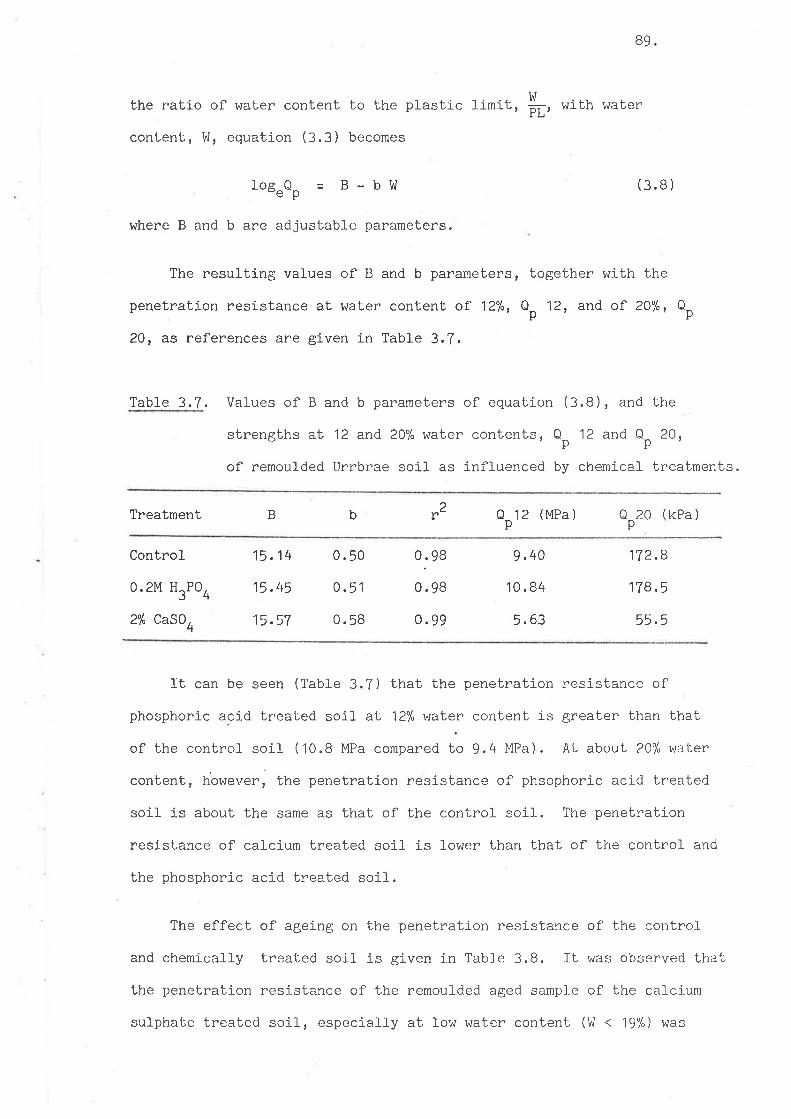
B9
the ratio of water content to the plastic Ìimit
content, lrl, equation (3.3) becomes
B-bV'l
with water
(3.8)
togefher with the
12, and of 20%, nO
!'l
'8,
fop O"ep
where B and b are adjustable parameters.
The resulting values of B and b parameters,
penetration resistance at water content of 12%¡ O
20, as references are given in Table 3.7.
Table 3.7.
p
Val-ues of B and b parameters of equation (3.8), and the
strengths aL 12 and 20% water contentsr QO 12 and Qp 20,
of remoulded Urrbrae soil as infl-uenced by chemícal treatments.
Treatment 020pbB
2r 8p12 (MPa ) (kPa )
Control
0.2M H3P04
27" CaSOO
15.14
15.45
15.57
0.50
0. 51
0.58
0.98
0.98
0.99
9.40
10.84
5.63
1T 2.8
1T8.5
55.5
It can be seen (Table 3.7) that the penetration resistance of
phosphoric acid treated soil at 12% waíer content is greater than bhat
of the control- soil (10.8 MPa compareO to 9.4 MPa). At about 20%waLer
content, however, the penetration resistance of phsophoric acid treated
soil is about the same as that of the control soil. The penetrati-on
resistance of calcium treated soil is l-ower than that of the controf and
the phosphoric acid treated soil.
The effect of agelng on the penetration resistance of the control
and chemically treated soil- is given in TabÌe 3.8. It was observed Lhat;
the penetration resistance of the remoulded aged sample of the calcium
sulphal,e treated soil, especially at 1ow water content (W < 19%) wa.s

Table 3.8.
90.
Effect of ageing on the penelration resistance of remoulded
Urrbrae soil as inftuenced by chemical treatments.
Ageing (days) 0 6
Op
Treatment (kPa )
llüater
content(%)
Packing
density0p
(kPa )
!,later
content(%)
Packing
densi-ty
Control
H PO (0 . 2M)3 4
CaSO (2%)4
2353.4
1009.9
417.4
110.8
19 .3
3193.5
1601 . 6
117 .6
30.4
¿.o
746.9
228.6
107 .0
6.2
1.1
14.50
17 .0
18. 68
20.04
24.54
13. 70
17 .06
20.54
22.9O
28.40
15.30
17.68
19.28
23.24
27 .00
0.538
0.575
0.600
0.592
0.550
0.516
0.564
0.570
0.584
0.544
0.645
0.660
o.625
0.560
0.514
2519.3
1711.5
774.4
168.4
22.0
3278.0
2934.6
326.2
100.6
5.9
1 473.0
497.1
224.4
16.5
5.8
14.25
16.98
18.26
20 .14
24.01
13.72
17 .07
20.51
22.87
28.32
15.36
17.66
19.21
23.25
27.05
o.544
0.569
0.608
0.597
o.546
o.515
0.560
0.570
0. 583
0. 570
0. 648
0.65')
0.626
0.559
0.520
greater than.that of the O day sample. It is thought that the remoulding
forces used were not high enough to destroy the bonds formed by cal-cium
sutphate ab thls water content. Because of th1s, in the following
discussion, the term age hardening will be used.
A plot of water content at time of remoul-ding against age hardening
ratio, shows that both phosphoric acid and calcium sulphate addition
increase the age strength ratio (Figure 3.10), For the phosphoric acid

6.0
5.0
.e83.
põl,l
s
I
Fig. 3.10.
w (%)
Effect of chemical treatment on age strength ratioof Urrbrae Ìoam after 6 days of ageing, as influencedby water content.
O: control; o z 0.2 M H3P04; o : 2% CaSOO

91.
treated soi-I, age strength ratio increases with increasing water content
up to 23% waber content, and then decreases with further increases in
water content. For the calcium treated soil, on the other handr age
strength ratio stitl increases with increasing water content up to
N=?B%.
The increase j-n age strength ratio with chemical trealment is thought
to be a consequence of the formation of chemical compounds which act as
cementing bonds, such as carbonate, iron or aluminium oxide. Ingles
(1970) hassuggested that calcium which is always present in the extract
as calcium hydroxide can form cementing bonds. Yeoh (1979) nas found
that phosphoric acid addition releases aluminium and silicon.
Seed et a-2. (1960) showed that soj-I sensi-tj-viby increased linearly
with increasing amounts of carbonates plus free iron oxide in soils.
This indicates that age strength should increase with increasing
concentration of cementing bonds present in the soil. An increase in
sensitivity with some other chemical additives, such as phosphate, has
been noted by Rosenqvist (1955).
Aggregate tensil-e strength
-The effect of chemical- treatment on the tensil-e strength of freshly
remoul-decl (O Oay) and 6 days aged aggregates is shown in Figure 3.1'l .
Un1ike the penetration resistance, cafcium sulphate application increased
the tensile strength of both the freshly remoulded and 6 days aged
aggregates. Phosphoric acid applicatì-on, on the other hand, decrea.sed
the tensile strength of these aggregates.
Further, Figure 3.i1 shows that the greatest age hardening for the
phosphoric acj-d treated soil- was obtained al about 24% waLer contenb.
This result is in agreemenL wj-th the result given in Figure 3.'10.

30
25
20
oo-,x
d
Fie. 3.11.
24
w (%)
Effecb of a.geì-ng on the tensile strength of remouldedchemically treated Urrbrae 1oam, as influenced bywater content.
o: control (0 day); o : control (6 days);o :o.5 M H"POå (0 day); ¡ :o.5 M H"POá (6 days);A : 5% CaSOO (0 day); t :5% CaSO[ (6 days).

92.
The 59" ""tln
treated. soil liquified when it \^/as remoulded at water contents
above 22>". This prevented. aggregates being prepared. Thus, CaSOn decreased
the strength and increased. the sensitivity of remoulded soil. This is
discussed further on p.95-96.
The decrease in aggregate tensil-e strength due to phosphoric acid
addition and the j-ncrease in aggregate tensile strength with calci.um
sulphate addition was found also in the natural aggregaLes (aggregate
formation occurred as described in section 3,2.2). For these
aggregates, the decrease in tensile strength occurs with increasing
phosphoric acid addition up to at l-east 0.5 M concentration. The
Lensile strength of aggregates treated with calcium sul-pllate increased
up to 2% calcium sulphate application, and then decreased with increasing
application rate (Figure 3.12).
One could argue that the application rate of calcium suJ-phate in
this experiment was rather high. 1% of calcium sulphate is equal to
about 14 tonnes CaSOO/ha (assuming a soit bulk density of 1.4 g/cm3,
and the chemical is mixed into the top 10 cm). A common appl-ication
rate of cafcium sulphate in agricul-tural practice is around J. ! tonnes
CaSOO/ha (Loveday , 1974). Illith this rate, Loveday (1974 ) found that
calcium sulphate decreased the peneLration reslstance of the soÍl-.
A decrease in tensiLe strength ofl remoulded soil due to phosphot'ic
acid appJ-ication has afso been found by Lutz and Pinto (1965) and Yeoh
(1979). Ingles (1970) found that even after ageing for 90 days, the
unconfined compressive strength of phosphoric acid treated soi.f was
still less than that of the control-. For this phenomenon, Ingles (1970)
explained that phosphoric acid was incapabJ-e of forming insoluble
compounds to provide bonds, so that the stnength did noL increase. He'
however, gave no explanation for the strength decrease.

1
HrPOr (f\4,
(Z-4mm)(9.5 - 17 mm)
(Z-4mm)(9.j _ 17 mm)
3 0.4 5
r!ô-.f
tsÞ
m
50CaSO. ('¿ ¡
Fig. 3.12, Effect of chemi-cal treatment on the tensil.e strength(or) of naturaL aggregates of Urrbrae loam.
O: H'PO
Q: H3P0
û: CaSO
¡f '. CaS0
4
4
4
4

93.
A comparison of the results given in Figure 3.9 with those in
Figures 3.11 and 3.12 leads to an explanation of the action of phosphoric
acid on soil-. As discussed in section 2, the resistance offered by soil
to a penetrometer probe is a compound of shear and compressive strength,
and soil probe friction. Aluminium and silicon which are rel-ea-sed by
phosphoric acid (Yeoh, 1979) fiotO clay size parti-cle to form larger unit-s
or volume elements which are separat,ed by micro-cracks or flaws. A
penetrometer imposes a st,rain pattern in the soil (Figure 2.6, Section 2)
which cannot take advantage of these flaws, and hence the penetrometer
resistance i-ncreases. A1so, the j-ncreased effective particle size can
increase the angle of soil internal friction (Kenneyr 1967), and thus
give rise to an increase in soil shear strength through this mechanism.
This suggestion is supported by the fact that at high waLer content,
the penetration resistance of the phosphoric acid treated soil was about
the same as that of the control. Mulqueen et a-1. (1977) found that as
water content j-ncreases, penet,ration resistance becomes insensitive to
shear or compressive strength changes. In addj-tion, since water acts
as a lubricant when j-t is applied to sheet mineral-s (Horn and Deere,
1962), the difference in the frictional resistance at high wa1,er
content disappeared so that the penetration resi-stance of these two
soil-s were not much dif ferent as was found i-n this experintent.
To test the truth of the above suggestion, the shear strength
parameters of these treated soils were determine Soil samples were
passed through a 0.5 mm sieve, and remoulded at 17% waLer content. After
equiJ-ibration overnight, they hrere remoulded again, and cores wlth 38 mm
diameter and 82 mm height were made. Shear tests (drained) were done
in tri-axial cell with a consLant strain rate of 0.4 mm per minuLe, and
with minor prÍncipal stresses of o" = 0; 100; and 200 kPa respectively.

Plate 3.3. Measurement of soil shear strength in a
triaxial cell.


94.
It was observed that the phosphoric acid treated soil ( freshly
remoulded and 4 days aged) tested at the minor principal stress o3 = 0
kPa, produced a clear fai]ure plane. For the others, until 10% strain,
even in some observation where the measurement was continued unLl-l- 20%
strain, did not produce a failure plane (Plate 3,4). For samples which
produced failure planes, the strength r^¡as measured as the peak strength,
and for those which did not produce failure planes, the strength was
measured aL 10% strain.
The results are shown by Mohr circles (Figure 3.13). It can be
seen that the friction angle of the phosphoric acid treated soj-I (2Bo.B')
was much higher compared to that of the control (160.9') and the cafcium
sulphate trealed soil- (160).
The shear strength of these soils increased with ageing
The shea.r strengths of the control, phosphoric acid treated,
sulphate treated soils are
otan 160.9'
otan 2Bo.Bt
otan 160
(Figure 3.14).
and calcium
(3.9a)
(3. 9b )
(3. 9c )
(3.10a)
(3. 10b )
(3. 10c )
rf
rf
rf
32+
22+
46+
at 0 day, and
Tf = 40 + otan 18o.3t
Tf = 40 + otan 290.3'
.f = 55 + otan 17o .5'
after ageing for 4 days, respectively.
The suggestion and findings discussed above is not necessarily in
contradiction with the explanation given by Yeoh (1979) who used the
particle size disl,ribution changes as the basis of his explanation. He
observed that. phosphoric acid apprication increased the proportion of
silt and sand size partÍcJ.es. He, therefore, suggested bhat phosphoric

Ilate 3.4. l-loil deforrn¡tio¡rs r:esul tirrg frorn trlaxialtests after agei.ng for 4 cìa¡rs.
a. Contr:ol (107, str:ain, Ç1 = 0 k!.a)
b. o., M HrI'04 treated (1071 strain, o, = 0 kPa)
c. 1% CaSOO treated (2O% stra.in , Ç5 = O Ìc]'a)

)
I q
I
If

1-( kpa)
Fig. 3.13"
c
0 2üû 400 6Ðû
Mchr failure envelope of the cònfrol (a), phosphoric acid treated (b), and calciumsulphate treated (c) of tlrrbrae loam at 0 day aged.
Control tanQ = 0.3C-,'O = 160.9' Tf = 32+olan 160.9'
irhosphoric aci{ tan $ = 0.55 + O = 28o.3t af = 22 + o tan 28o.8t
Calcium su-lphate: tan Q - C"29 + Ô = t6o.0' ,f = 46 + o tan 160'0'
80s g (kPa)
b
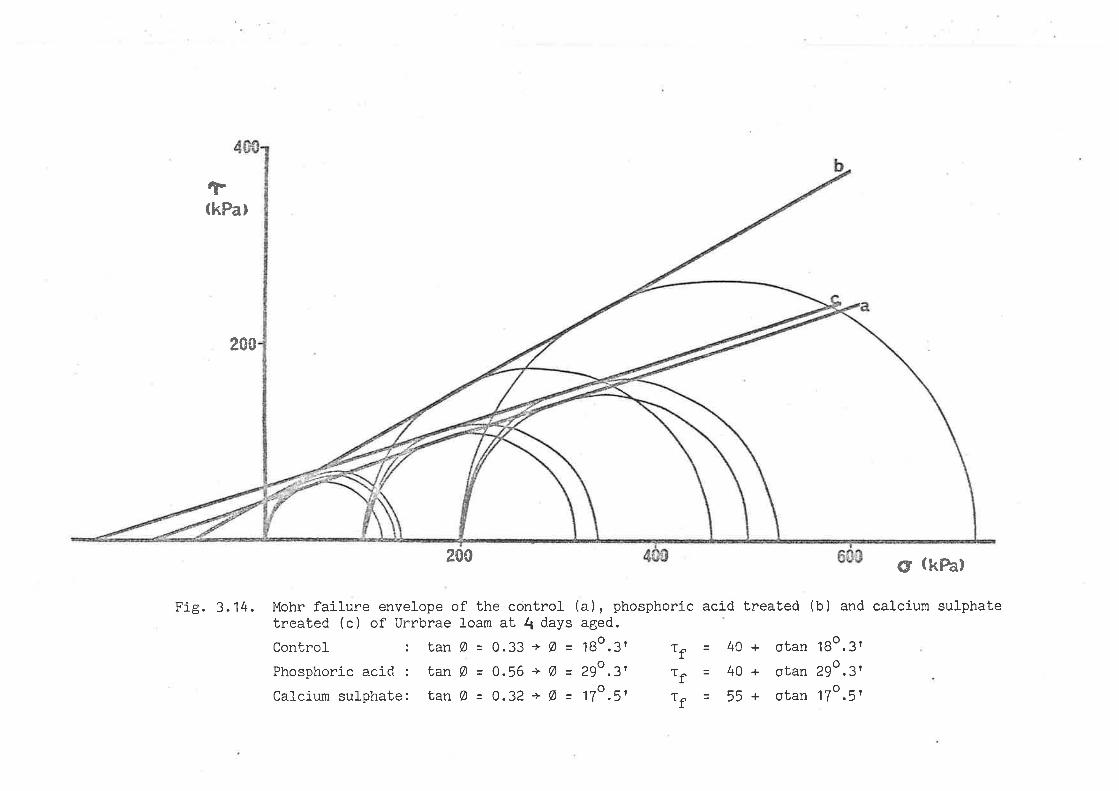
t(kPa)
200
6t (kPa)
FiS. 3.14. Mohr failure envelope of the control (a), phosphoric acid treated (b) and calcium sulphate
2CI0
treated (c) of Urrbrae
Control : tan
Phosphoric acicl. : tan
Calcium sulphate: tan
loam at 4 days
Ø = 0.33 + Ø =
Ø = 0.56 + Ø =
Ø = 0.32 + Ø =
aged.
180.3'
2go.3,
170 .5'
olan 1go.3r
oLan 2go.3'
otan 1To .5'
Tf=Tf=Tf=
40+40+55+

95
acid addition woufd decrease the actual contact between soil particles, and
hence resulted in a decrease in attractive forces with a conseçluent reduction
of the tensile strength.To study the effect of treatment on particle size distribution, the
samples were dispersed \nrith 5e" sodium hexametaphosphate, and the size
distribution was measured by the hydrometer method. The result (Table 3.9)
shoh¡s that phosphoric acid application increased the proportion of sand size
particles and decreased cfay size particles. rhis phenomenon can be explained
from the finding of Yeoh (1979) that phosphoric acid releases aluminium and
silicon which may bind clay particles into J-arger units-
Teble 3.9. Effect of phosphoric acid and calcium sulphate application
on particle size distribution of Urrbrae l-oam.
Fraction(USDA system)
% in soil tneated withcontrol 0.2M H3P04 27" CaSO
4
cl-ay size
silt size
sand size
(< 2 pm)
(2 - 50 ¡rm)
(> 5o pm)
15.5
60. 5
24.0
7.5
59.0
33. 5
17
57
¿o
For cafcium sulphate treatment, IngJ-es (1970) suggested that cal-ci-um
which is always present in extracts migrates to and reacts at the silica-
or aluminium-rich surface (i.e. the cJ-ay) to coat if with an insoluble
product. This feads to an increase in the strength of the soil.
The fowen penetration resistance of the soil treated with calcium
sut.phate (Figure 3.9) did not necessary mean that calcium sulphate
application decreased soil strength. This was the strength of remoulded
soi.I, and probably jusb indicates that the addition of calcium sulphate
brould increase the sensitivity of the soil- as discussed previously. 'lnlhen
thj-s soil is al-l-owed to age for a longer time, its penetration resistance
shoul-d be higher than the untreated soil. This suggestiotr is supporLed
by the resuft given in Figure 3.15. It can be seen that after 16 days
ageing, the strength regain of the control soil effectively ceased. For
the calcium LreaLed soil, on the other hand, the strengl,h regain stil-l

120
60
20
Fig. 3.15.
(!6-.fèg
00 5 10
Ageing (days)
Effect of ageing on the resistance to probepenetration of CaSOO treated Urrbrae loam.
ô .. Control (lü = 19 . CB )
rl : Control (Ïü = 22.40)Ã i5% CaSOO (!ü = 19.43)
z:5% CaSOO (W = 22.06)

96.
increased steadity. Extr.rpolation to greater ageing ti:nes is rather
hazardous, but is seems probaJrle that the penetration resistance of
CaSOn treáted soil may be greater than that of the control.
This result supporls the suggestion of V\tilliams et ai. (1967 ) discussed
previously. Ing1es (1970) found that the unconfined compressive strength
of calcium hydroxide treated kaol-inite (7 days aged) was about 2.2 MPa,
and after ageing for one year the sbrength was about 12.8 MPa. The
strength of the control- treatment blas about 1.1 MPa.
. Plotting the logarithm of'the tensil-e strength as ordinate and the
logarithm of the volume of natural aggregates (see 3,2.2) as abscissa
resulted in a straight line
1oe.o, = K-kIoe"V (3.11)
Here, K and k are adjustable parameters depending on the properties of
the soil.
The resulting K and k value is given in Table 3.10, and the resulting
curves in Figure 3.16. As a reference, the tensil-e strength of 10 mm
aggregates, S1O, is also given in Table 3.9.
Table 3.10. Values of K and k panameters of equation (3.1 1 ) of
Urrbrae loam as influenced by chemicaf treatments.
2Treatment rkK e (kPa )
10
control-
0.1 M H3
PO
0.2 M H3PO
0.5 M H3PO
17" CaSOO
2% CaSoO
5% CaSOO
4
4
4
2.42
0.63
0,27
0. B6
4.90
4.53
4 .43
0.08
0.16
0. 18
0.12
-0.02
0.04
0.03
0. 86
0. 95
0.93
o.92
0.62
0. 68
0.68
35.1
19. B
16 .4
13. 3
95.5
157 .5
123.9

{.
filo.]l
ö
$
3.
2.0
Fie. 3. 16.
-12Log. V
Effect of chemical treatment on the 1og aggregaletensile strength-volume relaLionship of Urrbrae loam.The continuous curves are flt of equation (3.11), andthe measurements are shown by:
O Controlo 0..1 M
o 0.2Mr o.¡ ¡r
^ 17" CaSO
a 2% caSoX
5% CaSO
H3P
H:P
H:P
or,
rì"4o,r
4
4
4

97.
The large varue of the parameter x of Lhe soiL treated withphosphoric acid indicates that the strength of rarger aggregates ismuch l-ower than that of the smalÌer aggregates. The calcium Lreated
soil' on the other hand, had a smaller k value compared to the control
and phosphoric acid treated soil. This indicates that the tensil_e
strength of soil aggregates treated with calcium sulphate is littleinfl-uenced by aggregate volume. These resul-ts are consistent with the
mechanism by which phosphoric acid and calcium sulphate react with soÍIas discussed previously. For the phosphoric acld treated soil, the primary
soil particles are bound into rarger particles separat.ed by fl_aws. rnthis case, larger aggregates would be more 1ike1y to contain Ìarger
f1aw.s, and hence the soil- might be expected to fracture at a l-ower
stress. As sugge-sted, calcium sutphate forms insol-uble compounds which
are distributed between soil particles. These compounds fil-l in the
flaws, so thal the flaws have a much reduced influence on tensile strength
and the tensile strength of the smaller aggregates is not much differentfrom that of the larger aggregates.
It is suggested that equation (3.7) which was firstly devetoped by
Braunack et aL. (1979) is a measure of soil- friability. The friabil-ityof a soil- can be expressecl by the varue of the parameter lrr. A val_ue
of k = 0 appties for a classical, ideal-plast,ic (non-friable material),and a k vafue gneater than 0.4 indicates that the soil is so friablethat it is mechanically unstabfe. The results in Table 3.10 and Figure
3.16 indicate that phosphorlc acid application increased soil- friability,whereas calcium sulphate application decreased soil friability. A funther
discussion on soil- friabj lity is presented in section 5 and in Utomo and
Dexter ( 1981a).
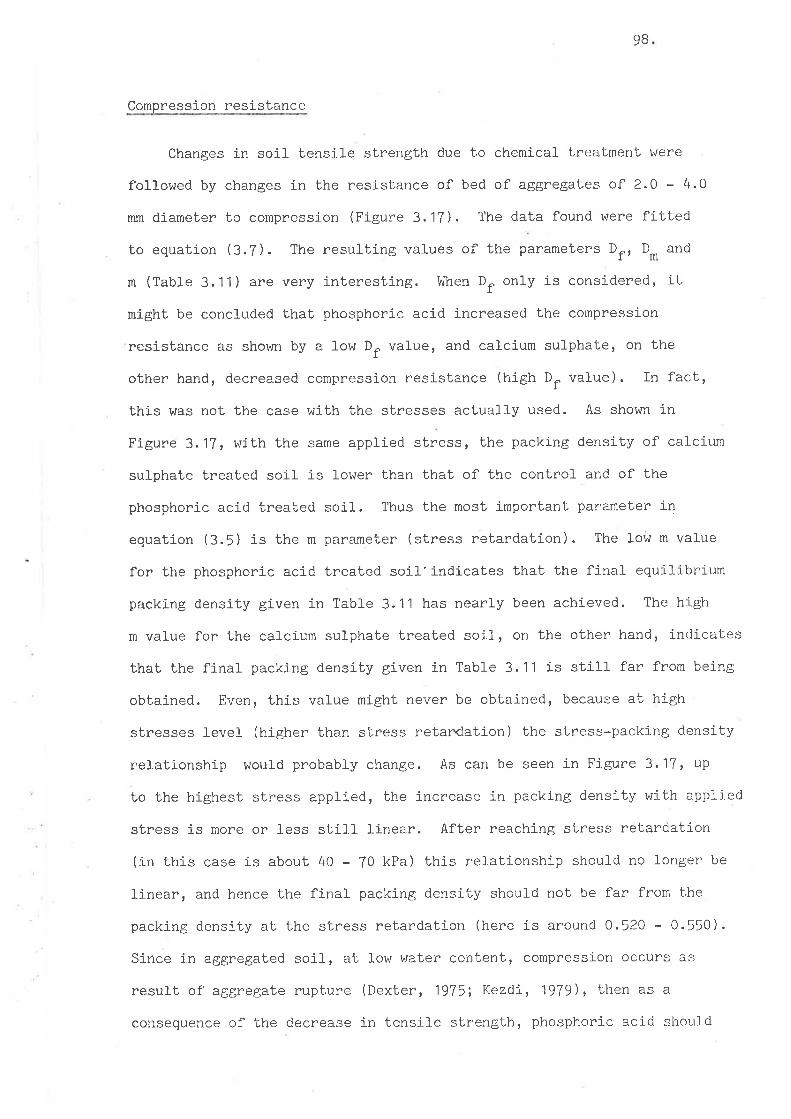
9B
Compressì-on resistance
Changes in soil tensile strength due to chemical treatment were
followed by changes in the resistance of bed of aggregates of 2.0 - 4.0
mm diameter to compressj-on (Figure 3.17). The data found were fitted
to equation (3.7). The resulting values of the parameters D¡r D* and
m (Table 3.11) are very interesting. I'lhen D,' only is considered, it
might be concluded that phosphoric acid increased the compression
resistance as shown by a low D, value, and cal-cium sulphate, on the
other hand, decreased compression resistance (high D,' value). In fact ,
thj-s was not the case with the stresses actually used. As shown in
Figure 3.17¡ with the same applied stress, the packing density of calcium
sulphate treated soil- is lower than that of the control and of the
phosphoric acld treated soil. Thus the most important parameter in
equation (3.5) is the m parameter (stress retardation). The low m value
for the phosphoric acld treated soif indicates that bhe final equilibrium
packing density given in Tabl-e 3.1'l has nearly been achieved. The high
m value for the calcj-um sulphate trealed soil, on the other hand, indicates
that the final packing density given in Table 3.11 is still- far from being
obtained. Even, this value might never be obtained, because at high
stresses l-evel- (nigfrer than stress retardation) bhe stress-packi.ng density
relationship woul-d probably change. As can be seen i-n Fì-gure 3.17 t up
to the highest stress applied, the increase in packing density with applied
stress is more or fess still linear. After reaching stress re1-ardation
(in this case is about 40 - 70 kPa) this rel-ationship should no longer be
IÍnear, and hence the final packing density should not be far from the
packing density at the stress retardation (here is around 0.520 - 0.550).
Since in aggregated soil, at low water content, compression occurs as
resul-t of aggregate rupture (Dexter, 1975; Kezdi, 1979), Lhen as a
collsequence of the decrease in tensj-Ie strength, phosphoric acici should
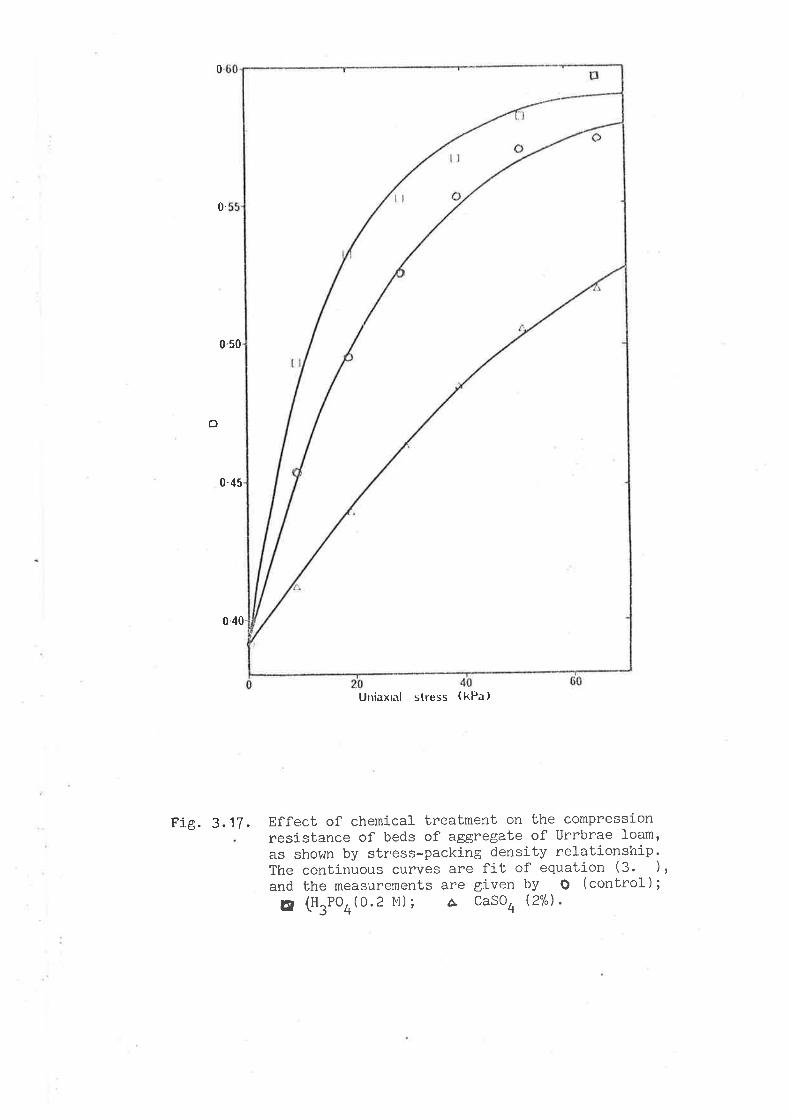
0
0.
0-s0
o
0-45
0.40
Fig. 3.17.
U¡iaxial stress (kPa)
Effect of chemical treatment on the compressionresistance of beds of aggregate of Urrbrae loam,as shown by stress-packing density relationship'The continuous curves are fit of equation (3. ),and the measurements are given by O (control);p (HrPoO(O.2 l'i) ; ô CaSoO (2%).
Table 3. '1 1 .
99.
Values of D. D,nr ,and m parameters of equation (3.7)
resulting from compression tests on beds of aggregates of
2.0 - 4.0 mm diameter of Urrbrae loam as influenced by
chemical treatment.
Treatment Df Dm
m (kPa )
control
0.1M H3P04
0.2M H3P04
17" CaSOO
2% CaSOO
5% CaSOO
0.596 ( t0.006 )
0.587 ( ro. oo2 )
o.590(to.oo8)
o.629 (t0.004 )
0 .624 ( t0. 038 )
0.641 (10.01 )
0.286 ( 10.005 )
0.195(10.003)
0.198(r0.o1o)
0 .240 (r0 . 004 )
0.236 ( r0.036 )
0 .252 (t0 . 010 )
27.12(r1.98)
17 .47 ( t0 .85 )
15.75 G2.39)
43.33 (11 . 69 )
78.13(t18.63)
47 .89 (13. 87 )
reduce the compressive strength. Cal-cium sulphate, on the other handt
since 1t increased aggregate tensile strength, should j-ncrease the
compressive strength. An increase in the compressive strength of beds
of aggregates with increasing lensil e strength of the individual aggregates
was found by Braunack and Dexter (1978). To make a comparison, the data
in this experiment (aII treatments combined) and those for natural field
aggregates given in Braunack and Dexter (1978) were fitted to
H/H. = N+nexp(-ntS/or), ß.12)
where H and H* and the height and the initial height of the sample, SI
is the appliéd stress, and N, n and nr are adjustable paramet.ers. The
resulting equations were
H/Hí = 0.63 + 0.36 exp (-3.84 s/or) (3.13a)
andH/HL = 0.73 + 0.25 exp (-1.43 S/or) (3.13b)
for the combined data in this experimenl and those in Braunack and
Dexter (1978) respectively.
'100.
3.3 Conclusions
Some agricultural soils exhibit appreciable thixotropic behaviour
around the water content at which tiJ-l-age is usuaÌl-y performed. This
behaviour can be evaluated by probe penetration, tensil-e strengLh,
compression resistance as wel-l as by shear strength measurements.
Ageing, after remoul-ding or disturbing these soils, results j-n an
increase in the shear strength, tensile strength, compnessive strength,
and penetration resistance. These changes might have some significance
in agricultural practice. The increase in the penel,ration resistance
and tensj-J-e strengfh might influence seed germination and the growth of
plant roots. l4uch work has been done to study the effect of penetration
resistance on root growbh, and an excellent review has been published
by Barley and Greacen (1967). The effect of soil- tensil-e strength on
root elongation rate, however, has not yet been investigated. These types
of investigatlons could have an interesbing future in relation to
thixotropic phenomenon. Koenigs (1961) has related thixotropic hardening
to the growth of rice. He suggested that a fl-occul-ated mud is a better
environment in which to grow rice then either a paste or a granulated soil-.
The fact that matric water potentia'I becomes more negative with
ageing after remoulding or disturbing the soj-I could have some negative
effects on seed gerrnination or crop growth. Soil- water previously
available for seed germination or crop development may become unavailabfe
due to this change. In addition, the rate of water movement (to pl-ant
organs) might be influenced by the increase in soil strength. It has
been shorn¡n that the rate of seed germination and primary roo1, elongation
are reduced when the seed is encÌosed by soil of high strength because
of the restrictj-on of water imbibition (Col-Iis-George and l{i11iams, 1968)

WAITE INSTITUTE
LIBRARY
The incnease in the compression resistance with ageing could be
taken into account i-n soif management practice. It has been suggested
that titlage disturbs or remoulds a soil to some extent (Dext,er and
Tanner , 1974; Godwin and Spoor , 19TT; Utomo and Dex1,er, 1981b) . V'ihen
such a soil- exhibits thixotropì-c behaviour, allowing the soil- to resb
for several days before any other activity is performed coul-d have a
significant effect in reducing compaction damage.
In the second experiment, it has been shou¡n that adding chemicals
to a soil can have effects on tf," strength regain behaviour resulting
from ageing at constant water content. Addition of phosphoric acid or
calcium sulphate increases the age hardening ratio. This result
supports the conclusion draurn by some earl-ier workers (Rosenqvist,
1955; Seed et aJ., 1960) that adding some chemical- compounds to a soil
can increase the sensitivity of the soil.
It has been found that phosphoric acid decreases aggregate tensil-e
strength, and increases soil friability. An appJ-ication of these fì.ndings
is that the phosphoric acid should not be used on a soil which already
has aggregates of low tensil-e strength. Although phosphoric acid can
increase aggregate water stability as has been shown by many i^¡orkers
(e.g.Yeoh, 1979) the soil could suffer excessive compaction damage as
a result of t,he reduction of tensil-e strength. Phosphoric acid woul-d l¡e
more useful if it is used in a hard strong soil. In this soiJ-, the double
beneficial effects of phosphoric acid, that is an increase Í.n aggregate
waber stability and soil friability could be expected. Phosphoric acid
might afso be useful in restoration of sorne soils which have been
degraded by bhe formation of hard-pan layers.
Applicat,i-on of cal-cium sulphate increased the tensile strength of
soi-l aggregates, and hence t he resistance of beds of these aggregates to

102.
compression. It would, therefore, be more valuable if calcium sulphate
is applied in a soil with aggregates with an initially low tensife
strength. By doing this, the double benefj.cial affect of calciunt
sulphate, that is an increase in aggregale water stability and a
decrease in the susceptibllity of the soil to compactì-on can be attained.

103.
SECTION 4
EFFECT OF WETT]NG AND DRYING CYCLES ON FORMATION
AND VüATER STABILITY OF SOIL AGGREGATES.
4.1 Introduclion
The results of some earlier workers on the effects of wetting and
drying cycles have been discussed extensively in section 2. It has
been shown that wetting and drying cycles assist the formabion of soil
aggregates, especially in non-aggregated puddled soil (McHenry and
Russell , 1943; I'loodburn, 1944; Ri-chardson, 1976). t'letting and drying
cycles have been shown to decrease aggregate water stability (Itlillis,
1955; Tisdall et aI., 1978), but they also have been shown to increase
.aggregate water stability (SiJ-lanpaa andll,lebber ¡ 1961; Hofman, 1976).
In this work, the hypothesis was that wetting and drying cycles
might initiate the formation of soil aggregates through the particle
rearrangements and the formation of planes of weakness. SimiJ-arly, in
aggregated soil, wetting and drying cycles could also infl-Llence
aggregate waten stability. The direction in which this change might
occur could depend on many facbors, such as Lhe mechanism by which
aggnegates are formed, and the prevÍous management of the soj-l-.
To study these suggeslions, experi-ments on effects of wetting and
drying cycles'on aggregate formation and water stability were done on
some red brown earth soil-s from South Australia.
4,2 Materia]s and Methods
Soil s
The soils used were from the Urrbrae, Sl-rathalbyn and Mortlock

104 .
experimental stations of the Vrlaite Institute. These soils are red
brown earths, and some properties of these soíls have been described
in section 3.
Aggregate formation
Samples from the A horizons of these soils were passed through a
0.25 mm sieve, and then remoulded at water contents slighl-ly above their
pì-astic limits. After allowing them to equilibrate overnight, these
samples vÍere remoulded again fòr about 2 minutes, and soil balls with
diameters of about 40 - 50 mm were made by rolling these remoulded soils
by hand. To minjmize any effects from age hardening, the balls were pre-
aged for 2 weeks at -f00 kPa on a pressure plate.
These ball-s were then treated as follows:
a. control : the bal-ls were kept at -I kPa potential-- The other ballswere subjected to two cycli:s of wetting and drying between the followingmatric .water potentials.
b. -1 kPa and -10 kPa.
c. -1 kPa and -20 kPa.
d. -1 kPa and -100 kPa.
e. -1 kPa and oven dried (6OoC).
f. -10 kPa and -100 kPa.
g. -10 kPa ancl oven dried (6OoC).
h. -20 kPa and oven dried (6OoC).
Vrletting was done on sintened funnels, and drying vJas done on
sintered funnels (-10 and -20 kPa), in pressure pJ-ate apparatus (-100
kPa) and in an electric oven (6OoC oven dried). One cycle of wetting
and drying consisted of wetting, then drying and rewetting. To complete 2
cycles of wetting and drying, the balls were again dried and rewetted-
After compteting the cycles of wetting and drying, all treatments were
air dried for 10 days, and the formation of soil aggregates $¡as assessed by
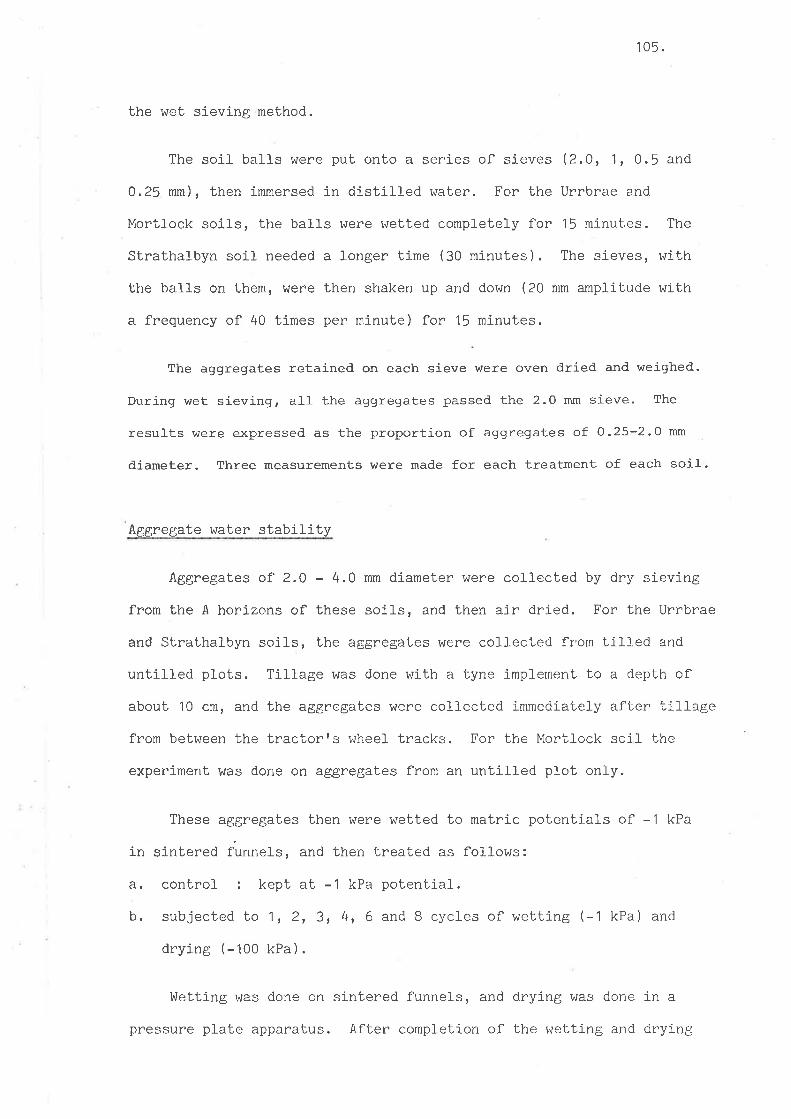
105.
the wet sieving method.
The soit balls were put onto a series of sieves (2.0r 11 0.5 and
0.25 mm), then immersed in distilled water. For the Urrbrae and
Mortlock soils, the balls were wetted completely for 15 minut.es. The
Strathatbyn soil needed a longer time (30 minutes). The sieves, with
the balls on them, were then shaken up and down (20 mm amplitude with
a frequency of 40 times pen m.inute) for 15 minutes.
The aggregates retained on each sieve \^tere oven dried and weighed.
During wet sieving, alt the aggregates passed the 2.0 mm sieve. The
results \^/ere expressed as the proportion of aggregates of O.25-2.0 mm
diameter. Three measurements were made for each treatment of each soil.
Aggregate water stability
Aggregates of 2.0 - 4.0 mm dj.ameter were collected by dry sieving
from the A horizons of these soils, and then air dried. For the Urrbrae
and Strathal-byn soils, the aggregates vrene collected from tilled and
untill-ed plots. Tillage r¡¡as done with a tyne implement to a depth of
about 10 cm, and the aggregates were coll-ected immediaLely after tillage
from between the tractorrs wheel- tracks. For the Mortlock soil the
experiment was done on aggregates from an until-led plot only.
These aggregates then were wetted to matric potentials of -1 kPa
in sintered flnneJ-s, and then l,reated as follows:
a. control : kept at -1 kPa potential.
b. subjected to 1, 2, 3, 4, 6 and B cycl-es of wetting (-l tpa) and
dryJ-ng (-100 kPa).
hretting was done on si-ntered funnels, and drying v'/as done in a
pressure plate apparatus. After completion of the weLting and drying

106.
cycl-es al-l- treatments were equilibrated to -1 kPa matric potential for
two days, after which their water stability was evaluatecj.
Aggregate water stability was eval-uated by the wet sieving method.
20 g of each treatrnent for each soil was put onto a series of sieves
(2,0, 1.0, 0.5 and 0.25 mm)r ancl then i-mmersed in distilled water for
5 minutes. These sieves, with tLre aggregates, were shaken up and down
as described previously for 30 minutes. The aggregates retained on each
sieve were oven dried and weighed. The results were calcul-ated as the
proportion of aggregabes > 0.5 mnt diameter.
4.3 Results and Discussion
Aggregate formation
It was found that wetting ancì drying cycles could resul-t in the
formation of water stable aggregates'(Table 4.1). It seems that planes
of weakness (micro-cracks) which were formed by al-ternate wetting and
drying were abl-e to provide the initial faces of soil aggregates as
has been suggesbed by i^lhite (1966). Thus, when there vras a sufficj-ent
force to break the soil mass, such as a more intensive wetting (when
air dry soil mass was wetted suddenl-y pr.ior to wet sieving) or mechanical
forces (the action of water while the sieves were shaken up and dolun),
this soil mass coul-d fraci,ure al-ong the planes of weakness to form
soiJ- aggregates. This mechanism has also been proposed by llewitt and
Dexter (1980) in studying the effect of t:lllage and stubb-ì-e management,
on the strructure of swelling soil. In that case, however, Lhe f-orce
breaking up the soil was a tillage implement, and the aggregates fonmed
were not evaluated in terms of water stability. A similar concfusion
coul-d also be drawn from l-he work of Ojeniyi and Dexl,er (1979a) who
found that the slructure produ.ced by tillage in a more intensively wettecÌ
and dried soil (pasture) fiaO a higlrer proportion of fine aggregal-es.

Tabl.e 4. 1 .
i 07.
Effect of 2 cycles of wetting and drying on the formation
of water stable aggregates of 0.25 - 2.0 mm diameter.
The potential (kPa)to which the soilwas wetted and dried
% aggregates 0.25 - 2.0 nm
Strathalbyn Montlock
A
B
c
D
E
F
G
H
Control
-1 and -10 kPa
-1 and -20 kPa
-1 and -100 kPa
-1 and oven dried
-10 and -100 kPa
-10 and oven dried
-20 and oven dried
( 600c )
9.47
10.68
13.39
16.62
15.60
5.65
4.32
3.57
6.02
9.05
8. BB
18. 07
16.33
4.74
3.37
3.66
( 6ooc )
( 6ooc )
LSD 5% 3.77 2.69
Table 4.1 also shows that the greater is the range of potentials
over which the soil was wetted and dried, the larger j-s the proportion
of aggregates of 0.25 - 2.0 mm diameten. This is consistent with the
mechanism by which wetting and drying assists the formation of soil
aggregates proposed above. It \^ras reasonable to expect that the more
the soil is wetted and dried, the greater are the stresses produced
by the wetting and drylng. As a result, the formation of planes of
weakness would be more intensive, with the consequence that the number
of aggregates formed (when there vlas enough force to break the soil
mass) would be greal,er. It has been shown el-sewhere that the rate of
breakdown of a soil mass into finer fractions increased as the rate of
wetting increases (Emerson and Grundy, 1954; Panabokke and Quirk, 1957],.
The rates of wetting between different water potentials are shown in
Figure 4. 1 .
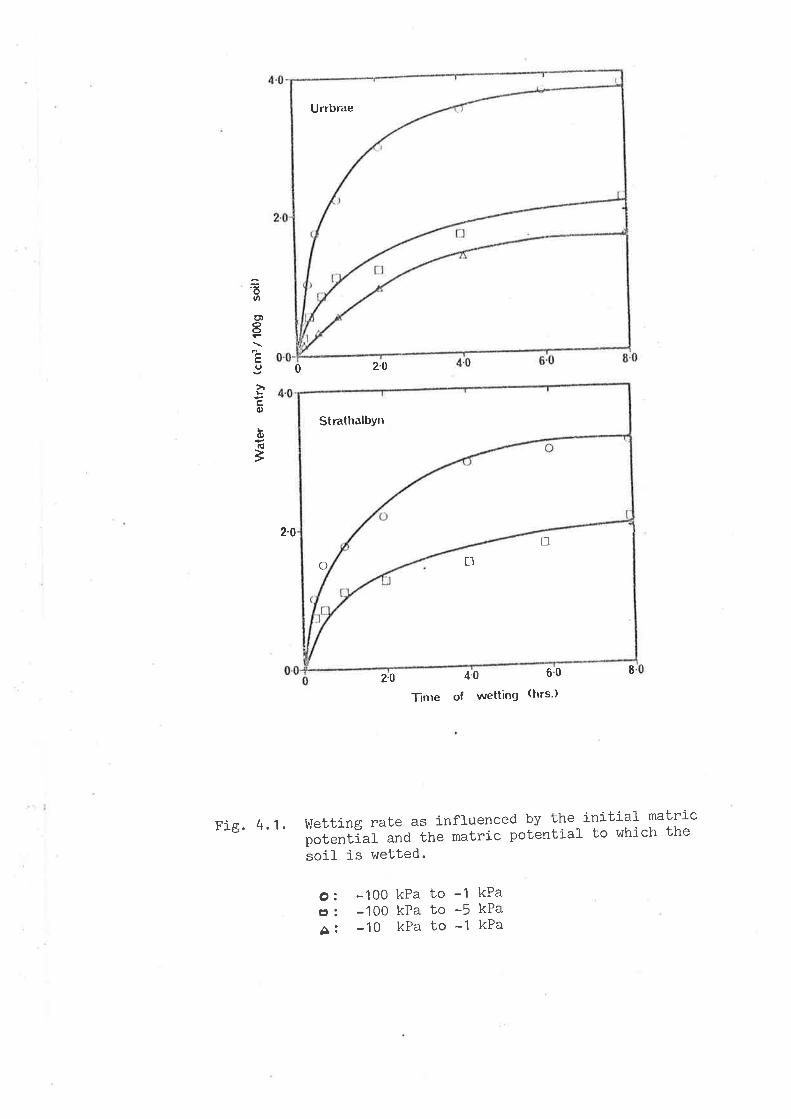
Urrbrae
ôtA
o)IEu
EcO)
ó)
rl,
0 2-0
2-0 4'0 6-0
Tinre of wetting (hrs')
o: -1OO kPa to -1 kPaE : -100 kPa to -5 kPa
A: -10 kPa to -1 kPa
2-0
I
Fig. 4.1. !üetting rate as influenced by the initial matricpotentlal and the matric potential to which the
soil is wetted'
tlt_l
al
StrathalbYtt

108.
In studying the formation of soil- aggregates in terms of the concept
of stresses and strains produced by wetting and drying, Van de Graff
(1978) found that rapid rates of wetting and drying produced smaller-
sized aggnegates, and sfow rates of wetting and drying produced larger-
sized aggregates.
In addition to the mechanism suggested above, desiccation which
causes orientation of water dipoles as suggested by McHenry and Russel-l
(1943) might also contribute to the formation of soil aggregates found
in this experiment.
Baver et a7. (1972) suggested that aggregates formed by wetting
and drying such as are not stable to waten. To obtain water stable
aggregates, there musL be another process, such as the formation of
'cementing bonds caused by microorganism activity or bonds formed by
other soil constituents.
To study the importance of soil microorganism activity in forming
water slable aggregates, the following experiment was carried out. A
sample of the Urrbrae soil was passed through a 0.25 mm sieve, ancl
remoulded at a water content slightJ-y above the plastic limit (20%)
with (a) deionized water, and (b) a solution containing mercuric
chloride and sodium azi-de. After alJ-owlng this so1l 1,o equilibrate
overnight, this soil was remoulded again, and soil ball-s with diameter
of 40 - 50 mnl were made by rolling this remoulded soil by hand. These
soll balls then treated as folfows:
(a) control (kept at -1 kPa), and
(b) subjected to 1, 2, 4 and 6 cycles of wetting (-l t<pa) and drying
(-100 kPa).
For the steril-izecl soil, the sintered funnels and pressure plate on lvhich
the soil was v¡etted and dried, hiere connected to reservoirs of the rnercur.ic
chl-oride and sodium azide soi-ution.

109 .
The result is shov¡n in Figure 4.2. It can be seen tliat the
percentage of aggregates 0,25 - 2.0 mm diameter increasecl with increasing
wetting and drying cycles both in steril-ized and unsterilized soif. This
tendency occurred al-so in the Mortlock soil- (unsterifized). Again, this
result supports the suggested mechanism by rvhich wetting and drying
assists aggregate formation. With increasing numbers of cycles of
wetting and drying (probably to a maximum value), it can be expected
that increasing numbers of pl-anes of weakness are formed. Thus one
would expect that increasing numbers of smal-l- aggregates woufd be formed
with increasing numbers of wetting and drying cycles. This resul-t is
in good agreement with that of McHenny and RusseII (1943) who founcl that.
the percentage of aggregates larger than 0.25 mm diameter increased with
increasing wetting and drying up to 20 cycles. I¿rloodburn (1944 ) found
that the formation of aggregates of 0.5 - 2.0 mm increased r,vith increasing
wetting and drying up to two cycles, but decreased on further wetting
and drying cycles. The result shourn in Figure 4.2 also demonstrates the
importance of soil- mi-croorganism activity in formlng water stable
aggregates. When soil- microorganism activity was restrÍcted, aJ-fhough
wetting and drying cycles were sti1J. capable of forming rvater stable
aggnegate-s, the percentage of aggregates formed was much l-ower compa,red
to that when soif mi_croorganism activity was unrestrictecl.
!'lith the formation of planes of weakness and/or particle rearrange-
ments due to wetting and drying there should be a change in the porosity
or pore size distrlbution of the soil-. This phenomenon was sLudied on
the Strathal-byn soj], A sample of this soil- was passed through a 0,25
mm si-eve, and remoul.ded at a waLer contenL slightly above the pJ-astic
limit Q0%). After equilibration overnight, the soif was relnoulded
again and soil aggregates with diameters of about 15 ^ 20 mm were tnade
by rolling this remoul-ded soil by hand, To minimi ze any effects resul,tirlg
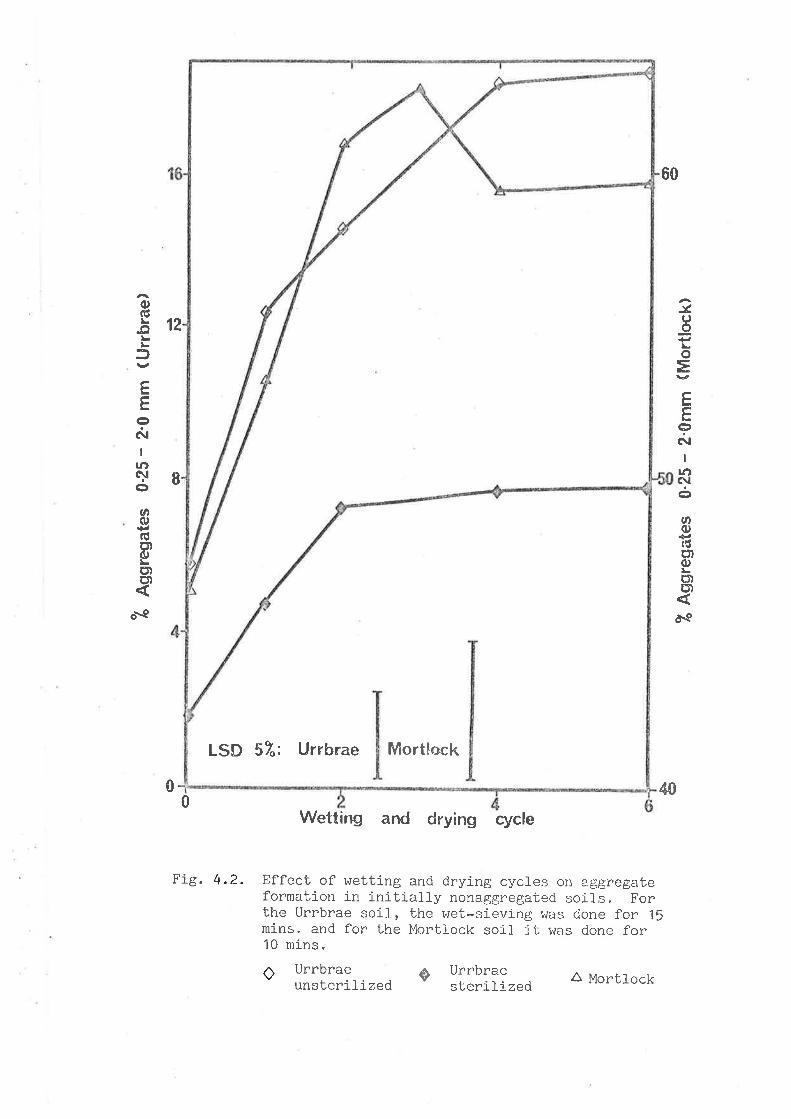
MortlockLSÐ 51": Urrbrae
o(ú\.-o
3
EEoNI
rl':,qlott6J
GcÐoq)g)
o\e
12
60
40
-v.uoEoE
ËËIN
I
lJ')c\¡C'
U)o(ú(t)0)l-Ëtct)
ò9
I
00
Fig. 4.2.
Wetting and drying cycle
Effect of wetting and drying cycles on aggregateformation in initially nonaggregaLed soil_s. Forthe Urrbrae soil, the wet-sieving vras done for 15mins. and for the Mortlock soiJ iL was done fo::10 mins.
ôo UrbraeunsteriLized
Urrbraesterilized A Mortlock

1 10.
from thixotropic changes, these aggregates were aged at -20 kPa
potential in sintered funnels for two weeks. These aggregates then
treated as folLows:
(a) control (the aggregates were kept aL -20 kPa matric potential) and
(b) subjected to one cycre of wetting (-l t<pa) and drying (-100 kPa) '
After the cycle of wetting and drying, all treatments blere wetted
to -0.5 kPa potential for two days, and then dried to -1 , -3, '-6, -10,
-15 and -100 kPa for two days, after which the water content was
determined gravlmetrically. ffiree replicates üIere done for each
treatment at each level of matric potential. Each replicate corltained
3-4soilaggregates.
The result (Figure 4.3a) supports the above suggestion. Unlike
thixotropic changes which only create large pores (small pores disappeared)
as discussed 1n section 3, wetting and drying creates smal] pores as well
as large pores. The change in pore size distribution with wetting and
drying is given in Figure 4.3b. This is reasonable because the pores
created by wetting and drying are formed not only by particle reanrange-
ment, as in thixotropic changes, but also by the formation of cracks.
Coughlan and Fox (1977 ) used soil bulk density to evaluate the change
in porosity with weLting anö drying. They found that as aggregates
formed (by wetting and drying cycles), the bulk density decrea.sed.
Aqsregate water stabilitY
The effect of wetting and drying cycles on water stability of
aggregates collected from untilled soil-s differs from that col-lected
from tilled soil (Figure 4.4), Figure 4.4 shows that the water stabiliby
of non-cycl-ed aggregates coll-ected from til-led soil- was much lower than
that of those coll-ected from non-til1ed soil-. This result demonstrates

a
b.
Fig. 4.3.
i.ll
2
w (7")
27
Log,o õ (prn)
Effect of one cycle of wetting (-1 kPa) anddrying (-100 kPa) on water characteristics (a)and pore size distribution (b) of 6: control;¡r -wetted and dried.
1.
çÐ-
a:,
FE¡I
à-.e
rOvtlloIt.E 30
gbo,
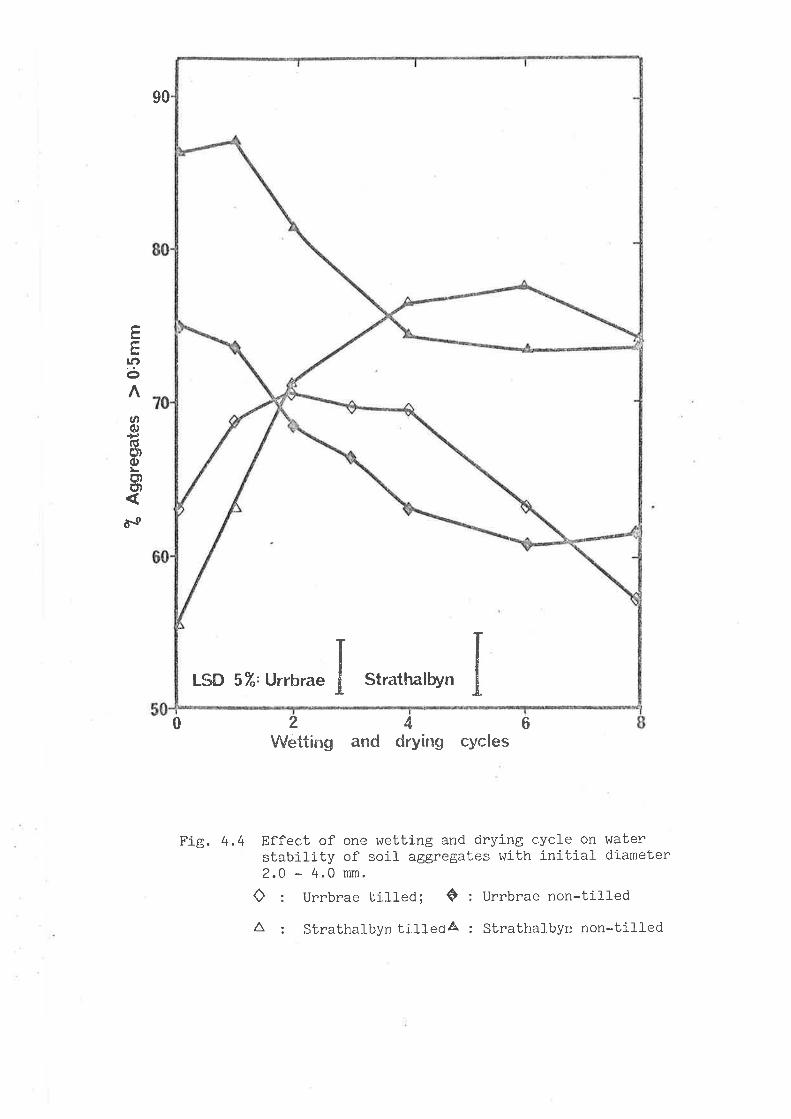
90
EÉ¡f)ê
o@
r!cÐoct)C'){ð.9
0 2Wetting and
46drying cycles
Fie. 4.4 Effect of one wetting and drying cycle on waterstability of soil aggregates with initial- diameter2.0 - 4.0 mm.
O : Urrbrae tilled; ô : Urrbrae non-till-ed
LSÐ 5%,Urrbrae Strathalbyn
^ : Strathalbyn tilledA : Strathalbyn non-ti]led

111
that tillage destroys much of the previous bonding within soil
aggregates so that their water stability decreases. A simil-ar result
has been found by Rovira and Greacen (1957) in a laboratory experiment.
tr'letting and drying of soil aggregates coflected from the tilled
soils first resulted in an increase in aggregate water stability (up to
4 - 6 cycl.es ) , and further increase in wetting and drying cycles
decreased aggregate water stabiJ-ity. This shows that wetting and drying
might promote the reformation of bonds which have been desbroyed by
tilJ-age. It has been suggested that soj-l disl,urbance by tilJ-age makes
avaitable some of the soil organic matter previously unavailabl-e for
microorganism activity (Rovira and Greacen, 1957). liith thls increase
in energy resource, soil microorganism activity can increaser so that
organic bonds which have been disturbed and broken by tiJ-J-age can be
restored. This bond reformation might be speeded up by wetting and
drying cycles. An increase in microbia.I activity with soil wetting
and drying has been shown by many workers (e.g. Birch, 1958; Agarwal,
Singh and Kanehiro, 1971).
, An increase in water stability of aggregates disturbed by tilJ age
due to wetting and drying has also been found by Rovina and Greacen
(1957). They, however, did not extend their observati-ons to further
cycles. Tisdall_ et aL. (1978)' on the other hand, found that' wetting
and drying aggregates disturbed by til-lage steadily decrea.sed aggregal,e
water stabilÍty. It. seems that the tillage treatment in thls experiment
was not abl-e to destroy and./on rearrange soil aggregaLes to make
unavailable organic matter avail-abl-e for microorganism activity. Since
there was no additional energy source, the microorganistns were probably
not able to replace readil-y the bonds which had been destroyed by wetting
ancl drying. This suggestion is in agreement with the result fourld on the
112.
effect of wetting and drying cycles on water stability of aggregates
col-l-ected from untilled soi1. These aggregates were obtained by dry
sieving the air dried sampl-e, thus Ij-ftle disturbance occurred. As
can be seen in Figure 4.4, after 2 - 3 cycles of wetting and drying
the water stability of these aggregates decreased significantly. As
in the first experi-ment, here it is thought that wetting and drying
caused the formatíon of planes of weakness. lrlhen the aggregates ürere
subjected t,o a greater force (when they were sieved) these aggregates
broke down into finer fractions.
As discussed previously, the increase in water stabÍlity of soil
aggregates disturbed by tillage with wetting and drying is thought to be
due to microbial- activ1ty. To test this suggestion, the following
experiment. was carried out.
Aggregates of 2.0 - 4.0 mm from the tilled pJ-ot of the Urrbra.e
and Strathalbyn soi-l, and from untilled plot of Mortlock soil were
wetted to -1 kPa potential in sintered funnel-s connected to a sofution
of mercuric chloride and sodium azide. Then, these aggregates \^iere
treated as follows:
(a) control (the aggregates were kept at -1 kPa) and
(b) the aggregates were subjected to 11 2, lr and 6 cycles of weLting
(-t t<Pa) and drying (-100 kPa).
Webting and drying and aggregate water stability eval-uation was done
as described before.
The resul-t (figure 4.5) shows that in the absence of microorganism
actj-viby, aggregate water stabiJ-ity decreased steadily with increasing
wetLing and drying cycles. This is consistent with the suggestion
dj-scussed previously. Since soil microorganism activity was restrict.ed,
the bonds which had been destroyed by till-age cou.ld not be reformed.

StrathalbynLSD 5 Z, Urrbrae
wetting a¡rcl drYingMortlock
LSD 5%' sterilization
EEçct
ao(úct)'oo)('l
d\o
60
50
0
Fie. 4.5.
2
Cycles of wetting and clrYing
Effect of wetting and drying cycles on water stabilityof soil aggregates with lnitial diameter of 2.0 - 4.0 mm,
as influenced by steril-ization.
oDAA
Urrbrae sterilized (tilled)Strathalbyn sterilized (tillecl)Mortlock unsterilized (non-tilled)Mortlock steril-ized (non-tiIIed)

1 13.
trtith the additional formation of planes of weakness, wetting and drying
even decreased aggnegate water sl,ability. Tisdall et al. (1978) found
that the decrease in aggregate water stability in si,erilized samples
occurred much greater extent than in unsterilized sa.mples. In this
experiment, the water stability of sterilized aggregates (Mortlock soil)
at each cycle of wetting and drying was l-ower bhan thal. of unstenil.ized
soil aggregates.
4 .4 Concl-usions
This work shows that wetting and drying cycles j-nfluence both the
formation and water stability of soil aggregates.
In a non-aggregated (puddled) soir, wetting and drying creates
planes of weakness which provide initial faces of soil aggregates. The
exÍstence of these planes of weakness allows soil to break-up more
readil-y under the action of mechanical stress into finer soil aggregates.
This aggregati-on, especially in forming water slable aggregates, might
be assisted by the rearrangement of soil- particles caused by wetting and
drying. !{ith this finding, it is suggested thaL, for many purposes'
soil structure can be improved by subjecting the soil to al-ternate ttetting
and drying.
The effect of wetting and drying cycles on water stabilil,y of soi-l-
aggregates v./as infl-uenced by the mechanism by which the aggregates ivere
formed. It has been found that the water stability of aggregates
dlsturbed by tilJ-age first increased to a maximum value, and then
decreased with increasing numbers of v¡etting and drying cycles. For
natural (undisturbed) aggregates, wetting and drying cycles steadily
decreased the waLer stabilit'y.

114,
The increase in water stability of aggregates disturbed by
tillage is suggested to be a consequence of increased microbial
activity. !ühen the energy source for microbial activity is a l-imiting
factor as with undisturbed soil, aggregate water stability decreases
with wetfing and drying cycles. This idea is supported by the results
obtained with sterilized samples. lt is therefore suggested that the
incorporation of planl residues in til,lage could provide an additional
energy source for soil microorganism activity. It could then be
expecled that the water stability of aggregates disturbed by tillage
v¡ould increase so that the risk of aggregate breakdovm and hence
run-off with consequent soi-1 erosion, couÌd be minimized.

1 15.
SECTION 5
EFFECT OF üIETT]NG AND DRYTNG ON SOIL STRENGTH
5.1 Effecf of wetting and drying cycles on soj I strength
5.1.1 Introduction
It has been shown (section 4) that wetting and drying a soil
j-nfl-uences both the formation and water stability of soil aggregates'
hlith the assumption that one of the processes causing these phenomena
originates from particle movement or/and reorientation (McHenry and
Russell , 1943), it is likeJ-y that the attractive and repulsive forces
which determine the interpartj-cl-e cohesion change with wetting and
drying. It is, therefore, reasonabfe to suggest that wet,ting and
drying cycJ-es inffuence soil strength.
In the past, most experiments have been timited to the study of
the effecb of either wetting or drying individually on soil- strength
(!',lint.erkorn, 1g42i Gil-l, 1g5g; Gerard et a7' ' 1961i Gerard ' 1965i
Camp and Gill-, 1969). It has þeen suggested that the increase in soil
strength with drying ì-s one of the important factors responsible for
the formation of pan layers in some soils of the United States (Gerard
et a7., 1961; Taylor, Mathers and Lotspeich, 1964) ' It has been
suggested that this increase is caused by the increase in ati,naction
forces due to closer packing of soil particl-es (Gerard, CowIey and
Kunze , 1966). In addition, cementation which can develop during
drying (Lambe, 1960), has afso been Lhought bo be one of the factors
which increases soil strength (Ingles,1962). An increase in t'he
shear cohesion (c) and the coefficient of soil- internal- frj.cti-on (tan
Ø) with dnying has been found by Camp and Gill (1969)'

116 .
In another study, Gerard (1965) found t'hat the rnethod of drying
influenced the end effect of drying on soil strength. He suggested
that the cohesive action of wai,er molecul.es duning slow drying was
simil-ar to the actÍon of Na+, i.e. to increase close packing, and
therefore, soil strength. Fast drying resul-ted in a -Lower strength
due to the disruptive action of escaping water molecules on the
arrangement of soil particl-es. Baver et af. (1972) real-ized that on
rapid drying the dehydration of the soil mass can not be uniform.
This gives rise to unequal strains throughout the soil- mass, and
results in the formation of planes of weakness, such as cracks.
Strength decrease due to cracks can be predicted by the Griffith
(1921) theory, and the contribution of cracks to the neduction in
strength of materials has been extensively studied for a range of
materials such as rocks (!'lalsh, 1965), ceramics (I¡lil-liamson, 1960),
and stabilized soils (Ing]es and Lafeber, 1966). The mechanism of
crack fomation and propagal,ion, mainly due to an applied stress has
been discussed by Ingles and Lafeber (1967 ), anda stati.stical analysis
of cracks in soil aggregates has been developed by Braunack et a-2.
(1979).
hletting generally results in weakening and may lead to a colJ-apse
of some structures. The movement of wat,er mol-ecul.es into a soil mass
tend to weaken the cohesive forces (l'linterkorn, 1942; Rogowski and
Kirkham, 1976) and can result in a considerabfe reduction of the
strength. The stresses and strains devefoped by unequal swelling of
the soil, and stresses developed by entrapped air may also be invofved
in weakeni-ng soil bonds wlth a consequenL decrease of soj-f strength.
\dinterkonn and Fehrman (1944) found that after subjecting their
soil samples to 12 cycles of wetting and dnying, the bearing capacity
decreased almost Lo zero. A decrease j.n soil- strength due Lo i^retl-i-ng

117 .
and drying cycles has also been observed b¡r Gibbs et aL. (1960). The
shear cohesion of a soil which had an initial vafue of about 28 kPa
decreased to about 15 kPa after one cycle of wetting and drying, and
to about 6.5 kPa after 2 cycles of wetting and drying. Gerard,
et aL. (1962) used penetration resistance as a measure of soil-
strength, and found that penetration resistance increased with
increasing number of wetting and drying cycles.
Carnes (1934) and Lemos and Lutz (1957 ) rel-ated wetting and
drying to the formati-on of soil crusts. Carnes (1934) found that
rapid drying produced crusts which broke easily, whilst sj-ow drying
produced stronger crusts. Lemos and Lutz (1957 ) extended this study
by investigating the effect of wetting and drying cycles on crust
strength. They found that wetting and drying cycles decreased the
modul-us of rupture of the crust. A decrease in the modulus of rupture
with wetting and drying cycles was also found by Sharma and AgrawaJ-
(1979).
The object of the work described here was to study the effect of
wetting and drying cycles on the strength of soil. If wetting and
drying cycles influence soif strength, then it might be worthwhile t.o
consider this change in soil management practice. Possible applications
of these changes will- be discussed.
5,1.2 Materials and Methods
Soils
The soils used were the Urrbrae, Strathalbyn, Mortlock, and Vlaco
soil.s. Some properties of these soil-s have been descrj-bed in section 3.
1 18.
Remoulded aggregates
Samples from the A horizons of these soifs vüere passed through a
1.0 mm sieve, and remoufded at water contents slightly above the plastic
Iimits with distilled water. These samples were al-lowed to equilibrate
overnight, and then were again remoulded for about 2 minutes. Aggregates
of about 10 mm diameter were made by rolling these remoulded soils by
hand. These aggregates then treated as follows:
(a) Control 1 (the aggregates vlere stored at -100 kPa matric water
potential ) .
(b) Control 2 (Lhe aggregates l^tere stored at -1 kPa matric water
potential- ) .
(b) The aggregates were subjected to wetting and drying cycle(s) bebween
different water potenlials.
One cycle of wetting and drying.consisted of drying' then wetting'
and redrying. lr,letting and drying I^Ias done in sintered funnels (for
potentials less negative than -100 kPa) and in pressure plate apparatus
(for potentials more negative than -100 kPa). Each wetting or drying
was done for 2 days.
Prior to strength measurement, all treal,ments l^Iere driecl to the
potentia] of -100 kPa in a pressure plate apparatus for 2 days. The
tensil-e strengths of 16-20 aggregates vüere measured by crushing 1-he
aggregates indivldualty between parallel plates (Rogowski, 1964;
Dexter, 1975) as described in section 3, and the tensi.fe strength, oT,
was calculated from
2oT = 0.576 F/r d (5.1)
where F is the force required to crush the aggregate unLil fracture
occurs, and d is the aggregate diameter.
119.
Soil cones (Brazilian test)
Samples from the A horixon of the Urrbnae and Mortl-ock soils were
passed through a 1.0 mm sieve, and remoutded at water contents slightly
a.bove the plastic limits. After allowing these samples 1,o equllibrate
overnight, they were agai.n remoulded and pressed into plastic cores of
24 mn diameter and 15 mm height. These cores then treated as folfows:
(a) Controt (the cores vrere stored aL -1OO kPa matric water potential).
(b) The cores were subjected to one cycle of wetting (-l i<pa) and
drying (-100 kPa).
Ir,letting and drying l¡as done as described before. Prior to the
measurement of the strength, all- treatments were dried to the potenlial
of -100 kPa in a pressure plate apparatus for 2 days. The tensile
strength I¡Ias measured by the Brazilian method. The core was placed
on 1ts side on a horizont.al plate, and a crushing force, F,'h/a-s applied
through ancther horizontal plate above the core until the core ruptured.
Tensile strength, oT, was calculated from the equation (Kirkham et a7.,
1959)
or = ,ffi $.2)
where d is the diameter of the core, and l- is the core length.
15 cores v,rere prepared for each treatment of each soil. It was decided
to compare tensile strengths measured by the Rogowski-Dexter method
(call-ed the aggregate tensil-e strength) with that measured by the
Brazilian test, (called the core tensile strength). To do thisr both
tests were done on (non-cycled soil-) Urrbrae untreated, Urrbrae
phosphoric acid treated, and Strathalbyn, Mortl-ock and i,/aco soifs.

120.
Penetration resistance
Samples from the A horizon of the Urcbrae and Mortlock soils were
passed through a 1.0 mm sieve and remoul-ded at water contents slightly
above the plastic limit,s. After allowing these soils to equilibra.te
overnight, they were again remoufded for about 2 minutes, and then
pressed into plastic cores of 24 mm diameter and 15 mm height.
(a)
(b)
These cores then treated as follows:
Control (the cores were stored at -100 kPa matric water potential-).
The cores were subjected to one cycle of wetting (-1 kPa) and
drying (-100 kPa).
!ùetting and drying hlas done as described before. Prior to the
strength measurement, all treatments were dried to the potent,ial of
-100 kPa in a pressure plate apparatus for 2 days. The penetration
resistance was measured by a motor dþiven l-aboratory penetrometer as
described in section 3. The penetration resistance, Qp, was calculated
by
o = 4 F/t¡ d2 (5.3)p
where F is the force required to push the probe to a depth of ! mm,
and d (= 1.OO mm) 1s the probe diameter. 3 measunements were done on
each of 10 cores for each treatment of each soil.
Fietd clods and aggregates
Clods of about 100-150 mm diameter were collected from a tilted
plot of the Urrbrae soil- at various numbers of days after tillage.
The tiLlage system is described 1n section 6. These clods were then
wetted bo near saturation by capillary action, and then l,reated as
fol-lows:

(a)
(b)
121.
Controt (the cl-ods blere stored at -100 kPa matric water potential-).
The clods were subjected to one cycle of wetting (-1 kpa) and
drying (-100 kPa).
The strength of clods which was determined after alI treatments were
dried bo -100 kPa potent,ial for 2 daysr l/\ias determl.ned by the drop
shat.ter test (Marshall and Quirk, 1950; GilI and McCreery, 1960; Ingles'
1963). Each clod was dropped from a height of 200 cm, and then t'he size
distribution of the resufting clods/aggregat.es was measured by dry
sieving. B clod strength r^¡ere'determined for each treatment for each
time of sampling.
In addition to those measurements, the tensile strengths of
smaller aggregates were measured. Aggregates with diameters of 4.0-9.5
rnm Ûrere col-lected from tilled and non-tilled pJ-ots of the Urrbrae and
Strathal-byn soils. These aggregates l^Iere wetted by capil-Iary action,
and then treated as follows:
(a) Control- (the aggregates were stored at -100 kPa matrlc water
potential ) .
(b) The aggregates were subj""t"O to one cycle of wetting (-1 kPa)
and drying (-100 kPa).
The sbrengths of 20 aggregates of each treatment for each soil
were determined as described before.
5.1.3 Resul-ts and Discussion
Tensile strength of soil- aEEreAates and soil cores
Before comparison of the tensil-e strengLh vafues obtained by the
Rogor^rski-Dexl,er method (sojI aggregates) with those obtained by the
Brazilian test (so1] cores), it is interesting to compare the tensil-e
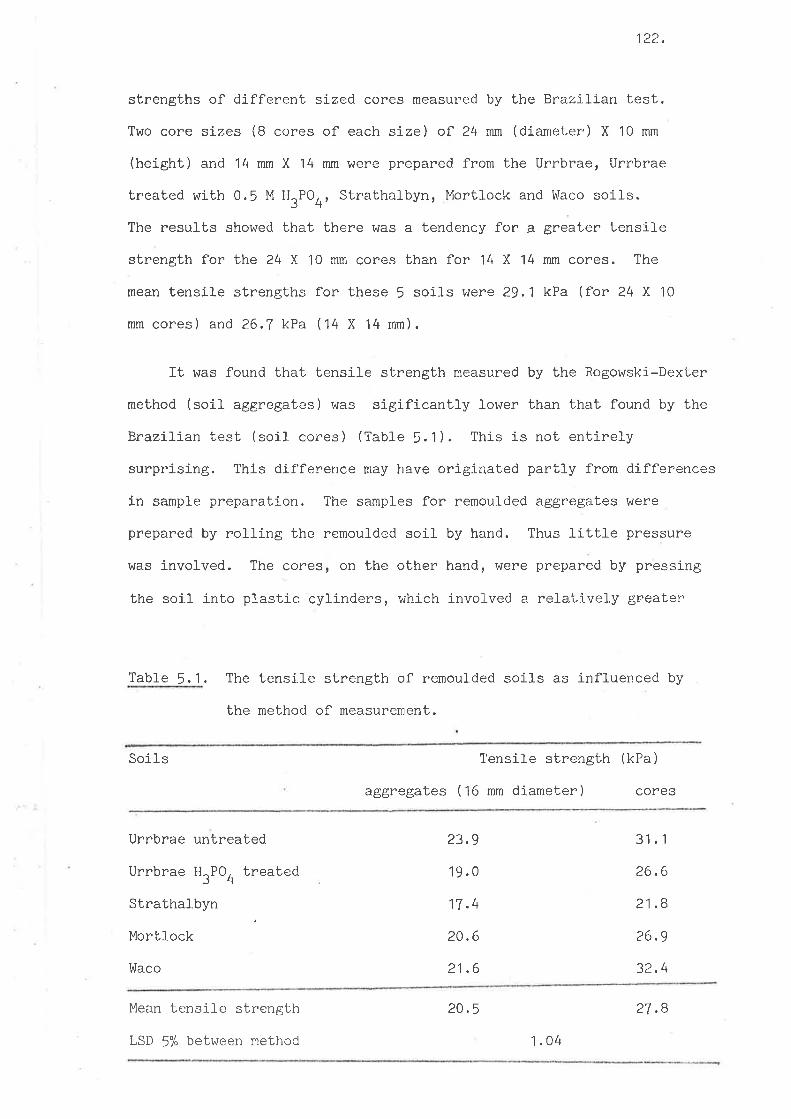
1?2.
strengths of different sized cores measured by the Brazilian test.
Two core sizes (B cores of each size) of 24 mm (diameter) X 10 mm
(height) and 14 mm X 14 mm were prepared from the Urrbrae, Urrbrae
treated with 0.5 M H3P04, Strat,halbyn, Morllock and V'laco soi-ls.
The results showed that there r^/as a tendency for a greater tensil-e
strength for the 24 X 10 mm cores bhan for 14 X 14 mm cores. The
mean tensile strengths for these 5 soils were 29.1 kPa (for 24 X 10
mm cores) and 26.7 kPa (14 X 14 mm).
It was found that tensile strength measured by the Rogowski-Dexter
method (soil aggregates) was sigificantly l-ower than that found by the
Brazilian test (soil cores) (Table 5.1). This is not entirely
surprising. This difference may have originated partly from differences
in sample preparation. The sampl-es for remouLded aggregates were
prepared by rolling the remoulded soil by hand. Thus little pressure
was involved. The cores, on the other hand, r^rere pnepared by pressing
the soj.l into plastic. cylinders, which involved a refatively greater
Table 5.1. The tensile strength of remoulded soils as infl-uenced by
the method of measurement.
SoÍ1s TensiLe strength (kPa)
aggregates (16 mm dlameter) cores
Urrbrae untreated
Urrbrae H^PO. treated34Strathal.byn
Morllock
trnlaco
23.9
19 .0
17 .4
20.6
21.6
31.1
26.6
21.8
26.9
32.4
Mean tensiJ-e strengl"h
LSD 5"/" between method
20.5
1 .04
27.8
123.
pressure. As a comparison, the packing density for the aggregates
of Urubrae H^PO, treated and Strathalbyn soil-s were 0.575 and 0.562,3I+
whereas the corresponding packing density for cores was 0.744.
fncreasing packing density often resul-ts in soil particles being
cfoser together and this may resuì t in greater attractive forces.
Another possible reason for thís difference is the uncertainty regarding
the trconstantrt 0.576 in equation 5.1. As discussed in section 2,
Rogowski and Kirkham (1976) have subsequently suggested an rrimprovedrl
value of 0.821. The tensile strengths measured by the two methods u-sed
here would be equal if this value were 0.781. However, iL ì-s difficult
to make an accurate comparison because tensile strengLh is itself a
function of sample size.
Effect of wetting and drying on the strength of remoul-ded soils
It was found that wetting and drying can decrease the tensile
strength of remoufded soil aggregates (Table 5.2). The results
given in Table 5.2 show that wetting and drying between -1 and -100
kPa; -1 and -200 kPai -5 and -100 kPa; and -5 and -200 kPa; sígnificantìy
decreased aggregate tensile strength. lrletting and drying between -10 and
-'100 kPa dicl not significantty influence tensile strength.. The decrease
in the tensile strength with wetting and drying between -1 and -100 kPa
was afso found in the soil- core.s (Table 5.3). One cycle of wetting
(-t tpa) and drying (-lOO kPa) however, did not significantJ-y influence
soiJ- penetration resisLance (Table 5.4).
hlhen a remoulded soil is subjected to wetting and drying cycles,
there are several- pr"ocesses which might be invol-ved in influencing the
strength. I¡rlhen the soil is wet enough, the first process which can be
expected to occur is thixol-ropic change. As discussed in section llr
this change nesults in an increase in the strength. The second possibJ-e
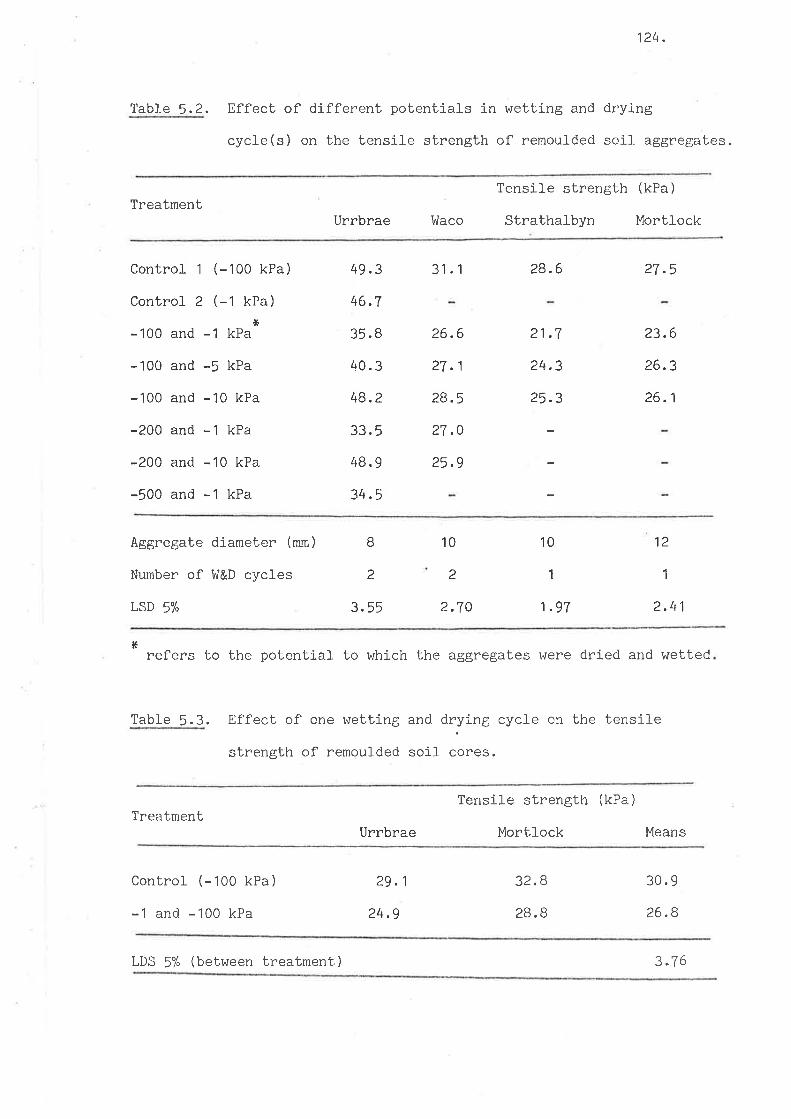
Tabl.e 5.2.
124.
Effect of different potentlals in wetting and drying
cycle(s) on the tensile strength of remoul-ded soil aggregal,es.
TreatmentUrrbrae Inlaco
Tensil-e strength (kPa)
Strathalbyn Mortlock
Control 1 (-100 kPa)
Control 2 (-1 kPa)
-100 and -1 kPa
-100 and -5 kPa
-100 and -10 kPa
-200 and -1 kPa
-200 and -10 kPa
-500 and -1 kPa
49.3
46.7
35 .8
40.3
48.2
33. 5
48.9
34.5
31.1
26.6
27 .1
28.5
27.0
25.9
28.6
21.7
24.3
25.3
27.5
23.6
26.3
26.1
Aggregate diameter (mm)
Number of I'l&D cycles
LSD 5%
2
3.55
10
2
2.70
10
1
1.97
12
2.41
B
1
I
refers to the potential to which the aggregates were dried and wetted
Table 5.3. Effect of one wetting and drying cycJ-e cn the tensile
strength of remoulded soil *.u",
Tensile strength (kPa)
MortlockTreatment
Urrbrae Means
Control (-'100 kPa)
-1 and -100 kPa
29.1
24.9
32.8
28. B
30.9
26.8
LDS 5% (between treatment) 3.76

Table 5.4.
125.
Effect of one cycl-e of wetting and drying on the resistance
of the soils to probe penetration.
Treatmenl Penetration resistance (kPa)
Urrbrae Mortlock
Control (-100 kPa)
-1 and -100 kPa
3203. B
3370.4
NS
3258.1
3216.6
NS
process is the movement or/and rearrangement of individual soiL partì-cles
due to wett,ing and dnying. How thi.s process influences soil strength
might depend on the method of wetting and drying. As suggested by
Gerard (1965) fast drying decreased soif strength, whereas sl-ow. drying
incrpased the strength of the soil. . The third possible process is
the formation and propagation of internal cracks. The occurrence of
this process is a consequence of unequal swelJ-ing and shrinkage
resuJ-ting from uneven wetting and drying. The formation of cracks
in remoulded aggregaf,es caused by wetting and drying is shown in
ptate 5.1, In agreement with Griffith's. (1921) theory, the existence
of these cracks resul-ts in a decrease in the tensile strength.
The stresses and strains developed by wetting and drying between
water matric potential of -1 and -100 kPai -5 and -100 kPa; -1 and
-200 kPa; -1 and -500 kPa; are high enough to initiate and propagate
planes of weakness. Although there is a strength increase due to the
thixotropic process (see Table 3.5r section 3.1), it seems that the
decrease in the strength due l,o crack formation is much greater, so

Plate 5. 1 . Micro-cracks in remoul-ded soiJ- aggregates formed
by wetting and drying (magnification of B times).

126
that the net resu.It is a decrease in the tensile strength. The
peneLration resistallce, on the other hand, is not infl-uenced by this
change. This is presumably because the compressive soil- fail-ure mode
for a penetromeler shown in Figure ?..3 can not take advantage of these
cracks
It seems that the stresses and strains produced by wetting and
drying between matric potentials of -10 and -100 kPa were not higlt
enough to create planes of weakness. Or if' there was crack formation,
it was not intensive enough, and the decrease in the strength caused
by this process was cornpensated by the increase in the strength due
to the thixotropic process. Thus there was no net change in tensile
strength
From Tabl-e 5.2, it can be seen that the less negative the poLential
to which the soil is wetted, the greater is the decrease in the tensile
strength. As shown in section 4 (Figure 4.2) the rate of wetting is
greater when soil is in contact with a source of water at a fess
negative matric potential. This indicates that with increasing wetting
rate, the stresses and strains set up by unequal swelling increaser and
hence cracks form more readily. In addition, the breakdown of soil
bonds occurs more intensive as the raLe of wetting i¡s¡s¿-ses (Emerson
and Gruncly, 195t¡). This suggestion is supported by the result given in
Table 5.5 which show that although the aggregates were wetted t,o the
same matric water poLential (8, C and D) and (E and F) r the tensil-e
strength can be different. The greater the rate of weLting, the loiçer
the tensile sLrength. The rate of wetting in treatment B v¡as greater
than that in treatments C and D, so that the tensile strength of
aggregates subjecLed to B treatment is lower tllan thaL of those subjected
to C and D Lr-eatments. A simi.lar tendency occures in treatment E
compared with treatment F.

Table 5.5.
127 .
Effect of wetting method of a wetting and drying cycle
on the tensile strength of remoul-ded aggregates of
Urrbrae soil.
Treatment Tensile strength (kPa)
A. Control (-100 kPa)
B. -100 and -1 kPa
C. -100 and -10, -1 kPa
D. -100 and -10, -5, -1 kPa
E. -100 and -5 kPa
F. -i00 and -10, -5 kPa
40.2
24.7
35.3
36. 3
36.2
40. B
aggregate diameter (mm)
LSD 5%
8.6
2.47
As discussed previously, the decrease in tensile strength of
aggregates subjected to one cycle of wettj-ng and drying between
potentials of -'10 and -100 kPa might be partial-]y compensated by an
increase in strength caused by the thixotropic process. To test this
suggestion, remoulded aggnegates \¡tere aged ab -100 kPa matric water
potential in a pressure plate apparatus for 2 weeks before being
subjected to wetting and drying. These aggregates then treated as
follows:
(a) Control (the aggregates were stored at -100 kPa matric water
pobential ) .
(b) The aggregates were subjected to one cycle of wetting and drying
between potentials of -1 and -1OO kPa; -5 and -100 kPa; and -10
and -100 kPa.

128.
Prior to the measuremenl of the strength, all treatments were
dried to the potential- of -'100 kPa in a pressure plate apparatus for
2 days. The results (Table 5.6) show that when the thixotropic process
has virtually ceased (after 2 weeks ageing) a cycle of wetting and
drying of -10 and 100 kPa significantly decreased aggregate tensil-e
strength.
The tensile strength of both freshÌy remoulded and aged aggregates
of the Urrbrae soil decreased with increasing numbers of cycles of
wetting (-l rpa) and drying (-100 kPa). For freshly remoulded aggregates
the minimum tensile strength occurs at 2 cycles, and then slightÌy
increased with further cycles of wetting and drying. For the aged
aggregates, a decrease in the tensile strength occurs up to 4 cycles of
wetting and drying, beyond which further wetting and drying cycles do
not significantly influence the tensile strength (Figure 5.1). For the
aged aggregates, the decrease in tensile strength with wetting and drying
cycles, oT(n¡ r vras fitted to the exponential equation
Table 5.6.
ot(n) = A+a[1-exp(-a'n)] ß.4)
Effect of one cycle of wetting and dnying on tensile
strength of aged aggregates.
Treatment Tensile strength
StrathalbynUrrbrae I'Iaco
Control (-100'kPa)
-100 and -1 kPa
-100 and -5 kPa
-100 and -10 kPa
53.7
40.2
47 .1
48.9
34.8
29.3
29.3
31 .1
34.4
29 .4
29.e
26.8
Aggregate diameter (mm)
LSD 5%
8.6
3. 39
10 10
2.22 3. 31

70
60
?50ô..v,
Pot-F,,40-g'g
É
30
200 Ð
Fig. 5.1 .
hlr¡rnber of wetting and drying cycles.
Effect of wetting and drylng cycles on the tensilestrength of remoulded aggregates of Urrbrae foam.o : non aged aggregates,@: aged aggregates (for thís treatment the
continuous curve is equation (5.5) ).
LSD 5/" úrcsr-a$ed) I

129.
where A, a, and ar are adjustable parameters and n j-s the number of
wetting and drying cycl-es. The resulting equation is
or(n)
ot(n)
62.19 - 32.81 tr(tl.r34)G2.091)
- exp(-0.61n) l(10. 10 )
(5.5)
(5.6 )
A similar tendency was also found when aggregates made fronl the
Strabhalbyn soil rvere wetted and dried between -1 kPa and -100 kPa
(Figure 5,2). The aggregates of the control treatment of this soil
were stored at -20 kPa matric water potenl-ial- in sintered funnels.
The results for non-aged Strathalbyn aggregates (5.4) gave
Field clods and aggregates
Vletting and drying clods col-Iecled from tilled soil can afso
influence clod strength (Table 5.7). !,lhen the cl-ods were collecLed
at 0 days and / days after tillage, wetting and drying decreased cÌod
strength. This was shourn by the fact that the proportion of aggregates
small-er than 4.0 mm diameter resulting from the drop shatter test in
the wetted and dried clods was greater than fhat in the control. For
the clods collected 20 days after tillage, on the othen hand, one
cycle of wetting and dryi¡g did not slgnificantly influence cl-od
strength. It is probable that these cl-ods had then reached an
equilibrium val.ue of strength where further wetting and drying could
noL cause further soil- break up.
For soil- aggregates (4.0 - 9.5 mtn), one cycle of wetting and drying
infl-uenced the strength of aggregates from non-til-l-ed Strathalbyn soil '
but did not significanl,ly infl-uence the strength of aggregates from
non-til-Ìed Urrbrae soil- (Table 5.8). Further, TabJ-e 5.8 shows that a
26.62 - 8.09 tr(r0.37) (10.43)
- exp(-1.14n) l(r0. i6)

t\lÊ-ld
fizz(t)ËotE
th
ql,öcÉ
420
Number of wettlng and drying cycles.
Effect of wetting and drying cycles on the tensil-estrength of remoulded (non aged) Strathalbyn aggregates'The continuous curve is a plo1. of equation (5.5).
Fie.5.2.

Table 5.7.
130.
Effect of one cycle of wetbing and drying on clod strength,
as shown by the proportion of aggregates < 4.0 mm produced
by the drop shatter test, of the Urrbrae tilted soil.
Treatment "/" aggregates < 4.0 mm
days after tillage
70 20
Conlrol (-100 kPa)
-100 and -1 kPa
20.2
27.3
28.6
34.5
37.4
36.0
LSD 57" 5.79
cycle of wetting and drying between water matric potentials of -10 and
-i00 kPa significantly decreased the tensile strength of the larger
aggregates (6.7-9.5 mm), but did not significantly influence the tensile
strength of the smaller aggregates (4.0-6.7 mm). This phenomenon will
be considered further when discussing soil friability (section 5,2),
Table o Effect of one cycle of wetting and drying on the tensile
strength of aggregates from non-ti.lled soil.
Treatment Tensile strength (kPa)
Urrbrae Sfrathalbynaggregate diameter (mm)
4 .0-6.7 6.7-9 .5 4.0-6.7 6.7-9 .5
Control (-100 kPa)
-100 and -1 kPa
-100 and -10 kPa
22.1
22.8
22.6
25.0
20.6
24.8
LSD 5%
16. 0
16.9
15.7
3.48
21.5
16 .4
16.9
: between aggregate: size : 2,37

131 .
For the field aggregated collected from tilled soiJ-, it was found
that a cycJ-e of wetting and drying significantly decreased the tensile
strength of the larger aggregates (6.7-9.5 mm). It can be seen in
Tabte 5.9r that for the smaÌl-er aggregaLes (4.0-6.7 mm)r the decrease
in the tensile strength is not significant at the 5% probability level.
Table 5.9. Effect of one cycle of wetting and drying on the tensil-e
strength of aggregates from tilled Urrbrae soiL.
TreatmentTensil.e strength (kPa)
aggregate diameter (mm)
4.0-6.7 6.7-9.5
Control (-100 kPa)
-100 and -1 kPa
-100 and -10 kPa
28.1
26.7
28.9
26.2
19.7
24.2
LSD 5% 2.48
Effect of ageing on the streneth of aggregates which have been weakened
by wetting and drying
The following experiment was designed to study the effects of
ageing on the tensile strength of soil aggregates previously weakened
by wetting and drying cycles. Remoulded aggregates of the Urrbrae and
I¡üaco soils hrere made as described before. These aggregates were aged
at -100 kPa matric water potential in a pressure plate apparal,us for
two weeks, then treaLed as fol-lows:
(a) ConLrol (the aggregates were stored at -100 kPa).
(b) The aggregates were subjected to one cycle of wetting (-1 kPa)
and drying (-100 kPa).

132.
After the cycl-e of wetting and drying, aJ-J- treatments l^/ere
subjected to the polential- of -100 kPa in a pressure plate apparalus
for 2 days. The tensile strengths of 16 aggregates of each treatment
for each soil were measured as described before, and the remainder
were kept al -100 kPa for later testing.
The resul-ts (Table 5.10) shows that ageing (until B days) did not
result in any significant change in tensi-le strength of aggregaLes
which had been weakened by wetting and drying.
Table 5.10. Effect of ageing on the tensile strength of soil aggregates
which have been weakened by one cycJ-e of wetting (-l kPa)
and drying (-100 kPa).
Ageing
( days ) Urrbrae
Tensile strength (kPa)
llaco
hI & D controlcontrol !,1 &D
0
4
B
54.6
56.3
54.3
47 .1
46.8
48.8
26.8
27.6
27.2
22.3
22.3
22.9
Mean . tensilestrength
LDS 5% betweenmeans
55.1 4T .6 27.2 ¿¿.5
5.72 2.38
Aggregatediameter (mm) 8.6 12
Temperature cycl-ing
In nature, wetting and drying are usually accompanied by temperature
changes. In order to try to isol-ate the factor primarily invol-ved in

133
decreasing aggregale tensil-e strength, an experiment was done to tesl,
any effects of temperature changes on the mechanical. propert.ies of soj.l-
aggregates.
The experiment. was done on boLh natural and artificial aggregaLes
from the Urrbrae fine sandy }oam. Natural aggregates of 10-13 mm
diameter were collecLed from the A horizon of the Urrbrae soil. Artificial
aggr.egates were made by rolling the remoulded Urrbrae soil as de-scribed
before. To eliminate any effects resulting from thixotropic hardening,
these artificial aggregates were a.ged at -100 kPa matric water potential
in a pressure plate a-pparatus for two weeks. Then both the natural- and
the artificial aggregates hrere air dried, after which they were treated
as foll-ows:
(a) Contro] (1) : the aggregates were stored aL a constanL tempenature
of 1Ooc.
(b) Control (2) : the aggregates brere stored at a constant temperature
of 5ooC.
(c) The aggregates were subjected to bemperature cycl-ing beLween lOoC
and 50oC for 1, 2, 3 and 4 cycles.
Prior to strength measurement, aIJ- treatments were subjected to a
matric water potential of -153 MPa over saturated CaCI, solution in a
vacuum desiccator for two weeks. The tensile sLrengths of 16 (for
artificial) and 20 (for natural) aggregates were measured by crushing
the aggregates individually between ffat paralle1 plates until- fracture
occurred, as described before.
The results (Tabl-e 5,11) show that temperature cycling did not
significantly influence the tensile strength of either natural or
artificial. aggregates. This resulb supported the hypol-hesis that the
decrease in aggregate tensile strength is chiefly caused by the forrnation

134.
of cracks due to unequal swelling and shrinkage resulting from wetting
and drying.
Tab1e 5.11. Effect of temperature cycles on the tensile strength of
natural and art,j-ficial- aggregates of Urrbrae soil.
Treatment(temperature cycling)
Tensil-e strength (kPa)
Natural Artificial
Control 'l
Control 2
1 cycle
2 cycles
3 cycles
4 cycles
( lOoC )
( 5ooc )
46.5
47.5
48.3
48.4
48.9
48.7
NS
417 .9
417 .5
406.0
406.5
420.9
400. 6
NS
5.2 Soil Friability
5.2.1 ïntroducLion
The application of conventional soif mechanics to tillage (e.9.
Payne, 1956) predicts that the size of the primary fragments sheared
from the undisturbed (bulk) soil is independent of the shear cohesion
and only slightly influenced by the angle of internal friction. Whilst
this theory has been proved to be useful for predicting the draughl,
forces of simpLe implemenls, is of no use in predicting soil fragmentation
produced by tillage. Observation shows that different soils, or even the
same soil at differenl water contents, fragment quite differential.ly.
CJ-early, a factor other than the conventional soil mechanical quanbities
quantities must be implicated.
1:35
The term ffsoil friabilityrr has been defined as the tendency of a,
mass of unconfj-ned so1I in bulk to crumbÌe and breakdown uncler applied
stress into smaller fragnents, aggregates anci individual soil particles
(Bodman, 1949), Christensen (1930) employed stress-strain relationships
to attempt lo measure soil friabitity. The modulus of rupture best
(Richard, 1953) has also been used in an attempt to measure soil-
friabj.Iity by Jamison (1954). Both of these approaches, however, only
measure how easy the soil. is worked, or in other words, soil strength.
Neither takes account the size dlstribution of the resulting pulverized
fragnents.
One of lhe aims of tillage is to break up the large soil mass into
smaller clods or aggregates. It is, therefore, desirable that the
material of the smaller fragments, which comprise the large clods, have
a relatively greater strength than the large clods or the bulk soil
mass. Otherwise, with applied stress the soil mass could break down
into individual- soil particle or dust. !'lith this considerabion, the
definition of soil friabilify given by Bodman (1949) can be modified
and sharpened. In this thesis, soil friability is defined as the
tendency of a mass of unconfined soil to breakdown and crurnble unden
applied stress j-nto a particular size "áng"
of smal-ler aggregates. Thus
not necessarily inbo individual soil particles or dust.
Rogowski and Kirkham (1976) and Braunack et aL. (1979) have found
thaf fhe tensil-e strength of soil aggregates is a function of aggregate
size. The larger are the aggregates, the small-er is the tensi.le strength.
Braunack et af. (1979) showed this relationship by the equation
Iog" o, K-k1oB"V (5.7)
K
where
t6ge (oro vk f (1+k)) (5.8 )
136.
Here, oTo "nd
Vo are the strength and volunle respecti-vely of the
basic soil- elements which comprise the bulk soil aggregates, f is the
tabul-ated Gamma function, k is an adjustable parameter, and the parameter
k is a measure of the dispersion of the strengths of the microcracks
within the aggregates. The intercept K is, 1n ef.fect, an extrapolated
estimat.e of the tensile strength of unit (1 m3) samples of the bulk soi-I.
A comparison of the objectives of tillage with the definition of
soil friability given in this thesis, Ieads to the conclusion that
equation (5.7) can be used to measure soil- friabiliby. The value of k
is an indicator of how easily large clods will breakdown into a range
of smaller soil aggregates. Large k values indicate that the larger
clods have a much smaller strength than the smal-l-er aggregates. Thus
large k values are associated with situations where the large clods have
a low mechanical stability and may readily be fragmented. Fragmentation
does not proceed indefinitely, however, because of the relatively
greater strength and hence mechani-ca1 stability of the smaller aggregates.
Very small k values, on the other hand, indicate that the strength of
the large cl-ods does not differ much from that of any smaller unit
volume of soil element which compri-se these Large cl-ods. fn this case,
when a mass of this soil is subjected tq applied stress, such as by
tillage, it will break up into clods and aggregates of arbitrary slze.
As a result of these consi-derations, in this thesis the parameter
k of equation (5,7) is identifj.ed as a mea.sure of -sojl friabi-J-ity, and
discussed as a quantity separate from soil. strength. Thus a soil- of
any strength can have any value of friability, k.
137 .
5.2.2 Materi.als and Methods
Effect of soil water content
As discussed in section 2.1,4, soil water content at ti-Ilage
influences the size distribution of the resuJ-ting clods (Lyles and
lrloodruff , 1962; Bhushan and Ghildyal, 1972; 0jeniyi and Dexter, 1979a).
Since there is an optimum water content for tillage at whÍch the
maximum fragmentation is produced, it was decided to test whether a
maximum in friability, as measured by k in equation (5.7), afso occurred
at a similar water content.
Aggregates with diameter of 2.0-4.0; 4.0-6.7i 6.7-9.5i and 9.5-17
mm ürere col-l-ected by dry sieving from the A horizons ofl the Urrbrae and
Stnathalbyn soils. These aggregates $¡ere air dried, and then v¡etted
slowly by capilJ-ary action close to saturation in sintered funnefs.
These aggregates then dried to matric water potenti-als of -'10 kPa (in
sintered funnels), -50, -1OO and -500 kPa (in pressure pJ-ates) for
two days.
The tensile strengths of 20 aggregates of each diameter cfass at
each water content for each soil were measured by crushing the
aggregates indlvidually between parallel plates (Rogowski, 1964; Dexter,
1975) as done in section 5.1.
!ùetting and drying
It has been shown (section 5.1) that cycles of wetting and drying
are able to decnease aggregate tensile strength. In the field I âhY
i.ncrease in amplitude of wetting and drying can resuft in greater soil
fragmentation on titJ-age. The later is the I'tilth mellowingrr effect
and is discussed in section 6. Consideration of lhese phenomena, led

138.
to the suggestion that. wel,ting and drying cycles are capable noL only
of decreasing aggregate tensiÌe strengLh, but also of increasing the
friability of the soil. To test this idea, the following experiments
were done.
Samples from the A horizons of Urrbrae and Mortlock soil-s r^iere
passed through a 1 mm sieve, and nemoulded at water contents sJ-ighfly
above their plastic l-imits with distilled water. These rernoulded soil-s
were a1l-owed to equilibrate overnight, and were theri again remoul-ded.
Aggregates with diameters of about !, B, 10, 13 and 17 mm were made by
ro1J-íng these soil-s by hand. To el.iminate any effects of thj-xotropic
(age) hardening, these aggregates r^rere aged at a maLric water pot.ential
of -100 kPa in a pressure plate apparatus for two weeks. The aggregates
were then lreated as follows:
(a) Control : the aggregates r"rere stored at -100 kPa matrj-c water
potential
(b) The aggregates were subjected to different numbers cf cycles of
wetting and drying between different water potentials.
After wetting and drying, al-l treatments were subjected to a matric
water potential of -100 kPa in a pressure plate a.pparatus for two days.
The tensile strengths of 16 aggreg.t"= oi each size for each l,reatment
of each soil- were determined as described before.
Freezl and thawin
In nal,ure, 1-he formaLicrn of flaws or cracks wit,hin the soil tnass
is not created by wetting and drying cycles alone. As discussed in
section 2,1.3, freezing and thawing a soil- may also result in 1,he
formation of cracks. The folì-owing experiment was designed to investigate
effects of f'reez.in¿5 and thawing cycles on soil- friabj.lity as measured by

... ;
139.
the k value of equation (5.8).
RemouLded Urrbrae soil was treated as fol-Iows:
(a) Control : the aggregates r¡¡ere stored in pì-asLic containers and
placed in a constant temperature room'
(b) The aggregates were subjected to 1 and 3 cycles of freezing and
thawing.
Freezing was done by placing the aggregates in a -l5oC room for one
day, and thawing was done aL zOoC for one clay. After freezing and
thawing, all treatments v,Iere dried to a matri-c water potential of
-1OO kPa J.n a pressure plate apparatus for two days. The tensil-e strengtits
of 16 aggregates of each size for each treatment l/,tere measured as
described before.
5.2,3 Results and Discussion
The effect of soil water content
The effects of aggregate volume on the tensile.strength, oT,of the
Urrbrae and -Strathal-byn aggregates are shou¡n in Figures 5. 3 and 5.4.
Variations of the derived parameters K and k, together with the tensile
strengths of 10 mm diameter aggregates, oT1O, as a reference for the
Urrbrae and Strathalbyn soils are given in Table 5.12.
At low water contents, aggregates of both the Urrbrae and
Strathalbyn soils have a small- k value and a large tensile strength.
This indicates that at these water conLents the soils are difficult to
crush. At high water contents, the soil-s have reÌatively small strength.
However, they are not suitable for tillage because the soil will turn up
into arbilrary sÍzes of clods as shoi^¡n by the smal-I value of k. Maximum
values of k = O.2B for the Urrbrae and k = 0.22 for the SLrathal-byn
soils were obtained at water contents corresponding to a matric water

4.0
b'o
rtroJ
3.0
2-0
1.5-18 -16 -14 -12
Fie. 5.3.
L<rg " V (rnr)
Effect of matric water potential on the log aggregatetensile strength-vol-ume rel_ationship of Urrbrae ioam.The continuous curves are fils of equation (S.T), andthe measurements are gÍven by O (-tO Xea); â (_50kPa); e¡ (-lOO t<Pa); and ¡ (-¡OO kpa).

3.
4.0
2.0
tÉJ
I
LoE. V (m3)
Fis. 5.4.

Table 5.12.
140.
Effect of water content on the values of parameters of
K and k of equation $.7) and on the strengfhs of 10 mm
diameter aggregates, of1O.
Matricwaterpotentiaì-(kPa )
Urrbrae Strathalbyn
watercontent
('/" )
K
(kPa )
oT 1o
(kPa )
wabercontent
(%)
KK ot 1o
(kPa )
k
(kPa)
- 10
-50
- 100
-500
- 1 53000
30. 2
22.4
18. 1
12.3
2
1.64
0.56
-1.48
1 .60
3. 06
0.05
0. 13
0.28
0.12
0.07
10.1
11.5
12.7
2T .1
59 .1
34.6
25.6
16.3
11 .B
0.54
0.02
-0.55
0.65
0. 10
0.16
0.22
0.17
7.7
10. 0
13. 5
23.0
IR
calculated from the data of Braunack et al. (1979) .
potential of -100 kPa.
the Strathalbyn soils.
to be friable.
These are 18.1% for the Urrbrae and 16.3% for
Under these conditions, the soils were considered
Some earlier workers found that large clods were produced when
titlage was done at very low or very high water contents (e.9. Lyles
and !'loodruff , 1962). For the Urrbrae fine sandy loam, Ojeniyi and
Dexter (1979a) have found that the water content giving the maximum
soil crumbling on tillage is around 0.9-1.0 ofthepl-astic limit. This
is in good agreement the observeci peak in frj-abi.ìi.ty found in this
experl.ment.
The k values in Table 5.12 can be fitted to quadratic equations as
done in tillage experiments of 0jeni.yi and DexLer (1979a) - They
normalized the soil water conl,ents by dividlng them by the plast,ic

141
Iimit (PL). The intention of this was to make the resul-ts as far as
possibJ-e independenL of soil type. The same procedure was adopted
here, and the resulting equations are
k = -0.32 + 1.07 t$l - 0.54 th,t, r = 0.64 (5.9)
for the Urrbrae soil, and
tkt - 0.12 Í,1
ÞT
2k =0.08+0.24 , r = 0.86
for the Slrathalbyn soil.
For both soils, differentiation shows that the maximum value of k
occurs at a gravimetric water content of hl = 1.0 PL. Although these
equations are deri-ved from on]y a few data points and have only a
relativel-y low statistical significance, they do il-lustrate we1I this
maximum va1ue.
In their tillage experiments, Ojeniyi and Dexter (1979a) found
that the proportion of aggregates, P, smal-ler than or equal Lo 4 mm 1n
intercepted length (measured on impregnated sections) at the mid-depth
of tillage varied as
(5.10)
(5.11)P = -0.51 + 1.89 ( ) - o.e1 ,h,'Iiù
Þf,
A comparison of values of k from equation (5.9) with the vafues of
P from equation (5.11) shows that the ratio P/k remains remarka.bl-y constant
aL 2.3 t 0.1 over the range of water contents 0.6 < I'llPl- < 1.12. Qver
this range, both P and k values vary by 67'1, and the tensile strength of
10 nm diameter aggregates, oT1O, varies by a facLor of about 3.
It seems that the influence of aggregate vol-ume on soil strength
becornes small at r¿ater content.s significanLl-y different from the pJ.astic
limit. It is probably thal, at high water contents sonie flaws close so
14?_ .
bhat the strength of the soj.l- is no longer l-imited by fJ-aw sevenity.
Under these conditions, soil- strength mainly originates from the mai-ric
potential of the soil water. It must be kept in mind, however' that
the closure of flaws caused by swelJ-ing (or their filling by water
under tension) does not result in a net j-ncrease in soil strength. As
discussed above, the inter-fl-aw soil- slrength is then weakened througll
another mechanism as a result of the increased soif water content. The
reason for the observed decrease in k at small water contents is not yet
understood.
Effect of wettine and drYine
It was expected that the flaw severity in non-cycJ-ed remoulded
aggregates woul-d not vary much with aggnegaLe vofume. The val.ue of k in
equation ß,7) for these aggregates, then, shoul-d be close Lo zero. In
fact, however, this 1s not quite the case. As shourn in Figure 5,5
and Tables 5.13 and 5,14, the strength of non-cycled remoulded aggregates
was still slightly influenced by aggregate size. This Ís shown by the
fact that the k values of these aggregates \^Iere k = 0 ' 07 for the urrbrae
soil, and k = 0. 1 1 for the Mortlock soil. This is presumably because
some flaws vrere formed during the slight drying and ageing processes to
which these samples were subjected.
As the soil aggregates were wetted and dried, the flaw severity
increased, consequently wetting and drying not only decreased the l,ensil-e
strength of the aggregates, but al-so increased the k vafue. The increase
in k wi.th wetting and drying indicates that the decrease in strength in
Iarger aggregates occurred much more rapidly than in smaÌler aggregates.
As discussecl in section 5. 1 , the decrease in Lhe t.ensile strength of soil
aggregates with wetting and drying is probably caused by the formal-ion
of cracks due Lo uneven swel1.ing and shrink:rge. Since wel-ting and drying
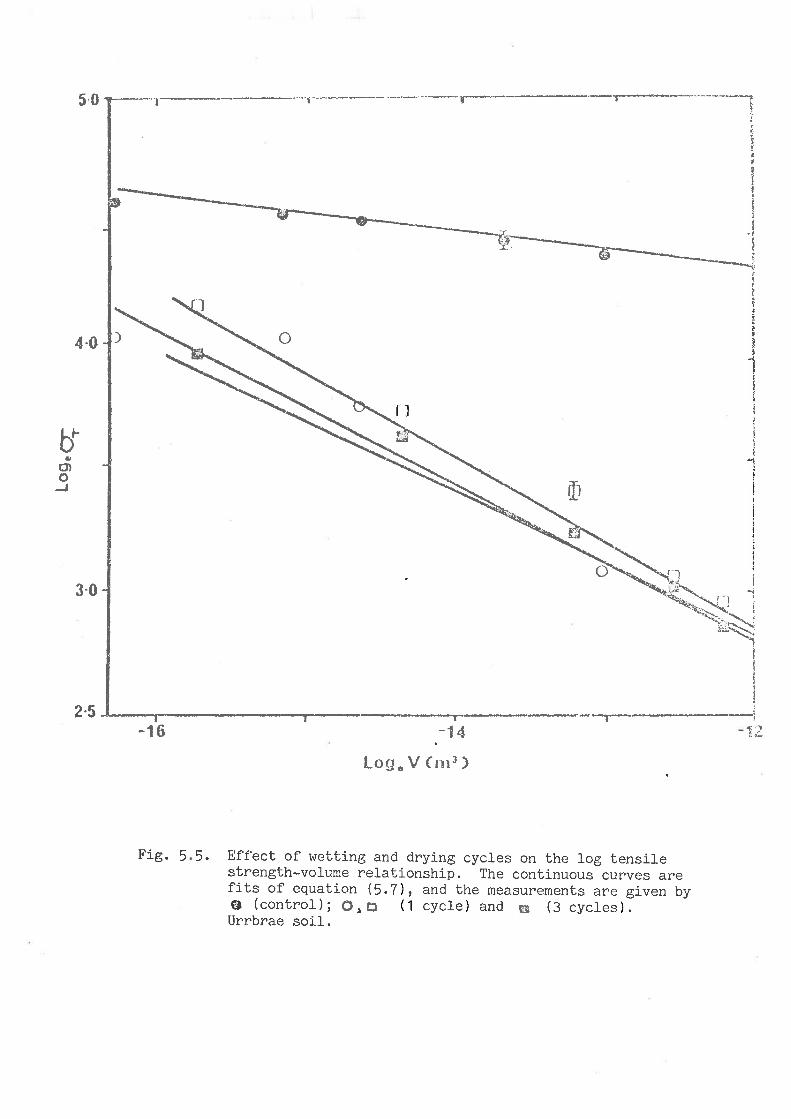
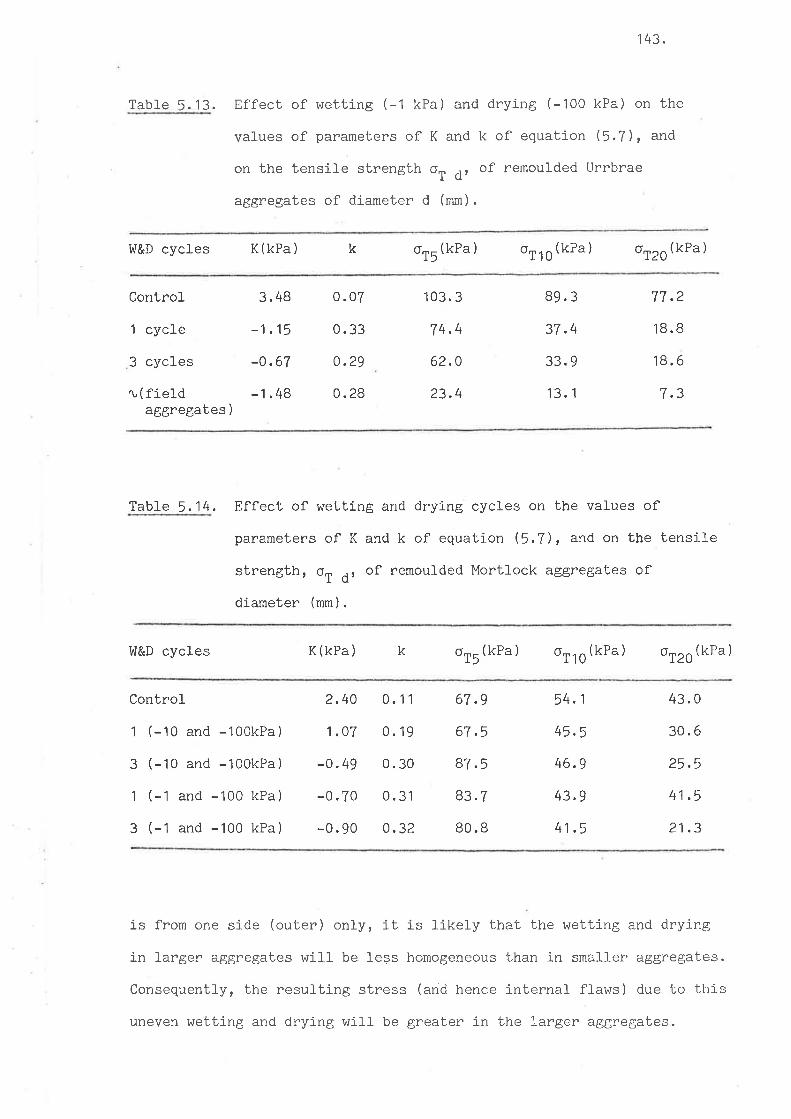
Table 5. '13.
143.
Effect of wetting (-1 kPa) and drying (-100 kPa) on the
values of parameters of K and k of equation (5.71, and
on the tensile strength oT d, of remoulded Urrbrae
a.ggregates of diameter d (mm).
tü&D cycles K (kPa ) k or'(kPa) oftO(kPal otz.(kPa)
ControL
1 cycle
3 cycles
ru(fieldaggregates )
3.48
-1.15
-0.67
-1.48
0.07
0.33
0.29
0.28
103. 3
74.4
62.0
23.4
89.3
37.4
33. 9
13.1
77 .2
18. B
18.6
7.3
Table 5,14, Effect of wetting and drying cycles on the values of
parameters of K and k of equation ß.7), and on the tensile
strength, oT d, of remoulded Mortlock aggregates of
diameter (mm).
Iiü&D cycles K(kPa) x orr(kPa) orlO(kPa) oreo(kPa)
Control
1 (-10 and -100kPa)
3 (-10 and -100kPa)
1 (-1 and -100 kPa)
3 (-1 and -100 kPa)
2.40
1.07
-o .49
-0.70
-0.90
0.11
0.19
0.30
0.31
0.32
67 .9
67 .5
87.5
83.7
80. B
54 ,1
45.5
46.9
43.9
41.5
43. 0
30. 6
25.5
41 .5
21.3
is from one side (outer) only, it is J-ikeJ-y that the wetting and drying
in larger aggregates will be less homogeneous than in smaller aggregates.
Consequently, the resul-ting stress (and hence internal- fl-aws) due 1,o thi.s
uneven wetting and drying wilJ- be greater 1n the larger aggregates.

144 .
From the data in Table 5.13, it isnotpossible to fit a very
meaningful equation to the vari-ation of k with wetting and drying
cycles. Utonlo and Dexter (1981a) fitted the tensiÌe strength results
to the equation
oTd C+cexp(-ctn) $.12)
which predicts the decrease in the tensile strength of aggregates of
dì-ameter d, oT d, with the number of wetting and drying cycles' n.
lrlith the assumption that the C val-ue was equal to the values of o, aff,er
- cycles (field aggregates), they found cr values of 0.23, 0.38r and
o,52 for aggregates of 5, 10 and 20 mm diameter respectively. Although
these are rather crude val-ues, they support the previous suggestion that
the decrease in the tensile strength (with wetting and drying) occured
much more rapldJ-y in larger aggregates.
In stead of the number of wetting and drying cycles, it is probably
useful to express the variation of the k val-ue of equation (5.7 ) \^¡ith
the cumulative water content change (X A I,\i) which occurred during
wetting and drying. This has been done for the Mortl-ock soil (Table
5.14). The values of I A !'l were cafculated from the resul.ts given in
section 3 (Figure 3) for lhe aged sample. The resul.ting equation was
quadratic
k = 0.11 + 0.02 (I A l,ü) - 0.0003 (I AI/\r)2, r=0.97 (5.13)
and is applicable up to X A !ü = 40%.
Effect of freezing and thawing.
The effect of freezing and thawing cycles on the parameters K
and k of equat.ion $.7), together wibh the strengths of 10 mm aggrega|es
are given in Table 5.15. As in the wetting and drying process, lreezíng

Table 5 .15.
145.
Effect of freezing and thawing cycles on the val.ues of
parameters K and k of equation (5.7 ), and on the tensile
strength, oT1O, of 10 mm diameter aggregates of remoul-ded
Urrbrae soil-.
Freezing and
lhawing cycJ-es
K
(kPa)
k o,10(kPa )
Control
1 cycle
3 cycl-es
1 .35
1 .46
and thawing also decreases aggregate tensil-e strength and increases
soil friabitity as shown by the increase in the vafue of k parameter of
equation (5.7 ) ,
The weakening due to freezing and thawing cycles was al-so though
to be caused by the formation of microctacks in the aggregates. The
mechanism of crack formation, however, is of course not the same as
that in the wetting and drying cycJ-es. In this case, the cracks are
formed as a result of ice formation. Thus the p"/" increase in the
volume of water in soil when it is frozen disrupt soil bonds whrch
result in the format.i-on of cracks. In certain soil-s under certain
conditions, ice lenses can be formed. Unlike the cracks produded by
wetting and drying which were not so apparent, these cracks, especialJ-y
the outer cracks on the aggregates, r^rere visible to the naked eye.
5.3 Conclusions
It has been shown (section 5.1) tnat wet,1,ing and drying can decrease
the tensile sl,rength of renioul-ded aggregates, and of clods procluced by
2.33 0.04
0. 10
0.08
18.1
65.3
1lr. 0

146 .
tillage. The evidetrce suggests that the vieakening process invoÌved is
the formation of planes of weakness resul-ting from unequal- swelling and
shri-nkage " This finding suggests that it might be useful- to control_
natural wetting and drying cycles in field soir management practÍce.
ïn tillage practice, one implement pass j-s u-sualry noL enough to
produce a suitabl-e seecl bed. The use of nai.urar wetting and drying to
reduce clod sLrength couì-d be achievecl by al-towing the soil, after the
first implement pass, to dry during the day and to wet du.ring the night
for several- days. The formation of planes of weakness as a resul-t of
this wetting and drying might enabl-e the soil to be biÌled more easily,
and hence reduce the input energy and cost of tilJ-age. rn addition,
with decreasing clod strength, it might be possibte to reduce the nurnber
of implement passes, so that compacLion damage by the tillage machinery
can be minimized. This possibilify is investigated in section 6.
fn section 5.2 a measure of soil- friabil_ity has been deveJ_oped
from a theory for the brittle fracture of soil aggregates. rt seems
that this can account for observed differences in the crumbling behavj-our
of soil-s.
Soil friability varies with soil- water content. The Urrbrae and
the Strathalbyn soils were mosl, friable when their water contenls were
equal Lo the-ì-r plastic limils. This indicates that when these and
probably most obher soils are till-ed at this water content the l-arge
clods wil-I break dov¡r most readily into a seed bed of rel-ativel-y stable
aggnegates. The optimum water content predicted by this methocl is in
good agreement with 1.he results of tillage experirnents obtained by some
earl-ier workers.
Idetting and drying cycles, and also freezing and thavring cycres
not only decrease a.ggregate tensile strength, but al-so i-ncrease soil-

147.
friability as shown bl' the increase in the value of parameter k of
equation (5.7). This i.s a consequence of the more intensive crack
formation (due to uneven wetting and drying or freezing and thawing)
in large aggregates.
It is difficult to sel-ect the magnitude of k which must be
possessed by a soii- for it to be called friable. In spite of this,
on the basis of the practicat experience obtained, the following
rather arbitrary classification is proposed :
k < 0.05 : not friable
k = 0.05 - 0.10 : slightlY friable
k = 0.10 - 0.25 : friable
k = 0.25 - 0.40 : very friabl-e
k > 0.40 : mechanicallY unstabÌe
These values may be compared with the vafue of k = 0 which applies
for the classical, ideal p]astic materials. An upper bound of k = 0.66
applies for the case when the crushing force, F, is the same for aI1
sizes of aggregates.
The choice of k > 0.40 as being mechanically unstable is consistent
with the obser.vation that larger aggregates (> 5 mm) do not. occur in
virgin self-mulching black earths such as the V,laco soil (Coughlan et al-,
1973) which have the largesl, k values which have been encountered so
far (Bnaunack et a7. , 1979),
It is important Lo rea.Lize that particular values of friability
only apply over particular ranges of aggregate size. This is il-l-ustrated
by the fact that aggregates larger than 5 mm in arable I,rlaco soil- (thou.ght
to be formed by compacting effect of machinery) fall on corrpletely
different strength-volume curves than the small-er aggnegates formed by
148.
natural processes (see Figure 2 in Braunack ex a7., 1979). Thus the
strength-vol-ume relationship must change for larger clods. Such a
change would probably manifest itself as a change in tensil-e strength
at a certain size (as with the l,laco soit) or as a sudden change in the
slope of the log(strength) - 1og(volume) curve,
Similar discontinuities must occur with decreasÍng aggregate size.
It is not meaningfuJ- for the tensile strength to approach infinity for
very small aggregates. A disconti-nuity woufd be expected in many soil
types at aggregate sizes around 100-250 pm, which is probably the
size of the basic structural elements of the larger aggregates for
many soiÌs. The discontinuities in the log(strength) - Iog(volume)
curves, or their differentialsr mâV be indicative of chànges in the
internal micro structure and particle bonding mechanism ab that
particular size.
The measure of friabilitY, k, described in this thesÍs may prove
useful- in future studies because friability is almost synonymous with
the quatity of the physical condition of unsaturated soiL.

149.
SECTION 6
EFFECT OF NATURAL I/úETTING AND DRYING
ON THE PROPERTIES OF TILLED SOILS
6,1 Soil water behaviour
6.1.1 Introduction
There is no doubt that tiltage modifies the behaviour of soi-]
ü¡ater due to the alteration in soil structure. UsuaIIy ühe effect
of li-l1age on soi] water is discussed from point of view of soil water
conservation (Aasheim, 1949; A1lmaras, 1967). It is believed that
tillage can conserve soil water. A greater net soil water content
in tilled soil compared to that in non-tilled soil has been shown by
Allmaras (1967). This is caused partty by greater infil-tration into
tilled soil (Burwel1, AÌlmaras and Sloneker, 1966; Johnson, Mannering
and Moldenhauen, 1979), and partly by reduced rates of evaporation
from tilted soils (l'Iil1is, 1960; Hadas and HiJ-J-el, 1972; Hadas , 1975).
Hadas (1975) and Braunack (1979) have discussed the evaporation
data of Allmaras (1967). They concluded that due to interactions of
sit,e, infiltration and non-isothermaÌ conditions these data are difficult
to interprete and are inconclusive. These data, however, are still
very vaÌuable, because there are very fewdataavail-able for real field
conditions. The resul-ts given by other workers (Wil1is, 1960; Hadas
and Hillel, 1972; Hillel and Hadas, 1972; and Hadas, 1975) were obtained
under artificial conditions.
It is a common assumption that in the long term, the raLe of
evaporation from a tille<l soil j-s fess 1;han that of from non-biIled
soil. This assumption has been supponted by the results of I,úilli-s (1960)
150.
and others (e.g. Hadas and HiJ-lel, 197?; Hadas, 1975). Evaporation
rate from a real- tilled soiÌ, however, cannot be predict,ed with any
accuracy.
The evaporation rate from the til-led layer, providing soil
unsaturated hydraulic conduct,ivily is high enough to meet evaporati-ve
demand, is often greater than that from the same layer (depth) of
non-tilled soil. This is caused by the increase in the net radiation
with increasing surface roughness (All-maras, 1967). The decnease in
soil heat flux after tillage (van Duin, 1954 ) has also been suggested
as one of the factors responsible for increasÍng evaporatj-on from
relativeÌy wet tilled layers. In addition, the convective movement of
atmosphereic air resul-ting from air turbul-ence effects (Oienj-yi, 1978)
may also contribute significantly to evaporation from thi-s layer.
Tillage, therefore, results in a drier tilled J-ayer, but tends to
conserve water in the soil beneath the titled layer.
In discussing some results of Russian workers, Lemon (1956) came
to the conclusion that evaporati-on of soil waLer after wetting coul-d
be characterized by three stages. The first stage is that rapid loss
of water where capiJ-J-ary fl-ow to the soil surface is sufficient to meet
the evaporative demand of the above g.ornO environment. This sta.ge of
evaporation onl-y occurs whilst, the soil profiJ-e is able to suppJ-y water
to the evaporating surface at a rate satisfy the evaporative potential.
As the soil pnofile dries out, the unsaLurated hydraul-ic conductivity
falls, and water can no longen be supplied at the potenlial evaporative
rate. As a consequence, evaporatíve loss decreases rapidly, and this is
known as Lhe second stage. In this stage the rate of evaporaLion is
controfLed by the soil and the soit water. In the third stage, evaporat.-lon
occurs at extremely s-Low rates and is governed by adsorptive forces of
mofecular disLance at the soil liquid solid interface and by vapour

diffusion i.rr the air-filled pore space.
The external evaporative demand, E,
Penmanrs ( 1948) equation
E
151.
is usual-ly calcul-ated from
(6.1)
where H is the net radiation available at the surfacer "¡z is the wet
and dry hygrometer constant, ¡ = de^/d.. (here e^ is the satura-teda la a
vapour pressure of water in the air at temperature Tu) r and E. =
(u" - e.)f(u) (here eO is the åaturated vapour pressure at the dew
point, and f(u) is a function of wind speed, u.
Hanks and lrloodruff (1958) have demonstrated the importance of wind
speed 1n influencing evaporation rate. Their experiment showed that the
evaporation rate from a wet soil underneath a dry mulch increased two
to six times when the wind speed was increased from 0 to 40 km hr-1.
Kimball (1973), on the other hand, found little or no correlation between
wi.nd speed and evaponation rate. In a later study, Hadas (1975) observed
that cumulatuve evaporation from sieved aggregates decreased with
environmenlal factors in the order wind > continuous radiation > inter-
mittent radiation over a thirty day period.
(HA+Eay)/ (A+"¡)
related evaporation through aggregate beds (E)
o), and by developing the equation
Braunack (1979)
to pan evaporation (g
E/E c + a(ps - pa) + ab. u(ps - pa) rc.2)o
with a, b, and c being adjustable parameters. He found that wind
speed (u) and the water vapour deficit (ps - pa) did not sJgnifi.cantly
affect E/Eo.
Gardner arid Hill-el- (1962) found that the flor+ of heat has lit1,le
influence on evaporation. Hanks, Gardner and Fairbourn (.1967)
152.
demonstratecl that computation of evaporation assuming isothermal-
conditions for a soil initialJ-y wet to near saturation woul-d probably
estimate total evaporation to within 10% errcr. They concl-udecl that
this was sufficiently accurate for many purposes. Hadas (1975)t o.n
the other hand, stressed that employing an isothermal equation of water
fl-ow to non-isothermal- conditions can result in large errors.
The significance of thermally-induced flow during evaporation
has also been pointed out by Idiegand and Taylor (1962) and Cary (1965;
1966). In order to calculate this flux, Cary (1965; 1966) developed
the equations
-"1 (6.3 )
and
(6.4 )
where, J' and J, are vapour and liquid flux respectively' Dis
diffusivity, k is capillary conductivity, H is heat of evaporation,
I is liquid heat transport, R is the gas constant, T is temperatu¡e,
and rvì is a factor accounting for pore geometry.I
using these equations, cary (1966 ) tabulated the results of
some earl-ien workens and showed that in saturated conditions the
Lhermally-induced flow becomes more important as the hydnaulic
conductivity decreases. In unsaturated soils, the reLative importance
of thermally-induced flow rises rapidly as the soil- water content
decreases.
The aim of the experiments conducted here was to study the effects
of tillage on soil water behavi-our. The interest was not in the whole
til-led soiI, but only in the fluctuation of soil water in the tilled
Jv
dr
dz
Dp.Hn2 t3
dr
ã-z
k8ãTJt

153.
layer. Because of this, the term I'cìrying'r wiJ-I be used to describe
the l-oss of water (from this layer) instead of evaporation. In
addition, bhe experiments were afso designed to study the iniportance
of meteorological factors in deternrining the rate of drying.
6,1 .2 Materi-a1s and l4ethods
SoiI water content fl-uctuations in tilled and untilled soils
Urrbrae red brown earth, with the propenLies described 1n section
3, was tilled with one pass of a tyne cultivator to a depth of about
10 cm in the Spring (Aug/sept; Sept.oct)1978, and in the Winter (June)
1979, To measure soil water content fJ-uctuation, soil- water content
(of the tilled and until-led soil) was measured aL g.OO a.m. (to give
the daiJ-y maximum soil water content as a result of wetting) and at
5.00 p.m. (to give the daity minimum soil- water conLent as a resul-t
of drying) daily. These times were chosen j-n the light of the results
of Ojeniyi- (1978) which showed that soil water contents at these tlmes
were close to the dail-y maximum and minimunl val-ues.
Samples of about 50 g soil were collected from the 0-10 cm J-ayer
(6 samples at each time for the 1978 experiment, and ! samples for the
1979 experiment), and the soif wat.er content was d.etermined gravimetrically.
In addit,ion, to study the variation in -soif water content with depth in
titled soiJ-, a further experiment was done in the l¿'iinler (July) 1979.
In this experiment, the mean soif water contents were measured over
the depth ranges of 0-5 cm and 5-10 cm.
The claily wetting and drying (A I,{) was found by summiug up the
changes in soil water content between 9.00 a.m. arrd 5.00 p.m. ' and
betr¡een 5.00 p.m. and Ç.00 a.m. on the followlng day. The cumufative
wetting and drying was calculated from

( lnw,, l+ law,l+ Inw,l+ .* Inwr l ) - 2 t'(ffi)
154.
(6.5)x^hlf
where, the subscripts, 11 2r 3 and t denote the amount of wet,ting and
drying in day 1, day 2, day 3, and day t respectively. t A !Ù j.s theL
culul-ative amount of wetting and drying between day 0 and day t' and
.2 S.(;=ãl is the estimated error resulting from summi-ng differences betweenvrnsuccessive sub-sampl-es of a normal- population of soil- wa.ter contents
(see appendix).
The affect of meteorologicaf factors on (daily) soil drying was
analysed by the t'Path analysis'r theory developed by l.lright (1921; 1923)
and discussed by Tukey (1954). By doing this, not only the dependence
of soil drying on meteorol-ogical factors can be discussed, but also
the mutuaf association between these factors.
By taking the error into accottnt, bhe daily amount of drying, Ad,
of the O-10 cm layer was calculated fy
Ad = w9 ..*. - w5 o.r. - ffit (6.6)
!ühen the resulting ^d
< 0, the drying vfas assumed to be zero. The
meteorological data was found from the lrlaite Institute meteorol-ogicaÌ
station (located at about 500 m from thd experimental location).
Effect of tillaee system on soil water behaviour
The experiment was carrj-ed out at the Mortlock experimental station
of the lrlaite Institute i.n the l¡linter (June) 1980. The soil- is a red
brown earth with the properties described jn section 3.1. The treatments
t'rere:
Minimum tillage : direct dril.Ied with a combine drill fitLed with
5 cm lucerne points ( 1 1 /6 1980) .
A1^I

155.
B__. Minimum tillage : seeding with rotary seeder and compactionv'I
roller (6/6 1980).
Cvr. Conventional tiJ-lage : cultivated with scarifier (29/4 1980),
harrowed with heavy stump jump harrow (13/5 1980), cuJ-tivated
with combine with 10 cm shares (21/5 1980, harrowed (26/5 1980),
seeding with combine with 10 cm shares (10/6 1980).
DZ, Conventional tillage : tilIed with Howard rotary hoe (30/4 1980
and 26/5 1980), seeding with rotary seeder and compaction roller
rc/6 1980 ) .
A_. The plot caried pasture (the previous year this plot wasp
culbivaLed as A").
D-. The plot carried pasture (the previous yea.r this plot wasp
cultivated as D").
The subscnipts w and p denote that, when the experiment was carried
out, the plot carci-ed wheat (recently sown) and pasture respectively.
A and D r^rere considered to constitute non-tiIled soi-L as l,here waspplibtle pasture cover on them.
Observations r^rere started on 17/6/ 1980 and were completed
on 26/6/ 1980. To s1,udy the daily variation water content, the
measurements of soil wafer content was done at 8.00, 9.00, and 10.00
a.m.; and at 3.00,4.00, and 5.00 p.m. Unlike in the previous experimenL,
soil water content r^ras measured frorn samples from the 0-3 cm layer only.
6. 1 .3 Results and Discussion
Soil- water content fl-uctuations
It was found that the fluctuation of soil- water content in the
tilled plots was much higher than that j.n the non-til-led pJ.ots. Thus
the t1lled plots wetted ond dried more j-ntensively than non-tilted

1¡
\,
\\\
III
Y
Eìto
10
Oaj,s after tillege.
Soil water content fluctuati-ons of tilled (c) and non-tilled (r) p1ots.Exp. 1 1978 ( 29/e - 20/9 1978 ).
Fig. 6 .1 .

\
è-!
I
5
Da¡s after tillage
Soil water contenl fluctuations of tilled (ô) and non-ti-}Ied (ç) plots.Exp. 2, 1978 ( 20/9 - 10/ 10 1978 ).
Fig. 6 .2.

azltàrg
ì
Days after tillage
SoiI water content fluctuations of tilled (o) and non-tilleo (r) plots.Exp. 3 (6/6-28/6/7e)
Fig. 6.3

156.
plots (Figure 6.1, 6.2, and 6.3). As a nesult, the cumul-atlve wetting
and drying in the tilled plots was much greater than that in the
non-til-Ied plots. Up Lo 20 days after tillage the cumulative wetting
and drying in the tilled plot was 1.79, 1.T8, and 2.09 times greater
than of the non-tilled plot for the 1978 (experiment 1 ), 1978
(experimenL 2), and 1979 experiment respectively.
The greater cumul-ative wetting and drying in the till-ed pl-ots can
also be seen from the slope (b) value of equation
X^hr = B+bt (6.7)t
obtained by plotting the cumulative wetting and drying against time,
t (in days), afler tiltage'(Tabl-e 6.1, Figures 6.4, 6.5, and 6.6).
Table 6.1. Values of B and the b parameters and coefficient of
determination of equation (6.7 ) obtained from the tilled
(TL) and non-til-Ied (NTL) p1ots.
Experiment(year ) TL NTL TL NTL TL NTL
B b2r
1978 (1)
1978 (2)
1979
-4.05
10.26
6.92
-1.94
3.01
0.55
4.03
3. 15
2.43
2.26
2.07
1 .30
0.99
0.93
0.98
0. 99
0.94
0. 96
The greater amount of wetting in the till-ed plots vuas more
slgnificant after rainy days. Because of the greater porosity in the
tilled soil, the rate of infiltration, as well as Lhe a.mount of water
which can be stored i-s greater than that in the non-l"i1-Ied plot. In
these experiments (Figure 6.'1, 6.2, and 6.3) t,he maximum soil- r,vater
content (after rainy days) observed was around 25% (-in the t,illed plot)

BO
IJ3h&.
0
t (days )
Cumulative wetting and drying, t A \''ür (as a functionof time, t, afLer tillage) of tilled (o) andnon-tilled (a) plots (1978 exp. 1).
Fig. 6.4 .

\oo\
ãN
20
Fig.6.5.
0 2Ð0
t (days)
Cumulative wetti-ng and drying, I A bl' (as a functi-onof time, t, after tillage) of tj-Iled (c) and
non-tiIÌed (A) plots (1978, €xP.2).

IÈ
N
0
Fig. 6.6.
1
t (days)
Cumulative wetting and drylng, I A !Ù, (as a functionof time, t, after tiltage) of tilled (S) and non-tilled(a) p1ots, 1979 exp.

15't .
and 21% (in the non-til-l-ed pJ-ot). The increase in the potentjal-
storage capacity due to tillage has aLso been found by some lìussÍan
workers (van Duin, 1955).
The tilled plot not only had a greater total porosity but also had
larger pores. The importance of pore size distribution in determining
the rate of infiltration has been weII established by Marshall (1958). By
his classical equation, Marshall (1958) demonstrated that hydraulic con-
ductivity and hence infil-tration rate of a soil increases with increasing
void volume and síze, and with the degree of soil saturation.
In addition, the increase in surface roughness due to ti11a9e
(Burwell et af .,1966; Allmaras et a-I .,L97'7; Dexter, L977) can influence
surface detention of water. By increasing the time available for infil-
tration, this surface roughness significantly increases infiltration-
Burwell et af. (1965) have shown that a soil which has been ploughed with
porosity fraction of 0.66 and random roughness of 4.98 crn had a cumulative
v¡ater intake (prior to run off) of I7.2 mm, whereas non-tilled soil with
porosity fraction of 0.53 and.ãhao roughness of 0.76 cm had onty 0.89 mm.
Greater infiltration due to the increase in the surface roughness has also
been found by Johnson et aL.(L979). There was some run-off from the non-
tilled., but not the tilfed, plots in the l-978 and 1979 experiments reported
here.
ft can be seen in Figures 6.1, 6,2, and 6.3, that even on days
with no rain, the rate of weLting in the tilled pl.ots uras stil-I greater
than in the non-tiIled plots. This r^¡as probably due to the higher
v,rater content of the deeper Ìayers of 1,he tilled plots. Because of
the higher infiltration, the 1.ayer beneath Lhe tilled J-ayer stores a
larger amount of r^/ater than that of the same (depth) layer beneath
a non-tilled top soil. The higher water content j,n this layer may
afso resul.t from dournward movement of water from Lhe Lill ed }ayer during

158.
the hotl,est part of the day. This dol.mward movement is caused by
the temperature gradient (Gurr, Marshalf and Hutton, 1952; 0jeniyi'
197S). Gurr et aL. (1952) suggesbed that the maxinlum net water
movement is toward the coofer temperature. Temperatune of a tj-Iled
soil, during the day, decreases with cìepth (Allmaras et a7.,1977;
ojeniyi, 1978). Though the temperature in non-til-Ied soil- also
decreases with dept,h, it seems that due to the modification of the
heat flux (de Vnies, 1963; Hadas, 1975) and the net radiation
(Allmaras, 1967), the temperature gradient in the tilled soil i.s
greater than that in non-tiIled soil. So, it j-s reasonable tcì assume
that any dovnnrvard movement of soil water in the tiIled soil is greater
than that in non-tilled soi}.
At night, the temperaLure of the surface layer decreases. Aì-so'
matric water potentiaÌ at the surface is more negative than it is
deeper down. Thus, water flows upwards for two reasons. Since the
flux of hrater is proportional to the potential gradient' and because
of the potential gradj-ent in the tilled soil- is higher than that in
non-til}ed soil, it is, therefore reasonable to su.ggest bhat the
tilled soil will wet more rapidly than non-tilled soil-. In addition'
because the surface of the titled plot gets colder at night (van Duin'
1954), it wiJ-1 attract more condensation (dew) water from l,he
atmosphere, and this factor can also conl-ribute to this greater wetting
rate.
The greater drying rate of the tilled layer found in Lhis experiment
is not necessarity in contradiction with the resul-ts of evaporation
experiments done by some earlier workens (l{illis , 1960; Hillel and Hadas,
1972). As discussed previously, the data found in these experinents
just showed t.he water f oss from the ti.lled layer, noL the tol,al f oss
fnorn the soit. The data of those workers was obtained fron a ì.aboratory

159.
study in the presence of water table, and thus showed the total l-oss
of water from the soil. (water table).
Gardner (1958) has shourn that the maximum evaporation rate is
rel-ated to the soil hydraulic conductivity and the depth of the water
table. Hol-mes Greacen and Gurr, (1960) have reported fhal, the water
table of the Urrbrae red brown earth is at about 30 m depthr and that
there is no capillary rise from this water table to the soil surface.
Under these conditions, the influence of the water table can be
ignored. The rate of drying in these experiments, therefore, is mainl-y
related to the soil unsaturated hydraulic conductivity.
There i-s no doubt that tillage modifies pore size and pore
arrangement, and hence hydraulic conductivity. In an attempt to reduce
evaporation from a tilled soil, several workers (Holmes et al-.,1960i
Hillel and Hadas, 1972; Kimball, 1973; Hadas, 1975; Braunack, 1979) have
stuclied the effect of aggregate size on evaporation. They found that
a minimum evaporation occurs thnough beds of aggregates of 1.0 - 2.0
mm diameter. In these experiments, the fj-rst impl-ement pass produced
more than 607" (1978 experiment) and more than 50% (1979 experiment)
aggregates with diameters larger than 9.5 mm. It has been found that
there is a greater penetratj-on of turbul-'enb air currents into larger
interaggregate pores (Hanks and l,'/oodruff , 1958; Holmes et aL., 1960).
As a result, evaporative water l-oss is correspondingly higher. Hol-mes
et al-. (1960) found that the evaporation rate from a seed bed with
c]ods of 25.0 - 50 mm diameter r¡/as as high as 2. 4 tlmes that front
non-tilled soil.
In addition, the dor^mward movement of water due to the midday
temperature gnadient, as has been suggestedr ßâY also contribute to
this greater water loss from the surface soi}. Becau,.se of the higher

'ì60 .
net radiation (All-maras et a7., 1977) and small-er heat flux (cle Vr-ies,
1963; Allmaras et aJ., 1977) the surface of a t,il-led soi.l has a highen
temperaLure than that of non-tilfed soil. This means thaf tillage
increases the temperature gradient between the surface and the sub-"soil-.
Hay (1977) found that except for a very cool day (air" temperature belou¡
aoc) the temperature gracìient (with cìepth) in Lilled soil is relativel-y
high compared to that. in non-til led soil. As a consequence of thj-s
temperaLure i-ncrease, the thermal-ly-induced flow in till-ed soil- is more
significant than that in non-tilled soil. The significance of v¡aber
flow due to temperature gradi-ents in infl-uencing evapora';icn has been
poì.nted out by several workens (Gurr et a1,, 1952; Víiegand and Taylor,
1962; Cary, 1965; Cary, 1966). Cary (1965) found LhaL a ternperature
gradient of 0.5oc/cm at a matric water potential of -6 .l kPa woufcì mc-,ve
as much as water through the soil as a waf,er potential gradienL of Q,2
kPa per cm. Joshua and de Jong (1973) observed that a temperature
gradient small-er bhan 1,60/cm had a significant effect on water coirt.ent
in a fine sandy l-oam soi1. Ojeniyi (1978) has shown that a temperature
difference as large as 5oC can exist between the 5 and lO cm depths
in a coarsely-ti11ed soil-.
As expected, the intensity of wetting and drying i.n the 5-10 cn
layer of the tilled pJ-ot was much fower than thaL in 0-5 cm layer
(Figure 6,7). Fit,ting this data to equation (6.7) resul-ted in the B
and b val.ues given in Table 6.2. It i-s necessary to point out Lhat
the resufts for the soiÌ with very smal-l soif waber conterrl- ffuctu¿:.ticrr
(such as in the 5-10 cm layer) are meaningless for the first, few days,
because they pnedict X A I,^l being negative. This occurs becattse thet
standard deviation (S, in equati-on 6.5) is much greal,er" than the soj-l
water content changes. As Shown in Figure 6.8 the ct¡.mulative w¿rtei'
conLent change is negative when L fess than 3 days. Tliis Lend.jncy can
afso be seen in the resuft in Figure 6,4.
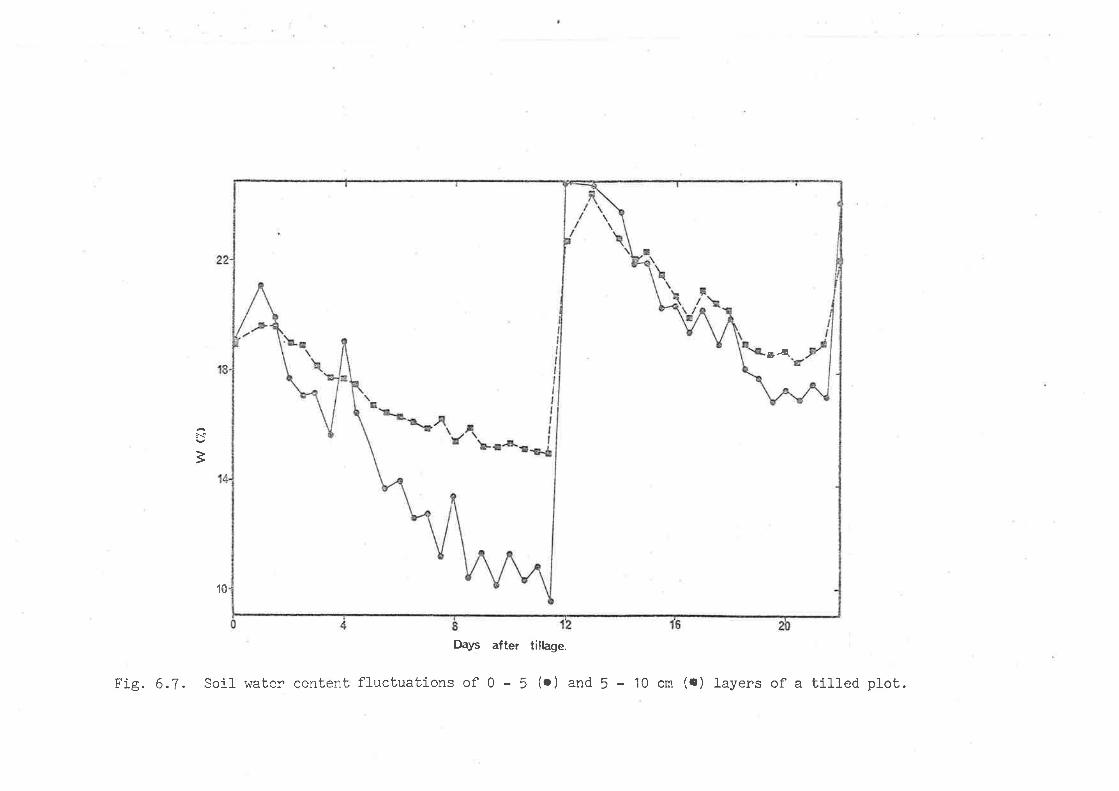
E'-ã.
10
Days after tillage.
Fie. 6.7. SoiI water contenL fluctuations of 0 - 5 (r) and 5 - 10 cm (¡) layers of a tilled plot.

Tabl-e 6.2.
161 .
Values B and b parameters, and coefficient of determination
of equation (6.7) found from 0-5 cm and 5-10 cm layen of
the tilled plot.
Layer depth (cm) 2rbB
0-55-10
2.11
-3.23
2. 17
1 .08
0.94
o.94
The ratio of the cumulative wetting and drying in the 0-5 cm
Iayerto that in the 5-10 cm layer in the first 4 days was 10.81. For
a longer time this ratio decreased due to a high wetting nat.e in 1-he
5-10 cm layer caused by rainfall. Until 20 days after tillage, this
ratio was only 2.02.
The great,er soil water cont.ent of the 5-10 cm layer compared to
that of the 0-5 cm Iayer is reasonable. This occurs due to the
continuous replenishment that occurs from the stored water in the
undisturbed soil underlying the tilled 1ayer. In additionr any downward
movement of water from the top tilled layen as discussed above would
also contribute to this larger vafue of soil- water content.
Effect of tillage system on soil- water behaviour
The mearrwater contents of the A* treatment at 8.00, 9.00, and
10.00 a.m., and at 3.00, 4.00, and 5.00 p.m. were 25.44%, 25.43%t 24.22%
and 20.23%t 19.30% and 18.93% respectively. For lhe D, treatmentr the
corresponding mean v¡ater contents were 23.06%, 22.94%, 22,18% and 17.82%,
17.59% and 17.50%. The effects of tiJ-lage systems on the mean soil
water contents at 9.00 a.m. and at 5.00 p.m. are given in Table 6.3.

o
o
o
A
o
^
AoA
o
oo
oo o
N
ìl^l
Fig.6.8.
t (days)
Cumulative wetting and drylng, X A l,'i' (as afunction of time, t, after lillage) of 0 - 5
cm (o) anO 5 - 10 cm (¡) layers of a tilledplot.
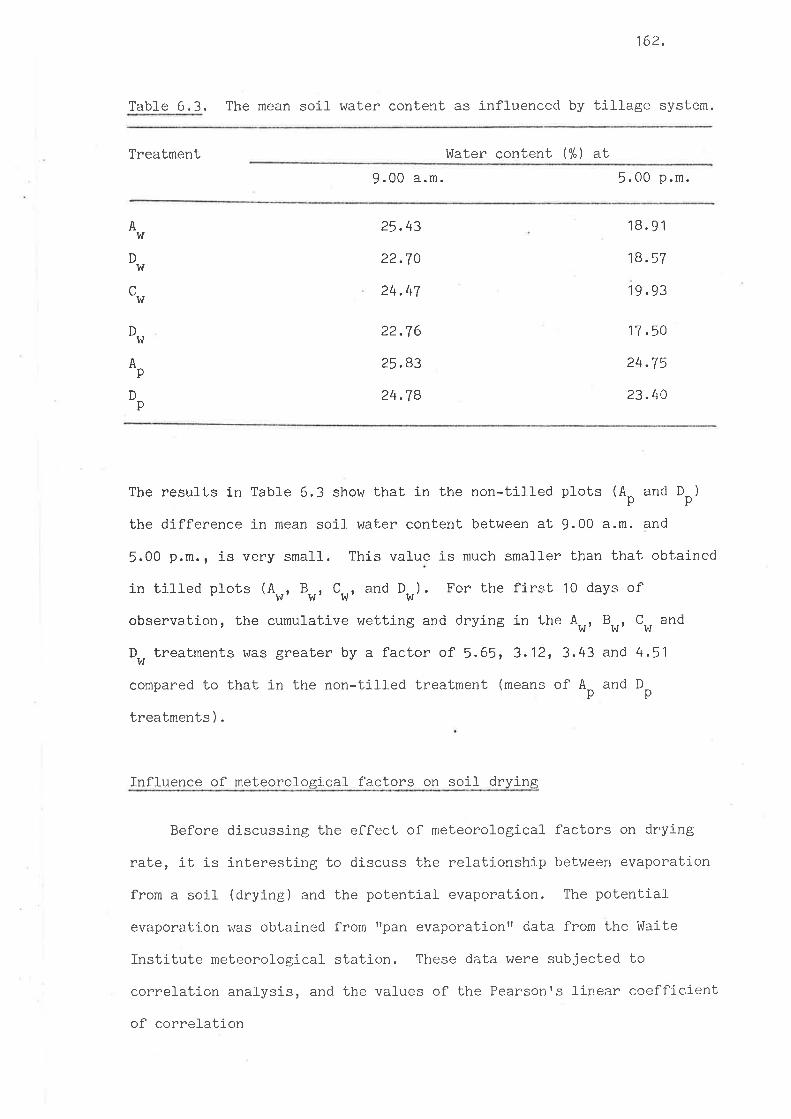
162.
Table 6.3. The mean soil vrater content as influenced by tillage system.
Treatment lnlater content (%) at9.00 a.m. 5. 00 p.m.
AI^I
D}J
Ap
cvt
D1^¡
p
25.43
22.70
24 .47
22.T0
25.83
24.78
18.91
18.57
19.93
17.50
24.75
23.40D
The results in Table 6.3 show that in the non-till-ed plots (AO and DO)
the difference in mean soil water content between aL 9.00 a.m. and
5.00 p.m., is very small. This val-ue is much smalfer than that obt.ained
in tilled pJ-ots (4", 8", Cw, and D") . For the first 10 days of
observation, the cumulative wetting and drying in the A*r Bw, C" and
D-- treatments was greater by a factor of 5.651 3.121 3.43 and 4.5'lvt
compared fo that in the non-tilIed treatment (means of
treatments ) .
Ap and Dp
Influence of meteoroloEical- factors on soil- dryine
Before discussing the effect of meteorological factors on drying
raLe, it is interesting to discuss the relationship between evaporation
from a soil- (drying) and the potential evaporation. The potential-
evaporation r,tas obtained from rrpan evaporationrr data from the \,'laite
Inst,itute meteorological station. These data were subjected to
correl-ation analysi-s, and the values of the Pearsonrs l.inear coefficient
of correl-ation
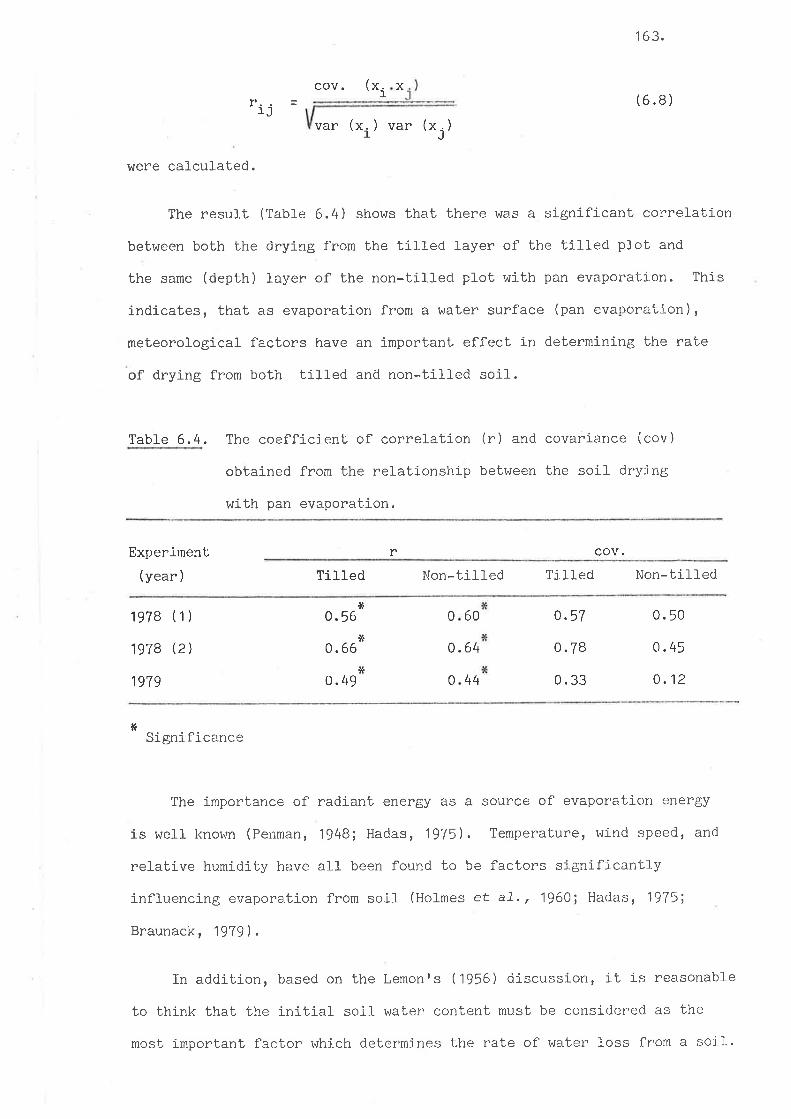
cov. (xl_
1 63.
(6.8 )r.1Jvar (xr) var (xr)
were calculated.
The resul.t (Table 6.4) shows that there wa-s a significant correlabion
between both the drying from the tilled layer of the tilled plot and
the same (depth) layer of the non-tilled plot with pan evaporation. This
indicates, that as evaporation from a water surface (pan evaporation),
meteorological factors have an important effect in determining the rate
of drylng from both tilled ancl non-tilled soil.
Table 6.4 . The coefficient of correlation (r) and covariance (cov)
obtained from the relationship between the soil drying
with pan evaporation.
Experiment(year ) TiIted
r cov.
Non-tilled Tilled Non-til-]ed
1978
1978
1979
(1)
(2)
0. 56
0.66
0.49
4.57
0.78
0.33
0. 50
0.45
0.12
*
*
t(
60
44
0
0.64
0
2Signifj-cance
The importance of radiant energy as a source of evaporation energy
is well known (Penman, 1948; Hadas, 1975). Temperature, wì-nd speed, and
relatíve humidity have all been found to be factors signifj-cantJ-y
influencing evapora.tion from soil (tlolmes et a7., 1960; Hadas, 19751
Braunack, 1979).
Tn addition, based on the Lemonrs (1956) discussion, it is reasonable
to think that 1-he initial soil water cc¡nt,ent must be considered as the
most imporLanL factor which determines the rate of water loss from a soil-.
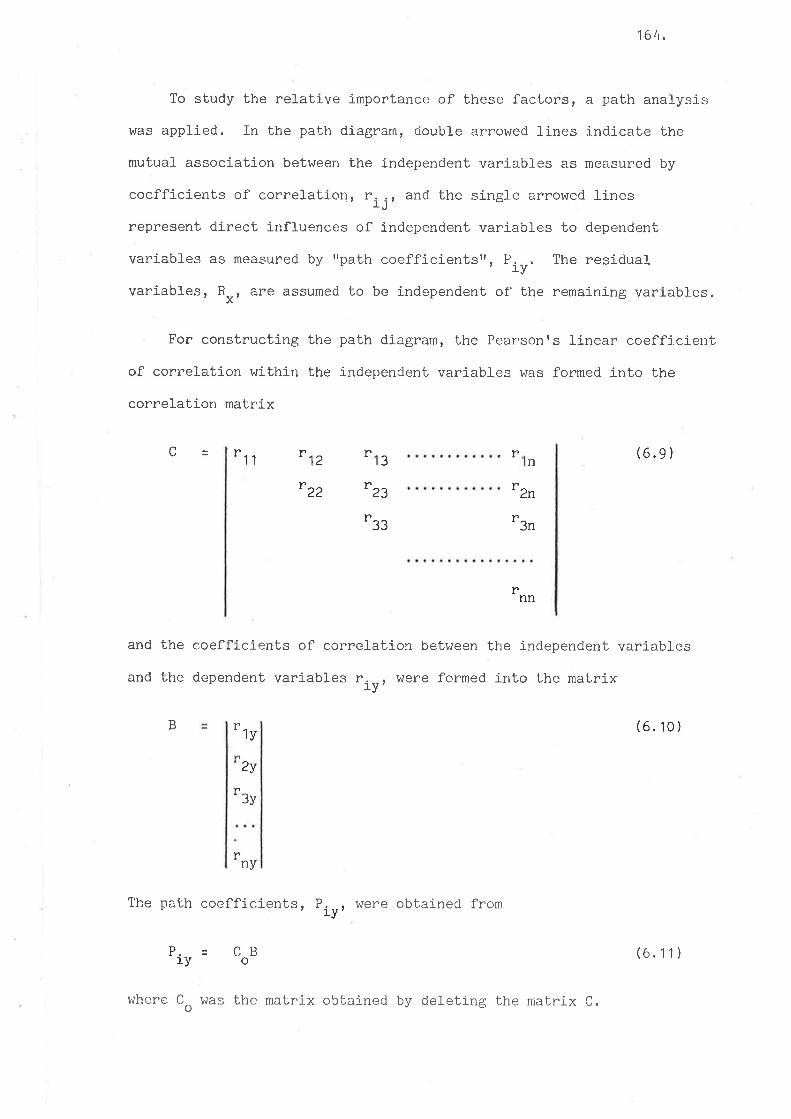
164.
To study the rel-ative importance of these factors, a path anal-ysis
was applied. fn the path diagram, double amowed lines indicate the
mutual association between the independent variabl-es as measured by
coefficients of correlation, "ij, and the si-ngte arrowed lines
represent direct influences of independent variables to dependent
vari-abl-es as mea-sured by rrpath coefficientstr, tru. The residuar
variables, R--, are a-ssumed to be independent of the remaining variables.,x,
For constructing the path diagram, the Pearsonrs finear coeffj.cient
of correlation within the independent variabl-es was formed into the
correlation matrix
c (6.9)"11
rr2
r1 3 n
2n
3n
'22 '23
"33
r
r
?nn
and the coefficients of correlation between the independent variables
and the dependent variables rrrr were formed into the mat.rix
B I
r
T
(6. 10 )1y
2y
T3y
ny
The path coefficients, P were obt.ained fromiy'
oD-l.
1y c B
where C^ was the matrix obtained by deleting the matrix C.o
(6.11)
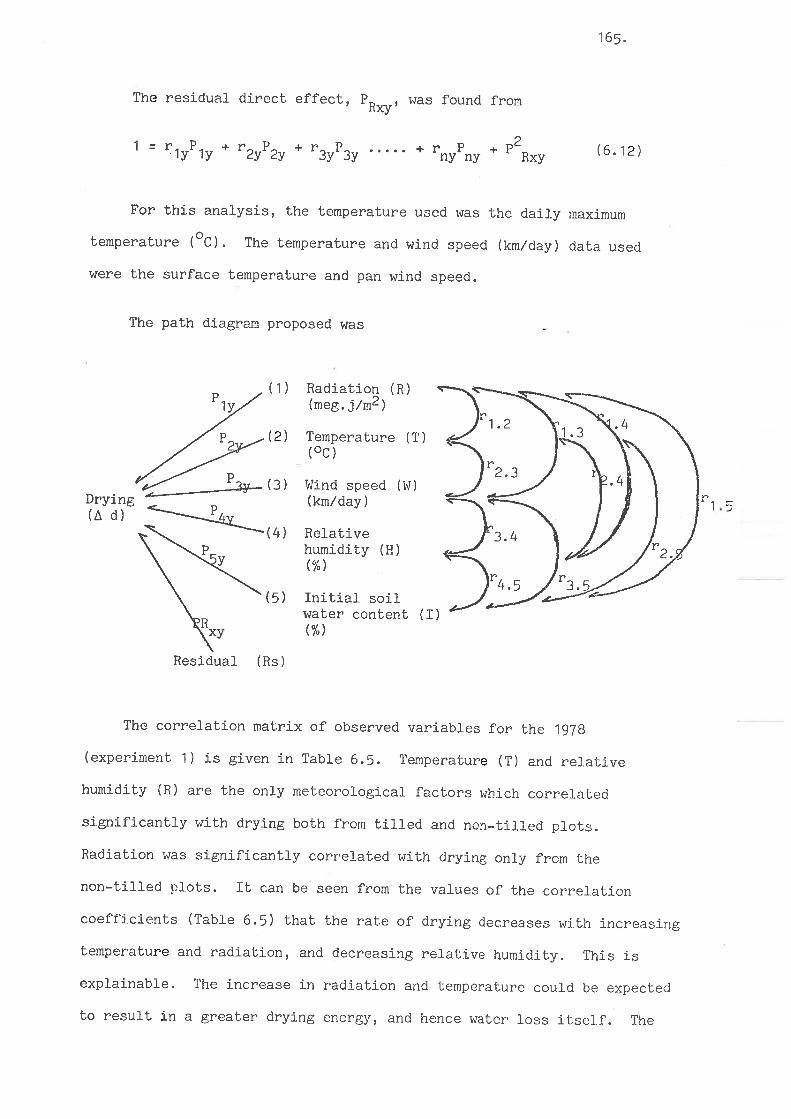

166.
Cornel-ation matrix of observed variabl-es for the 1978
experiment 1.
Tab1e 6.5.
Kinds of R
variabfes
T hI
0.12 -0.33
_ 0.39
TL NTL
Drying rate
TL (tiv)nrl
H
-0.36
-0.77r(
-0.20
-0.09
-o'71x
-0. 20
0.72x
-0 .12
-o ' 74r(
-0.23
0.75x
0.26
0. 5grç
0.23
-0. 51rç
-0.38
0. 441(
0. 61*
0.21
-0.59r(
-0.28
I
R
T
lr,l
H
I
significant at the probability of 5%
decrease in relative humidity results in an j-ncrease in the tendency of
soil water to move to the air.
There was a tendency for a decrease in water loss to be associated
with increasing initial water content as can be seen from the negative
corelation coefficients (r = -0.38 and r = -0.28¡ for the tilled and
non-tilled plot respectively). Actual1y. the increase in soiL water
content resulLed in an increase in drying rate as shown by the positive
path coefficient (Table 6.6, Figure 6.9), but due to the occurrence of
positive correlation between initial soj-l- water content with relative
humidity (r = 0.72), which in turn was negatively correlated with drying
both from the till-ed (r = -0.51) and non-til-led plots (r = -0.59), and
negative correl-ation between initial soil water content and temperature
(r = -0.71), which positively correlaLed with drying (r = 0.59 and
r = 0.61), the net result is negal,ive. The path coefficient (Table 6.6)
shows that this negative vaÌue originated from its indirect effect
through temperature, refative humidity, radj-ation and wind speed.

Table 6.6
167.
Path coefficient of observed variables upon drying rate from
tilled ancl non-tilled ptots ( 1978-1 ) .
Drying versusPlot Via
IhIR T
1Tilled
plot
R
T
V\r
H
I
o "21
0.06
-0.03
0.02
0.00
0.03
0. 54
0.03
0.05
-0.06
-0.07
0.21
0.09
0.01
-0. 01
-0.08
-0. 41
-0.02
-0.06
0.06
-0.02
-0. 38
-0. 02
-0.04
0. 0B
r.1y 0.26 0.59 0.23 -0.51 -0.38
Non-tiIled
plot
0.35
0.08
-0.04
0.11
-0.06
0.04
0. 65
0.05
o.25
-0. 38
-0 .12
0.25
0.13
0.07
-0 .12
-0 .12
-0.50
-0.02
-9-:-æ.
0.38
-0.04
-0.48
-0.03
-0.24
0.51
R
T
!t
H
I
r.1y 0.44 0.61 0.21 -0.59 -0.28
1 direct effect
Although relative humidity was significantly correl-ated with drying'
its direct effect on drying r^ras very smal-l, even smal-ler than the direct
effect of wj-nd speed (for the till.ed plot) which was not signì-ficantly
correlated with drying. This occurs because alrnost al-l of the relative
humidity effect was indirect via temperature (-0.41 for the bill-ed plot'
and -0.50 for the non-tilled plot). It can be seen from the pa1,h
coefficient value (I'able 6.6, Figure 6.9) that temperature and radiant
energy were the most irnporbant factors inffuencing the drying from both.
the tiIled and non-tj-Il-ed p1ots.
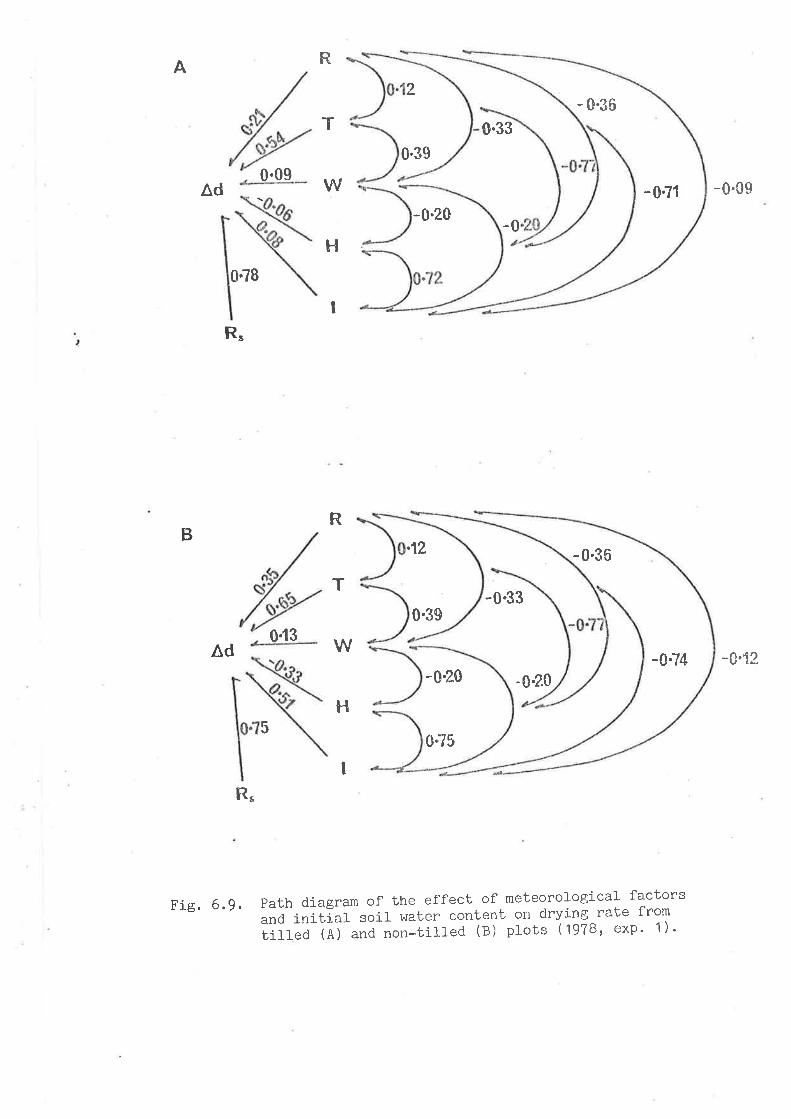
R
T
w
t-l
^d
A2
- 0.36
0.090.39
-0.20
0.3s
-0.20
0.75
0.33
-0
-0.33
-0.7'l -0'0s
-0.74 -t'12
0.78
I
B
R"
^d
R
T
W
H
.12-0.30
0.13
-0.20
5
t
R"
Path diagram of the effect of meteorological factorsãnO ititlal soil water content on drying rate from
tilled (A) and non'tilled (B) plots (19TBr exP' 1 ) '
Fj-e. 6.9.

168.
The result of the second experi-ment which was conducl,ed in the
late Spring 1978 (Table 6.7) shows that the only meteorological factor
which was significantly correfated wj.th drying both from the tilled and
non-tilled plots was temperature (r = 0.58 and r = 0.68). It is
interesting to notice that in this experiment, the initial soll- water
content was the most important factor determining drying rate, as can
be seen from both the coefficient of correlation (Table 6.7) and path
coefficient (Table 6.8 and Figure 6.10). It can be thought that the
second stage of drying as dj-scussed by Lemon (1956) existed in this
experiment. From Figures 6. f "nO
6.2 iL can be seen that the initial
soil water content in this experiment was mostly small-er than that in
the previous experiment. In the previous experiment (Figure 6.1 ) the
smaller initial water content r^ras around 15%, whereas in lhis experiment
(Figure 6.2) it was around 10%. Thus it can be suggested that when the
soil water content of the Urrbrae red brov¡n earth r^ras around 107" or
lower, the second stage of drying occurs.
Table 6.7. Corrleation matri-x of observed varlabl-es for the 1978
experiment 2.
Kinds of R T hI H T
vari-ab1es
Drying(r. )ry
NTL
-0.02 -0.15
0.03
TL
0. 35
0.07
0.03
0.08
NTL
0. 38
0.20
0.02
-0.02
TL
R
T
1rü
H
I
-0. 36
-0. 59r(
0.32
0.22
0.58x
0. 38
-0,32
0.61åe
0.11
0.68å(
0.29
-0.11
0.61f(
*significant, at the probabi-ì-ity of 5%.
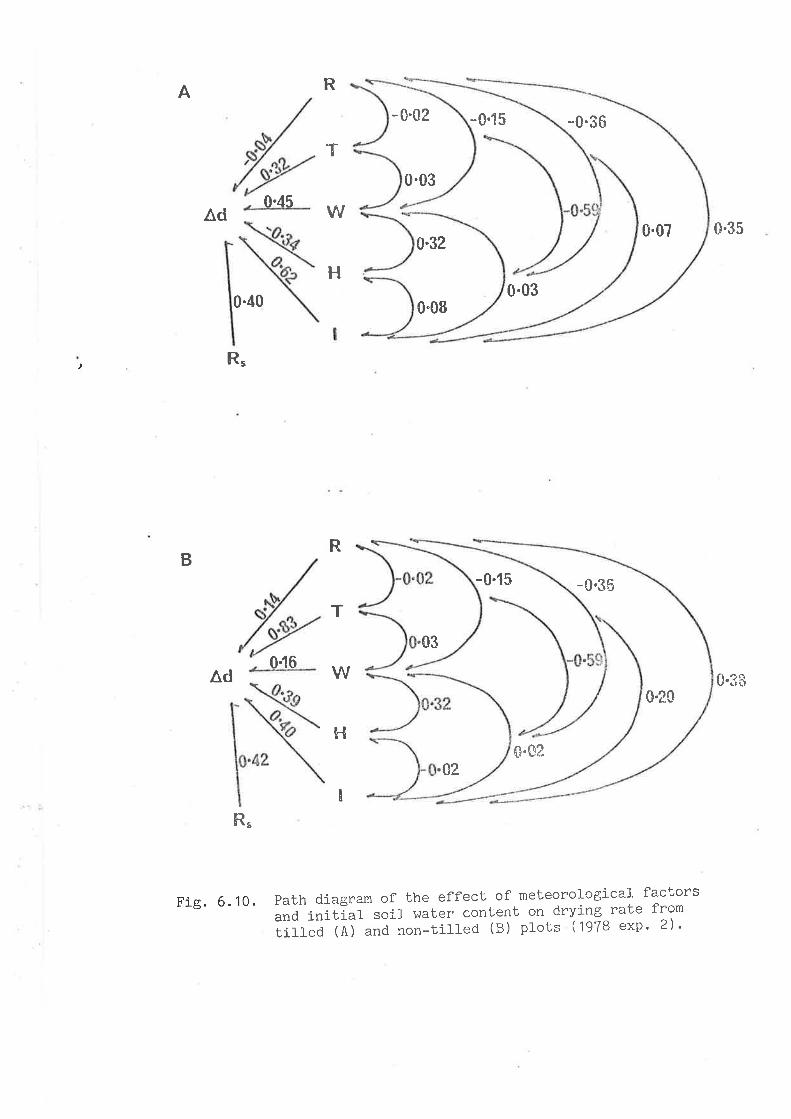
0.03
R
T
w
H
Ad
A-0.02 -0.15 -0.36
0.03
0.45
0.32
0.08
-0.15 -0.3s
0.07
0.20
0.35
0-3?,
0.40
^d
R"
R"t
BR
T
w
hl
03046
0.0202
l
Path diagram of the effect of meteorological factorsand initial soil v¡ater content on drying rate from
tilled (A) and non-tilled (B) plots (1978 exp. 2\.Fie. 6.10.

Table 6.8.
169.
Path coefficient of observed variable-s upon drying rate from
tilled and non-tilled plot (1978 -2).
Drying versusPlot Via
R T !'l H ï
1Tilled
plot
-9..0i.
-0. 01
-0.07
0.12
0,22
0. 01
0.32
0. 01
0.20
0.04
0.01
0. 01
0 .45
-0.11
0.02
0.01
-0. 1B
0.13
-0.34
0.06
-0. 01
0.02
0. 01
-0.03
0.62
R
T
IJü
H
ï
?. 0,221y 0.58 0. 38 -0.32 0.61
Non-tilled
plot
-0.00
0.-83
0.00
-0.23
0.08
-0.05
-0 .49
0.05
0. 39
-0.01
0.05
0 .17
0.00
-0.01
0.40
R
T
I,¡¡
H
I
0. 14 -0.02
0.02
0. 16
0.12
0.01
-0.02
-0.02
-0.14
0.15
r. 0.11ry 0.68 0 .29 -0.11 0.61
dlrect effect
Unlike in the previous experiment, rel-ative humidì-ty was not
significantly correlated with drying. It seems that the lnitial water
contenL was too small to be infl-uenced by relative humidity (r = 0.08
and r - -0.02 for the tilled and non*till-ed plots respectively). As a
consequence, the drrying vras l-ess infl-uenced by relative humidity.
In the l¡linter 1979 t radiation and temperature were not significantly
correlated wj.th drying either from the titled or the non-til-Ied plots
(Table 6.9). It is 1ike1.y that radiaLion and temperature were too l-ow to
influence soil drying. fn this seasorì, rvind speed v,ras an inrportant factor

170.
Correlation matrix of observed variab'ì-es for the 1979
experiment.
Tab]e 6.9,
Ki.nds of
"variables
RT I Drying (tiy)
TL NTL
R
T
!'l
H
I
0.21
Id
-0.07
0.37
H
-0.23
-0.39
-0 . 511(
TL
-0 .47x
-0.49rç
-0.23
o.52x
NTL
-0.26
-0.54x
-0. 20
0.52x
0.36
0.36
0. 49r(
-0. 38
.0i
0.31
0.21
0.37
-0. 43
0. 15
g" significant at the probability of 5%.
as can be seen from correlatlon coefficient (Table 6'9) and path
coefficient (Table 6.10 and Figure 6.11). As in the second experiment
of 1978, relative humidity was not significantly coffelated with soil
water loss from the top 10 cm layer, and the initial- soil water content
was the most important factor det.ermining this water loss.
From Lhe results dj-scussed above, it can be concLuded (as suggested
by Lemon, 1956) trrat when soif water content is high enough to meet
evaporation demand, the rate of drying was chiefly controtled by
meteorological factors (1978 experiment 1). In this conditlon' the
initiat soil water content did not significantly lnfluence drying rate.
As the soil- water content decreased to a value at which the second stage
of drying occurs (for the Urrbrae red brov¡n earth this was around 10%),
the dominance of these meteorol-ogical factors was replaced by the
dominance of the initial soil water content'

RA0'21
Ad
0.37
T
w
H
I
0.21
R
T
w
H
Ad
R"
0.52
0.37
-0.07 -0.23
-0'23
0.07
-0'49
-CI'54
"û'47 .
-{i'?ô
B
024
- 0,5'Í
0.52-0'?8
0.69
R"I
Path diagram of the effect of meteorological factors
and initial soll -"át""
content on drying rate from
tírred (A) una non]iin"¿ (B) prots (1979 exp' )'
¿
Fie. 6.11.
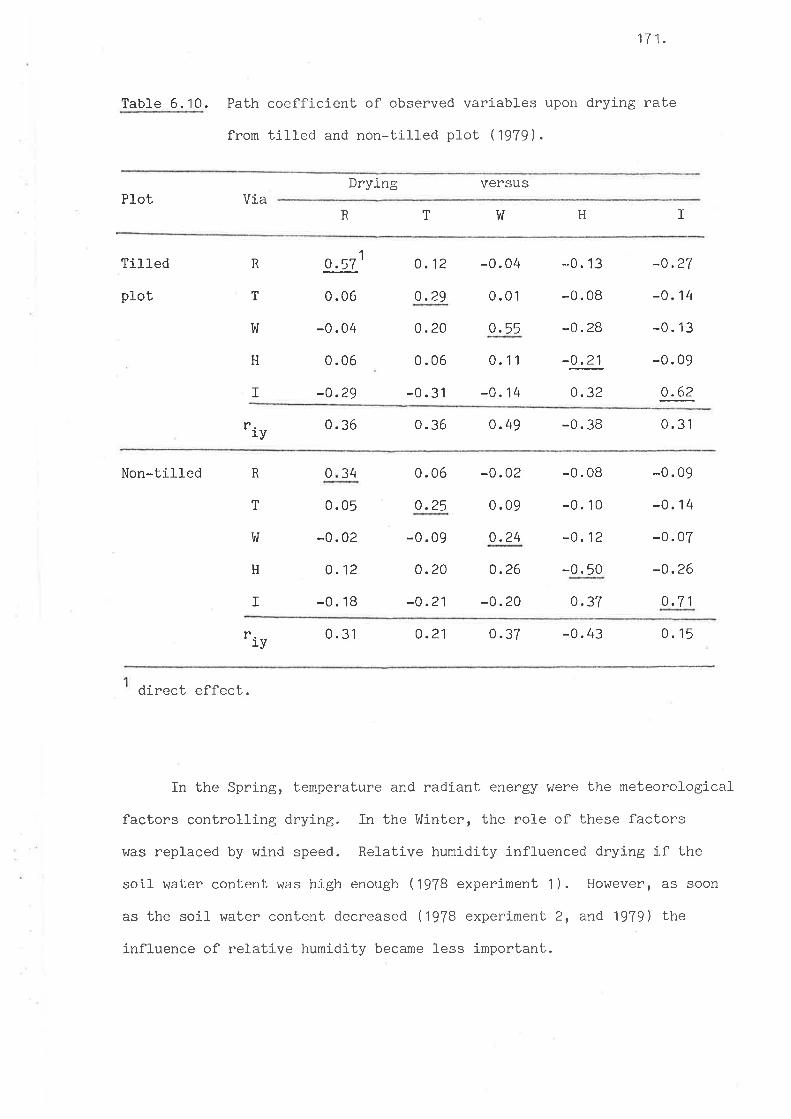
Table 6.10.
17 1.
Path coefficient of observed variables upon drying rate
from tilled and non-tilled plot (1979).
Drying VETSUSPlot Via
R T V'I H I
1Tilled
plot
R
T
l/t
H
I
0.57-
0.06
-0.04
0.06
-o.29
0.20
0.06
-0.31
0.55
0.12 -0.04
o .29 0.01
-0. 13
-0.08
-0.28
-9-3J
0.32
-0.27
-0. 14
-0. 13
-0.09
u.õ¿
0.11
-0. 14
r.r_y
0.36 0.36 0.49 -0.38 0.31
Non-tiIled R
T
hr
H
I
340
0.05
-0. 02
0 .12
-0. 1B
0.06
o.25
-0.09
0.20
-0.21
-0.02
0.09
0.24
0.26
-0.20
-0.08
-0. 10
-0.12
-0. 50
0.37
-0. 0g
-0. 14
-0. 07
-0.26
0.71
r.1y 0.31 0.21 0.37 -0.43 0. 15
direct effect.
In the Spring, temperature and radiant energy were the meteorological
factors controlling drying. In the hlinter, the role of these factors
was replaced by wind speed. ReLatj-ve humidity influenced drying if the
soil water content was high enough (1978 experiment 1). However, as soon
as the soj-l water content decreased (1978 experi-ment 2, and 1979) the
influence of relative humidity became less important.

1',( ?_.
6.2 Tilth mellowing
6,2,1 Introduction
It has been shou¡n (section 5. 1 ) l,hat the tensil-e strength of
synthetic aggregates decreases with wetting and drying. If this occurs
also in the fÍeld, it couJ-d be very useful to use the natural wetting
and drying to reduce soiL strenglh as a soil management practice.
Usually a single pass of a tillage implement is not suffj-cient to
form a good seed bed from a settl-ed soil. Natural- wetting and drying'
therefore, can be used by atlowing the soil, after the first implement
pass, to dry during the day and to weL durj.ng the night for several days
before doing the seconci implement pass. Since tilJ-age increases the
inbensity of wetting and drying (section 6.1), it can be expected that
this will result in a decrease in the strength of Lhe clods, and hence,
these clods wil-l be more easi-J-y broken by mechanical impact of the
tillage implement in the second implement pass. The decrease in cl-od
strength due to natural wetting and drying is referred to as Ittilth
mellowingrr.
It seems that these natural processes have been used by some farmers
in seed bed preparation practice. According i,o Jones, Flamb1in and
Leonard (1941) tfre Flouston clay soil of the U.S.A. is very difficult to
handl-e j-n most seecl bed preparation practices. I'lhen this soil is ploughed'
it turns up in large clods, and onJ-y nature, by wetting and drying' can
reduce the strength of these clods wj-thout excessive cost. irloodburn (1944)
noticed that some farmers in the Bl.ack prairie secti-on of Mississippi aud
Alabama plough thej-r -ì-and as long as possíbl.e before planting. By doi.ng
this, Lhey expect that there wil-l be enough 1,ime for weather to break up
and to reduce the strengLh of the cl ods.

173.
The clependence of a farmer on weathering action to reduce clod
stnength to a val-ue where breakage is possibÌe has also been noted by
Fountaine et al-. (1956). Baver el- aL, (1972) obsenved that some farmers
allowed thein land to dry out thoroughly and then be rewetted slowly.
l^lhen it has become dry again, this soil is more easily tilled and can
produce a good seed bed.
A1though these processes seem to have a great practical importance'
there is still limited quantitative data. Lyles and l{oodruff (1961) are
probably the only workers to have shourn the change, both in bhe decrease
in the size distribution ancl in the mechanical- sfability of clods due to
weathering action. However, they did not interpret their data in terms
of tilth mellowing. This was probably because the aim of their experinent
was to study the resistance of soil- to wind erosi-on.
Arndt (1964) conducted a comprehensive experiment to study some
physical probtem of t,he tateritic reO eartfrs around Katherjne in NorLhern
Australia. By using the term t'physical condit.ioning'r to clescríbe the
action of natura]- wetting and drying i.n modi-fying the physical properlies
of a soil, he suggested that during the physical condil,iol-ling pnocess
large clods are reduced by slaking and cul-tivation, and at i,he same time,
the dusty fraction is pantly aggregated üy v¡etting and intense sun drying.
The aim of the experiments described here was to stucly the effect
of the natural wetting and drying in tilled sojl (which is mone intensive
than in non-ti]led soil as discussecl in section 6. 1 ) on the strength of
the cl-ods proclucecl by til1age. If there is a decrease in cfod sbrcngtht
then a1lowing this soil to wet and dny naturally for several days after
the fjrst implement pass wil-f resul-1, in an iucrease in tLte proportion of
smalfer aggregates produced by a second implement pass. If this is t,he
case, then it will be a good idea to delay 1.he second -ì-mplenent pass for

1'l 4.
a few days, so that the soj.l can be tilled to produce a good seed
bed with minimum energy consumption and cost.
6.2.2 Material-s and Methods
Tilljee
The experiments were conducted in the Spring (September-October)
19?B on Urrbrae fine sandy loam, and l^Iere repeated in the Vlinter (June)
lgTg). To obtain data from a different soiL, the third experiment was
conducted at +,he Charllck experiment Station of the Vüait,e Institute at
Strathalbyn. Some properties of these soil-s have been descnibed in
section 3.1.
At the Urrbrae site, the soil had been bare for several years and
tillage was done with a tyne cu]tivator lo a depth of aboui 10 cm' At
Strathalbyn, where the soil had carri-ed pasture for a number of years'
the first impì-ement pass ütas done with a chi-sel plough, and the second
pass bras with a tyne cultivator. As with the Urrbrae experiment, tillage
was done to a depth of about 10 cm.
Wetting and drying
The wetting and drying used was the natural wettj-ng and drying.
This was done by allowing the soil (after the first implement pass) to
dry during the day as a result of solar radiation, wind, etc., and to
wet during the night by capitlary action from the layer below, condensatj-on
of water vapour wjthin the tillecl layer and frcm the atmosphere, etc'
The webting and drying was cafculatecl from the dai1.y changes in soil
water content. SoiI waLer content was determined aL 9.00 a.m' and at
5.00 p.m. each day. The total wetting and drying was gi-ven by the
175.
cumulative differences between these successive soil water contents'
The measuremenL of soil water content and the calculation of the amount
of wetting and drying was done as described in section 6.1.
Because of transport limitations, the measurement of soil water
content was done only at the Urrbrae experiment. At Strathalbyn, the
changes in soil properties v\tas measured as a function of time (in days)
after the first implement Pass.
Measurement of clod strength
The strength of the clods was determined by the I'dnop shattertt
test as used in determining the strength of coals (ASTM' 1946). This
method has been used successfully to determine clod strength by Marshall
and Suirk (1950), GiIl and McCreery (1960) and Ingles (1963). To do
this, 6 clods (each time) of about 10O mm dlameter which had been
subjected to di-fferent amoun.ts of wetting and drying vüere coll-ected from
the tilled plots. To obtain different amounts of natural wetting and
drying, clods were coflected and measured ab dj-fferenl, numbers of days
after tillage. To el-iminate any effects resulting from differences in
water status of the clods, the test was done after the clods had been
equilibrated to the same water matric potentiat. The clods were wetted
by capÍllary action to near saturation, and then dried to a water matric
potential of -1OO kPa i-n a pressure plate apparatus for 2 days. The
drop shatter test was done by dropping the clods individually from a
height of 2OO cm, and then measuring the resulting clod size distribution
by dry sieving.
To obtain a relationship between the amounl- of energy required to
break the cl-ods and the size distribution of the resulti-ng clods/aggregates,
for the 1929 Urrbrae experiment, Lhe drop was done from severa1 different
176.
heights, i.€., 60, 120, 1BO, and 240 cm. The energy (J) required i^tas
calculated by multiplying the clod mass (kg), the height of the drop (m),
and the acceleration of gravity (9,81 *"-2).
The change in the strength of the clods was also evaluated by
measuring the size distributÍon of the clods produced by the second
implement pass. This was based on the assumption that due to the
formation of internal cracks caused by unequal swel-l-ing and shrinkage
resulted from wetting and drying, the cl-ods (produced by the first
implement pass) become weaker, and hence, would be more easily broken by
the tillage implement. l¡lith this phenomenon, there should be a greater
amount of the smal-l-er fraction produced by the second implement pass with
increasing time, and hence wetting and drying, after the first tillage.
One (for the 1978 experj-ment) and 3 (for the'1979 experiment) sampl-es of
each 7 - 10 kg soil- were collected immediately after the second lmplement
pass. To avoid the infl-uence of tractor wheels, the samples were
collected from between the tractor wheel- tracks to a depth of about 10 cm.
Moulds of 40 X 20 X 10 cm brere pressed into the tilled plots down
to the depth of ti-llage, and the samples were gently collected- with a
spade into a plastic basket. Cl-od sorting was done by dry sieving into
the following size ranges: > 40 mm (measureO individually with a rule;
9.5 - 40, 6,7 - 9.5, 4.0 - 6.7,2,0 - 4,0, 1,0 - 2.0, and < 1.0 mm. The
weight of each group vras expressed as a percentage of the total weight
of the sample.
6.2.3 Resul-ts and Discussion
"clod strength
There ü/as a t.endency for the wetting and drying to decrease Lhe
strength of the ctods pnoduced by ti.1lage. As the clods were subjected

177 .
by wetting and drying they becanle more easily broken in the drop shatter
test. This was shown by the increase in the proportion of the smaller
fraction, and at the same time a decrease in the proportion of the
larger fraction, resulting from the drop shatter test (Table 6.11).
Table 6.11. Effecl of cumulative wetting and drying (I A !{) on cfod
strength of Urrbrae soil-, as shown by the size distribution
of the clods produced b)' the drop shat'ter test'
% clods wÍth diameters of (mm)xAvù
(%) >9.5 6.7-9.5 4.0-6.7 2.0-4.0 1.0'2.0 <1.0
0
20.3
43.9
78.1
1 18.4
161.7
64.2
54.0
42.0
36.5
31.1
30.4
6.2
10.2
8.1
11.6
8.9
10.6
8.0
8.3
9.4
12.4
11.9
12.2
6.4
9.5
14.6
14.8
13. g
13. 0
7.4
8.0
12.4
12.0
15.7
15.0
5.4
9.0
12.0
11 .6
13.6
14.2
A plot of the cumulative of wetting and drying against the proportion
of the aggregate fraction smaller than 4.0 mm diameter yielded an
asymptotic curve. Ïilithin an experimental error, this curl.re can be
expressed by the exponential euqation
6 (t A I,'I) = A+a I1-exp(-a'IAli)l (6.13)
where PO(f ¡ W) is the proportion of the clods smaller or larger Lhan
diameter, ô (in this case smal]er than 4.0 mm diameter), after a
cumulative wet,ting and drying of X A lll, and A, a, and ar are adjustable
parameters. In fact A is the proportion of cl-ods larger or small.er than
diameter, 6, of the clods that had not been subjected to wetting and
P
17 B.
drying (å^ïü = 0).
The resulting equation was (Figure 6.12)
P<4.0(IAt^t) =18.54(!2.62)
+ 24.65 t t - exp(-O.027 tALr) I (6.14)(13.20) (10.009)
To study the amount of energy required to break up the clods' the
Iogarithm input energy was plotted against the mean weight dj-ameter (MÌ,'lD)
of the resulting cl-ods (urrbrae 1979). The mean weight diamet.er wa.s
calculat,ect by the method of Youker and McGuinness ( 1957), and the resulting
equation I4Ias a straight line
M^lD = C-cIoB.,OE (6. 15 )
Here, MlrlD is the mean weight diameter (mm), E is the input energy (J),
and C and c are adjustable parameters.
The resul.ting parameters C and c (Table 6.12) decrease with
increasing amounts of wetting and drying. This shows that wetting and
drying decrease the amount of the input energy required to break the
clods to produce a given value of mean weight diameter. For instance
(Figure 6.13), to produce clod size distribution with the MllD of 15 mmr
an input energy of 1.78 J was required for the clods which had noL been
subjected to wetting and drying, whereas only 0.56 J was required for
the clods which had been subjected to a wettJ-ng and drying cf X A lrr =
26.8% since the first implement pass.
The decrease in the strength of clods wlth wetting and clrying can
be explained in terms of crack formation. As discussed in section 5.1,
wetting and drying a soil causes swelling and shrinkage. Sj-nce swelling
and shrinkage is not equal throughout the mass of the soil, it may produce
cracks which decrease the strength of lhe soil. TL is important to

o0,Ê.g!
E
S3scfil-c
gatl
E(r¡
45
150
Fig. 6.12.
€ ¿w (%l
.t,'lt3zs.oo\
18060 120
Effect of wetting and drying (X A Íl) on clodstrength (as sfrov¡n by the proportion of fractionsmaller than 4.0 mm diameter resulting from thedrop shatter test) for Urrbrae soil'

20
Etut:ooE,5 to
.E,9oì
12cG'oE
18
10
I20 0.0 0. 20 0.4 0
Log,o E (J )
Fie. 6. 13.' Ef fect of r^retting and drying (X A I'li on therelationship between log.,-.,E and the M!ÙD. ofaggregates resulting frorii"the drop shattertest on Urrbrae soil.a. LW = 21.7
. XAIü=o; b.26.8%i43.3%.
X^1,¡XA1,¡X A I¡'l
s
dlot
s5.4%;

17 9.
Table 6.12, Values of C and c parameters and coefficient of debermination
(r2) of equation (6.15) as influenced by wetting and drying
(x ^
t¡).
X A !'l (%) 2rcc
0
21.7
26.8
35.9
43. 3
60. B
18.15
17 .86
15.67
15.12
14.76
15 .00
14 .40
14.09
11.67
13.06
9.76
11.99
0.98
0.97
0. 98
0.97
0. 93
0.94
realize that this experiment was not aimed to discuss the gross swelì-ing
anci shrinkage of normally-swelling cJ-ays. It is believed that even
minute soil rrresidual shrinkagesrr are sufficient for crack initiation and
propagation. lt has been shown in the laboratory study (section 5.1) that
wetting and drying between matric water potentials of -10 kPa and -100
kPa (corresponding to gravimetric soil water contents of abouL 21% and
187") were able to decrease the tensile strength of artificial aggregates.
The devel-opment of cracks in a cl-od with weLting and drying is shov¡n in
plate 6.1. The occurrence of cracksaccompanyingshrinkage on drying of a
clod has also been noticed by ülilton (1963).
Larson and All-maras (1971) have pointed out that as water is lost
from a soil, the specific volume may change, but the mass of the solid
remains constant. Since there is a decrease in specific volume creating
horizontally oriented tensile stress, shrinkage cracks may form along
vertical planes (or, more generally, along planes normal to the drying
surface) where t.he soil may be wetter and has a lower tensi]e strength.

Plate 6.1. The development of cracks in a clod of Urrbrae
loam in the field observed by time-lapse photography
a, Initial stage of crack formation.
b. Cracks have already been formed.
c. Some cracks closed after wetting.

3
q
a

1 U0.
According lo Russel-I (1973) allowing a clod to dry a.nd wet not only causes
some sl-aking of crumbs from its outer surfa.ce, but also causes some
slaki.ng to develop internally due to uneven shrinking of the clod during
drying, and perhaps to some extent by compression of entrapped air during
wet,ting.
A decrease in mechanical stability of clocls due to weathering action
has also been found by Lyles and V,loodruff (1961). They investigated the
relationship between soil density (expressed as a percentage of maxj-mum
density) anO the proportion of 'clods larger than 6.4 mrn Ciarnet er. They
found that the resistance of clods to weathering action was positively
correlated with the density. Further, they showed that the decrease in
the mechanical stabitity of cl-ods llas very marked on silty clay loam and
sandy loam, but was less significanL in clay soil-s.
Clod size distribution
As expected, the change in clod strength was followed by Lhe change
in the size distribut,ion of the cl-ods produced by the second inrplement
pass. Thus, with decreasing clod strength (due to wetting and drying),
the clods v{ere more easily shattered by the mechanical- ir,rpacr- oi the
tillage implement. As a resul.t, the proportion of the small-er aggregate
fraction increased, and at the same time, the proportion of t.he larger
fraction d.ecreased (Figure 6,14). The change in the size djstribut.ion
vras very rapid at first (mainly in the first 3-5 days after the first
imptement pass) and Lhen gradually sfowed down with further wetting and
drying or time. These data were wel-l described by equatjon (6.i3), and
the resulting values of the parameters A, a' and ar for the clods wlth
the diameter of > 9.5 nun; < 6.? rnrn; and < 4"0 mm are given i¡ Tab]-e 6.13,
and the resul.ting graphs in Fl.gure 6.15.
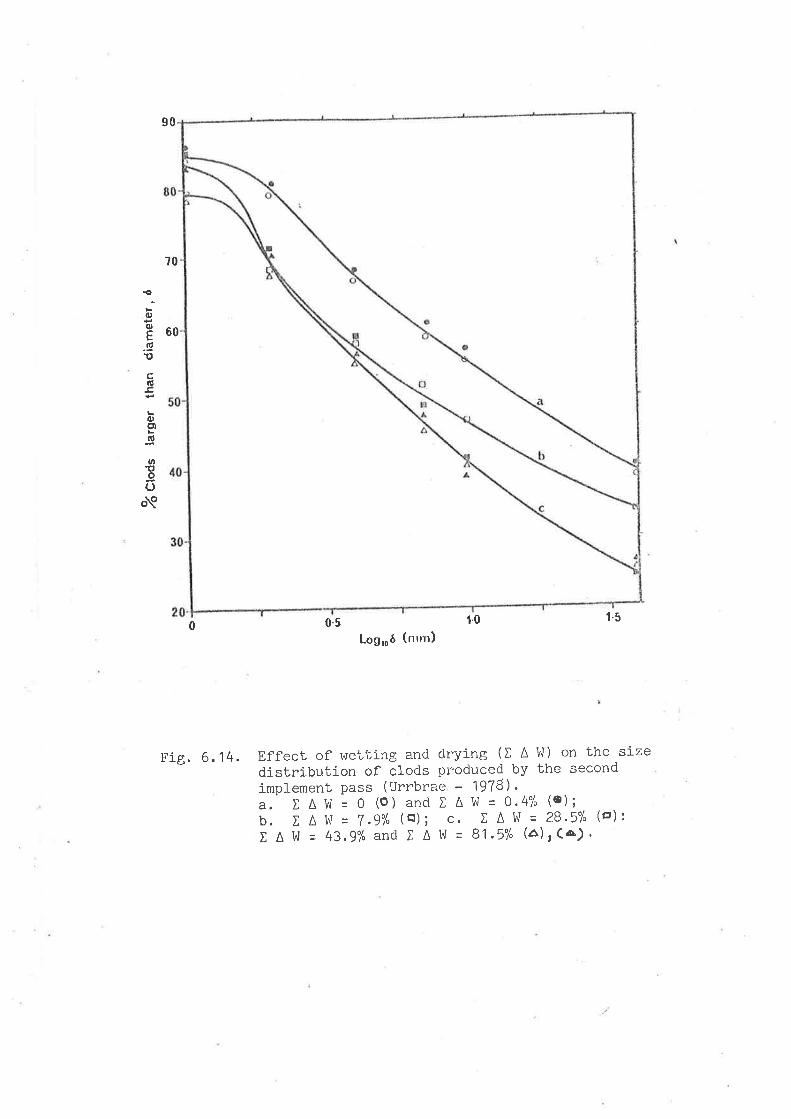
60
.o
o(¡)
E.g1t
có
0)ctlL
-g
o!o()ñ
90
70
Fig.6.14.
Log,oó (nrrn)1.00.50
1.5
Effect of wetl,ing and drying (t A !¡) on the sizedistribution of clods produced by the secondimplement pass (Urrbrae - 1978).a. X A l,i = 0 (O) and X A I'l = 0.4% (e);b. XAIrI=7.9% (q) ; c. t^!'l=28.5% (cr) :
X A I'l = 43.9% and I A I,¡ = 81.5% (a)¡ (a) .

60
(ø
CJ
.É
cl
ó)ùl
o
0)
o
tâ
t)
Oòe
€Âw (z )
Effect of wetting and drying (t ^
t{) on the proportion of clods smaller or largerthan diameter, ðl proOucäO UV the second implement pass (Urrbrae, 1978) 'The curves are fit-of equation (6.13), and the measurements are given by:(¿)<4.0mm;(e)<6.7mm;and(o)>9'5mmdiameter'
Fis. 6.15.

Table 6.13.
181.
The values of the parameters A, at and ar of equation
(6.13) for the Urrbrae 1978 experlment.
Clod diamel,er (mm) A ë, ar
> 9,5
< 6.7
< 4.0
56 .40(t1.38)
36.78(t1.51)
30.79(11.33)
-17 .24('!2.25)
15.99(12. 18 )
0.054(10.021 )
0. 067( r0.030 )
0.124(10.060)
11.67
(r1.69)
It was surprising that with a small- soil water content fluctuation
(Figure 6.1), there l,üas a l-arge increase in the proportion of -small-er
fraction when the second implement pass v/as done on day 3. This supports
the previous suggestion that minute residual shrinkages are able to
initiate and propagate cracks in the .clods produced by fi1lage. fn
addition, it is likely that besides bhe decrease in clod strength (due
to wetting and drying), this increase \^ras afso caused by the direct effects
of wetting and drying. Thus wetting and dryi-ng themseì-ves l^¡ere able to
disintegrate the clods produced by tiÌlage. This wiII be discussed
further later in this section.
The result of the 1979 Urrbrae experiment was in good
with the previous experiment. A slighb difference was that
change in clod size distribution did not occur in the first
but after the soil had been subjected to a larger amount of
and drying (Figure 6.16).
agreement
the major
few days,
wetting
It is necessary t.o note that in the first few da.ys afLer the
.first implement pass there vJere cloudy and ra.iny days. It is, therefore'
assumed bhat the clods did not dny sufficiently for cracks to develop.
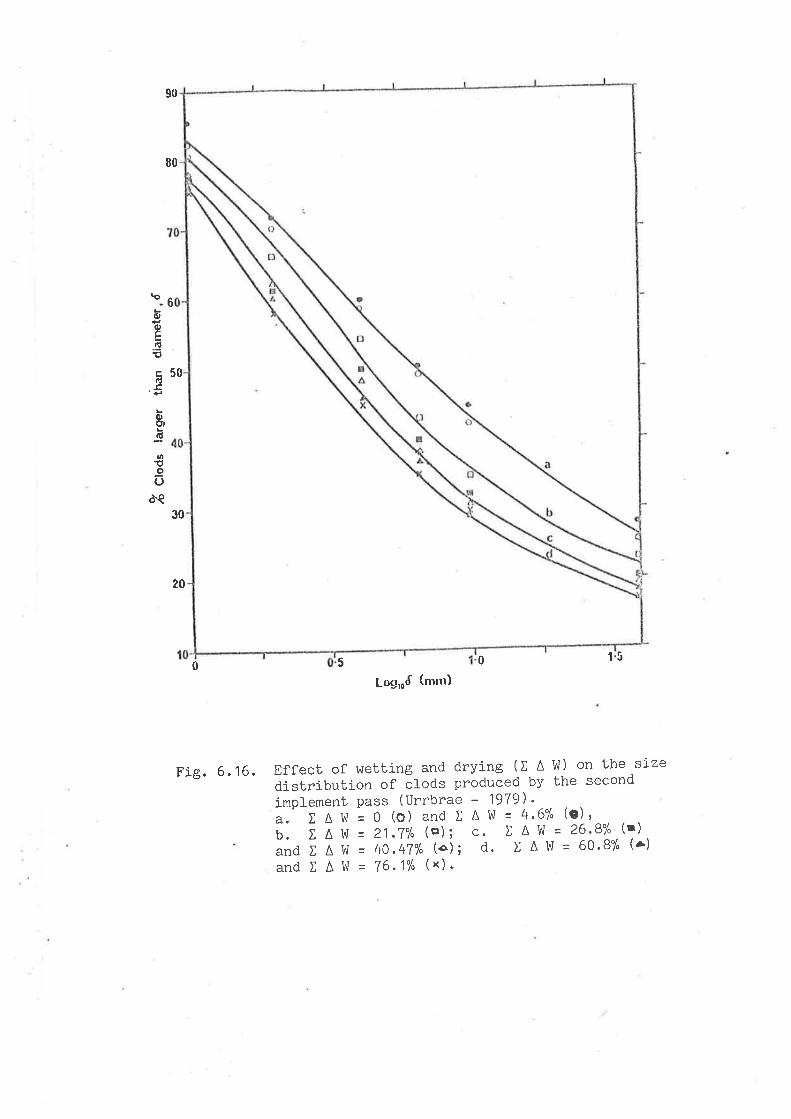
6
50
rO
ooÊ.ç!cÉ
E'L
Tt¡,
!-9o
òe
90
80
30
20
0 t 550
Logrot (mrn)
Fis.6,16. Effect of wetting and drying (X A !'I) on the slzedistribution of ðfoO" produced by the second
implement pass (Urbrae - 1979) ';.' r ¡ w = o (o) and X ¡ l¿'l = 4'67" (e),b. E^!,t=21.7% (e) ; c' tAl¡l=26'8% (r)andXAI^l=40.47% (oi ; d. IAhl=60'8%(¿)and X A !,1 = 76.1% (x).

182.
The cumul-ative waLer content change was hÍgh enough (I A l^l = 21 .7% on
day 5, cornpared to X A W = 7.9% on day -a in the 1978 experiment when
the third treatment was done), however, this mostJ-y originated from
wetting which is less likely to initiate crack formation. As a
consequence, the strength of the clods did not much change and there
was therefore little change in 1,he size disLribution of the clods
produced by bhe second implement pass. This suggestion can be supported
by the resul-t shou¡n in Figure 6.13 which shows that there ûras no difference
in the relationship between the. 1og input. energy and the mean r.reight
diameter of the clods resulting from the drop shatter test of the clods
which had not been subjected to wetting and drying (X A I,{ = 0%) and
that of the cl-ods which had been subjected to a wetting and drying of
X A l¡¡ = 21.7%, This indicates that with the same amount of input energy'
the cl-ods produced by the second implement pass done at I A lri = 0"/" wiJ-l-
have the same mean weight diameter as when the second implement pass
was done at X A W = 21.7% ín this case.
Another factor which might also have infl-uenced this difference
was the soil water content at the time of tilJ-age (see Figures 6.1 and
6.2). The importance of soil water content in detenmining the size
distribution of clods produced by tiJ-lage has been discussed exLensi-vely
in section 2.1.4. For the Urrbrae red brov¡n earth, Ojeniyi and Dexter
(1979a) found that tillage at 17% soil water content produced the small-est
proportion of large cl-ods using a simil-ar implement to that used here.
Further, they showed that billage at 15.8% soil waLer content produced
about 57% of clods larger than 4.0 mm diameLer, whereas til-lage at
18.3% soil water content produced 66% of cfods larger than 4.0 mm
diameter.
The soil water contents at the times of tillage for the firs1,,
second, thircl and fourth treatments in the 1978 experiment v¡ere 15.0%

183.
(when the second implement pass was done ab day 0 immediately aft,er the
first implement pass' or X A I'l = 0%) , 15.1% (day 1, X A Ï'l = 0'4%),
14.6% (day 3, I A W -- T.g%), and 19.2% (day B, X A !'l = 28.5%), In the
1g7g experiment, the soil water contents vüere 15.9% (day 0)' 14.0%
(day 1, x a v,l = 4,6%), 18.6% (day 5, I A t¡! = 21.7%), and 20.9% (day B'
X ^
tü = 26.8%) .
From the result of the 1978 experiment, it was expected that the
major change in the size distribution of the cl-ods produced by the second
imptement pass would occur on the 3td o" 4bL o"y after the first implement
pass. Unfortunately, the soil water content on these days was too high
to do tillage (19.5% on the day 3, and 19.6% on the day 4). Even when
tillage was done on day 5, the soil water content was stil-] too high
(18.6%), as it was done on day B (20.4%).
The data were fitted to equation 6,13, and the resul.ting val-ues of
the parameters A, a, and ar are given in Table 6.14. The curves of
these equations are shown in Figure 6,17.
Table 6.14. The values of the parameters A, a, and ar of equation
(6.13) (Urrbrae, 1979).
Clod diameter (mm) A a ar
> 9.5
< 6.7
43.97(r1.18)
49.10(11.10)
40. 85( 10.92 )
- 15 .08(11.94)
13.79(11 .78 )
0. 038(10. 013 )
0.037(r0. 013 )
0.029(10 . 010 )
< 4.0 13.69( !2.07 )
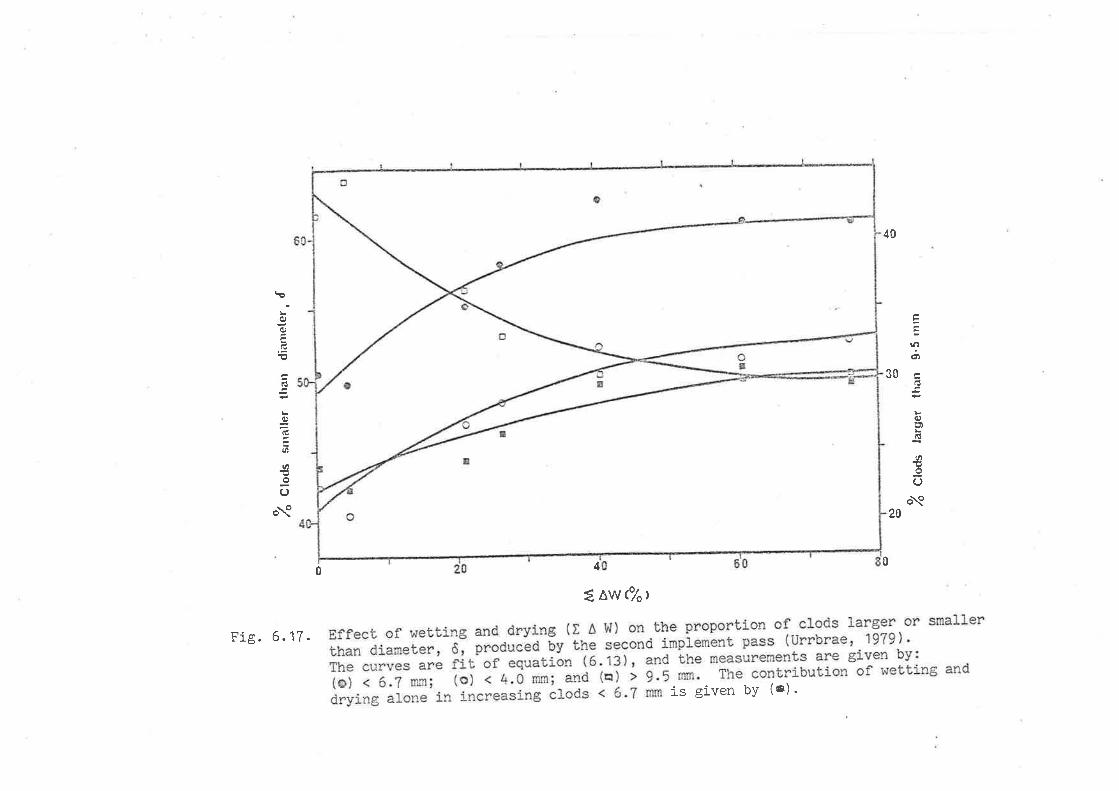
'{ H.
0q O\
--1
/o C
loA
t sr
nalle
r tl¡
alr
dian
rete
r, d
t\) (93
.% C
n¿t
targ
er t
lran
9'5
nrrr
t
o 5¿
v\ Þ ã \o o\ Y
l-¡ r
v) Ûq ts. o d Ë ì-
è rte

184.
As in the l-aboratory study (section 5.1)r the decrease in clod
strength due to wel,ting and drying occurred also in the Strathalbyn
experiment. Thus delaying the second implement pass a few days after
bhe first implement pass increased the proportion of the small-er
fraction. The result h¡as very similar to the result of the Urrbrae
1978 experiment where the major change in the size distri.bulion of the
clods produced by the second implement pass occurred a few days after the
first implement pass (Figure 6.18). The soil water contents at tillage
for the first, second, thÍrd, and fourth treatment were 13.7% (day 0) t
13,6% (day 1), 13.9% (day 2), and 14.47" (day 4).
since the changes in soil water content, were not measured, the
data coul-d not be fitted to equation (6.13) directly. To overcome this
problem, equati.on (6.13) was modified to
PO(r) - A+a [1-exP(-a"t)] (6'16)
where t is the time (days) after the first implement pass.
The resultÍng values of A, a, and aft parameters is given in
Table 6,15, and bhe curves for this equation are shown in Figure 6.19
Table 6.15. The values of the parameter A, ar and atr of equation
(6.16) for the Strathalbyn experiment
Clod diameter (mm) A CL ^ild
> 9,5
< 6.7 24 .43(!1.45)
69.69(11.63)
-12.69(t1.85)
10 .45(11.63)
0 .461(r0.166)
0.497(10. 189 )
18.31(!1.15)
< 4.0 7 .56(11.30)
0.452(10.193)

100
90
\Þ 70
t_oPÉ|lõ60crlE
!0)
ËsoUIE9()àq 40
80
20
Fie. 6. 18.
30
0 0.5 1.0 1'5
Loç¡,od (mrrr)
Effect of wetting and drying (as shor^nr by bime

l035
30
(Jo\9
Fig.6.19.
5
Tirne ¿tller lirst10
¡nss (daYsl
05
6)
0.J
.9
.g
E
PC¡)
crd
q)o)
st¡ioo()
\oo\
ri0
55
(o
t,c,çh25!
crlt
3?Elt
tt)
€zo
5015
0
Effect of wetting and drying (as shown by time aftertillage) on the proportion of clods smaller or largerthan ãiameter, ôr produced by the second itnplementpass (StrathalbYn).ih" "r",r"s
are fib of equation (6' i6) ' and the
measurements are given by (o) < 6'7 mm; and (o)
. ,*.0 n*l; (o) t é.5 *to. The conlribution of wettingand drying alone in increasing clods < 6'7 mm diameteris given by (a).
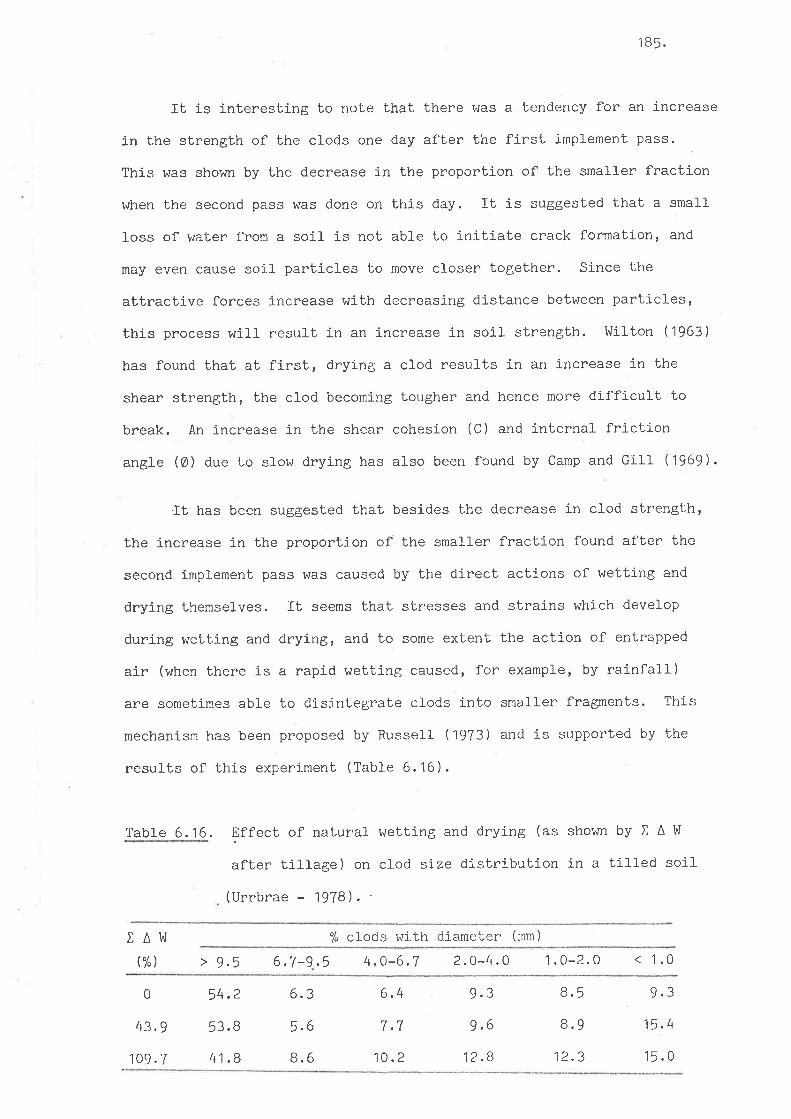
185.
It is interesl"ing to note that. there r¡¡as a tendency for an increase
in the strength of the clods one day after the first implement pass.
Thi.s was shown by the decrease in the proportion of bhe smal-ler fraction
when the second pass hras done on this day. It is suggested that a smal-I
foss of waber from a soil is not abl-e to initiate crack formation, and
may even cause soiJ- particl-es Lo move closer together. Since Lhe
attractive forces increase with decreasing distance between parti-c1es '
this process will- result in an increase in soll strength. hlilton (1963)
has found that at first, drying a clod results in an increase in the
shear strength, the clod becoming tougher and hence more difficult to
break. An increase in the shear cohesion (C) and internal friction
angle (Ø) due to sfow drying has also been found by Camp and GilÌ (1969).
.It has been suggested that besides the decrease in clod strengbh'
the increase in the proportion of the small-er fraction found after the
second implement pass r4ras caused by the direct actions of wetting and
drying themselves. It seems that stresses and strains which develop
during wetting and drying, and to some extent the action of entrapped
air (when there is a rapid wetting caused, for example, by rainfall)
are sometimes able to disintegrate clods into smaller fragments. This
mechanism has been proposed by RusseÌl (1973) and is supported by the
resul-ts of this experiment (Table 6.16).
Table 6.16, Effect of natural wetting and drying (as shov¡n by X A I'l
after tÍllage) on clod size distribution in a tilled soil
(Urrbrae - 1978),
XA!'l(%)
% clods with diameter (mm)
> 9.5 6.7-9.5 4.0^6.7 2.0-4.0 1.0-2.0 < 1.0
0
43.9
109.7
54.2
53. B
41.8
6.3
5.6
8.6
6.4
7,7
10.2
9.3
9.6
12.8
8.5
8.9
12.3
9.3
15.4
15.0

1B6.
Arndt (1964) found that slaking of clods caused by rainfall- is one
of the important factors in modifyi-ng the structure in a til-led soil.
By using the term 'rsurface roughnessrr, R, that j-s
x 100 (6.17 )
he showed that till-ed soil- which had a roughness of R = 21.6 (before rain)
decreased to R = 1.6 (after rain). I'he decrease in random roughness of
severaf tillage treatments on various soil. types has a.lso been measured
by Allmaras et a-2. (1977 ) and by Dexter (1977).
Fox (1964) has suggested that due to non-uniformity of wetting and
drying throughout. the soil mass, the associated sweJ-J-i-ng and shrinking
create regions of failure during drying. Further, he demonslrated that
clods with diameters of 12 - 40 mm were preval-ent when the bulk field
sample was moist, but as these J-arge clocls dried to a matric wafer
potential of about. -3.2 MPa, they spohtaneously broke j-nto aggrepEates
rather uniformly with diameters of 2,0 - 4.0 mm.
As a consequence of the result of the 1978 experiment (Tabl-e 6.16),
it was decided to study the contribution of wetting and drying alone in
modifying the size distribution of the clods in a tilled soil. This was
done i¡ t,he 1979, in both the Urrbru" "nå
the Strathalbyn experiments by
measuring clod size distribul,ion prior to the second implement pass (:
santples of / kg for each measurement). The results were fitted lo
equation rc.14) for the Urrbrae experiment, and to the equation rc.17)
for the Strat,halbyn experiment. The resulting equal,ions were
R, acl,ual- lengLh - direct l-ength \' direct length
P 41 .93 + 10.71 I I(10.99) (13.14)
- exp (-0.023 x A I/ü)l(r0 . 015 )
exp (.-0.514 t)l(to . 218 )
(6. 1B )<6.7(X A W)
for the Urrbrae experiment, and
P.O.Z(r) = 16.94+5.15 tl(10.81 ) (ro.9i )
for the Slrathal-byn expenì.nlent.
(6. 19 )

1e7 .
Tt can be seen (Figures 6.17 and 6.19) that wetting and drying
alone contribute about 40% of the total j-ncrease in the fraction smal-ler
than 6.7 mm diameter observed aft.er a second implement pass.
6.3 Tensil-e Strength ancl Aggregate hlater Stabil.ity
6.3.1 Introduction
It has been shown j.n section 5.'l that the greater is the difference
in the potenlial to which the soil was wetted and dried, the greater is
the decrease in the strength. Thus it can be suggested that t he intensity
of wetting and drying infl-uences the end effect of wetting and drying
cycles on soil strength. The greaten soil water content fl-ucl,uation in
tilled soil than in non-tilled soil has been discussed in section 6.1.
It was therefore suggested that due to a greater intensity of wetting
and drying in ti-J-led soil-, the decrea.se in the strength of aggregates in
tilled soil will be greater than that of aggregates in non-tilled soil-.
Thus after the soil has been aÌlowed to wet and dry for several days,
the strength of aggregates from the tilled soil may be fower than that
of aggregates from non-tilled soil.
It is clear from the previous discussion (section 6.2) that the
increase in the amount of v¡etting and dnying was followed by a decrease
in clod strength. Likewise, j-t can be expected that the mean strengths
of aggregates col-lected from soil- tilled at different times will be
different. Thus aggregates coll-ected from a pJ-ot A, tilled earJ-ier,
will have a l.ower strength than 1-hose of coll-ected from a plot B, till-ed
l-ater.
The effect of tillage on aggregate water stabil.ity has been w1.dely
studied (e.g. Olmstead, 1946; Low, 1972). The general finding is that
tillage over a period of years results in a neL decrease in aggregal,e

1 BB.
vrater stabiJ-ity in the few days or weeks after tilJ-age. It seems Lhat
this field of study has not neceived much attention.
Rovira and Greacen (1957 ) did simul-ated cultlvation in the
laboratory to study effects of tiJ-lage on aggregate disruption and soil-
microorganism activity. By using the term rrdis-aggregationrt (for the
definition see section 2,1.1) tfrey found that titlage increases dis-
aggregation up Lo 20 times compared to that of non-till-ed soil. Further,
they showed that one cycle of wetting and drying increases disaggregation
in non-tilled soil. A small decrease in disaggregation r,{as observed in
some tiÌl-age treatments. However, their observation $ras noL continued
over a period of time. This might have provided additj-onal information
on any changes in aggregate water stability in the few days after tillage.
After tillage, there are two processes whichmightoccur which
could influence aggregate water stabil-ity. Firstly, there might, be an
increase in soil microorganism activity due to ti-lJ-age treatment (Rovira
and Greacen, 1957) or due to alternate wetting and drying (Birch, 1958;
Agarwal et a7., 1971). Secondly, physical processes might occur as a
resuft of an increase in the intensity of wetting and drying.
The importance of microbial activity on aggregate water stability
has been discussed elsewhere (MarLin et a7. , 1955i Harris et a7. , 1966),
and the effect of wetting and drying on aggregat.e fcnmation and aggregat.e
water stabil-it.y has been disc.ussed in section 4,
The experiments conducted here were aimed to study changes jn the
tensile strength and water stabjJ-ity of soiJ- aggregates in the few days
after tillage.

1Bq .
6,3.2 Materials and Methods
Aggregate tensile strength
The effect of the intensity of wetting and drying on aggregate
tensile strength was studied by testing the tensil'e strength of soil
aggregates coll-ected from tilled and non-tilled pJ-ots. This was done
on the same pJ-ots which were used in the experiment described in
sect,ion 6.2 (Urrbrae - 19Te). At 30 days after LiJ-J-age (the tilled
plot had been wetted and dried to I À inl = pB,B"/", and the non-till-ed
plot t,o X A I¿ü = 42,0%), 5 kg sampl-es were coll-ected from between the
tractor wheel- tracks of t,he t,illed pÌot, and from the non-tilled plot
bo a depth of about 10 cm. Aggregates of 4.0 - 6.7 mm diameter were
separated from these sampJ-es by dry sieving. T'hese aggregates v,rere
wetted by capillary action, and then subjected to a matric water
potential of -100 kPa in a pressure plate apparaLus for 2 da.ys.
To obtain additional information, from a different soil, the
effects of the amount of wetting and drying on aggregate strength was
studled on aggregates colÌected from Condobol-in, N.S.1^1. This soil- has
22% c}ay, 13% silt, 63% sand, and the soil- from the paddocks from which
the samples were col-l-ected varies from gradational. (Gn. 2.12) to dr.rplex
(Dr 2,23) (Northcote, 1971). Plot A was tilled six times, i.e. on
August 17, 1978 with a disc plough, 3-10-1978 wit.h a scarifier, 2?.-11-1978
wlth a disc plough, 9-2-1979 wj.th a rod weeder, 3-4-1979 vtith a scarifier,
and on 1-5-1979 with a scarifier. Plot B was tilled 3 times, i.e. on
3-4-1979 with a disc plor-rgh, 1^5-1979 with a scarifier, and on 18-5-1979
with a rod weeder. The samples were col-lecl,ed on May 21, 1979. lVhen
the sampling was done, plot A had received 16.6 mm rain since the final
tillage, and ploL B had received 1.0 mm.

1 90.
Aggregates with diamet,ers of 4. 0 - 6,7 , 6.7 - 9 ,5, and 9.5 - 15 mm
hrere separated from these samples, and subjected to a matric water
potentiaÌ of -'153 MPa over saturated CaCI, solution in a vacuum
desiccator for 2 weeks.
The tensile sl,rengths of 20 aggregates of each size range were
determined as described 1n section 5. 1 .
Aggregate water stability
The experiments r^iere carried out on the Urrbrae (Juty, 1979) and
Strathalbyn (September, 1979]' soils. Til]age r¡ras done as described in
section 6.2. Aggregates of 2.0 - 4.0 mm diameter were collecbed from
between the tractor wheel tracks from depths of 0 - 5 cmr and 5 - 10 cm'
at various numbers of days after tillage.
These aggregates r^rere wetted to near saturation by capillary
action, and then dried lo -10 kPa in sintered funnels for 2 days. The
water stability of the aggregates was determined by the wet sieving (see
seclion 4 ) . The aggregates were immersed in distilled water for 5
minutes, and then shaken up and down for 15 minutes.
6.3.3 Results and Discussion
Tensile strengLh
The results were veny interesting. The firsb experiment (Table
6.17) showed that there was no significant difference in the strength of
the aggregates col-Iected from the tilled and non-tilled Urrbrae plots.
If Lhe discussion is based only on this result, and the results of the
Iabora|ory study (section 5.1, Table 5.8) which show that wetting and
drying do not influence the tensile strength of aggregates collected from

Table 6.17 .
191 .
Mean tensile strength of aggregates of 4.0 - 6.7 mm di-ameter
collected from the tilled and non-tilled Urubrae plots
(40 days after tillage).
Aggregate origin Tensile strength (kPa)
Tilled plot
Non-tilled plol
23.6 (1
24.9 (t
N.S.
4.5)
3.8 )
a non-til1ed soil, it would be possible to conclude that wet.ting and
drying do not influence the tensile strength of soil aggregates. Thls
is in contradi-ction with the other results.
The result of the second experiment, on Lhe other hand, was in
good agreement with the hypothesis. Thus the amount of wetting and
drying, as shourn by the time after tillage' did have an effect on the
tensile strength of the aggregates collected from the tilled soil of
Condobolin (Table 6. 18).
Table 6. 18. Mean tensile strength of aggregates coll-ected from the
tilled plobs at Condobolin.
Aggregate origin Mean tensil-e strength (kPal of aggregateswi-th diameter (mm)
2.0-4 .0 4 .0-6 .7 6 -7 -9 .5 9 .5-15
!
Plot A (24 .days*)
PlotB(Tdays)
80.3
91 .8
57.2
66.7
55.7
55.4
39.7
39 6
LSD 5% 10.95
^ refers to the number of days for whj.ch the plot had been exposed to
wetting and drying sj-nce the finaÌ tj-l-J-age.

192.
Further, Tabl-e 6.18 show-s that the difference in the tensile
strength occurs in small aggregates (2.0 - 4.0 and 4.0 - 6.7 mm) but
not in the large aggregates (> 6.7 mnr). The reason for this phenomenon
will be discussed later in this section.
To study fttrther the phenomenon shor"¡n in Table 6,17 t a simif ar
experimenl was conducted in 1979. This was done on the same plot as
used in section 6.2 (Urcbrae - 1979), fn this experiment the treatment
was extended to incÌude the following factors: (1) aggregate diameter
(4.0 - 6.7 and 6.7 - 9.5 nrn), and (2) aggregate onigin (0 - 5 cm and
5 - 10 cm layers of the tilled plot, and 0 - 10 cm layer of the non-til-Ied
plot). The differentiation between the 0 - 5 cm and 5 - 10 cm layers
of the t,illed plot was ba.sed onthe (finding discussed in section 6.1),
lhat the fluctuation of soil water content in the 0 - 5 cm layer vras
much greater than that in the 5 - 10 cm Ìayer. Thus if the intensity
of wetting and drying influences aggregate strength, then after the soil-
is exposed to weathering action for a number of days, the strength of
the aggregates from 0 - 5 cm layer would be expected to be l-ower than
thab of aggregat.es from the 5 - 10 cm layer.
The results (Table 6.19) show that the tensile strength of the
aggregates from the 5 - 10 cm layer of tf,e tilled plot., especiall-y that.
for aggregat.es with diameters of 4.0 - 6.7 mm was greater than that of
aggregates from the 0 - 5 cm l-ayer and thaL from the non-til-led plot,
This resuÌt demoirstrates the importance of the intensity as well as the
amount of wetting and drying in decreasing the strength of aggregates
in a titled soil-. It can be seen in Figunes 6.7 and 6.8 (section 6.1)
that. the aggregates from the 0 - 5 cm layer were nct only wetted and
dried mot"e intensively, but afi.er the same numberofdays after billage
the amount of wel-l-clefinecl wetting and drying tirey had received, \^Jas
a1-so greater.

Table 6.19.
1 93.
The tensile strength of the aggregaLes from 0 - 5 and
5 - 10 cm J-ayers of tilled and 0 - 10 cm layer of non-
tilled Urrbrae ptots Q1 days after tillage).
Aggregate origin Mean tensile strength (kPa) of aggregateswi.th diameter (mm)
4.0-6.7 6.7-9 .5
0-5 cm Ìayer (titlecl plot)
5-10 cm layer (tilled plot)
Non-tilled plot
22.7
25.4
20.0
18.2
19.3
17 .7
LSD 5% 2.61
It is likely fhat tillage tends to increase the strengbh of individual
aggregate. This can be seen from the resul-ts given j-n Table 6.19 which
show that the strength of the aggregátes from the tilled ptot (the 5 - 10
cm ]ayer with diameter of 4.0 - 6.7 mm) was greater than that of aggregates
from the non-tilIecì. plot. Due to the increased wetting and drying, the
strength of the aggregates from the tilled plot decreased boi^¡ard the
-strength of the aggregates from the non-tilled plot. This was shown
by fhe fact that afLer 21 days of wetbinþ and drying the strength of
aggregates from 0 - 5 cm layer was about the same as lhat of aggregates
from the non-til-l-ed plot.
To test thls suggestion, experiments were conducted at the Urrbrae
(Ju1y, 1979) and Strathalbyn (Septemben, 1979) sites. In these experiments'
aggregate. strength was studied as a function cf the amount webti-ng and
drying (the Urrbrae experiment) and as a function of time after tillage
(the Strathalbyn experiment.).

19 4.
Titlage was done as clescribed in section 6.2. The soil- t^rater
conLent al tillage was 17.8% (Urrbrae) and 17.4% (S1.rathalbyn).
Aggregates of 4.0 - 6.7 and 6,7 - 9,5 nm diameter hlere colfecLed (at
various numbers of days after tillage) from the 0 - 5 cm and 5 - 10 cm
layers of the tilled plots, and from the O - 10 cm tayers of non-tilled
plots. These aggregates were r¡retted by capilJ-ary action to near
saturat.ed, and then driecl to a matrj-c wa.ter potential of -100 kPa in
a pressure pJ-ate apparatus for 2 days. The tensile strengths of 20
aggregates ri,Iere determined as d.escribed before.
The results (Table 6.20 and 6.21) supported the above suggestion.
Thus the strengtl-r of the aggregates from the till-ed plot, especial-ly at'
O days afLer tillage, lJas much greater than that of those from the non-
till-ed p1ot. These values are 36.1 kPa and 31.4 kPa compared with 21.0
and 25.6 kPa (4.0 - 6.7 mm aggregates), and 28.3 kPa and 25'6 kPa
compared with 16.7 kPa and 22.5 kPa rc.7 - 9.5 mm aggregates) for the
Urrbnae and Strathalbyn soils respectively. It is possible that the
stresses produced by tillage equipment cÌose the cracks whlch exist in
natural aggregates (before tillage), and therefore, yieJ-d an increase
in the tensil-e strength of these aggregates. An increase in strength
due to the cfosure of cracks has also been found in coals (Murrelft
1958), rocks (Brace , 1964), and stabilised soils (Ingles and Lafeber'
1967). The increase in the stnength of the aggregai,es with tillage
may also be caused by rearrangement of particles wjthin an aggregate'
The stresses devel-oped by tilJ-age imptemenbs may make the aggregates
more clense. This mea-ns that bhe distance between soil- particJ-es will
become smaller, ancl the at.tractive forces, therefore, increase.
It is necessary t,o point out l.hat these results do not mean that
the butk strength of the tilled soil- was grea|er than 1.hat of 1,he non-
til1ed .soil . AlLirough the rnean strengt.h of individual aggnegates of

Table 6.20.
195.
Effect of wetting and dryÍ.ng (X A !'l) on the mean tensilestrength of aggregates from tilled (0 - 5 and 5 - 10 cm
Iayers) and non-tilled Urrbrae plots.
Days
afterTensile strengLh (kPa) of aggregates from
Ti1led plot Non-tilled pJ-ob
tir 0-5 cm layerrAW 4.0-6.7 6.7-9 .5(%)
5-10 cm layerr^I,ü 4.0-6.7 6.7-9.5 XAI,'I 4.0-6.7 6.7-9.5$t $)
0
2
4
7
11
17
25
0
2.9
5.9
9.0
19 .8
35.4
42.2
36. 1
29 .1
25.9
18.5
19.7
19 .4
18.9
28.3
23.9
23.6
15.2
16. 0
16.4
16.9
0
0.0
0.2
0.7
1.9
15. B
21.9
36.1
34.9
34.2
28.9
25.1
21.5
22.1
28.3
27.7
25.2
24.9
17 .7
16.3
16.5
0
1.2
1.5
3.5
6.1
19.9
26.3
21.0
20.1
20.0
18.5
19.0
20.7
19.3
16.7
17.6
17 .T
16.9
16.2
16.4
17 .0
refers to aggregate dianeter (mm)
Table 6.21 . Effect of wetting and drying (time after tillage) on the
mean tensil-e strength of aggregates from the til-led (0 - 5
and 5 - 10 cm layer) and non-tilled Strathalbyn plots
Mean tensile strength (kPa) of aggregates f'romDays
aftertillage 0-5 cm layer
4 .0-6.7 6.7-9 .5
5-10 cm layer4.0-6 .7 6 .7 -9.5
Non-tilled pJ-ot
4 .0,6 .7 6.7-9 .5
Tilled plot
0
2
4
B
14
21
30
31.4
26.6
24.6
22.5
19.6
18.7
20 .4
25.6
18.T
18.6
14.9
15.8
15.6
17 .7
31 .4
30.7
28.9
25.7
24.0
22.1
21.2
25.6
24.0
21 .1
20.5
15.5
18.6
18. 7
25.6
24.3
26.7
25.4
24.4
24.0
23.1
22.5
23.O
22.8
21.0
19.3
1T .2
aQ ')lU. J

19 6.
the tilled soil was higher, the bulk strength of the tillecl soil is sti-l-I
lower than that of non-till-ed so11 becuase of the increased macro-
porosity.
To obt,ain a relationship between the amount of wetting and drying
and aggregate mean tensile strength, the data were fitted to equation
(6.13) for the Urrbrae experiment, and to equation (6.16) for the
Strathalbyn experiment. By replacing the term trthe proportion' Pô,
of the aggregates larger or smaller than diameLer drr with tensile
strength, oT, these equations become
of(l¡W) = A+a [1 -exp(-a'XAi,¡)] (6.20)
for the Urrbrae experiment, and
or(t) = A+a [1 -exp(-art)J (6.21)
for the Strathalbyn experiment.
The resul-ting values of the parameters A, a, and ar or arr are
given in Tabl-e 6.22, and the "rt,ru" of these equations are shown in
Figures 6.20 and 6.21.
The larger aggregates had not only a smalfer tensll-e strength'
but also a more rapid decrease in t'he strength caused by wetting and
drying. This can be seen from the resulls in Table 6.18 which shows
that the difference in the strengths of aggregates from plot A and B
occurs only in the aggregates with diameters smal-l-er than 6.7 mm. A
simil-ar tendency is shown in Table 6.19, These results indicate thaþ
after a certain amount of wetting and dryì-ng the l.arger aggregates
reach an equilibrium val-ue of tensiÌe strength. The smaller aggregates
on the other hand, take longer to reach their new equì-librium strength.
The more rapid dec::ease in the strength of the larger aggregates is

2
Fig. 6.20.
ãfLJü
: ^w
(7.)
Effect of wetting and drying (t A !I) on tensile strengthof the aggregates from the till-ed plot of Urrbrae l-oam.The continuous curves are fit of equation (6,20) andthe measurements are given by: (o) 4.0 - 6.7 mm
diameter, and (o) 6.7 - 9.5 mm diameter.

(úo-ll
Fþ
20
Flg. 6.21 .
t (days)
Effect of wetting and drying (as shovm by time, t, afterthe tillage) on tensile strength of the aggregates fromtilled plots of Strathalbyn soil.The continuous curve a fit of equation (6.21), and themeasurements are given by (o) aggregates of 4.0 - 6.7 mm
from O - 5 cm J-ayer, (o) aggregates of 6.7'9.5 mm fromO - 5 cm layer, (a) aggregate of 4.0 - 6.7 mm from 5 - 10
cm Iayer, and (a) aggregate of 6.7 - 9.5 mm from 5 - 10 cm
Iayer.

Table 6.22.
197.
The vaJues of parameters of A, ar and ar of equatÍon
(6.20) and rc.21) obtained from the Urubrae and Strathalbyn
experiments.
Experiment Aggregatediameter (mm)
d-A ^ta
Urrbrae
Strathalbyn0-5 cm layer
4.0-6.7
6.7-9 .5
34.32(11.20)
27.10(11.02)
31.09(r0.82)
25.81( t0.78 )
31 .78(r0.45)
25.90(11.34)
- 13.93(t1.32)
-11.02(11.17)
-11.58(10.93)
0.24(r0.02)
0,26(10.02)
0.02( 10.04 )
0.32) (r0.06)
0 .81( 10.02 )
0. 18(10.09)
4.0-6.7
6.7-9.5
5- 10 cm layer 4 .0-6 ,7
6.7-9.5
- 0.79( t0. 87
-11 .17( r0.75 )
- 8.06(11.53)
shown more clearly in Tables 6.20 and 6.21; and Figures 6.20 and 6.21,
These results are in agreement with the result found in -qection 5,2,
where the reason for this phenomenon has been discussed.
Tab1es 6,20 a.nd 6.21 also show that the tensil-e stnength of
aggregates from the non-tilled pJ-ot did not change much with additional
natural wetting and drying. Ib is lì-kely that these aggregates were
already cl-ose Lo the equilibrium strength appropriate to their natural
wetfing and drying regime. This suggestion is supported by the results
in Figures 6.20 and 6.21 which show that after reaching a val-ue about the
same as that of the tensile strength of the aggregates from untiJ-Ied plot,'
further wetting and drying had no or Iittle inffuence on the tensile
strengl,h of the aggregal,es from the tilled plot.

1 98.
To study effects of different tillage systems, which resul-t in
different intensities of wetting and drying (see section 6.1 ), samples
of aggregates of 2.0 - 4.0 and 9,5 - 15 mm diarneters were col-lected from
bhe Mortlock ploLs used in section 6.1 to a depth of about 3 ctn. 't¡ilhen
the first sampling was done plots A"r Bw, C* and D" had been exposed to
natural- wetting and drying for 6, 11r 7 and 11 days (since the final
tillage) respectively. The aggregates vrere air dried, wetted to near
saturation by capillary action, and Lhen dried to a matric water potentiaÌ
of -1OO kPa in a pressure plate apparatus. The mean strength of 20
aggregates of each size diameter for each treatment l^¡as measured as before.
The sampling and tensile strength measurement were repeated after the plots
had been exposed to further wetting and drying.
The results are given in Table 6.23. Because of lnLeractions of
tillage system (which might result in different initial aggregate tensile
strengths), the number of days for whj-ch the aggregates had been exposed
to wettirtg and drying (after the final tiÌlage), and the intensiLy of
wetting and drying, the resul-ts are very difficult Lo interprete, and
is not possible to make a general comparison. If the influence of tiJ.lage
system on initial aggregate tensil-e strengh is assumecl Lo be the same'
than comparj-sons coul-d be made between the ptots lvhich had been exposed
to the same amount or number of days of wel,ting and drying. Thus
aggregates from A,o could be compared with those from Curr and aggregates
from B-. coul-d be compared with those from D--.I^t -- ' i^t
tr'lith the assumption that the relative intensity of vretting and
drying before observation and during the observation was the same' i,t
can be suggested Lhat Lhe greater is the inteirsity of wettj-ng and drying'
the greater is the decrease i-n aggnegate tensife strength. This can be
seen by comparing the 1,ensile strengl.hs of a"pSgregates from A* and C"r
especiall-y for the aggregates witlr diarneter 2.0 - 4.0 tnm (LSD 5% for

Table 6.23.
199.
Mean tensile strengths of aggregates of Mortl-ock soil as
influenced by different tillage treatments
Firsl sampling Second samplingTreat-ment days
aftertillage
tensile strength(kPa)
2.0-4 .O 9 . 5- 151
tensile strength ltea)
2.0_4 .0 g .0_ 15
xAvü ciafter 1""sampling
('/" )
l¡I
Ap
A!,t
B
cI^I
Dw
pD
6
11
7
11
31.6
33.7
35.4
2e.9
25.O
24.0
18.2
17 .1
19.1
16. 3
16.5
15 .4
70 .45
38. 87
42.81
56.30
11.36
13.59
23.2
26.2
24.5
24.7
23.8
22.9
12.7
14.5
13.6
12.8
17 .9
16.0
these two treabments is 2.72). A simil-ar tendency is also fcund when
comparing the tensile strengths of aggregates from B" aud D, (LSD 5% =
2.59).
In addition, the results in Table 6.22 aLso support the previous
suggestion that titlage tends to increase aggregale tensile strength
(as can be seen by the fact that at the first sampling the mean l,ensil-e
strength of aggregates from tilled plots was greater than that fronl the
non-tilled plot), and due to wetting and drying, this strength decreases
toward the equilibrium strength of non-tilled aggregates.
Aggregate water stability
After tillage, there were significant changes in aggt'egal,e water
stability (Table 6.24). For the Urrbrae experj-ment, where the independent
variabl-e was the amount, of webtjng and drying, changes in the watet"

200.
stability of aggregates from the 0 - 5 and 5 - 10 cm layers 'h¡ere
analyzed ai-l,ogether. For the Strathalbyn experiment, however, since
the independent variabl-e used vras time after til1age, 1,he analysis was
done separately.
In the first few days after tillage, aggregate water stability
increased wi-th wetting and drying (urrbrae) or time after fillage
(Strathalbyn). After reachlng a maximum value of stabil-ity, it decreased
with further wetting and drying or time after tillage (Figures 6.22 and
6.23). The data were fitted to quadratic equatlons
L+I(X^l,I) +Ir (XAVtr) 2 rc.22)> 0.5
and
PrO.5 = L+l(t) +r'ft)z rc.n)
for the Urrbrae and Strathalbyn experiments respectively. Here PrO.5
is the proportion of water stabile aggregates larger than 0.5 mm' X A W
is the cumulative wetting and drying, t is the time after bil.J-age. The
val-ues of the adjustable parameters L, I and Irare given in Table 6.24.
These equations, of course, only represent the results up to X A !'l = B0%
and t = 40 days, respectively. It is likely that the -stability, as with
the tensile strength, al-so tends towards equil-ibrium values.
Table 6,24. The vaLues of parameters of L, l and lrof equa.tlons (6.22)
and (6.23) .
Experiment
P
aggregate diameterbefore sieving (mm)
L I Ir r
Urrbrae
Strathalbyn0-5 cm layer
5-i0 cm layer
2.0 -1.0 -
2.0 -1.0 -
2.0 -1.0 -
4.0
2.0
4.0
2.0
4.0
2.0
59 .19
49.55
53.41
33. 0B
0 .12
0.51
1.75
2.50
1 .09
0.66
-0 .004
-0.01
-0. 04
-0. 05
-0.02-0.01
0.56
0,77
0.49
0.51
0 .91
0.76
63 69
6047.

o
oa
EI
o
EEço
.nø(!ö)(D
õ)(Ð
o\9
3000 0 20
t (daysl
Effect of wetting and drying (as shomr by time, t, affert1IIage) on the water stability of the aggregates fromtilled Strathalbyn soil. The continuous curves are fitof equation (6.23). The measurements are given by:
Fig. 6.23.
AggregaLes of 1
and 5 - '10 cm (
Aggregates of 2and5-10cm(
.O - 2.0 mm diameter from 0 - 5 cm (O' a)o , b) j-aYers..O - 4.0 mm diameter from 0 - 5 cm (o, c)e , d) Iayers.

0E
o@
oo
o
o
o
70
60
EEIoso
tt)orúg)E
åooo*
30s 2ç 4S
E ¡w tz¡Effect of wettlng and dr"ying ( I A Ì{) on the water stability of the aggregatesfrom tilleC Urrbrae soil. The continuous curves are fit of equation (6.22) -
The measurements are glven bY:a: aggregates of 1.0 - 2.0 mm diameter from 0 - 5 cm (O) and 5 - 10 cm (o) Iayers.b : aggregates of 2.0 - 4.0 mm diameter from O - 5 cm (t¡) and 5 - 10 cm (n) Iayers.
Fig. 6.22.
201.
These changes in aggregat-,e water stability afLer tillage might
have resul-ted from a combination of the increase in the intensity of
wett-ing ancl drying, and the activity of soil microorganisms followlng
tilJ.age.
Til1age exposes soil organic matter previousJ-y not. available to
microorgani-sms (Rovira and Greacen, 1957), and results in an increase
in soil- microorganism activi-ty. An increase i.n soil microorganism
activity may also occur as a consequence of an increase in 1-he arnplitude
of natural- wetting and drying cyctes. The increase in the intensity
of wet.ting and drying with ti-Ilage has been discussed exteusively in
section 6.1, and an increase jn microorganisrn acLivity wìt,h wetting
and drying has been demonstrat,ed by many workers (e.g. Bjrch' 1958;
AganwaÌ et a7.,1971; Jagnow, 1972). This is in agreement with the
results of the laboratory study (section 4) which showed that in the
presence of microorganism activity, wetting and drying up to 3 cycles
increased aggregate water stability, and that further wetting and drying
cycles decreased aggregate water stabiJ,ity. This did not occur when
wetting and drying vJas done in the absence of microorganism activit,y
(steril-ized so1l).
The changes in aggregate stability found in this experiroen't- were
similar to those found by Monier (1965) in str.rdying the change in aggregate
wal,er stabiliLy with time after incorporation of organic matter. Monier
(1965) suggested that the peak of the curve represen|s that aggregal,ion
broughL about by the microbial- bodies in the soil. The rnaior factor
involved during t.his period is a mechanical bj.ncling ac|ion by t,he mycelia
of fungi and actinomycetes, and to some extent of bacterial cell .s " This
type of aggregate stability is onJ-y temporary sitrce the mycelia a.nd cells
in l,urn undergo bacterial- decomposition as the intensit5' ¡¡ Lhe bioloSlical
action decreases.

202.
The increase in the water stabiJ-1ty in the Strathalbyn experj,ment
lasted much longer than that. in the Urrbrae experiment (Figures 6.22
and 6.23), These results support bhe above suggestion. The Strathal-b¡'¡
soil has a higher soi 1 organic mat.ter cont.ent than the Urrbrae soil
(2.8% compared lo 1.7%). Thus, the StrathalbS.¡ soil can provlde a
greater source of energy, and hence any increase in soil microorganism
activity can persist longer.
Effects of different intensities of wetting and drying resulting
from different tillage systems on aggregate water stability were studied
on the Mortl-ock plots (see section 6.1). The resul-ts are given in
Table 6.25. Agaj-n, as with the tensiìe strength, because of the interaction
of the tillage system, the number of ctays the aggregat,es had been exposed
to wetting ancl drying, and the inlensity of wetting and dryingr these
results are very difficult to int.erpret, and a general conparison cannot
be made. These data, however,' well illustrate that the water stability
Tab1e 6.25. Aggregate water stability of Mortlock soil- as inffuenced
by different tillage treatment,s.
Treatment. First sampl-ing Second sampling Thj.rd sampling
days o/" aggregatesafter >0.5 mm
til lage
IAI'I %a.sEre-after 1st gãão"sampling >0,5 mm
(%)
I: AWafter 1sDsampling
(%)
"1" aggre-gates
>0.5 mm
¡1,1^/
BI^l
C¡ól
vtD
6
11
7
11
78.2
83.0
73.7
79.4
83. B
80.9
27.36
11.78
14.31
23,24
6. 86
4.29
84.7
85.7
82.0
84. 1
83.6
83. B
70 .45
38. 37
42.81
56.30
11 .36
13,59
90.0
85.4
82.6
86. 3
83.2
Q"O
Ap
Dp
Tnitial aggregate diarneLer was 2.0-4.0 mm,
innrersed in distilled v¡ater for 5 minuLes,and t-,he agg;rega1-es \^/ereand shal<eln for 15 nlinutes,

203.
of soil aggregates differs with different tillage system or with the
intensity of wetting and drying. The most important fact found in this
experimenf is that tillage tends to decrease aggregate water stability
(see aggregate water stability at the first sampling), and thus is
consistent with the results discussed in section 4. Further, from
Tabl-e 6.25 iL can be seen that the water stability of the tilled aggregates
increased with wetting arrd dryÍng (time) after tillage. This is in
agreement with the results for the Urrbrae and Strathalbyn experiments
discusses previously.
The organic matter content of the soil did not change significantly
with wetting and drying after tiJ-tage (Tab1e 6.26). Thus, the changes
in aggregate water stabitity after tillage were not caused by so1l
organic matter content such as, but rather by their disposition in the
soi-I as has been suggested by Rovira and Greacen (1957).
Tab1e 6,26, Soil organic malter content of Mortl-ock soil as influenced
by different till-age systems.
Treatment %CaLFirst sampling Second sampling Third sampJ-ing
AIt
Bl4t
Ap
C
D
t¡I
I^I
2.08
2.73
2.7 4
2.9t
2.21
3.07
2.10
2.72
2.7 4
2.7 0
2.23
3. 01
2.05
2.54
2.70
2.79
2.21
3.21pD
204.
6.4 Effect of ageing on the water stability and compression resistance
of aggr tes disturbed bY tì-lJ-age
6.4.1 Introduction
Since the studies of Scott Blair (1937 ) and Scott Blair and Cashen
(1g38) a number of experiments have been conducted to study the
compaction of aggregated agricultural soils. These incl-ude McMurdie and
Day (1958), Kuipers (1958), Davis, Dexter and Tanner (1973), Dexter and
Tanner (1973 1974) and Braunack and Dexter (1978). A comprehensive
reference work, mainly on non-aggregated soils, has been published by
the American Society of Agricuì-tural Engineers (ASAE' 1971). An
adequate understanding of compaction, however, is stil-I far from being
achieved. The compaction problem, meanwhile, is becoming potentialJ-y
more serious and complex as a consequence of the increasing use of
heavier and larger machinery in modern agriculture.
Cooper (1971) suggested that care must be taken not to run over a
tilled soil with heavy loads, because a soil which has been broken up
and then recompacted is often more dense l,han it was before Lillage.
However, he did not describe the reason fon this phenomenon. Dexter and
Tanner (1g74) showed that the soil compression process is time dependent,
and can be described by the equation
D exp (6.24)
where
x Di - (Dr - Di) (6.25)j
Here D is packing density, and the subscripts t, f, and i denote the
packing density at time t, fj.nal packing density and the jnitial packing
density respectively, and the rj are retardation times.
l-L / -, .)J
= D^ - X D.I.Jt

For a soil with packing density, Dt,
increasj.ng after the time t = 105 seconds,
205.
which is still sbeadiJ-y
the equation nsed was
DL
P+Qexp(-L/t)+Ct (6.26)
with P, I and C being adjustable parameters.
Vrlith these equations, Dexter and Tanner (1974) were abl-e to
demonstrate that a remoul-ded soil compressed much more rapidly than an
undisturbed soil-. They, therefore, suggested that a soil whj-ch has been
tilled is more susceptibl-e to compaction than a soil which has not been
ti11ed.
Godwin and Spoor (1977) has observed that tractor sinkage on an
undisturbed soil is one third to one quanter to that on a cultivated
soil, al-though, of course, the initiai- packing density is also .small-er
in a cultivatecl soi1. However, the l-ower initial- packing density is
not sufficient to account for this jncreased sinkage.
As discussed in section 3. 1 , together with the increase in the
strength of remoul-ded soil with ageing, which i-s knorn¡n as rrthixotropic
hardeningrr, there is a corresponding increase in the resistance to
compression. Evidence for thixotropic behaviour in agricuftural soil-s
has also been shou¡n by Blake and Gil-man (1970) and Arya and Bl-ake (1972).
In studying the water stabjlity of newly-formed aggregates, they fotrnd
that. the water stabiJ-ity increased with ageing. They suggested Lhat this
process was analogous to the increase in the strength in remoul-ded
thixotropj-c soil-.
The tensile strength of cl-ods or aggregates in l,he top (0-5 cm)
layer decreases v¡ith time after tillage (sectiorr 5.1 and 6.3) due to
crack formal,ion caused by uneven wetting and drying. The shear strength
or penel-ratiorl resl-stance, on the cther hand, might not be influencecl by

206.
these cracks (see section 5.1 ), and might even increase wi,th time after
tilJ-age. For the deeper layer (> 5 crn depth), which is dominabed by
small-er aggregates (0jeniyi and Dexter, 1979b), ageing afler tiÌlage
increases aggregate tensil-e strength. This is because the soil w¿rter
content fluctuations. in thi-s layer are insufficient 1,o cause aggregate
cracking. I,{ith these strength increases, it can be expected that the
resistance of beds of these aggregates to compression al-so increases.
If this is the case, then al-l-owing a tilled thixotropic soil- lo rest
for several days after the fj-rst implement pass results not, only in a
lower cost and energy in tilling the soil (section 6.2), but also in
a reduction of compaction damage in the deeper part of the tilled 1a5'6¡
(> 5 cm depth).
As suggested in seclion 3, fiJ-Iage invol-ves some remoulding and
disturbance, then aIlowing a till-ed thixotropic soil- to rest for
several days before any other operation are performed can increase the
strength of the soil.
6,4,2 Materials and Methods
The experiment was conducted on the Urrbrae red brown earLh.
Tillage was done witlr a tyne cultivator to a depth of abouL 10 cm. l,rrater
content at tillage was 15.5%.
The extgnt to which this tillage formed neu¡ aggregates or just
disturbed and rearranged the existing ones is now known. In the following,
these aggregates are described as rthaving been disturbed by t.illagerr.
Aft,er tilJ-age, 10 kg of soil- was colfected from between the t.racLor
wheel tracks, and aggregates with diameters of 1.0 - 2.0 mm vùene separated
from Lhis sampÌe by dry sieving. Sub-sampl.es of these aggregal,es vJere

207.
used to determine aggregate water stability and the resistance of beds
of these aggregates to compression. The remaÍnder were stored at.
constant waber content for later testing. To do this, the aggregates
were stored in a beaker, wrapped in thin plastic sheeting and alumÍnium
foil, and stored in a constant temperature room (zOoC).
Aggregate water stability was determined by the web sieving
method (see section 4). 20 g of aggregates brere immersed in distilled
wat.er for 5 minutes, and then shaken up and dov¡n for 5 minutes. Aggregate
water stability was calculated as the final percentage of aggregates
larger than 0.5 mm diameter. 3 measurements were done for each agelng
time.
The compresslon test on beds of these aggregates hlas done in a
standard consolidometer (see section 3) with uniaxial stresses of 0,
2.5, 4.9t 9.8' 14,7 t 19.6 ancl 29.4 kPp',
6.4.3 Results and Discussion
Aggregate water stability
It was found that th,e water stability of the aggregates disturbed
by tillage from Urrbrae red brovm earth increased with ageing tlme
(Figure 6.24). The daLa were fitted to equati.on (6.13). By introducing
the term rrstability, St, at time trr, the equation was
<rJ = 46. 61 + 12.07 t I(r1.69) (t2.04)
- exp (-0.19 t))(10.09)
(6.27L
Several processes might be invol-ved in causlng thj s increase.
There is no doubt that the presence of organic maLl,er as an energy source
is one of the important factors responsible for this increase. So is
the contribulicn of sojl microorganisms as discussed in Sectj-on 6.3.
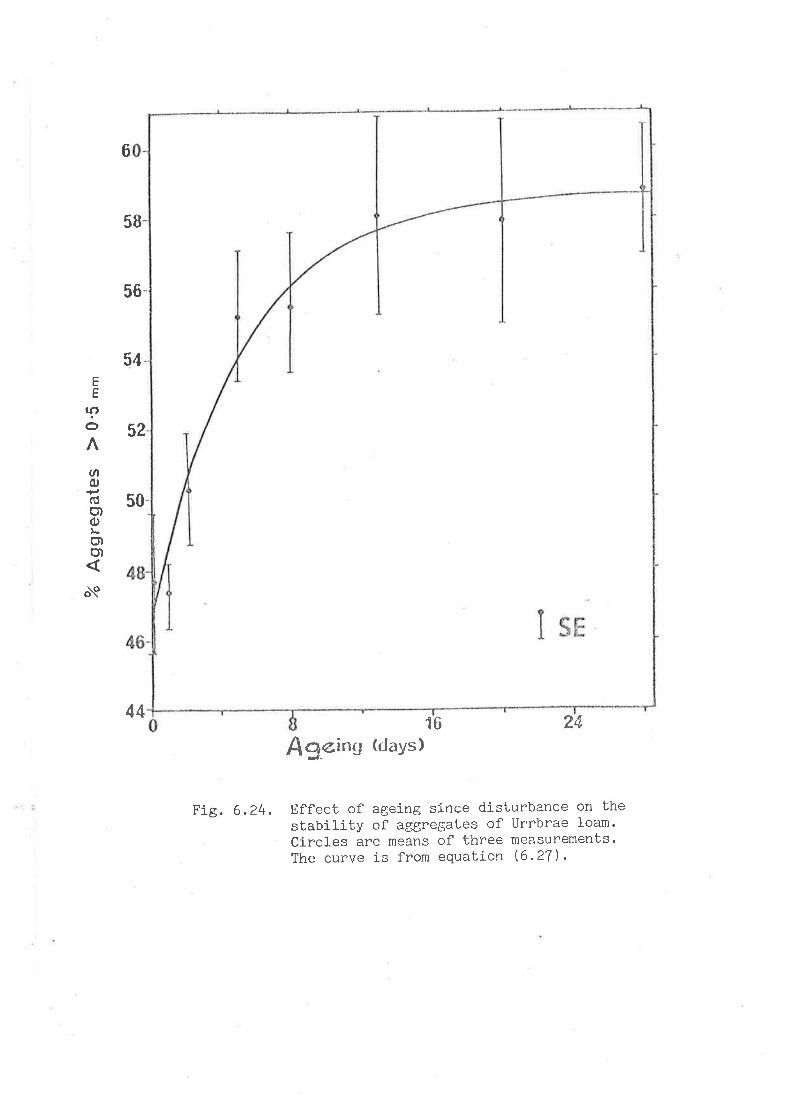
6
5B
56
54
52
50
EE
lPo
ûo(úo,(,tbo)ct)
ñ
4416 ¿L¿
Fig. 6.24 .
Ag.øin(t (days)
Effect of ageing since disturbance on t'he
stability of aggregates of Uml¡rae loam'Circles are means of three measurements'The curve is from equation (6.27).

20 B.
t'lithout ignorirrg the importance of these factors, Blake arrd Gill-man
(1970) suggested that the increase in water stability of new1.y forlned
aggregates with ageing is a thixotropic process, It was shown that in
the absence of organic matter there is stil-I an increase in aggregat.e
wa1,er stability.
From thixotropic point of vi-ew, it can be suggested that tiJ-l-age
disturbed and probabty formed new aggregates. Soil shearing and compressi-on
prcduced by the tillage implement may cause some rearrangement of the
platy clay particl-es into a uniform, parallel arrangement. lrlhen the
tillage implement has passed, the external forces whi-ch assist the
repulsive forces drop to zero, and now the attractive force.s in the
system are much greater. Vüith this condition, the structure tends to
adjust to an equilibrium state with a more random arrangement. Together
with this change, there is a corresponding increase in interpartj-c1e
attraction, Blake and Gilman (1970) suggested Lhat this interparticle
attraction and linkage tends to make the aggregates resist sì-aking.
Compression resistance
Together with the incnease in aggregate water stabilityr there
hras an increase in the resistance of beds of these aggregates to
compression (Figure 6.25). The data wa.s fitled Lo equation (6.24),
with the uniaxial sl-ress, S, replacing the tj-me t:
-Dm
exP (-S/m) (6.28)
The resul-ting values of the parameters Drr D and m are given in Tablem
6.26.
It can be seen from Table 6.2T that ageing decreased the maximum
packing density from 0.791 (O Oay sample) to 0.668 (6 days aged sample).
DS
Dr
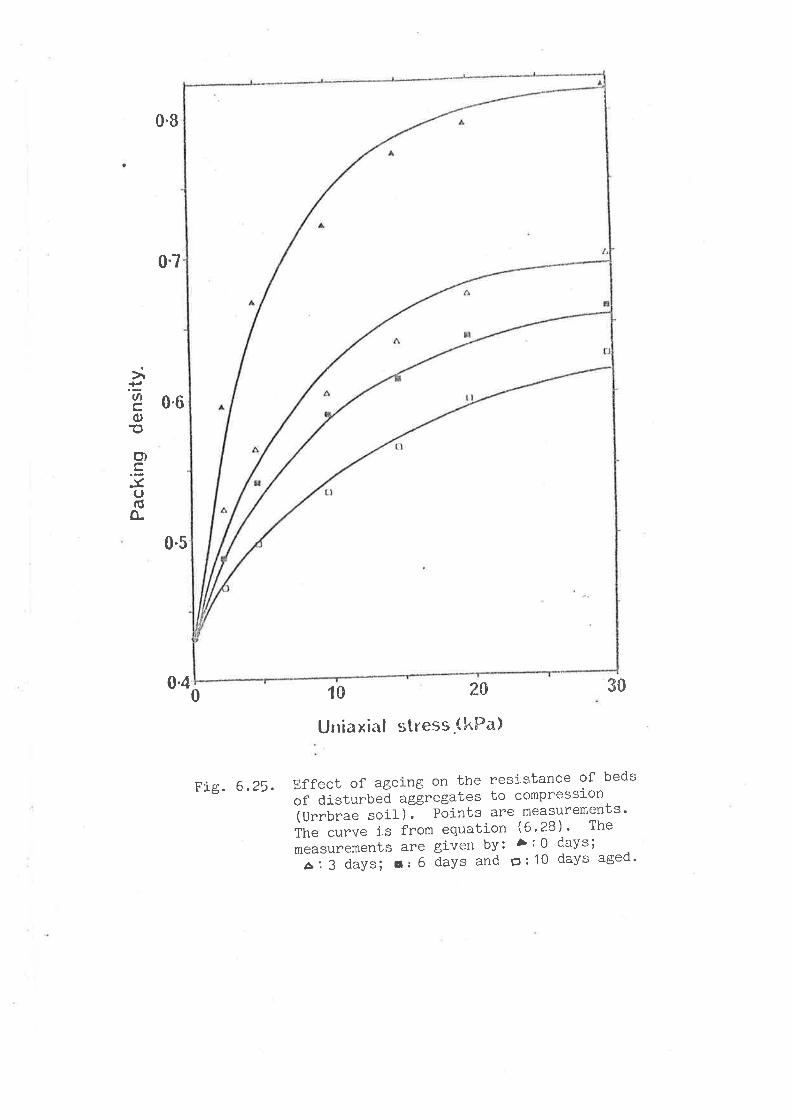
>2 0.6o-o
ol
!o(úo-
0.8
0.7
0-5
0.410 2t 30
0
Fie.6.25.
U¡riaxi¿rl stress.(kPa)
Effect of ageing on the resistance of beds
of disturbed aggregates to compression
iü"ru;.; soil)l- póints are measurements'
ih" "r"u" is from equation (6'28) ' The
measurements are given bY: ò:0 daYS;-;43 davs; a I 6 ãaYs and o: 1o daYs aged'
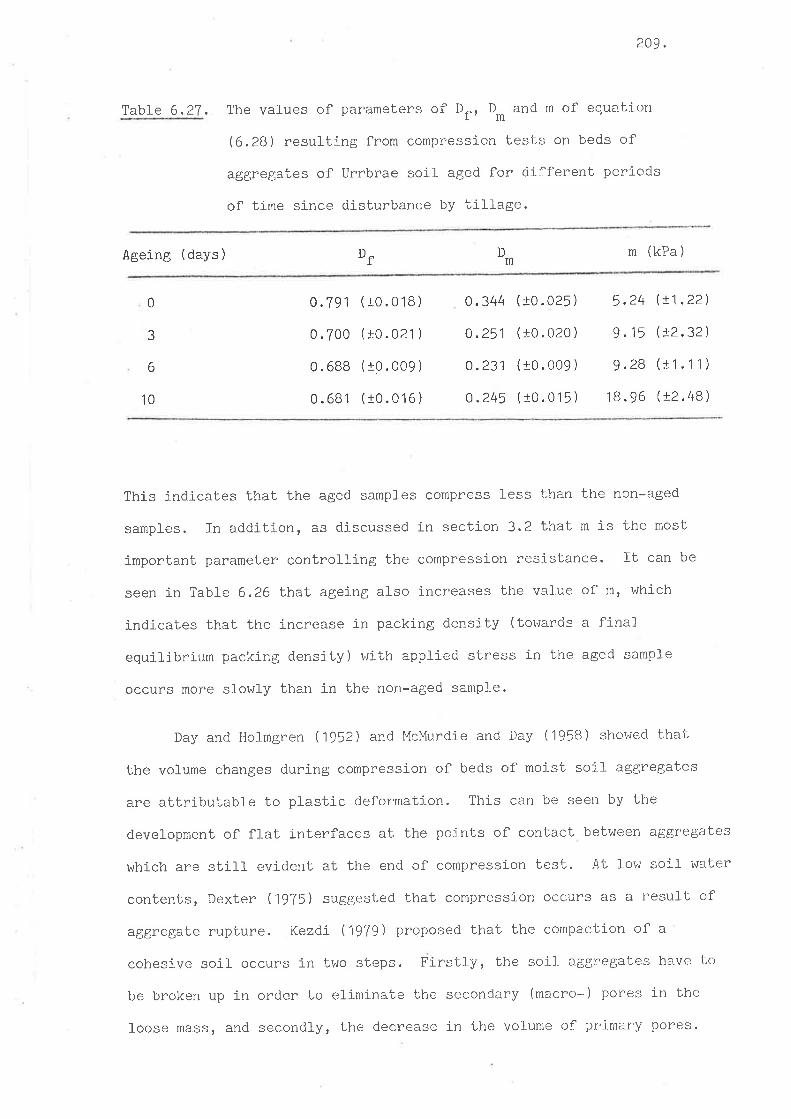
Table 6.27.
209.
The values of parameters of D. D* and m of equation
rc.28) resulting from compr'ession tests on beds of
aggregates of Urrbrae soil- aged for different periods
of time since disturbance by ti1J.age.
Ageing (days) D D m (kPa)f m
0
3
6
10
0.791
0.700
O.688
0.681
(t0.018)
(r0.021)
( t0.009 )
(10.016 )
0.344
0.251
0.231
o.245
( r0.025 )
( r0.020 )
( to. oo9 )
(t0 . 015 )
5.24
9.15
9.28
18.96
(!1.22)
(!2.32)
(11.11)
(12.48)
This indicates that the aged samples compress less than tl're non*aged
samples. In addition, as discussed in seclion 3.2 that m is Lhe most
important parameter controÌIing the compression resistance. It can be
seen in Table 6.26 LhaL agei.ng al-so increases the value of m, which
indicates that the increase in packing density (tolands a final
equilibrium packing densitY) with applied stress in f,he aged sample
occurs more slowJ-y than in the non-aged santple.
Day and Holmgren (1952) and McMurdie and Day (1958) showed thaL
the volume changes during compression of beds of moist soil aggregates
are attributabte to pl-astic deformatj,on. This can be seen by the
development of f]at interfaces at the poinl,s of cr¡ntact between aggregat.es
which are sLil-I evident at the end of compression Lest. At Ìow soil water
contenbs, Dexter (1975) suggested that compression occurs as a result of
aggregate rupLure. Kezdi (1979) proposed that the compacLion of a
cohesivc soif occurs in two s1,eps. Firstly, the soi-l a.ggnegal,es have to
be broken up in order to elirninate Lhe secondary (macro-) pores in Lhe
Ioose mass, and secondly, the decrease in the volurne of prì.rnary pores.
?.10
In this experiment, soil r+ater content was 15.5%, and it is likely
that. the change in packing density was mainfy caused by aggregate
rupture and the decrease in the vol-ume of primary pores.
It was thought that the increase in the strength of remoufded.
aggregates (section 3) occurs also in the aggregates dì-sturbed by
iilt-age. As has been shown by Braunack and Dexter ( 1978) r an increase
in the tensite strength of the individual- aggregates will result in an
Íncrease in the resistance of beds of these aggregates to compression.
Thus, it is reasonabfe to suggest that ageing can increase the
compressi-on resistance. The process by which ageing increases soiÌ
strength has been extensively discussed in section 3.
A further experiment was designed to test the extenl to which Lhis
behaviour occurs when tillage is done at dlfferent soil water contents,
especially those close to the optimum soil water contenL for tiJ-Iage.
As was predicted by the soil- frj.ability measurement (section 5,2), which
is in good agreement with the results of Ojeniyi and Dexter (1979a),
the opbimum soil water content for tillage for tl-le Llrrbrae fine sandy
Ioam is around 17% (or 0.9 of the Plastic limit).
In addition, it is intere.sting bo discuss Dexter and Tannerrs
(1974) suggesl,ion that remoulded soil compresses more rapidly than
undisturbed soiÌ (see equation 6,24). !'lith this equatiou, the resistance
to compressi-on can be seen both from the final- packing densiLy and the
time for compression. So, if ageing increases the resistance of the soil
to compression il wilt probably also resutt jn an increase in rel,ardatiou
l,ime of the compression process, DexLer and Ta.nner (1974) have pointed
out the irnportance of compression time in control-l-ing the compact-ì-on
problem, and suggested thaL a retardati.on tj-me of about 103 s woufcl be
an advantageous for agriculturaf soi-Ls.
211 .
Because of the weather, it was not possible to do tiJ-lage exactly
at the optimum soil water content. The soil water contenL at tillage
was lrl = 19.3%. Aù this water content, it was very difficult to sieve
aggregates of 1.0 - 2.0 mm diameter. So, unlike in the previous
experiment, the aggregates used here had diameters in the range 1.0 - 4.0
mm
To provide information from another soil, an additional experiment
was done at the Charlick Experimental Station at Strathalbyn. Some
properties of lhis soil have been described in section 3. As in the
Urrbrae experiment, tillage was done with a tyne cultivator to a depth
of about 10 cm. The soil- water content at ti-l]-age was ïrl = 19,2%. The
aggregates used for the compression test had diameters in 1"he range
1.0 - 4.0 mm.
The variation of packing density with time could not sal,isfactorily
be described by a slngle exponential equation, so they were fitted to the
double exponential equation
-D exp(-L/TN
rc.29)nDt = Df - Drexp (-L/ rI)
The resulting parameters Drr Dl-,
Table 6.28 for the Urrbrae experiment,
Strathalbyn experiment.
'rf t and are given inTN
and in Table 6.29 for Lhe
D'.n'
As expected, the resul-ts (Tables 6.28 and 6.29) show that ageing
not only decreased the final equilibrium packing density, but also
increased the time for compression. The 1 day aged Urrbrae soil
(Table 6.28 and Fi.gure 6,26) had retardation times of .l = 5.6 and
149 s, whereas f,he 10 days aged sarnple had retardaLion times ofTN
.rI = 8.0 s and,n = 383 s. For the Strathalbyn soil (Table 6.29 and

#tf)
e)\J
@TJ'
Çßtu
0.6
0.6
0.62
0.60
0.5
0.56
0.5
0.54
0 400 800
Compressian tinte1200 1600
{s}isturbed aggregates to compressrol-l
ãi-"q"atioñ- t o. zg I ' The neasurements
and o ¡ 10 daYs ageci 'Fig. 6.26 Effect of ageing on the resistance of beds of d
îù;;;;.; "oil). The continuous curves are rit
are given by: ,â I 0 days; a"' 2 days; c: 4 days

Table 6.2q.
212.
The val-ues of parameters Df, Dl , Dn, .rl_r and an of
equation (6.29) resutting from compression tests (29.4 kPa
stress) on beds of aggregates of the Urrbrae soil aged for
different times.
Ageing (days) D Dtf Dn tl(s) tn(s)
0
2
4
0.664(r0.001 )
0.627( 10.000 )
0.627( t0. 000 )
0.603(10.001 )
0.106( r0.000 )
0. 082(r0.001 )
0.079(10.002)
0.052( t0 .002 )
0.025( r0.000 )
0.013( r0.000 )
0.016(10.001 )
0.018( r0.00 1 )
0 .80( 10.35 )
5.60( 10.30 )
5.20( r0.70 )
B. 01(11.00)
27.88(r 1.08)
149.07(J1B.1B)
246.26ft55.74)
383. 5B(1125. 9 1 )
10
Table 6.29, The values of paramel,ers Df, Dl_, Dn, tlr and rn of
equation rc.29) resul-ting from compressì-on tests (29,4 l<Pa
stress) on beds of aggregates of the Strathalbyn soil- aged
for different times.
Ageing (days) D Dtf Dn tt(s) 'rn (s )
0 0.657(t0.001 )
0 . 'l38( r0.002 )
0 .128( t0.003 )
0. 105( 10.005 )
0.101( r0.002 )
0.069(10.001)
0.020(r0.001 )
0.025( r0.002 )
0.020( t0. oo4 )
0.108( r0.00 1 )
0.013(10.001 )
2.20(10. 19 )
193.93e5?-.50)
201.26( 169. 53 )
112.60( r53. 20
212.60(151 .95 )
179.37( t40. 64 )
3
7
0 .651(r0.002)
0.624(10.001)
0.617( r0 .000 )
0.581( t0.000 )
?70( J0.34 )
3.76(10.52)
3.21(10. 21 )
3.77( r0.23 )
14
213.
Figure 6.27) the retardat.ion times for the non-aged sautples ".t".r- = 2.?. s¡
and = 193 s. v¡hereas the retardation tÍmes for 7 days aged samples wereTN
- = 3.7 s and = 212 s. ft seelns that these vafues are smal-l-, but itT1 TN
must be realized that a soil- j-s stressed by tractor tyres for arouud 5 X
-Ro-210-r s, and by animal feet for around 10" - 10- s (Dexter and Tatrner,
1974). Together with the decrease in the final equil-ibrium packing
densil,y, these increases in retardation times coul-d have some influence
on soil conpaction in the fieid.
lùith soil water contents of V'i = 19,3% (Urrbrae) and 19.2"t"
(Strathalbyn) (each slightly above the pJ-astic J-imit), it can be expecled
that compression mainly resufted from plastic deformation as suggested by
Day and Holmgren (1952) and McMurdie and Day (1958). At bhe end of
the test, it was observed that in addition to plastic deformation as
could be seen by the occurrence of flat interfaces at points of inter-
aggregate contact as drawn schematicalJ-y by Davies et af. (1973) there
\^ras some rupture of some aggregates. This result demonstrates thaL even
at the plastic limj-t, the aggregates disturbed by til1.age from the
Urrbrae and Strathalbyn soifs can exhj-bit britl,Ie behavj-our. Braunack
and Dexter (1978) found that even r^¡ith water matric potentials as cfose
bo saturation as -1 kPa (corresponding to a water content of about
l^J = 3O%), natural- aggregates from the Urbrae fine sandy loam can still-
behave as a brittle nratoriai under tensil.e stress.
Plastic'deformation can only occun if the applied stress ove;lcomes
the shear strengf,h of the soil, and aggregate rupture occurs when the
applied stress overconles the tensile strength of l,he aggregates. Thus by
considering the process by which compression occurs, it can be thought
that the increase in the compression nesistance of beds of aggregates for:rid
in th-is experiment resulted from the j-ncrease in the shear strengl,h and
in Lhe tensile strength of aged aggregates.
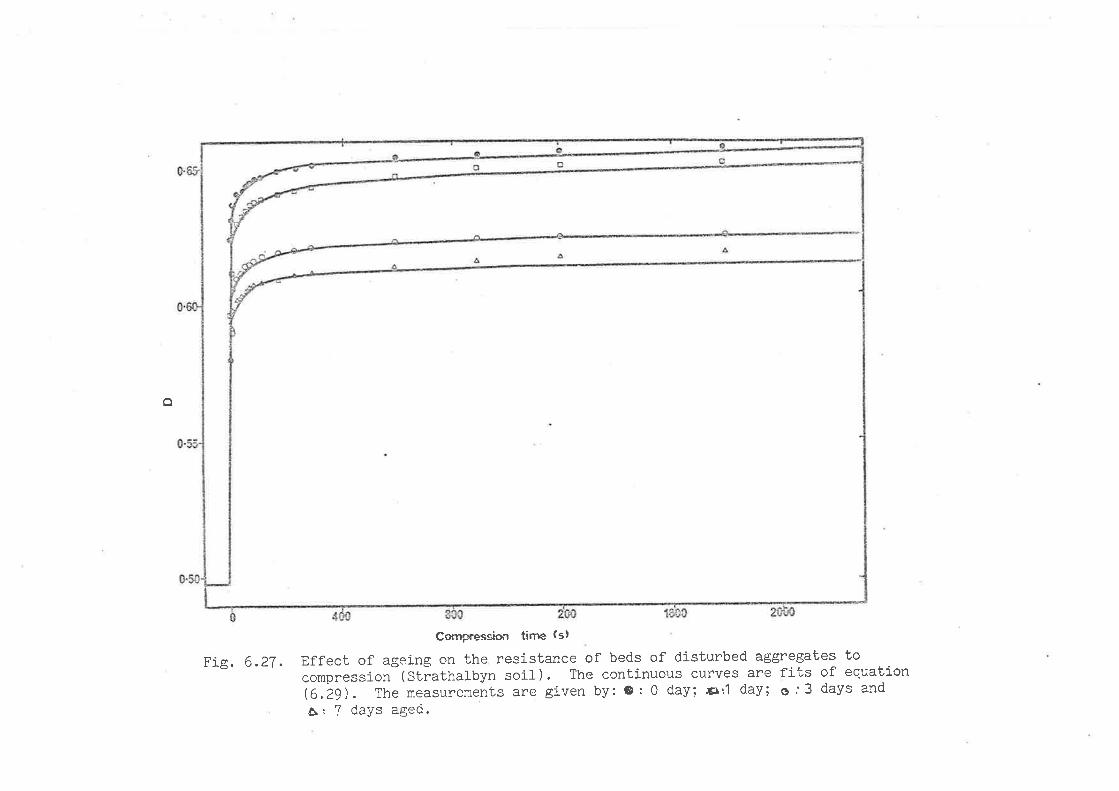
o
Cornpression tinre (s)
Effect of ageing on the resistance of beds of disturbed aggregates toconpression (Strathalbyn soil). The continuous curves are fits of equationrc.zg). The measurements are given by: e I 0 day; a:1 day; s;3 days and
O, 7 days aged.
Fig. 6 .27 .

214.
Based on the resuJt discussed above, it can be suggested that
allowing a thixotropic soil to rest for several- days after tiJ-lage
before any other activity is performed can reduce both compaction damage
and the aggregate brea-kdo'wn risk.
6.5 Conclusions
The experimental results discussed above have demonstrated that the
amplitude as weÌl- as the rates of wetting and drying are gt'eater in tilled
soil than in non-tilled soil. Different tillage systems can resuÌt in
different amplitudes of soil- wetting and drying.
Meteorological factors have an important role in controlfing drying
from a soil- when soil water content is high enough to provide the
evaporative demand. hlhen soil- water content is low (about, l{ = 10% for
the Urrbrae fine sandy loam), the ratê of drying is mainJ-y conLrolled by
soil water content.
In the Spring, the meteorological factors which inffuence drying
from a soil were radiation and temperature. Vüind speed had only a slight
effect. In the lrlinter, however, the role of radial"ion and temperature
are l-ess imporl-ant, and winci speeO is *ore important.
Relative humidity influences soif drying when the soil- water
content is high enough to provide the evaporative demand (Urrbra.e - 1978),
As soon as the soif water contenL decreases (i978 exp. 2, and 1979 exp.),
the influence of relabive humidity becomes insignificant.
Natural- wettlng and drying decreases the strength of Lhe cl-ods
produced by billage. This is shown both by the decrease j.n the energ5'
requ.ired to break the cl-ods, and in the tensile sLrength of soil aggnegates
produced by tillage. The decrease in clod strength is also shown by the

215.
fact that the proportion of the small-er aggregate fracLion produced by
the second implement pass is greater after the soil has been all-owed
to wet and dry naturalJ-y for several days than when i1" is done straight
away after the first implement pass. An increase in the proportion of
the smaller aggregate fraction has also been shown to be caused by the
direct action of wetting and drying.
It has been found that in the first few days after tillage, there
is an increase in aggregate water stability. It is suggested that the
i-ncrease in aggregate water stability in the top tilled layer is a
result of a combination the increase in the amplitude of soil water
content fluctuation and an increase in soif microorganism activit.y.
The increase in water sfability of the aggregates from the deeper layers
of the tilled soil is attributed to a thixol,ropic process.
fn the laboratory, it was fotrnd that ageing the aggregates
distu:.bect by tillage increases the resistance of beds of these aggregates
to compression. Thls was shown both by the decrease in lhe final
equilibrium packing density and by the increase in the time for
compression.
It is suggested that it would be a good idea to delay a second
implement pass a few days after the firsL impì-ement pass. By doing this,
it can be expected that soif can be till-ed with minimum cost and energ5r
to produce a good seed bed. In addj-tion, due to an increase in aggregate
water stability and in the compression resistance, it can be expected
that the compaction problem and aggregate breakclown risk can be minimized.
216.
SECTION 7
GENERAL DISCUSSION AND CONCLUSIONS
7.1 Tntroduction
As discussed in section 1, the main objective of the investigations
described in this thesis is lo study any changes it'l soil physical
properties resul-ting from soil management practices, and then to
rel-ate these changes back to soil management systems. It is expected
that at l-east some of the results which hal'e been obtained catl be
applied to develop soil management systems which a-ì-Ìow the production
of food crops at minimum cost, and which at the same tj-me, minimize
soil ileterioration caused by unnecessary removal of p1anL nutrients '
erosion and compaction.
Much effort has been put into attempts to achieve efficient soil
management systems. History has proven that while we have been
successful- in our attempts to increase crop yield per unit area in a
good soil, r^¡e have faLl-en behind in our attempts to maj-ntain the
condition of the soil-. As suggested in section 1, one of the reasons
for this is probably the limited information avaifabl-e on the effects
of soil management systems on soif physical properties. Cotlsider,
for exampì-e, tì-llage. This is one of the oldesL branches of
agricultural science, and probably one of the mosL inl,ensively studied
In spite of this, soil physical property changes caused by this form
of soil management, especialJ-y any changes in bhe period imnrecliately
aften tillage, have not been studied in any detail. Some farmers have
for a long time be]ieved that al-l-owing a soil to wet and dry naturally
for severaÌ days afLer a first inplement pass enabl.es the soil. to be
more easiJ-y broken in a subsequenL tillage operation (Jones et a7",
1941; VJoodbunn, 1944; Fountaine et a7., 1956). For this phenorûenon
217 .
Sir E.J. Russell (1957) wrotetrfor making the crumbs, the operative
agents are climatic, and the purpose of cul-tivation is to put the soil
into such condiLion that they can act most efficiently the
alternate wetting and drying affected by the rain and wind prompts
the formation of stable crumbs; the resuJ-ting swêIling and contractions
cause cracks which weaken the cl-ods and if now they are struck by a
hoe or harrow while just sufficiently moist, l,hey fal-I into smaller
fragments whích can be further worked dohmrr. It seems this is a
common assumption, and yet there has been little or no attention given
either to the acquisit.ion of quanti|ative data or to Lhe el-ucidation
of the mechanisms involved in this important phenomenon. If the changes
and the mechanisms by which the changes in soil physical properties
can be understood, then it might be possible to make use of these
effects in the development of new soil management systems.
The resul-ts discussed in section 3, 41 5 and 6 have shovm that
these management systems can be attained by simple and nonexcessive
means. In this section, an atlempt is made to discuss al-l the result,s
together, and to combj-ne or to rel-ate them to each other to obtain a
comprehensive soif management systern. Some suggestions for furthen
research are afso made.
7.2 Discussion and Concl-usions
It has been shown (section 6) that tillage modifies soil water
behaviour, and infl-uences both the water stability and the tensile
strength of soiÌ aggregates.
TiJ-1.age influences both the ampliLude of soll waLer coutent
flucl.uation (wetting and drying) and tl-ie mean soil water coutenL.
The rate of drying of the tilted layer of till-ed soil, is ¿qreater Lhan

218.
that of the same layer of non-tilled soil- because of a better water,/
vapour conductivity (Gardner, 1958), pe¡etration of turbul-ent air (Flanks
and Woodruff, 1958; Holmes et aJ. , 1960), and dou¡nward movement of
waLer/vapour due to a higher micl-day temperature gradient (De Vries,
1963; Allmaras et aJ., 1977; Hay, 1977). The greater l^rett-ing rate in
tilled soil- has been suggested to be caused by a greater rain water
infiltrabion due to the greater surface roughness (Burwell et a7.,
1966; Dexter, 1977; Johnson et a7., 1979), a greater water movement
from the deeper layer (the layer beneath the tilled layer), and a
greater water condensation due'-o a col-der surface temperature at nighL
time (van Duin,1954). Under South Australia condiLions, untiÌ 20 days
after bill-age, the cumulative wetting and drying (X A !'I) in the tifled
layer (O - ]0 cm depth) of titled soil- was greater by a factor of 'l .-/ -
2.0 compared with that in the same layer of non-tilled soil. This
magnitude was infl-uenced by the system and the intensity of tillage.
It was found that the cumulative wetting and drying (X A W) in the Lop
layer (O - 3 cm depth) of tilled soiÌ was greater by factors of J,6'
3.1, 3.4, and 4.5 for soil which was managed by direcL drilling with
a combine drill fitted with 5 cm l-ucerne points on sowing; by a rotany
seeder and compaction rol,l-er; by a scarifier, harrow, combi.ne atrd
harrow; and by a Howard rotary seeder, nu""o", rotary seeder, compacLion
rofÌer; respectively.
It was found (section 6.1) that meteoroJ-ogicaÌ factors have an
important role in controlling the rate of drying when. soil water content
is high enough to provide the evaporative demand. When soil water
content is l-ow (below aboub 10% for the Urrbrae fine sandy loam), the
rat.e of dryi.ng is mainly conLroll-ed by soil water content. In the
Spring, the meteorol-ogical factors rvhj-ch infl-uence the rate of drying
are radiatj.on and temperature . Wind speed has on1.y a smal-f ef'fect.
219.
In the irlinter, however, the role of radia.tion and temperature i-s less
important, and wind speed becomes mone imporLant. Relative humidity
influences the rate of drying when soil water content is high enough to
provide the evaporal,ive demand. As soon as the soil- water content
decreases to a value that cannot meet the evaporative dematrd, the
influence of relative humidity becomes insignificant.
Due to the breakdown of interparticÌe bonds, soil disturbance by
tillage decreases aggregate water stability (sections 4 and 6). lriebting;
and drying after tiJ-J-age give rise to an increase in aggregate water
stability. It has been suggesLed that the increase in aggregate water
stabiJ-íty (> 0.5 mm) in the top layer of a bill-ed soil- results from a.
combination of increasing soil water content fl-uctuations (due to
billage) and of increasing soi1. microorganism activity.
The activity of soif microorganisms increases (after tilJ-age) because
there is an extra energy sounce from soil organic matter which was
previously not avail-abl-e (Rovira and Greacen, 1957), and is stimulated
by wetLing and drying (Birch' 1958; Agarvral et aJ-., 1971). This
suggestion is supported by the fact that after reaching a maximurn value
of water stability (after which the organic ntatter is 1-hought again to
become a limiting factor), aggregat.e water sLabil-ity decreases with
time or wetting and drying (section 6.3). The results of a laboral,ory
experiment discussed in section 4 show that in the absence of micro-
organism activity (sterilized soil), wetting and drying a€lgregates which
had been disturbed by tillage resulted in a steady decrease in Lheir
water stabil-ity in agreement with the above suggestion. The increase
in aggnegate water st,abiliLy in the deeper layen, in which diurnal soil
v¡ater content fl.ucLuatious are negligible, was suggested to be mainl-y a
t hixotropic process.

220.
l{ith these findings, it is suggested that an increase in the
water stability of aggregates disburbed by tiJ-lage can be achieved
by providing an extra energy source for soil microorganism activity.
The microorganisms can then replace the inLerparticle bonds (by
exudation, etc. ) which have been destroyed by tiIÌage" Thj-s extra
energy source can be obtained, for example, by incorporating plant
residues during tillage. By doing this, it can be expected that soil
organic matter will not become a limiting factor so soon' and thenefore'
that aggregate water stability will not begin to decrease so rapidJy.
In th1s case, aggregate breakdown risk, and run off with j-ts consequence
of erosion, which usually occurs before complete crop cover is atf,ained,
can probably be mÍnimized.
The finding that wetting and drying cycles can assist the formatiou
of soil aggregates (in nonaggregated soil-s) might be useful in the
restoration of some structurally degraded soils. The rel'atively greater
amplitude of soil water content fl-uctuations in tilled compared wlth
non-till-ed soil, or on stubble burnt compared with stubble retained
managements before billage (HewiLt and Dexter, 1980)' can j-ncrease the
formation of planes of weakness. The soil can then be rnore readily
broken down into a sultable structure. . It is important to remember
that as discussed in section 2.1.4, tillage can have a much higher
efficiency if it makes use of existing planes of weakness ln tlie soil'
This wilI be discussed further l-ater in this section when discussing
soil friability.
To obtain water stabl-e aggregates, welting and drying cycles alone
are not sufficient. As shov¡n in section 4, the exisl,ence of micro-
organism activity in Lhe soil is necessary to produce these water stabl.e
aggregates. Hence, the i-ncorporation of ptant residues in tilJ-age
practice wilt not only stabi.lize the small aggregates tvhich have been

221.
formed by tillage, but will also sLabil.ize tlrose aggregates formed by
wetting and drying which are stil-l held in J-arge cLods, so i,hat when
these cl-ods are broken, they break into smal-l-er water stabl-e aggregates.
In secl,ion 5,1, it has been shown that wetl-ing and drying may
decrease the strength ( drop shatter and tensil-e test ) of remoul-ded and
field aggregates. In field experiments (section 6.2), it lvas found
that as a resul-t of increasing the amplitude of wetting and drying
(section 6.1), the strength of clods produced by tiJ-Iage decreased wlbh
wetbing and dryi.ng cycles. This was shor¡n by the fact that with the
same applied enengy (in the drop shaLter test), clods which have been
subjected to naturaì- wetLing and drying cycles break up more than cl-ods
which have been recently formed and thus which have not been subjected
to increased wetting and drying. The results of tillage experiments
(section 6.2) show that, under South AusLralian conditions, when a
second implement pass is done a few days after the first implement
pass a gneater proportion of smal-1er aggregat,es are produced than when
til.lage is done straight away after t he first implement pass. This
tilth melJ-owing effect is attributed to the effecl,s of the i-ncrease
amplitude of wetting and drying cycles in the til.led soil relative to
that in the non-tilled soil. Based on this finding, it is suggested
that it is worLhwhile to deJ-ay a second implement pass for several
days to alIow the natural- wetting and drying cycles to weaken the clods
by forming internal micro cracks. The cfods can then be broken more
easily by the mechanical i.mpact of a tillage implemetrt. If this is
the case, then 1-he soil- can be tilled with minimum cost and energy to
produce a good seed bed. In addil,ion, with decreasing clod strength'
it. may be possible to reduce the number of implement passes, so Lhat the
compaction problenl caused by the weì gh1, of tlre tractor and implernettt
can be minimized.

22?..
It has been found (secl"ion 3.1) that some agricultural t,op soils
exhibiL appreciable thixotropic behaviour around the water contents
at which tillage is usuall-y performed. Ageing these remoul-ded soils
results in an increase in their strength. In this thesis, this is sho¡rn
by increases in shear strength, penetratioll resi-stancer tensiJe sl,rengtli,
and compnession resÍstance. The water content at which the nlaxinlum
thixotropic strength ratio occurs is influenced by the type of clay
minerals in the soil. For soils containing kaoJ-inite (in this thesis
Urrbrae and Mortlock red brourn earth), the maximum thixotropic strength
ratÍo occurs at a water content around the ptastic limit. For soil-s
containing monLmorillonite or illite, but not containing any kaolini.t,e
(in 1"his thesis V'laco and Strathalbyn soils), this maximum vafue occut's
at a highen water content (between the plasti.c and liquid lirniLs).
Since tilJ-age involves some remoulding and disturbance of' Lhe
soil, il, is suggested that allowing a tilled thixotropic soil- to rest
for several days before any other operations are performed can increase
the sLrength of the soiÌ aggregates which have been disturbed by Lil-Iage.
Due to crack formation (caused by wet,ting and drying) ttre tensile
strength of clods or aggregates in the top (0 - 5 crn) layer of a till.ed
soil decreases with time after til-lage. The sliear strengLh or
penetrati.on resj-stance, on the other hand, miglit noL be influenced by
therse cracks (see section 5.1), and it might even j-ncrease wiLh tj.me
after tilJ-age. For clods or aggregates in the deeper layer, since soil
water contenL fluctuations, at least in t.he first few days after
tillage, are negligible (sect,ion 6.1), in addition to shear strengtlr
increase, there might be an increase in tensÍIe stnength. Vrlith these
strength increases, it can be expected l,hat al-Ìowing a tilled i,hixol,ropi c
soj-l- t o rest for several- days after the first irnpl.ernenL pass resu.ì-ts
noL only in a l-ower cost and energ)¡ in tilli-ng t,he soif as discussecJ
previousì-y, but al-so in a reduction of compacLion damage. This sup;g;est-i.ntl

223
Ís supported by the resul t discussed in section 6.4 which shows that
ageing aggregates disturbed by tillage can increase the resistance of
beds of these aggregates to compression.
The effects of chemical soil conditioners on aggregate water
stability have been wldely reported. In this thesis, it has been
shown that chemical condiLioners also influence the strength of
unsaturated soil (section 3.?). The addition of either phosphoric
acid or cal-cium sul-phate increase the soil- sensitivity, which is
clefinecl as the ratio of the undisturbed soil strength to the remoulded
strength. The application of phosphoric acid increases soil penetration
resistance, bul, decreases the tensile strength of both remoul-ded and
natural aggregates. Cal-cium suJ-phate, on the other hand, deci"eases the
penetration resi-st.ance of remoul-ded soii-, and increases the tensile
strength of both remoulded and natural aggregates. Phosphoric acid
additi.on decreases the resistance of beds of aggregates as a consequence
of its effect in decreasing aggnegate tensile strength. Likewi.se' sj-nce
calcium sulphate increases the tensile strength of soil aggregates, the
addition of this chemical has been found to increase the resi-stance of
treds of these aggregates to compression. This finding 1s consistent
with the work of Braunack atrd Dexl,er (1978) which shor'ved that the
resistance of beds of aggregates to compression increased wj-th increasing
tensile strength of the indiviclual aggregates.
On the basis of 1,hese resufts, it is suggested that conditioners
which decrease aggregate tensj-Ie strength (in this thesis, phosphoric
acid ) should not be used in a soj-l which alneady has aggregates of l-ow
tensiÌe strength. Although such condit¡'-oners can increase aggregat-.e
water stability (e.g.Yeoh, 1979), but to a clecrease in aggregate tensile
sLrength, Lhe soíf could be more susceptible to compactj-on dama.ge.
Phosphoric acicl (ancl any other conditioner v¡ilich decrease aggregale
224.
tensife strength) would be more valuabl.e if it. is used in a hard strong
soil. In this case, the doubl-e beneficial effects of phosphoric
acid, that is an increase in aggregate water stability, and a decrease
in aggregate tensile strength so that the soil can be broken more easily,
can be expected. Phosphoric aci.d might also be useful- in restoral-ion of
some soils which have been degraded by the formation of hard-pan layers.
Since cal-cium sulphate increases aggregate tensil-e strength, it is
suggested that this chemi-ca1 (and any other chemical whi-ch increase
aggnegate tensll-e strength) should be u-sed in soil- wittr aggregates of
low initial tensil-e strength. The double benefic-lal effects of calcium
sulphate, that is to increase aggregate water stability, and to increase
aggregate tensil-e strength with a consequence of increasing the
resistance of the soil to compression can then be attained.
The measuremenL of soil friability developed in section 5.2 has been
found to be very useful- for the prediction of the soil. water ccntent
which gives maximum soil crumbling when the soil is tilled. This approach
is based on a brit.tl-e fracture theory for soil aggregates developed by
Braunack et al-. (1979). The friability is measut'ed by l-he vafue of
the parameter k of equation
Iog" o, K-klog V Q.1)e
where orr and V are the tensife strength and the vol-ume of indì.vidual
aggregates respectì-ve]y, and K and k are adjusl,able parameters. The
val-ue of k ranges from k < 0.05 (which is consiciered to be no1, friabl-e)
to k > O.40 (which is considered to be mechanically unstable).
The Urrbrae and Strathalbyn soi1s, and probably most other soi1.s'
are most friable at water contenLs corresponding to a matric water
potential of -100 kPa (!rt = 18.1% for the Urrbrae soil and lnl = 16.3 for

2?_5.
the Strathalbyn soj.l- ) . At this water conLenl the Urrbrae soíl has a
k value of 0.28, and the Strathalbyn soil has a k val-ue of 0.22. The
optimum water contenL for tillage predicted by this theory (which is
slightly below the plastic limib) is in good agreement with that found
in previous til-lage experiments (Lyles and l,'loodruff , 1962; Bushatr and
Ghildyal , 1972; Ojeniyi and Dexter, 1979a).
l^lith this theory it is possibl-e to explain why this optimuin water
content occurs. It. is widely known thab when tillage is done in very
wet soils, it cannot produce a good tilth, and may even destroy the
previously exisLing aggregates, Likewise when t,illage is penformed in
a dry soi1, excessively large clods are produced instead of smal-l- stabl-e
aggregat,es. As shown in section 5.2, at these water contents the
Urrbrae and Strathalbyn soifs, and probably most other soils, have a
small k value, and are therefore not friable. Under these condiLions,
the strength of any small soiJ- aggregates does not differ much from
that of the soil- mass itself. Thus, when this soil is till-ed' it
cannot break up into rnechanicalJ-y stable soil- aggregates, btt1, it v¡ill
break up into individual- particles or dust (if the tensiÌe strength is
very 1ow) or tunn up into large cl-ods (if the tensÍl-e strength is very
high). Thus, at these water contents, tillage is not able to make lrse
of the pre-existing planes of weakness.
This approach coul-d be useful- in the study of the effects of soil
management practices, such as the application of soil conditioners,
stubble management etc., on soif physical- properties, because friabì.Uby
is almost synonitnous with t he quality of Lhe physicaÌ condi-tion of an
unsaturabed soil-. It has been shoi^rn (section 3.2) that the application
of chemical- conditioners not only inffuences soil strength, but also
soil- friabillty as measured by 1,he parameter k of equation (7.1).
Wetting arrd drying and freezing and thawing cycles have also been shomr

¿¿.o.
to infl-uence the friability, k. It is therefore suggested that in a
soil of low strength, soil management practice should be directed to
increase soil- strength, and aL Lhe same time should al-so increase the
friâbility of the soil. Thus to obtain maximum benefit, the application
of calcium sulphate (since it decreases soil friabili-by as shovm in
section 3.2) shoul-d be combined with other management practices which
can increase soil friability, such as by increasing the amplitude of
wetting and drying etc. For phosphoric acid, it seems that when it is
used in soil of high tensil-e strength there is no problem, because
besides decreasing tensi.le strength, Ít is al-so abl-e to increase soil-
friability.
The measurement of soil friability nay also prove to be useful to
explain other soif nechanical phenomena. As discussed in section 2.1.4,
Bushan and Ghitdyat (1971; 1972) found that the mean welght diameter
(MV'ID) of cl-o<1s produced by tillage increased with i-ncreasing radius of
curvature of the implement. This is not surprising. ImpÌements of
greaten radius (i.e. Ìess curved implements) probabJ-y produce smalfer
compressive stresses in the soil. Such compressive stresses can give
rj.se bo clod or aggregate LensiÌe failure. The sj-ze of the resulting
fragments depends on the val-ue of the soil- friabiliLy' k.
7 .3 Suggestions for further rvorl<
It has been shown (section 6.2) that under South Austra]ian conditi.ons,
the increase in the ampliLude of wetting and drying of a soil- tj lled
with one implemenl, pass can result in greater cl-od f'ragmentatic¡n in the
second implement pass. In another study, Utomo ancl Dexter ('1981c)found
that this practice did not resuft in a si-gnificant change in the
fragmenl,ation of soils of the Coombe and Vtricken soil- series of England..

227
The reason for this difference in bel'raviour is nob yet undersLoocl.
Clearly, the appropriate amplitudes of wetting and drying for internal
micro-cracking are not attained in these soil-s. This might be a
consequence of the climatic conditions prevailing during the experj-ment
and/or a consequence of the values of certain key physical properties
of the soifs resulting, perhaps, from their mineralogy and chemistry.
Further experiments to investj-gaLe these factors woufd be very useful
to explain this phenomenon.
The increase in soil strength after remoulding or disturbance
(section 3.1 ) can be taken into account in soil- mana¿qement practice to
reduce compaction damage caused by the weight of agricultural- implements.
It has been suggested that this process might al-so infl-uence seed
germination and crop growth. To test this suggestion, further experirnents
into factors such as the effects of matric water potential changes which
accompany thixotropic hardening on plant water ava:ilabiIÍby, and the
effects of increasing soil strength and changing pore size distribution
on water and pl-ant nutrient movement, are requj-red. fnvestigations into
the optimum soil structures required for crop growth, such as su,ggested
by Koenigs (1961) for rice, could al-so be rel-ated to the Lhixotropy
phenomenon.
As discussed in section 3.2, the appJ-ication rate of cafcj-um
sulphate in this work mj-ght be consj-dered too high from the agricuJ-t.ural
point of view. An investigation to study Lhe minimum applicat ion rate
which can increase soll- strength, or to obtain oLher chemical
condiLioners whj-ch coufd economically irrcnease soil- strength woul<i be
very useful for managing soils of low stretrgth.

Aasheim,
Aitchison, G.D.Mech.
Allmaras,
Anderson,
228.
B]BI-IOGRAPHY
T.S. 1949. The effect of tillage method on soil moisl,ureconservation and on yieJ-d quality of spring wheat in theplains area of Nonthern Montana.Montana State Coll. Agric. Exp. Sta., Montatla. Bull. No.
1965. Panef discussion. Proc. 6and Fndn. Engng. 3: 318-321,
468.
Abrukova, L.P. 1971. Structural and mechanical properties of typicalthick chernozem.Pochvovedenie No. 6: 79-87,
Agarwal,4.S., Singh, B.R. and Kanehiro, Y. 1971. Soil nitrogeir andcarbon mineral-ization as affected by drying - rerveLting cycles.Soil Sci. Soc. Amer. Proc. 35: 96-100.
tl-l Int. Conf. on Soil
Allison, L.E. and Moore, D.C. 195A. Effect of Varna and HPAN condiiiorlei"son aggregation, surface crusting, and moisture retentj-on inalkali soils.SoiI Sci. Soc. Amer. Proc. 20: 143-146.
Allmaras, R.R. 1967, Soil- water storage as affected by infil-trationand evaporation in rel-ation to tiJ-lage-induced soif sl-ruci-uneProc. Conf. TilJ-age for Greater Crop Production. ASAE PubI.No. 168.
R.R., Hall-auer, E.4., Nelson, W.W. and Evans' S.D. 1977.Surface energy balance and soil thermal property modifj,cationsby tiltage-induced soil structure.Agric.Exp. Sta. Univ. Minn. Tech.8uI1.306.
D . M. and Hoekstra, P . 196rs . Migration of j-nterlamel-Iar wai,erduring freezing and thawing of TJyoming bentonite.Soil Sci. Soc. Amer. Proc. 29: 498-504.
Anderson, G., Pidgeon, J.D., Spencer, H.B. and Parkes, R.A new hand-held recording penetrometer for soilJ. Soil Sci. 31: 279-296.
1 gB0.sLucii-es.
Aref , K.E., Chancellon, Il'I.J. and Nielsen, D.R. 1975, Dynam:lc sl-iearstrength properties of unsaturai;ed soils.Transactions of the ASAE 1B : B 18-823 .
Arndt, I,tJ. 1964. Investigation of some physical probl-ems of Katherinesoils.Techn. Memo. 64/3, C.S.I.R.0. Div. of Land Res. and RegionalSurvey, Canberra.
Arya, L.M. and Blake, G.R. 1972. Stabili.za|ion ofl newly formed soilaggregates.Agron. J. 64:177-180.
ASAE. 1971. Compaction of Agriculturaf Soils.ASAE monograph, ASA11, St. Joseph, Michigan, U'S.4.

?-29.
ASTM 1946. Methocl of drop shatter te.st for coal- (D 440-37 T).Proc. Amer. Soc. for T'esting Materials 46: 372-374.
Aylmore, L.A.G. 1960. The hydration and swelling of clay mineralsystems.Ph.D. thesis, Univ. of Adelaide.
Bail-ey, A.C . 1971, Compaction and shear in compacted soil-s.Transactions of the ASAE 14: 201-205.
Bailey, A.C. and Vanden Berg, G.E. 1969. Yielding by compaction andshear in unsaturated soils.Transactions of the ASAE 11: 307-311, 317.
Bar1ey, K shearing strength of an arable red brownP. 1964. The highearth.Aust. J. Sci. 26:
Barley, K.P . , Farrel-l- , D. A. and Greacen, E. L . 1965. T'he infl-uence ofsoil sLrength on l,he penetration resj-stance of a J-oam byplant roots.Aust. J. Soil Res. 3: 69-79.
Barley, K.P. and Greacen, E.L. 1967. Mechanical resistance as a soiffactor infl-uencing the growth of roots and underground shoots.Adv. Agron. 19: 1-40.
Bateman, H.P., Naik, M.P. and Yoerger, R.R. 1965. Energy required topulverize soil- at different degrees of compaction.J. Agric. Engng. Res. 10: 132-141.
Baver, L.D., Gardner, W.H. and Gardner, W.R.4th ed. New York : John WiJ-ey.
1972, Soil PhYsics
Baver, L.D. and Rhoades, rl'F. 1932. Aggregate analysis as an aid in thestudy of soil- structure relationships.J. Amer. Soc. Agron. 24: 920-930.
Becher, H.H, 1978. !'lasserspannungsabhanglger eindringwiderstand eines'- pelosol-s.
Geoderma 21: 105- 1 18.
224
fntroduction to Terrain-Vehicle Systems.:--Tfie Univ. of t4ichigãñ-Pness.
Bekker, M.G. 1969,Ann Arbor
Benoit, G.R. . 1973. Effect of freeze-thar,v cycles on aggregate sLabilityand hydraufic conductivity of three soil aggregate sizes.Soil Sci. Soc. Amer. Proc. 372 3-5.
Berger, L. and Gnaedinger, J. 1949. Thixotropic strength regain ofclays.Anler. Soc. for Testing Material-s Bull- . No. 160: 64*68.
Birch, H.F. 1958. The effect of soil- drying on Lrumtts decotttposiLionsand niLrogen availabilitY.Pl-ant and Soil 10: 9-31.

230.
Bisal-, F. and Nielsen, K.!'. 1964, SoiI Aggregates do not necessarilybreakdown over winLer.Soil Sci. 9Bz 345.
Bishop, A.W. 1959. The pninciple of effective stress.Teknisk Ukeblad 196¡ $!S-863.
BÍshop, A.W. and Henkel, D.J. 1967. The Íìeasurement of soil- properLiesin the triaxla] test.2nd ed. London : Erdward Arnold Pub1.
Bjerrum, L. and Lo, K.Y. 1963. Effecl of aging on shear strengtlrproperties of normalÌy consolidated clays.Geotechnique i3: 147-156.
Bfackmore, A.V. 1956. Time and tempera.ture as factors in the dispersionsoif crumbs in water.Aust. J. Agric. Res. ' 7 : 5':4-565 .
Blake, G.R. and Gi1man, R.D. 1970. Thixotropic changes with aging ofsynthetic soil aggregates.Soil Sci. Soc. Amer. Proc, 34: 561-564.
Bodman, G.B. 1949. Mebhods of measuring soil consistency.Soil Sci. 68:37-56,
Bodman, G.B. and Day, P.R. 1943. Freezing points of a group ofCalifornia soils and their extracted clays.Soil Sci. 55: 225-246.
Bouyoucos, G.J, 1924. The influence of waten on soil- granulation.Soil Sci. 1B: 103-109.
Brace, W.F. 1964. Brittle fracture of rocks.the Earth's Ci'ust (ed. i,,i.R. Judd).New York EI sevl-er.
In State of Stress i.n
Braunack, M.V.Ph. D.
1979. Properties of aggregate seed bedsthesis, Univ. of Adelaide.
Braunack, M.V. and Dexter, A.R. ß79. Compaction of aggregate beds.In l"fodification of Soi I Structure (eds . lrJ.l^1. Ernersou, R . D.llond and A. H. Dexter).I-ondon : John l^liley.
Braunack, M.V., Hewitt, J.S. and Dexter, A'R. 1979. Brittle fractltreof soif aggregates and the compaction of aggregate beds.J. Soil- Sci. 30: 653-667.
Bromwel-l-, L.G. 1966. The friction of quarLz in high vacuum.Sc . D. thesis , M. I . T. , Cambridge l4ass .
Cited by Lambe, T.W. and Whitman, R.V. 1969. Soi I MechanicsNev¡ York John Il,lil-ey.
Bryant, J.C., Bendixen, T.W. and Slater, C
the water-st,ability of soiÌs.Soil Scj . 65t 341-345.
S. 1948. Measurement of
231.
Burgers, J.M. and Scott-Blair, G.W. 1948. Report on the principfesof rheol-ogical- nomencLature.Proc. Int. Rheological Congress, Amsterdam.
Burwell , R. E. , Al-l-maras, R. R. and Sloneker, L. L': 1966. 'Structuralalteration of soil- surface by tilJ-age and rainfal-l.J. Soil Vrlater Conserv. 212 61-63.
Bushan, L. S. and Ghildyal , B.P . 1971 . Infl-uence of shape of impJ-emetrt son soil structure.Tndian J. Agric. Sci.41:744-751,
Bushan, L.S. and Ghildyal, B.P. 1972. Influence of radius of curvatureof mouldboard on soil structure.Indian J. Agric. Sci. 42: i-5.
Byrd, C.ü1. and Cassell, D.K. 1980. The effect of sand cont.erit uponcone index and selected physÍcal properties.Soil Sci. 129: 197-204.
Camp, C.R. and GilI, W.R. 1969. The effect of drying on soil- strengthparameters.Soil Sci. Soc. Amer. Proc. 33: 641-644.
CampbelJ-, D.J, 1975. Liquid lirnit determination of arabl-e top soilsusing a drop cone penetrometen.J. Soil Sci. 26: 234-240.
Campbell, D.J. 1976. Plastic limit determination using a drop-conepenetrometer.J. Soil Sci. 27: 295-300.
CampbelJ-, D.J, 1977. A laboratory penetrometer for the measurement ofthe strength of soil- cl-ods.J. Agrlc. Engng. Res. 22: B5-9'1 .
Campbell, D.J., Stafford, J.V. and Blackwell, P.S. 1980. The plasticlimit, as determined by the drop-cone test, in reÌation tothe mechanicaf behaviour of soil-.J. SoÍl Sci. 31: 11-24.
Campbell, R.B. 1952. Freezing point of water in puddled and unpuddJ-eclsoils at different soil moisbure tension values.Soil Sci . T3: 221-229.
Carneiro, and Barcellos, A.. Bull. No. 13.
1953. Concrete tensile strength.
Carnes, A. 1934. Soil crust. Methods of study, their strength andmethod of overcoming.Agric . Engng . 15: 167 -169 , 1T 1 .
Cary, J.i/ú. 1965. Water fl.ux in moist soil-: Thermal versus suctiongradl ent.s.Soil Sci. 100: 168-175.
Cary, J.'t'i. 1966. SoiI moisture l-ransport due to thermal gradi-enLs.Soil Sci. Soc. Amer. Proc. 30: 428-433.
F. L. L. B.R. 1. L. E.M
¿Jt.
Cashen, G.H. 1966. Thixotrophy and Dilatancy.Clay minerals 6: 323-331.
CeraLzki, W. 1956. Zur wirkung des frostes auf die strul<tur des bodens.Z, Pflanzenerahr, Dungung Bodenk, 72: 15-32.Cited by Baver, L.D., Gardner, ü/.H. and Gardner, W.R, 1972.Soil Physics. 4th ed. New York : John WiJ-ey.
Cernuda, C.F., Smith, R.M. and Vicente-Chandler, J. 1954. Inffuenceof iniLial moisture condition on resistance of macro-aggregatesto slaking and 1-o water-drop impact.Soil Sci . 77: 19-27 .
Chancel-Ior , I,nl. J . and Schmidt, R . H. 1962. A study of soil- deformat.ionbeneath surface l-oads.Transactions of the ASAE 5: 240-246.
Chance]lor, W.J., Vomocil, J.A. and Aref, K.S. 1969. Energy dispositionin compression of three agricultural- soils.Transactions of the ASAE 12: 524-528, 532.
Chisci, G., Lonenzi, G. and Piccolo, L. 19T8. Effect of ferric
Chri-stensen, O. 1930. An index of friability of soils.Soil Sci. 29: 119-135.
Cockroft, 8., Banley, K.P. and Greacên, E.L. 1969. The penetrationof clays by fine probes and root tips.Aust. J. Soil- Res. Tz 333-348.
Collis-George, N. and LJ-oyd, J.E. 19T8. Description of seedbeds in
conditj-oner on c1ay. In(eds. V,l.hl. Emerson, R.D.London : John l,nlj.ley.
terms of shea.r' strength.(eds. hI.lr/. Emerson, R.D.London : John hliJ-ey.
Modification of Soil StructureBond and /\. H er).
In Modification of Soif StructureA ter
In
Collis-George, N. and Vriilliams , J. 1968 . Comparison of the ef fec1,s ofsoil matric pol-ential- and isobropic effective stress on thegermination of L,actuna sativa.Aust, J. Soil. Res. 6: 179-192
Cooper, A.W, 1971. Effect of tilJ-age on soil compactionCompaction ofl Agricultura.f Soils.ASAE monograph, ASAE Sb. Joseph, Michigan, U.S.A.
Cornfield, A.H. 1955. The measurenlent of soi-l- structure and factorsaffecting it.J. Sci. Food and Agric. 6¿ 356-360.
Conte, A.E, 1962. Verlica] migration of parti.cles i-n front of amoving freeztng plane.J. Geophys. Res . 67 : 1 085- 1 090.
Coughlan, K.J., Fox, Id.E. and Hughes, J.D. 1973. Aggregation in swel]lngcJ-ay soi1s.Aust. J. Soil, Res. 11: 133-141.

233.
Coughlan, K.J. and Fox, !'1.E. 1977, Measurement of aggregate size.Aust. J. Soil Res. 15: 211-219.
Crawford, C.B. 1964. Interpretation of consofidation test.J. SoiI Mech. and Fndn. Div., A.S.C.E. 90 (SM 5): 87'102.
Croney, D. and Coleman, J.D. 1954. Soil- structure in relation tosoil- suction (pF) .
J. Soil Sci. 5z 75-84.
Davis, P.F., Dexter, A.R. and Tanner, D.W, 1973. IsoLropic compressionof hypotheticaf and synl,hetic bilths.J. Terramechanics 10: 21-34.
Day, P.R. ancì Holmgren, G.G. 1952. Mj-croscoplc changes in soilstructure during compression.Soil Sci. Soc. Amer..Proc. 16t 73-77.
Day, P.R. and RippJ-e, C.D. 1966. Effect of shear on suction insaturated clays.Soil Sci. Soc. Proc. 30: 675-679.
De Boodt, M. and Gabriels, D. 1976 (eds. ) Proc.on soil conditioning.Med. Fac. Landbouww. Rijksuniv. Gent.
rd3 Int. symposium
Dettmann, . 1958. I¿'later uptake by pure cJ-ays and soil crumbs.Soil Sci. 9: 306-315.
Dettmann, M.G. and Emerson, W.W. 1959. A modified permeability testfor measuring the cohesion of soil crumbs.J. Soil Sci. 102 215-2?6.
de Vries, D.A. 1963. Thermal- properties of soils.Pl-ant Environment (ed. van Wijk, !'1.R. ).ãñlÈerOam : North Holland Publ.
In Physics of
Dexter, 1975, Uniaxial- compression of ideal brii.tle tilths.Terramechanics 12: 3-14.
Dexter, A"R, 1977. Effect of rainfal-1, on the surface microrel-ief oftilled soil-.J. Terramechanics 14t 11-22.
Dexter, A.R, 1978. A stochastic model- for the growth of roots 1ntitled soil-.J. Soil Sci. 29: 102-116.
41/1.
M.GJ.
A. R.J.
Dexter,
Dexter,
A.R. and Tanner, D.1,{. 1972, SoiI deformations by a movingcutting blade, an expanding tube and a penetral-ing sphere.J. Agric. Engng. Res. 17t 371-375.
A . R " and Tanner, D .l'1. 1973a. The response of unsaturated soil-sto i-soLropic stress.J. Soil Sci. 24: 491-502.
Dexter, A.R. and Tanner, D.W. 1973b. The force on spheres penetratingsoil .
J. Terramechanics 9: 31-39.

234.
Dex|en, A.R. and Tannen, D.W. 1974. Time dependence of compressibilityfor remoul-ded and undisturbed soils.J. Soil Sci. 25: 153-164.
Dowdy, R.H. 1975. The effect of organic polymers and hydrous ironoxides on the tensil-e strength of clays. In Soil Conditioners.Soil Sci. Soc. Amer., Madison. Special publ. ¡¡o. Z.
Dowdy, R.H. and Larson, W.E, 1970. Tensil-e strength of clay films.A measuring technique.Soil Sci. Soc. Amer. Proc. 34: 948-950.
Dowdy, R.H. and Larson, W.E . 1971. Tensil-e strength of montmoriLl-oniteas a function of saturating cation and water contenL.Soil Sci. Soc. Amer. Proc. 35: 1010-1014.
Emerson, W.W, 1954. The cletermination of the stabiJ-ity of soif crumbs.J. Soil Sci. 5: 233-?-50.
Emerson, W.W. 1955. A note on the sodium saturation test for determiningthe cohesion of moist soif crumbs.J. Soil Sci. 6z 160-161.
Emerson, W.W, 1967. A cl-assification of soil- aggregates based on theircoherence in water.Aust. J. Soil Res. 5: 47-57,
Emerson, W.W., Bond, R.D. and Dexter, A.R. 1978.of Soif Structure.
(eds. ) Moclifical,iot-t
iIey.
Emerson, w.w. and Grundy, G.M.F. 1954. The effect of rate of wettingon water uptake and cohesion of soÍl- crumbs.J. Agric. Sci. 442 248-253.
Evans, A.C. 1948. Some effects of eanthlvorms on soil structure.Ann. Appl. Biol . 35: 'l- 13.
Farrell, D.A. and Greacen, E.L. 1966. Resistance to penetration offine probes in compressible soil-.Aust. J. Soil Res, 4z 1-17,
Farrell, D.4., Greacen, E.L. and Larson, W.E. 1967. The effect ofwater content on axial strain in a l-oam soil under Lensionand compression.Soil Sci. Soc. Amer. Proc. 31 : 445-450.
Farrel-Ì, D.4., Larson, W.E. and Greacen, E.L. 1967. A modeJ- study ofthe effect of soil variabil-ity on tensiÌe strength andfracfure.Paper presented at 1,he 1967 ASA meeting, Washir-igton.
Fisher, R.A, 1926. 0n the capilJ-ary forces in an ideal soil;Correction of formulae given by l{.8. Haines.J. Agric. Sci. 16: 492^505.
Fc¡untaine, E.R., Brown, N.ll. and Payne, P.C.J. 1956. The measuremeni,of soil- workability.Trans. 6th Int. Cong. Soit Sci. VI (3): 495_504.
n

235.
Fox, !'1.E. 1964. A study of bulk density and waten in a swel-Iing soilSoil Sci. 98: 307-316.
FreundJ-ich, H. 1935, Thixotropy.Paris : Henman et Cie.
Furukawa, H. and Kawaguchi, K. 1969. The breakdown of soil aggregatesand its refationship to the f'low behaviour of cJ-ayey soil.Soil and Ferts. 34 ( 1971 ): 505.
Gardner, W.R. 1958. Some steady state sofutions of the unsaturatedmoisture flow equation with application to evaporati-on froma wa.t.er table.Soil Sci. 85 : 228-?.32.
Gardner, W.R. and Hillel, D.I. 1962. The relation of externalevaporative conditions to the drying of soils.J. Geophys. Res. 67: 4319-4325.
George, K.P. 1967. Effecl of soil structure and thixotnopic hardeningon the swell-ing behavior of compacted clay soiÌs (Discussion).Highway Res. Record No. 209. 20-22.
Gerard, C.J. 1965. The influence of soil moisture, soil texture,drying conditions, and exchangeable cations on soil strength.Soil Sci. Soc. Amen. Proc. 29: 641-645.
Gerard, C.J., Bloodworth, M.E., Burl-eson, C.A. and CowJ-ey, W.R. 1961.Hardpan formation as affected by soil moisture l-oss.Soil- Sci. Soc. Amer. Proc. 252 460-463,
Gerard, C.J., Cowley, W.R., Burl-eson, C.A. and Bloodworth, M.E. 1962,Soil hardpan formation as affected by rate of moLsture loss,cyclic wetting and drying and sunface applied forces.SoiI Sci. Soc. Amer. Proc. 26: 601-605.
Gerard, C.J., Cowley, W.R. and Kunze, C.W. 1966. Influence of dryingconditions on noncapillary porosity.Soil Sci. 102t 59-63.
Gibbs, H.J., Ili:ì-f , J.W., Holt.z, W.G. and Wal-ter, F.L. 1960. Shearstrength of cohesive soi.ls.Proc. Res. Conf. on Shear sLrength of cohesive soils.A. S. C. E. - Uni.v. of Col-orado : 33^162.
Gill, !'1.R. 1-959. The effects of drying on the mechanical strengLhof Loyd clay.Soil- Sci. Soc. Amer. Proc, 23: 255-257.
Gill , l^1. R . and McCreery, W. F . 1960. Rel-ation of size of cut t,otiltage tool efficiency.Agric. Engng. 41: 372-374, 381.
Gill, i,'i .R. and Vanden Berg, G.ETraction.
1967 , Soì.1 Dynanrics in T-i-1l,age
USDA Agr. I'landbook No. 316,
Gooderham, P .TPh. D
1973.thesis,
SoiÌ physical conditions ancl root growth.Univ. of Reading.

236.
Goodwi.n, and Spoor,Proc. Inst.
G. 1977 . Soil- factors infl-uencing work days.Agric. Engrs. 32: 87-90.J
Gray, D.l{. and Kashmeery, N.A, 1971. Thixotropic behavior of compactedclays.J. Soil Mech. and Fndn. Div., A.S.C.E. 9T (SM 1): 193-207.
Greacen, 1960. Vrlater content and soif si;rength.Soil Sci. 11:313-333.
Greenland, D.J., Rimmer, D. and Payne, D. 1975. Determination ofstructural stability class of English and l,rlelsh soj-ls, usinga water coherence tesL.J. Soil Sci. 26i 294-303.
Grierson, T.T, and Oades, J.M. 1977, A rainfall- simulator for fj-eldstuciies of runoff and soif erosion.J. Agric. Engng. Res, 22: 37-4/+.
R.J
E.LJ.
Griffith, A.A.Phit.
1921, The phenomena of rupture and ffow in solids.Trans. Soc. (London) A ZZI: 163-198.
Gurr, C .G., Marshal-I, T.J. and Hutton, J.T. 1952. l4ovement of waterin soil due to a temperature gradient.Soil Sci. T4: 335-345.
lladas, A. 1975, Drying of layered soil col-umns under nonisothermal-conditions.Soil Sci. 119: '143-'148.
Hadas, A. and HilIeJ-, D. 1972. Steady state evaporation throughnon-homogenous soils from a shall-ow water table.Soil Sci. 1 13: 65-73.
Haefeli, R. 1951. Investigations and measurements of the shearstrengths of saturated cohesive soil-s.Geotechnique 2:'l86-208.
Haines, W.B, 1925. Studies in the physical properties of soils.II. A note on the cohesion developed by capillary forcesin ideal soif.J. Agric. Sci. 15t 529-535.
Haines, W.B. 1927. Studies in the physical properties of soils.IV. A further contribulion to the theory of capiJ-laryphenomena in soil-.J. Agric. Sci_. 17: 264-290.
Harnpton, D.J., Yoder, E.J. and Burr, I.l,,i. 1962. Varjability of engj-neer-ing properties of Brool<ston and Crosby soifs.Highway Res. Board Proc. 41: 621-649.
Hanks, R .J. and Harkness, K.A, 1956. Soil penetrometer employs strain02 0ôqõgbvu.
Agric. Engng. 372 553-554.
.J., Gardner, H.R. and Fairbourn, M.L. 1967. EvaporaLion ofwaler from soils as infl-uencecl by ciryìng r.riLh wind or r¿td-iation.Soil Sci. Soc. Arner. Proc. 31: 593-598.
Hanks, R
Hanks, R .J. and !'loodruff, N.P. 1958.vapor transfer through soil,Soil Sci . 86 : 1 60-164 .
237.
fnfluence ofl wi-nd on v¡atergravel and straw nlul-ches.
Hansbo, S. 1957. A new approach to the determination of the shearstrength of clay by the fall cone test.Royal Swedish Geotech. Inst. Proc. No. 14.
Hardy , f . 1925 . Cohesion in coll-oj.dal- soil.s .
J. Agric. Sci. 152 420-433.
Harris, R.F., Chesters, G. and All-en, 0.N. 1966. Dynamics of soil-aggregation.Adv. Agron. 18z 107-169.
Harris, !'l L. 1971. The soil compacUion process. TnAgricultural Soil-s.
Compaction of
ASAE monograph, ASAE, St. Joseph, Michigan, U.S.A.
Harris, lnl.L., Buchefe, W.F. and MaÌvern, L.E. 1964. Rel-at,ionshipof mean stness, volumetric strain, and dynamic l-oads in soil-.Transactions of the ASAE 7: 362-364, 369.
Hay, R.K.M. 1977. Effects of tillage and direct drÍJ-Iing on soiltemperature in wi-nter.J. Soil Sci, 28: 403-409.
Hendrick, J.C. and Vanden Berg, G.E. 1961. Strength and energyrel-ation of dynamically loaded clay soiJ-.Transactions of the ASAE 4: 31-32.
Henin, c 1938. Etude physico-chimique de Ia stabilite structuraledes terres.Monognaph, Nationaf Center of Agronotnic Res., Paris.Cit,ed by Baver, L.D., Gardner, W.H. and Gardner, W.R, 1972.Soil Physics. 4th ed. New York : John I'liley.
Hewitt, J.S. and Dexter, A.R. 1980. Effects of tillage and sLubbfemanagement on the structure of a swelJ-ing soil.J. Soil Sci. 31: 203-215.
HilJ-el, D. and Hadas, A. 1972, Isothermal drying of structurallyJ-ayered soif cof unms.Soil- Sci. 113: 30-35.
Hinman, W.C. and Bisal, F. 1968. Alterations of soil- sl,rucf-ure uponfreezing and subsequent drying.Can. J. Soil- Sci. 48: 193-197.
Hofman, G. 1976. The j-nfluence of drying and stoning soi-l samples onaggregate sLabi-1ity.Med. Fac. L,andbouww. Rijksuniv., GenL 41/1: '101-106.
Hol-mes, J.W., Greacen, E.L. and Gurr, C.G. 1960. The evaporation c.rf
water frpp bare soils with different tilths.Trans. 7Ln Int. Congr. Soi.l ScI. 1: 'lBB-194.
238.
Horn, H.M. and Deere, D.U. 1962. Frictional characteristics ofminerals.Geotechnique 12:. 319-335.
Ingì-es, 0.G. 1962. A theory of tensile strength for stabitized andnaturally coherent soil-s.Proc. 1st Aust. Road Res. Board 1: 1025-1047,
fngJ-es, 0.G. 1963. The shatter test as an index of strength for soilaggregates.Tewksbury symposium on fracture, Univ. of Melbourne: 284-302.
Ingles, 0.G, 1970. Mechanj-sm of clay stabilization with inorganicacids and alkali.Aust. J. Soil Res. B: B1-96.
Ingles, 0.G. and Frydman, S. 1963, An examination of some methods forstrengi.h measurements in soifs.Proc. 4th Aust.-N.2. Conf. Soil Mech. and Fndn. Engng.: 213-219.
Ingles, 0.G. and Lafeber, D. 1966. The influence of vofume defectson the strength and strength isotropy of stabilized cJ-ays.Engng. Geol_ogy 1: 305-310.
Ingles, 0.G. and Lafeber, D. 1967. The initiation and devel-opment ofcrack and joint systems in granular masses.Proc. Symp. on Stress and Fail-ure Around Underground Opening,Uni-v. Sydney.
Jagnow, G 1972. SoiJ- respiration, nitrogen mineral-ization, and humusdecomposition in East African soils after drying and rewetting.Soil and Ferts. 35 (1972): 546,
Jamison, V.C. 1954. The effecL of some soif conditioners on friabilityand compactibil-ity of soil-s.Soil Sci. Soc. Amer. Proc. 18: 391-394.
Jenkinson, D.S. and Oades, J.M. 1979, A method for measuring AdenosineTriphosphaLes in soil.Soil Biol . Biochem. 1 'l : 193- 199 .
Johnson, C.B. , Mannering, J.V. and Moldenhauer, Id.C. 1979. Influence ofsurface roughness and clod size and stability on soil and waterlosses.Soil- Sci. Soc, Aner. J. 43: 772-777,
Jones, T .N., Hamblin, I.E. and Leonard, 0.4 " 1941, VJeed control- andcotton tillage in Blackbelt (Prairie) soils.Miss, Stat,e ColI., Agnic. Exptl. Sta. Mississlppi. Tech.Bull. No. 29.
Joshua, W,D: and de Jong, E. 1973. SojL moisture movemenl undertemperature gradients.Catr . J. Soil Sci . 53 : 49-')T .
Kentper, W.D. and Koch , E. J. 1966 . Aggregate stabiJ-ity of soj.ls fromwestern United States and Canada.USDA Agric. Techn. Bull. No. 1355.

239.
Kenney, T.C. 1967. The influence of minera]ogical composition onresidual strength of natural soj-Is.Proc. of the Oslo Geotech. Conf. on Shear Strength andProperties of Natural- Soil-s and Rocks 1 : 123-129.
Kezdi, A 1979. Soil. Physi.qs. Selected Topics.Elsevier : Amsterdam.
Kimball, B.A. 1973. lnlater vapoun movement through mulches unden fiel-dconditions.Soil Sci. Soc. Amer. Proc, 37: 813-818.
Kirkham , D., De Boodt, M.F. and De Leenheer, L. 1959. Modulus ofrupture determination on undisturbed soil core sampJ-es.Soil Sci. 87: 141-144.
Knight, S.J. and Freitag, D.R. 1962. Measurement of soil trafficabilitychanacteristics.Transactions of the ASAE 5: 121-125, 132.
Koenigs, F.F.R, 1961. The mechanical stability of clay soil-s asinfl-uenced by the moistune conditions and some other factorsThesis, Univ. VJageningen.ClLed by Drover, D.V. 1967. J. Aust. Inst. Agric. Sci.33: 54-55.
KooJ.en,
Kubota, T 1972. Aggregate formation of allophanic soils. Effect ofdrying on the dispersions of bhe soil-s.Soil Sci. and Plant Nutni. 1Bt 79-87.
Kuipers, H. 1958. Confined compression tests on soil aggregate sampÌes.Proc. Int. Symp. Soil Structure, Genl.8u11. Stat,e Agric. Univ. and State Agric. Res. Sta., Gent. 24 (1):349-357.
Lambe, T.W. 1953. The structure of inorganic soil-.Proc. A.S.C.E. Volume J!, Sepqrate No. 315
Lambe, T.W. 1960. A mechanistic picture of shear strength inProc. Conf. on Shear Strength of Cohesive Sojl-s. A.Univ. Co]orado, Boulder, Colorado: 555-580.
clay
Lambe, T.W. and Whitman, R . V. 1969 . Soil Mechanics .
New York : John I'liJ-ey.
Larson, W.E. and Allmaras, R.R. 1971. Management factors and naturafforces as related to compacbion.Soil s.
In Compaction of Agricultural-
ASAE monograph, ASAE, St. Joseph, Michigan, U,S.A.
Lemon, E.R. 1956. The poten|ialities for decreasing soil- moistu.reevaporation loss.Soil Sci. Soc. Amer. Proc. 20: 120-125.
A. J.J.
197 4.Agric.
A method for soil compactibility determinat.ion.Engng. Res. 19: 271-278.
S. C. E.
240.
Lemos, P. and Lutz, J.F. 1957. Soil crus|ing and some factorsaffecting it.Soil Sci. Soc. Amer. Prcc, 21: 485-490.
Logsdail, D.E. and I'lebber, L.R. 1959. Effect of frost action onstructure of Haldiman clay.Can. J. Soil Sci. 39: 103-106.
Loveday, J. 1974. Recognition of gypsum-responsive soil-s.Aust. J. Soil Res. 25: 87-96.
Loveday, J. and PyIe, J. 1973, The Emersion dispersion test and itsreÌationshíp to hydrauJ-ic conductivity.CSIRO Div. of Soils Tech. Paper },lo. 15.
Lot^r, A.J. 1954. The study of soil structure in the field and thelaboratory.J. SoiI Sci. 5z 57-74.
Low, A.J. 1972, The effect of cultivation on the structure and otherphysical characteristics of grassland and arable soil-s(1945-1970).J. Soil Sci. 23: 363-380.
LuLz, J.F. and Pinto, R.A. 1965. Effect of phosphorus on somephysical- properties of soifs. I. Modulus of rupture.Soit Sci. Soc. Amer. Proc. 29t 458-460.
Lyles, L. and Vloodruff , N.P. 1961. Surface soil cl-odiness in rel-ationto soif density and time of til-lage.Soit Sci. 912 178-182.
Lyles, L. and l,,loodruff , N.P. 1962. How moisture and tillage affecl- soj-lcfodiness for wind erosion control.Agric. Engng . 43: '150- 153, 159 .
Marshall_, T.J. 1956. A plummet bafance for measuring the sizedistribution of soil Particfes.Aust. J. Appl. Sii. 7; 142-148,
Marshall-, T.J. 1958. A rel-atjon bebween permeability and sizedistribution of pores.J. Soil Sci. 9: 1-8.
Marshal_l_, T.J. 1962. The nature, deveì.opment. and significance ofsoil- structure.Tráns. Comm. IV and V Int. Soc. Soil Sci., 243-257 -
Marshal-l, T. J. and Quink,of dry soj-I.Aust. J. Agric.
J.P, 1950. Stability of structural aggregates
Res. l: 266-275.
lvlartin, J.P., Martin, W.P., Page, J.8., Raney, W.A. and De Ment,, J.D.1955. SoiI aggregal-ion.Adv. Agron. 7: 1-37.
Martin , R .T. 1958 . lnla.ter vapor sorption on lithium kaol-iniLe.Cl-ays and Clay Minerals 5: ?3-38,
241.
Marl,inson, D.C. and Ol-mstead, L.B.aggregated soÍ1. materials.Soil Sci. Soc. Amer. Proc,
Crushing strength of
34-38.
1949.
14:
Mathers, A.C . , Inleed , S. B. and Colernan, N. T. 1955 , The ef f'ect ofacid and heat treatment on montmorillonoids.Clays and Clay Minerals 3: t¡03-412.
Mazurak, A.P. 1950. Effect of gaseous phase on water stabl-e syntheticaggregates.Soil Sci. 69: '135-148.
Mazurak, A.P. and Mosher, P.N. 1970. Detachment of sojl aggregatesby simulated rainfall.Soil. Sci. Soc. Amer. Proc, 34: 798-800.
McCalIa, T.M, 1942. Influence of biological producton soil- slructureand infiltrat.ion.Soil Sci. Soc. Amer. Proc. 7: 209-214,
McCalla, T.M. 1944. hrater drop method of determining sl"abillty ofsoil structure.Soil Sci. 58: 117-121.
McCormack, D.E. and ittilding, L. P . 1979. Soil properties i,nfluencingstrength of Canfield and Geeburg soils.Soil Sci. Soc. Amer. J. 43: 167-173.
McHenry, J.R. and Russel-l, M.B. 1943. Elementary mechanics of soilaggregation of puddted matêrial-s.Soil Sci. Soc. Amer. Proc. B:71-78.
McMurdie, J.L. and Day, P.R. 1958.stress.SoiI Sci. Soc. Amer. Proc.
Compression of soil by isotropic
22: 1B-21.
Metcalf, J.B. and Frydman, S. 1962, A prelimì.nary study of the tensil.estresses. in stabilized soil pavement.s.Proc. 1st Aust. Res. Board 1: 1O4B-.1058.
Meyer, L.D. and McCune, D.L. 1958. Rainfall simulators for runoffplots.Agric. Engng. 39: 644-648.
Middleton, H.E. 1930. Properties of soils which infJuence soil erosion.USDA Agric. Techn. BuIl. No. 178,
Mirreh, H.F. and Ketcheson, J.W. 1972. fnfl-uence of soil bulk densityand matric pressure on soil- resistance Lo penet,ration.Can. J. Soil Sci. 52: 477-483.
Mitchell, K, 1960. Fundamental aspects of thixotropy in soil-s.Soil Mech. and Fndn. Div., A.S.C.E. 86 (SM 3): 19-52.
Mit,chel-l-, J.K. 1976. Fundamentaf s of SoiI Behavior.New York : Joñn l,fiE.
1965. Action des matieres organiques sur l.a s1-abilj-te.Structural-e des sol.s.Ann. Agron. 16: 327-400, 471^534.
JJ
Monier, G
242.
Effect of natural hardening on the unconfinedon strength of remoulded c1a¡'s.Int. Conf. Soil Mech. and Fndn. Engng. 1: 137-144.
Mul-Iins, C.E. and Fraser, A. 1980. Use of the drop cone penetrometenon undisturbed and remoulded soils at a range of soil watertensions.J. SolI Sci. 31: 25-32.
Mulqueen, J., Stafford, J.V. and Tanner, D.W. 1977. Evaluation ofpenetrometers for measuring soil- strengfh.J. Terramechanics 14: 137-151,
MoretLo, 0. 1948,compressiProc. znd
Murrell,
Nevo, Z.
Newmark,
Nichols,
Nichols,
0j eniyi ,
0jeniyi,
Nishida, Y . 1961,- Determination of -stresses around a compaction piIe.Proc. 5th Int. Conf. Soil Mech. and Fndn. Engng. 2: 123-128.
. and Rausel-1-Co1om, J.A. 1962, Flffect of freezj-ng on l.hesweJ-ling of clay mineral-s.Clay Mineral BulI. 5: 9-16.
K.H. 1971. A Factual Kev for the Recognitj-on of Australian
Norrish, K
Northcote,Soi.ls.ffii¿e: Retlim Tech. Publs.
Ojeniyi, S.0. 1978. Tilth structure and soil physical conditions.Ph.D. thesis, Univ. of Adelaide.
S.A.F. 1958. The strength of coal- under triaxial- compression.Tn Mechanical Properties of Non-meLallic Brittfe Materiafs.(ed . H. H. I¡lalton ) .London : Butterworths.
and Hagin, J. 1966. Changes occurring in soil- sampJ-esduring air-dry storage.Soil Bci. 102t 157-160.
N.M. 1960. Failure hypotheses for soils.Proc. Res. Conf. Shear -strength of Cohesíve Soils. A.S.C.E.-Univ. Colorado, BouIden, Coloradot 1T-32.
M.L. 1931. The dynamic properties of soil. I. An explanal-ionof the dynamic properties of soils by rneans of colloidal- fj-lms.Agric. Engng. 122 259-264.
M.L. and Baver, L.D. 1930. An int,erpretation of Lhe physicalproperties of soil- affecling tillage and implernent desigu bymeans of the Atterberg consistency constants.Trans. 2no Int. Congr. Soil Sci. 6: 175-188.
S.0. and Dexter, A.R. 1979a. SoiI factors affecting the macrostructures produced by til-lage.Transactions of the ASAE 22: 339-343.
S.0. ancl Dexter', A. R . 1979ti. Soil stt'uctural. chauges duringmuJ-tiple pass tillage.Transactions of the ASAE 22: 1068-1072.

243.
OLmsteacl, L.B. 1946. The effecL of longtime cropping sysLems a.nd
til.lage practices upon soil aggregation at Hays, Kansas.Soil Sci. Soc. Arner. Proc. 11: e9-92.
Panabokke, C.R. and Quirk, J.P. 1957. Effect of initial water contenton stability of soil aggregales in water.Soil Sci . 83 : 185-'l 95 .
Panwan, J.S. and Siemens, J.C, 1972. Shear strength and energy ofsoil faj.lune rel-ated to density and moisture.Transactions of the ASAE 15: 423-427,
Payne, P.J.C. 1956. The relationship between the mechanical propertiesof soil- and the performance of simpl-e cultivation impJ-ements.J. Agric. Engng. Res. 1: 23-50,
Penman, H.L, 1948. Natural evaporation from open water, bare soil andgrass.Proc. Roy. Soc. (London) A 193: 120-145.
Pereira, H.C, 1955. The assessment of structure in tropical- solls.J. Agric. Sci. 45: 401-410.
Petterson, J.B. 1943. Formation of water stable structure in puddledsoiÌs.Soil- Sci . 55: 289-300.
Prather, 0.C., Hendrick, J.G. and Schafer, R.L.hand-operated recording penetrometer.Transactions of the ASAE '13: 385-386,
1970. An electronic
390.
Price-Jones, J. 1952. Studies in thixotropy.Kol-loid Z. 129: 96-122.
Pugh, 4.L., Vomocil-, J.A. and Nief sen, T.R. 1960. ModjficaLion of somephysi-caì- characl-eristics of soils with VAMA, ferric sul-phateand triphenlysulfonium chl-oride.Agron. J. 52: 399-402.
Quirk, J .P. 1950. The wa.t,er stability'of soj-l aggregates in rel-ationto the wat-er conbent. at the time of' wetting.CSIRO Div. of Soil Report No. 12/50.
Quirk, J P. and Pa.nabokke, C.R. 1962. Incipient failure of soilaggregates.J. Soil Sci. 13: 60-70.
Raghavan, G.S.V., I"lcKyes, E., Amir, I., Chasse, M. and Broughton, R.S.1976. Prediction of soil- compacLion due to off road vehicletraffi c.TransacLions of the ASAE 19: 610-613.
Riclrard , L.A.SoiI
1953. ModuÌus of rupture as index of crusting of soil-.Sci. Soc. Amer. Proc. 172 321-323.
Richardson, S.J. 1976. Effect of artificiaÌ weathering cycles on thestrucLural stabil-i|y of dispersed soil.J. Soil Sci. 2(t: 287-29/t.

244.
Robinson, G.W. 1922, Note on the mechanical analysis of humus soi1s.J. Agr-ic. Sci. 12: 287-291.
Rogowski, A.S. 1964. The strength of soil aggregates.Ph.D. thesis, Iowa state Univ.
Rogowski, A.S. and Kirkham, D. 1962. Moisture, pressure and formationof water-stabl-e soil aggregates.Soil- Sci. Soc. Amer. Proc. 26: 213-216.
Rogowski, A.S. and Kirkham, D. 1976. Strength of soil- aggregaLes.ïnfl-uence of size, density and cl-ay and organic matter content.Med. Fac., Landbouww. Rijksuniv. Gent. 41 (i): 85î100.
Rosenqvist, f. Th. 1952. Considerations on the sensitivity ofNorwegian quick clays.Geotechnique 3 | 195-200.
Rosenqvist, ï. Th. 1955, Investigations in the cJ-ay electrolytewater system.Norwegian Geotech. Inst. Publ. No. 9.
Rosenqvist, I. Th. 1959. Physico chemical properties of soifs.Soil--water system.J. Soil Mech. and Fndn. Div., A.S.C.E. 85 (SM 2): 31-53.
Rovj-ra, A.D. and Greacen, E.L. 1957. The effect of aggregaLe disruptionon the activity of microorgani-sm in the soil-.Aust. J. Agric. Res. B: 659-673.
Rowe, P.ll. 1962. The stress dilatancy reJ-ation for static equilJbriumof an assembly of particles in contact.
. Proc. Roy. Soc. (London) A 269: 500-527.
Rowell, D.L. and Dillon, P.J. 1972. Migration and aggregation ofNa and Ca cJ-ays by the freezing of dispersed and flocculaLedsuspension.J. Soil Sci. 232 442-447.
RusseJ-1, E,J. 1957. The \rlorld of the Soil.London: ColÌins.
Russell, E.W.rmp
1938 . Soil St,ructure.Bur. SoiI Sci. Tech. Commun. No. 37, Harpenden
Russel-I, E.!ü.. 1950. Soil Conditions and Plant Growth.Bth ed. Lono
Rusself, E.W. 1971. Soil- structure: Its maint,enance ancl managementJ. Soil Sci, 22: 137-151,
Russel-l , E.W. 1973. Soil Conditions and Pfant Grolth.lOth ed. London : Longmans Gneen.
J. 1977, Applications of the Theory of Plasticity in Soill4echanics.
Salencon,
New Yonk : John lrliley.

Sall-as, J.A.J. and.Serratosa, J.M. 1953.Proc. 3ro Int. Conf. Soil Mech.
245.
Compresslbility of clays.and Fndn. Engng. 1: 192-198.
Schweikle, V., Blake, G,R. and Arya, L.M. 1974. Matric suction andstability-phanges in sheared soil-.Trans. 1Ou'r Int. Congr. Soil Sci. 1: 187-193.
SmaJ-ley, I. J . 1978. Mineral ogy,, interpart i-cl-e forces , and soil-structure of the Leda/Champlaìn clays of Flastern Cauada.In Moclifical-ion of SoiL Structure (eds. I,'l.W' Emerson' R.D.
Scott-Bl-air, G.hl. 1937, Compressibility curves as a quantitativemeasure of soil til-th.J. Agric. Sci. 2T: 5t+1-556.
Scott-B1air, G.W. and Cashen, G.H. 1938. Compressibility curves as aquantitative measure of soil tilth II.J. Agric. Sci. 2Bz 367-378.
Seed, H.B. and Chan, C.K, 1957. Thixotropic characteristics ofcompacted cì-ays.J. Soil Mech. and Fndn. Div. A.S.C.E. 83 (SM 4): 1427.1-1427.35.
Seed, tl.B., Mitchell, J.K. and Chan, C.K. 1960. The strength ofcompacted cohesive soil-s.Proc. Res. Conf. Shear Strength of Cohesive Soifs. A.S.C.E.-Univ. Colorado, Boulder, CoÌorado. pp. 877-964.
Sequi, P 1978. Soil- StrucLure. An outlook.Agrochimica 22: 403-425.
Sharma, D.P. and Agrawal, R.P. 1979. ModuÌus of rupture of soi.l asaffected by temperature and rate of drying, wetting anddrying cycles, moisture content and meLhoci of saturation.fndian Soil Sci. Soc. J. 27. 361-368.
Sherwood, P.T. and Ryley, M.D. 1970. An i.nvestigat.ion of a cone-penetrometer method for the determinaLion of the J-iquid limit.Geotechnique 20z 203-208"
Sillanpaa, M. and fi'lebber, L.R. 1961. The effect of freezLng - thawingand wetting - drying cycJ-es on soif aggregaLion.Can. J. Soil Sci, 41: 182-187.
Sills, I.D., Aytmore, L.A.G. and Quirk, J.P, 1973, An anal-ysis ofpore size in iÌlite-kaolinite mixtures.J. Soil Sci. 24: 480-490.
Skempt,on, A.W. and Northey, R.D. 1952. The sen'sitivity of clays.Geotechnique 3:30-53.
Slater, C.S. and Hopp, H. 1949. The action of frost on the water-stability of soils.J. Agric. Res. 78 z 341-346.
Slater, C S . and llopp , H. 1951 .
cl-ean till ed soil .
Agron. J. 43:1-4.
Vfin|er decl-ine of soil structure in
Bond,London
and A. R. Dexter).: .John l^li1ey.
246.
Smith, R.M. and Cernuda, C.F. 1951. Some applications of water-dropsl,abiJ.ity testing to Lropical so1ls of Puerto Rico'Soil Sci. 71: 337-345.
Soulides, D.A. and AlÌison, F.E. 1961. Effect of drying and freezingsoils on carbon dioxide production, available mineralnutrients, aggregation and bacterial population.Soil Sci , 91: 291-298.
SSSA. 1975. Soil Conditioners.SolI Sci. Soc. Amer. special publ.. No. 7.
Stace, H.C.T., Hubble, G.D., Brewer, R., NorthcoLe, K.H., Sfeman, J.R.,Mulcahy, M. J. , and Hall-sworth ' E. GAustralian Soils.
. 1968. A Handbook of
Gl-enside, South Austral-ia Rellim Tech. Publs.
Stefanson, R.C. 1971. Effect of periodate and pyrophosphate on theseasonal changes in aggregate stability.Aust. J. Soil Res. 9z 33-42.
Stone, A.A. and l,rlilliams, L. L . 1939. l4easurement of soil- hardness.Agric. Engng. 20i 25-26.
Swanson, C.L.l,/., Hanna, R.M. and De Roo, H.C, 1955' Effect ofexcessive cultivation and puddling on conditioner treatedsoi-fs in the laboratory.Soil Sci, 79: 15-24.
Taylor, H.M., Mathers, A.C. and L,otspeich, F.BSouthern great plain soiÌs.Agron. J. 562 328-332.
1964. Pans in the
Taylor, H.M., Roberson, G.M. and Parker Jr, J.J. 1966. Soil strengthroot peneLration rel-a'Lions for medium to coarse texture soj-Imaterials.Soil Sci. 102: 18-22,
Telfair, D., Garner, M.R. and Miars, D. 1957. The restoration of a
structural-ly degeneraled soiÌ.SoiI Sci. Soc. Amer. Proc. ?1: 131-134.
Terzaghi, K. 1941. Undistunbed clay samples and unclisturbed clays.J. Bost.on Soc. C.E. 28:211
Terzaghì-, K. 19t¡4. Ends and means in soil- mechanics.Engng. Jourual (Canada) 27 z 608-613.
TisdaII,J.M., Cockroft, B. and Uren, N.C. 1979. The stability of soilaggregates as af f'ected by organic material-s, microbiaJ-activity and physical- disruption.Aust. J. Soil- Res . 16: 9-17 .
Tjulin, A.F. 1933. CerLain consideraLions on the geues-ls of soiÌstructure and on methods for its deLermination.Proc. Int. Soc. Soil Sci. Soviet Sec. 1: 111-132.
Towner, G.D. 1961, Infl-uence of soil--wat-er sucLion on some mechanicalproperties of soil-s.J. Soil Sci. 12: 180-187.

247.
Towner, G.D. 1973, An exami-nation of fall-cone melhod for thedetermination of some strength properties of remoufdedagricultural- soifs.J. Soil Sci. 24: 470-479.
Towner, G.D. 1974. The assessment of soil texture from soil strengthmeasurements.J. SoiI Sci. 252 298-306.
Towner, G.D. and Child, E.c. 1972. The mechanical strength ofunsaturated porous gnanular rnaterial.J. Soil Sci. 23: 481-498.
Trollope, D.H. and Chan, C.K. 1960. Soil- structure and the step-strain phenomenon.J. Soit Mech. and Fndn. Di.v., A.S.C.E. 86 (SM 2): 1-39.
Tschebotarioff , G.R., Inland, E.R. and De Phillipe, A.A. 1953. Thetensil-e qtrength of disturbed and recompacted soils.Proc. 3ro Int. Conf. Soil Mech. and Fndn. Engng. 1: 207-210.
Tukey, J .1,1t. 1954 . Causation , regression and path anal ysis . InStatistj-cs and I'lathematics in Bi ology ( eds . 0. Kempthorne
'TT-IEucroft, J.\,'/.-Gowen aña-iT. Tltn) .
New York : Hafner.
Utomo, W.H.J
and Dexter, A.R. 1981a. Soil friabil-ity.Soil Sci. 32 Q) (to be PubJ-ished).
to textural parameters, depth and drainage.of So:'-l Structune (eds. hl.l¡1. Emerson, R.D.
Utomo, W.H. and Dexter, A.R. 1981b. Effect of ageing on the cotnpressionresistance ancì water stability of soil- aggregates disturbedby tiIlage.Soil and Tillage Res. 1 (to be published).
Utomo, W.H. and Dexter, A.R. 1981c. Tilth mellowi.ng.J. Soil- Sci. 32 (2) (to be published).
van Bavel, C.H.M. 1949. Mean weight diameter of soil aggregates asa statistical index of aggregation.Soil Sci. Soc. Amer. Proc. 14: 20-23,
van de Graff , R.FI.M. 1978, Size of subso-il blocky peds in refat,ionIn Modi fication
Bond and A.lì . Dexter ).London : John Wiley.
Vanden Berg, G.E., Buchefe, W.F. and Malvern, L.E. 1958. App}ì-cation ofconti-nuum mechani-cs to soil cotnpaction'Transactions of the ASAE 1; 24-27 ,
van Duin, R.H.A. ig54. Influenc.e of tilth on soil and air Lemperalure.Neth. J. Agric. Sci. 2: 229'241.
van Duin, R.H.A. 1955. Tilìage in relation to rainfal-l- intensity andj-nfil-tration capacity of soif s.Neth. J. Agnic. Sci. 3: 182-191-
vershinin, P.v, 1g5g. Solicl phases of soil- as the basis of iLsphvsical regime. fn Funclamental.s of igt'gÈyPts:' (eds ' A ' F 'Ioffe, I.B. Revut).TranslaLed frorn Russian b]' Isreal- Progran for Scienf ificTransì-atj-on, f PST CaL. No. 1295 '
248.
Vomocil, J.A. and Chancellon, hr.J. 1967. Compressive and tensilefailure of three agricuJ-tural- soifs.Transactions of the ASAE 10: 771-774, 779.
Vomocif , J.4., and V'lal-dron, L.J. 1962. Effect of moisture contenton tensj-l-e strength of unsaturated glass beads sysl,ern.Soil Sci. Soc. Amer. Proc. 26: 409-412.
Vomocil- , J.A. , Illaldron , L. J. and ChanceÌlor , W.J. 1961 . Soil tensilesbrengbh by centrifugatì-on.Soil Sci. Soc. Amer. Proc. 25: 176-180.
Voorheess, M.L. and lrlallcer, P.N. 1977. Tractionability as a functj-onof soil moisture.Transactions of the ASAE 20: 806-809.
llalsh, J.B. 1965. The effect of cracks i-n rocks on Poisonrs ratj-o.J. Geophys. Res. 702 5249-5257.
lrlarkentin, B.P. and Yon61, R.N. 1962. Shear strengLh of montomorill-oniteand kaol-lnite related to interparticl-e forces.Clays and Clay Minerals 9z 201-218.
r¡,lhite, E.M. 1966. Subsoil structure genesis: Theoretical considerat.ion.SoiI Sci. 101 : 135-141.
White, E.M. 1967. Soil age and texture factors in subsoil structuregenesis.Soil- Sci. 103: 2BB-298.
!üiegand, G.L. and Taylor, S.A. 1962. Temperature depression andtemperature distribution in drying soil columns.Soil Sci. 94t 75-79.
!'h.lliams, 8.G., Greenland, D.J. and Quirk, J.P. 1967. The tensil-estrength of soi.l cores containing polyvinyl al-coho1.Aust. J. Soil Res. 5: 85-92.
lrliJ-liams, J. and Shaykewich, C.F. 1970. The influence of soil watermalric potential- on the strength properties of unsaturatedsoiI.Soil Sci. Soc. Amer. Proc, 34: 835-840.
tr{il-lì-amson, !'I.0. 1960. Some effects of deformation on the structureand deformation of c1ay.Mineral Industrj-es 29: 1-8.
i¡h]Iis, W.0. 195'j. Freezing and thawing, and wetting and drying insoils treated with organic chemicals.Soil Sci. Soc. Amer. Proc. 19: 263-267.
llüillis, ld.0. 1960. Evaporation from l-ayered soils in the presence ofa water l,abl e.Soil Sci. Soc. Amer. Proc. 24: 239-242.
1963. The use of high-velociLy tines in breaking clods..I. Agric. lingng. Res. B:107-114,
I,,/i J- ton , B
249.
hlinterkorn, H.F. 1942. Mechanism of water attack on dry cohesj-vesoiJ- systems.Soil Sci. 54: 259-273.
lrlinterkorn, FLF. and Fehrman, R.G. 1944. The effect of freezLng-thawing, and wetting-drying cycles on the density andbearing povJer of five soils.Soil Sci. Soc. Amer. Proc. 9: 248-252.
Winterkorn, H.F. and Tschebotarioff, G.P. 1947. Sensitivlty of clayto remolding and its possible causes.Proc. Highway Res. Board 27:. 435-442,
lrlismer, R. D . and Luth, H. J. 197 4 . Off road traction prediction forwheeled vehicles.Transactions of the ASAE 1Tt B-11, 14.
trloodburn, R. 1944. Aggregation of Houston clay in Mississippi.Soil Sci. Soc. Amer. proc. 9z 30-36.
lrlright, S 1921. Correlation and causatj-on.J. Agri-c. Res. 20: 557-585,
lrlright, S. 1923. The theory of path coefficients.Genetics B: 239-255.
Yasutomi-, R. and Sudo, S. 1966. A concept of softening and hardeningof clay based upon the change i-n'soil structure by remolding.Soil Sci . 105 : 384-39'l .
Yeoh¡ N.S. 1979. Propenties of clays and soils after acid treatment.M.Ag. Sci. thesis, Univ. of Adelaide.
Yoder, R.E. 1936. A direct method of aggregate analysis of soifs anda study of the physical nature of erosion l-osses.J. Amer. Soc. Agron, 28: 337-351.
Yong, R.N. and \¡,larkentin, B.P. 1966. Introduction to Soil Behaviour.New York McMill-an.
Yong, R.N. and !,larkentin, B.P. 19'15.Amsterdam : Elsevi-er.
SoiJ- Properties and Behaviour.
Youker, R.E. and McGuinness, J.L. 1957. A short method of obtainingmean weight diameter value of aggregate analysis.So1l Sci. 83 z 291-294 .
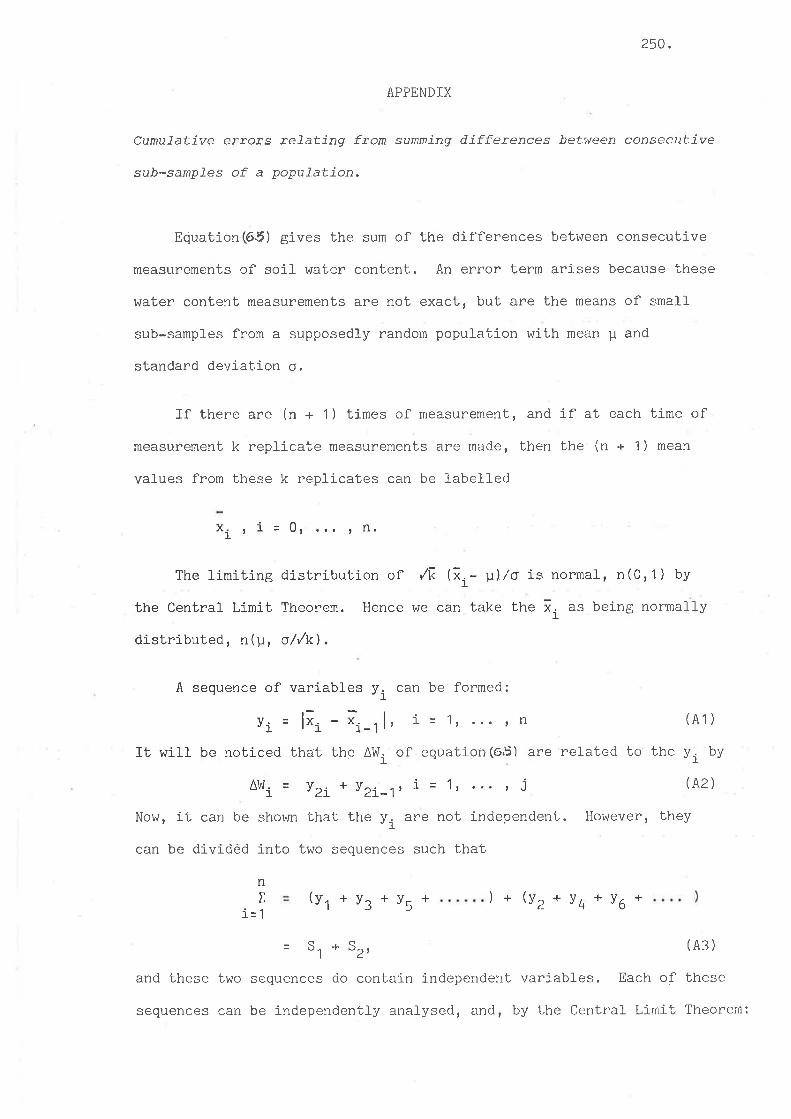
250.
APPENDIX
Cunufative er¡o.rs reTating from summing differences between consecutive
sub-sanpJes of a popuJ.ation.
Equation(6.5) gives the sum of the differences between consecutive
measurements of soil- water content. An error term arises because these
water content measurements are not exact, but are the means of small
sub-samples from a supposedly nandom population with mean p and
standard deviation o.
If there are (n + 1 ) times of measurement, and if af each time of
measurement k replicale measurements are made, then the (n + 1 ) mean
vafues from these k repllcates can be labelled
*i , i = 0, , n.
The limiting distribution of /É {ir- U).io is normal, n(0,1) by
the Central Limit Theorem. Hence vre can take the I
distributed, n(1l o//k).
can be formed:
, i = 1, , n (41)
of equation(6$) are refated to the y, by
as being normaLly1
A sequence of variables y,
vi = lît - ir-1 |
It will be noticed
AV'l ' =1
that the Afrl.I
Yzi * !2i-j' (A2 )
However, theyNow, it can be shov¡n LhaL the y1 are not independent.
can be dividéd into two sequences such that
(v., +V3*v5* )+(Vr+V4*y6*
= 51 * 32, (43)
and these two sequences do contain independent variabfes. Each of these
sequences can be independently anal-ysed, and, by the Central Limit Theorem:
i = 1, r i
nx
i=1

251.
@ æ
-co-@
otrm.
-(1r__1- u)2u/zo2
andy=o
r" n(0r'l )
-(ii- Ð2u/zo2
s, - ånu'
Here, the pr and or are the means and standard deviations of the
random variable Y, of which the measured val-ues are y.. T'hus a graphn
of X V* against n will be a straì-ght line with a slope pr.I
1=l
The value
E(l;i - Ìi_11 )u
(A4 )
(A5 )
(A6 )
JJ i -xi-1r (#"
E(
ã\
)d*id*i-.r
Putting x =
oã(i, - u)/k
o
Ztr/u
gives
o
@@
-æ¡.æ
,2 2
l* - yl "-(*- +Y')/2 axdy
and changing to poJ-ar coordinates gives
2r
lcos0 - sinOl oe.Ztr/u
0
2o/ff (Az I
Thus values of XAlnl, as defined in equations(Ë>.5) and (42) contain, inj
addition to rrgenuinetr water content changes, error terms equal to
4jo//nk which resuJt from taking finite sarnples of size k from a normal
u' ,:_
ut =
o-r2 /z2
er
0
u
population.