�� additive and �� ultra-additive maps, Gromov's trees, and the Farris transform
Upload
khangminh22Category
view
0download
0
Materials 2022, 15, 2047. https://doi.org/10.3390/ma15062047 www.mdpi.com/journal/materials
Review
Additive Manufacturing of AlSi10Mg and Ti6Al4V
Lightweight Alloys via Laser Powder Bed Fusion: A Review of
Heat Treatments Effects
Emanuele Ghio * and Emanuela Cerri
Department of Engineering and Architecture, University of Parma, 43124 Parma, Italy; [email protected]
* Correspondence: [email protected]
Abstract: Laser powder bed fusion (L‐PBF) is an additive manufacturing technology that is gaining
increasing interest in aerospace, automotive and biomedical applications due to the possibility of
processing lightweight alloys such as AlSi10Mg and Ti6Al4V. Both these alloys have microstruc‐
tures and mechanical properties that are strictly related to the type of heat treatment applied after
the L‐PBF process. The present review aimed to summarize the state of the art in terms of the mi‐
crostructural morphology and consequent mechanical performance of these materials after different
heat treatments. While optimization of the post‐process heat treatment is key to obtaining excellent
mechanical properties, the first requirement is to manufacture high quality and fully dense samples.
Therefore, effects induced by the L‐PBF process parameters and build platform temperatures were
also summarized. In addition, effects induced by stress relief, annealing, solution, artificial and di‐
rect aging, hot isostatic pressing, and mixed heat treatments were reviewed for AlSi10Mg and
Ti6AlV samples, highlighting variations in microstructure and corrosion resistance and consequent
fracture mechanisms.
Keywords: additive manufacturing; laser powder bed fusion; AlSi10Mg; Ti6Al4V; heat treatments;
mechanical properties; microstructural characterization; fracture mechanism; corrosion resistance
Citation: Ghio, E.; Cerri, E. Additive
Manufacturing of AlSi10Mg and
Ti6Al4V Lightweight Alloys via
Laser Powder Bed Fusion: A Review
of Heat Treatments Effects.
Materials 2022, 15, 2047.
https://doi.org/10.3390/ma15062047
Academic Editor: Tomasz Czujko
Received: 3 February 2022
Accepted: 4 March 2022
Published: 10 March 2022
Publisher’s Note: MDPI stays neu‐
tral with regard to jurisdictional
claims in published maps and insti‐
tutional affiliations.
Copyright: © 2022 by the authors. Li‐
censee MDPI, Basel, Switzerland.
This article is an open access article
distributed under the terms and con‐
ditions of the Creative Commons At‐
tribution (CC BY) license (https://cre‐
ativecommons.org/licenses/by/4.0/).
Table of Contents
Abstract 1
1. Introduction 2
2. Laser‐Pwoder Bed Fusion (L‐PBF) Process 3
Process Parameters 6
3. L‐PBFed AlSi10Mg: Microstructure 12
3.1. As‐Built Microstructure 12
3.2. Heat‐Treated Microstructure 18
4. L‐PBFed AlSi10Mg: Mechanical Properties 22
5. L‐PBFed AlSi10Mg: The corrosion Resistance 31
6. L‐PBFed Ti6Al4V: Microstructure 34
6.1. As‐Built Microstructure 34
6.2. Heat‐Treated Microstructure 43
Heat Treatments Effects on α’, α and β Phases 52
7. L‐PBFed Ti6Al4V: Mechanical Properties 57
8. L‐PBFed Ti6Al4V: The Corrosion Resistance 67
9. Conclusions 68
9.1 Microstructure and Corrosion Resistance of AlSi10Mg 68

Materials 2022, 15, 2047 2 of 85
1. Introduction
Aluminium and titanium lightweight alloys are of great interest in automotive, aer‐
ospace and biomedical fields where high performance is required [1–3]. The rapid devel‐
opment of marine, aerospace and automotive transportation has induced constant evolu‐
tion in terms of safety and fuel efficiency, qualities that are met by the lightweight alloys
[4,5]. AlSi10Mg and Ti6Al4V, the most studied alloys in the lightweight alloy family,
found a wide range of applications thanks to the advantages of additive manufacturing
(AM) and their mechanical performance and corrosion resistance. For these reasons, the
present review aimed to summarize and discuss the effects induced by different heat treat‐
ments (HTs) on these alloys.
AlSi10Mg is an age‐hardening alloy based on the Al‐Si‐Mg ternary system and is
characterized by low density (2.67 g/cm3, [6]), good mechanical properties, excellent casta‐
bility and capability of being heat‐treated [7–9]. The Al‐Si phase diagram, shown in Figure
1a, highlights the fact that AlSi10Mg presents a short solidification range (ΔT ~ 40 K),
making it the most common aluminium alloy used in additive manufacturing (AM)
[10,11]. This phase diagram is typical of partially miscible liquids characterizing age‐hard‐
ening alloy. In this scenario, the 0.2 ÷ 0.4 wt.% Mg content increases strengthening via
precipitation hardening due to the precipitation of fine ε‐Mg2Si phase during the aging
heat treatment (HT, direct or T6 heat treatment) and/or during the AM process [12–14]. At
the same time, Si is added to increase the castability and the amount of shrinkage during
melt freezing, as well as to change the microstructure from rosette (low Si) to dendritic
[13,15]. Wang et al. [16] emphasized significant effects on the mechanical properties of the
Al‐Si‐Mg alloys with variation in Si (wt%).
Figure 1. Phase diagrams of the: (a) AlSi10Mg where the α is related to the Al matrix; (b) Ti6Al4V.
Ti6Al4V in an α + β alloy exhibited prolonged biocompatibility, high fatigue re‐
sistance and toughness, as well as higher tensile strength and density (4.41 g/cm3, [6])
than AlSi10Mg alloy [17,18]. At the same time, its corrosion resistance makes it possible
to use in marine and chemical industries and in the biomedical field for orthopedic, cranial
and orthodontic implants [19–21]. A tempering treatment performed at 400–600 °C makes
the Ti6Al4V alloy suitable for the manufacturing of cold engine components [22]. Figure
1b shows a portion of the Ti‐6Al phase diagram, where the red iso‐concentration line high‐
lights the cooling/heating path of Ti6Al4V alloy. In the same figure, the hexagonal closed
9.2 Mechanical Properties of AlSi10Mg 68
9.3 Microstructure and Corrosion Resistance of Ti6Al4V 69
9.4 Mechanical Properties of Ti6Al4V 69
10. Future Trends and Prospective 70
11. Acronyms 70
References 72

Materials 2022, 15, 2047 3 of 85
packed and the body cubic centered lattice structures of the α and β phases are illustrated,
respectively. Starting from the β‐region (T > T = ~ 995 °C, [17]), where the Ti alloy shows
a fully β‐phase microstructure, to the room temperature, the β‐phase is almost completely
transformed into α‐phase (~90 ÷ 95%) + β‐phase (~5 ÷ 10%) due to the presence of Al and
V alloying elements that stabilize the hexagonal closed packed α‐phase and the body cen‐
tered cubic β‐phase, respectively [17,23]. Considering, instead, a Ti6Al4V extra low inter‐
stitial (ELI) alloy, the previously described microstructural transformation is the same,
except that the β‐transus temperature is at 975 °C due to the different wt% content of al‐
loying elements [24–26]. At the same time, Al and V increase elongation, tensile strength,
toughness and fatigue resistance, which also depend on the α + β phases morphology at
room temperature, as discussed in Section 6 [27,28].
Ti6Al4V exhibits a Widmanstätten microstructure (plate‐like α + β phase) after slow
cooling (furnace, cooling rate of 2 °C/s) and a martensitic microstructure after rapid cool‐
ing (water, cooling rate of 20 °C/s) due to the intersection between the cooling path and
the martensitic start (Ms) line. The air cooling (cooling rate of 3.5 °C/s) induces, firstly, a
martensitic transformation of the β‐phase and then a diffusional transformation that re‐
duces the volume fraction of the α’ martensite phase [29–32].
Generally, AlSi10Mg and Ti6Al4V alloys are forged or cast, followed by machining
to obtain the final dimensions and shape. Owing to the large amount of material waste
and the high manufacturing costs and time that characterize these conventional manufac‐
turing processes, they have been replaced by AM technology [33,34]. In this scenario, the
ability to manufacture samples with complex geometry, efficient material usage, material
flexibility and dimension control are advantages that can be added at the AM field as
discussed in Section 2.
The aim of the present review is to summarize and discuss the effects induced by
different HTs on the most studied alloys in the AM field: AlSi10Mg and Ti6Al4V. Firstly,
the as‐built microstructure and consequent mechanical properties are studied, highlight‐
ing the effects of build platform (BP) pre‐heating. Subsequently, by manufacturing high‐
quality samples characterized by excellent mechanical properties, these can effectively be
optimized with post‐process HTs. Secondly, the microstructure and mechanical proper‐
ties obtained after different HTs are illustrated to summarize and discuss the state of the
art of AlSi10Mg and Ti6Al4V alloys in the field of AM. Finally, the facture mechanisms
and corrosion resistance characterizing as‐built and heat‐treated alloys are also reviewed.
2. Laser‐Powder Bed Fusion (L‐PBF) Process
AM technology is a process opposed to the subtractive manufacturing methodolo‐
gies because it joins materials to make components from a 3D model, as defined through
the ASTM 52900:2015 standard specification [35]. If low‐volume and high‐value objects
(e.g., in aerospace and biomedical fields) are considered, the manufacturing processes be‐
longing to the AM scenario present different advantages as opposed to the conventional
subtractive manufacturing (as mentioned in Section 1) [1–3,33,34,36]. In this scenario, an‐
other advantage is the ability to print lightweight objects thanks to a complex software
system that minimizes the part geometry after a careful engineering analysis. In parallel
with the metallurgical sector, other research fields focus their attention on the sample de‐
sign and the surface geometry to improve the mechanical properties of the manufactured
object and the consequent advantages induced by AM [37,38].
Focusing on these processes, the building of 3D metal physical objects takes place
through the fusion or bond (e.g., melting, sintering) of the material feedstock, which is in
the form of powder and/or filament/wire, joined layer by layer [35]. The different form of
the material feedstock subdivides the processes in powder bed fusion (PBF) and direct
energy deposition (DED). In the former printing method, a laser or electron beam energy
source melts and fuses the powder following the 3D project of the component (Figure 2a),
while, in the latter method, a nozzle deposits the material feedstock, as shown in Figure
2b [35,39–41].

Materials 2022, 15, 2047 4 of 85
Figure 2. (a) laser powder bed fusion (L‐PBF) process; (b) direct energy deposition (DED) process
(Adapted from references [40,42]).
The present review is based on the L‐PBF AM process (Figure 2a), a technology where
the powder bed, deposited on the build platform (BP) by a recoater roller or blade, is
scanned and melted through a laser beam characterized by a laser power P [W], and gen‐
erated by one of the following energy sources: Yb:YAG fiber, Nd:YAG, CO2 laser, infrared,
etc. [43]. The moving mirror, controlled by a computer system, deflects the laser source
according to the 3D project. Only when a layer is totally scanned and melted, the BP low‐
ers by a quantity equal to the layer thickness (t, [mm]) and the recoater roller or blade
spreads a new powder layer. This procedure is repeated until the complete 3D physical
object is manufactured [44–46].
During the L‐PBF process, the laser beam transmits enough energy to melt the entire
layer depth and a portion of the previously solidified layer, guaranteeing the adhesion
between them [47]. The molten pool (MP) depth is key to obtaining this adhesion and the
absence of defects. Tang et al. [48] illustrated the following criterion to have a full melting:
ℎ𝑊
𝑡𝐷
1 (1)
where h is the hatch spacing (mm), which is the distance between the center of one laser
scan track and the consecutive one (Figure 3) [47], W is the width (mm), D is the total
depth of the MP (mm), and t is the layer thickness (mm). The full melting is obtained only
if Equation (1) is satisfied. As a matter of fact, the MP overlap and the consequent yellow
zone shown in Figure 3 are guaranteed. Another important process parameter, in addition
to P (W), h (mm) and t (mm) is the scan speed (v, (mm/s)) at which the laser source moves.
Combining these parameters, the energy density function (ED, (J/mm3)) can be defined as
follows:
𝐸𝐷𝑃𝑣ℎ𝑡 (2)

Materials 2022, 15, 2047 5 of 85
Figure 3. Schematic representation of the interaction between the laser beam source and the powder
bed during the L‐PBF process highlighting the overlap area between two adjacent laser scan tracks
where the principal dimensions are labelled (Reprinted from reference [49]).
According to the manufacturing requirements, the ED function determines the sam‐
ple’s density and, therefore, characterizes the as‐built mechanical properties. Table 1
shows a wide range of process parameters used to manufacture both AlSi10Mg and
Ti6Al4V alloys, highlighting whether the obtained samples are fully dense (δ ≥ 99.0%), or
dense (99.0 < δ ≤ 85%) or porous (δ < 85.0%).
Table 1. Principal process parameters values used to manufacture AlSi10Mg and Ti6Al4V samples
via L‐PBF process.
Materials P, (W) v, (mm/s) h, (μm) t, (μm) ED, (J/mm3) Fully Dense, Dense,
Porous
BR 1,
(cm3/h) Ref.
AlSi10Mg
350 1050 170 50 39 Fully dense 32 [14]
788 1099 300
60
40 Fully dense 71
[50]
463, 625, 788,
950
500, 800, 1099, 1400,
1700, 2000
300, 350,
400 17–75 Dense
38–174
300, 463, 788 800, 1400, 1700, 2300 300, 350,
400 Porous
100 250, 500, 750, 1000 50, 100 40 25–200 Dense 2–14 [51]
320, 360, 400 600, 750, 900 70.90–
116.40 30 145–200 Dense 25–28 [52]
370 1300 190 30 50 Dense 27 [53]
240, 260, 320,
360, 400
1200, 1400, 1600, 1800,
2000
36, 40, 45,
51.4, 60 30 111 Fully dense 8–13 [54]
400, 440 1350, 1500 105 50 38–56 Fully dense 25–28 [55]
300 1230 105 50 68 Dense 23
150 500, 1500, 2500 45, 75, 105 30 74, 95, 222 Fully dense 2–28
[56] 250 1500 75 30 74 Dense 12
150 2500 105, 150 30, 60 9, 13 Porous 28–81
Ti6Al4V
250 1600 60 30 87 Fully dense 10 [32]
170 1250 100 30 45 Dense 13 [57]
200 200 180 50 111 Dense 6 [58]
157 225 100 50 14 Dense 4 [59]
100 700 75 30 6 Dense 6 [60]
Ti6Al4V 260, 280, 300 1000, 1200, 1400 140 30 44–67 Dense 15–21 [61]

Materials 2022, 15, 2047 6 of 85
55–95 150–1000 49.5–99 25 148–269 Fully dense 1–11 [62]
240, 300, 360 800, 1000, 1200 80, 100, 120 40 62.5–94 Dense 9–21 [63]
200 800 80 30 10 Porous 7 [64]
240 240 50 30 67 Porous 1 [65]
100 400 70 50 7 Porous 5 [66]
90 600 90 30 6 Porous 6 [67] 1 BR is the acronymous of the build rate.
In this scenario, the porous Ti6Al4V samples were often manufactured for biocom‐
patibility requirements into biomedical fields because the cell adhesion and proliferation
were increased [65–67].
Process Parameters
The principal process parameters (P, v, h, t), which define the ED function (Equation
(1)), influence microstructure and mechanical properties of AlSi10Mg and Ti6Al4V as‐
built samples manufactured via L‐PBF process [9,14,68]. As shown in Figure 4, they are
the only parameters that can be fully controlled, together with the laser source parameters,
to obtain a high‐quality sample. On the other hand, the other parameters such as environ‐
ment, material characteristics and parameters of the 3D model can compromise its quality
due to their partial controllability. Table 2 illustrates the type of defects that affect the
sample’s quality.
Figure 4. Factors correlated to the selective laser melting (or L‐PBF) and subdivided into controlled
and partially controlled (Reprinted from reference [69]).
Table 2. Defects present into L‐PBFed samples: cause, remedy and effects.
Type of Defect Cause Remedy Effects Ref.
Lack‐of‐fusion (LOF)
Inhomogeneous distribution of the
powder bed Reduction in the layer
thickness and increase
of energy penetration
Decrease in mechanical
properties and fatigue
resistance
[51,59,70–
72]
Non‐optimization of the ED function
Lack of material or low energy inducing
no complete adherence of the melt to
the surrounding material
Keyhole pore
MP instability Increase in energy
depth penetration and
laser power
Decrease in mechanical
properties and fatigue
resistance
[48,73] Non‐optimized process parameters
Gas pores Gas dissolution within the melt material [51,74–79]

Materials 2022, 15, 2047 7 of 85
Gas wrapped into the gas atomized par‐
ticles Reduction in the layer
thickness, and the pres‐
sure into the chamber
Reduction in the O2
Re‐melting
Loss density, decrease
in tensile strength and
fatigue resistance. Gas
pores are less critical in
crack propagation than
the LOF
Entrapment of the gas present into the
build chamber
Gas flow within the build chamber
Anisotropy Build orientation HTs
Tensile properties cor‐
related to the orienta‐
tions
[59,80,81]
Preferential evaporation Temperature‐dependent vapor pressure
Reduction in linear en‐
ergy density rather than
the hatch spacing
Alloying elements loss
and pore’s formation [82–84]
Residual stress and distortion High thermal gradient during the L‐PBF
process
Pre‐heated BP
Post‐process HTs
Opportune scan strat‐
egy and re‐melting
Sacrificial material and
support structures
Sample distortion if re‐
sidual stress is higher
than the YS
Alloying elements loss
and pore’s formation
Loss of tolerance re‐
quirement
Reduction in fatigue re‐
sistance and tensile
properties
[85–88]
Balling
Low viscosity of melt material
Reduction in ED value
Porosity
[62,89–93]
Excess of melt material Stress Concentration
point
MP instability: capillarity, Marangoni’s
effect
Surface quality and
roughness
Splashing of MP due to its high surface
temperature Intralayer connection
The main types of defects present within a sample manufactured via L‐PBF process
are lack‐of‐fusion (LOF), keyhole, and gas pores; each one of these is characterized by a
distinct formation mechanism and growth [51,75,84]. Focusing on LOF pores, it can be
classified as a defect with partially melted powders (Figure 5a) or poor binding defect due
to the insufficient melt material during solidification (Figure 5b) [94]. De facto, LOF is
derived from an improper melting of the powder particles or from the MP instability (as
discussed later) due to the inadequate value of the ED function.

Materials 2022, 15, 2047 8 of 85
Figure 5. Lack of Fusion (LOF) pores classifying as pores: (a) with un‐melted particles, (b) poor
bonding defects (Adapted from references [95,96]). Schematic representation of the LOF formation
during the L‐PBF process: (c) lack of adequate laser scan tracks overlap; (d) presence of defects such
as spatter.
Tang et al. [48] illustrated the typical trend of sample porosity in relation to the ED
and the variation of the scan speed maintaining the laser power constant (Figure 6). In
detail, the LOF pores are formed with low ED and high scan speed, while high ED and
low scan speed induce a keyhole pore formation.
Figure 6. Porosity trend in relation to the ED and scan speed variations (Adapted from reference
[97]).
Darvish et al. [98], however, showed that the LOF formations are also caused by the
imperfect overlap of the laser scan tracks (Figure 5c) or by the presence of spatter on the
layer surface (Figure 5d).
On the other hand, the keyhole and LOF formation mechanisms are very difficult to
determine due to the interaction of different physical phenomena (e.g., Maragoni effect,
vaporization, recoil pressure, laser reflection) that take place within micron seconds dur‐
ing the rapid solidification of the MP [73]. In this scenario, Bayat et al. [73] added capillar‐
ity pressure as a physical phenomenon to determine the MP instability and the consequent

Materials 2022, 15, 2047 9 of 85
keyhole formation. Thus, the presence of different cold zones characterized by high sur‐
face tension and negligible pressure recoil causes the pore’s formation. The same results
were obtained by [99].
Finally, the LOF and keyhole are grouped under the name melting‐related defects
due to their irregular shape (Figure 5a,b), while gas pores are considered separately due
to their spherical morphology (<100 μm) [51,94]. The main causes of gas pore formation
(Table 2) are the presence of gas wrapped into the gas atomized powder, or the dissolu‐
tion/entrapment of gas present within the build chamber [51,74–79]. Focusing on
AlSi10Mg samples, the gas pores can also be caused by the H2O reduction during the L‐
PBF process due to the thermal cycles induced by the printing methodology [100]. De
facto, the water follows the subsequent chemical reactions:
2H2O → 2H2 + O2
3H2O + 2Al → Al2O3 + 3H2
producing diatomic hydrogen that dissolves into monoatomic hydrogen atoms (H2 2Habsorbed). Subsequently, the H atoms diffuse within the liquid aluminium due to their
high solubility in this metallic material [101]. Considering that the partition coefficient
depends on the solidification rate, the L‐PBF is characterized by a greater solubility of
hydrogen than the cast process because the AM process is a rapid solidification process
[102]. Weingarten et al. [75] summarized that the formation of pores decreases where the
hydrogen contamination of the powder is lower (<50% of pores after the drying of the
powder at 200 °C) or where optimized management is used. In relation to the mechanical
properties, Gong et al. [103] concluded that the tensile strength and fatigue resistance of
as‐built Ti6Al4V samples are not influenced by 1 vol% of gas pores but are considerably
degraded with a volume fraction of 5 vol%. The same conclusions can be rewritten for
AlSi10Mg as‐built samples [14,104]. In this scenario, the hot isostatic pressing (HIP) HT
can be used not only to densify the material but also to reduce the residual stress [105,106].
At the same time, if the fatigue resistance is increased due to the pore’s reduction, the
tensile properties of Ti6Al4V samples decrease, as can be observed in Figure 7 [107–111].
In contrast, the ductility increases. More details and microstructural analysis will also be
discussed in Sections 3, 4, 6 and 7 for AlSi10Mg samples.
Figure 7. Tensile properties of heat‐treated Ti6Al4V samples after stress relief (a) and hot isostatic
pressing HTs (b) (Reprinted from reference [111]).
The best mechanical properties of the as‐built sample, which are necessary to obtain
excellent mechanical properties after the HT, can be reached by printing with optimized
process parameters. In other words, working in the operating window shown in Figure 8
must be necessary [88]. On the other hand, this generalization neglects other important
phenomena (Table 2, Figure 4) that must be considered during the L‐PBF process.

Materials 2022, 15, 2047 10 of 85
Figure 8. Operating window of the L‐PBF process in relation to the laser beam source and scanning
speed (Reprinted from reference [88]).
Focusing on the balling phenomena and preferential evaporation defects, the main
causes are strictly related to the thermal gradient and the instability of the MP [62,89–93].
Kruth et al. [112] suggested that the balling phenomenon takes place when the material
underlying the MP does not wet due to the surface tension. As a matter of fact, the balling
phenomenon occurs when the MP surface becomes larger than the surface of a sphere that
contains the same volume. This situation can be prevented if the process parameters are
contained in the operating window (Figure 8).
On the other hand, if the temperature of the exposed powder exceeds the tempera‐
ture melting point, the evaporation phenomena occur, inducing a loss in mechanical prop‐
erties of the as‐built samples [82,112]. Juechther et al. [82] affirmed that the evaporation
effects decrease linearly with the ED transferred to the MP. Masmoudi et al. [113], analyz‐
ing the build chamber atmosphere, concluded that the evaporated volume during the L‐
PBF process can be controlled. Generally, the inert environment (continuous Ar or Ar+ He
or N gas flow, [114,115]) is used to avoid metal oxidation during the laser‐powder process,
particularly for Ti6Al4V and AlSi10Mg alloys that are characterized by high oxygen affin‐
ity. The build chamber environment is already high‐oxidizing for the spatter particles and
MP, considering an oxygen level of 1000 ppm [114,115]. On the other hand, an opportune
gas flow stabilizes the depth of the MP and reduces the spatter phenomena and, conse‐
quently, oxidation [116,117]. Last but not least, the inert gas environment is an essential
factor to obtain a better quality of the samples due to the pores and surface roughness
reduction [118,119].
The principal process parameters (P, h, v, t) also influence the MP temperature and
dimension, melt lifetime and the build rate [90,120]. De facto, the MP characterized by a
typical semi‐ellipsoidal shape is described by a thermal gradient decreasing from the cen‐
ter to its boundaries (Figure 9a) [121].

Materials 2022, 15, 2047 11 of 85
Figure 9. (a) temperature trends of a molten pool (MP) measured and calculated along the xy plane;
(b) distribution of temperature along the xy and xz planes (Adapted from reference [121]).
Due to the conduction heat transfer, the solidified material around the MP is also
invested by a thermal gradient distribution (Figure 9b), causing a heat affected zone
(HAZ) and consequent microstructural effects in AlSi10Mg and Ti6Al4V samples
[14,121,122]. In addition, these thermal gradients and the MP dimensions are affected by
the process variation induced by the optimization of sample quality (Figure 10) [123,124].
Figure 10. MP depth (a,c) and width (b,d) related to the: (a,b) laser scan speed (mm/s) and (c,d) laser
powder (W) (Adapted from reference [124]).
Lastly, the v, h, and t variation in L‐PBF process cause a variation of the build rate
(BR, (cm3/h), [120]) and the consequent productivity because it is defined as follows:
𝐵𝑅 𝑣ℎ𝑡, (3)

Materials 2022, 15, 2047 12 of 85
where v, h and t are the scan speed (mm/s), hatch spacing (mm) and layer thickness (mm),
respectively. Thus, being that the BR equation is the denominator of Equation (1), the ED
function is strictly related to industrial productivity. Generally, a build rate of 5–20 cm3/h
characterizes the L‐PBF systems, but new AM machines (e.g., XLine 1000) also reach 100
cm3/h [125–127]. Table 2 shows some BR values referred to in the literature analyzed and
the samples’ density reached. Shi et al. [128] showed an increase of layer thickness up to
200 μm, maintaining a Ti6Al4V sample density δ > 99.73% (fully dense). On the other
hand, varying the layer thickness of AlSi10Mg and Ti6Al4V samples manufactured via L‐
PBF changes the mechanical properties obtained [9,32,103,128]. The use of double or quad‐
ruple lasers, which work in parallel on the same layer powder bed, or the use of skin‐core
scan strategy are other examples concerning the increase in the BR [120,129].
3. L‐PBFed AlSi10Mg: Microstructure
3.1. As‐Built Microstructure
The as‐built microstructure of the hypoeutectic AlSi10Mg alloy L‐PBF‐ed is shown in
Figure 11, where two different machine setups are compared. Figure 11a,c illustrate the
samples manufactured with a single laser, while Figure 11b,d those with multi‐laser (4 ×
400 W) [14]. Both optical micrographs performed along the xy plane (Figure 11a,b) show
the laser scan tracks sections that are placed according to the scan strategy. At the same
time, it is possible to highlight the typical semi‐ellipsoidal shape of the MP as reported in
Section 2. The microstructure along the build direction (Figure 11c,d) presents a typical
fish‐scale morphology due to the overlapping of the laser scan tracks, as shown in Figure
12 [14,130,131].
Figure 11. OM micrographs of the as‐built AlSi10Mg samples along the xy (a,b) and xz (c,d) planes.
Panels (a,c) are related to the single laser machine set‐up and (b,d) to the multi laser. The green
arrow indicates the build direction (Reprinted from reference [14]).
The schematic representation of different types of scanning strategies is shown in
Figure 12, as also analyzed by Su et al. [131].
The same authors suggested three laser scans overlapping, different from the con‐
ventional scanning strategy (Figure 12a), to obtain a continuous track during the L‐PBF
process. At the same time, the full melting criterion describe in Equation (1) is satisfied.
The intra‐ (Figure 12b), inter‐ (Figure 12c) and mixed (Figure 12d) laser scanning strategies

Materials 2022, 15, 2047 13 of 85
tend to avoid the presence of the zone with low density (Figure 12a) generating LOF/key‐
hole pores, as highlighted in Figure 11c. At the same time, Figure 11a shows the spherical
gas pores discussed and analyzed in Section 2.
Figure 12. Schematic representation of: (a) conventional scanning strategy; (b) intra‐layer, (c) inter‐
layer, (d) mixed overlapping regimes.
Despite this, comparing the single and multi‐laser machine set up, no microstructural
differences can be emphasized, as also reported by Zhang et al. [132], who analyzed the
isolated and overlapped areas through the EBSD (Electron Backscatter Diffraction) meas‐
urements
These EBSD maps show the same grain morphology in addition to the same grain
size: in fact, the single laser area shows an average size of 5.72 μm, and the overlap area
of 5.62 μm [132]. On the other hand, the same EBSD measurements highlight the presence
of columnar grains nucleated and grown during the solidification process.
De facto, during the cooling of the MP, the primary planar grains nucleate and grow
at the interface between the solid and liquid phases (Figure 13a). Subsequently, the den‐
drites grow and compete following the direction of the heat flux, but in opposite versus
along the <100> direction, as shown by other fcc metals [133]. Figure 13b illustrated the
last solidification step, where the columnar grains are arranged as previously discussed,
and where the Si‐eutectic network is formed as highlighted within the circular area
[134,135].
Figure 13. Schematic representation of the MP solidification process: (a) interaction between the
laser beam during the melt of powder bed and the initiation of the solidification process; (b) final

Materials 2022, 15, 2047 14 of 85
phase of the solidification process. The red circle highlights the α‐Al matrix surrounded by Si‐eu‐
tectic network.
Lingda et al. [134], who analyzed the CET (columnar‐to‐equiaxed transition) into an
MP, highlighted an increase in undercooling zones during the MP solidification due to
the decrease in MP area during the increase in solidification time. This situation induces
a competitive grain growth stage, where the equiaxed grain can also nucleate and grow.
De facto, the same authors affirmed that the MP can be formed by only equiaxed grains if
it reaches an undercooling of ΔT = 15K. Hadadzadeh et al. [136], correlating the CET to
the thermal gradient (G, (K/m)) and the solidification rate (R, (m/s)) ratio, affirmed that
the CET is promoted if the G/R decreases. Paul et al. [137] showed these grain differences
within an MP through the EBSD measurements, highlighting the preferential grain
growth along the <100> direction. The same authors also showed a reduction in equiaxed
grain amount with the increase in the layer thickness (t, (mm)) and the hatch spacing (h,
(mm)). De facto, by decreasing the t and h, the grain size decreases. Ghio et al. [9] showed,
instead, an increase in the amount of the equiaxed grains with the increase in layer thick‐
ness and decrease in the hatch spacing.
Figure 14 illustrates SEM micrographs of the AlSi10Mg as‐built microstructure,
showing the Si‐eutectic network that surrounds the α‐Al matrix, as analyzed by
[14,87,128,138] and previously discussed in Figure 13c. The same authors highlight the
presence of Si‐rich precipitates within the α‐Al matrix (Figure 14a) that coarsened (Figure
14b) if the pre‐heated BP at 200 °C was used during the L‐PBF process. This microstruc‐
tural configuration is also shown by [14]. Van Cauwenbergh et al. [139] showed the pres‐
ence of Si‐rich precipitates in the α‐Al matrix, confirming again that it is a supersaturated
solid solution (SSS).
Figure 14. L‐PBFed AlSi10Mg samples using: (a) a cold BP (35 °C); (b) pre‐heated BP (200 °C) (Re‐
printed from reference [138]).
These microsegregation features, related to the SSS, are caused by the chemical com‐
position fluctuation at the liquid/solid interface during the solidification process. It can be
predicted through Brady‐Fleming’s cellular microsegregation model to determine the ef‐
fects induced in the AlSi10Mg L‐PBFed alloy. This mathematical model describes the pro‐
file of the solid‐state concentration through the following Equation (4):
𝐶 𝑘 𝐶𝑎
𝑘 11
𝑎𝑘𝑘 1
1 𝑓 (4)
where 𝑘 (‐) is the equilibrium partition coefficient, 𝐶 (‐) is the alloy solute concentration, 𝑓 (‐) is the solid fraction, 𝑎 (‐) is the cellular microsegregation parameter. In this scenario,
the cellular microsegregation coefficient is strictly related to the alloy characteristics (dif‐
fusion coefficient into liquid (Dl, (m2/s)), and slope liquid (ml, (K)) and to the process con‐
ditions (thermal gradient (G, (K/m)) and solidification rate (R, (m/s)). In fact, it is defined
as follows:

Materials 2022, 15, 2047 15 of 85
𝑎𝐺𝑅
𝐷𝑚 𝐶
(5)
The ratio between the thermal gradient and the solidification rate also determines,
firstly, the microstructures’ morphology obtained after the solidification process and, sec‐
ondly, the grains size [136,139–141]. In the first case, the relationships between G and R
allow for obtaining a solidification map as shown in Figure 15a where the lines and hy‐
perbola branches are described by the (that affects the structure morphology) and G × R
(that affects the microstructure scale), respectively.
Figure 15. (a) Solidification map obtained by the G/R and G × R factors; (b) SEM micrographs of the
MP center (MPC) and MP boundaries (MPB) (Adapted from reference [139]).
Through this graphical representation, the cellular fine microstructure and cellular
dendritic structure, which characterized the MP center (MPC) and the MP boundaries
(MPBs), respectively, can be predicted (Figure 15b) [139].
In the second case, G and R are related to SDAS (Secondary Dendrite Arm Spacing)
as follows:
𝑆𝐷𝐴𝑆 𝑘 𝐺 𝑅 (6)
where the material constants k and n are 43.2 m(K/s)n and 0.324, respectively [140]. Despite
this equation describing the cast alloy, different research study validates the same equa‐
tion to describe the AlSi10Mg alloy manufactured via L‐PBF process considering the
SDAS as the cellular island of α‐Al [136,139]. Moreover, in this case, if the MPC is charac‐
terized by a higher cooling rate (~105 ÷ 106 K/s, [9,136,139]) than the MPB, the adjacent
solidified material is exposed to annealing temperatures that generated the HAZ as ex‐
pressed in Section 2. These three different zones are characterized by an increment of the
grain size due to the Si diffusion [7,14,136,139,142,143]. De facto, this local high‐tempera‐
ture exposure modifies the cellular microstructure, destroying the Si‐eutectic network
(Figure 16) [139,142].

Materials 2022, 15, 2047 16 of 85
Figure 16. (a) SEM micrograph of the AlSi10Mg sample along the xz plane: (b,c) SEM micrographs
at high magnification of the MPBs that highlight the Si‐eutectic network destruction and the colum‐
nar grains (Reprinted from reference [139]).
Delahaye et al. [142] showed the reduction in Si‐rich fraction from the MPC and MPB
to the HAZ due to the Ostwald ripening phenomenon. All of this reflects on the HV mi‐
crohardness, as is widely reported in the literature [9,137,144].
From a three‐dimensional point of view, as‐built AlSi10Mg samples are characterized
by a tubular structure of the α‐Al matrix, which is surrounded by the Si‐eutectic network
(Figure 17a), due to the thermal gradient developed during the L‐PBF [87,145]. In the same
scenario, Figure 17b illustrates the same tubular structure containing, however, the Si par‐
ticles that precipitate thanks to the pre‐heated BP as previously discussed.
Figure 17. Schematic 3D rendering of the as build L‐PBFed AlSi10Mg manufactured on: (a) cold BP,
(b) hot BP.
As regards the Al, Si, Mg and Fe elements present in AlSi10Mg alloys, during the L‐
PBF process, these are distributed into microstructures (Figure 18a) as illustrated through
the Figure 17b–e, as reported by Bai et al. [146]. The higher Si content is present in Si‐
eutectic particles along the cell boundaries where the Mg content is also segregated and
into α‐Al matrix (Figure 18b,d,e), as already discussed in Figures 14 and 16. Zhou et al.
[147] confirmed this distribution through the TEM measurements that also showed the
(200), (111), (311) diffraction spots of Si‐particles within the α‐Al matrix cell boundaries.
In addition, the same authors reported the presence of fine acicular Si precipitates (length
of 50 ÷ 300 nm and width of ~10 nm) characterized by the following orientation relation‐
ship: 001 ∥ 122 and 200 ∥ 111 . In conclusion, they did not report if the BP
was used at room temperature or at higher temperatures.

Materials 2022, 15, 2047 17 of 85
Figure 18. (a) Microstructural morphology of the as‐built AlSi10Mg sample; (b–e) element map‐
pings of the Al, Si and Mg (Reprinted from reference [146]).
Finally, Fe content is distributed into Fe‐rich intermetallic phases such as π‐
Al8Si6Mg3Fe [147] or as brittle needle‐like β‐Al5FeSi phase [148,149]. At the same time, the
AlSi10Mg is an age‐hardening alloy (Figure 1a) that is characterized by the precipitation
phenomena of the ε‐Mg2Si phase [7,150,151]. Some authors show the presence of this ε
phase already in as‐built samples [14,148], while other studies do not achieve the same
results [152,153]. As a matter of fact, Mathe et al. [154] showed an increase of ε phase with
a decrease in the ED from 133 to 67 J/mm3. Casati et al. [138] showed, however, an increase
in the precipitation phenomena using the pre‐heated BP. De facto, the CP AB (cold plat‐
form at 35 °C, as‐built) sample presents the sequence of precipitation peaks in the DSC
(Differential Scanning Calorimetry) curves shown in Figure 19, unlike the HP AB (hot
platform at 200 °C, as‐built) sample, proving that the pre‐heated BP at 200 °C induces
precipitation phenomena of the ε‐Mg2Si phase.
Figure 19. DSC analysis of as built AlSi10Mg samples manufactured using a cold BP at 35 °C (CP
AB) and a pre‐heated BP at 200 °C (HP AB). CP sol represents the CP AB sample after the solution
heat treatment (SHT) (Reprinted from reference [138]).
Cerri et al. [14], who analyzed the effects induced by the pre‐heated BP at 150 °C,
showed different amounts of ε‐Mg2Si and Si particles within the α‐Al matrix between the
bottom and top regions into an AlSi10Mg billet (height of 300 mm). Thus, despite the use

Materials 2022, 15, 2047 18 of 85
of a pre‐heated BP, the as‐built sample can be characterized by a different distribution of
the precipitation phenomena induced by the BP temperature.
3.2. Heat‐Treated Microstructure
Table 3 reports the HTs analyzed in the present review and the nomenclature used.
Table 3. Classification of the HTs analyzed in the present review for the L‐PBFed AlSi10Mg samples.
HTs Temperature Used Scopes Ref.
Direct aging DA T ≤ 200 °C
Si‐eutectic network is not
destroyed (T ≤ 200 °C).
Alloying strengthening
[7,9,14,138,13
9,155–158]
Stress relief SR ~ 300 °C
Avoid deformations during
sample removal from the BP
Residual stress reduction
[139,143,155,1
59–163]
Solution heat
treatment SHT
T6
400 < TSHT < Teutectic 1
TSHT > 480 °C 2
Formation of SSS
Melt of Si‐eutectic (T > Teutec‐
tic)
Increase of ductility
[7,143,157,162
–166]
Artificial aging AA TAA ≤ 200 °C
160 < TAA < 180 °C 2 Alloying strengthening
Hot Isostatic
Pressing HIP 500 °C < T < Teutectic
Sample’s densification
Increase of ductility
[107,109,165,1
67,168] 1 400 < T < 480 ÷ 500 °C can be considered as an annealing (ANN) HT. 2 According to the ASTM
F3318‐18 [166].
The direct aging (DA) HT allows researchers to strengthen the as‐built AlSi10Mg
through the precipitation phenomenon of the ε‐Mg2Si phase, which follows the subse‐
quent precipitation sequence: SSS of Al → GP zones formation (aggregation of Si/Mg at‐
oms) → dissolution of Mg → cluster formation → precipitation of ε’’ phase → precipita‐tion of ε’ and ε’’ phases → precipitation of stable ε‐Mg2Si phase [7,150,155]. Different stud‐
ies show the DSC curve performed on the as‐built AlSi10Mg samples highlighting the
exothermic peaks related to the precipitation phenomena of the ε‐Mg2Si sequence. Fiocchi
et al. [155] showed a single precipitation peak at 256 °C attributable to ε‐Mg2Si phase performing the DSC between 0 and 500 °C. Van Cauwenbergh et al. [139] showed, instead,
the first and second exothermic peaks at 195 and 295 °C, respectively, related to the pre‐
cipitation phenomenon. Tonelli et al. [156] reported another exothermic peak at 150 °C
related to the ε’’ precipitate. In this scenario, these studies can confirm the effects induced
by the pre‐heated BP at temperatures between 100 and 200 °C.
The stress relief (SR) HT was often used to remove the manufactured samples from
the BP to avoid their deformation.
Finally, T6 HT allows for obtaining an increase in ductility thanks to the solution heat
treatment (SHT) and the alloy strengthening through the precipitation phenomena during
the following artificial aging (AA). While HIP HT was used to increase the sample density.
The microstructures obtained after the DA (180 ÷ 225 °C) are shown in Figure 20, as
reported by [14,139].

Materials 2022, 15, 2047 19 of 85
Figure 20. SEM micrographs of the AlSi10Mg samples DA at: (a,b) 170 °C × 6 h; (c) 200 °C × 6 h; (d)
225 °C × 6 h (Adapted from references [14,139]).
At low magnification (Figure 20a), the MPC and MPBs do not show any microstruc‐
tural variation, as also reported by [9,157,158,169]. On the other hand, finer Si‐rich precip‐
itates are visible in the α‐Al matrix, as shown in Figure 20b by [139]. It is necessary to
underline that the sample analyzed in Figure 20a,b was manufactured on the BP at room
temperature (Figure 13). The same authors analyzed the AlSi10Mg alloy in the same con‐
dition shown in Figure 13, where the samples were manufactured on the BP at room tem‐
perature. Cerri et al. [14] showed an increase in these precipitates, which were already
present in as‐built α‐Al matrix, after the DA at 200 °C for 6 h (Figure 20c) and at 225 °C ×
6 h (Figure 20d). At the same temperature, Baek et al. [157] affirmed that the precipitation
of these particles can cause a uniform distribution of the dislocation, unlike the HT per‐
formed at 225 °C, which induces initial destruction of the Si‐eutectic network. The open‐
ings within this network become larger as the temperature increases from 240 to 300 °C
during the SR HT due to the Ostwald ripening effect (Figure 21a–c)
[139,155,159,160,163,164].
Moreover, in this case, Van Cauwenbergh et al. [139] did not detect the presence of
the stable ε‐Mg2Si phase even after the SR HT at 270 °C, confirming the DSC analysis pre‐
viously discussed.
Despite the loss in mechanical properties (that will be discussed in Section 4), SR heat
treatment aims firstly to decrease the residual stress that is generated during the L‐PBF
process and, secondly, to avoid the consequent deformations derived by the removal of
the printed sample from the BP [156,161]. In this scenario, the use of the pre‐heated BP
can prevent the execution of the SR HT due to the lower amount of residual stress into the
as‐built sample [138,162]. At the same time, the Si‐eutectic network is not destroyed (Fig‐
ure 13) and the mechanical properties are preserved (which will be discussed in Section
4).
Figure 21d,e show the AlSi10Mg microstructure after the T6 heat treatment (SHT +
AA), where the high anisotropy characterizing the as‐built sample is cancelled even if, in

Materials 2022, 15, 2047 20 of 85
Figure 21d, the MPBs can still be observed after the SHT at 505 °C × 4 h [9]. Ji et al. [170]
explained this behavior through the Si content variation between the laser scan tracks
boundaries and their centre. During the SHT, the microstructural evolution follows the
schematic representation shown in Figure 22.
Figure 21. SEM micrographs: (a–c) of AlSi10Mg samples SR at 240 (a), 270 (b) and 300 °C (c), respec‐
tively; OM micrographs of the T6 heat‐treated performed along the: (d) xy plane, (e) xz plane
(Adapted from references [9,139]).
Figure 22. Schematic representation of the Si‐eutectic network evolution during the SHT treatment,
where the α‐Al matrix is the gray background: (a) as‐built AlSi10Mg with a full cellular structure
where the Si‐eutectic network is undamaged, (b) Si‐eutectic network destroyed with the initial Si‐
particle coarsening, (c) Si‐particle coarsened.
After the SHT + AA, the Si is rejected from the α‐Al matrix and forms small Si parti‐
cles as illustrated in Figure 22a,b. Due to the high SHT temperature/time, the Si particles
precipitate along the Al‐Si cellular boundaries and grow up as reported in Figure 22c. By
increasing the Si particle size, their density in terms of quantity decreases. The increase in
size with the SHT temperature is related to the decrease of Si density; the same authors
confirm that the as‐built α‐Al matrix is SSS. De facto, the excess of Si is rejected from the
lattice structure [170,171]. Other authors showed an increase in Si particle size also with
the holding time at high SHT temperature [148,172]. In this scenario, Li et al. [171] reported
the Si solubility study considering the following Vegard’s law:
𝜛 0.0032𝑋 0.40494 (7)

Materials 2022, 15, 2047 21 of 85
where 𝜛 is the lattice parameter of α‐Al and XSi is the atomic fraction of Si into α‐Al. The
same authors show a solubility of 8.89% for the as‐built AlSi10Mg and 3.25, 2.75 and 2.13%
after the SHT at 450, 500 and 550 °C, respectively. The values were reduced by the follow‐
ing AA at 180 °C for 12 h to 2.52, 2.02, and 1.68%, respectively, due to the precipitation
phenomena. During the same SHT, Zhou et al. [147] also showed the presence of needle‐
like Fe‐rich phase (β‐Al5FeSi), in addition to the spherical precipitates rich in Si and Fe
within the α‐Al. The same authors confirm the precipitation of needle‐like ε’’ precipitates
(length < 10 nm) placed along <100> direction and GP zones after 520 °C × 2 h of SHT and
160 °C/2 h of AA. Liu et al. [173] showed the same results after 530 °C × 6 h, as shown in
Figure 23.
Figure 23. (a,c–g) STEM‐HAADF (Scanning Transmission Electron Microscope—High‐Angle An‐
nular Dark Field)images of the β‐Al5FeSi intermetallic phase, Al, Si and Mg elements detected into
solution heat treated AlSi10Mg sample at 530 °C × 6 h. (b) SAED (Selected Area Electron Diffraction)
pattern of the area marked with a circle in (a) (Reprinted from reference [173]).
They also affirmed the absence of ε’ and ε precipitates, unlike Wei et al. [172], who
confirmed the presence of ε‐Mg2Si precipitate after 540 °C × 2 h.
The same results were obtained by Iturrioz et al. [174], who analyzed the AlSi10Mg
samples after SHT at 450 and 550 °C and AA at 180 °C. They supposed that the undetect‐
ability of the ε‐Mg2Si precipitates is because their lower amount than the detection limit.
On the other hand, the intensity of Si peaks increases from the as‐built to the heat‐treated
condition confirm the increase of Si content into α‐Al due to the Si precipitates as reported
by [14,143,147,170,174]. In addition, the T6 HT induces a coarsening of the columnar
grains formed during the L‐PBF fusion rather than the DA and SR HTs [157]. Increasing
the SHT temperature and/or time, the recrystallized equiaxed grains form due to the re‐
crystallization process [148]. This phenomenon balances the reduction in plasticity in‐
duced by the Si particles precipitation [143]. Wei et al. [172] showed that the grain size
increases slightly between the as‐built‐ and T6 heat‐treated at (540 °C × 2 h) + (170 °C × 4
h) samples and that the % of recrystallization grains is the same. De facto, Chen et al. [175]

Materials 2022, 15, 2047 22 of 85
affirmed that the dislocations present within the cellular boundaries of the as‐built sample
can act as nucleation sites. On the other hand, Si particles can hinder the grain growth
because of the recrystallization process during the T6 HT [172,175]. If the higher micro‐
structural variation takes place during only the SHT treatments, Merino et al. [165]
showed Si particles coarsening, even after an AA performed at 177 °C × 1000 h.
In conclusion, the HIP HT, which can be used to reduce the internal pores inducing
the sample’s densification, confers the same microstructural effects of the T6 HTs
[107,108,167]. Merino et al. [165] showed a complete recrystallization process after HIP
(515 °C × 3 h × 100 MPa) and HIP + T6 (515 °C × 3 h × 100 MPa) + ((530 °C × 6 h) + (160 °C
× 6 h)) HTs. In this scenario, Ertuğrul et al. [107] also combined the HIP HT with the T6 to
increase the mechanical properties, but the round Si particles become larger and more
spherical, and the microstructure shows needle‐like Fe‐rich phases. The same results were
reported by Schneller et al. [108] and Hafenstein et al. [167] who showed a decrease be‐
tween 64 and 66% of the internal pores.
4. L‐PBFed AlSi10Mg: Mechanical Properties
Table 4 shows the mechanical properties of L‐PBFed AlSi10Mg samples before and
after the heat treatments of which microstructural effects are discussed in Section 3.2. (DA,
SR, SHT, and HIP). Due to the influence of the ED on both the presence of defects and
microstructure, all studies reported in the following table showed ED values from 35 to
60 J/mm3. Thus, all illustrated values are comparable to each other. For a better under‐
standing, H and V represent the horizontal and vertical directions, respectively.
Table 4. Mechanical properties of as‐built and heat‐treated L‐PBFed AlSi10Mg samples.
Process Parameters
Directions HT UTS
(MPa)
YS
(MPa) A (%) Ref. P
(W)
v
(mm/s)
h
(μm)
t
(μm) BP
370 1400 70 90 150
°C H As‐built
441 ± 3 285 ± 6 6.6 ± 0.8
[9] 411 ± 9 1
237 ± 6 7.0 ± 1.3
750 1100 ‐‐ ‐‐ RT ‐‐ As‐built 375 ±
18
225 ±
14 6.0 ± 2.5 [13]
350 1150 170 50 150
°C H As‐built
430 ± 8 286 ± 8 7.0 ± 0.4
[14] 365 ± 7 1
220 ± 2 7.2 ± 0.3
‐‐ ‐‐
190 60
‐‐
H
As‐built
323 ± 2 190 ± 6 6.7 ± 0.2
[137]
30 367 ± 4 244 ± 1 6.9 ± 1.0
100 30 469 ± 4 314 ± 1 5.6 ± 0.6
190 60
V
340 ± 1 214 ± 6 3.2 ± 0.1
30 380 ± 2 233 ± 2 3.9 ± 0.2
100 30 437 ± 4 278 ± 1 3.4 ± 0.1
‐‐ ‐‐ ‐‐ 60
RT
‐‐ As‐built
435 250 7.5 ± 2.5
[139] 200
°C 310 160 5.0 ± 1.0
370 1300 190 30 165
°C
H As‐built
429 ± 8 226 ± 7 4.0 ± 0.3 [143]
V 418 ± 7 269 ± 6 7.8 ± 0.4
340 1300 200 30 160
°C
H As‐built
386 ± 3 248 ± 2 8.6 ± 1.4 [138]
V 412 ± 5 228 ± 4 7.0 ± 0.1
250 1400 130 30 ‐‐ ‐‐ As‐built 448 264 9.8 [158]
300 1000 130 40 ‐‐ ‐‐ As‐built 463 ± 3 237 ± 4 7.6 ± 1.0 [165]
350 1140 170 50 100
°C ‐‐ As‐built
434 ±
12 322 ± 8 5.3 ± 0.2 [170]
200 1000 150 30 ‐‐ V As‐built 465 ± 8 305 ± 4 8.6 ± 1.4 [176]
‐‐ ‐‐ ‐‐ ‐‐ ‐‐ H As‐built 318 216 5.7 [177]

Materials 2022, 15, 2047 23 of 85
V 320 221 5.4
370 1300 190 30 ‐‐ H
As‐built 409 ± 2 242 ±2 10.9 ± 0.7
[178] V 410 ± 2 224 ± 1 6.7 ± 0.3
390 1300 190 30 RT H As‐built 525 ± 4 287± 2 ‐‐ [179]
350 1150 170 50 150
°C V As‐built
393 ±
20 273 ± 3 2.5 ± 0.4 [180]
370 1400 70 90 150
°C
H DA 200 °C × 4 h
374 ± 1 231 ± 2 8.2 ± 1.2
[9]
363 ± 8 1
219 ± 6 8.5 ± 0.6
350 1150 170 50 150
°C
371 ± 9 230 ± 8 8.2 ± 0.7
348 ± 2 1
209 ± 2 7.6 ± 0.8
750 1100 ‐‐ ‐‐ RT ‐‐ DA 160 °C × 8 h 399 ±
13
284 ±
16 4.5 ± 1.9 [13]
350 1150 170 50 150
°C H
DA 175 °C × 6 h
419 ±
16 258 ± 9 7.6 ± 0.4
[14]
396 ±
18 1
232 ±
11 7.6 ± 0.6
DA 200 °C × 6 h
395 ±
11
235 ±
12 9.0 ± 1.0
350 ± 9 1
199 ± 6 9.2 ± 0.5
DA 225 °C × 6 h
341 ±
15 199 ± 6 13.6 ± 1.1
331 ±
19 1 184 ± 5 15.2 ± 1.0
‐‐ ‐‐ ‐‐ 60 RT ‐‐ DA 170 °C × 6 h 400 295 5.05 ± 0.5 [139]
340 1300 200 30 RT H
DA 160 °C × 4 h 471 ± 1 321 ± 2 8.6 ± 0.5
[138] V 493 ± 1 292 ± 1 6.0 ± 0.6
250 1400 130 30 ‐‐ ‐‐ DA 180 °C × 6 h 452 310 6.2 [158]
300 1000 130 40 ‐‐ ‐‐
DA
1 177 °C × 10 h 418 ± 9
233 ±
12 5.1 ± 0.8
[165] DA
2 177 °C × 100 h 403 ± 9
229 ±
12 4.2 ± 0.6
DA
3 177 °C × 1000 h 391 ± 5 231 ± 9 4.6 ± 0.7
750 1000 ‐‐ ‐‐ RT ‐‐ SR 300 °C × 2 h 225 ± 7 132 ± 9 11.5 ± 3.5 [13]
370 1300 190 30 RT ‐‐ SR 300 °C × 2 h 302 ±
15
210 ±
16 10.7 ± 1.6 [107]
‐‐ ‐‐ ‐‐ 60 RT ‐‐ SR 270 °C × 2 h 335 210 12 ± 2 [139]
370 1300 190 30 165 H
SR 300 °C × 2 h 257 ± 1 160 ± 1 18.1 ± 0.5
[143] V 261 ± 3 170 ± 2 19.1 ± 1.0
300 1000 130 40 ‐‐ ‐‐
SR 285 °C × 2 h 249 ±
10 153 ± 8 21.3 ± 1.7
[165]
SR
+D
A1
285 °C × 2 h + 177
°C × 10 h 246 ± 9 154 ± 8 21.6 ± 1.8
SR
+D
A2
285 °C × 2 h + 177
°C × 100 h 271 ± 4 174 ± 3 16.5 ± 1.2
SR
+D
A3
285 °C × 2 h + 177
°C × 1000 h 245 ± 5 155 ± 2 14.8 ± 2.0
SR 190 °C × 2 h 2 443 ±
16 258 ± 4 4.7 ± 1.2

Materials 2022, 15, 2047 24 of 85
SR
+
DA
1
190 °C × 2 h + 177
°C × 10 h 441 ± 9 231 ± 7 5.0 ± 0.8
SR
+
DA
2
190 °C × 2 h + 177
°C × 100 h 407 ± 8 229 ± 7 5.0 ± 0.7
SR
+
DA
3
190 °C × 2 h + 177
°C × 1000 h 387 ± 4 221 ± 6 5.3 ± 1.1
200 1000 150 30 ‐‐ V SR 300 °C × 4 min 322 ± 5 220 ± 4 6.3 ± 0.2
[176] SR 300 °C × 40 min 282 ± 4 192 ± 6 12.8 ± 0.7
390 1300 190 30 RT H
SR 250 °C × 2 h 421 ± 2 249 ± 2 ‐‐
[179] SR 300 °C × 2 h
341 ±
16
212 ±
12 ‐‐
‐‐ ‐‐ ‐‐ ‐‐ 200
°C
H SR 300 °C × 2 h
327 ± 3 209 ± 1 ‐‐ [181]
V 350 ± 0 209 ± 0 ‐‐
370 1400 70 90 150
°C H T6
505 °C × 4 h + 175
°C × 4 h
295 ± 2 239 ± 2 11.3 ± 2.5
[9] 292 ± 5 1
236 ± 5 9.5 ± 2.2
750 1100 ‐‐ ‐‐ RT ‐‐
SR
+
T6
300 °C × 2 h + 543
°C × 1 h + 180 °C
× 1 2h
329 ±
12
278 V
6 6.0 ± 1.4
[13] 300 °C × 2 h + 543
°C × 3 h + 180 °C
× 8 h
332 ±
11
292 ±
12 4.4 ± 0.8
350 1150 170 50 150
°C H T6
505 °C × 4 h + 175
°C × 4 h
274 ± 3 226 ± 2 8.4 ± 0.8
[14] 290 ± 4 1
238 ± 4 9.7 ± 1.0
370 1300 190 30 RT ‐‐ T6 540 °C × 2 h 297 ±
10 234 ± 7 5.0 ± 1.5 [107]
‐‐ ‐‐ ‐‐ ‐‐ RT ‐‐ T6 540 °C × 8 h + 160
°C × 6 h 225 180 ‐‐ [139]
370 1300 190 30 165
°C H
SH
T 500 °C × 2 h 133 ± 1 78 ± 1 29 ± 1 [143]
340 1300 200 30 RT H
T6 540 °C × 1 h + 160
°C × 4 h
323 ± 0 243 ± 0 15.3 ± 2.4 [138]
V 302 ± 2 223 ± 3 16.0 ± 1.4
300 1000 130 40 ‐‐ ‐‐
T6 530 °C × 6 h 308 ± 8 240 ± 8 16.2 ± 1.5
[165]
T6
+
DA
1
530 °C × 6 h + 160
°C × 6 h + 177 °C
× 10 h
283 ±
10 232 ± 7 14.5 ± 1.5
T6
+
DA
2
530 °C × 6 h + 160
°C × 6 h + 177 °C
× 100 h
201 ± 2 159 ± 3 16.2 ± 0.6
T6
+
DA
3
530 °C × 6 h + 160
°C × 6 h + 177 °C
× 1000 h
144 ± 6 94 ± 4 28.9 ± 2.7
350 1140 170 50 100
°C ‐‐
SH
T
450 °C × 2 h 282 ± 6 197 ± 4 13.4 ± 0.5
[170] 500 °C × 2 h 214 ± 5 126 ± 2 23.5 ± 0.8
550 °C × 2 h 168 ± 2 91 ± 2 23.7 ± 0.8

Materials 2022, 15, 2047 25 of 85
200 1000 150 30 ‐‐ V
SH
T 540 °C × 2 h 185 ± 7 98 ± 2 16.7 ± 0.5
[176]
T6 540 °C × 2 h + 160
°C × 2 h 254 ± 7 194 ± 5 7.0 ± 0.3
250 1400 130 30 ‐‐ ‐‐ T6 520 °C × 2 h + 180
°C × 6 h 242 180 9.6 [180]
‐‐ ‐‐ ‐‐ ‐‐ 200
°C
H SR
+
T6
300 °C × 2 h + 540
°C × 8 h + 160 °C
× 10 h
337 ± 8 280 ± 5 ‐‐
[181] V
315 ±
15
267 ±
12 ‐‐
370 1300 190 30 RT ‐‐
HI
P
500 °C × 75 min +
100 MPa 176 ± 2 108 ± 3 25.0 ± 0.5
[107]
SR
+H
IP
+
T6
300 °C × 2 h + 500
°C × 75 min + 100
MPa + 540 °C × 2
h + 180 °C × 4 h
345 ± 1 308 ±
25 5.8 ± 1.7
SR
+
HI
P +
T6
300 °C × 2 h + 500
°C × 75 min + 100
MPa + 540 °C × 2
h + 180 °C × 12 h
306 ± 9 254 ± 9 8.7 ± 3.3
300 1000 130 40 ‐‐ ‐‐ HI
P
515 °C × 3 h + 100
MPa 144 ± 1 88 ± 4 32.2 ± 1.2 [165]
300 1000 130 40 ‐‐ ‐‐
HI
P +
DA
1
515 °C × 3 h + 100
MPa + 177 °C × 10
h
144 ± 1 93 ± 2 31.8 V 1.0
[165]
HI
P +
DA
2
515 °C × 3 h + 100
MPa + 177 °C ×
100 h
138 ± 1 93 ± 1 30.5 ± 3.1
HI
P+
DA
3
515 °C × 3 h + 100
MPa + 177 °C ×
1000 h
127 ± 1 80 ± 1 33.3 ± 1.3
1 The UTS, YS and A are related to the top samples (maximum distance from the pre‐heated BP) [14]. 2 HT defined as SR by the same authors [165].
Generally, the tensile strengths of the as‐built samples reach high values due to the
microstructure shown in Figures 12,13 and 20. On the other hand, the ductility values do
not meet the standard specification and project requirements very often (Table 4)
[9,13,137,139,166,176]. In this scenario, despite the similar ED values of all studies ana‐
lyzed, the process parameters and the build chamber orientation significantly influence
the mechanical properties of the as‐built sample [137,138,143,176,177]. Firstly, Paul et al.
[137] showed a reduction in the strength of ~ 10–12% with an increase in t from 30 to 60
μm. In this case, the ductility was not affected. The UTS (Ultimate Tensile Strength) and
YS (Yield Strength) reach 323 MPa and 190 MPa from 367 MPa and 244 MPa, respectively,
with 190 μm of hatch spacing. Both the UTS and YS values increase with decreasing the
hatch spacing at 100 μm, as shown in Table 4. Ghio et al. [9] showed, instead, increase in
strengths of about 5.5% by increasing the layer thickness (+40 μm) and decreasing the
hatch spacing (–100 μm). Secondly, the H‐samples show lower UTS and YS than the V‐
samples, in addition to the ductility’s variation, highlighting the anisotropy that charac‐
terizes the as‐built samples [138,139,143]. Other authors have not reported differences be‐
tween the tensile strength values in relation to the build orientation [177,178]. In terms of
ductility, Ben et al. [177] explained this variation, firstly, through the load conditions

Materials 2022, 15, 2047 26 of 85
during the tensile test, secondly, through the presence of voids. They affirmed that the
crack‐like voids (LOF) present along the MPBs are more dangerous than the spherical
pores (Section 2) due to their different deformation during the tensile test. The spherical
pores show limited deformation compared to the crack‐like voids along the load direction.
Another factor that influences the tensile properties is the presence of the pre‐heated
BP during the L‐PBF process, which influences the precipitation phenomena, as reported
in Figure 19. Cerri et al. [14] reported a decrease in UTS and YS from 430 ± 8 MPa and 365
± 7 MPa and from 286 ± 8 MPa to 220 ± 2 MPa, respectively, analyzing the effects of the
pre‐heated BP at 150 °C (see both Table 4 and Section 3.1). As a matter of fact, the aging
phenomenon and Si‐particles precipitation occurring in as‐built samples (Figure 13) in‐
crease the tensile strengths. The elongation values are not significantly influenced. At the
same time, the BP effects are equally significant after the DA HT performed at similar
temperatures of the platform. De facto, Cerri et al. [14] showed an increase of UTS and YS
values on top samples (which are not affected by the hot BP) rather than the bottom sam‐
ples after the DA at 175 °C × 6 h. Yang et al. [13] highlighted the same effects performing
the DA at 160 °C × 8 h on AlSi10Mg samples manufactured on cold BP (35 °C), while Casati
et al. [138] showed these effects after the DA at 160 °C × 4 h. Finally, it is necessary to
observe that the effects induced by the pre‐heated BP are strictly related to its temperature,
and to the printing time.
Analyzing the SR HT, no study shows the increase in the tensile strengths due to the
microstructure reported in Figure 21. Obviously, the higher decrease in strengths is ob‐
tained only after the SHT or HIP HTs when the UTS and YS values are similar to those
obtained for the as‐cast AlSi10Mg alloy [7,10,49,147]. On the other hand, the elongation
values reached with the SR heat treatment can already satisfy the standard specification
requirements (A > 10%) [166]; however, those obtained after the SHT and HIP heat treat‐
ment reach the maximum obtainable values (23 ÷ 31%). In all cases, the tensile strengths
were recovered through opportune DA heat treatments. Li et al. [176] showed the UTS
and YS increase of 30 and 50%, respectively, after the DA at 160 °C × 2 h performed on
solution heat‐treated samples at 500 °C × 2 h. The same results are reported by [143,170].
For each heat treatment, a disproportionate holding time at the aging temperatures in‐
duces a decrease in strength due to the microstructural effects, as shown by Merino et al.
[165]. The same authors applied different DA heat treatments at 177 °C × 10, 100, 1000 h
on HIPed and T6 heat‐treated.
The decreasing trend of UTS and YS values, opposite to the elongation values, are
appropriately described by [157,164,165,176]. Starting from the as‐built samples and the
direct aged samples at low temperature (where no microstructural variation was ob‐
served), Li et al. [176] proposed three deformation scenarios (Figure 24) that deviated from
the Orowan bowing mechanisms around the Si particles and that could justify the tensile
strength behavior. The first one is the dislocation de‐pinning from supersaturated atoms
in α‐Al (Figure 24a); the second one is the deformation by cutting dislocation forest near
the interface between the Al/Si interfaces (Figure 24b); the last one is the dislocation emis‐
sion from the same interfaces (Figure 24c).

Materials 2022, 15, 2047 27 of 85
Figure 24. Schematic representation of plastic deformation mechanisms of the full cellular structure:
(a) dislocation de‐pinning from the atoms dispersed into SSS α‐Al matrix; (b) deformation by cutting
dislocation “forests”; (c) emission of dislocation from the interface between the Al and Si.
The presence of dislocation density around the solute atoms into the aluminium ma‐
trix is also reported in Section 3.1.
Thus, the high mechanical properties can be expressed through the following sum of
strengthening effects [182,183]:
𝜎 . 𝜎 𝜎 𝜎 𝜎 𝜎 𝜎 (8)
where 𝜎 (MPa) is the friction stress of the lattice, 𝜎 (MPa) is the solid solution strength‐
ening, 𝜎 (MPa) is the strength obtained by the grain size (Hall–Petch equation), 𝜎
(MPa) is the Orowan strengthening, 𝜎 (MPa) is the dislocation hardening and 𝜎 (MPa)
is the contributed sum of the dislocation and precipitates. Li et al. [176] showed that the
first parameter can be calculated as 5.5 MPa; for this reason, it can be neglected if com‐
pared with the other contributions. Yang et al. [13] expressed the solid solution strength‐
ening as follows:
𝜎 𝑘 𝐶 𝐾 𝐶 (9)
where 𝑘 and 𝑘 are 17 and 11 MPa wt%−1, respectively, m is 1 and C is the chemical
concentration of Mg and Si into the α‐Al matrix, respectively. The same authors suggest
that this contribution is negligible after the T6 HT. Hadadzadeh et al. [182] proposed the
use of the Hall–Petch equation (considering the cellular structure of the L‐PBFed
AlSi10Mg):
𝜎𝐾
√𝑑, (10)
where 𝐾 is a material constant (~0.04 MPa m1/2, [184]), and 𝑑 is the average cell size (m).
The Orowan strengthening was expressed by Dieter [185], as follows:
𝜎0.13𝐺𝑏
𝜆ln𝑟𝑏
, (11)
where 𝐺 (GPa) is the Al shear modulus (26.5, [158,183]), 𝑏 is the Burgers vector (0.286 nm),
[158,184], 𝜆 is the interparticle spacing (nm) 𝜆 𝑟 , [148] and 𝑟 is the particle ra‐
dius (nm). Figure 25a,b show the schematic interaction between a dislocation and the cell
boundaries via Orowan looping in a full‐cellular AlSi10Mg structure [164]. When an ap‐
plied load moves a large dislocation (same magnitude of the grain size) into the AlSi10Mg
microstructure, it will be pinned by the Si‐eutectic network, forming both dislocation
loops around the Si‐particles and a new dislocation (Figures 24a and 25b). Chen et al. [186]

Materials 2022, 15, 2047 28 of 85
observed a high amount of dislocation and dislocation loop through HRTEM (High‐Res‐
olution Transmission Electron Microscope) observations in a deformed AlSi10Mg sample.
Figure 25. Schematic representation of the dislocation interaction (a,b) with the cell boundaries via
Orowan mechanism and formation of the dislocation loop (c).
Rodriguez [187] expressed the dislocation hardening contribution as follows:
𝜎 𝛽𝑀𝐺𝑏 𝜌 (12)
where 𝛽 is a material constant (0.16, [181]), 𝑀 is the Taylor factor (3.06, [158,184]), 𝐺 (GPa) is the Al shear modulus, 𝑏 is the Burgers vector and 𝜌 is the density dislocation. Finally, Starink et al. [188] suggested the following equation to predict the strengthening contri‐
bution conferred by the dislocation and precipitates:
𝜎 𝐶𝐺𝑏
𝑙 𝑙𝑓 0.7𝑓
𝑙𝑙
0.12𝑙𝑙
𝑓 (13)
where 𝐶 (‐) is a material constant, 𝑙 and 𝑙 are the diameter (nm) and thickness of the
precipitate (nm), 𝑓 is the volume fraction (‐). Thus, considering all contributions expressed
through the Equations (9)–(13), the Equation (8) can be rewritten as follows:
𝜎 . 5.5 𝑘 𝐶 𝐾 𝐶𝐾
√𝑑
0.13𝐺 𝑏𝜆
ln𝑟𝑏
𝛽𝑀𝐺𝑏 𝜌
𝐶𝐺𝑏
𝑙 𝑙𝑓 0.7𝑓
𝑙𝑙
0.12𝑙𝑙
𝑓 (14)
Focusing on the microstructure obtained after the T6 and HIP HTs (Section 3.2), some
contributions reported in Equation (13) decrease with respect to the as‐built case. Baek et al. [157] showed a decrease of 𝜎 from 89.22 MPa to 12.46 MPa considering the as‐built
and T6 heat‐treated sample, respectively. The same authors highlighted an obvious incre‐
ment of the Orowan strengthening from 59.05 MPa (as‐built condition) to 183.30 MPa con‐
sidering the direct aged samples (180 °C × 6 h), and a subsequent drastic decrease to 12.56
MPa analyzing the T6 heat‐treated samples. Finally, the contribution related to the dislo‐
cation amount decreases with the HT temperature and holding time (Section 3.2). Merino
et al. [165] observed that the mechanical properties of T6 and HIP heat‐treated samples is
dominated by the grain size and Si particles in terms of size and distribution. In fact, the
tensile strength decrease showed by the same authors is confirmed through the coarsen‐
ing effects (Section 3.2), and not through the precipitation phenomena, despite the DA

Materials 2022, 15, 2047 29 of 85
HT. The same observations were emphasized by Baek et al. [157]. Wei et al. [172] did not
show the same results due to the slight increase in the grain size after the T6 HT. They
affirmed that the decrease in hardness is dominated only by the reduction of the disloca‐
tion amount within the cells and not by the grain size.
In this scenario, the microstructural configuration reported in Figures 11,16 and 21
dominate the fracture mechanisms and the elongation of the L‐PBFed AlSi10Mg samples
in as‐built and heat‐treated conditions. Delahaye et al. [142], who analyzed the fracture
mechanism into as‐built AlSi10Mg samples, highlighted that the dislocation can easily
move into the HAZ zones rather than into MPC due to their microstructure (Figure 16)
and due to the different values of the yield strength. Other important factors characteriz‐
ing the fracture mechanism are the Si‐particle decohesion from the α‐Al matrix, and the
formation of voids at their interface [142,179]. This crack path characterizes more the V‐
samples than the H‐samples, as reported in different studies [137,177,189,190]. De facto,
the load direction changes the mechanical behavior between the H‐ and V‐samples due to
the microstructural texture characterizing the as‐built samples [13,137]. Yang et al. [13]
affirmed that the H‐samples show a grain deformation, while the V‐samples are charac‐
terized by deformation along the MPBs through a detailed description of the strain and
stress anisotropy. Thus, the path of the cracks can vary, as schematically shown in Figure
26 and carefully described by [137,189].
Figure 26. Fracture mechanism of L‐PBFed AlSi10Mg samples.
The presence of internal pores is another important factor into damage mechanisms
because they caused an early break of the sample under a load [13,177,190].
The fracture surfaces shown in Figure 27, analyzed by Zhou et al. [191], report the
presence of dimples, cleavage surface, cracks and the typical geometry of the MPBs, which
confirms what was previously discussed. The lamellar features and the segments of the
Si‐eutectic network present on fracture surfaces are caused by the load‐bearing capacity
of the Si network and by the load transfer from the same particles to the α‐Al matrix [179].
The same authors proposed an interesting scheme of damage mechanisms about the mi‐
crostructural variation from the full‐cellular to coarsened structures. In the former case,
the crack propagates along the cell boundaries, while, in the latter one, the crack intercon‐
nects the Si particles and voids caused by the Si‐particle decohesion from the matrix. Fig‐
ure 28 shows what was just reported, in addition to the effects induced by the MP bound‐
ary that remained in the T6 heat‐treated microstructure (Section 3.2) [9]. The same results
are shown in other studies conducted by [9,13,107,142,157]. Martin [192] proposed the fol‐
lowing correlation to obtain the work W necessary to create a crack between the Si‐particle
and the α‐Al matrix:
𝑊 ∝ 𝛾 𝛾 𝛾 (15)
where 𝛾 (J/m2) and 𝛾 (J/m2) are the matrix and precipitate surface energy, while 𝛾
(J/m2) is the interface energy. This last term is strictly related to the Si‐particle size, and it
increases with the size.

Materials 2022, 15, 2047 30 of 85
Figure 27. Fracture surfaces of the as‐built AlSi10Mg H‐samples after tensile test that show: (a) crack,
(b) mixture of small dimples, (c) layer‐layer MPBs and track–track MPBs crack pahts, (d) non‐melted
powder and cleavage step (Adapted from reference [191]).
Figure 28. Fracture profiles (a,b) of the T6 heat‐treated AlSi10Mg samples at (505 °C × 4 h) + (175 °C
× 4 h) where (c,d) highlight the zones indicated by the orange and light‐blue arrows, respectively
(Reprinted from reference [9]).
The coarsened microstructure obtained after the T6 or HIP HTs increase the value of
the interface energy (𝛾 ) and, consequently, reduces the work necessary to nucleate a
crack. In addition, the nucleation and propagation of the crack can be influenced by the
presence of brittle β‐Al5FeSi phases and by the density variation after the HTs [13,49,107].

Materials 2022, 15, 2047 31 of 85
As a matter of fact, already after the SR at 300 °C × 2 h the sample’s density can decrease
from 2.68 g/cm3 to 2.58 ÷ 2.61 g/cm3 as reported by Mfusi et al. [160]. The same results were
also obtained after different T6 heat treatments by [13,48,49]. Yang et al. [13] and Girelli et
al. [49] justified the increase in porosity through the matrix deformation caused by the gas
pressure during the heat treatment. De facto, the yield strength of the material around the
pore decreases due to the high temperature; the increase in gas pressure can deform it.
5. L‐PBFed AlSi10Mg: The Corrosion Resistance
The corrosion resistance of the as‐built and heat‐treated AlSi10Mg samples is strictly
related not only to their surface finishing but also to their microstructure, which depends
on the following aspects: ED values used during the L‐PBF process, HT time and temper‐
atures, build orientations and presence of defects (Table 5) [193–200].
Table 5. Review on the corrosion of the AlSi10Mg samples.
Environment Corrosion Related
to HT Corrosion Characteristics Ref.
Harrison’s so‐
lution
Surface finish,
build orientation As built
Anisotropy of corrosion resistance be‐
tween the xz and xy planes Ecorr = −0.6 ÷ −0.7 V [193]
Harrison’s so‐
lution
Surface finish and
HTs
As built
The spontaneously passive layer formed
in air is more protective than the same
forming during the L‐PBF process.
Ecorr/unpolished = −0.561 ÷ −0.649 V
Ecorr/polished = −0.570 ÷ −0.758 V
[194]
275 °C × 2 h (AC)
SR does not reduce the susceptibility to
the corrosion attack penetration.
Ecorr/unpolished = −0.615 ÷ −0.869 V
Ecorr/polished = −0.476 ÷ −0.624 V
275 °C × 2 h (AC)
+ 525 °C × 1 h
(WQ)
SR + SHT increase the local corrosion Ecorr/unpolished = −0.600 ÷ −0.608 V
Ecorr/polished = −0.610 ÷ −0.620 V
01M NaCl Scans strategy,
layer thickness
As‐built (BP T =
180 °C)
Pitting into MPBs, crack formation. Rela‐
tion between the cellular grain size and
the Volta potential between Si and α‐Al.
Ecorr = −0.639 ÷ −0.650 V [197]
3.5 wt% NaCl SLM/As cast As built As built lower mass loss than as cast Ecorr = −0.73 V, icorr = 0.54 μA/cm2 [199]
3.5 wt% NaCl Surface finish 300 °C × 2 h Higher resistance for the polished than
unpolished samples
Unpolished 2.13 pit/cm2.
Polished 0.93 pit/cm2 [200]
Fathi et al. [198] showed an apparently better corrosion resistance of the as‐built L‐
PBFed AlSi10Mg samples than the same as‐cast samples due to their finer microstructure.
Revilla et al. [197] demonstrated that the potential difference between the Si crystals inside
the MPBs and the α‐Al matrix was higher, at about 127 mV, than the same difference be‐
tween the Si crystals and the outside zone (95 mV) (see Figure 29a). The same authors
showed a presence of crystallographic pitting developing in the α‐Al grains within the
MPBs.

Materials 2022, 15, 2047 32 of 85
Figure 29. Potential profile along the HAZ and MPB of the as built AlSi10Mg (Adapted from refer‐
ence [201]).
The same results were also obtained by [172,197,198,202]. Cabrini et al. [202] high‐
lighted that the Si‐eutectic network partially shielded the MPC from the corrosion attack
because the local acidification formed during the corrosion process prevent the oxide film
reformation.
On the other hand, several studies show a large corrosion attack penetration along
the MP boundaries [193,194,196,203]. De facto, Figure 30 shows a schematic representation
of the corrosion initiation and propagation of the as‐built L‐PBFed Al‐Si alloys as pro‐
posed by [204].
Figure 30. Schematic representation of the corrosion mechanism in the AlSi10Mg as built sample:
(a) surface without corrosion attack, (b,c) initiation of the corrosion attack, (d) micro‐crack for‐
mation, (e) micro‐crack and corrosion attack propagation (Reprinted from reference [201]).
Figure 30a–c show the initiation of the corrosion attack that takes place at the MPB
due to the higher driving force for galvanic corrosion induced by the higher potential dif‐
ference. Moreover, crack formation can be due to the Si‐eutectic destruction into HAZ
correlated to the residual stress characterizing the as‐built samples (Sections 2 and 3.2)
and to the α‐Al matrix dissolution. Finally, the corrosion path can follow the crack prop‐
agation (Figure 30d,e) [203].

Materials 2022, 15, 2047 33 of 85
Finally, the presence of pores might play a significant role in stress corrosion cracking
(SCC) due to their concentration point effects during the mechanical loading (Sections 2.1
and 3). In this scenario, the residual stress characterizing the L‐PBFed sample also influ‐
ences the SCC [197].
As for the mechanical properties (Section 3.1), the corrosion resistance is also aniso‐
tropic along the xy and xz planes of the as‐built samples [193,205]. It is, however, neces‐
sary to highlight that the greater anisotropy is obtained with the intergranular corrosion
test [203] rather than with the potential dynamic polarization experiment in Harrison’s
solution in the aerated solution of NaCl [193,204–207]. If Chen et al. [207] show higher
corrosion resistance on the xz plane than on the xy for the as‐built Al‐12Si alloy, the pre‐
vious studies show the opposite. This difference behavior can be attributable to the differ‐
ent chemical compositions, even if they belong to the same family.
Starting from the DA samples, the corrosion attack takes place still along the MPB
due to the slight microstructural change (Figure 20). Cabrini et al. [194] showed that the
penetration of the corrosion attack along the MPB was higher in the AlSi10Mg after DA
at 200 °C rather than in the SR samples at 300 °C. In all cases, the influence of the build
orientation remains visible. Rubben et al. [206] showed the corrosion attack along the MPB
even after the SR at 300 °C × 2 h. As a matter of fact, the corrosion mechanism changes in
relation to the heat treatment, as shown in Figure 31, due to the microstructural variation
between the as‐built (first row) and heat‐treated samples (T > 300 °C, second row). Despite
this, in both cases, corrosion propagation occurs along the MPBs.
Figure 31. Schematic representation of the corrosion mechanism in the as‐built AlSi10Mg (first row)
and in the SR (second row) samples (Reprinted from reference [201]).
Increasing the heat treatment temperature, Cabrini et al. [195] showed more general
corrosion after the intergranular test performed on the heat‐treated samples at 400 °C. De
facto, the propagation of the corrosion attack is no longer obstructed by the Si‐eutectic
network that is gradually destroyed with the temperature (Figures 20 and 21). Reaching
the SHT temperatures and focusing on T6 HT, Wei et al. [172] reported an increase in the
weight loss from 0 to 400 mg/cm−3 with the SHT temperatures and time.
On the corroded surface, the same authors showed the typical pit of pitting corrosion
after the T6 HT, in addition to a greater corrosion effect around the Si particles and/or ε‐
Mg2Si precipitates after the corrosion test in 1M HNO3 solution. The dissolution of the α‐
Al matrix occurs for the following reasons after the T6 HT:
The amount of the Si rejected from the α‐Al;
The formation of the ε‐Mg2Si precipitates that increase the galvanic couple.
In addition, the corrosion effects accelerate if these precipitates are characterized by
big dimensions [192]. Generally, the presence of the Mg alloying element within the

Materials 2022, 15, 2047 34 of 85
chemical composition tends to decrease the corrosion resistance of the aluminium alloys;
in fact, Al12Si is characterized by higher corrosion resistance than the AlSi10Mg and the
AlSi7Mg0.6 [207–210]. De facto, the ε‐Mg2Si phase is anodic to the α‐Al matrix when the
corrosion attack occurs, as demonstrated by Zeng et al. [208]. During the corrosion phe‐
nomenon, the Mg content decreases and the consequent shift of the potential to more pos‐
itive values make the ε‐Mg2Si cathodic to α‐Al matrix. This variation in terms of potential
is induced by the increase in the Si effects.
6. L‐PBFed Ti6Al4V: Microstructure
6.1. As‐Built Microstructure
The as‐built L‐PBF‐ed Ti6Al4V alloy shows a fully or majority martensitic (α’) micro‐
structure within prior columnar β‐grains that are arranged along the build direction (Fig‐
ure 32a,b,d,f), as also reported by [32,59,211,212].

Materials 2022, 15, 2047 35 of 85
Figure 32. OM (Optical Microscope) micrographs of the as‐built Ti6Al4V samples manufactured
along different build directions: (a,b) H‐sample, sample A; (c,d) 45°‐sample, sample B; (e,f) V‐sam‐
ple, sample C (Adapted from reference [211]).
The typical square shape of the columnar β‐grains is shown in Figure 32e, which rep‐
resents the cross‐section of sample C; they are contained in laser scan tracks. For this rea‐
son, their distribution and size depend on the scanning strategy [211,213,214]. De facto,
some authors showed that their thickness size is in agreement with the width of the laser
scan tracks [59,213], while the α’ martensite thickness is between 0.5 and 3 μm [215,216].
The main causes of this grains size variation are correlated firstly with the selection of
different process parameters, which vary the ED and the heat transfer, and, secondly, with
the temperature of the BP. Cepeda‐Jiménez et al. [217] showed a fine and weakly textured
microstructure at ED < 37 J/mm3, which became strongly textured at ED higher than 37
J/mm3. Other studies illustrate the same results [218–220]. Table 6 reports the correlation
between the ED values and the obtained microstructure in the L‐PBFed as‐built Ti6Al4V
samples, as reported by Xu et al. [221].
Table 6. As‐built microstructure of Ti6Al4V samples manufactured through different ED values.
Sample ED (J/mm3) Microstructure Ref.
S1 68.47 Acicular α’‐martensite
[221] S3 50.62 Lamellar α + β
S7 33.74 Acicular α’‐martensite + minority of α + β
Reducing the ED from 68.47 to 33.74 J/mm3 (increasing the layer thickness, hatch
spacing and laser power from 30 μm, 120 μm and 175 W to 60 μm, 180 μm and 375 W,
respectively), the fully acicular α’‐martensite microstructure is gradually replaced by α +
β lamellar structure. Barriobero‐Vila et al. [222] showed a gradual microstructure trans‐
formation between the bottom region characterized by the ultrafine α + β microstructure
and the top region showing the acicular α’‐martensite (Figure 33). Xu et al. [221] suggested
that the control of ED is necessary to achieve an ultrafine α + β during the L‐PBF rather
than after the STA (solution treatment and aging), as is discussed in Section 6.2.

Materials 2022, 15, 2047 36 of 85
Figure 33. (a,b) OM micrographs performed along the z‐axis, between top (A, A1) and bottom (B)
regions; (c–e) SEM micrographs related to: (c) z = 10 mm, (d) z = 5 mm, (e) z = 0 mm (Reprinted from
reference [222]).
In this scenario, the as‐built sample formed by a fully α’ martensite structure does
not show any portion of the β‐phase in the XRD spectrum, as shown in Figure 34. The
same results are illustrated by [111,223–225]. On the other hand, increasing the presence
of the α + β phase, the XRD spectrum starts showing small peaks related to the β‐phase,
as highlighted in the red spectrum related to the Ti6Al4V stress‐relieving sample. These
can be considered as confirmation of the α’ → α + β decomposition, as highlighted through
the orange spectra (Figure 34) after the SR HT. Finally, the fully α + β microstructure in‐
creases the intensity of the peaks related to β and α phases, respectively.

Materials 2022, 15, 2047 37 of 85
Figure 34. XRD spectra of as‐built and stress relieved Ti6Al4V samples. In this context, the last heat‐
treated condition can be compared to an as‐built sample also formed by α + β microstructure (Re‐
printed from reference [213]).
Secondly, Ali et al. [226] demonstrated the effects induced on microstructures and
mechanical properties by the pre‐heated BP. At temperatures up to 370 °C, the microstruc‐
ture remains martensitic but shows an increase in the α’ lath sizes with temperature (Fig‐
ure 35a,b). At 470 °C, the α’ → α decomposition occurs according to the study on phase
transformation of Ti6Al4V conducted by Kaschel et al. [227]. The authors reported TEM
results indicating the decomposition temperature at 400 °C, as also shown by Xing et al.
[228], and a full decomposition at 700 °C. Sallica‐Leva et al. [229] reported, however, an
exothermic peak related to the martensite decomposition between 760 and 850 °C. Other
authors collocated this decomposition in the range of 600–800 °C [221,230]. Considering,
instead, the BP at 570 °C, the α’ → α + β (basketweave) transformation takes place, while
the globularization of the α‐phase occurs from 670 °C. At the same time, the authors
showed the presence of β nanoparticles inside the α laths (Figure 35d) that increase with
temperature (Figure 35e,f).

Materials 2022, 15, 2047 38 of 85
Figure 35. As‐built Ti6Al4V microstructures of samples manufactured on BP at different tempera‐
tures: (a) 100 °C, (b) 370 °C, (c) 470 °C, (d) 570 °C, (e) 670 °C and (f) 770 °C where red arrows indicate
the β‐particles precipitate (b) and their growth (c‐f) (Adapted from reference [226]).
Simultaneously, the pre‐heated BP induces a residual stress reduction, as described
by the decreasing trend shown in Figure 36 [226,231]. Malỳ et al. [231] also emphasized a
residual stress reduction that increased the ED from 65.5 to 83.3 J/mm3.

Materials 2022, 15, 2047 39 of 85
Figure 36. The trend of the residual stress in relation to the BP temperatures (Reprinted from refer‐
ence [226]).
During the L‐PBF process, the β‐grains originate from the base and grow up through
each deposited layers generating a string texture along the build direction (i.e., <100>, par‐
allel to the heat extraction direction) [32,59,232–235]. Moreover, in this case, the L‐PBF
process is characterized by a high cooling rate (up to 108 K/s, [236,237]); focusing on G/R
and G × R factors, the L‐PBFed Ti6Al4V is composed of columnar or columnar‐mixed‐
equiaxed grains, which are distributed as proposed in Figure 37 by Saboori et al. [238].
Figure 37. Schematic representation of the columnar β‐grains during the AM process in longitudinal
(a) and transvers (b) cross‐section (Reprinted from reference [238]).
De facto, the partial remelting of the previously solidified layer (Figure 4a) and the
steeper gradient of temperature make more favorable the formation and growth of the
columnar grains [239]. Bontha et al. [240] demonstrated that the process parameters vari‐
ation induces a morphological grain change, as also discussed in Section 1. The same au‐
thors showed that the transformation from columnar grains to mixed equiaxed micro‐
structure is possible by increasing laser power or by decreasing scan speed. The same

Materials 2022, 15, 2047 40 of 85
results are obtained by [214,217]. After the β‐grains nucleation and growth, the diffusion‐
less β → α’ transformation occurs due to the concomitance of cooling below the Ms (575 ≤
TMs ≤ 800 °C, [241]) at a rate exceeding 470 K/s [242]. In addition, this transformation is
fulfilled according to the following crystallographic dependences [243]:
111 112 ≡ 2113 2112 ; 111 101 ≡ 2113 1; 001
Yang et al. [244] reported an interesting point of view about the α’‐martensite ana‐
lyzing their hierarchical structure. As matter of fact, the Ti6Al4V microstructure is formed
by columnar β‐grains containing primary, secondary, tertiary and quartic α’ due to the
thermal cycles generated during the manufacturing process (Figure 38).
Figure 38. Temperatures reached during the different cycles that characterized the L‐PBF process
(Reprinted from reference [99]).
Figure 39a–d show the hierarchical structure in addition to the β precipitates and the
twin structures. Other authors also highlighted the presence of a high number of disloca‐
tions [99,213,244–246] that promote the martensite nucleation and the hierarchical struc‐
ture [244]. Karimi et al. [246] demonstrated that the number of dislocations increases from
a single to a triple re‐melting during the L‐PBF process.
Focusing on the cycle related to the (l + 3)th layer, into the same diagram tempera‐
ture‐time shown in Figure 38, the α’‐martensite can decompose generating α’+β+α final
microstructure [99,242,244]. In addition, due to the high heat inputs, developed during
the L‐PBF process, the α2‐Ti3Al can precipitate (Figure 40) due to its precipitation temper‐
ature in the range 500 ÷ 650 °C [222,247,248].

Materials 2022, 15, 2047 41 of 85
Figure 39. (a,b) SEM micrographs of as‐built Ti6Al4V microstructure showing: (a) the primary, sec‐
ondary, tertiary α’‐martensites, (b) β precipitates within the α lath; (c,d) SAED micrographs that
highlight the 1011 twinning plane (Adapted from references [99,213]).
This spheroidal α2 precipitate formed by 25% of Al, is essential during the AA HT
[249,250]. Figure 40a shows the α + β ultrafine microstructure of an as built Ti6Al4V sam‐
ple containing the α2‐Ti3Al precipitate highlighted by the electron diffraction pattern
shown in Figure 40b [222].
Figure 40. (a) BFTEM (Bright‐Field Transmission Electron Microscopy) image shows the α + β ul‐
trafine microstructure of the as‐built Ti6Al4V sample which highlight the following Burgers orien‐
tation relationship 011 ∥ 0001 , (b) SAED patter showing the α2‐Ti3Al precipitate within the α
lamella (Reprinted from reference [222]).

Materials 2022, 15, 2047 42 of 85
Thus, the L‐PBF process allows reaching the precipitation temperature range for a
sufficient time to form α2 precipitates. In fact, some authors showed that α2 precipitates in
the range of 500–600 °C for several hours [222,241,251]. Dear et al. [251], considering the
as‐cast Ti‐7Al, showed an increase in the intensity of superlattice reflections of α2‐Ti3Al
through TEM micrographs after 500 °C × 2 h (AC). The intensity increases significantly
after 240 and 2880 h. In this scenario, not only the thermal gradient reached during the L‐
PBF process but also the Al and O contents promote the α2 transformation due to their
effects on the α + α2 phase‐field [252,253].
In relation to the α’‐martensite, which is an acicular vanadium supersaturated phase,
it crystallizes into hexagonal closed packed (hcp) as well as the equilibrium α‐phase (Sec‐
tion 1). Due to the difference in V content, these phases should be characterized by several
lattice parameters (a, c) and c/a ratio; however, the values shown in Table 7 do not high‐
light important differences. De facto, the peaks related to the α’ and α phases are in the
same position, and the labels α’, α’/α and α can be achieved after a careful analysis of the
presence of β peaks and after scanning and/or transmission microscopy measurements
(Figure 34) [221]. The absence of the peaks of the β‐phase indicates that its amount is lower
than the detection limit, so the microstructure can be considered fully martensitic. On the
other hand, the spectra showing the peaks related to the β‐phase do not discriminate the
presence or absence of the α’‐martensite, especially after heat treatments at low tempera‐
tures (Section 6.2).
Table 7. Lattice parameters of the α and α’ phases into L‐PBFed Ti6Al4V sample.
Phases a (Å) c (Å) c/a Ref.
α‐phase
0.295 0.468 1.5896 [243]
0.294 0.467 1.588 [254]
0.293 0.468 1.597 [255]
α’‐martensite 0.293 0.468 1.597 [227]
0.293 0.467 1.594 [256]
On the other hand, Takase et al. [257] showed a lattice parameters variation in rela‐
tion to the distance from the pre‐heated BP (z‐axis) at 520 °C (Figure 41a) due to the dif‐
ferent cooling rate during the manufacturing process that induces a α’ and α phases trans‐
formation. These obtained results are in opposition to what is discussed in Figure 33. The
same authors also showed an increase of c/a ratio from 1.595 to 1.598 considering the α’
and α phases, respectively (Figure 41b). All of these reflect on the results obtained by the
X‐Ray diffraction analysis where the α and α’ phases are considered together due to the
peaks overlap [111,227,230,258,259]. In this scenario, Sallica‐Leva [229] reported the anal‐
ysis of the FWHM to discriminate the presence of the α’ and α phases. Focusing on Figure
41a, Takase et al. [257] demonstrated that Ti6Al4V structure varies in relation to the Z
position, while the process parameters remain the same due to the different cooling rates
obtained. Figure 41b, however, highlighted the influence of the process parameters vari‐
ation.

Materials 2022, 15, 2047 43 of 85
Figure 41. Lattice parameters variation in relation to: (a) z‐axis, (b) thermal history (Adapted from
reference [257]).
The other phase that can be formed during the solidification process is the ortho‐
rhombic α’’‐martensite. Fleißner‐Rieger et al. [260] proposed a schematic representation
of the β → α’’ → α transformation where, due to the heat inputs, the equilibrium structure
is not perfectly matched and the intermediate α’’‐martensite can be nucleated. On the
other hand, the β → α’ transformation occurs where the atomic movement is completed,
and the hcp structure is formed. The same authors reported the following lattice parame‐
ters: a = 2.96 Å, b = 5.05 Å and c = 4.68 Å (c/a = 1.581); according to Brag’s law
2𝑑 sin𝜃 𝑛𝜆 , the α’’ orthorhombic phase changes the peaks obtained into XRD spec‐
tra. Kazanteva et al. [261] and Requena et al. [262] reported the same results. Motyka et al.
[243] affirmed that the α’’‐martensite can be formed with opportune atom volume, elec‐
trons’ concentration, and valency (elements with valency > 4 as V).
At the same time, the supersaturated α’ and α’’ martensites show a need‐like struc‐
ture. Finally, different studies conducted by [258,259,261,263,264] reported the following
crystallographic relationships among all microstructures present in as‐built Ti6Al4V sam‐
ples:
011 ‖ 0001
110 ‖ 0001
110 ‖ 001
Due to both the previously described Burgers relationship and the self‐accommoda‐
tion of the α’ phase, the martensite phases are inclined by 0, 30, 60 and 90° to each other
[59,244,265]
6.2. Heat‐Treated Microstructure
Table 8 shows the heat treatments, and their nomenclature, analyzed in the present
review. Focusing on the Ti6Al4V phase diagram (Figure 1b), these heat treatments must
be subdivided in relation to the β‐transus, namely, above and below 995 °C. De facto, only
the SHT and HIP are subdivided into βSHT, βHIP T T and α + βSHT and α + βHIP
T T in relation to the temperature reached during the heat treatments.

Materials 2022, 15, 2047 44 of 85
Table 8. Classification of the heat treatments analyzed in the present review for the L‐PBFed
Ti6Al4V samples.
HTs Temperature Used Scopes Ref.
Stress Relief SR 400 < TSR < 800 °C 1
Residual stress reduction
Mechanical properties im‐
provement
Avoid distortions
[54,59,111,265
–270]
Annealing ANN 700 < TANN < 940 °C
Martensite decomposition
Mechanical properties im‐
provement (balance be‐
tween strength and ductil‐
ity: bi‐modal structure)
[226,230,245,2
59,260,271]
SHT SHT
STA
940 < TSHT < 970 °C 2
TβSHT > β‐transus Microstructural variation to
improve ductility
[30,271–276]
Artificial aging AA TAA ≤ 700 °C 3
Higher mechanical proper‐
ties than the ANNed sam‐
ples.
α, β, α2‐Ti3Al precipitation
Hot Isostatic
Pressing HIP
900 < TSHT < 1050 °C
(p ~ 100 MPa) 4
Sample’s densification
Increase in ductility and fa‐
tigue strength
Improvement of biocompat‐
ibility
[110,111,269,2
76–279]
1 According to the ASTM F3310‐18 [269]. 2 According to H‐81200C specification [280]. 3 Overagin
conditions. 4 In some cases, the pressure used is 150 ÷ 200 MPa
On the other hand, the temperatures reached during the SR, ANN and AA HTs are
in the α + β region. The only distinction among these heat treatments is the subdivision
proposed by Haar et al. [245], who showed the following categories (Figure 42):
low‐SSTR (Solid Solution Temperature Region): Tdess < T ≤ 800 °C
medium‐SSTR: 800 < T ≤ 900 °C (~T0)
high‐SSTR: 900 < T ≤ T
Figure 42. α‐phase vol% versus the HT temperatures (Reprinted from reference [245]).
Tdess is the α‐phase dissolution temperature from which the α → β transformation
takes place. In fact, the Tdess line shown in Figure 42 decreases with increasing temperature
up to the β‐transus. In addition, T0 is defined as a critical temperature that is a temperature
range between 872 and 893 °C, from which the α’‐martensite can be obtained after a fast
cooling (WQ or AC) [245,281,282].

Materials 2022, 15, 2047 45 of 85
In this scenario, not only is the temperature reached during the heat treatment fun‐
damental, but also the following cooling method is observable in the CCT (Continuous
Cooling Transformation) curves illustrated in Figure 43.
Figure 43. Continuous cooling transformation curve of Ti6Al4V alloy (Reprinted from reference
[29]).
At the same time, as discussed in Section 6.1, the α’ martensite decomposition already
takes place at 400 °C, while the α‐phase decomposition occurs around 700–705 °C and
continues with an exponential decrease in the β‐transus. Table 9 shows the microstructure
obtained after different HTs [59,245,269,283].
Table 9. Effects of different HTs on Ti6Al4V microstructure.
HT Cooling Method Microstructure Ref.
500 °C × 10 h FC α’‐martensite decomposition [227]
T < 600 °C WQ
No morphological changes of the as‐built microstructure
[233] α’‐martensite decomposition in α platelet arranged in the same martensite orienta‐
tion
640–650 °C ‐ Nucleation of β phase [284]
700 °C × 2 h FC Partially α’‐martensite decomposition
[212] Fine α needle‐like phase
700 °C × 2 h FC α’ → α + β transformation
[230] Small fraction of β nano‐particles
704 °C × 2 h FC α’ → α + β transformation [268]
730 °C × 2 h FC α’ → α + β transformation and grain growth
[59] α’ and α phases with the same length and width size
750 °C × 2 h WQ α’ → α decomposition (same directions) [233]
750 °C × 8 h AC
α’ → α + β transformation (quartic α’ → β; and primary, secondary and tertiary α’
→ α) [245]
Minimal grain growth
750 °C × 10 h FC α’ → α + β fully transformed [227]
800 °C × 2 h FC
α’ → α + β transformation does not reach the equilibrium
Solute distribution into the matrix
α’, α and β microstructure [230]
800 °C × 6 h FC Twins disappeared + recovered microstructure

Materials 2022, 15, 2047 46 of 85
800 °C × 10/20 min AC 10 min does not affected the microstructure, while 20 min induces α’ decomposi‐
tion [265]
800 °C × 4 h AC Complete decomposition of α’ martensite
Regular arrangement of α + β structure caused by self‐accommodation α’
850 °C × 1 h FC α’ → α decomposition and β formation due to the V content
α’, α and β microstructure [270]
910 °C × 0.5/2/8 h WQ Primary α’ → α lamella in β matrix, tertiary and quartic α’ into β
0.5 h is not sufficient to obtain equilibrium phases which are obtained after 2 h
[245] 945 °C × 4 h WQ Large amount of grain growth
960 °C × 0.5/4 h WQ
0.5 h is similar to the 910 °C × 0.5 h (WQ).
Globularisation of the α phase and significant grain growth. The α phase becomes
elongated.
900 °C × 2 h AC α’ → α + β transformation with lamellar morphology
[285] Heterogeneous distribution of alloying elements + secondary α
950 °C × 2 h FC α’ → α + β lamella more stable and α’ is fully decomposed
[265] β grains become equiaxed
950 °C × 1 h WQ Primary α coarsened
[275]
Precipitate dissolve and a SSS is formed
950 °C × 1 h AC
β → α’’ transformation
Grain growth, but finer than FC
Bi‐lamella structure with secondary α + β nano‐particles
950 °C × 1 h FC Greater diffusion‐controlled nucleation
1000 °C WQ Recrystallization (β equiaxed grain) + α’ martensite
Colony‐tipe α’ martensite → weave‐type α’ martensite [212]
1000 °C × 2 h FC α’ → α + β lamellae stable transformation
1015 °C × 15 min WQ α’ martensite into columnar β grains [268]
1015 °C × 15 min AC α’ coarse needle + α coarse phase
1015 °C × 2 h FC α + β lamella [32]
1050 °C × 1 h FC Recrystallization (β equiaxed grain) + α crystalizes in the β grain boundaries
α + β structure [270]
1050 °C × 1 h AC Recrystallization (equiaxed + half equiaxed β grains) [265]
1150 °C × 2 h AC Recrystallization (β equiaxed grain) + α crystalizes in the β grain boundaries
α + β coarsened lamella structure [285]
920 °C × 2 h + 100 MPa
+ 920 °C × 12 h AC + AC 1 α’ → α + β equilibrium lamellar mixture without a significant dislocation density [275]
704 °C × 2 h + 920 °C ×
2 h + 100 MPa FC + AC α’ → α + β equilibrium lamellar mixture [268]
955 °C × 1 h + 600 °C×
8 h FC+WQ 2 + AC α + β lamellar microstructure into semi‐equiaxed grains [286]
850 °C × 2 h + (975 °C ×
30 min → 875 °C → 975 °C × 30 min) 3
FC + AC α + β lamellar microstructure (width of α laths increases with temperature)
Large primary + fine secondary α phases [224]
950 °C × 2 h + (975 °C ×
30 min → 875 °C → 975 °C × 30 min) 3
FC + AC
α + β lamellar microstructure (width of α laths increases with temperature)
Large primary + fine secondary α phases [224]
1020 °C × 2h + (975 °C
× 30 min → 875 °C → 975 °C × 30 min) 3
FC + AC
950 °C × 15 min + 500
°C × 8 h WQ + AC Acicular α’ + primary rod‐like α phase [287]
950 °C × 4 h + 150 MPa ‐‐ Coarsened α + β lamellar [288]
900 °C × 2 h + 100 MPa FC α + β lamellar [223]
920 °C × 2 h + 100 MPa ‐‐ α + β lamellar and recrystallization process [110]

Materials 2022, 15, 2047 47 of 85
1050 °C × 2 h + 100
MPa α + β lamellar more coarsened than 900 °C × 2 h
1 Controlled air cooling with a cooling rate of 0.02 °C/s [111]. 2 FC between 955 and 855 °C and WQ
at room temperature [275]. 3 cyclic annealing (C‐ANN) to obtain a bi‐modal structure [224].
Starting from the as‐built microstructure formed by fully α’ martensite (pre‐heated
BP at T < 400 °C, [226]), the SR HT does not induce any morphological variation up to 640–
650 °C, where Brown et al. [225] showed the presence of β phase through the XRD spectra
indicating the α’ → α + β transformation. The same authors reported a complete β trans‐
formation at 1008 °C. Lekoadi et al. [212] did not show any observable microstructural
changes after 700 °C × 2 h (FC), while Simonelli et al. [59] highlighted the α’ → α + β transformation after 730 °C × 2 h (FC) showing a microstructure formed by α + β structure.
In the same temperature range, Eshawish et al. [268] confirmed the presence of the β
phase after the SR at 704 °C × 2 h (FC), while Malinov et al. [284] determined the β phase
nucleation at 650 °C confirming the results shown by [225]. Longhitano et al. [271] re‐
ported the same results after 650 °C × 3 h (FC). Finally, the morphology of the columnar
β‐grains is not affected during the SR heat treatments, while the quartic α’ is transformed
into β phase and the other (primary, secondary and tertiary) into α phase (Table 9)
[59,212,227,233,245,265,268,271,285].
Figure 44 illustrates the focal point of the SR heat treatment, namely, the residual
stress reduction in as‐built L‐PBFed Ti6Al4V samples.
Figure 44. Residual stress trends in relation to SR temperatures and time (Reprinted from reference
[289]).
The same graph highlights that the time required to obtain an acceptable stress re‐
duction is strictly related to the SR temperature. In this scenario, an appropriate choice of
this temperature should be necessary due to the following reasons: the microstructural
variations as previously discussed, and the precipitation phenomena of β nano‐particles,
α, β phases and of the α2‐Ti3Al [230,247,268,271,285,290]. As concerns the β nano‐particles,
Etesami et al. [285] showed the presence already in as‐built Ti6Al4V samples manufac‐
tured on cold BP. The same results were obtained by Ali et al. [226]. The presence of the
α2‐Ti3Al particles is caused by its precipitation temperature range and for the fact that the
as‐built samples are SSS (see Section 6.1). De facto, some studies reported a solute distri‐
bution and diffusion during the HTs, confirming the obtained microstructural variations
and precipitation phenomena [225,230,265]. Thus, the SR heat treatment parameters must
be selected to obtain the excellent reduction in the residual stress and not to incur precip‐
itation phenomena.

Materials 2022, 15, 2047 48 of 85
The α’‐martensite decomposition and the α, β grains growth increase with the tem‐
perature increasing, i.e., considering the ANN heat treatments. De facto, the range tem‐
perature between 750 ÷ 900 °C fully decomposes the α’‐martensite into α platelets and
induces the β‐phase formation due to the V diffusion [225,230,265]. Clear differentiation
between the ANN and SR heat treatments are not reported through the literature; how‐
ever, Table 8 illustrates this in the scopes section. In terms of microstructure, Huang et al.
[265] reported α + β structure with a regular arrangement caused by the self‐accommoda‐
tion of α’ martensite. In addition, they affirmed that the presence of defects induced by
the L‐PBF process impedes the grain boundary movements restricting the grain growth.
On the other hand, already at ANN temperatures, the holding time and the cooling
method become significantly more important to the microstructure morphology (Table 9).
Haar et al. [245] obtained a greater grain growth (1.5–3.5 μm) of the α grain width in sam‐
ple heat‐treated at 870 °C × 2 h (FC) than in the sample (1.5–2.5 μm) heat‐treated at 870 °C
× 4 h (AC). Etesami et al. [285] showed an increase in size and volume of α and β with
time, in addition to the increase in secondary α phase and the formation of rod‐shaped β
between the laths of α phases.
The same authors reported the β → α’ martensite transformation after 930 °C × 2 h
(WQ), confirming the T0 critical temperature, while secondary α phase into primary α
phase was obtained after 930 °C × 2 h (AC). The FC cooling, however, induces a complete
microstructural change into α + β, where α globularized and β is distributed into α laths.
A schematic representation of the microstructural variation (Figure 45) is reported by
Haar et al. [245], who analyzed different HTs in the low‐, medium‐ and high‐SSTR. During
the ANN below the T0 (T < 900 °C), α’ → β begins from the smallest quartic α’, while the
other phases coarsen. Increasing the holding time at high temperatures, the α’ → β trans‐formation also occurs from the larger grains (first the tertiary and then the secondary mar‐
tensites) (Figure 45a–c). At the same time, the β phase nucleates and grows at the grain
boundaries and the complete β‐phase transformation from the primary α’‐martensite oc‐
curs at T > T . As also shown in Table 9, the ANN microstructures obtained at high
temperatures reach a primary α’ → α transformation. On the other hand, increasing the
temperature above the T0, the fragmentation of primary and secondary α grains (Figure
45d) takes place due to the β‐phase formation into twinning sites. In addition, the grain
growth increases after the fragmentation process due to the increase in the surface energy
minimization.
Figure 45. Hierarchical structure of α’‐martensite in as‐built condition (a), and of the α‐phase after
the ANN heat treatments in low‐SSTR (b), medium‐SSTR (c) and high‐SSTR (d) (Adapted from ref‐
erence [245]).
After a high cooling rate, the α’‐martensite becomes a matrix where the fragmented
primary and secondary α phases are. Thus, a subsequent ANN HT in low‐SSTR can be
considered to obtain the α’ → α transformation.
The AA HT, which can be directly performed on as‐built Ti6Al4V samples, can be
used to reduce the residual stress without excessive microstructural changes (Tables 9 and
10). On the other hand, its focal points are the balance of the tensile strengths and ductility

Materials 2022, 15, 2047 49 of 85
with a bi‐modal microstructure (as will be discussed successively in Section 6) and the
precipitation of α, β and α2‐Ti3Al [179,224,271,276,285,291,292].
For these reasons, and for the fact that the solvus temperature of the α2‐Ti3Al is
around 500 °C, G. Lütjering [292] affirmed that the heat treatments at 600 °C or above will
only change the microstructure and reduce the residual stress. Gehlin et al. [249] reported
that the crystallographic ordering of Al can occur in the range between 500 and 700 °C,
which leads to the precipitation of the α2‐Ti3Al. De facto, long‐term aging performed at
500–600 °C produces precipitates between 5 and 10 nm. In addition, the α2‐Ti3Al formation
is influenced by the alloying elements as oxygen and the other β‐stabilizers [293,294].
From a mechanical point of view, the microstructure obtained after the AA heat treat‐
ments is more important than the precipitation phenomena due to the strict relationship
between the microstructure and the fracture mechanisms under different load conditions
[59,295–298]. De facto, the temperature reached during the βSHT T 𝑇 or the
α + βSHT T 𝑇 and the subsequent cooling method induce different micro‐
structures, such as α’‐martensite, α‐colonies, plate‐like α, acicular α, grain boundary α,
basketweave or Widmanstätten structure into equiaxed or columnar β‐grains (Table 9)
[59,227,230,233,265,271,276,285]. As regards the holding or residence time at high temper‐
atures, the main effect is the grain growth, which is more effective at near β‐transus tem‐
perature. In fact, considering the heat treatments into low‐SSTR, the α and β grains tend
to grow, but will hinder each other [32]. Into high‐SSTR or, even above the β‐transus, the
holding time has a greater influence on the microstructural morphology and size.
Eshawish et al. [268] also reported the presence on the columnar β‐grains after 1015 °C ×
15 min (WQ), unlike Wu et al. [233], who instead showed the recrystallization process
(columnar → equiaxed β grains) after 1000 °C × 40 min (WQ). In this context, Huang et al.
[265] reported the same transformation after 1050 °C × 1 h (AC), suggesting that the equi‐
axed grains form from the split of the columnar grains. In fact, the same authors showed
that the diameter of the equiaxed grains is the same as the columnar width. Lekoadi et al.
[212] reported an incomplete β‐grains transformation after 1000 °C × 2 h, a fully α’ mar‐
tensite decomposition into α + β lamellar with α‐colonies after 4 h, and a globularization
after 8 h (Figure 46).

Materials 2022, 15, 2047 50 of 85
Figure 46. OM micrographs of Ti6Al4V microstructures in as‐built condition (a,b) and after the HTs
at the following temperatures: (c,d) 700 °C, (e,f) 950 °C and (g,h) 1000 °C (Reprinted from reference
[212]).
As previously reported, the other focal point is the cooling method; however, in this
case, it also depends on the temperature from which the cooling pathway starts. The ef‐
fects induced by the cooling rate are moderate if the samples are heat‐treated in low‐
SSTRs, but they become very important when the samples are at temperature > T0, as pre‐
viously discussed [32,212,265,271,276,285]. Focusing on this last temperature range,
Etesami et al. [285] reported a microstructure formed by primary α‐phase containing β‐
particles and needle‐like α’‐martensite after 930 °C × 2 h (WQ). The same authors showed
a mixture of primary α and secondary α + β‐phase structure after 930 °C × 2 h (AC), which

Materials 2022, 15, 2047 51 of 85
change in total α + β lamellar after the same heat treatment followed by furnace cooling.
Lekoadi et al. [212], who analyzed the same cooling methods and holding time at 1000 °C,
showed a fully α’ martensite structure contained into columnar β‐grains after both the
WQ and AC. As reported by Huang et al. [265], it is possible to underline that this α’‐
martensite is different to that formed during the L‐PBF process due to the different re‐
sponses to the heat treatment. The former decomposes more easily than the latter after 800
°C × 1 h (AC). Finally, only the FC promoted the basketweave structure formed by lamel‐
lar α + β. In relation to the cooling pathway, Muhammad et al. [276] demonstrated that
the 950 °C × 1 h (FC) rather than the 950 °C × 1 h (AC) allows one to dissolve a large part
of the nanoparticles present within the α‐phase laths.
The α’‐martensite decomposition and the α → α + β transformation are also obtained
after the HIP HT due to the temperature to which the treatment was carried out. Moreo‐
ver, in this case, it can be subdivided into β‐HIP T T and α + β‐HIP T T and
the following obtained microstructure depends on both the holding time (generally 2h)
and cooling pathway (Table 9). Benzing et al. [299], who analyzed the additive manufac‐
tured Ti6Al4V samples, showed the columnar → equiaxed β‐grains transformation after
(1050 °C × 2 h (WQ) + 100 MPa) + (800 °C × 2 h + 30 MPa) and a greater microstructural
homogeneity than after HIP at 920 °C × 2 h + 100 MPa. At the same time, a significant
increase in the grain size from the as‐built (α + β) to the HIP samples is not highlighted.
On the other hand, the greatest coarsening of the α laths starting from α’‐martensite was
obtained after 1050 °C × 2 h + 100 MPa rather than after 920 °C × 2 h + 100 MPa, as shown
in the study of Leuders et al. [110]. The vast majority of the HIP heat treatments reported
on different research were performed in the temperature and pressure ranges of 900–950
°C and 100–150 MPa, respectively; the α + β lamellar structure is the microstructure ob‐
tained [110,111,223,268,288,300]. In this scenario, not only the T T influence the α
laths coarsening but also the T T , as reported by Wycisk et al. [301], who showed a α
laths coarsening from ~1 μm to 4 μm. The same results are shown by Mahmud et al. [111],
who reported a linear increase with time. To avoid an excessive grain coarsening, Herzog
et al. [302] proposed an increase in pressure to 200 MPa and a consequent decrease in
temperature up to 820 °C. Other studies, however, proposed different cooling pathways
to control the α lamellar dimensions after the HIP heat treatments (from 500 nm of the α’
to 3 ÷ 60 μm of the α phase) [223,287,301,303].
Apart from the microstructural effects, the HIP heat treatment allows for obtaining
the sample densification through the reduction in LOF, keyhole and gas pores, cracks, etc.,
(see Section 2) present into as‐built samples [111,223,268,300,302]. Herzog et al. [302]
demonstrated that a fully dense (δ > 99.9%) sample can be obtained if its density in as‐
built conditions is higher than 95%. In fact, they reported an increase from 93.4 to 98.7%
and from 97.7 to 99.9%, respectively, after the HIP at 820 °C × 2 h + 200 MPa. The densifi‐
cation effects are also supported in the study conducted by Eshawish et al. [268], where
the volume fraction of the spherical pores decreases from 0.31 ± 0.2% to 0.20 ± 0.09% after
900 °C × 2 h + 100 MPa. The same HIP heat treatment induced the decrease in the maxi‐
mum pore’s diameter from 140 μm to 15–21 μm. Therefore, the HIP heat treatment in‐
duces sample densification, allowing an expansion of the process window illustrated in
Figure 8 [302]; however, if the as‐built samples is manufactured with optimized process
parameters, their microstructure can be optimized through other heat treatments.
From a last microstructural point of view, L‐PBFed Ti6Al4V samples can present a
bimodal microstructure after heat treatment to obtain a good balance between strength
and ductility. Chong et al. [304] reported that the so‐called bimodal microstructure is a
“dual‐phase” composed of the primary αp phase and secondary αs phase transformed by
β‐phase, as reported in Figure 47.
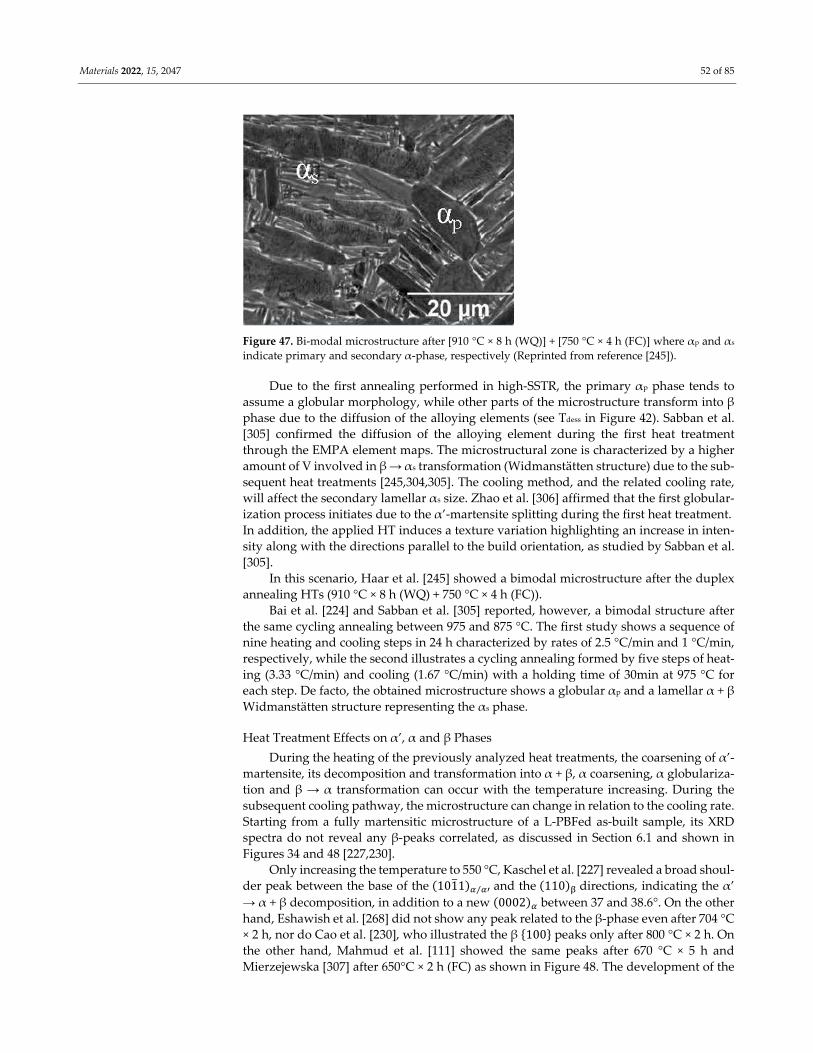
Materials 2022, 15, 2047 52 of 85
Figure 47. Bi‐modal microstructure after [910 °C × 8 h (WQ)] + [750 °C × 4 h (FC)] where αp and αs
indicate primary and secondary α‐phase, respectively (Reprinted from reference [245]).
Due to the first annealing performed in high‐SSTR, the primary αp phase tends to
assume a globular morphology, while other parts of the microstructure transform into β
phase due to the diffusion of the alloying elements (see Tdess in Figure 42). Sabban et al.
[305] confirmed the diffusion of the alloying element during the first heat treatment
through the EMPA element maps. The microstructural zone is characterized by a higher
amount of V involved in β → αs transformation (Widmanstätten structure) due to the sub‐
sequent heat treatments [245,304,305]. The cooling method, and the related cooling rate,
will affect the secondary lamellar αs size. Zhao et al. [306] affirmed that the first globular‐
ization process initiates due to the α’‐martensite splitting during the first heat treatment.
In addition, the applied HT induces a texture variation highlighting an increase in inten‐
sity along with the directions parallel to the build orientation, as studied by Sabban et al.
[305].
In this scenario, Haar et al. [245] showed a bimodal microstructure after the duplex
annealing HTs (910 °C × 8 h (WQ) + 750 °C × 4 h (FC)).
Bai et al. [224] and Sabban et al. [305] reported, however, a bimodal structure after
the same cycling annealing between 975 and 875 °C. The first study shows a sequence of
nine heating and cooling steps in 24 h characterized by rates of 2.5 °C/min and 1 °C/min,
respectively, while the second illustrates a cycling annealing formed by five steps of heat‐
ing (3.33 °C/min) and cooling (1.67 °C/min) with a holding time of 30min at 975 °C for
each step. De facto, the obtained microstructure shows a globular αp and a lamellar α + β
Widmanstätten structure representing the αs phase.
Heat Treatment Effects on α’, α and β Phases
During the heating of the previously analyzed heat treatments, the coarsening of α’‐
martensite, its decomposition and transformation into α + β, α coarsening, α globulariza‐
tion and β → α transformation can occur with the temperature increasing. During the
subsequent cooling pathway, the microstructure can change in relation to the cooling rate.
Starting from a fully martensitic microstructure of a L‐PBFed as‐built sample, its XRD
spectra do not reveal any β‐peaks correlated, as discussed in Section 6.1 and shown in
Figures 34 and 48 [227,230].
Only increasing the temperature to 550 °C, Kaschel et al. [227] revealed a broad shoul‐
der peak between the base of the 1011 ⁄ and the 110 directions, indicating the α’
→ α + β decomposition, in addition to a new 0002 between 37 and 38.6°. On the other
hand, Eshawish et al. [268] did not show any peak related to the β‐phase even after 704 °C
× 2 h, nor do Cao et al. [230], who illustrated the β 100 peaks only after 800 °C × 2 h. On the other hand, Mahmud et al. [111] showed the same peaks after 670 °C × 5 h and
Mierzejewska [307] after 650°C × 2 h (FC) as shown in Figure 48. The development of the

Materials 2022, 15, 2047 53 of 85
XRD spectra is, therefore, caused by the alloying element diffusion, which induces not
only the phases transformation but also the stress relaxation. All of this is strictly related
to the crystal lattice evolution shown in Figure 49 where the α’‐martensite evolves into
equilibrium α phase at 700 °C. The first considerable variation of the lattice parameters
takes place at 400 °C due to the internal diffusion and self‐accommodation of the Al and
V alloying elements. As matter of fact, the α’‐martensite decomposition begins at 400 °C
(see Section 6.2); other changes at temperatures lower than 400 °C can be induced by a
thermal expansion of the lattice structure [227,308]. A higher increase in lattice parameters
is shown at 550 °C, where the V atoms diffuse out of the lattice structure and the Ti atoms
replace them. De facto, the increase in lattice parameters is caused by the Ti radius (1.47
Å), which is higher than the V radius (1.43 Å) [309]. Finally, the α’ martensite is fully de‐
composed in the equilibrium α phase at 700 °C (Figure 49c).
Figure 48. XRD spectra related to the as‐built (a) and heat‐treated (b–e) Ti6Al4V samples at: (b)
650°C × 2 h(FC), (c) 750°C × 2 h(FC), (d) 850°C × 2 h(FC), (e) 950°C × 2 h(FC) (Reprinted from refer‐
ence [307]).

Materials 2022, 15, 2047 54 of 85
Figure 49. (a–c) Lattice structure transformation from α’‐martensite to equilibrium α‐phase at: (a)
25 °C, (b) 550 °C and (c) 700 °C.
At the same time, Kaschel et al. [227] showed the c/a ratio variation with temperature,
and that the ratio increased significantly only after 500–550 °C. The same authors sug‐
gested that the α → β transformation induces a decrease in the c/a ratio after 995 °C. In
addition, Tsai et al. [310] showed the variation of the β‐phase lattice parameters from 3.188
to 3.244 Å into a temperature range of 550–800 °C.
During the same heat treatments, in particular, during SR and ANN, the twin struc‐
tures (Figure 39) and the number of dislocations present into α’‐martensite laths are re‐
duced. In detail, the twin structures are fully dissolved only after 800 °C × 6 h [230]. The
same results were obtained by Li et al. [287] and Tsai et al. [310]. On the other hand, the
number of dislocations was deeply reduced after the HIP at 920 °C × 12 h with the for‐
mation of α + β lamellar microstructure rather than after the SR at 670 °C × 5 h as illustrated
in Figure 50 [111].
Figure 50. BFTEM images (a,d), SAED patterns (b,e,f) and HAADF STEM (c) images of SR (a–c) and
ANN (d–f) Ti6Al4V samples (Adapted from reference [111]).

Materials 2022, 15, 2047 55 of 85
Together with the decrease of the dislocations, twin structures, and α’ → α + β trans‐formation, the already formed α platelets tend to coarse if the temperature of the heat
treatment exceeds the low‐SSTR (i.e., the temperature of α’ → α + β decomposition). In
fact, Figure 51 shows a slight coarsening effect at 700 °C, which increases as fast as the
increase in temperature. This trend is described by the following relationship:
𝛿 ∗ 𝛿 𝑡 (16)
where the 𝛿 is the average lamellar width (μm) of the as‐built Ti6Al4V sample,
namely with t = 0 of HT, t and T are the time (h) and temperature (K) of the HT [311].
Considering the tangents of all curves shown in this graph and their slope, the coarsening
rate increases with temperature but decreases with time.
Figure 51. Coarsening effects of lamellar α width in relation to the heat treatment temperatures (700,
800, 900 and 950 °C) and time (0 ÷ 180 h) using Equation (16).
In this scenario, the lamellar coarsening of the α‐phase width follows the coarsening
theory (LSW) developed by Lifshitz, Slyozov and Wagner [312,313]:
𝑑 𝜉𝑡 (17)
where the d is the average lamellar width (μm), 𝜉 is a constant of proportionality, n is the coarsening coefficient and t is the heat treatment time [s]. This equation can be rewritten
into logarithmic form, as follows:
ln 𝑑 ln 𝜉 𝑛 ln 𝑡 (18)
assuming a linear trend if it is plotted into an ln‐ln diagram (Figure 52, [111]). As is also
shown in the same figure, Mahmud et al. [111] reported that n is equal to 0.29, 0.30 and
0.31 for 920, 950 and 970 °C, respectively, while 𝜉 is equal to 6.03∙10−10, 6.62∙10−10 and 7.32∙10−10 m/s, respectively. Moreover, 0.33, 0.33 ÷ 0.40, 0.40 ÷ 0.50 were obtained at 700 ÷
800 °C, 900 and 950 °C by Cao et al. [314]. The same results were obtained by Liu et al.
[311] who confirmed that the coarsening kinetics model of the α‐phase follows the LSW
theory (Equations (17) and (18)).

Materials 2022, 15, 2047 56 of 85
Figure 52. Plots of Equation (18) into ln‐ln diagram considering the coarsening effects induced by
the heat treatment temperature at 920, 950 and 970 °C (Reprinted from reference [111]).
Focusing on the HT temperature and on the high holding time, the α‐phase also tend
to globularize following one of these mechanisms [288,305,315–317]:
direct cylinderization (Figure 53a): initiates at the edge of the α platelet where the
different curvature allows for the mass transfer to the flat part of the same platelet.
The subsequent formation of these ridges can induce a cylindrical morphology if the
ridges join together.
edge spheroidization (Figure 53b), which differs from the direct cyliderization (Fig‐
ure 53b) due to eventual perturbations developing along the ridges which separate
the lamella into spheroids.
thermal grooving and boundary splitting (Figure 53c): induce α globularization due
to the initial groove’s formation into triple junction generated by sub‐grain bounda‐
ries into α lamellae with α/β interface, and due to the sequent Al and V diffusion that
break the lamella with the β‐phase formation.
termination migration consists of the mass transfer from the curved surface of the
lamella to the flat lamella.
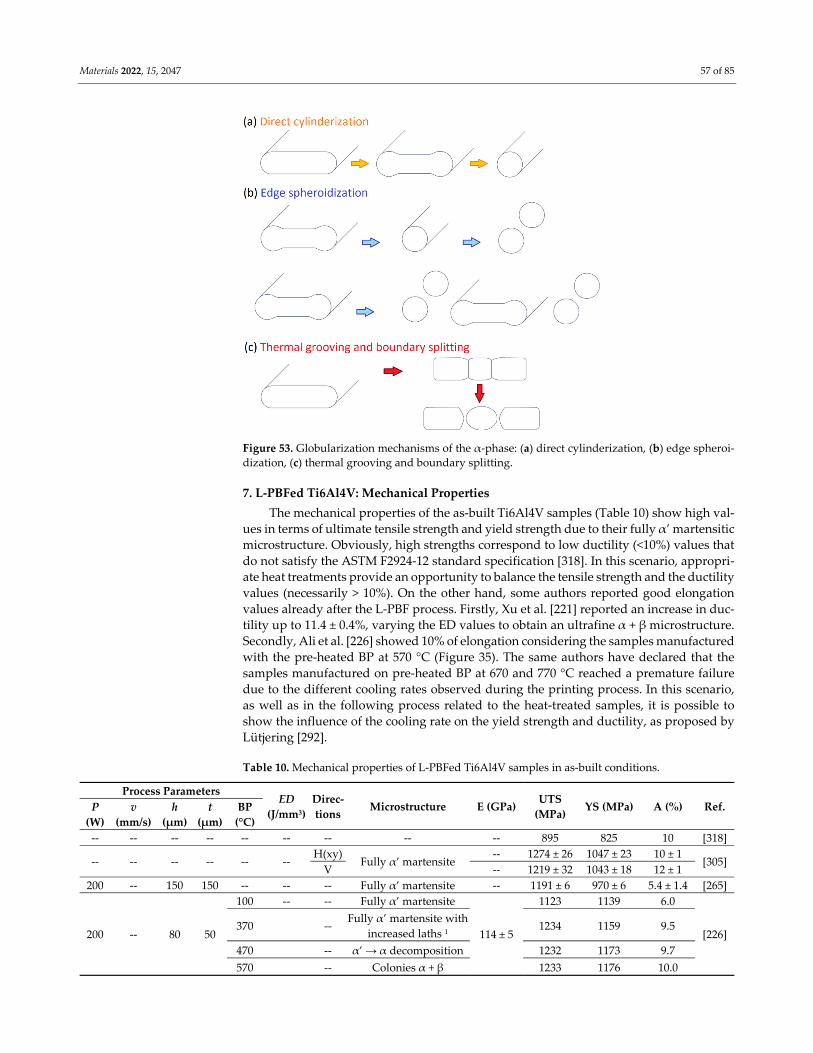
Materials 2022, 15, 2047 57 of 85
Figure 53. Globularization mechanisms of the α‐phase: (a) direct cylinderization, (b) edge spheroi‐
dization, (c) thermal grooving and boundary splitting.
7. L‐PBFed Ti6Al4V: Mechanical Properties
The mechanical properties of the as‐built Ti6Al4V samples (Table 10) show high val‐
ues in terms of ultimate tensile strength and yield strength due to their fully α’ martensitic
microstructure. Obviously, high strengths correspond to low ductility (<10%) values that
do not satisfy the ASTM F2924‐12 standard specification [318]. In this scenario, appropri‐
ate heat treatments provide an opportunity to balance the tensile strength and the ductility
values (necessarily > 10%). On the other hand, some authors reported good elongation
values already after the L‐PBF process. Firstly, Xu et al. [221] reported an increase in duc‐
tility up to 11.4 ± 0.4%, varying the ED values to obtain an ultrafine α + β microstructure.
Secondly, Ali et al. [226] showed 10% of elongation considering the samples manufactured
with the pre‐heated BP at 570 °C (Figure 35). The same authors have declared that the
samples manufactured on pre‐heated BP at 670 and 770 °C reached a premature failure
due to the different cooling rates observed during the printing process. In this scenario,
as well as in the following process related to the heat‐treated samples, it is possible to
show the influence of the cooling rate on the yield strength and ductility, as proposed by
Lütjering [292].
Table 10. Mechanical properties of L‐PBFed Ti6Al4V samples in as‐built conditions.
Process Parameters ED
(J/mm3)
Direc‐
tions Microstructure E (GPa)
UTS
(MPa) YS (MPa) A (%) Ref. P
(W)
v
(mm/s)
h
(μm)
t
(μm)
BP
(°C)
‐‐ ‐‐ ‐‐ ‐‐ ‐‐ ‐‐ ‐‐ ‐‐ ‐‐ 895 825 10 [318]
‐‐ ‐‐ ‐‐ ‐‐ ‐‐ ‐‐ H(xy)
Fully α’ martensite ‐‐ 1274 ± 26 1047 ± 23 10 ± 1
[305] V ‐‐ 1219 ± 32 1043 ± 18 12 ± 1
200 ‐‐ 150 150 ‐‐ ‐‐ ‐‐ Fully α’ martensite ‐‐ 1191 ± 6 970 ± 6 5.4 ± 1.4 [265]
200 ‐‐ 80 50
100 ‐‐ ‐‐ Fully α’ martensite
114 ± 5
1123 1139 6.0
[226] 370 ‐‐
Fully α’ martensite with
increased laths 1 1234 1159 9.5
470 ‐‐ α’ → α decomposition 1232 1173 9.7
570 ‐‐ Colonies α + β 1233 1176 10.0

Materials 2022, 15, 2047 58 of 85
200 ‐‐ 80 50
670 ‐‐
Colonies α + β + β nano‐
particles + α globulariza‐
tion
1201 1174 2.58
[226]
770 ‐‐ Increase the effects ob‐
tained at 670 °C 207 2 748 2 ‐‐ ‐‐
‐‐ ‐‐ ‐‐ ‐‐ 37 ‐‐ ‐‐ Fully α’ martensite ‐‐ 1236 ± 27 1181 ± 34 8.7 ± 0.5 [285]
1000 1400 230 100
70
38.3 H Fully α’ martensite (<
1μm)
‐‐ 1204 ± 27 1052 ± 16 2.1 ± 0.3
[288]
V ‐‐ 1075 ± 80 958 ± 73 1.8 ± 0.2
800 1925 190 50 43.7 H
Fully α’ martensite (1–2
μm)
‐‐ 1176 ± 8 1024 ± 6 2.5 ± 0.4
V ‐‐ 1086 ± 6 933 ± 7 2.5 ± 0.3
350 770 180 50 50.5 H ‐‐ 1251 ± 114 1067 ± 27 3.4 ± 1.3
V ‐‐ 1191 ± 19 1065 ± 27 2.4 ± 1.2
170 1250 100 30 ‐‐ 45.33 ‐‐ Fully α’ martensite 109 ± 4 1218 ± 2 1015 ± 10 5.9 ± 1.0 [271]
375 1029 120 60 ‐‐ 50.62 V Ultrafine α + β ‐‐ ~ 1240 1106 ± 6 11.4 ± 0.4 [221] 3
280 1200 140 30 100 55.56 ‐‐ Fully α’ martensite 1206 ± 23 1041 ± 23 9.6 ± 0.4 [288]
175 710 120 30 ‐‐ 68.47 V Fully α’ martensite ‐‐ ~ 1160 ‐‐ ~ 9 [221] 3
175 710 120 30 ‐‐ 68.47 H Fully α’ martensite ‐‐ 1321 ± 6 1166 ± 6 2.0 ± 0.7 [319]
250 1600 60 30 ‐‐ 86.81 ‐‐ Fully acicular α’ marten‐
site ‐‐ 1267 ± 5 1110 ± 9 7.3 ± 1.1 [32]
157 225 100 50 ‐‐ 139.56
H(xz)
Fully α’ martensite
115 ± 6 1143 ± 6 978 ± 5 11.8 ± 0.5
[59] H(xy) 113 ± 5 1199 ± 49 1075 ± 25 7.6 ± 0.5
V 119 ± 7 1117 ± 3 967 ± 10 8.9 ± 0.4 1 possible decomposition into α equilibrium phase. 2 Sample reaches the premature failure [226]. 3
Samples manufactured with a Focal Offset Distance of 2 mm.
Lütjering [292] showed an increase in yield strength and with the increase of the cool‐
ing rate due to the consequent variation in terms of colonies size. The final exponential
increment is conferred by the α’‐martensite. At the same time, the ductility increases up
to a maximum, after which it declines drastically. The author affirmed that, at the maxi‐
mum point, the fracture mechanism passes from ductile transcrystalline dimple type to
intercrystalline dimple type along with the continuous layers of α phase.
If the ED values and pre‐heated BP can influence the as‐built mechanical properties,
another important factor is the build direction of the sample within the build chamber. In
this context, it is useful to remember that the columnar β‐grains growth occurs through
the layers and, therefore, in the perpendicular direction to the BP, regardless of the build
orientation (Section 6.1). As reported in Table 10, the samples manufactured vertically for
the xy plane show generally lower tensile strengths and ductility than the H‐samples due
to the relationship between the load direction and the columnar β‐grains distribution
[59,230,320,321]. Figure 54 illustrates a schematic representation where, if the load is ap‐
plied along with the major axis of the columnar β‐grains (Figure 54a), the β‐phase grain
boundaries are subjected to Mode I opening tension, while the α‐phase grain boundaries
are subjected to Mode I opening tension when the load is applied along the short axes of
the columnar β‐grains (Figure 54b) [320].

Materials 2022, 15, 2047 59 of 85
Figure 54. Schematic representation of the load conditions considering: (a) V‐sample, (b) H‐sam‐
ple.
In the same context, Willson‐Heid et al. [321] analyzed and demonstrated that the
anisotropic elongation and the β grain aspect ratio (x) can be correlated as follows:
𝑦 0.00125𝑒 . 0.98 (19)
where y is related to elongation. Its anisotropy becomes significant when x > 6. Another
important factor influencing the anisotropy of the mechanical properties is the presence
of the LOF (Figure 55a–c).
Figure 55. Schematic representation of the load direction and the LOF major axis during a tensile
test in V‐samples (b,d) and H‐sample (c,e); (d,e) Schematic representation of the load direction and
the different orientation of LOF major axis within the same sample and correlated to the different
layers (Adapted from reference [322]).
If the load direction and the major axis of the LOF are from an angle of 90°, the pores
tend to open, inducing a stress concentration on their apexes and possible consequent
crack initiation. This configuration can induce a premature failure into as‐built sample
rather than that shown in Figure 55c, where the angle θ is 0°. In this situation, the LOF
pore will be closed; in fact, the void growth and the crack initiation need a greater tensile
load [322]. As discussed in Section 2, the presence of LOF pores along the xy plane depend
on the process parameters and on the scanning strategy. Thus, the V‐samples are more
affected by LOF opening during the tensile test than the H‐samples (Figure 55d,e), where
the angle between load direction and the LOF major axis can vary between 0 and 90° [322].
The different sample’s orientation also affects the fracture mechanisms, as shown in
Figure 56, where the grey ellipses represent the columnar β‐grains [296]. When the H‐
sample (Figure 56b) is subjected to a tensile load, the main failure is Mode I with low
ductility values obtained. On the other hand, the V‐sample (Figure 56c) is characterized

Materials 2022, 15, 2047 60 of 85
by an intergranular fracture much more tortuous than in the H‐sample (Figures 56b)
[59,295]. Focusing on 45° samples (Figure 56d), the effects of the tensile load must be sub‐
divided into normal and shear stresses and the crack propagation is transgranular [296].
In this scenario, the best mechanical properties depend on a good combination between
the build orientation and the presence of defects, which also reduce the layer interconnec‐
tion and vary with the process parameters, in addition to the dimensions and relative as‐
pect ratio of the β‐grains [59,294,321,322]. Simonelli et al. [59] show the typical surface
fracture of the as‐built Ti6Al4V samples characterized by an almost flat central region and
an external portion high inclined at around 45°. Additionally, the same profiles show an
intergranular fracture, where crack propagation is strictly related to the crystallographic
orientation of the α’ and α phases (see Sections 6.1. and 6.2.) that may arise as single α‐
phase or as α‐colonies. This situation can characterize both the as‐built and the SR heat‐
treated samples where the crack can be deflected due to the microstructural texture re‐
maining, however intergranular [59,110,323]. Figure 57a–c shows V‐sample where some
β‐grains are cut from the crack propagation along the α grain boundaries then others can
directly accommodate the crack propagation. Finally, the H‐samples are subjected the
crack propagation along the β‐grains boundaries [59,295]. Zafari et al. [322] also showed
deformed α’ plates through TEM analysis, which emphasizes entangled dislocations and
dislocation cells (Figure 57d,e).
Figure 56. Schematic representation of different Ti6Al4V samples: (a) H‐, 45°‐ and V‐samples, (b–d)
under the same load conditions but with different orientation between the load axis and the colum‐
nar β‐grains (blue lines represent the β‐grains boundaries).

Materials 2022, 15, 2047 61 of 85
Finally, the SAEDP map shown in Figure 57f illustrates a randomly orientation of the
α’ martensite.
Figure 57. SEM micrographs of as‐built Ti6Al4V V‐sample after tensile testing (a–c); (d) TEM of the
BB section shown in panel (c), where the square area is shown in panel (e); (f) SAEDP image show‐
ing the rings related to the α’ martensite (Reprinted from reference [324]).
Starting from the mechanical properties of the as‐built samples, generally, the elon‐
gation increases at the expense of the tensile strengths as reported in Table 11, where the
mechanical properties of heat‐treated Ti6Al4V samples were illustrated. If the SR heat
treatment slightly increases the elongation with a small loss in tensile strength, the ANN
heat treatment confers good ductility satisfying the ASTM F2924‐12 standard specification
[32,59,230,271,318]. Generally, the heat treatments performed above the β‐transus show a
decreasing trend of the tensile strengths and an increase in ductility (Table 11).
Table 11. Mechanical properties of the heat‐treated Ti6Al4V samples manufactured via L‐PBF pro‐
cess.
HT Region HT Microstructure 1 Directions E (GPa) UTS (MPa) YS (MPa) A (%) Ref.
α + β
540 °C × 5 h
(WQ) SR ‐‐ V 113 ± 30 1223 ± 52 1118 ± 39 5.4 ± 2.0 [32]
611 °C × 2 h (AC) SR α’ martensite + β pre‐
cipitate V ‐‐ 1213 ± 20 1171 ± 40 13.3 ± 0.7 [285]
640 °C × 2 h ANN 2 β(C)
1225 ± 4 1104 ± 8 7.4 ± 1.6
[319] 1214 ± 24 1140 ± 43 3.2 ± 2.0
1256 ± 9 1152 ± 11 3.9 ± 1.2
650 °C × 3 h (FC) SR α’ martensite + α, β
precipitation in β(C) V 111 ± 1 1101 ± 5 1040 ± 7 7.8 ± 0.7 [271]
670 °C × 5 h (FC) SR Acicular α’ + α + β in
β(C)
H(xz) 116 ± 1 1170 ± 5 1112 ± 4 9.2 ± 0.2
[111] H(xy) 115 ± 1 1207 ± 5 1147 ± 7 7.9 ± 0.6
V 121 ± 1 1193 ± 8 1164 ± 5 3.8 ± 0.1
700 °C × 2 h (FC) SR α’ + α + β H ‐‐ 1109 ± 18 1013 ± 17 13.5 ± 0.2 [230]
700 °C × 1 h (10
K/min) SR
α’ + α (fine needles) +
β in β(C) ‐‐ 117.45 1115 1051 11.3 [304]
705 °C × 3 h (AC) ANN β(C) V 115 ± 2 1082 ± 34 1026 ± 35 9.1 ± 2.0 [32]
730 °C × 2 h (AC) ANN α’ + α + β in β(C) H(xz) 113 ± 9 1057 ± 8 958 ± 6 12.4 ± 0.7 [59]

Materials 2022, 15, 2047 62 of 85
α + β
730 °C × 2 h (AC) ANN α’ + α + β in β(C) H(xy) 112 ± 6 1065 ± 21 974 ± 7 7.0 ± 0.5
[59] V 117 ± 6 1052 ± 11 937 ± 9 9.6 ± 0.9
730 °C × 2 h (AC) ANN H 101 ± 4 1046 ± 6 965 ± 16 9.5 ± 1
[325] V 110 ± 29 1000 ± 53 900± 101 1.9 ±8 0.8
800 °C × 2 h (AC) ANN α’ + α (0.7μm) + β in
β(C) ‐‐ ‐‐ 1073 ± 9 1010 ± 11 17.0 ± 1.0 [265]
800 °C × 2 h SR β(C) V ‐‐ 1228 ± 32 ‐‐ 8.0 ± 1.5 [110]
800 °C × 2 h (FC) ANN
α + β lamellae
H ‐‐ 1024 ± 10 955 ± 9 14.7 ± 0.4
[230] 800 °C × 6 h (FC) ANN H ‐‐ 1017 ± 5 928 ± 6 18.9 ± 1.3
800 °C × 12 h
(FC) ANN H ‐‐ 1007 ± 4 923 ± 3 18.5 ± 0.6
850 °C × 1 h (FC) ANN α’ + α + β in β(C) V 114 ± 1 1003 ± 4 945 ± 6 8.1 ± 0.3 [271]
850 °C × 2 h (FC) ANN α + β with increase of
β fraction in β(C) V 115 ± 4 1004 ± 6 955 ± 6 12.8 ± 1.4
[32]
850 °C × 5 h (FC) ANN α + β with increase of
β fraction in β(C) V 112 ± 3 965 ± 20 909 ± 24 ‐‐
900 °C × 30′ (AC) ANN α + β V ‐‐ 1013 ± 23 981 ± 26 16.1 ± 2.9
[285] 900 °C × 60′ (AC) ANN α + β V ‐‐ 1026 ± 8 974 ± 1 15.5 ± 0.6
900 °C × 120′
(AC) ANN α + β V ‐‐ 1021 ± 18 975 ± 16 15.0 ± 0.2
920 °C × 2 h + 100
MPa HIP β(E) V ‐‐ 1086 ± 26 ‐‐ 13.8 ± 1.3 [110]
930 °C × 2 h (FC) ANN
α + β V
‐‐ 968 ± 4 924 ± 8 19.5 ± 3.2
[285] 930 °C × 2 h (AC) ANN ‐‐ 1031 ± 44 991 ± 47 16.9 ± 1.9
930 °C × 2 h
(WQ) ANN ‐‐ 1097 ± 12 1048 ± 15 9.2 ± 1.0
940 °C × 1 h (AC)
+ 650 °C × 2 h
(AC)
STA α + β in β(C) V 116 ± 3 948 ± 27 899 ± 27 13.6 ± 0.3 [32]
950 °C × 2 h (AC) ANN Bi‐lamellar structure
α (2.4 μm) + β in β(C) ‐‐ ‐‐ 945 ± 5 893 ± 3 14.1 ± 1.5 [265]
950 °C × 1 h (FC) ANN α’ + α + β coarsen in
β(C→E) V 114 ± 2 926 ± 3 860 ± 5 10.5 ± 0.6 [271]
950 °C × 1 h
(WQ) + 700 °C ×
2h(AC)
Mixed α + β
H 103 ± 11 1036 ± 30 944 ± 8 8.5 ± 1
[325] V 98 ± 3 1040 ± 4 924 ± 14 7.5 ± 2
900 °C × 2 h + 700
°C × 1 h (10
K/min)
Mixed α/β phase columnar
in β(C) ‐‐ 118.8 988 980 9.5 [303]
910 °C × 8 h
(WQ) + 750 °C ×
4 h (FC)
Mixed Bimodal microstruc‐
ture ‐‐ ‐‐ ~950 ~900 ~18 [245]
900 °C × 2 h + 100
MPa + 700 °C × 1
h (10 K/min)
HIP +
ANN
α/β phase columnar
in β(C) ‐‐ 115.4 973 ± 1 885 ± 3 19.0 ± 0.5 [303]
920 °C × 2 h(AC)
+ 100 MPa + 920
°C × 12 h (AC)
HIP +
ANN
Basketweave α + β in
β(E)
H(xz) 116 ± 1 1007 ± 1 937 ± 1 16.0 ± 0.4
[111] H(xy) 117 ± 2 1003 ± 1 936 ± 3 15.4 ± 0.3
V 113 ± 1 999 ± 1 911 ± 4 16.9 ± 0.9
920 °C × 2 h + 100
MPa β(E) ‐‐ ‐‐ 1089 ± 26 ‐‐ 13.8 ± 1.3 [110]
See Table 9 C ANN Bimodal microstruc‐
ture
H(xy) ‐‐ 1017 ± 16 865 ± 19 18 ± 1 [305]
V ‐‐ 1004 ± 23 849 ± 12 16 ± 1
α + β 940 °C × 1 h + 650
°C × 2 h (AC) STA ‐‐ V 116 ± 2 948 ± 27 899 ± 27 13.6 ± 0.3 [32]

Materials 2022, 15, 2047 63 of 85
β
1020 °C × 2 h
(FC) SHT
α + β + α2‐Ti3Al in
β(E) V ‐‐ 840 ± 27 760 ± 19 14.1 ± 2.5 [32]
1050 °C × 1 h
(FC) SHT
α + β + αp along β
grain boundaries
β(E)
V 114 ± 1 869 ± 3 787 ± 4 11.5 ± 1.0 [241]
1050 °C × 1 h
(WQ) + 820 °C ×
2 h (AC)
SHT +
ANN α + β
H 96.7 ± 5 1019 ± 11 913 ± 7 8.9 ± 1.0
[325] V 95 ± 4 951 ± 55 869 ± 64 7.9 ± 2.0
1050 °C × 2 h SHT β(C) V ‐‐ 986 ± 45 ‐‐ 13.8 ± 0.8
[110] 1050 °C × 2 h +
100 MPa HIP β(E) V ‐‐ 1007 ± 15 ‐‐ 13.5 ± 0.7
1050 °C × 1 h
(AC) SHT
α (0.7μm) +β in β(E,
hE) ‐‐ ‐‐ 988 ± 8 869 ± 4 13.4 ± 0.7
[265] 1050 °C × 1 h
(WQ) + 990 °C ×
30′ (AC)
SHT +
ANN
Basketweave α + β in
β(E, hE) ‐‐ ‐‐ 962 ± 12 838 ± 6 12.0 ± 0.1
1150 °C × 2 h
(AC) SHT
α + β coarsen + α
grain boundaries V ‐‐ 1128 ± 8 1107 ± 10 4.9 ± [285]
β 1200 °C × 1 h
(AC) SHT
α (0.9μm) + β in β(E,
hE) ‐‐ ‐‐ 988 ± 8 878 ± 7 11.2 ± 1.2 [265]
β + α + β
1015 °C × 30′
(AC) + 843 °C × 2
h (FC)
SHT +
ANN β(C) V ‐‐ 874 ± 23 801 ± 20 13.5 ± 1.2
[32] 1015 °C × 30′
(AC) + 730 °C × 2
h (AC)
STA β(E) V 113 ± 3 902 ± 19 822 ± 25 12.7 ± 0.6
1 C, E and hE indicate Columnar, Equiaxed and half‐Equiaxed β‐grains. 2 the authors defined this
heat treatment as ANN highlighting however the effects induce by the SR heat treatment.
As summarized in the same Table 12, the HTs effects are already significant as the
temperatures reach T0, and then ~995 °C, where the cooling method and the residence time
must be considered.
Table 12. Effects induced on microstructure and tensile properties by the different heat treatment
temperatures.
HT Region Microstructural Strength Ductility
α + β
T < low‐SSTR
α’ → α decomposition
Slight coarsening (high residence
time)
No effects of the cooling rate
Ti3Al precipitation
~as‐built
low‐ < T < medium‐SSTR
α’ → α + β decomposition (~705 °C)
Slight coarsening
No effects of the cooling rate
↓ ↑
medium‐ < T < high‐SSTR
α + β microstructure + α globulariza‐
tion
Coarsening effects
Effects of cooling tare (T → T0)
↓ ↑↑
β T > T
Recrystallization process (C → E) Coarsening effects
Effects of cooling method
↓↓ ↑↑
De facto, Etesami et al. [285] showed a significant increase of tensile strength despite
the heat treatment at 930 °C × 2 h due to the followed WQ that induces the diffusionless
α’‐martensite transformation of the formed β‐phase. Increasing the temperature above the

Materials 2022, 15, 2047 64 of 85
β‐transus, the recrystallization process (columnar → equiaxed β‐grains) takes place only after adequate holding time and cooling method as previously discussed through the
study conducted by [268]. Thus, a slow cooling rate increases tendentially the ductility
values and decreases the tensile strengths, while a high cooling rate induces higher tensile
strengths, but does not significantly improve the ductility (Tables 11 adnd 12). Consider‐
ing the HIP heat treatments, a very important reduction in the vol % of LOF surely in‐
creases the obtained tensile strengths and ductility due to the reduction in potential trig‐
gers of cracks [111,268,299,300]. On the other hand, considering a dense or fully dense as‐
built sample, the HIP heat treatment does not significantly improve the tensile properties
compared to the effects induced by the same heat treatments without the use of pressure.
In this scenario, Mahmud et al. [111] and Kasperovich et al. [303] show higher ductility
combining the α + βHIP to the ANN heat treatment. These values were not even reached
by the βHIP at 1050 °C × 2 h +100 MPa as proposed and analyzed by Leuders et al. [110].
The same authors showed that the tensile strength obtained after α + βHIP 920 °C × 2 h +
100 MPa are slightly higher than those obtained after βHIP 1050 °C × 2 h + 100 MPa despite
an equal elongation (Table 11). A good balance between the strengths and ductility can be
reached by performing a mixed heat treatment that induces a bi‐modal microstructure
(Section 6.2). De facto, Table 12 shows an increment of the tensile strengths, maintaining
excellent elongations [112,224,265,305]. A good balance between the tensile strengths and
the ductility was obtained in the research conducted by Sabban et al. [305]. The authors
showed UTS > 1GPa, YS > 850 MPa and the elongation higher than 16% after the cycling
annealing (Table 11). Bai et al. [224], performing the same heat treatment with a holding
time of 30′ for each step at 975 °C, showed higher UTS and YS values (1196 ± 10 MPa and
1054 ± 10 MPa, respectively) but an elongation of 9.8 ± 1.8%.
Gallaraga et al. [30] showed that mechanical properties variation resides in the mi‐
crostructural changes after the different HTs (Tables 10 and 11). De facto, the increase in
strengths and the decrease in ductility (Figure 58) are related to the following microstruc‐
ture: in relation to the different microstructure: equiaxed β‐grains with α + β microstruc‐
ture rather than columnar β‐grains with α + β, partially or fully α’ martensite.
Figure 58. Trend of the UTS and YS values (blue and red lines) and ductility (orange dotted line) in
relation to the Ti6Al4V microstructure obtained by the re‐plotting of the results analyzed by Gal‐
laraga et al. [30].
In this scenario, considering different samples having the same microstructure mor‐
phology, the tensile strength variation can be caused by the coarsening effects (see Section

Materials 2022, 15, 2047 65 of 85
6.2). Moreover, in this case, the Hall–Petch relationship (Equation (10)) can be considered
to evaluate the strengthening mechanisms of the Ti6Al4V alloy in as‐built and heat‐treated
conditions, respectively. Unlike the AlSi10Mg, the term d is the average of the α lamellae
width in the lamellar microstructure, or the average grain size of the α‐phase in the equi‐
axed microstructure [326]. Despite this, the yield strength decreases with the increasing
width/grain size [30,327–329]. Considering the as‐built case, Akram et al. [330] demonstrated the validity of the
Hall–Petch equation also highlighting the mechanical properties anisotropy between the
H‐ and V‐samples. The same authors confirmed that H‐samples are characterized by
higher tensile strengths than the V‐samples, highlighting a faster increase in the yield
strength with the inverse square root of the α width (Figure 59).
Figure 59. YS values versus the inverse square root of the α‐lamella width for the H‐ and V‐samples
(Reprinted from reference [330]).
The same graph shown in Figure 59 highlights R2 of 0.79 for the transverse samples
(V‐samples) indicating a greater values’ dispersion due to the microstructural texture and
presence of defects previously discussed [330].
However, focusing on the heat‐treated Ti6Al4V samples, which are characterized by
a bi‐modal microstructure, Galindo‐Fernàndez et al. [327] proposed the variation of the
Hall–Petch equation, as follows:
𝜎 𝜎 𝐾𝑉
𝑑
1 𝑉
𝑑 (20)
where 𝑉 (‐) is the volume fraction of the secondary αs phase, 𝑑 and 𝑑 (m) are the av‐
erage grain size of the primary αp and the secondary αs phases, respectively. The same
authors reported that the friction stress 𝜎 , MPa must be considered for the α and the
β phases unlike for the as‐built Ti6Al4V samples, as follows:
𝜎 𝜎 𝑉 𝜎 1 𝑉 (21)
where 𝜎 and 𝜎 (MPa) are the friction stress related to α and β phases, respectively. In
addition, the Equation (21) can be rewritten as follows:
𝜎 𝜎 𝜎 𝑉 𝜎 1 𝑉 (22)
where 𝜎 is the stress required to activate the prismatic slip (~90 MPa), while 𝜎 (MPa)
is the solid solution strengthening stress defined as follows:

Materials 2022, 15, 2047 66 of 85
𝜎 ∑ 𝐵 ⁄ 𝑥 (23)
where 𝑥 is the concentration of the atoms of the element i and 𝐵 is its strengthening con‐stant. Galindo‐Fernàndez et al. [327] suggested 𝜎 = 454 MPa and a friction stress of 544
MPa. At the same time, they concluded the following Equation (24) to describe the flow
stress of the Ti6Al4V alloy:
𝜎 𝜎 ∙ 𝐺 𝑇, 𝜀 0.3𝑀𝜇𝑏 𝜌 (24)
where 𝐺 𝑇, 𝜀 is the normalized activation energy G for the cross‐slip dislocation, which
depends on the temperature T and on the strain rate (𝜀), M is the Taylor factor (0.05 ÷ 3), 𝜇 is the shear modulus 𝜇 54 0.03𝑇 GPa, 𝑏 is the Burgers vector and 𝜌 is the disloca‐tions’ density. The fully martensitic microstructure leads to an increase in the yield
strength of ~400 MPa due to the very small α’‐martensite laths (Section 6.1), while the
lamellar structure (~3 μm) and the equiaxed grains (~8 ÷ 10 μm) induced a contribution of
~170 and ~100 MPa, respectively.
In this scenario, the bimodal structure shows higher yield strength than the lamellar
and equiaxed structures, respectively, due to its greater impediment to the dislocation
movement thanks to the crystallographic misorientation of the primary αp phase, second‐
ary αs phase and β phase [111,327]. The presence of the β‐phase after the α’‐martensite
decomposition during the heat treatments (Section 6.2) induces the decrease in strength
and varies the dislocation movement as reported in Figure 60 by Zheng et al. [331]. De
facto, the β‐phase is present between two adjacent α‐lamellae (Figure 60) and can be con‐
sidered as a barrier of the dislocations’ motion, which forms a pile‐up generating a stress
concentration [222,326,331]. In this scenario, Zheng et al. [331] and Kohn et al. [332] af‐
firmed that the contribution of the β‐phase was ignored by the Hall–Petch mechanism,
considering that it was controlled by the platelets and/or laths of the α‐phase.
Figure 60. Schematic representation of the interaction between the dislocations and the α/β interface
(a) during a plastic deformation emphasizing the effect of β laths: (b) pure α‐phase, (c) one thin β‐
phase, (d) one thick β‐phase, (e) two thin β‐phase (Adapted from reference [331]).
In fact, the deformation initiated into α‐grain, and with the subsequent strain hard‐
ening, the plastic flow starts into adjacent α‐phase after the slip transfer across the β‐phase
that is an interface [326]. In this scenario, Zheng et al. [331] affirmed that due to the differ‐
ent Burgers vector between the α and β phases, a residual Burgers vector ∆𝑏

Materials 2022, 15, 2047 67 of 85
𝑁 𝑏 𝑏 is left at the α/β interface generating a new residual dislocation (Figure 60).
On the other hand, the amount of the β‐phase and the α + β morphology induce significant
effects on the mechanical behavior, as previously reported. Through Figures 60b‐e, Zheng
et al. [331] proposed a schematical representation of the dislocation pile‐up variation in‐
duced by the amount and size of the β‐phase.
Finally, Tan et al. [333] reported an interesting point of view regarding the crack ini‐
tiation and propagation into a bimodal and/or trimodal microstructure (Figure 61). In this
scenario, the trimodal microstructure is a structure formed by globular primary αp phase,
lamellar αp phase, and secondary αs phase + β which is formed by the β‐phase [334,335].
Figure 61. (a) Schematic representation of crack initiation and propagation into a trimodal micro‐
structure; (b,c) SEM micrographs of the Ti6Al4V fracture surface where αp and αl indicate primary
and lamellar α‐phase, respectively (Adapted from reference [333]).
Generally, the crack nucleates at the primary αp laths rather than at the boundaries
of the β‐grains and propagates tortuously because it is deflected by both the globular αp
phase and by the same β‐grains boundaries. Tan et al. [333] affirmed that the trimodal
microstructure or the bimodal microstructures with an appropriate amount of the αp equi‐
axed phase may confer higher ductility than the lamellar micro‐stretches. Moreover, a
greater resistance of crack propagation is obtained if the globular αp phase is at the β‐
grains boundaries. Figure 61c showed that αp equiaxed phase is relatively soft and reaches
yielding first due to the high amount of the slip band contained.
8. L‐PBFed Ti6Al4V: The Corrosion Resistance
Moreover, in this case, the corrosion resistance is strongly correlated to the micro‐
structural morphology and the vol% of the α and β phases, respectively, in other the as‐
pects highlighted for the AlSi10Mg samples (Section 5) [209,336,337]. As reported in Sec‐
tion 6.1, the as‐built Ti6Al4V samples are generally formed by a fully α’ martensitic mi‐
crostructure, an SSS phase considered as a non‐equilibrium phase enough to reduce the
corrosion resistance [337]. De facto, the as‐built Ti6Al4V samples showed lower corrosion
resistance than the as‐cast sample showing an α + β structure in the same corrosion envi‐
ronment [337]. In this scenario, Zhao et al. [338] affirmed that the as‐built L‐PBF samples
showed a lower corrosion rate of the electron beam melted samples if the potential is
lower than 1.2 V. The opposite results were highlighted with values > 1.5 V. The same
authors explained this behavior through the different densities of the grain boundaries
amount. The same results are obtained by [337].
As discussed for the mechanical properties, the corrosion resistance also varies in
relation to the considered plane. Dai et al. [339] reported a slight variation between the xy
and the xz planes, which showed 0.7 and 0.9 mg/cm2 of the weight loss, respectively, after
15 min in 1M HCl. On the other hand, the same samples are not corroded if the 3.5wt% of
NaCl solution was used [340].
Focusing on the effects induced by the different heat treatments, Dai et al. [339]
showed a decrease in the corrosion resistance with an increase in the corrosion current
(icorr) from 0.9 μA/cm2 in as‐built condition to values higher than 1.5 μA/cm2 after the heat

Materials 2022, 15, 2047 68 of 85
treatment at 1000 °C × 2 h. This atypical correlation between the increase in the β‐phases
caused by the heat treatment (Section 6.2) and the decrease in the corrosion resistance
were explained through the grain refinement. Chandramohan et al. [341] demonstrated
that the 3.5 wt% of NaCl solution becomes corrosive on the heat‐treated Ti6Al4V sample
showing an increase in icorr after the heat treatments both at 900 °C × 1 h and 1000 °C × 1 h.
In the first case, the corrosion rate reaches 5.9 × 10 –4 mm/y; while 3.4 × 10⁻⁴ mm/y in the
second case. Finally, Pazhanivel et al. [342] showed an increase in Ecorr (potential of corro‐
sion) from −0.30 ± 0.02 to −0.20 ± 0.02 V in as‐built and heat‐treated condition at 850 °C ×
2 h, respectively. The authors affirmed that the oxide film is more protective in heat‐
treated samples than in the as‐built samples after the corrosion test in 3.5 wt% of NaCl
due to the microstructural morphology. In fact, the homogeneous ultrafine α + β structure
confers a higher number of nucleation sites of the passivation layer and, consequently,
higher corrosion resistance than the inhomogeneous α’‐martensite [342].
9. Conclusions
In the present paper, the effects induced by different heat treatments on as‐built
AlSi10Mg and Ti6Al4V samples produced via L‐PBF were reviewed. From an industrial
point of view, the wide range of applications makes heat treatment optimization necessary
to obtain excellent mechanical properties through microstructural stabilization. Manufac‐
turing high‐quality, fully dense samples is a necessary requirement. Excellent mechanical
performance characterizing as‐built samples can be maintained even after heat treatment.
The effects induced by both the process parameters and BP temperature on the micro‐
structure, mechanical properties and fracture mechanisms of as‐built samples have been
reviewed. Systematically, the same effects have been analyzed after the following heat
treatments: SR, ANNs, SHT + AA (T6 and STA), HIP.
In relation to AlSi10Mg samples manufactured via L‐PBF, the main findings are re‐
ported as follows:
9.1. Microstructure and Corrosion Resistance of AlSi10Mg
1. The as‐built microstructure is formed by a Si‐eutectic network containing the α‐Al
matrix with Si particles, β‐Al5FeSi intermetallics, GP zones and finely dispersed ε’’/ε’
precipitates depending on the process parameters and/or BP temperatures.
2. Increasing the BP temperature leads to increased stress relaxation, the number of pre‐
cipitates and their size. Such effects decrease with increasing distance from the pre‐
heated BP plate.
3. DA and SR: precipitation phenomena induced on as‐built sample manufactured on
a cold BP and Si‐eutectic network destruction at T > 200 °C with Si particle coarsen‐
ing.
4. SHT (+AA): Si particles coarsen with total Si‐eutectic network destruction and micro‐
structure recrystallization. This induces precipitation phenomena and β‐Al5FeSi for‐
mation. T6 can increase the vol% of pores, unlike the HIP HT.
5. The corrosion resistance, which is characterized by an anisotropic mechanism in full
and quasi‐cellular structures, decreases from the as‐built samples to the SR and T6
heat‐treated samples due to both variations in the Si eutectic and precipitation phe‐
nomena.
9.2. Mechanical Properties of AlSi10Mg
6. Due to the strengthening phenomena conferred by this microstructure, the mechan‐
ical behavior is strongly anisotropic, exhibiting high tensile strength (UTS > ~400
MPa, YS > ~240 MPa) and low elongation (A < ~9%).
7. The post‐HT tensile strength generally decreases while the ductility increases with
increasing heat treatment temperatures. By increasing the DA temperatures above
255 °C, initiation of Si‐eutectic network destruction induces a decrease in the tensile

Materials 2022, 15, 2047 69 of 85
strength (UTS = ~340 MPa, YS = ~200 MPa) but also an increase in elongation with
values higher than 10%. In this scenario, the anisotropic mechanical performance can
be eliminated after the SR at 300 °C × 2 h.
8. The ductility can reach 23–29% after T6 and HIP HTs. Firstly, the subsequent AA to
complete the T6 heat treatment recovers the tensile strength due to precipitation of
the ε‐Mg2Si (UTS = 230–330 MPa, YS = 180–280 MPa). Secondly, the tensile strength
can be increased with the T6 rather than a DA after the HIP heat treatments.
9. In as‐built samples and DA samples at low temperatures, the fracture mechanisms
are dominated by both the laser scan tracks and MP boundaries, where the crack
generally propagates (inter‐layer and inter‐track fractures). In other cases, the crack
also propagates inside the center of the MP, generating a trans‐track fracture. In re‐
lation to the SR at 300 °C and, therefore, after the T6 and HIP heat treatments, the
fracture mechanisms are dominated by the Si‐eutectic particles which generate the
voids at their interface with the α‐Al matrix. In this case, cracks can be deflected by
the laser scan tracks and MP boundaries remaining after the heat treatment at high
temperatures.
In relation to Ti6Al4V samples manufactured via L‐PBF process, the main conclu‐
sions are outlined as follows:
9.3. Microstructure and Corrosion Resistance of Ti6Al4V
10. The as‐built microstructure is formed by columnar β‐grains arranged along the di‐
rections of the heat flux. In relation to the BP temperature, process parameters and
the distance from the BP plane, columnar grains can contain a fully α’ microstructure
(primary, secondary, tertiary and quartic α’‐martensite’s), a mixture of α’ and α + β
lamellar phase, or a fully ultrafine α + β microstructure.
11. Corrosion resistance is influenced by the β grain boundary density and is character‐
ized by anisotropic behavior, increasing from the as‐built state to samples formed by
an α + β microstructure due to the higher number of nucleation sites where the pas‐
sivation layer can form.
12. The heat‐treated microstructure is progressively more influenced by heat treatment
temperatures as the latter increase. Starting from ~400 °C, the α’ → α decomposition
takes place inducing the diffusion of the Al and V, which cause β precipitation. At
around 704–705 °C, the α’ → α + β transformation occurs, increasing drastically after
the 800 °C up to the β‐transus. Above the critical temperature, and into high‐SSTR,
the tensile strength can be recovered with appropriate cooling methods, remember‐
ing that the α‐phase progresses towards globularization. These effects become pro‐
gressively more important above the β‐transus, where the recrystallization process
from columnar to equiaxed grains also begins, depending on the time that the mate‐
rial is held at this temperature.
9.4. Mechanical Properties of Ti6Al4V
13. The UTS, YS (higher than 1.1 GPa and 950 MPa, respectively) and elongation (A <
9%) do not exhibit great differences between as‐built samples formed by α’ marten‐
site or ultrafine α + β microstructure.
14. The SR and ANN heat treatments performed in low‐SSTR, which are not affected by
the different cooling rate (WQ, AC, FC), induce slight coarsening effects that reflect
on the tensile strength: UTS > 1GPa, YS > 900 MPa and A < 10%. Between the medium‐
and high‐SSTRs, coarsening effects increase and the α’ → α + β is completed. In ad‐
dition, the cooling method becomes significant, reaching the T0. The UTS and YS de‐
crease up to ~970 and ~900 MPa, respectively, after the ANN HT at 850 °C × 5 h (FC).
15. The ductility also increases up to 14%, and the tensile strengths decrease at values
that can also satisfy the ASTM F2924‐12 standard specification after HTs performed
into high‐SSTR

Materials 2022, 15, 2047 70 of 85
16. The balance between the tensile strengths and elongation can be obtained with a bi‐
modal and/or a trimodal microstructure after an appropriate combination of differ‐
ent ANN heat treatments below and/or above the β‐transus.
17. The fracture mechanisms of the as‐built and unrecrystallized samples are related,
firstly, to the load conditions and columnar β‐grain directions and, secondly, to the
α‐phase crystallographic orientations. This damaging behavior, together with the
presence of LOF pores in the xy plane, induces significant anisotropic mechanical
properties that can be reduced with the HIP heat treatment. In this case, the as‐built
samples transform their structure into α + β Widmanstätten, where the β‐phase be‐
tween two adjacent α lamellae modifies the fracture mechanism. Focusing on bi‐
modal and/or trimodal microstructures, crack propagation follows the α‐phase, and
is finally characterized by a tortuous path due to the presence of the β‐grains bound‐
aries and globular αp phase. The greatest effects are induced when this globular
phase is located at β‐grains boundary.
10. Future Trends and Prospective
AM processes are revolutionizing the industrial setting due to their important ad‐
vantages in terms of sample geometry, customization and reduction in weight compared
to conventional manufacturing processes. Reductions in production time and cost are also
of fundamental importance. L‐PBF makes up a large part of metal AM applications, where
AlSi10Mg and Ti6Al4V cover the largest portion of demand in the aerospace, automotive
and biomedical fields. For this reason, they are the most studied alloys in relation to this
manufacturing process. AlSi10Mg and Ti6Al4V must guarantee the high requirements of
these different applications, necessitating the manufacturing of excellent mechanical com‐
ponents and physical objects. Consequently, the effects induced by appropriate process
parameters and HTs must be controlled to obtain the best results.
For both lightweight alloys, there are many gaps in the optimization of the heat treat‐
ment parameters in relation to the microstructural morphology obtained by different L‐
PBF process parameters. Very few researchers have studied the effects of the BP temper‐
ature on as‐built samples, for which the effects of heat treatment on the same samples are
also largely unknown. These factors could potentially have important implications on the
design of samples and their mechanical properties. Future studies must, therefore, define
new heat treatments to optimize the mechanical properties of these alloys in order to pre‐
serve the metallurgical advantages conferred by the L‐PBF process. Another area of inter‐
est is the mechanism involved during post‐process heat treatments performed on Ti6Al4V
alloy to improve mechanical properties. At the same time, more studies on cyclic heat
treatments may be necessary.
11. Acronyms
Table 13 illustrates all acronyms and their definitions within the present review.
Table 13. Acronyms used in the present review and their definitions.
Acronyms Meanings
A Elongation at break (%)
AA Artificial Aging
AC Air Cooling
AM Additive Manufacturing
ANN Annealing
BFTEM Bright‐Field Transmission Electron Microscopy
BP Build Platform
BR Build Rate
C‐ANN Cycling Annealing
CP Cold Platform

Materials 2022, 15, 2047 71 of 85
DA Direct Aging
DED Direct Energy Deposition
DSC Differential Scanning Calorimetry
ED Energy Density
EBSD Electron Backscatter Diffraction
FC Furnace Cooling
H Horizontal
HAADF High‐Angle Annular Darf‐Field
HAZ Heat Affected Zone
HIP Hot Isostatic Pressing
HP Hot Platform
HRTEM High‐Resolution Transmission Electron Microscopy
HT Heat Treatment(s)
L‐PBF(ed) Laser‐Powder Bed Fusion/(Fused)
LSW Lifshitz, Slyozov, Wagner
LOF Lack‐Of‐Fusion
Ms, Mf Martensite start, finish
MP Melt/Molten pool
MPB MP Boundary(s)
MPC MP Center(s)
OM Optical Microscope
PBF Powder Bed Fusion
SAED Selected Area Electron Diffraction
SCC Stress Corrosion Cracking
SEM Scanning Electron Microscopy
SDAS Secondary Dendrite Arm Spacing
SHT Solution Heat Treatment
SLM Selective Laser Melting
SSTR Solid Solution Temperature Region
STA Solution Treated and Aged
STEM Scanning Transmission Electron Microscope
TEM Transmission Electron Microscope
UTS Ultimate tensile strength
V Vertical
XRD X‐Ray Diffraction
YS Yield Strength
WQ Water Quenching
Author Contributions: Conceptualization, E.G., E.C.; methodology, E.G.; validation, E.C.; re‐
sources, E.G.; data curation, E.G.; writing—original draft preparation, E.G.; writing—review and
editing, E.G., E.C.; visualization, E.G., E.C.; supervision, E.C. All authors have read and agreed to
the published version of the manuscript.
Funding: This research received no external funding.
Institutional Review Board Statement: Not applicable.
Informed Consent Statement: Not applicable.
Data Availability Statement: All the data is available within the manuscript.
Conflicts of Interest: The authors declare no conflict of interest.
References
1. Martin, J.H.; Yahata, B.D.; Hundley, J.M.; Mayer, J.A.; Schaedler, T.A.; Pollock, T.M. 3D printing of high‐strength aluminium
alloys. Nature 2017, 549, 365–369. https://doi.org/10.1038/nature23894.
2. Williams, J.C.; Boyer, R.B. Opportunities and issues in the application of titanium alloys for aerospace components. Metals 2020,
10, 705. https://doi.org/10.3390/met10060705.

Materials 2022, 15, 2047 72 of 85
3. Vanmuster, L.; D’Haeyer, C.; Coucke, P.; Braem, A.; Van Hooreweder, B. Mechanical behavior of Ti6Al4V produced by laser
bed fusion with engineered open porosity for dental applications. J. Mech. Behav. Biomed. Mater. 2022, 126, 104974.
https://doi.org/10.1016/j.jmbbm.2021.104974.
4. Bertam, M.; Buxmann, K.; Furrer, P. Analysis of greenhouse gas emissions related to aluminium transport applications. Int. J.
Life Cycle Assess. 2009, 14, 62–69. https://doi.org/10.1007/s11367‐008‐0058‐0.
5. Rugg, D.; Dixon, M.; Burrows, J. High‐temperature application of titanium alloys in gas turbine. Material life cycle opportunities
and threats—An industrial perspective. Mater. High Temp. 2016, 33, 536–541. https://doi.org/10.1080/09603409.2016.1184423.
6. EOS GmBH—Electro Optical Systems. Material Data Sheet: EOS Aluminium AlSi10Mg. München. Available online:
www.eos.info (accessed on 6 December 2021).
7. Aboulkhair, N.T.; Tuck, C.; Ashcroft, I.; Maskery, I.; Everitt, N.M. On the precipitation hardening of selective laser melted
AlSi10Mg. Metall. Mater. Trans. A 2015, 46, 3337–3341. https://doi.org/10.1007/s11661‐015‐2980‐7.
8. Hartlieb, M. Aluminium alloys for structural die casting. Die Cast. Eng. 2013, 57, 40–43.
9. Ghio, E.; Cerri, E. Work hardening in heat‐treated AlSi10Mg alloy manufactured by selective laser melting: Effect of Layer
Thickness and Hatch Spacing. Materials 2021, 14, 4901. https://doi.org/10.3390/ma14174901.
10. Kempen, K.; Thijs, L.; Van Humbeeck, J.; Kruth, J.‐P. Mechanical properties of ALSi10Mg produced by selective laser melting.
Phys. Procedia 2012, 39, 439–446. https://doi.org/10.1016/j.phpro.2012.10.059.
11. Alghamdi, F.; Haghshenas, M. Microstructural and small‐scale characterization of additive manufactured AlSi10Mg alloy. SN
Appl. Sci. 2019, 1, 255–265. https://doi.org/10.1007/s42452‐019‐0270‐5.
12. Schmid‐Fetzer, R.S. Phase‐diagram: The Beginning of Wisdom. J. Phase Equilibria Diff. 2014, 35, 735–760.
https://doi.org/10.1007/s11669‐014‐0343‐5.
13. Yang, K.V.; Rometsch, P.; Davies, C.H.J.; Huang, A.; Wu, X. Effect of heat treatment on the microstructure and anisotropy in
mechanical properties of A357 alloy produced by selective laser melting. Mater. Des. 2018, 154, 275–290.
https://doi.org/10.1016/j.matdes.2018.05.026.
14. Cerri, E.; Ghio, E.; Bolelli, G. Effect of the distance from BP and post‐heat treatment of AlSi10Mg manufactured by single‐ and
multi‐laser selective laser melting. JMEP 2021, 30, 4981–4992. https://doi.org/10.1007/s11665‐021‐05577‐8.
15. Caceres, C.H.; Davidson, C.J.; Griffiths, J.R.; Hogan, L.M.; Wang, Q.C. Hypoeutectic Al‐Si‐Mg foundry alloys. Metall. Mater.
Trans. A 1999, 30, 2611–2618. https://doi.org/10.1007/s11661‐999‐0301‐8.
16. Wang, Y.; Liao, H.; Wu, Y.; Yang, J. Effect of Si content on microstructure and mechanical properties of Al‐Si‐Mg alloys. Mater.
Des. 2014, 53, 634–638. https://doi.org/10.1016/j.matdes.2013.07.067.
17. Donachie, M.J. Titanium: A Technical Guide, 2nd ed.; ASM International: Materials Park, OH, USA, 2000.
18. Ducato, A.; Fratini, L.; La Cascia, M.; Mazzola, G. An automated visual inspection system for the classification of the phasaes
of Ti6Al4V titanium alloy. In Proceedings of the Computers Analysis of Images and Patterns, York, UK, 27–29 August 2013;
Springer: Berlin/Heidelberg, Germany, 2013; pp. 362–369. https://doi.org/10.1007/978‐3‐642‐40246‐3_45.
19. Bower, K.; Murray, S.; Reinhart, A.; Nieto, A. Corrosion resistance of selective laser melted Ti‐6Al‐4V alloy in salt for environ‐
ment. Res. Mater. 2020, 8, 100122. https://doi.org/10.1016/j.rinma.2020.100122.
20. Murr, L.E.; Quinones, S.A.; Gaytan, S.M.; Lopez, M.I.; Rodela, A.; Martinez, E.Y.; Hernandez, D.M.; Martinez, E.; Medina, F.;
Wicker, R.B. Microstructure and mechanical properties of Ti‐6Al‐4V produced by rapid‐layer manufacturing, for biomedical
applications. J. Mech. Behav. Biomed. Mater. 2009, 2, 20–32. https://doi.org/10.1016/j.jmbbm.2008.05.004.
21. Mistry, S.; Roy, S.; Maitra, N.J.; Roy, R.; Datta, S.; Chandra, A.; Sarkak, S. Safety and efficacy of additive and subtractive surface
modification of Ti6Al4V endossesous implant in goat bone. J. Mech. Behav. Biomed. Mater. 2016, 57, 69–87.
https://doi.org/10.1016/j.jmbbm.2015.11.019.
22. Śliwa, R.E.; Bernaczek, J.; Budzik, G. The application of direct metal laser sintering (DMLS) of titanium alloy powder in fabri‐
cating components of aircraft structures. Key Eng. Mater. 2016, 687, 199–205. https://doi.org/10.4028/www.scien‐
tific.net/KEM.687.199.
23. Sibisi, N.P.; Popoola, A.P.I.; Arthur, N.K.K.; Pityana, S.L. Review on direct metal laser deposition manufacturing technology for
Ti6Al4V alloy. J. Adv. Manuf. Tachnol. 2020, 107, 1163–1178. https://doi.org/10.1007/s00170‐019‐04851‐3.
24. Seshacharyulu, T.; Medeiros, S.C.; Morgan, J.T.; Malas, J.C.; Frazier, W.G.; Pradas, Y.V.R.K. Hot deformation and microstruc‐
tural damage mechanisms in extra‐low interstitial (ELI) grade Ti‐6Al‐4V. Mater. Sci. Eng. A 2020, 279, 289–299.
https://doi.org/10.1016/S0921‐5093(99)00173‐2.
25. Chandra, T.; Wanderka, N.; Reimers, W.; Ionescu, M. Study of alpha‐beta transformation in Ti‐6Al‐4V ELI, Mechanical and
Microstructural characteristics. Mater. Sci. Forum 2010, 638–642, 712–717. https://doi.org/10.4028/www.scientific.net/MFS.638‐
642‐712.
26. Lee, H.‐S.; Yoon, J.‐H.; Park, C.H.; Ko, Y.G.; Shin, D.H.; Lee, C.S.; A study of diffusion bonding of superplastic Ti‐6Al‐4V ELI
grade. J. Mater. Process. Technol. 2007, 187–188, 526–529. https://doi.org/10.1016/j.jmatprotec.2006.11.215.
27. Chang, J.Z.‐C.; Tsai, P.‐I.; Kuo, M.Y.‐P.; Sun, J.‐S.; Chen, S.‐Y.; Shen, H.‐H. Augmentation of DMLS biomimetic dental implants
with weight bearing strut to balance of biological and mechanical demands: From Bench to Animal. Materials 2019, 12, 164.
https://doi.org/10.3390/ma12010164.
28. Shaikh, A.; Kumar, S.; Dawari, A.; Kirwai, S.; Patil, A.; Singh, R. Effect of temperature and cooling rates of α + β morphology of
Ti‐6Al‐4V alloy. Procedia Struct. Integr. 2019, 14, 782–789. https://doi.org/10.1016/j.prostr.2019.07.056.

Materials 2022, 15, 2047 73 of 85
29. Zhong, C.; Liu, J.; Zhao, T.; Schopphoven, T.; Fu, J.; Gasser, A.; Schleifenbaum, J.H. Laser metal deposition of Ti‐6Al‐4V—A
brief review. Appl. Sci. 2019, 10, 764. https://doi.org/10.3390/app10030764.
30. Gallaraga, H.; Warren, R.J.; Lados, D.A.; Dehoff, R.R.; Kirka, M.M.; Naudwana, P.; Effects of heat treatments on microstructure
and properties of Ti‐6Al‐4V ELI alloy fabricated by electron beam melting (EBM). Mater. Sci. Eng. A 2017, 685, 417–428.
https://doi.org/10.1016/j.msea.2017.01.019.
31. Shao, H.; Zhao, Y.; Ge, P.; Zeng, W. Influence of cooling rate and aging on the lamellar microstrucutre and fractography of TC21
titanium alloy. Metallogr. Microstruct. Anal. 2013, 2, 35–41. https://doi.org/10.1007/s13632‐012‐0055‐3.
32. Vrancken, B.; Thijs, L.; Kruth, J.‐P.; Van Humbeeck, J. Heat treatment of Ti6Al4V produced by selective laser melting: Micro‐
Strucutre and Mechanical Properties. J. Alloys Compd. 2012, 541, 177–185. https://doi.org/10.1016/j.jallcom.2012.07.022.
33. Huang, R.; Riddle, M.; Graziano, D.; Warren, J.; Das, S.; Nimbalkar, S.; Cresko, J.; Masanet, E. Energy and emissions saving
potential of additive manufacturing: The Case of Lightweight Aircraft Components. J. Chem. Prod. 2016, 135, 1559–1570.
https://doi.org/10.1016/j.jclepro.2015.04.109.
34. Duda, T.; Raghanav, L.V. 3D metal printing technology: The Need to Re‐invent Design Practice. AI Soc. 2018, 33, 241–252.
https://doi.org/10.1007/s00146‐018‐0809‐9.
35. ASTM 52900:2015(E); Standard Terminology for Additive Manufacturing–General Principles–Terminology. ASTM: West Con‐
shohocken, PA, USA, 2000.
36. Khorasani, M.; Ghasemi, A.H.; Rolfe, B.; Gibson, I. Additive manufacturing a powerful tool for the aerospace industry. Rapid
Prototyp. J. 2022, 28, 87–100. https://doi.org/10.1108/RPJ‐01‐2021‐0009.
37. Giganto, S.; Martínez‐Pellitero, S.; Cuesta, E.; Zapico, P.; Barreiro, J. Proposal of design rules for improving the accuracy of
selective laser melting (SLM) manufacturing using benchmarks parts. Rapid Prototyp. J. 2022. https://doi.org/10.1108/RPJ‐06‐
2021‐0130.
38. Zhou, Y.; Abbara, M.E.; Fiang, D.; Azizi, A.; Poliks, M.D.; Ning, F. High‐cycle fatigue properties of curved‐surface AlS10Mg
parts fabricated by powder bed fusion additive manufacturing. Rapid Prototyp. J. 2022. https://doi.org/10.1108/RPJ‐09‐2021‐0253.
39. Babuska, T.F.; Krick, B.A.; Susan, D.F.; Kustas, A.B. Comparison of powder bed fusion and direct energy deposition for tailoring
mechanical properties of traditionally brittle alloys. Manuf. Lett. 2021, 28, 30–34. https://doi.org/10.1016/j.mfglet.2021.02.003.
40. Teixeira, Ó.; Silva, F.J.G.; Ferreira, L.P.; Atzeni, E. A review of heat treatments on Improving the quality and residual stresses
of the Ti‐6Al‐4V parts produced by Additive Manufacturing. Materials 2020, 10, 1006–1030. https://doi.org/10.3390/met10081006.
41. Dutta, B.; Froes, F.H.S. The additive manufacturing (AM) of titanium alloys. Met. Powder Rep. 2017, 72, 96–106.
https://doi.org/10.1016/j.mprp.2016.12.062.
42. Arias‐Gonzáles, F.; Rodríguez‐Contreras, A.; Punset, M.; Manero, J.M.; Barro, Ó.; Fernández‐Arias, M.; Lusquiños, F.; Javier Gil,
F.; Pou, J. In‐Situ laser direct energy deposition of biomedical Ti‐Nb and Ti‐Zr‐Nb alloys from elemental powders. Materials
2021, 11, 1205. https://doi.org/10.3390/met11081205.
43. Lee, H.; Lim, C.H.J.; Low, M.J.; Tham, N.; Murukeshan, V.M.; Kim, Y.‐J. Lasers in additive manufacturing: A Review. Int. J.
Precis. Eng. Manuf.‐Green Technol. 2017, 4, 307–322. https://doi.org/10.1007/s40684‐017‐0037‐7.
44. Sames, W.J.; List, F.A.; Pannala, S.; Dehoff, R.R.; Babu, S.S. The metallurgy and processing science of metal additive manufac‐
turing. Int. Mater. Rev. 2016, 61, 315–360. https://doi.org/10.1080/09506608.2015.1116649.
45. Galba, M.J.; Reischle, M. Additive manufacturing of metals using powder‐based technology. In Additive Manufacturing, 1st ed.;
Bandyopadhyay, A., Bose, S., Eds.; Taylor & Francis Group: Boca Raton, FL, USA, 2016; Volume 4, p. 46.
https://doi.org/10.1201/b18893.
46. Yang, L.; Hsu, K.; Baughman, B.; Godfrey, D.; Medina, F.; Menon, M.; Wiener, S. Additive Manufacturing of Metals: The Technology,
Materials, Design and Production; Springer International Publishing: New York, NY, USA, 2017.
47. Kruth, J.‐P.; Kumar, S. Statistical analysis of experimental parameters in selective laser sintering. Adv. Eng. Mater. 2005, 7, 750–
755. https://doi.org/10.1002/adem.200500030.
48. Tang, M.; Pistorius, P.C.; Benth, J.L. Prediction of a lack‐of‐fusion porosity for powder bed fusion. Add. Manuf. 2017, 14, 39–48.
https://doi.org/10.1016/j.addma.2016.12.001.
49. Letenneur, M.; Kreitcberg, A.; Brailovski, V. Optimization of laser powder bed fusion processing using a combination of melt
pool modeling and design of experiment approaches: Density Control. Manuf. Mater. Process. 2019, 3, 21–34.
https://doi.org/10.3390/jmmp3010021.
50. Bai, S.; Perevoshchikova, N.; Sha, Y.; Wu, X. The effects of selective laser melting process parameters on relative density of the
AlSi10Mg parts suitable procedures of the archimedes method. Appl. Sci. 2019, 9, 583. https://doi.org/10.3390/app9030583.
51. Aboulkhair, N.T.; Everitt, N.M.; Ashcroft, I.; Tuck, C. Reducing porosity in AlSi10Mg parts processed by selective laser melting.
Add. Manuf. 2014, 1–4, 77–86. https://doi.org/10.1016/j.addma.2014.08.001.
52. Majeed, A.; Zhang, Y.; Lv, J.; Peng, T.; Atta, Z.; Ahmed, A. Investigation of T4 and T6 heat treatment influences on relative
density and porosity of AlSi10Mg alloy components manufactured by SLM. Comput. Ind. Eng. 2020, 139, 106194.
https://doi.org/10.1016/j.cie.2019.106194.
53. Girelli, L.; Tocci, M.; Gelfi, M.; Pola, A. Study of heat treatment parameters for additively manufactured AlSi10Mg in compari‐
son with corresponding cast alloy. Mater. Sci. Eng. A 2019, 739, 317–328. https://doi.org/10.1016/j.msea.2018.10.026.
54. Yang, T.; Liu, T.; Liao, W.; MacDonald, E.; Wei, H.; Zhang, C.; Chen, X.; Zhang, K. Laser powder bed fusion of AlSi10Mg:
Influence of Energy Intensities on Spatter and Porosity Evolution, Microstructure and Mechanical Properties. J. Alloys Compd.
2020, 849, 156300. https://doi.org/10.1016/j.jallcom.2020.156300.

Materials 2022, 15, 2047 74 of 85
55. Riener, K.; Oswald, S.; Winkler, M.; Leichtfried, G.J. Influence of storage conditions and reconditioning of AlSi10Mg powder
on the quality of parts produced by laser powder bed fusion (LPBF). Add. Manuf. 2021, 39, 101896.
https://doi.org/10.1016/j.addma.2021.101896.
56. Hastie, J.C.; Kartal, M.E.; Carte, L.N.; Attalah, M.M.; Mulvihillm, D.M. Classifying shape on internal pores within AlSi10Mg
alloy manufactured by laser powder bed fusion using 3d X‐Ray microcomputed tomography: Influence of process parameters
and heat treatment. Mater. Charact. 2020, 163, 110225. https://doi.org/10.1016/j.matchar.2020.110225.
57. Wycisk, E.; Emmelmann, C.; Siddique, S.; Walther, F. High cycle fatigue (HCF) performance of Ti‐6Al‐4V alloy processed by
selective laser melting. Adv. Mater. Res. 2013, 816–817, 134–139. https://doi.org/10.4028/www.scientific.net/AMR.816‐817.134.
58. Edwards, P.; Ramulu, M. Fatigue performance evaluation of selective laser melted Ti‐6Al‐4V. Mater. Sci. Eng. A 2014, 598, 327–
337. https://doi.org/10.1016/j.msea.2014.01.041.
59. Simonelli, M.; Tse, Y.Y.; Tuck, C. Effect of the build orientation on the mechanical properties and fracture modes of SLM Ti‐6Al‐
4V. Mater. Sci. Eng. A 2014, 616, 1–11. https://doi.org/10.1016/j.msea.2014.07.86.
60. Khorasani, A.; Gibson, I.; Goldberg, M.; Littlefair, G. On the role of different annealing heat treatments on mechanical properties
and microstructure of selective laser melted and conventional wrought Ti‐6Al‐4V. Rapid. Prototyp. J. 2017, 23, 295–304.
https://doi.org/10.1108/RPJ‐02‐2016‐0022.
61. Hu, Y.N.; Wu, S.C.; Withers, P.J.; Zhang, J.; Bao, H.Y.X.; Fu, Y.N.; Kang, G.Z. The effect of manufacturing defects of the fatigue
life of selective laser melted Ti‐6Al‐4V structures. Mater. Des. 2020, 192, 108708. https://doi.org/10.1016/j.matdes.2020.108708.
62. Pal, S.; Lojen, G.; Hudak, R.; Rajtukova, V.; Brajlih, T.; Kokol, V.; Drstvenšek, I. As‐fabricated surface morphologies of Ti‐6Al‐
4V samples fabricated by different laser processing parameters in selective laser melting. Add. Manuf. 2020, 33, 101147.
https://doi.org/10.1016/j.addma.2020.101147.
63. Xiao, Z.; Chen, C.; Xhu, H.; Hu, Z.; Nagarajan, B.; Guo, L.; Zeng, X. Study of residual stress in selective laser melting of Ti6Al4V.
Mater. Des. 2020, 193, 108846. https://doi.org/10.1016/j.matdes.2020.108846.
64. Zhang, M.; Yang, Y.; Wang, D.; Xiao, Z.; Song, C.; Weng, C. Effect of heat treatment on the microstructure and mechanical
properties of Ti6Al4V gradient structures manufactured by selective laser melting. Mater. Sci. Eng. A 2018, 736, 288–297.
https://doi.org/10.1016/j.msea.2018.08.084.
65. Yan, X.; Li, Q.; Yin, S.; Chen, Z.; Jenkins, R.; Chen, C.; Wang, J.; Ma, W.; Bolot, R.; Lupoi, R.; et al. Mechanical and in vitro study
of anisotropic Ti6Al4V lattice structure fabricated using selective lase melting. J. Alloys Compd. 2019, 782, 209–223.
https://doi.org/10.1016/j.jallcom.2018.12.220.
66. Xiong, Y.‐Z.; Gao, R.‐N.; Zhang, H.; Dong, L.‐L.; Li, J.‐T.; Li, X. Rationally designed functionally graded porous Ti6Al4V scaf‐
folds with high strength and toughness built via selective laser melting for load‐bearing orthopedic applications. J. Mech. Behav.
Biomed. Mater. 2020, 104, 103673. https://doi.org/10.1016/j.jmbbm.2020.103673.
67. Bartolomeu, F.; Costa, M.M.; Alves, N.; Miranda, G.; Silva, F.S. Selective laser melting of Ti6Al4V sub‐millimetric cellular struc‐
tures: Prediction of Dimensional Deviations and Mechanical Performance. J. Mech. Behav. Biomed. Mater. 2021, 113, 104123.
https://doi.org/10.1016/j.jmbbm.2021.104123.
68. Olakanmi, E.O.; Cockrane, R.; Dalgarno, K. A review of selective laser sintering/melting (SLS/SLM) of aluminium powders:
Processing, Microstructures and Properties. Prog. Mater. Sci. 2015, 74, 401–477. https://doi.org/10.1016/j.pmatsci.2015.03.002.
69. Metel, A.S.; Stebulyanin, M.M.; Fedorov, V.S.; Okunkova, A.A. Powder density distribution for laser additive manufacturing
(SLM): Potential, Fundamentals and Advanced Applications. Technologies 2019, 7, 5. https://doi.org/10.3390/technolo‐
gies7010005.
70. Coeck, S.; Bisht, M.; Plas, J.; Verbist, F. Prediction of lack of fusion porosity in selective laser melting based on MP monitoring
data. Add. Manuf. 2019, 25, 347–356. https://doi.org/10.1016/j.addma.2018.11.015.
71. Xu, Z.W.; Wang, Q.; Wang, X.S.; Tan, C.H.; Guo, M.H.; Gao, P.B. High fatigue performance of AlSi10mG alloy produced by
selective laser melting. Mech. Mater. 2020, 148, 103499. https://doi.org/10.1016/j.mechmat.2020.103499.
72. Li, P.‐H.; Guo, W.‐G.; Huang, W.‐D.; Su, Y.; Liu, X.; Yuan, X.‐B. Thermomechanical response of 3D laser‐deposited Ti6Al4V ally
over a wide range of strain rates and temperatures. Mater. Sci. Eng. A 2015, 647, 34–42. https://doi.org/10.1016/j.msea.2015.08.043.
73. Bayat, M.; Thanki, A.; Mohanty, S.; Witvrouw, A.; Yang, S.; Thorborg, J.; Tiedje, J.N.; Hattel, J.H. Keyhole‐induced porosities in
laser‐powder bed fusion (L‐PBF) of Ti6Al4V: High‐Fidelity Modeling and Experimental Validation. Add. Manuf. 2019, 30,
100835. https://doi.org/10.1016/j.addma.2019.100835.
74. Wirth, F.; Frauchiger, A.; Gutknecht, K.; Cloots, M. Influence of the inert gas flow on the laser powder bed fusion (LPBF) process.
In Industrializing Additive Manufacturing; Mebolt, M., Khahn, C.A., Eds.; Springer: Cham, Switzerland, 2020; pp. 192–204.
https://doi.org/10.1007/978‐3‐030‐54334‐1_14.
75. Weingarten, C.; Buchbinder, D.; Pirch, N.; Meiners, W.; Wissenbach, K.; Propawane, R. Formation and reduction of hydrogen
during selective laser melting of AlS10Mg. J. Mater. Process. Technol. 2015, 221, 122–120. https://doi.org/10.1016/j.jmatpro‐
tec.2015.02.013.
76. Emminghaus, N.; Paul, J.; Hoff, C.; Hermsford, J.; Kairle, S. Development of an empirical process model for adjusted porosity
in laser‐based powder bed fusion Ti‐6Al‐4V. Int. J. Adv. Manuf. Technol. 2022, 118, 1239–1254. http://doi.org/10.1007/s00170‐021‐
07847‐0.
77. Shiomi, M.; Osakada, K.; Nakamura, K.; Yamashita, T.; Abe, F. Residual stress within metallic model made by selective laser
melting process. CIRP Ann. 2004, 53, 195–198. https://doi.org/10.1016/s0007‐8506(07)60677‐5.

Materials 2022, 15, 2047 75 of 85
78. Yu, G.; Gu, D.; Dai, D.; Xia, M.; Ma, C.; Chang, K. Influence of processing parameters on laser penetration depth and melting/re‐
melting densification during selective laser melting of aluminum alloy. Appl. Phys. A 2016, 122, 122–134.
https://doi.org/10.1007/s00339‐016‐0428‐6.
79. Yu, W.; Sing, S.L.; Chua, C.K.; Tan, X. Influence od re‐melting on surface roughness and porosity of AlSi10Mg parts fabricated
by selective laser melting. J. Alloys Compd. 2019, 792, 574–581. https://doi.org/10.1016/j.jallcom.2019.04.017.
80. Maconachie, T.; Leary, M.; Zhang, J.; Medvedev, A.; Sarker, A.; Ruan, D.; Lu, G.; Faruque, O.; Brandt, M. Effect of build orien‐
tation on the quasi‐static and dynamic response of SLM AlSi10Mg. Mater. Sci. Eng. A 2020, 788, 139445.
https://doi.org/10.1016/j.msea.2020.139445.
81. Murchio, S.; Dallago, M.; Zanini, F.; Carmignato, S.; Zappini, G.; Berto, F.; Maniglio, D.; Benedetti, M. Additively manufactured
Ti‐6Al‐4V thin structures via laser powder bed fusion: Effect of Building Orientation on Geometrical Accuracy and Mechanical
Properties. J. Mech. Behav. Biomed. Mater. 2021, 119, 104495. https://doi.org/10.1016/j.jmbbm.2021.104495.
82. Jucther, V.; Scharowsky, T.; Singer, R.F.; Körner, C. Processing window and evaporation phenomena for Ti‐6Al‐4V produced
by selective electron beam melting. Acta Mater. 2014, 76, 252–258. https://doi.org/10.1016/j.actamat.2014.05.037.
83. King, W.E.; Barth, H.D.; Castillo, U.M.; Gallegos, G.F.; Gibbs, J.W.; Hahn, D.E.; Kamath, C.; Rubenchik, A.M. Observation of
keyhole‐mode laser melting in laser powder‐bed fusion additive manufacturing. J. Mater. Process. Technol. 2014, 214, 2915–2925.
https://doi.org/10.1016/j.jmatprotec.2014.06.005.
84. Martin, A.A.; Calta, N.P.; Khairallah, S.A.; Wnag, J.; Depond, P.J.; Fong, A.Y.; Thampy, V.; Guss, G.M.; Kiss, A.M.; Stone, K.H.;
et al. Dynamics of pore formation during laser powder bed fusion additive manufacturing. Nat. Commun. 2019, 10, 1987–1997.
https://doi.org/10.1038/s41467‐019‐10009‐2.
85. Wang, T.; Dai, S.; Liao, H.; Zhu, H. Pores and the formation mechanisms of SLMed AlSi10Mg. Rapid Prototyp. J. 2020, 26, 1657–
1664. https://doi.org/10.1108/RPJ‐02‐2020‐0036.
86. Strano, G.; Hao, L.; Everson, R.M.; Evans, K.E. A new approach to the design and optimization of support structures in additive
manufacturing. Int. J. Adv. Manuf. Technol. 2013, 66, 1247–1254. https://doi.org/10.1007/s00170‐012‐4403‐x.
87. Macías, J.G.S.; Douillard, T.; Zhao, L.; Maire, E.; Pyka, G.; Simar, A. Influence on microstructure, strength and ductility of BP
temperature during laser powder bed fusion of AlSi10Mg. Acta Mater. 2020, 201, 231–243. https://doi.org/10.1016/j.ac‐
tamat.2020.10.001.
88. Oliviera, J.P.; Lalonde, A.D.; Ma, J.; Processing parameters in laser powder bed fusion metal additive manufacturing. Mater.
Des. 2020, 193, 108762. https://doi.org/10.1016/j.matdes.2020.108762.
89. Agarwala, M.; Bourell, D.; Beaman, J.; Marcus, H.; Barlow, J. Direct selective laser sintering of metals. Rapid Prototyp. J. 1995, 1,
26–36. https://doi.org/10.1108/13552549510086853.
90. Sun, S.; Brandt, M.; Easton, M. Powder bed fusion processes: An Overview. In Additive Manufacturing: Materials, Design, Tech‐
nologies and Applications, Brandt, M., Ed.; Deans, M., Eds.; Woodhead Publishing: Sawston, UK, 2017; pp. 55–77.
https://doi.org/10.1016/B978‐0‐08‐100433‐3.00002‐6.
91. Liu, S.; Guo, H. Balling behavior of stainless steel and nickel powder during selective laser melting process. Int. J. Adv. Manuf.
Syst. 2020, 13, 3632–3653. https://doi.org/10.3390/ma13163632.
92. Yadroitsev, I.; Gusarov, A.; Yadroitsava, I.; Smurov, I. Single track formation in selective laser melting of metal powders. J.
Mater. Process. Technol. 2010, 210, 1624–1631. https://doi.org/10.1016/j.jmatprotec.2010.05.010.
93. Zhou, L.; Wen, S.F.; Song, B.; Zhou, X.; Teng, Q.S.; Wei, Q.; Shi, Y.S. A novel titanium alloy manufactured by selective laser
melting microstructure, high temperature oxidation. Mater. Des. 2016, 89, 1199–1204.
https://doi.org/10.1016/j.matdes.2015.10.092.
94. Zhang, B.; Li, Y.; Bai, Q. Defect formation mechanisms in selective laser melting: A review. Chin. J. Mech. Eng. 2017, 30, 515–527.
https://doi.org/10.1007/s10033‐017‐0121‐5.
95. Gouveia, R.M.; Silva, F.J.G.; Atzeni, E.; Sormaz, D.; Alves, J.L.; Pereira, A.B. Effect of scan strategies and use of support structures
on surface quality and hardness of L‐PBF AlSi10Mg parts. Materials 2020, 13, 2248. https://doi.org/10.3390/ma13102248.
96. Zafer, Y.E.; Goel, S.; Ganvir, A.; Jansson, A.; Joshi, S. Encapsulation of Electron Beam Melting produced alloy 718 to reduce
surface connected defects by Hot Isostatic Pressing. Materials 2020, 13, 1226. https://doi.org/10.3390/ma13051226.
97. Dass, A.; Moridi, A. State of the art in direct energy deposition: From Additive Manufacturing to Materials Design. Coatings
2019, 9, 418. https://doi.org/10.3390/coatings9070418.
98. Darvish, K.; Chen, Z.W.; Pasang, T. Reducing lack of fusion during selective laser melting of CoCrMo alloy. Effect of laser power
on geometrical features of tracks. Mater. Des. 2016, 112, 357–366. https://doi.org/10.1016/j.matdes.2016.09.086.
99. Pantawane, M.V.; Ho, Y.H.; Joshi, S.S.; Dahotre, N.B. Computational assessment of thermokinetics and associated microstruc‐
tural evolution in laser powder bed fusion manufacturing of Ti‐6Al‐4V alloy. Sci. Rep. 2020, 10, 7579.
https://doi.org/10.1038/s41598‐020‐63281‐4.
100. Mukherejee, T.; Wei, H.L.; De, A.; DebRoy, T. Heat and fluid flow in additive manufacturing—Part II: Powder Bed Fusion of
Stainless Steel, and Titanium, Nickel and Aluminium Base Alloys. Compt. Mater. Sci. 2018, 150, 369–380.
https://doi.org/10.1016/j.commatsci.2018.04.027.
101. Tiryakioğlu, M. The effect of hydrogen on pore formation in aluminium alloy castings: Myth versus reality. Metals 2020, 10, 368.
https://doi.org/10.3390/met10030368.

Materials 2022, 15, 2047 76 of 85
102. Huang, Y.; Long, M.; Liu, P.; Chen, D.; Chen, H.; Gui, L.; Liu, T.; Yu, S. Effects of partition coefficients, diffusion coefficients,
and solidification paths on microsegregations in Fe‐based multinary alloy. Metall. Mater. Trans. B 2017, 48, 2504–2515.
https://doi.org/10.1007/s11663‐017‐1045‐2.
103. Gong, H.; Rafi, K.; Gu, H.; Janaki Ram, G.D.; Starr, T.; Stucker, B. Influence of defects on mechanical properties if Ti‐6Al‐4V
components produced by selective laser melting and electron beam melting. Mater. Des. 2015, 86, 545–554.
https://doi.org/10.1016/j.matdes.2015.07.147.
104. Laursen, C.M.; DeJong, S.A.; Dickens, S.M.; Exil, A.N.; Susan, D.F.; Carroll, J.D. Relationship between ductility and the porosity
of additively manufactured AlSi10Mg. Mater. Sci. Eng. A 2020, 795, 139922. https://doi.org/10.1016/j.msea.2020.139922.
105. Plessis, A.D.; Yelamanchi, B.; Fischer, C.; Miller, J.; Beamer, C.; Rogers, K.; Cortes, P.; Els, J.; MacDonald, E. Productivity en‐
hancement of laser powder bed fusion using compensated shelled geometries and hot isostatic pressing. Adv. Inf. Manuf. Eng.
2021, 2, 100031. https://doi.org/10.1016/j.aime.2021.100031.
106. Masuo, H.; Tanaka, Y.; Morokoshi, S.; Yagura, H.; Uchida, T.; Yamamoto, Y.; Murakami, Y. Influence of defects, surface rough‐
ness and HIP on fatigue strength of Ti‐6Al‐4V manufactured by additive manufacturing. Int. J. Fatigue 2018, 117, 163–179.
https://doi.org/10.1016/j.ijfatigue.2018.07.020.
107. Ertuğrul, O.; Öter, Z.Ç.; Yilmaz, H.S.; Şahin, E.; Coşkun, M.; Tarakçi, G.; Koç, E. Effect of HIP process and subsequent heat
treatment on microstructure and mechanical properties of direct metal laser sintered AlSi10Mg alloy. Rapid Prototyp. J. 2020, 26,
1421–1434. https://doi.org/10.1108/RPJ‐07‐2019‐0180.
108. Schneller, W.; Leitner, M.; Springer, S.; Grün, F.; Taschaner, M. Effect of HIP treatment on microstructure and fatigue strength
of selectively laser melted AlSi10Mg. Manuf. Mater. Process. 2019, 3, 16–25. https://doi.org/10.3390/jmmp3010016.
109. Romero, C.; Yang, F.; Bolzoni, L. Fatigue and fracture properties of Ti alloys from powder‐based processes—A review. Int. J.
Fatigue 2018, 117, 407–419. https://doi.org/10.1016/j.ijfatigue.2018.08.029.
110. Leuders, S.; Lieneke, T.; Lammers, S.; Tröster, T.; Niendorf, T. On the fatigue properties of metals manufactured by selective
laser melting—The role of ductility. J. Mater. Res. 2014, 19, 1911–1919. https://doi.org/10.1557/jmr.2014.157.
111. Mahmud, A.; Huynh, T.; Zhou, L.; Hyer, H.; Mehta, A.; Imholte, D.D.; Woolsthenhulme, N.E.; Wachs, D.M.; Sohn. Mechanical
behavior assessment of Ti‐6Al‐4V ELI alloy produced by laser powder bed fusion. Metals 2021, 11, 1671.
https://doi.org/10.3390/met11111671.
112. Kruth, J.P.; Froyen, L.; Van Vaerenbergh, J.; Mercelis, P.; Romboust, M.; Lauwers, B. Selective laser melting of iron‐based pow‐
der. J. Mater. Process. Technol. 2014, 149, 616–622. https://doi.org/10.1016/j.jmatprotec.2003.11.051.
113. Masmoudi, A.; Bolot, R.; Coddet, C. Investigation of the powder laser‐atmosphere interaction zone during the selective laser
melting process. J. Mater. Process. Technol. 2015, 225, 122–132. https://doi.org/10.1016/j.jmatprotec.2015.05.008.
114. Santecchia, E.; Spigarelli, S.; Cabibbo, M. Material reuse in laser powder bed fusion: Side Effects of the Laser—Metal Powder
Interaction. Metals 2020, 10, 341. https://doi.org/10.3390/met10030341.
115. Pauzon, C.; Forêt, P.; Hryha, E.; Arunprasad, T.; Nyborg, L. Argon‐helium mixtures as laser‐powder bed fusion atmospheres:
Towards Increased Build Rate of Ti‐6Al‐4V. J. Mater. Process. Technol. 2020, 279, 116555. https://doi.org/10.1016/j.jmatpro‐
tec.2019.116555.
116. Huang, H.‐Y. Effects of shielding gas composition and activating flux of GTAW weldments. Mater. Des. 2009, 30, 2404–2409.
https://doi.org/10.1016/j.matdes.2008.10.024.
117. Anwar, A.B.; Pham, Q.‐C. Selective laser melting of AlSi10Mg: Effects of Scan Direction, Part Placement and Inert Gas Flow
Velocity on Tensile Strength. J. Mater. Process. Technol. 2017, 240, 388–396. https://doi.org/10.1016/j.jmatprotec.2016.10.015.
118. Vastola, G.; Pei, Q.‐X.; Zhang, Y.W. Predictive model for porosity in powder‐bed fusion additive manufacturing at high beam
energy regime. Add. Manuf. 2018, 22, 817–822. https://doi.org/10.1016/j.addma.2018.05.042.
119. Li, B.‐Q.; Li, Z.; Bai, P.; Li, B.; Kuai, Z. Research on surface roughness of AlSi10Mg parts fabricated by laser powder bed fusion.
Metals 2018, 8, 524. https://doi.org/10.3390/met8070524.
120. Buchbinder, D.; Schleifenbaum, H.; Heidrich, S.; Meiners, W.; Bültmann, J. High power selective laser melting (HP SLM) of
aluminium parts. Phys. Procedia. 2011, 12, 271–278. https://doi.org/10.1016/j.phpro.2011.03.035.
121. Ansari, M.J.; Nsguyen, D.S.; Park, H.S. Investigation of SLM process in terms of temperature distribution and melting pool size:
Modeling and Experimental Approaches. Materials 2019, 12, 1272. https://doi.org/10.3390/ma12081272.
122. Yang, J.; Sun, S.; Brandt, M.; Yan, W. Experimental investigation and 3D finite element prediction of the heat affected zone
during laser assisted machining of Ti6Al4V alloy. J. Mater. Process. Techonol. 2010, 210, 2215–2222.
https://doi.org/10.1016/j.jmatprotec.2010.08.007.
123. Du, Y.; You, X.; Qiao, F.; Guo, L.; Liu, Z. A model for prediction the temperature field during selective laser melting. Results
Phys. 2019, 12, 52–60. https://doi.org/10.1016/j.rinp.2018.11.031.
124. Schwerz, C.; Nyborg, L. Linking in situ melt pool monitoring to melt size distributions and internal flaws in laser powder bed
fusion. Metals 2021, 11, 1856. https://doi.org/10.3390/met11111856.
125. Bhavar, V.; Kattire, P.; Patil, V.M.; Khot, S.M.; Gujar, K.; Singh, R.R. A review of powder bed technology of metal additive
manufacturing. In Additive Manufacturing Handbook; Taylor & Francis Group: Abingdon, UK, 2017.
https://doi.org/10.1201/9781315119106‐15.
126. Concept Laser Website. Available online: www.conceptlaser.de (accessed on 11 December 2021).
127. Fiegl, T.; Franke, M.; Körner, C. Impact of build envelope on the properties of additive manufactured parts from AlSi10Mg. Opt.
Laser. Technol. 2019, 111, 51–57. https://doi.org/10.1016/j.oplastec.2018.08.050.

Materials 2022, 15, 2047 77 of 85
128. Shi, X.; Ma, S.; Liu, C.; Chen, C.; Wu, Q.; Chen, X.; Lu, J. Performance of high layer thickness in selective laser melting of Ti6Al4V.
Materials 2016, 9, 975. https://doi.org/10.3390/ma9120975.
129. Bremer, S.; Meiner, W.; Diatlov, A. Selective laser melting—A manufacturing technology for the future? Laser Technik J. 2012, 9,
975–990. https://doi.org/10.1002/latj.201290018.
130. Yu, T.; Hyer, H.; Sohn, Y.; Bai, Y.; Wu, D. Structure‐property relationship in high strength and lightweight AlSi10Mg microlat‐
tice fabricated be selective laser melting. Mater. Des. 2019, 182, 108062. https://doi.org/10.1016/j.matdes.2019.108062.
131. Su, X.; Yang, Y. Research on tack overlapping during selective laser melting of powders. J. Mater. Process. Technol. 2012, 212,
2074–2079. https://doi.org/10.1016/j.jmatprotec.2012.05.012.
132. Zhang, C.; Zhu, H.; Hu, Z.; Zhang, L.; Zeng, X. A comparative study on single‐laser and multi‐laser selective laser melting
AlSi10Mg: Defects, Microstructure and Mechanical Properties. Mater. Sci. Eng. A 2019, 746, 416–423.
https://doi.org/10.1016/j.msea.2019.01.024.
133. Takata, N.; Kodaira, H.; Sekizawa, K.; Kobashi, M.; Suzuki, A. Change in microstructure of selectively laser melted AlSi10Mg
alloy with heat treatments. Mater. Sci. Eng. A 2017, 704, 218–228. https://doi.org/10.2464/jilm.67.582.
134. Lingda, X.; Gouli, Z.; Gaoyang, M.; Chunming, W.; Ping, J. A phase‐field simulation of columnar‐to‐equiaxed transition in the
entire laser welding MP. J. Alloys Compd. 2021, 858, 157669. https://doi.org/10.1016/j.jallcom.2020.157669.
135. Takata, N.; Nishida, R.; Suzuki, A.; Kobashi, M.; Kato, M. Crystallographic features of microstructure in maraging steel fabri‐
cated by selective laser melting. Metals 2018, 8, 440. https://doi.org/10.3390/met8060440.
136. Hadadzadeh, A.; Amirkhiz, B.S.; Li, J.; Mohammadi, M. Columnar to equiaxed transition during direct laser metal sintering of
AlSi10Mg alloy: Effect of Building Direction. Add. Manuf. 2018, 23, 121–131. https://doi.org/10.1016/j.addma.2018.08.001.
137. Paul, M.J.; Liu, Q.; Best, J.P.; Li, X.; Kruzic, J.J.; Ranamurty, U.; Gludovatz, B. Fracture resistance of AlSi10Mg fabricated by laser
powder bed fusion. Acta Mater. 2021, 211, 116869. https://doi.org/10.1016/j.actamat.2021.116869.
138. Casati, R.; Nasab, M.H.; Coduri, M.; Tirelli, V.; Vedani, M. Effect of platform pre‐heating and thermal treatments strategy on
properties of AlSi10Mg alloy processed by selective laser melting. Metals 2018, 8, 954. https://doi.org/10.3390/met8110954.
139. Van Cauwenbergh, P.; Samaee, V.; Thijs, L.; Nejezchlebová, J.; Sedlák, P.; Iveković, A.; Schyvers, D.; Van Hooreweder, B.;
Vanmeensel, K. Unravelling the multi‐scale structure‐property relationship of laser powder bed fusion processed and heat‐
treated AlSi10Mg. Sci. Rep. 2021, 11, 6423. https://doi.org/10.1038/s41598‐021‐85047‐2.
140. Mtyjia, H.; Giessen, B.C.; Grant, N.J. The effect of cooling rate on the dendrite pacing on splat‐cooled aluminium alloys. J. Int.
Mater. 1968, 96, 30–32.
141. Li, Y.; Gu, D. Parametric analysis of thermal behavior during selective laser melting additve manufacturing of aluminum alloy
powder. Mater. Des. 2014, 63, 857–867. https://doi.org/10.1016/j.matdes.2014.07.006.
142. Delahaye, J.; Tchuindjang, J.T.; Lecomte‐Beckers, J.; Rigo, O.; Habreken, A.M.; Mertens, A. Influences of Si particles on fracture
mechanisms of AlSi10Mg parts processed by selective lase melted. Acta Mater. 2019, 175, 160–170.
https://doi.org/10.1016/j.actamat.2019.06.013.
143. Padovano, E.; Badini, C.; Pantarelli, A.; Gili, F.; D’Aiuto, F. A comparative study of the effects of thermal treatments on AlSi10Mg
produced by laser powder bed fusion. J. Alloys Compd. 2020, 831, 154822. https://doi.org/10.1016/j.jallcom.2020.154822.
144. Dong, S.; Zhang, X.; Ma, F.; Jiang, J.; Yang, W. Research on deposited tracks and microstructure of AlSi10Mg alloy produced by
selective laser melting. Appl. Phys. A 2020, 126, 643–653. https://doi.org/10.1007/s00339‐020‐03826‐6.
145. Xiong, Z.H.; Liu, S.L.; Shi, Y.; Yang, Y.F.; Misra, R.D.K. Role of melt pool boundary condition in determining the mechanical
properties of selective laser melting AlSi10Mg alloy. Mater. Sci. Eng. A 2019, 740–741, 148–156.
https://doi.org/10.1016/j.msea.2018.10.083.
146. Bai, P.; Hou, P.; Kang, T.; Zhao, Z.; Du, W.; Liang, M.; Li, Y.; Liao, H.; Liu, Y. Failure analysis of the tree column structures type
AlSi10Mg alloy branches manufactured by selective laser melting. Materials 2020, 13, 3969. https://doi.org/10.3390/ma13183969.
147. Zhou, L.; Mehta, A.; Schulz, E.; McWilliams, B.; Cho, K.; Sohn, Y. Microstructure, precipitates and hardness of selectively laser
melted AlSi10Mg alloy before and after heat treatment. Mater. Charact. 2018, 143, 5–17.
https://doi.org/10.1016/j.matchar.2018.04.022.
148. Maamoun, A.H.; Elbestawi, M.; Dosbaeva, G.K.; Veldhius, S.C. Thermal post processing of AlSi10Mg parts produces by Selec‐
tive Laser Melting using recycled powder. Addit. Manuf. 2018, 21, 234–247. https://doi.org/10.1016/j.addma.2018.03.014.
149. Yan, Q.; Song, B.; Shi, Y. Co MParative study of performance co MParision of AlSi10Mg alloy prepared by selective laser melting
and casting. J. Mater. Sci. Technol. 2020, 41, 199–208. https://doi.org/10.1016/j.jmst.2019.08.049.
150. Edwards, G.A.; Stiller, K.; Dunlop, G.L.; Couper, M.J. The precipitation sequence in Al‐Si‐Mg alloys. Acta Mater. 1998, 46, 3893–
3904. https://doi.org/10.1016/s1359‐6454(98)00059‐7.
151. Dolon, W.T. Precipitation of aluminium in the silicon phase contained in W319 and A356 aluminium alloys. Metall. Mater. Trans.
A 2003, 34, 523–529. https://doi.org/10.1007/s11661‐003‐0088‐y.
152. Li, Z.; Kuai, Z.; Bai, P.; Nie, Y.; Fu, G.; Liu, W.; Yang, S. Microstructure and tensile properties of AlSi10Mg alloy manufactured
by multi‐laser beam selective laser melting (SLM). Metals 2019, 9, 1337. https://doi.org/10.3390/met9121337.
153. Bai, Y.; Yang, Y.; Xiao, Z.; Zhang, M.; Wang, D. Process optimization and mechanical properties evolution of AlSi10Mg0.75 by
selective laser melting. Mater. Des. 2018, 140, 257–266. https://doi.org/10.1016/j.matdes.2017.11.045.
154. Mathe, N.R.; Tshabalala, L.C. The validation of the microstructural evolution of selective laser‐melted AlSi10Mg on the in‐house
built machine: Energy Density Studies. Prog. Addit. Manuf. 2019, 4, 431–442. https://doi.org/10.1007/s40964‐019‐00086‐6.

Materials 2022, 15, 2047 78 of 85
155. Fiocchi, J.; Tuissi, A.; Bassani, O.; Biffi, C.A. Low temperature annealing dedicated to AlSi10Mg selective laser melting products.
J. Alloys Compd. 2017, 695, 3402–3409. https://doi.org/10.1016/j.jallcom.2016.12.019.
156. Tonelli, L.; Liverani, E.; Morri, A.; Ceschini, L. Role of direct aging and solution hea treatment on hardness, microstructure and
residual stress of the A357 (AlSi17Mg0.6) alloy produced by powder bed fusion. Metall. Mater. Trans. 2021, 52, 2484–2496.
https://doi.org/10.1007/s11663‐021‐02179‐6.
157. Baek, M.‐S.; Kreethi, R.; Park, T.‐H.; Sohn, Y.; Lee, K.‐A. Influence of heat treatment on the high‐cycle fatigue properties and
fatigue damage mechanism of selective laser melted AlSi10Mg alloy. Mater. Sci. Eng. A 2021, 819, 141486.
https://doi.org/10.1016/j.msea.2021.141486.
158. Park, T.‐A.; Baek, M.‐S.; Hyer, H.; Sohn, Y.; Lee, K.‐A. Effect of direct aging on microstructure and tensile properties of AlSi10Mg
alloy manufactured by selective laser melting. Mater. Charact. 2021, 176, 111113. https://doi.org/10.1016/j.matchar.2021.111113.
159. Kleiner, S.; Zürcher, J.; Bauer, O.; Margraf, P. Heat treatment response of selectively laser melted AlSi10Mg. J. Heat Treat. Mat.
2020, 75, 327–341. https://doi.org/10.3139/105.110418.
160. Mfusi, B.J.; Mathe, N.R.; Tshabalala, L.C.; Poopola, P.A. The effects of stress relief on the mechanical and fatigue properties of
additively manufactured AlSi10Mg parts. Metals 2019, 9, 1216. https://doi.org/10.3390/met9111216.
161. Marola, S.; Bosia, S.; Veltro, A.; Fiore, G.; Manfredi, D.; Lombardi, M.; Amato, G.; Barrico, M.; Battezzati. L. Residual stresses in
additively manufactured AlSi10Mg: Raman spectroscopy and X‐Ray diffraction analysis. Mater. Des. 2021, 202, 109550.
https://doi.org/10.1016/j.matdes.2021.109550.
162. Bartlett, J.L.; Croom, B.P.; Burdick, J.; Henkel, D.; Li, X. Revealing mechanisms of residual stress development in additive man‐
ufacturing via digital image correlation. Addit. Manuf. 2018, 22, 1–12. https://doi.org/10.1016/j.addma.2018.04.025.
163. Paoletti, C.; Cerri, E.; Ghio, E.; Santecchia, E.; Cabibbo, M.; Spigarelli, S. Effect of low‐temperature annealing of an AlSI10MG
alloy produced by additive manufacturing: Experiments and Modelling. Metals 2021, 11, 179.
https://doi.org/10.3390/met11020179.
164. Chen, Y.; Wang, L.; Feng, Z.; Zhang, W. Effects of heat treatments on microstructure and mechanical properties of SLMed Sc‐
Modified AlSi10Mg alloy. Prog. Nat. Sci. Mater. 2021, 31, 714–721. https://doi.org/10.1016/j.pnsc.2021.08.003.
165. Merino, J.; Ruvalcaba, B.; Varela, J.; Arrieta, E.; Murr, L.E.; Wicker, R.B.; Benedict, M.; Medina, F. Multiple, comparative heat
treatment and aging schedules for controlling the microstructures and mechanical properties of laser powder bed fusion fabri‐
cated AlSi10Mg alloy. J. Mater. Res. Technol. 2021, 13, 669–685. https://doi.org/10.1016/j.jmrt.2021.04.062.
166. ASTM F3318‐18; Standard for Additive Manufacturing—Finished Part Properties—Laser Beam. ASTM: West Conshohocken,
PA, USA, 2018.
167. Hafenstein, S.; Hitzler, L.; Sert, E.; Öchsner, A.; Merkel, M.; Werner, E. Hot isostatic pressing of aluminium‐silicon alloys fabri‐
cated by laser powder‐bed fusion. Technologies 2020, 8, 48. https://doi.org/10.3390/technologies8030048.
168. Hirata, T.; Kimura, T.; Nakamoto, T. Effects of hot isostatic pressing and internal porosity on the performance of selective laser
melted AlSi10Mg alloys. Mater. Sci. Eng. A 2020, 772, 138713. https://doi.org/10.1016/j.msea.2020.138713.
169. Fusanová, M.; Dvorský, D.; Michalcová, A.; Vojtĕch, D. Changes in the microstructure and mechanical properties of additively
manufactured AlSi10Mg alloy after exposure to elevated temperatures. Mater. Charact. 2018, 137, 119–126.
https://doi.org/10.1016/j.matchar.2018.01.028.
170. Ji, Y.; Dong, C.; Kong, D.; Li, X. Design materials based on simulation results of silicon induced segregation at AlSi10Mg inter‐
face fabricated by selective laser melting. J. Mater. Sci. Technol. 2020, 46, 145–155. https://doi.org/10.1016/j.jmst.2020.01.037.
171. Li, W.; Li, S.; Liu, J.; Zhang, A.; Zhou, Y.; Wei, Q.; Yan, C.; Shi, Y. Effect of heat treatment on AlSI10Mg alloy fabricated by
selective laser melting: Microstructure Evolution, Mechanical Properties and Fracture Mechanism. Mater. Sci. Eng. A 2016, 663,
116–125. https://doi.org/10.1016/j.msea.2016.03.088.
172. Wei, P.; Chen, Z.; Zhang, S.; Fang, X.; Lu, B.; Zhang, L.; Wei, Z. Effect of T6 heat treatment on the surface tribological and
corrosion properties of AlSi10Mg samples produced by selective laser melting. Mater. Charact. 2021, 171, 110769.
https://doi.org/10.1016/j.matchar.2020.110769.
173. Liu, M.; Takata, N.; Suzuki, A.; Kobashi, M. Effect of heat treatment on gradient microstructure of AlSi10Mg lattice structure
manufactured by laser powder bed fusion. Materials 2020, 13, 2487. https://doi.org/10.3390/ma13112487.
174. Iturrioz, A.; Gil, E.; Petite, M.; Garciandia, F.; Mancisidor, A.M.; San Sebastian, M. Selective laser melting of Alsi10Mg alloy:
Influence of Heat Treatment Condition on Mechanical Properties and Microstructure. Weld World 2018, 62, 885–892.
https://doi.org/10.1007/S40194‐018‐0592‐8.
175. Chen, R.; Xu, Q.; Jia, Z.; Liu, B. Precipitation behavior and hardening effects of Si‐containing dispersoids in Al‐Si‐Mg alloy
during SHT. Mater. Des. 2016, 90, 1059–1068. https://doi.org/10.1016/j.matdes.2015.11.069.
176. Li, Z.; Li, Z.; Tan, Z.; Xiong, D.‐B.; Guo, Q. Stress relaxation and the cellular structure‐dependence of plastic deformation in
additively manufactured AlSi10Mg alloys. Int. J. Plast.2020, 127, 102640. https://doi.org/10.1016/j.ijplas.2019.12.003.
177. Ben, D.D.; Ma, Y.R.; Yang, H.J.; Meng, L.X.; Shao, X.H.; Liu, H.Q.; Wang, S.G.; Duan, Q.Q.; Zhang, Z.F. Heterogeneous micro‐
structure and voids dependence of tensile deformation in a selective laser melted AlSi10Mg alloy. Mater. Sci. Eng. A 2020, 798,
140109. https://doi.org/10.1016/j.msea.2020.140109.
178. Bharath, C.; Shamanth, V.; Hemath, K. Studies on mechanical behaviour of AlSi10Mg alloy produced by selective laser melting
and A360 alloy by die casting. Mater. Today Proc. 2021, 45, 78–81. https://doi.org/10.1016/j.matpr.2020.10.095.
179. Zhao, L.; Macías, J.G.S.; Ding, L.; Idrissi, H.; Simar, A. Damage mechanisms in selective laser melted AlSi10Mg under as built
and different post‐process conditions. Mater. Sci. Eng. A 2019, 764, 138210. https://doi.org/10.1016/j.msea.2019.138210.

Materials 2022, 15, 2047 79 of 85
180. Bagherifard, S.; Beretta, N.; Monti, S.; Riccio, M.; Bandini, M.; Guagliano, M. On the fatigue stresses enhancement of additive
manufactured AlSi10Mg parts by mechanical and thermal post‐processing. Mater. Des. 2018, 145, 28–41.
https://doi.org/10.1016/j.matdes.2018.02.055.
181. Ngnekon, J.N.D.; Nadot, Y.; Henaff, G.; Nicolai, J.; Kan, W.H.; Cairney, J.M.; Ridosz, L. Fatigue properties of AlSi10Mg produced
by additive manufacturing. Int. J. Fatigue 2019, 119, 160–172. https://doi.org/10.1016/j.ijfatigue.2018.09.029.
182. Hadadzadeh, A.; Baxter, C.; Amirkhiz, B.S.; Mohammadi, M. Strengthening mechanisms in direct metal laser sintered
AlSi10Mg: Comparison between Virgin and Recycled Powders. Add. Manuf. 2018, 23, 108–120.
https://doi.org/10.1016/j.addma.2018.07.014.
183. Zhang, X.; Huang, L.; Zhang, B.; Chen, Y.Z.; Liu, F. Microstructural evolution and strengthening mechanism of an Al‐Si‐Mg
alloy processed by high‐pressure torsion with different heat treatments. Mater. Sci. Eng. A 2020, 794, 139932.
https://doi.org/10.1016/j.msea.2020.139932.
184. Ryen, Ø.; Holmedal, B.; Nijs, O.; Nes, E.; Sjölander, E.; Holmedd, B.; Ekstrom, H. Strengthening mechanism in solid solution
aluminum alloy. Metall. Mater. Trans. A 2006, 37, 1999–2006. https://doi.org/10.1007/s11661‐006‐0142‐7.
185. Dieter, G.E. Mechanical Metallurgy, 1st ed.; Mc‐GrawHill: New York, NY, USA, 1986; pp. 212–220.
186. Chen, B.; Moo, S.K.; Yao, X.; Bi, G.; Shen, J.; Umeda, J.; Kondoh, K. Strength and strain hardening of selective laser melted
AlSi10Mg alloy. Scr. Mater. 2017, 141, 45–49. https://doi.org/10.1016/j.scriptamat.2017.07.025.
187. Rodriguez, P. Sixty years dislocations. Bull. Mater. Sci. 1996, 19, 857–852. https://doi.org/10.1007/BF02744623. 188. Starink, M.J.; Wang, S.C. A model for the yield strength of overaged Al‐Zn‐Mg‐Cu alloys. Acta Mater. 2003, 51, 5131–5150.
https://doi.org/10.1016/S1359‐6454(03)00363‐X.
189. Girelli, L.; Giovagnoli, M.; Tocci, M.; Pola, A.; Fortini, A.; Merlin, M.; La Vecchia, G.M. Evaluation of impact behaviour of
AlSi10Mg alloy produced using laser additive manufacturing. Mater. Sci. Eng. A 2019, 748, 38–51.
https://doi.org/10.1016/j.msea.2019.01.078.
190. Roth, C.C.; Tancogne‐Dejen, T.; Mohr, D. Plasticity and fracture of cast and SLM AlSi10Mg: High‐throughput Testing and Mod‐
elling. Add. Manuf. 2021, 43, 101998. https://doi.org/10.1016/j.addma.2021.101998.
191. Zhou, S.; Su, Y.; Gu, R.; Wang, Z.; Zhou, Y.; Ma, Q.; Yan, M. Impacts of defocusing amount and molten pool boundaries on
mechanical properties and microstructure of selective laser melted AlSi10Mg. Materials 2019, 12, 73.
https://doi.org/10.3390/ma12010073.
192. Martin, J.W. Precipitation Hardening, 2nd ed.; Butterwirth‐Heinemann: Oxford, UK; Boston, MA, USA, 1998.
193. Cabrini, M.; Lorenzi, S.; Pastore, T.; Pellegrini, S.; Manfredi, D.; Fino, P.; Biamino, S.; Badini, C. Evaluation of corrosion resistance
of Al‐Si10Mg alloy obtained by means of direct metal laser sintering. J. Mater. Process. Technol. 2016, 231, 326–335.
https://doi.org/10.1016/j.jmatprotec.2015.12.033.
194. Cabrini, M.; Lorenzi, S.; Pastore, T.; Pellegrini, S.; Ambrosio, E.P.; Calignano, F.; Manfredi, S.; Pavese, M.; Fino, P. Effect of heat
treatment on corrosion resistance of DMLS AlSi10Mg alloy. Electrochem. Acta. 2016, 206, 346–355.
https://doi.org/10.1016/j.electacta.2016.04.157.
195. Cabrini, M.; Calignano, F.; Fino, P.; Lorenzo, S.; Lorusso, M.; Manfredi, D.; Testa, C.; Pastore, T. Corrosion behavior of heat‐
treated AlSi10Mg manufactured by laser powder bed fusion. Materials 2018, 11, 1051. https://doi.org/10.3390/ma11071051.
196. Rafieazad, M.; Mohammadi, M.; Nasiri, A.M. Microstructure and early stage corrosion performance of heat treated direct metal
laser sintered AlSi10Mg. Add. Manuf. 2019, 28, 107–119. https://doi.org/10.1016/j.addma.2019.04.023.
197. Revilla, R.I.; Liang, J.; Godet, S.; De Graeve, I. Local corrosion behavior of additive manufactured AlSiMg alloy assessed by SEM
and SKPFM. J. Electrochem. Soc. 2017, 164, C27–C35. https://doi.org/10.1149/2.0461702jes.
198. Fathi, P.; Mohammadi, M.; Duour, X.; Nasiri, A.M. A comparative study on corrosion and microstructure of direct laser sintered
AlSi10Mg_200C and die cast A360.1 aluminium. J. Mater. Process. Technol. 2018, 259, 1–14. https://doi.org/10.1016/j.jmatpro‐
tec.2018.04.013.
199. Leon, A.; Shirizly, A.; Aghion, E. Corrosion behavior of AlSi10Mg alloy produced by additive manufacturing (AM) vs. its coun‐
terpart gravity cast alloy. Metals 2016, 6, 148. https://doi.org/10.3390/met6070148.
200. Leon, A.; Aghion, E. Effect of surface roughness on corrosion fatigue performance of AlSi10Mg alloy produced by selective
laser melting (SLM). Mater. Charact. 2017, 131, 188–194. https://doi.org/10.1016/j.matchar.2017.06.029.
201. Revilla, R.I.; Verkens, D.; Rubben, T.; De Raeve, I. Corrosion and corrosion protection of additively manufactured aluminium
alloys—A critical review. Materials 2020, 13, 4804. https://doi.org/10.3390/ma13214804.
202. Cabrini, M.; Lorenzi, F.; Pastore, T.; Testa, C.; Manfredi, D.; Lorusso, M.; Calignano, F.; Pavese, M.; Andreatta, F. Corrosion
behavior of AlSi10Mg alloy produced by laser powder bed fusion under chloride exposure. Corros. Sci. 2019, 152, 101–108.
https://doi.org/10.1016/j.corsci.2019.03.010.
203. Cabrini, M.; Lorenzi, S.; Pastore, T. Corrosion behavior of aluminium‐silicon alloys obtained by Direct Metal Laser Sintering. In
Proceedings of the EUROCORR 2017—The Annual Congress of the European Federation of Corrosion, 20th International Cor‐
rosion Congress and Process Safety Congress, Prague, Czech Republic, 3–7 September 2017.
204. Revilla, R.I.; De Graeve, I. Influence of Si content on the microstructure and corrosion behavior of additive manufactured Al‐Si
alloys. J. Electrochem. Soc. 2018, 165, C926–C932. https://doi.org/10.1149/2.0101814jes.
205. Cabrini, M.; Lorenzi, F.; Pastore, T.; Pellegrini, S.; Pavese, M.; Fino, P.; Ambrosio, E.P.; Calignano, F.; Manfredi, D. Corrosion
resistance of direct metal lase sintering AlSi10Mg alloy. Suf. Interface Anal. 2016, 48, 818–826. https://doi.org/10.1002/sia.5981.

Materials 2022, 15, 2047 80 of 85
206. Rubben, T.; Revilla, R.I.; De Graeve, I.; Influence of heat treatments on the corrosion mechanism of additive manufactured
AlSi10Mg. Corros. Sci. 2019, 147, 406–415. https://doi.org/10.1016/j.corsci.2018.11.038.
207. Chen, Y.; Zhang, J.; Gu, X.; Dai, N.; Qin, P.; Zhang, L.‐C. Distinction of corrosion resistance of selective laser melted Al‐12Si
alloy on different planes. J. Alloys Compd. 2018, 747, 648–658. https://doi.org/10.1016/j.jallcom.2018.03.062.
208. Zeng, F.; Wei, Z.; Li, J.‐F.; Li, C.‐X.; Tan, X.; Zhang, Z.; Zheng, Z. Corrosion mechanism associated with Mg2Si and Si particles
in Al‐Si‐Mg alloys. Trans. Nonferrous Mater. Soc. China 2011, 21, 2559–2567. https://doi.org/10.1016/S1003‐6326(11)61092‐3.
209. Gupta, R.K.; Sukiman, N.L.; Fleming, K.M.; Gibson, M.A.; Birbilis, N. Electrochemical behavior and localized corrosion associ‐
ated with Mg2Si particles in Al and Mg alloys. ECS Electrochem. Lett. 2012, 1, C1–C3. https://doi.org/10.1149/2.002201eel.
210. Ahlatci, H. Production and corrosion behaviours of the Al‐12Si‐XMg alloys containing in situ Mg2Si particles. J. Alloys Compd.
2010, 503, 122–126. https://doi.org/10.1016/j.jallcom.2010.04.214.
211. Sui, Q.; Li, P.; Wang, K.; Yin, X.; Liu, L.; Zhang, Y.; Zhang, Q.; Wang, S.; Wong, L. Effect of build orientation on the corrosion
behavior and mechanical properties of selective laser melted Ti‐6Al‐4V. Metals 2019, 9, 976. https://doi.org/10.3390/met9090976.
212. Lekoadi, P.; Tlotleng, M.; Annan, K.; Maledi, N.; Masina, B. Evolution of heat treatment parameters on microstructure and
hardness properties of high‐speed selective laser melted Ti6AL4V. Metals 2021, 11, 255. https://doi.org/10.3390/met11020255.
213. He, J.; Li, D.; Jiong, W.; Ke, L.; Qin, G.; Ye, Y.; Qin, Q.; Qiu, D. The martensitic transformation and mechanical properties of
Ti6Al4V prepared via selective laser melted. Materials 2019, 12, 321. https://doi.org/10.3390/ma12020321.
214. Liu, J.; Li, G.; Sun, Q.; Li, H.; Sun, J.; Wang, X. Understanding the effect of scanning strategies on the microstructure and crys‐
tallography texture of Ti‐6Al‐4V alloy manufactured via laser powder bed fusion. J. Mater. Process. Technol. 2022, 299, 117366.
https://doi.org/10.1016/j.jmatprotec.2021.117366.
215. Lui, E.W.; Xu, W.; Pateros, A.; Qian, M.; Brandt, M. New development in selective laser melting of Ti‐6Al‐4V: A Wider Pro‐
cessing window for the achievement of fully lamellar α + β microstructures. JOM 2017, 69, 2679–2683.
https://doi.org/10.1007/s11837‐017‐2599‐9.
216. Karami, K.; Blok, A.; Weber, L.; Ahmadi, S.M.; Petrov, R.; Nikolic, K.; Borisov, E.V.; Leeflang, S.; Ayas, C.; Zadpoor, A.A.; et al.
Continuous and pulsed selective laser melting of Ti6Al4V lattice structures: Effect of Post‐Processing on Microstructural Ani‐
sotropy and Fatigue Behavior. Add. Manuf. 2020, 36, 101433. https://doi.org/10.1016/j.addma.2020.101433.
217. Cepeda‐Jiménez, C.M.; Potenza, F.; Magalini, E.; Luchin, V.; Molinari, A.; Pérez‐Prado, M.T. Effect of energy density on the
microstructure and texture evolution of Ti‐6Al‐4V manufactured by laser powder bed fusion. Mater. Charact. 2020, 163, 110238.
https://doi.org/j.matchar.2020.110328.
218. Simonelli, M.; Tse, Y.Y.; Tuck, C. On the texture formation of the selective laser melted Ti‐6Al‐4V. Metall. Mater. Trans. 2014, 45,
2863–2872. https://doi.org/10.1007/s11661‐014‐2218‐0.
219. Kumar, P.; Prakash, O.; Ramamurty, U. Micro‐ and macro‐structures and their influence on mechanical properties of selectively
laser melted Ti‐6Al‐4V. Acta Mater. 2018, 154, 246–260. https://doi.org/10.1016/j.actmat.2018.05.044.
220. Dilip, J.J.S.; Zhang, S.; Teng, C.; Zeng, K.; Robinson, C.; Pal, D.; Stucker, B. Influence of process parameters on the evolution of
MP, porosity, and microstructures in Ti‐6Al‐4V alloy parts fabricated by selective laser melting. Prog. Add. Manuf. 2017, 2, 157–
167. https://doi.org/10.1007/s40964‐017‐0030‐2.
221. Xu, W.; Brandt, M.; Sun, S.; Elambasseril, J.; Liu, Q.; Latham, K.; Xia, K.; Qian, M. Additive manufacturing of strong and ductile
Ti‐6Al‐4V by selective laser melting via in situ martensite decomposition. Acta Mater. 2015, 85, 74–84.
https://doi.org/10.1016/j.actamat.2014.11.028.
222. Barriobero‐Vila, P.; Gussone, J.; Haubrich, J.; Sandlöbes, S.; Da Silva, J.C.; Cloetens, P.; Schell, N.; Requena, G. Inducing stable
α + β microstructures during selective laser melting of Ti‐6Al‐4V used intensified intrinsic heat treatment. Materials 2017, 10,
268. https://doi.org/10.3390/ma10030268.
223. Leuders, S.; Thöne, M.; Riemer, A.; Niendorf, T.; Tröster, T.; Richard, H.A.; Maier, H.J. On the mechanical behavior of titanium
alloy Ti6Al4V manufactured by selective laser melting: Fatigue Resistance and Crack Growth Performance. Int. J. Fatigue 2013,
48, 300–307. https://doi.org/10.1016/j.ijfatigue.2012.11.011.
224. Bai, H.; Deng, H.; Chen, L.; Liu, X.; Qin, X.; Zhang, D.; Liu, T.; Cui, X. Effect of heat treatment on the microstructure and me‐
chanical properties of selective laser‐melted Ti64 and Ti‐5Al‐5Mo‐5V‐1Cr‐1Fe. Metals 2021, 11, 534.
https://doi.org/10.3390/met11040534.
225. Brown, D.W.; Anghel, V.; Balogh, L.; Clausen, B.; Johson, J.S.; Martinez, R.M.; Pagan, D.C.; Rafailov, G.; Ravkov, L.; Strantza,
M.; et al.Evolution of the microstructure of laser powder bed fusion Ti‐6Al‐4V during post‐build heat treatment. Metall. Mater.
Trans. A 2021, 52, 5165–5181. https://doi.org/10.1007/s11661‐021‐06455‐7.
226. Ali, H.; Ma, L.; Ghadbeigi, H.; Mumtaz, K. In situ residual stress reduction martensitic decomposition and mechanical proper‐
ties enhancement through high temperature powder bed pre‐heating of selective laser melted Ti6Al4V. Mater. Sci. Eng. A 2017,
695, 211–220. https://doi.org/10.1016/j.msea.2017.04.033.
227. Kaschel, F.R.; Vijayaraghavan, R.K.; Shmeliov, A.; McCarthy, E.K.; Canavan, M.; McNally, P.J.; Dowling, D.P.; Nicolosi, V.;
Celikin, M. Mechanism of stress relaxation and phase transformation in additively manufactured Ti‐6Al‐4V via in‐situ high
temperature XRD and TEM analyses. Acta Mater. 2020, 188, 720–732. https://doi.org/10.1016/j.actamat.2020.02.056.
228. Xing, L.‐L.; Zhang, W.‐J.; Zhao, C.‐C.; Gao, W.‐Q.; Shen, Z.‐J.; Liu, W. Influence of powder bed temperature on the microstruc‐
ture and mechanical properties of Ti‐6Al‐4V alloys fabricated via laser powder bed fusion. Materials 2021, 14, 2278.
https://doi.org/10.3390/ma14092278.

Materials 2022, 15, 2047 81 of 85
229. Sallica‐Leva, E.; Caram, R.; Jardini, A.L.; Fogagnolo, J.B. Ductility improvement due to martensite’ decomposition in porous Ti‐
6Al‐4V parts produced by selective laser melting for orthopedic implants. J. Mech. Behav. Biomed. Mater. 2016, 54, 149–158.
https://doi.org/10.1016/j.jmbbm.2015.09.020.
230. Cao, S.; Chu, R.; Zhou, X.; Yang, K.; Jia, Q.; Lim, C.V.S.; Huang, A.; Wu, X. Role of martensite decomposition in tensile properties
of selective laser melted Ti‐6Al‐4V. J. Alloys Compd. 2018, 744, 357–363. https://doi.org/10.1016/j.jallcom.2018.02.111.
231. Malý, M.; Höller, C.; Skolan, M.; Meier, B.; Koutný, D.; Pichler, R.; Sommitsch, C.; Paloušek, D. Effect of process parameters and
high temperature pre heating on residual stress and relative density of Ti6Al4V processed by selective laser melting. Materials
2019, 12, 930. https://doi.org/10.3390/ma12060930.
232. Antonysamy, A.A.; Meyer, J.; Prangnell, P.B. Effect of build geometry on the β‐grains structure and texture in additive manu‐
facture of Ti‐6Al‐4V by selective electron beam melting. Mater. Charct. 2019, 84, 153–168.
https://doi.org/10.1016/j.matchar.2013.07.012.
233. Wu, S.Q.; Lu, Y.J.; Gan, Y.L.; Huang, T.T.; Zhao, C.Q.; Lin, J.J.; Guo, S.; Lin, J.X. Microstructural evolution and microhardness
of a selective‐laser‐melted Ti‐6Al‐4V alloy after post heat treatment. J. Alloys Compd. 2016, 672, 643–652.
https://doi.org/10.1016/j.jallcom.2016.02.183.
234. Wang, T.; Zhu, Y.Y.; Zhang, S.Q.; Tang, H.B.; Wang, H.M. Grain morphology evolution behaviour of titanium alloy components
during laser melting deposition additive manufacturing. J. Alloys Compd. 2015, 632, 505–513. https://doi.org/10.1016/j.jall‐
com.2015.01.256.
235. Yang, J.; Yu, H.; Wang, Z.; Zeng, X. Effect of crystallographic orientation on mechanical anisotropy of selective laser melted Ti‐
6Al‐4V alloy. Mater. Charact. 2017, 127, 137–145. https://doi.org/10.1016/j.matchar.2017.01.014.
236. Yang, X.; Barrett, R.A.; Tong, M.; Harrison, N.M.; Leen, S.B. Towards a process‐structure model for Ti‐6Al‐4V during additive
manufacturing. J. Manuf. Proc. 2021, 61, 428–439. https://doi.org/10.1016/j.jmapro.2020.11.033.
237. DebRoy, T.; Wei, H.; Zuback, J.S.; Mukherjee, T.; Elmer, J.W.; Milewski, J.O.; Beese, A.M.; De Willson‐Heid, A.; Zhang, W.
Additive manufacturing of metallic components‐process, structure and properties. Prog. Mater. Sci. 2018, 92, 112–124.
https://doi.org/10.1016/j.pmatsci.2017.10.001.
238. Saboori, A.; Gallo, D.; Biamino, S.; Fino, P.; Lombardi, M. An overview of additive manufacturing of titanium components by
direct energy deposition: Microstructure and mechanical properties. App. Sci. 2017, 7, 883. https://doi.org/10.3390/app7090883.
239. Fu, H.Z.; Lin, L. Progress of directional solidification in processing of advanced materials. Mater. Sci. Forum 2005, 475–479, 607–
612. https://doi.org/10.4028/www.scientific.net/MSF.475‐479.607.
240. Bontha, S.; Klingbeil, N.W.; Kobrin, P.A.; Fraser, H.L. Thermal process maps for predicting solidification microstructure in laser
fabrication on thin‐wall structures. J. Mater. Process. Technol. 2006, 178, 135–142. https://doi.org/10.1016/j.jmatprotec.2006.03.155.
241. Boyer, R.; Welsch, G.; Colling, E.W. Materials Properties: Handbook; ASM International: Novelty, OH, USA, 1994.
242. Davis, W.J.; Chen, H.; Nomoto, K.; Wang, H.; Babu, S.; Priming, S.; Liao, X.; Brenn, A.; Ringer, S.P. Phase transformation path‐
ways in Ti‐6Al‐4V manufactured via electron beam powder bed fusion. Acta Mater. 2021, 215, 117131.
https://doi.org/10.1016/j.actmat.2021.117131.
243. Motyka, M.; Kubiak, K.; Sianiawski, J.; Ziaja, W. Phase transformation and characterization of α + β titanium alloys. In Compre‐
hensive Materials Processing; Elsevier: Amsterdam, The Netherlands, 2014; pp. 7–36. https://doi.org/10.1016/B978‐0‐08‐096532‐
1.00202‐8.
244. Yang, J.; Yu, H.; Yin, J.; Gao, M.; Wang, Z.; Zeng, X. Formation and control of martensite in Ti‐6Al‐4V alloy produced by selective
laser melting. Mater. Des. 2016, 108, 308–318. https://doi.org/10.1016/j.matdes.2016.06.117.
245. Haar, G.M.T.; Becker, T.H. Selective laser melting produced Ti‐6Al‐4V: Post‐Process Heat Treatment to Achieve Superior Ten‐
sile Properties. Materials 2018, 11, 146. https://doi.org/10.3390/ma11010146.
246. Karimi, J.; Xie, M.S.; Wang, Z.; Prashanth, K.G. Influence of substructures on the selective laser melted Ti‐6Al‐4V alloy as a
function of laser re‐melting. J. Mater. Process. Mater. 2021, 68, 1387–1394. https://doi.org/10.1016/j.jmapro.2021.06.059.
247. Thijs, L.; Verhaeghe, F.; Craeghs, T.; Van Humbeeck, J.; Kruth, J.‐P. A study of the microstructural evolution during selective
laser melting of Ti‐6Al‐4V. Acta Mater. 2010, 58, 3303–3312. https://doi.org/10.1016/j.actamat.2010.02.004.
248. Welsch, G.; Bunk, W. Deformation modes of the α‐phase of Ti‐6Al‐4V as a function of oxygen concentration and aging temper‐
ature. Metall. Trans. A 1982, 13, 889–899. https://doi.org/10.1007/BF02642403.
249. Gehlin, P.C. The Crystallographic Structure of Ti3Al; Jaffe, R.I., Ed.; Permogon Press: New York, NY, USA, 1970.
250. Williams, J.C.; Sommer, A.W.; Tung, P.P. The influence of oxygen concentration internal stress and dislocations arrangements
in α titanium. Metall. Mater. Trans. B 1972, 3, 2979–2984. https://doi.org/10.1007/BF02652870.
251. Dear, F.F.; Konts, P.; Gault, B.; Ilavsky, J.; Rugg, D.; Dye, D. Mechanisms of Ti3Al precipitation in hpc α‐Ti. Acta Mater. 2020.
2021, 212, 116811.
252. Pushilina, N.; Panin, A.; Syrtanov, M.; Kashkarov, E.; Kudiiarov, V.; Perevalova, O.; Laptev, R.; Lider, A.; Koptyug. Hydrogen‐
induced phase transformation and microstructure evolution for Ti‐6Al‐4V parts produced by electron beam melting. Metals
2018, 8, 301. https://doi.org/10.3390/met8050301.
253. Leyens, C.; Peters, M. Application of titanium and titanium alloys. In Titanium Alloy, 1st ed; Moiseyev, V.N., Ed.; Taylor &
Francis Group: Abingdon, UK, 2005; p. 12. https://doi.org/10.1201/9781420037678‐10.
254. Grabovetskaya, G.P.; Helnikova, E.N.; Kolobov, Y.R.; Chernov, I.P.; Naidenkin, E.V.; Nikitenkov, N.N.; Mishin, I.P. Evolution
of the structural and phase states of Ti‐6Al‐4V alloy in forming submicroscopy crystalline structure with use of temporary
hydrogenation. Russ. Phys. J. 2006, 49, 442–447. https://doi.org/10.1007/s11182‐006‐0123‐8.

Materials 2022, 15, 2047 82 of 85
255. Zhu, T.; Li, M. Lattice variations of Ti‐6Al‐4V alloy with hydrogen content. Mater. Charact. 2011, 62, 724–729.
https://doi.org/10.1016/j.matchar.2011.04.019.
256. Yu, J.; Rombouts, M.; Maes, G.; Motamans, F. Materials properties of Ti6Al4V parts produced by laser metal deposition Phys.
Procedia 2012, 39, 416–424. https://doi.org/10.1016/j.phpro.2012.10.056.
257. Takase, A.; Ishimoto, T.; Morita, N.; Ikeo, N.; Nakano, T. Comparison of phase characteristics and residual stress in Ti‐6Al‐4V
alloy manufactured by laser powder bed fusion (L‐PBF) and electron beam powder bed fusion (EB‐PBF) techniques. Crystals
2021, 11, 796–813. https://doi.org/10.3390/cryst11070796.
258. Huang, S.; Sing, S.L.; de Looze, G.; Wilson, R.; Yeong, W.Y. Laser Powder bed fusion of titanium‐tantalium alloys: Compositions
and Designs for Biomedical Applications. J. Mech. Behav. Biomed. Mater. 2020, 108, 103775.
https://doi.org/10.1016/j.jmbbm.2020.103775.
259. Xie, Z.; Dai, Y.; Ou, X.; Ni, S.; Song, M. Effects of selective laser melting build orientations on the microstructure and tensile
performance of Ti‐6Al‐4V alloy. Mater. Sci. Eng. A 2020, 776, 139001. https://doi.org/10.1016/j.msea.2020.139001.
260. Flißner‐Rieger, C.; Tunes, M.A.; Gammer, C.; Jörg, T.; Pfeifer, T.; Musi, M.; Mendez‐Martin, F.; Clemens, H. On the existence of
orthorhombic martensite in a near‐α titanium base alloy used for additive manufacturing. J. Alloys Compd. 2022, 897, 163155.
https://doi.org/10.1016/j.jallcom.2021.163155.
261. Katantseva, N.; Krakhmalev, P.; Thuvander, M.; Yadroitsev, I.; Vinogradova, N.; Ezhov, I. Martensitic transformation in Ti‐6Al‐
4V (ELI) alloy manufactured by 3D printing. Mater. Charact. 2018, 146, 101–112. https://doi.org/10.1016/j.matchar.2018.09.042.
262. Requena, G.; Cloetens, P.; Altendorfer, W.; Poletti, C.; Tolnai, D.; Warchomicka, F.; Degischer, H.P. Sub‐micrometer synchrotron
tomography of multiphase metals using Kirkpatrick‐baez optics. Scripta Mater. 2009, 61, 760–763. https://doi.org/10.1016/j.scrip‐
tamat.2009.06.025.
263. Li, C.; Li, G.; Yang, Y.; Varlioglu, M.; Yang, L. α’’ martensitic twinning in α + β Ti‐3.5Al‐4.5Mo titanium alloy. J. Metall. 2011,
2011, 924032. https://doi.org/10.1155/2011/924032.
264. Zhang, H.; Liu, X.; Yang, S.; Jiang, H.; Shi, Z.; Yang, M.; Wang, C. The clarification of the α’’ phase precipitate from β phase in
Ti‐15Mn alloy by mismatch theory. Mater. Letter. 2017, 202, 138–141. https://doi.org/10.1016/j.matlet.2017.05.032.
265. Huang, Q.; Liu, X.; Yang, X.; Zhang, R.; Shen, Z.; Feng, Q. Specific heat treatment of selective laser melted Ti‐6Al‐4V for bio‐
medical applications. Front. Mater. Sci. 2015, 9, 373–381. https://doi.org/10.1007/s11706‐015‐0315‐7.
266. Yadroitsev, I.; Yadroitsava, I.; Plessis, A.D.; MacDonald, E. Fundamentals of Laser Powder Bed Fusion of Metals, 1st ed, Elsevier:
Amsterdam, The Netherlands, 2021; pp. 245–276.
267. Cotulo, A.; Elangeswaran, C.; de Formanoir, C.; Muralidharan, G.K.; Van Hooreweder, B. Effect of heat treatments on fatigue
properties of Ti‐6Al‐4V and 316L produced by laser powder bed fusion in as‐built surface condition. In TMS 2019 148th Annual
Meeting & Exhibition Supplemental Proceedings; Springer Cham: Cham, Switzerland, 2019. https://doi.org/10.1007/978‐3‐030‐
05861‐6_36.
268. Eshawish, N.; Malinov, S.; Sha, W.; Walls, P. Microstructure and mechanical properties of Ti‐6Al‐4V manufactured by selective
laser melting after stress relieving, hot isostatic pressing treatment, and post‐heat treatment. J. Mater. Eng. Perform. 2021, 30,
5290–5296. https://doi.org/10.1007/s11665‐021‐05753‐w.
269. ASTM F3301‐18a; Additive Manufacturing—Post Processing Methods—Standard Specification for Thermal Post‐Processing
Metals Part Made via Powder Bed Fusion. ASTM International: West Conshohocken, PA, USA, 2018.
270. Bartsch, K.; Herzog, D.; Bossen, B.; Emmelmann, C. Material modelling of Ti‐6Al‐4V processed by laser powder bed fusion for
application in macro‐scale process simulation. Mater. Sci. Eng. A 2021, 814, 141237. https://doi.org/10.1016/j.msea.2021.141237.
271. Longhitano, G.A.; Larosa, M.A.; Jardini, A.L.; de Carvalho Zavaglia, C.A.; Filipini Ierardi, M. Correlation between microstruc‐
ture and mechanical properties under tensile and compression test heat‐treated Ti‐6Al‐4V ELI alloy produced by AM for bio‐
medical application. J. Mater. Process. Technol. 2018, 252, 202–210. https://doi.org/10.1016/j.jmatprotec.2017.09.022.
272. Meyer, L.W.; Krüger, L.; Sommer, K.; Halle, T.; Hockanf, M. Dynamic strength and failure behavior of titanium alloy TI‐6Al‐4V
for a variation of heat treatments. Mech. Time‐Depend. Mater. 2008, 12, 237–247. https://doi.org/10.1007/s11043‐008‐9060‐y.
273. Lin, Y.C.; Tang, Y.; Jiang, Y.‐C.; Chen, J.; Wang, D.; He, D.‐G. Precipitation of secondary phase transformation behavior of a
solution‐treated Ti‐6Al‐4V alloy during high‐temperature aging. Adv. Eng. Mater. 2020, 22, 1901436.
https://doi.org/10.1002/adem.201901436.
274. Liu, C.; Yu, L.; Zhang, A.; Tian, X.; Liu, D.; Ma, S. Beta heat treatment of laser melting deposited high strength near β titanium
alloy. Mater. Sci. Eng. A 2016, 673, 185–192. https://doi.org/10.1016/j.msea.2016.07.027.
275. Kent, D.; Wang, G.; Wang, W.; Dargusch, M.S. Influence of ageing temperature and heating rate on the properties and micro‐
structure β Ti alloys, Ti‐6Cr‐5Mo‐4Al. Mater. Sci. Eng. A 2012, 531, 98–106. https://doi.org/10.1016/j.msea.2011.10.040.
276. Muhammad, M.; Pegeus, J.W.; Shamsei, N.; Haghshenas, M. Effect of heat treatments on microstructure/small‐scale properties
of additive manufactured Ti‐6Al‐4V. Int. J. Adv. Manuf. 2019, 103, 4161–4172. https://doi.org/10.1007/s00170‐019‐03789‐w.
277. Jamshidi, P.; Aristizabal, H.; Kong, W.; Villapun, V.; Cox, S.C.; Grover, L.M.; Attallah, M.M. Selective laser melting of Ti‐6Al‐
4V: The impact Post‐Processing on the Tensile, Fatigue and Biological Properties for Medical Implant Applications. Materials
2020, 13, 2813. https://doi.org/10.3390/ma13122813.
278. Cox, S.C.; Jamshidi, P.; Eisenstein, N.M.; Webber, M.A.; Burton, H.; Moakes, R.J.; Addison, O.; Attallah, M.; Shepherd, D.E.;
Grover, L.M. Surface finish has a critical influence of biofilm formation and mammalian cell attachment to additively manufac‐
tured prosthetics. ACS Biomater. Sci. Eng. 2017, 3, 1616–1626. https://doi.org/10.1021/acsbiomaterials.7b00336.

Materials 2022, 15, 2047 83 of 85
279. Chafino, J.A.; Yamanaka, K.; Mercier, F.; Rivory, P.; Balvoy, S.; Hartmann, D.J.; Chiba, A.; Fabregue, D. The influence of tem‐
perature during water‐quench rapid heat treatment on the microstructure, mechanical properties and biocompatibility of Ti‐
6Al‐4V ELI alloy. J. Mech. Behav. Biomed. Mater. 2019, 96, 144–151. https://doi.org/10.1016/j.jmbbm.2019.04.024.
280. SAE AMS‐H‐81200C‐2010; Heat Treatment of Titanium and Alloys; SAE International Group: Warrendale, PA, USA, 2010.
281. Ji, Y.; Heo, T.W.; Zhang, F.; Chen, L.Q. Theoretical assessment on the phase transformation kinetic pathways of multi‐compo‐
nent Ti alloys: Application to Ti‐6Al‐4V. J. Phase Equilibria Diffus. 2016, 37, 53–64. https://doi.org/10.1007/s11669‐015‐0436‐9.
282. Lu, S.L.; Qian, M.; Tang, H.P.; Yan, M.; Wang, J.; StJohn, D.H. Massive transformation in Ti‐6Al‐4V additively manufactured by
selective electron beam melting. Acta Mater. 2016, 104, 303–311. https://doi.org/10.1016/j.actamat.2015.11.011.
283. ASTM F1580‐12; Standard Specification for Titanium and Titanium‐6 Aluminium‐4 Vanadium Alloy Powders for Coatings of
Surgical Implants. ASTM International: West Conshohocken, PA, USA, 2012.
284. Malinov, S.; Sha, W.; Guo, Z.; Tang, C.C.; Long, A.E. Synchrotron X‐Ray diffraction study of the phase transformation in tita‐
nium alloys. Mater. Charact. 2002, 48, 279–295. https://doi.org/10.1016/s1044‐5803(02)002863.
285. Etesami, S.A.; Fotovvati, B.; Asadi, E. Heat treatment of Ti‐6Al‐4V alloy manufactured by laser‐based powder‐bed fusion: Pro‐
cess, Microstructures, and Mechanical Properties Correlations. J. Alloys Compd. 2021, 895, 162618. https://doi.org/10.1016/j.jall‐
com.2021.162618.
286. Losertová, M.; Kubeš, V. Microstructural and mechanical properties of selective laser melted Ti6Al4V alloy. In IOP Conf. Ser.
Mater. Sci. Eng. 2017, 266, 012009. https://doi.org/10.1088/1757‐899X/266/1/012009.
287. Li, C.‐L.; Hing, J.‐K.; Narayana, P.L.; Choi, S.‐W.; Lee, S.W.; Park, C.H.; Yeom, J.T.; Mei, Q. Realizing superior ductility of selec‐
tive laser melted Ti‐6Al‐4V through a multi‐step heat treatment. Mater. Sci. Eng. A 2021, 799, 140367.
https://doi.org/10.1016/j.msea.2020.140367.
288. Cao, S.; Chen, Z.; Lim, C.V.S.; Yang, K.; Jia, Q.; Jarvis, T.; Tomus, D.; Wu, X. Defect, microstructure, and mechanical property of
Ti‐6Al‐4V alloy fabricated by high‐power selective laser melting. JOM 2017, 69, 2684–2693. https://doi.org/10.1007/s11837‐017‐
2581‐6.
289. Cao, S.; Zou, Y.; Voon Samuel Lin, C.; Wu, X. Review of laser powder bed fusion (LPBF) fabricated Ti‐6Al‐4V: Process, Post‐
Process Treatment, Microstructure, and Property. Light Adv. Manuf. 2021, 2, 313–332. https://doi.org/10.97188/lam.2021.020.
290. Haubrick, J.; Gussone, J.; Barriero‐Vila, P.; Kürnsteiner, P.; Jägle, E.A.; Raabe, D.; Schell, N.; Requena, G. The role of lattice
defects, element portioning and intrinsic heat effects on the microstructure in selective laser melted Ti‐6Al‐4V. Acta Mater. 2019,
167, 136–148. https://doi.org/10.1016/j.actamat.2019.01.039.
291. Callegari, B.; Marçola, J.V.; Aristizabal, K.; Soldera, F.A.; Müklich, F.; Pinto, H.C. Effect of microstructure on Ti3Al precipitation
during ageing of Ti‐6Al‐4V alloy. MATEC Conf. 2020, 321, 12014. https://doi.org/10.1051/matecconf/202032112014.
292. Lütjering, G. Influence of processing on microstructure and mechanical properties of (α + β) titanium alloys. Mater. Sci. Eng. A
1998, 243, 32–45. https://doi.org/10.1016/S0921‐5093(97)00788‐8.
293. Schuster, J.C.; Palm, M. Reassessment of the binary aluminium‐titanium phase diagram. J. Phase Equilibria Diffus. 2006, 27, 255–
277. https://doi.org/10.1361/154770306X109809.
294. Bagot, P.A.J.; Radecka, A.; Magyar, A.P.; Gong, Y.; Bell, D.C.; Smith, G.D.W.; Moody, M.P.; Dye, D.; Rugg, D. The effect of
oxidation on the subsurface microstructure of a Ti‐6Al‐4V alloy. Scripta Mater. 2018, 148, 24–28. https://doi.org/10.1016/j.scrip‐
tamat.2018.01.015.
295. Sun, W.; Ma, Y.E.; Zhang, W.; Qian, X.; Huang, W.; Wang, Z. Effects of build orientation on mechanical performance of laser
powder bed fusion additively manufactured Ti6Al4V under different loadings. Adv. Eng. Mater. 2021, 23, 2100611.
https://doi.org/10.1002/adem.202100611.
296. Moridi, A.; Demir, A.G.; Caprio, L.; Hart, A.J.; Previtali, B.; Colosimo, B.M. Deformation and failure mechanisms of Ti‐6Al‐4V
as built by selective laser melting. Mater. Sci. Eng. A 2019, 768, 138456. https://doi.org/10.1016/j.msea.2019.138456.
297. Rafi, H.K.; Starr, T.L.; Stucker, B.E. A comparison of the tensile, fatigue, and fracture behavior of Ti‐6Al‐4V and 15‐5PH stainless
steel parts made by selective laser melting. Int. J. Adv. Manuf. Technol. 2013, 69, 1299–1309. https://doi.org/10.1007/s00170‐013‐
5106‐7.
298. Vilardell, A.M.; Fredrksson, G.; Yadroitsev, I.; Krakhmalev, P. Fracture mechanisms in the as‐built and stress‐relieved laser
powder bed fusion Ti‐6Al‐4V ELI alloy. Optic. Laser Technol. 2019, 109, 608–615. https://doi.org/10.1016/j.optlastec.2018.08.042.
299. Benzing, J.; Hrabe, N.; Quinn, T.; White, R.; Rentz, R.; Ahlfors, M. Hot isostatic pressing (HIP) to achieve isotropic microstruc‐
ture and retain as‐built strength in an additive manufacturing titanium alloy (Ti‐6Al‐4V). Mater. Lett. 2019, 257, 126690.
https://doi.org/10.1016/j.matlet.2019.126690.
300. Li, P.; Warner, D.H.; Pegeus, J.W.; Roach, M.D.; Shamsaei, N.; Phan, H. Investigation of the mechanisms by which hot isostatic
pressing improves the fatigue performance of powder bed fused Ti‐6Al‐4V. Int. J. Fatigue 2019, 120, 342–352.
https://doi.org/10.1016/j.ijfatigue.2018.10.015.
301. Wycisk, E.; Siddique, S.; Hergoz, D.; Walther, F.; Emmelmann, C. Fatigue performance of laser additive manufactured TI‐6Al‐
4V in very high cycle fatigue regime up to 109 cycles. Front. Mater. 2015, 2, 72. https://doi.org/10.3389/fmats.2015.00072.
302. Hergoz, D.; Bartsch, K.; Bossen, B. Productivity optimization of laser powder bed fusion by hot isostatic pressing. Add. Manuf.
2020, 36, 101494. https://doi.org/10.1016/j.addma.2020.101494.
303. Kasperovich, G.; Hausmann, J. Improvement of fatigue resistance and ductility of Ti6Al4V processed by selective laser melting.
J. Mater. Proc. Technol. 2015, 220, 202–214. https://doi.org/10.1016/j.jmatprotec.2015.01.025.

Materials 2022, 15, 2047 84 of 85
304. Chong, Y.; Bhattacharjee, T.; Tian, Y.; Shibata, A.; Tsuji, N. Deformation mechanism of bimodal microstructure in Ti‐6Al‐4V
alloy: The Effects on Interfacial Annealing Temperature and Constituent Hardness. J. Mater. Res. Technol. 2021, 71, 138–151.
https://doi.org/10.1016/j.jmst.2020.08.057.
305. Sabban, R.; Bahl, S.; Chatterjee, K.; Suwas, S. Globularization using heat treatment in additively manufactured Ti‐6Al‐4V for
high strength and toughness. Acta Mater. 2019, 162, 239–254. https://doi.org/10.1016/j.actamat.2018.09.064.
306. Zhao, Z.; Chen, J.; Tan, H.; Zhang, G.; Lin, X.; Huang, W. Achieving superior ductility for laser solid formed extra low interstitial
Ti‐6Al‐4V titanium alloy through equiaxial alpha microstructure. Scripta Mater. 2018, 146, 187–191.
https://doi.org/10.1016/j.scriptmat.2017.11.021.
307. Mierzejewska, Z.A. Effect of laser energy density, internal porosity and heat treatment on mechanical behavior of biomedical
Ti6Al4V alloy obtained with DMLS technology. Materials 2019, 12, 2331–2354. https://doi.org/10.3390/12142331.
308. Swarnakar, A.K.; Van der Biest, O.; Baufeld, B. Thermal expansion and lattice parameters of shaped metal deposited Ti‐6Al‐4V.
J. Alloys Compd. 2011, 509, 2723–2728. https://doi.org/10.1016/j.jallcom.2010.12.014.
309. Slater, J.C. Atomic radii in crystals. J. Chem. Phys. 1964, 41, 3199–3205. https://doi.org/10.1063/1.1725697.
310. Tsai, M.‐T.; Chen, Y.‐W.; Chao, C.‐Y.; Jang, J.S.C.; Tsai, C.‐C.; Su, Y.‐L.; Kuo, C.‐N. Heat treatment effects on mechanical prop‐
erties and microstructure evolution of Ti‐6Al‐4V alloy fabricated by laser powder bed fusion. J. Alloys Compd. 2020, 816, 152615.
https://doi.org/10.1016/j.jallcom.2019.152615.
311. Gallaraga, H.; Lados, D.A.; Dehoff, R.R.; Kirka, M.M.; Nandwana, P. Effects of the microstructure and porosity on properties of
Ti‐6Al‐4V ELI alloy fabricated by electron beam melting (EBM). Add. Manuf. 2016, 10, 47–57.
https://doi.org/10.1016/j.addma.2016.02.003.
312. Lifshtz, M.; Slyozov, V.V. The kinetics of precipitation from supersaturated solid solutions. J. Phys. Chem. Solids 1961, 19, 35–50.
https://doi.org/10.1016/0022‐3697(61)90054‐3.
313. Liu, J.; Zhang, K.; Yang, Y.; Wang, H.; Zhu, Y.; Huang, A. Grain boundary α‐phase precipitation and coarsening: Comparing
Laser Powder Bed Fusion with As‐cast Ti‐6Al‐4V. Scripta Mater. 2022, 207, 114261. https://doi.org/10.1016/j.scrip‐
tamat.2021.114261.
314. Cao, S.; Hu, Q.; Huang, A.; Chen, Z.; Sun, M.; Zhang, J.; Fu, C.; Jia, Q.; Lim, V.C.S.; Boyer, R.R.; et al. Static coarsening behavior
of lamellar microstructure in selective laser melted Ti‐6Al‐4V. J. Mater. Sci. Technol. 2019, 35, 1578–1586.
https://doi.org/10.1016/j.mst.2019.04.008.
315. Stefansonn, N.; Semiatin, S.L. Mechanisms of globularization of Ti‐6Al‐4V during static heat treatment. Metall. Mater. Trans. A
2003, 34, 691–698. https://doi.org/10.1007/s11661‐003‐0103‐3.
316. Roy, S.; Suwas, S: Orientation dependent spheroidization response and macro‐zone formation during sub β‐transus processing
of Ti‐6Al‐4V alloy. Acta Mater. 2017, 134, 283–301. https://doi.org/10.1016/j.actamat.2017.04.071.
317. Sharma, G.; Ramanujan, R.V.; Tiwari, G.P. Instability mechanisms in lamellar microstructures. Acta Mater. 2000, 48, 875–889.
https://doi.org/10.1016/s1359‐6454(99)00378‐x.
318. ASTM F2924‐12; Standard Specification for Additive Manufacturing Titanium‐6 Aluminium‐4 Vanadium with Powder Bed
Fusion. ASM International: West Conshohocken, PA, USA, 2013.
319. Mertens, A.; Reginster, A.; Paydas, H.; Contrepois, Q.; Dormol, T.; Lemaire, O.; Lecomte‐Beckers, J. Mechanical properties of
alloy Ti‐6Al‐4V and of stainless steel 316L processed by selective laser melting: Influence of Out‐of‐Equilibrium Microstructure.
Powder Metall. 2014, 57, 184–190. https://doi.org/10.1179/1743290114Y0000000092.
320. Carroll, B.E.; Palmer, T.A.; Beese, A.M. Anisotropy tensile behavior of Ti‐6Al‐4V components fabricated with direct energy
deposition additive manufacturing. Acta Mater. 2015, 87, 309–320. https://doi.org/10.1016/j.actamat.2014.12.054.
321. Wilson‐Heid, A.E.; Wang, Z.; McCornac, B.; Beese, A.M. Quantitative relationship between anisotropic strain to failure and
grain morphology in additively manufactured Ti‐6Al‐4V. Mater. Sci. Eng. A 2017, 706, 287–294.
https://doi.org/10.1016/j.msea.2017.09.017.
322. Ronnenberg, I.; Davies, C.M.; Hooper, P.A. Revealing relationships between porosity, microstructure and mechanical properties
of laser powder bed fusion 316L stainless steel through heat treatment. Mater. Des. 2020, 189, 108481.
https://doi.org/10.1016/j.matdes.2020.108481.
323. Cain, V.; Thijs, L.; Van Humbeeck, B.; Van Hooreweder, B.; Knutsen, R. Crack propagation and fracture toughness of Ti6Al4V
alloy produced by selective laser melting. Add. Manuf. 2015, 5, 68–76. https://doi.org/10.1016/j.addma.2014.12.006.
324. Zafari, A.; Xia, K. High ductility in a fully martensitic microstructure: A Paradox in a Ti alloy Produced by Selective Laser
Melting. Mater. Res. Lett. 2018, 6, 627–633. https://doi.org/10.1080/21663831.2018.1525773.
325. Vilaro, T.; Colin, C.; Bartout, J.D. As‐fabricated and heat‐treated microstructures of the Ti‐6Al‐4V alloy processed by selective
laser melting. Metall. Mater. Trans. A 2011, 42, 3190–3199. https://doi.org/10.1007/s11661‐011‐0731‐y.
326. Muiruri, A.; Maringa, M.; du Preez, W. Validation of a microstructure‐based model for prediction the high strain rate flow
properties of various forms of additively manufactured Ti6Al4V (ELI) alloy. Metals 2011, 11, 1628.
https://doi.org/10.3390/ma11101628.
327. Galindo‐Fernàndez, M.A.; Mumtaz, K.; Rivera‐Díaz‐del‐Castillo, P.E.J.; Galindo‐Nova, E.I.; Ghadbeigi, H. A microstructure
sensitive model for deformation of Ti‐6Al‐4V describing cast‐and‐wrought and additive manufacturing morphologies. Materials
Des. 2018, 160, 350. https://doi.org/10.1016/j.matdes.2018.09.028.

Materials 2022, 15, 2047 85 of 85
328. Todaro, C.J.; Easton, M.A.; Qiu, D.; Zhang, S.; Bermingham, M.J.; Lui, E.W.; Brandt, M.; StJohn, D.H.; Qian, M. Grain structure
control during metal 3D printing by high‐intensity ultrasound. Nat. Commun. 2020, 11, 142–151. https://doi.org/10.1038/s41467‐
019‐13874‐z.
329. Qian, M.; Xu, W.; Brandt, M.; Tang, H.P. Additive manufacturing and post processing of Ti‐6Al‐4V for superior mechanical
properties. MRS Bull. 2016, 41, 775–784. https://doi.org/10.1557/mrs.2016.215.
330. Akram, J.; Pal, D.; Stucker, B. Establishing flow stress and elongation relationship as a function of microstructural features of
Ti6Al4V alloy processed using SLM. Designs 2019, 3, 21. https://doi.org/10.3390/designs3020021.
331. Zheng, Z.; Waheed, S.; Balint, D.S.; Dunne, F.P.E. Slip transfer across phase boundaries in dual phase titanium alloys and the
effect on strain rate sensitivity. Int. J. Plast. 2018, 104, 23–38. https://doi.org/10.1016/j.ijplas.2018.01.011.
332. Kohn, D.H.; Ducheyene, P. Tensile and fatigue strength of hydrogen‐treated Ti6Al4V alloy. J. Mater. Sci. 1991, 26, 328–334.
https://doi.org/10.1007/BF00576523.
333. Tan, C.; Fan, Y.; Sun, Q.; Zhang, G. Improvement of the crack propagation resistance in an α + β titanium alloy with a trimodal
microstructure. Metals 2020, 10, 1058. https://doi.org/10.3390/met10081058.
334. Hosseini, R.; Morakabarti, M.; Abbasi, S.M.; Hajari, A. Development of a trimodal microstructure with superior combined
strength ductility and creep‐rupture properties in a near α titanium alloy. Mater. Sci. Eng. A 2017, 696, 155–165.
https://doi.org/10.1016/j.msea.2017.04.068.
335. Zhang, S.; Zhang, Y.; Zou, Z.; Shi, Y.; Zhang, Y. The microstructure and tensile properties of additively manufactured Ti‐6Al‐
2Zr‐1Mo‐1W with a trimodal microstructure obtained by multiple annealing heat treatment. Mater. Sci. Eng. A 2022, 831, 142241.
https://doi.org/10.1016/j.msea.2021.142241.
336. Chen, L.‐Y.; Zhang, H.‐Y.; Zheng, C.; Yang, H.‐Y.; Qin, P.; Zhao, C.; Lu, S.; Liang, S.‐X.; Chai, L.; Zhang, L.‐C. Corrosion behavior
and characteristics of passive films of laser powder bed fusion produced Ti‐6AlV in dynamic Hank’s solution. Mater. Des. 2021,
208, 109907. https://doi.org/10.1016/j.matdes.2021.109907.
337. Chin, T.‐M.; Mahmudi, M.; Dai, W.; Elevany, A.; Liang, M.; Castaneda, M. Corrosion assessment of Ti6Al‐4V fabricated using
laser powder‐bed fusion additive manufacturing. Electrochem. Acta 2018, 279, 143–151
https://doi.org/10.1016/j.electacta.2018.04.189.
338. Zhao, B.; Wang, H.; Qiao, N.; Wang, C.; Hu, M. Corrosion resistance characteristics of a Ti‐6Al‐4V alloy scaffold that is fabricated
by electron beam melting and selective laser for implantation in vivo. Mater. Sci. Eng. C 2017, 70, 832–841.
https://doi.org/j.msec.2016.07.045.
339. Dai, N.; Zhang, J.; Chen, Y.; Zhang, L.‐C. Heat treatment degrading the corrosion resistance of selective laser melted Ti‐6Al‐4V
alloy. J. Electrochem. Cos. 2017, 164, C428–C434. https://doi.org/10.1149/2.1481707jes.
340. Dai, N.; Zhang, L.‐C.‐; Zhang, J.; Chen, Q.; Wu, M. Corrosion behavior of selective laser melted Ti‐6Al‐4V alloy in NaCl solution.
Corros. Soc. 2016, 102, 484–489. https://doi.org/10.1016/j.corsci.2015.10.041.
341. Chandramohan, P.; Bhero, S.; Obadele, B.A.; Olubambi, B.A. Laser additive manufactured Ti‐6Al‐4V alloys: Tribology and Cor‐
rosion Studies. Int. J. Adv. Manuf. Technol. 2017, 92, 3051–3061. https://doi.org/10.1007/s00170‐017‐0410‐2.
342. Pazhanivel, B.; Sathiya, P.; Sozhan, G. Ultra‐fine bimodal (α + β) microstructure induced mechanical strength and corrosion
resistance of Ti‐6Al‐4V alloy produced via laser powder bed fusion process. Opt. Laser Technol. 2020, 125, 106017.
https://doi.org/10.1016/j.optlastec.2019.106017.
Copyright © 2022 FDOKUMEN