Drying kinetics of Pleurotus eryngii slices during hot air drying

Maderas. Ciencia y tecnología 13(2): 153-162, 2011
153
ISSN impresa 0717-3644ISSN online 0718-221X
FIBRE LEVEL MODELLING OF FREE WATER BEHAVIOUR DURING WOOD DRYING AND WETTING♣
Jarl-Gunnar Salin1
ABSTRACT
Most drying simulation models describe the moisture migration in wood as a diffusion process, including free water flow at contents greater than the fibre saturation point. This means that wood is seen as a homogeneous material lacking internal structure. However, especially in softwood narrow sections, bordered pits, divide the free water phase into rather distinct units. It is thus quite clear that the flow of free water is governed by capillary forces and not by diffusion. A model has been developed that investigates how water filled units are emptied one by one in a drying process. Simulations with the model explain some experimentally seen features that cannot be obtained using solely diffusion type models.
Water absorption by dried wood is generally assumed to be governed by capillary (surface tension) forces. An additional feature is that a considerable part of the bordered pits have been aspirated, i.e. closed, in the drying process and the number of possible flow paths is thus reduced. Thus the driving force for water flow is the capillary suction into the lumen. Modelling wood wetting by these principles also introduces some interesting specific features, such as a limit regarding the maximal achievable water saturation.
In summary it is found that specific behaviour seen on a real macroscopic level originates from properties at the microscopic, fibre level. This clearly indicates that experience from fibre level models should be included in future drying and wetting simulation models. The work in this direction so far, has been promising.
Keywords: Capillarity, free water, modelling, percolation, wood drying, wetting
INTRODUCTION
Timber drying models generally describe the moisture migration process as diffusion (i.e. caused by a gradient in the moisture content, MC). This is a reasonable assumption for MC:s below the fibre saturation point (FSP) but is obviously not true for free water. The flow of free water is clearly governed by capillary forces in the fibre network. This free water flow process should thus be strongly dependent on the microscopic structure of the fibre matrix. As there are experimentally observed features of the drying process that cannot be explained by pure diffusion models, there is a need to investigate the influence of capillarity on the free water drying process.
Absorption of water into a dried wood is an important process. This is especially true for outdoor wooden elements/constructions exposed to rain, as an increased MC affects the durability of the construction. In this case also, the absorption has often been modelled as a diffusion process, i.e. wood has been viewed as a homogeneous material without internal structure. It is however obvious that capillarity is the driving force in the absorption process. Again the microscopic structure of the material should have a strong influence on the process.
♣This is a modified version of a paper originally presented at the European COST Action E53 Conference in Edinburgh, May 2010.1Romensvägen 12 A, FI-02210 Esbo, FinlandReceived: 13.11.2010 Accepted: 20.03.2011 Corresponding author: [email protected]
DOI 10.4067/S0718-221X2011000200003
Maderas. Ciencia y tecnología 13(2): 153-162, 2011
154
Universidad del Bío - Bío
Thus there is a need to try to model both drying and wetting of solid wood taking into account the capillary network, in order to get a better understanding of these processes and their reflections on the macroscopic scale.
Modelling drying of free waterSoftwoods have a relatively simple structure at the fibre level. The tracheids are the dominating
structural elements and their lumina are the main volumetric space available for free water. Tiny openings in the cell walls, bordered pits, are where lumina of adjacent fibres are interconnected. These bordered pits are mainly concentrated to the overlapping fibre ends, i.e. to surfaces in the radial-longitudinal (R-L) direction. A few openings are also found along the fibres, at the R-L cell wall. Connections in the radial direction are mainly created by the ray cells. Some 50-300 bordered pits per fibre are normal, and in never dried sapwood these openings are available for water flow, i.e. pits are not aspirated. For comparison the lumen diameter is ~30 µm while the bordered pit opening diameter ~1 µm. As a result the air-water interface, or meniscus, in the pit opening is associated with a capillary pressure 30 times greater than that in the lumen. From a modelling point of view, softwood can be seen as a regular network of rather distinct units (tracheids) that are connected through the bordered pit flow paths.
Consider a cluster of fibres more or less filled by a continuous, interconnected water phase. During drying evaporation occurs from the free water surfaces and as bound water flow through cell walls. As the free water content decreases the meniscus with the lowest capillary force (lowest resistance) will retract. For slow drying processes the liquid phase pressure remains almost equal (no pressure gradients) throughout the cluster. The larger diameter menisci retract (i.e. lumina) first, followed by progressively smaller diameter menisci until reaching the smaller set associated with the bordered pits. As drying continues the meniscus in the widest opening cannot withstand further suction and retracts into the corresponding lumen which is then gradually emptied. This will uncover new openings where the meniscus stops, and the process is repeated.
This rather simple process description forms the basis for a theoretical model of free water behaviour as wood dries. Although there are a lot of openings between adjacent fibres, only the widest opening will influence the process in this model. As the opening size is a random variable, this introduces a stochastic element into the model. It should be further noted that the lumen being emptied at each stage does not need to be near the point of highest moisture removal from the water phase in the cluster. The lumen volume is also a random variable with a mean and standard deviation that can be estimated. In addition this mean varies across the annual growth ring.
Such a capillary-type model of the microscopic structure of wood should develop results that differ from a traditional diffusion-based model. Such a computational algorithm has been proposed by (Salin 2006a-b, Salin 2008a). Simulation results of MC variation during drying from opposite sides with a simplified model for a 2-dimensional network are shown in fig. 1.

Maderas. Ciencia y tecnología 13(2): 153-162, 2011
155
Fibre level modelling ...: Salin.
Figure 1. Four stages of two-sided drying from a 100 x 180 square network. On the right hand side of each distribution is the averaged water concentration in the thickness direction presented.
A fragmentation of the free water phase is seen and separated clusters develop. This is quite different
from a well defined receding front as predicted by a pure diffusion model. This gives a cause for a more detailed investigation. It is known from general percolation theory (Stauffer and Aharony 1992) that a 2-dimensional model is not a good approximation of a 3-dimensional process.
A typical 3-D result for two-sided drying of an initially water saturated sapwood slab is seen in Fig. 2 as subsequent MC profiles in the thickness direction. Two very interesting features are observed. Firstly, drying seems to proceed without any noticeable moisture gradients, i.e. the profiles are flat, except for a few fibres close to the wood surface. Secondly, this process stops at a well defined point (MC ~ 95 %) and is replaced by receding fronts instead. The “gradient free drying” has been experimentally observed (Wiberg and Morén 1999) and the transfer to receding fronts corresponds to the break-up of the continuous water phase (Stauffer and Aharony 1992) which has been named “irreducible saturation” in wood science (Spolek and Plumb 1981). Both these features are not easily modelled using a pure diffusion based approach.
Figure 2. Moisture profiles in the radial thickness direction for two-sided drying of a sapwood plate, calculated with a percolation approach.
Maderas. Ciencia y tecnología 13(2): 153-162, 2011
156
Universidad del Bío - Bío
In the two examples above, the bound water distribution in the ‘dry’ area (no free water) as seen in fig.1, has been calculated based on the normal diffusion equation. The numerical solution of this equation – which has to be repeated each time a fibre is emptied – is the most time consuming part in the whole calculation. For a reasonable 3-D network size – for instance 360000 fibres as in fig.2 – the calculation time with a personal computer is days, even weeks. There are in addition some mathematical problems associated with the boundary conditions, which are solved by assuming a cyclic sample property variation instead of an infinite sample in the direction perpendicular to the main moisture flow. Details regarding the numerical calculations are found in (Salin 2006a-b, Salin 2008a). More general descriptions of modelling drying at pore level are found in (Prat 1995, Metzger et al. 2007, Frank and Perré 2010)
The fibre level percolation model, as described above, has been used for investigation of different question related to wood drying, such as drying rate and both air and free water relative permeability, as well as inclusion of film and corner flow phenomena (Salin 2008a). It is found that several features that cannot be modelled by diffusion-type approaches are explained by percolation models. One such item where the new approach gives a nice explanation is the concept of ‘damaged wood surface layer’.
Damaged surface layerThe above percolation model is easily extended with a calculation of the evaporation rate at different
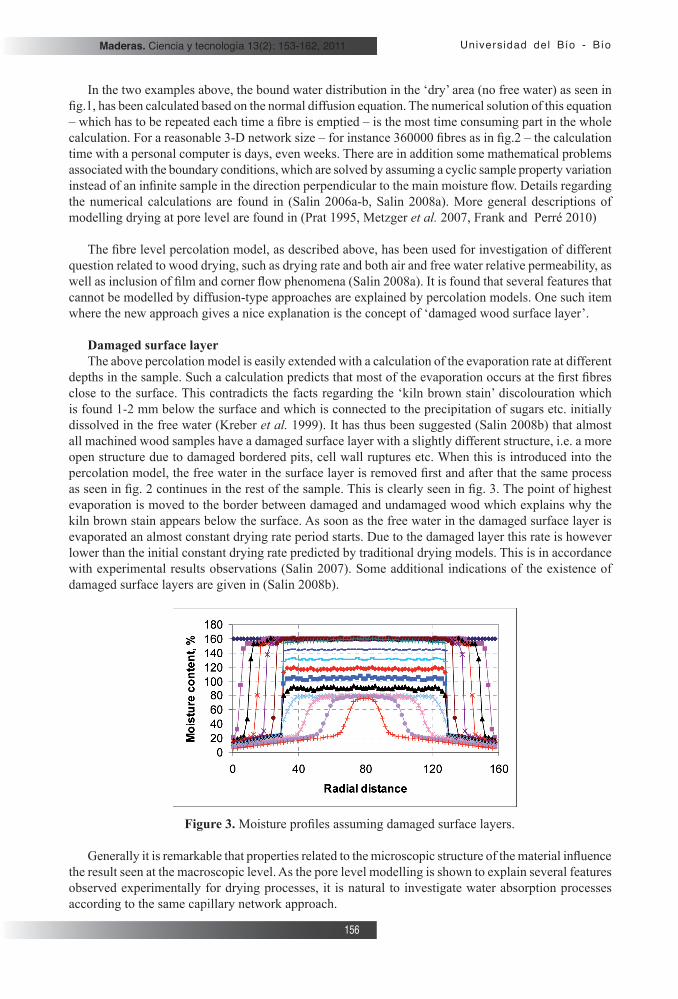
depths in the sample. Such a calculation predicts that most of the evaporation occurs at the first fibres close to the surface. This contradicts the facts regarding the ‘kiln brown stain’ discolouration which is found 1-2 mm below the surface and which is connected to the precipitation of sugars etc. initially dissolved in the free water (Kreber et al. 1999). It has thus been suggested (Salin 2008b) that almost all machined wood samples have a damaged surface layer with a slightly different structure, i.e. a more open structure due to damaged bordered pits, cell wall ruptures etc. When this is introduced into the percolation model, the free water in the surface layer is removed first and after that the same process as seen in fig. 2 continues in the rest of the sample. This is clearly seen in fig. 3. The point of highest evaporation is moved to the border between damaged and undamaged wood which explains why the kiln brown stain appears below the surface. As soon as the free water in the damaged surface layer is evaporated an almost constant drying rate period starts. Due to the damaged layer this rate is however lower than the initial constant drying rate predicted by traditional drying models. This is in accordance with experimental results observations (Salin 2007). Some additional indications of the existence of damaged surface layers are given in (Salin 2008b).
Figure 3. Moisture profiles assuming damaged surface layers.
Generally it is remarkable that properties related to the microscopic structure of the material influence the result seen at the macroscopic level. As the pore level modelling is shown to explain several features observed experimentally for drying processes, it is natural to investigate water absorption processes according to the same capillary network approach.
Maderas. Ciencia y tecnología 13(2): 153-162, 2011
157
Fibre level modelling ...: Salin.
Modelling absorption of waterSimilar to wood drying, liquid water absorption into dried wood has often been modelled as a
diffusion process. As described above for drying processes, a fibre level model gave an explanation to several experimentally observed features that cannot be modelled by diffusion processes. This gives thus a cause to investigate the absorption process with a fibre level approach.
The most important properties of the fibre level structure in softwood were given above. The main driving force for water flow into dried wood from a reservoir is certainly the capillary suction caused by menisci in the lumina. This suction gives a flow of water into the lumen from adjacent water filled fibres (or from the reservoir) through the bordered pits. When the lumen is filled the absorption continues into the empty neighbour fibres through the pits. The flow resistance is of course much higher in the bordered pits than in the lumen itself. It is thus reasonable to assume that all the flow resistance is concentrated to the bordered pits. It is well known that most of the 50-300 bordered pits per fibre in dried wood are aspirated (closed) and thus not available for water transport. This means that the percentage of aspirated bordered pits is an important parameter as the number of available flow paths will influence the absorption rate. The number and location of available openings are certainly stochastic variables.
The suction caused by the meniscus in the lumen is of course dependent on the lumen (effective) diameter. This diameter varies across the annual ring due to the difference in earlywood and latewood forms. Superimposed to this variation there is certainly a pure stochastic variation also. In addition to the influence on suction, the diameter is also directly connected to the lumen volume, i.e. the amount of water needed to fill the lumen. A small diameter will thus in both ways shorten the time for filling the lumen.
A computer based model for the absorption process in the longitudinal direction from a water reservoir has been developed (Salin 2008c). The set-up corresponds to the situation with a wooden stick with one end dipped into water. The model covers the width of one annual ring. The average (effective) lumen diameter is assumed to vary linearly across the annual ring with minimum and maximum values ±70 % from the overall average. Upon this a stochastic variation according to a (truncated) normal distribution is added. Regarding bordered pits it is in the model assumed that each of the overlapping R-L surfaces at the fibre ends have 25 pits, i.e. a total of 100 per fibre. Further these are aspirated with a probability p, i.e. the number of open paths is a stochastic variable with a binomial distribution. It is assumed that the flow resistance is the same for all open bordered pits. Finally 5 % of all fibres are assumed to have one, always open, bordered pit on the T-L surface. This accounts in a way for the influence of the ray cells.
The starting point for simulation with this theoretical model is the suction pressure caused by menisci in lumina in the process of being filled. This creates a pressure field in the liquid phase from these lumina down to the reservoir. The pressure field interacts with the water flow and the resistance (number of openings) across the open bordered pits. At each stage this pressure field and the flows have to be calculated. This corresponds to a discrete solution of the Laplace equation. When one of the fibres has been filled and the water continues into adjacent fibres, this pressure field calculation has to be repeated for the next constellation. In this way the calculation proceeds fibre by fibre. This pressure field calculation is of course the most time consuming part of the model.
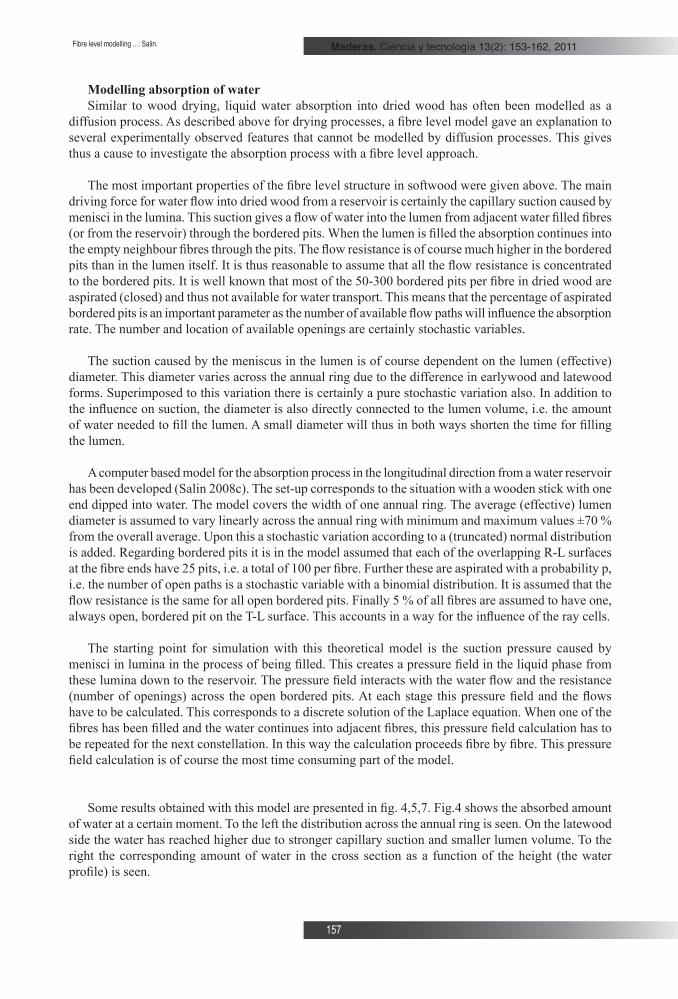
Some results obtained with this model are presented in fig. 4,5,7. Fig.4 shows the absorbed amount of water at a certain moment. To the left the distribution across the annual ring is seen. On the latewood side the water has reached higher due to stronger capillary suction and smaller lumen volume. To the right the corresponding amount of water in the cross section as a function of the height (the water profile) is seen.
Maderas. Ciencia y tecnología 13(2): 153-162, 2011
158
Universidad del Bío - Bío
Figure 4. Calculated water absorption in an annual growth ring.
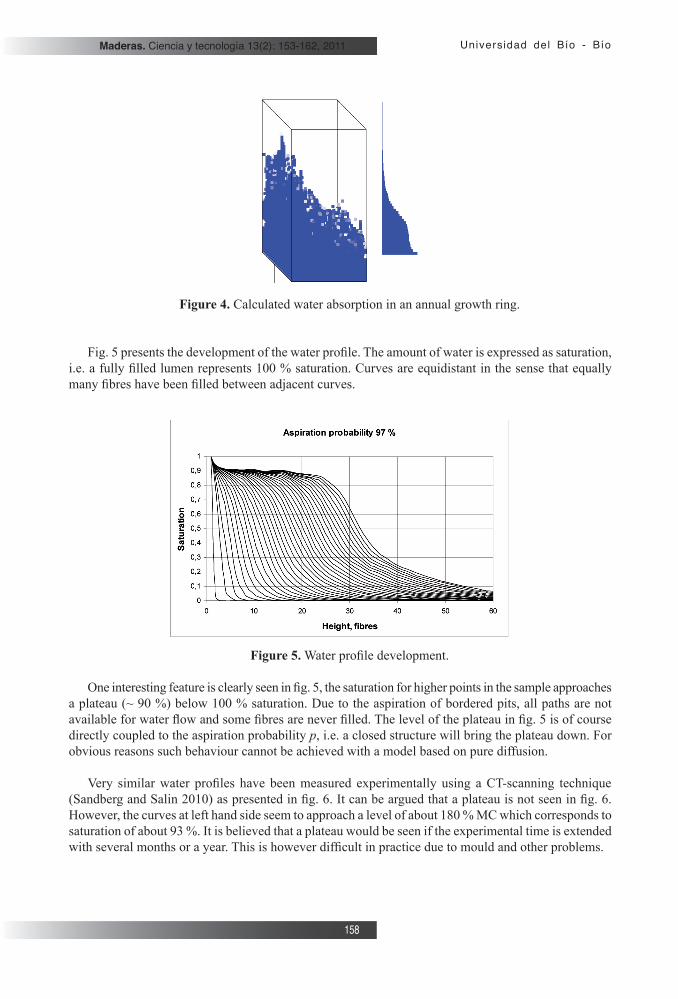
Fig. 5 presents the development of the water profile. The amount of water is expressed as saturation,
i.e. a fully filled lumen represents 100 % saturation. Curves are equidistant in the sense that equally many fibres have been filled between adjacent curves.
Figure 5. Water profile development.
One interesting feature is clearly seen in fig. 5, the saturation for higher points in the sample approaches a plateau (~ 90 %) below 100 % saturation. Due to the aspiration of bordered pits, all paths are not available for water flow and some fibres are never filled. The level of the plateau in fig. 5 is of course directly coupled to the aspiration probability p, i.e. a closed structure will bring the plateau down. For obvious reasons such behaviour cannot be achieved with a model based on pure diffusion.
Very similar water profiles have been measured experimentally using a CT-scanning technique (Sandberg and Salin 2010) as presented in fig. 6. It can be argued that a plateau is not seen in fig. 6. However, the curves at left hand side seem to approach a level of about 180 % MC which corresponds to saturation of about 93 %. It is believed that a plateau would be seen if the experimental time is extended with several months or a year. This is however difficult in practice due to mould and other problems.

Maderas. Ciencia y tecnología 13(2): 153-162, 2011
159
Fibre level modelling ...: Salin.
Figure 6. Water profiles after 1-14 days of absorption into a Norway spruce sample. Measured with a CT-scanning technique.
One interesting question is how the absorption rate develops as a function of time. Fig. 7 shows the calculated total absorbed amount of water as a function of the square root of time (Salin 2008c).
Figure 7. Absorbed amount of water as a function of square root of time for different bordered pits aspiration probabilities.
As seen, except for an initial phase, the absorption is a linear function of the square root of time. In the model the first layer of fibres in the wet end of the sample is assumed to have an open structure – in accordance with the damaged surface layer concept discussed in section 2.1. After that the number of available flow paths drops to a level corresponding to the plateau seen in fig. 5. There is thus an enhanced absorption rate in the very beginning which is seen as the curved initial part in fig. 7. The linear dependence on the square root of time – including the deviating initial part – has been observed in accurate experiments (Candanedo and Derome 2005). It should finally be remarked that diffusion into a semi-infinite solid will in the same way produce a linear dependence on the square root of time. As shown this linearity cannot be taken as a proof of a pure diffusion driven process.
Maderas. Ciencia y tecnología 13(2): 153-162, 2011
160
Universidad del Bío - Bío
As seen in fig. 7 the absorption rate is strongly dependent on how open the structure is. For a very closed structure the absorption will stop as all flow paths eventually reach dead ends. This is the case for the lowest curves in fig. 7 which stop at the black circles.
As for drying processes, modelling water absorption using a fibre level approach, introduces features that cannot be simulated with diffusion type models. These features seem to be supported by experimental observations.
Some additional considerationsThe discussion has so far been focused on sapwood of softwood. The heartwood of softwood
constitutes a problem. As the tree grows heartwood is gradually formed from the sapwood and most of the free water is repelled, although the capillary geometry is essentially unchanged. This indicates perhaps that the hydrophilic cell wall has become hydrophobic, i.e. the wetting angle has changed. Experimental data show that dried heartwood samples absorb liquid water, but much slower than sapwood (Sandberg and Salin 2010). However, most of the water seems to migrate as bound water, except for a few layers of fibres in the wet end where free water is seen. Absorption in heartwood of softwood is thus governed more by bound water diffusion than by capillarity. The same has been seen for absorption in heartwood of a hardwood (Johansson and Salin 2010). Regarding drying processes, the initial MC in heartwood is normally low and the amount of free water so low that drying can be treated as a diffusion process.
The microscopic structure of hardwoods is more complicated, with different structural elements. One could thus expect that free water behaviour should differ from softwoods. Absorption of liquid water in aspen, oak and pine has been investigated by (Johansson and Kifetew 2010, Johansson and Salin 2010). Some differences were seen but these are difficult to specify.
CONCLUSIONS
The simulations reported above, regarding both drying and wetting, have clearly shown that there are several features experimentally seen on a macroscopic scale that originate from the microscopic wood structure. These features cannot be explained by pure diffusion based models that assume a homogeneous material. There is thus a need to include fibre level descriptions for free water behaviour in future models. The calculations referred to above are however extremely time consuming and are thus useful mainly for scientific investigations of basic questions. Models for more practical use have to use simplified sub-models that take into account the most important fibre level influences. It is suggested that future work in this field should on one hand investigate how structural details influence the behaviour, and on the other hand try to find efficient model simplifications as supplement to diffusion based approaches.
Maderas. Ciencia y tecnología 13(2): 153-162, 2011
161
Fibre level modelling ...: Salin.
REFERENCES
Candanedo, L.; Derome, D. 2005. Numerical simulation of water absorption in softwoods. Proceedings of the 9th International IBPSA Conference, August 15-18, Montreal, Canada. pp 123-130. (Consulted April 2011). http://www.ibpsa.org/proceedings/BS2005/BS05_0123_130.pdf.
Frank, X.; Perré. P. 2010. The potential of meshless methods to address physical and mechanical phenomena involved during drying at pore level. Drying Technology 28 (8): 932-943.
Johansson, J.; Kifetew, G. 2010. CT-scanning and modelling of the capillary water uptake in aspen, oak and pine. Eur. J. Wood Prod. 68: 77-85.
Johansson, J.; Salin, JG. 2010. Application of percolation modelling on end-grain water absorption in aspen (Populus tremula L.) Accepted for publication in Wood Material Science and Engineering.
Kreber, B.; Haslett, A.N.; McDonald, A.G. 1999. Kiln brown stain in Radiata pine: A short review on cause and methods for prevention. Forest Prod. J. 49(4): 66-70.
Metzger, T.; Tsotsas, E.; Prat, M. 2007. Pore-network models: A powerful tool to study drying at the pore level and understanding the influence of structure on drying kinetics. In Modern Drying Technology: Vol.1. Computational Tools at Different Scales, Wiley-VCH, Weinheim, Germany.
Prat, M. 1995. Isothermal drying of non-hygroscopic capillary-porous materials as an invasion percolation process. International Journal of Multiphase Flow 21: 875-892.
Salin, JG. 2006a. Modelling of the behaviour of free water in sapwood during drying. Part I. A new percolation approach. Wood Material Science & Engineering 1: 4-11.
Salin, JG. 2006b. Modelling of the behaviour of free water in sapwood during drying. Part II. Some simulation results. Wood Material Science & Engineering 1: 45-51.
Salin, JG. 2007. External heat and mass transfer. In: Perré, P. (Ed.) Fundamentals of wood drying. A.R.BO.LOR Nancy, France. ISBN 9 782907 086127. 175-201pp.
Salin, JG. 2008a. Drying of liquid water in wood as influenced by the capillary fiber network. Drying Technology 26: 560-567.
Salin, JG. 2008b. Almost all wooden pieces have a damaged surface layer – impact on some properties and quality. Proceedings of COST Action E53 Conference 29-30th October, Delft, The Netherlands, pp 135-143.
Salin, JG. 2008c. Modelling water absorption in wood. Wood Material Science & Engineering 3: 102-108.
Sandberg, K.; Salin, JG. 2010. Liquid water absorption in dried Norway spruce measured with CT scanning and viewed as a percolation process. Published online in Wood Sci. Technol. September 14.
Spolek, G.A.; Plumb, O.A. 1981. Capillary pressure in softwoods. Wood Sci. Technol. 15: 189-199.

Maderas. Ciencia y tecnología 13(2): 153-162, 2011
162
Universidad del Bío - Bío
Stauffer, D.; Aharony, A. 1992. Introduction to percolation theory. London. Taylor & Francis. UK. 181p.
Wiberg, P.; Morén, T.J. 1999. Moisture flux determination in wood during drying above fibre saturation point using CT-scanning and digital image processing. Holz als Roh- und Werkstoff 57: 137-144.
Copyright © 2022 FDOKUMEN