
Water Resource Management Plan
63
WATER RESOURCE MANAGEMENT PLAN A CASE STUDY OF MADURAI CITY DISSERTATION PROGRAM – 2013-2014 FINAL REVIEW Thesis By: A.R.Alagarsamy (IP0112) Guidance By: Dr.Anjana Vyas Date : 22/04/14
Transcript of Water Resource Management Plan
WATER RESOURCE
MANAGEMENT PLANA CASE STUDY OF MADURAI CITY
DISSERTATION PROGRAM – 2013-2014
FINAL REVIEW
Thesis By: A.R.Alagarsamy (IP0112)
Guidance By: Dr.Anjana Vyas
Date : 22/04/14

SCHEME OF PRESENTATION
INTRODUCTION
BACKGROUND
NEED FOR STUDY
RESEARCH AIM, OBJECTIVES
METHODOLOGY
LITERATURE REVIEW
ABSTRACT FROM CASE STUDIES
STUDY AREA DELINEATION
WATER SUPPLY SYSTEM IN MADURAI
ANALYSIS & ISSUES IN WATER SUPPLY
PROPOSALS & STRATGIES
Chapter 1
Chapter 2
Chapter 3
Chapter 4
Chapter 5
Chapter 6

INTRODUCTIONBackground of Study
Need of Study
Aim, Objective & Methodology
BACKGROUND
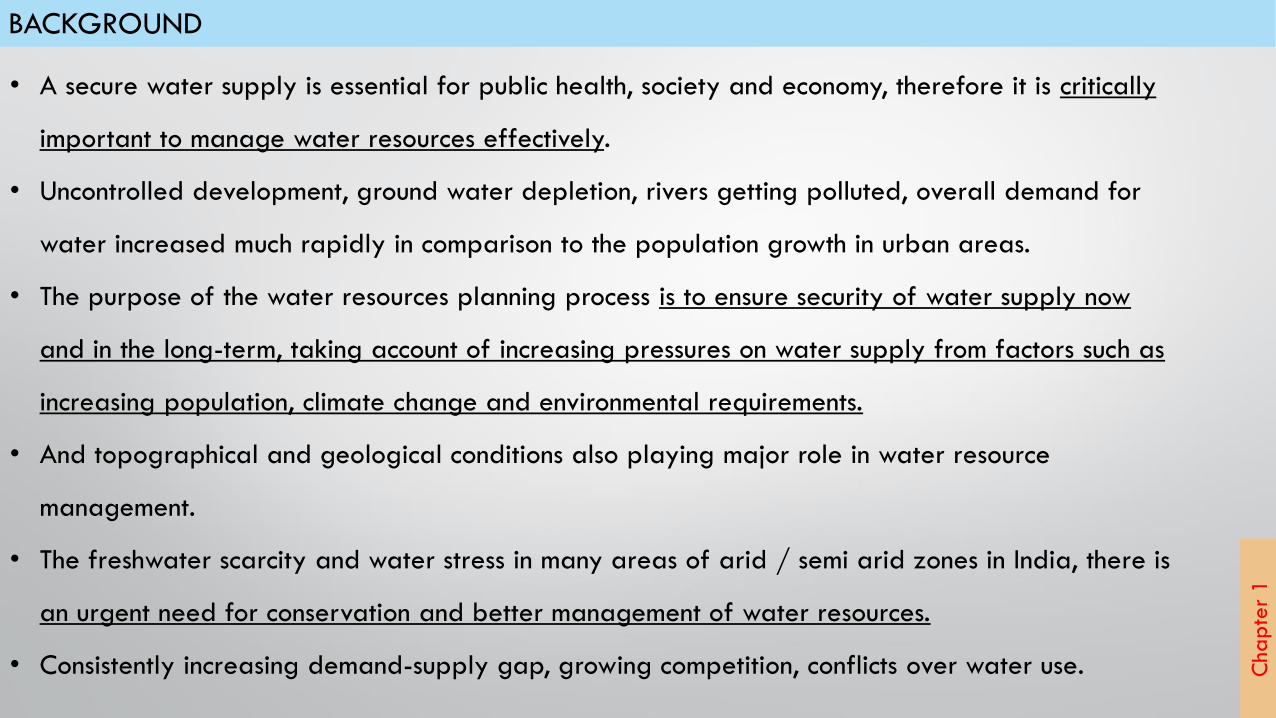
• A secure water supply is essential for public health, society and economy, therefore it is critically
important to manage water resources effectively.
• Uncontrolled development, ground water depletion, rivers getting polluted, overall demand for
water increased much rapidly in comparison to the population growth in urban areas.
• The purpose of the water resources planning process is to ensure security of water supply now
and in the long-term, taking account of increasing pressures on water supply from factors such as
increasing population, climate change and environmental requirements.
• And topographical and geological conditions also playing major role in water resource
management.
• The freshwater scarcity and water stress in many areas of arid / semi arid zones in India, there is
an urgent need for conservation and better management of water resources.
• Consistently increasing demand-supply gap, growing competition, conflicts over water use. Cha
pte
r 1
Source: Madurai CDP-2006, Census 2011
INTRODUCTION - MaduraiTIRUVALLUR
VELLORE
TIRUVANNAMALAI
DHARMAPURI
COIMBATORE
MADURAI
SIVAGANGATHENI
RAMANATHAPURAM
TUTICORINTIRUNELVELI
NILGIRIS
KANNIYAKUMARI
SALEM
NAMAKKALERODE
KARUR
PUDUKKOTTAI
DINDIGULNAGAPATTINAM
CUDDALORE
THIRUVARUR
PERAMBALUR
THANJAVUR
CHENNAI
VILUPPURAMPONDICHERRY
(PONDICHERRY)
NH
.5
NH.4
NH
.45
NH
.47
NH
.7
NH.49
NH
.49
NH.7A
NH
.7
NH.45
TIRUCHCHIRAPPALLI
Tamil Nadu State
VIRUDHUNAGAR
KANCHIPURAM
Madurai District
Peraiyur
Tirumangalam
Usilampatti
Vadipatti
Nattam
Melur
MADURAI
Source: Madurai CDP 2006
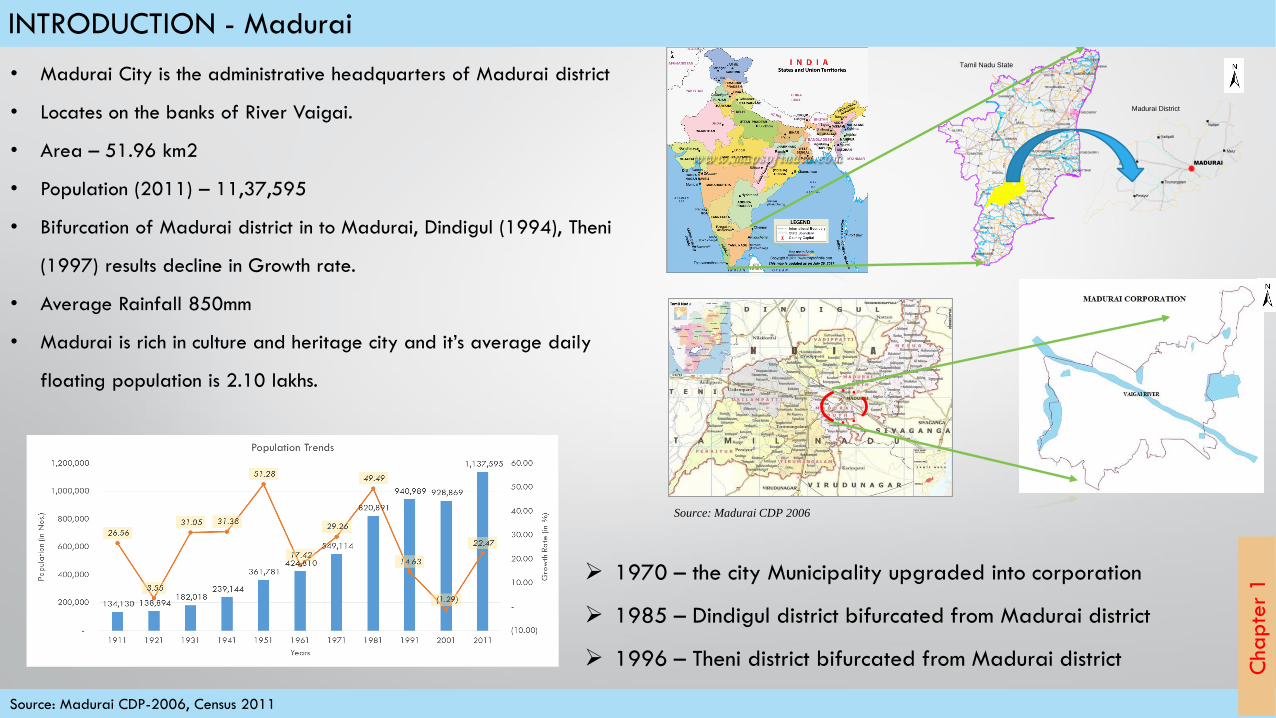
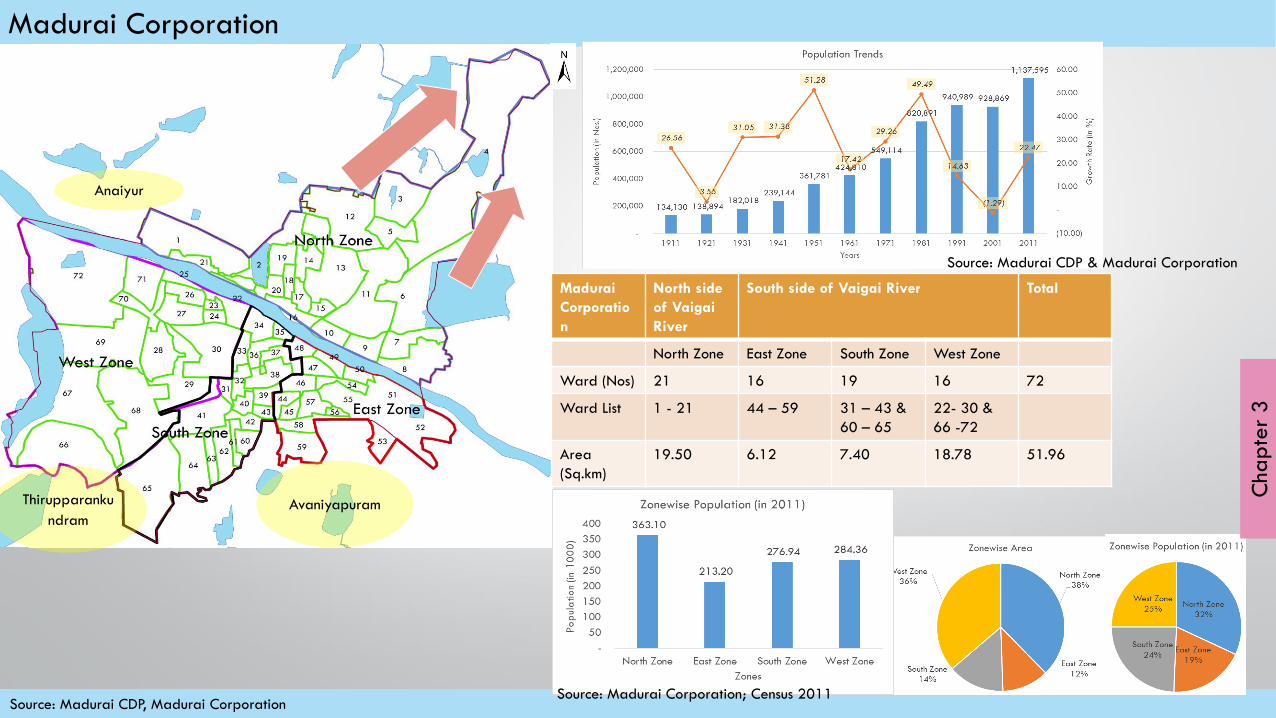
• Madurai City is the administrative headquarters of Madurai district
• Locates on the banks of River Vaigai.
• Area – 51.96 km2
• Population (2011) – 11,37,595
• Bifurcation of Madurai district in to Madurai, Dindigul (1994), Theni
(1997) results decline in Growth rate.
• Average Rainfall 850mm
• Madurai is rich in culture and heritage city and it’s average daily
floating population is 2.10 lakhs.
1970 – the city Municipality upgraded into corporation
1985 – Dindigul district bifurcated from Madurai district
1996 – Theni district bifurcated from Madurai district Cha
pte
r 1
NEED OF THE STUDY
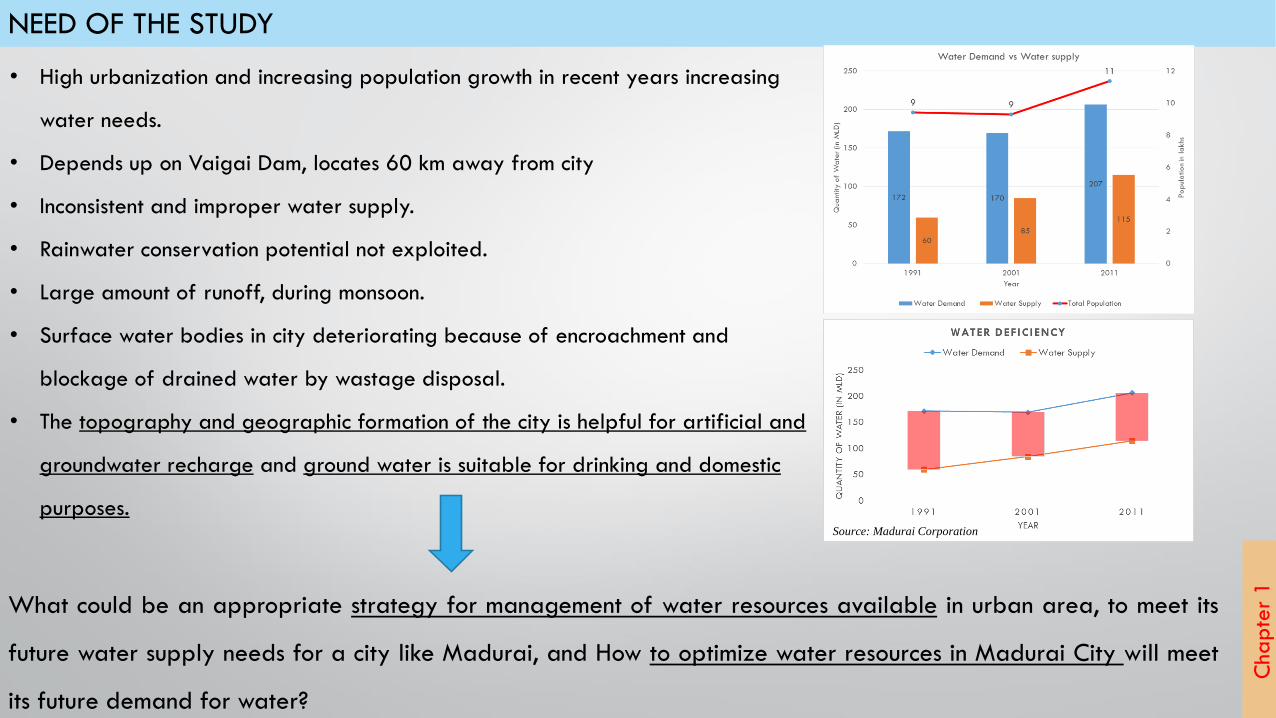
• High urbanization and increasing population growth in recent years increasing
water needs.
• Depends up on Vaigai Dam, locates 60 km away from city
• Inconsistent and improper water supply.
• Rainwater conservation potential not exploited.
• Large amount of runoff, during monsoon.
• Surface water bodies in city deteriorating because of encroachment and
blockage of drained water by wastage disposal.
• The topography and geographic formation of the city is helpful for artificial and
groundwater recharge and ground water is suitable for drinking and domestic
purposes.
What could be an appropriate strategy for management of water resources available in urban area, to meet its
future water supply needs for a city like Madurai, and How to optimize water resources in Madurai City will meet
its future demand for water?
Cha
pte
r 1
Source: Madurai Corporation
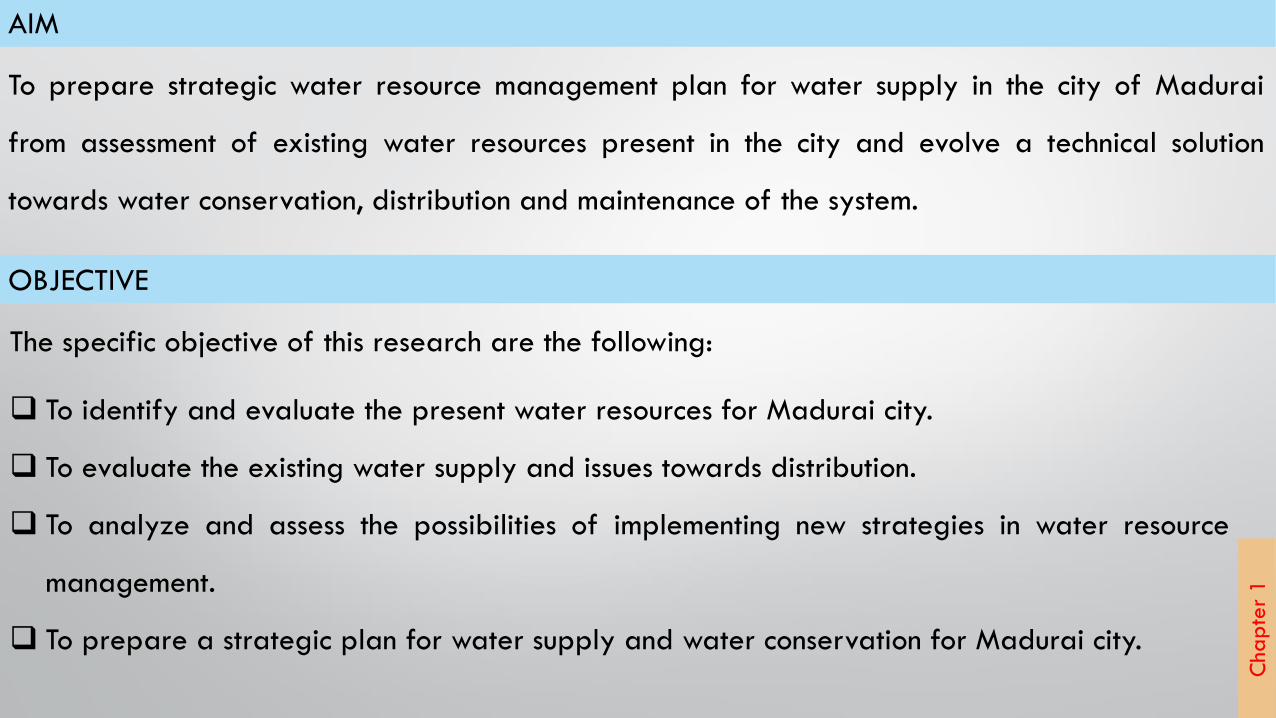
AIM
To prepare strategic water resource management plan for water supply in the city of Madurai
from assessment of existing water resources present in the city and evolve a technical solution
towards water conservation, distribution and maintenance of the system.
OBJECTIVE
The specific objective of this research are the following:
To identify and evaluate the present water resources for Madurai city.
To evaluate the existing water supply and issues towards distribution.
To analyze and assess the possibilities of implementing new strategies in water resource
management.
To prepare a strategic plan for water supply and water conservation for Madurai city.
Cha
pte
r 1
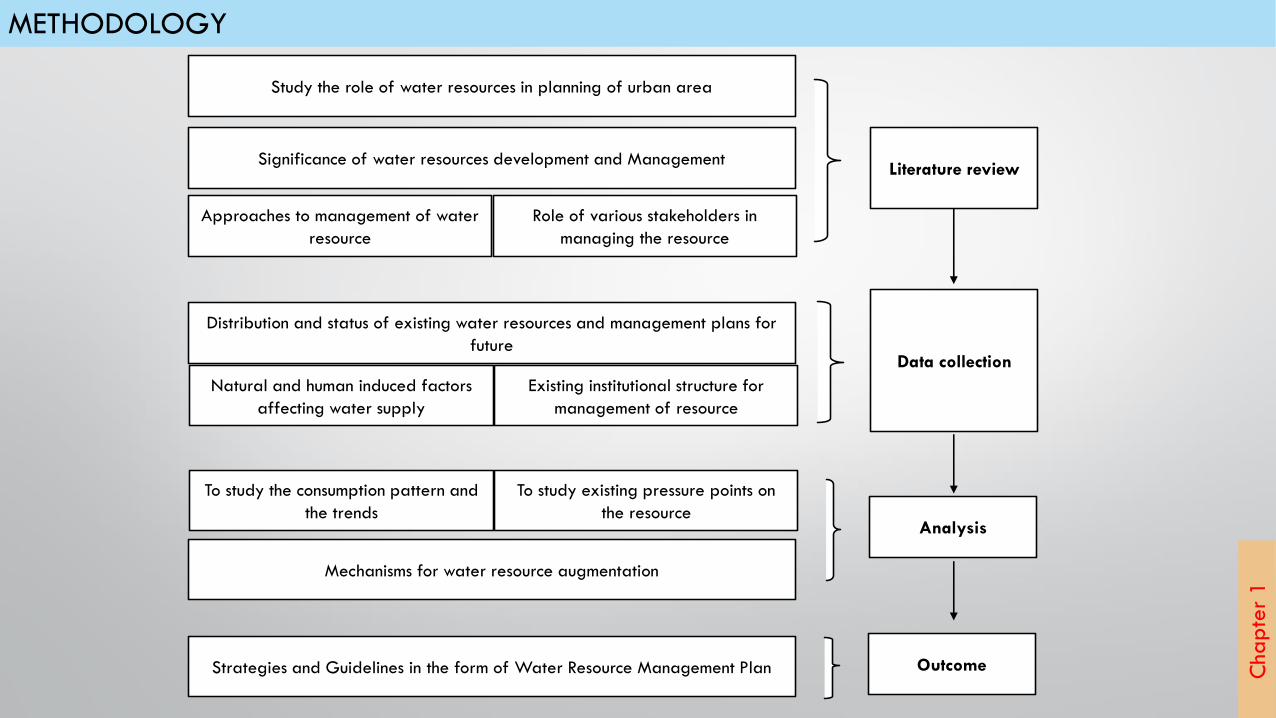
METHODOLOGY
Study the role of water resources in planning of urban area
Significance of water resources development and Management
Approaches to management of water
resource
Role of various stakeholders in
managing the resource
Distribution and status of existing water resources and management plans for
future
To study existing pressure points on
the resource
Natural and human induced factors
affecting water supply
Existing institutional structure for
management of resource
To study the consumption pattern and
the trends
Mechanisms for water resource augmentation
Strategies and Guidelines in the form of Water Resource Management Plan
Literature review
Data collection
Analysis
Outcome Cha
pte
r 1

LITERATURE REVIEWPolicy Review (in Central & State Level)
Case Studies Review
Inferences from Case Studies
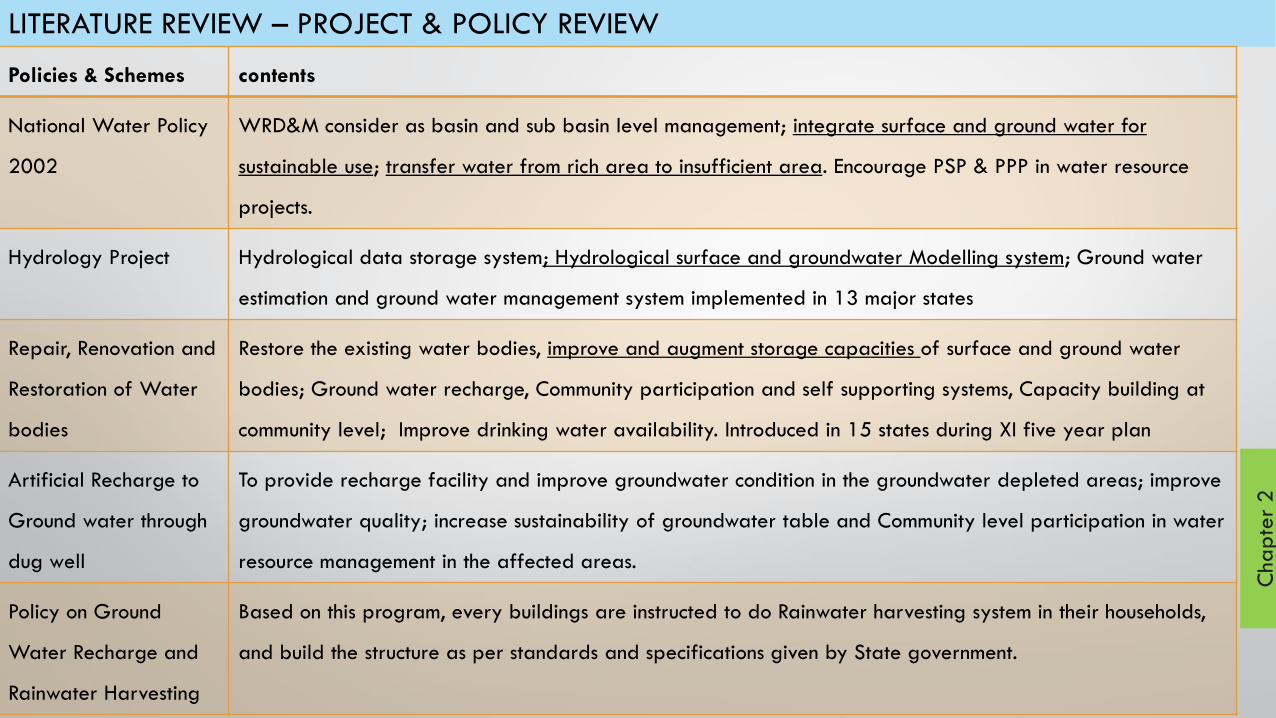
LITERATURE REVIEW – PROJECT & POLICY REVIEW
Policies & Schemes contents
National Water Policy
2002
WRD&M consider as basin and sub basin level management; integrate surface and ground water for
sustainable use; transfer water from rich area to insufficient area. Encourage PSP & PPP in water resource
projects.
Hydrology Project Hydrological data storage system; Hydrological surface and groundwater Modelling system; Ground water
estimation and ground water management system implemented in 13 major states
Repair, Renovation and
Restoration of Water
bodies
Restore the existing water bodies, improve and augment storage capacities of surface and ground water
bodies; Ground water recharge, Community participation and self supporting systems, Capacity building at
community level; Improve drinking water availability. Introduced in 15 states during XI five year plan
Artificial Recharge to
Ground water through
dug well
To provide recharge facility and improve groundwater condition in the groundwater depleted areas; improve
groundwater quality; increase sustainability of groundwater table and Community level participation in water
resource management in the affected areas.
Policy on Ground
Water Recharge and
Rainwater Harvesting
Based on this program, every buildings are instructed to do Rainwater harvesting system in their households,
and build the structure as per standards and specifications given by State government.
Chapte
r 2
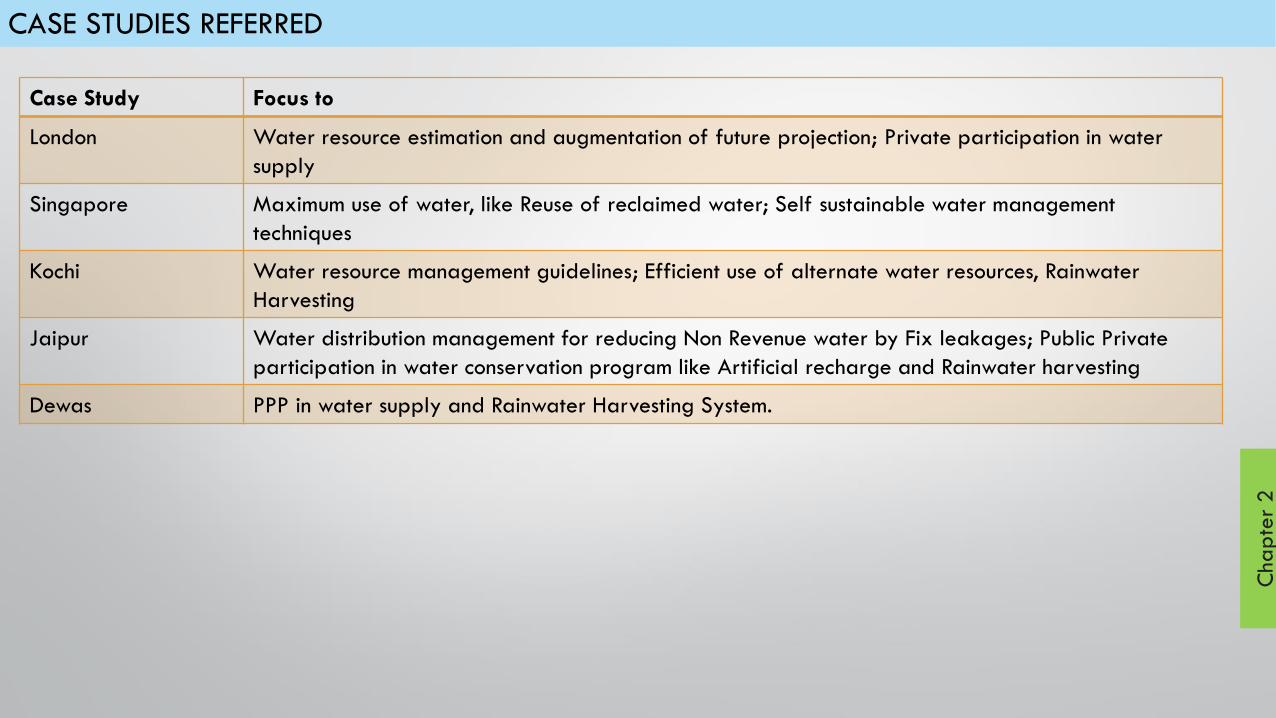
CASE STUDIES REFERRED
Case Study Focus to
London Water resource estimation and augmentation of future projection; Private participation in water
supply
Singapore Maximum use of water, like Reuse of reclaimed water; Self sustainable water management
techniques
Kochi Water resource management guidelines; Efficient use of alternate water resources, Rainwater
Harvesting
Jaipur Water distribution management for reducing Non Revenue water by Fix leakages; Public Private
participation in water conservation program like Artificial recharge and Rainwater harvesting
Dewas PPP in water supply and Rainwater Harvesting System.
Chapte
r 2
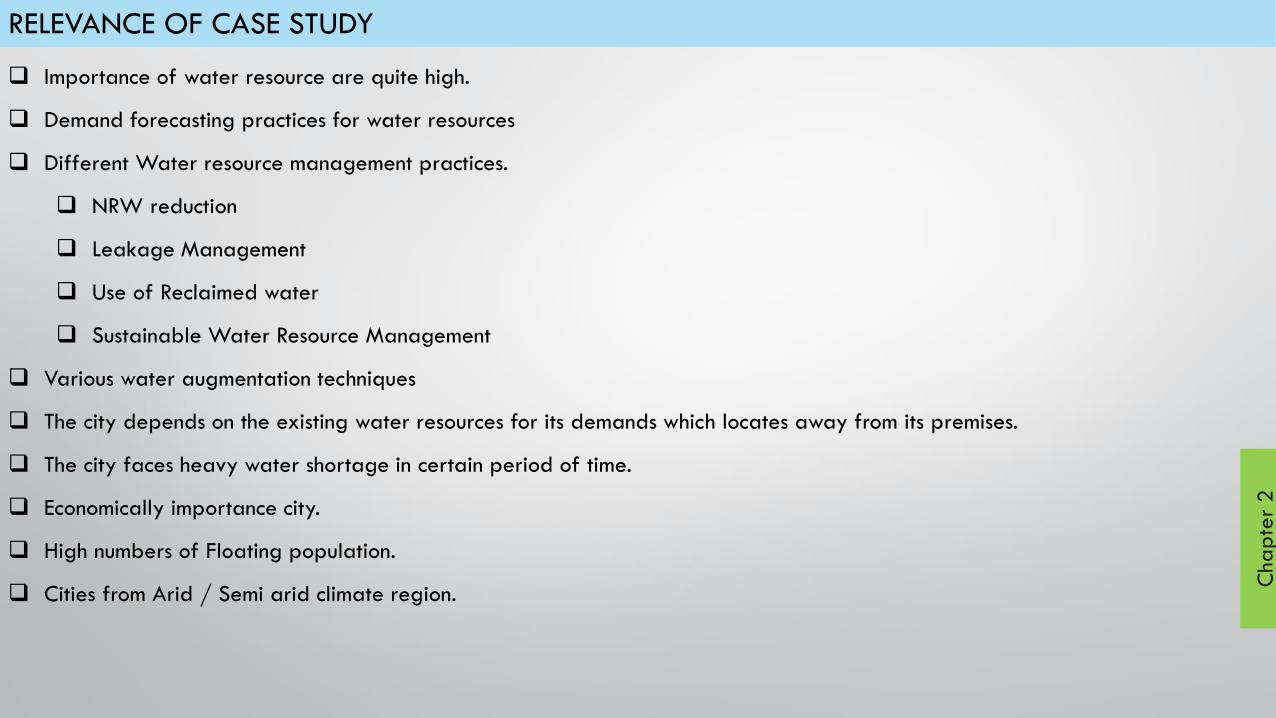
RELEVANCE OF CASE STUDY
Importance of water resource are quite high.
Demand forecasting practices for water resources
Different Water resource management practices.
NRW reduction
Leakage Management
Use of Reclaimed water
Sustainable Water Resource Management
Various water augmentation techniques
The city depends on the existing water resources for its demands which locates away from its premises.
The city faces heavy water shortage in certain period of time.
Economically importance city.
High numbers of Floating population.
Cities from Arid / Semi arid climate region.
Chapte
r 2
Chapte
r 2
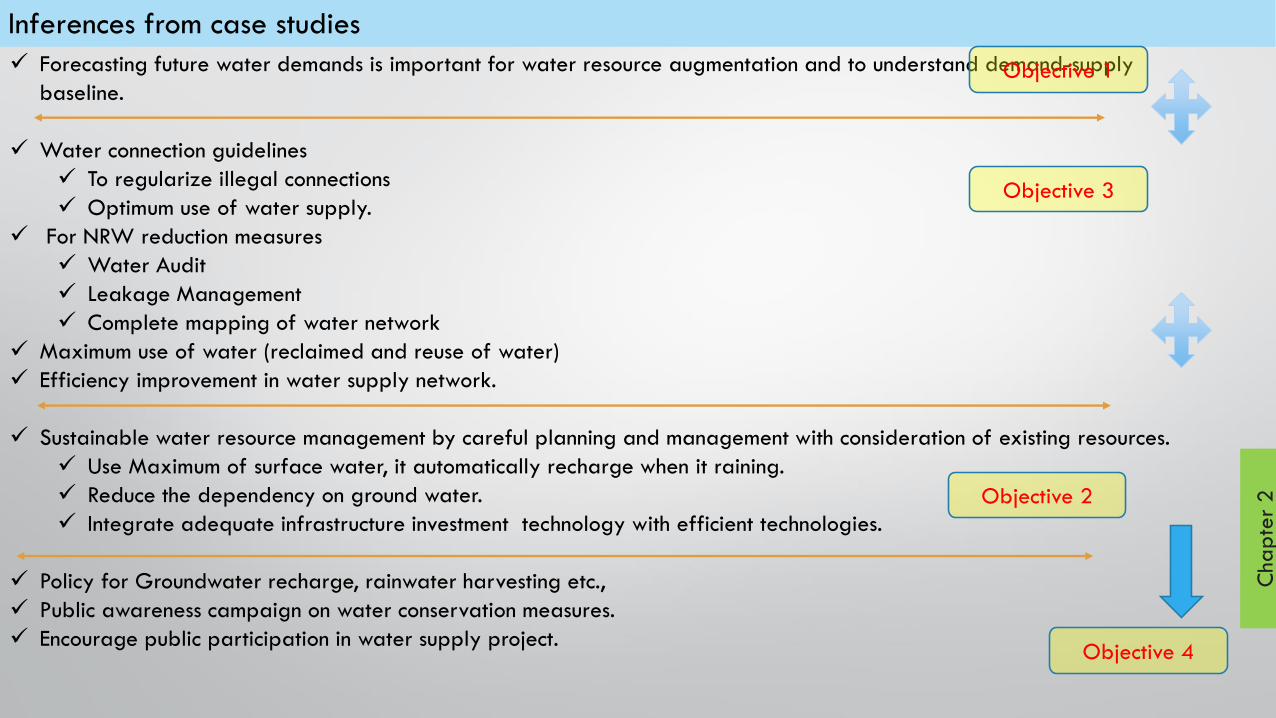
Inferences from case studies
Forecasting future water demands is important for water resource augmentation and to understand demand-supply
baseline.
Water connection guidelines
To regularize illegal connections
Optimum use of water supply.
For NRW reduction measures
Water Audit
Leakage Management
Complete mapping of water network
Maximum use of water (reclaimed and reuse of water)
Efficiency improvement in water supply network.
Sustainable water resource management by careful planning and management with consideration of existing resources.
Use Maximum of surface water, it automatically recharge when it raining.
Reduce the dependency on ground water.
Integrate adequate infrastructure investment technology with efficient technologies.
Policy for Groundwater recharge, rainwater harvesting etc.,
Public awareness campaign on water conservation measures.
Encourage public participation in water supply project.
Objective 1
Objective 3
Objective 2
Objective 4
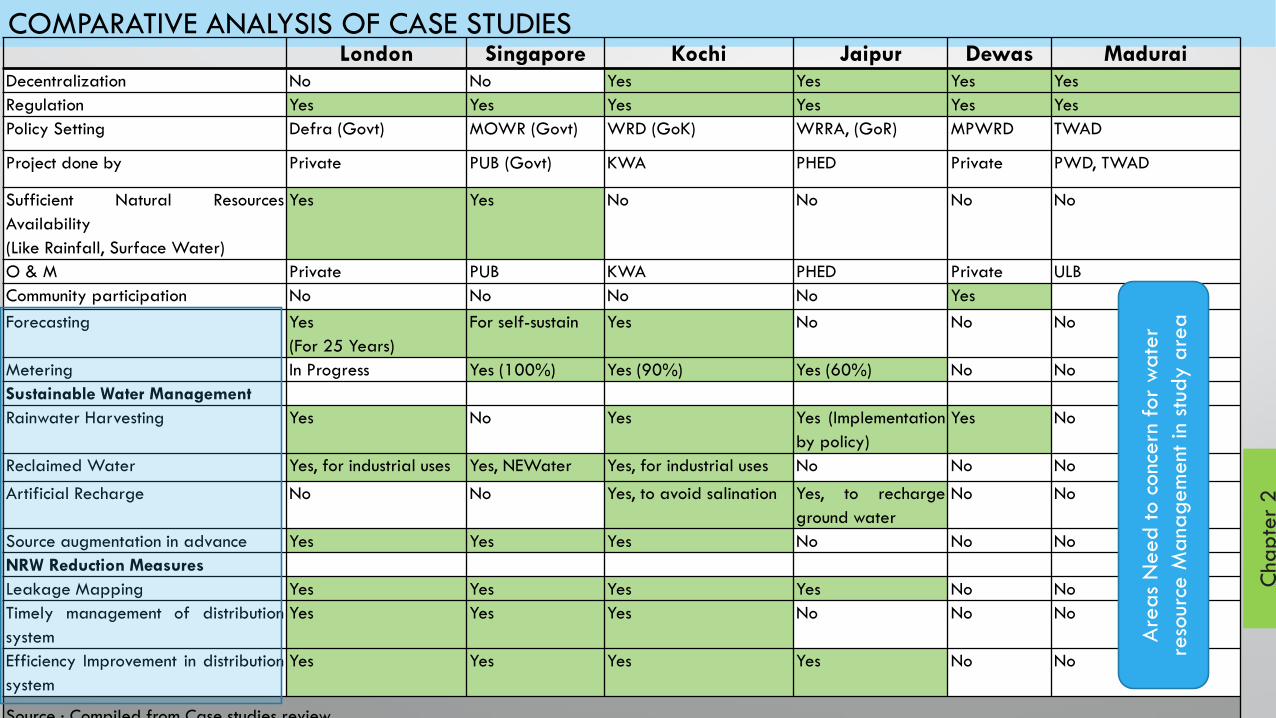
COMPARATIVE ANALYSIS OF CASE STUDIESLondon Singapore Kochi Jaipur Dewas Madurai
Decentralization No No Yes Yes Yes Yes
Regulation Yes Yes Yes Yes Yes Yes
Policy Setting Defra (Govt) MOWR (Govt) WRD (GoK) WRRA, (GoR) MPWRD TWAD
Project done by Private PUB (Govt) KWA PHED Private PWD, TWAD
Sufficient Natural Resources
Availability
(Like Rainfall, Surface Water)
Yes Yes No No No No
O & M Private PUB KWA PHED Private ULB
Community participation No No No No Yes
Forecasting Yes
(For 25 Years)
For self-sustain Yes No No No
Metering In Progress Yes (100%) Yes (90%) Yes (60%) No No
Sustainable Water Management
Rainwater Harvesting Yes No Yes Yes (Implementation
by policy)
Yes No
Reclaimed Water Yes, for industrial uses Yes, NEWater Yes, for industrial uses No No No
Artificial Recharge No No Yes, to avoid salination Yes, to recharge
ground water
No No
Source augmentation in advance Yes Yes Yes No No No
NRW Reduction Measures
Leakage Mapping Yes Yes Yes Yes No No
Timely management of distribution
system
Yes Yes Yes No No No
Efficiency Improvement in distribution
system
Yes Yes Yes Yes No No
Source : Compiled from Case studies review
Are
as
Need
to c
onc
ern
for
wa
ter
reso
urce
Ma
na
gem
ent
in
study a
rea
Chapte
r 2
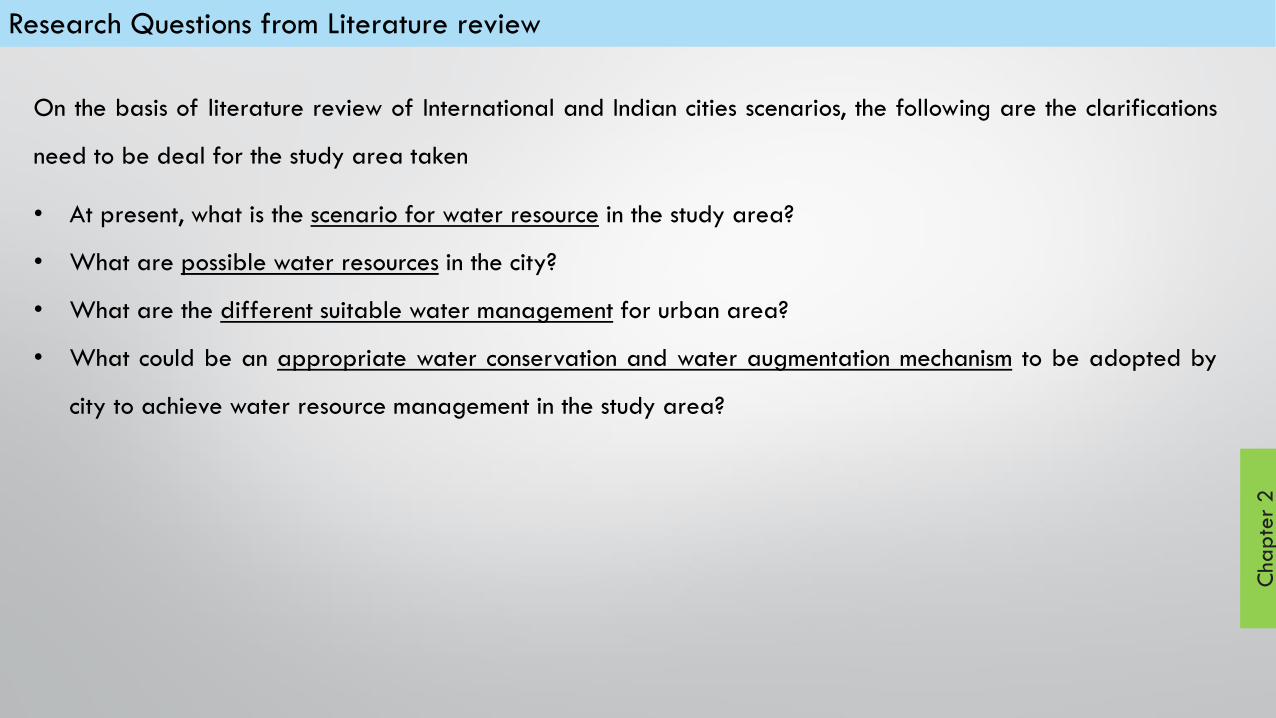
Research Questions from Literature review
On the basis of literature review of International and Indian cities scenarios, the following are the clarifications
need to be deal for the study area taken
• At present, what is the scenario for water resource in the study area?
• What are possible water resources in the city?
• What are the different suitable water management for urban area?
• What could be an appropriate water conservation and water augmentation mechanism to be adopted by
city to achieve water resource management in the study area?
Chapte
r 2

STUDY AREA DELINEATIONAdministrative zones
Population Trends
Budget Analysis
Source: Madurai CDP, Madurai Corporation
Madurai Corporation
Madurai
Corporatio
n
North side
of Vaigai
River
South side of Vaigai River Total
North Zone East Zone South Zone West Zone
Ward (Nos) 21 16 19 16 72
Ward List 1 - 21 44 – 59 31 – 43 &
60 – 65
22- 30 &
66 -72
Area
(Sq.km)
19.50 6.12 7.40 18.78 51.96
Cha
pte
r 3
Anaiyur
AvaniyapuramThirupparanku
ndram
Source: Madurai CDP & Madurai Corporation
Source: Madurai Corporation; Census 2011
Source: Madurai Corporation. Madurai CDP
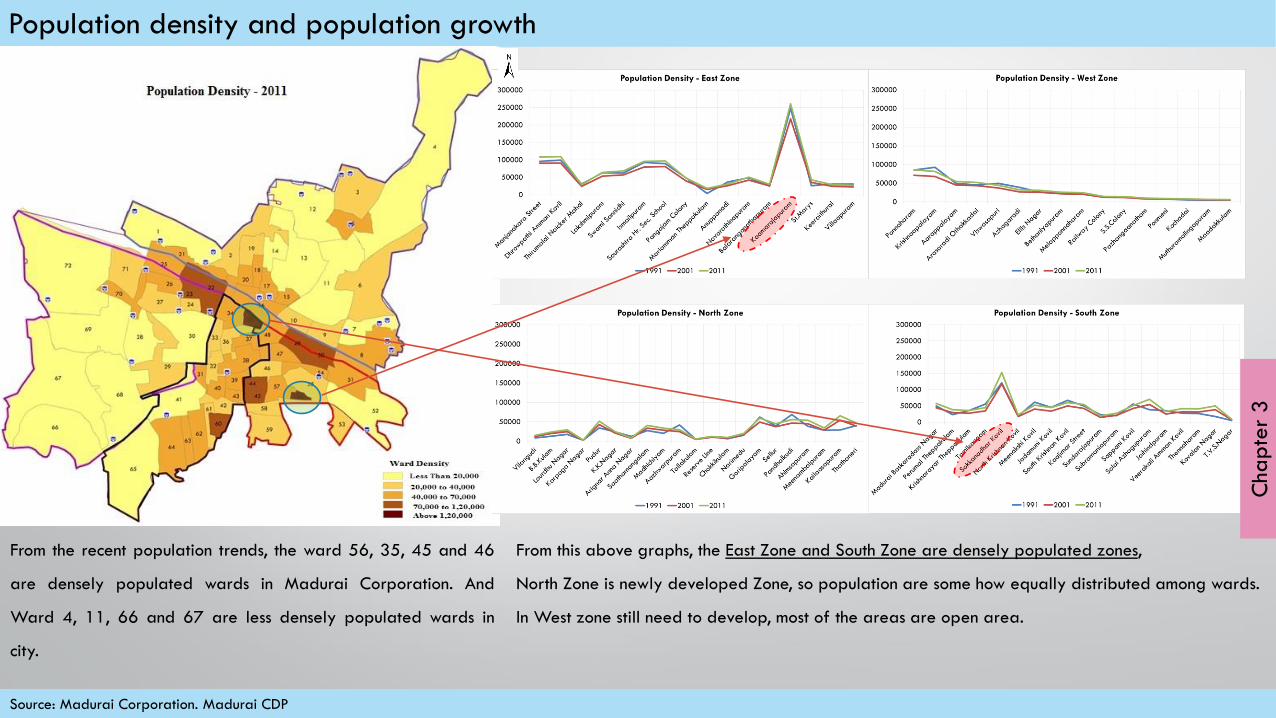
Population density and population growth
From the recent population trends, the ward 56, 35, 45 and 46
are densely populated wards in Madurai Corporation. And
Ward 4, 11, 66 and 67 are less densely populated wards in
city.
From this above graphs, the East Zone and South Zone are densely populated zones,
North Zone is newly developed Zone, so population are some how equally distributed among wards.
In West zone still need to develop, most of the areas are open area.
Cha
pte
r 3
Source: Madurai Corporation
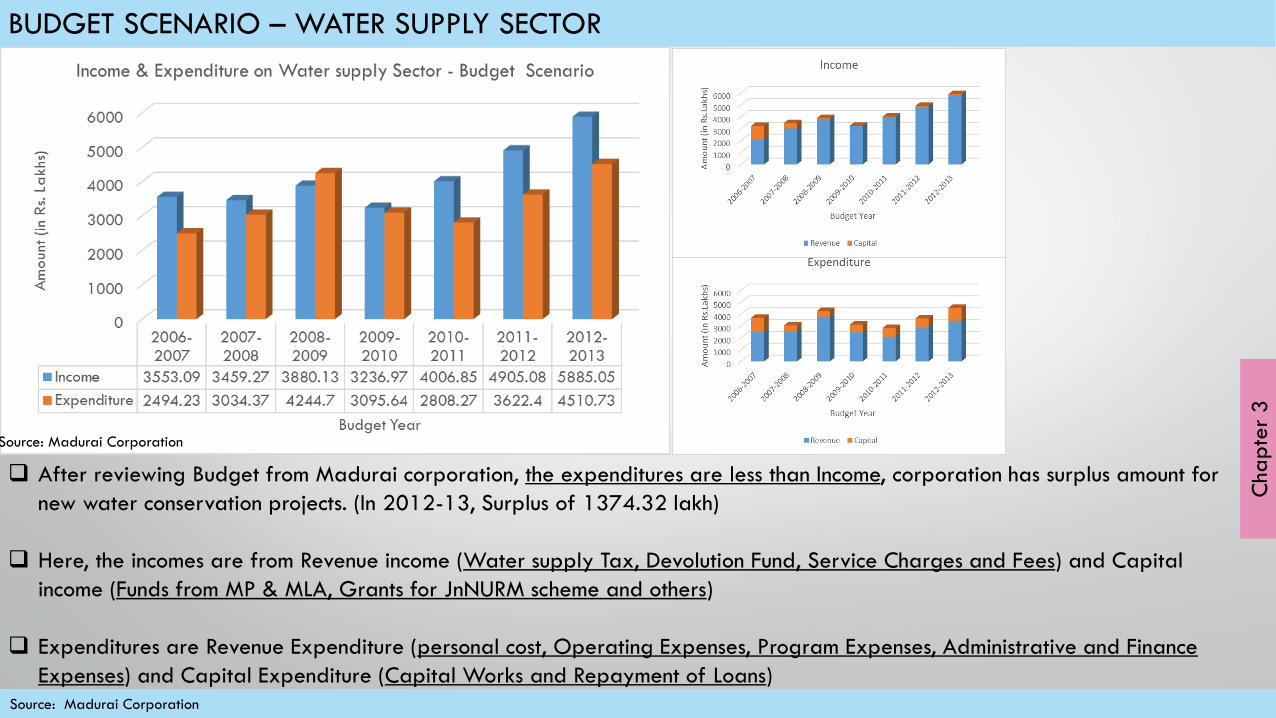
BUDGET SCENARIO – WATER SUPPLY SECTOR
After reviewing Budget from Madurai corporation, the expenditures are less than Income, corporation has surplus amount for
new water conservation projects. (In 2012-13, Surplus of 1374.32 lakh)
Here, the incomes are from Revenue income (Water supply Tax, Devolution Fund, Service Charges and Fees) and Capital
income (Funds from MP & MLA, Grants for JnNURM scheme and others)
Expenditures are Revenue Expenditure (personal cost, Operating Expenses, Program Expenses, Administrative and Finance
Expenses) and Capital Expenditure (Capital Works and Repayment of Loans)
Cha
pte
r 3
Source: Madurai Corporation

WATER SUPPLYWater Source
Water supply Process
Per Capita Supply
Water supply Indicators
Source: Madurai Corporation, Google Earth
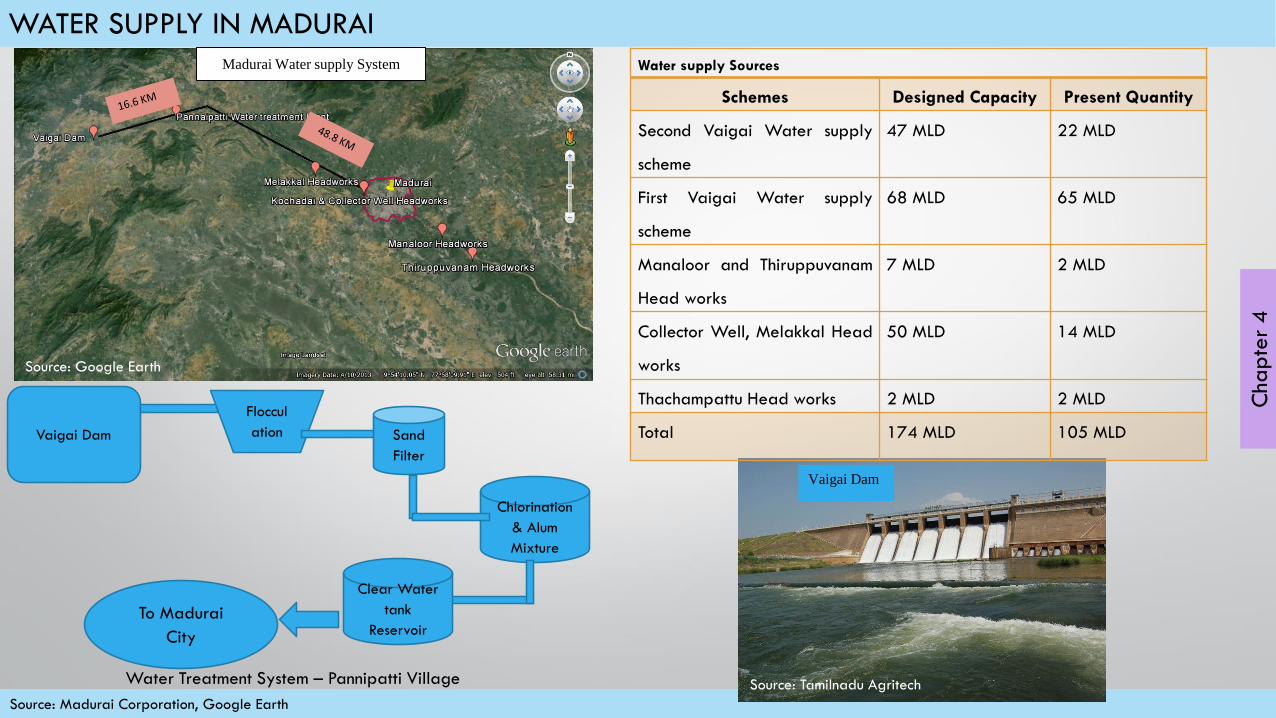
WATER SUPPLY IN MADURAI
Madurai Water supply System
Vaigai Dam
Water supply Sources
Schemes Designed Capacity Present Quantity
Second Vaigai Water supply
scheme
47 MLD 22 MLD
First Vaigai Water supply
scheme
68 MLD 65 MLD
Manaloor and Thiruppuvanam
Head works
7 MLD 2 MLD
Collector Well, Melakkal Head
works
50 MLD 14 MLD
Thachampattu Head works 2 MLD 2 MLD
Total 174 MLD 105 MLDVaigai Dam
Floccul
ation Sand
Filter
Chlorination
& Alum
Mixture
Clear Water
tank
ReservoirTo Madurai
City
Water Treatment System – Pannipatti Village
Chap
ter
4
Source: Google Earth
Source: Tamilnadu Agritech
Source: TWAD Board; Madurai Corporation
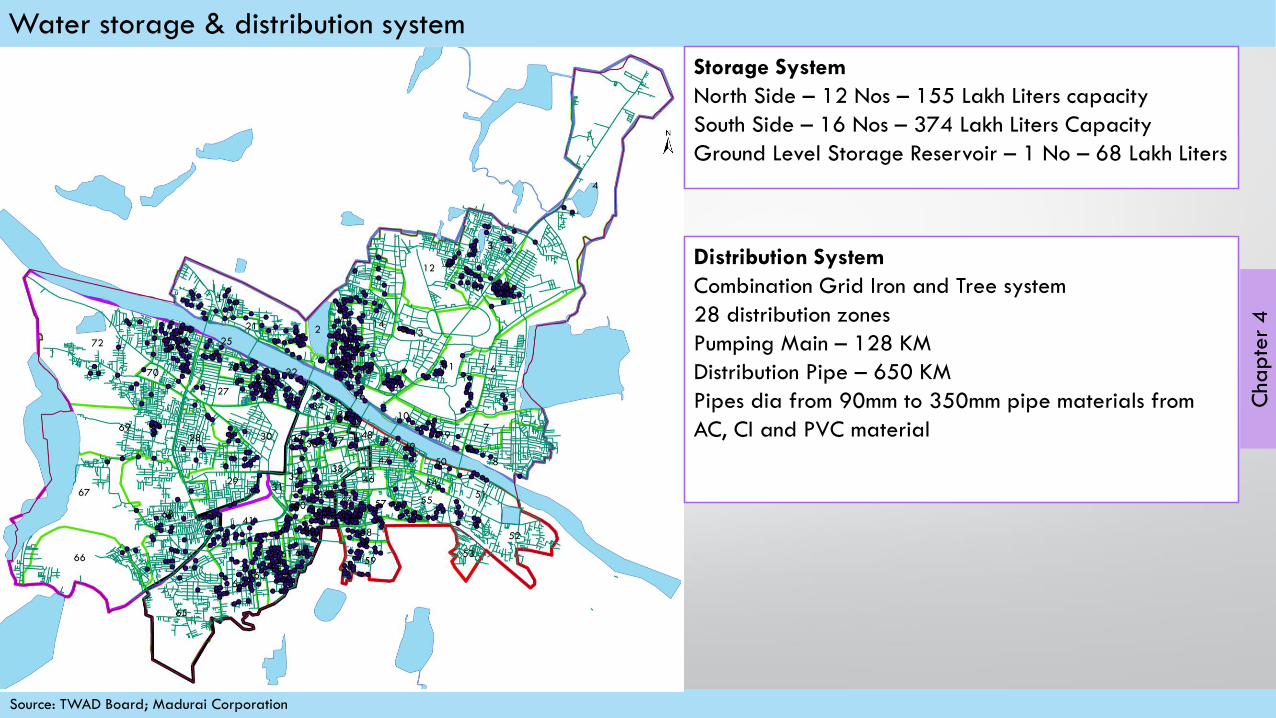
Water storage & distribution system
Storage System
North Side – 12 Nos – 155 Lakh Liters capacity
South Side – 16 Nos – 374 Lakh Liters Capacity
Ground Level Storage Reservoir – 1 No – 68 Lakh Liters
Distribution System
Combination Grid Iron and Tree system
28 distribution zones
Pumping Main – 128 KM
Distribution Pipe – 650 KM
Pipes dia from 90mm to 350mm pipe materials from
AC, CI and PVC material
Chap
ter
4
Source: Madurai Corporation
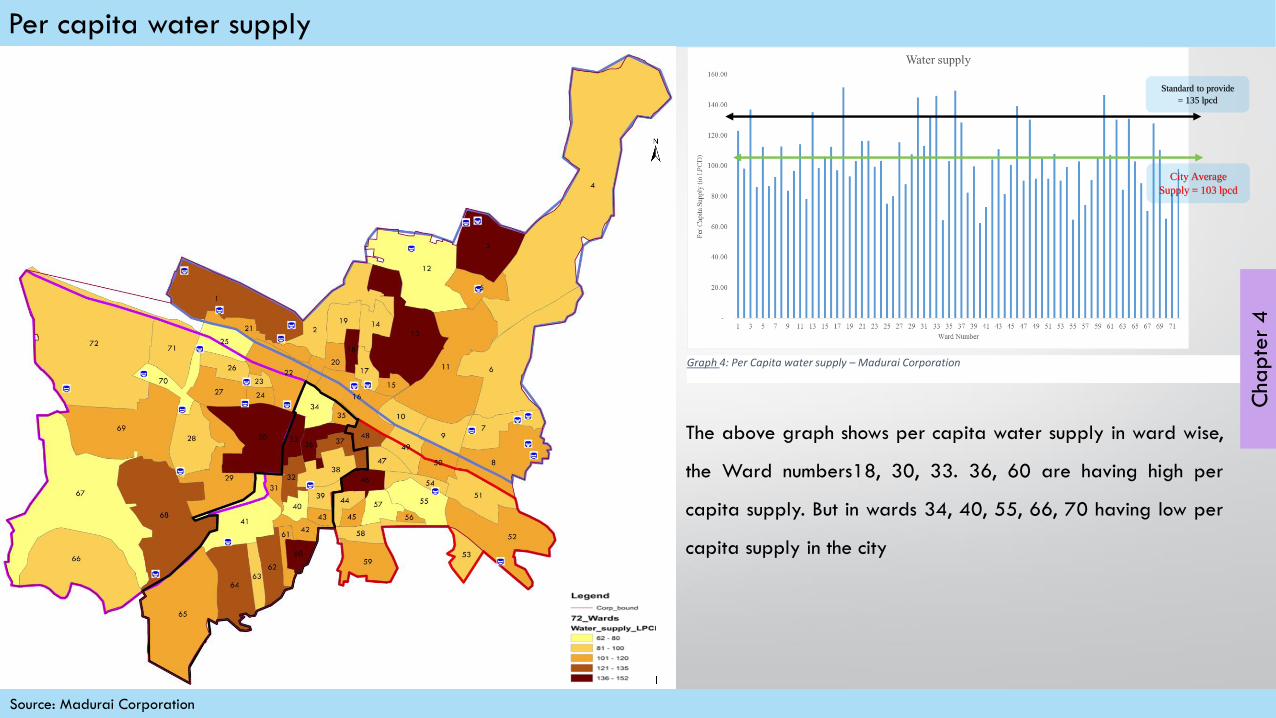
Per capita water supply
Standard to provide
= 135 lpcd
City Average
Supply = 103 lpcd
Graph 4: Per Capita water supply – Madurai Corporation
The above graph shows per capita water supply in ward wise,
the Ward numbers18, 30, 33. 36, 60 are having high per
capita supply. But in wards 34, 40, 55, 66, 70 having low per
capita supply in the city
Chap
ter
4
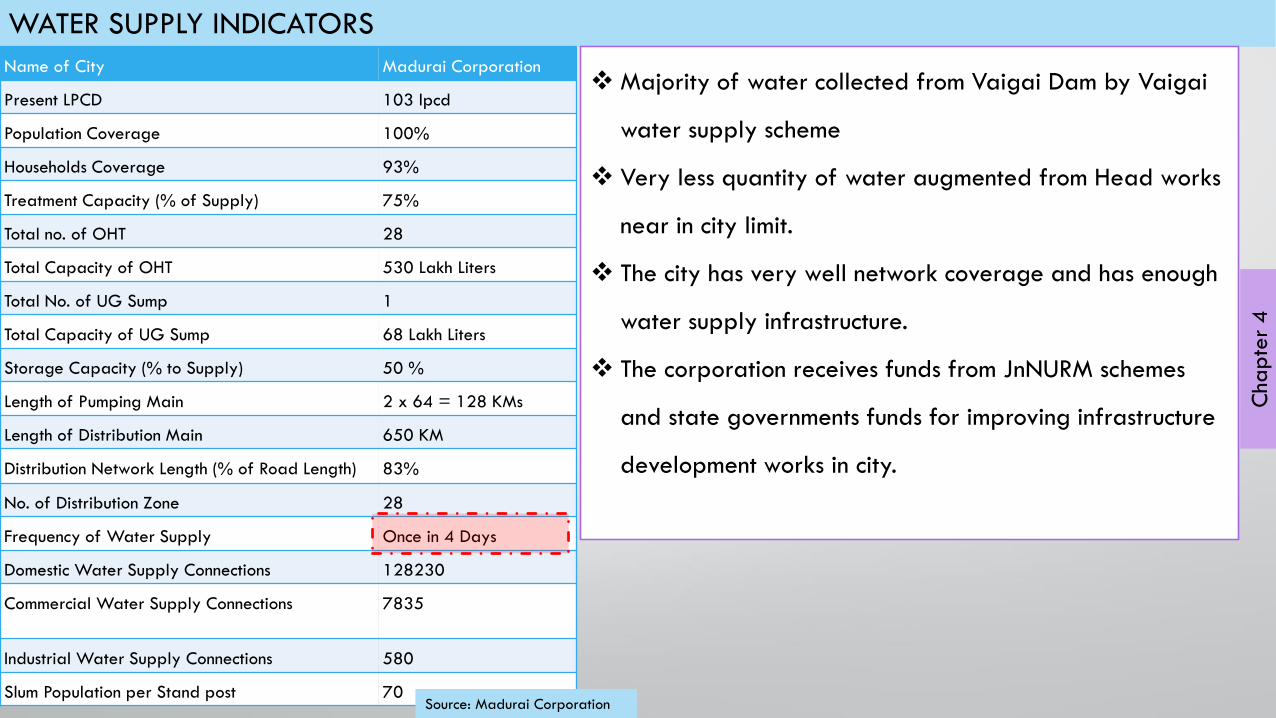
WATER SUPPLY INDICATORS
Name of City Madurai Corporation
Present LPCD 103 lpcd
Population Coverage 100%
Households Coverage 93%
Treatment Capacity (% of Supply) 75%
Total no. of OHT 28
Total Capacity of OHT 530 Lakh Liters
Total No. of UG Sump 1
Total Capacity of UG Sump 68 Lakh Liters
Storage Capacity (% to Supply) 50 %
Length of Pumping Main 2 x 64 = 128 KMs
Length of Distribution Main 650 KM
Distribution Network Length (% of Road Length) 83%
No. of Distribution Zone 28
Frequency of Water Supply Once in 4 Days
Domestic Water Supply Connections 128230
Commercial Water Supply Connections 7835
Industrial Water Supply Connections 580
Slum Population per Stand post 70
Majority of water collected from Vaigai Dam by Vaigai
water supply scheme
Very less quantity of water augmented from Head works
near in city limit.
The city has very well network coverage and has enough
water supply infrastructure.
The corporation receives funds from JnNURM schemes
and state governments funds for improving infrastructure
development works in city.
Chap
ter
4
Source: Madurai Corporation
ANALYSISIssues (Surface Water & Ground Water)
Non Revenue Water
Water Demand Projection
Deficiency Measures (Water Demand Vs. Water Source Availability)
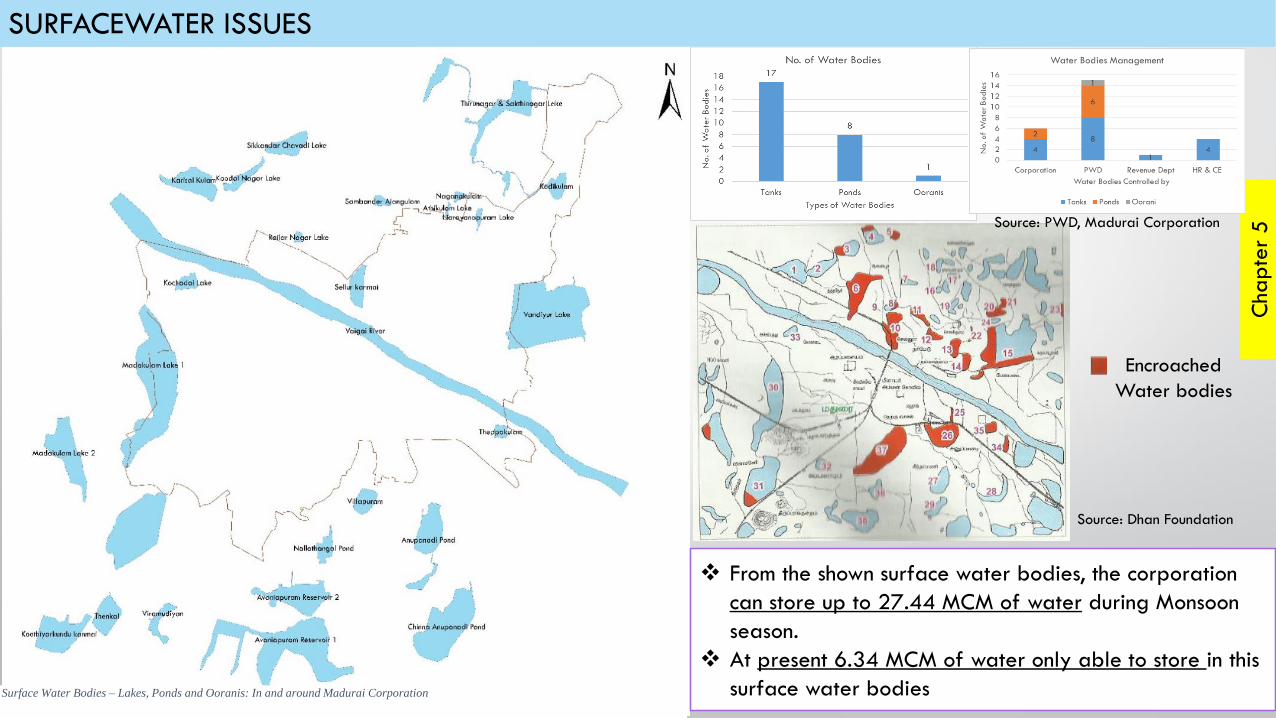
SURFACEWATER ISSUES
Surface Water Bodies – Lakes, Ponds and Ooranis: In and around Madurai Corporation
From the shown surface water bodies, the corporation
can store up to 27.44 MCM of water during Monsoon
season.
At present 6.34 MCM of water only able to store in this
surface water bodies
Encroached
Water bodies
Source: Dhan Foundation
Cha
pte
r5Source: PWD, Madurai Corporation
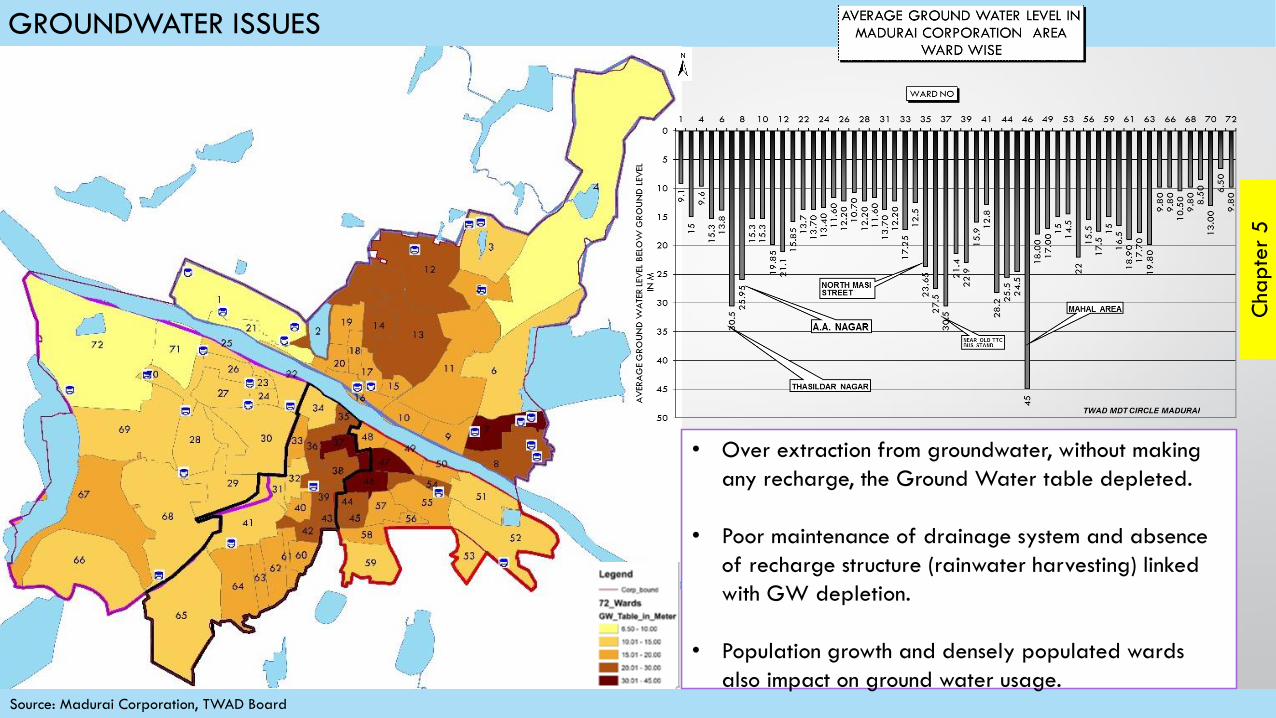
Source: Madurai Corporation, TWAD Board
GROUNDWATER ISSUES
• Over extraction from groundwater, without making
any recharge, the Ground Water table depleted.
• Poor maintenance of drainage system and absence
of recharge structure (rainwater harvesting) linked
with GW depletion.
• Population growth and densely populated wards
also impact on ground water usage.
Cha
pte
r5
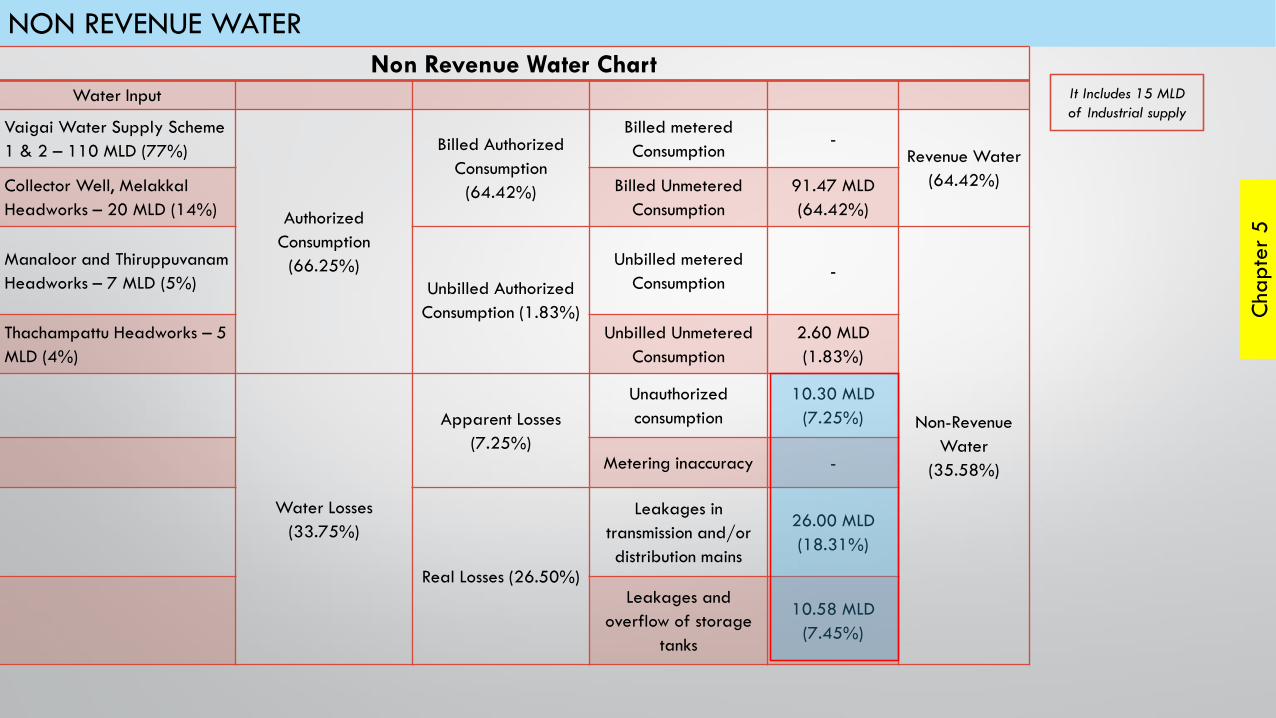
NON REVENUE WATER
Non Revenue Water ChartWater Input
Vaigai Water Supply Scheme
1 & 2 – 110 MLD (77%)
Authorized
Consumption
(66.25%)
Billed Authorized
Consumption
(64.42%)
Billed metered
Consumption-
Revenue Water
(64.42%)Collector Well, Melakkal
Headworks – 20 MLD (14%)
Billed Unmetered
Consumption
91.47 MLD
(64.42%)
Manaloor and Thiruppuvanam
Headworks – 7 MLD (5%) Unbilled Authorized
Consumption (1.83%)
Unbilled metered
Consumption-
Non-Revenue
Water
(35.58%)
Thachampattu Headworks – 5
MLD (4%)
Unbilled Unmetered
Consumption
2.60 MLD
(1.83%)
Water Losses
(33.75%)
Apparent Losses
(7.25%)
Unauthorized
consumption
10.30 MLD
(7.25%)
Metering inaccuracy -
Real Losses (26.50%)
Leakages in
transmission and/or
distribution mains
26.00 MLD
(18.31%)
Leakages and
overflow of storage
tanks
10.58 MLD
(7.45%)
It Includes 15 MLD
of Industrial supply
Cha
pte
r5
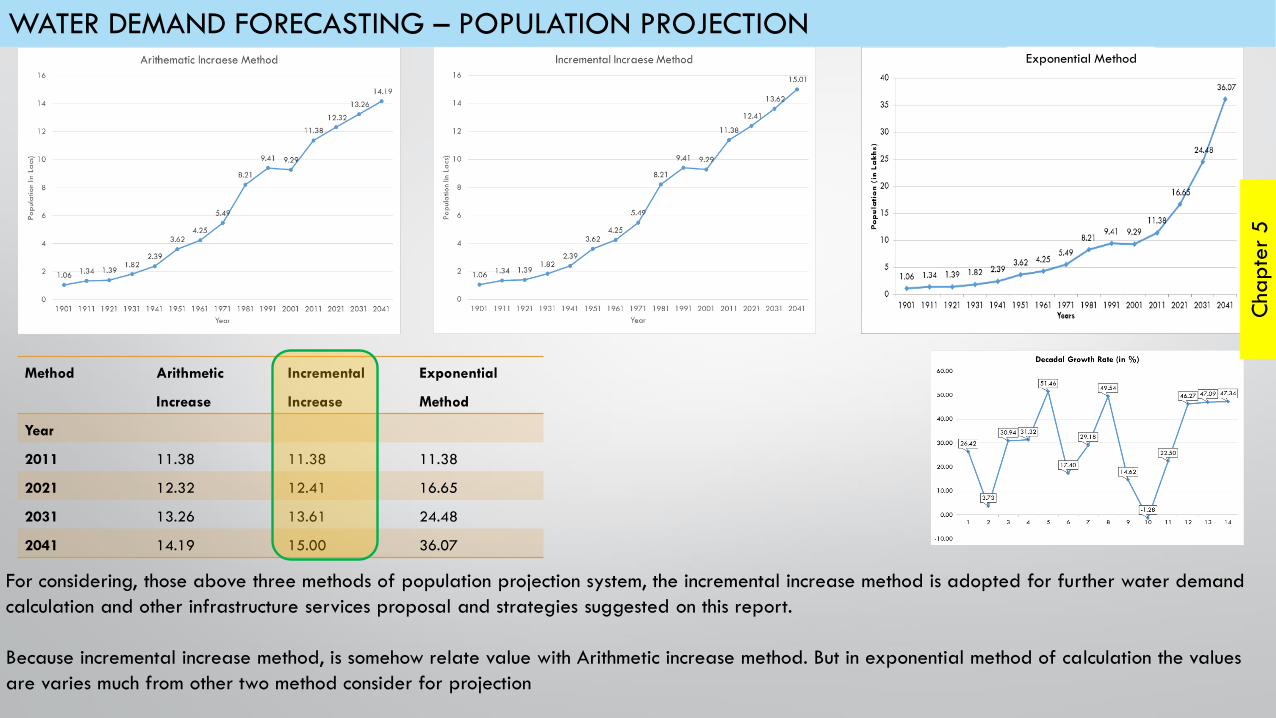
WATER DEMAND FORECASTING – POPULATION PROJECTION
For considering, those above three methods of population projection system, the incremental increase method is adopted for further water demand
calculation and other infrastructure services proposal and strategies suggested on this report.
Because incremental increase method, is somehow relate value with Arithmetic increase method. But in exponential method of calculation the values
are varies much from other two method consider for projection
Exponential Method
Method Arithmetic
Increase
Incremental
Increase
Exponential
Method
Year
2011 11.38 11.38 11.38
2021 12.32 12.41 16.65
2031 13.26 13.61 24.48
2041 14.19 15.00 36.07
Cha
pte
r5
Source:: Discussion with Madurai corporation officials
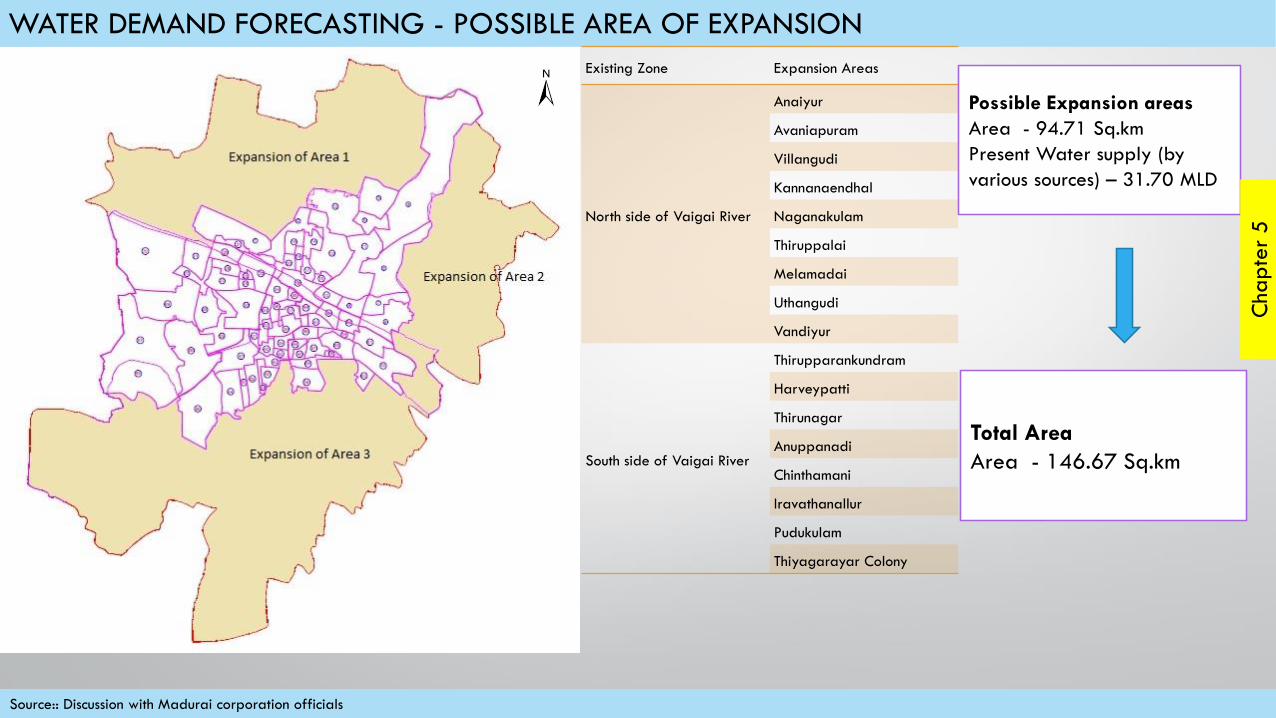
WATER DEMAND FORECASTING - POSSIBLE AREA OF EXPANSION
Existing Zone Expansion Areas
North side of Vaigai River
Anaiyur
Avaniapuram
Villangudi
Kannanaendhal
Naganakulam
Thiruppalai
Melamadai
Uthangudi
Vandiyur
South side of Vaigai River
Thirupparankundram
Harveypatti
Thirunagar
Anuppanadi
Chinthamani
Iravathanallur
Pudukulam
Thiyagarayar Colony
Possible Expansion areas
Area - 94.71 Sq.km
Present Water supply (by
various sources) – 31.70 MLD
Total Area
Area - 146.67 Sq.km
Cha
pte
r5
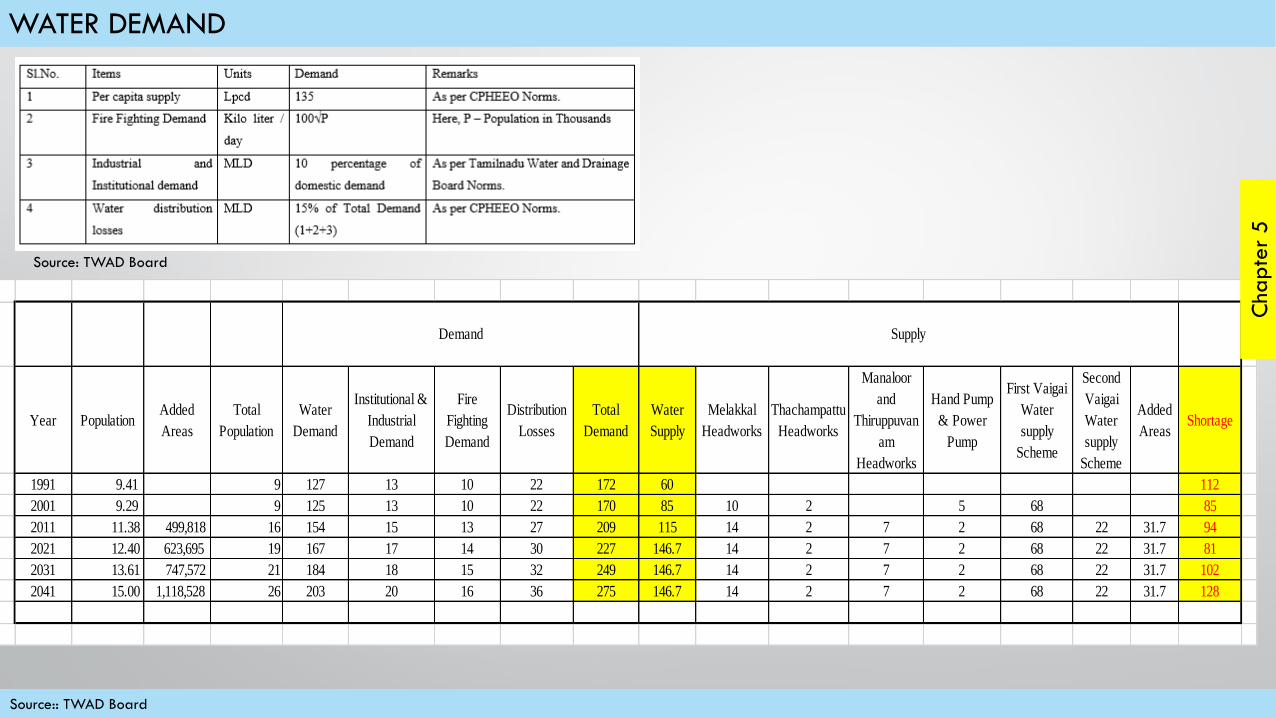
WATER DEMAND
Year PopulationAdded
Areas
Total
Population
Water
Demand
Institutional &
Industrial
Demand
Fire
Fighting
Demand
Distribution
Losses
Total
Demand
Water
Supply
Melakkal
Headworks
Thachampattu
Headworks
Manaloor
and
Thiruppuvan
am
Headworks
Hand Pump
& Power
Pump
First Vaigai
Water
supply
Scheme
Second
Vaigai
Water
supply
Scheme
Added
AreasShortage
1991 9.41 9 127 13 10 22 172 60 112
2001 9.29 9 125 13 10 22 170 85 10 2 5 68 85
2011 11.38 499,818 16 154 15 13 27 209 115 14 2 7 2 68 22 31.7 94
2021 12.40 623,695 19 167 17 14 30 227 146.7 14 2 7 2 68 22 31.7 81
2031 13.61 747,572 21 184 18 15 32 249 146.7 14 2 7 2 68 22 31.7 102
2041 15.00 1,118,528 26 203 20 16 36 275 146.7 14 2 7 2 68 22 31.7 128
Demand Supply
Cha
pte
r5
Source:: TWAD Board
Source: TWAD Board
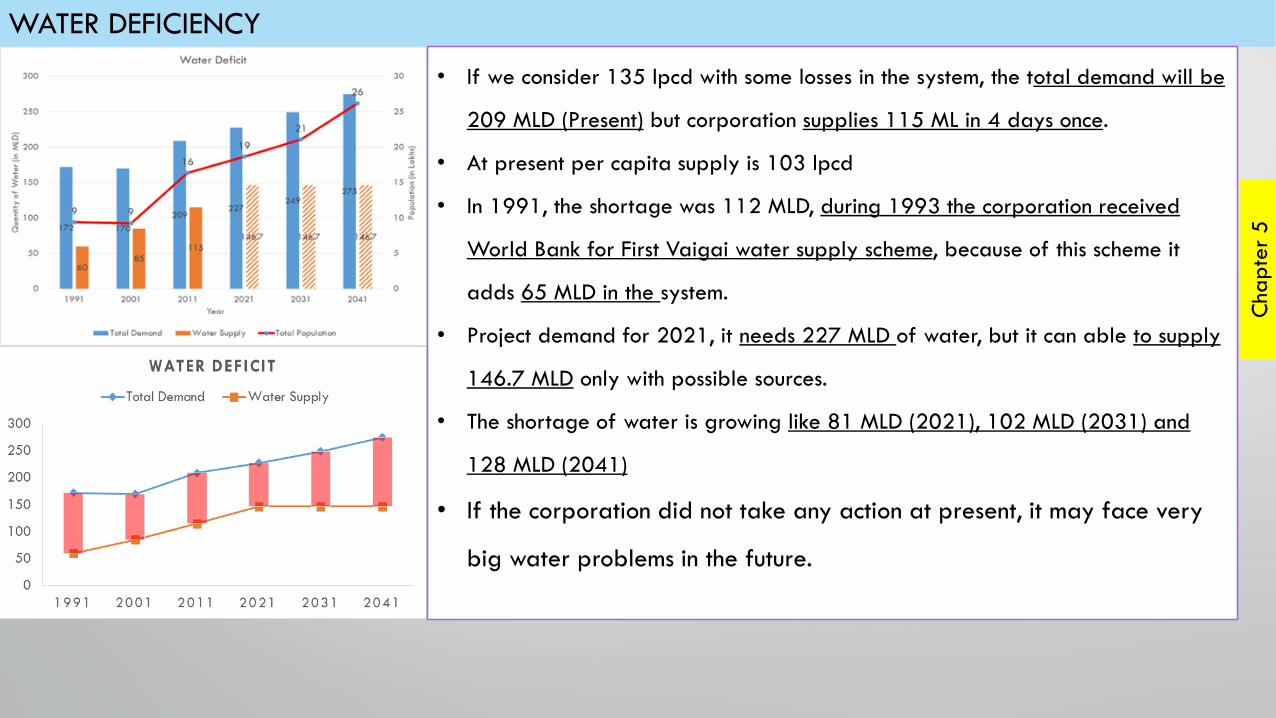
WATER DEFICIENCY
• If we consider 135 lpcd with some losses in the system, the total demand will be
209 MLD (Present) but corporation supplies 115 ML in 4 days once.
• At present per capita supply is 103 lpcd
• In 1991, the shortage was 112 MLD, during 1993 the corporation received
World Bank for First Vaigai water supply scheme, because of this scheme it
adds 65 MLD in the system.
• Project demand for 2021, it needs 227 MLD of water, but it can able to supply
146.7 MLD only with possible sources.
• The shortage of water is growing like 81 MLD (2021), 102 MLD (2031) and
128 MLD (2041)
• If the corporation did not take any action at present, it may face very
big water problems in the future.
Cha
pte
r5
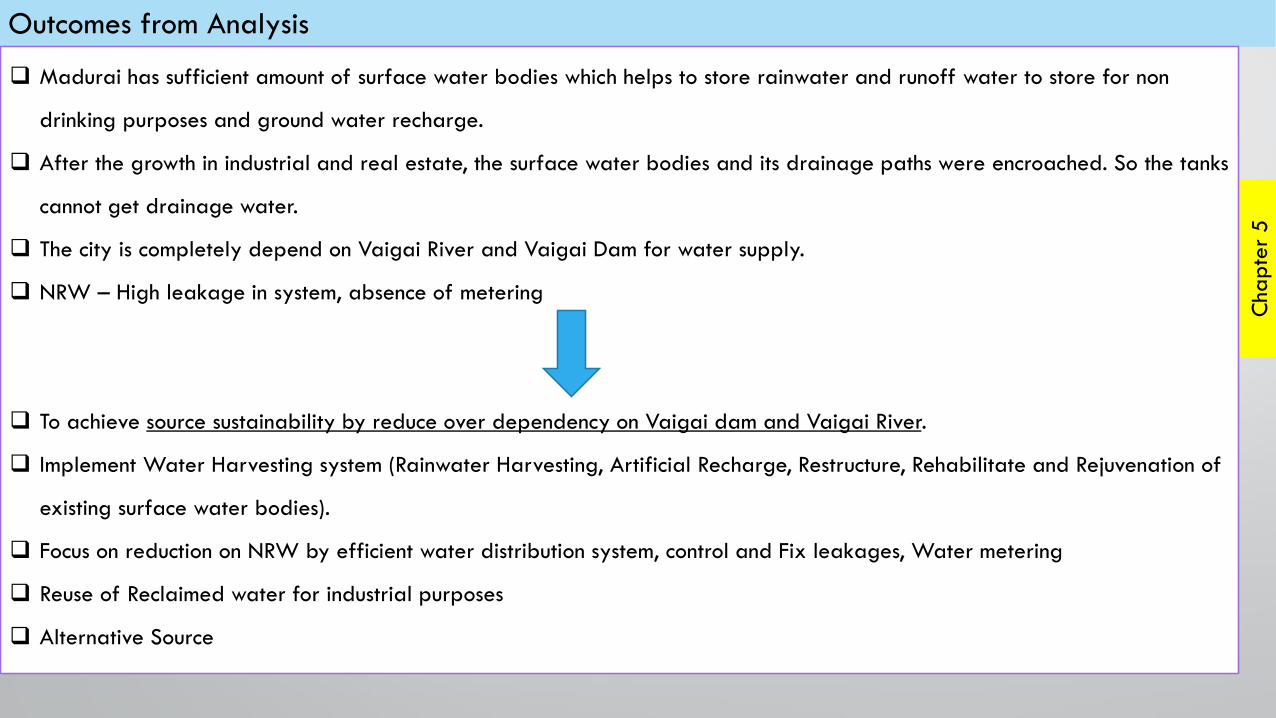
Outcomes from Analysis
Madurai has sufficient amount of surface water bodies which helps to store rainwater and runoff water to store for non
drinking purposes and ground water recharge.
After the growth in industrial and real estate, the surface water bodies and its drainage paths were encroached. So the tanks
cannot get drainage water.
The city is completely depend on Vaigai River and Vaigai Dam for water supply.
NRW – High leakage in system, absence of metering
To achieve source sustainability by reduce over dependency on Vaigai dam and Vaigai River.
Implement Water Harvesting system (Rainwater Harvesting, Artificial Recharge, Restructure, Rehabilitate and Rejuvenation of
existing surface water bodies).
Focus on reduction on NRW by efficient water distribution system, control and Fix leakages, Water metering
Reuse of Reclaimed water for industrial purposes
Alternative Source
Cha
pte
r5

PROPOSALS & STRATEGIESPossible Strategies
NRW Reduction
Water Harvesting
Reclaimed Water
Groundwater Extraction

Proposals and Strategies – Methods to be adopted for WRM
Cha
pte
r 6
Sl.No Strategies Major scope
1 Implement metering in all kind of water connections to regularize the water supply process and increase the revenue.
NRW Reduction
2 Use computer application and software for monitor water supply process.
3 Leakage Control – Water Auditing, Fix overflow sensor
4 Detect and regularize the illegal connection
5 Optimum usage of produced water
6 Harvesting of Rainwater and other water sourcesWater Harvesting
7 Artificial Recharge
8 Systems and technologies development for Recycling and Reuse of waste water for reducing burden on water resources. Reclaimed Water
9 Restoration and Rejuvenation of surface water bodies Alternate resources
10 Optimum use of conserved water
Management
approach
11 Maximum usage of storage reservoirs and Tanks
12 Improvement of water supply in scarce locations
13 Integration of surface water management and Ground Water management
14 Transfer the approach from water supply management to water demand management
15 Watershed level management approach
16 Private sector participation in water supply projects in capital and O&M activities. PSP
17 Public awareness campaign and IEC activities for economic use of water. IEC
Source: Water Resources Management-A World Bank Policy Paper
Proposals and Strategies – NRW Reduction
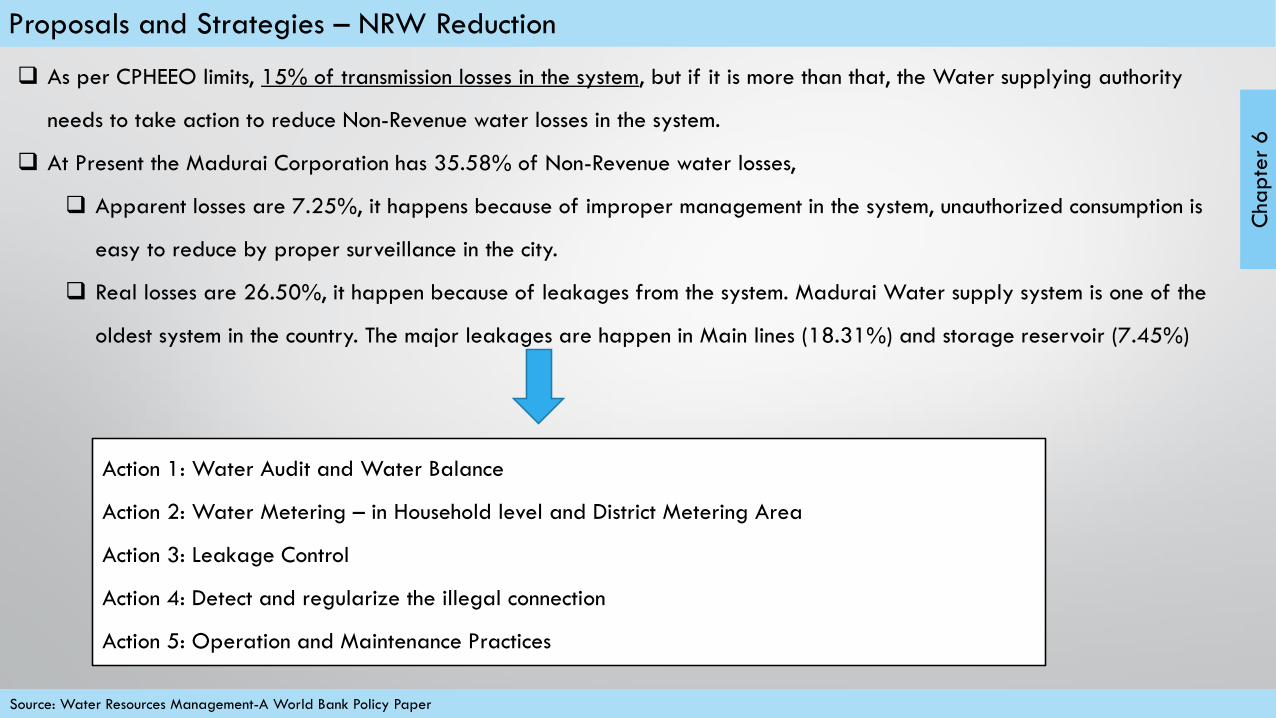
As per CPHEEO limits, 15% of transmission losses in the system, but if it is more than that, the Water supplying authority
needs to take action to reduce Non-Revenue water losses in the system.
At Present the Madurai Corporation has 35.58% of Non-Revenue water losses,
Apparent losses are 7.25%, it happens because of improper management in the system, unauthorized consumption is
easy to reduce by proper surveillance in the city.
Real losses are 26.50%, it happen because of leakages from the system. Madurai Water supply system is one of the
oldest system in the country. The major leakages are happen in Main lines (18.31%) and storage reservoir (7.45%)
Action 1: Water Audit and Water Balance
Action 2: Water Metering – in Household level and District Metering Area
Action 3: Leakage Control
Action 4: Detect and regularize the illegal connection
Action 5: Operation and Maintenance Practices
Cha
pte
r 6
Proposals and Strategies – NRW Reduction
Cha
pte
r 6
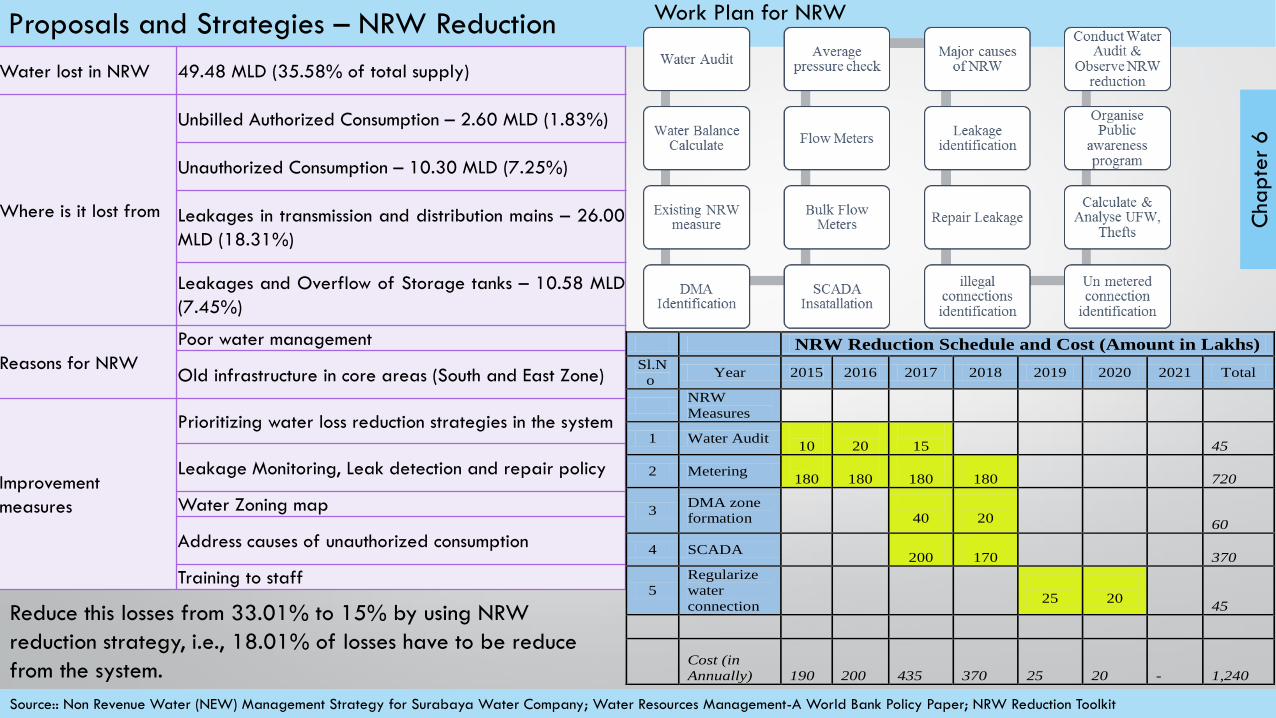
Water lost in NRW 49.48 MLD (35.58% of total supply)
Where is it lost from
Unbilled Authorized Consumption – 2.60 MLD (1.83%)
Unauthorized Consumption – 10.30 MLD (7.25%)
Leakages in transmission and distribution mains – 26.00
MLD (18.31%)
Leakages and Overflow of Storage tanks – 10.58 MLD
(7.45%)
Reasons for NRW
Poor water management
Old infrastructure in core areas (South and East Zone)
Improvement
measures
Prioritizing water loss reduction strategies in the system
Leakage Monitoring, Leak detection and repair policy
Water Zoning map
Address causes of unauthorized consumption
Training to staff
NRW Reduction Schedule and Cost (Amount in Lakhs)
Sl.N
o Year 2015 2016 2017 2018 2019 2020 2021 Total
NRW
Measures
1 Water Audit
10
20
15
45
2 Metering
180
180
180
180
720
3 DMA zone
formation
40
20
60
4 SCADA
200
170
370
5
Regularize
water
connection
25
20
45
Cost (in
Annually)
190
200
435
370
25
20
-
1,240
Work Plan for NRW
Reduce this losses from 33.01% to 15% by using NRW
reduction strategy, i.e., 18.01% of losses have to be reduce
from the system.
Source:: Non Revenue Water (NEW) Management Strategy for Surabaya Water Company; Water Resources Management-A World Bank Policy Paper; NRW Reduction Toolkit
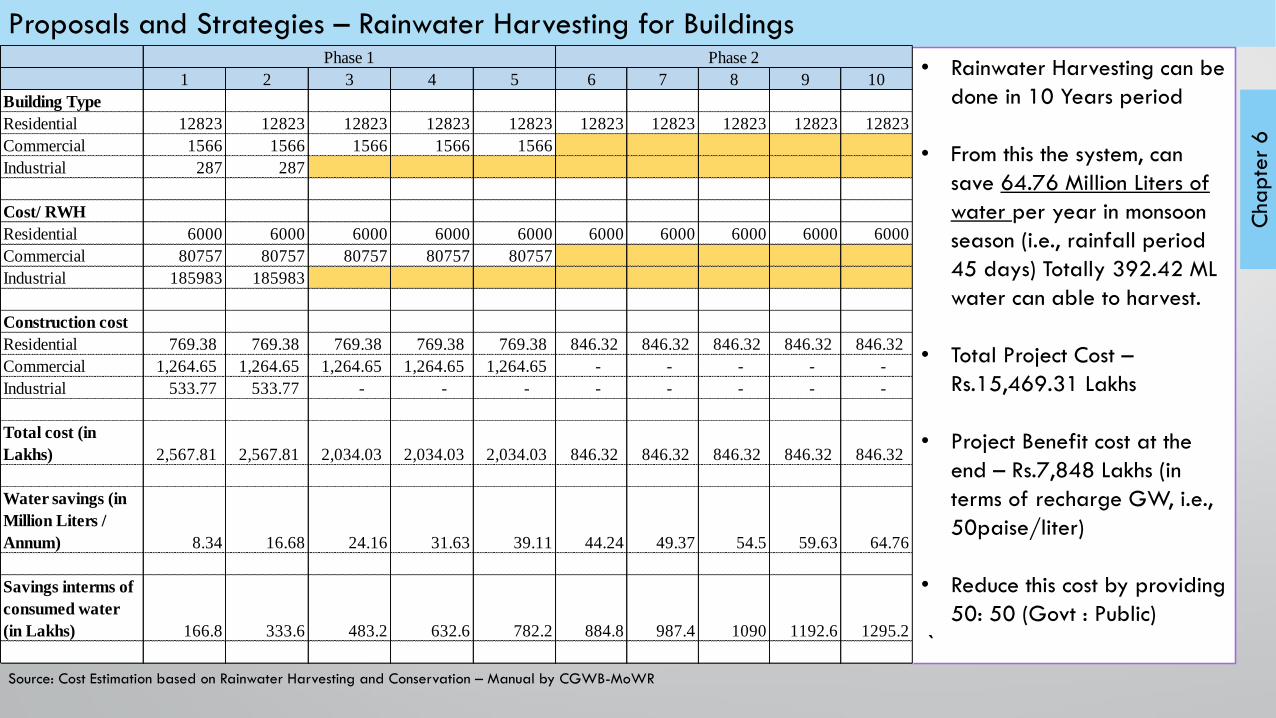
Proposals and Strategies – Rainwater Harvesting for Buildings
• Rainwater Harvesting can be
done in 10 Years period
• From this the system, can
save 64.76 Million Liters of
water per year in monsoon
season (i.e., rainfall period
45 days) Totally 392.42 ML
water can able to harvest.
• Total Project Cost –
Rs.15,469.31 Lakhs
• Project Benefit cost at the
end – Rs.7,848 Lakhs (in
terms of recharge GW, i.e.,
50paise/liter)
• Reduce this cost by providing
50: 50 (Govt : Public)
`
Cha
pte
r 6
Source: Cost Estimation based on Rainwater Harvesting and Conservation – Manual by CGWB-MoWR
1 2 3 4 5 6 7 8 9 10
Building Type
Residential 12823 12823 12823 12823 12823 12823 12823 12823 12823 12823
Commercial 1566 1566 1566 1566 1566
Industrial 287 287
Cost/ RWH
Residential 6000 6000 6000 6000 6000 6000 6000 6000 6000 6000
Commercial 80757 80757 80757 80757 80757
Industrial 185983 185983
Construction cost
Residential 769.38 769.38 769.38 769.38 769.38 846.32 846.32 846.32 846.32 846.32
Commercial 1,264.65 1,264.65 1,264.65 1,264.65 1,264.65 - - - - -
Industrial 533.77 533.77 - - - - - - - -
Total cost (in
Lakhs) 2,567.81 2,567.81 2,034.03 2,034.03 2,034.03 846.32 846.32 846.32 846.32 846.32
Water savings (in
Million Liters /
Annum) 8.34 16.68 24.16 31.63 39.11 44.24 49.37 54.5 59.63 64.76
Savings interms of
consumed water
(in Lakhs) 166.8 333.6 483.2 632.6 782.2 884.8 987.4 1090 1192.6 1295.2
Phase 2Phase 1
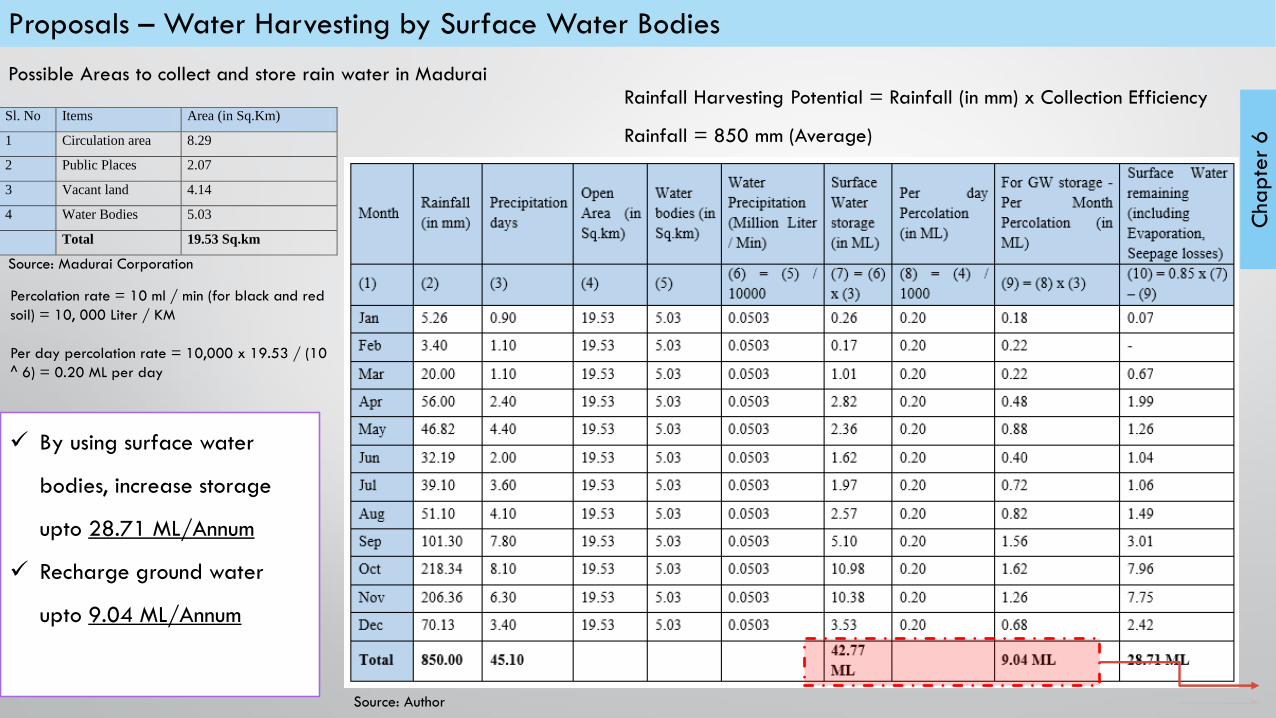
Proposals – Water Harvesting by Surface Water Bodies
Rainfall Harvesting Potential = Rainfall (in mm) x Collection Efficiency
Rainfall = 850 mm (Average)Sl. No Items Area (in Sq.Km)
1 Circulation area 8.29
2 Public Places 2.07
3 Vacant land 4.14
4 Water Bodies 5.03
Total 19.53 Sq.km
Possible Areas to collect and store rain water in Madurai
Percolation rate = 10 ml / min (for black and red
soil) = 10, 000 Liter / KM
Per day percolation rate = 10,000 x 19.53 / (10
^ 6) = 0.20 ML per day
By using surface water
bodies, increase storage
upto 28.71 ML/Annum
Recharge ground water
upto 9.04 ML/Annum
Cha
pte
r 6
Source: Author
Source: Madurai Corporation
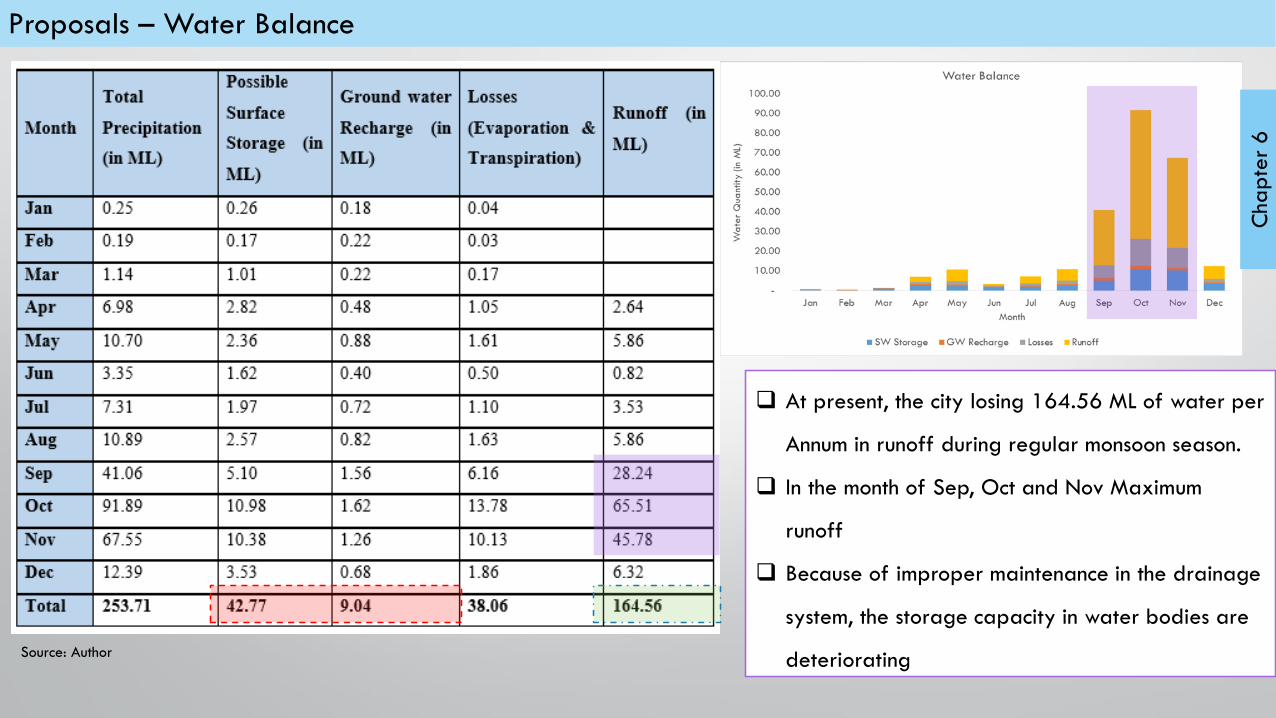
Proposals – Water Balance
At present, the city losing 164.56 ML of water per
Annum in runoff during regular monsoon season.
In the month of Sep, Oct and Nov Maximum
runoff
Because of improper maintenance in the drainage
system, the storage capacity in water bodies are
deteriorating
Cha
pte
r 6
Source: Author
Source: PWD, Madurai Corporation
GROUNDWATER EXPLORATION
Cha
pte
r 6
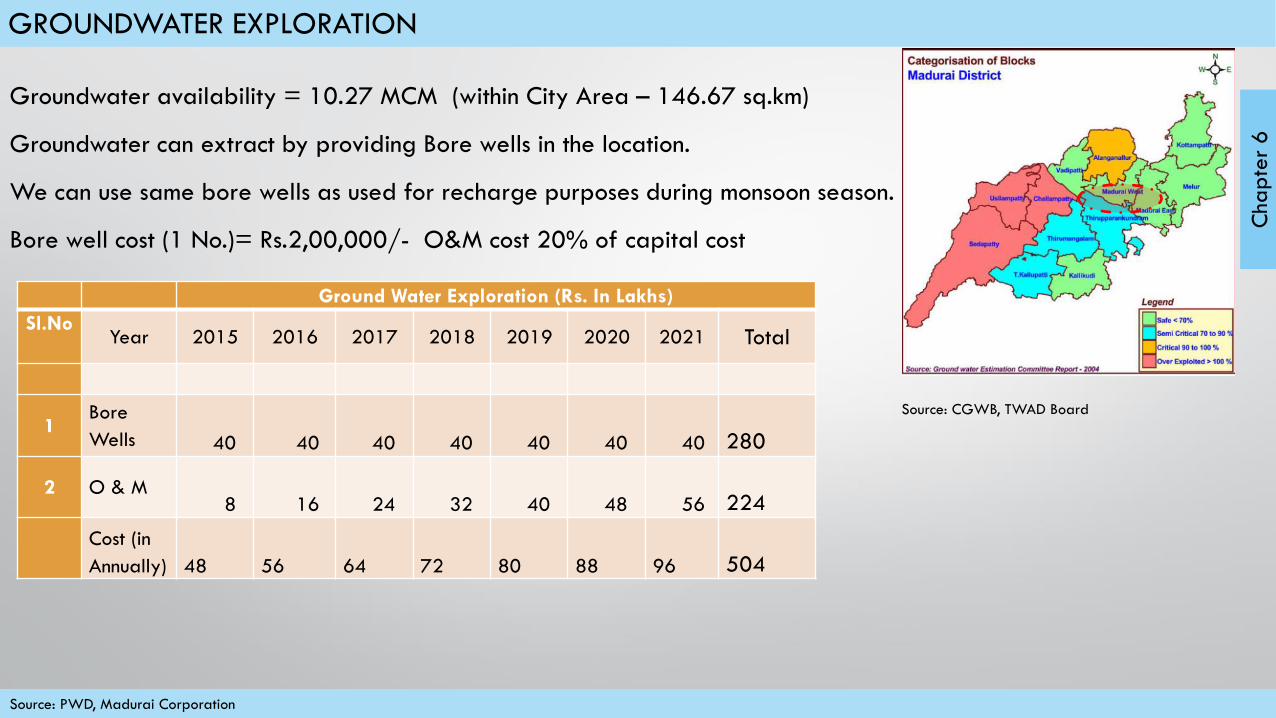
Groundwater availability = 10.27 MCM (within City Area – 146.67 sq.km)
Groundwater can extract by providing Bore wells in the location.
We can use same bore wells as used for recharge purposes during monsoon season.
Bore well cost (1 No.)= Rs.2,00,000/- O&M cost 20% of capital cost
Ground Water Exploration (Rs. In Lakhs)
Sl.NoYear 2015 2016 2017 2018 2019 2020 2021 Total
1Bore
Wells 40 40 40 40 40 40 40 280
2 O & M 8 16 24 32 40 48 56 224
Cost (in
Annually) 48 56 64 72 80 88 96 504
Source: CGWB, TWAD Board
Proposals and Strategies – Waste Reuse in Industrial purposes
Cha
pte
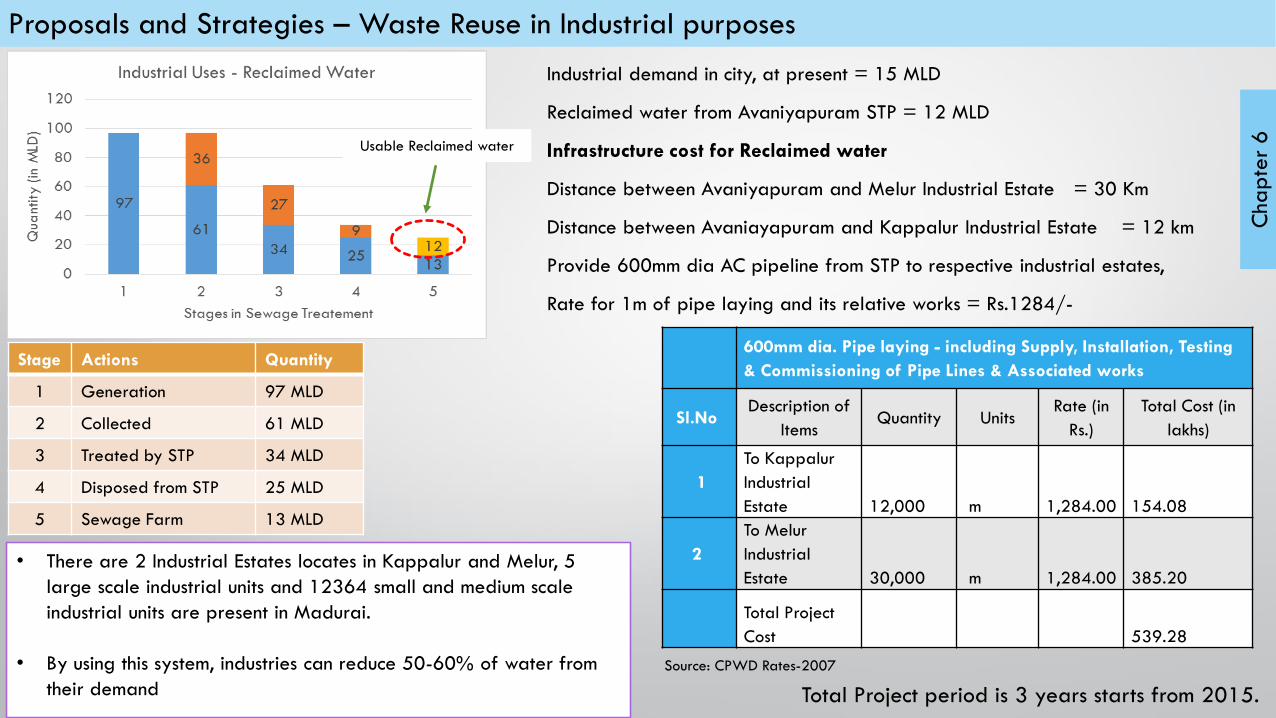
r 6Usable Reclaimed water
Stage Actions Quantity
1 Generation 97 MLD
2 Collected 61 MLD
3 Treated by STP 34 MLD
4 Disposed from STP 25 MLD
5 Sewage Farm 13 MLD
Industrial demand in city, at present = 15 MLD
Reclaimed water from Avaniyapuram STP = 12 MLD
Infrastructure cost for Reclaimed water
Distance between Avaniyapuram and Melur Industrial Estate = 30 Km
Distance between Avaniayapuram and Kappalur Industrial Estate = 12 km
Provide 600mm dia AC pipeline from STP to respective industrial estates,
Rate for 1m of pipe laying and its relative works = Rs.1284/-
600mm dia. Pipe laying - including Supply, Installation, Testing
& Commissioning of Pipe Lines & Associated works
Sl.NoDescription of
ItemsQuantity Units
Rate (in
Rs.)
Total Cost (in
lakhs)
1
To Kappalur
Industrial
Estate 12,000 m 1,284.00 154.08
2
To Melur
Industrial
Estate 30,000 m 1,284.00 385.20
Total Project
Cost 539.28
Total Project period is 3 years starts from 2015.
Source: CPWD Rates-2007
• There are 2 Industrial Estates locates in Kappalur and Melur, 5
large scale industrial units and 12364 small and medium scale
industrial units are present in Madurai.
• By using this system, industries can reduce 50-60% of water from
their demand
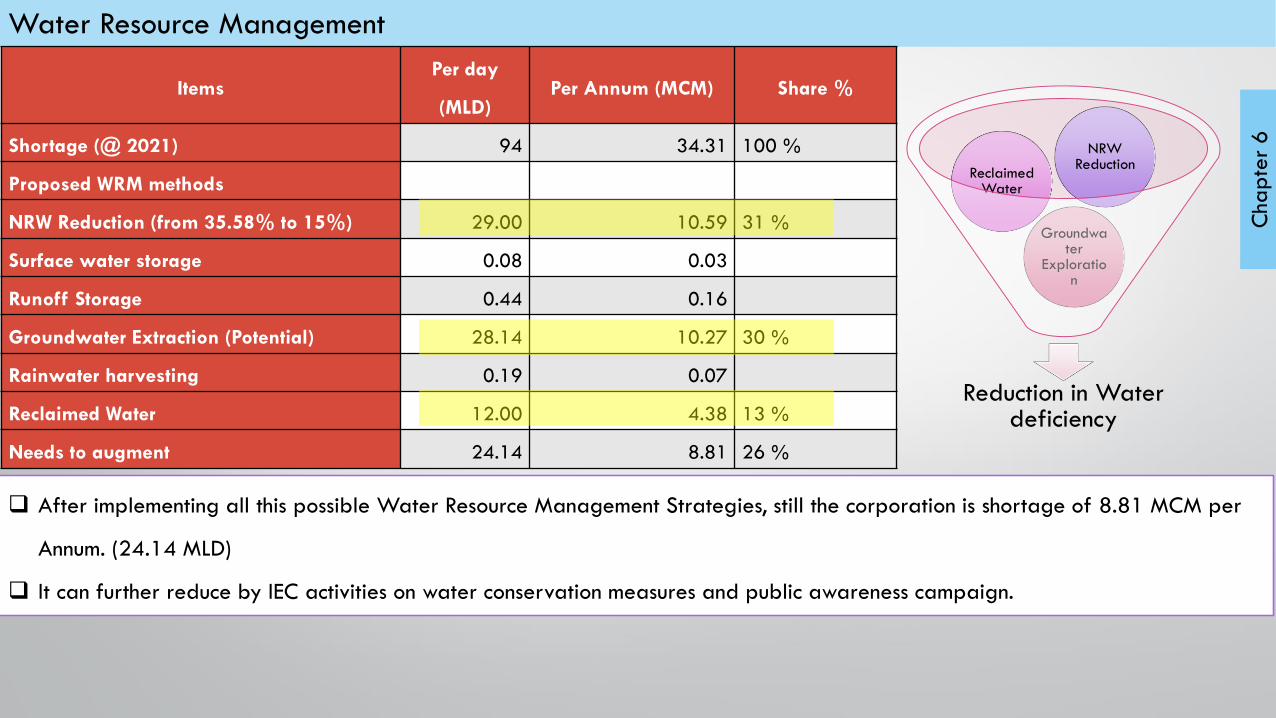
Water Resource Management
After implementing all this possible Water Resource Management Strategies, still the corporation is shortage of 8.81 MCM per
Annum. (24.14 MLD)
It can further reduce by IEC activities on water conservation measures and public awareness campaign.
Cha
pte
r 6
ItemsPer day
(MLD)Per Annum (MCM) Share %
Shortage (@ 2021) 94 34.31 100 %
Proposed WRM methods
NRW Reduction (from 35.58% to 15%) 29.00 10.59 31 %
Surface water storage 0.08 0.03
Runoff Storage 0.44 0.16
Groundwater Extraction (Potential) 28.14 10.27 30 %
Rainwater harvesting 0.19 0.07
Reclaimed Water 12.00 4.38 13 %
Needs to augment 24.14 8.81 26 %
Reduction in Water deficiency
Groundwater
Exploration
Reclaimed Water
NRW Reduction
Water Resource Management
Cha
pte
r 6
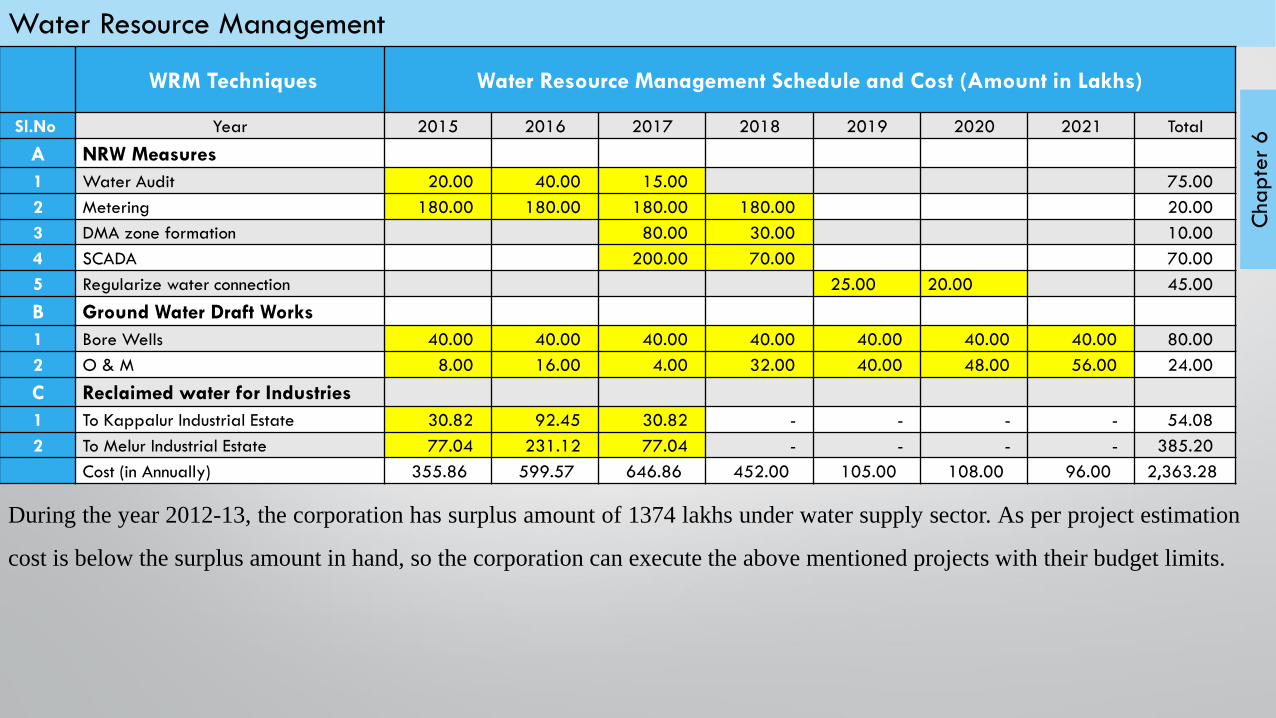
WRM Techniques Water Resource Management Schedule and Cost (Amount in Lakhs)
Sl.No Year 2015 2016 2017 2018 2019 2020 2021 Total
A NRW Measures
1 Water Audit 20.00 40.00 15.00 75.00
2 Metering 180.00 180.00 180.00 180.00 20.00
3 DMA zone formation 80.00 30.00 10.00
4 SCADA 200.00 70.00 70.00
5 Regularize water connection 25.00 20.00 45.00
B Ground Water Draft Works
1 Bore Wells 40.00 40.00 40.00 40.00 40.00 40.00 40.00 80.00
2 O & M 8.00 16.00 4.00 32.00 40.00 48.00 56.00 24.00
C Reclaimed water for Industries
1 To Kappalur Industrial Estate 30.82 92.45 30.82 - - - - 54.08
2 To Melur Industrial Estate 77.04 231.12 77.04 - - - - 385.20
Cost (in Annually) 355.86 599.57 646.86 452.00 105.00 108.00 96.00 2,363.28
During the year 2012-13, the corporation has surplus amount of 1374 lakhs under water supply sector. As per project estimation
cost is below the surplus amount in hand, so the corporation can execute the above mentioned projects with their budget limits.

Bibliography
Asian Development Bank. Non Revenue Water Reduction Toolkit. New Delhi, 2012. Toolkit.
Atkins. "Future Proofing Indian Cities - Final Urban Diagnostic for Madurai." Urban Diagnostic. 2014. Report.
Brar, Tejwant Singh, R.K. Jain and Deepak Khare. "Water resource Management Plan for An Urban Area - Patiala." International Journal of Earth Sciences and
Engineering ISSN 0974-5904, Volume 04, No 06 SPL 4.6 (2011): 997-1003.
Central Ground Water Board - Ministry of Water Resources. Manual on Artificial Recharge of Ground Water. New Delhi: Central Ground Water Board, 2007. Manual.
12 April 2014. <http://cgwb.gov.in/documents/Manual%20on%20Artificial%20Recharge%20of%20Ground%20Water.pdf>.
—. Rainwater Harvesting and Conservation - Manual. Manual. New Delhi: Central Ground Water Board , 2002. Document.
Centre for science and Environment. LEGISLATION ON RAINWATER HARVESTING. n.d. 25 March 2014. <http://www.rainwaterharvesting.org/policy/legislation.htm>.
Centre for Science and Environment. www.rainwaterharvesting.org. n.d. 17 March 2014. <http://www.rainwaterharvesting.org/Urban/Costs.htm>.
Dass Amit, Jethoo A.S, Poonia M.P. "Impact of Drought on Urban Water Supply: A Case Study of Jaipur City." International Journal of Engineering and Innovative
Technology (IJEIT) 1.3 (2012): 170-173. Case Study.
Daykin, Ann Davies Suzie. Review of Water Resources Management Plan Process-Final Report. Policy Projects for CLG, DfT, DECC and Defra. London: ihpr-In House
Policy Resources, June 2011. Report.
Dhan Foundation. Neerindri ... (No Water). Madurai: Dhan Foundation, 2007.
Farley, Malcolm, et al. The Manager's Non-Revenue Water Handbook. Bangkok: United States Agency for International Development (USAID), 2008. Handbook.
Gaurav Dwivedi, Makarand Purohit. Privatised Industrial Water supply in DEWAS - A Case Study Of Impacts And Conflicts. Case Study. Barwani, MP: Manthan
Adhyayan Kendra, 2012. Report.
GIZ-ASEM. Draft City Sanitation Plan-Kochi. Sanitation Plan. Cochin: Corporation of Cochin, 2011. Report.
Gopakumar, Govind. Transforming Urban Water Supplies in India - The role of reform and partnerships in globalization. New York: Routledge, 2012. Contemporary
South Asia series.
Bibliography
Government of Tamilnadu. Tamilnadu Government Gazette. Housing and Urban Development Report. Chennai: Government of Tamilnadu, 2010. Document. 26 Feb
2014. <http://www.madurai.tn.nic.in/madurailpa/procedures/DCR_maduraiLPA.pdf>.
International Institute of Health and Hygiene,New Delhi . ENVIS Centre on Hygiene, Sanitation, Sewage Treatment Systems and Technology. n.d. 05 April 2014.
<http://www.sulabhenvis.nic.in/Database/STST_wastewater_2090.aspx>.
K.C.Sivaramakrishnan. "Drinking Water Supply: Right and Obligation." Ramaswamy.R.Iyer. Water and the Laws in India. New Delhi: SAGE Publications India Pvt. Ltd,
2009. 251-274.
Loh, Jieying. Water management: Learning from Singapore’s water success. 26 March 2009. Article. 29 January 2014.
<http://workingwithwater.filtsep.com/view/934/water-management-learning-from-singapore-s-water-success/>.
M.S., C. Balamurugan: Dheenadayalan. "Studies on the quality of groundwater in Madurai, Tamilnadu, India." Journal of Chemical and Pharmaceutical Research
(2012): 1632-1637. Research Article.
M.S.Vani. "Community Management in Water Governance." India, Water and the Laws in. Ramaswamy R.Iyer. New Delhi: SAGE Publications India Pvt. Ltd, 2009. 167-
209.
Madurai Corporation. n.d. 18 March 2014. <http://203.101.40.168/newmducorp/citizencharter.htm#c>.
—. City Development Plan. Development Plan. Madurai, 2006. Report.
—. Detailed Project Report for Basic Services to Urban Poor. Jnnurm Report. Madurai, 2010.
—. Madurai Corporation Website. n.d. Ma. 11 November 2013. <http://203.101.40.168/newmducorp/general.htm>.
Ministry of the Environment and Water Resources. Key Environmental Statistics. Statistics. Singapore, 2013.
Ministry of Urban Development. Non Revenue Water Reduction Toolkit. Toolkit. New Delhi: JnNURM, 2012.
Ministry of Water Resources - Government of India. Guidelines for Repair, Renovation and Restoration of Water Bodies. Guidelines. New Delhi: MOWR, 2009.
Document.
Ministry of Water Resources. Ministry of Water Resources. n.d. 11 March 2014. <http://wrmin.nic.in/index2.asp?sublinkid=574&langid=1&slid=786>.
Bibliography
Nair, Shadananan. "Challenges in urban water management in a changing environment – case study from a growing tropical city." Novatech 2010. Lyon, France, 2010.
1-7.
P.C.Bansil. Water Management in India. New Delhi: Concept Publishing Company, 2004.
PPP Cell Department of Economic affiars-Ministry of Finance. Toolkit for Public Private Partnerships in Urban Water Supply for Maharshtra. New Delhi: Macro Graphics
Pvt. Ltd., 2009. Toolkit. 12 April 2014. <http://www.pppinindia.com/pdf/dea_ppp_water-supply.pdf>.
PUB. PUB, Singapore's National Water Agency. n.d. 29 January 2014. <http://www.pub.gov.sg/water/Pages/singaporewaterstory.aspx>.
Puthucherril, Tony George. "Riparianism in Indian Water Jurisprudence." R.Iyer, Ramaswamy. Water and the Laws in India. New Delhi: SAGE Publications India Pvt.Ltd,
2009. 98.
R.P.S.Malik and John Briscoe. India's Water Economy: Bracing for a Turbulent future. New Delhi: Oxford University Press, 2006.
Sapient Techno Consultants. Preliminary Water Audit: Estimation of Water Losses and Strategy for Loss Reduction - City of Kalol, Gujarat, India . PAS project.
Ahmedabad: PAS, 2010.
Sharma, Dinesh. "Drinking Water Management of Jaipur City." Jaipur, 24 January 2011. Presentation.
SSWM. Sustainable Sanitation and Water Management. n.d. 17 March 2014. <http://www.sswm.info/category/implementation-tools/water-
sources/hardware/precipitation-harvesting/rainwater-harvesting-u>.
Sutton and East Surrey Water plc. "Water Resources Management Plan 2013 ." Ed. Anthony Ferrar. Surrey, 2013. 1-48.
The World Bank. Water Resources Management-A World Bank Policy Paper. Washington: International Bank for Reconstruction and Development, 1993. Policy Paper.
TWAD Board - Rainwater Harvesting. Rainwater Harvesting. n.d. 24 March 2014. <http://www.aboutrainwaterharvesting.in/rwh_cost.htm>.
TWAD Board. Hand Book on Water supply. Chennai: Office of the Principal Accountant General (Civil Audit), n.d. Handbook. 12 April 2014.
<http://saiindia.gov.in/english/home/Public_Folder/Professional_Practices_Group/State_Local_Manual/PUDUCHERRY_MANUAL/Wad%20Manual/Water%20Su
pply.pdf>.
—. Major Water Supply Schemes. n.d. 3 April 2014. <http://www.twadboard.gov.in/twad/watersupply_schemes5.aspx>.
Bibliography
—. Rainwater Harvesting. n.d. 25 March 2014. <http://www.aboutrainwaterharvesting.in/rwh_methods_ppm.htm>.
—. Tamilnadu Water supply and Drainage Board. n.d. 20 March 2014. <http://www.twadboard.gov.in/twad/madurai_dist.aspx>.
—. Tamilnadu Water Supply and Drainage Board. n.d. 21 March 2014. <http://www.aboutrainwaterharvesting.in/rwh_methods_individual.htm>.
United Utilities. Draft Water Resource Management Plan. Report. London: United Utilities PLC, 2013.
UNWater-WWAP. UN Water. 6 11 2013. <http://www.unwater.org/statistics_res.html#sthash.QKPQ7VmZ.dpuf>.
W.Mays, Larry. Water Resources Engineering - Second Edition. Tempe, Arizona: John Wiley & Sons, Inc., 2011.
World Bank (John Briscoe; R.P.S.Malik). India's Water Economy: Bracing for a Turbulent future. New Delhi: Oxford University Press, 2006.
World Bank. Non Revenue Water (NEW) Management Strategy for Surabaya Water Company. Kualalumpur: Ranhill Water Services Sdn. Bhd., 2011.


Source: ‘Water Resource Management Plan’ – Thames Water Report
Water Resource Estimation for future projection
Before WRMP
• In Early stage, water drawn from Thames River, and its tributaries. The City authorities
appointed water keepers to maintain, operate the water conduit and collect fees from the
water users [ Concept for Private companies ]
• In 1902, the private water companies were nationalized, acquires and created as
‘Metropolitan Water Board’ by the Metropolitan Water Act, because of bad quality in water
supply.
• The MWB, started and Operated several reservoirs in & around London because increase in
demand side. The MWB & Other local water boards were combined and formed ‘Thames
Water Authority’. Later it was privatized as ‘Thames Water’, a state regulated private
company. Which currently provide London’s water supply needs.
Present Water Resources and it’s Management
Present Water demand = 1,217 MLD
• Demand vs Supply Baseline to calculate Surplus / deficit in every year
• Every five years, water companies in England and Wales are required to produce
a Water Resources Management Plan that sets out how they aim to maintain water
supplies over a 25-year period.
• Water resource management can be done in four various ways: 1) Leakage
Management, 2) Efficiency Improvement, 3) Use of reclaimed water, 4)
Development of New water resources
Location England, Europe
Population 8.17 Million (2011)
Climate Zone Oceanic
Area 1,572 Km2
Urban Water use 150 lpcd
Decentralization No
Regulator Ofwat (Office of Water service)
Policy Setting Defra (Department of Environment,
Food and Rural affairs)
Project Private Water Companies (Thames
Water in Greater London)Learnings from Literature Review - London study
Source: http://www.pub.gov.sg/water/Pages/singaporewaterstory.aspx#sthash.snSIBAzZ.dpuf
Sustainable Water Resources Management
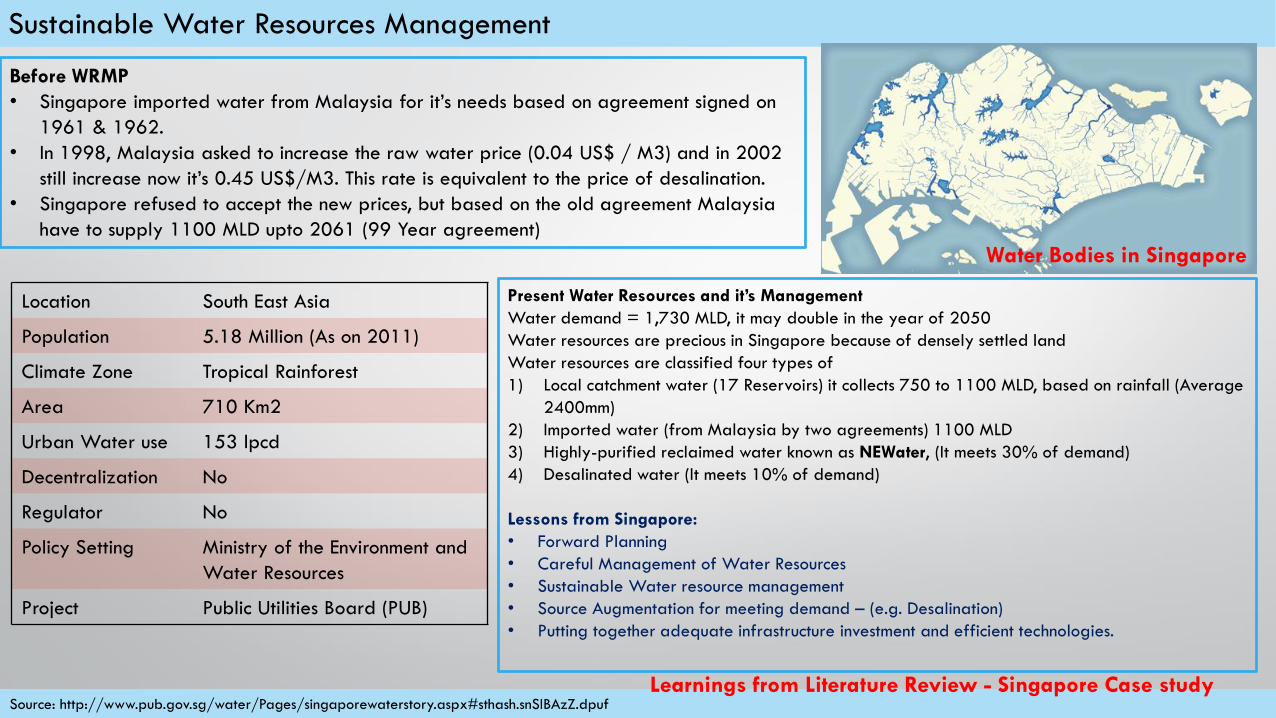
Before WRMP
• Singapore imported water from Malaysia for it’s needs based on agreement signed on
1961 & 1962.
• In 1998, Malaysia asked to increase the raw water price (0.04 US$ / M3) and in 2002
still increase now it’s 0.45 US$/M3. This rate is equivalent to the price of desalination.
• Singapore refused to accept the new prices, but based on the old agreement Malaysia
have to supply 1100 MLD upto 2061 (99 Year agreement)
Present Water Resources and it’s Management
Water demand = 1,730 MLD, it may double in the year of 2050
Water resources are precious in Singapore because of densely settled land
Water resources are classified four types of
1) Local catchment water (17 Reservoirs) it collects 750 to 1100 MLD, based on rainfall (Average
2400mm)
2) Imported water (from Malaysia by two agreements) 1100 MLD
3) Highly-purified reclaimed water known as NEWater, (It meets 30% of demand)
4) Desalinated water (It meets 10% of demand)
Lessons from Singapore:
• Forward Planning
• Careful Management of Water Resources
• Sustainable Water resource management
• Source Augmentation for meeting demand – (e.g. Desalination)
• Putting together adequate infrastructure investment and efficient technologies.
Water Bodies in Singapore
Location South East Asia
Population 5.18 Million (As on 2011)
Climate Zone Tropical Rainforest
Area 710 Km2
Urban Water use 153 lpcd
Decentralization No
Regulator No
Policy Setting Ministry of the Environment and
Water Resources
Project Public Utilities Board (PUB)
Learnings from Literature Review - Singapore Case study
Source: Kochi CDP, Kochi CSP, “Challenges in urban water management in a changing environment – case study from a growing tropical city” –Shadanan Nair
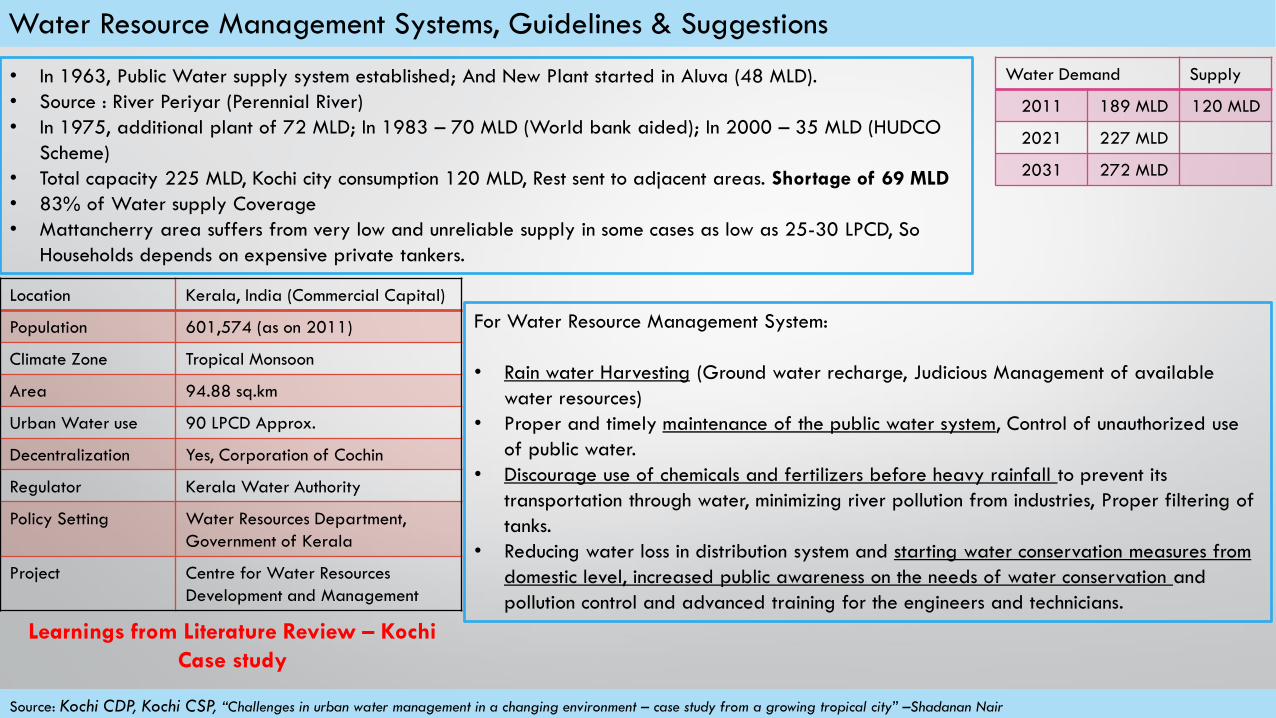
Water Resource Management Systems, Guidelines & Suggestions
• In 1963, Public Water supply system established; And New Plant started in Aluva (48 MLD).
• Source : River Periyar (Perennial River)
• In 1975, additional plant of 72 MLD; In 1983 – 70 MLD (World bank aided); In 2000 – 35 MLD (HUDCO
Scheme)
• Total capacity 225 MLD, Kochi city consumption 120 MLD, Rest sent to adjacent areas. Shortage of 69 MLD
• 83% of Water supply Coverage
• Mattancherry area suffers from very low and unreliable supply in some cases as low as 25-30 LPCD, So
Households depends on expensive private tankers.
For Water Resource Management System:
• Rain water Harvesting (Ground water recharge, Judicious Management of available
water resources)
• Proper and timely maintenance of the public water system, Control of unauthorized use
of public water.
• Discourage use of chemicals and fertilizers before heavy rainfall to prevent its
transportation through water, minimizing river pollution from industries, Proper filtering of
tanks.
• Reducing water loss in distribution system and starting water conservation measures from
domestic level, increased public awareness on the needs of water conservation and
pollution control and advanced training for the engineers and technicians.
Location Kerala, India (Commercial Capital)
Population 601,574 (as on 2011)
Climate Zone Tropical Monsoon
Area 94.88 sq.km
Urban Water use 90 LPCD Approx.
Decentralization Yes, Corporation of Cochin
Regulator Kerala Water Authority
Policy Setting Water Resources Department,
Government of Kerala
Project Centre for Water Resources
Development and Management
Water Demand Supply
2011 189 MLD 120 MLD
2021 227 MLD
2031 272 MLD
Learnings from Literature Review – Kochi
Case study
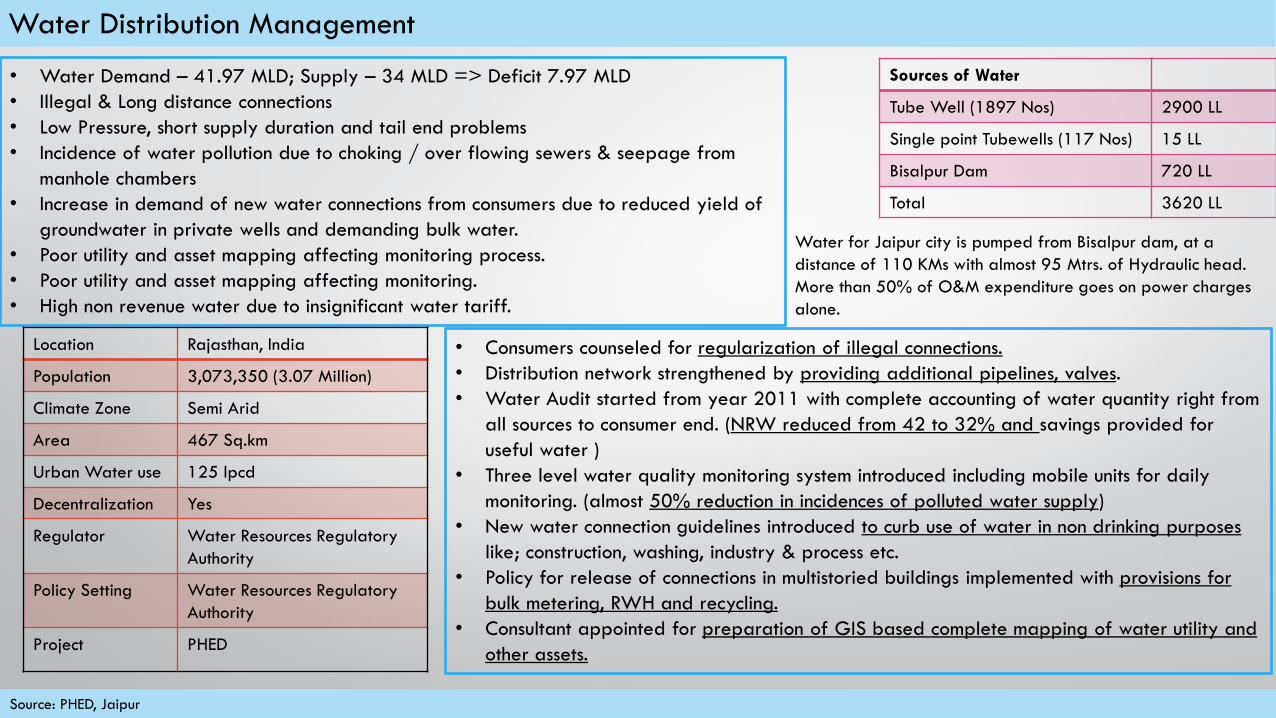
Source: PHED, Jaipur
Water Distribution Management
• Water Demand – 41.97 MLD; Supply – 34 MLD => Deficit 7.97 MLD
• Illegal & Long distance connections
• Low Pressure, short supply duration and tail end problems
• Incidence of water pollution due to choking / over flowing sewers & seepage from
manhole chambers
• Increase in demand of new water connections from consumers due to reduced yield of
groundwater in private wells and demanding bulk water.
• Poor utility and asset mapping affecting monitoring process.
• Poor utility and asset mapping affecting monitoring.
• High non revenue water due to insignificant water tariff.
• Consumers counseled for regularization of illegal connections.
• Distribution network strengthened by providing additional pipelines, valves.
• Water Audit started from year 2011 with complete accounting of water quantity right from
all sources to consumer end. (NRW reduced from 42 to 32% and savings provided for
useful water )
• Three level water quality monitoring system introduced including mobile units for daily
monitoring. (almost 50% reduction in incidences of polluted water supply)
• New water connection guidelines introduced to curb use of water in non drinking purposes
like; construction, washing, industry & process etc.
• Policy for release of connections in multistoried buildings implemented with provisions for
bulk metering, RWH and recycling.
• Consultant appointed for preparation of GIS based complete mapping of water utility and
other assets.
Location Rajasthan, India
Population 3,073,350 (3.07 Million)
Climate Zone Semi Arid
Area 467 Sq.km
Urban Water use 125 lpcd
Decentralization Yes
Regulator Water Resources Regulatory
Authority
Policy Setting Water Resources Regulatory
Authority
Project PHED
Sources of Water
Tube Well (1897 Nos) 2900 LL
Single point Tubewells (117 Nos) 15 LL
Bisalpur Dam 720 LL
Total 3620 LL
Water for Jaipur city is pumped from Bisalpur dam, at a
distance of 110 KMs with almost 95 Mtrs. of Hydraulic head.
More than 50% of O&M expenditure goes on power charges
alone.
Source: P.C.Bansil. Water Management in India. New Delhi: Concept Publishing Company, 2004; Gaurav Dwivedi, Makarand Purohit. Privatised Industrial Water supply in DEWAS - A Case Study Of
Impacts And Conflicts. Case Study. Barwani, MP: Manthan Adhyayan Kendra, 2012. Report.
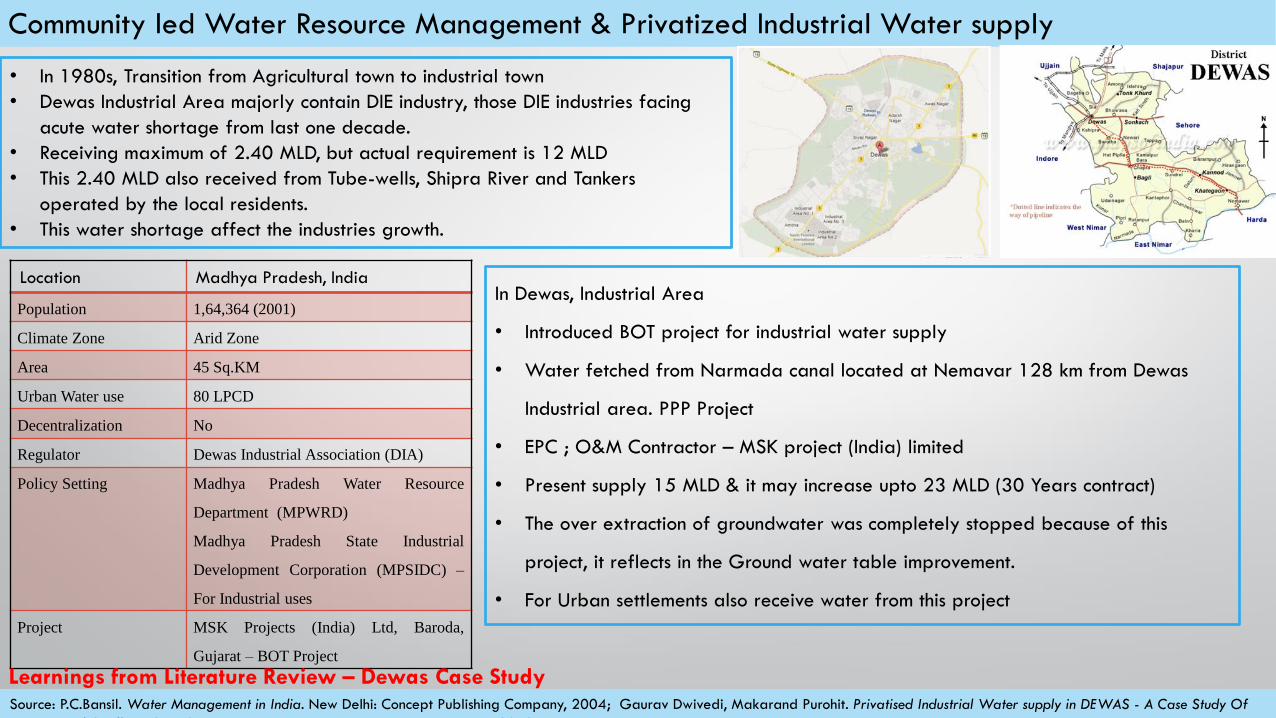
Community led Water Resource Management & Privatized Industrial Water supply
• In 1980s, Transition from Agricultural town to industrial town
• Dewas Industrial Area majorly contain DIE industry, those DIE industries facing
acute water shortage from last one decade.
• Receiving maximum of 2.40 MLD, but actual requirement is 12 MLD
• This 2.40 MLD also received from Tube-wells, Shipra River and Tankers
operated by the local residents.
• This water shortage affect the industries growth.
In Dewas, Industrial Area
• Introduced BOT project for industrial water supply
• Water fetched from Narmada canal located at Nemavar 128 km from Dewas
Industrial area. PPP Project
• EPC ; O&M Contractor – MSK project (India) limited
• Present supply 15 MLD & it may increase upto 23 MLD (30 Years contract)
• The over extraction of groundwater was completely stopped because of this
project, it reflects in the Ground water table improvement.
• For Urban settlements also receive water from this project
Location Madhya Pradesh, India
Population 1,64,364 (2001)
Climate Zone Arid Zone
Area 45 Sq.KM
Urban Water use 80 LPCD
Decentralization No
Regulator Dewas Industrial Association (DIA)
Policy Setting Madhya Pradesh Water Resource
Department (MPWRD)
Madhya Pradesh State Industrial
Development Corporation (MPSIDC) –
For Industrial uses
Project MSK Projects (India) Ltd, Baroda,
Gujarat – BOT Project
Learnings from Literature Review – Dewas Case Study

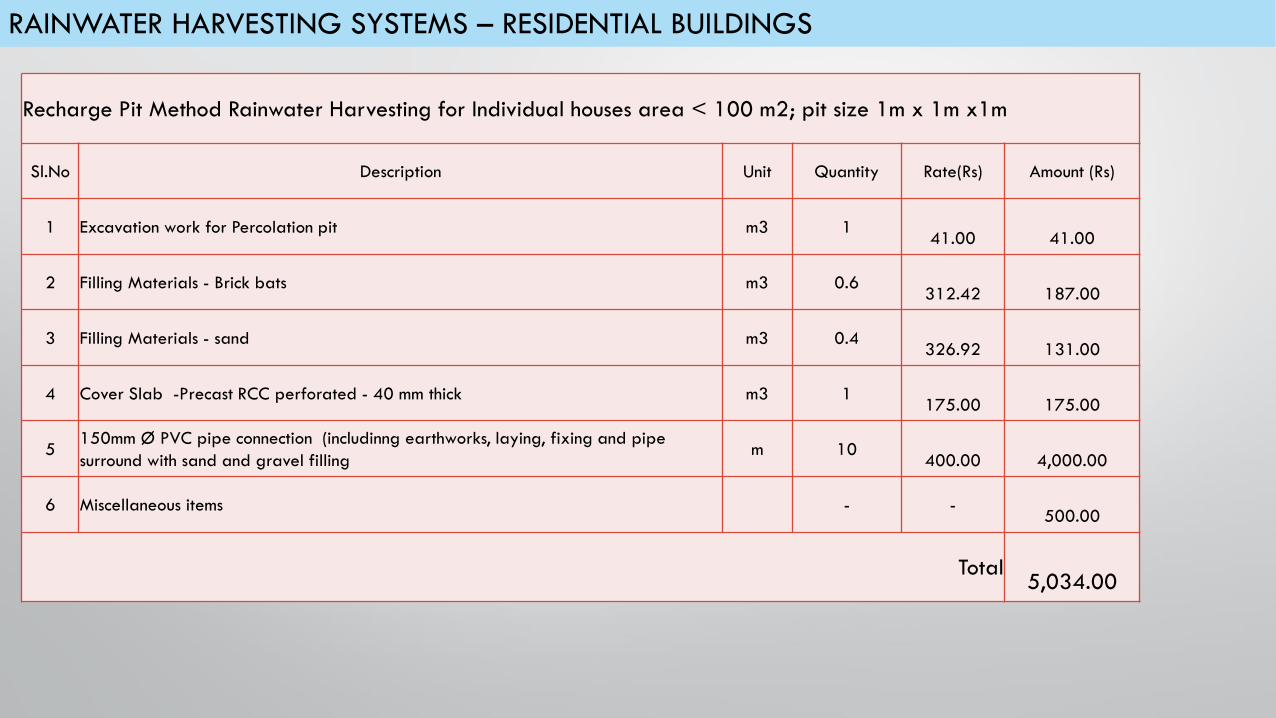
RAINWATER HARVESTING SYSTEMS – RESIDENTIAL BUILDINGS
Recharge Pit Method Rainwater Harvesting for Individual houses area < 100 m2; pit size 1m x 1m x1m
Sl.No Description Unit Quantity Rate(Rs) Amount (Rs)
1 Excavation work for Percolation pit m3 141.00 41.00
2 Filling Materials - Brick bats m3 0.6312.42 187.00
3 Filling Materials - sand m3 0.4326.92 131.00
4 Cover Slab -Precast RCC perforated - 40 mm thick m3 1175.00 175.00
5150mm Ø PVC pipe connection (includinng earthworks, laying, fixing and pipe
surround with sand and gravel fillingm 10
400.00 4,000.00
6 Miscellaneous items - -500.00
Total5,034.00
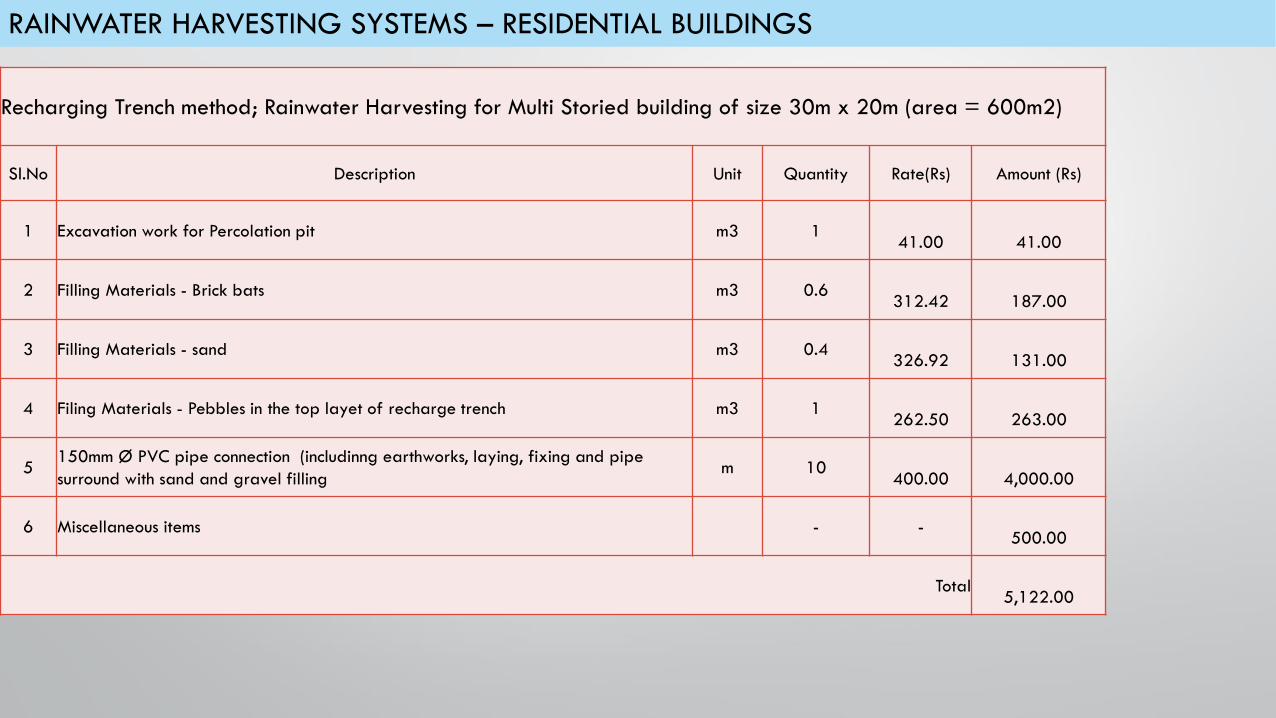
RAINWATER HARVESTING SYSTEMS – RESIDENTIAL BUILDINGS
Recharging Trench method; Rainwater Harvesting for Multi Storied building of size 30m x 20m (area = 600m2)
Sl.No Description Unit Quantity Rate(Rs) Amount (Rs)
1 Excavation work for Percolation pit m3 141.00 41.00
2 Filling Materials - Brick bats m3 0.6312.42 187.00
3 Filling Materials - sand m3 0.4326.92 131.00
4 Filing Materials - Pebbles in the top layet of recharge trench m3 1262.50 263.00
5150mm Ø PVC pipe connection (includinng earthworks, laying, fixing and pipe
surround with sand and gravel fillingm 10
400.00 4,000.00
6 Miscellaneous items - -500.00
Total5,122.00
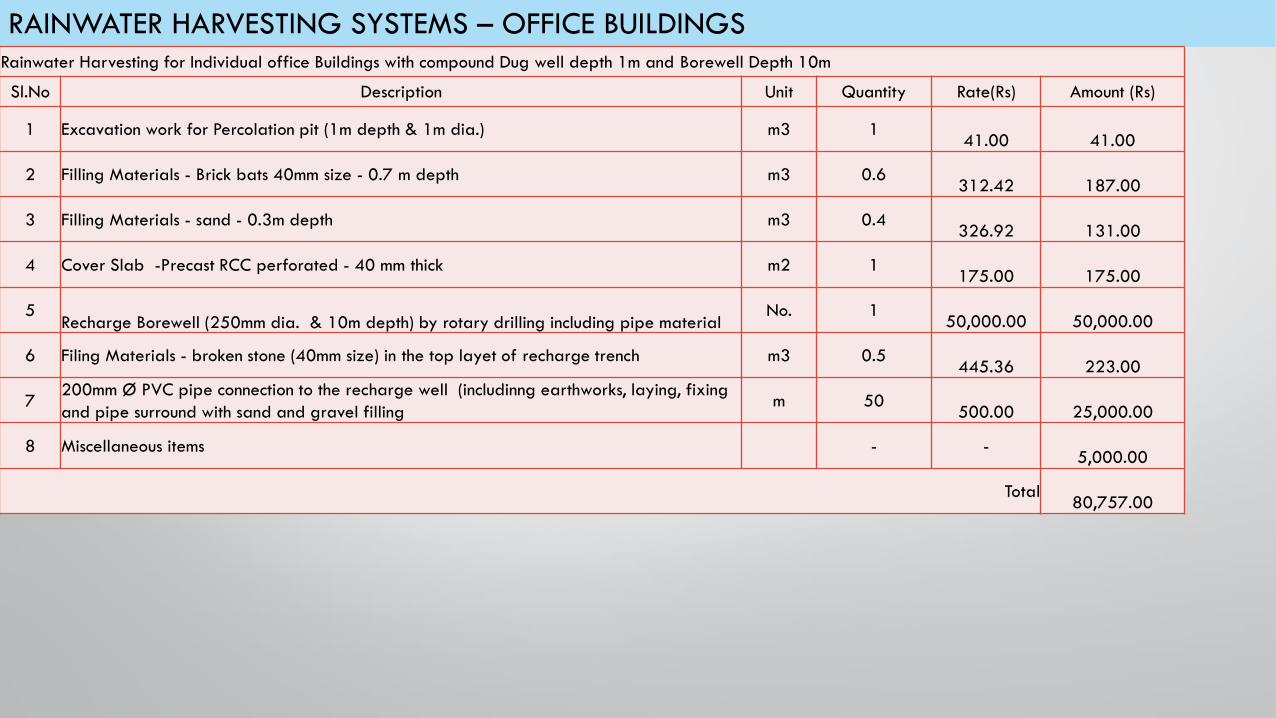
RAINWATER HARVESTING SYSTEMS – OFFICE BUILDINGSRainwater Harvesting for Individual office Buildings with compound Dug well depth 1m and Borewell Depth 10m
Sl.No Description Unit Quantity Rate(Rs) Amount (Rs)
1 Excavation work for Percolation pit (1m depth & 1m dia.) m3 141.00 41.00
2 Filling Materials - Brick bats 40mm size - 0.7 m depth m3 0.6312.42 187.00
3 Filling Materials - sand - 0.3m depth m3 0.4326.92 131.00
4 Cover Slab -Precast RCC perforated - 40 mm thick m2 1175.00 175.00
5Recharge Borewell (250mm dia. & 10m depth) by rotary drilling including pipe material
No. 150,000.00 50,000.00
6 Filing Materials - broken stone (40mm size) in the top layet of recharge trench m3 0.5445.36 223.00
7200mm Ø PVC pipe connection to the recharge well (includinng earthworks, laying, fixing
and pipe surround with sand and gravel fillingm 50
500.00 25,000.00
8 Miscellaneous items - -5,000.00
Total80,757.00
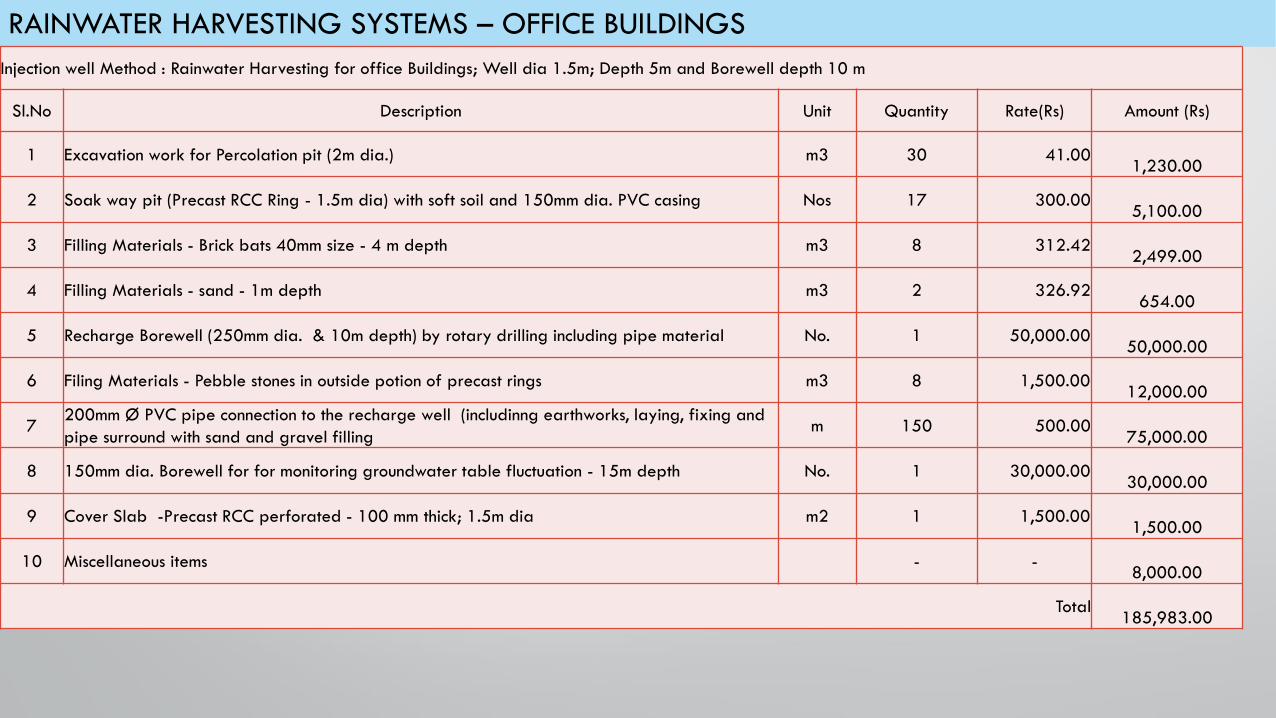
RAINWATER HARVESTING SYSTEMS – OFFICE BUILDINGS
Injection well Method : Rainwater Harvesting for office Buildings; Well dia 1.5m; Depth 5m and Borewell depth 10 m
Sl.No Description Unit Quantity Rate(Rs) Amount (Rs)
1 Excavation work for Percolation pit (2m dia.) m3 30 41.00 1,230.00
2 Soak way pit (Precast RCC Ring - 1.5m dia) with soft soil and 150mm dia. PVC casing Nos 17 300.00 5,100.00
3 Filling Materials - Brick bats 40mm size - 4 m depth m3 8 312.42 2,499.00
4 Filling Materials - sand - 1m depth m3 2 326.92 654.00
5 Recharge Borewell (250mm dia. & 10m depth) by rotary drilling including pipe material No. 1 50,000.00 50,000.00
6 Filing Materials - Pebble stones in outside potion of precast rings m3 8 1,500.00 12,000.00
7200mm Ø PVC pipe connection to the recharge well (includinng earthworks, laying, fixing and
pipe surround with sand and gravel fillingm 150 500.00
75,000.00
8 150mm dia. Borewell for for monitoring groundwater table fluctuation - 15m depth No. 1 30,000.00 30,000.00
9 Cover Slab -Precast RCC perforated - 100 mm thick; 1.5m dia m2 1 1,500.00 1,500.00
10 Miscellaneous items - -8,000.00
Total185,983.00
Source: CGWB, TWAD Board
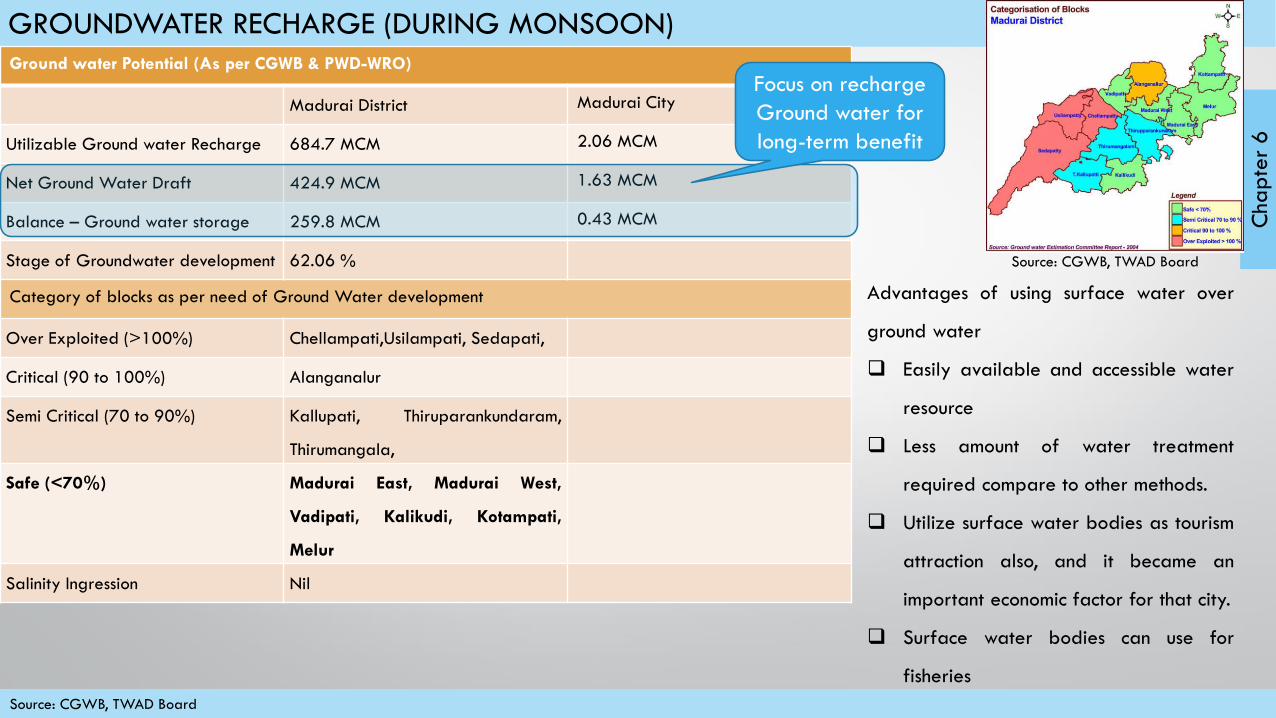
GROUNDWATER RECHARGE (DURING MONSOON)
Ground water Potential (As per CGWB & PWD-WRO)
Madurai District Madurai City
Utilizable Ground water Recharge 684.7 MCM 2.06 MCM
Net Ground Water Draft 424.9 MCM 1.63 MCM
Balance – Ground water storage 259.8 MCM 0.43 MCM
Stage of Groundwater development 62.06 %
Category of blocks as per need of Ground Water development
Over Exploited (>100%) Chellampati,Usilampati, Sedapati,
Critical (90 to 100%) Alanganalur
Semi Critical (70 to 90%) Kallupati, Thiruparankundaram,
Thirumangala,
Safe (<70%) Madurai East, Madurai West,
Vadipati, Kalikudi, Kotampati,
Melur
Salinity Ingression Nil
Focus on recharge
Ground water for
long-term benefit
Advantages of using surface water over
ground water
Easily available and accessible water
resource
Less amount of water treatment
required compare to other methods.
Utilize surface water bodies as tourism
attraction also, and it became an
important economic factor for that city.
Surface water bodies can use for
fisheries
Cha
pte
r 6
Source: CGWB, TWAD Board
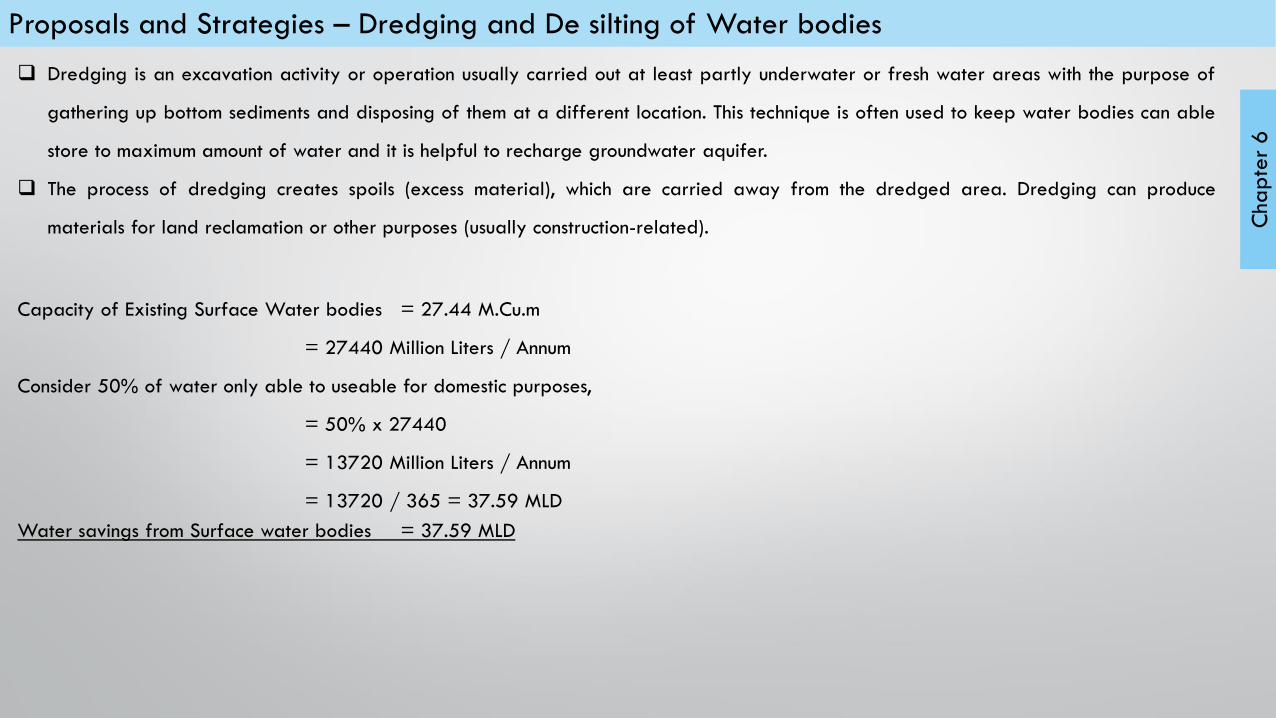
Proposals and Strategies – Dredging and De silting of Water bodies
Dredging is an excavation activity or operation usually carried out at least partly underwater or fresh water areas with the purpose of
gathering up bottom sediments and disposing of them at a different location. This technique is often used to keep water bodies can able
store to maximum amount of water and it is helpful to recharge groundwater aquifer.
The process of dredging creates spoils (excess material), which are carried away from the dredged area. Dredging can produce
materials for land reclamation or other purposes (usually construction-related).
Capacity of Existing Surface Water bodies = 27.44 M.Cu.m
= 27440 Million Liters / Annum
Consider 50% of water only able to useable for domestic purposes,
= 50% x 27440
= 13720 Million Liters / Annum
= 13720 / 365 = 37.59 MLD
Water savings from Surface water bodies = 37.59 MLD
Cha
pte
r 6
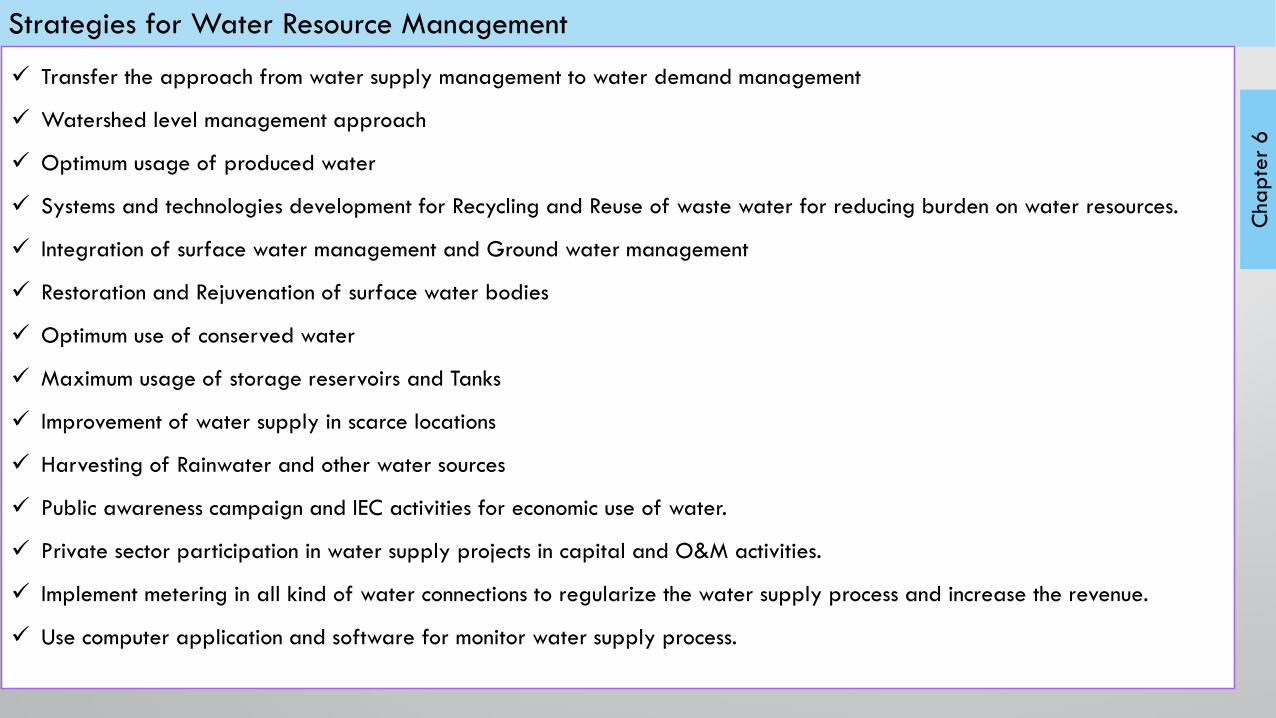
Strategies for Water Resource Management
Transfer the approach from water supply management to water demand management
Watershed level management approach
Optimum usage of produced water
Systems and technologies development for Recycling and Reuse of waste water for reducing burden on water resources.
Integration of surface water management and Ground water management
Restoration and Rejuvenation of surface water bodies
Optimum use of conserved water
Maximum usage of storage reservoirs and Tanks
Improvement of water supply in scarce locations
Harvesting of Rainwater and other water sources
Public awareness campaign and IEC activities for economic use of water.
Private sector participation in water supply projects in capital and O&M activities.
Implement metering in all kind of water connections to regularize the water supply process and increase the revenue.
Use computer application and software for monitor water supply process.
Cha
pte
r 6