
2020 Virginia Integrated Resource Plan - Dominion Energy
298
Atlanta | Austin | Baltimore | Brussels | Charlotte | Charlottesville | Chicago | Dallas | Houston | Jacksonville | London | Los Angeles - Century City Los Angeles - Downtown | New York | Norfolk | Pittsburgh | Raleigh | Richmond | San Francisco | Tysons | Washington, D.C. | Wilmington May 1, 2020 BY ELECTRONIC DELIVERY Joel H. Peck, Clerk Document Control Center State Corporation Commission 1300 E. Main Street, Tyler Bldg., 1st Fl. Richmond, VA 23219 Commonwealth of Virginia, ex rel. State Corporation Commission, In re: Virginia Electric and Power Company’s Integrated Resource Plan filing pursuant to Va. Code § 56-597 et seq. Case No. PUR-2020-00035 Dear Mr. Peck: Please find enclosed for electronic filing in the above-captioned proceeding the 2020 Integrated Resource Plan of Virginia Electric and Power Company (the “2020 Plan”) filed pursuant to § 56-597 et seq. of the Code of Virginia (“Va. Code”), the December 23, 2008 Order Establishing Guidelines for Developing Integrated Resource Plans issued by the State Corporation Commission of Virginia (“Commission”) in Case No. PUE-2008-00099 (“Order Establishing Guidelines”), and the Integrated Resource Planning Guidelines (“Guidelines”). As required by the Commission, a reference index is enclosed that identifies the sections of the 2020 Plan that comply with the Va. Code, the Guidelines, and the requirements of relevant prior Commission orders. Also enclosed is a copy of the Company’s proposed notice in this proceeding pursuant to Section E of the Guidelines. Along with the 2020 Plan, the Company is filing two addenda under separate cover. Virginia Addendum 1 contains a Virginia residential bill analysis, and is being filed in public and extraordinarily sensitive versions. Virginia Addendum 2 contains the Grid Transformation Plan Document, and is being filed in public version only. In addition to the addenda, the Company is contemporaneously filing its Motion for Entry of a Protective Order and Additional Protective Treatment for Extraordinarily Sensitive Information under separate cover. Separate from these filings with the Commission, the Company is providing Commission Staff with the Guidelines schedules associated with the 2020 Plan in electronic format pursuant to Section E of the Guidelines, and is providing a copy of the 2020 Plan to members of the General Assembly pursuant to Va. Code § 56-599. McGuireWoods LLP Gateway Plaza 800 East Canal Street Richmond, VA 23219-3916 Phone: 804.775.1000 Fax: 804.775.1061 www.mcguirewoods.com Vishwa B. Link Direct: 804.775.4330 [email protected]
-
Upload
khangminh22 -
Category
Documents
-
view
0 -
download
0
Transcript of 2020 Virginia Integrated Resource Plan - Dominion Energy

Atlanta | Austin | Baltimore | Brussels | Charlotte | Charlottesville | Chicago | Dallas | Houston | Jacksonville | London | Los Angeles - Century City Los Angeles - Downtown | New York | Norfolk | Pittsburgh | Raleigh | Richmond | San Francisco | Tysons | Washington, D.C. | Wilmington
May 1, 2020 BY ELECTRONIC DELIVERY Joel H. Peck, Clerk Document Control Center State Corporation Commission 1300 E. Main Street, Tyler Bldg., 1st Fl. Richmond, VA 23219
Commonwealth of Virginia, ex rel. State Corporation Commission, In re: Virginia Electric and Power Company’s Integrated Resource Plan
filing pursuant to Va. Code § 56-597 et seq. Case No. PUR-2020-00035
Dear Mr. Peck:
Please find enclosed for electronic filing in the above-captioned proceeding the 2020 Integrated Resource Plan of Virginia Electric and Power Company (the “2020 Plan”) filed pursuant to § 56-597 et seq. of the Code of Virginia (“Va. Code”), the December 23, 2008 Order Establishing Guidelines for Developing Integrated Resource Plans issued by the State Corporation Commission of Virginia (“Commission”) in Case No. PUE-2008-00099 (“Order Establishing Guidelines”), and the Integrated Resource Planning Guidelines (“Guidelines”). As required by the Commission, a reference index is enclosed that identifies the sections of the 2020 Plan that comply with the Va. Code, the Guidelines, and the requirements of relevant prior Commission orders. Also enclosed is a copy of the Company’s proposed notice in this proceeding pursuant to Section E of the Guidelines.
Along with the 2020 Plan, the Company is filing two addenda under separate cover.
Virginia Addendum 1 contains a Virginia residential bill analysis, and is being filed in public and extraordinarily sensitive versions. Virginia Addendum 2 contains the Grid Transformation Plan Document, and is being filed in public version only.
In addition to the addenda, the Company is contemporaneously filing its Motion for Entry
of a Protective Order and Additional Protective Treatment for Extraordinarily Sensitive Information under separate cover.
Separate from these filings with the Commission, the Company is providing Commission Staff with the Guidelines schedules associated with the 2020 Plan in electronic format pursuant to Section E of the Guidelines, and is providing a copy of the 2020 Plan to members of the General Assembly pursuant to Va. Code § 56-599.
McGuireWoods LLP Gateway Plaza
800 East Canal Street Richmond, VA 23219-3916
Phone: 804.775.1000 Fax: 804.775.1061
www.mcguirewoods.com
Vishwa B. Link Direct: 804.775.4330

May 1, 2020 Mr. Joel H. Peck Page 2
Please do not hesitate to contact me if you have any questions in regard to this filing.
Very truly yours,
/s/ Vishwa B. Link
Vishwa B. Link Enclosure cc: Honorable D. Mathias Roussy, Hearing Examiner
Paul E. Pfeffer, Esq. Audrey T. Bauhan, Esq. Jennifer D. Valaika, Esq. Sarah R. Bennett, Esq. Service List

2020 Integrated Resource Plan Reference Index
Case No. PUR‐2020‐00035
Order / Guideline 2020 Plan Section Requirement
Va. Code § 56‐598 (1) Section 2.2
Alternative Plans
An IRP should:
1. Integrate, over the planning period, the electric utility's forecast of demand for electric generation
supply with recommended plans to meet that forecasted demand and assure adequate and sufficient
reliability of service, including, but not limited to: a. Generating electricity from generation facilities
that it currently operates or intends to construct or purchase; b. Purchasing electricity from affiliates
and third parties; and c. Reducing load growth and peak demand growth through cost‐effective
demand reduction programs;
Va. Code § 56‐598 (2) 2020 Plan Identify a portfolio of electric generation supply resources, including purchased and self‐generated
electric power, that: a. Consistent with § 56‐585.1, is most likely to provide the electric generation
supply needed to meet the forecasted demand, net of any reductions from demand side programs, so
that the utility will continue to provide reliable service at reasonable prices over the long term; and b.
Will consider low cost energy/capacity available from short‐term or spot market transactions,
consistent with a reasonable assessment of risk with respect to both price and generation supply
availability over the term of the plan;
Va. Code § 56‐598 (3) Section 2.2
Alternative Plans
Reflect a diversity of electric generation supply and cost‐effective demand reduction contracts and
services so as to reduce the risks associated with an over‐reliance on any particular fuel or type of
generation demand and supply resources and be consistent with the Commonwealth's energy policies
as set forth in § 67‐102; and
Va. Code § 56‐598 (4) 2020 Plan
Reference Index
Include such additional information as the Commission requests pertaining to how the electric utility
intends to meets its obligation to provide electric generation service for use by its retail customers
over the planning period.
Va. Code § 56‐599 (A) 2020 Plan Each electric utility shall file an updated integrated resource plan by July 1, 2015. Thereafter, each
electric utility shall file an updated integrated resource plan by May 1, in each year immediately
preceding the year the utility is subject to a triennial review filing. A copy of each integrated resource
plan shall be provided to the Chairmen of the House and Senate Committees on Commerce and Labor
and to the Chairman of the Commission on Electric Utility Regulation.
Va. Code § 56‐599 (A) 2020 Plan
Reference Index
All updated integrated resource plans shall comply with the provisions of any relevant order of the
Commission establishing guidelines for the format and contents of updated and revised integrated
resource plans. Each integrated resource plan shall consider options for maintaining and enhancing
rate stability, energy independence, economic development including retention and expansion of
energy‐intensive industries, and service reliability.
Va. Code § 56‐599 (B) Chapter 5
Generation ‐ Supply‐Side Resources
In preparing an integrated resource plan, each electric utility shall systematically evaluate, and may
propose:
1. Entering into short‐term and long‐term electric power purchase contracts;
Va. Code § 56‐599 (B) Chapter 5
Generation ‐ Supply‐Side Resources
In preparing an integrated resource plan, each electric utility shall systematically evaluate, and may
propose:
2. Owning and operating electric power generation facilities;
Va. Code § 56‐599 (B) Chapter 5
Generation ‐ Supply‐Side Resources
In preparing an integrated resource plan, each electric utility shall systematically evaluate, and may
propose:
3. Building new generation facilities;
Va. Code § 56‐599 (B) Section 4.2
Capacity Market Assumptions
In preparing an integrated resource plan, each electric utility shall systematically evaluate, and may
propose:
4. Relying on purchases from the short term or spot markets;
Va. Code § 56‐599 (B) Chapter 6
Generation ‐ Demand‐Side Management
In preparing an integrated resource plan, each electric utility shall systematically evaluate, and may
propose:
5. Making investments in demand‐side resources, including energy efficiency and demand‐side
management services;
Va. Code § 56‐599 (B) Section 2.2
Alternative Plans
In preparing an integrated resource plan, each electric utility shall systematically evaluate, and may
propose:
6. Taking such other actions, as the Commission may approve, to diversify its generation supply
portfolio and ensure that the electric utility is able to implement an approved plan;
Va. Code § 56‐599 (B) Section 2.2
Alternative Plans
In preparing an integrated resource plan, each electric utility shall systematically evaluate, and may
propose:
7. The methods by which the electric utility proposes to acquire the supply and demand resources
identified in its proposed integrated resource plan;
Va. Code § 56‐599 (B) Section 1.2
Virginia Clean Economy Act
Section 1.3
Regional Greenhouse Gas Initiative
Section 1.11
Other Environmental Regulation
Section 5.2.3
Environmental Regulations
In preparing an integrated resource plan, each electric utility shall systematically evaluate, and may
propose:
8. The effect of current and pending state and federal environmental regulations upon the continued
operation of existing electric generation facilities or options for construction of new electric
generation facilities;
Va. Code § 56‐599 (B) Section 2.3
NPV Results
In preparing an integrated resource plan, each electric utility shall systematically evaluate, and may
propose:
9. The most cost effective means of complying with current and pending state and federal
environmental regulations, including compliance options to minimize effects on customer rates of
such regulations;
Page 1 of 9
2020 Integrated Resource Plan Reference Index
Case No. PUR‐2020‐00035
Order / Guideline 2020 Plan Section Requirement
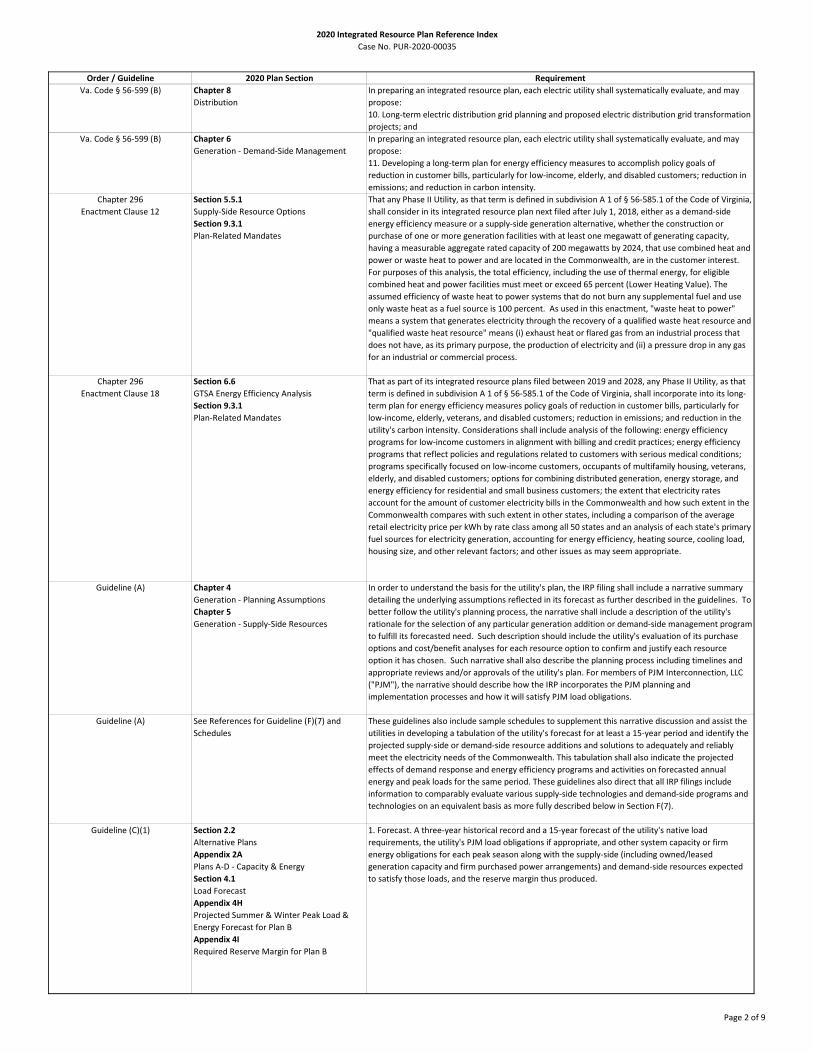
Va. Code § 56‐599 (B) Chapter 8
Distribution
In preparing an integrated resource plan, each electric utility shall systematically evaluate, and may
propose:
10. Long‐term electric distribution grid planning and proposed electric distribution grid transformation
projects; and
Va. Code § 56‐599 (B) Chapter 6
Generation ‐ Demand‐Side Management
In preparing an integrated resource plan, each electric utility shall systematically evaluate, and may
propose:
11. Developing a long‐term plan for energy efficiency measures to accomplish policy goals of
reduction in customer bills, particularly for low‐income, elderly, and disabled customers; reduction in
emissions; and reduction in carbon intensity.
Chapter 296
Enactment Clause 12
Section 5.5.1
Supply‐Side Resource Options
Section 9.3.1
Plan‐Related Mandates
That any Phase II Utility, as that term is defined in subdivision A 1 of § 56‐585.1 of the Code of Virginia,
shall consider in its integrated resource plan next filed after July 1, 2018, either as a demand‐side
energy efficiency measure or a supply‐side generation alternative, whether the construction or
purchase of one or more generation facilities with at least one megawatt of generating capacity,
having a measurable aggregate rated capacity of 200 megawatts by 2024, that use combined heat and
power or waste heat to power and are located in the Commonwealth, are in the customer interest.
For purposes of this analysis, the total efficiency, including the use of thermal energy, for eligible
combined heat and power facilities must meet or exceed 65 percent (Lower Heating Value). The
assumed efficiency of waste heat to power systems that do not burn any supplemental fuel and use
only waste heat as a fuel source is 100 percent. As used in this enactment, "waste heat to power"
means a system that generates electricity through the recovery of a qualified waste heat resource and
"qualified waste heat resource" means (i) exhaust heat or flared gas from an industrial process that
does not have, as its primary purpose, the production of electricity and (ii) a pressure drop in any gas
for an industrial or commercial process.
Chapter 296
Enactment Clause 18
Section 6.6
GTSA Energy Efficiency Analysis
Section 9.3.1
Plan‐Related Mandates
That as part of its integrated resource plans filed between 2019 and 2028, any Phase II Utility, as that
term is defined in subdivision A 1 of § 56‐585.1 of the Code of Virginia, shall incorporate into its long‐
term plan for energy efficiency measures policy goals of reduction in customer bills, particularly for
low‐income, elderly, veterans, and disabled customers; reduction in emissions; and reduction in the
utility's carbon intensity. Considerations shall include analysis of the following: energy efficiency
programs for low‐income customers in alignment with billing and credit practices; energy efficiency
programs that reflect policies and regulations related to customers with serious medical conditions;
programs specifically focused on low‐income customers, occupants of multifamily housing, veterans,
elderly, and disabled customers; options for combining distributed generation, energy storage, and
energy efficiency for residential and small business customers; the extent that electricity rates
account for the amount of customer electricity bills in the Commonwealth and how such extent in the
Commonwealth compares with such extent in other states, including a comparison of the average
retail electricity price per kWh by rate class among all 50 states and an analysis of each state's primary
fuel sources for electricity generation, accounting for energy efficiency, heating source, cooling load,
housing size, and other relevant factors; and other issues as may seem appropriate.
Guideline (A) Chapter 4
Generation ‐ Planning Assumptions
Chapter 5
Generation ‐ Supply‐Side Resources
In order to understand the basis for the utility's plan, the IRP filing shall include a narrative summary
detailing the underlying assumptions reflected in its forecast as further described in the guidelines. To
better follow the utility's planning process, the narrative shall include a description of the utility's
rationale for the selection of any particular generation addition or demand‐side management program
to fulfill its forecasted need. Such description should include the utility's evaluation of its purchase
options and cost/benefit analyses for each resource option to confirm and justify each resource
option it has chosen. Such narrative shall also describe the planning process including timelines and
appropriate reviews and/or approvals of the utility's plan. For members of PJM Interconnection, LLC
("PJM"), the narrative should describe how the IRP incorporates the PJM planning and
implementation processes and how it will satisfy PJM load obligations.
Guideline (A) See References for Guideline (F)(7) and
Schedules
These guidelines also include sample schedules to supplement this narrative discussion and assist the
utilities in developing a tabulation of the utility's forecast for at least a 15‐year period and identify the
projected supply‐side or demand‐side resource additions and solutions to adequately and reliably
meet the electricity needs of the Commonwealth. This tabulation shall also indicate the projected
effects of demand response and energy efficiency programs and activities on forecasted annual
energy and peak loads for the same period. These guidelines also direct that all IRP filings include
information to comparably evaluate various supply‐side technologies and demand‐side programs and
technologies on an equivalent basis as more fully described below in Section F(7).
Guideline (C)(1) Section 2.2
Alternative Plans
Appendix 2A
Plans A‐D ‐ Capacity & Energy
Section 4.1
Load Forecast
Appendix 4H
Projected Summer & Winter Peak Load &
Energy Forecast for Plan B
Appendix 4I
Required Reserve Margin for Plan B
1. Forecast. A three‐year historical record and a 15‐year forecast of the utility's native load
requirements, the utility's PJM load obligations if appropriate, and other system capacity or firm
energy obligations for each peak season along with the supply‐side (including owned/leased
generation capacity and firm purchased power arrangements) and demand‐side resources expected
to satisfy those loads, and the reserve margin thus produced.
Page 2 of 9

2020 Integrated Resource Plan Reference Index
Case No. PUR‐2020‐00035
Order / Guideline 2020 Plan Section Requirement
Guideline (C)(2) Chapter 5
Generation ‐ Supply‐Side Resources
Chapter 6
Generation ‐ Demand‐Side Management
2. Option analyses. A comprehensive analysis of all existing and new resource options (supply‐ and
demand‐side), including costs, benefits, risks, uncertainties, reliability, and customer acceptance
where appropriate, considered and chosen by the utility for satisfaction of native load requirements
and other system obligations necessary to provide reliable electric utility service, at the lowest
reasonable cost, over the planning period.
Guideline (C)(2)(a) Section 4.2
Capacity Market Assumptions
a. Purchased Power ‐ assess the potential costs and benefits of purchasing power from wholesale
power suppliers and power marketers to supply it with needed capacity and describe in detail any
decision to purchase electricity from the wholesale power market.
Guideline (C)(2)(b) Section 5.5
Future Supply‐Side Generation Resources
b. Supply‐side Energy Resources ‐ assess the potential costs and benefits of reasonably available
traditional and alternative supply‐side energy resource options, including, but not limited to
technologies such as, nuclear, pulverized coal, clean coal, circulating fluidized bed, wood, combined
cycle, integrated gasification combined cycle, and combustion turbine, as well as renewable energy
resources such as those derived from sunlight, wind, falling water, sustainable biomass, energy from
waste, municipal solid waste, wave motion, tides, and geothermal power.
Guideline (C)(2)(c) Chapter 6
Generation ‐ Demand‐Side Management
Appendix 4L
Load Duration Curves
c. Demand‐side Options ‐ assess the potential costs and benefits of programs that promote demand‐
side management. For purposes of these guidelines, peak reduction and demand response programs
and energy efficiency and conservation programs will collectively be referred to as demand‐side
options.
Guideline (C)(2)(d) Chapter 4
Generation ‐ Planning Assumptions
d. Evaluation of Resource Options ‐ analyze potential resource options and combinations of resource
options to serve system needs, taking into account the sensitivity of its analysis to variations in future
estimates of peak load, energy requirements, and other significant assumptions, including, but not
limited to, the risks associated with wholesale markets, fuel costs, construction or implementation
costs, transmission and distribution costs, environmental impacts and compliance costs.
Guideline (C)(3) As Applicable 3. Data availability. To the extent the information requested is not currently available or is not
applicable, the utility will clearly note and explain this in the appropriate location in the plan, narrative,
or schedule.
Guideline (D) Chapter 1
Significant Development and Context for
Integrated Planning Process
Each utility shall provide a narrative summary detailing the major trends, events, and/or conditions
reflected in the forecasted data submitted in response to these guidelines.
Guideline (D)(1) Section 4.1
Load Forecast
Section 4.2
Capacity Market Assumptions
1. Discussion regarding the forecasted peak load obligation and energy requirements. PJM members
should also discuss the relationship of the utility's expected non‐coincident peak and its expected PJM
related load obligations.
Guideline (D)(2) Section 2.2
Alternative Plans
Chapter 3
Short‐Term Action Plan
2. Discussion regarding company goals and plans in response to directives of Chapters 23 and 24 of
Title 56 of the Code of Virginia, including compliance with energy efficiency, energy conservation,
demand‐side and response programs, and the provision of electricity from renewable energy
resources.
Guideline (D)(3) Chapter 4
Generation ‐ Planning Assumptions
3. Discussion regarding the complete planning process, including timelines, assumptions, reviews,
approvals, etc., of the company's plans. For PJM members, the discussion should also describe how
the IRP integrates into the complete planning process of PJM.
Guideline (D)(4) Section 4.1
Load Forecast
4. Discussion of the critical input assumptions to determine the load forecast and expected changes in
load growth including factors such as energy conservation, efficiency, load management, demand
response, variations in customer class sizes, expected levels of economic activity, variations in fuel
prices and appliance inventories, etc.
Guideline (D)(5) Chapter 4
Generation ‐ Planning Assumptions
Chapter 5
Generation ‐ Supply‐Side Resources
Chapter 6
Generation ‐ Demand‐Side Management
5. Discussion regarding cost/benefit analyses and the results of such factors on this plan, including the
methodology used to consider equal or comparable treatment afforded both the demand‐side options
and supply‐side resources.
Guideline (D)(6) Section 5.2
Evaluation of Existing Generation
Appendix 5J
Potential Unit Retirements
Appendix 5K
Planned Changes to Existing Generation Units
Appendix 5L
Environmental Regulations
6. Planned changes in operating characteristics such as unit retirements, unit uprates or derates,
changes in unit availabilities, changes in capacity resource mix, changes in fuel supplies or transport,
emissions compliance, unit performance, etc.
Page 3 of 9

2020 Integrated Resource Plan Reference Index
Case No. PUR‐2020‐00035
Order / Guideline 2020 Plan Section Requirement
Guideline (D)(7) Section 2.2
Alternative Plans
7. Discussion regarding the effectiveness of the utility's IRP to meet its load obligations with supply‐
side and demand‐side resources to enable the utility to provide reliable service at reasonable prices
over the long term.
Guideline (E) 2020 Plan By September 1, 2009, and every two years thereafter, each utility shall file with the Commission its
then current integrated resource plan, which shall include all information required by these guidelines
for the ensuing 15‐year planning period along with the prior three‐year historical period. The process
and analyses shall be described in a narrative discussion and the results presented in tabular format
using an EXCEL spreadsheet format, similar to the attached sample schedules, and be provided in both
printed and electronic media. For those utilities that operate as part of a multi‐state integrated power
system, the schedules should be submitted for both the individual company and the generation
planning pool of which the utility is a member. The top line stating the company name should indicate
that the data reflects the individual utility company or the total system. For partial ownership of any
facility, please provide the percent ownership and footnote accordingly
Guideline (E) Chapter 3
Short‐Term Action Plan
Each filing shall include a five‐year action plan that discusses those specific actions currently being
taken by the utility to implement the options or activities chosen as appropriate per the IRP.
Guideline (E) 2020 Plan
Motion for Protective Order
If a utility considers certain information in its IRP to be proprietary or confidential, the utility may so
designate, file separately and request such treatment in accordance with the Commission's Rules of
Practice and Procedures.
Guideline (E) 2020 Plan
Proposed Notice
As § 56‐599 E requires the giving of notice and an opportunity to be heard, each utility shall also
include a copy of its proposed notice to be used to afford such an opportunity.
Guideline (F)(1) Section 4.1
Load Forecast
1. Forecast of Load. The forecast shall include descriptions of the methods, models, and assumptions
used by the utility to prepare its forecasts of its loads, requirements associated with the utility's PJM
load obligation (MW) if appropriate, the utility's peak load (MW) and energy sales (MWh) and the
variables used in the models
Guideline (F)(1)(a) Appendix 4A
Total Sales by Customer Class (DOM LSE)
(GWh)
Appendix 4B
Virgiinia Sales by Customer Class (DOM LSE)
(GWh)
Appendix 4C
North Carolina Sales by Customer Class (DOM
LSE) (GWh)
a. The most recent three‐year history and 15‐year forecast of energy sales (kWh) by each customer
class
Guideline (F)(1)(b) Appendix 4H
Projected Summer & Winter Peak Load &
Energy Forecast for Plan B
Appendix 4I
Required Reserve Margin for Plan B
b. The most recent three‐year history and 15‐year forecast of the utility's peak load and the expected
load obligation to satisfy PJM's coincident peak forecast if appropriate, and the utility's coincident
peak load and associated noncoincident peak load for summer and winter seasons of each year (prior
to any DSM), annual energy forecasts, and resultant reserve margins. During the forecast period, the
tabulation shall also indicate the projected effects of incremental demand‐side options on the
forecasted annual energy and peak loads
Guideline (F)(1)(c) Section 5.5
Future Supply‐Side Generation
c. Where future resources are required, a description and associated characteristics of the option that
the utility proposes to use to address the forecasted need
Guideline (F)(2) Chapter 1
Significant Developments and Context for
Integrated Planning Process
Chapter 5
Generation ‐ Supply‐Side Resources
2. Supply‐side Resources. The forecast shall provide data for its existing and planned electric
generating facilities (including planned additions and retirements and rating changes, as well as firm
purchase contracts, including cogeneration and small power production) and a narrative description of
the driver(s) underlying such anticipated changes such as expected environmental compliance, carbon
restrictions, technology enhancements, etc.
Page 4 of 9
2020 Integrated Resource Plan Reference Index
Case No. PUR‐2020‐00035
Order / Guideline 2020 Plan Section Requirement
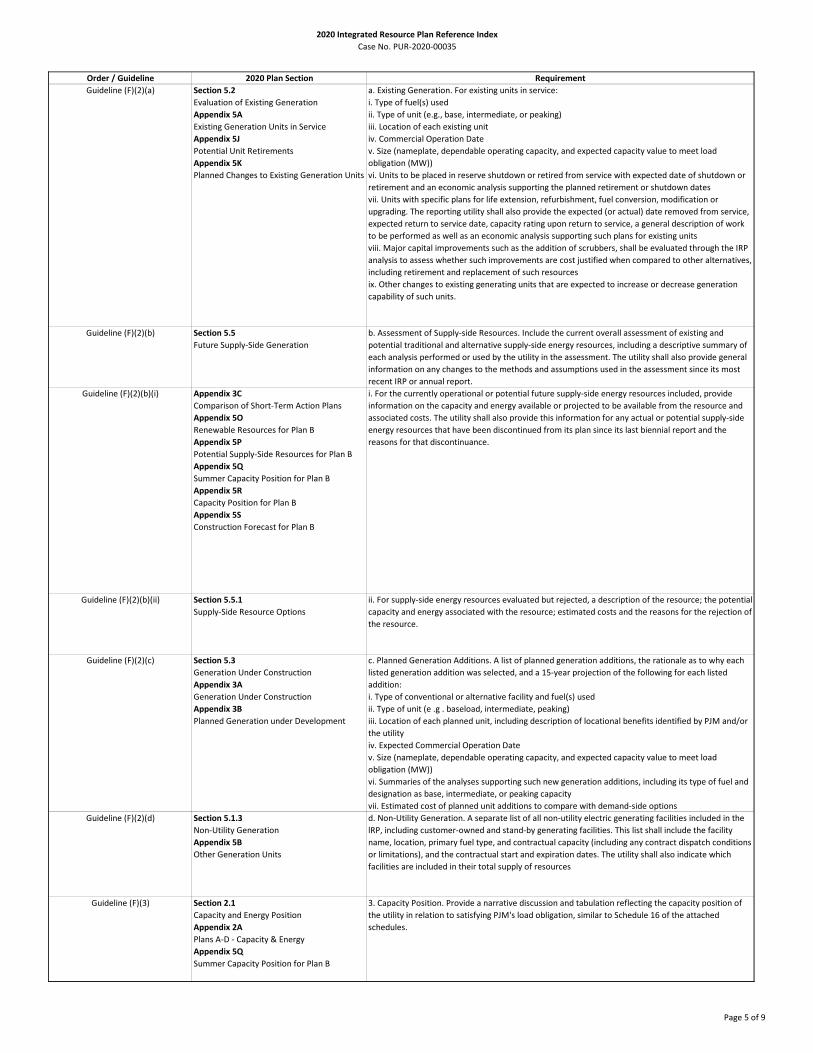
Guideline (F)(2)(a) Section 5.2
Evaluation of Existing Generation
Appendix 5A
Existing Generation Units in Service
Appendix 5J
Potential Unit Retirements
Appendix 5K
Planned Changes to Existing Generation Units
a. Existing Generation. For existing units in service:
i. Type of fuel(s) used
ii. Type of unit (e.g., base, intermediate, or peaking)
iii. Location of each existing unit
iv. Commercial Operation Date
v. Size (nameplate, dependable operating capacity, and expected capacity value to meet load
obligation (MW))
vi. Units to be placed in reserve shutdown or retired from service with expected date of shutdown or
retirement and an economic analysis supporting the planned retirement or shutdown dates
vii. Units with specific plans for life extension, refurbishment, fuel conversion, modification or
upgrading. The reporting utility shall also provide the expected (or actual) date removed from service,
expected return to service date, capacity rating upon return to service, a general description of work
to be performed as well as an economic analysis supporting such plans for existing units
viii. Major capital improvements such as the addition of scrubbers, shall be evaluated through the IRP
analysis to assess whether such improvements are cost justified when compared to other alternatives,
including retirement and replacement of such resources
ix. Other changes to existing generating units that are expected to increase or decrease generation
capability of such units.
Guideline (F)(2)(b) Section 5.5
Future Supply‐Side Generation
b. Assessment of Supply‐side Resources. Include the current overall assessment of existing and
potential traditional and alternative supply‐side energy resources, including a descriptive summary of
each analysis performed or used by the utility in the assessment. The utility shall also provide general
information on any changes to the methods and assumptions used in the assessment since its most
recent IRP or annual report.
Guideline (F)(2)(b)(i) Appendix 3C
Comparison of Short‐Term Action Plans
Appendix 5O
Renewable Resources for Plan B
Appendix 5P
Potential Supply‐Side Resources for Plan B
Appendix 5Q
Summer Capacity Position for Plan B
Appendix 5R
Capacity Position for Plan B
Appendix 5S
Construction Forecast for Plan B
i. For the currently operational or potential future supply‐side energy resources included, provide
information on the capacity and energy available or projected to be available from the resource and
associated costs. The utility shall also provide this information for any actual or potential supply‐side
energy resources that have been discontinued from its plan since its last biennial report and the
reasons for that discontinuance.
Guideline (F)(2)(b)(ii) Section 5.5.1
Supply‐Side Resource Options
ii. For supply‐side energy resources evaluated but rejected, a description of the resource; the potential
capacity and energy associated with the resource; estimated costs and the reasons for the rejection of
the resource.
Guideline (F)(2)(c) Section 5.3
Generation Under Construction
Appendix 3A
Generation Under Construction
Appendix 3B
Planned Generation under Development
c. Planned Generation Additions. A list of planned generation additions, the rationale as to why each
listed generation addition was selected, and a 15‐year projection of the following for each listed
addition:
i. Type of conventional or alternative facility and fuel(s) used
ii. Type of unit (e .g . baseload, intermediate, peaking)
iii. Location of each planned unit, including description of locational benefits identified by PJM and/or
the utility
iv. Expected Commercial Operation Date
v. Size (nameplate, dependable operating capacity, and expected capacity value to meet load
obligation (MW))
vi. Summaries of the analyses supporting such new generation additions, including its type of fuel and
designation as base, intermediate, or peaking capacity
vii. Estimated cost of planned unit additions to compare with demand‐side options
Guideline (F)(2)(d) Section 5.1.3
Non‐Utility Generation
Appendix 5B
Other Generation Units
d. Non‐Utility Generation. A separate list of all non‐utility electric generating facilities included in the
lRP, including customer‐owned and stand‐by generating facilities. This list shall include the facility
name, location, primary fuel type, and contractual capacity (including any contract dispatch conditions
or limitations), and the contractual start and expiration dates. The utility shall also indicate which
facilities are included in their total supply of resources
Guideline (F)(3) Section 2.1
Capacity and Energy Position
Appendix 2A
Plans A‐D ‐ Capacity & Energy
Appendix 5Q
Summer Capacity Position for Plan B
3. Capacity Position. Provide a narrative discussion and tabulation reflecting the capacity position of
the utility in relation to satisfying PJM's load obligation, similar to Schedule 16 of the attached
schedules.
Page 5 of 9

2020 Integrated Resource Plan Reference Index
Case No. PUR‐2020‐00035
Order / Guideline 2020 Plan Section Requirement
Guideline (F)(4) Appendix 4K
Wholesale Power Sales Contracts
4. Wholesale Contracts for the Purchase and Sale of Power. A list of firm wholesale purchased power
and sales contracts reflected in the plan, including the primary fuel type, designation as base,
intermediate, or peaking capacity, contract capacity, location, commencement and expiration dates,
and volume.
Guideline (F)(5) Chapter 6
Generation ‐ Demand‐Side Management
Appendices 6A to 6N
5. Demand‐side Options. Provide the results of its overall assessment of existing and potential
demand‐side option programs, including a descriptive summary of each analysis performed or used by
the utility in its assessment and any changes to the methods and assumptions employed since its last
IRP. Such descriptive summary, and corresponding schedules, shall clearly identify the total impact of
each DSM program.
Guideline (F)(6) Chapter 5
Generation ‐ Supply‐Side Resources
Section 4.6.3
Solar Interconnection and Integration Costs
6. Evaluation of Resource Options. Provide a description and a summary of the results of the utility's
analyses of potential resource options and combinations of resource options performed by it pursuant
to these guidelines to determine its integrated resource plan. IRP filings should identify and include
forecasted transmission interconnection and enhancement costs associated with specific resources
evaluated in conjunction with the analysis of resource options.
Guideline (F)(7) Section 5.5.2
Levelized Busbar Costs
Appendix 5M
Tabular Results of Busbar
Appendix 5N
Busbar Assumptions
7. Comparative Costs of Options. Provide detailed information on levelized busbar costs, annual
revenue requirements or equivalent methodology for various supply‐side options and demand‐side
options to permit comparison of such resources on equitable footing. Such data should be tabulated
and at a minimum, reflect the resource's heat rate, variable and fixed operating maintenance costs,
expected service life, overnight construction costs, fixed charged rate, and the basis of escalation for
each component.
Schedule 1 Appendix 4H
Projected Summer & Winter Peak Load &
Energy Forecast for Plan B
Peak load and energy forecast
Schedule 2 Appendix 5G
Energy Generation by Type for Plan B (GWh)
Generation output
Schedule 3 Appendix 5H
Energy Generation by Type for Plan B (%)
System output mix
Schedule 4 Appendix 5R
Capacity Position for Plan B
Seasonal capability
Schedule 5 Appendix 4J
Summer and Winter Peak for Plan B
Seasonal load
Schedule 6 Appendix 4I
Required Reserve Margin for Plan B
Reserve margin
Schedule 7 Appendix 5F
Existing Capacity for Plan B
Installed capacity
Schedule 8 Appendix 5C
Equivalent Availability Factor for Plan B
Equivalent availability factor
Schedule 9 Appendix 5D
Net Capacity Factor
Net capactiy factor
Schedule 10 Appendix 5E
Heat Rates for Plan B
Average heat rate
Schedule 11 Appendix 5O
Renewable Resources for Plan B
Renewable resources
Schedule 12 Appendix 6D
Approved Programs Energy Savings for Plan B
(MWh) (System Level)
Appendix 6I
Proposed Programs Energy Savings for Plan B
(MWh) (System Level)
Appendix 6L
Future Undesignated EE Energy Savings for
Plan B (MWh) (System Level)
DSM programs
Schedule 13 Appendix 5K
Planned Changes to Existing Generation Units
Unit size uprate and derate
Schedule 14 Appendix 5A
Existing Generation Units in Service
Appendix 5B
Other Generation Units
Existing unit performance data
Page 6 of 9

2020 Integrated Resource Plan Reference Index
Case No. PUR‐2020‐00035
Order / Guideline 2020 Plan Section Requirement
Schedule 15 Appendix 3A
Generation under Construction
Appendix 3B
Planned Generation under Development
Appendix 5P
Potential Supply‐Side Resources for Plan B
Planned unit performance data
Schedule 16 Appendix 5Q
Summer Capacity Position for Plan B
Utility capacity position
Schedule 17 Appendix 5S
Construction Forecast for Plan B
Construction forecast
Schedule 18 Appendix 4R
Delivered Fuel Data
Fuel data
Case No. PUR‐2020‐00035
Order at 1‐2
Section 2.2
Alternative Plans
Section 4.10
VCEA‐Related Assumptions
Dominion should model the costs and reliability impacts of the VCEA and other relevant legislation in
its 2020 IRP.
In addition to existing requirements, including the requirement to model a "least cost plan,"
Dominion's 2020 IRP shall:
1. Model the mandates and requirements of the VCEA and other relevant legislation based on the best
available information, using reasonable and appropriately documented assumptions if necessary;
Case No. PUR‐2020‐00035
Order at 2
Section 2.4
NPV Results
Dominion's 2020 IRP shall:
2. Calculate separately the net present value costs to customers of the least cost plan, the VCEA, and
other relvant legislation including not only generation costs but also transmission and distribution
costs;
Case No. PUR‐2020‐00035
Order at 2
Section 2.6
Virginia Residential Bill Analysis
Va. Plan Addendum 1
Virginia Residential Bill Analysis
Dominion's 2020 IRP shall:
3. Calculate separately the annual bill impacts of the least cost plan, the VCEA, and additional
legislation over each of the next ten years as compared to the bill of a residential customer using
1,000 kilowatt‐hours per month as of May 1, 2020, including not only generation costs but also
transmission and distribution costs;
Case No. PUR‐2020‐00035
Order at 3
Section 4.1.3
Energy Efficiency Adjustment
Dominion's 2020 IRP shall:
4. For purposes of the modeling directed herein, other than the least cost plan, the Company shall
model the impact of applicable energy efficiency requirements on the load forecast, separately as (a)
an impact on the PJM peak load and energy sales forecast, and (b) a supply‐side resource;
Case No. PUR‐2020‐00035
Order at 3
Section 2.5
Transmission System Reliability Analysis
Section 7.5
Transmission System Reliability Analysis
Dominion's 2020 IRP shall:
5. Include an engineering analysis of the effects of the mandates and requirements of the VCEA and
other relevant legislation on reliability of service to customers and identify any Company concerns
regarding the impact of the mandates and requirements of the VCEA and other relevant legislation on
the reliability of the Company's service; and
Case No. PUR‐2020‐00035
Order at 3
Section 9.2
Effect of Infrastructure Programs on Overall
Resource Plan
Dominion's 2020 IRP shall:
6. Include an analysis of how the infrastructure deployment and costs associated with the Company's
electric distribution and transmission system programs, such as its Grid Transformation Plan,
Underground Transmission Line Pilot, Battery Storage Pilot and Strategic Undergrounding Program,
impact the Company's overall resource plan. Identify whether these distribution and transmission
improvements enable broader deployments of distributed energy resources such as residential
rooftop solar and whether such broader deployment displaces the need for traditional generation
resources in the proposed build plans, Include any reduction in costs associated with changes in the
proposed build plans that would otherwise be required by the IRP.
Case No. PUR‐2018‐00065
Final Order at 11
Case No. PUR‐2018‐00065
Order on Reconsideration at 3
Section 2.2
Alternative Plans
Section 4.9
Least‐Cost Plan Assumptions
In future IRPs, the Company shall:
1. Model a true least‐cost plan, as defined in the December 2018 Order.
In the Order on Reconsideration, the Commission confirmed that this directive encompasses the
concept that Commission‐approved generation resources will not be required to be "modeled" for
inclusion at all, but will appear as existing or under construction depending upon their development
status.
Case No. PUR‐2018‐00065
Final Order at 11
Section 4.1
Load Forecast
In future IRPs, the Company shall:
2. Continue to use the PJM load forecast, reduced by the energy efficiency spending requirement of
Senate Bill 966 (Enactment Clause 15), both as an energy reduction and a supply resource, and
separately identify the load associated with data centers.
Case No. PUR‐2018‐00065
Final Order at 11
Section 4.7
Storage‐Related Assumptions
In future IRPs, the Company shall:
3. Model battery storage using the most updated cost estimates available.
Case No. PUR‐2018‐00065
Final Order at 11
Section 4.4
Commodity Price Assumptions
In future IRPs, the Company shall:
4. Model compliance with the Regional Greenhouse Gas Initiative.
Case No. PUR‐2018‐00065
Final Order at 11
Case No. PUR‐2018‐00065
Dec. 2018 Order at 5, n. 14
Section 4.8
Gas Transportation Cost Assumptions
In future IRPs, the Company shall:
5. Model gas transportation costs, including a reasonable estimate of fuel transportation costs (firm
and interruptible transportation, if applicable) associated with all natural gas generation facilities as
well as fuel commodity costs, consistent with the December 2018 Order
Page 7 of 9

2020 Integrated Resource Plan Reference Index
Case No. PUR‐2020‐00035
Order / Guideline 2020 Plan Section Requirement
Case No. PUR‐2018‐00065
Final Order at 11‐12
Case No. PUR‐2018‐00065
Order on Reconsideration at 5
Section 4.6.1
Solar Capacity Factor
In future IRPs, the Company shall:
7. Model future solar PV tracking resources using two alternative capacity factor values:
(a) the actual capacity performance of Dominion's Company‐owned solar tracking fleet in Virginia
using an average of the most recent three‐year period; and (The Commission additionally noted that
for the 2020 IRP, the Company should use the three‐year average of calendar years 2017‐2019. For
those solar tracking facilities that have not been in service for three years, the Company should use
the historic data that is available.)
(b) 25%.
In the Order on Reconsideration, the Commission approved the Compay's request to run one of the
capacity factors contained in Directive #7 as a sensitivity; however, if the Company chooses to do so, it
shall model the actual capacity performance of Dominion's Company‐owned solar tracking fleet as the
baseline assumption and use 25% as the sensitivity.
Case No. PUR‐2018‐00065
Final Order at 12
Chapter 8
Distribution
Va. Plan Addendum 2
GT Plan Document
In future IRPs, the Company shall:
8. Systematically evaluate long‐term electric distribution grid planning and proposed electric
distribution grid transformation projects (Code § 56‐599 B 10). For identified grid transformation
projects, the Company shall include:
(a) A detailed description of the existing distribution system and the identified need for each
proposed grid transformation project;
(b) Detailed cost estimates of each proposed investment;
(c) The benedits associated with each proposed investment; and
(d) Alternatives considered for each proposed investment.
Case No. PUR‐2018‐00065
Final Order at 12, n. 49
Appendix 5I
Solar and Wind Generating Facilities Since
July 1, 2018
In future IRPs, the Company shall:
9. Provide a schedule identifying the Company's contribution towards meeting the 5,000 MW target
identified in Code § 56‐585.1:4, including
(a) a list of each project in service or under construction;
(b) the nameplate capacity of each project;
(c) the actual or projected in‐service date;
(d) whether the project is Company‐build or a third‐party PPA; and
(e) the cost recovery mechanism (e.g., fuel, base rates, RAC, ring‐fence arrangement, etc.)
The Company shall also maintain this information on an on‐going basis and provide it to Staff upon
request.
Case No. PUR‐2018‐00065
Final Order at 12
Appendix 3D
List of Planned Transmission Projects During
the Planning Period
In future IRPs, the Company shall:
10. Provide, in addition to a list of planned transmission projects, the projected cost per transmission
project and indicate whether or not each project is subject to PJM's Regional Transmission Expansion
Planning process.
Case No. PUR‐2018‐00065
Final Order at 12, n. 47
Case No. PUR‐2018‐00065
Thomas 2nd Rebuttal at 7
Section 4.4.6
REC Price Forecasting Methodology
Appendix 4Q
Overview of PJM REC Price Forecasting
The Commission previously found the Company's REC price forecast methodology to be unreasonable
(Dec. 2018 Order at 9‐10). The Company proposes to work in consultation with the Staff to develop
an appropriate REC price methodology, including appropriate risk scenarios, for upcoming IRP filings
(Thomas Rebuttal at 7). We agree and so direct.
Case No. PUE‐2016‐00049
Final Order at 3
Case No. PUE‐2015‐00035
Final Order at 18
2020 Plan
Reference Index
Dominion shall continue to comply with all requirements directed in prior IRP orders, including the
requirement to include an index that identifies the specific location(s) within the IRP that complies
with each such requirement.
Case No. PUE‐2015‐00035
Final Order at 10
Section 5.4.4
Extension of Nuclear Licensing
The Commission directs the Company to: continue to investigate the feasibility and cost of extending
the operating licenses for Surry Unit 1, Surry Unit 2, North Anna Unit 1, and North Anna Unit 2
Case No. PUE‐2015‐00035
Final Order at 16
Case No. PUE‐2013‐00088
Final Order at 7
Section 5.5.3
Third‐Party Market Alternatives
In future IRP filings, Dominion shall: include a more detailed analysis of market alternatives, especially
third‐party purchases that may provide long‐term price stability, and includes, but is not limited to,
wind and solar resources
Case No. PUE‐2015‐00035
Final Order at 16
Case No. PUE‐2013‐00088
Final Order at 7
Section 4.6.2
Solar Company‐Build vs. PPAs
Section 5.5.3
Third‐Party Market Alternatives
In future IRP filings, Dominion shall: examine wind and solar purchases at prices (including prices
available through long‐term purchase power agreements) and in quantities that are being seen in the
market at the time the Company prepares its IRP filings
Case No. PUE‐2015‐00035
Final Order at 16
Case No. PUE‐2013‐00088
Final Order at 7
Section 4.6.2
Solar Company‐Build vs. PPAs
Section 5.5.3
Third‐Party Market Alternatives
In future IRP filings, Dominion shall: provide a comparison of the cost of purchasing power from wind
and solar resources from third‐party vendors versus self‐build options, including off‐shore and on‐
shore wind, with this comparison including information from a variety of third‐party vendors
Case No. PUE‐2015‐00035
Final Order at 17
Section 4.6.3
Solar Interconnection and Integration Costs
In future IRPs, Dominion shall: develop a plan for identifying, quantifying, and mitigating cost and
integration issues associated with greater reliance on solar photovoltaic generation
Case No. PUE‐2013‐00088
Final Order at 4
Section 5.4
Generation Under Development
Section 5.4.4
Extension of Nuclear Licensing
Next, we find that in future IRP filings, the Company shall provide further analysis related to the
construction of North Anna 3 and the future of Surry Unit 1, Surry Unit 2, North Anna Unit 1, and
North Anna Unit 2, all of which have licenses that are scheduled to expire within the next thirty years.
Page 8 of 9

2020 Integrated Resource Plan Reference Index
Case No. PUR‐2020‐00035
Order / Guideline 2020 Plan Section Requirement
Case No. PUE‐2013‐00088
Final Order at 5‐6
Section 5.4.4
Extension of Nuclear Licensing
The Company shall also provide status updates on any discussions it engages in with the United States
Nuclear Regulatory Commission on a possible extension for the operating licenses for Surry Unit 1,
Surry Unit 2, North Anna Unit 1, and North Anna Unit 2, in its future IRP and IRP update filings.
Case No. PUE‐2013‐00088
Final Order at 8
Section 6.7
Overall DSM Assessment
Next, the Commission finds that in future IRP filings, Dominion Virginia Power should compare the
cost of its demand‐side management proposals to the cost of new generating resource alternatives.
Specifically, Staff has suggested that it would be informative to compare the Company's expected
demand‐side management costs per megawatt hour saved to its expected supply side costs per
megawatt hour. We agree and direct the Company to evaluate demand‐side management
alternatives using this methodology.
Case No. PUE‐2013‐00088
Final Order at 8
Section 4.4
Commodity Price Assumptions
Appendix 4O
ICF Commodity Price Forecasts
Appendix 4P
ICF Price Forecasts
Further, we direct Dominion Virginia Power to include a broad band of prices used in future
forecasting assumptions, such as forecasting assumptions related to fuel prices, effluent prices,
market prices and renewable energy credit costs, in order to continue to set reasonable boundaries
around the modeling assumptions, and to continue to refine the specific assumptions and sensitivity
adjustments of its modeling data in future IRP filings.
Page 9 of 9

1
NOTICE TO THE PUBLIC OF A FILING BY VIRGINIA ELECTRIC AND POWER COMPANY
OF ITS INTEGRATED RESOURCE PLAN CASE NO. PUR-2020-00035
On May 1, 2020, Virginia Electric and Power Company (the “Company”), submitted to the State Corporation Commission (“Commission”) its Integrated Resource Plan (the “Plan”) pursuant to § 56-597 et seq. of the Code of Virginia (“Va. Code”). An integrated resource plan, as defined by Va. Code § 56-597, is “a document developed by an electric utility that provides a forecast of its load obligations and a plan to meet those obligations by supply side and demand side resources over the ensuing 15 years to promote reasonable prices, reliable service, energy independence, and environmental responsibility.” Pursuant to Va. Code § 56-599 C, the Commission will analyze the Company’s Plan and make a determination as to whether the Plan is reasonable and in the public interest. The Commission entered an Order Establishing Schedule for Proceedings (“Procedural Order”) that, among other things, scheduled a public hearing at 9:30 a.m. on October 27, 2020, in the Commission’s second floor courtroom located in the Tyler Building, 1300 East Main Street, Richmond, Virginia 23219, to receive opening statements, testimony, and evidence offered by the Company, respondents, and the Staff on the Company’s Plan. On [date], the Commission entered an Order for Notice and Comment (“Notice Order”) that directed the Company to provide notice to the public and offered interested persons an opportunity to comment on the Company’s Plan.
An electronic copy of the public version of the Company’s Plan may be obtained, at no charge, by requesting it in writing from Jennifer D. Valaika, Esquire, McGuireWoods LLP, Gateway Plaza, 800 East Canal Street, Richmond, Virginia 23219, or [email protected] If acceptable to the requesting party, the Company may provide the documents by electronic means. Interested persons may also download unofficial copies of the public version of the Plan and other documents from the Commission’s website: http://www.scc.virginia.gov/case. On or before October 20, 2020, interested persons may file written comments concerning the issues in this case by following the instructions found on the Commission’s website: http://www.scc.virginia.gov/case. All comments shall refer to Case No. PUR-2020-00035. In light of the ongoing public health emergency related to the spread of COVID-19, the Commission will subsequently schedule, if practicable, oral public comment in this matter; if scheduled, such will be noticed via Commission order and accompanying news release. Any interested person may participate as a respondent in this proceeding by filing a notice of participation on or before August 4, 2020. Such notice of participation shall include the email addresses of such parties or their counsel. The respondent

2
simultaneously shall serve a copy of the notice of participation on counsel to the Company. Pursuant to 5 VAC 5-20-80, Participation as a respondent, of the Commission’s Rules of Practice and Procedure (“Rules of Practice”), any notice of participation shall set forth: (i) a precise statement of the interest of the respondent; (ii) a statement of the specific action sought to the extent known; and (iii) the factual and legal basis for the action. Any organization, corporation, or government body participating as a respondent must be represented by counsel as required by Rule 5 VAC 5-20-30, Counsel, of the Rules of Practice. All filings shall refer to Case No. PUR-2020-00035. For additional information about participation as a respondent, any person or entity should obtain a copy of the Commission’s Procedural Order. The Commission’s Rules of Practice may be viewed at http://www.virginia.gov/case. A printed copy of the Commission’s Rules of Practice and an official copy of the Commission’s Procedural Order in this proceeding may be obtained from the Clerk of the Commission at the address set forth above.
VIRGINIA ELECTRIC AND POWER COMPANY

Virginia Electric and Power Company’s Report of Its Integrated Resource Plan
Before the Virginia State Corporation Commission and North Carolina Utilities Commission
Case No. PUR-2020-00035 Docket No. E-100, Sub 165
Filed: May 1, 2020

i
Table of Contents
Introduction ..................................................................................................................................... 1
Executive Summary ........................................................................................................................ 2
Chapter 1: Significant Developments and Context for Integrated Planning Process .................... 9
1.1 Dominion Energy Net Zero Target .................................................................................. 9
1.2 Virginia Clean Economy Act ........................................................................................... 9
1.3 Regional Greenhouse Gas Initiative ............................................................................... 11
1.4 North Carolina Clean Energy Plan ................................................................................. 13
1.5 Need for a Modern Distribution Grid ............................................................................. 13
1.6 Forward Capacity Markets ............................................................................................. 14
1.6.1 Minimum Offer Price Rule ...................................................................................... 14
1.6.2 Fixed Resource Requirement Alternative ............................................................... 15
1.7 Environmental Justice .................................................................................................... 17
1.8 New and Developing Technologies ............................................................................... 17
1.9 COVID-19 ...................................................................................................................... 19
1.10 Other Legislative Developments .................................................................................... 20
1.11 Other Environmental Regulations .................................................................................. 20
1.11.1 Affordable Clean Energy Rule ................................................................................ 20
1.11.2 New Source Performance Standards for Greenhouse Gas Emissions from Electric Generating Units ................................................................................................................... 21
1.11.3 Ozone National Ambient Air Quality Standards ..................................................... 21
1.11.4 Cross-State Air Pollution Rule ................................................................................ 21
1.11.6 Mercury & Air Toxics Standards ............................................................................ 22
1.11.7 Coal Combustion Residuals .................................................................................... 23
1.11.8 Clean Water Act ...................................................................................................... 23
Chapter 2: Results of Integrated Planning Process ...................................................................... 25
2.1 Capacity and Energy Positions ....................................................................................... 25
2.2 Alternative Plans ............................................................................................................ 26
2.3 Transmission System Reliability Analysis ..................................................................... 31
2.4 NPV Results ................................................................................................................... 31
2.5 Virginia Residential Bill Analysis .................................................................................. 32
Chapter 3: Short-Term Action Plan ............................................................................................. 34
3.1 Generation ...................................................................................................................... 34
3.2 Demand-Side Management ............................................................................................ 35
ii
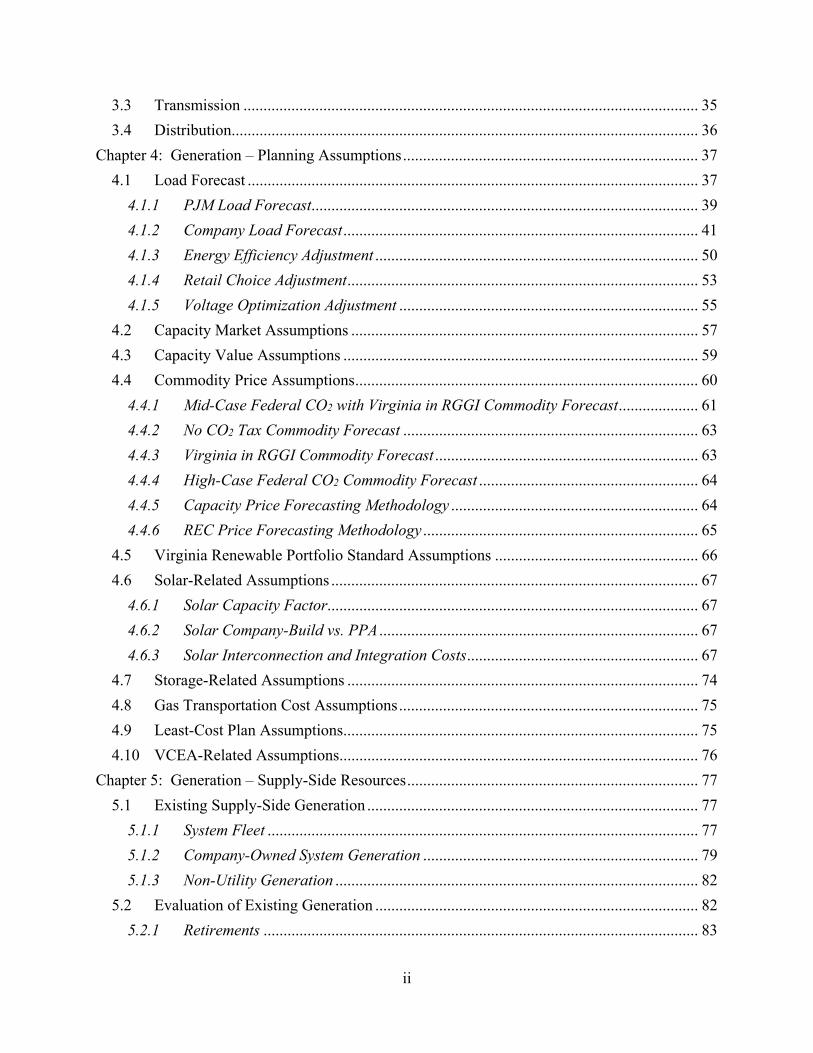
3.3 Transmission .................................................................................................................. 35
3.4 Distribution..................................................................................................................... 36
Chapter 4: Generation – Planning Assumptions .......................................................................... 37
4.1 Load Forecast ................................................................................................................. 37
4.1.1 PJM Load Forecast................................................................................................. 39
4.1.2 Company Load Forecast ......................................................................................... 41
4.1.3 Energy Efficiency Adjustment ................................................................................. 50
4.1.4 Retail Choice Adjustment ........................................................................................ 53
4.1.5 Voltage Optimization Adjustment ........................................................................... 55
4.2 Capacity Market Assumptions ....................................................................................... 57
4.3 Capacity Value Assumptions ......................................................................................... 59
4.4 Commodity Price Assumptions ...................................................................................... 60
4.4.1 Mid-Case Federal CO2 with Virginia in RGGI Commodity Forecast .................... 61
4.4.2 No CO2 Tax Commodity Forecast .......................................................................... 63
4.4.3 Virginia in RGGI Commodity Forecast .................................................................. 63
4.4.4 High-Case Federal CO2 Commodity Forecast ....................................................... 64
4.4.5 Capacity Price Forecasting Methodology .............................................................. 64
4.4.6 REC Price Forecasting Methodology ..................................................................... 65
4.5 Virginia Renewable Portfolio Standard Assumptions ................................................... 66
4.6 Solar-Related Assumptions ............................................................................................ 67
4.6.1 Solar Capacity Factor............................................................................................. 67
4.6.2 Solar Company-Build vs. PPA ................................................................................ 67
4.6.3 Solar Interconnection and Integration Costs .......................................................... 67
4.7 Storage-Related Assumptions ........................................................................................ 74
4.8 Gas Transportation Cost Assumptions ........................................................................... 75
4.9 Least-Cost Plan Assumptions ......................................................................................... 75
4.10 VCEA-Related Assumptions.......................................................................................... 76
Chapter 5: Generation – Supply-Side Resources ......................................................................... 77
5.1 Existing Supply-Side Generation ................................................................................... 77
5.1.1 System Fleet ............................................................................................................ 77
5.1.2 Company-Owned System Generation ..................................................................... 79
5.1.3 Non-Utility Generation ........................................................................................... 82
5.2 Evaluation of Existing Generation ................................................................................. 82
5.2.1 Retirements ............................................................................................................. 83

iii
5.2.2 Uprates and Derates ............................................................................................... 84
5.2.3 Environmental Regulations ..................................................................................... 84
5.3 Generation Under Construction ..................................................................................... 84
5.4 Generation Under Development ..................................................................................... 84
5.4.1 Solar ........................................................................................................................ 84
5.4.2 Offshore Wind ......................................................................................................... 85
5.4.3 Pumped Storage ...................................................................................................... 85
5.4.4 Extension of Nuclear Licensing .............................................................................. 85
5.4.5 Combustion Turbines .............................................................................................. 87
5.5 Future Supply-Side Generation Resources .................................................................... 87
5.5.1 Supply-Side Resource Options ................................................................................ 88
5.5.2 Levelized Busbar Costs / Levelized Cost of Energy ................................................ 92
5.5.3 Third-Party Market Alternatives............................................................................. 95
5.6 Challenges Related to Significant Volumes of Solar Generation .................................. 96
5.6.1 Challenges Related to Capacity .............................................................................. 96
5.6.2 Challenges Related to Energy ................................................................................. 97
5.6.3 Challenges Related to the Solar Production Profile............................................... 99
5.6.4 Challenges Related to Black Start and System Restoration .................................. 101
5.6.5 Challenges Related to Constructability ................................................................ 101
Chapter 6: Generation – Demand-Side Management ................................................................ 103
6.1 DSM Planning Process ................................................................................................. 104
6.2 Approved DSM Programs ............................................................................................ 106
6.3 Proposed DSM Programs ............................................................................................. 106
6.4 Future DSM Initiatives ................................................................................................. 107
6.5 Rejected DSM Programs .............................................................................................. 108
6.6 GTSA Energy Efficiency Analysis .............................................................................. 108
6.6.1 Considerations for Certain Customers Groups and Options for Combining Distributed Generation, Energy Storage, and Energy Efficiency ....................................... 109
6.6.2 Electricity Rate and Consumption Comparison ................................................... 110
6.6.3 National Comparison of Primary Fuel Sources for Generation .......................... 112
6.6.4 Other Relevant Issues for Energy Efficiency Analysis .......................................... 112
6.7 Overall DSM Assessment ............................................................................................ 113
Chapter 7: Transmission ............................................................................................................ 116
7.1 Transmission Planning ................................................................................................. 116
7.2 Existing Transmission Facilities .................................................................................. 117

iv
7.3 Transmission Facilities Under Construction ................................................................ 117
7.4 Future Transmission Projects ....................................................................................... 117
7.5 Transmission System Reliability Analysis ................................................................... 117
7.5.1 Inertia and Frequency Control ............................................................................. 121
7.5.2 Short-circuit System Strength ............................................................................... 121
7.5.3 Power Quality ....................................................................................................... 122
7.5.4 Reactive Resources and Voltage Control ............................................................. 122
7.5.5 System Restoration and Black Start Capabilities ................................................. 123
7.5.6 Grid Monitoring and Control Capabilities ........................................................... 123
7.5.7 Energy Storage Requirements............................................................................... 124
7.5.8 High-voltage Direct Current ................................................................................. 124
7.5.9 Summary of Preliminary Results .......................................................................... 124
Chapter 8: Distribution .............................................................................................................. 126
8.1 Distribution Planning ................................................................................................... 126
8.2 Existing Distribution Facilities ..................................................................................... 128
8.3 Grid Transformation Plan............................................................................................. 128
8.4 Strategic Undergrounding Program ............................................................................. 129
8.5 Battery Storage Pilot Program ...................................................................................... 129
8.6 Electric School Bus Program ....................................................................................... 130
8.7 Rural Broadband Pilot Program ................................................................................... 130
Chapter 9: Other Information ..................................................................................................... 132
9.1 Customer Education ..................................................................................................... 132
9.2 Effect of Infrastructure Programs on Overall Resource Plan ....................................... 134
9.2.1 Grid Transformation Plan .................................................................................... 134
9.2.2 Battery Storage Pilot Program ............................................................................. 135
9.2.3 Underground Line Programs ................................................................................ 136
9.3 GTSA Mandates ........................................................................................................... 136
9.3.1 Plan-Related Mandates ......................................................................................... 137
9.3.2 Rate-Related Mandates ......................................................................................... 137
9.3.3 Mandated Reports ................................................................................................. 137
9.3.4 Pilot Program Mandates....................................................................................... 137
9.3.5 Mandate Related to Electric Distribution Grid Transformation Projects ............ 138
9.3.6 Mandate Related to Energy Conservation Measures ........................................... 138
9.4 Economic Development Rates ..................................................................................... 138

v
List of Acronyms
Acronym Meaning 2018 Plan 2018 Integrated Resource Plan 2019 Update 2019 Update to the 2018 Plan 2020 Plan 2020 Integrated Resource Plan AC Alternating Current ACE Rule Affordable Clean Energy Rule AMI Advanced Metering Infrastructure BDM Bass Diffusion Model BESS Battery Energy Storage System BSER Best System of Emissions Reduction CAA Clean Air Act CAGR Compound Annual Growth Rate CC Combined-Cycle CCR Coal Combustion Residual CCS Carbon Capture and Sequestration CFR Code of Federal Regulations CHP Combined Heat and Power CO2 Carbon Dioxide CO2e Carbon Dioxide Equivalents COD Commercial Operation Date COL Combined Operating License Company Virginia Electric and Power Company CPCN Certificate of Public Convenience and Necessity CPP Clean Power Plan CSAPR Cross-State Air Pollution Rule CT Combustion Turbine CVOW Coastal Virginia Offshore Wind CWA Clean Water Act DAC Direct Air Capture DC Direct Current DER Distributed Energy Resource(s) DOM LSE Dominion Energy Load Serving Entity DOM Zone Dominion Energy Zone DSM Demand-Side Management DynADOR Dynamic Assessment and Determination of Operating Reserves EC Enactment Clause ECR Emission Containment Reserve EE Energy Efficiency EGU Electric Generating Unit(s) ELCC Effective Load Carrying Capability ELG Effluent Limitations Guidelines
vi
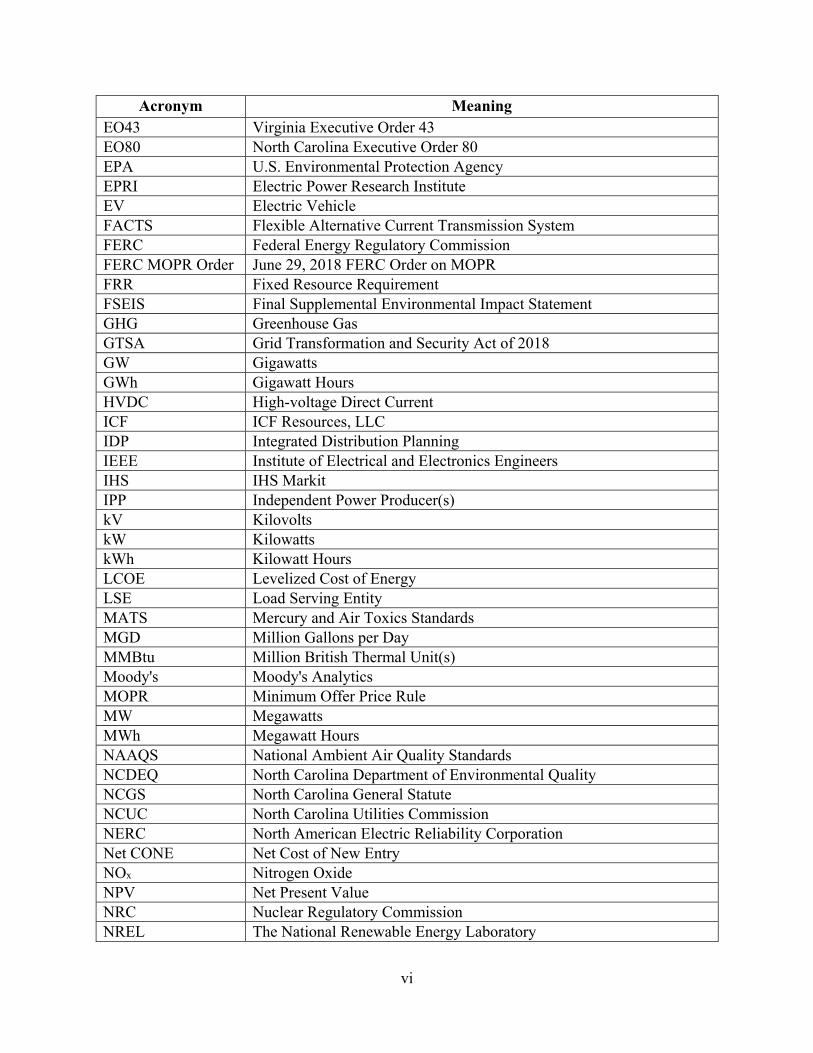
Acronym Meaning EO43 Virginia Executive Order 43 EO80 North Carolina Executive Order 80 EPA U.S. Environmental Protection Agency EPRI Electric Power Research Institute EV Electric Vehicle FACTS Flexible Alternative Current Transmission System FERC Federal Energy Regulatory Commission FERC MOPR Order June 29, 2018 FERC Order on MOPR FRR Fixed Resource Requirement FSEIS Final Supplemental Environmental Impact Statement GHG Greenhouse Gas GTSA Grid Transformation and Security Act of 2018 GW Gigawatts GWh Gigawatt Hours HVDC High-voltage Direct Current ICF ICF Resources, LLC IDP Integrated Distribution Planning IEEE Institute of Electrical and Electronics Engineers IHS IHS Markit IPP Independent Power Producer(s) kV Kilovolts kW Kilowatts kWh Kilowatt Hours LCOE Levelized Cost of Energy LSE Load Serving Entity MATS Mercury and Air Toxics Standards MGD Million Gallons per Day MMBtu Million British Thermal Unit(s) Moody's Moody's Analytics MOPR Minimum Offer Price Rule MW Megawatts MWh Megawatt Hours NAAQS National Ambient Air Quality Standards NCDEQ North Carolina Department of Environmental Quality NCGS North Carolina General Statute NCUC North Carolina Utilities Commission NERC North American Electric Reliability Corporation Net CONE Net Cost of New Entry NOx Nitrogen Oxide NPV Net Present Value NRC Nuclear Regulatory Commission NREL The National Renewable Energy Laboratory
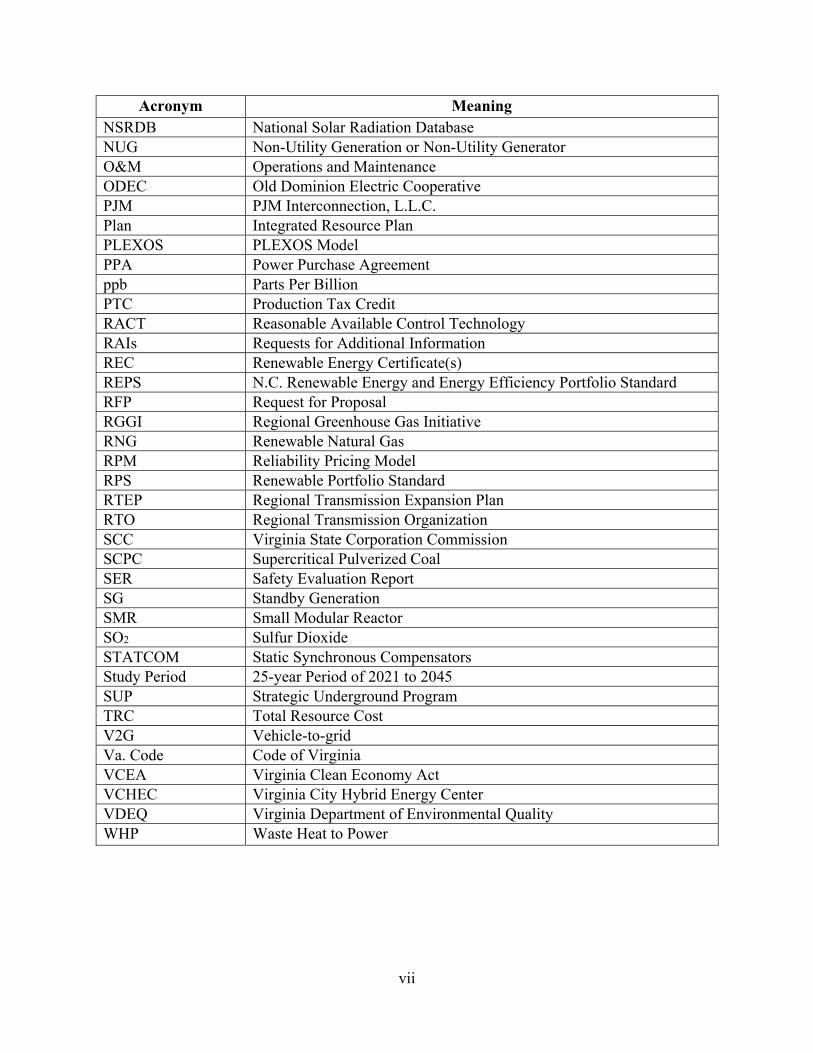
vii
Acronym Meaning NSRDB National Solar Radiation Database NUG Non-Utility Generation or Non-Utility Generator O&M Operations and Maintenance ODEC Old Dominion Electric Cooperative PJM PJM Interconnection, L.L.C. Plan Integrated Resource Plan PLEXOS PLEXOS Model PPA Power Purchase Agreement ppb Parts Per Billion PTC Production Tax Credit RACT Reasonable Available Control Technology RAIs Requests for Additional Information REC Renewable Energy Certificate(s) REPS N.C. Renewable Energy and Energy Efficiency Portfolio Standard RFP Request for Proposal RGGI Regional Greenhouse Gas Initiative RNG Renewable Natural Gas RPM Reliability Pricing Model RPS Renewable Portfolio Standard RTEP Regional Transmission Expansion Plan RTO Regional Transmission Organization SCC Virginia State Corporation Commission SCPC Supercritical Pulverized Coal SER Safety Evaluation Report SG Standby Generation SMR Small Modular Reactor SO2 Sulfur Dioxide STATCOM Static Synchronous Compensators Study Period 25-year Period of 2021 to 2045 SUP Strategic Underground Program TRC Total Resource Cost V2G Vehicle-to-grid Va. Code Code of Virginia VCEA Virginia Clean Economy Act VCHEC Virginia City Hybrid Energy Center VDEQ Virginia Department of Environmental Quality WHP Waste Heat to Power

1
Introduction Headquartered in Richmond, Virginia, Virginia Electric and Power Company (the “Company”) currently serves approximately 2.6 million electric customers located in approximately 30,000 square miles of Virginia and North Carolina. The Company is a subsidiary of Dominion Energy, Inc. (“Dominion Energy”)—one of the nation’s largest producers and transporters of energy, energizing the homes and businesses of more than seven million customers in 20 states with electricity or natural gas. The Company’s supply-side portfolio consists of 20,063 megawatts (“MW”) of generation capacity, including approximately 812 MW of non-utility generation (“NUG”) resources. The Company’s demand-side management (“DSM”) portfolio consists of energy efficiency and demand response programs in Virginia and North Carolina. The Company owns approximately 6,800 miles of transmission lines at voltages ranging from 69 kilovolts (“kV”) to 500 kV in Virginia, North Carolina, and West Virginia; and approximately 58,000 miles of distribution lines at voltages ranging from 4 kV to 46 kV in Virginia and North Carolina. The Company is a member of PJM Interconnection, LLC (“PJM”) Regional Transmission Organization (“RTO”), the operator of the wholesale electric grid in the Mid-Atlantic region of the United States. The 2020 Integrated Resource Plan (the “2020 Plan” or the “Plan”) was prepared for the Dominion Energy Load Serving Entity (“DOM LSE”) within PJM. The Company files this 2020 Plan with the Virginia State Corporation Commission (“SCC”) in accordance with § 56-597 et seq. of the Code of Virginia (or “Va. Code”) and the SCC’s guidelines issued on December 23, 2008. The Company also files this 2020 Plan with the North Carolina Utilities Commission (“NCUC”) in accordance with § 62-2 of the North Carolina General Statutes (“NCGS”) and Rule R8-60 of NCUC’s Rules and Regulations. The 2020 Plan also addresses requirements identified by the SCC and the NCUC in prior relevant orders, as well as current and pending provisions of state and federal law. This 2020 Plan covers the 15-year period beginning in 2021 and continuing through 2035 (the “Planning Period”), using 2020 as the base year. In certain instances, the Company evaluates the longer 25-year period of 2021 to 2045 (the “Study Period”). Overall, the 2020 Plan is a long-term planning document based on a “snapshot in time” of current technologies, market information, and projections, and should be viewed in that context.

2
Executive Summary Throughout its history, the Company has been dedicated to the delivery of safe, reliable, and affordable energy to its customers. This dedication has included a strong movement towards a clean environment. For example, over the last two decades, by changing its generation mix and employing best practices, the Company’s power generation fleet has reduced certain air emissions, including nitrogen oxide, sulfur dioxide, and mercury, by as much as 99%. The Company has also reduced its greenhouse gas emissions, lowering its carbon intensity by approximately 47% since 2000. Further, by adopting the latest technology and applying creative design, the Company is using less water in its operations through the use of air-cooled condensers. The Company has now entered a new phase in its overall efforts to preserve the environment. On February 11, 2020, the Company’s parent company—Dominion Energy—announced a significant expansion of its greenhouse gas emissions reduction goals, establishing a new company-wide commitment to achieve net zero carbon dioxide (“CO2”) and methane emissions by 2050. Net zero does not mean eliminating all emissions, but instead means that any remaining emissions are balanced by removing an equivalent amount from the atmosphere. For example, this can occur through carbon capture, reforestation, or negative-emissions technologies such as renewable natural gas. This strengthened commitment to net zero CO2 and methane emissions builds on Dominion Energy’s strong history of environmental stewardship, while acknowledging the need to further reduce emissions consistent with the findings of the United Nations’ Intergovernmental Panel on Climate Change. The commitment is also a recognition of the increased expectations and interest among customers, policy makers, and employees in building a clean energy future. This net zero CO2 and methane emissions commitment from Dominion Energy parallels the commitments made to clean energy in both Virginia and North Carolina. In Virginia, the Virginia Clean Economy Act (the “VCEA”) will become law effective July 1, 2020. The VCEA establishes a mandatory renewable portfolio standard (“RPS”) aimed at 100% clean energy from the Company’s generation fleet by 2045. In furtherance of this mandatory RPS, the VCEA requires the development of significant energy efficiency, solar, wind, and energy storage resources; it also mandates the retirement of all generation units that emit CO2 as a byproduct of combustion by 2045, unless the retirement of a particular unit would threaten grid reliability and security. Based on other new legislation, the Company expects that Virginia will soon become a full participant in the Regional Greenhouse Gas Initiative (“RGGI”)—a regional effort to cap and reduce CO2 emissions from the power sector. In North Carolina, the Clean Energy Plan, a compilation of policy and action recommendations developed through a public stakeholder process, sets a statewide carbon neutrality goal by 2050. This 2020 Plan focuses on presenting alternative plans that set the Company on a trajectory to achieve these clean energy targets. Indeed, the Company has already begun to transition its generation fleet, as well as its transmission and distribution systems, to achieve a cleaner future. Examples of this ongoing transition include:

3
The retirement of over 2,200 MW of coal-fired and inflexible, higher cost oil- and natural gas-fired generation over the past ten years;
The construction of approximately 198 MW of solar generation over the past ten years, with an additional 198 MW of solar generation currently under construction;
The procurement of approximately 874 MW of solar NUGs over the past ten years; The continued work to extend the licenses of the Company’s nuclear units at Surry and
North Anna; The construction of the Coastal Virginia Offshore Wind (“CVOW”) demonstration
project, along with the development of a larger build-out of offshore wind generation off the coast of Virginia;
The continued transformation of the Company’s distribution grid to provide an enhanced platform for distributed energy resources (“DERs”) and targeted DSM programs; more secure and reliable service, leading to the increased availability of DERs; and more ways for customers to save energy and money through DSM programs and other rate offerings; and
The continued work associated with energy storage technology, including the development of a new pumped storage hydroelectric facility in Virginia and the deployment of three battery energy storage system (“BESS”) pilot projects.
Over the long term, however, achieving the clean energy goals of Virginia, North Carolina, and the Company will require supportive legislative and regulatory policies, technological advancements, grid modernization, and broader investments across the economy. This includes support for the testing and deployment of technologies such as large-scale energy storage, hydrogen, advanced nuclear, and carbon capture and sequestration, all of which have the potential to significantly reduce greenhouse gas emissions. In this 2020 Plan, the Company presents four alternative plans (the “Alternative Plans”). Except for Alternative Plan A, all Alternative Plans assume that Virginia is a full RGGI participant.
Plan A – This Alternative Plan presents a least-cost plan that estimates future generation expansion where there are no new constraints, including no new regulations or restrictions on CO2 emissions. Plan A is presented for cost comparison purposes only in compliance with SCC orders. Given the legislation that will take effect in Virginia on July 1, 2020, this Alternative Plan does not represent a realistic state of relevant law and regulation.
Plan B – This Alternative Plan sets the Company on a trajectory toward dramatically reducing greenhouse gas emissions, taking into consideration future challenges and uncertainties. Plan B includes the significant development of solar, wind, and energy storage resources envisioned by the VCEA. Plan B preserves approximately 9,700 MW of natural gas-fired generation to address future system reliability, stability, and energy independence issues. While Plan B—and indeed all Alternative Plans—incorporate only known, proven technologies, the Company fully expects that new technologies could take the place of today’s technologies over the Study Period. Overall, Plan B is the lowest cost of Alternative Plans B, C, and D, decreases the reliance on outside markets to meet customer demand and produces similar regional CO2 emissions as Plans C and D. Over

4
the Study Period (i.e., 2021 to 2045), this Alternative Plan includes the development of approximately 31 gigawatts (“GW”) of solar capacity, approximately 5 GW of offshore wind capacity, and approximately 5 GW of new energy storage.
Plan C – This Alternative Plan uses similar assumptions as Plan B, but retires all
Company-owned carbon-emitting generation in 2045, resulting in close to zero CO2 emissions from the Company’s fleet in 2045. To reach zero CO2 emissions from the Company’s fleet in 2045, Plan C significantly increases the amount of energy storage resources and the level of imported power. Specifically, in the last ten years of the Study Period, Plan C requires the addition of approximately 1 GW of incremental solar capacity and approximately 4.8 GW of incremental energy storage as compared to Plan B. In addition, beginning in Year 16 of Plan C, the Company’s transmission import capacity would need to double to approximately 10.4 GW total in order to support the Company’s winter import needs, as well as spring and fall export needs. This imported power from PJM would come in part from CO2-emitting generation, meaning that while CO2 emissions from the Company’s fleet would be near zero, regional CO2 emissions would remain at similar levels as Plan B.
Plan D – This Alternative Plan uses similar assumptions as Plan C but changes the
capacity factor assumption for future solar resources from 25% to 19%. As a result, Plan D significantly increases the amount of solar resources needed to reach zero CO2 emissions in 2045. Specifically, over the Study Period, this Plan includes approximately 9.2 GW of incremental solar capacity and approximately 4.8 GW of incremental energy storage as compared to Plan B, which is approximately 8.1 GW more solar capacity than Plan C. Like Plan C, beginning in Year 16 of Plan D, the Company’s transmission import capacity would need to be doubled to approximately 10.4 GW total in order to support the Company’s winter import needs, as well as spring and fall export needs. Accordingly, also like Plan C, regional CO2 emissions would remain at similar levels as Plan B based on the increased dependence on imported power. Notably, the lower 19% capacity factor is based on the historical performance of the Company’s solar generation resources as required by an SCC order; in the Company’s view, this 19% capacity factor does not represent a reasonable estimate of solar generation’s expected potential.

5
The following table presents a high-level summary of the Alternative Plans:
Executive Summary Table: 2020 Plan Results Plan A Plan B Plan C Plan D
NPV Total ($B) $44.3 $66.2 $78.6 $80.8 Approximate CO2 Emissions
from Company in 2045 (Tons) 24 M 10 M 0 0
Approximate CO2 Emissions Regionally in 2045 (Tons)
34 M 4 M 4 M 5 M
Solar (MW) 6,720 15-year
11,520 25-year
15,920 15-year
31,400 25-year 15,920 15-year
32,480 25-year 18,800 15-year
40,640 25-year
Offshore Wind (MW) --- 15-year
--- 25-year 5,112 15-year
5,112 25-year 5,112 15-year
5,112 25-year 5,112 15-year
5,112 25-year
Storage (MW) --- 15-year
--- 25-year 2,714 15-year
5,114 25-year 2,714 15-year
9,914 25-year 2,714 15-year
9,914 25-year
Natural Gas-Fired (MW) 1,940 15-year
3,531 25-year 970 15-year
970 25-year 970 15-year
970 25-year 970 15-year
970 25-year Import / Export
Capability (MW) 5,200 15-year
5,200 25-year 5,200 15-year
5,200 25-year 5,200 15-year
10,400 25-year 5,200 15-year
10,400 25-year
Retirements (MW) 3,030 15-year
4,651 25-year 3,183 15-year
5,414 25-year 3,183 15-year
13,978 25-year 3,183 15-year
13,978 25-year As can be seen in the table above, Alternative Plans B through D are very similar over the first 15 years. This general alignment over the Planning Period sets a common pathway for the Company to pursue now while allowing new technologies to mature. All Alternative Plans include 970 MW of natural gas-fired combustion turbines (“CTs”) as a placeholder to address probable system reliability issues resulting from the addition of significant renewable energy resources and the retirement of coal-fired facilities. While all Alternative Plans in this 2020 Plan incorporate only known, proven technologies, the Company fully expects that new technologies could take the place of today’s technologies over the Study Period. The Company intends to explore all new and promising technologies that support a cleaner future and that will enable the Company to achieve its environmental goals, as well as the goals of Virginia and North Carolina. The Company will provide information on these developments in future Plans and update filings. Based on the current state of technology and the need for technological advances to truly achieve a cleaner future, Alternative Plans B through D as presented in this 2020 Plan all pose challenges over the long term. Alternative Plans B through D factor in the implementation of energy efficiency programs and measures to achieve both 5% total annual energy savings by 2025, as targeted by the VCEA, and $870 million in proposed spending by 2028, as required by the Grid Transformation and Security Act of 2018 (the “GTSA”). The Company has modeled these objectives by supplementing the Company’s approved and pending DSM programs with a generic level of energy efficiency at a fixed price. This approach is a theoretical assumption used for planning purposes only. In reality, the level of energy efficiency savings included in this 2020 Plan may not materialize in

6
the same manner as modeled due to many outside factors. These factors include the ability of future vendors to deliver program savings at the assumed fixed price, the desire of customers to participate in the program at that price, and the effectiveness of the program to be administered at that price. The modeled costs and level of savings attributable to generic energy efficiency are thus placeholders as future phases of actual energy efficiency programs are developed and implemented. From a permitting perspective, all Alternative Plans include large quantities of solar capacity located in Virginia. In fact, to meet customers’ demand, Alternative Plans B through D require between 31,400 MW and 40,640 MW of new solar capacity by 2045. Given current technology, 31,400 MW of solar generating capacity in the Commonwealth would require the land use of 490 square miles. This land mass is nearly 25% larger than Fairfax County, Virginia, or the equivalent of nearly 237,000 football fields. Utilization of such a large land mass area for energy generation will likely encounter local and environmental permitting issues. The large quantities of solar capacity in Alternative Plans B through D also pose challenges from a technical perspective. A key component included in the traditional design of the North American electric power grid is the inertia from many existing traditional turbines to create a reservoir of kinetic energy. This kinetic energy automatically provides grid support by balancing the myriad of instantaneous discrepancies between generation and load at any moment in time. Inverter-based generation such as intermittent solar and wind resources do not provide such a reservoir of kinetic energy. Therefore, the retirement of traditional generation units coupled with the addition of large quantities of intermittent renewable generation will adversely affect both electric system reliability and the Company’s ability to restore the system in the event of a large-scale blackout. Transmission planning work has begun, but more planning analysis is necessary to model the grid under different conditions to assure system reliability, stability, and security with the retirement of traditional generation. Although Plans B through D show significantly reduced carbon emissions by 2045 associated with these projected retirements, additional transmission and distribution projects potentially needed to address system reliability and security have not been fully assessed and evaluated in this 2020 Plan. The Company will provide the results of these additional analyses in future Plans and update filings. In the long term, based on current technology, other challenges will arise from the significant development of intermittent solar resources in all Alternative Plans. For example, based on the nature of solar resources, the Company will have excess capacity in the summer, but not enough capacity in the winter. Based on current technology, the Company would need to meet this winter deficit by either building additional energy storage resources or by buying capacity from the market. In addition, the Company would likely need to import a significant amount of energy during the winter, but would need to export or store significant amounts of energy during the spring and fall. In Alternative Plan B, the Company preserved approximately 9,700 MW of efficient natural gas-fired generation units to address these future system reliability, stability, and energy independence issues. In future Plans, these units could be replaced by new types of generation such as small modular reactors. These units could also be transformed into low-carbon or carbon-free generation by installing new technologies such as carbon capture sequestration or

7
refueling these units with hydrogen or renewable natural gas. For example, the Company could use excess energy from renewable facilities during periods of lower demand (i.e., spring and fall) to create and store hydrogen fuel that could subsequently be used in these gas-fired generators. When hydrogen fuel is used in gas-fired generators, the byproduct is water rather than CO2. The Company will continue to study these types of innovative alternatives and will, when and if feasible, reflect those alternatives in future Plans. Unlike Alternative Plan B, Alternative Plans C and D model the retirement of all Company-owned carbon-emitting generation by 2045. If the Company retires all carbon-emitting generation units by 2045 as modeled in Alternative Plans C and D, given current energy storage and solar technology—and even with approximately 10,000 MW of new incremental storage—customers’ winter peak load demand could not be met unless grid transmission import capacity is approximately doubled. Doubling transmission import capacity is a significant task that requires additional study, and would require significant capital expenditures and permitting challenges. Even if this import capacity could be doubled from a technical perspective, Virginia would become dependent on other jurisdictions to meet its winter peak needs, which, in the Company’s view, presents an unacceptable risk. This risk increases as neighboring states elect to pursue the development of significant solar resources similar to Virginia and face similar challenges meeting winter peak load demand. Doubling transmission import capacity as modeled in Plans C and D would also result in similar regional CO2 emissions as Alternative Plan B because the imported power from PJM would come in part from CO2-emitting generation. Separate from the proposed build plans and related system upgrades, Alternative Plans B through D include foundational investments to transform the Company’s electric distribution grid to facilitate the integration of DERs, to enhance reliability and security, and to improve the customer experience (the “Grid Transformation Plan”). The Grid Transformation Plan will prepare the Company’s distribution grid to support the cleaner future envisioned by Virginia, North Carolina, and the Company. For example, with advanced metering infrastructure (“AMI”) and a new customer information platform, the Company can offer advanced rate options to all customers across its system targeted at energy efficiency and demand reduction. A transformed grid will also support electric vehicle (“EV”) adoption while minimizing the effect of EV charging on the distribution grid, thus maximizing the benefits of electrification. Foundational components of the Grid Transformation Plan, such as AMI, deployment of intelligent grid devices, advanced control systems, and a robust and secure telecommunications network, are necessary to integrated distribution planning that can produce inputs into future Plans. The Company fully supports the transition towards clean energy without compromising reliability, and stands ready to meet the challenges discussed with continued study, technological advancement, and innovation. Importantly, as noted above, the first 15 years of Alternative Plans B through D present very similar paths forward; the dramatic differences between the Alternative Plans occur during the last ten years of the 25-year Study Period. This alignment between Alternative Plans B through D over the 15-year Planning Period creates a common pathway for the Company to pursue now while allowing new technologies to emerge and mature, and allowing analysis and study to continue. Accordingly, for this 2020 Plan, the Company recommends a path forward that substantially aligns with the first 15 years of Alternative Plans

8
B through D. Over the longer-term, however, based on current technology and this “snapshot in time,” the Company recommends Alternative Plan B. Going forward, long-term integrated resource plans will evolve and will continue to support the cleaner future envisioned by public policy, by lawmakers, and by the Company. As noted, this future, while achievable, will require supportive legislative and regulatory policies, technological advancements, and broader investments across the economy. It will also require further study and analyses of necessary investments in the transmission and distribution systems to ensure the reliable electric service that customers expect and deserve. Overall, the Company’s deliberate transitional approach to a cleaner future has, and will continue, to provide customers a path to clean energy that meets public policy objectives while maintaining the standard of reliability necessary to power Virginia’s and North Carolina’s modern economies.

9
Chapter 1: Significant Developments and Context for Integrated Planning Process The Company’s comprehensive planning process considers significant emerging policy, market, regulatory, and technical developments that could affect its operations and, in turn, its customers. 1.1 Dominion Energy Net Zero Target In February 2020, Dominion Energy announced its commitment to net zero CO2 and methane emissions across its nationwide electric generation and natural gas infrastructure operations by 2050. The goal covers CO2 and methane emissions, the dominant greenhouse gases (“GHGs”), from electricity generation and gas infrastructure operations. The strengthened commitment builds on Dominion Energy’s strong history of environmental stewardship, while acknowledging the need to further reduce emissions. Net zero is a framework under which companies effectively achieve “zero” emissions through a combination of actions to reduce emissions at their own facilities and through initiatives such as reforestation and various other verifiable measures that reduce emissions. By 2050, Dominion Energy is committed to achieve net zero CO2 and methane emissions across all of its electric and natural gas operations in all 20 states where it does business, which is the timeframe referenced in climate work published by the United Nations Intergovernmental Panel on Climate Change. Dominion Energy has been actively lowering its CO2 and methane emissions by employing existing technology and resources, such as extending the licenses of its zero-carbon nuclear fleet; rapidly expanding wind and solar resources; continuing to rely on low-carbon natural gas; promoting the use of electric vehicles and energy efficiency; and investing in renewable natural gas. Dominion Energy continuously monitors internal operations and external factors (e.g., technology, public policy, stakeholder feedback) to assess for appropriateness in all of its sustainability commitments, including its climate goals. Achieving net zero CO2 and methane emissions will require technological advancements in the utility sector and broader investments in technology across the entire economy in the long term. In the near term, Dominion Energy will continue to explore new technologies to accelerate future progress. This includes an industry-leading methane emissions reduction program that is one of the most aggressive and sweeping in the nation. Dominion Energy has reduced methane emissions from its gas infrastructure by approximately 25% since 2010 and has committed to achieving a 65% reduction by 2030 and an 80% reduction by 2040. In addition, Dominion Energy has partnered with the nation’s largest hog and dairy producers to turn farm waste into clean renewable natural gas. By 2029, these projects will reduce methane emissions from the nation’s farms by the same amount as taking 650,000 cars off the road or planting 50 million new trees each year. Overall, Dominion Energy is committed to pursuing all reasonable paths to assure its goal of net zero CO2 and methane emissions is achieved while maintaining the reliability that customers demand. 1.2 Virginia Clean Economy Act The VCEA—Senate Bill No. 851 and House Bill No. 1526 from the 2020 Regular Session of the Virginia General Assembly—was signed into law on April 11, 2020, and becomes effective July

10
1, 2020. The VCEA includes provisions that institute a mandatory renewable portfolio standard, enhance renewable generation and energy storage development, require the retirement of certain generation units, establish energy efficiency targets, and expand net metering.
The VCEA establishes a mandatory RPS that: o Includes RPS annual requirements based on a percentage of non-nuclear electric
energy sold by the Company, reaching 100% by 2045; o Sets standards for meeting the RPS requirements, including 1% from distributed
generation and 75% from resources located in the Commonwealth; o Requires the development of renewable generation and energy storage resources,
as discussed further below; o Requires the retirement of generation units that emit CO2 as a byproduct of
combustion, as discussed further below; o Recognizes the benefits and necessity of nuclear license extensions; and o Establishes penalties if the Company does not meet the RPS requirements in any
compliance year.
The VCEA requires the Company to petition the SCC for approval to construct or purchase up to 5,200 MW of offshore wind generation and declares such offshore wind generation to be in the public interest if those facilities achieve commercial operation by 2034.
o The costs associated with between 2,500 MW and 3,000 MW of utility-owned offshore wind are presumed to be reasonably and prudently incurred if the facilities achieve commercial operation by 2028, the Company complies with mandated competitive procurement requirements, and the levelized cost of energy (“LCOE”) does not exceed 1.4 times the LCOE of a CT as estimated by the U.S. Energy Information Administration in 2019.
The VCEA requires the Company to petition the SCC for approval to construct or purchase 16,100 MW of solar or onshore wind generation located in the Commonwealth.
o The Company must petition for approval to construct or purchase the 16,100 MW of solar or onshore wind generation on the following schedule: 3,000 MW by 2024; 6,000 MW by 2027; 10,000 MW by 2030; and 16,100 MW by 2035.
o Thirty-five percent of the solar and onshore wind generating capacity must be procured from third-party-owned facilities through power purchase agreements (“PPAs”).
o The 16,100 MW development must include 1,100 MW of small-scale solar (i.e., projects less than 3 MW), and 200 MW of solar placed on previously developed project sites.
The VCEA requires the Company to petition the SCC for approval to construct or
purchase 2,700 MW of energy storage resources located in the Commonwealth and

11
declares such resources to be in the public interest provided those facilities achieve commercial operation by 2035.
o At least 35% of such energy storage capacity must be procured from third-party-owned resources through PPAs.
o Ideally, at least 10% of energy storage resources should be located behind the meter.
o The Company may procure a single energy storage project up to 800 MW, allowing for construction of a pumped hydroelectric storage facility.
The VCEA mandates the retirement of generation units that emit CO2 as a byproduct of
combustion on the following schedule, unless the Company petitions and the SCC finds that a given retirement would threaten the reliability and security of electric service:
o Chesterfield Units 5 and 6 (coal) and Yorktown Unit 3 (heavy oil) by 2024; o Altavista, Hopewell, and Southampton (biomass) by 2028; and o All remaining generation units that emit CO2 as a byproduct of combustion by
2045.
The VCEA encourages energy efficiency programs and measures that target a 5% reduction in energy sales (as measured against 2019 jurisdictional electricity sales) by 2025.
o The SCC would evaluate the programs in 2025 and establish the going-forward savings targets in three year increments.
o If targets are not achieved, costs of energy efficiency programs would be recovered without a margin, and the SCC may not certificate new generation units that emit CO2 as a byproduct of combustion unless a threat to system reliability or security exists.
The VCEA expands the net metering cap from 1% to 6% of the previous year’s adjusted
peak load forecast, with 1% reserved for low-income customers. o At the earlier of 2025 or after 3% of the previous year’s peak demand is reached,
the SCC will initiate a proceeding to determine a new net metering rate. The VCEA formalizes the administrative policy goals set by Virginia Governor Northam in September 2019 through Executive Order 43: Expanding Access to Clean Energy and Growing the Clean Energy Jobs of the Future (“EO43”). EO43 established statewide goals and targets for reducing carbon emissions. Specifically, EO43 included a goal that by 2030, 30% of the Commonwealth’s electric system would be powered by renewable energy sources. By 2050, the goal was for 100% of Virginia’s electricity to be produced from carbon-free sources such as wind, solar, and nuclear. In establishing a mandatory RPS, the VCEA sets forth a framework to meet the goals of EO43. 1.3 Regional Greenhouse Gas Initiative RGGI is a collaborative effort to cap and reduce CO2 emissions from the power sectors of participating states, which currently include Connecticut, Delaware, Maine, Maryland, Massachusetts, New Hampshire, New Jersey, New York, Rhode Island, and Vermont.
12
The concept of Virginia joining RGGI is not new. Starting with former Governor McAuliffe’s Executive Directive 11, Virginia began a process that has thoroughly investigated RGGI and the effect of Virginia’s participation. On May 27, 2019, the Virginia Department of Environmental Quality (“VDEQ”) published a final rule that established a state cap-and-trade program for electric generation units (“EGUs”) in Virginia (the “VDEQ Carbon Rule”). The VDEQ Carbon Rule became effective on June 26, 2019. In 2019, the state budget bill (signed by Virginia Governor Northam) prohibited VDEQ from continued work on the VDEQ Carbon Rule. The VDEQ Carbon Rule thus included a section that allowed for delayed implementation. Specifically, implementation of most elements of the program, including requirements for holding and surrendering CO2 allowances, was delayed until further authorization for appropriating funding to implement the program. Nevertheless, the VDEQ Carbon Rule included specific near-term requirements for affected entities, including:
A requirement to submit to the VDEQ by August 25, 2019, the annual net electric output in megawatt-hours (“MWh”) for calendar years 2016, 2017, and 2018 for each EGU subject to the rule, which the VDEQ would use to determine the CO2 allowance allocations for the initial control period; and
A requirement to submit to the VDEQ by January 1, 2020, a complete CO2 budget permit
application for affected sources with an applicable EGU subject to the program.
The Company complied with these requirements by the required deadlines. While the final VDEQ Carbon Rule removed specific references to RGGI, the rule remained structured in a way that would allow for the Virginia program to link with a regional program such as RGGI. Other key elements of the VDEQ Carbon Rule as finalized are:
A starting (baseline) statewide CO2 emissions cap of 28 million tons in 2020, reduced by about 3% per year through 2030, resulting in a 2030 cap of 19.6 million tons (however, the rule allowed for adjustment of the starting cap for delayed implementation);
No references to continued cap reductions after 2030 that the VDEQ had included in
prior versions of the rule;
Reinstated language to clarify that affected units under the rule would only have to hold allowances for emissions associated with fossil fuel combustion, assuring that the Company’s Virginia City Hybrid Energy Center (“VCHEC”) would not have to hold allowances for emissions related to biomass co-firing; and
No opportunity to generate offsets from projects in Virginia, though the rule includes a
provision that would recognize eligible emissions offsets from other participating states in a regional trading program. The VDEQ has indicated it may re-evaluate offset provisions during the next program review.

13
In 2020, legislation passed the Virginia General Assembly related to RGGI. In addition to the legislative provisions of the VCEA discussed in Section 1.2, the VCEA also directs Virginia’s participation in a carbon trading program through 2050. Separate legislation provides for Virginia’s participation in RGGI. Specifically, the Clean Energy and Community Flood Preparedness Act—Senate Bill No. 1027 and House Bill No. 981 from the 2020 Regular Session of the Virginia General Assembly—will become law effective July 1, 2020. This Act authorizes Virginia to join RGGI directly and authorizes the VDEQ to implement the VDEQ Carbon Rule. Given the passage of this Act combined with Virginia’s previous efforts associated with RGGI participation, the Company believes it is highly probable that Virginia will become a full RGGI participant. 1.4 North Carolina Clean Energy Plan In October 2018, North Carolina Governor Cooper issued Executive Order 80: North Carolina’s Commitment to Address Climate Change and Transition to a Clean Energy Economy (“EO80”). Among other goals, EO80 set a statewide GHG reduction goal of 40% by 2025 (using a 2005 baseline), an electric power sector goal of 70% GHG reduction by 2030 (using a 2005 baseline), and a carbon neutrality goal by 2050. EO80 also required the North Carolina Department of Environmental Quality (“NCDEQ”) to develop a North Carolina Clean Energy Plan to establish pathways for achieving the EO80 goals. After the public comment period, NCDEQ issued the final North Carolina Clean Energy Plan in October 2019. NCDEQ has also established stakeholder groups to establish recommendations for policy designs to align with EO80 goals. 1.5 Need for a Modern Distribution Grid Electricity has become a basic need, vital to the economy, to public safety, and to customers’ way of life. Critical services and infrastructure increasingly rely on electricity, including homeland security, large medical facilities, public safety agencies, state and local governments, telecommunications, transportation, and water treatment and pumping facilities. As society has grown more dependent on electricity, customers expect both highly reliable service and easy access to their energy usage information so that they can make informed decisions about their consumption. Another fundamental change in the energy industry is the emerging shift within the transportation industry as it continues toward electrification of personal vehicles, fleets, and mass transit. Another vital resource powered by electricity is the internet, which drives commerce and everyday life. Even a brief interruption or power quality anomaly at, for example, a data center can be catastrophic for both the data center itself and the businesses that rely on that data center. While service interruptions have always been an inconvenience in modern society, the safe, reliable, and consistent delivery of power has never been more important than it is today. In addition to the increasing importance of reliable electric service, the rise of DERs requires a fundamental change to the electric grid. With DERs, electricity is now flowing onto the distribution system from multiple points. The distribution system that was designed for the one-way flow of electricity must now accommodate the two-way flow of electricity. In addition, the intermittent nature of some of these DERs resulting from weather variability creates power fluctuations not typical of traditional generation resources. Propagated in an arbitrary manner,
14
DERs are independent nodes that can disrupt traditional grid power quality and reliability. But when paired with investments to increase visibility on and control of the distribution system, DERs can transform into a system resource that can be equitably managed to maximize the value of other available resources, and potentially offset the need for future “traditional” generating assets or grid upgrades, all while maintaining reliable service to customers. Because DERs rely on the distribution system to deliver the electricity they produce, a resilient distribution system is vital to maximizing the value of DERs. Day to day outages, as well as major weather events, not only cause prolonged outages for customers, but also prevent DERs from delivering electricity. The distribution system must be reliable and resilient so that it can operate for DERs like the transmission system operates for large, centralized generators. Foundational investments to transform the distribution grid will allow the Company to use the distribution system differently than it does today, all for the benefit of customers. Transformational investments in infrastructure resilience, AMI, a customer information platform, intelligent grid devices, automated control systems, and advanced analytics will enable the Company to improve operations (e.g., more efficient restoration, reducing truck rolls, more predictive and efficient maintenance, and increased visibility), better forecast load shape, and better predict future behaviors (e.g., identifying and fixing grid problems before an outage occurs), resulting in a better, more informed customer experience that meets customers’ changings needs and expectations. 1.6 Forward Capacity Markets The Company is closely following the developments in the PJM forward capacity market, including the Federal Energy Regulatory Commission (“FERC”) Minimum Offer Price Rule (“MOPR”) proceedings, and is considering its options, including election of the fixed resource requirement (“FRR”) alternative. As discussed further in Section 4.2, however, the modeling for this 2020 Plan is indifferent to whether the Company participates in the PJM forward capacity market or elects the FRR alternative. 1.6.1 Minimum Offer Price Rule PJM has had the MOPR concept in place since the late 2000s. MOPR is designed to prevent price suppressive behavior of resources that participate in PJM’s Reliability Pricing Model (“RPM”) capacity market. This rule requires new resources to bid into the capacity market at or above the resource type’s net cost of new entry (“Net CONE”). CONE reflects a resource’s capital investments and fixed operations and maintenance (“O&M”) expenses. Net CONE refers to CONE value net of the expected energy and ancillary market revenues. Net CONE, therefore, reflects the capacity revenue the resource would need to remain profitable. Some generation entities filed a complaint at FERC in 2017 arguing the lack of effectiveness of capacity markets in PJM due to state subsidies. Specifically, the generation entities argued that state subsidies could have the effect of lowering capacity market clearing prices because the units receiving subsidies were receiving additional revenue that lowered their need from the market.

15
On June 29, 2018, FERC issued an order finding that PJM’s Open Access Transmission Tariff was unjust and unreasonable because the MOPR “fail[ed] to address the price-distorting impact of resources receiving out-of-market support” (the “FERC MOPR Order”). On December 19, 2019, FERC directed PJM to expand MOPR to address state-subsidized resources, with very limited exemptions. Although one of the exemptions included existing self-supply resources, the FERC MOPR Order would subject new resources from self-supply entities (such as the Company) to the expanded MOPR. Because there is no guarantee that the capacity market would clear above a resource’s Net CONE value (which it never has), the capacity market revenues for most new resources, including those from self-supply entities, would be uncertain. On March 19, 2020, PJM submitted its compliance filing on the FERC MOPR Order. Specifically, PJM’s compliance filing sets the Net CONE and net avoidable cost rate values for necessary resource classes; offers flexibility for unit-specific offer reviews; addresses circumstances where resources elect the competitive exemption and receive a subsidy later; and establishes auction timing for the 2022/2023 delivery year and beyond. 1.6.2 Fixed Resource Requirement Alternative The Company joined PJM in 2005. In 2007, in order to assure reliability, PJM instituted the RPM, which created a forward generation capacity market that placed a value on reliability. PJM’s existing rules allow vertically-integrated utilities to opt out of the capacity market by electing the FRR alternative. American Electric Power Company, the parent of Appalachian Power Company, has been the only significant utility in PJM to use this option since 2007. The Company has participated in the RPM forward capacity market since 2007. One advantage of the RPM forward capacity market is that it draws upon resources from across PJM to ensure that sufficient supply- and demand-side resources are secured three years before they may be called upon to serve customer load. The market will pay those resources for their availability when the future delivery year arrives. This forward market provides a financial incentive and a degree of certainty designed to incentivize investment in new and existing resources beyond what is available through PJM’s energy and ancillary services markets. The three-year forward auctions in the RPM have resulted in auction clearing reserve margins in the approximately 19% to 24% range—in excess of PJM’s installed reserve margin—which means that the DOM LSE must purchase about 20% more unforced capacity than its forward load forecast. RPM participation considers a variable resource requirement defined by a demand curve in relation to supply offers; where supply offers cross the demand curve creates the capacity clearing price and the reserve margin for load. Based on the recent FERC MOPR Order, virtually all new generation resources will need to offer at Net CONE or an otherwise calculated market seller offer cap—which could be above the RPM market clearing price—resulting in $0 revenue for these un-cleared resources. As an alternative to the RPM forward capacity market, PJM permits the FRR construct. The Company is eligible to elect the FRR alternative because it is an investor-owned utility. One of the key requirements for FRR is to demonstrate that sufficient generation resources are available to meet the reliability requirement for the FRR service area. The reliability requirement for the FRR service area is the forward load forecast plus the target reserve margin. This is one of the

16
primary differences between RPM and FRR, as the PJM coincident peak target reserve margin for FRR is forecasted to be approximately 15%—over 5% less than where the RPM market has been clearing recently. From a long-term planning perspective, this reserve margin requirement difference could be significant. If the Company’s forecasted load was 20,000 MW, for each percent difference between cleared reserve margin and target reserve margin, electing FRR would result in about a 200 MW reduction in purchase requirement. That said, considering the FERC MOPR Order and related filings, both the clearing price and the clearing reserve margin of the upcoming RPM forward capacity market remain highly uncertain. An FRR election is for a minimum of five consecutive delivery years. A load serving entity (“LSE”) must demonstrate its ability to meet the reserve requirement on an annual basis by committing sufficient resources to meet the reliability requirement as part its FRR plan. If an FRR plan’s capacity commitment is insufficient for a delivery year, the LSE would be assessed an FRR commitment insufficiency charge for the shortage. This penalty is two times Net CONE times the MW deficiency. Capacity resources committed to an FRR plan continue to be subject to the same capacity performance requirements that apply to resources committed through the RPM forward capacity market if they are called upon in an emergency. To the extent an LSE has capacity in excess of its load requirement, those excess capacity resources may not generate the same revenue as if offered into the RPM market. The first 450 MW of excess capacity is held in reserve until the third incremental auction, with the next additional block of excess capacity up to 1,300 MW being able to offer into the RPM market auctions. Because of its five-year minimum commitment requirement, risks to FRR election should be carefully weighed against the benefits. Risks include future environmental changes, regulatory changes, zonal constraints, and capacity and energy market changes. The potential benefits of FRR election include lower required reserve margin and the absence of MOPR risk to new generation used to meet the load obligation. All new generation would be able to be counted against the load obligation with the FRR alternative, whereas with RPM there is the likelihood that new generation would receive no capacity revenue to offset the load cost. If the Company opts out of the RPM forward capacity market through the election of the FRR alternative, it would continue to participate in PJM’s energy and ancillary services markets in the same manner it does today. The Company is continuing to evaluate the FERC MOPR Order and the FRR alternative; it has made no decision at this time. If the Company were to elect FRR, it would have to do so in advance of the next RPM base auction. Typically, this election would need to happen about six months prior to that auction; however due to the pending MOPR-related filings with FERC, the schedules may be compressed. The schedule depends on if, and when, FERC accepts PJM’s recent compliance filing. PJM currently estimates the next RPM auction to occur in late 2020 or early 2021, depending on FERC’s response to the PJM compliance filing.

17
1.7 Environmental Justice Environmental justice is defined as the fair treatment and meaningful involvement of every person—regardless of race, color, national origin, income, faith, or disability—regarding the development, implementation, or enforcement of any environmental law, regulation, or policy. The Company is dedicated to meeting environmental justice expectations of fair treatment and meaningful involvement by being inclusive, understanding, and dedicated to finding solutions, and by effectively communicating with its customers and neighbors. The Company adopted an environmental justice policy in 2018 through which it committed to hearing, fully considering, and responding to the concerns of all stakeholders. This commitment includes ensuring that a voice in decisions about siting and operating energy infrastructure is given to all people and communities. Communities should have ready access to accurate information and a meaningful voice in the project development process. The Company has pledged to be a positive catalyst in its communities. Environmental justice is also a priority for Virginia and North Carolina. In its 2020 Regular Session, the Virginia General Assembly passed multiple bills aimed at promoting environmental justice. This legislation, among other things, establishes the Virginia Council on Environmental Justice to advise the Governor on the advancement of environmental justice, and adds as a purpose of the VDEQ to further environmental justice. In addition, the Virginia Environmental Justice Act—Senate Bill No. 406 and House Bill No. 704 from the 2020 Regular Session of the Virginia General Assembly—establishes “the policy of the Commonwealth to promote environmental justice and ensure that it is carried out throughout the Commonwealth.” Similarly, in North Carolina the Secretary of NCDEQ established an Environmental Justice and Equity Advisory Board to assist NCDEQ in achieving fair and equal treatment of all communities across the state. The Company is dedicated to meeting these environmental justice expectations. 1.8 New and Developing Technologies Dominion Energy has assembled a new organization dedicated to pursuing innovative and sustainable technologies that will help guide the Company toward the clean future envisioned by Virginia and North Carolina. Some of the more promising new technologies being investigated are as follows:
Natural Gas Combined-Cycle Technology with Carbon Capture and Sequestration. Natural gas combined-cycle plants fitted with carbon capture and sequestration (“CCS”) are being consistently modeled as a necessary component of a low-carbon electric generation portfolio. Models of low-carbon scenarios by the Intergovernmental Panel on Climate Change, the International Energy Agency, Bloomberg New Energy Finance, and others all show significant contributions from CCS in the electric generation sector.
Hydrogen. Hydrogen is both a fuel and a carrier that can be used to store and transport energy. Opportunities exist in the production, transportation, and usage of hydrogen to support a clean energy future when produced from low- or no-carbon sources. One example is the use of hydrogen to “co-fire” natural gas generation. Production and

18
storage of hydrogen fuel can be one solution to the excess renewable energy that may result as increasing amounts of renewable generation resources are added to the grid.
Electric Vehicles as a Resource. Electric vehicles are becoming more prolific in most forms of transportation. With EVs, new technologies and software are being developed to maximize the benefits of electrification, such as load shifting and other applications that complement renewable generation. For example, vehicle-to-grid (“V2G”) technologies are being developed through which electricity stored in EVs’ batteries can be fed back onto the grid to lower peak demand or to provide grid support. See Section 8.6 for a discussion of the Company’s Electric School Bus Program through which it seeks to explore V2G technology. A precursor to take advantage of this resource is a modernized grid that has full situational awareness.
Renewable Natural Gas. Renewable natural gas (“RNG”) is derived from biomethane or other renewable resources and is pipeline-quality gas that is fully interchangeable with conventional natural gas. RNG can thus be safely employed in any end use typically fueled by natural gas, including electricity production, heating and cooling, industrial applications, and transportation. Adding RNG as a source of natural gas generation reduces overall emissions. These sources may be expanded based on new technologies to capture RNG from untapped sources and in remote areas.
Continuous Improvement in Solar Output. Solar technology improvements such as
advanced trackers, bifacial modules, and other technologies continue to improve capacity, output, intermittency profiles, and operational efficiency of solar generation. As these technologies mature, these improvements—especially higher capacity factor improvements—could provide more carbon-free generation with potentially less land use.
Medium and Long-Term Energy Storage. The need for energy storage will grow with
the proliferation of intermittent generation. Storage technologies that are on the horizon include new and improved batteries, hydrogen, thermal storage, and mechanical storage. See Section 5.5.1 for additional discussion of energy storage technologies.
Carbon Offsets. There is a substantial and growing market in carbon offsets in the
United States. Carbon offsets can be generated by any activity that compensates for the emission of CO2 or other GHGs (measured in carbon dioxide equivalents (“CO2e”)) by providing for an emission reduction elsewhere. Because greenhouse gases are widespread in Earth’s atmosphere, there is a climate benefit from emission reductions regardless of where the reductions occur. If carbon reductions are equivalent to the total carbon footprint of an activity, then the activity is said to be “carbon neutral.” Carbon offsets can be bought, sold, or traded as part of a carbon market. Carbon offsets, verified by third parties, are used in voluntary and compliance markets across the country.
Direct Air Capture Technology. This aspirational technology is an industrial process
for large-scale capture of atmospheric CO2. Direct air capture (“DAC”) technology pulls in atmospheric air then, through a series of chemical reactions, extracts the CO2 from it while returning the rest of the air to the environment. This is what plants and trees do

19
every day as they photosynthesize, except DAC technology does it much faster, with a smaller land footprint, and delivers the CO2 in a pure, compressed form that can then be stored underground or reused. The potential of the DAC technology is tied to systems where excess or curtailed renewable energy is available at a very low cost to power the industrial process that removes CO2 from the air. Utilizing the captured CO2 to develop other products provides additional support to this process. Captured CO2 can be produced in a solid form for safe storage creating a “negative emissions” industrial scale process, or can be paired with end-use applications such as oil field CO2 recovery or development of synthetic fuels to provide carbon neutral transportation fuels.
The HAZER® Process. The HAZER® Process converts natural gas into hydrogen and high quality graphite using iron ore as a process catalyst. The aim of the HAZER® Process is to achieve savings for the hydrogen producer, as well as providing “clean” hydrogen with significantly lower CO2 emissions. This “clean” hydrogen can then be used in a range of developing clean energy applications, including power generation. The graphite can be used in the production of lithium ion batteries.
Advanced Analytics. The economy is experiencing both a rapid increase in computing power and an explosive growth in data. Both trends will allow energy companies to manage the electric grid and aggregate resources in ways that they have not been able to do in the past, providing additional opportunities to reduce CO2 emissions. A precursor to the use of this data is a modernized grid that gathers data through AMI and intelligent grid devices, and incorporates a sophisticated distributed energy resource management system.
1.9 COVID-19 At the time of filing this 2020 Plan, the world continues to confront the ongoing public health emergency related to the spread of coronavirus, also known as COVID-19. The Company’s first priority is the health, safety, and well-being of its employees and communities. For its employees, the Company implemented early directives limiting travel, instituting work-from-home protocols, and expanding health and paid-time-off benefits. For its customers, the Company has suspended service disconnections for all customers, waived late payment fees for all customers, and worked to reconnect certain residential customers. Because of the preparation schedule associated with this 2020 Plan, the Plan does not reflect any potential effects related to the COVID-19 public health emergency. PJM has published initial reports of lower demand for electricity. The Company believes it is too early to predict the long-term effects of the COVID-19 public health emergency, including the effect on customer load. The Company will continue to monitor the effects of this ongoing public health emergency and will incorporate any long-term effects as needed in future Plans and update filings.

20
1.10 Other Legislative Developments In addition to the VCEA and the legislation enabling Virginia to join RGGI discussed in Sections 1.2 and 1.3, respectively, legislation was signed into law on April 11, 2020, that incorporated the relevant policy objectives into the Virginia Energy Plan—Senate Bill No. 94 and House Bill No. 714 from the 2020 Regular Session of the Virginia General Assembly. Also relevant to this 2020 Plan, House Bill 889 established a pilot program for up to 200 MW of non-residential customers load to aggregate and purchase electricity from third-party suppliers. The Company has incorporated the effects of House Bill 889 into its load forecast, as discussed in Section 4.1.4. 1.11 Other Environmental Regulations The following section outlines changes to various environmental regulations since the Company filed its 2018 Plan. The 2018 Plan contains a historical perspective on some of the environmental regulations discussed. For a comprehensive list of relevant environmental regulations, see Section 5.2.3. 1.11.1 Affordable Clean Energy Rule The Environmental Protection Agency (“EPA”) released the final version of the Affordable Clean Energy Rule (“ACE Rule”) on June 19, 2019, which replaced and repealed the Clean Power Plan. The ACE Rule was published on July 8, 2019, and applies to existing coal-fired power plants greater than or equal to 25 MW. Under the ACE Rule, the EPA has set the best system of emissions reduction (“BSER”) for existing coal-fired steam EGUs as heat rate efficiency improvements based on a range of “candidate technologies” and improved O&M practices that can be applied at the unit level. States are directed to determine which of the candidate technologies apply to each covered EGU and establish standards of performance (expressed as an emissions rate in CO2 pounds per MWh) based on the degree of emission reduction achievable with the application of BSER. The EPA required that each state determine which of the candidate technologies apply to each coal-fired unit based on consideration of remaining useful plant life and other factors such as reasonable cost of the candidate technologies. The ACE Rule requires compliance at the unit level; it does not allow averaging across units at the same facility or between facilities as a compliance option. In addition, it does not allow states to use alternative carbon mitigation programs, such as a cap-and-trade program, to demonstrate compliance as part of their state plans. A steam generating unit that is subject to a federally-enforceable permit that limits annual net-electric sales to one-third or less of its potential electric output, or 219,000 MWh or less, can be excluded from the ACE Rule. The ACE Rule requires states to develop plans by July 2022. The EPA must approve these state plans by January 2024. If states do not submit a plan or if their submitted plan is not acceptable, the EPA will have two years to develop a federal plan.

21
1.11.2 New Source Performance Standards for Greenhouse Gas Emissions from Electric Generating Units The EPA issued final Standards of Performance for Greenhouse Gas Emissions From New, Modified, and Reconstructed Stationary Sources: Electric Utility Generating Units in October 2015. In December 2018, the EPA proposed revisions to these standards that have not yet been finalized. If finalized, these standards would apply to any newly constructed or reconstructed steam generating units or stationary CTs that (i) have a base load rating over 250 million British thermal unit (“MMBtu”) per hour of heat input of fossil fuel and (ii) serve a generator capable of selling greater than 25 MW of electricity to a utility power distribution system. In the proposed revisions, the EPA did not revise the performance standard for newly constructed or reconstructed natural gas combined-cycle units, which remains at the 1,000 pounds CO2 per gross MWh standard on a 12-operating month rolling average basis. Any newly constructed or reconstructed gas turbine selling greater than 25 MW of electricity to a utility power distribution system would need to comply with the CO2 emission standards and work practice standards required by this rule. 1.11.3 Ozone National Ambient Air Quality Standards The ozone National Ambient Air Quality Standard (“NAAQS”) governs nitrogen oxide (“NOx”) emissions. The Company has entered into a mutual shutdown agreement with VDEQ to shut down and retire Possum Point Unit 5 by June 1, 2021, because the installation and operation of selective non-catalytic reduction technology to control NOx emissions from that unit would otherwise be needed to meet reasonably available control technology (“RACT”) requirements under the 2008 ozone NAAQS of 75 parts per billion (“ppb”). The Clean Air Act (“CAA”) requires the EPA to review the NAAQS every five years and revise the NAAQS if necessary. On November 22, 2019, the EPA issued a finding that seven states including Virginia failed to submit state implementation plans to satisfy the interstate report requirements of the CAA as it pertains to the 2015 eight-hour ozone NAAQS. VDEQ submitted a draft proposal to the EPA for review in early February, and is awaiting a response from the EPA prior to the VDEQ opening its draft proposal for public comment. The EPA initiated its review of the ozone NAAQS in May 2018 and concluded in a draft policy assessment that the current NAAQS of 70 ppb is adequate. The EPA expects to finalize this policy assessment, and issue a final decision in late 2020 or early 2021. 1.11.4 Cross-State Air Pollution Rule The Cross-State Air Pollution Rule (“CSAPR”) aims to reduce emissions of sulfur dioxide (“SO2”) and NOx from power stations in the eastern half of the U.S. CSAPR requires certain states to reduce annual SO2 emissions and annual ozone season NOx emissions to assist in attaining the ozone and fine particle NAAQS. The rule establishes an emissions cap for SO2 and NOx and limits the trading for emission allowances by separating affected states into two groups with no trading allowed between the groups.

22
While CSAPR was originally intended to help downwind states attain the 1997 ozone NAAQS, the EPA revised the emission caps downward as an update to the CSAPR in 2016 in order to aid states in meeting the 2008 ozone NAAQS (the “CSAPR Update Rule”). As a companion to the CSAPR Update Rule, the EPA issued a rule in 2018 that found that states in the program need take no additional steps to meet the 2008 ozone NAAQS beyond compliance with the existing trading program’s mandates (the “CSAPR Close-Out Rule”). On September 13, 2019, the D.C. Circuit partially remanded the CSAPR Update Rule to the EPA without vacating it. The court found that the rule was inconsistent with the CAA because it did not set a deadline by which upwind states must eliminate their significant contribution to downwind states’ nonattainment of the 2008 ozone NAAQS to comply with the “good neighbor” provision of the CAA. On October 1, 2019, the D.C. Circuit granted consolidated petitions for review of the CSAPR Close-Out Rule, thereby vacating and remanding the rule back to the EPA. 1.11.5 New York’s Clean Air Act Section 126(b) Petition In March 2018, the State of New York filed a petition with the EPA under Section 126 of the CAA alleging that certain stationary sources of NOx emissions in nine states—including several EGUs in Virginia that are owned and operated by the Company—contribute to nonattainment in New York and are interfering with maintenance of the 2008 or 2015 ozone NAAQS in New York. The petition requested the EPA to impose strict NOx limits equivalent to RACT requirements that New York has imposed on its facilities. On October 18, 2019, the EPA finalized its decision to deny the petition on the basis that New York had not demonstrated (i) that any areas in New York except for one would exceed either the 2008 or 2015 ozone NAAQS by 2023, or (ii) that the identified sources contributed to any such exceedance. On October 29, 2019, New York, New Jersey, and New York City jointly filed a petition for review in the D.C. Circuit, challenging the EPA’s denial of this petition. The Company is participating as an intervenor in the litigation in support of the EPA. On February 19, 2020, the States of New Jersey, Connecticut, Delaware, New York, and Massachusetts, along with the City of New York filed a lawsuit against the EPA in the U.S. District Court for the Southern District of New York seeking to compel the EPA to promulgate federal implementation plans for the 2008 NAAQS for ozone that fully address the requirements of the “good neighbor provision” of the CAA for seven upwind states, including Virginia. 1.11.6 Mercury & Air Toxics Standards In February 2019, the EPA published a proposed rule to reverse its previous finding that it is appropriate and necessary to regulate toxic emissions from power plants. However, the emissions standards and other requirements of the Mercury & Air Toxics Standards (“MATS”) rule would remain in place, as the EPA is not proposing to remove coal- and oil-fired power plants from the list of sources that are regulated under MATS. All of the Company’s applicable units are complying with the applicable requirements of the MATS rule. On April 16, 2020, the EPA finalized its reconsideration of its MATS supplemental cost finding and its proposed residual risk and technology review for MATS. The action was consistent with
23
the EPA’s February 2019 proposal, and rescinded the supplemental finding that had found it appropriate and necessary for the EPA to regulate mercury and hazardous air pollutant emissions from power plants. The EPA concluded that it was not appropriate and necessary to regulate hazardous air pollutant emissions from power plants under the MATS rule because the costs outweigh the benefits of emissions reductions. The EPA is also finalizing its determination that it will not be changing emissions standards for affected coal- and oil-based electric generating units. The effective date of the action will be 60 days after publication in the Federal Register. The Company expects that this action will result in litigation. 1.11.7 Coal Combustion Residuals The Company currently operates inactive ash ponds, existing ash ponds, and coal combustion residual (“CCR”) landfills at eight different facilities. In April 2015, the EPA enacted a final rule regulating (i) CCR landfills; (ii) existing ash ponds that still receive and manage CCRs; and (iii) inactive ash ponds that do not receive, but still store, CCRs. This rule created a legal obligation for the Company to retrofit or close all inactive and existing ash ponds over a certain period of time, and to perform required monitoring, corrective action, and post-closure care activities as necessary. Since the rule was enacted, the EPA has reconsidered portions of the rule in response to litigation and petitions for reconsideration. In July 2018, the EPA promulgated the first phase of changes to the CCR rule and continues to issue changes to the CCR rule. In August 2018, the D.C. Circuit issued a decision in the pending challenges of the CCR rule, vacating and remanding to the EPA three provisions of the CCR rule. The Company does not expect the scope of the D.C. Circuit’s decision to affect its closure plans. At the state level, in April 2018, Virginia Governor Northam signed legislation that required the Company to solicit and compile information from third parties on the suitability, cost, and market demand for beneficiation (i.e., treatment of raw materials to improve chemical or physical properties) or recycling of coal ash from units at Bremo, Chesapeake, Chesterfield, and Possum Point. The coal ash recycling business plan was submitted to the Virginia General Assembly in November 2018. In March 2019, Governor Northam then signed legislation that required any CCR unit located at the Company’s Bremo, Chesapeake, Chesterfield, or Possum Point power stations that stopped accepting CCR prior to July 2019 be closed by removing the CCR to an approved landfill or through recycling for beneficial reuse. The legislation further required that at least 6.8 million cubic yards of CCR be beneficially reused. 1.11.8 Clean Water Act The Clean Water Act (“CWA”) is a comprehensive program that uses a broad range of regulatory tools to protect the waters of the United States, including a permit program to authorize and regulate discharges to surface waters with strong enforcement mechanisms. Section 316(b) In October 2014, the final regulations under Section 316(b) of the CWA became effective; these regulations govern existing facilities and new units at existing facilities that employ a cooling water intake structure and that have flow levels exceeding a minimum threshold. The rule

24
establishes a national standard for impingement based on seven compliance options, but forgoes the creation of a single technology standard for entrainment. Instead, the EPA has delegated entrainment technology decisions to state regulators. State regulators are to make case-by-case entrainment technology determinations after an examination of five mandatory facility-specific factors including a social cost-benefit test, and six optional facility-specific factors. The rule governs all electric generating stations with water withdrawals above two million gallons per day (“MGD”), with a heightened entrainment analysis for those facilities over 125 MGD. The Company currently has seven facilities that are subject to the final Section 316(b) regulations. Additionally, the Company may have one hydroelectric power facility subject to the final regulations. The Company anticipates that it may have to install impingement control technologies at certain of these stations that have once-through cooling systems. The Company is currently evaluating the need or potential for entrainment controls under the final rule; decisions will be made on a case-by-case basis after a thorough review of detailed biological, technology, cost, and benefit studies. Effluent Limitation Guidelines In September 2015, the EPA revised its effluent limitations guidelines (“ELG”) for the steam electric power generating category. The final rule established updated standards for wastewater discharges that apply primarily at coal and oil steam generating stations. Affected facilities are required (i) to convert from wet to dry or closed cycle coal ash management, (ii) to improve existing wastewater treatment systems, and/or (iii) to install new wastewater treatment technologies in order to meet the new discharge limits. In April 2017, the EPA granted two separate petitions for reconsideration of the ELG rule and stayed future compliance dates in the rule. In September 2017, the EPA signed a rule to postpone the earliest compliance dates for certain waste streams regulations in the ELG rule from November 2018 to November 2020; however, the latest date for compliance for these regulations remains December 2023. In November 2019, the EPA released proposed revisions to the ELG rule that, if adopted, could extend the deadlines for compliance with certain standards at several facilities. The effects of this revised rule are still being evaluated and studies are currently underway to determine the best path for compliance.

25
Chapter 2: Results of Integrated Planning Process This chapter presents the results of the integrated planning process, including the Company’s current capacity and energy positions, the Alternative Plans presented to meet the future capacity and energy needs of the Company’s customers, and the net present value (“NPV”) of each Alternative Plan. This section also includes the results of the initial transmission system reliability analysis related to the retirement of all Company-owned carbon-emitting generation in 2045, and the results of a Virginia residential bill analysis. 2.1 Capacity and Energy Positions Figures 2.1.1 and 2.1.2 illustrate the Company’s current capacity and energy positions using unit retirement assumptions for Alternative Plan B. After adjusting for energy efficiency, voltage optimization, and retail choice as discussed in Sections 4.1.3, 4.1.4, and 4.1.5, respectively, DOM LSE is expected to experience a compound annual growth rate (“CAGR”) of 1.0% in future summer peak demand and 1.3% in energy requirements over the Planning Period.
Figure 2.1.1 - Current Company Capacity Position (2021 to 2035)
Notes: “Existing Generators + NUGS” also include generation under construction; “DR” = demand response; “EE” = energy efficiency; “PP5” = Possum Point Unit 5 (oil); “CH5&6” = Chesterfield Units 5 & 6 (coal); “YT3” = Yorktown Unit 3 (oil); “CL1&2” = Clover Units 1 & 2 (coal); “Rose” = Rosemary (oil); “AV” = Altavista (biomass); “HW” = Hopewell (biomass);
“SH” = Southampton (biomass).

26
Figure 2.1.2 - Current Company Energy Position (2021 to 2035)
Notes: “Existing Generators + NUGS” include generation under construction; “EE” = energy efficiency; “PP5” = Possum Point
Unit 5 (oil); “CH5&6” = Chesterfield Units 5 & 6 (coal); “YT3” = Yorktown Unit 3 (oil); “CL1&2” = Clover Units 1 & 2 (coal); “Rose” = Rosemary (oil); “AV” = Altavista (biomass); “HW” = Hopewell (biomass); “SH” = Southampton (biomass).
2.2 Alternative Plans The 2020 Plan presents a range of alternatives representing paths forward for the Company to meet the future capacity and energy needs of its customers. Notably, however, the build plans shown in Alternative Plans B through D do not fully account for possible system reliability and security issues. More planning work is necessary to test the grid under different conditions to ensure system reliability and security in the long term. The Company’s options for meeting customers’ future capacity and energy needs are: (i) supply-side resources, (ii) demand-side resources, and (iii) market purchases. A balanced approach—which includes the consideration of options for maintaining and enhancing rate stability, increasing energy independence, promoting economic development, incorporating input from stakeholders, and minimizing adverse environmental impact—will help the Company meet growing demand and achieve its clean energy goals while protecting customers from a variety of potential challenges. Specifically, the Company presents four different Alternative Plans designed to meet customers’ needs in the future under different scenarios, which were designed using constraint-based least-cost planning techniques:

27
Plan A – This Alternative Plan presents a least-cost plan that estimates future generation
expansion where there are no new constraints, including no new regulations or restrictions on CO2 emissions. Plan A is presented for cost comparison purposes only in compliance with SCC orders. Given the legislation that will take effect in Virginia on July 1, 2020, this Alternative Plan does not represent a realistic state of relevant law and regulation.
Plan B – This Alternative Plan sets the Company on a trajectory toward dramatically reducing greenhouse gas emissions, taking into consideration future challenges and uncertainties. Plan B includes the significant development of solar, wind, and energy storage resources envisioned by the VCEA. Plan B preserves approximately 9,700 MW of natural gas-fired generation to address future system reliability, stability, and energy independence issues.
Plan C – This Alternative Plan uses similar assumptions as Plan B, but retires all
Company-owned carbon-emitting generation in 2045, resulting in close to zero CO2 emissions from the Company’s fleet in 2045. To reach zero CO2 emissions in 2045, Plan C significantly increases the amount of energy storage resources and the level of imported power.
Plan D – This Alternative Plan uses similar assumptions as Plan C, but changes the
capacity factor assumption for future solar resources from 25% to 19%. As a result, Plan D significantly increases the amount of solar resources needed to reach zero CO2 emissions in 2045.
Figures 2.2.1 through 2.2.4 show the build plans for each Alternative Plan. See Appendix 2A for the capacity and energy associated with all Alternative Plans.
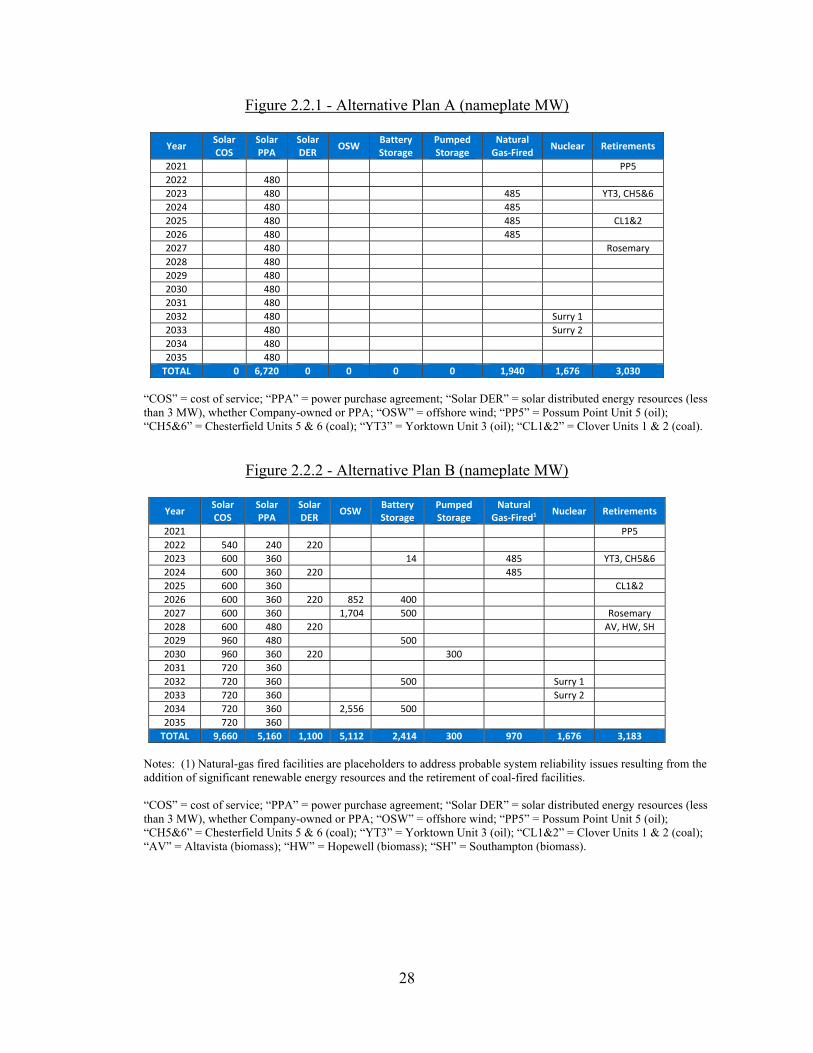
28
Figure 2.2.1 - Alternative Plan A (nameplate MW)
Year Solar COS
Solar PPA
Solar DER
OSW Battery Storage
Pumped Storage
Natural Gas‐Fired Nuclear Retirements
2021 PP5
2022 480
2023 480 485 YT3, CH5&6
2024 480 485
2025 480 485 CL1&2
2026 480 485
2027 480 Rosemary
2028 480
2029 480
2030 480
2031 480
2032 480 Surry 1
2033 480 Surry 2
2034 480
2035 480
TOTAL 0 6,720 0 0 0 0 1,940 1,676 3,030
“COS” = cost of service; “PPA” = power purchase agreement; “Solar DER” = solar distributed energy resources (less than 3 MW), whether Company-owned or PPA; “OSW” = offshore wind; “PP5” = Possum Point Unit 5 (oil); “CH5&6” = Chesterfield Units 5 & 6 (coal); “YT3” = Yorktown Unit 3 (oil); “CL1&2” = Clover Units 1 & 2 (coal).
Figure 2.2.2 - Alternative Plan B (nameplate MW)
Year Solar COS
Solar PPA
Solar DER
OSW Battery Storage
Pumped Storage
Natural Gas‐Fired1 Nuclear Retirements
2021 PP5
2022 540 240 220
2023 600 360 14 485 YT3, CH5&6
2024 600 360 220 485
2025 600 360 CL1&2
2026 600 360 220 852 400
2027 600 360 1,704 500 Rosemary
2028 600 480 220 AV, HW, SH
2029 960 480 500
2030 960 360 220 300
2031 720 360
2032 720 360 500 Surry 1
2033 720 360 Surry 2
2034 720 360 2,556 500
2035 720 360
TOTAL 9,660 5,160 1,100 5,112 2,414 300 970 1,676 3,183
Notes: (1) Natural-gas fired facilities are placeholders to address probable system reliability issues resulting from the addition of significant renewable energy resources and the retirement of coal-fired facilities. “COS” = cost of service; “PPA” = power purchase agreement; “Solar DER” = solar distributed energy resources (less than 3 MW), whether Company-owned or PPA; “OSW” = offshore wind; “PP5” = Possum Point Unit 5 (oil); “CH5&6” = Chesterfield Units 5 & 6 (coal); “YT3” = Yorktown Unit 3 (oil); “CL1&2” = Clover Units 1 & 2 (coal); “AV” = Altavista (biomass); “HW” = Hopewell (biomass); “SH” = Southampton (biomass).

29
Figure 2.2.3 - Alternative Plan C (nameplate MW)
Year Solar COS
Solar PPA
Solar DER
OSW Battery Storage
Pumped Storage
Natural Gas‐Fired1 Nuclear Retirements
2021 PP5
2022 540 240 220
2023 600 360 14 485 YT3, CH5&6
2024 600 360 220 485
2025 600 360 CL1&2
2026 600 360 220 852 400
2027 600 360 1,704 500 Rosemary
2028 600 480 220 AV, HW, SH
2029 960 480 500
2030 960 360 220 300
2031 720 360
2032 720 360 500 Surry 1
2033 720 360 Surry 2
2034 720 360 2,556 500
2035 720 360
TOTAL 9,660 5,160 1,100 5,112 2,414 300 970 1,676 3,183
Notes: (1) Natural-gas fired facilities are placeholders to address probable system reliability issues resulting from the addition of significant renewable energy resources and the retirement of coal-fired facilities. “COS” = cost of service; “PPA” = power purchase agreement; “Solar DER” = solar distributed energy resources (less than 3 MW), whether Company-owned or PPA; “OSW” = offshore wind; “PP5” = Possum Point Unit 5 (oil); “CH5&6” = Chesterfield Units 5 & 6 (coal); “YT3” = Yorktown Unit 3 (oil); “CL1&2” = Clover Units 1 & 2 (coal); “AV” = Altavista (biomass); “HW” = Hopewell (biomass); “SH” = Southampton (biomass).
Figure 2.2.4 - Alternative Plan D (nameplate MW)
Year Solar COS
Solar PPA
Solar DER
OSW Battery Storage
Pumped Storage
Natural Gas‐Fired1 Nuclear Retirements
2021 PP5
2022 540 240 220
2023 600 360 14 485 YT3, CH5&6
2024 600 360 220 485
2025 600 360 CL1&2
2026 960 360 220 852 400
2027 960 480 1,704 500 Rosemary
2028 960 480 220 AV, HW, SH
2029 960 480 500
2030 960 600 220 300
2031 960 600
2032 960 600 500 Surry 1
2033 960 600 Surry 2
2034 720 360 2,556 500
2035 720 360
TOTAL 11,460 6,240 1,100 5,112 2,414 300 970 1,676 3,183
Notes: (1) Natural-gas fired facilities are placeholders to address probable system reliability issues resulting from the addition of significant renewable energy resources and the retirement of coal-fired facilities. “COS” = cost of service; “PPA” = power purchase agreement; “Solar DER” = solar distributed energy resources (less than 3 MW), whether Company-owned or PPA; “OSW” = offshore wind; “PP5” = Possum Point Unit 5 (oil); “CH5&6” = Chesterfield Units 5 & 6 (coal); “YT3” = Yorktown Unit 3 (oil); “CL1&2” = Clover Units 1 & 2 (coal); “AV” = Altavista (biomass); “HW” = Hopewell (biomass); “SH” = Southampton (biomass).

30
Alternative Plans B, C, and D include 970 MW of natural gas-fired CTs as a placeholder to address probable system reliability issues resulting from the addition of significant renewable energy resources and the retirement of coal-fired facilities. Figure 2.2.5 shows the CO2 emissions from the Company’s fleet for each Alternative Plan, while Figure 2.2.6 shows the regional CO2 emissions for each Alternative Plan. Because the regional CO2 emissions capture the effects of both energy imports and exports required to meet customer needs, the regional emissions are a better indicator of customers’ impact on the environment.
Figure 2.2.5 – Virginia CO2 Output from Company Fleet for Alternative Plans

31
Figure 2.2.6 – Regional CO2 Output for Alternative Plans
As seen in Figures 2.2.2 through 2.2.4, Plans B through D are all very similar over the first 15 years of each Alternative Plan. This alignment between Alternative Plans B through D over the 15-year Planning Period creates a common pathway for the Company to pursue now while allowing new technologies to emerge and mature, and allowing analysis and study to continue. Accordingly, for this 2020 Plan, the Company recommends a path forward that substantially aligns with the first 15 years of Alternative Plans B through D. Over the longer-term, however, based on current technology and this “snapshot in time,” the Company recommends Alternative Plan B. 2.3 Transmission System Reliability Analysis In order to understand the possible transmission system reliability implications of retiring all Company-owned carbon-emitting generation in 2045, as contemplated by Alternative Plans C and D, the Company performed a transmission system power flow analysis by developing a base power flow case and three different scenarios, and utilizing simplifying assumptions. The initial results of this analysis identified North America Electric Reliability Corporation (“NERC”) reliability deficiencies on twenty-six 115 kV lines, thirty-two 230 kV lines, six 500 kV lines, and eleven transmission transformers that would need to be resolved to avoid NERC violations. In addition, the results indicated that Alternative Plans C and D would require construction of four interstate transmission lines at an estimated cost of $8.4 billion. A discussion of this analysis and the full results are provided in Section 7.5. 2.4 NPV Results The Company evaluated the Alternative Plans to compare and contrast the NPV utility costs for each build plan over the Study Period. Figure 2.4.1 presents these NPV results on the “Total

32
System Costs” line, as well as the estimated NPV of proposed investments in the Company’s transmission and distribution systems, broken down by specific line item.
Figure 2.4.1 – NPV Results
Notes: (1) Total system costs include the results from Figures 2.2.1 through 2.2.4 plus approved, proposed, and generic DSM; solar interconnection costs; and solar integration costs. (2) Numbers may not add due to rounding.
2.5 Virginia Residential Bill Analysis The bill of a typical residential customer in Virginia using 1,000 kWh per month as of December 31, 2019, was $122.66. As of May 1, 2020, this typical bill is $116.18, largely attributable to a significant decrease in the fuel factor. The Company calculated the projected residential bill for Alternative Plans A and B over each of the next ten years. Figure 2.5.1 presents the summary results of these projections in 2030, as well as the CAGR. Importantly, these bill projections are not final—all Company rates are subject to regulatory approval. Additionally, the bill projection associated with Alternative Plan A is presented for comparison purposes only in compliance with SCC orders. Given the legislation that will take effect in Virginia on July 1, 2020, Plan A does not represent a realistic state of relevant law and regulation. As can be seen in Figure 2.5.1, about 40% of the projected bill increase from 2020 to 2030 is associated with investments incentivized or mandated by the VCEA and other legislation from the 2020 Regular Session of the Virginia General Assembly. Roughly one-third is attributable to compliance with directives that pre-date 2020, including the GTSA. Overall, the projected bill increase is approximately 2.9% on a compound annual basis using year-end 2019 customer bill as a baseline. The Company used year-end 2019 for this calculation to compare full-year data points. For comparison, in 2008, the year following passage of the Virginia Electric Utility Regulation Act, the bill of a typical residential customer in Virginia using 1,000 kWh per month was $107.20. Using 2008 as a baseline, the projected compound annual growth rate in the typical residential customer bill through 2030 is approximately 2.1%.
2020 $B Plan A Plan B Plan C Plan D
Total System Costs134.7$ 56.8$ 60.7$ 63.0$
GT Plan 0.2$ 3.2$ 3.2$ 3.2$ SUP 2.2$ 2.2$ 2.2$ 2.2$ Broadband -$ 0.2$ 0.2$ 0.2$ Transmission Underground Pilot -$ 0.2$ 0.2$ 0.2$ Transmission 5.1$ 5.1$ 5.1$ 5.1$ Transmission Level Import Increase -$ -$ 8.4$ 8.4$ Customer Growth 2.0$ 2.0$ 2.0$ 2.0$
Subtotal Plan NPV2 44.3$ 69.7$ 82.1$ 84.3$ Less Benefits of GT Plan -$ (3.5)$ (3.5)$ (3.5)$
Total Plan NPV 44.3$ 66.2$ 78.6$ 80.8$ Plan Delta vs. Plan A -$ 21.9$ 34.3$ 36.6$

33
Figure 2.5.1 – Residential Bill Projection (1,000 kWh per Month)
2030 CAGR 2019 Year End $122.66
Plan A1 $11.70 0.8% Pre-2020 Legislation2 $15.28 1.0%
2020 Legislation3 $18.94 1.1% Total 2030 Year End $168.58 2.9%
Total Bill Increase $45.92
Notes: (1) Represents bill projections associated with future generation in Alternative Plan A; approved and proposed investments in DSM; approved investments in the Grid Transformation Plan (i.e. Phase IA and IB); investments in the Strategic Underground Program; and compliance with environmental laws and regulations,
including CCR investments. (2) Represents bill projections associated with future generation in Alternative Plan B and other investments incentivized or mandated by legislation prior to 2020, including legislation related to pumped storage (2017), the GTSA (2018), and rural broadband (2019). (3) Represents bill projections associated with future
generation in Alternative Plan B and other investments incentivized or mandated by the VCEA and other 2020 legislation.
For perspective, the average residential rate for RGGI states normalized for 1,000 kWh monthly usage—approximately $184.45—is approximately 50% higher than the Company’s typical residential bill as of year-end 2019 (i.e., $122.66). See Figure 2.5.2.
Figure 2.5.2 – Residential Bill Comparison for RGGI States1
Note: (1) Based on residential rate data for RGGI states from U.S. Energy Information Administration as of
February 2020, normalized for 1,000 kilowatt-hour monthly usage. Typical 1,000 kilowatt-hour residential bill for Company as of year-end 2019.

34
Chapter 3: Short-Term Action Plan The short-term action plan provides the Company’s strategic plan for the next five years (2020 to 2025). Generally, the Company plans to proactively position itself in the short-term to meet its commitment to clean energy for the benefit of all stakeholders over the long term. The Company also plans to continue its analyses on how to meet both its clean energy goals and the requirements of the VCEA while continuing to provide safe and reliable service to its customers. As shown in Figures 2.2.2 through 2.2.4, Alternative Plans B through D present the same path forward in the next five years, and substantially similar paths over the next 15 years. 3.1 Generation Over the next five years, the Company expects to take the following actions related to existing and proposed generation resources:
File annual plans for the development of solar, onshore wind, and energy storage resources consistent with the RPS requirements established by the VCEA, including related requests for approval of certificates of public convenience and necessity and for prudence determinations related to PPAs;
Continue the construction of the CVOW demonstration project; Continue development and begin construction of a larger build-out of offshore wind off
the coast of Virginia; Meet its targets under the Virginia RPS at a reasonable cost and in a prudent manner by:
(i) applying renewable energy from existing generating facilities, including NUGs; (ii) constructing and operating new renewable energy facilities and energy storage facilities; (iii) purchasing cost-effective RECs, including optimizing RECs produced by Company-owned generation (i.e., when higher priced RECs are sold into the market and less expensive RECs are purchased and applied to the Company’s RPS requirements);
Meet its target under North Carolina Renewable Energy Portfolio Standard at a reasonable cost and in a prudent manner, and submit its annual compliance report and compliance plan;
Support ongoing Nuclear Regulatory Commission (“NRC”) review of the subsequent license renewal application submitted for Surry Units 1 and 2 in October 2018;
Submit an application to the NRC for the subsequent license renewal for North Anna Units 1 and 2 by the end of 2020;
Continue developmental work for 300 MW of new pumped hydroelectric storage in southwestern Virginia;
Achieve a minimum of 10% electricity production at VCHEC through the use of renewable waste wood by the end of 2021;
Continue to make investments at existing generation units needed to comply with environmental regulations;
In order to preserve the option to address probable system reliability issues resulting from the addition of significant renewable energy resources and the retirement of coal-fired facilities in the near term, evaluate sites and equipment for the construction of gas-fired CT units;

35
Continue to evaluate potential unit retirements in light of changing market conditions and regulatory requirements; and
Enhance access to natural gas supplies, including shale gas supplies from multiple supply basins.
Appendices 3A and 3B provide further details on each generation project under construction and under development, respectively. Appendix 3C provides a comparison of the short-term action plan for generation resources in this 2020 Plan compared to the 2018 Plan. 3.2 Demand-Side Management Over the next five years, the Company will continue to identify and propose new or revised DSM programs that meet the existing requirements of the GTSA and the new requirements and targets in the VCEA in conjunction with the DSM stakeholder process. The Company also expects to complete a new market potential study in late 2020, and will work with stakeholders through the existing stakeholder processes towards development of a long-term strategy to achieve legislative requirements in both the GTSA and VCEA as they relate to energy efficiency. In Virginia, the Company filed its Phase VIII DSM application in December 2019 seeking approval of 11 DSM programs and an extension of one existing program. The SCC must issue its final order on this application by August 2020. In North Carolina, the Company will continue its analysis of future programs and will file for approval in North Carolina for those programs that have been approved in Virginia that continue to meet Company requirements for new DSM resources. For programs that are not approved by the SCC, the Company will evaluate the programs on a North Carolina-only basis. 3.3 Transmission Over the next five years, the Company will continue to assess its transmission system and to construct facilities required to meet the needs of its customers. Generally, the Company anticipates transmission projects that are needed to rebuild aging infrastructure and to interconnect data center customers. The Company also intends to pursue an additional underground transmission line project under the pilot program established by the GTSA as modified by House Bill No. 576 from the 2020 Regular Session of the Virginia General Assembly, which was signed into law on March 4, 2020. Appendix 3D provides a list of planned transmission projects during the Planning Period, including projected cost per project as submitted to PJM. The Company will also explore options to address probable system reliability issues resulting from the addition of significant renewable energy resources and the retirement of coal-fired facilities. Finally, the Company will continue its long-term analysis of the actions and costs associated with the retirement of dispatchable carbon-emitting generating units and the integration of large volumes of intermittent renewable generation on the transmission system.

36
3.4 Distribution Over the next five years, the Company will continue to assess its distribution system, adapt the distribution grid to meet the needs of a modernized system, and implement solutions and programs to meet the needs of its customers both today and in the future. Specifically, the Company expects to take the following actions related to its distribution system:
Implement the Grid Transformation Plan, including initiatives to facilitate the integration of DERs, enhance grid reliability and security, and improve the customer experience;
Publish hosting capacity maps for both utility scale and net metering DERs; Continue to develop integrated distribution planning capabilities, including a
standardized screening process to consider non-wires alternatives for distribution grid support;
Continue its Strategic Undergrounding Program (“SUP”); Pilot V2G technology through the Electric School Bus Program; Pilot BESS as grid support resources; and Participate in the rural broadband pilot program.

37
Chapter 4: Generation – Planning Assumptions The generation planning process begins with the development of a long-term annual peak and energy requirements forecast. Next, existing and approved supply- and demand-side resources are compared with expected load and reserve requirements. This comparison yields the Company’s expected future capacity and energy needs to maintain reliable service for its customers over the Study Period. The Company also completes a retirement analysis on certain existing supply-side resources to determine the economic feasibility of those resources. Next, a feasibility screening, followed by a busbar screening curve analysis, is conducted to identify a set of future supply-side resources potentially available to the Company, along with their individual characteristics, using input assumptions such as load, fuel prices, emissions costs, maintenance costs, and resource costs. Additionally, the Company incorporates the cost-benefit screening used to determine demand-side resources that could potentially fit into the Company’s resource mix. These potential resources and their associated economics are next incorporated into the PLEXOS model—a utility modeling and resource optimization tool—along with any regulatory requirements (e.g., the requirements in the VCEA). The Company then develops a set of alternative plans using PLEXOS that represent future paths forward considering the major drivers of future uncertainty. The Company develops these alternative plans in order to test different resource strategies against scenarios that may occur given future market and regulatory uncertainty. The NPV utility costs from PLEXOS include the variable costs of all resources (including emissions and fuel), the cost of market purchases, and the fixed costs of future resources. The Company currently models its system in PLEXOS based on hourly data. This 2020 Plan does not incorporate sub-hourly analysis because the Company is still developing the inputs required for such an analysis. Sub-hourly analysis will require sub-hourly inputs based on historical performance for all resource type that could represent the operating characteristics of those resource for future projections. In addition, the Company must use internal information to establish the adjusted reserve margin and coincidence factor, because PJM does not provide this level of detail. Nevertheless, the Company intends to incorporate sub-hourly analysis in future Plans and update filings once the required inputs and processes are developed and validated. This sub-hourly analysis would capture the potential benefits from ancillary service markets. For example, sub-hourly analysis would be able to capture the benefits that battery energy storage systems could offer to the regulating services. In this 2020 Plan, the Company relies on several assumptions for its integrated resource planning process. This chapter discusses these assumptions related to load forecast, capacity needs, capacity value, commodity prices, RPS, solar, storage, gas transportation, the least-cost plan, and the VCEA. The Company updates its assumptions annually to maintain a current view of relevant markets, the economy, and regulatory drivers. 4.1 Load Forecast The 2020 Plan presents two load forecasts: (i) the 2020 PJM Load Forecast and (ii) the 2020 Company Load Forecast. The 2020 PJM Load Forecast was used in the development of all Alternative Plans. Because of the limited nature of the information provided by PJM, however,

38
the Company presents and discusses the 2020 Company Load Forecast as well, and presents a sensitivity using the Company Load Forecast. Figures 4.1.1 and 4.1.2 compare these two load forecasts, and provide historical peak load and energy. To provide an apples-to-apples comparison of peak load, the Company added back behind-the-meter generation resources to the PJM Load Forecast. Overall, the PJM Load Forecast anticipates summer peak demand and energy CAGR for the Dominion Energy Zone (“DOM Zone”) of approximately 1.0% and 1.3%, respectively, over the Planning Period. The Company’s Load Forecast anticipates DOM Zone summer peak demand and energy forecast CAGR of 1.2% and 1.4%, respectively.
Figure 4.1.1 - DOM Zone Peak Load Comparison
Figure 4.1.2 - DOM Zone Annual Energy Comparison
10,000
12,000
14,000
16,000
18,000
20,000
22,000
24,000
26,000
199
9
200
0
200
1
200
2
200
3
200
4
200
5
200
6
200
7
200
8
200
9
201
0
201
1
201
2
201
3
201
4
201
5
201
6
201
7
201
8
201
9
202
0
202
1
202
2
202
3
202
4
202
5
202
6
202
7
202
8
202
9
203
0
203
1
203
2
203
3
203
4
203
5
PE
AK
DE
MA
ND
(M
W)
History 2020 Company 2020 PJM
HISTORY FORECAST
50,000
60,000
70,000
80,000
90,000
100,000
110,000
120,000
130,000
140,000
199
9
200
0
200
1
200
2
200
3
200
4
200
5
200
6
200
7
200
8
200
9
201
0
201
1
201
2
201
3
201
4
201
5
201
6
201
7
201
8
201
9
202
0
202
1
202
2
202
3
202
4
202
5
202
6
202
7
202
8
202
9
203
0
203
1
203
2
203
3
203
4
203
5
AN
NU
AL
EN
ER
GY
(G
Wh
)
History 2020 Company 2020 PJM
HISTORY FORECAST

39
A 10-year history and 15-year forecast of sales and customer count at the system level, as well as a breakdown at Virginia and North Carolina levels, are provided in Appendices 4A through 4F. Appendix 4G provides a summary of the summer and winter peaks used in the Company Load Forecast. The 3-year actual and 15-year forecast of summer and winter peak, annual energy, DSM peak and energy, and system capacity are shown in Appendix 4H. Appendix 4I provides the reserve margins for a 3-year actual and 15-year forecast, and Appendix 4J provides the 3-year actual and 15-year forecast summer and winter peaks to show seasonal load. Finally, the 3-year historical load and 15-year projected load for wholesale customers are provided in Appendix 4K. See Appendix 4L for load duration curves for the years 2020, 2025, and 2035 with and without DSM. The information provided in Appendices 4A through 4F and 4K use the Company Load Forecast because PJM does not provide this level of detail. Notably, neither the 2020 PJM Load Forecast nor the Company Load Forecast incorporates any effects on load of the ongoing public health emergency related to the spread of COVID-19. 4.1.1 PJM Load Forecast The Company utilized the DOM Zone load forecast as published by PJM in its 2020 PJM Load Forecast Report dated January 2020 in the development of Alternative Plans A through D included in this 2020 Plan. The PJM website (www.PJM.com) contains information on the methods used by PJM in developing this forecast. To properly use the PJM Load Forecast in the development of this 2020 Plan, the Company needed to adjust that forecast for modeling purposes. Because the PJM Load Forecast only provides a 15-year forecast, PJM’s 15-year CAGR of 1.0% and 1.3% was used to extend the summer peak demand and energy forecasts, respectively, for years 2035 through 2045. Since PJM does not provide a DOM LSE forecast, the Company then scaled down the PJM DOM Zone coincident peak load forecast and energy forecast. This required the Company to adjust PJM’s DOM Zone forecasts by a percentage factor calculated using a regression technique that utilized historical peak and energy data over the preceding 10-year period. Figure 4.1.1.1 presents the forecast extension and the DOM Zone adjustment.

40
Figure 4.1.1.1 – PJM Load Forecast Adjusted to LSE Requirements
Year
DOM Zone
Coincident Peak
(MW)
DOM LSE
Equivalent
(MW)
DOM Zone
Energy
(GWh)
DOM LSE
Equivalent
(GWh)
2021 19,486 16,802 104,845 90,435
2022 19,837 17,105 107,471 92,700
2023 20,178 17,339 110,012 94,893
2024 20,462 17,644 112,951 97,428
2025 20,651 17,807 114,053 98,378
2026 20,880 18,004 115,176 99,347
2027 21,072 18,170 116,343 100,353
2028 21,250 18,323 117,880 101,679
2029 21,404 18,456 118,745 102,426
2030 21,572 18,601 119,722 103,269
2031 21,756 18,759 120,756 104,160
2032 22,008 18,977 122,161 105,372
2033 22,176 19,121 122,831 105,950
2034 22,326 19,251 123,897 106,870
2035 22,249 19,357 125,114 107,920
2036 22,686 19,561 126,752 109,333
2037 22,926 19,768 128,412 110,765
2038 23,168 19,977 130,093 112,215
2039 23,413 20,188 131,797 113,685
2040 23,661 20,402 133,522 115,174
2041 23,911 20,617 135,270 116,682
2042 24,163 20,835 137,042 118,210
2043 24,419 21,055 138,836 119,758
2044 24,677 21,278 140,654 121,326
2045 24,938 21,503 142,495 122,915
Next, the Company needed to adjust the PJM Load Forecast to properly incorporate it into PLEXOS. Planning models, including PLEXOS, require 8,760-hour (i.e., the total hours in a year) load shapes (“8,760 load shapes”) as a necessary input. PJM does not provide forecasted 8,760 load shapes. Instead of attempting to generate 8,760 load shapes for PJM, the Company adjusted a historical DOM LSE summer peak 8,760 load shape to meet the annual coincident peak demand and energy derived from the 2020 PJM DOM Zone Load Forecast. PJM’s practice is to adjust their load forecasts downward for current and forecasted DERs, which includes a forecast for net metering customers. Given this practice, all PLEXOS modeling that utilized the PJM Load Forecast in this 2020 Plan excluded DERs (including net metering customers) from the supply options. One final note regarding the 2020 PJM Load Forecast is that PJM developed several revisions to its load forecasting process in 2019. Because of those changes, PJM now considers the DOM Zone to be a winter peaking zone. In other words, the winter peak demand forecast for the DOM Zone now exceeds the summer demand peak in all years of the forecast period according to PJM.

41
Given that the PJM RTO is still a summer peaking entity, however, PJM will still procure capacity for the DOM Zone at levels commensurate with the DOM Zone coincident summer peak forecast. As such, the Company developed this 2020 Plan using a summer peak 8,760 shape modified to align with PJM’s DOM Zone summer coincident peak demand and energy forecast. 4.1.2 Company Load Forecast This 2020 Plan also includes the Company’s internally developed peak demand and energy forecast. The Company ran a sensitivity on Alternative Plan B, re-optimizing the build plan based on use of this internally developed forecast instead of the PJM Load Forecast. Figure 4.1.2.1 displays the results of this sensitivity analysis.
Figure 4.1.2.1 - Load Forecast Sensitivity
Plan B
Plan B Load Forecast Sensitivity
Load Forecast PJM Company NPV Total $66.2 B $66.8 B
Solar (MW) 15,920 15-year
31,400 25-year 15,920 15-year
31,400 25-year Offshore Wind (MW) 5,112 15-year
5,112 25-year 5,112 15-year
5,112 25-year Storage (MW) 2,714 15-year
5,114 25-year 2,714 15-year
5,114 25-year Combustion Turbine (MW 970 15-year
970 25-year 970 15-year
970 25-year PJM Imports (MW) 5,200 15-year
5,200 25-year 5,200 15-year
5,200 25-year Retirements (MW 3,183 15-year
5,414 25-year 3,183 15-year
5,414 25-year As can be seen, the Company Load Forecast produces the same build plan as the PJM Load Forecast, all other Plan B assumptions being equal. The NPV is slightly higher using the Company Load Forecast because the Company would need to purchase additional energy in the later years of the Study Period. These results confirm that the two forecasts are very similar. In addition, it shows that the main driver for the units selected in the build plan for Alternative Plan B was the requirements of the VCEA, not the load forecast. The following paragraphs describe the Company’s internal load forecasting process, plus the new revisions to that process that were incorporated since the 2018 Plan was published.

42
Methodology The Company uses two econometric models with an end-use orientation to forecast sales, energy, and peak demand. The first is a customer class level sales model (“Sales Model”) and the second is a system level hourly load model (“Peak and Energy Model”). The models used to produce the Company Load Forecast have been developed, enhanced, and re-estimated annually for over 20 years. Both models were estimated over a rolling 15-year historical period as each long-term forecast is developed. Sales Model The Sales Model incorporates separate monthly sales equations for residential, non-data center commercial, industrial, public authority, street and traffic lighting, and wholesale customer classes, as well as other LSEs in the DOM Zone (all of which are in the PJM RTO). The monthly sales equations are specified in a manner that produces estimates of heating load, cooling load, and non-weather sensitive load. In addition to developing a sales forecast, the primary role of the Sales Model is to provide estimates of historical and projected weather sensitive appliance stocks and non-weather sensitive base demand for use as exogenous variables in the Peak and Energy Model. The residential sales equation also relies on an algorithm that dynamically adjusts forecasted appliance saturation and usage based on historical trends. These historical trends are determined from appliance data collected through surveys of the Company’s residential customers. Figure 4.1.2.2 shows historical and forecasted saturation and usage data for residential heat pumps.
Figure 4.1.2.2 – Residential Heat Pump (Cooling) Saturation and Usage
The next residential and commercial customer appliance survey and subsequent conditional demand analysis will be completed in the second half of 2020.
80.0%
82.0%
84.0%
86.0%
88.0%
90.0%
92.0%
94.0%
96.0%
98.0%
100.0%
-10
490
990
1490
1990
2490
2990
2010 2012 2014 2016 2018 2020 2022 2024 2026 2028 2030 2032 2034
kWh
Heat Pump Average Usage
Heat Pump Saturation
Satu
ration
%

43
The Company has performed out-of-sample testing on its Sales Model for the residential, commercial, industrial, and public authority (government) customer classes. The results of tests are included in the Company’s load forecasting model documentation. Peak and Energy Model The Company’s second model, the Peak and Energy Model, is comprised of 24 separate equations, one for each hour of the day, with adjusted DOM Zone loads as the dependent variable. Prior to estimating the Peak and Energy Model equations, historical hourly loads are adjusted by adding back historical distributed solar generation and load management reductions. This adjustment is performed in order to ascertain the true load rather than a load that is masked by these devices. The Company’s practice is to account for distributed solar and load management programs as supply resources, not as a load modifier. The Peak and Energy Model equations include a non-weather sensitive base demand variable, derived from the estimated aggregate non-weather sensitive base demand components from the Sales Model as well as a detailed specification of weather variables. The weather variables include interactions between both current and lagged values of temperature, humidity, wind speed, sky cover, and precipitation for five weather stations in conjunction with residential heating and cooling appliance stocks. The Peak and Energy Model also employs indicator variables to capture monthly, day of week, time of day, holiday, and other seasonal effects, as well as unusual events such as hurricanes that produce widespread outages. The forecast of expected DOM Zone monthly and seasonal peaks and energy output is produced by simulating hourly demands from the estimated Peak and Energy Model over actual hourly weather from each of the past 15 years under projected economic conditions. The final forecasted zonal peak and energy values include subsequent adjustments for projected data centers, EVs, or other significant load additions not reflected in the hourly regression equations. The final monthly peak and energy forecast for the DOM LSE is based on a regression of historical DOM LSE loads onto historical DOM Zone loads. The estimated coefficients are applied to the projected zonal loads resulting in a load forecast for the DOM LSE that is then adjusted for known firm contractual obligations in the forecast period. Data Center Forecast Data center sales, energy, and peak demand are now being forecasted by the Company as a standalone category and are being applied to the Company’s sales, peak, and energy forecasts as an exogenous adjustment. This action is consistent with a forecasting recommendation provided by Itron Inc. (“Itron”), as discussed below. Figures 4.1.2.3 and 4.1.2.4 reflect the data center peak and energy forecast, respectively.
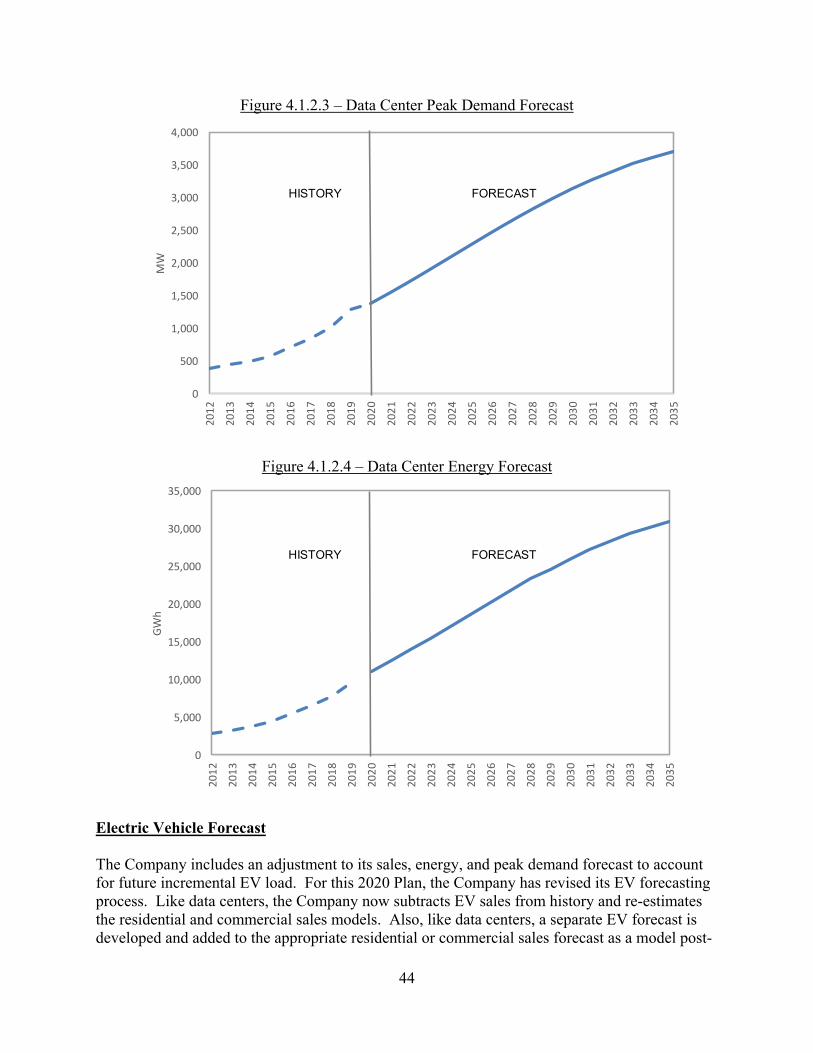
44
Figure 4.1.2.3 – Data Center Peak Demand Forecast
Figure 4.1.2.4 – Data Center Energy Forecast
Electric Vehicle Forecast The Company includes an adjustment to its sales, energy, and peak demand forecast to account for future incremental EV load. For this 2020 Plan, the Company has revised its EV forecasting process. Like data centers, the Company now subtracts EV sales from history and re-estimates the residential and commercial sales models. Also, like data centers, a separate EV forecast is developed and added to the appropriate residential or commercial sales forecast as a model post-
0
500
1,000
1,500
2,000
2,500
3,000
3,500
4,000
2012
2013
2014
2015
2016
2017
2018
2019
2020
2021
2022
2023
2024
2025
2026
2027
2028
2029
2030
2031
2032
2033
2034
2035
MW
HISTORY FORECAST
0
5,000
10,000
15,000
20,000
25,000
30,000
35,000
2012
2013
2014
2015
2016
2017
2018
2019
2020
2021
2022
2023
2024
2025
2026
2027
2028
2029
2030
2031
2032
2033
2034
2035
GWh
HISTORY FORECAST
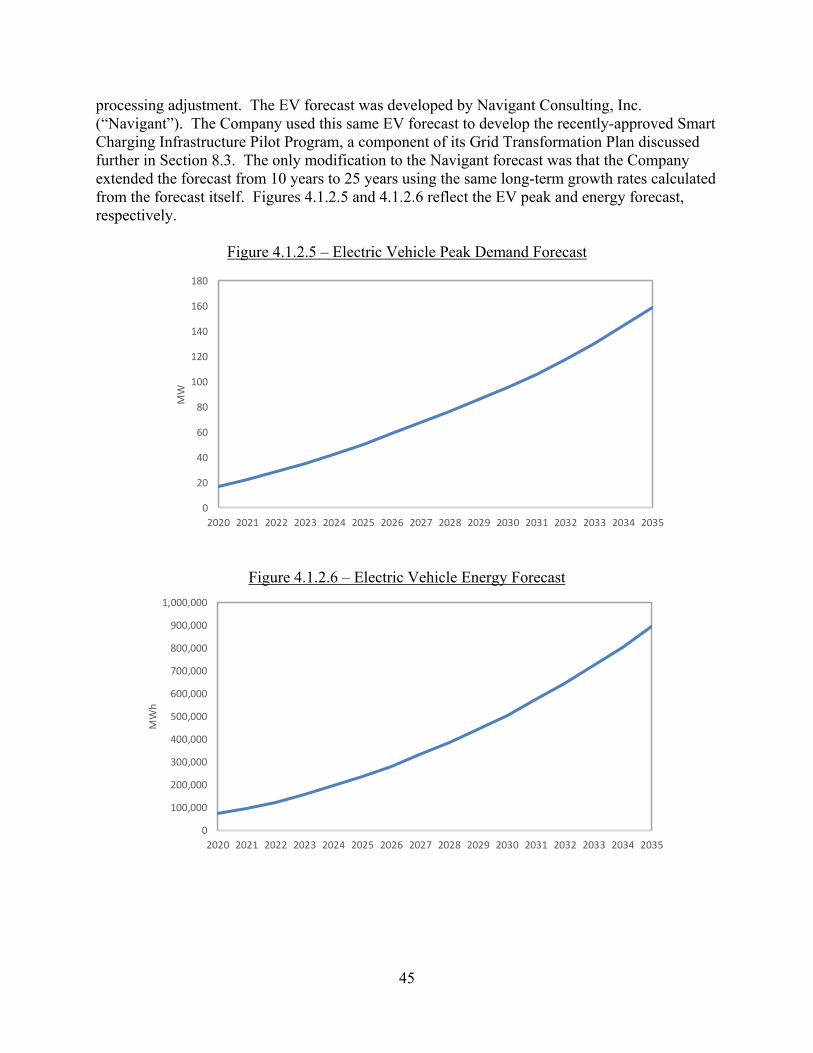
45
processing adjustment. The EV forecast was developed by Navigant Consulting, Inc. (“Navigant”). The Company used this same EV forecast to develop the recently-approved Smart Charging Infrastructure Pilot Program, a component of its Grid Transformation Plan discussed further in Section 8.3. The only modification to the Navigant forecast was that the Company extended the forecast from 10 years to 25 years using the same long-term growth rates calculated from the forecast itself. Figures 4.1.2.5 and 4.1.2.6 reflect the EV peak and energy forecast, respectively.
Figure 4.1.2.5 – Electric Vehicle Peak Demand Forecast
Figure 4.1.2.6 – Electric Vehicle Energy Forecast
0
20
40
60
80
100
120
140
160
180
2020 2021 2022 2023 2024 2025 2026 2027 2028 2029 2030 2031 2032 2033 2034 2035
MW
0
100,000
200,000
300,000
400,000
500,000
600,000
700,000
800,000
900,000
1,000,000
2020 2021 2022 2023 2024 2025 2026 2027 2028 2029 2030 2031 2032 2033 2034 2035
MWh

46
Independent Review of the Company’s Load Forecasting Process In response to feedback received during the 2018 Plan proceeding, the Company engaged Itron in 2019 to (i) review its load forecasting process and methods and (ii) perform a long term (i.e., greater than 5 years) study of data center growth within the Company’s service territory. Overall, Itron concluded that the Company’s load forecast methodology provides reasonable projections for long-term resource planning, and offered general recommendations that could improve that approach. The Company has incorporated the following load forecast recommendations into this 2020 Plan:
Itron recommended that the Company shorten the coefficient estimation period from the Company’s traditional period of 30 years. Consistent with this recommendation, the 2020 Company Load Forecast utilized 15 years of history to re-estimate the model and also used 15 years of weather history in its weather normalization process.
Itron recommended that the Company isolate the data center loads from commercial sales and system hourly loads. Consistent with this recommendation, the 2020 Company Load Forecast removed the data center peak demand and energy from the commercial sector and estimated each sector (i.e., non-data center commercial and data centers) independently.
The Company will continue to review the results of the Itron study and incorporate recommendations into its load forecasting process as appropriate. Itron also made several findings regarding long-term data center growth, including:
With continuing demand growth for offsite computing and cloud-based computer service, strong Northern Virginia data center demand is expected to grow well into the future;
Data center demand is expected to increase 176 MW on average per year between 2020 and 2030; and
Utilizing the Bass Diffusion Model is a reasonable approach to forecasting long-term data center growth.
Economic and Demographic Assumptions The economic and demographic assumptions that were used in the Company Load Forecast models were supplied by Moody’s Analytics, prepared in October 2019, and are included as Appendix 4M. Figure 4.1.2.7 summarizes the economic variables used to develop the Company’s sales and peak load forecasts.

47
Figure 4.1.2.7 - Major Assumptions for the Sales and Peak and Energy Models
Note: (1) “State & Local Government” = State (Commonwealth of Virginia) + Local (County + Municipalities) (2) “Government” = State (Commonwealth of Virginia) + Local (County + Municipalities) + Federal Employment (Non-
Military)
Explanatory Variable Comparison
The Company relies on Virginia economic explanatory variable forecasts supplied by third parties in the development of its load forecast for the DOM Zone. The supplier of these explanatory variable forecasts for the 2020 Company Load Forecast was Moody’s Analytics (“Moody’s”); PJM also used explanatory variables from Moody’s in the development of its 2020 Load Forecast.
In past proceedings, questions have arisen about the use of Moody’s and whether other entities could provide such forecasts. To the Company’s knowledge, the only other reputable supplier of these forecast variables is IHS Markit (“IHS”). For direct comparison purposes in this 2020 Plan, the Company procured Virginia economic variable forecasts from both Moody’s and IHS. Appendix 4N provides charts comparing different relevant variables. As shown in Appendix 4N, except for housing permits, IHS forecasts are similar to or higher than Moody’s. The Company uses the housing permit forecast as an input variable in its residential load forecasting process to determine the number of residential customers. The residential load forecast also incorporates other input variables, such as disposable income forecast. If the Company had used IHS’s economic variable forecasts instead of Moody’s, it is likely that the residential sales results would be similar because while IHS’s housing permit forecast is lower than Moody’s, IHS’s disposable income forecast is higher.
2020 2035Compound Annual
Growth Rate (%) 2020 - 2035
DEMOGRAPHIC:Customers (000)
Residential 2,373 2,754 1.00%Commercial 247 279 0.81%
Population (000) 8,627 9,341 0.53%
ECONOMIC:Employment (000)
State & Local Government 545 616 0.82%Manufacturing 244 202 -1.25%Government 728 800 0.63%
Income ($)Per Capita Real disposable 47,758 62,345 1.79%
Price IndexConsumer Price (1982-84=100) 261 368 2.33%
VA Gross State Product (GSP) 497 659 1.90%

48
Net Metering Forecast The Company has developed a process that can forecast residential and commercial net metering customers on a feeder level basis. This forecasting method can be used by the Company in forecasting future net metering supply-side resources. It cannot be used when using the PJM Load Forecast because PJM calculates behind-the-meter (including net metering) resources using different methods and reduces its overall load forecast by the determined values. The net metering forecast process is composed of two components. The first component is the three parameter Bass Diffusion Model (“BDM”) and the second component is a logit classification model. On a feeder level basis, the BDM is fit to actual net metering customer data to determine the first two parameters of the BDM, which are the coefficient of innovation and the coefficient of imitation. The logit classification model is used to determine the maximum number of potential customers that will elect to implement net metering technology at their premises using demographic information such as premises size, age, and value. This maximum number of potential customers figure is then utilized within the BDM framework as the third parameter to determine the leveling off point or the 100% saturation level of the BDM. This process will determine the net metering customer forecast, which is then translated into kWh using feeder averages for single unit size and capacity factor. The methods should prove valuable as the Company’s distribution planners proceed with feeder assessments as part of evolving integrated distribution planning capabilities. Wholesale Power Sales The Company currently provides full requirement wholesale power sales to three entities, which are included in the Company Load Forecast. Appendix 4K provides a list of wholesale power sales contracts with parties to whom the Company has either committed or expects to sell power during the Planning Period. Results The DOM Zone is typically a summer peaking system. The all-time summer unrestricted peak demand for the DOM Zone is 20,328 MW and was set in the summer of 2011. On July 20, 2019, the DOM Zone unrestricted peak demand was 20,161 MW. The peak-producing weather event that drove this 2019 summer demand culminated on a Saturday. The Company estimates that had this weather pattern culminated on a weekday, the load would have been approximately 500 MW higher, thus resulting in a new all-time summer peak demand of 20,661 MW. However, during the winter periods of 2013/2014, 2014/2015, 2017/2018, and 2018/2019, significant DOM Zone unrestricted peaks were set at 19,978 MW, 21,867 MW, 21,350 MW, and 20,104 MW, respectively. Nevertheless, based on its load forecasting process—and unlike PJM—the Company still considers the DOM Zone to be a summer-peaking zone through 2031. The historical DOM Zone summer peak growth rate has averaged about 1.3% annually over the 2004 to 2019 period. The annual average energy growth rate over the same period is approximately 0.8%. Historical DOM Zone peak load and annual energy output along with a 15-year forecast are shown in Figures 4.1.2.8 and 4.1.2.9. Figure 4.1.2.8 also reflects the actual

49
winter peak demand. DOM LSE peak and energy requirements are both estimated to grow annually at an approximate CAGR of 1.3% and 1.4%, respectively, throughout the Planning Period.
Figure 4.1.2.8 – DOM Zone Peak Load Based on Company Load Forecast
Figure 4.1.2.9 – DOM Zone Annual Energy Based on Company Load Forecast
10,000
12,000
14,000
16,000
18,000
20,000
22,000
24,000
26,0002004
2005
2006
2007
2008
2009
2010
2011
2012
2013
2014
2015
2016
2017
2018
2019
2020
2021
2022
2023
2024
2025
2026
2027
2028
2029
2030
2031
2032
2033
2034
2035
PEAK DEMAND (MW)
SUMMER PEAK ACTUAL WINTER PEAK ACTUAL
SUMMER PEAK FORECAST WINTER PEAK FORECAST
HISTORY FORECAST
50,000
60,000
70,000
80,000
90,000
100,000
110,000
120,000
130,000
140,000
2004 2006 2008 2010 2012 2014 2016 2018 2020 2022 2024 2026 2028 2030 2032 2034
ANNUAL ENERGY (GWh)
HISTORY FORECAST
50
4.1.3 Energy Efficiency Adjustment The load forecasts in this 2020 Plan include a downward post-model adjustment for energy efficiency (“EE”). The EE adjustment to the forecasts can be broken down into two distinct categories. The first category (“Category 1 Programs”) consists of previously-approved EE programs that remain effective, along with programs that are currently pending approval before the SCC in Case No. PUR-2019-00201. The second category (“Category 2 Program”) is a “generic” EE program that is designed to meet the requirements of the: (i) VCEA; and (ii) GTSA. Specifically, the Category 2 Program was designed to increase the level of EE to meet the 2022 through 2025 EE targets set in the VCEA and to meet the GTSA requirement to propose $870 million in EE programs by 2028. Alternative Plan A includes only adjustment for Category 1 Programs. Alternative Plans B through D include adjustment for both Category 1 and Category 2 Programs. To estimate the Category 2 Program, the Company first determined the projected 2028 EE savings and EE costs associated with the Category 1 Programs. Using this information, the Company then determined the added EE savings necessary to meet the EE targets of the VCEA and also the EE savings needed to achieve the $870 million in EE-related spending by 2028. The Category 2 Program volumes were determined assuming a generic EE program fixed price of $200/MWh, which is based on the Company’s 2018 solicitation to vendors. This approach is a theoretical assumption used for planning purposes only. In reality, the level of energy efficiency savings included in this 2020 Plan may not materialize in the same manner as modeled due to many outside factors. These factors could include but are not limited to the ability of future vendors to deliver program savings at the fixed price, the desire of customers to participate in the program at that price, and the effectiveness of the program to be administered at that price. Therefore, the costs and level of savings modeled for the Category 2 Program are placeholders that will be revised as future phases of actual EE programs are developed and implemented. The Category 2 Program forecast uses a start date of January 1, 2021, and grows at a pace that will meet the 2022, 2023, 2024, and 2025 EE targets required in the VCEA. The Program continues to grow until the total EE spend equates to $870 million in 2028. After 2028, the Category 2 Program levels out for a five-year period, and then begins a slow downward trajectory that simulates a loss in program participation. Figures 4.1.3.1 and 4.1.3.2 identify the EE energy and capacity adjustments to the load forecasts used in this 2020 Plan. As stated, Alternative Plan A includes only adjustment for Category 1 Programs, while Alternative Plans B through D include adjustment for both Category 1 and Category 2 Programs.

51
Figure 4.1.3.1 – EE Energy Forecast
Figure 4.1.3.2 – EE Coincident Summer Peak Demand Forecast
‐
500,000
1,000,000
1,500,000
2,000,000
2,500,000
3,000,000
3,500,000
4,000,000
4,500,000
5,000,000
2020 2021 2022 2023 2024 2025 2026 2027 2028 2029 2030 2031 2032 2033 2034 2035
MWh
Category 1 Programs Category 1 Programs Plus Category 2 Program
2022 VCEA Target
2025 VCEA Target
2024 VCEA Target
2023 VCEA Target
0
100
200
300
400
500
600
700
800
900
1000
2020 2021 2022 2023 2024 2025 2026 2027 2028 2029 2030 2031 2032 2033 2034 2035
MW
Category 1 Programs Category 1 Programs Plus Category 2 Program

52
The Company also modeled EE as a supply-side resource in the PLEXOS model. The modeling of EE as a load reducer and as a supply-side resource resulted in effectively identical results. Figures 4.1.3.3 and 4.1.3.4 show the Company’s current capacity and energy position with DSM modeled as a supply-side resource using unit retirement assumptions for Alternative Plan B.
Figure 4.1.3.3 - Current Company Capacity Position (2021 to 2035)
Notes: “Existing Generators + NUGS” also include generation under construction; “DR” = demand response; “EE” = energy efficiency; “PP5” = Possum Point Unit 5 (oil); “CH5&6” = Chesterfield Units 5 & 6 (coal); “YT3” = Yorktown Unit 3 (oil); “CL1&2” = Clover Units 1 & 2 (coal); “Rose” = Rosemary (oil); “AV” = Altavista (biomass); “HW” = Hopewell (biomass);
“SH” = Southampton (biomass).

53
Figure 4.1.3.4 - Current Company Energy Position (2021 to 2035)
Notes: “Existing Generators + NUGS” also include generation under construction; “EE” = energy efficiency; “PP5” = Possum
Point Unit 5 (oil); “CH5&6” = Chesterfield Units 5 & 6 (coal); “YT3” = Yorktown Unit 3 (oil); “CL1&2” = Clover Units 1 & 2 (coal); “Rose” = Rosemary (oil); “AV” = Altavista (biomass); “HW” = Hopewell (biomass); “SH” = Southampton (biomass).
4.1.4 Retail Choice Adjustment The load forecasts in this 2020 Plan include a downward post-modeling adjustment for customers within the Company’s service territory who have chosen (or may choose) to purchase energy and capacity from third-party retail electric suppliers under Va. Code § 56-577 (“Choice Customers”). To develop this forecast the Company first determined the number of current and potential Choice Customers for 2019 and 2020. This included those customers eligible to participate in the pilot program established by House Bill No. 889 in the 2020 Regular Session of the Virginia General Assembly for up to 200 MW of non-residential load to aggregate and purchase electricity from third-party suppliers. Based on this total set of customers, the Company then determined the average energy and peak demand for each of these customers over the last three years. The summation of each customer’s average annual energy and capacity use then formed the starting point for the Choice Customer forecast. This Choice Customer starting point is composed of two different types of customers. The first set is customers that have pursued, or may pursue, third-party supply under Va. Code § 56-577 A 3 or A 4 (“A 3 and A 4 Choice Customers”), while the second set is made up of customers that have opted, or may opt, for third-party supply under Va. Code § 56-577 A 5 (“A 5 Choice Customers”). Given that A 3 and A 4

54
Choice Customers must provide five years’ advanced written notice before returning to purchase electricity from the Company, the Company assumed in this forecast adjustment that those customers would remain under third-party supply for the entire Study Period. To the extent A 3 and A 4 Choice Customers file written notice to return to Company service, the Company can factor this load into its future load forecast adjustments. Given that A 5 Choice Customers have no similar advance written notice requirement, the Company must remain cognizant that those customers could return to Company service at any time and must plan accordingly as the default service provider. In addition, A 5 Choice Customers will no longer be able to purchase electricity from third-party suppliers if the SCC approves the Company’s proposed Rider TRG pending in Case No. PUR-2019-00094. Therefore, the Company assumed in this forecast that A 5 Choice Customers gradually return to full Company service by the end of 2023. Figures 4.1.4.1 and 4.1.4.2 identify the Choice Customer peak demand and energy forecast adjustment in this 2020 Plan.
Figure 4.1.4.1 – Choice Customer Energy Forecast
0
100
200
300
400
500
600
2020 2021 2022 2023 2024 2025 2026 2027 2028 2029 2030 2031 2032 2033 2034 2035
MW

55
Figure 4.1.4.2 – Choice Customer Coincident Summer Peak Demand Forecast
4.1.5 Voltage Optimization Adjustment As part of its Grid Transformation Plan, discussed further in Section 8.3, the Company seeks to fully deploy AMI across its service territory, and then use this technology to enable voltage optimization. Voltage optimization, if approved and deployed, would lead to energy and capacity savings. Because of the preparation schedule associated with this 2020 Plan, Alternative Plans B, C, and D include a post-model downward adjustment to the load forecast to account for the savings associated with voltage optimization as proposed in the Grid Transformation Plan. Figures 4.1.5.1 and 4.1.5.2 reflect the peak demand and energy savings forecast adjustment resulting from voltage optimization.
‐
500,000
1,000,000
1,500,000
2,000,000
2,500,000
3,000,000
3,500,000
4,000,000
4,500,000
5,000,000
2020 2021 2022 2023 2024 2025 2026 2027 2028 2029 2030 2031 2032 2033 2034 2035
MWh
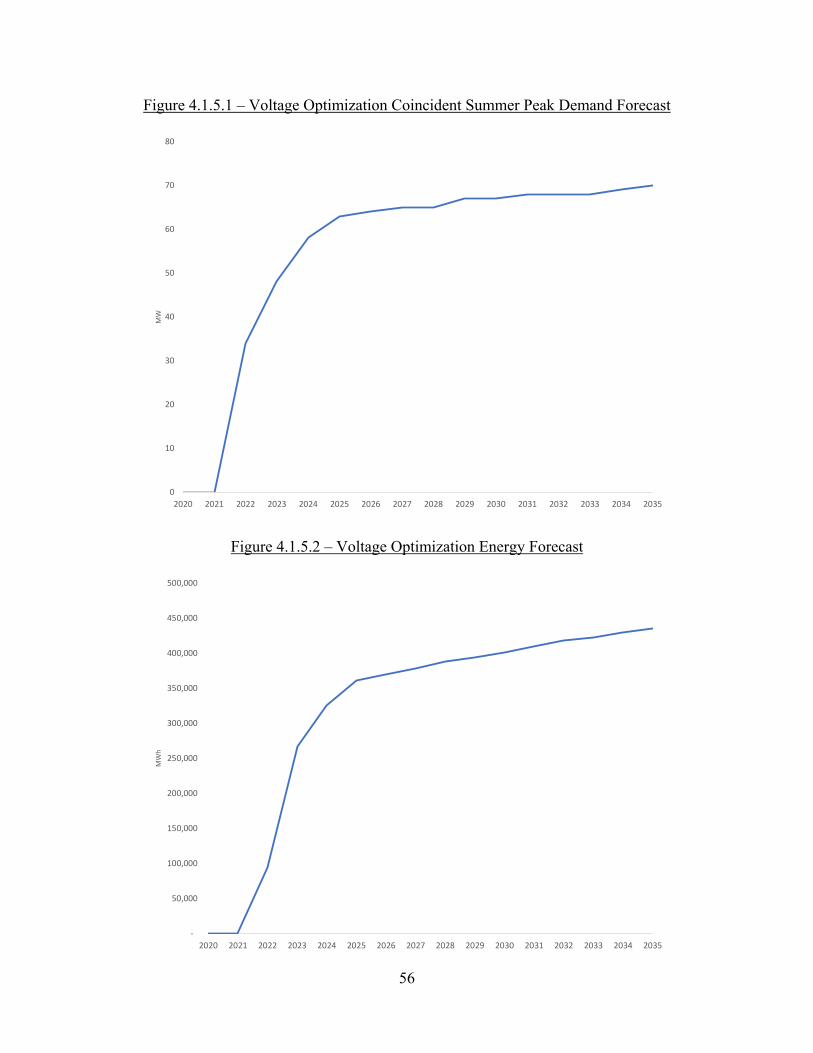
56
Figure 4.1.5.1 – Voltage Optimization Coincident Summer Peak Demand Forecast
Figure 4.1.5.2 – Voltage Optimization Energy Forecast
0
10
20
30
40
50
60
70
80
2020 2021 2022 2023 2024 2025 2026 2027 2028 2029 2030 2031 2032 2033 2034 2035
MW
‐
50,000
100,000
150,000
200,000
250,000
300,000
350,000
400,000
450,000
500,000
2020 2021 2022 2023 2024 2025 2026 2027 2028 2029 2030 2031 2032 2033 2034 2035
MWh

57
4.2 Capacity Market Assumptions The Company participates in the PJM capacity planning process to ensure supply of capacity resources for its customer load. As a member of PJM, the Company has the option to buy capacity in order to satisfy the mandated reliability requirements either (i) through the RPM forward capacity market or (ii) through the FRR alternative. PJM’s planning years (referred to as “delivery years” for RPM) run from June 1 to May 31. The Company has satisfied its capacity obligation through the RPM auction through May 31, 2022. Short-Term Capacity Planning As a PJM member, the Company is a signatory to PJM’s Reliability Assurance Agreement, which obligates the Company to purchase sufficient capacity to maintain overall system reliability. PJM determines these obligations for each zone using its annual load forecast and reserve margin guidelines as inputs. PJM then conducts a capacity auction process for meeting these input requirements up to three years into the future. This auction process includes the base RPM auction as well as and subsequent incremental auctions that are held to allow market sellers and PJM to adjust positions for changes such as construction delays or outage assumptions. This auction process determines the clearing reserve margin and the capacity price for each zone for the delivery year that is three years in the future (e.g., the 2018 base RPM auction procured capacity for the delivery year 2021/2022). PJM has delayed the 2019 and 2020 auction processes due to the pending FERC MOPR proceeding discussed in Section 1.6.1. Following resolution of this proceeding, PJM plans to compress the timelines for these auctions, currently targeting late 2020 or early 2021 for resuming the RPM auction process. Currently, the Company offers its capacity resources, including owned and contracted generation, into the RPM auction as a generation provider. As an LSE, the Company is then obligated to purchase capacity to cover its PJM auction-determined capacity requirements. In the future, the Company could satisfy its capacity obligation through the FRR alternative. As discussed in Section 1.6.2, this alternative would allow the Company to self-supply its capacity obligation. Importantly for modeling purposes, however, the modeling is indifferent to whether the Company satisfies its capacity obligation through the RPM auction or through the FRR alternative. Operating under the FRR alternative, the Company would self-supply its capacity obligation. Instead of collecting a capacity revenue stream for generating resources, the Company assumes generating resources would obtain capacity benefit by avoiding capacity market purchases. For modeling purposes, the Company would continue to use capacity market forecasts and assume generating resources collect capacity benefits by avoiding capacity purchases under FRR. Further, the modeling is indifferent to whether the Company operates under the FRR alternative because the Company models the forecasted reserve margin at the minimum reserve margin, which is also the obligation under FRR. Figure 2.1.1 indicates both the minimum PJM reserve requirement (i.e., the solid line) and the typical market reserve requirement (i.e., the dashed line).

58
Long-Term Capacity Planning – Reserve Requirements The Company uses PJM’s reserve margin guidelines to determine its long-term capacity requirement. PJM conducts an annual reserve requirement study to determine an adequate level of capacity in its footprint to meet the target level of reliability, measured as a loss of load expectation equivalent to one day of outage in ten years. To satisfy the NERC and Reliability First Corporation Adequacy Standard BAL-502-RFC-02, Planning Resource Adequacy Analysis, Assessment, and Documentation, PJM’s 2019 Reserve Requirement Study recommended using an installed reserve margin of 15.9% for delivery year 2020/2021, 15.1% for delivery year 2021/2022, 14.9% for delivery year 2022/2023, and 14.8% for delivery year 2023/2024. PJM develops reserve margin estimates for planning years rather than calendar years. Because PJM is a summer peaking entity, and because the summer period of PJM’s planning year coincides with the calendar year summer period, calendar and planning year reserve requirement estimates are determined based on the identical summer time period. For example, the Company uses PJM’s 2020/2021 delivery year assumptions for the 2020 calendar year in this 2020 Plan because it represents the expected peak load during the summer of 2020. The Company makes one assumption when applying the PJM reserve margin to the Company’s modeling efforts. Since PJM uses a shorter planning period than the Company (i.e., ten years for PJM rather than 15 years for the Company), the Company uses the most recent PJM Reserve Requirements Study and assumes the reserve margin value for delivery year 2023 would continue throughout the Study Period. Figure 4.2.1 shows the adjusted load forecast used in the modeling of Alternative Plans B, C, and D.
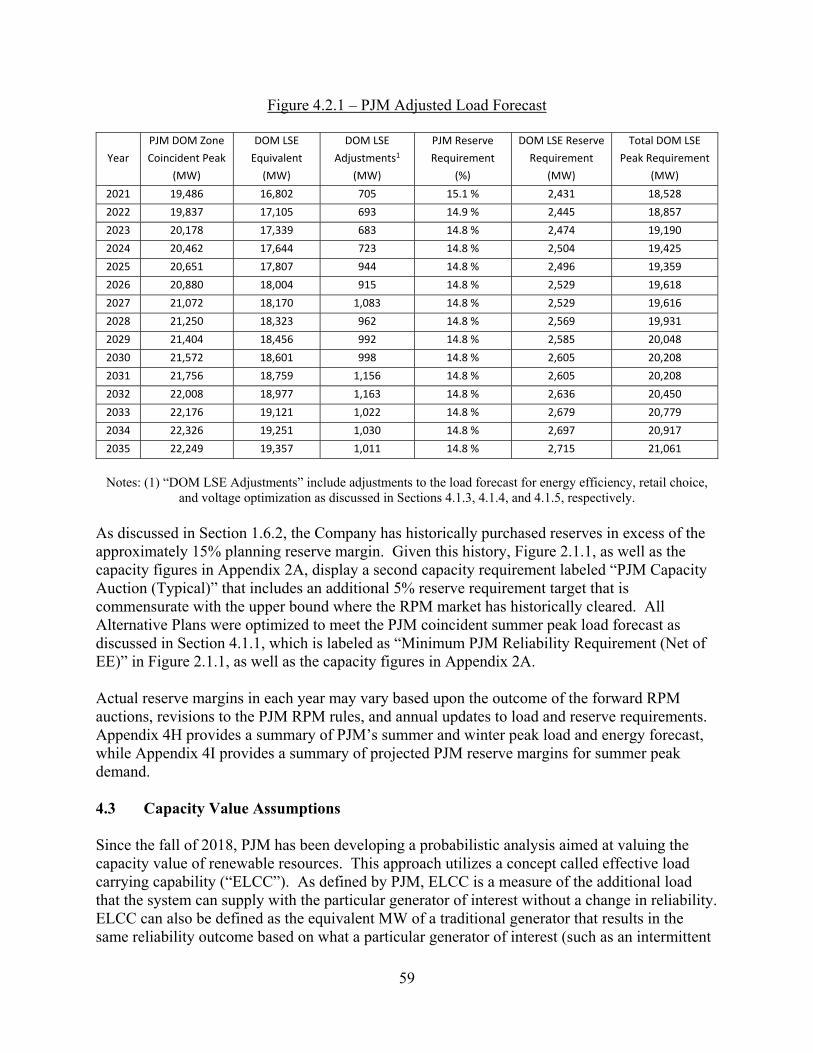
59
Figure 4.2.1 – PJM Adjusted Load Forecast
Year
PJM DOM Zone
Coincident Peak
(MW)
DOM LSE
Equivalent
(MW)
DOM LSE
Adjustments1
(MW)
PJM Reserve
Requirement
(%)
DOM LSE Reserve
Requirement
(MW)
Total DOM LSE
Peak Requirement
(MW)
2021 19,486 16,802 705 15.1 % 2,431 18,528
2022 19,837 17,105 693 14.9 % 2,445 18,857
2023 20,178 17,339 683 14.8 % 2,474 19,190
2024 20,462 17,644 723 14.8 % 2,504 19,425
2025 20,651 17,807 944 14.8 % 2,496 19,359
2026 20,880 18,004 915 14.8 % 2,529 19,618
2027 21,072 18,170 1,083 14.8 % 2,529 19,616
2028 21,250 18,323 962 14.8 % 2,569 19,931
2029 21,404 18,456 992 14.8 % 2,585 20,048
2030 21,572 18,601 998 14.8 % 2,605 20,208
2031 21,756 18,759 1,156 14.8 % 2,605 20,208
2032 22,008 18,977 1,163 14.8 % 2,636 20,450
2033 22,176 19,121 1,022 14.8 % 2,679 20,779
2034 22,326 19,251 1,030 14.8 % 2,697 20,917
2035 22,249 19,357 1,011 14.8 % 2,715 21,061
Notes: (1) “DOM LSE Adjustments” include adjustments to the load forecast for energy efficiency, retail choice,
and voltage optimization as discussed in Sections 4.1.3, 4.1.4, and 4.1.5, respectively. As discussed in Section 1.6.2, the Company has historically purchased reserves in excess of the approximately 15% planning reserve margin. Given this history, Figure 2.1.1, as well as the capacity figures in Appendix 2A, display a second capacity requirement labeled “PJM Capacity Auction (Typical)” that includes an additional 5% reserve requirement target that is commensurate with the upper bound where the RPM market has historically cleared. All Alternative Plans were optimized to meet the PJM coincident summer peak load forecast as discussed in Section 4.1.1, which is labeled as “Minimum PJM Reliability Requirement (Net of EE)” in Figure 2.1.1, as well as the capacity figures in Appendix 2A. Actual reserve margins in each year may vary based upon the outcome of the forward RPM auctions, revisions to the PJM RPM rules, and annual updates to load and reserve requirements. Appendix 4H provides a summary of PJM’s summer and winter peak load and energy forecast, while Appendix 4I provides a summary of projected PJM reserve margins for summer peak demand. 4.3 Capacity Value Assumptions Since the fall of 2018, PJM has been developing a probabilistic analysis aimed at valuing the capacity value of renewable resources. This approach utilizes a concept called effective load carrying capability (“ELCC”). As defined by PJM, ELCC is a measure of the additional load that the system can supply with the particular generator of interest without a change in reliability. ELCC can also be defined as the equivalent MW of a traditional generator that results in the same reliability outcome based on what a particular generator of interest (such as an intermittent

60
generator) can provide. The metric of reliability used by PJM is loss of load expectation, a probabilistic metric that is driven by the timing of high loss-of-load probability hours. Therefore, PJM states that a resource that contributes a significant level of capacity during high-risk hours will have a higher capacity value (i.e., a higher ELCC) than a resource that delivers the same capacity only during low-risk hours. “High-risk hours” are those hours that PJM expects the peak demand to occur. For the purposes of the 2020 Plan, the Company has used the PJM ELCC studies published to date to estimate the capacity value of solar resources. This approach indicated the capacity value of solar is currently in the 45% range, but decreases over time as the solar saturation grows. PJM currently performs its load forecasts, installed reserve margins, reliability metrics, and ELCC calculations at the hourly or daily level. The Company has assumed approximately 30% capacity value for offshore wind. This capacity value is based on the PJM-approved capacity value associated with the Company’s proposed offshore wind queue projects because, to date, PJM has not published an ELCC-based analysis for offshore wind. For storage resources, PJM currently adheres to a 10-hour run requirement for determining capacity value. This rule dictates that for capacity market participation, a storage resource with duration less than 10 hours will be de-rated down to the capacity value equal to the resource’s duration as a fraction of 10 hours. This rule is currently under review by FERC. PJM has also recently initiated an effort to develop ELCC calculations for storage resources. The storage approach would likely incorporate the dispatch characteristics and duration of storage resources. Because of these pending initiatives, the Company has modeled the capacity value of storage resources using PJM’s existing 10-hour requirement for the purposes of the 2020 Plan. 4.4 Commodity Price Assumptions The Company utilizes a single source to provide multiple scenarios for the commodity price forecast to ensure consistency in methodologies and assumptions. The Company performed the analyses in this 2020 Plan using energy and commodity price forecasts provided by ICF Resources, LLC (“ICF”) in all periods except the first 36 months of the Study Period. The forecasts used for natural gas, coal, power, emissions (SOx, NOx) and renewable energy certificate (“REC”) prices rely on forward market prices as of December 31, 2019, for the first 18 months of the Study Period and then blended forward prices with ICF estimates for the next 18 months. Beyond the first 36 months, the Company used the ICF commodity price forecast exclusively. The forecast used for capacity and CO2 prices are provided by ICF for all years forecasted within this 2020 Plan. The capacity prices are provided on a calendar year basis and reflect the results of the PJM RPM base residual auction through the 2021/2022 delivery year, thereafter transitioning to the ICF capacity forecast beginning with the 2022/2023 delivery year. In the 2020 Plan, the Company utilized four commodity forecasts:
- No CO2 Tax - Mid-Case Federal CO2 with Virginia in RGGI

61
- Virginia in RGGI - High-Case Federal CO2
Appendix 4O provides the annual prices for each commodity forecast. These commodity forecasts approached carbon scenarios using various potential outcomes to regulations or legislation designed to reduce CO2 emissions. The Virginia in RGGI commodity forecast addressed RGGI on a standalone basis. To address the potential for more stringent regulation or legislation at the federal level, the High-Case Federal CO2 commodity forecast was developed. The combined impact of RGGI and more moderate federal CO2 regulation or legislation is addressed in the Mid-Case Federal CO2 with Virginia in RGGI commodity forecast. The Company utilized the Mid-Case Federal CO2 with Virginia in RGGI commodity forecast for Alternative Plans B through D, and the No CO2 Tax commodity forecast in Plan A. The Company ran sensitivities on Alternative Plan B, keeping the same build plan, but then applying the Virginia in RGGI commodity forecast and, separately, the High-Case Federal CO2 commodity forecast. The intent of these sensitivities is to show the effect on NPV using a range of commodity prices. Figure 4.4.1 displays the results of these sensitivities.
Figure 4.4.1 – Commodity Forecast Sensitivity
Plan B Plan B Commodity
Forecast Sensitivity 1 Plan B Commodity
Forecast Sensitivity 2 Load Forecast Mid-Case Federal CO2 Virginia in RGGI High-Case Federal CO2
NPV Total $66.2 B $65.7 B $67.6 B As can be seen, using the High-Case Federal CO2 commodity forecast results in a higher NPV because of higher CO2 prices, all other Plan B assumptions being equal. The sensitivity using the Virginia in RGGI commodity forecast results in a similar NPV as Alternative Plan B because of the similarities in pricing between these two forecasts. Because of the preparation schedule associated with this 2020 Plan, the commodity price forecasts do not include the regional impacts on commodity prices that may result from the VCEA. As with all forecasts, there remain multiple possible outcomes for future prices that fall outside of the commodity prices developed for this 2020 Plan. History has shown that unforeseen events and events not contemplated five or ten years before their occurrence can result in significant changes in market fundamentals. The effects of unforeseen events should be considered when evaluating the viability of long-term planning objectives. The commodity price forecasts analyzed in the 2020 Plan present reasonably likely outcomes given the current understanding of market fundamentals, but do not present all possible outcomes. 4.4.1 Mid-Case Federal CO2 with Virginia in RGGI Commodity Forecast The Mid-Case Federal CO2 with Virginia in RGGI commodity forecast was developed for the Company to address a future market environment where both regional and federal carbon regulations affect electric generation units. The Mid-Case Federal CO2 with Virginia in RGGI

62
commodity forecast reflects both (i) Virginia being a full member of RGGI in 2021 and (ii) a federal carbon program. The federal carbon program assumed in this forecast is driven by regulations reflecting a federal policy consistent with the goals identified under the last iteration of the federal Clean Power Plan (“CPP”). ICF recalculated the CPP mass caps to reflect the changes in emission levels since the EPA first determined the CPP state budgets. While it is likely that future regulation would include different requirements than the CPP, ICF relied on the requirements of this representative “mid” case for future CO2 regulations of the power sector. This representation assumes that states adopt mass-based standards within a national trading structure covering all states, except California which maintains a state-specific program. It also assumes that existing and new sources are included under the cap-and-trade program; RGGI and the California-specific programs continue as individual programs. This type of CO2 program is assumed to begin in 2026 because it would not require legislative action at the federal level. Utilizing the Mid-Case Federal CO2 with RGGI in Virginia commodity forecast allows the Company to evaluate Alternative Plans using a commodity price forecast that reflects ICF’s independent view of future market conditions with Virginia being a full participant in RGGI and modest regulations on carbon emissions from electric generation activities at the federal level. ICF’s independent, internal views of key market drivers include: (i) market structure and policy elements that shape allowance markets; (ii) fuel and power market fundamentals ranging from expected capacity and pollution control installations; (iii) environmental regulations; and (iv) fuel supply-side issues. The development process assesses the effect of environmental regulations on the power and fuel markets and incorporates ICF’s views on the outcome of new regulatory initiatives. Figure 4.4.1.1 presents a comparison of average fuel, power, and REC prices used in the 2018 Plan and the 2019 update to the 2018 Plan (the “2019 Update”) relative to those used in this 2020 Plan. See Appendix 4P for additional details of these forecasts, including fuel, allowance, power price forecasts, and the PJM RTO capacity price forecast. See Appendix 4R for delivered fuel prices and primary fuel expense from the PLEXOS model output using the Mid-Case Federal CO2 with Virginia in RGGI commodity forecast.

63
Figure 4.4.1.1 –Fuel, Power, and REC Price Commodity Forecast Comparison
Notes: 1) Zone 5 natural gas price used in Plan analyses. Henry Hub prices shown to provide market reference. 2) Capacity price represents actual clearing price from the PJM RPM base residual auction through delivery year 2020/2021 for
2018 Plan, and through delivery year 2021/2022 for the 2020 Plan and 2019 Update. 3) 2018 Planning Period 2019-2033, 2019 Planning Period 2020-2034, 2020 Planning Period 2021-2035.
4) The 2018 Plan column reflects the PJM Tier 1 REC prices as filed in the 2018 Compliance Filing.
4.4.2 No CO2 Tax Commodity Forecast The No CO2 Tax commodity forecast anticipates a future without any new regulations or restrictions on CO2 emissions beyond those already in place or previously approved. DOM Zone peak energy prices are slightly lower than the Mid-Case Federal CO2 with Virginia in RGGI commodity forecast across the Planning Period because there is no incremental requirement to comply with CO2 regulation targets to pass through to power prices. Given forthcoming law in Virginia imposing CO2 regulation, this assumption is, in the Company’s view, no longer reasonable. The No CO2 Tax forecast is utilized only in analysis of Alternative Plan A, which is presented solely to measure additional costs of various planning scenarios. 4.4.3 Virginia in RGGI Commodity Forecast The Virginia in RGGI commodity forecast includes New Jersey and Virginia as new participants in RGGI (Virginia in 2021), along with the nine existing RGGI states. The key assumptions regarding market structure and the use of an integrated, internally-consistent fundamental based modeling methodology remain consistent with those utilized in the other commodity forecast except that the carbon program modeled is RGGI and that there is no federal program addressing CO2 reduction targets. RGGI utilizes an emissions containment reserve (“ECR”) as a trigger to limit downward pressure on the CO2 allowance price. The ECR price trigger starts at $6 in 2021 and increases at 7% annually. If triggered, the ECR withholds up to 10% of the auction budget of states opting to implement the ECR (the ECR is modeled for all states but Maine and New Hampshire). In the
Fuel Price
Henry Hub Natural Gas1 ($/MMbtu) 4.29 3.81 4.05
Zone 5 Delivered Natural Gas1 ($/MMbtu) 3.71 3.54 3.68
CAPP CSX: 12,500 1%S FOB ($/MMbtu) 2.66 2.42 2.97
No. 2 Oil ($/MMbtu) 18.52 17.78 17.89
1% No. 6 Oil ($/MMbtu) 11.93 11.56 11.52
Electric and REC Prices
PJM-DOM On-Peak ($/MWh) 41.29 38.94 44.58
PJM-DOM Off-Peak ($/MWh) 34.36 32.79 34.78
PJM Tier 1 REC Prices4 ($/MWh) 5.73 6.72 9.13
RTO Capacity Prices2 ($/KW-yr) 59.33 62.50 57.34
2020 Plan Mid-Case Federal CO2 with
Virginia in RGGI 3
2018 Plan
Federal CO2 3
2019 Update
Virginia in RGGI 3
Planning Period Comparison Average Value (Nominal $)

64
Virginia in RGGI commodity forecast, the RGGI prices are forecasted to be below the ECR trigger price and, therefore, in ICF’s model the emission budget (cap) is reduced by 10% in the years it is triggered. Even with the 10% reduction in allowances, the market clearing prices remain below the ECR trigger prices. The reason for the lower clearing prices is that the CO2 allowance supply in this case is driven not by coal generation displacement, but by the state policies (in member states) that continue to drive non-fossil generation growth. Carbon reductions are being driven by the high RPS targets in many of the RGGI states, with several states targeting 50% renewable or clean energy standards by the 2030 to 2035 timeframe, and further increasing beyond those years. Additionally, offshore wind procurements are modeled in 7 of the 11 RGGI states (i.e., RI, VA, CT, MA, MD, NJ, NY), providing added clean energy in the RGGI region and displacing fossil resources. As noted earlier, the Virginia in RGGI commodity forecast does not include the regional effects of VCEA on RGGI allowance prices; therefore, the forecast does not account for the additional carbon reductions associated with the revised RPS requirements in Virginia. 4.4.4 High-Case Federal CO2 Commodity Forecast The High-Case Federal CO2 commodity forecast addresses a scenario with a more stringent CO2 regulatory environment implemented nationwide. In this commodity forecast, CO2 regulation is addressed as a legislative approach to a national mass cap-and-trade program that begins in 2028 and targets an approximately 80% reduction from 2005 sector emissions by 2050. This target is similar to CO2 reduction levels being discussed by several states, and it is consistent with what was proposed under the Waxman-Markey Bill in 2009. Load under this scenario increases relative to the other cases because of state electrification efforts. The tightening carbon cap and higher load compared to the No CO2 Tax commodity forecast leads to higher renewable buildout and lower nuclear retirements. The “high” case includes existing and new sources under a national cap and trade program. This representation assumes that all states participate in the program except for California, which maintains its state-specific program. In this commodity forecast, ICF assumed that Virginia does not join RGGI. Compared to the Mid Case Federal CO2 with RGGI in Virginia commodity forecast, the power prices are lower in the near term, while post-2025 all hours prices are roughly 36% higher on average. The higher power price is driven by CO2 allowance price in excess of $100/ton by 2050. 4.4.5 Capacity Price Forecasting Methodology In most wholesale electricity markets, electric power generators are paid for providing:
Energy: the actual electricity consumed by customers; Capacity: standing ready to provide a specified amount of electric energy; and Ancillary Services: a variety of operations needed to maintain grid stability and security,
including frequency control, spinning reserves, and operating reserves. The purpose of a mandatory capacity market is to encourage new investments where they are most needed on the grid. PJM’s capacity market (i.e., the RPM), ensures long-term grid reliability by procuring the appropriate amount of supply- and demand-side resources needed to meet predicted peak demand in the future. In a capacity market, utilities or other electricity
65
suppliers are required to purchase adequate resources to meet their customers’ demand plus a reserve amount. Suppliers offer supply- or demand-side resources into the capacity market at a price. To the extent the supply offer clears the market, then those capacity resources are obligated to supply energy (or reduce energy in the case of demand-side resources) when dispatched, or pay penalty fees. The RPM is designed to provide financial incentives to attract and maintain sufficient capacity to meet the load demands anticipated by PJM; in concept, revenues from energy and ancillary services plus capacity payments should equal the amount necessary to attract new entry. Parallel to the actual market construct, forecasting of long-term capacity prices is based on estimating the amount of capacity revenue a generation resource requires, in addition to revenue from energy and ancillary services. The capacity revenue forecast represents the amount by which a resource’s cost exceeds its forecasted wholesale electricity market revenues. The basic concept utilized in forecasting is that in order to maintain appropriate reserve levels to assure reliable electric service, generating resources will require sufficient revenue to cover expenses and, when necessary, support the required new investment. When wholesale market energy and ancillary services revenue is not sufficient, then capacity revenues are required to fill this gap. When forecasting capacity prices over long periods, it is reasonable to assume markets will move toward equilibrium and will provide sufficient revenue to support existing resources and incent investment in new resources that require equity returns on the capital expended for development and construction of the new resource. In markets with excess capacity, existing resources generally set the capacity price. These resources require revenue to cover only operating expenses and do not include equity returns or significant going forward capital expenditures. Because of this, the capacity price tends to be lower in markets with excess capacity. However, over the long term, the market is expected to move to an equilibrium status where sufficient revenues are provided, which assures adequate resource capacity and encourages market efficiency. Note that while long-term forecasts tend toward an equilibrium pricing, it is expected that actual markets will continue to follow an up-and-down cycle that moves around equilibrium levels. Long-term forecasts for capacity focus on the equilibrium level pricing rather than attempting to estimate the cyclical movement. For these reasons, the issues surrounding the FERC MOPR Order described is Section 1.6.1 do not change the methods used to develop long-term capacity price forecasts. 4.4.6 REC Price Forecasting Methodology Together with ICF, the Company developed a revised methodology for forecasting REC Tier 1 prices from what was presented in the 2018 Plan. A white paper describing the forecasting methodology and providing details related to the revised methodology for forecasting REC prices is provided in Appendix 4Q. The white paper also includes a section that illustrates the impact on REC prices if the federal tax credits for production tax credits and investment tax credits are extended indefinitely. Figure 4.4.6.1 provides a graph of the REC price forecast for the Virginia in RGGI commodity forecast.
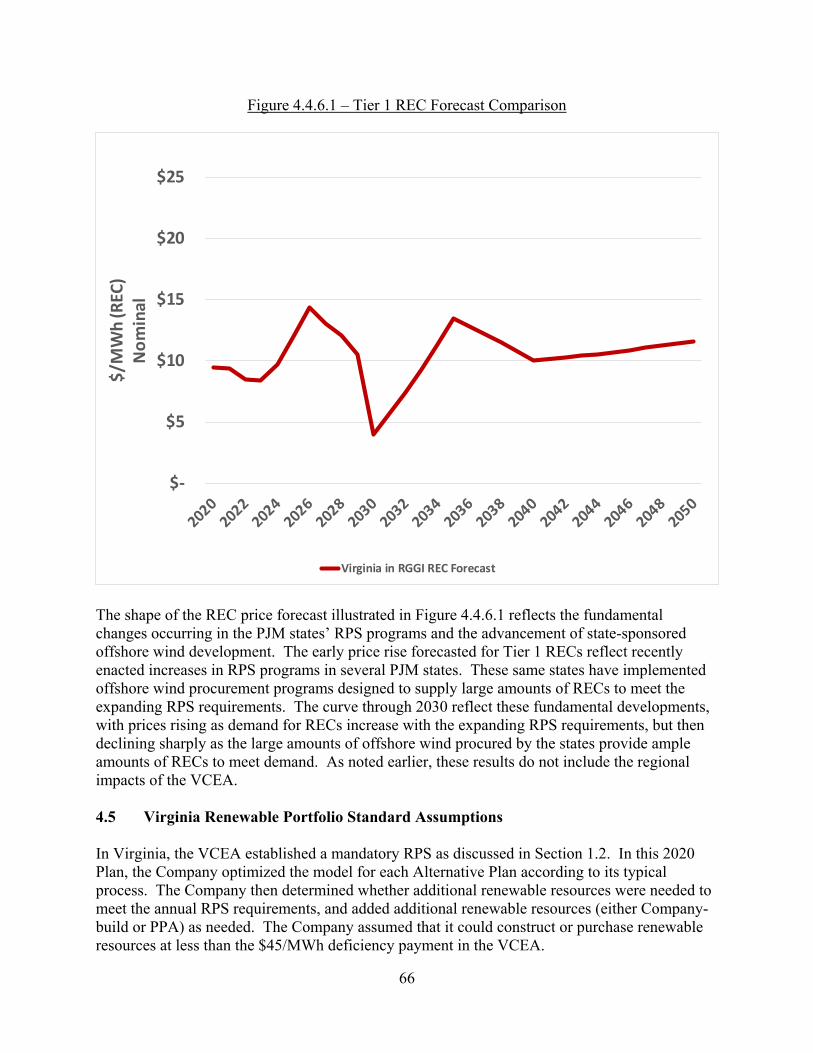
66
Figure 4.4.6.1 – Tier 1 REC Forecast Comparison
The shape of the REC price forecast illustrated in Figure 4.4.6.1 reflects the fundamental changes occurring in the PJM states’ RPS programs and the advancement of state-sponsored offshore wind development. The early price rise forecasted for Tier 1 RECs reflect recently enacted increases in RPS programs in several PJM states. These same states have implemented offshore wind procurement programs designed to supply large amounts of RECs to meet the expanding RPS requirements. The curve through 2030 reflect these fundamental developments, with prices rising as demand for RECs increase with the expanding RPS requirements, but then declining sharply as the large amounts of offshore wind procured by the states provide ample amounts of RECs to meet demand. As noted earlier, these results do not include the regional impacts of the VCEA. 4.5 Virginia Renewable Portfolio Standard Assumptions In Virginia, the VCEA established a mandatory RPS as discussed in Section 1.2. In this 2020 Plan, the Company optimized the model for each Alternative Plan according to its typical process. The Company then determined whether additional renewable resources were needed to meet the annual RPS requirements, and added additional renewable resources (either Company-build or PPA) as needed. The Company assumed that it could construct or purchase renewable resources at less than the $45/MWh deficiency payment in the VCEA.
$‐
$5
$10
$15
$20
$25
$/M
Wh (R
EC)
Nominal
Virginia in RGGI REC Forecast

67
4.6 Solar-Related Assumptions 4.6.1 Solar Capacity Factor For Alternative Plans A and D, the Company modeled future solar resources using a capacity factor of 19%, which is the average capacity factor of the Company’s owned solar tracking fleet in the Commonwealth for the most recent three-year period (i.e., 2017, 2018, 2019). For Plans B and C, the Company modeled future solar resources using a design solar capacity factor of 25% based on average modeled output from solar tracking resources. 4.6.2 Solar Company-Build vs. PPA For solar resources in Alternative Plan A, the Company allowed the model to select either Company-build cost-of-service solar or third-party PPA solar limited at 480 MW per year, which is an assumption on the amount of solar generation available each year. For Alternative Plans B through D, the Company modeled solar PPAs as 35% of the solar generation capacity placed in service over the Study Period. These Alternative Plans exceed the 480 MW per year modeling constraint to meet the requirements of the VCEA. 4.6.3 Solar Interconnection and Integration Costs The integration of intermittent solar generation into the electric grid involves multiple considerations. Solar generation must first be physically interconnected to the electric grid, either at the transmission or distribution level. The developer of a solar generating facility typically pays the costs to physically interconnect the resource, including any upgrades required near the point of interconnection to assure grid stability. The Company refers to these costs in this 2020 Plan as solar interconnection costs. As increasing volumes of solar generation are interconnected to the grid, additional system-level upgrades must be made by the Company to address grid stability and reliability issues caused by the intermittent nature of these resources. The Company refers to the costs related to these upgrades in this 2020 Plan as solar integration costs. All of these costs are incorporated in the NPV for “Total System Costs” shown in Figure 2.4.1. In this 2020 Plan, three different categories of solar resources were available in PLEXOS: (i) Company-build solar; (ii) solar PPAs; and (iii) small-scale solar (i.e., less than 3 MW). The Company assumed interconnection cost of $94/kW for Company-build solar and $125.50/kW for small-scale solar. The Company assumed $0 in interconnection costs for solar PPAs because the PPA price from the developer includes interconnection costs. For solar integration costs, this 2020 Plan includes three categories of system upgrades costs based on different issues caused by the intermittent nature of solar resources:
- Transmission Integration Costs: These costs represent physical enhancements to the transmission system needed to resolve low voltage and thermal conditions caused by

68
integrating significant volumes of solar generation. Figure 4.6.3.1 shows the incremental integration costs as solar generation is added to the system.
- Generation Re-dispatch Costs: This category represents costs resulting from real-time variability of load and generator availability compared to day-ahead forecasted load and generator availability. The analysis the Company performed resulted in the cost curve shown in Figure 4.6.3.3, which the Company used to add a specific amount per MWh of solar generation by year.
- Regulating Reserves Costs: This category represents ancillary payments the Company must make to resources to ensure that the system can balance intra-day or intra-hour differences in load and generation. Figure 4.6.3.4 shows the net cost to customers of regulating reserves included in each Alternative Plan.
The sections below explain the analyses performed for each of these three categories. While the Company has refined its methods to estimate the solar integration costs compared to prior Plans, more analysis is required in order to fully assess the necessary grid modifications and associated costs of integrating increasing amounts of solar generation. Transmission Integration Costs The transmission integration costs were assessed by performing a steady state power flow analysis where a total of 7,000 MW of solar generation is present on the transmission grid. Within this analysis, all possible interconnection locations and sizes were selected from the PJM generation interconnection queue to accurately reflect the behaviors of solar developers. Ten different scenarios were considered; the sites that make up the 7,000 MW were a randomly selected subset from the total list of sites from the PJM queue. Using these ten different solar cases, the PSS®E power flow model were assessed under 2022 PJM light load demand conditions. This analysis included the retirement of certain existing generation units. Additional assumptions included maximum solar generation output (with reactive power support of +/- 0.95 power factor), and displacement of generation from other Company-owned facilities. The results of these modeling cases identified several low voltage and thermal violations that would require physical enhancements to the Company’s transmission system. As noted, this analysis was conducted assuming the addition of 7,000 MW of solar generation. In this 2020 Plan, all Alternative Plans include the addition of significantly more solar generation. Figure 4.6.3.1 shows the incremental integration costs assumed for Company-build solar as additional solar generation is added to the system.

69
Figure 4.6.3.1 – Total Solar Interconnection and Integration Costs
Solar (COS) MW Total Cost Comments
Less than 7,000 $ 94 /kW Interconnections costs
7,000 – 15,000 $159 /kW Additional transmission integration costs
15,001 – 25,000 $224 /kW Additional transmission integration costs
25,001 – 35,000 $289 /kW Additional transmission integration costs
35,001 – 45,000 $354 /kW Additional transmission integration costs
Future Plans will expand on this analysis by studying the addition of more significant volumes of solar generation. The Company will also expand this analysis to consider dynamic system conditions and other sensitivity analyses that model sudden fluctuations of solar generation output and the need for other grid services described in Section 7.5. Generation Re-dispatch Costs Re-dispatch generation costs are defined in this 2020 Plan as additional costs that are incurred due to the unpredictability of events that occur during a typical power system operational day. Historically, these types of events were driven by load variations due to actual weather that differs from what was forecasted for the period in question. Most power system operators assess the generation needs for a future period, typically the next day, based on load forecasts and commit a series of generators to be available for operation in that period. These committed generators are expected to operate in an hour-to-hour sequence that minimizes total cost. Once within that period, however, actual load may vary from what was planned and the committed generators may operate in a less than optimal hour-to-hour sequence. The resulting additional costs due to real time variability are known as re-dispatch costs. As more intermittent generation—like solar—is added to the grid, additional uncertainty about re-dispatch costs is added due to factors such as unpredictable cloud cover or changes in wind speed. In order to assess the resulting re-dispatch costs, the Company performed a simulation analysis to determine the cost impact on generation operations at varying levels of solar penetration. To study the effects of these intermittent resources, the Company first performed a historical 20-year irradiance study (1998 to 2017) of 22 locations within the PJM region plus North Carolina and South Carolina using the National Solar Radiation Database (“NSRDB”) provided by the National Renewable Energy Laboratory (“NREL”). Based on the irradiance data in the NSRDB, for each studied location, the Company produced a base hourly solar generation profile along with a set of 200 different hourly solar simulation profiles. To perform its generation re-dispatch cost analysis, the Company utilized the Aurora planning model with a simulation topology of the Eastern Interconnection. The results from the Aurora model captured not only the DOM Zone hourly prices interactively but also the potential system cost impacts from intermittent resources outside the Company’s service territory. This is an improvement over what was provided in the 2018 Plan.

70
The Company determined scenarios by assuming different levels of the CO2 prices using assumptions provided by ICF, and two different levels of solar penetration and wind resources by 2030: (i) 2 GW of solar with 852 MW of offshore wind and (ii) 6 GW of solar with 2.5 GW of offshore wind. The renewable penetration level for other states in the Eastern Interconnection was set to a level that met the requirements in the applicable state RPS programs. For each scenario, the Company performed a base case Aurora simulation by using the base hourly solar generation profiles, and performed an additional 200 simulations by using the unit commitment decision determined by the base case and applying different hourly solar simulation profiles from the irradiance study to re-optimized the system cost. The total system cost for each simulation was compared to the base case system cost. This delta system cost is composed of the respective differences in fuel cost, variable O&M cost, emission cost, and purchase/sale cost. The re-dispatch cost is the delta of the system cost divided by the total solar generation. The analysis results are shown in Figure 4.6.3.2.
Figure 4.6.3.2 – Re-Dispatch Analysis Results
The analysis shows that, under the same level of the solar penetration, higher CO2 prices result in slightly higher re-dispatch costs along with slightly higher cost volatility. The results also show, however, that as solar penetration increases, the overall re-dispatch costs decrease. This is because higher solar penetration lowers the DOM Zone energy hourly price, which results in lower re-dispatch costs. Due to the scale of the simulation, the Company only performed the analysis for the study year of 2030. Using this data, the Company constructed a generation re-dispatch cost curve for the Study Period, as shown in Figure 4.6.3.3. These values were used as a variable cost adder for all solar generation evaluated in this 2020 Plan.

71
Figure 4.6.3.3 - Generation Re-dispatch Cost Results ($/MWh)
Even the 6 GW solar penetration level assessed in this analysis was significantly lower than the volume of solar generation added in all Alternative Plans. In future analyses, the Company will study the addition of more significant volumes of solar generation. The Company will also study the possibilities of incorporating the sensitivities of other intermittent resources, such as onshore and offshore wind generating units within the study footprint. Regulating Reserve Costs Regulating reserves are defined in this 2020 Plan as additional reserves needed to balance the uncertainty of forecast errors of net load that occur during a typical power system operational day. These reserves exclude contingency reserves, which are defined as the loss of a major power system generation or transmission system asset. Within the PJM market, these regulating reserves are an ancillary service, the cost of which is charged to customers. Revenues collected for this ancillary service are paid to resources available to supply (or reduce) additional energy to correct forecast errors. Unlike contingency reserves, regulating reserves are needed to either increase (“up reserves”) or decrease (“down reserves”) generation in any given operational hour. These reserves also differ from re-dispatch costs; they are paid to the resource whether they are used or not during the operating hour. The regulating reserve costs ensure that the transmission system has adequate resources available to handle forecast uncertainty. The system pays for regulating reserves so that it has the capability to quickly re-dispatch. In contrast, the operating costs to dispatch these regulating resources (to mitigate forecast errors and stabilize the transmission system) are part of re-dispatch costs. Historically, the level of regulating reserves was primarily driven by the uncertainty associated with load during any given operating day. The intermittent nature of solar and wind generation adds to this uncertainty. Accordingly, the levels of regulating reserves will need to increase to compensate for this added uncertainty.

72
A variety of resources can be used to address system uncertainty: energy storage, unscheduled combustion turbine capacity, unscheduled duct burner capacity (on scheduled combined cycle units), intraday purchases and sales, and interruptible load. In order to assess the increase of regulating reserves that will result from increasing volumes of solar generation, the Company utilized the Electric Power Research Institute (“EPRI”) Dynamic Assessment and Determination of Operating Reserves (“DynADOR”) tool. This tool calculates operating reserves based on correlations to other variables (e.g., forecasted generation, time of day) and can be used to evaluate solar, wind, and load variations separately and in combination. For the purposes of this study, the Company used solar data from the Morgan’s Corner Solar Facility and wind speed data from Norfolk Airport. The study’s timeframe was three years, from April 2016 to March 2019. Norfolk’s surface wind speeds were adjusted by a constant wind gradient coefficient to achieve the 42% capacity factor observed in NREL’s 2008 to 2012 Wind Tool Kit study of a point located in the Virginia Wind Energy Area. Forecasted wind speeds at 4:00 PM the previous day were used to simulate a day-ahead forecast of wind energy. Using the solar and wind data described above, the DynADOR tool was set to determine the level of operating reserves needed for 1,000 MW (nameplate) of solar capacity and 1,000 MW (nameplate) of wind capacity each at a 95% confidence interval. This analysis assumed no diversity benefit from the combination of solar and wind, nor any diversity benefits from geography spread. These model results were then applied to the PJM solar and wind renewable expansion plans included in the ICF Virginia in RGGI commodity forecast for each year of the Study Period. This resulted in an hourly level of regulating services needed for each year of the Study Period. One of the key observations from this study was the benefit during daylight hours of having both solar and wind generation. Because the forecast errors of solar and wind were not highly correlated, the operating reserves were significantly lower in combination than when evaluated independently and added together. This demonstrates the value of having a diverse portfolio of intermittent generation (in addition to the inherent diversity of geographic distribution). Accordingly, the next phase of this study will broaden the impact of increasing renewables generation to assess the benefit of diversity at the PJM level. Solar and wind hourly data from NREL were used to estimate the hourly benefit of technology and geographic diversity throughout PJM. This data was then used to calculate an hourly PJM diversity factor that was multiplied against the combined total of solar and wind hourly regulating reserves, which results in a lower overall hourly regulating reserve volume. Once the volume of solar and wind (in MW) was determined as described above, the next phase of the analysis was to determine a market price for these reserves. Because of its historical structure that resulted in more definitive regression results, the Company chose the PJM Day-Ahead Secondary Reserves market as a basis to forecast a regulating reserve price. Participation in this market is restricted to dispatchable resources (generation, energy storage, and interruptible load) that are not scheduled in the day-ahead energy market. This market excludes intermittent resources, nuclear, and run-of-river hydro units. The resource must be able to bring the bid

73
energy on the grid within 30 minutes of notification. This market varies in demand and pricing through the year. In 2019, this market averaged $0.39/MW, but hours ranged from $0.00 to over $20.00. Regression was used on these hourly results to shape a relationship between incremental reserves demand (net of incremental reserves supply) and a forecasted market price. This regulating reserve price construct was then applied to the hourly regulating reserve volumes to assess the annual costs of incremental regulating reserves resulting from increased intermittent renewable build within the PJM region. The results of this analysis reflect the hourly (per MW) cost of regulating reserves gradually increases from $0.61 in 2021 to $20.18 in 2045. This occurs because the rate that PJM is forecasted to increase the need for regulating reserves (driven by the level of renewables build) grows more quickly within PJM than the projected addition of resources that provide regulation reserves in PJM. The forecasts of resource additions (both renewable and regulating resources) is based on ICF projections in states other than Virginia. Virginia resource additions are based on the projections in this 2020 Plan for the Company; for Appalachian Power Company and other sellers of electric power in Virginia, the projections assume solar and wind resource additions according to the RPS requirements for Appalachian Power Company. From a Company perspective, regulating costs will be incurred when the regulating costs to serve the Company’s load exceed the revenue received from PJM for the Company units that supply this ancillary service. Figure 4.6.3.4 shows the net cost to customers included in this 2020 Plan. The Company will continue its analysis of regulating reserves needed for system stability incorporating technological advancements that may mitigate these potential costs, and will present its results in future Plans and update filings.

74
Figure 4.6.3.4 – Company Net Regulating Reserves Cost of Market Purchases ($000,000)
Note: Zero values indicate that the DOM LSE has adequate regulating reserves to supply reserve requirements from the LSE’s load and renewable generation portfolio that year.
4.7 Storage-Related Assumptions As discussed further in Section 5.5, two types of energy storage resources were available in the PLEXOS model—battery energy storage systems and pumped storage. For BESS, the Company used cost estimates from the request for proposals for the recently-approved BESS pilot at Scott Solar Facility. This BESS is based on a 4-hour discharge configuration. For pumped storage, the Company used preliminary internal cost estimates for a large pump storage facility to be located in southwest Virginia. In Plans B through D, the Company set constraints requiring the PLEXOS model to select 2,700 MW of energy storage by 2035, consistent with the VCEA, including 300 MW of pumped storage. Third-party owned energy storage will make up 35% of the 2,700 MW. Given the lack

75
of sufficient pricing for storage PPAs, however, the Company did not differentiate between Company-owned and third-party-owned energy storage resources in this 2020 Plan. 4.8 Gas Transportation Cost Assumptions Natural gas is largely delivered on a just-in-time basis, and vulnerabilities in gas supply and transportation must be sufficiently evaluated from a planning and reliability perspective. Mitigating strategies such as storage, firm fuel contracts, alternate pipelines, dual-fuel capability, access to multiple natural gas basins, and overall fuel diversity all help to alleviate this risk. There are two types of pipeline transportation service contracts: firm and interruptible. Natural gas provided under a firm service contract is available to the customer at all times during the contract term and is not subject to a prior claim from another customer. For a firm service contract, the customer typically pays a facilities charge representing the customer’s share of the capacity construction cost and a fixed monthly capacity reservation charge. Interruptible service contracts provide the customer with natural gas subject to the contractual rights of firm customers. The Company currently uses a combination of both firm and interruptible service to fuel its natural gas-fired generation fleet. The Company included natural gas transportation costs in its modeling. The Company assumed firm transportation service for CCs and interruptible transportation service for CTs. The Company assumed interruptible transportation service for CTs because these peaking resources typically operate with less than 20% capacity factors and because they are typically equipped with on-site oil backup. Pipeline deliverability can affect electrical system reliability. A physical disruption to a pipeline or compressor station can interrupt or reduce the flow pressure of gas supply to multiple EGUs at once. Electrical systems also have the ability to adversely affect pipeline reliability. For example, the sudden loss of a large efficient generator can force numerous smaller gas-fired CTs to be started in a short period of time. This sudden change in demand may cause drops in pipeline pressure that could reduce the quality of service to other pipeline customers, including other generators. Electric transmission system disturbances may also interrupt service to electric gas compressor stations, which can disrupt the fuel supply to electric generators. 4.9 Least-Cost Plan Assumptions Alternative Plan A presents a least-cost plan using assumptions required by the SCC. Specifically, Plan A uses the PJM Load Forecast adjusted for only existing and proposed energy efficiency as discussed in Section 4.1.3, and uses the No CO2 Tax commodity forecast as discussed in Section 4.4.2. For Plan A, the Company did not force the model to select any specific resources, and did not exclude any reasonable resource options. The potential unit retirements shown in Plan A are those that are financially at risk for retirement based on market conditions.

76
4.10 VCEA-Related Assumptions The Company modeled the requirements and targets contained in the VCEA when it passed the General Assembly on March 5, 2020, as this was the best available information at the time the Company completed its modeling. Virginia Governor Northam signed the VCEA into law without amendment on April 11, 2020. In addition to the VCEA, the Company modeled “other relevant legislation” from the 2020 Regular Session of the Virginia General Assembly (i) related to RGGI as discussed in Section 1.3 and (ii) related to the aggregation pilot as discussed in Section 1.10.

77
Chapter 5: Generation – Supply-Side Resources This chapter provides an overview of the Company’s existing supply-side generation, the generation resources under construction or development, and the Company’s analysis of future supply-side generation. This chapter also provides a discussion of challenges related to the development of significant volumes of solar resources. 5.1 Existing Supply-Side Generation 5.1.1 System Fleet Figure 5.1.1.1 shows the Company’s 2019 capacity resource mix by unit type.
Figure 5.1.1.1 - 2019 Capacity Resource Mix by Unit Type
Due to differences in operating and fuel costs of various types of units and in PJM system conditions, the Company’s energy mix is not equivalent to its capacity mix. The Company’s generation fleet is dispatched by PJM within PJM’s larger footprint, ensuring that customers in the Company’s service territory receive the economic benefit of all resources in the PJM power pool regardless of the source. PJM dispatches resources within the DOM Zone from the lowest cost units to the highest cost units, while maintaining its mandated reliability standards. Figures 5.1.1.2 and 5.1.1.3 provide the Company’s 2019 actual capacity and energy mix.
Generation Resource TypeNet Summer Capacity
(MW)Percentage (%)
Coal 3,684 17.7%
Nuclear 3,348 16.1%
Natural Gas 8,413 40.3%
Pumped Storage 1,808 8.7%
Oil 2,143 10.3%
Renewable 667 3.2%
NUG-Coal 0 0.0%
NUG- Natural Gas Turbine 0 0.0%
NUG- Solar 592 2.8%
NUG- Contracted 198 0.9%
Company Owned 20,063 96.2%
Company Owned and NUG Contracted 20,853 100.0%
Purchases 0 0.0%
Total 20,853 100.0%

78
Figure 5.1.1.2 - 2019 Actual Capacity Mix
Figure 5.1.1.3 - 2019 Actual Energy Mix
Appendices 5A through 5E provide basic unit specifications and operating characteristics of the Company’s supply-side resources, both owned and contracted. Appendix 5F provides a summary of the existing capacity by fuel class. Appendices 5G and 5H provide energy generation by type and by the system output mix. Appendix 5I provides a list of all Company-build or third-party PPA solar and wind generating facilities placed in service, under construction, or under development since July 1, 2018. Appendix 5O provides a list of renewable resources, and Appendix 5P provides a list of potential supply-side resources. Appendices 5Q and 5R present the Company’s summer capacity position and seasonal
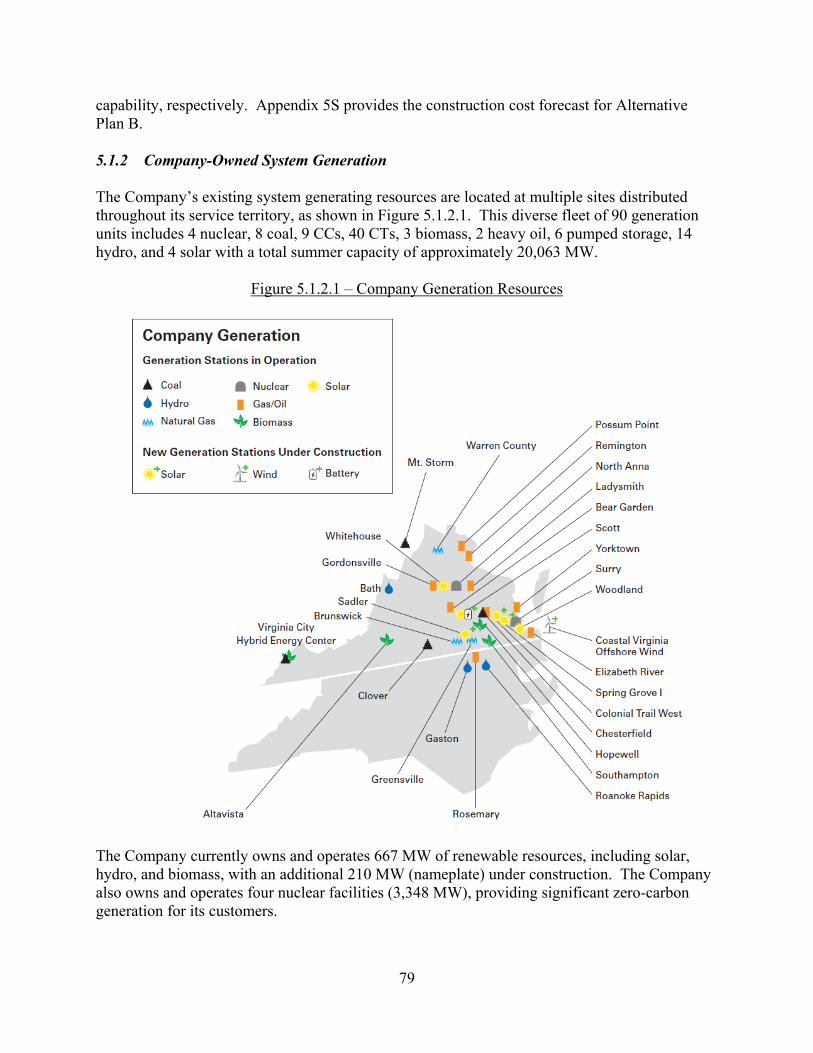
79
capability, respectively. Appendix 5S provides the construction cost forecast for Alternative Plan B. 5.1.2 Company-Owned System Generation The Company’s existing system generating resources are located at multiple sites distributed throughout its service territory, as shown in Figure 5.1.2.1. This diverse fleet of 90 generation units includes 4 nuclear, 8 coal, 9 CCs, 40 CTs, 3 biomass, 2 heavy oil, 6 pumped storage, 14 hydro, and 4 solar with a total summer capacity of approximately 20,063 MW.
Figure 5.1.2.1 – Company Generation Resources
The Company currently owns and operates 667 MW of renewable resources, including solar, hydro, and biomass, with an additional 210 MW (nameplate) under construction. The Company also owns and operates four nuclear facilities (3,348 MW), providing significant zero-carbon generation for its customers.
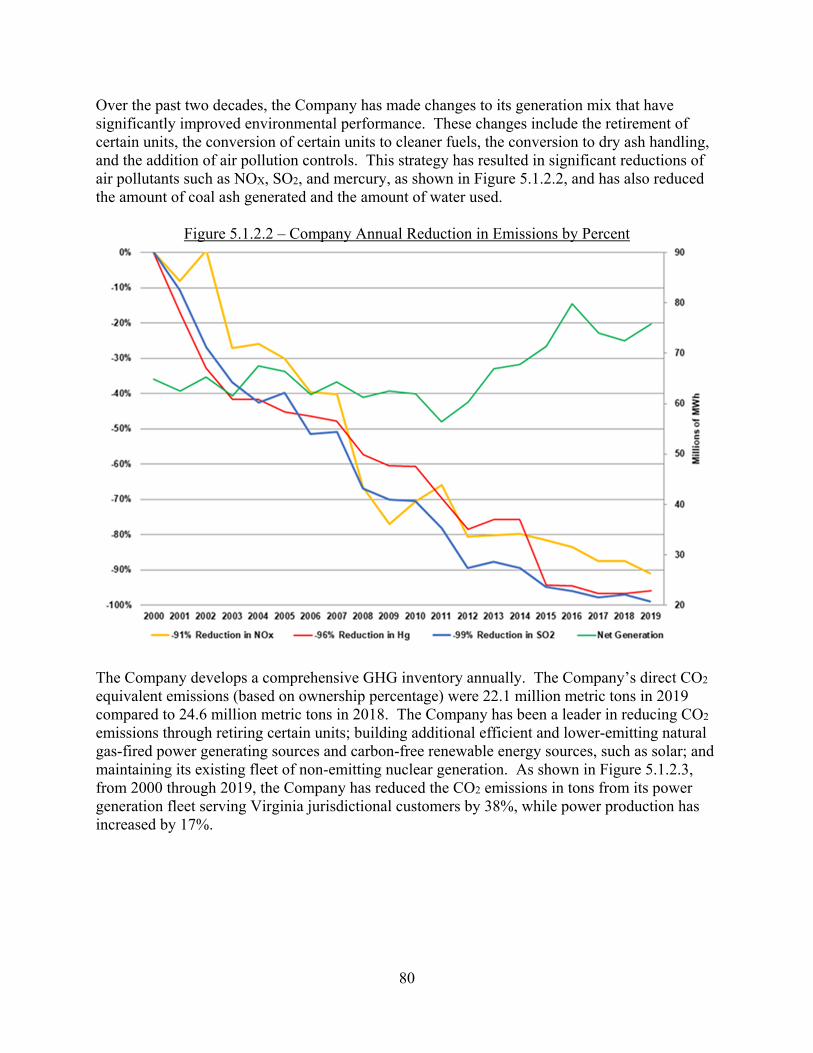
80
Over the past two decades, the Company has made changes to its generation mix that have significantly improved environmental performance. These changes include the retirement of certain units, the conversion of certain units to cleaner fuels, the conversion to dry ash handling, and the addition of air pollution controls. This strategy has resulted in significant reductions of air pollutants such as NOX, SO2, and mercury, as shown in Figure 5.1.2.2, and has also reduced the amount of coal ash generated and the amount of water used.
Figure 5.1.2.2 – Company Annual Reduction in Emissions by Percent
The Company develops a comprehensive GHG inventory annually. The Company’s direct CO2 equivalent emissions (based on ownership percentage) were 22.1 million metric tons in 2019 compared to 24.6 million metric tons in 2018. The Company has been a leader in reducing CO2 emissions through retiring certain units; building additional efficient and lower-emitting natural gas-fired power generating sources and carbon-free renewable energy sources, such as solar; and maintaining its existing fleet of non-emitting nuclear generation. As shown in Figure 5.1.2.3, from 2000 through 2019, the Company has reduced the CO2 emissions in tons from its power generation fleet serving Virginia jurisdictional customers by 38%, while power production has increased by 17%.

81
Figure 5.1.2.3 – Company CO2 Mass Reductions versus Net Generation
The Company’s integrated business strategy has also resulted in significant reduction in CO2 emission intensity. CO2 intensity is the amount of emissions per MWh delivered to customers. This calculation includes emissions from any source used to deliver power to customers, including Company-owned generation, NUGs, and net purchased power. As shown in Figure 5.1.2.4, customer impact CO2 intensity has decreased by 43% since 2000.
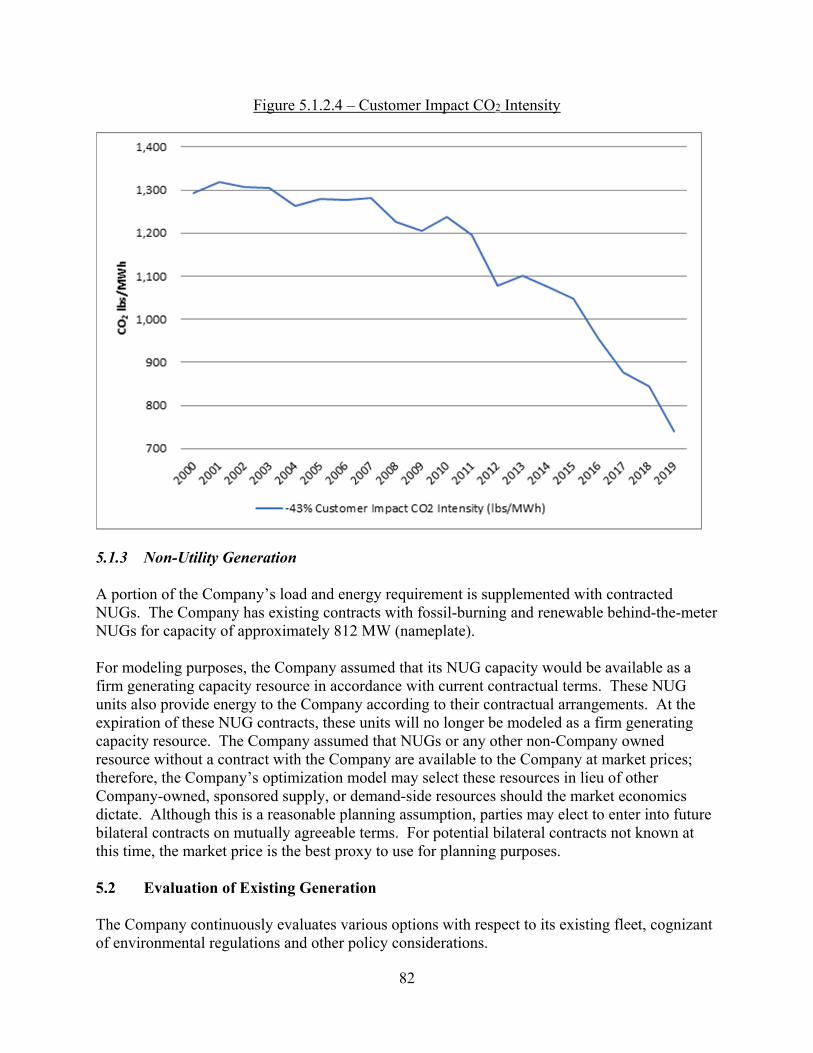
82
Figure 5.1.2.4 – Customer Impact CO2 Intensity
5.1.3 Non-Utility Generation A portion of the Company’s load and energy requirement is supplemented with contracted NUGs. The Company has existing contracts with fossil-burning and renewable behind-the-meter NUGs for capacity of approximately 812 MW (nameplate). For modeling purposes, the Company assumed that its NUG capacity would be available as a firm generating capacity resource in accordance with current contractual terms. These NUG units also provide energy to the Company according to their contractual arrangements. At the expiration of these NUG contracts, these units will no longer be modeled as a firm generating capacity resource. The Company assumed that NUGs or any other non-Company owned resource without a contract with the Company are available to the Company at market prices; therefore, the Company’s optimization model may select these resources in lieu of other Company-owned, sponsored supply, or demand-side resources should the market economics dictate. Although this is a reasonable planning assumption, parties may elect to enter into future bilateral contracts on mutually agreeable terms. For potential bilateral contracts not known at this time, the market price is the best proxy to use for planning purposes. 5.2 Evaluation of Existing Generation The Company continuously evaluates various options with respect to its existing fleet, cognizant of environmental regulations and other policy considerations.
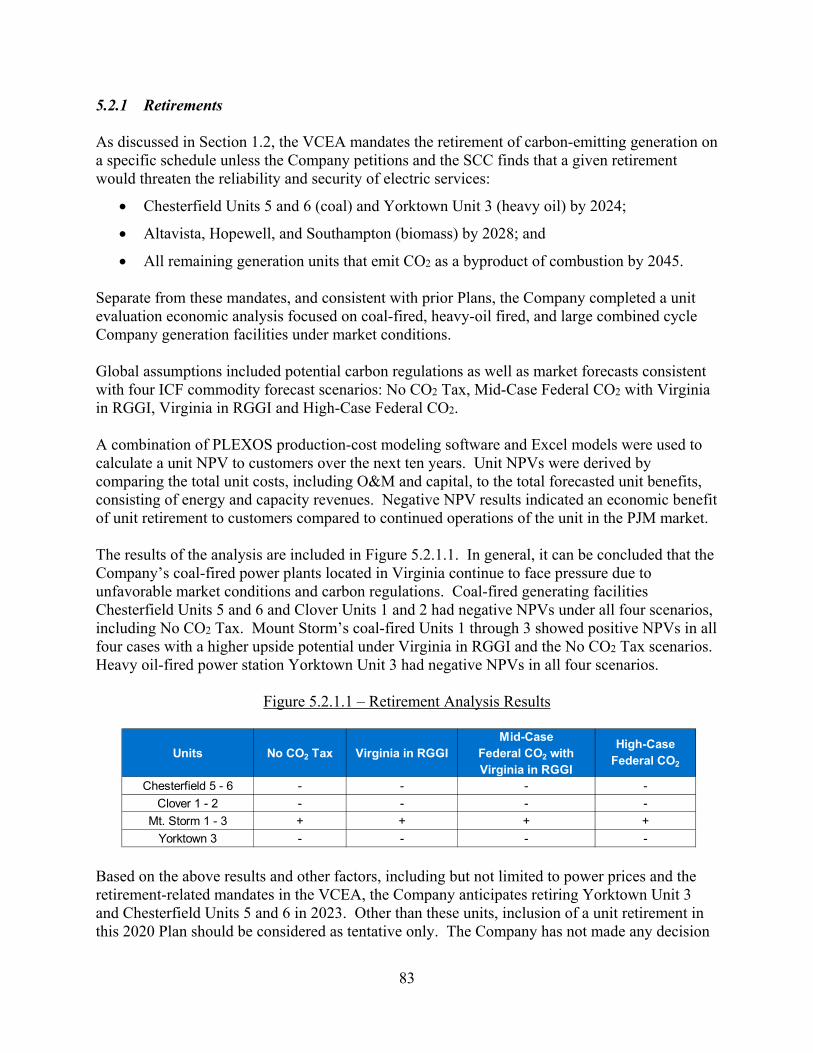
83
5.2.1 Retirements As discussed in Section 1.2, the VCEA mandates the retirement of carbon-emitting generation on a specific schedule unless the Company petitions and the SCC finds that a given retirement would threaten the reliability and security of electric services:
Chesterfield Units 5 and 6 (coal) and Yorktown Unit 3 (heavy oil) by 2024;
Altavista, Hopewell, and Southampton (biomass) by 2028; and
Separate from these mandates, and consistent with prior Plans, the Company completed a unit evaluation economic analysis focused on coal-fired, heavy-oil fired, and large combined cycle Company generation facilities under market conditions. Global assumptions included potential carbon regulations as well as market forecasts consistent with four ICF commodity forecast scenarios: No CO2 Tax, Mid-Case Federal CO2 with Virginia in RGGI, Virginia in RGGI and High-Case Federal CO2. A combination of PLEXOS production-cost modeling software and Excel models were used to calculate a unit NPV to customers over the next ten years. Unit NPVs were derived by comparing the total unit costs, including O&M and capital, to the total forecasted unit benefits, consisting of energy and capacity revenues. Negative NPV results indicated an economic benefit of unit retirement to customers compared to continued operations of the unit in the PJM market. The results of the analysis are included in Figure 5.2.1.1. In general, it can be concluded that the Company’s coal-fired power plants located in Virginia continue to face pressure due to unfavorable market conditions and carbon regulations. Coal-fired generating facilities Chesterfield Units 5 and 6 and Clover Units 1 and 2 had negative NPVs under all four scenarios, including No CO2 Tax. Mount Storm’s coal-fired Units 1 through 3 showed positive NPVs in all four cases with a higher upside potential under Virginia in RGGI and the No CO2 Tax scenarios. Heavy oil-fired power station Yorktown Unit 3 had negative NPVs in all four scenarios.
Figure 5.2.1.1 – Retirement Analysis Results
Based on the above results and other factors, including but not limited to power prices and the retirement-related mandates in the VCEA, the Company anticipates retiring Yorktown Unit 3 and Chesterfield Units 5 and 6 in 2023. Other than these units, inclusion of a unit retirement in this 2020 Plan should be considered as tentative only. The Company has not made any decision
Units No CO2 Tax Virginia in RGGIMid-Case
Federal CO2 with Virginia in RGGI
High-Case Federal CO2
Chesterfield 5 - 6 - - - -
Clover 1 - 2 - - - -
Mt. Storm 1 - 3 + + + +
Yorktown 3 - - - -
All remaining generation units that emit CO2 as a byproduct of combustion by 2045.

84
regarding the retirement of any generating unit other than Yorktown Unit 3 and Chesterfield Units 5 and 6. The Company’s final decisions regarding any unit retirement will be made at a future date. Appendix 5J lists the generating units for potential retirement. 5.2.2 Uprates and Derates Efficiency, generation output, and environmental characteristics of units are reviewed as part of the Company’s normal course of business. Many of the uprates and derates occur during routine maintenance cycles or are associated with standard refurbishment. However, several unit ratings have been and will continue to be adjusted in accordance with PJM market rules and environmental regulations. Appendix 5K provides a list of historical and planned uprates and derates to the Company’s existing generation fleet. 5.2.3 Environmental Regulations There are a number of final, proposed, and anticipated EPA regulations that will affect certain units in the Company’s current fleet of generation resources. Appendix 5L shows regulations designed to regulate air, solid waste, water, and wildlife. For further discussion on significant developments to environmental regulation, see Sections 1.3 and 1.11. 5.3 Generation Under Construction The Company currently has four generation projects under construction for which the SCC has issued a certificate of public convenience and necessity: (i) the CVOW demonstration project; (ii) Spring Grove 1 Solar Project; (iii) Sadler Solar Project; and (iv) the Battery Energy Storage System at Scott Solar Facility. Appendix 3A provides details on each project. 5.4 Generation Under Development The Company currently has solar, offshore wind, pumped storage, and CT generation projects under development. The Company is also pursuing subsequent license extensions for its nuclear facilities. The following sections provide details on these projects, as does Appendix 3B. The Company has paused material development activities for North Anna 3 following receipt of the combined operating license (“COL”) in 2017. The Company is currently incurring minimal capital costs associated with North Anna 3 specific to the administrative functions of maintaining the COL. 5.4.1 Solar The Company issued a request for proposal (“RFP”) for new solar and wind resources in August 2019. The Company is currently evaluating the results of that RFP and intends to bring new Company-build and PPA resources before the SCC for approval as part of its annual plan regarding the development of solar, onshore wind, and energy storage required by the VCEA.

85
5.4.2 Offshore Wind The Company is actively participating in offshore wind policy and innovative technology development to identify ways to advance offshore wind generation responsibly and cost-effectively. The CVOW demonstration project—the Mid-Atlantic’s first offshore wind project in a federal lease area—is under construction with a targeted in-service date by the end of 2020. This demonstration project is an important first step toward offshore wind development for Virginia and the United States. Along with clean energy, it is providing the Company valuable experience in permitting, constructing, and operating offshore wind resources, which will help inform utility-scale development of the adjacent 112,800 acre wind lease area. As discussed in Section 1.2, the VCEA specifies that the construction or purchase of up to 5,200 MW of offshore wind capacity is in the public interest. In September 2019, the Company filed with PJM to interconnect more than 2,600 MW of offshore wind capacity by 2026 (“CVOW commercial project”), enough to power more than 650,000 homes during peak winds. On January 7, 2020, the Company selected Siemens Gamesa Renewable Energy as the preferred turbine supplier for the CVOW commercial project with the intent to provide their latest state-of-the-art wind turbine, based on its proven Offshore Direct Drive platform. Ongoing efforts of this project include ocean survey work that will be performed in 2020 to support the development of the Construction and Operations Plan, which is expected to be submitted to the Bureau of Ocean Energy Management in late 2020. Pending regulatory approval, the CVOW commercial project is expected to be in-service by the end of 2026. 5.4.3 Pumped Storage Pumped storage hydroelectric power is a mature proven storage technology. It can also serve as a system-stabilizing asset to accommodate the intermittent and variable output of renewable energy sources such as solar and wind. Virginia Senate Bill No. 1418 became law effective on July 1, 2017, and supported construction of “one or more pumped hydroelectric generation and storage facilities that utilize on-site or off-site renewable energy resources as all or a portion of their power source . . . located in the coalfield region of the Commonwealth.” On September 6, 2017, the Company filed a preliminary permit application with FERC for a location in Tazewell County, Virginia. This application was approved on December 11, 2017, and the Company is continuing to conduct feasibility studies for a potential pumped storage facility at the Tazewell County site. 5.4.4 Extension of Nuclear Licensing An application for a subsequent license renewal is allowed during a nuclear plant’s first period of extended operation—that is, in the 40 to 60 years range of its service life. Surry Units 1 and 2 entered into that initial license renewal period in 2012 and 2013, respectively. North Anna Units 1 and 2 entered or will enter into that period in 2018 and 2020, respectively. The Company has

86
continued to track the preliminary cost estimates for the extension of the nuclear licenses at its Surry and North Anna Units. In November 2015, the Company notified the NRC of its intent to file for subsequent license renewal for its two nuclear units (1,676 MW total) at Surry in order to operate an additional 20 years, increasing their operating life from 60 to 80 years. As with other nuclear units, Surry was originally licensed to operate for 40 years and then renewed for an additional 20 years. Absent subsequent license renewal approval, the existing licenses for Surry Units 1 and 2 will expire in 2032 and 2033, respectively. In support of the application development, the NRC finalized guidance documents in early July 2017, related to developing and reviewing subsequent license renewal applications. The Surry subsequent license renewal application was submitted to the NRC on October 15, 2018, in accordance with Title 10 of the Code of Federal Regulations (“CFR”) Part 54. The Surry subsequent license renewal application was subsequently declared “technically sufficient and available for docketing” by the NRC on December 10, 2018, which began the safety and environmental reviews required for the renewed licenses. Several NRC audits and public meetings have been conducted during both the safety and environmental reviews in late 2018 and 2019 related to this licensing action. The NRC staff has asked requests for additional information (“RAIs”) during this review period seeking clarification or additional action to be taken by the Company prior to entering the subsequent period of operation. These environmental and safety RAIs have been addressed to the satisfaction of the NRC staff. As a result, the NRC issued the Final Safety Evaluation Report (“SER”) for Surry Power Station on March 9, 2020. On the basis of its review of the Surry subsequent license renewal application, the NRC staff determined that the requirements of 10 CFR 54.29(a) have been met for the subsequent license renewal of Surry Units 1 and 2. The NRC also issued the Final Supplemental Environmental Impact Statement (“FSEIS”) on April 6, 2020. The NRC staff’s conclusion was “that the adverse environmental impacts of license renewal for Surry are not so great that preserving the option of license renewal for energy-planning decision makers would be unreasonable.” The Advisory Committee on Reactor Safeguards (“ACRS”) Full-Committee meeting was conducted on April 8, 2020, with unanimous approval by the committee to approve the renewal of the operating licenses for Surry Units 1 and 2. The NRC Director of Nuclear Reactor Regulation will make a decision for renewed licenses for Surry Units 1 and 2 based on the issuance of the FSEIS, Final SER and the ACRS letter of recommendation in June 2020. This will preserve the option to continue operation of Surry Units 1 and 2 until 2052 and 2053, respectively. The Company notified the NRC in November 2017 of its plans to file an subsequent license renewal application for its two nuclear units (1,672 MW total) at North Anna in accordance with 10 CFR Part 54 in late 2020. Absent subsequent license renewal approval, the existing licenses for the two units will expire in 2038 and 2040, respectively. The review process for North Anna will remain unchanged, so the expected outcome would be similar to Surry. The renewed
87
licenses for North Anna would be expected 18 months following the NRC declaring the subsequent license renewal application as technically sufficient and available for docketing, which is expected within 45 to 60 days following the Company’s submittal. Currently, the forecast receipt of the renewed licenses for North Anna Units 1 and 2 is June 2022, based on a targeted submittal date in October 2020. 5.4.5 Combustion Turbines In order to preserve the option to address probable system reliability issues resulting from the addition of significant renewable energy resources and the retirement of coal-fired facilities in the near term, the Company is evaluating sites and equipment for the construction of gas-fired CT units. 5.5 Future Supply-Side Generation Resources The process of selecting alternative resource types starts with the identification and review of the characteristics of available and emerging technologies, as well as any applicable statutory requirements. Next, the Company analyzes the current commercial status and market acceptance of the alternative resources. This analysis includes determining whether particular alternatives are feasible in the short- or long-term based on the availability of resources or fuel within the Company’s service territory or PJM. The technology’s ability to be dispatched is based on whether the resource is able to alter its output up or down in an economical fashion to balance the Company’s constantly changing demand and supply conditions. Further, analysis of the alternative resources requires consideration of the viability of the resource technologies available to the Company. This step identifies the risks that technology investment could create for the Company and its customers, such as site identification, development, infrastructure, and fuel procurement risks. The feasibility of both conventional and alternative generation resources is considered in utility-grade projects based on capital and operating expenses including fuel and O&M. Figure 5.5.1 summarizes the resource types that the Company reviewed as part of the generation planning process. Those resources considered for further analysis in the busbar (i.e., LCOE) screening model are identified in the final column. Further analysis was conducted in PLEXOS to incorporate seasonal variations in cost and operating characteristics, while integrating new resources with existing system resources. This analysis more accurately matched the resources found to be cost-effective in this screening process. This PLEXOS simulation analysis further refines the Company’s analysis and assists in selecting the type and timing of additional resources that economically fit the customers’ current and future needs.

88
Figure 5.5.1 - Alternative Supply-Side Resources
5.5.1 Supply-Side Resource Options The following sections provide details on certain newer supply-side resource options the Company has considered. Previous Plans provide additional details on the more proven technologies, including biomass, CCs, CTs, nuclear, and solar. In addition, Section 5.4 provides additional details on generation currently under development, including offshore wind and pumped storage. Aero-derivative Combustion Turbine Aero-derivative CT technology consists of a gas generator that has been derived from an existing aircraft engine and used in an industrial application. Designed for a small footprint and low weight using modular construction, aero-derivative CTs utilize advanced materials for high efficiency and fast start-up times with little or no cyclic life penalty. Aero-derivative CTs have been designed for quick removal and replacement, allowing for fast maintenance and greatly reduced downtimes, and resulting in high unit availability and flexibility. This is a fast ramping and flexible generation resource that can effectively be paired with intermittent, non-dispatchable renewable resources, such as solar and wind. Combined Heat and Power / Waste Heat to Power Combined heat and power (“CHP”) is the use of a power station to generate electricity and useful thermal energy from a single fuel source. CHP plants capture the heat that would otherwise be wasted to provide useful thermal energy, usually in the form of steam or hot water. The recovery of otherwise wasted thermal energy in the CHP process allows for more efficient fuel usage.
Resource Unit Type Dispatchable Primary FuelBusbar
Resource
PLEXOS
Resource
Combined Cycle ‐ 3X1 Intermediate/Baseload Yes Natural Gas Yes Yes
Combined Cycle ‐ 2X1 Intermediate/Baseload Yes Natural Gas Yes Yes
Combined Cycle ‐ 1X1 Intermediate/Baseload Yes Natural Gas Yes Yes
Combustion Turbine Peak Yes Natural Gas Yes Yes
Aero‐derivative Combustion Turbine Peak Yes Natural Gas Yes Yes
Large Nuclear Baseload Yes Uranium Yes No
Nuclear Small Modular Reactor Baseload Yes Uranium Yes Yes
Biomass Baseload Yes Renewable Yes No
Fuel Cell Baseload Yes Natural Gas Yes No
Supercritical Pulverized Coal with CCS Intermediate Yes Coal Yes No
Solar & Aero‐derivative CT Peak Yes Renewable Yes No
Solar Intermittent No Renewable Yes Yes
Wind ‐ Onshore Intermittent No Renewable Yes Yes
Wind ‐ Offshore Intermittent No Renewable Yes Yes
Battery Generic (30 MW) Peak Yes Varies Yes Yes
Pumped Storage (300 MW) Peak Yes Renewable Yes Yes
Combined Heat and Power Peak Yes Varies Yes Yes

89
CHP’s reduction in primary energy use through fuel efficiency leads to lower greenhouse gas emissions. Waste heat to power (“WHP”) is a type of combined heat and power that generates electricity through the recovery of qualified waste heat resources. WHP captures heat byproduct discarded by existing industrial processes and uses that heat to generate power. Industrial processes that involve transforming raw materials into useful products all release hot exhaust gases and waste streams that can be captured to generate electricity. WHP is another form of clean energy production. The Company will continue to track this technology and its associated economics based on site and fuel resource availability. Energy Storage There are five main types of energy storage technologies: electromechanical, electrochemical, thermal, chemical, and electrical. Electromechanical storage involves creating potential energy, which can be converted to kinetic energy. Pumped storage hydro, the most commonly used electromechanical storage technology, requires pumping large quantities of water to a reservoir at a higher elevation than the source, which creates potential energy that can be converted to kinetic energy that then spins a water turbine. Pumped storage hydro is a mature technology compared to other types of energy storage, and it represents the largest amount of installed storage capacity in the United States. See Section 5.4.3 for a discussion of the pumped storage hydroelectric facility under development. Other examples of electromechanical storage include flywheels and compressed air energy storage. Electrochemical (or battery) storage involves storing electricity in chemical form. One advantage of electrochemical storage is the fact that electrical and chemical energy share the same carrier—the electron—which limits efficiency losses due to converting one form of energy to another. Lithium ion is now the most commonly used type of battery in utility-scale projects because lithium ion costs have been falling rapidly for nearly a decade. This decrease in cost is attributable to advancements in battery design, efficiency gains in manufacturing, and increased supply. Other examples of electrochemical storage include lead acid batteries, sodium sulfur batteries, and flow batteries. Batteries serve a variety of purposes that make them attractive options to meet energy needs in both distributed and utility-scale applications. Batteries can be used to provide energy for a power station black start, peak load shaving, frequency regulation services, or peak load shifting to off-peak periods. They vary in size, differ in performance characteristics, and are usable in different locations. Batteries have gained considerable attention due to their ability to integrate intermittent generation sources, such as wind and solar, onto the grid. Battery storage technology approximates dispatchability for these variable energy resources. The primary challenge facing battery systems is the cost. Other factors such as recharge times, variance in temperature, energy efficiency, and capacity degradation are also important considerations for

90
utility-scale battery systems. The SCC recently approved the Company’s application to pilot three lithium ion battery energy storage systems for different use cases. The results of these pilots will inform future deployment of batteries. Thermal storage involves converting stored heat into energy, or supplying cool air to reduce air conditioning load. Water heaters, ice storage, and chilled water storage are all examples of thermal storage. Chemical storage involves altering the molecular structure of compounds (such as water) by splitting or combining molecules. For example, hydrogen gas can be created by splitting H2O molecules into H2 and O2. The H2 (hydrogen gas) can be stored and later burned to produce steam to power a turbine. Another example of chemical storage is power-to-gas conversion, which converts electrical power into gaseous fuel. Electrical storage primarily refers to super capacitors and magnetic energy storage, which can provide short, powerful bursts of energy to jumpstart other technologies. Cost considerations and technology maturity have restricted widespread deployment of most of these technologies, with the exception of pumped storage hydroelectric power and batteries. At present, lithium-ion batteries and pumped storage are the most commercially viable energy storage technologies for utility-scale projects. Based on the most current information sourced from the U.S. Energy Information Administration, the amount of utility-scale battery storage installed in the entire United States is just over 1,000 MW, as shown in Figure 5.5.1.1. Of those 1,000 MW, only 335 MW are located within the PJM region.
Figure 5.5.1.1 – Utility-Scale Battery Storage Installations

91
As discussed in Section 1.2, the VCEA requires the Company to build 2,700 MW of energy storage by 2035. The Company will continue to study energy storage to determine the feasibility of constructing this quantity of energy storage capacity. Fuel Cell Fuel cells convert chemical energy from hydrogen-rich fuels into electricity and heat, there is no burning of the fuel. Fuel cells emit water and CO2, resulting in power production that is almost entirely absent of NOx, SOx, or particulate matter. Similar to a battery, a fuel cell is comprised of many individual cells that are grouped together to form a fuel cell stack. Each individual cell contains an anode, a cathode, and an electrolyte layer. When a hydrogen-rich fuel, such as clean natural gas or renewable biogas, enters the fuel cell stack, it reacts electrochemically with oxygen (i.e., ambient air) to produce electric current, heat, and water. While a typical battery has a fixed supply of energy, fuel cells continuously generate electricity as long as fuel is supplied. Fuel cells were invented in 1932 and put to commercial use by NASA in the 1950s. They are now most common as a power source for buildings and remote areas, but continual improvements in technology are quickly bringing them into wider use. Integrated-Gasification Combined Cycle with Carbon Capture Sequestration Integrated-gasification CC plants use a gasification system to produce synthetic natural gas from coal that is then used to fuel a CC. The gasification process produces a pressurized stream of CO2 before combustion, which, as research suggests, provides some advantages in preparing the CO2 for CCS systems. Integrated-gasification CC systems remove a greater proportion of other air effluents in comparison to traditional coal units. Reciprocating Internal Combustion Engine Reciprocating internal combustion engines use reciprocating motion to convert heat energy into mechanical work. Stationary reciprocating engines differ from mobile reciprocating engines in that they are not used in road vehicles or non-road equipment. There are two basic types of stationary reciprocating engines, spark ignition and compression ignition. Spark ignition engines use a spark (across a spark plug) to ignite a compressed fuel-air mixture. Typical fuels for such engines are gasoline and natural gas. Compression ignition engines compress air to a high pressure, heating the air to the ignition temperature of the fuel, which then is injected. The high compression ratio used for compression ignition engines results in a higher efficiency than is possible with spark ignition engines. Diesel fuel oil is normally used in compression ignition engines, although some are duel-fueled (i.e., natural gas is compressed with the combustion air and diesel oil is injected at the top of the compression stroke to initiate combustion). Small Modular Reactors Small modular reactors (“SMRs”) are utility-scale nuclear units with electrical output of 300 MW or less. SMRs are manufactured largely off-site in factories, and then delivered and

92
installed on-site in modules. The smaller power output of SMRs when compared to conventional baseload nuclear units currently in operation offers a number of advantages, including reduced land surface area, potential for reduced security and emergency planning zone requirements, lower initial capital and operating costs, and flexibility in meeting specific power needs by staging multiple units in the same or multiple locations. A typical SMR design entails underground placement of reactors and spent-fuel storage pools and a natural cooling feature that can continue to function in the absence of external power. SMR design development and permitting have advanced with some designs currently under review by the NRC. The Company will continue to monitor the industry’s ongoing research and development regarding this technology. The federal government recently approved partial co-funding for up to two demonstration projects. The Company is reviewing and evaluating the potential for participation in this funding opportunity in support of its emission reduction targets. 5.5.2 Levelized Busbar Costs / Levelized Cost of Energy The Company’s busbar model was designed to estimate the levelized cost of energy of various generating resources on an equivalent basis. The busbar results show the LCOE of various generating resource technologies at different capacity factors and represent the Company’s initial quantitative comparison of various alternative resources. These comparisons include fuel, heat rate, emissions, variable and fixed O&M costs, expected service life, and overnight construction costs. Figures 5.5.2.1 and 5.5.2.2 display summary results of the busbar model comparing the economics of the different technologies. The results are separated into two figures because non-dispatchable resources are not equivalent to dispatchable resources for the energy and capacity value they provide to customers. For example, dispatchable resources are able to generate when power prices are the highest, while non-dispatchable resources may not have the ability to do so. Furthermore, non-dispatchable resources typically receive less capacity value for meeting the Company’s reserve margin requirements and may require additional technologies in order to assure grid stability.

93
Figure 5.5.2.1 - Dispatchable LCOE (2023 COD)
Figure 5.5.2.2 - Non-Dispatchable LCOE (2023 COD)
$0
$50
$100
$150
$200
$250
$300
$350
$400
0% 10% 20% 30% 40% 50% 60% 70% 80% 90% 100%
$/kw‐yr
Capacity Factor
OFF SHORE WIND
ON SHORE WIND
SOLAR 25% CF
SOLAR 19% CF

94
Appendix 5M contains the tabular results of the screening level analysis. Appendix 5N displays the assumptions for heat rates, fixed and variable O&M expenses, expected service lives, and the estimated construction costs. In Figure 5.5.2.1, the lowest values represent the lowest cost assets at the associated capacity factors along the x-axis. Therefore, one should look to the lowest curve (or combination of curves) when searching for the lowest cost combination of assets at operating capacity factors between 0% and 100%. Resources with LCOE above the lowest combination of curves generally fail to move forward in a least-cost resource optimization. Higher LCOE resources, however, may be necessary to achieve other constraints like those required by carbon regulations. Figures 5.5.2.1 and 5.5.2.2 allow comparative evaluation of resource types. In Figure 5.5.2.1, the value of each cost curve at 0% capacity factor depicts the amount of invested total fixed cost of the unit. The slope of the unit’s cost curve represents the variable cost of operating the unit, including fuel, emissions, and any REC or production tax credit (“PTC”) value a given unit may receive. Figure 5.5.2.2 displays the non-dispatchable resources that the Company considered in its busbar analysis. Wind and solar resources are non-dispatchable with intermittent production and lower dependable capacity ratings. Both resources produce less energy at peak demand periods than dispatchable resources, requiring more capacity to maintain the same level of system reliability. Non-dispatchable resources may require additional grid equipment and technology changes in order to maintain grid stability. As shown in Figure 5.5.2.1, CT technology is currently the most cost-effective option at capacity factors less than approximately 25% for meeting the Company’s peaking requirements. The CC 3x1 technology is the most economical option for capacity factors greater than approximately 25%. As depicted in Figure 5.5.2.2, solar is a competitive choice at capacity factors of approximately 25%. Figure 5.5.2.3 shows the estimated LCOE for a 300 MW pumped storage facility and generic 30 MW 4-hour battery. All LCOE are based on a 15% capacity factor, which was derived from the historical performance of the Company’s pumped storage facilities, and projected performance of future energy storage technologies, as calculated by the PLEXOS model.

95
Figure 5.5.2.3 - Energy Storage LCOE (2023 COD)
The assessment of alternative resource types and the busbar screening process provides a simplified foundation in selecting resources for further analysis. However, the busbar curve is static in nature because it relies on an average of all of the cost data of a resource over its lifetime. 5.5.3 Third-Party Market Alternatives During the last several years, the Company has increased its engagement of third-party solar developers in both its Virginia and North Carolina service territories. In Virginia, the Company has issued an annual RFP for utility-scale solar and wind generating facilities since 2015. These RFPs have resulted in both Company-owned solar facilities and solar PPAs. Outside of the utility-scale solar and wind RFPs, the Company entered into PPA agreements for several solar facilities totaling 67 MW. The Company has also issued RFPs for small-scale solar resources. The Company will continue to issue annual RFPs for solar and wind resources, consistent with the competitive procurement requirements of the VCEA. In North Carolina, the Company has signed 91 PPAs totaling approximately 686 MW (nameplate) of new solar NUGs. Of these, 572 MW (nameplate) are from 80 solar projects that were in operation as of March 2020. The majority of these projects are qualifying facilities contracting to sell capacity and energy at the Company’s published North Carolina Schedule 19 rates in accordance with the Public Utility Regulatory Policies Act.

96
5.6 Challenges Related to Significant Volumes of Solar Generation All Alternative Plans in this 2020 Plan include significant development of solar resources, as shown in Section 2.2. Based on current technology, challenges will arise as increasing amounts of these non-dispatchable, intermittent resources are added to the system. This section seeks to identify these challenges, which include intra-day, intra-month, and seasonal challenges posed by the interplay of solar generation and load, as well challenges related to system restoration. This section also discusses challenges related to constructing the level of solar generation in Alternative Plans B through D. In this 2020 Plan, Alternative Plan B best addresses these challenges based on current technology. But the Company stands ready to meet these challenges with continued study, technological advancement, and innovation, and will provide the results of these advancements in future Plans and update filings. 5.6.1 Challenges Related to Capacity Solar generation significantly contributes to meeting peak demand in the summer, but barely contributes to meeting winter peak demand. This is because summer peak demand occurs during late afternoon hours when the sun is typically shining and, consequently, when the solar facilities are producing energy. In contrast, winter peak demand typically occurs in the early morning hours when the sun is beginning to rise, and when solar facilities are just starting to ramp up production. As the Company adds increasing amounts of solar resources to the system, this will result in the system having excess capacity in the summer, but not having enough capacity in the winter. For example, Figure 5.6.1.1 shows the nameplate capacity, summer capacity, and winter capacity of existing and new resources in Alternative Plan D compared to the 2020 PJM Load Forecast. As can be seen, the Company has approximately 11,500 MW more capacity than needed in the summer in Alternative Plan D, but then has a deficit of approximately 8,800 MW in the winter.

97
Figure 5.6.1.1 – Alternative Plan D Capacity in Summer and Winter
Notes: “Other” = biomass, small combustion turbines, NUGs, demand response, purchases, & heavy oil units
Adding energy storage resources is one way the Company could meet this winter capacity deficit. The capacity value of energy storage resources is limited, however, by the size of the resource and by the time it takes to recharge. Significantly more energy storage capacity would be needed, both in magnitude and duration, as the peak gets steeper and as the period that those resources are expected to support the system becomes longer. The combination of these factors would likely lead to an overbuilt system (i.e., a system with higher resource nameplate capacity compared to peak load). In addition, many forms of utility-scale energy storage are still in the early stages of development, as discussed further in Section 5.5.1, with higher costs relative to other current technologies. Technological advancements may provide other options to meet this challenge in the long term without necessitating an overbuild of the system. The Company could also meet this challenge related to winter capacity in the future by buying capacity to fill the deficit to the extent required by PJM market rules. In this 2020 Plan, the Company assumed it would meet any winter deficit with capacity from the market. Historically, the Company was able to self-supply to meet the vast majority of all its capacity needs; Alternative Plans C and D rely heavily on the market to maintain the reliability of the system. 5.6.2 Challenges Related to Energy In addition to challenges related to winter capacity, development of significant volumes of solar generation also present challenges related to energy. Specifically, the Company would likely need to import a significant amount of energy during the winter, but would need to export

98
significant amounts of energy during the spring and fall. Figure 5.6.2.1 shows the level of imports for each Alternative Plan. Figure 5.6.2.2 shows what percentage of time in the year 2045 the Company must use imports to meet load. In addition, Figure 5.6.2.2 shows the percentage of time in year 2045 that imports are constrained by system limitations—5,200 MW for Plans A and B, and 10,400 MW for Plans C and D.
Figure 5.6.2.1 – Annual Imports for Each Alternative Plan
0
5,000
10,000
15,000
20,000
25,000
30,000
35,000
2035 2036 2037 2038 2039 2040 2041 2042 2043 2044 2045
Import M
Wh
Plan D
Plan C
Plan A
Plan B

99
Figure 5.6.2.2 – Year 2045 Import Duration Curve
Importing significant energy presents its own challenges. Section 7.5 includes a discussion of the upgrades that would be needed to the Company’s transmission system to physically import these increased levels of energy, as well as an estimate of those costs. Notably, relying on increased imports could also contribute to regional CO2 emission because the imported power from PJM would come in part from carbon-emitting generation in the PJM region. Figure 2.2.6 shows regional carbon emissions for each Alternative Plan. 5.6.3 Challenges Related to the Solar Production Profile Output from solar facilities generally tracks the sun, ramping up in the morning as the sun rises, producing consistently throughout the day subject to cloud cover, and then ramping down as the sun sets. This production profile generally (although not perfectly) fits well with customer demand in the summertime because customer demand is higher during the afternoon hours when solar production is high. In the spring and fall, however, as increasing amounts of solar generation is added to the system, solar can produce more energy than is needed to meet customer demand during the daytime. Figure 5.6.3.1 shows the capacity of the solar and wind resources in Alternative Plan D during a typical day in April compared to the PJM Load Forecast. As can be seen, the inclusion of large amounts of solar and wind generation significantly alters the shape of the net load profile (i.e., forecasted load less the non-dispatchable solar and wind energy) causing a dip in the middle of the day. This profile is commonly referred to as a “duck curve” because it produces a profile
0
2,000
4,000
6,000
8,000
10,000
12,0000%
3%
6%
9%
12%
15%
17%
20%
23%
26%
29%
32%
35%
38%
41%
44%
47%
49%
52%
55%
58%
61%
64%
67%
70%
73%
76%
79%
82%
84%
87%
90%
93%
96%
99%
Import M
W
Plan D
Plan C
Plan B
Plan A

100
that resembles the silhouette of a duck. As Figure 5.6.3.1 shows, the Company would need additional energy at dawn and dusk, but would have excess energy during the daytime.
Figure 5.6.3.1 – Solar and Wind Capacity Compared to Load Forecast
The Company could address this challenge with additional energy storage resources, though some energy would be lost when storage resources are used. The Company could also increase the amount of energy it exports subject to system need, though this would be limited by transmission export capacity. The Company may also be limited in its ability to export excess energy in the spring and fall to the extent neighboring states elect to develop significant volumes of solar resources similar to Virginia and also have excess energy. In some instances, it would become more economic to “dump” this excess energy when compared to the costs of building additional energy storage resources, increasing transmission export capacity, or facing negative market energy prices. From an operational perspective, energy is “dumped” by lowering the output levels of certain solar facilities during periods of low demand. One possible clean energy solution to this challenge, however, would be to utilize long-term storage solutions for this dump energy. For example, the Company could utilize this excess energy to create carbon-free hydrogen fuel that could subsequently be used in natural gas-fired generators. When hydrogen fuel is used in gas-fired generators, the byproduct is water rather than CO2. The Company will continue to study these types of innovative alternatives to address challenges caused by increasing levels of solar generation on the system. Based on the advancements and innovations in the industry in the next 25 years, Virginia may need to adjust its RPS to accommodate other potential technologies that would provide clean energy while maintaining system reliability. Another potential issue caused by the solar production profile shown in Figure 5.6.3.1 is the steep generation changes in the dawn and dusk periods. In a three-hour period, the system would

101
have to ramp over 30,000 MW of supply—an extremely large magnitude, especially over that short of a duration. Essentially, the Company would be ramping up and down its entire fleet of dispatchable resources twice a day. Backup generation resources along with energy storage resources may be required to manage these large transitions. 5.6.4 Challenges Related to Black Start and System Restoration “Black start” refers to the critical process of restoring the system without relying on the external transmission network to recover from a total or partial shutdown. Development of significant volumes of solar generation also present challenges in a black start event. The system has traditionally been set up to rely on dispatchable, quick-start units for black start, such as combustion turbines. Initial power from these units are used to start larger dispatchable generators, allowing even larger units (e.g., nuclear) and customers to reconnect to the grid in a very logical and coordinated process. This process is largely a manual process for grid operators as they must maintain a fine balance between energy supply and demand; black start units thus have strict operational requirements to be available around-the-clock and be able to produce steady and predictable output. Such requirements impose difficulties for non-dispatchable, intermittent solar resources to be included in the system restoration plan. In this 2020 Plan, Alternative Plan B preserves approximately 9,700 MW of natural gas-fired generation to address future system reliability, stability and energy independence, including challenges related to black start. The Company will continue to study how to address these black start-related challenges as the Company transition to a cleaner future, as discussed further in Section 7.5.5. 5.6.5 Challenges Related to Constructability Beyond the system challenges that arise from adding increasing amounts of intermittent generation to the system, solar developers—including the Company—will face increasing challenges in permitting and constructing the amount of solar generation envisioned by the VCEA, as modeled in Alternative Plans B through D. Utility-scale solar generating facilities require a significant amount of land. Based on current technology, every one megawatt of solar capacity requires approximately 10 acres of land. The VCEA requires this new solar capacity to be located in Virginia. Acquiring this amount of land—and receiving the required permits for that land—could prove increasingly difficult as development continues. This difficulty in acquiring land and permitting projects will be exacerbated if localities and members of the public continue to raise objections to siting solar facilities in their communities. For example, in October 2019, the Culpepper County Board of Supervisors adopted new provisions to its Utility Scale Solar Development Policy intended “to limit ‘utility scale solar sprawl.’” These new provisions would limit total solar development in the county to 2,400 acres—1% of the total land mass in Culpeper—and would limit the size of individual projects to 300 acres (the equivalent of approximately 30 MW). As another example, in Spotsylvania County, Virginia, neighboring property owners and community members have filed complaints

102
with the county’s board of zoning appeals related to the development of a 6,300 acres utility-scale solar facility. Aside from the land, the supply chain organization for the solar industry will be challenged to meet the level of solar generation in Alternative Plans B through D. This includes both equipment suppliers and construction contractors. Specifically, world-wide panel manufacturers will need to ramp up production as the demand for solar generation increases both inside the Company’s service territory and across the United States. Additionally, qualified construction contractors for building utility-scale solar facilities will need to expand and train a large a labor force. Utilizing a skilled vendor to construct the solar facilities will be an important factor going forward, as the land available for future solar development is expected to be less optimal, requiring more design and engineering work to meet output targets.

103
Chapter 6: Generation – Demand-Side Management This chapter provides a description of the DSM planning process, and an overview of approved, proposed, and rejected DSM programs. See Section 4.1.3 for discussion of how the Company adjusted the load forecasts used in this 2020 Plan to account for energy efficiency targets. This chapter also provides the energy efficiency-related analysis required by the GTSA. In this 2020 Plan, there is a total reduction of 1,120 GWh by 2020 in DSM-related savings. By 2025, there are 3,459 GWh of reductions included in the PLEXOS modeling for this 2020 Plan. Projected energy savings include reductions from identified sources (i.e., DSM programs approved by and proposed to the SCC), as well as unidentified sources (i.e., “generic” DSM as discussed below). For modeling purposes, neither the identified nor the unidentified sources included free-ridership effects. If these sources had included free-ridership effects, the reductions by 2020 and 2025 would be 945 GWh and 3,028 GWh, respectively. Projected savings attributable to DSM programs in 2025 are shown in Figure 6.1. There are several drivers that will affect the Company’s ability to meet the current level of projected energy and demand reductions, including the cost-effectiveness of the DSM programs when filed, the SCC and NCUC approval of newly filed programs, the continuation of existing programs, the final outcome of proposed environmental regulations, the full implementation of AMI and the customer information platform through the Company’s Grid Transformation Plan, and customers’ willingness to participate in approved DSM programs.

104
Figure 6.1 - DSM Program Projected Savings By 2025
6.1 DSM Planning Process The Company has historically used the following process related to its DSM programs:
ProgramProjected MW
Reduction
Projected GWh
SavingsStatus (VA/NC)
Air Conditioner Cycling Program 54 ‐ Approved / Approved
Residential Low Income Program 2 8
Residential Lighting Program ‐ ‐
Commercial Lighting Program ‐ ‐
Commercial HVAC Upgrade 1 4
Non‐Residential Distributed Generation Program 12 1 Extension Approved / Rejected
Non‐Residential Energy Audit Program ‐ ‐
Non‐Residential Duct Testing and Sealing Program 8 81
Residential Bundle Program 7 29
Residential Home Energy Check‐Up Program 1 10
Residential Duct Sealing Program 1 2
Residential Heat Pump Tune Up Program ‐ ‐
Residential Heat Pump Upgrade Program 4 17
Non‐Residential Window Film Program 4 4
Non‐Residential Lighting Systems & Controls Program 19 115
Non‐Residential Heating and Cooling Efficiency Program 7 34
Income and Age Qualifying Home Improvement Program 2 17 Extension Approved/Approved
Residential Appliance Recycling Program ‐ ‐ Completed
Small Business Improvement Program 16 90 Approved/Approved
Residential Retail LED Lighting Program (NC only) 1 7 No Plans/Completed
Phase VI Non‐Residential Prescriptive Program 8 21
Residential Efficient Products Marketplace Program 6 436
Non‐Residential Lighting Systems & Controls Program 9 43
Residential Appliance Recycling Program 4 28
Non‐Residential Heating and Cooling Efficiency Program 9 42
Non‐Residential Window Film Program 2 9
Residential Home Energy Assessment Program 15 88
Non‐Residential Office Program 2 26
Non‐Residential Small Manufacturing Program 3 15
Residential Customer Engagement Program 15 51
Residential Smart Thermostat Management Program (DR) 83 ‐
Residential Smart Thermostat Management Program (EE) 4 23
Non‐Residential Midstream EE Products 12 19
Non‐Residential New Construction 5 21
Residential EE Kits 3 38
Residential Home Retrofit 6 21
Residential Manufactured Housing 4 17
Multifamily Program 21 68
HB 2789 HVAC Component 6 19
Residential New Construction 17 32
Non‐Residential Small Business Improvement Enhanced 14 47
Residential Electric Vehicle EE/DR 6 2
Residential Electric Vehicle Peak Shaving 1 0
Phase ICompleted / Completed
Closed / Closed
Phase II
Completed /Completed
Phase III
Phase IV
Phase V
Approved/Approved
Phase VII
Approved/Future
Phase VIII Proposed/Future

105
The GTSA established the DSM stakeholder group, which helps to generate program ideas. The Company takes those ideas and develops them into more concrete program parameters, which are then compiled into an RFP of candidate program designs and implementation services sent to qualified vendors. The Company develops assumptions for new DSM programs by engaging vendors through a competitive RFP process to submit proposals for candidate program design and implementation services. As part of the bid process, basic program design parameters and descriptions of candidate programs are requested. The Company generally prefers, to the extent practical, that the program design vendor is ultimately the same vendor that implements the program in order to maintain as much continuity as possible from design to implementation. Once proposals through an RFP process are received, the Company’s energy conservation group works with its supply chain group to systematically review the proposals. Program designs are reviewed for responsiveness to the RFP, practicality of the design, technology requirements, staffing plan, marketing plan, reasonableness of the measures proposed, overlap with existing measures, cost reasonableness, previous experience, work history with the Company, expected ability to deliver the services proposed, and ability of the proposing firm to comply with the Company’s terms and conditions, data protection requirements, and financial requirements. Proposals must contain detailed information regarding measure load profiles and market penetration projections in a specific format that allows modeling of the program as a demand side resource when compared against other resources, including supply-side resources. Candidate designs that are judged to be reasonable, based on preliminary review, are evaluated for cost-effectiveness from a multi-perspective approach using four of the standard tests from the California Standards Practice Manual: (i) the Participant Test, (ii) Utility Cost Test, (iii) Total Resource Cost (“TRC”) Test, and (iv) Ratepayer Impact Measure Test. Each test uses the NPV of costs and benefits. Tests are conducted at a program level. PLEXOS does not have the ability to conduct cost-benefit evaluations for DSM within the model itself, leading to the need for an additional model, tool, or process. For this reason, the Company has continued its use of Strategist for DSM evaluations using consistent data between the models. The inputs into Strategist are consistent with those in PLEXOS for the 2020 Plan. The Company looks at the results of all of the cost-benefit test scores, as well as NPV results, to evaluate whether to file for regulatory approval of a potential program or program extension. If the programs are cost effective based on the modeling results, or otherwise legislatively deemed to be in the public interest for policy reasons, the programs are then filed with the SCC for approval. The SCC approval process lasts approximately eight months. For the programs that are approved, the Company works with the RFP suppliers to finalize a contract for full implementation of the program. Once all details are finalized, a new DSM program can be launched for participation by eligible customers. Finally, the Company conducts evaluation, measurement and verification of all DSM programs and provides reports to the SCC each May for the prior calendar year on specific program metrics, including participation, spending, and energy and demand savings.

106
6.2 Approved DSM Programs Appendix 6A provides program descriptions for the currently active DSM programs. Included in the descriptions are the branded names used for customer communications and marketing plans that the Company is employing and its plans to achieve each program’s penetration goals. Appendices 6B, 6C, 6D, and 6E provide the system-level non-coincidental peak savings, coincidental peak savings, energy savings, and penetrations for each approved program. In July 2019, the Company filed for NCUC approval of the (i) Residential Home Energy Assessment Program, (ii) Residential Efficient Products Marketplace Program, (iii) Residential Appliance Recycling Program, (iv) Non-Residential Window Film Program, (v) Non-Residential Small Manufacturing Program, (vi) Non-Residential Office Program, (vii) Non-Residential Lighting Systems & Controls Program, and (viii) Non-Residential Heating and Cooling Efficiency Program. In November 2019, the NCUC issued its Final Order approving all eight programs. The Company also currently offers one DSM pricing tariff, the standby generation (“SG”) rate schedule, to enrolled commercial and industrial customers in Virginia. This tariff provides incentive payments for dispatchable load reductions that can be called on by the Company when capacity is needed. Two customers are on SG in Virginia. The SG rate schedule provides a direct means of implementing load reduction during peak periods by transferring load normally served by the Company to a customer’s standby generator. The customer receives a bill credit based on a contracted capacity level or the average capacity generated during a billing month when SG is requested. During a load reduction event, a customer receiving service under the SG rate schedule is required to transfer a contracted level of load to its dedicated on-site backup generator. Figure 6.2.1 provides estimated load response data for summer/winter 2019.
Figure 6.2.1 - Estimated Load Response Data
The Company modeled this existing DSM pricing tariff over the Study Period based on historical data from the Company’s customer information system. Projections were modeled with diminishing returns assuming new DSM programs will offer more cost-effective choices in the future. 6.3 Proposed DSM Programs On December 3, 2019, the Company filed for SCC approval in Case No. PUR-2019-00201 of eleven new DSM programs and extension of one existing program. The eleven proposed programs in Phase VIII are:
Residential Electric Vehicle (EE & DR);
Residential Electric Vehicle (Peak Shaving);
Number of Events
Estimated MW Reduction
Number of Events
Estimated MW Reduction
Standby Generation 19 2 0 0
Tariff
Summer 2019 Winter 2019

107
Residential Energy Efficiency Kits;
Residential Home Retrofit;
Residential Manufactured Housing;
Residential New Construction;
Residential/Non-Residential Multifamily;
Non-Residential Midstream Energy Efficient Products;
Non-Residential New Construction;
Small Business Improvement Program Enhanced; and
HB 2789 Heating and Cooling/Health and Safety. In addition, the Company filed for an extension of the existing Air Conditioner Cycling Program and expedited approval to launch three of the Phase VII programs. The SCC must issue its Final Order in Case No. PUR-2019-00201 by August 2020. Through House Bill No. 2789 from the 2019 Regular Session of the Virginia General Assembly, the Company is required to seek approval of a three-year rebate program targeting low-income, elderly, and disabled customers. The program would incentivize energy conservation measures that reduce residential heating and cooling costs and enhance the health and safety of residents (at least $25 million available in rebates). Another program targeting participants in the above-described program must incentivize installation of solar equipment (not to exceed $25 million). In December 2019, the Company filed for approval of the energy efficiency component of the rebate program. The solar stakeholder group continues to develop the solar component of this program. Appendix 6F provides program descriptions for the proposed DSM programs. Appendices 6G, 6H, 6I and 6J provide the system-level non-coincidental peak savings, coincidental peak savings, energy savings, and penetrations for each proposed program. 6.4 Future DSM Initiatives The Company is currently conducting an appliance saturation study and, once completed, will begin a new DSM market potential study within the Company’s service territory. This market potential study will provide additional guidance regarding what additional DSM measures are achievable. As noted in Section 6.1, during the first and second quarter of each year, the Company conducts an RFP process to solicit designs and recommendations for a broad range of DSM programs. The Company anticipates continuing this process for the foreseeable future. Within this process, detailed proposals are requested for programs that include measures identified in the most recent DSM Potential Study, as well as other potential cost-effective measures based upon current market trends.

108
Load conditions, energy prices, generation resource availability, and customer tolerance for the use of DSM are all important considerations for the Company in determining which DSM resources to deploy in the future. The use of these DSM resources largely depends on the circumstances and cannot be prescribed in any definitive manner. The Company will continue to identify and seek approval to implement DSM programs that are cost effective or meet public policy goals.
As to cost-effective DSM available to respond to the growth of the winter peak, the Company’s Distributed Generation Program is currently available to eligible non-residential customers in Virginia and provides dispatchable demand savings during winter periods to non-residential customers who meet participation requirements based upon size. The Company currently has a demand response residential thermostat control program pending approval in Virginia, which would also provide winter demand and energy savings. Further, the Company’s other proposed DSM programs noted in Section 6.3 address both summer and winter peaks as well as energy requirements. While demand response programs can be used to reduce peak periods explicitly, energy efficiency programs can also provide reductions during winter hours. The Company is also participating in a stakeholder process required by the GTSA to help it identify potential opportunities for future energy efficiency and demand response programs. This effort will hopefully lead to future DSM initiatives that will address both summer and winter peak hours. Appendices 6K and 6L provide the system-level coincidental peak savings and energy savings for future undesignated EE programs. 6.5 Rejected DSM Programs The Company rejected the following programs as part of the 2019 DSM process: (i) Non-Residential Agricultural EE, (ii) Non-Residential Strategic Energy Management, and (iii) Non-Residential Telecommunications Optimization. A list of these and other rejected DSM programs from prior integrated resource planning cycles is shown in Appendix 6M. Rejected programs may be re-evaluated and included in future DSM portfolios. 6.6 GTSA Energy Efficiency Analysis Enactment Clause 18 of the GTSA required the Company to “incorporate into its long-term plan for energy efficiency measures policy goals of reduction in customer bills, particularly for low-income, elderly, veterans, and disabled customers; reduction in emissions; and reduction in the utility’s carbon intensity.” The Company is committed to meeting state energy goals, which is why the Company offers energy conservation programs to help customers save energy and maximize savings while also reducing emissions and the Company’s carbon intensity. The GTSA sets the target of proposing $870 million of spending on energy efficiency between 2018 and 2028. Of this amount, the VCEA directs that at least 15% be for programs aiding low-income, elderly, veteran, and disabled customers. The VCEA further sets the target of reaching 5% energy efficiency savings (based on 2019 jurisdictional electricity sales) by 2025.

109
The Company has determinedly sought approval of new DSM programs from the SCC—including 22 new programs in the last two years—to meet these targets. The Company is also actively involved in regular stakeholder meetings to generate new program concepts and then utilizes an annual solicitation of new measures and program re-designs from expert vendors within the industry. The Company considers the stakeholder forum, which provides transparency and inclusivity in the process, to represent the best opportunity to develop a long-term plan for energy efficiency measures that will ultimately achieve the DSM policy goals set by the Commonwealth. Enactment Clause 18 of the GTSA also directed that utility considerations of energy efficiency within its long-term plan shall include analysis of the following:
Energy efficiency programs for low-income customers in alignment with billing and credit practices;
Energy efficiency programs that reflect policies and regulations related to customers with serious medical conditions;
Programs specifically focused on low-income customers, occupants of multifamily housing, veterans, elderly, and disabled customers;
Options for combining distributed generation, energy storage, and energy efficiency for residential and small business customers;
The extent that electricity rates account for the amount of customer electricity bills in the Commonwealth and how such extent in the Commonwealth compares with such extent in other states, including a comparison of the average retail electricity price per kWh by rate class among all 50 states;
An analysis of each state’s primary fuel sources for electricity generation, accounting for energy efficiency, heating source, cooling load, housing size, and other relevant factors; and
Other issues as may seem appropriate. 6.6.1 Considerations for Certain Customers Groups and Options for Combining Distributed
Generation, Energy Storage, and Energy Efficiency The Company’s existing Residential Income and Age Qualifying Home Improvement Program provides in-home energy assessments and installation of select energy-saving products at no cost to eligible participants. The Program is available to qualified customers in the Company’s Virginia service territory. The Program conforms to the Virginia Department of Housing and Community Development qualification guidelines, which is currently set at 60% state median income. It is also available to customers who are 60 years or older with a household income of 120% of the state median income. Notably, the Company has proposed changing eligibility for this and future income-based programs to use area median income to allow greater eligibility among participants living in higher-income areas of the state that may still be in need. The Program is available to qualified individuals living in single-family homes, multifamily homes, and mobile homes. Based on evaluation, measurement and verification, however, this Program’s participants have largely—more than 90%—come from multifamily living situations.

110
Additionally, a special subgroup focused on low income DSM program improvements is meeting as part of the stakeholder process and making valued suggestions for future improvements that will result in better alignment with the state’s federally funded program. The Company has and will continue to work with the Department of Housing and Community Development to establish alignment with programs where helpful and beneficial. Finally, in December 2019, the Company requested SCC approval of the first component of the House Bill 2789 (Heating and Cooling/Health and Safety) Program as part of its DSM Phase VIII proposal. Virginia House Bill 2789 requires that a petition be submitted for a program for income qualifying, elderly and disabled individuals consisting of two components. The first component would offer incentives for the installation of measures that reduce residential heating and cooling costs and enhance the health and safety of residents, including repairs and improvements to home heating and cooling systems and installation of energy-saving measures in the house, such as insulation and air sealing. The second component would offer incentives to participants of the first component for the installation of equipment to generate electricity from sunlight. The Company expects to request approval of the second component associated with solar generation equipment in a future filing. 6.6.2 Electricity Rate and Consumption Comparison Electricity bills are driven by a combination of electricity rates and electricity consumption. The following charts show where each state and the Company falls by electricity rate and consumption. In the residential sector, the Company and Virginia as a whole fall within a cluster of mostly southern states with below-average rates and relatively high consumption. The consumption level reflects a high saturation of electric heating equipment compared to other parts of the U.S., paired with high cooling loads.
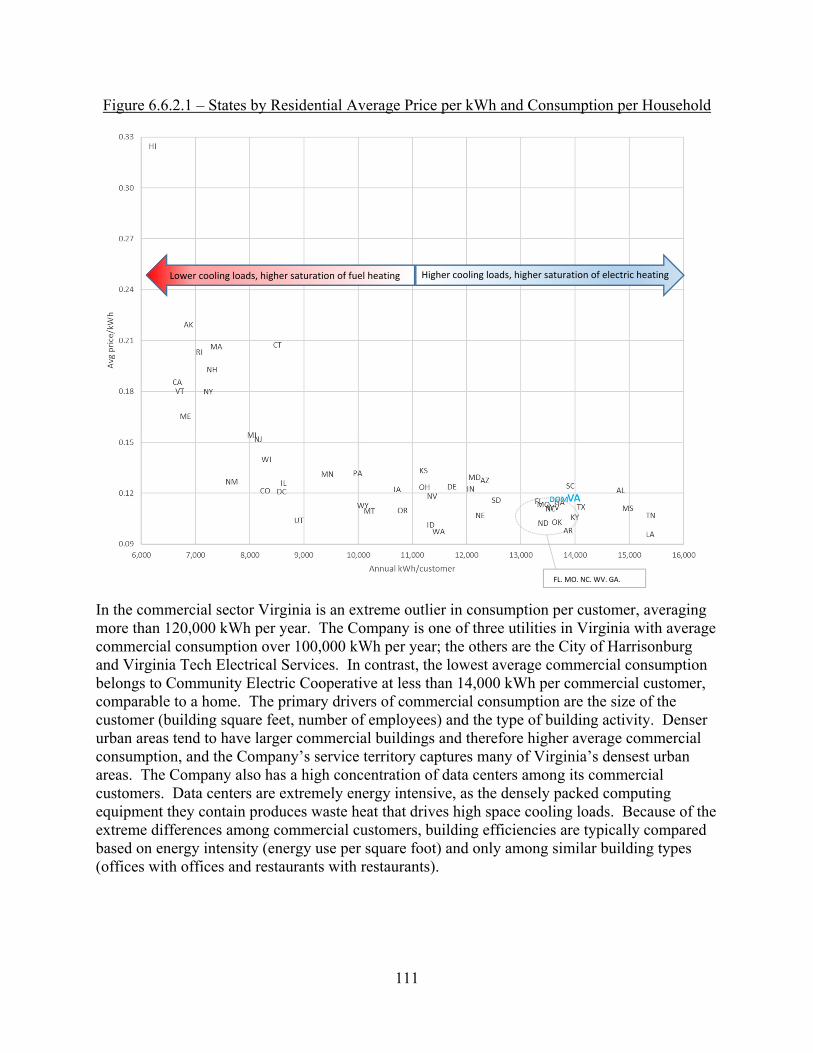
111
Figure 6.6.2.1 – States by Residential Average Price per kWh and Consumption per Household
In the commercial sector Virginia is an extreme outlier in consumption per customer, averaging more than 120,000 kWh per year. The Company is one of three utilities in Virginia with average commercial consumption over 100,000 kWh per year; the others are the City of Harrisonburg and Virginia Tech Electrical Services. In contrast, the lowest average commercial consumption belongs to Community Electric Cooperative at less than 14,000 kWh per commercial customer, comparable to a home. The primary drivers of commercial consumption are the size of the customer (building square feet, number of employees) and the type of building activity. Denser urban areas tend to have larger commercial buildings and therefore higher average commercial consumption, and the Company’s service territory captures many of Virginia’s densest urban areas. The Company also has a high concentration of data centers among its commercial customers. Data centers are extremely energy intensive, as the densely packed computing equipment they contain produces waste heat that drives high space cooling loads. Because of the extreme differences among commercial customers, building efficiencies are typically compared based on energy intensity (energy use per square foot) and only among similar building types (offices with offices and restaurants with restaurants).
Higher cooling loads, higher saturation of electric heating Lower cooling loads, higher saturation of fuel heating
FL, MO, NC, WV, GA,

112
Figure 6.6.2.2 – States by Average Commercial Price per kWh and Average Consumption per Commercial Customer
6.6.3 National Comparison of Primary Fuel Sources for Generation
The Company engaged DNV GL Energy Insights U.S.A. (“DNV GL”) to analyze fuel source for generation, as well as the additional metrics referred to in the legislation. This analysis is provided in Appendix 6N. 6.6.4 Other Relevant Issues for Energy Efficiency Analysis DNV GL, on behalf of the Company, also regularly assesses both the current stock of appliances through an appliance saturation study, and the potential for electric energy (kWh) and demand (kW) savings from Company-sponsored DSM programs through a Market Potential Study of both residential and commercial customers. The most recent iteration of this process is currently underway and results are expected by late 2020. The results will include
Estimates of the magnitude of potential savings on an annual basis; Estimates of the costs associated with achieving those savings; and Calculations of the cost effectiveness of the measures based on the estimates
above from a TRC perspective assuming PJM market price estimates. The Company and DNV GL conducted previous Market Potential Studies in 2015 and 2017; the 2017 Market Potential Study was updated in 2018 to reflect changes to eligibility for commercial
MS, NM, WY, KY, SD, WI, IN, KS
Variation in: ● Saturation of electric heating and cooling ● Building energy intensities
● Avg physical size of customer buildings ● Mix of building types

113
customers due to the GTSA. Appliance Saturation Studies and Residential Conditional Demand Analyses were conducted in 2013 and 2016, and included mail and electronic surveys of residential and commercial customers. The Market Potential Studies estimate three basic types of energy efficiency potential:
Technical potential: The complete penetration of all measures analyzed in applications where they were deemed technically feasible from an engineering perspective.
Economic potential: The technical potential of those energy efficiency measures that are cost-effective when compared to supply-side alternatives.
Achievable program potential: The amount of savings that would occur in response to specific program funding, marketing, and measure incentive levels. In this study, the Company looked at the potential available under two funding scenarios—50% incentives and 75% incentives.
The Company, through its DSM stakeholder process, uses the information contained in the Market Potential Studies to help develop ideas for potential DSM programs to include measures that may be cost beneficial. The most recent Market Potential Study is typically released with a Company solicitation for DSM programs. 6.7 Overall DSM Assessment At the end of the Planning Period (i.e., 2035), energy reductions projected for the identified DSM programs are approximately 1,373 GWh. This compares to 1,276 GWh identified in the 2019 Update, or an approximately 8% increase in energy reductions. The majority of the increase in energy reductions is attributed to the proposed Phase VIII DSM programs included in the 2019 Virginia DSM filing. The capacity reductions at the end of the Planning Period for the identified DSM programs are 383 MW in this 2020 Plan. This compares to 405 MW in the 2019 Update, or an approximately 5% decrease in demand reductions. This decrease is largely attributable to (i) the Non-Residential Prescriptive Program not yet realizing adoption of high energy and high capacity reduction measures; and (ii) corrected design assumptions for the Residential Thermostat Programs. In this 2020 Plan, the unidentified DSM resources are presented as an unidentified generic block of energy efficiency reductions priced at $200/MWh to meet the GTSA and VCEA requirements, as explained in Section 4.1.3. For comparison, in the 2019 Update, the Company included an unidentified generic block of energy efficiency reductions to meet the requirements of the GTSA only. See Section 4.1.3 for a discussion of the energy efficiency reductions used as adjustments to the load forecast in this 2020 Plan. Figures 4.1.3.1 and 4.1.3.2 show these energy efficiency energy and capacity adjustments, respectively.

114
Figure 6.7.3 presents a comparison of the Company’s expected demand-side management costs relative to expected supply-side costs. The costs are provided on a levelized cost per MWh basis for both supply- and demand-side options. The supply-side options’ levelized costs are developed by determining the revenue requirements, which consist of the dispatch cost of each of the units and the revenue requirement associated with the capital cost recovery of the resource. The demand-side options’ levelized cost is developed from the cost-benefit runs. The costs include the yearly program cash flow streams that incorporate program costs, customer incentives, and evaluation, measurement, and verification costs. The NPV of the cash flow stream is then levelized over the Planning Period using the Company’s weighted average cost of capital. The costs for both types of resources are then sorted from lowest cost to highest cost and are shown in Figure 6.7.3.
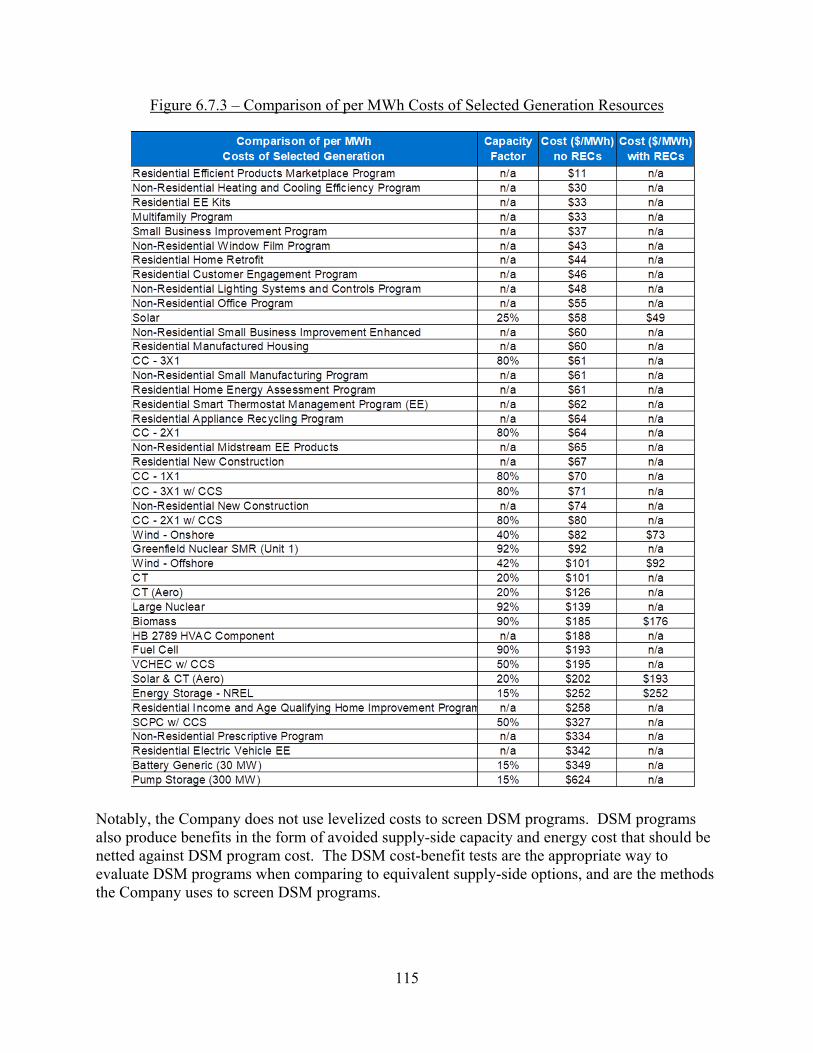
115
Figure 6.7.3 – Comparison of per MWh Costs of Selected Generation Resources
Notably, the Company does not use levelized costs to screen DSM programs. DSM programs also produce benefits in the form of avoided supply-side capacity and energy cost that should be netted against DSM program cost. The DSM cost-benefit tests are the appropriate way to evaluate DSM programs when comparing to equivalent supply-side options, and are the methods the Company uses to screen DSM programs.

116
Chapter 7: Transmission This chapter provides an overview of the transmission planning process, as well as a list of current and future transmission projects. In addition, this chapter provides the results of the system reliability analysis performed to assess the potential effect of retiring all generating units that emit CO2 as a byproduct of combustion by 2045. 7.1 Transmission Planning The Company’s transmission system is responsible for providing transmission service: (i) for redelivery to the Company’s retail customers; (ii) to Appalachian Power Company, Old Dominion Electric Cooperative (“ODEC”), Northern Virginia Electric Cooperative, Central Virginia Electric Cooperative, and Virginia Municipal Electric Association for redelivery to their retail customers in Virginia; and, (iii) to North Carolina Electric Membership Corporation and North Carolina Eastern Municipal Power Agency for redelivery to their customers in North Carolina (i.e., collectively, the DOM Zone). Also, several independent power producers (“IPPs”) are interconnected with the Company’s transmission system and are dependent on the Company’s transmission system for delivery of their capacity and energy into the PJM market. The Company is part of PJM, which is currently responsible for ensuring the reliability of, and coordinating the movement of, electricity through all or parts of Delaware, Illinois, Indiana, Kentucky, Maryland, Michigan, New Jersey, North Carolina, Ohio, Pennsylvania, Tennessee, Virginia, West Virginia, and the District of Columbia. The Company also is part of the Eastern Interconnection transmission grid, meaning its transmission system is interconnected, directly or indirectly, with all of the other transmission systems in the United States and Canada between the Rocky Mountains and the Atlantic Coast, except for Quebec and most of Texas. All of the transmission systems in the Eastern Interconnection are dependent on each other for moving bulk power through the transmission system and for reliability support. The Company’s transmission system is designed and operated to ensure adequate and reliable service to customers while meeting all regulatory requirements and standards. Specifically, the Company’s transmission system is developed to comply with the NERC Reliability Standards, as well as the Southeastern Reliability Corporation supplements to the NERC Standards. Federally-mandated NERC Reliability Standards constitute minimum criteria with which all public utilities must comply as components of the interstate electric transmission system. Moreover, the Energy Policy Act of 2005 mandates that electric utilities follow these NERC Reliability Standards and imposes fines for noncompliance of approximately $1.3 million per day per violation. The Company participates in numerous regional, inter-regional, and sub-regional studies to assess the reliability and adequacy of the interconnected transmission system. The Company is a member of PJM; PJM is registered with NERC as the Company’s planning coordinator and transmission planner. Accordingly, the Company participates in the PJM regional transmission expansion plan (“RTEP”) to develop the RTO-wide transmission plan for PJM. The PJM RTEP covers the entire PJM control area and includes projects proposed by PJM, as well as projects proposed by the Company and other PJM members through internal planning
117
processes. The PJM RTEP process includes both a 5-year and a 15-year outlook. The Company is actively involved in supporting the PJM RTEP process. The Company also evaluates its ability to support expected customer growth through its internal transmission planning process. The results of this evaluation indicates if any transmission improvements are needed, which the Company includes in the PJM RTEP process as appropriate. If the need is confirmed, then the Company seeks approval for the transmission improvements from the appropriate regulatory body. Additionally, the Company performs seasonal operating studies to identify facilities in its transmission system that could be critical during the upcoming season. The Company coordinates with neighboring utilities to maintain adequate levels of transfer capability to facilitate economic and emergency power flows. 7.2 Existing Transmission Facilities The Company has approximately 6,800 miles of transmission lines in Virginia, North Carolina, and West Virginia at voltages ranging from 69 kV to 500 kV. These facilities are integrated into PJM. 7.3 Transmission Facilities Under Construction A list of the Company’s transmission lines and associated facilities that are under construction can be found in Appendix 7A. Through participation in the PJM RTEP as well as regional, inter-regional, and sub-regional studies described in Section 7.1, the Company annually assesses the reliability and adequacy of the interconnected transmission system to ensure the system is adequate to meet customers’ electrical demands both in the near-term and long-term planning horizons. 7.4 Future Transmission Projects Appendix 3D provides a list of planned transmission projects during the Planning Period, including projected cost per project as submitted to PJM as part of the RTEP process. 7.5 Transmission System Reliability Analysis In order to understand the possible system reliability implications of Alternative Plans C and D—both of which retire all Company-owned carbon-emitting generation in 2045 resulting in close to zero CO2 emissions from the Company’s fleet in 2045—the Company performed a power flow analysis by developing a base power flow case and three different scenarios. To conduct this analysis, the Company made numerous simplifying assumptions. Standard transmission planning analysis is conducted in a near-term horizon (years 1 to 5) and a long-term horizon (years 6 to 10). The reliability analysis conducted for the evaluations of Alternative Plans C and D is 15 years and 30 years into the future, which is significantly longer than standard long-term reliability assessment timeframes. Because the timeframe for analysis was for an additional twenty years, the analysis was unable to account for the significant changes to

118
the transmission systems topology (e.g., transmission lines, load, generation resources) both in the DOM Zone and the Eastern Interconnection that will occur during this timeframe. In addition, the planning model used in this analysis models the Eastern Interconnection, which encompasses all the transmission facilities, generation resources and system loads from essentially the Rocky Mountains to the East Coast. This model incorporates the 2023 year topology of the transmission system and was the base case used for other model changes to perform the future year assessments. The only loads adjusted in this model for the future year assessments were in the DOM Zone, and were scaled up uniformly to levels projected for summer 2035, winter 2035 and summer 2050 based on the growth rates shown in 2020 PJM Load Forecast. The generation resources located in the DOM Zone were modified as discussed below. In all power flow cases developed for this reliability analysis, approximately 900 MW of ODEC gas-fired generation and approximately 2,900 MW of IPP gas-fired generation was modeled on-line on the Company’s system, as it is the Company’s understanding that the VCEA does not require the retirement of these generating units. Additionally, approximately 21,000 MW of solar and approximately 5,400 MW of offshore wind were modeled as per PJM RTEP protocols (i.e., PJM capacity factors used to calculate capacity injection rights). The four power flow cases modeled all Company-owned carbon-emitting generation in 2045 as off-line (retired), except as modified below:
Power Flow Case 1 (base case): Warren, Greensville and Brunswick County gas-fired CC generating units remained in service for each year under study.
Power Flow Case 2: Warren and Greensville gas-fired CC generating units remained in service for each year under study.
Power Flow Case 3: Warren gas-fired CC generating unit remained in service for each year under study.
Power Flow Case 4: Brunswick, Greensville, and Warren County gas-fired CC generating units off-line (retired) for each year under study.
The initial results of the 2035 and 2050 analysis of all four power flow cases identified NERC reliability deficiencies on twenty-six 115 kV lines, thirty-two 230 kV lines, six 500 kV lines, and eleven transmission transformers that would need to be resolved to avoid NERC violations. The results of these studies are in no way a substitution for the actual generation retirement analysis and generation queue analysis that any generator must follow as part of PJM’s RTEP process, especially if they are or want to be considered a PJM capacity resource. Based on the summer 2035, winter 2035 and summer 2050 peak load runs described above, a first contingency incremental transfer capability analysis was performed. This analysis indicated that for Alternative Plans C and D, the Company’s transmission system is not capable of importing the amounts of energy required without the development of significant interregional transfer capability or the addition of significant generation resources (as discussed below) in the DOM Zone, which would need to be directly connected to the Company’s transmission system in order to be available to serve both the peak winter and peak summer loading conditions. The interregional transfer capability would be added by the addition of new multi-state transmission

119
lines (“Interregional Transmission Lines”). These multistate lines would have to interconnect with generation resources located in the PJM system and terminating in major load centers in Virginia, like Northern Virginia, the Richmond metropolitan area, and the Hampton Roads metropolitan area. These Interregional Transmission Lines could be either alternating current (“AC”) or direct current (“DC”) transmission lines. The Trail Project, built in 2006 at a cost of approximately $1.2 billion and going from Pennsylvania to West Virginia to Virginia, was the most recent type of interregional transmission facility built on the PJM system. Further, additional generation resources located in the DOM Zone would be needed in order to address the amount of intermittent renewable resources being added to the system in the Planning Period. These generation resources would need to be quick start and capable of continued operation that is not impacted by weather conditions. As shown in the Figure 5.6.2.2, Alternative Plans A, B, C, and D require the Company’s transmission system to be able to import 5,200 MW to serve the DOM Zone load in the Planning Period, and between 5,200 MW (Alternative Plans A and B) and 10,400 MW (Alternative Plans C and D) to be able to serve DOM Zone load in the Study Period. The transmission impacts related to each of the Alternative Plans is summarized below.
Plan A – Normal transmission planning expected with no additional transmission level import increase required to maintain 5,200 MW of import capability. Since Alternative Plan A has a smaller portion of its generation resources that are impacted by weather conditions (i.e., renewable generation) and fewer generation retirements, this alternative still reflects the DOM Zone operating in a firm operational state not dependent upon weather conditions.
Plan B – Normal transmission planning expected with no additional transmission level import increase costs required to maintain 5,200 MW of import capability. While Alternative Plan B has a larger amount of solar, energy storage, and offshore wind resources added as compared to Alternative Plan A, Plan B preserves approximately 9,700 MW of natural gas-fired generation to address future system reliability, stability, and energy independence issues as compared to Alternative Plan A and, therefore, construction of Interregional Transmission Lines are not anticipated.
Plan C – This alternative will require additional transmission level import increase costs in order to construct Interregional Transmission Lines to obtain 10,400 MW of import capability. Alternative Plan C has a larger amount of solar, energy storage, and offshore wind resources added as compared to Alternative Plan A, as well as significantly more generation retirements of the existing DOM Zone generation fleet as compared to Alternative Plan A. As a result, four Interregional Transmission Lines would need to be constructed at a placeholder estimated cost of approximately $8.4 billion.
Plan D – This alternative will require additional transmission level import increase costs in order to construct Interregional Transmission Lines to obtain 10,400 MW of import capability. While Alternative Plan D has a larger amount of solar resources added than Alternative Plan C and a larger amount of energy storage and offshore wind resources added as compared to Alternative Plan A, based on capacity factors, there is no change in the amount of generation retirements of the existing DOM Zone generation fleet as

120
compared to Alternative Plan C. As a result, four Interregional Transmission Lines would need to be constructed at a placeholder estimated cost of $8.4 billion.
Importantly, this analysis is high level, preliminary and made with numerous simplifying assumptions. Extensive additional analysis is needed over time. For example, this analysis does not address analysis and costs that arise from the loss of traditional rotating synchronous generators. Transitioning from traditional rotating synchronous generation to inverter-based (i.e., intermittent renewable) solar- and wind-powered resources and the addition of large-scale energy storage facilities (e.g., battery and pumped storage) will change the very nature of the electric grid, and requires a fundamental reevaluation of the electric grid for based on two primary results:
The loss of dispatchable, or controllable generation and challenges associated with the addition of large-scale energy storage facilities; and
The loss of stored kinetic energy. Traditional generation sources are large rotating turbines usually powered by either heated steam or falling water, and therefore these generation sources and their output can be both predicted and controlled. Controlling the output of these generators is achieved by regulating the input supply of water or steam. Inverter-based generation relies on resources (e.g., the sun and the wind) that cannot be controlled or predicted in this way. As a result, these generation sources are not dispatchable in response to changes in electrical demand and can be unavailable to serve peak loading conditions. This is the first fundamental difference that must be addressed. Currently, one of the ways PJM manages this is by calculating a dependable capacity rating for intermittent resources. This dependable capacity rating is what is required to be used in transmission planning analysis as part of PJM’s FERC-approved RTEP process. While this capacity rating is designed to match the average output of intermittent resources in a region during peak summer loading conditions, it misses the range of conditions that the electric system may have to withstand, such as timeframes when intermittent generation output is close to 100% of its nameplate rating or during winter loading conditions when, for example, the solar generation output is essentially zero. The addition of large-scale storage facilities can support these challenges with solar- and wind-based resources, but these storage facilities will create new challenges themselves that must be addressed. One essential challenge with the addition of large-scale storage facilities on the Company’s system is that it will result in a significant increase in peak system load requirements. Storage will primarily be discharged (i.e., behaving like a generator) at night time to serve system load when solar output across the system is zero. Therefore, the storage facilities will charge (i.e., behaving like a load) during daylight hours, contributing to the peak system load conditions that occur across the daylight hours, like a summer peak load. For example, approximately 9,930 MW of storage could potentially be added as system load in Alternative Plans C and D, significantly increasing the peak load that the Company’s transmission system must reliably serve consistent with NERC reliability criteria. It is also critical to note that the storage facilities must be charged up and available to serve the night time load; therefore, during daylight hours the uses of these storage facilities will be very limited, as the primary use must be charging up to be ready for the night time load.

121
The loss of stored kinetic energy is a more technical concern. The rotation of traditional turbines creates a reservoir of kinetic energy that automatically provides support when problems arise and balances the myriad of instantaneous discrepancies between generation and load at any moment in time. Inverter-based generation does not provide such a reservoir. This correlates to several areas of study that have not historically been necessary to consider during transmission system planning studies and analyses, but will be essential going forward. Today, these include the areas of study listed below, but the Company expects this list to grow and evolve over time.
Inertia and frequency control; Short-circuit system strength; Power quality; Reactive resources and voltage control; System restoration and black start capabilities; Grid monitoring and control capabilities; Energy storage requirements; and High-voltage direct current (“HVDC”).
7.5.1 Inertia and Frequency Control
Electrical inertia is the capacity of a system to resist changes in electrical frequency, which is the real-time balance between generation and load. Electrical inertial response acts to overcome an immediate imbalance between power supply and demand. Electrical inertia is directly related to the reservoir of stored kinetic energy inherent to the traditional rotating synchronous generators on the system. Inertia is what allows the electric grid to control the frequency deviations that occur all the time, which are caused by events such as load changes, transmission and distribution outages, generation shedding, and system instability. Inverter-based solar- and wind-powered resources have no rotating components and, as a result, typically do not contribute to system inertia. This can lead to significant problems in managing system frequency, leading to a less reliable electric grid under high penetration of inverter-based generation resources. This problem must be studied and resolved over time with new frequency control strategies and technologies that must be designed, tested, and implemented on the system. This could include new technologies and concepts that are being explored and researched now, including the emulation of inertia in inverter control systems. 7.5.2 Short-circuit System Strength
A short circuit, also known as a fault, is an undesirable electrical connection, such as a tree branch falling across electrical lines. When these short circuit events occur, it is critical to remove from service the faulted energized equipment as quickly as possible to ensure personnel and public safety, prevent or reduce equipment failure, and maintain the stability of the electric grid. This is done today in the timeframe of milliseconds to seconds by protection and control systems that are comprised of relays, circuit breakers, reclosers, and fuses installed across the entire system. In today’s electric grid, a short circuit typically results in a spike in electrical current to that point and depressed voltage around the location of the fault. This occurs today because traditional rotating synchronous generators supply this significant amount of current during short-circuit events. The protection and control systems in operation today, across the

122
entire system in generation plants, transmission and distribution substations, distribution circuits, and even inside customer facilities and homes, are all primarily designed to remove short circuit events by the detection of very high current. Inverter-based generation resources (e.g., solar and wind) do not provide any significant increase in current during short circuit events; rather they provide either no change in current or only a very nominal amount during the short circuit events. As traditional rotating synchronous generators are retired and replaced with more and more inverter-based generation, it is expected that the system will experience a fundamental change in short circuit behaviors across all levels of the grid, specifically lowering the currents and strength of short circuits. This will cause the Company’s existing protection and control systems installed across the entire system to have major challenges in detecting these short circuit events and protecting the system, personnel, and the public. This problem must be studied and resolved over time, looking into new technologies that must be designed, tested, and implemented, such as new grid devices that provide fault current or new protection and control schemes on generation, transmission, distribution, and customer facilities that are have new designs and operating characteristics. 7.5.3 Power Quality
All standards for grid-tied systems set demands on the quality of the power supply. These systems have previously drawn from the centralized reservoir of kinetic energy previously discussed—the dispatchable nature of traditional generation and the fundamental frequency of the electric grid (i.e., 60 Hertz (“Hz”)). Electric grids dominated by inverter-based generation resources face challenges to reliable operation on two power quality aspects. First, the non-controllable variability of solar and wind resources leads to voltage and frequency fluctuations that require mitigation in order to balance the instantaneous supply and demand across the electric grid. Second, inverters operate by creating harmonic frequencies, multiples of the 60 Hz fundamental, and these harmonics can cause a variety of issues including reduced system transmission capacity and premature aging of electrical equipment. These power quality issues will have to be studied and resolved over time. 7.5.4 Reactive Resources and Voltage Control
Electrical generation can be divided into real power and reactive power. Real power does actual work (e.g., creating heat and light). Reactive power supports electromagnetic fields required to control voltage levels and move real power across the electric grid. Traditional voltage regulation devices that adjust reactive power are traditional rotating synchronous generators, transformer load tap changers, voltage regulators, capacitor banks, and reactor banks. The variability (due to weather patterns) and historical operation of inverter-based resources will cause added voltage variability on the system, requiring the implementation of technologies that can automatically mitigate this variability to maintain stable voltage across the system. An example of these technologies is Flexible Alternative Current Transmission System (“FACTS”) devices, with the two most common devices being static volt-ampere reactive compensators, and static synchronous compensators (“STATCOMs”). Another example is the concept of using the inherent ability of inverters to help control voltage. These technologies need to be studied,

123
developed, tested, and deployed because the cost of mitigating voltage control could become cost-prohibitive. 7.5.5 System Restoration and Black Start Capabilities
Large-scale blackouts negatively impact the public, the economy, and the power system itself. A proper black start system restoration plan can help to restore power quickly and effectively. Black start—which restores electric power stations and the electric grid without relying on external connections—is the most critical scenario for system restoration. A black start unit is a generator that can start from its own power without the support from the power grid, which is essential in the event of a major system collapse or a system-wide blackout. Black start units, and the generation included in the system restoration plan, must be available 24/7 and must have constant and predictable output when operational. These requirements provide difficulties for solar- and wind-generation resources, causing challenges to future black start restoration plans that will need to be studied and resolved. In addition, current black start restoration procedures start from the transmission system and quick start synchronous generation stations and then work towards restoring the distribution system. However, with significant DERs, system restoration procedures will need be evaluated to account for these DERs, including investigation into new DER technology like grid-forming inverters used in microgrids. 7.5.6 Grid Monitoring and Control Capabilities
Electricity demand that has historically been inelastic is becoming more variable and dynamic due to rapid growth of DERs. Greater temporal granularity is required to understand coincidence of system loading and DER production. Furthermore, DER production and performance contain inherent uncertainty that must be considered. Additionally, the dynamics of system loading itself is changing as new equipment and resources are integrated as unmeasured / unmetered resources, impacting the ability to understand and forecast these quantities. Low visibility and lack of control is a key problem for customer-level DERs such as roof-top or community solar, battery storage, electric vehicle charging infrastructure, and DSM. As DERs increase across the grid, investments in additional grid monitoring resources and equipment are vital. A robust and secure communications network is especially important to ensure bandwidth capacity and satisfy communication latency requirements for monitoring and control systems. The Company has proposed investments that will provide this level of granularity at the distribution level as part of its Grid Transformation Plan, as discussed further in Section 8.3. As these investments are deployed, and as the Company develops the integrated distribution planning process discussed further in Section 8.1, the outputs generated by integrated distribution planning will feed into and inform further analyses related to required controls at the transmission level. Beyond monitoring, maintaining grid stability requires robust coordination between inverter controls, grid system protection and control systems, and electrical equipment loading capabilities. In-progress updates to the Institute of Electrical and Electronics Engineers (“IEEE”) Standard 1547 will provide industry guidance on how inverter-based generation should provide automatic local (decentralized) voltage and frequency control and system disturbance ride through functionality. Decentralized control is not yet perfected, and the benefits of centralized control should still be weighed against potential failure modes inherent to

124
decentralized algorithms. Extensive study and testing is needed to develop and deploy the safest and most reliable monitoring and control options possible. The Company is actively engaged in both the IEEE-1547 standards evaluation as well as research and development of inverter-based grid support functionality. 7.5.7 Energy Storage Requirements
Due to the intermittence and uncertainty of wind and solar generation, energy storage is vital. Excess energy from peak generation periods could also be collected with an energy storage system and released when load outpaces supply. However, significant study is needed to determine the requirements for efficient, reliable, cost-effective, and safe utilization of energy storage. Location, safety and environmental concerns, and end-of-life must be explored for all energy storage technologies and options. These battery storage pilot program discussed further in Section 8.5 will provide the Company with valuable insight and experience toward deployment of BESS in the future 7.5.8 High-voltage Direct Current AC transmission cable systems are a mature technology, and the cost of HVDC technology is considerably higher than traditional AC transmission lines. This higher cost is mainly due to the converter stations at both ends of the DC connection. However, any AC cable length over six miles requires costly reactive power compensation infrastructure such as reactor banks, STATCOMs, or other FACTS devices. HVDC cables do not have this reactive power compensation requirement. Due to this, the cost per unit length of an HVDC line may be significantly less than a comparable high-voltage AC line over long distances. This potential lower cost is especially important when considering offshore generation and interregional transmission transfer capabilities to other areas of the system. Other potential HVDC benefits include higher power transfer capability, smaller right-of-way requirements, lower power losses, dynamic real and reactive power control, fault ride-through, greater system strength tolerance, inertial emulation, frequency control, power oscillation damping, and black start capability. Since this HVDC technology is relatively new, the Company must rigorously study each of these applications along with other advanced control schemes to assure that it can deliver safe, reliable, and affordable power before implementing HVDC solutions. 7.5.9 Summary of Preliminary Results In summary, the results and issues identified in this section are high level and preliminary in nature and the Company made several simplifying assumptions. As the parameters of the VCEA are identified and developed in greater detail, a comprehensive transmission plan will be developed that addresses these new technical challenges the transmission system will face. Nevertheless, Alternative Plans C and D will severely challenge the ability of the transmission system to meet customers’ reliability expectations. For example, prolonged cold weather or multiple days of clouds and rain will greatly challenge the transmission system operators who must balance load and generation resources in real-time operations, while also maintaining

125
compliance with NERC reliability requirements. While the Company will be able to develop a transmission expansion plan that will allow for the reliable operation of the transmission system consistent with the parameters identified in the VCEA, this expansion plan will require an investment level that exceeds current transmission level expenditures and will likely exceed the future transmission level costs initially identified in this 2020 Plan.

126
Chapter 8: Distribution The Company’s obligation to provide safe and reliable service carries on as the Company transitions toward a cleaner energy future. In fact, providing reliable and resilient service becomes inherently more important during this transition where availability of extensive DERs and expanding electrification are added essentials. As the distribution grid evolves to support a more dynamic energy system, the Company must continuously identify new scenarios and solutions to ensure safe and reliable service. Those solutions will likely include emerging technologies such as comprehensive distributed energy resource management systems, distribution-level STATCOMs, and customer-owned assets leveraged for grid support as non-wires alternatives. Regardless of which solutions are implemented, a robust telecommunication infrastructure that provides real-time situational awareness and supports analysis and control of grid components will be essential for an adaptable and responsive distribution system. This chapter provides an overview of the distribution planning process, and an overview of current initiatives related to the distribution grid. 8.1 Distribution Planning Current distribution planning methodologies and processes were designed for a distribution grid in a world of centralized large-scale generation and a one-way power flow. In the evolving paradigm where DERs and other emerging technologies are increasing on the distribution grid causing two-way power flows, the Company’s distribution planning process must also evolve. Distribution grids with high penetration levels of inverter-based generation resources at the feeder level face challenges to reliable operation on two power quality aspects. First, the non-controllable variability of solar and wind resources leads to voltage fluctuations that require mitigation. Second, inverters operate by creating harmonic frequencies, multiples of the 60 Hz fundamental; these harmonics can cause a variety of challenges including reduced distribution grid capacity and premature aging of electrical equipment. These power quality issues, along with the emerging changes in the distribution grid’s utilization, will have to be studied and solutions will have to be incorporated over time. In September 2019, the Company filed a white paper that provided a detailed overview of the Company’s current distribution planning process, the limitations of the current process, and the integrated distribution planning (“IDP”) process that the Company planned to implement going forward (the “2019 IDP White Paper”). Appendix 8A provides the 2019 IDP White Paper. As discussed in Section 4.0 of the 2019 IDP White Paper, true IDP will require changes to people’s skills, the technologies and tools they use, and processes for performing planning activities. The Company has made progress on some of the identified enhancements:
Section 4.1 – People. The Company has completed the centralization of modeling and analysis activities and continues to evaluate its organizational structure as integrated distribution planning matures.

127
Section 4.2 – Technologies. The Company continues to evaluate options for advancing IDP. Without the granular data and situational awareness from full deployment of AMI, intelligent grid devices, and control systems proposed as part of the Grid Transformation Plan, the evolution of IDP will continue to be limited based on the technologies that the Company currently has deployed.
Section 4.3 – Processes and Tools. o Process Enhancement 1 – Comprehensive Feeder Level Forecasting. The
Company has developed initial net metering and utility-scale DER forecasts at the feeder level based on feeder head data where available. These forecasts will be integrated with the traditional feeder-level seasonal peak load forecast in support of long-term capacity planning on the distribution grid. With just a portion of residential customer energy usage data being collected by AMI, the Company continues to refine data analytics that approximate the peak demand of non-AMI metered residential customers based upon monthly billing data. This enhancement continues to be limited to forecasting peak demands.
o Process Enhancement 2 – Hosting Capacity Analysis. The Company is on track to complete an initial hosting capacity analysis and make hosting capacity maps publicly available on the Company’s website by the end of 2020. This initial analysis will be static based on the limited data inputs that are available. Improvements to the hosting capacity analysis will require additional data providing more granular visibility of the grid.
o Process Enhancement 3 – Multi-Hour Capacity Planning Analysis. The Company has engaged in a research and development project with EPRI focused on modernizing distribution planning using automated processes and tools. The project is a multi-year effort with the objective of developing, testing, and demonstrating new methods and tools to automate planning assessments and support holistic decision-making in support of integrated distribution planning. Similar to the hosting capacity analysis, specific Grid Transformation Plan investments that gather highly granular grid data are necessary to support robust distribution grid analysis.
o Process Enhancement 5 – Non-Wires Alternatives Analysis. The Company has started work on two battery storage pilot projects as discussed further in Section 8.5, one of which will study batteries as a non-wires alternative to reduce transformer loading. Additionally, the Company is preparing to start working on the Locks Campus Microgrid Demonstration Project that was recently approved as part of the Grid Transformation Plan. Aspects of non-wires alternative analysis are included in the EPRI research project discussed above. In the shorter term, the Company is engaged with EPRI on the development of tools to identify metrics, analytics, and practices for efficient screening of non-wires alternative projects based on economic suitability and technical feasibility. The objective of this effort is to enable more rapid determination of non-wires alternative feasibility and viability and support effective integration of DER into future resource plans. This research is a part of EPRI’s 2020 research portfolio with prototype results expected by the end the year.

128
The Company will provide further updates on progress toward integrated distribution planning in future Plans and update filings. 8.2 Existing Distribution Facilities The Company’s existing distribution system in Virginia consists of more than 53,000 miles of overhead and underground cable, and over 400 substations operating at distribution voltage levels ranging from 4 kV to 46 kV. The distribution system utilizes a variety of devices for functions from voltage control to power flow management, and relies on multiple operating systems for various functions from customer billing to outage management. Section III of the executive summary of the Grid Transformation Plan filed in Case No. PUR-2019-00154 (the “GT Plan Document”) provided a detailed description of the Company’s existing distribution system. 8.3 Grid Transformation Plan With the passage of the GTSA, Virginia declared electric distribution grid transformation to be in the public interest, and mandated that utilities file a plan for grid transformation. The GTSA required that any such plan “shall include both measures to facilitate integration of distributed energy resources and measures to enhance physical electric distribution grid reliability and security.” The Company set forth its comprehensive plan to transform its electric distribution grid to facilitate the integration of DERs, to enhance reliability and security, and to improve the customer experience—the Grid Transformation Plan. The GT Plan Document described the need for grid modernization, the state of the existing distribution system, the development of the Grid Transformation Plan, an overview of the Grid Transformation Plan itself, and the associated customer benefits. The Company has sought approval of the first three years of its ten-year Grid Transformation Plan (i.e., 2019, 2020, and 2021) in two separate proceedings before the SCC, Case Nos. PUR-2018-00100 and PUR-2019-00154. The GT Plan Document includes information on the need, costs, and benefits of each of the proposed investments. Over these two proceedings, the SCC has approved as reasonable and prudent investments in (i) a customer information platform; (ii) a hosting capacity analysis; (iii) the Locks Campus Microgrid Project; (iv) mainfeeder hardening; (v) targeted corridor improvement; (vi) voltage island mitigation; (vii) telecommunications; (viii) physical and cyber security; and (ix) a Smart Charging Infrastructure Pilot Program to support managed charging for EVs. The SCC recently denied, without prejudice to the Company seeking approval of the Grid Transformation Plan in future petitions, investments in (i) AMI; (ii) a self-healing grid; (iii) advanced analytics; (iv) an enterprise asset management system; and (v) proactive component upgrades. Because of the preparation schedule associated with this 2020 Plan, for purposes of the NPV results, the Company has incorporated the costs and benefits as filed in Case No. PUR-2019-00154.

129
The passage of the VCEA has further emphasized the need for grid transformation. The VCEA requires energy efficiency programs to achieve annual targets that reach 5% by 2025, using a 2019 baseline. Full deployment of AMI across the Company’s service territory enables advanced rate options, such as time-varying rates; enhances DSM programs by providing the energy usage data that will enable more targeted suggestions to customers for measures to optimize customers’ energy savings; and provides the interval data to refine evaluation, measurement, and verification. AMI also enables voltage optimization, which, as can be seen in the forecast provided in Section 4.1.5, provides an effective energy efficiency program. The VCEA also envisions a significant build out of solar and wind resources. Much of this capacity would likely be connected to the distribution grid, including the 1,100 MW of small-scale solar. The situational awareness enabled by a self-healing, digital grid would prove invaluable to siting, interconnecting, and managing this significant level of renewable resources where it makes the most sense in terms of costs and benefits. Paired with the full deployment of AMI and other future investments, a self-healing, digital grid will enable more advanced and dynamic hosting capacity analysis, as well as advancements in integrated distribution planning as discussed in Section 8.1. Overall, the Grid Transformation Plan is vital to achieving the clean energy goals discussed in this 2020 Plan. 8.4 Strategic Undergrounding Program The Company is continuing the SUP, which is in its seventh year. Originally conceived as a 4,000 mile program in 2014, the Company has converted approximately 1,325 miles of outage-prone overhead tap lines as of January 2020. A legislative sunset clause currently requires the SUP to conclude in 2028. More details on the SUP are available in the Company’s annual filings with the SCC, which specify the miles of tap lines converted and their location, tap line reliability performance pre- and post-conversion, and system-wide reliability statistics.
Both local and system-wide benefits are key aspects of the SUP. Specifically, the SUP was designed to shorten restoration times in severe weather events by reducing the number of labor-intensive work locations associated with outage-prone single phase overhead tap lines, especially those in the rear of houses with significant tree coverage. By converting those tap lines to underground, directly served customers will either see a shorter outage or no outage. Perhaps more importantly, this enables crew redeployment to other outage locations, allowing a faster recovery after severe weather events for the benefit of all customers. The SUP remains the most effective and comprehensive solution for eliminating work associated with systemic tap line outages, and is complemented by the mainfeeder hardening program in the Grid Transformation Plan, which targets mainfeeders serving customers with the poorest reliability. 8.5 Battery Storage Pilot Program The Company is beginning to study the use of battery energy storage systems on its distribution system through the pilot program established by the GTSA. The SCC recently approved the deployment of two BESS on the distribution system in Case No. PUR-2019-00124:

130
Through BESS-1, the Company will deploy a 2 MW/4 MWh AC lithium-ion BESS that will study the prevention of solar back-feeding onto the transmission grid at a substation located in New Kent County; and
Through BESS-2, the Company will deploy a 2 MW/4 MWh AC lithium-ion BESS that will study batteries as a non-wires alternative to reduce transformer loading at a substation located in Hanover County.
The SCC also approved deployment of a lithium-ion BESS at the Company’s Scott Solar Facility to study solar plus storage. These BESS provide the Company the opportunity to study important statutory objectives, and the information and experience gained from each will provide valuable insight and experience toward deployment of BESS in the future. The Company continues to explore additional unique energy storage use cases for future consideration within the battery storage pilot program. 8.6 Electric School Bus Program The Company’s Electric School Bus Program combines the Company’s efforts with energy storage technologies and electric vehicles, while at the same time assisting customers’ decarbonization efforts. In addition to reducing the carbon footprint of the Commonwealth and improving air quality for students, the batteries in electric school buses can be used to increase the stability and reliability of the grid, and can help to facilitate the integration of renewable energy resources such as solar and wind onto the distribution system. In Phase I of this Program, the Company intends to bring 50 electric school buses to 16 localities in the Company’s service territory by the end of 2020. This Electric School Bus Program, coupled with a modernized grid, will allow the Company to gain understanding and knowledge related to (i) the changes in system loading due to increased adoption of electric vehicle technology; (ii) the managed charging strategies necessary to accommodate a large presence of EVs on the grid; (iii) V2G technology that leverages bus batteries to store and inject energy onto the grid during periods of high demand when the buses are not needed for transport; and (iv) strategic deployment of EVs as resources for the benefit of customers and the grid. 8.7 Rural Broadband Pilot Program The Company plans to participate in the pilot program established by House Bill 2691 from the 2019 Regular Session of the Virginia General Assembly to support the delivery of broadband service to unserved areas in Virginia. Through the broadband pilot program, the Company plans to leverage the telecommunications infrastructure deployed as part of the Grid Transformation Plan by using a portion of the fiber capacity to meet its own distribution system needs, and then leasing another portion to an internet service provider. By utilizing the telecommunication infrastructure for both operational needs and broadband access, the Company can reduce broadband deployment costs for internet service providers, which these providers would then use to deliver high-speed internet access to unserved residences and business. The Company has partnered with a subsidiary of Prince George Electric Cooperative to extend access to

131
approximately 2,400 Company customers and 1,200 cooperative members in Surry County currently not offered broadband services. Additionally, the Company has entered into a memorandum of understanding with All Points Broadband, Northern Neck Electric Cooperative, and the Counties of King George, Northumberland, Richmond, and Westmoreland to advance a regional broadband partnership that aims to deliver fiber-optic broadband service to unserved households and businesses in Virginia’s Northern Neck region.

132
Chapter 9: Other Information This chapter provides other information in response to specific SCC or NCUC requirements. 9.1 Customer Education The Company is committed to improving the customer experience. Key to achieving this goal is educating customers about their energy consumption and how to manage their costs, and empowering customers to take advantage of the numerous enhanced customer capabilities enabled by the Grid Transformation Plan and other initiatives. The Company’s customer education initiatives include providing demand and energy usage information, educational opportunities, and online customer support options to assist customers in managing their energy consumption and taking advantage of new incentives and offerings.
Website and Supporting Print Collateral State: Virginia and North Carolina The Dominion Energy website is a main hub for public education. The Company offers program- and project-specific information, factsheets, brochures, videos, and other supporting documents to provide background and updates on the benefits and enhanced capabilities associated with a variety of investments and initiatives. These include, but are not limited to, approved elements of the Grid Transformation Plan, major infrastructure projects, and new offerings (such as rates, tools and mobile apps) as they become available. https://www.dominionenergy.com
Social Media State: Virginia and North Carolina The Company uses the social media channels of Twitter® and Facebook® to provide real-time updates on energy-related topics, promote Company messages, and provide two-way communication with customers. The Company also manages pages on YouTube® and Instagram for further outreach to the general public, residential customers, and business customers. LinkedIn is leveraged for reaching commercial and industrial customers. The Company’s Twitter® account is available online at: https://twitter.com/dominionenergy The Company’s Facebook® account is available online at: https://www.facebook.com/dominionenergy The Company’s YouTube® account is available online at https://www.youtube.com/user/DomCorpComm The Company’s Instagram account is available online at https://www.instagram.com/dominionenergy/. The Company’s LinkedIn account is available online at https://www.linkedin.com/company/dominionenergy// News Releases State: Virginia and North Carolina The Company prepares news releases and reports on the latest developments regarding its customer-facing initiatives and provides updates on Company offerings and recommendations

133
for saving energy as new information and programs become available. Current and archived news releases can be viewed at: https://news.dominionenergy.com/news. Customer Information Platform State: Virginia and North Carolina The customer information platform—recently approved by the SCC as part of the Grid Transformation Plan—will enable the Company to provide customers with better information. For example, customers will be able to utilize various notification, billing, and pay options to more easily monitor usage and to take advantage of new rate structures and rate comparison tools. Overall, with the new capabilities and customer functionality within the customer information platform, customers will be in a better position to save time and money. Energy Conservation Programs State: Virginia and North Carolina The Company’s website has a section dedicated to energy conservation that contains helpful information for both residential and non-residential customers, including information about the Company’s DSM programs. Dozens of programs are featured on the website and include eligibility guidelines, program details, steps to enroll, and success stories, as well as contact information to speak with program specialists. Through consumer education using a variety of channels to reach multiple customer classes, the Company is working to encourage the adoption of energy-efficient technologies in residences and businesses in Virginia and North Carolina. Online Energy Calculators State: Virginia and North Carolina The Company is committed to helping customers save on their energy bills and provides saving tips and a “Lower My Bill Guide” on the Company website. Home and business energy calculators are provided as well to estimate electrical usage for homes and business facilities. The calculators can help customers understand specific energy use by location and discover new means to reduce usage and save money. For customers considering the environmental impact of transportation choices, a calculator is offered to compare emissions and cost savings of cars side-by-side with more efficient hybrid or all-electric vehicles. An appliance energy usage calculator and holiday lighting calculator are also available to customers. The energy calculators are available at: https://www.dominionenergy.com/home-and-small-business/ways-to-save/energy-saving-calculators. Community Outreach – Trade Shows, Exhibits, and Speaking Engagements State: Virginia and North Carolina The Company conducts outreach seminars and speaking engagements in order to share relevant energy conservation program information to both residential and commercial audiences. The Company also participates in various trade shows and exhibits at energy-related events to educate customers on the Company’s programs and inform customers and communities about the importance of implementing energy-saving measures in homes and businesses and taking advantage of new rates and offerings as they become available. Company representatives positively impact the communities the Company serves through presentations to elementary, middle, and high school students about its programs, wise energy use, and environmental stewardship. Additional partnerships with the educational community are offered through
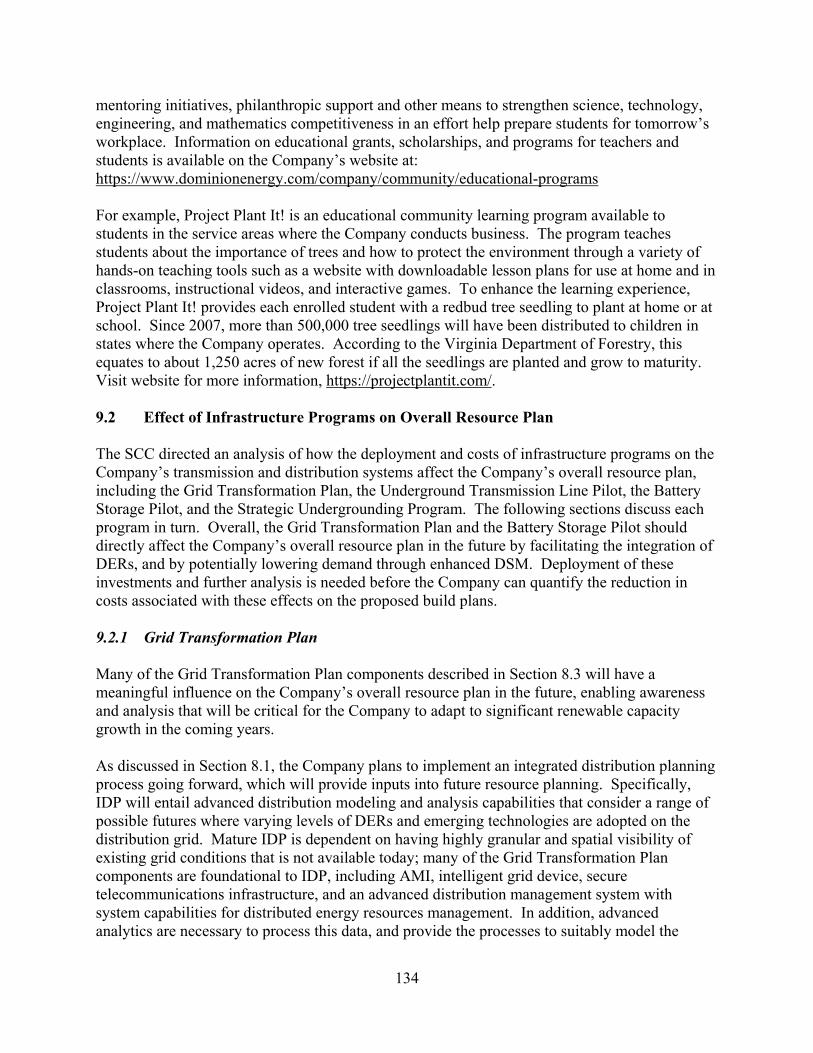
134
mentoring initiatives, philanthropic support and other means to strengthen science, technology, engineering, and mathematics competitiveness in an effort help prepare students for tomorrow’s workplace. Information on educational grants, scholarships, and programs for teachers and students is available on the Company’s website at: https://www.dominionenergy.com/company/community/educational-programs For example, Project Plant It! is an educational community learning program available to students in the service areas where the Company conducts business. The program teaches students about the importance of trees and how to protect the environment through a variety of hands-on teaching tools such as a website with downloadable lesson plans for use at home and in classrooms, instructional videos, and interactive games. To enhance the learning experience, Project Plant It! provides each enrolled student with a redbud tree seedling to plant at home or at school. Since 2007, more than 500,000 tree seedlings will have been distributed to children in states where the Company operates. According to the Virginia Department of Forestry, this equates to about 1,250 acres of new forest if all the seedlings are planted and grow to maturity. Visit website for more information, https://projectplantit.com/. 9.2 Effect of Infrastructure Programs on Overall Resource Plan The SCC directed an analysis of how the deployment and costs of infrastructure programs on the Company’s transmission and distribution systems affect the Company’s overall resource plan, including the Grid Transformation Plan, the Underground Transmission Line Pilot, the Battery Storage Pilot, and the Strategic Undergrounding Program. The following sections discuss each program in turn. Overall, the Grid Transformation Plan and the Battery Storage Pilot should directly affect the Company’s overall resource plan in the future by facilitating the integration of DERs, and by potentially lowering demand through enhanced DSM. Deployment of these investments and further analysis is needed before the Company can quantify the reduction in costs associated with these effects on the proposed build plans. 9.2.1 Grid Transformation Plan Many of the Grid Transformation Plan components described in Section 8.3 will have a meaningful influence on the Company’s overall resource plan in the future, enabling awareness and analysis that will be critical for the Company to adapt to significant renewable capacity growth in the coming years. As discussed in Section 8.1, the Company plans to implement an integrated distribution planning process going forward, which will provide inputs into future resource planning. Specifically, IDP will entail advanced distribution modeling and analysis capabilities that consider a range of possible futures where varying levels of DERs and emerging technologies are adopted on the distribution grid. Mature IDP is dependent on having highly granular and spatial visibility of existing grid conditions that is not available today; many of the Grid Transformation Plan components are foundational to IDP, including AMI, intelligent grid device, secure telecommunications infrastructure, and an advanced distribution management system with system capabilities for distributed energy resources management. In addition, advanced analytics are necessary to process this data, and provide the processes to suitably model the

135
behavior of the entire distribution grid including the renewable resources. These applications can analyze weather patterns along with past generation profiles and forecast the generation that will be available from the DERs. Advanced analytics will also highlight opportunities for non-wires alternatives to be evaluated. As IDP capabilities increase, the Company can include a quantification of aggregate DER impacts to the Company’s overall resource plan. As part of the Grid Transformation Plan, the Company will make static hosting capacity maps for both utility-scale and net metering DER publicly available by the end of 2020. The situational awareness enabled by hosting capacity analysis will prove invaluable to siting, interconnecting, and managing significant levels of DER. As AMI and intelligent grid devices are deployed, and as grid visibility and operational capabilities increase, the hosting capacity analysis will become more dynamic and will support opportunities to reduce interconnection costs when DER output can be informed and adjusted through non-firm DER capacity agreements to avoid grid limitations utilizing a distributed energy resources management system. The Grid Transformation Plan will also facilitate the integration of DERs by enhancing the reliability and resiliency of the grid, increasing the availability of the output from these DERs. Specifically, the mainfeeder hardening program will reduce sustained outages on poorly performing feeder segments, improving availability on outage prone mainfeeders to support both utility-scale and residential DERs. Finally, the Grid Transformation Plan includes the Locks Campus Microgrid Demonstration Project. This pilot project marries several DER technologies and, similar to the Battery Storage Pilot, will provide the research and operational experience needed to prove the viability of advanced grid support capabilities, non-wires alternatives, and other functionality of DER on the Company’s distribution grid. In addition to facilitating the integration of DERs, the Grid Transformation Plan will affect the overall resource plan by potentially lowering demand through enhanced DSM. As discussed in Section 8.3, AMI enables advanced rate options, such as time-varying rates; enhances DSM programs by providing energy usage data that will enable more targeted suggestions to customers for measures to optimize energy savings; and provides the interval data needed for more refined evaluation, measurement, and verification. In addition, AMI enables voltage optimization, which can lead to significant energy savings, as discussed in Section 4.1.5. The Grid Transformation Plan also includes the Smart Charging Infrastructure Pilot Program, which will provide the information needed in furtherance of future managed charting pilots, programs, or rate designs that will support EV adoption while minimizing the impact of EV charging on the distribution grid. Managing increasing EV charging load could also minimize costs for the Company and its customers, such as the need for additional distribution upgrades or the need for more fast ramping peaker plants. 9.2.2 Battery Storage Pilot Program The Battery Storage Pilot Program discussed in Section 8.5 will provide the Company the opportunity to study important statutory objectives, and the information and operational experience gained from each project will provide valuable insight and experience toward

136
integration of the significant energy storage capacity. Indeed, one of the pilot projects seeks to study solar plus storage, with both AC- and DC-coupled BESS, the results of which will inform the deployment of this paired application in the future. 9.2.3 Underground Line Programs Two of the Company’s infrastructure programs relate to undergrounding lines—the Strategic Undergrounding Program and the Underground Transmission Line Pilot. As discussed in Section 8.4, the Strategic Undergrounding Program converts the most outage-prone electric distribution tap lines to underground to improve customer reliability. An indirect benefit of the SUP to the overall resource plan may be to support expanded residential DER by improving availability on the formerly outage-prone tap lines. The Underground Transmission Line Pilot contemplates two underground electric transmission projects to further the Company’s understanding of underground electric transmission lines. The purposes of these programs differ from the Grid Transformation Plan and the Battery Storage Pilot Program, and any potential benefits to the overall resource plan are indirect. 9.3 GTSA Mandates Figure 9.3.1 provides a list of “mandates” from the GTSA and the accompanying citation to the GTSA. The sections that follow outline these mandates and detail the Company’s plans related to each one. Several provisions of the GTSA encourage specific public policies, such as greater deployment of renewable energy, without taking the form of a mandate.
Figure 9.3.1 – GTSA Mandates
Mandate Citation Evaluate in future Plans: (i) electric grid transformation projects, (ii) energy efficiency measures, and (iii) combined heat and power or waste heat to power
Va. Code § 56-599; EC 12; EC 18
Adjust rates to reflect the reduction in corporate income taxes EC 6; EC 7 Provide one-time, voluntary bill credits EC 4; EC 5 Offer Manufacturing and Commercial Competitiveness Retention Credit EC 11 File triennial review Va. Code § 56-585.1; Va.
Code § 56-585.1:1 Report on potential improvements to renewable programs EC 17 Report on economic development activities EC 16 Report on the feasibility of providing broadband using utility infrastructure EC 13 Report on energy efficiency programs by an independent monitor EC 15
Va. Code § 56-596.2 Fund energy assistance and weatherization pilot program Va. Code § 56-585.1:2 Propose a plan to deploy 30 MW of battery storage under new pilot program Va. Code § 56-585.1:6
(EC 9; EC 10) Propose a plan for electric distribution grid transformation projects Va. Code § 56-585.1 A 6 Propose a plan for energy conservation measures with a projected cost of no less than $870 million
Va. Code § 56-596.2 (EC 15)
Note: “EC” = Enactment Clause

137
9.3.1 Plan-Related Mandates This 2020 Plan includes all of the analyses required by Va. Code § 56-599, including long-term planning related to the distribution grid and energy efficiency measures. In this Plan, the Company considered combined heat and power as a possible generation resource as required by Enactment Clause 12 of the GTSA, as discussed in Section 5.5. Finally, Section 6.6 provides the analysis related to energy efficiency measures required by Enactment Clause 18 of the GTSA. 9.3.2 Rate-Related Mandates The GTSA contained a number of mandates related to customer rates. The Company has complied or will comply with each of these provisions:
The Company reduced its rates for generation and distribution services by $182.574 million to reflect the reduction in corporate income taxes under the federal Tax Cuts and Jobs Act of 2017 consistent with Enactment Clauses 6 and 7 of the GTSA. See SCC Case No. PUR-2018-00055.
The Company issued one-time, voluntary generation and distribution services bill credits
totaling $200 million consistent with Enactment Clauses 4 and 5 of the GTSA. See SCC Case No. PUR-2018-00053.
The Company began offering a Manufacturing and Commercial Competitiveness
Retention Credit, designated Rider CRC, to eligible customers consistent with Enactment Clause 11 of the GTSA. See SCC Case No. PUR-2018-00133.
The Company will make a triennial review filing by March 31, 2021.
9.3.3 Mandated Reports The GTSA mandated a list of reports for the Company to file with the SCC and others. The Company has filed the following reports:
Solar Energy Report (Nov. 1, 2018) (EC 17); Economic Development Report (Dec. 1, 2018) (EC 16); Broadband Feasibility Report (Dec. 1, 2018) (EC 13); and The Report of the Independent Monitor on the Status of the Energy Efficiency
Stakeholder Process (Jun. 28, 2019) (EC 15, Va. Code § 56-596.2). 9.3.4 Pilot Program Mandates The GTSA contained two mandates related to pilot programs. First, under the amended language in Va. Code § 56-585.1:2, the Company must continue its pilot program for energy assistance and weatherization for low income, elderly, and disabled individuals “at no less than $13 million for each year the utility is providing such service.” The Company has continued this pilot program and has met the required funding.

138
Second, the GTSA required the SCC to establish a pilot program for storage batteries. The SCC established guidelines for this pilot program on November 2, 2018, in Case No. PUR-2018-00060. The SCC approved the Company’s first application to participate in the pilot program on February 14, 2020, allowing for the deployment of three BESS projects totaling 16 MW. 9.3.5 Mandate Related to Electric Distribution Grid Transformation Projects The GTSA mandated that the Company petition the SCC for approval of a plan for electric distribution grid transformation projects. Section 8.3 provides details on the Company’s Grid Transformation Plan. 9.3.6 Mandate Related to Energy Conservation Measures The GTSA directed the Company to develop a proposed program of energy conservation measures with a proposed cost of no less than $870 million by July 1, 2028, and established an energy efficiency stakeholder process. See Chapter 6 for more details on the Company’s DSM initiatives. 9.4 Economic Development Rates As of March 1, 2020, the Company has seven unique customers located in Virginia receiving service under economic development rates. The total load associated with these rates is approximately 154 MW. As of March 1, 2020, the Company has no customers in North Carolina receiving service under economic development rates.

APPENDIX

Appendix 2A – Plan A – Capacity & Energy
Capacity
Energy
Notes: “Existing Generators + NUGS” also include generation under construction; “DR” = demand response; “EE” = energy efficiency; “PP5” = Possum Point Unit 5 (oil); “CH5&6” = Chesterfield Units 5 & 6 (coal); “YT3” = Yorktown Unit 3 (oil);
“CL1&2” = Clover Units 1 & 2 (coal); “Rose” = Rosemary (oil).

Appendix 2A cont. – Plan B – Capacity & Energy
Capacity
Energy
Notes: “Existing Generators + NUGS” also include generation under construction; “DR” = demand response; “EE” = energy efficiency; “PP5” = Possum Point Unit 5 (oil); “CH5&6” = Chesterfield Units 5 & 6 (coal); “YT3” = Yorktown Unit 3 (oil); “CL1&2” = Clover Units 1 & 2 (coal); “Rose” = Rosemary (oil); “AV” = Altavista (biomass); “HW” = Hopewell (biomass);
“SH” = Southampton (biomass).

Appendix 2A cont. – Plan C – Capacity & Energy
Capacity
Energy
Notes: “Existing Generators + NUGS” also include generation under construction; “DR” = demand response; “EE” = energy efficiency; “PP5” = Possum Point Unit 5 (oil); “CH5&6” = Chesterfield Units 5 & 6 (coal); “YT3” = Yorktown Unit 3 (oil); “CL1&2” = Clover Units 1 & 2 (coal); “Rose” = Rosemary (oil); “AV” = Altavista (biomass); “HW” = Hopewell (biomass);
“SH” = Southampton (biomass).
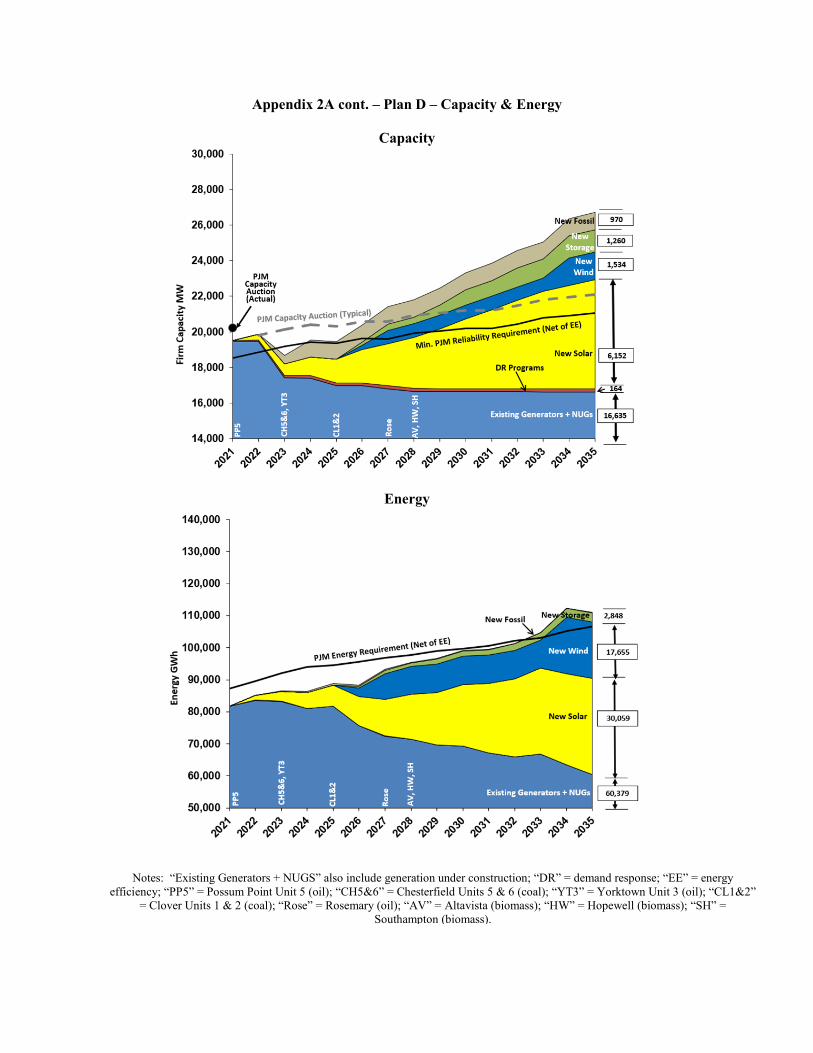
Appendix 2A cont. – Plan D – Capacity & Energy
Capacity
Energy
Notes: “Existing Generators + NUGS” also include generation under construction; “DR” = demand response; “EE” = energy efficiency; “PP5” = Possum Point Unit 5 (oil); “CH5&6” = Chesterfield Units 5 & 6 (coal); “YT3” = Yorktown Unit 3 (oil); “CL1&2”
= Clover Units 1 & 2 (coal); “Rose” = Rosemary (oil); “AV” = Altavista (biomass); “HW” = Hopewell (biomass); “SH” = Southampton (biomass).

Appendix 3A – Generation under Construction
Notes: 1) Commercial Operation Date. 2) Accounts for line losses.
Company Name: Virginia Electric and Power Company Schedule 15aUNIT PERFORMANCE DATAPlanned Supply-Side Resources (MW)
Unit Name Location Unit Type Primary Fuel Type C.O.D.(1) MW
Annual FirmMW
NameplateUnder Construction
Spring Grove 1 Solar VA Intermittent Solar 2021 34 98
Sadler Solar VA Intermittent Solar 2021 34 100
CVOW Demonstration Pilot VA Intermittent Wind 2021 4 12(2)
Solar + Storage Battery Pilot VA Storage Solar 2021 5 12

Appendix 3B – Planned Generation under Development
Notes: 1) Includes the additional resources under development in the Alternative Plans. 2) Estimated commercial operation date.
Company Name: Schedule 15cUNIT PERFORMANCE DATAPlanned Supply-Side Resources (MW)
Unit Name Location Unit Type Primary Fuel Type C.O.D.(2) MWSummer
MWNameplate
Under Development(1)
Surry Unit 1 Nuclear Extension VA Baseload Nuclear 2032 838 875Surry Unit 2 Nuclear Extension VA Baseload Nuclear 2033 838 875North Anna Unit 1 Nuclear Extension VA Baseload Nuclear 2038 838 868North Anna Unit 2 Nuclear Extension VA Baseload Nuclear 2040 834 863Solar 1 VA Intermittent Solar 2022 42Solar 2 VA Intermittent Solar 2022 118Solar 3 VA Intermittent Solar 2022 85Solar 4 VA Intermittent Solar 2022 20Combustion Turbine 1 VA Peaker Natural Gas 2023 485 485Combustion Turbine 2 VA Peaker Natural Gas 2024 485 485Offshore Wind Block 1 VA Intermittent Wind 2026 852Offshore Wind Block 2 VA Intermittent Wind 2027 852Offshore Wind Block 3 VA Intermittent Wind 2027 852Tazewell Pump Storage VA Storage Water 2030 300 300
Virginia Electric and Power Company

Appendix 3C – Comparison of Short-Term Action Plans for Generation Resources in 2018 Plan and 2020 Plan
Key: Retire: Remove a unit from service; BESS: Battery Energy Storage Systems; CH: Chesterfield Power Station; CL: Clover Power Station; CT: Combustion Turbine; CVOW: Coastal Virginia Offshore Wind Demonstration Pilot; PP: Possum Point
Power Station; SLR: Generic Solar; US-3 Solar 2: Spring Grove 1 Solar Facility; YT: Yorktown Power Station.
Color Key: Blue: Updated resource since 2018 Plan; Red with Strike: 2018 Plan resource replacement; Black: No change from 2018 Plan.
Year New Conventional New Renewable Retire Demand-side Resources
2021
US-3 Solar 2 CVOW
SLR (600 MW)PP 5
2022 CT SLR (480 MW) YT 3
2023
CT BESS (14 MW) SLR (480 MW)
YT 3, CH 5-6
2024 CT SLR (780 MW)2025 SLR (480 MW) CL 1-2
Approved DSM
Supply-Side Resources

Appendix 3D - List of Planned Transmission Projects During the Planning Period
Line TerminalsLine
Voltage (kV)
Target Date
Location
PJM RTEP Cost
Estimates($M)
Sandlot 230 kV Delivery - DEV 230 Mar-20 VA 5.5Freedom Substation (Redundant 69 kV Facility) 69 Mar-20 VA 5.4Fork Union Sub to mitigate Bremo Units 3 & 4 Reserve Status 115; 230 Apr-20 VA 27.0Line #548 Valley Switching Station Fixed Series Capacitors replacement
500 Apr-20 VA 16.8
Line #547 Lexington Substation Fixed Series Capacitors Replacement
500 Apr-20 VA 17.7
Gordonsville Transformer #3 Replacement 230/115 May-20 VA 3.5Skippers - New 115 kV Switching Station 115 May-20 VA 8.0Genito 230 kV Delivery Point - DEV 230 May-20 VA 10.0Spring Hill 230 kV Delivery 230 May-20 VA 35.0Idylwood - Convert Straight Bus to Breaker-and-a-Half 230 May-20 VA 103.1Line #217 Chesterfield to Lakeside Rebuild 230 May-20 VA 41.5Line #211 and #228 Chesterfield to Hopewell Partial Rebuild 230 May-20 VA 28.5Line #2199 Remington to Gordonsville – New 230 kV Line 230 May-20 VA 112.0Line #86 Partial Rebuild Project 115 May-20 VA 7.0Greenwich Substation – New line #120 Breaker 115 May-20 VA 1.5Line #549 Dooms to Valley Rebuild 500 Jun-20 VA 62.3Paragon Park 230 kV Delivery - DEV 230 Jul-20 VA 2.5Winterpock 230 kV Delivery and 230 kV Ring Bus 230 Sep-20 VA 8.5Line #76 and #79 Yorktown to Peninsula Rebuild 115 Oct-20 VA 24.5Columbia Tap - CVEC 115 Oct-20 VA 7.0Dawson’s Crossroads – Delivery Point (HEMC) 115 Nov-20 NC 0.7Global Plaza 230 kV Delivery - DEV 230 Nov-20 VA 40.0Winters Branch 230 kV New Substation 230 Dec-20 VA 7.1Line #112 Fudge Hollow to Lowmoor Rebuild 138 Dec-20 VA 12.6Perimeter 230 kV DP - NOVEC 230 Dec-20 VA 8.0Line #231 Landstown to Thrasher Rebuild 230 Dec-20 VA 19.0Buttermilk 230 kV Delivery - DEV 230 Dec-20 VA 11.0Line #154 Twittys Creek to Pamplin Rebuild 115 Dec-20 VA 18.1Line #1011 Mackeys to Creswell Rebuild 115 Dec-20 NC 36.7Poland Road 230 kV Delivery - Add 4th Transformer - DEV 230 Dec-20 VA 2.0Clarksville Tap Line 193 Rebuild 115 Dec-20 VA 3.2Peninsula Transformer #4 Replacement and 230 kV Ring Bus 230 Apr-21 VA 16.1Clover Substation – New 500 kV STATCOM and Rawlings Switching Station – New 500 kV STATCOM
500 May-21 VA 47.0
Farmwell 230 kV Delivery 230 May-21 VA 6.2Evergreen Mills 230 kV Delivery 230 May-21 VA 27.8Ladysmith 2nd 500-230 kV Transformer 230 May-21 VA 25.0Line #274 Pleasant View to Beaumeade Rebuild 230 Jun-21 VA 10.0Line #2176 Gainesville to Haymarket and Line #2169 Haymarket to Loudoun – New 230 kV Lines and New 230 kV Substation
230 Jul-21 VA 176.0
Lucky Hill Substation 115; 230 Jul-21 VA 7.5Varina Substation 230 Nov-21 VA 0.9DTC 230 kV Delivery - DEV 230 Nov-21 VA 25.0Line #49 New Road to Middleburg Rebuild 115 Dec-21 VA 12.7Line #65 Norris Bridge Rebuild 115 Dec-21 VA 103.0Line #550 Mount Storm to Valley Rebuild 500 Dec-21 WV– VA 288.2Line #120 Dozier to Thompsons Corner Partial Rebuild 115 Dec-21 VA 12.6

Appendix 3D cont. - List of Planned Transmission Projects During the Planning Period
Notes: 1) Line #101 capacity will be 262 MVA.
2) Line #139 capacity was 33 MVA. 3) Line #247 capacity will be 1,047 MVA.
4) Line #2144 capacity will be 1,047. 5) Line #81 capacity will be 262 MVA.
6) Line #2056 capacity will remain at 470 MVA. 7) Line #2181 and Line #2058 both capacities will be 1,047 MVA.
Line TerminalsLine
Voltage (kV)
Target Date
Location
PJM RTEP Cost
Estimates($M)
Line #127 Buggs Island to Plywood Rebuild 115 Dec-21 VA 42.4Line #16 Great Bridge to Hickory and Line #74 Chesapeake Energy Center to Great Bridge Rebuild
115 Dec-21 VA 27.0
New Switching Station to Retire Line #1392 Everetts to Windsor DP;Line #139 Everetts to Windsor DP Retirement
115 Dec-21 NC 11.5
Line #2008 Partial Rebuild and Line #156 Retirement 115;230 Dec-21 VA 14.5Line #128 Rebuild Mt. Jackson -SVEC 115 Dec-21 VA 13.1Line #2023 and Line #248 Potomac Yards Undergrounding & Glebe GIS Conversion
230 May-22 VA 120.0
Mt. Storm - GIS 500 May-22 WV 69.0Line #2001 Possum Point to Occoquan Reconductor and Uprate 230 Jun-22 VA 4.7Line #43 Staunton - Harrisonburg Rebuild 115 Jun-22 VA 39.6Lockridge 230 kV Delivery - DEV 230 Jul-22 VA 35.0Nimbus 230 kV Delivery - DEV 230 Nov-22 VA 20.0Line #2175 Idylwood to Tyson's – New 230 kV Line 230 Dec-22 VA 121.8Line #552 Bristers to Chancellor Rebuild 500 Dec-22 VA 62.2Line #2473 Suffolk to Swamp Rebuild 230 Dec-22 VA-NC 31.0Line #205 and #2003 Chesterfield to Tyler Partial Rebuild 230 Dec-22 VA 11.1Line #29 Fredericksburg to Possum Point Partial Rebuild 115 Dec-22 VA 19.2Line #295 and Partial Line #265 Rebuild 230 Dec-22 VA 15.5Line #2173 - Loudoun to Elklick Rebuild 230 Dec-22 VA 13.5Line #21444 Winfall to Swamp Rebuild 230 Dec-22 NC 6.0Judes Ferry 230 kV DP 230 May-23 VA 1.1Fines Corner 230 kV DP 230 May-23 VA 1.0Brickyard 230kV Delivery 230 May-23 VA 2.0Possum Point 2nd 500-230 kV Transformer 500/230 Jun-23 VA 21.0Line #227 Partial Rebuild 230 Jun-23 VA 15.8Possum Point Breakers Replacement 230 Jun-23 VA 19.0Prince Edward 230 kV DP 230 Nov-23 VA 1.2Line #581 Chancellor - Ladysmith 500 kV Rebuild 500 Dec-23 VA 44.4Line #34 Skiffes Creek to Yorktown and Line #61 Whealton to Yorktown Partial Rebuild and Fort Eustis Tap Rebuild 115 Dec-23 VA 24.2
Line #224 Lanexa to Northern Neck Rebuild 230 Dec-23 VA 86.0Lines #265, 200, and 2051 Partial Rebuild 230 Dec-23 VA 11.5Line #141 & Line #28 Rebuild 115 Dec-23 VA 20.0Line #574 Elmont to Ladysmith Rebuild 500 Dec-24 VA 65.5Line #2113 Waller to Lightfoot Partial Rebuild 230 Dec-24 VA 4.0Line #2154 and #19 Waller to Skiffes Creek Rebuild 230 Dec-24 VA 10.0Lines #2063 and Partial #2164 Rebuild 230 Dec-24 VA 22.0Line #815 and Partial Line #20566 Rebuild 115; 230 Dec-24 NC 25.0Line #254 Clubhouse-Lakeview Rebuild 230 Dec-24 VA 27.0Line #21817 and Line #20587 Hathaway to Rocky Mount (DEP) Rebuild
230 Dec-24 NC 13.0
Line #569 Loudoun - Morrisville Rebuild 500 Dec-24 VA 4.5

Appendix 4A – Total Sales by Customer Class (DOM LSE) (GWh)
Note: Based on the Company’s internal forecast; information not provided by PJM Load Forecast.
Historic (2009 – 2019). Projected (2020 – 2035).
Year Residential Commercial Industrial PublicAuthority
Streetand
TrafficLighting
Salesfor
ResaleTotal
2009 29,904 28,455 8,644 10,448 276 1,909 79,635 2010 32,547 29,233 8,512 10,670 281 1,980 83,223 2011 30,779 28,957 7,960 10,555 273 2,013 80,538 2012 29,174 28,927 7,849 10,496 277 1,947 78,671 2013 30,184 29,372 8,097 10,261 276 1,961 80,150 2014 31,290 29,964 8,812 10,402 261 1,850 82,579 2015 30,923 30,282 8,765 10,159 275 1,620 82,024 2016 28,213 31,366 8,715 10,161 253 1,599 80,307 2017 29,737 32,292 8,638 10,555 258 1,515 82,994 2018 32,139 33,591 8,324 10,761 260 1,633 86,707 2019 31,439 35,296 7,302 10,645 263 1,580 86,524 2020 31,636 31,512 9,155 11,074 260 1,521 85,159 2021 31,790 33,177 8,978 11,190 258 1,530 86,923 2022 32,104 35,346 8,858 11,252 256 1,545 89,360 2023 32,467 37,733 8,750 11,381 254 1,562 92,147 2024 32,964 39,350 8,723 11,480 252 1,584 94,353 2025 32,384 41,842 8,510 11,451 250 1,597 96,034 2026 32,459 43,287 8,492 11,526 248 1,615 97,628 2027 32,674 45,057 8,522 11,558 246 1,632 99,689 2028 32,950 46,814 8,557 11,621 244 1,653 101,839 2029 32,859 47,833 8,476 11,697 242 1,664 102,770 2030 32,926 49,050 8,450 11,744 241 1,678 104,089 2031 32,981 50,198 8,442 11,627 239 1,694 105,182 2032 33,134 51,510 8,448 11,818 238 1,712 106,860 2033 33,090 52,463 8,452 11,705 236 1,721 107,667 2034 33,302 53,370 8,407 11,800 234 1,734 108,848 2035 33,478 54,223 8,385 11,712 233 1,747 109,778

Appendix 4B – Virginia Sales by Customer Class (DOM LSE) (GWh)
Note: Based on the Company’s internal forecast; information not provided by PJM Load Forecast.
Historic (2009 – 2019). Projected (2020 – 2035).
Year Residential Commercial Industrial PublicAuthority
Streetand
TrafficLighting
Salesfor
ResaleTotal
2009 28,325 27,646 7,147 10,312 268 1,860 75,558 2010 30,831 28,408 6,872 10,529 273 1,928 78,842 2011 29,153 28,163 6,342 10,423 265 1,962 76,309 2012 27,672 28,063 6,235 10,370 269 1,897 74,507 2013 28,618 28,487 6,393 10,134 267 1,911 75,809 2014 29,645 29,130 6,954 10,272 253 1,798 78,052 2015 29,293 29,432 7,006 10,029 266 1,567 77,593 2016 26,652 30,537 6,947 10,033 245 1,547 75,961 2017 28,194 31,471 6,893 10,429 250 1,466 78,704 2018 30,437 32,752 6,598 10,633 252 1,581 82,254 2019 29,829 34,472 5,591 10,517 254 1,530 82,194 2020 30,016 30,651 7,011 10,952 251 1,473 80,355 2021 30,162 32,287 6,875 11,067 250 1,481 82,122 2022 30,460 34,425 6,783 11,128 248 1,495 84,539 2023 30,805 36,779 6,700 11,256 246 1,512 87,298 2024 31,276 38,360 6,680 11,354 244 1,533 89,447 2025 30,726 40,793 6,516 11,326 242 1,546 91,149 2026 30,797 42,205 6,503 11,400 240 1,563 92,708 2027 31,001 43,933 6,526 11,432 238 1,580 94,710 2028 31,263 45,650 6,553 11,494 236 1,600 96,795 2029 31,176 46,644 6,490 11,569 234 1,610 97,725 2030 31,240 47,834 6,471 11,615 233 1,624 99,017 2031 31,293 48,954 6,465 11,499 231 1,640 100,082 2032 31,438 50,236 6,469 11,689 230 1,657 101,719 2033 31,396 51,167 6,472 11,576 228 1,666 102,505 2034 31,597 52,053 6,438 11,671 227 1,679 103,664 2035 31,764 52,885 6,421 11,584 225 1,691 104,570
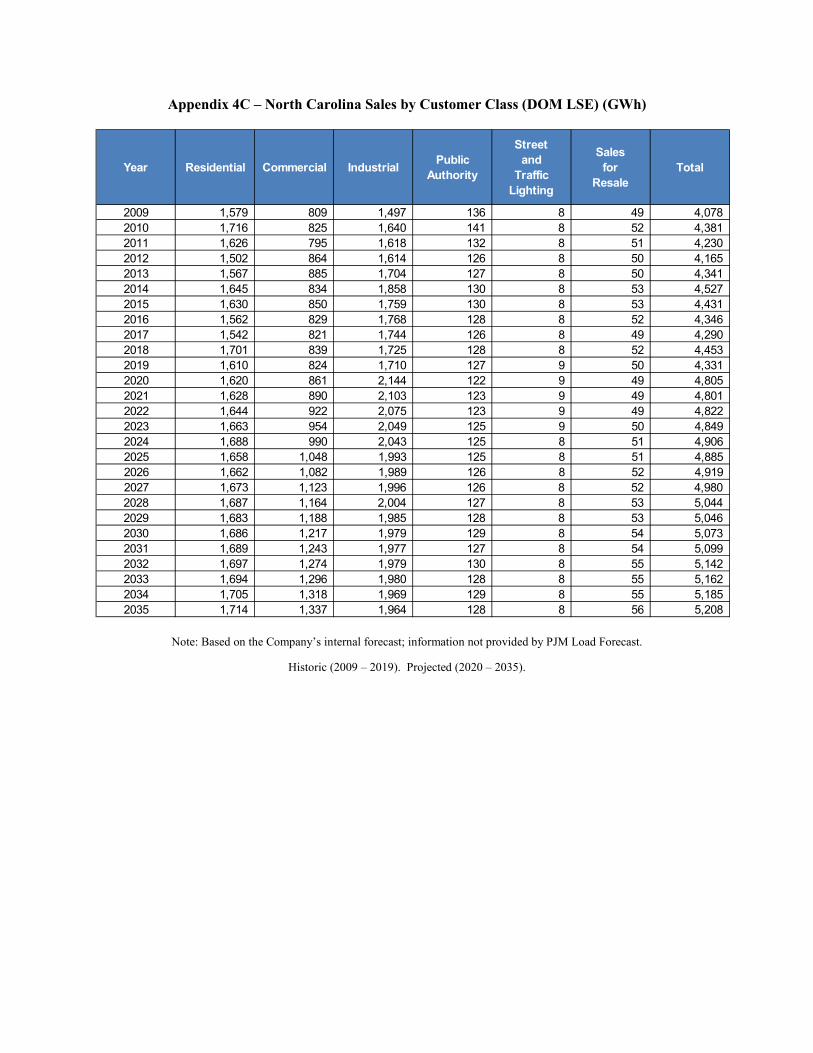
Appendix 4C – North Carolina Sales by Customer Class (DOM LSE) (GWh)
Note: Based on the Company’s internal forecast; information not provided by PJM Load Forecast.
Historic (2009 – 2019). Projected (2020 – 2035).
Year Residential Commercial Industrial PublicAuthority
Streetand
TrafficLighting
Salesfor
ResaleTotal
2009 1,579 809 1,497 136 8 49 4,078 2010 1,716 825 1,640 141 8 52 4,381 2011 1,626 795 1,618 132 8 51 4,230 2012 1,502 864 1,614 126 8 50 4,165 2013 1,567 885 1,704 127 8 50 4,341 2014 1,645 834 1,858 130 8 53 4,527 2015 1,630 850 1,759 130 8 53 4,431 2016 1,562 829 1,768 128 8 52 4,346 2017 1,542 821 1,744 126 8 49 4,290 2018 1,701 839 1,725 128 8 52 4,453 2019 1,610 824 1,710 127 9 50 4,331 2020 1,620 861 2,144 122 9 49 4,805 2021 1,628 890 2,103 123 9 49 4,801 2022 1,644 922 2,075 123 9 49 4,822 2023 1,663 954 2,049 125 9 50 4,849 2024 1,688 990 2,043 125 8 51 4,906 2025 1,658 1,048 1,993 125 8 51 4,885 2026 1,662 1,082 1,989 126 8 52 4,919 2027 1,673 1,123 1,996 126 8 52 4,980 2028 1,687 1,164 2,004 127 8 53 5,044 2029 1,683 1,188 1,985 128 8 53 5,046 2030 1,686 1,217 1,979 129 8 54 5,073 2031 1,689 1,243 1,977 127 8 54 5,099 2032 1,697 1,274 1,979 130 8 55 5,142 2033 1,694 1,296 1,980 128 8 55 5,162 2034 1,705 1,318 1,969 129 8 55 5,185 2035 1,714 1,337 1,964 128 8 56 5,208
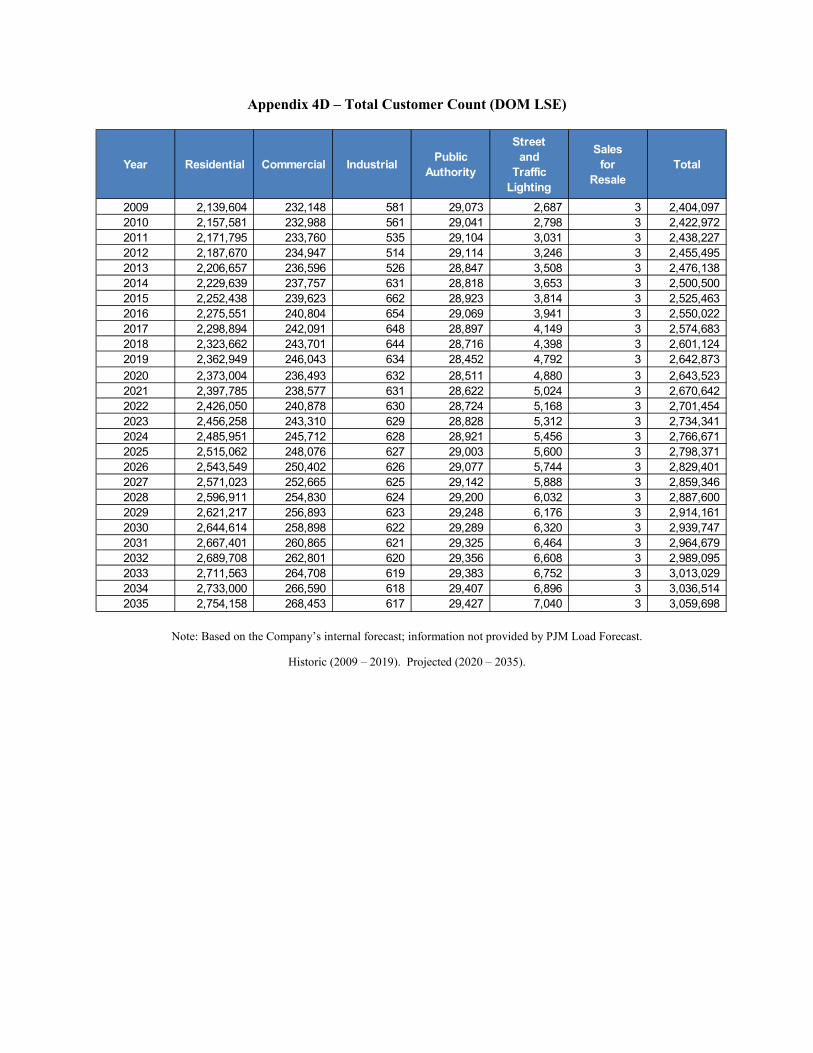
Appendix 4D – Total Customer Count (DOM LSE)
Note: Based on the Company’s internal forecast; information not provided by PJM Load Forecast.
Historic (2009 – 2019). Projected (2020 – 2035).
Year Residential Commercial Industrial PublicAuthority
Streetand
TrafficLighting
Salesfor
ResaleTotal
2009 2,139,604 232,148 581 29,073 2,687 3 2,404,097 2010 2,157,581 232,988 561 29,041 2,798 3 2,422,972 2011 2,171,795 233,760 535 29,104 3,031 3 2,438,227 2012 2,187,670 234,947 514 29,114 3,246 3 2,455,495 2013 2,206,657 236,596 526 28,847 3,508 3 2,476,138 2014 2,229,639 237,757 631 28,818 3,653 3 2,500,500 2015 2,252,438 239,623 662 28,923 3,814 3 2,525,463 2016 2,275,551 240,804 654 29,069 3,941 3 2,550,022 2017 2,298,894 242,091 648 28,897 4,149 3 2,574,683 2018 2,323,662 243,701 644 28,716 4,398 3 2,601,124 2019 2,362,949 246,043 634 28,452 4,792 3 2,642,873 2020 2,373,004 236,493 632 28,511 4,880 3 2,643,523 2021 2,397,785 238,577 631 28,622 5,024 3 2,670,642 2022 2,426,050 240,878 630 28,724 5,168 3 2,701,454 2023 2,456,258 243,310 629 28,828 5,312 3 2,734,341 2024 2,485,951 245,712 628 28,921 5,456 3 2,766,671 2025 2,515,062 248,076 627 29,003 5,600 3 2,798,371 2026 2,543,549 250,402 626 29,077 5,744 3 2,829,401 2027 2,571,023 252,665 625 29,142 5,888 3 2,859,346 2028 2,596,911 254,830 624 29,200 6,032 3 2,887,600 2029 2,621,217 256,893 623 29,248 6,176 3 2,914,161 2030 2,644,614 258,898 622 29,289 6,320 3 2,939,747 2031 2,667,401 260,865 621 29,325 6,464 3 2,964,679 2032 2,689,708 262,801 620 29,356 6,608 3 2,989,095 2033 2,711,563 264,708 619 29,383 6,752 3 3,013,029 2034 2,733,000 266,590 618 29,407 6,896 3 3,036,514 2035 2,754,158 268,453 617 29,427 7,040 3 3,059,698

Appendix 4E – Virginia Customer Count (DOM LSE)
Note: Based on the Company’s internal forecast; information not provided by PJM Load Forecast.
Historic (2009 – 2019). Projected (2020 – 2035).
Year Residential Commercial Industrial PublicAuthority
Streetand
TrafficLighting
Salesfor
ResaleTotal
2009 2,038,843 216,663 522 27,206 2,290 2 2,285,525 2010 2,056,576 217,531 504 27,185 2,404 2 2,304,202 2011 2,070,786 218,341 482 27,252 2,639 2 2,319,502 2012 2,086,647 219,447 464 27,265 2,856 2 2,336,680 2013 2,105,500 221,039 477 26,996 3,118 2 2,357,131 2014 2,128,313 222,143 579 26,966 3,267 2 2,381,269 2015 2,150,818 223,946 611 27,070 3,430 2 2,405,877 2016 2,173,472 225,029 603 27,223 3,560 2 2,429,889 2017 2,196,466 226,270 596 27,041 3,768 2 2,454,143 2018 2,220,797 227,757 594 26,872 4,017 2 2,480,039 2019 2,257,900 229,988 584 26,614 4,417 2 2,519,505 2020 2,267,955 219,287 583 26,680 4,457 2 2,518,964 2021 2,291,639 221,226 582 26,784 4,589 2 2,544,821 2022 2,318,653 223,367 581 26,880 4,720 2 2,574,203 2023 2,347,523 225,630 581 26,977 4,852 2 2,605,564 2024 2,375,902 227,864 580 27,064 4,983 2 2,636,395 2025 2,403,724 230,064 579 27,141 5,115 2 2,666,623 2026 2,430,950 232,227 578 27,210 5,246 2 2,696,214 2027 2,457,208 234,333 577 27,271 5,378 2 2,724,768 2028 2,481,950 236,347 576 27,325 5,509 2 2,751,709 2029 2,505,180 238,267 575 27,370 5,641 2 2,777,035 2030 2,527,541 240,132 574 27,408 5,772 2 2,801,430 2031 2,549,319 241,962 573 27,442 5,904 2 2,825,202 2032 2,570,638 243,763 572 27,471 6,036 2 2,848,482 2033 2,591,526 245,538 571 27,496 6,167 2 2,871,301 2034 2,612,014 247,288 570 27,519 6,299 2 2,893,692 2035 2,632,235 249,021 569 27,538 6,430 2 2,915,796

Appendix 4F– North Carolina Customer Count (DOM LSE)
Note: Based on the Company’s internal forecast; information not provided by PJM Load Forecast.
Historic (2009 – 2019). Projected (2020 – 2035).
Year Residential Commercial Industrial PublicAuthority
Streetand
TrafficLighting
Salesfor
ResaleTotal
2009 100,761 15,485 59 1,867 398 1 118,572 2010 101,005 15,457 56 1,857 395 1 118,771 2011 101,009 15,418 53 1,852 392 1 118,725 2012 101,024 15,501 50 1,849 390 1 118,815 2013 101,158 15,557 50 1,851 390 1 119,007 2014 101,326 15,614 52 1,853 386 1 119,231 2015 101,620 15,677 52 1,853 384 1 119,586 2016 102,079 15,775 51 1,846 381 1 120,133 2017 102,429 15,821 52 1,857 381 1 120,541 2018 102,865 15,944 50 1,844 381 1 121,085 2019 105,049 16,055 50 1,838 375 1 123,368 2020 105,049 17,206 49 1,831 423 1 124,559 2021 106,146 17,351 49 1,838 435 1 125,820 2022 107,398 17,511 49 1,845 448 1 127,251 2023 108,735 17,680 49 1,851 460 1 128,776 2024 110,049 17,848 49 1,857 473 1 130,277 2025 111,338 18,012 49 1,862 485 1 131,748 2026 112,599 18,174 49 1,867 498 1 133,188 2027 113,815 18,332 49 1,871 510 1 134,578 2028 114,961 18,483 48 1,875 523 1 135,891 2029 116,037 18,626 48 1,878 535 1 137,126 2030 117,073 18,766 48 1,881 548 1 138,317 2031 118,082 18,903 48 1,883 560 1 139,477 2032 119,069 19,038 48 1,885 572 1 140,614 2033 120,037 19,171 48 1,887 585 1 141,728 2034 120,986 19,302 48 1,888 597 1 142,822 2035 121,922 19,431 48 1,890 610 1 143,902

Appendix 4G – Zonal Summer and Winter Peak Demand (MW) Company Load Forecast
Historic (2009 – 2019). Projected (2020 – 2035).
YearSummer
Peak Demand (MW)
Winter Peak Demand
(MW)
2009 18,137 18,079 2010 19,140 17,689 2011 20,061 17,532 2012 19,249 16,881 2013 18,763 17,623 2014 18,692 19,784 2015 18,980 21,651 2016 19,538 18,948 2017 18,902 19,661 2018 19,244 21,232 2019 19,607 19,930 2020 20,258 18,908 2021 20,448 19,196 2022 20,709 19,656 2023 21,037 20,129 2024 21,433 20,575 2025 21,738 21,044 2026 22,048 21,609 2027 22,361 21,942 2028 22,678 22,440 2029 22,914 22,745 2030 23,109 23,169 2031 23,300 23,605 2032 23,479 23,868 2033 23,669 24,016 2034 23,869 24,295 2035 24,128 24,702

Appendix 4H - Projected Summer & Winter Peak Load & Energy Forecast for Plan B
Notes: 1) Actual metered data. 2) Demand response programs are classified as capacity resources and are not included in adjusted load.
3) Historical numbers include existing DSM programs. For forecasted numbers, the Company included adjustments for energy efficiency, retail choice, and voltage optimization as discussed in Sections 4.1.3, 4.1.4, and 4.1.5 of the Plan, which are not included in the above numbers.
4) Actual historical data based on measured and verified EM&V results. 5) Actual historical data based upon measured and verified EM&V results. Projected values represent modeled DSM firm capacity.
6) Future behind-the-meter, which is not included in the base forecast.
Company Name: Virginia Electric and Power CompanyI. PEAK LOAD AND ENERGY FORECAST
(ACTUAL)(1) (PROJECTED)
2017 2018 2019 2020 2021 2022 2023 2024 2025 2026 2027 2028 2029 2030 2031 2032 2033 2034 2035
1. Utility Peak Load (MW) A. Summer 1a. Base Forecast 16,350 16,528 16,599 16,533 16,802 17,105 17,399 17,644 17,807 18,004 18,170 18,323 18,456 18,601 18,759 18,977 19,121 19,251 19,357 1b. Additional Forecast
NCEMC - - - - - - - - - - - - - - - - - - - 2. Conservation, Efficiency(5) -109 -119 -135 -144 -190 -259 -345 -431 -513 -572 -676 -634 -613 -637 -648 -697 -599 -579 -565 3. Demand Response(2)(5) -70 -58 -55 -63 -63 -64 -64 -65 -65 -65 -65 -66 -66 -66 -66 -66 -66 -66 -66 4. Demand Response-Existing(2)(3) -1 -2 -2 -2 -2 -2 -2 -2 -2 -2 -2 -2 -2 -2 -2 -2 -2 -2 -2 5. Peak Adjustment - - - 6. Adjusted Load 16,241 16,409 16,464 16,389 16,612 16,846 17,053 17,213 17,294 17,432 17,493 17,689 17,843 17,964 18,112 18,279 18,523 18,672 18,792 7. % Increase in Adjusted Load -3.4% 1.0% 0.3% -0.5% 1.4% 1.4% 1.2% 0.9% 0.5% 0.8% 0.4% 1.1% 0.9% 0.7% 0.8% 0.9% 1.3% 0.8% 0.6% (from previous year)
B. Winter 1a. Base Forecast 16,618 17,792 16,842 16,737 17,004 17,356 17,711 18,074 18,448 18,621 18,807 19,008 19,168 19,371 19,537 19,676 19,839 19,974 20,120 1b. Additional Forecast
NCEMC - - - - - - - - - - - - - - - - - - - 2. Conservation, Efficiency(5) -109 -119 -135 -240 -340 -216 -292 -404 -512 -589 -739 -579 -575 -791 -670 -693 -598 -589 -582 3. Demand Response(2)(4) -5 -6 -6 -16 -37 -58 -76 -92 -100 -102 -103 -104 -105 -106 -107 -108 -109 -110 -111 4. Demand Response-Existing(2)(3) -1 -1 -2 -2 -2 -2 -2 -2 -2 -2 -2 -2 -2 -2 -2 -2 -2 -2 -2 5. Adjusted Load 16,509 17,673 16,707 16,497 16,664 17,140 17,419 17,670 17,936 18,032 18,068 18,429 18,593 18,580 18,867 18,983 19,241 19,385 19,538 6. % Increase in Adjusted Load 2.7% 7.1% -5.5% -1.3% 1.0% 2.9% 1.6% 1.4% 1.5% 0.5% 0.2% 2.0% 0.9% -0.1% 1.5% 0.6% 1.4% 0.8% 0.8%
2. Energy (GWh) A. Base Forecast 84,046 88,377 87,078 88,786 90,435 92,700 94,893 97,428 98,378 99,347 100,353 101,679 102,426 103,269 104,160 105,372 105,950 106,870 107,920 B. Additional Forecast
Future BTM(6) - - - - - - - - - - - - - - - - - - - C. Conservation & Demand Response(5) -660 -727 -801 -945 -1,014 -1,166 -1,395 -1,524 -1,580 -1,596 -1,594 -1,586 -1,598 -1,612 -1,606 -1,590 -1,589 -1,578 -1,586 D. Demand Response-Existing(2)(3) - - - - - - - - - - - - - - - - - - - E. Adjusted Energy 83,386 87,650 86,277 87,841 89,420 91,534 93,498 95,905 96,798 97,751 98,760 100,094 100,827 101,657 102,554 103,782 104,361 105,292 106,334 F. % Increase in Adjusted Energy -0.9% 5.1% -1.6% 1.8% 1.8% 2.4% 2.1% 2.6% 0.9% 1.0% 1.0% 1.4% 0.7% 0.8% 0.9% 1.2% 0.6% 0.9% 1.0%
Schedule 1

Appendix 4I - Required Reserve Margin for Plan B
Notes: 1) Calculated based on total net capacity for summer and winter. 2) Does not include spot purchases of capacity or energy efficiency programs.
3) The Company follows PJM reserve requirements, which are based on loss of load expectation.
Company Name: Virginia Electric and Power Company Schedule 6POWER SUPPLY DATA (continued)
(ACTUAL) (PROJECTED)
2017 2018 2019 2020 2021 2022 2023 2024 2025 2026 2027 2028 2029 2030 2031 2032 2033 2034 2035
I. Reserve Margin(1)
1. Summer Reserve Margin
a. MW(1) 3,799 2,946 3,399 3,480 3,387 2,746 2,125 2,042 1,846 2,500 3,305 3,523 3,898 4,568 4,767 5,149 5,249 6,413 6,638 b. Percent of Load 23.2% 17.8% 20.5% 21.2% 20.4% 16.3% 12.5% 11.9% 10.7% 14.3% 18.9% 19.9% 21.8% 25.4% 26.3% 28.2% 28.3% 34.3% 35.3%
c. Actual Reserve Margin(2) N/A N/A N/A 20.0% 18.6% 14.8% 10.4% 9.4% 7.7% 11.1% 15.0% 16.3% 18.4% 21.9% 22.7% 24.4% 25.1% 31.2% 32.3% 2. Winter Reserve Margin
a. MW(1) N/A N/A N/A 4,343 4,170 3,095 2,025 1,525 829 1,154 1,668 1,311 1,200 1,518 1,229 1,316 1,057 1,884 1,735 b. Percent of Load N/A N/A N/A 26.3% 25.0% 18.1% 11.6% 8.6% 4.6% 6.4% 9.2% 7.1% 6.5% 8.2% 6.5% 6.9% 5.5% 9.7% 8.9%
c. Actual Reserve Margin(2) N/A N/A N/A N/A N/A N/A N/A N/A N/A N/A N/A N/A N/A N/A N/A N/A N/A N/A N/A
II. Annual Loss-of-Load Hours(3) N/A N/A N/A N/A N/A N/A N/A N/A N/A N/A N/A N/A N/A N/A N/A N/A N/A N/A N/A

Appendix 4J – Summer and Winter Peak for Plan B
Notes: 1) Adjusted load from Appendix 4H. 2) Includes firm Additional Forecast, Conservation Efficiency, and Peak Adjustments from Appendix 4H.
Company Name: Virginia Electric and Power CompanyPOWER SUPPLY DATA
(ACTUAL) (PROJECTED)
2017 2018 2019 2020 2021 2022 2023 2024 2025 2026 2027 2028 2029 2030 2031 2032 2033 2034 2035II. Load (MW) 1. Summer a. Adjusted Summer Peak(1) 16,241 16,409 16,464 16,389 16,612 16,846 17,053 17,213 17,294 17,432 17,493 17,689 17,843 17,964 18,112 18,279 18,523 18,672 18,792 b. Other Commitments(2) 109 119 135 144 190 259 345 431 513 572 676 634 613 637 648 697 599 579 565 c. Total System Summer Peak 16,350 16,528 16,599 16,533 16,802 17,105 17,399 17,644 17,807 18,004 18,170 18,323 18,456 18,601 18,759 18,977 19,121 19,251 19,357 d. Percent Increase in Total Summer Peak -3.3% 1.1% 0.4% -0.4% 1.6% 1.8% 1.7% 1.4% 0.9% 1.1% 0.9% 0.8% 0.7% 0.8% 0.9% 1.2% 0.8% 0.7% 0.6%
2. Winter a. Adjusted Winter Peak(1) 16,509 17,673 16,707 16,497 16,664 17,140 17,419 17,670 17,936 18,032 18,068 18,429 18,593 18,580 18,867 18,983 19,241 19,385 19,538 b. Other Commitments(2) 109 119 135 240 340 216 292 404 512 589 739 579 575 791 670 693 598 589 582 c. Total System Winter Peak 16,618 17,792 16,842 16,737 17,004 17,356 17,711 18,074 18,448 18,621 18,807 19,008 19,168 19,371 19,537 19,676 19,839 19,974 20,120 d. Percent Increase in Total Winter Peak 2.8% 7.1% -5.3% -0.6% 1.6% 2.1% 2.0% 2.0% 2.1% 0.9% 1.0% 1.1% 0.8% 1.1% 0.9% 0.7% 0.8% 0.7% 0.7%
Schedule 5
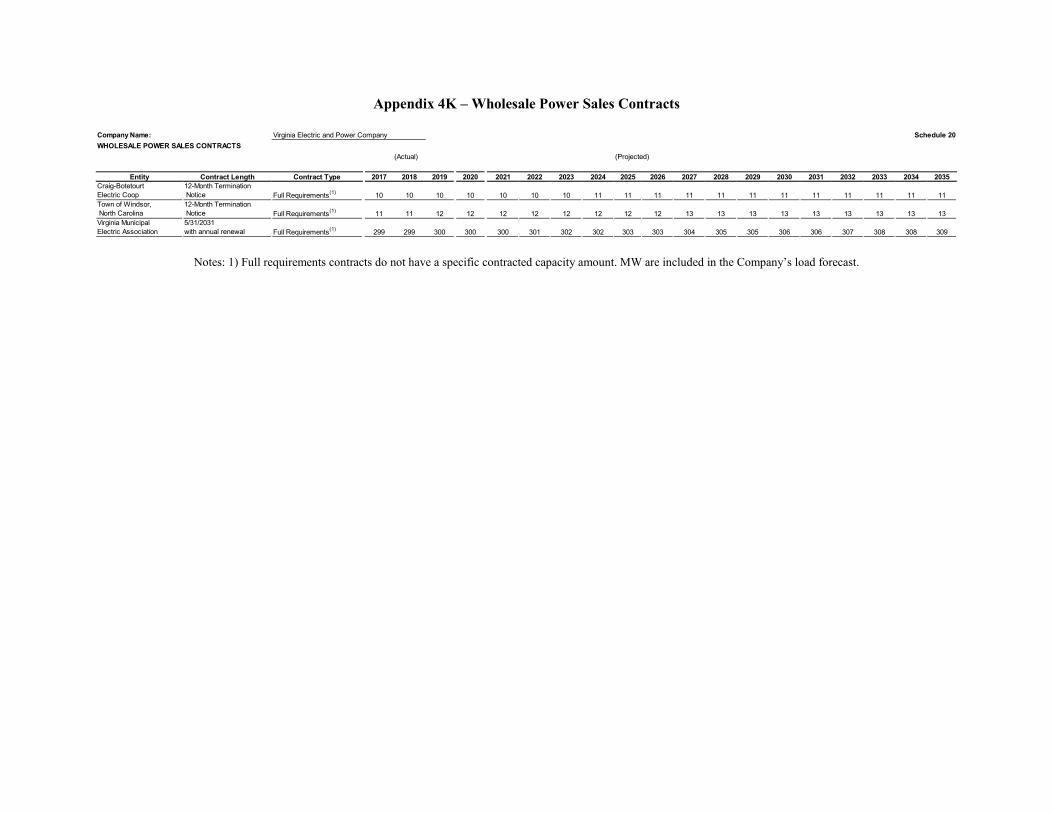
Appendix 4K – Wholesale Power Sales Contracts
Notes: 1) Full requirements contracts do not have a specific contracted capacity amount. MW are included in the Company’s load forecast.
Virginia Electric and Power Company Schedule 20WHOLESALE POWER SALES CONTRACTS
(Actual) (Projected)
Entity Contract Length Contract Type 2017 2018 2019 2020 2021 2022 2023 2024 2025 2026 2027 2028 2029 2030 2031 2032 2033 2034 2035Craig-BotetourtElectric Coop
12-Month Termination Notice Full Requirements(1) 10 10 10 10 10 10 10 11 11 11 11 11 11 11 11 11 11 11 11
Town of Windsor, North Carolina
12-Month Termination Notice Full Requirements(1) 11 11 12 12 12 12 12 12 12 12 13 13 13 13 13 13 13 13 13
Virginia MunicipalElectric Association
5/31/2031with annual renewal Full Requirements(1) 299 299 300 300 300 301 302 302 303 303 304 305 305 306 306 307 308 308 309
Company Name:

Appendix 4L – Load Duration Curves
2020 Load Duration Curve
2025 Load Duration Curve
-
5,000
10,000
15,000
20,000
25,000M
WWithout DSM
With DSM
-
5,000
10,000
15,000
20,000
25,000
MW
Without DSM
With DSM
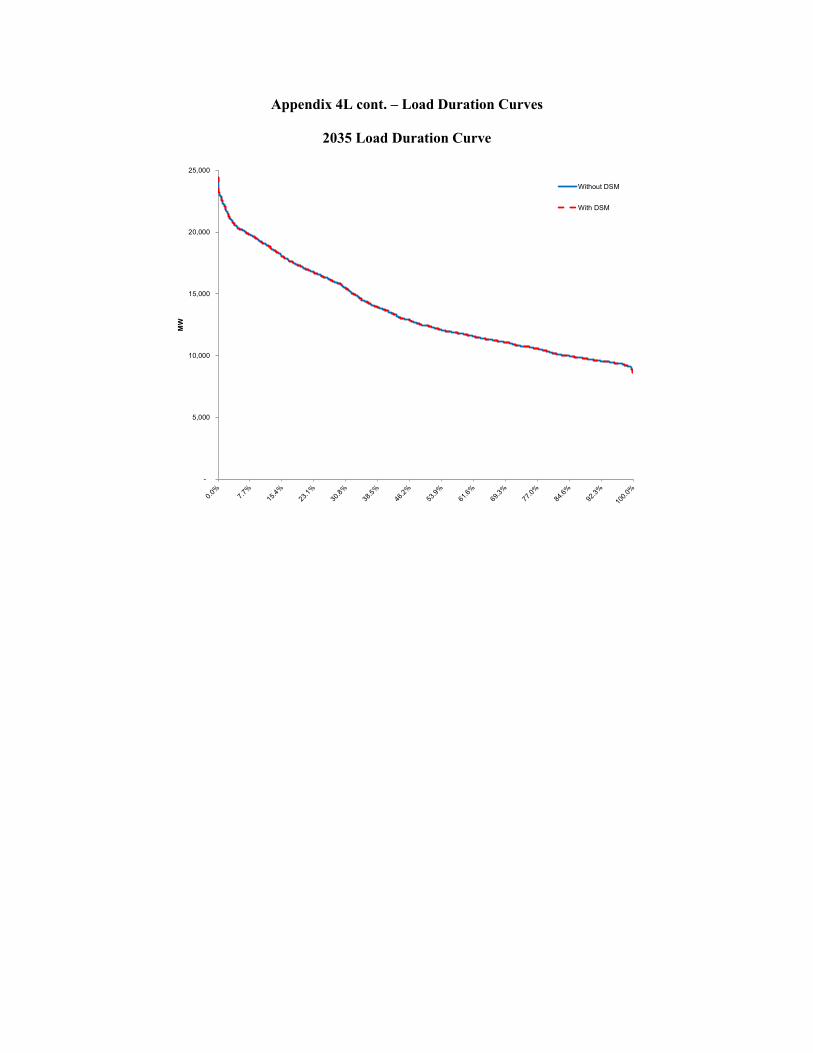
Appendix 4L cont. – Load Duration Curves
2035 Load Duration Curve
-
5,000
10,000
15,000
20,000
25,000M
WWithout DSM
With DSM
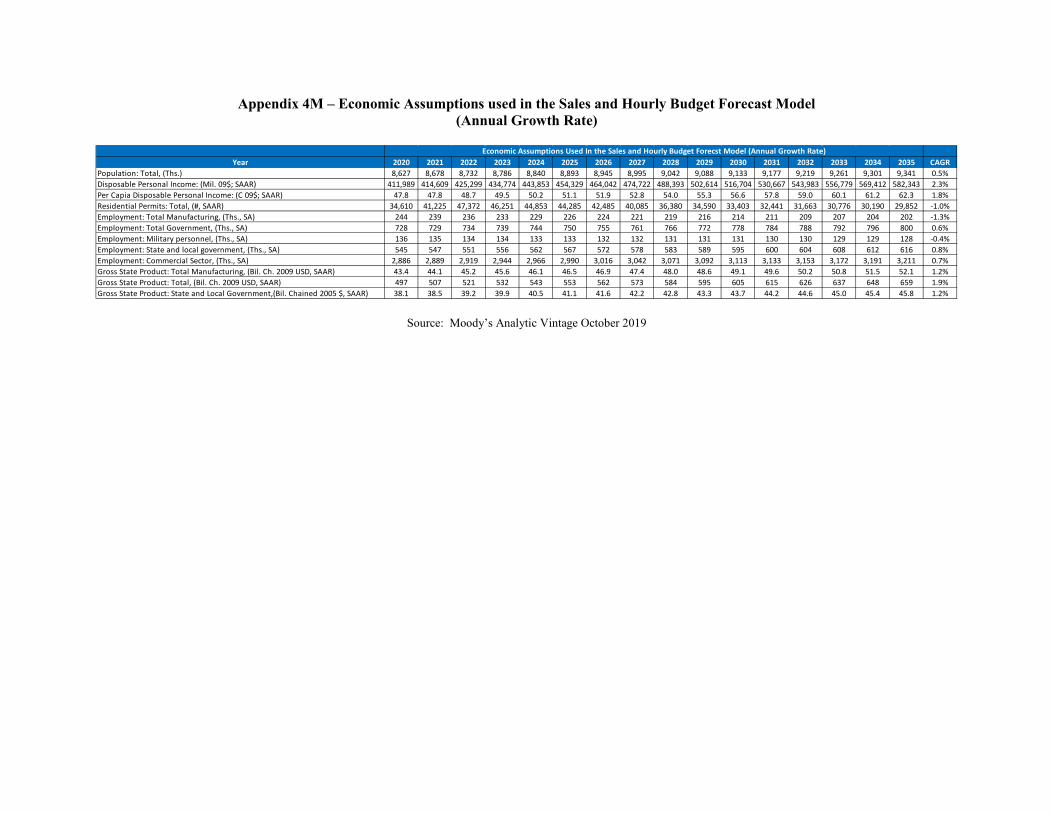
Appendix 4M – Economic Assumptions used in the Sales and Hourly Budget Forecast Model (Annual Growth Rate)
Source: Moody’s Analytic Vintage October 2019
Year 2020 2021 2022 2023 2024 2025 2026 2027 2028 2029 2030 2031 2032 2033 2034 2035 CAGRPopulation: Total, (Ths.) 8,627 8,678 8,732 8,786 8,840 8,893 8,945 8,995 9,042 9,088 9,133 9,177 9,219 9,261 9,301 9,341 0.5%Disposable Personal Income: (Mil. 09$; SAAR) 411,989 414,609 425,299 434,774 443,853 454,329 464,042 474,722 488,393 502,614 516,704 530,667 543,983 556,779 569,412 582,343 2.3%Per Capia Disposable Personal Income: (C 09$; SAAR) 47.8 47.8 48.7 49.5 50.2 51.1 51.9 52.8 54.0 55.3 56.6 57.8 59.0 60.1 61.2 62.3 1.8%Residential Permits: Total, (#, SAAR) 34,610 41,225 47,372 46,251 44,853 44,285 42,485 40,085 36,380 34,590 33,403 32,441 31,663 30,776 30,190 29,852 -1.0%Employment: Total Manufacturing, (Ths., SA) 244 239 236 233 229 226 224 221 219 216 214 211 209 207 204 202 -1.3%Employment: Total Government, (Ths., SA) 728 729 734 739 744 750 755 761 766 772 778 784 788 792 796 800 0.6%Employment: Military personnel, (Ths., SA) 136 135 134 134 133 133 132 132 131 131 131 130 130 129 129 128 -0.4%Employment: State and local government, (Ths., SA) 545 547 551 556 562 567 572 578 583 589 595 600 604 608 612 616 0.8%Employment: Commercial Sector, (Ths., SA) 2,886 2,889 2,919 2,944 2,966 2,990 3,016 3,042 3,071 3,092 3,113 3,133 3,153 3,172 3,191 3,211 0.7%Gross State Product: Total Manufacturing, (Bil. Ch. 2009 USD, SAAR) 43.4 44.1 45.2 45.6 46.1 46.5 46.9 47.4 48.0 48.6 49.1 49.6 50.2 50.8 51.5 52.1 1.2%Gross State Product: Total, (Bil. Ch. 2009 USD, SAAR) 497 507 521 532 543 553 562 573 584 595 605 615 626 637 648 659 1.9%Gross State Product: State and Local Government,(Bil. Chained 2005 $, SAAR) 38.1 38.5 39.2 39.9 40.5 41.1 41.6 42.2 42.8 43.3 43.7 44.2 44.6 45.0 45.4 45.8 1.2%
Economic Assumptions Used In the Sales and Hourly Budget Forecst Model (Annual Growth Rate)

Appendix 4N – Comparison of Moody’s and IHS Total Housing Permits
Real Disposable Income ($000)
0
10,000
20,000
30,000
40,000
50,000
60,000
IHS Economics Moody's Analytics
300
350
400
450
500
550
600
650
IHS Economics Moody's Analytics
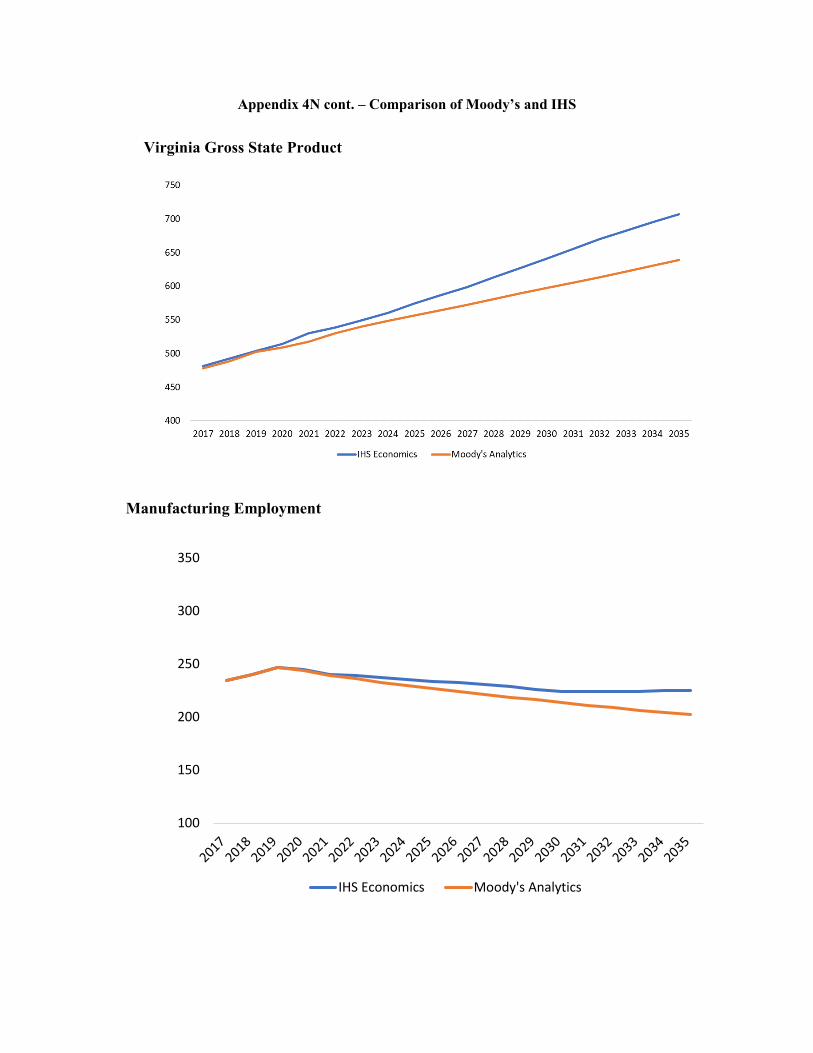
Appendix 4N cont. – Comparison of Moody’s and IHS
Virginia Gross State Product
Manufacturing Employment
100
150
200
250
300
350
IHS Economics Moody's Analytics
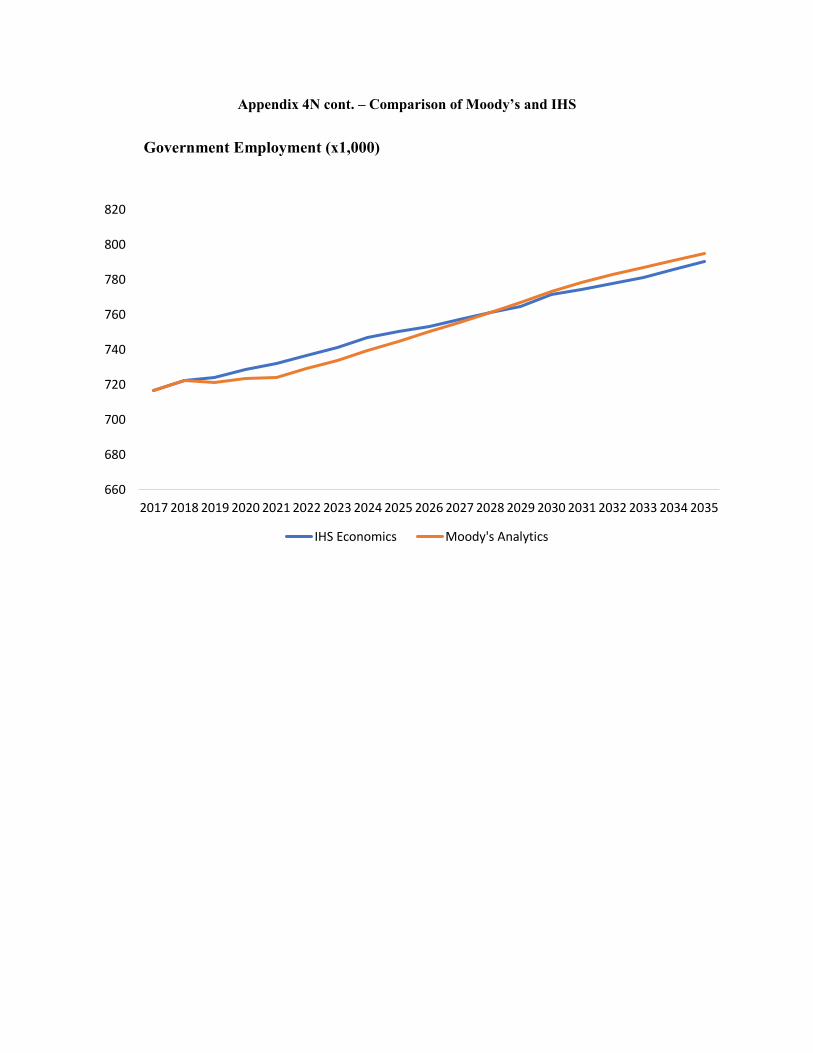
Appendix 4N cont. – Comparison of Moody’s and IHS
Government Employment (x1,000)
660
680
700
720
740
760
780
800
820
2017 2018 2019 2020 2021 2022 2023 2024 2025 2026 2027 2028 2029 2030 2031 2032 2033 2034 2035
IHS Economics Moody's Analytics

Appendix 4O ICF Commodity Price Forecasts for Virginia Electric and Power
Company
Fall 2019 Forecast

NOTICE PROVISIONS FOR AUTHORIZED THIRD PARTY USERS.
This report and information and statements herein are based in whole or in part on information obtained from various sources. ICF makes no assurances as to the accuracy of any such information or any conclusions based thereon. ICF is not responsible for typographical, pictorial or other editorial errors. The report is provided AS IS.
NO WARRANTY, WHETHER EXPRESS OR IMPLIED, INCLUDING THE IMPLIED WARRANTIES OF MERCHANTABILITY AND FITNESS FOR A PARTICULAR PURPOSE IS GIVEN OR MADE BY ICF IN CONNECTION WITH THIS REPORT. You use this report at your own risk. ICF is not liable for any damages of any kind
attributable to your use of this report.

ICF Mid-Case Federal CO2 with Virginia in RGGI Forecast (Nominal $)
CSAPR CSAPR CSAPR
SO2 ($/ton) Ozone NOx
($/ton)Annual NOx
($/ton)
2020 2.29 2.54 1.96 14.26 10.75 32.49 24.01 9.43 31.50 86.31 3.54 103.68 3.54 0.00 2021 2.49 2.90 2.14 13.62 9.55 34.55 26.05 9.38 41.45 113.55 3.54 98.36 3.54 5.05 2022 2.95 3.01 2.46 13.20 8.71 37.65 28.96 8.48 51.31 140.59 3.33 35.69 3.33 5.29 2023 3.29 2.96 2.66 13.62 8.44 38.68 29.75 8.47 52.48 143.78 3.24 3.24 3.24 5.54 2024 3.38 2.90 2.72 14.46 9.03 38.35 29.65 9.72 53.50 146.57 3.30 3.30 3.30 5.80 2025 3.48 3.00 2.79 15.26 9.58 40.49 31.38 11.93 54.52 149.36 3.37 3.37 3.37 6.07 2026 3.69 3.30 2.85 15.96 10.07 43.09 33.45 14.04 55.56 152.21 3.43 3.43 3.43 9.60 2027 3.91 3.44 2.92 16.87 10.70 43.67 34.04 12.27 56.64 155.17 3.50 3.50 3.50 9.31 2028 4.14 3.63 2.99 17.93 11.44 44.66 34.93 10.76 57.74 158.20 3.57 3.57 3.57 9.10 2029 4.37 3.88 3.06 18.98 12.18 46.30 36.32 8.73 58.88 161.32 3.64 3.64 3.64 8.94 2030 4.61 4.19 3.13 19.89 12.82 48.58 38.24 3.96 60.04 164.50 3.71 3.71 3.71 8.84 2031 4.71 4.20 3.21 20.63 13.33 48.44 38.19 5.16 61.21 167.70 3.78 3.78 3.78 9.30 2032 4.80 4.24 3.28 21.23 13.73 48.73 38.43 6.42 62.39 170.92 3.86 3.86 3.86 9.79 2033 4.90 4.44 3.36 21.76 14.08 50.93 40.09 7.75 63.59 174.23 3.93 3.93 3.93 10.31 2034 5.00 4.61 3.44 22.24 14.40 52.78 41.50 9.17 64.81 177.57 4.01 4.01 4.01 10.86 2035 5.10 4.56 3.52 22.70 14.70 51.73 40.80 10.65 66.05 180.95 4.09 4.09 4.09 11.44
PJM-DOM Off-Peak ($/MWh)
PJM Tier 1 REC
Prices ($/MWh)
($/kW-yr) CO2
($/ton)
Fuel Price Emission Prices
1% No.6 Oil ($/MMBtu)
PJM-DOM On-Peak ($/MWh)
($/MW-day)1
Power and REC Prices RTO Capacity Prices
YearHenry Hub
Natural Gas ($/MMBtu)
Zone 5 Delivered
Natural Gas ($/MMBtu)
CAPP CSX: 12,500 1%S
FOB ($/MMBtu)
No. 2 Oil ($/MMBtu)
Note: The 2020 - 2022 prices are a blend of futures/forwards and forecast prices for all commodities except capacity and CO2 prices. 2023 and beyond are forecast prices. Capacity prices reflect PJM RPM auction clearing prices through delivery year 2021/2022, forecast thereafter. CO2 prices reflect the price in Virginia.
1) RTO Capacity prices are restated in the units used by the PJM Capacity market.
COPYRIGHT © 2019 ICF Resources, LLC. All rights reserved.

ICF Commodity Forecast: Natural Gas
Note: The 2020 - 2022 prices are a blend of futures/forwards and forecast prices. 2023 and beyond are forecast prices.
YearNo CO2 Tax Commodity
Forecast
Mid-Case Federal CO2
with Virginia in RGGI Commodity Forecast
Virginia in RGGI Commodity
Forecast
High-Case Federal CO2 Commodity
Forecast
2020 2.29 2.29 2.29 2.29 2021 2.49 2.49 2.49 2.49 2022 3.01 2.95 3.01 2.93 2023 3.34 3.29 3.34 3.28 2024 3.41 3.38 3.41 3.38 2025 3.48 3.48 3.48 3.47 2026 3.67 3.69 3.67 3.74 2027 3.87 3.91 3.87 4.02 2028 4.08 4.14 4.08 4.30 2029 4.29 4.37 4.29 4.60 2030 4.51 4.61 4.51 4.91 2031 4.61 4.71 4.60 4.87 2032 4.70 4.80 4.70 4.82 2033 4.80 4.90 4.79 4.77 2034 4.89 5.00 4.89 4.72 2035 4.99 5.10 4.98 4.66
Henry Hub Natural Gas ($/MMBtu)
COPYRIGHT © 2019 ICF Resources, LLC. All rights reserved.

ICF Commodity Forecast: Natural Gas
Year No CO2 Tax Commodity Forecast
Mid-Case Federal CO2
with Virginia in RGGI Commodity Forecast
Virginia in RGGI Commodity Forecast
High-Case Federal CO2 Commodity
Forecast2020 2.54 2.54 2.54 2.54 2021 2.90 2.90 2.90 2.90 2022 3.06 3.01 3.06 2.98 2023 3.02 2.96 3.02 3.00 2024 2.93 2.90 2.93 3.03 2025 3.00 3.00 3.00 3.12 2026 3.28 3.30 3.28 3.43 2027 3.40 3.44 3.40 3.50 2028 3.58 3.63 3.58 3.81 2029 3.81 3.88 3.81 4.03 2030 4.09 4.19 4.09 4.27 2031 4.10 4.20 4.10 4.58 2032 4.14 4.24 4.13 4.52 2033 4.34 4.44 4.33 4.42 2034 4.51 4.61 4.50 3.83 2035 4.46 4.56 4.45 4.31
Zone 5 Delivered Natural Gas ($/MMBtu)
Note: The 2020 - 2022 prices are a blend of futures/forwards and forecast prices. 2023 and beyond are forecast prices.
COPYRIGHT © 2019 ICF Resources, LLC. All rights reserved.

ICF Commodity Forecast: Coal – FOB
Year No CO2 Tax Commodity Forecast
Mid-Case Federal CO2 with Virginia in RGGI
Commodity Forecast
Virginia in RGGI Commodity Forecast
High-Case Federal CO2
Commodity Forecast
2020 1.96 1.96 1.96 1.96 2021 2.14 2.14 2.14 2.14 2022 2.46 2.46 2.46 2.46 2023 2.66 2.66 2.66 2.65 2024 2.73 2.72 2.73 2.72 2025 2.79 2.79 2.79 2.78 2026 2.86 2.85 2.86 2.85 2027 2.93 2.92 2.93 2.92 2028 3.00 2.99 3.00 2.98 2029 3.07 3.06 3.07 3.06 2030 3.14 3.13 3.14 3.13 2031 3.22 3.21 3.22 3.20 2032 3.29 3.28 3.29 3.28 2033 3.37 3.36 3.37 3.35 2034 3.45 3.44 3.45 3.43 2035 3.53 3.52 3.53 3.51
CAPP CSX: 12,500 1%S FOB ($/MMBtu)
Note: The 2020 - 2022 prices are a blend of futures/forwards and forecast prices. 2023 and beyond are forecast prices.
COPYRIGHT © 2019 ICF Resources, LLC. All rights reserved.
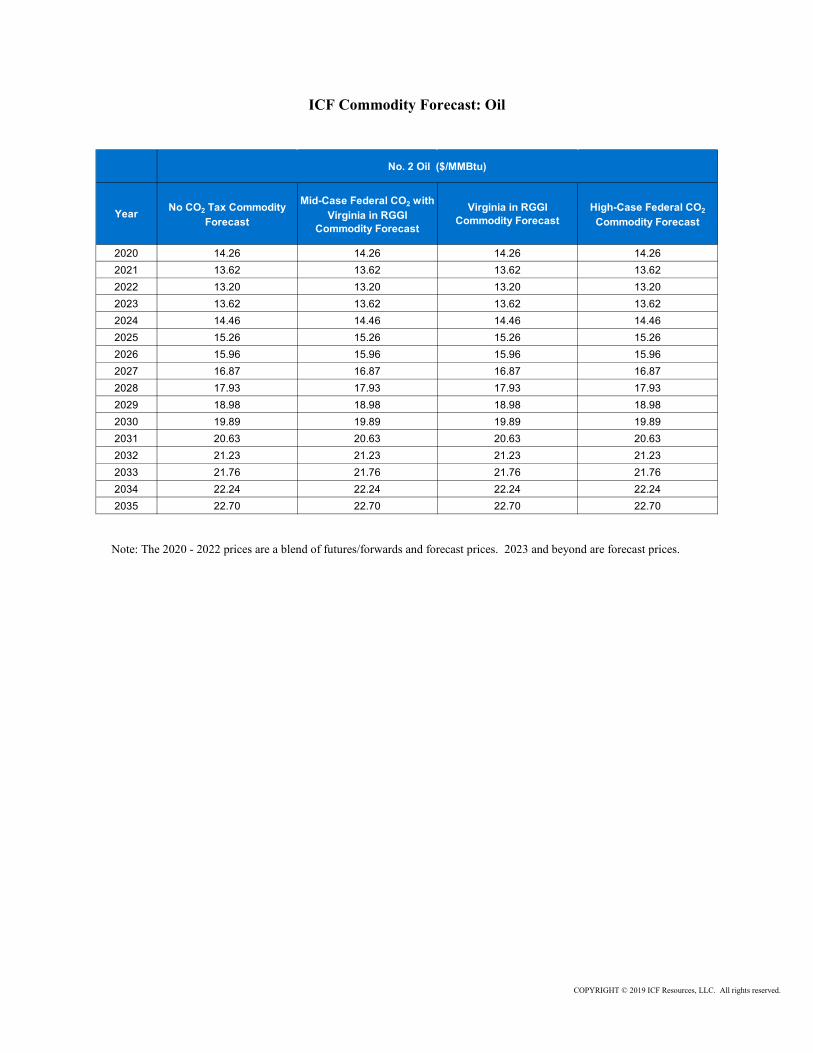
ICF Commodity Forecast: Oil
Year No CO2 Tax Commodity Forecast
Mid-Case Federal CO2 with Virginia in RGGI
Commodity Forecast
Virginia in RGGI Commodity Forecast
High-Case Federal CO2
Commodity Forecast
2020 14.26 14.26 14.26 14.26 2021 13.62 13.62 13.62 13.62 2022 13.20 13.20 13.20 13.20 2023 13.62 13.62 13.62 13.62 2024 14.46 14.46 14.46 14.46 2025 15.26 15.26 15.26 15.26 2026 15.96 15.96 15.96 15.96 2027 16.87 16.87 16.87 16.87 2028 17.93 17.93 17.93 17.93 2029 18.98 18.98 18.98 18.98 2030 19.89 19.89 19.89 19.89 2031 20.63 20.63 20.63 20.63 2032 21.23 21.23 21.23 21.23 2033 21.76 21.76 21.76 21.76 2034 22.24 22.24 22.24 22.24 2035 22.70 22.70 22.70 22.70
No. 2 Oil ($/MMBtu)
Note: The 2020 - 2022 prices are a blend of futures/forwards and forecast prices. 2023 and beyond are forecast prices.
COPYRIGHT © 2019 ICF Resources, LLC. All rights reserved.
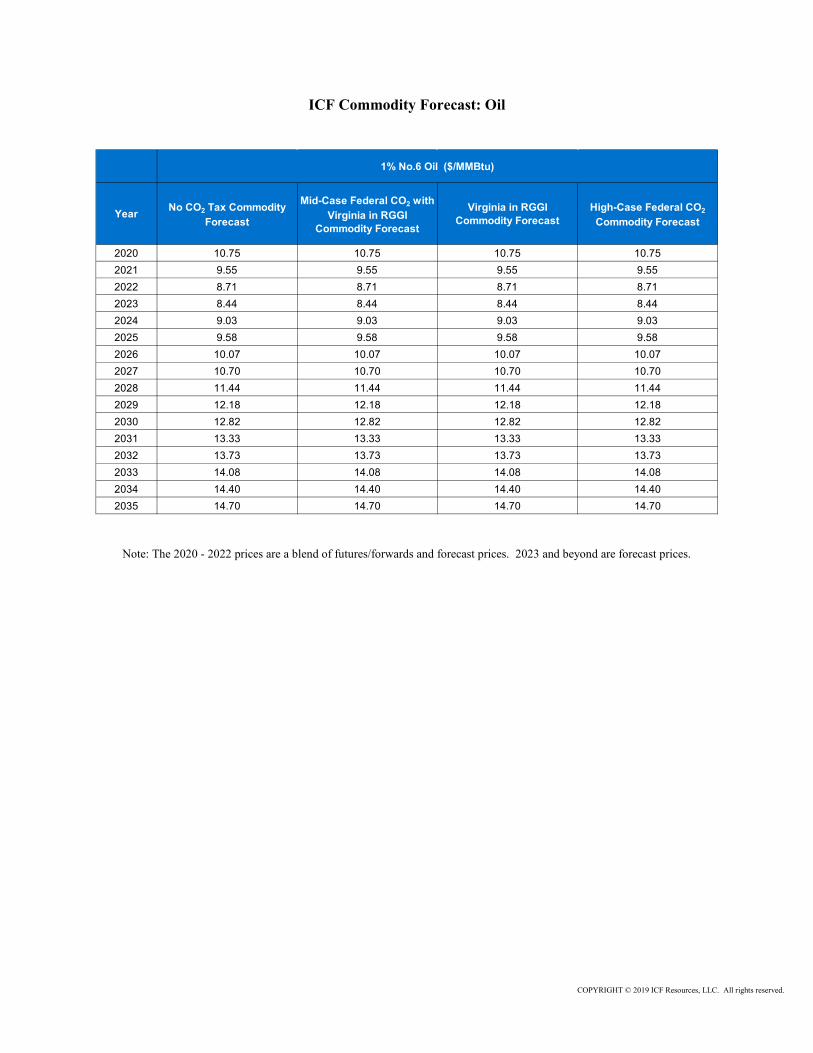
ICF Commodity Forecast: Oil
Year No CO2 Tax Commodity Forecast
Mid-Case Federal CO2 with Virginia in RGGI
Commodity Forecast
Virginia in RGGI Commodity Forecast
High-Case Federal CO2
Commodity Forecast
2020 10.75 10.75 10.75 10.75 2021 9.55 9.55 9.55 9.55 2022 8.71 8.71 8.71 8.71 2023 8.44 8.44 8.44 8.44 2024 9.03 9.03 9.03 9.03 2025 9.58 9.58 9.58 9.58 2026 10.07 10.07 10.07 10.07 2027 10.70 10.70 10.70 10.70 2028 11.44 11.44 11.44 11.44 2029 12.18 12.18 12.18 12.18 2030 12.82 12.82 12.82 12.82 2031 13.33 13.33 13.33 13.33 2032 13.73 13.73 13.73 13.73 2033 14.08 14.08 14.08 14.08 2034 14.40 14.40 14.40 14.40 2035 14.70 14.70 14.70 14.70
1% No.6 Oil ($/MMBtu)
Note: The 2020 - 2022 prices are a blend of futures/forwards and forecast prices. 2023 and beyond are forecast prices.
COPYRIGHT © 2019 ICF Resources, LLC. All rights reserved.

ICF Commodity Forecast: On-Peak Power Price
Year No CO2 Tax Commodity Forecast
Mid-Case Federal CO2 with Virginia in RGGI
Commodity Forecast
Virginia in RGGI Commodity Forecast
High-Case Federal CO2
Commodity Forecast
2020 32.49 32.49 32.49 32.49 2021 34.54 34.55 34.58 34.51 2022 37.61 37.65 38.01 37.06 2023 38.66 38.68 39.19 37.52 2024 38.29 38.35 38.79 37.81 2025 40.33 40.49 40.84 38.88 2026 42.44 43.09 42.90 44.52 2027 42.51 43.67 42.90 47.17 2028 42.94 44.66 43.27 53.13 2029 44.00 46.30 44.24 56.27 2030 45.64 48.58 45.79 63.37 2031 45.42 48.44 45.55 69.91 2032 45.62 48.73 45.72 70.05 2033 47.62 50.93 47.73 69.21 2034 49.31 52.78 49.38 60.07 2035 48.19 51.73 48.26 68.39
PJM-DOM On-Peak ($/MWh)
Note: The 2020 - 2022 prices are a blend of futures/forwards and forecast prices. 2023 and beyond are forecast prices.
COPYRIGHT © 2019 ICF Resources, LLC. All rights reserved.

ICF Commodity Forecast: Off-Peak Power Price
Year No CO2 Tax Commodity Forecast
Mid-Case Federal CO2 with Virginia in RGGI
Commodity Forecast
Virginia in RGGI Commodity Forecast
High-Case Federal CO2
Commodity Forecast
2020 24.01 24.01 24.01 24.01 2021 26.06 26.05 26.07 26.03 2022 29.00 28.96 29.25 28.51 2023 29.81 29.75 30.16 28.73 2024 29.65 29.65 30.00 28.98 2025 31.29 31.38 31.65 29.85 2026 32.94 33.45 33.28 34.60 2027 33.09 34.04 33.37 37.17 2028 33.50 34.93 33.74 42.28 2029 34.40 36.32 34.58 45.15 2030 35.75 38.24 35.87 51.27 2031 35.65 38.19 35.74 56.41 2032 35.81 38.43 35.87 56.48 2033 37.32 40.09 37.37 55.69 2034 38.59 41.50 38.62 48.45 2035 37.84 40.80 37.84 55.00
PJM-DOM Off-Peak ($/MWh)
Note: The 2020 - 2022 prices are a blend of futures/forwards and forecast prices. 2023 and beyond are forecast prices.
COPYRIGHT © 2019 ICF Resources, LLC. All rights reserved.

ICF Commodity Forecast: PJM Tier 1 Renewable Energy Certificates
Year No CO2 Tax Commodity Forecast
Mid-Case Federal CO2 with Virginia in RGGI
Commodity Forecast
Virginia in RGGI Commodity Forecast
High-Case Federal CO2
Commodity Forecast
2020 9.43 9.43 9.43 9.43 2021 9.38 9.38 9.38 9.38 2022 8.51 8.48 8.46 8.58 2023 8.53 8.47 8.39 8.80 2024 9.83 9.72 9.70 10.21 2025 12.20 11.93 12.01 12.27 2026 14.70 14.04 14.36 13.22 2027 13.34 12.27 13.06 8.29 2028 12.25 10.76 12.04 4.08 2029 10.64 8.73 10.48 3.88 2030 3.96 3.96 3.96 3.96 2031 5.70 5.16 5.65 4.04 2032 7.56 6.42 7.43 4.11 2033 9.52 7.75 9.33 4.19 2034 11.58 9.17 11.33 4.28 2035 13.77 10.65 13.44 4.36
PJM Tier 1 REC Prices ($/MWh)
Note: The 2020 - 2022 prices are a blend of futures/forwards and forecast prices. 2023 and beyond are forecast prices.
COPYRIGHT © 2019 ICF Resources, LLC. All rights reserved.

ICF Commodity Forecast: PJM RTO Capacity
Note: PJM RPM auction clearing prices through delivery year 2021/22, forecast thereafter.
COPYRIGHT © 2019 ICF Resources, LLC. All rights reserved.

ICF Commodity Forecast: PJM RTO Capacity
Year No CO2 Tax Commodity Forecast
Mid-Case Federal CO2 with Virginia in RGGI
Commodity Forecast
Virginia in RGGI Commodity Forecast
High-Case Federal CO2
Commodity Forecast
2020 86.31 86.31 86.31 86.31 2021 113.55 113.55 113.55 113.55 2022 140.70 140.59 140.61 140.58 2023 144.09 143.78 143.85 143.76 2024 147.08 146.57 146.68 146.54 2025 150.09 149.36 149.51 149.32 2026 153.16 152.21 152.41 152.15 2027 156.35 155.17 155.41 155.10 2028 159.61 158.20 158.49 158.11 2029 162.98 161.32 161.66 161.22 2030 166.42 164.50 164.90 164.38 2031 169.88 167.70 168.14 167.56 2032 173.38 170.92 171.43 170.77 2033 176.97 174.23 174.79 174.06 2034 180.60 177.57 178.19 177.38 2035 184.28 180.95 181.63 180.74
RTO Capacity Prices ($/MW-day)
Note: RTO Capacity prices are restated in the units used by the PJM Capacity market. PJM RPM auction clearing prices through delivery year 2021/22, forecast thereafter.
COPYRIGHT © 2019 ICF Resources, LLC. All rights reserved.

ICF Commodity Forecast: SO2 Emission Allowances
Note: The 2020 - 2022 prices are a blend of futures/forwards and forecast prices. 2023 and beyond are forecast prices.
Year No CO2 Tax Commodity Forecast
Mid-Case Federal CO2 with Virginia in RGGI
Commodity Forecast
Virginia in RGGI Commodity Forecast
High-Case Federal CO2
Commodity Forecast
2020 3.54 3.54 3.54 3.54 2021 3.54 3.54 3.54 3.54 2022 3.33 3.33 3.33 3.33 2023 3.24 3.24 3.24 3.24 2024 3.30 3.30 3.30 3.30 2025 3.37 3.37 3.37 3.37 2026 3.43 3.43 3.43 3.43 2027 3.50 3.50 3.50 3.50 2028 3.57 3.57 3.57 3.57 2029 3.64 3.64 3.64 3.64 2030 3.71 3.71 3.71 3.71 2031 3.78 3.78 3.78 3.78 2032 3.86 3.86 3.86 3.86 2033 3.93 3.93 3.93 3.93 2034 4.01 4.01 4.01 4.01 2035 4.09 4.09 4.09 4.09
CSAPR SO2 ($/Ton)
COPYRIGHT © 2019 ICF Resources, LLC. All rights reserved.
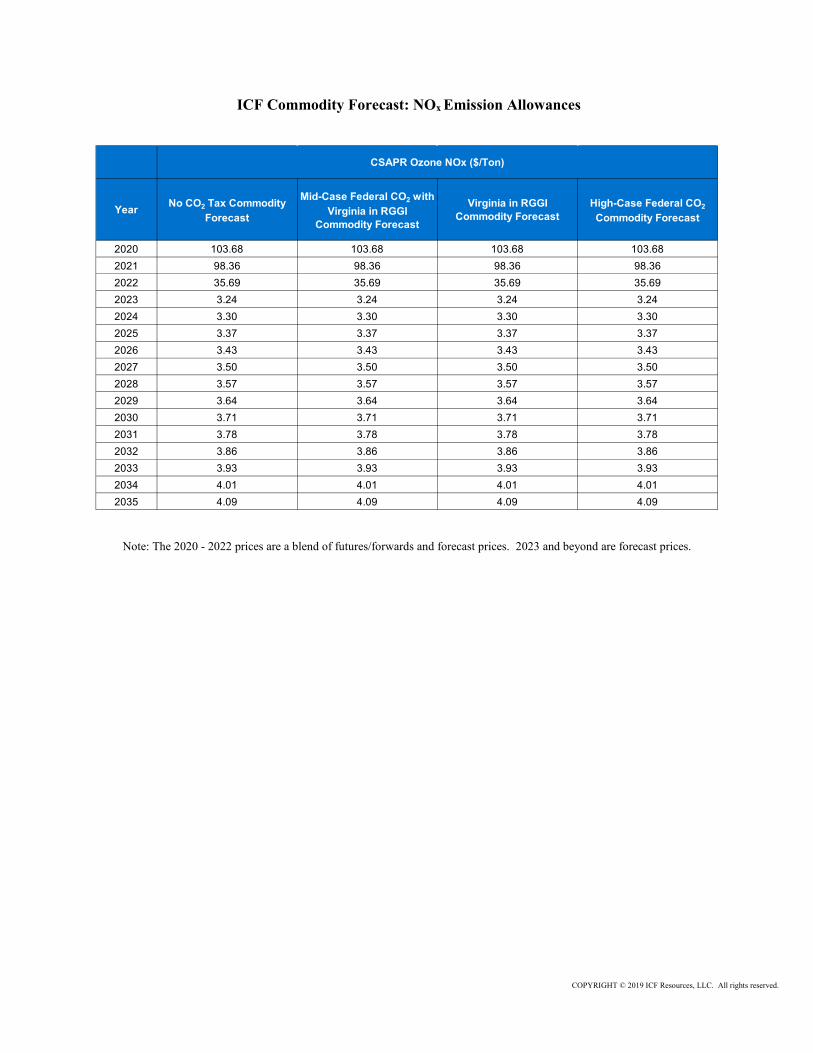
ICF Commodity Forecast: NOx Emission Allowances
Note: The 2020 - 2022 prices are a blend of futures/forwards and forecast prices. 2023 and beyond are forecast prices.
Year No CO2 Tax Commodity Forecast
Mid-Case Federal CO2 with Virginia in RGGI
Commodity Forecast
Virginia in RGGI Commodity Forecast
High-Case Federal CO2
Commodity Forecast
2020 103.68 103.68 103.68 103.68 2021 98.36 98.36 98.36 98.36 2022 35.69 35.69 35.69 35.69 2023 3.24 3.24 3.24 3.24 2024 3.30 3.30 3.30 3.30 2025 3.37 3.37 3.37 3.37 2026 3.43 3.43 3.43 3.43 2027 3.50 3.50 3.50 3.50 2028 3.57 3.57 3.57 3.57 2029 3.64 3.64 3.64 3.64 2030 3.71 3.71 3.71 3.71 2031 3.78 3.78 3.78 3.78 2032 3.86 3.86 3.86 3.86 2033 3.93 3.93 3.93 3.93 2034 4.01 4.01 4.01 4.01 2035 4.09 4.09 4.09 4.09
CSAPR Ozone NOx ($/Ton)
COPYRIGHT © 2019 ICF Resources, LLC. All rights reserved.

ICF Commodity Forecast: NOx Emission Allowances
Note: The 2020 - 2022 prices are a blend of futures/forwards and forecast prices. 2023 and beyond are forecast prices.
Year No CO2 Tax Commodity Forecast
Mid-Case Federal CO2 with Virginia in RGGI
Commodity Forecast
Virginia in RGGI Commodity Forecast
High-Case Federal CO2
Commodity Forecast
2020 3.54 3.54 3.54 3.54 2021 3.54 3.54 3.54 3.54 2022 3.33 3.33 3.33 3.33 2023 3.24 3.24 3.24 3.24 2024 3.30 3.30 3.30 3.30 2025 3.37 3.37 3.37 3.37 2026 3.43 3.43 3.43 3.43 2027 3.50 3.50 3.50 3.50 2028 3.57 3.57 3.57 3.57 2029 3.64 3.64 3.64 3.64 2030 3.71 3.71 3.71 3.71 2031 3.78 3.78 3.78 3.78 2032 3.86 3.86 3.86 3.86 2033 3.93 3.93 3.93 3.93 2034 4.01 4.01 4.01 4.01 2035 4.09 4.09 4.09 4.09
CSAPR Annual NOx ($/Ton)
COPYRIGHT © 2019 ICF Resources, LLC. All rights reserved.

ICF Commodity Forecast: CO2
Note: The CO2 prices are reflective of the price in Virginia.
COPYRIGHT © 2019 ICF Resources, LLC. All rights reserved.

Appendix 4P – ICF Price Forecasts
Fuel Price Forecast – Natural Gas Henry Hub
Fuel Price Forecast – Natural Gas Transco Zone 5

Appendix 4P cont. – ICF Price Forecasts
Fuel Price Forecast – Coal
Fuel Price Forecast – #2 Oil
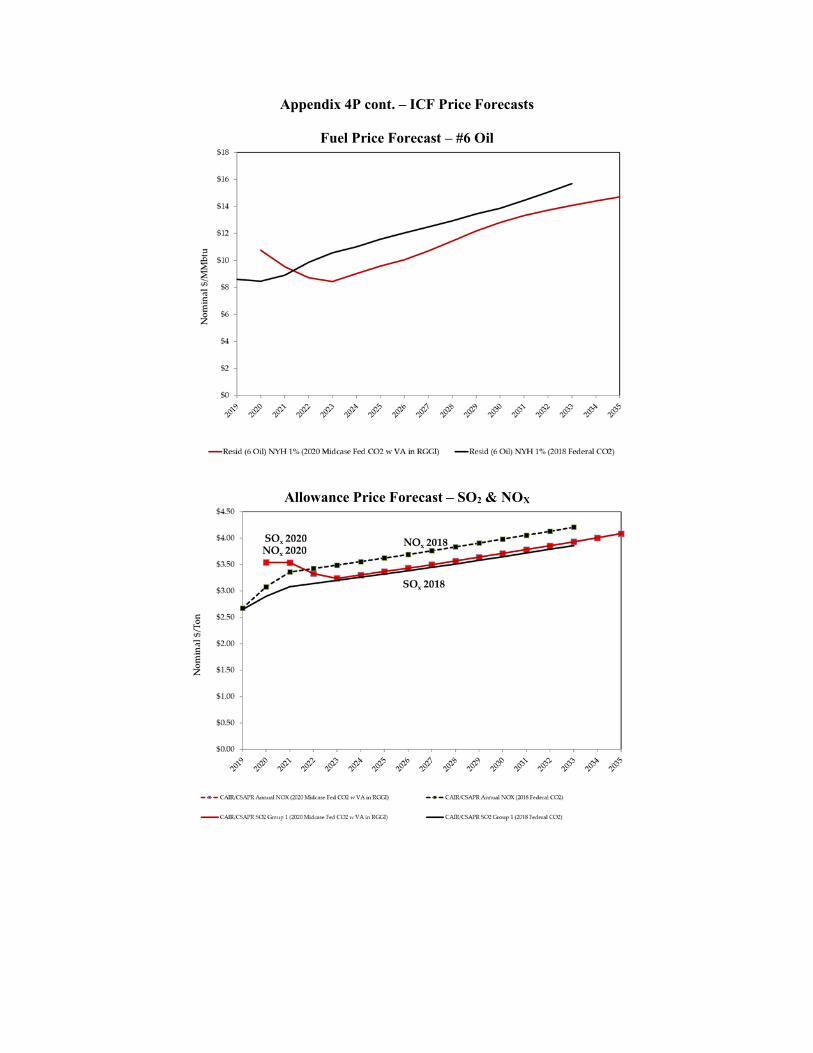
Appendix 4P cont. – ICF Price Forecasts
Fuel Price Forecast – #6 Oil
Allowance Price Forecast – SO2 & NOX

Appendix 4P cont. – ICF Price Forecasts
Allowance Price Forecast – CO2
Note: The Federal CO2 commodity forecast used in the 2018 Plan included a CO2 allowance price beginning in 2026 on a per ton basis. The Mid-Case Federal CO2 with Virginia in RGGI Commodity Forecast used in the 2020 Plan utilizes the RGGI
allowance.
Power Price Forecast – On-Peak Power
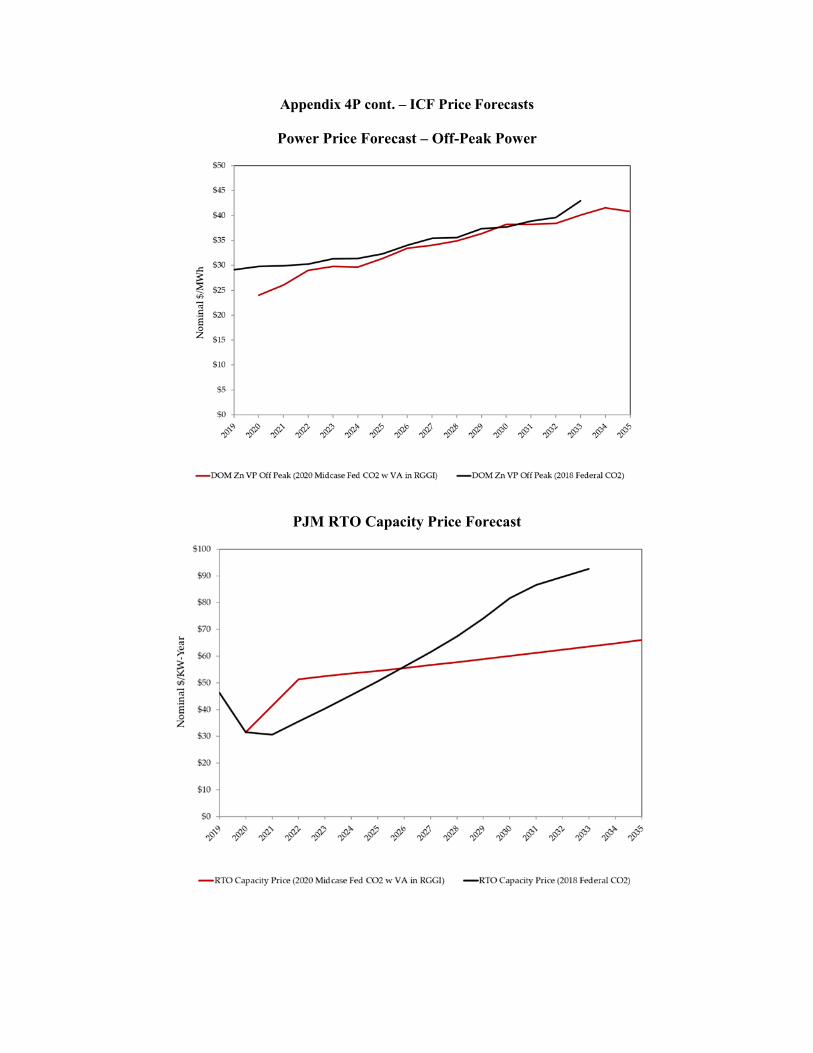
Appendix 4P cont. – ICF Price Forecasts
Power Price Forecast – Off-Peak Power
PJM RTO Capacity Price Forecast
1 | P a g e
Overview of PJM REC Price Forecasting
March 2020
Prepared For: Dominion Energy Virginia
Prepared by: ICF Resources, LLC
Appendix 4Q – Overview of PJM REC Price Forecasting

2 | P a g e
Overview of PJM REC Price Forecasting
NOTICE PROVISIONS FOR AUTHORIZED THIRD PARTY USERS.
This report and information and statements herein are based in whole or in part on information obtained from
various sources. ICF makes no assurances as to the accuracy of any such information or any conclusions based
thereon. ICF is not responsible for typographical, pictorial or other editorial errors. The report is provided AS IS.
NO WARRANTY, WHETHER EXPRESS OR IMPLIED, INCLUDING THE IMPLIED WARRANTIES OF MERCHANTABILITY AND
FITNESS FOR A PARTICULAR PURPOSE IS GIVEN OR MADE BY ICF IN CONNECTION WITH THIS REPORT. You use this
report at your own risk. ICF is not liable for any damages of any kind attributable to your use of this report.
3 | P a g e
Overview of PJM REC Price Forecasting
Table of Contents PJM Market Background .................................................................................................................4
ICF Fundamental Modeling for REC pricing .......................................................................................5
Demand......................................................................................................................................5
Supply ........................................................................................................................................6
Sensitivity Case Modeling ................................................................................................................8
Case Results ................................................................................................................................. 11
Business as Usual Policy Case ..................................................................................................... 11
The Moderate Policy Case.......................................................................................................... 11
The Aggressive Policy Case ......................................................................................................... 12
Probability Weighted REC Price Projection .................................................................................. 13
REC Price Projection Comparisons .............................................................................................. 13
Federal Tax Credit Extension Sensitivity ...................................................................................... 14
Voluntary REC Markets .............................................................................................................. 14

4 | P a g e
Overview of PJM REC Price Forecasting
PJM Market Background The PJM power market includes nine states or areas with sizeable Renewable Portfolio Standards (RPS).
The standards—in Delaware, Illinois, Maryland, Michigan, New Jersey, North Carolina, Ohio,
Pennsylvania, and Washington DC—require an escalating portion of retail sales be met through qualified
renewable energy (RE) generation.1 Additionally, Indiana has voluntary targets.
Load serving entities in the PJM region comply with their relevant RPS obligations via Renewable Energy
Credits (RECs), where one credit represents one MWh of qualifying generation. RECs are tradeable and
have varying values depending on the state. Many states have multiple types of RECs, including Tier I,
Tier II and solar carve-out RECs (or SRECs). Of these, SRECs and Tier I RECs are typically the most
valuable. Of the PJM states with mandatory RPS requirements, all but Michigan require that a minimum
percent of their load be supplied by solar energy, known as a solar carve-out. More recently, several
states in the U.S. have added targets for offshore wind within their renewable goals. Within PJM,
Maryland and New Jersey have done so. The current RPS mandates for each PJM state are shown in
Exhibit 1.
Exhibit 1: Current State Level RPS Targets
State Tier I Target Solar Carve-out Offshore Wind Buildout
New Jersey 50% by 2030 5.1% by 2021, TBD by 2030 3,500 MW by 2030 Pennsylvania 8% by 2021 0.5% by 2021 N/A
Maryland 50% by 2030 14.5% by 2028 1,568 MW by 2030
Delaware 25% by 2025 3.5% by 2025 N/A
Ohio 8.5% by 2026 N/A N/A
Washington, D.C. 100% by 2032 10% by 2041 N/A
Illinois1 25% by 2026 4 million RECs by 2030 N/A
Michigan1,2 15% by 2021 N/A N/A North Carolina1 12.5% by 2021 0.2% by 2018 N/A 1 Only part of the state falls within the PJM footprint. 2 Michigan utilities Consumers and DTE have committed to 25% renewable energy by 2030.
The ICF Forecasting methodology for REC pricing begins with a fundamentals view of the PJM market,
through assessing the drivers of supply and demand for RECs. For the 2020 IRP forecast for Dominion
Energy Virginia (“Dominion”), ICF has expanded this fundamentals approach to better capture the
uncertainty in REC markets by creating a weighted price forecast considering alternate forward looking
renewable market scenarios. Below is a discussion of the fundamentals modeling approach, which is
used within each of the scenario modeling, followed by a discussion of the RPS sensitivities and
weighting methodology used to capture uncertainty.
1 In March 2020 the Virginia General Assembly passed the Virginia Clean Economy Act, mandating 100% clean energy by 2045 for Phase II Utilities and by 2050 for Phase I Utilities. This legislation was not included in the modeling.

5 | P a g e
Overview of PJM REC Price Forecasting
ICF Fundamental Modeling for REC pricing
Demand ICF models the PJM RPS demand using state level RPS requirements and provides a Mid-Atlantic PJM
Tier 1 REC price forecast to Dominion. The PJM Tier I trading market is represented by New Jersey,
Pennsylvania, Maryland, Delaware, Ohio and D.C. REC markets. Due to overlapping generator eligibility
criteria, these states typically coalesce into one REC trading market with similar clearing prices, as shown
in Exhibit 2. The Tier I market reflects the RPS demand net of the solar carve-outs, which are supplied in
a separate compliance market using SRECs. REC prices typically represent the gap between the costs of a
new renewable facility and the revenues they receive from energy and capacity markets.
Exhibit 2: Historical PJM Tier I REC Market Trading Prices
Source: Lawrence Berkeley National Labs, U.S. Renewable Portfolio Standards 2019 Annual Status Report.
The demand for PJM Tier I RECs is equal to the retail sales of eligible load-serving entities (LSE) in each state, multiplied by the RPS requirement. In its BAU Case, ICF models fully promulgated renewable portfolio standards (i.e. no proposed or speculative goals are used to establish the BAU case). ICF assumes that once a state reaches its terminal target (see Exhibit 1), the percent target remains flat over time. The latest terminal target within the Mid-Atlantic States is 2032. Beyond the point at which the terminal targets are met, changes in the demand for RECs are driven only by load growth. ICF relies on the PJM 2019 load forecast as the basis for the load growth which is used to determine RPS demand requirements. Exhibit 3 provides the BAU Case RPS demand by state over time.

6 | P a g e
Overview of PJM REC Price Forecasting
Exhibit 3: Projected RPS Demand1 2020-2050 for PJM States2
1 Demand shown is Tier I net of solar carve-outs. 2 Demand is shown at a state level; for those states only partially contained within PJM, demand outside the PJM area is
included.
Each state also has an Alternative Compliance Payment (ACP) mechanism as part of its RPS program
shown in Exhibit 4. ACPs effectively serve as a price ceiling on the market price for RECs and, to some
extent, they act as a cap on the market demand for RECs.
Exhibit 4: State Alternative Compliance Payments
State Tier I ACP
New Jersey $50/MWh
Pennsylvania $45/MWh
Maryland1 $30/MWh
Delaware2 $25/MWh
Ohio $45/MWh
Washington, D.C. $50/MWh 1 The MD ACP is $30/MWh in 2019, reduced to $22.35/MWh by 2030. 2 If a Delaware retail electricity supplier has paid the $25/MWh ACP in a previous year, then the ACP increases to $50/MWh for the second deficient year, and $80/MWh for subsequent deficient years.
Supply ICF’s modeling of state level RPS programs specifies generator type eligibility at the program level.
Geographic eligibility is also specified at the program level for each RPS program. Banked RECs are also
eligible to meet RPS demand (states typically have 3-year REC lifetimes). The current supply of existing
eligible resources, as well as all eligible new resources that could be built to meet incremental RPS
demand based on the eligibility criteria are reflected in the ICF analysis.
Exhibit 5 illustrates that most PJM Tier 1 RPS programs accept RECs that are generated anywhere within
PJM. Some states have limitations on solar eligibility, like New Jersey, and others have more restrictive
Tier I eligibility, such as Ohio.
-
50
100
150
200
2020 2025 2030 2035 2040 2050 2060
TWh
Projected RPS Demand Growth
OH PA NJ MD DE DC IL MI NC
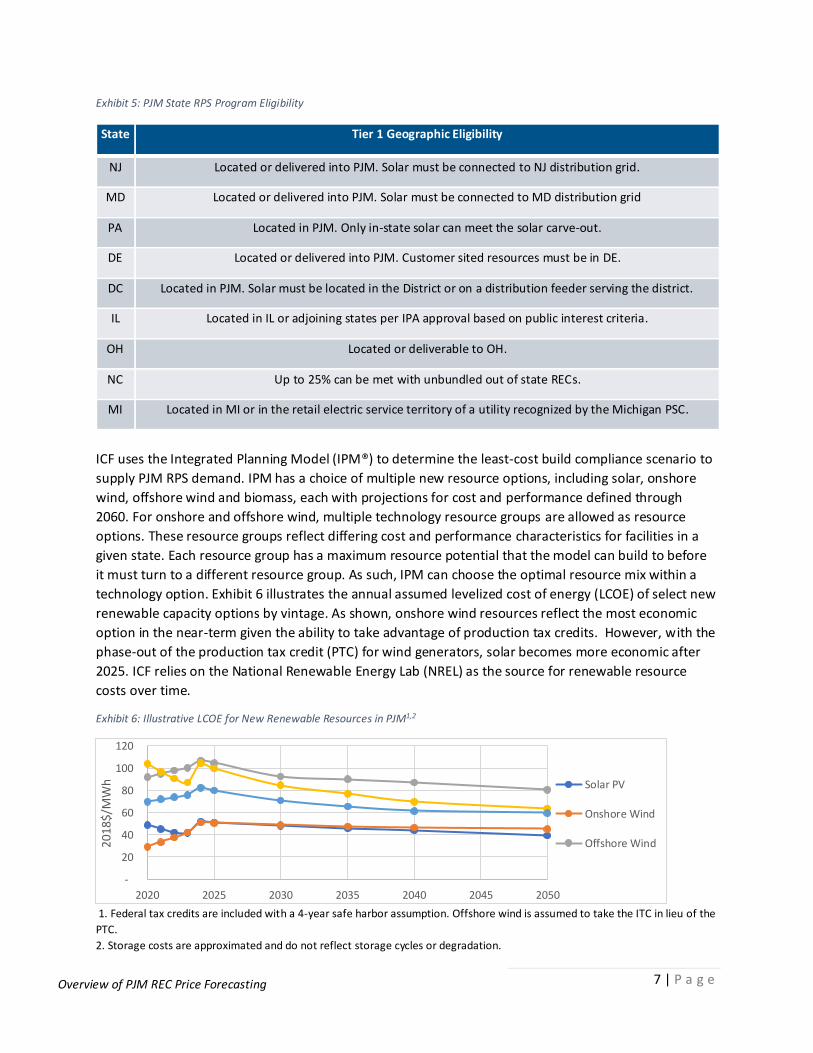
7 | P a g e
Overview of PJM REC Price Forecasting
Exhibit 5: PJM State RPS Program Eligibility
State Tier 1 Geographic Eligibility
NJ Located or delivered into PJM. Solar must be connected to NJ distribution grid.
MD Located or delivered into PJM. Solar must be connected to MD distribution grid
PA Located in PJM. Only in-state solar can meet the solar carve-out.
DE Located or delivered into PJM. Customer sited resources must be in DE.
DC Located in PJM. Solar must be located in the District or on a distribution feeder serving the district.
IL Located in IL or adjoining states per IPA approval based on public interest criteria.
OH Located or deliverable to OH.
NC Up to 25% can be met with unbundled out of state RECs.
MI Located in MI or in the retail electric service territory of a utility recognized by the Michigan PSC.
ICF uses the Integrated Planning Model (IPM®) to determine the least-cost build compliance scenario to
supply PJM RPS demand. IPM has a choice of multiple new resource options, including solar, onshore
wind, offshore wind and biomass, each with projections for cost and performance defined through
2060. For onshore and offshore wind, multiple technology resource groups are allowed as resource
options. These resource groups reflect differing cost and performance characteristics for facilities in a
given state. Each resource group has a maximum resource potential that the model can build to before
it must turn to a different resource group. As such, IPM can choose the optimal resource mix within a
technology option. Exhibit 6 illustrates the annual assumed levelized cost of energy (LCOE) of select new
renewable capacity options by vintage. As shown, onshore wind resources reflect the most economic
option in the near-term given the ability to take advantage of production tax credits. However, with the
phase-out of the production tax credit (PTC) for wind generators, solar becomes more economic after
2025. ICF relies on the National Renewable Energy Lab (NREL) as the source for renewable resource
costs over time.
Exhibit 6: Illustrative LCOE for New Renewable Resources in PJM1,2
1. Federal tax credits are included with a 4-year safe harbor assumption. Offshore wind is assumed to take the ITC in lieu of the
PTC.
2. Storage costs are approximated and do not reflect storage cycles or degradation.
-
20
40
60
80
100
120
2020 2025 2030 2035 2040 2045 2050
2018
$/M
Wh Solar PV
Onshore Wind
Offshore Wind
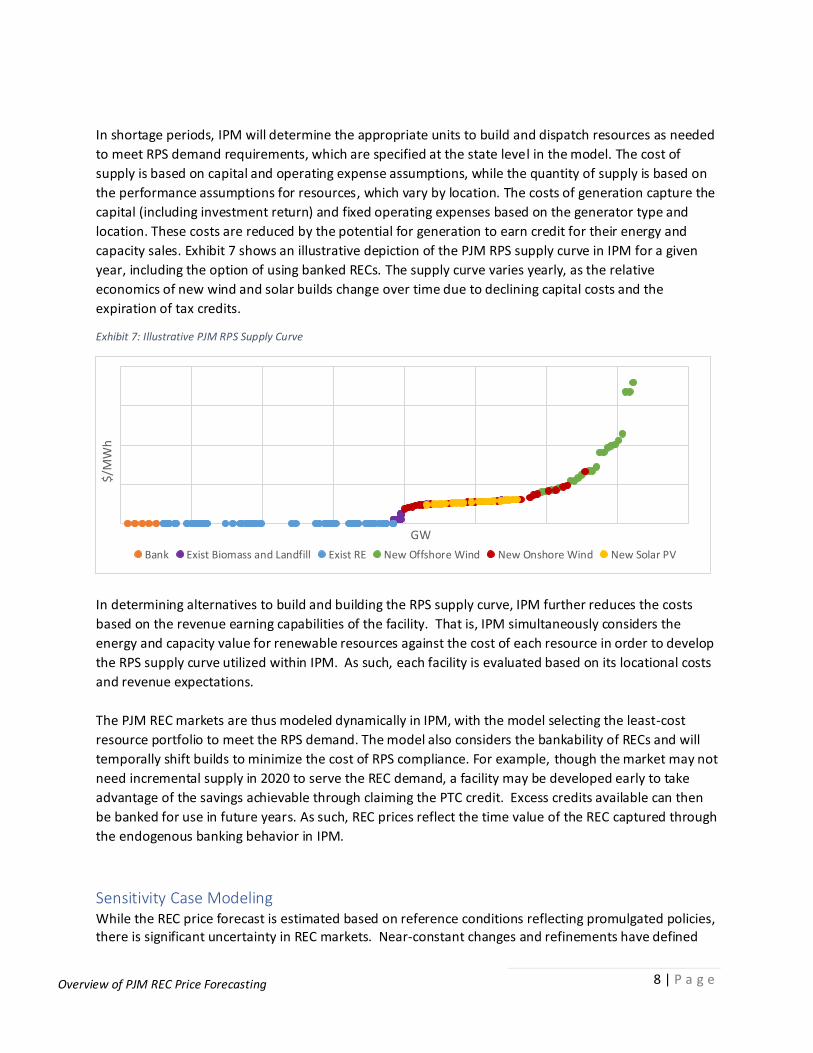
8 | P a g e
Overview of PJM REC Price Forecasting
In shortage periods, IPM will determine the appropriate units to build and dispatch resources as needed
to meet RPS demand requirements, which are specified at the state level in the model. The cost of
supply is based on capital and operating expense assumptions, while the quantity of supply is based on
the performance assumptions for resources, which vary by location. The costs of generation capture the
capital (including investment return) and fixed operating expenses based on the generator type and
location. These costs are reduced by the potential for generation to earn credit for their energy and
capacity sales. Exhibit 7 shows an illustrative depiction of the PJM RPS supply curve in IPM for a given
year, including the option of using banked RECs. The supply curve varies yearly, as the relative
economics of new wind and solar builds change over time due to declining capital costs and the
expiration of tax credits.
Exhibit 7: Illustrative PJM RPS Supply Curve
In determining alternatives to build and building the RPS supply curve, IPM further reduces the costs
based on the revenue earning capabilities of the facility. That is, IPM simultaneously considers the
energy and capacity value for renewable resources against the cost of each resource in order to develop
the RPS supply curve utilized within IPM. As such, each facility is evaluated based on its locational costs
and revenue expectations.
The PJM REC markets are thus modeled dynamically in IPM, with the model selecting the least-cost
resource portfolio to meet the RPS demand. The model also considers the bankability of RECs and will
temporally shift builds to minimize the cost of RPS compliance. For example, though the market may not
need incremental supply in 2020 to serve the REC demand, a facility may be developed early to take
advantage of the savings achievable through claiming the PTC credit. Excess credits available can then
be banked for use in future years. As such, REC prices reflect the time value of the REC captured through
the endogenous banking behavior in IPM.
Sensitivity Case Modeling While the REC price forecast is estimated based on reference conditions reflecting promulgated policies, there is significant uncertainty in REC markets. Near-constant changes and refinements have defined
$/M
Wh
GW
Bank Exist Biomass and Landfill Exist RE New Offshore Wind New Onshore Wind New Solar PV

9 | P a g e
Overview of PJM REC Price Forecasting
renewable portfolio standards since near the inception of such programs. As illustrated in Exhibit 8, states have enacted changes to their RPS policies over time. States in PJM have had frequent changes in their policy goals – for example, Maryland enacted a revision 2017 as shown, and again in 2019.
Exhibit 8: State RPS Revisions
Rather than rely on a single point estimate of the REC price for PJM Tier 1, ICF has adopted a
methodology to account for uncertainty in the RPS policies. As such, the PJM Tier 1 REC price forecast
provided to Dominion reflects a weighted average REC price forecast based on consideration of multiple
possible policy outcomes. Specifically, ICF modeled three RPS scenarios to capture the regulatory
uncertainty around RPS policies:
• Business As Usual (BAU) Policy Case,
• Moderate Policy Case, and
• Aggressive Policy Case
The BAU Policy Case scenario reflects current policy goals, assuming no changes to established policies over time. The Moderate Policy Case includes states taking partial action in a given direction, while the Aggressive Policy Case reflects more aggressive action taken. Exhibit 9 provides an indication of the relative demand for RECs across the three cases and additional details of each of the cases is provided in Exhibit 10 which indicates overall Tier I RPS requirement for each state, along with relevant solar carve-out requirements and offshore wind (OSW) procurement targets.
Source: Lawrence Berkeley National Labs, U.S. Renewable Portfolio Standards 2019 Annual Status Report.

10 | P a g e
Overview of PJM REC Price Forecasting
Exhibit 9: Scenario RPS Demand Comparison1
1Demand shown is Tier I net of solar carve-outs.
Exhibit 10: Scenario RPS Assumption Summary
BAU Policy Case (No Change) Moderate Policy Case Aggressive Policy Case
NJ
50% by 2030 50% by 2030, 70% by 2050 50% by 2030, 85% by 2050
Solar: 5.1% by 2021 Solar: 10% by 2030, 20% by 2050 Solar: 15% by 2030, 30% by 2050
OSW: 3.5 GW by 2030 OSW: 3.5 GW by 2030, 5 GW by 2050 OSW: 3.5 by 2030, 6 GW by 2050
PA 8% by 2021 30% by 2030, 50% by 2050 30% by 2030, 85% by 2050
Solar: 0.5% by 2021 Solar: 10% by 2030, 20% by 2050 Solar: 10% by 2030, 30% by 2050
MD
50% by 2030 50% by 2030, 70% by 2050 50% by 2030, 85% by 2050
Solar: 14.5% by 2028 Solar: 25% by 2050 Solar: 30% by 2050
OSW: 1.5 GW by 2030 OSW: 1.5 GW by 2030, 3 GW by 2050 OSW: 1.5 GW by 2030, 4 GW by 2050
DE
25% by 2025 30% by 2030, 50% by 2050 50% by 2030, 70% by 2050
Solar: 3.5% by 2025 Solar: 5% by 2030, 15% by 2050 Solar: 10% by 2030, 30% by 2050
OSW: 0 OSW: 200 MW by 2030 OSW: 200 MW by 2030, 1 GW by 2050
OH 8.5% by 2026 8.5% by 2026 8.5% by 2026
D.C. 100% by 2032 No change No change
Solar: 10% by 2041 No change No change
The final ICF forecast reflects a probability weighted average of the three scenarios that reflects the
likelihood of RPS policy changes over time. The probabilities consider the likelihood of specific states
acting to change their RPS programs, and on what timeline they may act.
While representative of a broad range of forecast results, these cases do not capture all uncertainty.
Elements not addressed include the potential for PTC/ITC extensions, costs and performance
improvements for renewables, carbon price risk, market rule changes for storage, technological
advances for storage, integration costs, and changes in the value of the electric load carrying capability
of facilities.
-
50
100
150
200
TWh
PJM Tier I RPS Demand
DC
DE
MD
NJ
PA
OH
2025 2030 2050

11 | P a g e
Overview of PJM REC Price Forecasting
Case Results The case used for the RPS policy discussed below is the Virginia in RGGI Case, which includes no
assumed federal carbon regulations and assumes that VA links with RGGI. The trends in this case are
similar to those in the other cases. The Tax Credit Extension Sensitivity is discussed separately below.
Business as Usual Policy Case In the BAU Policy Case, BAU RPS targets are modeled, where current mandatory RPS programs stay in
place with no changes. This means, for example, that New Jersey’s target of 50% by 2030 remains its
target through 2060. The resulting BAU Policy Case PJM Tier I REC price is shown in Exhibit 11.
Exhibit 11: BAU Policy Case PJM Tier I REC (2019$/MWh)
$/REC 2020 2021 2022 2023 2024 2025 2026 2027 2028 2029 2030 2035 2040 2050 2060 BAU 7.32 7.41 7.37 7.7 8.71 10.56 12.41 11.07 10.01 8.57 3.2 3.2 3.2 3.2 3.2
In 2020, the Tier I demand net of solar carve-outs is approximately 42 TWh. In the BAU Policy Case, Tier I
RPS demand increases to approximately 77 TWh in 2030, an increase of nearly 35 TWh. A significant
portion of this Tier I demand is met by mandated offshore wind capacity additions, including 3,500 MW
in New Jersey and 1,568 MW in Maryland. These offshore wind projects meet approximately 57% of the
incremental Tier I demand between 2020 and 2030. The remaining demand is met by a combination of
new wind and solar capacity additions and increased generation from existing dispatchable resources,
such as hydro and biomass.
BAU Policy Case Tier I REC prices hover around $7-9/MWh through 2024 as the PJM REC market stays in
the relatively balanced state that characterizes the current market. As PTC-subsidized wind builds are
removed as a cost-effective compliance option for Tier I RPS compliance, REC prices increase to continue
driving new renewable resources in an environment with continued RPS demand increases. While
Pennsylvania reaches its final target in 2021, targets in New Jersey, Maryland, Ohio and Delaware all
continue increasing.
As such, prices increase through 2026 before declining through 2030. This is due to state-sponsored
offshore wind projects beginning to come online in the two states (besides D.C.) that still have
increasing RPS demand through 2030. Both New Jersey and Maryland’s Tier I RPS demand increases
from 2025 to 2030 are completely supplied by their respective offshore wind additions. Thus, by 2030,
the PJM Tier I market is fully supplied. With no RPS percentage increases for any PJM state post 2030,
the spot market price falls to just the transactional value for a compliance REC, for which ICF has used
$3.20/MWh. The $3.20/MWh value is at a premium to voluntary markets due to additional compliance
and reporting requirements placed on LSEs.
The Moderate Policy Case The Moderate Policy Case RPS target assumptions (see Exhibit 10) reflect REC price risk as a result of
likely policy changes in the near- and mid-term, particularly those states whose terminal years are
reached prior to 2030.
In the Moderate Policy Case, the New Jersey target assumes an increase in the solar carve-out over
time, a process that the state BPU is currently undertaking. Beyond the BAU target of 50% by 2030, the

12 | P a g e
Overview of PJM REC Price Forecasting
Moderate Policy Case extends the program by 1%/yr, reaching 70% in 2050. The offshore wind mandate
increases as well, adding an additional 1,500 MW by 2050.
The Pennsylvania target increases to 30% by 2030, with a 1%/yr increase after that to reach 50% by
2050. The interim 2030 target is based on legislation introduced in the state in 2019, SB 600, which
would increase the Tier I target to 30% by 2030 and increase the solar carve-out to 10% by 2030. The
10% by 2030 target is also in line with PA DEP’s Solar for the Future Plan, which outlines pathways to
10% solar penetration by 2030.
The Maryland target follows New Jersey in reaching 70% by 2050, with a slightly higher solar carve-out
of 25% by 2050, consistent with a higher BAU solar carve-out. For Delaware, the Tier I target increases
1%/yr from the BAU level, and Washington, D.C. remains unchanged from the BAU, since it already has a
mandate for 100% renewable energy. Ohio also remains unchanged from the BAU, with a terminal
target of 8.5% by 2026.
The Aggressive Policy Case The Aggressive Policy Case RPS target assumptions (see Exhibit 10) reflect REC price risk as a result of
likely policy changes in the mid- and long-term, particularly those states with long-term decarbonization
efforts. States are already looking towards decarbonization goals. In New Jersey, Governor Murphy’s
Executive Order 28 directed the 2019 Energy Master Plan to provide a blueprint towards achieving 100%
clean energy by 2050.2 In Maryland the recently passed SB 516 which increased the state’s RPS target to
50% by 2030 also requires an assessment of the costs and benefits of a 100% renewable energy by 2040
goal and the completion of a plan with recommendations for the achievement of that goal.
In the Aggressive Policy Case, the New Jersey, Pennsylvania, Maryland and Delaware targets all reflect
an assumption of decarbonization by 2050, but rather than assuming targets of 100% by 2050, ICF has
used 85% in acknowledgement of the feasibility constraints that exist in attaining a 100% RPS with
status quo technology and transmission assumptions. All solar carve-out and offshore wind targets,
where applicable, increase to higher levels than in the Moderate Policy Case by 2050. As in the
Moderate Policy Case, Ohio and D.C. targets remain unchanged from the BAU.
The resulting REC prices from the Moderate and Aggressive Policy Cases offer a slight upside to the BAU
Policy Case REC price forecast through 2030 but provide a more significant upside post 2030. Through
2030, the increases in the Moderate and Aggressive Policy Case Tier I requirements are more than offset
by increases in solar and offshore wind carve-outs, as in the BAU scenario. The significant increase in
2050 targets puts upward pressure on REC prices as the more aggressive targets lead to greater
incentive to bank allowances for use in later years. Exhibit 12 shows the REC price projections for each
Case.
Exhibit 12: Scenario Case REC Prices (2019$/MWh)
$/REC 2020 2021 2022 2023 2024 2025 2026 2027 2028 2029 2030 2035 2040 2050 2060 BAU 7.3 7.4 7.4 7.7 8.7 10.6 12.4 11.1 10.0 8.6 3.2 3.2 3.2 3.2 3.2
Moderate 7.3 7.4 7.6 8.0 9.0 10.9 12.7 11.3 10.2 8.7 3.2 9.8 6.3 4.9 6.3
Aggressive 7.3 7.4 7.6 8.0 9.0 10.9 12.7 11.3 10.2 8.7 3.2 10.2 7.7 9.1 7.5
2 In June 2019 the Draft 2019 Energy Master Plan was released (https://nj.gov/emp/pdf/Draft%202019%20EMP%20Final.pdf)

13 | P a g e
Overview of PJM REC Price Forecasting
Probability Weighted REC Price Projection Exhibit 13 reflects the risk of policy uncertainty regarding existing PJM RPS programs. Each probability considers the likelihood of specific states within each Case taking action to change their RPS programs, and on what timeline they may act. In the resulting weighted REC price forecast shown in Exhibit 14, ICF weighted each Case together with the probabilities shown in Exhibit 13.
Exhibit 13: Scenario Case Probabilities (%)
Probabilities 2020 2021 2022 2023 2024 2025 2026 2027 2028 2029 2030 2035 2040 2050 2060
BAU 90 80 75 70 65 55 45 35 25 15 5 0 0 0 0
Moderate 5 15 20 25 30 40 47 54 61 68 75 75 70 60 40
Aggressive 5 5 5 5 5 5 8 11 14 17 20 25 30 40 60
Exhibit 14: Virginia in RGGI Case PJM Tier I Weighted REC Price Forecast (2019$/MWh)
$/REC 2020 2021 2022 2023 2024 2025 2026 2027 2028 2029 2030 2035 2040 2050 2060
Weighted 7.3 7.4 7.4 7.8 8.8 10.7 12.6 11.2 10.1 8.6 3.2 9.9 6.7 6.6 7.0
The BAU Policy Case has a high probability in 2020, but it quickly begins to decrease and by 2035 it
reaches 0%. This is because of the high rate of change that RPS programs experience; it is highly unlikely
that the PJM states will not again revise their RPS programs in the next couple years.
The Moderate Policy Case probability increases quickly, as the likelihood of such near-term changes is
high. The probability of the Moderate Policy Case peaks at 75% for 2030-2035 before falling to 40% by
2060. The Moderate Policy Case targets do extend from 2030 to 2050 in all states (except Ohio), so
there’s a chance that states don’t increase all the way to the Aggressive Policy Case 2050 targets.
The Aggressive Policy Case targets focus on the post-2030 period, with minor differences to the
Moderate Policy Case prior to 2030. The Aggressive Policy Case is weighted at 5% until 2026, after which
it increases to 20% by 2030. By 2060, the likelihood increases to 60%, as current political goals for
decarbonization are expected to continue and only get stronger in the future. The offshore wind carve-
outs in the Aggressive Policy Case for 2060 may end up being conservative in reality; however, given
current costs and industry reliance on state mandates, ICF did not take an aggressive stance on offshore
wind additions outside of current state mandates. As such, there’s room for offshore wind to play a
much large role in meeting long-term RPS targets than it does in this analysis, which would result in
lower Tier I REC prices in the long-term, all else equal.
REC Price Projection Comparisons Differences in REC prices between the cases, both with and without Virginia in RGGI and with various
CO2 price assumptions, are largely driven by changes in market revenues due to the CO2 price
specification. As shown below, the weighted REC prices from the cases with no assumed federal carbon
regulation track closely. The Mid-Case CO2 with Virginia in RGGI and High Federal CO2 Case fall below
the prior two cases. The High Federal CO2 Case is below all the other cases due to the higher energy
revenues, leading to an earlier and sustained collapse in REC prices.

14 | P a g e
Overview of PJM REC Price Forecasting
Exhibit 15: PJM Tier I Weighted REC Price Forecast Comparison (2019$/MWh)
Federal Tax Credit Extension Sensitivity The Tax Credit Extension Case extends the PTC at 60% of its full value and the ITC at 30% indefinitely.
This significantly reduces the cost to build renewables, resulting in a greater renewable capacity
buildout and depressed REC prices. Exhibit 16 below shows the REC price forecast for the three RPS
scenarios as well as the weighted price. REC prices immediately decline in each of the three RPS
scenarios after the forwards period, reaching the floor price in 2028 in all RPS scenarios and remaining
there until 2060. In each of these cases, onshore wind and solar are both economic 2028-2060 and do
not need incremental revenue support to meet the states’ RPS requirements.
Exhibit 16: ICF Tax Extension Case PJM Tier I Weighted REC Price Forecast (2019$/MWh)
$/REC 2020 2021 2022 2023 2024 2025 2026 2027 2028 2029 2030 2035 2040 2050 2060
BAU 7.32 7.41 8.35 6.34 4.06 3.69 3.33 3.20 3.20 3.20 3.20 3.20 3.20 3.20 3.20
Moderate 7.32 7.41 8.35 6.34 4.31 4.04 3.68 3.22 3.20 3.20 3.20 3.20 3.20 3.20 3.20
Aggressive 7.32 7.41 8.35 6.34 4.30 4.03 3.66 3.20 3.20 3.20 3.20 3.20 3.20 3.20 3.20
Weighted 7.32 7.41 8.35 6.34 4.15 3.85 3.51 3.21 3.20 3.20 3.20 3.20 3.20 3.20 3.20
Voluntary REC Markets Outside of the mandated RPS goals of individual states, a voluntary market for renewable supply exists.
This market is driven by companies, government agencies, and private consumers who choose to
procure renewable energy products for goodwill gained through environmental marketing value, or
other purposes outside the RPS policy requirements. Developers with renewable energy projects
outside of the eligibility criteria of a state RPS program may find an opportunity to generate additional
revenue through the sale of RECs into the voluntary market.
Most voluntary market purchases are unbundled RECs (i.e. not inclusive of energy or capacity), and rely
on certification programs that verify that the RECs were generated by an eligible facility and that the
0
2
4
6
8
10
12
14
2020 2025 2030 2035 2040 2045 2050
2019
$/M
Wh
Virginia in RGGI Mid-Case CO2 with Virginia in RGGI
No CO2 Tax High Federal CO2

15 | P a g e
Overview of PJM REC Price Forecasting
chain of REC custody is fully audited. Voluntary buyers are generally highly interested in where the REC
was generated. For example, a buyer in Virginia may be more willing to purchase locally generated RECs
then those from far away to maximize the benefit perceived by the local community and stakeholders.
Unlike RPS driven requirements, there is no enforcement of voluntary markets, and hence, the demand
is considered a soft demand, motivated by internal drivers rather than external ones. While higher
voluntary (Green-e) REC prices are exhibited in ERCOT and some WECC markets, the value of Green-e
RECs tend to remain at a lower level on an average basis. Exhibit 17 shows ICF’s Green-e REC price
forecast.
Exhibit 17: Green-e REC Price Forecast (2019$/MWh)
$/REC 2020 2021 2022 2023 2024 2025 2026 2027 2028 2029 2030 2035 2040 2050 2060
Green-e 0.6 0.6 0.6 0.6 0.6 0.7 0.7 0.7 0.7 0.8 0.8 0.9 1.0 1.0 1.0

Appendix 4R – Delivered Fuel Data for Plan B
Notes: 1) Delivered fuel price for NAPP (12,900, 3.2% FOB), No. 2 Oil, No. 6 Oil, DOM Zone Delivered Natural Gas are used to represent Coal, Heavy Fuel, Light Fuel Oil and Natural Gas respectively.
2) Light fuel oil is used for reliability only at dual-fuel facilities. 3) Primary Fuel Expenses for Nuclear, Biomass, Coal, Heavy Fuel Oil and Natural Gas are based on North Anna 1, Altavista, Mount Storm 1, Possum Point 5, Possum Point 6, respectively
4) Average of NUGs fuel expenses. 5) Average cost of market energy purchases.
Company Name: Virginia Electric and Power Company Schedule 18FUEL DATA
(ACTUAL) (PROJECTED)
2017 2018 2019 2020 2021 2022 2023 2024 2025 2026 2027 2028 2029 2030 2031 2032 2033 2034 2035I. Delivered Fuel Price ($/mmBtu)(1)
a. Nuclear 0.70 0.67 0.61 0.61 0.60 0.63 0.70 0.70 0.70 0.69 0.70 0.70 0.72 0.73 0.74 0.74 0.75 0.76 0.77
b. Biomass 3.00 3.02 3.09 2.53 2.55 2.58 2.61 2.63 2.66 2.69 2.72 2.75 2.79 2.84 2.89 2.94 3.00 3.05 3.11
c. Coal 2.70 2.94 2.82 1.97 2.09 2.39 2.60 2.66 2.73 2.80 2.87 2.94 3.00 3.08 3.16 3.23 3.31 3.39 3.47
d. Heavy Fuel Oil 6.34 7.28 7.77 11.08 9.91 9.09 8.83 9.42 9.98 10.46 11.10 11.84 12.59 12.89 13.22 13.55 13.89 14.23 14.58 e. Light Fuel Oil(2) 11.73 10.91 14.90 14.90 14.28 13.87 14.31 15.16 15.97 16.69 17.61 18.68 19.75 20.78 21.60 22.26 22.83 23.34 23.83
f. Natural Gas 3.50 4.83 3.44 2.86 3.22 3.33 3.29 3.22 3.32 3.62 3.76 3.96 4.21 4.45 4.54 4.63 4.72 4.81 4.92
II. Primary Fuel Expenses (cents/kWh)(3)
a. Nuclear 0.72 0.69 0.63 0.63 0.63 0.66 0.72 0.73 0.73 0.72 0.73 0.73 0.75 0.75 0.76 0.77 0.78 0.79 0.80
b. Biomass 4.25 4.57 4.79 2.81 2.90 2.94 2.99 3.09 3.13 3.16 3.22 3.27 0.00 0.00 0.00 0.00 0.00 0.00 0.00
c. Coal 2.88 3.02 3.13 1.94 2.05 2.35 2.56 2.63 2.69 2.76 2.83 2.90 2.96 3.04 3.11 3.19 3.27 3.35 3.43
d. Heavy Fuel Oil 7.60 6.15 0.00 10.97 10.07 9.18 8.23 N/A N/A N/A N/A N/A N/A N/A N/A N/A N/A N/A N/A e. Light Fuel Oil(2) 16.32 15.83 18.40 N/A N/A N/A N/A N/A N/A N/A N/A N/A N/A N/A N/A N/A N/A N/A N/A
f. Natural Gas 2.64 3.34 2.41 1.73 1.87 2.06 2.08 1.98 2.09 2.27 2.36 2.48 2.64 2.78 2.88 2.95 2.94 2.98 3.08 g. NUG(4) 5.28 4.49 4.67 0.00 N/A N/A N/A N/A N/A N/A N/A N/A N/A N/A N/A N/A N/A N/A N/A i. Economy Energy Purchases(5) 3.36 4.88 3.25 2.29 2.36 2.60 2.70 2.63 3.04 3.29 3.29 3.37 3.42 3.64 3.50 3.51 3.92 4.02 3.74
j. Capacity Purchases ($/kW-Year) 52.64 58.12 46.35 31.50 41.45 51.31 52.48 53.50 54.52 55.56 56.64 57.74 58.88 60.04 61.21 62.39 63.59 64.81 66.05

Appendix 5A – Existing Generation Units in Service
Note: (1) Commercial operation date.
Company Name: Virginia Electric and Power Company Schedule 14aUNIT PERFORMANCE DATAExisting Supply-Side Resources (MW)
Unit Name Location Unit Class Primary Fuel Type C.O.D.(1) MWSummer
Altavista Altavista, VA Base Renewable Feb-1992 51Bath County 1-6 Warm Springs, VA Intermediate Hydro-Pumped Storage Dec-1985 1,808Bear Garden Buckingham County, VA Intermediate Natural Gas-CC May-2011 622Brunswick Brunswick County, VA Intermediate Natural Gas-CC May-2016 1,376Chesapeake CT 1, 4, 6 Chesapeake, VA Peak Light Fuel Oil Dec-1967 39
Chesterfield 5 Chester, VA Base Coal Aug-1964 336
Chesterfield 6 Chester, VA Base Coal Dec-1969 678Chesterfield 7 Chester, VA Intermediate Natural Gas-CC Jun-1990 197Chesterfield 8 Chester, VA Intermediate Natural Gas-CC May-1992 195
Clover 1 Clover, VA Base Coal Oct-1995 220Clover 2 Clover, VA Base Coal Mar-1996 219Colonial Trail West Surry, VA Intermittent Renewable Dec-2019 93Darbytown 1 Richmond, VA Peak Natural Gas-Turbine May-1990 84Darbytown 2 Richmond, VA Peak Natural Gas-Turbine May-1990 84Darbytown 3 Richmond, VA Peak Natural Gas-Turbine Apr-1990 84Darbytown 4 Richmond, VA Peak Natural Gas-Turbine Apr-1990 84
Elizabeth River 1 Chesapeake, VA Peak Natural Gas-Turbine Jun-1992 110Elizabeth River 2 Chesapeake, VA Peak Natural Gas-Turbine Jun-1992 110Elizabeth River 3 Chesapeake, VA Peak Natural Gas-Turbine Jun-1992 110Gaston Hydro Roanoake Rapids, NC Intermediate Hydro-Conventional Feb-1963 220Gordonsville 1 Gordonsville, VA Intermediate Natural Gas-CC Jun-1994 109Gordonsville 2 Gordonsville, VA Intermediate Natural Gas-CC Jun-1994 109Gravel Neck 1-2 Surry, VA Peak Light Fuel Oil Aug-1970 28Gravel Neck 3 Surry, VA Peak Natural Gas-Turbine Oct-1989 85Gravel Neck 4 Surry, VA Peak Natural Gas-Turbine Jul-1989 85Gravel Neck 5 Surry, VA Peak Natural Gas-Turbine Jul-1989 85
Gravel Neck 6 Surry, VA Peak Natural Gas-Turbine Nov-1989 85Greensville Brunswick County, VA Intermediate Natural Gas-CC Dec-2018 1,588Hopewell Hopewell, VA Base Renewable Jul-1989 51Ladysmith 1 Woodford, VA Peak Natural Gas-Turbine May-2001 151Ladysmith 2 Woodford, VA Peak Natural Gas-Turbine May-2001 151
Ladysmith 3 Woodford, VA Peak Natural Gas-Turbine Jun-2008 161
Ladysmith 4 Woodford, VA Peak Natural Gas-Turbine Jun-2008 160Ladysmith 5 Woodford, VA Peak Natural Gas-Turbine Apr-2009 160Lowmoor CT 1-4 Covington, VA Peak Light Fuel Oil Jul-1971 48

Appendix 5A cont. – Existing Generation Units in Service
Note: (1) Commercial operation date.
Company Name: Virginia Electric and Power Company Schedule 14aUNIT PERFORMANCE DATAExisting Supply-Side Resources (MW)
Unit Name Location Unit Class Primary Fuel Type C.O.D.(1) MWSummer
Mount Storm 1 Mt. Storm, WV Base Coal Sep-1965 548Mount Storm 2 Mt. Storm, WV Base Coal Jul-1966 553Mount Storm 3 Mt. Storm, WV Base Coal Dec-1973 520Mount Storm CT Mt. Storm, WV Peak Light Fuel Oil Oct-1967 11North Anna 1 Mineral, VA Base Nuclear Jun-1978 838North Anna 2 Mineral, VA Base Nuclear Dec-1980 834North Anna Hydro Mineral, VA Intermediate Hydro-Conventional Dec-1987 1Northern Neck CT 1-4 Warsaw, VA Peak Light Fuel Oil Jul-1971 47Possum Point 5 Dumfries, VA Peak Heavy Fuel Oil Jun-1975 623Possum Point 6 Dumfries, VA Intermediate Natural Gas-CC Jul-2003 573Possum Point CT 1-6 Dumfries, VA Peak Light Fuel Oil May-1968 72Remington 1 Remington, VA Peak Natural Gas-Turbine Jul-2000 153Remington 2 Remington, VA Peak Natural Gas-Turbine Jul-2000 151Remington 3 Remington, VA Peak Natural Gas-Turbine Jul-2000 152Remington 4 Remington, VA Peak Natural Gas-Turbine Jul-2000 152Roanoke Rapids Hydro Roanoake Rapids, NC Intermediate Hydro-Conventional Sep-1955 95Rosemary Roanoke Rapids, NC Peak Natural Gas-CC Dec-1990 165Scott Solar Powhatan, VA Intermittent Renewable Dec-2016 11Solar Partnership Program Distributed Intermittent Renewable Jan-2012 5Southampton Franklin, VA Base Renewable Mar-1992 51Surry 1 Surry, VA Base Nuclear Dec-1972 838Surry 2 Surry, VA Base Nuclear May-1973 838Virginia City Hybrid Energy Center Virginia City, VA Base Coal Jul-2012 610Warren Front Royal, VA Intermediate Natural Gas-CC Dec-2014 1,370Whitehouse Solar Louisa, VA Intermittent Renewable Dec-2016 12Woodland Solar Isle of Wight, VA Intermittent Renewable Dec-2016 13Yorktown 3 Yorktown, VA Peak Heavy Fuel Oil Dec-1974 790
7,1858,2634,220
13419,802Total
Subtotal - BaseSubtotal - IntermediateSubtotal - PeakSubtotal - Intermittent

Appendix 5B – Other Generation Units
Notes: (1) In operation as of April 1, 2020; generating facilities that have contracted directly with Virginia Electric and Power Company (2) PPA is for excess energy only typically 4,000 – 14,000 kW.
(3) PPA is for excess energy only typically 3,500 kW.

Appendix 5B cont. – Other Generation Units
Notes: (1) In operation as of April 1, 2020; generating facilities that have contracted directly with Virginia Electric and Power Company. (2) PPA is for excess energy only typically 4,000 – 14,000 kW.
(3) PPA is for excess energy only typically 3,500 kW.
.
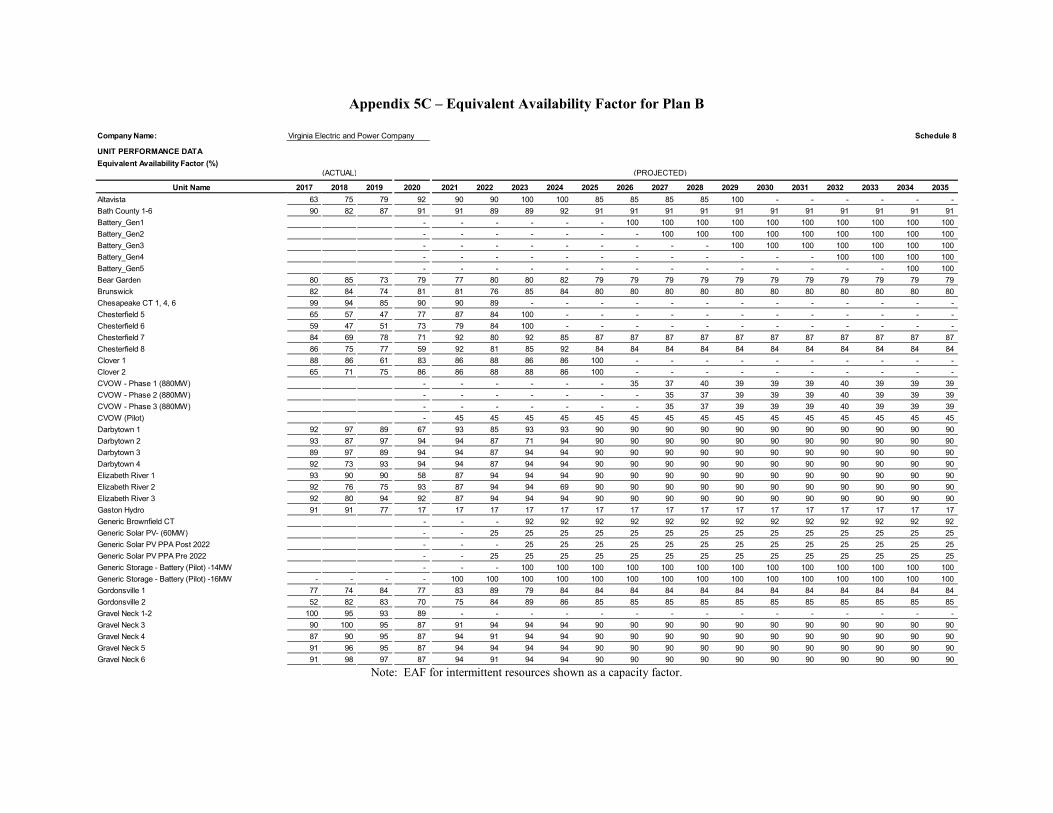
Appendix 5C – Equivalent Availability Factor for Plan B
Note: EAF for intermittent resources shown as a capacity factor.
Company Name: Virginia Electric and Power Company Schedule 8
UNIT PERFORMANCE DATAEquivalent Availability Factor (%)
(ACTUAL) (PROJECTED)
Unit Name 2017 2018 2019 2020 2021 2022 2023 2024 2025 2026 2027 2028 2029 2030 2031 2032 2033 2034 2035Altavista 63 75 79 92 90 90 100 100 85 85 85 85 100 - - - - - - Bath County 1-6 90 82 87 91 91 89 89 92 91 91 91 91 91 91 91 91 91 91 91 Battery_Gen1 - - - - - - 100 100 100 100 100 100 100 100 100 100 Battery_Gen2 - - - - - - - 100 100 100 100 100 100 100 100 100 Battery_Gen3 - - - - - - - - - 100 100 100 100 100 100 100 Battery_Gen4 - - - - - - - - - - - - 100 100 100 100 Battery_Gen5 - - - - - - - - - - - - - - 100 100 Bear Garden 80 85 73 79 77 80 80 82 79 79 79 79 79 79 79 79 79 79 79 Brunswick 82 84 74 81 81 76 85 84 80 80 80 80 80 80 80 80 80 80 80 Chesapeake CT 1, 4, 6 99 94 85 90 90 89 - - - - - - - - - - - - - Chesterfield 5 65 57 47 77 87 84 100 - - - - - - - - - - - - Chesterfield 6 59 47 51 73 79 84 100 - - - - - - - - - - - - Chesterfield 7 84 69 78 71 92 80 92 85 87 87 87 87 87 87 87 87 87 87 87 Chesterfield 8 86 75 77 59 92 81 85 92 84 84 84 84 84 84 84 84 84 84 84 Clover 1 88 86 61 83 86 88 86 86 100 - - - - - - - - - - Clover 2 65 71 75 86 86 88 88 86 100 - - - - - - - - - - CVOW - Phase 1 (880MW) - - - - - - 35 37 40 39 39 39 40 39 39 39 CVOW - Phase 2 (880MW) - - - - - - - 35 37 39 39 39 40 39 39 39 CVOW - Phase 3 (880MW) - - - - - - - 35 37 39 39 39 40 39 39 39 CVOW (Pilot) - 45 45 45 45 45 45 45 45 45 45 45 45 45 45 45 Darbytown 1 92 97 89 67 93 85 93 93 90 90 90 90 90 90 90 90 90 90 90 Darbytown 2 93 87 97 94 94 87 71 94 90 90 90 90 90 90 90 90 90 90 90 Darbytown 3 89 97 89 94 94 87 94 94 90 90 90 90 90 90 90 90 90 90 90 Darbytown 4 92 73 93 94 94 87 94 94 90 90 90 90 90 90 90 90 90 90 90 Elizabeth River 1 93 90 90 58 87 94 94 94 90 90 90 90 90 90 90 90 90 90 90 Elizabeth River 2 92 76 75 93 87 94 94 69 90 90 90 90 90 90 90 90 90 90 90 Elizabeth River 3 92 80 94 92 87 94 94 94 90 90 90 90 90 90 90 90 90 90 90 Gaston Hydro 91 91 77 17 17 17 17 17 17 17 17 17 17 17 17 17 17 17 17 Generic Brownfield CT - - - 92 92 92 92 92 92 92 92 92 92 92 92 92 Generic Solar PV- (60MW) - - 25 25 25 25 25 25 25 25 25 25 25 25 25 25 Generic Solar PV PPA Post 2022 - - - 25 25 25 25 25 25 25 25 25 25 25 25 25 Generic Solar PV PPA Pre 2022 - - 25 25 25 25 25 25 25 25 25 25 25 25 25 25 Generic Storage - Battery (Pilot) -14MW - - - 100 100 100 100 100 100 100 100 100 100 100 100 100 Generic Storage - Battery (Pilot) -16MW - - - - 100 100 100 100 100 100 100 100 100 100 100 100 100 100 100 Gordonsville 1 77 74 84 77 83 89 79 84 84 84 84 84 84 84 84 84 84 84 84 Gordonsville 2 52 82 83 70 75 84 89 86 85 85 85 85 85 85 85 85 85 85 85 Gravel Neck 1-2 100 95 93 89 - - - - - - - - - - - - - - - Gravel Neck 3 90 100 95 87 91 94 94 94 90 90 90 90 90 90 90 90 90 90 90 Gravel Neck 4 87 90 95 87 94 91 94 94 90 90 90 90 90 90 90 90 90 90 90 Gravel Neck 5 91 96 95 87 94 94 94 94 90 90 90 90 90 90 90 90 90 90 90 Gravel Neck 6 91 98 97 87 94 91 94 94 90 90 90 90 90 90 90 90 90 90 90

Appendix 5C cont. – Equivalent Availability Factor for Plan B
Note: EAF for intermittent resources shown as a capacity factor.
Company Name: Virginia Electric and Power Company Schedule 8UNIT PERFORMANCE DATAEquivalent Availability Factor (%)
(ACTUAL) (PROJECTED)
Unit Name 2017 2018 2019 2020 2021 2022 2023 2024 2025 2026 2027 2028 2029 2030 2031 2032 2033 2034 2035Greensville - 96 73 80 81 79 80 78 79 79 79 79 79 79 79 79 79 79 79 Hopewell 78 83 83 43 88 88 100 100 82 82 82 82 100 - - - - - - Ladysmith 1 85 93 86 90 90 90 79 90 90 90 90 90 90 90 90 90 90 90 90 Ladysmith 2 85 94 86 90 90 90 79 90 90 90 90 90 90 90 90 90 90 90 90 Ladysmith 3 84 74 87 90 90 90 90 90 90 90 90 90 90 90 90 90 90 90 90 Ladysmith 4 77 79 87 90 90 90 90 90 90 90 90 90 90 90 90 90 90 90 90 Ladysmith 5 83 95 87 90 90 90 90 90 90 90 90 90 90 90 90 90 90 90 90 Lowmoor CT 1-4 98 98 99 91 91 91 - - - - - - - - - - - - - Mount Storm 1 74 76 64 80 82 76 76 87 81 81 81 81 81 81 81 81 81 81 81 Mount Storm 2 81 66 60 70 76 86 86 81 81 81 81 81 81 81 81 81 81 81 81 Mount Storm 3 71 72 54 76 86 76 86 88 82 82 82 82 82 82 82 82 82 82 82 Mount Storm CT 96 79 98 90 90 89 - - - - - - - - - - - - - New Pump Storage - - - - - - - - - - 70 70 70 70 70 70 North Anna 1 100 90 93 98 89 91 98 79 91 98 91 84 98 84 91 98 91 91 98 North Anna 2 90 99 88 89 98 91 77 98 91 91 98 91 84 98 84 91 91 98 91 North Anna Hydro 100 100 100 29 29 29 29 29 29 29 29 29 29 29 29 29 29 29 29 Northern Neck CT 1-4 94 99 97 90 90 90 - - - - - - - - - - - - - Possum Point 5 62 57 69 77 84 100 - - - - - - - - - - - - - Possum Point 6 75 83 69 60 72 82 84 77 75 75 75 75 75 75 75 75 75 75 75 Possum Point CT 1-6 97 95 100 90 90 90 - - - - - - - - - - - - - Remington 1 91 94 79 89 90 90 90 90 90 90 90 90 90 90 90 90 90 90 90 Remington 2 91 87 79 89 90 90 90 90 90 90 90 90 90 90 90 90 90 90 90 Remington 3 70 89 76 89 90 87 90 90 90 90 90 90 90 90 90 90 90 90 90 Remington 4 83 88 79 89 90 87 90 90 90 90 90 90 90 90 90 90 90 90 90 Roanoke Rapids Hydro 92 90 72 35 35 35 35 35 35 35 35 35 35 35 35 35 35 35 35 Rosemary 78 78 85 92 83 96 83 96 90 90 100 100 100 100 100 100 100 100 100 Scott Solar 24 24 24 24 24 24 24 24 23 23 23 23 23 23 23 23 Solar Partnership Program 14 14 14 14 14 14 14 14 14 14 14 14 14 14 14 14 Solar_DG - - 15 15 15 15 15 15 15 15 15 15 15 15 15 15 Southampton 68 84 83 92 92 90 100 100 84 84 84 84 100 - - - - - - Surry 1 99 87 89 98 91 91 98 84 84 98 84 91 98 74 91 100 100 100 100 Surry 2 92 89 100 87 91 98 91 84 98 82 84 98 74 91 98 98 100 100 100 US-3 Solar 1 25 25 25 25 25 25 25 25 25 25 25 25 25 25 25 25 US-3 Solar 2 - 25 25 25 25 25 25 25 25 25 25 25 25 25 25 25 US-4 Solar - 25 25 25 25 25 25 25 26 26 26 26 26 26 26 27 Virginia City Hybrid Energy Center 74 64 55 75 78 78 78 78 77 77 77 77 77 77 77 77 77 77 77 Warren 88 78 80 81 72 81 81 81 79 79 79 79 79 79 79 79 79 79 79 Water Strider - 25 25 25 26 26 26 26 26 26 26 26 27 27 27 27 Westmoreland_PPA - 24 25 25 25 25 25 25 25 25 26 26 26 26 26 26 Whitehouse Solar 25 25 24 24 24 24 24 24 24 24 23 23 23 23 23 23 Woodland Solar 25 25 25 25 25 24 24 24 24 24 24 24 24 24 23 23 Yorktown 3 78 74 71 74 81 81 81 100 - - - - - - - - - - -

Appendix 5D – Net Capacity Factor for Plan B
Company Name: Virginia Electric and Power Company Schedule 9UNIT PERFORMANCE DATANet Capacity Factor (%)
(ACTUAL) (PROJECTED)
Unit Name 2017 2018 2019 2020 2021 2022 2023 2024 2025 2026 2027 2028 2029 2030 2031 2032 2033 2034 2035Altavista . 61.3 61.0 40.3 53.1 72.5 40.5 4.6 5.9 6.7 5.7 6.0 - - - - - - - Bath County 1-6 14.2 15.5 12.2 9.6 10.7 10.2 10.1 10.6 9.9 9.8 9.0 8.4 7.3 6.3 7.2 6.6 6.7 6.8 7.5 Battery_Gen1 - - - - - - 14.8 13.1 13.7 12.7 12.2 12.2 11.7 12.9 14.2 14.9 Battery_Gen2 - - - - - - - 13.1 13.4 12.6 12.1 12.4 11.9 13.3 14.7 14.6 Battery_Gen3 - - - - - - - - - 12.9 11.9 12.2 11.9 12.9 15.0 14.9 Battery_Gen4 - - - - - - - - - - - - 11.9 12.6 14.3 15.1 Battery_Gen5 - - - - - - - - - - - - - - 13.9 15.1 Bear Garden 62.1 74.3 65.3 74.2 65.2 74.6 74.3 76.5 73.1 68.4 66.1 63.5 62.2 62.3 53.2 48.8 50.9 41.8 36.3 Brunswick 67.8 70.0 69.1 77.8 77.5 72.9 81.9 80.7 76.2 73.5 70.0 67.8 65.5 65.9 60.1 55.9 60.5 54.6 49.6 Chesapeake CT 1, 4, 6 0.0 0.7 0.1 - - - - - - - - - - - - - - - - Chesterfield 5 43.4 24.1 10.4 12.9 12.8 6.4 - - - - - - - - - - - - - Chesterfield 6 31.3 22.5 10.6 9.2 7.5 5.0 - - - - - - - - - - - - - Chesterfield 7 89.7 74.4 84.3 65.5 82.2 71.8 80.6 70.0 70.1 62.4 57.1 53.9 49.3 51.8 44.1 39.0 45.3 36.6 31.1 Chesterfield 8 90.2 76.6 74.4 53.0 81.3 71.9 73.9 79.6 67.2 63.2 58.3 55.3 52.3 53.0 46.3 40.9 47.2 39.4 33.1 Clover 1 48.0 38.6 17.3 12.9 13.8 9.9 8.0 8.6 - - - - - - - - - - - Clover 2 37.1 37.3 16.1 13.9 13.5 8.9 7.9 8.2 - - - - - - - - - - - CVOW - Phase 1 (880MW) - - - - - - 35.3 37.4 39.5 39.4 39.4 39.4 39.5 39.4 39.4 39.4 CVOW - Phase 2 (880MW) - - - - - - - 35.3 37.4 39.4 39.4 39.4 39.5 39.4 39.4 39.4 CVOW - Phase 3 (880MW) - - - - - - - 35.3 37.4 39.4 39.4 39.4 39.5 39.4 39.4 39.4 CVOW (Pilot) - 44.8 44.8 44.8 44.8 44.8 44.8 44.8 44.8 44.8 44.8 44.8 44.8 44.8 44.8 44.8 Darbytown 1 1.9 2.2 2.0 2.7 2.9 2.2 1.7 1.7 1.5 1.3 1.1 1.0 0.9 0.7 0.8 0.6 0.5 0.5 0.3 Darbytown 2 1.8 2.5 2.2 3.5 2.9 2.2 1.1 1.7 1.5 1.3 1.1 1.0 0.9 0.8 0.8 0.6 0.6 0.5 0.3 Darbytown 3 2.7 3.5 1.6 3.5 2.9 2.2 1.9 1.7 1.5 1.3 1.1 1.0 0.9 0.8 0.8 0.6 0.6 0.5 0.4 Darbytown 4 8.7 3.3 2.6 3.5 2.9 2.2 1.7 1.7 1.5 1.3 1.1 1.0 0.9 0.8 0.8 0.6 0.6 0.5 0.3 Elizabeth River 1 3.3 9.1 4.0 1.9 1.6 2.1 2.3 2.2 2.4 2.2 1.3 1.3 0.8 0.3 0.2 0.3 0.2 0.1 0.1 Elizabeth River 2 3.5 8.1 4.6 2.6 1.6 2.0 2.3 2.1 2.4 2.1 1.3 1.2 0.6 0.3 0.2 0.3 0.2 0.1 0.1 Elizabeth River 3 3.2 9.3 1.7 2.6 1.6 2.1 2.3 2.2 2.4 2.1 1.3 1.3 0.7 0.3 0.2 0.3 0.2 0.1 0.1 Gaston Hydro 14.1 24.5 19.1 16.6 16.6 16.6 16.6 16.6 16.6 16.6 16.6 16.6 16.6 16.6 16.6 16.6 16.6 16.6 16.6 Generic Brownfield CT - - - 2.9 2.9 4.4 3.6 2.6 1.9 1.3 0.9 0.3 0.3 0.3 0.1 0.1 Generic Solar PV- (60MW) - - 25.4 25.4 25.4 25.4 25.4 25.4 25.4 25.4 25.4 25.4 25.4 25.4 25.4 25.4 Generic Solar PV PPA Post 2022 - - - 25.4 25.4 25.4 25.4 25.4 25.4 25.4 25.4 25.4 25.4 25.4 25.4 25.4 Generic Solar PV PPA Pre 2022 - - 25.4 25.4 25.4 25.4 25.4 25.4 25.4 25.4 25.4 25.4 25.4 25.4 25.4 25.4 Generic Storage - Battery (Pilot) -14MW - - - 14.2 14.3 13.4 12.1 10.3 9.9 8.9 7.8 8.4 7.3 - - - Generic Storage - Battery (Pilot) -16MW - 14.8 14.3 14.2 14.3 13.4 12.1 10.3 9.9 8.9 7.8 - - - - - Gordonsville 1 14.2 39.7 64.9 55.6 44.4 49.3 34.9 36.5 39.7 32.9 29.2 26.7 22.8 22.1 18.7 15.5 19.3 15.2 11.8 Gordonsville 2 9.6 49.2 61.2 48.1 42.9 48.2 40.1 38.2 38.1 32.6 28.0 26.6 22.5 21.6 18.4 15.4 18.9 15.0 11.5 Gravel Neck 1-2 0.1 0.1 0.0 0.3 - - - - - - - - - - - - - - - Gravel Neck 3 3.6 4.8 4.2 3.9 2.9 2.9 2.9 3.3 4.3 3.1 2.5 2.2 1.7 1.4 0.6 0.3 0.3 0.3 0.2 Gravel Neck 4 0.8 1.5 0.3 4.0 3.0 3.0 3.0 3.3 4.3 3.1 2.5 2.3 1.8 1.4 0.7 0.4 0.7 0.6 0.3 Gravel Neck 5 3.3 2.9 4.6 3.9 3.0 3.0 3.0 3.4 4.4 3.1 2.5 2.2 1.8 1.4 0.6 0.4 0.3 0.5 0.3 Gravel Neck 6 0.6 3.1 1.5 4.0 3.0 3.0 3.0 3.3 4.3 3.1 2.5 2.3 1.8 1.4 0.6 0.4 0.7 0.5 0.3

Appendix 5D cont. – Net Capacity Factor for Plan B
Company Name: Virginia Electric and Power Company Schedule 9UNIT PERFORMANCE DATANet Capacity Factor (%)
(ACTUAL) (PROJECTED)
Unit Name 2017 2018 2019 2020 2021 2022 2023 2024 2025 2026 2027 2028 2029 2030 2031 2032 2033 2034 2035Greensville - 34.8 70.9 77.0 78.2 76.4 77.6 75.1 76.0 75.7 74.2 71.8 70.8 71.0 66.2 63.3 66.7 63.1 59.5 Hopewell 66.0 68.4 64.0 11.7 35.3 59.2 48.2 3.8 4.3 5.3 3.9 4.4 - - - - - - - Ladysmith 1 9.4 11.3 11.0 9.7 7.0 7.8 8.3 8.7 8.6 6.8 6.0 5.7 5.3 4.9 3.8 3.4 3.2 3.6 1.9 Ladysmith 2 11.1 22.3 8.5 9.8 6.9 7.9 8.3 8.6 8.5 6.8 6.0 5.7 5.2 5.0 3.8 3.6 3.2 3.6 1.9 Ladysmith 3 5.7 9.0 11.7 10.0 7.4 7.9 8.6 8.9 8.7 7.0 6.3 5.9 5.4 5.2 3.9 3.5 3.4 3.9 2.0 Ladysmith 4 9.4 5.5 13.4 9.7 7.2 8.0 8.6 9.0 8.7 7.1 6.3 5.9 5.4 5.1 3.9 3.4 3.4 3.9 2.0 Ladysmith 5 6.5 3.6 3.3 9.8 7.2 8.2 8.6 8.9 8.7 7.0 6.3 6.0 5.5 5.2 3.9 3.5 3.4 3.9 2.0 Lowmoor CT 1-4 0.1 0.7 0.1 - - - - - - - - - - - - - - - - Mount Storm 1 49.4 43.4 36.8 38.1 41.2 40.6 32.1 31.9 36.8 12.4 11.0 11.3 12.6 14.5 13.8 11.3 9.8 6.7 5.2 Mount Storm 2 58.0 32.2 34.6 38.0 41.3 45.4 38.0 34.3 39.3 13.0 11.8 12.2 13.9 15.5 15.5 12.1 10.8 7.5 6.0 Mount Storm 3 39.1 41.2 25.2 29.2 36.0 32.3 24.8 23.5 30.8 8.1 7.0 7.3 8.1 9.6 7.9 6.7 5.8 3.8 3.1 Mount Storm CT 0.0 0.2 0.2 - - - - - - - - - - - - - - - - New Pump Storage - - - - - - - - - - 8.4 8.3 7.9 8.0 8.5 8.7 North Anna 1 102.3 91.1 94.5 96.3 87.8 89.2 96.3 77.8 89.0 96.3 88.9 82.9 96.3 82.9 89.0 96.3 88.9 89.0 96.1 North Anna 2 92.3 101.9 90.4 87.5 96.4 89.2 75.7 96.4 88.9 89.1 96.4 88.9 82.9 96.4 82.9 89.1 88.9 96.2 88.5 North Anna Hydro 29.2 26.2 7.0 29.1 29.0 29.0 29.0 29.1 29.0 29.0 29.0 29.1 29.0 29.0 29.0 29.1 29.0 29.0 29.0 Northern Neck CT 1-4 0.2 0.6 0.1 - - - - - - - - - - - - - - - - Possum Point 5 0.9 0.8 0.5 6.0 6.0 - - - - - - - - - - - - - - Possum Point 6 59.1 71.2 56.3 57.0 63.3 76.5 77.8 71.3 66.9 62.4 60.2 57.1 54.8 53.4 48.0 44.9 49.2 43.3 36.5 Possum Point CT 1-6 0.1 0.3 0.1 - - - - - - - - - - - - - - - - Remington 1 9.9 19.5 6.5 4.7 2.6 3.3 3.7 5.2 5.7 4.9 3.9 3.1 2.7 1.9 1.8 1.1 1.1 0.8 0.8 Remington 2 9.8 16.0 3.8 4.6 2.7 3.3 3.6 5.1 5.6 4.9 3.9 3.1 2.6 1.9 1.9 1.1 1.1 0.8 0.8 Remington 3 10.0 18.8 7.1 5.6 3.0 4.0 4.4 5.4 6.0 5.2 4.2 3.5 2.9 2.0 2.0 1.1 1.2 0.8 0.9 Remington 4 8.6 17.7 4.9 5.6 3.2 3.7 4.6 6.0 6.6 5.2 4.2 3.3 2.7 2.0 1.9 1.4 1.2 0.8 0.8 Roanoke Rapids Hydro 25.7 45.2 36.5 34.5 34.5 34.5 34.5 34.5 34.5 34.5 34.5 34.5 34.5 34.5 34.5 34.5 34.5 34.5 34.5 Rosemary 9.8 2.0 0.2 1.0 1.0 1.0 1.0 1.0 1.0 1.0 - - - - - - - - - Scott Solar 20.6 13.7 13.9 24.4 24.3 24.2 24.1 23.9 23.8 23.7 23.6 23.5 23.4 23.3 23.1 23.0 22.9 22.8 22.7 Solar Partnership Program - 13.7 13.7 13.7 13.7 13.7 13.7 13.8 13.7 13.7 13.7 13.7 13.7 13.7 13.7 13.7 13.7 Solar_DG - - 14.6 14.6 14.6 14.6 14.6 14.6 14.6 14.6 14.6 14.6 14.6 14.6 14.6 14.6 Southampton 62.5 70.2 59.4 20.6 35.2 60.1 55.8 3.6 4.1 5.3 3.8 4.5 - - - - - - - Surry 1 102.4 89.4 90.5 95.9 89.2 88.7 95.9 82.9 82.2 95.9 82.8 88.4 95.9 72.5 88.4 - - - - Surry 2 94.2 90.7 102.6 85.7 88.7 95.9 88.7 82.3 95.9 80.2 82.2 95.9 72.5 88.4 95.9 95.9 - - - US-3 Solar 1 - 25.0 25.0 25.0 25.0 25.0 25.0 25.0 25.0 25.0 25.0 25.0 25.0 25.0 25.0 25.0 25.0 US-3 Solar 2 - - 25.0 25.0 25.0 25.0 25.0 25.0 25.0 25.0 25.0 25.0 25.0 25.0 25.0 25.0 25.0 US-4 Solar - - 24.7 24.8 24.9 25.0 25.2 25.3 25.4 25.5 25.7 25.8 26.0 26.1 26.2 26.4 26.5 Virginia City Hybrid Energy Center 62.4 55.4 22.2 5.7 6.8 7.4 7.4 8.0 10.8 7.9 6.7 7.1 7.8 9.4 8.3 6.7 6.2 4.2 3.2 Warren 75.7 69.2 73.1 69.4 53.0 67.5 73.4 75.4 73.6 66.1 62.3 58.5 56.0 56.7 51.9 49.2 52.2 42.8 36.2 Water Strider - 25.2 25.3 25.4 25.6 25.7 25.8 26.0 26.1 26.2 26.3 26.4 26.6 26.7 26.8 26.9 Westmoreland_PPA - 24.5 24.6 24.7 24.8 25.0 25.1 25.2 25.3 25.5 25.6 25.7 25.9 26.0 26.1 26.2 Whitehouse Solar 19.9 16.2 23.9 24.7 24.5 24.4 24.3 24.2 24.1 23.9 23.8 23.7 23.6 23.5 23.3 23.2 23.1 23.0 22.9 Woodland Solar 17.8 19.1 21.6 25.1 25.0 24.8 24.7 24.6 24.5 24.4 24.2 24.1 24.0 23.9 23.8 23.6 23.5 23.4 23.3 Yorktown 3 1.1 3.8 0.8 3.0 3.0 3.0 3.0 - - - - - - - - - - - -
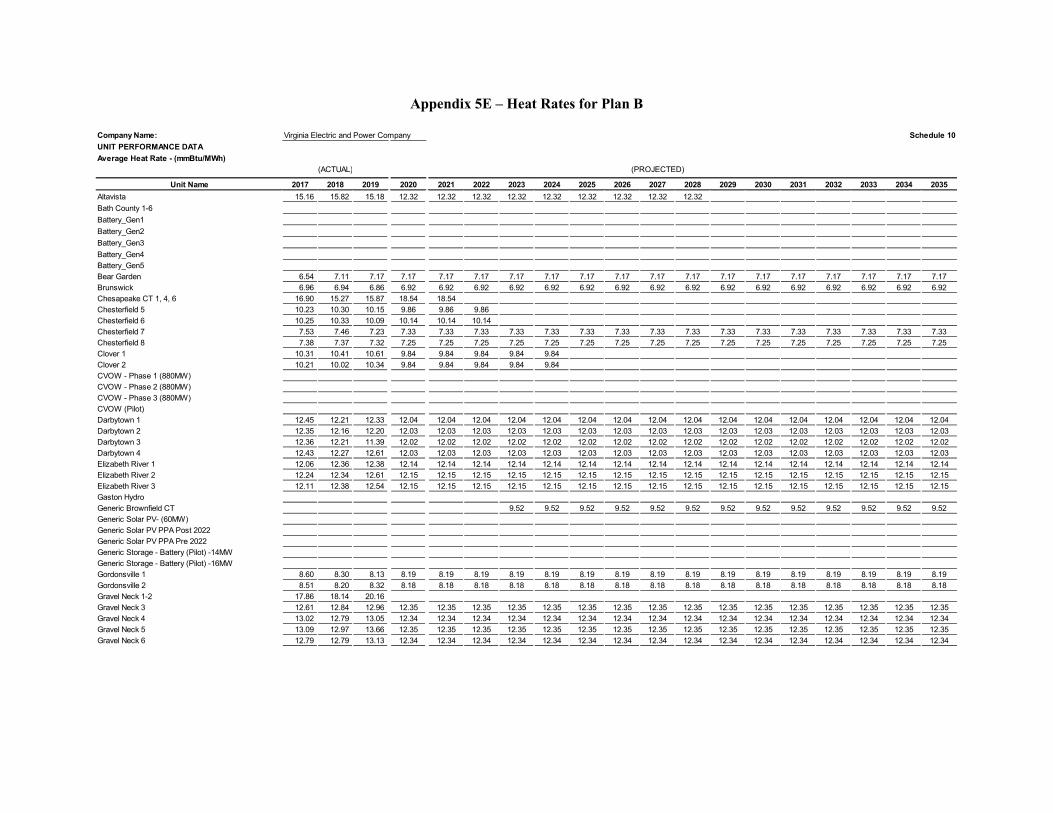
Appendix 5E – Heat Rates for Plan B
Company Name: Virginia Electric and Power Company Schedule 10UNIT PERFORMANCE DATAAverage Heat Rate - (mmBtu/MWh)
(ACTUAL) (PROJECTED)
Unit Name 2017 2018 2019 2020 2021 2022 2023 2024 2025 2026 2027 2028 2029 2030 2031 2032 2033 2034 2035Altavista 15.16 15.82 15.18 12.32 12.32 12.32 12.32 12.32 12.32 12.32 12.32 12.32Bath County 1-6Battery_Gen1Battery_Gen2Battery_Gen3Battery_Gen4Battery_Gen5Bear Garden 6.54 7.11 7.17 7.17 7.17 7.17 7.17 7.17 7.17 7.17 7.17 7.17 7.17 7.17 7.17 7.17 7.17 7.17 7.17Brunswick 6.96 6.94 6.86 6.92 6.92 6.92 6.92 6.92 6.92 6.92 6.92 6.92 6.92 6.92 6.92 6.92 6.92 6.92 6.92Chesapeake CT 1, 4, 6 16.90 15.27 15.87 18.54 18.54Chesterfield 5 10.23 10.30 10.15 9.86 9.86 9.86Chesterfield 6 10.25 10.33 10.09 10.14 10.14 10.14Chesterfield 7 7.53 7.46 7.23 7.33 7.33 7.33 7.33 7.33 7.33 7.33 7.33 7.33 7.33 7.33 7.33 7.33 7.33 7.33 7.33Chesterfield 8 7.38 7.37 7.32 7.25 7.25 7.25 7.25 7.25 7.25 7.25 7.25 7.25 7.25 7.25 7.25 7.25 7.25 7.25 7.25Clover 1 10.31 10.41 10.61 9.84 9.84 9.84 9.84 9.84Clover 2 10.21 10.02 10.34 9.84 9.84 9.84 9.84 9.84CVOW - Phase 1 (880MW)CVOW - Phase 2 (880MW)CVOW - Phase 3 (880MW)CVOW (Pilot)Darbytown 1 12.45 12.21 12.33 12.04 12.04 12.04 12.04 12.04 12.04 12.04 12.04 12.04 12.04 12.04 12.04 12.04 12.04 12.04 12.04Darbytown 2 12.35 12.16 12.20 12.03 12.03 12.03 12.03 12.03 12.03 12.03 12.03 12.03 12.03 12.03 12.03 12.03 12.03 12.03 12.03Darbytown 3 12.36 12.21 11.39 12.02 12.02 12.02 12.02 12.02 12.02 12.02 12.02 12.02 12.02 12.02 12.02 12.02 12.02 12.02 12.02Darbytown 4 12.43 12.27 12.61 12.03 12.03 12.03 12.03 12.03 12.03 12.03 12.03 12.03 12.03 12.03 12.03 12.03 12.03 12.03 12.03Elizabeth River 1 12.06 12.36 12.38 12.14 12.14 12.14 12.14 12.14 12.14 12.14 12.14 12.14 12.14 12.14 12.14 12.14 12.14 12.14 12.14Elizabeth River 2 12.24 12.34 12.61 12.15 12.15 12.15 12.15 12.15 12.15 12.15 12.15 12.15 12.15 12.15 12.15 12.15 12.15 12.15 12.15Elizabeth River 3 12.11 12.38 12.54 12.15 12.15 12.15 12.15 12.15 12.15 12.15 12.15 12.15 12.15 12.15 12.15 12.15 12.15 12.15 12.15Gaston HydroGeneric Brownfield CT 9.52 9.52 9.52 9.52 9.52 9.52 9.52 9.52 9.52 9.52 9.52 9.52 9.52Generic Solar PV- (60MW)Generic Solar PV PPA Post 2022Generic Solar PV PPA Pre 2022Generic Storage - Battery (Pilot) -14MWGeneric Storage - Battery (Pilot) -16MWGordonsville 1 8.60 8.30 8.13 8.19 8.19 8.19 8.19 8.19 8.19 8.19 8.19 8.19 8.19 8.19 8.19 8.19 8.19 8.19 8.19Gordonsville 2 8.51 8.20 8.32 8.18 8.18 8.18 8.18 8.18 8.18 8.18 8.18 8.18 8.18 8.18 8.18 8.18 8.18 8.18 8.18Gravel Neck 1-2 17.86 18.14 20.16 Gravel Neck 3 12.61 12.84 12.96 12.35 12.35 12.35 12.35 12.35 12.35 12.35 12.35 12.35 12.35 12.35 12.35 12.35 12.35 12.35 12.35Gravel Neck 4 13.02 12.79 13.05 12.34 12.34 12.34 12.34 12.34 12.34 12.34 12.34 12.34 12.34 12.34 12.34 12.34 12.34 12.34 12.34Gravel Neck 5 13.09 12.97 13.66 12.35 12.35 12.35 12.35 12.35 12.35 12.35 12.35 12.35 12.35 12.35 12.35 12.35 12.35 12.35 12.35Gravel Neck 6 12.79 12.79 13.13 12.34 12.34 12.34 12.34 12.34 12.34 12.34 12.34 12.34 12.34 12.34 12.34 12.34 12.34 12.34 12.34

Appendix 5E cont. – Heat Rates for Plan B
Company Name: Virginia Electric and Power Company Schedule 10UNIT PERFORMANCE DATAAverage Heat Rate - (mmBtu/MWh)
(ACTUAL) (PROJECTED)
Unit Name 2017 2018 2019 2020 2021 2022 2023 2024 2025 2026 2027 2028 2029 2030 2031 2032 2033 2034 2035Greensville - 4.26 6.55 6.66 6.66 6.66 6.66 6.66 6.66 6.66 6.66 6.66 6.66 6.66 6.66 6.66 6.66 6.66 6.66Hopewell 15.98 15.74 16.35 12.10 12.10 12.10 12.10 12.10 12.10 12.10 12.10 12.10Ladysmith 1 9.96 10.30 9.84 10.31 10.31 10.31 10.31 10.31 10.31 10.31 10.31 10.31 10.31 10.31 10.31 10.31 10.31 10.31 10.31Ladysmith 2 9.70 9.75 9.55 10.31 10.31 10.31 10.31 10.31 10.31 10.31 10.31 10.31 10.31 10.31 10.31 10.31 10.31 10.31 10.31Ladysmith 3 9.99 9.95 9.75 10.31 10.31 10.31 10.31 10.31 10.31 10.31 10.31 10.31 10.31 10.31 10.31 10.31 10.31 10.31 10.31Ladysmith 4 9.84 10.13 9.60 10.31 10.31 10.31 10.31 10.31 10.31 10.31 10.31 10.31 10.31 10.31 10.31 10.31 10.31 10.31 10.31Ladysmith 5 9.98 10.17 9.70 10.31 10.31 10.31 10.31 10.31 10.31 10.31 10.31 10.31 10.31 10.31 10.31 10.31 10.31 10.31 10.31Lowmoor CT 1-4 16.86 15.44 16.75 16.76 16.76Mount Storm 1 10.16 10.15 10.42 9.86 9.86 9.86 9.86 9.86 9.86 9.86 9.86 9.86 9.86 9.86 9.86 9.86 9.86 9.86 9.86Mount Storm 2 10.05 10.04 10.38 9.78 9.78 9.78 9.78 9.78 9.78 9.78 9.78 9.78 9.78 9.78 9.78 9.78 9.78 9.78 9.78Mount Storm 3 10.56 10.79 10.60 10.19 10.19 10.19 10.19 10.19 10.19 10.19 10.19 10.19 10.19 10.19 10.19 10.19 10.19 10.19 10.19Mount Storm CT 16.03 14.18 14.63 20.36 20.36New Pump StorageNorth Anna 1 10.36 10.36 10.33 10.40 10.40 10.40 10.40 10.40 10.40 10.40 10.40 10.40 10.40 10.40 10.40 10.40 10.40 10.40 10.40North Anna 2 10.39 10.34 10.34 10.42 10.42 10.42 10.42 10.42 10.42 10.42 10.42 10.42 10.42 10.42 10.42 10.42 10.42 10.42 10.42North Anna HydroNorthern Neck CT 1-4 16.87 15.44 17.47 16.83 16.83Possum Point 5 11.87 11.69 12.43 9.93 9.93Possum Point 6 7.18 7.08 7.11 7.43 7.43 7.43 7.43 7.43 7.43 7.43 7.43 7.43 7.43 7.43 7.43 7.43 7.43 7.43 7.43Possum Point CT 1-6 17.32 15.28 17.03 16.83 16.83Remington 1 10.01 9.92 9.82 10.48 10.48 10.48 10.48 10.48 10.48 10.48 10.48 10.48 10.48 10.48 10.48 10.48 10.48 10.48 10.48Remington 2 10.10 10.08 9.98 10.48 10.48 10.48 10.48 10.48 10.48 10.48 10.48 10.48 10.48 10.48 10.48 10.48 10.48 10.48 10.48Remington 3 10.03 9.93 9.85 10.48 10.48 10.48 10.48 10.48 10.48 10.48 10.48 10.48 10.48 10.48 10.48 10.48 10.48 10.48 10.48Remington 4 9.99 10.00 9.89 10.48 10.48 10.48 10.48 10.48 10.48 10.48 10.48 10.48 10.48 10.48 10.48 10.48 10.48 10.48 10.48Roanoke Rapids Hydro - Rosemary 9.48 10.07 10.82 8.76 8.76 8.76 8.76 8.76 8.76 8.76 8.76 8.76 8.76 8.76 8.76 8.76 8.76 8.76 8.76Scott SolarSolar Partnership ProgramSolar_DGSouthampton 15.70 16.45 16.63 11.70 11.70 11.70 11.70 11.70 11.70 11.70 11.70 11.70Surry 1 10.21 10.24 10.26 10.31 10.31 10.31 10.31 10.31 10.31 10.31 10.31 10.31 10.31 10.31 10.31 10.31 10.31 10.31 10.31Surry 2 10.24 10.33 10.26 10.31 10.31 10.31 10.31 10.31 10.31 10.31 10.31 10.31 10.31 10.31 10.31 10.31 10.31 10.31 10.31US-3 Solar 1US-3 Solar 2US-4 SolarVirginia City Hybrid Energy Center 10.02 10.01 11.67 9.39 9.39 9.39 9.39 9.39 9.39 9.39 9.39 9.39 9.39 9.39 9.39 9.39 9.39 9.39 9.39Warren 6.88 6.85 6.87 6.95 6.96 6.96 6.96 6.95 6.96 6.96 6.96 6.95 6.96 6.96 6.96 6.95 6.96 6.96 6.96Water StriderWestmoreland_PPAWhitehouse SolarWoodland SolarYorktown 3 10.86 10.17 9.97 10.15 10.15 10.15 10.15

Appendix 5F – Existing Capacity for Plan B
Notes: 1) Net dependable annual firm capability during peak season. 2) Each item in Section I as a percent of line n (Total).
3) Includes current estimates for renewable capacity by VCHEC. 4) Includes 35% Solar DG and 35% energy storage battery.
Company Name: Virginia Electric and Power Company Schedule 7CAPACITY DATA
(ACTUAL) (PROJECTED)
2017 2018 2019 2020 2021 2022 2023 2024 2025 2026 2027 2028 2029 2030 2031 2032 2033 2034 2035I. Firm Capacity (MW)(1)
a. Nuclear 3,357 3,357 3,357 3,349 3,349 3,349 3,349 3,349 3,349 3,349 3,349 3,349 3,349 3,349 3,349 3,349 3,349 3,349 3,349 b. Biomass(3) 183 183 183 205 211 214 214 214 214 214 214 214 61 61 61 61 61 61 61 c. Coal 4,400 4,400 3,654 3,632 3,626 3,623 2,609 2,609 2,170 2,170 2,170 2,170 2,170 2,170 2,170 2,170 2,170 2,170 2,170 d. Heavy Fuel Oil 1,572 1,572 1,559 1,413 1,413 790 790 - - - - - - - - - - - - e. Light Fuel Oil 596 596 584 234 206 206 - - - - - - - - - - - - - f. Natural Gas-Boiler 543 - - - - - - - - - - - - - - - - - - g. Natural Gas-Combined Cycle 4,948 5,756 6,293 6,304 6,304 6,304 6,304 6,304 6,304 6,304 6,139 6,139 6,139 6,139 6,139 6,139 6,139 6,139 6,139 h. Natural Gas-Turbine 2,053 2,053 2,051 2,408 2,408 2,408 2,882 3,367 3,367 3,367 3,367 3,367 3,367 3,367 3,367 3,367 3,367 3,367 3,367 i. Hydro-Conventional 316 316 316 316 316 316 316 316 316 316 316 316 316 316 316 316 316 316 316 j. Pumped Storage & Battery 1,808 1,808 1,808 1,808 1,815 1,815 1,820 1,820 1,820 1,924 2,054 2,054 2,184 2,484 2,478 2,608 2,602 2,732 2,732 k. Renewable 6 6 6 73 147 367 571 810 1,012 1,504 2,215 2,449 2,770 3,125 3,360 3,594 3,827 4,825 5,055 l. Total Company Firm Capacity 19,782 20,047 19,810 19,741 19,793 19,391 18,855 18,788 18,552 19,148 19,824 20,058 20,356 21,011 21,240 21,604 21,831 22,959 23,189 m. Other (NUG)(4) 238 - - - 36 137 260 401 523 719 909 1,089 1,319 1,456 1,573 1,759 1,875 2,060 2,175 n. Total 20,020 20,047 19,810 19,741 19,829 19,528 19,114 19,190 19,075 19,867 20,733 21,147 21,675 22,467 22,813 23,363 23,706 25,019 25,364
II. Firm Capacity Mix (%)(2)
a. Nuclear 16.8% 16.7% 16.9% 17.0% 16.9% 17.1% 17.5% 17.4% 17.6% 16.9% 16.2% 15.8% 15.4% 14.9% 14.7% 14.3% 14.1% 13.4% 13.2% b. Biomass(3) 0.9% 0.9% 0.9% 1.0% 1.1% 1.1% 1.1% 1.1% 1.1% 1.1% 1.0% 1.0% 0.3% 0.3% 0.3% 0.3% 0.3% 0.2% 0.2% c. Coal 22.0% 21.9% 18.4% 18.4% 18.3% 18.6% 13.6% 13.6% 11.4% 10.9% 10.5% 10.3% 10.0% 9.7% 9.5% 9.3% 9.2% 8.7% 8.6% d. Heavy Fuel Oil 7.9% 7.8% 7.9% 7.2% 7.1% 4.0% 4.1% 0.0% 0.0% 0.0% 0.0% 0.0% 0.0% 0.0% 0.0% 0.0% 0.0% 0.0% 0.0% e. Light Fuel Oil 3.0% 3.0% 2.9% 1.2% 1.0% 1.1% 0.0% - - - - - - - - - - - - f. Natural Gas-Boiler 2.7% 0.0% 0.0% 0.0% 0.0% 0.0% 0.0% 0.0% 0.0% 0.0% 0.0% 0.0% 0.0% 0.0% 0.0% 0.0% 0.0% 0.0% 0.0% g. Natural Gas-Combined Cycle 24.7% 28.7% 31.8% 31.9% 31.8% 32.3% 33.0% 32.9% 33.0% 31.7% 29.6% 29.0% 28.3% 27.3% 26.9% 26.3% 25.9% 24.5% 24.2% h. Natural Gas-Turbine 10.3% 10.2% 10.4% 12.2% 12.1% 12.3% 15.1% 17.5% 17.7% 16.9% 16.2% 15.9% 15.5% 15.0% 14.8% 14.4% 14.2% 13.5% 13.3% i. Hydro-Conventional 1.6% 1.6% 1.6% 1.6% 1.6% 1.6% 1.7% 1.6% 1.7% 1.6% 1.5% 1.5% 1.5% 1.4% 1.4% 1.4% 1.3% 1.3% 1.2% j. Pumped Storage & Battery 9.0% 9.0% 9.1% 9.2% 9.2% 9.3% 9.5% 9.5% 9.5% 9.7% 9.9% 9.7% 10.1% 11.1% 10.9% 11.2% 11.0% 10.9% 10.8% k. Renewable 0.0% 0.0% 0.0% 0.4% 0.7% 1.9% 3.0% 4.2% 5.3% 7.6% 10.7% 11.6% 12.8% 13.9% 14.7% 15.4% 16.1% 19.3% 19.9% l. Total Company Firm Capacity 98.8% 100.0% 100.0% 100.0% 99.8% 99.3% 98.6% 97.9% 97.3% 96.4% 95.6% 94.9% 93.9% 93.5% 93.1% 92.5% 92.1% 91.8% 91.4% m. Other (NUG)(4) 1.2% 0.0% 0.0% 0.0% 0.2% 0.7% 1.4% 2.1% 2.7% 3.6% 4.4% 5.1% 6.1% 6.5% 6.9% 7.5% 7.9% 8.2% 8.6% n. Total 100.0% 100.0% 100.0% 100.0% 100.0% 100.0% 100.0% 100.0% 100.0% 100.0% 100.0% 100.0% 100.0% 100.0% 100.0% 100.0% 100.0% 100.0% 100.0%

Appendix 5G – Energy Generation by Type for Plan B (GWh)
Notes: (1) Includes current estimates for renewable energy generation by VCHEC. (2) Payback energy is accounted for in Total Generation.
(3) Includes all sales or delivery transactions with other electric utilities (e.g., firm or economy sales).
Company Name: Virginia Electric and Power Company Schedule 2GENERATION
(ACTUAL) (PROJECTED)
2017 2018 2019 2020 2021 2022 2023 2024 2025 2026 2027 2028 2029 2030 2031 2032 2033 2034 2035I. System Output (GWh) a. Nuclear 28,683 27,361 27,720 27,928 27,601 27,673 27,199 25,925 27,144 27,556 26,691 27,227 26,498 25,923 27,163 28,612 27,722 28,286 28,242 b. Biomass(1) 1,163 1,196 1,008 355 590 897 686 97 123 121 97 106 43 51 45 37 34 23 18 c. Coal 15,376 12,302 7,177 6,925 7,509 7,027 5,328 5,136 5,775 2,035 1,795 1,875 2,084 2,405 2,241 1,815 1,605 1,090 862 d. Heavy Fuel Oil 141 313 88 633 383 208 86 - - - - - - - - - - - - e. Light Fuel Oil 131 313 35 0 - - - - - - - - - - - - - - - f. Natural Gas-Boiler 163 111 - - - - - - - - - - - - - - - - - g. Natural Gas-Combined Cycle 26,832 28,500 37,219 40,996 39,496 41,421 43,507 43,048 41,601 39,378 37,654 36,156 34,861 34,999 31,773 29,829 31,925 28,193 25,197 h. Natural Gas-Turbine 1,246 1,888 1,168 1,445 1,012 1,113 1,311 1,576 1,760 1,432 1,158 1,007 843 702 518 425 411 404 240 i. Hydro-Conventional 876 1,577 1,311 612 610 610 610 612 610 610 610 612 610 610 610 612 610 610 610 j. Pumped Storage & Battery 2,240 2,453 1,934 1,523 1,718 1,634 1,633 1,720 1,603 1,926 2,130 2,057 2,202 2,202 2,342 2,552 2,665 3,274 3,446 k. Renewable 102 80 90 444 915 2,294 3,616 5,128 6,423 10,541 17,255 19,258 21,579 23,831 25,355 26,963 28,381 38,709 40,201 l. Total Generation 76,953 76,094 77,750 80,862 79,833 82,877 83,976 83,241 85,039 83,599 87,390 88,298 88,721 90,723 90,048 90,845 93,352 100,588 98,815 m. Purchased Power (NUGs) 4,611 4,289 2,616 - 219 850 1,647 2,544 3,326 4,208 4,988 6,145 7,164 8,027 8,786 9,569 10,294 11,042 11,786 n. Purchased Power (Battery Storage) - - - - - - - - - 181 362 373 547 518 528 693 753 1,061 1,096 o. Purchased Power (Market / PJM) 10,488 14,537 13,552 4,773 7,127 6,347 7,089 9,315 6,747 9,275 7,304 6,949 7,593 7,208 7,998 8,467 7,525 4,272 6,256 p. Total Payback Energy(2) 8 9 12 16 19 22 24 25 24 23 23 23 23 23 23 24 q. Less Pumping Energy (3,014) (3,043) (2,801) (1,904) (2,147) (2,023) (2,052) (2,154) (1,994) (2,583) (3,036) (2,962) (3,341) (3,283) (3,444) (3,900) (4,108) (5,204) (5,457) r. Less Other Sales(3) (1,680) (225) (561) (2,222) (1,653) (2,219) (2,268) (2,607) (2,155) (3,126) (4,808) (5,559) (6,636) (8,354) (8,236) (8,922) (10,377) (13,329) (12,952) s. Total System Firm Energy Req. 87,359 91,652 90,556 81,510 83,379 85,832 88,392 90,340 90,962 91,554 92,200 93,244 94,047 94,838 95,680 96,752 97,440 98,431 99,544
II. Energy Supplied by Competitive Service Providers N/A N/A N/A N/A N/A N/A N/A N/A N/A N/A N/A N/A N/A N/A N/A N/A N/A N/A N/A

Appendix 5H – Energy Generation by Type for Plan B (%)
Notes: (1) Includes current estimates for renewable energy generation by VCHEC. (2) Payback energy is accounted for in Total Generation.
(3) Includes all sales or delivery transactions with other electric utilities (e.g., firm or economy sales).
Company Name: Virginia Electric and Power Company Schedule 3GENERATION
(ACTUAL) (PROJECTED)
2017 2018 2019 2020 2021 2022 2023 2024 2025 2026 2027 2028 2029 2030 2031 2032 2033 2034 2035III. System Output Mix (%) a. Nuclear 32.8% 29.9% 30.6% 34.3% 33.1% 32.2% 30.8% 28.7% 29.8% 30.1% 28.9% 29.2% 28.2% 27.3% 28.4% 29.6% 28.5% 28.7% 28.4% b. Biomass(1) 1.3% 1.3% 1.1% 0.4% 0.7% 1.0% 0.8% 0.1% 0.1% 0.1% 0.1% 0.1% 0.0% 0.1% 0.0% 0.0% 0.0% 0.0% 0.0% c. Coal 17.6% 13.4% 7.9% 8.5% 9.0% 8.2% 6.0% 5.7% 6.3% 2.2% 1.9% 2.0% 2.2% 2.5% 2.3% 1.9% 1.6% 1.1% 0.9% d. Heavy Fuel Oil 0.2% 0.3% 0.1% 0.8% 0.5% 0.2% 0.1% 0.0% 0.0% 0.0% 0.0% 0.0% 0.0% 0.0% 0.0% 0.0% 0.0% 0.0% 0.0% e. Light Fuel Oil 0.2% 0.3% 0.0% 0.0% 0.0% 0.0% 0.0% - - - - - - - - - - - - f. Natural Gas-Boiler 0.2% 0.1% 0.0% 0.0% 0.0% 0.0% 0.0% 0.0% 0.0% 0.0% 0.0% 0.0% 0.0% 0.0% 0.0% 0.0% 0.0% 0.0% 0.0% g. Natural Gas-Combined Cycle 30.7% 31.1% 41.1% 50.3% 47.4% 48.3% 49.2% 47.7% 45.7% 43.0% 40.8% 38.8% 37.1% 36.9% 33.2% 30.8% 32.8% 28.6% 25.3% h. Natural Gas-Turbine 1.4% 2.1% 1.3% 1.8% 1.2% 1.3% 1.5% 1.7% 1.9% 1.6% 1.3% 1.1% 0.9% 0.7% 0.5% 0.4% 0.4% 0.4% 0.2% i. Hydro-Conventional 1.0% 1.7% 1.4% 0.8% 0.7% 0.7% 0.7% 0.7% 0.7% 0.7% 0.7% 0.7% 0.6% 0.6% 0.6% 0.6% 0.6% 0.6% 0.6% j. Pumped Storage & Battery 2.6% 2.7% 2.1% 1.9% 2.1% 1.9% 1.8% 1.9% 1.8% 2.1% 2.3% 2.2% 2.3% 2.3% 2.4% 2.6% 2.7% 3.3% 3.5% k. Renewable 0.1% 0.1% 0.1% 0.5% 1.1% 2.7% 4.1% 5.7% 7.1% 11.5% 18.7% 20.7% 22.9% 25.1% 26.5% 27.9% 29.1% 39.3% 40.4% l. Total Generation 88.1% 83.0% 85.9% 99.2% 95.7% 96.6% 95.0% 92.1% 93.5% 91.3% 94.8% 94.7% 94.3% 95.7% 94.1% 93.9% 95.8% 102.2% 99.3% m. Purchased Power (NUGs) 5.3% 4.7% 2.9% 0.0% 0.3% 1.0% 1.9% 2.8% 3.7% 4.6% 5.4% 6.6% 7.6% 8.5% 9.2% 9.9% 10.6% 11.2% 11.8% n. Purchased Power (Battery Storage) 0.0% 0.0% 0.0% 0.0% 0.0% 0.0% 0.0% 0.0% 0.0% 0.2% 0.4% 0.4% 0.6% 0.5% 0.6% 0.7% 0.8% 1.1% 1.1% o. Purchased Power (Market / PJM) 12.0% 15.9% 15.0% 5.9% 8.5% 7.4% 8.0% 10.3% 7.4% 10.1% 7.9% 7.5% 8.1% 7.6% 8.4% 8.8% 7.7% 4.3% 6.3% p. Total Payback Energy(2) 0.0% 0.0% 0.0% 0.0% 0.0% 0.0% 0.0% 0.0% 0.0% 0.0% 0.0% 0.0% 0.0% 0.0% 0.0% 0.0% 0.0% 0.0% 0.0% q. Less Pumping Energy -3.5% -3.3% -3.1% -2.3% -2.6% -2.4% -2.3% -2.4% -2.2% -2.8% -3.3% -3.2% -3.6% -3.5% -3.6% -4.0% -4.2% -5.3% -5.5% r. Less Other Sales(3) -1.9% -0.2% -0.6% -2.7% -2.0% -2.6% -2.6% -2.9% -2.4% -3.4% -5.2% -6.0% -7.1% -8.8% -8.6% -9.2% -10.6% -13.5% -13.0% s. Total System Firm Energy Req. 100.0% 100.0% 100.0% 100.0% 100.0% 100.0% 100.0% 100.0% 100.0% 100.0% 100.0% 100.0% 100.0% 100.0% 100.0% 100.0% 100.0% 100.0% 100.0%
IV. System Load Factor 57.7% 56.6% 59.0% 60.6% 61.3% 61.0% 61.3% 61.8% 61.6% 61.9% 62.4% 61.8% 61.9% 62.5% 62.1% 62.2% 61.9% 62.0% 62.1%

Appendix 5I – Solar and Wind Generating Facilities Since July 1, 2018
* Variable pricing based on PJM energy and capacity prices.
Project Name Status Nameplate(MWac)
In ServiceDate Type
Cost Recovery
MechanismHollyfield Operational 17 2018 Company-build Ring-FenceMontross Operational 20 2018 Company-build Ring-FencePuller Operational 15 2018 Company-build Ring-FenceColonial Trail West Operational 142 2019 Company-build RACGloucester Operational 20 2019 Company-build Ring-FenceSpring Grove 1 In Construction 98 2020 (proj) Company-build RACSadler In Construction 100 2020 (proj) Company-build RACWestmoreland In Construction 20 2020 (proj) PPA Fuel / BaseRives Road * In Construction 20 2020 (proj) PPA Fuel / BasePamplin * In Construction 16 2020 (proj) PPA Fuel / BaseHickory * In Construction 32 2020 (proj) PPA Fuel / BaseWater Strider In Construction 80 2020 (proj) PPA Fuel / BaseCoastal VA Offshore Wind (CVOW) In Construction 12 2020 (proj) Company-build Base RateGrasshopper In Construction 80 2020 (proj) Company-build Ring-FenceBelcher In Construction 88 2020 (proj) Company-build Ring-FenceRochambeau In Construction 20 2021 (proj) Company-build Ring-FenceFort Powhatan In Construction 150 2021 (proj) Company-build Ring-FenceBedford In Construction 70 2021 (proj) Company-build Ring-FenceRocky Forge In Construction 77 2021 (proj) Company-build Ring-FenceMaplewood In Construction 120 2022 (proj) Company-build Ring-Fence

Appendix 5J - Potential Unit Retirements
Notes: (1) Reflects retirement assumptions used for planning purposes, not firm Company commitments. (2) These units are shown as planned retirements in all Alternative Plans.
(3) These units are shown as planned retirements in Alternative Plans B, C, and D only.
Company Name: Schedule 19UNIT PERFORMANCE DATAPlanned Unit Retirements(1)
Unit Name Location Unit Type
Primary Fuel Type
ProjectedRetirement
Year
MWSummer
MWWinter
Gravel Neck 1 Surry, VA CombustionTurbine Light Fuel Oil 2020 28 38 Gravel Neck GT1 12 Gravel Neck GT2 16
Possum Point 5(2) Dumfries, VA Steam-Cycle Heavy Fuel Oil 2021 623 623
Chesapeake CT 1 Chesapeake, VA CombustionTurbine Light Fuel Oil 2022 15 20 Chesapeake GT1 15
Chesapeake CT 2 Chesapeake, VA CombustionTurbine Light Fuel Oil 2022 24 33 Chesapeake GT4 12 Chesapeake GT6 12
Lowmoor CT Covington, VA CombustionTurbine Light Fuel Oil 2022 48 65 Lowmoor GT1 12 Lowmoor GT2 12 Lowmoor GT3 12 Lowmoor GT4 12
Mount Storm CT Mt. Storm, WV CombustionTurbine Light Fuel Oil 2022 11 15 Mt. Storm GT1 11
Northern Neck CT Warsaw, VA CombustionTurbine Light Fuel Oil 2022 47 63 Northern Neck GT1 12 Northern Neck GT2 11 Northern Neck GT3 12 Northern Neck GT4 12
Possum Point CT Dumfries, VA Steam-Cycle Light Fuel Oil 2022 72 106 Possum Point CT1 12 Possum Point CT2 12 Possum Point CT3 12 Possum Point CT4 12 Possum Point CT5 12 Possum Point CT6 12
Yorktown 3(2) Yorktown, VA Steam-Cycle Heavy Fuel Oil 2023 790 792
Chesterfield 5(2) Chester, VA Steam-Cycle Coal 2023 336 342
Chesterfield 6(2) Chester, VA Steam-Cycle Coal 2023 678 690
Clover 1(2) Clover, VA Steam-Cycle Coal 2025 220 222
Clover 2(2) Clover, VA Steam-Cycle Coal 2025 219 219
Rosemary(2) Roanoke Rapids, NC Combine Cycle Fuel Oil 2027 165 165
Altavista(3) Altavista, VA Steam-Cycle Biomass 2028 51 51
Hopewell(3) Hopewell, VA Steam-Cycle Biomass 2028 51 51
Southampton(3) Franklin, VA Steam-Cycle Biomass 2028 51 51
Virginia Electric and Power Company

Appendix 5K – Planned Changes to Existing Generation Units
Note: Peak net dependable capability as of this filing. Incremental uprates shown as positive and decremental derates shown as negative.
Company Name: Virginia Electric and Power Company Schedule 13aUNIT PERFORMANCE DATA(1)
Unit Size (MW) Uprate and Derate(ACTUAL) (PROJECTED)
Unit Name 2017 2018 2019 2020 2021 2022 2023 2024 2025 2026 2027 2028 2029 2030 2031 2032 2033 2034 2035Altavista - - - - - - - - - - - - - - - - - - - Bath County 1-6 - - - - - - - - - - - - - - - - - - - Bear Garden 26 - - - - - - - - - - - - - - - - - - Brunswick - - - - - - - - - - - - - - - - - - - Chesapeake CT 1, 4, 6 - - - - - - - - - - - - - - - - - - - Chesterfield 5 - - - - - - - - - - - - - - - - - - - Chesterfield 6 - - - - - - - - - - - - - - - - - - - Chesterfield 7 - - - - - - - - - - - - - - - - - - - Chesterfield 8 - - - - - - - - - - - - - - - - - - - Clover 1 - - - - - - - - - - - - - - - - - - - Clover 2 - - - - - - - - - - - - - - - - - - - Colonial Trail West - - - - - - - - - - - - - - - - - - - Darbytown 1 - - - - - - - - - - - - - - - - - - - Darbytown 2 - - - - - - - - - - - - - - - - - - - Darbytown 3 - - - - - - - - - - - - - - - - - - - Darbytown 4 - - - - - - - - - - - - - - - - - - - Elizabeth River 1 - - - - - - - - - - - - - - - - - - - Elizabeth River 2 - - - - - - - - - - - - - - - - - - - Elizabeth River 3 - - - - - - - - - - - - - - - - - - - Gaston Hydro - - - - - - - - - - - - - - - - - - - Gordonsville 1 - - - - - - - - - - - - - - - - - - - Gordonsville 2 - - - - - - - - - - - - - - - - - - - Gravel Neck 1-2 - - - - - - - - - - - - - - - - - - - Gravel Neck 3 - - - - - - - - - - - - - - - - - - - Gravel Neck 4 - - - - - - - - - - - - - - - - - - - Gravel Neck 5 - - - - - - - - - - - - - - - - - - - Gravel Neck 6 - - - - - - - - - - - - - - - - - - - GreensvilleHopewell - - - - - - - - - - - - - - - - - - - Ladysmith 1 - - - - - - - - - - - - - - - - - - - Ladysmith 2 - - - - - - - - - - - - - - - - - - - Ladysmith 3Ladysmith 4 - - - - - - - - - - - - - - - - - - - Ladysmith 5 - - - - - - - - - - - - - - - - - - - Lowmoor CT 1-4 - - - - - - - - - - - - - - - - - - - Mount Storm 1 - - - - - - - - - - - - - - - - - - - Mount Storm 2 - - - - - - - - - - - - - - - - - - - Mount Storm 3 - - - - - - - - - - - - - - - - - - - Mount Storm CT - - - - - - - - - - - - - - - - - - - North Anna 1 - - - - - - - - - - - - - - - - - - - North Anna 2 - - - - - - - - - - - - - - - - - - - North Anna Hydro - - - - - - - - - - - - - - - - - - - Northern Neck CT 1-4 - - - - - - - - - - - - - - - - - - - Possum Point 5 - - - (163) - - - - - - - - - - - - - - - Possum Point 6 - - - - - - - - - - - - - - - - - - - Possum Point CT 1-6 - - - - - - - - - - - - - - - - - - - Remington 1 - - - - - - - - - - - - - - - - - - - Remington 2 - - - - - - - - - - - - - - - - - - - Remington 3 - - - - - - - - - - - - - - - - - - - Remington 4 - - - - - - - - - - - - - - - - - - - Roanoke Rapids Hydro - - - - - - - - - - - - - - - - - - - Rosemary - - - - - - - - - - - - - - - - - - - Scott Solar - - - - - - - - - - - - - - - - - - - Solar Partnership Program - - - - - - - - - - - - - - - - - - - Southampton - - - - - - - - - - - - - - - - - - - Surry 1 - - - - - - - - - - - - - - - - - - - Surry 2 - - - - - - - - - - - - - - - - - - - Virginia City Hybrid Energy Center - - - - - - - - - - - - - - - - - - - Warren - - - - - - - - - - - - - - - - - - - Whitehouse Solar - - - - - - - - - - - - - - - - - - - Woodland Solar - - - - - - - - - - - - - - - - - - - Yorktown 3 - - - - - - - - - - - - - - - - - - -

Appendix 5L – Environmental Regulations
Key Regulation Final Rule Compliance Date Baseline Means of ComplianceHg/HAPS Mercury & Air Toxics Standards (1) (MATS) 12/16/2011 4/16/2017 All affected units compliant
CSAPR (2) 2011 2015/2017 Allowances (In-Sys.; Trading)SO2 NAAQS (75 ppb, 1-hr avg) 6/2/2010 2018 Maintain current % sulfur oil level (3)
2008 Ozone Standard (75 ppb) May 2012 2019DEQ requiring installation/operation of SNCR by 6/1/2019 to meet RACT or permanent retirement of unit by 6/1/2021 with operational limitations (no SNCR or NOx limit) in the interim. (4) Mutual agreement executed in June 2019 to retire unit by June 2021.
2015 Ozone Standard (70 ppb) 10/1/2015 2021 Compliance with RACT (as described above)CSAPR (5) 2011 2015/2017 Allowances (In-Sys.; Trading)
NSR Permitting for GHGS 5/2010 2011 GHG BACT
EGU NSPS (New) (6) (Subpart TTTT)Proposed revision
10/23/2015
12/20/2018
Retro to 1/8/2014Retro to
12/20/2018
Build Gas CC or Install CCS
Proposed revision: Build Gas CC or super-critical coal
EGU NSPS (Modified and Reconstructed) (6)Proposed revision (Subpart TTTT)
10/23/2015
12/20/2018
10/23/2015
12/20/2018Will need to evaluate on a project-by-project basis.
Affordable Clean Energy (ACE)(replacement to CPP) 2019 2024/2025
To be determined by state plans. States to establish unit-specific emission performance standards based on identification of best system of emission reductions (BSER) based on unit heat rate improvement potential per EPA-established BSER guidelines.
Virginia Carbon Regulations or RGGI (7)(20) 2019 2020 with
glidepath to 2030
DEQ reproposed and has finalized with starting cap of 28 million tons.Cap reduced about 3%/year through 2030 (19.6 short tons) .Link to regional trading program via use of consignment auction with revenue returned to generators.If VA joins RGGI in future, auction proceeds go back to state (not generators)Compliance with renewables, new gas, possible unit retitrements and allowance purchases (if applicable).
Federal CO2 Program (Alternative Federal Legislation)
Uncertain 2026 Expected Price for CO2
Exectuive Order 43 (30% of VA gen from RE resources, 100% carbon-free by 2050) 9/16/2019 Plan due 7/1/2020
(19)
The Director of Department of Mines, Minerals and Energy (DMME), in consultation with the Secretary of Commerce and Trade, the Secretary of Natural Resources, and the Director of the Department of Environmental Quality (DEQ), shall develop a plan of action to produce thirty percent of Virginia’s electricity from renewable energy sources by 2030 and one hundred percent of Virginia’s electricity from carbon-free sources by 2050.
Virginia Energy Plan; Commonwealth Energy Policy 7/1/2020 2020 - 2045
Sets a goal for VA to reach net zero emissions by 2045 and additionally states: that by 2040 Virginia will have a net zero carbon energy economy for all sectors, including electricity, transportation, building and industrial sectors. Developing energy resources necessary to produce 30 percent of VA's electricity from renewable energy sources by 2030 and 100 percent from VA's electricity carbon-free sources by 2040.
Virginia Clean Economy Act 7/1/2020 2020 - 2045
VCEA establishes a mandatory portolio standard in VA. There are mandates for significant developments of renewable energy and energy storage resources, as well as retirement of existing carbon-emitting resources. Includes mandatory retirement of certain fossil-generating units: Chesterfield Units 5 & 6 and Yorktown 3 by 2024. Biomass facilities (Altavista, Hopewell, Southampton) by 2028) and shutting down all remaining fossil generating units by 2045. Allows petition for relief from these provisions if electric reliability or security is at risk
Constituent
SO2
NOx
AIR
CO2

Appendix 5L cont. – Environmental Regulations
Key Regulation Final Rule Compliance Date Baseline Means of Compliance
4/2018; 2020+ Close landfill & pond due to station closure. Pond and landfill to be excavated and recycled off site. (8)
6/2018; 2020+ Close all three coal ash ponds by excavating material and placing into new landfill at or adjacent to plant. (8)
4/2018; 2020+ All five ponds to be closed. A/B/C and E excavated to D. New landfill to be developed for ash in pond D. Continuning to evaluate onsite landfill or offsite recycling. (8)
6/2019; 2020+Fly &/or Bottom Ash - Wet to Dry Conversion to include construction and operation of new landfill; Lower and Upper Pond Closure through excavation and hauling to landfill or off site for recycling; construct new treatment ponds. (8)
2020 Landfill closure (due to coal unit retirements)10/2018 Pond retrofit.
10/2018 Pond retrofit and/or rebuilding.
TBD Monitor groundwater and corrective actions, if needed.
2016 (16)
2019 (11)
2020
2021
2023 (12)
2023 (13)
2025 (13)
2025 (13)
2023 Possible Low Capacity Exemption12/2023 FGD Water Treatment Facilities
12/31/2023 (15) Bottom Ash - Closed Loop Wet System
Atlantic Sturgeon Endangered Species Listing 2/6/2012 2019/2020 Seeking ITP which may contain potential mitigation measures to address impingement and entrainment of Atlantic Sturgeon and impacts to critical habitat. (18)Thermal discharge studies at CH and SU to determine compliance needs during NPDES permit reissuance.
316(b) Studies to Determine Compliance Needs and Submit Design & Source Water Body Data
VSDs; Screens; Fish Returns
Water ELG Effluent Limitation Guidelines (14) 9/30/2015
2017 2019-2023(17)
WA
STE
ASH CCR's 4/17/2015
WA
TER Water
316b316(b) Impingement & Entrainment (9) (10) 5/19/2014
Constituent
Atlantic Sturgeon Critical Habitat Listing
WIIL
DLI
FE
Threatened & Endangered

Appendix 5L cont. – Environmental Regulations
Notes: Compliance assumed January 1 unless otherwise noted. 1) CEC 1-4 retired in 2014. YT 1-2, CH 3-4, MK 1-2 retired in 2019. On 12/28/2018, EPA proposed revisions to MATS Supplemental Finding but proposing to keep MATS in
place. MATS went to OMB on 10/4, expecting final rule to be issued first half of 2020. 2) SO2 allowances decreased by 50% in 2017. Retired units retain CSAPR allowances for 4 years. System is expected to have sufficient SO2 allowances.
3) SO2 NAAQS modeling submitted to VDEQ in 11/2016. Modeling shows compliance with the NAAQS. EPA has approved and issued notice indicating NAAQS attainment 8/2017. In March 2019, EPA published final rule retaining 75 ppb 1-hr SO2 NAAQS. No additional impacts expected.
4) VDEQ issued SOP on 1/31/2019. 5) Final revisions to CSAPR reduced ozone season NOx allowances by ~22% beginning in 2017. Projected to have sufficient allowances even if limits imposed on use of banked
Phase I allowances (~ 3.5:1). Retired units retain CSAPR allowances for 4 years. System is expected to have sufficient annual NOx allowances. 6) 2015 rule under EPA review for possible repeal or replacement rule. EPA published proposed revisions on December 20, 2018.
7) In May 2019, VDEQ issued final rule establishing a cap-and-trade program that allows for linkage to an existing regional trading program (such as RGGI) and includes about a 30% reduction from 2020 levels by 2030 and other allowance pool reduction mechanisms. In 2020, legislation passed the Virginia General Assembly related to RGGI.
8) As a result of the 2019 SB1355 legislation, ash in ponds must be excavated and disposed of in the landfill or taken off site for recycling. Exact timing of start of work at each site TBD.
9) Rule would not apply to Mt. Storm under the assumption that the plant’s man-made lake does not qualify as a “water of the U.S.” 10) 316(b) studies will be due with discharge permit applications beginning in mid-2018. Installation of 316(b) technology requirements will be based on compliance schedules put
into discharge permits. 11) 316(b) information due with permit application by March 2019. VDEQ has concurred with CCRS status for impingement but will grant only limited waivers to other
requirements. 12) Assumes permit is issued in 2019 with 316(b) with submittal due 270 days before permit expires.
13) Assumes permit issued with a 4-year compliance schedule. Permit issuance dates: North Anna - Dec 2019, Surry - March 2021, CH - September 2021, PP 3 & 4 - April 2023. 14) Rule does not apply to simple-cycle CTs or biomass units.
15) Assumes June 2023 applicability date included in next permit cycle based on timetable of current reconsideration of ELG rule. 16) 316(b) studies and reports completed and submitted to agency. Permits administratively continued and waiting for BTA determination.
17) Compliance dates are determined during NPDES permit reissuance process and are expected to be as follows for each facility: SU-2021, CH-2021. (18) ITP permit addendum to be filed fall 2019. Expect permit in fall 2020.
(19) The Director of DMME shall report monthly to the Secretary of Commerce and Trade on the progress of these efforts and shall submit the final plan to the Governor by July 1, 2020. Commonwealth shall procure at least 30% of the electricity under the statewide electric contract with Dominion Energy Virginia from renewable energy resources by
2022. (20) HB 981 and SB 1027 authorizes Virginia to join Regional Greenhouse Gas Initiative model.

Appendix 5M – Tabular Results of Busbar
$/kW-Year 0% 10% 20% 30% 40% 50% 60% 70% 80% 90% 100%CC - 3X1 170$ 202$ 234$ 266$ 298$ 330$ 362$ 394$ 426$ 459$ 491$ CC - 2X1 185$ 217$ 250$ 283$ 316$ 348$ 381$ 414$ 447$ 479$ 512$ CC - 1X1 216$ 251$ 285$ 320$ 354$ 389$ 423$ 457$ 492$ 526$ 561$ CT 64$ 121$ 178$ 235$ 291$ 348$ 405$ 462$ 519$ 576$ 633$ CT (Aero) 126$ 174$ 221$ 269$ 316$ 364$ 411$ 459$ 506$ 554$ 601$ Large Nuclear 1,021$ 1,031$ 1,042$ 1,052$ 1,063$ 1,074$ 1,084$ 1,095$ 1,105$ 1,116$ 1,126$ Nuclear SMR 644$ 654$ 664$ 674$ 685$ 695$ 705$ 715$ 725$ 735$ 746$ Biomass 928$ 979$ 1,030$ 1,082$ 1,133$ 1,184$ 1,235$ 1,286$ 1,337$ 1,388$ 1,440$ Fuel Cell 1,256$ 1,285$ 1,315$ 1,344$ 1,373$ 1,403$ 1,432$ 1,461$ 1,491$ 1,520$ 1,549$ SCPC w/ CCS 1,028$ 1,109$ 1,190$ 1,271$ 1,352$ 1,433$ 1,514$ 1,595$ 1,676$ 1,757$ 1,838$ Solar & CT (Aero) 248$ 284$ 321$ 357$ 394$ 430$ 467$ 503$ 539$ 576$ 612$ Solar (1) 104$ Wind - Onshore (2) 255$ Wind - Offshore (3) 342$ Battery Generic (30 MW) (4) 475$ Pump Storage (300 MW) (4) 841$
(1) Solar has a capacity factor of 25%.(2) Onshore Wind has a capacity factor of 40%.(3) Offshore Wind has a capacity factor of 42%.(4) Batteries and Pump Storage have a capacity factor of 15%.
Capacity Factor (%)
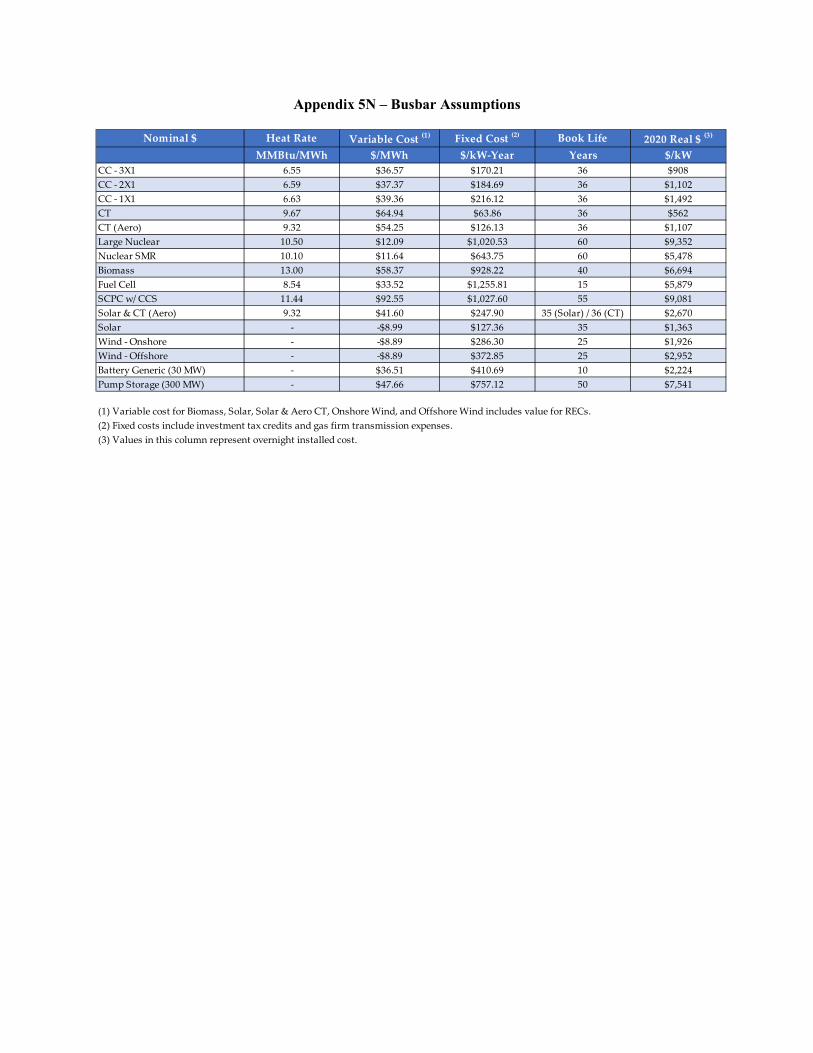
Appendix 5N – Busbar Assumptions
Nominal $ Heat Rate Variable Cost (1) Fixed Cost (2) Book Life 2020 Real $ (3)
MMBtu/MWh $/MWh $/kW-Year Years $/kWCC - 3X1 6.55 $36.57 $170.21 36 $908CC - 2X1 6.59 $37.37 $184.69 36 $1,102CC - 1X1 6.63 $39.36 $216.12 36 $1,492CT 9.67 $64.94 $63.86 36 $562CT (Aero) 9.32 $54.25 $126.13 36 $1,107Large Nuclear 10.50 $12.09 $1,020.53 60 $9,352Nuclear SMR 10.10 $11.64 $643.75 60 $5,478Biomass 13.00 $58.37 $928.22 40 $6,694Fuel Cell 8.54 $33.52 $1,255.81 15 $5,879SCPC w/ CCS 11.44 $92.55 $1,027.60 55 $9,081Solar & CT (Aero) 9.32 $41.60 $247.90 35 (Solar) / 36 (CT) $2,670Solar - -$8.99 $127.36 35 $1,363Wind - Onshore - -$8.89 $286.30 25 $1,926Wind - Offshore - -$8.89 $372.85 25 $2,952Battery Generic (30 MW) - $36.51 $410.69 10 $2,224Pump Storage (300 MW) - $47.66 $757.12 50 $7,541
(1) Variable cost for Biomass, Solar, Solar & Aero CT, Onshore Wind, and Offshore Wind includes value for RECs.(2) Fixed costs include investment tax credits and gas firm transmission expenses.(3) Values in this column represent overnight installed cost.
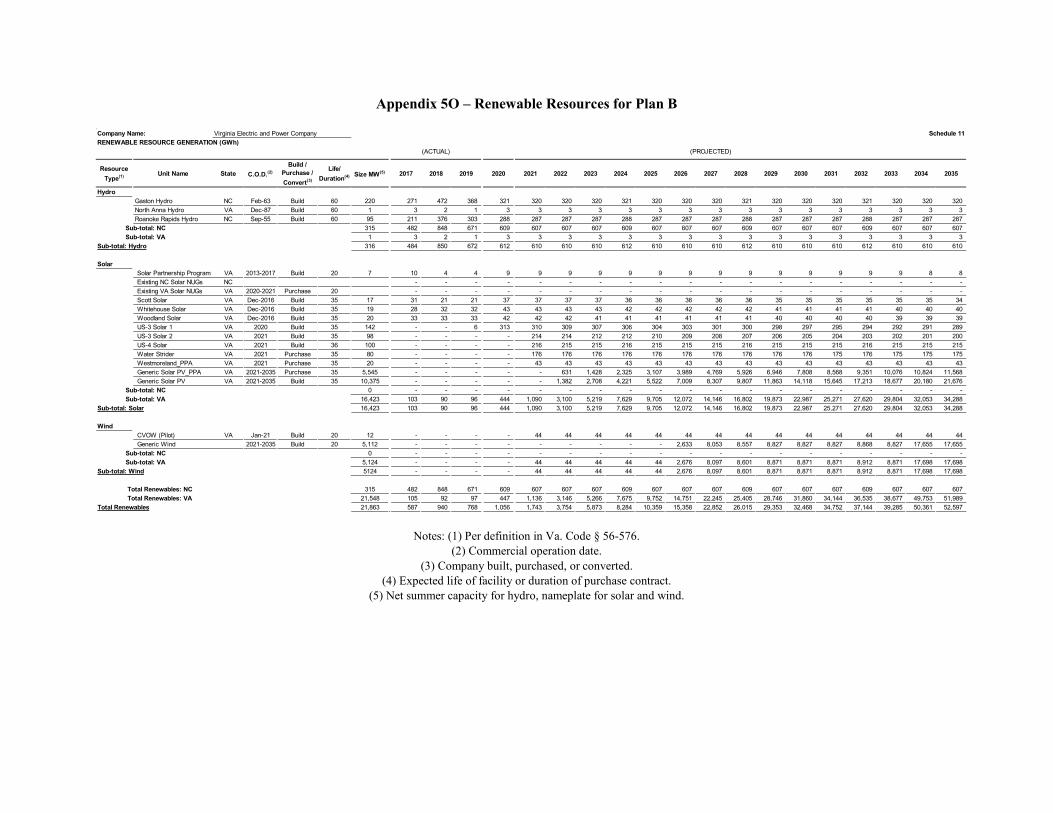
Appendix 5O – Renewable Resources for Plan B
Notes: (1) Per definition in Va. Code § 56-576. (2) Commercial operation date.
(3) Company built, purchased, or converted. (4) Expected life of facility or duration of purchase contract.
(5) Net summer capacity for hydro, nameplate for solar and wind.
Company Name: Virginia Electric and Power Company Schedule 11RENEWABLE RESOURCE GENERATION (GWh)
(ACTUAL) (PROJECTED)
Resource Type(1) Unit Name State C.O.D.(2)
Build / Purchase / Convert(3)
Life/ Duration(4) Size MW(5) 2017 2018 2019 2020 2021 2022 2023 2024 2025 2026 2027 2028 2029 2030 2031 2032 2033 2034 2035
HydroGaston Hydro NC Feb-63 Build 60 220 271 472 368 321 320 320 320 321 320 320 320 321 320 320 320 321 320 320 320 North Anna Hydro VA Dec-87 Build 60 1 3 2 1 3 3 3 3 3 3 3 3 3 3 3 3 3 3 3 3 Roanoke Rapids Hydro NC Sep-55 Build 60 95 211 376 303 288 287 287 287 288 287 287 287 288 287 287 287 288 287 287 287
Sub-total: NC 315 482 848 671 609 607 607 607 609 607 607 607 609 607 607 607 609 607 607 607 Sub-total: VA 1 3 2 1 3 3 3 3 3 3 3 3 3 3 3 3 3 3 3 3 Sub-total: Hydro 316 484 850 672 612 610 610 610 612 610 610 610 612 610 610 610 612 610 610 610
SolarSolar Partnership Program VA 2013-2017 Build 20 7 10 4 4 9 9 9 9 9 9 9 9 9 9 9 9 9 9 8 8 Existing NC Solar NUGs NC - - - - - - - - - - - - - - - - - - - Existing VA Solar NUGs VA 2020-2021 Purchase 20 - - - - - - - - - - - - - - - - - - - Scott Solar VA Dec-2016 Build 35 17 31 21 21 37 37 37 37 36 36 36 36 36 35 35 35 35 35 35 34 Whitehouse Solar VA Dec-2016 Build 35 19 28 32 32 43 43 43 43 42 42 42 42 42 41 41 41 41 40 40 40 Woodland Solar VA Dec-2016 Build 35 20 33 33 33 42 42 42 41 41 41 41 41 41 40 40 40 40 39 39 39 US-3 Solar 1 VA 2020 Build 35 142 - - 6 313 310 309 307 306 304 303 301 300 298 297 295 294 292 291 289 US-3 Solar 2 VA 2021 Build 35 98 - - - - 214 214 212 212 210 209 208 207 206 205 204 203 202 201 200 US-4 Solar VA 2021 Build 36 100 - - - - 216 215 215 216 215 215 215 216 215 215 215 216 215 215 215 Water Strider VA 2021 Purchase 35 80 - - - - 176 176 176 176 176 176 176 176 176 176 175 176 175 175 175 Westmoreland_PPA VA 2021 Purchase 35 20 - - - - 43 43 43 43 43 43 43 43 43 43 43 43 43 43 43 Generic Solar PV_PPA VA 2021-2035 Purchase 35 5,545 - - - - - 631 1,428 2,325 3,107 3,989 4,769 5,926 6,946 7,808 8,568 9,351 10,076 10,824 11,568 Generic Solar PV VA 2021-2035 Build 35 10,375 - - - - - 1,382 2,708 4,221 5,522 7,009 8,307 9,807 11,863 14,118 15,645 17,213 18,677 20,180 21,676
Sub-total: NC 0 - - - - - - - - - - - - - - - - - - - Sub-total: VA 16,423 103 90 96 444 1,090 3,100 5,219 7,629 9,705 12,072 14,146 16,802 19,873 22,987 25,271 27,620 29,804 32,053 34,288 Sub-total: Solar 16,423 103 90 96 444 1,090 3,100 5,219 7,629 9,705 12,072 14,146 16,802 19,873 22,987 25,271 27,620 29,804 32,053 34,288
WindCVOW (Pilot) VA Jan-21 Build 20 12 - - - - 44 44 44 44 44 44 44 44 44 44 44 44 44 44 44 Generic Wind 2021-2035 Build 20 5,112 - - - - - - - - - 2,633 8,053 8,557 8,827 8,827 8,827 8,868 8,827 17,655 17,655
Sub-total: NC 0 - - - - - - - - - - - - - - - - - - - Sub-total: VA 5,124 - - - - 44 44 44 44 44 2,676 8,097 8,601 8,871 8,871 8,871 8,912 8,871 17,698 17,698 Sub-total: Wind 5124 - - - - 44 44 44 44 44 2,676 8,097 8,601 8,871 8,871 8,871 8,912 8,871 17,698 17,698
Total Renewables: NC 315 482 848 671 609 607 607 607 609 607 607 607 609 607 607 607 609 607 607 607 Total Renewables: VA 21,548 105 92 97 447 1,136 3,146 5,266 7,675 9,752 14,751 22,245 25,405 28,746 31,860 34,144 36,535 38,677 49,753 51,989 Total Renewables 21,863 587 940 768 1,056 1,743 3,754 5,873 8,284 10,359 15,358 22,852 26,015 29,353 32,468 34,752 37,144 39,285 50,361 52,597

Appendix 5P – Potential Supply-Side Resources for Plan B
Note: (1) Estimated commercial operation date.
Company Name: Schedule 15bUNIT PERFORMANCE DATAPotential Supply-Side Resources (MW)
Unit Name Unit Type Primary Fuel Type C.O.D.(1) MW Annual Firm
MWNameplate
Solar 2022 Intermittent Solar 2022 319 1,000Battery Pilot Storage 2023 6 14Solar 2023 Intermittent Solar 2023 330 960Generic CT Peak Natural Gas 2023 485 485Solar 2024 Intermittent Solar 2024 381 1,180Generic CT Peak Natural Gas 2024 458 458Solar 2025 Intermittent Solar 2025 330 960Generic Battery Storage 2026 160 400Solar 2026 Intermittent Solar 2026 381 1,180CVOW - Phase 1 Intermittent Wind 2026 256 852Generic Battery Storage 2027 200 500Solar 2027 Intermittent Solar 2027 330 960CVOW - Phase 2-3 Intermittent Wind 2027 511 1,704Solar 2028 Intermittent Solar 2028 422 1,300Generic Battery Storage 2029 200 500Solar 2029 Intermittent Solar 2029 495 1,440Pump Storage Storage 2029 300 300Solar 2030 Intermittent Solar 2030 505 1,540Solar 2031 Intermittent Solar 2031 372 1,080Generic Battery Storage 2032 200 500Solar 2032 Intermittent Solar 2032 372 1,080Solar 2033 Intermittent Solar 2033 372 1,080Generic Battery Storage 2034 200 500Solar 2034 Intermittent Solar 2034 372 1,080Generic Offshore Wind Intermittent Wind 2034 767 2,556Solar 2035 Intermittent Solar 2035 372 1,080

Appendix 5Q – Summer Capacity Position for Plan B
Notes: (1) Existing DSM programs are included in the load forecast.
(2) Efficiency programs are not part of the Company’s calculation of capacity. (3) Actual historical data based upon measured and verified EM&V results. Projected values represent modeled DSM firm capacity.
Company Name: Schedule 16UTILITY CAPACITY POSITION (MW)
(ACTUAL) (PROJECTED)
2017 2018 2019 2020 2021 2022 2023 2024 2025 2026 2027 2028 2029 2030 2031 2032 2033 2034 2035Existing Capacity Conventional 17,620 17,173 17,681 17,544 17,516 16,893 15,662 14,872 14,434 14,434 14,269 14,269 14,116 14,116 14,116 14,116 14,116 14,116 14,116 Renewable NC 315 315 315 315 315 315 315 315 315 315 315 315 315 315 315 315 315 315 315 Renewable VA 58 58 58 74 74 73 73 73 73 72 72 72 72 71 71 71 71 70 70 Renewable 373 373 373 389 389 388 388 388 388 387 387 387 387 386 386 386 386 385 385 Storage NC - - - - - - - - - - - - - - - - - - - Storage VA 1,809 1,809 1,809 1,808 1,808 1,808 1,808 1,808 1,808 1,808 1,808 1,808 1,808 1,808 1,808 1,808 1,808 1,808 1,808 Storage 1,809 1,809 1,809 1,808 1,808 1,808 1,808 1,808 1,808 1,808 1,808 1,808 1,808 1,808 1,808 1,808 1,808 1,808 1,808 Total Existing Capacity 19,802 19,355 19,863 19,741 19,713 19,090 17,859 17,068 16,630 16,629 16,464 16,464 16,310 16,310 16,310 16,310 16,309 16,309 16,309
Generation Under Construction Conventional - - - - - - - - - - - - - - - - - - - Renewable NC - - - - - - - - - - - - - - - - - - - Renewable VA - - - - 74 74 73 73 73 72 72 72 71 71 70 70 70 69 69 Renewable - - - - 74 74 73 73 73 72 72 72 71 71 70 70 70 69 69 Storage NC - - - - - - - - - - - - - - - - - - - Storage VA - - - - 6 6 6 6 6 6 6 6 6 6 - - - - - Storage - - - - 6 6 6 6 6 6 6 6 6 6 - - - - - Total Planned Construction Capacity - - - - 80 80 80 79 79 79 78 78 78 77 70 70 70 69 69
Generation Under Development Conventional - - - - - - - - - - - - - - - - - - - Renewable NC - - - - - - - - - - - - - - - - - - - Renewable VA - - - - - - - - - - - - - - - - - - - Renewable - - - - - - - - - - - - - - - - - - - Storage NC - - - - - - - - - - - - - - - - - - - Storage VA - - - - - - - - - - - - - - - - - - - Storage - - - - - - - - - - - - - - - - - - - Total Planned Development Capacity - - - - - - - - - - - - - - - - - - -
Potential (Expected) New Capacity Conventional - - - - - - 485 970 970 970 970 970 970 970 970 970 970 970 970 Renewable NC - - - - - - - - - - - - - - - - - - - Renewable VA - - - - - 221 426 665 868 1,360 2,072 2,307 2,628 2,984 3,220 3,454 3,688 4,686 4,917 Renewable - - - - - 221 426 665 868 1,360 2,072 2,307 2,628 2,984 3,220 3,454 3,688 4,686 4,917 Storage NC - - - - - - - - - - - - - - - - - - - Storage VA - - - - - - 6 6 6 110 240 240 370 670 670 800 794 924 924 Storage - - - - - - 6 6 6 110 240 240 370 670 670 800 794 924 924 Total Potential New Capacity - - - - - 221 916 1,641 1,843 2,440 3,282 3,516 3,968 4,624 4,859 5,224 5,452 6,580 6,811
Other (NUG) Conventional 238 - - - - - - - - - - - - - - - - - - Renewable NC - - - - - - - - - - - - - - - - - - - Renewable VA - - - - 36 137 260 401 523 663 783 963 1,123 1,260 1,377 1,493 1,609 1,724 1,839 Renewable - - - - 36 137 260 401 523 663 783 963 1,123 1,260 1,377 1,493 1,609 1,724 1,839 Storage NC - - - - - - - - - - - - - - - - - - - Storage VA - - - - - - - - - 56 126 126 196 196 196 266 266 336 336 Storage - - - - - - - - - 56 126 126 196 196 196 266 266 336 336 Total Other (NUG) Capacity 238 - - - 36 137 260 401 523 719 909 1,089 1,319 1,456 1,573 1,759 1,875 2,060 2,175
Unforced Availability - - Net Generation Capacity 20,040 19,355 19,863 19,741 19,829 19,528 19,114 19,190 19,075 19,867 20,733 21,147 21,675 22,467 22,813 23,363 23,706 25,019 25,364
Existing DSM Reductions Demand Response 2 2 2 2 2 2 2 2 2 2 2 2 2 2 2 2 2 2 2 Conservation/Efficiency - - - - - - - - - - - - - - - - - - - Total Existing DSM Reductions(1) 2 2 2 2 2 2 2 2 2 2 2 2 2 2 2 2 2 2 2
Approved DSM Reductions Demand Response(3) 69 58 55 63 63 64 64 65 65 65 65 66 66 66 66 66 66 66 66 Conservation/Efficiency(2)(3) 109 122 135 129 125 127 136 134 122 113 105 102 101 99 97 95 93 92 93 Total Approved DSM Reductions 178 180 190 191 188 191 201 199 188 179 171 167 167 165 163 160 159 158 158
Proposed DSM Reductions Demand Response(3) - - - 7 27 47 63 77 83 84 85 86 87 88 89 89 90 91 92 Conservation/Efficiency(2) - - - 16 26 45 66 88 114 124 124 124 124 128 129 129 129 129 133 Total Proposed DSM Reductions - - - 23 53 92 129 165 197 208 209 210 211 216 217 218 219 219 224
Unidentified DSM Reductions Demand Response(3) - - - - - - - - - - - - - - - - - - - Conservation/Efficiency(2) - - - - 39 87 143 209 276 335 447 408 388 409 422 474 377 358 340 Total Proposed DSM Reductions - - - - 39 87 143 209 276 335 447 408 388 409 422 474 377 358 340
Total Demand-Side Reductions(1) 180 182 192 216 282 372 475 575 663 724 829 787 768 792 804 854 757 738 725
Net Generation & Demand-side 20,220 19,537 20,055 19,957 20,110 19,900 19,589 19,765 19,738 20,590 21,562 21,934 22,442 23,259 23,616 24,217 24,462 25,757 26,089
Capacity Requirement orPJM Capacity Obligation 19,769 20,548 20,251 20,022 20,218 19,800 20,150 20,396 20,327 20,599 20,596 20,927 21,050 21,219 21,219 21,472 21,818 21,963 22,114
Net Utility Capacity Position 452 (1,010) (196) (65) (107) 99 (560) (632) (589) (8) 965 1,007 1,392 2,040 2,398 2,745 2,645 3,794 3,975
Virginia Electric and Power Company

Appendix 5R – Capacity Position for Plan B
Notes: (1) Net seasonal capability. (2) Does not include firm commitments from existing NUGs and estimated solar NUGs.
(3) Included in the winter capacity forecast. (4) Does not include behind-the-meter generation MW.
(5) Actual historical data based upon measured and verified EM&V results. Projected values represent modeled DSM firm capacity. Values reflective of free-ridership.
Company Name:POWER SUPPLY DATA
(ACTUAL) (PROJECTED)
2017 2018 2019 2020 2021 2022 2023 2024 2025 2026 2027 2028 2029 2030 2031 2032 2033 2034 2035I. Capability (MW)
1. Summer a. Firm Capacity
Capacity(1) 19,802 19,355 19,863 19,741 19,793 19,391 18,855 18,788 18,552 19,148 19,824 20,058 20,356 21,011 21,240 21,604 21,831 22,959 23,189 b. Positive Interchange
Commitments(2) 238 - - - 36 137 260 401 523 719 909 1,089 1,319 1,456 1,573 1,759 1,875 2,060 2,175 c. Capability in Cold Reserve/
Reserve Shutdown Status(1) - - - - - - - - - - - - - - - - - - - d. Demand Response - Existing 2 2 2 2 2 2 2 2 2 2 2 2 2 2 2 2 2 2 2
e. Demand Response - Approved(5) 69 58 55 63 63 64 64 65 65 65 65 66 66 66 66 66 66 66 66
f. Demand Response - Future(5) - - - 7 27 47 63 77 83 84 85 86 87 88 89 89 90 91 92
g. Total Net Summer Capability(4) 20,109 19,413 19,918 19,809 19,917 19,637 19,240 19,330 19,221 20,014 20,881 21,297 21,825 22,618 22,965 23,516 23,860 25,174 25,520
2. Winter a. Firm Capacity
Capacity(1) 19,802 19,355 19,863 20,824 20,796 20,176 19,366 19,099 18,660 19,022 19,500 19,502 19,482 19,785 19,781 19,913 19,909 20,808 20,810 b. Positive Interchange Commitments(2) 238 - - - 0 1 2 3 5 62 133 134 206 207 208 279 280 351 352 c. Capability in Cold Reserve/
Reserve Shutdown Status(1) - - - - - - - - - - - - - - - - - - -
d. Demand Response(5) 6 6 6 16 37 58 76 92 100 102 103 104 105 106 107 108 109 110 111
e. Demand Response-Existing(3) 1 1 2 2 2 2 2 2 2 2 2 2 2 2 2 2 2 2 2
f. Total Net Winter Capability(4) 20,046 19,361 19,869 20,840 20,833 20,235 19,444 19,194 18,765 19,186 19,736 19,741 19,793 20,098 20,096 20,300 20,298 21,269 21,272
Virginia Electric and Power Company Schedule 4

Appendix 5S – Construction Forecast for Plan B
Company Name: Virginia Electric and Power CompanyCONSTRUCTION COST FORECAST (Thousand Dollars)
(PROJECTED)
2020 2021 2022 2023 2024 2025 2026 2027 2028 2029 2030 2031 2032 2033 2034 2035I. New Traditional Generating Facilities a. Construction Expenditures (non-AFUDC) 319,804 326,223 518,290 644,848 436,991 312,115 385,020 381,492 249,784 248,810 216,379 59,406 90 - - - b. AFUDC 674 2,036 3,816 5,129 5,953 7,532 9,001 10,617 11,948 12,999 13,979 6,116 6,241 - - - c. Annual Total 320,478 328,259 522,106 649,976 442,944 319,647 394,021 392,109 261,732 261,809 230,358 65,522 6,331 - - - d. Cumulative Total 320,478 648,736 1,170,843 1,820,819 2,263,763 2,583,411 2,977,432 3,369,541 3,631,273 3,893,083 4,123,441 4,188,962 4,195,293 4,195,293 4,195,293 4,195,293
II. New Renewable Generating Facilities a. Construction Expenditures (non-AFUDC) 1,373,964 986,242 1,510,731 1,751,487 2,968,887 3,522,621 2,886,428 2,173,190 1,776,645 1,485,727 1,977,360 1,721,729 3,653,218 4,534,938 1,852,148 - b. AFUDC 3,619 6,815 8,220 10,995 16,772 17,150 14,149 9,080 11,811 11,693 11,878 14,142 20,266 32,226 5,469 - c. Annual Total 1,377,583 993,057 1,518,951 1,762,483 2,985,659 3,539,771 2,900,577 2,182,269 1,788,457 1,497,421 1,989,238 1,735,870 3,673,485 4,567,164 1,857,617 - d. Cumulative Total 1,377,583 2,370,640 3,889,592 5,652,074 8,637,733 12,177,505 15,078,081 17,260,351 19,048,807 20,546,228 22,535,466 24,271,336 27,944,821 32,511,985 34,369,601 34,369,601
III. New Storage Facilities a. Construction Expenditures (non-AFUDC) 80,059 31,873 48,798 40,065 773,117 1,082,325 1,076,455 569,975 1,251,422 147,334 56,572 851,006 - 882,437 - 732,024 b. AFUDC 169 265 435 491 2,206 6,810 8,975 8,287 13,041 11,677 - 2,760 - 2,862 - 2,374 c. Annual Total 80,227 32,138 49,234 40,556 775,323 1,089,135 1,085,430 578,261 1,264,463 159,011 56,572 853,765 - 885,299 - 734,398 d. Cumulative Total 80,227 112,365 161,599 202,156 977,478 2,066,613 3,152,043 3,730,304 4,994,767 5,153,778 5,210,350 6,064,115 6,064,115 6,949,414 6,949,414 7,683,812
IV. Other Facilities a. Transmission 921 885 885 723 751 751 751 751 751 751 751 751 751 751 751 751 b. Distribution 1,134 1,250 1,408 1,350 1,248 1,129 1,121 1,118 1,115 831 831 831 831 831 831 831 c. Energy Conservation & DR 16 0 0 0 0 0 0 0 0 0 0 0 0 0 0 0 d. Other e. AFUDC 44 56 50 45 47 47 47 47 47 47 47 47 47 47 47 47 f. Annual Total 2,116 2,191 2,344 2,117 2,046 1,926 1,919 1,915 1,913 1,629 1,629 1,629 1,629 1,629 1,629 1,629 g. Cumulative Total 2,116 4,307 6,650 8,768 10,814 12,740 14,659 16,574 18,486 20,115 21,744 23,372 25,001 26,630 28,258 29,887
V. Total Construction Expenditures a. Annual 1,780,404 1,355,645 2,092,635 2,455,133 4,205,972 4,950,479 4,381,947 3,154,555 3,316,564 1,919,869 2,277,797 2,656,786 3,681,444 5,454,092 1,859,246 736,027 b. Cumulative 1,780,404 3,136,049 5,228,684 7,683,817 11,889,789 16,840,268 21,222,215 24,376,770 27,693,334 29,613,203 31,891,000 34,547,786 38,229,230 43,683,322 45,542,567 46,278,594
VI. % of Funds for Total ConstructionProvided from External Financing N/A N/A N/A N/A N/A N/A N/A N/A N/A N/A N/A N/A N/A N/A N/A N/A
Schedule 17

Appendix 6A – Description of Active DSM Programs
Air Conditioner Cycling Program Branded Name: Smart Cooling Rewards State: Virginia & North Carolina Target Class: Residential VA Program Type: Peak-Shaving NC Program Type: Peak-Shaving VA Duration: 2010 – 2045 NC Duration: 2011 – 2045 Program Description: This Program provides participants with an external radio frequency cycling switch that operates on central air conditioners and heat pump systems. Participants allow the Company to cycle their central air conditioning and heat pump systems during peak load periods. The cycling switch is installed by a contractor and located on or near the outdoor air conditioning unit(s). The Company remotely signals the unit when peak load periods are expected, and the air conditioning or heat pump system is cycled off and on for short intervals. Program Marketing: The Company uses business reply cards, online enrollment, and call center services. Non-Residential Distributed Generation Program Branded Name: Distributed Generation State: Virginia Target Class: Non-Residential VA Program Type: Demand-Side Management VA Duration: 2012 – 2045 Program Description: As part of this Program, a third-party contractor will dispatch, monitor, maintain and operate customer-owned generation when called upon by the Company at anytime for up to a total of 120 hours per year. The Company will supervise and implement the Non-Residential Distributed Generation Program through the third-party implementation contractor. Participating customers will receive an incentive in exchange for their agreement to reduce electrical load on the Company’s system when called upon to do so by the Company. The incentive is based upon the amount of load curtailment delivered during control events. When not being dispatched by the Company, the generators may be used at the participants’ discretion or to supply power during an outage, consistent with applicable environmental restrictions. Program Marketing: Marketing is handled by the Company’s implementation vendor.
Appendix 6A cont. – Description of Active DSM Programs
Income and Age Qualifying Home Improvement Program Target Class: Residential VA Program Type: Energy Efficiency NC Program Type: Energy Efficiency VA Duration: 2015 – 2045 NC Duration: 2016 – 2045 Program Description: This Program provides income and age-qualifying residential customers with energy assessments and direct install measures at no cost to the customer. Program Marketing: The Company markets this Program primarily through weatherization assistance providers and social services agencies. Small Business Improvement Program Target Class: Non-Residential VA Program Type: Energy Efficiency NC Program Type: Energy Efficiency VA Duration: 2016 – 2045 NC Duration: 2017 – 2045 Program Description: This Program provides eligible small businesses an energy use assessment and tune-up or re-commissioning of electric heating and cooling systems, along with financial incentives for the installation of specific energy efficiency measures. Participating small businesses are required to meet certain connected load requirements. Program Marketing: The Company uses a number of marketing activities to promote its approved DSM programs, including but not limited to: direct mail, bill inserts, web content, social media, and outreach events. Because these programs are implemented using a contractor network, customers will enroll in the program by contacting a participating contractor. The Company utilizes the contractor network to market the programs to customers as well.

Appendix 6A cont. – Description of Active DSM Programs
Non-Residential Prescriptive Program Target Class: Non-Residential VA Program Type: Energy Efficiency NC Program Type: Energy Efficiency VA Duration: 2017 – 2045 NC Duration: 2018 – 2045 Program Description: This Program provides an incentive to eligible non-residential customers not otherwise eligible or who choose not to participate in the Company’s Small Business Improvement Program. The Program offers incentives for the installation of energy efficiency measures such as Refrigerator Evaporator Fans (Reach-in and Walk-in Coolers and Freezers), Commercial ENERGY STAR Appliances, Commercial Refrigeration, Commercial ENERGY STAR Ice Maker, Advanced Power Strip, Cooler/Freezer Strip Curtain, HVAC Tune-Up, Vending Machine Controls, Kitchen Fan Variable Speed Drives and Commercial Duct Testing and Sealing. Program Marketing: The Company uses a number of marketing activities to promote its approved DSM programs, including but not limited to: direct mail, bill inserts, web content, social media, and outreach events. Because these programs are implemented using a contractor network, customers will enroll in the program by contacting a participating contractor. The Company utilizes the contractor network to market the programs to customers as well. Residential Appliance Recycling Program Target Class: Residential VA Program Type: Energy Efficiency NC Program Type: Energy Efficiency VA Duration: 2019 – 2045 NC Duration: 2020 – 2045 Program Description: This Program provides incentives to eligible residential customers to recycle specific types of qualifying freezers and refrigerators that are of specific of age and size. Appliance pick-up and proper recycling services are included. Program Marketing: The Company uses a number of marketing activities to promote its approved DSM programs, including but not limited to: direct mail, bill inserts, web content, social media, and outreach events.

Appendix 6A cont. – Description of Active DSM Programs
Residential Efficient Products Marketplace Program Target Class: Residential VA Program Type: Energy Efficiency NC Program Type: Energy Efficiency VA Duration: 2019 – 2045 NC Duration: 2020 – 2045 Program Description: This Program provides eligible residential customers an incentive to purchase specific energy efficient appliances with a rebate through an online marketplace and through participating retail stores. The program offers rebates for the purchase of specific energy efficient appliances, including lighting efficiency upgrades such as A-line bulbs (prior to 2020), reflectors, decoratives, globes, retrofit kit and fixtures, as well as other appliances such as freezers, refrigerators, clothes washers, dehumidifiers, air purifiers, clothes dryers, and dishwashers. Program Marketing: The Company uses a number of marketing activities to promote its approved DSM programs, including but not limited to: direct mail, bill inserts, web content, social media, and outreach events. Residential Home Energy Assessment Program Target Class: Residential VA Program Type: Energy Efficiency NC Program Type: Energy Efficiency VA Duration: 2019 – 2045 NC Duration: 2020 – 2045 Program Description: This Program provides qualifying residential customers with an incentive to install a variety of energy saving measures following completion of a walk-through home energy assessment. The energy saving measures include replacement of existing light bulbs with LED bulbs, heat pump tune-up, duct insulation/sealing, fan motors upgrades, installation of efficient faucet aerators and showerheads, water heater turndown, replacement of electric domestic hot water with heat pump water heater, heat pump upgrades (ducted and ductless), and water heater and pipe insulation. Program Marketing: The Company uses a number of marketing activities to promote its approved DSM programs, including but not limited to: direct mail, bill inserts, web content, social media, and outreach events. Because this program is implemented using a contractor network, customers will enroll in the program by contacting a participating contractor. The Company utilizes the contractor network to market the programs to customers as well.

Appendix 6A cont. – Description of Active DSM Programs
Non-Residential Lighting Systems & Controls Program Target Class: Non-Residential VA Program Type: Energy Efficiency NC Program Type: Energy Efficiency VA Duration: 2019 – 2045 NC Duration: 2020 – 2045 Program Description: This Program provides qualifying non-residential customers with an incentive to implement more efficient lighting technologies that can produce verifiable savings. The Program promotes the installation of lighting technologies including but not limited to LED based bulbs and lighting control systems. Program Marketing: The Company uses a number of marketing activities to promote its approved DSM programs, including but not limited to: direct mail, bill inserts, web content, social media, and outreach events. Because this program is implemented using a contractor network, customers will enroll in the program by contacting a participating contractor. The Company utilizes the contractor network to market the programs to customers as well. Non-Residential Heating and Cooling Efficiency Program Target Class: Non-Residential VA Program Type: Energy Efficiency NC Program Type: Energy Efficiency VA Duration: 2019 – 2045 NC Duration: 2020 – 2045 Program Description: This Program provides qualifying non-residential customers with incentives to implement new and upgrade existing high efficiency heating and cooling system equipment to more efficient HVAC technologies that can produce verifiable savings. Program Marketing: The Company uses a number of marketing activities to promote its approved DSM programs, including but not limited to: direct mail, bill inserts, web content, social media, and outreach events. Because this program is implemented using a contractor network, customers will enroll in the program by contacting a participating contractor. The Company utilizes the contractor network to market the programs to customers as well.

Appendix 6A cont. – Description of Active DSM Programs
Non-Residential Window Film Program Target Class: Non-Residential VA Program Type: Energy Efficiency NC Program Type: Energy Efficiency VA Duration: 2019 – 2045 NC Duration: 2020 – 2045 Program Description: This Program provides qualifying non-residential customers with incentives to install solar reduction window film to lower their cooling bills and improve occupant comfort. Program Marketing: The Company uses a number of marketing activities to promote its approved DSM programs, including but not limited to: direct mail, bill inserts, web content, social media, and outreach events. Because this program is implemented using a contractor network, customers will enroll in the program by contacting a participating contractor. The Company utilizes the contractor network to market the programs to customers as well. Non-Residential Small Manufacturing Program Target Class: Non-Residential VA Program Type: Energy Efficiency NC Program Type: Energy Efficiency VA Duration: 2019 – 2045 NC Duration: 2020 – 2045 Program Description: This Program provides qualifying non-residential customers with incentives for the installation of energy efficiency improvements, consisting of primarily compressed air systems measures for small manufacturing facilities. Program Marketing: The Company uses a number of marketing activities to promote its approved DSM programs, including but not limited to: direct mail, bill inserts, web content, social media, and outreach events. Because this program is implemented using a contractor network, customers will enroll in the program by contacting a participating contractor. The Company utilizes the contractor network to market the programs to customers as well.

Appendix 6A cont. – Description of Active DSM Programs
Non-Residential Office Program Target Class: Non-Residential VA Program Type: Energy Efficiency NC Program Type: Energy Efficiency VA Duration: 2019 – 2045 NC Duration: 2020 – 2045 Program Description: This Program provides qualifying non-residential customers with incentives for the installation of energy efficiency improvements, consisting of recommissioning measures at smaller office facilities. Program Marketing: The Company uses a number of marketing activities to promote its approved DSM programs, including but not limited to: direct mail, bill inserts, web content, social media, and outreach events. Because this program is implemented using a contractor network, customers will enroll in the program by contacting a participating contractor. The Company utilizes the contractor network to market the programs to customers as well.
Residential Customer Engagement Program
Target Class: Residential VA Program Type: Energy Efficiency NC Program Type: Energy Efficiency VA Duration: Re-Proposed NC Duration: Future
Program Description:
This Program provides educational insights into the customer’s energy consumption via a Home Energy Report (on-line and/or paper version). The Home Energy report is intended to provide periodic suggestions on how to save on energy based upon analysis of the customer’s energy usage. Customers can opt-out of participating in the program at any time.

Appendix 6A cont. – Description of Active DSM Programs
Residential Smart Thermostat Program (DR)
Target Class: Residential VA Program Type: Demand Response NC Program Type: Demand Response VA Duration: Re-Proposed NC Duration: Future
Program Description:
All residential customers who are not already participating in the Company’s DSM Phase I Smart Cooling Rewards Program and who have a qualifying smart thermostat would be offered the opportunity to enroll in the peak demand response portion of the Program. Demand Response will be called by the Company during times of peak system demand throughout the year and thermostats of participating customers would be gradually adjusted to achieve a specified amount of load reduction while maintaining reasonable customer comfort and allowing customers to opt-out of specific events if they choose to do so.
Residential Smart Thermostat Program (EE)
Target Class: Residential VA Program Type: Energy Efficiency NC Program Type: Energy Efficiency VA Duration: Re-Proposed NC Duration: Future
Program Description:
This Program provides an incentive to customers to either purchase a qualifying smart thermostat and/or enroll in an energy efficiency program, which helps customers manage their daily heating and cooling energy usage by allowing remote optimization of their thermostat operation, and provides specific recommendations by e-mail or letter that customers can act on to realize additional energy savings. The Program is open to several thermostat manufacturers, makes, and models that meet or exceed the Energy Star requirements and have communicating technology. Rebates for the purchase of a smart thermostat are provided on a one-time basis; incentives for participation in remote thermostat management are provided on an annual basis. For those customers who are enrolled in thermostat management, additional energy-saving suggestions based on operational data specific to the customer's heating and cooling system are provided to the customer at least quarterly.

Appendix 6B – Approved Programs Non-Coincidental Peak Savings for Plan B (kW) (System Level)
Note: Values reflective of free-ridership.

Appendix 6C– Approved Programs Coincidental Peak Savings for Plan B (kW) (System Level)
Note: Values reflective of free-ridership.
Programs 2020 2021 2022 2023 2024 2025 2026 2027 2028 2029 2030 2031 2032 2033 2034 2035Air Conditioner Cycling Program 53,826 53,826 53,826 53,826 53,826 53,826 53,826 53,826 53,826 53,826 53,826 53,826 53,826 53,826 53,826 53,826Residential Low Income Program 2,344 2,344 2,344 2,344 2,191 1,639 1,051 642 273 50 0 0 0 0 0 0Residential Lighting Program 10,398 3,152 0 0 0 0 0 0 0 0 0 0 0 0 0 0Commercial Lighting Program 9,154 5,328 1,335 86 36 0 0 0 0 0 0 0 0 0 0 0Commercial HVAC Upgrade 668 668 668 668 668 582 339 88 0 0 0 0 0 0 0 0Non-Residential Energy Audit Program 4,523 2,248 628 214 0 0 0 0 0 0 0 0 0 0 0 0
Non-Residential Duct Testing and Sealing Program 7,595 7,595 7,595 7,595 7,595 7,595 7,595 7,595 7,595 7,595 7,595 7,595 7,595 7,595 7,595 7,595
Non-Residential Distributed Generation Program 9,025 9,463 10,076 10,514 11,127 11,590 11,632 11,668 11,700 11,731 11,763 11,794 11,826 11,857 11,889 11,920
Residential Bundle Program 13,347 9,699 7,965 7,926 7,413 6,701 6,064 5,746 5,284 4,499 3,532 2,275 1,326 781 243 0
Residential Home Energy Check-Up Program 2,236 2,236 2,235 2,196 1,683 971 334 27 0 0 0 0 0 0 0 0
Residential Duct Sealing Program 1,458 1,458 1,458 1,458 1,458 1,458 1,458 1,458 1,458 1,458 1,457 1,432 1,326 781 243 0
Residential Heat Pump Tune Up Program 5,381 1,733 0 0 0 0 0 0 0 0 0 0 0 0 0 0
Residential Heat Pump Upgrade Program 4,272 4,272 4,272 4,272 4,272 4,272 4,272 4,261 3,825 3,041 2,075 843 0 0 0 0Non-Residential Window Film Program 5,211 5,211 5,211 5,211 4,873 4,012 3,205 1,468 197 18 0 0 0 0 0 0Non-Residential Lighting Systems & Controls Program 34,310 34,310 34,310 33,805 28,074 18,903 11,277 5,589 3,472 3,472 3,472 3,472 3,472 3,472 3,472 3,472Non-Residential Heating and Cooling Efficiency Program 7,058 7,058 7,058 7,058 7,058 7,058 7,058 7,058 7,058 6,999 5,816 4,074 2,378 859 125 0Income and Age Qualifying Home Improvement Program 983 1,121 1,259 1,397 1,535 1,598 1,608 1,617 1,626 1,634 1,638 1,617 1,588 1,580 1,585 1,592Residential Appliance Recycling Program 1,744 1,744 1,744 1,513 788 0 0 0 0 0 0 0 0 0 0 0Small Business Improvement Program 13,336 15,213 15,513 15,820 16,135 16,314 16,394 16,473 16,549 16,624 16,692 16,689 16,668 16,708 16,777 16,845Residential Retail LED Lighting Program (NC only) 755 755 755 755 755 755 755 755 755 755 755 755 755 755 755 755Non-Residential Prescriptive Program 5,899 7,152 7,742 7,859 7,979 8,064 8,123 8,182 8,238 8,294 8,348 8,401 8,454 8,506 8,557 8,607Residential Efficient Products Marketplace Program 1,673 2,650 3,740 4,931 5,483 5,546 5,608 5,669 5,728 5,785 5,840 5,894 5,947 5,999 6,050 6,100Residential Customer Engagement Program 15,236 14,701 13,689 12,745 11,866 15,236 14,701 13,689 12,745 11,866 15,236 14,701 13,689 12,745 11,866 15,236Non-Residential Lighting Systems & Controls Program 2,947 4,952 6,448 7,945 8,615 8,694 8,772 8,850 8,925 8,998 9,070 9,140 9,210 9,278 9,346 9,412Residential Appliance Recycling Program 1,124 2,041 2,959 3,877 4,287 4,336 4,384 4,396 4,476 4,519 4,562 4,603 4,644 4,683 4,722 4,761Non-Residential Heating and Cooling Efficiency Program 2,040 3,922 5,805 7,688 8,518 8,597 8,674 8,751 8,825 8,897 8,968 9,038 9,107 9,175 9,241 9,307Non-Residential Window Film Program 496 949 1,402 1,855 2,054 2,073 2,092 2,111 2,128 2,146 2,163 2,180 2,196 2,213 2,229 2,245Residential Home Energy Assessment Program 1,765 4,471 9,388 13,174 14,721 14,891 15,059 15,223 15,380 15,533 15,681 15,827 15,969 16,108 16,244 16,378Residential Smart Thermostat Management Program (DR) 7,180 26,931 47,038 63,049 76,806 82,530 83,460 84,369 85,243 86,088 86,912 87,717 88,503 89,273 90,030 90,775Residential Smart Thermostat Management Program (EE) 286 1,065 1,898 2,614 3,282 3,573 3,614 3,653 3,691 3,727 3,763 3,798 3,832 3,865 3,898 3,930Non-Residential Office Program 454 874 1,294 1,713 1,898 1,916 1,933 1,950 1,966 1,983 1,998 2,014 2,029 2,044 2,059 2,074Non-Residential Small Manufacturing Program 755 1,451 2,148 2,845 3,152 3,181 3,210 3,238 3,266 3,292 3,319 3,344 3,370 3,395 3,420 3,444Total 214,130 230,893 253,839 279,027 290,735 289,209 280,434 272,603 268,947 268,331 270,949 268,756 266,384 264,717 263,928 268,276

Appendix 6D – Approved Programs Energy Savings for Plan B (MWh) (System Level)
Note: Values reflective of free-ridership.
Programs 2020 2021 2022 2023 2024 2025 2026 2027 2028 2029 2030 2031 2032 2033 2034 2035Air Conditioner Cycling Program 0 0 0 0 0 0 0 0 0 0 0 0 0 0 0 0Residential Low Income Program 10,435 10,435 10,435 10,435 9,827 7,512 4,811 2,961 1,322 257 0 0 0 0 0 0Residential Lighting Program 111,791 36,179 0 0 0 0 0 0 0 0 0 0 0 0 0 0Commercial Lighting Program 60,617 36,203 9,453 567 258 0 0 0 0 0 0 0 0 0 0 0Commercial HVAC Upgrade 4,732 4,719 4,719 4,719 4,732 4,152 2,484 676 0 0 0 0 0 0 0 0Non-Residential Energy Audit Program 35,976 18,719 5,087 1,810 0 0 0 0 0 0 0 0 0 0 0 0Non-Residential Duct Testing and Sealing Program 80,567 80,567 80,567 80,567 80,567 80,567 80,567 80,567 80,567 80,567 80,567 80,567 80,567 80,567 80,567 80,567Non-Residential Distributed Generation Program 118 1,136 133 690 381 707 1,393 687 860 707 762 1,412 1,415 1,419 1,423 1,427Residential Bundle Program 49,096 43,799 41,152 40,788 35,979 28,684 22,258 18,845 17,085 14,055 10,371 5,631 1,743 1,050 329 0
Residential Home Energy Check-Up Program 22,584 22,584 22,577 22,212 17,403 10,109 3,683 307 0 0 0 0 0 0 0 0Residential Duct Sealing Program 1,912 1,912 1,912 1,912 1,912 1,912 1,912 1,912 1,912 1,912 1,910 1,878 1,743 1,050 329 0Residential Heat Pump Tune Up Program 7,937 2,640 0 0 0 0 0 0 0 0 0 0 0 0 0 0Residential Heat Pump Upgrade Program 16,663 16,663 16,663 16,663 16,663 16,663 16,663 16,626 15,173 12,143 8,461 3,752 0 0 0 0
Non-Residential Window Film Program 5,598 5,598 5,598 5,598 5,234 4,308 3,442 1,572 211 19 0 0 0 0 0 0Non-Residential Lighting Systems & Controls Program 203,441 203,441 203,441 200,683 168,998 114,603 68,666 34,535 20,588 20,588 20,588 20,588 20,588 20,588 20,588 20,588Non-Residential Heating and Cooling Efficiency Program 34,035 34,035 34,035 34,035 34,035 34,035 34,035 34,035 34,035 33,797 28,895 20,334 12,234 4,720 735 0Income and Age Qualifying Home Improvement Program 10,240 11,725 13,210 14,695 16,180 16,942 17,043 17,142 17,237 17,329 17,383 17,238 16,999 16,927 16,985 17,066Residential Appliance Recycling Program 11,484 11,484 11,484 10,034 5,368 0 0 0 0 0 0 0 0 0 0 0Small Business Improvement Program 72,728 84,085 85,739 87,433 89,165 90,216 90,659 91,094 91,517 91,929 92,304 92,252 92,039 92,215 92,595 92,971Residential Retail LED Lighting Program (NC only) 7,269 7,269 7,269 7,269 7,269 7,269 7,269 7,269 7,269 7,269 7,269 7,269 7,269 7,269 7,269 7,269Non-Residential Prescriptive Program 14,949 18,142 19,713 20,011 20,316 20,537 20,688 20,837 20,982 21,123 21,261 21,398 21,531 21,663 21,793 21,922Residential Efficient Products Marketplace Program 128,674 205,013 290,431 383,696 430,667 435,634 440,548 445,355 449,977 454,442 458,799 463,054 467,211 471,282 475,278 479,215Residential Customer Engagement Program 50,810 49,025 45,649 42,503 39,570 50,810 49,025 45,649 42,503 39,570 50,810 49,025 45,649 42,503 39,570 50,810Non-Residential Lighting Systems & Controls Program 14,217 24,407 31,857 39,307 42,880 43,275 43,666 44,051 44,425 44,790 45,148 45,499 45,845 46,186 46,522 46,855Residential Appliance Recycling Program 7,221 13,263 19,304 25,346 28,216 28,535 28,851 28,915 29,456 29,743 30,023 30,296 30,563 30,824 31,081 31,334Non-Residential Heating and Cooling Efficiency Program 9,095 18,245 27,395 36,546 41,366 41,747 42,124 42,497 42,858 43,211 43,556 43,896 44,230 44,560 44,884 45,205Non-Residential Window Film Program 2,033 3,897 5,761 7,626 8,454 8,532 8,609 8,685 8,759 8,830 8,901 8,970 9,038 9,106 9,172 9,237Residential Home Energy Assessment Program 9,326 21,478 35,892 49,014 55,565 56,206 56,840 57,461 58,058 58,634 59,197 59,746 60,283 60,808 61,324 61,832Residential Smart Thermostat Management Program (DR) 0 0 0 0 0 0 0 0 0 0 0 0 0 0 0 0Residential Smart Thermostat Management Program (EE) 1,594 6,244 11,660 16,433 21,075 23,444 23,708 23,967 24,217 24,457 24,692 24,921 25,145 25,364 25,580 25,792Non-Residential Office Program 5,212 10,387 15,562 20,737 23,397 23,613 23,827 24,037 24,241 24,440 24,636 24,828 25,017 25,203 25,387 25,569Non-Residential Small Manufacturing Program 3,521 6,896 10,270 13,645 15,262 15,402 15,542 15,679 15,812 15,941 16,069 16,194 16,317 16,439 16,559 16,677Total 944,780 966,392 1,025,820 1,154,187 1,184,761 1,136,731 1,086,055 1,046,517 1,031,979 1,031,699 1,041,229 1,033,118 1,023,685 1,018,693 1,017,641 1,034,336

Appendix 6E – Approved Programs Penetrations for Plan B (System Level)
Note: Values reflective of free-ridership.
Programs 2020 2021 2022 2023 2024 2025 2026 2027 2028 2029 2030 2031 2032 2033 2034 2035Air Conditioner Cycling Program 85,000 85,000 85,000 85,000 85,000 85,000 85,000 85,000 85,000 85,000 85,000 85,000 85,000 85,000 85,000 85,000Residential Low Income Program 12,743 12,743 12,743 12,743 11,312 7,192 4,656 2,653 653 0 0 0 0 0 0 0Residential Lighting Program 2,243,150 0 0 0 0 0 0 0 0 0 0 0 0 0 0 0Commercial Lighting Program 2,057 749 21 21 0 0 0 0 0 0 0 0 0 0 0 0Commercial HVAC Upgrade 127 127 127 127 127 99 40 0 0 0 0 0 0 0 0 0Non-Residential Energy Audit Program 1,437 305 154 17 0 0 0 0 0 0 0 0 0 0 0 0Non-Residential Duct Testing and Sealing Program 4,694 4,694 4,694 4,694 4,694 4,694 4,694 4,694 4,694 4,694 4,694 4,694 4,694 4,694 4,694 4,694Non-Residential Distributed Generation Program 9 9 10 10 11 11 11 11 11 11 11 11 11 11 11 11Residential Bundle Program 98,903 78,621 75,993 74,424 54,722 39,866 24,610 22,975 19,680 15,987 11,172 5,004 3,336 1,153 278 0
Residential Home Energy Check-Up Program 52,963 52,963 52,932 51,363 31,661 16,805 1,549 0 0 0 0 0 0 0 0 0Residential Duct Sealing Program 3,853 3,853 3,853 3,853 3,853 3,853 3,853 3,853 3,853 3,853 3,845 3,737 3,336 1,153 278 0Residential Heat Pump Tune Up Program 22,879 2,597 0 0 0 0 0 0 0 0 0 0 0 0 0 0Residential Heat Pump Upgrade Program 19,208 19,208 19,208 19,208 19,208 19,208 19,208 19,122 15,827 12,134 7,327 1,267 0 0 0 0
Non-Residential Window Film Program 476,780 476,780 476,780 476,780 423,759 326,638 269,410 37,776 3,913 0 0 0 0 0 0 0Non-Residential Lighting Systems & Controls Program 4,674 4,674 4,674 4,556 3,302 2,056 1,165 473 473 473 473 473 473 473 473 473Non-Residential Heating and Cooling Efficiency Program 422 422 422 422 422 422 422 422 422 416 299 204 98 18 0 0Income and Age Qualifying Home Improvement Program 30,294 34,794 39,294 43,794 48,294 48,602 48,907 49,202 49,485 49,760 50,029 50,291 50,548 50,799 51,046 51,290Residential Appliance Recycling Program 14,072 14,072 14,072 10,866 3,131 0 0 0 0 0 0 0 0 0 0 0Small Business Improvement Program 4,145 4,228 4,313 4,400 4,489 4,512 4,534 4,556 4,577 4,598 4,618 4,638 4,658 4,677 4,697 4,716Residential Retail LED Lighting Program (NC only) 334,497 334,497 334,497 334,497 334,497 334,497 334,497 334,497 334,497 334,497 334,497 334,497 334,497 334,497 334,497 334,497Non-Residential Prescriptive Program 2,336 2,792 2,834 2,877 2,921 2,943 2,964 2,985 3,006 3,026 3,045 3,065 3,084 3,102 3,121 3,139Residential Efficient Products Marketplace Program 5,284,607 7,959,658 10,879,110 14,067,818 14,232,435 14,394,619 14,555,576 14,711,134 14,860,043 15,005,051 15,146,784 15,285,084 15,420,379 15,552,950 15,683,296 15,811,937Residential Customer Engagement Program 287,500 277,400 258,300 240,500 223,900 287,500 277,400 258,300 240,500 223,900 287,500 277,400 258,300 240,500 223,900 287,500Non-Residential Lighting Systems & Controls Program 998 1,364 1,730 2,096 2,116 2,135 2,154 2,173 2,191 2,209 2,226 2,243 2,260 2,277 2,293 2,309Residential Appliance Recycling Program 15,589 25,089 34,589 44,089 44,595 45,093 45,588 46,066 46,523 46,969 47,404 47,829 48,245 48,652 49,053 49,448Non-Residential Heating and Cooling Efficiency Program 1,050 1,750 2,450 3,150 3,179 3,208 3,237 3,265 3,292 3,319 3,345 3,371 3,396 3,421 3,446 3,471Non-Residential Window Film Program 202,350 336,300 470,250 604,200 609,825 615,383 620,912 626,306 631,524 636,640 641,671 646,613 651,477 656,270 661,005 665,695Residential Home Energy Assessment Program 41,387 76,407 110,455 144,863 146,558 148,228 149,886 151,488 153,021 154,514 155,974 157,398 158,791 160,156 161,498 162,823Residential Smart Thermostat Management Program (DR) 6,808 20,673 29,836 38,473 45,348 45,865 46,378 46,873 47,348 47,810 48,261 48,702 49,133 49,555 49,971 50,381Residential Smart Thermostat Management Program (EE) 9,071 27,173 40,828 54,200 66,569 67,328 68,080 68,808 69,504 70,183 70,846 71,493 72,125 72,745 73,355 73,957Non-Residential Office Program 126 210 294 378 382 385 388 392 395 398 401 405 408 411 414 416Non-Residential Small Manufacturing Program 105 175 245 315 318 321 324 327 329 332 335 337 340 342 345 347Total 9,164,931 9,780,706 12,883,715 16,255,310 16,351,906 16,466,596 16,550,833 16,460,375 16,561,082 16,689,785 16,898,586 17,028,752 17,151,253 17,271,705 17,392,392 17,592,105

Appendix 6F – Description of Proposed Programs
Residential Electric Vehicle EE/DR Program
State: Virginia & North Carolina Target Class: Residential VA Program Type: Energy Efficiency NC Program Type: Energy Efficiency VA Duration: Proposed NC Duration: Future
Program Description:
The Residential Electric Vehicle Program would provide an incentive to customers to purchase a qualifying charger for their electric vehicle and who agree to enroll in the demand response ("DR") component of the proposed program. Customers who receive an incentive for the purchase of the qualifying chargers must also participate in the DR component of the program. Demand response would be called by the Company during times of peak system demand throughout the year and vehicle chargers enrolled in the Program would be activated by remote control to temporarily reduce load. Customers can opt-out of specific events if they choose to do so.
Residential Electric Vehicle Peak Shaving Program
State: Virginia & North Carolina Target Class: Residential VA Program Type: Peak Shaving NC Program Type: Peak Shaving VA Duration: Proposed NC Duration: Future
Program Description:
The Residential Electric Vehicle Peak Shaving Program is for customers who already have a qualifying Level 2 charger and wish to participate in the demand response component only (no purchase incentive).

Appendix 6F cont. – Description of Proposed Programs
Residential Energy Efficiency Kits Program
State: Virginia & North Carolina Target Class: Residential VA Program Type: Energy Efficiency NC Program Type: Energy Efficiency VA Duration: Proposed NC Duration: Future
Program Description:
The Residential Energy Efficiency Kits Program would provide residential customers with newly connected homes the opportunity to receive Welcome Kits. The Welcome kit will initially include a Tier I advanced power strip and an educational insert informing customers about opportunities to manage their energy use and how to opt into receiving additional free measures by going online to the program website or calling the program hotline. To receive the additional measures, customers will have to confirm their address and account status and answer a few questions to confirm the measures will be of value in producing electric energy savings in the home. Additionally, customers will receive educational materials on proper use of each measure, energy use in general, and energy savings available through other Company DSM programs.
Residential Home Retrofit Program
Target Class: Residential VA Program Type: Energy Efficiency NC Program Type: Energy Efficiency VA Duration: Proposed NC Duration: Future
Program Description:
The Residential Home Retrofit Program would target high users of electricity within the Company's Virginia service territory with an incentive to conduct a comprehensive and deep whole house diagnostic home energy assessment by BPI certified whole house building technicians. The diagnostic-driven audit will typically take between 2 ½ and 4 hours depending on home size, and will include: visual inspection of all areas of the home including attic and crawl spaces; blower door testing of envelope leakage; duct blaster equivalent testing of ducting system if present; line logger testing of major appliances; thermal imaging where required; physical measurements of key spaces and insulation levels; and efficiency determinations of major equipment.

Appendix 6F cont. – Description of Proposed Programs Residential Manufactured Housing Program
Target Class: Residential VA Program Type: Energy Efficiency NC Program Type: Energy Efficiency VA Duration: Proposed NC Duration: Future Program Description:
The Residential Manufactured Housing Program would provide residential customers in manufactured housing with educational assistance and an incentive to install energy efficiency measures. The auditor will perform a walk-through audit covering the envelope and all energy systems in the home, paying particular attention to the condition of DHW and HVAC systems, levels of insulation, and the condition of belly board. The contractor will be required to use the Program’s energy analysis software to collect required data to perform energy calculations and generate a detailed report showing projected energy and potential cost savings specific to each customer’s home. The intuitive audit software calculates and captures measure level savings values, which produces a consumer-friendly report outlining energy savings recommendations. The auditor will review the findings and recommendations of the complete report with the homeowner. The auditor will utilize a user-friendly audit software that calculates and captures measure-level savings values and produces a consumer-friendly report that clearly outlines additional energy savings recommendations. The auditor will review the findings and recommendations of the complete report with the homeowner.
Residential New Construction Program
Target Class: Residential VA Program Type: Energy Efficiency NC Program Type: Energy Efficiency VA Duration: Proposed NC Duration: Future Program Description:
The Residential New Construction Program will provide incentives to home builders for the construction of new homes that are ENERGY STAR certified by directly recruiting existing networks of homebuilders and Home Energy Rating System (“HERS”) Raters to build and inspect ENERGY STAR Certified New Homes. ENERGY STAR certification requires that homes be efficient at the system level instead of a menu-based offering. ENERGY STAR certification of new homes involves a whole-house set of standards that ensure homes are at least 15% more efficient than a home built to state-level minimum codes. Key components include: Shell improvements, HVAC performance, proper ventilation requirements (supports healthy indoor environments in certified homes) and durability (proper weather sealing, flashing details, site and foundation details). Participating homes must submit an energy model developed using Ekotrope or REM/Rate energy modeling software, along with a copy of the home's ENERGY STAR certificate (both provided by the rater) in order to qualify for an incentive.

Appendix 6F cont. – Description of Proposed Programs
Residential/Non-Residential Multifamily Program
Target Class: Residential/Non-Residential VA Program Type: Energy Efficiency NC Program Type: Energy Efficiency VA Duration: Proposed NC Duration: Future
Program Description:
The Multifamily Program is designed to encourage investment in both residential and commercial (i.e., common spaces) service aspects of multifamily properties. The Program design is based on a whole building approach where the implementation vendor will identify as many cost-effective measure opportunities as possible in the entire building (both residential and commercial meter) and encourage property owners to address the measures as a bundle. This approach provides one-stop-shop programming for multifamily property owners with solutions to include direct install-in-unit measures and incentives for prescriptive efficiency improvements. The Program will identify, track and report residential (in-unit) and commercial (common space) savings separately according to the account type.
Non-Residential Midstream EE Products Program
Target Class: Non-Residential VA Program Type: Energy Efficiency NC Program Type: Energy Efficiency VA Duration: Proposed NC Duration: Future
Program Description:
The Non-Residential Midstream EE Products Program consists of enrolling equipment distributors into the Program through an agreement to provide point-of-sales data in an agreed upon format each month. These monthly data sets will contain, at minimum, the data necessary to validate and quantify the eligible equipment that has been delivered for sale in the Company's service territory. In exchange for the data sets, the distributor will discount the rebate-eligible items sold to end customers. This Program aims to increase the availability and uptake of efficient equipment for the Company’s non-residential customers.

Appendix 6F cont. – Description of Proposed Programs
Non-Residential New Construction Program
Target Class: Non-Residential VA Program Type: Energy Efficiency NC Program Type: Energy Efficiency VA Duration: Proposed NC Duration: Future
Program Description:
The Non-Residential New Construction Program would provide qualifying facility owners with incentives to install energy efficient measures in their new construction project. Program engineers will determine what potential energy efficiency upgrades are of interest to the owner and feasible within their budget. These measures coupled with basic facility design data will be analyzed to determine the optimized building design. This in-depth analysis will be performed using building energy simulation models, which will allow for “bundles” of measures to be tested for potential energy savings gains from interactive effects. The results will be presented to the facility owner to determine which measures are to be installed. Program design building types modeled include small offices, medium offices, stand-alone retail, and outpatient health care.
Small Business Improvement Enhanced Program
Target Class: Non-Residential VA Program Type: Energy Efficiency NC Program Type: Energy Efficiency VA Duration: Proposed NC Duration: Future
Program Description:
The Small Business Improvement Enhanced Program would provide small businesses an energy use assessment and tune-up or re-commissioning of electric heating and cooling systems, along with financial incentives for the installation of specific energy efficiency measures. Participating small businesses would be required to meet certain size and connected load requirements.

Appendix 6F cont. – Description of Proposed Programs
House Bill 2789 Program (Heating and Cooling/Health and Safety Component)
Target Class: Residential/Non-Residential VA Program Type: Energy Efficiency NC Program Type: Energy Efficiency VA Duration: Proposed NC Duration: Future
Program Description:
The Heating and Cooling/Health and Safety Component of Virginia House Bill 2789 requires that a petition be submitted for a program for income qualifying, elderly and disabled individuals. This component would offer incentives for the installation of measures that reduce residential heating and cooling costs and enhance the health and safety of residents, including repairs and improvements to home heating and cooling systems and installation of energy-saving measures in the house, such as insulation and air sealing.

Appendix 6G – Proposed Programs Non-Coincidental Peak Savings for Plan B (kW) (System Level)
Note: Values reflective of free-ridership.
Programs 2019 2020 2021 2022 2023 2024 2025 2026 2027 2028 2029 2030 2031 2032 2033 2034 2035Non-Residential Midstream EE Products 0 0 1,741 4,274 6,973 9,672 12,371 13,567 13,686 13,802 13,916 14,027 14,136 14,243 14,349 14,453 14,557Non-Residential New Construction 0 0 221 790 1,953 3,738 5,603 6,633 6,692 6,750 6,806 6,862 6,916 6,969 7,021 7,073 7,124Residential EE Kits 0 0 2,494 4,987 7,480 9,974 12,467 12,607 12,742 12,871 12,996 13,119 13,239 13,356 13,471 13,584 13,695Residential Home Retrofit 0 0 415 1,339 2,570 4,216 5,984 6,765 6,839 6,910 6,978 7,045 7,110 7,174 7,236 7,298 7,358Residential Manufactured Housing 0 0 467 1,494 2,614 3,840 5,157 5,743 5,805 5,865 5,924 5,980 6,036 6,090 6,143 6,195 6,246Multifamily Program 0 0 2,198 6,320 11,411 16,501 21,592 23,873 24,128 24,374 24,611 24,843 25,070 25,291 25,508 25,721 25,931HB 2789 HVAC Component 0 0 6,690 13,380 23,002 31,848 31,848 31,848 31,848 31,848 31,848 31,848 31,848 31,848 31,848 31,848 31,848Residential New Construction 0 0 2,325 5,770 9,645 13,842 18,157 20,085 20,304 20,514 20,718 20,916 21,110 21,299 21,484 21,666 21,846Non-Residential Small Business Improvement Enhanced 0 0 784 2,339 3,894 5,530 7,251 8,622 8,699 8,774 8,847 8,918 8,988 9,057 9,125 9,192 9,258Residential Electric Vehicle EE/DR 0 0 803 1,895 3,566 6,063 9,731 9,849 9,954 10,055 10,153 10,249 10,343 10,435 10,524 10,612 10,700Residential Electric Vehicle Peak Shaving 0 0 134 244 412 664 1,034 1,045 1,056 1,067 1,077 1,088 1,098 1,107 1,117 1,126 1,135Total 0 0 18,272 42,832 73,520 105,889 131,198 140,638 141,755 142,832 143,875 144,895 145,893 146,869 147,827 148,769 149,698

Appendix 6H – Proposed Programs Coincidental Peak Savings for Plan B (kW) (System Level)
Note: Values reflective of free-ridership.
Programs 2020 2021 2022 2023 2024 2025 2026 2027 2028 2029 2030 2031 2032 2033 2034 2035Non-Residential Midstream EE Products 0 1,550 4,207 6,865 9,522 12,179 13,356 13,474 13,588 13,699 13,809 13,916 14,022 14,126 14,229 14,331Non-Residential New Construction 0 129 544 1,420 2,850 4,510 5,228 5,275 5,319 5,363 5,406 5,448 5,489 5,530 5,570 5,610Residential EE Kits 0 432 1,172 1,913 2,653 3,393 3,726 3,766 3,805 3,843 3,880 3,916 3,951 3,985 4,019 4,052Residential Home Retrofit 0 306 1,203 2,536 4,161 5,907 6,678 6,750 6,820 6,888 6,954 7,018 7,081 7,143 7,203 7,263Residential Manufactured Housing 0 274 1,071 2,158 3,285 4,411 4,912 4,965 5,017 5,066 5,115 5,162 5,209 5,254 5,298 5,342Multifamily Program 0 1,891 6,187 11,234 16,282 21,329 23,582 23,834 24,077 24,311 24,540 24,764 24,983 25,197 25,407 25,615HB 2789 HVAC Component 0 1,208 3,279 5,350 6,213 6,213 6,213 6,213 6,213 6,213 6,213 6,213 6,213 6,213 6,213 6,213Residential New Construction 0 1,934 5,384 9,075 13,025 17,085 18,899 19,105 19,303 19,494 19,681 19,863 20,041 20,216 20,387 20,556Non-Residential Small Business Improvement Enhanced 0 1,816 4,930 8,043 11,156 14,270 15,649 15,787 15,920 16,051 16,179 16,305 16,429 16,551 16,671 16,790Residential Electric Vehicle EE/DR 0 344 1,059 2,109 3,692 6,029 7,199 7,277 7,353 7,426 7,497 7,566 7,634 7,700 7,766 7,830Residential Electric Vehicle Peak Shaving 0 60 151 262 427 673 796 804 813 821 829 836 844 851 858 865Total 0 9,943 29,187 50,966 73,265 95,999 106,238 107,251 108,228 109,176 110,102 111,008 111,896 112,766 113,623 114,467
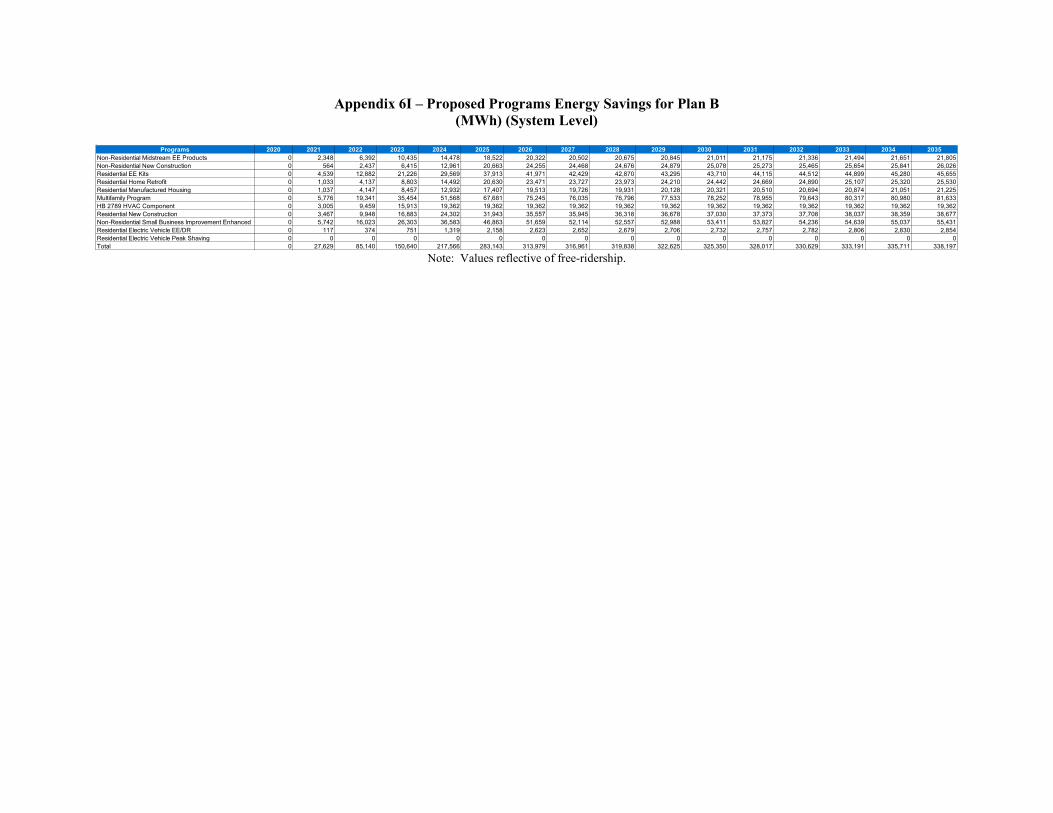
Appendix 6I – Proposed Programs Energy Savings for Plan B (MWh) (System Level)
Note: Values reflective of free-ridership.
Programs 2020 2021 2022 2023 2024 2025 2026 2027 2028 2029 2030 2031 2032 2033 2034 2035Non-Residential Midstream EE Products 0 2,348 6,392 10,435 14,478 18,522 20,322 20,502 20,675 20,845 21,011 21,175 21,336 21,494 21,651 21,805Non-Residential New Construction 0 564 2,437 6,415 12,961 20,663 24,255 24,468 24,676 24,879 25,078 25,273 25,465 25,654 25,841 26,026Residential EE Kits 0 4,539 12,882 21,226 29,569 37,913 41,971 42,429 42,870 43,295 43,710 44,115 44,512 44,899 45,280 45,655Residential Home Retrofit 0 1,033 4,137 8,803 14,492 20,630 23,471 23,727 23,973 24,210 24,442 24,669 24,890 25,107 25,320 25,530Residential Manufactured Housing 0 1,037 4,147 8,457 12,932 17,407 19,513 19,726 19,931 20,128 20,321 20,510 20,694 20,874 21,051 21,225Multifamily Program 0 5,776 19,341 35,454 51,568 67,681 75,245 76,035 76,796 77,533 78,252 78,955 79,643 80,317 80,980 81,633HB 2789 HVAC Component 0 3,005 9,459 15,913 19,362 19,362 19,362 19,362 19,362 19,362 19,362 19,362 19,362 19,362 19,362 19,362Residential New Construction 0 3,467 9,948 16,883 24,302 31,943 35,557 35,945 36,318 36,678 37,030 37,373 37,708 38,037 38,359 38,677Non-Residential Small Business Improvement Enhanced 0 5,742 16,023 26,303 36,583 46,863 51,659 52,114 52,557 52,988 53,411 53,827 54,236 54,639 55,037 55,431Residential Electric Vehicle EE/DR 0 117 374 751 1,319 2,158 2,623 2,652 2,679 2,706 2,732 2,757 2,782 2,806 2,830 2,854Residential Electric Vehicle Peak Shaving 0 0 0 0 0 0 0 0 0 0 0 0 0 0 0 0Total 0 27,629 85,140 150,640 217,566 283,143 313,979 316,961 319,838 322,625 325,350 328,017 330,629 333,191 335,711 338,197

Appendix 6J – Proposed Programs Penetrations for Plan B (System Level)
Note: Values reflective of free-ridership.
Programs 2019 2020 2021 2022 2023 2024 2025 2026 2027 2028 2029 2030 2031 2032 2033 2034 2035Non-Residential Midstream EE Products 0 0 300 600 900 1,200 1,500 1,513 1,527 1,539 1,552 1,564 1,576 1,588 1,600 1,611 1,623Non-Residential New Construction 0 0 20 70 170 320 470 474 478 482 486 490 494 498 501 505 508Residential EE Kits 0 0 30,000 60,000 90,000 120,000 150,000 151,677 153,298 154,850 156,361 157,838 159,279 160,689 162,070 163,429 164,769Residential Home Retrofit 0 0 900 2,900 5,400 8,400 11,400 11,527 11,651 11,769 11,883 11,996 12,105 12,212 12,317 12,421 12,522Residential Manufactured Housing 0 0 1,000 3,200 5,600 8,000 10,400 10,516 10,629 10,736 10,841 10,943 11,043 11,141 11,237 11,331 11,424Multifamily Program 0 0 10,100 25,825 41,550 57,275 73,000 73,799 74,571 75,311 76,033 76,738 77,427 78,101 78,762 79,412 80,054HB 2789 HVAC Component 0 0 8,800 17,600 26,400 26,400 26,400 26,400 26,400 26,400 26,400 26,400 26,400 26,400 26,400 26,400 26,400Residential New Construction 0 0 4,250 8,798 13,664 18,870 24,076 24,345 24,605 24,854 25,097 25,334 25,565 25,792 26,013 26,231 26,447Non-Residential Small Business Improvement Enhanced 0 0 675 1,350 2,025 2,700 3,375 3,405 3,435 3,464 3,492 3,519 3,546 3,573 3,599 3,625 3,651Residential Electric Vehicle EE/DR 0 0 1,100 2,596 4,884 8,304 13,328 13,477 13,621 13,759 13,893 14,024 14,153 14,278 14,401 14,521 14,640Residential Electric Vehicle Peak Shaving 0 0 101 184 311 501 780 789 797 805 813 821 828 836 843 850 857Total 0 0 57,246 123,123 190,904 251,970 314,729 317,924 321,012 323,970 326,851 329,668 332,417 335,107 337,744 340,336 342,895

Appendix 6K - Future Undesignated EE Coincidental Peak Savings for Plan B (kW) (System Level)
Programs 2020 2021 2022 2023 2024 2025 2026 2027 2028 2029 2030 2031 2032 2033 2034 2035GTSA/VCEA Reductions 0.00 39,000.00 87,000.00 143,000.00 209,000.00 276,000.00 335,000.00 447,000.00 408,000.00 388,000.00 409,000.00 422,000.00 474,000.00 377,000.00 358,000.00 340,000.00

Appendix 6L - Future Undesignated EE Energy Savings for Plan B (MWh) (System Level)
Programs 2020 2021 2022 2023 2024 2025 2026 2027 2028 2029 2030 2031 2032 2033 2034 2035GTSA/VCEA Reductions - 190,920 544,938 899,006 1,266,768 1,607,767 1,962,001 2,316,233 2,509,660 2,479,532 2,479,532 2,479,532 2,511,743 2,413,919 2,293,536 2,173,774
Total 0 190,920 544,938 899,006 1,266,768 1,607,767 1,962,001 2,316,233 2,509,660 2,479,532 2,479,532 2,479,532 2,511,743 2,413,919 2,293,536 2,173,774

Appendix 6M – Rejected DSM Programs
ProgramNon-Residential HVAC Tune-Up ProgramEnergy Management System ProgramENERGY STAR® New Homes ProgramGeothermal Heat Pump ProgramHome Energy Comparison ProgramHome Performance with ENERGY STAR® ProgramIn-Home Energy Display ProgramPremium Efficiency Motors ProgramResidential Refrigerator Turn-In ProgramResidential Solar Water Heating ProgramResidential Water Heater Cycling ProgramResidential Comprehensive Energy Audit ProgramResidential Radiant Barrier ProgramResidential Lighting (Phase II) ProgramNon-Residential Refrigeration ProgramCool Roof ProgramNon-Residential Data Centers ProgramNon-Residential Curtailable ServiceNon-Residential Custom IncentiveEnhanced Air Conditioner Direct Load Control ProgramResidential Programmable Thermostat ProgramResidential Controllable Thermostat ProgramResidential Retail LED Lighting Program (VA)Residential New Homes ProgramVoltage ConservationResidential Home Energy AssessmentNon-Residential Re-commissioning ProgramNon-Residential Compressed Air System ProgramNon-Residential Strategic Energy ManagementNon-Residential Agricultural EENon-Residential Telecommunication Optimization
DNV GL Energy Insights U.S.A.
Appendix 6N – National Comparison Analyses
National Comparison Analyses Virginia Electric and Power Company

DNV GL Energy Insights U.S.A. 1
Section 1: Fuel Source for Generation
The generation mix of a state can be a significant determinant of its electricity cost. Figures 1 and 2 compare Virginia’s generation mix with the rest of the country. Virginia’s primary source of electricity generation is natural gas, followed by nuclear. This mix is most similar to that of Louisiana and New Jersey. Connecticut, Mississippi, and Rhode Island also have energy generation mixes that may be comparable to Virginia.

DNV GL Energy Insights U.S.A. 2
Figure 1: Electricity generation mix, as fraction of total

DNV GL Energy Insights U.S.A. 3
Figure 2: Map of the primary generation fuel source in each state

DNV GL Energy Insights U.S.A. 4
Section 2: Other Metrics
Variation in electricity bills between states depends in part on the prevalence of electric heating and cooling equipment, cooling and heating loads, and housing size.
Space heating represents a large proportion of many consumers’ total energy use. The use of electricity for heating varies widely across regions. Among electrically heated homes, some types of equipment are more efficient than others. Table 1 shows the percentage of different fuels used for home heating in ten Census divisions. Virginia is part of the South Atlantic division that includes Delaware, Maryland, West Virginia, North Carolina, South Carolina, Georgia, Florida, and the District of Columbia. Table 12 shows the mix of different heating equipment by Census division. Table 3 shows the mix of different electric heating equipment by Census division. The South Atlantic division has a large fraction of homes heated by electricity compared to the more northern parts of the country. Of those South Atlantic customers who use electric heat, most use either electric central warm-air furnaces or electric heat pumps. The South Atlantic division also has a larger fraction of homes without heating equipment, as compared to the other regions. Relatively fewer customers in the South Atlantic use central warm-air furnaces for heat, and relatively more use heat pumps when compared to other areas.1
Table 1: Space heating equipment by fuel source by Census division
New England
Middle Atlantic
East North Central
West North Central
South Atlantic
East South Central
West South Central
Mountain North
Mountain South Pacific
Natural gas 37.5% 60.4% 72.9% 66.3% 27.2% 27.8% 37.7% 78.6% 46.5% 48.0% Electricity 8.9% 14.9% 19.9% 21.7% 55.7% 62.5% 52.9% 14.3% 37.2% 31.3%
Fuel oil/kerosene
39.3% 16.9% N/A N/A 3.4% N/A N/A N/A N/A N/A
Propane 7.1% 2.6% 5.0% 8.4% 3.4% 6.9% 3.6% 2.4% N/A 2.2% Wood 7.1% 3.9% 1.7% 3.6% 2.1% N/A 1.4% N/A N/A 3.9%
Some other fuel3
N/A N/A N/A N/A N/A N/A N/A N/A N/A N/A
Do not use heating
equipment N/A N/A N/A N/A 8.1% N/A 3.6% N/A 4.7% 14.5%
1 https://www.eia.gov/consumption/residential/data/2015/, tables HC6.7 and HC6.8

DNV GL Energy Insights U.S.A. 5
Table 1: Saturation of heating equipment types by Census division
New England
Middle Atlantic
East North Central
West North Central
South Atlantic
East South Central
West South Central
Moun-tain North
Moun-tain South
Pacific
Central warm-air furnace
57.1% 48.7% 77.3% 73.5% 46.8% 51.4% 68.1% 78.6% 58.1% 51.4%
Heat pump N/A 4.5% 3.9% 4.8% 26.4% 26.4% 9.4% N/A 18.6% 7.3%
Steam or hot water system
23.2% 29.2% 6.1% 8.4% 3.0% N/A N/A 7.1% N/A 1.7%
Built-in electric units
N/A 7.8% 8.8% 6.0% 8.5% 8.3% 6.5% N/A 4.7% 10.1%
Built-in oil or gas room
heater 5.4% 3.2% N/A N/A 1.3% 5.6% 2.9% N/A N/A 4.5%
Portable electric heaters
N/A N/A N/A N/A 3.0% 5.6% 5.8% N/A N/A 3.4%
Heating stove burning wood
5.4% 2.6% 1.1% 3.6% 1.7% N/A N/A N/A N/A 2.8%
Built-in pipeless furnace
N/A N/A N/A N/A N/A N/A N/A N/A N/A 2.2%
Fireplace N/A N/A N/A N/A N/A N/A N/A N/A N/A 1.1%
Some other equipment
N/A N/A N/A N/A N/A N/A N/A N/A N/A N/A
Do not use heating
equipment N/A N/A N/A N/A 8.1% N/A 3.6% N/A 4.7% 14.5%

DNV GL Energy Insights U.S.A. 6
Table 2: Electric heating equipment mix
New England
Middle Atlantic
East North Central
West North Central
South Atlantic
East South Central
West South Central
Moun-tain North
Moun-tain South
Pacific
Fraction of Homes Heated by Electricity
8.9% 14.9% 19.9% 21.7% 55.7% 62.5% 52.9% 14.3% 37.2% 31.3%
Frac
tion
Elec
tric
-Hea
ted
Hom
es U
sing
:
Central warm-air furnace
N/A 13.0% 33.3% 44.4% 35.9% 40.0% 60.3% 50.0% 37.5% 33.9%
Heat pump N/A 26.1% 16.7% 16.7% 42.7% 37.8% 15.1% N/A 43.8% 21.4% Built-in
electric units N/A 52.2% 44.4% 27.8% 15.3% 13.3% 12.3% N/A 12.5% 32.1%
Portable electric heaters
N/A N/A N/A N/A 5.3% 8.9% 11.0% N/A N/A 10.7%
Some other equipment
N/A N/A N/A N/A N/A N/A N/A N/A N/A N/A
Climate is also a key driver of customers’ electricity bills. Heating degree days (“HDD”) and cooling degree days (“CDD”) are often used as proxies for cooling and heating load. It also measures how much the daily temperature diverges from a base temperature (below 65° Fahrenheit for heating and above the 65° Fahrenheit for cooling). Virginia’s annual cooling and heating degree days in 2019 were near the US average. In 2019, Virginia had 1,401 CDD compared to the national average of 1,453 CDD and 3,998 HDD compared to the national average of 4,377 HDD.2
However, the number of HDD and CDD vary widely across US regions. See Figures 3 and 4. We added Virginia’s 2018 CDD and HDD to the maps for comparison.
2 NNDC Climate Data Online, National Climatic Data Center, U.S. Department of Commerce. https://www7.ncdc.noaa.gov/CDO/CDODivisionalSelect.jsp

DNV GL Energy Insights U.S.A. 7
Figure 3: Cooling degree days by Census division in 2018
Virginia
1,402

DNV GL Energy Insights U.S.A. 8
Figure 4: Heating degree days by Census division in 2018
(https://www.eia.gov/energyexplained/units-and-calculators/degree-days.php)
Virginia
4,319
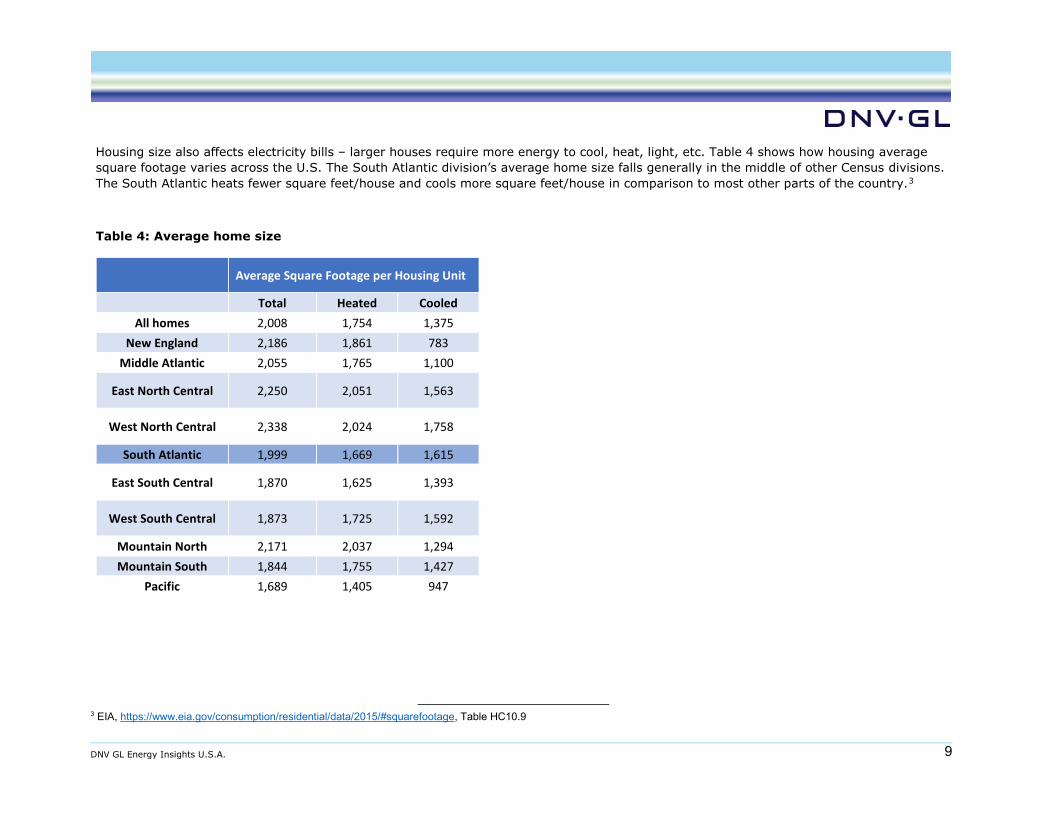
DNV GL Energy Insights U.S.A. 9
Housing size also affects electricity bills – larger houses require more energy to cool, heat, light, etc. Table 4 shows how housing average square footage varies across the U.S. The South Atlantic division’s average home size falls generally in the middle of other Census divisions. The South Atlantic heats fewer square feet/house and cools more square feet/house in comparison to most other parts of the country.3
Table 4: Average home size
Average Square Footage per Housing Unit
Total Heated Cooled All homes 2,008 1,754 1,375
New England 2,186 1,861 783 Middle Atlantic 2,055 1,765 1,100
East North Central 2,250 2,051 1,563
West North Central 2,338 2,024 1,758
South Atlantic 1,999 1,669 1,615
East South Central 1,870 1,625 1,393
West South Central 1,873 1,725 1,592
Mountain North 2,171 2,037 1,294 Mountain South 1,844 1,755 1,427
Pacific 1,689 1,405 947
3 EIA, https://www.eia.gov/consumption/residential/data/2015/#squarefootage, Table HC10.9

Appendix 7A – List of Transmission Lines Under Construction
Note: see Appendix 3D for North Carolina line capacity levels.
Line TerminalsLine
Voltage (kV)
Target Date Location
Sandlot 230 kV Delivery - DEV 230 Mar-20 VAFreedom Substation (Redundant 69 kV Facility 69 Mar-20 VAFork Union Substation – New Substation 115; 230 Apr-20 VALine #548 Valley Switching Station Fixed Series Capacitors replacement 500 Apr-20 VALine #547 Lexington Substation Fixed Series Capacitors Replacement 500 Apr-20 VALine #211 and #228 Chesterfield to Hopewell Partial Rebuild 230 May-20 VALine #217 Chesterfield-Lakeside Rebuild 230 May-20 VALine #86 Partial Rebuild Project 115 May-20 VALine #2199 Remington to Gordonsville– New 230 kV Line 230 May-20 VASkippers - New 115 kV Switching Station 115 kV May-20 VAGordonsville Transformer #3 Replacement 230/115 May-20 VAIdylwood - Convert Straight Bus to Breaker-and-a-Half 230 May-20 VALine #549 Dooms to Valley Rebuild 500 Jun-20 VALine #76 and #79 Yorktown to Peninsula Rebuild 115 Oct-20 VAColumbia Tap- CVEC 115 Oct-20 VADawson’s Crossroads – Delivery Point (HEMC) 115 Nov-20 NCClarksville Tap Line 193 Rebuild 115 Dec-20 VAWinters Branch – New Substation 230 Dec-20 VALine #154 Twittys Creek to Pamplin Rebuild 115 Dec-20 VALine #112 Fudge Hollow to Low Moor Rebuild 138 Dec-20 VALine #231 Landstown to Thrasher Rebuild 230 Dec-20 VALine #101 Mackeys to Crewswell Rebuild 115 Dec-20 NCButtermilk 230 kV Delivery 230 Dec-20 VAPerimeter 230 kV DP – NOVEC 230 Dec-20 VAEvergreen Mills 230 kV Delivery 230 May-21 VAClover Substation – New 500 kV STATCOM 500 May-21 VALadysmith 2nd 500-230 kV transformer 500/230 May-21 VAFarmwell – 230 kV Delivery 230 May-21 VALine #274 Pleasant View to Beaumeade Rebuild 230 Jun-21 VALine #2176 Gainesville to Haymarket and Line #2169 Haymarket to Loudoun – New 230 kV Lines and New 230 kV Substation
230 Jul-21 VA
Rawlings Switching Station New 500 kV STATCOM 500 Sep-21 VALine #65 Norris Bridge Rebuild 115 Dec-21 VALine #49 New Road to Middleburg – Rebuild 115 Dec-21 VALine #127 Buggs Island to Plywood Rebuild 115 Dec-21 VALine #16 Great Bridge to Hickory and Line #74 Chesapeake Energy Center to Great Bridge Partial Rebuild
115 Dec-21 VA
Line #120 Dozier-Thompson Corner Partial Rebuild 115 Dec-21 VANew Switching Station to Retire Line #139 Everetts to Windsor DP 115 Dec-21 NCLine #2008 Partial Rebuild and Line #156 Retirement 115; 230 Dec-21 VALine #550 Mt. Storm to Valley Rebuild 500 Dec-21 WV– VAMt. Storm - I/S GIS 500 May-22 WVLine #43 Staunton to Harrisonburg – Rebuild 115 Jun-22 VALine #247 Suffolk Swamp Rebuild 230 Dec-22 VA– NCLine #2175 Idylwood to Tyson's – New 230 kV Line 230 Dec-22 VA

DOMINION ENERGY VIRGINIA’S INTEGRATED DISTRIBUTION PLANNING WHITE PAPER
1.0 INTRODUCTION
A major trend over the last 10-plus year period in the electric power industry has been the development of renewable generation, especially photovoltaic (“PV”) and wind generation. Since 2008, wind generation capacity in the U.S. has experienced a compound annual growth rate (“CAGR”) of approximately 19%, while PV has seen an approximately 61% CAGR. The Company expects these renewable energy growth trends to continue as customers demand more carbon free forms of energy. An important sub-trend is the growth of distributed energy resources (“DERs”)—resources connected to the distribution system. According to the Energy Information Administration (“EIA”), the growth in U.S. of clean DERs (e.g., hydroelectric, wind, PV) from 2009 through 2017 has been approximately 23%. The Company has experienced an approximately 43% DER growth rate on its system during that same timeframe, primarily in the form of PV systems. A subset of the EIA data for non-net metered PV DER experienced a CAGR of approximately 48% nationwide. This trend is expected to continue given the expected efficiency improvements and cost reductions in PV technology.
Along with this increase in distributed generation resources interconnected to the distribution system, other trends continue to develop, including the addition of high-energy electric vehicle charging, the adoption of energy storage, and a change in customer energy usage patterns driven by AMI-enabled time-varying rates. Utility planners must continue to adapt their skills, tools, and processes to integrate these new challenges into the electric energy infrastructure planning landscape. No longer is grid planning based only on load growth and the static impact during peak usage periods on the distribution grid. Now, planners must also anticipate new supply-side and demand-side resources in the form of DERs, understand the dynamic impact to the grid, and examine how DERs can provide non-traditional solutions to traditional grid challenges, such as line overloads and voltage deviations. To that end, historical distribution planning methods must change to an integrated distribution planning process.
The Company defines integrated distribution planning (“IDP”) as a process to address the capacity, reliability, and DER integration needs of the distribution grid using traditional solutions as well as new solutions offered by customer-owned DER and other non-traditional technologies. IDP also accounts for uncertainties introduced by the dynamic nature of variables impacting grid operation, shifting results and associated decisions from deterministic to probabilistic outcomes. True IDP requires changes in planner’s skills, technologies and tools used, and processes. Throughout, trained professionals are vital to fully leverage the technologies and optimize the processes and emerging tool sets. Technologies and communications systems that provide visibility into the distribution grid to the customer premises level are foundational to enabling integrated distribution planning. Processes and tools must then be developed to incorporate the data gathered, including advanced distribution modeling and analysis tools that consider a range of possible futures where varying levels of DER and emerging technologies are adopted on different parts of the distribution system.
This white paper provides an overview of the Company’s current planning process, highlights the limitations of the current process, and sets forth the initial steps the Company plans to take to transition toward integrated distribution planning.
Appendix 8A - Integrated Distribution Planning White Paper as Filedin Case No. PUR-2019-00154

2.0 CURRENT DISTRIBUTION PLANNING
The Company’s current distribution planning occurs through three distinct processes: (i) distribution capacity planning; (ii) distribution reliability planning; and (iii) DER interconnection. Together, these efforts result in a plan designed to address customer needs to ensure safe, reliable, and cost-effective electric service using traditional utility solutions.
2.1 Current Distribution Capacity Planning
2.1.a Overview of the Current Capacity Planning Process
The purpose of distribution capacity planning is to evaluate grid utilization during seasonal peak loading conditions based on projected load growth, identifying any necessary improvements to the distribution system needed to satisfy thermal and voltage criteria as the demands placed on the distribution infrastructure change over time. Figure 2.1 provides an overview of the current process.
Figure 2.1: Current Distribution Planning Process
2.1.b Current Distribution Load Growth Forecasting
The historical distribution capacity planning process centers around assessing current and anticipated constraints on the distribution grid associated with forecasted seasonal peak load conditions. Therefore, the Company annually develops a six-year summer and winter peak load forecast (for the next 5 years and for the 10th year into the future) for each of the approximately 1,800 feeders currently on the Company’s system. These forecasts are assembled based on historical data measured at the feeder head (i.e., the point of demarcation between the transmission and distribution systems) and information acquired through discussions with (and formal requests from) current and future customers. Examples of the information used to develop the forecast are historical load growth trends, planned new housing developments, new high-rise buildings, information regarding data center expansions or additions and commercial and industrial development. This information is then used by the Company’s distribution planners to update feeder-level load growth projections. Generally, load growth forecasting is not location specific beyond information regarding block load additions that are known in the short term (e.g., a new big box retail store under construction). Of note, there are no inputs related to customer-level usage patterns or DER and emerging technology penetration growth included in this current forecasting process. Traditional static capacity planning focuses on the system’s summer and winter peak conditions, studying the traditional “worst case scenarios.” Based on this focus, the current load growth forecasting utilizes only peak customer demand and removes DER to ensure the grid will remain reliable under these conditions.

2.1.c Current Distribution Capacity Planning
The current distribution capacity planning process is conducted on an annual basis and evaluates the adequacies of each of the Company’s distribution feeders under the forecasted annual summer and winter peak load conditions over the planning period. The primary measurable input to this is currently limited to data collected at the feeder head. This evaluation is performed under normal operations and first contingency (N-1) conditions. Normal operations are defined as seasonal peak load conditions under normal distribution system configuration. First contingency (N-1) conditions are defined as situations that simulate the loss of a single distribution substation transformer during seasonal peak loading conditions.
Under both normal and first contingency conditions, distribution planners use computer modeling tools to identify if and when violations of capacity planning criteria are projected to occur on a particular feeder, feeder component or distribution substation transformer. Using feeder head data, the model approximates the expected loading along a feeder and all of its components based on engineering assumptions. The typical engineering limitations examined are conductor, transformer or equipment thermal limits (ampacity), and high or low voltage.
Once the timing and type of violations are determined on any given feeder component or substation transformer, the next step is to identify what grid mitigation solutions are necessary to correct the violation. Mitigation solutions may include re-configuration of the feeder, the addition or replacement of equipment (e.g., capacitors, transformers, protection devices), replacing conductor with larger conductor (i.e., reconductoring), or adding an entirely new substation or feeder. These all are considered traditional solutions.
2.2 Current Distribution Reliability Planning
2.2.a Overview of the Current Reliability Planning Process
The purpose of reliability planning is to identify causes of service interruptions and risks to the grid, and to develop cost-effective and prudent solutions to improve overall grid performance and customer experience. Figure 2.2 provides an overview of the current process.
Figure 2.2: Current Distribution Reliability Planning
2.2.b Current Distribution Reliability Planning
Reliability planning is based on data analytics of service outage information. The Company maintains a historical database of service outages that includes the when, where, and why associated with each service outage generated by the Company’s outage management system (“OMS”). This data is analyzed to identify areas of the distribution system that have exhibited reliability performance issues, including root causes. For repeat outages on the same feeder or

feeder section, the Company evaluates the cause to determine if there is a pattern to these outages. Depending on this pattern, the Company can devise mitigation measures to improve feeder performance. If, for example, lightning strikes have caused excessive amounts of outages in a specific area, the Company can mitigate future outages through the use of additional surge arresters for lightning protection, or investigate if grounding is within its operating specifications and physically improve the grounding system if it does not meet the operating specification. Another example of mitigation measures is to recondition poorly performing feeders by repairing defects and restoring the feeder to current construction standards.
This data examination process is conducted by the Company on a continual basis. The findings are gathered and used to support reliability improvement investment decisions.
2.3 DER Generation Interconnection Process
The Company’s DER generation interconnection process requires the customer to request to export energy directly onto the distribution grid. Which interconnection process DER customers must follow depends upon (i) whether the DER customer opts to sell its output wholesale to PJM Interconnection, LLC (“PJM”) or to the Company; and (ii) whether the DER customer elects to interconnect directly to distribution infrastructure as a small electrical generator or behind the customer’s meter via net energy metering.
DER requests involving wholesale market participation requests are submitted to PJM. PJM administers the processing of the interconnection requests to its queue and coordinates the interconnection study process, as applicable, with the Company. The Company administers all other generator interconnection requests under the appropriate state jurisdictional procedures.
2.3.a Small Electrical Generator Interconnection Process
The interconnection process for small electric generators is administered in accordance with the Commission’s Regulations Governing Interconnection of Small Electrical Generators, 20 VAC 5-314-10 et seq. The Commission initiated a rulemaking proceeding in September 2018 to possibly revise these regulations, Case No. PUR-2018-00107. The proceeding remains pending. A high level view of this current interconnect process is provided in Figure 2.3.a.
Figure 2.3.a: Overview of DER Small Electrical Generator Interconnection Process
The Company must study the interconnection of all generation that operates in parallel with the electric grid to identify if grid modifications are needed to accommodate the proposed interconnection while maintaining safe and reliable operation of the grid for all customers. Under the governing standards, the interconnection customer submitting the request is responsible for the costs to study the impact of the DER on the distribution system and for the costs to modify the grid to accommodate the proposed generation.

The Company’s technical study process for utility-scale solar systems ensures that the output of the renewable generator does not result in thermal overload conditions or voltage deviations outside of an acceptable bandwidth on any feeder component or substation transformer to which the PV generator interconnects. The fault current contribution of the generator is also analyzed for its potential impact to the grid. The study is a static analysis based on the ability of the PV system to operate at full-rated output during daylight hours, with secondary consideration of inverter-based DERs to provide grid support for this injection or absorption of reactive power. Based on current grid visibility and control limitations, the Company has asked a small percentage of the generators to apply a fixed power factor setting, other than unity, for voltage support as a secondary measure.
DER interconnection requests have grown significantly over the past several years. Currently there are 28 utility-scale solar generation sites totaling 275 MW interconnected to the Company’s electric distribution system in Virginia. As of August 1, 2019, there are 22 interconnection requests totaling 225 MW with executed interconnection agreements that are in the construction process, and 114 requests totaling 1,584 MW that are at some level of evaluation under the state jurisdictional procedures.
2.3.b Net Energy Metering Interconnection Process
If a renewable DER is proposing to offset a portion of a customer’s own load, the customer may be eligible to apply for net energy metering. Net metering is administered in accordance with the Commission’s Regulations Governing Net Energy Metering, 20 VAC 5-315-10 et seq. The Commission initiated a proceeding in August 2019 to amend these regulations consistent with new legislation, Case No. PUR-2019-00119. The proceeding remains pending.
The technical study process for net energy metering is currently a more simplified approach than the process for small electrical generators given the much smaller DER system size. The simplified approach ensures that the interconnecting system does not create an adverse thermal or voltage issue. Any necessary system upgrades (if any) are included in the Company’s current base rate structure.
The Company has seen a dramatic growth rate in net metering interconnections, with a clear trend showing concentrated growth in certain geographic areas. Figures 2.3.b.1 and 2.3.b.2 show the total number of net metering customers for the top 10 office locations, as well as the growth in net metering by office since January 1, 2018.

Figure 2.3.b.1: Local Office Totals
Figure 2.3.b.2: Local Office Growth Since January 1, 2018
3.0 LIMITATIONS OF CURRENT PLANNING PROCESS
Current distribution planning methodologies and processes have been in place for decades and were designed to identify the most cost-effective means of maintaining a safe and reliable distribution grid. These practices have been effective in a world of centralized large-scale generation and one-way power flows. In that light, modeling and analyzing distribution grid limitations for discrete conditions (seasonal peak conditions) have worked effectively as a manual process. In the new paradigm of increasing DERs and other emerging end-use technologies creating a more dynamic distribution grid with bi-directional and constantly changing power flows, awareness of temporal and spatial growth and operating characteristics are necessary. Modeling the distribution grid under this necessity can no longer be done using traditional techniques. Future modeling and analysis requires the development of advanced and automated tools that are capable of using significantly more granular data and providing outputs on a much broader time scale of probabilistic distribution grid limitations. Limitations of grid visibility beyond the feeder head present uncertainty in determining non-peak characteristics of how the grid is functioning. Additionally, the ability to confidently leverage non-wires alternatives as a prudent alternative to traditional grid solutions requires a level of situational awareness, communications infrastructure, and control capabilities that do not currently exist on the Company’s distribution grid.

The historical process of determining distribution system need only during forecasted seasonal peak conditions, with grid visibility limited primarily to the feeder head, is approaching obsolescence. Under the current distribution capacity planning process, anticipated growth in DERs and emerging technology are not able to be addressed. Further, the current process does not assess multiple potential scenarios of adoption rates of DER and emerging technologies. Changing distribution grid load flows along with temporal and spatial growth patterns and operating characteristics at times other than peak hours are, and will continue, to change the dynamics (i.e., the load shape) of the distribution grid moving forward. Limitations of grid visibility beyond the feeder head present uncertainty in determining non-peak characteristics of how the grid is functioning.
4.0 FUTURE INTEGRATED DISTRIBUTION PLANNING PROCESS
The Company plans to implement an integrated distribution planning (“IDP”) process that will evolve the current planning processes to adapt to the increasing proliferation of customer-owned DERs and other changes relevant to the modern grid. True IDP will require changes to people’s skills, the technologies and tools they use, and processes for performing planning activities. The sections below describe the enhancements the Company plans to make within each of these categories. Figure 4.0 provides a chart showing the evolution of integrated distribution planning over time as enabling technologies are deployed.
Figure 4.0: IDP Evolution
4.1 People
As an initial step towards integrated distribution planning, the Company is centralizing the modeling and analysis activities for capacity planning, reliability planning, and DER interconnection as an integrated functional organization. The Company will continue to evaluate its organizational structure as integrated distribution planning matures in support of the

enhancements described below.
4.2 Technologies
IDP is highly dependent on having highly granular and spatial visibility of existing grid conditions. The Company has a plan to transform its distribution grid (the “Grid Transformation Plan” or “GT Plan”) to adapt to the fundamental changes to the energy industry described above and to meet its customers’ needs and expectations. Many of these proposed investments are foundational to IDP, including investments in advanced metering infrastructure (“AMI”); a self-healing grid, including intelligent grid device and an advanced distribution management system (“ADMS”) with system capabilities for distributed energy resources management (“DERMS”); and Advanced Analytics. Advanced Analytics can suitably model the behavior of the entire distribution network including the renewable resources. These applications can analyze weather patterns along with past generation profiles and forecast the generation that will be available from the DER. Advanced Analytics will highlight opportunities for non-wires alternatives to be evaluated. Also vital are secure communications between the field devices and the back office systems. The Company’s executive summary of the Grid Transformation Plan (the “Plan Document”) provides additional information on these proposed investments.
4.3 Processes and Tools
IDP requires advanced distribution modeling and analysis capabilities that consider a range of possible futures where varying levels of DER and emerging technologies are adopted on the distribution system. The distribution grid needs to be analyzed at a wide range of load conditions, rather than at just peak load periods. The ability to successfully perform time series modeling analysis (“TSA”) of the distribution grid is heavily reliant on a highly granular visibility of existing load and DER characteristics. Finally, given the uncertainty associated with the size and location of DER growth, probabilistic or stochastic analytical techniques will be required to evaluate the robustness of the distribution grid from the feeder head to the feeder edge.
The Company plans to implement the following process-related enhancements to its distribution planning process to move toward IDP. These enhancements are illustrated in Figure 4.3 and discussed in more detail below.
Figure 4.3: Enhanced Distribution Planning Process

4.3.a Process Enhancement 1 – Comprehensive Feeder Level Forecasting
Long-term (i.e., minimum 10 year) demand growth forecasts will be refined for each individual distribution feeder and include not only the amount but also the type of future DER capacity. Utility-scale, commercial, and residential net metering-scale sites will be forecasted annually. Unlike conventional demand forecasting methods, however, these forecasts will be more granular in that they will be developed down to the customer site whenever possible and will cover all hours in a year rather than just peak demand hours. The Company initially plans to develop these forecasts utilizing data obtained from its customers currently served with AMI meters and/or intelligent grid device data, where available. Until full deployment of AMI has been achieved, the Company will develop hourly demand assumptions for its monthly-metered customers using relationships obtained from historic AMI hourly load shapes and monthly customer billing records. Comprehensive feeder level forecasts will allow the Company to simulate power flow scenarios within a planning period. This ability is critically important as the Company expects more active management of grid stability to be necessary during low demand conditions that are coupled with high DER output.
For example, during the month of April, a residential customer’s electricity demand at any hour is typically low (less than 5 kW). If that same customer has a solar PV system rated at 10 kW installed at their premise, it is quite likely that for many hours during April, the supply from that customer’s premise will exceed their demand and that excess power will flow onto the distribution grid. This situation could cause a localized increase in distribution voltage levels that exceed rated standards. This voltage violation could result in damage to the Company’s equipment or damage to appliances of other customers that are on the same feeder. As DERs continue to grow on the Company’s system, phenomena such as this can spread to all areas of the distribution feeders and even onto the transmission grid. This undesirable phenomenon is not related to overall system DER penetration but rather is specific to locational concentrations of DER penetration. The magnitude of the challenge grows as this scenario occurs at grid locations with limited host capacity available.
4.3.b Process Enhancement 2 – Hosting Capacity Analysis
The Company will also study the DER hosting capacity on every distribution feeder in order to determine the strength of the distribution system during varying degrees of DER penetration and solar irradiance levels for every hour of the day. This analysis when overlaid with the Company’s DER forecast can determine the year when a specific feeder becomes at risk for exceeding feeder design specifications (both thermal and voltage parameters), and will enable the use of active power management of DER as an alternative to traditional grid upgrades. The forecasts described above will be updated annually and will form the base or expected cases for subsequent distribution analysis and planning activities. Until such time as a proper stochastic algorithm can be developed, the Company will also prepare annually, high and low DER growth forecasts for each feeder to support the scenario analysis described below. This transition requires highly manual analysis until such time as automated analytical systems are developed and validated.
If the GT Plan investments are approved by the Commission, the Company plans to publish initial hosting capacity maps for both utility-scale and net metering DER by the end of 2020. As additional grid technologies and smart meters are deployed and grid operation capabilities increase, the hosting capacity maps will become more dynamic and support opportunities to reduce interconnection costs when DER output can be informed and adjusted to avoid grid
limitations through a DERMS.
4.3.c Process Enhancement 3 – Multi-Hour Capacity Planning Analysis
Consistent with conventional distribution capacity planning analysis, each feeder will be assessed under seasonal peak demand periods using the forecast for demand and DER growth described above. Also, like current state, the analysis will evaluate the distribution grid for violations with respect to loading and voltage. Beyond current state, the distribution grid will also be examined at conditions other than peak demand periods. At a minimum, the Company will evaluate the distribution grid under peak demand and minimum demand conditions for each month of the planning period. The frequency and the study time window of these studies will increase as advanced modeling techniques are refined. As discussed further below, the Company is investigating, with industry peers and research entities, the development of the necessary engineering tools and systems that can perform this analysis on a time series (i.e., 8760) basis so that, when appropriate, each hour of the planning period can be examined in an automated fashion. This will ensure the Company examines all load and generation conditions associated with the base forecast for demand and DER growth. These new tools and systems will result in a more thorough analysis of each feeder under various load and generation conditions that is more representative of two-way power flows caused by DERs. Notably, specific GT Plan investments in intelligent grid devices and smart meters that gather this highly granular data are necessary to support robust analyses with greatly reduced uncertainty.
4.3.d Process Enhancement 4 – DER Scenario Analysis
The key uncertainties associated with future DER growth is with respect to rate of growth and location. As such, the enhanced distribution planning analysis will also include scenario analysis that utilizes the high and low DER growth forecasts identified above. Again, the Company will analyze each feeder for violations with respect to loading and voltage under monthly peak and low demand conditions using both the high and low DER growth rate forecasts.
4.3.e Process Enhancement 5 – Non-Wires Alternatives Analysis
In addition to traditional distribution grid solution approaches such as re-conductoring or equipment upgrades, the Company will also assess non-wires alternatives to address violations that may surface in the distribution grid analysis process. New mitigation options such as utilizing customer-owned advanced inverter capabilities, battery energy storage systems, micro-grids, or demand response will be evaluated along with traditional solutions to assure that the optimal solutions for the Company and customers are prudently implemented.
5.0 PROOF OF CONCEPT ANALYSIS AND RESULTS
The ultimate objective of the Company’s IDP process is to develop a prudent distribution investments roadmap based on load growth, reliability needs, DER growth, new technology adoptions, and other changes on the distribution system over the planning horizon. To that end, the Company engaged DNV GL Digital Solutions (“DNV GL”) to develop a proof of concept. The DNV GL analysis focused on the process enhancements described above, namely multi-hour capacity planning analysis, DER scenario analysis, and non-wires alternatives analysis.
DNV GL developed an analytical process using Synergi Electric software, which provides tools

that are capable of automating the grid analysis. DNV GL then tested the software using three demonstration feeders identified by the Company. The analytical process involved running a multi-year time series analysis (“TSA”), identifying times where technical violations may occur due to load growth or due to DER operation, designing appropriate mitigations and evaluating the hosting capacity of the system for different capacities of DER.
The Company intends to continue to work with DNV GL as the Company implements the process enhancements described above. Notably, the DNV GL process integrates the Company’s current capacity planning and DER interconnection processes, but does not incorporate the current reliability planning processes. As recognized industry-wide, incorporating the reliability planning component is the area of analysis having the greatest complexity . The Company will continue to work toward complete integration of its distribution planning process.
DNV GL produced a report providing its analyses and results. The report is Attachment 1 to this white paper.
6.0 CAPABILITIES ENABLED BY INTEGRATED DISTRIBUTION PLANNING
The evolution of IDP over time will enable capabilities and benefits for the Company and customers not available today. For instance, with people, technologies, and processes described above, locational net benefits could be identified and published, an expanding portfolio of non-wires alternatives can be developed and utilized, and lower DER integration costs can result. With proper policy and regulatory support, IDP also enables aggregated DER transactions.
7.0 GENERATION, TRANSMISSION, AND DISTRIBUTION INTEGRATION ASSESSMENT
Currently, power system analysis is performed separately for generation, transmission and distribution systems. With higher overall system penetration levels of DERs expected, the one-way flow of the Company’s distribution system is being significantly altered and will impact the generation, transmission, and distribution systems. Therefore, the Company (along with the electric utility industry) needs to continue its development of new methods and tools to properly integrate the overall power system. For example, as DERs continue to grow within the Company’s service territory and emerging technologies take hold, customer load shapes will change. This change in load shape will not only impact the distribution grid but also the transmission and generation systems as well. Power flows along the transmission system will change (and could even reverse) and traditional generators will be dispatched in a manner that may be quite different than has been done in the past in order to accommodate these new customer demands. Thus, it is important that the Company understand how customer energy use is changing and how those changes are impacting the entire electric network, from distribution, to transmission and generation.
Importantly, the shift to integrated distribution planning is a process that will take time, as illustrated in Figure 4.0. The Virginia Code now requires that the Company’s total-system integrated resource plans evaluate long-term electric distribution grid planning. Va. Code § 56-599 B 10. The Company thus intends to continue to report on its progress toward IDP in future integrated resource plans. The Company plans to include IDP as part of the stakeholder processes used for the Company’s GT Plans and integrated resource plans.

CERTIFICATE OF SERVICE
I hereby certify that on this 1st day of May 2020, a true and accurate copy of the foregoing filed in Case No. PUR-2020-00035 was delivered by hand, email, or mail first class postage pre-paid, or was provided by electronic service, to the following: Ashley B. Macko, Esq. K. Beth Clowers, Esq. Office of the General Counsel State Corporation Commission Tyler Building, 1300 E. Main St., 10th Floor Richmond, Virginia 23219
C. Meade Browder, Jr., Esq. C. Mitch Burton, Jr., Esq. Office of the Attorney General Division of Consumer Counsel 202 N 9th Street, 8th Floor Richmond, VA 23219
William C. Cleveland, Esq. Gregory D. Buppert, Esq. Nathaniel Benforado, Esq. Hannah Coman, Esq. Southern Environmental Law Center 201 W Main Street, Suite 14 Charlottesville, VA 22902-5065
/s/ Vishwa B. Link