QUALITY ASSURANCE PROJECT PLAN - State Water ...
347
Study of Lakes and Reservoirs with Low Concentration of Contaminants in Sport Fish May 2014 Final Quality Assurance Program Plan 2014
-
Upload
khangminh22 -
Category
Documents
-
view
0 -
download
0
Transcript of QUALITY ASSURANCE PROJECT PLAN - State Water ...
Study of Lakes and Reservoirs with Low Concentration of Contaminants in Sport Fish
May 2014
Final Quality Assurance Program Plan 2014
Group A Elements: Project Management Element 1. Title and Approval Sheets
QUALITY ASSURANCE PROJECT PLAN
Study of Lakes and Reservoirs with Low Concentration of Contaminants in Sport Fish
The Bioaccumulation Oversight Group (BOG)
Surface Water Ambient Monitoring Program
May 2014
BOG Low Concentration Lakes QAPP May 2014
Page 2 of 346
Program Title SWAMP Bioaccumulation Oversight Group Wildlife BMF Study
Lead Organization SJSURF Marine Pollution Studies Lab 7544 Sandholdt Road
Moss Landing, CA 95039 Autumn Bonnema, Project Coordinator Primary Contact Jay Davis, Lead Scientist San Francisco Estuary Institute 4911 Central Avenue Richmond, CA 94804 (510) 746-7368 Autumn Bonnema, Project Coordinator SJSURF Marine Pollution Studies Lab 7544 Sandholdt Road Moss Landing, CA 95039 (831) 771-4175 Effective Date This Quality Assurance Project Plan (QAPP) is effective from
April 2014 to May 2016 unless otherwise revised, approved and distributed accordingly at an earlier date.
Citation for QAPP Bonnema, A. 2014. Quality Assurance Project Plan: A Study of
Lakes and Reservoirs with Low Concentrations of Contaminants in Sport Fish. Moss Landing Marine Labs. Prepared for SWAMP BOG, 64 pages plus appendices and attachments.
QAPP Preface
This Quality Assurance Project Plan (QAPP) document defines procedures and criteria that will be used for this project conducted by SWAMP Bioaccumulation Oversight Group (BOG) in association with the California Department of Fish and Wildlife Marine Pollution Studies Laboratory (MPSL-DFG), California Department of Fish and Wildlife Water Pollution Control Laboratory (DFG-WPCL), and the San Francisco Estuary Institute (SFEI). Included are criteria for data quality acceptability, procedures for sampling, testing (including deviations) and calibration, as well as preventative and corrective measures. The responsibilities of MPSL-DFG, DFG-WPCL, and SFEI also are contained within. The BOG selects the sampling sites, the types and size of tissue samples, and the number of analyses to be conducted.
This work is funded through the Surface Water Ambient Monitoring Program (SWAMP)
fiscal year 13/14 Bioaccumulation funding.
BOG Low Concentration Lakes QAPP May 2014
Page 3 of 346
Approvals The approvals below were submitted separately, preventing their inclusion in this signature block. Instead, they appear in Appendix VI of this document. Originals are kept on file by Autumn Bonnema of MPSL-DFG. Rusty Fairey Contract Manager _______________________________________________ Date____________________
Jay Davis Lead Scientist _______________________________________________ Date____________________ Eric von der Geest SWAMP Quality Assurance Liaison _______________________________________________ Date____________________ Beverly can Buuren Program Quality Assurance Officer _______________________________________________ Date____________________
Autumn Bonnema Project Manager/ MPSL-DFG Quality Assurance Officer _______________________________________________ Date____________________
Gail Cho DFG-WPCL Quality Assurance Officer _______________________________________________ Date____________________
Branden Johnson USGS-FRESC Quality Assurance Officer _______________________________________________ Date____________________
BOG Low Concentration Lakes QAPP May 2014
Page 4 of 346
Amy Kleckner USGS-WRD Quality Assurance Officer _______________________________________________ Date____________________
John DeWild USGS-MRT Quality Assurance Officer _______________________________________________ Date____________________
BOG Low Concentration Lakes QAPP May 2014
Page 5 of 346
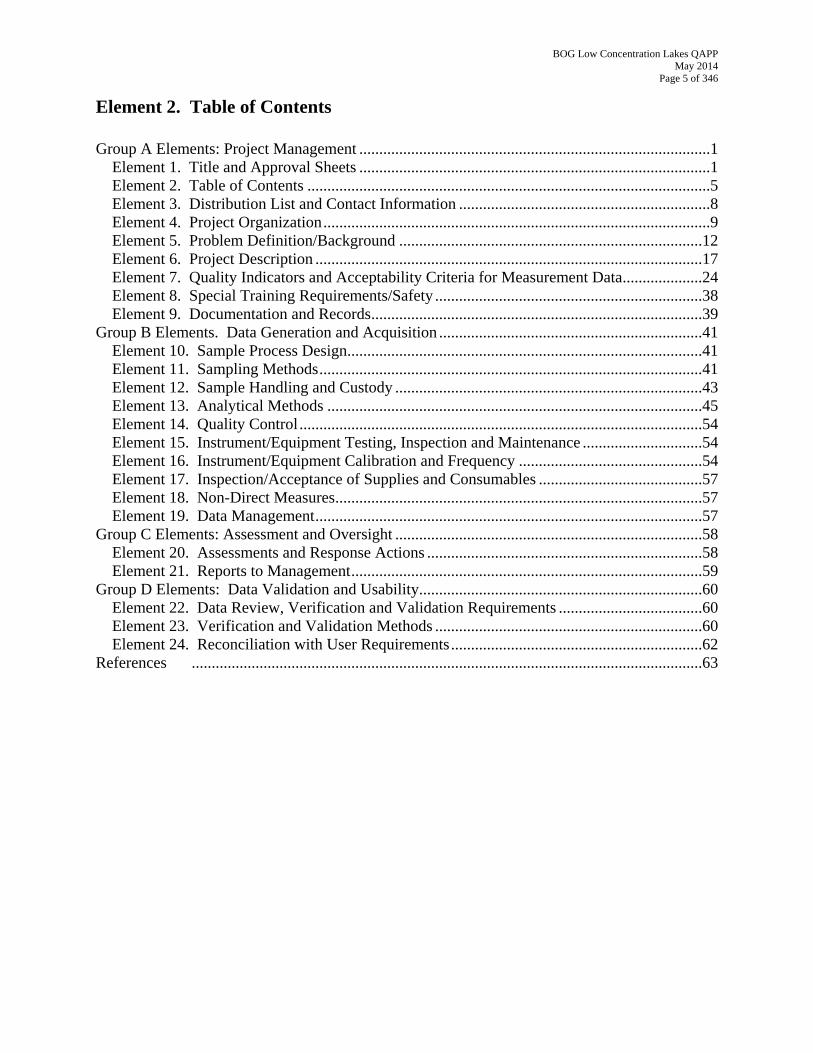
Element 2. Table of Contents Group A Elements: Project Management ........................................................................................1
Element 1. Title and Approval Sheets ........................................................................................1 Element 2. Table of Contents .....................................................................................................5 Element 3. Distribution List and Contact Information ...............................................................8 Element 4. Project Organization.................................................................................................9 Element 5. Problem Definition/Background ............................................................................12 Element 6. Project Description .................................................................................................17 Element 7. Quality Indicators and Acceptability Criteria for Measurement Data....................24 Element 8. Special Training Requirements/Safety ...................................................................38 Element 9. Documentation and Records...................................................................................39
Group B Elements. Data Generation and Acquisition ..................................................................41 Element 10. Sample Process Design.........................................................................................41 Element 11. Sampling Methods................................................................................................41 Element 12. Sample Handling and Custody .............................................................................43 Element 13. Analytical Methods ..............................................................................................45 Element 14. Quality Control .....................................................................................................54 Element 15. Instrument/Equipment Testing, Inspection and Maintenance ..............................54 Element 16. Instrument/Equipment Calibration and Frequency ..............................................54 Element 17. Inspection/Acceptance of Supplies and Consumables .........................................57 Element 18. Non-Direct Measures............................................................................................57 Element 19. Data Management.................................................................................................57
Group C Elements: Assessment and Oversight .............................................................................58 Element 20. Assessments and Response Actions .....................................................................58 Element 21. Reports to Management........................................................................................59
Group D Elements: Data Validation and Usability.......................................................................60 Element 22. Data Review, Verification and Validation Requirements ....................................60 Element 23. Verification and Validation Methods ...................................................................60 Element 24. Reconciliation with User Requirements...............................................................62
References ................................................................................................................................63
BOG Low Concentration Lakes QAPP May 2014
Page 6 of 346
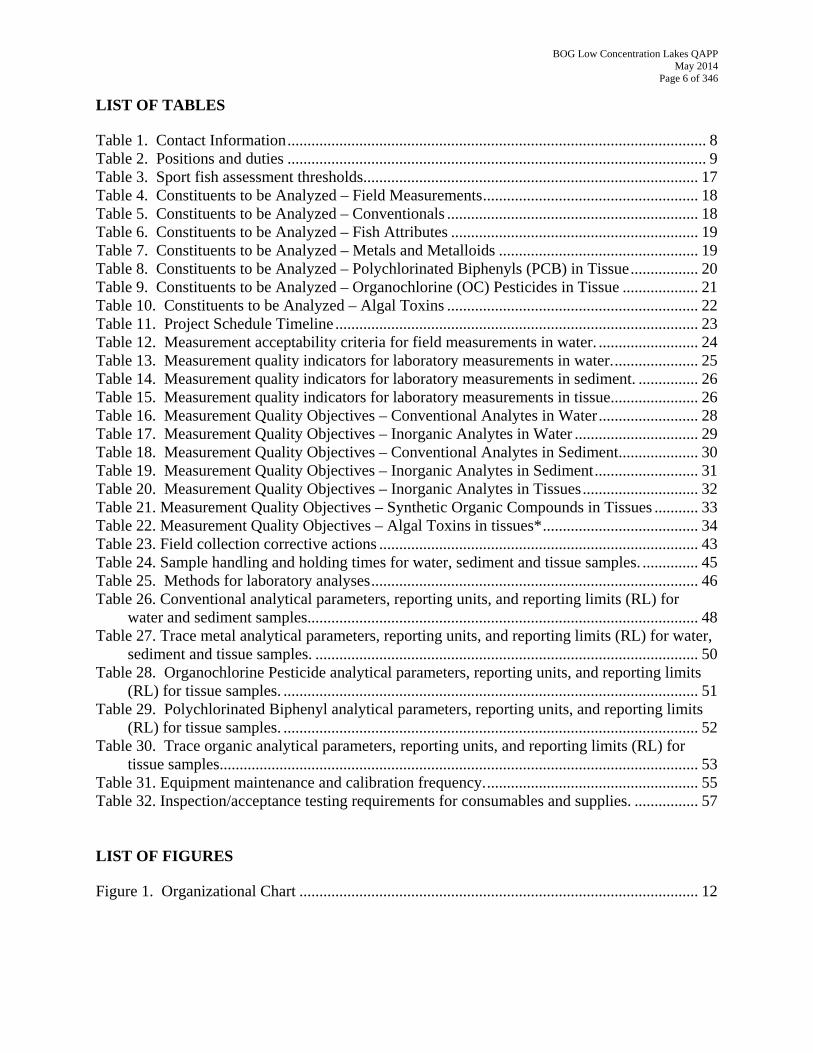
LIST OF TABLES Table 1. Contact Information......................................................................................................... 8
91718181919202122232425262628293031323334434546
48
50
51
52
535557
12
Table 2. Positions and duties ......................................................................................................... Table 3. Sport fish assessment thresholds.................................................................................... Table 4. Constituents to be Analyzed – Field Measurements...................................................... Table 5. Constituents to be Analyzed – Conventionals ............................................................... Table 6. Constituents to be Analyzed – Fish Attributes .............................................................. Table 7. Constituents to be Analyzed – Metals and Metalloids .................................................. Table 8. Constituents to be Analyzed – Polychlorinated Biphenyls (PCB) in Tissue................. Table 9. Constituents to be Analyzed – Organochlorine (OC) Pesticides in Tissue ................... Table 10. Constituents to be Analyzed – Algal Toxins ............................................................... Table 11. Project Schedule Timeline ........................................................................................... Table 12. Measurement acceptability criteria for field measurements in water. ......................... Table 13. Measurement quality indicators for laboratory measurements in water...................... Table 14. Measurement quality indicators for laboratory measurements in sediment. ............... Table 15. Measurement quality indicators for laboratory measurements in tissue...................... Table 16. Measurement Quality Objectives – Conventional Analytes in Water......................... Table 17. Measurement Quality Objectives – Inorganic Analytes in Water ............................... Table 18. Measurement Quality Objectives – Conventional Analytes in Sediment.................... Table 19. Measurement Quality Objectives – Inorganic Analytes in Sediment.......................... Table 20. Measurement Quality Objectives – Inorganic Analytes in Tissues............................. Table 21. Measurement Quality Objectives – Synthetic Organic Compounds in Tissues ........... Table 22. Measurement Quality Objectives – Algal Toxins in tissues*....................................... Table 23. Field collection corrective actions ................................................................................ Table 24. Sample handling and holding times for water, sediment and tissue samples. .............. Table 25. Methods for laboratory analyses.................................................................................. Table 26. Conventional analytical parameters, reporting units, and reporting limits (RL) for
water and sediment samples.................................................................................................. Table 27. Trace metal analytical parameters, reporting units, and reporting limits (RL) for water,
sediment and tissue samples. ................................................................................................ Table 28. Organochlorine Pesticide analytical parameters, reporting units, and reporting limits
(RL) for tissue samples. ........................................................................................................ Table 29. Polychlorinated Biphenyl analytical parameters, reporting units, and reporting limits
(RL) for tissue samples. ........................................................................................................ Table 30. Trace organic analytical parameters, reporting units, and reporting limits (RL) for
tissue samples........................................................................................................................ Table 31. Equipment maintenance and calibration frequency...................................................... Table 32. Inspection/acceptance testing requirements for consumables and supplies. ................ LIST OF FIGURES Figure 1. Organizational Chart ....................................................................................................
BOG Low Concentration Lakes QAPP May 2014
Page 7 of 346
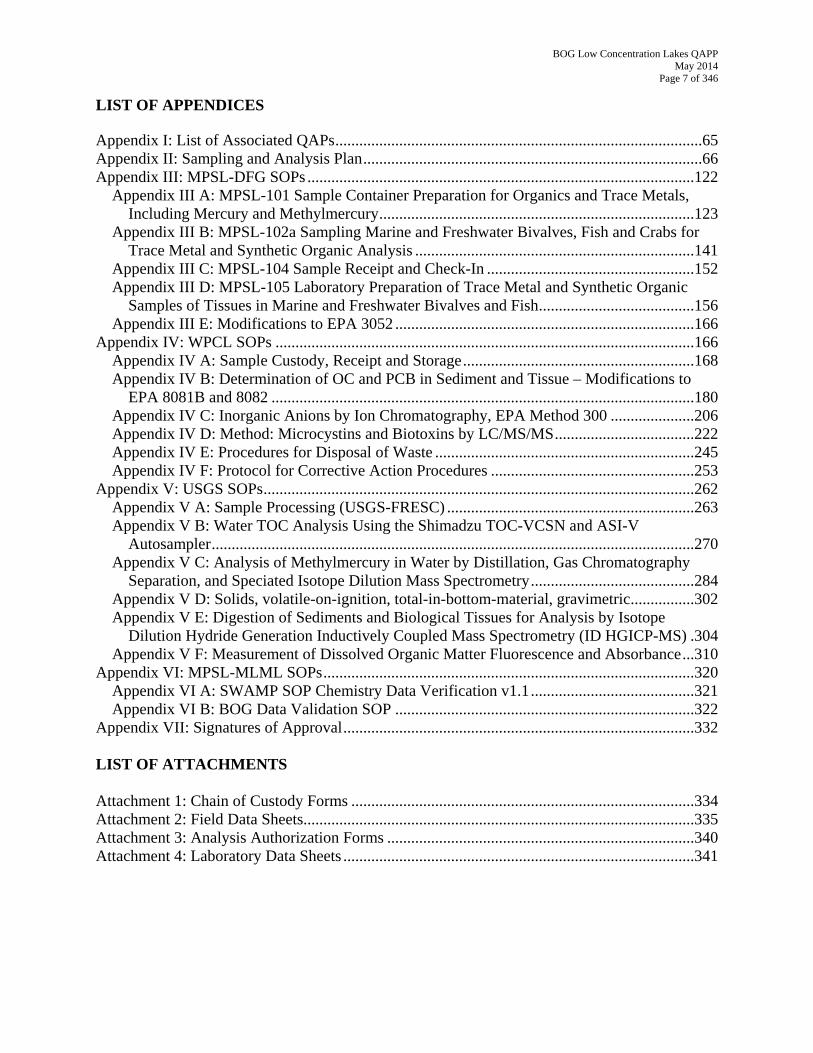
LIST OF APPENDICES Appendix I: List of Associated QAPs............................................................................................65 Appendix II: Sampling and Analysis Plan.....................................................................................66 Appendix III: MPSL-DFG SOPs .................................................................................................122
Appendix III A: MPSL-101 Sample Container Preparation for Organics and Trace Metals, Including Mercury and Methylmercury...............................................................................123
Appendix III B: MPSL-102a Sampling Marine and Freshwater Bivalves, Fish and Crabs for Trace Metal and Synthetic Organic Analysis ......................................................................141
Appendix III C: MPSL-104 Sample Receipt and Check-In ....................................................152 Appendix III D: MPSL-105 Laboratory Preparation of Trace Metal and Synthetic Organic
Samples of Tissues in Marine and Freshwater Bivalves and Fish.......................................156 Appendix III E: Modifications to EPA 3052 ...........................................................................166
Appendix IV: WPCL SOPs .........................................................................................................166 Appendix IV A: Sample Custody, Receipt and Storage..........................................................168 Appendix IV B: Determination of OC and PCB in Sediment and Tissue – Modifications to
EPA 8081B and 8082 ..........................................................................................................180 Appendix IV C: Inorganic Anions by Ion Chromatography, EPA Method 300 .....................206 Appendix IV D: Method: Microcystins and Biotoxins by LC/MS/MS...................................222 Appendix IV E: Procedures for Disposal of Waste .................................................................245 Appendix IV F: Protocol for Corrective Action Procedures ...................................................253
Appendix V: USGS SOPs............................................................................................................262 Appendix V A: Sample Processing (USGS-FRESC) ..............................................................263 Appendix V B: Water TOC Analysis Using the Shimadzu TOC-VCSN and ASI-V
Autosampler.........................................................................................................................270 Appendix V C: Analysis of Methylmercury in Water by Distillation, Gas Chromatography
Separation, and Speciated Isotope Dilution Mass Spectrometry.........................................284 Appendix V D: Solids, volatile-on-ignition, total-in-bottom-material, gravimetric................302 Appendix V E: Digestion of Sediments and Biological Tissues for Analysis by Isotope
Dilution Hydride Generation Inductively Coupled Mass Spectrometry (ID HGICP-MS) .304 Appendix V F: Measurement of Dissolved Organic Matter Fluorescence and Absorbance...310
Appendix VI: MPSL-MLML SOPs.............................................................................................320 Appendix VI A: SWAMP SOP Chemistry Data Verification v1.1.........................................321 Appendix VI B: BOG Data Validation SOP ...........................................................................322
Appendix VII: Signatures of Approval........................................................................................332 LIST OF ATTACHMENTS Attachment 1: Chain of Custody Forms ......................................................................................334 Attachment 2: Field Data Sheets..................................................................................................335 Attachment 3: Analysis Authorization Forms .............................................................................340 Attachment 4: Laboratory Data Sheets ........................................................................................341
BOG Low Concentration Lakes QAPP May 2014
Page 8 of 346
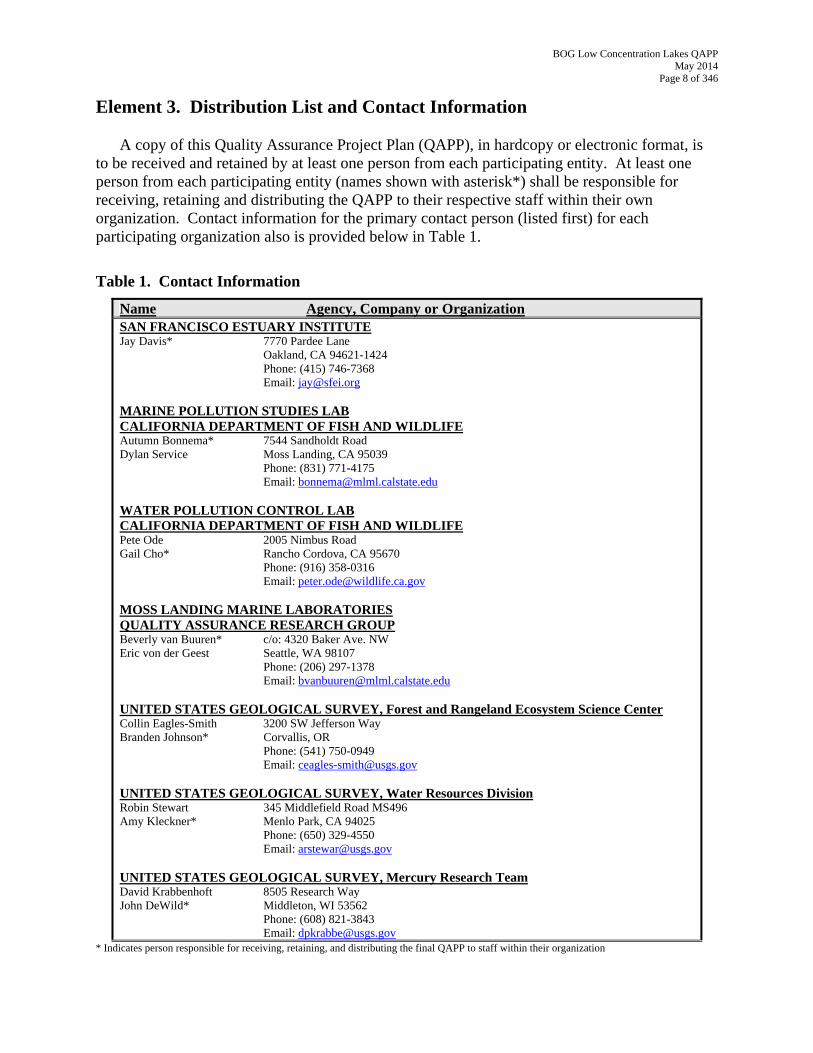
Element 3. Distribution List and Contact Information
A copy of this Quality Assurance Project Plan (QAPP), in hardcopy or electronic format, is to be received and retained by at least one person from each participating entity. At least one person from each participating entity (names shown with asterisk*) shall be responsible for receiving, retaining and distributing the QAPP to their respective staff within their own organization. Contact information for the primary contact person (listed first) for each participating organization also is provided below in Table 1.
Table 1. Contact Information
Name Agency, Company or Organization SAN FRANCISCO ESTUARY INSTITUTE Jay Davis* 7770 Pardee Lane Oakland, CA 94621-1424 Phone: (415) 746-7368 Email: [email protected] MARINE POLLUTION STUDIES LAB CALIFORNIA DEPARTMENT OF FISH AND WILDLIFE Autumn Bonnema* 7544 Sandholdt Road Dylan Service Moss Landing, CA 95039 Phone: (831) 771-4175 Email: [email protected] WATER POLLUTION CONTROL LAB CALIFORNIA DEPARTMENT OF FISH AND WILDLIFE Pete Ode 2005 Nimbus Road Gail Cho* Rancho Cordova, CA 95670 Phone: (916) 358-0316 Email: [email protected] MOSS LANDING MARINE LABORATORIES QUALITY ASSURANCE RESEARCH GROUP Beverly van Buuren* c/o: 4320 Baker Ave. NW Eric von der Geest Seattle, WA 98107 Phone: (206) 297-1378 Email: [email protected] UNITED STATES GEOLOGICAL SURVEY, Forest and Rangeland Ecosystem Science Center Collin Eagles-Smith 3200 SW Jefferson Way Branden Johnson* Corvallis, OR Phone: (541) 750-0949 Email: [email protected] UNITED STATES GEOLOGICAL SURVEY, Water Resources Division Robin Stewart 345 Middlefield Road MS496 Amy Kleckner* Menlo Park, CA 94025 Phone: (650) 329-4550 Email: [email protected] UNITED STATES GEOLOGICAL SURVEY, Mercury Research Team David Krabbenhoft 8505 Research Way John DeWild* Middleton, WI 53562 Phone: (608) 821-3843 Email: [email protected]
* Indicates person responsible for receiving, retaining, and distributing the final QAPP to staff within their organization
BOG Low Concentration Lakes QAPP May 2014
Page 9 of 346
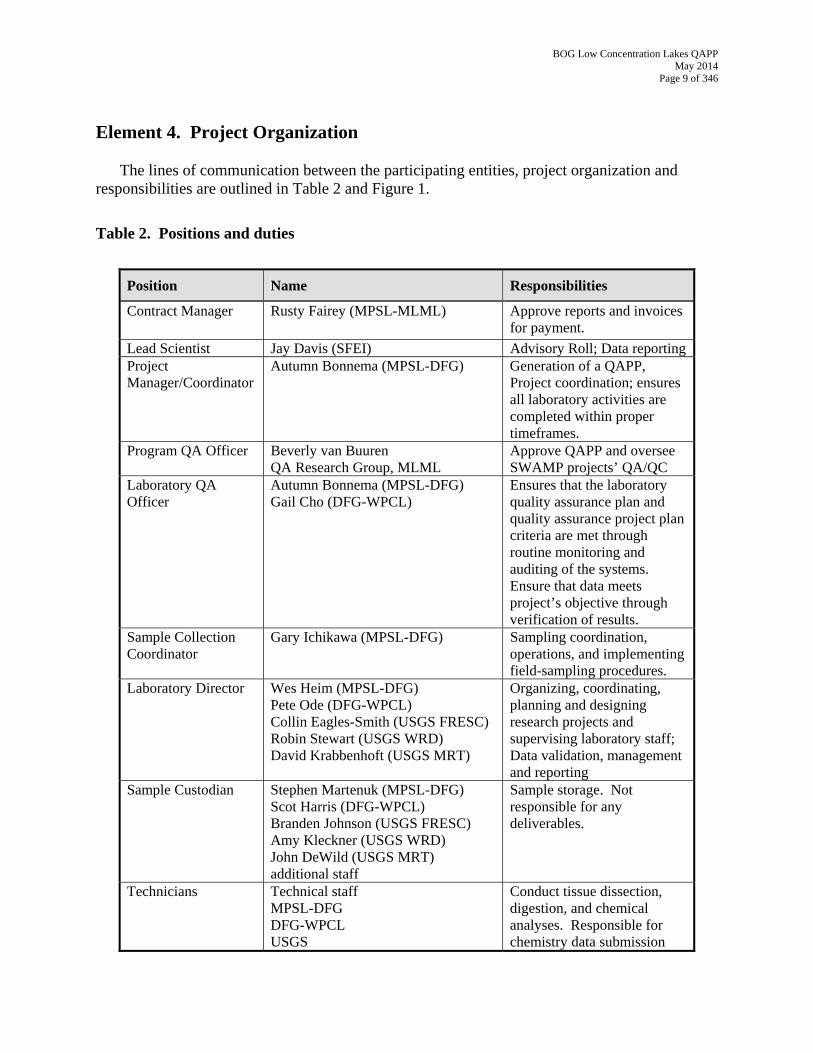
Element 4. Project Organization
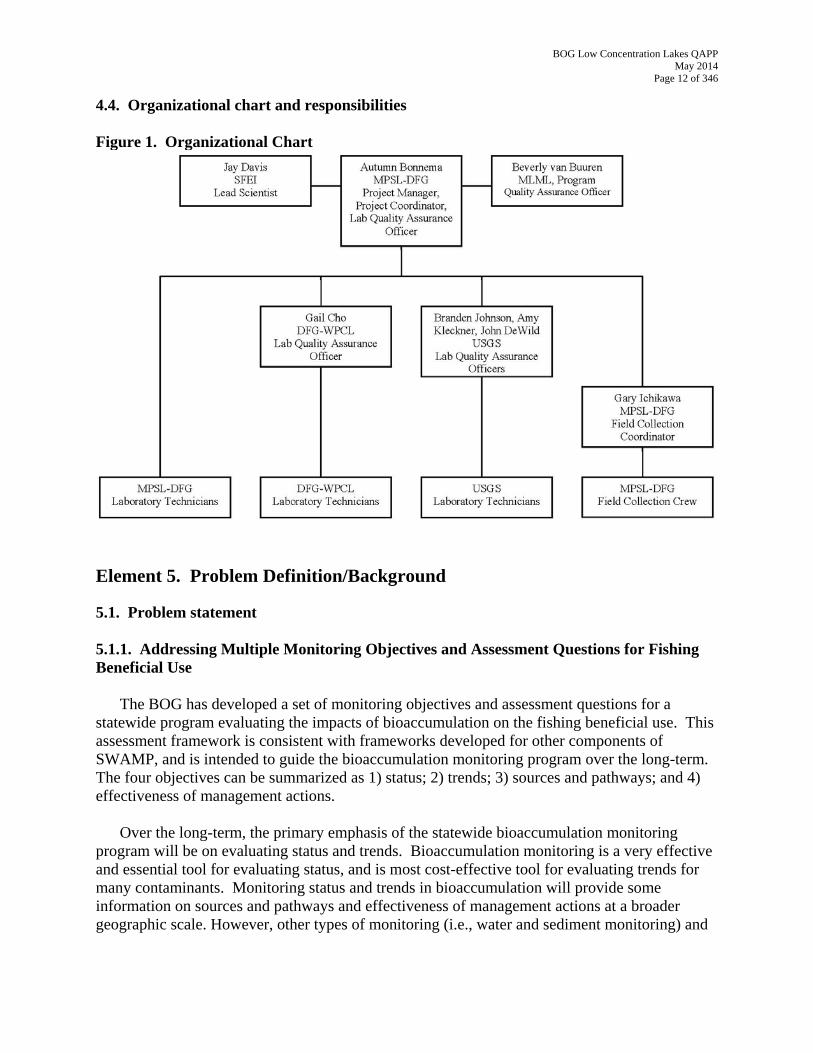
The lines of communication between the participating entities, project organization and responsibilities are outlined in Table 2 and Figure 1.
Table 2. Positions and duties
Position Name Responsibilities
Contract Manager Rusty Fairey (MPSL-MLML) Approve reports and invoices for payment.
Lead Scientist Jay Davis (SFEI) Advisory Roll; Data reporting Project Manager/Coordinator
Autumn Bonnema (MPSL-DFG) Generation of a QAPP, Project coordination; ensures all laboratory activities are completed within proper timeframes.
Program QA Officer Beverly van Buuren QA Research Group, MLML
Approve QAPP and oversee SWAMP projects’ QA/QC
Laboratory QA Officer
Autumn Bonnema (MPSL-DFG) Gail Cho (DFG-WPCL)
Ensures that the laboratory quality assurance plan and quality assurance project plan criteria are met through routine monitoring and auditing of the systems. Ensure that data meets project’s objective through verification of results.
Sample Collection Coordinator
Gary Ichikawa (MPSL-DFG) Sampling coordination, operations, and implementing field-sampling procedures.
Laboratory Director
Wes Heim (MPSL-DFG) Pete Ode (DFG-WPCL) Collin Eagles-Smith (USGS FRESC) Robin Stewart (USGS WRD) David Krabbenhoft (USGS MRT)
Organizing, coordinating, planning and designing research projects and supervising laboratory staff; Data validation, management and reporting Sample storage. Not responsible for any deliverables.
Sample Custodian Stephen Martenuk (MPSL-DFG) Scot Harris (DFG-WPCL) Branden Johnson (USGS FRESC) Amy Kleckner (USGS WRD) John DeWild (USGS MRT) additional staff
Technicians Technical staff MPSL-DFG DFG-WPCL USGS
Conduct tissue dissection, digestion, and chemical analyses. Responsible for chemistry data submission
BOG Low Concentration Lakes QAPP May 2014
Page 10 of 346
4.1. Involved parties and roles
Rusty Fairey of Marine Pollution Studies Lab - Moss Landing Marine Laboratories (MPSL-MLML) will be the Contract Manager (CM) for this project. The CM will approve reports and invoices for payment.
Jay Davis of San Francisco Estuary Institute (SFEI) is the Lead Scientist (LS) and primary
contact of this project. The LS will 1) generate the Sampling and Analysis Plan (SAP), 2) approve the QAPP, and 3) provide the BOG with a final report on completion of this project.
Autumn Bonnema of MPSL-DFG will serve as the Project Manager (PM) and Project
Coordinator (PC). The PC will 1) prepare the QAPP, 2) ensure that laboratory technicians have processing instructions and 3) ensure all laboratory activities are completed within the proper timelines. In addition, the PC may assist field crew in preparation and logistics. As PM, she will 1) review, evaluate and document project reports, and 2) verify the completeness of all tasks.
Dylan Service of MPSL-DFG is in charge of directing fish collection for this project. He
will 1) oversee preparation for sampling, including vehicle maintenance and 2) oversee sample and field data collection.
Stephen Martenuk is responsible for sample storage and custody at MPSL. His duties will be
to oversee compositing of tissue samples. Scot Harris will do the same for samples processed at DFG-WPCL; Robin Stewart, Collin Eagles-Smith, and Dave Krabbenhoft for USGS.
Pete Ode will serve as the Laboratory Director (LD) for the DFG-WPCL component of this
project. His specific duties will be to 1) review and approve the QAPP, 2) provide oversight for all organic chemical analyses to be done for this project, and 3) ensure that all DFG-WPCL activities are completed within the proper timelines.
Wes Heim will serve as the Laboratory Director (LD) for the MPSL-DFG component of this
project. His specific duties will be to 1) review and approve the QAPP, 2) provide oversight for mercury analyses on fish tissues to be done for this project, and 3) ensure that all MPSL-DFG activities are completed within the proper timelines.
Collin Eagles-Smith, Robin Stewart and Dave Krabbenhoft will serve as the Laboratory
Directors (LD) for the USGS component of this project. Their specific duties will be to 1) review and approve the QAPP, 2) provide oversight for mercury analyses on grebe tissues to be done for this project, and 3) ensure that all USGS activities are completed within the proper timelines.
The following serve in an advisory role and are not responsible for any deliverables: Terry
Fleming (EPA), Bob Brodberg (Office of Environmental Health Hazard Assessment (OEHHA)), Karen Taberski (RWQCB2), Mary Hamilton (RWQCB3), Michael Lyons (RWQCB4), Chris Foe, Stephen Louie, Carrie Austin and Patrick Morris (RWQCB5), Tom Suk (RWCQB6), Jeff Geraci (RWCB7), Chad Loflen (RWQCB9), Cassandra Lamerdin (MPSL-MLML), Jennifer Salisbury (State Water Resources Control Board (SWRCB)), and Jennifer Hunt (SFEI).
BOG Low Concentration Lakes QAPP May 2014
Page 11 of 346
4.2. Quality Assurance Officer (QAO) Role
The Laboratory Quality Assurance Officers fulfill the functions and authority of a project quality assurance officer (QAO). Autumn Bonnema is the MPSL-DFG QAO, and Gail Cho is the DFG-WPCL QAO and Branden Johnson, Amy Kleckner and John DeWild serve as the QAOs for each of the USGS laboratories. The role of the Laboratory QAO is to ensure that quality control for sample processing and data analysis procedures described in this QAPP are maintained throughout the project. The Program QAO (Beverly van Buuren, MLML) acts in a consulting role to the Laboratory QAOs and ensures the project meets all SWAMP QA/QC criteria (QAPrP, 2008).
The Laboratory QAOs will review and assess all procedures during the life of this project
against QAPP requirements, and assess whether the procedures are performed according to protocol. The Laboratory QAOs will report all findings (including qualified data) to the Program QAO and the PM, including all requests for corrective action. The Laboratory and Program QAOs have the authority to stop all actions if there are significant deviations from required procedures or evidence of a systematic failure.
A conflict of interest does not exist between the Laboratory QAOs and the work outlined in
this QAPP as neither Laboratory QAO participates in any of the chemical analyses of the project. There is not a conflict of interest with one person fulfilling the roles of Laboratory QAO and Project Coordinator (PC), as laboratory decisions are not made by the PC and no other duties overlap. The role of the PC is detailed above. 4.3. Persons responsible for QAPP update and maintenance
Revisions and updates to this QAPP will be carried out by Autumn Bonnema (PC), with technical input of the Laboratory and Program QAOs. All changes will be considered draft until reviewed and approved by the PM and the SWAMP QAO. Finalized revisions will be submitted for approval to the SWAMP QAO, if necessary.
Copies of this QAPP will be distributed to all parties involved in the project. Any future
amended QAPPs will be held and distributed in the same fashion. All originals of these first and subsequent amended QAPPs will be held on site at SFEI, DFG-WPCL and MPSL-DFG.
BOG Low Concentration Lakes QAPP May 2014
Page 12 of 346
4.4. Organizational chart and responsibilities Figure 1. Organizational Chart
Element 5. Problem Definition/Background 5.1. Problem statement 5.1.1. Addressing Multiple Monitoring Objectives and Assessment Questions for Fishing Beneficial Use The BOG has developed a set of monitoring objectives and assessment questions for a statewide program evaluating the impacts of bioaccumulation on the fishing beneficial use. This assessment framework is consistent with frameworks developed for other components of SWAMP, and is intended to guide the bioaccumulation monitoring program over the long-term. The four objectives can be summarized as 1) status; 2) trends; 3) sources and pathways; and 4) effectiveness of management actions. Over the long-term, the primary emphasis of the statewide bioaccumulation monitoring program will be on evaluating status and trends. Bioaccumulation monitoring is a very effective and essential tool for evaluating status, and is most cost-effective tool for evaluating trends for many contaminants. Monitoring status and trends in bioaccumulation will provide some information on sources and pathways and effectiveness of management actions at a broader geographic scale. However, other types of monitoring (i.e., water and sediment monitoring) and
BOG Low Concentration Lakes QAPP May 2014
Page 13 of 346
other programs (regional TMDL programs) are also needed for addressing sources and pathways and effectiveness of management actions. The current workplan describes an effort to refine the characterization of the status of lakes and reservoirs with regard to impairment due to bioaccumulation. SWAMP surveys to date have focused on identifying water bodies with elevated concentrations of bioaccumulative contaminants so that managers could develop strategies for addressing problem areas. In contrast, this survey will aim to provide information on another facet of status: identification of lakes and reservoirs with relatively low levels of contamination. This information will be useful to managers in their efforts to protect these relatively high quality ecosystems and to replicate these conditions in other water bodies. The information will also be valuable to the fishing public, drawing attention to water bodies where beneficial uses can be enjoyed with reduced exposure to bioaccumulative contaminants 5.2. Decisions or outcomes Three management questions (one primary question, and two secondary questions) have been articulated to guide the design of this study. The primary question is the main driver of the sampling design. The secondary questions will be addressed to the extent possible with the resources available for the study, after assuring that the primary question is appropriately addressed. 5.2.1. Management Question 1 (MQ1) Which popular lakes in California can be confirmed to have relatively low concentrations of contaminants in sport fish?
Answering this question will address the critical need of managers and the public to know which water bodies can be considered relatively clean. With this information, the fishing public can be directed to water bodies where they can enjoy the benefits of fishing and fish consumption and have reduced exposure to contaminants.
The data needed to answer this question are repeated observations of low concentrations of
all contaminants of concern (including methylmercury, PCBs, legacy pesticides, and selenium) in the species with the greatest tendency to accumulate high concentrations. For methylmercury, top predators such as black bass tend to accumulate relatively high concentrations. High-lipid, bottom-feeding species such as catfish, carp, and sucker have the greatest tendency to accumulate relatively high concentrations of organic contaminants of concern (PCBs and legacy pesticides). Selenium also biomagnifies primarily through accumulation in muscle, but past monitoring in the San Joaquin Valley (Beckon et al. 2010) suggests that bottom-feeders accumulate slightly higher concentrations. Measuring low concentrations of contaminants in both of these types of indicator species provides compelling evidence that a water body has a low overall degree of contamination. Given the variance associated with contaminant concentrations, the evidence becomes even more compelling if the low concentrations are observed on more than one occasion. This higher level of confidence obtained through repeated observation of low concentrations in both types of indicator species is desirable to be assured of providing reliable information to the public to guide their decisions on where to fish.
BOG Low Concentration Lakes QAPP May 2014
Page 14 of 346
In some water bodies, it is not feasible to obtain both types of indicator species because they are not present in high enough abundance. Lakes at higher elevations with colder water where trout species predominate are a common example. For these lakes, repeated observation of the species that do occur there and are most likely to have high concentrations is the best basis that can be obtained for characterizing a lake as one with relatively low concentrations. 5.2.2. Management Question 2 (MQ2) Why do some lakes have relatively low concentrations of methylmercury in sport fish?
Many of the lakes found to have low concentrations of contaminants in the 2007-8 survey were lakes where only rainbow trout were collected. Rainbow trout generally had low concentrations of methylmercury, with a statewide average of 0.05 ppm. Concentrations of organics in trout were also generally low. To some degree, this was due to lower concentrations of contaminants in these lakes, but other factors also likely played a role. Trout generally occupy a lower trophic position and accumulate lower concentrations of methylmercury and other pollutants than black bass. However, a factor that probably contributed to lower observed concentrations in trout is that, in many lakes, recently planted hatchery fish are part of the catch. A previous study found that hatchery trout consistently had very low concentrations of methylmercury (rainbow trout from four hatcheries all had less than 0.023 ppm – Grenier et al. 2007).
With the level of effort that could be expended in the statewide survey of 2007-8 it is
possible that other resident species with a potential to have higher concentrations were missed, such as resident populations of trout or small populations of warmwater predators like black bass or bottom feeders like sucker. With the greater effort planned for the present study, it is anticipated that information will be obtained that will allow for some evaluation of the accuracy of the 2007-8 assessment for lakes where only one species was obtained.. 5.2.3. Management Question 3 (MQ3) Did the 2007-8 survey accurately characterize the status of lakes in which only rainbow trout were collected?
Many of the lakes found to have low concentrations of contaminants in the 2007-8 survey were lakes where only rainbow trout were collected. Rainbow trout generally had low concentrations of methylmercury, with a statewide average of 0.05 ppm. Concentrations of organics in trout were also generally low. To some degree, this was due to lower concentrations of contaminants in these lakes, but other factors also likely played a role. Trout generally occupy a lower trophic position and accumulate lower concentrations of methylmercury and other pollutants than black bass. However, a factor that probably contributed to lower observed concentrations in trout is that, in many lakes, recently planted hatchery fish are part of the catch. A previous study found that hatchery trout consistently had very low concentrations of methylmercury (rainbow trout from four hatcheries all had less than 0.023 ppm – Grenier et al. 2007).
With the level of effort that could be expended in the statewide survey of 2007-8 it is
possible that other resident species with a potential to have higher concentrations were missed,
BOG Low Concentration Lakes QAPP May 2014
Page 15 of 346
such as resident populations of trout or small populations of warmwater predators like black bass or bottom feeders like sucker. With the greater effort planned for the present study, it is anticipated that information will be obtained that will allow for some evaluation of the accuracy of the 2007-8 assessment for lakes where only one species was obtained 5.2.4. Overall Approach The overall approach to be taken to answer these three questions is to re-sample a select subset of lakes that were identified as having relatively low concentrations of contaminants in the 2007-8 survey. The same basic design used in the 2007-8 survey will be repeated, as the goal is to obtain confirmation of the earlier results. 5.2.5. Coordination The BOG is coordinating with other efforts to significantly leverage the funds for this survey and achieve a more thorough evaluation of California lakes with relatively low levels of contamination. These coordinated efforts are adding approximately $169,000 worth of work to the BOG funds available for sampling and analysis in this study ($240,000).
The Colorado River Basin Regional Water Quality Control Board (Region 7) will be conducting a survey of contaminants in sport fish in Region 7 lakes this summer. Region 7 has a relatively large proportion of lakes that meet the criteria for having low concentrations, including 10 of the 14 lakes that will be sampled in the Region. Resources for this statewide effort will be pooled with Region 7 resources to allow a more thorough and definitive assessment of the lakes in this region. The data from the Region 7 effort will be processed and reported along with the data from the statewide effort.
The Los Angeles Regional Water Quality Control Board (Region 4) will partner to expand
this study in their region. Region 4 is covering the cost of all of the work in their region, including an extra lake (Castaic Lake) to complement sampling of Castaic Lagoon. In addition, they will pay for some of the costs of lakes outside their region.
The San Diego Regional Water Quality Control Board (Region 9) is planning a study of
cyanotoxins in reservoirs for this summer. One of the lakes to be sampled in that effort (Lake Henshaw) is also a candidate for inclusion in this study. If Lake Henshaw is selected for this study, the work will be coordinated with the cyanotoxin study. Effort will be made to collect Lake Henshaw at a similar time the other lakes from the Region 9 study are being collected.
Several U.S. Geological Survey (USGS) research labs are partnering with this study as an opportunity to provide improved understanding of mercury cycling in the western US. The USGS Wisconsin Water Science Center’s Mercury Research Team will partner with SWAMP on this study by performing chemical analysis of water and sediment samples for total mercury, methylmercury, and related parameters. The MRT operates one of the premier mercury labs in the country, and frequently contributes to mercury studies at regional and national scales.
BOG Low Concentration Lakes QAPP May 2014
Page 16 of 346
The Corvallis Research Group of the USGS Forest and Rangeland Ecosystem Science Center in Corvallis OR will partner with SWAMP on this study by performing chemical analysis of small fish samples for total mercury.
The Water Resources Division of USGS in Menlo Park CA will partner with SWAMP on this study by performing chemical analysis of small fish samples for selenium. They will also be analyzing selenium in sport fish livers from select lakes
5.3. Tissue contamination criteria
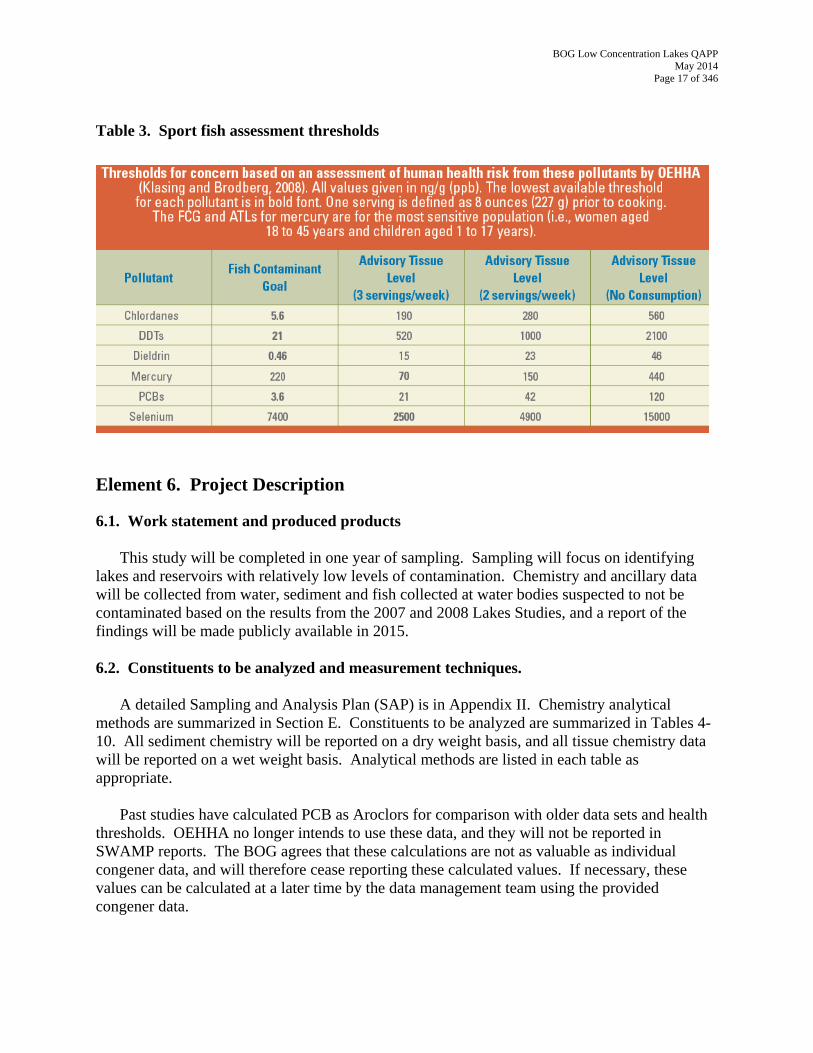
The state is in the process of developing a statewide tissue objective for mercury that is anticipated to be 0.2 ppm wet weight (all concentrations mentioned in this document are presented on a wet weight basis). This threshold will be used for the next round of listing. Through BOG discussion, the 0.2 ppm objective and listing threshold was selected as the criterion for classifying lakes as having relatively low concentrations of mercury. To be confident that a lake truly has fish mercury concentrations below 0.2 ppm, it is desirable to have measured concentrations in species such as black bass that are known to accumulate high concentrations. The California Office of Environmental Health Hazard Assessment (OEHHA) has established two sets of thresholds - fish contaminant goals and advisory tissue levels - that are relevant as selection criteria for lakes to be included in this study (Klasing and Brodberg [2008], Table 3). Fish contaminant goals (FCGs) are health protective values for lifetime exposure and consider only the toxicity of the contaminants. They were developed by OEHHA to assist other agencies to establish fish tissue-based criteria for cleanup. For the two main chemicals of concern in this study, the FCGs are 0.22 ppm for mercury and 3.6 ppb for PCBs. The FCG for mercury (0.22 ppm) is of the same magnitude as the statewide tissue objective of 0.2 ppm, based only on toxicity and one serving per week of consumption. FCGs are being used by the Water Boards in the latest round of 303(d) listing determinations. Advisory Tissue Levels (ATLs) consider both the toxicity of contaminants and the health benefits of fish consumption. They are used to develop sport fish consumption advice for the public. OEHHA has developed ATL ranges for one to seven servings per week. A comparison of the same consumption frequency (one serving per week), shows that, for mercury, the low end of the ATL range (150 to 440 ppb) for the sensitive population (children and women of child-bearing age) encompasses the statewide tissue objective (200 ppb). For PCBs, the low end of the ATL range (21 ppb) for a 2 servings per week consumption rate was also considered as a lake selection criterion.
For organics, given their use in 303(d) listing determinations, the FCGs are a relevant benchmark to use in assessing the degree of contamination. To be confident that a lake truly has organics concentrations below FCGs, it is desirable to have measured concentrations in species such as catfish, carp, or sucker that are known to accumulate high concentrations
Water and sediment results will not be compared with any thresholds as they are not being assessed for human health concerns. These data are intended only to help inform what may be contributing to low contaminant concentrations in certain lakes and reservoirs.
BOG Low Concentration Lakes QAPP May 2014
Page 17 of 346
Table 3. Sport fish assessment thresholds
Element 6. Project Description 6.1. Work statement and produced products This study will be completed in one year of sampling. Sampling will focus on identifying lakes and reservoirs with relatively low levels of contamination. Chemistry and ancillary data will be collected from water, sediment and fish collected at water bodies suspected to not be contaminated based on the results from the 2007 and 2008 Lakes Studies, and a report of the findings will be made publicly available in 2015. 6.2. Constituents to be analyzed and measurement techniques.
A detailed Sampling and Analysis Plan (SAP) is in Appendix II. Chemistry analytical methods are summarized in Section E. Constituents to be analyzed are summarized in Tables 4-10. All sediment chemistry will be reported on a dry weight basis, and all tissue chemistry data will be reported on a wet weight basis. Analytical methods are listed in each table as appropriate.
Past studies have calculated PCB as Aroclors for comparison with older data sets and health
thresholds. OEHHA no longer intends to use these data, and they will not be reported in SWAMP reports. The BOG agrees that these calculations are not as valuable as individual congener data, and will therefore cease reporting these calculated values. If necessary, these values can be calculated at a later time by the data management team using the provided congener data.
BOG Low Concentration Lakes QAPP May 2014
Page 18 of 346
In the SWAMP Lakes Study (conducted in 2007 and 2008), PBDE data were provided at a screening level only as a free service from the analytical lab. These compounds are important emerging contaminants however they are cost prohibitive and not part of our current analyte list. Archives of each sample will be retained for potential future analysis.
Also, Tedion has been removed from the analyte list. This compound was discontinued from
use in 1985 and has a very short residence time. Furthermore, it is a compound that is not bioaccumulated.
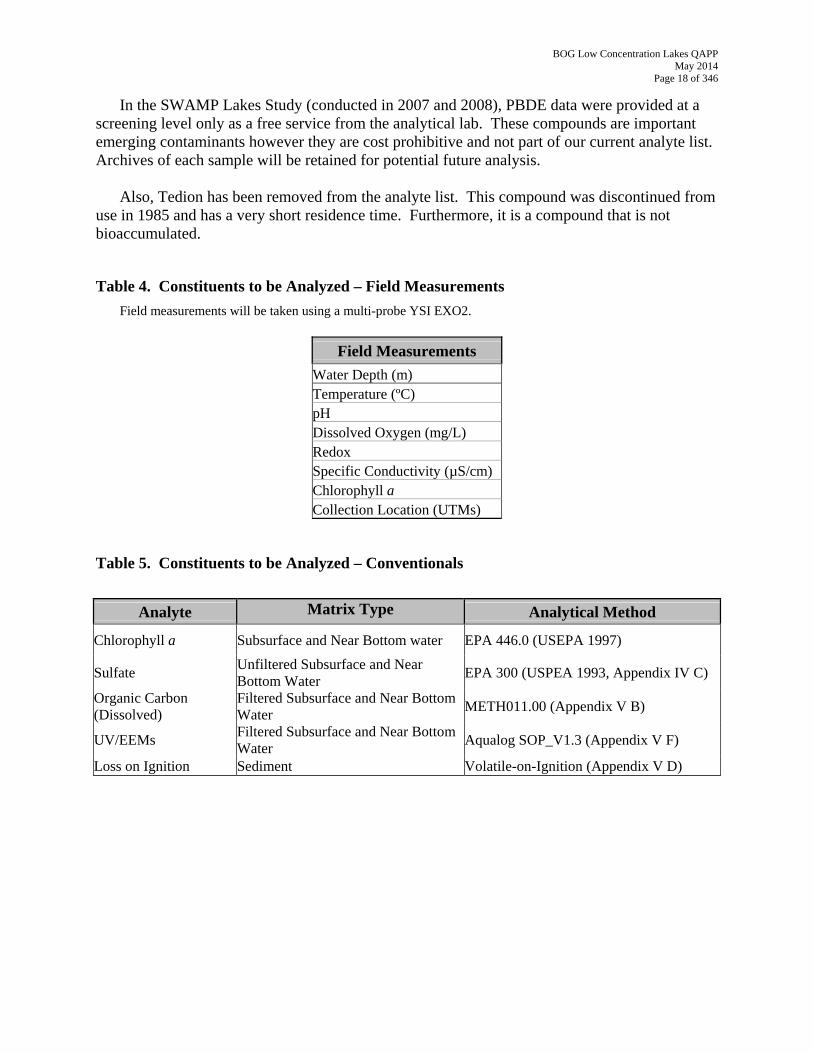
Table 4. Constituents to be Analyzed – Field Measurements Field measurements will be taken using a multi-probe YSI EXO2.
Field Measurements Water Depth (m) Temperature (ºC) pH Dissolved Oxygen (mg/L) Redox Specific Conductivity (µS/cm) Chlorophyll a Collection Location (UTMs)
Table 5. Constituents to be Analyzed – Conventionals
Analyte Matrix Type Analytical Method
Chlorophyll a Subsurface and Near Bottom water EPA 446.0 (USEPA 1997)
Sulfate Unfiltered Subsurface and Near Bottom Water
EPA 300 (USPEA 1993, Appendix IV C)
Organic Carbon (Dissolved)
Filtered Subsurface and Near Bottom Water
METH011.00 (Appendix V B)
UV/EEMs Filtered Subsurface and Near Bottom Water
Aqualog SOP_V1.3 (Appendix V F)
Loss on Ignition Sediment Volatile-on-Ignition (Appendix V D)
BOG Low Concentration Lakes QAPP May 2014
Page 19 of 346
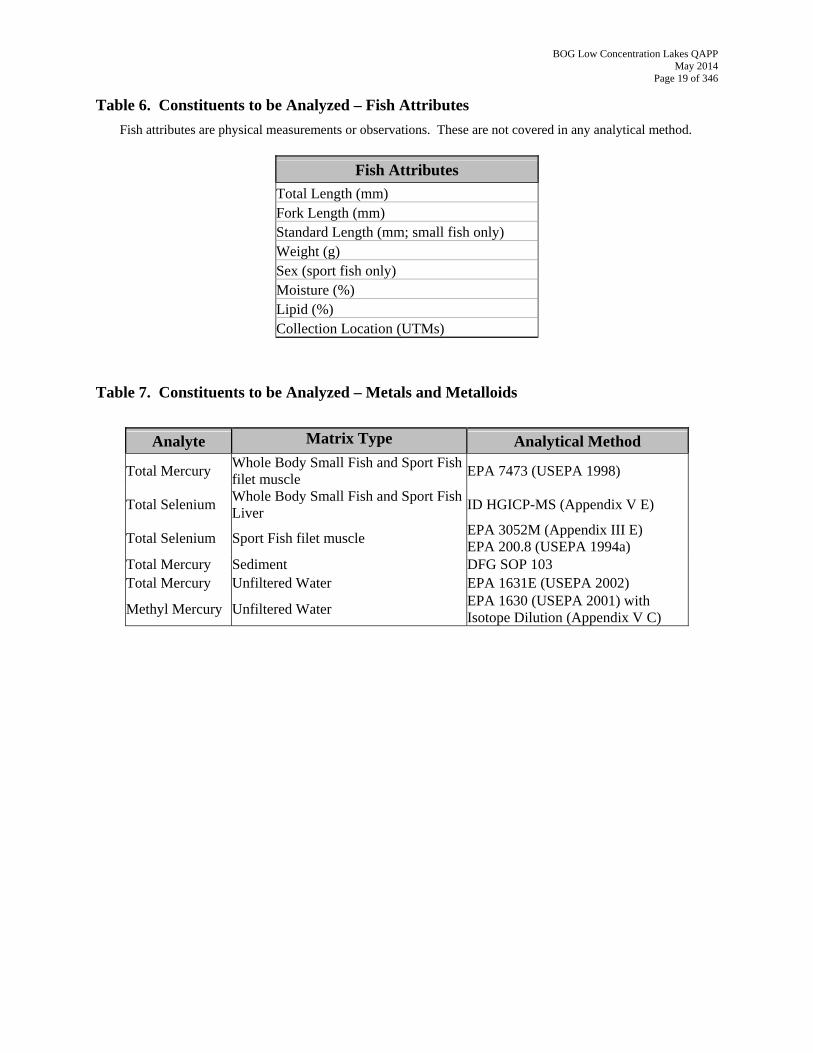
Table 6. Constituents to be Analyzed – Fish Attributes Fish attributes are physical measurements or observations. These are not covered in any analytical method.
Fish Attributes Total Length (mm) Fork Length (mm) Standard Length (mm; small fish only) Weight (g) Sex (sport fish only) Moisture (%) Lipid (%) Collection Location (UTMs)
Table 7. Constituents to be Analyzed – Metals and Metalloids
Analyte Matrix Type Analytical Method
Total Mercury Whole Body Small Fish and Sport Fish filet muscle
EPA 7473 (USEPA 1998)
Total Selenium Whole Body Small Fish and Sport Fish Liver
ID HGICP-MS (Appendix V E)
Total Selenium Sport Fish filet muscle EPA 3052M (Appendix III E) EPA 200.8 (USEPA 1994a)
Total Mercury Sediment DFG SOP 103 Total Mercury Unfiltered Water EPA 1631E (USEPA 2002)
EPA 1630 (USEPA 2001) with Isotope Dilution (Appendix V C)
Methyl Mercury Unfiltered Water
BOG Low Concentration Lakes QAPP May 2014
Page 20 of 346
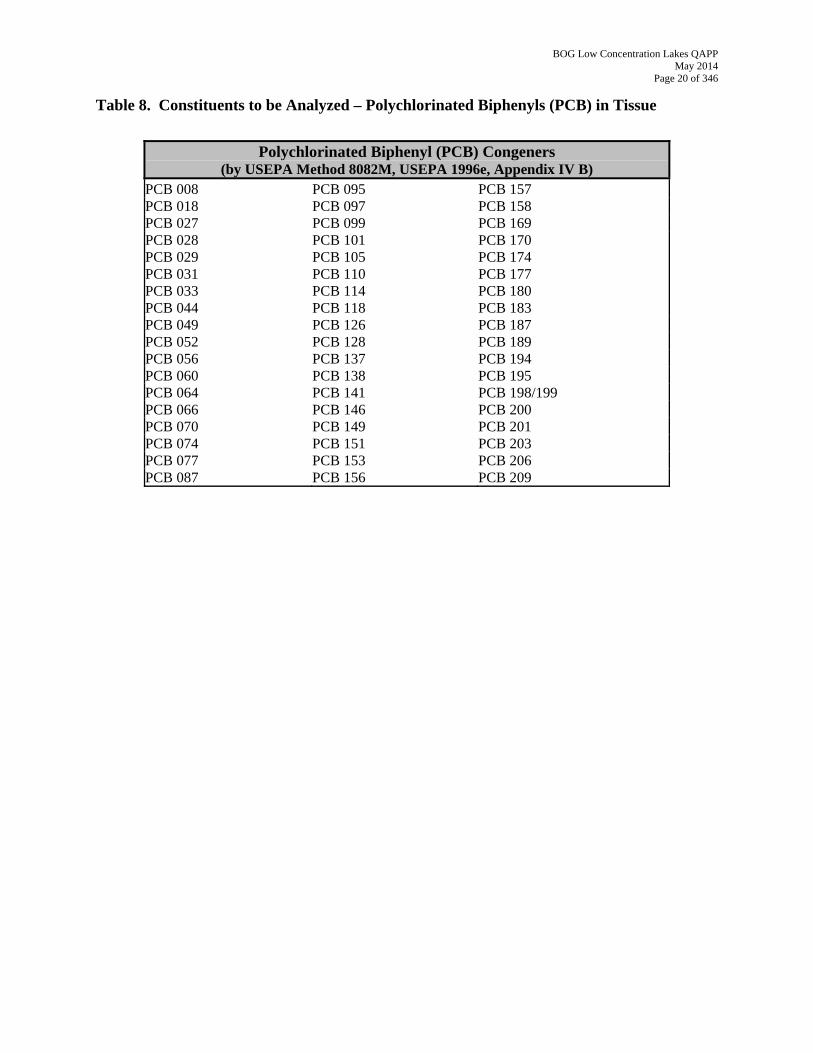
Table 8. Constituents to be Analyzed – Polychlorinated Biphenyls (PCB) in Tissue
Polychlorinated Biphenyl (PCB) Congeners (by USEPA Method 8082M, USEPA 1996e, Appendix IV B)
PCB 008 PCB 095 PCB 157 PCB 018 PCB 097 PCB 158 PCB 027 PCB 099 PCB 169 PCB 028 PCB 101 PCB 170 PCB 029 PCB 105 PCB 174 PCB 031 PCB 110 PCB 177 PCB 033 PCB 114 PCB 180 PCB 044 PCB 118 PCB 183 PCB 049 PCB 126 PCB 187 PCB 052 PCB 128 PCB 189 PCB 056 PCB 137 PCB 194 PCB 060 PCB 138 PCB 195 PCB 064 PCB 141 PCB 198/199 PCB 066 PCB 146 PCB 200 PCB 070 PCB 149 PCB 201 PCB 074 PCB 151 PCB 203 PCB 077 PCB 153 PCB 206
PCB 209 PCB 087 PCB 156
BOG Low Concentration Lakes QAPP May 2014
Page 21 of 346
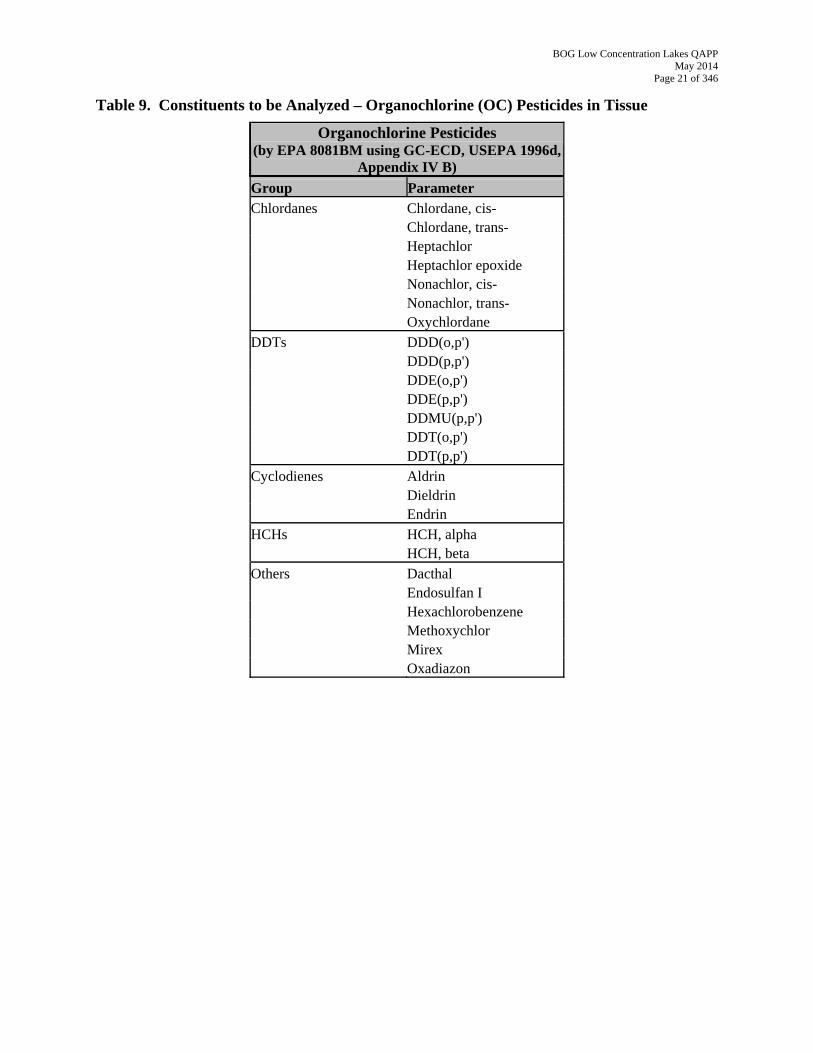
Table 9. Constituents to be Analyzed – Organochlorine (OC) Pesticides in Tissue
Organochlorine Pesticides (by EPA 8081BM using GC-ECD, USEPA 1996d,
Appendix IV B) Group Parameter Chlordanes Chlordane, cis- Chlordane, trans- Heptachlor Heptachlor epoxide Nonachlor, cis- Nonachlor, trans- Oxychlordane
DDTs DDD(o,p') DDD(p,p') DDE(o,p') DDE(p,p') DDMU(p,p') DDT(o,p') DDT(p,p') Cyclodienes Aldrin Dieldrin Endrin HCHs HCH, alpha HCH, beta
Others Dacthal Endosulfan I Hexachlorobenzene Methoxychlor Mirex Oxadiazon
BOG Low Concentration Lakes QAPP May 2014
Page 22 of 346
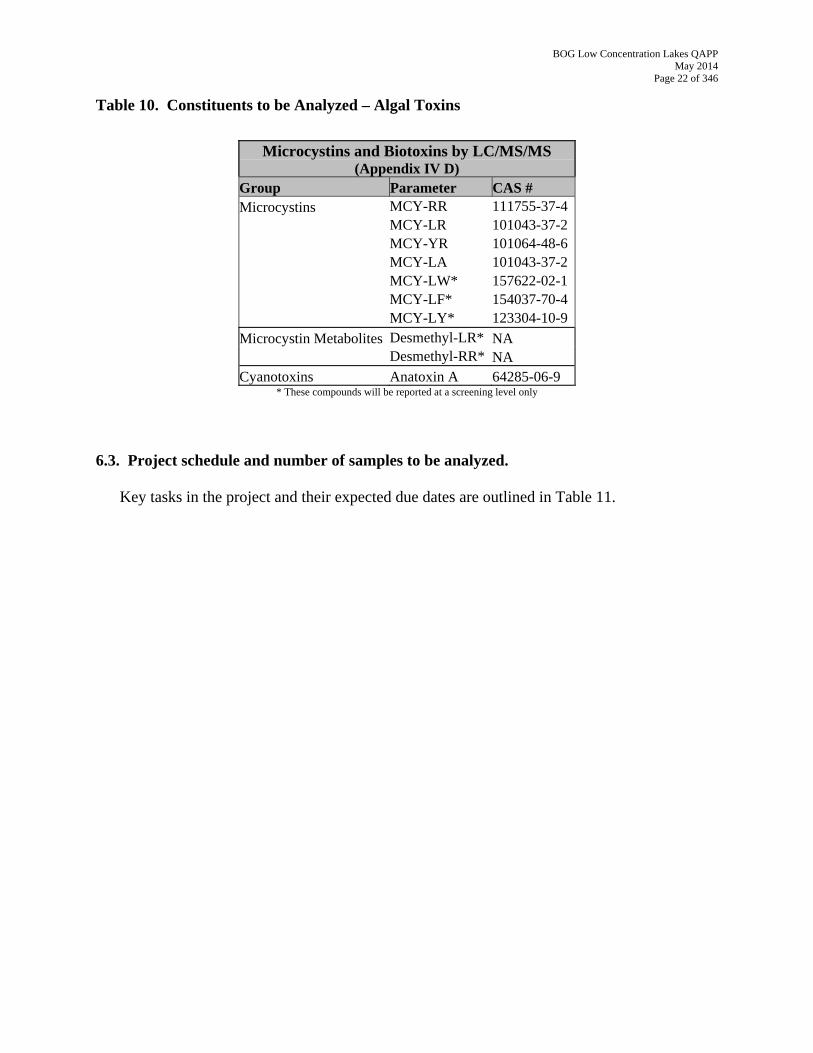
Table 10. Constituents to be Analyzed – Algal Toxins
Microcystins and Biotoxins by LC/MS/MS (Appendix IV D)
Group Parameter CAS # Microcystins MCY-RR 111755-37-4 MCY-LR 101043-37-2 MCY-YR 101064-48-6 MCY-LA 101043-37-2 MCY-LW* 157622-02-1 MCY-LF* 154037-70-4 MCY-LY* 123304-10-9
Microcystin Metabolites Desmethyl-LR* NA Desmethyl-RR* NA Cyanotoxins Anatoxin A 64285-06-9
* These compounds will be reported at a screening level only
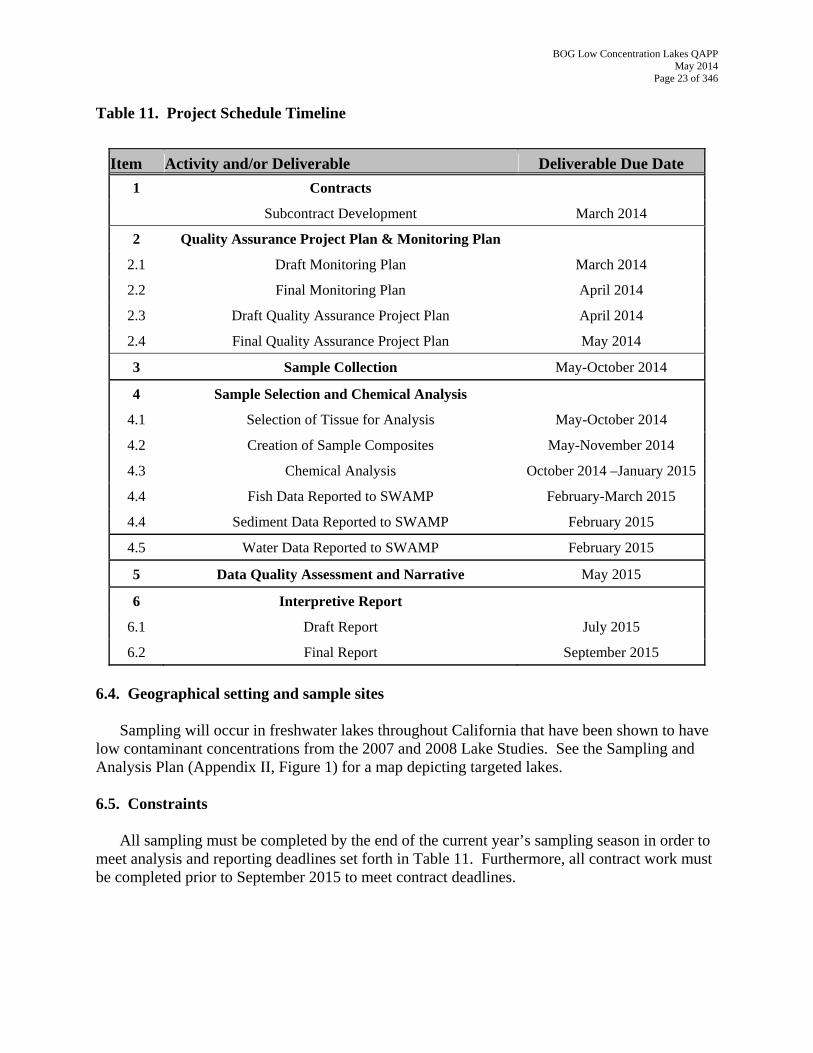
6.3. Project schedule and number of samples to be analyzed.
Key tasks in the project and their expected due dates are outlined in Table 11.
BOG Low Concentration Lakes QAPP May 2014
Page 23 of 346
Table 11. Project Schedule Timeline
Item Activity and/or Deliverable Deliverable Due Date 1 Contracts
Subcontract Development March 2014
2 Quality Assurance Project Plan & Monitoring Plan
2.1 Draft Monitoring Plan March 2014
2.2 Final Monitoring Plan April 2014
2.3 Draft Quality Assurance Project Plan April 2014
2.4 Final Quality Assurance Project Plan May 2014
3 Sample Collection May-October 2014
4 Sample Selection and Chemical Analysis
4.1 Selection of Tissue for Analysis May-October 2014
4.2 Creation of Sample Composites May-November 2014
4.3 Chemical Analysis October 2014 –January 2015
4.4 Fish Data Reported to SWAMP February-March 2015
4.4 Sediment Data Reported to SWAMP February 2015
4.5 Water Data Reported to SWAMP February 2015
5 Data Quality Assessment and Narrative May 2015
6 Interpretive Report
6.1 Draft Report July 2015
6.2 Final Report September 2015
6.4. Geographical setting and sample sites
Sampling will occur in freshwater lakes throughout California that have been shown to have low contaminant concentrations from the 2007 and 2008 Lake Studies. See the Sampling and Analysis Plan (Appendix II, Figure 1) for a map depicting targeted lakes. 6.5. Constraints
All sampling must be completed by the end of the current year’s sampling season in order to meet analysis and reporting deadlines set forth in Table 11. Furthermore, all contract work must be completed prior to September 2015 to meet contract deadlines.
BOG Low Concentration Lakes QAPP May 2014
Page 24 of 346
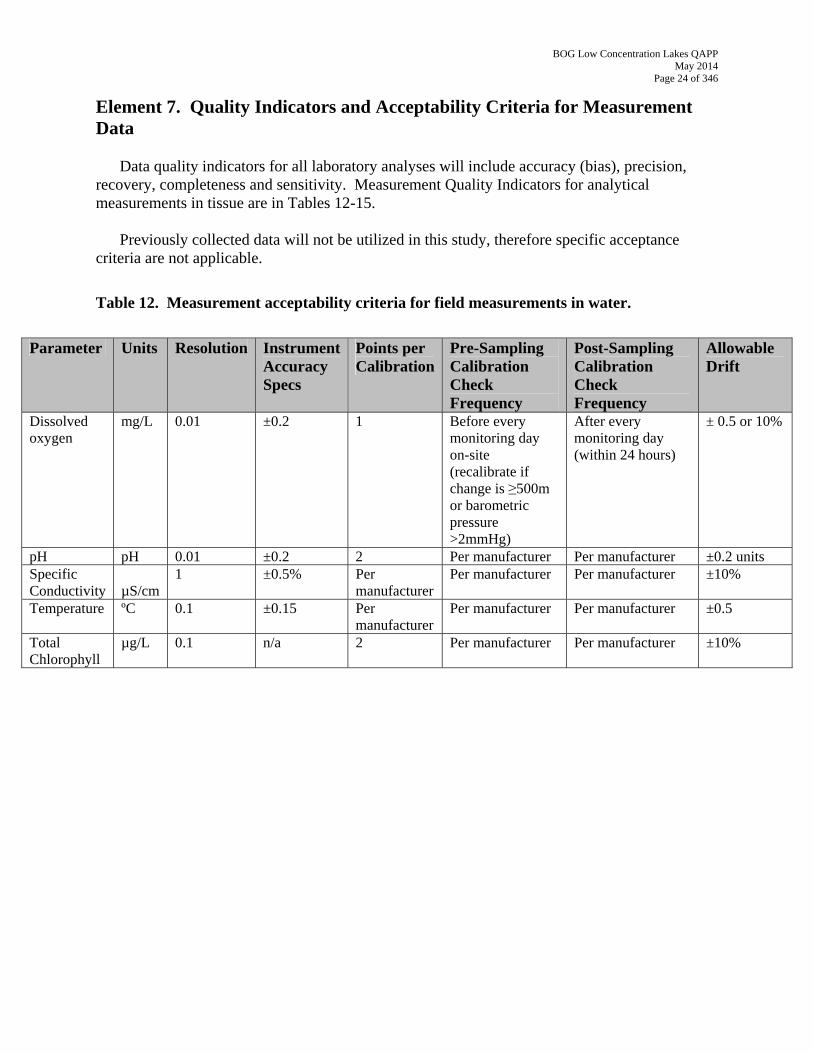
Element 7. Quality Indicators and Acceptability Criteria for Measurement Data
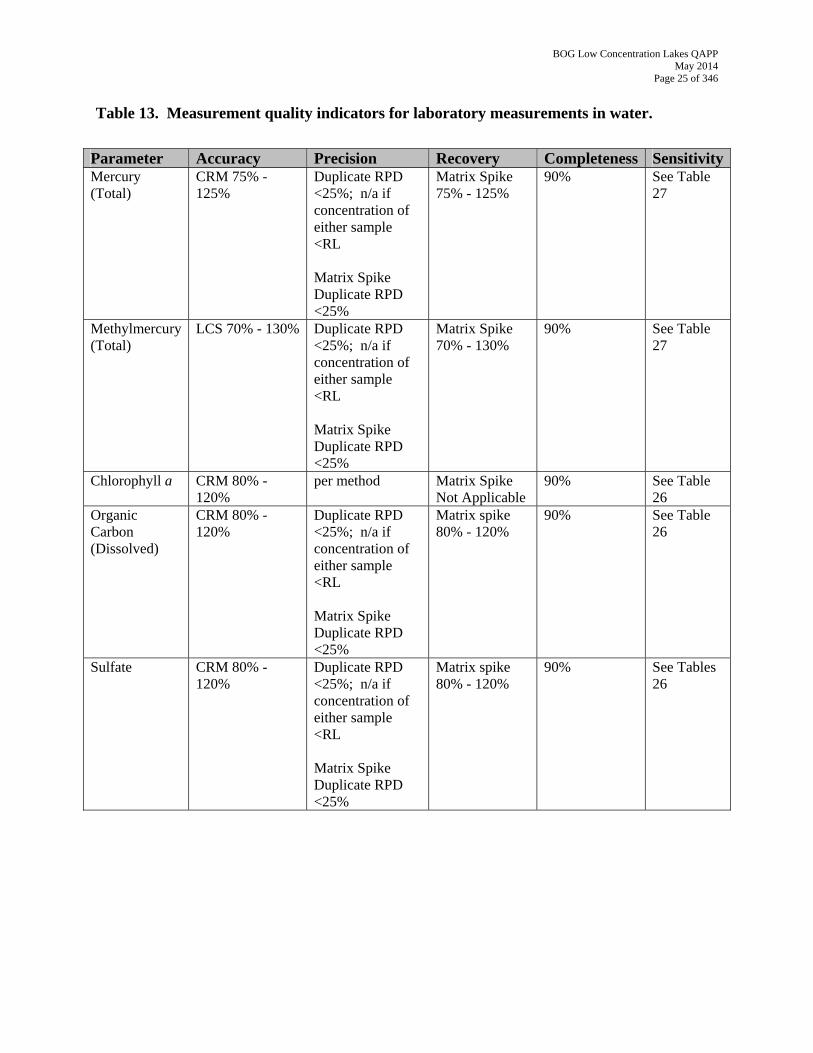
Data quality indicators for all laboratory analyses will include accuracy (bias), precision, recovery, completeness and sensitivity. Measurement Quality Indicators for analytical measurements in tissue are in Tables 12-15.
Previously collected data will not be utilized in this study, therefore specific acceptance
criteria are not applicable.
Table 12. Measurement acceptability criteria for field measurements in water.
Parameter Units Resolution Instrument Accuracy Specs
Points per Calibration
Pre-Sampling Calibration Check Frequency
Post-Sampling Calibration Check Frequency
Allowable Drift
Dissolved oxygen
mg/L 0.01 ±0.2 1 Before every monitoring day on-site (recalibrate if change is ≥500m or barometric pressure >2mmHg)
After every monitoring day (within 24 hours)
± 0.5 or 10%
pH pH 0.01 ±0.2 2 Per manufacturer Per manufacturer ±0.2 units Specific Conductivity
µS/cm
1 ±0.5% Per manufacturer
Per manufacturer Per manufacturer ±10%
Temperature ºC 0.1 ±0.15 Per manufacturer
Per manufacturer Per manufacturer ±0.5
Total Chlorophyll
µg/L 0.1 n/a 2 Per manufacturer Per manufacturer ±10%
BOG Low Concentration Lakes QAPP May 2014
Page 25 of 346
Table 13. Measurement quality indicators for laboratory measurements in water.
Parameter Accuracy Precision Recovery Completeness SensitivityMercury (Total)
CRM 75% - 125%
Duplicate RPD <25%; n/a if concentration of either sample <RL Matrix Spike Duplicate RPD <25%
Matrix Spike 75% - 125%
90% See Table 27
Methylmercury (Total)
LCS 70% - 130% Duplicate RPD <25%; n/a if concentration of either sample <RL Matrix Spike Duplicate RPD <25%
Matrix Spike 70% - 130%
90% See Table 27
Chlorophyll a CRM 80% - 120%
per method
Matrix Spike Not Applicable
90% See Table 26
Organic Carbon (Dissolved)
CRM 80% - 120%
Duplicate RPD <25%; n/a if concentration of either sample <RL Matrix Spike Duplicate RPD <25%
Matrix spike 80% - 120%
90% See Table 26
Sulfate CRM 80% - 120%
Duplicate RPD <25%; n/a if concentration of either sample <RL Matrix Spike Duplicate RPD <25%
Matrix spike 80% - 120%
90% See Tables 26
BOG Low Concentration Lakes QAPP May 2014
Page 26 of 346
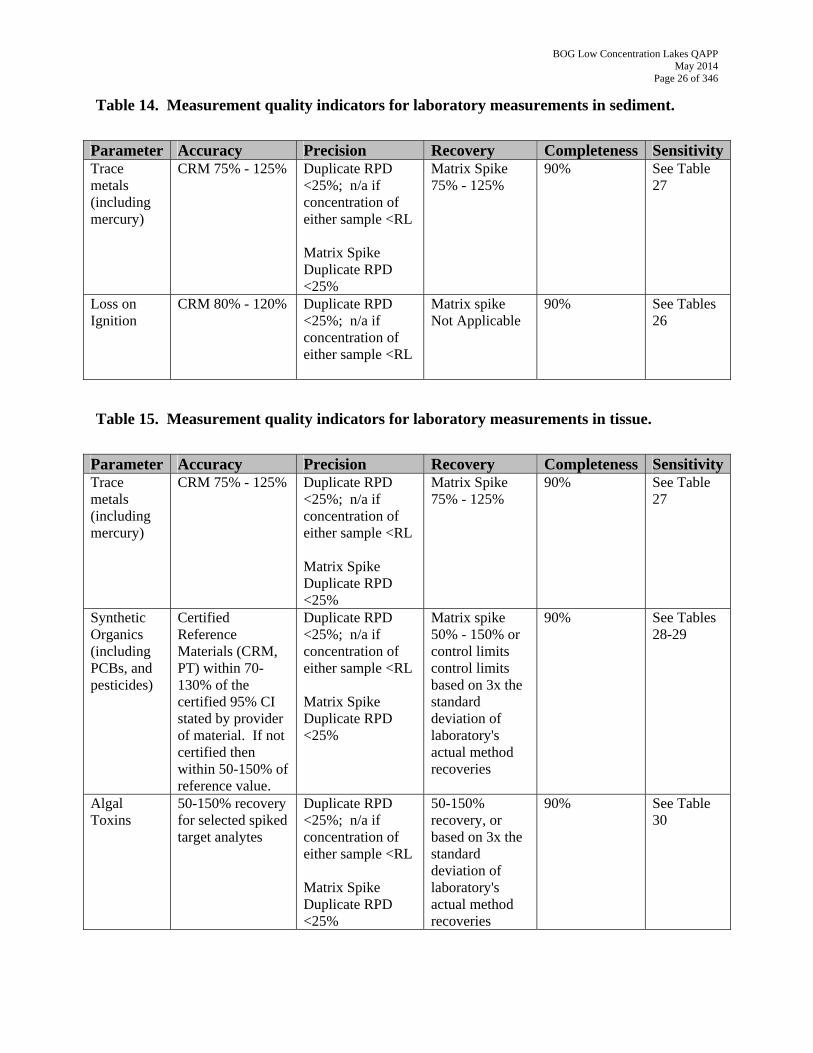
Table 14. Measurement quality indicators for laboratory measurements in sediment.
Parameter Accuracy Precision Recovery Completeness SensitivityTrace metals (including mercury)
CRM 75% - 125% Duplicate RPD <25%; n/a if concentration of either sample <RL Matrix Spike Duplicate RPD <25%
Matrix Spike 75% - 125%
90% See Table 27
Loss on Ignition
CRM 80% - 120% Duplicate RPD <25%; n/a if concentration of either sample <RL
Matrix spike Not Applicable
90% See Tables 26
Table 15. Measurement quality indicators for laboratory measurements in tissue.
Parameter Accuracy Precision Recovery Completeness SensitivityTrace metals (including mercury)
CRM 75% - 125% Duplicate RPD <25%; n/a if concentration of either sample <RL Matrix Spike Duplicate RPD <25%
Matrix Spike 75% - 125%
90% See Table 27
Synthetic Organics (including PCBs, and pesticides)
Certified Reference Materials (CRM, PT) within 70-130% of the certified 95% CI stated by provider of material. If not certified then within 50-150% of reference value.
Duplicate RPD <25%; n/a if concentration of either sample <RL Matrix Spike Duplicate RPD <25%
Matrix spike 50% - 150% or control limits control limits based on 3x the standard deviation of laboratory's actual method recoveries
90% See Tables 28-29
Algal Toxins
50-150% recovery for selected spiked target analytes
Duplicate RPD <25%; n/a if concentration of either sample <RL Matrix Spike Duplicate RPD <25%
50-150% recovery, or based on 3x the standard deviation of laboratory's actual method recoveries
90% See Table 30
BOG Low Concentration Lakes QAPP May 2014
Page 27 of 346
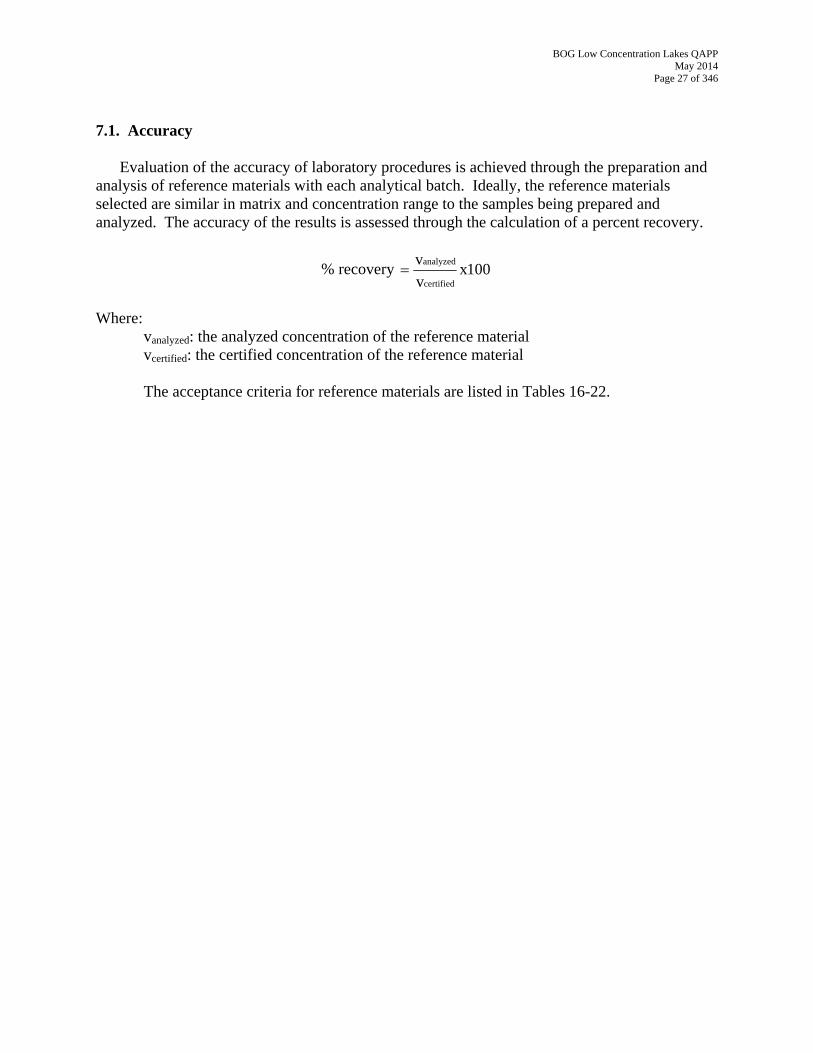
7.1. Accuracy
Evaluation of the accuracy of laboratory procedures is achieved through the preparation and analysis of reference materials with each analytical batch. Ideally, the reference materials selected are similar in matrix and concentration range to the samples being prepared and analyzed. The accuracy of the results is assessed through the calculation of a percent recovery.
% recovery 100xv
v
certified
analyzed=
Where:
vanalyzed: the analyzed concentration of the reference material vcertified: the certified concentration of the reference material
The acceptance criteria for reference materials are listed in Tables 16-22.
BOG Low Concentration Lakes QAPP May 2014
Page 28 of 346
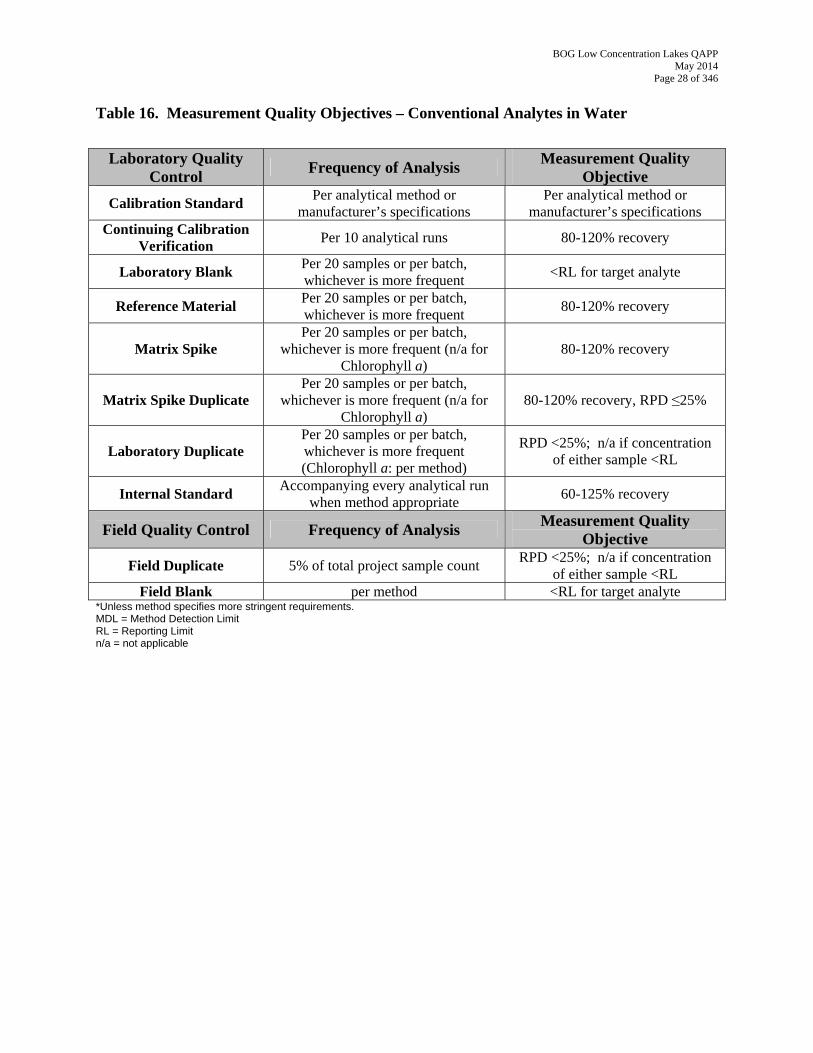
Table 16. Measurement Quality Objectives – Conventional Analytes in Water
Laboratory Quality Control Frequency of Analysis Measurement Quality
Objective Calibration Standard Per analytical method or
manufacturer’s specifications Per analytical method or
manufacturer’s specifications Continuing Calibration
Verification Per 10 analytical runs 80-120% recovery
Laboratory Blank Per 20 samples or per batch, whichever is more frequent
<RL for target analyte
Reference Material Per 20 samples or per batch, whichever is more frequent
80-120% recovery
Matrix Spike Per 20 samples or per batch,
whichever is more frequent (n/a for Chlorophyll a)
80-120% recovery
Matrix Spike Duplicate Per 20 samples or per batch,
whichever is more frequent (n/a for Chlorophyll a)
80-120% recovery, RPD ≤25%
Laboratory Duplicate Per 20 samples or per batch, whichever is more frequent (Chlorophyll a: per method)
RPD <25%; n/a if concentration of either sample <RL
Internal Standard Accompanying every analytical run when method appropriate
60-125% recovery
Field Quality Control Frequency of Analysis Measurement Quality Objective
RPD <25%; n/a if concentration of either sample <RL
Field Duplicate 5% of total project sample count
Field Blank per method <RL for target analyte *Unless method specifies more stringent requirements. MDL = Method Detection Limit RL = Reporting Limit n/a = not applicable

BOG Low Concentration Lakes QAPP May 2014
Page 29 of 346
Table 17. Measurement Quality Objectives – Inorganic Analytes in Water
Laboratory Quality Control Frequency of Analysis Measurement Quality
Objective Calibration Standard Per analytical method or
manufacturer’s specifications Per analytical method or
manufacturer’s specifications Continuing Calibration
Verification Per 10 analytical runs 80-120% recovery
Laboratory Blank Per 20 samples or per batch, whichever is more frequent
<RL for target analyte
Reference Material Per 20 samples or per batch, whichever is more frequent
75-125% recovery (70-130% for methylmercury)
Matrix Spike Per 20 samples or per batch,
whichever is more frequent (n/a for Chlorophyll a)
75-125% recovery (70-130% for methylmercury)
Matrix Spike Duplicate Per 20 samples or per batch,
whichever is more frequent (n/a for Chlorophyll a)
75-125% recovery (70-130% for methylmercury), RPD ≤25%
Laboratory Duplicate Per 20 samples or per batch, whichever is more frequent (Chlorophyll a: per method)
RPD <25%; n/a if concentration of either sample <RL
Internal Standard Accompanying every analytical run when method appropriate
60-125% recovery
Field Quality Control Frequency of Analysis Measurement Quality Objective
RPD <25%; n/a if concentration of either sample <RL
Field Duplicate 5% of total project sample count
Field Blank 5% of total project sample count <RL for target analyte *Unless method specifies more stringent requirements. MDL = Method Detection Limit RL = Reporting Limit n/a = not applicable
BOG Low Concentration Lakes QAPP May 2014
Page 30 of 346
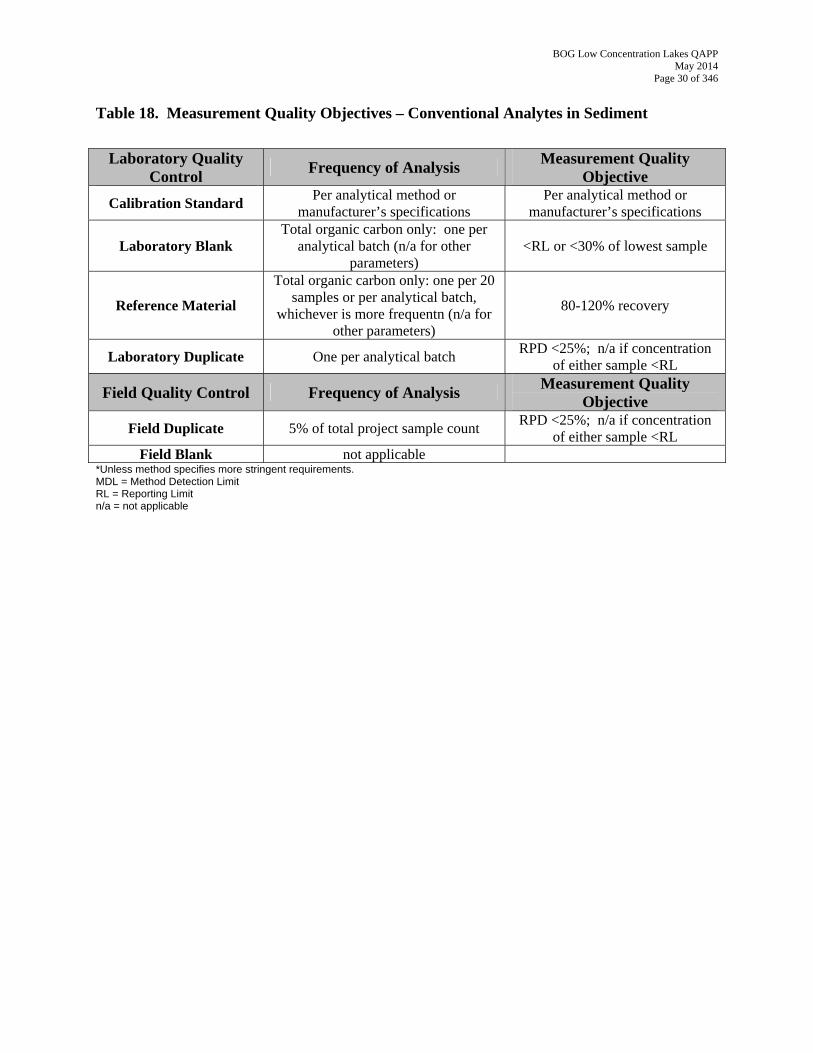
Table 18. Measurement Quality Objectives – Conventional Analytes in Sediment
Laboratory Quality Control Frequency of Analysis Measurement Quality
Objective Calibration Standard Per analytical method or
manufacturer’s specifications Per analytical method or
manufacturer’s specifications
Laboratory Blank Total organic carbon only: one per
analytical batch (n/a for other parameters)
<RL or <30% of lowest sample
Reference Material
Total organic carbon only: one per 20 samples or per analytical batch,
whichever is more frequentn (n/a for other parameters)
80-120% recovery
RPD <25%; n/a if concentration of either sample <RL
Laboratory Duplicate One per analytical batch
Field Quality Control Frequency of Analysis Measurement Quality Objective
RPD <25%; n/a if concentration of either sample <RL
Field Duplicate 5% of total project sample count
Field Blank not applicable *Unless method specifies more stringent requirements. MDL = Method Detection Limit RL = Reporting Limit n/a = not applicable
BOG Low Concentration Lakes QAPP May 2014
Page 31 of 346
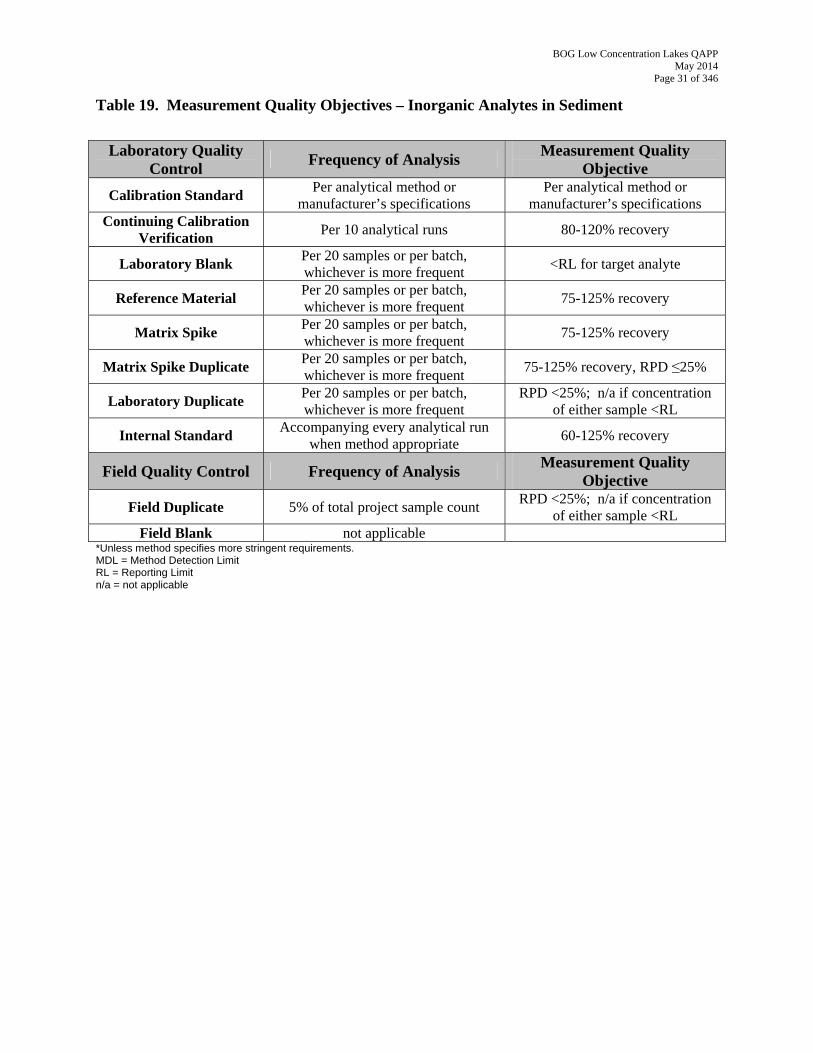
Table 19. Measurement Quality Objectives – Inorganic Analytes in Sediment
Laboratory Quality Control Frequency of Analysis Measurement Quality
Objective Calibration Standard Per analytical method or
manufacturer’s specifications Per analytical method or
manufacturer’s specifications Continuing Calibration
Verification Per 10 analytical runs 80-120% recovery
Laboratory Blank Per 20 samples or per batch, whichever is more frequent
<RL for target analyte
Reference Material Per 20 samples or per batch, whichever is more frequent
75-125% recovery
Matrix Spike Per 20 samples or per batch, whichever is more frequent
75-125% recovery
Matrix Spike Duplicate Per 20 samples or per batch, whichever is more frequent
75-125% recovery, RPD ≤25%
Laboratory Duplicate Per 20 samples or per batch, whichever is more frequent
RPD <25%; n/a if concentration of either sample <RL
Internal Standard Accompanying every analytical run when method appropriate
60-125% recovery
Field Quality Control Frequency of Analysis Measurement Quality Objective
RPD <25%; n/a if concentration of either sample <RL
Field Duplicate 5% of total project sample count
Field Blank not applicable *Unless method specifies more stringent requirements. MDL = Method Detection Limit RL = Reporting Limit n/a = not applicable
BOG Low Concentration Lakes QAPP May 2014
Page 32 of 346
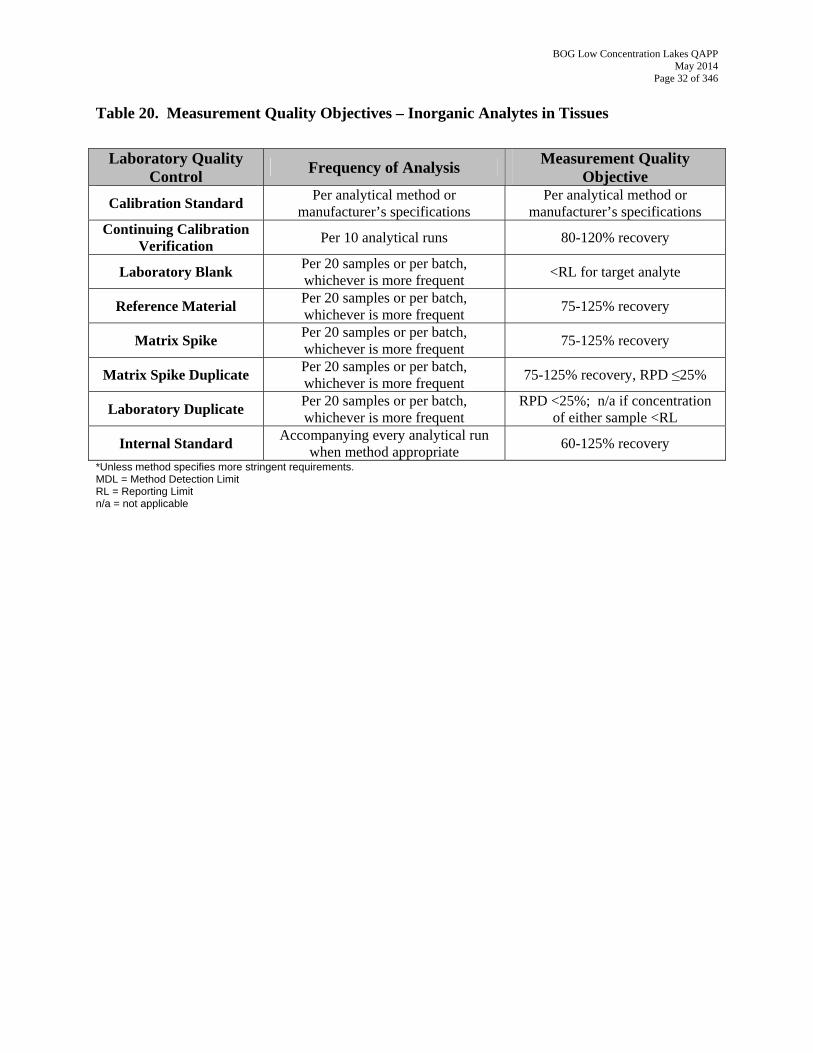
Table 20. Measurement Quality Objectives – Inorganic Analytes in Tissues
Laboratory Quality Control Frequency of Analysis Measurement Quality
Objective Calibration Standard Per analytical method or
manufacturer’s specifications Per analytical method or
manufacturer’s specifications Continuing Calibration
Verification Per 10 analytical runs 80-120% recovery
Laboratory Blank Per 20 samples or per batch, whichever is more frequent
<RL for target analyte
Reference Material Per 20 samples or per batch, whichever is more frequent
75-125% recovery
Matrix Spike Per 20 samples or per batch, whichever is more frequent
75-125% recovery
Matrix Spike Duplicate Per 20 samples or per batch, whichever is more frequent
75-125% recovery, RPD ≤25%
Laboratory Duplicate Per 20 samples or per batch, whichever is more frequent
RPD <25%; n/a if concentration of either sample <RL
Internal Standard Accompanying every analytical run when method appropriate
60-125% recovery
*Unless method specifies more stringent requirements. MDL = Method Detection Limit RL = Reporting Limit n/a = not applicable
BOG Low Concentration Lakes QAPP May 2014
Page 33 of 346
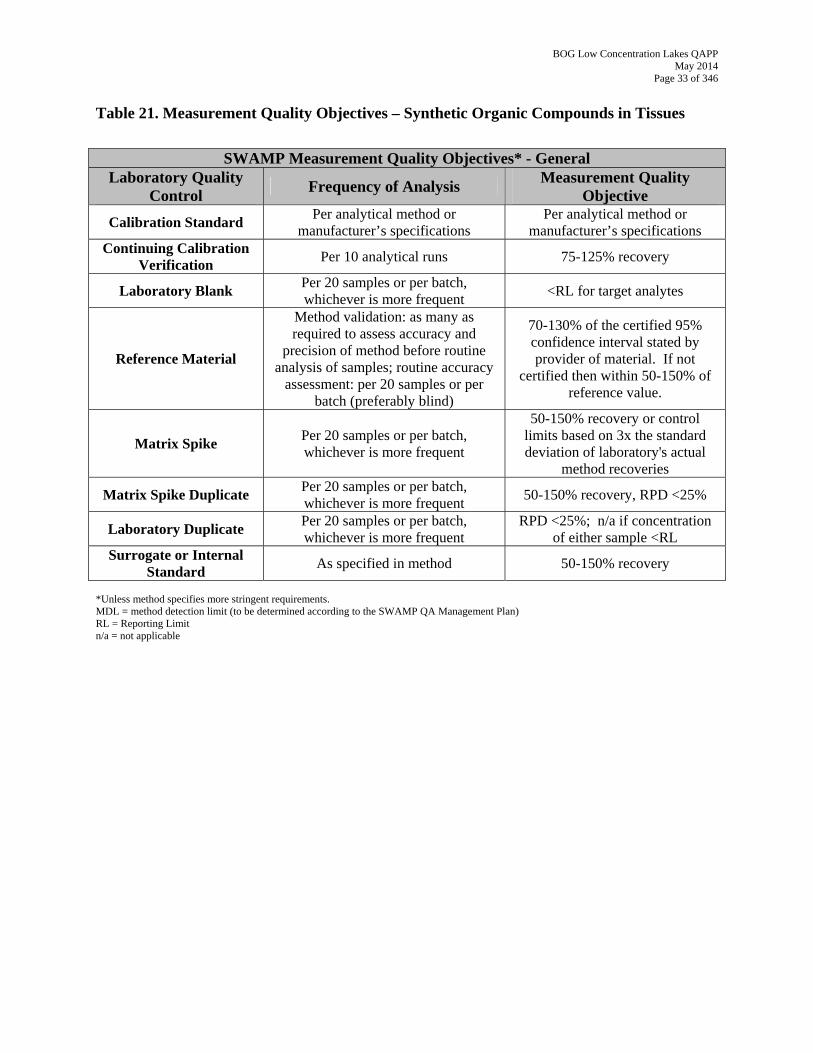
Table 21. Measurement Quality Objectives – Synthetic Organic Compounds in Tissues
SWAMP Measurement Quality Objectives* - General Laboratory Quality
Control Frequency of Analysis Measurement Quality Objective
Calibration Standard Per analytical method or manufacturer’s specifications
Per analytical method or manufacturer’s specifications
Continuing Calibration Verification Per 10 analytical runs 75-125% recovery
Laboratory Blank Per 20 samples or per batch, whichever is more frequent
<RL for target analytes
Reference Material
Method validation: as many as required to assess accuracy and
precision of method before routine analysis of samples; routine accuracy
assessment: per 20 samples or per batch (preferably blind)
70-130% of the certified 95% confidence interval stated by provider of material. If not
certified then within 50-150% of reference value.
50-150% recovery or control limits based on 3x the standard deviation of laboratory's actual
method recoveries
Matrix Spike Per 20 samples or per batch, whichever is more frequent
Matrix Spike Duplicate Per 20 samples or per batch, whichever is more frequent
50-150% recovery, RPD <25%
Laboratory Duplicate Per 20 samples or per batch, whichever is more frequent
RPD <25%; n/a if concentration of either sample <RL
Surrogate or Internal Standard As specified in method 50-150% recovery
*Unless method specifies more stringent requirements. MDL = method detection limit (to be determined according to the SWAMP QA Management Plan) RL = Reporting Limit n/a = not applicable
BOG Low Concentration Lakes QAPP May 2014
Page 34 of 346
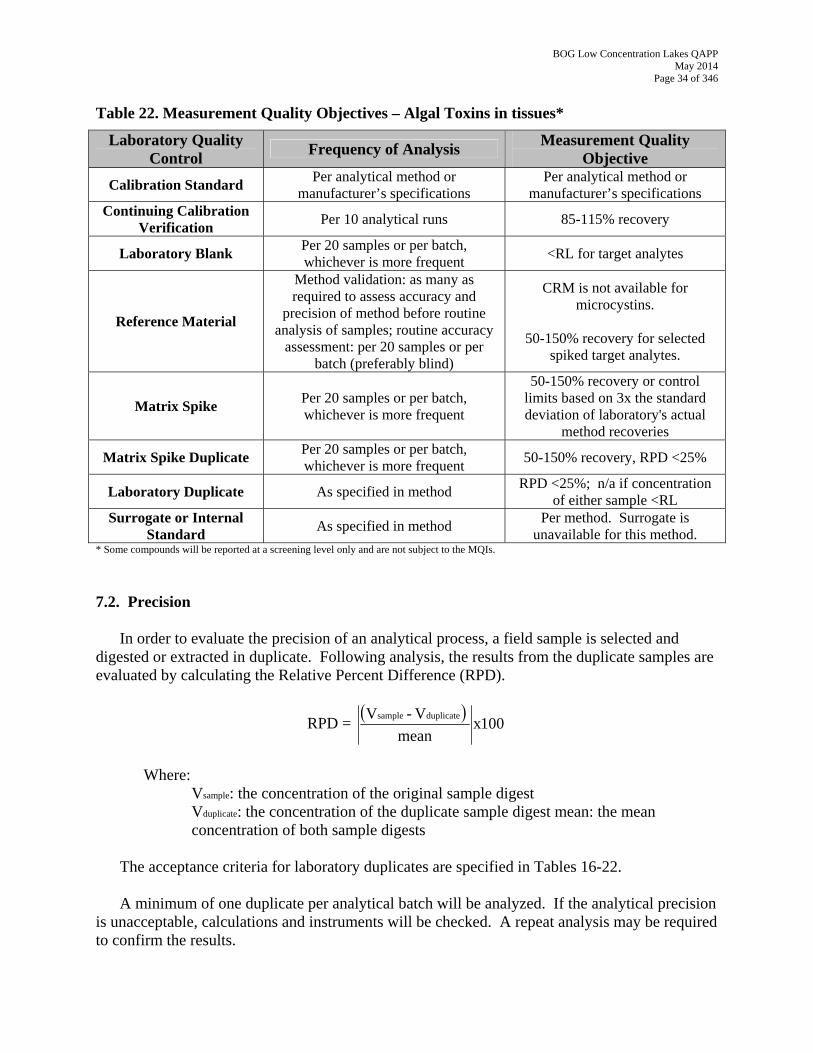
Table 22. Measurement Quality Objectives – Algal Toxins in tissues*
Laboratory Quality Control Frequency of Analysis Measurement Quality
Objective Calibration Standard Per analytical method or
manufacturer’s specifications Per analytical method or
manufacturer’s specifications Continuing Calibration
Verification Per 10 analytical runs 85-115% recovery
Laboratory Blank Per 20 samples or per batch, whichever is more frequent
<RL for target analytes
Reference Material
Method validation: as many as required to assess accuracy and
precision of method before routine analysis of samples; routine accuracy
assessment: per 20 samples or per batch (preferably blind)
CRM is not available for microcystins.
50-150% recovery for selected
spiked target analytes.
50-150% recovery or control limits based on 3x the standard deviation of laboratory's actual
method recoveries
Matrix Spike Per 20 samples or per batch, whichever is more frequent
Matrix Spike Duplicate Per 20 samples or per batch, whichever is more frequent
50-150% recovery, RPD <25%
RPD <25%; n/a if concentration of either sample <RL
Laboratory Duplicate As specified in method
Surrogate or Internal Standard As specified in method
Per method. Surrogate is unavailable for this method.
* Some compounds will be reported at a screening level only and are not subject to the MQIs.
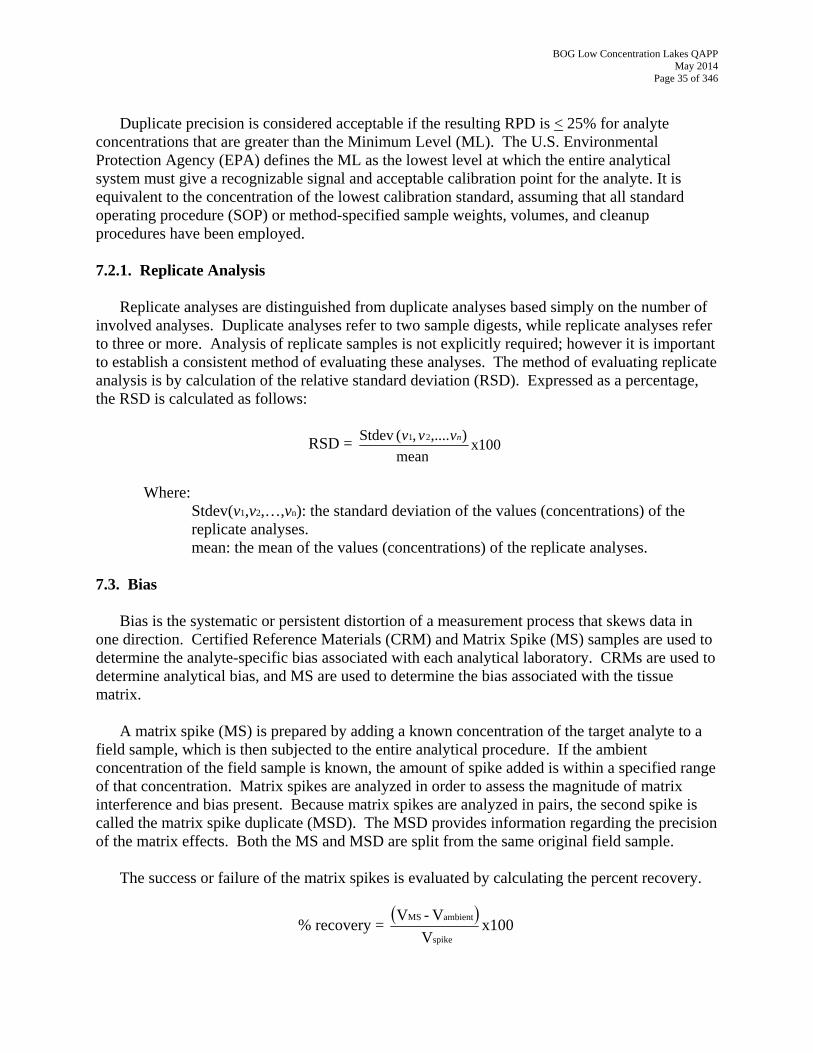
7.2. Precision
In order to evaluate the precision of an analytical process, a field sample is selected and digested or extracted in duplicate. Following analysis, the results from the duplicate samples are evaluated by calculating the Relative Percent Difference (RPD).
RPD = ( )
100xmean
V- V duplicatesample
Where:
Vsample: the concentration of the original sample digest Vduplicate: the concentration of the duplicate sample digest mean: the mean concentration of both sample digests
The acceptance criteria for laboratory duplicates are specified in Tables 16-22. A minimum of one duplicate per analytical batch will be analyzed. If the analytical precision
is unacceptable, calculations and instruments will be checked. A repeat analysis may be required to confirm the results.
BOG Low Concentration Lakes QAPP May 2014
Page 35 of 346
Duplicate precision is considered acceptable if the resulting RPD is < 25% for analyte
concentrations that are greater than the Minimum Level (ML). The U.S. Environmental Protection Agency (EPA) defines the ML as the lowest level at which the entire analytical system must give a recognizable signal and acceptable calibration point for the analyte. It is equivalent to the concentration of the lowest calibration standard, assuming that all standard operating procedure (SOP) or method-specified sample weights, volumes, and cleanup procedures have been employed. 7.2.1. Replicate Analysis
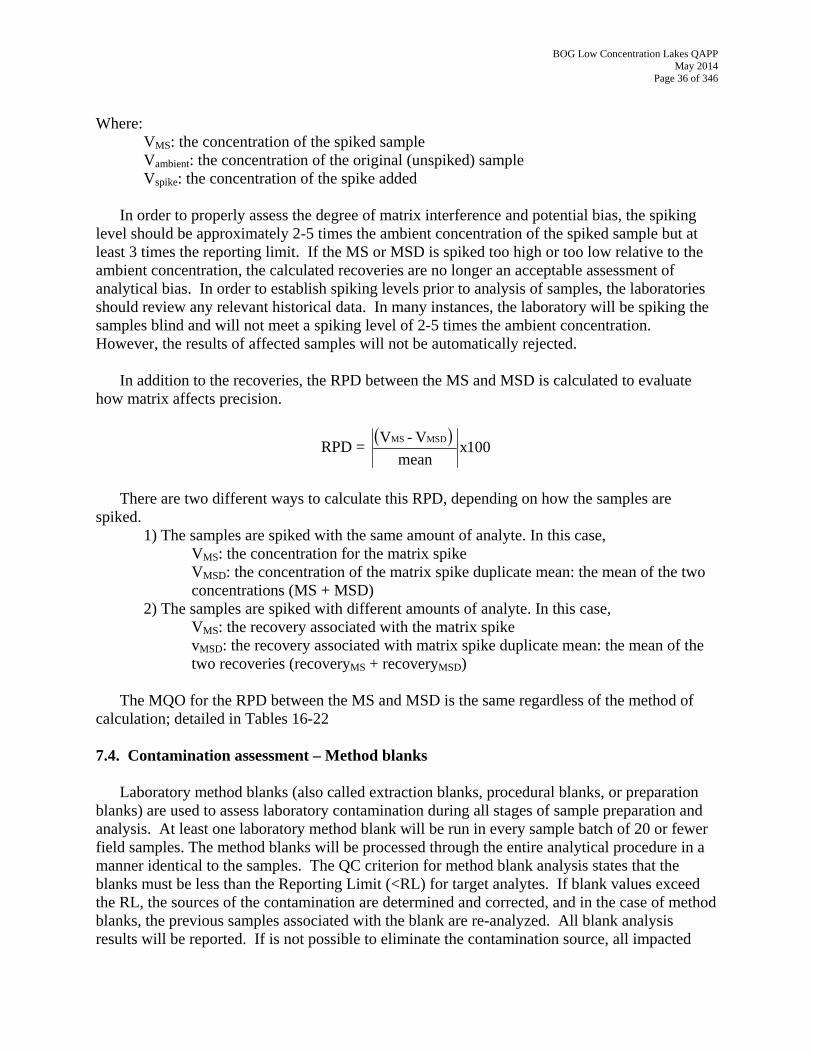
Replicate analyses are distinguished from duplicate analyses based simply on the number of involved analyses. Duplicate analyses refer to two sample digests, while replicate analyses refer to three or more. Analysis of replicate samples is not explicitly required; however it is important to establish a consistent method of evaluating these analyses. The method of evaluating replicate analysis is by calculation of the relative standard deviation (RSD). Expressed as a percentage, the RSD is calculated as follows:
RSD = 100xmean
),....,(Stdev 21 nvvv
Where:
Stdev(v1,v2,…,vn): the standard deviation of the values (concentrations) of the replicate analyses. mean: the mean of the values (concentrations) of the replicate analyses.
7.3. Bias
Bias is the systematic or persistent distortion of a measurement process that skews data in one direction. Certified Reference Materials (CRM) and Matrix Spike (MS) samples are used to determine the analyte-specific bias associated with each analytical laboratory. CRMs are used to determine analytical bias, and MS are used to determine the bias associated with the tissue matrix.
A matrix spike (MS) is prepared by adding a known concentration of the target analyte to a
field sample, which is then subjected to the entire analytical procedure. If the ambient concentration of the field sample is known, the amount of spike added is within a specified range of that concentration. Matrix spikes are analyzed in order to assess the magnitude of matrix interference and bias present. Because matrix spikes are analyzed in pairs, the second spike is called the matrix spike duplicate (MSD). The MSD provides information regarding the precision of the matrix effects. Both the MS and MSD are split from the same original field sample.
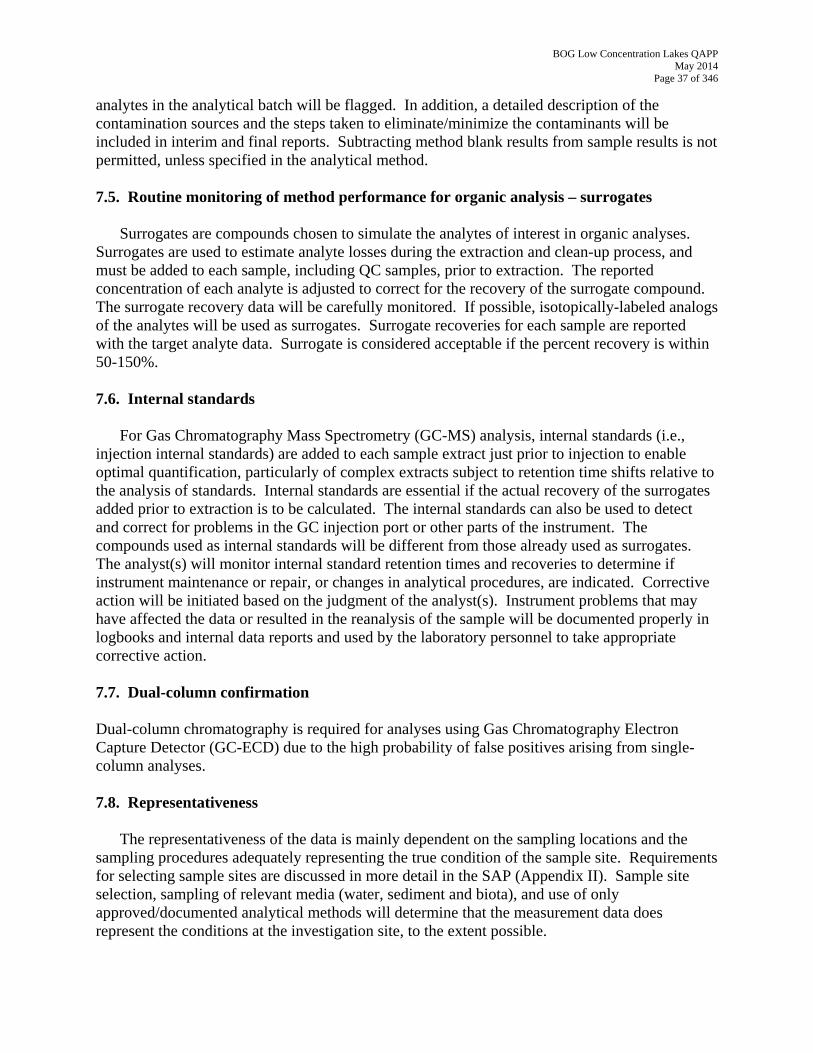
The success or failure of the matrix spikes is evaluated by calculating the percent recovery.
% recovery = ( )
x100V
V - V
spike
ambientMS
BOG Low Concentration Lakes QAPP May 2014
Page 36 of 346
Where:
VMS: the concentration of the spiked sample Vambient: the concentration of the original (unspiked) sample Vspike: the concentration of the spike added
In order to properly assess the degree of matrix interference and potential bias, the spiking
level should be approximately 2-5 times the ambient concentration of the spiked sample but at least 3 times the reporting limit. If the MS or MSD is spiked too high or too low relative to the ambient concentration, the calculated recoveries are no longer an acceptable assessment of analytical bias. In order to establish spiking levels prior to analysis of samples, the laboratories should review any relevant historical data. In many instances, the laboratory will be spiking the samples blind and will not meet a spiking level of 2-5 times the ambient concentration. However, the results of affected samples will not be automatically rejected.
In addition to the recoveries, the RPD between the MS and MSD is calculated to evaluate
how matrix affects precision.
RPD = ( )
100xmean
V- V MSDMS
There are two different ways to calculate this RPD, depending on how the samples are
spiked. 1) The samples are spiked with the same amount of analyte. In this case,
VMS: the concentration for the matrix spike VMSD: the concentration of the matrix spike duplicate mean: the mean of the two concentrations (MS + MSD)
2) The samples are spiked with different amounts of analyte. In this case, VMS: the recovery associated with the matrix spike vMSD: the recovery associated with matrix spike duplicate mean: the mean of the two recoveries (recoveryMS + recoveryMSD)
The MQO for the RPD between the MS and MSD is the same regardless of the method of
calculation; detailed in Tables 16-22 7.4. Contamination assessment – Method blanks
Laboratory method blanks (also called extraction blanks, procedural blanks, or preparation blanks) are used to assess laboratory contamination during all stages of sample preparation and analysis. At least one laboratory method blank will be run in every sample batch of 20 or fewer field samples. The method blanks will be processed through the entire analytical procedure in a manner identical to the samples. The QC criterion for method blank analysis states that the blanks must be less than the Reporting Limit (<RL) for target analytes. If blank values exceed the RL, the sources of the contamination are determined and corrected, and in the case of method blanks, the previous samples associated with the blank are re-analyzed. All blank analysis results will be reported. If is not possible to eliminate the contamination source, all impacted
BOG Low Concentration Lakes QAPP May 2014
Page 37 of 346
analytes in the analytical batch will be flagged. In addition, a detailed description of the contamination sources and the steps taken to eliminate/minimize the contaminants will be included in interim and final reports. Subtracting method blank results from sample results is not permitted, unless specified in the analytical method. 7.5. Routine monitoring of method performance for organic analysis – surrogates Surrogates are compounds chosen to simulate the analytes of interest in organic analyses. Surrogates are used to estimate analyte losses during the extraction and clean-up process, and must be added to each sample, including QC samples, prior to extraction. The reported concentration of each analyte is adjusted to correct for the recovery of the surrogate compound. The surrogate recovery data will be carefully monitored. If possible, isotopically-labeled analogs of the analytes will be used as surrogates. Surrogate recoveries for each sample are reported with the target analyte data. Surrogate is considered acceptable if the percent recovery is within 50-150%. 7.6. Internal standards
For Gas Chromatography Mass Spectrometry (GC-MS) analysis, internal standards (i.e., injection internal standards) are added to each sample extract just prior to injection to enable optimal quantification, particularly of complex extracts subject to retention time shifts relative to the analysis of standards. Internal standards are essential if the actual recovery of the surrogates added prior to extraction is to be calculated. The internal standards can also be used to detect and correct for problems in the GC injection port or other parts of the instrument. The compounds used as internal standards will be different from those already used as surrogates. The analyst(s) will monitor internal standard retention times and recoveries to determine if instrument maintenance or repair, or changes in analytical procedures, are indicated. Corrective action will be initiated based on the judgment of the analyst(s). Instrument problems that may have affected the data or resulted in the reanalysis of the sample will be documented properly in logbooks and internal data reports and used by the laboratory personnel to take appropriate corrective action. 7.7. Dual-column confirmation Dual-column chromatography is required for analyses using Gas Chromatography Electron Capture Detector (GC-ECD) due to the high probability of false positives arising from single-column analyses. 7.8. Representativeness
The representativeness of the data is mainly dependent on the sampling locations and the sampling procedures adequately representing the true condition of the sample site. Requirements for selecting sample sites are discussed in more detail in the SAP (Appendix II). Sample site selection, sampling of relevant media (water, sediment and biota), and use of only approved/documented analytical methods will determine that the measurement data does represent the conditions at the investigation site, to the extent possible.
BOG Low Concentration Lakes QAPP May 2014
Page 38 of 346
7.9. Completeness
Completeness is defined as “a measure of the amount of data collected from a measurement process compared to the amount that was expected to be obtained under the conditions of measurement” (Stanley and Verner, 1985).
Field personnel will always strive to achieve or exceed the SWAMP completeness goals of
90% for fish samples when target species (Appendix II, Tables 6-7) are present. Due to the variability and uncertainty of species availability in each zone, this level of completeness may not be attainable. If fish cannot be collected from a particular location, another location may be chosen to replace it. Additional locations will be chosen by the PI with input from Regional Board staff.
In the event field documentation is incomplete, datasheets will be returned to the collection
crew for amendment. Laboratories will strive for analytical completeness of 90% (Tables 12-15). In the event
laboratory documentation is incomplete, datasheets will be returned to the dissector for amendment.
Occasionally digestates or extracts are rendered unusable for various reasons in the
preparation process. If this occurs, the sample(s) affected will be re-processed. Element 8. Special Training Requirements/Safety 8.1. Specialized training and safety requirements Analysts are trained to conduct a wide variety of activities using standard protocols to ensure samples are analyzed in a consistent manner. Training of each analyst includes the use of analytical equipment and conducting analytical protocols, and other general laboratory processes including glassware cleaning, sampling preparation and processing, hazardous materials handling, storage, disposal. All laboratory staff must demonstrate proficiency in all the aforementioned and required laboratory activities that are conducted, as certified by the Laboratory QAO. 8.2. Training, safety and certification documentation Staff and safety training is documented at USGS and MPSL-DFG. Documentation consists of a record of the training date, instructor and signatures of completion. The Laboratory QAO will certify the proficiency of staff at chemical analyses. Certification and records are maintained and updated by the Laboratory QAO, or their designee, for all laboratory staff.
BOG Low Concentration Lakes QAPP May 2014
Page 39 of 346
8.3. Training personnel The USGS or MPSL-DFG Lab Director (LD) trains or appoints senior staff to train personnel. The Laboratory QAO ensures that training is given according to standard laboratory methods, maintains documentation and performs performance audits to ensure that personnel have been trained properly. 8.3.1. Laboratory Safety New laboratory employees receive training in laboratory safety and chemical hygiene prior to performing any tasks in the laboratory. Employees are required to review the laboratory’s safety program and chemical hygiene plan and acknowledge that they have read and understood the training. An experienced laboratory employee or the laboratory safety officer is assigned to the new employee to provide additional information and answer any questions related to safety that the new employee may have. On-going safety training is provided by quarterly safety meetings conducted by the laboratory’s safety officer or an annual laboratory safety class conducted by the USGS Safety Officers or MLML Chemical Safety Officer. 8.3.2. Technical Training New employees and employees required to learn new test methods are instructed to thoroughly review the appropriate standard operating procedure(s) and are teamed up with a staff member who is experienced and qualified to teach those test methods and observe and evaluate performance. Employees learning new test methods work with experienced staff until they have demonstrated proficiency for the method both by observation and by obtaining acceptable results for QC samples. This demonstration of proficiency is documented and certified by the section leader, Laboratory QAO and the laboratory director prior to the person independently performing the test method. Training records are retained on file for each employee by their supervisor or QAO. On-going performance is monitored by reviewing QC sample results. Element 9. Documentation and Records The following documents, records, and electronic files will be produced:
• Quality Assurance Project Plan (submitted to contract manager in paper and electronic formats)
• Sampling and Analysis Plan (submitted to contract manager in paper and electronic formats)
• Archived Sample Sheets (internal documentation available on request)
• Chain-of-Custody Forms (exchanged for signatures with chemistry lab, and kept on file)
• Lab Sample Disposition Logs (internal documentation available on request)
BOG Low Concentration Lakes QAPP May 2014
Page 40 of 346
• Calibration Logs for measurements of water quality standards (internal documentation available on request)
• Refrigerator and Freezer Logs (internal documentation available on request)
• Quarterly Progress Reports (oral format to contract manager)
• Data Tables (submitted to contract manager in electronic formats)
• Draft Manuscript (produced in electronic format)
• Final Manuscript (in electronic format)
• Data Appendix (submitted to contract manager in paper and electronic spreadsheet formats)
Copies of this QAPP will be distributed by the project manager to all parties directly involved in this project. Any future amended QAPPs will be distributed in the same fashion. All originals of the first and subsequent amended QAPPs will be held at MPSL-DFG. Copies of versions, other than the most current, will be discarded to avoid confusion. The final report will consist of summary data tables and an appendix that contains all project data in electronic SWAMP compatible spreadsheet format. All laboratory logs and data sheets will be maintained at the generating laboratory by the Laboratory Manager for five years following project completion, and are available for review by the Contract Manager or designee during that time. Copies of reports will be maintained at SFEI for five years after project completion then discarded, except for the database, which will be maintained without discarding. Laboratories will provide electronic copies of tabulated analytical data (including associated QA/QC information outlined below) in the SWAMP database format or a format agreed upon by the Contract Manager. All electronic data are stored on computer hard drives and electronic back-up files are created every two weeks or more frequently.
Laboratories will generate records for sample receipt and storage, analyses and reporting. Laboratories maintain paper copies of all analytical data, field data forms and field
notebooks, raw and condensed data for analysis performed on-site, and field instrument calibration notebooks.
The PC will be responsible for sending out the most current electronic copies of the approved
QAPP to all appropriate persons listed in Table 1.
BOG Low Concentration Lakes QAPP May 2014
Page 41 of 346
Group B Elements. Data Generation and Acquisition Element 10. Sample Process Design
The project design is described in the Sampling and Analysis Plan (SAP), Section E, pp. 10-15 (Appendix II). Twenty-four lakes and reservoirs identified as having relatively low contaiminatn concentrations will be sampled, where possible, water, sediment, small fish and sport fish.
Potential small fish and sport fish sampling equipment and methods can be found in MPSL-102a (Appendix III B). Once samples have been identified for composite creation, they will be processed according to the timeline in Table 11.
All measurements and analyses to be performed in tissue are critical to address the objectives
laid out in Section III of the SAP (Appendix II), with the exception of fish weight, sex, age, and moisture content. These parameters may be used to support other data gathered. Water and sediment analyses are not as critical because they are not used to assess human health. These data may be used to inform MQ3.
10.1. Variability Due to potential variability of contaminant loads in individual tissue samples, samples will be analyzed in composites as outlined in the SAP (Appendix II) and MPSL-DFG SOPs (Appendix III). 10.2. Bias
Bias can be introduced by using fish of one particular species and/or total length for chemistry regressions and statistical analyses. The SAP (Appendix II) was reviewed by a Scientific Review Panel which approved of the inclusion of length ranges and multiple target species to reduce the associated bias. Element 11. Sampling Methods
Water samples will be collected after fish are collected, but before sediment is collected at the site. Samples will be collected according to MPSL Field SOP v1.1 and the clean-hands dirty-hands collection methods where appropriate. It is important to follow the clean-hands dirty-hands collection method when collecting total and methylmercury samples to avoid sample contamination. One sub-surface water grab will be collected each for unfiltered total and methyl mercury in a clear glass 250 mL bottle, demonstrated to be free of contaminants, at 0.1 m below the water surface. A sulfate sample will be collected at the same depth using a 125 mL HDPE bottle. Sample collection will occur in an area where the boat does not interfere with the sample, with the collector wearing clean polyethylene gloves. Containers will be opened and recapped under water to avoid surface water contamination of the sub-surface sample. Near-bottom water
BOG Low Concentration Lakes QAPP May 2014
Page 42 of 346
will be collected utilizing a 2L capacity Kemmerer. Each analyte will be dispensed into the appropriate bottle for analysis.
A stainless steel Young-modified Van Veen grab will be deployed to collect bed sediments at
the 3 locations where water is collected (MPSL Field SOP v1.1). The grab will be slowly lowered to the bottom of the lake with a minimum of substrate disturbance, and the closed grab will be retrieved at a moderate sped (< 2 ft s-1). Upon retrieval the lids of the grab will be opened and the material examined to ensure it is undisturbed and of sufficient quality (recently deposited fine sediment) for use in chemical analyses. Specific rejection criteria are found in MPSL Field SOP v1.1, p59.
Only the top 2 cm of the collected material will be transferred to the sample bag using a pre-cleaned polyethylene scoop. All sediment will be stored in WhirlPac bags, and will be field frozen immediately on dry ice.
Fish will be collected in accordance with MPSL-102a, Section 7.4 (Appendix III B) except
where noted here. Because habitats may vary greatly, there is no one method of collection that is appropriate. Field crews will evaluate each fishing site and species targeted to determine the correct method to be employed. Potential sampling methods include, but are not limited to: electroshocking, seining, gill netting, and hook and line. Field Crew will determine the appropriate collection method based on physical site parameters such as depth, width, flow, and accessibility. Field crew will indicate collection method on data sheets (Attachment 2).
Details on targeted fish species, number of individuals and size ranges can be found in the
SAP (Appendix II, Tables 6-7). The following adaptation to MPSL-102a, Section 7.4.5 (Appendix III B) has been made:
Collected fish may be partially dissected in the field. At the dock, the fish is placed on a measuring board covered with clean aluminum foil; fork and total length are recorded. Weight is recorded. Large fish such as carp will then be placed on the cutting board covered with a foil where the head, tail, and guts are removed using a clean cleaver (scrubbed with Micro™, rinsed with tap and deionized water). The fish cross section is tagged with a unique numbered ID, wrapped in aluminum foil, and placed in a clean labeled bag. When possible, parasites and body anomalies are noted. The cleaver and cutting board are re-cleaned with Micro™, rinsed with tap and deionized water between fish species, per site if multiple stations are sampled.
Special care is being taken to prevent the potential contamination of invasive species from
one location to another. A 10% bleach solution is sprayed on all boat and personal gear components that come into contact with ambient water from each location. In addition, a visual inspection of the boat or equipment is conducted to ensure any algae or other organisms are not transferred between locations. Furthermore, boat bilges are verified to be dry before the boat is launched into a location.
Further details on sample collection and processing can be found in the SAP (Appendix II).
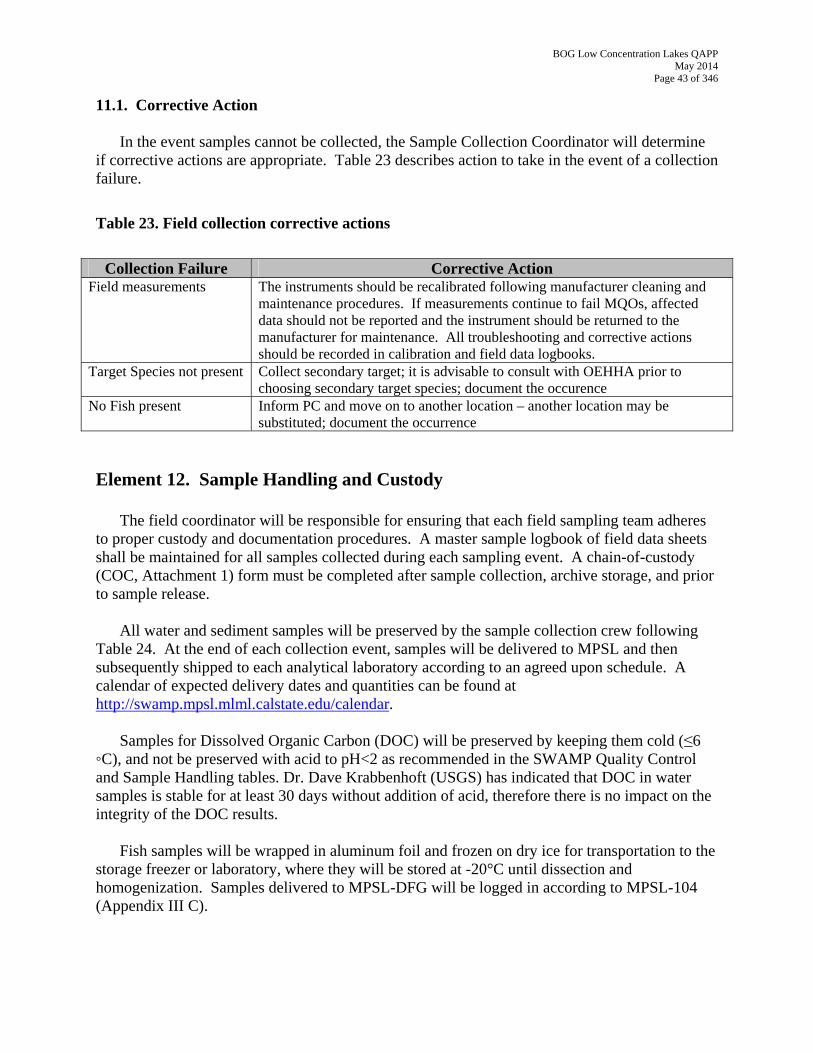
BOG Low Concentration Lakes QAPP May 2014
Page 43 of 346
11.1. Corrective Action In the event samples cannot be collected, the Sample Collection Coordinator will determine if corrective actions are appropriate. Table 23 describes action to take in the event of a collection failure.
Table 23. Field collection corrective actions
Collection Failure Corrective Action Field measurements The instruments should be recalibrated following manufacturer cleaning and
maintenance procedures. If measurements continue to fail MQOs, affected data should not be reported and the instrument should be returned to the manufacturer for maintenance. All troubleshooting and corrective actions should be recorded in calibration and field data logbooks.
Target Species not present Collect secondary target; it is advisable to consult with OEHHA prior to choosing secondary target species; document the occurence
No Fish present Inform PC and move on to another location – another location may be substituted; document the occurrence
Element 12. Sample Handling and Custody
The field coordinator will be responsible for ensuring that each field sampling team adheres to proper custody and documentation procedures. A master sample logbook of field data sheets shall be maintained for all samples collected during each sampling event. A chain-of-custody (COC, Attachment 1) form must be completed after sample collection, archive storage, and prior to sample release.
All water and sediment samples will be preserved by the sample collection crew following
Table 24. At the end of each collection event, samples will be delivered to MPSL and then subsequently shipped to each analytical laboratory according to an agreed upon schedule. A calendar of expected delivery dates and quantities can be found at http://swamp.mpsl.mlml.calstate.edu/calendar.
Samples for Dissolved Organic Carbon (DOC) will be preserved by keeping them cold (≤6
◦C), and not be preserved with acid to pH<2 as recommended in the SWAMP Quality Control and Sample Handling tables. Dr. Dave Krabbenhoft (USGS) has indicated that DOC in water samples is stable for at least 30 days without addition of acid, therefore there is no impact on the integrity of the DOC results.
Fish samples will be wrapped in aluminum foil and frozen on dry ice for transportation to the
storage freezer or laboratory, where they will be stored at -20°C until dissection and homogenization. Samples delivered to MPSL-DFG will be logged in according to MPSL-104 (Appendix III C).

BOG Low Concentration Lakes QAPP May 2014
Page 44 of 346
Authorization forms will be provided to each dissecting laboratory detailing the dissection and analysis to be performed (Attachment 3). Samples will be dissected according to MPSL-105 (Appendix III D) and data retained on the lab data sheets in Attachment 4.
Lab homogenates will be frozen until analysis is performed. Frozen tissue samples have a 12
month hold time from the date of collection. If a hold-time violation has occurred, data will be flagged appropriately in the final results.
Organic compounds frequently have 40 day hold times between extraction and analysis.
Please refer to the appropriate method for specific holding time requirements. Violations will be flagged appropriately in the final results. This type of hold time is not applicable to metals and metalloids.
Holding times for each analyte can be found in Table 24.
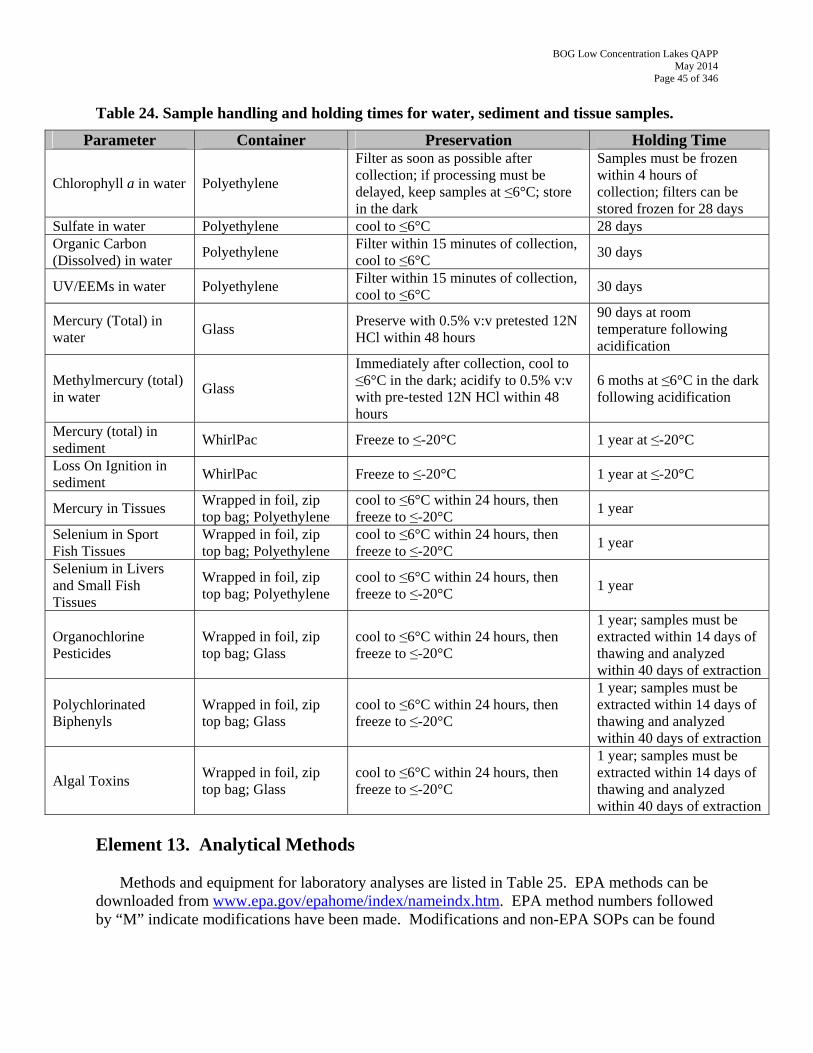
BOG Low Concentration Lakes QAPP May 2014
Page 45 of 346
Table 24. Sample handling and holding times for water, sediment and tissue samples.
Parameter Container Preservation Holding Time
Chlorophyll a in water Polyethylene
Filter as soon as possible after collection; if processing must be delayed, keep samples at ≤6°C; store in the dark
Samples must be frozen within 4 hours of collection; filters can be stored frozen for 28 days
Sulfate in water Polyethylene cool to ≤6°C 28 days Organic Carbon (Dissolved) in water
Polyethylene Filter within 15 minutes of collection, cool to ≤6°C
30 days
UV/EEMs in water Polyethylene Filter within 15 minutes of collection, cool to ≤6°C
30 days
90 days at room temperature following acidification
Mercury (Total) in water
Glass Preserve with 0.5% v:v pretested 12N HCl within 48 hours
Methylmercury (total) in water
Glass
Immediately after collection, cool to ≤6°C in the dark; acidify to 0.5% v:v with pre-tested 12N HCl within 48 hours
6 moths at ≤6°C in the dark following acidification
Mercury (total) in sediment
WhirlPac Freeze to ≤-20°C 1 year at ≤-20°C
Loss On Ignition in sediment
WhirlPac Freeze to ≤-20°C 1 year at ≤-20°C
Mercury in Tissues Wrapped in foil, zip top bag; Polyethylene
cool to ≤6°C within 24 hours, then freeze to ≤-20°C
1 year
Selenium in Sport Fish Tissues
Wrapped in foil, zip top bag; Polyethylene
cool to ≤6°C within 24 hours, then freeze to ≤-20°C
1 year
Selenium in Livers and Small Fish Tissues
Wrapped in foil, zip top bag; Polyethylene
cool to ≤6°C within 24 hours, then freeze to ≤-20°C
1 year
1 year; samples must be extracted within 14 days of thawing and analyzed within 40 days of extraction
Organochlorine Pesticides
Wrapped in foil, zip top bag; Glass
cool to ≤6°C within 24 hours, then freeze to ≤-20°C
1 year; samples must be extracted within 14 days of thawing and analyzed within 40 days of extraction
Polychlorinated Biphenyls
Wrapped in foil, zip top bag; Glass
cool to ≤6°C within 24 hours, then freeze to ≤-20°C
1 year; samples must be extracted within 14 days of thawing and analyzed within 40 days of extraction
Algal Toxins Wrapped in foil, zip top bag; Glass
cool to ≤6°C within 24 hours, then freeze to ≤-20°C
Element 13. Analytical Methods Methods and equipment for laboratory analyses are listed in Table 25. EPA methods can be downloaded from www.epa.gov/epahome/index/nameindx.htm. EPA method numbers followed by “M” indicate modifications have been made. Modifications and non-EPA SOPs can be found
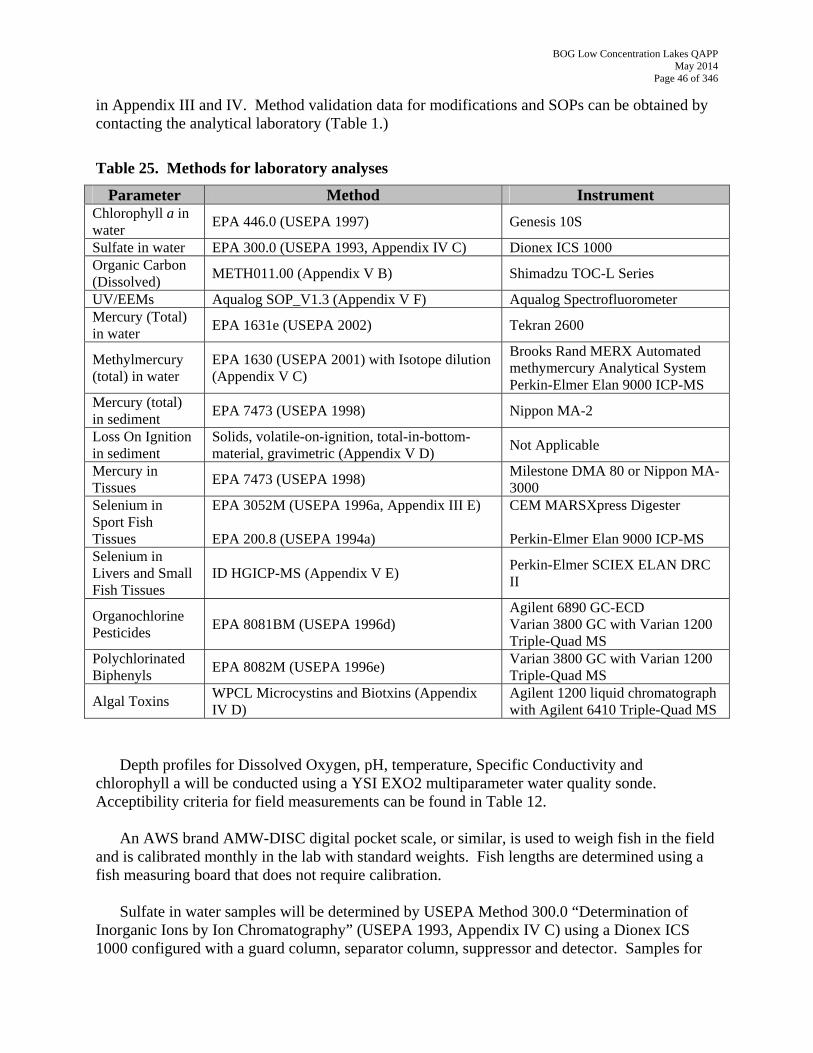
BOG Low Concentration Lakes QAPP May 2014
Page 46 of 346
in Appendix III and IV. Method validation data for modifications and SOPs can be obtained by contacting the analytical laboratory (Table 1.)
Table 25. Methods for laboratory analyses
Parameter Method Instrument Chlorophyll a in water
EPA 446.0 (USEPA 1997) Genesis 10S
Sulfate in water EPA 300.0 (USEPA 1993, Appendix IV C) Dionex ICS 1000 Organic Carbon (Dissolved)
METH011.00 (Appendix V B) Shimadzu TOC-L Series
UV/EEMs Aqualog SOP_V1.3 (Appendix V F) Aqualog Spectrofluorometer Mercury (Total) in water
EPA 1631e (USEPA 2002) Tekran 2600
Methylmercury (total) in water
EPA 1630 (USEPA 2001) with Isotope dilution (Appendix V C)
Brooks Rand MERX Automated methymercury Analytical System Perkin-Elmer Elan 9000 ICP-MS
Mercury (total) in sediment
EPA 7473 (USEPA 1998) Nippon MA-2
Loss On Ignition in sediment
Solids, volatile-on-ignition, total-in-bottom-material, gravimetric (Appendix V D)
Not Applicable
Mercury in Tissues
EPA 7473 (USEPA 1998) Milestone DMA 80 or Nippon MA-3000
Selenium in Sport Fish Tissues
EPA 3052M (USEPA 1996a, Appendix III E) EPA 200.8 (USEPA 1994a)
CEM MARSXpress Digester Perkin-Elmer Elan 9000 ICP-MS
Selenium in Livers and Small Fish Tissues
ID HGICP-MS (Appendix V E) Perkin-Elmer SCIEX ELAN DRC II
Organochlorine Pesticides
EPA 8081BM (USEPA 1996d) Agilent 6890 GC-ECD Varian 3800 GC with Varian 1200 Triple-Quad MS
Polychlorinated Biphenyls
EPA 8082M (USEPA 1996e) Varian 3800 GC with Varian 1200 Triple-Quad MS
Algal Toxins WPCL Microcystins and Biotxins (Appendix IV D)
Agilent 1200 liquid chromatograph with Agilent 6410 Triple-Quad MS
Depth profiles for Dissolved Oxygen, pH, temperature, Specific Conductivity and chlorophyll a will be conducted using a YSI EXO2 multiparameter water quality sonde. Acceptibility criteria for field measurements can be found in Table 12.
An AWS brand AMW-DISC digital pocket scale, or similar, is used to weigh fish in the field and is calibrated monthly in the lab with standard weights. Fish lengths are determined using a fish measuring board that does not require calibration.
Sulfate in water samples will be determined by USEPA Method 300.0 “Determination of
Inorganic Ions by Ion Chromatography” (USEPA 1993, Appendix IV C) using a Dionex ICS 1000 configured with a guard column, separator column, suppressor and detector. Samples for
BOG Low Concentration Lakes QAPP May 2014
Page 47 of 346
sulfate analysis are collected in pre-cleaned plastic 250 mL containers. No chemical preservation is required after collection. Samples should be shipped and stored at <6°C, then analyzed within 28 days of collection. Standards, blanks, instrument checks, and batch quality control samples are prepared using ASTM Type II water. The instrument is calibrated with a 6-point calibration curve, then verified immediately after with a second-source reference standard. Instrument drift and sample carryover is monitored by the analysis of calibration verifications (CCV)and verification blanks after every 10 samples. The acceptance criteria for the CCV is + 20% of the true value and + reporting limit for the verification blank. A method blank, lab control spike, matrix spike, matrix spike duplicate, and sample duplicate is analyzed with every batch of 20 or fewer samples. If any instrument or batch quality control samples do not meet acceptance criteria, the corrective action is to investigate possible causes for the failure, correct the cause, and reanalyze the affected samples. Reporting Limits (RL) can be found in Table 26 and Measurement Quality Objectives (MQO) in Section 7, Table 16.
Chlorophyll a in water samples will be determined by USEPA Method 446, “In Vitro
Determination of Chlorophylls a, b, c1+c2 Pheopigments in Marine and Freshwater Algae by Visible Spectrophotometry.” (USEPA 1997) Periphyton are separated from water samples by filtering a measured volume of water through a glass fiber filter. The filter is wrapped to protect it from light then frozen for shipment to the laboratory. The filter is vortexed, sonicated, shaken, then steeped with a 90% acetone solution to extract the pigments from the periphyton. The UV spectrophotometer is zeroed using a blank, calibrated with standards, and the calibration verified with a certified reference standard. Absorbance of the blanks, standards, reference material, and sample extracts are recorded before and after acidification. Resultant readings are entered into “Lorenzen’s Equation” as described in the method. A method blank, certified reference standard, and extract replicate are extracted with every batch of 20 or fewer samples. The mid-point calibration extract is reanalyzed after every 10 samples and end of analysis to monitor for drift (CCV). The acceptance criteria for the CCV is + 20% of the true value and + reporting limit for the method blank. If any instrument or batch quality control samples do not meet acceptance criteria, the corrective action is to investigate possible causes for the failure, correct the cause, and reanalyze the affected samples. Reporting Limits (RL) can be found in Table 26 and Measurement Quality Objectives (MQO) in Section 7, Table 16.
Loss On Ignition will be determined by Volatile on Ignition (Appendix V D). Sample is
weighed into aluminum boats and heated to 550ºC for two hours. The percent of sample mass lost following heating is reported as Loss on Ignition (LOI). One sample per analysis is weighed in triplicate to assess method precision.
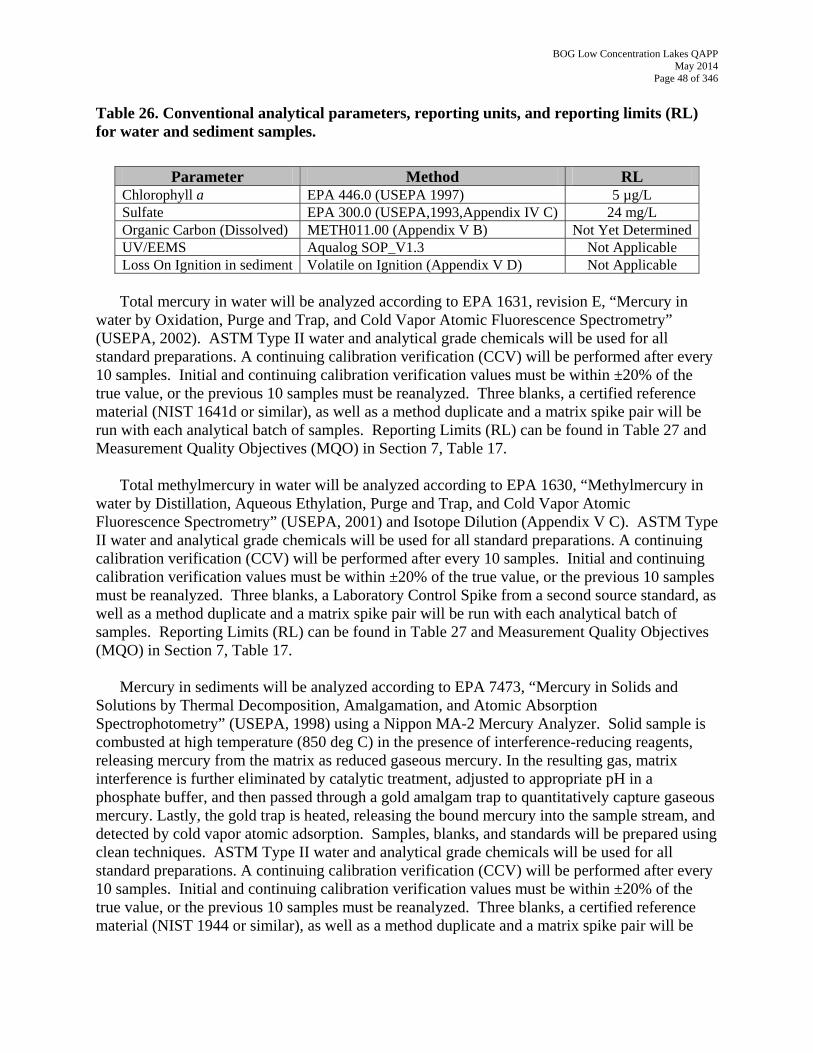
BOG Low Concentration Lakes QAPP May 2014
Page 48 of 346
Table 26. Conventional analytical parameters, reporting units, and reporting limits (RL) for water and sediment samples.
Parameter Method RL Chlorophyll a EPA 446.0 (USEPA 1997) 5 µg/L Sulfate EPA 300.0 (USEPA,1993,Appendix IV C) 24 mg/L Organic Carbon (Dissolved) METH011.00 (Appendix V B) Not Yet DeterminedUV/EEMS Aqualog SOP_V1.3 Not Applicable Loss On Ignition in sediment Volatile on Ignition (Appendix V D) Not Applicable
Total mercury in water will be analyzed according to EPA 1631, revision E, “Mercury in
water by Oxidation, Purge and Trap, and Cold Vapor Atomic Fluorescence Spectrometry” (USEPA, 2002). ASTM Type II water and analytical grade chemicals will be used for all standard preparations. A continuing calibration verification (CCV) will be performed after every 10 samples. Initial and continuing calibration verification values must be within ±20% of the true value, or the previous 10 samples must be reanalyzed. Three blanks, a certified reference material (NIST 1641d or similar), as well as a method duplicate and a matrix spike pair will be run with each analytical batch of samples. Reporting Limits (RL) can be found in Table 27 and Measurement Quality Objectives (MQO) in Section 7, Table 17.
Total methylmercury in water will be analyzed according to EPA 1630, “Methylmercury in water by Distillation, Aqueous Ethylation, Purge and Trap, and Cold Vapor Atomic Fluorescence Spectrometry” (USEPA, 2001) and Isotope Dilution (Appendix V C). ASTM Type II water and analytical grade chemicals will be used for all standard preparations. A continuing calibration verification (CCV) will be performed after every 10 samples. Initial and continuing calibration verification values must be within ±20% of the true value, or the previous 10 samples must be reanalyzed. Three blanks, a Laboratory Control Spike from a second source standard, as well as a method duplicate and a matrix spike pair will be run with each analytical batch of samples. Reporting Limits (RL) can be found in Table 27 and Measurement Quality Objectives (MQO) in Section 7, Table 17.
Mercury in sediments will be analyzed according to EPA 7473, “Mercury in Solids and Solutions by Thermal Decomposition, Amalgamation, and Atomic Absorption Spectrophotometry” (USEPA, 1998) using a Nippon MA-2 Mercury Analyzer. Solid sample is combusted at high temperature (850 deg C) in the presence of interference-reducing reagents, releasing mercury from the matrix as reduced gaseous mercury. In the resulting gas, matrix interference is further eliminated by catalytic treatment, adjusted to appropriate pH in a phosphate buffer, and then passed through a gold amalgam trap to quantitatively capture gaseous mercury. Lastly, the gold trap is heated, releasing the bound mercury into the sample stream, and detected by cold vapor atomic adsorption. Samples, blanks, and standards will be prepared using clean techniques. ASTM Type II water and analytical grade chemicals will be used for all standard preparations. A continuing calibration verification (CCV) will be performed after every 10 samples. Initial and continuing calibration verification values must be within ±20% of the true value, or the previous 10 samples must be reanalyzed. Three blanks, a certified reference material (NIST 1944 or similar), as well as a method duplicate and a matrix spike pair will be
BOG Low Concentration Lakes QAPP May 2014
Page 49 of 346
run with each analytical batch of samples. Reporting Limits (RL) can be found in Table 27 and Measurement Quality Objectives (MQO) in Section 7, Table 19.
Mercury in fish tissues will be analyzed according to EPA 7473, “Mercury in Solids and Solutions by Thermal Decomposition, Amalgamation, and Atomic Absorption Spectrophotometry” (USEPA, 1998) using a Direct Mercury Analyzer (DMA 80). Samples, blanks, and standards will be prepared using clean techniques. ASTM Type II water and analytical grade chemicals will be used for all standard preparations. A continuing calibration verification (CCV) will be performed after every 10 samples. Initial and continuing calibration verification values must be within ±20% of the true value, or the previous 10 samples must be reanalyzed. Three blanks, a certified reference material (DORM-3 or similar), as well as a method duplicate and a matrix spike pair will be run with each analytical batch of samples. Reporting Limits (RL) can be found in Table 27 and Measurement Quality Objectives (MQO) in Section 7, Table 20.
Selenium sport fish composites will be digested according to EPA 3052M, “Microwave Assisted Acid Digestion of Siliceous and Organically Based Matrices” (USEPA, 1996a), modified (Appendix III E), and will be analyzed according to EPA 200.8, “Determination of Trace Elements in Waters and Wastes by Inductively Coupled Plasma-Mass Spectrometry” (USEPA, 1994a). Samples, blanks, and standards will be prepared using clean techniques. ASTM Type II water and analytical grade chemicals will be used for all standard preparations. A continuing calibration verification (CCV) will be performed after every 10 samples. Initial and continuing calibration verification values must be within ±20% of the true value, or the previous 10 samples must be reanalyzed. Two blanks, a certified reference material (NIST 2976, NRCC DORM-3 or similar), as well as a method duplicate and a matrix spike pair will be run with each set of samples. Reporting Limits (RL) can be found in Table 27 and Measurement Quality Objectives (MQO) in Section 7, Table 20.
Selenium in small fish composites and livers will be digested and analyzed according to ID
HGICP-MS (Appendix V E). An 82Se enriched isotope spike is used to measure isotope dilution. Calibration of the enriched 82Se spike is achieved by reverse spike isotope dilution. The digestates are mixed with concentrated hydrochloric acid to reduce the selenium to the most favorable valence for hydride generation. The solutions are then analyzed by inductively coupled plasma mass spectrometry coupled with hydride generation (ID HGICP-MS). Polyatomic and isobaric interferences are removed through the use of hydride generation and background correction using 82Se enriched isotope spike. Samples, blanks, and standards will be prepared using clean techniques. ASTM Type II water and analytical grade chemicals will be used for all standard preparations. A continuing calibration verification (CCV) will be performed after every 4-5 samples. Initial and continuing calibration verification values must be within ±20% of the true value, or the previous samples must be reanalyzed. Two blanks, two certified reference materials (NIST 2976, NRCC DORM-3 or similar), as well as two method duplicates and a matrix spike pair will be run with each set of samples. Reporting Limits (RL) can be found in Table 27 and Measurement Quality Objectives (MQO) in Section 7, Table 20.
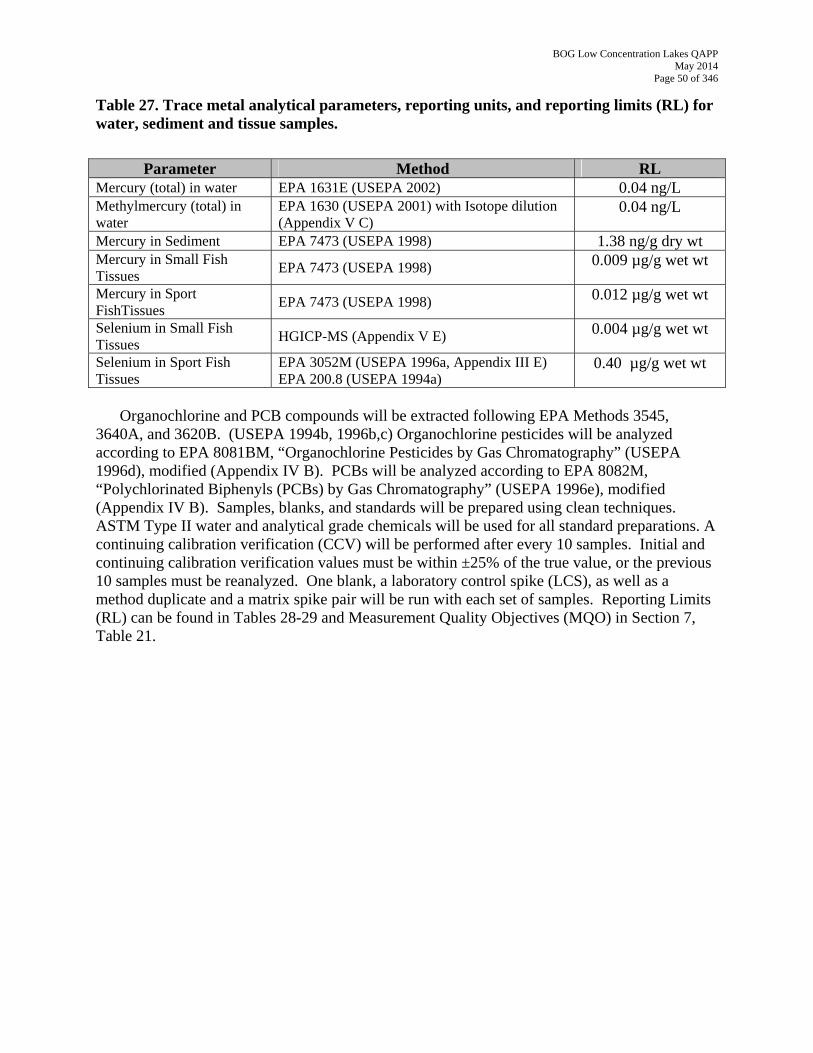
BOG Low Concentration Lakes QAPP May 2014
Page 50 of 346
Table 27. Trace metal analytical parameters, reporting units, and reporting limits (RL) for water, sediment and tissue samples.
Parameter Method RL 0.04 ng/L Mercury (total) in water EPA 1631E (USEPA 2002) 0.04 ng/L Methylmercury (total) in
water EPA 1630 (USEPA 2001) with Isotope dilution (Appendix V C)
1.38 ng/g dry wt Mercury in Sediment EPA 7473 (USEPA 1998) 0.009 µg/g wet wt Mercury in Small Fish
Tissues EPA 7473 (USEPA 1998)
0.012 µg/g wet wt Mercury in Sport FishTissues
EPA 7473 (USEPA 1998)
0.004 µg/g wet wt Selenium in Small Fish Tissues
HGICP-MS (Appendix V E)
0.40 µg/g wet wt Selenium in Sport Fish Tissues
EPA 3052M (USEPA 1996a, Appendix III E) EPA 200.8 (USEPA 1994a)
Organochlorine and PCB compounds will be extracted following EPA Methods 3545, 3640A, and 3620B. (USEPA 1994b, 1996b,c) Organochlorine pesticides will be analyzed according to EPA 8081BM, “Organochlorine Pesticides by Gas Chromatography” (USEPA 1996d), modified (Appendix IV B). PCBs will be analyzed according to EPA 8082M, “Polychlorinated Biphenyls (PCBs) by Gas Chromatography” (USEPA 1996e), modified (Appendix IV B). Samples, blanks, and standards will be prepared using clean techniques. ASTM Type II water and analytical grade chemicals will be used for all standard preparations. A continuing calibration verification (CCV) will be performed after every 10 samples. Initial and continuing calibration verification values must be within ±25% of the true value, or the previous 10 samples must be reanalyzed. One blank, a laboratory control spike (LCS), as well as a method duplicate and a matrix spike pair will be run with each set of samples. Reporting Limits (RL) can be found in Tables 28-29 and Measurement Quality Objectives (MQO) in Section 7, Table 21.
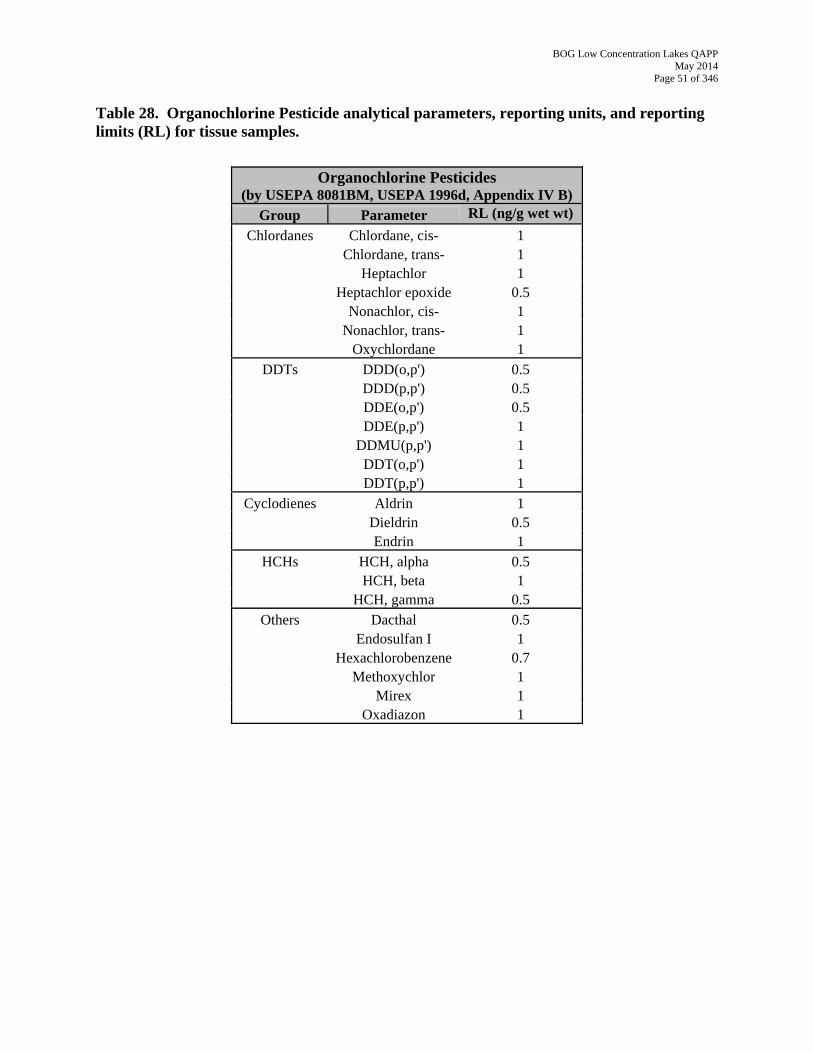
BOG Low Concentration Lakes QAPP May 2014
Page 51 of 346
Table 28. Organochlorine Pesticide analytical parameters, reporting units, and reporting limits (RL) for tissue samples.
Organochlorine Pesticides (by USEPA 8081BM, USEPA 1996d, Appendix IV B)
Group Parameter RL (ng/g wet wt) Chlordanes Chlordane, cis- 1
Chlordane, trans- 1 Heptachlor 1 Heptachlor epoxide 0.5 Nonachlor, cis- 1 Nonachlor, trans- 1 Oxychlordane 1
DDTs DDD(o,p') 0.5 DDD(p,p') 0.5 DDE(o,p') 0.5 DDE(p,p') 1 DDMU(p,p') 1 DDT(o,p') 1 DDT(p,p') 1
Cyclodienes Aldrin 1 Dieldrin 0.5 Endrin 1
HCHs HCH, alpha 0.5 HCH, beta 1 HCH, gamma 0.5
Others Dacthal 0.5 Endosulfan I 1 Hexachlorobenzene 0.7 Methoxychlor 1 Mirex 1 Oxadiazon 1
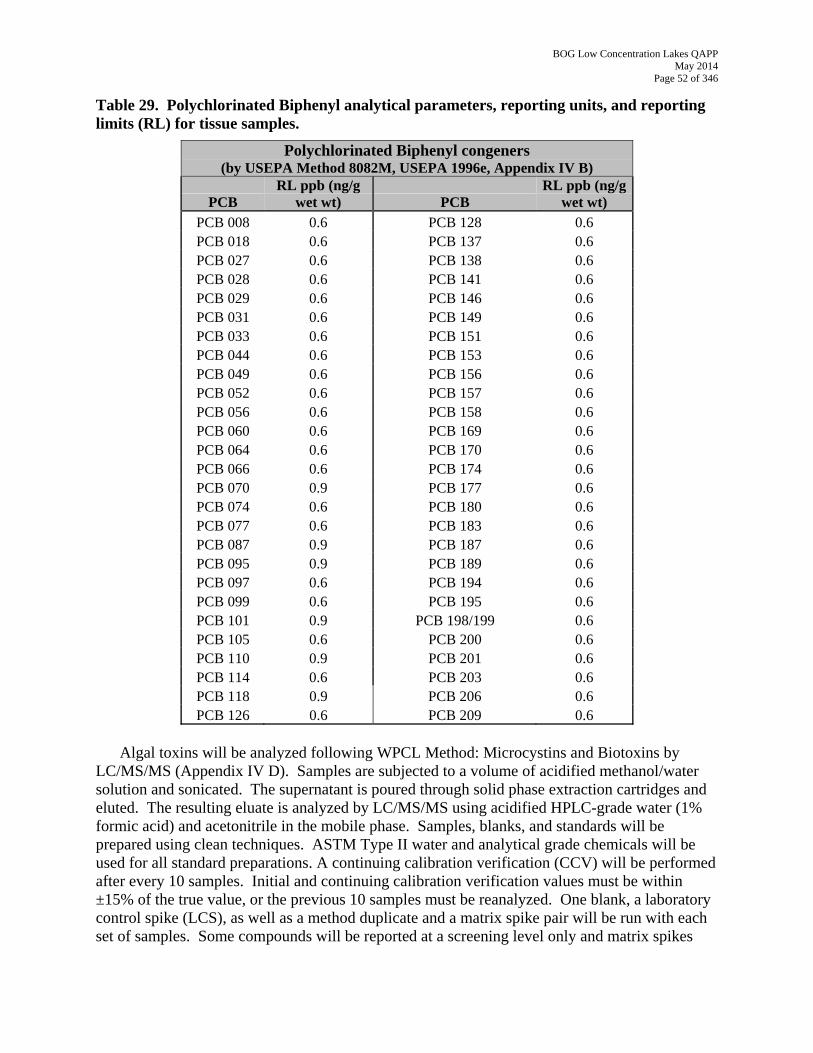
BOG Low Concentration Lakes QAPP May 2014
Page 52 of 346
Table 29. Polychlorinated Biphenyl analytical parameters, reporting units, and reporting limits (RL) for tissue samples.
Polychlorinated Biphenyl congeners (by USEPA Method 8082M, USEPA 1996e, Appendix IV B)
PCB RL ppb (ng/g
wet wt) PCB RL ppb (ng/g
wet wt) 0.6 PCB 008 0.6 PCB 128 0.6 PCB 018 0.6 PCB 137
PCB 027 0.6 PCB 138 0.6 0.6 PCB 028 0.6 PCB 141 0.6 PCB 029 0.6 PCB 146 0.6 PCB 031 0.6 PCB 149 0.6 PCB 033 0.6 PCB 151
PCB 044 0.6 PCB 153 0.6 0.6 PCB 049 0.6 PCB 156 0.6 PCB 052 0.6 PCB 157
PCB 056 0.6 PCB 158 0.6 PCB 060 0.6 PCB 169 0.6 PCB 064 0.6 PCB 170 0.6 PCB 066 0.6 PCB 174 0.6
0.6 PCB 070 0.9 PCB 177 PCB 074 0.6 PCB 180 0.6 PCB 077 0.6 PCB 183 0.6 PCB 087 0.9 PCB 187 0.6
0.6 PCB 095 0.9 PCB 189 PCB 097 0.6 PCB 194 0.6 PCB 099 0.6 PCB 195 0.6
0.6 PCB 101 0.9 PCB 198/199 0.6 PCB 105 0.6 PCB 200 0.6 PCB 110 0.9 PCB 201 0.6 PCB 114 0.6 PCB 203 0.6 PCB 118 0.9 PCB 206
PCB 126 0.6 PCB 209 0.6
Algal toxins will be analyzed following WPCL Method: Microcystins and Biotoxins by LC/MS/MS (Appendix IV D). Samples are subjected to a volume of acidified methanol/water solution and sonicated. The supernatant is poured through solid phase extraction cartridges and eluted. The resulting eluate is analyzed by LC/MS/MS using acidified HPLC-grade water (1% formic acid) and acetonitrile in the mobile phase. Samples, blanks, and standards will be prepared using clean techniques. ASTM Type II water and analytical grade chemicals will be used for all standard preparations. A continuing calibration verification (CCV) will be performed after every 10 samples. Initial and continuing calibration verification values must be within ±15% of the true value, or the previous 10 samples must be reanalyzed. One blank, a laboratory control spike (LCS), as well as a method duplicate and a matrix spike pair will be run with each set of samples. Some compounds will be reported at a screening level only and matrix spikes
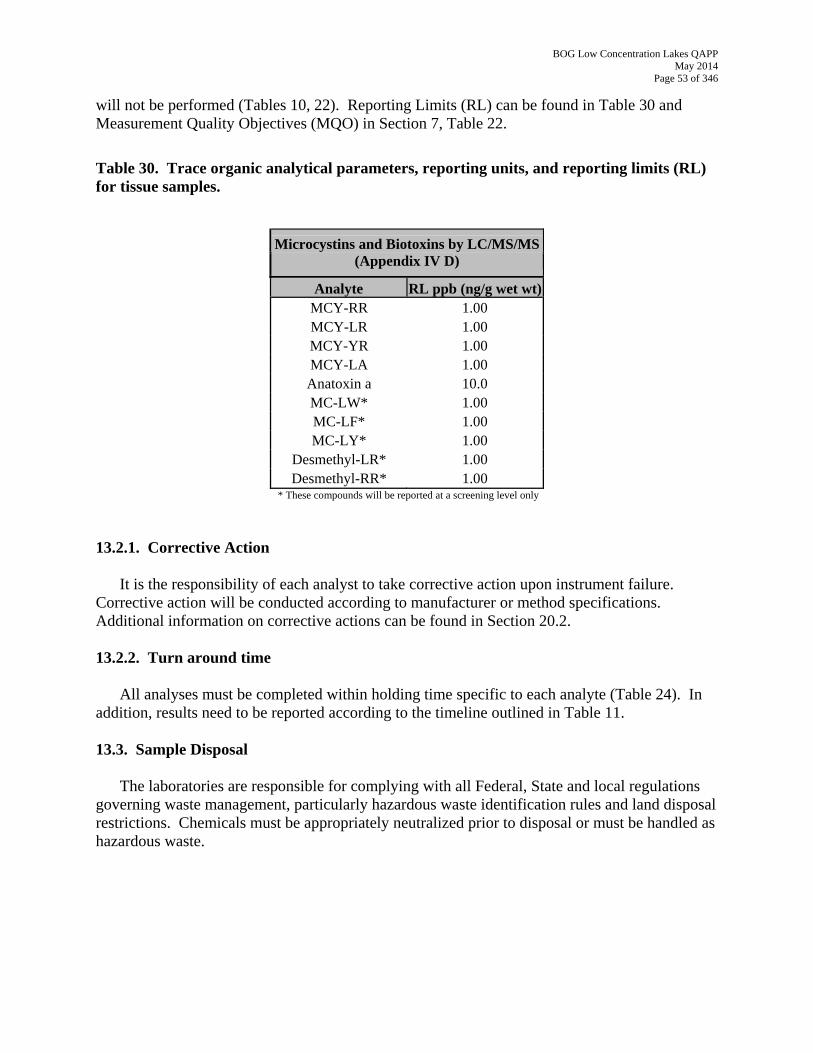
BOG Low Concentration Lakes QAPP May 2014
Page 53 of 346
will not be performed (Tables 10, 22). Reporting Limits (RL) can be found in Table 30 and Measurement Quality Objectives (MQO) in Section 7, Table 22.
Table 30. Trace organic analytical parameters, reporting units, and reporting limits (RL) for tissue samples.
Microcystins and Biotoxins by LC/MS/MS
(Appendix IV D)
Analyte RL ppb (ng/g wet wt)MCY-RR 1.00 MCY-LR 1.00 MCY-YR 1.00 MCY-LA 1.00 Anatoxin a 10.0 MC-LW* 1.00 MC-LF* 1.00 MC-LY* 1.00
Desmethyl-LR* 1.00 Desmethyl-RR* 1.00
* These compounds will be reported at a screening level only 13.2.1. Corrective Action It is the responsibility of each analyst to take corrective action upon instrument failure. Corrective action will be conducted according to manufacturer or method specifications. Additional information on corrective actions can be found in Section 20.2. 13.2.2. Turn around time All analyses must be completed within holding time specific to each analyte (Table 24). In addition, results need to be reported according to the timeline outlined in Table 11. 13.3. Sample Disposal The laboratories are responsible for complying with all Federal, State and local regulations governing waste management, particularly hazardous waste identification rules and land disposal restrictions. Chemicals must be appropriately neutralized prior to disposal or must be handled as hazardous waste.
BOG Low Concentration Lakes QAPP May 2014
Page 54 of 346
Element 14. Quality Control MPSL-DFG and DFG-WPCL conduct quality control through several activities and methods. These methods of quality control are performed to identify possible contamination problem(s), matrix interference and the ability to duplicate/repeat results. When control limits are exceeded the Laboratory QAO will review with appropriate laboratory staff to ascertain the possible cause of the exceedance. A review of SOPs will be conducted and any deficiencies will be identified, documented, and corrected. A written report of the corrective action(s) will be provided to the PI and PM via email. The PM will contact the SWAMP QAO as needed. Each aspect of laboratory quality control is listed in Tables 12-22 for frequency as well as Measurement Quality Objectives (MQO) for each. Element 15. Instrument/Equipment Testing, Inspection and Maintenance
Laboratory instruments are inspected and maintained in accordance with lab SOPs, which include those specified by the manufacturer and those specified by the method (Table 25). These SOPs have been reviewed by each respective Laboratory QAO and found to be in compliance with SWAMP criteria. Analysts are responsible for equipment testing, inspection, and maintenance. Appendices III and IV list the referenced SOPs. DFG-WPCL SOPs are available upon request from the Laboratory Director by email: [email protected]. Likewise, MPSL-DFG SOPS are available upon request from the Laboratory QAO by email: [email protected].
Electronic laboratory equipment usually has recommended maintenance prescribed by the
manufacturer. These instructions will be followed as a minimum requirement. Due to the cost of some laboratory equipment, back up capability may not be possible. But all commonly replaced parts will have spares available for rapid maintenance of failed equipment. Such parts include but are not limited to: batteries; tubes; light bulbs; tubing of all kinds; replacement specific ion electrodes; electrical conduits; glassware; pumps; etc.
The lead chemist, or designee, is responsible for the testing, inspection, and maintenance of
equipment. Each instrument has its own logbook where the results of tests, inspections, maintenance and repairs are documented. When an instrument’s test results fail to meet accuracy and/or precision criteria after the lead chemist has performed maintenance, the manufacturer will be contacted. Element 16. Instrument/Equipment Calibration and Frequency
Laboratory instruments (listed in Table 31) are calibrated, standardized and maintained according to procedures detailed in laboratory QAPs (Appendix I). Instrument manuals identify step-by-step calibration and maintenance procedures. If analytical instrumentation fails to meet performance requirements, the instrument(s) will be checked according to their respective SOP(s) and recalibrated. If the instrument(s) does again does not meet specifications, it will be
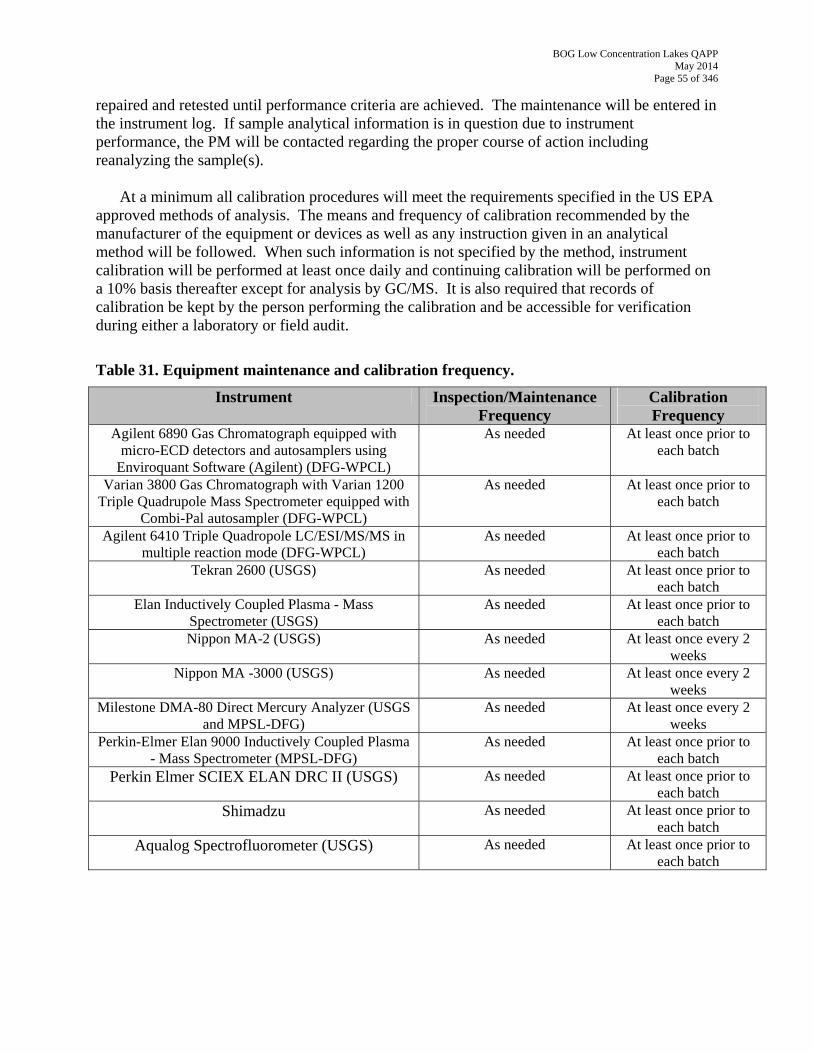
BOG Low Concentration Lakes QAPP May 2014
Page 55 of 346
repaired and retested until performance criteria are achieved. The maintenance will be entered in the instrument log. If sample analytical information is in question due to instrument performance, the PM will be contacted regarding the proper course of action including reanalyzing the sample(s).
At a minimum all calibration procedures will meet the requirements specified in the US EPA
approved methods of analysis. The means and frequency of calibration recommended by the manufacturer of the equipment or devices as well as any instruction given in an analytical method will be followed. When such information is not specified by the method, instrument calibration will be performed at least once daily and continuing calibration will be performed on a 10% basis thereafter except for analysis by GC/MS. It is also required that records of calibration be kept by the person performing the calibration and be accessible for verification during either a laboratory or field audit.
Table 31. Equipment maintenance and calibration frequency.
Instrument Inspection/Maintenance Frequency
Calibration Frequency
Agilent 6890 Gas Chromatograph equipped with micro-ECD detectors and autosamplers using
Enviroquant Software (Agilent) (DFG-WPCL)
As needed At least once prior to each batch
Varian 3800 Gas Chromatograph with Varian 1200 Triple Quadrupole Mass Spectrometer equipped with
Combi-Pal autosampler (DFG-WPCL)
As needed At least once prior to each batch
Agilent 6410 Triple Quadropole LC/ESI/MS/MS in multiple reaction mode (DFG-WPCL)
As needed At least once prior to each batch
Tekran 2600 (USGS) As needed At least once prior to each batch
Elan Inductively Coupled Plasma - Mass Spectrometer (USGS)
As needed At least once prior to each batch
Nippon MA-2 (USGS) As needed At least once every 2 weeks
Nippon MA -3000 (USGS) As needed At least once every 2 weeks
Milestone DMA-80 Direct Mercury Analyzer (USGS and MPSL-DFG)
As needed At least once every 2 weeks
Perkin-Elmer Elan 9000 Inductively Coupled Plasma - Mass Spectrometer (MPSL-DFG)
As needed At least once prior to each batch
Perkin Elmer SCIEX ELAN DRC II (USGS) As needed At least once prior to each batch
Shimadzu As needed At least once prior to each batch
Aqualog Spectrofluorometer (USGS) As needed At least once prior to each batch
BOG Low Concentration Lakes QAPP May 2014
Page 56 of 346
16.1. Analytical Instrumentation 16.1.1. Instrument calibration
Upon initiation of an analytical run, after each major equipment disruption, and whenever on-going calibration checks do not meet recommended MQOs, the system will be calibrated with a full range of analytical standards. Immediately after this procedure, the initial calibration must be verified through the analysis of a standard obtained from a different source than the standards used to calibrate the instrumentation, prepared in an independent manner, and ideally having certified concentrations of target analytes of a CRM or certified solution. Frequently, calibration standards are included as part of an analytical run, interspersed with actual samples. However, this practice does not document the stability of the calibration and is incapable of detecting degradation of individual components, particularly pesticides, in standard solutions used to calibrate the instrument. The calibration curve is acceptable if it has an R2 of 0.990 or greater for all analytes present in the calibration mixtures. If not, the calibration standards, as well as all the samples in the batch are re-analyzed. All calibration standards will be traceable to a recognized organization for the preparation and certification of QC materials (e.g., National Institute of Standards and Technology, National Research Council Canada, US EPA, etc.).
Calibration curves will be established for each analyte and batch analysis from a calibration
blank and a minimum of three analytical standards of increasing concentration, covering the range of expected sample concentrations. Only data which result from quantification within the demonstrated working calibration range may be reported (i.e., quantification based on extrapolation is not acceptable). Alternatively, if the instrumentation is linear over the concentration ranges to be measured in the samples, the use of a calibration blank and one single standard that is higher in concentration than the samples may be appropriate. Samples outside the calibration range will be diluted or concentrated, as appropriate, and reanalyzed. 16.1.2. Continuing calibration verification (CCV)
Calibration verification solutions traceable to a recognized organization are inserted as part of the sample stream. The sources of the calibration verification solutions are independent from the standards used for the calibration. Calibration verification solutions used for the CCV will contain all the analytes of interest. The frequency of these verifications is dependent on the type of instrumentation used and, therefore, requires considerable professional judgment. The required frequencies for this project are listed in Tables 16-22. All analyses are bracketed by an acceptable calibration verification; all samples not bracketed by an in control CCV should be reanalyzed. If the control limits for analysis of the calibration verification solution are not met, the initial calibration will have to be repeated. All samples analyzed before the calibration verification solution that failed the MQOs will be reanalyzed following the recalibration. Only the re-analysis results will be reported. If it is not possible or feasible to perform reanalysis of samples, all earlier data (i.e., since the last successful calibration control verification) are suspect. In this case, the laboratory QAO will contact the PM to determine proceedings, and will flag the data and note the issue in interim and final reports.
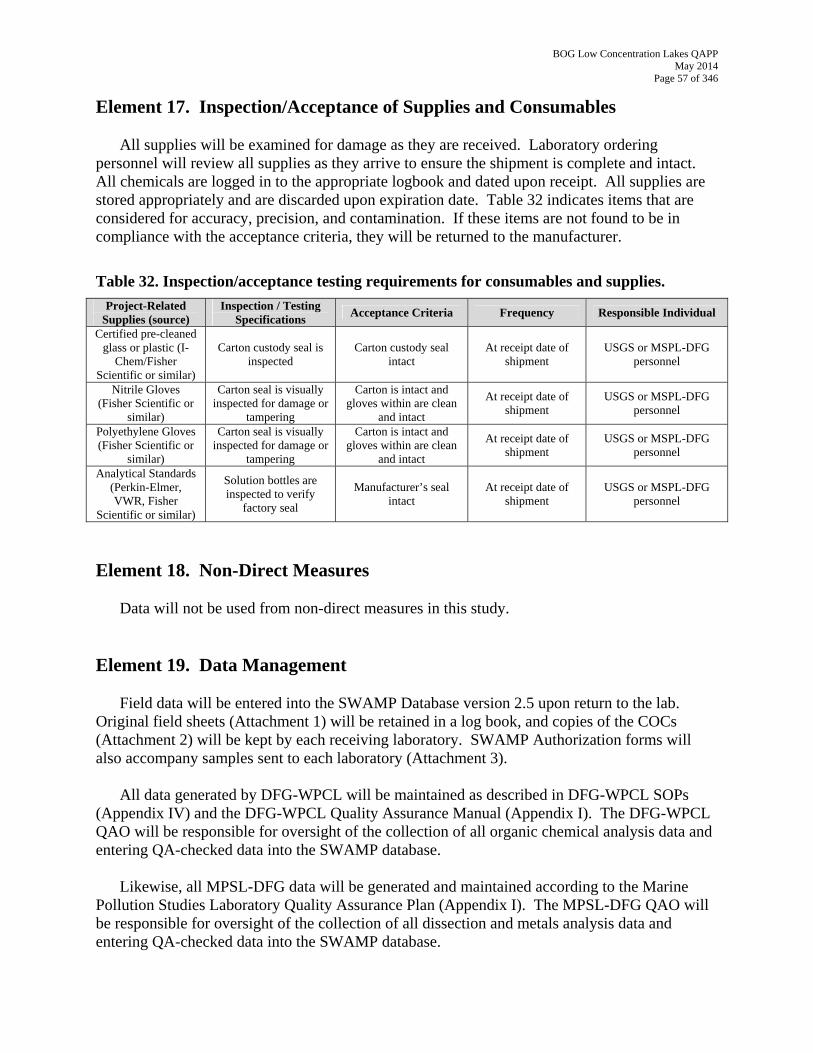
BOG Low Concentration Lakes QAPP May 2014
Page 57 of 346
Element 17. Inspection/Acceptance of Supplies and Consumables
All supplies will be examined for damage as they are received. Laboratory ordering personnel will review all supplies as they arrive to ensure the shipment is complete and intact. All chemicals are logged in to the appropriate logbook and dated upon receipt. All supplies are stored appropriately and are discarded upon expiration date. Table 32 indicates items that are considered for accuracy, precision, and contamination. If these items are not found to be in compliance with the acceptance criteria, they will be returned to the manufacturer.
Table 32. Inspection/acceptance testing requirements for consumables and supplies. Project-Related
Supplies (source) Inspection / Testing
Specifications Acceptance Criteria Frequency Responsible Individual
Certified pre-cleaned glass or plastic (I-
Chem/Fisher Scientific or similar)
Carton custody seal is inspected
Carton custody seal intact
At receipt date of shipment
USGS or MSPL-DFG personnel
Nitrile Gloves (Fisher Scientific or
similar)
Carton seal is visually inspected for damage or
tampering
Carton is intact and gloves within are clean
and intact
At receipt date of shipment
USGS or MSPL-DFG personnel
Polyethylene Gloves (Fisher Scientific or
similar)
Carton seal is visually inspected for damage or
tampering
Carton is intact and gloves within are clean
and intact
At receipt date of shipment
USGS or MSPL-DFG personnel
Analytical Standards (Perkin-Elmer, VWR, Fisher
Scientific or similar)
Solution bottles are inspected to verify
factory seal
Manufacturer’s seal intact
At receipt date of shipment
USGS or MSPL-DFG personnel
Element 18. Non-Direct Measures
Data will not be used from non-direct measures in this study. Element 19. Data Management
Field data will be entered into the SWAMP Database version 2.5 upon return to the lab. Original field sheets (Attachment 1) will be retained in a log book, and copies of the COCs (Attachment 2) will be kept by each receiving laboratory. SWAMP Authorization forms will also accompany samples sent to each laboratory (Attachment 3).
All data generated by DFG-WPCL will be maintained as described in DFG-WPCL SOPs (Appendix IV) and the DFG-WPCL Quality Assurance Manual (Appendix I). The DFG-WPCL QAO will be responsible for oversight of the collection of all organic chemical analysis data and entering QA-checked data into the SWAMP database.
Likewise, all MPSL-DFG data will be generated and maintained according to the Marine
Pollution Studies Laboratory Quality Assurance Plan (Appendix I). The MPSL-DFG QAO will be responsible for oversight of the collection of all dissection and metals analysis data and entering QA-checked data into the SWAMP database.
BOG Low Concentration Lakes QAPP May 2014
Page 58 of 346
Furthermore, all USGS data will be generated and maintained according to the USGS
Laboratory Quality Assurance Plan (Appendix I). The USGS QAO will be responsible for oversight of the collection of all dissection and metals analysis data and sending all QA-checked data to the PM.
All data collected will be entered into electronic spreadsheets that are SWAMP compatible.
Each data element is checked at a minimum by the technician that entered the data and verified by the technician’s signature on the data sheet. Tissue data will be provided to the PC in Microsoft Excel spreadsheets. Data will be reviewed to ensure they are consistent with the format of the database and other data records.
All raw and statistical analysis data are subject to a 100% check for accuracy by the PM and
Laboratory QAOs. Data are analyzed and proofread for accuracy, and then QA checked against the QAPP and SWAMP criteria before being entered into the SWAMP database. Original hard copies of the data are filed in a secure cabinet until requested by the PM and/or inclusion into the Final Report. Electronic copies are stored and backed up by each analyst and respective laboratory internal project manager.
Hardware and software will be updated as recommended by the manufacturer or as needed.
Testing of each component is not required on a regular basis aside from day to day functionality. Each entity is responsible for the necessary updates or upgrades, whether provided regularly through an Information Technology department or otherwise.
Data management checklists are not required. Analytical completeness will be tracked
through the SWAMP Database version 2.5.
Group C Elements: Assessment and Oversight Element 20. Assessments and Response Actions 20.1. Audits
All reviews of QA data will be made by the QAO of each laboratory prior to submission of each batch to the PM or SWAMP Tissue Database 2.5. Reviews of the sampling procedures will be made by the Field Collection Coordinator and the Project Coordinator in case problems occur. As SOPs are updated and refined, additional reviews will be made. Each data technician is responsible for flagging all data that does not meet established QA/QC criteria.
Project data review established for this project will be conducted once all data sets have been
received, and includes the following:
BOG Low Concentration Lakes QAPP May 2014
Page 59 of 346
- Initial review of analytical and field data for complete and accurate documentation, chain of custody procedures, compliance with analytical holding times, and required frequency of laboratory QA samples.
- Comparison of all spike and duplicate results with the MQOs in Tables 16-22. - Assigning data qualifier flags to the data as necessary to reflect limitations identified by
the process. If a review discovers any discrepancy, the QAO will discuss it with the personnel responsible
for the activity. The discussion will include the accuracy of the information, potential cause(s) leading to the deviation, how the deviation might impact data quality and the corrective actions that might be considered. If the discrepancy is not resolved, the QAO will issue a stop work order until the problem is fixed.
Assessments by the QAO will be oral; if no discrepancies are noted and corrective action is
not required, additional records are not required. If discrepancies are observed, the details of the discrepancy and any corrective action will be reported and appended to the report.
All assessments will be conducted as data is received by the laboratory QAO in accordance
with the timeline in Table 11. 20.2. Deviations and corrective actions
Analyses are conducted according to procedures and conditions recommended by the US EPA and described in laboratory SOPs (Appendices III, IV, and V), with the exception of those reported herein. Beyond those identified, deviations from these recommended conditions are reported to the Laboratory QAO. The PM will be notified within 24 hours of these deviations.
In the event of a SOP/QAPP deviation or corrective action, a deviation/corrective action form
will be prepared, completed, signed and the PM notified. Best professional judgment will be used in interpretation of results obtained when deviations in the test conditions have occurred. All deviations and associated interpretations will be reported in interim and final reports. Protocol amendments will be submitted to the Laboratory QAO and PM. Upon approval, protocol amendments will be employed.
This study strives for 90% analytical data completeness. If this goal cannot be achieved,
various corrective actions can be undertaken as described in Section D24. Element 21. Reports to Management
The following products are to be delivered to PM:
o Each LD shall regularly brief the LS and PM on the progress of all on-going chemical analyses in emails or conference calls. When deemed necessary for decision making, other BOG participants will also be notified of progress.
BOG Low Concentration Lakes QAPP May 2014
Page 60 of 346
o The LS will provide a draft final report and a final report to the PM in accordance with the dates listed in Table 11.
Group D Elements: Data Validation and Usability Element 22. Data Review, Verification and Validation Requirements
All data reported for this project will be subject to a 100% check for errors in transcription, calculation and computer input by the laboratory internal project manager and/or laboratory QAO. Additionally, the Laboratory QAO will review sample logs and data forms to ensure that requirements for sample preservation, sample integrity, data quality assessments and equipment calibration have been met. At the discretion of the LD, data that do not meet these requirements will either not be reported, or will be reported with qualifiers which serve as an explanation of any necessary considerations.
Reconciliation and correction will be decided upon by the Laboratory QAO and LD. The
Laboratory QAO will be responsible for informing data users of the problematic issues that were discussed, along with the associated reconciliations and corrections.
Data generated by project activities will be reviewed against the measurement quality
objectives (MQOs) in Tables 16-22. Furthermore, the final dataset as a whole will scrutinized for usability to answer the three Management Questions. Element 23. Verification and Validation Methods
Data will be reported electronically to the Project Coordinator, then to the SWAMP Database Management Team (DMT) for inclusion in the SWAMP Database version 2.5. The DMT will follow SWAMP SOP Chemistry Data Verification V1.1 (Appendix VI A).
All tissue data will be validated according to BOG Data Validation (Appendix VI B),
outlined below. Please refer to the appended document for complete descriptions and validation steps, as well as examples of potential QC failures.
Water and sediment chemistry data will not be validated for this project. These results aim to
address why fish tissues may or may not show contamination, and are not intended to be used in any other way. Furthermore, there are currently no validation criteria developed for non-tissue chemistry results.
QA narratives will be produced to be incorporated in the BOG Wildlife Report. This
narrative will summarize the data set from a QA standpoint. Validated data will be made available to users via the State Water Resources Control Board CEDEN website (http://www.ceden.us/AdvancedQueryTool).
BOG Low Concentration Lakes QAPP May 2014
Page 61 of 346
23.1. Blank Contamination Check
Blank verification samples identify if the target analyte has contaminated field samples via lab contamination from any part of sample preparation and analysis. One method blank (laboratory derived) sample is run with each analytical batch (≤20 samples). The method blanks will be processed through the entire analytical procedure in a manner identical to the field samples. The ideal scenario is that method blank samples are non-detects. If a field sample is contaminated from laboratory procedures and the analytical quantification of that field sample is low, then a high proportion of the field sample value could be from laboratory contamination which results in that value being uncertain and not usable. Laboratory blank contamination could result in a false positive when field sample results are low. There is less concern of blank contamination affecting a field sample if field samples are some multiple higher than the method blank result (in this case 3 times the method blank concentration).
Please refer to BOG Data Validation Standard Operating Procedure (Appendix VI B) for
details on the steps taken to determine blank contamination.
23.2. Accuracy Check
Accuracy is the degree of agreement of a measurement with a known value and is utilized to assess the degree of closeness of field samples to their real value. Using the bull's-eye analogy, accuracy is the degree of closeness to the bull's-eye (which represents the true value). Over/under estimation of analytical quantification is important in this project. If the QA elements indicate overestimation of the field sample result than this could lead to false positives above particular human health consumption thresholds and potentially limit human consumption of particular sport fish species. If the QA elements indicate underestimated analytical quantification then low field sample values could falsely suggest that fish are below human health thresholds when they may actually be above the thresholds. Good accuracy in a data set increases the confidence and certainty that the field sample value is close to the true value. Accuracy is determined by such QC elements as: certified reference materials (CRM), laboratory control samples, blind spikes, matrix spikes, and performance samples.
Please refer to BOG Data Validation Standard Operating Procedure (Appendix VI B) for
details on the steps taken to determine accuracy.
23.3. Precision Check
Precision is the degree to which repeated measurements under unchanged conditions show the same result (usually reported as a relative standard deviation [RSD] or relative percent difference [RPD]). The repeatability measure indicates the variability observed within a laboratory, over a short time, using a single operator, item of equipment, etc. These QA elements also show the reproducibility of an analytical measurement. Good precision provides confidence that the analytical process is consistently measuring the target analyte in a particular matrix. Please refer to BOG Data Validation Standard Operating Procedure (Appendix VI B) for details on the steps taken to determine precision.
BOG Low Concentration Lakes QAPP May 2014
Page 62 of 346
Element 24. Reconciliation with User Requirements
Data will be reported in the SWAMP Database version 2.5. Data that do not meet with the Measurement Quality Objectives in Table 16-22 will be flagged accordingly as discussed in Section D23. Rejected data will not be included in data analyses while data flagged as estimated will be evaluated for inclusion on a case-by-case basis in conjunction with the associated QA data and program objectives.
As stated earlier, PCBs will be summed for comparison with threshold values in Table 3. It
is possible that some of the parameters that comprise each summation may be flagged as rejected through the Validation process (Appendix VI B). When this occurs, the censored results will not be included in the summation used for comparison. However, the difference between summations with and without rejected values will be compared to each other. If the rejected values comprise more than 30% of the total sum for a sample, and the concentration prior to censoring was above the threshold level in Table 3, then the sample will be designated for reanalysis. Samples with censoring of more than 30% but with uncensored sums below the threshold level will not be designated for reanalysis.
The project needs sufficient data, as represented by the completeness objective (Tables 13-
15), to address the management questions laid out in the Sampling Plan (Appendix II). A failure to achieve the number of data points cited could mean an inability to answer these questions.
MQ1 will be assessed by comparing sport fish results from each location to the thresholds
used for 303(d) listing determinations and to ATLs established by OEHHA (Klasing and Brodberg 2008) (Table 3). Data on water and sediment are being collected to address MQ2, and will not be compared to any assessment thresholds..
MQ2 will be assessed in collaboration with the Water Board staff working on the Reservoir
TMDL. In addition to the parameters being measured in this study, other data that could help in addressing MQ2 include lake characteristics such as morphometry (surface area, shoreline length, bathymetry, volume), turnover, catchment area, water level fluctuation, fishing pressure, and landscape features such as wetlands (connected or adjoining), and agricultural land cover. If the budget allows, the influence of these parameters on concentrations of mercury in fish will be evaluated. If not covered by this study, it is likely that these factors will be evaluated by Water Board staff working on the statewide TMDL for reservoirs.
MQ3 will be assessed to the extent possible (depending on how many lakes are successfully
sampled in a manner supporting this comparison) through a narrative summary of how the follow-up data compare to the previous results.

BOG Low Concentration Lakes QAPP May 2014
Page 63 of 346
References Davis, J.A., J. L. Grenier, A.R. Melwani, S. Bezalel, E. Letteney, and E. Zhang. 2007. Bioaccumulation of pollutants in California waters: a review of historic data and assessment of impacts on fishing and aquatic life. Prepared for the Surface Water Ambient Monitoring Program, California Water Resources Control Board, Sacramento, CA. Evers, DC, LJ Savoy, CR DeSorbo, DE Yates, W Hansen, KM Taylor, LS Siegel, JH Cooley, MS Bank, A Major, K Munney, BF Mower, HS Vogel, N Schoch, M Pokros, MW Goodale, J Fair. 2007. Adverse effects from environmental mercury loads on breeding common loons. Ecotoxicology. Evers, DC, KM Taylor, A Major, RJ Taylor, RH Poppenga, AM Scheuhammer. 2003. Common loon eggs as indicators of methylmercury availability in North America. Ecotoxicology. 12:69-81. Klasing, S. and R. Brodberg. 2008. Development of Fish Contaminant Goals and Advisory Tissue Levels for Common Contaminants in California Sport Fish: Chlordane, DDTs, Dieldrin, Methylmercury, PCBs, Selenium, and Toxaphene. California Office of Environmental Health Hazard Assessment, Sacramento, CA. Stanley, T. W., and S. S. Verner. 1985. The U. S. Environmental Protection Agency's quality assurance program. pp 12-19 In: J. K. Taylor and T. W. Stanley (eds.). Quality Assurance for Environmental Measurements, ASTM STP 867. American Society for Testing and Materials, Philadelphia, Pennsylvania. State Water Resources Control Board (SWRCB). 2003. 2002 California 305(b) Report on Water Quality [prepared as required by Federal Clean Water Act section 305(b)]. Sacramento, CA: State Water Resources Control Board. US Environmental Protection Agency. 1993. Method 300.0. Determination of Inorganic Anions by Ion Chromatography. Revision 2.1. US Environmental Protection Agency, Washington, DC. US Environmental Protection Agency. 1994a. Method 200.8. Determination of Trace Elements in Waters and Wastes by Inductively Coupled Plasma – Mass Spectrometry. Revision 5.4. US Environmental Protection Agency, Washington, DC. US Environmental Protection Agency. 1994b. Method 3460A. Gel-Permeation Cleanup. Revision 1. US Environmental Protection Agency, Washington, DC. US Environmental Protection Agency. 1996a. Method 3052. Microwave Assisted Acid Digestion of Siliceous and Organically Based Matrices. Revision 0. US Environmental Protection Agency, Washington, DC.

BOG Low Concentration Lakes QAPP May 2014
Page 64 of 346
US Environmental Protection Agency. 1996b. Method 3545. Pressurized Fluid Extraction (PFE). Revision 0. US Environmental Protection Agency, Washington, DC. US Environmental Protection Agency. 1996c. Method 3545. Florisil Cleanup. Revision 2. US Environmental Protection Agency, Washington, DC. US Environmental Protection Agency. 1996d. Method 8081B. Organochlorine Pesticides by Gas Chromatography. Revision 1. US Environmental Protection Agency, Washington, DC. US Environmental Protection Agency. 1996e. Method 8082. Polychlorinated Biphenyls (PCBs) by Gas Chromatography. Revision 0. US Environmental Protection Agency, Washington, DC. US Environmental Protection Agency. 1997. Method 446.0. In Vitro Determination of Chlorophylls a, b, c1 + c2 and Pheopigments in Marine and Freshwater Algae by Visible Spectrophotometry.. Revision 1.2. US Environmental Protection Agency, Washington, DC. US Environmental Protection Agency. 1998. Method 7473. Mercury in Solids and Solutions by Thermal Decomposition, Amalgamation, and Atomic Absorption Spectrophotometry. Revision 0. US Environmental Protection Agency, Washington, DC. US Environmental Protection Agency. 2000. Guidance for Assessing Chemical Contaminant Data for Use in Fish Advisories: Volume 1, Fish Sampling and Analysis, Third Edition. EPA 823-R-93-002B-00-007. US Environmental Protection Agency, Office of Water, Washington, DC. US Environmental Protection Agency. 2001. Method 1630. Methyl Mercury in Water by Distillation, Aqueous Ethylation, Purge and Trap, and Cold Vapor Atomic Fluorescence Spectrophotometry. US envirionmental Protection Agency, Washington, DC. US Environmental Protection Agency. 2002. Method 1631, Revision E. Mercury in Water by Oxidation, Purge and Trap, and Cold Vapor Atomic Fluorescence Spectrophotometry. US envirionmental Protection Agency, Washington, DC.
BOG Low Concentration Lakes QAPP May 2014
Page 65 of 346
Appendix I: List of Associated QAPs MPSL-DFG Laboratory QAP, Revision 5. February, 2006 CDFG WPCL Laboratory QAPP, Revision 9. August, 2006 Quality Assurance Plan for USGS Environmental Mercury Lab USGS Mercury research Laboratory Quality Assurance Manual
BOG Low Concentration Lakes QAPP May 2014
Page 66 of 346
Appendix II: Sampling and Analysis Plan
BOG Low Concentration Lakes QAPP May 2014
Page 67 of 346
BOG Low Concentration Lakes QAPP May 2014
Page 68 of 346
BOG Low Concentration Lakes QAPP May 2014
Page 69 of 346
BOG Low Concentration Lakes QAPP May 2014
Page 70 of 346
BOG Low Concentration Lakes QAPP May 2014
Page 71 of 346
BOG Low Concentration Lakes QAPP May 2014
Page 72 of 346
BOG Low Concentration Lakes QAPP May 2014
Page 73 of 346
BOG Low Concentration Lakes QAPP May 2014
Page 74 of 346
BOG Low Concentration Lakes QAPP May 2014
Page 75 of 346
BOG Low Concentration Lakes QAPP May 2014
Page 76 of 346
BOG Low Concentration Lakes QAPP May 2014
Page 77 of 346
BOG Low Concentration Lakes QAPP May 2014
Page 78 of 346
BOG Low Concentration Lakes QAPP May 2014
Page 79 of 346
BOG Low Concentration Lakes QAPP May 2014
Page 80 of 346
BOG Low Concentration Lakes QAPP May 2014
Page 81 of 346
BOG Low Concentration Lakes QAPP May 2014
Page 82 of 346
BOG Low Concentration Lakes QAPP May 2014
Page 83 of 346
BOG Low Concentration Lakes QAPP May 2014
Page 84 of 346
BOG Low Concentration Lakes QAPP May 2014
Page 85 of 346
BOG Low Concentration Lakes QAPP May 2014
Page 86 of 346
BOG Low Concentration Lakes QAPP May 2014
Page 87 of 346
BOG Low Concentration Lakes QAPP May 2014
Page 88 of 346
BOG Low Concentration Lakes QAPP May 2014
Page 89 of 346
BOG Low Concentration Lakes QAPP May 2014
Page 90 of 346
BOG Low Concentration Lakes QAPP May 2014
Page 91 of 346
BOG Low Concentration Lakes QAPP May 2014
Page 92 of 346

BOG Low Concentration Lakes QAPP May 2014
Page 93 of 346
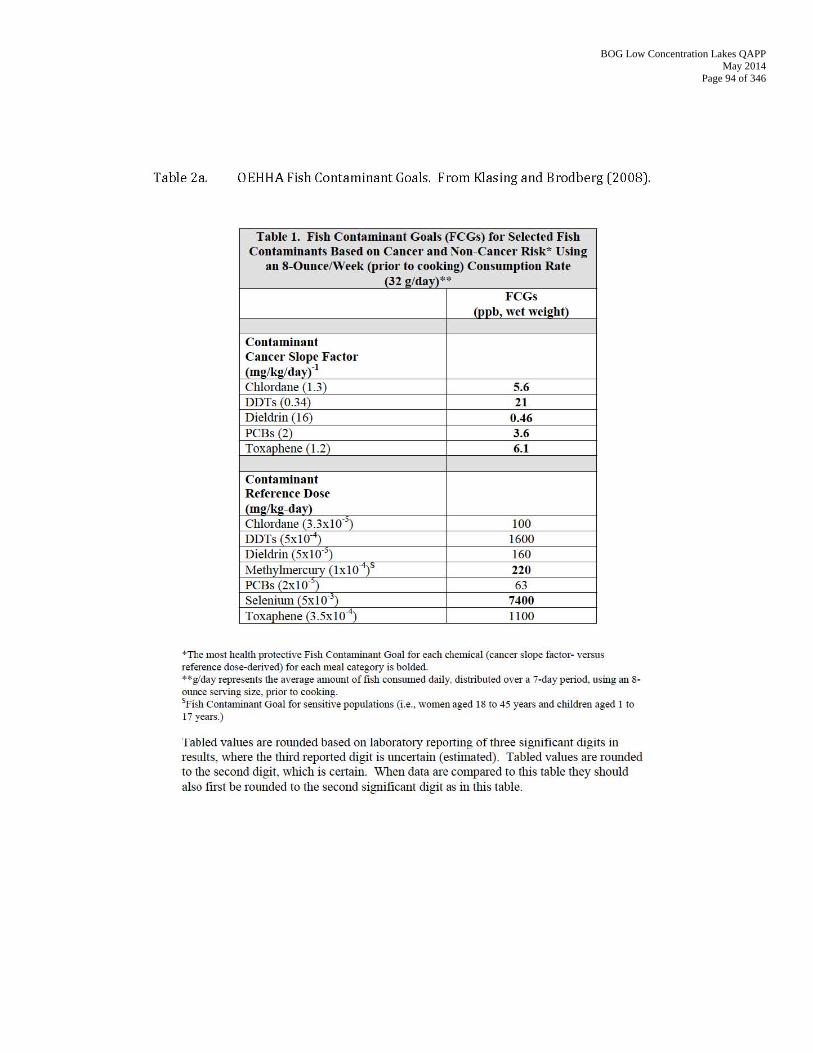
BOG Low Concentration Lakes QAPP May 2014
Page 94 of 346
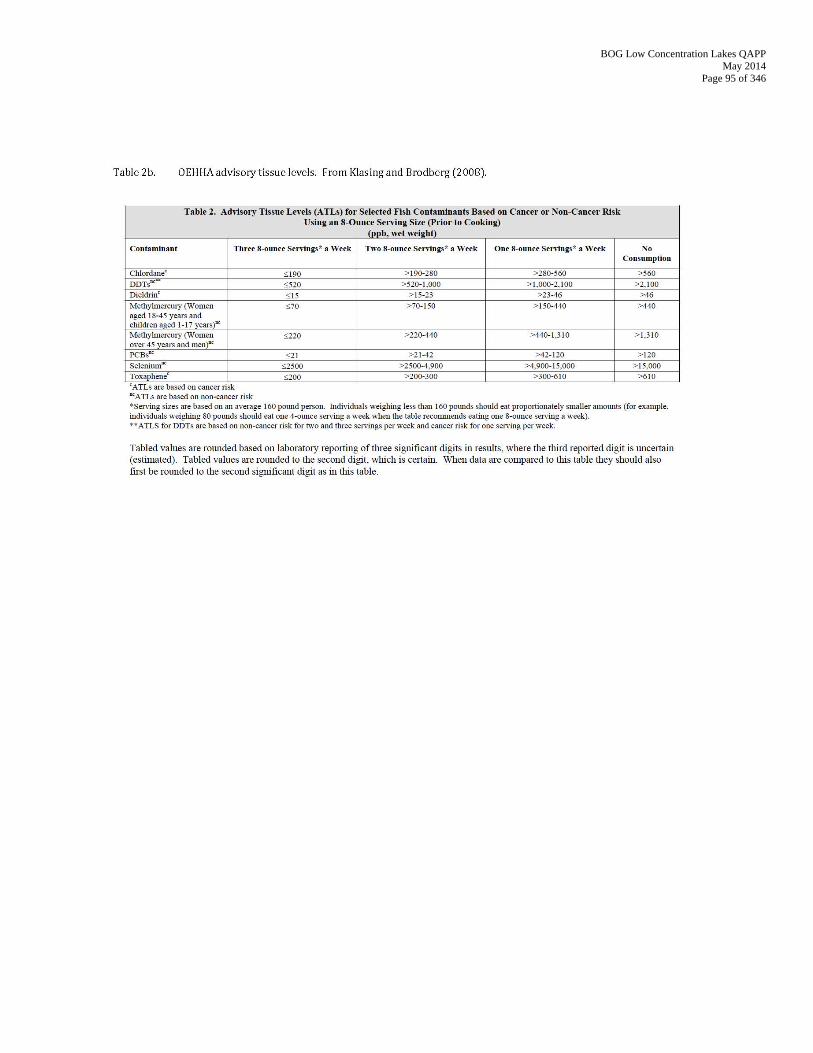
BOG Low Concentration Lakes QAPP May 2014
Page 95 of 346
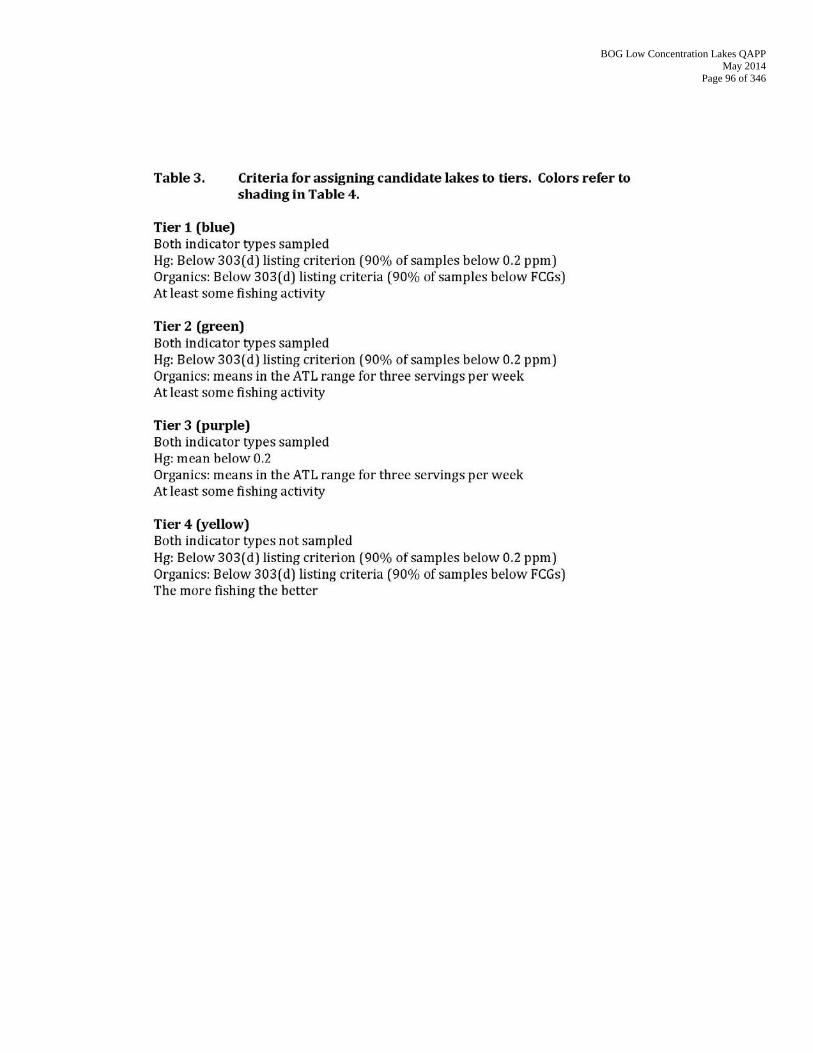
BOG Low Concentration Lakes QAPP May 2014
Page 96 of 346
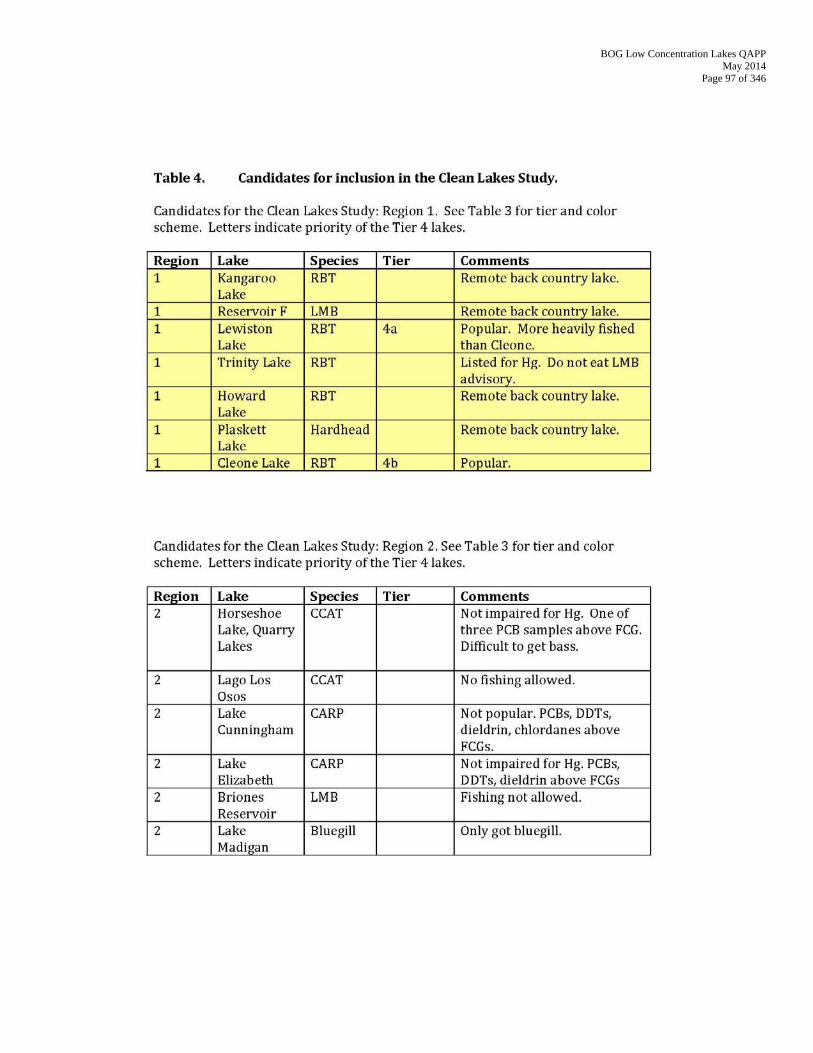
BOG Low Concentration Lakes QAPP May 2014
Page 97 of 346
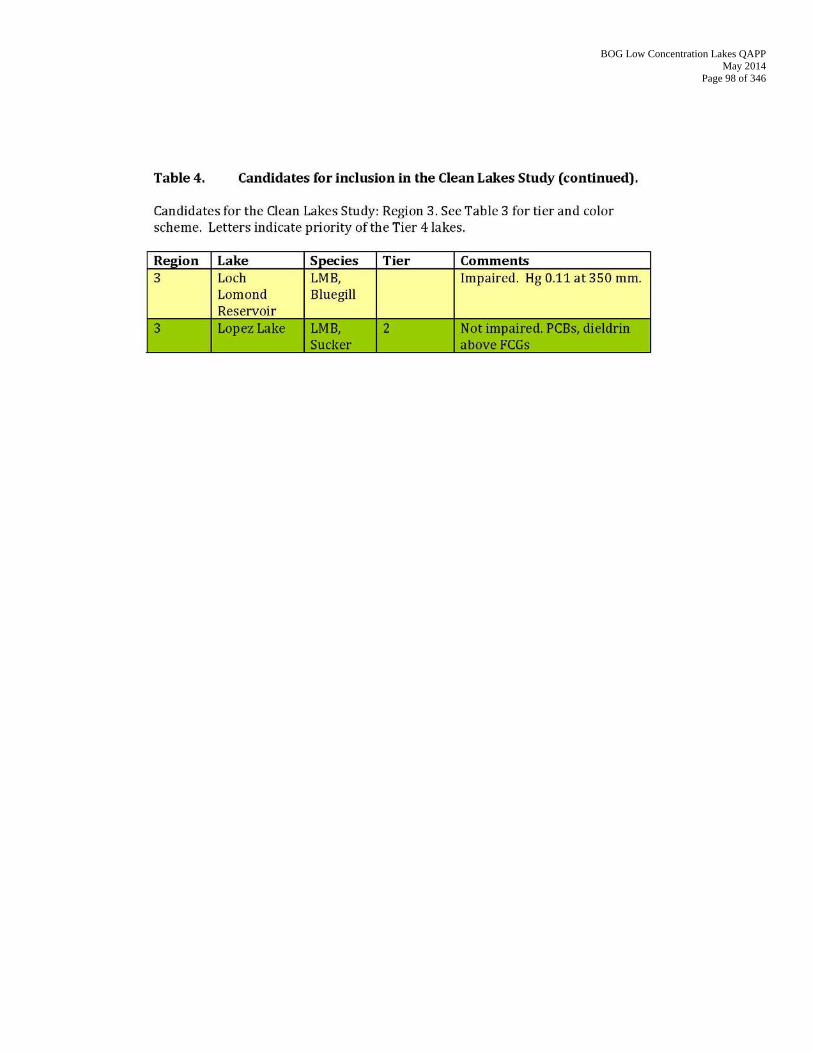
BOG Low Concentration Lakes QAPP May 2014
Page 98 of 346
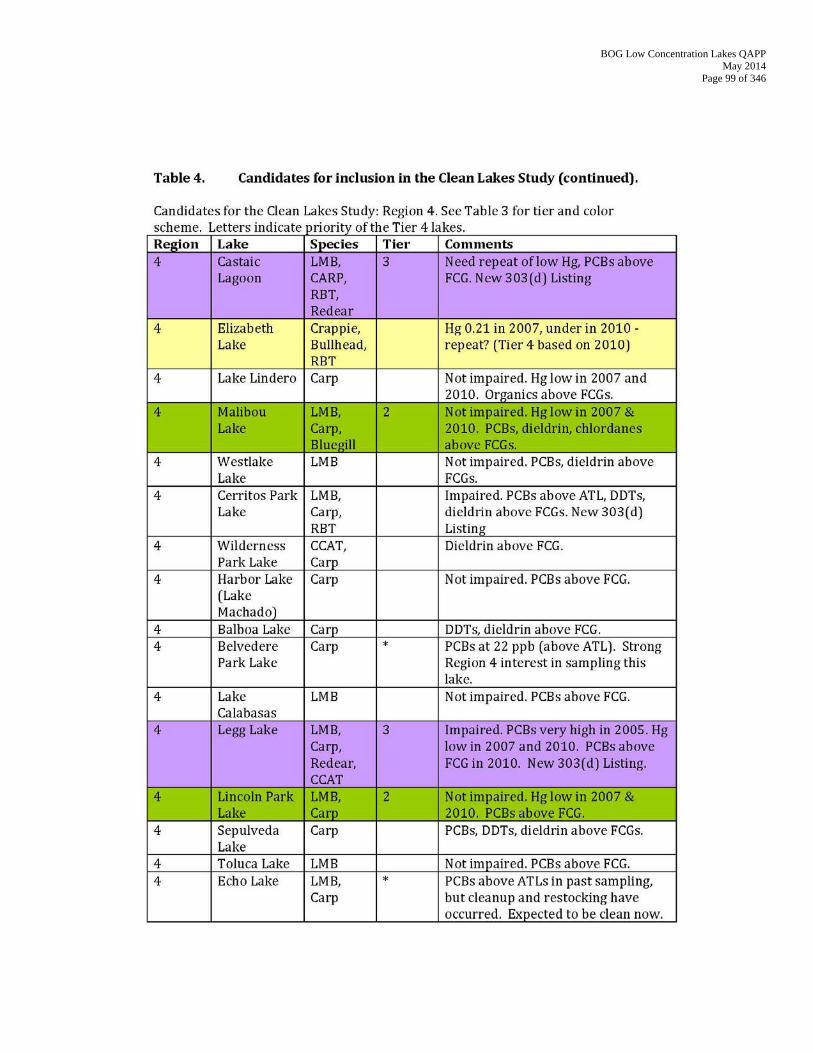
BOG Low Concentration Lakes QAPP May 2014
Page 99 of 346
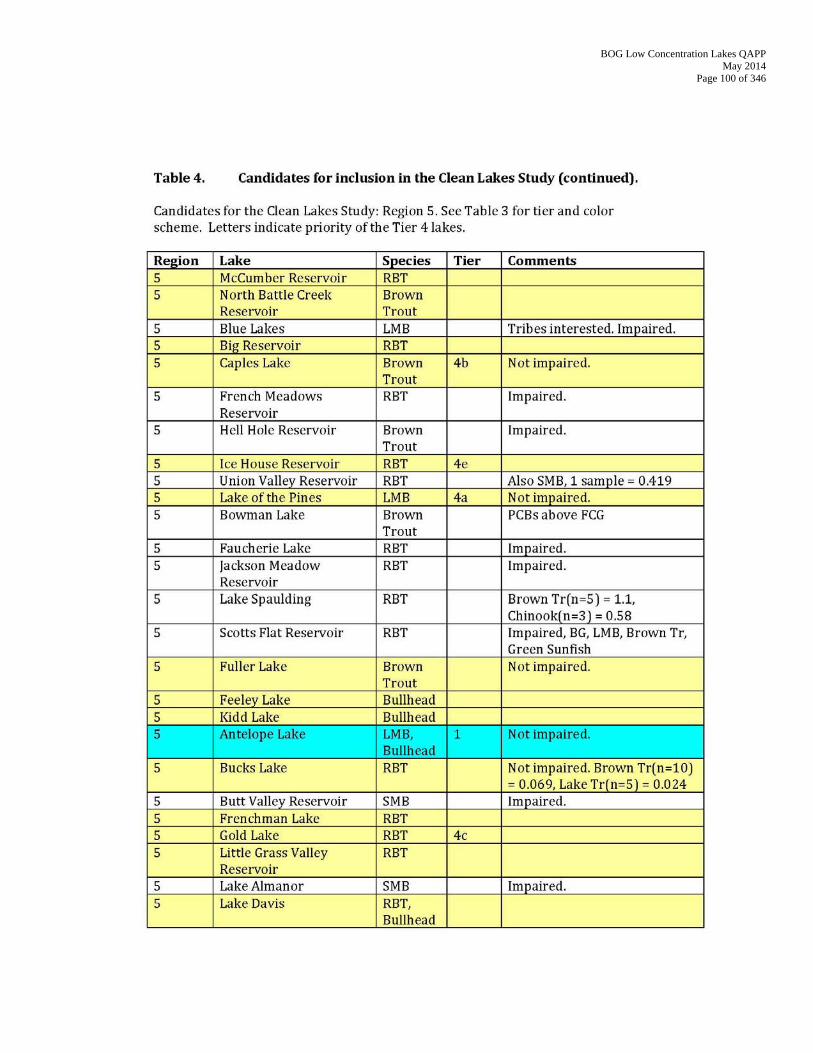
BOG Low Concentration Lakes QAPP May 2014
Page 100 of 346
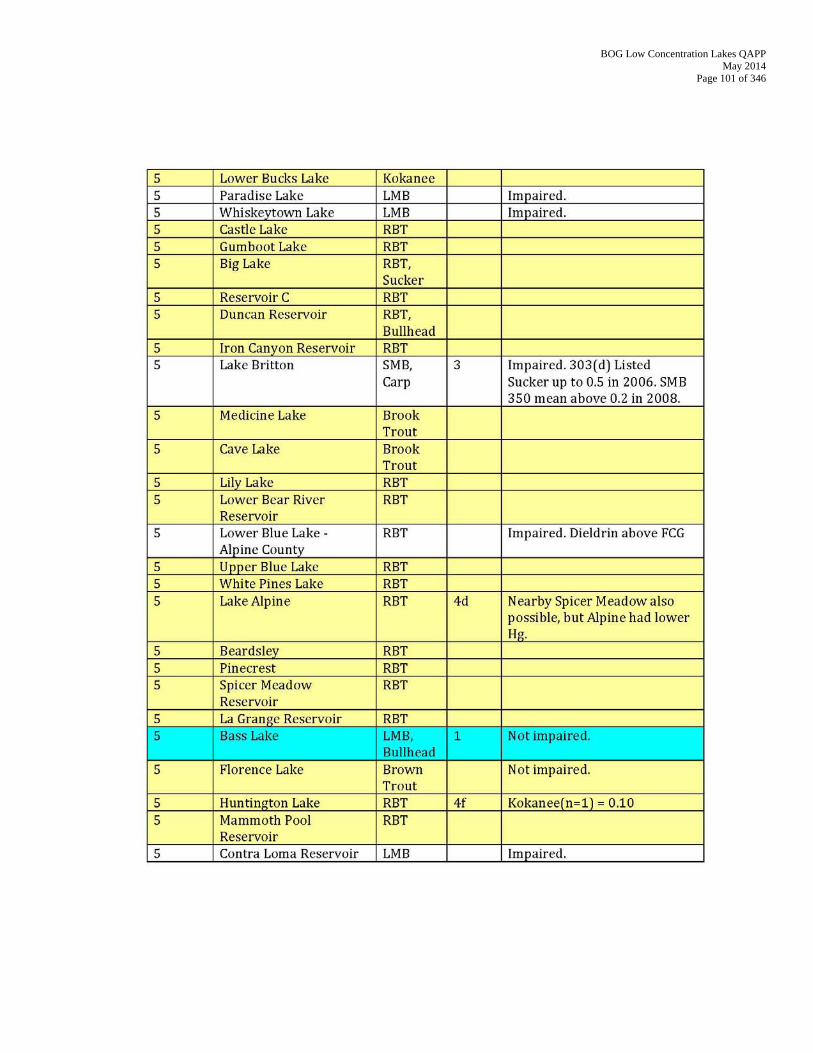
BOG Low Concentration Lakes QAPP May 2014
Page 101 of 346
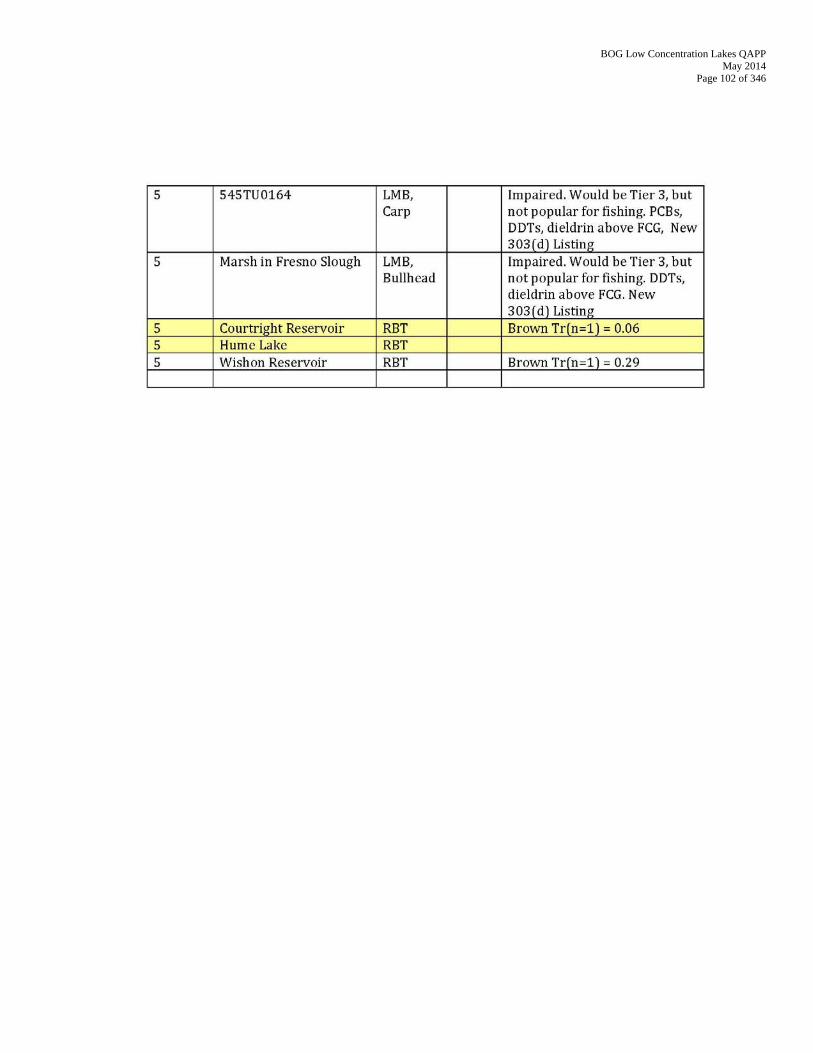
BOG Low Concentration Lakes QAPP May 2014
Page 102 of 346
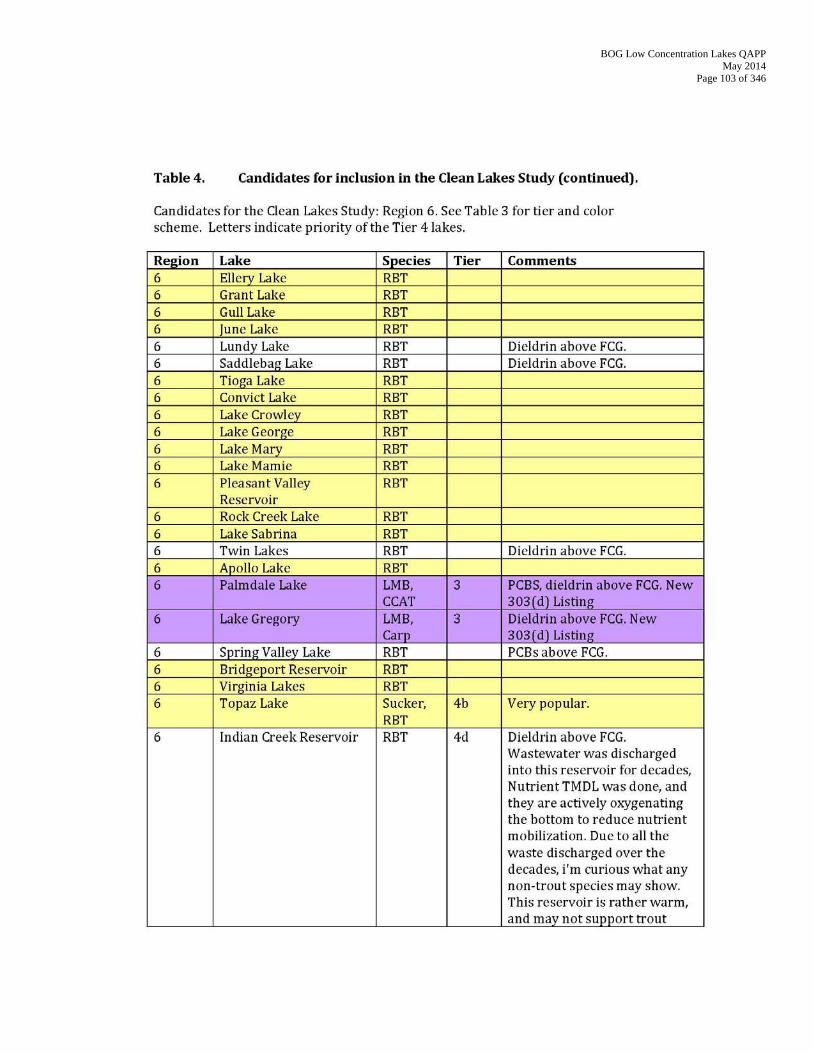
BOG Low Concentration Lakes QAPP May 2014
Page 103 of 346
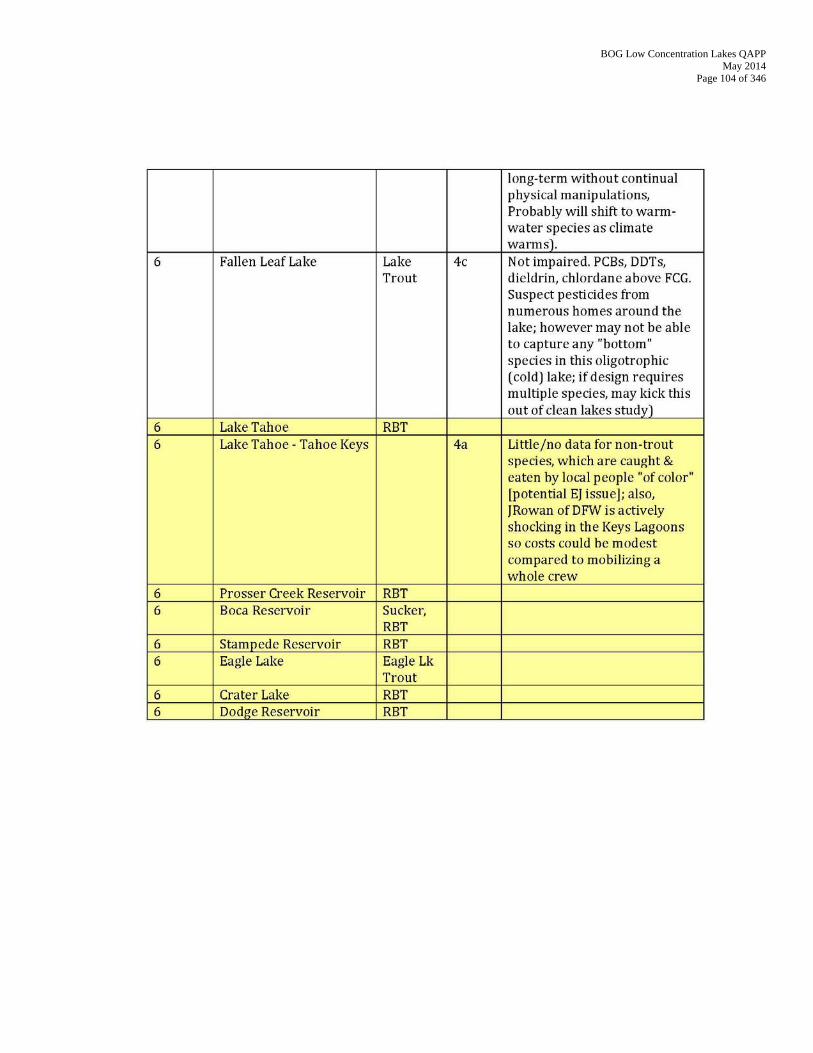
BOG Low Concentration Lakes QAPP May 2014
Page 104 of 346
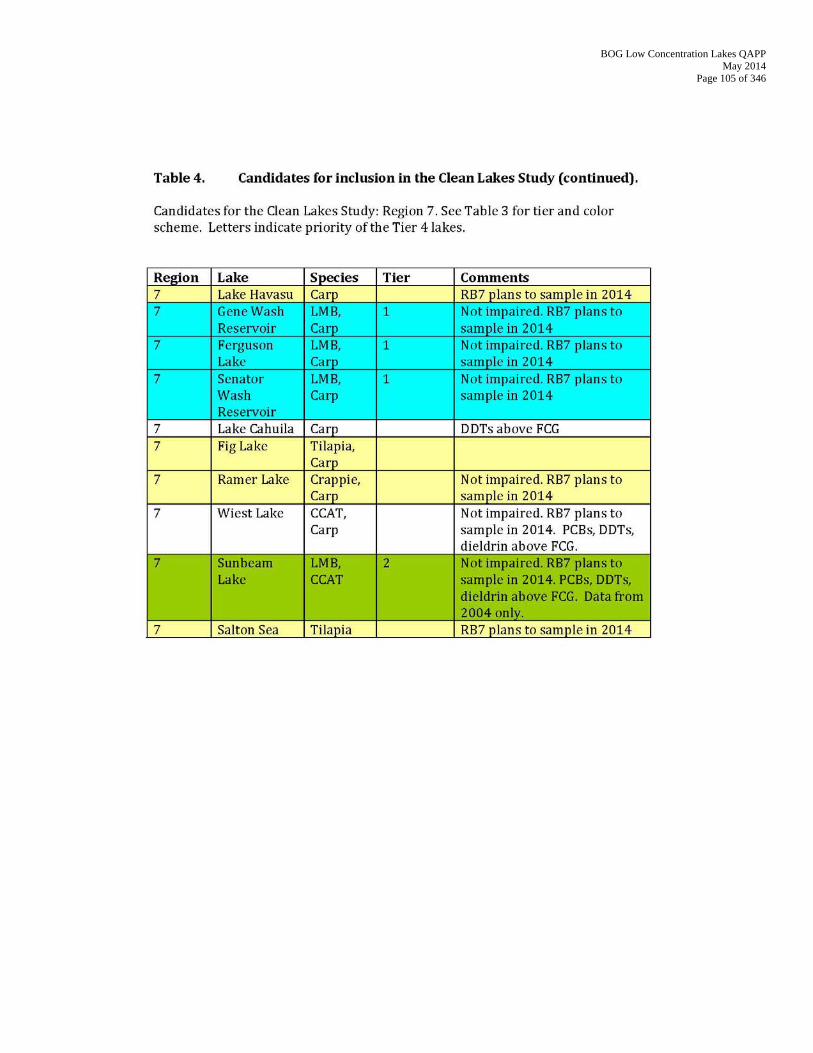
BOG Low Concentration Lakes QAPP May 2014
Page 105 of 346
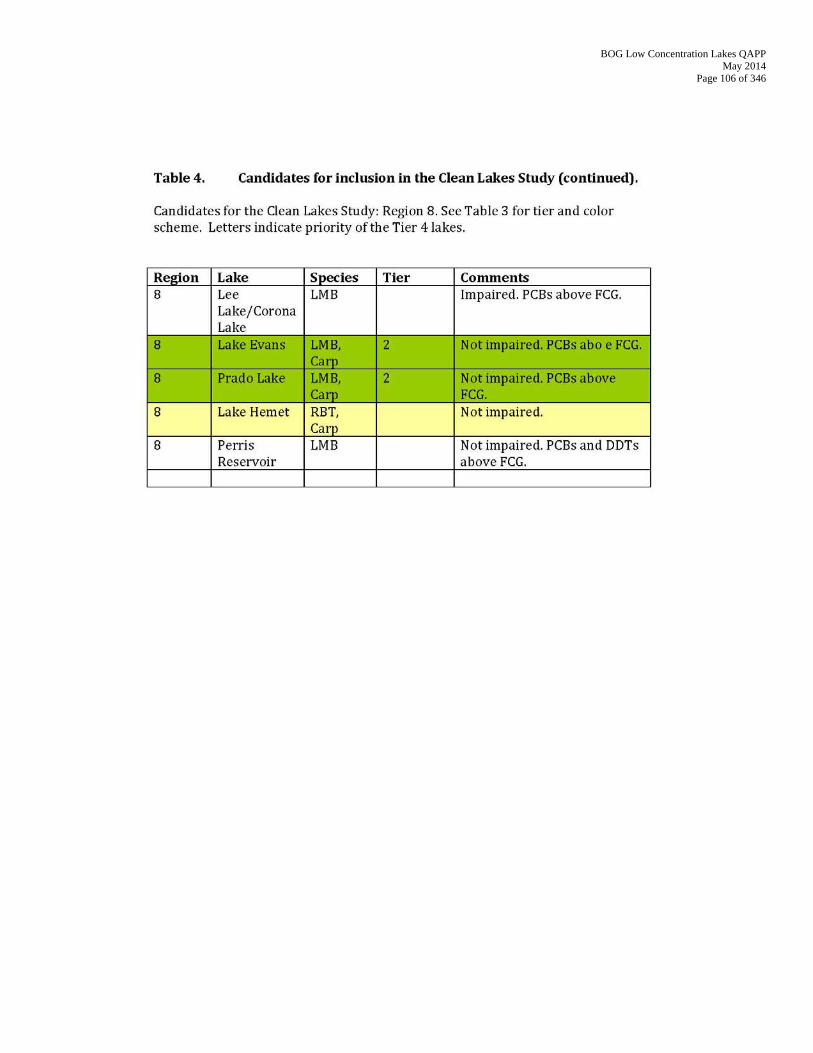
BOG Low Concentration Lakes QAPP May 2014
Page 106 of 346
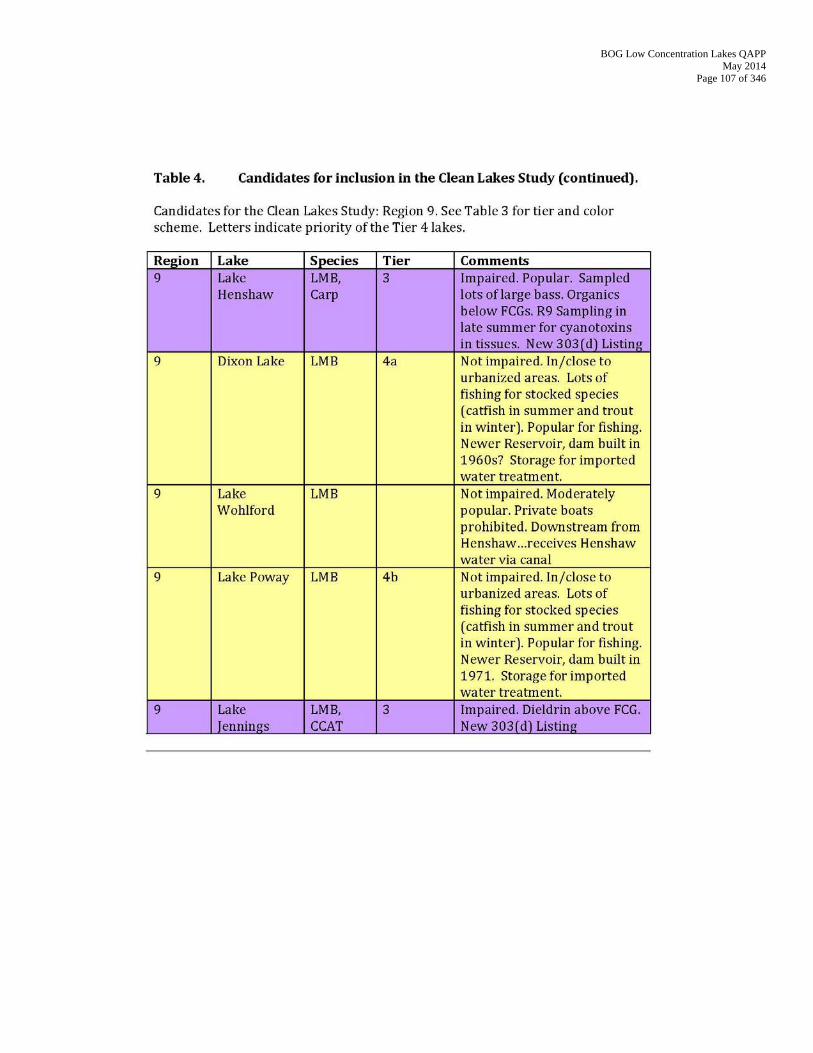
BOG Low Concentration Lakes QAPP May 2014
Page 107 of 346
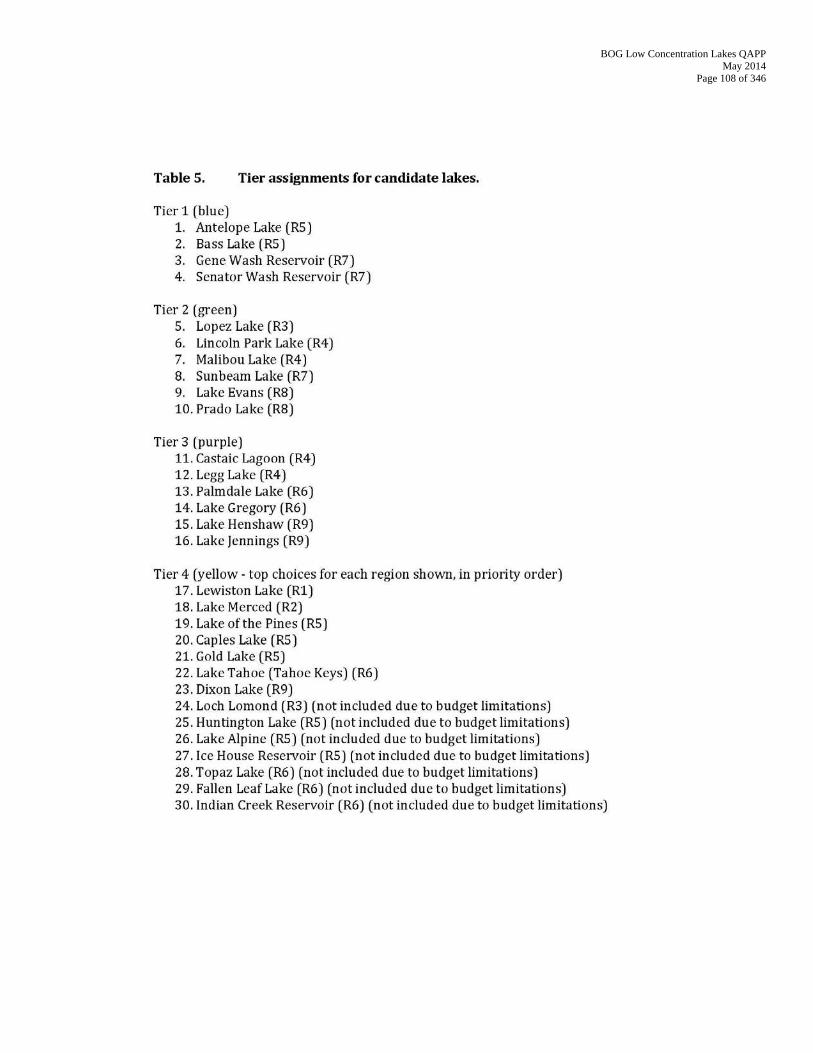
BOG Low Concentration Lakes QAPP May 2014
Page 108 of 346
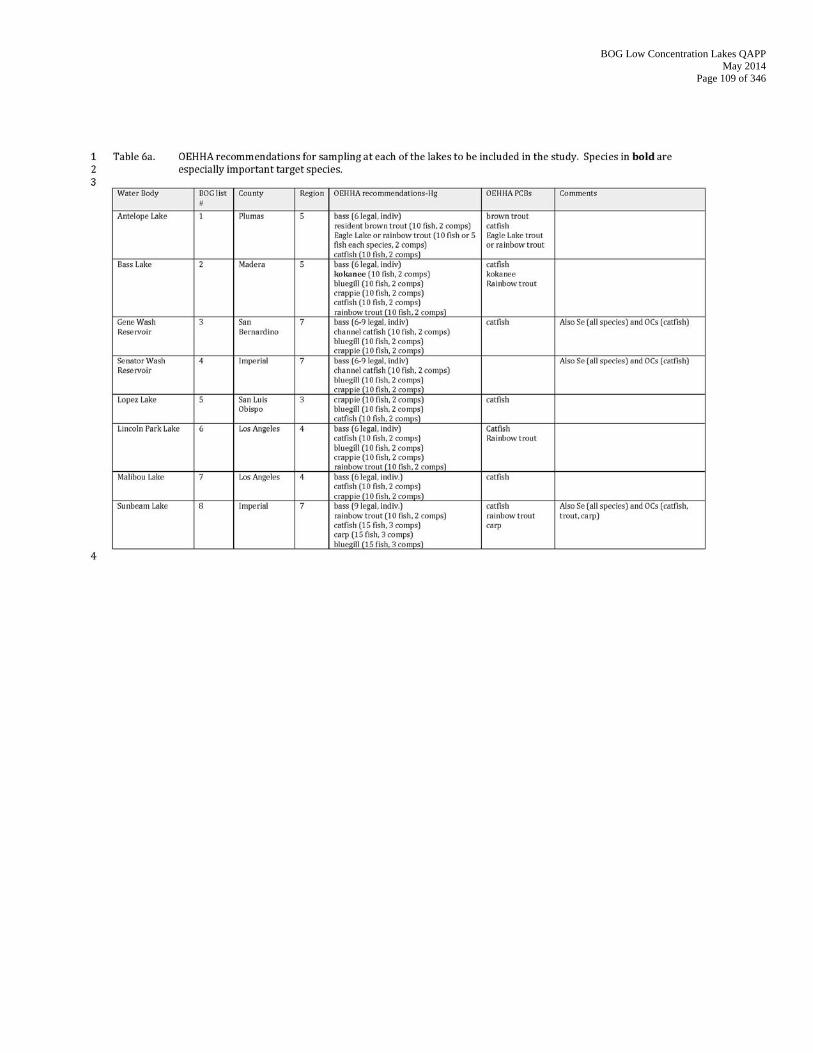
BOG Low Concentration Lakes QAPP May 2014
Page 109 of 346
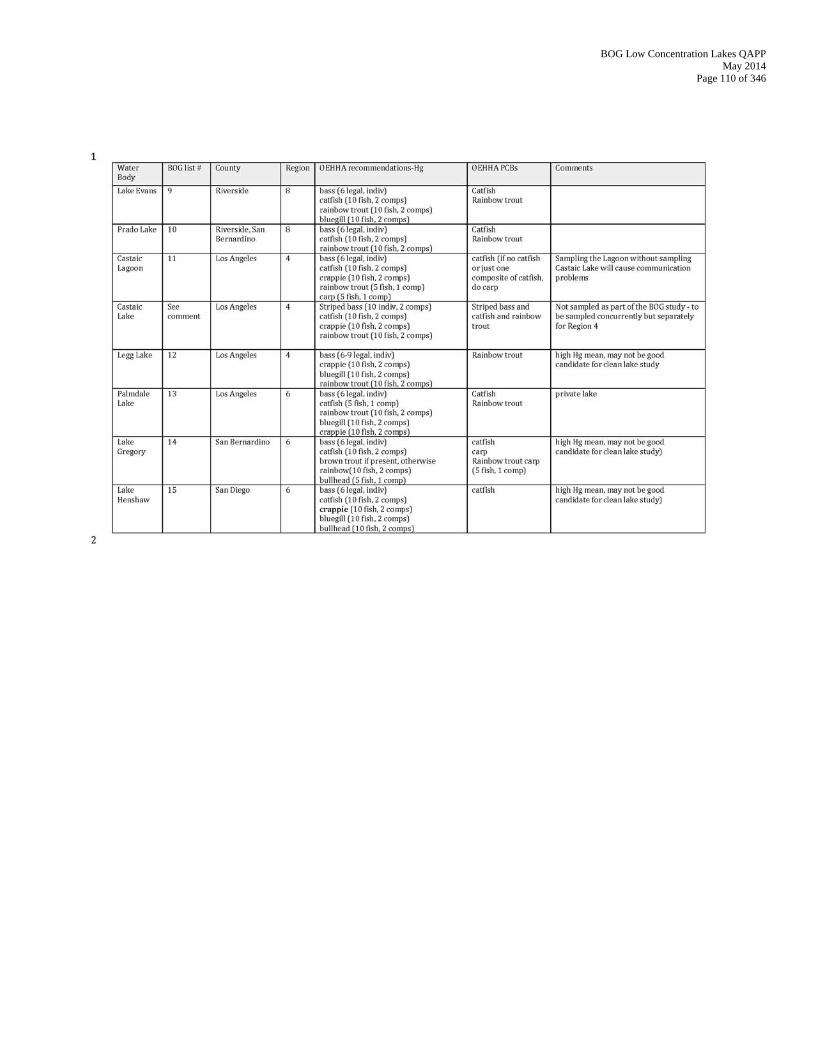
BOG Low Concentration Lakes QAPP May 2014
Page 110 of 346
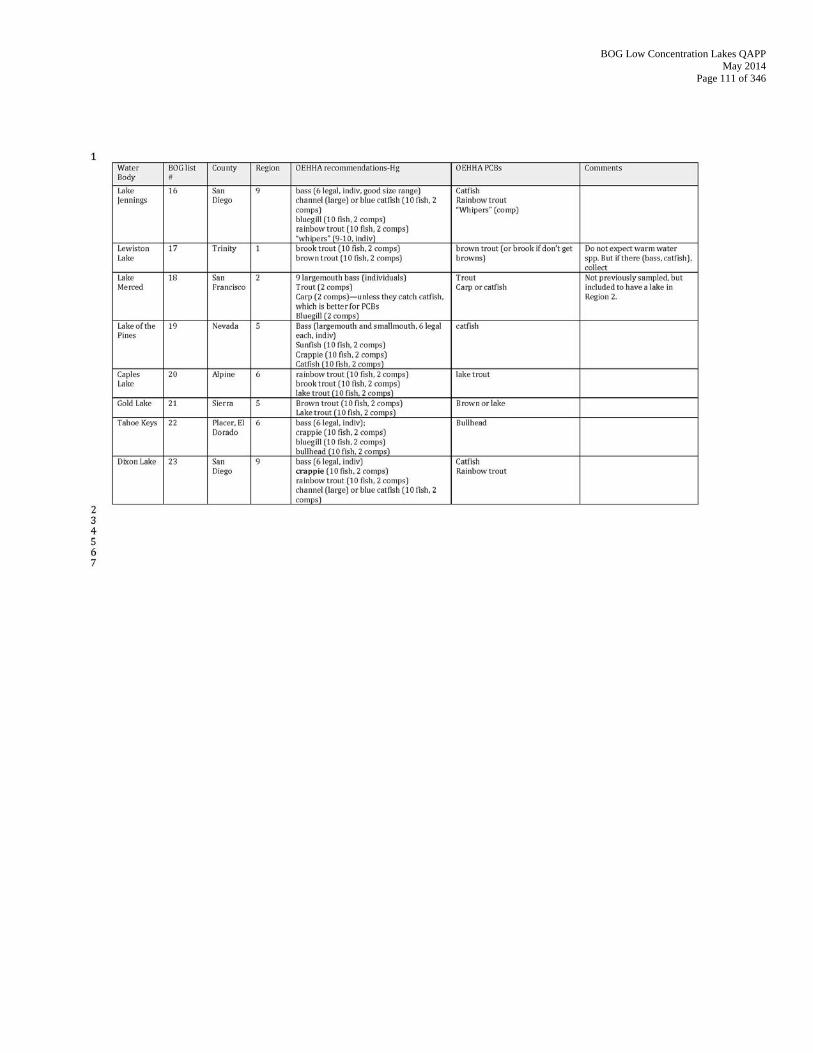
BOG Low Concentration Lakes QAPP May 2014
Page 111 of 346
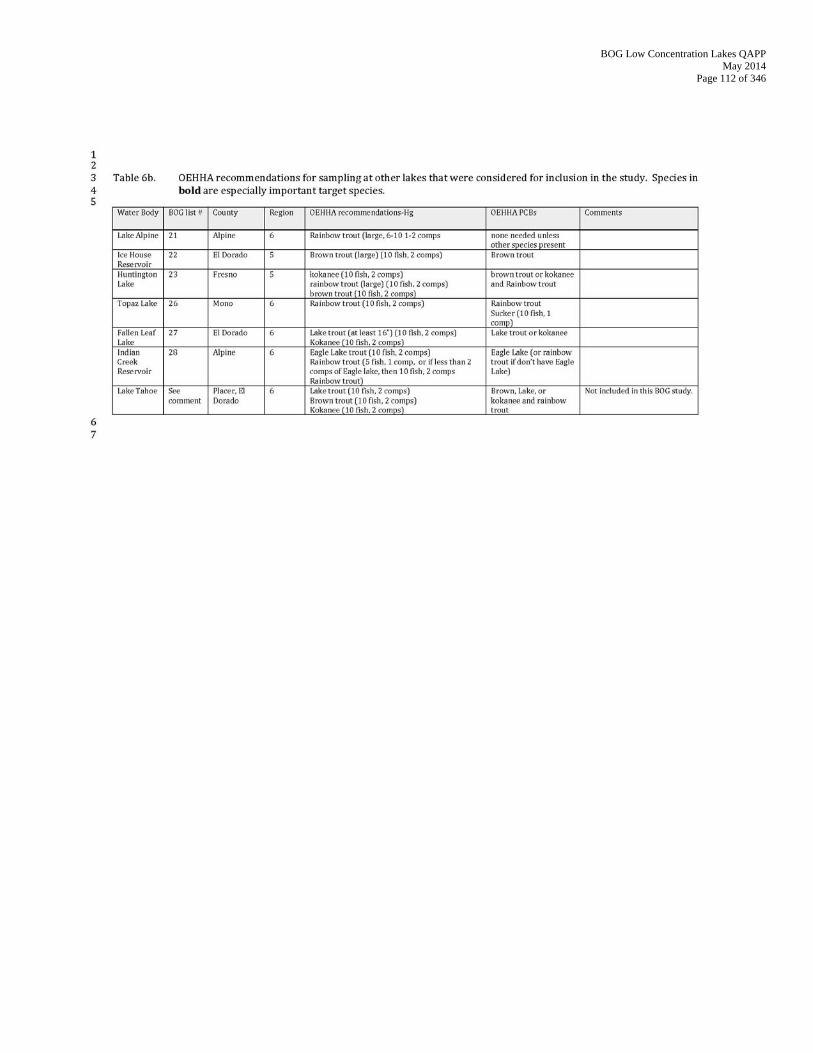
BOG Low Concentration Lakes QAPP May 2014
Page 112 of 346
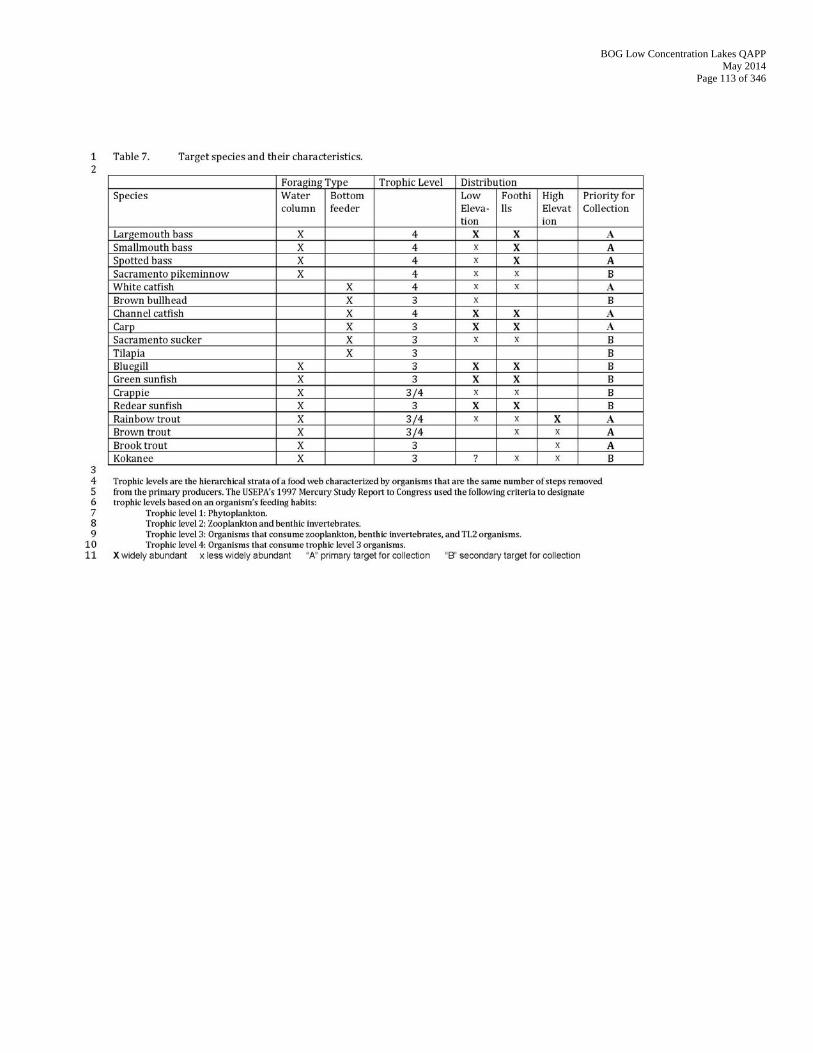
BOG Low Concentration Lakes QAPP May 2014
Page 113 of 346
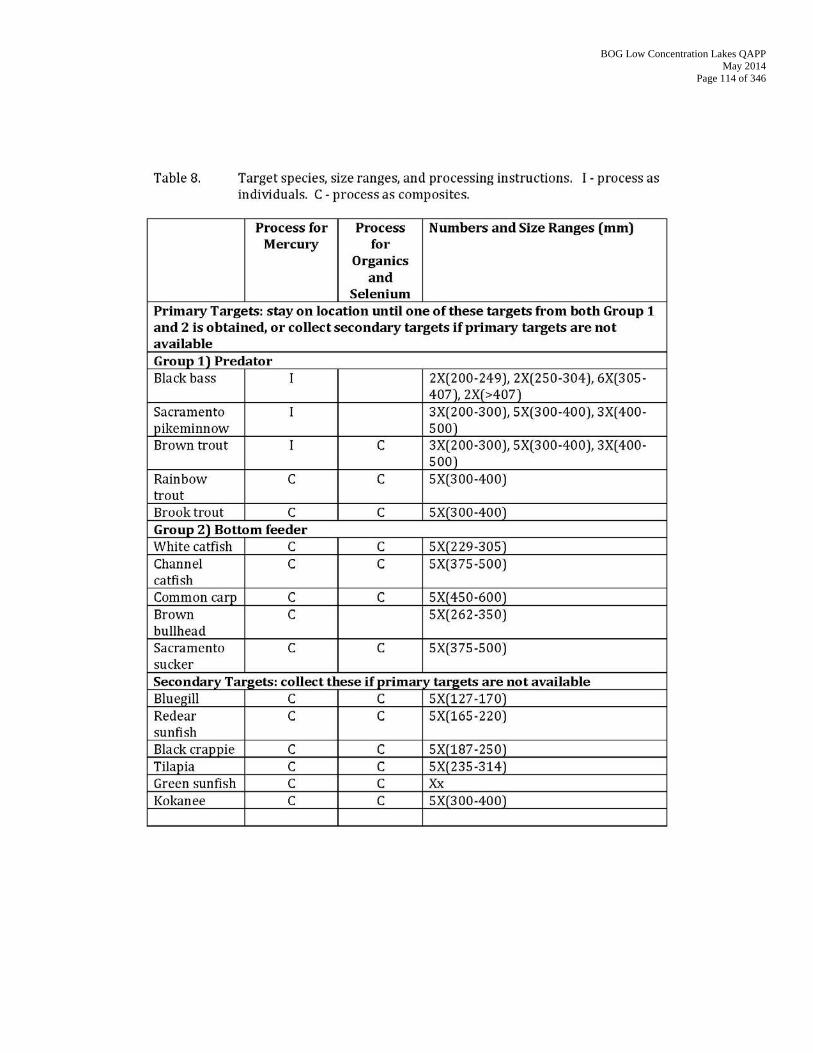
BOG Low Concentration Lakes QAPP May 2014
Page 114 of 346
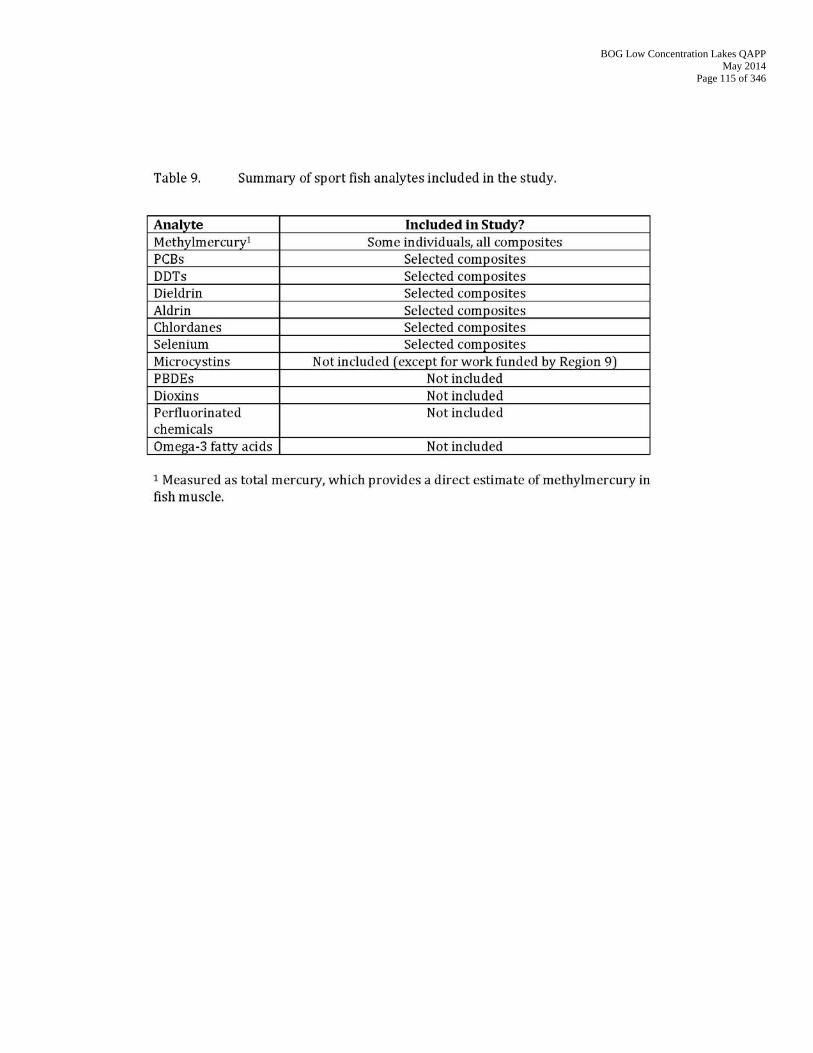
BOG Low Concentration Lakes QAPP May 2014
Page 115 of 346
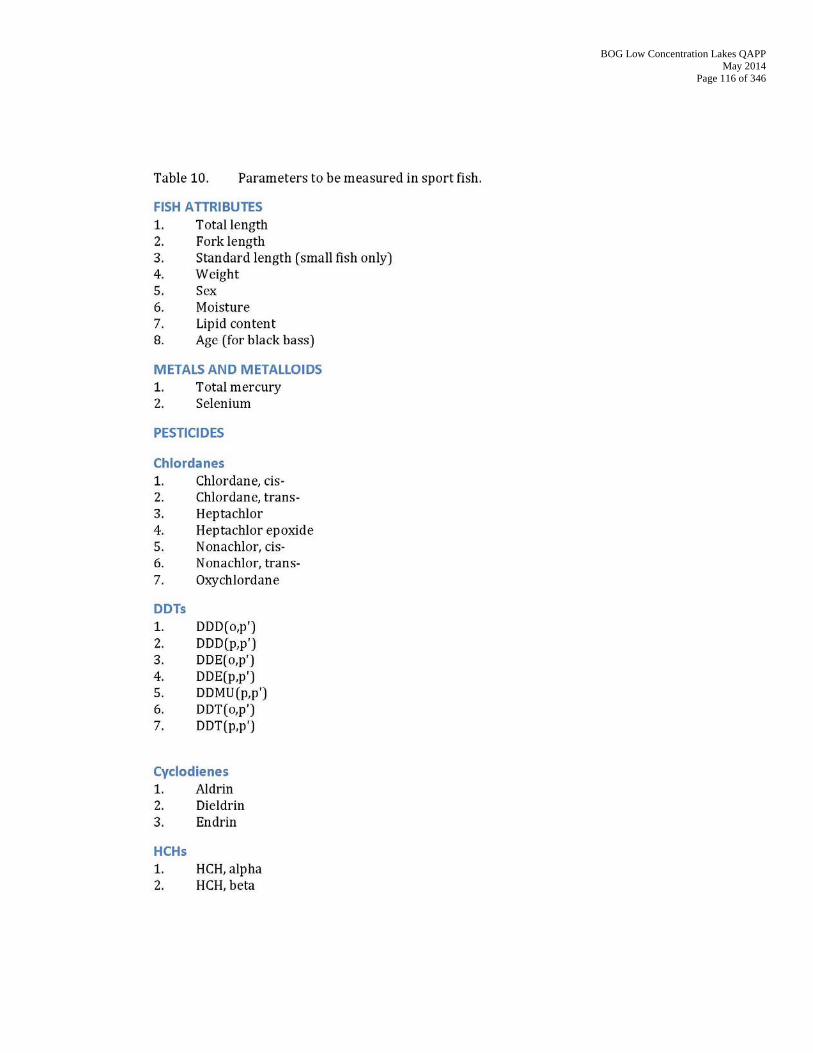
BOG Low Concentration Lakes QAPP May 2014
Page 116 of 346

BOG Low Concentration Lakes QAPP May 2014
Page 117 of 346
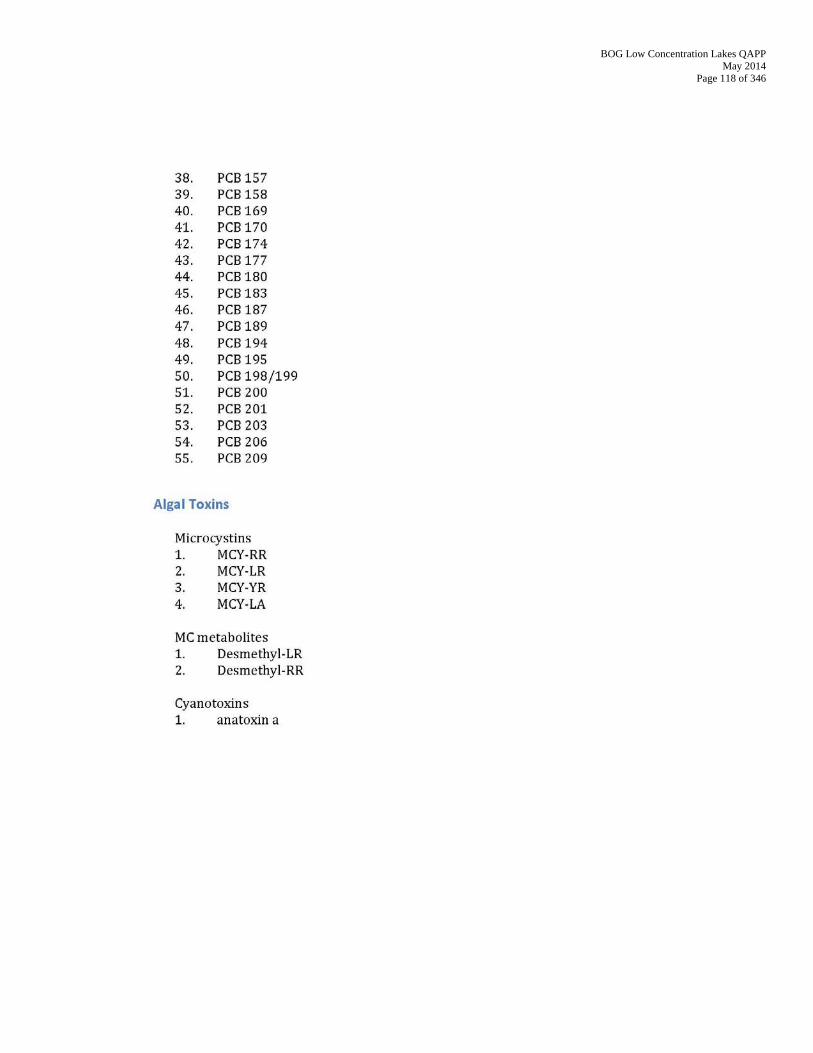
BOG Low Concentration Lakes QAPP May 2014
Page 118 of 346
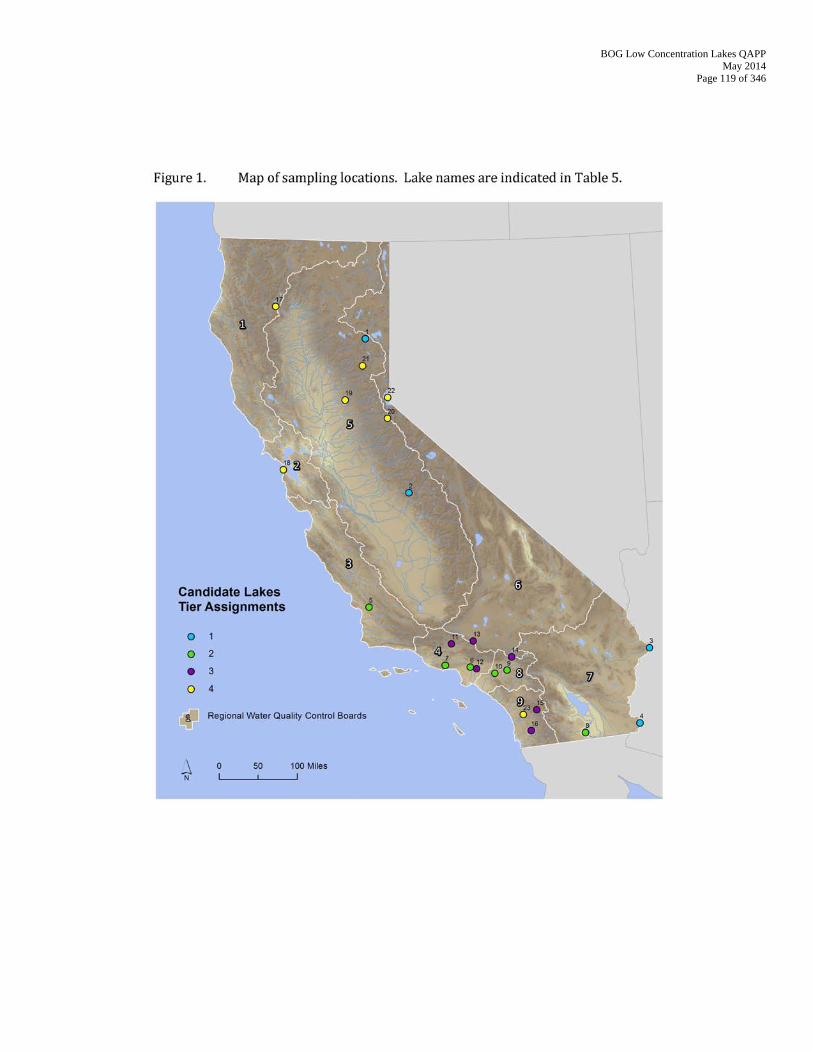
BOG Low Concentration Lakes QAPP May 2014
Page 119 of 346
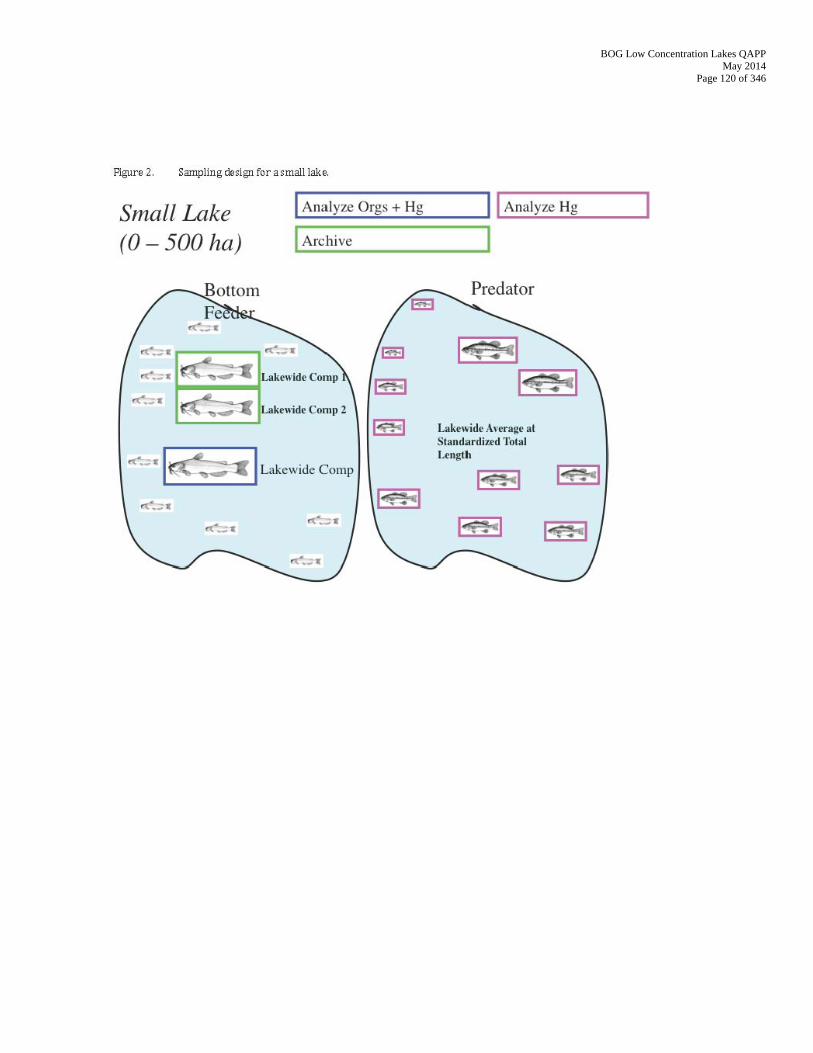
BOG Low Concentration Lakes QAPP May 2014
Page 120 of 346
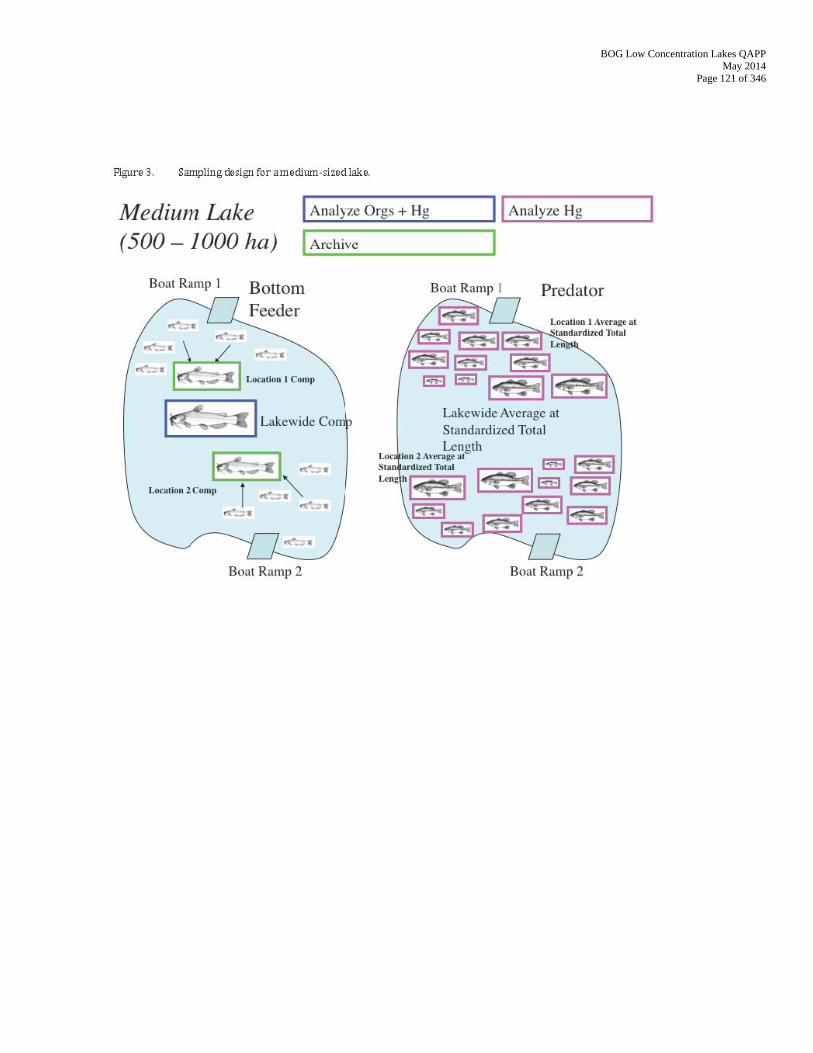
BOG Low Concentration Lakes QAPP May 2014
Page 121 of 346
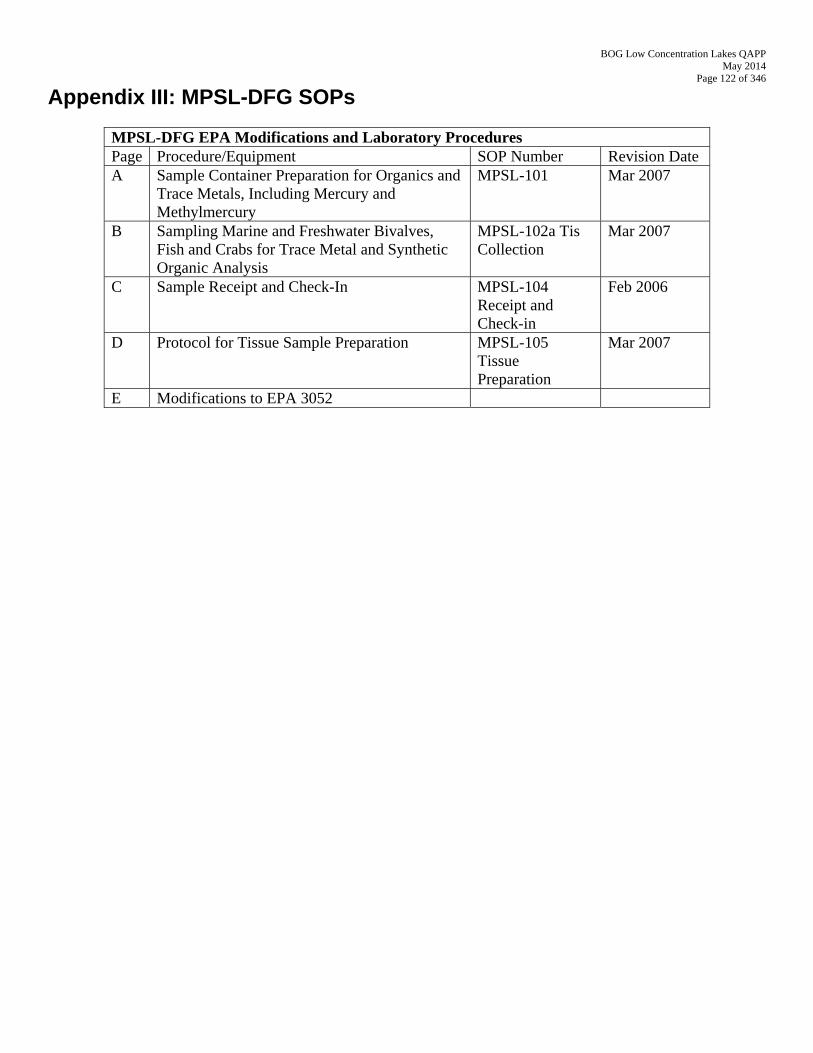
BOG Low Concentration Lakes QAPP May 2014
Page 122 of 346
Appendix III: MPSL-DFG SOPs
MPSL-DFG EPA Modifications and Laboratory Procedures Page Procedure/Equipment SOP Number Revision Date A Sample Container Preparation for Organics and
Trace Metals, Including Mercury and Methylmercury
MPSL-101 Mar 2007
B Sampling Marine and Freshwater Bivalves, Fish and Crabs for Trace Metal and Synthetic Organic Analysis
MPSL-102a Tis Collection
Mar 2007
C Sample Receipt and Check-In MPSL-104 Receipt and Check-in
Feb 2006
D Protocol for Tissue Sample Preparation MPSL-105 Tissue Preparation
Mar 2007
E Modifications to EPA 3052
BOG Low Concentration Lakes QAPP May 2014
Page 123 of 346
Appendix III A: MPSL-101 Sample Container Preparation for Organics and Trace Metals, Including Mercury and Methylmercury
BOG Low Concentration Lakes QAPP May 2014
Page 124 of 346
BOG Low Concentration Lakes QAPP May 2014
Page 125 of 346
BOG Low Concentration Lakes QAPP May 2014
Page 126 of 346
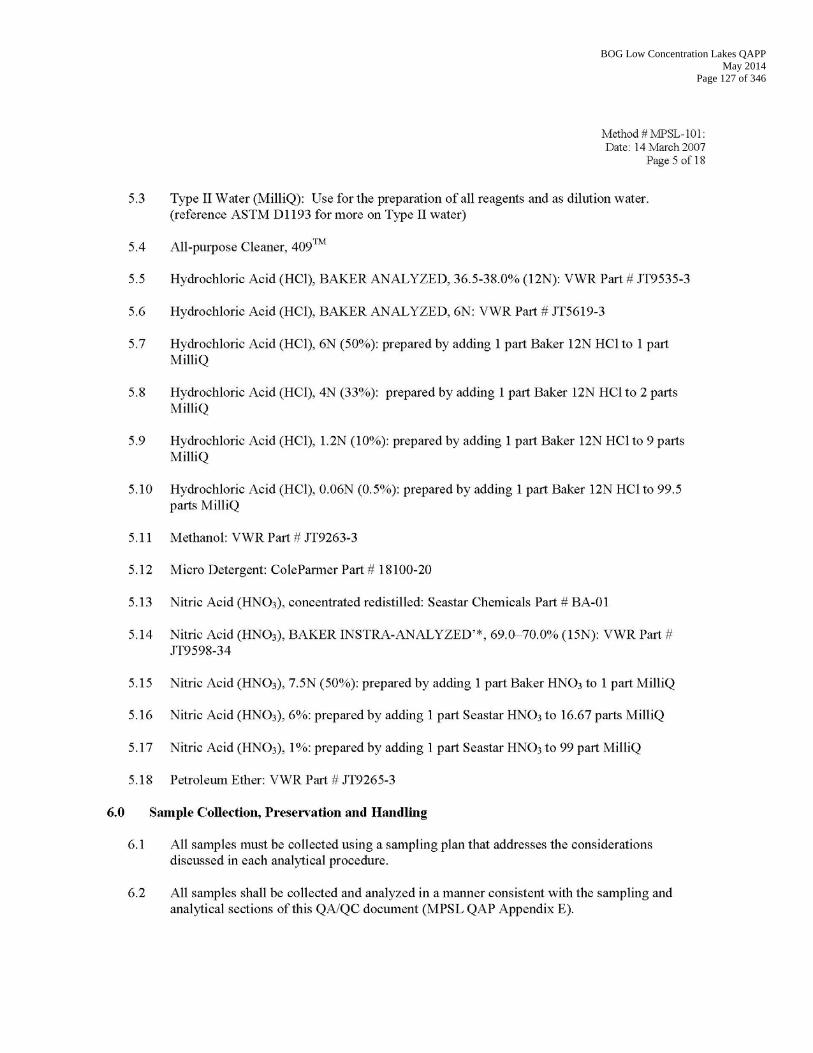
BOG Low Concentration Lakes QAPP May 2014
Page 127 of 346
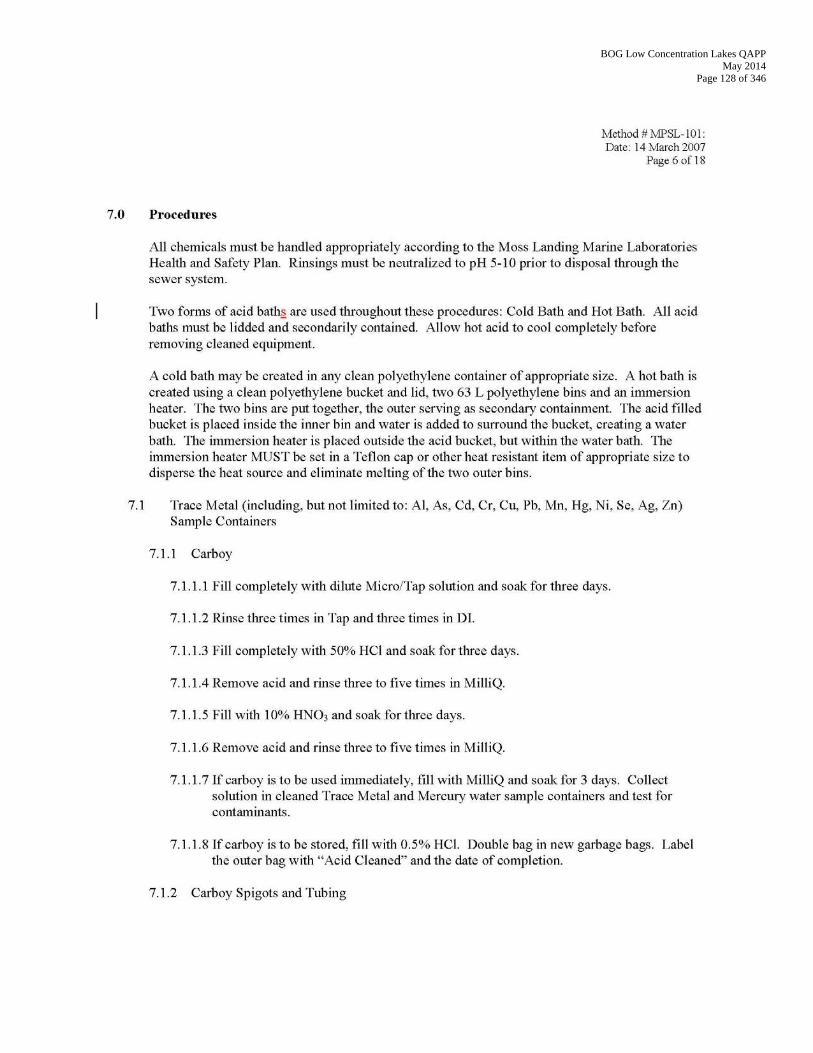
BOG Low Concentration Lakes QAPP May 2014
Page 128 of 346
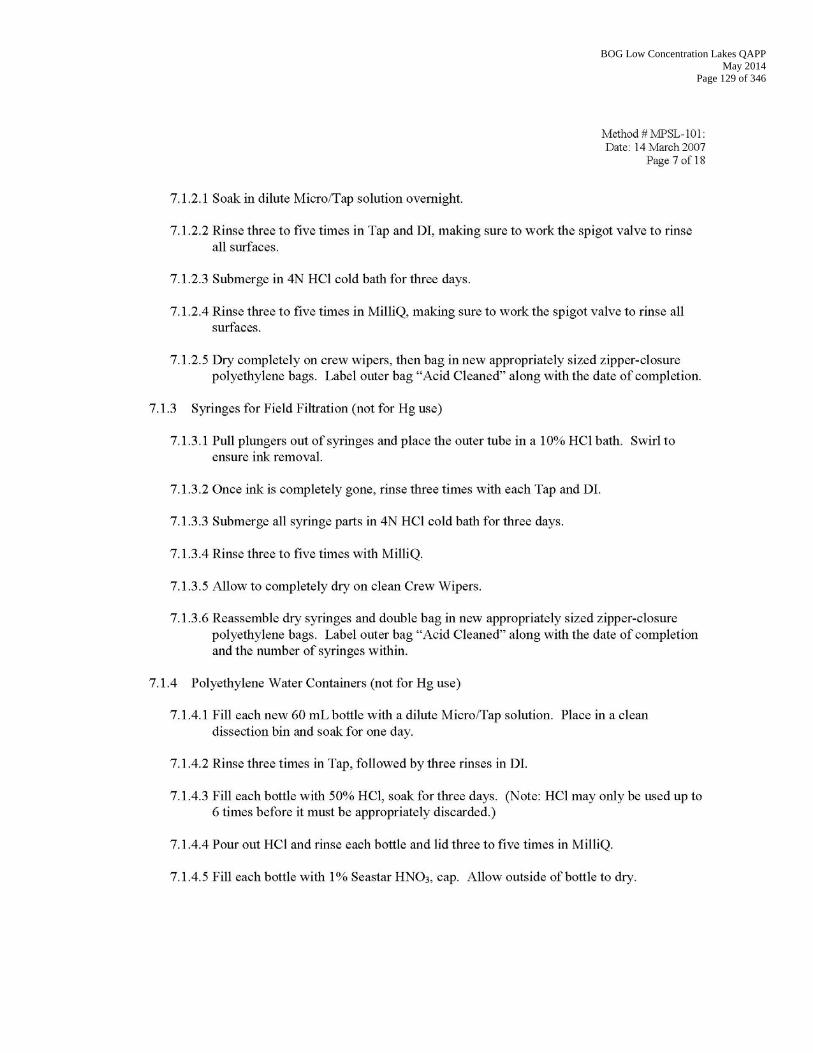
BOG Low Concentration Lakes QAPP May 2014
Page 129 of 346
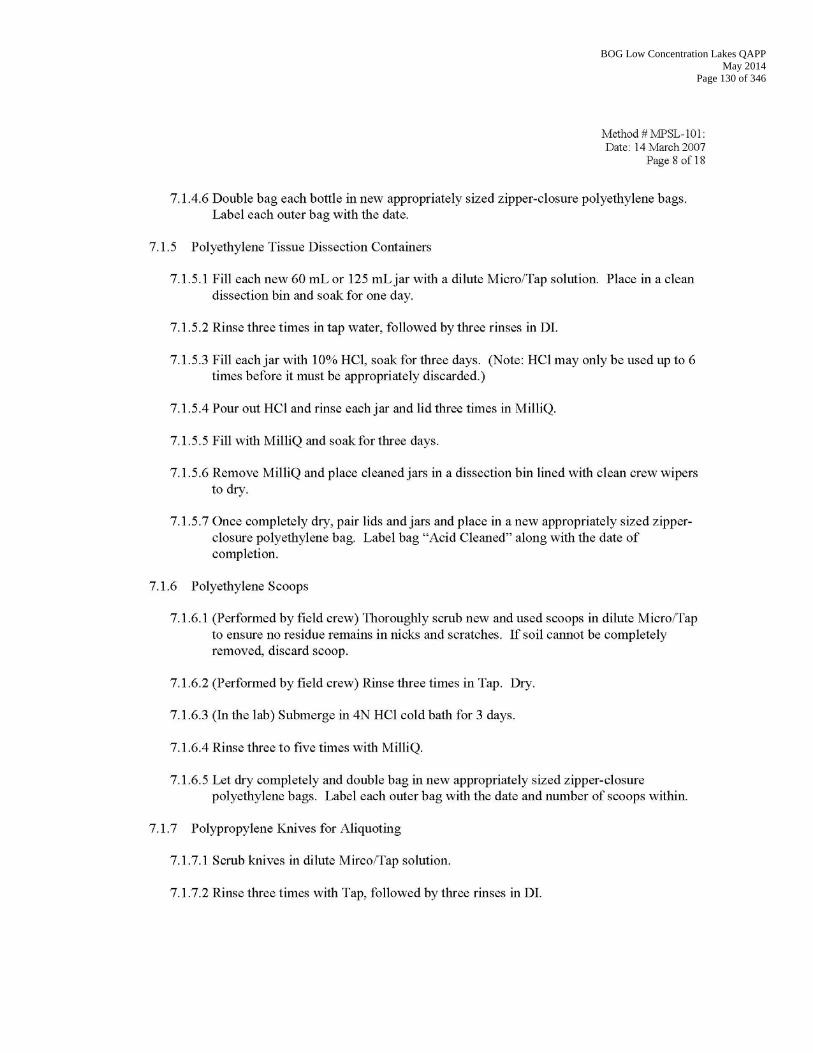
BOG Low Concentration Lakes QAPP May 2014
Page 130 of 346

BOG Low Concentration Lakes QAPP May 2014
Page 131 of 346
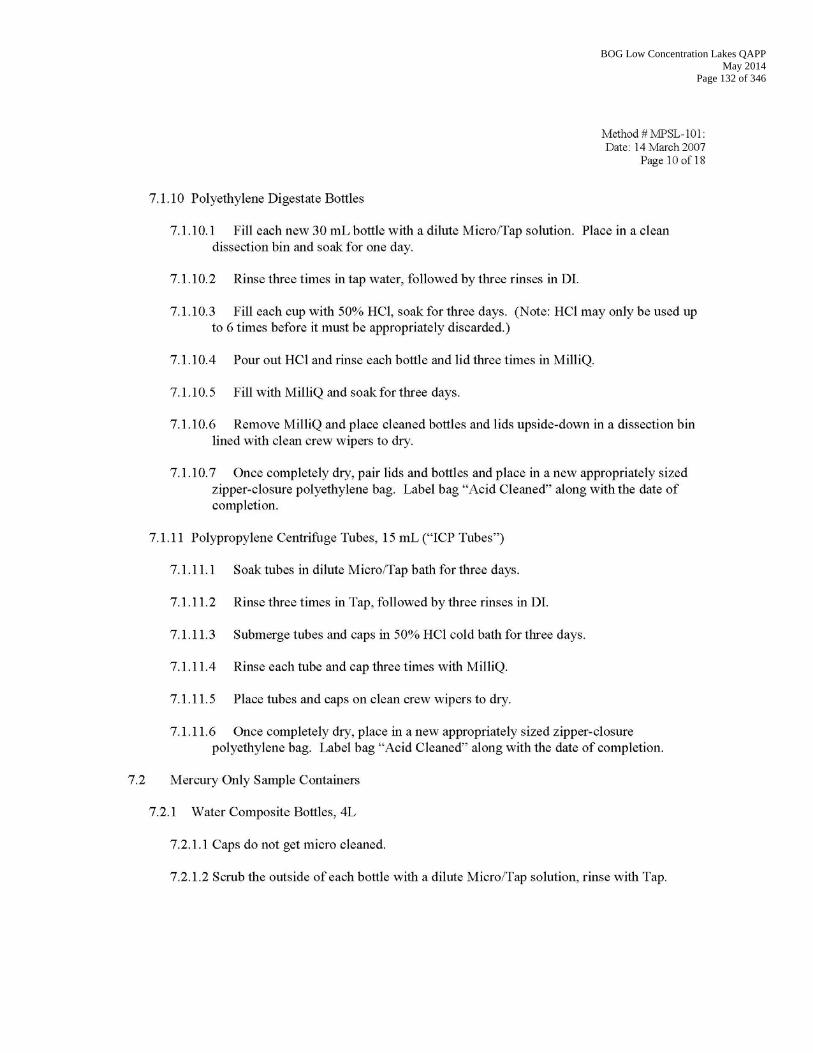
BOG Low Concentration Lakes QAPP May 2014
Page 132 of 346
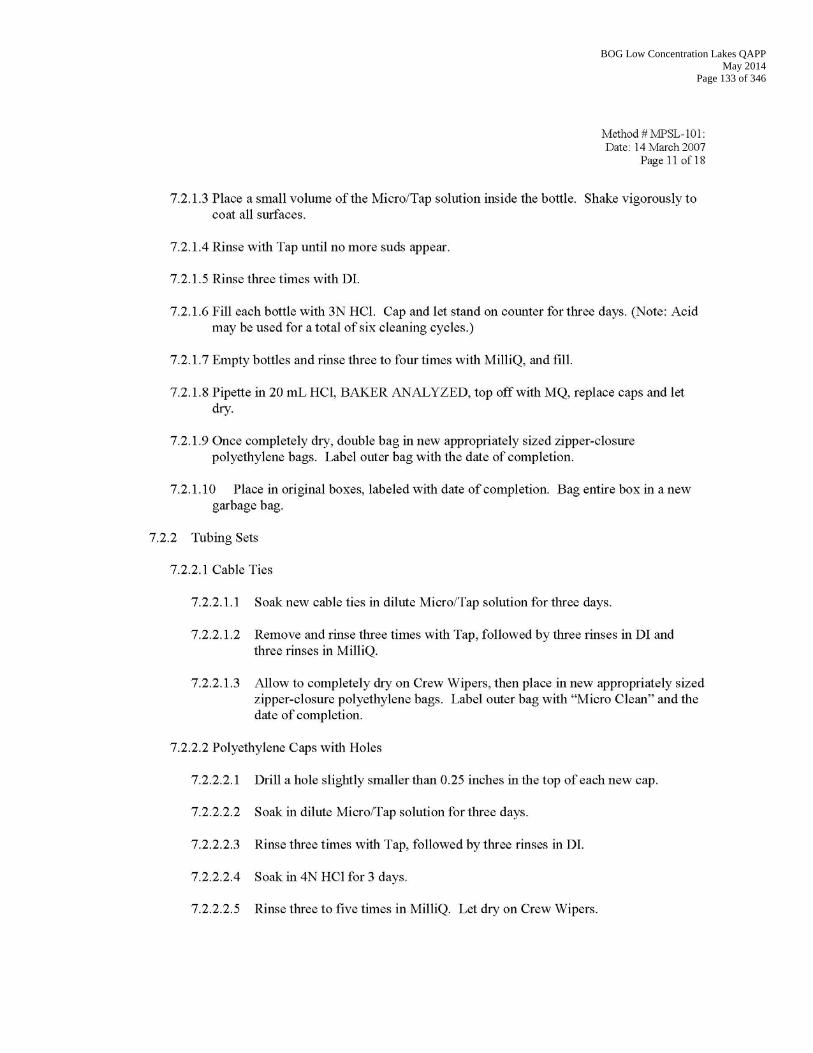
BOG Low Concentration Lakes QAPP May 2014
Page 133 of 346
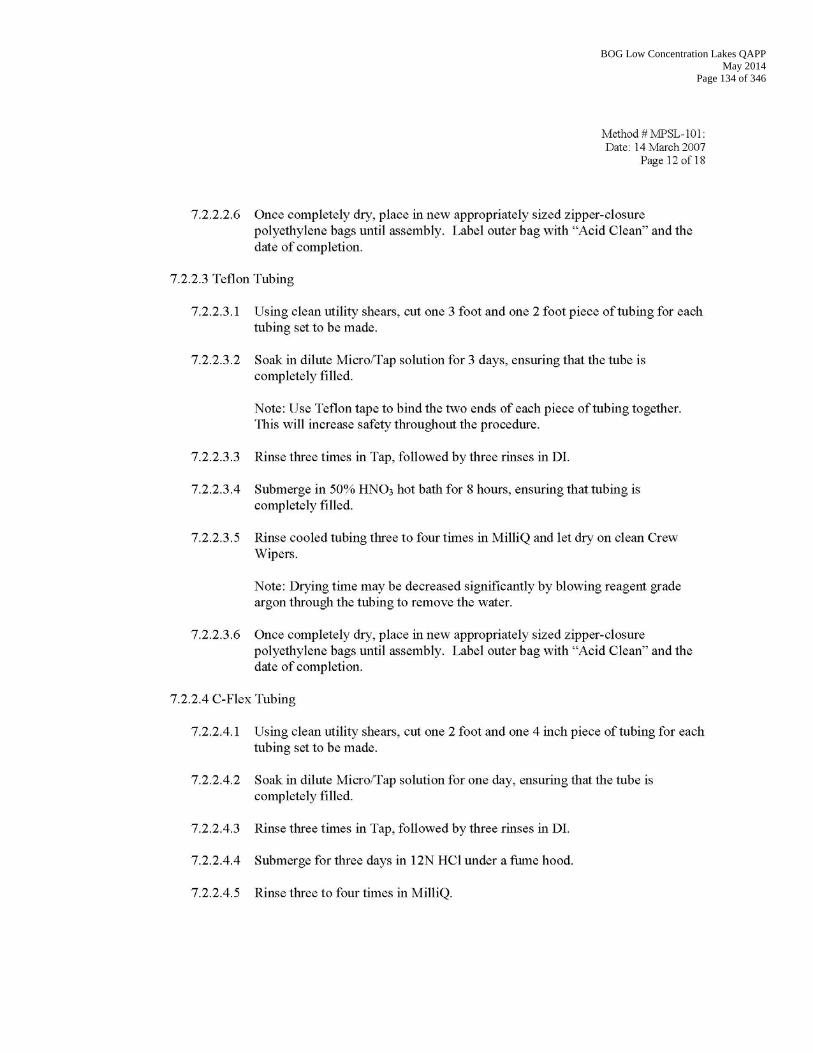
BOG Low Concentration Lakes QAPP May 2014
Page 134 of 346
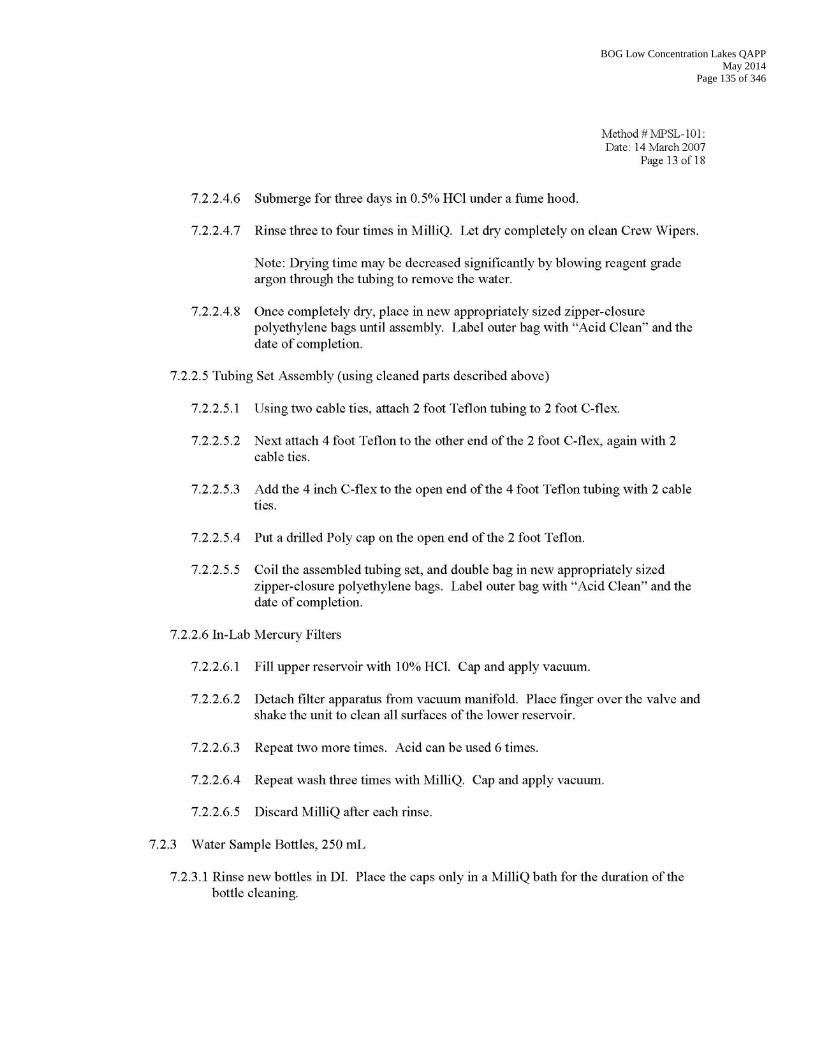
BOG Low Concentration Lakes QAPP May 2014
Page 135 of 346
BOG Low Concentration Lakes QAPP May 2014
Page 136 of 346
BOG Low Concentration Lakes QAPP May 2014
Page 137 of 346
BOG Low Concentration Lakes QAPP May 2014
Page 138 of 346
BOG Low Concentration Lakes QAPP May 2014
Page 139 of 346
BOG Low Concentration Lakes QAPP May 2014
Page 140 of 346
BOG Low Concentration Lakes QAPP May 2014
Page 141 of 346
Appendix III B: MPSL-102a Sampling Marine and Freshwater Bivalves, Fish and Crabs for Trace Metal and Synthetic Organic Analysis
BOG Low Concentration Lakes QAPP May 2014
Page 142 of 346
BOG Low Concentration Lakes QAPP May 2014
Page 143 of 346
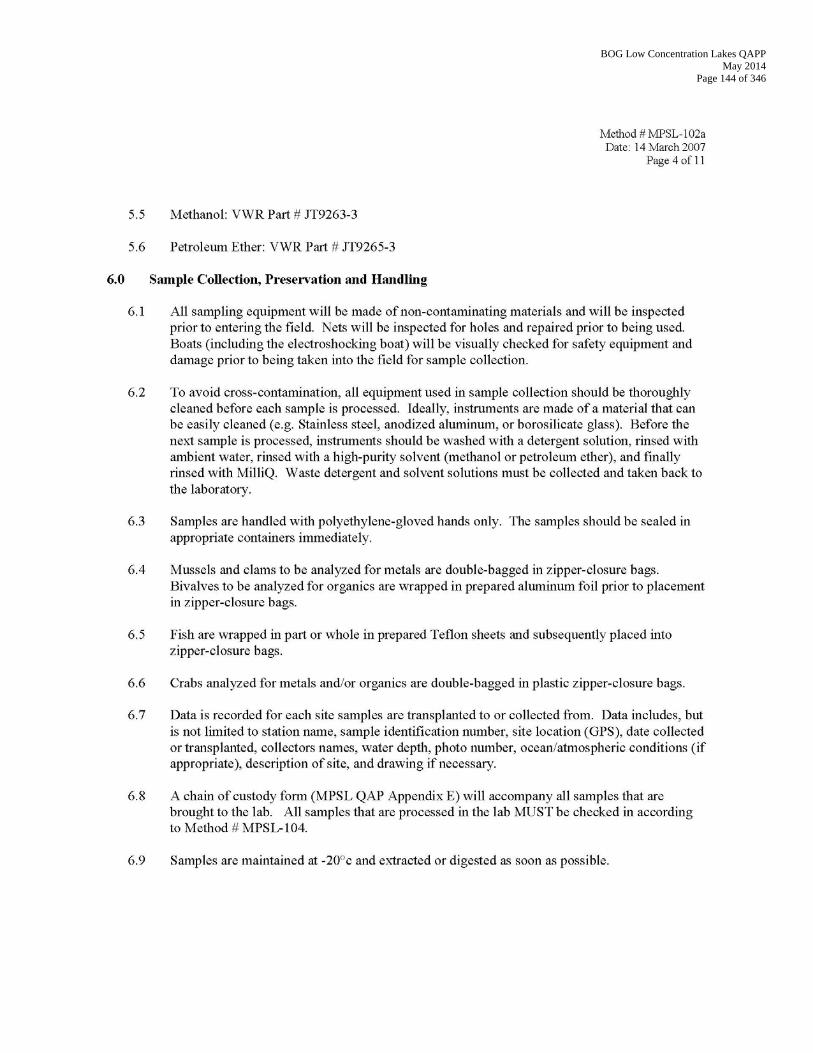
BOG Low Concentration Lakes QAPP May 2014
Page 144 of 346
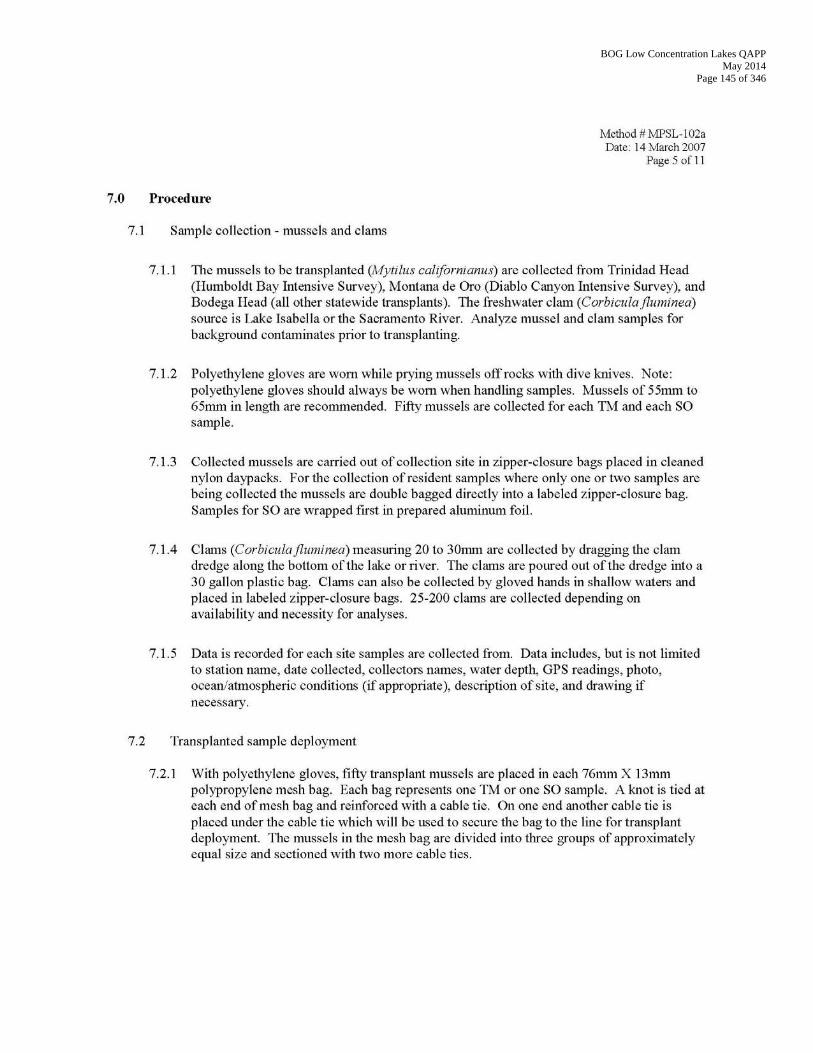
BOG Low Concentration Lakes QAPP May 2014
Page 145 of 346
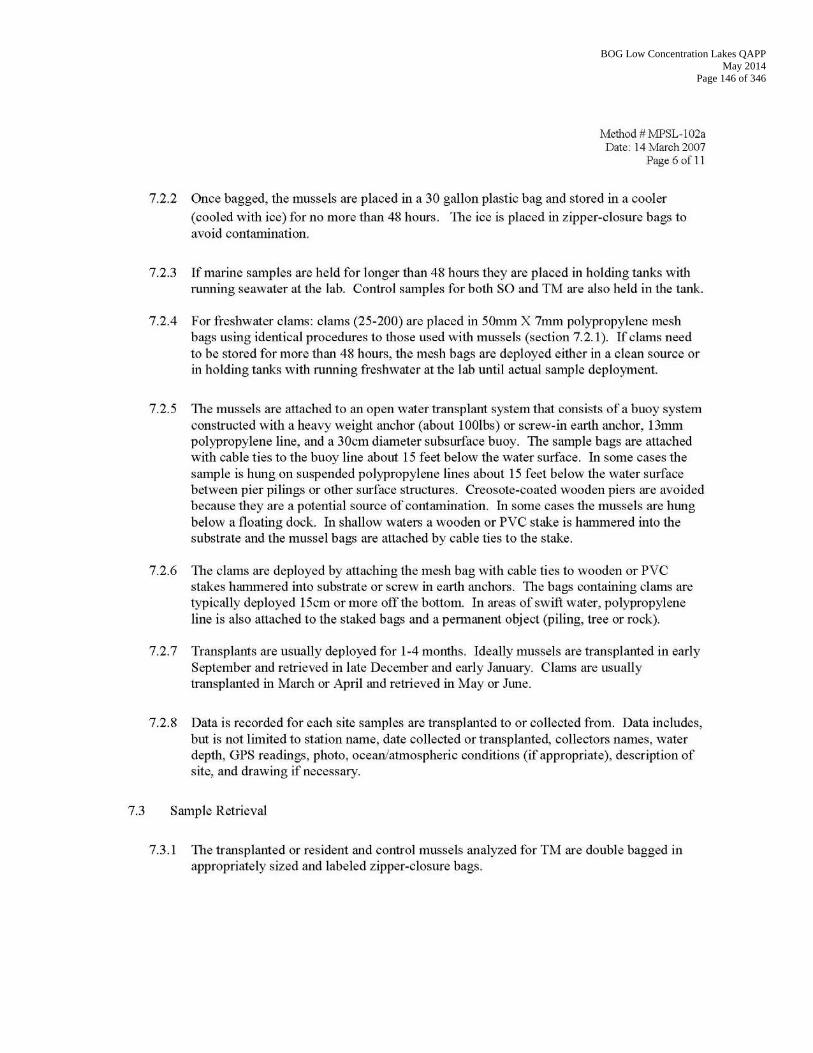
BOG Low Concentration Lakes QAPP May 2014
Page 146 of 346

BOG Low Concentration Lakes QAPP May 2014
Page 147 of 346
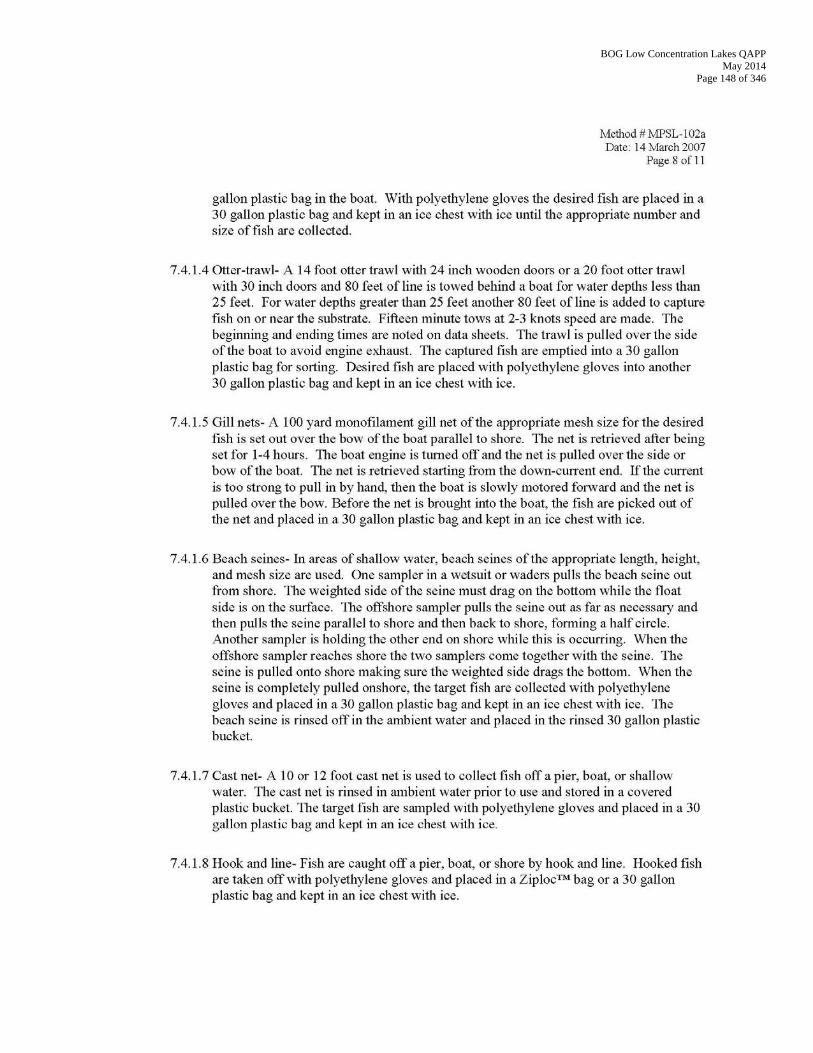
BOG Low Concentration Lakes QAPP May 2014
Page 148 of 346
BOG Low Concentration Lakes QAPP May 2014
Page 149 of 346
BOG Low Concentration Lakes QAPP May 2014
Page 150 of 346
BOG Low Concentration Lakes QAPP May 2014
Page 151 of 346
BOG Low Concentration Lakes QAPP May 2014
Page 152 of 346
Appendix III C: MPSL-104 Sample Receipt and Check-In
BOG Low Concentration Lakes QAPP May 2014
Page 153 of 346
BOG Low Concentration Lakes QAPP May 2014
Page 154 of 346
BOG Low Concentration Lakes QAPP May 2014
Page 155 of 346
BOG Low Concentration Lakes QAPP May 2014
Page 156 of 346
Appendix III D: MPSL-105 Laboratory Preparation of Trace Metal and Synthetic Organic Samples of Tissues in Marine and Freshwater Bivalves and Fish
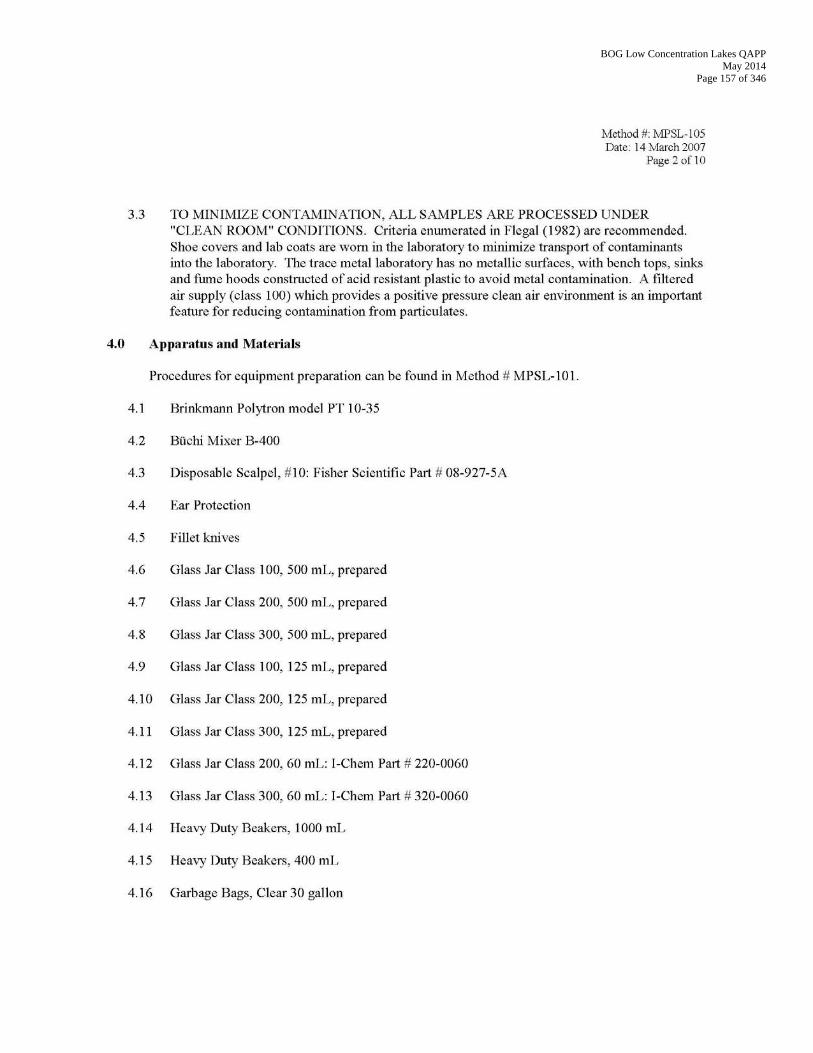
BOG Low Concentration Lakes QAPP May 2014
Page 157 of 346
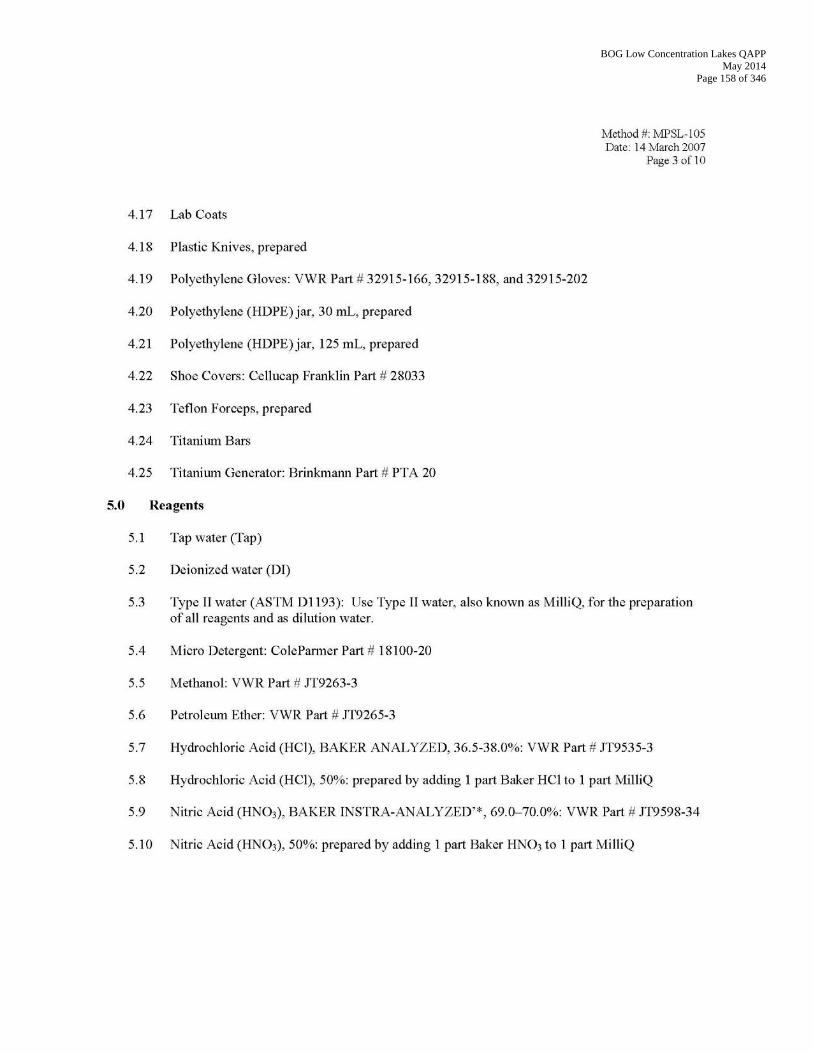
BOG Low Concentration Lakes QAPP May 2014
Page 158 of 346
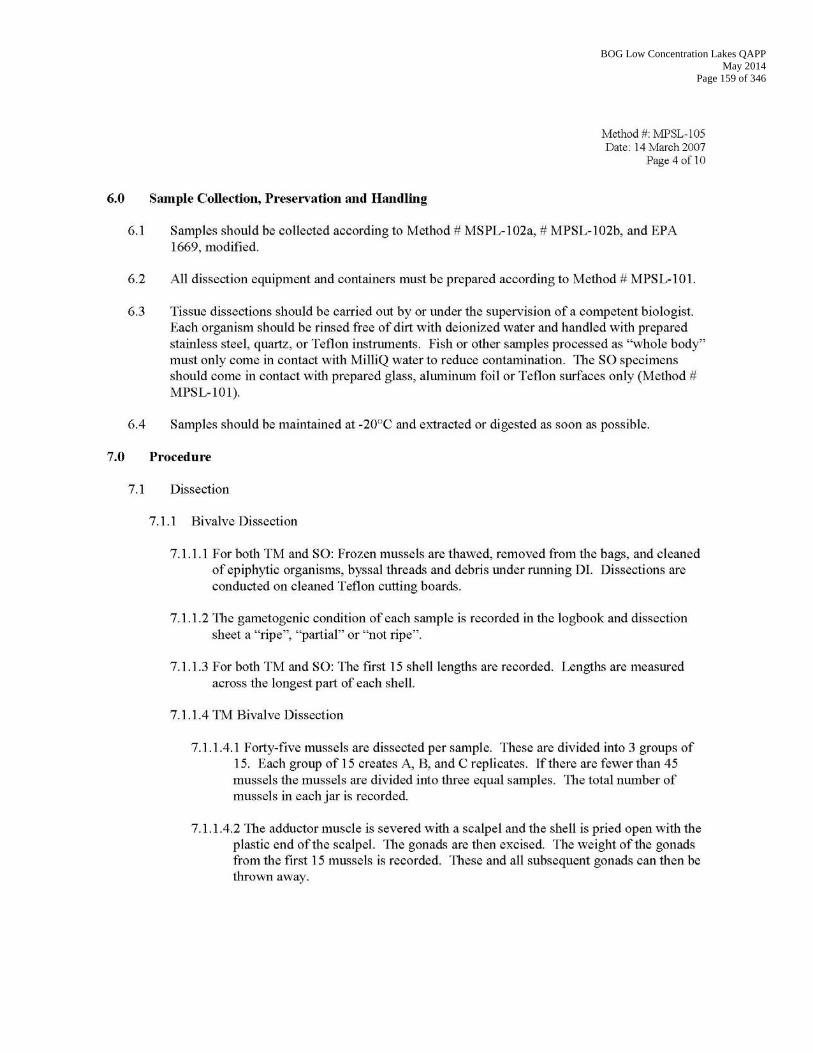
BOG Low Concentration Lakes QAPP May 2014
Page 159 of 346
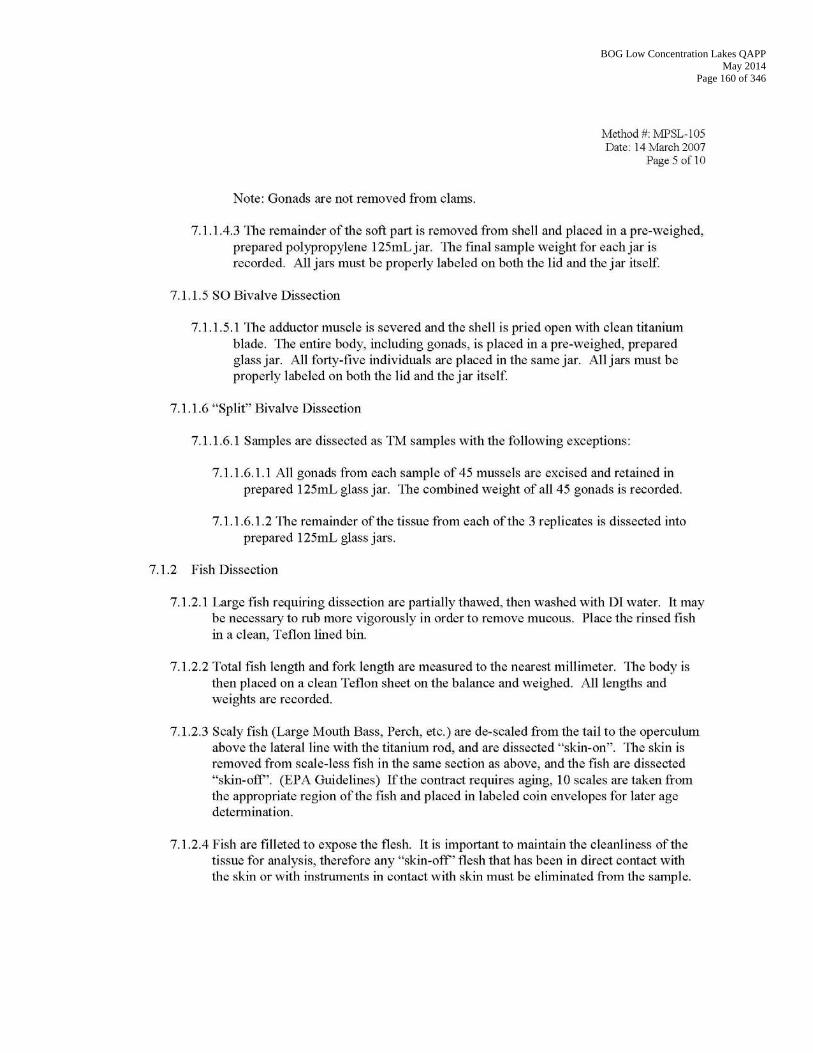
BOG Low Concentration Lakes QAPP May 2014
Page 160 of 346

BOG Low Concentration Lakes QAPP May 2014
Page 161 of 346
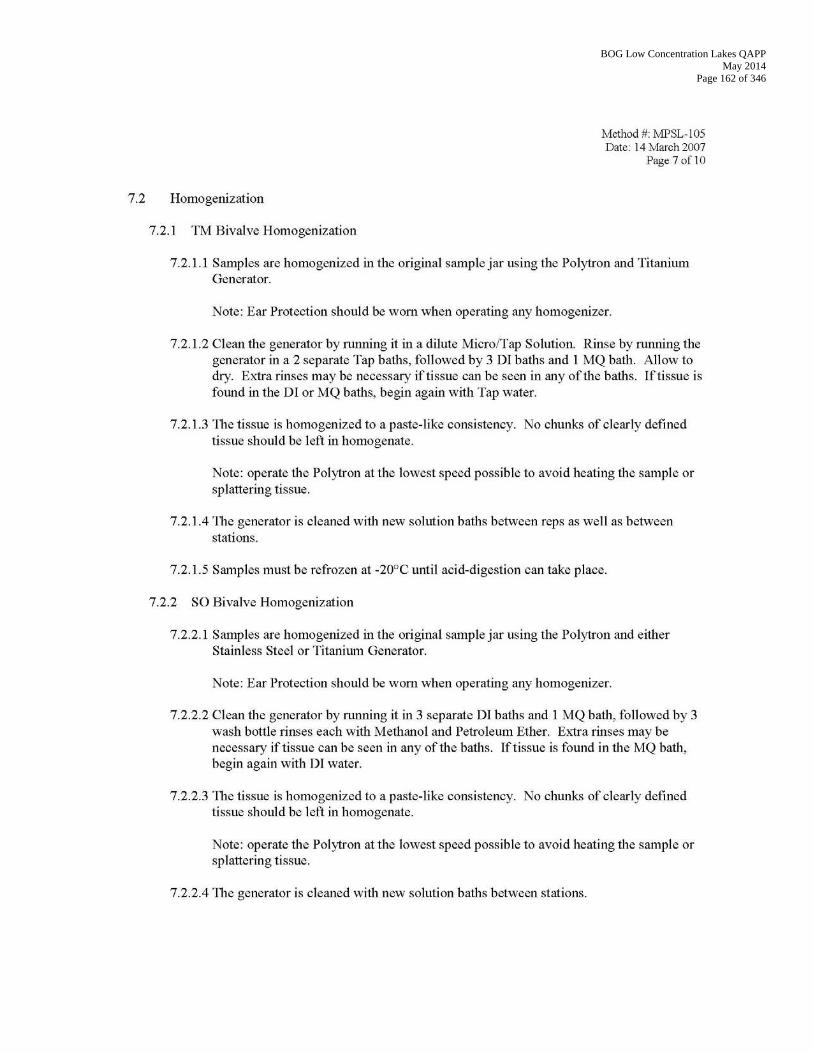
BOG Low Concentration Lakes QAPP May 2014
Page 162 of 346
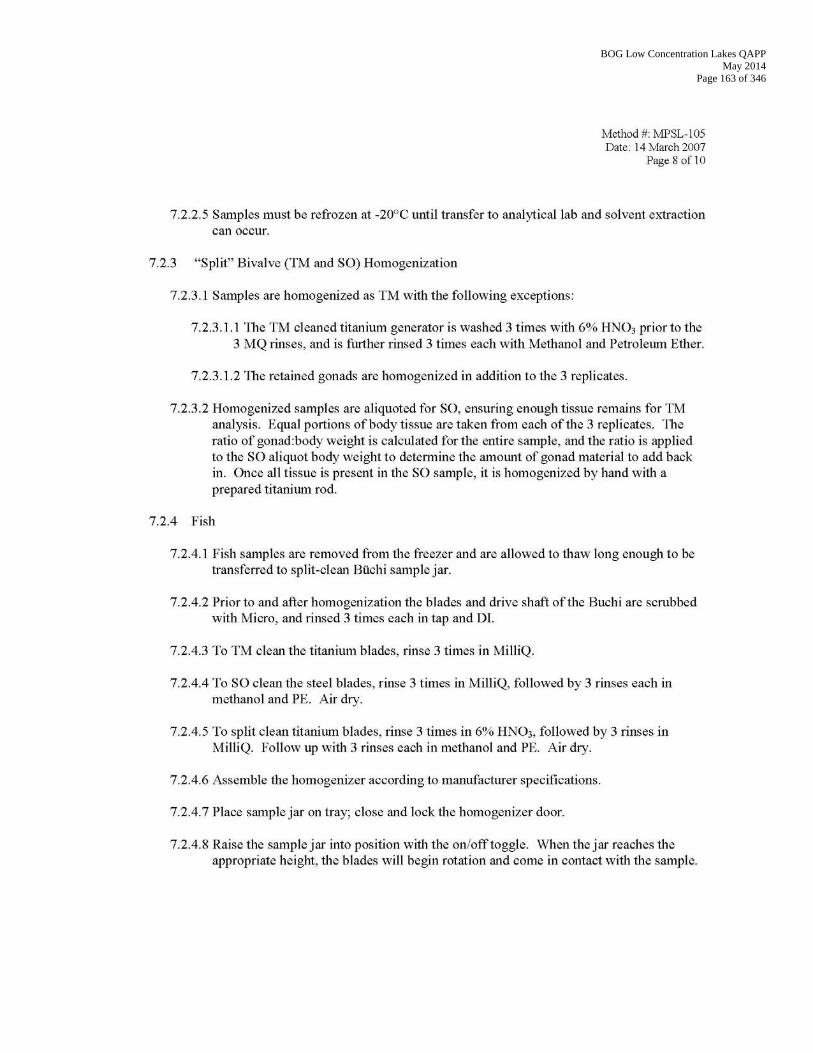
BOG Low Concentration Lakes QAPP May 2014
Page 163 of 346
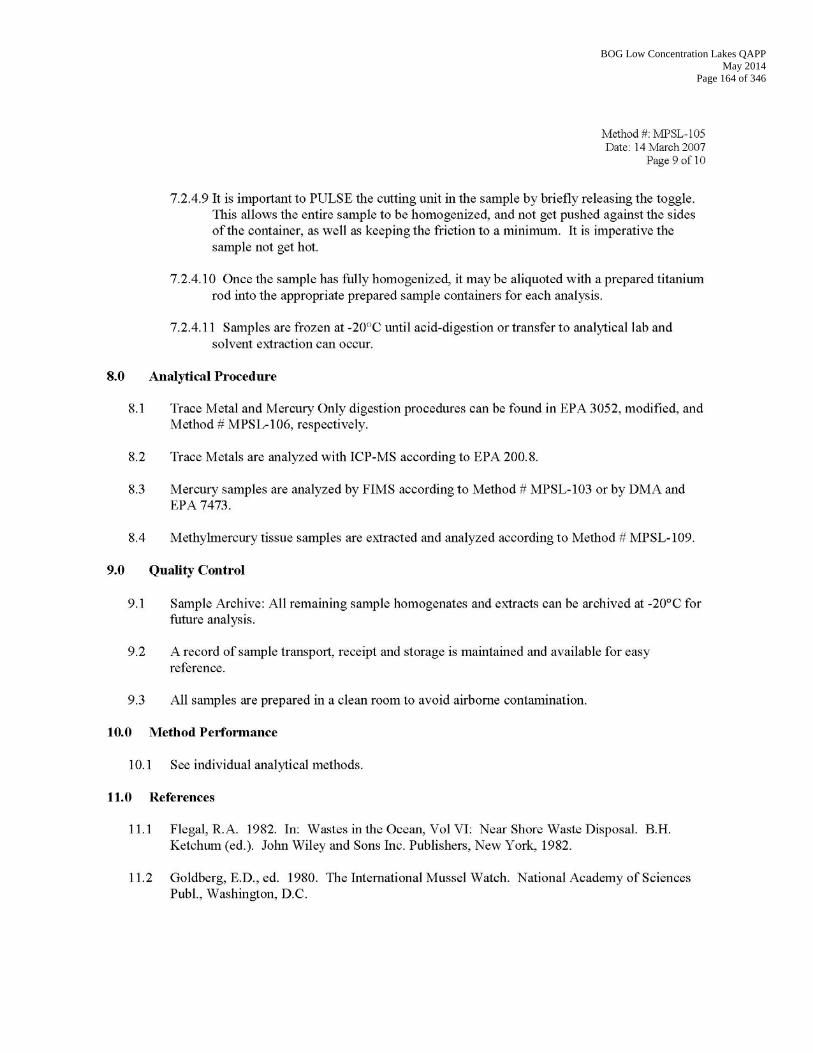
BOG Low Concentration Lakes QAPP May 2014
Page 164 of 346
BOG Low Concentration Lakes QAPP May 2014
Page 165 of 346
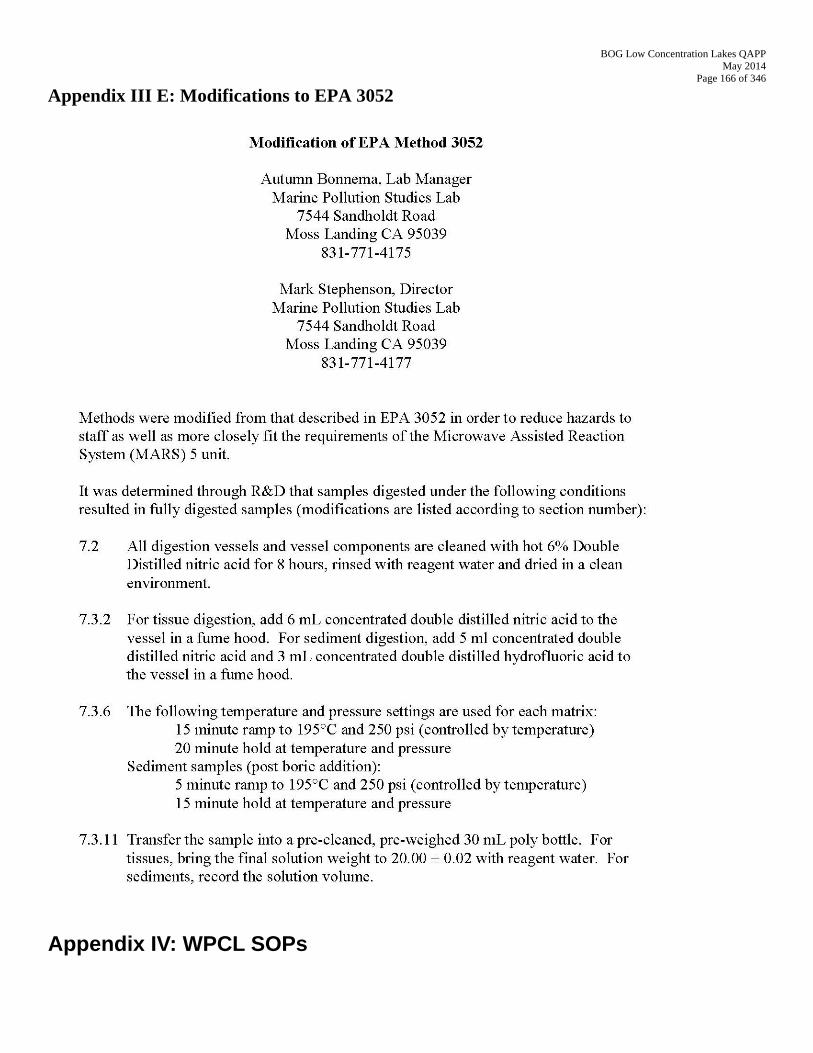
BOG Low Concentration Lakes QAPP May 2014
Page 166 of 346
Appendix III E: Modifications to EPA 3052
Appendix IV: WPCL SOPs
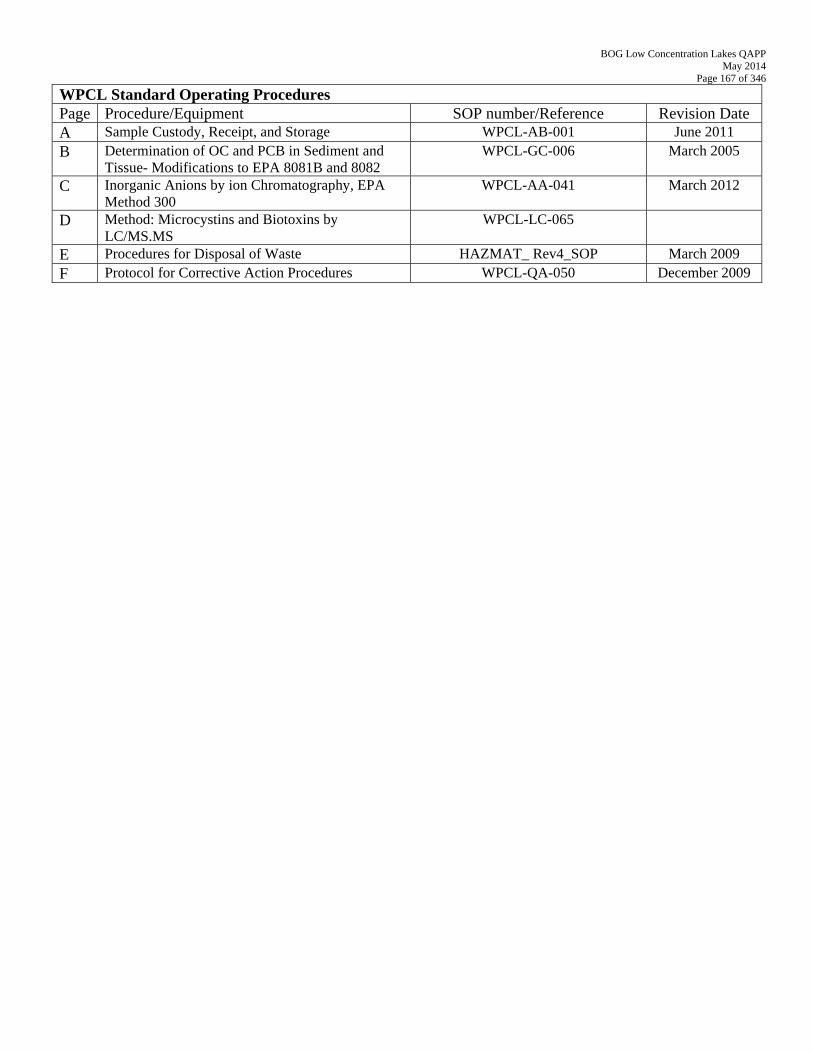
BOG Low Concentration Lakes QAPP May 2014
Page 167 of 346
WPCL Standard Operating Procedures Page Procedure/Equipment SOP number/Reference Revision Date A Sample Custody, Receipt, and Storage WPCL-AB-001 June 2011 B Determination of OC and PCB in Sediment and
Tissue- Modifications to EPA 8081B and 8082 WPCL-GC-006 March 2005
C Inorganic Anions by ion Chromatography, EPA Method 300
WPCL-AA-041 March 2012
D Method: Microcystins and Biotoxins by LC/MS.MS
WPCL-LC-065
E Procedures for Disposal of Waste HAZMAT_ Rev4_SOP March 2009 F Protocol for Corrective Action Procedures WPCL-QA-050 December 2009

BOG Low Concentration Lakes QAPP May 2014
Page 168 of 346
Appendix IV A: Sample Custody, Receipt and Storage
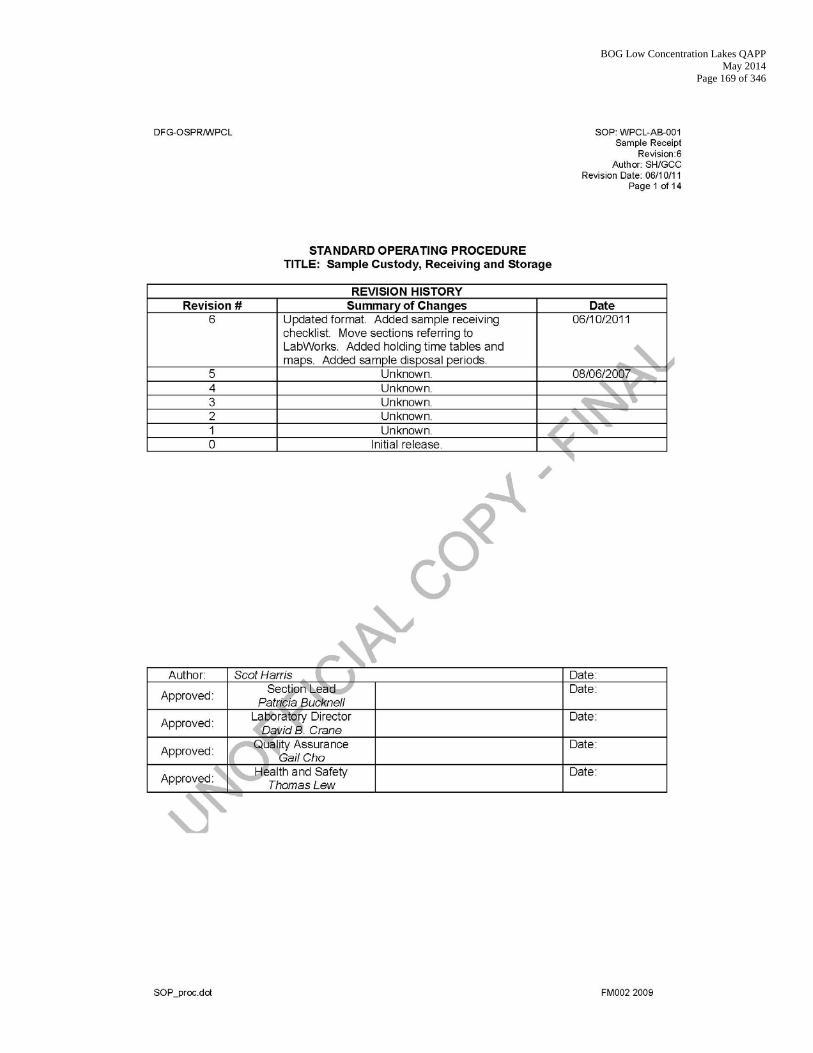
BOG Low Concentration Lakes QAPP May 2014
Page 169 of 346

BOG Low Concentration Lakes QAPP May 2014
Page 170 of 346
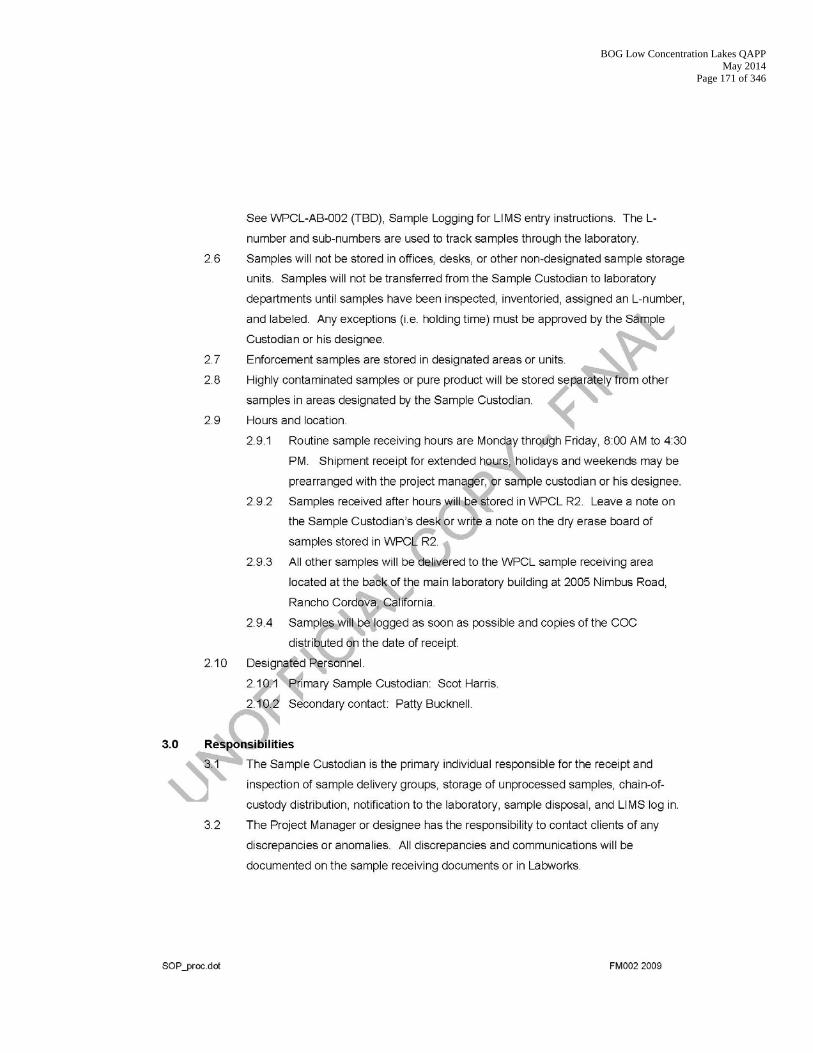
BOG Low Concentration Lakes QAPP May 2014
Page 171 of 346
BOG Low Concentration Lakes QAPP May 2014
Page 172 of 346
BOG Low Concentration Lakes QAPP May 2014
Page 173 of 346
BOG Low Concentration Lakes QAPP May 2014
Page 174 of 346
BOG Low Concentration Lakes QAPP May 2014
Page 175 of 346
BOG Low Concentration Lakes QAPP May 2014
Page 176 of 346
BOG Low Concentration Lakes QAPP May 2014
Page 177 of 346
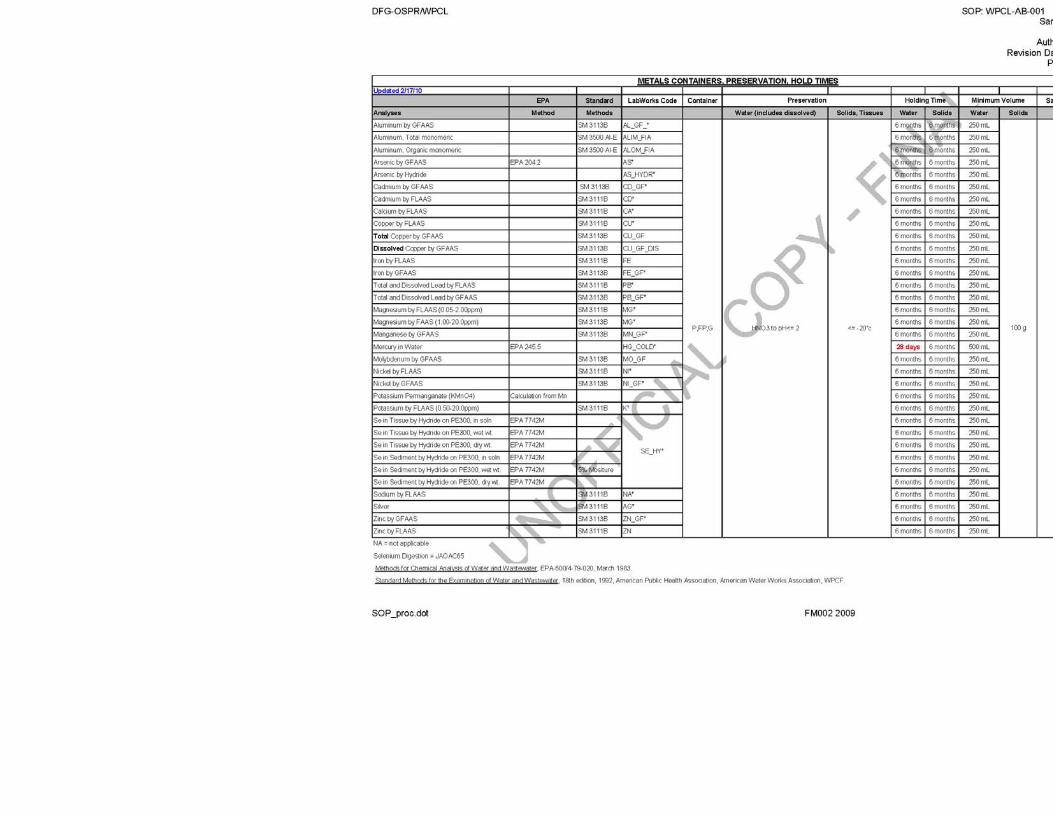
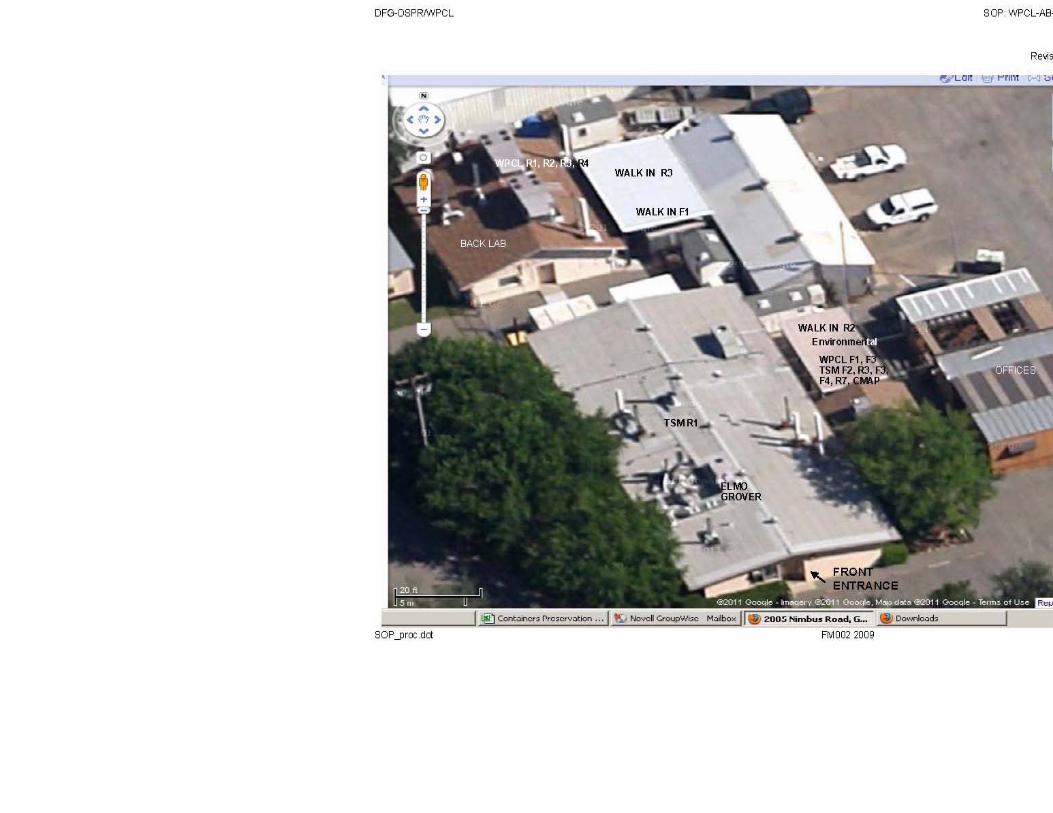

BOG Low Concentration Lakes QAPP May 2014
Page 180 of 346
Appendix IV B: Determination of OC and PCB in Sediment and Tissue – Modifications to EPA 8081B and 8082
BOG Low Concentration Lakes QAPP May 2014
Page 181 of 346
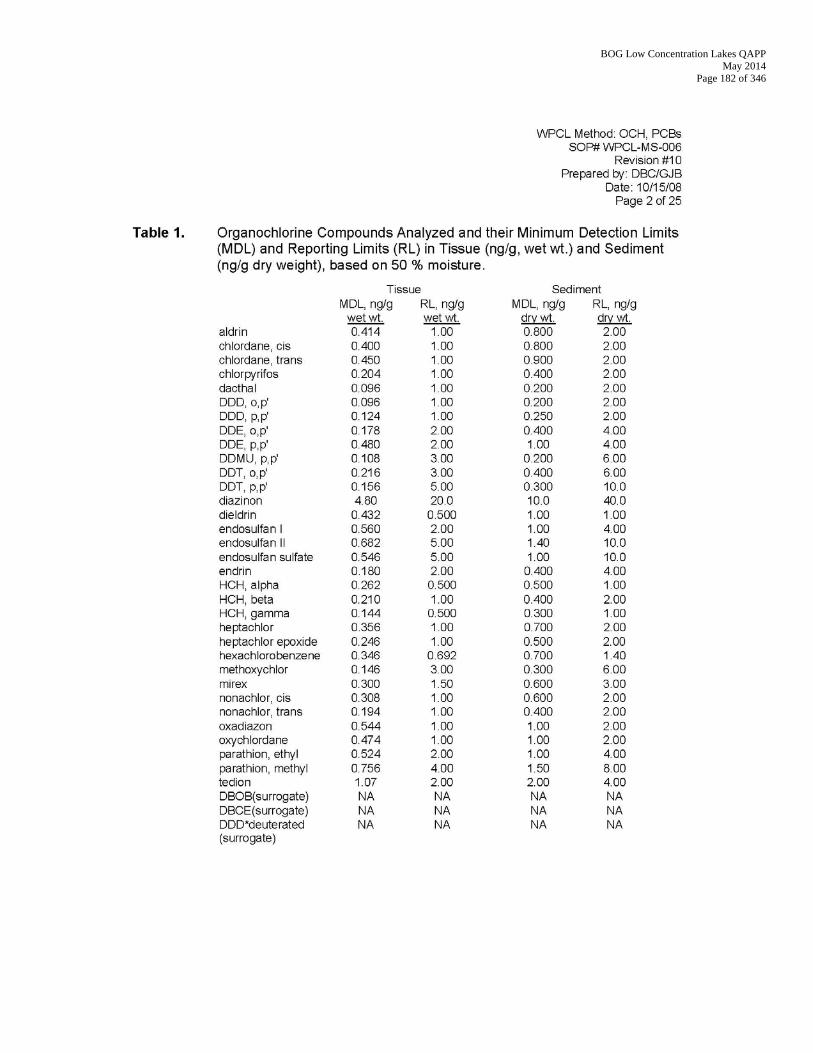
BOG Low Concentration Lakes QAPP May 2014
Page 182 of 346
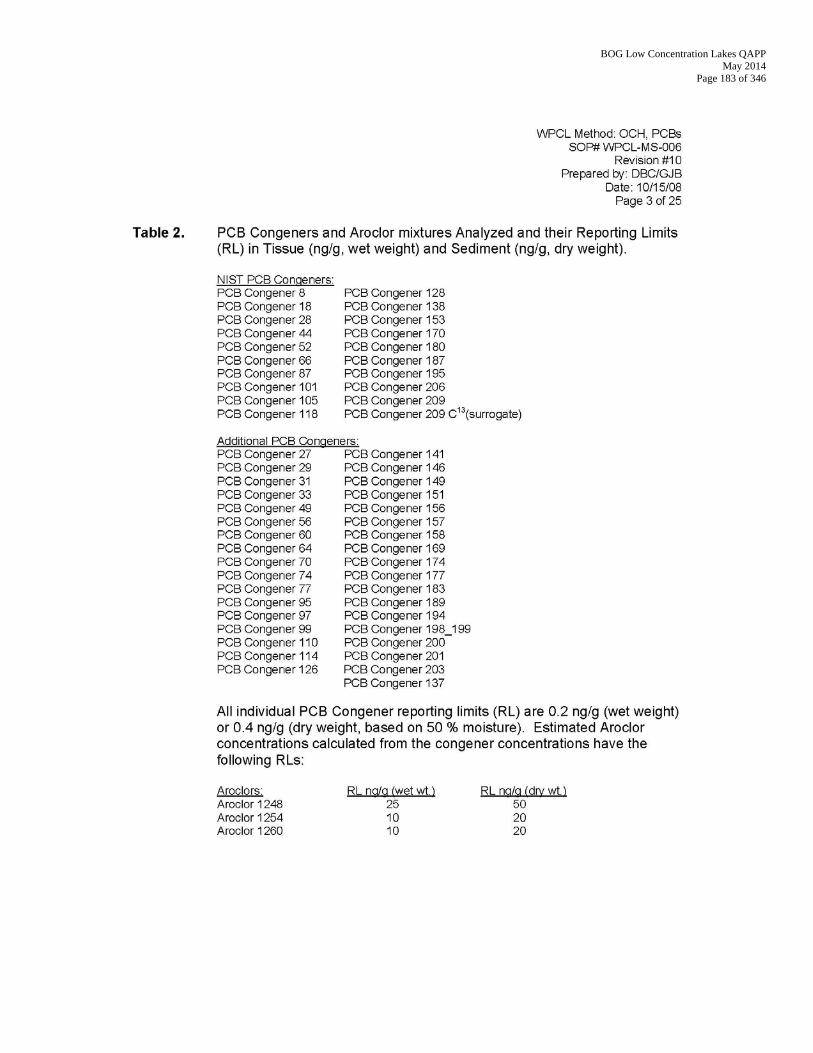
BOG Low Concentration Lakes QAPP May 2014
Page 183 of 346
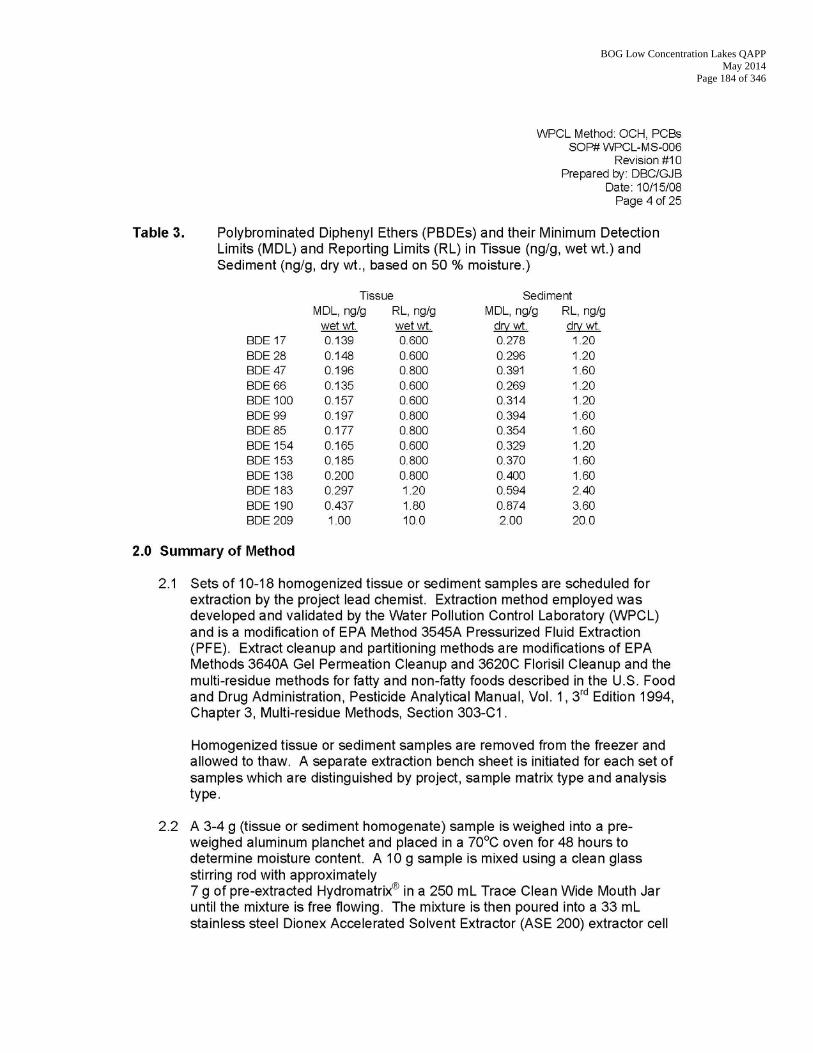
BOG Low Concentration Lakes QAPP May 2014
Page 184 of 346
BOG Low Concentration Lakes QAPP May 2014
Page 185 of 346

BOG Low Concentration Lakes QAPP May 2014
Page 186 of 346
BOG Low Concentration Lakes QAPP May 2014
Page 187 of 346
BOG Low Concentration Lakes QAPP May 2014
Page 188 of 346
BOG Low Concentration Lakes QAPP May 2014
Page 189 of 346
BOG Low Concentration Lakes QAPP May 2014
Page 190 of 346
BOG Low Concentration Lakes QAPP May 2014
Page 191 of 346
BOG Low Concentration Lakes QAPP May 2014
Page 192 of 346
BOG Low Concentration Lakes QAPP May 2014
Page 193 of 346
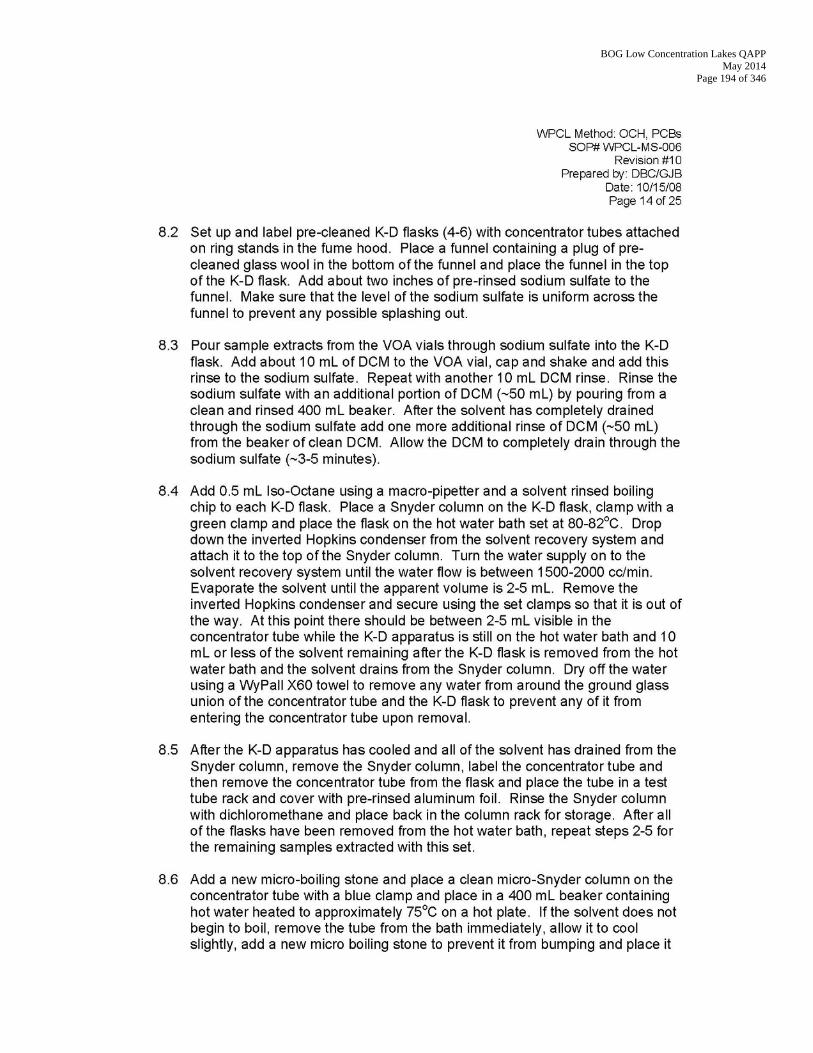
BOG Low Concentration Lakes QAPP May 2014
Page 194 of 346
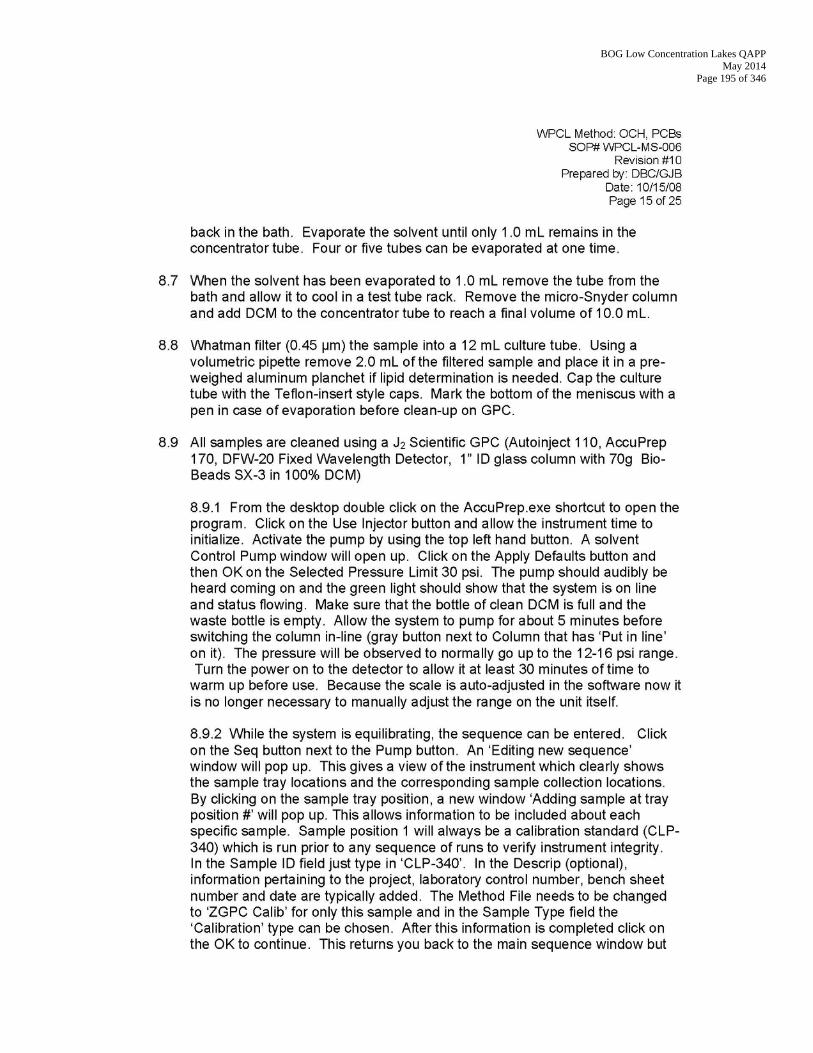
BOG Low Concentration Lakes QAPP May 2014
Page 195 of 346
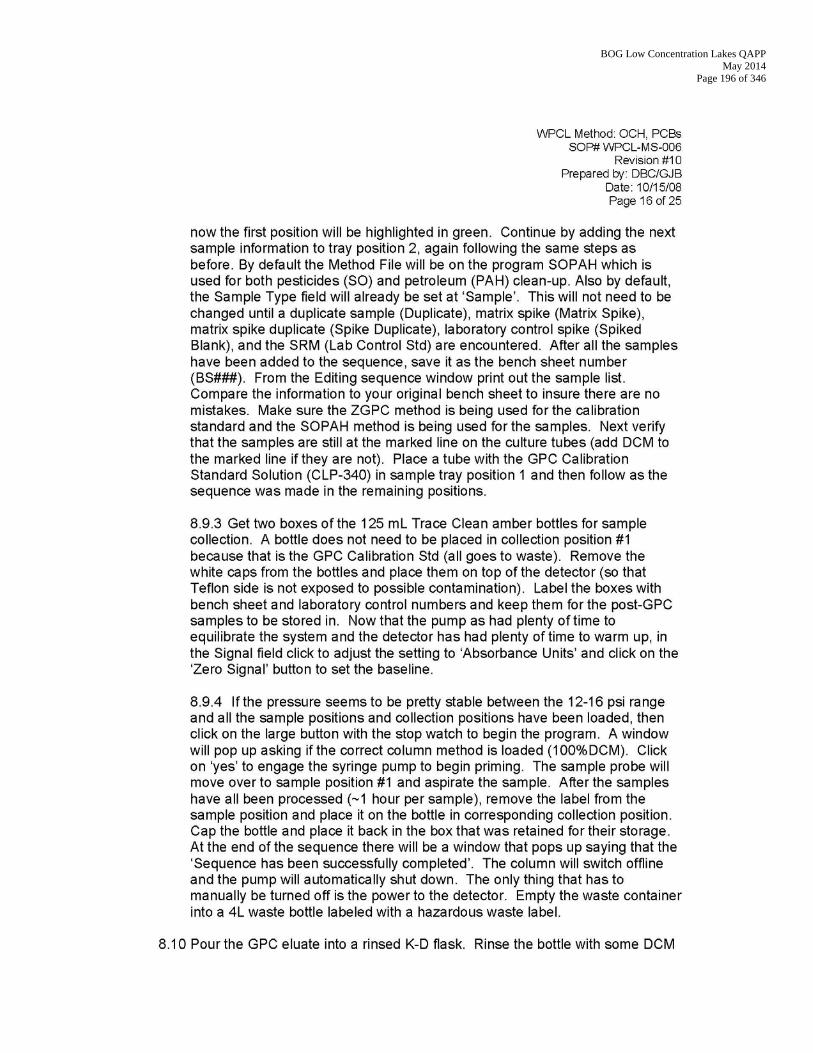
BOG Low Concentration Lakes QAPP May 2014
Page 196 of 346
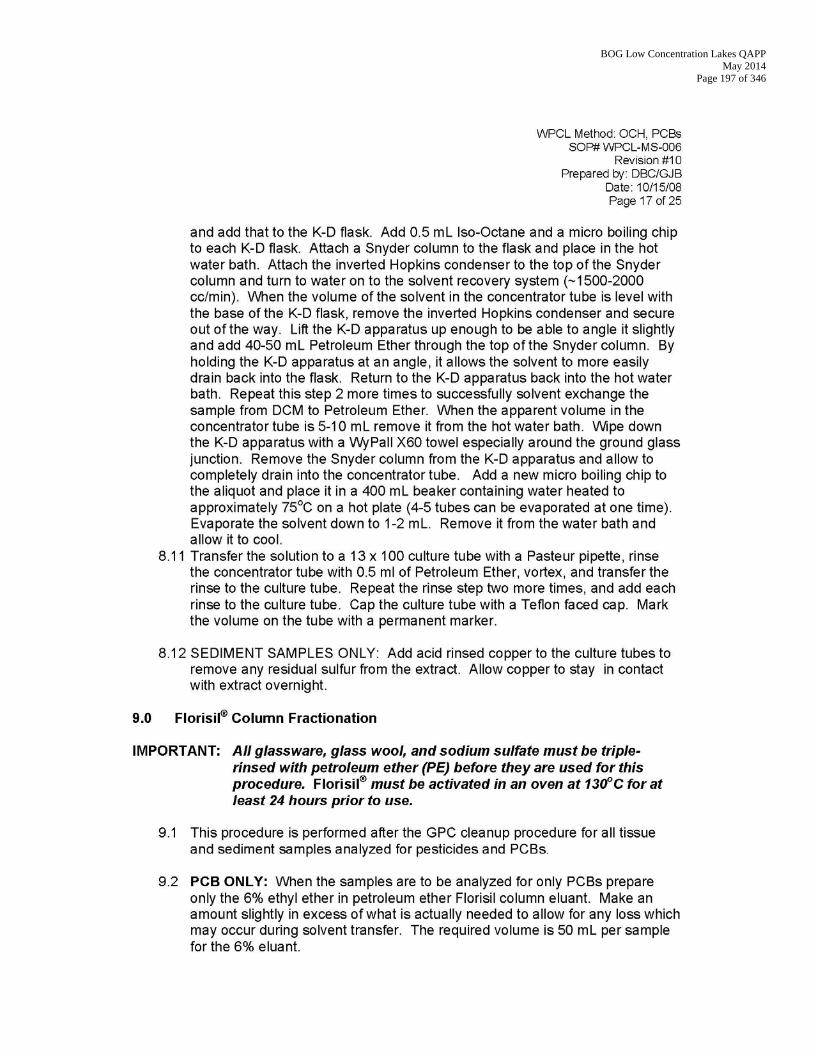
BOG Low Concentration Lakes QAPP May 2014
Page 197 of 346
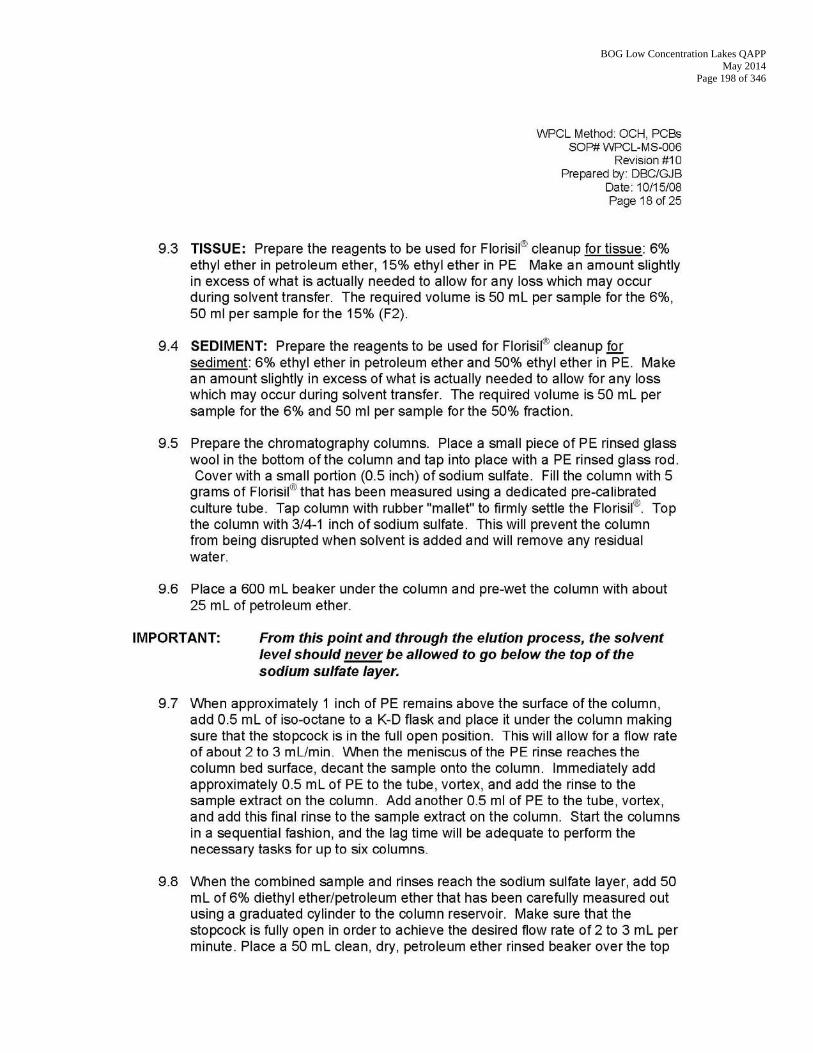
BOG Low Concentration Lakes QAPP May 2014
Page 198 of 346
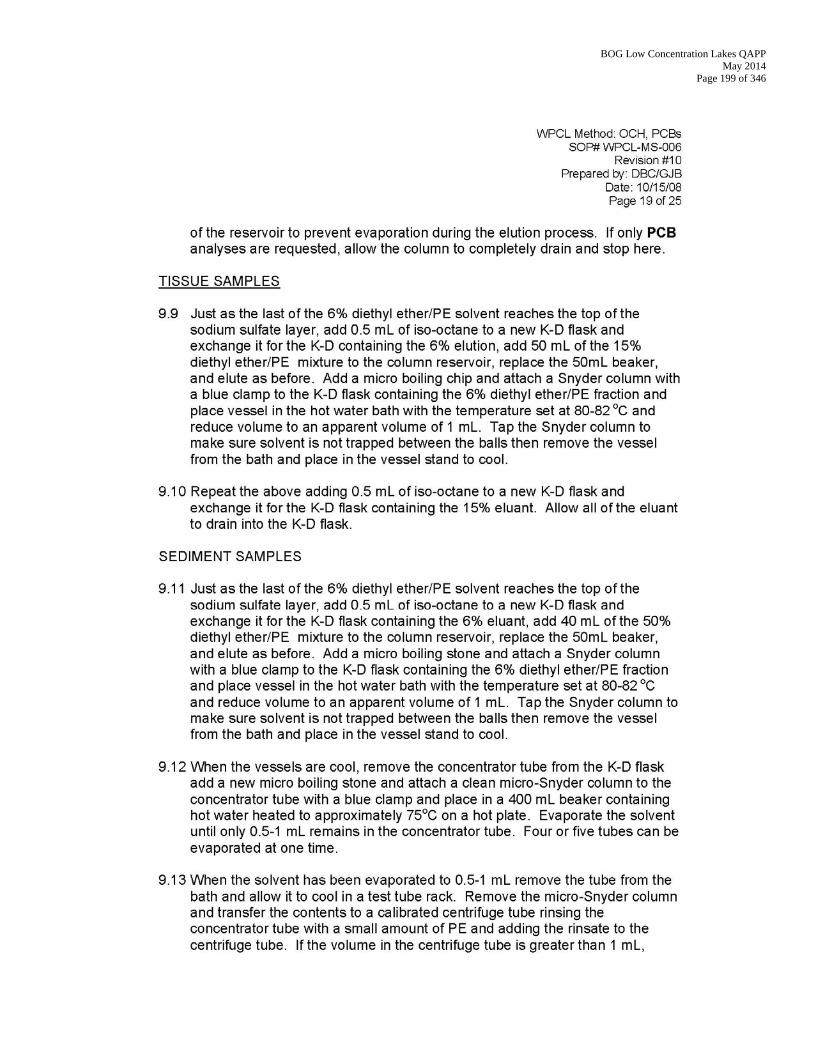
BOG Low Concentration Lakes QAPP May 2014
Page 199 of 346
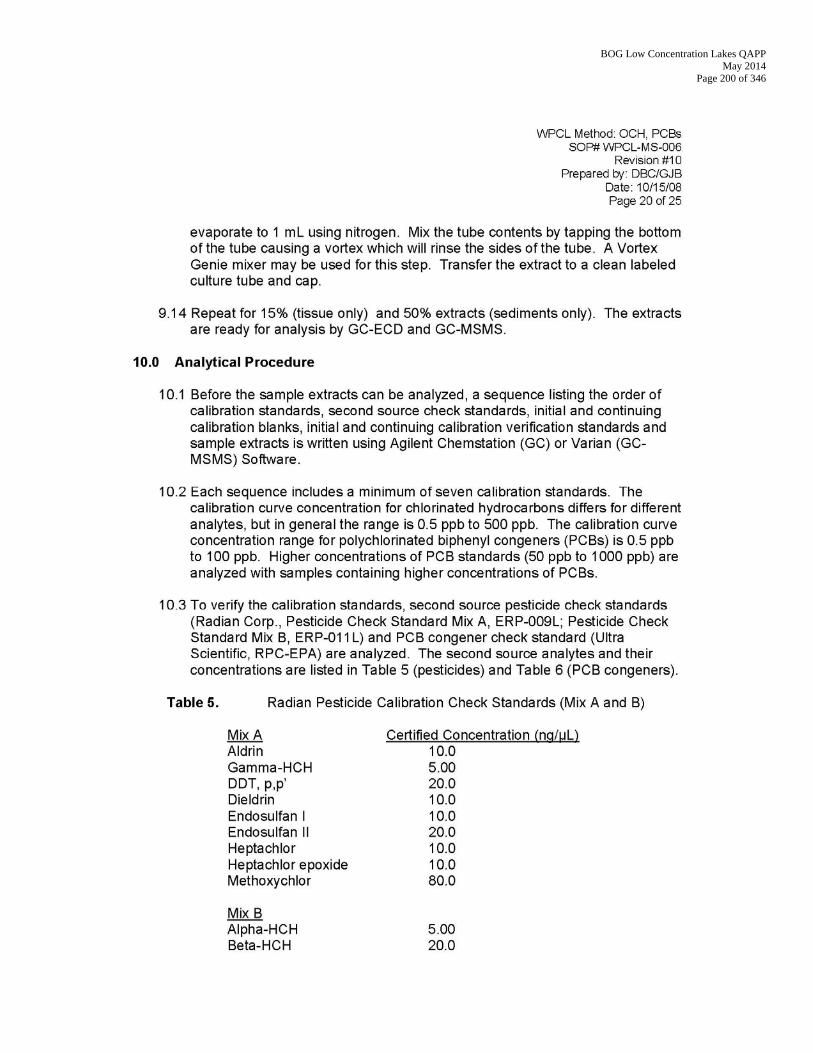
BOG Low Concentration Lakes QAPP May 2014
Page 200 of 346
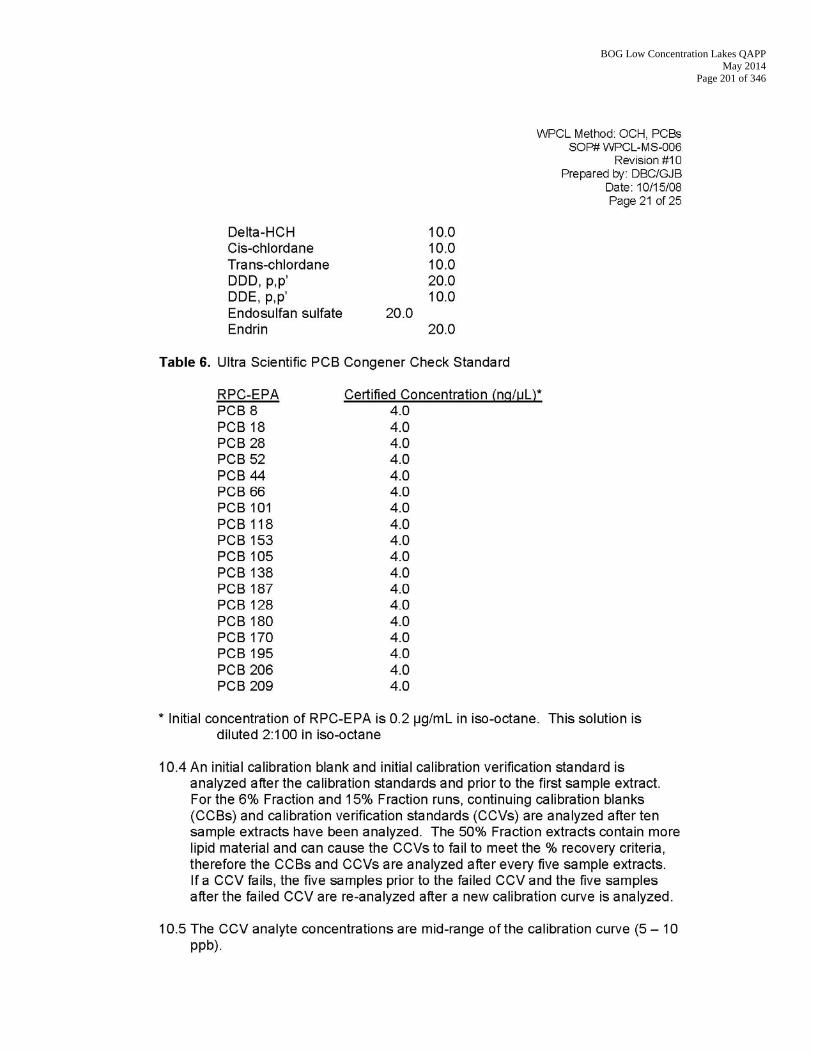
BOG Low Concentration Lakes QAPP May 2014
Page 201 of 346
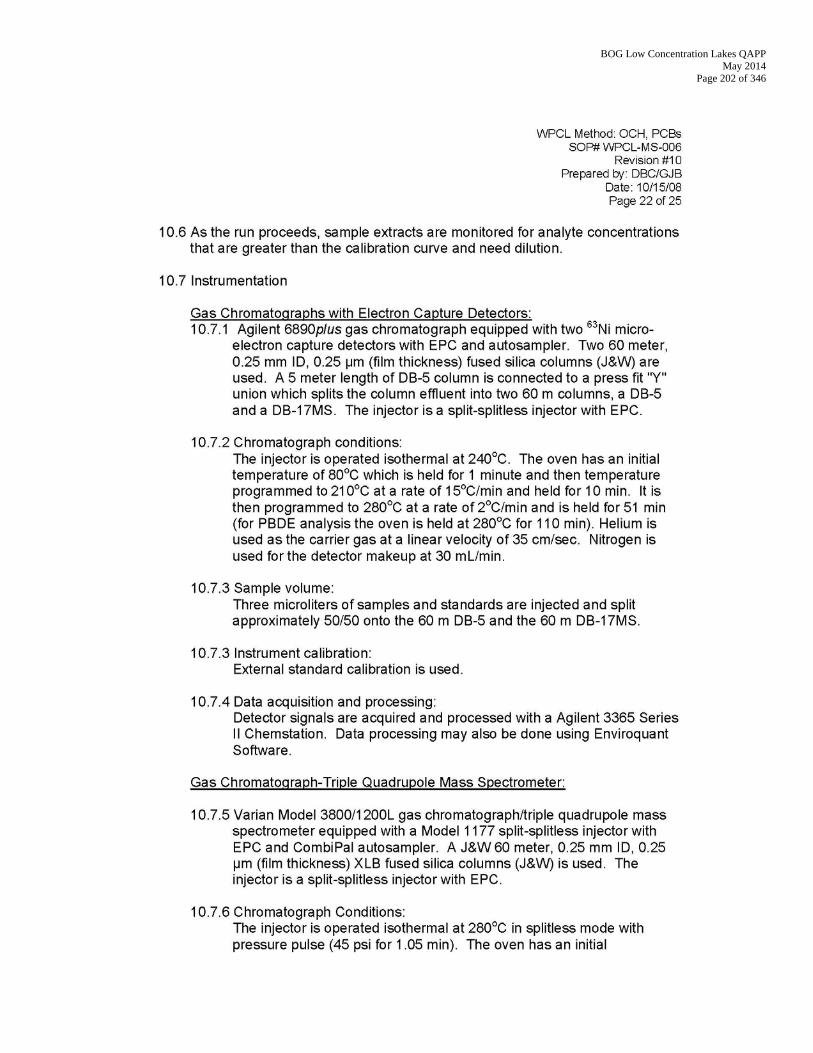
BOG Low Concentration Lakes QAPP May 2014
Page 202 of 346

BOG Low Concentration Lakes QAPP May 2014
Page 203 of 346
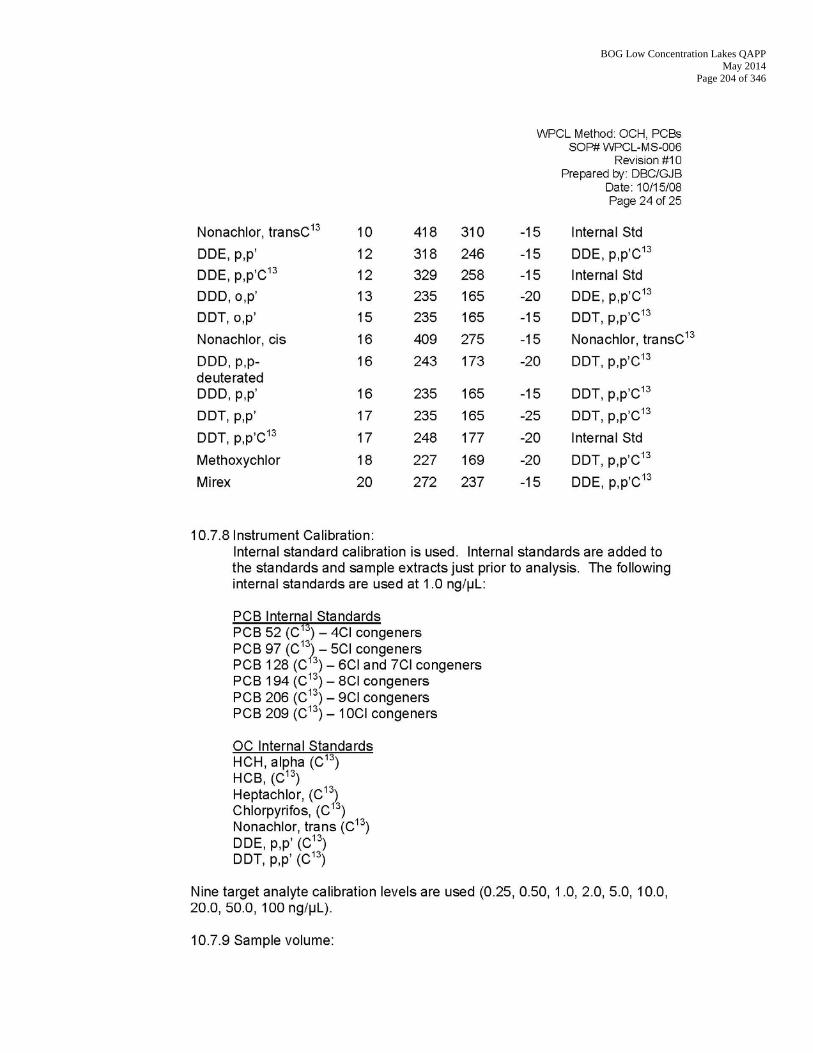
BOG Low Concentration Lakes QAPP May 2014
Page 204 of 346
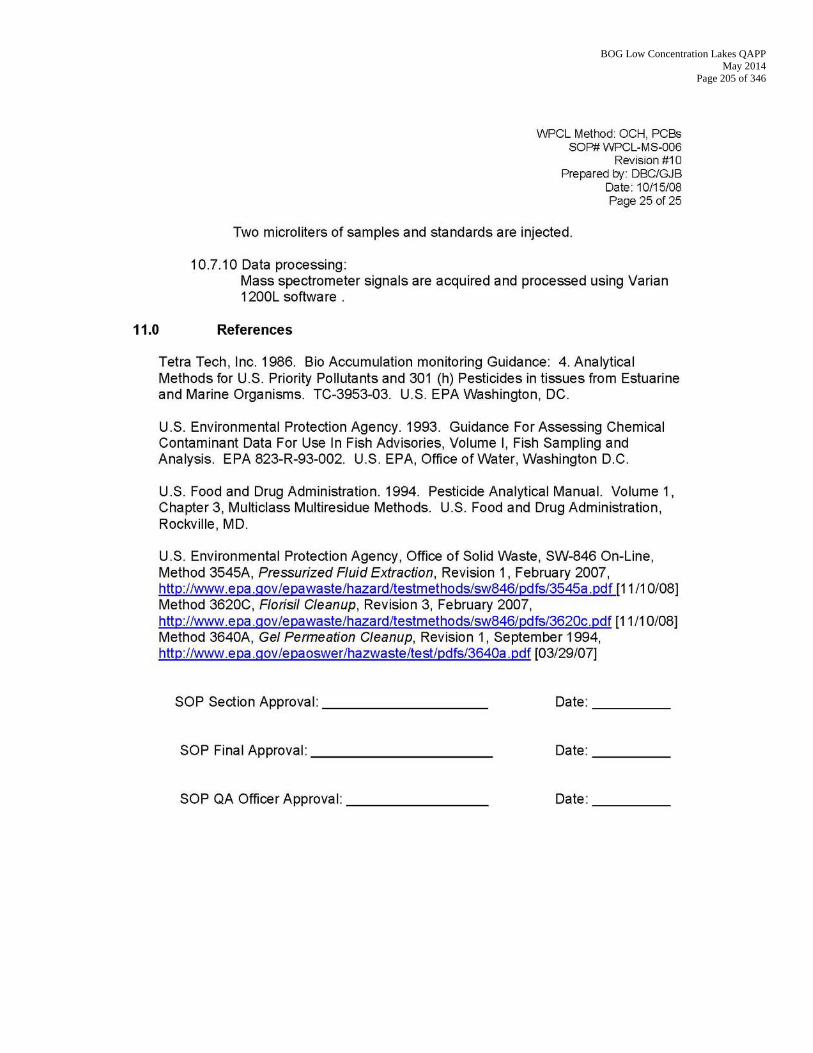
BOG Low Concentration Lakes QAPP May 2014
Page 205 of 346
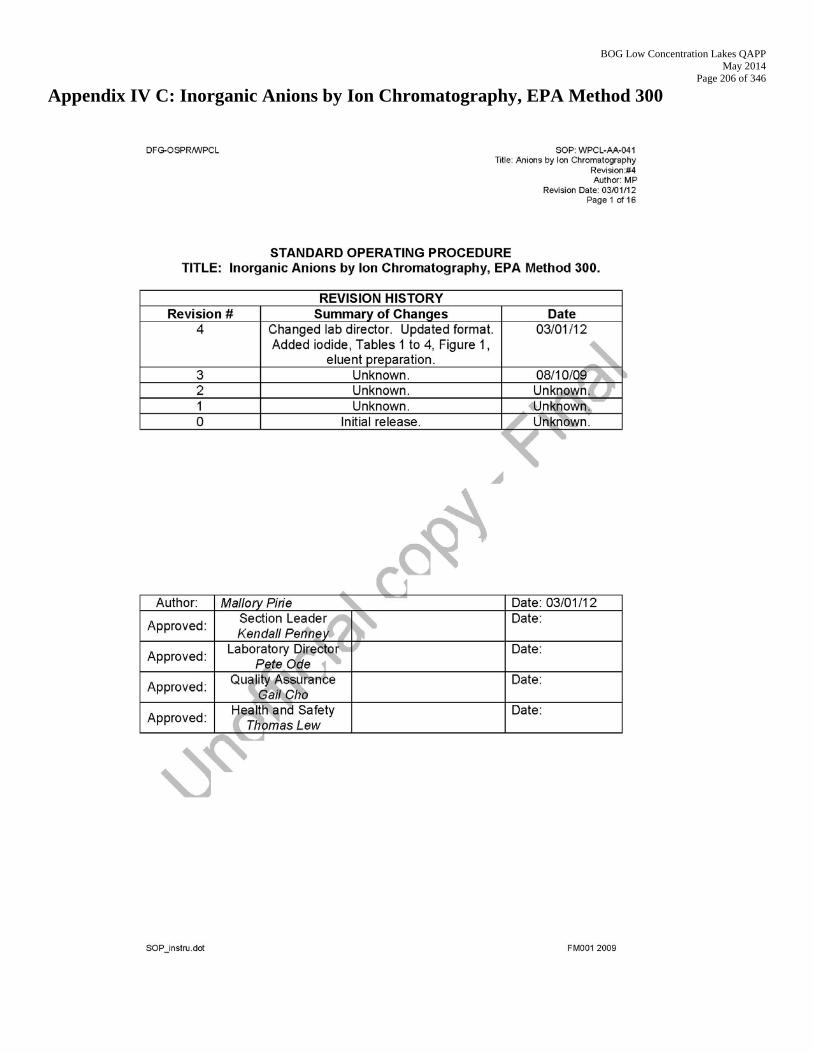
BOG Low Concentration Lakes QAPP May 2014
Page 206 of 346
Appendix IV C: Inorganic Anions by Ion Chromatography, EPA Method 300
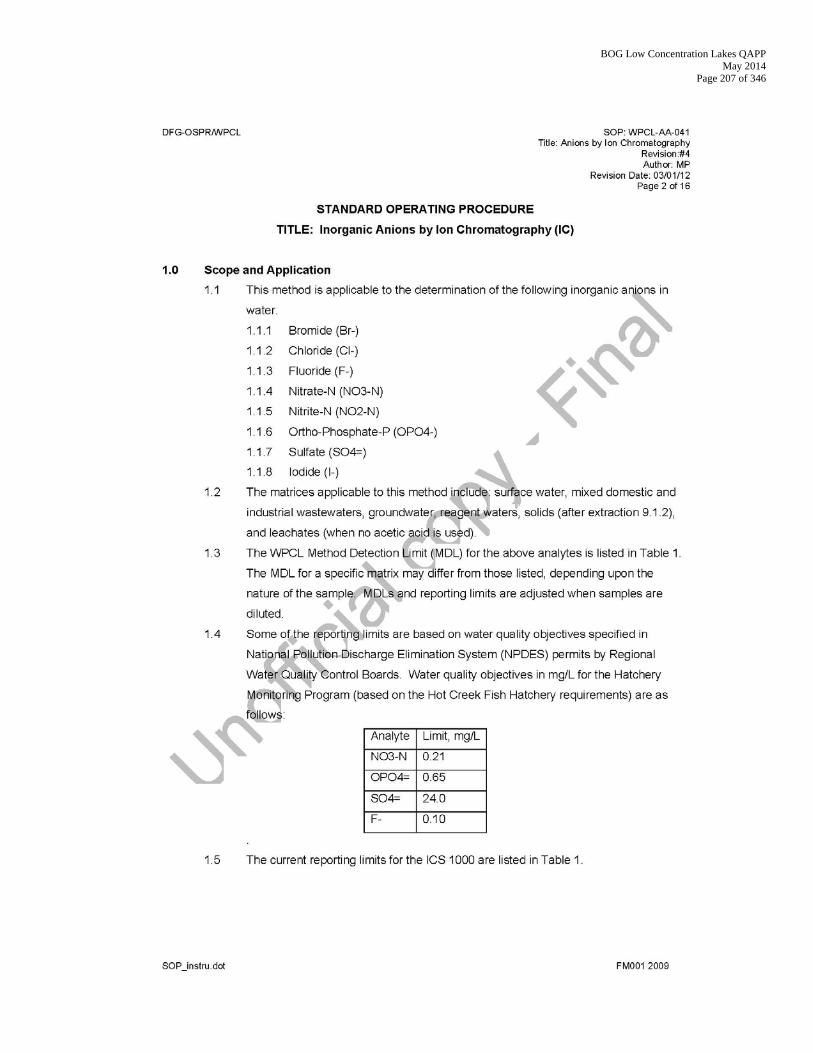
BOG Low Concentration Lakes QAPP May 2014
Page 207 of 346
BOG Low Concentration Lakes QAPP May 2014
Page 208 of 346
BOG Low Concentration Lakes QAPP May 2014
Page 209 of 346
BOG Low Concentration Lakes QAPP May 2014
Page 210 of 346
BOG Low Concentration Lakes QAPP May 2014
Page 211 of 346
BOG Low Concentration Lakes QAPP May 2014
Page 212 of 346
BOG Low Concentration Lakes QAPP May 2014
Page 213 of 346
BOG Low Concentration Lakes QAPP May 2014
Page 214 of 346
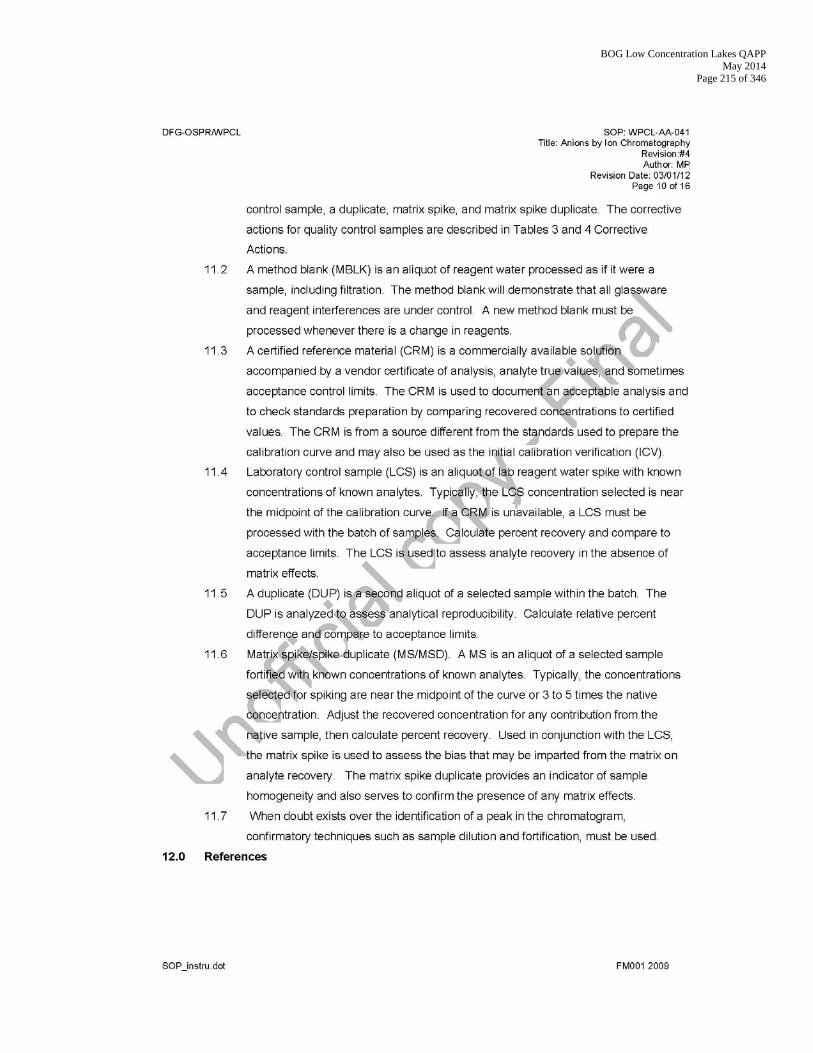
BOG Low Concentration Lakes QAPP May 2014
Page 215 of 346
BOG Low Concentration Lakes QAPP May 2014
Page 216 of 346

BOG Low Concentration Lakes QAPP May 2014
Page 217 of 346

BOG Low Concentration Lakes QAPP May 2014
Page 218 of 346
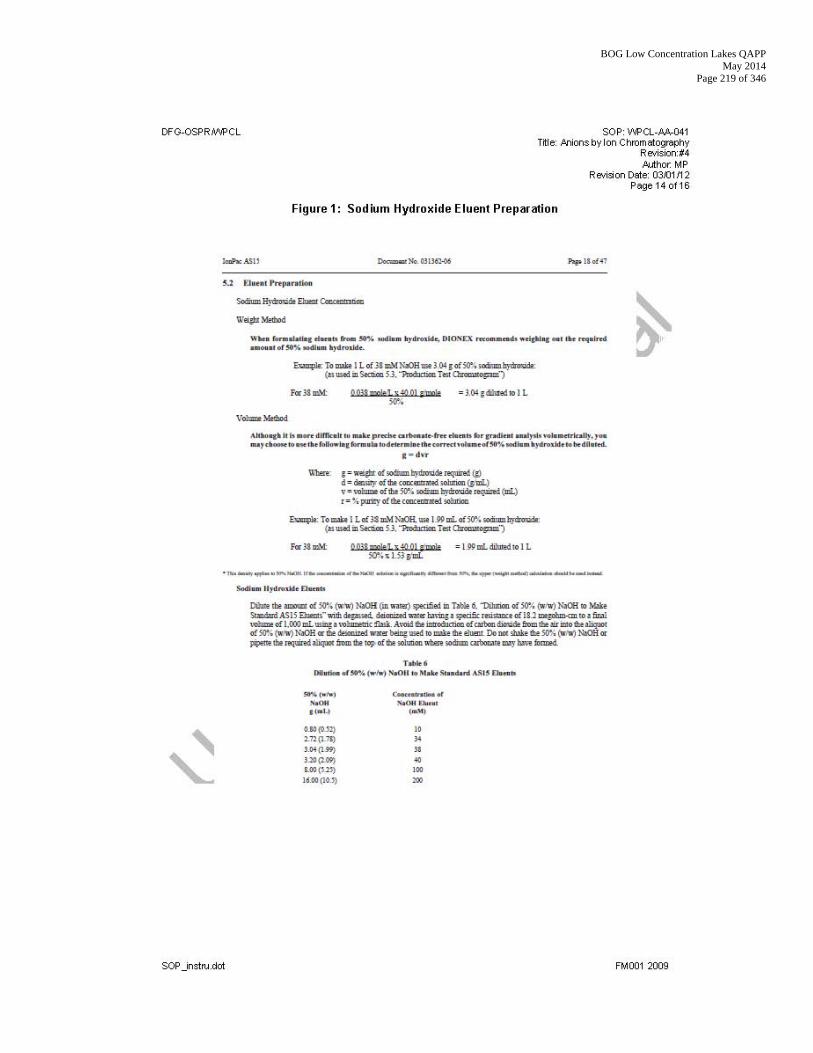
BOG Low Concentration Lakes QAPP May 2014
Page 219 of 346
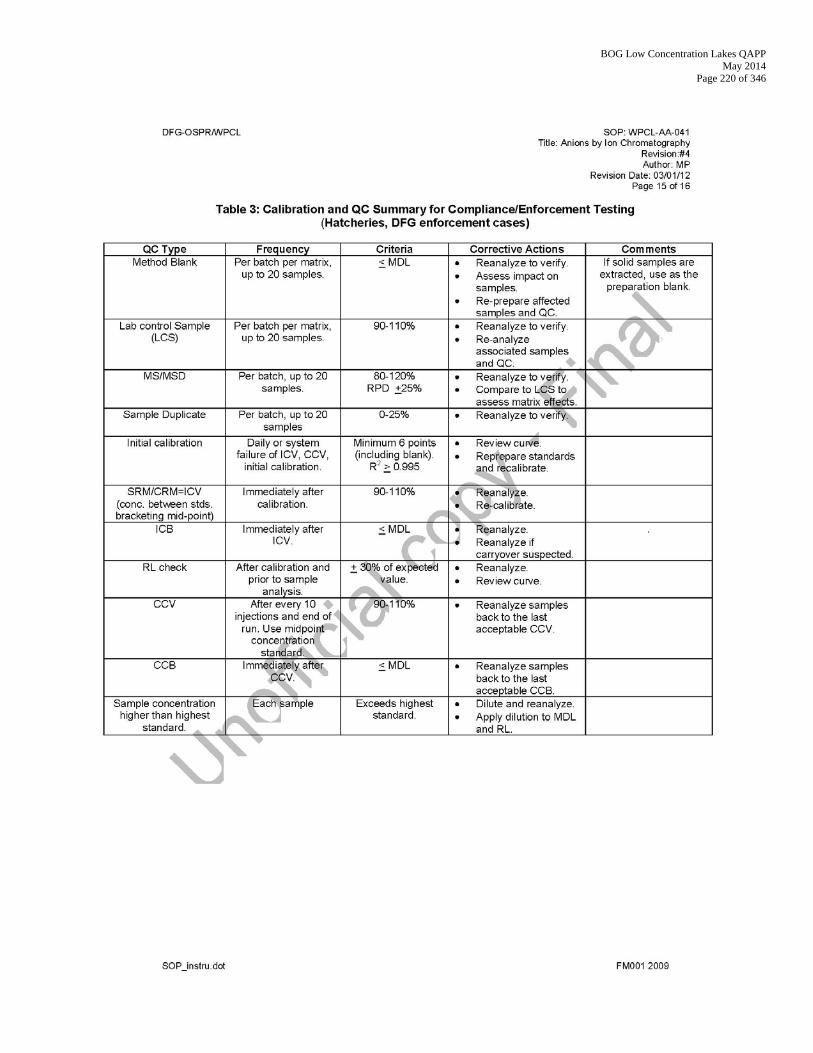
BOG Low Concentration Lakes QAPP May 2014
Page 220 of 346
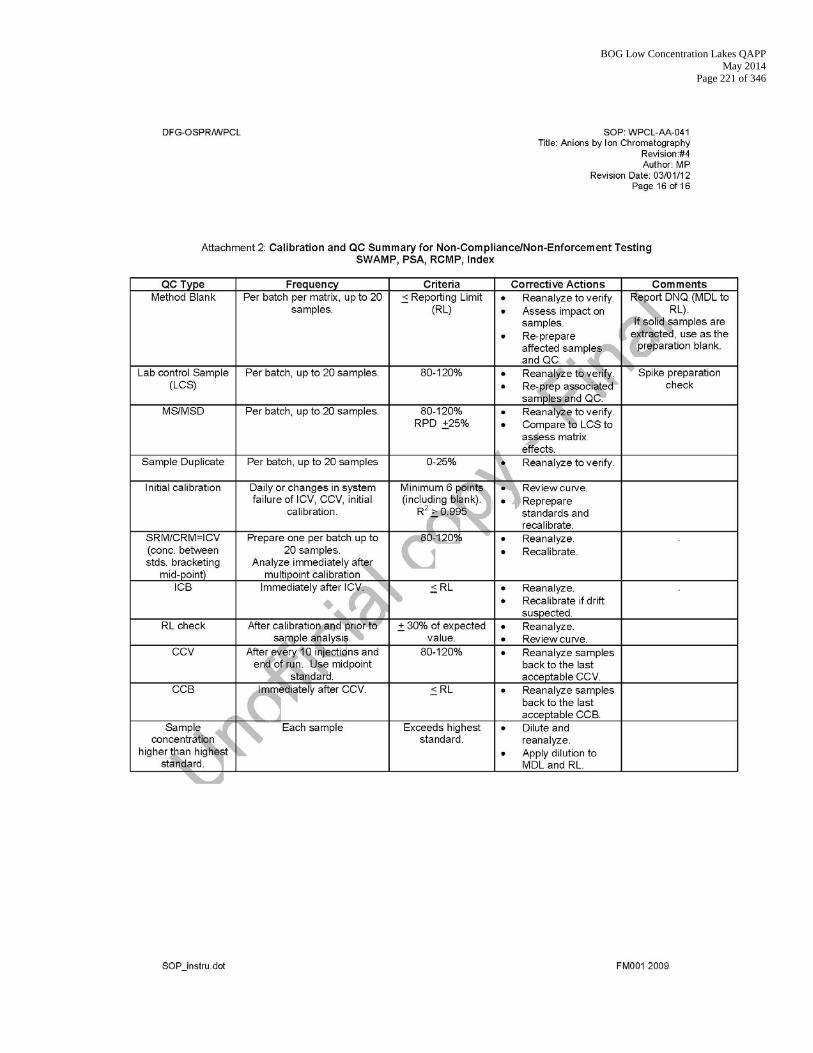
BOG Low Concentration Lakes QAPP May 2014
Page 221 of 346
BOG Low Concentration Lakes QAPP May 2014
Page 222 of 346
Appendix IV D: Method: Microcystins and Biotoxins by LC/MS/MS
BOG Low Concentration Lakes QAPP May 2014
Page 223 of 346
BOG Low Concentration Lakes QAPP May 2014
Page 224 of 346
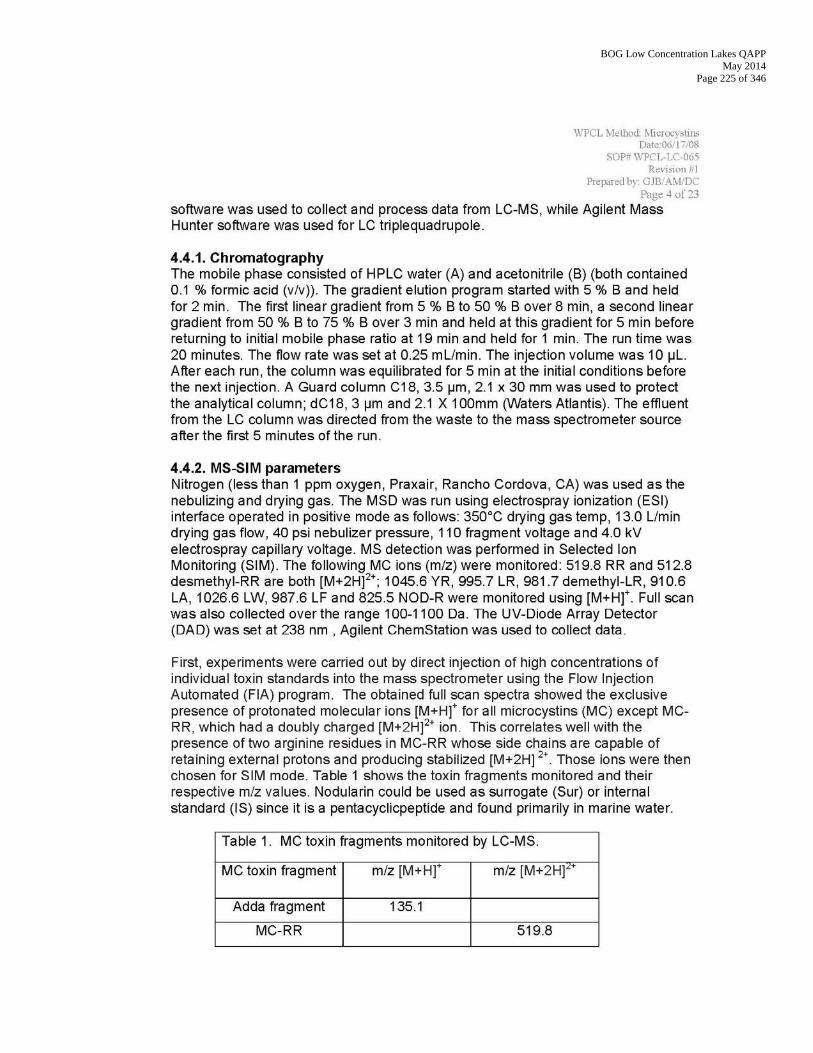
BOG Low Concentration Lakes QAPP May 2014
Page 225 of 346
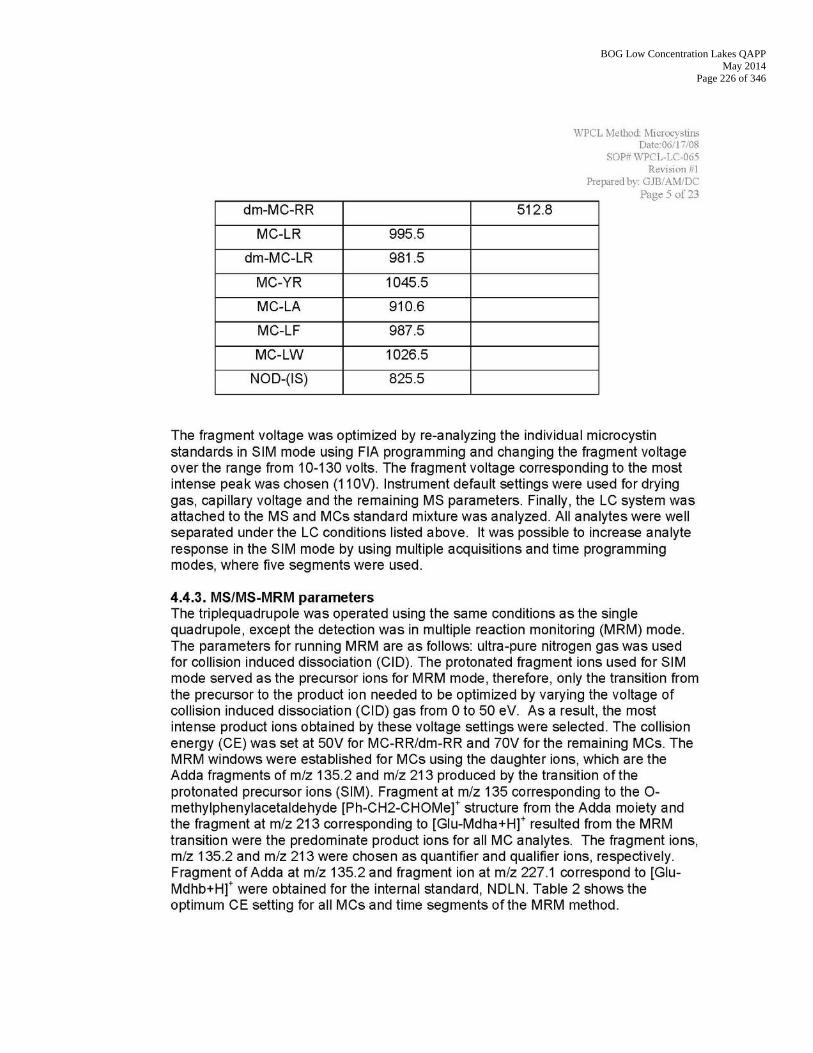
BOG Low Concentration Lakes QAPP May 2014
Page 226 of 346
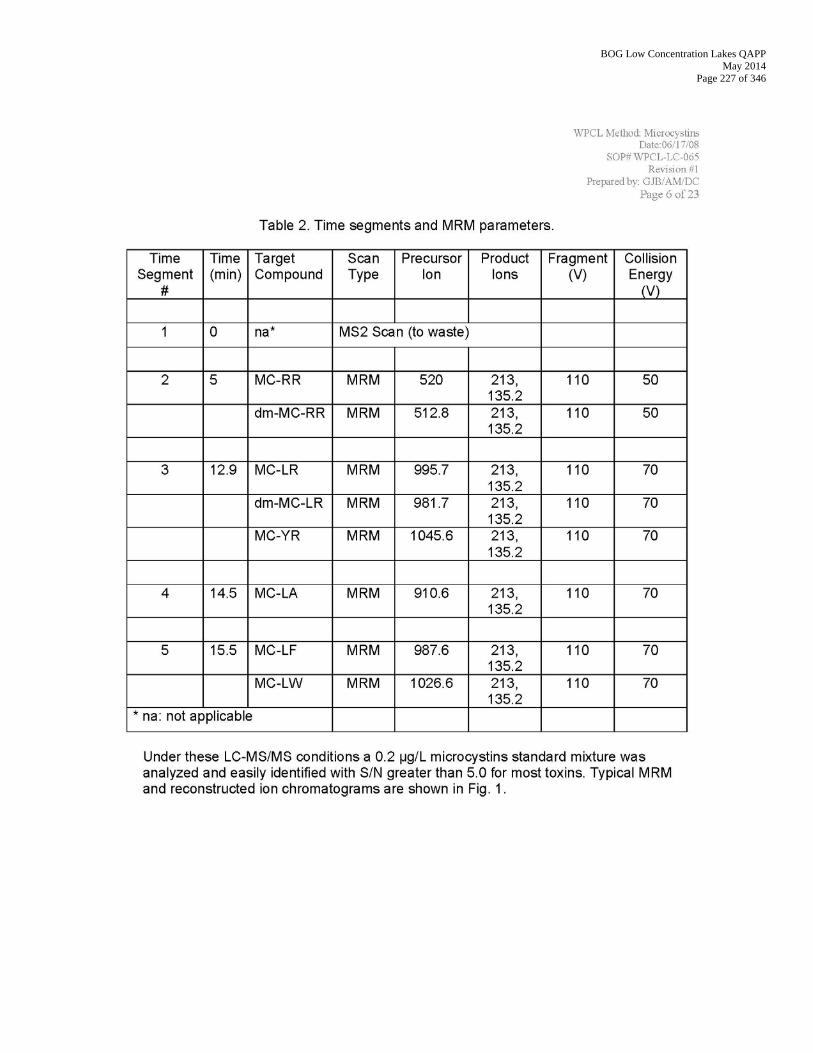
BOG Low Concentration Lakes QAPP May 2014
Page 227 of 346
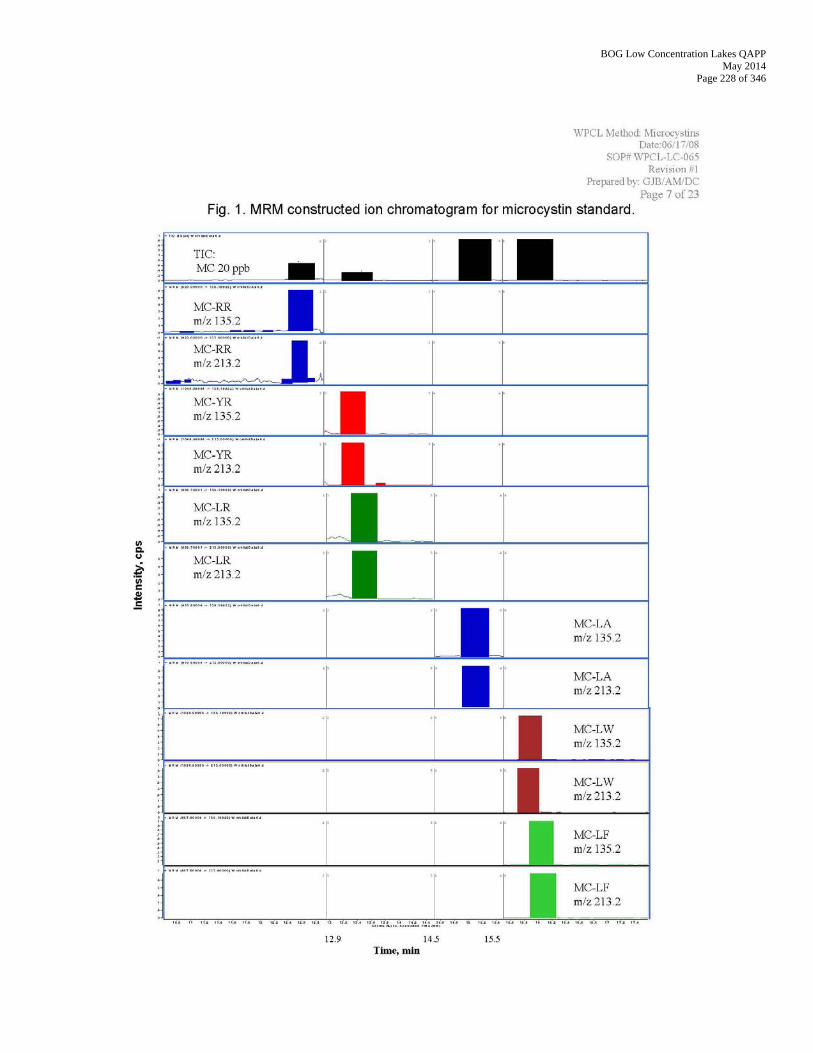
BOG Low Concentration Lakes QAPP May 2014
Page 228 of 346
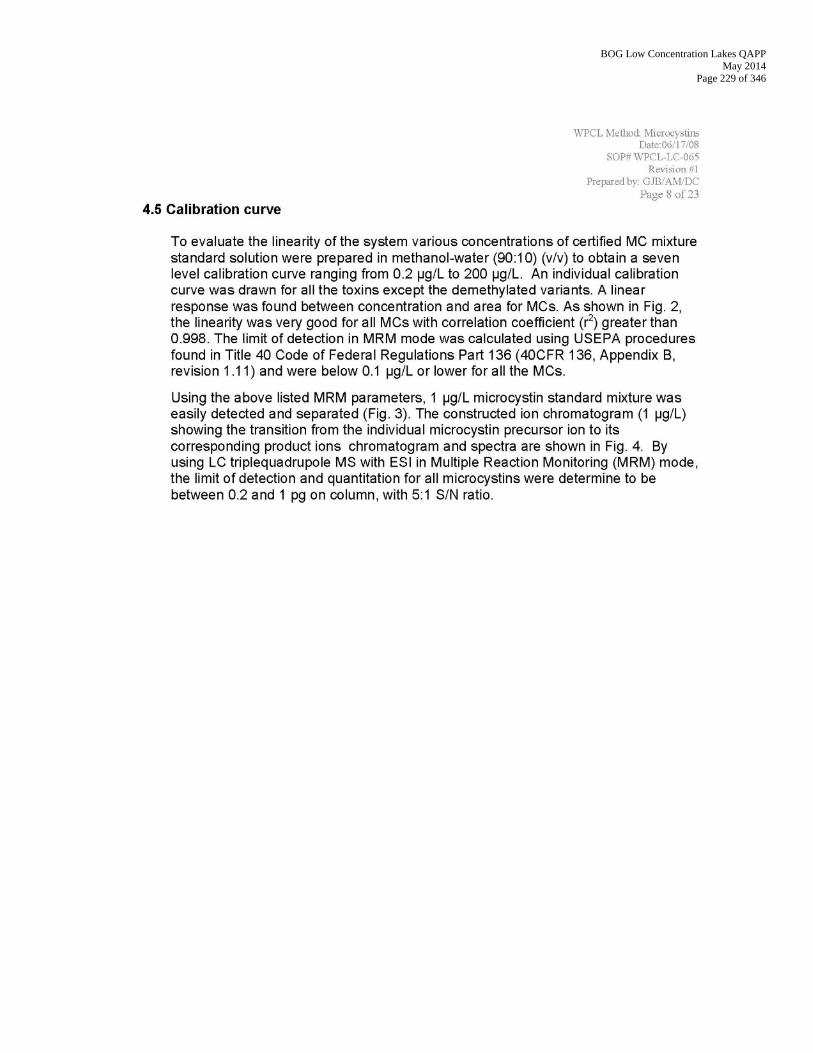
BOG Low Concentration Lakes QAPP May 2014
Page 229 of 346
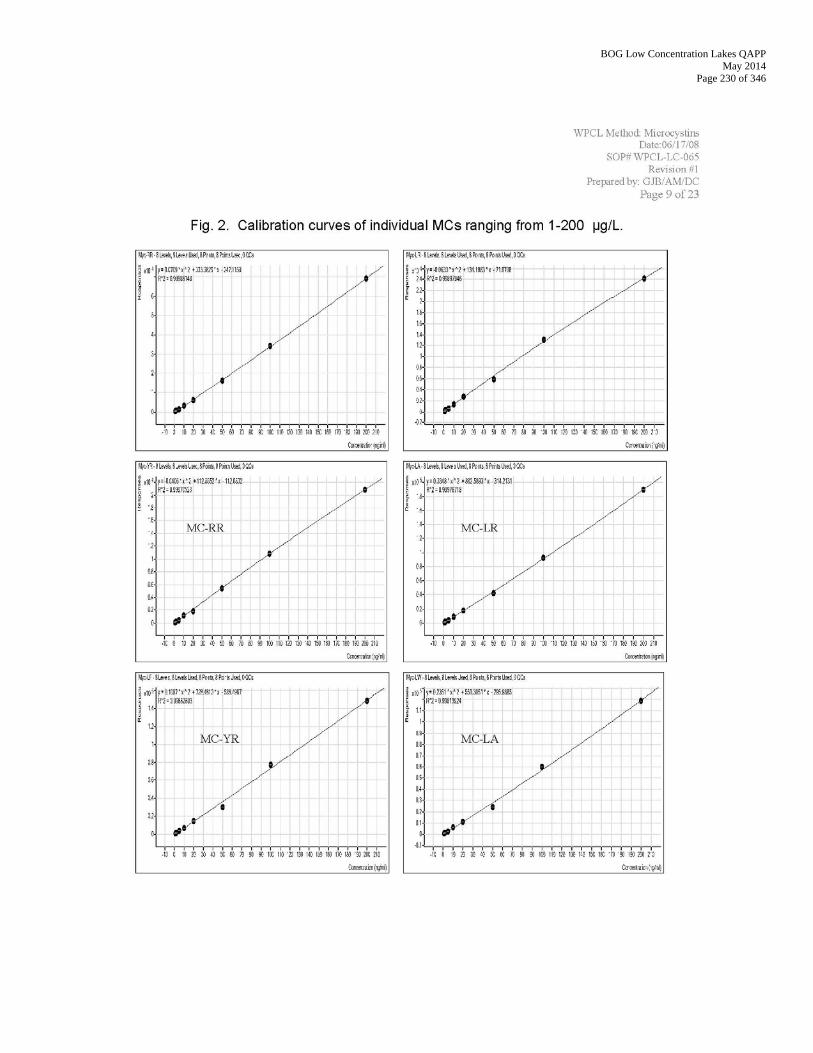
BOG Low Concentration Lakes QAPP May 2014
Page 230 of 346
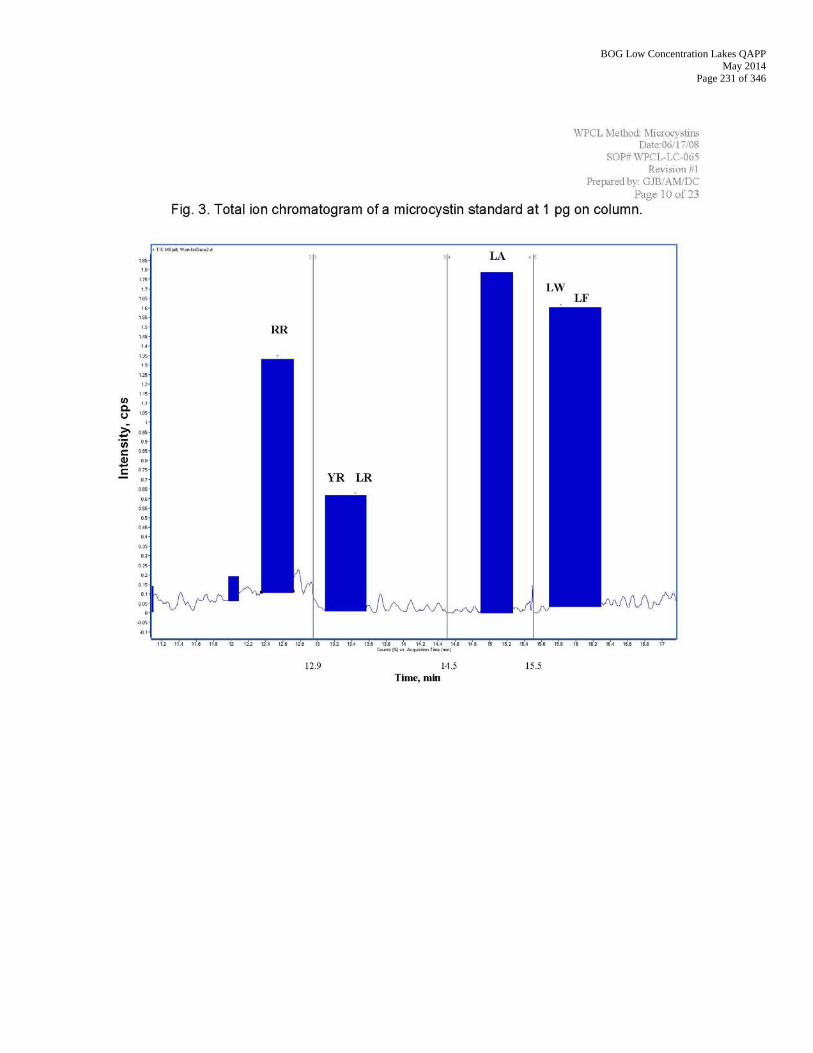
BOG Low Concentration Lakes QAPP May 2014
Page 231 of 346
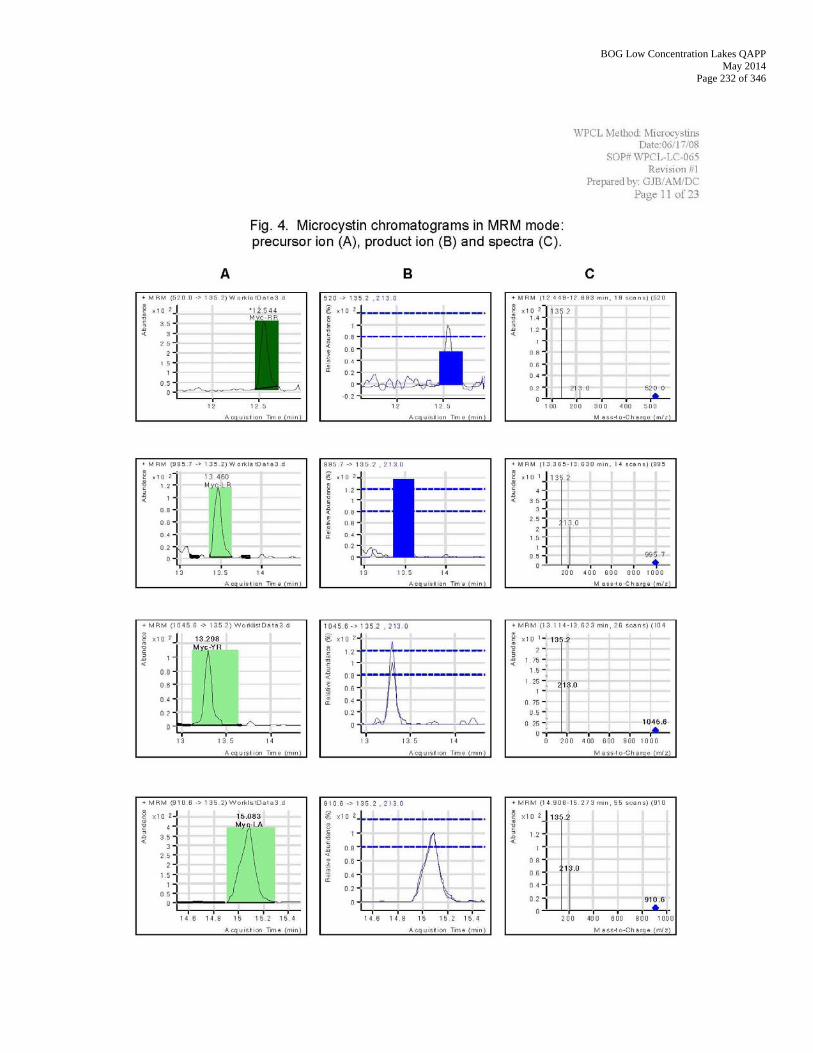
BOG Low Concentration Lakes QAPP May 2014
Page 232 of 346
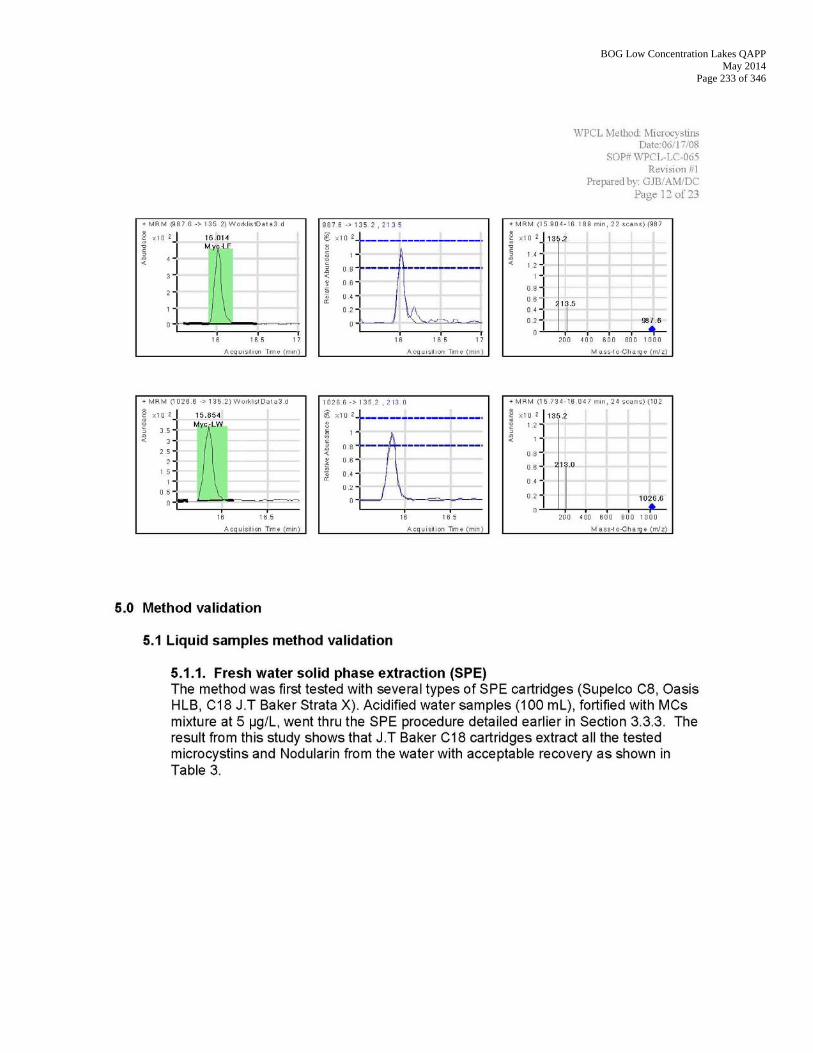
BOG Low Concentration Lakes QAPP May 2014
Page 233 of 346
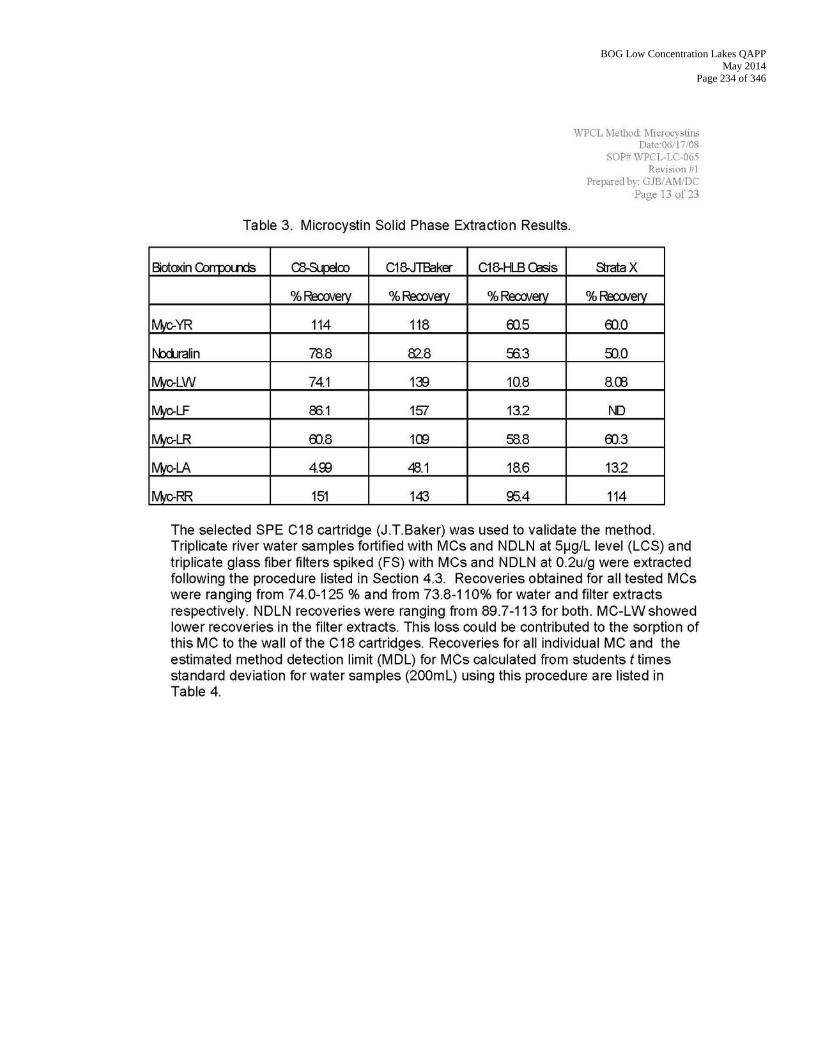
BOG Low Concentration Lakes QAPP May 2014
Page 234 of 346
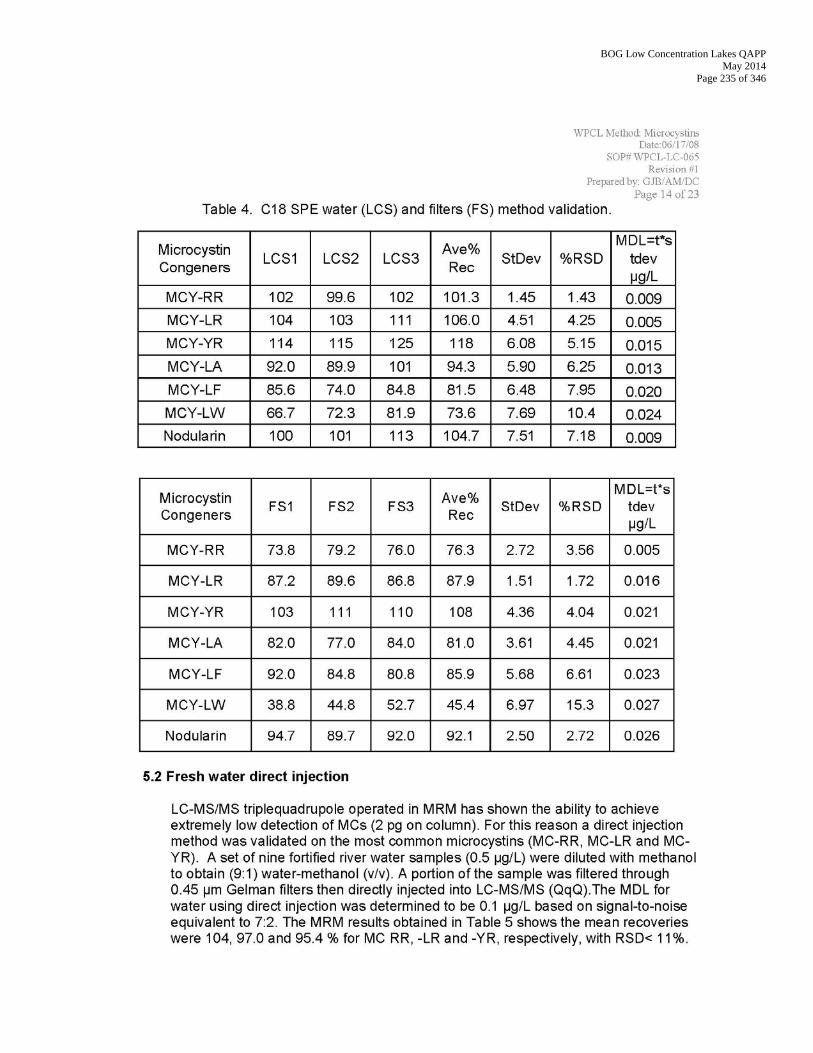
BOG Low Concentration Lakes QAPP May 2014
Page 235 of 346
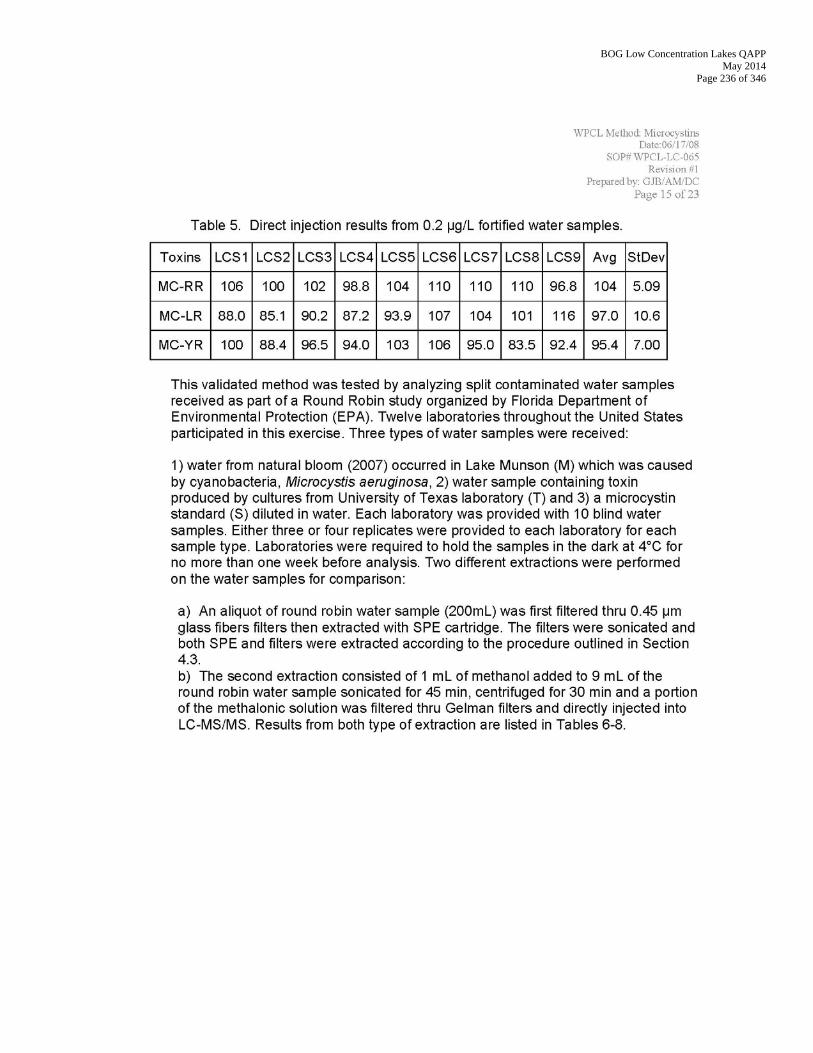
BOG Low Concentration Lakes QAPP May 2014
Page 236 of 346
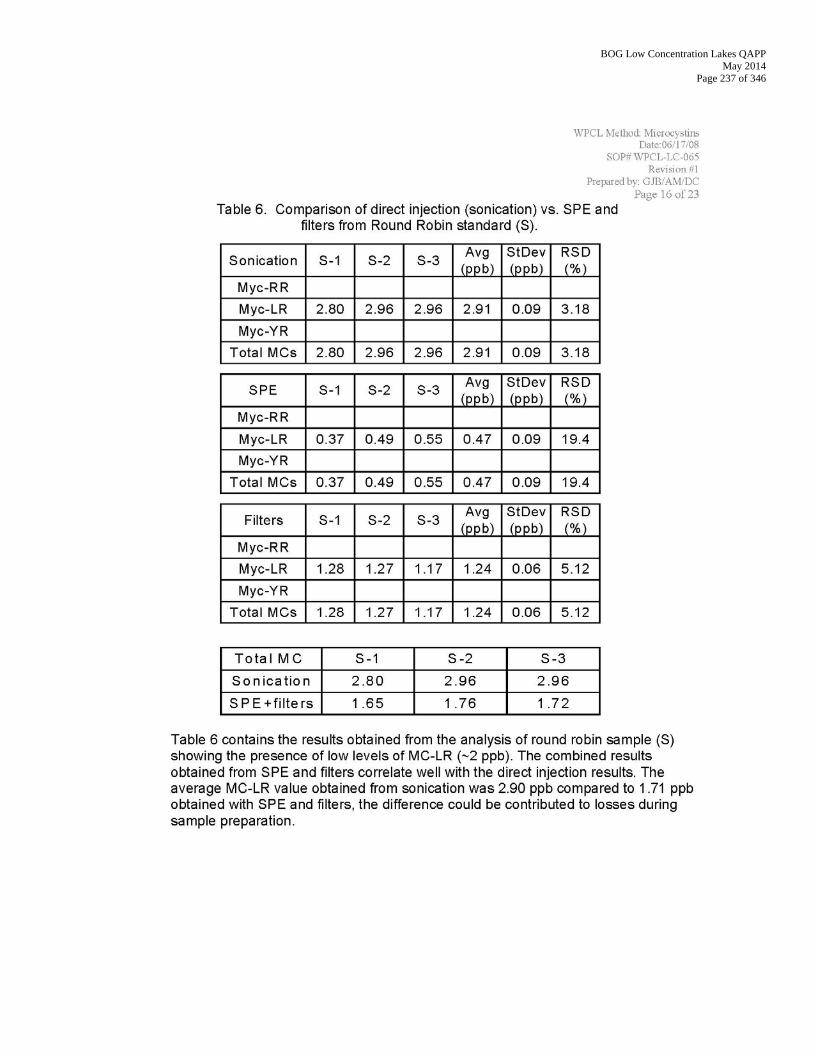
BOG Low Concentration Lakes QAPP May 2014
Page 237 of 346
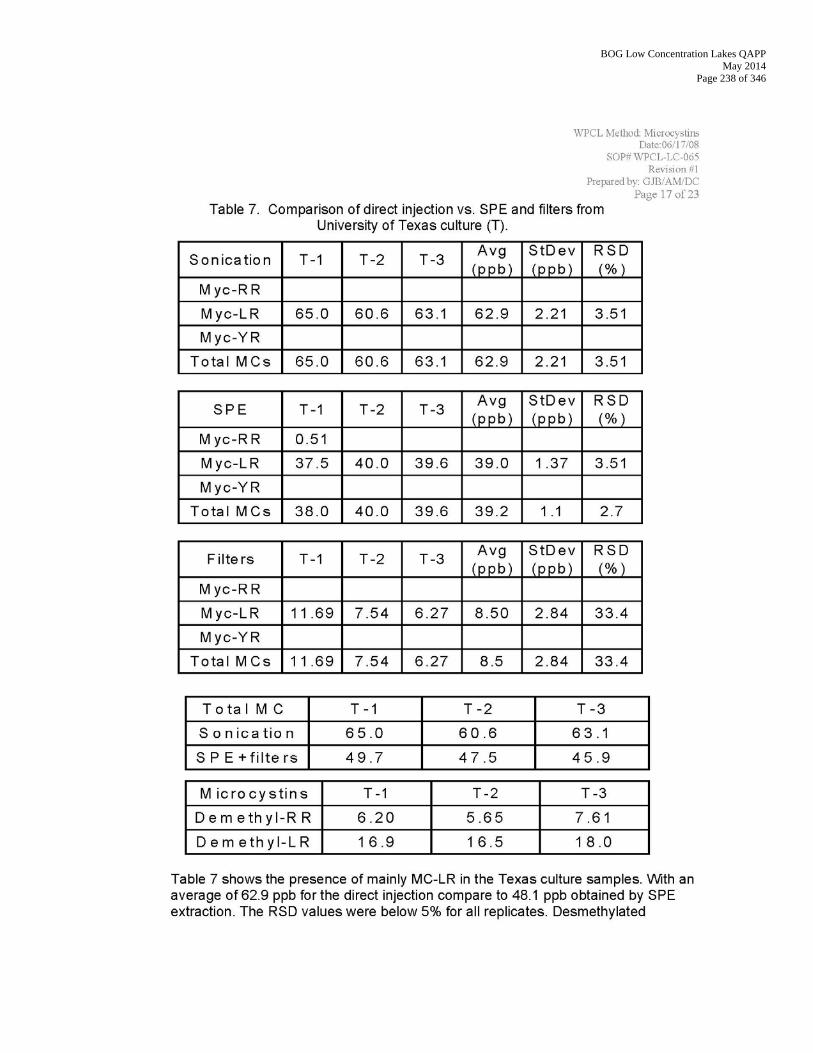
BOG Low Concentration Lakes QAPP May 2014
Page 238 of 346
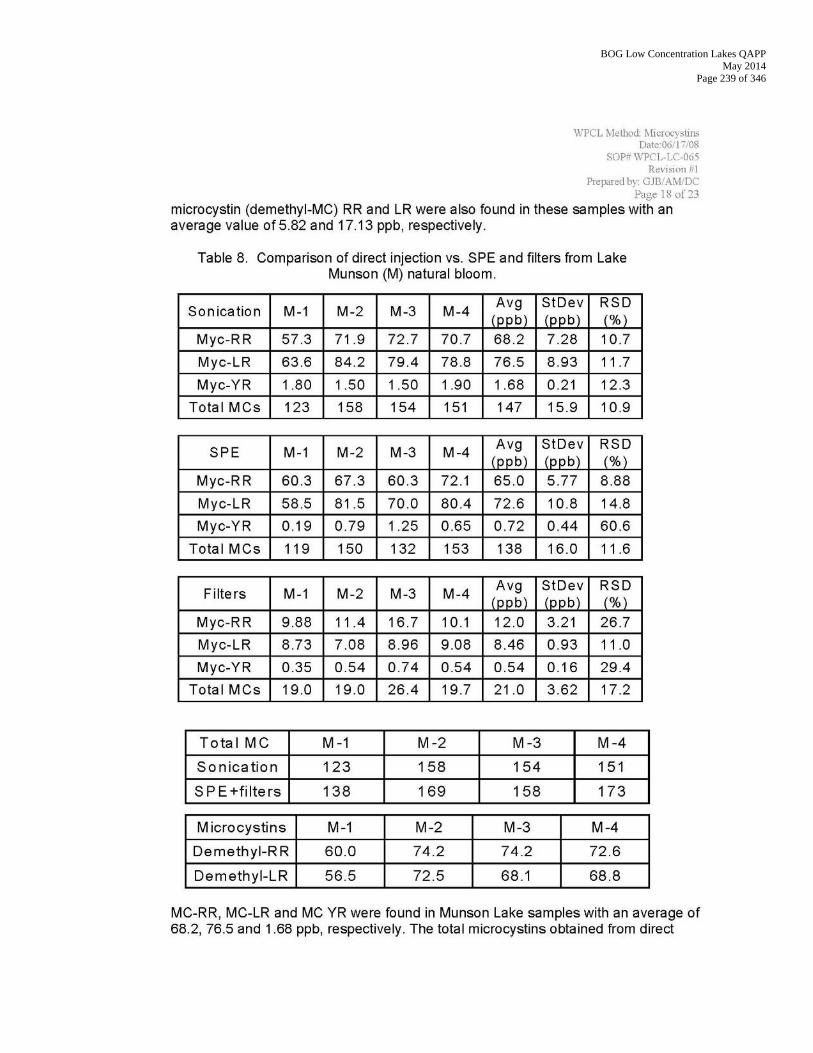
BOG Low Concentration Lakes QAPP May 2014
Page 239 of 346
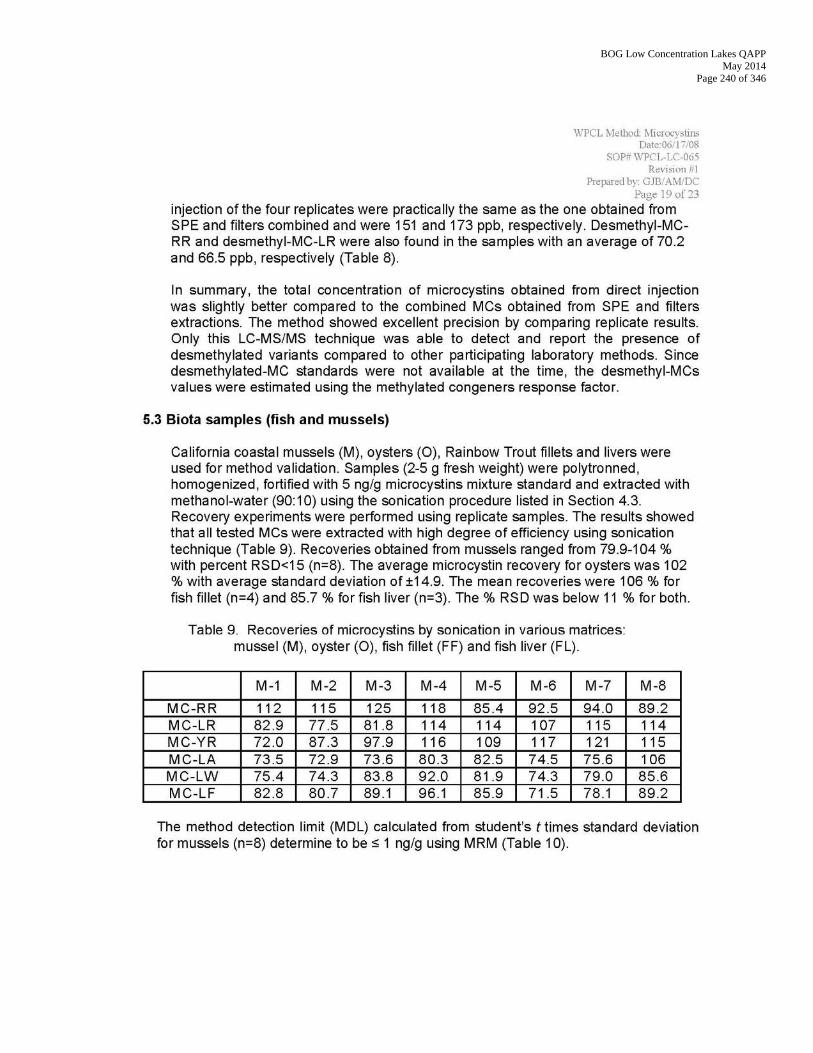
BOG Low Concentration Lakes QAPP May 2014
Page 240 of 346

BOG Low Concentration Lakes QAPP May 2014
Page 241 of 346
BOG Low Concentration Lakes QAPP May 2014
Page 242 of 346
BOG Low Concentration Lakes QAPP May 2014
Page 243 of 346
BOG Low Concentration Lakes QAPP May 2014
Page 244 of 346
BOG Low Concentration Lakes QAPP May 2014
Page 245 of 346
Appendix IV E: Procedures for Disposal of Waste
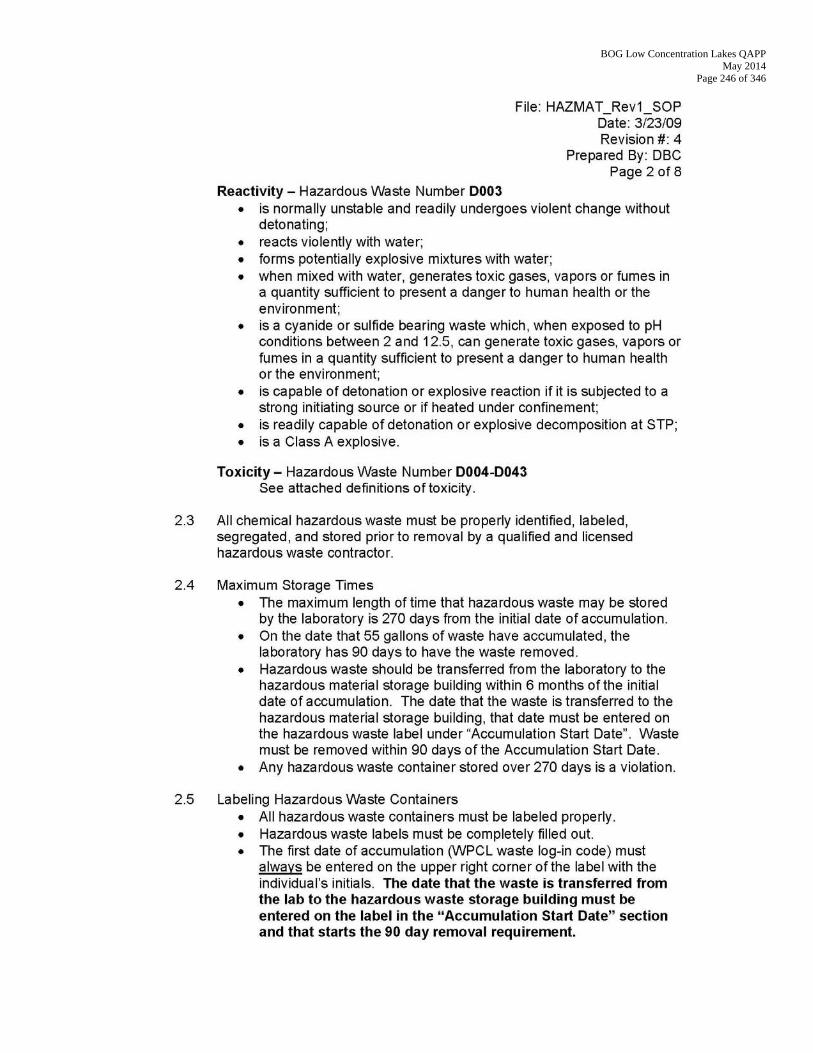
BOG Low Concentration Lakes QAPP May 2014
Page 246 of 346
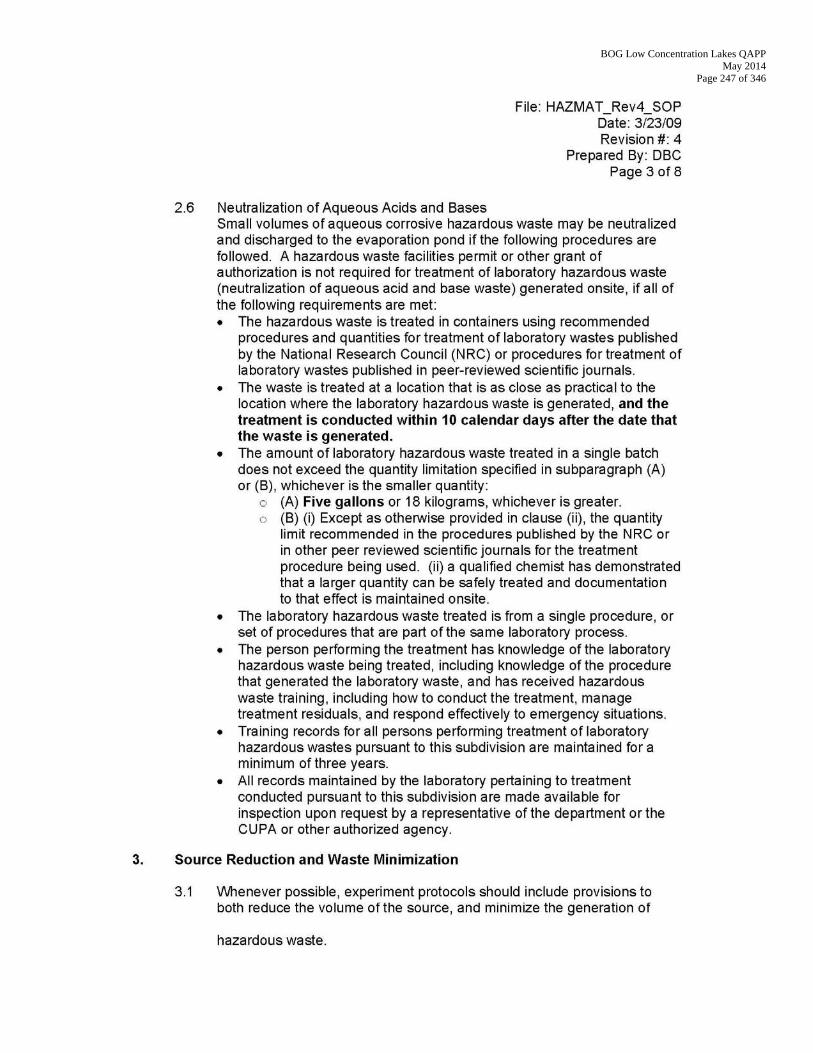
BOG Low Concentration Lakes QAPP May 2014
Page 247 of 346
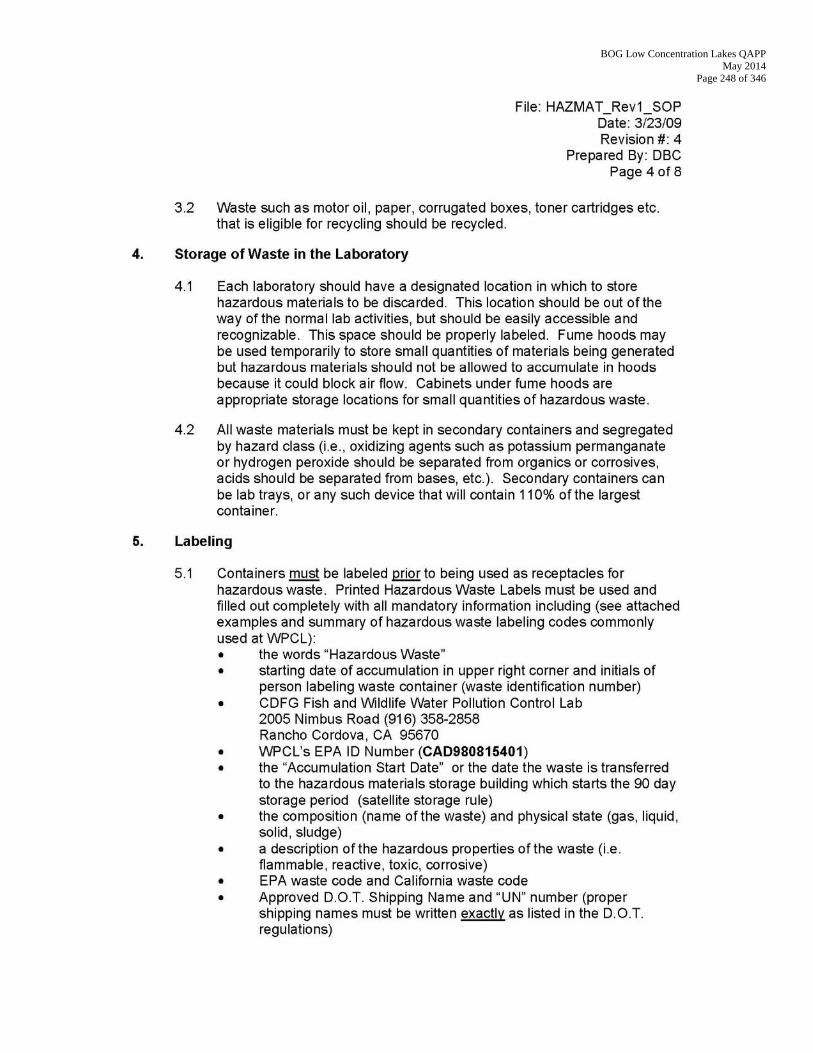
BOG Low Concentration Lakes QAPP May 2014
Page 248 of 346
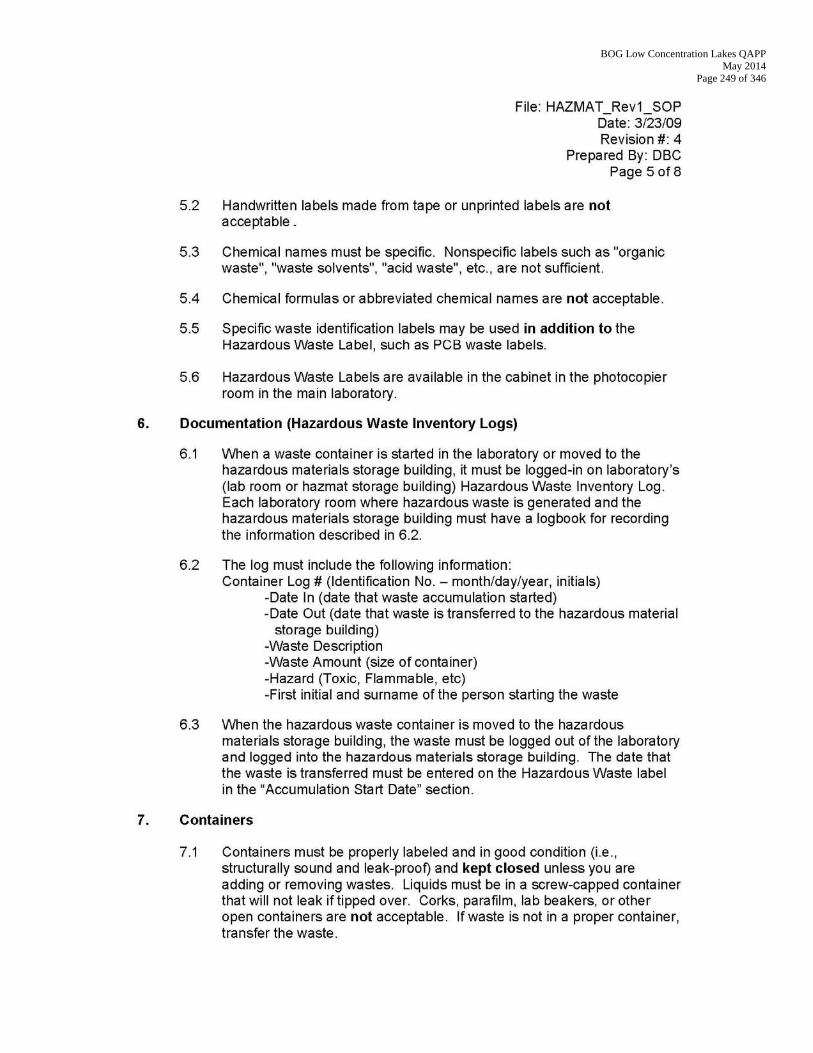
BOG Low Concentration Lakes QAPP May 2014
Page 249 of 346
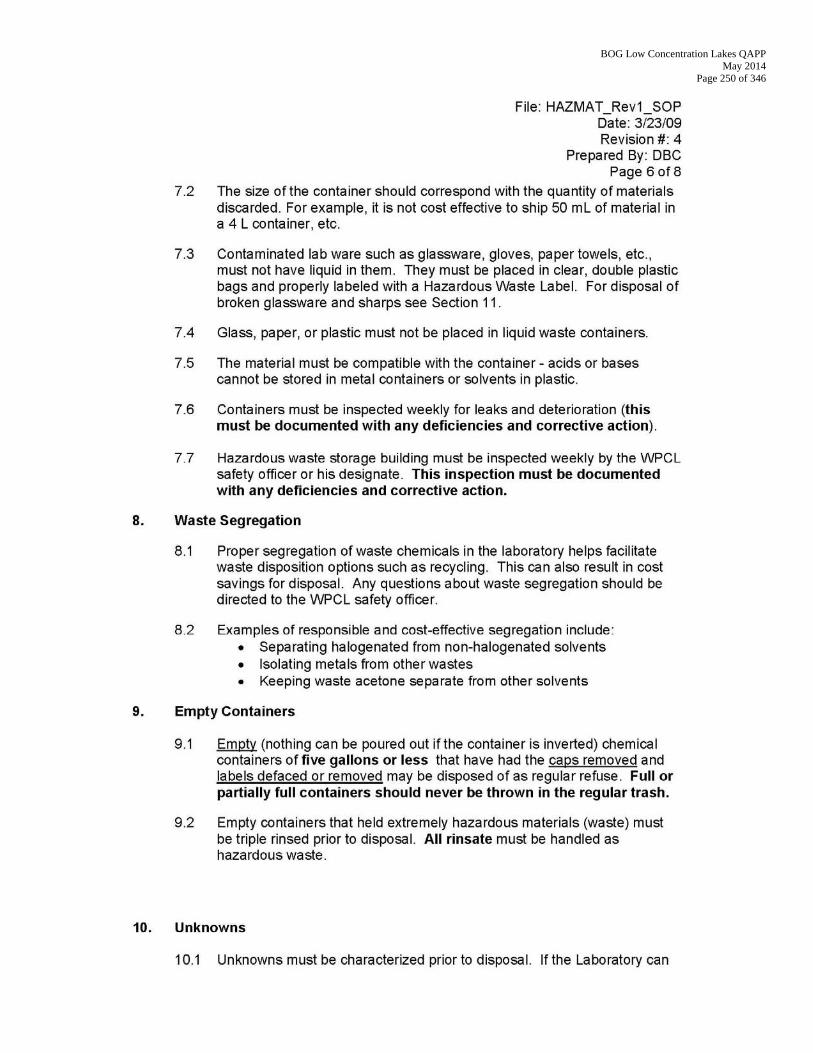
BOG Low Concentration Lakes QAPP May 2014
Page 250 of 346

BOG Low Concentration Lakes QAPP May 2014
Page 251 of 346
BOG Low Concentration Lakes QAPP May 2014
Page 252 of 346
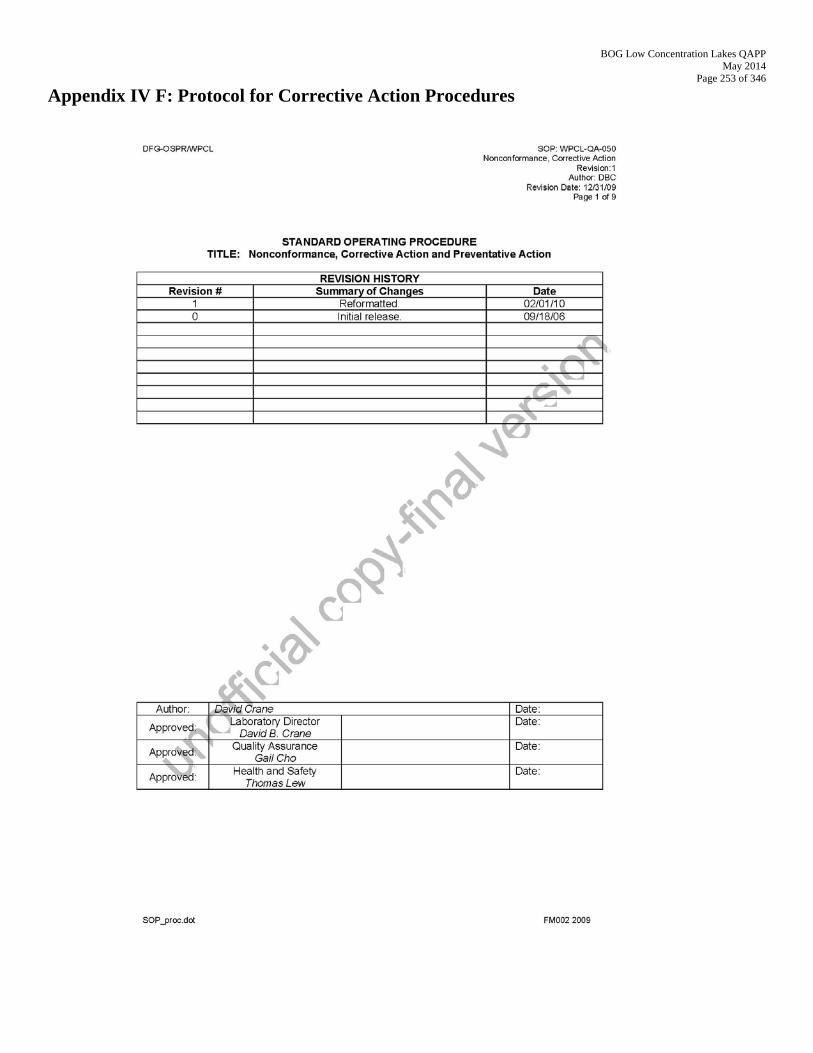
BOG Low Concentration Lakes QAPP May 2014
Page 253 of 346
Appendix IV F: Protocol for Corrective Action Procedures
BOG Low Concentration Lakes QAPP May 2014
Page 254 of 346
BOG Low Concentration Lakes QAPP May 2014
Page 255 of 346

BOG Low Concentration Lakes QAPP May 2014
Page 256 of 346
BOG Low Concentration Lakes QAPP May 2014
Page 257 of 346
BOG Low Concentration Lakes QAPP May 2014
Page 258 of 346
BOG Low Concentration Lakes QAPP May 2014
Page 259 of 346

BOG Low Concentration Lakes QAPP May 2014
Page 260 of 346

BOG Low Concentration Lakes QAPP May 2014
Page 261 of 346
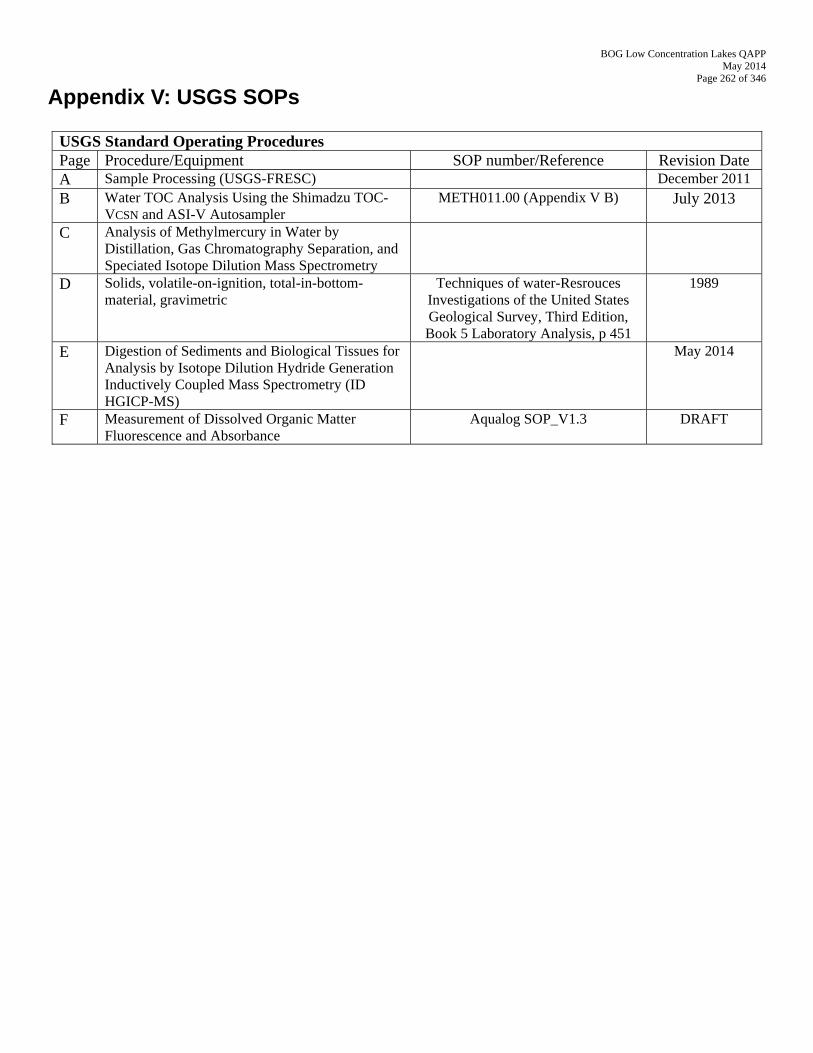
BOG Low Concentration Lakes QAPP May 2014
Page 262 of 346
Appendix V: USGS SOPs
USGS Standard Operating Procedures Page Procedure/Equipment SOP number/Reference Revision Date A Sample Processing (USGS-FRESC) December 2011
B Water TOC Analysis Using the Shimadzu TOC-VCSN and ASI-V Autosampler
METH011.00 (Appendix V B) July 2013
C Analysis of Methylmercury in Water by Distillation, Gas Chromatography Separation, and Speciated Isotope Dilution Mass Spectrometry
D Solids, volatile-on-ignition, total-in-bottom-material, gravimetric
Techniques of water-Resrouces Investigations of the United States Geological Survey, Third Edition, Book 5 Laboratory Analysis, p 451
1989
E Digestion of Sediments and Biological Tissues for Analysis by Isotope Dilution Hydride Generation Inductively Coupled Mass Spectrometry (ID HGICP-MS)
May 2014
F Measurement of Dissolved Organic Matter Fluorescence and Absorbance
Aqualog SOP_V1.3 DRAFT
BOG Low Concentration Lakes QAPP May 2014
Page 263 of 346
Appendix V A: Sample Processing (USGS-FRESC)
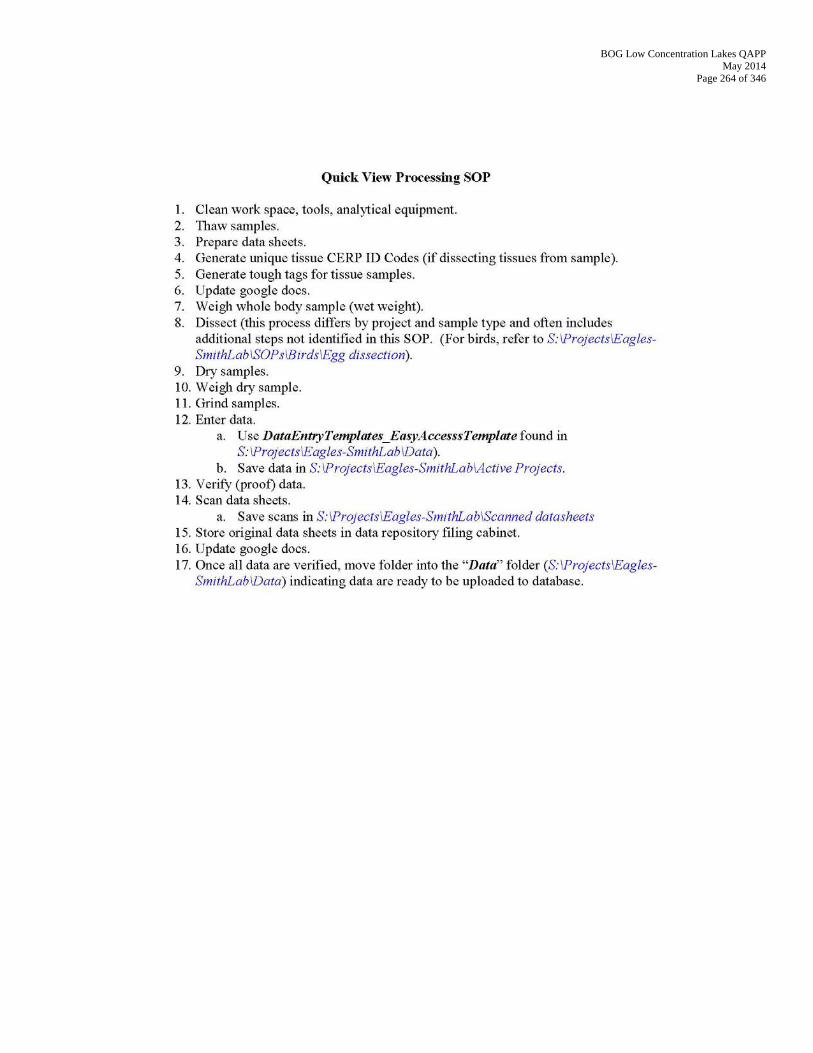
BOG Low Concentration Lakes QAPP May 2014
Page 264 of 346

BOG Low Concentration Lakes QAPP May 2014
Page 265 of 346
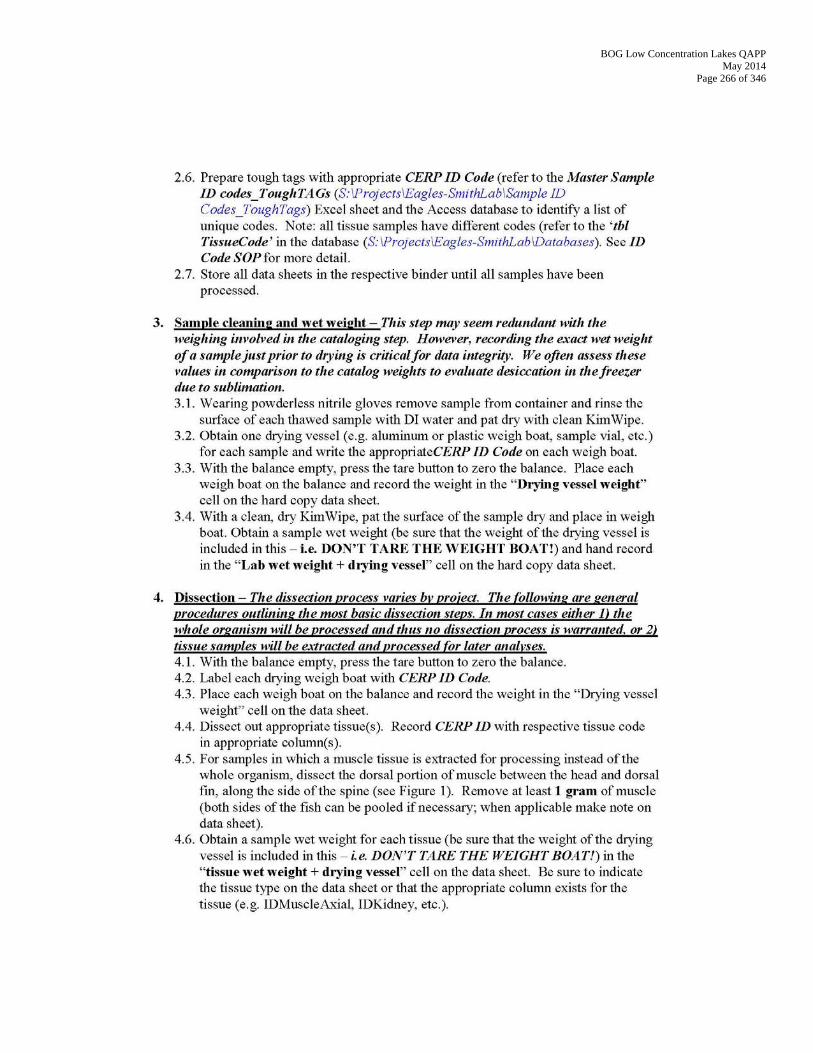
BOG Low Concentration Lakes QAPP May 2014
Page 266 of 346
BOG Low Concentration Lakes QAPP May 2014
Page 267 of 346
BOG Low Concentration Lakes QAPP May 2014
Page 268 of 346
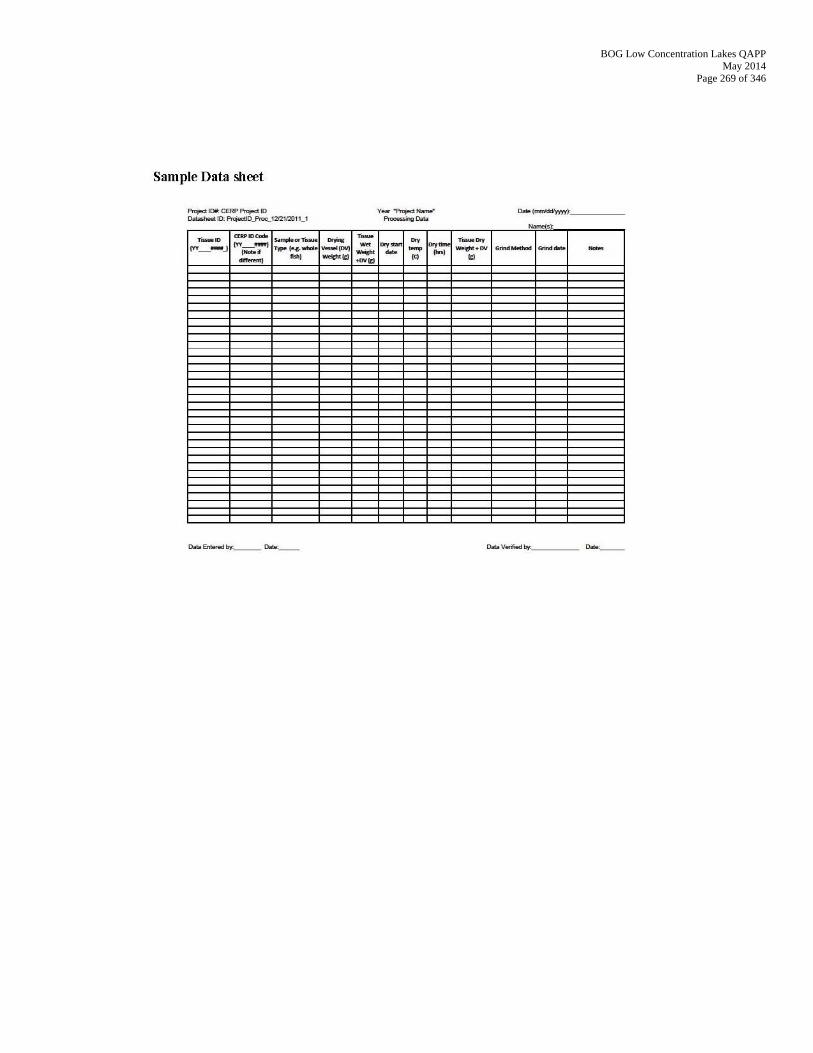
BOG Low Concentration Lakes QAPP May 2014
Page 269 of 346

BOG Low Concentration Lakes QAPP May 2014
Page 270 of 346
Appendix V B: Water TOC Analysis Using the Shimadzu TOC-VCSN and ASI-V Autosampler
BOG Low Concentration Lakes QAPP May 2014
Page 271 of 346
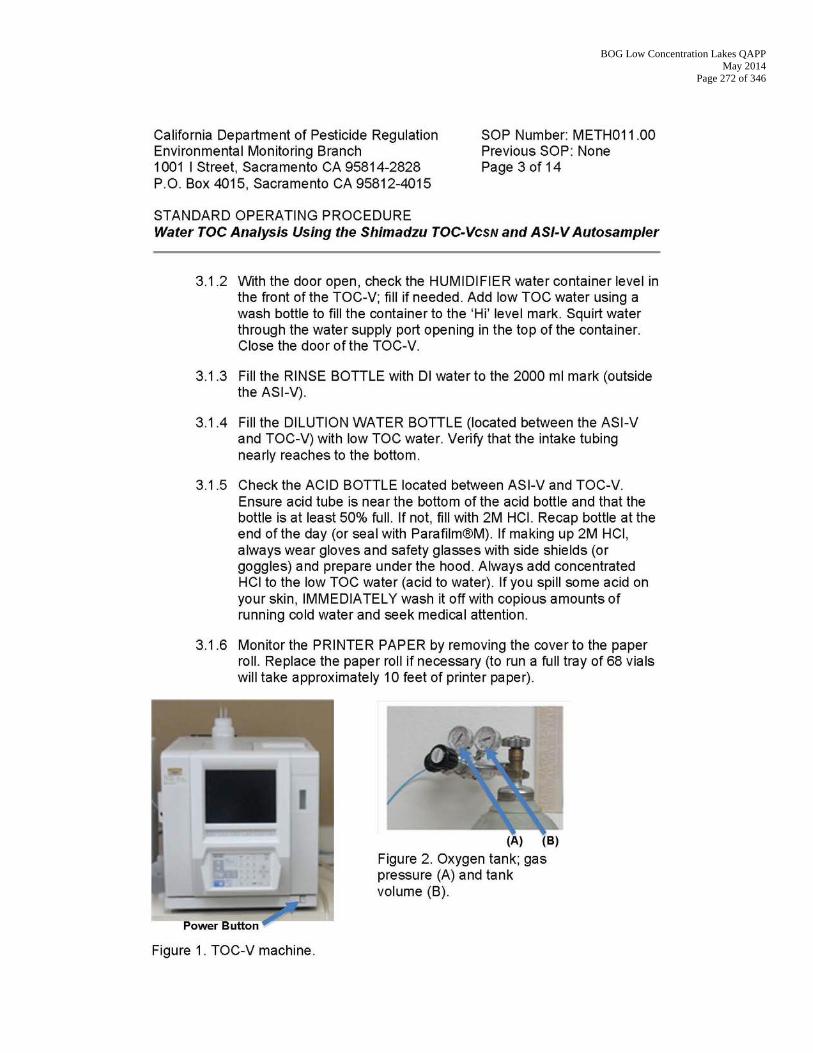
BOG Low Concentration Lakes QAPP May 2014
Page 272 of 346
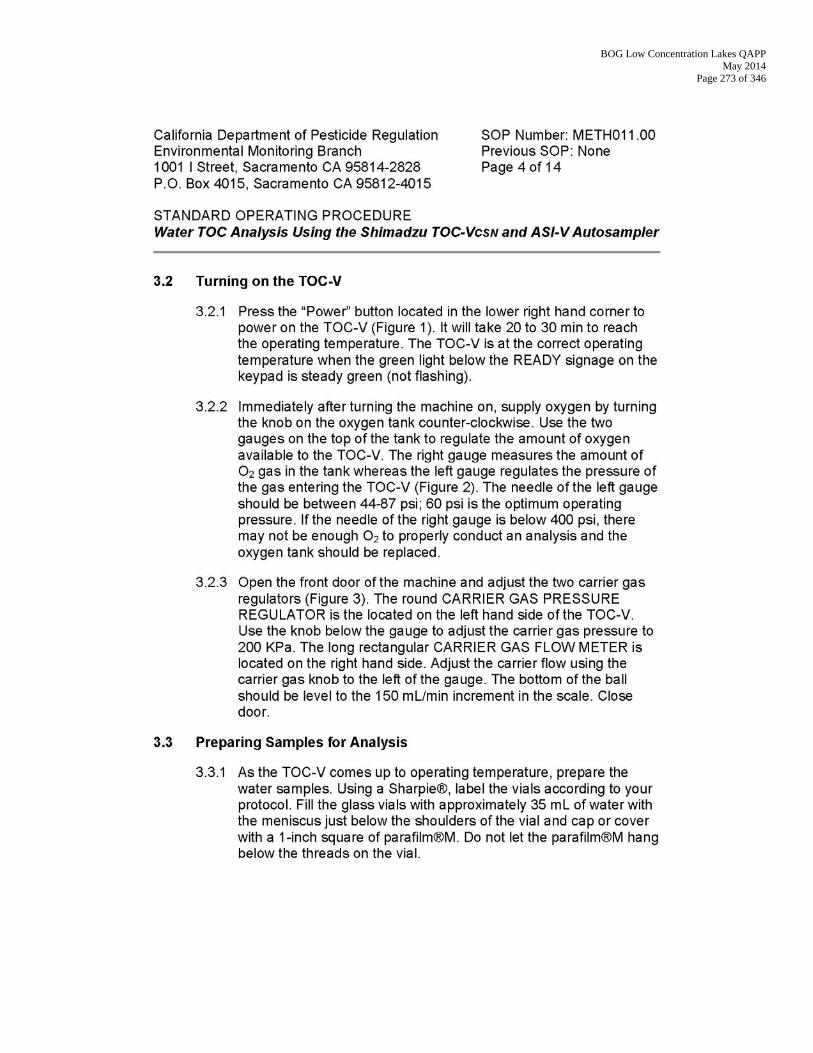
BOG Low Concentration Lakes QAPP May 2014
Page 273 of 346
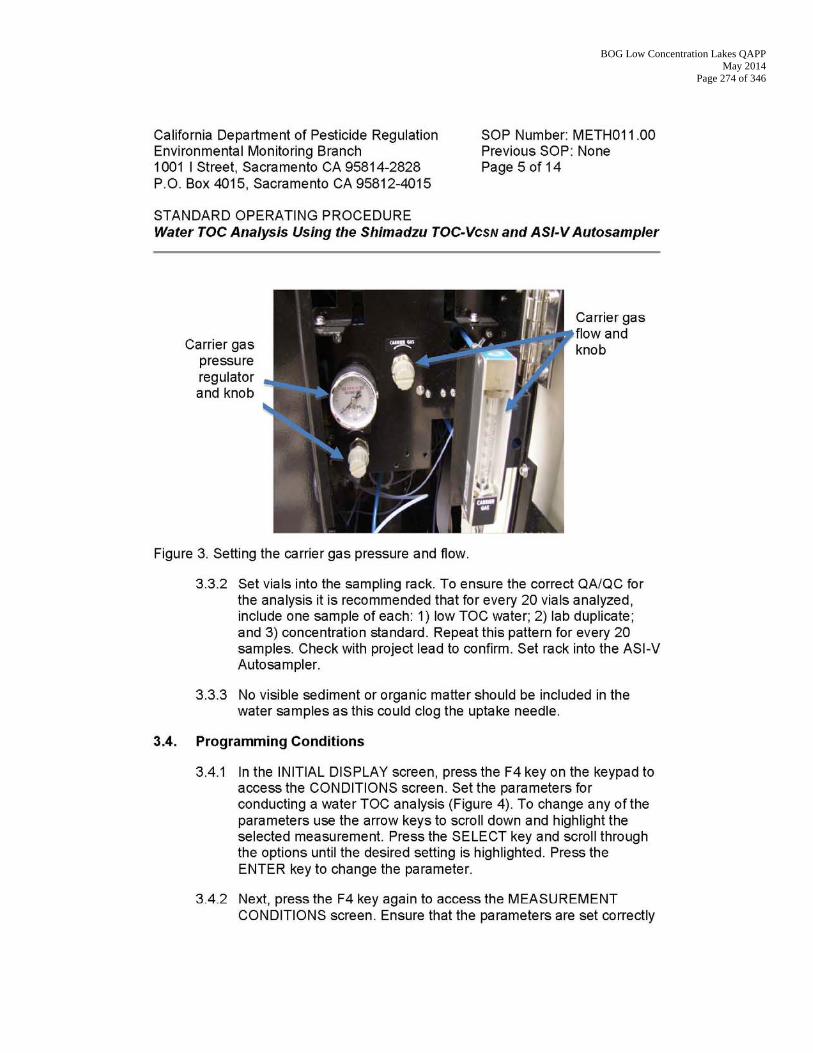
BOG Low Concentration Lakes QAPP May 2014
Page 274 of 346
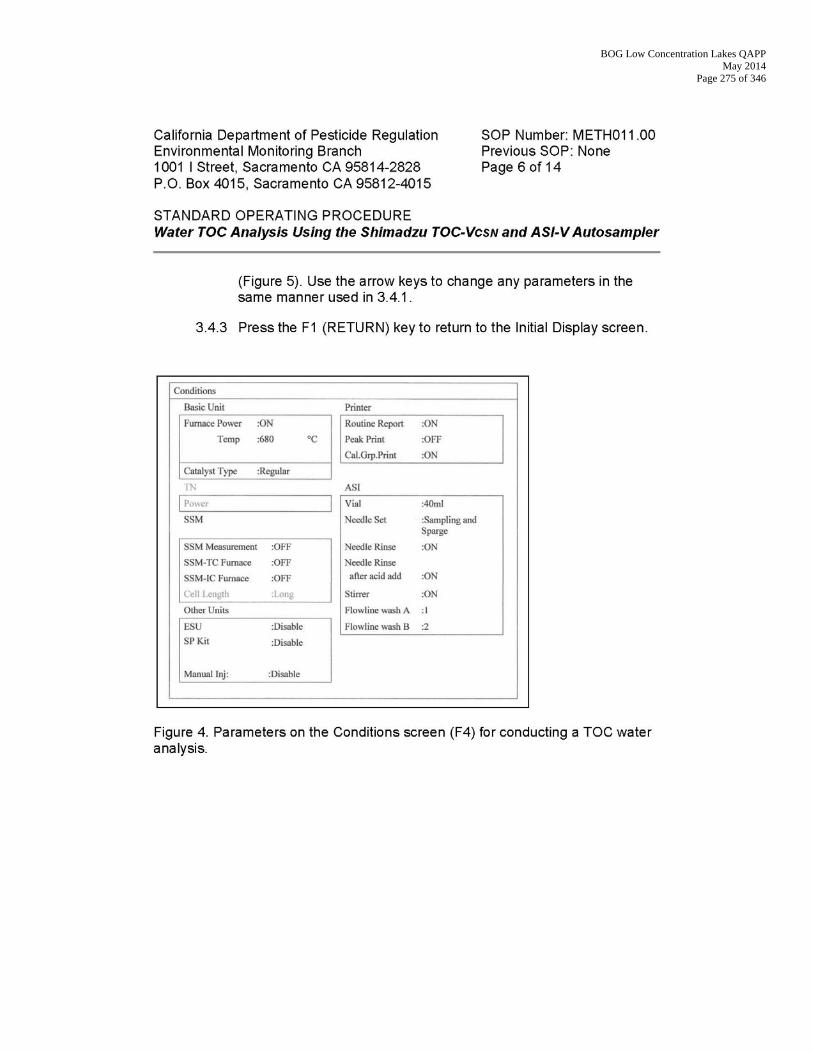
BOG Low Concentration Lakes QAPP May 2014
Page 275 of 346
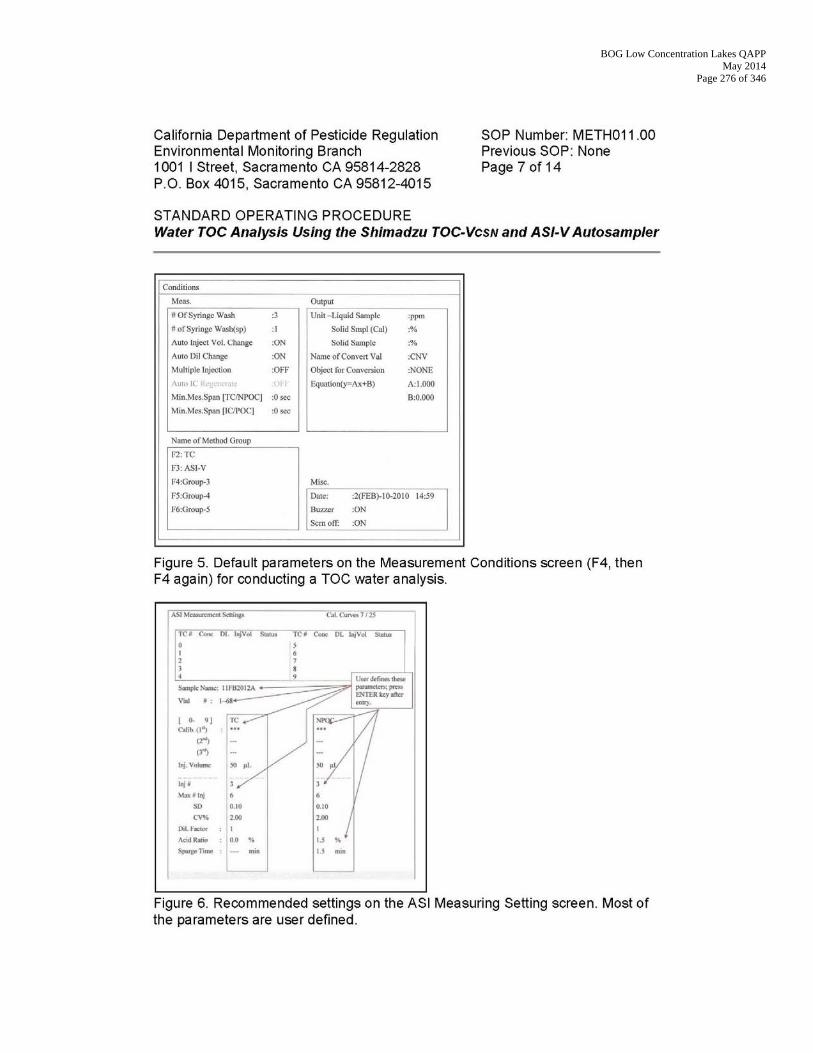
BOG Low Concentration Lakes QAPP May 2014
Page 276 of 346
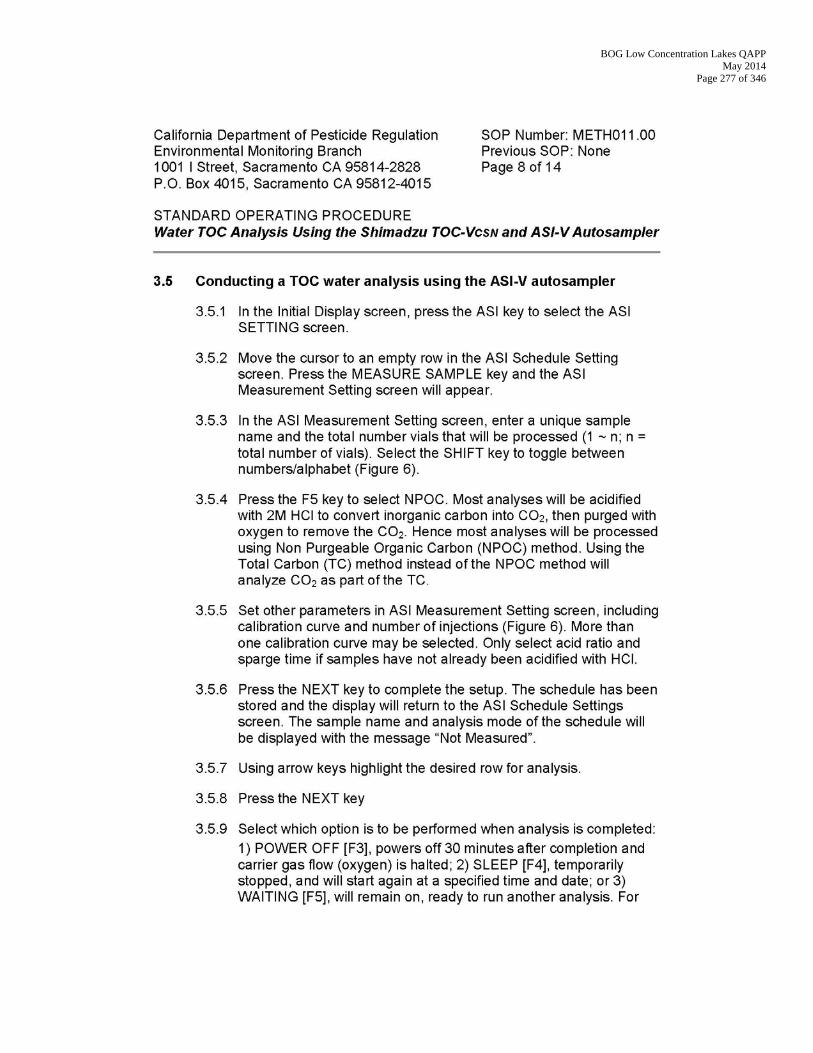
BOG Low Concentration Lakes QAPP May 2014
Page 277 of 346
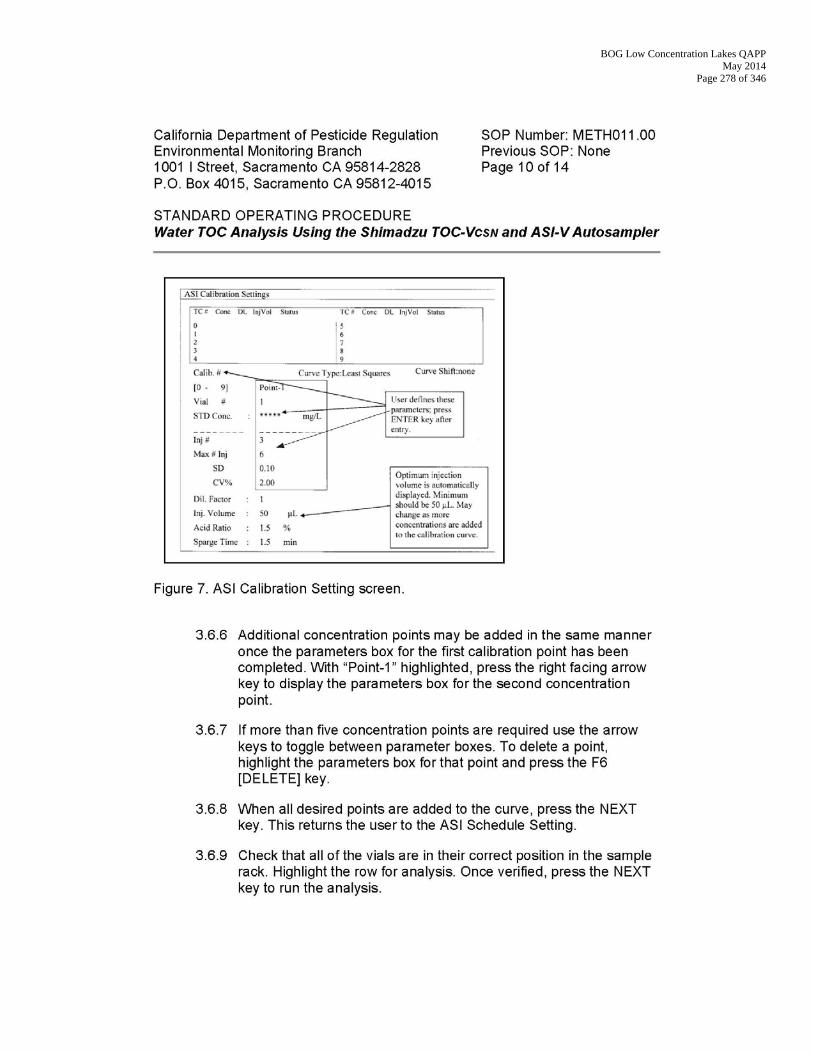
BOG Low Concentration Lakes QAPP May 2014
Page 278 of 346

BOG Low Concentration Lakes QAPP May 2014
Page 279 of 346
BOG Low Concentration Lakes QAPP May 2014
Page 280 of 346

BOG Low Concentration Lakes QAPP May 2014
Page 281 of 346
BOG Low Concentration Lakes QAPP May 2014
Page 282 of 346
BOG Low Concentration Lakes QAPP May 2014
Page 283 of 346
BOG Low Concentration Lakes QAPP May 2014
Page 284 of 346
Appendix V C: Analysis of Methylmercury in Water by Distillation, Gas Chromatography Separation, and Speciated Isotope Dilution Mass Spectrometry
BOG Low Concentration Lakes QAPP May 2014
Page 285 of 346
BOG Low Concentration Lakes QAPP May 2014
Page 286 of 346
BOG Low Concentration Lakes QAPP May 2014
Page 287 of 346
BOG Low Concentration Lakes QAPP May 2014
Page 288 of 346
BOG Low Concentration Lakes QAPP May 2014
Page 289 of 346

BOG Low Concentration Lakes QAPP May 2014
Page 290 of 346
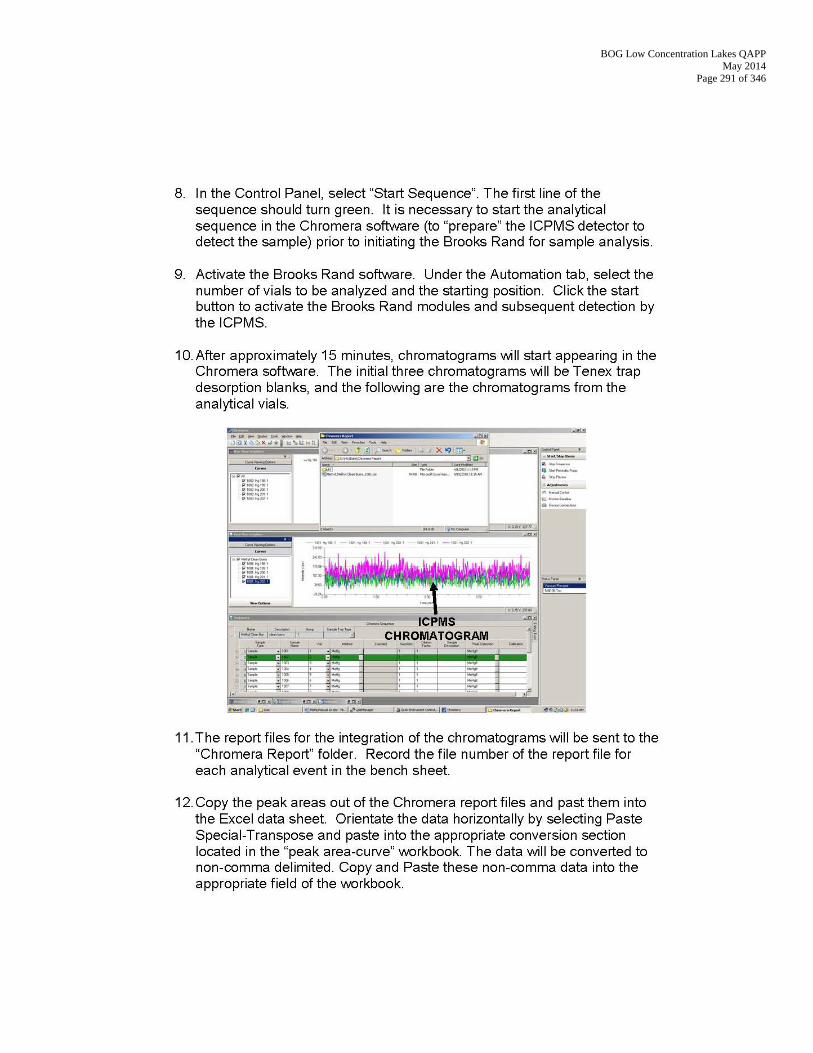
BOG Low Concentration Lakes QAPP May 2014
Page 291 of 346
BOG Low Concentration Lakes QAPP May 2014
Page 292 of 346
BOG Low Concentration Lakes QAPP May 2014
Page 293 of 346
BOG Low Concentration Lakes QAPP May 2014
Page 294 of 346
BOG Low Concentration Lakes QAPP May 2014
Page 295 of 346
BOG Low Concentration Lakes QAPP May 2014
Page 296 of 346
BOG Low Concentration Lakes QAPP May 2014
Page 297 of 346
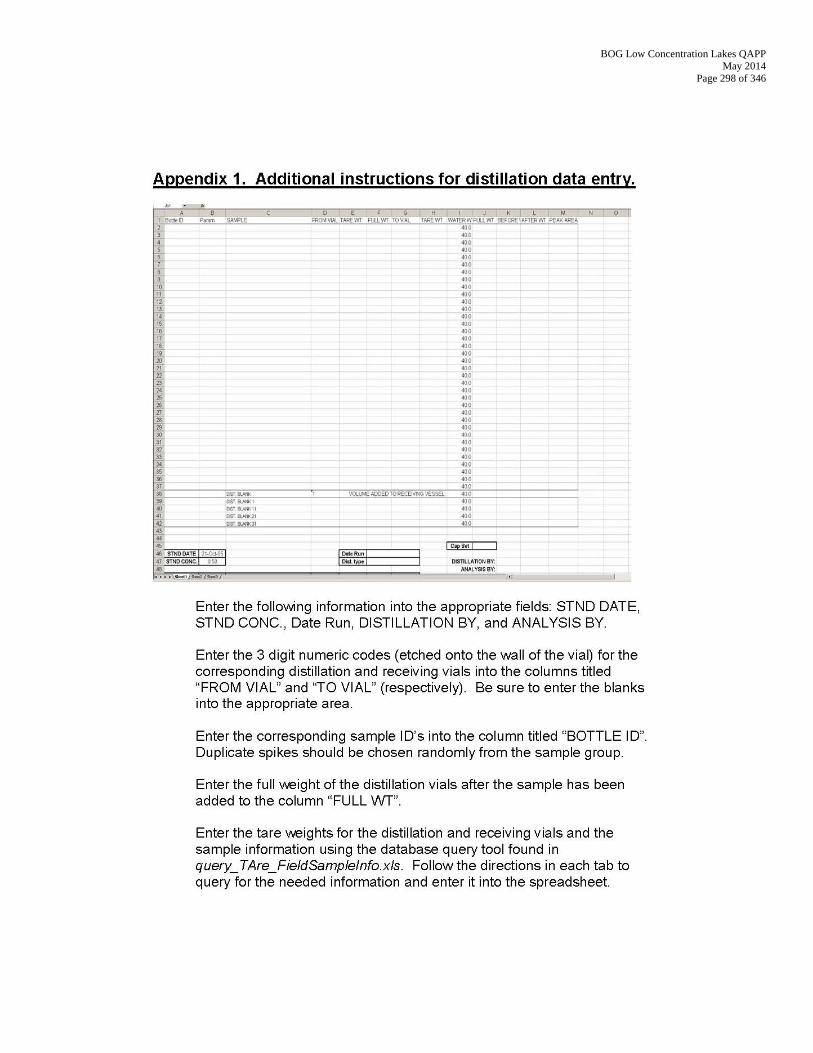
BOG Low Concentration Lakes QAPP May 2014
Page 298 of 346
BOG Low Concentration Lakes QAPP May 2014
Page 299 of 346
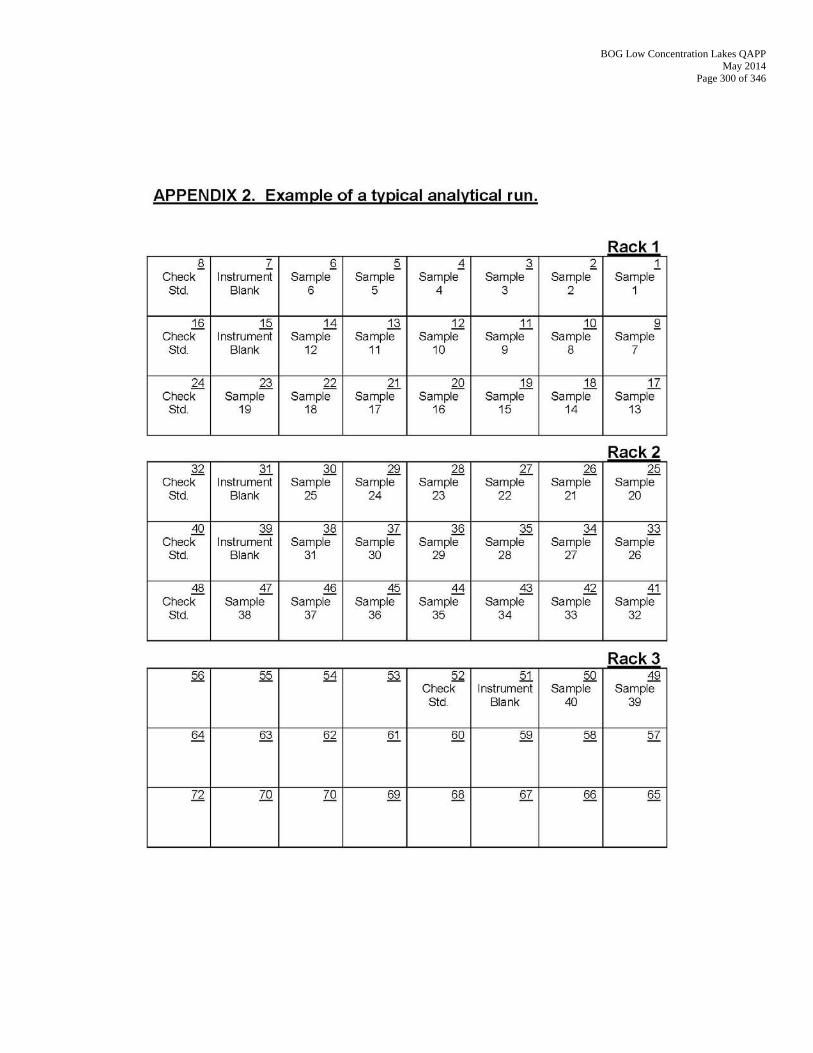
BOG Low Concentration Lakes QAPP May 2014
Page 300 of 346
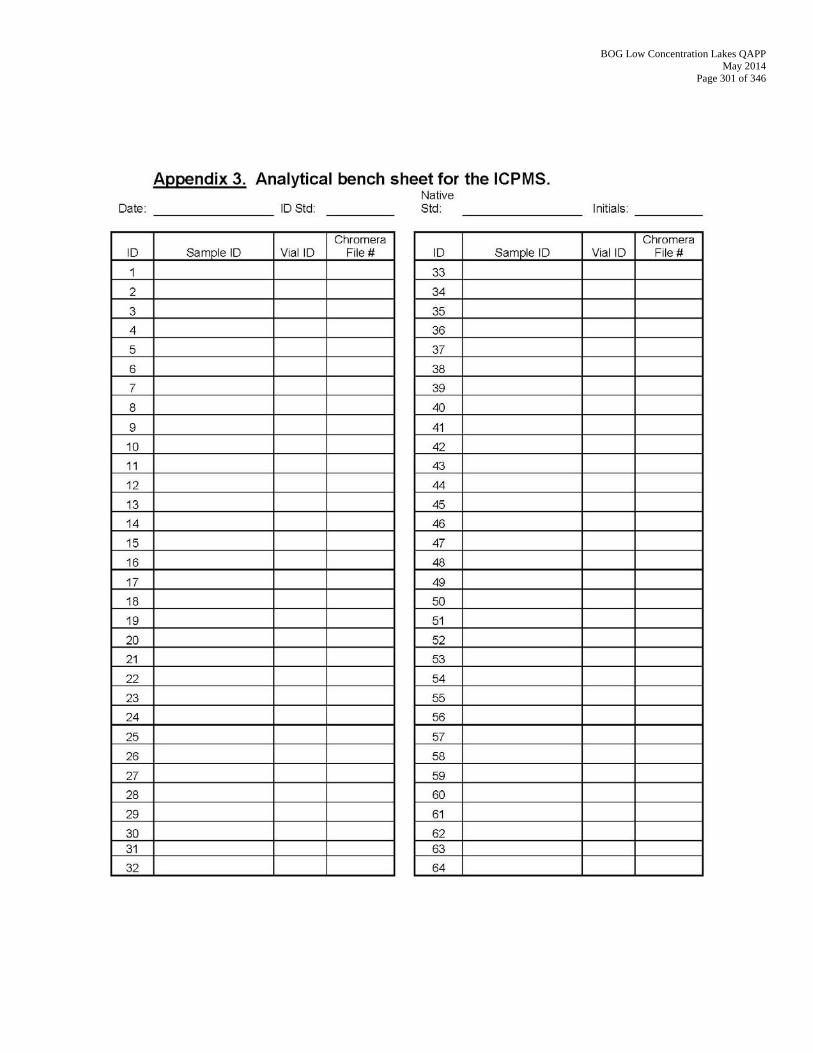
BOG Low Concentration Lakes QAPP May 2014
Page 301 of 346
BOG Low Concentration Lakes QAPP May 2014
Page 302 of 346
Appendix V D: Solids, volatile-on-ignition, total-in-bottom-material, gravimetric
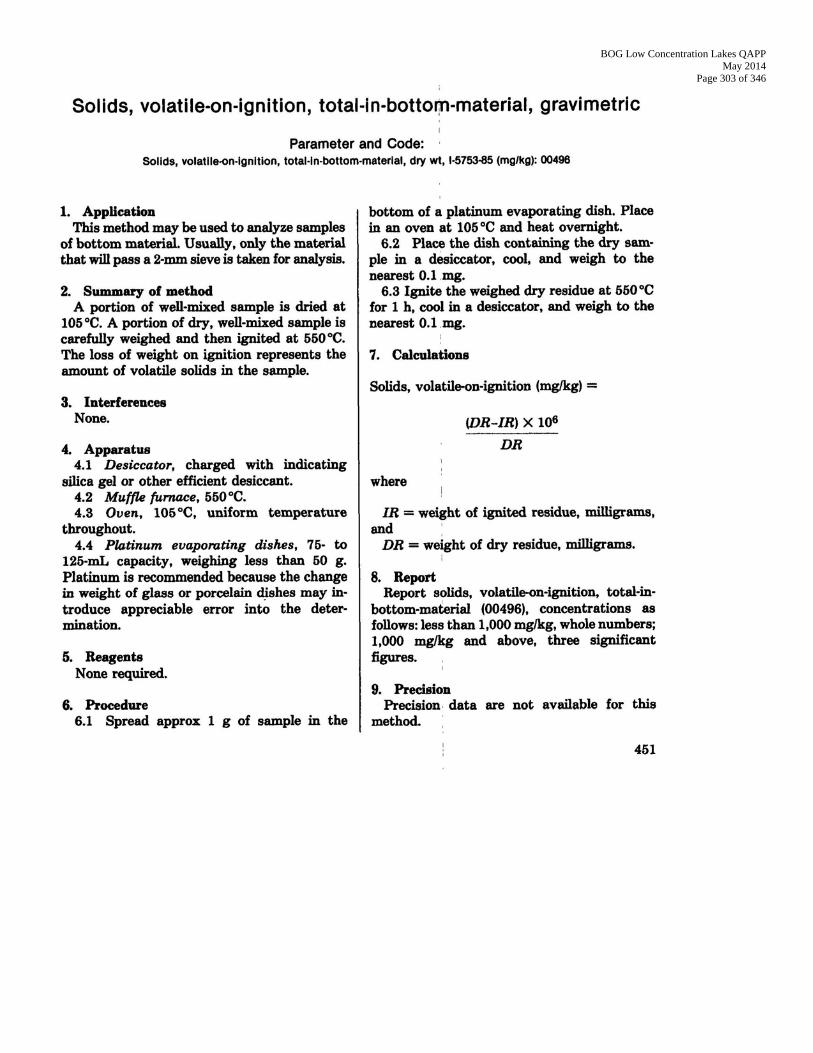
BOG Low Concentration Lakes QAPP May 2014
Page 303 of 346
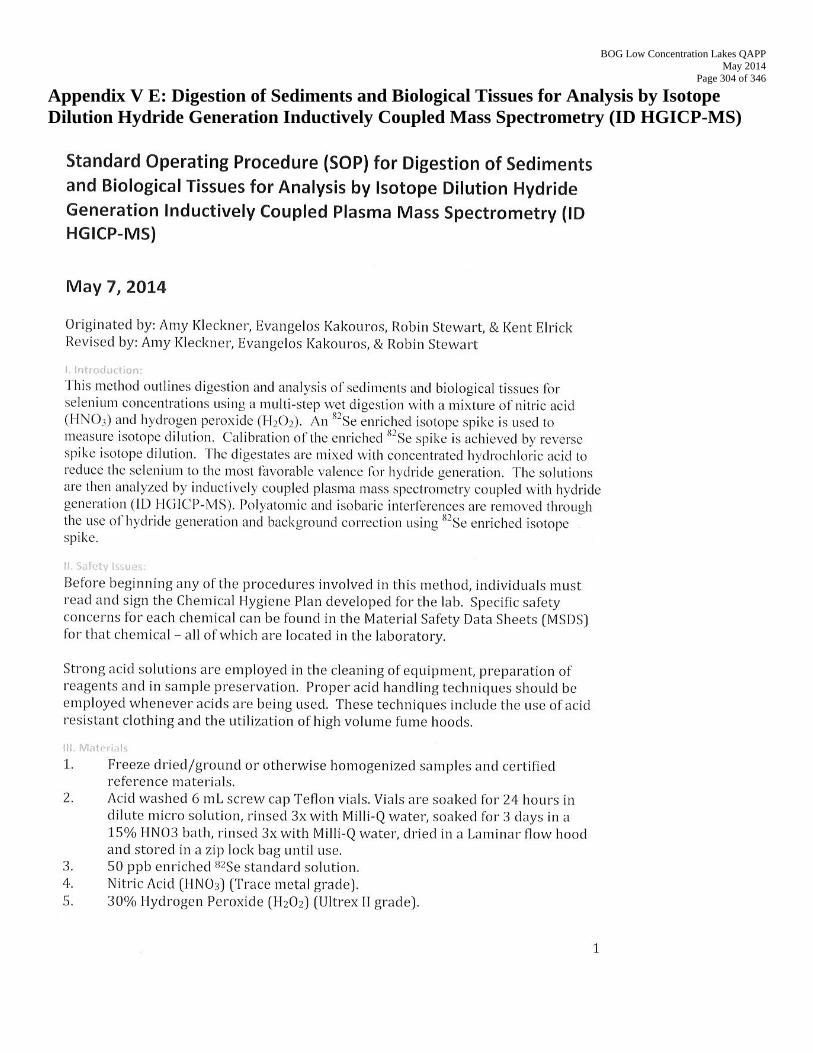
BOG Low Concentration Lakes QAPP May 2014
Page 304 of 346
Appendix V E: Digestion of Sediments and Biological Tissues for Analysis by Isotope Dilution Hydride Generation Inductively Coupled Mass Spectrometry (ID HGICP-MS)
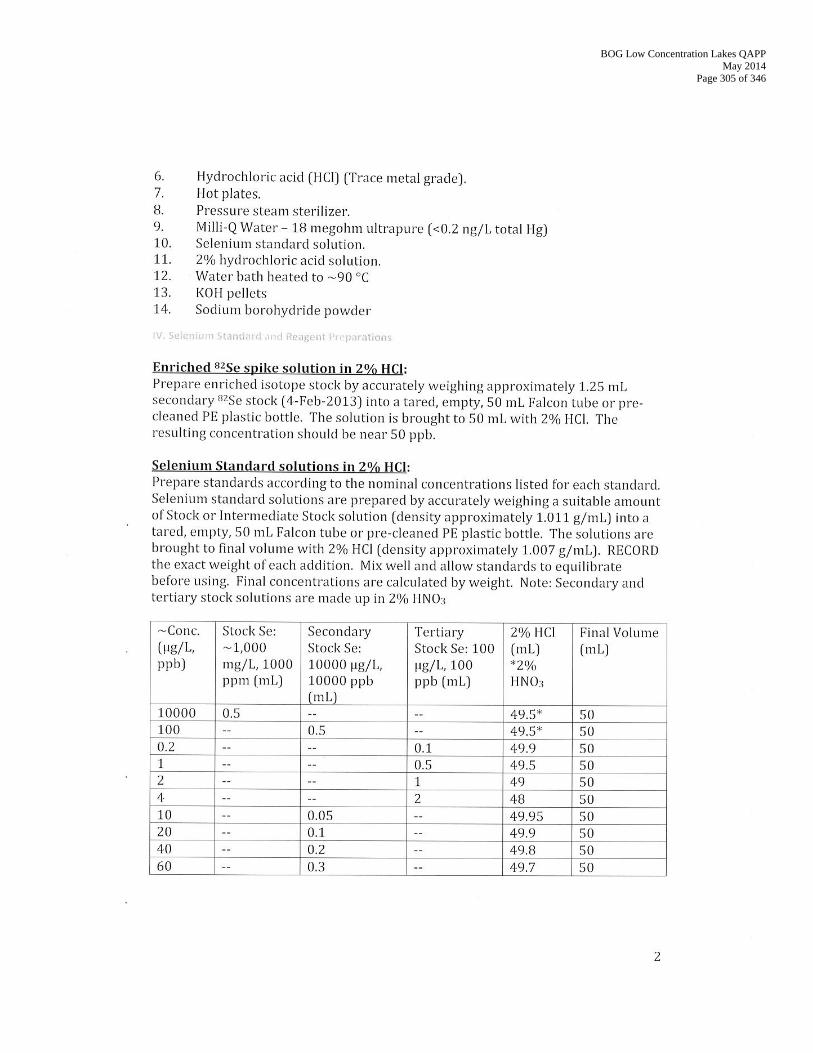
BOG Low Concentration Lakes QAPP May 2014
Page 305 of 346
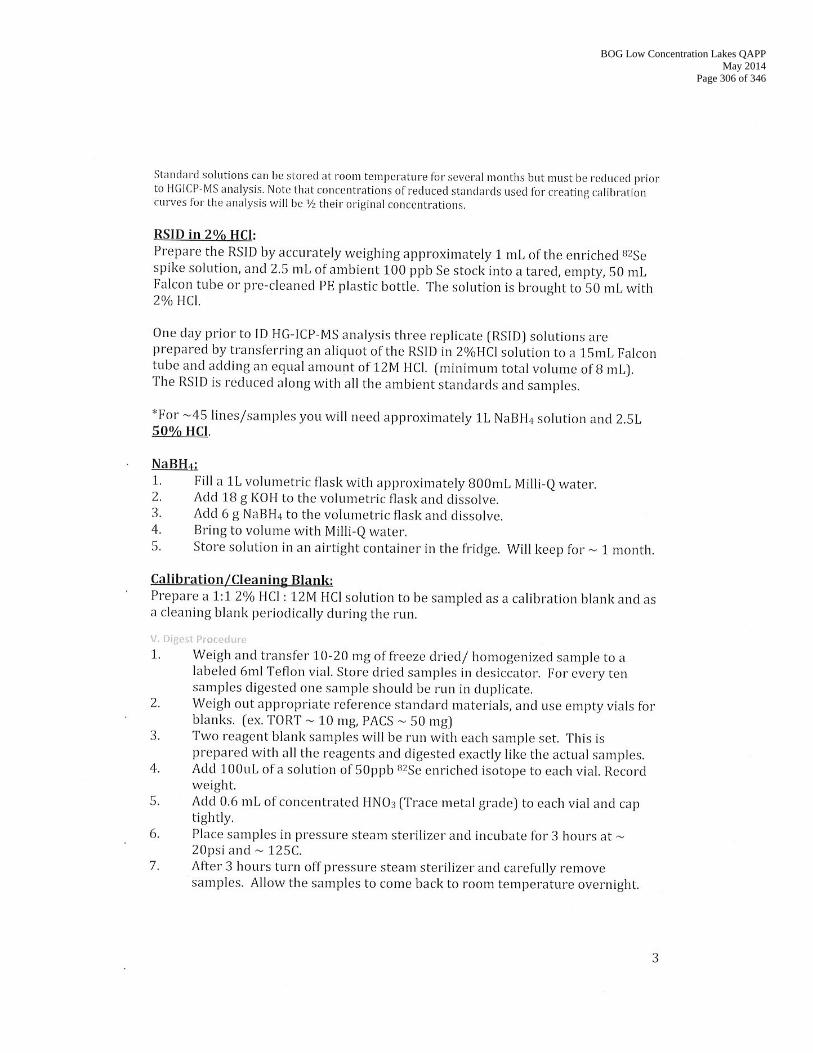
BOG Low Concentration Lakes QAPP May 2014
Page 306 of 346
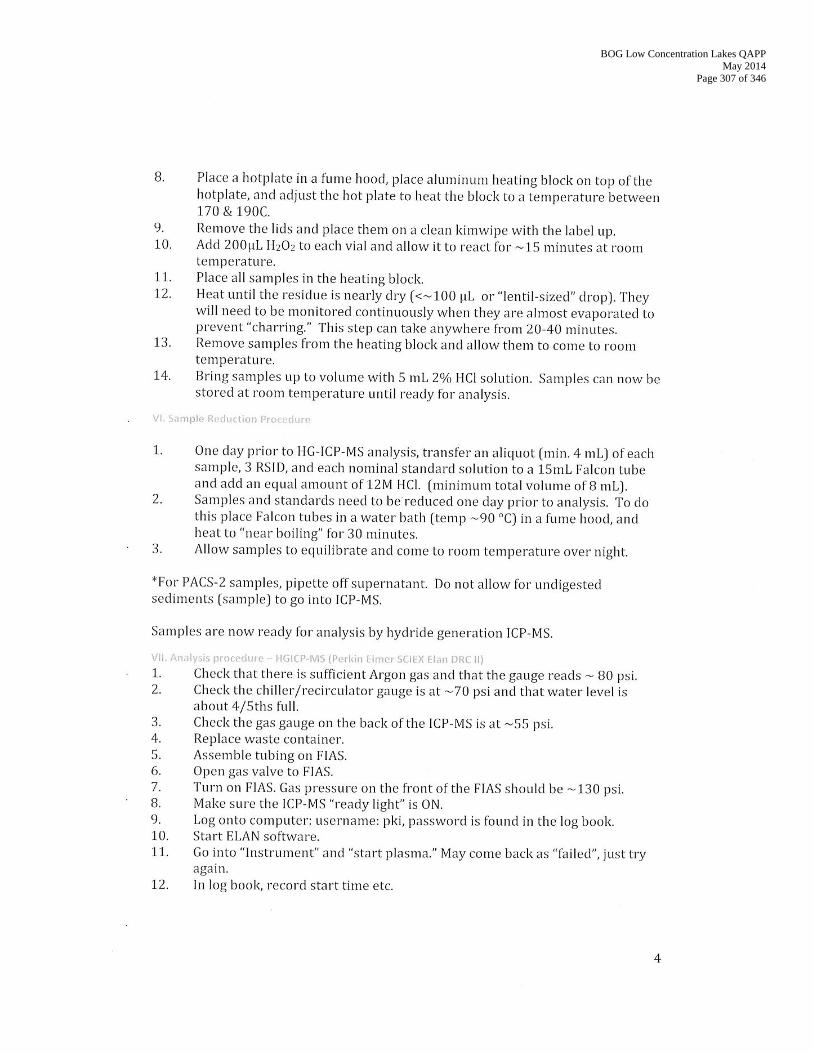
BOG Low Concentration Lakes QAPP May 2014
Page 307 of 346

BOG Low Concentration Lakes QAPP May 2014
Page 308 of 346
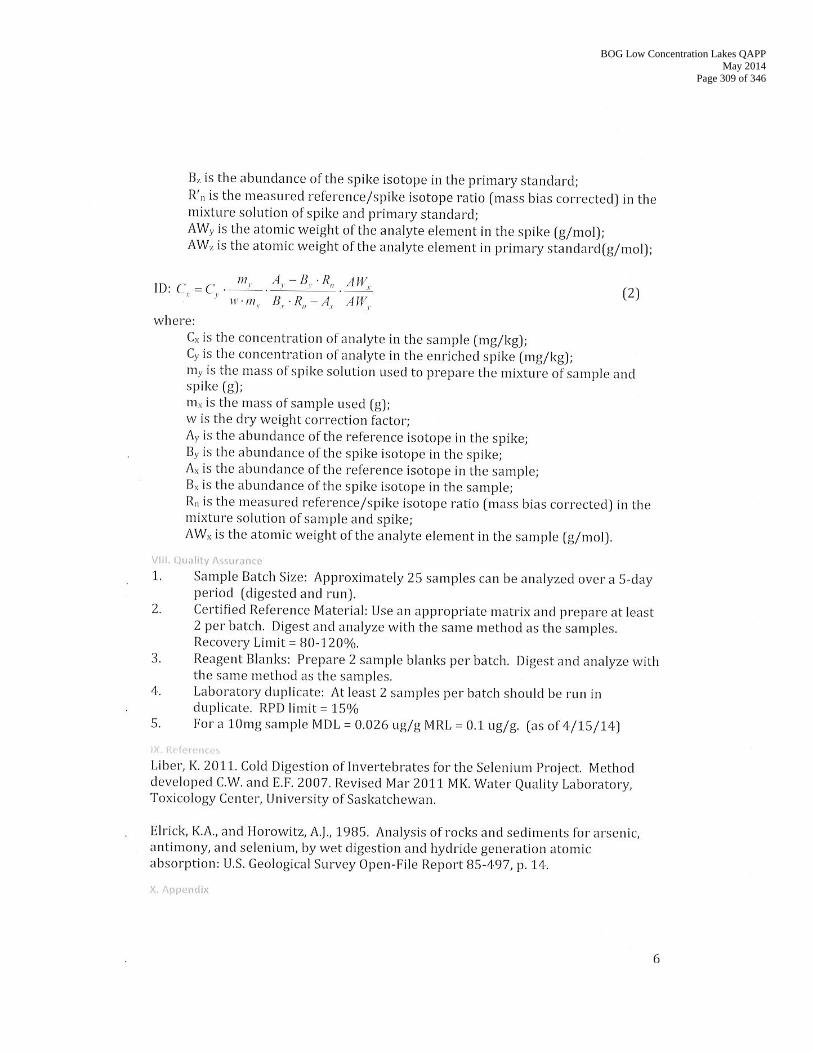
BOG Low Concentration Lakes QAPP May 2014
Page 309 of 346

BOG Low Concentration Lakes QAPP May 2014
Page 310 of 346
Appendix V F: Measurement of Dissolved Organic Matter Fluorescence and Absorbance
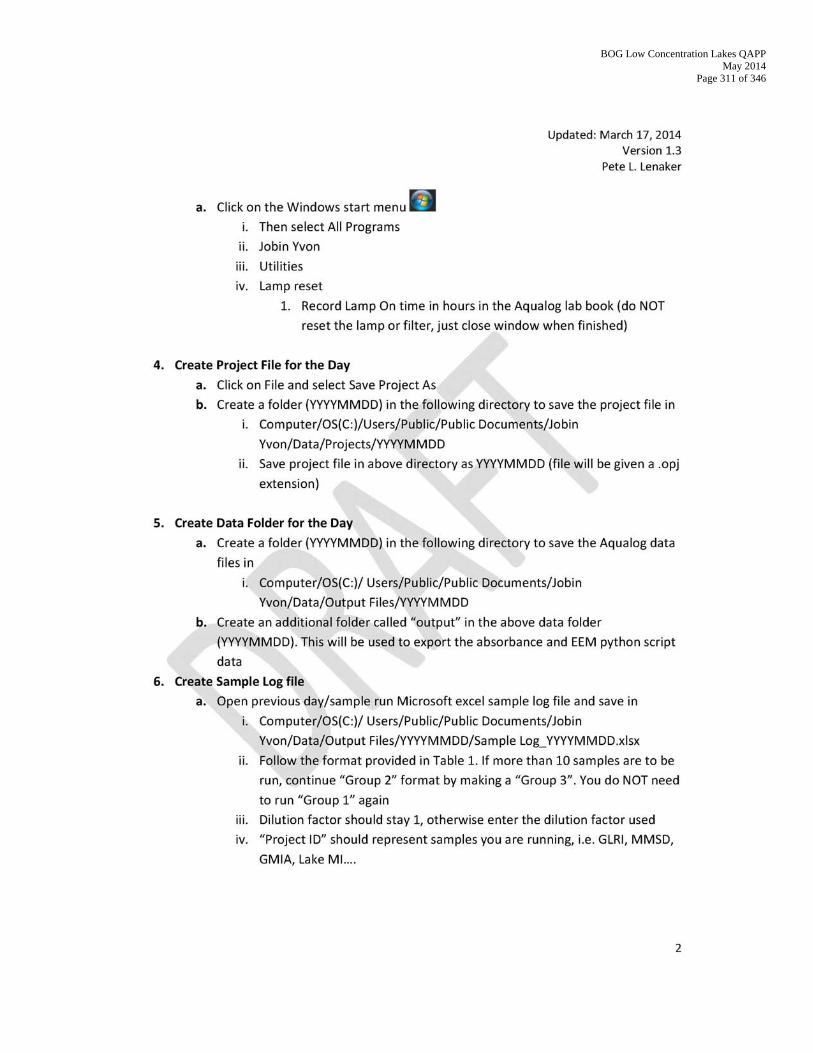
BOG Low Concentration Lakes QAPP May 2014
Page 311 of 346
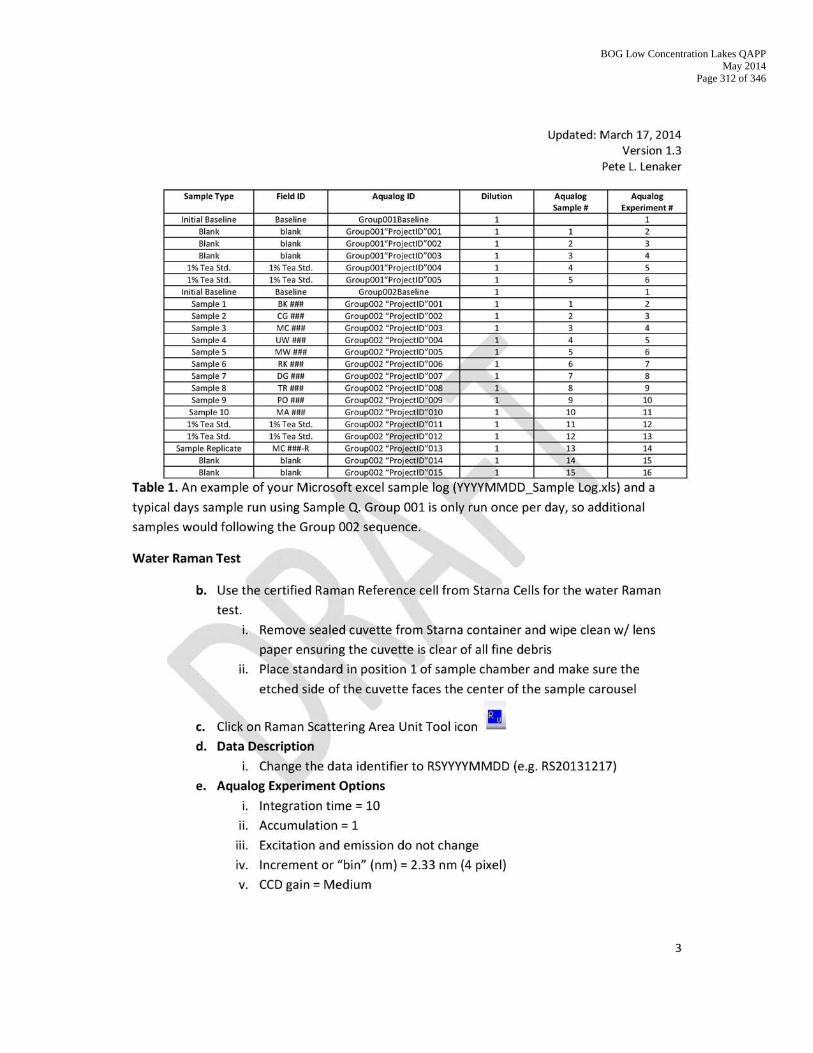
BOG Low Concentration Lakes QAPP May 2014
Page 312 of 346
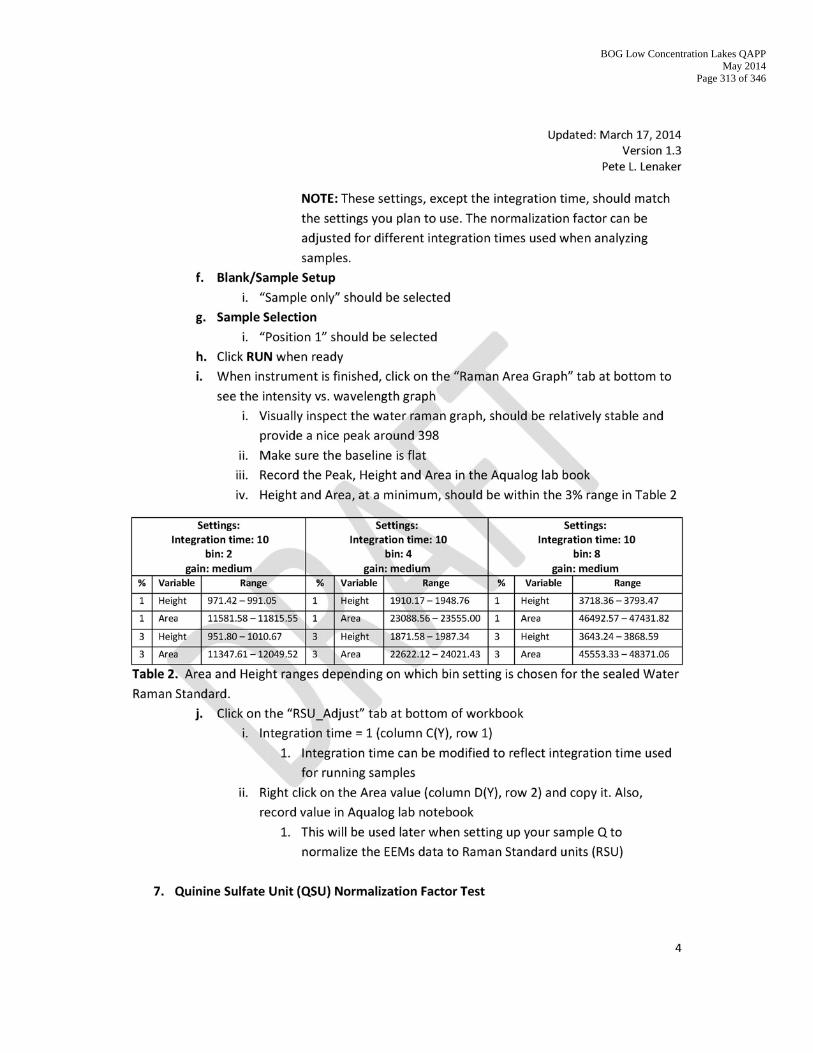
BOG Low Concentration Lakes QAPP May 2014
Page 313 of 346
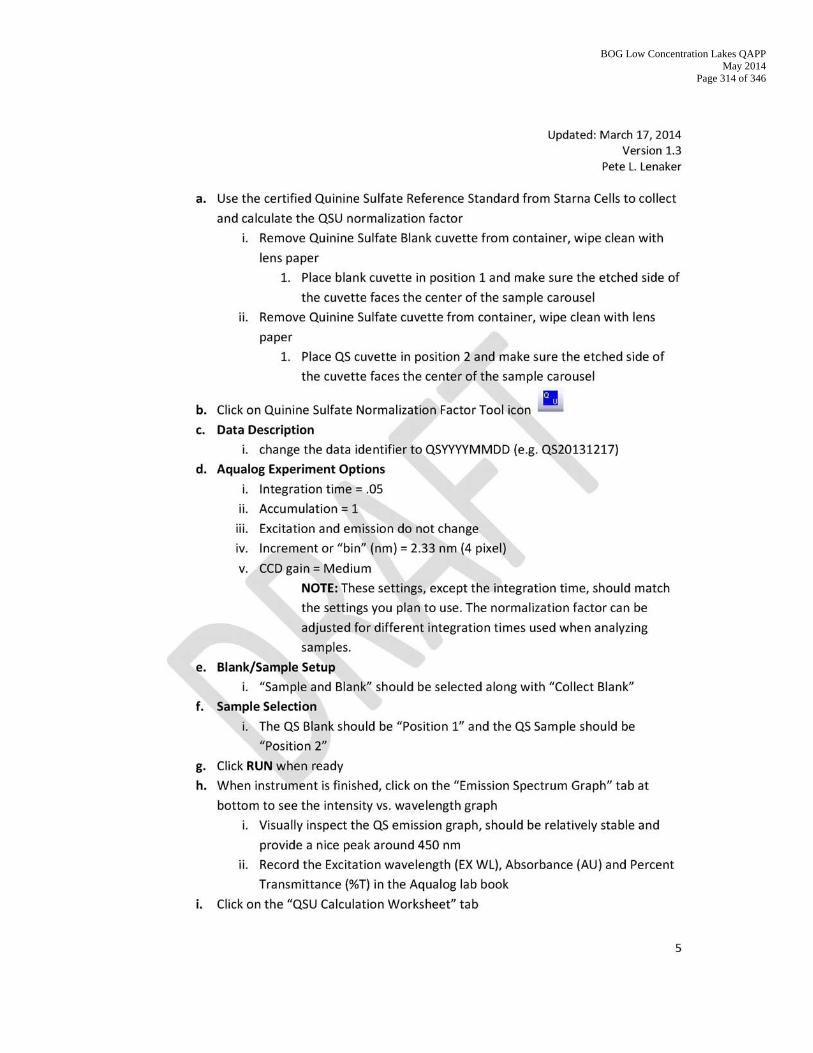
BOG Low Concentration Lakes QAPP May 2014
Page 314 of 346
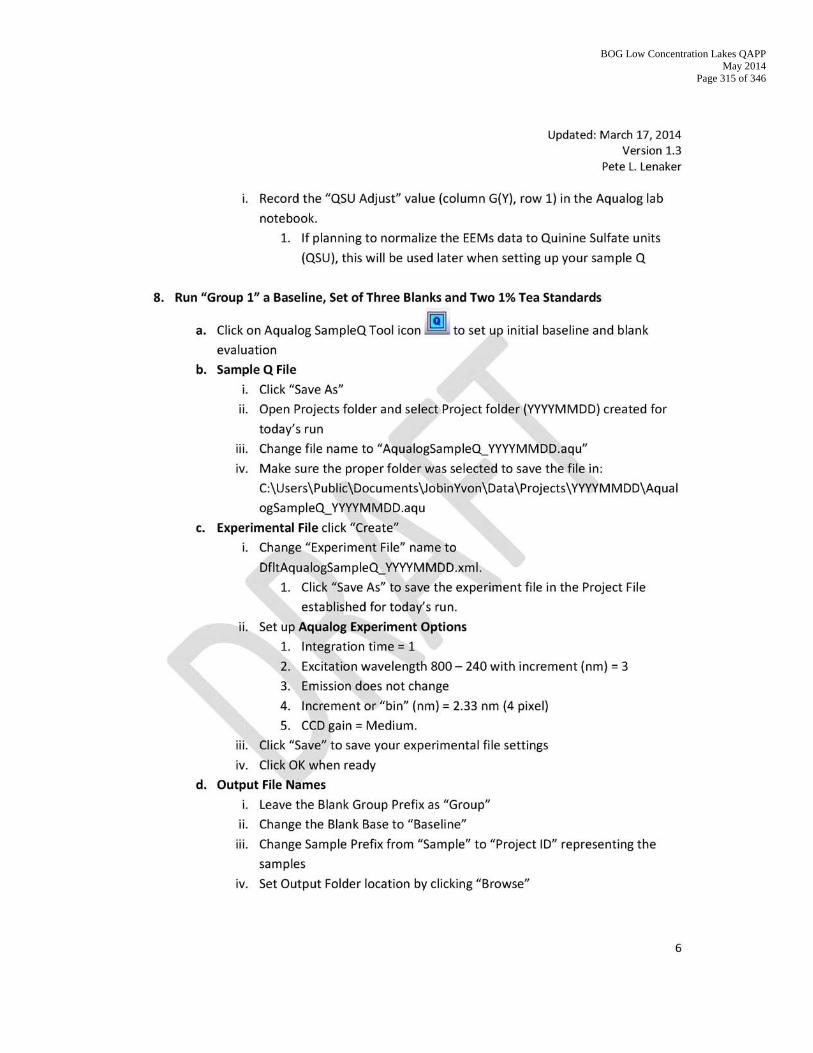
BOG Low Concentration Lakes QAPP May 2014
Page 315 of 346
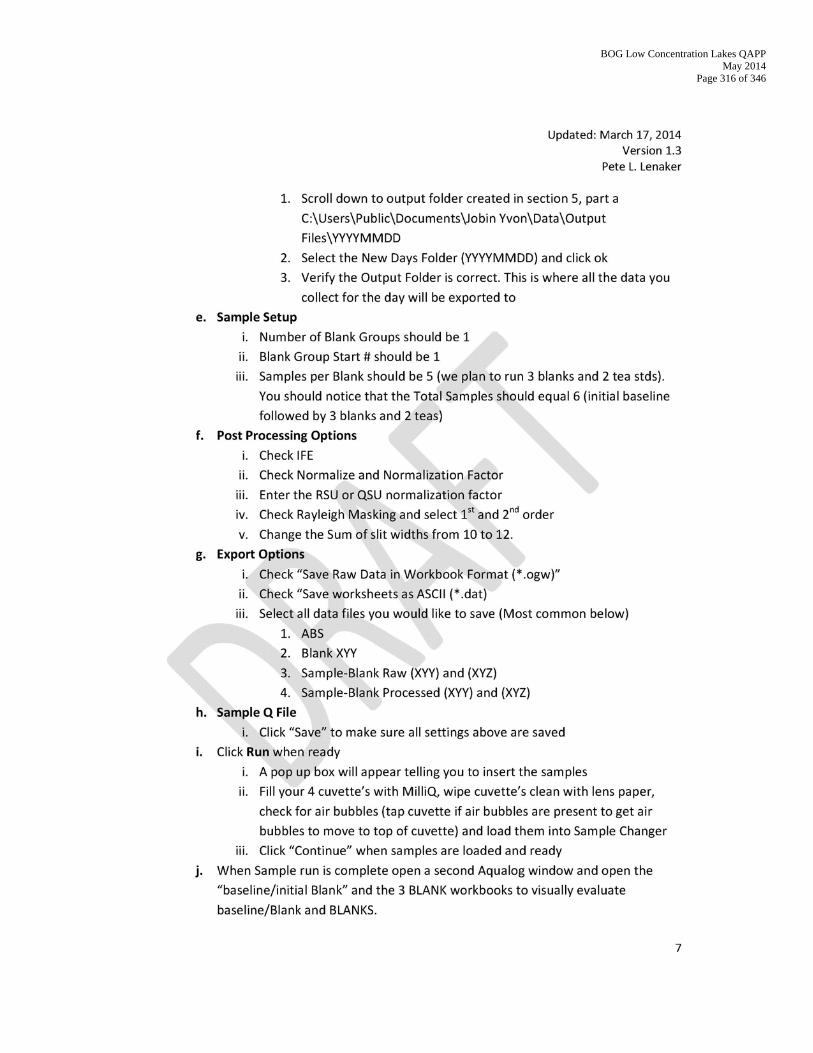
BOG Low Concentration Lakes QAPP May 2014
Page 316 of 346
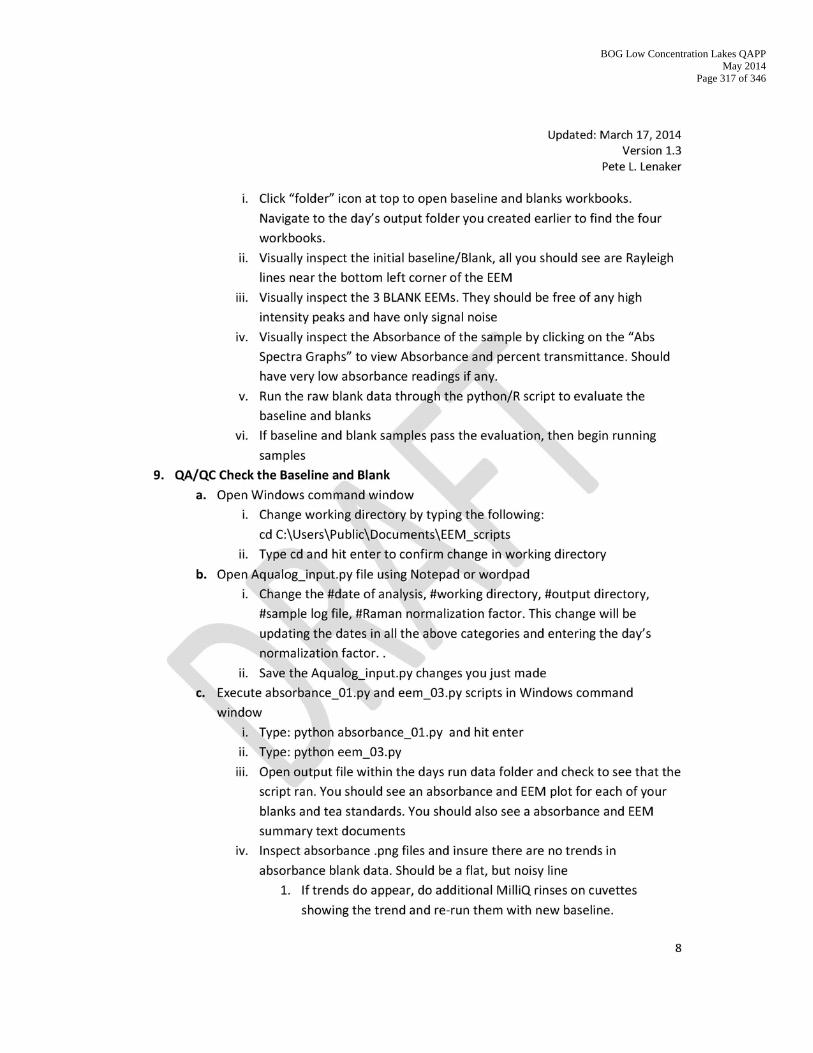
BOG Low Concentration Lakes QAPP May 2014
Page 317 of 346
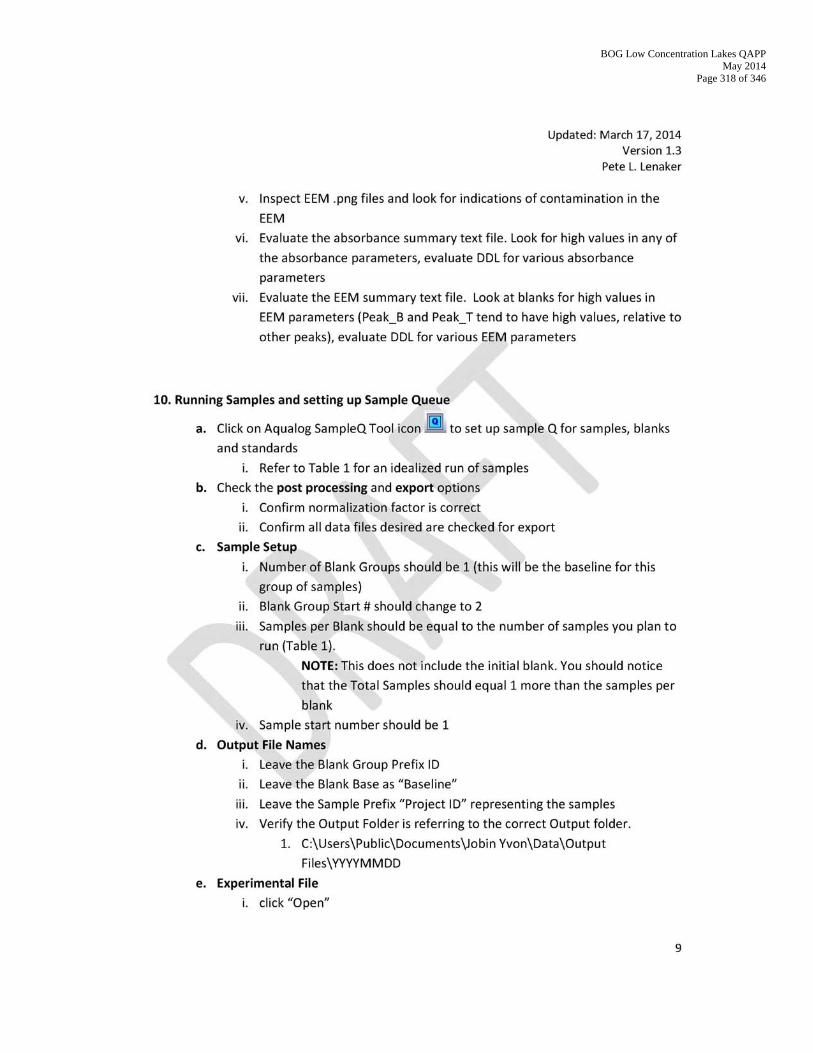
BOG Low Concentration Lakes QAPP May 2014
Page 318 of 346
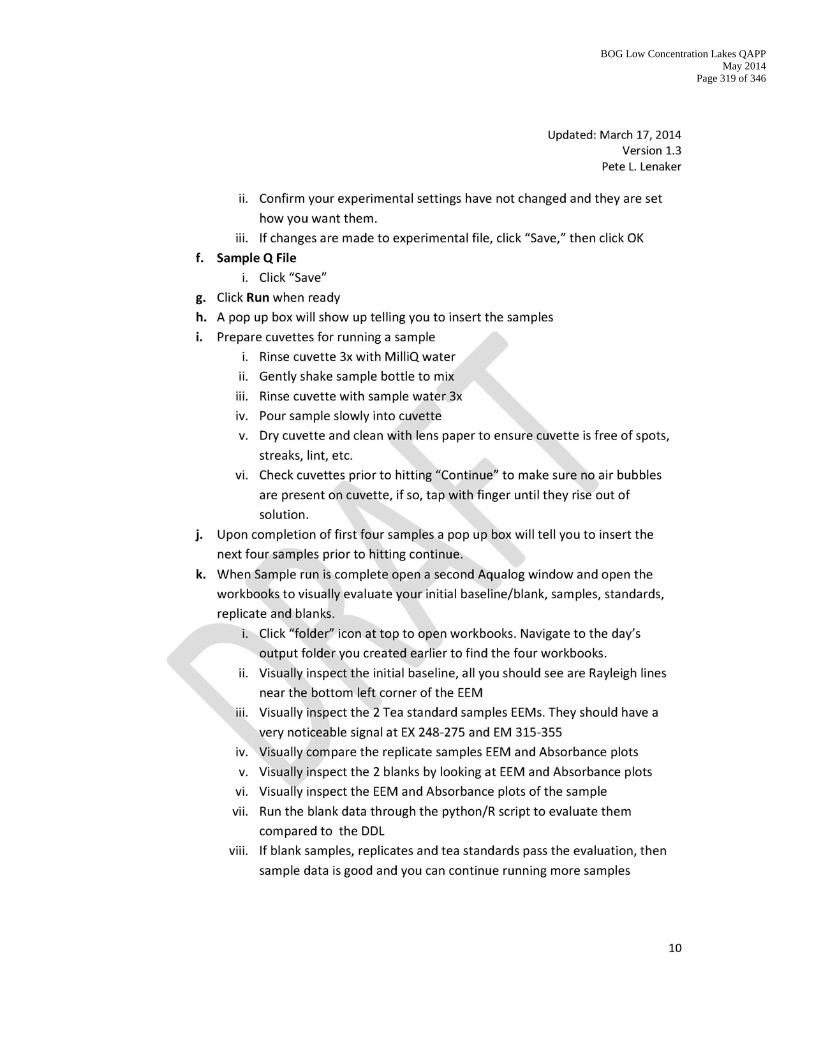
BOG Low Concentration Lakes QAPP May 2014
Page 319 of 346
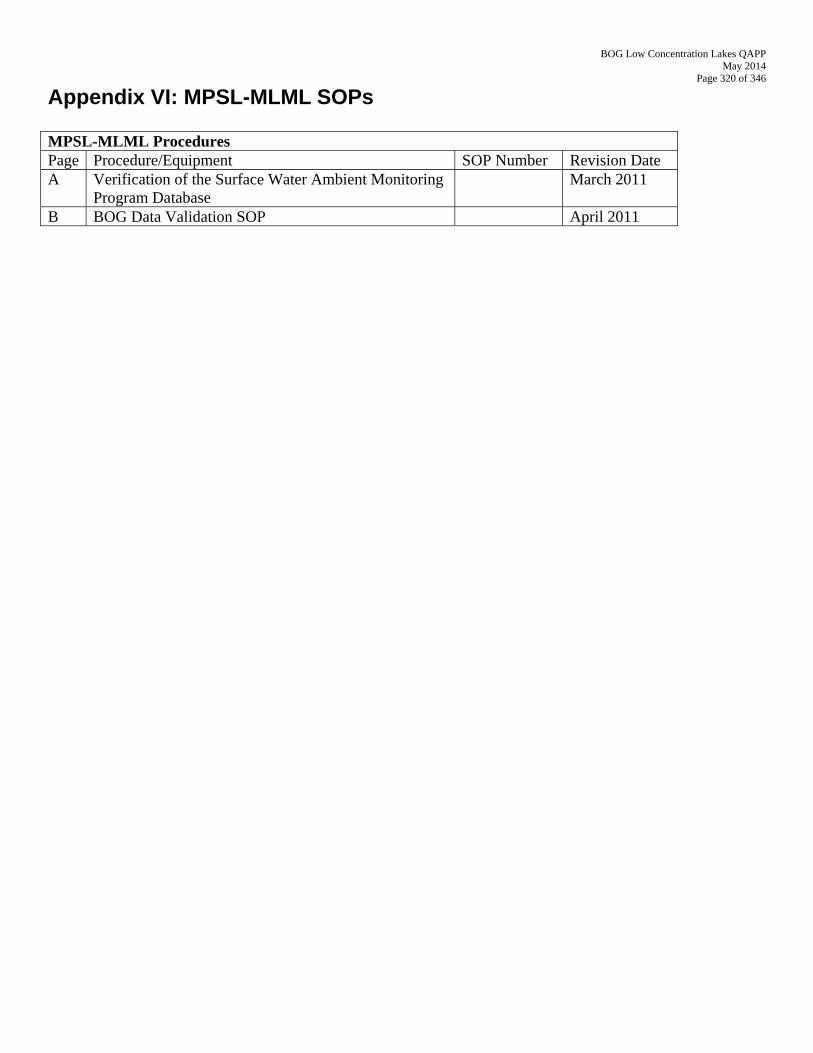
BOG Low Concentration Lakes QAPP May 2014
Page 320 of 346
Appendix VI: MPSL-MLML SOPs MPSL-MLML Procedures Page Procedure/Equipment SOP Number Revision Date A Verification of the Surface Water Ambient Monitoring
Program Database March 2011
B BOG Data Validation SOP April 2011
BOG Low Concentration Lakes QAPP May 2014
Page 321 of 346
Appendix VI A: SWAMP SOP Chemistry Data Verification v1.1 This document is an official SWAMP SOP and can be found at: http://swamp.mpsl.mlml.calstate.edu/wp-content/uploads/2011/06/SWAMP_SOP_Chemistry_Data_Verification_03.23.11.pdf
BOG Low Concentration Lakes QAPP May 2014
Page 322 of 346
Appendix VI B: BOG Data Validation SOP Please note that BOG QAPP table references do not refer to this document but rather previous BOG QAPPs. Please use the information in the tables in the above sections.
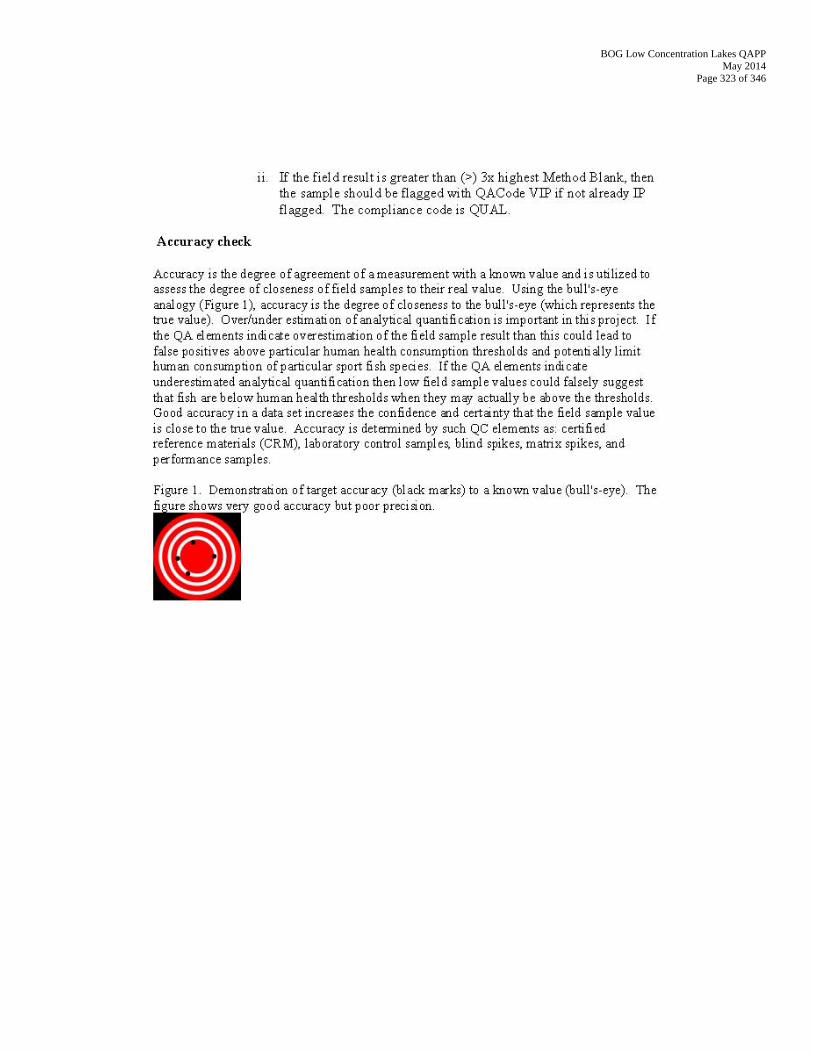
BOG Low Concentration Lakes QAPP May 2014
Page 323 of 346
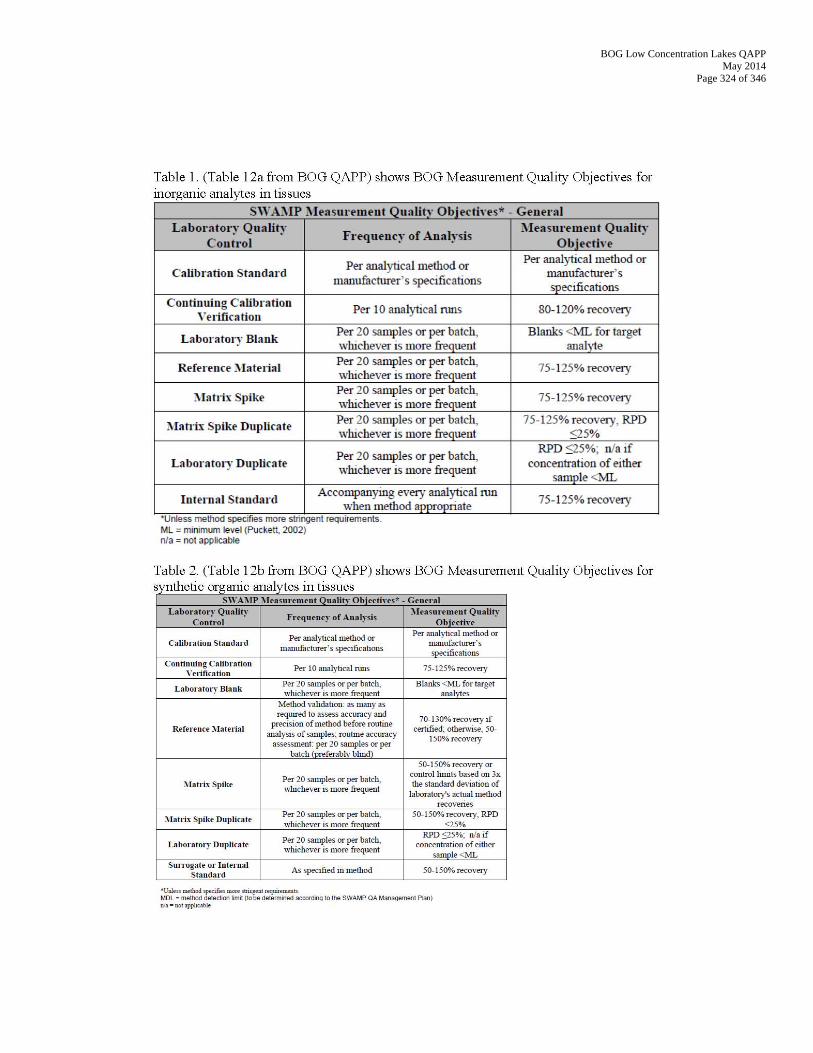
BOG Low Concentration Lakes QAPP May 2014
Page 324 of 346
BOG Low Concentration Lakes QAPP May 2014
Page 325 of 346

BOG Low Concentration Lakes QAPP May 2014
Page 326 of 346
BOG Low Concentration Lakes QAPP May 2014
Page 327 of 346
BOG Low Concentration Lakes QAPP May 2014
Page 328 of 346
BOG Low Concentration Lakes QAPP May 2014
Page 329 of 346
BOG Low Concentration Lakes QAPP May 2014
Page 330 of 346
BOG Low Concentration Lakes QAPP May 2014
Page 331 of 346

BOG Low Concentration Lakes QAPP May 2014
Page 332 of 346
Appendix VII: Signatures of Approval

BOG Low Concentration Lakes QAPP May 2014
Page 333 of 346
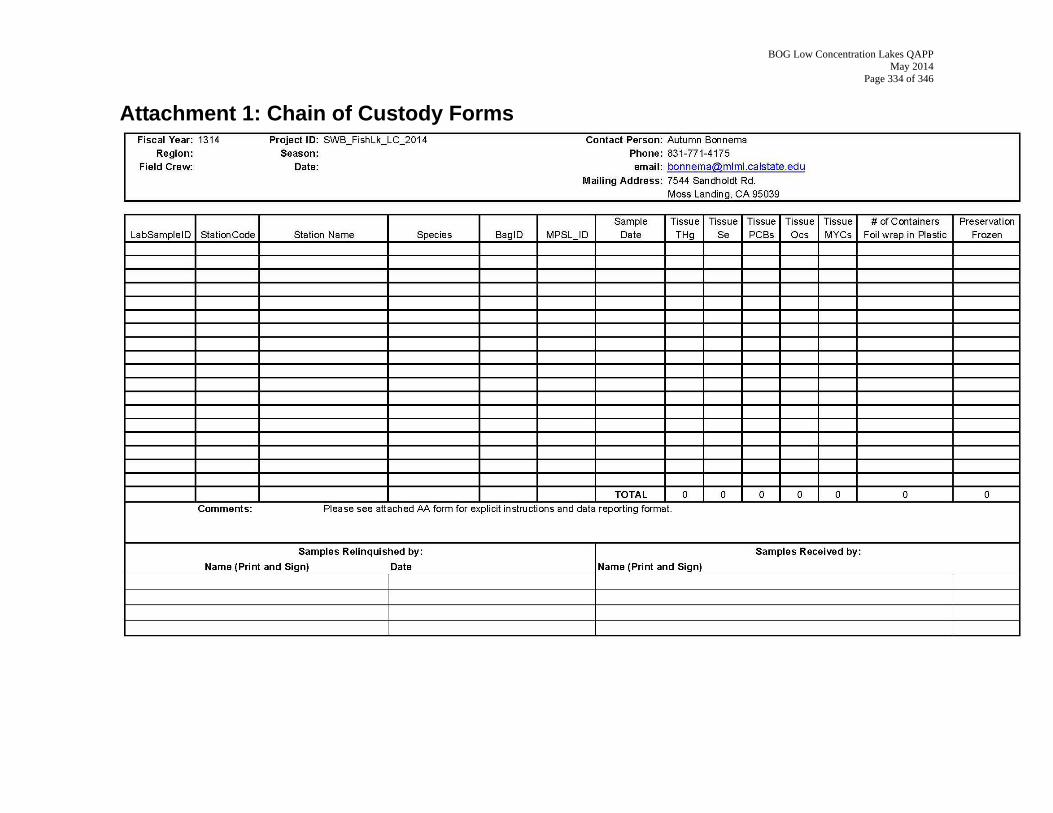
BOG Low Concentration Lakes QAPP May 2014
Page 334 of 346
Attachment 1: Chain of Custody Forms
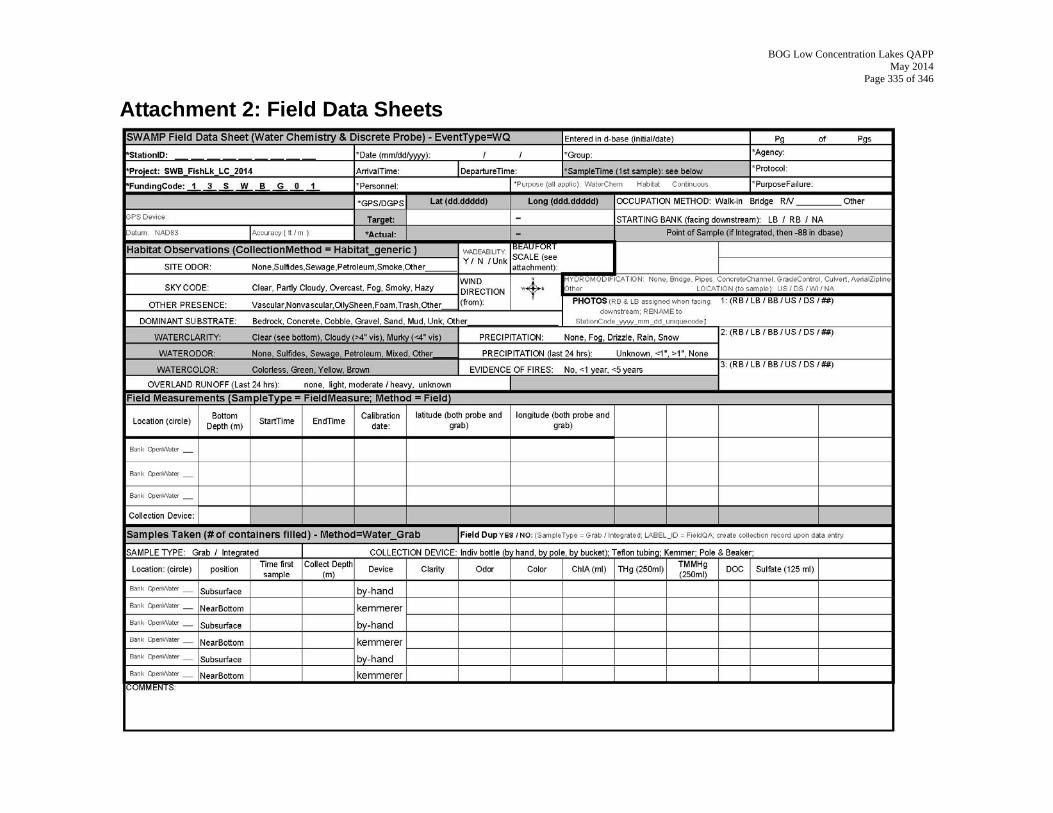
BOG Low Concentration Lakes QAPP May 2014
Page 335 of 346
Attachment 2: Field Data Sheets
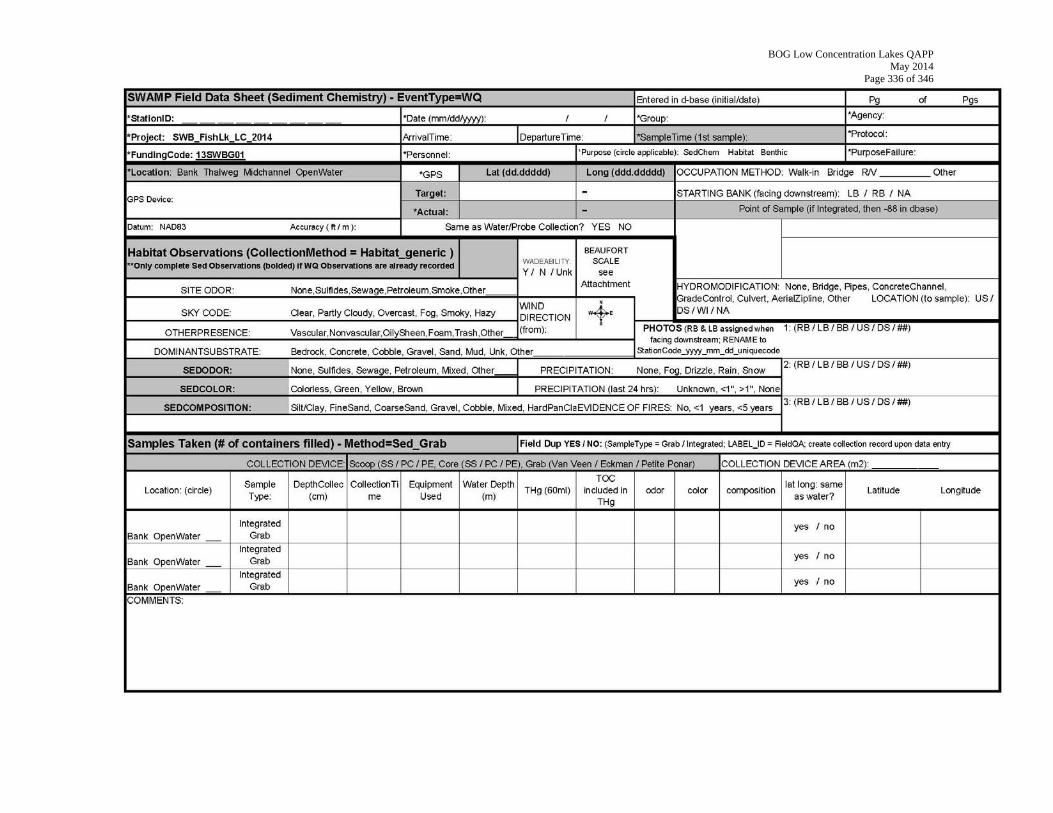
BOG Low Concentration Lakes QAPP May 2014
Page 336 of 346
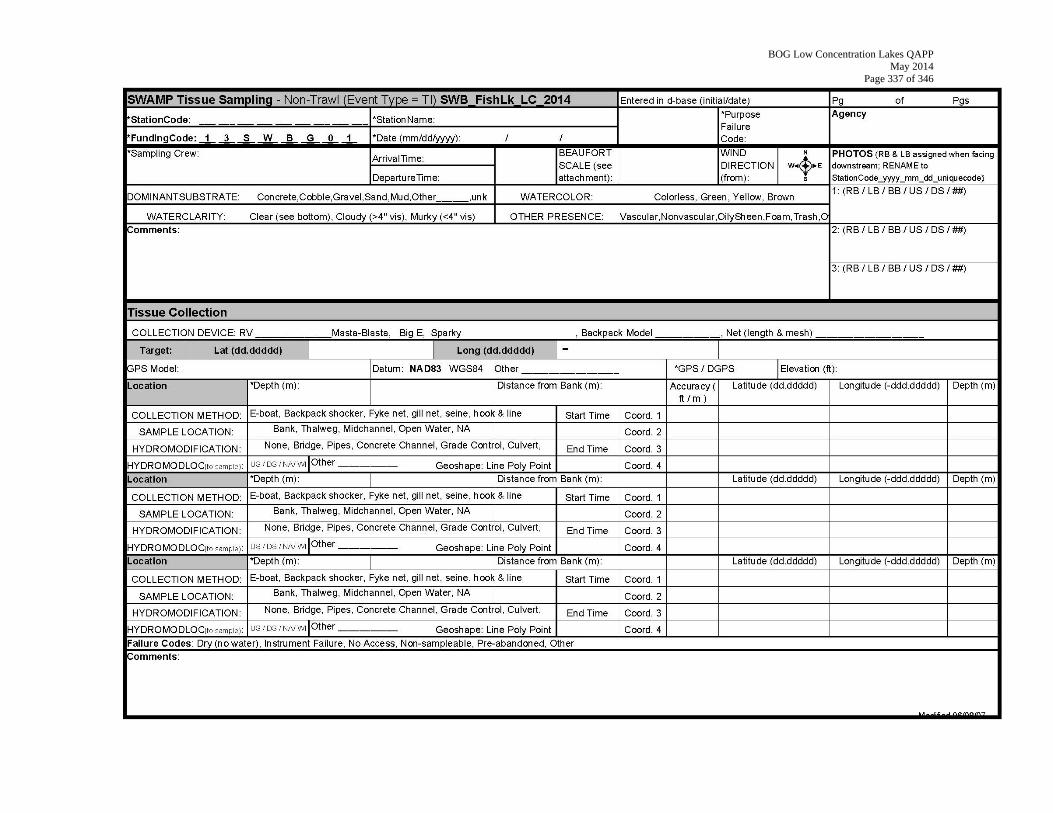
BOG Low Concentration Lakes QAPP May 2014
Page 337 of 346

BOG Low Concentration Lakes QAPP May 2014
Page 338 of 346
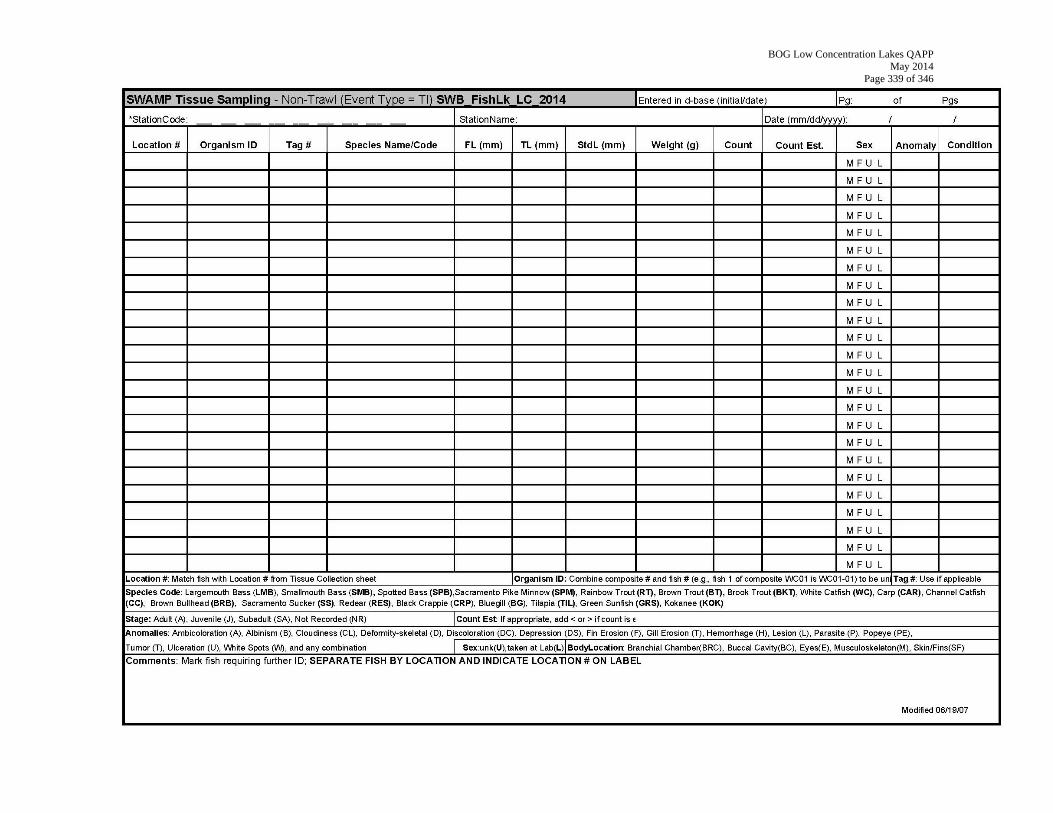
BOG Low Concentration Lakes QAPP May 2014
Page 339 of 346

BOG Low Concentration Lakes QAPP May 2014
Page 340 of 346
Attachment 3: Analysis Authorization Forms
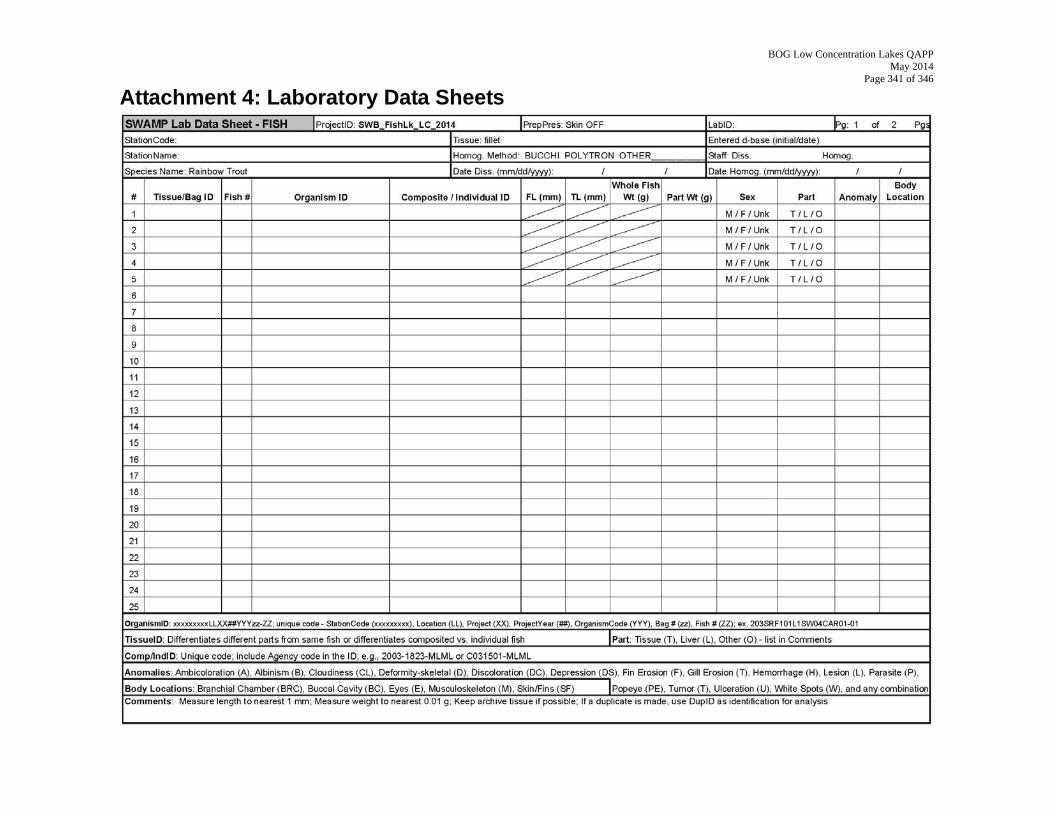
BOG Low Concentration Lakes QAPP May 2014
Page 341 of 346
Attachment 4: Laboratory Data Sheets
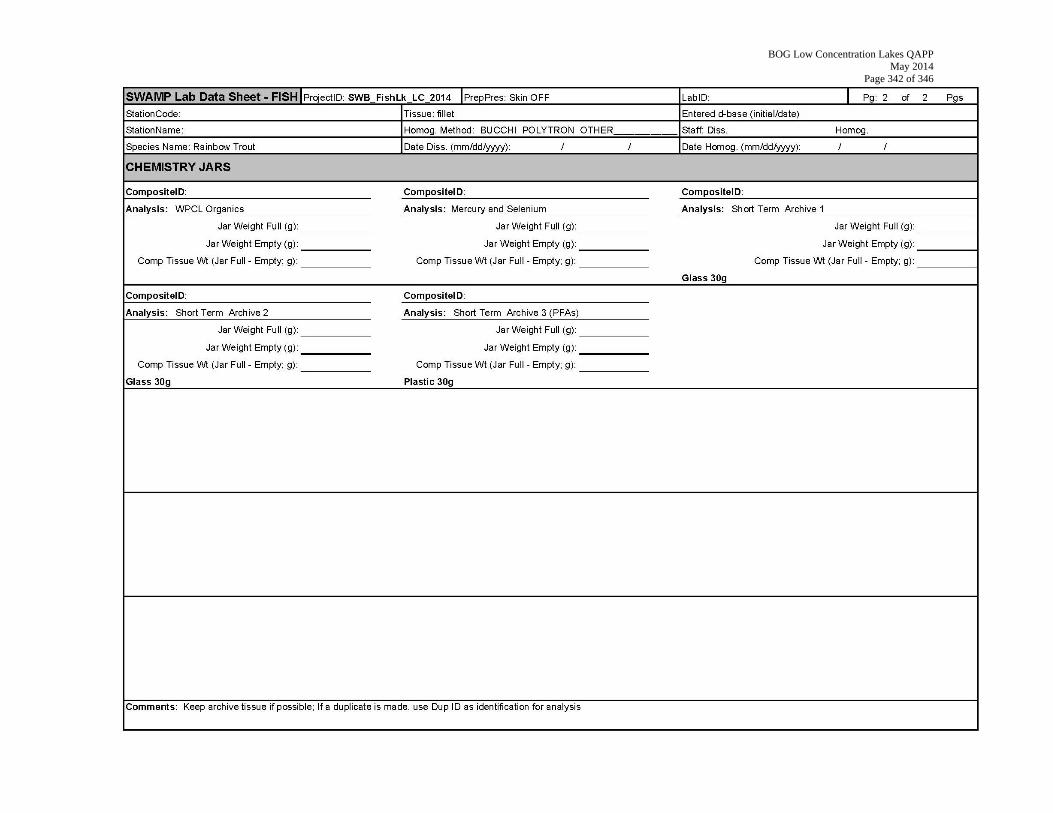
BOG Low Concentration Lakes QAPP May 2014
Page 342 of 346
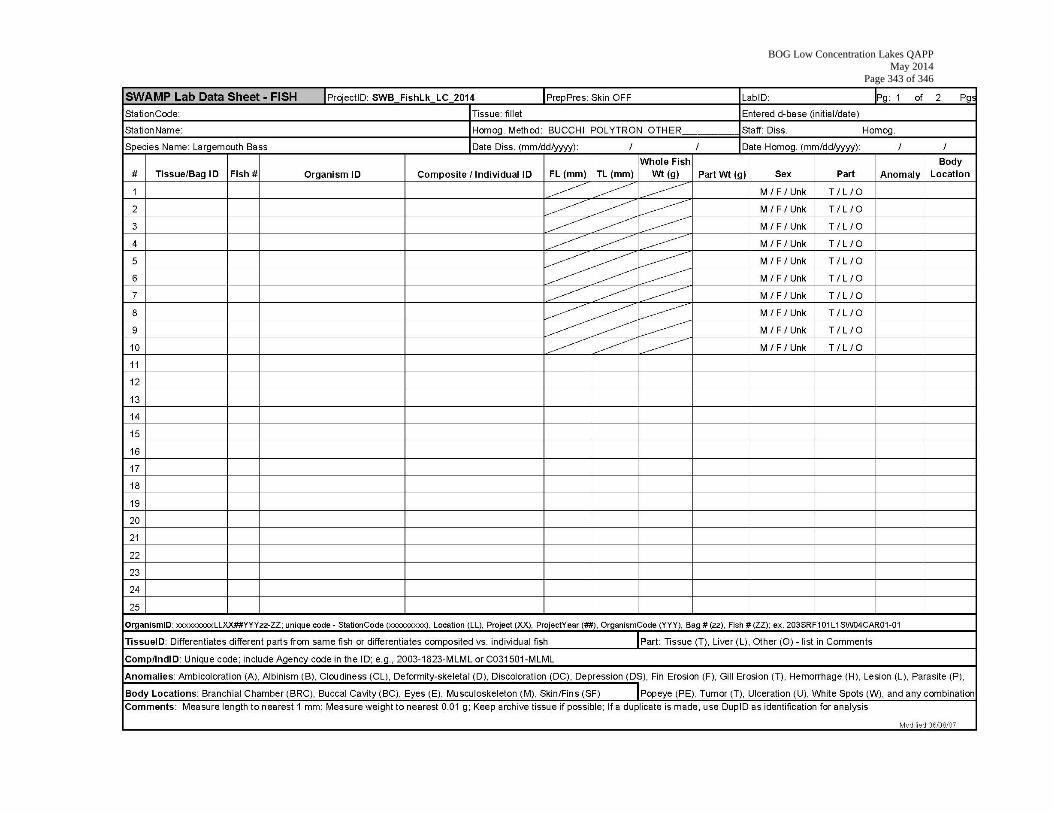
BOG Low Concentration Lakes QAPP May 2014
Page 343 of 346
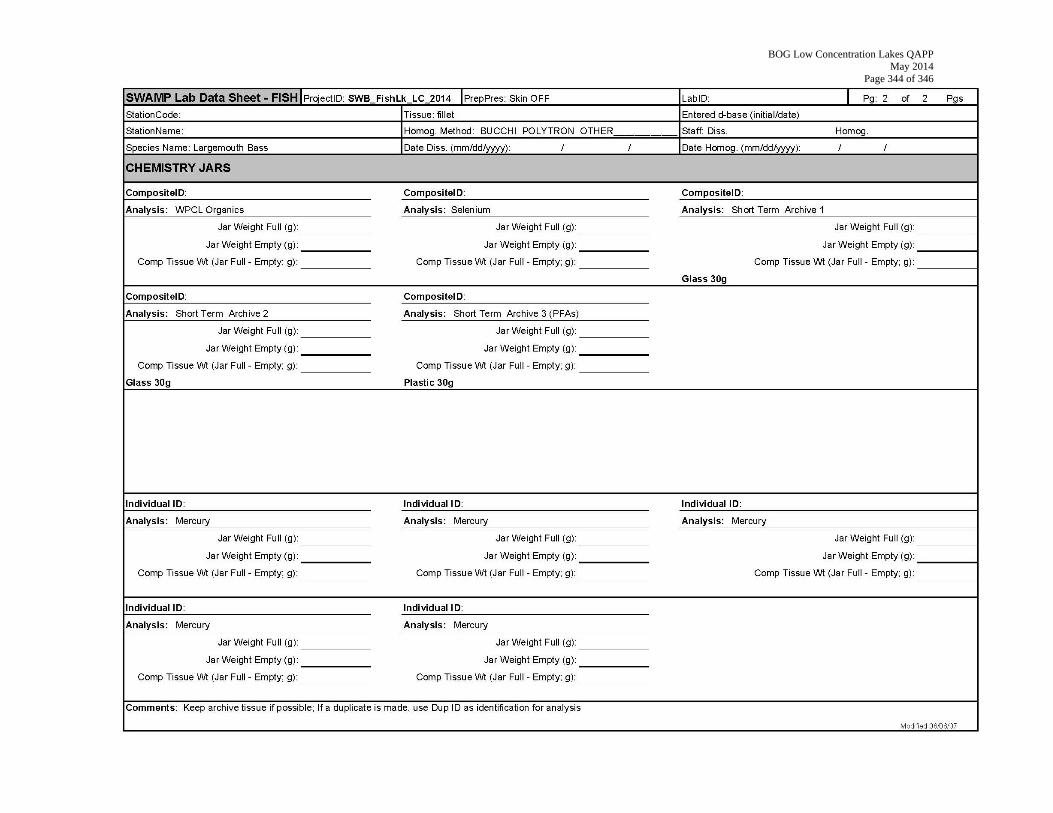
BOG Low Concentration Lakes QAPP May 2014
Page 344 of 346
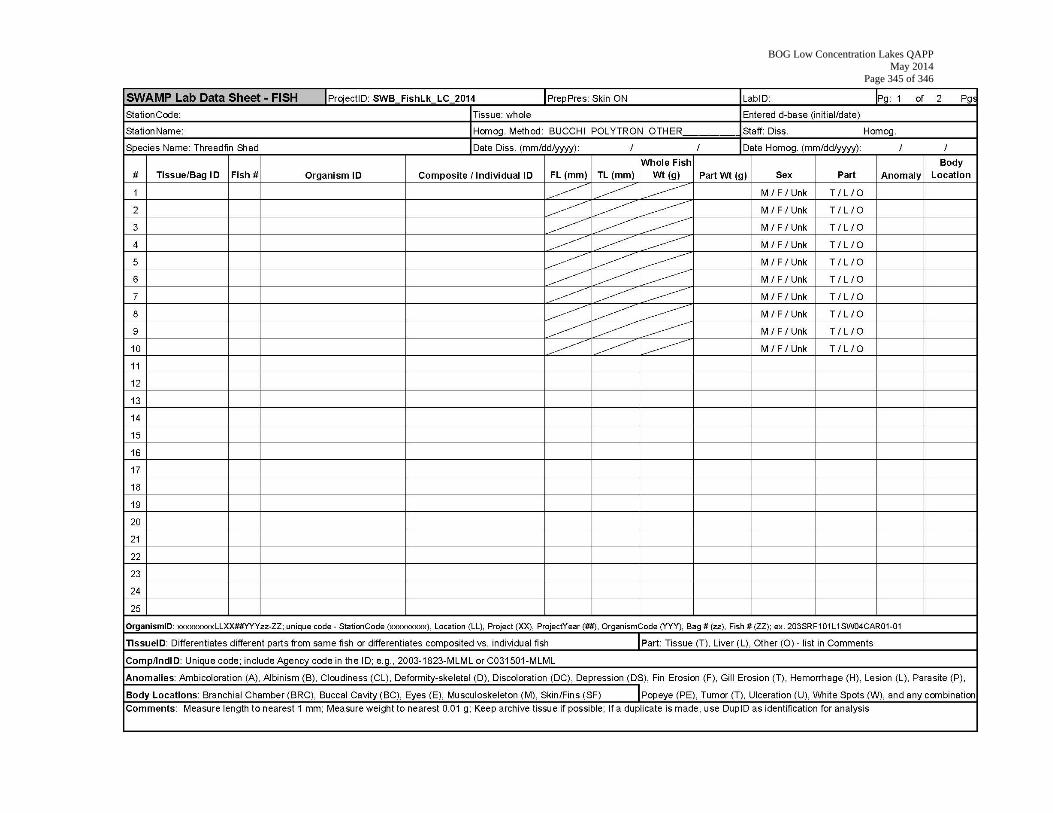
BOG Low Concentration Lakes QAPP May 2014
Page 345 of 346
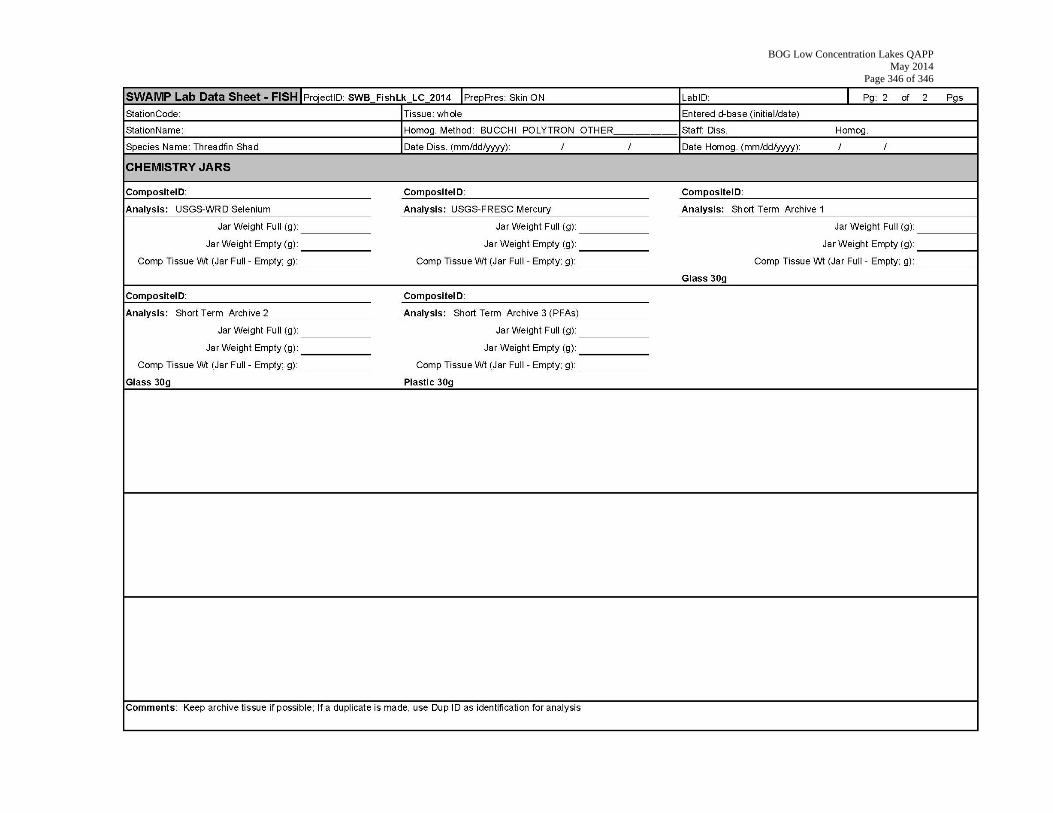
BOG Low Concentration Lakes QAPP May 2014
Page 346 of 346