Draft Quality Assurance Project Plan (QAPP) for Eighteenmile ...
61
002386_NC13_01-B2132 Draft Quality Assurance Project Plan (QAPP) for Eighteenmile Creek Beneficial Use Impairment Assessment Niagara County, New York February 2007 Prepared for: NIAGARA COUNTY SOIL AND WATER CONSERVATION DISTRICT 4487 Lake Avenue Lockport, NY 14094 Niagara County Date E & E Project Manager Date Project Manager E & E QA Director Date EPA Date EPA QA Officer Date Project Officer
-
Upload
khangminh22 -
Category
Documents
-
view
3 -
download
0
Transcript of Draft Quality Assurance Project Plan (QAPP) for Eighteenmile ...

002386_NC13_01-B2132
Draft Quality Assurance Project Plan (QAPP) for Eighteenmile Creek
Beneficial Use Impairment Assessment
Niagara County, New York
February 2007
Prepared for:
NIAGARA COUNTY SOIL AND WATER CONSERVATION DISTRICT 4487 Lake Avenue Lockport, NY 14094
Niagara County Date E & E Project Manager Date Project Manager E & E QA Director Date EPA Date EPA QA Officer Date Project Officer

02:002386_NC13_01-B2132 iii R_BUI Assessment QAPP 18m Creek.doc-02/12/07
able of Contents T Section Page
1 Project Management................................................................ 1-1 1.1 Project Organization......................................................................................... 1-1 1.2 Problem Definition/Background ...................................................................... 1-5
1.2.1 Problem Definition............................................................................... 1-5 1.2.2 Background .......................................................................................... 1-7
1.3 Project Description ........................................................................................... 1-8 1.3.1 Fish Community Surveys/Analysis of Fish Tumors and
Deformities........................................................................................... 1-9 1.3.2 Wildlife Population Surveys ................................................................ 1-9 1.3.3 Status of Bird or Animal Deformities or Reproductive
Impairment ......................................................................................... 1-10 1.3.4 Use of Study Results to Evaluate Beneficial Use Impairments.......... 1-10
1.3.4.1 Existence of Fish Tumors and Other Deformities ............... 1-11 1.3.4.2 Status of Fish and Wildlife Populations .............................. 1-11 1.3.4.3 Status of Bird or Mammal Deformities or Reproductive
Impairment ........................................................................... 1-12 1.4 Quality Objectives and Criteria ...................................................................... 1-13
1.4.1 Data Assessment Definitions.............................................................. 1-13 1.5 Special Training/Certification ........................................................................ 1-16 1.6 Documentation and Records .......................................................................... 1-16
1.6.1 Field Documentation .......................................................................... 1-17 1.6.2 Laboratory Data Reporting................................................................. 1-18 1.6.3 Record Retention................................................................................ 1-19
2 Data Generation and Acquisition............................................ 2-1 2.1 Sampling Process Design ................................................................................. 2-1 2.2 Sampling Methods............................................................................................ 2-2
2.2.1 Fish Sampling Methodology ................................................................ 2-2 2.2.1.1 Community Surveys............................................................... 2-2 2.2.1.2 Targeted Fish Collection for Analysis of Fish Tumors
and Deformities...................................................................... 2-9 2.2.1.3 Fish Tissue Chemistry.......................................................... 2-12
2.2.2 Wildlife Surveys................................................................................. 2-13 2.2.3 Equipment Maintenance – Fish Surveys ............................................ 2-15
2.3 Sample Handling and Custody ....................................................................... 2-16

Table of Contents (cont.) Section Page
02:002386_NC13_01-B2132 iv R_BUI Assessment QAPP 18m Creek.doc-02/12/07
2.3.1 Sample Handling ................................................................................ 2-16 2.3.2 Sample Custody.................................................................................. 2-16
2.4 Analytical Method Requirements................................................................... 2-18 2.5 Quality Control............................................................................................... 2-18
2.5.1 Laboratory Quality Control Analyses................................................. 2-18 2.6 Instrument/Equipment Testing, Inspection, and Maintenance ....................... 2-21 2.7 Instrument/Equipment Calibration and Frequency......................................... 2-21 2.8 Inspection/Acceptance of Supplies and Consumables ................................... 2-22 2.9 Non-Direct Measurements ............................................................................. 2-22 2.10 Data Management........................................................................................... 2-22
3 Assessment and Oversight ..................................................... 3-1 3.1 Assessment and Response Actions................................................................... 3-1
3.1.1 Peer Review.......................................................................................... 3-1 3.1.2 Technical Systems Assessments........................................................... 3-2 3.1.3 Corrective Action ................................................................................. 3-2
3.2 Reports to Management.................................................................................... 3-4
4 Data Validation and Usability.................................................. 4-1 4.1 Data Review, Validation, and Verification Requirements ............................... 4-1 4.2 Validation and Verification Methods ............................................................... 4-1 4.3 Reconciliation with User Requirements........................................................... 4-3
5 References ............................................................................... 5-1 Appendix
A Field Procedures and Data Sheets ........................................ A-1
B Laboratory Procedures – Fish Pathology ............................. B-1
C Laboratory Procedures – Chemical ....................................... C-1

02:002386_NC13_01-B2132 v R_BUI Assessment QAPP 18m Creek.doc-02/12/07
ist of Tables L Table Page 1-1 Project Organization, Eighteenmile Creek Beneficial Use Impairment
Assessment................................................................................................................. 1-3
1-2 General Data Quality Objectives, Eighteenmile Creek Projects.............................. 1-14
2-1 Summary of Data and Analyses Collected at Sampling Locations............................ 2-2
2-2 Relationship Between Measures of Statistical Performance and Number Of Samples Required .................................................................................................... 2-13
2-3 Field Instruments and Associated Preventative Maintenance.................................. 2-16
2-4 Laboratory Quality Control Sample Guidelines, Eighteenmile Creek BUI Assessment Study Projects....................................................................................... 2-19
02:002386_NC13_01-B2132 vii R_BUI Assessment QAPP 18m Creek.doc-02/12/07
ist of Figures L Figure Page 1-1 Eighteenmile Creek BUI Assessment Project Organization Chart ............................ 1-2
2-1 Eighteenmile Creek Study Area................................................................................. 2-3
2-2 Oak Orchard Creek Study Area ................................................................................. 2-5

02:002386_NC13_01-B2132 ix R_BUI Assessment QAPP 18m Creek.doc-02/12/07
ist of Abbreviations and Acronyms L AOC Area of Concern
ASP Analytical Services Protocol
BUI Beneficial Use Impairments
COC chain-of-custody
CPR cardiopulmonary resuscitation
DGPS Differential Global Positioning Systems
DOT United States Department of Transportation
DUSR Data Usability Summary Report
EDD electronic data deliverable
E & E Ecology and Environment, Inc.
ELAP Environmental Laboratory Accreditation Program
EPA United States Environmental Protection Agency
EPL Experimental Pathology Laboratories
GIS geographic information system
LCS laboratory control sample
MDL method detection limit
mg/kg milligram per kilogram
MS/MSD matrix spike/matrix spike duplicate
MSB matrix spike blank
NCSWCD Niagara County Soil and Water Conservation District
NELAP National Environmental Laboratory Accreditation Program

List of Abbreviations and Acronyms (cont.)
02:002386_NC13_01-B2132 x R_BUI Assessment QAPP 18m Creek.doc-02/12/07
NYSDEC New York State Department of Environmental Conservation
NYSDOH New York State Department of Health
PARCC precision, accuracy, representativeness, completeness, and comparability
PCB polychlorinated biphenyl
PE performance evaluation
PPE personal protection equipment
QA/QC quality assurance/quality control
QAPP Quality Assurance Project Plan
QMP Quality Management Plan
RAP Remedial Action Plan
RPD relative percent difference
SDG sample delivery group
SOP Standard Operating Procedure
SPDES State Pollutant Elimination System
TOC total organic carbon
TRV toxicity reference value
µg/Kg microgram per kilogram

02:002386_NC13_01-B2132 xi R_BUI Assessment QAPP 18m Creek.doc-02/12/07
Distribution List
Party Affiliation and Title Revision Date Sent Eighteenmile Creek QAPP Original Distribution Marcia Meredith Galloway E & E QA Director January , 2007 Kris Erickson E & E Project Manager January , 2007 Victor DiGiacomo NCSWCD Project Manager January , 2007 Barbara Belasco EPA Project Officer January , 2007 Donna Ringel EPA QA Officer January , 2007 Marie Christine Pace Analytical January , 2007 William Elzinga MACTEC January , 2007 Jeff Wolf EPL January , 2007 Field Team Leader Sean Meegan January , 2007

Section No.: 1 Revision No.: 0 Date: February 2007
02:002386_NC13_01-B2132 1-1 R_BUI Assessment QAPP 18m Creek.doc-2/12/2007
Project Management This Quality Assurance Project Plan (QAPP) has been prepared by Ecology and Environment, Inc. (E & E) for the Niagara County Soil and Water Conservation District (NCSWCD) in support of the Eighteenmile Creek Beneficial Use Impairment Assessment located in Niagara County, New York. This QAPP has been prepared in accordance with “United States Environmental Protection Agency (EPA) Requirements for Quality Assurance Project Plans,” fi-nal, EPA QA/R-5 (March 2001) and EPA Region 2 Guidance for the Develop-ment of QAPP for Environmental Monitoring Projects (April 2004); and also in-corporates New York State Department of Environmental Conservation (NYSDEC) requirements. This QAPP presents the policies, organization, objec-tives, functional activities, and specific quality assurance/quality control (QA/QC) procedures that will be employed by E & E to ensure that all technical data gener-ated for the Eighteenmile Creek Beneficial Use Impairment Assessment are accu-rate, representative, and ultimately capable of withstanding judicial scrutiny. These activities will be implemented under the requirements of E & E’s compre-hensive QA program as documented in the corporate Quality Management Plan (QMP). The QAPP is formatted to address the four major sections listed in the EPA QAPP guidance document: Project Management, Data Generation and Acquisition, Assessment and Oversight, and Data Validation and Usability. 1.1 Project Organization The organizational chart for the project work is presented on Figure 1-1. The QA Director independently reports to the NCSWCD Project Manager on all QA/QC issues. The specific names and contact information for the current project team are provided in Table 1-1. The roles and specific QA responsibilities of key pro-ject personnel are described below.
1

Section No.: 1 Revision No.: 0 Date: February 2007
1. Introduction
02:002386_NC13_01-B2132 1-2 R_BUI Assessment QAPP 18m Creek.doc-2/12/2007
Figure 1-1 Eighteenmile Creek BUI Assessment Project Organization Chart
Project Manager The Project Manager is responsible for QA/QC functions for all task-specific op-erations on the Eighteenmile Creek Beneficial Use Impairment Assessment pro-ject, and the overall quality of E & E’s performance on the NCSWCD contract. The Project Manager will also be responsible for the overall quality of work per-formed under project activities as it relates to the following specific roles: ■ Overseeing day-to-day performance including all technical and administrative
operations; ■ Interfacing frequently with the NCSWCD Project Manager; ■ Tracking schedules and budgets and management of mobilization and contract
closeout activities; ■ Selecting and monitoring technical support staff; and ■ Reviewing and approving all final reports and other work products.

Section No.: 1 Revision No.: 0 Date: February 2007
1. Introduction
02:002386_NC13_01-B2132 1-3 R_BUI Assessment QAPP 18m Creek.doc-2/12/2007
Table 1-1 Project Organization, Eighteenmile Creek Beneficial Use Impairment Assessment
Key Team Member Contact Information NCSWCD Project Manager Victor F. DiGiacomo 716-434-4949 EPA Region 2 Project Officer Barbara Belasco 212-637-3848 E & E QA Director/Program QA Officer
Marcia Meredith Galloway 716-684-8060
E & E Project Manager Kris Erickson 716-684-8060 E & E Task Manager Sean Meegan 716-684-8060 E & E Project Chemist Rebecca Humphrey 716-684-8060 Subcontractors Experimental Pathology Labora-tories – (Pathology of fish livers)
Jeffrey C. Wolf, DVM, DACVP Experimental Pathology Laboratories 22866 Shaw Road Sterling, Virginia 20166
703-471-7060 ext. 242 703-471-8447 fax [email protected]
Pace Analytical – Green Bay – (Chemical Analysis)
Mary Christie Pace Analytical – Sales 205 Seagull Dr. Mosinee, WI 54455 Pace Analytical – Green Bay 1241 Bellevue Street, Suite 9 Green Bay, WI 54302 Pace Analytical – MN 1700 Elm Street, Suite 200 Minneapolis, MN 55414
Pace Sales 715-693-1953 715-573-1953 cell 715-693-1954 fax Pace Analytical – Green Bay 920-469-2436 920-469-8827 fax
MACTEC Engineering and Con-sulting
William J. Elzinga MACTEC Engineering and Con-sulting 3199 Riverport Tech Center Drive St. Louis, Missouri 63043
314-209-5900 314-209-5929 fax
QA Director/Project QA Officer The QA Officer is responsible for oversight of all QA/QC activities for NCSWCD projects. The QA Officer will remain independent of day-to-day, direct project involvement but will have the responsibility for ensuring that all project and task-specific QA/QC requirements are met. The QA Officer will have direct access to corporate executive staff, as necessary, to resolve any QA/QC problems, disputes, or deficiencies. The QA Officer’s specific duties include:

Section No.: 1 Revision No.: 0 Date: February 2007
1. Introduction
02:002386_NC13_01-B2132 1-4 R_BUI Assessment QAPP 18m Creek.doc-2/12/2007
■ Reviewing and approving the QAPP; ■ Conducting field and laboratory audits in conjunction and keeping written re-
cords of the audits; ■ Coordinating with the NCSWCD Project Manager, field team, and laboratory
management to ensure that QA objectives appropriate to the project are set and that laboratory and field personnel are aware of these objectives; and
■ Recommending, implementing, and/or reviewing actions taken in the event of
QA/QC failures in the laboratory or field. Project Chemist The Project Chemist is responsible for data validation and verification, generation of Data Usability Summary Reports (DUSRs), and independent assessment of the hard copy and electronic analytical data. The Project Chemist will report noncon-formance with QC criteria (including an assessment of the impact on data quality objectives) to the appropriate managers. Technical Support Staff The technical support staff for this program will be drawn from E & E’s pool of corporate resources. The technical support staff will implement project and field tasks, analyze data, and prepare reports/support materials. All support personnel assigned will be experienced professionals who possess the degree of specializa-tion and technical competence necessary to perform the required work effectively and efficiently. Field Support Field operations will be supported by MACTEC Engineering and Consulting, Inc. MACTEC will provide field equipment for the fish collection and will work under the direction of E & E’s Field Team Leader. The field procedures are described in Section 2 and additional support documentation is provided in Appendix A. Laboratories Laboratory analyses of will be completed by several different facilities. The fish will be prepared in the field. Fish livers will be sent to Experimental Pathology Laboratories (EPL) and the fish will be sent to Pace Analytical – Green Bay. The Green Bay laboratory will process the fish tissue and do the Polychlorinated Bi-phenyls (PCBs) analysis. The sample extract will be shipped to the Pace Analyti-cal Minneapolis laboratory for dioxin analysis. Pace Analytical is certified by both the New York State Department of Health (NYSDOH) Environmental Labo-ratory Accreditation Program (ELAP) for environmental analysis of water, solid and hazardous wastes, and air and National Environmental Laboratory Accredita-

Section No.: 1 Revision No.: 0 Date: February 2007
1. Introduction
02:002386_NC13_01-B2132 1-5 R_BUI Assessment QAPP 18m Creek.doc-2/12/2007
tion Program (NELAP). Appendix C includes detailed information on Pace Ana-lytical procedures. There is no certification for the fish pathology laboratory. Appendix B includes detailed information on EPL procedures which demonstrate their expertise in this field. EPL and Pace Analytical-Green Bay will assign a project manager. The labora-tory Project Manager QA duties include: ■ Reviewing the QAPP to verify that analytical operations will meet project re-
quirements; ■ Reviewing receipt of all sample shipments and notifying the E & E Project
Manager and Project Chemist of any discrepancies within one day of receipt; ■ Rapidly notifying the E & E Project Manager and Project Chemist regarding
laboratory nonconformance with the QAPP or analytical QA/QC problems af-fecting project samples; and
■ Coordinating with the E & E Project Manager and Project Chemist, and labo-
ratory management to implement corrective actions approved by NCSWCD. Stakeholders Other government organizations, private companies and the community groups that have interest in the project area are considered stakeholders. The groups are responsible for sharing historical data and participating in project planning to en-sure project objectives are coordinated with other related aspects of work at the site. The United States Army Corps of Engineers and New York State Depart-ment of Environmental Conservation (NYSDEC) are the primary government stakeholders. The stakeholders will be provided with copies of all technical de-liverables and project plans. 1.2 Problem Definition/Background 1.2.1 Problem Definition In 1987, the International Joint Commission (IJC) identified 43 Areas of Concern (AOC) in the Great Lakes Basin where the beneficial uses of the water were con-sidered impaired. Eighteenmile Creek was identified as one of the 29 United States Areas of Concern. The creek has been polluted by past industrial and mu-nicipal discharges, the disposal of waste, and the use of pesticides. Fish consump-tion restrictions exist because of PCB and dioxins found in fish flesh. The health of the benthos has been impaired by PCBs and metals in sediments. PCB and metal contamination prevents open lake disposal of dredged sediment material.

Section No.: 1 Revision No.: 0 Date: February 2007
1. Introduction
02:002386_NC13_01-B2132 1-6 R_BUI Assessment QAPP 18m Creek.doc-2/12/2007
Bird and animal health is likely impaired by PCBs, dioxins, DDT and its metabo-lites, and dieldrin found in fish flesh. Currently, two of the beneficial uses identified by the IJC (the existence of fish tumors and other deformities and the status of fish and wildlife populations) are classified as “unknown” for the Eighteenmile Creek AOC. Additionally, the status of bird or animal deformities or reproductive problems is currently classi-fied as “likely” for the Eighteenmile Creek Area of Concern. The NYSDEC was the lead agency during the development of the Remedial Action Plan (RAP) and was the lead agency for the management of the RAP for Eighteenmile Creek until December 31, 2004. However, due to budget issues, and the lack of a dedicated position in the NYSDEC to progress the implementation of the RAP, substantial progress was not made towards the de-listing of this AOC. The Niagara County Soil and Water Conservation District (NCSWCD) assumed management of the RAP in 2005, per funding support of the Great Lakes National Program Office. NCSWCD has been involved in re-invigorating investigative, remedial activities, and public education/outreach activities within the Eighteenmile Creek AOC. NCSWCD has developed this project to assist in determining the status of these two “unknown” and one “likely” beneficial uses and consequently make progress towards the de-listing of Eighteenmile Creek as an AOC. The purpose of this investigation is to initiate evaluation of contamination within portions of the Eighteenmile Creek AOC ecosystem. Similar field investigations and sampling will occur within Oak Orchard Creek in Orleans County, New York. Oak Orchard Creek has been recommended by the NYSDEC as a suitable control creek by which to compare and contrast fish and wildlife survey results. Both creeks are tributaries to Lake Ontario, are of similar size and surrounding geogra-phy, are subject to water level fluctuations due to changes in lake water levels, and contain hydro-electric dams some distance from the confluences of the creeks with the lake. Oak Orchard Creek is not listed as an AOC. The overall objective is to evaluate the status of three beneficial use impairments and to make progress in understanding the degree of impairment for these three beneficial uses. If the degree of impairment is found to be negligible, this assess-ment may ultimately lead to the de-listing of Eighteenmile Creek. Alternatively, any of the three beneficial uses listed above are found to be impaired, the results of this investigation will provide the framework for further ecosystem-based stud-ies and a long-term monitoring program for the site. Specific objectives are to: ■ Assess the prevalence of tumors or other deformities in AOC fish.

Section No.: 1 Revision No.: 0 Date: February 2007
1. Introduction
02:002386_NC13_01-B2132 1-7 R_BUI Assessment QAPP 18m Creek.doc-2/12/2007
■ Assess the status of fish and wildlife populations in the AOC by conducting seasonal fish and wildlife population surveys within the AOC and Oak Or-chard Creek.
■ Assess the status of bird or animal deformities and/or reproductive impairment
in wildlife populations in the AOC. 1.2.2 Background Eighteenmile Creek, located in the heart of Niagara County is surrounded by six residential townships. Many citizens own creek-front property from the start of its headwaters in the town of Lockport to its discharge to Lake Ontario in Olcott, New York. The creek is used extensively for fishing, boating, and recreation. The projected sampling location is primarily in a rural/residential area. Sediment contamination in the area upstream of the project area has impacted residential properties adjacent to the creek. PCBs contaminate the sediments of Eighteenmile Creek and within the AOC. PCBs are factors in restrictions on fish and wildlife consumption, bird and animal deformities, or reproductive problems and degradation of benthos. A surface sedi-ment sample taken in the 1994 Olcott Harbor Sediment Sampling from the AOC contained PCBs at a concentration greater than the NYSDEC guidance for screen-ing of contaminated sediments. Ten of 15 fish flesh samples from the creek con-tained PCBs at levels above the Food and Drug Administration action level of 2.0 milligrams per kilogram (mg/kg). Additionally, a surface sediment sample taken in 2005 by the NYSDEC upstream of project area (Flintkote Site) contained PCBs at 49 mg/kg. Sources and potential sources of PCBs to Eighteenmile Creek have been identi-fied as industrial and municipal wastewater discharges, combined sewer over-flows, inactive hazardous waste sites, the New York Barge Canal discharge, con-taminated sediments already present in the creek and an unknown source between Olcott Street and North Transit Road. Extensive progress has been made by monitoring discharges and updating State Pollutant Elimination System (SPDES) permits for industrial and municipal wastewater dischargers and de-listing inac-tive hazardous waste sites. NYSDEC conducted a sediment study in the area of the unknown source of PCBs located between Olcott Street and North Transit Road in August of 2005. NYSDEC expects a full remediation plan to be in place by 2008 for this entire area. Samples were collected for PCB screening using grab samples at 80 locations throughout the study area. A total of 80 samples and three duplicates were col-lected. Concentrations ranged from 59 µg/kg to 4300 µg/kg and 29 samples were non-detect. Comparison of PCB screening results to PCB confirmation samples at other sites, indicate the screening results need to be corrected by a factor of 6.5

Section No.: 1 Revision No.: 0 Date: February 2007
1. Introduction
02:002386_NC13_01-B2132 1-8 R_BUI Assessment QAPP 18m Creek.doc-2/12/2007
to be comparable to the confirmation results. A total of 12 cores were collected in areas for PCB confirmation. Three samples were collected at various depths. The concentrations in the core samples range from 12 µg/kg to 69000 µg/kg and only six samples were non-detect. The PCB results show that PCBs are present in all areas of Eighteenmile Creek. The core sample results show a general decrease in concentration with depth. The results indicate that the sediment is entirely contaminated with PCBs and only the native material in the creek bed is free of PCB contamination. The positive PCB results were corrected for an average total organic carbon (TOC) concentration and compared to NYSDEC criteria. Most of the positive PCB results exceeded PCB screening criteria. The results show a relatively uniform concentration of PCBs except at areas close to the Flintkote property and in the area near the inter-section of Old Niagara and Plank Road. The results indicate the potential for an additional source of PCBs in an area north of the waste water plant. The surface samples from all 12 cores also were analyzed for select metals. The metals results were compared to NYSDEC TAGM 4046 standards. All metal concentrations were near or exceeded TAGM criteria. The highest metals were found in core 2 and core 12, but the concentrations were relatively uniform throughout the study area. The results indicate that metals continue to be source of concern in the creek and need to be evaluated relative to background concentra-tions in other areas. Currently supported by numerous stakeholders, the NCSWCD, United States Army Corps of Engineers, and Niagara County are in the preliminary stages of developing a Comprehensive Watershed Management Plan for Eighteenmile Creek. It is apparent that the recovery and management of the creek will be better focused once there has been an evaluation of the three aforementioned Beneficial Use Impairments (BUIs). This would progress efforts of implementing the RAP for the Eighteenmile Creek AOC. The RAP’s mission is to restore the chemical, physical and biological integrity of the AOC ecosystem. Locating upstream sources of contamination to the AOC will aid in this mission and make progress towards the overall goal of de-listing Eighteenmile Creek as an AOC. Similarly, determinations on the BUIs will provide for the justification and objectives of fu-ture projects to aid in the de-listing of Eighteenmile Creek as an AOC. Should the results indicate impairment this investigation will provide direction for future monitoring activities. 1.3 Project Description The project has three main tasks as described in sections 1.3.1 through 1.3.3.

Section No.: 1 Revision No.: 0 Date: February 2007
1. Introduction
02:002386_NC13_01-B2132 1-9 R_BUI Assessment QAPP 18m Creek.doc-2/12/2007
1.3.1 Fish Community Surveys/Analysis of Fish Tumors and Deformities
Fish surveys will be conducted to document fish species composition at selected sampling locations within both of the creeks. In order to characterize the fish communities (taxonomic composition, general population structure of dominant taxa, etc.) of each study reach, sampling will be conducted on a seasonal basis during both spring (April/May) and summer seasons (July). The approach for this assessment will be to characterize resident fish communities during the spring spawning season (seasonally high water periods), and under summer low-flow conditions. Summer sampling will provide additional supporting information that can be used to evaluate spawning success and recruitment as indicated by the presence of young of the year specimens within collections. Survey reach loca-tions will be determined in the field during an initial field reconnaissance and then will be maintained for all survey efforts. Estimates of abundance, size distribu-tions, and biomass by species will be calculated and presented. The fish sampling will be completed to describe the existing fish communities as indicated above, and to collect the fish for tissue and liver analyses described below. A targeted effort to sample and collect fish within Eighteenmile Creek and Oak Orchard Creek will occur during the summer season community fish surveys. Se-lected fish specimens (longer than 250 mm in length) will be retained for gross body observations, and for performing tissue analyses to evaluate constituent up-take and ecological risks. Specifically, complete gross external and internal body observations and histo-pathological examinations will be conducted on approxi-mately 120 fish livers (60 from each creek) of brown bullheads or other Ictalurids or Castastomids. In addition tissue chemistry analyses of whole fish will be sub-sampled from the above-referenced 120 fish for bioaccumlative chemicals (PCBs and dioxin). 1.3.2 Wildlife Population Surveys Wildlife population surveys will also be completed within the Eighteenmile Creek AOC and a total area of similar size in Oak Orchard Creek to document species assemblages of wildlife populations. Species of particular interest will be those that are water dependent, or are in contact with the water, for hunting/foraging, swimming, loafing, etc. The surveys will document wildlife species composition within determined sampling reaches that represent a variety of available habitat types. Wildlife surveys are expected to occur during each season (winter 2007, spring 2007, summer 2007, and fall 2007) and will focus on birds, mammals, and amphibians. Bird species will be surveyed within each creek system at a mini-mum of 6 separate surveys between the winter of 2007 and fall of 2007. Addi-tional efforts for both amphibians and birds will include spring/early summer sur-veys following methods developed by the Marsh Monitoring Program established by Bird Studies Canada and Environment Canada with support from the United
Section No.: 1 Revision No.: 0 Date: February 2007
1. Introduction
02:002386_NC13_01-B2132 1-10 R_BUI Assessment QAPP 18m Creek.doc-2/12/2007
States Great Lakes Protection Fund, the EPA, and the Great Lakes 2000 Cleanup Fund. 1.3.3 Status of Bird or Animal Deformities or Reproductive
Impairment To assess this impairment, EPA indicates that the concentrations of PCBs and other bioaccumulative contaminants in adult fish and the process of bioaccumula-tion should be investigated. The current investigation will rely on the analysis of histological, pathological, and contaminant data in bullheads to assess the preva-lence of deformities and potential for bioaccumulation within Eighteenmile Creek. For comparison, the same information will be collected from the background area, Oak Orchard Creek. Fish survey efforts will be similar across both creeks to minimize effort bias between creeks when evaluating survey results. To evaluate potential reproductive effects on birds and mammals, the bullhead contaminant data will be used to estimate exposure and risk for fish-eating wildlife using stan-dard wildlife exposure models, exposure parameters, and toxicity reference values (TRVs; for reproductive effects). Exposure and risk will be calculated for the great blue heron (Ardea herodias) and mink (Mustela vison) because these two species prey heavily on forage fish such as bullheads and are known to use the AOC and background area. Exposure parameters and TRVs will be taken from EPA (1993), Sample et al. (1996), and other reputable sources. Lastly, the project team will evaluate the findings of the bioaccumulation study for Eighteen Mile Creek conducted by the United States Army Corps of Engineers, Buffalo District to help understand the process of bioaccumulation at the site. 1.3.4 Use of Study Results to Evaluate Beneficial Use Impairments As described in Section 1.2.1, three BUIs are being evaluated as part of the cur-rent investigation: ■ Existence of fish tumors and other deformities (status unknown); ■ Status of fish and wildlife populations (status unknown); and ■ Status of bird or mammal deformities or reproductive impairment (status
likely). The data generated by the activities described in Sections 1.3.1 to 1.3.3 will be used in a weight-of-evidence approach to determine the status of these three BUIs. For each type of data collected, the results for lower Eighteenmile Creek will be compared with background to identify impairment, or the lack thereof. In those cases where data collected for this study can be used to address more than one BUI, it is listed below under each BUI to which it applies.

Section No.: 1 Revision No.: 0 Date: February 2007
1. Introduction
02:002386_NC13_01-B2132 1-11 R_BUI Assessment QAPP 18m Creek.doc-2/12/2007
1.3.4.1 Existence of Fish Tumors and Other Deformities Two lines of evidence will be examined to evaluate the status of this BUI: ■ Prevalence and severity of external tumors and other deformities in bullheads
from the AOC compared with background; and ■ Prevalence and severity of liver tumors in bullheads from the AOC compared
with background. 1.3.4.2 Status of Fish and Wildlife Populations The status of fish, bird, mammal, and amphibian populations in the AOC will be evaluated as described in the following subsections. Fish Populations Four lines of evidence will be examined to evaluate possible impairment in fish populations in the AOC: ■ Diversity, abundance, biomass, and condition of fish species in the AOC com-
pared with background; ■ Concentrations of PCBs and dioxins/furans in bullheads from the AOC com-
pared with background. These data will be compared with critical tissue con-centrations from Dyer et al. (2000) and Windward (2004) to evaluate risk at the site relative to background.
■ Prevalence and severity of external tumors and other deformities in bullheads
from the AOC compared with background; and ■ Prevalence and severity of liver tumors in bullheads from the AOC compared
with background. Bird Populations Two lines of evidence will be examined to evaluate possible impairment of bird populations in the AOC: ■ Diversity and abundance of birds at the AOC compared with background; and ■ Risk of reproductive impairment to fish-eating birds from PCBs and diox-
ins/furans in forage fish compared with background. Risk will be calculated using the bullhead analytical data collected for this study and exposure pa-rameters and toxicity reference values from EPA (1993) and other reputable sources (e.g., Sample et al. 1996) for the great blue heron, a representative fish-eating bird that is likely to use the AOC.

Section No.: 1 Revision No.: 0 Date: February 2007
1. Introduction
02:002386_NC13_01-B2132 1-12 R_BUI Assessment QAPP 18m Creek.doc-2/12/2007
Mammal Populations Two lines of evidence will be examined to evaluate possible impairment of mammal populations in the AOC: ■ Diversity and abundance of mammals at the AOC compared with background;
and ■ Risk of reproductive impairment to fish-eating mammals from PCBs and di-
oxins/furans in forage fish compared with background. Risk will be calcu-lated using the bullhead analytical data collected for this study and exposure parameters and toxicity reference values from EPA (1993) and other reputable sources (e.g., Sample et al. 1996) for the mink, a representative fish-eating mammal that is likely to use the AOC.
Amphibian Populations Only a single line of evidence will be examined to evaluate the possible impair-ment of amphibian populations at the AOC: ■ Diversity and abundance of amphibians at the AOC compared with back-
ground. 1.3.4.3 Status of Bird or Mammal Deformities or Reproductive
Impairment Two lines of evidence will be used to determine the status of this BUI: ■ Risk of reproductive impairment to fish-eating birds and mammals from PCBs
and dioxins/furans in forage fish compared with background. Risk will be calculated using the bullhead analytical data collected for this study and expo-sure parameters and toxicity reference values from EPA (1993) and other reputable sources (e.g. Sample et al. 1996) for the great blue heron and mink, representative fish-eating wildlife species that are likely to use the AOC.
■ In addition, it is possible that dead or disabled birds, mammals, and amphibi-
ans may be found at the AOC and background area that can be examined for deformities and other abnormalities. If available, such information will be collected and used in the overall weight-of-evidence approach.
Project milestones are scheduled to include: ■ Project Start 1/2007 ■ QAPP Submittal 1/2007 ■ Field Reconnaissance of Study Areas 4/2007

Section No.: 1 Revision No.: 0 Date: February 2007
1. Introduction
02:002386_NC13_01-B2132 1-13 R_BUI Assessment QAPP 18m Creek.doc-2/12/2007
■ Wildlife Surveys 2/2007 – 10/2007 ■ Fish Community Surveys 5/2007, 7/2007 ■ Preparation of Semi-Annual Report 6/2007 ■ Targeted Fish Collection 7/2007 ■ Data Review and Analysis 7/2007 – 11/2007 ■ Draft Report Preparation 12/2007 – 2/2008 ■ Review and Approval of Final Report 4/2008 ■ Project End 5/2008 1.4 Quality Objectives and Criteria The specific objectives of this project are provided in Section 1.2.1. The objec-tives for each type of data are presented in Section 1.3.4. General quality objec-tives for the Eighteenmile Creek BUI Assessment are summarized in Table 1-2. Acceptance and performance criteria for field and analytical QC samples are out-lined in Section 2.4. Appendix B and C of this QAPP provides detailed accep-tance and performance criteria for analytical methods. 1.4.1 Data Assessment Definitions Acceptance and performance criteria are often specified in terms of precision, ac-curacy, representativeness, completeness, and comparability (PARCC) parame-ters. Numerical acceptance criteria cannot be assigned to all PARCC parameters, but general performance goals are established for most data collection activities. Numerical goals for analytical methods are presented in Section 2.4. Data as-sessment procedures throughout the QAPP clearly outline the steps to be taken, responsible individuals, and implications if QA objectives are not met. PARCC parameters are briefly defined below.

Section No.: 1 Revision No.: 0 Date: February 2007
02:002386_NC13_01-B2132 R_BUI Assessment QAPP 18m Creek.doc-2/12/2007
1-14
Table 1-2 General Data Quality Objectives, Eighteenmile Creek Projects Data
Collection Activity Quality Objectives Standardsa
Acceptability/ Performance Criteriab
Historical Data Collection
To incorporate all existing data that meets quality objectives for the RAP. Data must be geo-referenced.
■ EPA or NYSDEC sampling and analytical procedures
■ Data are generated using EPA or NYSDEC sampling and analytical methods or alternative methods approved under a RAP project.
■ Data must be from the original source. ■ Data must be geo-referenced or able to be digitized into a
GIS system. Sampling and Analysis
To have samples and analytical results that accurately represents the conditions present at the site or in the fish tissue. Data must be of sufficient quality to meet all regulatory requirements and allow assessment of impacts by comparison to background values. Data must present results to allow comparison of PCBs in tissue from reference sites. Field surveys must be documented and comply with this QAPP and standard industrial practice.
■ See Appendices B and C of the QAPP
■ Literature sources for levels of PCBs in Fish Tissue
■ Data must be collected under an approved QAPP. ■ Data must meet the acceptance and performance criteria
documented in Section 2 of this QAPP. ■ Reporting limits should be below risk-based screening val-
ues for 90% of target analytes and 100% of critical analytes of concern.
■ Data must be compared to standards. ■ Data must be compared to data collected in reference area.
Mapping To relate project work locations to existing local benchmarks.
■ DGPS data ■ Relation of all survey points to existing/known benchmarks. ■ Accurate horizontal coordinates ("3 feet for DGPS loca-
tions). Field Records To document all field activities and to allow
accurate representation field events in the final report. Records must be capable of withstanding legal scrutiny.
■ Section 2 of the QAPP ■ Appendix A of the QAPP
■ Consistency between field and laboratory data. ■ Clear and legible documentation for sample collection and
equipment decontamination for final report. ■ Clear and legible documentation for field observations as
documented on the attached forms. Outside Records To use the most current reference values, reports,
or data from outside sources in data assessments and recommendations for the site.
None ■ All versions of data or standards must be the most current values available.
■ Data or standards must be accurately incorporated into the final report.
Notes: a Major standards. b Major or noteworthy acceptability criteria. All performance criteria must be verified using procedures listed in the QAPP.
Key:
EPA = Environmental Protection Agency. GIS = Geographic Information System. NYSDEC = New York State Department of Environmental Conservation. QAPP = Quality Assurance Project Plan.

Section No.: 1 Revision No.: 0 Date: February 2007
1. Introduction
02:002386_NC13_01-B2132 1-15 R_BUI Assessment QAPP 18m Creek.doc-2/12/2007
Precision Precision measures the reproducibility of measurements under a given set of con-ditions. Specifically, it is a quantitative measure of the variability of a group of measurements compared to their average value, usually stated in terms of standard deviation or coefficient of variation. It also may be measured as the relative per-cent difference (RPD) between two values. Precision includes the interrelated concepts of instrument or method detection limits and multiple field sample vari-ance. Sources of this variance are sample heterogeneity, sampling error, and ana-lytical error. Accuracy Accuracy measures the bias of the measurement system. Sources of this error are the sampling process, field contamination, preservation, handling, sample matrix, sample preparation, and analysis. Data interpretation and reporting may also be significant sources of error. Typically, analytical accuracy is assessed through the analysis of spiked samples and may be stated in terms of percent recovery or the average (arithmetic mean) of the percent recovery. Blank samples are also ana-lyzed to assess sampling and analytical bias (i.e., sample contamination). Back-ground measurements similarly assess measurement bias. The number of samples collected will impact the confidence of the statistical data evaluation. Archive samples will be collected for analysis if additional samples are required. Representativeness Representativeness expresses the degree to which data represent a characteristic of a population, a parameter variation at a sampling point, or an environmental con-dition. Representativeness is a qualitative parameter, which is most concerned with proper design of the measurement program. Sample/measurement locations may be biased (judgmental) or unbiased (random or systematic). Representative-ness of the sampling scheme will be determined with evaluation of the historical data and statistical evaluation of the results compared to the reference site. Completeness Completeness is defined as the percentage of measurements performed which are judged to be valid. Although a quantitative goal must be specified, the complete-ness goal is the same for all data uses—that a sufficient amount of valid data be generated. A completeness goal of 90% is established for this project. Comparability Comparability is a qualitative parameter expressing the confidence with which one data set may be compared to another. Sample data should be comparable with other measurement data for similar samples and sample conditions. This goal is achieved through the use of standard techniques to collect and analyze samples. Historical data will be evaluated to ensure the methods and reporting limits are

Section No.: 1 Revision No.: 0 Date: February 2007
1. Introduction
02:002386_NC13_01-B2132 1-16 R_BUI Assessment QAPP 18m Creek.doc-2/12/2007
comparable to the proposed sampling. Data will only be evaluated if it is deter-mined to be comparable. 1.5 Special Training/Certification E & E training requirements for the Eighteenmile Creek BUI Assessment activi-ties are as follows: ■ E & E employees that participate in on-site activities must have completed the
40-hour health and safety training program and the cardiopulmonary resuscita-tion (CPR)/first aid certification course. To continue such participation, each employee must successfully complete a minimum of eight hours of refresher training, annually;
■ Use of appropriate scientific disciplines to successfully complete field surveys
and fish pathology as outlined in Appendices to the QAPP. Field personnel with appropriate degrees and experience must be used for this portion of the project.
■ All personnel shipping samples must complete the United States Department
of Transportation (DOT) hazardous materials transportation training and certi-fication, including training in specific International Air Transport Association regulations (air shipments).
All project personnel will be provided for the QAPP for review prior to project start-up. The field team will hold a project kick-off meeting prior to start of sam-pling to review procedures. The laboratory supervisor and project manager will oversee the implementation of the QAPP in the laboratory. 1.6 Documentation and Records The E & E Program QA Officer will approve the QAPP and maintain the most current approved version of the document. The E & E Project Manager is respon-sible for providing the most current copy of the QAPP and other planning docu-ments to the project team members. In addition to the QAPP and other planning documents, the primary documenta-tion for the project includes field datasheets, geographic information system (GIS) based mapping, and analytical data packages. Requirements for data recordation on field datasheets are similar across the different surveys types, although given the nature of the various sampling efforts there will be differences in the types of data recorded and the labeling of observation stations and samples (e.g., fish vs. mammals vs. birds, vs. fish health, etc.). The field datasheets are standard for these types of surveys. Requirements for analytical data packages are also de-scribed below. The remainder of the QAPP describes additional project documen-

Section No.: 1 Revision No.: 0 Date: February 2007
1. Introduction
02:002386_NC13_01-B2132 1-17 R_BUI Assessment QAPP 18m Creek.doc-2/12/2007
tation and record requirements for QA/QC assessments, data validation, data management, and other areas. 1.6.1 Field Documentation Fish Community and Wildlife Surveys Field data entry will be conducted using data sheets (see Appendix A). Data will be subsequently entered into a project database. Entries will be made in ink, signed or initialed, and dated. No erasures will be made. If an incorrect entry is made, the information will be crossed out with a single strike mark that is signed or initialed and dated by the sampler. The photographs, if any are taken, will be numbered and a brief description regarding the photograph will be noted. Data collected for the different surveys are summarized in Section 2.2. Analytical Fish Sample Identification Samples will be identified using the format described below. There will be two types of fish tissue samples collected for laboratory analyses: fish tissue chemis-try (whole body) and liver histo-pathology. Each sample will be labeled, chemi-cally preserved (as required), and sealed immediately after collection. To mini-mize handling of sample containers, labels will be completed prior to sample col-lection as practicable. The sample label will be completed using waterproof ink and will be firmly affixed to sample containers and protected with clear tape. The sample label will give the following information: ■ Date of collection; ■ Location of collection (Eighteenmile Creek [EMC] vs. Oak Orchard Creek
[OOC], stream reach number); ■ Unique sample number; ■ Analyses requested; and ■ Preservation. Each sample will be referenced by sample number on respective data sheets and on the chain-of-custody (COC) record. Individual samples will be identified by a unique alphanumeric code. Normal field samples (non-quality-control) will be numbered according to the following convention:

Section No.: 1 Revision No.: 0 Date: February 2007
1. Introduction
02:002386_NC13_01-B2132 1-18 R_BUI Assessment QAPP 18m Creek.doc-2/12/2007
EMC-###-BB-LP-TC-D
EMC - Three letter code for site name (OOC) ### - Sequential sample number BB - Species collected (BB – brown bullhead, OSP – other species [to be
cross-referenced to survey datasheet) LP - Liver pathology TC - Tissue Chemistry (added to string for those samples selected for PCBs
tissue chemistry analysis) D - Dioxin (added to string for those samples selected for dioxin tissue
analysis). Photographs The use of photography will be employed to record field sampling activities and to support documentation of gross visual fish observations. Section 2.__ provides details on photographic procedures for gross fish observations. The following in-formation will be noted on the pertinent datasheets concerning photographs: ■ Date, time, location, and direction photograph was taken; ■ Description of the photograph taken; ■ Sequential number of the digital photo; and ■ Camera system used. 1.6.2 Laboratory Data Reporting The data packages for all analytical services must be consistent with NYSDEC Analytical Services Protocol (ASP) (July 2005) for the tissue samples. The ana-lytical data reporting requirements are outlined in the scope of work provided in Appendix C. The laboratory will provide an electronic data deliverable that matches all data reported on the hard copy analytical report. Electronic data re-port requirements are described in Section 2.10. The analytical summary report will include the sample aliquot analyzed, final ex-tract volume, and dilution factor. The analytical summary data report also will include the laboratory reporting limit and method detection limit (MDL) for all target compounds. These limits will be corrected for percent moisture and all di-lution factors. Any compounds found less than the reporting limit, but greater than the MDL will be reported and qualified with a “J” flag as estimated. QC reports will provide a summary report or batch identifier clearly linking all QC results to actual field sample results. QC summary reports will include the laboratory control limits and flag any result reported outside control limits. The

Section No.: 1 Revision No.: 0 Date: February 2007
1. Introduction
02:002386_NC13_01-B2132 1-19 R_BUI Assessment QAPP 18m Creek.doc-2/12/2007
case narrative must include an explanation of all QC results reported outside con-trol limits. The laboratory must provide copies of any nonconformance or correc-tive action forms associated with data in the laboratory report. For fish pathology, EPL will prepare a separate technical report that details the findings of the samples received. 1.6.3 Record Retention All records related to the project must be stored in secure areas consistent with requirements in E & E’s QMP. All records related to the analytical effort will be maintained at the laboratory in lockable filing cabinets for at least one year, except those stored in the computer. All records must be maintained in a secure area for a period of six years after the end of the calendar year in which the final report is issued.
Section No.: 2 Revision No.: 0 Date: February 2007
02:002386_NC13_01-B2132 2-1 R_BUI Assessment QAPP 18m Creek.doc-2/12/2007
Data Generation and Acquisition This section of the QAPP contains descriptions of all aspects of the implementa-tion of field, laboratory and data handling procedures to meet the requirements of the Eighteenmile Creek BUI Assessment activities. 2.1 Sampling Process Design The purpose of the sampling described in this section is to collect data necessary to evaluate the status of three BUIs within the Eighteenmile Creek AOC. The BUIs in question are: ■ Prevalence of fish tumors and other deformities (status unknown); ■ Status of fish and wildlife populations (status unknown); and ■ Status of bird or animal deformities or reproductive problems (likely). In order to assess the status of the BUIs listed above, a set of integrated and inter-related sampling and analytical processes have been developed to: ■ Characterize the habitats within the Eighteenmile Creek AOC and Oak Or-
chard Creek study areas; ■ Identify the fish and wildlife species that occur within the study areas and gain
knowledge with regard to species community composition, relative abun-dance, and diversity;
■ Collect brown bullheads (or other bottom-dwelling fish if the bullhead is not
available) for gross external and internal visual observations for lesions, tu-mors, ulcers, etc.; liver pathology; and tissue chemistry (PCBs and dioxin) to determine the presence of potentially bioaccumlative chemicals within the study area ecosystems and food chains;
■ Quantify and report differences between the Eighteenmile Creek AOC and
Oak Orchard Creek; and
2

Section No.: 2 Revision No.: 0 Date: February 2007
2. Data Generation and Acquisition
02:002386_NC13_01-B2132 2-2 R_BUI Assessment QAPP 18m Creek.doc-2/12/2007
■ Use the weight-of evidence approach described in Section 1.3.4 to determine
the status the three BUIs being evaluated. Table 2-1 Summary of Data and Analyses Collected at Sampling
Locations Fish and Wildlife
Surveys Field /Analytical Data Collection Fish Community Surveys Date, Fish Species, Number, Reach Location, etc. Targeted Fish Collection Date, Fish Species, Number, Reach Location, etc.
Gross External and Internal Visual Observations, Photographs Liver Pathology and Whole Body Tissue Chemistry Sample Processing and Packaging
Wildlife Surveys Date, Species, Number, Location, Survey Type, Point Locations (Lat, Long)
Field Data Collection The specifics for field data collection are provided in Section 2.2; each collection and recordation activity for each data collection effort is critical to the data quality objectives for this project. The samples will be collected at areas with Eighteen-mile Creek AOC as shown in Figure 2-1 and the reference area Oak Orchard Creek as shown on Figure 2-2. The specific sampling locations will be deter-mined as field locations by differential Global Positioning Systems (DGPS) as noted below. Latitude/Longitude Location: These data will assist in developing BUI Assess-ment field data collection maps to document locales, points, and areas of surveys. A DGPS capable of ascertaining horizontal locations with < 5 meters of accuracy will be utilized. To achieve this accuracy, it is important that the DGPS is in good working order and are obtaining strong satellite signals. The field team will be responsible for checking the satellite signal strength for the DGPS system prior to recording this data and for ensuring that the system records equivalent horizontal locations. Any problems with signal strength shall be recorded in the field boring log. If problems are noted, the field team should provide a qualitative description of the sampling location utilizing any available, permanent landmarks. 2.2 Sampling Methods 2.2.1 Fish Sampling Methodology 2.2.1.1 Community Surveys Fish community surveys will be conducted in the Eighteenmile Creek AOC and within similar habitats of similar total area in Oak Orchard Creek. Similar sam-pling methods and effort will be used for both of these creeks. The fish surveys will document fish species composition at selected sampling sites, as well as

Burt Dam
LAKE
CREEK
MAIN
LOCKPORT OLCOTT
BLUFF
FRANKLIN
PARK
GODFREY
JACKSON
ALTHEA
ONTARIO
VAN BUREN
RAILROAD
VAN HORN
KRULL
BEACH
CLINTON
ALBRIGHT
CHARLES
CENT
ER
CRES C E NT WATER
COOPER
CR EEK S IDE
WASHINGTON
LAFFLER
SAXTON COLLARD
PEACH
MCKE
E
WRIGHT
MAIN
CHAR
LES
LAKE
WASHINGTON
0 200 400Meters
0 400 800Feet
Figure 2-1Eighteenmile Creek Study Area
CanadaLake Ontario
Lake Erie N e w Y o r kN e w Y o r k
P e n n s y l v a n i aP e n n s y l v a n i a
E i g h t e e n mi le C
reekE i gh t e e n m
i le Creek
L:\Buffalo\eighteenmile\Mxds\BurtDam\projectlocation.mxd

PARK
KENDRICK
ROOSEVELT
OAK
ORCH
ARD
BASS
HARD
WATERPORT CARLTON
WILS
ON
STILLWATER
OAK ORCHARD RIVER
HANLON
GAINES WATERPORT
LAKE ONTARIO STATE
FULL
ER
ARCHBALD
ASHWOOD
GREEN
POIN
T BRE
EZE
LAKE
MAIN
LAKE
SIDE
CL ARK M ILLS
MCCUTCHEN
WATE
RPOR
T
EAGLE HARBOR WATERPORT
LAKESHORE
ROCKLEDGEW
EST
BLUFF
EAST
WIND ING
941M
CALLARD
LA KES IDE PARK OAK ORCHAR D ON THE LAKE
CHURCH
SUNSET PARKWAYLAKEVIEW
CENT
ER
L AKESIDE BE ACH STATE
FR 14
4
FAIRVIEW
IROQ
UOIS
FR 14
5
HILLCREST
BAKERTANNERY
OTTER
ORC HARD
NORTH
ER
W AY TRAK
ONTARIO
POINTBREEZE
STATION
CREEK
END
LAKE
ONT
ARIO
STA
TE LAKE ONTARIO STATE
PARK LAKESHORE
HANLON
OAK ORC
HARD
RIV
ER
LAKE ONTARIO STATE
WATE
RPOR
T
R OO SEVELT
OAK ORCHARD RIVER
WEST
Figure 2-2Oak Orchard Creek Study Area
L:\Buffalo\eighteenmile\Mxds\Dam_Locations.mxd
CanadaLake Ontario
Lake Erie N e w Y o r kN e w Y o r k
P e n n s y l v a n i aP e n n s y l v a n i a
Oak Orchard Creek Dam
Oa k O r c h a r d
Cr e e k
Oa k O r c h a r d
Cr e e k
Lake Ontario
0 1,000 2,000Meters
0 2,500 5,000Feet

Section No.: 2 Revision No.: 0 Date: February 2007
2. Data Generation and Acquisition
02:002386_NC13_01-B2132 2-7 R_BUI Assessment QAPP 18m Creek.doc-2/12/2007
estimates of abundance, size distributions, and biomass by species. Three reaches of stream will be identified in the field that include habitats representative of each of the creeks from the downstream ends of the hydro-electric dams to the conflu-ences with Lake Ontario. It is currently assumed that marina areas will not be sampled rather more natural habitats will be the target of sampling efforts. Reach lengths will also be determined in the field, but will fall likely within the range of 500 – 1,000 feet. Surveys will be conducted to determine the assemblages of representative fish communities during the spring and mid-summer months within the creeks. Two survey events will occur at each of the creeks during the same time frame. Fall surveys will not be completed in order to avoid conflict with salmonid migrations from Lake Ontario to lake tributaries. Both Eighteenmile and Oak Orchard creeks are major destinations for seasonal anglers during the salmonid runs from the lake to the creeks. Both creeks are visited by thousands of anglers every fall season from other parts on New York, from Pennsylvania and Ohio, and portions of On-tario, Canada. Additionally, much is known about the sport fishery (e.g., sal-monid stocking programs - brown trout, steel head, etc.), compared to the warm water species that are considered to spend a majority of their life spans within the creeks (vs. the lake). The proposed gear types will include electrofishing, hoop netting, and potentially bag seining and back pack electrofishing. Electrofishing will be the primary gear type and will be used at selected locations along the shoreline within each study reach. Electrofishing shall be performed using a boat-mounted Smith Root pulsed DC electrofishing for 15 minute durations at each location. At locations lacking sufficient depth for boat-mounted electrofishing, a battery powered Smith Root backpack electrofishing unit or bag seine may be used. Fish immobilized during each electrofishing run will be dip-netted and put into aerated live wells for proc-essing. All sampling areas will be mapped using DGPS. Hoop nets (one-meter diameter) will be used opportunistically within each sam-pling reach to collect additional fish specimens. Fish collected by netting shall be removed from net cod ends, and placed in an aerated live well for processing. Net set time and run times shall be recorded for each net location, in order to calculate catch per unit effort. Additionally ancillary information that shall be recorded for net samples shall include water depth, in-stream habitat characteristics, and rela-tive water flow characteristics. At the end of each electrofishing run (or subsequent to retrieval of nets), fish will be processed by identifying each specimen, recording length (total length—TL) and weight (grams) using a digital top-loading scale. Identification of specimens contained in the samples will be to the lowest practicable taxonomic level using one or more of the following taxonomic keys:

Section No.: 2 Revision No.: 0 Date: February 2007
2. Data Generation and Acquisition
02:002386_NC13_01-B2132 2-8 R_BUI Assessment QAPP 18m Creek.doc-2/12/2007
■ Smith, L. 1985. The Inland Fishes of New York State. The New York State
Department of Environmental Conservation. Albany, NY.
■ Kraft, C. E., D. M. Carlson, and M. Carlson. 2006. Inland Fishes of New York (Online), Version 4.0. Department of Natural Resources, Cornell Uni-versity, and the New York State Department of Environmental Conservation.
Batch processing of samples may be performed if the number of specimens of the same species in a given sample exceeds 50. In such circumstances, 50 specimens of a given species shall be processed as stated above (individual length and weight measurements), thereafter the species/size category count will be estimated by sub-sampling. A sub-sample of 30 individuals will be weighed and the total sam-ple will be weighed. The number of individuals in the whole sample will be esti-mated from the ratio of the total sample weight to the sub-sample weight total and the count within the sub-sample. All collected fish (except those retained for tissue analysis) shall be released back into the source water body unharmed. The data collected will be used to generate a species list for each creek, a popula-tion estimate, and a 95% confidence interval for each species. The goal will be to generate probability-of-capture estimates based upon capture patterns. The cap-ture probability estimate is a measure of sampling efficiency. In addition, Ful-ton’s Condition Factor will be calculated. The condition factor compares the length and weight relationship of individual fish to assess their physical condition. Also, the total biomass density for each species at each sampling location will be calculated as the product of the estimated fish population and the mean weight of the sub-sampled fish divided by the surface area of the sampled reach. The results of the community surveys for Eighteenmile Creek and the control site will be compared to evaluate community-level differences in diversity and abundance be-tween the two creeks, and will factor into impairment analyses. Field Data Collection Field data collection activities will be recorded using project specific field data sheets; similar information will be collected in the field during the targeted fish collection activities. For each sampling event, the following field data will be re-corded: ■ General Sample Identification
- Date - Start time, Stop time - Weather, field team members - Sample collection method

Section No.: 2 Revision No.: 0 Date: February 2007
2. Data Generation and Acquisition
02:002386_NC13_01-B2132 2-9 R_BUI Assessment QAPP 18m Creek.doc-2/12/2007
- Sample location - Sample identification - Sample collectors
■ Water Quality - Water body - Temperature - Dissolved oxygen - pH - Conductivity
■ Biological Data
- Species common name - Length - Weight - Status/condition (live, dead, moribund) - DELT (disease, erosion, lesions, tumors – see additional datasheet for
gross body observations for brown bullhead) - Batched fish (length category, count, and weight)
Water Quality In-situ water quality data, including pH, dissolved oxygen, and conductivity will be measured at each fish sampling location during each event. Water quality measurements will be recorded on field data sheets. Water quality instruments will be subject to calibration prior to and following each field sampling event. Additionally, water quality instruments shall be properly maintained while in the field to ensure their accuracy. 2.2.1.2 Targeted Fish Collection for Analysis of Fish Tumors and
Deformities Annex 2 of the Great Lakes Water Quality Agreement between the United States and Canada called for the identification of the most severely degraded AOCs within the Great Lakes basin and the development of RAPs to restore impaired beneficial uses within these areas. Annex 2 specifically lists fourteen discrete BUIs for AOCs, including “fish tumors or other deformities.” As defined by In-ternational Joint Commission (1991) guidelines, the fish tumors or other deformi-ties BUI occurs:
“. . . when the incidence rates of fish tumors or other deformities exceed rates at unimpacted control sites or when survey data con-firm the presence of neoplastic or pre-neoplastic liver tumors in bullheads or suckers.”

Section No.: 2 Revision No.: 0 Date: February 2007
2. Data Generation and Acquisition
02:002386_NC13_01-B2132 2-10 R_BUI Assessment QAPP 18m Creek.doc-2/12/2007
The fish tumors or other deformities BUI has been identified in 14 of the 31 AOCs located within or partially within the United States. In U.S. AOCs, this BUI is most often related to the brown bullhead catfish (Ameiurus nebulosus) (Rafferty and Grazio, to be published in early 2007). Therefore, the ability to ac-curately and consistently identify tumors or other deformities in brown bullhead is critical for proper assessment and monitoring of the status of this BUI. To determine the prevalence of tumors gross visual external and internal observa-tions and histo-pathological examinations will be conducted to identify potential lesions and neoplasms. The histo-pathological work will involve the examination of the fish livers. This type of examination is a reliable tool for evaluating tissue damage resulting from contaminated sediments and environmental pollution. The target fish species, brown bullhead, will be collected within the three reaches where the fish community surveys will be conducted within the Eighteenmile Creek AOC and Oak Orchard creeks. The latter of which has been identified as a potential control site because of its similarity in geography, size and as a tributary to Lake Ontario. Both creeks are affected by lake-level fluctuation in Lake Ontario and contain hydro-electric dams. Lake Ontario tributaries are subject to spring and fall migrations of cold water species from the lake. In order to maximize the probability of capturing individual fish that are residents to each creek, fish collec-tion for identifying the prevalence of tumors or other deformities will occur in mid-summer. Similar field collection procedures employed for the fish commu-nity surveys will also be utilized for the collection of brown bullhead. A total of approximately sixty (60) adult brown bullheads will be collected within identified sampling reaches from both creeks to evaluate the presence of tumors and deformities. The primary collection method will be electrofishing, however, the prevalence of deeper water habitats and lower-than-anticipated numbers of fish collected via electro-shocking, may require the use of hoop nets. If an insuf-ficient number of fish are collected, sampling may include: bag seines, and/or an-gling. If an insufficient number of brown bullhead is collected, other Ictalurids (yellow bullhead) and possibly Catastomids (white sucker) will be collected for analysis. Subject fish will be kept alive during electrofishing runs, up to the point of proc-essing individual fish. The literature indicates that fish that die prior to being as-sessed should neither be grossly assessed or necropsied due to the potential for the development of post-mortem lesions (Rafferty and Grazio, to be published in early 2007). Gross internal, external, and liver and fish tissue sample processing will occur streamside after each electrofishing/sampling run in order to minimize the possibility of fish mortality. Gross internal and external visual observations will follow the procedures out-lined in Section 5.3 of the Field Manual for Assessing Internal and External

Section No.: 2 Revision No.: 0 Date: February 2007
2. Data Generation and Acquisition
02:002386_NC13_01-B2132 2-11 R_BUI Assessment QAPP 18m Creek.doc-2/12/2007
Anomalies in Brown Bullhead (Ameiurus nebulosus) (Rafferty and Grazio, to be published in early 2007; see Appendix A. A datasheet for visual observations and necropsy will be developed similar to the Fish Health Data Sheet in Rafferty and Grazio (Appendix A). Photographs will be taken of all fish exhibiting tumors, lesions, or other deformities, with the appropriate labeling (sample collection date, location, species, etc.) shown next to the fish for photo-documentation. For preparing the livers for histo-pathological examination, livers will be excised in toto from each fish and laid flat on a cutting surface. Five transverse slabs, each less than 1 cm thick, will be trimmed from each liver. The slabs will be lo-cated approximately equidistant from one another, except that one or more of the slabs may be oriented to include any macroscopic liver lesion(s) that might be present. The slabs will be placed immediately into the fish’s labeled individual container of 10% neutral buffered formalin. There will be sufficient formalin in each container so that the volume of fixative is at least 10 times the volume of the tissues. Portions of any non-hepatic tissues that have macroscopic abnormalities (those that are amenable to sampling) may also be placed in the same formalin container; these specimens will be trimmed so that they are no wider than 1 cm in at least one dimension, and they should contain some of the adjacent normal tissue if possible. Such specimens may be placed into labeled tissue cassettes to facili-tate subsequent identification. No other tissues will be collected routinely unless specified by protocol amendment. The additional samples could be used for analysis under a future project but is not considered within the scope of the exist-ing project. Unless otherwise specified, all histo-pathological procedures will be performed according to EPL® Standard Operating Procedures. At EPL, each of the five liver slabs will be trimmed transversely (i.e., perpendicular to the long axis of the tissue as submitted) to provide at least one flat surface for microtoming, and so that the trimmed specimen can be placed into a standard tissue cassette. The remaining liver tissues will be retained in the animal’s individual formalin container. Liver slabs with obvious lesions will be trimmed so that a portion of the lesion(s), and, if possible, a portion of adjacent unaffected tissue, will be evident in the single microtomed section to be produced from each slab. Excluded from this require-ment are lesions that are clearly parasitic in origin based on macroscopic observa-tion. Specimens in cassettes will be processed to paraffin-embedded sections on glass slides according to routine methods, and the slides will be stained with he-matoxylin and eosin prior to coverslipping. Non-hepatic tissues may be retained in the animal’s individual formalin container and not processed to slides unless specified by protocol amendment or other written directive from the Study Direc-tor. Similarly, as above, these tissues may be collected for future analysis under a different project.

Section No.: 2 Revision No.: 0 Date: February 2007
2. Data Generation and Acquisition
02:002386_NC13_01-B2132 2-12 R_BUI Assessment QAPP 18m Creek.doc-2/12/2007
Each of the sections on glass slides will be examined via light microscopy by a board-certified veterinary pathologist who has experience in the evaluation of neoplastic fish diseases. During the initial histo-pathologic evaluation, the pa-thologist will be aware of the collection site status of each animal, as advocated in Crissman et al., 2004. Unless otherwise specified, proliferative liver lesions (foci of cellular alteration and primary liver neoplasms) will be assessed according to criteria and terminology described in Blazer et al., 2006. If multiple proliferative lesions of a single type are present in one section, these will not be quantified; however, in such instances the term “multiple” will be a component of the diagno-sis. In general, non-proliferative lesions will be reported and scored for severity according to the following grading scheme: 1 = minimal, 2 = slight/mild, 3 = moderate, 4 = severe. Altered foci and neoplasms will not be scored for severity, and instead will be reported as “Present”. Certain types of non-proliferative le-sions that are not amenable to severity scoring may also be reported as “Present”. The pathologist will attempt to correlate macroscopic observations made at ne-cropsy or gross trimming with histopathologic diagnoses. Diagnoses will be re-corded into an electronic data system for tabulation and reporting. The pathology report will include, but not limited to: a narrative pathology summary (Introduc-tion, Methods, Results, Discussion, Summary and Conclusion sections); Histopa-thology Incidence Tables (HIT) and Summary Incidence Tables (SIT); and Corre-lation of Gross and Histopathologic Findings tables. [See Blazer, Fournie, Wolf, and Wolfe (2006) and Crissman, Goodman, Hildebrandt, Maronpot, Prater, Riley, Seaman, and Thake (2004) for supporting material regarding histo-pathological procedures.] 2.2.1.3 Fish Tissue Chemistry Eight bullheads (8 to 12 inch length) from both the AOC and background area will be collected for PCB analysis. This sample size will be adequate to detect a 50% increase over background with a statistical power and confidence of 90%, assuming a coefficient of variation (CV) of 50% for the fish contaminant data (see Table 2-2). Should the actual CV be greater than this, a comparison between the AOC and background area can still be made, but with a lower power and confi-dence. As a contingency, E & E will collect and archive five additional bullheads from both the AOC and background area. If the actual CV is considerably larger than assumed, the archived fish can be analyzed to provide a larger sample size, which will counter balance the larger than expected CV. Lastly, two bullhead samples from the AOC and two from the background area also will be measured for dioxins/furans to provide baseline data for this chemical group.

Section No.: 2 Revision No.: 0 Date: February 2007
2. Data Generation and Acquisition
02:002386_NC13_01-B2132 2-13 R_BUI Assessment QAPP 18m Creek.doc-2/12/2007
Table 2-2 Relationship Between Measures of Statistical Performance and Number Of Samples Required
Number of samples required to identify differences of 30%, 50%,
and 100% over background Coefficient of Variation (%) Power (%)
Confidence Level (%) 30% 50% 100%
10 90 90 2 1 0 20 90 90 4 2 1 30 90 90 8 4 1 40 90 90 14 6 2 50 90 90 20 8 3 60 90 90 28 11 4 70 90 90 38 15 5 80 90 90 49 19 6 90 90 90 61 23 7
Notes: 1. Based on EPA (1989, 1992).
2.2.2 Wildlife Surveys In addition to the fish sampling efforts described in Section 2.2.1, wildlife surveys will also be completed to determine the presence, relative abundance, and diver-sity of wildlife populations within the Eighteenmile Creek AOC and Oak Orchard Creek. Field surveys will include observations of mammals, amphibians, and birds and will be conducted during the winter, spring, fall, and winter of 2007. Bird surveys will involve a modified schedule. As with the fish sampling, similar efforts will be applied to, and methods will be standardized across, both study ar-eas to strengthen the comparison of the survey results. Species of particular inter-est will be those that are water dependent, or are in contact with the water, for hunting/foraging, swimming, etc. The survey will document wildlife species composition within a number of habitat types along and adjacent to each creek. The number of observation locations will be determined during an initial field re-connaissance, and will be based upon the diversity, locations, and frequencies of various habitats (e.g., floodplain forest, fringe wetlands, cattail (Typha spp.) is-lands, inland wetlands, mudflats, nearby uplands, etc.). Selected habitat types and locations for the amphibian and mammal surveys will be maintained and re-surveyed over the course of the field investigation. Separate datasheets will be developed and completed for each survey type (e.g., birds, mammals, and am-phibians). The data collected for this task will be used to infer the occurrence and relative abundance of each species observed during each season. Standardized methods and effort will allow for comparison between the Eighteenmile Creek AOC and Oak Orchard Creek. The results from the wildlife surveys will be compared to

Section No.: 2 Revision No.: 0 Date: February 2007
2. Data Generation and Acquisition
02:002386_NC13_01-B2132 2-14 R_BUI Assessment QAPP 18m Creek.doc-2/12/2007
determine what differences may be attributable to the degree of impairment in the AOC. Birds Bird occurrence within the principal habitat types will be made through visual ob-servations and by identification of bird calls or songs. Surveys for birds will in-clude point count surveys and focused surveys for marsh dwelling birds, with ef-fort will be placed on surveying water-dependent species that use marsh and bot-tomland forest habitats. Point Count Surveys – Point count-style bird surveys will be conducted in the two study areas during each season. . Sampling points will be selected during a field visit based on accessibility, viewing distances, and representative habitat. It is anticipated that 4-6 points will be surveyed in each study area. Following the field visit, a map will be created with the sample points and the location (locations will be mapped using DGPS), access, and habitat of each point will be described in writing. Each point count survey will be conducted by one observer familiar with the iden-tification of western New York birds by sight and sound. Point counts will be 10 minutes in duration, with the data separated for the first three minutes, the next two minutes, and the last five minutes. Aerial flyovers or foragers will be dis-tinctly indicated on the data sheet for data analysis purposes. Because bird activ-ity is greatest in the morning, the surveys will be conducted and concentrated in the morning hours, approximately in the first five hours after sunrise. Surveys will not be conducted on days with heavy precipitation, fog, or high wind. Marsh Bird Surveys – two surveys in the two study areas focused on identifying marsh-dwelling birds that are typically nocturnal and somewhat secretive as they are likely to be missed during the morning point count surveys. The Marsh Moni-toring Program protocol for avian surveys will be followed (Bird Studies Canada 2006), which includes playing taped recordings of several marsh bird calls and listening for a ten minute period to see if any marsh birds respond. The Marsh Monitoring Program protocol has been an established protocol to survey for marsh birds (and amphibians) in the Great Lakes Basin since 1994 and is sponsored by Bird Studies Canada in association with the EPA and Environment Canada. Mammals General, qualitative assessments of mammals will be made by a wildlife biologist familiar with local fauna and natural history of Eighteenmile and Oak Orchard creeks. Both sites will be traversed on foot, and all habitats will be evaluated for suitability to harbor various species of mammals. A general habitat map will be developed, so that the habitats present may be equated between the sites. All

Section No.: 2 Revision No.: 0 Date: February 2007
2. Data Generation and Acquisition
02:002386_NC13_01-B2132 2-15 R_BUI Assessment QAPP 18m Creek.doc-2/12/2007
wildlife survey information will be tallied and reported by habitat type and shown on a map for each study area. Direct observation of mammals will be noted, as will tracks, dens, scat, and other signs of mammal presence (tree damage, hair, etc.). Survey effort will be equal, or will be standardized by habitat area for each site (i.e., if 18 Mile Creek has equal proportions of 4 broad habitat types, effort in each will be estimated. By way of illustration, if the reference site has non-uniform distribution of habitat availability, say 10% in cattail marsh that takes 90% of the total survey time to inspect observations will be standardized accordingly to effort). Mammal obser-vations made incidental to other site surveys will be noted. It should be noted that the determination of abundance by “sign” can be misleading, since the “signs” of a single or a few active individuals can be encountered on many occasions within a small area. The relative abundance of mammalian species may be estimated from both observation of “signs” and the presence of preferred habitat. Amphibians Similar to the bird surveys, amphibian surveys will involve implementing Marsh Monitoring (Bird Studies Canada) methods during the spring and early summer. Additionally there will be a limited amount of temporary trapping for reptiles and amphibians which will be conducted using 5-gallon plastic buckets as pitfall traps (depending on the composition of soils, smaller buckets may have to be used as gravelly or rocky soils may prohibit holes the size to accommodate 5-gallon buck-ets). The buckets will be buried flush with the ground surface, and two nested buckets will form each trap. Captured individuals will be released alive. Traps will be checked first thing each morning, and before dark. The trap array size will be determined by budget constraints and availability of habitat within which to set up the pitfall traps. As indicated above, equivalent effort will be expended within both study areas to facilitate comparison. Alternatively, any differences in effort will be standardized before evaluating relative differences between sites. It should be noted that this technique under-represents certain taxa that are either less vulnerable to capture, or are capable of escaping (e.g., snakes), but in tandem with other survey techniques utilized should provide a suitable representation of species occurrence. 2.2.3 Equipment Maintenance – Fish Surveys Preventative maintenance of field equipment, which is performed by field person-nel routinely and preceding each field sampling event. Sampling technicians re-port performance of the equipment after each sampling event. Critical spare parts are kept in stock. At times, it is necessary to perform routine maintenance in the field; therefore, each field instrument is provided with an operating manual and any appropriate maintenance tools. The list of field equipment is provided in Ap-pendix A. A list of field instruments is provided on Table 2-3.

Section No.: 2 Revision No.: 0 Date: February 2007
2. Data Generation and Acquisition
02:002386_NC13_01-B2132 2-16 R_BUI Assessment QAPP 18m Creek.doc-2/12/2007
Table 2-3 Field Instruments and Associated Preventative Maintenance Instrument Probe Activity Frequency
Dissolved Oxygen (DO) Meter
Check battery Check to ensure that mechanical zero is set properly Check DO probe membrane Replace membrane
Daily and replace as needed Prior to each use As needed As needed
pH Meter Battery replacement Probe replacement
As needed As needed
Conductivity Meter Battery replacement Check loose connections
As needed Daily
Temperature Probe Check connections Check against calibrated Thermometer
Daily Prior to field use
2.3 Sample Handling and Custody 2.3.1 Sample Handling All fish samples will be preserved on ice immediately after collection. The sam-ples for fish livers will be prepared as noted in Appendix B and preserved with formalin. The remaining fish tissue will packaged on ice and shipped to the labo-ratory. The laboratory will either freeze the fish or process immediately. There are no specific holding times for fish tissue. As general guideline tissue can be analyzed within one year of freezing. The transportation and handling of samples must be accomplished in a manner that not only protects the integrity of samples but also prevents any detrimental effects due to the possible hazardous nature of the samples. Regulations for pack-aging, marking, labeling, and shipping of hazardous materials are promulgated by the DOT in 49 CFR 171 through 177. E & E trains all staff responsible for the shipment of samples in these regulations. Procedures for sample packing and shipping are documented in an E & E standard operating procedure (SOP). Spe-cific procedures for shipment of formalin preserved samples are included in Ap-pendix B. Sample Packaging Samples must be packaged carefully to avoid breakage or contamination and must be shipped to the laboratory at proper temperatures. Samples will be transported and hand delivered to the laboratory at the end of the sampling day will reduce the need for extensive packaging. 2.3.2 Sample Custody Formal sample custody procedures begin when the samples are collected. The laboratory must follow written and approved SOPs for shipping, receiving, log-ging, and internally transferring samples. Sample identification documents must

Section No.: 2 Revision No.: 0 Date: February 2007
2. Data Generation and Acquisition
02:002386_NC13_01-B2132 2-17 R_BUI Assessment QAPP 18m Creek.doc-2/12/2007
be carefully prepared so that sample identification and COC can be maintained and sample disposition controlled. Sample identification documents include: ■ Field data sheets; ■ Sample labels; ■ Custody seals; and ■ COC records. The primary objective of COC procedures is to provide an accurate written or computerized record that can be used to trace the possession and handling of a sample from sampling through completion of all required analyses. A sample is in custody if it is: ■ In a team member’s physical possession; ■ In a team member’s view; ■ Locked up; or ■ Kept in a secured area that is restricted to authorized personnel. Field Custody Procedures The following field custody procedure will be used for collection of samples: ■ As few persons as possible should handle samples; ■ Coolers or boxes containing cleaned bottles should be sealed with a custody
tape seal during transport to the field or while in storage prior to use; ■ The sample collector is personally responsible for the care and custody of
samples collected until they are transferred to another person or dispatched properly under COC rules;
■ The sample collector will record sample data in the field data sheet; and ■ The Field Team Leader will determine whether proper custody procedures
were followed during the fieldwork and decide if additional samples are re-quired.

Section No.: 2 Revision No.: 0 Date: February 2007
2. Data Generation and Acquisition
02:002386_NC13_01-B2132 2-18 R_BUI Assessment QAPP 18m Creek.doc-2/12/2007
Chain-of-Custody Record The COC form must be fully completed in duplicate by the field technician desig-nated by the Project Manager as responsible for sample shipment to the appropri-ate laboratory for analysis. In addition, if samples are known to require rapid turnaround in the laboratory because of project time constraints or analytical con-cerns (e.g., extraction time or sample retention period limitations), the person completing the COC record should note these constraints. The custody record also should indicate any special preservation techniques necessary or whether samples need to be filtered. Copies of COC records are maintained with the pro-ject file. Custody Seals Custody seals are preprinted, adhesive-backed seals with security slots designed to break if the seals are disturbed. Custody seals are placed over the cap of individ-ual sample bottles by the sampling technician. DOT-approved sample shipping containers are sealed in as many places as necessary to ensure security. Seals must be signed and dated before use. Upon receipt at the laboratory, the custodian must check and document on a cooler receipt form that seals on boxes and bottles are intact. 2.4 Analytical Method Requirements Analytical method requirements are documented in on standard operating proce-dures in Appendix C. SOPs are provided PCBs by Method 8082 and dioxin by Method 1613. Additional SOPs for percent lipid determination and sample prepa-ration also are provided. 2.5 Quality Control QC data are necessary to determine precision and accuracy and to demonstrate the absence of interferences and/or contamination of glassware and reagents. No spe-cific field QC samples are required for tissue samples. Laboratory-based QC will consist of standards, replicates, spikes, and blanks. Method QC limits for analy-ses are provided in Appendix C to this QAPP. 2.5.1 Laboratory Quality Control Analyses Analytical performance is monitored through QC samples and spikes, such as laboratory method blanks, surrogate spikes, QC check samples, matrix spikes, ma-trix spike duplicates, duplicate samples, and duplicate injections (see Table 2-4).
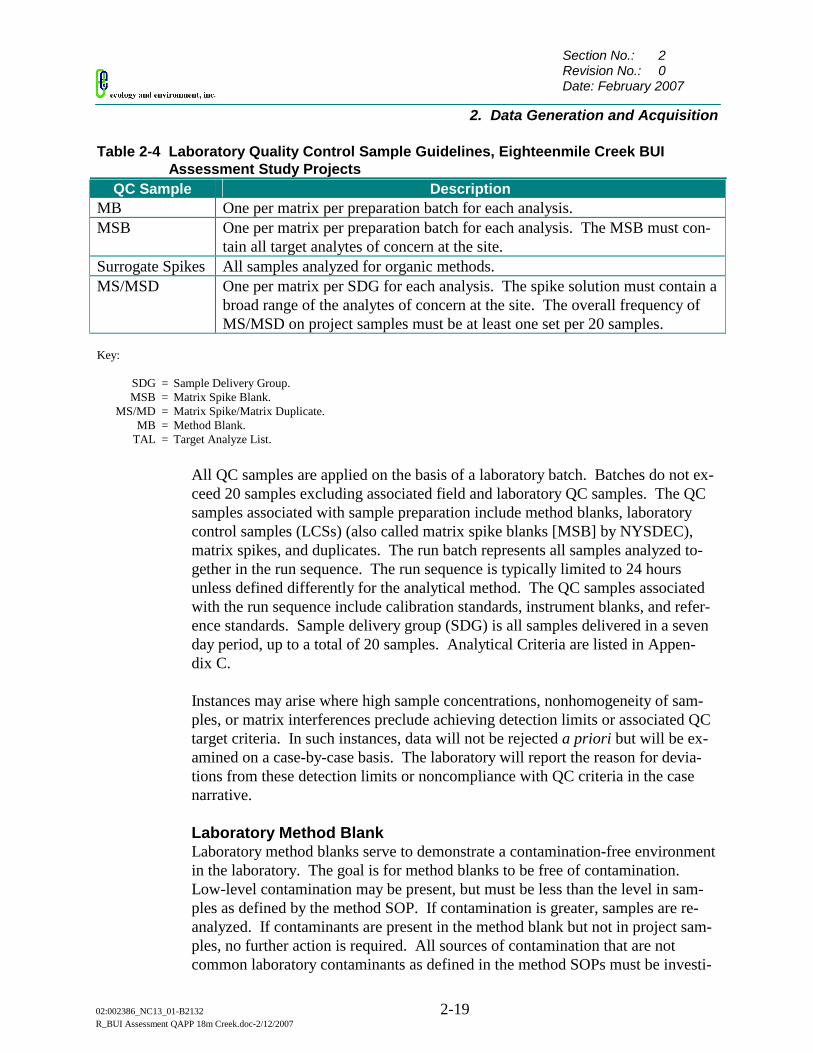
Section No.: 2 Revision No.: 0 Date: February 2007
2. Data Generation and Acquisition
02:002386_NC13_01-B2132 2-19 R_BUI Assessment QAPP 18m Creek.doc-2/12/2007
Table 2-4 Laboratory Quality Control Sample Guidelines, Eighteenmile Creek BUI Assessment Study Projects
QC Sample Description MB One per matrix per preparation batch for each analysis. MSB One per matrix per preparation batch for each analysis. The MSB must con-
tain all target analytes of concern at the site. Surrogate Spikes All samples analyzed for organic methods. MS/MSD One per matrix per SDG for each analysis. The spike solution must contain a
broad range of the analytes of concern at the site. The overall frequency of MS/MSD on project samples must be at least one set per 20 samples.
Key: SDG = Sample Delivery Group. MSB = Matrix Spike Blank. MS/MD = Matrix Spike/Matrix Duplicate. MB = Method Blank. TAL = Target Analyze List.
All QC samples are applied on the basis of a laboratory batch. Batches do not ex-ceed 20 samples excluding associated field and laboratory QC samples. The QC samples associated with sample preparation include method blanks, laboratory control samples (LCSs) (also called matrix spike blanks [MSB] by NYSDEC), matrix spikes, and duplicates. The run batch represents all samples analyzed to-gether in the run sequence. The run sequence is typically limited to 24 hours unless defined differently for the analytical method. The QC samples associated with the run sequence include calibration standards, instrument blanks, and refer-ence standards. Sample delivery group (SDG) is all samples delivered in a seven day period, up to a total of 20 samples. Analytical Criteria are listed in Appen-dix C. Instances may arise where high sample concentrations, nonhomogeneity of sam-ples, or matrix interferences preclude achieving detection limits or associated QC target criteria. In such instances, data will not be rejected a priori but will be ex-amined on a case-by-case basis. The laboratory will report the reason for devia-tions from these detection limits or noncompliance with QC criteria in the case narrative. Laboratory Method Blank Laboratory method blanks serve to demonstrate a contamination-free environment in the laboratory. The goal is for method blanks to be free of contamination. Low-level contamination may be present, but must be less than the level in sam-ples as defined by the method SOP. If contamination is greater, samples are re-analyzed. If contaminants are present in the method blank but not in project sam-ples, no further action is required. All sources of contamination that are not common laboratory contaminants as defined in the method SOPs must be investi-

Section No.: 2 Revision No.: 0 Date: February 2007
2. Data Generation and Acquisition
02:002386_NC13_01-B2132 2-20 R_BUI Assessment QAPP 18m Creek.doc-2/12/2007
gated as part of the corrective action process. Sample results must not be blank subtracted unless specifically required by the analytical method. Surrogate Standards Surrogate recoveries must be within QC criteria for method blanks and LCSs to demonstrate acceptable method performance. If surrogate recoveries are outside QC criteria for method blanks or LCSs, corrective action is required and the Pro-ject Chemist should be notified. Surrogate recoveries in the samples indicate the method performance on the particular sample matrix. Surrogate recoveries that are outside QC criteria for a sample indicate a potential matrix effect. Matrix ef-fects must be verified based on review of recoveries in the method blank or LCS, sample reanalysis, or evaluation of interfering compounds. Sample clean-up pro-cedures are required by the NYSDEC ASP must be implemented to alleviate po-tential matrix problems. Laboratory Control Sample LCS recoveries must be monitored on control charts for all non-Contract Labora-tory Procedure methods. Laboratory QC criteria must be established for each method and matrix using a minimum of 30 points. QC criteria should be updated annually. The LCS recovery must be within the control limits to demonstrate ac-ceptable method performance. Sporadic marginal failures of a few target analytes reported when greater than five target analytes are required are allowed as part of the data review guidance. If LCS recoveries are outside QC criteria for more than a few target analytes, recoveries are significantly low, or the compounds were de-tected in the samples, then corrective action is required. After corrective action is complete, sample re-analysis is required for failed parameters. If LCS recoveries exceed the QC criteria, and that parameter is not found in any samples, re-analysis is not necessary. For any other deviations from LCS control limits that can not be resolved by sample re-analysis within holding times, the Project Chemist must be notified immediately. If critical samples are affected, the Project Manager may determine that re-sampling is required. Matrix Spike Sample MS recoveries are a measure of the performance of the method on the sample be-ing analyzed. Field and trip blanks must not be chosen for spiking. MS recover-ies outside the control limits applied to the LCS indicate matrix effects. Sample clean-up procedures may be warranted for samples with severe matrix effects. The laboratory should notify the Project Chemist of these instances to determine an appropriate corrective action. Matrix Spike Duplicate Sample The MSD sample is commonly prepared in conjunction with the MS sample. The MSD is prepared from a separate portion of the sample and processed with the same additions as the MS. The MSD is prepared for methods that do not typically

Section No.: 2 Revision No.: 0 Date: February 2007
2. Data Generation and Acquisition
02:002386_NC13_01-B2132 2-21 R_BUI Assessment QAPP 18m Creek.doc-2/12/2007
show concentrations of target analytes above MDLs, such as organic methods. The RPD between the recoveries in the MS and MSD measure the precision of the analytical method on actual project samples. For this project, QC criteria for RPDs are 20% for waters and 35% for soils unless the laboratory provides addi-tional statistical criteria. Duplicate Sample The duplicate is prepared for methods that typically show concentrations of target analytes above MDLs, such as metals and wet chemistry methods. The RPDs be-tween recoveries in the original and duplicate measure the precision of the ana-lytical method on the actual project samples. For this project, QC criteria for RPDs are 20% for waters and 35% for soils unless the laboratory provides addi-tional statistical criteria. If all other QC criteria are met, RPD results outside control limits indicate poten-tial matrix effects. The laboratory should investigate significant deviations in the RPD results by observing the sample to determine any visual heterogeneity or re-viewing sample chromatograms for matrix interference. If visual observation does not indicate a potential problem, the sample may be reanalyzed. Potential matrix effects are reported in the case narrative. 2.6 Instrument/Equipment Testing, Inspection, and
Maintenance All laboratory and field instruments and equipment used for sample analysis must be serviced and maintained only by qualified personnel. Laboratory instrument maintenance procedures will be evaluated to verify that there will be no impacts on analysis of project samples due to instrument malfunction. For example, the laboratory must have duplicate instrumentation and/or major laboratory instru-ments (e.g., gas chromatograph/mass spectrometer) maintained under service agreements with the manufacturer that require rapid respond by manufac-turer-approved service agents. 2.7 Instrument/Equipment Calibration and Frequency All instruments and equipment used during sampling and analysis will be oper-ated and calibrated according to the manufacturer’s guidelines and recommenda-tions, as well as criteria set forth in applicable analytical methodology references. Personnel properly trained in these procedures will perform operation and calibra-tion of all instruments. Documentation of all field maintenance and calibration information will be maintained in the task logbook. Table 2-3 lists monitoring equipment that may be used during fieldwork. All field personnel receive annual refresher training on the field operation of all health and safety related equipment, which includes calibration procedures.
Section No.: 2 Revision No.: 0 Date: February 2007
2. Data Generation and Acquisition
02:002386_NC13_01-B2132 2-22 R_BUI Assessment QAPP 18m Creek.doc-2/12/2007
2.8 Inspection/Acceptance of Supplies and Consumables Measures are established in E & E’s QMP to assure that purchased material, equipment, and services, whether purchased directly or through contractors or subcontractors, conform to procurement documents. Documentation regarding the purchase of material, equipment, and services is prepared, reviewed, and ap-proved in accordance with requirements set forth in the QMP and E & E subcon-tracting procedures. Procedures for the procurement, inspection, maintenance and management of equipment and supplies for NCSWCD activities are documented in E & E’s Gov-ernment Property Procurement SOP. All field supplies and equipment will be procured as part of the contract and maintained by the technical team. Supplies and equipment will be inspected on receipt at the site to verify that the correct ma-terials were received. 2.9 Non-Direct Measurements For data acquired from non-direct measurement sources include the following: ■ Physical information such as descriptions of sampling activities and field ob-
servations; ■ State and local environmental agency files; ■ Reference computer databases and literature files; and ■ Historical reports on a site and subjective information gathered through inter-
views. Data from non-direct measurements will be reviewed and used as indicated in Section 2.3. 2.10 Data Management For data collected under this project, the Field Team Leader will review all field data for accuracy. Any field data not provided by the laboratory will be entered into a database or spreadsheet. The laboratory will provide an electronic data deliverable (EDD) for all analytical reports that is consistent with their standard spreadsheet. The E & E technical team will process the EDD and review all laboratory and field data to verify the results against the hard copy and check for transcription errors. The Project Chemist will review data against the criteria in this QAPP and add any data qualifiers. Data that will appear on data tables for the report will be
Section No.: 2 Revision No.: 0 Date: February 2007
2. Data Generation and Acquisition
02:002386_NC13_01-B2132 2-23 R_BUI Assessment QAPP 18m Creek.doc-2/12/2007
generated from EDD. E & E will develop a central data source for all data han-dling operations. The central database will be stored in a secure area on E & E’s network with ac-cess limited to data management specialists designated by the Project Manager. The central database will be electronically linked to E & E’s GIS systems, risk assessment programs, and other final data user models and statistical programs. Data users may enter additional electronic data such as risk-based criteria for comparison of results. This data will be stored in separate tables in the database and linked to the actual results. Any data from outside sources will include a de-scription of the data, a reference to the source, and the date updated. Outside data will be checked prior to use verify that current values are used. The central data-base will be used to create tables for the final report.

Section No.: 3 Revision No.: 0 Date: February 2007
02:002386_NC13_01-B2132 3-1 R_BUI Assessment QAPP 18m Creek.doc-2/12/2007
Assessment and Oversight E & E’s assessment and oversight procedures will be implemented in accordance with the QMP. The QMP outlines general roles and responsibilities for the pro-ject team. 3.1 Assessment and Response Actions E & E’s overall assessment activities include management assessments, develop-ment of SOPs, and performance evaluations. Management assessments include weekly meetings and conference calls to evaluate project readiness and staff utili-zation. Assignment of qualified personnel, maintenance of schedules and budg-ets, and quality of project deliverables are verified as part of these assessments. The development of SOPs and performance evaluations are used to provide trained and qualified personnel for the project. E & E’s technical assessment activities include peer review, data quality reviews, and technical system audits (i.e., laboratory and field). Procedures for assessment and audit of data quality are described in Section 4 of this QAPP. Procedures for peer review and technical assessments are summarized briefly below. Both overall and direct technical assessment activities may result in the need for corrective action. E & E’s approach to implementing a corrective action response program for both field and laboratory situations is summarized briefly below. The E & E QA Officer has stop work authority on all NCSWCD projects that may have negative quality impacts prior to completion of corrective actions. 3.1.1 Peer Review E & E implements peer review for all project deliverables including work plans, QAPPs, draft and final reports, and technical memoranda. The peer review proc-ess provides for a critical evaluation of the deliverable by an individual or team to determine if the deliverable will meet established criteria, quality objectives, tech-nical standards, and contractual obligations. The Project Manager will assign peer reviewers when the publications schedule is established. The publications staff will be responsible for ensuring all peer reviewers participate in the review proc-ess and approve all final deliverables. For technical memoranda and other project
3

Section No.: 3 Revision No.: 0 Date: February 2007
3. Assessment and Oversight
02:002386_NC13_01-B2132 3-2 R_BUI Assessment QAPP 18m Creek.doc-2/12/2007
documents, the Project Manager will be responsible for obtaining principal review and approval. 3.1.2 Technical Systems Assessments The entire project team is responsible for ongoing assessment of the technical work performed by the team, identification of nonconformance with the project objectives, and initiation, implementation and documentation of corrective action. Independent performance and systems audits are technical assessments that are a possible part of the QA/QC program. The following describes types of audits conducted, frequency of these audits, and personnel responsible for conducting audits. Field Audits Field audits, if performed, are under the direction of the QA Officer. No field au-dit will be performed for this field program. Field Inspections The Project Manager will be responsible for inspecting all field activities to verify compliance of activities with project plans. Laboratory Audits The laboratory must implement a comprehensive program of internal audits to verify compliance of their systems with SOPs and QA manuals. NYSDOH must certify the laboratory and will perform external systems audits at an approximate frequency of once a year. External audits include reviews of ana-lytical capabilities and procedures, COC procedures, documentation, QA/QC, and laboratory organization. No laboratory audits are planned for this project. 3.1.3 Corrective Action Corrective actions will be implemented as needed. In conjunction with the QA Officer and Laboratory QA Coordinator, the Project Manager is responsible for initiating corrective action and implementing it in the field and office, and the laboratory project manager is responsible for implementing it in the laboratory. It is their combined responsibility to see that all sampling and analytical procedures are followed as specified and that the data generated meet the prescribed accep-tance criteria. Specific corrective actions necessary will be clearly documented in the logbooks or analytical reports. Field Situations The need for corrective action in the field may be determined by technical assess-ments or by more direct means such as equipment malfunction. Once a problem

Section No.: 3 Revision No.: 0 Date: February 2007
3. Assessment and Oversight
02:002386_NC13_01-B2132 3-3 R_BUI Assessment QAPP 18m Creek.doc-2/12/2007
has been identified, it may be addressed immediately or an audit report may serve as notification to project management staff that corrective action is necessary. Immediate corrective actions taken in the field will be documented in the project logbook. Corrective actions may include, but are not limited to: ■ Correcting equipment decontamination or sample handling procedures if field
blanks indicated contamination; ■ Recalibrating field instruments and checking battery charge; ■ Training field laboratory personnel in correct sample handling or collection
procedures; and ■ Accepting data with an acknowledged level of uncertainty. After a corrective action has been implemented, its effectiveness will be verified. If the action does not resolve the problem, appropriate personnel will be assigned to investigate and effectively remediate the problem. Corrective actions recom-mended by NCSWCD personnel will be addressed in a timely manner. Laboratory Situations Out-of-control QC data, laboratory audits, or outside data review may determine the need for corrective action in the laboratory. Corrective actions may include, but are not limited to: ■ Reanalyzing samples, if holding times permit; ■ Correcting laboratory procedures; ■ Recalibrating instruments using freshly prepared standards; ■ Replacing solvents or other reagents that give unacceptable blank values; ■ Training additional laboratory personnel in correct sample preparation and
analysis procedures; and ■ Accepting data with an acknowledged level of uncertainty. The laboratory corrective actions must be defined in analytical SOPs. Any devia-tions from approved corrective actions must be documented and approved by the Project Chemist.
Section No.: 3 Revision No.: 0 Date: February 2007
3. Assessment and Oversight
02:002386_NC13_01-B2132 3-4 R_BUI Assessment QAPP 18m Creek.doc-2/12/2007
3.2 Reports to Management For reports to management include the following: ■ Data Usability Summary Report - A DUSR will be completed by the Project
Chemist and provided to the NCSWCD technical staff in the appendix of the report. Impacts on the usability of data will be tracked by adding qualifiers to individual data points as described in Section 4.
■ Project Status Reports - Project status reports are completed by the Project
Manager to document the overall assessment of the project on a monthly basis. Upon completion of a project sampling effort, analytical and QC data will be in-cluded in a comprehensive technical report that summarizes field activities and provides a data evaluation. A discussion of the validity of results in the context of QA/QC procedures will be made and the DUSR will be provided. Serious data problems will be reported immediately to NCSWCD personnel. Time and type of corrective action (if needed) will depend on the severity of the problem and relative overall project importance. Corrective actions may include altering procedures in the field or modifying laboratory protocol.

Section No.: 4 Revision No.: 0 Date: February 2007
02:002386_NC13_01-B2132 4-1 R_BUI Assessment QAPP 18m Creek.doc-2/12/2007
Data Validation and Usability E & E will implement procedures for data validation and usability described be-low. 4.1 Data Review, Validation, and Verification
Requirements All data generated will be reviewed by comparing accuracy and precision results listed Appendices B and C. ■ Field data and fish pathology results will be review by internal experts for
consistency with literature values; ■ Analytical reporting limits and target compounds and QC summary data for
surrogates, method blanks, LCS, and MS/MSD samples will be compared to limits listed in Appendix C;
■ Calibration summary data will be checked by the laboratory to verify that all
positive results for target compounds were generated under an acceptable cali-bration as defined by the analytical method. Any deviations will be noted in the case narrative and reviewed by the Project Chemist;
■ Field data such as sample identifications and sample dates will be checked
against the laboratory report; and ■ Any raw data files from the field and laboratory will not be reviewed unless
there is a significant problem noted with the summary information. 4.2 Validation and Verification Methods The laboratory is responsible for performing internal data review. The laboratory QA officer must perform review on 10% of the data packages. All levels of labo-ratory review must be fully documented and available for review if requested or if a laboratory audit is performed.
4

Section No.: 4 Revision No.: 0 Date: February 2007
4. Data Validation and Usability
02:002386_NC13_01-B2132 4-2 R_BUI Assessment QAPP 18m Creek.doc-2/12/2007
After receipt from the laboratory, project data will be validated using the follow-ing steps: Evaluation of Completeness The Project Chemist checks the electronic files for compliance with standard for-mat and the QAPP. If errors in loading are found, the EDD files will be returned to the laboratory. The Project Chemist also verifies that the laboratory informa-tion matches the field information and that the following items are included in the hard copy data package: ■ COC forms and Sample Summary forms; ■ Case narrative describing any out-of-control events and summarizing analyti-
cal procedures; ■ Data report forms (i.e., Form I); ■ QA/QC summary forms; and ■ Chromatograms documenting any QC problems. If the data package is incomplete, the Project Chemist will contact the laboratory, which must provide all missing information within one day. Evaluation of Compliance The validation procedures process the electronic data and assign qualifiers if out-liers are found. Project chemist will follow E & E SOPs for data review and complete checklists for PCBs. Additional compliance checks on representative portions of the data are briefly outlined below: ■ Review chromatograms and other raw data if provided as backup information
for any apparent QC anomalies; ■ Ensure that all analytical problems and corrections are reported in the case
narrative and that appropriate laboratory qualifiers are added; ■ For any problems identified, review concerns with the laboratory, obtain addi-
tional information if necessary, and check all related data to determine the ex-tent of the error; and
■ Non-analytical data on field data sheets will be reviewed as outlined in Sec-
tion 2.2.

Section No.: 4 Revision No.: 0 Date: February 2007
4. Data Validation and Usability
02:002386_NC13_01-B2132 4-3 R_BUI Assessment QAPP 18m Creek.doc-2/12/2007
Data Review Reporting The Project Chemist or reviewer of non-analytical data will perform the following reporting functions: ■ Alert the Project Manager to any QC problems, obvious anomalous values, or
discrepancies between the field and laboratory data, that may impact data us-ability;
■ Discuss QC problems in a DUSR for each laboratory report; ■ Prepare analytical data summary tables of qualified data that summarize those
samples and analytes for which detectable concentrations were exhibited in-cluding field QC samples; and
■ At the completion of all field and laboratory efforts, summarize planned ver-
sus actual field and laboratory activities and data usability concerns in the technical report.
4.3 Reconciliation with User Requirements Any deviations from analytical performance criteria or quality objectives for the project will be documented in the DUSR provided to the data users for the project. The QA Officer or Project Chemist will work with the final users of the data in performing data quality assessments. The data quality assessment may include some or all of the following steps: ■ Data that are determined to be incomplete or not usable for the project will be
discussed with the project team. If critical data points are involved which im-pact the ability to complete project objectives, data users will report immedi-ately to the Project Manager. The Project Manager will discuss resolution of the issue with NCSWCD technical staff and implement necessary corrective actions (for example re-sampling);
■ Data that are non-detect but have elevated reporting limits due to blank con-
tamination or matrix interference will be compared to screening values. If re-porting limits exceed the screening values, then results will be handled as in-complete data as described above; and
■ Data that are qualified as estimated will be used for all project decision mak-
ing. If an estimated result is close to a screening value, then there is uncer-tainty in any conclusions as to whether the result exceeds the screening value. The data user must evaluate the potential uncertainty in developing recom-mendations for the site. If estimated results become critical data points in making final decisions on the site, the Project Manager and NCSWCD techni-
Section No.: 4 Revision No.: 0 Date: February 2007
4. Data Validation and Usability
02:002386_NC13_01-B2132 4-4 R_BUI Assessment QAPP 18m Creek.doc-2/12/2007
cal staff should evaluate the use of the results and may consider the data point incomplete.
The assessment process involves comparing analytical results to screening values and background concentrations to determine if the contamination present is site-related (i.e., above background levels) or significant (i.e., above screening values). For PCBs, the fish concentrations listed in Dyer, 2000 are 440 µg/Kg and for di-oxins, the criteria listed in Windward 2004 are 72 pg/Kg. The quantitation limits used for this project will be below these criteria. Additional statistical assessments are described in Section 2.
Section No.: References Revision No.: 0 Date: February 2007
02:002386_NC13_01-B2132 5-1 R_BUI Assessment QAPP 18m Creek.doc-2/12/2007
References Blazer VS, Fournie, J.W., Wolf J.C., Wolfe, M.J. (2006) Diagnostic criteria for
proliferative hepatic lesions in brown bullhead Ameiurus nebulosus. Dis Aquat Org, 72: 19–30.
Crissman J, Goodman D, Hildebrandt P, Maronpot R, Prater D, Riley J, Seaman
W, Thake D. (2004) Best practices guideline: toxicologic histopathology. Toxicologic Pathology, 32(1):126-131
Dyer, S.D., C.E. White-Hull, and B. Shephard. 2000. Assessment of Chemical
Mixtures via Toxicity Reference Values Overpredict Hazard to Ohio River Fish. Environ. Sci. Technol. 34:2518-2524.
Sample, B., D. Opresko, and G. Suter. 1996. Toxicological Benchmarks for
Wildlife: 1996 Revision. Risk Assessment Program, Health Sciences Re-search Division, Oak Ridge National Laboratory. ES/ER/TM-86/R3.
Windward. 2004. Lower Duwamish Waterway. Quality Assurance Project Plan:
Fish and Crab Tissue Collection and Chemical Analysis. Appendices A to E. http://www.ldwg.org/assets/-qapps/tissue_qapp/final_tissue_qapp_apps_a-e.pdf
United States Environmental Protection Agency (EPA). 1989. Ecological Risk
Assessment of Hazardous Waste Sites: A Field and Laboratory Reference. EPA Environmental Research Laboratory, Corvallis, Oregon. EPA/600/3-89/013.
United States Environmental Protection Agency (EPA). 1992. Final Guidance
for Data Usability in Risk Assessment (Part A). EPA Office of Emergency and Remedial Response, Washington, D.C. OSWER Directive 9285.7-09A.
5

Section No.: 5 Revision No.: 0 Date: February 2007
5. References
02:002386_NC13_01-B2132 5-2 R_BUI Assessment QAPP 18m Creek.doc-2/12/2007
United States Environmental Protection Agency (EPA). 1993. Wildlife Exposure Factors Handbook. EPA Office of Research and Development, Washing-ton, D.C., EPA/600/r-93/187a and EPA/600/r-93/187b.

Section No.: A Revision No.: 0 Date: February 2007
02:002386_NC13_01-B2132 A-1 R_BUI Assessment QAPP 18m Creek.doc-2/12/2007
Field Procedures and Data Sheets
See CD in back pocket.
A

Section No.: B Revision No.: 0 Date: February 2007
02:002386_NC13_01-B2132 B-1 R_BUI Assessment QAPP 18m Creek.doc-2/12/2007
Laboratory Procedures – Fish Pathology
See CD in back pocket.
B

Section No.: C Revision No.: 0 Date: February 2007
02:002386_NC13_01-B2132 C-1 R_BUI Assessment QAPP 18m Creek.doc-2/12/2007
Laboratory Procedures – Chemical
See CD in back pocket.
C