
Schiller Station Quality Assurance Plan and Standard ...
81
SCHILLER STATION QUALITY ASSURANCE PLAN AND STANDARD OPERATING PROCEDURES FOR ENTRAINMENT MONITORING Revision 0 August2006 Prepared by NORMANDEAU ASSOCIATES INC. 25 Nashua Road Bedford, New Hampshire 03110 20472.000
-
Upload
khangminh22 -
Category
Documents
-
view
0 -
download
0
Transcript of Schiller Station Quality Assurance Plan and Standard ...

SCHILLER STATION QUALITY ASSURANCE PLAN AND STANDARD OPERATING PROCEDURES FOR
ENTRAINMENT MONITORING
Revision 0
August2006
Prepared by
NORMANDEAU ASSOCIATES INC. 25 Nashua Road
Bedford, New Hampshire 03110
20472.000

11
Rev. 0 Schiller Station QAP andSOPfor Entrainment Monitoring 2006 August 2006
TABLE OF CONTENTS
PAGE
1.0 INTRODUCTION................................................................................................................... l
2.0 ENTRAINMENT STANDARD OPERATING PROCEDURES ........................................ I
2.1 COOUNG WATER INTAKE STRUCTURE DESCRIPTION ..................................................... 2 2.1.1 Schiller Station Unit 4 CWIS .............................................................................. 2 2.1.2 Schiller Station Unit 5 and Unit 6 CWIS ............................................................ 3
2.2 SAMPLING SCHEDULE AND LOCATION ............................................................................ 5 2.3 EQUIPMENT.......................................................................... " .................... " .................... 6 2.4 ENTRAINMENT FIELD SAMPLING PROCEDURES .............................................................. 7
2.4.1 Sample Collection ..................................................................... .......................... 7 2.4.2 Sampling Flow Rate and Duration Determination .............................................. 8 2.4.3 Sample Handling ................................................................................................. 9 2.4.4 Use Code ........ ............................ ................................. ........................................ 9
2.5 ENVIRONMENTAL PARAMETERS ................................................................................... 10 2.5.1 Specifications .......... ......... ..................... , ........................................................... 10 2.5.2 Deployrrient....................................................................................................... 10 2.5.3 YSI Model85 Temperature, Conductivity, and Dissolved Oxygen Meter. ...... 10
2.6 ENTRAINMENT FIELD DATA HANDLING........................................................................ 12 2.6.1 Entrainment Field Data Sheets and Coding Instructions .................................. 12 2.6.2 Storage and Chain ofCustody ofData Sheets ........................ .......................... 16 2.6.3 Hazardous Substances Log ............................................................................... 16
2.7 INSTRUMENT CALIBRATION AND MAINTENANCE ......................................................... 16
3.0 ENTRAINMENT SURVIVAL ............................................................................................ 16
3.1 ENTRAINMENT SURVIVAL SAMPLE COLLECTION ......................................................... 17 3.2 INITIAL SURVIVAL STATUS OF ENTRAINED ORGANISMS ......'........................................ 19 3.3 LATENT (24-HOUR) SURVIVAL STATUS......................................................................... 20 3.4 ENTRAINMENT SURVIVAL FIELD OBSERVATION SHEET............................................... 21 3.5 CHAIN OF CUSTODY OF ENTRAINMENT SURVIVAL SAMPLES AND FIELD DATA
SHEETS........................................................................................................................... 22
4.0 ENTRAINMENT LABORATORY SOP ............................................................................ 22
4.1 SAMPLESTOBEANALYZED........................................................................................... 22 4.2 EQUIPMENT........................................................... ......................................................... 23 4.3 LABORATORY PROCEDURES .......................................................................................... 24
4.3.1 Subsampling......................................... ..................... ........................................ 24 4.3.1.1 Restrictions and Quotas ..................................................................... 24 4.3.1.2 Sequence............................................................................................ 24 4.3.1.3 Splitting Teclutique ............................................................................ 25
4.3.2 Sorting (Fish) ............... ........................ ............................................................. 25 4.3 .3 Identification (Fish) ........................................................................................... 26 4.3.4 Lobster and Macro-Crustacean (Crab) Larvae .................................................. 28
4.3.4.1 Lobster Larvae ................................................................................... 29 4.3.4.2 Macro-Crustacean (Crab) Larvae ........... ........ ................................... 29
20472 Schiller Station Entrai nment SOP Rev 0 Aug 2006 Normandeau Associates, Inc.

111
Rev.O Schiller Station QAP and SOPfor Entrainment Monitoring 2006 August 2006
4.4 SAMPLE HANDLING .................. ································· .................................................... 31 4.4.1 Sample Control .................................. ............. ............... ................................... 31 4.4.2 Chain ofCustody Records ................................................................................ 31 4.4.3 Preservation and Storage ........................ .................... .... ...... .... .......................... 31 4.4.4 Disposal............................................................................................................. 31
4.5 DATA HANDLING ....................................................... ............. ... ................................. ... 31 4.5.1 Data Sheets and Coding Instructions ................................................................ 31
4.5.1 .1 CountData...................................................................................... ... 32 4.5.1.2 Measurement Data ............................................................................. 33
4.5.2 Storage and Chain of Custody ofData Sheets .................................................. 34 4.6 QUALITY CONTROL ....................................................................................................... 34
4.6.1 Tasks Subject to Quality Control.. .................................................................... 34 4.6.2 Inspection Plans ................................................................................................ 34
4.6.3 Acceptance/Rejection Criteria .. ........................................................................ 35 4.6.3.1 Sorting .............................................................. ................................. 35 4.6.3.2 Identification...................................................................................... 35
4.6.4 Quality Control Records .................................... ............................................... 36 4.6.5 Quality Control Personnel... .............................................................................. 36
4.7 REFERENCE COLLECTION .............................................................................................. 36
4.8 INSTRUMENTCALlBRATION .......................................................................................... 36
5.0 DATA PROCESSING .......................................................................................................... 37
5 .1 DATA ENTRY VERIFICATION .... ..................................................................................... 37 5.2 SYSTEMATIC ERROR CHECKS ........................................................................................ 37 5.3 DATA FILE FORMAT ................. ..................................................................................... 37 5.4 QUALJTYCONTROLOFDATAFILES.............................................................................. 37
6.0 TRAININ'G ............................................................................................................................ 38
7.0 QUALITY ASSURANCE PLAN......................................................................................... 38
7.1 IMPORTANCE OF QUALITY ASSURANCE .................... .................................................... 39 7.2 QUALITY ASSURANCE ................................................................................................... 39 7.3 QUALITY CONTROL ............ ........................................................................................... 40 7.4 NONCONFORMANCE REPORTS AND CORRECTIVE ACTION ........................................... 40 7 .5 QAAUDITS.................................................................... ..... ......... ......... ............. .......... .. 41
APPENDICES
APPENDIX A: Forms
APPENDIX B: Taxon Identification Codes
APPENDIX C: YSI Model 85 Temperature, Conductivity, and Dissolved Oxygen Meter
20472 Schiller Station Entrainment SOP Rev 0 Aug 2006 Normandeau Associates, Inc.

Rev. 0 Schiller Station QAP andSOPfor Entrainment Monitoring 2006 August 2006
1.0 INTRODUCTION
Public Service Company ofNew Hampshire ("PSNH") owns and operates Schiller Station in Portsmouth, New Hampshire. The Station, which has four generating units ("Unit 3", "Unit 4", "Unit 5", and "Unit 6"), is located on the southwestern (New Hampshire) bank of the Piscataqua River, which forms the boundary between coastal New Hampshire and Maine. PSNH is currently in the process of completing the Northern Wood Power Project at Schiller Station. The existing 50 MWe coal-burning Unit 5 boiler will be replaced with a high efficiency fluidized bed wood-fired boiler scheduled to be fully operational during the sununer of2006.
The primary activity of Schiller Station is the generation ofelectric power. The Station generates at a rated capacity of 150 MWe and withdraws once-through cooling water from two separate cooling water intake structures ("CWIS's"), which are located in separate bulkheads at the shoreline of the Piscataqua River. The Unit 3 and Unit 4 CWIS's are located in the north bulkhead (Screen House #1), and the Unit 5 and Unit 6 CWIS's are located in the south bulkhead (Screen House #2). The two CWIS's at the Schiller Station have a combined total design intake flow in excess of50 million gallons per day ("MGD") and use at least 25% of the water withdrawn exclusively for cooling purposes. The current expected operating mode for Schiller Station over the next ten years is as a base-loaded facility at a capacity utilization rate in excess of 15%.
The final regulations implementing §316(b) ofthe Clean Water Act ("CWA") at existing electricitygenerating stations (the "Phase II Regulations"), among other things, establish performance standards for the reduction of impingement mortality by 80 to 95 percent and, under certain circumstances, for the reduction ofentfainment by 60 to 90 percent (See 69 Fed. Reg. 41576 (July 9, 2004)). The applicability of these performance standards is determined by several factors, including the type ofwater body from which a plant withdraws cooling water and the plant's capacity utilization factor. Under the Phase U Regulations, applicable performance standards can be met by design and construction technologies, operational measures, restoration measures, or some combination ofthese compliance alternatives.
The Phase II Regulations require submission ofa Proposal for Information Collection ("PIC") in certain circumstances. The following Quality Assurance Plan (QAP) and Standard Operating Procedures (SOP) comprise Appendix 3 ofthe PIC that PSNH is submitting to the United States Environmental Protection Agency ("USEPN'). They detail the methods for completing the 2006 entrainment study
at Schiller Station.
2.0 ENTRAINMENT STANDARD OPERATING PROCEDURES
PSNH proposes a one-year entrainment sampling program for Schiller Station beginning in August 2006 because the most recent and comprehensive annual entrainment data were obtained during the 1975-1976 study at the neighboring Newington Station as described in Section 6.1 of the PIC (Normandeau 2006), and because the present fish community in the Piscataqua River has most likely changed since then. The goal of the proposed entrainment program is to estimate the annual total ab
20472 Schiller Station Entra inment SOP Rev 0 Aug 2006 Normandeau Associates, Inc.

2 Rev.O
Schiller Station QAP andSOPfor Entrainment Monitoring 2006 August 2006
undance offish eggs and larvae, and macro-crustaceans that become entrained in the condenser cooling water withdrawn through the traveling screens of Schiller Station's two CWISs.
Entrainment sampling will be performed at Screen House# 2 (Unit 5 and Unit 6, Figure 2-1). Screen House# 1 (Unit 4, Figure 2-1) will not be sampled for entrainment at Schiller Station due to the absence ofaccess for sampling. Entrainment data obtained from sampling at Screen House # 2 (Unit 5 and Unit 6, Figure 2-1) will be applied to Screen House# 1 (Unit 4) because the Phase II Regulations allow such use ofdata from a comparable facility for estimating the calculation baseline. See 69 Fed. Reg. 41684 ("The calculation baseline may be estimated using: ... historical impingement mortality and entrainment data from your facility or from another facility with comparable design, operational, and environmental conditions").
2.1 COOLING WATER INTAKE STRUCTURE DESCRIPTION
Schiller Station has two once-through CWIS's; Screen House #1 and Screen House #2 (Figure 2-1). Screen House # 1 is located on the southwestern bank ofthe lower Piscataqua River in Portsmouth, New Hampshire at latitude 43°05'52" and longitude 70°46'59". Screen House# 2 is located approximately 150 ft south ofScreen House #1 on the southwestern bank of the lower Piscataqua River in Portsmouth, New Hampshire at latitude 43°05'52" and longitude 70°46'58".
2.1.1 Schiller Station Screen House #1 CWIS
Schiller Station Screen House #1 contains the CWIS for Unit 3 and Urtit 4. Screen House #1 withdraws non-contact cooling water from a submerged intake structure and intake tunnels located approximately 30ft offshore from Screen House #1 (Figure 2-1). Screen House #1 contains one traveling screen servicing the circulating water pump (Pump 4) supplying the Unit 4 condenser cooling system. The Unit 4 traveling screen (Screen 4) is located on the south side of Screen House #1 the CWIS (Figure 2-1 ). The north side of Screen House #1 is occupied by Unit #3, which currently inactive. The two intake pumps for Unit 4 are not found in Screen House #1; they are located in the power plant in a separate building approximately 300 ft to the west of Screen House #1. The cooling water pumps for Unit 4 withdraws Piscataqua River water from the submerged, offshore intake protected by a set ofcoarse bar racks ( 12 in x 12 in) and by a 1.5 in mesh fiberglass screen.
The Screen House #1 CWIS at Schiller Station has one operable traveling screen (Screen 4) servicing the Unit 4 circulating water pump (Figure 2-1). The Unit 4 traveling screen is a Rex (Chain Belt Company) screen with standard 3/8-inch (0.375-inch) square opening mesh panels ofwoven stainless steel wire screen cloth. The screen is 5.5 feet wide and 28 feet high (measured from the center of the head shaft to the center of the tail shaft) and consists of24 panels . Intake water passes through the submerged portion of the screen, where suspended fish and debris are deposited onto the screen cloth of the inclined trays and on the lower member ofeach tray which forms a shelf for lifting this solid material. The traveling screen is not rotated continuously, but is washed manually once every 6 hours or more frequently ifa pressure differential develops between the front and back side of the screen.
When the screen mechanism is operated, the screen trays ascend on the outboard (Piscataqua River) side and descend on the in-plant side at a speed of 10 feet per minute. Debris and fish are lifted from the water and removed from each tray just before it moves over the top sprockets and begins to de
20472 Schiller Station Entrainment SOP Rev 0 Aug 2006 Normandeau Associates, Inc.

3 Rev.O
Schiller Station QAP andSOPfor Entrainment Monitoring 2006 August 2006
scend by a spray manifold that is located in the head (top) section of the screen. The spray manifold for each screen has 5 overlapping spray nozzles operating at a relatively low 40 pounds per square inch (psig) spray pressure, and the spray wash covers the entire width ofeach tray. The fish and debris are washed by the spray manifold from the traveling screen into a 18-inch wide by 12-inch deep trough built into the concrete deck of the CWIS and located in front (Piscataqua River side) of the traveling screen. This trough runs south along Screen 4 and out the south side ofScreen House # 1, and all washed material is carried in the wash water for discharge into the Piscataqua River through the side of the CWIS at an elevation ofabout 11 ft. above MLW elevation.
2.1.2 Schiller Station Unit 5 and Unit 6 CWIS
The Schiller Station Unit 5 and Unit 6 CWIS is located in Screen House #2, which is a concrete bulkhead with a brick superstructure that is flush with the shoreline (Figure 2-1 ). Screen House #2 also has a canvas awning on the east (river) side to provide a degree ofprotection for the traveling screens from the weather. The single intake pump providing the Unit 5 circulating water flow is located on the north side of the Screen House #2, and the single intake pump providing the Unit 6 circulating water flow is located on the south side of the Screen House #2 (Figure 2-1).
The Unit 5 and Unit 6 intake pumps each have two vertical single entry/exit traveling screens (described below) providing a basic debris and fish handling and return system. A partition wall below the deck inside Screen House #2 divides the CWIS into two discrete forebays, one associated with each unit's intake pump. This partition wall separates the flow to each pump so that the fish and debris collected from the two traveling screens in the north forebay represent the collection from the water withdrawn through intake pump 5, and the fish and debris collected from the two traveling screens in the south forebay represent the collection from the water withdrawn through intake pump 6. Each of the Screen House #2 two forebay openings to the Piscataqua River consists ofa pair of8.5 ft. wide by 32 ft deep stop log slots, and each stop log slot is covered with a coarse bar rack that is 9 ft. wide and 32ft high with a 3 .5-inch clear space (4 inch on-center spacing).
The Screen House #2 CWIS at Schiller Station is portioned so that traveling screens 6a and 6b service the north inlet forebay to circulating water pwnp 6, and screens Sa and 5b service the south inlet to circulating water pump 5 (Figure 2-1). Each of the four traveling screens is a Rex (Chain Belt Company) screen with standard 3/8-inch (0.375-inch) square opening mesh panels ofwoven stainless steel wire screen cloth. Each of the four screens is 5.5 feet wide and 29 feet high (measured from the center of the head shaft to the center of the tail shaft) and consists of24 panels. Intake water passes through the submerged portion ofeach screen, where suspended fish and debris are deposited onto the screen cloth of the inclined trays and on the lower member ofeach tray which forms a shelf for lifting this solid material. The traveling screens are not rotated continuously, but are washed manually once every 6 hours or more frequently ifa pressure differential develops between the front and back side of the screens. When the screen mechanism is operated, the screen trays ascend on the outboard (Piscataqua River) side and descend on the in-plant side at a speed of 10 feet per minute. Debris and fish are lifted from the water and removed from each tray just before it moves over the top sprockets and begins to descend by a spray manifold that is located in the head (top) section ofeach screen. The spray manifold for each screen has 5 overlapping spray nozzles operating at a relatively low 40 pounds per square inch (psig) spray pressure, and the spray wash covers the entire width ofeach tray.
20472 Schiller Station Entrainment SOP Rev 0 Au& 2006 Normandeau Associates, Inc.

4 Rev.O
Schiller Station QAP andSOPfor Entrainment Monitoring 2006 August 2006
Screen House # 1
Unit 3
Unit 4 Screen 4
Fish and Debri~ I
tlt f<4Sluice
I
Shoreline
Screen House# 2
.___
Redundant
Q)
il 0
Uni t 3 E Cl)
Q)
~ ]
" Q) c.o... Q)
8 .D
:::1
Unit4 Cl)
~
1-
0 ...c::l
!13 ~
lmpingement ketSampling Bas
Impingement Sampling
Basket
Q) 0 5
Vi "' t:: .D Q)
Q
" § ...c::l
"' u:
North
South
Figure 2-1. Schiller Station Screen House#I (Unit 4) and Screen House #2 (Unit 5 and Unit 6) cooling water intake structures schematic showing the identification numbers for the circulating water pumps and traveling screens.
20472 Sthillcr Station Entrainment SOP Rev 0 Aug 2006 Normandeau Associates, Inc.

5 Rev. 0
Schiller Station QAP andSOPfor Entrainment Monitoring 2006 August 2006
The fish and debris are washed by the spray manifold from each traveling screen into a 24-inch wide by 18-inch deep trough built into the concrete deck of the CWIS and located in front (Piscataqua River side) ofeach traveling screen. This trough runs along the entire length of the Screen House #2, and all washed material is earned in the wash water to the north end of the CWIS for discharge into the Piscataqua River through the side of the CWIS at an elevation ofabout II ft. above MLW elevation.
2.2 SAMPLING SCHEDULE AND LOCATION
The entrainment sampling protocol for Schiller Station is a seasonally-stratified fixed date design, that is consistent with numerous entrainment programs both completed or on-going at CWISs located in estuaries throughout the United States (EPRI2005). Entrainment sampling will be conducted at the Schiller Station Screen House #2 CWIS. Entrainment sampling will not be performed at SchilLer Station Screen House #1 (Unit 4) because there is no access for sampling. Condenser supply water representing each entrainment sample will be drawn from a conunon service water feed line that taps into the Unit 5 and Unit 6 circulating water pumps on the condenser side ofthe pumps and then supplies water at the same pressure as found in each condenser supply (about 15 psig) to a service water pump. Sampling the condenser feed in this manner will allow entrainment samples to be taken ifeither the Unit 5 circulating water pump or the Unit 6 circulating water pump are in operation, or if both are operating. No atte~pt will be made to separate entrairunent abundance samples between Unit 5 and Unit 6, and the resulting abundance data will be applied to Unit 4 (Screen House #1), and to Unit 5 and Unit 6 (both in Screen House #2) of Schiller Station during data analysis and reporting.
The goal of the proposed entrainment program is to estimate the annual total abundance and mortality offish eggs, fish larvae and post-yolk-sac larvae, and macro-crustacean larvae (crabs and lobster) that become entrained in the cooling water drawn through the traveling screens ofeach operating unit of Schiller Station. Entrainment sampling will be performed on one sampling day per week when the plant is operating during 13 consecutive weeks in a June through August seasonal period ofpeak ichthyoplankton abundance, and again for 13 consecutive weeks during January through March to coincide with the recently reported primary and secondary peaks in seasonal occurrence offish eggs and larvae in the Piscataqua River nearfield area. Entrainment sampling will be conducted on one day every two weeks when the plant is operating during the 26 remaining weeks of lower seasonal abundance in April and May and from September through December. The resulting seasonally stratified entrainment sampling design will collect entrainment samples from 39 total weeks (26 weekly plus 13 biweekly samples) during 12 consecutive months. Operation is defined as having at least one circulating water pump at the Schiller Station Screen House #2 CWIS running for part or all ofone collection interval.
Weekly or biweekly entrairunent sampling will consist ofcollecting four separate 100m3 entrainment samples at six-hour intervals representing one consecutive 24-hour period. Entrainment sampling will be scheduled to occur from approximately 0900 on day 1 through 0859 on the next day (day 2). The same 24-hour period will be sampled during each scheduled week, and the four entrainment samples will be taken at approximately the same beginning and ending times (±one hour) during each 24-hour period. This design will provide 156 entrainment samples for the year ( 4 samples per
20472 Schiller Station Entrainment SOP Rev 0 Aug 2006 Normandeau Associates, Inc.

6 Rev.O
Schiller Station QAP andSOPfor Entrainment Monitoring 2006 August 2006
day x 39 days) if the plant operates during all scheduled 6-hour sampling intervals throughout the year.
2.3 EQUIPMENT
Each entrainment sample will be collected in the Schiller Station Screen House #2 from a 4-inch rawwater tap drawing un-chlorinated ambient cooling water at low pressure (about 15 psi) from a common service water feed line that taps into both the Unit 5 and Unit 6 circulating water pumps on the condenser side ofthe pumps. Sampling the condenser feed in this manner will allow entrairunent samples to be taken ifeither the Unit 5 circulating water pump or the Unit 6 circulating water pump are operation, or ifboth are operating. No attempt will be made to separate entrainment abundance samples between Unit 5 and Unit 6, and the resulting abundance data will be applied to Unit 4 (Screen House#I), and to Unit 5 and Unit 6 (both in Screen House #2) ofSchiller Station during data analysis and reporting.
The circulating water flow from the 4-inch service line will be supplied from above into a 0.300 mm mesh plankton net that is suspended in a tank (barrel sampler). When sufficient volume ofwater has been filtered through the plankton net (flow measured and recorded continuously with an in-line flowmeter), each entrainment sample will be concentrated into the 0.300 mrn cod-end cup of the plankton net, rinsed into a one-liter sample jar, preserved with 6 %buffered formalin, labeled with the date and time ofcollecti?n and a unique sample number, and taken to the laboratory for analysis. Water temperature, DO concentration, and conductivity will be recorded in the barrel sampler outflow near the beginning ofeach entrainment sample collection. DO and conductivity measurements will be converted into percent saturation (D.O.) and salinity at 25°C (conductivity) during data analysis.
The following additional equipment is required for entrainment field sampling:
• copy ofSOP and copy ofHealth & Safety Plan, • 0.300 nun plankton net with 0.300 mrn cod end cup,
• wash down pump or hose,
• data sheets, clipboard, and pencils, • samplejars (one liter),
• labels and waterproof markers, • 100% formalin preservative,
• flowmeter, • stop watch,
• hand calculator,
• YSI Model 85 temperature/salinity/dissolved oxygen meter,
• hard hats,
• gloves, • hand tools to aid sampler maintenance,
• flashlight,
• first aid kit,
• quality control log,
20472 $<:hiller St.1tion Entrainment SOP Rev 0 Aug 2006 Normandeau Associates, Inc.

7 Rev.O
Schiller Station QAP andSOPfor Entrainment Monitoring 2006 August 2006
• appropriate clothing, footwear, and personal protective equipment as specified in the Health & Safety Plan.
2.4 ENTRAINMENT FIELD SAMPLING PROCEDURES
2.4.1 Sample Collection
I . Check to be sure that at least one circulating water pump in Screen House #2 ofSchiller Station is operating (Pump 5 or Pump 6).
2. Inspect the entire entrainment sampling system shortly before the scheduled start of the 6hour sampling period to be sure that all plumbing is connected, the inner tank is clean, and the mesh panels are free from debris and the previous sample has been removed.
3. Install the 0.300 mm plankton net with clean 0.300 mm cod end collection cup into the tank (barrel) after inspecting it to be sure it is clean, and that no debris or organisms are carried over from previous collections.
4. Install the stand pipe and close the drain valves in the bottom of the tank.
5. Turn the ball valve controlling the water supply to the tank to the open position (valve handle parallel to the supply pipe) and record the time that water begins to enter the sampling tank through the net as the start of the 6-hour sample.
6. Simultaneously start the stopwatch when the water begins to enter the tank and record the flowmeter totalizer reading to initiate the start ofthe entrainment sampling and observe the seconds required to fill the sampler to the drain ports.
7. Stop the stopwatch when the tank is full and begins overflowing, and calculate the sampling time required to collect a 100m3 sample and calibrate the in-line flowmeter (Section 2.4.2 below).
8. Fill out the sample identification and flow rate data at the top of the Entrainment Field Data Sheet (Section 2.5.1 below).
9. Record the required water quality data from the water in the barrel sampler overflow (Secti<>n 2.6.3).
10. At times, clogging ofthe net mesh may make it necessary to collect multiple jar samples and clean the mesh between samples by using a wash down hose to prevent the inner tank from overflowing (possibly as frequently as every 20 minutes). The wash water is drawn from the outer tank using a low pressure submersible pump and represents filtered (through 0.300 mm mesh netting) water. Ifsubsamples are collected in this way to manage mesh clogging, adjust
the sampling time so that the required sampling time calculated in Section 2.4.2 represents the time supply water is actually flowing through the mesh of the sampler by adding the wash down time(s) to the sampling time.
20472 Schiller Station Entminmcnt SOP Rev 0 Aug 2006 Norm.andeau Associates, Inc.

8 Rev.O
Schiller Station Q,AP andSOPfor Entrainment Monitoring 2006 August 2006
11 . Wait until the flowmeter totalizer indicates 27,000 gallons to make sure that at least 100 cubic meters ofwater has been sampled before closing the ball valve to end the sample. After the volume has reached at least 27,000 gallons, tum off the pump, and record the time and totalizer reading. At a flow rate ofof250 gpm, a sample will take a little over 1 hour and 45 minutes to complete.
12. The sides and mesh of the net should be gently rinsed with a wash down hose to remove any clinging organisms or debris and washed contents will be allowed to drain into the cod end cup. The outer surface of the net will be sprayed with the wash down hose to prevent the introduction ofany additional organisms into the sample.
13. More than one subsample may be preserved in the same jar, but ifmultiple jars are used, label each one with the same sample number and indicate that multiple jars were used (e.g. "1 of _").
14. Collect the sample material from the cod end cup and place it in a labeled sample container. A 0.300-mm or finer sieve may be used to remove excess water from the sample before transferring it to the sample jar. Take care that none of the sample is spilled, and that the contents of the collection tank and cod end bucket are completely rinsed into the sample container or sieve. Pouring the sample into the jar should always be done over a larger container in case some sample is spilled. Sample containers and cod end cups that are open should be set down onJy in a container or bucket, just in case the sample is spilled.
15. Preserve the sample by adding sufficient formalin to make the final concentration 6% (60 ml offull-strength formalin per liter ofsample).
16. Repeat the above procedures for three additional diel samples within the 24-hr collection period. The starting times of the four diel samples should be six hours apart.
17. Before leaving the site, clean the net and cod end cup, and then disconnect and drain the barrel sampler to prevent biofouling or freezing during colder months.
2.4.2 Sampling Flow Rate and Duration Determination
At the start ofeach sampling day (i.e. the first of four consecutive 6-hour entrainment samples), measure the flow rate delivered from the supply line by opening the 4-inch ball valve and filling to the overflow ports a calibration vessel ofknown volume (the outer barrel sampler tank holds 210 gallons to the overflow). Simultaneously observe and record the in-line flowmeter readings. Record the time required from the start of filling the tank until it begins to overflow to the nearest 0.1 second. Calculate the observed flow rate (calibration gpm) and record the results on the field data sheet as follows:
calibration gpm =volwne ofcalibration tank in gallons I (calibration secondsl60)
Also estimate the sampling time required to obtain a 100m3 entrainment sample as follows:
Sampling time in decimal minutes = 26,420 gallons I calibration gpm.
20472 Schiller Station Entrainment SOP Rev 0 Aug 2006 Normandeau Associates, Inc.

9 Rev.O
Schiller Station QAP andSOPfor Entrainment Monitoring 2006 August 2006
For example, if it takes 80.0 seconds to fill the 210 gallon sampling tank to the overflow, then the calibration gpm = 210/(80/60) = 210/ 1.33 = 157.9 gpm, and the sampling time is 26420/ 157.9 =167 minutes or 2 hours and 47 minutes.
Then calculate the percent error indicated by the calibration trial as follows:
percent error = 100 x (gauge gpm - calibration gpm) I calibration gpm
The percent error can be positive or negative depending on whether the gauge gpm was larger or smaller than the calibration gpm. Record the results on the Entrainment Field Data Sheet (Appenctix A), including the minus sign ifthe percent error was negative. If the absolute value of the percent error is less than 3% then no further action is necessary.
Ifthe absolute value of the percent error is more than 3% then repeat the calibration trial two more times and average the three results, recording the results on the Entrainment Field Data Sheet. Keep the minus signs, ifany, in calculating the average (ifthere are both positive and negative percent errors, they will partially cancel each other out). If the absolute value of the average percent error is less than 10% then no further action is necessary.
Ifthe absolute value of the average percent error is more than 10% then replace the flowmeter and return it to the manufacturer for servicing. If there is no replacement flowmeter available immediately, continue to collect samples with the one that failed calibration, but enter the code for "flowmeter problem" in the sample status box on the Entrainment Field Data Sheet. (It may be feasible to estimate the sample volume by comparing the duration to durations ofsamples with known volumes collected during similar tidal conditions.)
2.4.3 Sample Handling
Fill entrainment sample jars completely by addition of6% formalin. Each sample jar should be no more than 25% full oforganisms and debris for adequate preservation. Label the jars externally with the sample number and the number ofjars (e.g., 1 of4, 2 of4, etc.). Place an internal label in each jar giving the sample number. All entrainment samples will be transferred from the field site to the Bedford, NH laboratory for processing.
2.4.4 Use Code
Each entrainment sample collected will be assigned a Use Code ( 1, 2, or 5) that defines its use in analytical tasks. Use Code 1 samples will be entrainment collections from which valid data were collected and no sampling problems were encountered. This means that each entrainment sample collected is representative of the 6-hour (diel) collection period in that the sample represents the entire contents of ichthyoplankton eggs and larvae and any macro-crustacean larvae collected in the circulating water flow supplied to the sample collection device during the 6-hour collection period. A use code 1 entrainment sample indicates no loss of any ichthyoplank:ton or macro-crustacean larvae in the sample, and no interruption ofcirculating water flow during the collection interval. Use Code 1 entrainment samples can be used for all analytical tasks. Use Code 2 samples will be collections in which there are sampling problems encountered relating to either the accurate measurement ofsample duration or volume, but ichthyoplankton or macro-crustacean larvae are caught. For example, ifan
20472 Schiller Station Entrainment SOP Rev 0 Aug 2006 Normandeau Associates, Inc.

10 Rev.O
Schiller Station Q;tP andSOPfor Entrainment Monitoring 2006 August 2006
unknown part of the sample was spilled when transferring it from the collection cup into a sample jar, or the sample volume is unknown, this sample would be classified as Use Code = 2. Use Code 2 samples will be excluded from calculations involving density estimates (number per unit volume), but may be used to describe diel or seasonal occurrence and length-frequency distributions. Use Code 5 samples will be void samples where the entire contents of the sample is lost. Use Code 5 samples will be excluded from all analysis.
2.5 ENVIRONMENTAL PARAMETERS
2.5.1 Specifications
The following environmental parameters will be observed and recorded at the Schiller Station Screen House #2 CWIS at both the start ofeach 6-hour collection: water temperature, dissolved oxygen concentration, salinity, and river surface conditions (wind direction and velocity, water level, cloud cover, and precipitation). Water quality measurements will be taken in the outer sampling tank in the overflow.
2.5.2 Deployment
Water quality measurements will be taken at both the start and end ofeach 24-hour collection. Temperature, salinity (nearest 0.1 ppt), and dissolved oxygen (nearest 0.1 mg/L) will be measured with a YSI model 85 dissolved oxygen meter. Air temperature (nearest 1.0°C) will be measured with an armored alcohol-filled thermometer. In general, Piscataqua River water temperatures should range between -2.0°C and +30.0°C during the course of this study, salinity should range between 4.0 ppt and 35.0 ppt, and dissolved oxygen concentrations should read between 5.0 mg/1 and 14.0 mg/1. Any temperature, salinity or dissolved oxygen (DO) readings outside of this range should be noted on the field data sheet and the instrument should be inspected and recalibrated.
Table 2-1 presents the saturation concentrations ofDO in water at various water temperatures and salinities. DO concentrations that are greater than the saturation levels at a given temperature and salinity are suspect. IfDO readings are above saturation, all connections on the meter should be checked, the membrane checked for contamination and bubbles, and the reading retaken. If the reading is still above saturation note any pertinent environmental conditions that may cause supersaturation such as excessive water turbulence below a dam and record these observations in the COMMENTS section.
2.5.3 YSI Model 85 Temperature, Conductivity, and Dissolved Oxygen Meter
Batteries will be recharged or replaced every six months or when the LO BATT appears on the LCD display. The instrument batteries are six "AA" size cells located inside the instrument. The probe's electrolyte fluid and membrane will be replaced at two-week intervals or when a bubble appears in the electrolyte.
Perform calibration checks at the beginning ofeach day' s use of the instrument, following the procedures reconunended by the manufacturer (Appendix C).
20472 Schiller Station Entrainment SOP Rev 0 Aug 2006 Normandeau Associates, Inc.

11 Rev. 0
Schiller Station QAP andSOPfor Entrainment Monitoring 2006 August 2006
Table 2-1. 100% saturation level ofoxygen in water ofdifferent salinities exposed to water saturated air at 1.0 atmospheric pressure (modified from APHA 1985).
Water Temperature in °C
100% Oxygen Saturation (mg/1) at Salinity (ppt)
0.0 9.0 18.0 27.1 36.1
0.0 14.6 13.7 12.9 12.1 J 1.4
2.0 13.8 13.0 12.2 11.5 10.8 4.0 13.] 12.3 11.6 10.9 10.3
6.0 12.4 11.7 11.0 10.4 9.8
8.0 ll.8 11.2 10.5 9.9 9.4
10.0 11.3 10.7 10.1 9.5 9.0 12.0 10.8 10.2 9.6 9.1 8.6 14.0 10.3 9.7 9.2 8.7 8.2
16.0 9.9 9.3 8.8 8.4 7.9 18.0 9.5 9.0 8.5 8.0 7.6
20.0 9.1 8.6 8.2 7.7 7.3 22.0 8.7 8.3 7.9 7.5 7.1
24.0 8.4 8.0 7.6 7.2 6.8 26.0 8.1 7.7 7.3 7.0 6.6 28.0 7.8 7.4 7.1 6.7 6.4 30.0 7.6 7.2 6.8 6.5 6.2 32.0 7.3 7.0 6.6 6.3 6.0
34.0 7.1 6.7 6.4 6.1 5.8 36.0 6.8 6.5 6.2 5.9 5.6
38.0 6.6 6.3 6.0 5.7 5.5
40.0 6.4 6.1 5.8 5.6 5.3
Two-point calibration checks of the YSI dissolved oxygen meter will be performed at the beginning ofa sampling day to maintain a field check of instrument performance and data quality. Calibration checks of the dissolved oxygen measurement system will be performed using water-saturated air for the 100% saturation point and a saturated solution ofsodium sulfite with a trace ofcobalt chloride for the 0% saturation point. These checks will be performed in the following manner and documented in an instrument calibration log:
• Inspect the probe to ensure that there are no air bubbles under the membrane and that it is not fouled.
• Ifair bubbles or fouling are observed, replace the membrane following procedures in the owner's manual.
• Ensure that the sponge inside the instrument's calibration chamber is wet and the probe is blotted dry.
20472 Schiller Station Entrainment SOP Rev 0 Aug 2006 Normandeau Associates, Inc.

12 Rev. 0
Schiller Station QA.P and SOPfor Entrainment Monitoring 2006 August 2006
• Insert the probe into the calibration chamber.
• Turn the instrument on by pressing the ON/OFF button on the front ofthe instrument.
• Press the MODE button until the dissolved oxygen is displayed in mg/L or % .
• Wait fo r the dissolved oxygen and temperature readings to stabilize (usually 15 minutes is required).
• Use two fingers to press and release the UP ARROW and DOWN ARROW buttons at the same time once.
• The LCD will prompt you to enter the local altitude in hundreds offeet. Use the arrow keys to increase or decrease the altitude. When the proper altitude appears on the LCD, press the ENTER button once. EXAMPLE: Entering the number 12 indicates 1200 feet.
• The Model85 should now display CAL in the lower left of the display, the calibration should be displayed in the lower right of the display and the actual % should be on the main display.
• Press the ENTER button and the display should read SAVE then should return to the Normal Operation Mode.
All calibrations should be completed at a temperature that is as close as possible to the sample temperature.
2.6 ENTRAINMENT FIELD DATA HANDLING
2.6.1 Entrainment Field Data Sheets and Coding Instructions
A unique sample number is assigned to each 6-hour entrainment abundance collection. The sample number is a four-digit number that is a composite ofsample task code (1 for entrainment abundance sample), week number (two digits), and die! period (one digit). Record the sample identification and status, collection times, flow rate, and flow calibration data on the Entrainment Field Data Sheet (Appendix A) according to the instructions below. Use the space for comments at the bottom of the data sheet to explain any problems or unusual circumstances. Use a separate data sheet for each 6-hour diel period entrainment sample.
VARIABLE INSTRUCTIONS
TASK CODE Pre-coded 1 for entrairunent abundance sample
Week Enter week number within year (01-52).
Diel Enter the code for die! period:
1 =0800-1400
2= 1400-2000
3=2000-0200
4=0200-0800
20472 Schiller Station Entra inment SOP Rev 0 Aug 2006 Normandeau Associates, Inc.
13 Rev.O
Schiller Station Q;4P andSOPfor E11trainment Monitoring 2006 August 2006
VARIABLE
Use Code
Comments
Start Month
Start Day
Start Hour
Start Minute
End Hour
End Minute
Gallons, end
Gallons, start
Gallons, difference
Gauge gpm
Calibration seconds
Calibration gallons
Calibration gpm
Sampling time
Percent error
Average % error
INSTRUCTIONS
Enter use code for status ofsample:
1 = valid sample
2 =sample is provisional due to problem with flow
5 =void (no sample)
Ifcomments are written at the bottom of the data sheet, enter 1;
ifnot, leave it blank
Record the month that the 24-hr sampling event began (should be the same for all samples collected in the 24-hr period)
Record the day that the 24-hr sampling event began (should be the same for all samples collected in the 24-hr period)
Record the hour that the 100-cubic-meter diel sample began, using 24-hr clock (0000-2359 hrs)
Record the minute that the 1 00-cubic-meter die! sample began, using 24-hr clock (0000-2359 hrs)
Record the hour that a 100-cubic-meter die! sample (or a subsample) ended, using 24-hr clock (0000-2359 hrs)
Record the minute that a 100-cubic-meter die! sample (or a subsample) ended, using 24-hr clock (0000-2359 hrs)
Record the flowmeter totalizer reading for total gallons at the end of the sample
Record the flowmeter totalizer reading for total gallons at the beginning of the sample
Subtract the starting flowmeter totalizer volume reading from the ending flowmeter totalizer volume reading
Record the pumping rate indicated by the flowmeter gauge to the nearest gallon per minute
Record the time to the nearest 0.1 seconds needed for the sampling pump to fill the calibration tank
Enter the calibration tank volume (21 0 gallons)
Calculate the observed pumping rate by dividing the calibration time by 60 then dividing that number into the calibration volume (record the result to the nearest gallon per minute)
Calculate the sampling time required to collect a 100m3 sample given the flow rate and record the results of this calculation in decimal minutes to the nearest 0.1 minute as described in Section 2.4.2
Calculate% error as described in Section 2.4.2 and record the result to the nearest 0.1% (keep the minus sign if it is negative)
Calculate average% error as described in Section 3.3.2 and record the result to the nearest 0.1% (keep the minus sign if it is negative)
20472 Schiller Station Entrainment SOP Rev 0 Aug 2006 Normandeau Associates, Inc.

14 Rev.O
Schiller Station QAP andSOPfor Entrainment Monitoring 2006 August 2006
VARIABLE
Start Temp.
End Temp.
Start Salinity
End Salinity
Start D.O.
End D.O.
Start Air Temp
End Air Temp
Start Cloud Cover
End Cloud Cover
INSTRUCTIONS
Record the temperature to the nearest 0.1 °C, at the start ofeach 6hour entrainment sample
Record the temperature to the nearest 0.1 °C, at the end of each 6-hour entrainment sample
Record the salinity to the nearest 0.1 parts per thousand (ppt) at the start of each 6-hour entrainment sample
Record the salinity to the nearest 0.1 parts per thousand (ppt) at the end ofeach 6-hour entrainment sample
Record the dissolved oxygen concentration to the nearest 0.1 mg/1 (ppm) at the start of each 6-hour entrainment sample
Record the dissolved oxygen concentration to the nearest 0.1 mg/1 (ppm), at the end ofeach 6-hour entrainment sample
Record air temperature COC) at start ofeach 6-hour entrainment sample
Record air temperature (0 C) at end of each 6-hour entrainment sample
Record the cloud cover at the start ofeach 6-hour entrainment sample
0 = 0-9%
1 = 10-19%
2 = 20-29%
3 =30-39%
4 = 40-49%
5 = 50-59%
6 = 60-69%
7 ;:;: 70-79%
8 = 80-89%
9 = 90-100%
Record the cloud cover at the end ofeach 6-hour entrainment sample
0 = 0-9%
1 = 10-19%
2 = 20-29%
3 = 30-39%
4 = 40-49%
5 = 50 -59%
6 =60-69%
7 = 70-79%
8 = 80-89%
20472 Schiller Station Entrainment SOP Rev 0 Aug 2006 Normandeau Associates, Inc.
15 Rev.O
Schiller Station QAP andSOPfor Entrainment Monitoring 2006 August 2006
VARIABLE
Start Precip.
End Precip.
Start Wind Dir.
End Wind Dir.
Start Wind Speed
End Wind Speed
INSTRUCTIONS
9 =90-100%
Record the precipitation at the start ofeach 6-hour entrainment sample
0 = None
l = Light Rain
2 = Heavy Rain
3 = Snow
Record the precipitation at the end ofeach 6-hour entrainment sample
O= None
1 = Light Rain
2 =Heavy Rain
3 =Snow
· Record the wind direction at the start ofeach 6-hour entrainment sample
O= No Wind
1 =North
2 = South
3 =East
4 =West
Record the wind direction at the end of each 6-hour entrainment sample
0 = No Wind
1 =North
2 =South
3 = East
4 =West
Record the estimated wind speed (MPH) at the start ofeach 6-hour entrainment sample
l = Leaves rustle, wind on face
2 = leaves and twigs in constant motion, flag waving
3 = raises dust and loose paper, small branches moving
4 = small trees begin to sway
5 = whole trees in motion
Record the wind speed (MPH) at the end ofeach 6-hour entrainment sample
1 = Leaves rustle, wind on face
2 = leaves and twigs in constant motion, flag waving
20472 Schiller Station Entrainment SOP Rev 0 Aug 2006 Normandeau Associates, Inc.

16 Rev.O
Schiller Station QAP andSOPfor Entrainment Monitoring 2006 August 2006
VARIABLE INSTRUCTIONS
3 =raises dust and loose paper, small branches moving
4 =small trees begin to sway
5 = whole trees in motion
2.6.2 Storage and Chain of Custody ofData Sheets
Check over all data sheets, to make sure they are completely and correctly filled out, and to be alert to any unusual or unexpected data values. Transport the original data sheets to the Bedford, NH office where they will be submitted to the technical data processing (TDP) center for keypunching and error checking. Document the transfer ofeach data packet using a data submittal chain ofcustody form supplied by the TOP. Retain a photocopy ofTDP chain ofcustody form.
2.6.3 Hazardous Snbstances Log
Maintain a log ofthe amounts offormalin preservative brought on site. Include in each log entry the date, the name ofperson making the log entry, and the volume in gallons of 1 00% formalin brought on site on that date. Make the log available for inspection as requested by PSNH's on-site Environmental Coordinator. Provide the log to PSNH's Environmental Coordinator at the end of the project.
2.7 INSTRUMENT CALIBRATION AND MAINTENANCE
Field instruments will be calibrated prior to each day ofuse, and service laboratory scales and balances will be calibrated once each year. Daily calibration checks will be performed with each use of a laboratory scale or balance; field scales will be calibrated every six months. Calibration logs will be maintained for all instruments and include the following information:
• instrument number and identification
• date ofcalibration
• initials ofthe person(s) calibrating the instrument
• standards used
• results, including instrument accuracy at receipt for calibration, adjustments made, instrument accuracy after calibration.
3.0 ENTRAINMENT SURVIVAL
Entrainment survival studies will be performed monthly at Schiller Station Screen House #2 to determine the survival ofentrained ichthyoplankton and macro-crustacean larvae (lobsters and cancer crabs) that have passed into the condenser cooling system through the CWIS. Entrainment survival collections at Schiller Station will be scheduled for one randomly selected day per month on a day already selected for entrainment abundance sampling. The regularly-scheduled entrainment abundance sample will be collected and preserved for each six-hour collection interval, and then one or more 1 0-minute samples will be collected in a collection tray and observed fo r entrainment survival. The entrainment survival studies will be staffed continuously during the collection and observation
20472 Schiller Slalion Entrainmenl SOP Rev 0 Aug 2006 Normandeau Associates, Inc.

17 Rev. 0
Schiller Station QAP andSOPfor Entrainment Monitoring 2006 August 2006
periods, and sufficient volume ofwater will be filtered through the entrainment collection device to
insure that at least 100 fish larvae are available for initial (0-hour) latent (24-hour) survival observations or eight hours ofsampling has occurred. The environmental parameters observed during collec
tion of the corresponding 6-hour entrainment abundance sample will be used to represent environ
mental conditions at the time ofcollection of the survival samples, so that a duplicate set ofthese data
is not required.
A barrel-type entrainment sampler (modified from EA 198~) will be set up near the north side of the
screen house for entrainment survival sampling. Unlike the plankton net suspended in the barrel, the entrainment survival sampler consists of two nested cylindrical tanks (Figure 2-2). The inner tank is 24 inches in diameter and 36 inches tall and is fitted at the bottom w ith a funnel that tapers from 24
inches down to 3 inches and protrudes 12 inches through the floor of the outer tank. The outlet of the funnel is fitted with a 3-inch ball valve and either a collection cup (for entrainment abundance sam
ples) or a flexible section ofclear vinyl tubing leading to a collection tray (for entrainment survival
samples). The walls of the inner tank are covered with 0.300 mrn mesh Nitex plankton netting. The outer tank (barrel) is 36 inches in diameter and 48 inches tall. Circulating water flow into the en
trainment sampler will be supplied from the north circulating water pump (1 B), controlled by a ball valve on the feed side, and the outlet of the 4-inch supply line will enter standing water near the bot
tom ofthe inner tank. The supply water outlet will be oriented at a tangential angle to the inner tank so that the incoming water will swirl slowly to disperse the incoming energy throughout the tank. In addition, the swirling motion will cause solids (i.e. fish eggs and larvae) to concentrate towards the
center of the tank so that they are not subjected to abrasion against the netting covering the walls of the inner tank. The water level in the barrel will be maintained by an overflow system so that the water velocity of the supply line (at 11 psi) is dispersed over the entire inner tank, minimizing the possi
bility ofnet abrasion of ichthyoplankton.
The entrainment survival studies will be staffed continuously during the collection and observation
periods, and sufficient volume ofwater will be filtered through the entrainment collection device to
insure that at least 200 fish eggs, fish larvae, and macro-crustacean larvae (in aggregate) are collected and available for the initial (0-hour) survival observations, and at least 100 ofthese are available for
latent (24-hour) survival observations, or 8 hours ofsampling has occurred. These entrainment survival samples will be sorted in the field into six categories (initial alive, initial stunned, initial dead,
latent alive, latent stunned and latent dead) and observed in the field for entrainment survival.
3.1 ENTRAINMENT SURVIVAL SAMPLE COLLECTION
Samples of ichthyoplankton and macro-crustacean larvae will be collected as specified in Section 2.4
(above), with the following exceptions to insure the viability of the collected organisms.
1. It is important to collect entrained ichthyoplankton and macro-crustacean larvae with mini
mum damage due to the collection and handling methods.
2. It is not important to know the volume ofwater represented by the entrainment survival sam
ple.
20472 Schiller Slalion Enlminmenl SOP Rev 0 Aug 2006 Normandeau Associates, Inc.
18 Rev_ 0
Schiller Station QAP andSOPfor Entrainment Monitoring 2006 August 2006
36 in.
From Condenser Supply Line
60 in.
Collection Tray
4 inch PVC
Water Exit To Drain
++...._-Inner Net Cylinder 300 micron screen
Outer Tank
Figure 2-2. Schematic diagram ofthe entrainment sampling device (Barrel sampler).
20472 Schiller Sialion Entrainmenl SOP R~v 0 Aug 2006 Normandeau Associates, Inc.

19 Rev. 0
Schiller Station QAP andSOPfor Entrainment Monitoring 2006 August 2006
3. Each entrainment survival sample will be collected in a clear glass processing tray which replaces the cod end cup.
4. No preservative ofany kind will be used.
5. Be sure the survival study is performed when the biofouling control system is not operating.
6. Be sure any wash water comes from a raw water, un-chlorinated source at ambient temperature and salinity.
7. The sample duration will be detennined based on field observations ofentrained organisms. Start by supplying flow to the barrel sampler for no longer than ten minutes, and then sort and enumerate the contents as described below in Section 3.2 to detennine the sample duration required to obtain at least 100 ichthyoplankton larvae and whatever additional number of fish eggs and macro-crustacean larvae are collected along with these fish larvae. It is better to collect ten 1 0-minute samples than one 1 00-minute sample.
8. It is important to identify each 1 0-minute entrainment survival collection with a unique sample number, and retain the distinction throughout the initial and latent observation periods.
3.2 INITIAL SURVIVAL STATUS OF ENTRAINED ORGANISMS
Entrained organisms collected and observed for survival will be classified (sorted) in the field into two taxonomic categories (fish or macro-crustaceans), into two life stages (eggs or larvae), and into three survival status categories (live, stunned, dead). Species and life stage identifications will not be performed in the field to minimize handling mortality. Instead, specific identification, life stage classification, enumeration and length measurements will be performed in the laboratory on preserved specimens. The purpose of field sorting and classification is to observe and record the survival status offish eggs, larvae and macro-crustacean larvae collected and place each organism in an appropriately labeled container designating the survival status for subsequent laboratory processing of the preserved samples.
Following collection ofan entrainment survival sample, the initial (0-hour) survival status oflive and dead ichthyoplankton eggs and larvae and any macro-crustacean larvae will be detennined by immediately sorting the contents of the glass collection tray on site with the aid ofa light table to classify each entrained organism in the initial observation period as live, stunned or dead according to the following criteria:
• Live (AD = 1)
o Larvae swimming vigorously, no apparent difficulty in swimming orientation.
o Eggs are translucent, chorion intact, and not cloudy in any internal portion.
• Dead (AD =2)
o Larvae showing no vital signs, no body or operculum movement; no movement when gently prodded.
o Eggs are opaque, chorion ruptured, or cloudy in any internal portion.
20472 Schiller Stotion Entrainment SOP Rev 0 Aug 2006 Normandeau Associates, Inc.

20 Rev.O
Schiller Station QAP andSOPfor Entrainment Monitoring 2006 August 2006
• Stunned (AD = 3)
o Larvae (only) swinuning abnormally, struggling to maintain swinuning position, or swimming sideways or upside down; or non-motile except when gently prodded.
Dead eggs and larvae will be removed from the initial (0-hour) sample after processing, placed in a labeled sample vial, designated as representing the "initial dead" class oforganisms, and preserved in 6% buffered formalin. A color-coded labeling system will be used to differentiate the three categories ofsample containers (alive = blue, stunned=green, dead=red), and a fourth label will designate eachjar as representing the initial (0-hour) survival observation (initial= yellow).
3.3 LATENT (24-HOUR) SURVIVAL STATUS
After initial survival status is determined, live eggs will be carefully transferred from the collection tray into one-liter glass holding containers that have been filled with ambient, filtered (300 microns) un-chlorinated river water using a wide mouth pipette.
After initial survival status is determined, live and stunned larvae will be carefully transferred from the collection tray into separate glass one-liter holding containers that have been filled with ambient, filtered (300 microns) un-chlorinated river water. Stunned larvae will be placed in one or more separate holding containers from live larvae. A maximum of ten eggs or five larvae will be held in each one-liter container. Small larvae will be held separately from large larvae and juveniles to reduce the possibility ofpredation or cannibalism. Try to minimize the handling of larvae during transfer into holding containers by decanting or pouring from the collection tray, and only use wide mouth pipettes or plastic spoons to transfer organisms ifnecessary.
These holding containers will be covered with fine screening and held in a continuous flow water bath ofambient water until they are processed again at the latent (24-hour) observation time. A continuous temperature recording device (e.g. Onset StowAway® Tidbit® 32k temperature logger or the equivalent with an operating accuracy of±0.4°C) will be used to record the water bath temperature during the 24-hour holding period.
After a 24-hour holding period, the latent survival status ofthe fish eggs and larvae will be determined using the same criteria and procedures described above for the initial survival observations. All eggs and larvae will be removed from the latent observation samples after processing, placed in alabeled sample vial using a separate container for each latent survival category (live, stunned, dead), and preserved in 6% buffered formalin. A color-coded labeling system will be used to differentiate the three categories ofsample containers (alive= blue, stunned=green, dead=red), and a fourth label will designate each jar as representing the latent (24-hour) survival observation (latent = white).
Preserved entrainment survival samples will be transported to the laboratory for identification, life stage determination, and enumeration. Total length ofall ichthyoplankton larvae collected in the entrainment survival samples will be measured to the nearest 0.1 mm and recorded. The same data sheets used for processing entrainment abundance samples (Section 4.0 below) will be used for processing entrainment survival samples, but a TASK CODE = 4 is assigned to each entrainment survival sample.
20472 Schiller Station Entrainment SOP Rev 0 Aug 2006 Normandeau Associates, Inc.

21 Rev.O
Schiller Station QAP andSOPfor Entrainment Monitori11g 2006 August 2006
3.4 ENTRAINMENT SURVIVAL FIELD 0BSERVATION SHEET
Field observations ofthe initial and latent classification and survival of entrained organisms will be recorded on the Entrainment Survival Field Observation Sheet (Appendix A) according to the following instructions. A new data sheet will be used for each 10-minute survival sample collected and processed in the field. The last three digits of the sample number (task code, week and die! period) must correspond to the 6-hour entrainment abundance sample number on the Entrainment Abundance Field Data Sheet (Section 2.6.1). The first digit (pre-coded as 4) will differentiate each survival sample from each entrainment abundance sample (pre-coded as 1).
VARIABLE
TASK CODE
Week
Die!
Collection Time
Unit
Holding Container ID #
Observation Time
Survival Period
Organism
Life Stage
INSTRUCTIONS
Pre-coded 4 for entrainment survival sample
Enter the two-digit week number within year (01-52).
Enter the one digit code for diel period:
1 =1000-1600
2= 1600-2200
3=2200-0400
4=0400-1 000
Record the hour and minute from the start of the 1 0-minute survival collection (llliMM) using 24-hr clock (0000-2359 hrs)
Enter the code indicating the Unit from which the data was collected
4=N/A
5 = Unit 5
6 = Unit 6
9 =Units 5 and 6 combined (continuous wash)
Enter the unique holding container number
Record the hour and minute the survival observations were made (Hillv1M) using 24-hr clock (0000-2359 hrs)
Enter the code indicating the survival period when status was observed
1 = initial observation at the time offirst colleetion (0-hours)
2 = survival status after 24 hour (latent) time period
Enter the code indicating the organism class for survival observations
1 = fish
2 = nnacro-crustacean
Enter the code indicating the organism life stage for survival observations
1 =egg
2 = larvae
20472 Schiller Station Entrainment SOP Rev 0 Aug 2006 Normandeau Associates, Inc.

22 Rev. 0
Schiller Station QAP andSOPfor Entrainment Monitoring 2006 August 2006
VARIABLE INSTRUCTIONS
AD Enter the Alive or Dead survival status of the organism and life stage at the time ofobsetvation
1 = alive
2 =dead
3 =stunned
Count Record a tally of the number oforganisms obsetved in each category
Comments Enter a 1 and write any comments at the bottom of the data sheet
3.5 CHAIN OF CUSTODY OF ENTRAINMENT SURVIVAL SAMPLES AND FIELD DATA
SHEETS
Check over all data sheets, to make sure they are completely and correctly filled out, and to be alert to any unusual or unexpected data values. Transport the original data sheets to the Bedford, NH office where they will be submitted to the technical data processing (TDP) center for keypunching and error checking. Document the transfer ofeach data packet using a data submittal chain ofcustody form supplied by the TDP. Retain a photocopy ofTDP chain ofcustody form. Presetved entrainment survival samples will be transported to the laboratory for identification, life stage determination, and enumeration.
4.0 ENTRAINMENT LABORATORY SOP
The ichthyoplankton and macro-crustaceans in each entrainment abundance sample (Section 2.0 above) and each initial and latent survival sample (Section 3.0 above) will be processed to identify individuals to species (lowest distinguishable taxon, generally species) and enumerate them by life stage. Ichthyoplankton (except winter flounder) will be enumerated into the following life stages: eggs, yolk-sac latvae, post-yolk-sac latvae, and juveniles. Winter flounder will be identified and enumerated into five life stages (1-5) using the criteria developed for Millstone Station in Long Island Sound (Dominion Resources Services, Inc. 2005). Lobster larvae will be identified and enumerated into four life stages (1-4) according to the criteria ofHerrick (1895). Crab larvae will be identified and enumerated into three life stages (zoea, megalops, and juvenile). The total length to the nearest 0.1 mm will be measured for up to 30 individuals ofeach ichthyoplankton life stage (except eggs) per sample. Ifmore than 30 ichthyoplankton latvae are present in a sample, a random selection of30 specimens will be measured. The sorted contents ofall entrainment samples will be retained in storage until the Comprehensive Demonstration Study is accepted by the regulatory agencies.
4.1 SAMPLES TO BE ANALYZED
Entrainment samples will be collected during a year-long period from the Schiller Station Screen House #2 CWIS. Entrainment sampling will be scheduled to occur on one sampling day per week when the plant is operating during 13 consecutive weeks in the June through August seasonal period ofpeak ichthyoplankton abundance, and again for 13 consecutive weeks during the January through March seasonal period to coincide with the recently reported primary and secondary peaks in seasonal
20472 Schiller Station Entrainment SOP Rev 0 Aug 2006 Normandeau Associates, Inc.

23 Rev.O
Schiller Station QAP and SOPfor Entrainment Monitoring 2006 August 2006
occurrence of fish eggs and larvae in the Piscataqua River nearfield area. Entrainment sampling will be conducted on one day every two weeks when the plant is operating during the 26 remaining weeks of lower seasonal abundance in April and May and from September through December. The resulting seasonally stratified entrainment sampling design will collect 156 entrainment samples from 39 total weeks (26 weekly plus 13 biweekly samples) during I2 consecutive months if the CWIS is operated on all scheduled sampling dates.
Weekly or biweekly entrainment sampling will consist ofcollecting four separate 100 m3 entrainment samples at six-hour intervals representing one consecutive 24-hour period. Each entrainment sample will be collected using a 0.300 mm mesh net. Entrainment sampling will be scheduled to occur from I 000 on day I through 0959 on the next day (day 2). The same 24-hour period will be sampled during each scheduled week, and the four entrainment samples will be taken at approximately the same beginning and ending times (± one hour) during each 24-hour period. This design will provide 156 entrainment samples for the year (4 samples per day x 39 days) ifthe plant operates during all schedluled 6-hour sampling intervals throughout the year.
Entrainment survival studies will be performed monthly at Schiller Station to detennine the survival ofentrained ichthyoplankton and macro-crustacean larvae that have passed into the condenser cooling system through the CWIS (Section 3.0 above). Entrainment survivai collections at Schiller Station will be scheduled for one randomly selected day per month on a day already selected for entrainment abundance sampling. The regularly-scheduled entrainment abundance sample will be collected and preserved for each six-hour collection interval, and then a series of tO-minute collections will be made to obtain sufficient eggs and larvae for initial (0-hour) and latent (24-hour) survival observations. Entrainment survival samples will be sorted in the field into six categories (initial alive, initial stunned, initial dead, latent alive, latent stunned, latent dead) and observed in the field for entrainment survival. Following field survival observations, all survival samples will be delivered to the Bedford, NH laboratory for identification, life stage classification, enumeration, and length measurements.
4.2 EQUIPMENT
The following items are required for laboratory analysis of ichthyoplankton and macro-crustacean larvae in entrainment samples:
• Sorting pans
• Lights
• Magnifiers
• Dissecting microscopes
• Motoda plankton splitter
• Sieves
• Rose bengal
• Gridded Petri dishes
• Divided Petri dishes
• Jars, with lids
• Forceps
• Pipettes
20472 Schiller Station Entrainment SOP Rev 0 Aug 2006 Normandeau Associates, Inc.

24 Rev. 0
Schiller Station QAP andSOPfor Entrainment Monitoring 2006 August 2006
• Multitally counters
• Squirt bottles
• Lab data sheets
• Pens
• Vials, with caps
• Vial labels
• Taxonomic literature
• Copy of SOP
• Ocular micrometers
• Millimeter rulers
• Masking tape
• Rubber bands
• Random number table
• Hensen Stempel Pipette
• Folsom Splitter
4.3 LABORATORY PROCEDURES
4.3.1 Subsampling
4.3.1.1 Restrictions and Quotas
Samples with high abundances may be subsampled in the laboratory, with a minimum of200 fish eggs and larvae to be analyzed. This quota applies to the total count ofall species combined, not to individual species.
For each sample with a low ichthyoplankton concentration and a high total volume ofdetritus and other plankton (more than 400 ml settled volume), sort a maximum ofone-halfof the sample for eggs and larvae.
Entraimnent survival samples will not be subsampled.
4.3.1.2 Sequence
Use the following sequence ofprocedures in processing a sample that is subsampled by splitting. To eliminate any chance ofbias, some steps in the procedure are to be performed by an assistant, as indicated below, so that the sorter has no prior knowledge ofwhich samples are to be subjected to quality control inspection.
This procedure also applies when a previously split sample is further subsampled, such as an "id. split" performed because the fraction sorted was larger than necessary to meet the quota. In this situation the term "sample" in the following procedure refers to the part of the original sample that is to be further subsampled, and the selected fraction(s) are "analyzed" rather than "sorted."
I. Examine the sample to estimate the smallest size fraction that is likely to contain at least 200 fish eggs and larvae.
20472 Schiller Station Entrainment SOP Rev 0 Aug 2006 Normandeau Associates, Inc.

25 Rev. 0
Schiller Station QAP andSOPfor Entrainment Monitoring 2006 August 2006
2. Divide the sample material into two equal parts using the techniques in Section 4.3 .1.3 .
3. Randomly select one of the two divisions for processing (or for further subsampling, ifa
smaller fraction is needed). Selection should be done using a random number table or a coin toss, so that each of the two divisions has an equal chance ofbeing selected. The person perfonning the division must not know which of the two divisions will be analyzed before the division is completed (it is not acceptable to always select the division from the same chamber of the splitter).
4. Set aside the fraction not selected for further processing and label it to identify the sample number and fractional size.
5. If the fraction that was selected for further processing needs to be subsampled further, repeat steps 2-4 as many times as necessary to produce the desired fraction for analysis. When the desired fraction is obtained, label it to show the sample number and fractional stze.
6. Sort the subsample by the procedures in Section 4.3.2. Organisms must be sorted from the
entire subsample even if the quota is reached before finishing the subsample.
4.3.1.3 Splitting Technique
Perform all sample splitting using a Motoda splitter. The presence of filamentous algae or large items (including large juvenile fish, or older age classes) can interfere with the even distribution ofmaterial and organisms between the two chambers of the splitter. Therefore, to insure successful results, observe the following techniques: (I) Adjust sample dilution to be great enough to allow free mixing of the sample but not so great as to promote clumping due to over dilution. (2) Remove large fish and excessive amounts offilamentous algae before splitting, returning any adhering ichthyoplanktori to the sample. (3) Pull apart remaining clumps ofalgae before splitting. ( 4) Scrutinize detritus and organisms during the splitting process to see that they appear equally distributed before making the fmal division. (5) Remix and split again ifthe two resulting portions ofa division do not appear equal. If a sample has so much algae that it cannot be satisfactorily split, sort the entire sample, and ifnumbers of ichthyoplankton are high splitting may be performed after sorting. Large juveniles that are removed from the whole sample before splitting must be kept separate from ichthyoplankton sorted from the sample after splitting, and they must be labeled to show they represent the whole sample.
4.3.2 Sorting (Fish)
Remove fish eggs, larvae andjuveniles, from the samples according to the following procedures:
• Samples may be stained with rose bengal to facilitate sorting.
• Pour the sample contents into a sieve with a mesh equivalent to, or finer than, 300 ~-tm and rinse with water to remove the preservative.
• If the sample contains large numbers offish eggs and larvae, prepare a subsample following the procedures in Section 4.3.1.
20472 Schiller Station Entrainment SOP Rev 0 Aug 2006 Normandeau Associates, Inc.

26 Rev.O
Schiller Station QAP and SOP for Entrainment Monitoring 2006 August 2006
• Carefully wash the sample contents into a container making certain that nothing remains in the sieve. Pour portions of the sample from the container into a pan and examine them under magnification.
• Remove fish eggs, larvae, and juveniles from the sample using forceps, pipettes, and probes. Remove only those fragments that include the head.
• Maintain a combined total count for eggs and larvae that are removed from the sample (i.e., the combined total ofeggs, yolk-sac larvae, post yolk-sac larvae, and juveniles).
• When sorting is completed, recheck the sample for organisms. After the sample has been rechecked, label vials containing the sorted organisms and place them in a box designated for sorted samples. Record the sorting results and date completed in a log.
• Carefully wash back the remaining sample contents into the original sample container, appropriately preserved, and return it to the storage area.
• Ifa sample is not completed by the end of the work day, it may be left unpreserved overnight ifadequate precautions are taken to prevent it from drying out. No sample or part ofa sample, however, should remain unpreserved for more than 24 hours.
4.3.3 Identification (Fisb)
Identify, stage, count, and measure the sorted ichthyoplankton according to the following procedures:
• Obtain the sample vials containing the sorted organisms from the storage area and sign them out by initialing a status log.
• Rinse specimens free ofpreservative and submerge them in water in a Petri dish. Use a binocular microscope with an ocular micrometer to examine the specimens, and identify them to the lowest practical taxon (usually species) by referring to the literature, the reference collections, and by consulting with fellow identifiers.
• Determine the life stage ofeach specimen. Pertinent life stages for all except winter flounder larvae are defmed and identified as follows:
Egg: the embryonic developmental stage, from spawning until hatching. Eggs frequently become damaged during collection and sample processing. Damaged eggs are counted as the number ofembryos (without regard to how many egg capsules are present). Do not count non-fertilized eggs if they are present.
Yolk-sac larva: the transition stage from hatching through the development ofa complete, functional digestive system (regardless of the degree ofyolk and/or oil globule retention)
Post yolk-sac larva: the transition stage from development ofa complete, functional digestive system to transformation to juvenile form (regardless of the degree of yolk and/or oil globule retention), including the leptocephalus stage of eels
20472 Schiller Station Entrainment SOP Rev 0 Aug 2006 Normandeau Associates, Inc.

27 Rev. O
Schiller Station QAP andSOPfor Entrainment Monitoring 2006 August 2006
Young-of-the year: the stage from completed transfonnation to Age 1 (i.e., 12
months after hatching). A young-of-the-year has a full complement of fin rays identical to that of an adult. Eels are classified in this stage until Age 2.
Yearling or older: a fish at least one year old
• Determine the life stage for winter flounder larvae as follows:
Stage 1: yolk-sac present or eyes not pigmented
Stage 2: no yolk-sac present and eyes pigmented, but either no fin ray development or no flexion of the notochord
Stage 3: fin rays present and notochord flexion has begun, but the left eye has not migrated to the midline of the head
Stage 4: left eye has reached the midline of the head, but full fm ray complement has not yet been attained
• Count the specimens of each life stage. Record the counts by species and stage on the lab data sheet (refer to Section 4.5J for coding instructions).
• From each entrairunent abundance sample, measure a maximum of30 larvae of each fish taxon and larval life stage to the nearest 0.1 rnm (total length) and record the measurements on the lab data sheet. Record total length ofjuvenile life stages to the nearest 1.0 nun. Ifmore than 30 larvae ofa given taxon and life stage are present, randomize the selection ofspecimens for measuring by the following procedure. Spread them uniformly
in a gridded container, select a starting point in the grid by means ofa random number table, and then measure the first 30 measurable specimens encountered in a predetermined pattern commencing at the starting point. Every grid space must have an equal probability ofbeing selected as the starting point, so that every specimen will have an equal probability ofbeing included in the subsample.
• All larvae from entrainment survival samples will be measured without subsampling.
• For each larva measured, record its life stage or developmental stage (stage 1-stage 4 as defmed above for winter flounder) .
• Place identified organisms in vials with an adequate amount ofpreservative for storage. Specimens may be removed for inclusion in the reference collection. For those removed, list the species, life stage, and numbers on the conunents section of the fonn and note
their removal on a tag retained inside the appropriate vial. Label all vials for a single sample, initial them and band them together. Record the number ofvials for the sample on the data fonn. For reference collection procedures refer to Section 4.7.
Larvae are usually identified to the species level except for occasional badly damaged specimens.
The primary exception is among bakes of the genus Urophycis sp. In the New Hampshire coastal region it is possible to collect red hake (U chuss), white hake (U tenuis), and spotted hake (U regi.a), but there is insufficient published information available for reliably distinguishing the larvae of the
20472 Schiller Station Entrainment SOP Rev 0 Aug 2006 Normandeau Associates, Inc.
28 Rev.O
Schiller Station QAP andSOPfor Entrainment Monitoring 2006 August 2006
three species. In estuaries and inshore waters along the NH coast red hake is probably the most abundant and spotted hake is probably relatively rare, although all three species have been identified in adult fish collections off Seabrook, NH. Northern searobin (Prionotus caro/inus) and striped searobin (P. evolans) occur occasionally in the area and are not distinguisilable in the egg and early larval stages, so they are identified only to genus.
Some groups oflarvae are often identified only to the generic level by others but are usually identified to species at Nonnandeau. These include grubby (Myoxocephalus aenaeus), longhorn sculpin (M octodecemspinosus), shorthorn sculpin (M scorpius), Atlantic seasnail (Liparis at/anticus), and Gulf snail fish (L. coheni). The abundant sand lance larvae are categorized by the Nonnandeau lab as American sand lance (Ammodytes americanus), although the possibility ofsome of them being northern sand lance (A. dubius) cannot be ruled out. The much less common redfish larvae are coded as Sebastes sp., although it most likely that they are all Acadian redfish (S.fasciatus). Golden redfish (S. norvegicus) and deepwater redfish (S. mentel/a) are distributed more offshore and they are difficult to distinguish from Acadian redfish even as adults.
Although most larvae are identified to species, there are some relatively abundant species that cannot routinely be identified to the species level in the egg stage. The very abundant cunner (Tautogolabrus adspersus, family Labridae) cannot Usually be distinguished from the occasional yellowtail flounder (Limandaferruginea, family Pleuronectidae) and the locally uncommon tautog (Tautoga onitis, family Labridae), except for occasional specimens that are close enough to hatching that the embryo within the egg capsule is well developed. These are routinely identified as "Labridael Limanda" eggs and are believed to be mostly cunner, based on the relative abundance ofthe larvae of the three species. A second commonly used category used for eggs is "Enchelyopus/Urophycis," which includes fourbeard rockling (E. cimbrius) and phycid hakes (Urophycis sp.). A third grouping ofspecies that are not usually distinguishable from each other at the egg stage includes the commonly occurring Atlantic cod (Gadus morhua) and witch flounder (G/yptocephalus cynoglossus), plus the much less common haddock (Melanogrammus aeglefinus), recorded as "Gadidae!Giyptocephalus ." Those three categories account for by far the most instances ofnot identifying eggs to the species level, but there are occasionally others.
4.3.4 Lobster and Macro-Crustacean (Crab) Larvae
In addition to ichthyoplankton, process the planktonic stages of the American lobster and macrocrustaceans (crabs) listed in the table below. The spider crab Libinia sp. is quite rare in coastal NH waters. The common spider crabs are Hyas coarctatus and H. aranea. Cancer sp. are difficult to distinguish in Stage 1 zoea and impossible to distinguish in later zoeal stages, so we use Cancer sp. for zoea, and identify megalopa and juveniles to the species level of taxonomy.
20472 Schiller Station Entrainment SOP Rev 0 Aug 2006 Normandeau Associates, Inc.
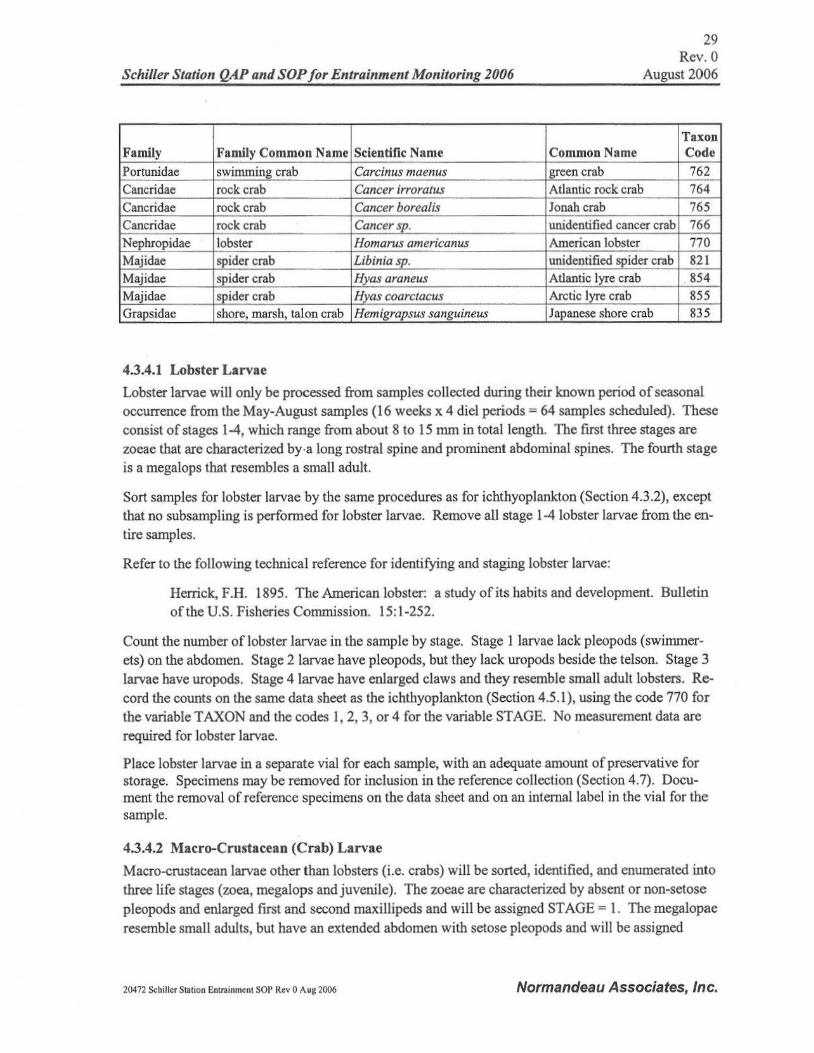
29 Rev.O
Schiller Station QAP and SOPfor Entrainment Monitoring 2006 August 2006
Family Family Common Name Scientific Name Common Name Taxon Code
Portunidae swimming crab Carcinus maenus green crab 762 Cancridae rock crab Cancer irroratus Atlantic rock crab 764 Cancridae rock crab Cancer borealis Jonah crab 765 Cancridae rock crab Cancersp. unidentified cancer crab 766 Nephropidae lobster Homarus americanus American lobster 770 Majidae spider crab Libinia sp. unidentified spider crab 821 Majidae spider crab Hyas araneus Atlantic lyre crab . 854 Majidae spider crab Hyas coarctacus Arctic lyre crab 855 Grapsidae shore, marsh, talon crab Hemigrapsus sanguineus Japanese shore crab 835
4.3.4.1 Lobster Larvae
Lobster larvae will only be processed from samples collected during their known period ofseasonal occurrence from the May-August samples (16 weeks x 4 diel periods = 64 samples scheduled). These consist of stages 1-4, which range from about 8 to 15 mm in total length. The flTSt three stages are zoeae that are characterized by·a long rostral spine and prominent abdominal spines. The fourth stage is a megalops that resembles a small adult.
Sort samples for lobster larvae by the same procedures as for ichthyoplankton (Section 4.3.2), except that no subsampling is performed for lobster larvae. Remove all stage 1-4 lobster larvae from the entire samples.
Refer to the following technical reference for identifying and staging lobster larvae:
Herrick, F .H. 1895. The American lobster: a study of its habits and development. Bulletin of the U.S. Fisheries Commission. 15:1-252.
Count the number of lobster larvae in the sample by stage. Stage 1 larvae lack pleopods (swimmerets) on the abdomen. Stage 2larvae have pleopods, but they lack uropods beside the telson. Stage 3 larvae have uropods. Stage 4 larvae have enlarged claws and they resemble small adult lobsters. Record the counts on the same data sheet as the ichthyoplankton (Section 4.5.1), using the code 770 for the variableTAXON and the codes 1, 2, 3, or 4 for the variable STAGE. No measurement data are required for lobster larvae.
Place lobster larvae in a separate vial for each sample, with an adequate amount ofpreservative for storage. Specimens may be removed for inclusion in the reference collection (Section 4.7). Document the removal ofreference specimens on the data sheet and on an internal label in the vial for the sample.
4.3.4.2 Macro-Crustacean (Crab) Larvae
Macro-crustacean larvae other than lobsters (i.e. crabs) will be sorted, identified, and enumerated into three life stages (zoea, megalops and juvenile). The zoeae are characterized by absent or non-setose pleopods and enlarged first and second maxillipeds and will be assigned STAGE = 1. The megalopae resemble small adults, but have an extended abdomen with setose pleopods and will be assigned
20472 Schiller Station Entrainment SOP Rev 0 Aug 2006 Normandeau Associates, Inc.
30 Rev.O
Schiller Station QAP andSOPfor Entrainment Monitoring 2006 August 2006
STAGE= 3. The juveniles resemble adults with the abdomen reflexed against the body, but which are sexually immature and will be assigned a STAGE= 4.
In general, subsampling will occur for numerically dominant species and life stages. The minimum count quota will be 100 individuals ofa species life stage for subsampling to be permitted. Less common species and life stages will be enumerated in the entire sample. Samples containing more than 40.0 ml ofsettled plankton volume will be split in half and only one-half will be analyzed.
• Pour sample into 256 micron mesh sieve to separate sample from preservative and rinse sample.
• Place sample in large beaker and adjust volume using water to provide a 10-rnl aliquot that will contain about 50-1 00 of the dominant crab larvae, ifpossible. Record adjusted volume (rnl).
• Using a 1 0-rnl Hensen Stempel pipette, homogenize the sample and remove an aliquot. Place the aliquot in a plankton counting tray. Identify and enumerate all target species and stages using a dissecting microscope at magnifications of6X-50X. Continue subsampling by aliquots until a minimum of 100 of the dominant crab larvae are counted. Count all individuals in the final aliquot. Record subsample volume (number ofaliquots x 1 0 rnl) and number counted.
• Depending on the numerical distribution of species in the sample, the taxonomist may either continue subsarnpling using the Hensen Stempel pipette to enumerate sub-dominant taxa or discontinue subsampling and process the remainder of the sample in its entirety ifall other species or stages are in relatively low abundance.
• To process sample in its entirety, mix and pour portions of the sample into the plankton counting tray and identify and enumerate using the dissecting microscope. Continue process until entire sample has been examined. Record counts and portion of sample examined.
• A Folsom splitter may be used to serially split the sample ifmoderate numbers of larvae are present (requiring one-half to one-eighth ofthe total sample be examined) or in cases where subsampling with a Hensen Stempel pipette is not possible due to large amounts ofdebris or filamentous material in the sample. Record counts and fraction ofsample examined.
• Consider the different lifestages ofa species to be discrete taxa. For example, ifa count quota of 100 zoea is attained for Cancer sp., continue counting the Cancer megalopa and juvenile stages in the remainder of the sample.
• After sample identification and enumeration is complete, return sample to jar, preserve and return to storage area. Fill out aJllogs and data sheets.
• Lengths ofany crustacean stage will not be measured .
• Voucher specimens ofeach species and life stage will be removed and placed in vials. Specimens only need to be removed from one sample of the project. Record sample, date and species.
20472 Schiller Station Entrairunent SOP Rev 0 Aug 2006 Normandeau Associates, Inc.

31 Rev.O
Schiller Station QAP andSOPfor Entrainment Monitoring 2006 August 2006
4.4 SAMPLE HANDLING
4.4.1 Sample Control
Each sample was given a unique sample number at the time ofcollection. Track each sample by that sample number throughout the laboratory and data processing functions .
4.4.2 Chain of Custody Records
The chain ofcustody documentation begins with the field staff providing a list with the following information for each sample in a shipment delivered to the laboratory facility in Bedford, New Hampshire: sample collection date, sample collection time, sample identification number, and number of jars. Upon receipt of the samples, a laboratory representative verifies that all jars ofall samples on the list are present, then signs and dates the chain ofcustody document. ·
After samples have been received in the laboratory, track their location and status during all phases of storage and laboratory analysis by means ofsample control logs. The function ofthis system is to provide a paper trail ofwho performed each step in the analysis ofa sample from collection to storage, when each step occurred, what condition the samples were in and where each step took place.
4.4.3 Preservation and Storage
Retain the original preservative (formalin solution) for reuse in preserving the residue ofsorted samples, adding 5% formalin as needed to fill the sample jars. Store processed samples (i.e., detritus and organisms not removed from split samples) until sorting quality control checks are completed. Keep sorted ichthyoplankton in vials in a heated storage area until disposal is authorized (when the Comprehensive Demonstration Study is submitted to USEP A, presently scheduled for January 2008). Tape the tops ofjars and vials to prevent loss ofpreservative by evaporation.
4.4.4 Disposal
Disposal of sample residue remaining after sorting (detritus and organisms not removed from split samples) may proceed after sorting quality control has been completed. Disposal ofvials oforganisms from processed samples may proceed after receiving authorization from PSNH. Follow all applicable state and federal regulations for hazardous waste disposal.
4.5 DATA HANDLING
4.5.1 Data Sheets and Coding Instructions
Record ichthyoplankton counts and measurements on Entrainment Lab Count Data Sheets and Entrainment Lab Length Data Sheets (Appendix A). The Entraimnent Lab Count Data Sheet is for species identifications, life stage determination, and count data for all taxa. The Entrainment Lab Length Data Sheet is for measurements ofall fish larvae. ·.Indicate in the upper right-hand corner ofeach data sheet how many pages there are for the sample (use " I of1" for a one-page sample, "I of 2" and "2 of 2" for a two-page sample, etc.). Also record in the upper right-hand section of the first page the identifier' s initials, the date the sample was identified, and the number ofvials.
20472 Schiller Station Entrainment SOP Rev 0 Aug 2006 Normandeau Associates, Inc.
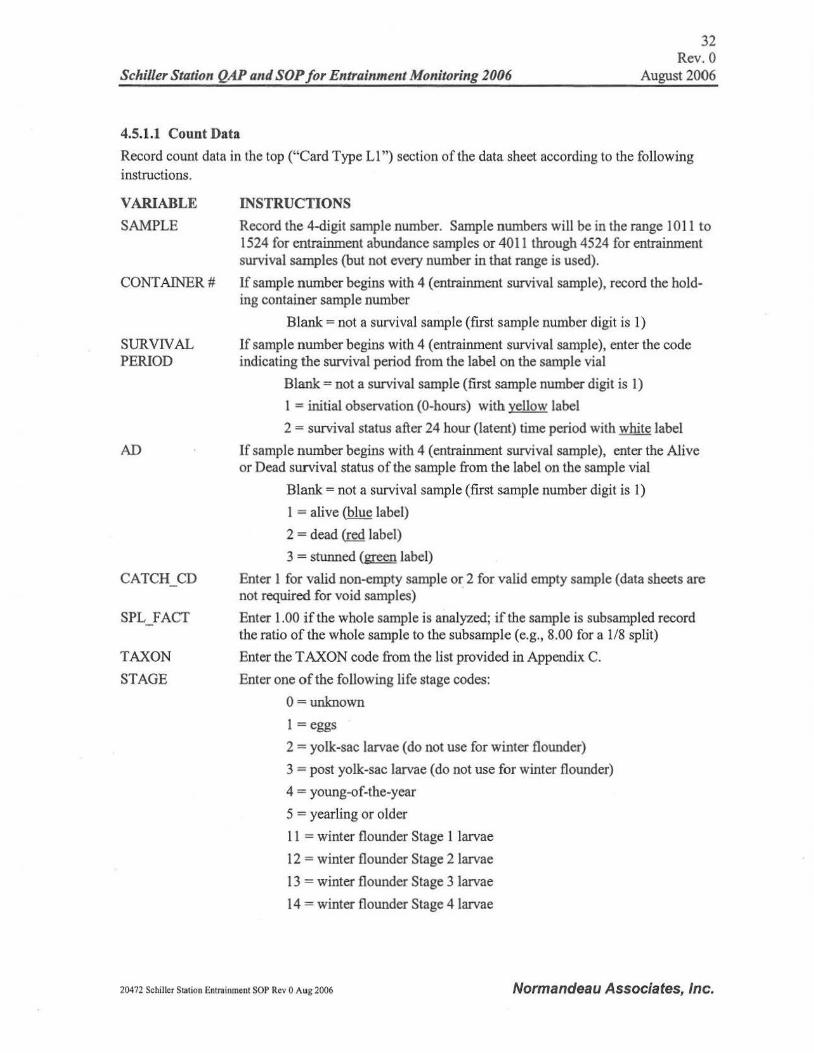
32 Rev.O
Schiller Station QAP andSOPfor Entrainment Monitoring 2006 August 2006
4.5.1.1 Count Data
Record count data in the top ("Card Type L1 ") section ofthe data sheet according to the following instructions.
VARIABLE
SAMPLE
CONTAINER#
SURVIVAL PERIOD
AD
CATCH CD
SPL FACT
TAXON
STAGE
INSTRUCTIONS
Record the 4-digit sample number. Sample numbers will be in the range 1011 to 1524 for entrainment abundance samples or 4011 through 4524 for entrainment survival samples (but not every number in that range is used).
Ifsample number begins with 4 (entrainment survival sample), record the holding container sample number
Blank= not a survival sample (first sample number digit is 1)
Ifsample number begins with 4 (entrainment survival sample), enter the code indicating the survival period from the label on the sample vial
Blank= not a survival sample (first sample number digit is 1)
1 =initial observation (0-hours) with yellow label
2 = survival status after 24 hour (latent) time period with white label
Ifsample number begins with 4 (entrainment survival sample), enter the Alive or Dead survival status ofthe sample from the label on the sample vial
Blank= not a survival sample (first sample number digit is 1)
I = alive (blue label)
2 = dead (red label)
3 = stunned (green label)
Enter I for valid non-empty sample or 2 for valid empty sample (data sheets are not required for void samples)
Enter 1.00 if the whole sample is analyzed; if the sample is subsampled record the ratio of the whole sample to the subsample (e.g., 8.00 for a l/8 split)
Enter the TAXON code from the list provided in Appendix C.
Enter one ofthe following life stage codes:
O=unknown
I= eggs
2 = yolk-sac larvae (do not use for winter flounder)
3 =post yolk-sac larvae (do not use for winter flounder)
4 = young-of-the-year
5 = yearling or older
11 = winter flounder Stage 1 larvae
12 = winter flounder Stage 2 larvae
13 = winter flounder Stage 3 larvae
14 = winter flounder Stage 4 larvae
20472 Schiller Station Entrainment SOP Rev 0 Aug 2006 Normandeau Associates, Inc.

33 Rev.O
Schiller Station QAP andSOPfor Entrainment Monitoring 2006 August 2006
VARIABLE
COUNT
SPECIES NAME
INSTRUCTIONS
Record the number oforganisms of the indicated taxon and life stage in the sample (or subsample)
Record the common name for the taxon
4.5.1.2 Measurement Data
Record measurement data for all fish larvae on one or more Entrainment Lab Length Data Sheets according to the following instructions.
VARIABLE
SAMPLE
Card Type
SURVIVAL PERIOD
AD
Conversion Factor
TAXON
FISH ID
STAGE(or "STG.")
SCALE
MEASUREMENT
INSTRUCTIONS
Record the sample number
Preprinted: L2
Ifsample number begins with 4 (entrainment survival sample), enter the code indicating the survival period from the label on the sample vial
Blank = not a survival sample (first sample number digit is I)
1 = initial observation at the time of frrst collection (0-hours)
2 = survival status after 24 hour (latent) time period
If sample number begins with 4 (entrainment survival sample), enter the Alive or Dead survival status ofthe sample from the label on the sample vial
Blank = not a survival sample (first sample number digit is 1)
1 = alive
2 =dead
3 =stunned
Record th.e number ofmillimeters per division for the optical micrometer used to measure larvae
Enter the TAXON code from the list provided in Appendix C.
Preprinted: 1-30 for each taxon of ichthyoplankton larvae.
Enter the life stage code for each larva measured (11, 12, 13, or 14 for winter flounder; or 2, 3, 4, or 5 for other species). Refer to the life stage code definitions used for count data (Section 4.3.3).
Enter 6 if measurements are recorded in optical micrometer units; enter 7 if measurements are recorded directly in millimeters. (Ifoptical micrometer units are recorded for a measurement, the actual length in millimeters will be obtained later by multiplying the measurement by the conversion factor.)
Record the total length offish larvae to the nearest 0.1 optical micrometer unit or to the nearest 0 .1 mm. Measure juvenile fish to nearest 1.0 mm.
20472 Schiller Station Entrainment SOP Rev 0 Aug 2006 Normandeau Associates, Inc.

34 Rev.O
Schiller Station QAP andSOPfor Entrainment Monitoring 2006 August 2006
4.5.2 Storage and Chain of Custody of Data Sheets
Maintain all completed data sheets in duplicate. Keep photocopies at the site oforigin and transfer the originals as needed from the laboratory to the data center, quality control, and a master project file. Track the custody of data sheets by means ofdata control logs.
4.6 QUALITY CONTROL
4.6.1 Tasks Subject to Quality Control
The following tasks are subjected to quality control checks consisting of reanalysis of randomly selected samples or measurements:
• sorting
• identification, life stage determination, and enumeration
4.6.2 Inspection Plans
Items are inspected using a quality control (QC) procedure derived from MIL-STD (militarystandard) 1235B (single and multiple level continuous sampling procedures and tables for inspection by attributes) to achieve a 10 percent or better AOQL (Average Outgoing Quality Limit). The QC procedure used is the CSP-1 continuous sampling plan, which is conducted in two modes as follows:
• Mode 1. Reinspect one hundred percent ofthe samples until "i" consecutive samples pass.
• Mode 2. After "i" consecutive samples pass QC reinspect~on, randomly choose (using a random numbers table) the fraction "f' ofthe samples for reinspection. Ifany QC sample fails then return to Mode 1.
For this application ofCSP-1, i=S and f=l/7, because the total number ofsamples analyzed by an individual is less than 500. It is important that QC inspections are performed as soon as possible after the original analysis; work-up ofQC samples must not be postponed to be done in batches. Keeping the QC program as current as possible insures that problems are detected and remedied quickly, minimizing the additional number ofsamples that are analyzed before the problem is addressed.
Select items for reanalysis according to the plan using a random number table. The original analyzer should not know whether a sample is to be checked before the analysis of that sample has been completed. Perform all quality control checks "blindly" (i.e. , the individual performing the QC inspection should have no knowledge of the original analyst's results).
Apply the QC plan on an individual processor basis, so that each person's work is subjected to the QC plan independently of others, starting at 100% inspection.
A resolution (third person) value may be determined for any sample found defective. All errors found during the QC check, whether the sample is found to be defective or not, are to be corrected on the data sheets. (A difference between original and QC counts that is within acceptable limits is not con
20472 Schiller Station Entrainment SOP Rev 0 Aug 2006 Normandeau Associates, Inc.
35 Rev.O
Schiller Station QAPandSOPfor Entrainment Monitoring 2006 August 2006
sidered to be an error). Results ofthe quality control program are to be presented to all sorters and identifiers and help is to be made available to anyone failing a QC check.
In some cases a QC inspection may be able to determine the taxon or life stage ofdamaged specimens when the original identifier has recorded them as unknown life stage, unidentified taxon, or a higher level taxon (genus or family). Ifa more general taxon or life stage used by the original identifier includes the more specific category used by the QC inspector, and that is the only reason for a count discrepancy, then that sample does not fail the QC inspection on the basis of that taxon. For example, damaged specimens recorded as Marone sp. by the original identifier and as striped bass by the QC
inspector are to be considered in agreement because the category Marone sp. includes striped bass. In contrast, an original determination ofunidentified gobiid would not be acceptable ifthe QC determination was striped bass, because striped bass is not included in the family Gobiidae. If substantial differences occur between the original and QC counts as a result of identifying or staging to different levels, then the identifier should be provided with additional guidance or training to minimize such differences in future samples.
4.6.3 Acceptance/Rejection Criteria
4.6.3.1 Sorting
A sample is considered defective if the sorter failed to remove 10 percent of the total organisms in the sample (or subsarnple). Percent error is calculated as follows (where "QC count" denotes the number missed by the sorter):
%error = 100% x QC count/(sorter's count+ QC count)
When the total count (sorter's plus QC) is ~0. then the sample is considered defective only if the sorter missed more than two organisms.
4.6.3.2 Identification
A sample is considered defective ifan error of 10 percent or more is made in identifying, assigning a life stage, or counting any species. In determining whether a sample is defective, analyzer and QC results are compared within each taxon/life stage combination.
For each taxon (or for a life stage within a taxon) the percent error is calculated as follows (except where the QC count is ~20, the percent error is considered to be zero ifanalyzer and QC counts differ by no more than two organisms):
% error = 100% x Ianalyzer count - QC count I/QC count
A sample with a percent error ofgreater than or equal to 10% for any life stage for any taxon is considered defective.
For each defective sample, a resolution may be determined in which a third person reanalyzes the sample (resolution value). The error for each species and life stage will then be calculated using the
resolution counts as the divisor. This will be done for both identification and QC counts:
% error = I 00% x Iidentifier count - resolution count II resolution count
20472 Schiller Station Entrainment SOP Rev 0 A11g 2006 Normandeau Associates, Inc.

36 Rev. O
Schiller Station QAP andSOPfor E11trainment Mo11itoring 2006 August 2006
% error =100% x IQC count - resolution count II resolution count
If the resolution vs. identifier error is <1 0 percent, the sample passes. If they are not, the sample fails and identifier counts are replaced by QC counts for all cases, provided the QC vs. resolution error is <1 0 percent. If the resolution vs. identifier and the resolution vs. QC errors are both 10 percent or more, the sample will be thoroughly reviewed by all three people and the identifier's sample processing will not continue until agreement can be reached on the identification ofthe sample. Subsequent samples will be reanalyzed by the QC person until eight consecutive samples pass. Notify the Laboratory Manager ofany identifier exceeding two failed samples.
4.6.4 Quality Control Records
Maintain quality control logs, documenting the samples analyzed, the samples selected for reanalysis according to the QC p lan, the results ofthe QC analysis, and any corrective action performed. All QC logs will be 100% inspected monthly by the Laboratory Supervisors. A summary report ofquality control results and follow-up corrective action will be submitted to the client upon request.
4.6.5 Quality Control Personnel
The QC of the sorting process is to be conducted under the direct supervision of the Sorting Supervisor. Only the Sorting Supervisor or individuals with a documented sorting QC record of superior performance may provide sort QC.
Regarding identification QC, only the Identification Supervisors will be performing the QC on ichthyoplankton identification.
4.7 REFERENCE COLLECTION
Make sure that each taxon and life stage identified in the entrainment program is represented in a project-specific reference collection at Normandeau's biology laboratory. Add to that reference collection as needed by removing specimens from PSNH entrainment samples and storing them in vials in a designated area. Ifavailable, include several (e.g., I 0) specimens per taxon per stage, displaying a variety ofsizes. Label the vials with the scientific name, date ofcapture, capture location, and a reference collection catalog number. The catalog number identifies a card containing more detailed sampling information, identifier, comments, etc. File the cards alphabetically by family, genus, and species.
4.8 INSTRUMENT CALIBRATION
Calibrate each ocular micrometer periodically (at least weekly) using a stage micrometer. After calibration ofocular micrometers on zoom microscopes, place a calibration mark on the microscope so that measurement accuracy is maintained. Ocular micrometers on microscopes that have been ad
justed or moved must be recalibrated before use. Document the calibrations in a log showing the dates and results of the calibrations.
20472 Schiller Station Entrainment SOP Rev 0 Aug 2006 Normandeau Associates, Inc.

37 Rev. 0
Schiller Station QAP andSOPfor Entrainment Monitoring 2006 August 2006
5.0 DATA PROCESSING
5.1 DATA ENTRY VERIFICATION
A submittal form will be provided with each batch ofdata sheets submitted to the Technical Data Processing (TDP) department in the Bedford office for data entry. Information on the submittal form should include names ofsender and recipient, date sent, and dates of impingement collections included in the batch.
All data will be keyed twice, resolving discrepancies between the two versions as they are flagged by the data verification program.
5.2 SYSTEMATIC ERROR CHECKS
Keyed data will be subjected to a series of systematic error checking programs developed specifically for this project. These consist ofunivariate, bivariate, and multivariate checks specified by project personnel. Univariate range checks identify records for which one or more variables have values outside their valid or expected ranges. Bivariate and multivariate checks compare values of related variables. Additional checks scan the data for duplicate or missing observations. All records flagged by these programs will be resolved, and corrections to both the data files and the data sheets will be made as necessary. After error checking is complete, data files will be subjected to quality control inspection (refer to Section 5.4).
5.3 DATA FILE FORMAT
Error checked data files will be assembled into a computerized database.
5.4 QUALITY CONTROL OF DATA FILES
Data flies that have completed the systematic error checking process will undergo a QC inspection to assure a 1% AOQL (Average Outgoing Quality Limit) according to a lot sampling plan (American Society for Quality Control. 1993. Sampling procedures and tables for inspection by attributes.
ANSJ/ASQC Zl.4-1993). This procedure insures that ~99% of the observations in a data file agree with the original data sheets. The number ofobservations to be checked, and the number of those that must be within tolerance. are shown below. Ifmore than the acceptable number of failures are found, then the data set must be inspected 100%.
20471 Schiller Station Entrainment SOP Rev 0 Aug 2006 Normandeau Associates, Inc.

38 Rev.O
Schiller Station QAP andSOPfor Entrainment Monitoring 2006 August 2006
Lot Sampling Plan for QC Inspection at Less Than 1% AOQL.
Number of Failures
Lot Size Sample Size Accept If :S Reject If~
1-32 ALL 0
33-500 32 0 1
501-3,200 125 I 2
3,201-10,000 200 2 3
I 0,001-35,000 315 3 4
35,001-150,000 500 5 6
150,001-500,000 800 7 8
500,001 and over 1,250 10 11
6.0 TRAINING
In order to assure the standardization offield, laboratory, and data processing procedures, Normandeau has developed a two-level system for training technicians: the first level being documented standard operating procedures; the second level being a training program for all new project personnel. At a minimum, this training program consists ofthe following steps:
• A complete reading and explanation of the project SOP and QA manual. This is documented by a sign-off sheet which is filed in the program file.
• Observation by the Program Manager, Field Site Supervisor or Laboratory Manager of the fliSt two or more times a new procedure is performed. This is documented with a signed checklist.
• Direct supervision by an experienced technician ofpersonnel assigned to unfamiliar tasks for their first two or more attempts.
• 1 00% quality control checks for at least the first five samples analyzed.
• On tasks requiring identification of fish and ichthyoplankton, the Program Manager will have fmal approval as to who is qualified to make these identifications. In some cases special training will be required to participate in tasks, as set forth by the Program Manager.
7.0 QUALITY ASSURANCE PLAN
Normandeau' s Program Manager is Mr. Richard Simmons. The program Technical Director is Dr. Mark Mattson, who will be the principle report reviewer and co-author. Normandeau's Quality Assurance Director is Mr. Robert Hasevlat, who is independent ofthe project and reports directly to the company's President, Ms. Pamela Hall. The Field Supervisor is Mr. Michael Jeanneau. Field crew members include Mr. Michael Jeanneau, Mr. Cory Francis, Mr. Donald Mason, Mr. AI Frizzell, Mr.
20472 Schiller Station Entrainment SOP Rev 0 Aug 2006 Normandeau Associates, Inc.

39 Rev.O
Schiller Station QAP andSOPfor Entrainment Monitoring 2006 August 2006
Chris Baker, Ms. Shayle Reed, and Mr. Randy Whistler. Nonnandeau's laboratory fish taxonomist is Mr. Joseph Strube. Nonnandeau's technical infonnation processing services will be provided by Ms. Susan Ward or Mr. Chris Gushin. Report authors and data analysts will include Mr. Paul Lindsay, Mr. Drew Trested, or Mr. Jason Wyda.
7.1 IMPORTANCE OF QUALITY ASSURANCE
The analytical study will provide qualitative and quantitative data for use in decision making. To be valuable, the data must accurately describe the characteristics and concentrations ofconstituents in the sample analyzed. In many cases, because they lead to faulty interpretations, approximate or incorrect results are worse than no results at all. Decisions on process changes, plant modifications or the construction ofnew facilities may be based upon the results offield and laboratory analysis. The financial implications ofsuch decisions make it imperative that extreme care be taken in analysis. The analyst should realize not only that he/she has considerable responsibility for providing reliable descriptions of the samples at issue, but also that his/her professional competence, the validity of the procedures used, and the resulting values reported may be challenged (perhaps in court). For the analyst to meet such challenges, he/she should support the data with an adequate documentation program that provides valid records of the control measures applied to all factors bearing on the final results of investigations. Although all analysts practice quality control (QC) in amounts depending upon their training, professional pride, and the importance of their particular projects, under actual working conditions sufficiently detailed QC may be neglected. An established, routine, quality assurance program applied to each analytical test will provide the detailed QC necessary to insure the validity and reliability of the data.
7.2 QUALITY ASSURANCE
A Quality Assurance (QA) Program will be implemented that will provide a 10% Average Outgoing Quality Limit (AOQL) (i.e., 10% or less non-conforming product) for all field or laboratory measurement parameters and a 1% AOQL (i.e., 1% or less non-conforming product) for all data calculations and data tables. This Quality Assurance Program is designed to meet or exceed the USEPA's guidance criteria and be consistent with the intent offederal regulations (10 CFR 50) which require that quality assurance be separated from operational and budgetary concerns. Normandeau has a full time Quality Assurance Director who supervises the implementation and documentation of the QA Program and reports directly to the President of the Company.
Normandeau's Quality Assurance Program will comprise two systems: a quality control (QC) system and a quality assurance (QA) system. The principal strengths of the QA Program are the functional independence of the systems and the common collection and interpretation point for quality related information, the Quality Assurance Director. The QC system is managed by the Program Manager
and conducted by operational personnel. The QA system is managed by Normandeau's Quality Assurance Director and utilizes project-independent technical personnel during performance and system audits.
20472 Schiller Station Entrainment SOP Rev 0 Aug 2006 Normandeau Associates, Inc.

40 Rev.O
Schiller Station QAP andSOPfor Entrainment Monitoring 2006 August 2006
7.3 QUALITY CONTROL
The function of the QC system is to continually monitor the reliability and validity (accuracy, precision, and completeness) ofdata produced on a daily basis. The QC system is approved by the QA Director and incorporated into the project Standard Operating Procedures (SOP); any changes to the SOP must be coordinated through Normandeau's QA Department and approved by a client representative. The project SOP will describe and document the following tasks:
• technical requirements, methods, and procedures,
• Quality Control program,
• instrument maintenance and calibration,
• document control and documentation ofthe resulting from sample analysis, instrument maintenance and calibration and data processing,
• sample control procedures, and
• training of technicians.
Tasks subject to 10% AOQL quality control inspection will be specified in the project SOP. Quality
assurance audits of field and laboratory activities will be performed at least once per year to verify that procedures are carried out as specified in the SOP and to verify the effectiveness of the quality control system. Computer entry ofdata from data sheets will be subjected to double entry verifica
tion. Computer files will be subjected to a rigorous set ofunivariate, bivariate, and multivariate sys
tematic error checks. Analytical files will then be subjected to a 1% AOQL quality control inspection
to verify that values have correctly been correctly transferred from data sheets to the analytical files . Representative data values in tables and graphs will be verified by recalculating them from the origi
nal data.
7.4 NONCONFORMANCE REPORTS AND CORRECTIVE ACTION
Documentation ofproblems or unusual events occurring during a program will be accomplished using Extraordinary Event/Nonconformity (EENC) forms. The EENC form (Appendix A) is designed to dispense information to the Program Manager and Quality Assurance department and to obtain necessary action on items that are critical to technical operations and management ofprograms. The report results from observations such as these:
• deviations from standard operating procedures
• losing a sample
• fmding an endangered species in a sample
• noting samples that are grossly different from expected (content, preservation, labels)
• noting a phenomenon that may deserve continued monitoring in the interest of the client and therefore may require a change in the scope ofwork
20472 Schiller Station Entrainment SOP Rev 0 Aug 2006 Normandeau Associates, Inc.
41 Rev.O
Schiller Station QAP andSOPfor Entrainment Monitoring 2006 August 2006
• quality control samples that exceed acceptable limits
• unusually high organism counts.
Items, samples, data, or information not in conformity with sp ecificat ions or which do not meet preconditions for the next step in processing or use, will be set aside until the problem is resolved and documented via the EENC report procedure.
The EENC report is designed for use by any person who identifies a problem or discovers information that is germane to a program scope ofwork or the improvement or change ofcontract performance. The originator describes the problem and may make recommendations for its resolution. Two temporary copies are made, and the original is sent to the Program Manager. One of the copies is kept by the originator in a file for "open" EENC reports (corrective action in progress), and the other is sent to the Quality Assurance Supervisor, who periodically checks on the progress ofcorrective action.
The Program Manager confers with appropriate parties and decides what corrective action will be required. Instructions to the Action Addressee (the person responsible for carrying out the corrective action) are written on the original EENC report. The Program Manger retains the original and sends a copy to the Action Addressee.
The Action Addressee resolves the problem as directed and then signs the EENC copy and returns it to the Program Manager to signify that the corrective action has been completed.
The Program Manager files the signed copy from each Action Addressee (there may be more than one), and when all corrective action is complete signs the original EENC report, keeps a temporary copy, and forwards the original to the QA Supervisor.
The QA Supervisor reviews the EENC report, and signifies acceptance of the resolution by signing and dating the report to "close" it. A copy ofthe closed EENC report is retained in QA files, the temporary copy received earlier from the originator is discarded, and the origin al is returned to the Program Manager.
The Program Manager discards the temporary copy and keeps the original on flle. A copy ofthe closed EENC report is sent to the originator, and additional copies are sent to any other affected parties. The originator discards the temporary copy in the file ofopen EENC reports and files the copy of the closed EENC report.
7.5 QA AUDITS
It is the responsibility of the Quality Assurance organization to verify the achievement ofquality through all phases of the project. Once the proposal, program design, and work development phases are complete, these responsibilities will be accomplished primarily by audits, tests, and surveys which will provide objective evidence that the quality control program and technical requirements, m ethods, and procedures as outlined in the study QA manual are being implemented. All fie ld, laboratory, and data processing tasks will be subject to at least one audit. These audits will be conducted by an audit team of technically qualified personnel familiar with, but independent ofand not responsible for, the
20472 Schiller Station Entra inment SOP Rev 0 Aug 2006 Normandeau Associates, Inc.

42 Rev. 0
Schiller Station QAP andSOPfor Entrainment Monitoring 2006 August 2006
work or activities under evaluation. The audit team will review the operations, specifications, QC systems, plans, and project objectives and examine the acquisition and transfer ofdata from field to report.
Observations ofnonconformities and program deficiencies will be classified into three categories:
A. Deficiencies that affect the data adversely;
B. Deficiencies that might affect the data adversely; and
C. Deficiencies or procedural changes that cannot affect the data adversely.
Class A deficiencies will be resolved before that portion of the program can proceed. Class B deficiencies must have a determination as to whether they should be changed to Class A or C deficiencies and whether or not corrective action is necessary. Ifcorrective action is necessary, it will be performed within a reasonable time frame agreed to by the program management, the Quality Assurance Department, and PSNH. Operations with Class A orB deficiencies will be subject to re-audit to determine the effectiveness ofcorrective action. Class C deficiencies must have corrective action accomplished before the next scheduled audit or end of the project, whichever comes first.
Audit results will be presented orally to the appropriate project or facility management by the audit team after the audit has been completed. At this time, specific findings will be presented and recommended courses ofcorrective action developed. Subsequently, the audit results will be documented in a written audit report and reviewed by management having responsibility in the areas audited. These reports will include a sununary ofaudit results, observations made with a listing ofnonconformities, recommendations and corrective action taken.
The quality assurance director will maintain a file ofall project and facility audits. This file will include copies ofthe audit checklists, audit reports, written replies, the record ofcompletion ofcorrective action and follow-up action. Further copies of the audit reports, written responses and records of completion ofcorrective actions will be sent to Ms. Pamela S. Hall, Normandeau' s President.
20472 Schiller Station Entrainment SOP Rev 0 Aug 2006 Normandeau Associates, Inc.

Rev. 0 Schiller Station QAP andSOPfor Entrainment Monitoring 2006 August 2006
APPENDIX A
Forms
20472 Schiller Suuion Entrainment SOP Rev 0 Aug 2006 Normandeau Associates, Inc.

Rev. 0 Schiller Station QAP and SOPfor Entrainment Monitoring 2006 August 2006
SCHILLER STATION, 2006 Entrainment Field Data Sheet
Ta.~k Code Wetk Die! Use Code Comments
Screen House #2OJ ITJ D D D _... 4•,. .... alo
DATE&TIME *Month. and day rtfu to whe.nSlarll end the 2.C ho urs umple beganI I I I
C ALIBRATION Gallons• Calibration seconds lime for sompUn.c pump 10 IUl calibration lank
Calibration gallons caUbratlon tank volurM (210 gal) ... Calibration gpm • cal. lonk vol./ (cal. Seconds / 60) "'"§IEllllfrer-..u· Sampling time • l6,4ZO gol / tal. Cpm
* flowme-ter totaliur rt:adiAC
%Error ~ 100 x (gaucc u>m - cali.brallon pm) I caUb,..Uon um
Average "'o Error If •;. error l"tafH tAla• J•/., condvd 3 trlab and l "tr'IICt EEE WATER QUALITY Start End
lemp. E§ temp. EE§ salinity I salinity I
D.O. D.O.
ENVIRONMENT
Start
End
COMMENTS
w..... numb«whbin ye~r (01·S2)
Did· 1•1000 · 1600
2. 1600 ·1200
l•2l00 · 114110
4 •1)41)0-1000
U..Cock 1-wlidU~~~pif
Cklw:ICO'\'tt:
2· ... . ............... _
J-..ld(oo,_ple)
- I.,. Iz... Pncip_
CODES
0:-:1-9% "'"""'"" ll-No Wind
1•10.19.... I•Nri
2-20-n% :z.so.~
1-30-39% ):af..Jt
~91>. ..,..... Sol<I-S9% 'Mo4Spool I•LcavaNttlt..willd,. fact- , ...~aa4 twtp •• a.JIMI... ftat ·~
7.-'70-79l. J-»!.1CillulltooieplpG', ,.., • .,...
1•10-1,... ......Uhesko-10 twa:r
-~-S._lllokna.. .obo•
I):
I•UpoR.Ilo
2•"-YR.>Io
l .,..Soow
I
20472 Schiller Station Entrainment SOP Rev 0 Aug 2006 Normandeau Associates, Inc.

Rev.O Schiller Station QAP andSOPfor Entrainment Monitoring 2006 August 2006
SCHILLER STATION, 2006 Entrainment Survival Field Observation Sheet Screen House #2
Task Code
[!] Week
I Die I
CJ Comments
D Unit
[!] Period
D
Collection Time:
min' hour•
• Start time for 10 min. survival collection (0000·2359 hrs)
Container 10# Observation Time . ! ; . ! : . I . . I . . I . • I . . I . . I • •
AD Count
Comments
CODES Per1od: 1 : Initial obsetVatlon (Ume'<Ohrs) AO: ! • aliveWeek: number wttlin ye~r l01-52}_ J
2 =dead Diel: 1 = 1000- 1600 2 =Latent observation (time=24hrs) I 2 . 1600-2200 3 • stunned Organism: 1 • fish
3 • 2200 - 0400 2 = macrCH:rustacean I 4 =0400- 1000 Life Stage: 1 = egg I
Comments: 1 • yes 2 • larvae
2 = no I
20472 Schiller Station Entrainment SOP Rev 0 Aug 2006 Normandeau Associates, Inc.
I

Rev. O Schiller Station QAP andSOPfor Entrainment Monitoring 2006 August 20 06
SCHILLER STATION, 2006 Entrainment Lab Count Data Sheet
Sample Card Container# Period AD Catch_ CD Analyzed By:----
DD D No. Vials:
Date: -----SPL_FACT TAXON STAGE COUNT SPECIES NAME
Sample I Card Type ~
.! CD
til I'll til fti u; ~ Msrmnt u; ~ Msrmnt
11 21
222 12
3 13 23
4 14 24
5 15 25
6 16 26
17 27 7
8 18 28
299 19
10 20 30
tilu;
Conversion Factor
Gl fti ~ Msrmnt
tilu; 31
32
33
34
35
36
37
38
39
40
Ql
fti ~
Stage Codes
0 = unknown
1 "899
2 =yolk-sac larvae
3 • post yolk sac larvae
4 =young ofyear
5 • ye ar11ng or older
6 • W F stage 1
7 • WF stage 2
8 =WF stage 3
9 • W F stage 4
Taxon
Ql "i
Msrmnt u; ~ Msrmnt til
41
4 2
43
44
4 5
46
4 7
4 8
4 9
50
PAGE of
20472 ~hiller Station Entrainment SOP Rev 0 Aug 2006 Normandeau Associates, Inc.
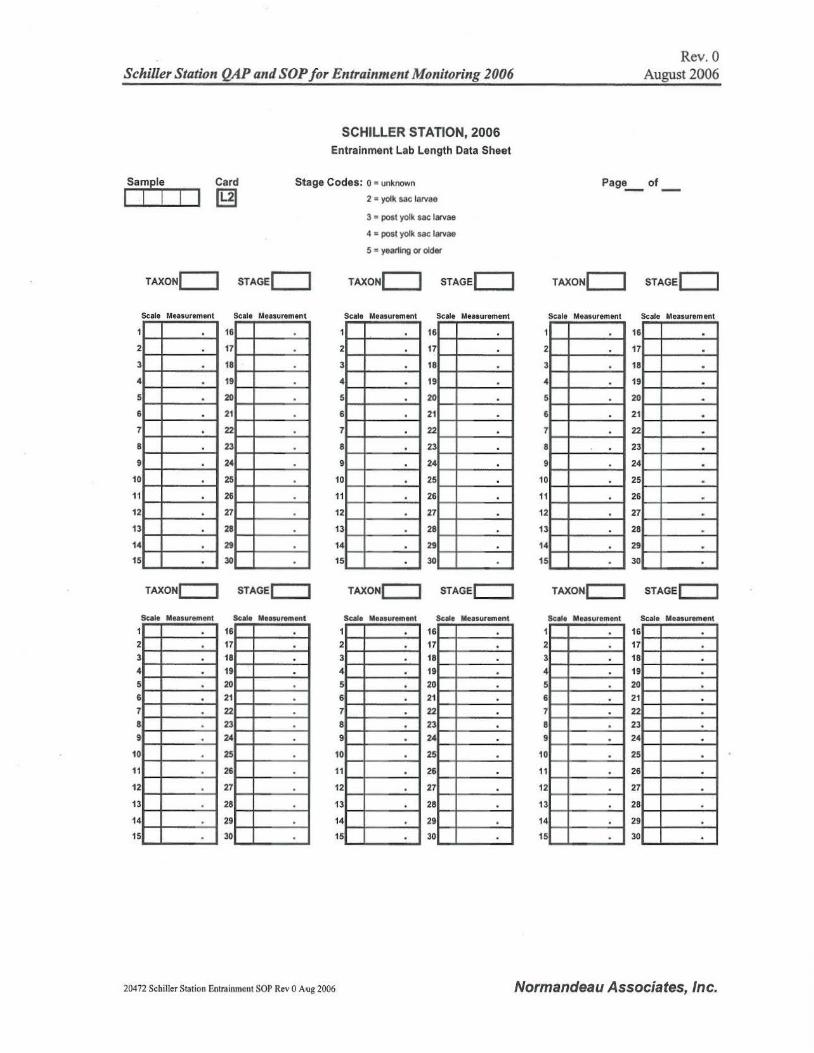
Rev. 0 Schiller Station QAP andSOPfor Entrainment Monitoring 2006 August 2006
SCHILLER STATION, 2006 Entrainment Lab Length Data Sheet
Sample Card Stage Codes: o~ unknown
I I I ~
TAXONc::J
Seale Mea.$urement
2
3
4
5
6
7
8
9
10
11
12
13
14
15
TAXONr::::J
Seale Mtasurement
2
3
4
5
6
7
a 9
10
11
12
13
14
15
STAGEc::J
Scala Measurement
16
17
18
19
20
21
22
23
24
25
26
27
28
29
30
STAGEc::::J
Scale M..ouroment
16
17
18
19
20
21
22
23
24
25
26
27
28
29
30
2 • yolk sac larvao
3 = post yolk sac larvae
4 • post yolk sac larvae
5 =year1ing 01" older
TAXONc::J
Scale Measurement
2
3
4
s 6
7
8
9
10
11
12
13
14
15
TAXONc:::J
Scale Meaaurement
1
2
3
4
5
6
7
8
9
10
11
12
13
14
15
STAGEc::J
Scale Measurement
16
17
18
19
20
21
22
23
24
25
26
27
28
29
30
STAGEc::::J
Seale Measurement
16
17
18
19
20
21
22
23
24
25
26
27
28
29
30
.
.
.
Page_ of
TAXONc::J
Seale Measurement
2
3
4
5
6
7
8
9
10
11
12
13
14
15
TAXONc:::J
Selle Meuurement
2
3
4
5
6
7
8
9
10
11
12
13
14
15
STAGEr::::::J Scale Measurement
16
17
18
19
20
21
22
23
24
25
26
27
28
29
30
STAGEc:::::J Scale Meuurement
16
17
18
19
20
21
22
23
24
25
26
27
28
29
30
20472 Schiller Station Entrainment SOP Rev 0 Aug 2006 Normandeau Associates, Inc.

____ _ _ ______ _
____________ _
.... ~ .....
g> "' EXTRAORDINARY EVENT/NONCONFORMITY REPORT ~ !f Dare:_________________________ From:EE/NC Report Number: FIELD( number)"' ~ c;·
m Project No.: Title:" --------------Respond by (date): ~ ;;·
Date closed:&:: ADDRESSEES:"' 0 QA: . { Project Mgr.: _ _ _ Field Mgr.: ___ _ LabMgr.: ___ Technical Mgr.: ___ Others: "" ~
< 0
>,; PROBLEM DEFINITION (e.g .. Sample ID, Activity, Data, Standard, etc. Not in Conformity):00
"' §!
RECOMMENDATIONS F OR or CORRECTIVE ACTION T AKEN:
Signed: g:
ACI'ION ADDRESSEE RESPONSE:~ a.
~ t: :t. Cll Cll
(') CORRECTIVE ACTION COMPLETED: Date: - - - ----Signed:-
j a. -· ---------------------------
Distribution: ORIGINAL:QA, COPIES OfORIGINAL: Originator, Addressees RESPONSES: QA (responses are10 bemade on copies)5"
~
~ ....:::: ~, ~ s· ::
~ .., ~ t'.)
~ ~ , ~ ~ s· $1 ~ :a ~ :: ~-, ~-~
~
~ ~ ~:::0 N~O< o · 0\0
0

Rev. 0 Schiller Station QAP and SOPfor Entrainment Monitoring 2006 August 2006
APPENDIXB
Taxon Identification Codes
20472 Schiller Slation Enlrnimnenl SOP Rev 0 Aug 2006 Normandeau Associates, Inc.
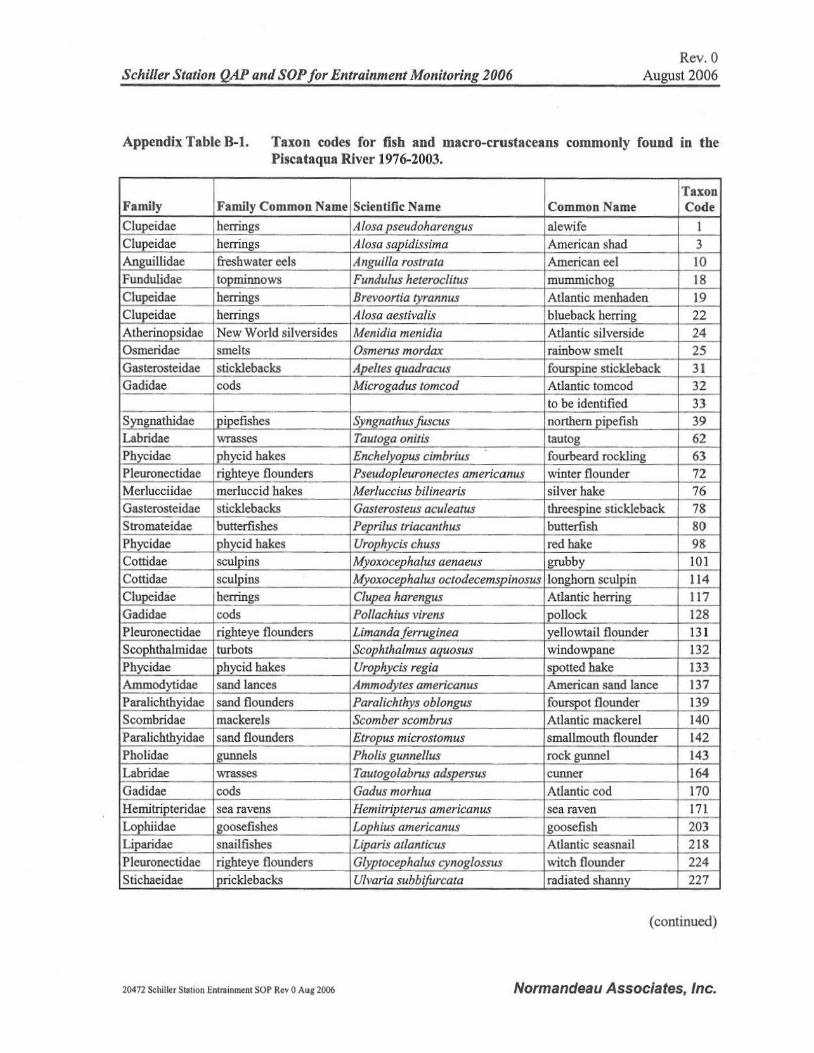
Rev.O Schiller Station QAP and SOPfor Entrainment Monitoring 2006 August 2006
Appendix Table B-1. Taxon codes for fish and macro-crustaceans commonly found in tbe Piscataqua River 1976-2003.
Family Family Common Name Scientific Name Common Name Taxon Code
Clupeidae herrings Alosa pseudoharengus alewife 1 Clupeidae herrings Alosa sapidissima American shad 3 Anguillidae freshwater eels Anguilla rostrata American eel 10 Fundulidae topminnows Fundulus heteroclitus mummichog 18 Clupeidae herrings Brevoortia tyrannus Atlantic menhaden 19 Clupeidae herrings Alosa aestivalis blueback herring 22 Atherinopsidae New World silversides Menidia menidia Atlantic silverside 24 Osmeridae smelts Osmerus mordax rainbow smelt 25 Gasterosteidae sticklebacks Apeltes quadracus fourspine stickleback 31 Gadidae cods Microgadus tomcod Atlantic tomcod 32
to be identified 33 Syngnathidae pipefishes Syngnathus foscus northern pipefish 39 Labridae wrasses Tautoga onitis tau tog 62 Phycidae phycid bakes Enchelyopus cimbrius fourbeard rockling 63 Pleuronectidae righteye flounders Pseudopleuronectes americanus winter flounder 72 Merlucciidae merluccid bakes Merluccius bilinearis silver hake 76 Gasterosteidae sticklebacks Gasterosteus acu/eatus thteespine stickleback 78 Stromateidae butterfishes Peprilus triacanthus butterfish 80 Phycidae _ehycid bakes Urop}!ycis chuss red hake 98 Cottidae sculpins Myoxocepha/us aenaeus grubby 101 Cottidae sculpins Myoxocepha/us octodecemspinosus longhorn sculpin 114
Clupeidae herrings Clupea harengus Atlantic herring 117 Gadidae cods Pollachius virens pollock 128 Pleuronectidae righteye flounders Limanda ferruginea yellowtail flounder 131 Scopbthalmidae turbots Scophtha/mus ag~,JOSus windowpane 132 Phycidae iphycid bakes Urophycis regia spotted bake 133 Ammodytidae sand lances Ammodytes american us American sand lance 137 Paralichthyidae sand flounders Paralichthys oblongus fourspot flounder 139 Scombridae mackerels Scomber scombrus Atlantic mackerel 140 Paralichthyidae sand flounders Etropus microstomus smallmouth flounder 142 Pholidae gunnels Pholis gunnel/us rock gunnel 143 Labridae wrasses Tautogolabrus adspersus cunner 164 Gadidae cods Gadus morhua Atlantic cod 170 Hemitripteridae sea ravens Hemitripterus americanus sea raven 171
Lophiidae . goosefishes Lophius americanus goose fish 203 Liparidae snail fishes Liparis at/anticus Atlantic seasnail 218 P leuronectidae righteye flounders Glyptocephalus cynoglossus witch flounder 224 Stichaeidae prickle backs U/varia subbiforcata radiated shanny 227
(continued)
20472 Schiller Station Entrainment SOP Rev 0 Aug 2006 Normandeau Associates, Inc.

Rev. 0 Schiller Station QAP andSOPfor Entrainment Monitoring 2006 August 2006
Appendix Table B-1. (Continued)
Family Family Common Name Scientific Name Common Name Taxon Code
Gadidae cads Brosme brosme cusk 228 Pleuronectidae righteye flounders Hippoglossoides platessoides American plaice 230 Gadidae cods Melanogrammus aeg/ejinus haddock 237 Portunidae swimming crab Carcinus maenus green crab 762 Cancridae rock crab Cancer irroratus Atlantic rock crab 764 Cancridae rock crab Cancer borealis Jonah crab 765 Cancridae rock crab Cancersp. unidentified cancer crab 766 Nephropsidae lobster Homarus americanus American lobster 770 Majidae spider crab Libinia sp. unidentified spider crab 821 Grapsidae shore, marsh., talon crab Hemigrapsus sanguineus Japanese shore crab 835 Note: check Appendix Table B-2 for taxa not found on this list.
20472 Schiller Station Entrainment SOP Rev 0 Aug 2006 Normandeau Associates, Inc.
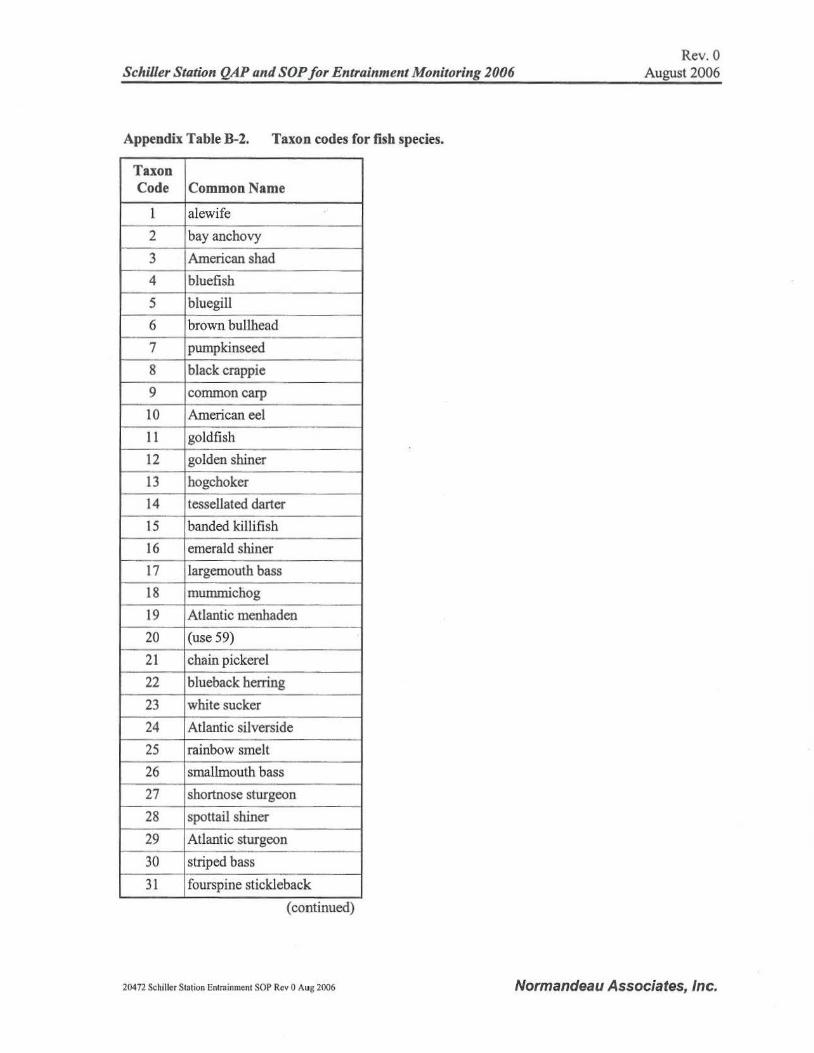
Rev.O Schiller Station QAP andSOPfor Entrainment Monitoring 2006 August 2006
Appendix Table B-2. Taxon codes for fish species.
T axon Code Common Name
1 alewife
2 bay anchovy
3 American shad
4 bluefish
5 bluegill
6 brown bullhead
7 pumpkinseed
8 black crappie
9 common carp
10 American eel
11 goldfish
12 golden shiner
13 hogchoker
14 tessellated darter
15 banded killifish
16 emerald shiner
17 largemouth bass
18 mummichog
19 Atlantic menhaden
20 (use 59)
21 chain pickerel
22 blueback herring
23 white sucker
24 Atlantic silverside
25 rainbow smelt
26 smallmouth bass
27 shortnose sturgeon
28 spottail shiner
29 Atlantic sturgeon
30 striped bass
31 fourspine stickleback
(continued)
20472 Schiller Station Entrainment SOP Rev 0 Aug 2006 Normandeau Associates, Inc.

Rev. O Schiller Station QAP and SOPfor Entrainment Monitoring 2006 August 2006
Appendix Table B-2 (Continued)
Taxon Code Common Name
32 Atlantic tomcod
33 to be identified
34 white catfish
35 white perch
36 yellow perch
37 satinfin shiner
38 rock bass
39 northern pipefish
40 redbreast sunfish
41 Atlantic needlefish
42 crevalle jack
43 eastern silvery rniJUlow
44 fall fish
45 weakfish
46 comely shiner
47 common shiner
48 mimic shiner
49 lookdown
50 unidentified clupeid
51 (use 50)
52 (use 60)
53 grass pickerel
54 lined seahorse
55 logperch
56 trout -perch
57 northern hog sucker
58 fathead minnow
59 unidentified cyprinid
60 unidentified Marone
61 redfin pickerel
62 tautog
63 fourbeard rockling
(continued)
20472 Schiller Station Entrainment SOP Rev 0 Aug 2006 Normandeau Associates, Inc.

Rev.O Schiller Station QAP andSOPfor Entrainment Monitoring 2006 August 2006
Appendix Table B-2 (Continued)
Taxon Code Common Name
64 striped cusk-eel
65 (use 96)
66 northern kingfish
67 spot
68 Atlantic moonfish
69 brook stickleback
70 unidentified sturgeon
71 scup
72 winter flounder
73 inland silverside
74 sea lamprey
75 gizzard shad
76 silver hake
77 striped mullet
78 threespine stickleback
79 brown trout
80 butterfish
81 white crappie
82 brook trout
83 northern pike
84 green sunfish
85 silver perch
86 northern puffer
87 eastern blacknose dace
88 bridle shiner
90 cutlip minnow
96 unidentified centrarchid
97 spotfm shiner
98 red hake
99 unidentifiable
100 central mudminnow
101 grubby
( contmued)
20472 Schiller Station Entrainment SOP Rev 0 Aug 2006 Normandeau Associates, Inc.

Rev.O Schiller Station QAP andSOPfor Entrainment Monitoring 2006 August 2006
Appendix Table B-2 (Continued)
Taxon Code Common Name
102 eastern mudminnow
103 white bass
104 rough silverside
105 longear sunfish
106 summer flounder
107 longnose dace
108 creek chub
109 black bullhead
110 striped searobin
111 northern searobin
113 Atlantic croaker
114 longhorn sculpin
115 round herring
116 hickory shad
117 Atlantic herring
118 reef silverside
119 striped anchovy
120 conger eel
121 striped killifish
122 warmouth
123 bluntnose minnow
124 walleye
125 white mullet
126 yellow bullhead
127 channel catfish
128 pollock
129 seaboard goby
130 nakedgoby
131 yellowtail flounder
132 windowpane
133 spotted hake
134 unidentified searobin
(continued)
20472 Schiller Station Entrainment SOP Rev 0 Aug 2006 Normandeau Associates, Inc.

Rev. 0 Schiller Station QAPandSOPfor Entrainment Monitoring 2006 August 2006
Appendix Table B-2 (Continued)
Taxon Code Common Name
136 northern stargazer
137 Aunericansandlance
138 fat sleeper
139 fourspot flounder
140 Atlantic mackerel
141 black sea bass
142 smallmouth flounder
143 rock gurmel
144 inshore lizardfish
145 unidentified mudminnow
146 silver lamprey
147 rainbow trout
148 rosyface shiner
149 unidentified Esox
150 unidentified gobiid
151 unidentified Fundulus
152 unidentified cyprinodontid
unidentified Myoxocephalus153
154 unidentified cottid
155 unidentified pleuronectiforrn
156 unidentified pleuronectid
157 unidentified atherinid
158 unidentified Menidia
159 unidentified bothid
160 speckled wormeel
161 unidentified syngnathid
162 mackerel scad
163 unidentified Ammodytes
164 cunner
165 unidentified sciaenid
166 unidentified gadid
(continued)
20472 Schiller Station Entrainment SOP Rev 0 Aug 2006 Normandeau Associates, Inc.

Rev. O Schiller Station QAP andSOPfor Entrai11me11t Monitoring 2006 August 2006
Appendix Table B-2 (Continued)
Taxon Code Common Name
167 flying gurnard
168 shield darter
169 gray snapper
170 Atlantic cod
171 sea raven
172 bigeye scad
173 striped burrfish
174 sheepshead
175 unidentified percid
176 spotfm mojarra
177 spotfin butterflyfish
178 unidentified gasterosteid
179 planehead fi1efish
180 Atlantic cutlassfish
181 pigfish
182 short bigeye
183 guaguanche
184 freckled blenny
185 unidentified tetraodontid
186 orangespotted filefish
187 margined madtom
188 bluespotted cometfish
189 black drum
190 northern sennet
191 scamp
192 cobia
193 least darter
194 unidentified percichthyid
195 scrawled cowfish
196 spotfin flyingfish
197 Gulfmenhaden
(continued)
20472 Schiller Station Entrainment SOP Rev 0 Aug 2006 Normandeau Associates, Inc.

Rev.O Schiller Station QAP andSOPfor Entrainment Monitoring 2006 August 2006
Appendix Table B-2 (Continued)
Taxon Code Common Name
198 pugnose shiner
199 redfin shiner
200 sand shiner
201 swallowtail shiner
202 t iger muskellunge
203 goosefish
204 permit
205 freshwater drum
206 king mackerel
207 longnose gar
208 . Spanish mackerel
209 highfin goby
210 unidentified sucker
211 unidentified labrid
212 blackcheek tonguefish
213 oyster toadfish
214 feather blenny
215 orange filefish
216 little skate
217 spiny dogfish
218 Atlantic seasnail
219 Gulf Stream flounder
220 spotted goatfish
221 brook silverside
222 harvestfish
223 pinfish
224 witch flounder
225 kokanee
226 ladyfish
227 radiated shanny
228 cusk
229 unidentified Urophycis
( contmued)
20472 Schiller Station Entrainment SOP Rev 0 Aug 2006 Normandeau Associates, Inc.

Rev.O S chiller Station QAP and SOPfor E ntrainmentMonitoring 2006 August 2006
Appendix Table B-2 (Continued)
Taxon Code Common Name
230 American plaice
231 slimy sculpin
232 sheepshead minnow
233 unidentified blenny 234 . unidentified skate
235 cleamose skate
236 weakfishlscup
237 haddock
238 rudd
Note: Check with the project Technical Director if taxon is not found in this list
20472 Schiller Station Entrainment SOP Rev 0 Aug 2006 Normandeau Associates, Inc.

Rev.O Schiller Station QAP andSOPfor Entrainment Monitoring 2006 August 2006
APPENDIXC
YSI Model85 Temperature, Conductivity, and Dissolved Oxygen Meter
20472 Schiller Station Entrainment SOP Rev 0 Aug 2006 Normandeau Associates, Inc.

YS I incorporated
YSI Model85
. Handheld Oxygen, Conductivity, Salinity, and Temperature System
Operations Manual
. '
·,
. ... .. -~ ··
•'
I

- · "'\
CONTENTS ,
SECTION I Introduction ..................................................................................................................1
SECTION2 Preparing The Meter·················································································-···-···-·······3 2.1 Unpacking ....................................................................................................................;.....3 2.2 Warranty Card.................................,..................................................................................3 2.3 Batteries..............................................................................................................................3 2.4 Calibration/Storage Chainber ..................................._.........................................................5 2.5. Hand Strap..........................................................................................................................S .•
2.6 The Meter Case ...........•.....................................................•................................................5
SEcriON 3 Preparing The Probe ··-·~········-···················•·················-············-·········-··-············? 3.1 Membrane Cap Installation..............................................................................................?
SEcriON 4 Overl'iew OfOperation························-··-······················..······-·······························9
SECTION 5 Calibration-..................- ...-·······..········..···-·······················-··········..·············..·········11 5.1 Calibration ofDissolved Oxygen ....................................................................................!! 5.2 Calibration ofConductivity .............................................................................................12
SEcriON 6 Advanced Conductivity' Setup.................................................................................15
6.1 Changing the Texnperature Coefficient ........................................................................... 15 6.2 Changing the Reference Temperature ...........................................................................~.16
6.3 Changing from Autoranging to Manual Ranging ........................................................... 16
SEC110N 7 Making Measurements .......................- ..·-············································-··-····-··...17
7.1 Turning the Instrument On ..............................................................................................17 7.2 The Measurement Modes ofthe Model 85 ....:................................................................ 17 7.3 Autoranging and Range Searching.................................................................................. 18 7.4 The Backlight....................................................................... ............................................ !&
SECfiON 8 Savi.n.g Data···························································-······-·--········-···········-···-··········21
8.1 Saving Data to Memory ......................................................,............................................21 8.2 Recalling Stored Data ......................................................................................................21 . '· 8.3 Erasing Stored Data .........................................................................................................27
SECfiON 9 M.aintenance.............................- ................................................................................23 ,, 9.1 Cleaning and Storage .......................................................................................................23 ' I
; : I
~dSECTION 10 Principles OfOperation .........................................................................................25 ..•
10.1 Temperature Effect on Conductivity .............................................................................25
I

SECTION 11 Discussion OfMeasurement Errors......................................................................27
11.1 Dissolved Oxygen Measurement Errors........................................................................27 11.2 Conductivity Measurement Errors.................................................................................29 11.3 Dissolved Oxygen Probe Precautions ...........................................................................31
SECTION 12 Troubleshooting -······-···-····-·······································-··-···········-······················33·
SECTION13 Warranty And' Repair .........••••.........•......•.•••.•......••.....•.•.............••........•.••...•...•..•.•...35
SECfiON14 Accessori~ And Replacement Parts..................................- .................................41
APPENDIX A Specifications..............._,____,.............................-·-···--·--·······-·-··-·····-······45 APPENDIXB Required Notice ....................................._ .••....•..•- .........................................- •.••••.•47 APPENDIXC Temperature Correction Data APPENDIXD
............-...................- .................................-........51
APPENDIXE Oxygen Solubility Table Conversion Chart -·········-·················-·-··········--····-..·····--···········-···················•53
........................................................................................53 APPENDIXF Calibration Values Table••...•.- ....••.-......................................................--·······55
11

SECTION 1 INTRODUCTION
The YSI Model85 Handheld Dissolved Oxygen, Conductivity, Salinity and Temperature System is a rugged, micro-processor based, digital meter with an attached YSI combination conductivity and dissolved oxygen probe.
The YSI Model 85 is designed for use in field, lab, and process control applications as well as for environmental, aquaculture, and industrial uses. The Model 85 is available with cable lengths of either 10, 25, 50 or 100 feet The body of the probe has been manufactured with stainless steel to add rugged durability and sinking weight. The probe also utilizes our easy to install cap membranes for measuring dissolved oxygen.
The YSI Model 85 probe is a non--detachable, combination sensor designed specifically for the YSI Model 85 Handheld System. The conductivity portion is a four ..electrode cell with a cell co~t of 5.0/cm ±4%. The dissolved oxygen portion is a polargraphic Clark type sensor.
The Model 85's microprocessor allows the system to be easily calibrated for dissolved oxygen or conductivity with the press of a few buttons. Additionally, the microprQCessor performs a selfdiagnostic routine each time the instrwnent is turned on. The self-diagnostic routine provides you with useful information about the conductivity cell constant and function of the instrument circuitry. The system simultaneously displays temperature (in °C), along with one of the following parameters: dissolved oxygen in either mg!L (milligrams per liter) or% air saturation; conductivity; temperature compensated conductivity; (in J.tS/cm or mS/cm), and salinity (in parts per thousand {ppt}).
The system requires only a single calibration regardless ofwhich dissolved oxygen display you use. The calibration of conductivity is not required but is available. A single calibration will adjust the instrument, regardless if you are reading conductivity or temperature compensated conductivity. You can switch between all ofthese parameters with the push ofa single key.
A calibration\storage chamber is built into the instrument case. A small sponge in the chamber can be moistened to provide a water saturated air environment that is ideal for air calibration of the dissolved oxygen probe. This chamber also provides a convenient place to store the probe when the system is not in use, and provid~ protection for the electrodes within the conductivity probe. The Model 85 case is also waterproof (rated to IP65). You can operate your Model 85 in the rain without damage to the instrument.
Six AA-size alkaline batteries power the instrument. A new set of alkaline batteries will provide ;! ., approximately 100 hours of continuous operation. When batteries need to be replaced, the LCD will display a "LO BAT" message.
.;
YSI, Incorporated Model &5

SECTION 2 PREPARING THE METER
2.1 UNPACKING
When you unpack your new YSI Model 85 Handheld Dissolved Oxygen, Conductivity, Salinity and Temperature System for the first time, check the packing list to make sure you have received everything you should have. Ifthere is anything missing or damaged, call the dealer from whom you purchased the Model85. Ifyou do not know which ofour authorized dealers sold the system to you, call YSI Customer Service at 800-765-4974 or 937-767-7241, and we'll be happy to help you.
2.2 WARRANTY CARD
Before you do anything else, please complete the Warranty Card and return it to YSI. This will record your purchase of this quality instrument in our computer system. Once your purchase is recorded, you will receive prompt, efficient service in the event any part of your YSI Model 85 should ever need repair and we will be able to quickly verify the warranty period.
2.3 BATTERIES
There are a few things you must do to prepare your YSI Model 85 for use. First, locate the six AAsiz.e alkaline batteries that were included in your purchase. Use a screwdriver or a small coin to remove the thumbscrew on the bottom of the instrument. This thumbscrew holds the batterychamber cover in place. The battery-chamber cover is marked with the words "OPEN" and "CLOSE."
Battery chamber cover
Thwnbscrew
YSI, Incorporated Model85
....-··· .... ·-·-:·~ ... ···-··· ...... ... ..

Preparing the Meter Section 2
NOTE: On some models, the battery cover thwnbscrew may be unscrewed by hand (a screwdriver may not be required).
There is a small label inside each ofthe two battery-chamber sleeves. These labels illustrate the correct way to install the batteries into eac~ sleeve ofthe battery-chamber.
NOTE: It is very important that the batteries be installed ONLY as illustrated. The instnunent will not function and may be damaged ifthe batteries are installed incorrectly.
4YSl, lncorporated Model85
• • ' . ... - ....·r• .,.__... .,.......,.Yf"."."

Preparing the Meter Section 2
Turn the instrument on by pressing and releasing the ON/OFF button on the front ofthe instrwnent. The liquid crystal display (LCD) should come on. Allow a few seconds for the instrument to complete its diagnostic routine. Notice that the instrument will display the specific cell constant ofthe conductivity probe dwing this diagnostic routine. Ifthe instrument does not operate? consult the section entitled Troubleshooting.
You may also want to take the instrument into a dark room and with the instrument ON, hold down the LIGHT button. The instrument backlight should illuminate the LCD so that the display can be easily read.
2.4 CALIBRATION/STORAGE CHAMBER
The Modei 85 has a convenient calibration storage chamber built into the instnnnents' side. This chamber provides an ideal storage area for the probe during transport and extended non-use. Ifyou look into the chamber you should notice a small round sponge in the bottom ofthe chamber. Carefully put 3 to 6 drops of clean water into the sponge. Tum the instrument over and allow any excess water to drain out ofthe chamber. The wet sponge creates a 1000/o water saturated air environment for the probe, which is ideal for dissolved oxygen calibration.
2.5 HAND STRAP
The hand strap is designed to allow comfortable operation ofthe Model 85 with minimwn effort. If the hand strap is adjusted correctly, it is unlikely that the instrument will be easily dropped or bumped from your hand. See figure on previous page.
To adjust the hand strap on the back ofthe meter, unsnap the vinyl cover and pull the two Velcro strips apart. Place your hand between the meter and the strap and adjust the strap length so that your hand is snugly held in place. Press the two Velcro strips back together and snap the vinyl cover back into place.
,: I
:2.6 THE METER CASE ~ :a•..
:IThe meter case is sealed at the factory and is not intended to be opened, except by authorized ,, service technicians. Do not attempt to separate the two halves ofthe meter case as this may damage "j
i the instrument, break the waterproofseal, and will void the manufacturers warranty. il
ijI· l· .l i!
YSI, Incorporated Model85 5

SECTION 3 PREPARING THE PROBE
The YSI Model85 dissolved oxygen probe is shipped dry. The protective membrane cap on tbe probe tip must be removed and replaced with KCI solution and a new membrane cap before using the probe. FoUow the instructions below to install KCI solution and the new membrane cap.
3.1 MEMBRANE CAP INSTALLATION
To install a new membrane on your YSI Model 85 dissolved oxygen probe:
1. Unscrew and remove the probe sensor guard 2. Unscrew and remove the old membrane cap. 3. Thoroughly rinse the sensor tip with distilled water. 4. Prepare the electrolyte according to thedirections on the KCI solution bottle. 5. Hold th~ membrane cap and fill it at least 1/2 full with the electrolyte solution. 6. Screw the membrane cap onto the probe moderately tight. A small amount of
electrolyte should overflow. 7. Screwthe probe sensor guard on moderately tight.
t.JnscmvGuard
...___... "'---'; \Ej
G? Saew Guald on moderately ti~
! '
·I
i :
~
!
J
I i., ~-
1j
~ ~
:I -:~.
:1 ."!
YSI, Incorporated Model85 7
· ~~~_.....--~.·-~· · --·-~

SECTION 4 OVERVIEW OF OPERATION
The following diagram is an overview ofthe operation of the Model85. See the following sections for de~ls ofoperation.
8 • 3 7-"4+--++-=-'~ conductMty or
.22.5'<~-+-H- Temperature reading....__ ___;;;::::;;;;;__;;;t
(mvarr)
;t ,.., :I...
YSI, Incorporated Model85 9
·•. ,lj:~.... ~~J":.'IIo~·~· •·• '• · ' '

SECTION 5 CALIBRATION
5.1 CALIBRATION OF DISSOLVED OXYGEN
To accurately calibrate the YSI Model85 you will need to know the approximate altitude of the region in which you are located.
1. Ensure that the sponge inside the instrument's calibration chamber is wet Insert the probe into the calibration chamber.
2. Turn the instnunent on by pressing the . ON/OFF button on the front ofthe instnunent Press the MODE button until dissolved oxygen is displayed in mg!L or %. Wait for the dissolved oxygen and temperature .readings to stabilize (bsually 15 minutes is required).
3. Use two fingers to press and release both the UP ARROW and DOWN ARROW buttons at the same time.
4. The LCD will prompt you to enter the local altitude in hundreds offeet. Use the arrow keys to increase or decrease the altitude. When the proper altitude appears on the LCD, press the ENTER button once. ·
EXAMPLE:·Entering the number 12 here indicates 1200 feet.
5. The Model85 should now display CAL in the lower left ofthe display, the calibration value should be displayed in the lower right ofthe display and the current % reading (before calibration) should be on the main display. Make sure that the current % reading (large display) is stable, then press the ENTER button. The display should read SAVE then should return to the Nonnal Operation Mode.
Each time the Model 85 is turned off, it may be necessary to re-calibrate before taking measurements. All calibrati9ns should be completed at a temperature which is as close as possible to tbe sample temperature. Dissolved oxygen readings are only as good as the calibration.
j'• ~ 'I'•I
YSI, Incorporated Model85 ll

,.....- .
Calibration Section 5
5.2 CALIBRATION OF CONDUCTIVITY
IMPORTANT: System calibration is rarely required because of the factory calibration of the YSI Model85. However, from time to time it is wise to check the system calibration and make adjustments when necessary.
Prior to calibration of the YSI Model 85, it is important to remember the following:
1. Always use clean, properly stored, NISI traceable calibration solutions (see Accessories and Replacement Parts). When filling a calibration container prior to performing the calibration procedures,. make certain that the level ofcalibrant buffers is high enough in the container to cover the entire probe. Gently agitate the probe to remove any·bubbles in the conductivity cell.
2. Rinse the probe with distilled water (and wipe dry) between changes ofcalibration solutions.
3. During calibration, allow the probe time to stabilize with regard to temperature (approximately 60 seconds) before proceeding with the calibration process. The readings after calibration are only as good as the calibration itself.
4. Perform sensor calibration at a temperature as close to 25°C as possible. This will minimize any temperature compensation error.
Follow these steps to perform an accurate calibration ofthe YSI Model 85:
1. Turn the instrument on and allow it to complete its self-test procedure.
2. Select a calibration solution that is most similar to the .sample you will be measuring.
• For sea water choose a 50 mS/cm conductivity $ndard (YSI Catalog# 3169) • For fresh water choose a 1 mS/c:m. conductivity standard (YSI Catalog# 3167) • For brackish water choose a 10 mS/cm conductivity standard (YSI Catalog# 3168)
3. Place at least 3 inches ofsolution in a clean glass beaker.
4. Use the MODE button to advance the insttument to display conductivity.
· 5. Insert the probe into the beaker deep enough so that the oval-shaped hole on the side ofthe probe is completely covered. Do not rest the probe on the bottom of.the container - suspend it above the bottom at least l/4 inch.
6. Allow at least 60 seconds for the temperature reading to become stable.
7. Move the probe vigorously from side to side to dislodge any air bubbles from the electrodes.
8. Press and release the UP ARROW and DOWN ARROW buttons at the same time.
The CAL symbol will appear at the bottom left ofthe display to indicate that the instrument is now in Caiibration mode.
YSI, Incorporated Model85 12

Calibration SectionS
9. Use the UP ARROW or DOWN ARROW button to adjust the reading on the display until it matches the value ofthe calibration solution you are using.
10. Once the display reads the exact value ofthe calibration· solution being used (the instrument will make the appropriate compensation for temperature variation from 25°C), press the
:.. -· ENTER button once. The word "SAVE" will flash across tl;le display for a second indicating that the calibration has been accepted.
The YSI Model 85 is designed to retain its last conductivity calibration pennanently. Therefore, there is no need to calibrate the instrument after battery changes or power down.
1
I YSI, Incorporated Modei8S 13
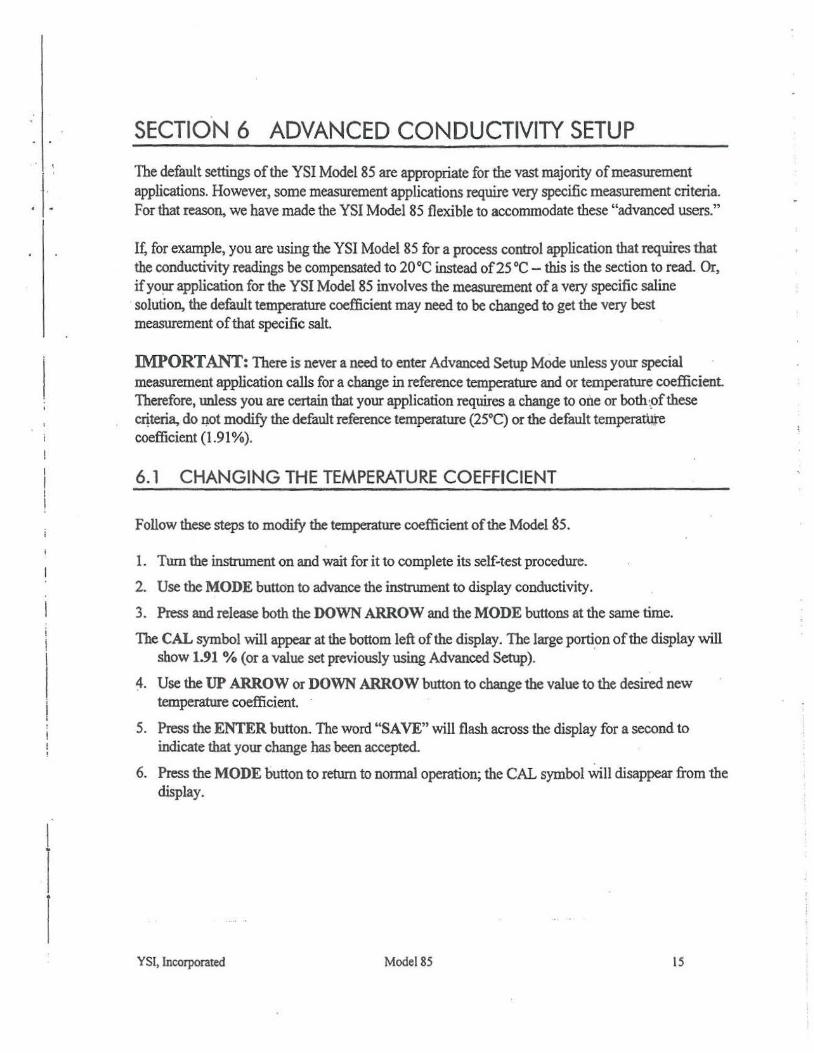
SECTION 6 ADVANCED CONDUCTIVITY SETUP
The default settings ofthe YSI Model 85 are appropriate for the vast majority ofmeasurement applications. However, some measurement applications require very specific measurement criteria For that reason, we have made the YSI Model 85 flexible to accommodate these "advanced users."
I~ for example, you are using the YSI Model 85 for a process control application that requires that the conductivity readings be compensated to 20°C instead of25 °C- this is the section to read. Or, ifyo~ application for the YSI Model 85 involves the measurement ofa very specific saline
·solution, the default temperature coefficient may need to be changed to get the very best measurement ofthat specific salt.
IMPORTANT: There is never a need to enter Advanced Setup Mode unless your special measurement application calls for a change in reference temperature and or temperature coefficient Therefore, unless you are certain that your application requires a change to one or both·pfthese cqteria, do Q.Ot modify the default reference temperature (25°C) or the default temperat\.u'e C()efficient (1.91%).
6.1 CHANGING THE TEMPERATURE COEFFICIENT
Follow these steps to modify the temperature coefficient ofthe Model SS.
1. Tum the instrument on and wait for it to complete its self-test procedure.
2. Use the MODE button to advance the instnunent to display conductivity.
3. Press and release both the DOWN ARROW and the MODE buttons at the same time.
The CAL symbol will appear at the bottom left ofthe display. The large portion ofthe display will show 1.91 % (or a value set previously using Advanced Setup). ·
~. Use the UP ARROW or DOWN ARROW button to change the value to the desired new temperature coefficient.
5. Press the ENTER button. The word "SAVE" will flash across the display for a second to indicate that your change has been accepted.
6. Press the MODE button to return to normal operation; the CAL symbol will disappear from the display.
I
l l
YSI, Incorporated Model85 15

~·· · ..··
Advanced Conductivity Setup Section 6
6.2 CHANGING THE REFERENCE TEMPERATURE
Follow these steps to modify the reference temperature ofthe Model 85.
1. Turn the instrument on and wait for it to complete its self-test procedure.
2. Use the MODE button to advance the instrwnent to display conductivity.
3. Press and release both the DOWN ARROW and the MODE buttons at the same time.
The CAL symbol will appear at the·bottom left ofthe display. The large portion ofthe display will show 1.91 o/o (or a value set previously using Advanced Setup).
4. Press and release the MODE button; the large portion ofthe display will show 25.0C (or a value set previously using Advanced Setup).
5. Use the UP ARROW or DOWN ARROW button to change the value to the desired new reference temperature (any value between 15°C and 25 °C is acceptable).
6. Press.the ENTER button. The word "SAVE" will flash across the display for a second to indicate that your change has been accepted.
7. The instrument will automatically return to normal operation mode.
6.3 CHANGING FROM AUTORANGING TO MANUAL RANGING
Ifyom application is easier to perform using a manual range that you select. the YSI Model 85 allows you to tum offthe default autoranging feature. While you are making conductivity or temperature compensated conductivity measurements, simply press and release the UP ARROW button. Each additional press ofthe UP ARROW button will cycie the Model 85 to a different manual range until you return again to autoranging. Five pushes ofthe UP ARROW button will cycle the Model 85 through the four manual ranges and retwn the instrument to autoranging.
NOTE: You may see an error message in some manual ranges ifthe manual range selected is not adequate for the sample you are measuring. Ifthis happens, simply press and release the UP ARROW button again until a range is selected which is suitable for your sample. Ifyou get lost and don't know ifyou're in a manual range or autoranging, simply tum the instrument offand back on. Also note that the conductivity units will flash while you are in manual range. The instrument will always default to autoranging when first turned on.
The four ranges ofthe YSI Model85 are:
Range 1 Range2 Range3 Range4 0 to 499.9 ~S/cm 0 to 4999 ~S/cm 0 to 49.99 mS/cm 0 to 200.0 mS/cm
YSI, Incorporated Model85 16

SECTION 7 MAKING MEASUREMENTS
7.1 TURNING THE INSTRUMENT ON
Once the batteries are installed correctly, press the ON/OFF button. The instrument will activate all segments ofthe display for a few seconds, which will be followed by a self-test procedure that will last for several more seconds. During this power on self-test sequence, the instrument's microprocessor is verifying that the instrument is working properly. The Model85 will display the cell constant ofthe conductivity probe when the se}f...test is complete. Ifthe instrwnent were to detect an internal problem, the display would show a continuous error message. See the section entitled Troubleshooting for a list ofthese error messages.
7.2 THE MEASUREMENT MODES OF THE MODEL 85
The Model 85 is designed to provide six distinct measurements:
> Dissolved Oxygen % - A measurement ofoxygen in percent ofsaturation. > Dissolved Oxygen mg!L - A measurement ofoxygen in mg!L
> Conductivity - A measurement ofthe conductive material in the liquid sample without regard to temperature
~ Specific Conductance -- Also known as temperature compensated conductivity which · automatically adjusts the reading to a calculated value which would have been read ifthe sample had been at 25° C (or some other reference temperature which you choose). See Advanced Setup.
~ Temperature- which is always displayed.
> Salinity - A calculation done by the instrument electronics, based upon the conductivity and temperature readings.
NOTE: When you tum the Model 85 off, it will "remember" which mode you used last and will return to that mode the next time the instrument is turned on.
To choose one ofthe measurement modes above (temperature is always displayed) simply press and release the MODE button. Carefully observe the small legends at the far right side ofthe LCD.
; ! I Specffic: Dissollied Oxygen )looo-' Disso!Yed Oxygen )oo- Conducti..;ty with >-{ Conductance ,..._; Salinity with •c: in% with•c in mgJL with ·c ·c with ·c
- - -··----' ·---- ----···--------
YSJ, Incorporated Model85 17

- · Making Measurements Section 7
Ifthe instrument is reading Specific Conductance the large numbers on the display will be followed by either a f.1S or an mS. Additionally the small portion ofthe display will show the o C flashing on and off
Ifthe instrwnent is reading Conductivity (not temperature ~mpensated) the large numbers on the display will be followed by either a JJS or an
. mS. Additionally the small portion ofthe display will show the °C NOT flashing.
Ifthe instrument is reading Dissolved OX)'gen the large numbers on the display will be followed by either a mg/L or %. It is important to remember that the dissolved oxygen probe is stirring dependent 1bis Is due to the consumption ofoxygen at the sensor tip during measurement When taking dissolved oxygen measurements the probe must be moved through the sample at a rate of1 foot per second to provide adequate stirring.
Ifthe instrument is reading Salinity the large numbers on the display will be followed by a ppt.
7.3 AUTORANGING & RANGE SEARCHING
The YSI Model 85 is an autoranging instrument This means that regardless ofthe conductivity or salinity ofthe solution (within the specifications ofthe instrument) all you need to do to get the most accurate reading is to put the probe in the sample. Tiris feature makes the Model 85 as simple as possible to operate.
When you first place the Model 85 probe into a sample or calibration solution, and again when you first remove the probe the inStrument will go into a range searc;h mode that may take as long as 5 seconds. During some range searches the instrument display will flash rANG to indicate its movement from one range to another. The length ofthe range search depends on the number of ranges that must be searched in order to find the correct range for the sample. During the range search, the instnnnent will appear· to freeze on a given reading for a few seconds then, once the range is located, will pinpoint the exact reading on the display. The display may also switch to 00.0 for a second or two during a range search before it selects the proper range.
7.4 THE BACKLIGHT
At times it may be necessary to take measuremen~ with the Model 85 in dark or poorly lit areas. To help in this situation, the Model85 comes equipped with a backlight that will illuminate the display so that it can be easily read. To activate the backlight, press and hold the LIGHT button.
YSI, Incorporated Model85 18 \•·
i

Making Measurements Section 7 The display will remain lit as long as the button is depressed. When you release it, the light goes out to preserve battery life.
l I
YSI, Incorporated Model85 19

SECTION 12 TROUBLESHOOTING
SYMPTOM POSSffiLE CAUSE ACI'ION
l. Instnunent will not tum on A. Low battery voltage A. Replace batteries B. Batteries installed wrong B. Check battery polarity. C. Meter req11ires service C. Return system for service
2. lnstrwnent will not calibrate A. Membrane is fouled or damaged A. Replace membrane & KCI(Dissolved Oxygen) B. Probe anode is fouled or dark B. Clean anode
C. Probe cathode is tarnished C. Clean cathode D. System requires service D. Return system for service
3. Instrument will not calibrate A Cell is contaminated A. See "Maintenance" Section (Conductivity)
4. Instrument "locks up" A Instrument has rec'd a shock A & B. Remove battefy lid, wait 15 B. Batteries are low ordamaged seconds for reset, replace lid. C. System requires service C. Return system for service
5. Instrument readings are inaccurate A. Cal altitude is·incorrect A. Recalibrate w/correct value(Dissolved Oxygen) B. Probe not in 1000/o <>2 saturatedair B. Moisten sponge & plac~ in Cal chamber
during Cal procedure w/ probe & Recal C. Membrane fouled or damaged C. Replace membrane D. Probe anode is fouled ordark D. Clean anode E. Probe cathode is tarnished E. Clean cathode F. System requires service F. R~m system for service
6. lnstrwnent readings are inaccurate A. Calibration is required A. See ..Calibration" Section (Conductivity) B. Cell is contaminated B. See "Maintenance" Section
C. Ternpco is set incorrectly C. See "Advanced Setup" Section D. Reference temperalUrC incorrect D. See"Advanced SetuP" Section E. Readings are or are not temperature E. See "Making Measurements"
compensated. Section
7..LCD displays "LO BAT" A. Batteries are low ordamaged A. Replace batteries
Main display flashes "off"
8. Main Display reads "OVEr" A Conductivity reading is >200 mS In all cases, check calibration values and (Secondary display reads "ovr") procedures; check advanced setup settings. (Secondary display reads «udr")
B. Temperanue reading is >65°C C. Temperature reading is <-5°C D. Salinity reading is >80 ppt Ifeach ofthese are set correctly, E. User cell constant cal K is >5.25 return instrument for service. f . DO temperature is >46°C G. DO% saturation is > 200"/o H. DO concentration is >20 mg!L
9. Main display reads "Undr" A. User cell constant cal K is <4.9 A. Recalibrate instrument using known good conductivity standard. Follow cell cleaning procedure in
tlle Maintenance section.
B. DO current too low to calibrate
B. Replace membrane, clean probe A. Use the mode key to select a higher or
manual range. 10. Main display reads "rEIT' A Reading exceeds user selected
lower manual range, or set system to autoranging.
A. See ~Advanced Setupn section. ·II. Main display reads ""PErr'' A. User cell constant cal K is 0.0 B. Refer to manual section for step by step·s. incorrect sequence ofkeystrokes.
instruction for the function you are
YSI, Incorporated Model85 33