DRAFT Discussion Paper, Employment Lands Official Plan ...
48
DRAFT DISCUSSION PAPER, EMPLOYMENT LANDS OFFICIAL PLAN REVIEW, BRADFORD WEST GWILLIMBURY PREPARED FOR THE CORPORATION OF THE TOWN OF BRADFORD WEST GWILLIMBURY September 1, 2016
-
Upload
khangminh22 -
Category
Documents
-
view
2 -
download
0
Transcript of DRAFT Discussion Paper, Employment Lands Official Plan ...

DRAFT DISCUSSION PAPER, EMPLOYMENT LANDS OFFICIAL PLAN REVIEW,
BRADFORD WEST GWILLIMBURY PREPARED FOR THE CORPORATION OF THE
TOWN OF BRADFORD WEST GWILLIMBURY
September 1, 2016

DRAFT Discussion Paper, Employment Lands Official Plan Review, Bradford West Gwillimbury
Table of Contents Executive Summary .............................................................................................................................. i
1 Introduction ................................................................................................................................... 1
1.1 Background and Objectives ............................................................................................................ 1
1.2 Approach ........................................................................................................................................ 2
2 Employment Lands Inventory ..................................................................................................... 3
2.1 Employment Land Characteristics .................................................................................................. 5
2.1.1 Artesian Industrial Park ............................................................................................................. 5
2.1.2 Reagens Industrial Park ............................................................................................................ 5
2.1.3 BWG Strategic Settlement Employment Area (“BWG SSEA”) ................................................. 5
2.1.4 Bradford By-Pass Employment Lands ...................................................................................... 6
2.2 Characteristics of Occupied Employment Lands in BWG .............................................................. 6
2.3 Supply of Vacant Employment Lands in BWG ............................................................................... 9
2.4 Summary ...................................................................................................................................... 11
3 Comparative Analysis ................................................................................................................ 12
3.1 Location and Transportation Analysis .......................................................................................... 13
3.2 Employment Clusters.................................................................................................................... 16
3.3 Skilled Labour Force ..................................................................................................................... 19
3.4 Supply of Vacant Employment Lands........................................................................................... 21
3.5 Industrial Property Tax Rates ....................................................................................................... 22
3.6 Industrial Development Charges .................................................................................................. 23
3.7 Summary ...................................................................................................................................... 23
4 Trend and Target Analysis ........................................................................................................ 24
4.1 Current Trends in Employment Lands Development ................................................................... 24
4.2 Business Type .............................................................................................................................. 25
4.3 Parcel size and Building Size ....................................................................................................... 25
4.4 Locational requirements ............................................................................................................... 26
4.5 Skills Labour requirements ........................................................................................................... 26
4.6 BWG Economic Development Strategy ........................................................................................ 26
5 Employment Land Demand ....................................................................................................... 28
5.1 Historic Employment Growth ........................................................................................................ 28
5.2 Employment Land Absorption ...................................................................................................... 30
5.3 Forecast Employment Growth ...................................................................................................... 32
5.4 Employment Growth on Employment Lands ................................................................................ 33
5.5 Employment Land Densities ......................................................................................................... 36
5.6 Market Contingency ...................................................................................................................... 38

DRAFT Discussion Paper, Employment Lands Official Plan Review, Bradford West Gwillimbury
5.7 Demand for Employment Lands ................................................................................................... 38
6 Land Needs ................................................................................................................................. 39
6.1 Employment Land Needs ............................................................................................................. 39
6.2 Population-Related Employment Land Needs ............................................................................. 40
7 Conclusions and Recommendations ....................................................................................... 41
7.1 Summary of Conclusions .............................................................................................................. 41
7.2 Recommendations – Land Supply Requirements ........................................................................ 42
7.3 Recommendations – Policy Development & Refinements ........................................................... 43
LIST OF FIGURES Figure 2-1: Location of Employment Area Lands in BWG ............................................................................ 4 Figure 2-2: BWG Occupied Employment Lands by Location and Land Use Designation (Gross Hectares) 6 Figure 2-3: BWG Occupied Employment Lands by Location and Zoning (Gross Hectares) ........................ 6 Figure 2-4: Average Employment Land Coverage by Location .................................................................... 7 Figure 2-5: Occupied Employment Lands by Type of Employment, BWG ................................................... 7 Figure 2-6: Employment Density ................................................................................................................... 8 Figure 2-7: Vacant GFA on Employment Lands, BWG ................................................................................ 8 Figure 2-8: BWG Vacant Employment Lands ............................................................................................... 9 Figure 2-9: BWG Developed and Vacant Employment Lands by Location, 2016 ...................................... 10 Figure 2-10: BWG Vacant Employment Land Supply by Land Use Designation, 2016 ............................. 10 Figure 2-11: BWG Vacant Employment Land Supply by Parcel Size, 2016 .............................................. 11 Figure 3-1: Study Area ................................................................................................................................ 13 Figure 3-2: Manufacturing LQ Relative to Ontario, BWG and Surrounding Study Area ............................. 17 Figure 3-3: Wholesale Trade LQ Relative to Ontario, BWG and Surrounding Study Area ........................ 17 Figure 3-4: Transportation & Warehousing LQ Relative to Ontario, BWG and Surrounding Study Area .. 18 Figure 3-5: Construction LQ Relative to Ontario, BWG and Surrounding Study Area ............................... 18 Figure 3-6: Unemployment Rate, BWG and Surrounding Study Area ....................................................... 19 Figure 3-7: Share of Population with Apprenticeship Certificate, College Diploma or University Degree .. 20 Figure 3-8: Vacant Employment Land Supply, BWG and Surrounding Study Area ................................... 21 Figure 3-9: Industrial Property Tax Rates, BWG and Surrounding Study Area .......................................... 22 Figure 3-10: Industrial Development Charges ($/sq.ft.), BWG and Surrounding Study Area .................... 23 Figure 4-1: Value of Goods and Services Produced in Manufacturing, Wholesale Trade and
Transportation and Warehousing, Ontario .................................................................................................. 24 Figure 5-1: Place of Work BWG by Industry, 2001 to 2011 ........................................................................ 29 Figure 5-2: Industrial New Construction Value, BWG ................................................................................. 30 Figure 5-3: Absorbed Industrial Land Parcels, BWG, 2002 to 2016 ........................................................... 31 Figure 5-4: BWG Absorbed Employment Lands ......................................................................................... 32 Figure 5-5: BWG Employment Forecast by Sector, 2011 to 2041.............................................................. 33 Figure 5-6: Commercial / Population-Related Employment Growth by Sector, 2016-2041 ....................... 35 Figure 5-7: Employment Growth on Employment Lands, BWG, 2016 to 2041 .......................................... 37 Figure 6-1: BWG Employment Land Needs ................................................................................................ 39
i
DRAFT Discussion Paper, Employment Lands Official Plan Review, Bradford West Gwillimbury
Executive Summary
MMM Group Limited, together with Metro Economics and urbanMetrics inc., hereafter referred to as the
“consulting team”, has been retained by the Corporation of the Town of Bradford West Gwillimbury
(“BWG”, “the Town”, or “the municipality”) to undertake a review of the Official Plan (“the Official Plan
Review” or “OPR”) to the year 2031. The fundamental purpose of this assignment is to conduct a review
and update of the Town’s Official Plan to comply with Section 26 of the Planning Act.
As part of this OPR, urbanMetrics has completed an Employment Lands Review to create a long-term
vision for existing and future employment lands within the Town. This discussion paper will be used by
the Town in long-range planning for employment lands.
For the purposes of this analysis, we have defined Employment lands as lands designated
Industrial/Commercial and Industrial in the BWG Official Plan and lands located within BWG Strategic
Settlement Employment Area (“BWG SSEA”).
Highlights from the Employment land analysis include:
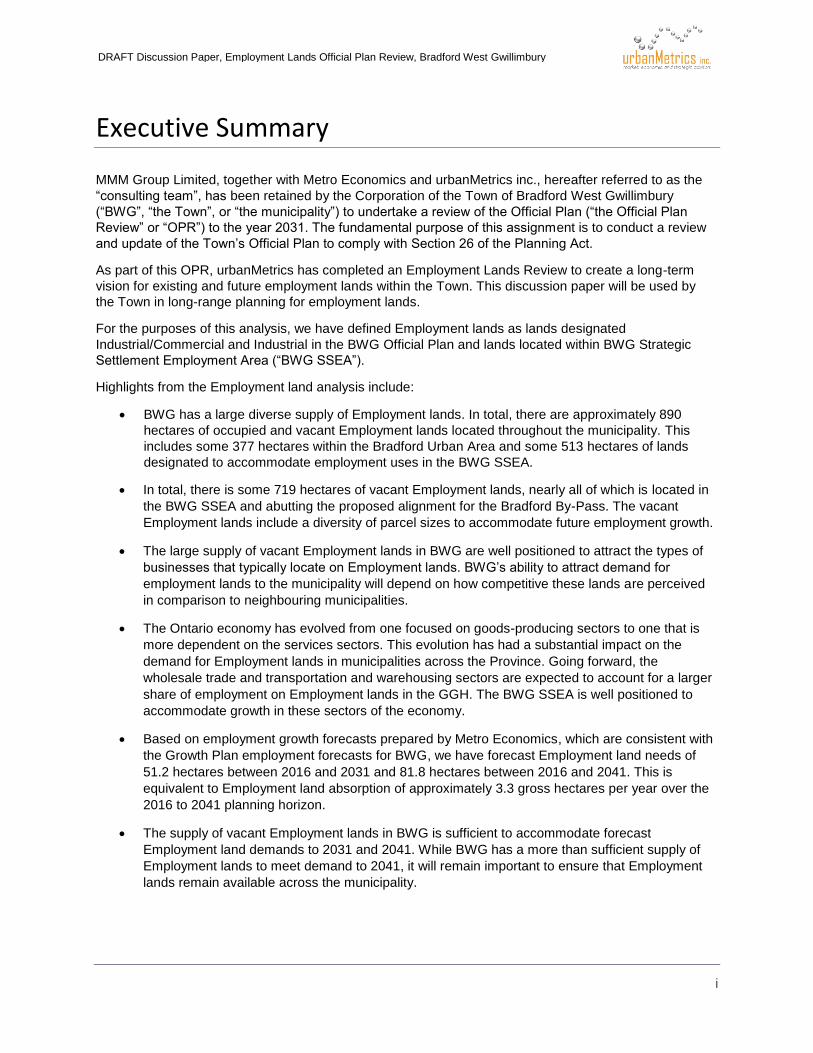
BWG has a large diverse supply of Employment lands. In total, there are approximately 890
hectares of occupied and vacant Employment lands located throughout the municipality. This
includes some 377 hectares within the Bradford Urban Area and some 513 hectares of lands
designated to accommodate employment uses in the BWG SSEA.
In total, there is some 719 hectares of vacant Employment lands, nearly all of which is located in
the BWG SSEA and abutting the proposed alignment for the Bradford By-Pass. The vacant
Employment lands include a diversity of parcel sizes to accommodate future employment growth.
The large supply of vacant Employment lands in BWG are well positioned to attract the types of
businesses that typically locate on Employment lands. BWG’s ability to attract demand for
employment lands to the municipality will depend on how competitive these lands are perceived
in comparison to neighbouring municipalities.
The Ontario economy has evolved from one focused on goods-producing sectors to one that is
more dependent on the services sectors. This evolution has had a substantial impact on the
demand for Employment lands in municipalities across the Province. Going forward, the
wholesale trade and transportation and warehousing sectors are expected to account for a larger
share of employment on Employment lands in the GGH. The BWG SSEA is well positioned to
accommodate growth in these sectors of the economy.
Based on employment growth forecasts prepared by Metro Economics, which are consistent with
the Growth Plan employment forecasts for BWG, we have forecast Employment land needs of
51.2 hectares between 2016 and 2031 and 81.8 hectares between 2016 and 2041. This is
equivalent to Employment land absorption of approximately 3.3 gross hectares per year over the
2016 to 2041 planning horizon.
The supply of vacant Employment lands in BWG is sufficient to accommodate forecast
Employment land demands to 2031 and 2041. While BWG has a more than sufficient supply of
Employment lands to meet demand to 2041, it will remain important to ensure that Employment
lands remain available across the municipality.

DRAFT Discussion Paper, Employment Lands Official Plan Review, Bradford West Gwillimbury
ii
It is also important to recognize that our employment land projections reflect Provincial
employment allocations within Simcoe County. Employment land absorption will ultimately
depend on a wide variety of factors such as the timing of the Bradford By-Pass and the ability of
the BWG SSEA lands to attract major tenants, which could act as a catalyst to future
development.
BWG has never had employment lands located along Highway 400, therefore, there may be
significant latent demand, beyond what is recognized in the Growth Plan employment allocations.
For these reasons, it is recommended that the municipality plan for employment land beyond
what is needed to 2041. Specifically, it will be important for the Town to protect Employment
lands located in the BWG SSEA, the Artesian and Reagens Industrial Parks and vacant
Employment lands located north of the proposed Bradford By-Pass for long-term employment
growth.

1
DRAFT Discussion Paper, Employment Lands Official Plan Review, Bradford West Gwillimbury
1 Introduction
MMM Group Limited, together with Metro Economics and urbanMetrics inc., hereafter referred to as the
“consulting team”, has been retained by the Corporation of the Town of Bradford West Gwillimbury
(“BWG”, “the Town”, or “the municipality”) to undertake a review of the Official Plan (“the Official Plan
Review” or “OPR”) to the year 2031. The fundamental purpose of this assignment is to conduct a review
and update of the Town’s Official Plan to comply with Section 26 of the Planning Act.
1.1 BACKGROUND AND OBJECTIVES In conducting the OPR, the consulting team have separated the analysis into three distinct phases. These
three phases are as follows:
Phase 1: Four Issues;
Phase 2: Policy Directions Report; and
Phase 3: New Official Plan Policies.
Collectively, these phases will form the OPR, which will guide and direct population and employment
growth in BWG through 2031.
Phase 1 of the OPR will involve ensuring conformity with recent Provincial planning policy and Council
priorities in four identified issue areas. This phase will also include Official Plan Amendments to
implement recommendations for these four issue areas. These four identified issues include:
Issue 1: Employment Lands
Issue 2: Growth and Population Distribution
Issue 3: Downtown Bradford Revitalization
Issue 4: Seniors Housing Options
The discussion paper provided herein represents Issue 1 in Phase 1 of the study. The purpose of this
discussion paper is to create a long-term vision for existing and future employment lands within the Town.
This discussion paper will be used by the Town in long-range planning for employment lands.
For the purposes of this analysis, we have defined Employment lands as lands designated
Industrial/Commercial and Industrial in the BWG Official Plan and lands located within BWG Strategic
Settlement Employment Area (“BWG SSEA”).

DRAFT Discussion Paper, Employment Lands Official Plan Review, Bradford West Gwillimbury
2
1.2 APPROACH In preparing this discussion paper, the following work steps have been undertaken:
Review of BWG Employment Land Inventory
This section of the analysis will review the existing and vacant Employment lands located in the
Town. This analysis will identify the characteristics of occupied Employment lands by location, parcel
size, land use designation and type of employment occupying the land. It will also examine the
location of Employment lands relative to complementary or sensitive land uses.
An important component of this analysis will also be the review of the supply of vacant Employment
lands within the municipality that are available to accommodate future employment growth. We will
categorize these vacant employment lands by location, parcel size, land use designation and the
availability of servicing.
Comparative Analysis
This section of the analysis assesses the competitiveness of Employment lands in BWG relative to
other local area municipalities. Variables considered in this analysis include the concentration of
employment compared to other local municipalities, land supply, property tax rates and development
charges.
Trend and Target Analysis
This section of the analysis reviews current trends in employment land development, including
business types, parcel and building size, and locational and skills requirements. We also comment on
the suitability of the employment land supply in BWG in terms of accommodating current and
anticipated future trends in Employment land demand.
Employment Lands Demand Analysis
Based on employment growth forecasts provided by Metro Economics and our own assumptions
regarding Employment land densities, we have forecasted demand for Employment lands to 2031
and 2041 within the municipality.
Demand and Supply Reconciliation
Based on the supply of vacant Employment lands and the Employment land demand projections, we
have determined the adequacy of the Employment lands supply in BWG to accommodate future
growth.

DRAFT Discussion Paper, Employment Lands Official Plan Review, Bradford West Gwillimbury
3
2 Employment Lands Inventory
The BWG Official Plan identifies a variety of land uses across the municipality that are permitted to
accommodate industrial uses. We have generally defined these lands as “Employment lands”. These land
use designations include:
Industrial/Commercial;
Industrial;
Industrial – Industrial/Commercial;
Industrial Special Policy Area (Section 5.3.5.8); and,
Lands Subject to Minister’s Zoning Order.
Within the Industrial/Commercial land use designation, permitted uses include a full range of light
industrial uses, offices, conference and convention facilities, public institutional uses and
commercial/recreation uses. Also, limited convenience commercial uses may be permitted. Retail uses
are not be permitted within this land use designation, with the exception of products that are produced or
assembled on site, in which case up to 10% of the main building may be utilized as a retail outlet for such
products.
Within the Industrial designation, permitted land uses include manufacturing activities that could have a
detrimental physical or visual impact on adjacent uses. The Industrial land use designation provides
limited direction of the types of uses that are permitted.
The Zoning By-Law for BWG establishes a number of zones that permit industrial employment uses.
These include:
General Employment (M1);
Prestige Employment (M2);
Rural Employment (M3);
Extractive (MX); and,
Ministers Zoning Order.
The M1 and M2 zones generally apply to Employment lands located within the Bradford Urban Area and
Bond Head Urban Area, whereas the M3 and MX zones generally apply to lands located in the Rural
Area of the municipality.
DRAFT Discussion Paper, Employment Lands Official Plan Review, Bradford West Gwillimbury
4
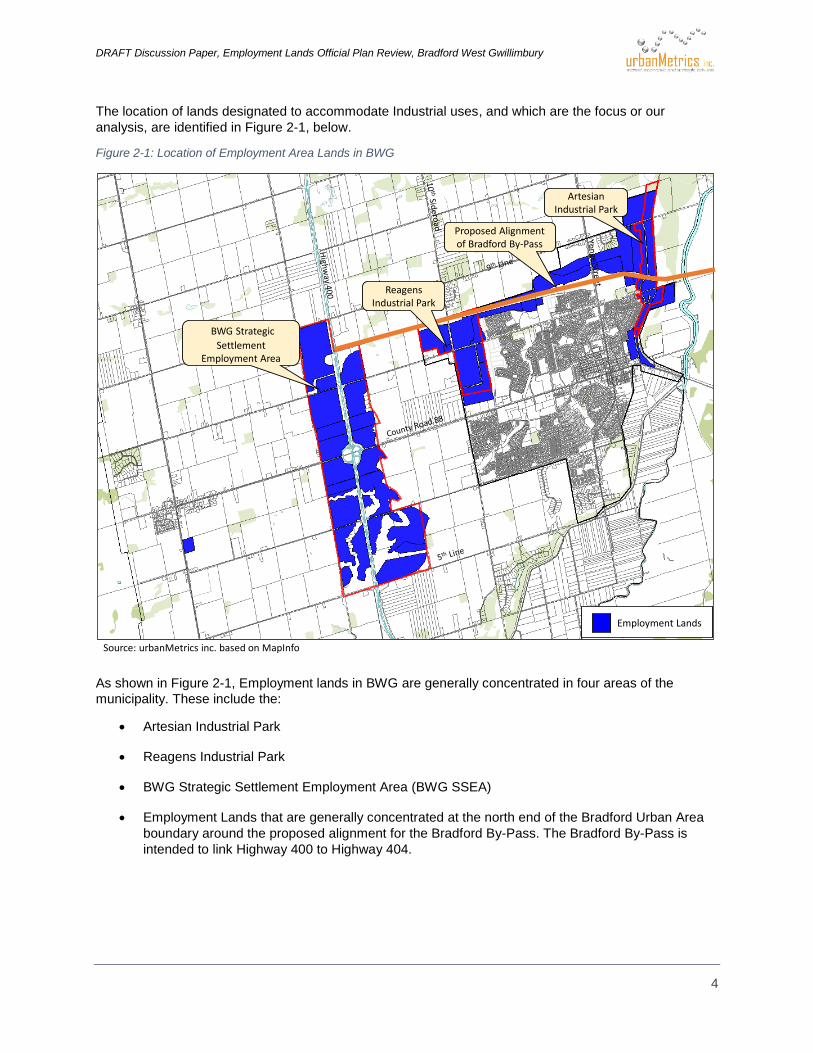
The location of lands designated to accommodate Industrial uses, and which are the focus or our
analysis, are identified in Figure 2-1, below.
Figure 2-1: Location of Employment Area Lands in BWG
As shown in Figure 2-1, Employment lands in BWG are generally concentrated in four areas of the
municipality. These include the:
Artesian Industrial Park
Reagens Industrial Park
BWG Strategic Settlement Employment Area (BWG SSEA)
Employment Lands that are generally concentrated at the north end of the Bradford Urban Area
boundary around the proposed alignment for the Bradford By-Pass. The Bradford By-Pass is
intended to link Highway 400 to Highway 404.
Source: urbanMetrics inc. based on MapInfo
Artesian Industrial Park
BWG Strategic
Settlement Employment Area
Employment Lands
Proposed Alignment of Bradford By-Pass
Reagens Industrial Park

DRAFT Discussion Paper, Employment Lands Official Plan Review, Bradford West Gwillimbury
5
2.1 EMPLOYMENT LAND CHARACTERISTICS This section of the discussion paper provides an overview of the supply of Employment lands in BWG
with respect to location, visibility and surrounding land uses.
2.1.1 Artesian Industrial Park The Artesian Industrial Park is located in the north eastern portion of the Bradford Urban Area. The
industrial park is 69.5 ha, and despite being the oldest industrial park in BWG, remains largely
undeveloped. Accessibility and visibility of the industrial park remain a challenge in attracting businesses,
as is access to 400-series highways. These factors have limited the types of business that have and will
likely locate in the industrial park.
The Employment lands in the Artesian Industrial Park are not constrained by any sensitive land uses. To
the east of the Industrial Park are lands designated as Open Space. Lands to the west of the Industrial
Park are currently vacant. While some of these lands are designated as Industrial/Commercial. Lands
further to the west are designated as Residential.
The majority of the businesses located in the Artesian Industrial Park are engaged in Commercial
Services and Construction. The Artesian Industrial Park is also characterized as having businesses with a
large amount of space dedicated to outdoor storage.
2.1.2 Reagens Industrial Park
The Reagens Industrial Park is located in the western portion of the Bradford Urban Area and is much
larger than the Artesian Industrial Park at 133.2 ha. The industrial park is connected to full municipal
services and also benefits from good access to Highway 400 via County Road 88.
The Reagens Industrial Park has experienced some difficulty with sensitive land uses located to the east.
This was a concern identified in the Economic Development Strategy1. In the Economic Development
Strategy, several property owners identified residential development encroaching to the east as a
potential challenge for the industrial park. While the open space buffer between the industrial and
residential uses has mitigated noise disturbances, other factors such as smells and safe
transportation/disposal of hazardous materials remains a challenge.
2.1.3 BWG Strategic Settlement Employment Area (“BWG SSEA”)
The BWG SSEA was designated under the provincial Growth Plan for the Greater Golden Horseshoe.
Land uses in the BWG SSEA are controlled by ministerial zoning orders. The BWG SSEA straddles
Highway 400 between Concession Rd. 9 in the north and Concession Rd. 5 in the south. While the BWG
SSEA is currently not serviced, there are plans to fully service the industrial park by late 2018.
Visibility and access to a major transportation corridor are important considerations when businesses
ultimately decide where to locate. As illustrated in Figure 2-1, the Employment lands subject to the
Minister’s Zoning Order have excellent visibility and access to Highway 400 and a potential future
interchange for the Bradford By-Pass.
While these lands have yet to be developed for employment purposes, it is less likely that there will be
significant challenges related to sensitive land uses than in the Bradford Urban Area, as the lands within
and surrounding the BWG SSEA consist of agricultural uses.
1 Town of Bradford West Gwillimbury Economic Development Strategy, Draft Final Report, October 2015, prepared by MDB Insight.

DRAFT Discussion Paper, Employment Lands Official Plan Review, Bradford West Gwillimbury
6
2.1.4 Bradford By-Pass Employment Lands
The additional large cluster of Employment lands extends across the northern portion of the Bradford
Urban Area boundary. These Employments lands generally straddle the proposed alignment for the
Bradford By-Pass. While these lands are currently undeveloped, they represent long-term potential for
employment lands in the community should the proposed highway be developed.
2.2 CHARACTERISTICS OF OCCUPIED EMPLOYMENT LANDS IN BWG As part of this section of the discussion paper, we have analyzed the profile of developed Employment
lands in BWG by land use designation, zoning, parcel size, lot coverage and type of employment.
BWG has approximately 171 hectares of occupied Employment lands located in the Town. As shown in
Figure 2-2, the majority of the occupied Employment lands in BWG are designated as Industrial and are
located in the Artesian and Reagens Industrial Parks.
Figure 2-2: BWG Occupied Employment Lands by Location and Land Use Designation (Gross Hectares)
We have also examined the zoning on occupied Employment lands in BWG. Figure 2-3 shows that most
occupied lands in the Town are zoned M1.
Figure 2-3: BWG Occupied Employment Lands by Location and Zoning (Gross Hectares)
Industrial
Industrial /
Commercial
Lands Subject
to Minister's
Zoning Order TOTAL Percentage
Artesian Industrial Park 46.9 1.5 0.0 48.4 28%
Reagens Industrial Park 70.7 0.0 0.0 70.7 41%
BWG SSEA 0.0 0.0 23.2 23.2 14%
Other BWG 6.0 23.1 0.0 29.1 17%
TOTAL 123.5 24.6 23.2 171.3 100%
Percentage 72% 14% 14% 100%
Source: urbanMetrics inc. based on June 2016 inventory of Employment Lands.
M1 M2 M3 I C5
Lands Subject
to Minister's
Zoning Order TOTAL Percentage
Artesian Industrial Park 47.1 1.2 0.0 0.0 0.0 0.0 48.4 28%
Reagens Industrial Park 66.6 0.0 0.0 4.0 0.0 0.0 70.7 41%
BWG SSEA 0.0 0.0 0.0 0.0 0.0 23.2 23.2 14%
Other BWG 19.0 4.1 4.5 0.0 1.5 0.0 29.1 17%
TOTAL 132.7 5.3 4.5 4.0 1.5 23.2 171.3 100%
Percentage 77% 3% 3% 2% 1% 14% 100%
Source: urbanMetrics inc. based on June 2016 inventory of Employment Lands.

DRAFT Discussion Paper, Employment Lands Official Plan Review, Bradford West Gwillimbury
7
The lot coverage ratio on Employment lands in BWG averaged 15% across the municipality. Coverage
was highest in the Reagens Industrial Park and somewhat lower in the Artesian Industrial Park. We
consider these lot coverage ratios to be very low. The low lot coverage ratios reflect lands being used for
outdoor storage and parking. For future planning purposes, we have assumed higher lot coverage ratios
on Employment lands.
Figure 2-4: Average Employment Land Coverage by Location
We have also estimated the share of Employment lands occupied by the various employment sectors.
These sectors include:
o Industrial - Employment primarily accommodated in low-rise industrial type buildings generally
located within business parks and industrial areas (i.e. Employment Area lands).
o Commercial / Population Related - Employment that primarily serves the resident population or
visitors, such as retail employment, as well as employment that typically occurs in office space
such as finance, insurance and real estate (FIRE), information and cultural services, professional,
scientific and technical services, and other business services.
o Institutional – Institutional employment also serves the resident population and includes jobs in
industries such as education, healthcare, and local government.
As shown in Figure 2-5, businesses engaged in
industrial employment account for nearly two-thirds
(64%) of occupied Employment lands in BWG.
Businesses engaged in commercial / population-related
employment is generally located in the Artesian
Industrial Park and consist of establishments such as
auto repair shops. The institutional component
represents the Bob Fallis Sports Centre located on Side
Road 10.
Coverage
Artesian Industrial Park 14%
Reagens Industrial Park 19%
Other BWG 10%
TOTAL 15%
Source: urbanMetrics inc. based on June 2016
inventory of Employment lands.
Industrial64%
Commercial / Population-
Related33%
Institutional3%
Source: urbanMetrics inc. based on June 2016 Employment Land Inventory
Figure 2-5: Occupied Employment Lands by Type of Employment, BWG

DRAFT Discussion Paper, Employment Lands Official Plan Review, Bradford West Gwillimbury
8
Based on the Employment land inventory conducted by urbanMetrics in June 2016 and data from the
2011 National Household Survey, we have calculated employment densities for industrial employment in
BWG. These densities range from a low of 400 square feet per employee in construction to a high of
1,450 square feet per employee in transportation, warehousing and wholesale trade.
Figure 2-6: Employment Density
BWG has approximately 262,000 square feet of vacant industrial Gross Floor Area (GFA) located on
Employment lands in the municipality. This represents a vacancy rate of 10.6%. Nearly all of the vacant
industrial GFA is located in the Reagens Industrial Park, and particularly in the former Faurecia industrial
building located at 100 Reagens Industrial Parkway.
We consider an industrial vacancy rate of 10.6% to be somewhat high in the Greater Toronto Area
(“GTA”) context. However, once the industrial building located at 100 Reagens Industrial Parkway is
occupied, the industrial vacancy rate in BWG would be approximately 3%, which is in line with the GTA
average.
Figure 2-7: Vacant GFA on Employment Lands, BWG
Density
(Sq.ft. Per
Employee)
Construction 400
Manufacturing 600
Transportation, Warehousing and Wholesale Trade 1,450
Source: urbanMetrics inc. based on 2011 NHS.
Vacant GFA Vacancy Rate
Artesian Industrial Park 29,712 4.0%
Reagens Industrial Park 191,607 13.6%
BWG SSEA 0 0.0%
Other BWG 41,140 13.4%
TOTAL 262,459 10.6%
Source: urbanMetrics inc. based on June 2016 inventory of
Employment lands.

DRAFT Discussion Paper, Employment Lands Official Plan Review, Bradford West Gwillimbury
9
2.3 SUPPLY OF VACANT EMPLOYMENT LANDS IN BWG The supply and location of vacant Employment lands within BWG will be a significant factor in
determining how competitive the Town will be in attracting employment uses.
Figure 2-8 identifies the location of vacant Employment lands within the Town as of June 2016. As
shown, these lands are generally located throughout the Town with the largest concentrations located in
the BWG SSEA and lands abutting the proposed alignment for the Bradford By-Pass.
Figure 2-8: BWG Vacant Employment Lands
Vacant Employment Lands
Source: urbanMetrics inc.

DRAFT Discussion Paper, Employment Lands Official Plan Review, Bradford West Gwillimbury
10
Figure 2-9 summarizes the supply of vacant Employment lands in BWG by industrial Park. Overall, as
shown, there is estimated to be a supply of approximately 719 hectares of vacant Employment lands in
the Town. This represents the net vacant supply of Employment lands and excludes environmentally
sensitive lands and internal infrastructure such as hazard lands, roads, stormwater ponds, easements,
etc. As shown, 89% of the vacant Employment land supply is located in the BWG SSEA or on lands
bordering the proposed Bradford By-Pass. The Artesian and Reagens Industrial Parks only account for
11% of the vacant Employment land supply, or approximately 76 hectares.
Figure 2-9: BWG Developed and Vacant Employment Lands by Location, 2016
Figure 2-10 identifies the vacant Employment land supply by Official Plan land use designation. It is
important that BWG maintain a healthy supply of vacant Employment lands within each land use category
to ensure that they can accommodate a variety of employment uses. As shown, the Employment land use
categories of Industrial, Industrial / Commercial, Industrial – Industrial / Commercial and Industrial Special
Policy Area account for 32% of the vacant Employment land supply. The remaining vacant Employment
lands are subject to the Minister’s Zoning Order.
Figure 2-10: BWG Vacant Employment Land Supply by Land Use Designation, 2016
The availability of a variety of parcel sizes will also be important in determining the future competitiveness
of BWG’s vacant Employment land supply. Transportation and Warehousing and Wholesale Trade type
uses will require large parcel sizes. Whereas, smaller manufacturing uses or construction type
businesses will likely require smaller Employment land parcels.
Developed Vacant Total
Percent
Vacant
Vacant
Percent of
Total
Artesian Industrial Park 48.4 20.5 68.8 30% 3%
Reagens Industrial Park 70.7 55.4 126.0 44% 8%
BWG SSEA 23.2 489.5 512.7 95% 68%
Other BWG 29.1 153.5 182.6 84% 21%
Total 171.3 718.8 890.1 81% 100%
Source: urbanMetrics and WSP, MMM Group Ltd.
Artesian
Industrial
Park
Reagens
Industrial
Park BWG SSEA Other BWG Total
Percent of
Total
Industrial 20.5 38.6 0.0 49.7 108.8 15%
Industrial / Commercial 0.0 13.1 0.0 60.6 73.7 10%
Industrial - Industrial / Commercial 0.0 0.0 0.0 36.9 36.9 5%
Industrial Special Policy Area 0.0 3.6 0.0 6.3 10.0 1%
Lands Subject to Minister's Zoning Order 0.0 0.0 489.5 0.0 489.5 68%
Total 20.5 55.4 489.5 153.5 718.8 100%
Source: urbanMetrics and WSP, MMM Group Ltd.

DRAFT Discussion Paper, Employment Lands Official Plan Review, Bradford West Gwillimbury
11
Figure 2-11 illustrates that BWG has a healthy supply of Employment land parcels of various sizes. BWG
must ensure that it maintains a large supply of vacant Employment land parcels of various sizes to ensure
the long-term competitiveness of its Employment lands.
Figure 2-11: BWG Vacant Employment Land Supply by Parcel Size, 2016
2.4 SUMMARY BWG has a large diverse supply of Employment lands. In total, there are approximately 890 hectares of
occupied and vacant Employment lands located throughout the municipality. Highlights from the
Employment land analysis include:
Approximately two-thirds of Employment lands within the Bradford Urban Area are occupied. In
addition to Employment lands within the Bradford Urban Area, there are also 512 hectares of
lands designated to accommodate employment uses in the BWG SSEA.
Developed Employment lands in BWG accommodate a variety of employment uses, including
industrial, commercial / population-related and institutional. Based on our Employment land
inventory, industrial employment accounts for 64% of occupied Employment lands, followed by
commercial / population-related at 33%.
Within BWG, nearly all of the 719 hectares of vacant Employment lands are located in the BWG
SSEA and abutting the proposed alignment for the Bradford By-Pass. The vacant Employment
lands include a diversity of parcel sizes to accommodate future employment growth.
Vacant Land
Area (Ha)
Percent of
Total
Vacant
Employment
Land Parcels
Percent of
Total
Less than 1 ha 13.8 2% 40 29%
1 - 1.9 ha 35.6 5% 24 18%
2 - 4.9 ha 112.8 16% 35 26%
5 - 9.9 ha 114.8 16% 15 11%
10 ha and greater 441.8 61% 22 16%
Total 718.8 100% 136 100%
Source: urbanMetrics and WSP, MMM Group Ltd.

DRAFT Discussion Paper, Employment Lands Official Plan Review, Bradford West Gwillimbury
12
3 Comparative Analysis
The large supply of vacant Employment lands in BWG are well positioned to attract a wide range of
businesses that typically locate on Employment lands. BWG’s ability to attract demand for employment
lands to the municipality will depend on how competitive these lands are perceived in comparison to
neighbouring municipalities. The location of BWG, at the southern edge of Simcoe County means that will
compete for business attraction and retention with municipalities in southern Simcoe County and
northwestern York Region.
In this section of the Discussion Paper, we have identified factors considered by businesses when
determining where to locate and how BWG compares to other local area municipalities. Variables
considered in our analysis include:
Locational Attributes of Employment Lands
Supply of Vacant Employment Lands
Access to Transportation (mainly Highway access)
Existing Types of Businesses in the Municipality
Skilled Labour Force
Property Tax Rates
Development Charge Rates
Based on these parameters, we have identified a study area for employment lands in BWG. Employment
lands in municipalities in our study area are expected to be most competitive with Employment lands in
BWG. Municipalities included in the Study Area include:
Barrie
Innisfil
Essa
New Tecumseth
King Township
East Gwillimbury
Newmarket
Aurora
Whitchurch-Stouffville
Vaughan
Georgina

DRAFT Discussion Paper, Employment Lands Official Plan Review, Bradford West Gwillimbury
13
These municipalities and the extent of the Study Area are identified in Figure 3-1.
Figure 3-1: Study Area
3.1 LOCATION AND TRANSPORTATION ANALYSIS All of the municipalities identified within the Study Area have employment lands that are located along or
in close proximity to a 400-series highway and are therefore directly competitive with Employment lands
in BWG. This section outlines the locational attributes of Employment lands in each municipality in the
Study Area.
City of Barrie
The City of Barrie has five Employment Areas within the old City of Barrie boundary, in addition to new
employment lands located in the lands annexed from Innisfil, which are located in the Salem Secondary
Plan. This secondary plan area includes approximately 170 gross hectares of employment lands
designated General Industrial and Highway 400 Industrial/Business Park.
Innisfil
Barrie
Essa
New Tecumseth
King
Vaughan
Whitchurch -Stouffville
Aurora
Newmarket
East Gwillimbury
Bradford West Gwillimbury
Source: urbanMetrics inc. based on MapInfo
Georgina

DRAFT Discussion Paper, Employment Lands Official Plan Review, Bradford West Gwillimbury
14
Nearly all employment lands in Barrie are located in close proximity to Highway 400. In fact, many of the
employment lands in Barrie are located adjacent to Highway 400 and therefore provide direct exposure to
passing vehicles.
Town of Innisfil
The largest concentration of employment lands in Innisfil are located in the Innisfil Heights Business Park,
which is a provincially designated employment area that straddles Highway 400. These lands total 320
hectares and are designated to accommodate a total of 7,700 highway commercial, general industrial and
business park jobs. These lands provide excellent visibility to passing vehicles and access to Highway
400 via Innisfil Beach Road. Work is underway to bring full municipal servicing to the business park.
Aside from the Innisfil Heights Business Park, additional employment lands in Innisfil consist of Rural
Industrial lands scattered throughout the municipality. These lands are generally built-out and are not
serviced.
Township of Essa
The Township of Essa has three concentrations of employment lands, the majority of which are located in
the rural area of the municipality and are not on municipal services. The largest concentration of serviced
employment lands in Essa are located in the Angus urban area, approximately one-third of which are
vacant. The employment lands in the Angus urban area are approximately 20 kilometres from a Highway
400 interchange and therefore do not have visibility or easy access to Highway 400.
Town of New Tecumseth
All employment lands in New Tecumseth are located in the three urban areas of Alliston, Beeton and
Tottenham. The urban area of Alliston accounts for the largest share of these employment lands within
the municipality.
Similar to Essa, the Town of New Tecumseth does not have direct access and exposure to a 400-series
Highway. However, this lack of highway exposure has not limited the ability of the municipality to attract
high profile businesses to its industrial lands. Despite the lack of highway exposure, employment lands in
the municipality have easy access to Highway 400 via Highway 89.
King Township
Employment lands in King Township are located in the three urban areas of King City, Nobelton and
Schomberg. The largest concentration of occupied employment lands are located in the Schomberg
urban area at the intersection of Highway 27 and Highway 9. The industrial park in Schomberg also
includes a large supply of vacant employment parcels to support future employment growth. The supply
of vacant employment lands in the urban areas of King City and Nobelton are limited.
Although the employment lands in King Township do not have direct exposure to a 400-series, all of the
employment lands have convenience access to Highway 400.
City of Vaughan
The City of Vaughan has a total of 28 employment areas. The majority of these employment areas are
located in close proximity and have access to Highway 400, Highway 407 and the proposed future
extension of Highway 427.
Among municipalities included in the Study Area for BWG, the City of Vaughan has the largest and most
diverse supply of employment lands.
Employment lands located south of Rutherford Road along Highway 400 and Highway 407 are generally
build-out, with only a few large vacant lots remaining. For employment lands located along Highway 400

DRAFT Discussion Paper, Employment Lands Official Plan Review, Bradford West Gwillimbury
15
north of Rutherford Road and employment lands located west of Highway 27, there are a large number of
vacant parcels available for development. However, many of these vacant lots remain unserviced and are
part of Vaughan’s long-term employment land supply.
Town of East Gwillimbury
Employment lands in East Gwillimbury are located in six designated Employment Areas in the Town.
Within these Employment Areas, the Town currently has a supply of approximately 500 hectares of
vacant Employment lands. A large supply of the vacant Employment lands in East Gwillimbury have
access and visibility to Highway 404.
Town of Newmarket
The largest concentration of employment lands in Newmarket are located adjacent to Highway 404. While
these lands have excellent access and visibility to the highway, nearly all employment lands in
Newmarket are built-out. The only significant concentration of vacant employment lands in Newmarket
are located in the Leslie South employment area between Davis Drive and Mulock Drive.
Town of Aurora
Employment lands in Aurora are located in six business parks, which combined account for nearly 400
net hectares of employment lands. The majority of the vacant employment lands in Aurora are located
adjacent to Highway 404. The location of these vacant employment lands provide excellent access and
visibility to Highway 404.
Town of Whitchurch-Stouffville –
Whitchurch-Stouffville has four employment areas, including Cardico, Gromley, Vandorf and Stouffville.
The Cardico, Gromely and Vandorf employment areas all have access and some exposure to Highway
404.
Town of Georgina
Employment lands in Georgina are located within both the urban and rural areas of the municipality. The
largest concentration of employment lands in the municipality is located in the Keswick Secondary Plan.
The Town of Georgina is also proposing a new business park along the planned Highway 404 Extension
at Glenwoods Avenue. These lands are proposed to be designated as Business Park in the Keswick
Secondary Plan.

DRAFT Discussion Paper, Employment Lands Official Plan Review, Bradford West Gwillimbury
16
3.2 EMPLOYMENT CLUSTERS This section of the analysis has utilized Location Quotients (LQ’s) to compare the employment structure
in BWG with the municipalities in the Study Area. LQ’s are commonly used to identify the concentration of
employment activities and the relative strength in comparison to a regional economy. In this analysis, we
have calculated LQ’s by dividing the percentage of employment in a specific sector in a municipality by
total employment as a ratio of provincial employment in that sector.
Based on how LQ’s are derived, an LQ greater than 100% indicates that there is a concentration or
“cluster” of employment in a particular sector in comparison to the provincial average. Businesses cluster
together for a variety of reasons. When it comes to business sectors that typically locate on employment
lands, such as manufacturing, wholesale trade and transportation and warehousing, businesses cluster
together to take advantage of a pool of skilled labour, highway access, exposure to passing vehicles or
an abundance of large parcels of land.
An LQ equal to 100% indicates that the share of employment in a sector is the same as exists at the
provincial level. An LQ less than 100% indicates a concentration of employment in a particular sector that
is below the provincial average.
Figure 3-2 through Figure 3-5 summarizes LQ’s for BWG and other municipalities in the Study Area for
employment sectors that almost exclusively locate on Employment lands in business and industrial parks.
These sectors include manufacturing, wholesale trade, transportation & warehousing and construction.
Key findings from this analysis are as follows:
BWG has a cluster of manufacturing businesses located in the municipality. Aside from New
Tecumseth, which has a relatively high LQ due to the presence of the Honda facility, the LQ in
BWG is higher than other municipalities in the Study Area.
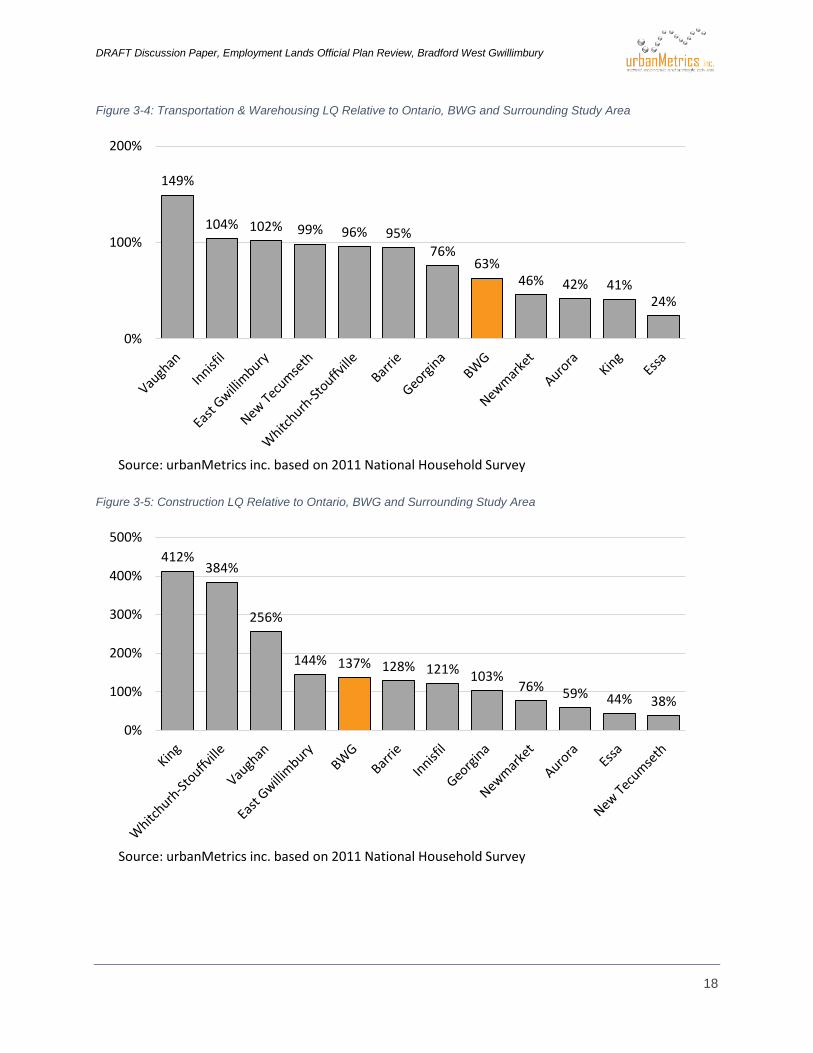
BWG also has a slight cluster of firms engaged in the construction sector. Most of these firms are
located in the Artesian Industrial Park in BWG.
The LQ analysis indicates that BWG has a relatively low concentration of wholesale trade and
transportation & warehousing companies relative to the provincial average and other
municipalities in the Study Area.
BWG’s lack of concentration in Wholesale Trade and Transportation and Warehousing is likely
related, in part, to the lack of convenient access to a 400-series Highway in the Artesian and
Reagens Industrial Areas. The opening of BWG SSEA lands located along Highway 400 would
likely attract a greater concentration of these types of businesses on Employment lands in the
municipality.

DRAFT Discussion Paper, Employment Lands Official Plan Review, Bradford West Gwillimbury
17
Figure 3-2: Manufacturing LQ Relative to Ontario, BWG and Surrounding Study Area
Figure 3-3: Wholesale Trade LQ Relative to Ontario, BWG and Surrounding Study Area
359%
245%
204%
127% 124%104% 91%
74% 65% 56%28% 22%
0%
100%
200%
300%
400%
Source: urbanMetrics inc. based on 2011 National Household Survey
210%
139%
93% 88% 77% 75% 70% 69% 68%
35% 33%21%
0%
100%
200%
300%
Source: urbanMetrics inc. based on 2011 National Household Survey
DRAFT Discussion Paper, Employment Lands Official Plan Review, Bradford West Gwillimbury
18
Figure 3-4: Transportation & Warehousing LQ Relative to Ontario, BWG and Surrounding Study Area
Figure 3-5: Construction LQ Relative to Ontario, BWG and Surrounding Study Area
149%
104% 102% 99% 96% 95%76%
63%46% 42% 41%
24%
0%
100%
200%
Source: urbanMetrics inc. based on 2011 National Household Survey
412%384%
256%
144% 137% 128% 121% 103%76% 59% 44% 38%
0%
100%
200%
300%
400%
500%
Source: urbanMetrics inc. based on 2011 National Household Survey
DRAFT Discussion Paper, Employment Lands Official Plan Review, Bradford West Gwillimbury
19
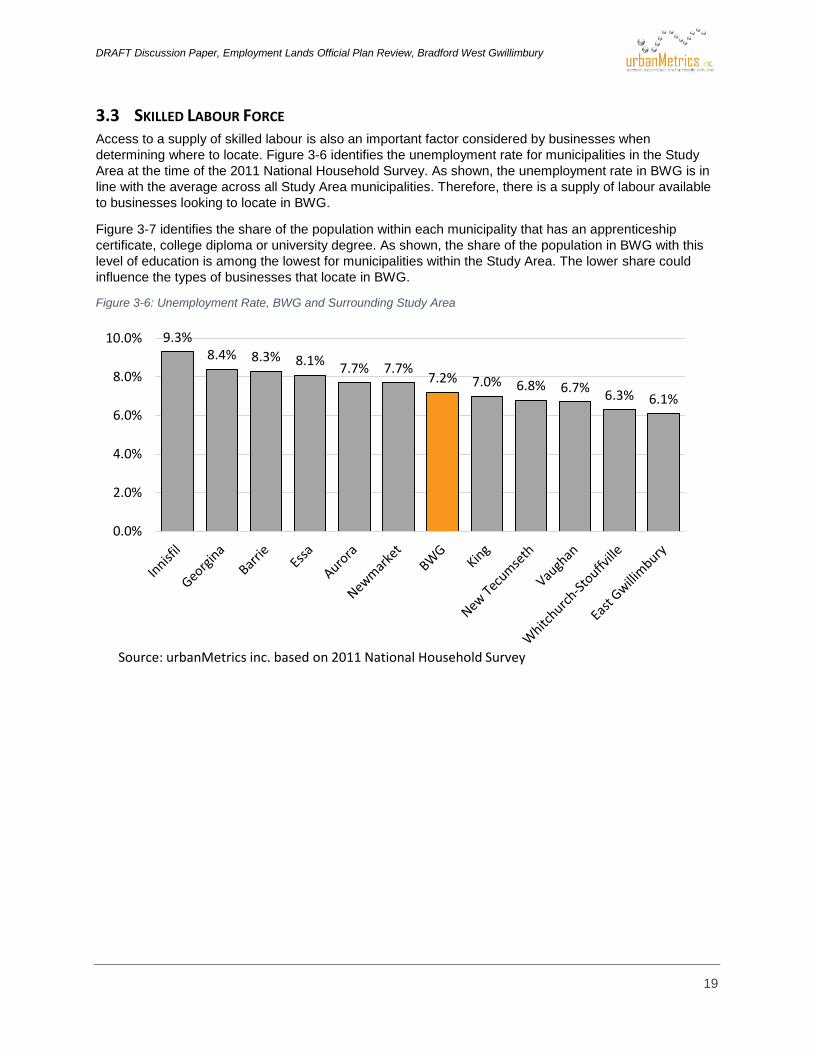
3.3 SKILLED LABOUR FORCE Access to a supply of skilled labour is also an important factor considered by businesses when
determining where to locate. Figure 3-6 identifies the unemployment rate for municipalities in the Study
Area at the time of the 2011 National Household Survey. As shown, the unemployment rate in BWG is in
line with the average across all Study Area municipalities. Therefore, there is a supply of labour available
to businesses looking to locate in BWG.
Figure 3-7 identifies the share of the population within each municipality that has an apprenticeship
certificate, college diploma or university degree. As shown, the share of the population in BWG with this
level of education is among the lowest for municipalities within the Study Area. The lower share could
influence the types of businesses that locate in BWG.
Figure 3-6: Unemployment Rate, BWG and Surrounding Study Area
9.3%8.4% 8.3% 8.1%
7.7% 7.7%7.2% 7.0% 6.8% 6.7%
6.3% 6.1%
0.0%
2.0%
4.0%
6.0%
8.0%
10.0%
Source: urbanMetrics inc. based on 2011 National Household Survey

DRAFT Discussion Paper, Employment Lands Official Plan Review, Bradford West Gwillimbury
20
Figure 3-7: Share of Population with Apprenticeship Certificate, College Diploma or University Degree
62% 60%57% 56% 55% 55%
51%48% 48% 46% 46% 45%
0%
15%
30%
45%
60%
75%
Source: urbanMetrics inc. based on 2011 National Household Survey

DRAFT Discussion Paper, Employment Lands Official Plan Review, Bradford West Gwillimbury
21
3.4 SUPPLY OF VACANT EMPLOYMENT LANDS Availability of vacant Employment lands is one of the most important locational factors for a business. As
such, we have summarized the supply of vacant Employment lands in each of the comparative
municipalities. As shown these municipalities have approximately 4,500 net hectares of vacant
Employment lands2. The City of Vaughan accounts for almost 30% of vacant Employment lands in these
municipalities.
The large supply of vacant employment lands in Vaughan has the potential to create challenges for the
other local municipalities in attracting employment uses. This is due to the proximity of Vaughan to
intermodal transportation hubs and Toronto’s Pearson International Airport.
Aside from Vaughan, BWG will also have to compete with other local municipalities that have a large
supply of vacant employment lands with access and exposure to 400-series highways. Therefore, BWG
will likely compete direction with municipalities such as East Gwillimbury, Barrie and Innisfil, as vacant
employment lands in these municipalities have similar locational attributes to vacant lands in the BWG
SSEA.
Figure 3-8: Vacant Employment Land Supply, BWG and Surrounding Study Area
2 Vacant employment land supply in the various municipalities is based on various dates.
1,296
719 682
418 399308
186 162 15483 75 34
0
500
1,000
1,500
Net Hectares
Note: Year of in which the supply was estimated is shown in brackets.Source: urbanMetrics inc. based on various sources.

DRAFT Discussion Paper, Employment Lands Official Plan Review, Bradford West Gwillimbury
22
3.5 INDUSTRIAL PROPERTY TAX RATES Property tax rates for industrial properties are also a factor that impacts where a business decides to
locate. Figure 3-9 summarizes the industrial tax rate for municipalities in the Study Area. These property
tax rates include the municipal, regional and educational tax rates. As shown, the tax rate for an industrial
property in BWG is amongst the highest in the Study Area. It is notable that municipalities in Simcoe
County have the highest industrial property tax rates, while municipalities in York Region have the lowest.
It is also important to note that these property tax rates are applied to the assessed value of a property.
What will be important to a business when determining where to locate is the final tax bill, which is the
industrial tax rate applied to the assessed value of the property. Since the assessed value of an industrial
property in Simcoe County is lower than a comparable property in York Region, it will affect the final tax
bill. Therefore, while the industrial property tax rate in Simcoe County municipalities is higher than York
Region municipalities, the final tax bill would likely be similar.
Figure 3-9: Industrial Property Tax Rates, BWG and Surrounding Study Area
3.0% 3.0% 2.9% 2.8%2.5% 2.4%
2.2% 2.2% 2.2% 2.2% 2.1% 2.0%
0.0%
0.5%
1.0%
1.5%
2.0%
2.5%
3.0%
3.5%
Source: urbanMetrics inc. based on various sources

DRAFT Discussion Paper, Employment Lands Official Plan Review, Bradford West Gwillimbury
23
3.6 INDUSTRIAL DEVELOPMENT CHARGES The industrial development charge rate in a municipality may also impact how competitive a municipality
is in attracting businesses to employment lands, as it will impact how much it will cost a business to build
a new facility in the municipality.
As shown in Figure 3-10, the industrial development charge in BWG is among the lowest for the
municipalities in the Study Area. These development charges include the municipal, regional and
educational rates per square foot. The development charge for BWG in Figure 3-10 is for industrial
development in the Bradford Settlement Area. The development charge for industrial buildings in the
Bond Head Settlement Area and the BWG SSEA is slightly lower at $18.16 per square foot.
Figure 3-10: Industrial Development Charges ($/sq.ft.), BWG and Surrounding Study Area
3.7 SUMMARY BWG is one of the only municipalities in the Study Area that did not have Employment lands with
access to a 400-series highway. The addition of the BWG SSEA, which has direct access and
exposure to Highway 400, will greatly enhance the ability of BWG to attract businesses engaged
in Wholesale Trade and Transportation and Warehousing.
The supply of vacant Employment lands in BWG will also be important in attracting businesses to
the municipality. BWG accounts for approximately 16% of vacant Employment lands among
municipalities in the Study Area.
BWG also has non-residential development charges that are among the lowest for municipalities
in the Study Area. The low development charges and an abundance of Employment lands with
access to Highway 400 will be important in attracting businesses to the municipality.
$28.6$25.7 $25.7 $24.8 $24.5
$22.4 $21.5 $20.7 $19.7 $19.4
$13.9$12.1
$0
$5
$10
$15
$20
$25
$30
$35
Source: urbanMetrics inc. based on various sources
DRAFT Discussion Paper, Employment Lands Official Plan Review, Bradford West Gwillimbury
24
4 Trend and Target Analysis
4.1 CURRENT TRENDS IN EMPLOYMENT LANDS DEVELOPMENT The Ontario economy has evolved from one focused on goods-producing sectors to one that is more
dependent on the services sectors. This evolution has had a substantial impact on the demand for
Employment lands in municipalities across the Province. In some municipalities in the GTA, there has
been a shift towards growth in Major Office Employment (MOE) on Employment lands. Whereas, in
municipalities that have not attracted Major Office Employment, absorption of Employment lands has
slowed.
The three main sectors in the economy that have contributed to demand for Employment lands in are the
manufacturing, wholesale trade and transportation and warehousing sectors.
The manufacturing sectors continues to play a significant role in the Ontario economy, accounting of
nearly 13% of the value of all goods and services produced in the Province. However, the value of goods
produced by the manufacturing sector is down significantly from the late 1990’s, when it accounted for as
much as 20% of Provincial output. While the manufacturing sector will continue to play a significant role in
the Ontario economy, the role of sectors such as wholesale trade and transportation and warehousing are
becoming more significant.
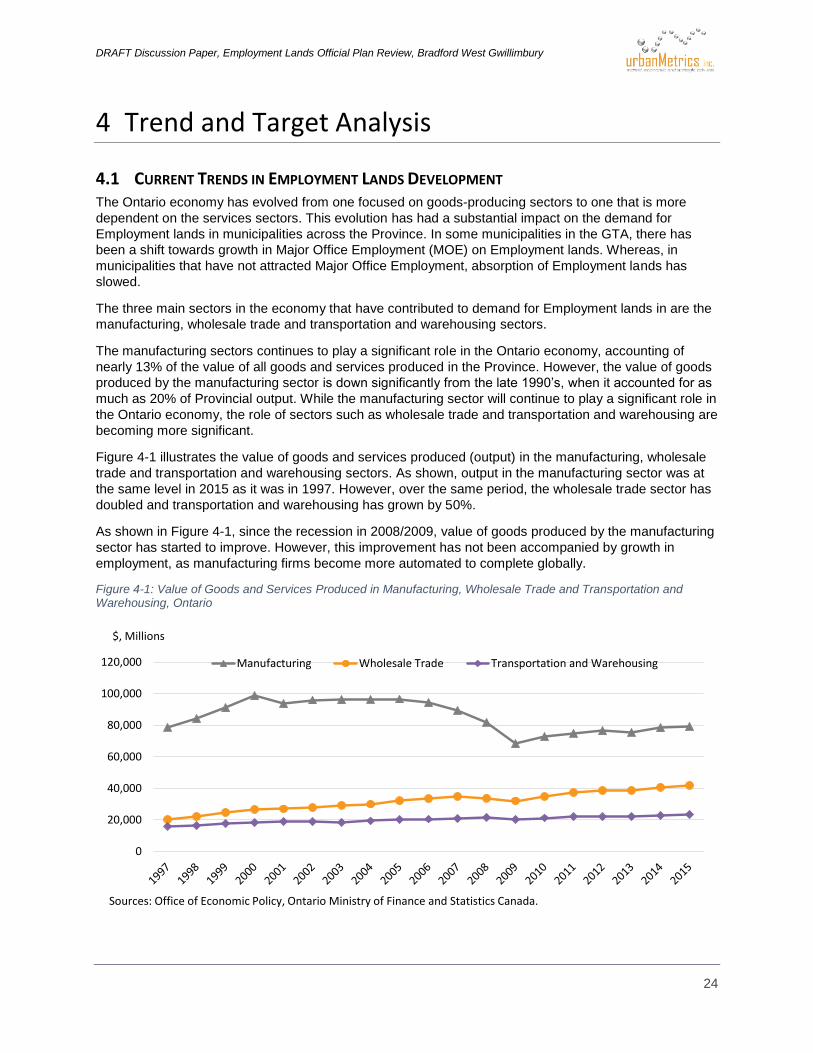
Figure 4-1 illustrates the value of goods and services produced (output) in the manufacturing, wholesale
trade and transportation and warehousing sectors. As shown, output in the manufacturing sector was at
the same level in 2015 as it was in 1997. However, over the same period, the wholesale trade sector has
doubled and transportation and warehousing has grown by 50%.
As shown in Figure 4-1, since the recession in 2008/2009, value of goods produced by the manufacturing
sector has started to improve. However, this improvement has not been accompanied by growth in
employment, as manufacturing firms become more automated to complete globally.
Figure 4-1: Value of Goods and Services Produced in Manufacturing, Wholesale Trade and Transportation and Warehousing, Ontario
0
20,000
40,000
60,000
80,000
100,000
120,000 Manufacturing Wholesale Trade Transportation and Warehousing
$, Millions
Sources: Office of Economic Policy, Ontario Ministry of Finance and Statistics Canada.

DRAFT Discussion Paper, Employment Lands Official Plan Review, Bradford West Gwillimbury
25
Needless to say, these changes in the regional economy will have an impact on the demand for the type
and location of employment lands across the Province and in BWG. The following section outlines the
impact these changes in the regional economy are likely to have on the types of businesses locating in
employment areas, the parcel size and building size desired by these new businesses, locational
requirements and skills requirements of businesses competing in this “new economy”.
The remainder of this section identifies trends in demand for Employment lands based on business types,
parcel and building size, locational requirements and skills requirements.
4.2 BUSINESS TYPE Businesses engaged in manufacturing, wholesale trade, and transportation and warehousing continue to
account for the majority of business types located on Employment lands in various municipalities,
including BWG.
In recent years, industrial employment growth is being driven by growth in the goods movement sectors
such as wholesale trade and transportation and warehousing. This is consistent with the increasing
contribution of these sectors to the Provincial economy.
Among traditional manufacturing type businesses, sectors that have seen their contribution to Provincial
GDP expand over the past decade include:
Food, Beverage & Tobacco Products;
Plastic and Rubber Products;
Transportation Equipment;
Primary Metal & Fabricated Metal Products; and
Other Manufacturing, which includes businesses engaged in the making of furniture, medical
equipment and supplies, jewellery, sporting goods, toys, office supplies and other products.
In recent years, businesses engaged in non-industrial sectors have accounted for a growing share of
Employment land absorption. For example, in larger urban communities, such as Vaughan, Richmond Hill
and Markham, there has been a trend towards office development locating in prestige employment areas.
The trend towards office development on Employment lands has been slow to migrate north of Vaughan.
Therefore, over the planning horizon for the BWG Official Plan, there is not expected to be strong
demand for Employment lands to accommodate office uses.
4.3 PARCEL SIZE AND BUILDING SIZE The recent trend towards businesses engaged in wholesale trade and transportation and warehousing is
anticipated to impact the size of parcels and buildings that are likely to be demanded within employment
areas. For example, the increasing importance of wholesale trade and transportation and warehousing,
has and will continue to influence the parcel and building sizes sought by these businesses. These types
of businesses tend to favour large warehouse facilities and therefore are attracted to large greenfield
lands that are priced competitively.
As industrial land prices in GTA municipalities continue to rise, it is expected to result in land extensive
sectors such as wholesale trade and transportation and warehousing companies moving further north of
the GTA to find more appropriate parcel sizes and more affordable land prices. This trend will likely
benefit lands located in the BWG SSEA.

DRAFT Discussion Paper, Employment Lands Official Plan Review, Bradford West Gwillimbury
26
4.4 LOCATIONAL REQUIREMENTS The locational requirements of businesses vary by sector. For example, in York Region, the vast majority
of employment growth has occurred in the southern municipalities of Vaughan and Markham. This strong
employment growth is tied to the increasing number of major office buildings locating on Employment
lands in these municipalities and the proximity of these municipalities to intermodal facilities.
As noted earlier, the types of businesses that are likely to be attracted to the BWG SSEA are those
engaged in wholesale trade and transportation and warehousing. Businesses engaged in these sectors
tend to be concentrated close to intermodal terminals such as Pearson International Airport or the
intermodal facilities in Vaughan. As a result, in recent years, there has been strong demand for
Employment lands in the southern municipalities in York Region. However, as the employment land
supply in these municipalities becomes more constrained and land prices increase, there will inevitably be
pressure to move further north for less expensive land.
Access to 400-Series highways is also an important consideration for businesses engaged in wholesale
trade and transportation and warehousing. The Employment lands in the BWG SSEA appear poised to
benefit from the movement towards larger parcel sizes with access to 400-series highway.
Within the Artesian Industrial Park, it is anticipated that vacant Employment lands will continue to appeal
to more localized businesses or firms engaged in construction that require outdoor storage space. The
significant cluster of manufacturing firms in the Reagens Industrial Park is anticipated to help attract these
types of firms to this area of the municipality.
4.5 SKILLS LABOUR REQUIREMENTS Access to skilled labour is increasing becoming an important consideration for businesses when
determining where to locate. With manufacturing, and transportation and warehousing increasingly
becoming automated, there has been an increased demand for a skilled workforce.
As demonstrated earlier in the locational quotient analysis, BWG already has a large concentration of its
labour force employed in the manufacturing sector, which may be important in attracting these types of
businesses to BWG. However, it was also demonstrated in the previous sector is this discussion paper
that BWG has a somewhat lower share of its labour force with an apprenticeship certificate, college
diploma or university degree. The relatively lower share of skilled labour in BWG could also have an
impact on the types of businesses that choose to locate in the municipality.
4.6 BWG ECONOMIC DEVELOPMENT STRATEGY In October 2015, MDB Insight prepared the Town of Bradford West Gwillimbury Economic Development
Strategy, hereafter referred to as the Economic Development Strategy. The purpose of this Economic
Development Strategy was to optimize BWG’s economic development capacity over the next five year
period. Based on BWG’s existing strengths, the Economic Development Strategy recommends that the
Town focus on attracting the following industries:
Food Processing;
Materials Manufacturing; and,
Transportation, Logistics and Warehousing
In the Economic Development Strategy, MDB Insight emphasized the importance of the BWG SSEA in
attracting businesses in each of these identified sectors, as this area is expected to accommodate a
significant share of the Town’s future employment growth.

DRAFT Discussion Paper, Employment Lands Official Plan Review, Bradford West Gwillimbury
27
Recent trends in employment land development highlighted in the previous section of this discussion
paper are positive for BWG’s ability to attract the types of businesses identified in the Economic
Development Strategy to employment lands within the municipality.
Based on the Economic Development Strategy and the characteristics of businesses engaged in food
processing, materials manufacturing and transportation, logistics and warehousing, the available
Employment lands in BWG are well suited to accommodate these types of uses.
For example, based on the Economic Development Strategy, businesses engaged in food processing
require skilled labour, a variety of parcel sizes and willing partners. BWG has all of these.
In addition to the types of employment uses that are identified in the Economic Development Strategy,
recent events such as the decision by Magna International Inc. to move its global headquarters to a site
near King City could act as a catalyst for future Employment land absorption in BWG based on the
proximity of these two municipalities.
BWG is well positioned to capitalize of the changing landscape for employment lands in the GGH.

DRAFT Discussion Paper, Employment Lands Official Plan Review, Bradford West Gwillimbury
28
5 Employment Land Demand
5.1 HISTORIC EMPLOYMENT GROWTH BWG’s has experienced robust employment growth in recent years, expanding by nearly 1,700 jobs
between 2001 and 2011 (Figure 5-1). This represented average annual growth of approximately 2.6% per
year, which significantly outpaced the provincial average of 0.7% over the same period. Despite strong
employment growth, BWG continues to be a net exporter of jobs to neighbouring municipalities. Although
there were 15,145 employed residents in BWG in 2011 there were only 7,500 jobs in the municipality.
The manufacturing sector remains the backbone of the BWG economy, accounting for nearly 1 in 4 jobs
in the municipality in 20113. While manufacturing has been challenged across the province over the past
decade, the manufacturing sector in BWG has been quite resilient. Between 2001 and 2011, BWG added
nearly 800 new manufacturing jobs, at a time when the province of Ontario lost nearly 280,000 jobs in this
sector.
Businesses engaged in the construction sector have also added jobs over the 10 year period between
2001 and 2011. Despite the strength of the wholesale trade and transportation and warehousing sectors
across the GGH, employment in these sectors in BWG was essentially flat between 2001 and 2011. The
lack of employment growth in these sectors is likely related, in part, to an insufficient supply of suitable
sites for these uses over this period in BWG.
Figure 5-1 illustrates the recent shift in the Provincial economy identified in the previous section of the
Discussion Paper. In BWG, between 2001 and 2006, the manufacturing sector accounted for the majority
of employment growth across the municipality. However, between 2006 and 2011, growth in
manufacturing employment stalled. In fact, between 2006 and 2011, the service sectors, specifically retail
trade, accommodation and food services and health care and social assistance, accounted for all
employment growth in the municipality.
3 Based on employed persons with a usual place of work and who work at home.

DRAFT Discussion Paper, Employment Lands Official Plan Review, Bradford West Gwillimbury
29
Figure 5-1: Place of Work BWG by Industry, 2001 to 2011
2001 2006 2011
Growth
2001 to 2011
585 500 375 -210
0 0 0 0
30 15 20 -10
265 340 445 180
1,180 2,025 1,975 795
2,060 2,880 2,815 755
255 290 250 -5
555 725 955 400
260 255 225 -35
65 45 110 45
140 185 145 5
70 75 105 35
345 185 210 -135
0 10 0 0
155 160 255 100
460 575 550 90
415 515 650 235
60 90 100 40
510 325 490 -20
360 370 380 20
90 150 275 185
3,740 3,955 4,700 960
5,810 6,835 7,500 1,690
Note: Numbers may not add to totals due to rounding.
Source:
Accommodation and food services
Other services (except public administration)
Public administration
Sub-total Services-Producing Sectors
TOTAL
urbanMetrics based on 2001 and 2006 Census of Canada and 2011 National Household Survey.
Professional, scientific and technical services
Management of companies and enterprises
Administrative and support, waste
management and remediation services
Educational services
Health care and social assistance
Arts, entertainment and recreation
Wholesale trade
Retail trade
Transportation and warehousing
Information and cultural industries
Finance and insurance
Real estate and rental and leasing
Agriculture, forestry, fishing and hunting
Mining and oil and gas extraction
Utilities
Construction
Manufacturing
Sub-total Goods-Producing Sectors

DRAFT Discussion Paper, Employment Lands Official Plan Review, Bradford West Gwillimbury
30
5.2 EMPLOYMENT LAND ABSORPTION Figure 5-2 summarizes the value of new industrial construction in BWG over the 2002 to 2013 period. As
shown, new industrial construction activity in BWG was very buoyant in the early part of the 2000s. This is
consistent with strong Employment land absorption in BWG during this period, most notably in the
Reagens Industrial Park, which saw the construction of new industrial buildings to accommodate
companies such as Dortec Industries, Spectra Aluminum Products, Landini Canda and Cericola Farms.
However, with the onset of the recession in 2008, the value of new industrial construction in BWG
declined significantly. More recently, new industrial construction values have increased slightly with the
addition of a second building for Array Canada in the Reagens Industrial Park.
Figure 5-2: Industrial New Construction Value, BWG
Figure 5-3 illustrates the location of absorbed Employment land parcels in BWG between 2002 and 2016.
As shown, nearly all of the Employment land absorption in BWG has occurred within the Artesian and
Reagens Industrial parks. In total, absorbed parcels accounted for 35.1 hectares over the 14 year period,
or approximately 2.5 hectares per year. However, as shown in Figure 5-3 absorption was strongest during
the 2002 to 2008 period and has since slowed. During the 2002 to 2008 period, average annual
Employment land absorption was approximately 5.0 hectares per year, declining to 0.2 hectares per year
during 2008 to 2012 during the recession, and since improving slightly to 1.0 hectares per year during
2012 to 2016. However, it is notable that some of the absorption that occurred during 2012 to 2016 was
for staff parking and storage in the Artesian Industrial Park.
0
5,000
10,000
15,000
20,000
25,000
2002 2003 2004 2005 2006 2007 2008 2009 2010 2011 2012 2013
Source: urbanMetrics inc. based on Town of Bradford West Gwillimbury Development Charge Background Study and Proposed By-Law, Consolidated Report, September 15, 2014, prepared by Watson & Associates Economists Ltd.
Dollars ($000)

DRAFT Discussion Paper, Employment Lands Official Plan Review, Bradford West Gwillimbury
31
Figure 5-3: Absorbed Industrial Land Parcels, BWG, 2002 to 2016
Source: urbanMetrics inc.
Absorbed 2002-2008 = 30.2 ha
Absorbed 2008-2012 = 1.0 ha
Absorbed 2012-2016 = 3.8 ha

DRAFT Discussion Paper, Employment Lands Official Plan Review, Bradford West Gwillimbury
32
Figure 5-4 summarizes various statistics for absorbed Employment land parcels in BWG between 2002
and 2016. As shown, the Reagens industrial park accounted for 74% of absorbed Employment lands in
BWG between 2002 and 2016. Absorbed parcels in the Reagens Industrial Park also had the highest lot
coverage at 23% during 2002 to 2016. By comparison, coverage for absorbed parcels in the Artesian
Industrial Park was quite low at 9%. This was due to some parcels being absorbed for on-site storage or
parking.
Approximately one-third (32%) of absorbed parcels during the 2002 to 2016 period were less than one
hectare in size. While there were only two absorbed parcels greater than 5 hectares, these parcels
accounted for about 40% of the absorbed land area in BWG.
Figure 5-4: BWG Absorbed Employment Lands
5.3 FORECAST EMPLOYMENT GROWTH As part of the OPR, Metro Economics has prepared population and employment growth forecasts for the
Town. These employment forecasts tie in with the 2031 employment forecasts for BWG in Schedule 7 of
the Growth Plan and are extended to 2041 by Metro Economics. In preparing these forecasts, Metro
Economics has forecast employment for 18 industry categories, which have then been aggregated by
urbanMetrics for the purposes of forecasting demand for Employment lands within the municipality.
Schedule 7 of the Growth Plan identifies total employment forecasts that are to be achieved by each
municipality in the Simcoe Sub-Area, which includes BWG. These Schedule 7 forecasts indicate that
BWG is expected to achieve 18,000 jobs by 20314. To plan for employment land needs, we have broken
down the employment forecasts into the following sub-categories:
o Primary – This generally includes employment in the rural areas of municipalities, primarily
agriculture.
4 Includes people with a usual place of work in BWG, BWG residents working at home and people with no fixed place of work.
Absorbed
Land Area
(Ha)
Building
Floor Space
Average
Coverage
Artesian Industrial Park 7.8 75,377 9%
Reagens Industrial Park 26.0 633,937 23%
Other Employment Lands 1.3 24,559 18%
Total 35.1 733,873 19%
Parcels % of Parcels Area (Ha)
Less than 1 ha 6 32% 3.1
1 to 4.9 ha 11 58% 18.3
5 ha and Larger 2 11% 13.7
Total 19 100% 35.1
Source: urbanMetrics and WSP, MMM Group Ltd.
Absorbed Parcels 2002-2016

DRAFT Discussion Paper, Employment Lands Official Plan Review, Bradford West Gwillimbury
33
o Industrial - Employment primarily accommodated in low-rise industrial type buildings generally
located within business parks and industrial areas (i.e. Employment Area lands).
o Commercial / Population Related - Employment that primarily serves the resident population,
such as retail employment, as well as employment that typically occurs in office space such as
finance, insurance and real estate (FIRE), information and cultural services, professional, scientific
and technical services, and other business services.
o Institutional – Institutional employment also serves the resident population and includes jobs in
industries such as education, healthcare, and local government.
o Work at Home - Includes persons who work at their place of residence (i.e. home office).
o No Fixed Place of Work (“NFPOW”) - Includes those who report they do not work in a fixed
location, such as truck drivers, construction workers, etc.
In planning for employment growth within a municipality, only the first three employment categories of
Industrial, Commercial / Population Related and Institutional require land to accommodate growth. It is
important to note that a portion of these forecast jobs will occur on Employment lands. However, this
proportion varies by category and municipality.
Figure 5-5 below summarizes employment forecasts for BWG prepared by Metro Economics by each
employment sub-category.
Figure 5-5: BWG Employment Forecast by Sector, 2011 to 2041
5.4 EMPLOYMENT GROWTH ON EMPLOYMENT LANDS Based on employment forecasts in Figure 5-5, we have forecast demand for Employment lands in BWG.
In forecasting demand for Employment lands, we have considered employment growth in the industrial,
commercial / population related and institutional sectors. It is assumed that employment growth in the
primary sector, work at home employment and NFPOW will not require Employment land to
accommodate future growth.
To determine the requirements for Employment lands by parcel size and location, it is important to identify
the specific industries where employment growth is anticipated to occur. Within the Industrial employment
category, the strongest employment growth over the 2016 to 2041 period is anticipated to be in the
Primary Industrial
Commercial /
Population-
Related Institutional
Work at
Home NFPOW1 Total
2011 275 2,615 2,445 1,345 825 1,820 9,325
2016 250 3,040 3,150 1,870 1,100 2,070 11,480
2021 230 3,360 4,000 2,380 1,360 2,330 13,660
2031 210 4,020 5,660 3,390 1,900 2,830 18,000
2041 170 4,580 7,360 4,440 2,450 3,540 22,540
2016-2021 -20 320 850 510 260 260 2,180
2016-2031 -40 980 2,510 1,520 800 760 6,520
2016-2041 -80 1,540 4,210 2,570 1,350 1,470 11,060
1 No Fixed Place of Work Employment.
Note: Forecasts rounded to the nearest 10 jobs. Values may not add to totals due to rounding.
Source: urbanMetrics inc. based on information from C4SE.

DRAFT Discussion Paper, Employment Lands Official Plan Review, Bradford West Gwillimbury
34
Construction, Wholesale Trade and Transportation and Warehousing categories. Demand for
Employment lands by parcel size for businesses engaged in Construction will be significantly different
from businesses engaged in Wholesale Trade and Transportation and Warehousing.
Construction businesses are typically located in areas that permit outdoor storage and do not require
direct access to a 400-series Highway. Based on the current employment base in BWG, many of these
businesses are located in the Artesian Industrial Park. As summarized in Section 4 of this Discussion
Paper, businesses engaged in Wholesale Trade and Transportation and Warehousing typically demand
large Greenfield parcels with direct access to a 400-series Highway. Therefore, it is anticipated that
employment growth in these industries will occur on lands located in the BWG SSEA or along the
Bradford By-Pass if it is developed during the forecast period.
The Commercial / Population Related employment sector includes a broad range of industries, as
summarized below:
Retail Trade
Information, Culture;
Finance, Insurance and Real Estate (FIRE)
Professional, Scientific and Technical Services
Other Business Services
Arts, Entertainment and Recreation
Accommodation and Food Services
Other Services
Figure 5-6 summarizes employment growth over the 2016 to 2041 period by industry. As shown,
Accommodation and Food Services and Retail Trade are anticipated to account for 55% of employment
growth in the Commercial / Population-Related sector, or approximately 2,300 jobs. While
accommodation uses such as a hotel are permitted in the Highway 400 County Road 88 Interchange
Special Policy Area, hotel uses are not permitted in the Industrial and Industrial / Commercial land use
designations.
It is notable that Retail uses are generally not permitted on lands identified as Employment lands in the
study. For example, the Industrial/Commercial land use designation only permits retail uses when
products are produced and assembled on site, in which case up to 10% of the main building may be
utilized as a retail outset for such products. Within the BWG SSEA, employment supportive uses, such as
retail are permitted in Area B, up to a maximum gross floor area per establishment. Overall, there is not
anticipated to be much employment growth in the retail trade sector on Employment lands.
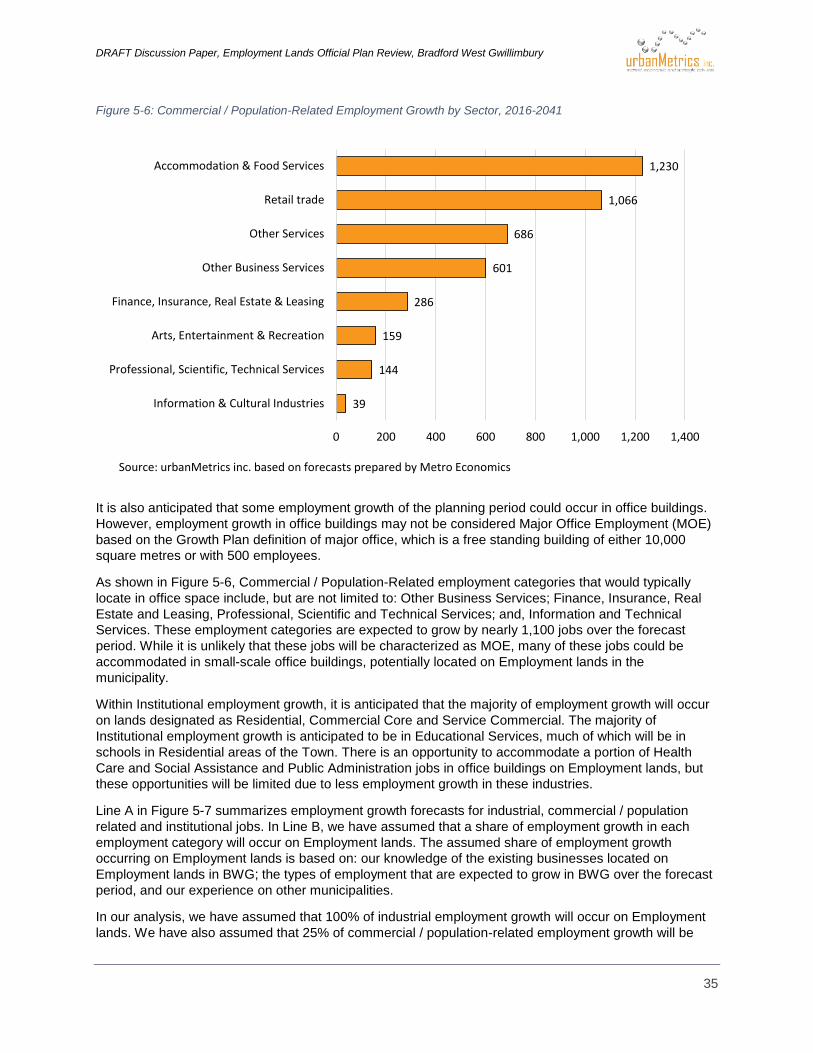
DRAFT Discussion Paper, Employment Lands Official Plan Review, Bradford West Gwillimbury
35
Figure 5-6: Commercial / Population-Related Employment Growth by Sector, 2016-2041
It is also anticipated that some employment growth of the planning period could occur in office buildings.
However, employment growth in office buildings may not be considered Major Office Employment (MOE)
based on the Growth Plan definition of major office, which is a free standing building of either 10,000
square metres or with 500 employees.
As shown in Figure 5-6, Commercial / Population-Related employment categories that would typically
locate in office space include, but are not limited to: Other Business Services; Finance, Insurance, Real
Estate and Leasing, Professional, Scientific and Technical Services; and, Information and Technical
Services. These employment categories are expected to grow by nearly 1,100 jobs over the forecast
period. While it is unlikely that these jobs will be characterized as MOE, many of these jobs could be
accommodated in small-scale office buildings, potentially located on Employment lands in the
municipality.
Within Institutional employment growth, it is anticipated that the majority of employment growth will occur
on lands designated as Residential, Commercial Core and Service Commercial. The majority of
Institutional employment growth is anticipated to be in Educational Services, much of which will be in
schools in Residential areas of the Town. There is an opportunity to accommodate a portion of Health
Care and Social Assistance and Public Administration jobs in office buildings on Employment lands, but
these opportunities will be limited due to less employment growth in these industries.
Line A in Figure 5-7 summarizes employment growth forecasts for industrial, commercial / population
related and institutional jobs. In Line B, we have assumed that a share of employment growth in each
employment category will occur on Employment lands. The assumed share of employment growth
occurring on Employment lands is based on: our knowledge of the existing businesses located on
Employment lands in BWG; the types of employment that are expected to grow in BWG over the forecast
period, and our experience on other municipalities.
In our analysis, we have assumed that 100% of industrial employment growth will occur on Employment
lands. We have also assumed that 25% of commercial / population-related employment growth will be
39
144
159
286
601
686
1,066
1,230
0 200 400 600 800 1,000 1,200 1,400
Information & Cultural Industries
Professional, Scientific, Technical Services
Arts, Entertainment & Recreation
Finance, Insurance, Real Estate & Leasing
Other Business Services
Other Services
Retail trade
Accommodation & Food Services
Source: urbanMetrics inc. based on forecasts prepared by Metro Economics

DRAFT Discussion Paper, Employment Lands Official Plan Review, Bradford West Gwillimbury
36
accommodated on Employment lands. This share is consistent with the existing share of commercial /
population related floor space in the Bradford Urban Area that is located on Employment lands. For
institutional employment, we have assumed that 5% of employment growth will occur on Employment
lands. Currently, there is very little institutional employment located on Employment lands in BWG. Also,
the majority of employment growth on Employment lands is expected to be in education, health and social
services, which are industries that do not have a large presence on Employment lands.
Applying the shares in Line B to the employment growth forecasts in Line A results in the forecast
employment growth on Employment Lands (Line C). As shown, BWG is forecast to accommodate 2,720
additional jobs on Employment lands within the Town between 2016 and 2041.
5.5 EMPLOYMENT LAND DENSITIES We have made various assumptions regarding employment density (floor space per worker) on
Employment lands based on our experience on similar municipalities. These assumptions are also based
on our knowledge of the existing employment base and the types of employment that are expected to
grow in BWG over the forecast period.
For industrial employment uses, we have estimated an employment density of 900 square feet per
employee. This estimate is based on our examination of existing employment densities in BWG and the
types of employment uses that are anticipated to locate in BWG over the forecast horizon, such as
wholesale trade and transportation and warehousing. For Commercial / Population Related employment
and Institutional employment, we have assumed densities of 500 square feet per employee and 700
square feet per employee, respectively.
Based on these employment densities we have forecast growth of approximately 1.2 million square feet
of non-residential GFA between 2016 and 2031 and 2.0 million square feet of non-residential floor space
on Employment lands in BWG between 2016 and 2041 (Line E). Based on a lot coverage of 25%, which
is consistent with our Employment land inventory in BWG, it results in demand for 77.4 gross hectares of
Employment lands between 2016 and 2041.

DRAFT Discussion Paper, Employment Lands Official Plan Review, Bradford West Gwillimbury
37
Figure 5-7: Employment Growth on Employment Lands, BWG, 2016 to 2041
Industrial
Commercial /
Population-
Related Institutional Total
2016-2021 320 850 510 2,180
2016-2031 980 2,510 1,520 6,530
2016-2041 1,540 4,210 2,570 11,060
BShare of Employment Growth on
Employment Lands100% 25% 5%
2016-2021 320 210 30 560
2016-2031 980 630 80 1,690
2016-2041 1,540 1,050 130 2,720
2016-2021 900 500 700
2016-2031 900 500 700
2016-2041 900 500 700
2016-2021 288,000 105,000 21,000 414,000
2016-2031 882,000 315,000 56,000 1,253,000
2016-2041 1,386,000 525,000 91,000 2,002,000
F Employment Land Lot Coverage 25% 25% 25%
2016-2021 10.7 3.9 0.8 15.4
2016-2031 32.8 11.7 2.1 46.6
2016-2041 51.5 19.5 3.4 74.4
H Market Contingency Factor 10.0%
2016-2021 11.8 4.3 0.9 16.9
2016-2031 36.1 12.9 2.3 51.2
2016-2041 56.7 21.5 3.7 81.8
Source: urbanMetrics inc.
G
Note: Employment forecasts rounded to the nearst 10 and floor space forecasts rounded
to nearest 1,000.
Density Assumptions - Floor Space Per Worker (sq.ft.)
Growth in Floor Space on Employment Lands (sq.ft.)
Employment Land Needs (Ha)
E
Adjusted Employment Land Needs (Ha)
I
Employment Growth on Employment Lands
Town-Wide Employment Growth
A
C
D
DRAFT Discussion Paper, Employment Lands Official Plan Review, Bradford West Gwillimbury
38
5.6 MARKET CONTINGENCY For long range forecasting purposes, our customary approach is to assign a market contingency for Employment lands in the order of 10 to 25%.
A market contingency is an adjustment factor that is applied as a planning safeguard, to ensure that a
certain proportion of land should remain vacant – at all times - to provide the business and investment
community with a healthy range of land development options at a variety of locations and price points to
sustain on-going industrial development. Another practical benefit of using a market contingency
adjustment is that it provides a certain degree of flexibility for a municipality, especially when confronted
with unanticipated opportunities for economic development (i.e. a major new manufacturing plant or
logistics facility that has above average land requirements). While the application of a market contingency
is purely discretionary, we strongly suggest that municipalities maintain their vacant industrial land
inventories at levels that are at least 10% above what is projected. For the purposes of this analysis, we
have applied a “market contingency” factor of 10%.
5.7 DEMAND FOR EMPLOYMENT LANDS After applying the market contingency factor, it results in an adjusted Employment land need of 51.2
hectares between 2016 and 2031 and a demand for 81.8 hectares between 2016 and 2041. This is
equivalent to Employment land absorption of approximately 3.3 gross hectares per year over the 2016 to
2041 planning horizon. This forecast Employment land absorption is slightly stronger than employment
land absorption that occurred between 2002 and 2016, when BWG averaged absorption of 2.5 hectares
per year.

DRAFT Discussion Paper, Employment Lands Official Plan Review, Bradford West Gwillimbury
39
6 Land Needs
6.1 EMPLOYMENT LAND NEEDS This section of the discussion paper summarizes the total Employment land needs in BWG through to
2031 and 2041 based on the supply of, and demand for, Employment lands in the municipality.
As shown in Figure 6-1, BWG’s supply of approximately 719 hectares of Employment lands is sufficient to
accommodate forecast Employment land demands to 2031 and 2041. While BWG has a sufficient supply
of Employment lands to meet demand to 2041, it will remain important to ensure that Employment lands
remain available across the municipality. As illustrated in this Discussion Paper, the majority of vacant
Employment lands are located in the BWG SSEA, which are currently unserviced. Therefore, it will be
important for BWG to maintain a supply of vacant and serviced Employment lands in its industrial parks
and in other locations within the Bradford Urban Area.
Also, as demonstrated in the
previous section of this Discussion
Paper, employment growth in
BWG over the forecast period is
anticipated to be broad-based in a
number of industries. Each of
these industries has specific
criteria when searching for vacant
employment lands that suit their
needs. Therefore, it will be
important to ensure there are a
variety of parcel sizes available to
accommodate growth.
Policy 1.3.2.4 of the 2014
Provincial Policy Statement (the
“PPS”) allows municipalities to plan for Employment lands beyond 20 years for the long-term protection of
lands. Similarly, Policy 2.2.6.9 of the Growth Plan for the Greater Golden Horseshoe (the “Growth Plan”),
encourages municipalities to preserve Employment lands within settlement areas in the vicinity of
highways.
This is particularly important in BWG, where the proposed Bradford By-Pass will “open up” Employment
lands for future development. For example, while employment uses in the Artesian Industrial Park are
generally focused on employment uses that do not require direct access to a 400-series Highway, the
construction of the Bradford By-Pass would provide these lands with exceptional access to a highway.
This would make the large parcels located adjacent to the Bradford By-Pass desirable to transportation
and logistics companies.
Therefore, it is our recommendation that vacant Employment lands located in the BWG SSEA, the
Reagens Industrial Park, the Artesian Industrial Park and vacant Employment lands located to the north
of the proposed alignment of the Bradford By-Pass be preserved for employment purposes over the long-
term.
Figure 6-1: BWG Employment Land Needs
2016-2031 2016-2041
Employment Land
Demand (Ha)51.2 81.8
Employment Land
Supply (Ha)718.8 718.8
Employment Land
Surplus667.6 636.9
Source: urbanMetrics inc.

DRAFT Discussion Paper, Employment Lands Official Plan Review, Bradford West Gwillimbury
40
6.2 POPULATION-RELATED EMPLOYMENT LAND NEEDS As part of the Employment Lands OPR, we have also reviewed the need for lands to accommodate
growth in Population-Related Employment (PRE), which includes the employment categories of
Commercial / Population-Related and Institutional reviewed in this study.
In our analysis, we have assumed that a portion of Commercial / Population-Related and Institutional jobs
would be accommodated on Employment lands under the Industrial and Industrial / Commercial land use
designations and within the lands Subject to the Minister’s Zoning Order.
Additional land use designations in the BWG Official Plan that will accommodate PRE jobs through the
forecast period include:
Residential;
Commercial Core; and,
Service Commercial.
In evaluating land needs for retail and service commercial uses, we have reviewed the Retail Analysis &
Commercial Policy Review, Town of Bradford West Gwillimbury, prepared by Malone Given Parsons Ltd.
(“MGP”) in June 2010, (the “Commercial Policy Review”). The Commercial Policy Review identifies a
need for an additional 2,140,000 square feet of retail GFA in BWG by 20315. Since MGP completed their
Commercial Policy Review in 2010, there has been significant commercial development in BWG,
particularly along Holland Street West in the First Gulf and Smart Centres developments. These new
commercial developments have been subtracted from the warranted commercial space identified by MGP
to determine the additional commercial space warranted between 2016 and 2031.
MMM Group has completed a Commercial land supply analysis to identify Commercial sites in BWG that
have permissions to accommodate additional commercial space and vacant commercial lands not under
application. Based on our review of this information, BWG has sufficient lands designated Commercial
Core and Service Commercial to accommodate retail and service commercial demand to 2031.
MMM Group has also completed an inventory of lands that are available to accommodate growth in
Institutional jobs to 2031 in BWG. Based on a review of this land supply, there is a sufficient supply of
land in BWG to accommodate Institutional job growth forecast by Metro Economics. Therefore, this is no
need for additional PRE lands to accommodate population and employment growth to 2031.
5 It is notable that in the Commercial Policy Review, MGP use a 2031 population of 52,000 persons in BWG, which is higher than the 2031 population forecast of 50,500 in Schedule 7 of the Growth Plan. Utilizing the lower population forecast will reduce the need for warranted commercial space to 2031.

DRAFT Discussion Paper, Employment Lands Official Plan Review, Bradford West Gwillimbury
41
7 Conclusions and Recommendations
The following provides a summary of our findings as they relate to the supply of Employment lands in
BWG and their ability to accommodate future employment growth within the municipality. We also identify
recommendations to be incorporated into the BWG Official Plan to guide the future development and
prosperity of Employment lands within the Town.
7.1 SUMMARY OF CONCLUSIONS BWG has a large diverse supply of Employment lands. In total, there are approximately 890
hectares of occupied and vacant Employment lands located throughout the municipality. This
includes some 377 hectares within the Bradford Urban Area and some 513 hectares of lands
designated to accommodate employment uses in the BWG SSEA.
In total, there is some 719 hectares of vacant Employment lands, nearly all of which is located in
the BWG SSEA and abutting the proposed alignment for the Bradford By-Pass. The vacant
Employment lands include a diversity of parcel sizes to accommodate future employment growth.
The large supply of vacant Employment lands in BWG are well positioned to attract the types of
businesses that typically locate on Employment lands. BWG’s ability to attract demand for
employment lands to the municipality will depend on how competitive these lands are perceived
in comparison to neighbouring municipalities.
The Ontario economy has evolved from one focused on goods-producing sectors to one that is
more dependent on the services sectors. This evolution has had a substantial impact on the
demand for Employment lands in municipalities across the Province. Going forward, the
wholesale trade and transportation and warehousing sectors are expected to account for a larger
share of employment on Employment lands in the GGH. The BWG SSEA is well positioned to
accommodate growth in these sectors of the economy.
Based on employment growth forecasts prepared by Metro Economics, which are consistent with
the Growth Plan employment forecasts for BWG, we have forecast Employment land needs of
51.2 hectares between 2016 and 2031 and 81.8 hectares between 2016 and 2041. This is
equivalent to Employment land absorption of approximately 3.3 gross hectares per year over the
2016 to 2041 planning horizon.
The supply of vacant Employment lands in BWG is sufficient to accommodate forecast
Employment land demands to 2031 and 2041. While BWG has a more than sufficient supply of
Employment lands to meet demand to 2041, it will remain important to ensure that Employment
lands remain available across the municipality.

DRAFT Discussion Paper, Employment Lands Official Plan Review, Bradford West Gwillimbury
42
It is also important to recognize that our employment land projections reflect Provincial
employment allocations within Simcoe County. Employment land absorption will ultimately
depend on a wide variety of factors such as the timing of the Bradford By-Pass and the ability of
the BWG SSEA lands to attract major tenants, which could act as a catalyst to future
development.
BWG has never had employment lands located along Highway 400, therefore, there may be
significant latent demand, beyond what is recognized in the Growth Plan employment allocations.
For these reasons, it is recommended that the municipality plan for employment land beyond
what is needed to 2041. Specifically, it will be important for the Town to protect Employment
lands located in the BWG SSEA, the Artesian and Reagens Industrial Parks and vacant
Employment lands located north of the proposed Bradford By-Pass for long-term employment
growth.
7.2 RECOMMENDATIONS – LAND SUPPLY REQUIREMENTS Based on our market demand and supply analysis, it is suggested that BWG take appropriate measures
to protect its overall Employment land base. Specifically, it is recommended that:
1. Protect Current Supply of Employment Lands - BWG should take steps to protect the supply
of vacant Employment lands within the municipality. The PPS and the Growth Plan allows for
municipalities to plan for and protect Employment lands, specifically lands in the vicinity of major
highway interchanges for uses such as manufacturing, warehousing, and associated retail, office
and ancillary facilities. Given that the proposed Bradford By-Pass is still being examined as a
potential project, it will be important to ensure that lands on the north side of this proposed
highway remain in the vacant employment land supply. It will be equally as important for BWG to
protect the supply of vacant Employment lands in the BWG SSEA, the Artesian Industrial Park
and Reagens Industrial Park from Employment land conversions.
2. Employment Land Reserve Designation - BWG should consider the creation of an
Employment Land Reserve designation in its Official Plan update. The application of this land use
designation is intended to reflect the on-going need for Employment lands beyond 2041. The new
designation should be applied to Employment lands located to the north of the proposed Bradford
By-Pass. The Employment Land Reserve designation would effectively protect lands located
adjacent to the proposed Bradford By-Pass from all forms of non-employment type development.
3. Prepare for Strong Employment Land Absorption in the BWG SSEA – There may be some
latent demand for large parcels of Employment lands with direct access to Highway 400. For
example, it is our understanding that a number of companies currently located in BWG have
expressed interesting in locating on the BWG SSEA lands. These companies have identified a
limited land supply in the Artesian and Reagens Industrial Parks as a barrier to growth. Therefore,
locating in the BWG SSEA will allow for future expansion opportunities.
4. Monitor Employment Land Absorption – BWG should monitor the absorption of Employment
lands within the municipality. If absorption is significantly stronger than forecast in this Discussion
Paper, it provides further justification for protecting Employment lands within the municipality over
the long-term.

DRAFT Discussion Paper, Employment Lands Official Plan Review, Bradford West Gwillimbury
43
7.3 RECOMMENDATIONS – POLICY DEVELOPMENT & REFINEMENTS 5. Industrial Areas Community Improvement Plans – The Community Improvement Plan (CIP)
for the Artesian and Reagens Industrial Parks came into effect in 2013. The CIP was recently
revised in 2016 to include eligibility for renovation work for existing businesses. The purpose of
the CIP is to stimulate investment by the private sector in lands zoned for industrial purposes
within the Artesian and Reagens Industrial Parks. While there has been limited take-up of this
program, we recommend that the CIP continue to be monitored and potentially extended when it
expires in 2021. The renewal of the CIP will help ensure that the Artesian and Reagens Industrial
Parks remain competitive in attracting employment uses when the BWG SSEA are fully serviced.
6. Broaden Permitted Uses in the Industrial Land Use Designation – The identified permitted
uses in the Industrial land use designation should be broadened to include more uses. The
current Industrial land use designation only identifies manufacturing as a permitted use. However,
the zoning by-law for the M1 and M2 zones include a much broader array of permitted
employment uses. The Town should take steps to increase the range of permitted uses in the
Industrial designation to reduce uncertainty for Employment land owners.
7. Employment Land Conversion Policies – the criteria to be established with respect to
employment land conversions needs to be further considered, with the criteria contained in the
Growth Plan being the “minimum”. In the Economic Development Strategy, many Employment
land owners identified the encroachment of residential uses as a significant concern to future
operations. Therefore, by converting Employment lands to non-employment uses, it could create
additional barriers to Employment land absorption in BWG.
8. Continue to Discourage Retail Uses on Employment Lands in the Bradford Urban Area –
As part of the OPR, it has been identified that BWG has a sufficient quantity of commercial lands
to accommodate retail uses to 2031. Therefore, the municipality should continue to discourage
retail uses on Employment lands within the municipality.