Chapter 1 2017 Integrated Resource Plan Introduction The ...
83
1 | Page Colton Electric Department 2017 Integrated Resource Plan Chapter 1 2017 Integrated Resource Plan Introduction The Colton Electric Department (CED) faces new regulatory, legislative and financial challenges in 2016 as California moves towards a more centralized electricity market while significantly reducing carbon emissions. This “2017 Integrated Resource Plan” (IRP) will present a strategy for dealing with some of the power supply issues that the CED faces and present alternative scenarios for resource procurement that are consistent with current legislative and regulatory constraints. An IRP takes into account both supply and demand side alternatives for meeting retail customer electricity demand. Supply-side alternatives include the procurement of new generation and transmission resources, specifically new renewable energy sources that meet California’s renewable energy portfolio requirements. Demand-side alternatives include programs that reduce energy and capacity requirements during high-use periods or increase energy sales during low-load periods when the CED has surplus energy. Conservation programs, such as the CED’s direct install program, refrigerator replacement program and compact florescent bulb replacement program, attempt to reduce the need for additional supply side resources. CED will also recommend new programs designed to provide better conservation options for customers. The CED believes that it is better for the community and the CED to reduce customer demand through conservation programs and rebates, rather than purchasing additional generation resources from power marketers. Historically, the CED has sought to acquire new resources at the lowest possible cost (consistent with safety and reliability requirements) without considering environmental constraints. However new state and federal environmental rules that went into effect in 2011 and then strengthened in 2015 are reshaping the CED’s power resource mix. CED’s planning efforts are complicated by the fact that generation and transmission resources have lives of 20 to 50 years. Hence, decisions made today, based upon current knowledge, legislation and technology, may be the “wrong” decision or a decision that results in higher costs ten or twenty years from now. Because of changes in the operating, legislative or regulatory environment, an IRP should be updated on an annual or bi-annual basis. That way, ratepayers can be assured the CED’s energy programs keep current with changes in the business and regulatory environment. The IRP is a long-term planning document with an emphasis on the first few years of operation. Today, many utilities are planning new transmission and generation resources that will not be operational for many years. Because of the long planning and permitting requirements of transmission and generation resources, utilities must begin the planning process years or decades in advance of need. CED is primarily concerned with identifying and acquiring new resources in the near future when its ownership rights in San Juan Generating Station, unit 3 ends on December 31, 2017 and CED has to replace the capacity and energy from this resource.
-
Upload
khangminh22 -
Category
Documents
-
view
3 -
download
0
Transcript of Chapter 1 2017 Integrated Resource Plan Introduction The ...

1 | P a g e Colton Electric Department 2017 Integrated Resource Plan
Chapter 1
2017 Integrated Resource Plan
Introduction
The Colton Electric Department (CED) faces new regulatory, legislative and financial challenges in 2016
as California moves towards a more centralized electricity market while significantly reducing carbon
emissions. This “2017 Integrated Resource Plan” (IRP) will present a strategy for dealing with some of
the power supply issues that the CED faces and present alternative scenarios for resource procurement
that are consistent with current legislative and regulatory constraints.
An IRP takes into account both supply and demand side alternatives for meeting retail customer
electricity demand. Supply-side alternatives include the procurement of new generation and transmission
resources, specifically new renewable energy sources that meet California’s renewable energy portfolio
requirements. Demand-side alternatives include programs that reduce energy and capacity requirements
during high-use periods or increase energy sales during low-load periods when the CED has surplus
energy. Conservation programs, such as the CED’s direct install program, refrigerator replacement
program and compact florescent bulb replacement program, attempt to reduce the need for additional
supply side resources. CED will also recommend new programs designed to provide better conservation
options for customers.
The CED believes that it is better for the community and the CED to reduce customer demand through
conservation programs and rebates, rather than purchasing additional generation resources from power
marketers.
Historically, the CED has sought to acquire new resources at the lowest possible cost (consistent with
safety and reliability requirements) without considering environmental constraints. However new state
and federal environmental rules that went into effect in 2011 and then strengthened in 2015 are reshaping
the CED’s power resource mix. CED’s planning efforts are complicated by the fact that generation and
transmission resources have lives of 20 to 50 years. Hence, decisions made today, based upon current
knowledge, legislation and technology, may be the “wrong” decision or a decision that results in higher
costs ten or twenty years from now.
Because of changes in the operating, legislative or regulatory environment, an IRP should be updated on
an annual or bi-annual basis. That way, ratepayers can be assured the CED’s energy programs keep
current with changes in the business and regulatory environment. The IRP is a long-term planning
document with an emphasis on the first few years of operation. Today, many utilities are planning new
transmission and generation resources that will not be operational for many years. Because of the long
planning and permitting requirements of transmission and generation resources, utilities must begin the
planning process years or decades in advance of need. CED is primarily concerned with identifying and
acquiring new resources in the near future when its ownership rights in San Juan Generating Station, unit
3 ends on December 31, 2017 and CED has to replace the capacity and energy from this resource.

2 | P a g e Colton Electric Department 2017 Integrated Resource Plan
An IRP is also a way for the City Council to specify its long-term goals for the Electric Department. The
Colton City Council can direct the CED to acquire resources for different purposes, for example to
minimize the cost of electricity for the City’s ratepayers or be a greener utility than required by law or to
maximize economic development within the City or to promote energy conservation. This IRP is
developed to meet CED’s following goals in order of importance:
Operate the utility safely:
Provide reliable energy to the residents and businesses in Colton;
Develop sustainable and renewable energy;
Meet all state and federal legislative and regulatory requirements;
Minimize the cost of electricity to CED’s business and residential customers;
Optimize the use of CED’s generation and transmission resources;
Develop demand-side programs to reduce energy use and costs by Colton’s commercial
and business customers;
Encourage economic development within Colton by purchasing resources from local
generators and developing demand-side programs that encourage businesses to locate and
expand within Colton.
Because of the technical nature of many of the terms used throughout this IRP, a Glossary of Terms has
been included in Appendix A.
Significant Changes from the 2013 Integrated Resource Plan
In 2013 there was uncertainty about the ultimate status of the San Juan Generating Station (SJGS). CED
did not know how the environmental litigation targeted at the SJGS was going to be resolved or if the
proposed resolution (expending almost $1 billion dollars on new pollution control equipment at the SJGS)
would be acceptable to California regulatory bodies.
The non-California participants did not want to spend $1 billion on upgrading the pollution control
equipment at the SJGS. After months of negotiations between utilities in California, Arizona, New
Mexico and Colorado and regulatory bodies in New Mexico and other states and the US Environmental
Protection Agency (EPA), a compromise was reached that allowed the project participants to
decommission two of the four units at the SJGS and allowed the California utilities to exit the plant.1
Also, in order to meet California’s new greenhouse gas (GHG) and renewable energy portfolio (RPS)
requirements without significantly over-resourcing itself, CED needed to sell or shut-down its share of
San Juan Generating Station Unit 3 (SJ3), something that could not be done without the consent of the
other participants in the SJGS, most of them not bound by California’s stringent GHG and RPS
requirements.
1 The California utilities do retain some obligations for future decommissioning, mine reclamation and other
possible future environmental costs.

3 | P a g e Colton Electric Department 2017 Integrated Resource Plan
With the litigation resolved, in 2013 CED began the process of replacing over 225,000 MWh (or roughly
two-thirds of CED total retail load) of energy and 30 MW of capacity that was used to meet retail load
requirements.
With the two SJGS units required to be decommissioned by December 31, 2017, the project owners are
not going to commit significant funds for operation and maintenance (O&M) expenses after 2016. So it is
possible (although not probable) that the unit will be shut down prior to the scheduled date. This requires
CED to acquire replacement capacity and energy in 2017 at additional cost, to meet its retail load
obligations in the event that SJ3 is decommissioned early resulting in a slight bump in 2017 power supply
costs.
CED has completed power purchase agreements (PPA’s) for 16 MW of solar generation and 10 MW of
landfill gas generation to replace the SJ3 capacity that will be lost in 2017.
Current Capacity Resources
Since the early 1980’s, Colton has invested in acquiring generation and transmission resources. Due
partially to its small size that makes it difficult for CED to purchase all the output from an entire
generation project, CED has generally participated with other municipal utilities in acquiring resources
through the Southern California Public Power Authority (SCPPA), a joint-power agency2. SCPPA
identifies potential resources for ownership through an extensive RFP process and the member cities can
choose which, if any, of the projects they wish to participate in and the capacity amount. CED can also
issue its own RFPs or negotiate with generators outside of the SCPPA RFP process.
Colton currently has ownership (or ownership-like rights) in the following generation resources:
MW
NAME ENTITLEMENT CAPACITY
San Juan Generating Station, Unit 3 30 MW 30 MW
Palo Verde Nuclear Generating Station 2 MW 2 MW
Magnolia Generating Station 10 MW 10 MW
Hoover Generating Station 3 MW 3 MW
Agua Mansa Power Plant 43 MW 43 MW
Iberdola Wind Project 1 MW3 0 MW
Colton Solar I (Walnut) 2.5 MW 2.5 MW
Colton Solar II (Agua Mansa) 1 MW 1 MW
MWD Small Hydro 3.8 MW 3.8 MW
Gonzales Center Solar Carport 0.5 MW 0.5 MW
Arbor Terrace Solar 0.3 MW 0.3 MW
2 In addition to Colton, SCPPA participants include the Cities of Los Angeles, Glendale, Burbank, Pasadena, Azusa,
Banning, Riverside, Anaheim, Cerritos and the Imperial Irrigation District. 3 Colton has a 3 MW purchase in the Iberdola Wind Project that was delivered at a fixed rate of 1 MW per hour. In a
2014 Amendment, Colton and Iberdola agreed that Iberdola would sell the energy into the CAISO and bill or credit
CED for the difference between the contract rate and the CAISO LMP price.

4 | P a g e Colton Electric Department 2017 Integrated Resource Plan
Kingbird Solar Project 3 MW 2.25 MW
Astoria Solar Project 5 MW 4 MW
Antelope DSR2 Solar Project 2 MW 1.6 MW
TOTAL 107.1 MW 103.95 MW
On January 1, 2017 the 10 MW Puente Hills Landfill Gas4 project (7.35 MW capacity) comes online
increasing CED’s total capacity existing capacity to 111.3 MW. But by the end of 2017, SJ3 will be
decommissioned, reducing CED’s generation capacity to 81.3 MW.
87 MW is sufficient to meet CED’s retail load but is about 6 MW short of CED’s capacity requirements
including reserves as established by the California Independent System Operator’s (CAISO’s) reliability
requirements for the three summer months, July, August and September. So by May of 2018, CED will
need to acquire another 6 MW.5
Forecast of Demand and Energy Requirements
CED has prepared a forecast of monthly peak demand and energy requirements for the period 2016 –
2021. The forecast is based upon state economic forecasts prepared by the California Department of
Finance and shows a slight increase in future economic activity in the Riverside – San Bernardino area for
the next few years. However, much of the electric demand growth is offset by additional small solar and
conservation efforts.
4 The Puente Hills Landfill Gas Project may be de-rated to reflect declining natural gas production at the landfill. 5 The CAISO requires entities to show that they have sufficient capacity to meet monthly loads two months in
advance.
-
5,000
10,000
15,000
20,000
25,000
30,000
35,000
40,000
45,000
Jan
07
Jun
07
No
v 0
7
Ap
r 0
8
Sep
08
Feb
09
Jul 0
9
Dec
09
May
10
Oct
10
Mar
11
Au
g 1
1
Jan
-12
Jun
-12
No
v-1
2
Ap
r 1
3
Sep
13
Feb
14
Jul 1
4
Dec
14
May
15
Oct
15
Mar
16
Au
g 1
6
Jan
17
Jun
17
No
v 1
7
Ap
r 1
8
Sep
18
Feb
19
Jul 1
9
Dec
19
May
20
Oct
20
Mar
21
Actual and Forecasted Energy Requirements (MWh) 2007-2021

5 | P a g e Colton Electric Department 2017 Integrated Resource Plan
Figure 1.1
Figure 1.2
The caveat to the economic forecast is potential development in the Agua Mansa Corridor and West
Valley area. Although there have been a number of proposed developments in these two areas, nothing
has been brought to completion and at the earliest development will not be seen until 2020 even if the
proposed projects begin construction in the next few months. As a result, the forecast needs to be watched
and adjusted when new projects actually begin construction.
Legislative and Regulatory Requirements
For the past fifteen years, state and federal agencies have been crafting rules for greenhouse gas reduction
and environmental regulations, including renewable energy standards, and implementing new regulations
intended to improve the reliability of the bulk power grid.
From the CED’s viewpoint, the regulations having the greatest initial impact on costs include:
California’s AB 32 and SB 350;
Regionalization efforts by the CAISO;
California’s proposed movement to a centralized capacity market;
Cap and trade efforts
California AB 32 and SB 350
California legislators have passed a number of bills that impact the operations and power supply costs of
CED. AB 32, the California Global Warming Solutions Act, passed in 2006, along with the more recent
SB 350, Clean Energy and Pollution Reduction Act of 2015, potentially have the greatest impact on CED.
The first, AB 32 requires California utilities to reduce greenhouse gases associated with the generation of
-
10
20
30
40
50
60
70
80
90
100
Jan
07
Jun
07
No
v 0
7
Ap
r 0
8
Sep
08
Feb
09
Jul 0
9
Dec
09
May
10
Oct
10
Mar
11
Au
g 1
1
Jan
-12
Jun
-12
No
v-1
2
Ap
r 1
3
Sep
13
Feb
14
Jul 1
4
Dec
14
May
15
Oct
15
Mar
16
Au
g 1
6
Jan
17
Jun
17
No
v 1
7
Ap
r 1
8
Sep
18
Feb
19
Jul 1
9
Dec
19
May
20
Oct
20
Mar
21
Actual and Forecasted Monthly Peak Demand (MW) 2007-2021

6 | P a g e Colton Electric Department 2017 Integrated Resource Plan
electricity. SB 350 requires utilities, in conjunction with California’s renewable portfolio standard
requirements codified in SB 26, to acquire renewable resources that have only a fraction of the greenhouse
gases of traditional fossil-fuel fired generation.
Some of the major impacts of AB 32 included:
Cap and trade emission allowance trading beginning in November 2012;
Annual inventory of utility greenhouse gas emissions;
Restrictions on the amount of new coal fired generation being imported into
California;
In addition to the mandated GHG reductions in AB 32, electric Load Serving Entities (LSEs) were
required by SB 2 to acquire 20 percent of their retail load requirements from renewable sources for the
period 2011-2013, increasing to 25 percent by 2016 and to 33 percent by 20207. These minimum
renewable energy standards are called the renewable portfolio standards (RPS) requirements.
The RPS mandates were increased, with the passage of SB 350, from 33 percent in 2020 to 50 percent by
2030, with an obligation for the LSEs to increase their renewable portfolio by 2 percent per year
beginning in 2021.
CED did not meet its 2011 – 2013 RPS requirements because it was already over-resourced with baseload
generation and could not take any renewable energy without raising total resource costs beyond 2.5
percent. Instead, CED claimed the cost-limitation restriction allowed in SB 32 to delay meeting its RPS
requirements.8
CED came into compliance with RPS requirements during the second compliance period (2014 – 2016)
and anticipates exceeding minimum RPS requirements with its current resource mix in the future.
A 2016 bill, SB 859, requires larger utilities (both investor-owned and publicly owned utilities) to
purchase 1 percent of their energy requirements from biomass resources. Currently, this bill does not
impact CED but it is expected an additional bill expanding the purchase requirement will be introduced in
2017. The purpose of the bill is to help biomass firms clear the forests of dead or dying trees caused by
the drought and that increase the fire hazard
CAISO Regionalization Efforts
In order to make it easier for California utilities to import renewable energy, particularly wind from the
Montana and Wyoming area, the CAISO has proposed a western states independent system operator led
by the CAISO. There are a number of issues from California participant’s viewpoint of the CAISO’s
6 Sometimes called SBX-1 2, referring to session 1 of the special legislation in the 2012 session in which it was
passed 7 In May 2013 the CEC also adopted intermediate standards governing procurement between 2016 and 2020. 8 The CEC is still reviewing RPS compliance filings for 2011-13 and has not yet made a final determination on
whether or not CED was in compliance with SB 2 for the 2011 – 2013 period.

7 | P a g e Colton Electric Department 2017 Integrated Resource Plan
proposal, including the allocation of transmission costs to all western utilities, governance issues and the
problem of forcing utilities in other states and other different regulatory entities to agree to the CAISO
proposal. Regardless, the CAISO is proceeding with their proposal at the direction of Governor Brown
who sees the west-wide grid as a key part of fighting global warming.
California municipalities, in general, oppose the CAISO’s desire to expand outside California. Some non-
state utilities, generally those with renewable energy they would like to sell into California, support the
proposal while others dislike the prospect of California attempting to require minimum amounts of
renewable energy and other capacity requirements greater than those in their home state and oppose the
CAISO’s regionalization efforts. Other obstacles to the regional expansion of the CAISO include the
problem of who would bear the cost of carbon emissions from renewable resources imported into
California.
Whether the CAISO is successful in their attempt to expand will likely be decided sometime in 2017.
Centralized Capacity Market
The CAISO is discussing implementing a centralized capacity market where it would require new
generation resources to be certain types of fuel or technology. In effect, the CAISO is attempting to create
a single energy market in the state and utilities would become participants in a state-wide financial market
tied to capacity ownership. This is going to take several years to finalize and CED will continue watching
the progress and participating in the hearing process as necessary.
Cap and Trade
The Cap and Trade (C&T) program for electric utilities has begun with the first auction of emission
allowances in November 2012. CED has implemented C&T requirements into its daily power resource
trading activities.
In 2009, CED was allocated Emission Allowances (EAs) from the California Air Resources Board
(CARB) equal to its then estimated emissions through 2020.
Currently C&T expires in 2020 and has not been extended due to opposition from the transportation
sector. While most people expect C&T to be eventually extended at least through 2030, which sectors
(stationary pollution sources or stationary and non-stationary sources) will be included nor has a method
been established for determining post-2020 EA allocations.
CED does not have sufficient freely allocated EAs to offset all its emissions so long as SJ3 is in
operation. Additionally, freely allocated EA’s cannot be used to meet emissions from CAISO sales so
CED will have to purchase some EAs in the quarterly auctions each year to cover the GHG obligations
for these sales.

8 | P a g e Colton Electric Department 2017 Integrated Resource Plan
Federal Clean-Air Act
The Clean-Air Act was enacted in 1990. The Act defines the Environmental Protection Agency’s
(EPA’s) responsibilities for protecting and improving the nation’s air quality.
San Juan Generating Station (SJGS) is owned by SCPPA, PNM, APS and a number of smaller
participants. CED has a 30 MW entitlement in San Juan Unit 3 (SJ3), one of 4 units at the Station. SJ3 is
CED’s largest generation resource, providing approximately 65 percent of CED’s annual electricity
requirements.
Because of its size (1,800 MW), location near the mouth of the Grand Canyon and initial lack of pollution
control equipment, the SJGS has been a concern to environmentalists since the 1980’s.
In 2006, Public Service Company of New Mexico (PNM), the plant majority owner and operator on
behalf of the participants, began a $320 million emission reduction program that included bag houses and
emission reduction equipment that significantly reduced particulate emissions including mercury,
nitrogen oxides, sulfur dioxides and particulates.
The environmental upgrade was completed in 2009. In response to additional lawsuits filed by
environmental groups in 2010 the EPA proposed additional environmental upgrades that would require
SJGS to meet a nitrogen oxide emission rate of 0.05 lb/mmbtu9 through the use of selective catalytic
reduction, the best available retrofit technology (BART) that would reduce emissions by more than 80
percent.
Another bill, California SB 1368, Emission Performance Standard of 2006 imposed restrictions on the
ability for California LSEs to invest in out-of-state coal plants, The California participants initiated
negotiations for an early exit from SJGS. In 2012, PNM and the EPA reached agreement to shut-down 2
units at San Juan no later than December 31, 2017. The California participants were allowed to shut-down
their units (or trade their capacity shares in units that would continue to operate for shares in units that
would be shut-down) and exit the project.
While an agreement between the participants and EPA has been reached, the negotiations between the
various parties on cost responsibilities are still ongoing. Entities that are leaving the plant are trying to
limit their long-term exposure to future environmental or decommissioning costs while the remaining
plant owners are hesitant about possibly assuming unanticipated costs that they believe should belong to
the departing owners.
Risk Management
Risk management identifies the dollar amount at risk of loss due to changes in fuel prices or unanticipated
outages of generation resources and recommends alternative actions to minimize this risk. The CED has
9 Mmbtu is one million btu’s, a measure of heat content of fuels.

9 | P a g e Colton Electric Department 2017 Integrated Resource Plan
not historically had significant risk management policies to prevent against over-purchasing natural gas or
electric generation resources.
There are a number of ways to define and measure risk but a common risk metric is the Value at Risk
(VAR).
The CED has adopted a risk management policy that attempts to limit the CED’s VAR and requires
multiple approvals (prior to final approvals by the Colton Utility Commission and City Council) for long-
term firm power supply purchases to insure adequate oversight of purchases that impact the financial
stability of the CED.
The major points of CED’s Risk Management Policy include:
Review by Colton’s Finance Director of any new long-term power supply purchases or firm
power supply purchase exceeding $500,000 in any single month;
Maximum monthly limits on CED’s power supply VAR (or a limit on how much CED’s
energy costs can increase month);
Required review and verification of CED’s monthly energy balance;
Review of monthly congestion costs and CRR status;
Review of monthly costs of EA’s and verification that CED has sufficient EAs to cover
expected annual emissions.
Summary and Recommendations
As a result of the studies that will be presented in this IRP, CED makes the following recommendations:
CED should construct a 2 to 3 MW solar project at Colton’s wastewater treatment plant (WWTP)
by mid-2018;
CED should attempt to re-start the 250 kW cogeneration facility at the WWTP that was shut-
down in 2009 due to problems with the methane scrubbing process at the site;
CED should increase its conservation activities to acquire at least 2 MW of load reduction by
2019. As part of this process, CED should implement new information programs that inform
people on a monthly or quarterly basis how their consumption of electricity and water compares
to people in their neighborhood;
CED should reduce its planned purchase of biogas from 1,500 mmbtu/day to 500 mmbtu/day as a
way of both ensuring the landfill gas project moves forward and reducing total power supply
costs.
CED should be able to complete these projects by 2018/19.
With these projects, and the decommissioning of SJ3, CED will only have three resources that emit GHG,
Agua Mansa Power Plant (AMPP), Magnolia Power Plant and Puente Hills Landfill. The AMPP emits
less than 25,000 tons per year based on historic dispatch, and will not have a compliance obligation
(unless it is dispatched more often resulting in higher than 25,000 tons per year). The Magnolia Power
Plant will have approximately 17,000 to 20,000 tons per year once the biogas contract begins. CED will
not have a compliance obligation from Puente Hills Landfill as CED is the off taker of a power purchase

10 | P a g e Colton Electric Department 2017 Integrated Resource Plan
agreement (PPA) and not the generator or owner of the facility. All of CED’s other resources are GHG
free or are small enough that they will not have a GHG compliance obligation.

11 | P a g e Colton Electric Department 2017 Integrated Resource Plan
Chapter 2
Demand and Energy Requirements
Introduction
An IRP begins with a forecast of future demand and energy requirements. The demand forecast identifies
how much generation capacity CED must have on a monthly basis for the next five years. The energy
forecast identifies monthly energy needs and provides an estimate of monthly electricity sales to retail
customers. The energy forecast also provides necessary information on the daily pattern of energy use
needed to ensure that the appropriate mix of generation resources is acquired.
Energy Forecast
Colton is a summer peaking utility with energy use increasing in the summer by as much as 40 percent
compared to the winter months. During the non-summer months, Colton’s energy use is around 25,000
MWh per month while in the three summer months energy use increases to around 39,000 MWh
primarily as a result of increased air conditioning use.
Colton does not appear to have much winter heating load although extreme cold temperature does result
in a small increase in energy demand likely due to electric space heaters.
The following figure illustrates how Colton’s daily load varies between the summer and winter months.
Figure 2.1
During the winter months, load begins to build as people wake up around 0430 and prepare for work in
the morning. Then the commercial industrial load begins around 0700 and stays fairly constant until
around 1600 each afternoon and then begins to drop as companies start shutting down. As people arrive
home, the early evening residential load causes a peak around 1900 and then load begins to decline
throughout the evening before the cycle begins again the next day.
0.0
10.0
20.0
30.0
40.0
50.0
60.0
70.0
80.0
90.0
1 2 3 4 5 6 7 8 9 10 11 12 13 14 15 16 17 18 19 20 21 22 23 24
Summer Load Wiinter Load
Figure 2.1 : Example of Summer and Winter Daily Load Curve (MW)
MW

12 | P a g e Colton Electric Department 2017 Integrated Resource Plan
During the summer the same pattern is followed except the additional air conditioning load begins around
0700 as firms begin pre-cooling in anticipation of people arriving for work and then continues to rise
during the day until around 1600 when temperatures begin moderating and people leave work. At around
1800 or 1900 there is a slight increase in energy use due to residential lighting and air conditioning loads
and then demand begins to decline as people begin going to bed around 2000.
While there is generally some increase in local economic activity during the summer months, most of
Colton’s additional summer load is due solely to increased air conditioning use.
The above load profiles help illustrate two key points. First, Colton requires about 25 to 30 MW of
baseload energy on an annual basis and secondly10, Colton’s summer peaks are greater than its winter
peaks and requires more seasonal generation capacity to meet the increased demand.
The daily load profiles also suggest that the primary drivers of electricity demand in Colton are
temperature and economic activity.
High temperature results in increased air conditioning use, while economic activity (measured in terms of
total employment in the Riverside-San Bernardino-Ontario SMSA) affects the number of
commercial/industrial businesses with the City.
The relationship between monthly energy use, temperature and economic activity was analyzed to
determine if a statistically valid relationship could be identified and if this relationship could be used to
forecast future monthly energy requirements.
A simple regression analysis was performed on the data and the following equation was determined to be
a good predictor of monthly energy use:
Monthly Energy Requirements = f(civilian employment, degree days heating and degree days cooling)11
Degree days cooling (DDC) is the sum of ((Daily High Temperature + Daily Low Temperature)/2) – 65.
DDC is a measure of the daily heat build-up that results in air conditioning use. Conversely, degree days
heating (DDH) is equal to:
65 – ((Daily High Temperature + Daily Low Temperature)/2)
Neither DDC or DDH can be negative, so if the average daily temperature is below 65 degrees, the DDC
is 0, while if DDH is greater than 65 degrees, then DDH is 0.
10 Colton currently has 43 MW of baseload generation
11 The regression specification
is: Coefficients Standard Error t Stat
Intercept 13669.11854 3854.679995 3.54611
Employment 0.011112269 0.003238412 3.431394
DDC 23.78236609 1.659614166 14.33006
DDH 1.095105476 1.919996722 0.570368

13 | P a g e Colton Electric Department 2017 Integrated Resource Plan
Civilian Employment in the Riverside-San Bernardino-Ontario SMSA was chosen as a measure of
economic activity and because the California State Department of Finance provides a forecast of Civilian
Employment for 3 years into the future as part of the State Economic Forecasting Project and data is
available on quarterly basis.
The following figure illustrates how the modeling performed in explaining monthly energy requirements
and the 2012, 2013 and 2014 forecast.
Figure 2.2
In general, the model very slightly under-forecasts winter energy requirements (by about 2 percent) but
otherwise tracks monthly energy use accurately.
The greatest cause of forecast uncertainty is weather variability. High temperatures result in greater
energy requirements while lower than anticipated temperatures result in over-forecasts.
Since 2014 energy requirements12 have stabilized around 370,000 MWh although proposed economic
development could increase requirements to over 400,000 MWh when the development actually occurs.
The forecast shows a slight improvement in energy requirements and sales from the 2015/16 levels of
373,759 MWh to 376,735 MWh in 2016/17 and then to 378,038 MWh in 2017/18. The Department of
Finance has slightly lowered its growth rate for California employment from the past few years, reflecting
the age of the current economic recovery, economic uncertainty due to the national elections and
economic issues in Asia and Europe.
Peak Demand Forecast
Forecasting peak demand is more difficult that forecasting monthly energy requirements. Monthly energy
requirements are the average of all the hourly demands during the month. Forecasting peak demand
requires picking the single greatest interval during the month, in a small system which is impacted by
12 Energy requirements are equal to sales + transmission losses + unaccounted for energy (UFE).
-
5,000
10,000
15,000
20,000
25,000
30,000
35,000
40,000
45,000
Jan
07
Jun
07
No
v 0
7
Ap
r 0
8
Sep
08
Feb
09
Jul 0
9
Dec
09
May
10
Oct
10
Mar
11
Au
g 1
1
Jan
-12
Jun
-12
No
v-1
2
Ap
r 1
3
Sep
13
Feb
14
Jul 1
4
Dec
14
May
15
Oct
15
Mar
16
Au
g 1
6
Jan
17
Jun
17
No
v 1
7
Ap
r 1
8
Sep
18
Feb
19
Jul 1
9
Dec
19
May
20
Oct
20
Mar
21
Actual and Forecasted Energy Requirements (MWh) 2007-2021

14 | P a g e Colton Electric Department 2017 Integrated Resource Plan
changes in weather and where even a large motor turning on or off can cause the monthly peak demand to
change.
Peak demand forecasts are necessary for the CAISO to determine how much generating capacity a utility
is required to acquire. Demand forecasts are required by regulatory and operating bodies such as the
California Energy Commission (CEC) which verifies CED’s demand forecast and the Western Area
Power Administration (Western) as a condition of receiving Hoover Dam capacity and energy.
In the CAISO market, LSE’s are required to have generation capacity equal to 115 percent of their
monthly forecasted peak demand. Because LSE’s recognize that having excess generating capacity is
expensive and might attempt to under-forecast monthly peak demand, the CEC verifies any peak demand
forecast on an annual basis to establish monthly capacity obligations. If the CEC determines that peak
demand forecasts are incorrect, they will issue a revised peak demand forecast that must be used to
determine the monthly capacity obligation.
Because of the difficulty in forecasting hourly peak demand with monthly statistical models, CED uses a
capacity factor model. The capacity factor is defined as:
Capacity Factor = (Monthly Energy Requirements) / (Peak Demand * Days in Month * 24 hours per day)
The average monthly capacity factor for the past eight years (2007 through 2015) was calculated and then
a monthly peak demand forecast was calculated based upon monthly forecasted energy requirements.
The monthly peak demand forecast is shown in Figure 2.3 below:
Figure 2.3: Monthly Peak Demand Forecast
-
10
20
30
40
50
60
70
80
90
100
Jan
07
Jun
07
No
v 0
7
Ap
r 0
8
Sep
08
Feb
09
Jul 0
9
Dec
09
May
10
Oct
10
Mar
11
Au
g 1
1
Jan
-12
Jun
-12
No
v-1
2
Ap
r 1
3
Sep
13
Feb
14
Jul 1
4
Dec
14
May
15
Oct
15
Mar
16
Au
g 1
6
Jan
17
Jun
17
No
v 1
7
Ap
r 1
8
Sep
18
Feb
19
Jul 1
9
Dec
19
May
20
Oct
20
Mar
21
Actual and Forecasted Monthly Peak Demand (MW) 2007-2021

15 | P a g e Colton Electric Department 2017 Integrated Resource Plan
The peak demand forecast shows the decline in monthly peak demands since the 2007 system peak and
then forecasts a very slight increase from 2014 levels as the local economy improves. These monthly
forecasted peak demands will be used to determine the CED’s monthly capacity obligations in the future.
The monthly demand and energy forecasts for 2015 – 2021 are shown in Appendix B.

16 | P a g e Colton Electric Department 2017 Integrated Resource Plan
Chapter 3
Existing Resources
Introduction
The CED currently has approximately 100 MW of capacity resources able to generate about 400,000
MWh annually at full capacity excluding the energy from the Agua Mansa Power Plant (AMPP) that is a
peaking unit designed to operate for relatively short periods when power prices are high. The following
chapter discusses each of the different resources.
While CED currently has enough generation to meet its retail load requirements, the planned
decommissioning of SJ3 in 2018 will result in CED having to acquire new generation resources.
SCPPA
CED does not own or operate any generating or bulk power transmission facilities except AMPP. All of
CED’s power supply contracts or transmission rights are either through the Southern California Public
Power Authority (SCPPA) or agreements with other entities.
SCPPA is a joint-power agency that enters into power purchase and transmission wheeling agreements or
owns generation and transmission resources on behalf of its member municipal utilities. SCPPA has no
retail load obligations.
Small utilities (such as CED) would have difficulty in acquiring financing to participate in large
generation projects or transmission contracts. SCPPA enters into the agreements on behalf of its members
and then guarantees any monthly financing or operating expenses by entering into power purchase
agreements with member agencies. Each of SCPPA’s projects has different participating utilities and only
the utilities participating in a project are liable for costs associated with any project.
San Juan Generating Station, Unit 3
San Juan Generating Station (SJGS) is comprised of four units, each with a total net output of almost
1,800 MW. Project participants include:
Units 1 and 2
PNM: 50 percent
Tucson Electric Power: 50 percent
Unit 3
PNM: 50 percent
Southern California Public Power Authority: 41.8 percent
Tri-State Generation and Transmission Association: 8.2 percent
Unit 4
PNM: 38.5 percent
MSR Public Power Agency: 28.8 percent
City of Anaheim, Calif.: 10 percent
City of Farmington: 8.5 percent
Los Alamos County: 7.2 percent
Utah Associated Municipal Power Systems: 7 percent

17 | P a g e Colton Electric Department 2017 Integrated Resource Plan
CED’s 30 MW entitlement in Unit 3 is through SCPPA’s 41.8 percent ownership in Unit 3.
The SJGS is located in the four corners region, near the borders of New Mexico, Arizona, Colorado and
Utah.
As the part owner of SJ3, SCPPA administers the project on behalf of its participants, the Cities of Azusa,
Banning, Colton, Glendale and the Imperial Irrigation District (IID).
SCPPA purchased its share of SJ3 in 1981 when the federal government was discouraging the use of
natural gas for fear of dwindling supply and expected long-term shortages of residential heating fuel. In
fact, the 1977 Fuel Use Act prohibited the construction of new natural gas generation facilities. As a
result, southern California municipal utilities purchased coal projects that provided long-term, stable
sources of electricity at relatively low prices.
SJ3 is CED’s largest single resource and generates about 250,000 MWh of energy in normal years or
approximately two-thirds of Colton’s energy requirements.
Energy from SJ3 is delivered to the Westwing substation near Phoenix under a displacement agreement
with Tucson Electric Power. From there, the CAISO delivers the energy to CED at Southern California
Edison’s (SCE) Vista Substation.
As a result of the lawsuits filed against the plant alleging violations of the Clean Air Act, the project
participants agreed to decommission Units 2 and 3 no later than December 31, 2017 and add non-
selective catalytic reduction equipment to units 1 and 4.
The California owners of Unit 4, Anaheim and MSR (Modesto Irrigation District, Santa Clara and
Redding) are trading their ownership in Unit 4 for capacity in Unit 3 so that when Unit 3 is
decommissioned in 2017, they will have no remaining capacity in the project.
The California participants (SCPPA, Anaheim and MSR) completed negotiations with the other
participants on the terms and conditions of decommissioning the two units prior to December 31, 2017. In
summary, SCPPA would pay all its debt off by December 31, 2016. SCPPA would not have any
minimum coal purchase obligations from January 1, 2016 until final unit decommissioning. SCPPA
would sell its coal stockpiles to PNM at an index price and pay a contract termination fee to the remaining
participants. From January 1, 2016 through decommissioning, SCPPA participants would not have
minimum coal purchase obligations but would pay for coal necessary to operate the unit at a
SJ3 Costs
The following table shows the annual costs and cost per MWh paid by the CED for energy from SJ3
between 2007/08 and 2015/16..

18 | P a g e Colton Electric Department 2017 Integrated Resource Plan
FY
2007/08
FY
2008/09
FY
2009/10
FY
2010/11
FY
2011/12
FY
2012/13
FY
2013/14
FY
2014/15
FY
2015/16
Total Cost
(000,000’s)
$14.098 $11.182 $14.577 $11.926 $13.720 $15.144 $12.528 $12.605 $13.149
Generation
(MWh)
192,182 211,088 189,543 209,845 240,823 193,226 181,902 197,313 170,878
Average
Cost/MWh
$73.40 $53.00 $76.90 $60.00 $54.90 $74.10 $68.80 $65.40
$75.53
Beginning in 2009, SJ3 costs have begun rising due to increased environmental regulations and several
expensive maintenance requirements including the replacement of the boilers. The large jump in annual
costs between 2011/12 and 2012/13 was due to the expected installation of SCRs necessary to comply
with EPA’s 2011 order to reduce NOx emissions from the plant.
With the anticipated retirement of the unit in 2017, O&M costs are likely to decline leading to more
frequent outages over the year.
One of the CED’s bigger concerns is that the reduced O&M expenditures results in an unplanned
permanent shut-down prior to the planned decommissioning date in 2017. This could result in CED
purchasing replacement capacity and energy in the marketplace at significantly increased costs although
currently market prices are below the total cost of energy from SJ3.
CED will also complete paying all outstanding debt from SJ3 by December 31, 2016. At this time, CED’s
monthly payments will decline by roughly 45 percent (from $1,180,000 to $630,100) for the remainder of
the project life assuming close to a 90 percent monthly operations. Under the terms of the
decommissioning agreements, CED does not have to pay for minimum fuel purchases and if the unit is
not generating, CED will receive a refund against its monthly budgeted costs.
Magnolia Power Project
CED has a 4 percent entitlement (10 to 12 MW) in the Magnolia Power Project (Magnolia) located in
Burbank, California. SCPPA is the owner of Magnolia, with the other project participants including
Anaheim, Burbank, Cerritos, Glendale and Pasadena.
Magnolia is a 310 MW combined cycle generator. A combined-cycle generator captures exhaust heat in a
heat recovery steam boiler and uses the waste heat to produce more energy. By recovering the waste heat,
Magnolia has a very high efficiency and produces much less emissions than simple-cycle generators that
burn gas and emit heat and emissions through the stack.
Magnolia Natural Gas Supplies
CED’s gas requirements for Magnolia are around 1,600 MMBTU/day. To meet the gas requirements,
CED has entered into a number of long-term gas supply contracts.

19 | P a g e Colton Electric Department 2017 Integrated Resource Plan
Pinedale Project
SCPPA negotiated its first purchase of existing natural gas wells in 2005. The Pinedale Natural Gas
Project (Pinedale) reserves are located in west/central Wyoming.
Pinedale includes 38 operating oil and gas wells and associated lateral pipelines, equipment, permits,
rights of way, and easements used in production.
In addition to Colton, that owns 7 percent of the Pinedale Project, participants include Anaheim, Burbank,
Glendale, Los Angeles, Pasadena, and the Turlock Irrigation District. Currently, Colton gets about 400
MMBTU/day from Pinedale.
The total cost of the Project was over $300 million. Los Angeles and Turlock hold their interests
individually, while Anaheim, Burbank, Colton, Glendale and Pasadena have ownership through SCPPA.
Recently, Ultra Energy, the site manager, declared bankruptcy. At this time, SCPPA is not sure how or if
Ultra’s bankruptcy will impact daily operations at Pinedale or result in increased costs for the SCPPA
participants. Regardless, SCPPA is now a participant in Ultra’s bankruptcy proceedings on behalf of the
SCPPA participants.
LADWP serves as Project Manager for the overall project.
Barnett Natural Gas Reserves Project
In 2006, SCPPA members purchased natural gas reserves in Texas, northwest of Dallas. The purchased
assets are located in one of the most active and largest natural gas fields in North America.
The acquisition by SCPPA and Turlock Irrigation District of the Barnett Natural Gas Reserves Project
(Barnett) has approximately 37 billion cubic feet of equivalent proven reserves.
The operator of the properties is Devon Energy Corporation. Devon is the largest acreage holder and
producer in the Barnett Shale, and at the time of purchase, had over 22 drilling rigs operating in the field.
Colton has a 9 percent entitlement in the project. The other SCPPA participants are Anaheim, Burbank,
Pasadena, and the Turlock Irrigation District. (Turlock holds its interest individually). Currently, Colton
receives about 400 MMBTU/day from the Barnett Project.
Pre-Paid Natural Gas
In 2007 SCPPA issued bonds for the purpose of funding a lump-sum prepayment of future natural gas
deliveries to the Project Participants over the next 30 years.
The total aggregate quantity of gas to be delivered by the gas supplier (J. Aron & Company) over the term
of the Prepaid Natural Gas Sales Agreements is approximately 135 billion cubic feet.
SCPPA entered into separate Gas Supply Agreements with each of the Project Participants. Each gas
supply contract provides for the discounted sale to Participants, on a pay-as-you-go basis, of all of the

20 | P a g e Colton Electric Department 2017 Integrated Resource Plan
natural gas to be delivered to SCPPA over the term of the Prepaid Natural Gas Sales Agreement (Prepay
Agreement). The price that the participants pay is the daily Southern California Citygate index less
(approximately) $0.70/mmbtu.
The CED has an 11 percent share of the pre-paid natural gas supplies. The other SCPPA participants are
Anaheim, Burbank, Glendale and Pasadena. The amount of daily gas CED receives varies by month from
a high of about 55,000 MMBTU in July and August to as little as 19,700 MMBTU in the spring.
As part of the Pre-Paid Gas Agreement, J. Aron has also agreed to remarket, on a daily or monthly basis,
quantities of gas designated by SCPPA or any of the City’s’ agent as remarketing surplus gas might be
necessary, generally when Magnolia is unavailable due to either scheduled or unscheduled outages.
Summary of Gas Contracts
The following table presents a summary of Magnolia’s annual costs (including natural gas and
transmission costs over LADWP’s system) beginning 2007/08.
FY
2007/08
FY
2008/09
FY
2009/10
FY
2010/11
FY
2011/12
FY
2012/13
FY
2013/14
FY
2014/15
FY
2015/16
Total Cost
(000,000’s)
$6.720 $6.295 $5.164 $4.949 $6.536 $6.137 $5.678 $6.145 $4.844
Generation
(MWh)
64,403 67,305 73,788 49,738 59,906 55,769 59,906 70,008 72,405
Average
Cost/MWh
$107.7 $93.50 $70.00 $99.50 $109.10 $110.00 $103.50 $87.70 $66.90
CED has negotiated a contract with Shell Energy (Shell) to convert Magnolia to a biogas facility.
However, the changing economics of biogas will require renegotiation or abandonment of this contract.
This will be discussed in more detail below.
Palo Verde Nuclear Generating Station (PVNGS)
PVNGS is located near Phoenix, Arizona. The total capacity of the three generators is more than 4,000
MW. SCPPA owns 225 MW of capacity of which Colton has a 1.3 percent entitlement, or about 3 MW.
Power from the PVNGS is transmitted over the Mead-Phoenix/Mead-Adelanto projects and then over
LADWP lines from Adelanto to SCE lines at Lugo for delivery to Colton.
Palo Verde is operated by APS and jointly owned by APS, Salt River Project, Southern California Edison
Co., El Paso Electric Co., Public Service Co. of New Mexico, SCPPA and the Los Angeles Department of
Water & Power.
CED has slightly less than 1 MW of capacity in each of the three units at PVNGS.
The following table shows the annual costs of PVNGS to Colton.

21 | P a g e Colton Electric Department 2017 Integrated Resource Plan
FY
2007/08
FY
2008/09
FY
2009/10
FY
2010/11
FY
2011/12
FY
2012/13
FY
2013/14
FY
2014/15
FY
2015/16
Total Cost
(‘000’s)
$875 $708 $706 $771 $784 $723 $745 $764 $904
Generation
(MWh)
15,577 17,955 18,948 18,627 18,609 18,000 18,000 18,000 19,292
Average
Cost/MWh
$55.10 $39.40 $40.70 $42.10 $38.80 $41.40 $42.400 $43.50 $46.90
Hoover Uprating Project
The Hoover Dam in Nevada is one of the most important power facilities for Southern California, with a
total capacity of over 1,950 MW divided between Nevada, Arizona and California and over 1,000 MW
delivered to southern California utilities.
In 1983, the generators at Hoover had to be replaced. SCPPA participants paid for the replacement which
resulted in an additional 80 MW of generation capacity that was divided among the SCPPA participants
(the Uprating Project).
The original contracts expired in 2017 but in 2012, Congress extended the SCPPA participants power
purchase agreements for 50 years. In exchange for this long-term extension, Colton’s entitlement of 3
MW would be reduced by about 5 percent (or 100 kW).
Hoover is Colton’s most economical resources, with delivered energy costs of less than $32/MWh.
The following table shows Colton’s historical costs for Hoover.
FY
2007/08
FY
2008/09
FY
2009/10
FY
2010/11
FY
2011/12
FY
2012/13
FY
2013/14
FY
2014/15
FY
2015/16
Total Cost
(‘000s)
$73.2 $75.6 $75 $80.0 $80.0 $80.0 $82.5 $81.0 $73.9
Generation
(MWh)
3,420 3,352 3,056 3,388 2,617 2,617 2,807 2,807 3,174
Average
Cost/MWh
$24.80 $27.1 $28.90 $27.40 $27.7 $27.30 $28.70 $28.80 $23.30
Agua Mansa Power Plant
The AMPP is a 43 MW (net) GE LM-6000 natural gas fired generating facility located in Colton. The
AMPP became commercially operational in 2003.
AMPP was designed as a peaking facility to operate only a few hours per day, primarily during the
summer on-peak periods. AMPP is too inefficient to operate as a baseload resource in comparison to
other generation units in the CAISO. Instead, AMPP provides other benefits to the CED in terms of acting
as a physical hedge against price spikes in the CAISO market and meeting CED’s resource adequacy
requirements, especially local and flexible RA capacity obligations.

22 | P a g e Colton Electric Department 2017 Integrated Resource Plan
The following table shows AMPP’s annual costs and generation.
FY
2007/08
FY
2008/0
9
FY
2009/10
FY
2010/11
FY
2011/12
FY
2012/1
3
FY
2013/14
FY
2014/15
FY
2015/16
Total Cost
(000’s)
$3,927 $3,260 $3,025 $1,449 $2,011
$5,039 $2,592 $3,000 $1,362
Generation
(MWh)
50,868 52,280 30,030 15,207 26,349
19,640
20,000
20,000 9,458
Average
Cost/MWh
$119.41 $87.78 $121.97 $137.91 $139.38 $76.77
$129.60 $150.00 $144.00
The above costs for AMPP do not include debt service costs that would add approximately $2,900,000
annually to total cost, approximately doubling the average cost per MWh.
Beginning in 2011/12, the energy from AMPP is included in the total cost of non-firm and day-ahead
purchases. This will be further discussed in the power supply cost forecast section.
In addition to providing a physical hedge against spikes in CAISO energy market prices, AMPP is a
source of system, local and flexible capacity. CED spent almost a year working with the SCAQMD to
modify the operating permit to meet the CAISO’s requirements for a flexible capacity resource.
Renewable Resources
CED has power purchase agreements (PPAs) with seven entities for eight renewable projects. These are
the High Wind Project, the Metropolitan Water District (MWD) small hydro power purchase agreement,
Antelope DSR2 Solar Project, Astoria Solar Project, Kingbird Solar and two small solar projects within
the City limits, Colton Solar 1 and Colton Solar 2 with SES. In addition, a 10 MW baseload landfill gas
generator, the Puente Hills Landfill Gas generation Project, will begin delivering energy to CED on
January 1, 2017. Together, these resources produce between 115,000 and 130,000 MWh of energy
annually or about 31 to 35 percent of Colton’s total energy requirements13.
High Wind Energy Center
The High Winds Energy Center (High Winds) is located along northern California's Montezuma Hills in
Solano County, midway between San Francisco and Sacramento. It is one of the largest wind projects in
California.
In September 2003, SCPPA member cities of Anaheim, Azusa, Colton, Glendale, and Pasadena joined
together in a long-term agreement to purchase wind energy through power marketer Iberdrola
Renewables from the owner FPL Energy. Merced Irrigation District is also a participant in this project.
13 One of the drawbacks of renewable energy contracts is that annual energy production depends on weather
conditions so the annual forecasts of production can be substantially different than annual production
23 | P a g e Colton Electric Department 2017 Integrated Resource Plan
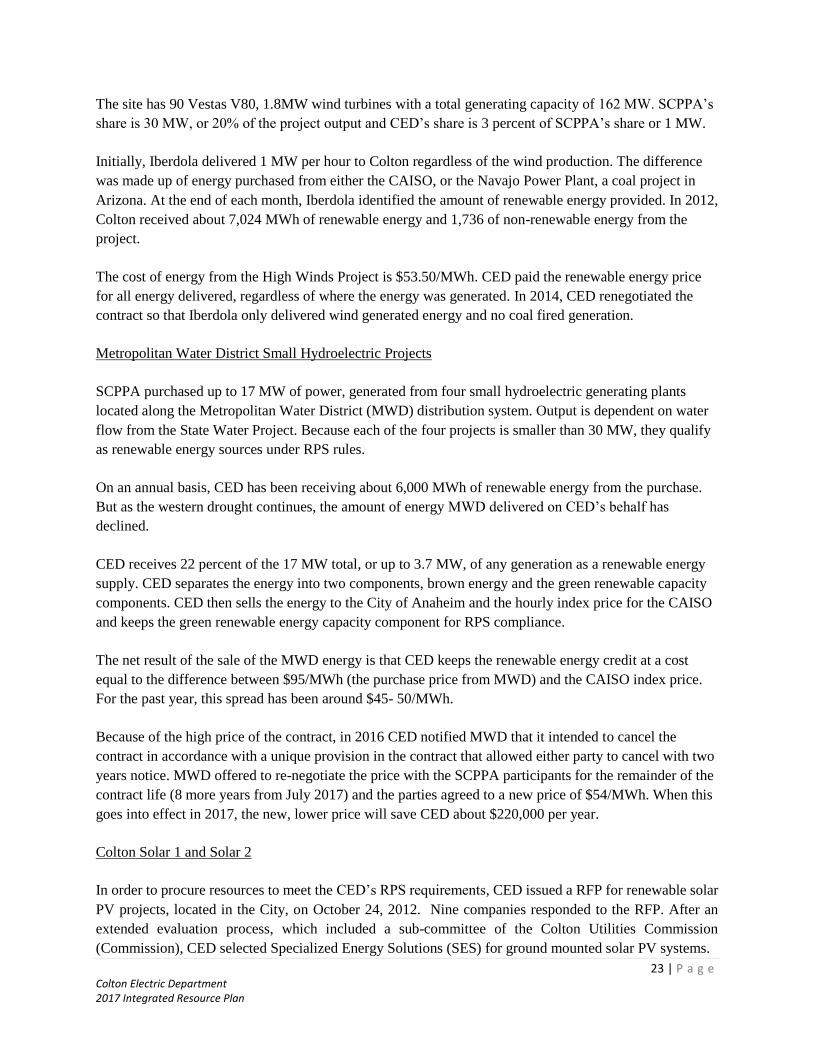
The site has 90 Vestas V80, 1.8MW wind turbines with a total generating capacity of 162 MW. SCPPA’s
share is 30 MW, or 20% of the project output and CED’s share is 3 percent of SCPPA’s share or 1 MW.
Initially, Iberdola delivered 1 MW per hour to Colton regardless of the wind production. The difference
was made up of energy purchased from either the CAISO, or the Navajo Power Plant, a coal project in
Arizona. At the end of each month, Iberdola identified the amount of renewable energy provided. In 2012,
Colton received about 7,024 MWh of renewable energy and 1,736 of non-renewable energy from the
project.
The cost of energy from the High Winds Project is $53.50/MWh. CED paid the renewable energy price
for all energy delivered, regardless of where the energy was generated. In 2014, CED renegotiated the
contract so that Iberdola only delivered wind generated energy and no coal fired generation.
Metropolitan Water District Small Hydroelectric Projects
SCPPA purchased up to 17 MW of power, generated from four small hydroelectric generating plants
located along the Metropolitan Water District (MWD) distribution system. Output is dependent on water
flow from the State Water Project. Because each of the four projects is smaller than 30 MW, they qualify
as renewable energy sources under RPS rules.
On an annual basis, CED has been receiving about 6,000 MWh of renewable energy from the purchase.
But as the western drought continues, the amount of energy MWD delivered on CED’s behalf has
declined.
CED receives 22 percent of the 17 MW total, or up to 3.7 MW, of any generation as a renewable energy
supply. CED separates the energy into two components, brown energy and the green renewable capacity
components. CED then sells the energy to the City of Anaheim and the hourly index price for the CAISO
and keeps the green renewable energy capacity component for RPS compliance.
The net result of the sale of the MWD energy is that CED keeps the renewable energy credit at a cost
equal to the difference between $95/MWh (the purchase price from MWD) and the CAISO index price.
For the past year, this spread has been around $45- 50/MWh.
Because of the high price of the contract, in 2016 CED notified MWD that it intended to cancel the
contract in accordance with a unique provision in the contract that allowed either party to cancel with two
years notice. MWD offered to re-negotiate the price with the SCPPA participants for the remainder of the
contract life (8 more years from July 2017) and the parties agreed to a new price of $54/MWh. When this
goes into effect in 2017, the new, lower price will save CED about $220,000 per year.
Colton Solar 1 and Solar 2
In order to procure resources to meet the CED’s RPS requirements, CED issued a RFP for renewable solar
PV projects, located in the City, on October 24, 2012. Nine companies responded to the RFP. After an
extended evaluation process, which included a sub-committee of the Colton Utilities Commission
(Commission), CED selected Specialized Energy Solutions (SES) for ground mounted solar PV systems.

24 | P a g e Colton Electric Department 2017 Integrated Resource Plan
SES constructed two solar facilities in Colton. Solar 1 is a 3.0 MW facility located in the north end of the
City and Solar 2 is a 1.0 MW facility located at the Agua Mansa Power Plant in the southwest portion of
the City.
The initial PPA price is $80/MWh increasing at 3.5% per year. Under the terms of the PPA, CED pays SES
for all energy delivered or available for delivery in the event CED chooses not to take deliveries. CED
receives all environmental and capacity attributes of the project. SES was required to register the project
with the California Energy Commission (CEC) and the Western Renewable Energy Generation Information
System (WREGIS) so that CED would receive appropriate credit for renewable energy production. The
PPA also includes a one-time right to require SES to sell the project to Colton at the end of Year 7 at a
negotiated value.
In the negotiations with SES, CED anticipated purchasing the units in year 6 or 7 using municipal financing.
Depending upon the year that the purchase is consummated, the total cost will be around $6.3 million with
an annual cost of about $425,000 or $45-48/MWh. This will significantly lower the cost of the solar project.
The reason for the anticipated purchase is that it allows SES to take tax credits, unavailable to the CED,
that are used to reduce the purchase price is year 7.
The CED leases the Walnut site from the Water Department for approximately $88,000 per year for the life
of the project. The Water Department has the right to relocate or reconfigure the existing water facilities on
the site if necessary for Water operations. If the Water Department’s improvements impact SES generation,
the Electric Department would pay SES for any lost generation or costs of accommodating the Water
Department’s requirements.
Astoria 2 Solar Project
In February, 2013, the City Council approved the SCPPA Renewable Development Agreement, Phase II,
allowing CED to participate in the annual SCPPA Request for Proposal process for renewable energy
projects. Each year, various developers submit proposed renewable projects to SCPPA. SCPPA staff and
the member utilities regularly evaluate the proposals and determine interest from the various members. If
there is sufficient interest, SCPPA and the members begin negotiations with the developers for a power
purchase agreement (PPA). The PPA is generally between SCPPA and the developer; however each utility
and its legal counsel are involved in the negotiation. In addition to the PPA, the project also involves a
Power Sales Agreement (PSA) between SCPPA and each member utility, for each utility’s share of the
project output.
As many renewable projects are too large for smaller utilities, such as CED, to contract for individually,
the SCPPA RFP process allows CED to consider participation in a wider scope of projects, generally with
better pricing than if it had to negotiate a PPA by itself.
The Astoria 2 project is a 75 MW solar PV facility located in Los Angeles County, California, and qualifies
as a local capacity resource (LCR) within the CAISO. The facility is built, owned and operated by Recurrent
Energy. CED’s share of the facility is 5 MW or 6.67 percent. The project is interconnected to the CAISO,
qualifying as a Power Content Category 1 resource. The project has received certification by the CEC as
an RPS eligible facility and has a large generator interconnection agreement (LGIA) allowing full capacity
deliverability status with resource adequacy (RA) benefits.

25 | P a g e Colton Electric Department 2017 Integrated Resource Plan
The contract price for energy from the project is $63.00 MW, fixed over the life of the contract, and includes
local RA. This price is lower than the delivered cost of energy from the San Juan unit, and slightly lower
than the cost of delivered energy from Magnolia, when the costs of emission allowances are included. The
contract term for Astoria 2 is 20 years and there is a purchase option beginning after year six. The facility
achieved commercial operation in December 2016.
The other SCPPA participants in this project are the Cities of Azusa, Banning, and Vernon. Although this
is a SCPPA project, in order to fully subscribe to the 75MW and to receive the $63.00 per MW pricing
structure, SCPPA opened the project to other non-SCPPA utilities in California. The other project
participants are the Cities of Lodi, Corona, Moreno Valley and Rancho Cucamonga, and the Power and
Water Resources Pooling Authority (PWRPA). SCPPA is the lead agency in this project. The share of
facility output for each of the participants is as follows:
Participant CapacityPercent Share in Project
Colton 5MW 6.67%
Azusa 2MW 2.67%
Banning 8MW 10.67%
Vernon* 30MW 40.00%
PWRPA 10MW 13.33%
Corona 2MW 2.67%
Moreno Valley 2MW 2.67%
Rancho Cucamonga 6MW 8.00%
*Vernon will increase its purchase from 20 to 30 MW in 2020
SCPPA’s staff and legal counsel, together with each participant’s staff and legal counsel negotiated the
PPA between SCPPA and Recurrent Energy, and the PSA between SCPPA and each participant. Best, Best
and Krieger (CED’s attorney) reviewed and participated in the drafting of the Agreements.
In addition to the renewable energy and capacity rights, the PPA also includes the environmental attributes
(RECs) from the output of the project. Under the terms of the PSA, the rights to these attributes (energy,
capacity and RECs) will be owned and will be transferred to each participant according to their project
share.
The proposed PPA and Power Sales Agreements were presented to the Colton Utilities Commission at their
Regular Meeting on May 12, 2014. The Utilities Commission recommended that the City Council approve
the Colton Electric Department’s participation in the PPA and on June 3, 2014 the City Council approved
the PPA. A First Amendment to the PSA was approved by the City Council on November 17, 2015 reducing
the purchase price from $64.00 to $63.00 MW.
Kingbird B Solar Project
The Kingbird B Solar Project is a 20 MW PV facility located in Kern County, California, and was built,
owned and operated by First Solar. This project was also identified through the SCPPA RFP process.

26 | P a g e Colton Electric Department 2017 Integrated Resource Plan
The contract price for energy from the project is $68.75 MW, fixed over the life of the contract, and includes
system resource adequacy (RA) capacity. This price is comparable, if not lower than, energy from SJ3 when
the costs of emission allowances are included. The contract term is 20 years.
The other participants in this SCPPA project are the Cities of Riverside and Azusa. Colton and Azusa will
each have a 3MW (15% entitlement each) share in the project’s output, and Riverside will take the
remaining 14MW (70% entitlement).
SCPPA’s staff and legal counsel, together with each participant’s staff and legal counsel, have negotiated
the PPA between SCPPA and First Solar, and the PSA between SCPPA and each participant. Best, Best
and Krieger was included in each step of the negotiation.
In addition to the renewable energy and capacity rights, the PPA also includes the environmental attributes
from the output of the project. Under the terms of the PSA, the rights to these attributes will be transferred
to each participant according to their project share.
As with other renewable projects, First Solar had to register the Kingbird Solar Project with the California
Energy Commission and WREGIS to ensure the project participants receive RECs along with any energy.
The proposed PPA and PSA were presented to the Colton Utilities Commission for recommendation of
approval at their regular meeting on September 9, 2013. The Colton Utilities Commission made a
recommendation that the City Council approve the PSA between SCPPA and the City of Colton, and the
City Council authorized the City Manager to execute the contract documents on September 17, 2013.
Antelope DSR Solar Project
SCPPA negotiated two PPAs (Antelope DSR1 and Antelope DSR2) with sPower Solar Holding LLC
(sPower) for the output of the 55 MW Antelope DSR Solar Project (Project). CED’s share of this project is
2 MW in the Antelope DSR2 PPA. This solar photovoltaic (PV) project is located in the City of Lancaster,
in Los Angeles County and qualifies as a local capacity resource (LCR) within the CAISO. The Project will
interconnect to the CAISO and will count as a Power Content Category 1 resource. The commercial
operation date of the facility is projected to be December 31, 2016.
The contract price of the energy from the Project is $53.75 per MWh, fixed over the 20 year term of the
contract, and includes rights to both the environmental and LCR attributes. This is the lowest price CED
has seen for similar solar projects. CED attributes the competitive price offered by sPower to several factors:
1. The continued decline in the equipment and labor costs of solar PV projects; and
2. The Project being a part of a much larger transmission interconnection position with the CAISO,
with an executed interconnection agreement of known cost exposure, and certain shared
interconnection upgrades, all of which contributing to reduced cost for the Project; and
3. Economy of scale due to sPower’s extensive holdings of more than 800MW of solar development
assets in the general Antelope Valley area; and

27 | P a g e Colton Electric Department 2017 Integrated Resource Plan
4. Solar developers’ mounting pressure to find off-takers so that the Project can timely come online
before the end of 2016 to fully capture the benefit of federal Investment Tax Credit (ITC). The
facility achieved commercial operation on November 30, 2016.
In addition to offering very competitive pricing, the project includes a Purchase Option Agreement and an
Energy Storage Option Agreement. The Purchase Option allows the Buyers to exercise an option to
purchase the facility in years ten, fifteen or twenty, at fair market value. The Energy Storage Option
Agreement provides space for the installation of an energy storage system (ESS) if the participants should
decide in the future that it is economical and beneficial to install ESS at this facility.
The proposed Power Sales Agreement (which includes the PPA between SCPPA and sPower as) were
presented to the Colton Utilities Commission at their Regular Meeting on July 13, 2015 and approved by
the City Council on July 21, 2015.
Puente Hills Landfill Gas Project
In addition to these solar projects, CED is a participant in the Puente Hills Gas-to-Energy Facility to add
10 of baseload renewable energy. The Puente Hills Gas-to-Energy facility is owned by the County
Sanitation District No. 2 of Los Angeles County, and is currently in operation with generation sold to
Southern California Edison until the end of 2016. Capacity and energy will be will be available to the
SCPPA participants beginning January 1, 2017.
The Puente Hills Facility has been certified by the California Energy Commission (CEC) as a renewable
resource and is qualified as a portfolio content category 1 (PCC1) resource. The energy associated with this
facility also qualifies for local resource adequacy (RA). The contract price for energy from the project is
$80.00 MW, fixed over the life of the contract. The contract term is 13 years. This price includes both local
RA and the environmental attributes (RECs) associated with the energy. This price is comparable to the
delivered cost of energy it will be replacing from the SJ3 unit and to the cost of delivered energy from
Magnolia, when the costs of emission allowances are included.
The contract price for power is high compared to intermittent generation resources like solar and wind but
low when compared to other baseload renewable resources, such as geothermal, biomass and biogas, most
of which have energy prices above $100/MWh.
The nameplate capacity of the facility is 46 MW and the projected output in 2017 is 43 MW. The Puente
Hills Landfill closed in October 2013, which will result in the degradation, or decline of landfill gas (fuel)
that will be produced during the life of this PPA. Because of this degradation of fuel, the facility output will
decline each year of the PPA and the energy output is expected to be reduced to 25 MW by the final year
of the PPA. CED has considered this in its analysis of the project and feels this project is a good fit for its
resource portfolio.
The other SCPPA participants in this project are the Cities of Azusa, Banning, Pasadena and Vernon. CED
and Vernon will each receive 23.26% (approx. 10 MW), Pasadena will receive 30.23% (approx. 13 MW),
Banning will receive 20.93% (approx. 9 MW) and Azusa will receive 2.33% (approx. 1 MW) of the facility
output. Recently, the project manager has stated concern that due to lower landfill gas production at the
site, generation could be curtailed by roughly 20 percent.

28 | P a g e Colton Electric Department 2017 Integrated Resource Plan
SCPPA’s staff and legal counsel, together with each participant’s staff and legal counsel, have negotiated
the PPA between SCPPA and the County Sanitation District No. 2 of Los Angeles County, and the PSA
between SCPPA and each participant. Best, Best and Krieger indicated no objections to the proposed
Agreements.
The proposed PPA and Power Sales Agreements were presented to the Colton Utilities Commission at their
Regular Meeting on May 12, 2014. The Utilities Commission approved the CED’s participation in the PPA
on June 3, 2014.
Biogas Contract
CED and Shell Energy entered into a contract whereby Shell would deliver up to 1,500 MMBTU/day of
biogas from a landfill in Kern County for use in the Magnolia Power Plant. This would have the effect of
making Magnolia a baseload RPS resource and increase CED’s annual renewable energy production to
around 200,000 MWh, or about 57 percent.
At this time, there are questions about whether or not the landfill gas operator will proceed with the sale.
There are a number of other uses of natural gas in the transportation sector that tend to have more value to
the biogas producer but do not have the stability of a long-term power sales agreement.
Summary of Renewable Resources
The following table summarizes CED’s current RPS resources.
If the Shell biogas project goes forth, CED’s renewable resources increase to almost 55 percent of total
requirements.
Regardless of the ultimate outcome of the Shell biogas contract, CED should meet 2030 requirements of
50 percent renewable by 2018 although additional solar and wind projects will be required in the 2022/23
time period. By 2026, CED may have to start acquiring a replacement for the Puente Hills landfill gas
Project
Resource
Type
Contract
Start Date
Capacity
(MW)
Estimated
Energy (MWh) Location
High Wind Wind 2003 4.00 6,500 Solano County
MWD Small Hydro Hydro 2008 3.80 4,500 Southern California
Colton Solar 1 Solar 2016 3.00 5,256 Colton, CA
Colton Solar 2 Solar 2016 1.00 1,752 Colton, CA
Gonzales Center Solar 2016 0.50 753 Colton, CA
Arbor Terrace Solar 2016 0.35 613 Colton, CA
Recurrent - Astoria Solar 2016 5.00 11,826 Kern County, CA
First Solar - Kingbird Solar 2016 3.00 7,096 Kern County, CA
Antelope Solar Project Solar 2016 2.00 4,730 Kern County, CA
Puente Hills Landfill Gas
Generator Biogas 2017 10.00 78,840 Industry Hills, CA
Total Renewable Energy 24.85 121,867

29 | P a g e Colton Electric Department 2017 Integrated Resource Plan
project that will see a declining output as landfill gas production declines. CED will have additional
capacity requirements by then that will have to meet with new renewable resources.
Greenhouse Gas Emissions
In 2015, CED was emitting GHG emissions from the Magnolia, Agua Mansa and San Juan Power Plants.
With the anticipated decommissioning of SJ3 no later than December 31, 2017 and the proposed biogas
purchase from Shell, CED will be emitting less than 20,000 tons of GHG annually by 2018, down from
211,000 tons in 2015. All of CED’s resources will be GHG free except Magnolia that currently emits
almost 26,000 tons of GHG annually but will be reduced to around 18,000 tons if CED completes the at
least a proposed 500 mmbtu/day biogas purchase as a substitute for natural gas use and AMPP that emits
about 3,500 tons per year of GHG emissions.
Transmission
The CAISO has assumed operational control of all 115 kV and above transmission14 of all Participating
Transmission Owner (PTO) utilities and transmission owners such as Citizens Energy that have turned
their operational rights over to the CAISO and the 115 kV and 69 KV transmission of PG&E and
SDG&E. The CAISO operates all this transmission to minimize daily transmission costs for the system as
a whole.
Each PTO utility charges the CAISO the total cost of its transmission plus a rate of return on any owned
transmission assets. The charge is called a utilities transmission revenue requirement (TRR). The CAISO
aggregates the TRRs of all PTOs and then divides this amount by the forecasted energy use on its system
for the year in order to develop a transmission wheeling rate that is paid based upon the total metered load
of the LSE. This rate is a “postage stamp” rate paid by the entity that takes final delivery of the energy. It
is called a postage stamp rate because every entity pays the same amount regardless of the voltage) or
how far energy is wheeled across the system.
Any generator or load can use the CAISO system. To manage the use of the transmission system, the
CAISO uses congestion pricing. In effect, if entities schedule more energy over a transmission path than
the path’s capacity, the CAISO begins adding a congestion charge to encourage entities to either move
energy to other transmission paths or to back generation down over that path. The CAISO keeps
increasing the congestion charge until generation is reduced to the transmission limits over a specific
path15.
Congestion charges can be quite high over some constrained paths, often more than the price of energy
being transmitted over these lines.
14 In PG&E and SDG&E’s service territory, the CAISO controls down to 66 kV transmission lines. 15 This is actually done by a mathematical formula approach that creates a large enough congestion charge to push
higher priced resources out of the dispatch order.
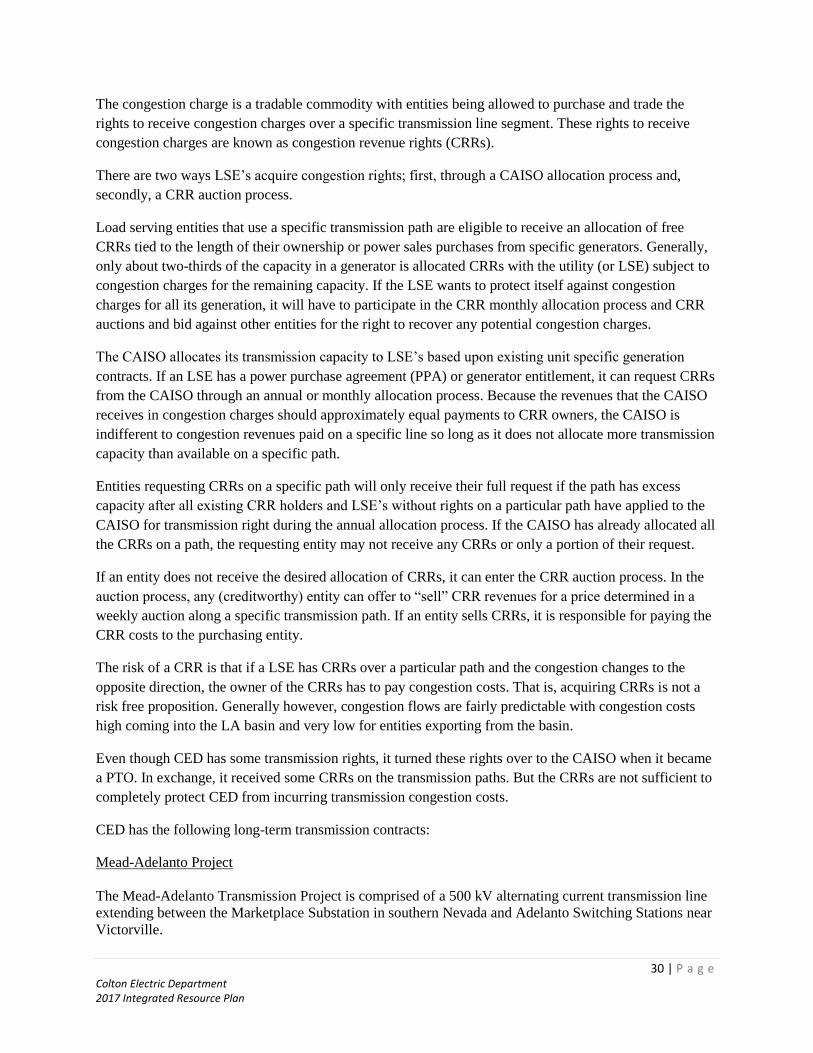
30 | P a g e Colton Electric Department 2017 Integrated Resource Plan
The congestion charge is a tradable commodity with entities being allowed to purchase and trade the
rights to receive congestion charges over a specific transmission line segment. These rights to receive
congestion charges are known as congestion revenue rights (CRRs).
There are two ways LSE’s acquire congestion rights; first, through a CAISO allocation process and,
secondly, a CRR auction process.
Load serving entities that use a specific transmission path are eligible to receive an allocation of free
CRRs tied to the length of their ownership or power sales purchases from specific generators. Generally,
only about two-thirds of the capacity in a generator is allocated CRRs with the utility (or LSE) subject to
congestion charges for the remaining capacity. If the LSE wants to protect itself against congestion
charges for all its generation, it will have to participate in the CRR monthly allocation process and CRR
auctions and bid against other entities for the right to recover any potential congestion charges.
The CAISO allocates its transmission capacity to LSE’s based upon existing unit specific generation
contracts. If an LSE has a power purchase agreement (PPA) or generator entitlement, it can request CRRs
from the CAISO through an annual or monthly allocation process. Because the revenues that the CAISO
receives in congestion charges should approximately equal payments to CRR owners, the CAISO is
indifferent to congestion revenues paid on a specific line so long as it does not allocate more transmission
capacity than available on a specific path.
Entities requesting CRRs on a specific path will only receive their full request if the path has excess
capacity after all existing CRR holders and LSE’s without rights on a particular path have applied to the
CAISO for transmission right during the annual allocation process. If the CAISO has already allocated all
the CRRs on a path, the requesting entity may not receive any CRRs or only a portion of their request.
If an entity does not receive the desired allocation of CRRs, it can enter the CRR auction process. In the
auction process, any (creditworthy) entity can offer to “sell” CRR revenues for a price determined in a
weekly auction along a specific transmission path. If an entity sells CRRs, it is responsible for paying the
CRR costs to the purchasing entity.
The risk of a CRR is that if a LSE has CRRs over a particular path and the congestion changes to the
opposite direction, the owner of the CRRs has to pay congestion costs. That is, acquiring CRRs is not a
risk free proposition. Generally however, congestion flows are fairly predictable with congestion costs
high coming into the LA basin and very low for entities exporting from the basin.
Even though CED has some transmission rights, it turned these rights over to the CAISO when it became
a PTO. In exchange, it received some CRRs on the transmission paths. But the CRRs are not sufficient to
completely protect CED from incurring transmission congestion costs.
CED has the following long-term transmission contracts:
Mead-Adelanto Project
The Mead-Adelanto Transmission Project is comprised of a 500 kV alternating current transmission line
extending between the Marketplace Substation in southern Nevada and Adelanto Switching Stations near
Victorville.

31 | P a g e Colton Electric Department 2017 Integrated Resource Plan
The City of Colton owns firm bidirectional service equaling 1.75% of the facility’s 1,291 MW rated
capability, or 22.59 MW that it has turned over to the CAISO.
Mead-Phoenix Project
The Mead-Phoenix Transmission Project is a 500 kV alternating current transmission line extending
between Westwing and Perkins Substation. CED is entitled to firm bidirectional service equaling
0.2308% of the facility’s 1,923 MW rated capability, or 4 MW.
CED also has an entitlement in the 500 kV alternating current transmission line extending between
Perkins and Mead Substations. With regard to this component, the City of Colton is entitled to firm
bidirectional service equaling 0.2308% of the facility’s 1,923 MW rated capability, or 4 MW.
The Mead-Phoenix Transmission Project includes a segment of Marketplace-McCullough transmission
line, a 500 kV alternating current transmission line extending between the Marketplace and McCullough
Switching Stations.
As part of both the Mead-Adelanto and Mead-Phoenix Transmission Projects, CED is entitled to firm
bidirectional service equal to its transmission entitlements in Mead-Phoenix and Mead-Adelanto between
McCullough and Marketplace (4 MW in Mead-Phoenix and 22.59 MW in Mead-Adelanto). This
entitlement has been turned over to the CAISO.
Adelanto-Victorville/Lugo
The Adelanto-Victorville/Lugo path is comprised of 500 kV alternating current transmission facilities
extending between the Adelanto Switching Station, the Victorville Switching Station, and the midpoint of
the Lugo-Victorville 500 kV line.
CED is entitled to firm bidirectional service over this path in an amount up to its transmission service
entitlement in the Mead-Adelanto Project (i.e., 22.59 MW).
Lugo/Victorville 500 kV to Vista 230 kV
CED’s 21 MW entitlement to firm unidirectional network service from the midpoint of the
Lugo/Victorville 500 kV line to the Vista Substation 230 kV Substation is derived from two separate
agreements with the Southern California Edison Company (SCE):
One agreement providing for 3 MW of service.
One agreement providing for 18 MW of service.
Mead 230 kV to Vista 230 kV
Colton’s 3 MW entitlement to firm unidirectional network service from the Mead Substation 230 kV bus
to the Vista Substation 230 kV bus is derived from a firm transmission service agreement with SCE. CED
is currently attempting to renegotiate this contract with SCE because the renewal of the Hoover Power
Purchase Agreement may trigger a transmission contract termination clause. SCE doesn’t appear to care
whether or not the transmission contract is renewed but they have turned all their non-contracted
transmission to the CAISO. If the transmission contract did terminate upon execution of the new Hoover
agreement, SCE cannot renew the transmission contract. SCE, the CAISO and the Hoover participants are
currently working on this issue.

32 | P a g e Colton Electric Department 2017 Integrated Resource Plan
Devers Substation to Vista 230 kV
CED’s 14.043 MW entitlement to firm unidirectional network service from the Devers Substation to the
Vista Substation 230 kV bus is derived from a firm transmission service agreement with SCE. CED does
not use this path for any specific resource.
Summary of CED’s Generation and Transmission Portfolio
Prior to 2013, CED did not have any transmission entitlements from Palo Verde Substation, the delivery
point for energy from San Juan, to Colton. As a result, CED was paying significant congestion costs to
transmit the San Juan generation to Colton. By becoming a PTO, CED was allocated about 20 MW of
spring and summer CRRs and a small amount of winter and fall CRRs. CED must participate in the
monthly CRR allocations and auctions to acquire more CRRs and protect it against congestion costs.
CED can sign power supply contracts with any generator interconnected on the CAISO grid. While the
transmission costs is fixed (at least annually) congestion costs change from hour to hour depending upon
CAISO loads, the location of generators and whether or not specific transmission paths have been derated
for maintenance.
CED does have some CRRs to protect against congestion costs from the Phoenix area to Colton, but not
enough to avoid monthly congestion payments during the winter and fall.
As a PTO, CED has been able to reduce its annual transmission costs but CED has exposure to congestion
and must manage daily congestion costs more carefully than it has in the past. The majority of CED’s
congestion risk will remain between Palo Verde and Colton where most of CED’s energy resources are
located.
Future Transmission Needs
Because CED is now a CAISO Participating Transmission Owner (PTO) it does not need to acquire a
transmission path between the generator and Colton loads. Instead, CED must manage the congestion risk
associated with using the CAISO’s system.
On many of CED’s new resources (and renegotiated contracts), CED just deliveries energy to the CAISO
grid at the interconnection point nearest the generator and withdraws energy to serve retail load at Vista
Substation, a 500 kV substation located on the 215 freeway in Grand Terrace. CED is paid the locational
marginal price (LMP) where it delivers energy to the grid and by the CAISO and is charged the LMP for
energy taken by CED at Vista. In the absence of congestion these two prices will be the same. With
congestion, the prices will vary. By acquiring CRR’s between the two points, CED can ensure that it gets
paid the same for energy delivers as it gets charged for energy withdrawals.
The only reason that CED would acquire transmission rights in the future, rather than congestion rights, is
a concern over the long-term structure of the electric industry and belief that eventually the CAISO might
fail or be dissolved and the industry revert back to the pre-2000 structure.

33 | P a g e Colton Electric Department 2017 Integrated Resource Plan
Chapter 4
Legislative and Regulatory Issues
Introduction
The past few years have seen legislative and regulatory bodies impose numerous environmental and
operating requirements on electric utilities. While the new legislation will reduce Greenhouse Gas (GHG)
emissions, the legislation will also cause increased operating costs in the near term. The legislative and
regulatory activities have also significantly changed the way utilities plan for and acquire new
transmission and generation resources. No longer do utilities plan to acquire resources based primarily on
least-cost planning considerations or reliability concerns. In many cases, utilities attempt to minimize
their GHG emissions, resulting in more renewable resources and conservation activities in the overall
resource mix with resources often located nearer load centers.
The major legislative and regulatory initiatives facing the CED today include:
GHG reduction, including the Federal Clean Air Act, California’s AB 32 Greenhouse
Gas Reduction Law and Renewable Portfolio Standards requirements and SB 350, a
successor bill to AB 32, the Clean Energy and Pollution Reduction Act of 2015;
Changes in the California wholesale electricity market including new types of flexible
capacity requirements intended to help mitigate the reliability effects of renewable
resources;
The CAISO’s attempt to move from a California entity to a western U.S., generating and
transmitting power in the 11 western states;
Required upgrades in physical security of generation, transmission and distribution
facilities.
Implementing many of the requirements is difficult due to over-lapping regulatory bodies that may or
may not have jurisdiction on some issues. For example, until 2011, California required both the Public
Utilities Commission (CPUC) and California Energy Commission (CEC) to regulate RPS compliance.
However, the CPUC did not have jurisdiction over publically-owned utilities and the CEC does not
(generally) have the ability to enforce their decisions. In many situations, local regulatory bodies, such as
the Colton City Council, were able to declare themselves in compliance with state renewable energy
requirements. As a result, both federal and state legislatures have resorted to putting the enforcement of
new rules under environmental bodies such as the federal Environmental Protection Agency (EPA) and
the California Air Resource Board (CARB) that have jurisdiction over local utilities regardless of
conflicting regulatory overlaps.
Federal Clean Air Act Impacts on San Juan Unit 3
SJ3 was one of the largest emitters of nitrogen oxides in the west but between 2006 and 2010 new
environmental controls were installed that reduced daily emissions by up to 80 percent and significantly
reduced mercury and carbon dioxide emissions. The cost of this environmental upgrade was $320 million
and CED’s share was approximately $5.45 million.

34 | P a g e Colton Electric Department 2017 Integrated Resource Plan
Even with the environmental upgrade completed, EPA was required to open another investigation on
regional haze caused by San Juan as the result of a lawsuit filed by the Sierra Club and Natural Resources
Defense Council (NRDC). At the conclusion of the investigation, EPA ordered the San Juan owners to
install Selective Catalytic Reduction (SCR) equipment on the plants at a cost of between $750 million and
$1.0 billion and have the upgrades completed by 2017.
CED’s estimated cost-share of these cost upgrades would have been $18 – $23 million, with the cost
impacts beginning in 2013.
The San Juan participants appealed EPA’s initial decision and requested that they be allowed to install
non-selective catalytic reduction (NSCR) equipment that would reduce emissions by 80 to 90 percent of
the SCR levels but at only around 10 percent of the total cost.
In 2011, EPA rejected the San Juan owner’s proposal and reaffirmed their initial decision on the need to
install SCRs but gave the owners of San Juan five years to complete the work rather than three as initially
ordered. However, this did not change the schedule for SCPPA participants.
PNM also filed suit against the EPA requesting a stay of EPA’s order. In March, 2012 the 10th Circuit
Court of Appeals rejected PNM’s request for stay and ordered work to proceed on the environmental
upgrades.
In March 2012 the New Mexico Public Service Commission (NMPSC), ordered an inquiry into
alternatives for San Juan. Options studied included conversion of the plant to a renewable site and natural
gas generation rather than coal generation.
PNM continued negotiations with EPA on alternatives to the installation of SCRs at the plant and with the
other San Juan owners. In February 2013, PNM and EPA agreed to decommission Units 1 and 3 no later
than December 31, 2017 and install NSCR equipment on the remaining 2 units. The California owners
(including CED) will not have any rights to capacity or energy from the SJGS once SJ3 is
decommissioned.
Once the EPA and SJGS participants agreed to decommission units 2 and 3, negotiations between the
various SJGS participants began. The two largest participants, PNM and Tucson Electric Power (TEP),
did not want to decommission the two units until December 31, 2017. The California utilities wanted to
decommission the two units as quickly as possible.
The negotiations between the participants dealt with how to implement the settlement and cost shares.
The participants remaining in SJGS will reduce their costs significantly, perhaps by as much as $650
million, by decommissioning the two units and installing NSCR equipment compared to SCRs. At the
same time, these same participants argue that their future costs could rise due to as yet unknown
additional environmental costs necessary to restore the site in the 2050 time period. The California
owners were unwilling to assume all potential future environmental costs.

35 | P a g e Colton Electric Department 2017 Integrated Resource Plan
Finally, in 2015 a settlement between all the parties was reached. The settlement included the following
points:
SJGS units 2 and 3 would be decommissioned no later than December 31, 2017;
SJGS units 1 and 4 would be retrofitted with the less expensive non-selective catalytic convertors;
All California entities would be allowed to exit the SJGS by December 31, 2017. Entities in SJ4
(Anaheim and Modesto, Santa Clara and Redding) would trade their ownership rights in SJ4 for
equivalent rights in SJ3;
An engineering study of unit 3 would be conducted to determine the decommissioning cost of SJ3
and common facilities in 2017. The parties in SJ3 would create a decommissioning trust fund
equal to the 2017 decommissioning cost that would be adjusted annually so whenever the entire
SJGS were decommissioned, sufficient funds would be available to fund the decommissioning of
SJ3;
An engineering study of the cost of coal field restoration would be conducted and a trust fund
would be established for future coal mine restoration to pre-1990 conditions;
SCPPA will sell its coal inventory to PNM at market price. The proceeds will be used to pay a
$10 million exit fee for the participants with the small remaining amount deposited into the coal
mine restoration trust fund;
SCPPA members no longer have a monthly minimum take obligation. Instead, they must take
their energy entitlement whenever it is available and incur and pay the incremental cost of coal.
Currently, this means that SCPPA members must pay about $45/MWh for energy whenever it is
available at the plant;
The participants will perform all minor maintenance on the plant. Any major maintenance must
be approved by a unanimous vote of the participants.
SCPPA members also voted to retire all SJ3 debt by December 31, 2016 so that they could leave the plant
if there was a catastrophic failure resulting in the early closure of SJ3.
State Clean Air Legislation
The umbrella legislation for California’s clean air legislation is AB 32. This legislation establishes the
goal of reducing emissions by California’s residents and businesses from current levels back to 1990
levels. AB 32 established the C&T approach to pollution control and indirectly required renewable energy
portfolios. AB 32 has spawned significant follow-up legislation and regulatory activity to determine how
to meet the goals established in the law.
With the passage of AB 32 in 2006, California is leading the nation in addressing climate change, with an
overall goal of reducing statewide GHG emissions to 1990 levels by 2020 and setting a path to further
reductions by 2050. There have been several attempts at the federal level to address climate change, both
through legislation and EPA regulations. With the exception of GHG reporting requirements for major
sources (25,000 metric tons), federal actions have stalled. Nonetheless, California continues to push to
reach its overall GHG emissions reductions goal.
In 2008 the California Air Resources Board (CARB) adopted the Climate Change Scoping Plan, which
identifies measures for the various economic sectors that would achieve real GHG reductions. Several

36 | P a g e Colton Electric Department 2017 Integrated Resource Plan
measures have been identified for the energy sector that have been or will be developed into regulations.
The following apply to CED:
AB 32 Cost of Implementation Fee Regulation (Fee Regulation)
Regulation for the Mandatory Reporting of GHG Emissions (Mandatory Reporting
Regulation)
Regulation for Reducing Sulfur Hexafluoride Emissions from Gas Insulated Switchgear
(SF6 Regulation)
The 2010 Mandatory Reporting Regulation revisions increased the exemption threshold for reporting for
electric generating facilities from 2,500 metric tons (MT) to 10,000 MT, and reduced retail seller
reporting obligations requirements starting in 2012.
A key portion of AB 32 is the requirement for increased energy efficiency measures and advanced
lighting technologies. AB 32 requires that utilities implement all cost-effective energy efficiency
measures prior to acquiring new generation resources.16
In 2015, California adopted SB 350, the Clean Energy and Pollution Reduction Act of 2015, a successor
bill to AB 32. SB 350 established new clean energy and GHG reduction goals for 2030. Among the major
goals of SB 350 are reducing GHG emissions by 40 percent of 1990 levels by 2030 and 80 percent by
2050. To accomplish the goal of reduced emissions, SB 350 requires utilities to double their current
energy efficiency efforts, increase the proportion of renewable energy from 33 percent in 2020 to 50
percent in 2030, increase transportation electrification efforts sector and explore expanding the CAISO
from a California grid manager to a western state grid manager to facilitate the transmission of renewable
resources from western states into California.
Cap and Trade
Under the C&T program, the total amount of emissions in tons per year (measured in CO2e or carbon
dioxide equivalent) is capped by CARB. CARB has estimated emissions in each industrial sector by
performing audits of emissions by sector for the past three years. Each business or entity covered by the
regulation was required to estimate its annual emissions and then have its emissions verified by an
independent auditor approved by CARB.
CARB then allocated each entity within each covered industrial sector emission allowances (EA). If the
entity accurately reported its emissions, the allocated EAs would equal the average of the annual
emissions over the past three years.
Each year CARB performs an audit of the emissions from each entity. If an entity does not have sufficient
EAs to offset all its emissions, it must either purchase EAs from another entity or pay a fine of about
$50/ton for emissions above its EAs. If an entity has more EAs than emissions, it will retire the EAs
necessary to offset its emissions and can then sell any remaining EAs. There is no expiration on EAs so
purchasing a 2013 EA allows an entity to use that EA any time after 2013 but future EAs cannot be
16 Refer to Chapter 4 of the IRP for information about CED’s current and planned energy efficiency programs.

37 | P a g e Colton Electric Department 2017 Integrated Resource Plan
brought back to meet past compliance obligations. So a 2013 EA can be used to meet 2015 requirements
but a 2017 EA cannot be used until 2017 or later.
Each year, the amount of EAs available and allocated to each entity declines, forcing all entities to reduce
their emissions by about 1 percent per year in aggregate.
CED has been allocated 243,130 EAs for 2017.
The freely allocated EAs can only be used to offset emissions associated with retail sales. CED cannot use
any of its freely allocated allowances to offset emissions from surplus generation or generation sold into
the CAISO market. As a result, CED must track all its hourly generation and emissions, determine which
source of energy is used to meet retail load and which energy is surplus to load and then acquire EAs to
offset emissions associated with surplus sales or purchases from the CAISO.
Initial estimates suggest that CED’s emissions are between 180,000 tons per year and 200,000 tons per
year. If actual emissions to serve load are less than 243,130, then CED can sell excess EAs and use the
revenues for reducing power supply costs by investing in renewable alternatives. If actual emissions are
greater than 243,130 tons, then CED will have to purchase EAs in addition to any purchases or sales from
the CAISO.
CED had developed procedures for calculating emissions, tracking CED’s emissions relative to its freely
allocated EAs and buying or selling EAs as necessary to remain compliant with the C&T program.
CED has additional issues dealing with AMPP. AMPP is dispatched by the CAISO and dispatch
generally results in surplus energy. The CAISO adds a payment for the cost of EAs but given the price
varies on a day to day basis (although the variation is currently small) CED has to ensure that it acquires
EAs in the market at a price less than or equal to what the CAISO paid or risk losing money on a AMPP
dispatch.
Possible Changes to C&T
The C&T program is currently scheduled to end in 2021. There are discussions at the legislature to
continue C&T through 2030 although the Air Resource Board (ARB) appears to prefer a command and
control approach.
If C&T continues, there are likely a number of changes to the program. First, it appears that the ARB
allocated too many allowances to entities in an attempt to minimize the initial financial impact of C&T.
As a result, few entities have had to make significant purchases of EAs or reduce their emissions. ARB is
proposing reducing freely allocated EAs by about 50 percent, or greater, in 2021 from current levels.
Secondly, ARB is proposing allocating EAs directly to the industrial customer rather than the serving
utilities. The industrial customer will be responsible for ensuring that it has sufficient EAs to meet its
emission obligations.

38 | P a g e Colton Electric Department 2017 Integrated Resource Plan
At this time it is unclear which, if any, of the proposed changes will adopted by ARB and the state
legislature. There are 3 more years under the current rules and no urgency on the part of the legislature to
make changes to C&T rules that threaten the long-term extension of C&T. This is especially true with
efforts to include the transportation sector (oil refineries) in C&T, an expansion that is strongly opposed
by the Western States Petroleum Association, an organization lobbying to end C&T efforts.
Renewables Portfolio Standard (RPS) Legislation
The second major component of AB 32 was the requirement of a renewable portfolio standard for all
LSEs within California. Governor Schwarzenegger had initially used AB 32 in establishing minimum
renewable energy requirements for investor-owned utilities. However, there was a debate on whether or
not his Executive Order should be applied to publically-owned utilities.
In April 12, 2011, Governor Brown signed SB 2, codifying into law an increase of the RPS mandate to 33
percent by 2020. SB 2 made significant modifications to the RPS program, including the use of multi-
year compliance periods with incremental targets and the specification of minimum product content for
most retail sellers’ RPS portfolios that changes with each compliance period. SB 2 also modified certain
delivery requirements for out-of-state resources and limited the ability to carry forward unbundled
renewable energy.
A key component of RPS is the concept of a Renewable Energy Credit or REC. For purposes of
regulatory compliance, energy is classified as “renewable” or non-renewable.” Non-renewable energy is
from traditional fossil-fuel generation. Renewable energy is from renewable energy sources. Renewable
energy can be further divided into two components, the energy and the renewable capacity attribute. A
renewable energy generator can separate the brown energy component from the renewable energy
attributes and sell the renewable energy as a REC.
For example, a wind generator in California can generate energy and sell it into the CAISO market as
non-renewable energy and retain the REC. The REC can then be sold to an entity that wants to offset its
brown energy purchases and turn them into green energy. However the use of RECs by utilities is limited
by SB 2.
Compliance Categories of RPS Resources
SB 2 established three Power Content Categories (PCC), or “buckets,” for RPS compliant resources. PCC
1 is bundled green energy produced within California or that has its first point of interconnection with a
California Balancing Authority (such as CAISO). PCC 3 is RECs.
PCC 2 is firmed and shaped green energy, or energy from renewable sources that does not meet the
criteria of categories 1 or 2.
Resources must meet the following criteria during the different compliance periods.

39 | P a g e Colton Electric Department 2017 Integrated Resource Plan
The final rules for RPS compliance were adopted by the CEC in May, 2013. Utilities are now attempting
to understand what their obligations in terms of reporting requirements and regulatory compliance
especially since the CEC continues to refine and redefine the various RPS categories.
One of CED’s concerns is the rules governing the use of biogas. CED believes biogas is the least
expensive means of meeting its RPS requirements and has entered into a long-term biogas purchase
agreement with Shell. In 2015, the CPUC added a requirement to biogas suppliers that significantly
increased the risk associated with biogas, threatening the viability of the Shell – CED purchase
agreement.17
In March, 2012 the CEC issued a “Notice to Consider Suspension of the RPS Eligibility Guidelines for
Biomethane.” In this Notice, the CEC stated that it did not believe that biogas injected into the interstate
pipeline system qualified as a renewable resource. Onsite uses of biogas, such as a landfill gas, would still
qualify.
In the Renewable Portfolio Standard Eligibility, 7th edition (RPS Guidebook), the CEC permitted the use
of biomethane provided it was produced from in-state resources and either cleaned to pipeline quality or
used for generation purposes on-site. In addition, any generator using biogas would have to be re-certified
by the CEC.
The RPS Guidebook is the overall regulatory guide for RPS compliance and is currently in its 8th edition.
17 The change dealt with the way suppliers would be allowed to restart gas deliveries after an outage, essentially
requiring a complete verification of the quality of the biogas and increasing the cost of injecting biogas into the
transmission system.

40 | P a g e Colton Electric Department 2017 Integrated Resource Plan
CED has executed a biogas contract with Shell Energy for meeting some of Magnolia’s daily gas
requirements, the first biogas contract in California under the revised rules. While a number of issues
need to be resolved before deliveries can commence, (anticipated in 2018), expanding the options for
renewable resources is helpful to CED.
Summary of GHG and RPS Legislation
CED was not in compliance with the RPS requirements in the first compliance period, 2011-2013 but
took advantage of cost-limitation guidelines permitted in AB 32. CED only had about 8 percent
renewable resources as opposed to the statutory requirement of 20 percent. CED anticipates meeting the
RPS requirements in the second compliance period, 2014-2016 and thereafter. A discussion of how CED
intends to meet its RPS requirements is given in Chapter 8.
The CEC has not yet ruled on CED’s cost-limitation claim. If they deem CED’s exemption claim to be
valid, the first compliance period will be finished. If the CEC decides that CED’s claim requires more
scrutiny, they will refer the claim to the CARB for resolution that could include fines for non-compliance.
North American Electricity Reliability Corporation (NERC) Standards
In August, 2012 CED was audited for compliance with applicable NERC reliability standards. This was
the first time CED was audited and required significant preparation to insure CED met its reliability
standards. Since 2012, CED has stayed in compliance with all of NERC standards and has self-certified
compliance each year.
NERC was established in 1968 to coordinate electricity operations of the bulk power system following
the great Electricity Blackout of 1965. NERC established nine reliability coordinating regions, separated
electrically from each other. The largest reliability region is the Western Electric Coordinating
Corporation (WECC) that includes 9 western states and parts of western Canada and Baja Mexico.
WECC has regulatory jurisdiction over CED.
In 2007, NERC was given the authority to establish and enforce reliability standards. Most reliability
standards are simple prudent utility operating requirements. However, NERC requires documentation that
utilities are actually following these standards. No longer can a utility just state that it is in compliance, it
must document compliance and prove that its documentation is accurate through a relatively rigorous
process.
There are different reliability standards for entities based upon their ability to affect the bulk power
system. Independent system operators have the most elaborate requirements, with balancing authorities
having the next most elaborate set, followed by bulk transmission owners and generators and then
distribution providers.
CED is currently classified as a resource planner but may be upgraded to a generation owner in the next
year due to its ownership and control of the AMPP. This would add to CED’s annual compliance
reporting obligations.

41 | P a g e Colton Electric Department 2017 Integrated Resource Plan
CED’s obligations under currently applicable requirements are to prepare an annual forecast of demand
and energy requirements, provide 66 kV planning and operating information to the local transmission
provider (SCE) and provide information on relay settings to SCE.
The information required to meet the reliability standards is not difficult. However, CED has never
documented why it established current relay settings or other information about its system. The
documentation process is fairly stringent, requiring copies of all correspondence and emails between CED
and SCE or the CAISO.
CED is currently NERC compliant. To remain compliant will require establishing a process where all
standards pertaining to CED are identified and updated whenever communication between CED and SCE
occur.
Beginning in 2009, NERC expanded its compliance requirements to include cyber-security. At this time,
CED is probably in compliance with the new cyber-security regulations. Generally, the cyber security
regulations require isolating system control equipment from the internet, restricting access to areas where
system control and data acquisition (SCADA) computer equipment is located and other minor actions
necessary to limit access to control equipment away from unauthorized individuals. CED has isolated its
control systems from the internet but still needs to more strictly restrict physical access to the SCADA
system.
CED also entered into a cyber-security monitoring contract with Dell Secure Works. This system
monitors the City’s computer system looking for viruses, worms, Trojan horses and any significant
upload of city data to off-site systems. Secure Works is a significant upgrade to the City’s cyber security
protection.
The other new area of concern is physical security concerns. As a result of several attempts across the
nation to damage substations, NERC has required new physical access restrictions. Some of these CED
can never meet due to the geographic constraints of where existing substations are located but most other
issues can be meet by better walls around existing substations and restricted access to areas where system
controls and computer access is available.
Resource Adequacy Program
Another key aspect of the market design that will undergo enhancements is California’s resource
adequacy (RA) program. CED (along with all other LSE’s) provides data to the Energy Commission that
is utilized to provide a monthly forecast of RA obligations to the CAISO. The forecast is equal to CED’s
coincident load with the CAISO plus the reserve margin of 15 percent18.
CED currently has sufficient RA capacity to meet its requirements in the CAISO market from its own
resources and does not have to purchase additional RA capacity. By 2018 or 2019 CED will be a few MW
short of meeting its summer peak system RA requirements and may have to purchase small amounts of
seasonal RA.
18 The CAISO is studying requiring utilities to have capacity to meet their non-coincidental load

42 | P a g e Colton Electric Department 2017 Integrated Resource Plan
Currently, utilities either contract to meet their capacity obligations through private bilaterally-negotiated
contracts, or utilize their own resources. In June 2010, the CPUC issued Decision 10-06-018 indicating
that it would not move towards a centralized capacity market or a multi-year forward resource adequacy
requirement. The CPUC concluded that the existing RA contracting mechanisms and practices are
sufficient and that the proposals may pose challenges for non-utility load serving entities. In 2012 the
CAISO began studying various capacity market alternatives partially as the result of more renewable
resources coming online.
Local RA Capacity
Under MRTU, the CAISO may procure Local RA Capacity (LRAC) if the CAISO determines there is a
capacity deficiency within a Local Capacity Area (LCA). A deficiency in LRAC can occur because
individual LSEs do not demonstrate sufficient LRAC in annual or monthly resource plans or because of a
collective deficiency of local capacity in a LCA. It should be noted that, according to the CAISO, the
AMPP is counted as a Local Capacity Resource. When needed, the CAISO will make supplemental
procurement for RA under the CPM provisions of its tariff. As detailed in the CAISO Tariff,19 the CPM
costs associated with the procurement of LRAC will be allocated proportionately to all deficient LSEs
within each Transmission Access Charge (TAC) Area, or in the case of a collective deficiency of local
capacity, to all Scheduling Coordinators that serve load in the TAC Area.
AMPP provides all of the CED’s local RA capacity.
Flexible Capacity Requirements
In 2014 the CAISO began requiring LSE’s to have flexible capacity to maintain reliability as more
intermittent renewable resources began supplying energy to the grid. Renewable resources such as solar,
wind and small hydroelectric generation do not offer a steady flow of energy. If the wind stops blowing or
a cloud obscures the sun, renewable energy production drops, often suddenly.
While the power markets are designed to accept a small (less than 15 percent) reduction in generation,
renewable resources now make us as much as 30 percent of generation offered to the CAISO each hour.
To protect the system against unanticipated reductions in renewable energy generation, the CAISO has
implemented flexible capacity requirements for LSE’s beginning in January 2015. Each LSE must have
base flexible capacity, peak flexible capacity and super peak flexible capacity.
Base flexible capacity must be available each day with thermal units being allowed at least two starts per
day for 6 hours per start.
Peak flexible capacity must be from generation units that have at least 30 starts per month and 3 hours per
start of run time.
Super peak flexible capacity must have at least 5 starts per month and 3 hours minimum run time per
start.
19 CAISO Tariff Section 43, Capacity Procurement Mechanism.

43 | P a g e Colton Electric Department 2017 Integrated Resource Plan
Each year the CAISO provides CED the amount of flexible capacity by type that CED must procure. The
following table presents CED’s 2016 FC requirements:
Figure 4.1
To meet its flexible capacity requirements, CED negotiated with the South Coast Air Quality
Management District (SCAQMD) to reduce the total number of hours AMPP could run each year in order
to increase the number of daily starts. As a result of this negotiation, which took over nine months, CED
was able to use AMPP as a source of flexible capacity.
Summary of CAISO Market Modifications
In general, CED has sufficient resources to meet its capacity obligations and satisfy its energy
requirements through 2017. By 2018, CED may need a small amount of system RA capacity due to the
decommissioning of SJ3 and forecasted load growth. CED relies upon the CAISO for all ancillary
services and some transmission. Shell Energy is scheduling CED’s resources as CED’s Scheduling
Coordinator (SC).
Jan Feb Mar Apr May Jun Jul Aug Sep Oct Nov Dec
Super-Peak Flexibility 0.52 0.58 0.39 0.51 0.15 0.23 0.58 0.45 0.36 0.29 0.51 0.57
Peak Flexibility 3.28 3.62 2.46 3.22 0.24 0.37 0.93 0.71 0.57 1.83 3.20 3.58
Base Flexiblity 6.62 7.31 4.97 6.50 2.68 4.01 10.15 7.76 6.22 3.68 6.45 7.23
0.002.004.006.008.00
10.0012.0014.00
MW
City of Colton Flexible Capacity Need by Category

44 | P a g e Colton Electric Department 2017 Integrated Resource Plan
Chapter 5
Conservation and Demand-Side Management
Introduction
Conservation and demand-side management (DSM) programs attempt to change how much, and when,
residents and businesses use energy in order to reduce their costs without changing the way they live or
do business. In effect, conservation and DSM programs attempt to encourage people to become more
efficient, reducing energy costs in the process.
Because of the relatively small cost of electricity to most residential customers, it is difficult to provide
incentives to encourage them to make significant capital improvements for energy savings. However,
commercial and industrial customers can make significant capital improvements to reduce energy use or
change production hours to reduce costs.
CED’s conservation and DSM programs are funded by a $0.00029/kWh public benefit charge that raises
approximately $1,000,000 annually for public benefit programs. The public benefit programs include;
Energy efficiency and energy conservation, cost effective DSM services, assistance provided for low
income electricity customers, investment in renewable energy resources and research, development and
demonstration projects.
Conservation Programs
Conservation refers to programs designed to reduce total energy use, regardless of when energy is used.
In effect, conservation programs help people reduce a customer’s energy use, without impacting their
lifestyle, by using more energy efficient appliances and equipment. Examples of conservation programs
offered by CED include energy efficient lighting, web-shop, refrigerator replacement, building envelope
upgrade rebates and energy efficiency audits with direct installation.
By offering rebates, providing energy efficient equipment at no or little cost, and by educating people and
businesses on how to reduce their energy costs, CED avoids having to purchase additional energy in the
market and helps reduce the overall costs for all Colton ratepayers.
Figure 5.1: Effects of Conservation Programs on Load
0.0
10.0
20.0
30.0
40.0
50.0
60.0
70.0
1 2 3 4 5 6 7 8 9 10 11 12 13 14 15 16 17 18 19 20 21 22 23 24Load Load After Conservation
Effects of Conservation on Load (MW)

45 | P a g e Colton Electric Department 2017 Integrated Resource Plan
DSM Programs
DSM programs differ from conservation programs in that the program goal is not necessarily to reduce
energy use but instead change the timing of use. While almost all conservation programs are DSM
programs, not all DSM programs are conservation programs.
Energy costs vary hourly each day, with energy use during the on-peak or high use periods is much more
expensive than energy use during the off-peak or low-load hours. During summer high-use periods,
energy may cost two or three times more than the cost during the off-peak or low-load periods. By
providing incentives, such as offering time-of-use pricing or equipment that shifts energy use to off-peak
periods, CED can smooth its daily load curve and lower the cost of acquiring energy for all its customers.
Figure 5.2: Effects of DSM Programs on Load
Evaluating Conservation and DSM Programs
There are three general ways to evaluate conservation and DSM programs; by their impact on the
customer, the utility, and on society.
A refrigeration replacement program reduces the amount of energy used by a customer, but it also reduces
the revenues received by the utility. Participating customers will see their energy costs decline, but non-
participating customers have to cover the loss of revenue. From the participating customer’s viewpoint,
the refrigeration program is a good program that reduced their individual costs.
From the utility’s viewpoint, the refrigeration program reduced both costs (by reducing the amount of
energy that it had to purchase) and revenues (by the value of reduced sales to the customer). Depending
upon the utility’s cost of acquiring capacity and energy, the program may result in lower revenues but not
lower costs, or costs may decline slightly, but not as much as the revenue loss.
0.0
10.0
20.0
30.0
40.0
50.0
60.0
70.0
1 2 3 4 5 6 7 8 9 10 11 12 13 14 15 16 17 18 19 20 21 22 23 24
Load Load After DSM
Effects of DSM on Load

46 | P a g e Colton Electric Department 2017 Integrated Resource Plan
The final way to evaluate conservation programs is to include the impacts on society of conservation
programs, including the negative effects of pollution and other societal impacts.
Because CED has to include the costs of renewable energy and emission offsets in evaluating
conservation programs, it is becoming easier to financially justify conservation programs.
DSM programs, generally result in lower costs of purchasing energy without any lost revenues, and
therefore, are almost always easier to financially justify than conservation programs. For example,
encouraging a manufacturing facility to operate at night, while using the same amount of energy, results
in lower costs and greater revenues to the utility. This happens because the retail cost of off-peak energy
is usually much higher than the revenue CED receives by selling the excess energy in the off-peak
wholesale market. However, since no manufacturer would generally operate at night without some
benefit, the lower costs of acquiring energy can be passed directly to the firm without impacting non-
participating customers.
At this time, CED does not offer any standard DSM programs but has successfully negotiated several
DSM projects for individual customers. In the past, CED did offer customers discounts for operating
during off-peak periods but these programs have expired. As will be discussed below, because of the large
amount of surplus off-peak energy generated by CED’s resources, CED can offer low-cost energy to
firms that are willing to shift their energy use to off-peak periods, reducing costs to both the participating
customers and non-participating customers.
One of the important programs that CED would like to implement in the near future is a load shedding
program that will compensate business customers to reduce load during periods of high system stress,
such as when a transmission line or generator fails, and the CAISO asks LSE’s to voluntarily reduce load
in advance of issuing mandatory load shedding programs.
Regulatory Requirements
CED does have regulatory requirements under SB 2 to reduce total energy use by 5 percent through
conservation programs by 2020. In addition, CED must meet annual conservation targets set by AB 2021.
Compliance with these regulations is enforced by the CEC and CARB.
In 2007, AB 2021 established a California goal of reducing energy consumption by 10 percent by 2016.
In 2011, CED’s conservation target was about a 3,100 MWh reduction in energy use, increasing to over
4,500 MWh by 2020.
CED Programs
CED is currently offering the following conservation/DSM programs to residential and business
customers in Colton:
Residential
Energy Efficiency Upgrade Rebates
AC Tune-Up Rebate
Air Conditioner Upgrade and Replacement Program

47 | P a g e Colton Electric Department 2017 Integrated Resource Plan
Refrigerator Replacement Program
Residential Energy Audit Program and Direct Installation
Residential Web-shop for LED, Smart Power Strips and Smart Thermostats
Residential Weatherization Rebates
Treebate
Living Wise School Program
Solar PV (Photovoltaic) Rebate Program
Low Income Assistance and Medical Baseline Billing
Level Pay Billing
Commercial/Industrial
Lighting and Equipment Upgrade Rebates
Online Energy Review for TOU accounts
Commercial Energy Audit and Direct Installation
Keep Your Cool Program
Hospitality Energy Audit and Direct Installation
Residential Program Details
Energy Efficiency Upgrade Rebates: CED offers varying rebates on a number of home energy efficiency
improvements. Currently CED offers rebates on: Occupancy sensors, energy star ceiling fans, box fans,
pool pumps, solar attic fans, whole house fans, room ACs, evaporative coolers, solar tube lights, energy
star clothes washer, energy star dishwasher and energy star refrigerators. Customers who participate in the
rebate program will experience a reduction in their annual energy costs.
AC Tune-Up Rebate: This program offers a rebate for preventative maintenance on residential customer
AC units up to 5 tons in size. The program requires the customer to select their own licensed AC
contractor that will replace filters, checks refrigerant levels and adjusts the AC unit to minimize seasonal
air conditioning costs.
Air Conditioner Upgrade and Replacement Program: This program offers up to $150/ton rebate to replace
a SEER 11 or lower AC system with a SEER 16 or higher AC system. Upgrading AC systems will
significantly lower residential customer’s energy costs.
Refrigerator Replacement Program: CED will provide a new ENERGY STAR refrigerator to replace an
existing inefficient refrigerator to qualified customers for the low cost of $180. The customer is charged
$15 a month for 12 consecutive months. To qualify for the new refrigerator, customers must have an
older, inefficient refrigerator that CED can recycle. 149 customers have participated in the refrigerator
replacement program since 2011. CED has saved over 61,239,000 kWh annually and a lifetime savings of
612,390,000 kWh.
Residential Energy Audit: CED residential customers with energy usage of over 10,000 kWh annually
can qualify to participate in a residential energy audit. Participants can be eligible for additional direct
install opportunities depending on audit recommendations. For customers who previously participated in

48 | P a g e Colton Electric Department 2017 Integrated Resource Plan
an energy audit in the past two years with over 10,000 kWh of usage they can participate in up to $500 of
direct install measured recommendations.
Residential WebShop: CED residents can now purchase LED light bulbs, smart power strips, holiday lights
and smart thermostats from the comfort of their own home. CED provides up to $50.00 per FY to buy down
the cost of these items. The customer can order directly from CED’s website and the items are shipped
directly to the customer’s home.
Residential Weatherization Rebates: CED offers residential customers rebates for installing replacement
windows and insulation in their homes. Windows must meet Energy Star approval with a U-Factor less
than 0.35 and SHGC less than 0.30 at a rebate amount of $4.00 per sq. ft. Insulation may be added to the
attic, and/or exterior walls. Rebates will also be provided for radiant barrier installed within the attic
space. Insulation and radiant barrier must meet the following R-Values:
Attic Insulation - Minimum R-30 Rebate is $0.40 per sq. ft.
Radiant Barrier - Minimum R-19 Rebate is $0.30 per sq. ft.
Exterior Walls - Minimum R-13 Rebate is $0.20 per sq. ft.
Treebate: CED residents are offered up to $50.00 a tree to plant an approved tree on their property that
would reduce their energy bill by providing shade to their home. Residents have a maximum of 5 trees a
lifetime.
Living Wise Program: The Living Wise Resource Action Program provides over 500 energy efficiency
and water conservation kits to 6th grade Colton Unified School District students. As part of the program
students and parents will install resource efficiency measure in their homes. Students and parents learn
how to measure pre-existing devices to calculate saving that is generated by their efficiency upgrade. The
goal of the program is to change customer behavior and experience energy savings from their actions.
Solar PV Rebate Program: CED offers a rebate to customers that install solar PV systems to serve their
home energy needs. CED solar rebate program has generated over 35,000,000 kWh/ year20 since the
inception of the solar rebate program. Residential solar rebates were reinstated beginning September 5th
2013 until the sunset of SB1 occurs in 2017. CED will cease solar rebates in 2017.
Low Income Assistance and Medical Baseline Billing: CED also provides programs to help low income
customers and those with medical conditions that require medical equipment to reduce their monthly
energy bills. CED customers with qualifying medical conditions receive an adjustment to increase the
baseline kilowatt hours on their utility bill. The baseline is increased so that the kilowatt hours that are
used for life sustaining medical equipment are charged at a lower tier. These programs are not designed to
conserve energy but instead recognize that the CED has an obligation to provide some level of financial
assistance to low income customers.
20 This is an estimate based upon the current total installed capacity of customer owned generation of 3.4 MW since
2005 at a 24 percent capacity factor assuming equal annual market penetration.

49 | P a g e Colton Electric Department 2017 Integrated Resource Plan
In Fiscal year 2012/13 CED had 2,148 low income customers participate in CED’s once a year credit on
electric charges. This allowed customers who received high bills during summer months, to receive up to
a $150 credit to pay their electric bill. In FY 2012/2013, $254,702.46 was provided by the CED to low-
income Colton residents.
Level Pay Plan: CED provides assistance to customers who are in need of stabilizing their energy bills.
Residents with at least 13 months of utility service at their current address may choose to sign up to
stabilize their energy bills and pay a consistent set dollar amount all year long. The dollar amount is based
on the customer’s annual consumption, on the 13 month is a true up.
Commercial/Industrial Program Details
The Commercial/Industrial Energy Rebate Program provides rebates to commercial/industrial customers
that install new energy efficiency equipment from lighting upgrades to programs specific to the
customer’s business. The amount of the rebate depends upon the annual energy savings.
Lighting and Equipment Upgrade Rebates: Commercial and industrial buildings can benefit from
substantial rebates given for improving lighting and equipment by increasing energy efficiency and
lowering consumption. CED offer $0.10 per kWh saved on the projected first year of savings.
Online Energy Review for TOU accounts: Automated energy is an online energy review CED offers to its
TOU (Time of Use) customers. Automated energy provides access to specific interval meter data through
their website.
Commercial Energy Audit: Small commercial businesses that use less than 30 KW annually qualify to
participate in CED commercial energy audit. Businesses can be eligible for additional direct install
opportunities depending on audit recommendations. CED is offering $1,000 of direct install measured
recommendations. This is a program to assist small businesses who are concerned with their energy
consumption and want to learn how they can minimize their usage, shift their load, and save on energy
costs.
Keep Your Cool Program: This program is a new program for FY2013/2014. Small commercial business
that have inefficient refrigeration, lighting and cooling such as mini marts and fast food restaurants can
benefit from participating in this program. CED will provide up to $3,000 per location in energy
efficiency upgrades.
Hospitality Audit and Direct Installation Program: CED assists hospitality businesses in energy efficiency
upgrades. The goals of this program are to; provide a comprehensive energy audit, proposal that provides
energy reducing measures and the savings calculations if installed, along with energy management
recommendations.

50 | P a g e Colton Electric Department 2017 Integrated Resource Plan
Measurement and Verification Activities
CED is required to have a third-party Metering and Verification (M&V) program to verify the claimed
energy savings from different programs. Currently, CED contracts with AESC, to provide program
savings verification and currently has the programs on a rotating cycle.
Electrification Programs
CED has developed a plug in electric vehicle (EV) strategy to advance EV’s in support of City policy to
promote alternative fuel transportation. CED began installing EV chargers on City property as a
demonstration program in late 2011. The demonstration program provided EV Level 2 charging service
at two (2) locations, City Hall and the Public Works Yard. CED has also been awarded a California
Energy Commission (CEC) Grant through the Southern California Public Power Authority (SCPPA) to
install two (2) additional public charging stations in the City of Colton.
The two sites selected that met the grant criteria were Arrowhead Regional Medical Center and Fiesta
Village Family Fun Park. Both businesses are one mile from the freeway, allowing commuters to
conveniently charge in the City of Colton off the Interstate 215 and Interstate 10 freeways. Both have
chosen the EV dual Level 2 charging systems.
With the success of the grants CED secured the City Council approved EV Charging as an ongoing
program. This action allowed CED to strategically expand this service while providing the necessary
flexibility to respond to the evolving EV market. The program allows for future installations of additional
charging stations based on customer demand and staff’s evaluation of sufficient utilization and investment
payback. Staff expect to move forward sensibly and only after justification of each station as approved by
the CED Utility Director.
Beyond this awarded grant, CED plans to pursue additional funding for upcoming charger installations.
Council action is requested to approve CED Utility Director Authority to accept the CEC grant, and apply
for and accept any additional EV charger infrastructure grants that may become available, so long as new
grants do not encumber City spending beyond approved CED budgets.
To make the EV Charging Program more enticing and to increase utilization, CED created EV charging
pricing as a volumetric rate. Volumetric pricing at a price per kWh is similar to selling electricity at a
price per kWh, or gasoline fuel sold at a price per gallon. CED would like to charge for use of these
stations at a rate of $0.20 a kWh. Typical charge time for a full EV charge is approximately 2 hours.
Pricing for Level 2 AC charging service is designed to recover costs for electric service and energy
charges, installation and maintenance costs, program administration costs, and public benefits charges.
CED also developed an EV Level 2 charging rebate for residential and commercial customers who install
the chargers in the City of Colton service territory. Customers can receive a $500 rebate for every
permitted charger installed.
The benefits of EV’s and EV charging infrastructure investment from CED is the following:
Load Growth

51 | P a g e Colton Electric Department 2017 Integrated Resource Plan
GHG mitigation
Enrollment in the Low Carbon Fuel Standard Benefit
Meeting State and Federal EV goals and objectives
Projected EV Growth in Colton
Energy Storage Programs
AB 2154 requires the CED to evaluate the cost effectiveness of energy storage programs, such as
batteries, compressed air systems, Ice Bear small thermal energy storage systems and other ways of
storing surplus energy, usually generated during the off-peak periods, to be used during high demand
periods.
With the exception of hydroelectric pumped storage units that CED has been attempting to acquire since
the mid-1990s, storage facilities are too expensive to be used for peak shaving.
CED has worked extensively with SCPPA to evaluate Ice Bear systems that use off-peak energy to create
ice to reduce on-peak AC requirements. CED has determined that the Ice Bears are not cost-effective for
its system.

52 | P a g e Colton Electric Department 2017 Integrated Resource Plan
At this time, it does not appear any smalls scale storage systems are cost effective and CED will continue
following technological advances to see when small scale energy storage systems become cost effective.
Storage does seem feasible for retail customers that face a high demand charge that can be mitigated for a
few hours each day. CED is working with several retail customers with short, intermittent demand spikes
to find suitable sites for retail energy storage.
Summary of Conservation and DSM Programs
CED’s conservation programs have met State goals for energy savings. In 2013 CED redesigned its
Public Benefits Program and significantly increased its outreach and offerings.
One of the things CED is studying is new DSM programs. CED has been concentrating on cutting its on-
peak demand and shifting energy from on to mid-peak periods. CED’s peak loads exceed 70 MW for only
80 hours per year. But CED has to plan to meet this load at a cost of around $250,000 to $400,000
annually. By developing load shifting and interruptible load programs targeted at these few hours of the
year, CED can lower it costs and reduce costs to both the participating and non-participating customers.
CED also has to ensure that its planned conservation and DSM programs are in compliance with the new
SB 2 and AB 32 conservation requirements. Both SB 2 and AB 32 require CED to reduce energy by at
least 5 percent by 2016. Because CED has concentrated on lighting programs in the past, it will be
difficult to meet these new goals without working closely with local businesses and residential customers.
Future Program Potential for Conservation and DSM Programs
CED has been investigating the potential of behavior changing software programs for energy savings
potential in the future. Currently CED is not smart metered (real-time metering) and would need to be in
order to use this type of analytical software to calculate energy savings by behavior change.

53 | P a g e Colton Electric Department 2017 Integrated Resource Plan
Chapter 6
Risk Management
Introduction
As a small utility primarily concerned with meeting retail load requirements, CED generally assumes a
risk-averse posture. CED prefers certainty in total power supply costs rather than risk upward price
movements in the energy market. CED does not speculate in the energy market and attempts to purchase
energy only to meet retail load requirements.
CED’s exposure to risk comes in a number of ways. For example, CED faces forecast risk, market-price
risk, regulatory risk, supply risk, counter-party risk and other types of business risk. A relatively new
source of risk is the development of the MRTU market and transmission congestion price risk.
The single largest risk exposure that CED faces is a prolonged outage of SJ3. SJ3 provides over 65% of
CED’s annual energy requirements and 30 MW of monthly system RA capacity. Each month that SJ3 is
out of service due to forced outages results in almost $800,000 in additional costs. The risk associated
with SJ3 will end with the decommissioning of SJ3 by December 31, 2017 and CED’s power supply costs
should be more stable from that time forward.
Forecast risk is the cost associated with over or under-forecasting CED’s retail requirements and having
either too much or too little energy that it needs to buy at higher than expected costs or sell energy from
existing contracts at a loss;
Market-Price risk is the risk associated with entering into long-term contracts and then having the
wholesale energy price fall such that CED could have purchased the energy less expensively. Conversely,
if CED chooses not to enter into a contract at current prices and then prices rise, CED could be criticized
for not locking in prices.
Regulatory risk is the added cost of changes in the regulatory process or new regulations that increase
CED’s cost of doing business. The greatest fear of regulatory risk is that CED takes actions to meet
current regulations and then the regulations are changed in such a manner that CED incurs costs to both
undo earlier actions and then has to spend money to meet the new regulations.
An example of regulatory risk is SJ3. In the late 1970’s, utilities were prohibited from using natural gas
for electricity generation. So CED, along with other SCPPA members, began investing in coal plants. 30
years later, natural gas is plentiful but the state and nation are concerned about air quality and Congress
and EPA have implemented new laws and regulations intended to reduce emissions from coal-fired
generation. CED, which had invested in coal generation, must now spend millions of dollars to mitigate
the air quality impact of high emission coal resources.
Supply risk is the chance that contracted sources of energy are not delivered for any reason, resulting in
CED having to incur additional costs to replace the energy. For example, each day that SJ3 is out of

54 | P a g e Colton Electric Department 2017 Integrated Resource Plan
service results in CED incurring approximately $20,000 to $40,000 in additional energy costs, depending
upon CAISO costs.
Counter-Party risk is the risk that a counter-party defaults on its obligations and CED incurs a financial
penalty attempting to replace energy contracted from the counter-party. To minimize this risk, CED
attempts to insure that its counter-parties are financially sound and contractually bound to meet their
supply obligations.
Transmission congestion risk is now one of CED’s biggest concerns. CED has acquired generation
resources and fuel supplies that meet most of its daily load requirements. However, other than through the
acquisition of CRRs, CED cannot easily hedge its congestion risks.
CED cannot avoid risk. Daily or hourly energy requirements cannot be forecast with a high degree of
certainty weeks or months in advance of need. Nor can CED control the actions of its contracted
generation resources or regulators.
Regardless of its inability to control the actions of the market or other entities, CED can design its
resource acquisition strategy to minimize the financial impact of forecast and market risk. CED has fixed
the price of roughly 80 percent of its energy requirements for the next few years, attempting to minimize
the impact of sudden price spikes in the power markets. CED only deals with companies that have good
credit ratings and periodically reviews these ratings. CED has reduced the amount of excess generation in
its resource portfolio after 2017 when SJ3 is decommissioned.
CED is also using AMPP as a physical hedge against spikes in CAISO energy prices. If energy prices are
below the cost of AMPP, CED purchases in the CAISO energy market. If energy prices are above AMPP
generation costs, CED generates. In either case, CED’s costs cannot exceed the cost of AMPP.21
An area of concern to CED is regulatory risk. CED is having significant problems keeping current with
GHG legislation, including new C&T and RPS requirements being implemented simultaneously. The
implementation of the MRTU market structure, proposed new capacity market structures, RPS and energy
efficiency requirements along with proposed new environmental rules are straining CED’s ability to
identify and comply with all the relevant regulatory requirements.
Development of a Risk Management Plan
Risk Management means limiting and reducing risk associated with CED’s business activities that could
result in economic loss. Risk management includes activities that identify, measure, assess, limit and
reduce risk. As related to the use of derivatives, risk management means reducing risks in the broad sense
of the term, including activities that select one type of risk over another when is considered more tolerable
but it does not include activities that increase risk.
21 A slight caveat – the CAISO will not dispatch AMPP for a spike of one or two hours. So in any short time period
CED could purchase above the cost of AMPP generation.

55 | P a g e Colton Electric Department 2017 Integrated Resource Plan
From a risk management perspective, CED’s primary objective is to meet its retail energy and regulatory
requirements. Power supply activities are focused around these objectives. Taking any unnecessary risk in
order to arbitrage market opportunities or risks unrelated to CED’s normal power supply business
activities is considered inappropriate. Power transactions made with the sole intent of maximizing
revenues could expose CED to unnecessary financial risks and are generally prohibited.
Risk management in this context is defined as financial risk management.
CED’s primary mission is serving the electricity needs of CED’s customers.
Specific objectives, listed in order of priority22, to achieve this mission include:
1. Providing electric power to its customers through the use of CED’s generation resources and
wholesale natural gas and power purchases.
2. Providing a reliable supply of natural gas for CED’s generation units to support the objective of
providing reliable electric power.
3. Optimizing CED’s generation and transmission resources to ensure that they are used in the most
economical way resulting in the lowest possible price to CED’s ratepayers.
4. Acquiring natural gas and wholesale power at prices that allow CED to maintain stable and
competitive retail rates.
5. Given the reliability of supply of natural gas and stability of prices of natural gas and wholesale
power as top priorities, obtaining the lowest reasonable natural gas and wholesale market prices.
Individuals or groups responsible for purchasing energy, capacity, natural gas and transmission for CED
may not engage in activities that expose CED to speculative commodity trading risk. Any activities that
are not related to CED’s normal power supply business and have the effect, or potential, of increasing
financial risk is to be avoided.
Speculative risk means any risk that is engaged in for its own sake and is not a business risk. For
example, an exposure to fluctuations in energy future prices is considered speculative if a position is
taken, for example a contract for natural gas or energy is purchased or sold, when there is no need or
intent to deliver energy. A speculative risk is unrelated to production and delivery of electricity to CED’s
retail customers and could be avoided without any financial penalty to CED.
The Risk Management Policy (RMP) articulates CED’s objectives, techniques and controls for managing
such risks related to wholesale energy markets. The RMP scope covers all wholesale capacity, energy and
natural gas contracts within or considered for CED’s portfolio. Policy implementation, compliance and
revision will be reviewed and approved by City’s Finance Director who will act as the Risk Management
Officer.
To the extent feasible, given political, regulatory and environmental constraints, CED shall insure that the
cost of its fuels, energy and related transmission resources shall remain competitive over the long term.
Therefore, CED shall conduct its fuel and energy procurement in a manner necessary to compete
22 Although safety is not mentioned in this discussion of financial goals, safety is the major goal of CED at all times.

56 | P a g e Colton Electric Department 2017 Integrated Resource Plan
successfully in the marketplace as a cost hedger. Fuel procurement activities will be conducted under the
same risk management principles and procedures as power supply.
Organizational Structure
CED is a small organization that currently outsources the daily scheduling and communications with the
CAISO. CED has hired Shell Energy (Shell) as its SC and Shell schedules CED’s resources to meet daily
forecasted load.
In a classic “front office – middle office – back office” organizational structure, Shell functions as the
“front office,” scheduling resources to meet load in conformance with applicable contracts.
Most of CED’s resources are power purchase agreements or wheeling agreements with SCPPA. SCPPA
is responsible for verifying the invoice from the project manager or owner and then each participant is
responsible for verifying their share of the project monthly costs. SCPPA also invoices CED for its share
of various natural gas purchases through SCPPA.
In addition to SCPPA, each month CED receives invoices from:
Shell for all CAISO costs, including use of the CAISO controlled grid, ancillary services,
the gas “floating for fixed” swap and the purchase and sale of imbalance energy;
SCE for wheeling services over existing transmission paths and several customer service
projects on behalf of CED;
The Cities of Burbank and LADWP for transmission service for MPP;
Bureau of Reclamation and Department of Energy for CED’s share of the Hoover
Uprating Project;
SES for energy from Colton Solar 1 and Colton Solar 2 Projects;
Solar City for energy from the Gonzales Center and Arbor Terrace Solar Projects;
The City of Anaheim for the MWD energy swap;
Avangrid Renewables, LLC for energy from the High Winds Project;
Transmission costs from SCE, LADWP and Burbank for non-CAISO transmission
service;
Management and operation costs of the AMPP.
Once an invoice is received, energy production and costs are verified against monthly forecasts of power
supply created as part of CED’s annual budget review process. In addition, an hourly balance of all
energy purchases and sales is created to ensure CED can account for all energy purchased or sold by CED
to retail and wholesale customers.
The Colton Finance Department serves as the “back office.” Only when invoices have been received and
verified will the Finance Department issue a check for payment. No one in the front office (Shell) or
middle office may issues checks for payment for power supply costs or expenses for CED.
At this time, CED does not have an internal counter-party policy. CED only purchases or sells to CAISO
approved counter-parties or with entities approved by SCPPA and operates under the CAISO or SCPPA
policies for counter-parties.

57 | P a g e Colton Electric Department 2017 Integrated Resource Plan
Colton’s Finance Director acts as CED’s Risk Management Officer (RMO). The RMO must agree with
the expected financial impacts of any proposed long-term firm power supply purchase or hedging contract
in excess of one year. In general, the Finance Director must verify that CED is entering into a power
purchase agreement for the purpose of meeting load requirements and not for speculating in forward
markets.
Value at Risk
The Value at Risk (VAR) is used by CED as a measure of power supply risk. The VAR is an estimate of
the potential change in portfolio value (which may consist of several commodities such as electricity
prices and natural gas prices) or cost parameters given a level of statistical confidence over a pre-defined
holding period (day, month, year).
CED’s targeted VAR is:
CED will have a budget VaR of less than 5 percent of total energy and capacity costs at least one
month ahead;
CED will have a budget VaR of less than 10 percent of total capacity and energy costs prior to the
beginning of the fiscal year;
CED will have a budget VaR of less than 20 percent of total capacity and energy costs prior to the
beginning of the second year.
CED will have a budget VaR of less than 30 percent of total capacity and energy costs prior to the
beginning of the third year.
CED’s current resource mix satisfies its targeted VAR. CED’s 2015/16 VAR is about 5 percent, or an
increase in natural gas costs of 50 percent will result in an increase of about $1,500,000 in total power
supply costs, primarily through increased costs of non-firm purchases in the CAISO market.
The greatest financial risk to CED is an extended outage of SJ3. Because of the take-or-pay requirements
in the power purchase agreement with SCPPA, if SJ3 were to suffer an extended forced outage, the cost
of replacement energy could be as much as $700,000 per month during the summer months and $500,000
per month during the winter months plus another $150,000 in replacement capacity costs.23
CED uses approximately 1,650 MMBTU/day of natural gas. Due to its pre-pay gas agreements and
entitlement in the Pinedale and Barnett producing fields, CED does not have any significant exposure to
increases in natural gas costs. On the other hand, CED does not benefit from declines in natural gas costs
except through purchase in the CAISO marketplace.
Historically, one area that CED had little or no control over was congestion risk. CED has had several
months since 2008 in which congestion costs exceeded $200,000 due to a high congestion costs from
Phoenix to the Los Angeles basin, the transmission path used by SJ3. Since mid-2012 CED has been
actively managing its congestion risk and has significantly reduced monthly congestion costs.
If Shell or CED realizes that a transmission path is constrained and congestion costs are greater than the
SJ3 cost less the LMP, Shell has been instructed to attempt to minimize CED’s use of that path in excess
23 These costs are based upon a $50/MWh cost of replacement energy. At current natural gas price costs around
$2.70/MMBTU, the estimate would be about $400,000 during the summer and $275,000 during the low load
months.
58 | P a g e Colton Electric Department 2017 Integrated Resource Plan
of CED’s CRRs. In most cases, this means CED will generally pay one or two days of congestion before
reducing schedules over a path if it does not have CRRs.
The difficulty with transmission congestion is that the congestion costs are not known until after day-
ahead bids are received by the CAISO. If congestion costs were known in advance, then entities could
decide whether or not to use a congested path. But since congestion costs depend upon who is planning to
use a transmission path, entities make their generation plans and then take the risk of congestion or
manage the risk by acquiring CRRs.
CED reviews all CAISO invoices on a daily basis as they are received from Shell verifies energy balances
and CRR costs. CED also monitors changes to the invoices as the CAISO makes its periodic reruns of
costs.
Summary of Risk Management Activities
In order to minimize CED’s exposure to significant changes in power supply costs and to provide an
additional layer of administrative review, CED has implemented a RMP. The primary components of the
RMP include:
Review by Colton’s RMO of any long-term power supply purchases or firm power supply
purchase exceeding $500,000 in any single month;
Maximum monthly limits on CED’s power supply VAR;
Required review and verification of CED’s monthly energy balance;
Review of monthly congestion costs and CRR status;
Review of monthly costs of EA’s and verification that CED has sufficient EAs to cover
expected annual emissions.
In December 2011, FERC issued FERC Order 741 requiring that all entities dealing in ISO’s with
congestion pricing verify that they are managing the risk of their congestion costs through a documented
risk-management plan by April 1 of each year. CED has prepared and filed its RMP with the CAISO and
agreed to perform the required periodic evaluations of market risk and congestion risk. The CAISO has
accepted CED’s past RMP filings and in 2016 performed an audit of CED’s RMP for completeness and
agreed CED’s RMP meet all regulatory requirements.

59 | P a g e Colton Electric Department 2017 Integrated Resource Plan
Chapter 7
Renewable Resources
Introduction
Renewable resources are resources that do not require fossil fuels to generate electricity. Renewable
resources include solar, including both solar photovoltaic and solar thermal plants, wind, geothermal,
small hydroelectric, biomass and biogas. A brief discussion of the pros and cons of each type of
renewable resource is provided below. This Chapter discusses which renewable resources will minimize
the rate impacts on CED’s ratepayers of meeting RPS standards.
Solar Photovoltaic (PV)
PV is the most successful renewable resource. PV panels convert sunlight into direct current (DC)
electricity and then an invertor system converts the DC energy to alternating current (AC) energy for use
on the electric grid.
PV differs from solar thermal in that PV converts solar energy directly into electricity while solar thermal
uses heat to power generators.
Five years ago PV was generally considered too expensive for use in large power generation facilities but
a huge drop in price of price of solar panels due to over-production has lowered the construction price
from roughly $3/watt to the current price of around $0.35/watt.
As a result of the price decline in solar PV, a number of large thermal solar projects have been re-
engineered to use PV rather than the original solar thermal design.
PV generation usually begins around 0830 in the morning and reaches maximum output around 2 hours
later. Output begins to decline around 1530 each afternoon and is usually not available by 1730 or earlier.
Output varies significantly during the year with winter generation sometimes as little as 60 percent of
maximum summer capacity.
Because many utilities, including CED, peak later in the day due to a combination of lighting load and air
conditioning loads, solar PV is not always available during the highest use periods of the day. This means
that a utility may require additional non-PV capacity available to meet its peak load requirements.
The CAISO has noticed the changing shape of daily energy demand due to solar production. Historically,
energy prices were greatest in the mid-afternoon due to air conditioning demand. As a result of solar PV
production, daily demands are now greatest during the morning and late afternoon/early evening and
energy prices are actually lowest during the mid-afternoons when solar PV production is highest.
This is one of the primary reasons the CAISO began implementing flexible capacity requirements.

60 | P a g e Colton Electric Department 2017 Integrated Resource Plan
Figure 7.1: Index of Solar PV Generation versus Hourly Load
The above figure shows that during the summer months, PV generation begins to decline even as retail
loads are high, resulting in CED having to keep additional thermal capacity available to meet loads.
During the winter months the PV generation is not available at all during the peak periods (that occur later
in the day). This mismatch of load requirements and generation reduces the value of PV to CED.
The greatest benefits of PV are that it can be constructed in small areas, is relatively inexpensive and
generally does not create off-peak surplus energy.
Solar Thermal
Solar thermal generation differs from PV in that sunlight is turned into heat that is then used to create
steam and turn a turbine. Currently, there is more solar thermal generation in California than PV but that
should change in a few years as more PV projects come online.
There are two major kinds of solar thermal generators. The Luz “trough” type, where high temperature oil
is sent through pipe. Parabolic mirrors focus sunlight heating the oil to around 800 degrees which is then
used to turn water into steam to power a generator. There are a number of these projects in the Barstow
and Harper’s Lake region of San Bernardino County.
-
0.20
0.40
0.60
0.80
1.00
1.20
1 3 5 7 9 11 13 15 17 19 21 23
Summer Load
Winter Load
Summer SolarGeneration
Winter SolarGeneration
Solar Generation Versus Daily Loads
Ind
ex o
f Lo
ad a
nd
Gen
erat
ion

61 | P a g e Colton Electric Department 2017 Integrated Resource Plan
The other type is SCE’s Solar 2 project, unofficially known as a “steam on a stick” where an array of
mirrors focuses sunlight on a small area that creates steam that is used to power the generator.
A picture of the Ivanpah solar thermal project shows how the array of mirrors focuses the sunlight unto
the top of a tower where the steam is created to power a generator.

62 | P a g e Colton Electric Department 2017 Integrated Resource Plan
Solar thermal projects tended to be larger than PV projects to justify the higher cost of generators but
since the decline in PV prices, many of the solar thermal projects have been converted to PV.
Solar thermal projects tend to generate a bit later in the day than PV projects, making them more
attractive as a capacity source since they become more coincident with utility peak loads.
Most new solar thermal projects have different kinds of heat storage, such as molten sodium, to extend
the daily generation capabilities. While this makes it more useful in meeting evening peak loads, the
additional costs also make solar thermal projects more expensive.
Wind
The expansion of wind energy is creating significant problems on the western transmission grid. If a large
amount of wind generation is available, thermal resources have to remain available in the event the wind
stops and generation drops significantly. Wind energy is inexpensive and generally abundant but the
operational issues associated with it have not yet been fully resolved. Wind energy may be plentiful and
then disappear from the grid all at once if the wind stops blowing. As a result of the lack of a reliable
supply, the CAISO derates the capacity from wind resources and requires entities with wind resources to
have flexible capacity available to make up any reduction in generation.
Wind energy has the greatest potential when paired with storage, including batteries, pumped storage or
some other firming resource that reduces the moment to moment generation changes.
Small Hydroelectric
Hydroelectric facilities currently count as renewable resources only if they are smaller than 30 MW and
do not interfere with run-of-river conditions (that is, no reservoirs or storage with a minor exception for
small conduit generation from new reservoir construction).
There are a number of bills that attempt to count large hydroelectric generation as renewable but so far,
none of them have passed the California legislature although large hydroelectric generation does count in
federal RPS proposals (none of which have passed Congress).
The major problem with small hydroelectric facilities is that there are few places in California where new
hydroelectric facilities can be constructed. California’s hydroelectric production has actually declined
over the past ten years as hydroelectric facilities have been taken out of service for environmental
considerations.
Hydroelectric is a good source of energy especially when storage (such as pumped-storage) is included
and energy can be dispatched to meet load requirements.
Biomass
Biomass generation is the production of energy using plant material, such as trees, plants, crop cuttings
and other plant sources. There are only a few biomass generators in southern California mostly burning
crop cuttings and dead trees remaining from the bark beetle infestation in the late 1990’s – 2000’s and the
recent 2009 – 2016 drought in the San Bernardino mountains.

63 | P a g e Colton Electric Department 2017 Integrated Resource Plan
Even though the raw resource is cheap, most of the facilities have very high costs due to the labor
necessary to gather the fuel stock. Biomass generation costs $85 – $110/ MWh, compared to as little as
$55/MWh for solar and slightly less for wind. The biggest advantage of biomass is that it is a baseload
renewable resource and can be counted on for generation.
In 2016, SB 859 was introduced in the California senate that requires most of the state’s utilities to enter
into power supply contracts with biomass generators. Biomass generation is seen as a way of getting rid
of trees in California’s forests that have died as a result of the prolonged drought and bark beetle
infestation.
SB 859 was signed by Governor Brown in September 2016. Investor and large publicly owned utilities
must enter into power supply contracts for at least five years for up to 125 MW of biomass generation.
For now, SB 859 does not affect CED but there is concern that in the 2017/18 legislative session the size
limitations of utilities will be reduced, possibly requiring CED to purchase biomass generation.
Geothermal
Imperial County has some of the best geothermal resources in the world and currently produces about
1,600 MW of geothermal energy, primarily for SCE and the Riverside Public Utilities Department.
The biggest problem with developing geothermal generation is that the brine is highly caustic and
corrodes steel pipe in several months. As a result, tungsten and stainless steel pipe has to be used at very
high cost (as much as $1,800 per foot) driving up the cost of production.
In addition, there is no guarantee that when a geothermal well is drilled that it will hit a viable brine
source. Since each well costs about $10,000,000 to drill, the cost of drilling failures is very high and has
prevented geothermal developers from getting project financing until the wells have been drilled and are
producing. The high upfront drilling cost has slowed the development of geothermal energy in the
western states.
Geothermal energy costs are between $90 and $115/MWh at current interest rates.
CED is in a project development agreement with other SCPPA members to investigate the feasibility of
developing a geothermal project. It will be a few more years before CED would have to determine if it
wanted to actually participate in a project.
Biogas
Biogas is methane collected from the decomposition of plant and waste materials. There are a number of
biogas facilities that use cow manure, landfills and other waste sources as the decomposing material and
then collect the gas, remove impurities and inject the gas into the interstate pipeline system where it is
burned in power plants.
Biogas is an inexpensive way to meet RPS goals. In March 2012, the CEC suspended the use of biogas as
a renewable fuel except for limited cases of landfill gas and digester gas. However, biogas that was
injected into the interstate pipeline system does not currently count as a renewable fuel.

64 | P a g e Colton Electric Department 2017 Integrated Resource Plan
In the 7th Edition of the “RPS Guidebook” the CEC approved biogas generation with a number of
restrictions. Biogas can be used to meet RPS requirements if the biogas is produced within California, if
the biogas can be cleaned and injected into the interstate pipeline system and the gas can be tracked to the
generator. Biogas can also be used to power onsite generators where the energy is transmitted to the grid.
Energy from biogas costs between $70 and $90/MWh if used in a high-efficiency power plant (for
example, the Magnolia project). If used as a fuel for AMPP, renewable energy would cost around $90-
$99/MWh.
CED has a biogas contract with Shell Energy. Shell will purchase biogas produced at a landfill in Kern
County where the biogas is cleaned, dried and blended with natural gas to achieve the required purity and
fuel content to inject into the interstate pipeline system for delivery to Magnolia. There is a question over
whether the developer can acquire the gas and clean it sufficiently to meet pipeline quality gas that is
delaying the project.
Waste Water Treatment Plant Cogeneration Facility
Prior to 2013, the Colton Waste Water Treatment Plant captured methane emissions from the
decomposition of solid waste and used it to power a small generator (250 kW) at the plant. In 2010 the
unit was shut down due to maintenance issues and has never been restarted. Instead, the methane is flared
(or burned). The value of energy produced by the cogeneration facility is about $240,000 annually.
The CED is evaluating the cogeneration facility to determine if it can be economically
retrofitted/repaired. An initial evaluation of the facility shows some of the major components can be used
but a large investment will be required to make the plant workable.
Renewable Resources That Meet CED’s Needs
CED does not currently need any additional baseload energy although by 2018 it will need approximately
15 MW of baseload generation. The renewable resources that appear to best meet CED’s requirements are
a combination of 13 to 15 MW of baseload generation (geothermal, biomass or biogas) and 15-20 MW of
intermittent resources (wind, solar PV).
Even though wind generation does not have a significant capacity value, CED has a capacity source with
AMPP and wind energy can be used to offset fossil fuel generation.
Biogas can be used as a fuel for either Magnolia or AMPP. If used at Magnolia, the cost of renewable
energy will be around $70-$75/MWh (assuming $12/MMBTU of biogas) while AMPP would generate
renewable energy at a cost between $90-99/MWh. The higher cost at AMPP is due to the higher heat rate
of the unit compared to Magnolia.
Finally, small PV projects within or near Colton would be the next most attractive renewable resource.
The following figure presents the range of costs of renewable resources in the market based upon SCPPA
RFP’s.

65 | P a g e Colton Electric Department 2017 Integrated Resource Plan
Technology 2014/15 RFP
Intermittent
Solar thermal -
Wind $57 - $73
Solar Photovoltaic $45 - $110
Small Hydrogeneration -
Energy Storage
Pricing is contingent
on a number of
factors
Baseload
Biomass $95 - $116
Geothermal $80 - $116
Biogas/ Landfill Gas $92 - $103
Table 7.1: Renewable Prices
SB 2 established 3 compliance periods, 2011-2013, 2014-2016 and 2017-2020. During the first
compliance period, utilities are required to meet a target of 20% of all retail sales to be provided by
qualified renewable resources. During the second compliance period, 25% of all retail sales must come
from renewable resources and by the end of the third compliance period, the minimum percentage of
renewable resources is 33%. The CEC also instituted additional compliance targets during the third
compliance period.
SB 350 continued the requirement for renewable energy until 2030 with a 50 percent requirement
generally increasing by 2 percent per year from 2020 to 2030.
In addition to the minimum percentages of retail load met by renewable resources, renewable resources
are further disaggregated to the type of renewable resources, with minimum amounts of each category
required during each compliance period.
The first type of renewable resource category or Portfolio Content Category (PCC) is renewable resources
located within California where the energy and green attributes are delivered to the utility for resale to its
retail customers.
The second type of PCC is when an energy generation source (like wind or solar) that varies from hour to
hour is delivered on an even basis during the day. Hourly fluctuations are usually made up by non-green
generation but only the actual green energy can be counted towards RPS requirements.
The third type of PCC is Renewable Energy Credits (RECs), where a green provider produced green
energy and sold the energy into a power pool, or to an end-user, and kept the green attributes. The RECs,
can be registered and sold separately from the energy. RECS may be used for up to 3 years.
The CEC has also created a new category of PCC called PCC Zero. This PCC covers renewable contracts
entered into prior to 2010 and helps meet the total RPS requirement but does not count as a specific PCC
renewable resource. Currently, three of CED’s renewable resources are categorized as PCCZero.

66 | P a g e Colton Electric Department 2017 Integrated Resource Plan
During the first compliance period, at least 50% of the renewable resources had to be from PCC 1. This
amount increased during the second period to 65% and increases to 75% in the third compliance period.
While PCC 1 is increasing, PCC 3 is decreasing, declining from a maximum of 25% of RPS requirements
in compliance period 1 to 15% in compliance period 2, and to 5% in compliance period 3. By 2017, RECs
can only be used only to make up a small portion of RPS requirements.
Western Renewable Energy Generation Information System (WREGIS)
Utilities in California, and the rest of the western states, use the WREGIS to keep track of renewable
resources and the purchase and sale of RECs.
Every green generator is required to register their generation facility with WREGIS. All generation from
the facility is then reported to WREGIS on an hourly basis. WREGIS is also responsible for auditing the
reported generation values.
WREGIS treats generated electricity as having 2 components, an energy component and a renewable
component. If the energy is sold as green energy, the renewable component is transferred to the
purchaser. If the energy is sold as brown energy, the generator retains the environmental attribute and it
becomes a PCC3 REC.
WREGIS tracks the history of the REC from the hour it was produced until when it is retired for
compliance purposes. If an entity has a compliance obligation of 1,000 MWh of green energy, it must
retire 1,000 RECs that were generated during the appropriate compliance period. All RECs must be
retired within 3 years of generation.
CED has an account with WREGIS through SCPPA. As CED purchases renewable energy, the REC is
transferred from the producer’s account to CED’s sub account with SCPPA.
While WREGIS tracks RECs, it does not track the California RPS requirements. It is up to the individual
utility to be able to prove that its resources satisfy the PCC restrictions of SB 2. This has become a
significant bookekeeping and verification effort for the CED based upon the initial CED filings with the
CEC.
CED’s Renewable Requirements and Potential Costs
An interesting aspect of renewable energy is that utilities that enter into PSAs will pay the developer high
prices for the life of the PSA and then have to go out and negotiate new contracts at high prices. This is
because the majority of a renewable resources cost is debt service. Once the debt is retired, renewable
resources are very inexpensive, with only annual operations and maintenance costs.
But if a utility continues to purchase only the energy (as opposed to the project itself) it continues to pay
for the debt of each generation resource, locking itself into a cycle of purchasing from resources with high
energy costs.
If a utility purchases the renewable generation resource, once the debt is retired the cost of the renewable
resource is very low and renewable resources can help lower long-term power supply costs.

67 | P a g e Colton Electric Department 2017 Integrated Resource Plan
In California, a general statement would be the large utilities (SCE, PG&E, SDG&E, LADWP and
SMUD) are purchasing renewable resources while the smaller utilities are entering into long-term PPAs.
By acquiring renewable resources in a slow, planned phase-in and planning on owning the generation
resource after the initial six year period when tax credits are available to private firms, CED can minimize
its power supply costs. This proposal would meet the Colton City Council’s cost-limitation criteria
established in R-103-11.
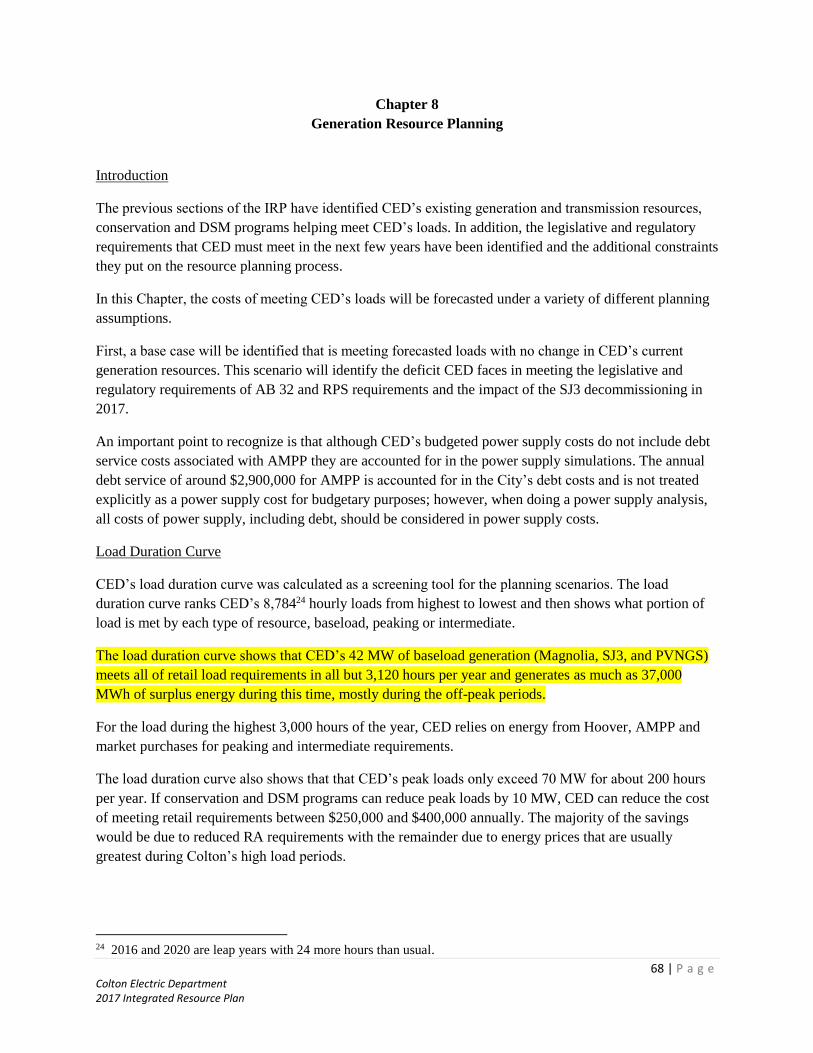
68 | P a g e Colton Electric Department 2017 Integrated Resource Plan
Chapter 8
Generation Resource Planning
Introduction
The previous sections of the IRP have identified CED’s existing generation and transmission resources,
conservation and DSM programs helping meet CED’s loads. In addition, the legislative and regulatory
requirements that CED must meet in the next few years have been identified and the additional constraints
they put on the resource planning process.
In this Chapter, the costs of meeting CED’s loads will be forecasted under a variety of different planning
assumptions.
First, a base case will be identified that is meeting forecasted loads with no change in CED’s current
generation resources. This scenario will identify the deficit CED faces in meeting the legislative and
regulatory requirements of AB 32 and RPS requirements and the impact of the SJ3 decommissioning in
2017.
An important point to recognize is that although CED’s budgeted power supply costs do not include debt
service costs associated with AMPP they are accounted for in the power supply simulations. The annual
debt service of around $2,900,000 for AMPP is accounted for in the City’s debt costs and is not treated
explicitly as a power supply cost for budgetary purposes; however, when doing a power supply analysis,
all costs of power supply, including debt, should be considered in power supply costs.
Load Duration Curve
CED’s load duration curve was calculated as a screening tool for the planning scenarios. The load
duration curve ranks CED’s 8,78424 hourly loads from highest to lowest and then shows what portion of
load is met by each type of resource, baseload, peaking or intermediate.
The load duration curve shows that CED’s 42 MW of baseload generation (Magnolia, SJ3, and PVNGS)
meets all of retail load requirements in all but 3,120 hours per year and generates as much as 37,000
MWh of surplus energy during this time, mostly during the off-peak periods.
For the load during the highest 3,000 hours of the year, CED relies on energy from Hoover, AMPP and
market purchases for peaking and intermediate requirements.
The load duration curve also shows that that CED’s peak loads only exceed 70 MW for about 200 hours
per year. If conservation and DSM programs can reduce peak loads by 10 MW, CED can reduce the cost
of meeting retail requirements between $250,000 and $400,000 annually. The majority of the savings
would be due to reduced RA requirements with the remainder due to energy prices that are usually
greatest during Colton’s high load periods.
24 2016 and 2020 are leap years with 24 more hours than usual.

69 | P a g e Colton Electric Department 2017 Integrated Resource Plan
Figure 8.1: CED’s 2012 Load Duration Curve
The analysis of the LDCs shows that with SJ3 in the resource mix, CED has surplus energy roughly 50
percent of the time, generally in the off-peak hours when CED is selling energy at a loss. However, when
SJ3 is decommissioned and replaced with the 10 MW baseload generator, Puente Hills, along with 15
MW of solar energy, CED will be short energy from its own resources unless it operates AMPP. AMPP
though is relatively expensive compared to purchases from the CAISO.
The net impact of the decommissioning is that CED will be significantly reduce its emissions obligation
allowing CED to sell a large percentage of its freely allocated EAs in the Cap and Trade Auctions through
2020. CED will still have to purchase EAs for any GHG emission obligations associated with the sales of
excess energy from Magnolia or AMPP. The proceeds CED receives for the sale of any freely allocated
EAs is restricted by state legislation. CED’s annual energy costs will decline as the less expensive CAISO
energy is used to replace more expensive SJ3 energy.
0
10
20
30
40
50
60
70
80
901
28
55
69
85
31
,13
71
,42
11
,70
51
,98
92
,27
32
,55
72
,84
13
,12
53
,40
93
,69
33
,97
74
,26
14
,54
54
,82
95
,11
35
,39
75
,68
15
,96
56
,24
96
,53
36
,81
77
,10
17
,38
57
,66
97
,95
38
,23
78
,52
1
Hours
MW
CED 2012 Load Duration Curve
Surplus Energy
CED Baseload Generation (SJ3, PVNGS, Magnolia)
Energy requirements met byAMPP, Hoover, renewable resources,CAISO purchases and conservation
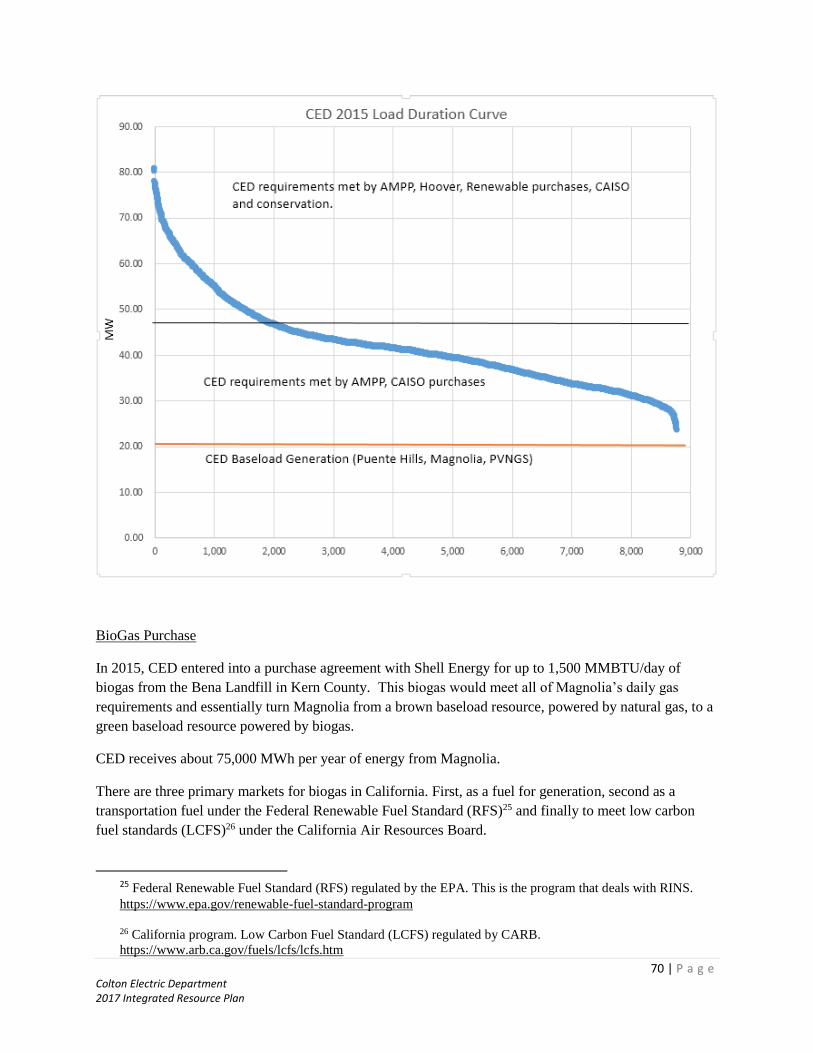
70 | P a g e Colton Electric Department 2017 Integrated Resource Plan
BioGas Purchase
In 2015, CED entered into a purchase agreement with Shell Energy for up to 1,500 MMBTU/day of
biogas from the Bena Landfill in Kern County. This biogas would meet all of Magnolia’s daily gas
requirements and essentially turn Magnolia from a brown baseload resource, powered by natural gas, to a
green baseload resource powered by biogas.
CED receives about 75,000 MWh per year of energy from Magnolia.
There are three primary markets for biogas in California. First, as a fuel for generation, second as a
transportation fuel under the Federal Renewable Fuel Standard (RFS)25 and finally to meet low carbon
fuel standards (LCFS)26 under the California Air Resources Board.
25 Federal Renewable Fuel Standard (RFS) regulated by the EPA. This is the program that deals with RINS.
https://www.epa.gov/renewable-fuel-standard-program
26 California program. Low Carbon Fuel Standard (LCFS) regulated by CARB.
https://www.arb.ca.gov/fuels/lcfs/lcfs.htm

71 | P a g e Colton Electric Department 2017 Integrated Resource Plan
Biogas can be used to create low carbon, low emission fuels. Various entities in the transportation sector
need to accumulate credits to meet their federal and state emission reduction obligations.
The problem is that the prices of credits in the RFS and LCFS markets varies and is often greater than the
value of RECs created by using biogas for electricity generation.
Bena Energy, the source of CED’s biogas, wants to capture the greater value of biogas in the RFS and
LCFS markets whenever their price is above the value of RECs. But unlike the REC market, there is no
long term market for RFS and LCFS credits, so Bena cannot use the future value of these two uses to
secure the needed funding to construct the landfill gas treatment facility needed to clean and mix biogas
to the necessary quality to inject into the intra-state natural gas pipelines.
Under the initial rules put out by the CEC, Bena was willing to sell the total output of biogas to CED.
However, the CPUC modified the rules in 2015, requiring additional testing and cleaning under certain
conditions. This made the cost of creating biogas uneconomic for just electricity generation.
Bena proposed reducing the daily volume of biogas to CED from 1,500 mmbtu/day to 500 mmbtu/day.
They would use the remaining 1,000 mmbtu/day for fuels to sell into the RFS and LCFS markets. The
revenue stream from CED would allow them to secure the needed financing to construct the facility.
By reducing daily volume form 1,500 mmbtu/day to 500 mmbtu/day, CED would reduce the amount of
renewable energy from roughly 75,000 MWh per year to 25,000 MWh. This is still enough renewable
energy to meet 43 percent of CED’s total energy requirements but by 2027 CED would have to acquire
roughly 50,000 MWh of renewable energy to meet SB 350 requirements.
Base Case Scenario
The base case scenario examines CED’s power supply costs with only existing resources and the demand
and energy forecast prepared using the model presented in Chapter 2. The simulation covers the period
2015/16 through FY 2020/21. The simulation does not include any additional conservation or DSM
measures to attempt to reduce CED’s monthly peak demands beyond the current programs.
SCPPA budget projections for the period 2015/16 through 2020/21 were used in the simulations.
In 2016/17, total power supply costs are forecasted to be $39.3 million up from $37.7 million in 2015/16.
The increase in 2016/17 is due to bringing new renewable projects online in 2016 and 2017 in advance of
need (for meeting energy requirements) because of the uncertainty of the date of SJ3’s decommissioning.
SJ3 costs will decline in 2015/16 and 2016/17 compared to 2014/15 because of the decommissioning of
SJ3. SCPPA members will make their last debt service payment on December 1, 2016. Thereafter,
SCPPA members will only pay for energy when it is actually received from the unit.
Overall, power supply costs remain rather stable from 2017/18 through 2020/21 even as loads increase
slightly, with customer solar installations offsetting about half of new load growth.

72 | P a g e Colton Electric Department 2017 Integrated Resource Plan
CED’s renewable percentage will be around 30 percent, depending upon when the new renewable
resources actually come online.
SJ3 Decommissioning on January 1, 2017
If SJ3 is decommissioned on January 1, 2017 rather than December 31, 2017, CED’s power supply costs
will be about $3.0 million less in 2016/17 and 2017/18 than under the baseline forecast. The reason is that
energy and O&M costs from SJ3 are around $55 to $60/MWh compared to $15 to $25/MWh from the
CAISO. The better SJ3 operates in its last year results in higher power supply costs for CED. Once SJ3 is
permanently decommissioned, forecasted costs under the baseline and early decommissioning scenario
are the same.
There is no change in CED’s renewable percentage under the two scenarios.
Cogeneration, Biogas, Additional Solar and Conservation
The next simulation that was performed assumed SJ3 was operational until the end of 2017, a 250 kW
cogeneration unit at the City’s Waste Water Treatment Plant (WWTP) was restored, 3 MW of solar was
installed at the WWTP where the existing sludge drying beds currently are and additional conservation
activities reducing load by about 2 MW were installed.
Overall, this scenario results in about $80,000 annually increased costs compared to the baseline
simulation primarily due to slightly higher costs from the new solar facility within the City compared to
alternatives outside the City.
Colton’s WWTP is one of the few remaining WWTP’s that still uses drying beds to dry the waste sludge
so that it can be transported from the site to disposal areas outside the LA Basin (generally Barstow or
into Arizona). In 2017, the WW division will install a centrifuge at the WWTP. The centrifuge spins the
waste, separating the water from the remaining waste that can be hauled to a disposal area without the
need for onsite storage while drying.
The centrifuge eliminates the need for drying beds, a source of groundwater contamination. The drying
beds at the WWTP take up about 7 acres with the possibility of using additional land to achieve 10 acres.
This is enough to build a 2 – 2.5 MW solar facility at the site on land that has no other viable use.
Finally, CED needs to expand its conservation and demand side management efforts to achieve another 1
– 2 MW of load reduction.
This scenario results in slightly higher annual power supply costs in 2018 through 2021 of roughly
$80,000 per year in comparison to the base case, not including the (unknown) initial costs of repairing the
WWTP cogeneration facility. CED’s renewable resources are increased by about 8,000 MWh or about 1
percent.
No Additional Renewables and 5 MW Baseload Gas Purchase
CED’s existing renewable resources meets SB 350 requirements through 2021 after which CED would
have to start acquiring additional renewable resources. A question arises of whether the cost of exceeding
SB 350 requirements is too high and should the CED instead concentrate on reducing power supply costs.

73 | P a g e Colton Electric Department 2017 Integrated Resource Plan
CED acquired quotes from power marketers of a 5 MW baseload natural gas power purchase agreement
that was added to CED’s current and future resources. No additional renewable or conservation activities
were undertaken during the period 2016/17 through 2020/21.
The annual financial impact of this scenario is between $200,000 and $500,000 per year, or roughly 1.3
percent per year. The lower costs of baseload natural gas generation are offset by reduced purchases from
the CAISO and surplus energy during the winter months.
CED believes the small additional costs of renewable and conservation activities compared to a baseload
resource are offset by non-quantifiable benefits such as lower bills and better health, plus reduced GHG
emissions, to justify the marginally greater costs.
Reduced Biogas Purchase
The final simulation performed examined the financial benefits of reducing the planned purchase of
biogas from Shell Energy from 1,500 mmbtu/day to 500 mmbtu/day. CED would still be in compliance
with SB 350 but instead of achieving a 60 percent renewable goal by 2018 would stay around 43 to 45
percent renewable through 2025. By 2027 CED would need to acquire additional renewable resources.
The reduced biogas purchase results in a savings of roughly $2,600,000 in comparison to the base case
and the solar/cogeneration/conservation case.
CED entered into the purchase agreement as a way of achieving compliance with SB 350. CED needs
additional baseload renewable energy in order to meet its RPS requirements. If Bena is willing to accept
market risk associated with reduced sales to CED (through Shell), CED is better off financially reducing
its daily must-take obligations and still be in compliance with SB 350 and GHG reduction requirements.
Summary of Simulation Results
The following graph compares the annual power supply costs under the different scenarios. The most
striking fact is that regardless of which resource plan CED ultimately chooses, costs are essentially the
same except for the impact of the biogas purchase.
The simulation that results in the lowest power supply costs consistent with meeting the RPS and GHG
goals of SB 350 is scenario 6 – CED’s existing and planned resources plus 3 MW of solar photovoltaic in
2018 plus 0.25 MW of cogeneration at the WWTP plus 2 MW of additional conservation programs. This
is not the least-cost scenario, which essentially allows the biogas contract to terminate because of Bena
not meeting milestone construction dates, but this scenario does not meet RPS requirements.

74 | P a g e Colton Electric Department 2017 Integrated Resource Plan
Storage Options
California Assembly Bill 2514 (AB 2514) requires the governing board of each publicly-owned utility
(POU) to determine appropriate targets, if any, for the utility to procure viable and cost-effective energy
storage systems. Each governing board must make its initial determination on target energy storage levels
by October 1, 2014 and no more than every 3 years thereafter.
Energy storage systems include large batteries, compressed air systems, thermal energy storage that
produces ice during the off-peak periods for use for air conditioning during the on-peak period and other
technologies. Energy storage systems not considered under AB 2514 includes hydroelectric pumped-
storage systems.
Electric storage systems use less expensive energy for charging and store this energy for periods of high
cost. Typically this means charging during off-peak periods and releasing energy into the grid during high
cost periods, generally the on-peak periods or morning ramp periods when energy demand is increasing
rapidly.
A financial analysis of electric storage systems is very dependent upon the expected use of the system.
Storage often makes financial sense for a retail customer who can charge their storage system with off-
peak energy that can be used during the on-peak period, reducing high on-peak energy charges and
cutting demand costs. Storage system may also make financial sense for intermittent generators, such as
wind and solar producers, who want to deliver a firm, known quality of energy to its wholesale customers.
Storage systems do not appear to make financial sense for a utility that has excess generation capacity
available to meet unexpected energy demand, such as the CED.
30,000,000
31,000,000
32,000,000
33,000,000
34,000,000
35,000,000
36,000,000
37,000,000
38,000,000
39,000,000
40,000,000
2015/16 Actual(000's)
2016/17 2017/18 2018/19 2019/20 2020/21
Scenaro 1: Existing Resources (Biogas) - Includes Debt service
Scenario 2: SJ3 shuts down at end of 2016
Scenario 3: SJ3 decommissioned 12/31/17, 3 MW solar 0.25 cogen, biogas
Senario 4: SJ3 decommissioned 12/31/17, 5 MW baseload purchase from Shell
Scenario 5: NO bioigas, 5 MW Shell 3 MW solar 2 MW conservation
Scenario 6: 500 MMBTU/day biogas, 3 MW solar, 2 MW conservation, 0.25 cogen

75 | P a g e Colton Electric Department 2017 Integrated Resource Plan
The large amount of intermittent renewable generation coming online during the next few years to meet
California’s renewable energy standards (RPS) requirements is stressing energy systems in the western
states. The demand for traditional thermal resources is actually declining during the early afternoon hours
but increasing in the late afternoon and early evening hours when solar PV production declines but
customer demand remains high.
Requiring thermal resources to be available to back-up intermittent resources is expensive. A gas-fired
generator (such as the Agua Mansa Power Plant) may cost $3,000 to $5,000 to start to generate for just a
few hours. Many gas-fired generators that cannot be started in a few hours are backed down to minimum
operating levels and generate surplus energy during low load periods.
To address the problems with intermittent resources, California is requiring investor-owned utilities to
acquire 1,325 MW of energy storage by 2020. POU’s are required to periodically investigate the cost-
effectiveness of energy storage and, once found cost-effective, to establish a procurement target.
A difficulty in analyzing storage systems is that their value is very dependent upon the specific use of the
storage system.
The major problem with storage systems is they are very expensive. Large batteries cost $1 million to $2
million per MW with the average cost of energy between $200 and $400/MWh. For comparison, the cost
of energy from AMPP is around $180/MWh when capacity (debt costs), energy and O&M costs are
included.
CED, can currently rely on the CAISO to meet moment to moment fluctuations in demand for a cost of
around $30/MWh (although during some short periods the cost could be much higher). There is no need
to invest in new storage systems when a utility is over-resourced and can generate less expensively than
purchasing a new storage system.
A key point however, is that there are situations where storage systems make sense from the customer’s
viewpoint. For example, if a customer is away from home during the day and uses a solar PV system to
charge their storage system, they could essentially meet their entire energy needs for the cost of the solar
PC system and storage system. Currently the equipment would cost around $25,000 to $50,000 but might
be more affordable in the next few years.
CED performed an analysis of the cost of meeting one additional MW of load on its system and compared
the cost of purchasing additional Resource Adequacy (RA) capacity for 3 months of the year and meeting
the additional load with its own resources the remainder of the year compared to a lithium ion battery
storage system, currently the least expensive storage system (other than pumped-storage).
CED can purchase 3 months of RA capacity for around $9,000 plus energy charges of $18,400 (for a
four-hour daily block) or about $27,400. A comparable cost of Lithium – Ion batteries would be around
$220,000. However, this analysis ignores that the lithium – Ion battery would be available all 365 hours
of the year. If the battery were priced for just 3 months, the cost would be around $54,000, just about
$19,000 (or almost 60% more) more than the cost of just purchasing capacity and energy.
The difficulty with making an analysis is that the battery cannot be shaped to meet CED’s annual
requirements. Any purchase results in excess capacity that just exacerbates CED’s surplus energy position

76 | P a g e Colton Electric Department 2017 Integrated Resource Plan
in the non-summer months. This also assumes that a 1 MW battery costs proportionately the same as a 4
MW battery (or a 1 MW battery costs one-fourth as much as a 4 MW battery which currently is not true).
A more viable alternative at this time is thermal energy storage (TES). TES uses off-peak energy to create
ice that is used for air conditioning needs during the day. TES systems are almost cost-effective for
certain customer uses (such as a new fitness center) especially if the customer faces real-time pricing.
TES systems may make financial sense from the customer’s viewpoint but not from the CED’s viewpoint
at this time. CED may want to encourage TES systems by offering rebates or special off-peak charging
rates to assist customers to install TES systems.
Because of this financial analysis, CED has recommended that the City Council not establish storage
targets for the CED at this time but revisit the economic feasibility in three years as required by the law.
CED does have an option to participate in the development of up to a 5 MW storage project at the
Antelope DSR2 Solar Project. However, at this time, CED does not see any advantage to this option.
However, CED is investigating the viability of storage for some of its larger industrial/commercial
customers.
Summary
The financial analysis presented above shows that of the alternatives, scenario 6 which includes CED’s
existing and planned resources but reducing biogas purchases to 500 mmbtu/day, plus a 3 MW solar
photovoltaic facility at the WWTP and a 0.25 MW cogeneration facility plus 2 MW of additional
conservation programs results in the lowest power supply costs that meets CED’s load requirements, RPS
requirements and GHG reduction requirements.
In order to accomplish the resource goals, CED will have to begin planning for the new solar facility in
2017. Planning cannot begin until the WWTP installs a new centrifuge and removes the existing sludge
piles from the site, a process that could take 4 to 6 months, depending upon weather.
If the proposed resource plan is followed, CED will remain in compliance with state RPS requirements
and GHG reduction requirements. CED will only have Magnolia and AMPP as GHG emitters that in total
produce about 20,000 tons of GHG emissions, compared to the 211,000 tons of GHG emissions in 2015.
The large amount of GHG emissions in 2015 is primarily due to almost 180,000 tons of emissions from
SJ3.

77 | P a g e Colton Electric Department 2017 Integrated Resource Plan
Appendix A
Glossary of Terms
Arbitrage: The risk-free exploitation of temporary market price anomalies in related commodities or
instruments, generally by the purchase of a commodity or instrument that is relatively low in price and the
sale of the commodity or instrument that is relatively high priced. In order to be market neutral, the
purchase and sale of the commodities or instruments should be simultaneous.
CAISO: The California Independent System Operator
Call Option: An option that gives the buyer (holder) the right, but not the obligation, to buy a futures
contract (enter into a long futures position) for a specified price within a specified period of time in
exchange for a one-time premium payment. It obligates the seller (writer) of an option to sell the
underlying futures contract (enter into a short futures position) at the designated price, should the option
be exercised.
Cost VaR (Value at Risk): Cost VaR summarizes the expected maximum “cost” exposure over a target
horizon with a given confidence level. For example, if trends indicate that an expected (or average) cost is
$100 but volatility indicates that this cost may fluctuate wildly, VaR will capture the magnitude of this
volatility as a summary number. This number, or estimate, can then be added to average or expected cost
in order to measure the impact of volatility on potential cost.
Counterparty: A party on either side of a transaction (i.e. purchasing counterparty as opposed to a selling
counterparty). External transacting parties such as the CAISO and NYMEX are not included in
calculating counterparty credit exposures.
Counterparty VaR: the dollar estimate of the risk that subsequent changes in market price will result in
increased counterparty credit exposure.
CO2e: Carbon dioxide equivalent emissions. The total impact of all emissions measured in terms of the
equivalent amount of CO2 that has the same environmental effect.
Credit VaR: The statistical estimate of potential losses in a portfolio due to changes in counterparty credit
ratings.
Derivative: Any financial instrument, such as a future contract, swap or option, which derives its value
from the value of an underlying security or physical commodity.
Discretionary resource: Resources that are flexible in their dispatch and, as a result, are often managed as
options in the sense that they may or may not be scheduled for dispatch. Discretionary resources contain
less contractual scheduling limitations than must-take resources.
Displacement: The replacement of one generation resource with the matching amount of another
competitively priced resource. Displacements provide for economic optimization of discretionary
resources.

78 | P a g e Colton Electric Department 2017 Integrated Resource Plan
Electric Capacity: The maximum amount of electric power available for generation or use, usually
expressed in kilowatts (kW) or megawatts (MW).
Electrical Energy: The generation or use of electric power over some period, usually expressed in
megawatthours (MWh), kilowatthours (kWh) or gigawatthours (GWh).
Exercise Price: Also known as the strike price. The price at which futures are brought or sold if an option
is exercised.
Least Cost Supply Portfolio: the mix of resources which optimizes the cost/risk profile of the utility. For
example, if the utility is risk adverse, a least-cost supply mix may have a higher cost than a supply mix
that exposes the utility to greater fluctuations in volatility and reliability.
Load balancing: Meeting fluctuations in demand for power.
Load Management: Economic reduction of electric energy demand during a utility’s peak generating
periods. Load management differs from conservation in that load management strategies shift the use of
energy while conservation programs reduce the demand for energy.
NERC: North America Electric Reliability Corporation. The federal entity charged with overseeing the
reliability of the US electric grid.
Optimization: The process of utilizing strategies and instruments to optimize economic benefits
associated with load and resource management. Optimization differs from trading in that the strategic
rationale for a transaction is the driver rather than the economic benefit alone. Trading functions are
designed to form a commodity position with the intent of speculating on market arbitrage opportunities.
Option: A contract that gives the holder the right, but not the obligation, to purchase or sell the underlying
commodity at a specified price during a specified time period.
Premium: The price of an option.
Prompt Month: The month following the current operating month.
Put Option: An option that gives the buyer, or holder of the contract, the right but not the obligation to
sell a futures contract at a specific price during a specific time period in exchange for a one-time premium
payment. It obligates the seller, or writer, of the option to buy the underlying futures contract at the
designated price should the option be exercised at that price.
SCPPA – the Southern California Public Power Authority, a joint power agency that finance’s generation
and transmission projects for its members, including the City of Colton. The member agencies are Los
Angeles Department of Water and Power and cities of Glendale, Burbank, Pasadena, Anaheim, Riverside,
Colton, Cerritos, Banning and Azusa and the Imperial Irrigation District.
Speculation: The taking of an unhedged position (short or long) with the intent of holding the position in
anticipation of changes in market prices.
Stop-Loss: A benchmark or “trigger” point at which a position will either be covered or closed. If a
position is “out of the money” the amount “out of the money” will be limited by a stop-loss limitation.

79 | P a g e Colton Electric Department 2017 Integrated Resource Plan
For example, if a stop-loss limit is $100,000, a corresponding position should be covered or closed if it is
out of the money $100,000 or more.
Supply Requirements: Those requirements related to reliability and reserve standards mandated by the
requirements of regulatory agencies of competent jurisdictions.
Swap: A custom-tailored, individually negotiated transaction designed to manage financial risk. In a
typical commodity or price swap parties exchange payments based upon the change in the price of a
commodity or market index while fixing the price they effectively pay for the physical commodity. The
transaction enables each party to manage exposure to commodity price or index values. Settlements are
made in cash.
Transaction Liquidity: The existence of sufficient volume of transactions of a particular product and
commodity that generally assures a party’s ability to locate a counterparty that is willing to either buy or
sell the product in question.
Uncovered Option: An option on an underlying asset for which the seller is not long (in the case of a call
option) or short (in the case of a put option) the underlying commodity.
Underlying Commodity: The commodity upon which the value of a derivative is dependent.
Volatility: The magnitude and frequency of changes in prices over time. Standard deviation is a measure
of volatility.
Wheeling: In the electric market wheeling refers to the interstate or intrastate sale of electricity or the
transmission of power from one system to another
WECC: The Western Electric Coordinating Council a regional reliability council created and recognized
by the North America Electric Reliability Council is responsible for establishing guidelines and
procedures related to the reliable electric operation of the 11 western U.S. states as well as parts of
Canada and Mexico.
WSPP: The Western Systems Power Pool is a power pool comprised of most western utilities and power
marketers. A significant development of WSPP is the WSPP agreement, a standardized enabling
agreement, or master contract, utilized by over 200 utilities, marketers and other entities across the U.S.

80 | P a g e Colton Electric Department 2017 Integrated Resource Plan
Appendix B
Colton Electric Department 2016-2021 Demand and Energy Forecast
Energy
Requirements
(MWh)
Monthly
Peak
Demand
(MW)
Jan 16 28,156 48
Feb 16 26,293 52
Mar 16 27,200 51
Apr 16 27,837 59
May 16 29,026 63
Jun 16 36,152 72
Jul 16 39,794 78
Aug 16 39,320 82
Sep 16 33,603 80
Oct 16 30,319 65
Nov 16 28,368 56
Dec 16 27,914 49
Total 373,982 82
Jan 17 27,924 48
Feb 17 27,967 53
Mar 17 28,108 51
Apr 17 29,033 60
May 17 30,497 64
Jun 17 33,886 73
Jul 17 37,776 79
Aug 17 38,495 83
Sep 17 35,524 80
Oct 17 30,575 65
Nov 17 28,607 56
Dec 17 28,149 49
Total 376,542 83
Jan 18 28,160 49
Feb 18 28,203 53
Mar 18 28,345 52
Apr 18 29,278 60
May 18 30,754 64
Jun 18 34,172 74
Jul 18 38,095 79
Aug 18 38,820 84
Sep 18 35,823 81
Oct 18 30,832 66
Nov 18 28,849 57
Dec 18 28,386 50
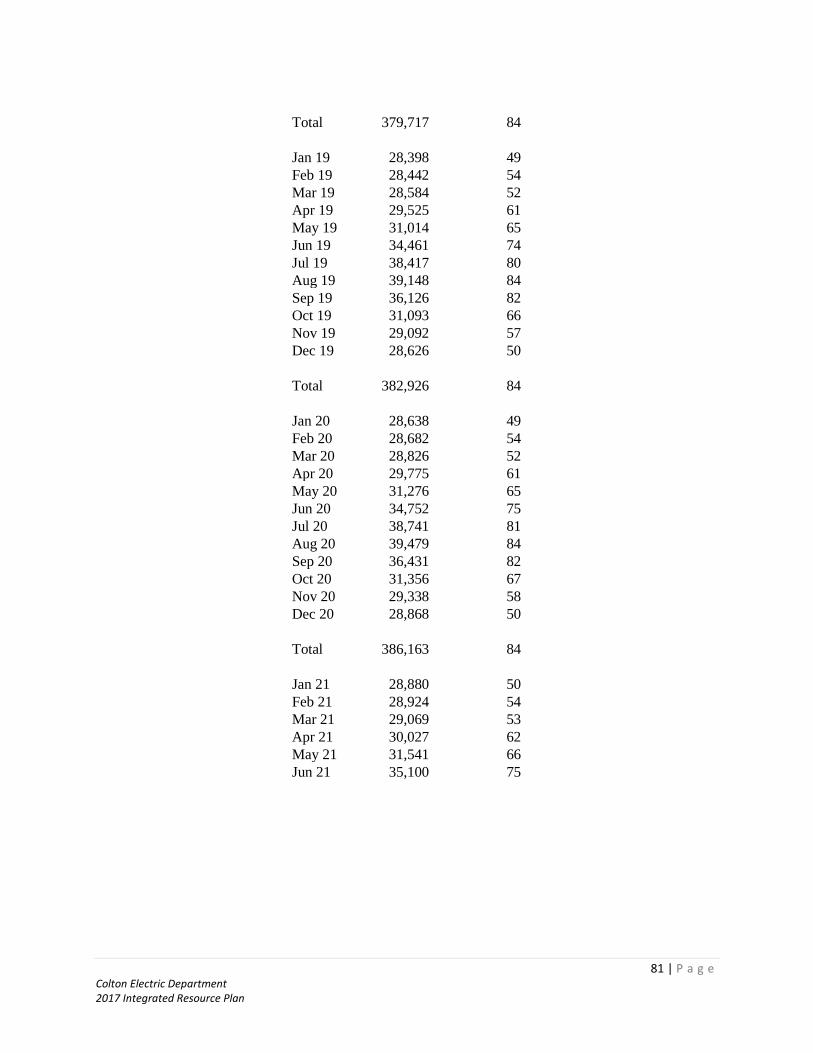
81 | P a g e Colton Electric Department 2017 Integrated Resource Plan
Total 379,717 84
Jan 19 28,398 49
Feb 19 28,442 54
Mar 19 28,584 52
Apr 19 29,525 61
May 19 31,014 65
Jun 19 34,461 74
Jul 19 38,417 80
Aug 19 39,148 84
Sep 19 36,126 82
Oct 19 31,093 66
Nov 19 29,092 57
Dec 19 28,626 50
Total 382,926 84
Jan 20 28,638 49
Feb 20 28,682 54
Mar 20 28,826 52
Apr 20 29,775 61
May 20 31,276 65
Jun 20 34,752 75
Jul 20 38,741 81
Aug 20 39,479 84
Sep 20 36,431 82
Oct 20 31,356 67
Nov 20 29,338 58
Dec 20 28,868 50
Total 386,163 84
Jan 21 28,880 50
Feb 21 28,924 54
Mar 21 29,069 53
Apr 21 30,027 62
May 21 31,541 66
Jun 21 35,100 75

82 | P a g e Colton Electric Department 2017 Integrated Resource Plan
APPENDIX C
Summary of Power Supply Simulations
Total Power Supply Cost per Year, $000’s
Resource Scenario
2015/16
Actual
(000's) 2016/17 2017/18 2018/19 2019/20 2020/21
TOTAL
COST-
2015/16 -
2020/21
Scenario 1: Existing
Resources (Biogas) -
Includes Debt service
39,132
39,327
37,182
37,720
38,163
37,806
229,330
Scenario 2: SJ3 shuts
down at end of 2016
39,132
37,013
36,195
37,720
38,163
37,803
226,026
Scenario 3: SJ3
decommissioned
12/31/17, 3 MW solar
0.25 cogen, biogas
39,132
39,289
37,146
37,648
38,167
37,782
229,164
Scenario 4: SJ3
decommissioned
12/31/17, 5 MW
baseload purchase
from Shell
39,132
39,327
37,008
37,234
38,154
37,697
228,552
Scenario 5: NO biogas,
5 MW Shell 3 MW
solar 2 MW
conservation
39,132
39,327
33,540
33,854
34,297
33,939
214,089
In Scenario 5 may not meet 2022 renewable standards - need roughly 20,000 MWh of renewable energy
biogas provides about 83,000 MWh annually that has to be replaced
Cogen plant at Wastewater Treatment Plant would add 2,100 MWh while reducing total WWTF
costs but impacting CED revenues and costs

83 | P a g e Colton Electric Department 2017 Integrated Resource Plan