Feedbacks, Critical Transitions and Social Change in Forager-Resource Systems: An Integrated...
203
Feedbacks, Critical Transitions and Social Change in Forager-Resource Systems An Integrated Modeling and Ethnoarchaeological Analysis by Jacob Freeman A Dissertation Presented in Partial Fulfillment of the Requirement for the Degree Doctor of Philosophy Approved April 2014 by the Graduate Supervisory Committee: John M. Anderies, Co-Chair Margaret C. Nelson, Co-Chair C. Michael Barton ARIZONA STATE UNIVERSITY May 2014
Transcript of Feedbacks, Critical Transitions and Social Change in Forager-Resource Systems: An Integrated...

Feedbacks, Critical Transitions and Social Change in Forager-Resource SystemsAn Integrated Modeling and Ethnoarchaeological Analysis
by
Jacob Freeman
A Dissertation Presented in Partial Fulfillmentof the Requirement for the Degree
Doctor of Philosophy
Approved April 2014 by theGraduate Supervisory Committee:
John M. Anderies, Co-ChairMargaret C. Nelson, Co-Chair
C. Michael Barton
ARIZONA STATE UNIVERSITY
May 2014

TABLE OF CONTENTS
Page
LIST OF TABLES . . . . . . . . . . . . . . . . . . . . . . . . . . . . . . . . . . . . . . . . . . . . . . . . . . . . . . . . . . . . v
LIST OF FIGURES . . . . . . . . . . . . . . . . . . . . . . . . . . . . . . . . . . . . . . . . . . . . . . . . . . . . . . . . . . . vii
CHAPTER
1 INTRODUCTION . . . . . . . . . . . . . . . . . . . . . . . . . . . . . . . . . . . . . . . . . . . . . . . . . . . . . . 1
The Arguments . . . . . . . . . . . . . . . . . . . . . . . . . . . . . . . . . . . . . . . . . . . . . . . . . . . . . . . . . 1
Motivation . . . . . . . . . . . . . . . . . . . . . . . . . . . . . . . . . . . . . . . . . . . . . . . . . . . . . . . . . . . . . 4
Dynamic models in archaeological research . . . . . . . . . . . . . . . . . . . . . . . . . . 8
Research Questions . . . . . . . . . . . . . . . . . . . . . . . . . . . . . . . . . . . . . . . . . . . . . . . . . . . . . 11
The importance of resilience and robustness: multiple system states . . . . 13
Let’s Get it Started in Here . . . . . . . . . . . . . . . . . . . . . . . . . . . . . . . . . . . . . . . . . . . . . . 22
2 INTELLECTUAL FOUNDATION: FEEDBACK PROCESSES IN HUMAN
ECOLOGY . . . . . . . . . . . . . . . . . . . . . . . . . . . . . . . . . . . . . . . . . . . . . . . . . . . . . . . . . . . . 23
General Models of Economic Development . . . . . . . . . . . . . . . . . . . . . . . . . . . . . . . 24
Hunter-gatherer Subsistence Change . . . . . . . . . . . . . . . . . . . . . . . . . . . . . . . . . . . . . 31
1. Traveler-processors . . . . . . . . . . . . . . . . . . . . . . . . . . . . . . . . . . . . . . . . . . . . . 31
2. Landscape “packing” . . . . . . . . . . . . . . . . . . . . . . . . . . . . . . . . . . . . . . . . . . . . 33
3. Economic Defensibility . . . . . . . . . . . . . . . . . . . . . . . . . . . . . . . . . . . . . . . . . . 36
Feedbacks in hunter-gatherer SES . . . . . . . . . . . . . . . . . . . . . . . . . . . . . . . . . . . 37
A General framework to Study the Evolution of SES . . . . . . . . . . . . . . . . . . . . . . . 42
Basic Analytical Concepts from Dynamical Systems Theory . . . . . . . . . . . 45
Conclusion . . . . . . . . . . . . . . . . . . . . . . . . . . . . . . . . . . . . . . . . . . . . . . . . . . . . . . . . . . . . 49
3 THE UNCERTAINTY REDUCTION HYPOTHESIS . . . . . . . . . . . . . . . . . . . . . . 50
A Baseline Hunter-gatherer SES . . . . . . . . . . . . . . . . . . . . . . . . . . . . . . . . . . . . . . . . . 51
The Effects of Productivity and Population on Forager-resource System States 58
ii

CHAPTER Page
Windows of vulnerability and common pool resource dilemmas . . . . . . . . 63
Scaling-up: Localized Critical Transitions Drive the Evolution of Foraging
Strategies . . . . . . . . . . . . . . . . . . . . . . . . . . . . . . . . . . . . . . . . . . . . . . . . . . . . . . . . . 66
Conceptual forager-resource systems . . . . . . . . . . . . . . . . . . . . . . . . . . . . . . . . 68
The Uncertainty Reduction Hypothesis . . . . . . . . . . . . . . . . . . . . . . . . . . . . . . 77
Conclusion . . . . . . . . . . . . . . . . . . . . . . . . . . . . . . . . . . . . . . . . . . . . . . . . . . . . . . . . . . . . 82
An archaeological implication . . . . . . . . . . . . . . . . . . . . . . . . . . . . . . . . . . . . . . 85
Onward . . . . . . . . . . . . . . . . . . . . . . . . . . . . . . . . . . . . . . . . . . . . . . . . . . . . . . . . . . 86
4 THE SOCIAL OPPORTUNITY HYPOTHESIS . . . . . . . . . . . . . . . . . . . . . . . . . . . 87
Incorporating the Augmentation of Biomass into the Hunter-gatherer SES
Model . . . . . . . . . . . . . . . . . . . . . . . . . . . . . . . . . . . . . . . . . . . . . . . . . . . . . . . . . . . . 88
The Effect of Biomass Augmentation on Forager-resource System States . . . . 92
Return time and variance in non-subsistence time . . . . . . . . . . . . . . . . . . . . . 94
The Coevolution of Food Production, the Productivity of Resources and Ter-
ritoriality . . . . . . . . . . . . . . . . . . . . . . . . . . . . . . . . . . . . . . . . . . . . . . . . . . . . . . . . . 96
Comparing landscape level systems: The Goldilocks zone . . . . . . . . . . . . . 100
The Social Opportunity Hypothesis . . . . . . . . . . . . . . . . . . . . . . . . . . . . . . . . . 105
Conclusion . . . . . . . . . . . . . . . . . . . . . . . . . . . . . . . . . . . . . . . . . . . . . . . . . . . . . . . . . . . . 107
Questions for future research . . . . . . . . . . . . . . . . . . . . . . . . . . . . . . . . . . . . . . . 109
Onward . . . . . . . . . . . . . . . . . . . . . . . . . . . . . . . . . . . . . . . . . . . . . . . . . . . . . . . . . . 109
5 A CROSS-CULTURAL ANALYSIS OF FOOD PRODUCTION AND TER-
RITORIAL OWNERSHIP . . . . . . . . . . . . . . . . . . . . . . . . . . . . . . . . . . . . . . . . . . . . . . 110
Preliminaries: Data and Methods . . . . . . . . . . . . . . . . . . . . . . . . . . . . . . . . . . . . . . . . . 111
Methods . . . . . . . . . . . . . . . . . . . . . . . . . . . . . . . . . . . . . . . . . . . . . . . . . . . . . . . . . . 116
iii

CHAPTER Page
The Social-ecological Contexts of Food Production . . . . . . . . . . . . . . . . . . . . . . . . 119
Predictions . . . . . . . . . . . . . . . . . . . . . . . . . . . . . . . . . . . . . . . . . . . . . . . . . . . . . . . 119
Results . . . . . . . . . . . . . . . . . . . . . . . . . . . . . . . . . . . . . . . . . . . . . . . . . . . . . . . . . . . 124
The Social-ecological Contexts of Territorial Ownership . . . . . . . . . . . . . . . . . . . 128
SOH predictions . . . . . . . . . . . . . . . . . . . . . . . . . . . . . . . . . . . . . . . . . . . . . . . . . . 129
URH predictions . . . . . . . . . . . . . . . . . . . . . . . . . . . . . . . . . . . . . . . . . . . . . . . . . . 130
Results . . . . . . . . . . . . . . . . . . . . . . . . . . . . . . . . . . . . . . . . . . . . . . . . . . . . . . . . . . . 132
Reflection & Conclusion . . . . . . . . . . . . . . . . . . . . . . . . . . . . . . . . . . . . . . . . . . . . . . . . 136
Onward . . . . . . . . . . . . . . . . . . . . . . . . . . . . . . . . . . . . . . . . . . . . . . . . . . . . . . . . . . 140
6 CONCLUSION . . . . . . . . . . . . . . . . . . . . . . . . . . . . . . . . . . . . . . . . . . . . . . . . . . . . . . . . 141
The Uncertainty Reduction Hypothesis Revisited . . . . . . . . . . . . . . . . . . . . . . . . . . 142
Some final thresholds . . . . . . . . . . . . . . . . . . . . . . . . . . . . . . . . . . . . . . . . . . . . . . 147
Using the URH to Guide Archaeological Research . . . . . . . . . . . . . . . . . . . . . . . . . 150
A brief illustration from the US Southwest . . . . . . . . . . . . . . . . . . . . . . . . . . . 155
Conclusion . . . . . . . . . . . . . . . . . . . . . . . . . . . . . . . . . . . . . . . . . . . . . . . . . . . . . . . . . . . . 161
REFERENCES . . . . . . . . . . . . . . . . . . . . . . . . . . . . . . . . . . . . . . . . . . . . . . . . . . . . . . . . . . . . . . . 163
APPENDIX
A REPORTS OF HUNTER-GATHERER FOOD PRODUCTION . . . . . . . . . . . . . 181
B ESTIMATING RESPONSE DIVERSITY . . . . . . . . . . . . . . . . . . . . . . . . . . . . . . . . . 189
iv

LIST OF TABLES
Table Page
3.1 Model state variables and parameters . . . . . . . . . . . . . . . . . . . . . . . . . . . . . . . . . . . 53
4.1 Model state variables and parameters with resource augmentation . . . . . . . . . 90
5.1 Variables and definitions . . . . . . . . . . . . . . . . . . . . . . . . . . . . . . . . . . . . . . . . . . . . . . 114
5.2 The predicted direction of the effect of explanatory variables on the like-
lihood that hunter-gatherers produce food. SOH is the social opportunity
hypothesis; URH is the uncertainty reduction hypothesis. . . . . . . . . . . . . . . . . . 123
5.3 The 95 percent confidence set of logistic regression models. 1=CV Rain f all,
2=Density, 3=Fishing, 4=Ownership & 5=NPP . . . . . . . . . . . . . . . . . . . . . . . . . 125
5.4 Means, standard errors and relative importance (∑wi for each variable) of
the explanatory variables in the 95 percent confidence set of models (n=110).125
5.5 The predicted direction of the effect of explanatory variables on the likeli-
hood that hunter-gatherers own territories. . . . . . . . . . . . . . . . . . . . . . . . . . . . . . . . 132
5.6 The 95 percent confidence set of models: 1=CV Rain f all 2=Density, 3=Hunting
& 4=NPP . . . . . . . . . . . . . . . . . . . . . . . . . . . . . . . . . . . . . . . . . . . . . . . . . . . . . . . . . . . . 133
5.7 Means, standard errors and relative importance (∑w for each variable) of
the explanatory variables included in the 95 % confidence set of models for
the full data set (n=339). . . . . . . . . . . . . . . . . . . . . . . . . . . . . . . . . . . . . . . . . . . . . . . . 134
5.8 The 95% confidence set of models for the reduced sample of 110 societies.
1=CV Rain f all, 2=Density, 3=Hunting, 4=NPP & 5=Enhancement . . . . . . . 134
5.9 Means, standard errors and relative importance (∑w for each variable) of
the explanatory variables included in the 95 percent confidence set of mod-
els for the reduced sample of societies (n=110). . . . . . . . . . . . . . . . . . . . . . . . . . . 135
v
Table Page
5.10 A summary of the predicted effects of explanatory variables on food pro-
duction and territorial ownership. Predictions highlighted in bold were sup-
ported by the data, predictions with a strike were not supported, and predic-
tions in plain text were supported, but with a very low degree of confidence
relative to the predictions in bold. . . . . . . . . . . . . . . . . . . . . . . . . . . . . . . . . . . . . . . 137
6.1 Expected effects of feedback processes on the pace of specialization on
domesticated plants for food at the expense of hunting and gathering. . . . . . . 156
vi

LIST OF FIGURES
Figure Page
1.1 Process of archaeological research . . . . . . . . . . . . . . . . . . . . . . . . . . . . . . . . . . . . . . 9
1.2 General stick figure representations of a human-resource system. Picture
(a) is a “static” model and picture (b) is a dynamic model. In the dynamic
model, the foraging decisions of humans and the resource base change at
similar time-scales. . . . . . . . . . . . . . . . . . . . . . . . . . . . . . . . . . . . . . . . . . . . . . . . . . . . 16
1.3 Different perspectives on the dynamics of change in social-ecological sys-
tem (figures designed after Scheffer (2009). The black curves represent all
of the possible equilibrium states of a system for a given ecological param-
eter. The blue dots represent a unique equilibrium solution. The arrows
indicate the direction that the system will move over time if it is not in
equilibrium. . . . . . . . . . . . . . . . . . . . . . . . . . . . . . . . . . . . . . . . . . . . . . . . . . . . . . . . . . . 19
2.1 General models of economic development . . . . . . . . . . . . . . . . . . . . . . . . . . . . . . . 27
2.2 A comparison of three models of subsistence change in hunter-gatherer
SES. The circles highlight the environmental structure identified as the
causal locus of change in the text. . . . . . . . . . . . . . . . . . . . . . . . . . . . . . . . . . . . . . . 35
2.3 A general framework for the study of social-ecological systems. Figure
adapted from Anderies et al. (2004). . . . . . . . . . . . . . . . . . . . . . . . . . . . . . . . . . . . . 43
2.4 An example stability landscape. The global structure of the system consists
of two attractors and one repellor. The ball represents a particular moment
in time at which a system could exist. The ball in attractor A is“buzzing” as
perturbations continually knock the system out of local equilibrium. The ar-
rows pointing down on each end of the landscape are forces that can change
the global structure of the system. . . . . . . . . . . . . . . . . . . . . . . . . . . . . . . . . . . . . . . 47
vii

Figure Page
3.1 Biomass to energy conversion (α) dynamics are controlled by population
density (p) and the interference coefficient (m). As population density in-
creases, biomass is converted into energy less efficiently. . . . . . . . . . . . . . . . . . 56
3.2 Foraging effort decision heuristic. The different regions in the daily en-
ergy deficit - daily energy harvest plane generates a decision heuristic that
foragers use to allocate effort. . . . . . . . . . . . . . . . . . . . . . . . . . . . . . . . . . . . . . . . . . . 58
3.3 Phase plots of foraging effort against resource density. All parameters are
held constant at default values except resource productivity (r). a-r = 0.5;
b-r = 0.3; c-r = 0.1. The circles highlight stable attractors. The square in
graph b highlights an unstable attractor. Each phase plot is paired with a
stability landscape (a-d; b-e; c-f) that provides a metaphor for the dynamics
portrayed in each phase plot. . . . . . . . . . . . . . . . . . . . . . . . . . . . . . . . . . . . . . . . . . . 60
3.4 Summary of the long-run of harvest states in the hunter-gatherer SES. The
lower solid line represents all of the productive harvest states as a function
of resource growth rate (a) and population density (b); the dashed middle
lines, all unstable equilibria, and the top solid lines all degraded states.
The gray shaded areas indicate “windows of vulnerability” that define the
parameter space for which environmental variation could generate a critical
transition between the productive and degraded harvest branches. . . . . . . . . . . 64
3.5 Idealized landscape composed of nine local forager-resource systems. The
conceptual model is scaled to the size of the landscape, the global forager-
resource system. . . . . . . . . . . . . . . . . . . . . . . . . . . . . . . . . . . . . . . . . . . . . . . . . . . . . . . 66
viii

Figure Page
3.6 Conceptualize forager-resource systems at the landscape scale. Each land-
scape is composed of nine forager-resource systems at the habitat scale. In
all three pictures: the top graph illustrates the r/p ratio over time on the
landscape. The black shading indicates the probability of a negative critical
transition, p(ei) for each system at the habitat scale. No black shading is
equivalent to p(ei) = 0. . . . . . . . . . . . . . . . . . . . . . . . . . . . . . . . . . . . . . . . . . . . . . . . . 72
3.7 Nested hierarchy of ecosystems, decisions and forager-resource systems
after Peterson et al. (1998). The rectangles are ecosystem structures. The
circles are decisions associated with each ecosystem structure. The blue
shaded ovals represent forager-resource systems (FRS) operating at differ-
ent scales of space and time. The arrows illustrate the kinds of disturbances
that hit a FRS. . . . . . . . . . . . . . . . . . . . . . . . . . . . . . . . . . . . . . . . . . . . . . . . . . . . . . . . . 79
3.8 System diagram of the hunter-gatherer SES that illustrates feedback pro-
cesses. . . . . . . . . . . . . . . . . . . . . . . . . . . . . . . . . . . . . . . . . . . . . . . . . . . . . . . . . . . . . . . 84
4.1 Phase plots of foraging effort against resource density. All parameters are
held constant at default values except the ecosystem input reallocation co-
efficient (z). a-z = 0; b-z = 0.01; c-z = 0.04. The circles highlight stable
attractors. The squares highlight unstable attractors. Each phase plot is
paired with a stability landscape (a-d; b-e; c-f) that provides a metaphor for
the stability of the attractors portrayed in each phase plot. . . . . . . . . . . . . . . . . 93
ix

Figure Page
4.2 The effects of population density (p) and the coefficient of augmentation
(z) on the return time of the productive attractor. The red portion of the
z = 0 curve indicates the values of p where the system is vulnerable to a
negative critical transition. All other model parameters are held equal at
default values. . . . . . . . . . . . . . . . . . . . . . . . . . . . . . . . . . . . . . . . . . . . . . . . . . . . . . . . . 95
4.3 A schematic of the multilevel selection argument made in the text. Fast
disturbance dynamics (e.g., inter-annual variation in rainfall) have a greater
affect on x at lower levels in the forager-resource system (FRS) hierarchy. . . 98
4.4 Three forager-resource systems at the landscape scale composed of nine
forager-resource systems at the habitat scale. In all three pictures: the top
graph illustrates change in the landscape’s r/p over an average 52 week
period. Each time series graph is paired with four snapshots of the nine
forager-resource systems at the habitat scale. The black on the pie charts
indicates the probability (p(ei)) of a negative critical transition in a habitat. . 102
5.1 (a)-The Relationship between the estimated productivity-to-population den-
sity ratio r/p and the coefficient of variation in rainfall . NPP is in units
of g/m2/yr−1 and Density is in units of people/km2. (b)-The percent of
diet from fishing and the coefficient of variation in rainfall. In both graphs,
triangles = groups who produce food; circles= groups who do not produce
food. . . . . . . . . . . . . . . . . . . . . . . . . . . . . . . . . . . . . . . . . . . . . . . . . . . . . . . . . . . . . . . . . 128
6.1 Summary of the uncertainty reduction hypothesis. . . . . . . . . . . . . . . . . . . . . . . . 143
x

Figure Page
6.2 Both graphs illustrate the log 10 of the ratio of population density (people/km2)
to net primary productivity (grams/m2/year−1) on the x-axis and the coef-
ficient of variation in rainfall on the y-axis. Threshold lines are placed at a
coefficient of variation of 0.21 and a population density-to-resource growth
ratio of -4. Circles=generic hunter-gatherers; squares=hunter-gatherers pro-
duce food; triangles=hunter-gatherers own territories, plus sign=hunter-
gatherers both produce food and own territories; box with x=ancillary cul-
tivating hunter-gatherers; stars= agriculturalists (≥ 30% of their diet from
agriculture after Freeman (2012a). . . . . . . . . . . . . . . . . . . . . . . . . . . . . . . . . . . . . . . 148
6.3 Final proposed feedback structures that affect the robustness of foragers’
supply of energy to population movements and climate variation. . . . . . . . . . 152
6.4 Maps of vegetation zones. Map (a) describes the number of edible species
in each zone; map (b) the mean frost tolerance of edible plants; map (c)
the tolerance edible plants relative to all plants in a vegetation zone (see
Appendix A for details). The dashed boxes highlight the study areas. Tem-
perature units in map (b) are in degrees C times 10. . . . . . . . . . . . . . . . . . . . . . . 159
B.1 Map of mean minimum monthly temperature and the spatial distribution of
Larrea tridentada. . . . . . . . . . . . . . . . . . . . . . . . . . . . . . . . . . . . . . . . . . . . . . . . . . . . . 191
B.2 Climate distribution of Larrea tridentada. The red line marks the 5th per-
centile of the distribution. . . . . . . . . . . . . . . . . . . . . . . . . . . . . . . . . . . . . . . . . . . . . . . 192
xi

Chapter 1
INTRODUCTION
The dissertation before you contributes to understanding the evolution of subsistence
economies based on agriculture from those based on hunting and gathering and the devel-
opment of formal rules and norms of territorial ownership in hunter-gatherer societies. My
research specifically combines formal and conceptual models with the empirical analysis
of large ethnographic and environmental data sets to study feedback processes in coupled
social-ecological systems (SES). I use simple models of SES as tools that aid in the devel-
opment of two alternative arguments that may explain the adoption of food production and
formal territorial ownership among hunter-gatherers. My approach combines the intellec-
tual frameworks of evolutionary ecology and resilience thinking. The result is a theory of
subsistence change in hunter-gatherer SES that integrates elements of three classic theories
of economic development with deep intellectual roots in human ecology: the Malthusian
(Malthus, 1888), Boserupian (Boserup, 1965) and Weberian (Weber, 1927) theories. The
take home message of my study is that evolutionary ecology and resilience thinking are
complementary frameworks for studying cultural evolution. In fact, I argue that evolution-
ary ecology needs resilience thinking. The reason is simple. SES are dynamic entities
characterized by feedbacks between individuals and resources. The only way to study such
feedback processes with scientific rigor is by using the intellectual tools of dynamical sys-
tems theory and dynamical systems theory lies at the core of resilience thinking.
The Arguments
The meat and potatoes, if you will, of this dissertation is my construction of two argu-
ments that may explain the adoption of food production and ownership rules (chapters 3 &
1

4). I call these two arguments the Uncertainty Reduction Hypothesis (URH) and the Social
Opportunity Hypothesis (SOH). Here, I use the term hypothesis in a general sense, mean-
ing an argument proposed to explain some group of phenomena. My goal is to evaluate
the fit of these two arguments with patterns of food production and territorial ownership
documented in the ethnographic record. In turn, the data analysis is designed to identify
the general mechanisms that drive social and technological change in hunter-gatherer SES.
The URH proposes that subtle changes in the net productivity-to-population density
ratio (r/p) of a forager-resource system have strong effects on the costs and benefits of
individual foraging strategies. When the r/p ratio is really high, population is low relative
to natural capital (resources). In this context, variation in the availability of resources is
modulated by large scale ecosystem structures that change at time scales slower than the
times scales at which perturbations shock resources and human foragers make decisions.
Decrease the r/p ratio and foragers can maintain a supply of energy that is robust to envi-
ronmental change by simply working a little harder. However, once the r/p ratio crosses
a critical threshold, a forager resource-system is suddenly characterized by multiple stable
states: a productive and a degraded state. In this situation, the strategy of working harder
to achieve an energy goal creates a stochastic common pool resource dilemma in which
the aggregate behavior of foragers creates the risk that every forager in a system is unable
to find their desired level of food. I argue that in this ecological context natural capital
accumulated at large scales (although still quite abundant) no longer effectively modulates
variation in the ability of foragers to meet their desire for food and foragers experience in-
creasing stress on their capacity to process information about the distribution of resources
in space and time. In turn, selection and copying pressures favor strategies that substitute
technological and social capital for natural capital to reduce the uncertainty associated with
achieving a desired level of resources.
The SOH proposes that there is a Goldilocks environmental zone where investments in
2

the production of food provides individual foragers with an immediate benefit. This benefit
is a predictable budget of non-subsistence time less sensitive to short-term climate varia-
tions at the level of a resource patch. In this Golidlocks zone, the immediate benefits of
non-subsistence time favor the directional copying of strategies that increase the produc-
tivity of food in an ecosystem. This copying scales the effects of ecosystem management
up to the habitat level where foraging populations have an incentive to adopt ownership
institutions. Ownership institutions allow foragers to more efficiently achieve their energy
target. At the landscape level, the r/p ratio increases and so does the robustness of for-
agers’ supply of food to potential shocks. Landscape level systems where the food supply
is robust to shocks have higher rates of population growth and expand at the expense of
less resilient systems at the landscape scale. In this scenario, the very harvest strategies
of foragers transform the social and biophysical environment across levels of ecological
organization and drive the future evolution of a hunter-gatherer SES.
Based on the logic of the URH and SOH, I develop expectations for patterns of food
production and formal territorial ownership documented in the ethnographic record of
hunter-gatherer societies (chapter 5). I then evaluate the consistency of the URH and SOH
with patterns of food production and territorial ownership in the ethnographic record. In
the end, the URH is more consistent with the patterns of food production and territorial
ownership in the ethnographic record. Thus, I argue that the URH provides a more ro-
bust foundation of knowledge for understanding the evolution of hunter-gatherer SES. The
URH is particularly relevant for studying the evolution of agricultural subsistence strate-
gies at the expense of strategies based on hunting and gathering. I briefly suggest how the
URH might be used to understand this process in the prehistoric American Southwest. At a
conceptual level, I argue that major shifts in how foragers manage resources, including the
adoption of domesticated plants, sometimes occur as regime shifts. In the context of this
dissertation, a regime shift describes an abrupt or discontinuous change in the ways that
3

forager-resource interactions are organized. My research indicates that regime shifts may
be propagated through populations of foragers as individuals respond to seemingly slight
changes in their demography or the net productivity of wild resources. These kind of evo-
lutionary dynamics, lead to mosaics of human-resource systems that coevolve and structure
the opportunities and constraints that individuals must cope with (Thompson, 2005).
Motivation
My primary motivation is to help clarify the relationship between the adoption of agri-
culture and formal rules of territorial ownership. I define agriculture as a set of strategies
used to grow food by managing disturbance and succession dynamics, as well as the distri-
bution of soil nutrients and water in space and time in an ecosystem. From this perspective,
agriculture falls on the far right of a continuum of strategies that humans might use to man-
age ecosystem processes and affect the availability of food. On the far left of the continuum
is simply the harvest of wild resources by hunter-gatherers. “Formal ownership” is defined
here as sets of rules and norms that define the who, when and where of territorial access.
Ownership rules may be defined at the level of the individual or at the level of social groups
or both levels simultaneously. The key is that individuals must act collectively to agree on,
maintain and enforce such rules. Ownership rules in hunter-gatherer societies have also
been viewed as a continuum in anthropological thought (Smith, 1988). On the far left of
the continuum, territory is open access in which no formal rules restrict who can use a
territory and when, but individuals may “ask permission” informally. On the far right of
the continuum individuals own private property or individually control who can access a
territory.
Arguments for the adoption of agriculture have long postulated important feedbacks be-
tween the productivity of resources, forager population densities and the costs vs. benefits
of individual foraging strategies (e.g., Binford, 2001, 1983; Bettinger, 1991; Dyson-Hudson
4

and Smith, 1978; Hayden, 2003, 1981; Keeley, 1995, 1988; Kelly, 1995; Redding, 1988;
Rosenberg, 1990, 1998; Smith, 1988; Winterhalder and Goland, 1993). However, only
rather recently has the coevolutionary effects of the adoption of agriculture and territorial
ownership on individual foragers become a topic of pressing research (e.g., Bettinger et al.,
2009; Bowles and Choi, 2013; Freeman and Anderies, 2012; Kennett and Winterhalder,
2006; Smith, 2012; Zeder, 2012). The reason for the recent interest in the relationship be-
tween the adoption of agriculture and formal ownership institutions (either at the group or
individual level) stems from two persistent and unexplained observations.
First, there is evidence that small-scale agriculture is less productive (in terms of energy
return per person-hour) than hunting and gathering (Barker, 2011; Bowles, 2011). This ev-
idence poses a conundrum: why would foragers give-up on more productive strategies for
farming? Of course, one answer is that in some ecological-contexts small-scale agriculture
is more productive than foraging (Barlow, 2006). Another potential answer is that agricul-
ture and, in Bowles and Choi’s (2013) terms, “private property” rights coevolve. In their
formulation, where wild resources are dense and predictable (i.e, “rich”), the ownership of
resources can provide an incentive for foragers to invest in agriculture because they can
monopolize the gains, something that a mobile, foraging lifestyle severely constrains. As I
discuss in chapter 2, Smith (2012) and Zeder (2012) make a similar argument.
Second, small-scale agriculture did not simply spread inexorably at the expense of hunt-
ing and gathering throughout the Holocene. In some places hunter-gatherer life-ways were
remarkably persistent, even though foragers could have adopted agriculture (e.g., Bettinger
et al., 2009; Johnson and Hard, 2008; Zvelebil, 1996). For example, Texas is a relatively
good place to grow maize, but prehistoric foragers over vast areas never adopted maize agri-
culture. Such examples of hunter-gatherers who persisted until very recently come from
California, the Great Basin, Argentina and, of course, Australia. One reason for the per-
sistence of Holocene hunter-gatherers may be that institutions of “ownership” compatible
5

with farming were slow to evolve in these locations. Another possible reason is that for-
agers devised strategies of low-level food production (ecosystem management) and ways
of organizing the ownership of foraging territories that were preferable to the adoption of
agriculture.
Agriculture transforms the earth. From local patterns of erosion, to the eutophication
of lakes, to the composition of the atmosphere; the list of agriculture’s impacts on the bio-
physical structure of the earth goes on and on. Ownership institutions set the “rules of the
game” and coordinate who, when and where individuals can access resources. Such institu-
tions can provide powerful incentives to conserve natural resources (Ostrom, 1990; Wilson
et al., 1994). Such institutions, however, require individuals to potentially pay at least two
costs. 1) Ownership institutions require individuals to cooperate and maintain trust in the
rules of the game. 2) Ownership institutions provide a justification for inequality, in terms
of access to resources and, thus, may severely constrain the ability of some individuals to
secure critical resources. If we, as a global community, hope to reduce hunger, keep the
bio-physical systems of the earth within a safe operating space for humanity and conserve
biological diversity, then we need to understand the processes that led to the evolution of
agriculture and formal institutions of ownership. Understanding such processes, I believe,
is essential to understand how to navigate the complex dynamics of an earth with a popu-
lation of over 7 billion people.
My second motivation is to contribute to a foundation of knowledge useful for un-
derstanding the prehistoric adoption of agriculture and territorial ownership. No one can
directly observe the past. This fact demands that practitioners of archaeology continually
develop more robust theories and methods for using ethnographic observations to inform
archaeological research. As Keeley (1995) pointed out almost two decades ago, controlled
ethnographic comparisons provide an opportunity to identify the general processes that
drive social and technological change in forager-resource systems. While archaeologists
6

have long conducted controlled comparisons of ethnographic data to understand major
changes in SES, (e.g., Binford, 2001, 1990; Feinman and Neitzel, 1984; Keeley, 1995,
1988; Kelly, 1995; Pryor, 1986; Smith, 2001), these comparisons have largely been induc-
tive and theoretically disjointed. The result is that the weight of the conclusions, although
insightful, is somewhat diluted. In this dissertation, I develop formal and conceptual mod-
els from first principles of human behavior and use these models to develop explanations
for investment in the low-level production of food and patterns of territorial ownership
among hunter-gatherers. Rather than working from a primarily inductive frame of refer-
ence, I build on the work of hunter-gatherer scholars to i) model a forager-resource system
and ii) develop and evaluate the relative merits of two explanations for the evolution of
hunter-gatherer SES. My research contributes to a growing literature on the macroecology
of human societies that uses large N cross-cultural data sets to evaluate the first principles
of human-environment interactions and, subsequently, uses these analyses to ask questions
about the archaeological record (e.g., Hamilton et al., 2009, 2007; Grove, 2010, 2009;
Grove et al., 2012; Ullah, 2013; Johnson, 2013).
My final motivation is to contribute to the ever growing literature in archaeology that
uses formal models (e.g., Anderies, 2006, 1998; Barton et al., 2010; Bowles and Choi,
2013; Bowles, 2009; Flannery, 1985; Freeman and Anderies, 2012; Kohler and van der
Leeuw, 2007; Kohler and Gumerman, 2000; Janssen et al., 2003; Winterhalder and Lu,
1997; Winterhalder and Goland, 1993; Winterhalder et al., 1988, and many others), as well
as conceptual models (e.g., Freeman, 2012b; Smith, 2012; Zeder, 2012) to understand the
coevolution of coupled SES. This growing literature crystallizes the view that the evolution
of individual decision making is inextricably linked to the evolution of the social, techno-
logical and biophysical environments that individuals must continually cope with. I believe
that studying the coevolution of individual decisions, ecosystem structures, institutions and
technology builds intellectual bridges between evolutionary ecology and resilience think-
7

ing (as well as other systems frameworks). These bridges, I am optimistic, are leading to
advances in our understanding of cultural evolution. My motivation, however, is not simply
to reinforce this point by building another model. I would like to contribute to a conver-
sation on the epistemological status of models in archaeological research and on the costs
vs. benefits of different kinds of modeling. Archaeologists have been quick to embrace
so-called agent based models, but the use of formal systems of differential equations is
trailing (Phillips, 2012). I argue that both kinds of modeling generate useful insights for
archaeologists and are complementary. Somewhat against the grain, I use a very simple
system of differential equations (simple as far as such models are concerned) to study the
coevolution of foragers and resources.
Dynamic models in archaeological research
Dynamic models are indispensable tools for building explanations of prehistoric changes
in SES. By dynamic model I mean the formal representation of a system (in this case inter-
acting humans and resources) and changes in the behavior of the system over time. At one
level, the benefits of dynamic models are the same as those of models in general. Models
help us evaluate the logic of our ideas (i.e., clarify our thinking); models often facilitate the
development of quantitative predictions and, thus, help us discriminate between compet-
ing theories (Winterhalder, 2002). However, in addition to these benefits, dynamic models
allow us to represent how a system changes over time and critically analyze how our as-
sumptions lead to different trajectories of change. I argue that this final benefit portends a
deep epistemological reason that dynamic models are particularly important to investigate
the research questions that archaeologists seek to answer. The reason stems directly from
the epistemological challenge of archaeological research.
As noted above, no one can directly observe processes that occurred 10,000 years ago.
Thus, all statements that archaeologists make about the past are, ultimately, inferences. All
8

Archaeologicalquestions
Mental model Statements aboutthe past
Ethnographic data
Formal models
Figure 1.1: Process of archaeological research
archaeological inferences are statements about the past based on a mental model developed
from our own intuition, ethnographic observations or experimental studies. This is true
whether one is a positivist, post-positivist or a relativist. Figure 1.1 illustrates how I con-
ceive the archaeological research process that my study is designed to help advance. This is
a cyclical process of identifying archaeological patterns that need an explanation, building
theories from actualistic studies (in this dissertation formal models and ethnographic data
analysis) and evaluating the theories against archaeological data to make statements about
the past. In turn, statements about the past inform the model building process and generate
new questions about the archaeological record. The key part of this process that I contribute
to here is the interplay between the construction of formal, dynamic models, ethnographic
analysis and mental models. In the conception of archaeological research presented in Fig-
ure 1.1, the construction of formal, dynamic models is central to any attempt to understand
patterns in the archaeological record. These formal models help clarify our thinking about
the mechanisms that generate change in SES and, thus, aid in our refinement of mental
models.
Working from a scientific epistemology, once the centrality of model building to the
process of building informed inferences is recognized, then the need to think carefully
about the basis of models is apparent. For example, in studies of subsistence change,
models are almost always based on ethnographic observations. Yet, ethnographic field
9

studies occur at scales of space and time that are much smaller and faster than the scales of
space and time over which major changes in human subsistence occur in the archaeological
record. The result, archaeologists are forced to imagine how processes observed at scales
of space and time appropriate to ethnographic studies play-out over longer time spans and
larger geographic areas. This requires mental gymnastics that are difficult to manage using
purely qualitative mental models. Moving across scales means dealing with increasingly
complex evolutionary processes that are very hard to intuit.
If all social-ecological phenomena can be understood by scaling-up in space and time
and, consequently, over levels of organization, then there is no problem. The idea that
processes are scalable from one level of organization to higher levels of organization is
known as the constructionist hypothesis (Anderson et al., 1972). However,
“The constructionist hypothesis breaks down when confronted with the twin
difficulties of scale and complexity. The behavior of large and complex aggre-
gates of elementary particles, it turns out, is not to be understood in terms of a
simple extrapolation of the properties of a few particles. Instead, at each level
of complexity entirely new properties appear, and the understanding of the new
behaviors requires research which I think is as fundamental in its nature as any
other” (Anderson et al., 1972:1).
This is a basic point that researchers who study biological systems have often made
(Bak, 1996; Holland, 1995; Holling, 1992; Levin, 1999). In the language of complexity
science, complex adaptive systems are more than the sum of the parts that compose a
system. When cross-scale interactions between systems and agents operating at different
scales of space and time lead to emergent social-ecological processes, then simply scaling-
up in an additive way is incorrect. The constructionist hypothesis potentially obscures the
feedback processes that affect evolutionary change. Formal, dynamic models are tools for
10

playing with scales of space and time that help clarify our thinking, in particular, about how
processes operating across levels of organization may lead to major changes in SES. From
an archaeological perspective, dynamic models help bridge archaeological questions and
ethnographic data for which the scales of space, time and levels of organization are often
poorly matched.
Research Questions
I believe that anthropology is in the throes of a major advance in our understanding
of the general social-ecological processes that drive the evolution of SES. The major shift
underway is the integration of evolutionary ecology and systems frameworks to understand
the coevolution of social and ecological systems. In the parlance of modern anthropological
theory, researchers are increasingly studying the reciprocal interactions of individual agents
and the environmental structures that affect individual behaviors. This cross-level integra-
tion is not new; however, the intellectual development of interdisciplinary frameworks, like
the complex adaptive systems framework, resilience thinking, and niche construction are
creating a critical mass of researchers interested in coevolutionary processes. The study of
coevolutionary processes
“require[s] a different way of thinking about evolution: one that no longer
treats environments as context, that formally recognizes organisms as part
constructors of environmental states, and that views such construction and
its legacy over time as evolutionary processes in their own right” (Laland,
2011:233-234).
A coevolutionary view of the processes that drive change in SES suggests that to explain
the evolution of agricultural SES from hunter-gatherer SES and territorial ownership, one
must ask how the coevolutionary process works. This requires understanding the structure
11

and affects of feedbacks in SES on individuals. My research specifically explores how
individual foraging strategies are potentially affected by changes in the attributes of feed-
backs in forager-resource systems and how changes in the behavior of individuals impacts
a forager-resource system. Two questions in particular, guide my research.
1. How do resource productivity and population density affect the robustness of for-
agers’ energy output in a forager-resource system to sets of potential shocks?
2. If there is an affect, how might the state of a forager-resource system, in turn, shape
the costs and benefits of the foraging strategies selected by individuals?
These are critical questions because they center our attention on the long-term conse-
quences of feedbacks between foragers and resources and the consequences of feedbacks
on the costs vs. benefits of foraging strategies that individuals might adopt. The answers
to these questions help illustrate the mechanisms that might cause individual foragers to
change their strategies of resource exploitation and lead to the evolution of agriculture and
territorial ownership.
The term ’robust’ in the context of my work refers to the capability of a resource pro-
curement strategy to reduce the likelihood that individual foragers experience a negative
event, specifically, obtaining less food than desired. The difference between robustness
and resilience in the context of my work is discussed more chapter 2. At this point, it is
sufficient to say here that resilience refers to how much change a system can cope with
before the structure of feedbacks flips into a qualitatively new configuration. Robustness
refers to the capacity of an individual to achieve a goal in a variable and uncertain environ-
ment. The two concepts are related here in that an increase or decrease in the resilience of
a system may directly affect the ability of individuals to obtain their goal.
12

The importance of resilience and robustness: multiple system states
I would like to briefly illustrate why it is important to study the resilience of a human-
resource system and the robustness of individual’s goals to environmental change in a
human-resource system. To illustrate the importance, I discuss the research questions that
anthropologists have historically asked about the adoption of agriculture. There have been
two major reformulations of the basic question that anthropologists ask about the adop-
tion and spread of agriculture. I contribute to a third reformulation that has been poised to
proliferate among researchers for at least two decades.
The human ecology of the adoption of agriculture starts first and foremost with the
processes that cause hunter-gatherer SES to change. V. Gordon Childe (1928:46) stated the
issue clearly in his explanation for the domestication of plants and animals:
“Faced with the gradual dessication consequent upon the redshift northward of
the Atlantic cyclone belt as the European glaciers contracted, three alternatives
were open to the hunting populations affected. They might move northward
or southward with their prey, following the climatic belt to which they were
accustomed; they might remain home eking out a miserable existence on such
game as could withstand the droughts or they might, still without leaving their
home-land, emancipate themselves from dependence on the whims of their
environment by domesticating animals and taking to agriculture.”
In this argument, the environment provides a range of options that hunter-gatherers might
choose to exploit. In response to climate change, the not so clever foragers “eek” out a
miserable existence while the clever foragers either move or emancipate themselves from
the constraints of a biophysical environment by adopting agriculture. Childe’s argument
rests on the assumption that agriculture allows people to produce a surplus of food, settle
in one place, relax and invent (Barker, 2011). This assumption is itself an outgrowth of
13

a more fundamental assumption: a progressive view of cultural evolution. In the progres-
sive view of cultural evolution, cultural evolution moves inexorably toward more complex
forms as human social groups invent better technologies for producing food. Given these
assumptions, there is really only one question to ask about the adoption of agriculture: why
would foragers, once in posSESion of the knowledge to do so, not adopt agriculture? The
answer to this question can only come from two sources: a) the mental deficiency of some
groups or b) sever biophysical constraints, such as absolutely no water or lack of a growing
season. Where mental capacity is lacking or water and solar energy are extremely scarce,
agriculture is not an option and foragers end-up persisting, eking out an existence.
In the 1960’s the pioneering studies of anthropologists among hunter-gatherers in the
Kalahari desert suggested that the hunter-gather economy was, in fact, not necessarily less
advantageous than a farming economy (e.g., Lee, 1966). Many hunter-gatherer societies,
including the !Kung, actually had more non-subsistence time than their farming neighbors
(Sahlins, 1972). Given that hunting and gathering is not necessarily less advantageous
than farming, many anthropologists reformulated the major research question. Instead of
asking what limits farming, researchers began to ask: what processes compel foragers to
give-up the foraging life-style for farming (e.g., Binford, 1968; Cohen, 1977; Flannery,
1968, 1973)? The proposed answers often drew on general systems theory and focused
on structural triggers, like population growth or climate change that push a hunter-gatherer
SES out of “equilibrium.” By structures, I mean the social and biophysical environments
that foragers live within (and create). Anthropologists have subsequently made many co-
gent criticisms of the application of systems theory to the study of hunter-gatherers (see
Bettinger, 1991:53-59 for a summary from an archaeological perspective).
In my view, a misfortune of the application of systems theory in anthropology is the
now pervasive idea that the concept of equilibrium is equivalent to a state of no change.
This is not exactly the case. An equilibrium is a unique solution to a system of equations.
14

As discussed in chapter 2, an equilibrium can have dynamic stability but this does not imply
a state of no change (see Scheffer and Carpenter (2003:650) for a discussion in relationship
to ecosystems). As I argue below, human behavioral ecology benefits from a theory of
complex systems, such as that posited by resilience thinking, because feedback processes
necessitate that forager-resource interactions are not scalable in an additive way. The re-
silience of a system state (collection of equilibria) allows us to understand how changes in
the attributes of a system might affect the costs and benefits of individual foraging strategies
in non-linear ways that are difficult to anticipate.
The second reformulation of research into the adoption and spread of agriculture has
occurred in conjunction with the integration of theory from evolutionary ecology into
anthropological research (e.g., Barlow, 2002; Bettinger and Baumhoff, 1982; Bettinger,
1991; Bird and OConnell, 2006; Keegan, 1986; Kelly, 1995; Kennett and Winterhalder,
2006; Layton et al., 1991; Redding, 1988; Winterhalder and Smith, 2000; Winterhalder
and Goland, 1993; Wills, 1988). In general, evolutionary ecologists assume that individuals
choose the behavioral strategy that best maximizes their reproductive success in any given
environment. From this point of view, the adoption of domesticated plants by an individual
forager may have either fitness costs or benefits, depending on the environment in which
a forager resides. From an evolutionary perspective, then, the question becomes: when
do the benefits of cultivating domesticated plants for food outweigh the potential costs of
such behaviors for individual foragers? This is a well posed question. The strengths are
numerous. 1) The question avoids the essentialist assumption that farming is “better” than
foraging. 2) The question allows us to view foraging and farming as alternative strategies
with fitness costs and benefits that are the outcome of forager-resource interactions. 3) The
question suggests that researchers use specific foraging models to rigorously asses the costs
vs. benefits of foraging and farming in different environments.
15

The cultivation of domesticates is the systematic control of growth, reproduction, com-
petition and dispersal within assemblages of plants, along with the distribution of water and
nutrients in space and time. The control of these basic ecosystem processes is not unique
to human societies that produce domesticated plants for food. Rather, the control of basic
ecosystems processes occurs in a wide range of hunter-gatherer societies to increase the
productivity of wild plants and hunted game- which I call here the low-level production
of food from“wild” resources (Anderson, 2005; Gould, 1971; Keeley, 1995; Smith, 2001).
Framed in this way, the cultivation of domesticated plants for food is really a specific in-
stance of a more general class of behaviors that alter ecosystem structures and increase the
productivity of food available to humans. This raises the more general question: in what
contexts do the benefits of modifying ecosystem structures to augment the productivity of
food in a given area outweigh the costs for individual foragers?
(b) Dynamic model
(a) Static model
Goal Effortallocation
OutputResource
Goal Effortallocation
OutputResource
Figure 1.2: General stick figure representations of a human-resource system. Picture (a)is a “static” model and picture (b) is a dynamic model. In the dynamic model, the foragingdecisions of humans and the resource base change at similar time-scales.
16

In the context of archaeological research, most studies guided by an evolutionary eco-
logical framework use static models of optimal behavior developed in the field of microe-
conomics. By the term static model I mean that human foraging dynamics play out on a
much faster time-scale than ecological dynamics; thus, the ecological system provides a
“static” context in which foragers make choices. These models assume that for any given
combination of environmental variables, there is a unique behavioral strategy that opti-
mizes an individual’s fitness, and the behaviors of human actors evolve toward this unique
strategy. Figure 1.2a is a representation of a static optimality model. There is a resource
that foragers need to decide how to use. The resource is controlled by an external input, like
rainfall or sunlight. Given a static resource, individuals allocate effort to obtain an output,
often energy. The output is compared to the assumed goal of a forager (e.g., maximize rate
of energy gain). Variation in the resource creates a continuum of trade-offs between strate-
gies for allocating effort (time) to meet a forager’s goal. Figures 1.3a & b illustrate how the
equilibrium state (unique solution to a model) of a forager-resource system changes when
there is a continuum of trade-offs between strategies for exploiting a resource. The blue
dots represent the state of a forager-resource system at a given ecological parameter that
determines the costs vs. benefits of individual behaviors. Though the state of the system
may change rapidly (Figure 1.3b), there is always a smooth continuum of unique equilib-
rium states that a forager-resource system can occupy. In sum, the value of the ecological
parameter determines the unique equilibrium state of the system and change is continuous,
which implies that one can observe a smooth continuum of states in reality.
Let me give a very brief example to illustrate the kind of model that generates the dy-
namics described by Figures 1.3a or b. In one of the most sophisticated applications of a
static foraging model to understand the adoption of maize by foragers, Barlow (2006) ar-
gues that the marginal rate of energy gain acquired from wild plants relative to the marginal
rate of energy gain acquired from cultivating maize determines an individual’s unique level
17

of investment in the production of maize. For simplicity here, let’s assume that the choice
an individual has to make is whether to invest in cultivating maize or harvesting mesquite
beans. Holding the time necessary to process mesquite beans constant, the primary deter-
minant of the marginal rate of energy gain from mesquite is the density of the resource on a
landscape. By analogy, the density of mesquite in an environment is the ecological param-
eter in Figure 1.3a or b. This implicitly assumes that the density of mesquite changes more
slowly than decisions about the effort to invest in the production of maize. As the density
of mesquite declines, selection pressures should favor increasing labor in the production of
maize because an individual invests more labor in the production of maize whenever the
marginal rate of energy gain from cultivating maize is higher than the marginal rate of gain
from collecting mesquite. Given this dynamic, there is a continuum of unique investment
levels in the production of maize.
Despite the strength and sophistication of static foraging models, such models have a
potential weakness. In coupled SES, the coevolutionary dynamics of individual decision
making and environmental structures may result in a special kind of nonlinear process, the
emergence of multiple stable states of human-resource interaction (e.g., Anderies, 2006,
1998; Clark, 1976; Flannery, 1985; Freeman and Anderies, 2012; Janssen et al., 2003).
Multiple stables states refers to the idea that there are discrete ways that social-ecological
(or just ecological) systems could be organized under the same environmental conditions.
Multiple stable states may be characteristic of many social and ecological systems from
local scales to the global earth-climate system (Scheffer, 2009). The presence of multiple
stable states in a system can 1) have an effect on the costs vs. benefits of individual strate-
gies and/or 2) lead to transitions that are difficult to anticipate. The only way to investigate
the potential presence and effects of multiple stable states is with dynamic models. Figure
1.2b illustrates a stick-figure dynamic model. In Figure 1.2b the allocation of effort now
feeds back to affect the resource. This kind of feedback can lead to non-linearity, including
18

Ecological parameter
Syst
emst
ate
(c)
(b)
(a)
Ecological parameter
Syst
emst
ate
Ecological parameter
Syst
emst
ate
Figure 1.3: Different perspectives on the dynamics of change in social-ecological system(figures designed after Scheffer (2009). The black curves represent all of the possibleequilibrium states of a system for a given ecological parameter. The blue dots represent aunique equilibrium solution. The arrows indicate the direction that the system will moveover time if it is not in equilibrium.
19

the emergence of multiple stable states.
Figure 1.3c illustrates the view that there are two alternative stable states that a human-
resource system might obtain represented by the two solid black curves. Again, changes in
the ecological parameter cause changes in the equilibrium state of the system. However, in
the gray shaded area there are two possible stable equilibrium states that the system might
obtain for the exact same values of the ecological parameter. In addition, perturbations
might cause an abrupt shift between the two possible states of the system. This is known
as a variance induced critical transition (Scheffer, 2009).
Lets return to mesquite and maize to provide a concrete illustration of the kind of dy-
namics illustrated in Figure 1.3c. Flannery (1985) examines the potential trade-offs be-
tween clearing mesquite forests to plant maize and collecting mesquite from a systems
perspective in the Valley of Oaxaca, Mexico. Flannery (1985:505) states,
“With maize crossing the the 250 kg/ha threshold, a new loop in the system
was established; mesquite trees were cut down to make way for maize, and al-
though preceramic peoples continued to collect mesquite pods, they were har-
vesting from ever dwindling Prosopis groves. Instead of propagating mesquite
seeds by their collecting and threshing behavior, they were propagating maize
kernels by eliminating mature mesquite.”
In this example, the ecological parameter is the productivity of maize controlled by
slow genetic changes in the population of plants managed by early Mesoamerican forager-
farmers. The equilibrium system state is the amount of area covered by mesquite, which
determines how much mesquite is collected. If we analogize Flannery’s argument to Figure
1.3c, then an increase in the productivity of maize causes a decrease in the level of effort
devoted to the collection of mesquite because foragers choose to plant more maize and cut
down mesquite as the productivity of maize increases. In this case, the 250 kg/ha threshold
20

is marked by the thick red line. Once maize productivity hits this threshold, farmers rapidly
shift toward a low effort invested in collecting mesquite and high effort devoted to the
production of maize. The dynamic that Flannery’s argument is missing, however, is that
when maize productivity hits the dashed red line, the system might become vulnerable to a
variance induced critical transition.
In Flannery’s argument, the whole reason the shift between equilibrium states occurs is
because, at the red line, deforestation and seed consumption decrease the rate of mesquite
reproduction past a critical threshold. Deforestation and consumption, however, are not
the only process that might deplete mesquite. There are shocks that constantly hit a so-
cial or ecological system generated by dynamics such as atmospheric variation and pest
cycles. For example, a disease outbreak could shock a mesquite forest and cause a decline
in mesquite forest cover. In the gray shaded area of Figure 1.3c, this shock could stimulate
forager-farmers to compensate by growing more maize despite the fact that productivity
is, on average, below the 250 threshold. This behavior, in turn, might drive the rate of
mesquite reproduction too low for a forest to recover and forager-farmers end up in an en-
vironment with a low density of mesquite trees and a high investment in the production
of maize. The resilience of the high mesquite cover system state is defined by how big of
a perturbation to the mesquite forest is required to push the system into the low mesquite
cover, high maize production state.
The potential existence of multiple stable states due to non-linear feedbacks suggests a
third reformulation of research into subsistence change in hunter-gatherer societies and the
adoption of domesticated plants. Rather than simply study the costs and benefits of cul-
tivating domesticates relative to wild resources in different static environments, research
questions must also focus on how the structure of a human-resource system feeds back
on the costs and benefits of individual decisions. In the example above, once the high
mesquite collection system state becomes vulnerable to variation, such as a pest outbreak,
21

the robustness of individual’s mesquite collecting goal may become uncertain. In such a
situation, the costs vs. benefits of collecting mesquite vs. producing maize may change
for individuals. Questions about the effects of feedbacks on the costs and benefits of indi-
vidual strategies compliment the foraging models traditionally applied by archaeologists to
understand changes in hunter-gatherer subsistence and the adoption of agriculture.
Let’s Get it Started in Here
In the remainder of this dissertation, I review models of hunter-gatherer subsistence
change that propose feedbacks between foragers and resources drive the evolution of hunter-
gatherer SES. I use these models as a starting point to develop the first principles of forager-
resource dynamics. In chapters 3 and 4, I use these first principles to frame a simple, dy-
namic forager-resource model. I use the model to develop two hypotheses that identify the
social-ecological conditions that favor strategies of food production and ownership institu-
tions. In chapter 5, I evaluate the consistency of these explanations with large ethnographic
and environmental data sets. In chapter 6, I sketch out the implications of my analysis
for understanding the prehistoric adoption of maize agriculture at the expense of hunting
and gathering in the US Southwest. I also summarize the implications of my research for
understanding the long-term evolution of forager-resource systems in general.
22

Chapter 2
INTELLECTUAL FOUNDATION: FEEDBACK PROCESSES IN HUMAN ECOLOGY
Anthropologists have long argued that a prerequisite to explain the adoption of domesti-
cated plants by hunter-gatherers is a knowledge of the processes that cause hunter-gatherer
social-ecological systems (SES) to change (e.g., Binford, 1983; Childe, 1928; Cohen, 1977;
Flannery, 1985, 1973; Hassan, 1981; Hayden, 1981; Keeley, 1995; Pryor, 1986; Stiner et al.,
1999; Winterhalder et al., 1988 and many others). In this chapter, I briefly describe the
deep intellectual traditions in human ecology that inform models of subsistence change in
hunter-gatherer societies. This review is necessarily selective. A comprehensive review
could fill several volumes. I have two related goals. The first goal is to situate specific
models of hunter-gatherer subsistence change within more general models of economic
development. Models of economic development describe how feedback processes in SES
might drive cultural evolution. The second goal is to propose a set of first principles that
describe the dynamics of forager-resource interactions. These first principles provide a
qualitative base upon which I model the coevolution of foragers and resources in chap-
ters 3 and 4 and investigate the robustness of hunter-gatherer preferences to environmental
change.
This chapter is divided into three sections. In the first section I briefly review mod-
els of economic development, in particular: the Malthusian, Weberian and Boserupian
models. Models of economic development are are intimately related to theories of cul-
tural evolution, the main difference being the time-scale on which these processes play
out (Richerson and Boyd, 1998), and these models have greatly influenced archaeolog-
ical explanations of subsistence change. This review provides a general framework for
describing the feedback structure of specific models that archaeologist propose to explain
23

subsistence change in hunter-gatherer SES. The second section reviews three models of
subsistence change in hunter-gatherer SES proposed by archaeologists. The three models
are the traveler-processor model (Bettinger, 1991), the packing model (Binford, 2001) and
a modified version of the model of economic defensibility (Smith, 2012). These models
provide the qualitative baseline that I begin from to quantitatively model the coevolution of
foragers and resources in chapters 3 and 4. Finally, I describe a general framework to study
the evolution of SES. The framework achieves two aims. First, this general framework in-
tegrates aspects of the Malthusian, Weberian and Boserupian general models of economic
development. Second, the framework provides a set of overarching assumptions that guide
my inquiry.
General Models of Economic Development
The history of human ecology is like one long dialog between competing models of
economic development. Models of economic development are sets of statements about the
processes that cause SES to change. Here, I describe three general models: The Malthu-
sian, the Weberian and the Boserupian models. The primary differences between these
general arguments is where researchers identify the locus of cause, that is, the environ-
mental structure that induces change in SES and the structure of feedbacks that relate the
elements of an SES. My comparison of these models provides an intellectual background
for comparing specific models of subsistence change in hunter-gatherer SES.
The history of intellectual thought on subsistence change is closely tied to models
of economic development because these models were devised to understand agricultural
change and the development of capitalist markets. Each general model discussed here pos-
tulates the social or ecological conditions that cause the intensification of food production.
The concept of intensification is generally defined as the process whereby an individual or
population extracts more food from a given unit of space (Binford, 2001; Richerson et al.,
24

2001; Netting, 1993; Boserup, 1965). Scholars interested in the transition from hunting
and gathering to agriculture have long sought to link the process of intensification with the
adoption of agricultural by hunter-gatherers (e.g., Binford, 2001, 1983, 1968; Braidwood,
1960; Flannery, 1968; Hayden, 1981; Layton et al., 1991; Redding, 1988; Richerson et al.,
2001; Smith, 2012; Wills, 1988; Zvelebil, 1996). This linkage is logical. The adoption of
techniques that manage ecosystem processes and the dispersal of particular species facil-
itates the ability of individuals to augment the production of food from a given parcel of
land (Hayden, 1981; Keeley, 1995). An extreme example of this process is the applica-
tion of manure to agricultural plots. This behavior subsidizes the availability of nutrients
that limit the rate at which plants can produce biomass on a given plot of land. Human
foragers engage in similar kinds of ecosystem management to increase the availability of
food, though often less labor intensive, such as the systematic burning of vegetation, re-
planting tubers or dispersing the seeds of desired grasses-low-level food production (Bird
et al., 2005; Keeley, 1995; Smith, 2001).
Boserup (1996) has developed an interdisciplinary framework for comparing models
of economic development, and I have adopted her framework here. According to Boserup
(1996), models of development are best characterized by the interaction of six environ-
mental structures: culture (C), family organization (F), occupational structure (O), popu-
lation (P), technology (T) and the biophysical environment (E). As Lemmen (2011) notes,
these six organizational structures can be collapsed into four structures: population (P),
the biophysical environment (E), culture (C) and technology (T). In this simplified frame-
work, culture (C) represents the human capital (i.e., knowledge) possessed by individuals
within social groups, as well as the social capital of a group the stems from the forma-
tion and maintenance of cooperative institutions. As such, culture is an aggregation of
Boserup (1996)’s culture (C) and family structure (F) categories. Technology is aggregated
to include physical artifacts, as well as organizational forms like the “assembly line,” and,
25

as such, technology and occupational structure are aggregated into a single technological
structure. In this four structure scheme, culture (C) and technology (T) are really a single
“infrastructure” dimension, separated for analytical convenience, that mediates the inter-
face of a human population with the biophysical environment (see Catton, 1987).
Figure 2.1 compares the proposed dynamics of the Malthusian, Weberian and Boseru-
pian models of economic development. The basic Malthusian model is characterized
by a P-to-E-to-P (Figure 2.1a) feedback loop. According to Malthus, Population, when
unchecked, increases at a geometrical ratio. Subsistence increases only in an arithmetical
ratio. A slight acquaintance with numbers will show the immensity of the first power in
comparison with the second (Malthus, 1888:4). In the Malthusian view, the world has a
finite amount of agricultural land, thus population growth necessitates that farmers expend
more labor on inferior land in an attempt to boost their supply of food. However, this strat-
egy cannot keep pace with population growth and, eventually, a scarcity of food will cause
population growth to cease and, potentially, decline. In this argument, it is the quality of
the environment that ultimately limits the size of a population in a given area; long-term
increases in population size only occur if some external force increases the quality of the
environment. The Malthusian model, thus, proposes that the intensification of agricultural
production is limited by the fact that population grows faster than farmers can increase
their production of food. In my view, purely Malthusian arguments are very rare in the ar-
chaeological literature on subsistence change (although Bettinger (1991) and Zeder (2006)
characterize Binford (1968) as a Malthusian argument).
Neo-Malthusian arguments, however, are more common. In the Neo-Malthusian view,
technology (T) (or culture (C)) mediates the population-environment feedback loop, be-
cause technology partly determines the productive capacity of a biophysical environment.
For example, to explain the emergence of agriculture Richerson et al. (2001) argue that the
amelioration of the Pleistocene climate set off a population-technological innovation pos-
26

P
E
C T
P
E
C T
P
E
C T
c) Boserup
b) Weber/Wittfogel
a) Malthus/Neo-Malthus
Figure 2.1: General models of economic development
27
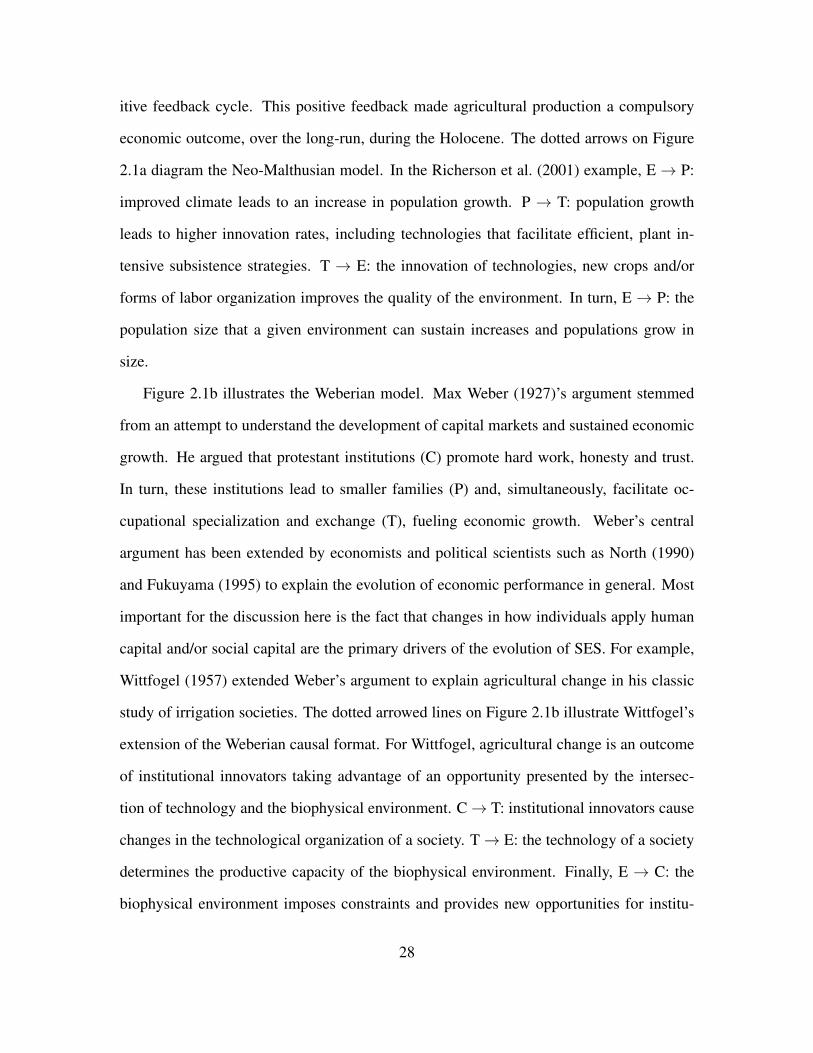
itive feedback cycle. This positive feedback made agricultural production a compulsory
economic outcome, over the long-run, during the Holocene. The dotted arrows on Figure
2.1a diagram the Neo-Malthusian model. In the Richerson et al. (2001) example, E→ P:
improved climate leads to an increase in population growth. P → T: population growth
leads to higher innovation rates, including technologies that facilitate efficient, plant in-
tensive subsistence strategies. T → E: the innovation of technologies, new crops and/or
forms of labor organization improves the quality of the environment. In turn, E→ P: the
population size that a given environment can sustain increases and populations grow in
size.
Figure 2.1b illustrates the Weberian model. Max Weber (1927)’s argument stemmed
from an attempt to understand the development of capital markets and sustained economic
growth. He argued that protestant institutions (C) promote hard work, honesty and trust.
In turn, these institutions lead to smaller families (P) and, simultaneously, facilitate oc-
cupational specialization and exchange (T), fueling economic growth. Weber’s central
argument has been extended by economists and political scientists such as North (1990)
and Fukuyama (1995) to explain the evolution of economic performance in general. Most
important for the discussion here is the fact that changes in how individuals apply human
capital and/or social capital are the primary drivers of the evolution of SES. For example,
Wittfogel (1957) extended Weber’s argument to explain agricultural change in his classic
study of irrigation societies. The dotted arrowed lines on Figure 2.1b illustrate Wittfogel’s
extension of the Weberian causal format. For Wittfogel, agricultural change is an outcome
of institutional innovators taking advantage of an opportunity presented by the intersec-
tion of technology and the biophysical environment. C→ T: institutional innovators cause
changes in the technological organization of a society. T→ E: the technology of a society
determines the productive capacity of the biophysical environment. Finally, E → C: the
biophysical environment imposes constraints and provides new opportunities for institu-
28

tional innovation. Wittfogel (1957:19) states this position succinctly in his discussion of
the evolution of managerial institutions to coordinate irrigation systems:
“The pioneers of hydraulic agriculture, like the pioneers of rainfall farming,
were unaware of the ultimate consequences of their choice. Pursuing recog-
nized advantage, they initiated an institutional development which led far be-
yond the starting point. Their heirs and successors built colossal political and
social structures; but they did so at the cost of many of those freedoms which
conservative dissenters endeavored and, in part, were able to preserve.”
Note, in this context “conservative dissenters” refers to social groups who eschewed irriga-
tion agriculture and maintained a rainfed agricultural system (see Wittfogel, 1957:15-19).
The Weberian argument in which culture (conceived of as knowledge and institutions)
drives subsistence change is common in archaeology. In my view, there are two forms of
Weberian argument developed by archaeologists. A social capital argument is exemplified
by Hayden (2003) (see also Bender, 1978; Brookfield, 1984; Hayden, 1990, 1998; Sahlins,
1972). Hayden argues that humans have an innate desire to acquire power and prestige.
Institutional innovators invest in the domestication of plants (and animals) to create a set
of luxury goods that are produced at a minimum cost, in the short-run, to increase an indi-
vidual’s prestige through social practices, such as feasting. This is a basic C-to-T structural
relationship. However, the long-term effect is that domesticated plants become inexpensive
and widely available due to genetic changes (Hayden, 2003). This population level change
in domesticated species increases the productivity of an environment and allows all for-
agers to intensify their land use through the cheap manipulation of ecosystem structures (T
→ E). In turn, institutional innovators must devise new ways to maximize their power and
prestige given the new properties of the biophysical environment (E→ C). In this Weberian
argument, changes in population are dependent on the T→ E→ C→ T feedback loop.
29

Alternatively, Braidwood (1960) makes a human capital argument for the adoption of
agriculture. This argument relies on the application of knowledge to create a better fit with
the environment, as opposed to institutional innovation per se. In this argument, knowledge
of an ecosystem’s processes (the human capital component of C) allows hunter-gatherers to
recognize the benefits of domesticating plants and animals (T). As Braidwood (1960:134)
states:
“[A]round8000 B.C. the inhabitants of the hills around the fertile crescent had
come to know their habitat so well that they were beginning to domesticate the
plants and animals they had been collecting and hunting.”
Domestication allows foragers to extract more food from the environment (E) and improve
their lives (the assumption being that farmers live “better” lives than foragers). In turn,
changes in the biophysical environment set the new conditions in which individuals con-
tinue to learn how to most effectively exploit resources and improve their lives. This is
a C → T → E → C feedback loop. Again, in this argument P is a dependent variable;
population growth is an outcome of foragers getting better at exploiting resources.
Finally, the Boserupian model is depicted by Figure 2.1c. As Boserup (1981:5-6) sums-
up her argument,
“A growing population gradually exhausts certain types of natural resources,
such as timber, virgin land, game, and fresh water supplies, and is forced to
reduce its numbers by emigration or change its traditional use of resources and
way of life. Increasing populations must substitute resources such as labor
for the natural resources which have become scarce. They must invest labor
in creation of amenities or equipment for which there was no need so long
as population was smaller. Thus, the increase of population within an area
provides an incentive to replace natural resources by labor and capital.”
30

The Boserupian model proposes a P-to-E-to-T-to-P feedback loop. P → E: population
growth within a bounded area causes a degradation of the biophysical environment. In turn,
E→ T (or C): farmers face declining per capita production and are stimulated to adapt their
technology and institutions to mitigate declines in productivity. T → P: where social or
technological innovation is successful, population growth continues. The central feature of
the Boserupian argument is that social-technological change occurs as individuals respond
to the degradation of the biophysical environment.
Hunter-gatherer Subsistence Change
With a descriptive scheme in place for describing models of SES change, I would now
like to examine three specific models of subsistence change and resource intensification in
hunter-gatherer SES. These three models are all specific instantiations of the general theo-
ries of economic development described above and provide the inspiration form my formal
investigation of the coevolution of foragers and resources in chapters 3 and 4. Each model
provides insight into the evolution of hunter-gatherer SES. However, each model also raises
questions that can only be answered by formally studying the feedback processes that affect
the robustness of an individual’s preferences and the resilience of forager-resource systems
to environmental change.
1. Traveler-processors
Bettinger and Baumhoff (1982) have proposed the traveler-processor model to explain
subsistence change in hunter-gatherer societies. In general, the traveler-processor model
is a Boserupian argument (Figure 2.2a). Specifically, the traveler-processor model qualita-
tively combines insights from the prey (also known as the “diet breadth model”) and patch
choice foraging models developed in evolutionary ecology (Charnov, 1976; MacArthur and
Pianka, 1966; Stephens and Krebs, 1986). As was common in early optimal foraging mod-
31

els, the traveler-processor model assumes that individual foragers are rational actors and
maximize the rate at which they obtain energy, which allows a forager to maximize her
reproductive success. In the traveler-processor model, foragers position themselves on a
landscape that is composed of many potential resource patches. Individuals can allocate
their time to 1) travel between patches, 2) search for food within a patch, 3) peruse/harvest
resources within a patch and 4) process resources post harvest. These categories, in the
model, are mutually exclusive activities to which a forager can allocate her time. Further,
following the prey choice model, a basic assumption of the traveler-processor model is that
processing time is inversely related to the quality of prey that forgers harvest.
Given the assumptions described above, the traveler-processor model describes a con-
tinuum of behavioral strategies that foragers use to maximize their rate of energy gain.
The population density of an environment determines the strategy that best minimizes the
time that a forager invests in the acquisition of food and maximizes the time available for
an individual forager to engage in other kinds of behaviors that maximize an individual’s
fitness (Bettinger, 1999:41-42;Winterhalder, 1983). Bettinger and Baumhoff (1982) argue
that when population density is low, the optimal strategy for an individual to maximize her
energy return rate (Kcals/time) is to minimize the time that she spends searching for re-
sources within a patch and move frequently between patches within a habitat. Holding all
other factors equal, as the population density of foragers in an environment increases, the
availability of high quality prey within resource patches declines (P→ E) and, in response,
foragers expand their diet breadth to include lower quality, more abundant resources (E
→ T) (Bettinger, 1991). The increase in processing time associated with harvesting lower
quality resources necessitates that foragers give-up time doing other activities, like trav-
eling between patches. As population density increases, foragers are expected to spend
more and more time maximizing the quantity of energy obtained from any given patch be-
cause this strategy maximizes an individual’s rate of energy gain better than spending time
32

moving between patches in search of high quality prey.
An interesting feature of the traveler-processor model is that foragers maximize the
quantity of energy taken from a patch to adapt to a context of resource depression caused
by increases in population density relative to high quality prey. This adaptation, Bettinger
(1991:102) argues, creates a situation in which female labor is highly valued to maximize
the returns gained from processing low-quality resources, and this leads to more population
growth. “The most obvious avenue leading to this is that in which, as suggested, female
infanticide is curtailed to make female labor available for resource processing” (Bettinger,
1991:102). This proposed process completes the feedback circuit: T→ C→ P.
2. Landscape “packing”
Binford (1999, 2001) has proposed the packing model, which also has theoretical un-
derpinnings in ecology (e.g., MacArthur, 1972:64-65). In my view, the packing model is
the basis of a Neo-Malthusian argument (Figure 2.2b). In this instance, it is important to
recognize that C and T are artificially separated, both refer to infrastructure used to medi-
ate human environment interactions. The basic idea is that hunter-gatherers aggregate into
basal camp groups that display an average size. These camping groups primarily exploit
a landscape by moving between foraging locations or resource zones. Population growth
drives a process of group segmentation and an increase in the number of basal camp groups
that occupy a landscape. Where all resource zones on a landscape have one camp group
in residence at the most dispersed phase of an annual settlement cycle, the landscape is
“packed” (Binford, 2001:238-239), and camp groups must either fight or cooperate to use
resources beyond their own compressed territories (P→ C). Binford (1999:7-8) argues that
the process of foraging territory compression to avoid conflict favors reductions in residen-
tial mobility, less reliance on animals of large body size and the targeting of food resources
with high rates of productivity (Binford, 2001:365-370) (C→ T).
33

Importantly, technology (resource selection) sets the “packing capacity” (as opposed
to the carrying capacity) of a biophysical environment (T→ E) because the resources that
foragers target partly determines how much space a basal camp group needs to meet their
subsistence needs (Binford, 2001:381). According to Binford (2001), foragers who primar-
ily hunt for food become packed on a landscape at a density of approximately 1.5 people
per 100 km2, while foragers who primarily harvest plants become packed at a population
density of approximately 9 people per 100 km2. The dynamic scenario envisioned by Bin-
ford is one in which the technologically mediated biophysical environment determines the
ability of basal camp groups to segment and reduce their territory without paying the costs
to cooperate or fight for territory beyond their compressed own ranges (E → P). Binford
states:
one [packing] threshold does not replace the other; rather, different constraints
on groups size and subsistence strategy operate on groups whose diets are made
up of resources from different trophic levels” (Binford, 2001:381) brackets
mine.
The implication is clear. The technologically mediated biophysical environment sets the
“packing capacity” of the environment, which constrains the ability of basal camp groups
to segment in response to population growth.
As discussed below, both the packing and traveler-processor models postulate complete
feedback circuits; all of the elements (P, C, T, & E) “co-influence” one another. The con-
sequence is that making a clean distinction between the most general models of economic
development is difficult. Indeed, this is a reason why dynamic modeling is needed.
34

P
E
C T
P
E
C T
P
E
C T
c) Economic defensibility
b) Packing
a) Traveler-processor
Figure 2.2: A comparison of three models of subsistence change in hunter-gatherer SES.The circles highlight the environmental structure identified as the causal locus of change inthe text.
35

3. Economic Defensibility
Recently, Zeder (2012) and Smith (2012) have proposed a model that I call here the
modified model of economic defensibility after Dyson-Hudson and Smith (1978). They
argue that their model provides a foundation for understanding the use of space by hunter-
gatherers and subsistence change. This modified model of economic defensibility is a
specific example of the more general Weberian model (Figure 2.2c) and extends arguments
made by Smith (1989), Rindos (1984) and Braidwood (1960).
The original model of economic defensibility is based on the evolutionary ecology of
stationary, pair bonding non-human foragers (Brown, 1964). In the formulation presented
by Dyson-Hudson and Smith (1978), the abundance and predictability of resources de-
termine the costs and benefits, in terms of maximizing energy return rates of defending
a territory for individuals. In the model of economic defensibility, where resources are
abundant and predictable (relative to a given population density), territories are expected to
shrink because an individual forager can maximize his net intake of energy by harvesting
food from less territory (Dyson-Hudson and Smith, 1978). In turn, the size of a territory
used by foragers decreases and, as a consequence, the costs of patrolling and defending a
territory also decrease because there is less time and energy needed to monitor and locate
intruders. Given the relationship between resource density, territory size and defense costs,
foragers are expected to use less space, become less mobile and defend their territory as re-
sources become more concentrated in space and time (E→ C) (Dyson-Hudson and Smith,
1978; Kelly, 1995; Smith, 1988; Zeder, 2012).
Smith (2012) and Zeder (2012) build on the logic of the model of economic defensi-
bility to understand how the intensification of land use and the cultivation of domesticated
plants might evolve in a forager-resource system. Drawing on the idea of symmetrical adap-
tation in which human foragers modify an environment to suit their needs, Smith (2012)
36

and Zeder (2012) propose a positive relationship between the modification of ecosystems
by hunter-gatherers to produce food and an increase in the concentration of resources in
an environment (T→ E). When this proposed relationship is combined with the model of
economic defensibility, the behaviors that foragers use to modify ecosystem structures (like
systematic burning, planting and weeding) augment the productivity of resources, and, in
turn, the increased concentration of resources allows individuals to adopt strategies that
exclude others from a territory because this strategy maximizes an individual’s return rate.
Given these relationships, Smith (2012:267) argues that systems of traditional ecological
knowledge (TEK) are updated in a population of foragers to take advantage of the future
opportunity that managing ecosystem productivity provides. When resources are abundant
and predictable, foragers are expected to decrease the amount of territory that they use, be-
come more territorial and invest in food production in a mutually reinforcing cycle (C→ T
→ E→ C). According to Zeder (2012:253) the model of economic defensibility: “provides
a framework for understanding how reduced mobility can come about within the context of
resource abundance and predictability in the absence of population pressure.” Thus, popu-
lation density is dependent upon the C→ T→ E→ C feedback loop. This is a Weberian
model par excellence.
Feedbacks in hunter-gatherer SES
Figure 2.2 illustrates two important characteristics shared by each of the three models.
First, although each specific model identifies an environmental structure that drives change,
each model clearly presupposes feedback loops. This means that any of the environmental
structures involved in the feedback loop might, in a simplistic sense, cause a hunter-gatherer
SES to change. Second, due to the presence of feedback loops, all three models imply that
system dynamics are important to consider. Certainly, it is individual foragers that select
strategies for harvesting resources and create the interconnections between environmental
37

structures. However, the presence of feedback loops introduces the possibility of non-
linearity and, as discussed in chapter 1, the possibility of multiple stable states. Non-
linear changes in the structure of a system may affect the costs and benefits of the foraging
strategies that individuals select in ways that are hard to predict or intuit. We simply cannot
know if multiple-stable states emerge from the presence of feedbacks and the subsequent
effect of such a situation on the costs and benefits of foraging for individuals without the
formal study of dynamic forager-resource systems.
The primary difference between the three models discussed above is the structure of
the feedback loops that link environmental structures. The traveler-processor and packing
models both suggest a complete circuit in which P, C, T, and E are linked. In these mod-
els, there is no truly independent and dependent environmental structure. Conversely, the
modified model of economic defensibility, discussed in more detail below, suggests that
population is dependent on the quality of the biophysical environment, which depends on
the C, T, E feedback loop.
The traveler-processor and packing models both describe a complete structural feed-
back loop (i.e., P, E, T & C are all linked). However, the form of the feedback loop in
each model is slightly distinct. The main difference between these two models is the em-
phasis placed on the mechanism of direct vs. indirect competition. In the packing model,
the formation of more basal camp groups on a landscape increases direct competition for
resources; this competition “stresses” institutional rules, like kinship obligations to allow
free access to a territory for relatives (P→ C). In terms of economics, the number of basal
camp groups in an environment partly determines the transaction costs of interaction be-
tween camp groups. Transaction costs, in this case, are those costs incurred, either in time
or energy, to gain access to resources; or simply the costs of economic activity (North,
1990). The traveler-processor model places emphasis on indirect competition. An increase
in population density degrades the availability of high quality prey and this increases the
38

search and processing costs that individuals pay to obtain food (P→E).
My juxtaposition of the traveler-processor and packing models implies that increases
in population density affect either the costs associated with exploiting the biophysical en-
vironment or the costs of interacting with other forgers. Of course, population density can
affect both simultaneously, and, if so, we might expect that increases in population density
have an increasing, non-linear affect on the costs associated with accessing resources.
Another subtle difference between the traveler-processor and packing models is the
causal role of individuals and system level attributes. This difference captures a tension be-
tween systems explanations and individual level explanations in models of hunter-gatherer
SES (e.g., Kelly, 1995:45-48; Winterhalder, 2002:221). Bettinger (1991) emphasizes the
drive of individuals to maximize their fitness; natural selection favors the best fitness max-
imizing behavior over time. Changes in hunter-gatherer systems are, thus, the sum of
changes in individual foraging behaviors. In Binford’s view, packing is a continuous,
deterministic process whereby the formation of new camp groups on a landscape causes
camp groups to reduce their territory and sacrifice the collection of information (Binford,
1983:208-210) until a technologically determined threshold of camp group density is hit.
When a landscape reaches the point where it is filled-up with basic camp groups, the land-
scape has reached a point of self-organized criticality (Binford, 1999). On a filled-up
landscape, the formation of just one new camp group will send a cascade of unresolved
competition through a hunter-gatherer SES (Binford, 2001). When this occurs, a break
occurs where new hunter-gatherer systems must emerge. “The break in continuity and the
new forms that appear directly after the packing threshold could not be anticipated, even
if one had full knowledge of the systems extant prior to reaching the [packing] threshold”
(Binford, 1999:9 brackets mine).
The dynamic model developed in chapters 3 is a tool that facilitates the study of how
individual foraging decisions scale-up to effect the dynamics of resources at the system
39

level, and, in turn, how resource dynamics feedback down to impact the costs and ben-
efits of individual foraging strategies. As discussed in chapter 1, when systems contain
feedbacks, they might exhibit multiple stable states. In chapter 3 I begin to investigate how
feedbacks between foragers and resources effect the long-term evolution of hunter-gatherer
SES. I specifically investigate whether a dynamic model built on first principles of human
behavior and resource dynamics can lead to multiple stable states. Given the presence of
multiple stable states, I begin to investigate the mechanisms that might drive social and
technological change in forager-resource systems.
This Weberian causal structure of the modified model of economic defensibility is quite
different from the traveler-processor and packing models. This causal structure necessitates
that population density is a dependent variable. Similar to the argument made by Braid-
wood (1960), Smith (2012:267) argues that where resources become more abundant and
predictable, foragers are able to develop a detailed knowledge of ecosystems and manip-
ulate ecosystems to boost the long-term productivity of food. This strategy “should be
viewed as a purposeful activity that seeks to shape the environment in ways that directly
and in the long-term promote the viability of groups that practice this behavior” (Zeder,
2012:258).
There is a straight forward logic here. An increase in an individual or group’s knowl-
edge of ecosystem dynamics facilitates increases in the productivity of the resources that
foragers desire, which drives the relative benefits-to-costs of territoriality up for individu-
als. In turn,
“the concept of ownership and the growing commitment to maintaining a group’s
investment in the territory serves as an additional incentive to engage in niche
construction activities. In fact, increased investment in ecosystem engineering
is another likely response, along with reduced mobility and territorial defense,
to environments with abundant and predictable resources” (Zeder, 2012:259).
40

The catalyst, then, that accelerates the C, T, E feedback loop is the development of institu-
tions of ownership that allow individuals to reap the gains of investments made to increase
the long-term productivity of a resource base.
There are two unresolved questions associated with this argument. First, it makes no
sense to defend a territory if there is no competition for resources. As Dyson-Hudson and
Smith (1978:25) state “[i]f a resource is so abundant that its availability or rate of cap-
ture is not in any way limiting to a population, then there is no benefit to be gained by its
defense and territoriality is not expected to occur.” Thus, by increasing the abundance and
predictability of resources through low-level food production strategies, like systematically
burning vegetation, foragers might reduce competition so much that there is no one to de-
fend resources from. In this situation, we might expect small and stable territories, but no
incentive to develop institutions of ownership and defense. However, as Rosenberg (1990)
suggests, where resources are abundant and predictable, population growth and increases in
population density should occur. This situation could, in turn, feed back through a forager-
resource system and affect a food supply. Clearly, there is an implicit relationship between
population density and the productivity of resources in the original model of economic de-
fensibility. In chapter 4, I further develop an evolutionary argument for the development of
food production following Smith (2012) and Zeder (2012). I formally consider the conse-
quences of “free” strategies of low-level food production and the affects of such strategies
on individual foragers.
Second, managing resources for the long-term would only makes sense if a social-
ecological environment has a requisite amount of stability. When systems are character-
ized by feedback processes, the internal dynamics of a system can create instability or
long-term uncertainties that make planning for the future difficult and/or costly. The mod-
ified model of economic defensibility raises a couple of interesting questions. 1) In what
social-ecological contexts does managing ecosystem structures to secure long-term bene-
41
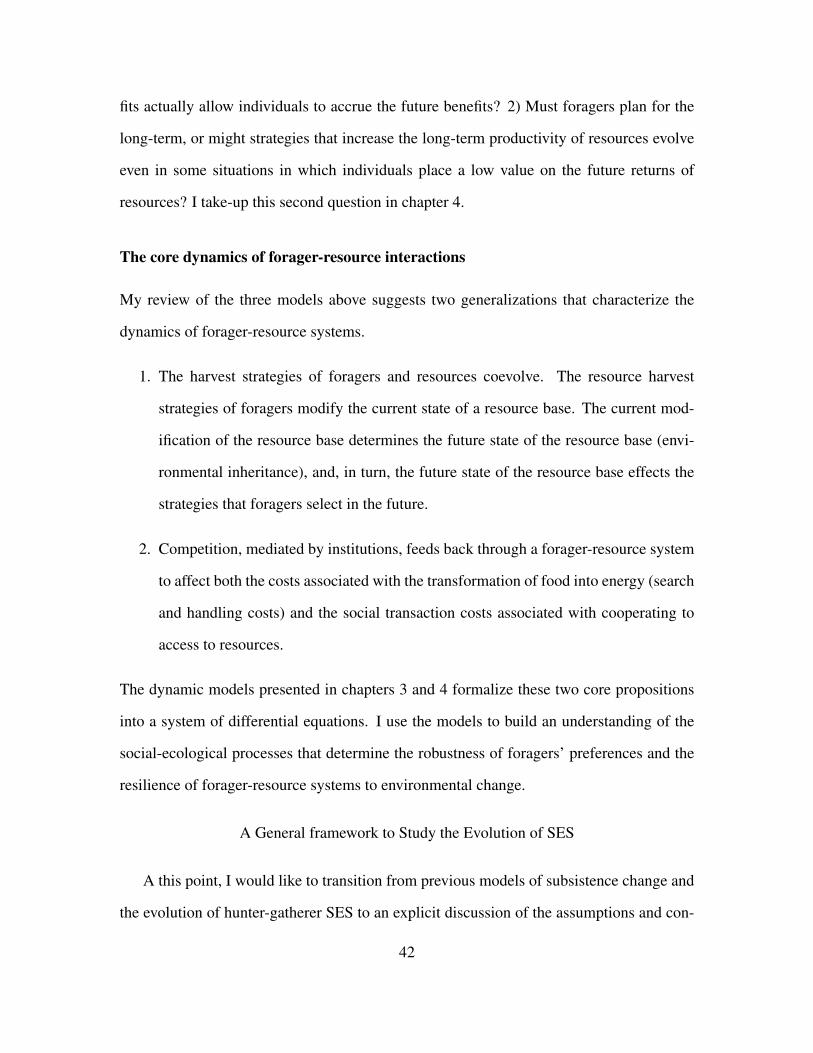
fits actually allow individuals to accrue the future benefits? 2) Must foragers plan for the
long-term, or might strategies that increase the long-term productivity of resources evolve
even in some situations in which individuals place a low value on the future returns of
resources? I take-up this second question in chapter 4.
The core dynamics of forager-resource interactions
My review of the three models above suggests two generalizations that characterize the
dynamics of forager-resource systems.
1. The harvest strategies of foragers and resources coevolve. The resource harvest
strategies of foragers modify the current state of a resource base. The current mod-
ification of the resource base determines the future state of the resource base (envi-
ronmental inheritance), and, in turn, the future state of the resource base effects the
strategies that foragers select in the future.
2. Competition, mediated by institutions, feeds back through a forager-resource system
to affect both the costs associated with the transformation of food into energy (search
and handling costs) and the social transaction costs associated with cooperating to
access to resources.
The dynamic models presented in chapters 3 and 4 formalize these two core propositions
into a system of differential equations. I use the models to build an understanding of the
social-ecological processes that determine the robustness of foragers’ preferences and the
resilience of forager-resource systems to environmental change.
A General framework to Study the Evolution of SES
A this point, I would like to transition from previous models of subsistence change and
the evolution of hunter-gatherer SES to an explicit discussion of the assumptions and con-
42

cepts that underpin my study. Figure 2.3 describes my general approach to understanding
the processes that drive the evolution of SES. The framework proposed in Figure 2.3 as-
sumes that SES are complex adaptive systems composed of agents that continually modify
and adapt to their social-ecological environment. SES are artificially bounded for research
purposes, but are always open systems through which energy, materials and information
flux. Figure 2.3 identifies four internal components of an SES. The four components are:
resource dynamics, resource users, infrastructure providers and the physical and social in-
frastructure that mediates forager-resource interactions. Anderies et al. (2004) originally
proposed this framework to study the robustness of SES to shocks in common pool re-
source settings. The shaded ovals place the components of the framework into the structural
scheme proposed by Boserup (1996).
Physical and social infrastructure
Resources
Resource users
Infrastructure providers
SES gradients
Biophysicalgradients
E
C & T
P1
2
3a
3b4
5
Figure 2.3: A general framework for the study of social-ecological systems. Figureadapted from Anderies et al. (2004).
Resource dynamics simply refer to key variables that characterize a resource base, for
example, growth rate, tolerance to frost or carrying capacity. The resource users and infras-
tructure providers are positions within a SES that might be held by an individual or group.
The resource users in this case are foragers. Variables such as population density char-
acterize an aggregate attribute of the resource users in a system and preferences, such as
43

minimizing harvest time, characterize individual foragers. Infrastructure providers refers to
the individuals or groups in a position to construct physical infrastructure (a wall or fishing
weir) and create social infrastructure (rules and norms about resource use). Physical infras-
tructure is the hard technology that facilitates the harvest and consumption of resources.
Social infrastructure is the soft technology that partly determines the benefits and costs of
cooperative and competitive behaviors (i.e., social transaction costs) in a system.
The links between the components of the system describe the potential effects of one
component on other components. Link 1 is a feedback between resource users and the re-
source base. Link 2 denotes the effect of social and physical infrastructure on the feedback
dynamics of forager-resource interactions. In a generic hunter-gatherer SES, the resource
users and infrastructure providers are generally the same individuals. Thus, links 3a and
b denote the social sphere in which individuals adopt and negotiate physical and social
infrastructure. Link 4 denotes the impact of social and physical infrastructure on the den-
sity of a resource base. Finally, link 5 denotes the feedback between resource users and
infrastructure. In this framework, all of the internal components of a forager-resource sys-
tem are interrelated and mutually reinforcing due to the presence of feedbacks between the
components.
In addition to the internal factors described above, a SES is perturbed by at least two
external factors: biophysical gradients and other SES. Biophysical gradients are generated
by variables such as mean annual temperature or rainfall that directly impact the charac-
teristics of a resource base. The SES gradient refers to the matrix of SES systems with
which individuals in the system under study interact. The red arrows represent a dynamic
feedback between the external and internal factors over long time scales. For example, I
have argued that specialization in domesticated plants by one social group creates an op-
portunity for foragers who interact with this social group to adopt a method of agriculture
known as casual cultivation (Freeman, 2012a). The strategy of casual cultivation is one in
44

which foragers spend very little effort in the production of domesticated plants and incur
a high risk of total crop failure (Huckell et al., 2002). The availability of seeds or cuttings
made possible by the specialized agriculturalists on a metaphorical SES landscape allows
casually cultivating hunter-gatherers to replenish seeds and, again, take-up casual cultiva-
tion after an episode of crop loss. This is a long-term coevolutionary relationship that may
result in a matrix of distinct types of foraging-farming SES on a landscape.
Basic Analytical Concepts from Dynamical Systems Theory
As Anderies et al. (2004:2) note, the framework presented above
“identifies a broad set of variables and their linkages. Within any particular
framework, alternative theories are used to make broad predictions about the
effect of changes in relevant variables, and multiple models operationalize the-
ories using a variety of techniques.”
In this study I use the tools of dynamical systems to operationalize a forager-resource sys-
tem and study the affects of factors such as population density, the productivity of resources
and food production on the robustness of foragers’ supply of energy and time budget.
In turn, I leverage my knowledge of the effects of such factors on the robustness of for-
agers’ preferences to environmental change to propose two theories of subsistence change
in forager-resource systems.
In chapters 3 and 4 I model a general forager-resource system with two, coupled dif-
ferential equations. Dynamical systems theory is the formal study of such systems and
provides a foundation for understanding the behavior of systems characterized by coupled,
non-linear differential equations. The models that I present are quite simple as far as such
systems are concerned. Simple and general models always have the advantage that they can
be made more specific and/or complex to deal with any particular situation. To interpret the
45

dynamics of the hunter-gatherer SES model presented in the following chapters, I present
four analytical concepts drawn from dynamical system theory. These concepts provide a
qualitative description of the processes and behaviors that occur in a model system. This
is not a complete overview of dynamical systems theory. The purpose is to introduce con-
cepts that are used to analyze the simple forager-resource system presented in preceding
chapters. Interested readers can consult Edelstein-Keshet (2005) and Tu (1994) for formal
introductions to dynamical systems theory.
The first two concepts are attractor and repellor. An attractor is the set of equilibrium
system states toward which a dynamical system tends as time tends to infinity. The sim-
plest example of an attractor is a single stable equilibrium point, but attractors can be very
complex and involve infinitely many points. A repellor is a set of equilibrium system states
that a dynamical system tends to move away from as time tends to infinity. The simplest
example of a repellor is, again, a single unstable equilibrium point. By studying the sta-
bility properties of equilibria, we can investigate how slow changes in parameters, like the
growth rate of resources, affects the robustness of foragers’ supply of food to perturbations.
This knowledge, in turn, is useful for understanding the social-ecological contexts in which
a forager-resource system is vulnerable to critical transitions from a desirable to an undesir-
able collection of system states. Such vulnerability can introduce uncertainty into a system
and create an environment that favors the selection/copying of foraging strategies that re-
duce uncertainty and improves the robustness of individual foragers’ supply of energy to
environmental shocks.
Importantly, the concepts of attractor and repellor describe local behaviors of modeled
forager-resource interactions as opposed to the global structure of a dynamical system. A
stability landscape is a metaphor that helps illustrate the local dynamics of a system, as
well as the global structure of a dynamical system. In Figure 2.4 the two valleys represent
attractors and the peak a repellor. The global structure of this hypothetical system consists
46

attractor Aattractor B
repellor
Figure 2.4: An example stability landscape. The global structure of the system consists oftwo attractors and one repellor. The ball represents a particular moment in time at which asystem could exist. The ball in attractor A is“buzzing” as perturbations continually knockthe system out of local equilibrium. The arrows pointing down on each end of the landscapeare forces that can change the global structure of the system.
of two attractors separated by a repellor. On the valley bottoms and at the peak, the slope
of the landscape is zero-signifying that the system is in equilibrium. The valley walls
represent the slope or how quickly a system returns to equilibrium if perturbed away by a
shock. Notice that on the landscape represented by Figure 2.4, there are two attractors. If
a perturbation that knocks attractor A out of equilibrium is too large, the system may not
return to “A”, but, instead, get knocked into attractor B where the structure of feedbacks is
different. This is an “attractor shift” also called a critical transition. There is always slow
change in real systems and deviations from the long-run equilibrium state of a system.
When I refer to real systems, I will, therefore use the term dynamic attractor or regime.
The final concepts that I would like to discuss in more detail are resilience and robust-
ness. In the forager-resource systems that I operationalize in chapters 3 and 4, I study the
resilience of forager-resource system states to draw conclusions about the robustness of
foragers’ energy target and time budget to environmental change. As alluded to above, “A
dynamical system is said to be structurally stable if small perturbations to the system itself
result in a new dynamical system with qualitatively the same dynamics” (Jen, 2003:12).
Given this definition, I equate dynamic stability with Holling’s (1973:14) concept of re-
47

silience “that is a measure of the persistence of systems and of their ability to absorb change
and disturbance and still maintain the same relationships between populations or state vari-
ables.” Hereafter, I use the term resilience when I discuss modeled forager-resource system
states. Metaphorically, the resilience of an attractor is represented by the width and depth
of a valley on a stability landscape.
As noted in chapter 1, I define robustness as the ability of some unit (an individual or
a group) to obtain a performance measure when subject to unpredictable external shocks
or uncertainty associated with internal design parameters (compare Anderies et al., 2004:1;
Jen, 2003; Page, 2011:148-166). The difference between robustness and resilience is a
pretty subtle epistemological divide. The two terms are related, and the resilience of a
system can have enormous consequences for the robustness of a particular performance
measure. For example, if foragers can meet their performance goal in attractor A but not in
attractor B on Figure 2.4, then we can say that the performance goal of foragers is vulner-
able and potentially uncertain due to perturbations that might generate a critical transition
from “A” to “B.”
Given the above definition of robustness, any analysis of robustness requires answering
three questions: what is robust to what; robust for whom and robust for how long (Anderies
et al., 2007; Carpenter et al., 2001; Freeman et al., 2014; Jen, 2003)? In this study, the what-
to-what is the harvest output of foragers (chapter 3) and foragers’ time budget (chapter 4 to
both short-term shocks, generated by processes such as inter-annual deviation in rainfall,
as well as long-term changes, such as a decline in the mean productivity of a resource base.
The who is simply a modeled forager. The how long question in the theoretical work done
here is a matter of hundreds of years (200 model time steps to be exact).
48

Conclusion
Now, the fun begins! In the following chapters, I present dynamic models of a forager-
resource systems. The models build on and extend the ideas of Binford (2001), Bettinger
(1991), Smith (2012) and Zeder (2012). The result of this effort is two hypotheses that state
how the coevolution of foragers and resources cause the foraging strategies of individual
foragers to change, including the adoption of food production and territorial ownership.
These hypotheses provide a set of propositions that are evaluated through comparative en-
thoarchaeological research. In turn, the comparative ethnoarchaeological analysis provides
a more informed context for designing archaeological research.
49

Chapter 3
THE UNCERTAINTY REDUCTION HYPOTHESIS
As noted in chapter 1, no one can directly observe the past. This means that archaeological
research is a process of constructing webs of inference to explain major changes in the
archaeological record. All inferences are statements about what the world is like based
on background knowledge that we assume is correct or at least useful. As a consequence,
part of archaeological research should be the continual development and critical evaluation
of the background knowledge upon which inferences about the dynamics of past SES are
built. This is not an easy task. Ethnographic studies are conducted at scales of space and
time that are inappropriate for making inferences about long-term processes that play out
across organizational scales and over large geographic regions. Thus, I argue that dynamic
models are a core intellectual tool that aid in the quest to develop a corpus of background
knowledge for making inferences. Dynamic models bridge analytical scales and help frame
an analysis of large ethnographic data sets to identify basic principles of subsistence change
that are testable against archaeological data.
My purpose over the next two chapters is to build and use formal and conceptual models
to study feedback processes in hunter-gatherer SES and develop insight into how these
processes might cause foraging strategies to evolve. The model that I specifically study
in this chapter is a tool for understanding how individual foraging decisions scale-up to
affect the robustness of food output in a forager-resource system to environmental change,
and how the state of a system might feed back on the foraging strategies of individuals and
drive the evolution of hunter-gatherer SES. The model presented here is a stylized, baseline
hunter-gatherer SES originally developed by Freeman and Anderies (2012). This baseline
model formalizes the core propositions identified in chapter 2: i) foraging strategies and
50

the state of a resource base coevolve and ii) competition affects the transformation and
transaction costs of the acquisition of resources. I specifically ask, given the open-access
nature of resources among hunters and gatherers, how do changes in the productivity of
resources and population density affect the robustness of food output in a forager-resource
system to potential shocks, and how might the state of a system effect the selection of
foraging strategies by individuals?
In the remainder of this chapter, I present and analyze the hunter-gatherer SES devel-
oped by Freeman and Anderies (2012). Next, I re-scale the hunter-gatherer SES model
to conceptually model the dynamics of forager-resource systems operating at multiple
scales of space and time. The result of this exercise is what I call the Uncertainty Re-
duction Hypothesis (URH). This hypothesis proposes that when the resource productivity-
to-population density ratio of a global forager-resource system is low, foragers can, in part,
rely on natural capital (large scale ecosystem structures like forests) to modulate higher fre-
quency variation in climate that might affect the availability of resources. However, once
this ratio declines past a critical threshold, individual foragers begin to face a common pool
resource dilemma at more local scales where natural capital has no modulating effect on
higher frequency environmental variation. The consequence is a high degree of uncertainty
about where to locate in space and time to harvest a sufficient level of food. In this situa-
tion, selection and copying pressure favors strategies that generate social and technological
infrastructure that reduce the uncertainty associated with planning where to locate in space
and time to harvest resources.
A Baseline Hunter-gatherer SES
The Hunter-gatherer SES is a stylized model of consumer-resource dynamics devel-
oped by Freeman and Anderies (2012:Box 1). Consumer-resource models have a deep in-
tellectual tradition in the study of non-human foragers in ecology and commercial fisheries
51

in economics (e.g., Clark, 1976; Noy-Meir, 1975; Scheffer, 2009). However, consumer-
resource models have only been applied to understand to a handful of anthropological-
archaeological questions (e.g., Anderies, 1998, 2006; Janssen et al., 2003; Lee and Tu-
japurkar, 2008; Lee et al., 2009; Puleston and Tujapurkar, 2008; Taylor and Brander, 1998),
and such models are even more rare in the study of hunter-gatherers (e.g., Freeman and An-
deries, 2012; Winterhalder and Lu, 1997; Winterhalder, 1993; Winterhalder and Goland,
1993; Winterhalder et al., 1988). The hunter-gatherer SES presented here links the be-
havior of individual forager units with the basic dynamics of a resource base to study the
coevolution of individual decisions and the state of a resource base. The model is scaled
to investigate the conditions that affect the robustness of food output in a forager-resource
system within a single habitat embedded on a larger landscape of multiple habitats. This is
important to note because there is a nested hierarchy of forager-resource systems in which
individuals participate. The model is a story succinctly written as a set of coupled differen-
tial equations:
x = G(x)−H(x,e) (3.1)
e = D(x,e). (3.2)
Put into prose, the change in resource biomass (x) is equal to the growth of resources,
G(x) less the total biomass harvested by a group of foragers, H(x,e); e is the change in
harvest effort (workdays/day) that depends on a decision function, D(x,e). The decision
function stipulates how individual foragers allocate their time to the harvest of resources,
given the different social and ecological conditions that they encounter. Please note that
the equations are coupled. This means that the availability of resources depends on the
decision function, and the decisions of foragers depend on the state of a resource base at
time t, as well as how much effort is needed at time t. Interpreting the dynamics of this
52

story requires four assumptions stated by Freeman and Anderies (2012:423-424) that are
expanded upon here.
State Variables Definitions Default Valuesx(t) The density of resources (biomass/area) at time t variese(t) The harvest effort (workdays/day) at time t variesParameters Definitions Default Valuesr The mean intrinsic rate of resource growth (yr−1) 0.3K The mean carrying capacity for resources
(biomass/area)1
q The harvest coefficient (biomass/effort/standingbiomass)
0.2
p The population density of foragers 0.7γ The energy target per forager 0.05l The baseline processing coefficient (Kcals/unit
biomass/effort/forager)1
m Interference (Kcals/biomass/effort/forager) 0.7c Basal metabolic requirements (Kcals/time) 0.02α The biomass to energy conversion coefficient de-
fined in the textvaries
α1 and α2 Relative weights given to harvest per unit effortand energy deficits
0.1 and 4
β The sharpness of the transition between valuingenergy deficits over harvest per unit effort
3
Table 3.1: Model state variables and parameters
First, the individual forager in the model is a “household” that exploits open access
resources. This is a critical assumption because it means that foragers do not coordinate
their access to resources via formal rules that define who, when and where resources may
be accessed. Part of the reason this model is a “baseline” hunter-gatherer SES is because
resources are, initially, treated as open access. However, the interference coefficient (m) can
be used to simulate the potential effects of more restricted access to resources via formal
rules that coordinate the harvest of resources within the system (Freeman and Anderies,
2012). Further, the resources that foragers exploit are stationary resources, such as grasses,
nut bearing trees or jack rabbits that only have an annual range of 1 square kilometer (much
smaller than the potential annual range of a human forager).
53

Second, the model implicitly holds space constant at K, which is the carrying capacity
of resources in terms of biomass/area. K or any other model parameter discussed, is not
an absolute constant. The model structure allows one to systematically vary K. In the
model, the value of K always defines the size of the habitat that foragers use to harvest
resources. Practically, this means that the spatial scale described by the model is a choice
made by the modeler. This choice is dictated by the scale of the question that one asks.
In this case, I assume that foragers exploit a habitat embedded on a larger landscape that
contains multiple habitats. A habitat is, metaphorically, the area that foragers cover from a
central base camp in order to obtain food, thus modeled foragers are central place foragers
(Kelly, 1995). Although not formally included in the model, I implicitly assume in the
interpretation of the model’s dynamics that a habitat contains a collection homogeneous
resource patches that foragers might access on any given workday from a residential base
camp. Further, I implicitly assume that foragers have complete information regarding the
availability and location of resources within a habitat.
Third, the population density (p) of foragers is a parameter. Every potential variable
that characterize SES are dynamic. Real systems are always in a state of change. By
making population density a parameter, as with K, I avoid the assumption that population
density does not change. Rather, the assumption is that population density changes more
slowly than the variables in the model that are dynamic (Freeman and Anderies, 2012:424).
It is the judicious exploitation of time-scales by a researcher that, in part, gives dynamical
systems their power to illuminate the dynamics of complex systems (see Scheffer (2009:82-
83) for a very cogent discussion). In terms of interpretation, the assumption that population
density is a parameter means that, again, foragers use a habitat that is embedded on a land-
scape of multiple habitats and a population of foragers. Individual foragers continuously
flow through the various habitats on the landscape.
Finally, foraging effort (e) is the time spent to harvest resources (workdays/day). For
54

example, I assume that one workday is equivalent to eight hours, so e(t) = 1 = 8 hrs.
worked per day. The decision function in the model assumes that foragers adjust their
harvest time in an effort to achieve a harvest goal in a minimum amount of time. This
is similar to assuming that foragers attempt to maximize their non-subsistence time, used
to socialize, travel, sleep, etcetera. For example, foragers might use their non-subsistence
time to perform an initiation ceremony. The above assumption, however, is contingent
upon foragers achieving a rate of harvest that is sufficient to meet their basal metabolic
needs (discussed below). Any formal model of a SES has to make an assumption about the
behavior of humans. The assumptions made here are not viewed as universal, static prefer-
ences that motivate human behavior. A potentially powerful use of dynamic models is the
ability to define the social-ecological contexts in which one might expect the preferences
of individuals to change.
Given the above assumptions, the functions presented in equations (3.1) and (3.2) are
now defined formally. G(x) is defined by the logistical function G(x) = rx(1− xK ), where
r is the intrinsic growth rate of a resource base, and K is the carrying capacity of the re-
source base in units of biomass per unit area (the limiting effect of competition on resource
growth). H(x,e) is simply ph(x,e), where p is population, and h(x,e) is the biomass har-
vested by an individual forager household. The function h(x,e) = qxe, where q is a propor-
tionally constant biomass capture coefficient (level of technological efficiency) in units of
biomass captured per unit effort per unit of standing biomass. The variable x(t) is biomass
density at time t, and e(t) is foraging effort at time t.
In order to determine time allocation, foragers must first convert the biomass that
they harvest into energy. The biomass to energy conversion coefficient, α is defined as
α = le(−mp) (see Figure 3.1 for a graphic depiction); where l is a baseline processing co-
efficient in Kcals per unit biomass per unit effort per forager. The parameter l defines the
costs of handling resources (converting biomass into usable energy) absent any transaction
55

costs in a system. The parameter m is an interference coefficient that defines the costs of
interacting with other foragers, transaction costs, in terms of Kcals/biomass/time/forager,
and e is the exponential. The interference coefficient is constrained by 0 < m < 1. Thus,
the energy obtained by a household is simply the energy conversion coefficient multiplied
by the biomass harvested by a household, αh(x,e). The energy conversion coefficient is an
aggregate measure of the effect of competition on how efficiently foragers convert biomass
into energy (see Freeman and Anderies, 2012:425). The coefficient combines the effects of
indirect competition and direct competition for resources.
0.0 0.5 1.0 1.5
0.2
0.4
0.6
0.8
1.0
Population density
Bio
mas
sto
ener
gyco
nver
sion
effic
ienc
y
Figure 3.1: Biomass to energy conversion (α) dynamics are controlled by population den-sity (p) and the interference coefficient (m). As population density increases, biomass isconverted into energy less efficiently.
Time is allocated to the harvest of resources based on two energy targets. The tar-
get c defines the minimum rate of energy gain that foragers are willing to tolerate (basal
metabolism), and the target γ defines the desired energy to maintain biological function,
reproduce and maintain social relationships. Foragers allocate their harvest effort at each
moment in time by evaluating if their harvest per unit of effort (αh(x,e)/e) is less than or
greater than their basal metabolic rate, c. If αh(x,e)/e≥ c, then foragers harvest more food
when they are hungry and decrease their effort when they are satiated. This is formalized
56

by the function: δ = γ−αh(x,e), where δ is the energy deficit at time t. If αh(x,e)/e < c,
then foragers decrease the effort that they exert in a habitat no matter how hungry they are.
If foragers cannot meet their basal metabolic need, the implication is that foragers leave
and find a new place to set-up camp (as noted above). Together, these time allocation rules
allow foragers to quickly find the allocation of effort that achieves γ in a minimum amount
of time. Please note, the best time to leave a habitat is not addressed by this decision pro-
cess. The decision process defines the allocation of time within a habitat, if the habitat
appears of a suitable quality.
The decision dynamics are formalized by a rational function (Freeman and Anderies,
2012:Box 2),
D(x,e) =α1δ [αh(x,e)/e]β −α2cβ
[αh(x,e)/e]β + cβ(3.3)
where β >> 1 is a parameter that scales the sharpness of the transition between the two
time allocation behaviors. The parameters α1 and α2 measure how rapidly foragers adjust
their effort based on the different resource conditions that they may encounter. Figure 3.3
graphically illustrates the decision process. At every moment in time, foragers evaluate
which region of Figure 3.3 that they “occupy” and adjust the effort that they devote to the
harvest of food accordingly.
57

Fora
ging
defic
it,δ Region 1. Resource density is
so low that more foraging ef-fort is required to meet basicmetabolic needs than foragersare willing to tolerate. Foragersreduce effort at a constant rate.That is, D(x,e) ≈ −α2 so thate≈−α2.
Harvest per unit foraging effort, αh(x,e)/ec0
-1
1
0
3
Region 2a. Resource density is highenough to meet basic metabolic needs.Thus, D(x,e) ≈ α1δ so that e ≈ α1δ .Here, δ > 0 so foraging effort will in-crease.
Region 2b. As in Region 2a, but here,δ < 0 so foraging effort will decrease.
Figure 3.2: Foraging effort decision heuristic. The different regions in the daily energydeficit - daily energy harvest plane generates a decision heuristic that foragers use to allo-cate effort.
The Effects of Productivity and Population on Forager-resource System States
Figure 3.3 is a set of phase-plane diagrams that describe how systematically varying
the productivity (growth rate) of resources (r) changes the global structure of the hunter-
gatherer SES. The orange curve describes all of the points in the system for which foraging
effort is at equilibrium (e = 0) and the green curve all of the points at which resource
density is at equilibrium (x = 0). Where the two curves meet, an equilibrium emerges (i.e.,
e & x = 0). All stable equilibria are marked by gray circles and the unstable equilibrium
in Figure 3.3b by a square. Each phase-plane has a corresponding stability landscape that,
metaphorically, represents the dynamics described by each respective phase-plane.
The black curves on each phase-plane represent individual model runs, and these il-
lustrate how the system changes over time for a particular set of initial conditions. For
example, the “1” on Figure 3.3a indicates an initial condition or starting point for a single
model run. The arrows on the curve indicate how the model behaved over time. In this case,
when the model run was initiated, foragers were in a depleted environment and spending
58

a significant amount of time in the harvest of food. Very quickly, foraging effort drops to
zero (foragers realize that αh(x,e)/e < c, so they decrease their effort). While foraging
effort is at zero, the density of resources recovers. At approximately x = 0.25, foragers
realize that αh(x,e)/e ≥ c and begin to harvest resources (i.e., re-enter the habitat). For-
aging effort and resource biomass increase over time until the orange curve is reached. At
this point, foragers devote just enough time to the harvest of biomass to meet their energy
target, γ . Resource density continues to increase because resource growth, G(x) is faster
than total harvest, H(x,e). As resource density increases, foraging effort declines until a
stable equilibrium is reached.
The global structure of the hunter-gatherer SES has a significant effect on the potential
trajectory of any particular model run. In Figure 3.3a there is only one, globally resilient
equilibrium. Thus, every potential model run will reach a system configuration that is pro-
ductive (i.e., foragers, in the long-run, meet their energy target of γ in a minimum amount
of time). Recall, the stable equilibrium reflects the position of the system, on average, over
time-scales longer than the time-scale at which decision processes are made in the model.
In this case, the long-term average is on a scale of successive years. The stable equilibrium
does not reflect a condition of no change. Rather, in a real system, environmental variations,
like population movement or droughts, would constantly shock forager-resource interac-
tions out of the long-run equilibrium. Despite such shocks, in the environment described
by Figure 3.3a, the ability of foragers to obtain their goal of γ is robust to environmental
variation because the system is globally resilient and always characterized by a productive
attractor.
However, if the mean intrinsic rate of resource growth declines too much, then the
global structure of the system changes. In Figure 3.3b, r is equal to 0.3. In this envi-
ronment, a second stable equilibrium, as well as an unstable equilibrium emerge. Initial
conditions and environmental variation may now have a significant effect on the long-run
59

0.0 0.2 0.4 0.6 0.8 1.0 1.2 1.4
0.0
0.5
1.0
1.5
2.0
0.0 0.2 0.4 0.6 0.8 1.0 1.2 1.4
0.0
0.5
1.0
1.5
2.0
0.0 0.2 0.4 0.6 0.8 1.0 1.2 1.4
0.0
0.5
1.0
1.5
2.0
1
(a)
(b)
(c)
(d)
(e)
(f)
Resource density (x)
Fora
ging
effo
rt(e
)
Resource density (x)
Fora
ging
effo
rt(e
)
Resource density (x)
Fora
ging
effo
rt(e
)
Figure 3.3: Phase plots of foraging effort against resource density. All parameters areheld constant at default values except resource productivity (r). a-r = 0.5; b-r = 0.3; c-r = 0.1. The circles highlight stable attractors. The square in graph b highlights an unstableattractor. Each phase plot is paired with a stability landscape (a-d; b-e; c-f) that provides ametaphor for the dynamics portrayed in each phase plot.
60

configuration of the system. If the modeled foragers begin to harvest resources within the
gray shaded area on Figure 3.3b, they get “caught” in a degraded attractor where resource
density is positive, but foragers can only meet their basal metabolic needs. Further, due
to the presence of a degraded attractor and a repellor (the unstable equilibrium), foragers
are now sensitive to environmental variations that might knock the system too far out of
equilibrium at the productive attractor. The distance between the equilibrium at the pro-
ductive attractor and the unstable equilibrium at the repellor in Figure 3.3b determines how
big of a shock the system can tolerate before flipping into the degraded attractor. It is im-
portant to recognize that foragers may never see a shock that drives their interaction with
a resource base into the degraded attractor coming. In order to prevent such a possibility,
foragers would have to first recognize that a novel vulnerability had emerged in the system,
then discover and remember the frequency, as well as intensity of shocks that might flip the
system. In contrast to the scenario depicted in Figure 3.3a, the system is vulnerable to a
critical transition between the productive and degraded attractors and this means that the
ability of foragers to achieve γ is potentially uncertain.
Finally, in Figure 3.3c r is equal to 0.1. In this environment the only stable equilibrium
is a degraded state. Foragers can obtain food in a manner that is sustainable for the re-
sources, but only enough food to meet their basal metabolic requirements. The system has
been pushed over a “tipping point,” where the productive attractor is no longer an option.
The degraded attractor is the only possible system state and the attractor is globally robust
to perturbations. This means that the ability of foragers to obtain their basal metabolic
requirement is globally robust, in the long-run, to environmental shocks, but it also means
that foragers will not, in the long-run, achieve their energy goal of γ . In real systems,
foragers are unlikely to ever tolerate such a situation for very long.
In general, the sequence of pictures shown in Figure 3.3a, b & c illustrates what is
called a robustness-vulnerability trade-off for modeled foragers. As the intrinsic growth
61

of resources in the system declines, foragers work harder to achieve γ . Modeled foragers
reallocate non-subsistence time to the harvest of resources to obtain their desired level
of food, and this strategy makes individuals robust to declines in the productivity of the
system (r). The strategy of working harder to obtain more food is effective. Working
harder to make γ robust, however, decreases the resilience of the productive attractor and
precipitates the emergence of the repellor and degraded attractor in Figure 3.3b. In turn,
achieving γ becomes potentially uncertain for foragers because the system is vulnerable
to environmental shocks that can generate a critical transition from the productive to the
degraded attractor. Importantly, this robustness-vulnerability trade-off is a consequence of
subtle increases in foraging effort.
Beginning from Figure 3.3a, a decline in the net productivity of resources, initially,
only has a small impact on how hard foragers work to achieve γ . The effort curve (orange
curve) for which foraging effort is not changing in the hunter-gatherer SES is highly non-
linear. Moving from right to left, the orange curve increases very slowly, then quickly until
a threshold, at which point the curve declines sharply. Due to the form of this curve, the de-
cline in resource productivity from Figure 3.3a to 3.3b is accommodated with only a slight
increase in foraging effort, from 0.51 to 0.57. As noted above, e(t) = 1 is equivalent to one
eight hour workday per day over the course of weeks to months of resource harvest. Thus,
the change from r = 0.5 to r = 0.3 only causes foragers to spend about 28 minutes more
per workday to harvest food at equilibrium in the productive attractor. This slight increase
in work effort may have little effect of the harvest decisions of foragers. However, when
every forager works just a bit harder, the aggregate effect is the depletion of resources just
enough that the productive attractor becomes vulnerable to environmental variations that
may “knock” the system into the degraded attractor. This situation is a stochastic common
pool resource dilemma. When each forager works a bit harder to maintain their goal (γ), ev-
ery forager in the system becomes vulnerable to a critical transition from the productive to
62

the degraded attractor induced by unpredictable environmental variation. When a negative
critical transition is generated, not a single forager would achieve their energy goal.
Windows of vulnerability and common pool resource dilemmas
Figure 3.4 is a set of bifurcation diagrams that summarize the effects of the resource
growth rate (r) and population density (p) on the global structure of the hunter-gatherer
SES. A bifurcation diagram is a specialized tool. Such diagrams help illustrate critical
changes in the global structure of a system.
Holding all other parameters constant at default values, the high productivity harvest
branch in Figure 3.4a represents all of the values of r for which the productive attractor is
present in the hunter-gatherer SES. The degraded harvest branch represents all of the values
of r for which the degraded attractor is present and the dashed line all of the values of r for
which the repellor is present. For example, viewing from right to left in Figure 3.4a, all of
the values of r > 0.337 (right of the gray shaded area) result is a hunter-gatherer SES with
only the globally resilient productive attractor (i.e., all values of r that result in the pictures
shown by Figures 3.3a & d). All of the values of r inside of the gray shaded area result
in a hunter-gatherer SES characterized by both the productive and degraded attractors, as
well as the repellor (i.e., all values of r that result in pictures similar to Figures 3.3b & e).
All of the values of r to the left of the gray shaded area result in a hunter-gatherer SES
characterized by the globally resilient, degraded attractor. Similarly, the high productivity
harvest branch in Figure 3.4b corresponds to all of the values of population density for
which the productive attractor is present and so on.
The gray shading in Figures 3.4a & b highlights a “window of vulnerability” where en-
vironmental variation may shock the long-term state of the system back and forth between
the productive harvest branch and the degraded harvest branch. In dynamical systems ter-
minology, the movement back-and-forth between attractors is called hysteresis. In real
63

systems, environmental variation may have a positive or negative impact on an element in
a system. To provide some intuition, inter-annual variation in rainfall may increase or de-
crease the growth rate of biomass useful as food in a real system. If we extend the window
of vulnerability metaphor to describe the potential system states in a real hunter-gatherer
SES, the effects of such positive and negative variations in rainfall may cause inter-annual
shifts between a productive and degraded forager-resource regime (here I use the term
regime instead of attractor because the reference is to a real rather than model system).
0.5 0.6 0.7 0.8 0.9 1.0 1.1
0.4
0.6
0.8
1.0
1.2
1.4
0.1 0.2 0.3 0.4 0.5
0.4
0.6
0.8
1.0
1.2
1.4
Population density (p)
Equ
ilibr
ium
fora
ging
effo
rt(e
)
high productivity harvest branch
unstable harvest branch
degraded harvest branch
(b)
(a)
Resource growth rate (r)
Equ
ilibr
ium
fora
ging
effo
rt(e)
high productivity harvest branch
unstable harvest branch
degraded harvest branch
Figure 3.4: Summary of the long-run of harvest states in the hunter-gatherer SES. Thelower solid line represents all of the productive harvest states as a function of resourcegrowth rate (a) and population density (b); the dashed middle lines, all unstable equilib-ria, and the top solid lines all degraded states. The gray shaded areas indicate “windowsof vulnerability” that define the parameter space for which environmental variation couldgenerate a critical transition between the productive and degraded harvest branches.
64

In general, Figure 3.4 illustrates that as either the growth rate of resources declines
or population density increases, in the model, foragers work harder to harvest resources
at the productive attractor. Once a threshold of either r = 0.337 or p = 0.775 is hit, the
system becomes vulnerable to a negative critical transition. When the system is vulnerable,
a shock may generate a critical transition from the productive to the degraded attractor.
These thresholds of r = 0.337 and p = 0.775 initiate “windows of vulnerability” in the
hunter-gatherer SES. Within a window of vulnerability, if population density increases or
the growth rate of resources declines, the productive attractor and repellor move closer
together. If the productive attractor and repellor get pushed together, a fold bifurcation or
deterministic critical transition occurs. Beyond this “tipping point,” the state of the forager-
resource system is degraded and globally resilient, but foragers can only meet their basic
metabolic needs (c).
In the window of vulnerability, modeled foragers face a stochastic common pool re-
source dilemma because each individual “selfishly” works to achieve γ , and this behavior
makes the system vulnerable to a variance induced critical transition from the productive to
the degraded attractor. The consequence of a negative critical transition is that every forager
in the system would fail to achieve γ . In this kind of social-ecological setting, some level
of uncertainty associated with achieving γ is generated that depends on a) the predictability
of external shocks that hit the system and b) the ability of foragers to accurately measure
the amount of harvest effort that a resource base can handle. The question is whether or
not foragers can realize that a common pool resource dilemma has emerged and adjust
their strategies for producing resources before a system permanently flips into a degraded
state? My argument is that foragers can detect the emergence of a common pool resource
dilemma precisely because the dilemma generates uncertainty associated with achieving
γ . How foragers adapt to this new social-ecological setting depends on their ability to
process information over a nested hierarchy of forager-resource systems and discover the
65

risk of variance induced critical transitions in many localized forager-resource systems that
compose a larger system.
Scaling-up: Localized Critical Transitions Drive the Evolution of Foraging Strategies
My analysis above focused on a forager-resource system scaled to a single habitat em-
bedded on a landscape of multiple habitats. This single system is, conceptually, a local
system that is simply a subsystem of a landscape scale forager-resource system (see Figure
3.5). Here, I conceptually rescale the hunter-gatherer SES to the landscape scale. This
allows me to summarize the behavior of a forager-resource system aggregated across all
of the habitats that comprise a landscape. Thus, equilibrium biomass and foraging effort
(x(t) and e(t)) now describe the level of biomass and foraging effort exerted on a landscape
aggregated across all of the forager-resource systems that exist at the habitat scale.
xi = G(xi)−H(xi,ei)
ei = D(xi,ei)
x = G(x)−H(x,e)
e = D(x,e)
Figure 3.5: Idealized landscape composed of nine local forager-resource systems. Theconceptual model is scaled to the size of the landscape, the global forager-resource system.
66

In a system at the landscape scale with many local forager-resource systems at the habi-
tat scale, variation in characteristics of the local systems is important. On a landscape in
which only one system at the habitat scale is ever vulnerable to a negative critical transition,
the experience of a negative critical transition would simply stimulate foragers to relocate
to a less vulnerable habitat. As long as there is a pool of forager-resource systems at the
habitat scale on a landscape and most of these habitats are not vulnerable to a negative
critical transition, then the experience of a negative critical transition is likely to only have
a weak feed back on individual foragers. However, if a window of vulnerability is charac-
teristic of many forager-resource systems, simultaneously, at the habitat scale, then simply
moving around may not allow individual foragers to avoid negative critical transitions. In
this setting, foragers must confront the fact that achieving γ is no longer a sure thing in any
of the habitats in which individuals might create a forager-resource system.
Uncertainty in the ability to achieve γ arises from two potential sources. The first is
assessment error. As illustrated in Figure 3.3b, harvesting resources at a rate that is initially
too high can drive a system into the degraded harvest state. So, when every habitat scale
system is vulnerable, the ability to discover and measure the harvest effort that a habitat
can handle and still converge to the productive attractor is critical for meeting a forager’s
energy target. Second, environmental variations that depress the availability of biomass,
like an immigration event or a drought, can cause habitat level systems to transition from
the productive to the degraded attractor and generate uncertainty in the ability of individuals
to schedule their movements between habitats to obtain γ . In both cases uncertainty is
a consequence of the fact that foragers “selfishly” work to meet their energy target and
generate a resource commons and associated stochastic commons dilemma. Although both
sources of uncertainty are potentially important, in the conceptual model that follows, I
investigate how environmental variation and the r/p ratio of a system at the landscape scale
interact to drive the evolution of foraging strategies. I argue that in settings where most
67

forager-resource systems at the habitat scale are vulnerable to a negative critical transition,
the uncertainty associated with locating in space and time to obtain food increases and this
is a signal that generates selective pressures on individual foragers.
Conceptual forager-resource systems
To interpret the dynamics of my conceptual model, I would like to precisely define
three terms: risk, uncertainty and information processing. Risk refers to a decision maker’s
perception of the probability distribution that a set of outcomes will occur (Knight, 1921;
Winterhalder et al., 1999); uncertainty is incomplete information about the possibility that
a set of outcomes will occur. As Knight (1921:233) makes the distinction,
“The principle difference between the two categories, risk and uncertainty, is
that in the former the distribution of the outcome in a group of instances is
known (either through calculation a priori or from statistics of past experi-
ence), while in the case of uncertainty, this is not true, the reason being in
general that it is impossible to form a group of instances, because the situation
dealt with is in a high degree unique.”
For example, when the productive and degraded attractors are both potential long-run states
of a system at the habitat scale, modeled foragers risk experiencing a negative critical tran-
sition every time they participate in a habitat level system. If critical transitions occur in a
highly patterned space-time context, then foragers might discover through experience and
cultural transmission the probability of a critical transition in any given system at the habitat
scale. This knowledge can then be used to estimate the risk of a negative critical transition
in the future. Uncertainty is the gap between foragers’ estimated risk of a negative critical
transition in a local system and the rate at which variance induced critical transitions actu-
68

ally occur. This gap is what Heiner (1983) refers to as the competence-difficulty gap (C-D
gap).
Information is, strictly speaking, a sequence of cues or symbols that can be interpreted
as a message. The message is informative because it resolves some degree uncertainty
about the state of a system. I assume here that foragers update and transmit messages
by observing cues within their social and ecological environments. These messages are
encoded by symbols that represent the state of some aspect of a forager-resource system.
Information processing occurs anytime that foragers update their representation of the cur-
rent state of a system and infer the likely future state of the system. Information processing
is an inherent dynamic of the knowledge base (collection of messages used to represent
a social-ecological system’s possible states) known as traditional ecological knowledge
(TEK). The information processing capacity of populations connected by a shared body of
TEK is described by Menzies and Butler (2006:7):
“TEK is rooted in, and informed by, a traditional or customary lifestyle, but it
adapts to change and incorporates contemporary information and technology.
New information is continually added and old information deleted, as the en-
vironment is transformed, as weather patterns shift, or as species are wiped out
or introduced.”
In this view, human foragers are Bayesian decision makers. A body of culturally trans-
mitted TEK forms a forager’s prior beliefs about the probable state of a SES, and foragers
process information to update their expectations about the probable future state/s of a SES.
Given these definitions, I would like to compare three forager-resource systems scaled
to the level of a landscape and composed of nine “local” forager-resource systems or habitat
level systems (Figures 3.6a-c). I assume that each system at the landscape scale is occu-
pied by one forager group and this group distributes harvest effort evenly among the nine
69

systems at the habitat scale in a given year. This assumption holds population density con-
stant and means that the only decision a forager has to make is where to locate in space
and time and, thus, the sequence in which harvest effort is devoted to each habitat level
system. In traditional anthropological terms this sequencing process is called scheduling
(Flannery, 1968; Jochim, 1976). I assume that all other potential parameters in each system
at the landscape scale are constant as well, except productivity (r). The landscape level
system in Figure 3.6a has a high value of r, 3.6b a moderate value and 3.6c a low value of
r. Each landscape is composed of pictures that illustrate how the probable system states
of forager-resource systems at the habitat scale vary as the net productivity-to-population
ratio (r/p) of the landscape changes. Each figure contains four elements. These elements
and associated assumptions are:
1. A hypothetical time series graph that illustrates the change in the aggregated r/p
ratio of the landscape (the dashed black line), for an average year (an interval of 52
weeks). Holding population density constant, the gray shading around the dashed
line represents the inter-annual coefficient of variation around the mean aggregated
r/p ratio over a time interval of 50 years. I assume that the aggregate r/p ratio
changes intra-annually based on external divers, like seasonal changes in temperature
and inter-annually due to atmospheric dynamics.
2. Each time series graph contains a solid red line and a dashed red line. The solid red
line denotes the aggregate r/p ratio on the landscape at which every forager-resource
system at the habitat scale is vulnerable to a critical transition. That is, when the
dashed black line is below the red line, all nine forager-resource systems at the habi-
tat scale are characterized by two potential stable states, the productive and degraded
attractors. The dashed red line marks the r/p value at which all nine forager-resource
70

systems at the habitat scale are characterized by the globally resilient, degraded at-
tractor.
3. Each time series graph is paired with a set of four snap shots of the landscape at four
short segments of time.
4. The pie charts visually represent the vulnerability of each of the nine systems at
the habitat scale to a variance induced critical transition. The black indicates the
probability p(ei) that a system will experience a negative critical transition if hit by
a shock of some kind; p(ei) is the average of all potential shocks that might hit a
system, again, assuming an equal distribution of harvest effort.
Figure 3.6a illustrates a landscape with a very low degree of uncertainty. In this system,
it really does not matter how the forager sequences their allocation of effort to each system
at the habitat scale because each local system is globally resilient and will always converge
on a productive attractor. Please note, as the dashed black line in the time series graph
approaches the solid red line, forager-resource systems at the habitat scale might become
vulnerable to a negative critical transition. In Figure 3.6a, this does not occur, on average.
However, in years where the r/p ratio is below the mean, a few of the nine systems at
the habitat scale may become vulnerable to a negative critical transition. In general, then,
this landscape is characterized by the globally resilient, productive attractor (analogous to
Figure 3.3a). In terms of real hunter-gatherer SES, another way to conceptualize Figure
3.6a is in terms of the TEK that foragers draw on to locate in space and time to access
and harvest resources; TEK is sufficient for choosing where and when to expend foraging
effort in virtually any sequence that foragers would like. It is unnecessary for a forager to
process information and update their TEK to discover and estimate the future vulnerability
of systems at the habitat scale to a negative critical transition because all nine systems are
globally resilient.
71

Time (weeks)
Lan
dsca
per/
pra
tio (c)
(b)
(a)
Time (weeks)
Time (weeks)
Lan
dsca
per/
pra
tioL
ands
cape
r/p
ratio
Figure 3.6: Conceptualize forager-resource systems at the landscape scale. Each landscapeis composed of nine forager-resource systems at the habitat scale. In all three pictures: thetop graph illustrates the r/p ratio over time on the landscape. The black shading indicatesthe probability of a negative critical transition, p(ei) for each system at the habitat scale.No black shading is equivalent to p(ei) = 0.
72

Figure 3.6b illustrates a landscape in which meeting γ is more uncertain and this re-
quires foragers to find a strategy for sequencing their distribution of foraging effort that
reduces uncertainty. On this landscape, each system at the habitat scale is susceptible to a
negative critical transition during a well defined annual interval. The susceptibility of each
localized system to a negative critical transition varies with the intrinsic rate of resource
growth (ri) in each habitat. The probability p(ei) that a shock will generate a negative
critical transition into the degraded attractor is, thus, heterogeneous across systems at the
habitat scale. On the landscape summarized by Figure 3.6b, there are now good and poor
strategies that foragers might choose to secure γ and avoid localized negative critical tran-
sitions. To develop the best possible strategy, foragers must discover from an assessment
of the state of the system and past experience of potential shocks, the p(ei) associated
with each forager-resource system at the habitat scale. In short, the benefit of processing
information on the probable future states of forager-resource systems at the habitat scale
increases from Figure 3.6a to 3.6b, but processing information also costs time.
Foragers must invest time in collecting and processing information to make accurate
estimates about the risk of experiencing a negative critical transition in any of the nine
forager-resource systems at the habitat scale. Holding population density constant at 1
forager, the ability to make accurate predictions, should depend on the predictability of the
r/p ratio from year-to-year driven by inter-annual changes in moisture and temperature.
As the coefficient of variation from the mean r/p ratio increases, foragers would have to
spend more time attempting to measure the current state of the systems at the habitat scale
to make inferences about the probable future states of these local systems. This would stress
the updating capacity of foragers’ TEK because the higher the coefficient of variation, the
more random actual critical transitions would appear from year-to-year. On the simplified
landscape described by Figure 3.6b, when the red line is crossed, the C-D gap of foragers
is controlled by external inputs (like inter-annual variation in rainfall). The higher the
73

coefficient of variation, the greater the C-D gap because the difficulty of estimating p(ei)
from year-to-year also increases.
Again, in terms of TEK in real hunter-gatherer SES, Figure 3.6b represents a landscape
in which there are periods of time during an average year that TEK is potentially insufficient
to locate in space and time to harvest resources. But, if these periods are predictable,
then foragers can plan ahead. For example, if the spatial location of the most and least
vulnerable systems at the habitat scale are always the same from year-to-year, foragers
could monitor the biophysical conditions of the environment and plan ahead to serially
move from the most to least susceptible systems, using the least susceptible systems as
“fall back” habitats (Gould, 1991). Again, however, this strategy depends on the ability of
individuals to discover and accurately predict the spatial distribution of p(ei) from year-to-
year.
Figure 3.6c illustrates a landscape where r/p is, on average, consistently below the red
line. As above, if the spatial distribution of p(ei) is constant, then foragers may experience
localized critical transitions over time and discover the spatial distribution of p(ei) for an
average year. However, this depends on the coefficient of variation associated with the
mean r/p ratio. If the coefficient of variation gets too high, the temporal distribution of
p(ei) will start to appear more random. With a higher coefficient of variation, in some
years many systems at the habitat scale will have a 100 % probability of flipping into the
degraded attractor; in other years, almost none of the systems would even be vulnerable to
a negative critical transition.
The critical point is the inability of an individual to know, from accumulated and trans-
mitted experiences, which attractor is likely to characterize a given forager-resource system
at the habitat scale at any given time. As the coefficient of variation goes up, previous ex-
periences used to establish the “prior probabilities” that any of the nine systems at the scale
of the habitat will experience a negative critical transition become meaningless.
74

In sum, Figures 3.6a to 3.6c illustrate two points. First, as the r/p ratio of a landscape
declines past the red line threshold, foragers must process more information on the current
state of forager-resource systems at the habitat scale to compute the probable future states
of habitats. Second, as the r/p ratio of a landscape declines past the red line threshold, the
prior knowledge (i.e., already accumulated body of TEK) becomes more irrelevant as the
coefficient of variation from the mean r/p ratio of a landscape increases. An increase in
the coefficient of variation will increase the likelihood that foragers poorly estimate p(ei)
and end up, temporarily, harvesting food in a system at the habitat scale that appears to
have a low likelihood of a negative critical transition but ends up in the degraded attractor.
As noted, these dynamics occur holding population density and the distribution of harvest
effort among habitats constant on a landscape. The only decision process that foragers have
to make is the sequence of locating in space and time to distribute harvest effort. Even with
these simplifying assumptions, the information processing load and the potential to incor-
rectly assess the risk of a negative critical transition are very sensitive to environmental
variation once the r/p ratio of a landscape crosses the red line. The complexity of de-
vising harvest schedules increases even more dramatically if we add more foragers to the
landscape.
At this point, let’s reconsider Figure 3.6c. Now imagine that there are two foragers on
the landscape (adjust the net productivity of the landscape up so that the mean r/p ratio
remains the same). Now with two foragers, the spatial distribution of p(ei) has the potential
to vary considerably from year-to-year. As long as the foragers closely coordinate the
spatial location of their harvest action, the spatial distribution will remain consistent. The
maintenance of coordinated movement requires time and effort, however. If movements
between systems at the habitat scale are not coordinated by agreed upon rules, then each
forager will have to monitor the other to estimate the spatial distribution of p(ei). Adding
population density, even if the mean r/p is the same, requires individuals to increase their
75

investment in processing information to estimate the spatial distribution of p(ei), unless
individual foragers engage in collective action to coordinate movement, which also costs
time.
Let me end this discussion by providing a concrete example of the kind of processes
described above. In their study of the role of information in Kua foraging strategies, Hitch-
cock and Ebert (2006:146-147) state:
“prior to the seasonal breakup of hunter-gatherer groups, the localities to be oc-
cupied by various family units were surveyed. The resources available in the
area to which people might move were assessed carefully, as were the current
states of occupancy, use and sentiments about resource sharing among groups
that had rights to that area. Once this process was complete, the relative advan-
tages and disadvantages of the alternative places were exhaustively discussed
prior to reaching a consensus on what options should be perused.”
This passage illustrates the central importance of information processing to plan out a se-
quence of movements in space and time to gain access to resources. The argument that I
use Figure 3.6 to demonstrate is that once the r/p ratio of a landscape crosses the red line,
this scout, discuss and move strategy is stressed. The emergence of multiple stable states
in many habitats both makes the time necessary to scout and discuss where to move next
longer and, depending on how unpredictable shocks are that hit a resource base, makes this
process of decision making less effective. People make a decision about which habitat it
is best to move into, but end up in the degraded attractor. This occurrence at the scale of
habitats is a signal that drives foragers to adopt strategies for reducing this possibility.
76

The Uncertainty Reduction Hypothesis
The uncertainty Reduction Hypothesis (URH) has two parts. First, the evolution of
foraging strategies in hunter-gatherer SES occurs when foragers attempt to reduce the un-
certainty associated with finding a sufficient level of food on a landscape. The uncertainty
is controlled by the r/p ratio of a forager-resource system at the scale of a landscape com-
posed of many systems at the habitat scale. Once this ratio passes a critical threshold, all of
the forager-resource systems at the habitat scale in which individuals might participate are
susceptible to a negative critical transition. In this social-ecological context, local negative
critical transitions occur at some rate determined by the distribution of people on the land-
scape and variation in the climate drivers of net productivity, like temperature and rainfall.
The development of a critical transition rate in systems at the habitat scale acts as a kind of
“signal” to individual foragers that their body of TEK used to schedule where to locate in
space and time is “out of whack.” The risk of a critical transition between a productive and
degraded attractor may stimulate punctuated adaptation on the part of individual foragers;
this adaptation, in turn, would create a new SES with novel feedback loops that condition
the future coevolution of individuals and resources. In sum, localized commons dilemmas
are generated when the r/p ratio of a landscape approaches and crosses a threshold. This
situation creates an environment in which foragers try out strategies for reducing the uncer-
tainty associated with experiencing localized negative critical transitions and the winnow-
ing processes of selection and/or copying lead to a reorganization of human-environment
relationships or the abandonment of a landscape (i.e., emigration or extinction on said land-
scape).
The second part of the URH builds on two additional generalizations. 1) Forager-
resource systems form a nested hierarchy in space and time (Figure 3.7) because ecosystem
structures form a nested hierarchy (Odum and Barrett, 2002; Holling, 1992; Peterson et al.,
77

1998) in space and time. Due to the hierarchical structure of ecosystems, human foragers
face a decision hierarchy regarding how to allocate effort (Orians, 1980). At the smallest
and fastest scale is the individual resource and food choice, next is the patch and patch
choice, then the habitat and habitat choice and so on. There are two important consequences
of this hierarchy.
First, as a forager moves up the decision hierarchy, the greater the number of ecological
and social dynamics that individuals must deal with to make decisions, thus, the greater
the information processing load for an individual to make decisions. The logic behind this
statement is quite intuitive. If you are in a patch of raspberry bushes, all you need to de-
cide is which raspberries are ripe and which are not. However, at the habitat scale, you
must know what patches of food (raspberries, wild onions, etcetera) comprise each habitat,
when those patches are in season, and who else might want those resources. Second, as
Holling (1992) describes, as one moves up the hierarchy, one encounters larger ecosystem
structures. A patch is clump of raspberry bushes and associated organisms. A landscape
encompasses a whole forest and is a mosaic of habitats. The point here that disturbance
dynamics, like fires, or dry periods, occur faster than the dynamics of change in ecosys-
tem structures (Holling, 1992:478; Peterson et al., 1998). This is important because large
ecosystems modulate variation in fast disturbance dynamics and “make their own weather”
(e.g.,Hare and Ritchie, 1972; Zeng et al., 1999). If foragers use enough space (i.e., have
a pool of potential forager-resource systems at the landscape scale), they gain the benefit
that ecosystem structures modulate variation in fast disturbance dynamics, but individuals
have to process more information to take advantage of this benefit. This information load
trade-off, in part, is why Holling (1992) expects non-human foragers to use rule’s of thumb
high up on the hierarchy and make more optimal decisions lower on the hierarchy.
2) As illustrated in Figure 3.6, when the r/p ratio of a landscape crosses a critical
threshold, many forager-resource systems at the habitat scale become vulnerable to shocks
78

0.1
10.0
1,000.0
1 100 10,000log 10 Space (km2)
log
10Ti
me
(yea
rs)
thunderstorm
long waves
el Nino
climate change
tree
patch
habitat
landscape
FRS1
FRS2
FRS3
FRS4
Figure 3.7: Nested hierarchy of ecosystems, decisions and forager-resource systems afterPeterson et al. (1998). The rectangles are ecosystem structures. The circles are decisionsassociated with each ecosystem structure. The blue shaded ovals represent forager-resourcesystems (FRS) operating at different scales of space and time. The arrows illustrate thekinds of disturbances that hit a FRS.
(e.g., temperature or rainfall extremes) that can generate a negative critical transition. As
a consequence, large scale ecosystems no longer modulate environmental variation in any
meaningful way and processing information on the vulnerability of habitat level systems is
now necessary, costly and potentially fruitless. The signal that this situation has arisen is
the experience of localized negative critical transitions. The more unpredictable the varia-
tion in physical inputs and population movements on a landscape, the more difficult it is for
foragers to estimate the risk of negative critical transitions in systems at the habitat scale,
and, thus, uncertainty associated with establishing a productive foraging regime increases.
As uncertainty increases, foragers have two options: a) migrate to a new landscape or b)
reduce the scale of space and time at which they use a landscape. Option b) has the ben-
efit of reducing the amount of information that foragers must process to make decisions
79

about where and when to locate to harvest food, but also has the cost of concentrating har-
vest effort on a few habitats, which might further decrease the resilience of the productive
foraging regime in those systems.
I propose that when migration is not an option, selection and copying pressures favor
strategies that simultaneously reduce the scales of space-time over which decisions are
made to locate in space and time (i.e., decrease an individual’s information processing
load) and dampen the susceptibility of systems at the habitat scale. This means strategies
that reduce the chances that variation in productivity caused by fluctuations in temperature,
rainfall, and/or population movements are favored. There are two important strategies that
fit this bill: the production of food to increase r and ownership institutions that decrease the
costs of interference defined in the hunter-gatherer SES model by m. The configuration of
these different means for constructing a niche should result from the sum of selection and
copying pressures that act on a population of hunter-gatherers in specific environments.
Expectations
Based on the logic of the URH, I expect the following general empirical patterns to man-
ifest in actual hunter-gatherer SES. First, the selection of land ownership” rules that for-
mally define who, when and where resources are accessed is favored in environments where
hunter-gatherer SES cross a critical r/p ratio and variation in the climate drivers of produc-
tivity is relatively predictable. In human social groups the costs associated with a owning a
territory are potentially determined by the costs necessary to coordinate the harvest of re-
sources and defend territories from intruders (i.e., social transaction costs) (Willems et al.,
2013). The recognition of ownership by individuals likely creates benefits for individuals
that outweigh the costs when many habitat level systems on a landscape are vulnerable to
a negative critical transition. Ownership rules should mitigate the need for individuals to
invest time to monitor where and when other foragers harvest resources on a landscape,
80

which is costly when many habitats on a landscape are characterized by multiple stable
states. Further, by regulating the amount of foraging effort that can be applied in systems
at the habitat scale, individuals cooperating in groups to regulate the movement of people
should obtain a more predictable supply of resources. I should note, however, that develop-
ing rules and norms of ownership requires some individuals to incur potentially significant
costs, like ceding control of a productive location to an owner or incurring bodily injury
in defense activities. Based on the URH, I expect that the benefits of collective action
necessary to develop ownership institutions outweigh the costs when foragers need to re-
duce the uncertainty generated by the uncoordinated movement of population in and out of
forager-resource systems.
Second, the selection of strategies that modify ecosystems to produce food is favored
in environments where hunter-gatherer SES cross a critical r/p ratio and variation in fac-
tors like rainfall or temperature, unpredictably shock the productivity of forager-resource
systems and generate negative critical transitions. In effect, food production raises the av-
erage r/p ratio of the systems at the habitat scale. In turn, this would have the effect of
decreasing the susceptibility the forager-resource systems at the habitat scale to negative
critical transitions. For example, in the ethnographic record, some foragers are known to
plant wild” species of plants and systematically burn vegetation (Anderson, 2005; Gould,
1971; Keeley, 1995; Mills, 1986). Both of these behaviors are different ways of modifying
an ecosystem that can increase the productivity of food. For example Shipek (1981:298)
describes how Kumeyaay foragers managed “wild” plants to increase the productivity of
desired species,
“Burning was followed by broadcasting seeds for next year’s crop.... In ad-
dition to seed, families ‘planted gardens’ of annual and extending grass areas
by broadcasting perennial greens, seeds, roots, and cactus cuttings in clearings
made near their homes.”
81

The key process is the management that individuals exert over the dynamics of vegetative
communities. This, in turn, may decrease the vulnerability of foragers to unpredictable en-
vironmental variation that can generate a negative critical transition. The secondary adop-
tion of staple domesticated plants by foragers is a potential alternative for producing food
when foragers face the risk of resource shortfalls generated by the presence of multiple
stable states across multiple scales of forager-resources systems.
In chapter 5, I challenge the expectations listed above with large ethnographic and en-
vironmental data sets. As developed in chapter 1, the whole point of the modeling exercise
undertaken in this chapter has been to begin to understand how feedbacks between for-
agers and resources across different scales and levels of organization might generate evo-
lutionary change in hunter-gatherer SES. This exercise provides a more informed context
for conducting large scale ethnographic comparisons and identifying general principles of
subsistence change.
Conclusion
I began this chapter by asking: given the open-access nature of resources among hunters
and gatherers, (1) how do changes in the productivity of resources and population density
affect the robustness of food output in a forager-resource system to potential shocks, and
(2) how might the global structure of the system determine the selection of foraging strate-
gies by individuals? The answer to question (1) is really important because it suggests
that feedbacks between individuals and resources lead to non-linear dynamics in a highly
general forager-resource system. Given the assumptions of the model, either medium-term
declines in the productivity of resources (r) or increases in population density (p) result
in the emergence of alternative stable states. One of the stable states is productive in that
modeled foragers can meet their energy goal of γ in a minimum amount of time; the other
stable state is degraded in that foragers can only meet their basal metabolism c. The pres-
82

ence of multiple stable states precipitated by crossing critical thresholds of productivity
and/or population density makes question (2) quite interesting. When the productive and
degraded attractors are simultaneously potential long-run stable states, the global structure
of the system dictates that foragers face a stochastic common pool resource dilemma. The
aggregate effect of individual foragers working to achieve their energy goal opens every
forager up to the risk of not achieving their energy goal due to a negative critical transition
from the productive to the degraded attractor.
Of course the potential common pool resource dilemma is of little consequence if for-
agers can simply move around to alternative forager-resource systems where the risk of a
negative critical transition is irrelevant. However, in a large scale forager-resource system
composed of multiple smaller scale forager-resource subsystems in which foragers risk a
negative critical transition, the resilience of the productive attractor, I propose, affects the
robustness of the strategies that individuals use to secure food in a variable environment.
Figure 3.8 illustrates the general feedback dynamics that I propose drive the evolution of
foraging strategies in hunter-gatherer SES. Variation in factors such as rainfall and tempera-
ture perturb the resource base from which foragers harvest food. Foragers harvest resources
and obtain an energy output and compare the output with their underlying preference/goal.
Based on the energy output, foragers update their TEK, which they use to make decision
about how to secure food in the future. Critically, when many forager-resource systems
at a habitat scale nested on a landscape are vulnerable to a negative critical transition, for-
agers face uncertainty associated with their ability to secure resources. The uncertainty is
a function of the external climate variation that affects the productivity of systems at the
habitat scale and the movement of foragers between systems because harvest effort makes
local systems more vulnerable. Foragers may be able to reduce uncertainty by processing
information and discovering the strength and frequency of variations that cause negative
critical transitions in systems at the habitat scale. However, as climate variation and for-
83

ager movements become more unpredictable, such information processing becomes more
costly and potentially fruitless.
Goal (γ) Resource(r, K)
Disturbance
Energyoutput
Effort(q,m)
Update TEK(C-D gap)
Figure 3.8: System diagram of the hunter-gatherer SES that illustrates feedback processes.
In terms of the model, there are two strategic options that foragers might select to make
their energy target more robust to climate variation and population movements when every
local system is vulnerable: (1) invest effort in the production of food to increase the pro-
ductivity of a resource base or (2) invest in collective action that regulates the distribution
of foraging effort across local systems. I have argued above that option (1) is adopted when
climate variation that determines inter-annual changes in the productivity of resources is
too unpredictable. When variation becomes too unpredictable, the best strategy is to alter
ecosystems and attempt to boost the mean productivity of resources. This should reduce
the vulnerability of systems to shocks and increase the robustness of the food output of in-
dividuals to shocks. I argue that option (2) is selected when variation in climate is relatively
predictable. Of course both options may be selected simultaneously.
84
An archaeological implication
Frequently, archaeologists turn static foraging models into dynamic models by quali-
tatively assuming feedbacks between foragers and resources (e.g., Bettinger, 1991; Stiner
et al., 1999). This is a good thing. This intellectual strategy recognizes that archaeologi-
cal data are often organized to study change over time and dynamic models are needed to
study change over time. The recognition of feedbacks between, in the language of chapter
2, environmental structures implicitly recognizes that foragers operate in a forager-resource
system. The fact that feedbacks may cross-cuts levels of organization introduces the pos-
sibility that non-linear dynamics characterize forager-resource systems. If this is indeed
the case, archaeology needs the intellectual tools of systems thinking and the mathematical
tools of dynamical systems theory to understand the foraging ecology of individuals. This
is not a new revelation per se, but the application of dynamical systems to archaeological
problems really remains in its infancy. We have much to learn about the coevolution of
individual decision making and the structure of SES.
A clear next step in the modeling that I have presented in this chapter is to formalize
the conceptual model developed in conjunction with Figure 3.6. For anyone familiar with
agent based models, I think the potential to transform the baseline hunter-gatherer SES
into an agent based model is relatively obvious, and there are potentially good reasons for
doing so. The point that I would like to make here, however, is somewhat different. In
general, the application of dynamical systems to archaeological questions is sorely lagging
the application of computational models or agent based models. There are no doubt a
number of reasons for this, but one potential reason is the argument made that agent based
models are epistemologically superior to dynamical systems of differential equations for
archaeological research because they are bottom up rather than top down representations
of SES (Kohler and Gumerman, 2000). There are intellectual trade-offs associated with
85

each type of modeling. Agent based models have the potential to capture more realism but
are difficult to analyze and the results are applicable to a more narrow array of settings.
The analysis of formal models is more robust to analytical uncertainty and generate results
that are useful for making generalizations across many social-ecological contexts, but the
results of such models may be so general that they boarder on trivial. These trade-offs are
why model building is as much an art as a science. Our challenge is to balance the costs
and benefits of the use of these tools. This balance facilitates our ability to understand the
dynamics of very complex processes and make statements about the processes that drive
the evolution of SES (see for example Barton et al., 2011).
Onward
The challenge ahead in this dissertation is to evaluate the URH with ethnographic data.
As I discussed in chapter 1, the model analysis and URH facilitates the deductive analysis
of cross-cultural data. However, simply evaluating the fit of the URH with data is not
enough. Almost every hypothesis purported to explain the dynamics of complex systems
garners some modicum of support in actual data sets. Does this mean that the hypothesis
is correct? Of course not. To most productively make use of broad-scale ethnographic
comparisons, I suggest that ethnographic data should be used to evaluate the relative merit
of multiple competing hypotheses. The next step is to develop an alternative hypothesis to
the URH. This is what chapter 4 is all about.
86

Chapter 4
THE SOCIAL OPPORTUNITY HYPOTHESIS
One of the goals of this dissertation is to help build a corpus of knowledge useful for un-
derstanding the processes that cause hunter-gatherer SES to change, with specific emphasis
on the social-ecological contexts that favor the adoption of food production. The approach
that I advocate is the use of dynamic models to develop hypotheses that explain variation
in the foraging strategies documented among ethnographically recorded societies. In turn,
the analysis of large ethnographic and environmental data sets to evaluate these hypotheses
generates a set of first principles useful for explaining major transitions in hunter-gatherer
subsistence documented in the archaeological record. This strategy, however, depends on
multiple competing hypotheses (Chamberlin, 1931). Simply creating one hypothesis is not
enough. Almost any reasonable hypothesis will find a modicum of support in data sets
that describe the attributes of complex systems (Johnson and Omland, 2004). The idea of
evaluating multiple competing hypotheses is basic scientific epistemology, but, in practice,
most of us tend to evaluate one model, find support and then stop (Keeley, 1995). The
point of this chapter is to build an alternative, though not necessarily mutually exclusive,
hypothesis to the URH.
In this chapter, I modify the baseline hunter-gatherer SES so that, as a byproduct of
foraging effort, the productivity (r) of a forager-resource system increases. This modifi-
cation formalizes the idea that the harvest strategies of foragers actually increase rather
than deplete the abundance of food in a system. The chapter is divided into three sections.
First, I describe how the augmentation of resources is incorporated into the baseline hunter-
gatherer SES model. Second, I investigate the effect of foraging strategies that augment the
abundance of food on the resilience of forager-resource system states and the robustness
87

of foragers’ non-subsistence time budgets to climatic and demographic shocks. Finally,
I leverage the knowledge gained from my analysis of the modified hunter-gatherer SES
model to build a multi-level selection argument for the coevolution of foraging strategies
and a resource base. This argument builds on the modified model of economic defensi-
bility proposed by Smith (2012) and Zeder (2012). As discussed in chapter 2, my work
buttresses the potential short-comings of Smith (2012) and Zeder’s (2012) argument by i)
integrating the affect of population density on foraging strategies and ii) eliminating the
need to assume that foragers make decisions based on expected gains in the long-term. A
final insight that emerges from my work is that individual foragers might be more sensitive
to variation in their non-subsistence time budgets than variability in their ability to achieve
a desired level of energy per se. This illustrates how our assumptions about the preferences
of individuals fundamentally alters how we explain coevolutionary processes. Understand-
ing the contexts in which one preference or another forms the basis of decision making is an
important direction for future research to which archaeologists should begin to contribute.
Incorporating the Augmentation of Biomass into the Hunter-gatherer SES Model
The basic dynamics of the baseline hunter-gatherer SES are described by a set of cou-
pled differential equations:
x = G(x)−H(x,e) (4.1)
e = D(x,e). (4.2)
This story simply states that a change in the biomass of resources is the growth of re-
sources less the total harvest of resources by foragers. The effort invested in the harvest
of resources depends on a decision function, which depends on the level of biomass and
effort at time t. One of the basic assumptions that underlies the behavior of this system is
88

that foragers attempt to satisfy a sufficient level of energy, γ in a minimum amount of time.
This assumption is critical to reconsider if foragers augment the production of biomass on
a landscape.
The augmentation of biomass production requires effort (i.e., time) and may entail a
trade-off between the time spent to augment the productivity of resources and the actual
harvest of resources. To modify the model, I make the most basic assumption possible.
This assumption is that resource augmentation occurs as a byproduct of the harvest strategy
of foragers. For example, in their pursuit of sand lizards, Martu foragers of the Australian
Western Desert burn off vegetation, mainly economically unimportant spinifex grasses, to
locate and collect lizards (Bird et al., 2005). This burning has the consequence of reallo-
cating nutrients and sunlight to plant species that recolonize the burned area and increases
the quality of available habitat for lizards; this, in turn, increases the density of lizards in
foraging areas harvested by the Martu (Bird et al., 2005, 2008). Under the assumption
that augmentation occurs as a byproduct of time spent in the harvest of resources, effort
invested to augment the productivity of resources does not require a trade-off in time al-
location. However, the elaboration of strategies of food production, like weeding or water
control, likely would require trade-offs in time investments.
In the baseline hunter-gatherer SES model, the growth or resource biomass, G(x) is
defined by the logistic function,
G(x) = rx(1− xK) (4.3)
where r is the intrinsic rate of biomass growth and K is the growth limiting effect of com-
petition (carrying capacity) on the resource base. To augment the production of resource
biomass foragers can either manage ecosystems to increase r, K or both parameters si-
multaneously. Management is a matter of manipulating disturbance-succession dynamics
89

to reallocate flows of nutrients, solar energy and water from undesired to desired species
(from a human forager’s perspective) and/or the dispersal of species within an ecosystem.
State Variables Definitions Default Valuesx(t) The density of resources (biomass/area) at time t variese(t) The harvest effort (workdays/day) at time t varies
Parameters Definitions Default Valuesr The mean intrinsic rate of resource growth (yr−1) 0.3rmax The maximum intrinsic rate of resource growth
for a given harvest regime (yr−1)0.5
K The mean carrying capacity for resources(biomass/area)
1
q The harvest coefficient (biomass/effort/standingbiomass)
0.2
p The population density of foragers 0.7γ The energy target per forager 0.05l The baseline processing coefficient (Kcals/unit
biomass/effort/forager)1
m Interference (Kcals/biomass/effort/forager) 0.7c Basal metabolic requirements (Kcals/time) 0.02α The biomass to energy conversion coefficient variesα1 and α2 Relative weights given to harvest per unit effort
and energy deficits0.1 and 4
β The sharpness of the transition between valuingenergy deficits over harvest per unit effort
3
E The upper limit of total effort at which harvest ac-tivities impact the growth of resource biomass
2.5
E The minimum level of total effort required forharvest activity to impact the growth of resourcebiomass
0.1
z The coefficient of resource augmentation 0a The proportion of foragers that adopt resource
augmenting strategies0
Table 4.1: Model state variables and parameters with resource augmentation
To capture the effect of resource augmentation, I assume that foraging activities, such as
burning off vegetation, increase the growth rate of a resource base (r). As noted above, the
augmentation of r is modeled as a byproduct of the effort put into the harvest of resources;
therefore, foragers in the model do not face time allocation trade-offs between time invested
in food production vs. the harvest of resources. The primary variable, then, that determines
the degree of resource augmentation is the total harvest effort exerted by foragers. Total
90

effort, E is simply E = pe; where p is population density and e is the effort exerted per
forager at time t. Equation 4.4 describes the augmentation of a resource base’s growth rate
as a function of total effort:
A(r) =
r E ≤ E
r+az(E−E) E < E ≤ E
rmax E > E.
(4.4)
Where E and E are critical total effort thresholds that determine whether or not harvest ac-
tivity has an affect on the growth rate of resources. The parameter z describes human mod-
ification of the environment. This coefficient defines how effectively the harvest strategies
of foragers enhance the flow of resources in a system. It is important to recognize that z is
a function of the strategies that foragers use to harvest resources. For example, in the case
of sand lizards mentioned above, burning is not a requirement of catching sand lizards; the
harvest of lizards could be done without burning. In the case of non-burning, the simple
search and find strategy would not augment r as effectively as the strategy of burn, search
and find. The parameter a is the proportion of foragers within a population that adopt har-
vest strategies that augment the productivity of resources. The parameter a is constrained
by 0 ≤ a ≤ 1. When a = 1, every forager in a system engages in harvest strategies that
augment r.
Equation 4.4 simply states that below a minimum total effort threshold, the harvest
activities of human foragers have no impact on the growth rate of a resource base. This
means that when population density is extremely low, harvest activities, like burning, have
no measurable impact, on average, on the growth rate of useful resources. Once a minimum
threshold of total effort has been crossed, the augmented growth rate of a resource base
increases as a linear function of total effort up to the maximum effort threshold, E. At
the maximum effort threshold, a landscape has been so transformed, at a given level of
91

technology, that harvest effort no longer increase the growth rate of resources. This is rmax
for a given resource augmentation regime. Thus, the growth of resources in the hunter-
gatherer SES model is now simply
G(x) = A(r)x(1− xK). (4.5)
The Effect of Biomass Augmentation on Forager-resource System States
Figure 4.1 illustrates phase-planes of resource biomass (x) plotted against foraging ef-
fort (e). Each plot illustrates a phase-plane in which population density is held equal at 0.8
for three different values of z, while all other parameters are held equal at the default values
specified in Table 4.1. As discussed in chapter 3, for the default parameter values, a pop-
ulation density of 0.8 results in the simultaneous presence of the productive and degraded
attractors. When these two attractors characterize the global structure of the hunter-gatherer
SES, foragers face the risk of not achieving the resource flow that they desire (γ). As with
Figure 3.3 in chapter 3, the orange curve describes all of the points in the system for which
foraging effort is at equilibrium (e = 0) and the green curve all of the points at which
resource density is at equilibrium (x = 0). Where the two curves meet, the system is at
equilibrium (i.e., e & x = 0). All stable equilibria are marked by gray circles and unstable
equilibria by squares.
Two observations are revealed by Figure 4.1. First, as the effectiveness or resource aug-
mentation increases (z), the growth rate of biomass increases and foragers spend less time
in the harvest of resources at the productive attractor compared with foragers who do not
augment the production of biomass. For example, in Figure 4.1a where z = 0, equilibrium
foraging effort (e) is equal to 0.68 at the productive attractor, while e = 0.67 at the produc-
tive attractor in Figure 4.1b and e = 0.65 at the productive attractor in Figure 4.1c. Second,
the parameter space (i.e., the window of vulnerability) in which two attractors are present
92

0
0.2
0.4
0.6
0.8
1
1.2
1.4
1.6
1.8
2
0 0.2 0.4 0.6 0.8 1 1.2 1.4
0
0.2
0.4
0.6
0.8
1
1.2
1.4
1.6
1.8
2
0 0.2 0.4 0.6 0.8 1 1.2 1.4
0
0.2
0.4
0.6
0.8
1
1.2
1.4
1.6
1.8
2
0 0.2 0.4 0.6 0.8 1 1.2 1.4
(a)
(b)
(c)
(d)
(e)
(f)
Resource density (x)
Fora
ging
effo
rt(e
)
Resource density (x)
Fora
ging
effo
rt(e
)
Resource density (x)
Fora
ging
effo
rt(e
)
Figure 4.1: Phase plots of foraging effort against resource density. All parameters are heldconstant at default values except the ecosystem input reallocation coefficient (z). a-z= 0; b-z = 0.01; c-z = 0.04. The circles highlight stable attractors. The squares highlight unstableattractors. Each phase plot is paired with a stability landscape (a-d; b-e; c-f) that providesa metaphor for the stability of the attractors portrayed in each phase plot.
93
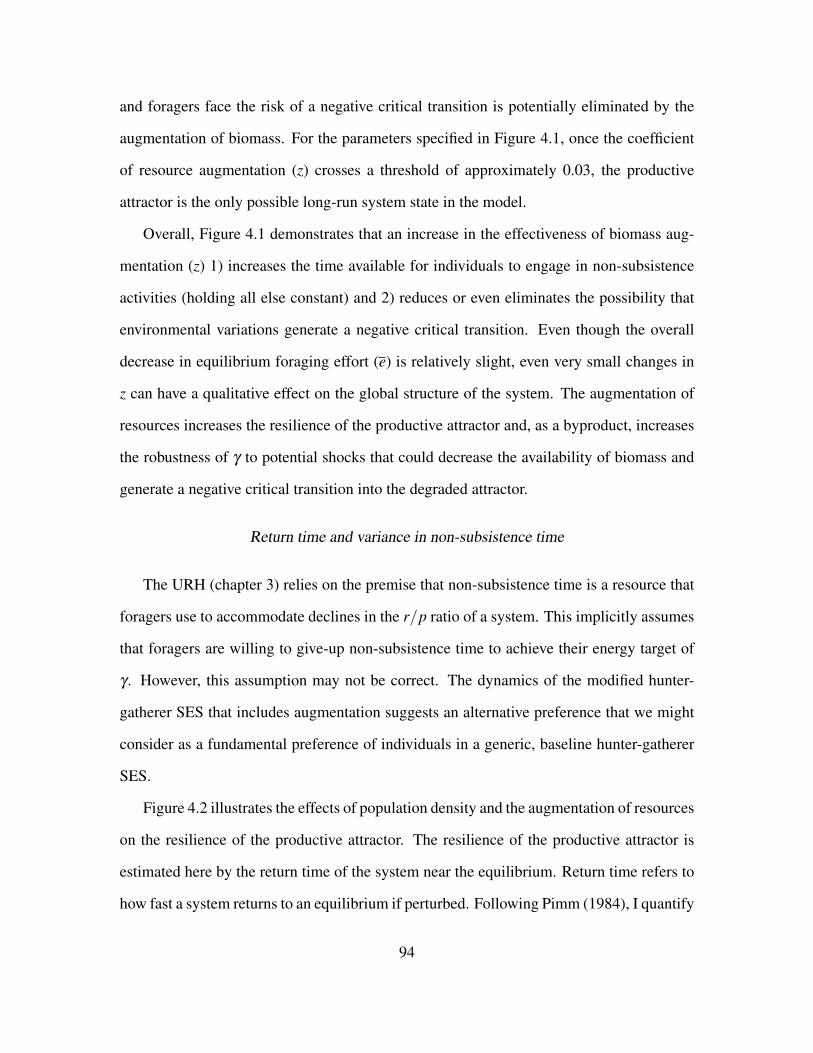
and foragers face the risk of a negative critical transition is potentially eliminated by the
augmentation of biomass. For the parameters specified in Figure 4.1, once the coefficient
of resource augmentation (z) crosses a threshold of approximately 0.03, the productive
attractor is the only possible long-run system state in the model.
Overall, Figure 4.1 demonstrates that an increase in the effectiveness of biomass aug-
mentation (z) 1) increases the time available for individuals to engage in non-subsistence
activities (holding all else constant) and 2) reduces or even eliminates the possibility that
environmental variations generate a negative critical transition. Even though the overall
decrease in equilibrium foraging effort (e) is relatively slight, even very small changes in
z can have a qualitative effect on the global structure of the system. The augmentation of
resources increases the resilience of the productive attractor and, as a byproduct, increases
the robustness of γ to potential shocks that could decrease the availability of biomass and
generate a negative critical transition into the degraded attractor.
Return time and variance in non-subsistence time
The URH (chapter 3) relies on the premise that non-subsistence time is a resource that
foragers use to accommodate declines in the r/p ratio of a system. This implicitly assumes
that foragers are willing to give-up non-subsistence time to achieve their energy target of
γ . However, this assumption may not be correct. The dynamics of the modified hunter-
gatherer SES that includes augmentation suggests an alternative preference that we might
consider as a fundamental preference of individuals in a generic, baseline hunter-gatherer
SES.
Figure 4.2 illustrates the effects of population density and the augmentation of resources
on the resilience of the productive attractor. The resilience of the productive attractor is
estimated here by the return time of the system near the equilibrium. Return time refers to
how fast a system returns to an equilibrium if perturbed. Following Pimm (1984), I quantify
94

return time as 1|λ | , where λ is the dominant eigenvalue of the equilibrium at the productive
attractor. Please recall, in the real world, a system is constantly perturbed. Return time
measures how quickly the interaction between foragers and resources will return to the
long-run equilibrium after a system is hit by a shock. The longer it takes a system to
return to equilibrium, the more variance that foragers would experience in their harvest of
resources and foraging effort over time-scales shorter than the long-run equilibrium.
0.4
0.6
0.8
0.2 0.4 0.6 0.8
Population density (p)
Ret
urn
time
z = 0
z = 0.03
Figure 4.2: The effects of population density (p) and the coefficient of augmentation (z)on the return time of the productive attractor. The red portion of the z = 0 curve indicatesthe values of p where the system is vulnerable to a negative critical transition. All othermodel parameters are held equal at default values.
Figure 4.2 demonstrates that as population density increases the resilience of the pro-
ductive attractor decreases and, thus, return time increases. This is an increasing non-linear
relationship. An increase in z has the effect of decreasing return time per unit of population
density. A subtle effect of increasing how well foragers augment a resource base, then, is
that foragers are less sensitive to shocks that cause, at the scale of the model, variance in
their harvest effort. Consequently, as z increases (holding all else constant) foragers would
also experience less variation in their budget of non-subsistence time and might be able to
convert this situation into future fitness gains because they can more easily plan ahead and
95

efficiently use time to find food and engage in non-subsistence activities. Foragers may, in
fact, have a specific tolerance level of variance in non-subsistence time that they are willing
to accept. Thus, foragers might have a fundamental preference for foraging strategies that
minimize variance in their budget of non-subsistence time. This preference may lead to a
different set of evolutionary dynamics than those described by the URH.
The Coevolution of Food Production, the Productivity of Resources and Territoriality
In this section, I use my understanding of the hunter-gatherer SES model to identify
the social-ecological contexts that might favor the coevolution of food production, terri-
toriality and increases in the productivity of resources. To do this, I make three basic
assumptions. 1) Foragers have an underlying preference for minimizing variance in their
budget of non-subsistence time. The basis of this assumption is that individuals with a
predictable budget of non-subsistence time can convert time into fitness gains better than
foragers with less predictable budgets of non-subsistence time. 2) Time is a finite resource,
thus if an individual works harder to obtain γ , she necessarily gives up time that could be
invested in non-subsistence activities (see Dunbar et al., 2009). 3) Foragers make decisions
in a hierarchical matrix of ecosystem structures that scale in space and time. The patch
is a homogeneous area of resources; a habitat is a larger area with multiple patches and a
landscape is an area composed of many habitats. Each level of the hierarchy is described by
a forager-resource system, with systems at each higher level aggregating many local sys-
tems from the next lowest level. Given these assumptions, the dynamics of hierarchically
organized forager-resource systems can generate directional, multi-level copying/selection
pressure for increasing investment in food production, territoriality and increasing resource
productivity.
Figure 4.3 describes my multi-level selection argument. From left to right, Figure 4.3
describes how cross-level dynamics bridge the patch-habitat-landscape hierarchy to gener-
96

ate directional copying and transmission of foraging strategies that coevolve with resources.
The fast dynamics of disturbances constantly shock a resource base at the lowest level of
the hierarchy (most acutely at the patch). In response to these shocks, following Flannery
(1985), I propose that foragers experiment with harvest strategies and discover the strate-
gies that augment productivity and reduce negative deviations in the availability of biomass.
For instance, burning off vegetation to look for small game increases the productivity of
the game more than a simple search and kill strategy. In this example, individuals who
systematically burn in foraging patches increase the density of resources (x) within that
patch, which increases the resilience of the patch level forager-resource system. As noted
in the previous section, when z is free, an increase in the resilience of a forager-resource
system at the productive attractor also reduces time spent foraging and variance in the non-
subsistence time budget of individuals. I argue that at the patch level individuals who find
harvest strategies that reduce variance in their budget of non-subsistence time are copied
by other individuals (which increases a) because, as assumed above, individuals preference
strategies that reduce variance in their non-subsistence time budget. This process is the
az→ x→ e feedback loop at the patch level illustrated in Figure 4.3.
The habitat level forager-resource system is an aggregate of many patch level forager-
resource systems. Thus, an increase in the augmentation of resources in many patch level
systems should scale-up and create an increase in the aggregate density of resources at the
habitat level (xp→ xh). Following Smith (2012) and Zeder (2012), this increase in the den-
sity of resources should provide an incentive for individual to “own” and defend habitats
from intruders because individuals need less space to find food and the costs of defense
decline. This assumes that incentives to cooperate in the ownership of territory linearly
scale-up from an individual to a social group. The consequence of the adoption of own-
ership, at first glance, may not be obvious. However, the dynamics of the hunter-gatherer
SES suggest that institutions of ownership actually amplify the increase in resource density
97

α ph plaz
xp xlxh
ehep el
Patch Habitat Landscape
Increasing effect of disturbance dynamics on x in a FRS
Figure 4.3: A schematic of the multilevel selection argument made in the text. Fast distur-bance dynamics (e.g., inter-annual variation in rainfall) have a greater affect on x at lowerlevels in the forager-resource system (FRS) hierarchy.
caused by the adoption of strategies that increase z at the patch level (xh→ α ph). One of
the main components of the hunter-gatherer SES discussed in chapter 3 is α . This param-
eter defines competition for resources as α = e−mp, where e is the exponential; m is an
interference coefficient that defines the cost of social interactions; and p is population den-
sity. A reduction in the interference coefficient of m reduces competition for resources and
harvest pressure. The result is that the density of resources available per unit of population
density actually increases as interference declines (Freeman and Anderies, 2012). In short,
ownership institutions should allow groups of foragers at the habitat level to increase the
predictability of their non-subsistence time budget because ownership institutions increase
the resilience of the forager-resource system at the habitat level (α p→e→xh) above and
beyond increases caused by an increase in z.
Finally, the landscape level forager-resource system is a collection of many habitats,
thus an increase in the resource density of habitat level systems should scale-up to increase
the density of resources at the landscape level (xh → xl). Again, the increase in resource
density should make the productive attractor in the landscape scale forager-resource system
98

more resilient. And the consequence of more resilience is that the energy supply of foragers
is more robust to potential perturbations and a consistent surplus of energy for individuals.
This fact results in population growth and an expansion of forager population density in the
landscape scale system, (xl→pl). In this way, landscape scale systems with many foragers
who adopt strategies that augment resources at the patch level are more robust at the land-
scape level to shocks and should out compete landscape level systems with few foragers
who adopt strategies that augment resources at the patch level. As noted in my description
of model assumptions, however, resource augmenting strategies have an rmax where forag-
ing effort, for a given strategy, no longer augments the productivity of resources. At this
point, forager-resource systems across the hierarchy are “reset,” and z is no longer “free.”
This means that beyond the critical threshold of E, any additional increase in population
density would necessitate that individuals reallocate time from non-subsistence activities
to harvest resources, and this can deplete the resource base (pl→el→xl), which feeds back
down to the patch level (xl→xp).
There are two points that I would like to make here. First, this multi-level selection
scenario takes time to unfold. Second, in the above scenario, food production coevolves
with territoriality and increases the productivity of resources because it does not take time
to augment a resource base (i.e., z is a byproduct of harvest effort). However, once rmax has
been hit, the only way to improve z is for foragers to invest in food production strategies
that have a cost in terms of time. Once the coevolutionary process has taken hold, the incen-
tive is for individuals to invest in more elaborate forms of food production. This is because
the combination of territoriality and increases in population density make abandoning food
production very costly. Once population density gets high enough and groups have stable,
owned territories, these conditions create an incentive to respond to decreases in the r/p
ratio of a system at the landscape scale by investing in more elaborate forms of food pro-
duction. The alternative of migrating somewhere else would only work if empty landscapes
99

were available. In short, once territoriality and low-level food production have coevolved,
in part, because foragers preference maintaining a predictable budget of non-subsistence
time, a kind of lock-in takes place where foragers are on a path dependent trajectory of
increasing investment the production of food.
Comparing landscape level systems: The Goldilocks zone
There are three caveats to the argument made above. First, if there are diminishing
returns to the fitness benefit gained from a predictable budget of non-subsistence time, for-
agers may never experience meaningful increases in the variance of their non-subsistence
time. As a consequence, individuals would have little incentive to copy other foragers who
experiment with foraging strategies that boost z because those strategies would not affect
variance in their budget of non-subsistence time. Second, if the r/p ratio of a hierarchy
of forager-resource systems is incredibly low, foragers might, again, gain no benefit from
adopting strategies that increase z. The reason is that the effect of biomass augmentation
is not strong enough to increase the robustness of foragers’ supply of energy by reducing
the chances foragers end up in a degraded state. Finally, if the r/p ratio is too variable on
a decade-to-century time scale due to climate variation, there likely would not be enough
time for the multilevel selection/copying processes to generate a self perpetuating selective
pressures for food production and territoriality. The reason for this is that drastic shifts be-
tween biophysical environments may generate a situation in which strategies that augment
the production of food in one environment do not work when the environment shifts or
even begin to have a negative impact. Below, I explore these caveats by comparing three
conceptual landscape scale forager-resource systems.
Figure 4.4 is analogous to Figure 3.6 in chapter 3. In each figure I hold population
density constant at two foragers and vary the intrinsic rate of productivity (r) from high in
4.4a to medium in 4.4b and low in Figure 4.4c. The dashed line is the mean resource-to-
100

population (r/p) ratio of a landscape level forager-resource system at the habitat level and
the gray shading indicates inter-annual deviations around this mean for a 50 year interval.
The red line is the critical r/p ratio at which every local forager-resource system becomes
vulnerable to a negative critical transition. The dashed red line is the critical r/p ratio
where every local system transitions into the degraded basin of attraction.
Figure 4.4a illustrates a forager-resource system at the landscape level where the intrin-
sic productivity is high relative to population density, thus none of the nine habitat level
systems are vulnerable to a negative critical transition. On this landscape, inter-annual
deviations in the r/p ratio are present, and foragers might adopt harvest strategies that
increase the z of patch level systems. However, it is not clear that this will necessarily
occur. The intrinsic productivity of the landscape in Figure 4.4a is so high that foragers
will not necessarily gain a fitness benefit from strategies that augment a resource base and
decrease variance in non-subsistence time (due to diminishing returns). In systems where
r is naturally very high, holding population density constant, non-subsistence time may be
so predictable that there is little to no pressure on individuals to experiment, discover and
copy foraging strategies that augment z because shocks do not ever increase variance in an
individual’s non-subsistence time budget above a tolerance threshold.
Figure 4.4b illustrates a landscape in which every habitat level system is vulnerable to
a negative critical transition. Further, each individual forager must work harder, relative to
Figure 4.4a, to obtain food. On this landscape, there is an incentive for individuals to ex-
periment and copy strategies that increase the z of patch level systems because the effect is
to make patches and habitats more productive, which increases the resilience of the produc-
tive attractor and makes an individual’s budget of non-subsistence time less variable. In the
social-ecological context described by Figure 4.4b, the immediate benefits of a predictable
budget of non-subsistence time favor the directional copying of strategies that increase the
productivity of a resource base (z) at the patch level. This copying scales the effects of food
101

Time (weeks)
Lan
dsca
per/
pra
tio
(c)
(b)
(a)
Time (weeks)
Time (weeks)
Lan
dsca
per/
pra
tioL
ands
cape
r/p
ratio
Figure 4.4: Three forager-resource systems at the landscape scale composed of nineforager-resource systems at the habitat scale. In all three pictures: the top graph illustrateschange in the landscape’s r/p over an average 52 week period. Each time series graph ispaired with four snapshots of the nine forager-resource systems at the habitat scale. Theblack on the pie charts indicates the probability (p(ei)) of a negative critical transition in ahabitat.
102

production strategies up to the habitat level where foraging populations have an incentive
to adopt ownership institutions. Ownership institutions allow foragers to more efficiently
achieve their energy target and this compounds the effect of an increase in z on the density
of biomass at the landscape level. At the landscape level, the r/p ratio, initially, increases
and so does the robustness of foragers’ supply of food to potential shocks. Over decades
to centuries, landscape level systems where the food supply is robust to shocks have higher
rates of population growth and expand at the expense of less robust systems. However, pop-
ulation growth eventually pushes a system to the rmax associated with a particular foraging
strategy and the dynamics of depletion again threaten the ability of foragers to maintain a
predictable budget of non-subsistence time and this feeds back to the patch level and favors
the elaboration of strategies that increase z.
My postulate is that there is a zone of r/p ratios bounded by the landscape level sys-
tems described in Figure 4.4a and 4.4b. I call this the Goldilocks zone. In the Goldilocks
zone the ecological conditions are just right for the coevolution of food production, terri-
toriality and increasing productivity of resources. The lower bound of the Goldilocks zone
described by Figure 4.4b is likely sensitive to inter-annual changes in the climate drivers
that shock the productivity of resources. This is because this variation occurs faster than
the net effect of augmentation scales-up, which, at minimum, likely takes years to increase
the density of resources in habitats and decades on landscapes. If the coefficient of varia-
tion in Figure 4.4b gets too high, then negative critical transitions are going to occur both
more unpredictably and frequently. Under these conditions, the coevolutionary cycle can-
not become self-perpetuating because frequent, habitat level negative critical transitions
cause foragers to abandon habitats. Following the model of economic defensibility, this
ecological context should favor foraging strategies that are territorially extensive..
Figure 4.4c illustrates a landscape in which the intrinsic productivity of resources is
very low. In this system, each habitat level system may have foragers who adopt the aug-
103

mentation of resources. But, in environments so low in productivity that landscape wide
flips into the degraded attractor are the norm, the proportion of foragers that adopt food
production may never boost resource growth rates high enough to sufficiently improve
the robustness of forager’s food supply to shocks and facilitate population growth. There
would, therefore, be no potential gain in the predictability of non-subsistence time and fit-
ness benefit for individuals in systems with high proportions of adopters. Some foragers
within hunter-gatherer SES may adopt strategies that augment resources in this environ-
ment, but a positive feedback cycle that causes these strategies to proliferate can not get
started because the productivity of forager-resource systems across the hierarchy are not
transformed enough to meaningfully increase the robustness of individual’s food supply to
shocks. The ability to achieve γ is just not a possibility in landscape level systems charac-
terized by Figure 4.4c.
A final point is that climate variation occurring at decade-to-centennial scales of time
may limit the coevolution of food production, territoriality and the productivity of re-
sources. In general, the Pleistocene witnessed much higher amplitude variations at this time
scale than is characteristic of the Holocene. Holding population density constant, such high
amplitude variation could move forager-resource systems in and out the Goldilocks zone
defined above on the time-scale of decades. This means that food production strategies that
augment the productivity of resources in one decade may not do so in the following decade.
In this scenario, there likely would not be enough time for the multilevel selection/copying
processes to generate a self perpetuating cycle (Bowles and Choi, 2013; Richerson et al.,
2001). Given enough stability at the centennial scale, the Goldilocks zone should lead to
systems where individuals are primed to improve z. And adopting the cultivation of domes-
ticated plants is a very powerful way to do so when the institutions are in place to protect
resources from competition. Of course, the adoption of domesticated plants would have
long-term consequences that totally transform a forager-resource system and might change
104

individual’s preferences for non-subsistence time.
The Social Opportunity Hypothesis
I propose that there is a Goldilocks zone where investments in the augmentation of
resource biomass provides individual foragers with a relatively short-term fitness benefit
derived from a predictable budget of non-subsistence time. The budget of non-subsistence
time is more predictable because the augmentation of resources makes a forager-resource
system, at the productive attractor, less sensitive to shocks that might depress the avail-
ability of food. In this Golidlocks zone, the fitness benefits of non-subsistence time favor
the directional copying of strategies that increase the productivity of a resource base. This
copying scales the effects of food production strategies up from the patch to the habitat
level where foraging populations have an incentive to adopt ownership institutions. Own-
ership institutions allow foragers to more efficiently achieve their energy needs and this
compounds the effect of an increase in z on the density of biomass at the landscape level.
At the landscape level, the r/p ratio increases and so does the robustness of foragers’ sup-
ply of food to potential shocks. Global systems where the food supply is robust to shocks
have higher rates of population growth and expand at the expense of less stable global sys-
tems. However, population growth eventually pushes a system to the rmax associated with
a particular foraging strategy and the dynamics of depletion again threaten the ability of
foragers to maintain a predictable budget of non-subsistence time and this feeds back to
the patch level and favors the elaboration of strategies that increase z. In this way, the very
strategies that foragers use to obtain food transform the social and biophysical environment
and drive the future evolution of a hunter-gatherer SES. Going farther afield, I speculate
that when this process gets started, foragers who have the opportunity to adopt domesti-
cated plants are very likely to do so, but this act will have long-term consequences, fueling
the growth of institutions, inequality and labor demands to manage more intensive food
105

production (a la Hayden, 2003).
Based on the logic of the social opportunity hypothesis, I develop three basic quan-
titative expectations for the social-ecological relationships that characterize variation in
hunter-gatherer SES.
1. Hunter-gatherers who invest in food production strategies live at higher population
densities than hunter-gatherers who do not. This expectation follows from the posi-
tive feedback proposed between increasing investment in the production of food and
increases in population density. With increasing fidelity of food production making
possible increases in population density and increases in population density, in turn,
creating contexts in which investment in the production of food is needed to maintain
a predictable budget of non-subsistence time.
2. The adoption of food production increases the likelihood that hunter-gatherers rec-
ognize territorial ownership. This follows from the argument that by increasing z,
foragers decrease the amount of territory necessary per forager to collect food. This
increases the net benefit of territorial ownership.
3. Finally, territorial ownership favors a continued investment in the production of food
by hunter-gatherers. As territorial ownership develops within a region composed
of multiple hunter-gatherer SES, territorial boundaries should become less perme-
able and limit the ability of foragers to expand their range in response to population
growth or a decline in the intrinsic productivity of resources in an environment. This
situation, in turn, should favor hunter-gatherer SES with high proportions of for-
agers who invest in food production and increase the overall productivity of their
territory because this increases a system’s resilience and reduces variation in the
non-subsistence time budgets of individuals.
106

Conclusion
In this chapter, I modified the hunter-gatherer SES model developed in chapter 3 to
study the effects of foraging strategies that augment rather than deplete a resource base.
In general, strategies that augment the productivity of a resource base, as a byproduct of
foraging effort, increase the resilience of the productive attractor in the hunter-gatherer SES
model. This means that foragers spend less time harvesting food and experience an increase
in the robustness of their food supply to shocks. Importantly, an increase in the resilience
of the productive attractor also decreases variation in how much foraging effort individuals
devote to the collection of food and, as a consequence, variation in an individual’s budget
of non-subsistence time also declines. Given these results, I have conceptually proposed a
set of processes that link hierarchical levels of forager-resource systems together to drive
the coevolution of food production, territoriality and the productivity of a resource base.
The SOH provides a highly general explanation for the evolution of food production and
territorial ownership.
The SOH builds on a set of ideas that, ultimately, trace back to Braidwood (1960) and
Rindos (1980, 1984) and Smith (1989) and are developed more fully by Zeder (2012) and
Smith (2012). In chapter 2, I discussed the modified model of economic defensibility that
Zeder (2012) and Smith (2012) propose to explain changes in resource use among hunter-
gatherers. This model has a compelling logic, but there are two fundamental short-comings.
The first is that population density is treated as a completely dependent variable. The sec-
ond is that the model relies on the the premise that individual foragers make decisions
based on gains expected in the long-term. Individuals certainly plan ahead, but making
decisions that increase the benefits of foraging in the future is a process fraught with uncer-
tainty. In fact, human foragers seem to discount the future at a very high rate, meaning that
individuals value immediate gains over the possibility of future gains (Tucker, 2001). So,
107

of course, understanding why discount rates change for individuals is important. I believe
that the SOH buttresses both of these short-comings associated with the modified model of
economic defensibility.
As argued in conjunction with Figure 4.4, population density plays an integral role in
creating the context in which food production, territoriality and resource density can co-
evolve. This is due to cross-level interactions that link the hierarchy of forager-resource
systems that hunter-gatherers create. If the resource-to-population density (r/p) ratio of a
landscape level system is too high, the positive coevolutionary feedback cycle is unlikely
to get started because each individual already has a sufficiently predictable budget of non-
subsistence time to get all the fitness gains that they can. Similarly, if the r/p ratio of a
landscape level system is too low, then the degraded attractor is almost a permanent forag-
ing context. In this setting, foragers are likely to abandon a landscape, if at all possible,
rather than invest in the production of food (provided more productive areas are available)
So, there is a Goldilocks zone where “population pressure” is just right (i.e., the r/p ratio
of hierarchically organized forager-resource systems) to foment the coevolution of food
production and territoriality.
The SOH does not rely on the assumption that foragers make decisions meant to in-
crease future benefits. Rather, I assume that foragers preference strategies that best reduce
short-term variation in their budget of non-subsistence time. I assume that foragers can
increase their fitness when they have a more predictable budget of non-subsistence time
because they can maximize their opportunities to socialize, find mates, and carry out the
proper rituals. Recall, in the Goldilocks zone, the augmentation of resources increases the
resilience of forager-resource systems and decreases variation in the time budgets of indi-
viduals. Given my assumption about the benefits of a predictable budget of non-subsistence
time, this dynamic creates a situation in which copying might favor the proliferation of
strategies that augment a resource base’s productivity. Forager’s do not need to plan for the
108

long-term to initiate a multilevel selection feedback process that favors the production of
food, territoriality and increases in the productivity of resources.
Questions for future research
A fundamental question raised by the SOH is whether foragers are willing to give-up
non-subsistence time to harvest food or are more sensitive to variations in their budget of
non-subsistence time. Further, what is the tolerance level of variation in non-subsistence
time? If the tolerance for variation is high, then the dynamics proposed by the URH are
potentially more likely to characterize the evolution of forager-resource systems. If the tol-
erance is low, then the dynamics proposed by the SOH are more likely to characterize evo-
lutionary processes in forager-resource systems. The only way to answer these questions
is by conducting controlled behavioral experiments with real humans, either in the field or
in the lab. This is not an area of research in which archaeologists typically participate. But
basic assumptions about preferences and the ecological contexts in which individuals have
different preferences are critical to the construction of models of coevolutionary processes.
This is especially true of models that attempt to work from first principles of human be-
havior. No one is going to study these issues in small-scale societies for archaeologists,
and I believe this is an area in which we need to expand and broaden our conception of
“ethnoarchaeology” to include contextualized behavioral experiments.
Onward
The next step is to evaluate the merits of the URH and SOH against ethnographic data.
This analysis provides a more informed body of knowledge for understanding patterns of
subsistence change in the archaeological record.
109

Chapter 5
A CROSS-CULTURAL ANALYSIS OF FOOD PRODUCTION AND TERRITORIAL
OWNERSHIP
In chapter 1 I argued that dynamic models help clarify our thinking about complex pro-
cesses that operate across scales of space, time and levels of organization. In turn, the
models are useful tools that aid in our development of explanations for social and techno-
logical change in SES. Two of the most fundamental evolutionary changes that occurred
prehistorically in hunter-gatherer societies are the adoption of food production and the
adoption of territorial ownership by social groups. The coevolutionary relationship be-
tween institutions of ownership and the adoption of food production is a critical debate that
we need to resolve to understand the evolution of subsistence economies based on agricul-
ture (Bettinger et al., 2009; Bowles and Choi, 2013; Hayden, 1995; Rosenberg, 1998, 1990;
Smith, 2012). In this chapter, I work back and forth between the Uncertainty Reduction
Hypothesis (URH), the Social Opportunity Hypothesis (SOH) and cross-cultural patterns
to help clarify the underlying relationships between investment in the production of food
and territorial ownership.
One of the primary differences between the URH and the SOH is how each hypoth-
esis logically links the formal ownership of territory and the practice of food production.
In the URH, the ownership of territory and food production are alternative strategies for
reducing the information processing costs associated with making robust land use choices
when a forager-resource system is characterized by multiple stable states. In the SOH, the
ownership of territory and food production are linked in a mutually reinforcing relation-
ship. Food production increases the incentive for individuals to own territories. In turn, the
ownership of territories increases the incentive for individuals to invest in more elaborate
110

forms of food production. The central question that I address in this chapter is whether
or not food production and territorial ownership are necessarily co-occurring strategies or
are potentially alternatives strategies adapting to distinct ecological contexts that generate
uncertainty associated with land use. The chapter is divided into four sections. In the first
section I describe the data and methods used to evaluate the consistency of the data with
each respective hypothesis. In the second section I evaluate the ability of each hypothesis
to explain the presence and absence of low-level food production strategies among hunter-
gatherers (e.g., burning vegetation, planting). In the third section I evaluate the ability
of the hypotheses to anticipate the presence and absence of territorial ownership among
ethnographically documented hunter-gatherers. In the fourth section I reflect back on the
URH and SOH to identify important questions for future research. In the end, the data are
more consistent with the URH than the SOH. The implication is that the adoption of food
production and the subsequent evolution of agriculture is driven by systems dynamics that
generate uncertainty in the ability of foragers to make robust land use choices.
Preliminaries: Data and Methods
The ethnographic data used here were compiled from three sources, Keeley (1995) and
Binford (2001) and my own data collection efforts to increase the sample of societies stud-
ied by Keeley (1995). The Keeley data set plus the cases I have added from ethnographic
sources is a sample of 110 societies. This data set records the presence and absence of
low-level food production strategies such as burning vegetation and planting select species.
These strategies may augment the productivity of terrestrial resources. A critical point is
that the data collected by Keeley and Binford were done independently of the theory devel-
oped in chapters 3 & 4. By independent, I mean that I did not go through the ethnographic
sources and select data to support one hypothesis or the other.
In general, the Keeley data set constitutes a sub-set of the data reported by Binford.
111

Both authors report population densities and the observations are consistent between the
two authors. The observations made on each society were collected from primary sources
written by ethnographers working independently and at different times and places. The
data, therefore, approximate an independent and unbiased sample of observations made on
hunter-gatherer societies (Hamilton et al., 2007). No data are perfect, and the data used here
are no different. However, the large sample sizes provided by Binford (2001) and Keeley’s
(1995) data allow researchers to check the consistency of competing hypotheses with data,
even if the falsification of a hypothesis is not realistic due to the potentially poor quality
of some ethnographic observations. These data have been used productively in a similar
manner by various authors (e.g., Fenner, 2005; Freeman and Anderies, 2012; Grove, 2009,
2010; Grove et al., 2012; Hamilton et al., 2007, 2009).
Keeley (1995:247-248) has recorded and published the presence and absence of four
activities that he originally termed protoagriculture. These are strategies of low-level food
production that hunter-gatherers use to influence the productivity of ecosystems, either on
purpose or as a fortuitous byproduct. 1) The systematic burning of vegetation to enhance
the availability of game (16/96 societies); 2) the systematic burning of vegetation to en-
hance the availability of plants useful as food (29/96 societies); 3) the cultivation (plant-
ing/seeding) of non-food plants (24/96 societies); and 4) the cultivation of plants for food
(9/96 societies). All four of these behaviors stimulate the productivity of resources within a
hunter-gatherer group’s territory. If a group practiced any one of these strategies as recorded
by Keeley (1995), they have been assigned a value of 1: the production of food present. If
the above strategies were not recorded by Keeley, I assigned a value of 0: the production of
food absent. I have supplemented these data with 14 additional hunter-gatherer groups. I
chose the added groups to develop a more complete coverage of the continent of Australia
and to try and increase the sample size of groups living in tropical settings (data reported
in Appendix A). Of course, more work can be done and should be done in the future to
112

document as fully as possible the strategies that hunter-gatherers use to modify ecosystems
via low-level food production.
Data on territorial ownership were obtained from a sample of 339 ethnographically
recorded hunter-gatherer societies (Binford, 2001). To assess territorial ownership, the
variable recoded by Binford (2001:384) called OWNERS is used. This variable is a cate-
gorical description of hunter-gatherer territorial ownership.
1 None reported, but all groups have identity and practical links to both land and re-
sources. There may be strong attachments in the form of persons seen as stewards
of both land and lore. There are, however, no personnel of local group claims on the
area in general. One’s interests and association are acknowledged by others asking
permission for economic use or camping privileges.
2 The local group definitely claims exclusive use rights, over resource locations, res-
idential sites, and the home range, in general. There may be a further set of claims
among the households within the local group– special trees, shell beds, etc. There
may be a kind of endogamous inheritance of stewardship roles with respect to land-
marks or special places.
3 Local group claims hunting areas, dominant animals, fishing sites, and animal drive
locations. Administration is by a group leader. Some resources may be said to be
“clan or lineage” owned. The system is characterized by differentiated and nested
ownership. The basic family, the descent unit, and the larger settlement group may
each claim land and resources at different scales of inclusiveness.
4 Elite ownership of land and resources. In addition, there may be family claims to
particular resource locations. Resource patches may be “owned” by a family and can
be given away, inherited or disposed of within the group. This may include house
113

Tabl
e5.
1:V
aria
bles
and
defin
ition
sV
aria
ble
Defi
nitio
nR
efer
ence
Enh
ance
men
tT
hepr
oduc
tion
ofre
sour
ces
Kee
ley,
1995
Ow
ners
hip
The
owne
rshi
pof
terr
itory
Bin
ford
,200
1D
ensi
tyPo
pula
tion
dens
ityB
info
rd,2
001
Fis
hing
The
perc
ento
fdie
tobt
aine
dfr
omaq
uatic
reso
urce
sB
info
rd,2
001
Hun
ting
The
perc
ento
fdie
tobt
aine
dfr
omhu
ntin
gla
rge
bodi
edan
imal
sB
info
rd,2
001
NP
PN
etpr
imar
ypr
oduc
tivity
(the
grow
thra
teof
biom
ass
ingr
ams/
m2 /
year
)G
ries
eret
al.,
2006
CV
Rai
nfa
llT
heco
effic
ient
ofva
riat
ion
ofin
ter-
annu
alra
infa
llB
eck
etal
.,20
04
114

sites as well. Not uncommonly, such “owned” resource locations are marked and
first fruit contributions may be expected by the elite from productive units within the
society.
This variable is collapsed here into a binary indicator variable for the presence of territorial
ownership, Ownership. Category 1 above is indicative that territories are open access and
ownership is “absent” (a new code of 0), even though permission may be asked to use
particular resources. Categories 2-4 indicate that territories are owned by social groups at
various levels of organization from households to larger settlement groups (a new code of
1).
Five additional variables are used to evaluate the consistency of the URH and SOH with
ethnographic data (see Table 5.1). 1) Population density, 2) the percent of diet obtained
from fishing, 3) the percent of diet obtained from hunting large animals 4) the net primary
productivity in a hunter-gatherer group’s territory and 5) the coefficient of variation in
rainfall in a group’s territory.
Net primary productivity is used to estimate the mean intrinsic productivity (r in the
hunter-gatherer SES model) of an environment occupied by hunter-gatherer groups. Net
primary productivity is a rate of biomass growth (see Odum and Barrett, 2002; Porter and
Marlowe, 2007). I assume that the higher the rate of biomass growth in an environment,
the higher the rate of growth for biomass that is useful as food. Of course, the relationship
between the growth of biomass and biomass useful as food may be more complex. Under-
standing the relationship between the rate of biomass growth and the growth of biomass
useful as food is an important direction for (collaborative) research in comparative hunter-
gatherer studies. I use the coefficient of variation in rainfall to estimate the predictability
and intensity of variation in the availability of water that plants in an ecosystem need to pro-
duce biomass. The higher the coefficient of variation in rainfall, the more unpredictably the
productivity of terrestrial biomass varies from year-to-year. The coefficient of inter-annual
115

variation in rainfall was calculated from global, gridded precipitation means calculated be-
tween 1950 and 2000 at a one decimal degree scale (Beck et al., 2004). The grid cell nearest
to the center of each group’s territory was used to estimate the coefficient of variation in
inter-annual rainfall experienced by each society.
Methods
I use an information theoretic approach to evaluate the consistency of each explanatory
hypothesis with the data (Burnham and Anderson, 2002). Multiple, binary logistic regres-
sion is used to develop statistical models that determine the joint probability, given a set of
explanatory variables, that a response variable is present or absent. In the two analyses con-
ducted here, food production (Enhancement) and the ownership of territory (Ownership)
are the response variables. Binary logistic regression is a general linear model that is useful
for statistically modeling qualitative differences between two potentially distinct groups in
a population (Dielman, 2001). I use the logistic function to relate the joint probability that
Enhancement or Ownership is present in a given society. For example
P(Enhancement = 1|x1, ...xi) =1
(1+ e−(α+∑i bixi))(5.1)
where x1, ...xi refers to a given set of explanatory variables, α is a constant and bi is a
coefficient associated with each variable. Equation 5.1 can be transformed into a general
linear model using the so-called logit link function, such that
ln(p
1− p) = α +∑
ibixi (5.2)
where p is the joint probability that a hunter-gatherer group enhances the productivity of
resources, given a set of explanatory variables.
116

The coefficients (bi) in equation 5.2 describe the effect that a change in an explanatory
variable has on the log-odds that a hunter-gatherer group either practices the production of
food or owns territory. I assume here that groups of hunter-gatherer societies are, a priori,
independent of model parameters and are equally likely to engage or not to engage in the
production of food or the ownership of territory. Thus, groups who are predicted to engage
in food production or territorial ownership with a probability greater than or equal to 0.5
are predicted to produce food or own territory and groups predicted with a probability of
less than 0.5 are predicted not to produce food or own a territory.
Model selection methods are used to evaluate the sign and relative importance of the
explanatory variables considered in this analysis. Model selection methods are useful for
comparing competing explanatory hypotheses, especially when the evaluation of these hy-
potheses relies on observational data drawn from complex systems (Johnson and Omland,
2004). The analysis of the relative importance of the explanatory variables is based on the
Akaike Information Criterion (AIC). AIC is a measure of the fit and complexity of a statisti-
cal model. The analytical procedure for estimating the sign and relative importance of each
explanatory variable was conducted using the R computing environment (R Development
Core Team, 2008) as follows.
1. The MurMin R package is used to calculate all potential binary logistic regression
models for the set of explanatory variables on the response variable. For example,
to analyze the presence and absence of food production (enhancement) in the sub-
sample of societies (n=110), there are five potential explanatory variables (population
density, the percent of diet obtained from fishing, the presence/absence of ownership,
net primary productivity, and the coefficient of variation in rainfall). Thus, this pro-
cedure results in 32 candidate logistical regression models, including a “null” model
that only includes an intercept.
117

2. Each model is ranked according to its AIC value from lowest to highest AIC. The best
model is the statistical model with the lowest AIC (i.e., the model that best balances
fit and complexity) This ranking allows one to calculate the change in AIC, ∆i, as
AICi−minAIC, where AICi is the AIC of a candidate model under consideration and
minAIC is the AIC of the model that best balances fit and complexity.
3. Standardized Akaike weights, wi are calculated for each candidate model. Akaike
weights summarize the likelihood that a given model is the best approximate fit, given
the data. The Akaike weight is calculated by first determining the likelihood that a
model is the best approximation to the data, which conveniently is: L(model|data) ∝
e0.5∆i . Next, the the sum of the likelihoods of all regression models is calculated.
Then, the Akaike weight is simply wi =e0.5∆i
∑Rr=1 e0.5∆r . The Akaike weight is used here
to define a 95% confidence set of models; that is, the set of models that is likely to
contain the regression model that is the best fit to the data.
4. The mean regression coefficient and standard error of each explanatory variable in-
cluded in the 95% confidence set of regression models is calculated. The relative
importance of each explanatory variable present in at least one regression model of
the 95% confidence set is also calculated. The relative importance of an explanatory
variable is simply the sum of the Akaike weights of each model in which a variable
is present. To illustrate, please consider the following hypothetical example. If the
95% confidence set of regression models analyzed to predict the production of food
contains three candidate regression models, each model with an Akaike weight of
0.40, 0.30 and 0.25, and population density is an explanatory variable in the top
two weighted models, then the relative importance of population density is 0.70
(0.40+0.30). If the percent of diet obtained from fishing were present in all three
models, its importance measure would be 0.95 (0.40+0.30+0.25). The importance
118

measures describe the relative likelihood that an explanatory variable is included in
the best regression model (i.e., the model closest to truly representing the data). In
this hypothetical example, fishing is 1.37 times more likely than population density
to have a true effect on the likelihood that foragers produce food. The closer a vari-
able’s importance measure is to 1, the more likely the variable is to have an effect on
the response variable, given the data and candidate set of regression models.
Finally, I combine the formal information theoretic approach described above with ex-
ploratory data analysis (EDA) to identify and illustrate important patterns in the data. Now
that these preliminaries are out of the way, let’s analyze some data!
The Social-ecological Contexts of Food Production
The two explanatory hypotheses outlined in chapters 3 & 4 specify the social-ecological
contexts that should partly determine the benefits and costs of food production for hunter-
gatherers. Below, I develop expectations reasoned from the logic of these alternative hy-
potheses. My goal is to identify expectations that are mutually exclusive to each explana-
tory hypothesis. This is a strategy for determining the relative consistency of each hypoth-
esis with the data.
Predictions
First, both the URH and SOH suggest that population density has a positive effect on the
likelihood that hunter-gatherers engage in the production of food (Pem1). The mechanisms
that cause this predicted relationship simply differ. In the URH, foragers begin to pro-
duce food because a decrease in the r/p ratio of a landscape scale forager-resource system
generates localized common pool resource dilemmas. In this situation, forager-resource
systems at the level of habitats are vulnerable to environmental shocks that can precipitate
a negative critical transition to the degraded attractor. An increase in population density
119

should, therefore, create ecological conditions where foragers are more likely to produce
food to buffer against the risk of getting shocked into a degraded basin of attraction. In the
SOH, the positive effect should result from the process of population growth in a forager-
resource system, at the landscape scale, with high proportions of foragers who adopt the
production of food. The population growth, in turn, should contribute to the establishment
of a social-ecological context that favors the continued elaboration of food production to
boost the productivity of resources.
Second, an implicit assumption of both the URH and SOH is that foragers primarily
target terrestrial species for food. This is because the hunter-gatherer SES model that the
hypotheses are based upon makes this simplifying assumption (see chapter 3). Human for-
agers clearly eat a wide variety of fresh water and marine resources (fish and shellfish). It is
not at all clear that managing the disturbance-succession dynamics of terrestrial ecosystems
would affect the productivity of aquatic resources. I assume here that as hunter-gatherers
become more dependent on aquatic resources for food, they are less likely to engage in
the production of food from terrestrial ecosystems (Keeley, 1995). This process occurs be-
cause, as foragers invest more in aquatic resources, time is more likely invested in strategies
that affect the productivity of aquatic resources rather than terrestrial ecosystems (Pem2).
Thus, to evaluate the URH and SOH as explanations for the adoption of food production,
we must control for the amount of food obtained from fishing.
Third, holding population density constant, the URH suggests that the intrinsic rate at
which biomass regenerates in an environment has an inverse effect on the likelihood that
foragers produce food (Pem3a). In the URH, it is the r/p ratio that determines whether
or not a forager-resource system is vulnerable to a negative critical transition from the
productive to the degraded attractor. Per the dynamics of the hunter-gatherer SES model
in chapter 3, as the growth rate of resources declines, foragers are more likely to enter a
window of vulnerability. And when a system is in the window of vulnerability, individuals
120

face the risk that systems will transition to a degraded state. The production of food is one
way that foragers might adapt to commons dilemmas generated by multiple stable states
and the uncertainty associated with planning how move among habitats on a landscape.
The SOH suggests a slightly more complex relationship between the intrinsic productiv-
ity of resources and the likelihood that foragers produce food. Holding population density
constant, prediction 3emb is a set of three statements: i) above a threshold of extraordinar-
ily high productivity, hunter-gatherers are less likely to produce food; ii) as productivity
declines below this upper threshold, hunter-gatherers are more likely to produce food until
a lower productivity threshold is reached; iii) below this lower threshold, hunter-gatherers
are less likely to engage in the production of food. It is probably rare for hunter-gatherers
to live in terrestrial environments that are so productive, relative to population density, that
variation in non-subsistence time would not decrease in a meaningful way if the productiv-
ity of resources was increased. I, therefore, predict that the productivity of resources has
a positive effect on the likelihood of food production (Pem3b). I explore this relationship
further in the section called “Ecological thresholds” below.
Fourth, the SOH posits a positive feedback between the production of food, the size
of hunter-gatherer territories and the costs of owning territory for hunter-gatherer groups.
In particular, the costs associated with owning a territory decline due to the increase in
the density of resources generated by the production of food. The ownership of territory,
in turn, partly catalyzes a positive feedback that favors the elaboration of strategies for
managing ecosystems to produce food. Thus, it is a basic prediction of the SOH that the
ownership of territories has a positive effect on the likelihood that foragers produce food
(Pem4a), because the two strategies co-occur in a mutual feedback relationship.
In contrast, the URH postulates that ownership and the production of food are alterna-
tive, though not mutually exclusive strategies. As argued in chapter 3, in forager-resource
systems where the risk of a negative critical transition in space and time is easier to esti-
121

mate, the ownership of territory may be sufficient to reduce the uncertainty associated with
land use choices, particularly the uncertainty associated with choosing how much effort
to exert various habitats by regulating who and when individuals can access habitats. As
the risk of a negative critical transition becomes harder to estimate from experience and
transmission, due to the impact of unpredictable environmental variation, the production
of food is a more useful strategy. As alternative strategies that are adopted in different
social-ecological contexts, the URH suggests that there is no discernible effect of territorial
ownership on the likelihood that hunter-gatherers produce food (Pem4b) because the two
strategies are not linked in a direct feedback loop. The two strategies are equally likely to
occur separately as to co-occur, controlling for all other explanatory factors.
Fifth, in the URH, the r/p ratio merely controls a threshold that, once crossed, ex-
poses foragers to the consequences of potentially negative environmental variations, like
droughts. In this hypothesis, the predictability and intensity of environmental variation is
a critical determinant of how foragers respond to the emergence of habitat level common
pool resource dilemmas. The more unpredictable inter-annual changes in resources are,
the URH suggests, the more likely foragers are to adopt the production of food. Thus, the
URH suggests that the unpredictability of inter-annual variation in the productivity of re-
sources has a positive effect on the likelihood that hunter-gatherers produce food (Pem5a)
and, this variable is more important than population density and/or the intrinsic productiv-
ity of resources. Inter-annual variation in, for example, rainfall, is more important precisely
because it is this variation that generates negative critical transitions that serve as a “ signal”
that a system is “out of whack”. The negative critical transitions create uncertainty associ-
ated with where to locate in space and time to harvest food and, thus, a social-ecological
context in which the benefits of food production outweigh the costs for individuals because
food production decreases the likelihood of negative critical transitions.
122

Table 5.2: The predicted direction of the effect of explanatory variables on the likelihoodthat hunter-gatherers produce food. SOH is the social opportunity hypothesis; URH is theuncertainty reduction hypothesis.
Explanatory variablesHypotheses Density Fishing NPP Ownership CV Rain f allSOH + - + + -URH + - - no effect +
Finally, the SOH suggests that the predictability of inter-annual variation in the pro-
ductivity of resources has a negative effect on the likelihood of food production (Pem5b).
As argued in chapter 4, in the Goldilocks zone there is a positive feedback between food
production, ownership and population growth. Whether or not this feedback process gets
started is sensitive to the predictability and intensity of inter-annual deviations in the pro-
ductivity of resources. If the coefficient of variation associated with a system’s productivity
gets too high, this drives the costs of territorial ownership up and generates a higher like-
lihood that habitat level systems will experience a negative critical transition. If variation
gets too unpredictable, there just is not enough time for the coevolutionary, cross-level
feedback cycle to get going.
Table 5.2 summarizes the expected effects of explanatory variables on the likelihood
that hunter-gatherers produce food through burning and planting. There are two analytical
questions that I answer regarding the predictions in Table 5.2: 1) what is the direction of
the effect of each explanatory variable, and 2) how likely is an explanatory variable to
have an effect on the production of food relative to the other variables in the data set? To
have confidence in either the URH or the SOH, a hypothesis needs to correctly predict the
sign of the effect of an explanatory variable and said explanatory variables should, in all
likelihood, have an effect on food production, given the data set and models analyzed.
123

Results
The main result of my analysis is that the URH is more consistent with the data than
the SOH and, thus, we should have more confidence in the processes prosed by the URH
than the SOH to explain the adoption of food production. In the data set analyzed here, the
coefficient of variation in rainfall and population density both have positive effects on the
likelihood that hunter-gatherers produce food and these two variables are far more likely to
have an effect than the percent of diet obtained from fishing, net primary productivity and
the ownership of territories. In sum, we can have a high degree of confidence that three of
the URH’s predictions are consistent with the data (Pem1, 4b & 5a) while we can only have
a high degree of confidence that one of the SOH’s predictions is consistent with the data
(Pem1).
Table 5.3 presents the 95 percent confidence set of models that best explain the pres-
ence and absence of food production among hunter-gatherer societies. The best model
includes two variables, the coefficient of variation in rainfall and population density. The
first regression model is approximately 1.73 times more likely to fit the data than the second
best regression model (0.33/0.19), which includes the following variables: the coefficient
of variation in rainfall, population density and the percent of diet obtained from fishing.
The second best model is 1.58 times more likely to fit the data than the third best model
(0.19/0.12), which includes the following variables: the coefficient of variation in rainfall,
population density and net primary productivity. Overall, the coefficient of variation in
rainfall is an explanatory variable in all 9 regression models in the 95 % confidence set,
while population density is an explanatory variable in 8/9 regression models. This fact re-
veals the overwhelming importance of the coefficient of variation in rainfall and population
density for estimating the likelihood that hunter-gatherers produce food relative to the other
variables.
124

Table 5.3: The 95 percent confidence set of logistic regression models. 1=CV Rain f all,2=Density, 3=Fishing, 4=Ownership & 5=NPP
Explanatory Variables Residual Deviance AIC ∆i wi
1,2 94.88 100.90 – 0.331,2,3 94.00 102.00 1.12 0.191,2,5 94.87 102.90 1.99 0.121,2,4 94.88 102.90 2.00 0.12
1,2,3,4 93.91 103.90 3.03 0.071,2,3,5 93.98 104.00 3.10 0.071,2,4,5 94.87 104.87 3.99 0.04
1 101.9 105.90 5.02 0.031,2,3,4,5 93.91 105.91 5.03 0.03
Table 5.4: Means, standard errors and relative importance (∑wi for each variable) of theexplanatory variables in the 95 percent confidence set of models (n=110).
Explanatory Variable Coefficient (b) Standard Error ImportanceIntercept -4.04 1.02 –
CV Rain f all 20.06 4.45 1.00Density 2.15 0.93 0.97Fishing -0.01 0.01 0.36
Ownership 0.04 0.57 0.26NPP 0.0001 0.004 0.26
Table 5.4 displays the mean coefficients for each explanatory variable in the 95 percent
confidence set of regression models. The two most important variables with importance
weights of 1.00 and 0.97 are the coefficient of variation in rainfall and population density.
The positive effect of population density on the likelihood that hunter-gatherers produce
food is consistent with the predictions of both explanatory hypotheses (Pem1). However, the
positive effect of the coefficient of variation in rainfall on the likelihood of food production
is only consistent with URH (compare Pem6a & 6b). Moreover, the coefficient of variation
in rainfall is a slightly more important than population density, as the URH implies. In
general, however, both variables are very likely to have an effect on the likelihood that
foragers produce food.
Consistent with the idea that investment in aquatic resources decreases the likelihood
that foragers produce food, the percent of diet obtained from fishing has a negative effect
125

on the likelihood that hunter-gatherers produce food (Pem2). However, the percent of diet
obtained from fishing is 2.77 times less likely to have an effect on the production of food
than the coefficient of variation in rainfall and 2.69 times less likely than population density.
In sum, we can only have a low degree of confidence that fishing has a true effect on
the likelihood of food production, relative to the predictability of rainfall and population
density.
The negative effect of net primary productivity on the likelihood of food production is
consistent with the URH (Pem3a) and inconsistent with the SOH (Pem3b). However, net
primary productivity is 3.84 times less likely than the coefficient of variation in rainfall to
effect the likelihood of food production and 3.73 times less likely than population density.
This all indicates that we should have a very low degree of confidence that net primary
productivity has an effect on the likelihood that hunter-gatherers produce food, in this data
set, relative to population density and the coefficient of variation in rainfall.
Finally, the ownership of territory has a positive effect on the likelihood that hunter-
gatherers produce food. This is consistent with the SOH (Pem4a). However, there is a very
low likelihood that the ownership of territory has an effect on the likelihood that hunter-
gatherers produce food, relative to the other variables in the data set. This observation
is potentially consistent with the URH’s prediction that ownership does not, by necessity,
co-occur with the production of food by foragers (Pem4b).
Ecological thresholds
Figure 5.1a presents evidence of a threshold near a coefficient of variation in rainfall value
of 0.21. This threshold distinguishes hunter-gatherers who produce food by managing
ecosystems from those who do not. When the coefficient of variation in rainfall is greater
than approximately 0.21, all but 5 hunter-gatherer societies produce food, even in settings
where th net primary productivity-to-population density (r/p) ratio is high! Further, 5.1a
126

illustrates that there is not an upper and lower threshold of productivity-to-population den-
sity that distinguishes societies who produce food from those who do not with, as the
SOH would suggest. The five hunter-gatherer groups who are not recored to produce food,
even though the coefficient of variation in rainfall is greater than 0.21 are the Gunwinggu,
Mamu, Taramuit, Karankawa and Seri. Interestingly, a normalized individual in three of
these groups is recorded to get more than 1/3 of their diet from aquatic resources (Bin-
ford, 2001:Table 5.01). These exceptions raise the interesting possibility that if the data set
were expanded, the effect of fishing on the likelihood of food production might increase.
Other factors not controlled for here, such as the quality or detail of ethnographic sources
is something to also consider for future empirical analyses.
Figure 5.1b illustrates the importance of the coefficient of variation in rainfall where
hunter-gatherer specialize in terrestrial resources. The vertical reference line at 33 percent
of the diet obtained from fishing on Figure 5.1b marks the point at which hunter-gatherers
obtain 2/3 of their diet from terrestrial resources (plants + animals). To the left of this
vertical line, there is a striking differentiation between hunter-gatherers who produce food
and hunter-gatherers who do not. In this region of the graph (the left half), all but two
societies that live in settings where the coefficient of variation is rainfall is greater than 0.21
produce food. In short, hunter-gatherers who primarily exploit terrestrial resources and live
in predictable environments do not produce food; conversely, hunter-gatherers that primary
depend on terrestrial resources and live in environments characterized by unpredictable
inter-annual deviations in rainfall, and, presumably, biomass growth, produce food.
127

0.1
0.2
0.3
0.4
0.5
0 25 50 75
0.1
0.2
0.3
0.4
0.5
100 1000 10000
(b)
(a)
log 10 NPP/Density
Coe
ffici
ento
fvar
iatio
nin
rain
fall
Percent of diet from fishing
Coe
ffici
ento
fvar
iatio
nin
rain
fall
Figure 5.1: (a)-The Relationship between the estimated productivity-to-population densityratio r/p and the coefficient of variation in rainfall . NPP is in units of g/m2/yr−1 andDensity is in units of people/km2. (b)-The percent of diet from fishing and the coefficientof variation in rainfall. In both graphs, triangles = groups who produce food; circles=groups who do not produce food.
The Social-ecological Contexts of Territorial Ownership
Given the recent proliferation of arguments that institutions of resource ownership are a
necessary condition for foragers to adopt domesticated plants for food (e.g.,Bettinger et al.,
2009; Bowles and Choi, 2013; Smith, 2012; Zeder, 2012, as well as chapter 4), it behooves
us to evaluate the processes that drive the evolution of territorial ownership. In my analysis
above, there is little evidence that ownership effects the likelihood that foragers produce
food through strategies such as burning and planting favored food species. The production
128

of food may have an effect on the likelihood that foragers own territories, however. In
this section, I continue to evaluate the relative ability of the URH and SOH to explain
the presence and absence of territorial ownership. I study both the “full” data set (n=339)
reported by Binford (2001) and the subsample of 110 societies studied above.
SOH predictions
As stated in chapter 4, the SOH predicts that the adoption of food production positively
effects the likelihood that foragers adopt formal institutions of territorial ownership. This
prediction is based on the underlying assumptions of the model of economic defensibility.
This model states, in general, that foragers are territorial and defend ownership claims when
resource density is high and predictable, and foragers forgo the defense of resources as the
predictability and/or density of resources declines (Baker, 2003; Dyson-Hudson and Smith,
1978). Stated within the framework of SOH, where resources are abundant and predictable
relative to a population, territories are expected to shrink because an individual forager
needs less time and territory, (assuming a proportional link between time needed to harvest
food and territory size) to satisfy their desired level of energy. In turn, the costs of patrolling
and defending a territory also decrease as the size of a forager’s territory declines. Given
these relationships, several predictions for hunter-gatherer ownership follow from the SOH.
First, we should expect that population density and the concentration of resources are
positively linked. As resources become more concentrated in space-time, populations grow,
density increases and, indirectly, population density has a positive effect on the likelihood
of territorial ownership (Po1).
Second, as the density of resources in an environment increases, the likelihood that
hunter-gatherers own territories should also increase. In hunter-gatherer societies, the den-
sity of exploited resources is a function of diet (i.e., the foods that foragers primarily target)
and the growth rate (biomass growth per area per unit time) of resources. In terms of diet,
129

large bodied mammals are less dense than plant resources and fish or shell-fish. Thus, we
should expect that groups who primarily hunt are less likely to own territories than groups
who primarily gather plants or fish for food (Po2a). Similarly, as biomass accumulates at
a faster rate, resource density should increase and the likelihood that hunter-gatherers own
territories should also increase (Po2b).
Third, the predictability of resources is also a function of diet and intrinsic variation in
the basic physical inputs that determine the productivity of resources, such as temperature
and rainfall. It is expected here that as the inter-annual coefficient of variation associated
with the productivity of resources increases, terrestrial resources become less predictable
in space and time and the likelihood that hunter-gatherers own territories declines because
the costs of staying put to defend resources increase and the benefits decline as resources
becomes less predictable (Po3a). Further, large bodied game are mobile and less predictable
in terms of harvest than stationary resources (Codding et al., 2011); therefore, I expected
that the likelihood of ownership increases as diet shifts from mobile to stationary resources
(Po3b).
Finally, the proposed positive feedback, coevolutionary cycle between the production
of food and ownership (see chapter 4) suggests a positive effect of food production on the
likelihood of ownership. I expect that the likelihood of territorial ownership in hunter-
gatherers societies increases in contexts where foragers produce food (Po4).
URH predictions
As stated in chapter 3, the URH suggests that the selection of rules that formally define
when and where resources are accessed (ownership) is favored in contexts where hunter-
gatherer SES cross a critical net productivity-to-population density (r/p) threshold. The
consequences of crossing such a threshold are discussed in chapter 3 and above. The
key point is that forager-resource systems are characterized by a common pool resource
130

dilemma when this threshold is crossed and may transition, unpredictably, from a pro-
ductive to a degraded attractor. Given this dynamic, the URH suggests that as population
density increases, foragers are more likely to own territories (Po5). As population den-
sity increases, tracking and predicting the consequences of other foragers’ movements on
a landscape gets more and more complex. It is the information processing costs associated
with determining the risk of negative critical transitions in multiple habitat level systems
that provides an incentive for individuals to cooperate and use well defined rules to regu-
late each others movements. Thus, as population density increases and depletion creates
a commons dilemma, foragers may cooperate to manage the risk of getting flipped into a
degraded harvest attractor (see also Charnov et al., 1976).
In contrast to the SOH, the URH suggests that as the productivity of resources declines,
the likelihood that hunter-gatherer societies own territories increases (Po6a). This predic-
tion follows from the same argument made for the effect of increases in population density
on the likelihood of ownership. A decrease in productivity too far pushes the r/p ratio past
a critical threshold, and this results in the emergence of localized commons dilemmas and
associated increases in the costs of processing information. Further, holding population
density constant, foragers who produce food are less likely to own territories than foragers
who do not (Po6b). If foragers produce food, they will dampen the effects of depletion
and mitigate the emergence of localized commons dilemmas. This should result in less
territorial ownership behavior, at least in the medium-term.
Finally, the URH suggests, holding the r/p ratio constant, that as inter-annual variation
in the productivity of biomass increases, foragers are less likely to own resource locations
(Po7). In predictable environments, individuals can discover the likelihood that external
shocks, in a given year, will flip a system into a degraded basin of attraction. Thus, for-
agers can regulate the use of forager-resource systems on a landscape through formal rules
that reduce the need to collect information on where and when foragers are harvesting
131

Table 5.5: The predicted direction of the effect of explanatory variables on the likelihoodthat hunter-gatherers own territories.
Explanatory variablesHypotheses Density Hunting NPP Enhancement CV Rain f allSOH + - + + -URH + Na - - -
resources. However, when productivity is too variable from year-to-year due to external
drivers (climate as opposed to population density), the URH suggests that foragers invest
in the production of food rather than ownership. However, the two adaptations are not
necessarily mutually exclusive.
Table 5.5 summarizes the expected effects of the explanatory variables on the likeli-
hood that territorial ownership is practiced in hunter-gatherer societies. To determine the
consistency of each model with the data, I, again, focus the analysis on the direction of the
effect of each explanatory variable and the relative importance of each explanatory variable
for predicting the likelihood of ownership.
Results
My analysis indicates that the URH is more consistent with the data than the SOH. We
should, therefore, have more confidence in the processes proposed by the URH to explain
the adoption of territorial ownership than the processes proposed by the SOH. In general,
we can have a high degree of confidence that 3/4 of the URH’s predictions are consistent
with the data (Po5, 6a & 7), and we can have a high degree of confidence that 2/5 of the
SOH’s predictions are consistent with the data (Po1 & 4). Critically, the expected effects of
net primary productivity and food production on the likelihood of ownership are consistent
with the URH but not the SOH. This is critical because the URH and SOH suggest mutually
exclusive predictions for the effects of these two variables on the likelihood of ownership.
Table 5.6 illustrates the 95 percent confidence set of models for the analysis of the
132

full data set (n=339). The best model includes three explanatory variables: population
density, net primary productivity and the coefficient of variation in rainfall. The second
best model includes all four explanatory variables. The weighting factor, w indicates that
the best model is about 1.02 times more likely to fit the data, given this set of models, than
the second best model that includes the percent of diet obtained from hunting. While the
top two models are almost equally likely to provide the best fit to the data, the relative
importance of individual explanatory variables tells a more interesting story.
Table 5.6: The 95 percent confidence set of models: 1=CV Rain f all 2=Density,3=Hunting & 4=NPP
Explanatory Variables Residual Deviance AIC ∆i w1,2,4 407.6 415.62 – 0.44
1,2,3,4 405.7 415.69 0.07 0.432,4 418.11 404.61 2.48 0.13
Table 5.7 illustrates the mean coefficient and relative importance of each explanatory
variable included in the 95 percent confidence set of regression models. First, population
density has a positive effect on the likelihood that hunter-gatherer groups own territories,
and this observation is consistent with both hypotheses (Po1 & Po5). Second, net primary
productivity has a negative effect on the likelihood that hunter-gatherers own territories.
This observation is inconsistent with the SOH (Po2a) but consistent with the URH (Po6a).
Third, the coefficient of variation in rainfall has a negative effect on the likelihood that
hunter-gatherers own territories, and this is consistent with both explanatory hypotheses
(Po3a & Po7). Finally, the percent of diet obtained from hunting has a negative effect on
the likelihood of ownership, and this is consistent with the SOH (Po2 & Po3b).
Although the effect of hunting is negative, the importance measure indicates that hunt-
ing is the least likely variable to have a true effect on the likelihood of ownership in the
data set. The percent of diet obtained from hunting is 2.32 times less likely to have an
effect on ownership than population density and net primary productivity. The percent of
133

Table 5.7: Means, standard errors and relative importance (∑w for each variable) of theexplanatory variables included in the 95 % confidence set of models for the full data set(n=339).
Explanatory Variable Coefficient (b) Standard Error ImportanceIntercept 0.66 0.64 –Density 0.04 0.007 1.00
NPP -0.007 0.002 1.00CV Rain f all -3.07 1.44 0.87
Hunting -0.01 0.007 0.43
diet obtained from hunting is 2.02 times less likely to have an effect on ownership than the
coefficient of variation in rainfall. In total, the effect of hunting on the likelihood of owner-
ship is much more uncertain than the effects of populating density, net primary productivity
and the coefficient of variation in rainfall on ownership, in the full data set.
Table 5.8 examines the consequences of food production on the likelihood of owner-
ship in the reduced sample of societies (n=110). The best model in this analysis includes
population density, net primary productivity and the coefficient of variation in rainfall. The
second best model includes population density, net primary productivity and the food pro-
duction variable. The best model is 1.86 times more likely to fit the data than the second
best model.
Table 5.8: The 95% confidence set of models for the reduced sample of 110 societies.1=CV Rain f all, 2=Density, 3=Hunting, 4=NPP & 5=Enhancement
Explanatory Variables Residual Deviance AIC ∆i w1,2,4 123.6 131.55 – 0.242,4,5 124.8 132.77 1.22 0.132,4 127.0 133.01 1.45 0.12
1,2,4,5 123.3 133.29 1.74 0.101,2,3,4 123.4 133.40 1.85 0.09
2 130.3 134.27 2.72 0.061,2, 128.6 134.59 3.04 0.052,5 128.7 134.72 3.17 0.05
2,3,4,5 124.8 134.77 3.21 0.052,3,4 126.9 134.92 3.27 0.04
1,2,3,4,5 123.1 135.11 3.56 0.042,3 130.0 136.04 4.49 0.03
134

Table 5.9: Means, standard errors and relative importance (∑w for each variable) of theexplanatory variables included in the 95 percent confidence set of models for the reducedsample of societies (n=110).
Explanatory Variable Coefficient (b) Standard Error ImportanceIntercept 0.60 0.90 –Density 4.36 1.40 1.00
NPP -0.007 0.0003 0.81CV Rain f all -3.27 2.72 0.42Enhancement -0.50 0.52 0.37
Hunting -0.002 0.015 0.25
Table 5.9 reports the coefficients and importance of the explanatory variables for the
95 percent confidence set of regression models in the reduced sample. Consistent with the
analysis of the full data set, population density has a positive effect on the likelihood of
ownership and net primary productivity has a negative effect on the likelihood of owner-
ship. Moreover, population density has a summed Akaike weight (importance) of 1, which
suggests that this variable is most likely to have a true effect on ownership, given the data.
Net primary productivity has the second highest Akaike weight of 0.81. In contrast to the
analysis of the full data set, the coefficient of variation in rainfall is a less important ex-
planatory variable in the reduced data set. Population density is 2.38 times more likely
and net primary productivity 1.92 times more likely to have an effect on the likelihood of
ownership than the coefficient of variation in rainfall. This result is very likely the conse-
quence of reduced sample size, though it is an indication that the effect of the predictability
of rainfall on the likelihood of ownership is much weaker than the effects of population
density and net primary productivity.
A critical observation illustrated in Table 5.9 is that the production of food by hunter-
gatherers has a negative effect on the likelihood of ownership. This observation is in-
consistent with the SOH (Po4), but is consistent with the URH (Po6b). As with variation
in inter-annual rainfall, however, the relative importance of food production is quite low.
Population density and net primary productivity are 2.70 and 2.18 times more likely to ef-
135

fect the likelihood of ownership, respectively, than food production. In sum, it is highly
uncertain whether food production has an effect on the likelihood of ownership, relative to
population density and net primary productivity.
Finally, in the reduced data set, the percent of diet obtained from hunting is the least im-
portant explanatory variable. The effect of hunting on the likelihood that hunter-gatherers
own territory is consistent with the SOH (Po2a & 3b). In this reduced data set, however,
hunting is the least likely variable to have an effect on the likelihood of ownership.
Reflection & Conclusion
Ethnographic observations have a fundamental role in the development of explanations
for archaeological phenomena; this is commonly recognized (e.g., Skibo, 2009). There
are two competing views on the role of ethnographic observations in archaeological re-
search. The first view is that ethnographic observations provide a store house of analogies
that archaeologists can draw upon to interpret the archaeological record (Watson, 1980). A
second view is that ethnographic observations are best studied from a comparative perspec-
tive to identify the general principles that underlie variation in human societies (Binford,
2001, 1990). In turn, patterns in the archaeological record, in conjunction with other data
sets, are used to evaluate the relevance of general principles identified from ethnographic
comparisons. In this chapter, I contribute to the identification of general principles that
operate across hierarchical levels in SES to drive the coevolution of foraging strategies and
a resource base.
In chapters 3 and 4 I took on the challenge of defining two explanations for social and
technological change hunter-gatherer SES. I developed the URH and SOH, in particular,
to explain the evolution of territorial ownership and the adoption of food production in
hunter-gatherer SES. My purpose in this chapter has been to evaluate the relative merits of
these two hypotheses. I have used large ethnographic and ecological data sets to evaluate
136

Table 5.10: A summary of the predicted effects of explanatory variables on food produc-tion and territorial ownership. Predictions highlighted in bold were supported by the data,predictions with a strike were not supported, and predictions in plain text were supported,but with a very low degree of confidence relative to the predictions in bold.
Food production Explanatory variablesHypotheses Density Fishing NPP Ownership CV Rain f allSOH + - + + -URH + - - no effect +
Ownership Explanatory variablesHypotheses Density Hunting NPP Enhancement CV Rain f allSOH + - + + -URH + Na - - -
the consistency of predictions reasoned from the logic of each hypothesis with the data (see
Table 5.10). The URH is more consistent with the data than the SOH. While not a single
prediction of the URH was inconsistent with the data, we can only have a low degree of
confidence in the effects of the percent of diet obtained from fishing on food production
and food production on ownership. In contrast, 4/10 predictions reasoned from the SOH
are inconsistent with the data. The most important are: 1) hunter-gatherers are less likely
to own territories as the growth rate of biomass increases (NPP); 2) hunter-gatherers are
less likely to own territory, controlling for all other variables, when they also engage in the
production of food. 3) Finally, hunter-gatherers are more likely to produce food as the net
primary productivity of an environment declines.
A prediction unique to the SOH was the positive effect of territorial ownership on the
likelihood that hunter-gatherers produce food. This prediction follows from the supposi-
tion that the ownership of territory and food production are directly related in a positive
feedback loop. In chapter 4, it was illustrated that the augmentation of resource biomass
in a hunter-gatherer SES results in an increase in the predictability of non-subsistence time
because, if adopted by a sufficient number of foragers, food production increases the avail-
ability of biomass to foragers and decreases the return time of the productive attractor.
137

Following Smith (2012), food production would have the effect of decreasing the territory
size of foragers and reducing the costs of territorial defense/ownership. This is where the
positive feedback loop is expected to emerge. The production of food creates a context
in which the benefits of territorial ownership outweigh the costs, and ownership rules and
norms evolve. These rules and norms, in turn, provide an incentive to invest more in the
production of food and manage the productivity of resources. This is a clean argument;
however, it is not process that seems occur in the ethnographic data analyzed in this chap-
ter. On average, the ownership of resources has a negative effect on the likelihood of food
production, but there is a great deal of uncertainty associated with this coefficient (Table
5.9). Of all of the variables analyzed, the ownership of territory is the least important (i.e.,
least likely variable to have an effect on the likelihood of food production in the data set).
Even more intriguing is the fact that the production of food by hunter-gatherers actually
has a negative effect on the likelihood that hunter-gatherers own territories (see Table 5.9).
This observation, combined with the irrelevance of territorial ownership for predicting the
production of food, suggests that the adoption of food production and ownership are not
related in a positive feedback cycle, at least as far as synchronic ethnographic comparisons
are able to reveal. In retrospect, this is perhaps not all that surprising. The SOH makes the
assumption that as the density of resources in space and time increases, foragers use less
territory to meet their energetic desires and the costs of “owning” a territory decline while
the benefits simultaneously increase. This assumption applies to individuals and the costs
vs. benefits for one individual do not necessarily scale-up in an additive way to a social
group. The ownership of territory by a social group requires collective action to agree upon
rules that govern who, when and where resources may be accessed. Such an agreement
requires individuals to undertake costly behaviors, such as: perform rituals that reaffirm
the rules, monitor and defend territories, as well as sanction individuals who violate the
rules (e.g., Fehr and Fischbacher, 2004; Ostrom, 1990; Sigmund et al., 2010). The costs of
138

these behaviors may not simply add up to the costs experienced by each individual, while
the benefit accrues to the social group rather than each individual directly per se. In fact,
ownership rules may relegate some individuals to inferior territories.
This raises the intriguing question of why individuals would agree to rules that are
costly and the benefits are potentially unequally distributed? The logic of the URH suggests
an answer. Individuals cooperate to institute ownership rules when shirking the rules means
that everyone has to deal with more uncertainty in their ability to make robust land use
choices. Based on the URH, we can surmise that one social-ecological context in which
the benefits of collective action to own territories outweigh the costs for individuals is
when localized commons dilemmas emerge in a larger forager-resource system. I argued
in chapter 3 that once a critical, landscape specific r/p ratio is hit, every local forager-
resource system on a landscape is vulnerable to a negative critical transition. Two sources
of environmental variation might generate a negative critical transition. One is external
drivers of the availability of biomass, like inter-annual variations in rainfall. The other
is the actual harvest behavior of foragers that locally depletes biomass on a landscape.
Local harvest rates vary as individuals and groups move between habitats on a landscape.
Both of these sources of variation might perturb local forager-resource systems and vary
predictably or extremely unpredictably in space and time.
If foragers live in environments where uncertainty in the ability to estimate the risk of
local critical transitions is only driven by external variations, like variations around climate
means, then foragers cannot adapt by simply cooperating to regulate who, where and when
local systems are accessed on a landscape. This is because it is very difficult to process
enough information to know from year-to-year the systems that are most and least likely to
transition into a degraded attractor. In this context, the best option is to increase the growth
rate of resources in an environment, and mitigate the chances of local attractor shifts by
increasing the r/p ratio of habitat level systems. This is, in fact, evidenced in Figure 5.1a
139

where foragers produce food in environments where the inter-annual coefficient of variation
in rainfall is greater than 0.21.
In contrast, if the harvest activity of other foragers is the primary source of variation
that can depress the availability of biomass, then uncertainty in the ability to estimate the
risk of a negative critical transition is primarily a function of population density. An in-
crease in population density (which creates a decrease in the r/p ratio) means that there
are more foragers to keep track of and the potential that foragers incorrectly estimate how
much harvest effort systems at the habitat level can cope with without generating a negative
critical transition. This, again, creates a highly non-linear increase in the amount of infor-
mation that foragers must process and, I suggest, creates a context in which the benefits of
collective action for individuals outweigh the costs. In this case, cooperating to define who,
when and where habitats are accessed will regulate the distribution of harvest effort on a
landscape, and reduce the uncertainty associated with planning where to locate in space
and time to harvest food.
Onward
How does all this translate into an understanding of archaeological data? This is the
issue taken up in the final chapter. At this point, suffice it to say that the URH implies
that the adoption of food production and territorial ownership are alternative strategies for
reducing the uncertainty associated with planning where to locate in space and time to
harvest food. The strategies may or may not co-occur. Co-occurrence will depend on the
interaction of the r/p ratio of a landscape, variation in the movement of populations and
variation in ecosystem inputs (like rainfall). I now turn my attention to describing how the
knowledge gained in chapters 3-5 can be used to guide archaeological research.
140

Chapter 6
CONCLUSION
“The hardest thing of all is to find a black cat in a dark room, especially if there
is no cat.
According to Stuart Firestein (2012), science, as a process of learning, is a lot like searching
for a black cat in a dark room. Science is the process of searching for answers in a dark
room that may contain no answers at all. Chapters 3-5 have been the search for a black cat in
a dark room. The black cats, if you will allow, are the evolutionary processes that lead to the
adoption of food production and territorial ownership by hunter-gatherers. The models that
I have studied and my analysis of the ethnographic record has shown a glimmer of light into
the dark room that hides these “black cats” from view. The challenge ahead is to decipher if
the room contains cats. In this final chapter I have two aims. First, I revisit the Uncertainty
Reduction Hypothesis (URH). Second, I sketch out how the URH can guide archaeological
research into the evolution of agricultural SES at the expense of hunting and gathering
SES. This final chapter is not about answers. It is about questions. The questions are a
result of the processes revealed by my study of simple, dynamic models and the analysis
of ethnographic data. Our understanding of how feedback processes generate evolutionary
change in small-scale societies, however, is (from the viewpoint of anthropology) still in
its infancy. I am optimistic that the integration of data and theory, as well as a commitment
to evaluating multiple arguments with a diversity of methods will radically change this
situation in the coming years.
141

The Uncertainty Reduction Hypothesis Revisited
In chapter 1 I made the argument that evolutionary ecology needs theory from dy-
namical systems and concepts from resilience thinking to understand some of the major
evolutionary transitions in human-resource systems. The reason is quite simple. When
systems are characterized by feedback processes, then the dynamics of the system are not
simply an additive result of the behaviors of individuals that make-up the system. This idea
is succinctly captured by the well turned phrase that “the whole is more than the sum of its
parts” (Bak, 1996; Holland, 1995). When the whole is more than the sum of its parts, the
non-linear dynamics of a system can generate selective pressures on individuals to modify
their strategies for using resources. In turn, this modification at the level of the individual
transforms a human-resource system. This is no doubt old news in evolutionary ecology
(e.g.,Clark and Mangel, 1986; Stephens et al., 2007), but the field of human behavioral
ecology has been slow to adopt and use the tools of dynamical systems (but see Anderies,
2006, 1996; Brander and Taylor, 1998; Freeman and Anderies, 2012; Janssen et al., 2003;
Phillips, 2012; Winterhalder et al., 1988; Winterhalder and Lu, 1997). In this dissertation,
I have used formal and conceptual models to study the effects of feedback processes in
forager-resource systems on the potential costs and benefits of foraging strategies for indi-
viduals. In particular, I sought to understand how feedback processes might affect the costs
and benefits of food production and territorial ownership for individual foragers. I asked
two general questions about a generic forager-resource system (chapter 3):
1. How do changes in the productivity of resources and population density affect the
robustness of foragers’ energy output and time budget in a forager-resource system
to sets of potential shocks?
2. If there is an affect, how might the state of a forager-resource system shape the costs
and benefits of the strategies that foragers could select to manage resources?
142

My investigation of these questions led to the construction of two alternative hypotheses,
the URH and the Social Opportunity Hypothesis (SOH). The SOH deserves and will receive
further consideration. However, cross-cultural analysis of hunter-gatherers suggests that the
dynamics proposed by the URH are more relevant for understanding food production and
ownership documented ethnographically than the SOH (Table 5.10).
There are two basic generalizations that ground the URH. First, hunter-gatherer SES
are characterized by a nested hierarchy of forager-resource systems. The dynamics in
each forager-resource system play out at different scales of space and time (See Figure
3.7 in chapter 3). Thus, individuals face a decision hierarchy that scales in space with
the forager-resource hierarchy (Orians, 1980). However, decisions about how to position
within the forager-resource system hierarchy occur faster than the processes that perturb re-
source systems (i.e., ecosystems) as one moves up the forager-resource hierarchy (Holling,
1992; Peterson et al., 1998). Second, in general, moving up the forager-resource system
hierarchy means that the dynamics of forager-resource systems get more costly to track for
an individual forager simply because there are more dynamics operating in space and time.
Var
iatio
nin
phys
ical
inpu
ts
Region 1: Ecosystem struc-tures (natural capital) are usedto modulate high frequencyvariation caused by populationmovement and atmospheric dy-namics.–High mobility across levels oforganization–Generalized knowledge andhighly bundled schema
Population density-to-net productivity (p/r)CPRT
Region 2a: Substitute technological andsocial capital for natural capital to mod-ulate high frequency variation. Initially,selection pressures favor technologicalcapital over social capital.
Region 2b: Same dynamics as above,but, initially, when p/r just crosses thethreshold, selection pressures favor so-cial capital over technological capital.
Figure 6.1: Summary of the uncertainty reduction hypothesis.
143

Given these two generalizations, I have used my knowledge of the dynamics in the
baseline hunter-gatherer SES (presented in chapter 3) to generate insight into the social-
ecological conditions that effect the costs vs. benefits of territorial ownership and the adop-
tion of food production. Figure 6.1 summarizes the URH. The primary variables that con-
trol the dynamics of a forager-resource system are the population density of foragers and
the net productivity (growth rate) of a resource base. In any given system, when the p/r
ratio is really low (Region 1 on figure 6.1), foragers can obtain their desired level of energy
in a minimum amount of time and their ability to achieve their energy goals is completely
robust to high frequency environmental perturbations. I propose that in real SES, this type
of robustness is derived from landscape scale ecosystem structures. At the landscape scale,
ecosystems serve as a storage bank of natural capital that modulates the effects of higher
frequency disturbances that affect resources at more local scales. For example, a fire might
wipe out several stands of oak trees that foragers use for food within a habitat scale system,
but at the landscape scale, the forest has many habitats with stands of oak trees. To take
advantage of this, however, individual foragers must keep track of processes that operate at
many scales of space and time, which increases their high information processing load.
I propose that when forager-resource systems operating at the upper two levels of the
forager-resource hierarchy (habitats and landscapes) are simultaneously in Region 1 of Fig-
ure 6.1, selection and copying pressures favor: (1) high mobility across levels of ecosystem
structures (i.e, the use of many patches, habitats and landscapes at different scales of time
(Binford, 1983) and 2) ecological knowledge that sacrifices detail for generality. I expect
(1) because it is frequent movement across all scales that allows foragers to minimize the
time expended to get food and preserve their budget of non-subsistence time that can be
converted into fitness gains. I expect (2) because individuals need to minimize the infor-
mation processing cost (time) necessary to keep track of dynamics across many levels of
forager-resource systems. Highly generalized knowledge allows an individual to quickly
144

categorize the state of a forager-resource system and efficiently plan how to sequence their
movements in space and time.
As the p/r ratio increases at the upper level of the forager-resource system hierarchy
(i.e., on landscapes), foragers can maintain the robustness of their energy supply by work-
ing a little harder at lower levels (i.e., in patches and habitats). I expect that this leads
to slight increases in residential stability. From the perspective of an individual forager,
working harder may not even be all that noticeable. In chapter 3, I demonstrated that an
increase in the p/r ratio (by decreasing r from 0.5 to 0.3) results in a mere increase of
28 minutes per workday over the course of months-to-a couple of years to harvest food
(holding all other parameters constant). The insight is that simply working a bit harder
may appear satisfactory for maintaining a robust supply of energy to an individual, but the
aggregate effect of all individuals doing this creates a stochastic common pool resource
dilemma. In short, by working harder, individuals make achieving their harvest goal robust
to slow changes in population density or the mean resource growth rate of a system, but
the forager-resource system becomes vulnerable to a critical transition into a degraded at-
tractor caused by faster environmental variations (like negative deviations from the mean
in rainfall). In the degraded attractor, no forager can achieve their desired level of resource
harvest.
The p/r ratio labeled CPRT in Figure 6.1 marks the threshold at which every forager-
resource system at the habitat level in a forager-resource hierarchy is vulnerable to a neg-
ative critical transition. Although working harder may not seem onerous for an individual,
once the CPRT threshold is hit in a system, some habitats will experience variance induced
flips from a productive to a degraded attractor. This will not cause anyone to starve (unless
every habitat permanently flips simultaneously), but it will create increasing variance in
the ability of individuals to obtain their desired level of food over successive years. I argue
that it is this variance that creates a context in which selection favors foraging strategies
145

that substitute technological and social capital for natural capital to increase the robustness
of individuals’ food output. Individuals who find successful strategies are more likely to
be copied than those who are unsuccessful, leading to the spread of such strategies in a
population.
In chapter 3 (Figure 3.6), I argued that the primary consequence of a landscape level
forager-resource system crossing the CPRT threshold is that it becomes computationally
messy for individual foragers to discover and transmit the best sequence of moves between
habitat level systems to distribute their foraging effort. Two sources of variation generate
uncertainty and stress the information updating capacity of foragers. 1) Fluctuation in the
physical inputs that disturb a resource base (rainfall and solar energy), and 2) population
movements that change the distribution of foraging effort among systems. I argue that the
production of food at lower-levels of the forager-resource hierarchy is selected by foragers
in response to unpredictable variation in the physical inputs that shock a resource base.
Where physical inputs are more predictable, foragers use rules of territorial ownership to
regulate the movement of individuals among habitat level systems. These arguments are
summarized by Region 2a and b on Figure 6.1. Both of these strategies would reduce the
need to collect information over many habitat scale systems for individuals and reduce or
hold steady the susceptibility of habitat scale systems to a negative critical transition by
decreasing or stabilizing the p/r ratio of habitat level systems.
Although I argue that food production and ownership rules are alternative strategies
for gaining robustness to variation in population movements and physical inputs, I expect
that if the p/r ratio increases too far, selective pressures do necessitate that foragers adopt
both strategies simultaneously. Once a system crosses into Region 2, selection pressures
also favor less movement at the habitat level and increasingly detailed knowledge of the
resources nested with the habitats that foragers use. In Region 2a, I expect that selection
favors strategies that allow foragers to maintain access to different landscapes through the
146

formation of social capital. This way, if a forager’s landscape gets hit by a physical shock
that causes every habitat system to temporarily undergo a negative critical transition, a
forager can access alternative landscapes via social connections. This, of course, depends
on alternative landscapes experiencing anti-correlated shocks (e.g., Anderies et al., 2008;
Cashdan, 1983; Kelly, 1995; Winterhalder, 1990). In settings with predictable physical
inputs into ecosystems, I expect more spatially constricted social networks that are not as
likely to cross-cut many landscape level systems.
Some final thresholds
To conclude my discussion of the URH, I would like to illustrate several empirical
thresholds highlighted by Figure 6.2a. Figure 6.2a displays the strategies of hunter-gatherer
groups in the reduced sample studied in chapter 5. The graph is divided into four quad-
rants. In the lower left quadrant, 16/19 “generic” hunter-gatherer groups are recorded.
These groups neither own territory nor produce food, and most of these cases cluster at a
very low p/r ratio. The lower left quadrant also contains 24/27 groups who own territory
but do not produce food. Thus, groups who simply own territory are biased toward en-
vironments with predictable rainfall. These groups also tend to live at a p/r ratio greater
than “generic” hunter-gatherer groups. The upper left quadrant of the graph contains 21/26
groups who just produce food. Finally, in the right two quadrants of of the graph, 12/13
societies practice ownership and produce food, regardless of the predictability of rainfall.
These patterns suggest that foragers select strategies that elaborate their technological and
social capital as the p/r ratio of a system increases in an effort to reduce uncertainty in
the maintenance of a sufficient flow of resources. The long-term consequences, I specu-
late, are increasing population growth, inequality and increases in per capita energy use
(Tainter, 2011). Different Boserupian “fixes” to Malthusian constraints.
Figure 6.2b adds agricultural societies to the mix (see Freeman (2012a) for data). There
147

0.1
0.2
0.3
0.4
0.5
0.001 0.100
0.1
0.2
0.3
0.4
0.5
0.0001 0.0010 0.0100
(b)
(a)
log 10 Density/NPP
Coe
ffici
ento
fvar
iatio
nin
rain
fall
log 10 Density/NPP
Coe
ffici
ento
fvar
iatio
nin
rain
fall
Figure 6.2: Both graphs illustrate the log 10 of the ratio of population density (people/km2)to net primary productivity (grams/m2/year−1) on the x-axis and the coefficient of varia-tion in rainfall on the y-axis. Threshold lines are placed at a coefficient of variation of 0.21and a population density-to-resource growth ratio of -4. Circles=generic hunter-gatherers;squares=hunter-gatherers produce food; triangles=hunter-gatherers own territories, plussign=hunter-gatherers both produce food and own territories; box with x=ancillary cul-tivating hunter-gatherers; stars= agriculturalists (≥ 30% of their diet from agriculture afterFreeman (2012a).
is a clear threshold at approximately log 10 p/r = 0.018 where hunter-gatherer societies
end and agricultural societies dominate. However, agricultural societies also “overlap”
with hunter-gatherer societies, especially in settings with predictable rainfall. I suspect that
the secondary adoption of domesticated plants by hunter-gatherers is an alternative way to
decrease the uncertainty associated with maintaining a flow of resources when commons
dilemmas are a threat in multiple habitats on a landscape (Freeman and Anderies, 2012).
148

I strongly suspect that, in some environments, the adoption of domesticated plants allows
individuals to maintain a greater autonomy over their access to resources than elaborating
rules of ownership might allow. If this is so, a counter intuitive expectation arises. In
predictable environments where foragers share the same p/r ratio as forager-farmers, the
forager-farmers are less territorial and wild resources are more freely accessed relative to
hunter-gatherer groups who recognize territorial ownership.
Moving on...
One motivation of this dissertation has been to investigate, in general, how feedback dy-
namics between foragers and resources drive the evolution of hunter-gatherer SES. At a
deeper level, my motivation has been to identify the general evolutionary processes that
cause agriculture SES to evolve at the expense of hunter-gatherer SES. My basic, though
implicit, assumption is that highly general arguments provide a necessary compliment to
local studies that focus on historically contingent sequences and processes. Consider the
statement made by Zeder (2006:114-115) on the emergence of agriculture:
[r]ather than a single forcing mechanism, it seems more likely that the tra-
jectory of plant and animal domestication in the Near East and the emer-
gence of agriculture was shaped by various broad-scale factors, such as climate
change, economic goals, and social opportunities and constraints, interacting
with highly local, contingent factors, such as the density and diversity of avail-
able resources, the history of human occupation, and the agency of individuals
coping with their environment, each other, and their universe...Attempts at ex-
planation that champion any one of these factors and deny the importance of
others will not, in the long run, contribute to understanding agricultural origins
either as a general process or as it played out in particular instances.
149

Certainly, Zeder’s (2006) assertion is sound; every phenomenon, whether it is a soci-
ety, person, animal or daisy results from a unique confluence of processes. But, are the
processes that lead to the evolution of agricultural SES so contingent that every possible
variable is equally important in the construction of an explanation? I argue, no. By for-
mally studying feedbacks in a modeled and highly general forager-resource system, the
power of generalization is unleashed. Generalizations are tools for learning that illuminate
the contingent variables that are important in any particular place and time. The URH is
a highly general argument that applies to any system in any place or time. However, the
above thresholds suggest that to continue building our understanding of the processes that
cause agricultural systems to evolve at the expense of hunting and gathering, we have to
leverage the URH to ask questions about the more specific attributes that affect the stability
of forager-resource interactions in specific regional contexts. The URH provides a set of
general dynamics that serve as a guide for designing archaeological research to do just that.
Using the URH to Guide Archaeological Research
As Binford (2001:epilogue) has optimistically noted, the primary constraint on our abil-
ity to understand the archaeological record is our imagination, which implies that we can
explain almost any archaeological phenomenon, as long as we develop the appropriate tools
to expand our imaginations. The URH provides a more informed position to imagine why
agricultural systems evolved in human societies at the expense of hunting and gathering.
In this section I would like to provide a brief illustration of how the URH might be used
to guide archaeological research. Specifically, I illustrate how the URH can guide archae-
ological research into the evolution of economies based on agriculture at the expense of
hunting and gathering.
The processes that might lead to the initial adoption of domesticated plants are in-
tensively studied by archaeologists (e.g., Barker, 2006; Bellwood, 2005; Binford, 2001,
150

1968; Childe, 1928; Flannery, 1985, 1973; Hayden, 1990, 1998; Huckell, 1995; Kennett
and Winterhalder, 2006; MacNeish, 1992; Piperno and Pearsall, 1998; Rindos, 1984, 1980;
Smith, 1995; Wills, 1988; Winterhalder and Goland, 1993, this dissertation). The long
standing justification for this intensity of research is that the adoption and spread of domes-
ticated plants fundamentally altered human-environment interactions, eventually leading to
dramatic changes in settlement, land use and social equality (e.g., Harris, 1996; Hayden,
1990; MacNeish, 1992:3; Smith, 1995:3; Wills, 1988:1). However, a change in settle-
ment, land use or social equality is not always correlated with the adoption of domesticated
plants per se (as argued above), but is often coincident with the specialization of production
on domesticated plants (Bender, 1978; Flannery, 1968; Hayden, 1990; Hunter-Anderson,
1986; Nichols, 1987). Prehistoric human-environment interactions changed profoundly
when prehistoric societies began to specialize by disproportionately allocating their time to
the production of domesticated plants at the expense of time previously devoted to hunt-
ing and gathering. Thus, a fundamental question is: Once domesticated plants became
part of the subsistence base, why did people in some archaeological regions increase their
time invested in farming at the expense of hunting and gathering while in other regions
people engaged in persistent mixed foraging and farming (Bettinger et al., 2009; Dole-
man, 2005; Freeman, 2012a; Harris, 1996; Hard, 1986; Hunter-Anderson, 1986; Phillips Jr,
2009; Smith, 2001; Vierra, 2005; Zvelebil, 1996)?
The URH suggests a set of dynamics that can help generate analyses to answer this
question in archaeological contexts. Figure 6.3 summarizes the feedback dynamics that
should determine the resilience of a productive attractor in a forager-resource system and,
as a consequence, the robustness of individuals’ supply of wild resources to climate vari-
ation and population movements (variation in harvest effort). At base, the URH suggests
that where forager-farmer’s supply of wild food is more robust to population and climate
shocks, the evolution of agricultural systems is slow. Where forager-farmer’s supply of
151

food is less robust to climate and population variation, individuals specialize on domes-
ticated plants more quickly at the expense of hunting and gathering. My basic postulate
is: the more effectively feedback processes identified in Figure 6.3 modulate variation in
climate and population movement, the more resilient the productive attractor of a forager-
resource system. In turn, the wild resource food supply of individuals’ is more robust and
uncertainty is less likely to stimulate forager-farmers to substitute domesticated plants for
wild resources.
Physical inputs(energy, water)
Effort(q,m) Output
Foraginggoal
Resource(r, K)
Ecosystemstructure
Update TEK(C-D gap)
Food acquisition process
Decision process
Bio-physical process
(1)
(2)
(3)
Figure 6.3: Final proposed feedback structures that affect the robustness of foragers’ sup-ply of energy to population movements and climate variation.
Figure 6.3 has two feedback loops. The outer loop links the physical inputs, like water
and energy, that determine the productivity of an ecosystem with the structure of an ecosys-
tem (e.g., the composition of species) and, finally, the resource base. This outer loop simply
states that variation in the growth rate (r) and carrying capacity (K) of a resource base is
determined by variation in the physical inputs that hit the resource base. Variation in r and
K, in turn, is modulated by the composition of the community of organisms that make-up
and ecosystem. This is simply to say that, due to variation in the structure of ecosystems,
152

a 10 % change in rainfall will not affect all ecosystems the same. The inner loop links the
goal of the foragers in a system with the resource base and body of cultural knowledge that
foragers use to make decisions about where, when and how to harvest resources.
The decision process (1) links the knowledge system of foragers with the rules, norms
and technology that foragers draw on to allocate effort to the acquisition of food. The deci-
sion process primarily modulates variation in the distribution of harvest effort. Institutions
set the rules of the game (Ostrom, 2005) that individuals follow to make decisions about
where and when to harvest resources. Variation in the effectiveness of rules that coordi-
nate the use of forager-resource systems within a hierarchy of such systems should affect
how unpredictable the distribution of harvest effort is on a landscape. More formal rules
that reward collective action should yield less unpredictability and less formal rules should
yield more unpredictability (given that the CPRT threshold for a “pure” foraging system
has been crossed).
The food acquisition process (2) links the foraging decisions of foragers and the re-
source base to produce an output of food. The food acquisition process for a given tech-
nological regime can either increase or deplete the future availability of food in a forager-
resource system. This process modulates the susceptibility of a forager-resource system
to climate and population shocks. Holding population density constant, a negative effect
of harvest effort on resource density will make a system more susceptible to shocks while
a positive effect will make a system less susceptible (see chapter 4). The effect of har-
vest effort on resource density is a function of harvest strategy (e.g., burning to find prey)
and the reproductive characteristics of the resources in question. For example, flowers
with underground storage organs that reproduce vegetatively (which many mammals eat)
may actually increase in density due to harvest pressure rather than deplete (Anderson and
Rowney, 1999). This is a result of the reproductive strategy of the plants. In situations
where foragers adopt domesticated plants for food, if the net effect of harvest effort on
153

wild resources increases the density of those resources, I expect that the wild resource sys-
tem is more resilient and a mixed forager-farmer strategy persists. In situations where the
net effect is negative, I expect that the wild resource component of the diet is more sensi-
tive to environmental variations and forager-farmers compensate for uncertainty in the wild
resource domain by specializing more quickly on domesticated plants.
Finally, the bio-physical process (3) links atmospheric dynamics that create patterns of
rainfall and energy availability with the structure of ecosystems. This process describes the
modulating effects of ecosystem structures on variation in the productivity of an ecosystem
caused by “disturbance,” in this case, variation in the physical inputs that flow into an
ecosystem. As I argued above and in chapter 3, ecosystem structures modulate the effects
of variation in physical inputs on the productivity of an ecosystem. Structures refer to the
attributes of communities of organisms interacting at either the patch, habitat or landscape
scale of an ecosystem hierarchy.
Recent work in community ecology has demonstrated the overwhelming importance of
two attributes of ecosystems for modulating variation in the productivity of an ecosystem:
functional redundancy and response diversity (e.g., Elmqvist et al., 2003; Norberg et al.,
2001; Norberg, 2004; Tilman et al., 1996; Walker et al., 1999). Functional redundancy
refers to the role of an organism in an ecosystem (e.g., a nitrogen fixer), and the number
of species in an ecosystem that perform the same function. Response diversity refers to
the variability in how species tolerate and come back from a disturbance. For instance,
consider an assemblage of 5 fruiting species of plants. If all five plants stop producing
fruits if subject to a light frost, this assemblage has no response diversity (every species
responds by shutting down the production of fruit). On the other hand, if only one of five
species stop producing fruit when hit by the frost and the other four each have an alternative
response (possibly including no response), the assemblage has a high response diversity.
Norberg et al. (2001) elegantly demonstrate that ecosystems composed of species with
154

diverse tolerances of climate conditions are more productive and less variable over long
time-scales than ecosystems composed of species with a more limited number of tolerances
and functional redundancies. The increase in long-term productivity results from the mod-
ulating effect of response diversity on short-term boom and busts in productivity generated
by environmental variation. In terms of the resilience of forager-wild resource systems,
we should expect a productive forager-resource regime to be more resilient as the response
diversity of the food resources in an ecosystem increases. As the response diversity of
resources increases, we should expect that variation in the availability of food caused by
climate shocks is reduced. As the response diversity of food resources decreases, we should
expect greater variation in the availability of wild food driven by disturbance processes.
Table 6.1 summarizes the general dynamics of the URH, the expected effects of these
dynamics on how quickly forager-farmers specialize in the production of domesticated
plants and data that might be used to assess the expected effects. Table 6.1 provides a set of
expectations for archaeological research into the persistence of low-level food production.
To end this dissertation, I would like to briefly illustrate how we might start to use these
expectations to investigate questions about archaeological data.
A brief illustration from the US Southwest
The deserts of the southwestern United States provide an interesting case study to
briefly illustrate how the dynamics of the URH might start to be evaluated in an archae-
ological context. The pace at which the specialized production of maize farming developed
prehistorically across the Eastern Jornada, Western Jornada Mogollon and Southern Ari-
zona/Tucson Basin archaeological regions of the American Southwest differs markedly
(Figure ??). Archaeological data, in general, suggests that specialization toward maize
farming was most rapid in Southern Arizona while specialization in the farming of maize
was the least rapid in the Eastern Jornada (Abbott et al., 1996; Diehl, 2005, 1996; Doleman,
155

Tabl
e6.
1:E
xpec
ted
effe
cts
offe
edba
ckpr
oces
ses
onth
epa
ceof
spec
ializ
atio
non
dom
estic
ated
plan
tsfo
rfoo
dat
the
expe
nse
ofhu
ntin
gan
dga
ther
ing.
Feed
back
proc
ess
UR
Hdy
nam
icE
xpec
ted
effe
ctR
elev
antd
ata
Bio
-phy
sica
lpr
oces
sIn
crea
sing
resp
onse
dive
rsity
offo
odsp
ecie
sto
dist
urba
nce
ina
FRS
Red
uce
rate
ofsp
ecia
lizat
ion
Cat
alog
ofed
ible
spec
ies
inar
chae
olog
ical
regi
on,t
oler
ance
sof
spec
ies
toph
ysic
alin
puts
Food
prod
uctio
npr
oces
sPo
sitiv
eef
fect
ofha
rves
tbeh
avio
ron
the
dens
ityof
wild
reso
urce
sR
educ
era
teof
spec
ializ
atio
nC
atal
ogof
edib
lesp
ecie
s,re
prod
uctiv
etr
aits
ofed
ible
spec
ies,
polle
nda
tafo
revi
denc
eof
fire,
site
dens
ityor
radi
oca
rbon
date
freq
uenc
ies
toes
timat
epo
pula
tion
dens
ityD
ecis
ion
proc
ess
Ow
ners
hip
inst
itutio
nsre
gula
tepo
pula
tion
mov
emen
tand
redu
ceun
cert
aint
yR
educ
era
teof
spec
ializ
atio
nSi
tede
nsity
orra
dio
carb
onda
tefr
eque
ncie
sto
estim
ate
popu
latio
nde
nsity
,dis
tanc
eof
cera
mic
orob
sidi
anm
ovem
ent
terr
itory
boun
dedn
ess,
bone
isot
opes
toes
timat
ete
rrito
rysi
zeor
mov
emen
t,ro
ckar
tcon
sist
entw
ithte
rrito
rial
dem
arca
tion
156

2005; Hard, 1986; Hard and Roney, 2005; Hard et al., 1996; Huckell, 1995; Mabry, 2008;
Mauldin, 1996; Phillips Jr, 2009; Roth, 1992).
All three regions are located in the basin and range zone of the American Southwest,
and were initially colonized by Paleoindian populations by 12000 BP (Abbott et al., 1996;
Huckell, 1996; Mauldin, 1995). By 3000 BP prehistoric inhabitants in all three regions had
adopted the production of maize (Abbott et al., 1996; Diehl, 1996; Hard, 1986; Huckell,
1996, 1995; Mabry, 2008; Mauldin, 1995). However, after the initial adoption of maize in
Southern Arizona, specialization occurred relatively quickly with investments in irrigation
infrastructure, storage and significant residential stability by 2500 BP, a trend of increas-
ing specialization that was fully manifest prior to 1000 BP (Huckell, 1996, 1995; Mabry,
2008, 2002; Roth, 1996; Wills and Huckell, 1994). In the western Jornada, maize special-
ization occurred more slowly after the initial introduction of the crop; however, by 1500
BP populations in the region were rapidly specializing in maize production (Diehl, 1996)
and investments in irrigation and significant residential stability are evident by 1000 BP
(Diehl and LeBlanc, 2001). In the Eastern Jornada, maize use remained relatively minor
between 3000 and 900 BP (Hard et al., 1996; Mauldin, 1996; Whalen, 1994). Populations
maintained a relatively stable mixed forager-farmer subsistence strategy for roughly 2100
years, with specialization occurring rapidly after 900 BP (Abbott et al., 1996; Hard et al.,
1996).
The response diversity of species to temperature extremes in the southern US South-
west
What explains the apparent persistence of a mixed forager-farmer adaptation in the Eastern
Jornada and more rapid specialization in the production of maize at the expense of hunting
and gathering in the Western Jornada and Southern Arizona? Based on the URH, one pos-
sibility is that the wild food species that foragers had access to in the Eastern Jornada had
157

a greater level of response diversity than did the food species in the Western Jornada and
Southern Arizona/Tucson Basin. If this were the case, once foragers in all three regions
had adopted domesticated plants, I would expect that foragers in the Eastern Jornada ex-
perienced less variance in their ability to gather wild resources and less pressure to reduce
their information processing over a forager-resource system hierarchy by specializing in
the production of maize. Differential rates of population growth, the effectiveness of insti-
tutions of ownership and the net effects of harvest pressure also may be important. Here,
I simply treat these variables as constants. This is a simplification dictated by purpose: to
illustrate the potential of the URH to guide archaeological research not to fully resolve why
specialization was slower in the Eastern Jornada.
I focus here on the tolerances of assemblages of edible plants in the southern US South-
west to cold extremes. I assume the greater the response diversity of an assemblage of food
species is to cold, the better able that assemblage dampens variation in a food supply that
might be caused by a cold extreme of a given intensity. The range of plant tolerances in
an assemblage dictates the most intense cold extreme that an assemblage can take and is
likely to still contain species that produce food. The methods for estimating the number of
edible plant species (n=741 species) and the tolerance of each species to cold is detailed in
Appendix A. As I stated above, the point of this data exercise is to illustrate how the URH
can guide analyses and help us investigate prehistoric human-environment interactions.
Figure 6.4a illustrates the estimated number of edible species in a vegetation zone
across the southern US Southwest. The study regions are highlighted by the dashed box.
Figure 6.4a illustrates that in the western portion of the focal study area, there is fine grained
variation in the number of edible species across the landscape. This is to say that the dis-
tance between a vegetation zone with many edible species and a zone with a few edible
species is very short. In the eastern portion of the study area there are large vegetation
swaths full of many edible species and larger swaths that have fewer species. This over-
158

-105°
-108°
-111°
33°
30°
2 - 5
6 - 8
9 - 1
2
13 - 1
5
16 - 1
9
Nu
mb
er
of
food
sp
eci
es
Rela
tive
mean
frost
tole
ran
ce
-105°
-108°
-111°
33°
30°
-25.7
- 7
.8
7.9
- 2
7
27.1
- 4
9.3
49.4
- 7
4.1
74.2
- 1
32.4
mean
fr
ost
tole
ran
ce
-105°
-108°
-111°
33°
30°
-89.
4 - -2
3.9
-23.
8 - -4
.5
-4.4
- 7
7.1
- 23
.8
23.9
- 4
4.2
Rela
tive
tole
ran
ce
(a)
(b)
(c)
Figu
re6.
4:M
aps
ofve
geta
tion
zone
s.M
ap(a
)de
scri
bes
the
num
ber
ofed
ible
spec
ies
inea
chzo
ne;
map
(b)
the
mea
nfr
ost
tole
ranc
eof
edib
lepl
ants
;m
ap(c
)th
eto
lera
nce
edib
lepl
ants
rela
tive
toal
lpl
ants
ina
vege
tatio
nzo
ne(s
eeA
ppen
dix
Afo
rde
tails
).T
heda
shed
boxe
shi
ghlig
htth
est
udy
area
s.Te
mpe
ratu
reun
itsin
map
(b)a
rein
degr
ees
Ctim
es10
.
159

all pattern might be related to how elevation gradients change from east-to-west and may
affect how hunter-gatherers use a landscape (Doleman, 2005). Please note, my analysis
here is simply illustrative. More work is required to rigorously quantify at various spa-
tial scales the number of edible species across the study region, using tools like moving
window analysis.
Figure 6.4b illustrates the mean tolerance of an assemblage of food species. This map
provides a very different picture of the landscape than Figure 6.4a. Although the western
portion of the study area tends to have more edible species than the eastern portion of the
study area, the mean tolerance of vegetation communities to cold is very homogeneous in
the west. The eastern portion of the study area is more heterogeneous, though there are big
patches of tolerant and intolerant communities.
Figure 6.4c illustrates the relative mean tolerance of an assemblage of plants to cold.
Positive values indicate that food species are less tolerant of cold than non-food species in
a vegetation zone and negative values that an assemblage of food species is more tolerant
of cold than the full assemblage. This measure provides an estimate of the relative intensity
of cold that would be required to shock the productivity of food species. In general, food
plants in the eastern portion of the study area have a greater relative mean tolerance of cold
extremes. Again, however, the western potion of the study area shows more fine grained
variation. There are many small vegetation zones where food plants are tolerant of cold and
many small vegetation zones where food plants are, on average, very intolerant of cold.
Obviously, much more work is needed. There are multiple disturbance dynamics that
affect vegetation communities, like rainfall and fire. So understanding the tolerance diver-
sity of vegetation communities to these processes will begin to more fully illustrate how
well assemblages of food might tolerate the kinds of external inputs that shock ecosystems
in the US Southwest. My point here is simply that by using the URH to structure archae-
ological analysis, we can raise interesting questions. For instance, there is not a simple
160

gradient of less tolerance to more tolerance of cold from west to east. What we do see is
very different scales of patchiness in the vulnerability of plant assemblages to cold. How
might different scales of patchiness in the assemblages of plant foods that are potentially
more resilient to cold snaps impact the strategies of prehistoric forager-farmers? Perhaps
where vegetation zones clump in very low and very high tolerance patches that are large
in spatial extent, it may take less information processing to discover and accurately predict
the vulnerability of habitat level forager-resource systems to cold shocks. Conversely, with
more fine grained variation, it may take more information processing to discover and ac-
curately predict the vulnerability of habitat scale forager-resource systems to cold shocks.
Based on the logic of the URH, this would suggest that fine grained environments are more
costly to learn about in terms of time. This is speculation that suggests further avenues
of research between the spatial grain of potential forager-resource systems and the costs
of information processing for individuals. Regardless, my point is that the URH is useful
for structuring more nuanced analyses of how climate variation and resources interact and
might effect the evolution of agricultural SES from hunter-gatherer SES in specific regional
contexts.
Conclusion
This dissertation has used dynamic and conceptual models to study feedback processes
across multiple scales of space and time in a general forager-resource system. The mod-
els were used to construct two competing hypotheses that explain the adoption of foraging
strategies that mange the productivity of ecosystems and territorial ownership: the un-
certainty reduction and social opportunity hypotheses. The relative merits of these two
competing hypotheses were evaluated against each other using large ethnographic and en-
vironmental data sets. The ethnographic and environmental data were more consistent with
the uncertainty reduction hypothesis. The ethnographic analysis provides an ethnoarchae-
161

ological foundation for understanding the evolution of social-ecological systems based on
agriculture at the expense of hunter-gatherer social-ecological systems.
Overall, my work illustrates the potential importance of systems dynamics in human
behavioral ecology. I have illustrated how feedback processes in a forager-resource system
create environmental legacies that effect the costs and benefits of the foraging strategies
that individuals might adopt to secure resources. An important direction of future research
in the human behavioral ecology of the archaeological record is to develop a more so-
phisticated understanding of the consequences of feedback processes in human-resource
systems on the fitness of individuals. I argue that to understand major transitions in human-
resource systems, studies grounded in human behavioral ecology are enhanced by the study
of feedback processes with the tools of dynamical systems theory and concepts draw from
resilience thinking.
162

REFERENCES
Abbott, J. T., R. Mauldin, P. E. Patterson, W. N. Trierweiler, R. J. Hard, C. Lintz, and C. L.Tennis1996. Significance standards for prehistoric archeological sites at Fort Bliss. Austin,TX: TRC Mariah Inc.
Anderies, J., M. Janssen, and E. Ostrom2004. A framework to analyze the robustness of social-ecological systems from an insti-tutional perspective. Ecology and Society, 9(1).
Anderies, J. M.1996. An adaptive model for predicting !kung reproductive performance: A stochasticdynamic programming approach. Ethology and Sociobiology, 17(4):221–245.
Anderies, J. M.1998. Culture and human agro-ecosystem dynamics: The Tsembaga of New Guinea.Journal of Theoretical Biology, 192(4):515–530.
Anderies, J. M.2006. Robustness, institutions, and large-scale change in social-ecological systems: TheHohokam of the Phoenix Basin. Journal of institutional economics, 2(2):133–155.
Anderies, J. M., B. A. Nelson, and A. P. Kinzig2008. Analyzing the impact of agave cultivation on famine risk in Pre-Hispanic, aridnorthern Mexico. Human Ecology, 36:409–422.
Anderies, J. M., A. A. Rodriguez, M. A. Janssen, and O. Cifdaloz2007. Panaceas, uncertainty, and the robust control framework in sustainability sci-ence. Proceedings of the National Academy of Sciences of the United States of America,104(39):15194–15199.
Anderson, M. K.2005. Tending the wild: Native American knowledge and the management of California’snatural resources. Berkeley: University of California Press.
Anderson, M. K. and D. L. Rowney1999. The edible plant Dichelostemma capitatum: Its vegetative reproduction responseto different indigenous harvesting regimes in California. Restoration Ecology, 7(3):231–240.
Anderson, P. W. et al.1972. More is different. Science, 177(4047):393–396.
Bak, P.1996. How nature works: The science of self-organized criticality. New York: Coperni-cus.
163

Baker, M. J.2003. An equilibrium conflict model of land tenure in hunter-gatherer societies. Journalof Political Economy, 111(1):124–173.
Barker, G.2006. The agricultural revolution in prehistory: Why did foragers become farmers?Oxford: Oxford University Press.
Barker, G.2011. Archaeology: The cost of cultivation. Nature, 473(7346):163–164.
Barlow, R. K.2002. Predicting maize agriculture among the Fremont: An economic comparison offarming and foraging in the American Southwest. American Antiquity, 67(1):65–88.
Barlow, R. K.2006. A formal model for predicting agriculture among the Fremont. In Behavioral ecol-ogy and the transition to agriculture, D. J. Kennett and B. Winterhalder, eds., Pp. 87–102. Berkeley, CA: University of California Press.
Barton, C. M., J. Riel-Salvatore, J. M. Anderies, and G. Popescu2011. Modeling human ecodynamics and biocultural interactions in the late Pleistoceneof western Eurasia. Human Ecology, 39(6):705–725.
Barton, C. M., I. Ullah, and H. Mitasova2010. Computational modeling and Neolithic socioecological dynamics: A case studyfrom southwest Asia. American Antiquity, 75(2):364–386.
Beck, C., J. Grieser, and B. Rudolf2004. A new monthly precipitation climatology for the global land areas for the period1951 to 2000.
Bellwood, P.2005. First farmers: The origins of agricultural societies. Malden, MA: BlackwellPublishing.
Bender, B.1978. Gatherer-hunter to farmer: A social perspective. World Archaeology, 10(2):204–222.
Bettinger, R., P. Richerson, and R. Boyd2009. Constraints on the development of agriculture. Current Anthropology, 50(5):627–631.
Bettinger, R. L.1991. Hunter-gatherers: archaeological and evolutionary theory. New York: PlenumPress.
164

Bettinger, R. L.1999. From traveler to processor: Regional trajectories of hunter-gatherer sedentism inthe Inyo-Mono Region, California. In Settlement pattern studies in the Americas: Fiftyyears since Viru , B. R. Billman and G. M. Feinman, eds., Pp. 39–55. Washington D.C.:Smithsonian.
Bettinger, R. L. and M. A. Baumhoff1982. The Numic spread: Great Basin cultures in competition. American Antiquity,Pp. 485–503.
Binford, L. R.1968. Post-Pleistocene adaptations. In New perspectives in archaeology, S. R. Binfordand L. R. Binford, eds., Pp. 313–341. Chicago: Aldine.
Binford, L. R.1983. In pursuit of the past: Decoding the archaeological record. New York: Thamesand Hudson.
Binford, L. R.1990. Mobility, housing, and environment: A comparative study. Journal of Anthropo-logical Research, 46:119–152.
Binford, L. R.1999. Time as a clue to cause? Proceedings of the British Academy, 101:1–35.
Binford, L. R.2001. Constructing frames of reference: An analytical method for archaeological theorybuilding using hunter-gatherer and environmental data sets. Berkeley: University ofCalifornia Press.
Bird, D. W., R. B. Bird, and C. H. Parker2005. Aboriginal burning regimes and hunting strategies in Australias Western Desert.Human Ecology, 33(4):443–464.
Bird, D. W. and J. F. OConnell2006. Behavioral ecology and archaeology. Journal of Archaeological Research,14(2):143–188.
Bird, R. B., D. W. Bird, B. F. Codding, C. H. Parker, and J. H. Jones2008. The fire stick farming hypothesis: Australian aboriginal foraging strategies, bio-diversity, and anthropogenic fire mosaics. Proceedings of the National Academy of Sci-ences, 105(39):14796–14801.
Boserup, E.1965. The conditions of agricultural growth. New York: Aldine Publishing Co.
Boserup, E.1981. Population and technological change: A study of long-term trends. Chicago:University of Chicago Press.
165

Boserup, E.1996. Development theory: An analytical framework and selected application. Popula-tion and Development Review, 22:505–515.
Bowles, S.2009. Did warfare among ancestral hunter-gatherers affect the evolution of human socialbehaviors? Science, 324(5932):1293–1298.
Bowles, S.2011. Cultivation of cereals by the first farmers was not more productive than foraging.Proceedings of the National Academy of Sciences, 108(12):4760–4765.
Bowles, S. and J.-K. Choi2013. Coevolution of farming and private property during the early Holocene. Proceed-ings of the National Academy of Sciences, 110(22):8830–8835.
Braidwood, R. J.1960. The agricultural revolution. Scientific American, 5:30–141.
Brander, J. and M. Taylor1998. Open access renewable resources: Trade and trade policy in a two-country model.Journal of International Economics, 44(2):181–209.
Brookfield, H. C.1984. Intensification revisited. Pacific Viewpoint, 25(1):15–44.
Brown, J. L.1964. The evolution of diversity in avian territorial systems. The Wilson Bulletin,76:160–169.
Burnham, K. P. and D. R. Anderson2002. Model selection and multimodel inference, ”2nd” edition. New York: Springer.
Butterfield, B. J.2014. Environmental tolerances identify functional tradeoffs and community assemblypatterns of woody vegetation across the Southwest USA. Manuscript under review withPLOS ONE.
Carpenter, S., B. Walker, J. Anderies, and N. Abel2001. From metaphor to measurement: Resilience of what to what? Ecosystems,4(8):765–781.
Cashdan, E.1983. Territoriality among human foragers-ecological models and an application to 4Bushman groups. Current Anthropology, 24(1):47–66.
Catton, W. R.1987. The world’s most polymorphic species. Bioscience, 37(6):413–419.
166

Chamberlin, T. C.1931. The method of multiple working hypotheses. The Journal of Geology, 39(2):pp.155–165.
Charnov, E. L.1976. Optimal foraging, the marginal value theorem. Theoretical Population Biology,9(2):129–136.
Charnov, E. L., G. H. Orians, and K. Hyatt1976. Ecological implications of resource depression. The American Naturalist,110(972):247–259.
Childe, V. G.1928. The most ancient East: The oriental prelude to European prehistory. London: K.Paul, Trench, Trubner & Co. ltd.
Clark, C. W.1976. Mathematical bioeconomics: The optimal management of renewable resources.New York: Wiley.
Clark, C. W. and M. Mangel1986. The evolutionary advantages of group foraging. Theoretical Population Biology,30(1):45–75.
Codding, B. F., R. B. Bird, and D. W. Bird2011. Provisioning offspring and others: Risk-energy trade-offs and gender differencesin hunter-gatherer foraging strategies. Proceedings of the Royal Society B: BiologicalSciences, 278(1717):2502–2509.
Cohen, M. N.1977. The food crisis in prehistory: Overpopulation and the origins of agriculture. NewHaven, CT: Yale University Press.
Diehl, M. W.1996. The intensity of maize processing and production in upland Mogollon pithousevillages ad 200-1000. American Antiquity, 61:102–115.
Diehl, M. W.2005. Subsistence and resource use strategies of early agricultural communities in south-ern Arizona, volume 34. Tucson, AZ: Center for Desert Archaeology.
Diehl, M. W. and S. A. LeBlanc2001. Early pithouse villages of the Mimbres Valley and beyond. Cambridge: Papers ofthe Peabody Museum or Archaeology and Ethnology, Harvard University 83. PeabodyMuseum.
Dielman, T. E.2001. Applied regression analysis for business and economics. Duxbury/ThomsonLearning.
167

Doleman, W. H.2005. Environmental constraints on forager mobility and the use of cultigens in south-eastern Arizona and southern New Mexico. In The Late Archaic across the boarderlands:From foraging to farming, B. J. Vierra, ed., Pp. 113—140. Austin, TX: University ofTexas Press.
Dunbar, R. I. M., A. H. Korstjens, and J. Lehmann2009. Time as an ecological constraint. Biological Reviews, 84(3):413–429.
Dyson-Hudson, R. and E. Smith1978. Human territoriality: An ecological reassessment. American Anthropologist,80(1):21–41.
Edelstein-Keshet2005. Mathematical models in biology. Philadelphia: Society for Industrial and AppliedMathematics.
Elmqvist, T., C. Folke, M. Nystrom, G. Peterson, J. Bengtsson, B. Walker, and J. Norberg2003. Response diversity, ecosystem change, and resilience. Frontiers in Ecology andthe Environment, 1(9):488–494.
Fehr, E. and U. Fischbacher2004. Social norms and human cooperation. Trends in Cognitive Sciences, 8(4):185–190.
Feinman, G. and J. Neitzel1984. Too many types: An overview of sedentary prestate societies in the americas.Advances in Archaeological Method and Theory, 7:39–102.
Fenner, J. N.2005. Cross-cultural estimation of the human generation interval for use in genetics-based population divergence studies. American Journal of Physical Anthropology,128(2):415–423.
Firestein, S.2012. Ignorance. New York: Oxford University Press.
Flannery, K. V.1968. Archaeological systems theory and arly Mesoamerica. In Anthropological archae-ology in the Americas, B. J. Meggers, ed., Pp. 67–87. Washington D.C.: AnthropologicalSociety of Washington.
Flannery, K. V.1973. The origins of agriculture. Annual Review of Anthropology, 2:271–310.
Flannery, K. V.1985. Guila¡ Naquitz: Archaic foraging and early agriculture in Oaxaca, Mexico. Or-lando: Academic Press.
168

Freeman, J.2012a. Alternative adaptive regimes for integrating foraging and farming activities. Jour-nal of Archaeological Science, 39(9):3008 – 3017.
Freeman, J.2012b. Domesticated crop richness in human subsistence cultivation systems: a testof macroecological and economic determinants. Global Ecology and Biogeography,21(4):428–440.
Freeman, J. and J. M. Anderies2012. Intensification, tipping points and social change in a coupled forager-natural re-source system. Human Nature, 23:419–446.
Freeman, J., J. M. Anderies, A. Torvinen, and B. A. Nelson2014. Crop specialization, exchange and robustness in a semi-arid environment. HumanEcology, 42(2):297–310.
Fukuyama, F.1995. Trust: Social virtues and the creation of prosperity. New York: Free Press.
Gould, R. A.1971. Uses and effects of fire among the Western Desert Aborigines of Australia.Mankind, 8(1):14–24.
Gould, R. A.1991. Arid-land foraging as seen from Australia: Adaptive models and behavioral reali-ties. Oceania, 62:12–33.
Grieser, J., R. Gommes, S. Cofield, and M. Bernardi2006. New gridded maps of Koeppen’s climate classification. http://www.fao.org/nr/climpag/globgrids/kc_classification_en.asp.
Grove, M.2009. Hunter-gatherer movement patterns: Causes and constraints. Journal of Anthro-pological Archaeology, 28(2):222–233.
Grove, M.2010. Logistical mobility reduces subsistence risk in hunting economies. Journal ofArchaeological Science, 37(8):1913–1921.
Grove, M., E. Pearce, and R. I. M. Dunbar2012. Fission-fusion and the evolution of hominin social systems. Journal of HumanEvolution, 62(2):191–200.
Hamilton, M. J., O. Burger, J. P. DeLong, R. S. Walker, M. E. Moses, and J. H. Brown2009. Population stability, cooperation, and the invasibility of the human species.Proceedings of the National Academy of Sciences of the United States of America,106(30):12255–12260.
169

Hamilton, M. J., B. T. Milne, R. S. Walker, and J. H. Brown2007. Nonlinear scaling of space use in human hunter-gatherers. Proceedings of theNational Academy of Sciences of the United States of America, 104(11):4765–4769.
Hard, R. J.1986. Ecological relationships affecting the rise of farming economies: A test from theAmerican Southwest. PhD thesis, The University of New Mexico, Albuquerque, NM.
Hard, R. J., R. P. Mauldin, and G. R. Raymond1996. Mano size, stable carbon isotope ratios, and macrobotanical remains as multiplelines of evidence of maize dependence in the American Southwest. Journal of Archaeo-logical Method and Theory, 3(3):253–318.
Hard, R. J. and J. R. Roney2005. The transition to farming on the Rio Casas Grandes and in the southern JornadaMogollon region. In The Late Archaic across the boarderlands: From foraging to farm-ing, B. J. Vierra, ed., Pp. 141–186. Austin, TX: University of Texas Press.
Hare, F. K. and J. Ritchie1972. The boreal bioclimates. Geographical Review, Pp. 333–365.
Harris, D. R.1996. The origins and spread of agriculture and pastoralism in Eurasia. London: UCLPress.
Hassan, F. A.1981. Demographic archaeology. New York: Academic Press.
Hayden, B.1981. Research and development in the Stone Age: Technological transitions amonghunter-gatherers. Current Anthropology, Pp. 519–548.
Hayden, B.1990. Nimrods, piscators, pluckers, and planters-The emergence of food-production.Journal of Anthropological Archaeology, 9(1):31–69.
Hayden, B.1995. A new overview of domestication. In Last hunters first farmers, T. Price Douglasand A. B. Bebaur, eds., Pp. 273–299. Santa Fe, NM: School of American ResearchPress.
Hayden, B.1998. Practical and prestige technologies: The evolution of material systems (Designtheory). Journal of Archaeological Method and Theory, 5(1):1–55.
Hayden, B.2003. Were luxury foods the first domesticates? Ethnoarchaeological perspectives fromsoutheast Asia. World Archaeology, 34(3):458–469.
Heiner, R.1983. The origin of predictable behavior. American Economic Review, 73:560–595.
170

Hijmans, R., S. Cameron, J. Parra, P. Jones, and A. Jarvis2005. Worldclim, version 1.3. University of California, Berkeley. http://biogeo. berkeley.edu/worldclim/worldclim. htm.
Hitchcock, R. K. and J. I. Ebert2006. Where is that job at? Hunter-gatherer information systems in complex socialenvironments in the eastern Kalahari Desert, Botswana. In Information and its role inhunter-gatherer bands, R. Whallon, W. A. Lovis, and R. Hitchcock, eds., Pp. 133–166.Los Angeles: Cotsen Institute of Archaeology Press.
Holland, J. H.1995. Hidden order: How adaptation builds complexity. Reading, Mass.: Addison-Wesley.
Holling, C. S.1973. Resilience and stability of ecological systems. Annual Review of Ecology andSystematics, 4:1–23.
Holling, C. S.1992. Cross-scale morphology, geometry, and dynamics of ecosystems. EcologicalMonographs, 62(4):447–502.
Huckell, B. B.1995. Of marshes and maize: Preceramic agricultural settlements in the Cienega Valley,southeastern Arizona. Tucson, AZ: University of Arizona Press.
Huckell, B. B.1996. The Archaic prehistory of the North American Southwest. Journal of WorldPrehistory, 10(3):305–373.
Huckell, B. B., L. W. Huckell, and K. K. Benedict2002. Maize agriculture and the rise of mixed farming-foraging economies in southernArizona during the second millenium B.C. In Traditions, Transitions, and Technologies:Themes in Southwest Archaeology, S. H. Schlanger, ed., Pp. 134–150. Boulder, CO:University of Colorado Press.
Hunter-Anderson, R. L.1986. Prehistoric adaptation in the American Southwest. Cambridge Cambridgeshire;New York: Cambridge University Press.
Janssen, M. A., T. A. Kohler, and M. Scheffer2003. Sunk-cost effects and vulnerability to collapse in ancient societies. Current an-thropology, 44(5):722–728.
Jen, E.2003. Stable or robust? What’s the difference? Complexity, 8(3):12–18.
Jochim, M. A.1976. Hunter-gatherer subsistence and settlement: A predictive model. New York:Academic Press.
171

Johnson, A. L.2013. Exploring adaptive variation among hunter-gatherers with Binfords frames ofreference. Journal of Archaeological Research, 22:1–42.
Johnson, A. L. and R. J. Hard2008. Exploring Texas archaeology with a model of intensification. The Plains Anthro-pologist, 53:137–153.
Johnson, J. B. and K. S. Omland2004. Model selection in ecology and evolution. Trends in Ecology & Evolution,19(2):101–108.
Keegan, W. F.1986. The optimal foraging analysis of horticultural production. American Anthropolo-gist, 88(1):92–107.
Keeley, L. H.1988. Hunter-gatherer economic complexity and population pressure: A cross-culturalanalysis. Journal of Anthropological Archaeology, 7(4):373–411.
Keeley, L. H.1995. Protoagricultural practices among hunter-gatherers. In Last hunters first farm-ers, T. Price Douglas and A. B. Bebaur, eds., Pp. 243–272. Santa Fe, NM: School ofAmerican Research Press.
Kelly, R. L.1995. The Foraging Spectrum: Diversity in hunter-gatherer lifeways. Washington, D.C.:Smithsonian Institution Press.
Kennett, D. J. and B. Winterhalder2006. Behavioral ecology and the transition to agriculture. Berkeley: University ofCalifornia Press.
Knight, F. H.1921. Risk, uncertainty and profit. New York: Harper and Row.
Kohler, T. A. and G. J. Gumerman2000. Dynamics in human and primate societies: Agent-based modeling of social andspatial processes. New York: Oxford University Press.
Kohler, T. A. and S. E. van der Leeuw2007. The model-based archaeology of socionatural systems. Santa Fe, N.M.: Schoolfor Advanced Research Press.
Laland, K. N.2011. Cause and context in the biological sciences. Behavioral Ecology, 22(2):233–234.
Layton, R., R. Foley, and E. Williams1991. The transition between hunting and gathering and the specialized husbandry ofresources: A socio-ecological approach. Current Anthropology, 32:255–274.
172

Lee, C. T., C. O. Puleston, and S. Tuljapurkar2009. Population and prehistory III: Food-dependent demography in variable environ-ments. Theoretical Population Biology, 76(3):179–188.
Lee, C. T. and S. Tujapurkar2008. Population and prehistory I: Food-dependent population growth in constant envi-ronments. Theoretical Population Biology, 73(4):473–482.
Lee, R. B.1966. !Kung Bushman subsistence: An input-output analysis. Queen’s Printer.
Lemmen, C.2011. Malthusian assumptions, Boserupian response in models of the transitions to agri-culture. arXiv preprint arXiv:1108.2585.
Levin, S. A.1999. Fragile dominion: Complexity and the commons. Reading, MA: Perseus Books.
Mabry, J. B.2002. The role of irrigation in the transition to agriculture and sedentism in the South-west: A risk management model. In Traditions, transitions, and technologies: Themesin Southwest Archaeology, S. H. Schlanger, ed., Pp. 178–199. Boulder, CO: Universityof Colorado Press.
Mabry, J. B.2008. Las Capas: Early irrigation and sedentism in a southwestern floodplain, vol-ume 28. Tucson, Ariz.: Center for Desert Archaeology.
MacArthur, R. H.1972. Geographical ecology: Patterns in the distribution of species. Princeton Univer-sity Press.
MacArthur, R. H. and E. R. Pianka1966. On optimal use of a patchy environment. American Naturalist, 100:603–609.
MacNeish, R. S.1992. The origins of agriculture and settled life. Norman: University of OklahomaPress.
Malthus, T. R.1888. An essay on the principle of population: or, A view of its past and present effectson human happiness. London: London, Reeves and Turner.
Mauldin, R. P.1995. Groping for the past: Investigating archaeological patterns across time and spacein the southern southwestern United States. PhD thesis, The University of New Mexico,Albuquerque, NM.
173

Mauldin, R. P.1996. Exploring patterns in Late Archaic and early ceramic residential occupation inthe northern Chihuhuan Desert. In Early Formative Adaptations of the Southern South-west, B. J. Roth, ed., Pp. 85—97. Madison: Monographs in World Prehistory No. 25,Prehistory Press.
McLaughlin, S. P.1986. Floristic analysis of the southwestern United States. Western North AmericanNaturalist, 46(1):46–65.
Menzies, C. R. and C. Butler2006. Introduction: Understanding traditional ecological knowledge. In Traditionalecological knowldege and natural resource managment, C. R. Menzies, ed., Pp. 1–17.Lincoln, NE: University of Nebraska Press.
Mills, B.1986. Prescribed burning and hunter-gatherer subsistence systems. Haliksas, UNMContributions to Anthropology, 5:1–26.
Nelson, M., J. M. Anderies, M. Hegmon, and J. Norberg2010. CNH: The complexities of ecological and social diversity: A long-term perspec-tive. Proposal Submitted to the National Science Foundation.
Netting, R. M.1993. Smallholders, householders: Farm families and the ecology of intensive, sustain-able agriculture. Stanford, Calif.: Stanford University Press.
Nichols, D. L.1987. Risk and agricultural intensification during the Formative Period in the northernBasin of Mexico. American Anthropologist, 89:596–616.
Norberg, J.2004. Biodiversity and ecosystem functioning: A complex adaptive systems approach.Limnology and Oceanography, 49(4):1269–1277.
Norberg, J., D. Swaney, J. Dushoff, J. Lin, R. Casagrandi, and S. Levin2001. Phenotypic diversity and ecosystem functioning in changing environments: Atheoretical framework. Proceedings of the National Academy of Siences of the UnitedStates of America, 98(20):11376–11381.
North, D. C.1990. Institutions, institutional change and economic performance. New York: Cam-bridge University Press.
Noy-Meir, I.1975. Stability of grazing systems: an application of predator-prey graphs. The Journalof Ecology, Pp. 459–481.
Odum, E. P. and G. W. Barrett2002. Fundamentals of ecology, 5th edition. Belmont, CA: Thomson Brooks/Cole.
174

Orians, G. H.1980. General theory and applications to human behavior. In Evolution of human socialbehavior, J. Lockard, ed., Pp. 95–162. New York: Elsevier.
Ostrom, E.1990. Governing the commons: The evolution of institutions for collective action. Cam-bridge: Cambridge University Press.
Ostrom, E.2005. Understanding institutionaldiversity. Princeton: Princeton University Press.
Page, S. E.2011. Diversity and complexity. Princeton: Princeton University Press.
Peterson, G., C. R. Allen, and C. S. Holling1998. Ecological resilience, biodiversity, and scale. Ecosystems, 1(1):6–18.
Phillips, D. A.2012. Source-sink dynamics and their applicability to Neolithic period persistence inmarginal areas: An illustration from the US Southwest. Journal of AnthropologicalResearch, 68(4):503–517.
Phillips Jr, D. A.2009. Adoption and intensification of agriculture in the North American Southwest:Notes toward a quantitative approach. American antiquity, 74:691–707.
Pimm, S.1984. The complexity and stability of ecosystems. Nature, 307(5949):321–326.
Piperno, D. R. and D. M. Pearsall1998. The origins of agriculture in the lowland neotropics. San Diego: Academic Press.
Porter, C. C. and F. W. Marlowe2007. How marginal are forager habitats? Journal of Archaeological Science, 34(1):59–68.
Pryor, F.1986. The adoption of agriculture-some theoretical and empirical evidence. AmericanAnthropologist, 88(4):879–897.
Puleston, C. O. and S. Tujapurkar2008. Population and prehistory II: Space-limited human populations in constant envi-ronments. Theoretical Population Biology, 74(2):147–160.
R Development Core Team2008. R: A Language and Environment for Statistical Computing. R Foundation forStatistical Computing, Vienna, Austria. ISBN 3-900051-07-0.
Redding, R. W.1988. A general explanation of subsistence change: From hunting and gathering to foodproduction. Journal of Anthropological Archaeology, 7:56–97.
175
Richerson, P. J. and R. Boyd1998. Homage to Malthus, Ricardo, and Boserup toward a general theory of population,economic growth, environmental deterioration, wealth, and poverty. Human EcologyReview, 4:85–90.
Richerson, P. J., R. Boyd, and R. L. Bettinger2001. Was agriculture impossible during the Pleistocene but mandatory during theHolocene? A climate change hypothesis. American Antiquity, 66:378–411.
Rindos, D.1980. Symbiosis, instability, and the origins and spread of agriculture: A new model.Current Anthropology, 21:751–772.
Rindos, D.1984. The origins of agriculture: An evolutionary perspective. Orlando, Fla.: AcademicPress.
Rosenberg, M.1990. The mother of invention: Evolutionary theory, territoriality, and the origins ofagriculture. American Anthropologist, 92(2):399–415.
Rosenberg, M.1998. Cheating at musical chairs: Territoriality and sedentism in an evolutionary context.Current Anthropology, 39(5):653–681.
Roth, B. J.1992. Sedentary agriculturalists or mobile hunter-gatherers? Evidence on the Late Ar-chaic occupation of the northern Tucson Basin. Kiva, 57:291–314.
Roth, B. J.1996. Early Formative Adaptations in the Southern Southwest. Madison: Monographsin World Archaeology No. 25, Prehistory Press.
Sahlins, M. D.1972. Stone age economics. Chicago: Aldine-Atherton.
Scheffer, M.2009. Critical transitions in nature and society. Princeton: Princeton University Press.
Scheffer, M. and S. Carpenter2003. Catastrophic regime shifts in ecosystems: Linking theory to observation. Trendsin Ecology & Evolution, 18(12):648–656.
Shipek, F. C.1981. A Native American adaptation to drought: The Kumeyaay as seen in the SanDiego Mission records 1770-1798. Ethnohistory, 28:295–312.
Sigmund, K., H. De Silva, A. Traulsen, and C. Hauert2010. Social learning promotes institutions for governing the commons. Nature,466(7308):861–863.
176
Skibo, J.2009. Archaeological theory and snake-oil peddling: The role of ethnoarchaeology inarchaeology. Ethnoarchaeology, 1(1):27–56.
Smith, B.2012. A cultural niche construction theory of initial domestication. Biological Theory,6:1–12.
Smith, B. D.1989. Origins of agriculture in Eastern North America. Science, 246:1566–1571.
Smith, B. D.1995. The emergence of agriculture, volume 54. New York: Scientific American Library.
Smith, B. D.2001. Low-level food production. Journal of Archaeological Research, 9(1):1–43.
Smith, E. A.1988. Risk and uncertainty in the original affluent society: Evolutionary ecology ofresource sharing and land tenure. In Hunters and gatherers vol. I: History, evolution,and social change, T. Ingold, D. Riches, and J. Woodburn, eds., Pp. 222–251. Oxford:Berg.
Stephens, D. W., J. S. Brown, and R. C. Ydenberg2007. Foraging: Behavior and ecology. Chicago: University of Chicago Press.
Stephens, D. W. and J. R. Krebs1986. Foraging theory. Princeton: Princeton University Press.
Stiner, M. C., N. D. Munro, T. A. Surovell, E. Tchernov, and O. Bar-Yosef1999. Paleolithic population growth pulses evidenced by small animal exploitation. Sci-ence, 283(5399):190–194.
Tainter, J. A.2011. Energy, complexity, and sustainability: A historical perspective. EnvironmentalInnovation and Societal Transitions, 1(1):89–95.
Taylor, M. S. and J. A. Brander1998. The simple economics of Easter Island: A Ricardo-Malthus model of renewableresource use. The American Economic Review, 88(1):119–138.
Thompson, J. N.2005. The geographic mosaic of coevolution. Chicago: University of Chicago Press.
Tilman, D., D. Wedin, and J. Knops1996. Productivity and Sustainability Influenced by Biodiversity in Grassland Ecosys-tems. Nature, 379:718–720.
Tu, N. V. P.1994. Dynamical Systems: An introduction with applications in economics and biology,2 edition. New York: Springer-Verlag.
177

Tucker, B. T.2001. The behavioral ecology and economics of variation, risk, and diversificationamong Mikea forager-farmers of Madagascar. PhD thesis, University of North Car-olina, Chapel Hill, NC.
Ullah, I.2013. The consequences of human land-use strategiesdDuring the PPNB-LN transition:A simulation modeling approach. PhD thesis, Tempe, AZ.
Vierra, B. J.2005. The Late Archaic across the borderlands: from foraging to farming. Austin:University of Texas Press.
Walker, B., A. Kinzig, and J. Langridge1999. Plant attribute diversity, resilience, and ecosystem function: The nature and sig-nificance of dominant and minor species. Ecosystems, 2(2):95–113.
Watson, P. J.1980. The theory and practice of ethnoarcheology with special reference to the NearEast. Paleorient, 6:55–64.
Weber, M.1927. General economic history. Glenco, Ill.: Free Press.
Whalen, M. E.1994. Moving out of the Archaic on the edge of the Southwest. American antiquity,59:622–638.
Willems, E. P., B. Hellriegel, and C. P. van Schaik2013. The collective action problem in primate territory economics. Proceedings of theRoyal Society B: Biological Sciences, 280(1759).
Wills, W. H.1988. Early prehistoric agriculture in the American Southwest. Santa Fe, NM: Schoolof American Research Press.
Wills, W. H. and B. B. Huckell1994. Economic implications of changing land-use patterns in the Late Archaic. InThemes in Southwestern Prehistory, G. Gumerman, ed., Pp. 33–52. Santa Fe, NM:School of American Research Press.
Wilson, J. A., J. M. Acheson, M. Metcalfe, and P. Kleban1994. Chaos, complexity and community management of fisheries. Marine Policy,18(4):291–305.
Winterhalder, B.1983. Opportunity-cost foraging models for stationary and mobile predators. AmericanNaturalist, 122:73–84.
178

Winterhalder, B.1990. Open field, common pot: Harvest variability and risk avoidance in agricultural andforaging systems. In Risk and Uncertainty in tribal and peasant economies, E. Cashdan,ed., Pp. 67—87. Boulder, CO: Westview Press.
Winterhalder, B.1993. Work, resources and population in foraging societies. Man, 28:321–340.
Winterhalder, B.2002. Models. In Darwin and archaeology: A handbook of key concepts, J. P. Hart andJ. E. Terrell, eds., Pp. 201–223. Westport, Ct: Bergin and Garvey.
Winterhalder, B., W. Baillargeon, F. Cappelletto, I. Daniel, and C. Prescott1988. The population ecology of hunter-gatherers and their prey. Journal of Anthropo-logical Archaeology, 7(4):289–328.
Winterhalder, B. and C. Goland1993. On population, foraging efficiency, and plant domestication. Current Anthropol-ogy, 34(5):710–715.
Winterhalder, B. and F. Lu1997. A forager-resource population ecology model and implications for indigenousconservation. Conservation Biology, 11(6):1354–1364.
Winterhalder, B., F. Lu, and B. Tucker1999. Risk-senstive adaptive tactics: Models and evidence from subsistence studies inbiology and anthropology. Journal of Archaeological Research, 7(4):301–348.
Winterhalder, B. and E. A. Smith2000. Analyzing adaptive strategies: Human behavioral ecology at twenty-five. Evolu-tionary Anthropology Issues News and Reviews, 9(2):51–72.
Wittfogel, K. A.1957. Oriental despotism: A comparative study of total power. New Haven: YaleUniversity Press.
Zeder, M.2006. Central questions in the domestication of plants and animals. Evolutionary An-thropology: Issues, News, and Reviews, 15(3):105–117.
Zeder, M.2012. The broad spectrum revolution at 40: Resource diversity, intensification, and analternative to optimal foraging explanations. Journal of Anthropological Archaeology,31:241–264.
Zeng, N., J. D. Neelin, K.-M. Lau, and C. J. Tucker1999. Enhancement of interdecadal climate variability in the sahel by vegetation inter-action. Science, 286(5444):1537–1540.
179

Zvelebil, M.1996. The agricultural frontier and the transition to farming in the Circum-Baltic. InThe Origins and Spread of Agriculture and Pastoralism in Eurasia, D. R. Harris, ed.,Pp. 323–345. Washington DC: Smithsonian Institution Press.
180

APPENDIX A
REPORTS OF HUNTER-GATHERER FOOD PRODUCTION
181

This appendix reports on the 14 ethnographic groups that I added to the data set de-veloped by Keeley (1995). For a description of why these groups were added see chapter5.Name: G/Wi
References:
Tanaka, Jiro. 1980. The San Hunter-gatherers of the Kalahari: A study in ecological an-thropology. Tokyo: University of Tokyo Press.
Observations of Burning:
1) “During the dry season, the brush all over the withered veld is burned off to facilitatethe sighting of game and to improve the next year’s plant growth. On one occasion, drivenby the wind, one such fire meandered slowly for eight days until it reached a campsite some15 km away” (Tanaka 1980:112).
Observations of planting and tending:
1) “Again, some G//ana cultivate the tsama melon, n//an (Citrullus lanatus), but this inno way replaces the gathering of wild tsama melons and does not alter the overall San foodpattern. These habits of civilization were picked up by the G//ana from the Kgallagadi andare not seen at all among the g/wi of the =/ Kade area” (Tanaka 1980:14-15).
Name: Tiwi
References:
Hart,C. W. M., Pilling, A. 1960. The Tiwi of North Australia. Holt, Rinhaert and Winston:New york.
Observations of Burning:
1) “At the appointed time the hunters assembled, perhaps ten or fifteen adult men, withyounger ones doing the actual hunting and the older ones supervising. The woman andchildren acted as beaters; the grass was set on fire over a big area, and the kangaroosrounded up and killed while dazed by the smoke and the noise....”
2) “This sudden glut of meat was not, however, the main object of the burning, buta dividend. Even though few kangaroos were caught in the smoke and confusion, theburned-over area would provide good visibility for kangaroo hunting during the rest of thedry season, since the new tender shoots that sprang from the burned-over grass were a fa-vorite food of the kangaroo and served to lure them out of the denser scrub areas and themangrove swamps where hunting them was always difficult” (Hart and Philling 1965:42).
Observations of planting and tending:
182

Not reported in the consulted source.
Name: Kaurareg
References:
Moore, David r. 1979. Islanders and Aboriginies at Cape York. Humanities Press Inc.:New Jersey, USA.
Observations of Burning:
Not reported in the consulted source.
Observations of planting and tending:
1)“she makes it clear that the Kaurareg did plant sugarcane, in the form of slips broughtover by the Kulkalaig, and elsewhere she says that until 1849 there was only one garden inthe Prince of Wales group, on Horn Island, owned by a small group of men and their wives(Brierly 1849:162-163)......Barbara Thomson mentions that they would not take up the kotiplanted in the garricup in the current season, but would keep them as a standby in case thewild ones ’should get scanty in the rocks’, so obviously this was considered a possibility(Brierly 1849:178-179)” (Moore 1979: 278-279).
Name: Anbara
References:
Meehan, B. 1982. Shell bed to shell midden. Canberra : Australian Institute of AboriginalStudies ; Atlantic Highlands, N.J. : Distributed by Humanities Press.
Observations of Burning:
1) “During the wet season grass growing up to 2 m in height covers the whole site, as itdoes at Ngalidjibama, only to die or be burnt off during the height of the dry season. [siterefers to large campsite called Kopanga. [No indication of economic benefit of burning,information below indicates it is to help with mosquito problems] These measures [to determosquitos] include the thoughtful locatoin of camps and designs of houses, burning offgrass, making smoky fires,... ”(Meehan 1982:152-155).
Observations of planting and tending:
Not reported in the consulted source.
Name: Gunwinggu
References:
183

Altman, J. C. 1987. Hunter-gatherers Today: An aboriginal economy in North Australia.Australian Institute of Aboriginal Studies, Canberra.
Observations of Burning:
Not reported in the consulted source.
Observations of planting and tending:
Not reported in the consulted source.
Name: Worora
References:Blundell, V. J. 1975. Aboriginal Adaptation in Northwest Australia. PhD Thesis, Univer-sity of Wisconsin, Madison.
Observations of Burning:
1) “A group of men congregate and set the dry grass ablaze so that animals are driven ahead of the flames to a point where waiting hunters kill them with spears and clubs. Thispractice of burning off the vegetation also serves to kill smaller marsupials and reptileswhich are also collected. It further brings about the quick regeneration of the vegetationwith the ensuing first rains, which attracts marsupials and the larger birds into cleared areaswhere they are stalked by individual hunters”(Blundell 1975:467).
Observations of planting and tending:
Not reported in the consulted source.
Name: Mamu
References:
Harris, D. R. 1982. Aboriginal Subsistence in a Tropical Rainforest Environment: Foodprocurement, cannibalism and population regulation. In Food and Evolution: toward a the-ory of human food habits, M Harris and E. B. Ross (eds.) pp. 357-385. Temple UniversityPress: Philadelphia.
Harris, D. R. 1978. Adaptation to a tropical rain-forest environment: Aboriginal subsis-tence in Northeastern Queensland. In Human Behavior and Adaptation, N. Blurton Jonesand V. Reynolds (eds.) pp. 113-134.Taylor and francis Ltd.: New York.Observations of Burning:
Not reported in the consulted source.
184

Observations of planting and tending:
Not reported in the consulted source.
Name: Ngatajara
References:
Gould, R. 1971. Uses and Effects of Fire among the Western Desert Aborigines of Aus-tralia. Mankind 8:14-24.
Observations of Burning:
1) “There is evidence that in certain areas large fires were set to drive game....NgatatjaraAborigines residing today at Warburn say that in earlier times (i.e. during the first few yearsafter the founding of the Warburton Ranges Mission) they used fires to drive game overcliffs or up onto rock outcrops where the animals, mainly kangaroos and wallabies, couldbe surrounded and easily killed...”
2) “In anticipation of the possibility of these rains, numerous instances were notedwhere men would set fire to areas of spinifex with the idea that the green grass-shootswhich spring up shortly after a rain would attract kangaroos and other macropods into thearea.....”
3) “From an aboriginal subsistence point of view, spinifex and the few small trees andshrubs associated with spinifex climax (mainly species of Acacia) are not particularly at-tractive, whereas, in contrast, an area of spinifex which has burned and contains a widevariety of plants during the regeneration process may be much better. For among theseplants there are likely to be important staple species (like the ngaru observed 40 milessouth of Warburton) ” (Gould 1971:19,22).
Observations of planting and tending:
Not reported in the consulted source.
Name:Mardujdara
References:
Tonkinson, R. 1978. The Mardudjara aborigines: living the dream in Australia’s desert.New York : Holt, Rinehart and Winston.
Observations of Burning:
“The firing of vegetation flushes out small game such as marsupial rats, snakes, mice,lizards, and such, which can then be easily tracked and caught. Also, the burning ofspinifex, in particular, promotes the growth of grasses, herbs, and bush tomatoes that aremore useful as food resources, since spinifex seeds only for a short time and is laborious to
185

harvest” (Tonkinson 1978:39).
Observations of planting and tending:
Not reported in the consulted source.
Name: Kuku-Yalanji
References:
Hill, R., Baird, A., Buchana, D. 1999. Aborigines and Fire in the Wet Tropics of Queens-land, Australia: Ecosystem Management Across Cultures. Society & Natural Resources:An International Journal 12:205-223.
Observations of Burning:
“For subsistence purposes, Kuku-Yalanji people lit fires throughout the year from thetime the grass would first burn at the end of the wet season, to jarramali time, the hot drytime of the year. This created a mosaic of patches at different stages of regrowth. Somefood plants are easier to gather after ngalku, as they sprout first. Others have their produc-tivity enhanced, notably Cycas media, previously the most important carbohydrate foodsource” (Hill et al. 1999:211-212).
Observations of planting and tending:
Not reported in the consulted source.
Name: Kwakiutl
References:
Boas, F. 1921. The Kwakiutl of Vancouver Island. AMS Press: New York.
Turner, N C and Bell, M A M. 1973. The Ethnobotany of the southern Kwakiutl Indians ofBritish Columbia. Economic Botany 27: 257-310.
Observations of Burning:
1)“Although the Kwakiutl did not actually cultivate plants, they did attempt to improveyields by periodically burning over berry patches and by clearing the clover and cinquefoil’gardens’ of sticks and large rocks”(Turner and Bell 1973: 293).
Observations of planting and tending:
1)“They collected only the larger roots, leaving the smaller ones to grow for the nextharvest (Boas 1921, 1934).”
186

Name: Digueno
References:
Shipek, F. C. 1981. A Native American Adaptation to Drought: The Kumeyaay as Seen inthe San Diego Mission Records 1770-1798. Ethnohistory 28, 295-312.
Observations of Burning:
1)“Finally, fire was used to promote natural food crop succession on chaparral slopesby the use of a three to five, or more, year burning sequence, depending upon the plantsdesired in each locality” (Shipek 1981:298)
Observations of planting and tending:
1) “This grass was harvested by cutting and gathering stalks into sheaves. After harvest,the stubble was burned,a section at a time as it dried. Burning was followed by broadcast-ing seeds for next year’s crop.......................”
2) “In addition seed, families planted”gardens”of annual and extending grass areas bybroadcasting perennial greens, seeds, roots, and cactus cuttings in clearings made neartheir homes. Corn, beans, and squash were also planted in selected locations in mountainvalleys, below running springs, and on the desert, including the Colorado River delta dis-tributory system” (Shipek 1981:298).
Name: Shompen
References:
Arora, D. 2010. Sustainable management of tropical forest through indigenous knowledge:A case study of Shompens of Great Nicobar Island. Indian Journal of Traditional Knowl-edge 9:551-561.
Observations of Burning:
Not reported in the consulted source.
Observations of planting and tending:
“They clear a small patch of forest, say 10-15 m long and 10-15 m wide for their tem-porary camps. The trees are felled by cutting the trunk using the iron machete. The trunksare cut not at base or ground level but at a fairly high level of about 5-6 m above the ground.This is an ingenuous action as the trees in the forest of Great Nicobar have wide wing likebasal trunk growths called buttress. If the tree is to be cut at base, it would take more timeand efforts as girth at that level is many times more than the actual girth of trunk. It alsoprovides a chance to the jungle to grow again.... They are also said to possess gardensenclosed in zigzag fences, where they cultivate bananas, yams, and other tubers” (Arora
187

2010:559).
Name: Yuqui
References:
Stearman, A. M. 1989. Yuqui: Forest Nomads in a Changing World. Holt, Rinhart andWinston, New York.
Observations of Burning:
Not reported in the consulted source.
Observations of planting and tending:
Not reported in the consulted source.
188

APPENDIX B
ESTIMATING RESPONSE DIVERSITY
189

In this document I focus strictly on the plant resources that may have composed thewild resource portion of mixed forager-farmer diets in the southern Southwest US. To es-timate the plants available for food, I used Mclaughlin ’s (1986) floristic inventory of theSouthwest US to gain an inventory of the plants that occur in the southern Southwest US.This yielded a sample of 2394 species or a little less than 1/2 of the total number of speciesthat McLaughlin (1986) inventoried for the entire Southwest. I then used the North Amer-ican Ethnobotany Database to check for the use of each plant as a food by groups recordedethnographically. This yielded a sample of 394 species used as food ethnographically.In addition, I cross referenced the McLaughlin database of species with the database ofspecies that the USGS uses to calculate vegetation cover in the United States (GeologicalSurvey 2010). This cross-reference results in a list of 741 species of plant that were used asfood by ethnographically recorded societies in North America. I use the data set as an esti-mate of the species that were potentially available to prehistoric inhabitants of the southernBasin and Range province of the US Southwest.
The detailed methods for calculating the response (tolerance) diversity of assemblagesof species is detailed in Butterfield (2014). This work was done as part of an interdisci-plinary team funded by a Coupled Human Natural Systems Grant provided by the NationalScience Foundation (Nelson et al., 2010). In brief, species tolerances of cold extremeswere estimated by plotting the spatial distribution of each species over mean annual tem-perature climate layers in GIS. The spatial distribution of all species were acquired from theSouthwest Environmental Information Network (SEINet; www.swbiodiversity.org/portal),a data access portal to digital records from herbaria across the Southwest USA. Only geo-referenced records after 1900 were included and duplicates observations were removed.Climate data used to estimate each species’ tolerance to cold were acquired from World-Clim (Hijmans et al., 2005). This data set provides 1 km2 resolution rasters of interpolatedmonthly mean minimum temperature. WorldClim is a slightly coarser data set than thewell known PRISM climate data calculated for the lower 48 United States, but providesthe ability to estimate the tolerances of species whose distributions extend into Mexico, asmany of the species considered here are recorded in Mexico, as well as the US.
After the the spatial distribution of each species was plotted over the mean annual tem-perature raster, these values were extracted to the location of each species record. This wasdone for both species used as food in the ethnobotanical record and species not used asfood. For instance, Figure B.1 illustrates the spatial distribution of Larrea tridentada andthe mean annual temperature gradient in the US Southwest and Northern Mexico. At eachlocation where Larrea tridentada has been observed, the raster value for mean annual tem-perature was assigned to that individual species record. In this case, there are 955 speciesrecords, so we have 955 estimates of the minimum mean monthly temperature where thespecies lives. This allows one to calculate a climate distribution (Figure B.2) for Larreatridentada. It is assumed that the climate distribution reflects the constraints of temperatureon the niche space of a species. Beyond the tails of the distribution, the climate variableacts as an environmental filter, restricting the dispersal or post dispersal establishment ofthe species.
The 5th percentile is used as an estimate of the species tolerance of cold. This sameprocedure was carried-out for every species. It is assumed that if a plant experiences condi-tions colder than this value, in any given year, it is likely to die or not produce edible partsdue to cold stress. This is an initial simplification. Some plant parts, like bark, can obvi-ously be used as starvation food even if a tree is hit by a really cold snap. It is important to
190

&&
&&&&
&&&&&
&&&&&&
&
&
&
&
&
&
&
&
&&&&
&
&
&&
&
&&&&&&&&
&
&&&
&
&
&
&
&&
&
&
&&&
&&
&
&
&&
&
&
&&&&
&
&&
&
&
&
&
&
&
&&&
&&&&
&
&
&
&&
&
&&&&&&
&
&&
&
&
&
&
&&&
&
&
&&
&
&
&&&&&
&
&
&
&&&&
&
&&
&&&
&
&
&
&
&&
&
&
&&
&&
&
&
&&&&
&
&&&
&&&&
&
&
&
&
&&
&
&
&&
&
&&
&
&&
&
&
&
&
&
&
&
&
&
&
&
&
&&&
&
&
&&&
&&
&&&&&&&&
&&&&
&&
&
&
&
&
&
&
&&
&
&
&
&
&
&&&&&&&&&&&&
&
&
&
&
&
&
&
&&&
&
&&
&&&
&
&
&
&
&&&&
&
&
&
&
&
&&&
&
&&
&&&&&&
&
&
&&
&
&&
&
&&&
&
&
&
&
&
&&
&
&
&
&
&
&
&
&
&&
&&
&
&&
&
&
&
&
&&&
&
&&
&&
&&
&&&&&
&
&&&&&
&
&
&
&&&&
&
&
&&
&
&&
&&
&
&&
&&&&&
&
&
&
&
&
&
&&&&
&
&&
&&
&
&&
&&&
&
&&&
&
&
&&&&&&&
&
&&&
&
&&&&&&&&&&&&&
&&&&
&&&&&&&&&&&&
&
&&&&&&&&&&&&&&&&&&&&&&&&
&&
&&&
&
&
&
&&&
&
&&&&&&&&&&&&&&&&&&&&&&
&&
&&&
&
&
&
&&
&&&&
&
&&&&&&&&&&&&&
&
&
&
&&&&&&&&&&&
&
&&&
&&
&&&&&&
&
&
&&&&&&&&&&&&&&&&&&&&&&&&&
&&
&&&&
&&&&
&&&
&&&&&
&&
&&
&&&&
&&&&
&&&&
&&&&
&&&
&
&
&
&
&
&&&
&
&&
&
&
&&&&
&&
&&&&
&&&
&&&
&
&&
&&
&
&&&&&&
&
&&
&&&&&&
&&
&&&&&&&&
&
&&&
&
&&
&&&
&&
&&&&
&&&
&
&&
&&&&
&&
&&&&&&
&
&&
&&
&
&&
&
&&
&
&
&
&&
&
&
&&&&&&
&
&
&
&
&
&&
&&&
&&&&&&&&&&&&&&&&
&
&
&
&
&&
&&&&
&&
&&
&
&&
&&
&&
&&&&
&&&
&&
&
&
&
&&
&
&&&
&
&
&
&&&&&&&&&&&&&
&
&
&
&&&&
&
&&
&
&&
&
&&&
&&
&&
&&&
&&&&&&
&&&&
&
&
&
&&
&&
&&&&&
&&
&
&&&&&&&&&
&
&
&
&&&&
&&&&&&&&&&&&
&&
&
&
&
&&&&&&&&
&
&
&
&
&
&
&&&&
&&
&&&&&
&
&&
&
&
&
&&&
&
&&
&
&
&
&&&&
&
&
&
&&
&&
&
&
&
&
&&&&&&&&&&&
&
&
&
&
&
17-259-16.98.9-0.80.7- -7.4-7.5- -24
< -30-24- -30
Mean minimum temperature (degrees Celsius)
& Plant occurence
Figure B.1: Map of mean minimum monthly temperature and the spatial distribution ofLarrea tridentada.
remember that the data analysis done here is an illustration meant to forward more detailedstudies. In any assemblage of species then, the response diversity of an assemblage to coldis the collection of 5th percentiles from each species’ climate distribution. The assump-tion is that if a plant experiences a time period colder than this 5th percentile, the plant isstressed and is less likely to produce edible biomass for humans. A diverse assemblage isone with many different individual tolerances to cold. An assemblage that lacks responsediversity is one in which each species has the same tolerance of cold.
Each species was assigned an Ecological System, which are meso-scale vegetationclassifications representing vegetation types that recur consistently across similar physicalhabitats. These vegetation communities can be reliably mapped through remotely sensedand topographic data (Comer et al. 2003), and are the predominant vegetation classes inthe 30m-resolution LANDFIRE Existing Vegetation Map of the United States (Geologi-cal Survey 2010; http://landfire.cr.usgs.gov/viewer/). 93 vegetation zones arepresent in the study area and these zones are the scale at which the measures presented inFigure 6.4 are calculated.
191

0
50
100
150
200
−100 −50 0 50 100
Mean minimum monthly temperature (◦C)
Freq
uenc
y
Figure B.2: Climate distribution of Larrea tridentada. The red line marks the 5th per-centile of the distribution.
192


![Are there evolutionary consequences of plant–soil feedbacks along soil gradients?[2014]](https://static.fdokumen.com/doc/165x107/63323b83b6829c19b80bdf55/are-there-evolutionary-consequences-of-plantsoil-feedbacks-along-soil-gradients2014.jpg)

