national water & sanitation master plan: volume 2: plan to action
260
-
Upload
khangminh22 -
Category
Documents
-
view
0 -
download
0
Transcript of national water & sanitation master plan: volume 2: plan to action


National Water and Sanitation Master Plan Water is Life – Sanitation is Dignity
31 October 2018 NW&SMP: Volume 2: Plan to ActionFinal Draft (version 4.2)
i
DOCUMENTTITLE:
NATIONAL WATER & SANITATION MASTER PLAN:
VOLUME 2: PLAN TO ACTION
Document Revision Record
Rev.No.
Brief description of key revisions: Issue Date:
1.0 Combination of individual chapters 23 October 2017
2.2 Edited and repetition removed 30 October 2017
2.4 Better alignment published on DWS website 27 November 2017
2.6 Further editing and alignment 09 January 2018
2.8 Alignment with Volume 1: Call to Action 27 February 2018
2.9 Mark up for additional information 28 February 2018
3.0 Alignment of individual chapters’ content to Volume 1: Call to Action 13 March 2018
3.1 Incorporation of additional comment, technical and pre-final editing 27 March 2018
3.2 Revised RDI chapter 31 March 2018
3.3 Some Footnotes addressed 14 April 2018
3.4. Further Footnotes and edits 15 May 2018
4.0 Improved Section 3 and further footnotes 25 May 2018
4.1 Align numbering of Key Actions with the numbering of Actions inVolume 3 and enhance text linkages to Volumes 1 & 3
18 August 2018
4.2 Address final comments from DWS on draft document 31 October 2018

National Water and Sanitation Master Plan Water is Life – Sanitation is Dignity
31 October 2018 NW&SMP: Volume 2: Plan to ActionFinal Draft (version 4.2)
ii
DISCLAIMER:
This NW&SMP Volume 2: Plan to Action, is one of three volumeswhich together comprise the National Water and Sanitation MasterPlan (NW&SMP). The draft Master Plan was noted by Cabinet on27 June 2018 and will serve as the basis for further stakeholder
engagement at a forthcoming sector-wide planning initiative, namelythe Phakisa on Water and Sanitation scheduled for late 2018. TheNW&SMP is a ‘living’ plan, and annual updates and reviews will be
led the Department of Water and Sanitation in collaboration withsector partners.
National Water and Sanitation Master Plan Water is Life – Sanitation is Dignity
31 October 2018 NW&SMP: Volume 2: Plan to ActionFinal Draft (version 4.2)
iii
Contents
RATIONALE & CONTEXT ..............................................................................................1-1
1. THE NATIONAL WATER AND SANITATION MASTER PLAN ...........................1-1
1.1 Background and purpose of the National Water and Sanitation Master Plan(NW&SMP) 1-1
1.2 Key Challenges and NW&SMP Strategic Focus 1-5
2. BUILDING A WATER SECURE FUTURE.............................................................2-1
2.1 The Policy and Legislative Framework 2-1
2.2 Linkages between the NW&SMP with the SDGs, AU Agenda 2063, NDP andMTSF 2-2
2.2.1 Sustainable Development Goals..........................................................................2-2
2.2.2 African Union’s (AU) Agenda 2063 ......................................................................2-3
2.2.3 National Development Plan..................................................................................2-4
2.2.4 Medium Term Strategic Framework.....................................................................2-5
2.3 NW&SMP framework 2-5
2.4 NW&SMP Status and Process 2-8
Section 1: Water and Sanitation Management ...........................................................2-9
3. REDUCING WATER DEMAND AND INCREASING SUPPLY.............................3-9
3.1 Introduction 3-9
3.2 Present State 3-10
3.2.1 Available Water Resources................................................................................3-10
3.2.2 Water Requirements ..........................................................................................3-18
3.3 State of water losses and water use efficiency within the water sectors 3-19
3.3.1 Agriculture Sector ...............................................................................................3-20
3.3.2 Water Services Institutions and Local Government Sector ...............................3-20
3.4 Industries, Mining and Power Generation Sector (IMP) 3-29
3.5 WC/WDM Social Awareness and Advocacy Programmes 3-31
3.6 Drivers 3-32
3.6.1 Water Resources................................................................................................3-32
3.6.2 Water Requirements ..........................................................................................3-37
3.7 Priorities for the Future 3-41
3.7.1 Water availability ................................................................................................3-41
3.7.2 Water requirements............................................................................................3-47
3.7.3 Water balance ....................................................................................................3-48
3.7.4 Reconciliation Studies ........................................................................................3-49

National Water and Sanitation Master Plan Water is Life – Sanitation is Dignity
31 October 2018 NW&SMP: Volume 2: Plan to ActionFinal Draft (version 4.2)
iv
3.8 Priorities for the Future 3-52
4. REDISTRIBUTING WATER FOR TRANSFORMATION ......................................4-1
4.1 Present State 4-1
4.2 Drivers 4-2
4.3 Priorities for the Future 4-4
5. MANAGING EFFECTIVE WATER SUPPLY AND SANITATION SERVICES.....5-1
5.1 Water Supply and Sanitation Services 5-1
5.1.1 Present State........................................................................................................5-1
5.1.2 Priorities................................................................................................................5-7
5.2 Sanitation services 5-7
5.2.1 Present State........................................................................................................5-7
5.2.2 Priorities for the Future.......................................................................................5-13
5.3 operations and maintenance as part of Asset Management Cycle 5-13
5.3.1 Principles of Asset Management and Operations and Maintenance ................5-13
5.3.2 Present State of Asset Management .................................................................5-15
5.3.3 Priorities for Operations and Maintenance ........................................................5-18
5.4 Ensuring Implementation through Regulation 5-24
6. REGULATING THE WATER AND SANITATION SECTOR.................................6-1
6.1 Present state 6-1
6.2 Drivers 6-2
6.3 Priorities for the Future 6-4
7. IMPROVING RAW WATER QUALITY ..................................................................7-1
7.1 Present state 7-1
7.2 Priorities for the Future 7-3
7.2.1 High-level Water Quality Management Master Plan Targets ..............................7-3
7.2.2 Prioritised focus for maintaining or improving water quality ................................7-8
7.2.3 List of priority actions............................................................................................7-8
7.2.4 Provincial priorities .............................................................................................7-11
8. PROTECTING AND RESTORING ECOLOGICAL INFRASTRUCTURE.............8-1
8.1 Present State 8-4
8.1.1 River Ecosystems.................................................................................................8-4
8.1.2 Wetland Ecosystems............................................................................................8-4
8.1.3 Estuarine Ecosystems..........................................................................................8-5
8.1.4 Groundwater.........................................................................................................8-5
8.2 Drivers 8-6
8.2.1 River Ecosystems.................................................................................................8-6
8.2.2 Wetland Ecosystems............................................................................................8-6
8.2.3 Estuarine Ecosystems..........................................................................................8-6
8.2.4 Groundwater.........................................................................................................8-7

National Water and Sanitation Master Plan Water is Life – Sanitation is Dignity
31 October 2018 NW&SMP: Volume 2: Plan to ActionFinal Draft (version 4.2)
v
8.3 Priorities for the Future 8-7
8.3.1 Rivers and Wetlands ............................................................................................8-8
8.3.2 Estuaries...............................................................................................................8-8
8.3.3 High water yield areas play a critical role in securing South Africa’s watersupplies.................................................................................................................8-8
8.3.4 Groundwater.......................................................................................................8-10
8.3.5 List of Priority Actions.........................................................................................8-10
Section 2: Enabling Environment ................................................................................8-1
9. CREATING EFFECTIVE WATER SECTOR INSTITUTIONS ...............................9-1
9.1 Present State 9-1
9.2 Drivers 9-2
9.2.1 Specific Challenges..............................................................................................9-2
9.2.2 Drivers ..................................................................................................................9-3
9.3 Priorities for the Future 9-4
9.3.1 Priority Actions......................................................................................................9-5
10. MANAGING DATA AND INFORMATION ...........................................................10-1
10.1 Present state 10-1
10.2 Drivers 10-4
10.3 Priorities for the Future 10-5
11. BUILDING CAPACITY FOR ACTION .................................................................11-1
11.1.1 Approach to Skills Development and Capacity Building....................................11-1
11.1.2 Institutional Capacity ..........................................................................................11-2
11.1.3 Environmental Capacity .....................................................................................11-2
11.2 Present State 11-3
11.2.1 The Skills Development Mandate in the Water Sector......................................11-3
11.2.2 Skills Development.............................................................................................11-4
11.2.3 Current Supply Trends .......................................................................................11-5
11.3 Problems, Challenges & Drivers for Change 11-5
11.3.1 Human Skills.......................................................................................................11-5
11.4 Priorities for the Future 11-6
12. ENSURING FINANCIAL SUSTAINABILITY .......................................................12-1
12.1 Financial Health of the Sector 12-1
12.2 Key Challenges to Financial Health in Water and Sanitation 12-3
12.3 Present State 12-5
12.3.1 Strategic Overview of Financial Position ...........................................................12-5
12.3.2 Asset value of existing infrastructure .................................................................12-8
12.3.3 Capital investment need and funding.................................................................12-9
12.3.4 Operating cost and funding ..............................................................................12-13
12.3.5 Governance and Financial Management Cost and Funding...........................12-14

National Water and Sanitation Master Plan Water is Life – Sanitation is Dignity
31 October 2018 NW&SMP: Volume 2: Plan to ActionFinal Draft (version 4.2)
vi
12.4 Drivers 12-17
12.4.1 Reduce Costs ...................................................................................................12-22
12.4.2 Increase Revenue ............................................................................................12-23
12.4.3 Increase Fiscal Transfers.................................................................................12-31
12.4.4 Increase Loan Funding.....................................................................................12-32
12.5 Priorities for the Future 12-35
13. AMENDING THE LEGISLATION.........................................................................13-1
13.1 Present State 13-1
13.2 Drivers 13-2
13.3 Priorities for the Future 13-3
14. ENHANCING RESEARCH, DEVELOPMENT AND INNOVATION....................14-1
14.1 Present State 14-2
14.1.1 Pillars of the RDI Master Plan.............................................................................14-3
14.1.2 Supporting implementation of the RDI aspects of the Master Plan ...................14-3
14.2 DRIVERS 14-4
14.2.1 Re-imagining Water RDI Investment and Partnership .......................................14-4
14.2.2 Effective RDI Implementation Mechanisms.......................................................14-5
14.3 priorities for the Future 14-6
Section 3: Supporting Implementation....................................................................14-11
15. PERFORMANCE MANAGEMENT, MONITORING AND EVALUATION.........15-11
15.1 Introduction 15-11
15.2 Present State of Planning 15-11
15.2.1 Present Planning Requirements ......................................................................15-14
15.3 Present State of Monitoring and Evaluation 15-15
15.3.1 Current Monitoring Requirements....................................................................15-15
15.3.2 Current Evaluation Requirements....................................................................15-17
15.3.3 Current Evaluation Processes..........................................................................15-17
15.4 Desired State of Monitoring and Evaluation for the NW&SMP 15-17
15.4.1 Proposed Monitoring and Evaluation Processes.............................................15-18
16. INFORMATION MANAGEMENT AND DATA PORTAL.....................................16-1
16.1 Present State 16-1
16.2 Drivers for NW&SMP Web Portal 16-1
16.3 Content and Functionality 16-1
16.4 Action Plan 16-2
17. ENGAGING SECTOR PARTNERS .....................................................................17-1
17.1 Narrowing Focus To Maximise Break Through 17-3
17.2 INITIATING IMPLEMENTATION 17-7
18. CONCLUSION......................................................................................................18-1

National Water and Sanitation Master Plan Water is Life – Sanitation is Dignity
31 October 2018 NW&SMP: Volume 2: Plan to ActionFinal Draft (version 4.2)
vii
List of Figures
FIGURE 2-1: NW&SMP TIMELINES RELATIVE TO OTHER PLANNING INSTRUMENTS ...................................................................... 2-2FIGURE 2-2: ALIGNMENT OF NATIONAL PLANNING PROCESS WITH SECTORAL & DEPARTMENTAL PLANNING PROCESS ...................... 2-5FIGURE 2-3: NW&SMP PHILOSOPHY ................................................................................................................................ 2-8FIGURE 3-1: SOUTH AFRICA’S HYDROLOGICAL SITUATION ....................................................................................................... 3-9FIGURE 3-2: INTER-BASIN WATER TRANSFERS IN SOUTH AFRICA............................................................................................. 3-12FIGURE 3-3: GROUNDWATER AVAILABILITY IN SOUTH AFRICA ................................................................................................ 3-14FIGURE 3-4: INTERNATIONAL CONTEXT OF SURFACE (LEFT) AND GROUNDWATER (RIGHT) RESOURCES IN RSA................................. 3-16FIGURE 3-5: WATER USE BY SECTOR................................................................................................................................. 3-18FIGURE 3-6: MAP OF EIGHT WATER SUPPLY SYSTEMS THAT INDICATE WATER USE EFFICIENCY TARGETS FOR 2017 AND 2022 AND WATER
SAVINGS PERFORMANCE FOR THE YEAR 2016 FOR EACH SYSTEM .................................................................................... 3-22FIGURE 3-7: HISTORICAL TREND OF WATER USE EFFICIENCY WITHIN THE EIGHT LARGE WATER SUPPLY SYSTEMS ............................... 3-25FIGURE 3-8: NATIONAL IWA WATER BALANCE FOR WATER LOSSES AND NON-REVENUE WATER MM³/A .................................... 3-26FIGURE 3-9: NO DROP NATIONAL PERFORMANCE LOG 2014 ............................................................................................... 3-27FIGURE 3-10: STATUS OF WCDM PLANNING IN 152 MUNICIPALITIES ................................................................................... 3-28FIGURE 3-11: ESKOM’S PERFORMANCE (WATER INTENSITIES FOR THE PAST THREE YEARS) ......................................................... 3-30FIGURE 3-12: TYPICAL PROGRAMME FOR THE DEVELOPMENT OF WATER RESOURCES INTERVENTIONS ........................................... 3-33FIGURE 3-13: THE PLANNED SHIFTS IN WATER MIX IN THE MEDIUM AND LONG TERM, NOTING THAT THE TOTAL VOLUME INCREASES
SUBSTANTIALLY OVER THE PERIOD (GRAPH CREATED FROM NWRS1 PROJECTED TO 2015, FROM 2015 TO 2040 BY DWSDIRECTORATE: NATIONAL WATER RESOURCES PLANNING - NWRP).............................................................................. 3-41
FIGURE 3-14: PLANNING AND IMPLEMENTATION OF THE WATER RESOURCE DEVELOPMENT PROJECTS (SOURCE: DWS DIRECTORATE:NATIONAL WATER RESOURCES PLANNING – NWRP, OCTOBER 2017).......................................................................... 3-43
FIGURE 3-15: POTENTIAL ARTIFICIAL RECHARGE AREAS IN SOUTH AFRICA ............................................................................... 3-45FIGURE 3-16: OVERVIEW OF SOUTH AFRICA’S WATER REQUIREMENTS (SOURCE: DWS DIRECTORATE: NATIONAL WATER RESOURCES
PLANNING - NWRP)............................................................................................................................................. 3-48FIGURE 3-17: WATER BALANCE AT MUNICIPAL LEVEL FROM ALL TOWN STUDIES ..................................................................... 3-50FIGURE 5-1: ACCESS TO PIPED, RDP AND RELIABLE RDP WATER SUPPLY (SOURCE: STATSSA) ....................................................... 5-3FIGURE 5-2: NATIONAL WATER SUPPLY FIGURES .................................................................................................................. 5-4FIGURE 5-3: RELIABILITY OF WATER SUPPLY AND SANITATION SERVICES PER PROVINCE (SOURCE DWS) ......................................... 5-4FIGURE 5-4: RISK AND VULNERABILITY TO FAILURE PER WSA................................................................................................... 5-6FIGURE 5-5: SEVEN SANITATION POLICY PILLARS................................................................................................................... 5-8FIGURE 5-6: SANITATION BACKLOGS PER WSA, APRIL 2017 ................................................................................................ 5-10FIGURE 5-7: SANITATION NEEDS TO ADDRESS THE BACKLOG ................................................................................................. 5-11FIGURE 5-8: INTEGRATED ASSET MANAGEMENT ................................................................................................................. 5-14FIGURE 5-9: ELEMENTS OF ACCEPTABLE SERVICES .............................................................................................................. 5-14FIGURE 5-10: MUNICIPAL WASTEWATER TREATMENT RISK RATING PERFORMANCE TREND AS MEASURED IN 2016. THE CUMULATIVE RISK
RATING PERFORMANCE MEASUREMENT IS BASED UPON THE WASTEWATER RISK ABATEMENT PLANNING (W2RAP) CONCEPT WHICH
WAS JOINTLY DEVELOPED BY THE DEPARTMENT OF WATER AND SANITATION AND THE WATER RESEARCH COMMISSION. THE
PURPOSE IS TO HAVE A UNIFORM YARDSTICK FOR WASTEWATER PERFORMANCE MEASUREMENT AND TO SET RISK
ABATEMENT/REDUCTION TARGETS FOR EACH MUNICIPAL TREATMENT FACILITY. ................................................................ 5-17FIGURE 5-11: SUMMARY OF WATER SERVICES QUERIES TO THE DWS CUSTOMER SERVICE (JUNE 2016 – JUNE 2017).................. 5-17FIGURE 6-1: REGULATORY RESPONSIBILITIES FOR THE WATER AND SANITATION SECTOR ................................................................ 6-1FIGURE 7-1: DIFFERENT TYPES OF WATER QUALITY PROBLEMS ACROSS SOUTH AFRICA (ASHTON, 2012)........................................ 7-2FIGURE 7-2: HIGH-LEVEL WATER QUALITY MANAGEMENT MASTER PLAN TARGETS .................................................................... 7-4FIGURE 7-3: INTERNATIONAL, NATIONAL AND CATCHMENT WATER QUALITY PLANNING (ADAPTED FROM DWS, 2015).................... 7-7FIGURE 8-1: DETERIORATION OF ECOLOGICAL CONDITION OF SOUTH AFRICAN RIVERS, 1999 – 2011 (SOURCE: NEL, J.L. & DRIVER, A.
2015. NATIONAL RIVER ECOSYSTEM ACCOUNTS FOR SOUTH AFRICA) .............................................................................. 8-2FIGURE 8-2: ECOLOGICAL CONDITION OF SOUTH AFRICAN WETLANDS, 2011 (SOURCE: NEL J.L. AND DRIVER A. 2012. SOUTH AFRICAN
NATIONAL BIODIVERSITY ASSESSMENT 2011: TECHNICAL REPORT. VOLUME 2: FRESHWATER)............................................. 8-3FIGURE 8-3: KEY WATER SOURCE AREAS .............................................................................................................................. 8-9FIGURE 9-1: POSSIBLE FUTURE INSTITUTIONAL ARRANGEMENTS ............................................................................................... 9-4FIGURE 10-1: MONITORING NETWORK DESIGN: SURFACE WATER QUANTITY AND QUALITY....................................................... 10-3FIGURE 11-1: MULTI-DIMENSIONAL APPROACH TO CAPACITY BUILDING ................................................................................. 11-1FIGURE 11-2: PIPELINE APPROACH................................................................................................................................... 11-2FIGURE 11-3: NUMBER OF REGISTERED ENGINEERS PER MUNICIPAL CATEGORY ....................................................................... 11-5FIGURE 12-1: THREE SCENARIOS FOR THE FUTURE .............................................................................................................. 12-1FIGURE 12-2: MUSSA VULNERABILITY ASSESSMENT (MUSSA 2013/14) .............................................................................. 12-4

National Water and Sanitation Master Plan Water is Life – Sanitation is Dignity
31 October 2018 NW&SMP: Volume 2: Plan to ActionFinal Draft (version 4.2)
viii
FIGURE 12-3: FUNDING GAP........................................................................................................................................... 12-6FIGURE 12-4: COST SPLIT BETWEEN MUNICIPAL SERVICES & WATER SUPPLY CHAIN ............................................................... 12-13FIGURE 12-5: GOVERNANCE OF WATER .......................................................................................................................... 12-15FIGURE 12-6: ADDRESSING THE FUNDING GAP ................................................................................................................. 12-17FIGURE 12-7: PHASED MANAGEMENT APPROACH TO ADDRESS THE FUNDING GAP ................................................................. 12-20FIGURE 12-8: MUNICIPAL REVENUE PER SERVICE TYPE & SOURCE ....................................................................................... 12-24FIGURE 12-9: RAW WATER BILLING & RAW WATER DEBTS................................................................................................ 12-26FIGURE 12-10: POPULATION PAYING FOR DOMESTIC WATER SUPPLY................................................................................... 12-29FIGURE 12-11: REASON FOR NON-PAYMENT ................................................................................................................... 12-30FIGURE 14-1: DISTILLATION OF THREE DOCUMENTS............................................................................................................. 14-1FIGURE 15.1: LONG-TERM RELATIONSHIP AND TIMING OF GOVERNMENT ACCOUNTABILITY DOCUMENTS ................................... 15-13FIGURE 15.2: ACCOUNTABILITY DOCUMENTS WITHIN THE REPORTING FRAMEWORK ............................................................... 15-16FIGURE 15.3: THEORY OF CHANGE FOR THE NATIONAL WATER AND SANITATION MASTER PAN................................................. 15-18
List of Tables
TABLE 3-1: WATER USE REQUIREMENTS (SOURCE: DWS DIRECTORATE: NATIONAL WATER RESOURCES PLANNING – NWRP)........ 3-19TABLE 3-2: SUMMARY OF THE DESIRED TARGET VERSUS ACTUAL SAVINGS FOR MUNICIPALITIES .................................................... 3-23TABLE 3-3: SIMPLIFIED ASSURANCE OF SUPPLY PER USER SECTOR............................................................................................ 3-37TABLE 3-4: SUMMARY OF WATER REQUIREMENTS FOR THE EXISTING ESKOM POWER STATIONS (SOURCE: ESKOM, 2013, AND ESKOM
WEBPAGE) .......................................................................................................................................................... 3-39TABLE 3-5: THE PLANNED SHIFTS IN WATER MIX IN THE MEDIUM AND LONG TERM, NOTING THAT THE TOTAL VOLUME WATER AVAILABILITY
PER SECTOR (SOURCE: DWS DIRECTORATE: NATIONAL WATER RESOURCES PLANNING - NWRP)....................................... 3-42TABLE 3-6: CURRENT PROJECTIONS OF FUTURE WATER REQUIREMENTS ................................................................................. 3-47TABLE 3-7: PROVISIONAL NATIONAL WATER BALANCE WITH AND WITHOUT CRITICAL INTERVENTIONS ............................................ 3-48TABLE 3-8: WATER BALANCES FOR DIFFERENT WATER SUPPLY SYSTEM (MILLION M³/A) .............................................................. 3-51TABLE 3-9: PRIORITY ACTIONS......................................................................................................................................... 3-52TABLE 4-1: WATER ALLOCATION FOR IRRIGATION AREAS........................................................................................................ 4-3TABLE 4-2: SUMMARY OF PRIORITIES.................................................................................................................................. 4-5TABLE 5-1: PROVINCIAL SANITATION BACKLOGS ................................................................................................................... 5-9TABLE 5-2: GREEN DROP SCORES PER PROVINCE ................................................................................................................ 5-12TABLE 5-3: WATER OPERATIONS AND MAINTENANCE PERFORMANCE STANDARDS ................................................................... 5-19TABLE 5-4: PRIORITY ACTIONS......................................................................................................................................... 5-21TABLE 6-1: PRIORITY ACTIONS........................................................................................................................................... 6-5TABLE 7-1: HIGH-LEVEL WATER QUALITY MANAGEMENT MASTER PLAN TARGET 1 .................................................................... 7-5TABLE 7-2: HIGH-LEVEL WATER QUALITY MANAGEMENT MASTER PLAN TARGET 2 .................................................................... 7-6TABLE 7-3: HIGH-LEVEL WATER QUALITY MANAGEMENT MASTER PLAN TARGET 3 .................................................................... 7-7TABLE 7-4: PRIORITY ACTIONS .......................................................................................................................................... 7-9TABLE 7-5: PROVINCIAL PRIORITIES .................................................................................................................................. 7-11TABLE 8-1: PRIORITY ACTIONS......................................................................................................................................... 8-10TABLE 9-1: KEY DRIVERS .................................................................................................................................................. 9-4TABLE 9-2: PRIORITY ACTIONS .......................................................................................................................................... 9-6TABLE 10-1: PRIORITY ACTIONS....................................................................................................................................... 10-6TABLE 11-1: CIVIL ENGINEERING METRICS – 2005 COMPARED WITH 2015 ............................................................................ 11-4TABLE 11-2: PRIORITY ACTIONS....................................................................................................................................... 11-9TABLE 12-1: FOCUS AREAS FOR THE KEY DRIVERS ............................................................................................................ 12-17TABLE 12-2: PROPOSED FRAMEWORK............................................................................................................................ 12-36TABLE 12-4: PRIORITY ACTIONS .................................................................................................................................... 12-37TABLE 13-1: PRIORITY ACTIONS....................................................................................................................................... 13-3TABLE 14-1: KEY RDI IMPLEMENTATION MECHANISMS ....................................................................................................... 14-5TABLE 14-2: INVESTMENT THEMES FOR THE NW&SMP...................................................................................................... 14-7

National Water and Sanitation Master Plan Water is Life – Sanitation is Dignity
31 October 2018 NW&SMP: Volume 2: Plan to ActionFinal Draft (version 4.2)
ix
List of acronyms and abbreviations
ACIP Accelerated Community Infrastructure Program
AIP Alien Invasive Plants
AMCOW African Ministers’ Council on Water
AMD Acid Mine Drainage
ARC Agricultural Research Council
b/a billion per annum
BBBEE Broad-Based Black Economic Empowerment
bn Billion = 1 000 000 000 = one thousand million
BRICS Brazil, Russia, India, China and South Africa
CARA Central Adoption Resource Authority
CHE Council on Higher Education
CMAs Catchment Management Agencies
CME Compliance, Monitoring and Enforcement
CMF Catchment Management Forum
CMS Catchment Management Strategy
CoGTA Department of Cooperative Governance and Traditional Affairs
COP 17 17th Conference of the Parties
CRDP Comprehensive Rural Development Program
CRU Central RIA Unit
CSI Corporate Social Investment
CSIR Council for Scientific and Industrial Research
CSO Civil Society Organization
DAFF Department of Agriculture, Forestry and Fisheries
DBE Departments of Basic Education
DBSA Development Bank of Southern Africa
DDT Dichlorodiphenyltrichloroethane
DEA Department of Environmental Affairs
DFI Development Finance Institution
DHET Department of Higher Education and Training
DM District Municipality
DMR Department of Mineral Resources
DOE Department of Energy
DHS Department of Human Settlements
DPE Department of Public Enterprises
DPSA Department of Public Service & Administration
DRD&LR Department of Rural Development & Land Reform
DST Department of Science and Technology
DTI Department of Trade and Industry
DWA Department of Water Affairs
DWAF Department of Water Affairs & Forestry

National Water and Sanitation Master Plan Water is Life – Sanitation is Dignity
31 October 2018 NW&SMP: Volume 2: Plan to ActionFinal Draft (version 4.2)
x
DWM Developmental Water Management
DWS Department of Water and Sanitation
e.g. for example
EU European Union
ELU Existing Lawful Use
etc. etcetera; and so on
EWSETA Energy and Water Sector Education and Training Authority
EXCO Executive Committee
FAO Food and Agriculture Organisation
FET Further Education and Training
FETWater Framework Programme for Research, Education and Training in Water, South Africa (UNESCOinitiative)
G8 The Group of Eight (world’s eight wealthiest western countries)
GA General Authorisations
GCM Global Circulation Models
GCIS Government Communication Information System
GDP Gross Domestic Product
GET General Education and Training
GFETQSF General and Further Education and Training Qualifications Sub-Framework
GG Government Gazette
GGP Gross Geographic Product
GIS Geographical Information System
GLeWAP Groot Letaba River Water Development Project
GN Government Notice
GRIP Groundwater Resource Information Project
HDI Historically disadvantaged individuals
ha Hectares (10 000 square metres)
HE Higher Education
HEI Higher Education Institutes
HEQSF Higher Education Qualifications Sub-framework
HRDS Human Resources Development Strategy
HLoS Higher Level of Service
HYDSTRA Integrated water resources management software
IB Irrigation board
IBSA
IDP
The India-Brazil-South Africa Dialogue Forum
Integrated Development Plan
IDZ Industrial Development Zone
i.e. that is
IHP International Hydrological Programme
IPAP3 Industrial Policy Action Plan 3
IPP Independent Power Producers
IRP Integrated Resource Plan

National Water and Sanitation Master Plan Water is Life – Sanitation is Dignity
31 October 2018 NW&SMP: Volume 2: Plan to ActionFinal Draft (version 4.2)
xi
IRR Institutional Reform and Realignment
IT Information technology
i.t.o. in terms of
IUA Integrated Units of Analysis
IWA International Water Association
IWRM Integrated Water Resource Management
IWWMP Integrated Water and Waste Management Plan
IWTTSA Industry Water Task Team of South Africa
JPTC Joint Permanent Technical Committee
JSE Johannesburg Stock Exchange
JWC Joint Water Commission
KNP Kruger National Park
KPI Key performance indicator
LEDP Local Economic Development Plan
LGSETA Local Government Sector Education & Training Authority
LHDA Lesotho Highlands Development Authority
LHWP Lesotho Highlands Water Project
LRAD Land Reform for Agricultural Development
LTAS Long Term Adaptation Scenarios
LWC Limpopo Watercourse Commission
m3/a cubic meter per annum
mm/year millimetres per year
mg/l milligrams per litre
Ml/day megalitres per day= 1 000 000 litres/day
MAR mean annual runoff
MDG Millennium Development Goals
MFMA Municipal Finance Management Act
MIG Municipal Infrastructure Grant
MISA Municipal Infrastructure Support Agency
MMTS2 Mooi-Mgeni Transfer Scheme Phase 2
MoU Memorandum of Understanding
MTEF Medium Term Expenditure Framework
MWIG Municipal Water Infrastructure Grant
MW MegaWatts
NATED National Technical Education
NCBF National Capacity Building Framework for Local Government
NDP National Development Plan
NEMA National Environmental Management Act
NFEPA National Freshwater Ecosystem Priority Areas
NGA National Groundwater Archive
NGP New Growth Path
NGO Non-government organisation
National Water and Sanitation Master Plan Water is Life – Sanitation is Dignity
31 October 2018 NW&SMP: Volume 2: Plan to ActionFinal Draft (version 4.2)
xii
NGS National Groundwater Strategy
NMBMM Nelson Mandela Bay Metropolitan Municipality
NMIU National Monitoring and Implementation Unit
NPC National Planning Commission
NPS Non-point source
NPSS Non-Point Source Strategy
NQF National Qualifications Framework
NRF National Research Foundation
NRW Non-Revenue Water
NSA National Skills Accord
NSDP National Spatial Development Perspective
NSDS National Skills Development Strategy
NSI National System of Innovation
NT National Treasury
NWA National Water Act (Act 36 of 1998)
NWAC National Water Advisory Council
NWRI National Water Resource Institute
NWRS National Water Resource Strategy
NWRS1 National Water Resource Strategy (First edition, 2004)
NWRS2 National Water Resource Strategy (Second edition, 2013)
NWRSA National Water Resources and Services Authority
NWRSR National Water Resources and Services Regulator
ODA Official Development Assistance
OECD Organisation for Economic Cooperation and Development
ORASECOM Orange-Senqu (River Basin) Commission
ORWRDP Olifants River Water Resource Development Project
OQSF Occupational Qualifications Sub-Framework
OSD Occupation Specific Dispensation
PALAMA Public Administration Leadership and Management Academy
PES Present Ecological State
Ph Phase
PFMA Public Finance Management Act
PGDP Provincial Growth and Development Plan
PGDS Provincial Growth and Development Strategy
PMU Project Management Unit
PPP Public Private Partnerships
P/S pump station
PWC Permanent Water Commission
QCTO Quality Council for Trades and Occupations
R&D Research and Development
R&I Research and Innovation
RBIG Regional Bulk Infrastructure Grant

National Water and Sanitation Master Plan Water is Life – Sanitation is Dignity
31 October 2018 NW&SMP: Volume 2: Plan to ActionFinal Draft (version 4.2)
xiii
RBO River Basin Organizations
RDM Resource Directed Measures
RDP Reconstruction and Development Programme
REGIS Software system developed in the Netherlands, currently under investigation for its application inSouth Africa
RIA Regulatory Impact Assessment
RIDMP Regional Infrastructure Development Master Plan
RISDP Regional Indicative Strategic Development Plan
Rio+20 United Nations Conference on Sustainable Development, 2012
RPL Recognition of Prior Learning
RQO Resource Quality Objectives
RSA Republic of South Africa
RSAPIII Regional Strategic Action Plan III
RWH Rainwater harvesting
RWQO Receiving Water Quality Objective
SA South Africa
SAAWU South African Association of Water Utilities
SADC Southern African Development Community
SAICE South African Institution of Civil Engineering
SALGA South African Local Government Association
SAWS South African Weather Service
SDC Source Directed Controls
SETA Sector Education & Training Authority
SIP Strategic Integrated Project
SIV System Input Volume
SIWI Stockholm International Water Institute
SULP Sustainable Utilization Plans
SWPN Strategic Water Partnership Network
TAC Technical Advisory Committee
TCTA Trans Caledon Tunnel Authority
UDF Urban Development Framework
UN United Nations
UNCSD United Nations Conference on Sustainable Development
UNEP United Nations Environment Programme
GEMS Global Environment Monitoring System
UNFCCC United Nations Framework Convention on Climate Change
UNESCO United Nations Educational, Scientific and Cultural Organization
VGG Vaal Gamagara
WAR Water Allocation Reform
WAS Water Accounting System
WARMS Water Registration Management System
WARS Water Allocation Reform Strategy

National Water and Sanitation Master Plan Water is Life – Sanitation is Dignity
31 October 2018 NW&SMP: Volume 2: Plan to ActionFinal Draft (version 4.2)
xiv
WCWSS Western Cape Water Supply System
WCWDM Water Conservation and Water Demand Management
WDCS Waste Discharge Charge System
WISA Water Institute of Southern Africa
WMA Water Management Area
WMP Water Management Plan
WMS Water Management System
WRA Water Research Act
WRC Water Research Commission
WRM Water Resource Management
WRMI Water Resource Management Institution
WRTC Water Resources Technical Committee
WS Water Services
WSA Water Services Authority
WSAct Water Services Act (Act 108 of 1997)
WSDP Water Services Development Plans
WSLG Water Sector Leadership Group
WSP Water Services Provider
WMA Water Management Area
WTW water treatment works
WWC World Water Council
WWTW waste water treatment works
WUL Water Use License

National Water and Sanitation Master Plan Water is Life – Sanitation is Dignity
31 October 2018 NW&SMP: Volume 2: Plan to ActionFinal Draft (version 4.2)
xv
List of Units used in the Report
The following standard units have been used in this report
Description Standard unit Description Standard unit
Elevation m.a.s.l. Velocity, speed m/s, km/hr
Height m Discharge m3/s
Distance m, km Mass kg, ton
Dimension mm, m Force, weight N, kN, MN
Area m2 , ha or km2 Moment, torque Nm, kNm, MNm
Volume (storage) m3 , million m3 , Ml/day Ampere A, kA
Yield million m3/a Volt V, kV
Mean annual runoff million m3/a Electric power kVA, kW, MW
Pressure Pa, kPa, MPa Acceleration m/s2
Diameter mm dia., m dia. Density kg/m3
Power kW, MW Slope (H:V) or (V:H) 1:5 (H:V) or 5:1 (V:H)
Energy kJ, MJ Gradient (V:H) %
Temperature oC Frequency Hz, kHz, MHz
“Ready for the future and ahead of the curve”
National Water and Sanitation Master Plan Water is Life – Sanitation is Dignity
31 October 2018 NW&SMP: Volume 2: Plan to ActionFinal Draft (version 4.2)
1-1
RATIONALE & CONTEXT1. THE NATIONAL WATER AND SANITATION MASTER PLAN
ADDRESSING THE CRISIS AND CALLING SOUTH AFRICA TO ACTION TO BE READYFOR THE FUTURE AND AHEAD OF THE CURVE
1.1 BACKGROUND AND PURPOSE OF THENATIONAL WATER AND SANITATIONMASTER PLAN (NW&SMP)
Water security, defined by UN-Water as “the
capacity of a population to safeguard sustainable
access to adequate quantities of acceptable
quality water for sustaining livelihoods,
human well-being, and socio-economic
development, for ensuring protection against
water-borne pollution and water-related
disasters, and for preserving ecosystems in a
climate of peace and political stability”1 is a
critical challenge confronting South Africa in the
21st century. Water security presents a profound
challenge to South Africa’s social well-being and
economic growth.
South Africa is a water scarce country, receiving
around half of the global average annual rainfall,
with this rainfall distributed unevenly across the
country, and across seasons and years. This
water scarcity is being exacerbated by
escalating demand due to economic and
population growth, urbanization and rising
standards of living, unsustainable use and high
levels of wastage and loss, and increasing
pollution which renders water not fit for use. In
addition, the degradation of wetlands, changes
in rainfall patterns due to climate change and
increasing temperatures also driven by climate
change, are contributing to reduced security of
supply.
1 UN Water. 2013.Water is Water Security?
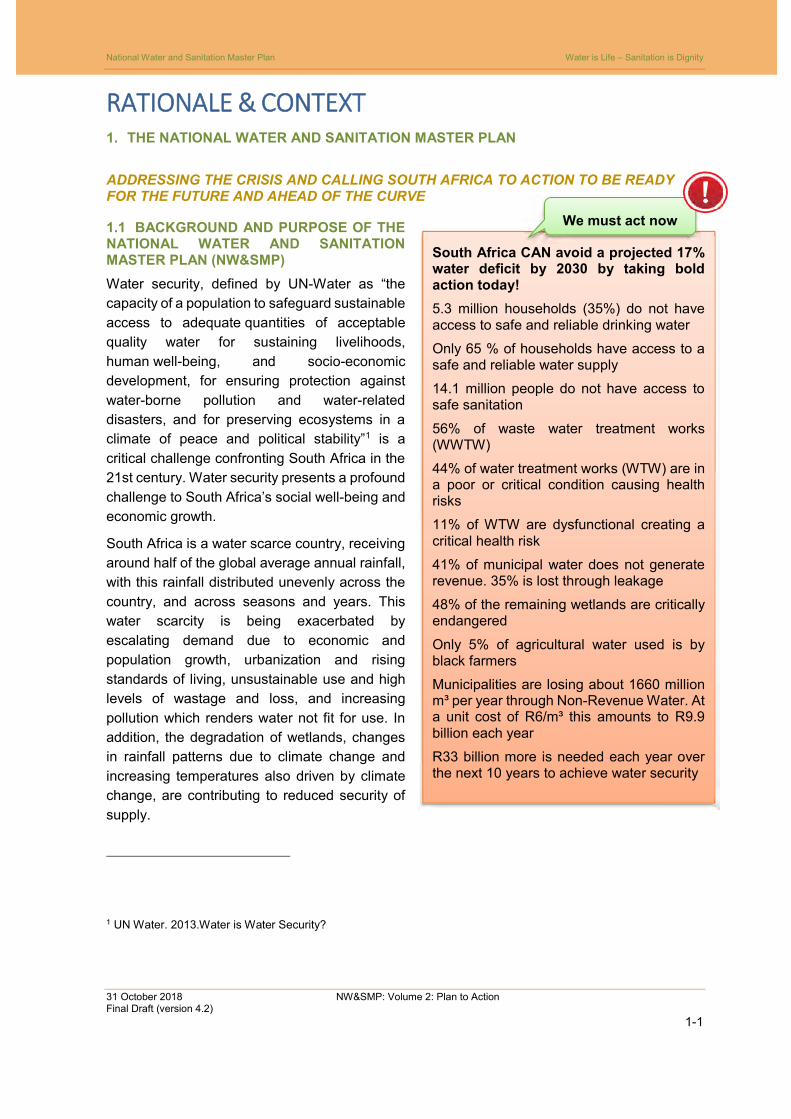
South Africa CAN avoid a projected 17%water deficit by 2030 by taking boldaction today!
5.3 million households (35%) do not haveaccess to safe and reliable drinking water
Only 65 % of households have access to asafe and reliable water supply
14.1 million people do not have access tosafe sanitation
56% of waste water treatment works(WWTW)
44% of water treatment works (WTW) are ina poor or critical condition causing healthrisks
11% of WTW are dysfunctional creating acritical health risk
41% of municipal water does not generaterevenue. 35% is lost through leakage
48% of the remaining wetlands are criticallyendangered
Only 5% of agricultural water used is byblack farmers
Municipalities are losing about 1660 millionm³ per year through Non-Revenue Water. Ata unit cost of R6/m³ this amounts to R9.9billion each year
R33 billion more is needed each year overthe next 10 years to achieve water security
We must act now

National Water and Sanitation Master Plan Water is Life – Sanitation is Dignity
31 October 2018 NW&SMP: Volume 2: Plan to ActionFinal Draft (version 4.2)
1-2
Based on current demand projections and without effective interventions2, the water deficit
confronting the country could be between 2.7 and 3.8 billion cubic meters, a gap of approximately
17% of available water sources, by 2030. The South African water sector must take bold steps to
adopt a `new normal’ to head off the projected water gap.
In addition, in April 20173, 14,1 million people still used sanitation facilities below the
Reconstruction and development Programme (RDP) standard and only 10,3 million households
(65%) had access to reliable water supply – lower than the percentage of the population that had
access to a reliable water supply in 1994. Approximately 56% of the over 1 150 municipal
wastewater treatment works (WWTWs) and approximately 44% of the 962 water treatment works
(WTWs) in the country are in a poor or critical condition and in need of urgent rehabilitation and
skilled operators4. Some 11% of this infrastructure is completely dysfunctional. This crisis in water
supply and sanitation threatens the health and well-being of poor South Africans in particular,
while also impacting negatively on economic growth and environmental sustainability.
The National Water and Sanitation Master Plan (NW&SMP) forms part of a suite of initiatives
announced by the newly appointed Minister of Water and Sanitation in May 2018, which will
provide key focus to the work of the water sector leader at this time. The Department will therefore
coalesce its efforts around these five strategic pillars in the coming period:
National Water Resources and Services Water Authority (NWRSA);
National Water Resources and Services Regulator (NWRSR);
Water Resources and Services Value Chain;
Water Resources and Services Master Plan; and
Institutional Rationalisation and Organisational Alignment.
The Department of Water and Sanitation (DWS) will work in conjunction with other government
departments and agencies, the private sector and civil society to ensure that the crisis in the water
and sanitation sector is addressed with the aim of attaining a water secure future with reliable and
safe water and sanitation services for all, and that these contribute towards meeting national
development objectives.
While the development of the Master Plan has been led by DWS in conjunction with key sector
partners including the TCTA and WRC, it is a country-wide plan as the critical challenges
confronting water and sanitation service delivery in the country requires concerted effort by all
water institutions and users to resolve. This first-of-its-kind NW&SMP introduces a new paradigm
that will guide the South African water sector, led by DWS and implemented and supported by
local government and other sector partners, towards the urgent execution of tangible actions. This
action will make a real impact on the management of South Africa’s water resources and the
supply and use of water and sanitation in the country.
2McKinsey. 2010. Confronting South Africa’s Water Challenge.3 Statistics South Africa. 2011. Census 2011 Statistical release P0301.4.
Statistics South Africa. 2016. Community Survey 2016 Statistical release P0301.4 Benchmarking of Water Loss, Water Use Efficiency and Non-Revenue Water in South African Municipalities, July
2017

National Water and Sanitation Master Plan Water is Life – Sanitation is Dignity
31 October 2018 NW&SMP: Volume 2: Plan to ActionFinal Draft (version 4.2)
1-3
The NW&SMP:
Sets out a schedule of prioritised actions for the period to 2030 that will create a water and
sanitation sector that can meet national objectives as set out in the National Development
Plan (NDP) and the internationally agreed Sustainable Development Goals (SDGs)
Sets out the roles and responsibilities in government, the private sector and civil society for
the implementation of the plan
Volume One of the NW&SMP is the Call to Action, which is divided into two sections, Water and
Sanitation Management, and Enabling Environment, each having six sub-sections. Each section
includes critical actions that, when implemented, will have a significant impact on addressing the
crisis. These actions are collated at the back of the document for ease of reference.
This Volume 2: Plan to Action provides a more detailed analysis of and rationale for, the key
issues raised in the Call to Action. References to further related bodies of knowledge are
contained in this Volume.
Volume 3: Schedule of Actions provides a detailed implementation plan with costs covering all
the actions required across the sector to achieve the objectives of the plan. The purpose of
Volume 3 is to order and define all actions and interventions identified within Volume 1 and
Volume 2 of the NW&SMP into annual measurable outcomes inclusive of roles and
responsibilities, time frames and associated estimated costs. DWS has worked with key sector
partners to develop the first draft of Volume 3, and in keeping with the ‘living’ nature of the Master
Plan, will continue to work with sector partners to refine this action schedule. A key milestone for
this engagement will be at the Phakisa on Water and Sanitation planning `laboratory’ supported
by Cabinet and scheduled for late 2018.

National Water and Sanitation Master Plan Water is Life – Sanitation is Dignity
31 October 2018 NW&SMP: Volume 2: Plan to ActionFinal Draft (version 4.2)
1-4
Implementation of the NW&SMP will be reviewed and reported on annually, and the NW&SMP
will be updated accordingly in an adaptive management approach. The soon to be established
DWS Project Management Unit (Delivery Unit) will be the custodian of these sector-wide
processes and responsible to drive implementation on the NW&SMP Programme of Action in
collaboration with sector partners.
The following actions necessary to give effect to these priorities, are recorded in Volume 3:
Action 5 Responsibility Completion date
Phakisa on water and sanitation to be held (Volume 3,Action 2.7.1)
DWS, DPME First quarter 2019/20
Determine cost required to implement NW&SMP andidentify where reprioritisation or cost savings can be usedto address the NW&SMP priorities (2.7.2)
DWS, WSAs 2019
Appoint skilled Management, Technical and ProgrammeManager staff for Delivery Unit (2.7.3)
DWS 2019
Monitor, review, evaluate, report on and updateNW&SMP (2.7.4)
DWS Annual report toParliament
5 Where actions apply to more than one chapter, they have been duplicated in the action tables at the end of the
relevant chapters. All actions are summarised in a table at the end of the Call to Action, without this duplication.

National Water and Sanitation Master Plan Water is Life – Sanitation is Dignity
31 October 2018 NW&SMP: Volume 2: Plan to ActionFinal Draft (version 4.2)
1-5
1.2 KEY CHALLENGES AND NW&SMP STRATEGIC FOCUS
Water resource management and water and sanitation service delivery challenges have
escalated over the past few years in the country and the water sector in South Africa cannot afford
to ignore these challenges and continue with business as usual. There is a need to act decisively
in addressing the deterioration of standards and to restore the integrity and effectiveness of
governance, delivery, management and monitoring systems. The NW&SMP sets out a strategic
focus and seeks to mobilise support and resources to address critical challenges and make a
measurable impact and ensure alignment of views, goals and actions.
The most important challenges and the key focus areas are outlined briefly below, and elaborated
in greater detail in relevant chapters:
Water security is one of the biggest issues/challenges facing South Africa
and the world in the 21st century (see Chapter 3 of this
document). Based on projections by McKinsey6, if no
substantive action is taken the water deficit by 2030 could
be between 2,7 and 3,8 billion m3/a - a gap of about 17%
of available surface and ground water. The growing
requirements of neighbouring states for water from our
shared river basins could further impact on water
availability for South Africa. A “Business Unusual”
approach is required to close the gap.
At the same time, water resources must benefit all citizens
equitably. Water is an important catalyst and driver of
socio-economic development. The water allocation to
agriculture is approximately 61%, but little has been
achieved in reallocating water to historically
disadvantaged individuals in this sector. The NW&SMP
aligns with government’s transformative agenda as
outlined in the National Development Plan (NDP) and
identifies actions to redress past inequities through the re-
allocation and use of water.
Water security will be further threatened as supply
decreases due to the negative impacts on yield arising
from climate change, degradation of wetlands and water resources, siltation of dams,
whilst water losses and demand escalates due to population and economic growth,
urbanization, inefficient use, and changing lifestyles. South Africans currently consume
more water per capita at approximately 237 l/c/d than the world average of approximately
6 McKinsey. 2010. Confronting South Africa’s Water Challenge.
- South Africa must balancesupply and demand
- South Africa must ensureequitable access to water
- South Africa must protectand restore ecologicalinfrastructure
- South Africa must reducedemand in all sectors andhalve physical water losses
- South Africa must diversifyits water mix
- South Africa must create afinancially sustainable watersector
- South Africa must buildeffective water sectorinstitutions
- South Africa must ensureeffective and efficient waterand sanitation services
National Water and Sanitation Master Plan Water is Life – Sanitation is Dignity
31 October 2018 NW&SMP: Volume 2: Plan to ActionFinal Draft (version 4.2)
1-6
173 l/c/d7. The country’s water losses are also exceptionally high with non-revenue water
(NRW) currently standing at about 41%. Studies indicate that actual physical losses in
municipal systems are at 35%8. Interventions will be made to reduce demand by
improving efficiency, adopting new technologies and reducing losses (especially in the
agricultural and municipal sectors).
Desalinated sea water (in coastal areas) and treated waste water will increasingly be
brought into the water mix, as well as increased use of groundwater.
Institutional arrangements will be optimised to improve governance and ensure that key
sector objectives are achieved. New institutional arrangements are under consideration
which include nine water boards, catchment agencies and local water resource
management institutions. A National Water Resources and Services Authority will be
established to finance, develop, manage and operate national water resource
infrastructure and sanitation. A National Water Resources and Services Regulator will be
established which will be responsible for ensuring the development, implementation,
monitoring and review of regulations across the water and sanitation value chain in
accordance with the provisions of the National Water Act (1998), the Water Services Act
(1997) and related water and sanitation policies.
The capacity of water services authorities (WSAs) to operate, maintain and manage
existing infrastructure will receive urgent attention. According to the Stats SA General
Household Survey (GHS)9:
o 89% households have access to operational services, but reliability is only at 64%.
Current access to sanitation services is 80% on average (50% in some LM’s). This will
be increased to 90% by 2019 and 100% by 2030 as per National Development Plan
(NDP) and Sustainable Development Goal (SDG) targets.
o 56% of the over 1 150 waste water treatment works (WWTW) are in poor and critical
state and will be rehabilitated urgently and properly maintained thereafter.
o 44% of 962 domestic Local Government water treatment works (WTWs) are in a poor
condition and require urgent rehabilitation. This is essential to ensure safe drinking
water to the population.
Deteriorating water quality is a major constraint to economic and social development,
reduces the sustainably of the available resource, and impacts significantly on the cost of
treating water. Urgent measures must be taken to protect and restore South Africa’s water
quality.
A lack of data and information resulting from weak monitoring systems poses high risks to
decision making and planning and will urgently be addressed by repairing and maintaining
measuring infrastructure, adopting new monitoring technologies, and improving data
management and distribution.
7 The world average per capita per day usage (173 l/c/d) does not appear in any report but is based on expert opinion8 Benchmarking of Water Loss, Water Use Efficiency and Non-Revenue Water in South African Municipalities, July
2017”9 Stats SA, 2018. Stats SA GHS General Household Survey 2016
National Water and Sanitation Master Plan Water is Life – Sanitation is Dignity
31 October 2018 NW&SMP: Volume 2: Plan to ActionFinal Draft (version 4.2)
1-7
Application of the latest research, innovation and development in water-less/alternative
water and sanitation systems will be implemented urgently to address excess demand.
National Water and Sanitation Master Plan Water is Life – Sanitation is Dignity
31 October 2018 NW&SMP: Volume 2: Plan to ActionFinal Draft (version 4.2)
2-1
2. BUILDING A WATER SECURE FUTURE
2.1 THE POLICY AND LEGISLATIVE FRAMEWORK
This NW&SMP gives effect to the mandate
given to the water sector through the
Constitution of the Republic of South Africa, the
White Paper on a National Water Policy for
South Africa (1997), the Strategic Framework
for Water Services (2002), the National
Sanitation Policy (2017), the National Water Act
(1998) and the Water Services Act (1997). In
addition, it takes into account other relevant
policy and legislation such as the Industrial
Policy Action Plan (IPAP), the Irrigation Strategy
developed by the Department of Agriculture,
Forestry and Fisheries (DAFF), the National
Climate Change Response White Paper, the
National Environmental Management Act, the
Public Finance Management Act, the Municipal
Finance Management Act, and the Municipal
Structures and Systems Acts.
The National Water Act and the Water Services
Act are currently under revision to ensure that
they effectively support the delivery of a water
secure future. A future in which there is
adequate water and sanitation for all.
The National Water Resources Strategy
(NWRS), required under the National Water Act,
is also currently under revision with the third
iteration of this strategy due for gazetting in
2018. There is a possibility under consideration
in the revision of the legislation that a future
strategy will include water resources, water
services and sanitation into an integrated
National Water and Sanitation Resources and
Services Strategy.
This NW&SMP is the implementation
mechanism for the NWRS2 (and any future
iterations of the NWRS) while also including
actions relating to water services and sanitation.
It defines the actions that are critical to achieve
the outcomes outlined in the strategy and to
ensure water security and safe sanitation for all.
#1: The values of the Constitution includethose of human dignity, the achievement ofequality and the advancement of humanrights and freedoms.
#2: The Constitution states that everyonehas the right to an environment that is notharmful to their health or well-being; and tohave the environment protected, for thebenefit of present and future generations,through reasonable legislative and othermeasures that
i) prevent pollution and ecological
degradation
ii) promote conservation; and
iii) secure ecologically sustainable
development and use of natural
resources while promoting
justifiable economic and social
development.
#3 The Constitution states that everyonehas the right to have access to sufficientfood and water.
#4 The Constitution states that the propertyclause may not impede the state fromtaking measures to achieve land, water andrelated reform, to redress the results of pastracial discrimination.
These constitutional imperatives, combinedwith the national water and sanitation policypapers, the National Water Act and theWater Services Act, give the mandate tothe water sector to:
• Provide universal and equitableaccess to reliable water supply andsanitation services
• Protect, manage and develop thenation’s water resources in amanner that supports justifiable andecologically sustainable economicand social development
• Transform access to water toredress the racial imbalancescreated by apartheid.

National Water and Sanitation Master Plan Water is Life – Sanitation is Dignity
31 October 2018 NW&SMP: Volume 2: Plan to ActionFinal Draft (version 4.2)
2-2
A water security framework is also being developed by the National Planning Commission, and
this plan will, iteratively, be aligned with that framework.
2.2 LINKAGES BETWEEN THE NW&SMP WITH THE SDGS, AU AGENDA 2063, NDP ANDMTSF
The NW&SMP sets out the framework for how South Africa will manage its water resources and
implement water and sanitation programmes to achieve targets set in Government’s National
Development Plan, Medium Term Strategic Framework (MTSF) and Medium-Term Expenditure
Framework (MTEF). The NW&SMP also addresses the global and African agendas outlined in
the Sustainable Development Goals (SDGs and the African Union’s (AU) Agenda 2063. The
diagram below illustrates how the NW&SMP fits within the timelines of the national and the global
planning framework.
Figure 2-1: NW&SMP timelines relative to other planning instruments
2.2.1 Sustainable Development Goals
The Sustainable Development Goals (SDGs), approved by the United Nations in 2015, provide a
unique opportunity to map a pathway to a better future for all. Goal 6, which stipulates, “to ensure
the availability and sustainable management of water and sanitation for all,” is central to realising
the vision of a better future for all and the NW&SMP is aligned with achieving this goal. The targets
and indicators for Goal 6 are set out below:
Target 6.1: By 2030, achieve universal and equitable access to safe and affordable drinking water
for all
Indicator: Proportion of population using safely managed drinking water services
Target 6.2: By 2030, achieve access to adequate and equitable sanitation and hygiene for all and
end open defecation, paying special attention to the needs of women and girls and those in
vulnerable situations

National Water and Sanitation Master Plan Water is Life – Sanitation is Dignity
31 October 2018 NW&SMP: Volume 2: Plan to ActionFinal Draft (version 4.2)
2-3
Indicator: Proportion of population using safely managed sanitation services, including a
hand-washing facility with soap and water
Target 6.3: By 2030, improve water quality by reducing pollution, eliminating dumping and
minimizing release of hazardous chemicals and materials, halving the proportion of untreated
wastewater and substantially increasing recycling and safe reuse globally
Indicator: Proportion of wastewater safely treated; Proportion of bodies of water with good
ambient water quality
Target 6.4: By 2030, substantially increase water-use efficiency across all sectors and ensure
sustainable withdrawals and supply of freshwater to address water scarcity and substantially
reduce the number of people suffering from water scarcity
Indicator: Change in water-use efficiency over time; Level of water stress: freshwater
withdrawal as a proportion of available freshwater resources
Target 6.5: By 2030, implement integrated water resources management at all levels, including
through transboundary cooperation as appropriate
Indicator: Degree of integrated water resources management implementation (0-100);
Proportion of transboundary basin area with an operational arrangement for water
cooperation
Target 6.6: By 2020, protect and restore water-related ecosystems, including mountains, forests,
wetlands, rivers, aquifers and lakes
Indicator: Change in the extent of water-related ecosystems over time
Target 6.A: By 2030, expand international cooperation and capacity-building support to
developing countries in water- and sanitation-related activities and programmes, including water
harvesting, desalination, water efficiency, wastewater treatment, recycling and reuse
technologies
Indicator: Amount of water- and sanitation-related official development assistance that is
part of a government-coordinated spending plan
Target 6.B: Support and strengthen the participation of local communities in improving water and
sanitation management
Indicator: Proportion of local administrative units with established and operational policies
and procedures for participation of local communities in water and sanitation management
2.2.2 African Union’s (AU) Agenda 206310
There are seven aspirations in the African Union’s Agenda 2063, which reflect the desire for
shared prosperity and well-being, for unity and integration, and for a continent of free citizens.
The most relevant aspiration for the NW&SMP is the first, which includes:
Eradicating poverty and achieving high standards of living for all
10 African Union (AU). 2015. Agenda 2063: The Africa We Want.

National Water and Sanitation Master Plan Water is Life – Sanitation is Dignity
31 October 2018 NW&SMP: Volume 2: Plan to ActionFinal Draft (version 4.2)
2-4
Ensuring well-educated citizens and a skills revolution underpinned by science,
technology and innovation
Modernising infrastructure and agriculture
Structurally transforming economies to create growth, decent jobs and economic
opportunities for all and
Preserving the environment and ecosystems.
2.2.3 National Development Plan
The National Development Plan (NDP), finalised in 2012, articulates the vision of development
for the country and identifies key milestones and targets to will be achieved in the various sectors.
It sets out a detailed blueprint for how the country can eliminate poverty and reduce inequality by
the year 2030. It was endorsed by Cabinet as a strategic framework to form the basis of future
government detailed planning. The NDP envisions a South Africa where everyone feels free yet
bounded to others; where everyone embraces their full potential, a country where opportunity is
determined not by birth, but by ability, education and hard work.
Realising such a society will require transformation of the economy and focused efforts to build
the country’s capabilities. To eliminate poverty and reduce inequality, the economy must grow
faster and in ways that benefit all South Africans. In particular, young people deserve better
educational and economic opportunities, and focused efforts are needed to eliminate gender
inequality. Promoting gender equality and greater opportunities for young people are integrated
themes that run throughout the NDP.
There is a burning need for faster progress, more action and better implementation. The future
belongs to all of us. The NDP is a vision for every South African, requiring action, change and
sacrifice from all sectors of society. The NDP emphasises the need to address poverty by
broadening access to employment, strengthening the social wage, improving public transport and
raising rural incomes. It outlines the steps that need to be taken to professionalise the public
service, strengthen accountability, improve coordination and prosecute corruption. The NDP
suggests that public infrastructure investment be set at 10 percent of the country’s gross domestic
product (GDP).
The NDP recognises the role of water in contributing to poverty eradication and social
development. The most relevant programmes and targets articulated by the NDP in this regard
include:
Ensure people have access to clean, potable water and that there is sufficient water for
agriculture and industry, recognizing trade-offs in the use of water
Reduce water demand in urban areas to 15% below business-as-usual scenario by
2030
Complete Lesotho Highlands Water Project Phase 2 by 2020
Implement a comprehensive management strategy including an investment programme
for water resource development, bulk supply and wastewater management for major
centres by 2012, with review every five years

National Water and Sanitation Master Plan Water is Life – Sanitation is Dignity
31 October 2018 NW&SMP: Volume 2: Plan to ActionFinal Draft (version 4.2)
2-5
Develop regional market for food, energy and water and put in place water management
agreement with neighbouring countries and
Develop regional utilities to deliver some local government services on an agency basis
where local or district municipalities lack capacity.
2.2.4 Medium Term Strategic Framework
The Medium Term Strategic Framework (MTSF) 2014 – 2019 confirms government’s commitment
to the goals of the NDP through resource allocation and budget prioritisation and sets out the
strategic plan of government for the 2014 – 2019 electoral term. The MTSF outcomes related
directly to the water sector include:
MTSF Outcome 6: An efficient, competitive and responsive economic infrastructure
MTSF Outcome 7: Vibrant, equitable, sustainable rural communities contributing towards
food security for all
MTSF Outcome 9: Responsive, accountable, effective and efficient developmental local
government system
MTSF Outcome 10: Protect and enhance our environmental assets and natural resources
and
MTSF Outcome 11: Related to international relations and co-operation.
Figure 2-2: Alignment of National Planning Process with Sectoral & Departmental Planning Process
2.3 NW&SMP FRAMEWORK
The aim of the NW&SMP is to achieve a water secure future and reliable and affordable access
to adequate and safe water and sanitation to improve social and economic well-being with due
regard to the environment. As introduced in Volume 1: Call to Action of the NW&SMP, the key
objectives of the Master Plan that define a ‘new normal’ for water and sanitation management in
South Africa speak to the main challenges within the water sector, including:
Resilient and fit-for-use water supply
Universal water and sanitation provision
Equitable sharing and allocation of water resources
Effective infrastructure management, operation and maintenance and
Reduction in future water demand.

National Water and Sanitation Master Plan Water is Life – Sanitation is Dignity
31 October 2018 NW&SMP: Volume 2: Plan to ActionFinal Draft (version 4.2)
2-6
The Master Plan recognises that achievingwater security in South Africa requires a newnormal: a significant paradigm shift that
recognises the limitations of water
availability
addresses the real value of water
ensures equitable access to limited water
resources
delivers reliable water and sanitation
services to all
focuses on demand management and
alternative sources of water
considers the impacts of climate change
and
addresses declining raw water quality.
In order to facilitate and accelerate progress towards the attainment of a water secure future for
South Africa, the NW&SMP deliberately maintains a tight focus that is based on twelve elements
which reflect the key programmes that have been identified as necessary to operationalise a new
water and sanitation sector paradigm in the country. These elements are clustered under two
key themes: water and sanitation management and enabling environment, each with clearly
defined sub-themes.
The new reality:
Water will becomemore expensive
Everyone (except thosewithout access to pipedwater) MUST use lesswater for the sameactivities
Everyone - except theindigent - MUST pay forwater and sanitationservices

National Water and Sanitation Master Plan Water is Life – Sanitation is Dignity
31 October 2018 NW&SMP: Volume 2: Plan to ActionFinal Draft (version 4.2)
2-7
Section1: Water and sanitation management
Reducing demand and increasing supply
Redistribution for transformation
Managing effective water and sanitation
services
Regulating water and sanitation
Improving raw water quality and
Protecting and restoring ecological
infrastructure
Section 2: Enabling environment
Creating effective institutions
Managing data and information
Building capacity for action
Ensuring financial sustainability
Amending the legislation and
Enhancing research, development and
innovation

National Water and Sanitation Master Plan Water is Life – Sanitation is Dignity
31 October 2018 NW&SMP: Volume 2: Plan to ActionFinal Draft (version 4.2)
2-8
Figure 2-3: NW&SMP Philosophy
2.4 NW&SMP STATUS AND PROCESS
As indicated above, the NW&SMP identifies critical priorities for the water sector, in alignment
with the SDGs, African Union Agenda 2063, the NDP and the MTSF. Ownership and support of
the NW&SMP by all stakeholders is critical as actions will be implemented by these stakeholders
in a collaborative manner. The successful implementation of the plan requires the stakeholders
to fully assume their roles and responsibilities and apply their resources within the agreed
timeframes.
Relevant stakeholders jointly developed this plan, and support the articulation of the critical
challenges, were engaged as follows:
Provincial workshops with facilitated discussions with
stakeholders
Presentations and discussions at stakeholder forums
Direct engagement with government departments to identify
areas of duplication and to improve integrated planning and
Online engagement with the document.
A copy of the NW&SMPStakeholder engagementreport is available onrequest

National Water and Sanitation Master Plan Water is Life – Sanitation is Dignity
31 October 2018 NW&SMP: Volume 2: Plan to ActionFinal Draft (version 4.2)
3-9
SECTION 1: WATER AND SANITATION MANAGEMENT
3. REDUCING WATER DEMAND AND INCREASING SUPPLY
3.1 INTRODUCTION
South Africa has a semi-arid climate, with an average
annual rainfall of 465 mm, compared to the world average
of 860 mm, as a result, South Africa’s water resources are
scarce and extremely limited. The mean annual rainfall
varies substantially across the country from about
3 000 mm in the east and on the high-lying mountains, to
less than 50 mm on the dry west coast, shown in Figure
3-1. The rainfall is also highly variable within seasonal
distribution patterns, with evaporation and transpiration
increasing inversely from the wetter east to the arid west11.
Figure 3-1: South Africa’s hydrological situation
South Africa’s water resource is highly developed, especially surface water systems through a
myriad of large dams around the country. This limits opportunities to augment future supply
11 Climate report

National Water and Sanitation Master Plan Water is Life – Sanitation is Dignity
31 October 2018 NW&SMP: Volume 2: Plan to ActionFinal Draft (version 4.2)
3-10
through the building of additional dams. Optimal sites for dams have already been developed and
future sites will come at a high social, economic and environmental cost.
Water conservation and water demand management (WC/WDM) is an integral part of broader
strategies needed to reconcile available supply with demand for water.
WC/WDM is needed across all water use sectors to balance supply and demand. Water use in
South Africa is dominated by irrigation, which accounts for around 61% of all water used in the
country. Domestic and urban use accounts for about 27%, while mining, large industries and
power generation account for some 8%. Commercial forestry plantations account for a little less
than 3% of total use by reducing runoff into rivers and streams12.
Integrated water resource management and planning ensures that water fit for use is available
for urban and rural growth, whilst ensuring that industrial and agricultural requirements at local,
regional and national scale are met at adequate assurances of supply. It must take into account
the potential for reducing water demand, through water conservation and water demand
management (WC/WDM), as well as options for further infrastructure development to increase
supply. For this, water resource information must be available to inform national planning
functions. At a most basic level, a water resource plan accounts for allocations to the different
water use sectors, ecological requirements (maintaining or improving river ecosystems) and
international obligations.
This section proposes interventions that will guide the management of water resources
management, planning and infrastructure in the future. These interventions, if implemented on
time, will endeavour to achieve and maintain the balance of available water with projected water
requirements in the short to medium term.
3.2 PRESENT STATE
3.2.1 Available Water Resources
Surface Water
The total national annual runoff is approximately 49 000 million m³/a giving a reliable yield of
surface water at an acceptable assurance of supply at 98% of approximately 10 200 million
m³/a13. Key water source areas are mostly situated in the north east of the country, with 8% of the
land area that contributes 50% of the mean annual runoff (MAR).
There are more than 4 395 registered dams in South Africa, of which 794 are considered large
dams (i.e. dams with a wall height ≥ 15m, or a wall height between 5 and 15 m and a storage
capacity exceeding 3 million m³)14. The combined storage capacity of large dams is in the order
of 31 000 million m3. Several dams and other resources are combined in a system to supply
12 Department of Water Affairs and Forestry. 2004.National Water Resources Strategy.
Pitman, W, V. 2011. Overview of water resource assessment in South Africa: Current state and future challenges.13Department of Water Affairs. 2013. Strategic overview of the water sector in RSA.14 Department of Water and Sanitation. Dam Safety Records.

National Water and Sanitation Master Plan Water is Life – Sanitation is Dignity
31 October 2018 NW&SMP: Volume 2: Plan to ActionFinal Draft (version 4.2)
3-11
water to an area, such as the Integrated Vaal River System that provides water to Gauteng, the
petro-chemical industries of SASOL as well as the ESKOM power stations in Mpumalanga
Operating rules assist in the efficient management of the water supply system, and are critical
during drought situations, also to trigger water restrictions when required. The DWS developed
operating rules for several large water supply systems in South Africa, such as the Integrated
Vaal River System, the Mngeni Water Supply System, the Orange River System, the Algoa
System, the Amatole System, the Western Cape System and the Groot Letaba System, as well
as rules for several stand-alone schemes. The large water supply systems in the country are
described in Reconciliation Strategies, further discussed in section 3.4.4 and with greater detail
provided in Annexure 2. DWS has also developed a Disaster Management Plan and a Guideline
to Flood Management.
The long-term climate change predictions in South Africa are for a drier western half of the country
and for far more variability, with more extreme events, towards the north and the east. Average
temperatures are expected to rise, and thus also an increase in evaporative losses.
To facilitate the management of water resources, the country has been divided into 9 catchment-
based water management areas (WMA) which are shown in Figure 3-2. The WMA boundaries
do not necessarily follow administrative or political boundaries (e.g. district municipality or
provincial) and in some instances this aspect presents water resource planning, management
and administrative challenges.

National Water and Sanitation Master Plan Water is Life – Sanitation is Dignity
31 October 2018 NW&SMP: Volume 2: Plan to ActionFinal Draft (version 4.2)
3-12
Figure 3-2: Inter-basin water transfers in South Africa

National Water and Sanitation Master Plan Water is Life – Sanitation is Dignity
31 October 2018 NW&SMP: Volume 2: Plan to ActionFinal Draft (version 4.2)
3-13
A unique feature of South African water management is that approximately 3 000 million m³/a of
the surface yield is moved via approximately 30 inter-basin transfers from water-rich source
catchments to water-poor areas in the country where in-basin requirements exceed available
supplies. Figure 3-2 shows the major inter-basin transfer schemes in South Africa.
Groundwater
The realistically accessable groundwater potential in South Africa is about 4 500 million m³/a of
the estimated sustainable potential groundwater yield of around 7 500 million m³/a, widely
distributed across the country, as shown in Figure 3-3. The present use of groundwater is
estimated at between 3 000 and 4 000 million m³/a15. Most groundwater infrastructure for
municipal domestic water supply was developed and is operated and maintained by
municipalities.
15 Department of Water and Sanitation. 2013. National Groundwater Strategy.

National Water and Sanitation Master Plan Water is Life – Sanitation is Dignity
31 October 2018 NW&SMP: Volume 2: Plan to ActionFinal Draft (version 4.2)
3-14
Figure 3-3: Groundwater availability in South Africa
National Water and Sanitation Master Plan Water is Life – Sanitation is Dignity
31 October 2018 NW&SMP: Volume 2: Plan to ActionFinal Draft (version 4.2)
3-15
The National Water Act (NWA) allows for “the intentional recharging of an aquifer with any waste
or water containing waste”. As the water quality of an aquifer will almost always be altered through
the artificial recharge process, this should only be allowable if it can be proven that no altering of
the water quality will take place.
There are currently two artificial recharge schemes in South Africa - at Atlantis (just north of Cape
Town) and Polokwane - that are using treated waste water to recharge groundwater. Also, two
licences were issued in the last few years to the Kolomela mine near Postmasburg (Northern
Cape) and Elandsfontein mine near Saldanha (Western Cape) to abstract groundwater to dewater
the aquifer for mining purposes and recharging (through injecting) the abstracted water
elsewhere.
Internationally-shared river basins
South Africa has four internationally-shared river basins: the Limpopo, Inkomati, Pongola/Maputo
and Orange rivers, that cover about 60% of the country’s land area, shown in Figure 3-4.
International river basins contribute 45% to the country’s total river flow, and support about 70%
of the country’s gross domestic product (GDP) and 70% of its population. Several international,
inter-catchment transfers and inter-country systems have been introduced.
These resources must be shared equitably with neighbouring states who also have increasing
water needs due to growing populations and economies. Signed partnership framework
agreements exists that have paved the way for different South African sectors to enter into
cooperation agreements, also known as Memoranda of Understanding (MoU) with these
neighbouring states. it is critical that co-basin organisations adequately support IWQM in these
shared river basins.

National Water and Sanitation Master Plan Water is Life – Sanitation is Dignity
31 October 2018 NW&SMP: Volume 2: Plan to ActionFinal Draft (version 4.2)
3-16
Figure 3-4: International context of surface (left) and groundwater (right) resources in RSA16
16 Water Research Commission. 2005. A compilation of all the freshwater agreements entered into by South Africa with other states (right)
Department of Water and Sanitation. 2013. National Groundwater Management Strategy (left)

National Water and Sanitation Master Plan Water is Life – Sanitation is Dignity
31 October 2018 NW&SMP: Volume 2: Plan to ActionFinal Draft (version 4.2)
3-17
Groundwater aquifers also extend across international borders, resulting in joint responsibility for
management of these aquifers. South Africa shares seven aquifers with neighbouring countries,
locations of these aquifers are shown in a simplified map in Figure 3-4.
South Africa has water sharing agreements with the countries with which it shares water
resources, and a number of projects are being implemented under these agreements, including:
Lesotho: Phase II of the LHWP is nearing readiness for implementation
Namibia: The feasibility study on the Noordoewer/Vioolsdrift project is nearing completion
Botswana: Several transboundary water management projects have been implemented
and
Zimbabwe: A framework has been approved to jointly commission a study to assess the
feasibility for South Africa to get water from Zimbabwean water sources.
Non-conventional resources/management options
Further to surface and groundwater resources, non-conventional resources, including re-use,
desalination, rainfall harvesting and water demand management are already part of the water
resources mix. These resources mostly make up the shortfall in surface or groundwater
resources, as described in the Reconciliation Strategies. (Further discussion on the
Reconciliation Strategies will be provided in section 3.7.4 with additional information contained
in Annexure 2 of this report).
Desalination: Desalination of brackish groundwater has been in operation for decades in various
small towns and settlements in the Northern Cape and along the coast, sometimes for emergency
supply during droughts. The coastal town of Bushmans River Mouth in the Eastern Cape is also
being served by a seawater desalination plant for more than 20 years. During the devastating
drought of 2009-2011 in the Southern Cape, several small desalination plants were established
at coastal towns, i.e. Sedgefield, Knysna, Plettenberg Bay and Mossel Bay, the latter being the
largest plant at 15 Ml/day. The plant at Mossel Bay has been mothballed since its completion as
an emergency scheme in 2011, as its water has not been required since then.
Re-use: The indirect re-use of water at present is estimated to already account for about 14% of
all available water. Water is re-used indirectly on a large scale in in-land areas, such as in
Gauteng in the Vaal and Crocodile-West catchments, as the return flows from the wastewater
plants forms part of a down-stream raw water abstraction from the same river. The water re-use
schemes in Beaufort-West (direct re-use) and George (indirect re-use), which were also built as
a result of the 2009-2011 drought, are operating full time and supply good quality water to the
inhabitants.
The Department of Water and Sanitation developed a National Strategy for Water Re-use
(NSWR) in 2011. The intent of the water re-use strategy is to encourage wise decisions relating
to water re-use at different scales and levels. The performance of existing wastewater treatment
plants in terms of meeting discharge standards and reliability is critical to the successful
integration of water reuse into reconciliation strategies and into water supply systems in SA
Control of Invasive Alien Vegetation: Estimates suggest that close to 3% of the national mean
annual runoff is intercepted by invasive alien vegetation, that intercept and evapo-transpirates
more water than natural vegetation. Removal and containment of such vegetation improve water
availability. The Working for Water program, first under the auspices of DWS and now the

National Water and Sanitation Master Plan Water is Life – Sanitation is Dignity
31 October 2018 NW&SMP: Volume 2: Plan to ActionFinal Draft (version 4.2)
3-18
responsibility of the Department of Environmental Affairs (DEA), is an initiative that has been
actively eradicating invasive alien plants (IAPs) for the past 20 years.
Rainfall harvesting: Rainwater harvesting involves the collection and storage of rainwater, either
for immediate use or use before the onset of the next rainy season and has been practised world-
wide for millennia. In South Africa, rainwater harvesting is growing, specifically in rural areas, and
where municipal systems are failing.
Water conservation and water demand management (WC/WDM): In addition to making more
water available, WC/WDM reduces water requirements. It is key to ensuring the sustainable use
of our water resources, and to ensure that sufficient water is available for the current and future
requirements. Water Conservation and other measures to manage demand will be actively
promoted as a preferred option to achieve these objectives, as discussed in Section 3.2.3.
3.2.2 Water Requirements
The distribution of water use by sector is shown in the diagram below:
Figure 3-5: Water Use by Sector
Agriculture, including afforestation and livestock watering, is the largest user at 66% of the total
water use, followed by municipal and domestic use at 27% (including industrial and commercial
users provided from municipal systems), with power generation, mining and bulk industrial use,
livestock and conservation and afforestation jointly making up the remaining 12%. The level of
assurance at which agricultural water is supplied is lower than that of the other sectors (90%).
Water for power generation is seen as strategically important and is provided with the highest
assurance of supply (99.5 %) (which translates to 1: 200-year risk of failure).
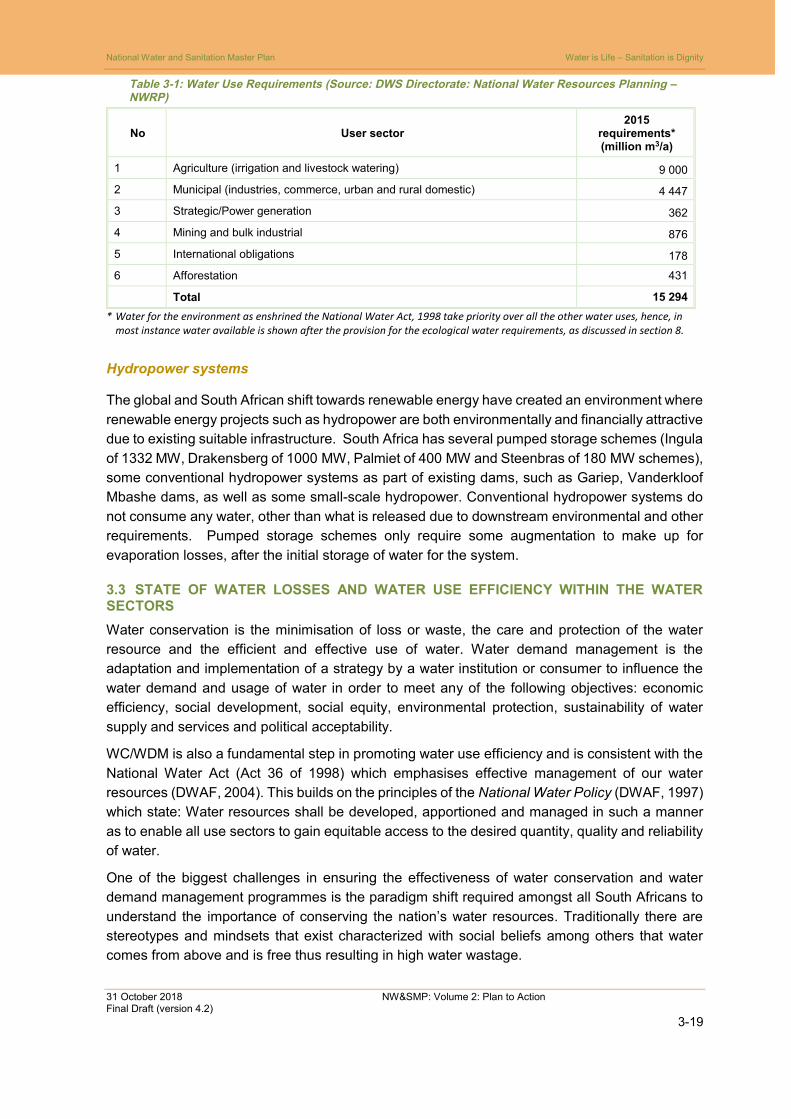
National Water and Sanitation Master Plan Water is Life – Sanitation is Dignity
31 October 2018 NW&SMP: Volume 2: Plan to ActionFinal Draft (version 4.2)
3-19
Table 3-1: Water Use Requirements (Source: DWS Directorate: National Water Resources Planning –NWRP)
No User sector2015
requirements*(million m3/a)
1 Agriculture (irrigation and livestock watering) 9 000
2 Municipal (industries, commerce, urban and rural domestic) 4 447
3 Strategic/Power generation 362
4 Mining and bulk industrial 876
5 International obligations 178
6 Afforestation 431
Total 15 294
* Water for the environment as enshrined the National Water Act, 1998 take priority over all the other water uses, hence, inmost instance water available is shown after the provision for the ecological water requirements, as discussed in section 8.
Hydropower systems
The global and South African shift towards renewable energy have created an environment where
renewable energy projects such as hydropower are both environmentally and financially attractive
due to existing suitable infrastructure. South Africa has several pumped storage schemes (Ingula
of 1332 MW, Drakensberg of 1000 MW, Palmiet of 400 MW and Steenbras of 180 MW schemes),
some conventional hydropower systems as part of existing dams, such as Gariep, Vanderkloof
Mbashe dams, as well as some small-scale hydropower. Conventional hydropower systems do
not consume any water, other than what is released due to downstream environmental and other
requirements. Pumped storage schemes only require some augmentation to make up for
evaporation losses, after the initial storage of water for the system.
3.3 STATE OF WATER LOSSES AND WATER USE EFFICIENCY WITHIN THE WATERSECTORS
Water conservation is the minimisation of loss or waste, the care and protection of the water
resource and the efficient and effective use of water. Water demand management is the
adaptation and implementation of a strategy by a water institution or consumer to influence the
water demand and usage of water in order to meet any of the following objectives: economic
efficiency, social development, social equity, environmental protection, sustainability of water
supply and services and political acceptability.
WC/WDM is also a fundamental step in promoting water use efficiency and is consistent with the
National Water Act (Act 36 of 1998) which emphasises effective management of our water
resources (DWAF, 2004). This builds on the principles of the National Water Policy (DWAF, 1997)
which state: Water resources shall be developed, apportioned and managed in such a manner
as to enable all use sectors to gain equitable access to the desired quantity, quality and reliability
of water.
One of the biggest challenges in ensuring the effectiveness of water conservation and water
demand management programmes is the paradigm shift required amongst all South Africans to
understand the importance of conserving the nation’s water resources. Traditionally there are
stereotypes and mindsets that exist characterized with social beliefs among others that water
comes from above and is free thus resulting in high water wastage.

National Water and Sanitation Master Plan Water is Life – Sanitation is Dignity
31 October 2018 NW&SMP: Volume 2: Plan to ActionFinal Draft (version 4.2)
3-20
3.3.1 Agriculture Sector
The irrigation sector is by far the largest water user in South Africa. Any percentage reduction in
water use in this sector will therefore have a significant effect on the total water requirements.
Efficiencies can be targeted both in terms of distribution networks (leaking pipelines and canals)
and application (choice of crops and irrigation technologies employed).
About 8.5 million people are directly or indirectly dependent on agriculture for employment and
income (GCIS, 2011). The sector contributes about 3% to the GDP and 7% to formal employment.
The agricultural sector is made up of commercial farmers and subsistence farmers: about 1.3
million hectares are irrigated. It has a huge potential socio-economic impact in rural communities.
The DWS through the Strategic Water Partnership Network (SWPN)17 has implemented the Water
Administration System (WAS) Release Module at a number of irrigation schemes i.e.
Hartbeespoort Irrigation Board (IB), Sand-Vet Water User Association (WUA), Orange-Riet WUA,
Vaalharts WUA, Impala WUA, Lower Orange River WUA and Loskop IB. With the WAS Release
Module, it is possible to release the correct amount of water from a dam (source) according to
applications (demand) and prevent wastages. Irrigation schemes are submitting Water Use
Efficiency Accounting Reports on a monthly basis reporting on their water use efficiency. Reports
are received from 75% (59 of 78) of the large irrigation schemes. The average water loss of the
reporting schemes is about 27%. It was determined that the seepage and evaporation loss in
concrete canals, which is unavoidable, is about 12% of the total loss.
Most of the country’s water supply systems and dams are controlled by Water Control Officers
(WCO). Their task is to distribute water to DWS clients and to improve water use efficiency in the
Agricultural Sector. As WCO`s need to ensure timeous delivery of irrigation water to water users
at a certain flow rate with the minimum water loss, they are capacitated through Water
Measurement, Water Distribution and Dam Control courses.
A proposed programme of high level key WC/WDM activities, measures, projects and
programmes for the water services sector are outlined in Volume 3 of the NW&SMP, to be read
together with this document.
3.3.2 Water Services Institutions and Local Government Sector
The National Development Plan (NDP) - 2030 sets out the priorities for water demand
management and projects the importance for a reduction in water demand by 2030. The NDP
projects an average reduction in water demand of 15% below baseline levels18 in urban areas by
2030, where the baseline is taken as year 2012. The Plan acknowledges and refers to the detailed
targets that have already been set for different catchments through the Reconciliation Strategies
and All Town Strategies19. Achieving demand reductions on this scale will require active
programmes to reduce water leakage in distribution networks, and to increase the efficiency of
17 Strategic Water Partnership Network. 2016. Water Administration System – Final Report Phase 1 Water Release
Module.18 National Planning Commission. 2011. National Development Plan19 Department of Water and Sanitation. All Towns Reconciliation Strategies for the Northern Planning Region

National Water and Sanitation Master Plan Water is Life – Sanitation is Dignity
31 October 2018 NW&SMP: Volume 2: Plan to ActionFinal Draft (version 4.2)
3-21
water use by domestic and commercial water users. The NDP requires targets to be in place for
up to the 2022 horizon.
The National Water Resource Strategy, 2013 (NWRS2) emphasizes WC/WDM as a top strategic
intervention to reconcile water requirements with water availability.
The eight large water supply systems (WSS) include: the Integrated Vaal River Water Supply
System (WSS), Crocodile West River WSS, Kwa-Zulu Natal Coastal Metropolitan WSS, Western
Cape WSS, Algoa WSS, Amatole WSS, Greater Bloemfontein WSS and Olifants River WSS. The
municipalities in these eight WSS are situated in areas of high economic significance and should
increase their efforts to achieve the targets set under the various water reconciliation strategies
to ensure water security. The following map represents the eight large water supply systems
areas with water use efficiency targets for to 2022 and water savings performance for the year
2016 for each system in Figure 3-6.

National Water and Sanitation Master Plan Water is Life – Sanitation is Dignity
31 October 2018 NW&SMP: Volume 2: Plan to ActionFinal Draft (version 4.2)
3-22
Figure 3-6: Map of eight water supply systems that indicate water use efficiency targets for 2017 and 2022 and water savings performance for the year 2016 for eachsystem

National Water and Sanitation Master Plan Water is Life – Sanitation is Dignity
31 October 2018 NW&SMP: Volume 2: Plan to ActionFinal Draft (version 4.2)
3-23
The DWS monitor and analyse the progress made with the implementation of WC/WDM and
targets set during the development of Reconciliation Strategies, at municipal level, within the eight
large water supply systems (WSS).
The results for the target versus actual savings achieved for these systems are summarised in
Table 3-2 and Figure 3-7 below, which indicate a total of 8.6% achieved savings by December
2016 compared with a target of 11.3%. Savings of 3.6% have been achieved between June 2016
and December 2016 which is encouraging as water restrictions were imposed in most of the water
supply systems. The Western Cape WSS, Kwa-Zulu Natal Coastal Metropolitan WSS and Greater
Bloemfontein WSS have reached their targets while the remaining five WSS are generally
representative of high populations that do not implement WC/WDM measures (DWS, 2017).
Table 3-2: Summary of the desired target versus actual savings for municipalities
System
ProjectedSystemInput
Volume(SIV)
withoutWDM
kl/annum
Projected SIVwith WDMkl/annum
Projected%
savings
Actualdemandkl/annum
Actual %
savings
Situation analysis
IVRS
(IntegratedVaal RiverSystem)
1 414 954845
1 259 521 968 11.0 % 1 374 064 291 2.9% The 2.9 % reduction indemand is positiveconsidering that thesemunicipalities haveexperienced a higherpopulation growth thanestimated. WC/WDMdemand projectionsneed revision
CWRWSS
(CrocodileWest WaterSupplySystem)
81 896 986 72 505 548 11.5% 75 149 020 8.2% Results indicate thatprogress has beenmade, althoughmunicipalities areexperiencing a higherpopulation growth thanestimated withoutcorrespondingWC/WDM demandprojections
KZNCMWSS
(Kwa ZuluNatal CoastalMunicipalityWater SupplySystems)
440 429 750 400 929 750 9.0% 399 750 304 9.2% Municipalities havebeen able to reducetheir demand andachieved their target
WCWSS
(WesternCape WaterSupplySystem)
481 866 055 420 515 925 12.7% 363 416 316 24.6% Municipalitiesachieved savings of24.6% which is higherthan their 12.7%target.

National Water and Sanitation Master Plan Water is Life – Sanitation is Dignity
31 October 2018 NW&SMP: Volume 2: Plan to ActionFinal Draft (version 4.2)
3-24
System
ProjectedSystemInput
Volume(SIV)
withoutWDM
kl/annum
Projected SIVwith WDMkl/annum
Projected%
savings
Actualdemandkl/annum
Actual %
savings
Situation analysis
AWSS
(Algoa WaterSupplySystem)
131 372 286 95 678 395 27.2% 113 623 290 13.5% Municipalities haveexperiences a higherthan estimatedpopulation growthwithout revisedWC/WDM demandprojections andachieved 13.5%savings compared with27.2% target
AmWSS
(AmatoleWater SupplySystem)
66 893 713 61 493 713 7.2% 74 797 137 -0.6% Municipalities haveseen higher thanplanned populationgrowth withoutWC/WDM demandprojections revised. Nosavings achieved
GBWSS
(GreaterBloemfonteinWater SupplySystem)
94 743 067 84 663 067 10.6% 65 780 175 30.6% The status could onlybe made based ondata from MangaungMunicipality, whichachieved a 30.6%savings compared witha 10.8% target, mainlydue to 20% restrictions
ORWSS
(Olifants RiverWater SupplySystem)
204 882 982 191 858 953 5.7% 199 681 021 1.1% Results show thatprogress has beenmade with reduction indemand although at avery low confidencelevel
Total 2 917 039684
2 587 167 319 11.3% 2 666 261 554 8.6%
Capital investment required to implement the programme R 10 Billion/ 10 years
From the base year 2012 to 2014 the actual demand was below the target demand and projected
demand without WC/WDM (high growth scenario). But for the years 2015 and 2016 the actual
demand was higher than the target demand which confirmed WC/WDM was not effective enough
and never impacted on the actual growth in demand.

National Water and Sanitation Master Plan Water is Life – Sanitation is Dignity
31 October 2018 NW&SMP: Volume 2: Plan to ActionFinal Draft (version 4.2)
3-25
Figure 3-7: Historical trend of water use efficiency within the eight large water supply systems
The following represents general WC/WDM challenges:
Municipalities put little or no effort to achieve the targets set, i.e. limited or lack of adequate
planning and funding to support the implementation of WC/WDM projects. Budgets are
allocated towards new infrastructure projects through capital grant programs such as the
Accelerated Community Infrastructure Programme (ACIP), Municipal Water Infrastructure
Grant (MWIG), Regional Bulk Infrastructure Grant (RBIG) and the Municipal Infrastructure
Grant (MIG). The management of these funds is fragmented with emphasis on new
infrastructure and insufficient focus on WC/WDM.
Lack of continuous monitoring and analyses of water balance data against which the
progress made with the implementation of WC/WDM could be measured.
Closer involvement and collaboration with National Treasury, the Auditor General and the
Department of Cooperative Governance and Traditional Affairs (COGTA) to ensure issues
related to funding of WC/WDM programmes, metering and billing issues are resolved.
The national International Water Association (IWA) water balance for water losses and non-
revenue water indicates that both items are growing at a higher rate in spite of WC/WDM work
and projects implemented. In the year 2012, it was recorded as 38% (WRC Report TT 522/12)
but it has since grown to 41% in 2016 (DWS, 2017a). This means stakeholders have to intensify
implementation of WC/WDM measures to ensure growth of both variables is contained within
acceptable parameters and targets as set out in the Reconciliation Strategies are achieved. The
IWA water balance reflects the current state of water losses and non-revenue water as part of
work done in the year 2015/16 and is a serious concern (DWS, 2017a).

National Water and Sanitation Master Plan Water is Life – Sanitation is Dignity
31 October 2018 NW&SMP: Volume 2: Plan to ActionFinal Draft (version 4.2)
3-26
Figure 3-8: National IWA Water Balance for Water Losses and Non-Revenue Water Mm³/a
The DWS as the custodian of national water resources is concerned about water security and the
knowledge that large volumes of water (and revenue) are lost at municipal level. Therefore, DWS
has sought avenues to collaborate and work in partnership with stakeholders to ‘close the water
gap by 2030. The Strategic Water Partners Network-SA (SWPN-SA) is one such partnership.
The SWPN resulted from a partnership with private partners launched by DWS and the Water
Resource Group at the World Economic Forum in 2011. One of the first projects conceptualised
under this partnership, was the No Drop Programme. The No Drop Programme is an incentive-
based regulatory programme that builds on the successful Green Drop and Blue Drop
Programmes of the Department to assist municipalities to assess and improve their water use
efficiency, water losses and non-revenue water. The No Drop Programme is based on
assessments against specific criteria to evaluate a municipality’s performance against legal and
international best practice requirements (No Drop Strategy, 2015).
3.3.2.1 Summary of the No Drop Results
Fisrt Order No Drop Assessment Results
The results are based on the findings of a No Drop assessment which formed part (3%) of the
2014 Blue Water Services Audit as Criteria 6. The No Drop component focused on 3 KPAs
namely: 1) water balance (30%); 2) strategy, planning and implementation (30%), and 3)
performance and compliance (40%). All 152 water services authorities (WSAs) having 949 water
supply systems participated in the 2014 No Drop assessment.
For the first order No Drop assessment, a municipality that achieved >90% No Drop score, was
considered to be knowledgeable of their current status in terms of WC/WDM. In total:
Only 30 % of the water supply systems assessed obtained more than a 50% No Drop
Score, and
64.1 %
35.9%
59.0%

National Water and Sanitation Master Plan Water is Life – Sanitation is Dignity
31 October 2018 NW&SMP: Volume 2: Plan to ActionFinal Draft (version 4.2)
3-27
Of the 152 WSAs assessed, good data sets were received from 71 municipalities
representing a total population of 32 580 710 and 9 043 534 households, which is
approximately 62 % of the country’s total population.
The national average No Drop score of 56.5% was achieved, which is considered an
average performance. The score is influenced by the good scores achieved (> 50 %) by
Gauteng, KwaZulu-Natal, Western Cape, Eastern Cape, and Free State Provinces. The
National Barometer for the country with a weighted average No Drop score of 56.9% is
shown in the figure below:
Figure 3-9: No Drop National Performance Log 2014
The results show that 51% of 152 WSAs have proper WC/WDM plans and strategies in place and
are busy with some form of implementation in the field. A total of 38-40%20 of 152 WSAs have
proper or partial water balances in place, which is a baseline requirement for planning and project
scoping. The current status makes a strong case to focus on improvement in the quality of
planning and the intensity and acceleration of implementation going forward. The following figure
shows the submissions made for No Drop assessment as pertaining to WC/WDM planning:
20 DWS 2017. MuSSA for Water Services for South Africa, 2016/2017”

National Water and Sanitation Master Plan Water is Life – Sanitation is Dignity
31 October 2018 NW&SMP: Volume 2: Plan to ActionFinal Draft (version 4.2)
3-28
Figure 3-10: Status of WCDM Planning in 152 Municipalities
The National Water Balance indicates a total System Input Volume of 2 997.58 million kl/annum,
which was based on the data set received from 71 municipalities. The country average per capita
consumption is 237 ℓ/c/d (the global average is only 173 l/c/day).
Non-Revenue Water (NRW) is defined as the volume of water supplied by a water services
provider (water utility), but for which it receives no income. The national weighted average NRW
is 34.6% of the total System Input Volume (SIV). Seven (7) of the nine (9) provinces have NRW
in excess of 30 %, which is considered poor performance. When comparing NRW per province,
the highest is noted for Eastern Cape, Limpopo, and North West. This can be due to the high
number of rural areas and the challenges associated with billing and metering in these provinces.
A total volume of 1 038 million kl/annum is lost as NRW which, calculated at a unit cost of R6/kl,
amounts to R 6 228 million per annum for the country as a whole. By implementing WC/WDM
projects, a potential saving of 331 million kl/annum can be achieved, which means that almost
R 2 billion can be saved every year.
2015 NO DROP FULL AUDIT RESULTS: METROPOLITAN MUNICIPALITIES
There are eight metropolitan municipalities (metros) in South Africa with a combined annual
demand of 2 158 million kl /annum, serving a population of 21.5 million. Metropolitan
municipalities represent 40% of the South African population and 47% of the urban water
consumption, which is the reason why the metropolitan municipalities were selected for a full No
Drop audit.
None of the metros received No Drop Certification (i.e. all scored <90%). The City of Cape Town
performed well, closely followed by Ekurhuleni, eThekwini and the City of Tshwane, which all
have above average scores. Nelson Mandela Bay, the City of Johannesburg, Mangaung and
Buffalo City all have scores below the average of 69%. Whilst reasonably good performance was
noted for the first round, metros are expected to perform better in the next audit as a result of
improved provision of evidence and understanding of the No Drop requirements.
The IWA water balance for metros for 2013/14 FY indicates a total System Input Volume (SIV) of
2 158 million kl/annum. The City of Johannesburg with the largest population in South Africa
accounts for 27% of the total metro consumption and is the largest urban water user, followed by
Ekurhuleni that accounts for 16 % as a result of the concentration of wet industries in the country.
Of concern to DWS, is that the combined Metro SIV is 2.4 % above the available supply from the

National Water and Sanitation Master Plan Water is Life – Sanitation is Dignity
31 October 2018 NW&SMP: Volume 2: Plan to ActionFinal Draft (version 4.2)
3-29
water resource this means that all the metros combined are actually “living above their means”
by using more water than what the resource can sustainably provide.
The total NRW for the metros is 923 million kl/ annum (34 % of the SIV). Six metros (three quarters)
have NRW in excess of 35%. This clearly shows on average the metros are not performing well
compared with the international benchmark at 10 - 20% NRW. The average litres / capita / day
within metros is 267. The average consumption is above the international benchmark of 180 ℓ/c/d
(WRC, 2012) and metros are encouraged to target an average consumption of below 200 ℓ/c/d.
By comparing potential savings on a Municipal Category level, it has been observed from the No
Drop, first order assessment Report (2014) that the majority of potential savings (84%) can be
generated by investing in WC/WDM in metropolitan municipalities and the secondary cities.
3.4 INDUSTRIES, MINING AND POWER GENERATION SECTOR (IMP)
Manufacturing Industries
The manufacturing sector contributes 15.5% to the GDP and 13.3% to jobs in 2009 (GCIS, 2011).
South Africa’s New Growth Path (NGP) has set a target of 350 000 new jobs for this sector by
202021. Water is an input in the manufacturing processes and it also used for cooling. The food
and beverage sectors are highly dependent on water for the production of their products. As the
manufacturing sector is the pillar sector required to drive economic growth and social
development of the country and rightfully earmarked for future growth in the water demand. The
need for WC/WDM in the sector cannot be over emphasized.
Mining Sector
According to the Chamber of Mines of South Africa, the mining sector contributed 8.8% directly
and 10% indirectly to the GDP of the country in 2009 (GCIS, 2011). This sector creates about 1
million direct and indirect jobs. The sector accounts for approximately one third of the market
capitalization of the Johannesburg Stock Exchange (JSE) and it is also the major attractor for
foreign investments. The NDP has set a potential employment target of 140 000 new jobs by 2020
for the mining sector (DED, 2010). Mining and related activities require significant quantities of
water whilst also impacting on the environment with associated potential pollution. The
development of new mines in water scarce areas requires forward planning to make
arrangements for the transfer of water and development of new sources. The water allocation to
the mining industry currently represents about 2.5 % of total water allocation in South Africa. The
efficiency of water usage by different mining sub-sectors has not yet been systematically
determined. However, data from a study commissioned by DWS in partnership with the Chamber
of Mines in 2012 does provide some indicative water use efficiency benchmarks for common
minerals mined in South Africa. This highlights potential opportunities for WC/WDM initiatives in
the mining sector. This along with a range of technical interventions developed in association
sector partners like the Water Research Commission (WRC) and the Council for Scientific and
Industrial Research (CSIR) aimed at improving water usage in mining, as well as water treatment
21Department of Economic Development. 2010. New Growth Path Framework.

National Water and Sanitation Master Plan Water is Life – Sanitation is Dignity
31 October 2018 NW&SMP: Volume 2: Plan to ActionFinal Draft (version 4.2)
3-30
and re-use options such as the eMalahleni Water Reclamation project and others, further illustrate
room for improvement.
The DWS has developed a methodology to guide the implementation of WC/WDM within the
mining sector. This methodology which is based on the generic implementation methodology
developed as part of the study to set water use efficiency benchmarks provides for a clear
distinction between the responsibilities and roles for the mining industry and for the regulator.
Power Generation Sector
The energy sector although only using 2% of water, contributes about 15% to the GDP of South
Africa and creates jobs for 250 000 people (GCIS, 2011). The sector generates about 95% of the
electricity in South Africa and also exports it to countries in Africa. The energy sector, including
Eskom, the national power generator, is highly dependent on reliable supplies of water for the
generation of electricity (steam generation and cooling processes). An elaborate and
sophisticated network of water transfer and storage schemes has been developed specifically to
support this sector and ensure high levels of reliability. The water sector is on the other hand
highly dependent on a constant and reliable supply of electricity to “move water”.
At present Eskom’s coal-based power plant fleet consists of 10 base load power plants (used
during normal demand) and 3 return to service (RTS) power plants (used during peak demand),
also refer to Section 3.3.2.3. These power plants have diverse technical parameters and use a
combination of cooling technologies which is bound to provide different water usage profiles.
Within the context of the current Integrated Resources Plan (IRP), South Africa’s energy mix is
bound to change in order to provide sufficient energy security. However, the abundance of local
reserves of coal is likely to keep coal a dominant fuel source (Pouris and Thopil, 2015).
Eskom has set itself a target of 1.39 l/kWhSO. It performed well below the target for the FY 13/14
and 14/15. The performance for the 15/16 year was however undesirably above the set target.
Figure 3-11: Eskom’s Performance (Water Intensities for the past three years)
1.3
1.32
1.34
1.36
1.38
1.4
1.42
1.44
1.46
Target 2013/14 2014/15 2015/16
l/kWhSO
Target
2013/14
2014/15
2015/16

National Water and Sanitation Master Plan Water is Life – Sanitation is Dignity
31 October 2018 NW&SMP: Volume 2: Plan to ActionFinal Draft (version 4.2)
3-31
3.5 WC/WDM SOCIAL AWARENESS AND ADVOCACY PROGRAMMES
One of the biggest challenges in ensuring the effectiveness of water conservation and water
demand management programmes is the paradigm shift required amongst all South Africans to
understand the importance of conserving the nation’s water resources.
Evidence has shown that most technical interventions without adequate social engagement and
education of communities often lead to failures of good technical interventions. The social pillar
is thus driven mainly to ensure community buy-in and support of technical programmes aimed at
reducing water losses and wastages within communities. The WC/WDM education and
awareness campaigns that the DWS has implemented are as follows:
“Be water wise” The truck / puppet shows campaign
This campaign is a road show campaign. The Truck Campaign is aimed to create awareness and
educate South Africans about water use efficiency. It became successful with the help of all
relevant stakeholders involved such as municipalities and other relevant stakeholders. The Truck
Campaign consists of a truck which is used to carry water use efficiency messages. The truck is
branded with the DWS logo and water saving tips. The Department also distributes water use
efficiency promotional material to community members, at all different stops during this campaign.
Most of the promotional material includes brochures, water bottles, cups, 25l buckets and school
bags. All these carry very powerful messages of water use efficiency. The Department appointed
the Water Ambassadors, who are celebrities and professional actors. These water use efficiency
ambassadors do industrial theatre performance which is an integral part of the campaign. The
performance conducted by water use efficiency ambassadors is aimed at creating awareness and
educating people on how water is being wasted on a daily basis and how people can save water
by giving them water saving tips to avoid unnecessary water wastage. Communities reached have
interacted very well with the water use efficiency ambassadors.
Campaigns and awareness workshops
The DWS and participating municipalities conduct door to door campaigns educating and creating
awareness for water use efficiency. This campaign is mostly dependent on the municipality that
has invited the Department. Promotional materials are also distributed, such as water saving tips
and how to fix leaking taps. The municipal officials in this campaign provide the plumbers and do
live demonstrations on how to fix leaking taps and toilets.
The DWS runs schools’ competitions to involve learners in solving water issues, especially within
the water use efficiency spectrum. The South African Youth Water Prize, which is a science &
technology-based project, begins at provincial level and proceeds to the national level. The
national winner then represents South Africa at the annual Stockholm Junior Water Prize (SJWP)
in Stockholm, Sweden where they compete against learners from 30 countries.
The DWS host workshops on irrigation schemes on water use efficiency and WC/WDM, as it is
estimated that the water losses through canals of the irrigation schemes are between 35 to 45%.
Efficient use of water by the sector has the potential to play a significant role towards making
more water available for use not only within the agricultural sector, but also for other sectors.

National Water and Sanitation Master Plan Water is Life – Sanitation is Dignity
31 October 2018 NW&SMP: Volume 2: Plan to ActionFinal Draft (version 4.2)
3-32
Education and awareness is not the function of national government only, all sector institutions,
private sector organizations and civil society should be institutionalising the promotion of
WC/WDM.
The proposed WC/WDM aspects of the national water and sanitation plan (see Volume 3) serves
as the blue print of key high-level measures, actions and programmes that must be implemented
to improve water use efficiency, cut down water losses and wastages. This will ensure water
security and sustainable use of water in the country.
3.6 DRIVERS
3.6.1 Water Resources
The challenge of a water scarce country is inadequate and limited supply of water resources
available to meet all growing requirements for humans and the economy, and this is aggravated
by climate change, increased competition for water between the various water use sectors, and
frequent and prolonged droughts. This challenge is deepened by the geographic misalignment
of the water resources and requirements in the country. When water shortages are experienced
in any part of the country, it has a negative bearing on the health sector, food security,
development, economic growth and job creation.
To meet these challenges, the country must shift focus towards the sustainable management of
water resources through initiatives like integrated catchment management and optimisation of
existing water use through implementing water conservation and water demand management
measures, the re-use of water, as well as the desalination of brackish groundwater, mine water,
and seawater, and supporting the harnessing of rainwater.
3.6.1.1 Surface Water
Although some large surface water schemes, such as the Lesotho Highlands Water Project
Phase 2 (LHWP-2), are currently planned and developed, South Africa is approaching full
utilisation of available surface water yields and is running out of suitable sites for developing large
dams, therefore other resources, which include groundwater, re-use and desalination, are
considered and further investigated in the Reconciliation Strategies. Inter-basin transfer schemes
are also considered, while the donor catchment should still retain the ability to sustain current and
future water requirements in the catchment in addition to such a transfer, and these schemes may
be fairly expensive due to long distances crossing catchment boundaries, either with a tunnel or
pumping.
Water resources planning and development involve long lead times (10 to 15 years on average
from start of planning for building a large dam to first water delivery, shown in Figure 3-12) and
high capital costs, while planning for an uncertain growth in requirements well into the future. Due
care must be exercised in planning and undertaking water resource infrastructure interventions
in time.

National Water and Sanitation Master Plan Water is Life – Sanitation is Dignity
31 October 2018 NW&SMP: Volume 2: Plan to ActionFinal Draft (version 4.2)
3-33
Figure 3-12: Typical programme for the development of water resources interventions

National Water and Sanitation Master Plan Water is Life – Sanitation is Dignity
31 October 2018 NW&SMP: Volume 2: Plan to ActionFinal Draft (version 4.1)
3-34
Other issues pertinent to the water resource management in the country include poor catchment
management, which is also a problem with high levels of erosion resulting in the increase of silt
deposition in the country’s dams and a subsequent reduction in yield, as for instance Welbedacht
Dam in the Caledon River.
The study on Future Climates in South Africa (DEA, SANBI, GIZ, 2013)22 concluded that climate
change will have a limited impact on water supply at a national level but could be quite significant
at regional level under particularly drier futures. The greatest concern regarding climate change,
are the isolated water resource systems that are dependent on a single resource or small
geographical area with limited hydrological variability, including small farm dams in headwater
catchments and water supply schemes for rural towns. Systems with greater integration and
diversification have greater resilience to climate change uncertainty, such as the Integrated Vaal
River System. The Western Cape System, being dependent on limited resources, and located in
the west, may experience substantial climate change impacts. Also, more variability due to
climate change, including more flush floods, may require more storage to provide the required
yield of a system.
Although climate change brings an added uncertainty to water resources, the impacts can and
should be mitigated. The relatively gradual nature of climate change allows time for well-
considered adaptation and mitigation measures. However, there is growing concern that the
decreasing monitoring through rainfall and flow gauging networks are no longer sufficient to
accurately detect these trends to ensure mitigation measures are planned and put in place
timeously.
3.6.1.2 Groundwater
Although groundwater currently is an underutilised resource, in some areas it is totally over-
utilised and groundwater levels are over abstracted.
Failure of groundwater supply schemes, such as typical conclusions that “the borehole dried up”,
or “the groundwater ran out”, is also often blamed on the resource (i.e. the aquifer or the
groundwater levels). In reality the cause is rather on poor maintenance and operation of the
infrastructure (including boreholes, pump, pipes and valves, pumping at very high rates for short
periods of time) used to abstract the groundwater or the poor monitoring or management of the
aquifer.
These challenges create the wrong impression about groundwater and make groundwater
unpopular with communities, resulting in them rather preferring water supply from a dam.
Groundwater is also subjected to climate change, as groundwater aquifers will not recharge
without suitable rain. The increase in temperatures due to climate change will also result in drier
root zones of plants, abstracting water from available groundwater.
Artificial groundwater recharge, with either surplus surface water or treated wastewater, is
recognised as an important alternative source, however, the impact on the receiving source must
be minimal (aquifer hydraulics), injection water must be almost the same quality (<10% difference
22Department of Environmental Affairs. 2013. The Economics of Adaptation to Future Climates in South Africa: An
integrated biophysical and economic analysis.

National Water and Sanitation Master Plan Water is Life – Sanitation is Dignity
31 October 2018 NW&SMP: Volume 2: Plan to ActionFinal Draft (version 4.1)
3-35
or pre-treated to similar quality) and the impact on the environment must be assessed and
minimised.
3.6.1.3 Internationally-shared river basins
The purpose of international water cooperation is to strategically develop, promote and manage
international relations on water resources between countries through bilateral and multilateral
cooperation instruments and organizations in line with the provisions of the National Water Act,
Act 36 of 1998 and to pursue the national interest at both African multilateral and global
multilateral organizations and forums in support of the water sector.
The Republic of South Africa (RSA) endeavours to meet all its international water obligations
which require maintaining specific flows in rivers crossing its borders and/or groundwater
abstraction from aquifers, at a reasonable quality. International obligations, although fixed, are
always subject to change through review of the agreements that give effect to these obligations,
in order to keep abreast of development and to stay relevant.
3.6.1.4 Alternative Sources
Alternative sources of water, although already part of the water resources mix, will be further
promoted and developed to fill the gap in available water.
Desalination of seawater and brackish water
Desalination is still a relatively expensive augmentation alternative, and it should only be
implemented as and when augmentation becomes necessary to form part of the permanent water
supply. Although it can be implemented as an emergency supply during a drought, it is probably
not feasible or sustainable, and may result in mothballing of the plant. While dormant the plant
will still need a fixed maintenance cost.
It is preferable that desalination plants form part of our coastal municipalities’ basket of water
resources for continuous water supply, and not be implemented as an emergency scheme, only
to be used intermittently or during times of drought and inadequate supply from the conventional
water resources. These schemes are too costly to be moth-balled for any length of time.
Water re-use
Direct re-use is where the discharge from a wastewater treatment works (WWTW) is treated to
process or potable standards and fed back into the water distribution system.
There is huge scope for developing this source, especially in the larger towns and cities where
suitable wastewater treatment technology is employed, suitably skilled staff is available to ensure
proper treatment and monitoring of the water, and it is economically feasible. The scope is
especially important for coastal cities where further freshwater resources are becoming very
scarce and costly to develop, while the outflow from WWTWs is often discharged into rivers close
to estuaries or directly into the sea.
The National Water Re-use policy aims to develop clear and practical guidelines for typical water
re-use projects on what regulatory approvals are needed, the status of reclaimed water in terms
of right to use and how these can be obtained cost and time effectively. There is also a need to
work with other institutions to align legislation, reduce the regulatory burden wherever practical,
and unblock regulatory obstacles to water re-use.

National Water and Sanitation Master Plan Water is Life – Sanitation is Dignity
31 October 2018 NW&SMP: Volume 2: Plan to ActionFinal Draft (version 4.1)
3-36
When considering the development of direct re-use inland, cognisance should be taken of the
impact of reducing return flows in the system on downstream users.
Acid Mine Drainage
In the Witwatersrand area, in Gauteng, gold mining has taken place since 1886 in the three
underground mining basins of the East, Central and West Rand, sinking more than 120 mines
that required to be dewatered to allow for safe mining conditions. As the mines were worked out
and abandoned, the mine voids (tunnels, drives and shafts) started filling with water, generating
Acid Mine Drainage23 (AMD) when sulphide bearing minerals are exposed to oxygen and water.
When the AMD starts overflowing from the mines, it will have a devastating impact on humans
and the environment, impacting much of the Vaal River System.
Recognising the challenge for South Africa, DWS led initial short-term interventions to protect the
environment. The opportunity to turn a pollution problem into a water source has been
investigated at feasibility level. The potential to treat the water, approximately 54,8 million m³/a,
to potable standard or for industrial use in the Witwatersrand was found to be feasible.
Rain Water Harvesting
Domestic rainwater harvesting should be encouraged as a way of improving household food
security, income savings and improved reliability of water supply, especially in rural areas.
Although mostly only suitable as augmentation, it has been proven that, with good management,
rainwater harvesting can yield more economical water than formal municipal water supply.
Water Conservation and Water Demand Management (WC/WDM)
WC/WDM targets will be set for all water use sectors: agriculture, industries, mining, power
generation, municipal and domestic water supply, to reduce total the water requirements, as
discussed in Section 3.2.3.
3.6.1.5 Flood Protection Infrastructure
Floods are a common occurrence in South Africa and they lead to the loss of lives and hundreds
of millions of rands worth of property destruction. Flooding occurs in all river systems in the
country with notable floods in the North-West province (2017), Lephalale (2014), Somerset West
(2013), Vereeniging (2010), Vaal (1996), KwaZulu-Natal (1987) and Laingsburg (1981). Other
flood prone areas include the towns of Douglas, Prieska and Upington along the Orange River.
Measures for protecting lives and property from floods can be both non-structural and structural.
The former aims to mitigate or reduce the impacts of floods by influencing human behaviour and
practices through policies and laws, public awareness raising, training and education.
The structural approach entails the creation of physical defence systems in order to control the
flood waters through the reduction of its destructive power or by redirecting the flood waters away
23 Department of Water Affairs. 2013. Feasibility Study for a Long-Term Solution to address the Acid Mine Drainage
associated with the East, Central and West Rand underground mining basins.

National Water and Sanitation Master Plan Water is Life – Sanitation is Dignity
31 October 2018 NW&SMP: Volume 2: Plan to ActionFinal Draft (version 4.1)
3-37
from exposed human settlements and property. It also includes measures such as planting
vegetation to retain extra water; terracing hillsides to slow flow downhill; the construction of
floodways (man-made channels) to divert floodwaters and construction of levees, lakes, dams,
reservoirs and retention ponds to hold extra water during times of flooding. The protection and
restoration of natural ecological infrastructure is also critical in flood management.
Owing to the high capital and maintenance costs, dedicated structural flood control measures are
not widespread in South Africa. The only major flood control dams in South Africa are Beervlei
and Qedusizi dams. Instead, major water storage infrastructure doubles as a flood control
measure. Those with gated spillways, such Vaal and Bloemhof dams, have supplementary
storage and specific operating rules for flood control.
Flood protection must create a safe environment. All dams will be designed to safely control
floods. Operating rules, based on a dynamic monitoring system of our rivers during flood events,
will be implemented, with appropriate warning systems.
3.6.2 Water Requirements
Rainfall, runoff and stream flow vary from year to year. As a result, 100% assurance of water
supply to any water user is not achievable. Implicit in this is the acceptance that some degree of
failure with respect to supplying of the full yield, will occur. For a specific river and water resource
infrastructure, the higher the assurance of supply required (or the smaller the risk of failure which
can be tolerated), the smaller the yield which can be abstracted, and vice versa.
In South Africa, water resource development projects have been designed, developed and
operated with allocation criteria or standard operating rules that allow for user classification and
their tolerance to failure of water supply.
Water for power generation is seen as strategically important and is provided with the highest
assurance of supply (99.5 %) (which translates to 1: 200-year risk of failure). Water to meet
international obligations is also given a high priority. These priorities are built into the
determination of the operating rules. Table 3-3 presents a simplified typical user classification for
different water users.
Table 3-3: Simplified assurance of supply per user sector
User sector Assurance of supply
Recurrence interval Annual reliability %
Strategic (power generation) 1:200 99.5%
Domestic – basic 1:200 99.5%
Industrial 1:100 99%
Domestic – other 1:50 98%
Irrigation – high value 1:20 95%
Irrigation – cash crops 1:10 90%
A brief description is given in the following sections on the perception of problems, challenges for
water requirements per water use sector.
3.6.2.1 Municipal and domestic, including commerce and industry in municipal areas
The current official census puts the population of South Africa at approximately 56 million. Further
growth in the population, eradication of backlogs and general improvement of water services will
see a steep increase in water requirements for this sector in the short to medium term. It is
National Water and Sanitation Master Plan Water is Life – Sanitation is Dignity
31 October 2018 NW&SMP: Volume 2: Plan to ActionFinal Draft (version 4.1)
3-38
expected that most of the new water that will have to be made available in future will be to meet
the growing requirement for this sector.
As indicated elsewhere in this document, average domestic water use in South Africa is around
237 litres per person per day, 64 litres per person per day more than the world average of 173
litres per person per day. The high-water use is partly due to significant distribution losses and
wastage in this sector and must be addressed to reduce the high growth in requirements. A stricter
approach towards implementation of WC/WDM measures by municipalities should be adopted.
The provision of waterborne sanitation is unsustainable and South Africa must adopt alternative
sanitation practices, such as waterless sanitation, which will also reduce water per capita
consumption and should be implemented where appropriate.
3.6.2.2 Agriculture and Forestry
Water use in agriculture is largely dominated by irrigation of crops, stock watering and by forestry.
Agricultural consumption is largely unmetered, and there are concerns about unauthorised
abstraction and water wastage in the sector. In addition, agricultural users pay a much lower tariff
than other users of untreated water and the relatively cheap water has not incentivised the
adoption of water efficient irrigation practices. However, the agricultural sector is important in
terms of jobs and contribution to GDP. The value of primary agricultural production in South Africa
was R263,2 billion in 201624.
The potential for future water resources developments purely for irrigation are limited and in
Section 4.2 of this NW&SMP an indication is given of the possible expansion of irrigation with an
additional 34 863 hectares (Irrigation Strategy [2013] of DAFF). Implementation plans will
carefully consider the capital and operational costs needed to provide affordable additional water
to this sector. The cost of raw water from newly developed schemes and high pumping costs can
limit the additional expansion of irrigation areas. Agriculture is encouraged to move to more
efficient methods of irrigation to allow for future expansion with the water already allocated to it.
New forestry expansion in stressed catchments will also be discouraged.
3.6.2.3 Strategic Power Generation
Eskom is the biggest power generation utility in Africa, and water supply to the power stations is
regarded as a strategic water use that is supplied at 99.5% assurance of supply, refer to Table
3-3.
DWS signed a Memorandum of Understanding (MoU) with Eskom in which the utility committed
to systematically move from wet-cooled to dry-cooled power generation systems, to reduce their
water foot-print. This undertaking was already implemented for the new coal power stations,
Kusile and Medupi with a water allocation estimated at 15.4 million m³/a.
In 2004 the National Environmental Management: Air Quality Act was promulgated, followed by
the publication of the Minimum Emission Standards (MES)25 in April 2010, heralding a new
approach to air quality management in South Africa. As the MES requires all plants to comply
24 Statistics South Africa. 2016. Gross Domestic Product by Industry.25 Department of Environmental Affairs (DEA). 2010. Minimum Emission Standards.

National Water and Sanitation Master Plan Water is Life – Sanitation is Dignity
31 October 2018 NW&SMP: Volume 2: Plan to ActionFinal Draft (version 4.1)
3-39
with the new emission standards from 1 April 2020, this will have significant water use implications
for Eskom, as the best available technology to remove pollutants from effluent gases utilizes
significant quantities of water, as shown in Table 3-4. The water requirements allocation for the
new Kusile and Medupi power stations include some provision to comply with the MES.
Table 3-4: Summary of Water Requirements for the existing Eskom Power Stations (Source: Eskom,2013, and Eskom Webpage26)
Power Station Installed capacity (MW) Current water requirements (millionm³/a)*
Additional water requirements(million m³/a) to implement MES$
Majuba 4 110 29 5 to 8
Matimba 3 990 3 5 to 8
Kendal 4 116 4 5 to 8
Tutuka 3 654 39 5 to 7
Lethabo 3 708 42 5 to 7
Duvha 3 600 39 5 to 7
Matla 3 600 45 5 to 7
Kriel 3 000 41 4 to 6
Arnot 2 352 27 3 to 9
Hendrina 2 000 25 3 to 9
Camden 1 510 20 2 to 8
Grootvlei 1 200 9 2 to 6
Komati 940 10 2 to 11
Total 37 780 333 51 to 101
New power stations
Medupi 4 788 4 / 15.4 8
Kusile 4 800 4 8
Total 47 368
Table 3-4 summarises the current water requirements at the existing power stations and the
additional water requirements27 at each power station should the relevant MES technology be
implemented, increasing the demand between 15% and 30% for existing power stations,
depending on the type of technology. This first order assessment indicates the possible impacts
on Eskom’s water use with the implementation of the emission reduction technology has the
potential to worsen the already existing water security challenge in South Africa. Further studies
are urgently required to quantify the impact, including a cost-benefit analysis to ensure that the
costs of augmenting water supply to the Eskom power stations to implement the best emission
reduction technology process option. This is in consideration of the fact that South Africa is a
water scarce country and that additional water may be used more beneficially to address the
transformation requirements in this sector and to increase assurance for domestic supply.
26 Eskom. 2013. fttp://www.eskom.co.za/Whatweredoing/ElectricityGeneration/PowerStations/Documents/
EskomGenerationDivMapREV8.pdf27 Eskom. 2013. Compilation of an application for exemption from Minimum Emission Standards and extension of the
Minimum Emission Standard timeframes for Eskom's Power Stations: Water Resources Assessment.

National Water and Sanitation Master Plan Water is Life – Sanitation is Dignity
31 October 2018 NW&SMP: Volume 2: Plan to ActionFinal Draft (version 4.1)
3-40
Water resource planning and development will need to take into consideration these additions to
the strategic water requirements for power generation in the country.
3.6.2.4 Mining and Industry
The economy of the country largely depends on mining and various large industries. Water
availability should not be a limiting factor to growth in this sector. Water resources developments
should prioritise the availability of water to this sector. However, mining and industry will also be
required to practice WC/WDM and to consider re-use of both mining and industrial wastewater in
their processes, to reduce raw water requirements. A target of a maximum of 15% water losses
should be set for all industries. Penalties for non-compliance should be considered.
3.6.2.5 International Obligations
South Africa has four internationally-shared river basins, the Orange, Limpopo, Inkomati and
Maputo river basins, covering about 60% of the country’s land area.
Climate change and economic growth in shared basin states may result in the re-assessment of
current arrangements with respect to transboundary water resources (surface and groundwater).
South Africa will always endeavour to meet all its international obligations hence any new water
resources development with a trans-boundary impact will be planned and implemented in
consultation with the relevant basin states.
3.6.2.6 Hydropower28
South Africa has potential to develop mainly small-scale hydropower at existing DWS
infrastructure such as dams, canals, pipelines as well as making use of the water resources in
the country, including that in shared river basins. Instead of dams being constructed for the
purpose of hydropower, existing reservoirs that are used for other purposes can be fitted with
hydropower plants in order to augment electricity supply towards meeting peak electricity
demands.
An objective of the NWRS2 (2013) is to “promote the optimal development of hydro-electricity
generation at all sites in South Africa where this is economically viable and can make a useful
contribution to electricity generation.” Hydropower development and its operation must be
developed and operated in accordance with the principles of the National Water Act, namely
sustainability, equity and efficiency.
Challenges with hydropower technology include: dependence on rainfall (no control over amount
of water available); changes in stream regimens (can affect fish, plants, and wildlife by changing
stream levels, flow patterns, and temperature); flooding of land and wildlife habitat (creation of
reservoir). Maintaining minimum flows of water downstream of a hydropower installation is critical
for the survival of riparian habitats.
3.6.2.7 Ecosystems
Providing for the ecological water requirements is a legal priority and is inherent in all water
resources planning that environmental water requirements will be catered for. In addition, critical
ecological infrastructure must be identified, protected and restored, including in high yield
28 Department of Water and Sanitation. 2016. Draft Policy on Sustainable Hydropower Generation

National Water and Sanitation Master Plan Water is Life – Sanitation is Dignity
31 October 2018 NW&SMP: Volume 2: Plan to ActionFinal Draft (version 4.1)
3-41
catchment and aquifer areas (see Section 8 on ecological infrastructure). Currently the ecological
condition of rivers and wetlands is deteriorating at an alarming rate.
3.7 PRIORITIES FOR THE FUTURE
The objective for water resources planning is to ensure water security for the country by matching
the increasing future water requirement in a situation of constrained resources by being innovative
and optimising a suite of interventions which include the management of resources (including
water conservation and water demand management, system operation and drought management
and the re-establishment of existing groundwater schemes), catchment support activities
(including catchment care and ecological infrastructure, rainfall harvesting and water quality
monitoring) and the infrastructure development of resources.
3.7.1 Water availability
The challenge of a water scarce country is to provide water security to all users while meeting the
growing future requirements with an optimised mix of all available water resources. Figure 3-13
shows the projected medium- and long-term available water resources mix of conventional and
unconventional water sources, including increased groundwater use, desalination, re-use and
artificial recharge.
Figure 3-13: The planned shifts in water mix in the medium and long term, noting that the total volumeincreases substantially over the period (Graph created from NWRS1 Projected to 2015, from 2015 to 2040 by
DWS Directorate: National Water Resources Planning - NWRP)
This figure includes the various interventions as explained in the Reconciliation Strategies.
Planned future storage dams include among others the Polihali Dam in Lesotho (Phase 2 of the
Lesotho Highlands Water Project), a dam on the Orange River near Vioolsdrift, the Ntabelanga
and the Lalini dams on the Itsitsa River (Umzimvubu), the Zalu Dam on the Xura River, the
Foxwood Dam on the Koonap River, Smithfield Dam on the uMkhomazi River, a dam on the Mvoti
River, a dam in the Crocodile River East Catchment, Nwamitwa Dam on the Groot Letaba River
as well as the Jana and Mielietuin dams on the Tugela River.

National Water and Sanitation Master Plan Water is Life – Sanitation is Dignity
31 October 2018 NW&SMP: Volume 2: Plan to ActionFinal Draft (version 4.1)
3-42
Table 3-5: The planned shifts in water mix in the medium and long term, noting that the total volumeWater availability per sector (Source: DWS Directorate: National Water Resources Planning - NWRP)
User sector Source Available yield million m³/a
2015 2020 2025 2030 2040
Municipal andIndustrial
Surface water 3000 3200 3500 3500 3600
Ground water 800 900 1000 1100 1200
Re-use 400 450 650 850 1000
Desalination 90 150 160 200 300
Strategic/Energy Surface water 360 350 348 344 300
Ground water 2 5 6 7 10
Re-use 0 39 61. 86 132
Agriculture Surface water 6400 6500 6700 6790 6800
Ground water 1800 1880 1900 1900 1900
Re-use 919 942 966 971 976
International transfersout
Surface water 178 178 178 178 178
TOTAL water persource
Surface water 9 938 10228 10726 10812 10878
Ground water 2 602 2785 2906 3007 3110
Re-use 1319 1431 1677 1907 2108
Desalination 90 150 160 200 300
TOTAL wateravailable
13949 14594 15469 15926 16396
It is important, that communities in the vicinity of new large water resource developments, without
local resources, will be supplied from these developments as a matter of principle.
It must also be noted that from a purely ecological viewpoint there are a number of rivers that
were identified to stay dam-free, or ‘free-flowing’ in South Africa. (See section 8.3.1 of Volume
2) This will call for a serious debate and wisdom based on sound investigations. The rivers are
identified in the National Freshwater Ecosystem Priority Areas (NFEPA)29.
29 Department of Environmental Affairs. 2011. National Freshwater Ecosystem Priority Areas.
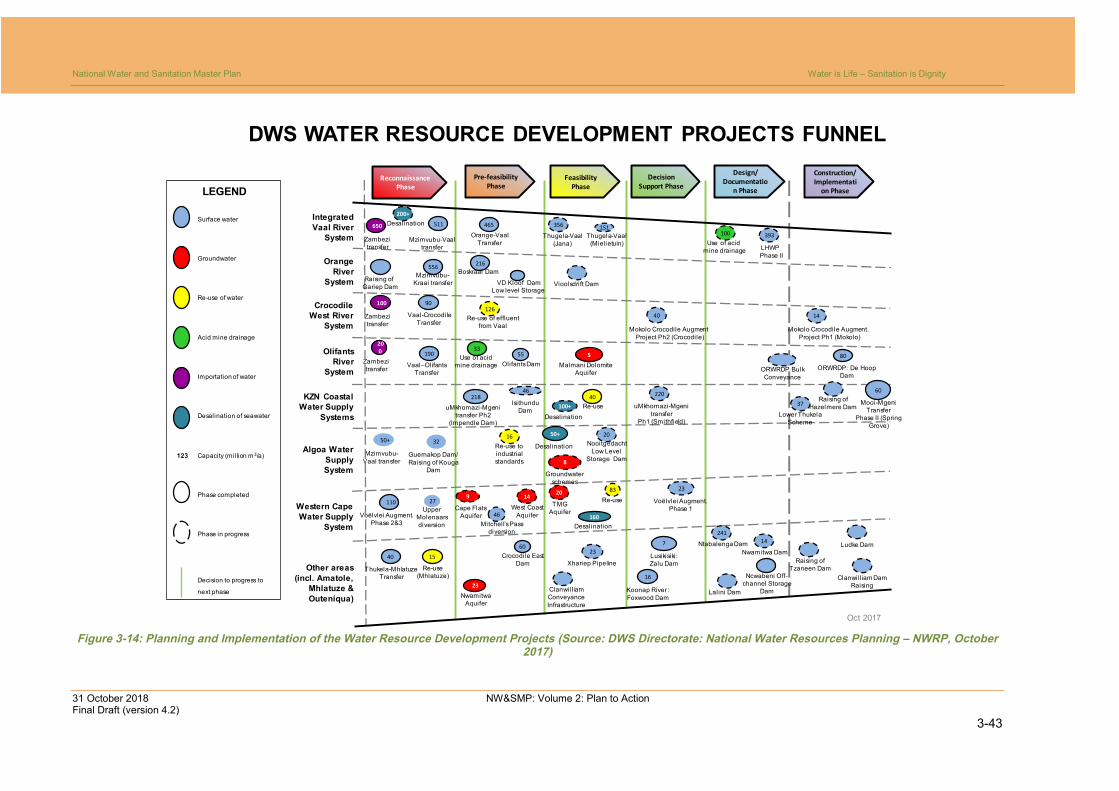
National Water and Sanitation Master Plan Water is Life – Sanitation is Dignity
31 October 2018 NW&SMP: Volume 2: Plan to ActionFinal Draft (version 4.2)
3-43
Figure 3-14: Planning and Implementation of the Water Resource Development Projects (Source: DWS Directorate: National Water Resources Planning – NWRP, October2017)
Mzimvubu-Vaal transfer
50+
110
Voëlvlei Augment.Phase 2&3
100
Zambezitransfer
200
Zambezitransfer
ReconnaissancePhase
FeasibilityPhase
Pre-feasibilityPhase
DecisionSupport Phase
Design/Documentatio
n Phase
Construction/Implementati
on Phase
IntegratedVaal River
System
OrangeRiver
System
CrocodileWest River
System
OlifantsRiver
System
KZN CoastalWater Supply
Systems
Algoa WaterSupplySystem
Western CapeWater Supply
System
Other areas(incl. Amatole,
Mhlatuze &Outeniqua)
DWS WATER RESOURCE DEVELOPMENT PROJECTS FUNNEL
VD Kloof DamLow level Storage
Surface water
Groundwater
Re-use of water
Acid mine drainage
Importation of water
Desalination of seawater
Capacity (million m3/a)
Phase completed
Phase in progress
Decision to progress to
next phase
123
LEGEND
650
Zambezitransfer
200+
Desalination 511
Mzimvubu-Vaaltransfer
556
Mzimvubu-Kraai transfer
465
Orange-VaalTransfer
100
Use of acidmine drainage
216
Boskraai Dam
Thugela-Vaal(Jana)
356 151
Thugela-Vaal(Mielietuin)
LHWPPhase II
393
Vioolsdrift DamRaising of
Gariep Dam
Re-use(Mhlatuze)
15
Thukela-MhlatuzeTransfer
40
Guernakop Dam/Raising of Kouga
Dam
32
Groundwaterschemes
8
90
Vaal-CrocodileTransfer
50+
Desalination
14
West CoastAquifer 160
Desalination
190
Vaal–OlifantsTransfer
126
Re-use of effluentfrom Vaal
33
Use of acidmine drainage
55
OlifantsDam
40
Re-use100+
Desalination
uMkhomazi-Mgenitransfer
Ph1 (Smithfield)
220
uMkhomazi-Mgenitransfer Ph2
(Impendle Dam)
218
16
Re-use toindustrialstandards
83
Re-use9
Cape FlatsAquifer
20
TMGAquifer
7
Lusikisiki:Zalu Dam
60
Crocodile EastDam
14
Nwamitwa Dam
27
UpperMolenaarsdiversion
23
Voëlvlei Augment.Phase 1
46
Mitchell’sPassdiversion
37
Lower ThukelaScheme
46
IsithunduDam
14
Mokolo Crocodile Augment.Project Ph1 (Mokolo)
40
Mokolo Crocodile AugmentProject Ph2 (Crocodile)
80
ORWRDP: De HoopDam
60
Mooi-MgeniTransfer
Phase II (SpringGrove)
241
NtabalengaDam Ludke Dam
20
NooitgedachtLow Level
Storage Dam
5
Malmani DolomiteAquifer
Raising ofHazelmere Dam
ORWRDP BulkConveyance
Clanwill iamConveyanceInfrastructure
16
Koonap River :Foxwood Dam
Raising ofTzaneen Dam
Ncwabeni Off-channel Storage
DamLalini Dam23
NwamitwaAquifer
23
Xhariep Pipeline
Clanwi ll iam DamRaising
Oct 2017

National Water and Sanitation Master Plan Water is Life – Sanitation is Dignity
31 October 2018 NW&SMP: Volume 2: Plan to ActionFinal Draft (version 4.2)
3-44
The additional potential of accesable groundwater between 1 500 and 2 500 million m³/a, is very
widely distributed across the country and its potential availability offers particular opportunitiesy
for small towns, villages, mines, and individual users to meet their water requirement for domestic
use, irrigation and stockwatering. Groundwater availablity will continously be assessed in the
Reconcilaiton Strategies and All Town Studies.
All future schemes, shown in Figure 3-15, will be developed utilising good planning and
engineering practice appropriate technology and must be cost effective.

National Water and Sanitation Master Plan Water is Life – Sanitation is Dignity
31 October 2018 NW&SMP: Volume 2: Plan to ActionFinal Draft (version 4.2)
3-45
Figure 3-15: Potential Artificial Recharge areas in South Africa

National Water and Sanitation Master Plan Water is Life – Sanitation is Dignity
31 October 2018 NW&SMP: Volume 2: Plan to ActionFinal Draft (version 4.2)
3-46
Artificial recharge of groundwater in certain areas will become a strategic focus in ensuring
sustainable and reliable water sources in future.
Alternative sources of water, although already part of the water resources mix, will be further
promoted and developed to fill the gap in available water.
Desalination: Feasibility studies for large-scale seawater desalination projects on a scale of 150
to 450 Ml/day have already been completed for both eThekwini and Cape Town, with the Nelson
Mandela Bay Municipality currently also investigating large-scale seawater desalination for future
augmentation of its resources30. Technical feasibility was established in both eThekwini and Cape
Town, even though cost considerations have led to other smaller water augmentation projects
being given priority.
The persistent drought and water crisis in the Western Cape has resulted in a call for short-term
desalination solutions. This may well precipitate a renewed consideration of the earlier large-
scale, permanent projects evaluated. Two or even three large-scale seawater desalination
projects are likely to be launched nationally within the next five years in the major coastal hubs.
Water re-use: Several successful projects to re-use treated municipal wastewater for industrial
processes are in operation in South Africa. At a river system level, it is estimated that return flows
account for 13% of the total available water. At the treatment facility level, the 1 150 municipal
wastewater treatment works, discharging approximately 2 100 million m³ per annum of treated
effluent, back to the river systems. DWS needs to develop guidelines for the implementation of
water re-use projects. These guidelines will have to support sound decision making and
implementation. The guidelines must also address the management and control, project
implementation, choice of technology, operations and maintenance, project financing,
development and implementation of tariffs and public and stakeholder education, engagement
and consultation for different types of water re-use projects.
Acid Mine Drainage: Approximately 54,8 million m³/a AMD water will be treated to potable
standard or for industrial use in the Witwatersrand. The Olifants River Water Supply System
Reconciliation Strategy also identified the use of treated mine water for future augmentation to
the system.
Re-allocation of Water: Identify re-allocation of water between water use sectors in the systems
where no alternative resource is available, in the relevant Reconciliation Studies.
Rain Water Harvesting: Encourage rainwater harvesting to improve the reliability of water supply
in rural areas and municipalities where services are unreliable.
Water Conservation and Water Demand Management: Encourage and promote WC/WDM
practices for all water use sectors.
The impact of climate change on resource availability and water requirements should be taken
into account in all future planning, including Reconciliation Strategies. Mitigation measures can
then be introduced as their necessity becomes evident, but then adequate data is essential to
30 Department of Water and Sanitation. 2016. KZN Metro Reconciliation strategy.
Department of Water and Sanitation. Reconciliation Strategies for Western Cape Water Supply System

National Water and Sanitation Master Plan Water is Life – Sanitation is Dignity
31 October 2018 NW&SMP: Volume 2: Plan to ActionFinal Draft (version 4.2)
3-47
support the decisions to be made. Therefore, it is vital that the monitoring of rainfall, evaporation
and runoff be continued rigorously, and the hydrological monitoring network improved to ensure
that the actual effects of climate change are measured accurately and brought as quickly as
possible into the analysis of resources. A specific climate change-related focus should be to find
alternative resources for the Western Cape System and other single source systems, to improve
resilience to future climate change uncertainty.
With the development of any water resource on an internationally-shared river basin, South Africa
endeavours to meet all its obligations through the recognised processes and protocols. South
Africa will also participate and cooperate in joint trans-boundary studies, joint projects and
development of common decision-support tools to ensure monitoring and decision making are
based on a common understanding.
Two projects are underway attempting to promote cooperative trans-boundary groundwater
governance and management between sharing countries. These are the South Eastern
Kalahari/Karoo Basin (known as the Stampriet Aquifer System) entering Phase 2 and funded by
the Swiss Agency for Development and Cooperation and the Khakhea/Bray Dolomite Basin
(known as the Ramotswa Aquifer) nearing the end of Phase 1 and funded by the United States
Agency for International Development (USAID).
3.7.2 Water requirements
Growth in water requirements depend on many factors, including the future economic growth,
existing policies and memoranda of understanding (MoUs) and agreement (MoAs) between
various industries and government. Current projections of future water requirements for each
sector are shown Table 3-6.
Table 3-6: Current Projections of Future Water Requirements
No User sector*Water requirements (million m³/annum)
2015 2020 2025 2030 2040
1Municipal (industries, commerce, urbanand rural domestic) 4 447 4 900 5 400 5 800 6 600
2Agriculture (irrigation and livestockwatering) 9 000 9 500 9 600 9 700 9 800
3 Strategic/Power generation 362 390 410 430 450
4 Mining and bulk industrial 876 921 968 1 017 1 124
5 International obligations 178 178 178 178 178
6 Afforestation 431 432 433 434 434
Total 15 294 16 321 16 989 17 559 18 586
* Water for the environment as enshrined the National Water Act, 1998 take priority over all the other water uses,
hence, in most instance water available is shown after the provision for the ecological water requirements, as
discussed in section 8.
The water requirements growth trends can be observed from Figure 3-16. Growth in the municipal
sector is mainly, driven by improved services, eradication of backlogs, population and most
importantly systems attrition resulting in huge real losses and this needs to be urgently addressed.
Growth in agriculture will soon reach a threshold level that expansion in this sector will only be
achievable if the sector capitalises on water savings or water re-allocated.

National Water and Sanitation Master Plan Water is Life – Sanitation is Dignity
31 October 2018 NW&SMP: Volume 2: Plan to ActionFinal Draft (version 4.2)
3-48
Figure 3-16: Overview of South Africa’s water requirements (Source: DWS Directorate: National WaterResources Planning - NWRP)
3.7.3 Water balance
The national water balance is a reconciled account of the entire country’s water resource
availability versus current and future estimated water requirements for all users. However, the
spatial distribution of water availability and requirements are not shown in the balance.
It should be noted that the future water balance is dependent on future economic and population
growth and the timely implementation of interventions. Effective operation and maintenance of
infrastructure (water resources and water services) results in improved water use efficiency,
reduced losses, and the ability to use water resources sustainably even in periods of drought.
Table 3-7: Provisional national water balance with and without critical interventions31
Water use sectors 2030 water requirements projections (million m³)
Without demandmanagementinterventions
With urban lossesreduced from 35%
to 15%
Reduce domesticdemand from
237 l/c/d to 175 l/c/d
Agriculture (irrigation and livestockwatering)
9 700 9 700 9 700
Municipal (industries, commerce, urbanand rural domestic)
5 800 4 941 3 696
Strategic/Power generation 430 430 430
Mining and bulk industrial 1 017 1 017 1 017
International obligations 178 178 178
Afforestation 434 434 434
Total water requirements (2030) 17 559 16 700 15 455
Total water available (2015) 13 949
Increased surface water yield 874
31 Department of Water and Sanitation. 2013 National Water Resource Strategy.
0
2 000
4 000
6 000
8 000
10 000
12 000
14 000
16 000
18 000
20 000
2000 2005 2010 2015 2020 2025 2030 2035 2040
Vo
lum
e(m
illio
nm
³/a)
Sectoral Water UseIrrigation
Urban
Rural
Mining andbulk industrial
Powergeneration
Afforestation
Total

National Water and Sanitation Master Plan Water is Life – Sanitation is Dignity
31 October 2018 NW&SMP: Volume 2: Plan to ActionFinal Draft (version 4.2)
3-49
Water use sectors 2030 water requirements projections (million m³)
Without demandmanagementinterventions
With urban lossesreduced from 35%
to 15%
Reduce domesticdemand from
237 l/c/d to 175 l/c/d
Increased groundwater use 405
Desalination (including treated AMD) 588
Re-use 110
Total water available (2030) 15 926 15 926 15 926
Deficit/surplus -1 633 -763 527
Deficit/surplus -10% -5% 3%
3.7.4 Reconciliation Studies
Reconciliation Strategies for the large water supply systems and metropolitan areas were
developed by DWS and are being updated regularly (annually) to establish the status quo of water
balances and to recommend interventions for ensuring sufficient future water resources are
developed to ensure a sustainable water for supply.
Reconciliation Strategies at a lesser scale of detail have also been developed for all other towns
and clusters of villages in the country in the All Town Studies. The figure below indicates where
water shortages are likely to occur in the next 10 years, and where they already exist.

National Water and Sanitation Master Plan Water is Life – Sanitation is Dignity
31 October 2018 NW&SMP: Volume 2: Plan to ActionFinal Draft (version 4.2)
3-50
Figure 3-17: Water Balance at Municipal Level from All Town Studies
CategoryCount of
schemes
% of
schemes
no shortage > 10 yrs 334 37%
water resource shortage 5 - 10 yrs 113 12%
water resource shortage 1 - 5 yrs 120 13%
water resource currently in deficit 273 30%
unknown 65 7%
Grand Total 905 100%

National Water and Sanitation Master Plan Water is Life – Sanitation is Dignity
31 October 2018 NW&SMP: Volume 2: Plan to ActionFinal Draft (version 4.2)
3-51
These Reconciliation Strategies are available on http://www.dwa.gov.za/projects.aspx, and the
concluded interventions from these inform and are inputs into the NW&SMP. See Annexure 2 for
a summary of these Reconciliation Studies.
The following sections present the reconciliation of the requirements for and availability of water
for each of the main systems in the country, summarised in Table 3-8. Interventions have been
identified for all these systems to resolve imbalances, together with more stringent
implementation of WC/WDM, regarded as non-negotiable. Implementation of development
options were scheduled according to the projected future water requirements, after provision was
made for the best estimates of the savings that could be achieved through WC/WDM.
Table 3-8: Water balances for different water supply system (million m³/a)32
Water SupplySystem
Major Townsand other users
Million m³/a 2015 2020 2025 2030 2035 2040
Vaal RiverSystem
Johannesburg,Pretoria
Requirements 3 000 3 120 3 290 3 430 3 530 3 600
Availability* 3 000 3 154 3 457 3 600 3 617 3 640
Orange Riversystem
Bloemfontein,Irrigation (OrangeFish Sundaystransfer)
Requirements 2 980 3 097 3 100 3 130 3 140 3 150
Availability*
3 000 2 950 3 250 2 966 2 830 2766
Kwa-ZuluNatal CoastalMetropolitanBulk WSS**
eThekwini(Durban),Msunduzi(Pietermaritzburg)
Requirements 499 561 583 679 720 705
Availability*
471 499 542 791 789 736
Richards BayWSS
Mhlatuze City Requirements 195 225 247 260 278 292
Availability* 241 239 247 284 283 290
MbombelaBulk WSS(CrocodileEast WMA)
Mbombela Requirements 58 62 67 70 73 76
Availability*
60 69 71 72 74 76
Western CapeWSS
Cape Town,
Agriculture
Requirements 520 590 710 850 1 000 1 125
Availability* 550 590 800 880 1 090 1160
Amatole BulkWSS
Buffalo city andKing WilliamsTown
Requirements 108 115 121 123 124 125
Availability*98 104 115 115 115 124
Algoa WSS Nelson MandelaBay, irrigation andindustry
Requirements 169 182 203 220 240 258
Availability*170 195 195 208 225 225
LimpopoWMA WSS***
Polokwane,mining, coal firepower generation
Requirements 193 261 312 362 374 408
Availability*178 268 409 418 422 433.15
Olifants RiverWSS
Agriculture, miningand KrugerNational Park
Requirements 405 458 496 524 546 566
Availability*409 425 422 427 435 442
Requirements 1 075 1 170 1 220 1 285 1 330 1 365
32 Water balances as per relevant Reconciliation Strategies, including the implementation of relevant interventions, as
summarized in Annexure 2.

National Water and Sanitation Master Plan Water is Life – Sanitation is Dignity
31 October 2018 NW&SMP: Volume 2: Plan to ActionFinal Draft (version 4.2)
3-52
Water SupplySystem
Major Townsand other users
Million m³/a 2015 2020 2025 2030 2035 2040
Crocodile(West) RiverSystem
Rustenburg,Thabazimbi,agriculture,mining, powergeneration
Availability*
1 115 1 200 1 260 1 350 1 410 1460
GreaterBloemfonteinBulk WSS
MangaungMunicipality andsurrounding areas
Requirements 89 104 123 143 168 191
Availability*94 105 130 162 162 162
Luvuvhu andLetaba WSS
Thohoyundou,Giyani, Tzaneen,Kruger NationalPark, Irrigation,mining
Requirements 164 215 240 251 266 277
Availability*
220 243 259 263 272 276
Colour code
DEFICIT BALANCED
* The water availability figures into the future in most of the systems are showing the implementation of the
recommended interventions to augment those systems, as per Reconciliation Strategies. If interventions are
not implemented, water availability figures will be constant from 2015.
** Kwa-Zulu Natal Coastal Metropolitan Bulk WSS includes the Mgeni System, the Northern (to the Thukela River)
and Southern (to the uMtwalume River) Coastal areas.
*** Some of the Limpopo WMA WSS exclude the irrigation.
**** Reconciliation Strategy not yet developed for Mahikeng Municipal Water Supply System.
Delays of intervention in the national critical water supply systems, such as the implementation
of Phase 2 of the Lesotho Highlands Water Project (LHWP) (to augment the Vaal River System
for greater Gauteng), the uMkhomazi Water Project Phase 1 (to augment the Mgeni System for
the KwaZulu-Natal Coastal Metropolitan Region) and the augmentation of the Western Cape
Water Supply System, significantly impacted the water security, and subsequently the socio-
economies of these areas. The recent water crisis in Cape Town serves as a stark reminder of
the impacts of delayed action.
Thirteen (13) out of the fourteen (14b) large systems Reconciliation Strategies that have been
developed are discussed in Annexure 2. It should be noted that continuous implementation and
monitoring of WC/WDM is critical in all systems.
3.8 PRIORITIES FOR THE FUTURE
The following table provides a summary of priority actions (as copied from Volume 1 of the
NW&SMP Call to Action):
Table 3-9: Priority Actions
Action Responsibility Completion date
PLANNING
Develop, update and maintain reconciliation planning studiesto achieve optimal water mix (surface water, groundwater,re-use and desalination, and incorporate climate change intostudies) (Volume 3, Action 1.1.5)
DWS, CMAs,WSAs
2030
Do detailed feasibility study (including EIA) of high priorityinterventions (identified in Reconciliation Strategies) anddevelop bankable projects, with business case of required
WSAs, DWS,CMAs
2030

National Water and Sanitation Master Plan Water is Life – Sanitation is Dignity
31 October 2018 NW&SMP: Volume 2: Plan to ActionFinal Draft (version 4.2)
3-53
Action Responsibility Completion date
infrastructure, financing, institutional arrangements forownership and operations as implementation mandate(1.1.6)
Water Resources Catchment studies (Continuously undertakehydrological monitoring in order to improve the resiliencyand sustainability of the available sources on account offuture climate change) (1.1.7)
DWS, CMAs 2050
Develop a guideline for the protection, recharge, use andmonitoring of groundwater (1.1.8)
DWS, WRC, CSIR 2022
Integrate results of All Towns studies and reconciliationstudies into sectoral plans (domestic, agriculture, energy,mining, industrial development, land reform and ruraldevelopment) (1.1.9)
DWS, DAFF, DoE,DMR, the dti,DRDLR
2022
Develop and implement Provincial Water Services DeliveryMaster Plans to provide reliable and sustainable water supplyand sanitation services to all households within South Africa:• Provincial Bulk Services Master Plans• Reliable Services Delivery Action Plans that includes abacklog analysis and infrastructure asset management plans(1.3.6)
DWS, WSAs,CoGTA, SALGA,NT, WBs
2030
REDUCING DEMAND
Reduce Non Revenue Water (NRW) and water losses in allmunicipalities to 15% below the business as usual (1.1.1)
DWS, CoGTA 2030
Set cap on water use with reducing targets over time (1.1.2) DWS, CMAs,WSAs, CoGTA
2030
Reduce the water demands and water losses at all majorirrigation and agricultural schemes by 2030, without affectingproductions (1.1.3)
DWS, DAFF 2030
Reduce water demand and increase water efficiencies ofindustrial users (1.1.4)
DWS, the dti 2026
Implement the Water Administration System on allgovernment irrigation schemes for transformation (1.2.3)
DWS,DAFF/PDAs
2024
Develop and implement a long-term plan for the turn-aroundof water supply and sanitation services in the country basedon a sector-wide approach, that recognises DWS as regulatorof W&S provision that includes the development ofcentralised programmes to obtain economies of scale and toensure impact (e.g. driving municipal non-revenue-waterimprovements, and assessing the cost-effectiveness andappropriate systems for desalination) (1.3.1)
DWS, CoGTA, NT,SALGA
Annually
Revitalise the Green, Blue and No Drop programmes andpublish results. Revise and establish norms and standards(1.4.1)
DWS, WSAs Annually
Include water use efficiency and water loss reduction targetsin the KPIs of municipal managers and municipal water supplyand sanitation managers, and in municipal implementationplans (1.4.2)
CoGTA,Municipalities
2019
Establish Water Efficiency Labelling and Standards (WELS)Scheme (1.4.3)
SABS, DWS 2025

National Water and Sanitation Master Plan Water is Life – Sanitation is Dignity
31 October 2018 NW&SMP: Volume 2: Plan to ActionFinal Draft (version 4.2)
3-54
Action Responsibility Completion date
Identify (Blue Scorpions) and prosecute major non-compliantabstractors (water thieves) across the country, with anational communication campaign to accompany the action(1.4.4)
CMAs, NPA,SAPS, DEA,Regulator, DMR,DWS, BlueScorpions
10 by 2020Additional 10 by2023
INCREASING SUPPLY
Development of strategic water resources infrastructure(1.1.10)
DWS, LHDA,WSAs, WBs,TCTA
2025
Refurbish gauging stations (1.1.11) CMAs, DWS 2027
Increase groundwater use (including artificial recharge) andre-use of water (1.1.12)
WBs, WSAs,DWS, CMAs
2024

National Water and Sanitation Master Plan Water is Life – Sanitation is Dignity
31 October 2018 NW&SMP: Volume 2: Plan to ActionFinal Draft (version 4.2)
4-1
4. REDISTRIBUTING WATER FOR TRANSFORMATION
4.1 PRESENT STATE
Transformation is critical in three areas: ensuring that the use of
water for productive purposes is equitable, making sure that the
governance of water is representative, and ensuring access to
decent water and sanitation services for all. The latter two issues
are dealt with in the institutional chapter and the chapter on effective
water and sanitation services.
This chapter deals specifically with the issue of ensuring that black South Africans have access
to sufficient water for productive purposes, whether small scale farming, commercial farming,
afforestation, or any other use. Since, in most catchments in South Africa, there is little
unallocated water still available, this requires the proactive transfer of water from current users to
black water users – a process similar to that of land reform.
The National Water Act (NWA) and the White Paper on a National Water Policy (NWP), as well
as the Second Edition of the National Water Resource Strategy (NWRS2) provide the legislative
and policy framework for water allocation. However, these documents do not provide the detailed
strategies and actions necessary to promote equity, sustainability and efficiency in water use, in
a fair, reasonable and consistent manner.
The NWA stipulates that equity, sustainability and efficiency are the guiding principles of water
resources management in South Africa. However, since the promulgation and implementation of
the NWA, one principle that has not received the desired attention is equity, resulting in
perpetuation of the status quo where the few large-scale water users still dominate access to and
use of the resource. This is due to the historical legacy, on the one hand, and the lethargy in
completing the roll-out and delegations to catchment management agencies (CMAs). This is an
operational reality that the Water Allocation Reform (WAR) programme within the Department of
Water and Sanitation (DWS) seeks to address. The Water Allocation Reform Strategy (WAR)
developed by the Department serves as the strategic link between policy intent and the practical
implementation of the provisions of the NWA. (DWA, 200833).
In the agricultural sector, around 95% of the water is estimated to be used by white commercial
farmers, many of whom continue to use water under the Existing Lawful Use clause of the
National Water Act. Existing Lawful Use (ELU) was intended as a transitional arrangement.
However, 20 years after the NWA was promulgated, ELUs still authorise the biggest volume of
water used in the country.
While the restitution of agricultural land has been slower than intended, the reallocation of water
has not always even kept pace with the transfer of that land. In some instances, the previous
owners traded away their existing lawful water use rights, so that the water allocation was not
33 Department of Water and Sanitation (DWS). 2008.Water Allocation Reform Strategy.
1. Water andSanitation
Management
1.2Redistribution for
Transformation

National Water and Sanitation Master Plan Water is Life – Sanitation is Dignity
31 October 2018 NW&SMP: Volume 2: Plan to ActionFinal Draft (version 4.2)
4-2
transferred to land reform beneficiaries. According to The Institute for Poverty, Land and Agrarian
Studies34, more than 70% of commercial farms in the country are owned by white farmers with
about 39 000 white commercial farmers and 5 300 black farmers, according to the African
Farmers Association of South Africa. Most of the black commercial farmers have relatively smaller
farms.
For a water resource system in a mature phase of development, the re-allocation of water
between water use sectors is an obvious and powerful method to move water from low to higher
economic use, although it does not add additional water to the mix. Of critical importance in the
re-allocation of water is the issue of achieving racial equity in access to water. At times this may
conflict with the movement of water from low value to higher value use, and priority must be given
to achieving racial transformation in access to water.
Transformation of representivity in water governance has also been slow. Membership of water
user associations generally reflects land ownership and water use, so that the governance of
those associations is often focussed on the interests of white commercial farmers.
The Irrigation Strategy35 developed by the Department of Agriculture, Forestry and Fisheries
(DAFF) has identified water schemes where there is the potential for irrigation expansion. This
expansion can contribute to access to water for black farmers.
4.2 DRIVERS
The Constitution, the NWA and NWRS2 have laid down the foundation for water allocation reform.
The water allocation strategies are meant to be implemented using various long-term and short-
term mechanisms in order to ensure the realisation of the transformation mandate contained in
the above policies.
The demand for land is high on the political agenda and will remain so until adequately addressed.
Where the land that is being transferred is irrigable, a water allocation is necessary to enable the
new land users to make full use of the land. However, it would appear that, under the land reform
programme, some irrigable land has been transferred to land reform beneficiaries without the
water allocation that was historically used on that land – the water rights have, essentially, been
sold prior to the transfer of the land. How widespread this issue is, is difficult to ascertain due to
the lack of an integrated approach between the Department of Rural Development and Land
Reform (DRDLR) and DWS in land and water reform. What is clear, however, is that there are a
number of black farmers, and other potential water users, such as business owners, who wish to
get access to water for productive purposes.
To date, the response from government has been largely reactive, waiting for licence applications
from black water users to be lodged with DWS. The prevalence of this situation has limited the
ability of recipients to make productive use of the land. In addition, there are black farmers and
entrepreneurs who have expressed their concerns about lack of access to water, and the
34 Institute for Poverty, Land and Agrarian Studies. Fact Check No. 1 Land Reform, The Distribution of Land in South
Africa: An Overview.34 Department of Agriculture, Forestry and Fisheries. 2015. Irrigation strategy for South Africa.

National Water and Sanitation Master Plan Water is Life – Sanitation is Dignity
31 October 2018 NW&SMP: Volume 2: Plan to ActionFinal Draft (version 4.2)
4-3
challenges in getting water allocated for farming and enterprise development. The pressure to
reallocate water to achieve more equitable water use thus remains high.
There are several opportunities that provide low-hanging fruits in providing raw water for
productive purposes to black South Africans. These are discussed briefly, below.
Implementing the Irrigation Strategy for South Africa
Capital costs for new storage infrastructure are too high to provide any significant amount of
affordable additional water to the agricultural sector. Agriculture is encouraged to move to more
efficient irrigation to allow for future expansion with the water already allocated to it. The critically
important re-allocation of water to black water users will need to take place within these
constraints, and where affordable additional water is available.
The Irrigation Strategy (2013) of DAFF states that “Although it is generally considered that South
Africa has very little areas left with irrigable soils that can be put under irrigation, there are a
number of substantial areas with soils of relatively good irrigation potential close enough to rivers
and at low enough elevation above them to make irrigation development on them a possibility”.
It also indicated 34 863 ha may be available for expansion as indicated in the table below,
although some of the 5 000 ha in the Northern Cape may already have been allocated. The water
allocated for irrigation areas listed in the table below will only be made available to HDI applicants.
Table 4-1: Water Allocation for Irrigation Areas
Province Scheme/Area PotentialExpansion
(ha)
Comments
Eastern Cape Upper Orange RiverCatchment
4 000 Orange River re-Planning Study (ORRS) (DWS2014)
Umzimvubu Dam 2 354 Mzimvubu Water Project Feasibility Study
Foxwood Dam 1 250 Foxwood Water Project Feasibility Study
Free State Upper Orange RiverCatchment
3 000 Orange River re-Planning Study (ORRS, DWS1990)
Gauteng 0 No possible expansion
Kwa-Zulu Natal Makhathini IrrigationScheme
10 000 Makhathini Master Plan
Limpopo 0 Over allocation of water resources (DWSreports)
Mpumalanga 3 000 Information supplied by official fromMpumalanga Depart of Agriculture
Northern Cape Upper Orange RiverCatchment
5 000 Orange River Planning Study (ORRS, DWS1990). Indications are that most of this hasbeen allocated
North West Taung IrrigationScheme
1 259 Budget Planning Report by Endecon Ubuntu2011
Western Cape 5 000 Availability of hectares depends on increasedcapacity from raising of Clanwillian Dam wall.
Total 34 863

National Water and Sanitation Master Plan Water is Life – Sanitation is Dignity
31 October 2018 NW&SMP: Volume 2: Plan to ActionFinal Draft (version 4.2)
4-4
There are also a number of ex-homeland irrigation schemes that require rehabilitation to enable
black farmers to use water effectively for production of crops. For example, according to the
Irrigation Strategy, there are 11 139 ha of small holder irrigation schemes in Mpumalanga that
need rehabilitation, for which R893 million is needed.
In addition, there are areas in which water use patterns are changing, such as where mines are
closing down, where the war on leaks and water conservation have reduced water use, where
validation and verification has identified registered water that is not being used, or areas where
groundwater or small dams may be able to provide extra water for agricultural development. DWS
should identify these opportunities and allocate such water to black applicants. This requires,
however, a partnership with DRDLR, DAFF and provincial departments of agriculture to identify
the location and need of black farmers, and to provide support to them to use the water
productively.
The reallocation of water is driven by the need to redress the inequities of the past and to ensure
more equitable access to key natural resources such as land and water for the black majority.
The reallocation of water is necessary, but not, in itself, sufficient, to achieve the ultimate
development outcome of the country, which is the eradication of poverty and inequality. What this
raises, is that any reallocation of water should be done in collaboration with the Departments of
Agriculture and Land Reform and Rural Development, to ensure that sufficient support is provided
to recipients of water to enable them to use it productively and optimally.
This is why the NWRS2 calls for an integrated land, water and agrarian reform programme. Within
such a programme, it is critical to recognise and respond to the specific needs of small-scale
water users, not only commercial enterprises.
4.3 PRIORITIES FOR THE FUTURE
The re-allocation of water to historically disadvantaged individuals will redress the historical
imbalance in access to water for productive purposes in South Africa and contribute to the broader
redress envisaged in the Constitution. It will also contribute to meeting the targets of the NDP.
General authorisations will be used proactively to support reallocation of water to black users,
and to legalise small scale water use without the need for a licence.

National Water and Sanitation Master Plan Water is Life – Sanitation is Dignity
31 October 2018 NW&SMP: Volume 2: Plan to ActionFinal Draft (version 4.2)
4-5
If done appropriately, and in conjunction with land and
agrarian reform, it will contribute to rural development and the
reduction in inequality and poverty in the country.
In order to do this, water allocations must be carried out in a
manner that promotes equity, addresses poverty, supports
economic growth and provides opportunities for job creation.
The allocation process recognises that redressing the effects
of previous discriminatory legislation is necessary for social
stability and to promote economic growth.
DWS will work closely with all spheres of government and
other institutions to promote the productive and responsible
use of water since these objectives go well beyond the
Department’s primary mandate and require the active pursuit
of cooperative governance arrangements to support the
productive use of water.
Summary of Priorities:
The following table provides a summary of priority actions (as copied from Volume 1 of the
NW&SMP Call to Action):
Table 4-2: Summary of Priorities
Action Responsibility Completion date
Identify alternative sources of water and water that isnot utilised (e.g. as mines are closing resulting fromWar on Leaks, etc) for transformation (Volume 3Action 1.2.1)
DWS, CMAs, WSAs 2019
Identify where more water can be made available ingovernment water schemes for transformation (1.2.2)
DWS, CMAs, WBs,DAFF/PDAs,
2019
Implement the Water Administration System on allgovernment irrigation schemes for transformation(1.2.3)
DWS, DAFF/PDA 2024
Implement pilot project on voluntary contributionsfrom farmers for water reallocation in prioritisedcatchments (1.2.4)
DWS, DAFF 2020
Identify areas where small dams or groundwaterdevelopment can provide water for small scale blackfarmers (1.2.5)
DWS, CMAs 2019
Align water, land and agrarian reform programmesand link to the Irrigation Strategy (1.2.6)
DWS, CMAs, DAFF,DRDLR
2030
Use General Authorisation to enable small scale wateruse by black farmers (1.2.7)
DWS, DAFF 2019
Investigate, revitalise, refurbish existing under-performing Black Owned schemes (1.2.8)
DAFF, DWS 2020
Define and implement process to allocate water(new/saved) to black applicants (1.2.9)
DWS, DAFF 2030
Establish the National Water Resources and ServicesRegulator (NWRSR) (2.1.6)
DWS, NT 2020
Call to Action
“the water sector has, over the past20 years, failed to deliver on itsmandate for water allocationreform, or the reallocation of waterto black water users. This, alongwith land reform, remains a majorchallenge facing the country, andone that must be addressed. It isproposed that a joint land, waterand agrarian reform programme, tobe led by the Department of RuralDevelopment and Land Reform beestablished to ensure that thereallocation of both land and waterare aligned and take place within aframework of agrarian reform andeffective rural development”

National Water and Sanitation Master Plan Water is Life – Sanitation is Dignity
31 October 2018 NW&SMP: Volume 2: Plan to ActionFinal Draft (version 4.2)
4-6
Action Responsibility Completion date
Establish regulations on required qualifications andexperience for senior and technical positions in DWS,CMAs, water boards and municipal servicesinstitutions (2.3.1)
DWS, CoGTA, SETA 2023
Develop regulations in terms of Section 139 (8) of theConstitution, which allows for a national entity to takeover the water service functions, including revenueand billing, in a municipality if service deliver criteriaare not met (2.4.4)
DWS, CoGTA 2022
Fund research into new models to better understandimplementation approaches for water allocationreform, and equity issues (2.6.6)
DWS, WRC, CSIR,DST
Ongoing

National Water and Sanitation Master Plan Water is Life – Sanitation is Dignity
31 October 2018 NW&SMP: Volume 2: Plan to ActionFinal Draft (version 4.2)
5-1
5. MANAGING EFFECTIVE WATER SUPPLY AND SANITATION SERVICES
This chapter focuses on
the provision, operation
and maintenance of water
supply and sanitation
services.
5.1 WATER SUPPLY AND SANITATION SERVICES
Access to sufficient water is a basic human right enshrined in the Constitution of South Africa.
Access to adequate sanitation services is a critical element of the right to dignity and the right to
an environment that is not harmful to health or well-being.
The South African Government has set clear and ambitious targets for water supply and sanitation
services:
Achieve universal, sustainable, safe and reliable water supply provision:
90% by 2019
100% by 2025
Achieve universal, sustainable and safe sanitation provision:
90% by 2020
100% by 2030
5.1.1 Present State
South Africa’s 56 million inhabitants live in more than 28 thousand communities, each requiring a
reliable and safe water supply and sanitation services. 144 municipalities have been assigned the
function of water services authorities (WSAs). District municipalities generally oversee the
96% of households have access to a basic water supply, butonly 65% of households are estimated to have a reliable andsafe water supply service – a lower figure than in 1994
11% of water supply schemes are completely dysfunctional.
In the 27 priority district municipalities the water reliability isonly 42%, with the worst 10 WSAs below 30% reliability.
56% of waste water treatment works (WWTW) in South Africahave functional challenges
44% of water treatment works (WTW) do not work properlyposing a huge risk to the health of the nation
Some 77% of rural households are indigent and are notrequired to pay for basic municipal services
1. Water andSanitation
Management
1.3Managing EffectiveWater Services and
Sanitation

National Water and Sanitation Master Plan Water is Life – Sanitation is Dignity
31 October 2018 NW&SMP: Volume 2: Plan to ActionFinal Draft (version 4.2)
5-2
delivery of services to the most vulnerable, rural poor citizens. At least 33% of municipalities are
regarded as dysfunctional and more than 50% have no or very limited technical capacity36.
South Africa is one of the most unequal countries in the world, with extremely high levels of
poverty. 63% of households earn less than R38 000 per year (indigent level) resulting in high
levels of grant dependency with related impacts on affordability and services viability. In rural
areas, this figure averages 77%. The percentage of individuals that benefited from social grants
consistently increased from 12,7% in 2003 to 29,7% in 201637.
While population growth is, on average, 1,2% per annum, this varies from negative to positive
across communities. The growth in the number of households is much higher and is currently at
around 3% per annum nationally. This is due to migration (mainly urbanisation) and the dedicated
housing programme of government, leading to sub-division of previous large households.
While only 33% of the population currently live in the rural areas, they represent 81% of the
national count of settlements due to their small, scattered nature. Urbanisation continues to have
a major impact on water supply and sanitation provision with many rural people moving to urban
centres in search of jobs and improved services.
Municipal water user profiles also include commercial, business and industrial users as well as
schools, hospitals, sports and recreation facilities, parks and government institutions.
Substantial new infrastructure for water supply and sanitation has been added since 1994 so that
it is estimated that 95% of the South African population have access to a basic water supply.
Unfortunately, the reliability of these services is currently declining. This is due to poor
management of and insufficient investment in water services and sanitation operation and
maintenance with the result that the reliability of these services is declining. This is a critical issue
that needs to be addressed. In 2016, nationally, 63,0% of households rated the quality of water-
related services they received as ‘good’. Satisfaction has, however, been eroding steadily since
2005 when 76,4% of users rated the services as good and the current percentage of the
population receiving reliable water services being lower than it was in 199438.
36 MuSSA for Water Services for South Africa, 2016/201737 Statistics South Africa. 2016 General Household Survey 2016 Statistical release P031838 Statistics South Africa. 2011. Census 2011 Statistical release P0301.4.
Statistics South Africa. 2016. Community Survey 2016 Statistical release P0301.

National Water and Sanitation Master Plan Water is Life – Sanitation is Dignity
31 October 2018 NW&SMP: Volume 2: Plan to ActionFinal Draft (version 4.2)
5-3
Figure 5-1: Access to piped, RDP and reliable RDP water supply (Source: StatsSA)
The water services functions are dispersed between several role players with ineffective
programme alignment, governance and supply chain management. There is an urgent need to
address issues of accountability, coordination and leadership, as well as the appropriate actions
to be put in place where WSAs show consistent failure in delivery of universal and reliable water
services.
Municipal domestic, commercial and industrial water uses in the region of 30% of the total water
used in South Africa. Water reticulation infrastructure includes more than 290 000 km of pipelines
and an estimated 7 680 456 house connections, 5 078 545 yard taps and more than 2 146 146
households served by street taps (StatsSA Community Survey 2016).
Baseline figures on access to water supply and reliable
sanitation service delivery are regularly collected by
StatsSA through the national census and through the
General Household Surveys. Figure 5-2 below indicates
the latest figures for water supply, which reveal that
although 96% of South Africans have access to RDP level
or higher water supply infrastructure, only 65% have
access to reliable services, where reliability is measured as
water of an appropriate quality being available for 300 days
of the year with interruptions in supply not lasting for longer
than two days at a time.
South Africa performed well ineradicating the backlog in basic waterservices infrastructure and access tobasic services from 59% in 1994 to96% in 2016
However, while infrastructure is inplace, about 11% of schemes arefully dysfunctional and in a collapsedstate, resulting in operational accessbeing reduced to 85%. Only 65% ofthe population have access to safeand reliable water supply, and in tenwater services authorities the figure isless than 30%.

National Water and Sanitation Master Plan Water is Life – Sanitation is Dignity
31 October 2018 NW&SMP: Volume 2: Plan to ActionFinal Draft (version 4.2)
5-4
Figure 5-2: National Water Supply Figures
Figure 5-3: Reliability of Water Supply and Sanitation Services per Province (source DWS) below
shows the reliability of water services per province, with the Eastern Cape and Limpopo having
the lowest reliability of supply, followed by North West, Mpumalanga and KwaZulu Natal. Gauteng
and the Western Cape have the highest levels of reliable water supply.
Figure 5-3: Reliability of Water Supply and Sanitation Services per Province (source DWS)

National Water and Sanitation Master Plan Water is Life – Sanitation is Dignity
31 October 2018 NW&SMP: Volume 2: Plan to ActionFinal Draft (version 4.2)
5-5
In the 27 priority district municipalities39 the water reliability is only 42%, while the worst 10 WSAs
have a below 30% reliability.
The unreliability of supply is a major source of public frustration. The StatsSA Community Survey
2016 asked participants what they perceived to be the biggest challenges they faced within their
municipality. 2.7 million households listed the lack of safe and reliable water supply, making it the
highest scoring issue, followed by the lack of or inadequate employment opportunities (2 million)
and the cost of electricity (1.7 million)40.
The following maps (Figure 5-4) show the integrated risk per water services authority and a
municipal self-assessment of their vulnerability to failure.
39 Amatole, Chris Hani, Joe Gcabi, OR Tambo, Xhariep, Ugu, uMgungundlovu, Uthukela, Umzinyathi, Amajuba,Zululand, Umkhanyakude, uThungulu, iLembe, Ehlanzeni, Mopani, Vhembe, Capricorn, Waterberg, Bojanala, NgakaModiri Molema, Dr Ruth Segomotsi Mompati, Sisonke, Alfred Nzo, Joe Taolo Gaetsewe, Greater Sekhukhune, WestRand.
40 Statistics South Africa. 2016. Community Survey 2016 Statistical release P0301.

National Water and Sanitation Master Plan Water is Life – Sanitation is Dignity
31October 2018 NW&SMP: Volume 2: Plan to ActionFinal Draft (version 4.2)
5-6
Integrated risk assessment per WSA Municipal vulnerability (self-assessment)
The average risk in the rural areas (27 priority DMs) is 67% and at a national level itis 55% showing the state of WSA’s
73% of municipalities indicated high vulnerability for under-performing. This figureis 86% in the 27 priority DMs
Figure 5-4: Risk and vulnerability to failure per WSA

National Water and Sanitation Master Plan Water is Life – Sanitation is Dignity
31 October 2018 NW&SMP: Volume 2: Plan to ActionFinal Draft (version 4.2)
5-7
5.1.2 Priorities
The South African Government agreed to meet the target of providing 100% reliable and safe
water supply by 2030 as set in the National Development Plan (NDP) and the Global Sustainable
Development Goals (SDGs).
The Government has made a further commitment by formally approving an interim target of 90%
coverage of reliable water supply by 2019. This implies a 13% improvement per annum on the
national scale, and even more for the 27 priority DMs (24%). For the worst WSA, an improvement
of 40% per annum is required.
In addition, the ladder towards higher levels of services will be climbed progressively for domestic
users with the accompanied progressive achievement of a full supply for schools, health services,
business, commerce and industry.
5.2 SANITATION SERVICES
The provision of sanitation services is a key requirement for the establishment of sustainable,
healthy communities, protection of the environment and to meet the human rights of all who live
in South Africa. Sanitation infrastructure and practices must enhance the principles of health,
dignity and the protection of the environment, ensuring an improved quality of life for all.
Changing the way sanitation services are provided and the nature of the facilities provided will
have social and economic benefits aligned to the national development goals. There are two
important aspects to this. The first is in recognising the nature of water scarcity in South Africa
and moving to waterless sanitation options for all South Africans. The second is in recognising
the nature of human excreta (faeces and urine) as a resource to be utilised, particularly for
fertiliser products, but also for the reclamation of important elements such as phosphorus which
is a critical and globally limited resource, essential for crop production.
5.2.1 Present State
5.2.1.1 Policy
Adequate sanitation facilities are a necessary part of achieving the rights to dignity and to an
environment that is not harmful to health or well-being, as enshrined in the Bill of Rights of the
Constitution.
Cabinet approved the National Sanitation Policy in 2016. This policy addresses the “seven policy
pillars” to achieve hygienic, sustainable, equitable and efficient sanitation services (Figure 5-5),
namely:
Integrated planning
Institutional arrangements
Participation
Capacity and resource development
Financial requirements
Sustainability and
Regulation.

National Water and Sanitation Master Plan Water is Life – Sanitation is Dignity
31 October 2018 NW&SMP: Volume 2: Plan to ActionFinal Draft (version 4.2)
5-8
Figure 5-5: Seven Sanitation Policy Pillars
Since 2014, the sanitation mandate of the Department of Water and Sanitation has been affirmed,
with the mandate including the regulation of the sanitation sector in the country, as well as
provision of macro planning, regional bulk services and monitoring, in accordance with the
Constitution. This requires capacity to establish national policy guidelines, national water and
sanitation strategy, the authorisation of waste discharge, the formulation of conditions for State
subsidies, the development and enforcement of regulations, the setting of minimum services
standards as well as monitoring and regulating sanitation service provision. National and
provincial government, according to the Constitution, have the legislative and executive authority
to see to the effective performance by municipalities of their functions in respect of matters listed
in Schedules 4 and 5, by regulating execution by municipalities of their executive authority
referred to in section 156 (1).
5.2.1.2 Backlogs
Since 1994, and particularly after 2001, an estimated 5.15 million households have been provided
with safe and acceptable sanitation facilities41. The backlog in 1994 was estimated at 4 million
households, whereas at April 2017 it is estimated that there are still 3.96 million unserved
households. The South African population increased from around 40 million in 1994 to a total of
55,6 million as recorded in the 2016 Census. Progress in the reduction of the backlog has been
hampered by this substantial population growth and by households becoming smaller (and hence
41 Statistics South Africa. 2011. Census 2011 Statistical release P0301.4.
Statistics South Africa. 2016. Community Survey 2016 Statistical release P0301.

National Water and Sanitation Master Plan Water is Life – Sanitation is Dignity
31 October 2018 NW&SMP: Volume 2: Plan to ActionFinal Draft (version 4.2)
5-9
growing at a faster rate than the population). Urban migration has also shifted where the needs
are.
In addition, the facilities provided to households previously have become inadequate in some
areas due to various factors including ventilated improved pit latrine (VIP) pits not being emptied
regularly, ageing infrastructure, poor facility operation and maintenance, and infrastructure
operated above its design capacity.
The provincial backlogs (services below RDP level) for sanitation services are indicated in the
table below:
Table 5-1: Provincial Sanitation Backlogs
Province Total HouseholdsNo. of householdsbelow RDP level
% households belowRDP level
Eastern Cape 1 807 050 416 391 23.0
Free State 969 199 190 802 19.7
Gauteng 5 153 011 469 836 9.12
Kwa-Zulu Natal 2 963 154 1 018 736 34.4
Limpopo 1 652 306 793 557 48.0
Mpumalanga 1 283 056 494 165 38.5
North West 1 288 454 431 003 33.5
Northern Cape 362 527 68 168 18.8
Western Cape 1 992 998 84 143 4.22
TOTAL 17 471 755 3 966 801 22.7
(Source: Census 2011 updated to April 2017 – DWS Water Services Knowledge System)
The backlogs per WSA are presented in Figure 5-6 below. The largest backlogs, both in terms
of percentage and in terms of the number of households, are in Limpopo, Mpumalanga and Kwa-
Zulu Natal. The WSAs in red have backlogs of greater than 50% of total households and the
efforts to eradicate the sanitation backlogs will be intensified in these areas.

National Water and Sanitation Master Plan Water is Life – Sanitation is Dignity
31 October 2018 NW&SMP: Volume 2: Plan to ActionFinal Draft (version 4.2)
5-10
Figure 5-6: Sanitation Backlogs per WSA, April 2017

National Water and Sanitation Master Plan Water is Life – Sanitation is Dignity
31 October 2018 NW&SMP: Volume 2: Plan to ActionFinal Draft (version 4.2)
5-11
22.7% of households do not have access to an acceptable and adequate sanitation service.
Approximately 3.0% of households have never received a service, while the remainder of
households have access to a sanitation service, but there are various requirements needed to
ensure its adequacy and sustainability. Figure 5-7 below sets out the various issues that need
to be addressed to ensure that these 22.7% of households are provided with the required level of
sanitation services.
Figure 5-7: Sanitation Needs to address the Backlog
The sanitation facilities provided for low income households, particularly VIPs, do not meet the
standards for ensuring that they are accessible to people with disabilities. People with disabilities
are one of the most excluded groups in society, and it is important to ensure that sanitation
standards are designed in a manner that meets their requirements.
5.2.1.3 Operation and Maintenance
Effective operation and maintenance is a critical element in providing sustainable and adequate
sanitation services, both for water-borne sanitation and for on-site services.
Two thirds of the WSAs that have settlements served with ventilation improved pit latrines (VIPs)
assume responsibility for desludging at least some of their VIPs. However, only half of the budget
required for this is available and only 17% of WSAs have a policy in place to guide this function.
The frequency of emptying VIP pits varies between municipalities, with most being in the range
of 5 to 8 years.
In terms of operation and maintenance of wastewater treatment works and associated sewerage
infrastructure, the situation was monitored by DWS via the Green Drop assessment42. The Green
Drop assessments have not been undertaken since 2014.
42
3.2
6.8
6.6
1.6
1.6
3.0
Sanitation needs toaddress the 22.7% household backlog
O&M needs
Infrastructure upgradeneeds
Infrastructure extensionneeds
infrastructurerefurbishment needs
resource needs
no services

National Water and Sanitation Master Plan Water is Life – Sanitation is Dignity
31 October 2018 NW&SMP: Volume 2: Plan to ActionFinal Draft (version 4.2)
5-12
Compliance with the Green Drop requirements in 2014 was generally very poor, with 119 of the
144 WSAs achieving less than 80% compliance. This reflects the lack of attention being afforded
to the proper management and maintenance of wastewater in most municipalities.
The table below indicates the Green Drop scores for 2014 for the different provinces in South
Africa.
Table 5-2: Green Drop Scores per Province
Province No of WWTWProvincial Green Drop
score (%)Risk profile (CRR as %
of CRR(max)
Eastern Cape 123 67.2 70.0
Free State 95 31.5 83.0
Gauteng 56 78.8 57.0
Kwa-Zulu Natal 143 82.0 55.0
Limpopo 67 24.0 79.0
Mpumalanga 76 56.0 73.0
North West 35 50.0 76.0
Northern Cape 71 23.0 76.0
Western Cape 155 83.1 62.0
TOTAL 821
(Green Drop Report, 2014, CRR = Cumulative Risk Rating
5.2.1.4 Sanitation provision in other sectors:
The provision of sanitation services to public institutions (for example hospitals, clinics, police
stations and correctional facilities) is the responsibility of the respective national or provincial
departments. The backlog has generally been eradicated, but the current status of these services
is not known. The budgets for the operation and maintenance of these facilities lie with the
relevant departments.
The provision of safe sanitation services to schools is the responsibility of the Department of
Education and has been accelerated since 2011 with the Department of Education (DoE)
introducing the Accelerated Schools Infrastructure Development Initiative (ASIDI) programme,
with ambitious targets for ensuring all schools have acceptable levels of sanitation.
However, the sanitation infrastructure at schools is not always safe and secure, ensuring that
learners feel comfortable to use the toilets. Issues of child sensitive design, proper operation and
maintenance, together with a number of social aspects, still needs to be addressed in the
provision of sanitation at schools, as do issues of sanitation to meet the needs of scholars and
teachers with disabilities.
There has been an increasing focus on the needs of the girl child which has resulted in both the
DoE and several non-government organisations (NGOs) and private enterprises and individuals
taking initiatives to provide personal sanitary supplies to keep girl children in school. The design
of school sanitation facilities should also take into account the safety of girl children who are
vulnerable to rape when using sanitation facilities that are far from the classrooms or hidden from
view.
Sanitation in the agricultural sector includes facilities for farm workers and for farm dwellers who
are not employed by the farmer. Sanitation for farm workers is covered by the Basic Conditions
of Employment Act, whilst farm dwellers are the joint responsibility of the farmer and the
National Water and Sanitation Master Plan Water is Life – Sanitation is Dignity
31 October 2018 NW&SMP: Volume 2: Plan to ActionFinal Draft (version 4.2)
5-13
municipality (where there is an agreement between the farm owner and the municipality). Farm
dwellers are vulnerable and, in some cases, receive very poor or no services.
Industrial discharge to sewers is subject to the by-laws of the responsible municipality. However,
in many cases the by-laws are out-dated and/or not specific on the quality of the effluent that may
be discharged to the sewers. This results in some wastewater treatment works receiving effluent
concentrations or types of pollutants that disrupt the treatment processes and a result in poor
quality final effluent.
5.2.2 Priorities for the Future
The key objectives for sanitation service delivery are:
Moving the country towards “water-less” sanitation options
The acceleration of adequate and equitable sanitation service delivery and meeting the target of
universal access to acceptable sanitation services by 2030 while paying special attention to the
needs of women and girls, people with disabilities, and those in vulnerable situations;
Meeting South Africa’s international obligations towards achieving the Sustainable
Development Goals (SDGs);
Focusing on operation and maintenance, institutional capacity, and adequate resources
for management of sanitation.
Applying smart and water efficient technology systems
Growing the application of safe resource recovery from sanitation systems; and
Raising the profile of sanitation.
A detailed sanitation master plan should to be formulated (and updated regularly) for each WSA.
The plans must address the backlogs within their area of jurisdiction as well as operation and
maintenance requirements. Municipalities must secure funding for sanitation master plan.
5.3 OPERATIONS AND MAINTENANCE AS PART OF ASSET MANAGEMENT CYCLE
5.3.1 Principles of Asset Management and Operations and Maintenance
Asset Management is the art and science of making the right decisions thereby optimising the
delivery value of an asset. Common objectives should be to minimise the total life cycle cost of
an asset and to ensure critical factors such as risk and/or business continuity are considered
objectively as part of standard decision-making processes.
Asset Management involves the balancing of costs, opportunities and risks measured against the
desired performance of assets, in support of broader organisational objectives. This balancing act
needs to be considered over different timeframes.
As indicated in Figure 5.8 there are different components and phases in a typical Asset
Management Cycle. Whilst the main focus is usually on the construction of new infrastructure the
Operations and Maintenance component is often neglected. The total lifespan of water
infrastructure can stretch over several decades and proper operations and maintenance will
eventually determine the optimal use of infrastructure. Effective operation and maintenance of
water and sanitation infrastructure is critical to the delivery of reliable services. Even though
Operations and Maintenance (O&M) is most often is used as a grouping of activities, these are
two definitively separate business elements.

National Water and Sanitation Master Plan Water is Life – Sanitation is Dignity
31 October 2018 NW&SMP: Volume 2: Plan to ActionFinal Draft (version 4.2)
5-14
The effective operation of infrastructure is based upon the requirements to deliver services
according to outcomes-based standards in terms of both quantity and quality.
Maintenance is implemented according to a programme which includes routine, planned and
unplanned maintenance protocols. These practices are to sustain the condition of infrastructure
to enable operations according to design limits.
Figure 5-8: Integrated Asset Management
Figure 5-9: Elements of Acceptable Services
Asset Management principles dictates for a more detailed approach to be followed in the space
of maintenance, where asset management planning informs the maintenance philosophies to be
adhered to. The lack of national asset management and maintenance standards in the South
African water sector leaves water supply and sanitation infrastructure and equipment vulnerable
to ineffective maintenance practices which is challenging to manage and regulate. A further case
could be made for maintenance to have detailed standards developed for the following reasons:
Maintenance Managers need a set of standards to measure the implementation
compliance against, especially in cases where work has to be outsourced. These
standards could be used to formulate, specifications for maintenance work to be done on
water supply and sanitation installations and equipment.

National Water and Sanitation Master Plan Water is Life – Sanitation is Dignity
31 October 2018 NW&SMP: Volume 2: Plan to ActionFinal Draft (version 4.2)
5-15
Sub-standard maintenance work does not only lead to expensive secondary work, but also
exacerbates the risk of an unreliable service.
Inadequate maintenance could lead to an increase in operational cost which would
detrimentally affect the affordability of service.
A risk-based assessment needs to be performed per asset class group (not only concentrating
on the operating status of a specific asset but also focussing on the sustainability for future
performance). Predictive modelling (probability forecasting) methodology needs to be developed
to forecast within a 90% level of confidence potential failures. Asset management plans should
be developed to show the strategic importance and prioritisation of assets within specific asset
class groupings. This exercise must be conducted every three years to be aligned to funding
mechanisms within the MTEF budgeting cycle. This will give effect to an asset management
philosophy which allows for the management of an asset throughout its life cycle, as well as to
adopt a structured approach towards preventing downtime (service interruptions), due to
breakdowns and unplanned maintenance.
Refurbishment and Rehabilitation programmes must be implemented according to risk-based
asset management protocols to inform on capital expenditure priorities.
From a Water Services perspective the Water Services Infrastructure Asset Management
Strategy serves as a solid foundation to guide towards improved practices towards sustaining
operability of water and sanitation systems.
5.3.2 Present State of Asset Management
5.3.2.1 Water Resource Infrastructure
Water resource infrastructure consists of bulk storage, abstraction and conveyancing. This
includes the major dams, pipelines and canals mostly owned and operated by DWS. The South
African Institute of Civil Engineers (SAICE) publishes from time to time an Infrastructure Report
Card (IRC) The latest one (2017) reflects the expert view of SAICE and its members on a wide
range of infrastructure including water and sanitation. Infrastructure for bulk water resources only
scored a worrying D minus with the following note: “The unchanged low grade belies the further
deterioration in the ageing bulk water infrastructure portfolio as a result of insufficient maintenance
and neglect of renewal...”
Some of the reasons behind this worrying trend are the following:
The diverse nature (aging and highly advanced) infrastructure technology used to store
and transfer bulk raw water, is rather challenging for the limited resources to effectively
operate to meet the demand of users
Inability to attract adequate numbers of specialised technical staff required to operate
government water schemes
The under-recovery of revenue prevents operational plans from being effectively
implemented and
Standard government procurement processes are not conducive for the implementation
of effective operational philosophies.
5.3.2.2 Dam Safety (Operations and Maintenance)
Dam Safety legislation (Regulations regarding the safety of dams in terms of Section 123 (1) of
the National Water Act, 1998) provides a clear basis for the operations and maintenance of all
National Water and Sanitation Master Plan Water is Life – Sanitation is Dignity
31 October 2018 NW&SMP: Volume 2: Plan to ActionFinal Draft (version 4.2)
5-16
structures utilised to store water, with the primary objective of the ensuring the safety of people
and the environment down-stream of the dam.
The Dam Safety legislation has been used as a tool in the management of water storage
infrastructure as far as asset maintenance is concerned. There is however a lack of set
maintenance standards for dams and reservoirs. The law requires the owner of a dam which has
been classified to be a safety risk to carry out mandatory evaluations by an experienced dam
specialist and for the owner to implement the recommendations of the dam specialist (i.e
Approved Professional Person). It is also a requirement to have an Operation and Maintenance
manual as well as an Emergency Preparedness Plan for a dam. These two documents assist the
operator to better manage the infrastructure and ensure the safety of all living downstream in the
event of failure.
For all state-owned dams, the Department takes responsibility for routine safety inspections,
deflection monitoring and rehabilitation based upon a risk-based model. To date 42 dams were
restored by the Dam Safety Rehabilitation Programme, 15 Projects are in Planning and Design
stage and 2 projects are under construction.
5.3.2.3 Water supply and sanitation services
Potable Water Supply Infrastructure
Interruption in water supply is one of the key public frustrations. Water Services Legislation
sets an acceptable standard of 48 hours for interruption of water supply; as per Regulation
4 under Section 9 of the Water Services Act.
Electrical and mechanical failures are mostly accounted to inadequate routine
maintenance which relates to unplanned outages, due to inability to lift water to reservoir
levels.
Vandalism (especially cable theft) often leads to the disruption in supply for periods longer
than the acceptable norm. The high levels of water losses could be linked to inadequate
pressure management within the reticulation systems, which might be due to the need to
supply according to an ever-increasing water demand.
Wastewater / Sanitation
The deterioration of resource water quality is often as a result of failing sewer collector
mains and pump-sets, as well as dysfunctional wastewater treatment works. The Green
Drop Regulation processes revealed that most of these failures are due to wastewater
treatment facilities being operated beyond its design capacity or being operated by
process controllers who lack the adequate skills.
Water treatment processes are compromised (becoming more complex) due to the
deterioration of the water resource quality. Process control at these treatment facilities are
required to be performed by skilled personnel to give effect to risk management controls,
as informed by water safety planning principles.

National Water and Sanitation Master Plan Water is Life – Sanitation is Dignity
31 October 2018 NW&SMP: Volume 2: Plan to ActionFinal Draft (version 4.2)
5-17
Figure 5-10: Municipal Wastewater Treatment Risk Rating Performance trend as measured in 2016. Thecumulative risk rating performance measurement is based upon the wastewater risk abatement planning(W2RAP) concept which was jointly developed by the Department of Water and Sanitation and the Water
Research Commission. The purpose is to have a uniform yardstick for wastewater performancemeasurement and to set risk abatement/reduction targets for each municipal treatment facility.
Figure 5-11: Summary of Water Services Queries to the DWS Customer Service (June 2016 – June 2017)
It is evident from the calls the Department’s Tollfree Call Centre received in a period of 1 year
(Figure 5-11) that the vast majority of citizen concerns refers to Assurance of Supply or Reliability
of supply (62%; considering that “Burst Pipe”, “No Water Supply”, “Water Outages” and “WS
Interruptions” are all indicators relating to this category). The responsible citizenry also reported
unacceptable sewer operations (17% of calls) which indicate that this is a component of the water
services business which requires improvement.
WWTWs with ImprovedPerformance = 198 plants
Unchanged = 118 plants
WWTWs with DecliningPerformance = 508 plants

National Water and Sanitation Master Plan Water is Life – Sanitation is Dignity
31 October 2018 NW&SMP: Volume 2: Plan to ActionFinal Draft (version 4.2)
5-18
5.3.3 Priorities for Operations and Maintenance
The desired state for water operations is a (1) reliable, (2) acceptable, (3) sustainable and (4)
affordable service rendered by an effective institution. Therefore, clearly defined Norms and
Standards are required to guide the sector in unison towards investing in infrastructure and
capability to operate and maintain according to these national expectations.
In 2003, Norms and Standards for Water Services were promulgated under Section 9 of the Water
Services Act (Act 108 of 1997), to guide the municipal water sector towards a desired state of
water supply. These standards were implemented but with limited success in the more rural areas,
mostly due to the lack of municipal working capital and the lack of strong regulation in the sector.
The implementation of the incentive-based regulation programmes (Blue Drop, Green Drop and
No Drop certification programmes) brought a significant improvement in the drinking water quality,
wastewater services and water conservation disciplines of municipal water services. This
indicates that the desired state of operations should be based upon the service outcome
expected, and not necessarily on detailed aspects of operations. This principle supports the
regulatory approach of setting standards within the limits of regulatory enforcement capability and
affording operations management the opportunity of optimisation through innovation.
5.3.3.1 Water Operations and Maintenance Performance Standards
The following is the documented performance standard for each water and sanitation operations
segment:

National Water and Sanitation Master Plan Water is Life – Sanitation is Dignity
31 October 2018 NW&SMP: Volume 2: Plan to ActionFinal Draft (version 4.2)
5-19
Table 5-3: Water Operations and Maintenance Performance Standards
Operations Segment Standard
Storage
(Dams: Storage of rawwater)
Existing:
Operate all dams according the requirements of:
National and Local Water Resource Operating Rules;
Dam Safety Legislation (Dam Safety);
Emergency Preparedness Planning requirements;
Resource Management Planning Requirements; and
Water Resource Catchment and Dam Basin ManagementPrinciples (Minimising Siltation or Mitigating the Risk of LosingStorage Capacity due to Siltation)
To be developed:
Maintenance Standards for mechanical outlets
Storage
(Reservoirs: Storage ofpotable water)
Existing:
Operate Potable Water Reservoirs to comply with Norms and Standards for:
1. Regulations under Section 9 of the Water Services Act (Act 108 of 1997):
a) Water supply not to be interrupted for more than 48hours due tounplanned outages;
b) The quality of potable water supply should not compromised dueto storage associated risks (SANS 241);
2. Operate on water balance principles to allow for adequate:
c) Operational storage;
d) Fire Storage; and
e) Emergency storage.
Measurement
(Raw Water Measurementand Potable WaterMetering)
Existing:
Regulation 11 under Section 9 of the Water Services Act:
Requires water quantities supplied to each bulk zone in thereticulation network and the determination of unaccounted forwater
Regulation 13 under Section 9 of the Water Services Act:
Water Services Institution to ensure that all user connections aremeasured by a suitable water volume measuring device.
Dam Safety Regulations apply for large weirs with storage capacity.
To be developed:
National Standards required to guide; Water Metering to be in-situverified and calibrated to adhere to ±3 % (raw water) and ±2%(potable water) meter reading accuracy levels.
In the light of increased water scarcity, there is a need to intensifythe ability of water institutions to impose Tariff Structures (in linewith current Regulation 6 under Section 10 Regulations; StepTariffing) and Credit Control to promote water measurement.
Conveyance &Reticulation
(Pipes, Tunnels andCanals)
Existing (Potable water):
Water Conservation and Demand Management targets.
Water Balance forms part of monthly operational targets (as perRegulation 11 under Section 9 of the WS Act).
Maintaining safe potable water quality levels (SANS 241 as perRegulation 5 under the WS Act).

National Water and Sanitation Master Plan Water is Life – Sanitation is Dignity
31 October 2018 NW&SMP: Volume 2: Plan to ActionFinal Draft (version 4.2)
5-20
Pressure Management required maintaining below 900kPa (WithinReticulation networks) as per Regulation 15 under Section 9 of theWS Act.
Repair Leaks within 48hours; as per Regulation 12 under Section9 of the WS Act.
To be Developed:
Standards need to set for the operations of raw water conveyancesystems, i.e. canals and pipe-lines, on water balancing to operatetowards minimising water losses.
Set Asset Management principles for the determination andprioritisation of rehabilitation (Risk-based Rehabilitation PriorityDetermination Methodology)
National standards for shut down (outage) procedures for thepurpose of maintenance (incl. opportunity, planned and unplannedmaintenance projects).
Abstraction & Transfer
(Pump-stations)
To be Developed:
Pumping capacity which is equal to the maximum daily demand(plus fire requirements)
Redundancy required catering for unforeseen breakdowns.
Back-up energy required for crucial domestic supply pumpfacilities.
Abstraction must be monitored continuously to ensure that theresource yield is not exceeded (especially with regards to use ofgroundwater).
National Maintenance Standards required for Mechanical andElectrical engineering work at pump-stations.
Water Treatment
(Conventional;Desalination andReclamation treatmentfacilities)
Existing:
Potable Water Quality at SANS 241 standards. Regulation 5under Section 9 of the Water Services Act (amended)
Maintain Demand of the water supply area in terms of Quality.
Reclamation and Desalination plants are also required to treatpotable water to SANS 241 standards.
The water treatment process is subjected to the water qualitymanagement requirements stipulated in SANS 241.
Ensure correct level of process control skill to ensure effectivetreatment of water as stipulated by Regulation 2834 (Regulation17)
Risk Management Requirements as per Water Safety Planningstandards (Blue Drop Certification Programme Requirements).
To be Developed:
Regulation 2834 to be reviewed to cater for new treatmenttechnologies, such as Desalination and Reclamation watertreatment facilities.
National Maintenance Standards required for Mechanical,Electrical and Civil Engineering work for all types of watertreatment works.
Norms and standards for the design of treatment facilitiesaccording to the economic spectrum of the specific area ofservice.

National Water and Sanitation Master Plan Water is Life – Sanitation is Dignity
31 October 2018 NW&SMP: Volume 2: Plan to ActionFinal Draft (version 4.2)
5-21
Wastewater Treatment Existing:
Treat wastewater to comply with the Authorisation water qualitylimits set for the receiving water body.
To regulate influent to comply with the design limits of thewastewater treatment facility as per Regulation 9 under Section 9of the WS Act;
To monitor wastewater collection systems for leakages and pumpspillages for less than 48 hour turn around as per Regulation 11under Section 9 of the Water Services Act.
Ensure correct level of process control skill to ensure effectivetreatment of water as stipulated by Regulation 2834 (Regulation17)
Wastewater Risk Abatement Planning (as per Green DropRequirements).
To be Developed:
Minimum Requirements for wastewater treatment works design toallow for operational cost requirements meeting the economicstrength of the town/city served.
National Maintenance Standards required for Mechanical,Electrical and Civil Engineering work for all types of watertreatment works.
Guidelines for:
The unlocking of Green Economy opportunities from wastewatertreatment facilities to be used as a source for OPEX funding.
Utilising wastewater effluent as a potential water source; andprescribing minimum requirements for pre-treatment precedingreclamation.
The national capacity to operate, maintain and manage water supply and sanitation assetsrequires urgent attention.
The following table as copied from Volume 1 (Call to Action) provides a summary of the PriorityActions:
Table 5-4: Priority Actions
Action Responsibility Completion date
Set cap on water use with reducing targets over time (Volume3, Action 1.1.2)
DWS, CMAs,WSAs, CoGTA
2030
Develop and implement a long-term plan for the turn-aroundof water supply and sanitation services in the country basedon a sector-wide approach, that recognises DWS as regulatorof W&S provision that includes the development ofcentralised programmes to obtain economies of scale and toensure impact (e.g. driving municipal non-revenue-waterimprovements, and assessing the cost-effectiveness andappropriate systems for desalination) (1.3.1)
DWS, CoGTA,NT, SALGA
Annually
Plan for disaster management by implementing adequateflood protection and drought management on regional level(1.3.2)
DWS, CMAs,NWRSA, WBs
2022
Revisit levels of service for water supply and sanitationservices against issues of affordability (1.3.3)
DWS, CoGTA,NT, SALGA
2025
National Water and Sanitation Master Plan Water is Life – Sanitation is Dignity
31 October 2018 NW&SMP: Volume 2: Plan to ActionFinal Draft (version 4.2)
5-22
Action Responsibility Completion date
Investigate and promote alternative service delivery modelssuch as BOTT (build, operate, train and transfer),management contracts and concessions (1.3.4)
NT, DWS 2025
Provide direct Water Services Development Planning supportto WSAs as part of a legal requirement and integration intoMunicipal IDPS (1.3.5)
WSAs, DWS,CoGTA, SALGA,NT
2025
Develop and implement Provincial Water Services DeliveryMaster Plans to provide reliable and sustainable water supplyand sanitation services to all households within South Africa:• Provincial Bulk Services Master Plans• Reliable Services Delivery Action Plans that includes abacklog analysis and infrastructure asset management plans(1.3.6)
DWS, WSAs,CoGTA, SALGA,NT, WBs
2030
Deliver services to achieve (100%) universal sanitationcoverage (Municipal Sanitation Projects) (1.3.7)
WSAs, DWS 2030
Deliver services to achieve (100%) universal water servicesprovision (Municipal Water Supply Projects) (1.3.8)
WSAs, CoGTA,DWS
2030
O&M of water resources and services infrastructure (1.3.9) DWS 2050
Align interventions with CoGTA on failing municipalities withexisting support programmes e.g. MISA (1.3.10)
CoGTA, MISA,DWS
2019
Lifecycle planning (asset management) conditions to be set byDWS (1.3.11)
DWS 2020
A National water and wastewater treatment performanceturnaround plan to be developed and implemented. Turnaround the functionality of five, currently dysfunctional, largewater and wastewater treatment works with anaccompanying publicity campaign, followed by a programmeaddressing the rest (1.3.12)
DWS, WSAs,NT, WBs,CoGTA
2030
Roll-out of Feasibility and Implementation Readiness studiesto align with national grant funding programmes (1.3.13)
WSAs, DWS 2025
Revitalise the Green, Blue and No Drop programmes andpublish results. Revise and establish norms and standards(1.4.1)
DWS, WSAs Annually
Include water use efficiency and conservation targets in theKPIs of municipal managers and municipal water supply andsanitation managers, and in municipal implementation plans(1.4.2)
CoGTA,Municipalities
2019
Ensure fiscal support for IWQM (SA38 & SA39) (1.5.11) DWS, WSAs 2021
Establish a business case for streamlined institutionalarrangements in the water and sanitation sector (2.1.1)
DWS 2020
Establish a Municipal Intervention Unit for Water andSanitation in DWS, staffed with highly competent experts todrive a national programme of intervention at the municipallevel (2.1.2)
DWS 2022
Establish financially sustainable CMAs across the country, andtransfer staff and budget and delegated functions, includinglicensing of water use and monitoring and evaluation of waterresources (2.1.3)
DWS 2020
Establish the National Water Resources and ServicesAuthority (NWRSA)(2.1.4)
DWS, NT 2020
National Water and Sanitation Master Plan Water is Life – Sanitation is Dignity
31 October 2018 NW&SMP: Volume 2: Plan to ActionFinal Draft (version 4.2)
5-23
Action Responsibility Completion date
Determine the optimal configuration of water boards tomanage regional bulk water supply, assist municipalities toperform their primary water and sanitation services mandatewhere necessary, manage regional water resourcesinfrastructure, manage regional bulk WTWs and WWTWs(2.1.5)
DWS, WBs 2020
Establish the National Water Resources and ServicesRegulator (NWRSR)(2.1.6)
DWS, NT 2020
Establish regulations on required qualifications andexperience for senior and technical positions in DWS, CMAs,water boards and municipal services institutions (2.3.1)
DWS, CoGTA,SETA
2023
Develop and implement programme for recruitingexperienced technical and managerial staff in South Africafirst and then internationally (2.3.2)
DWS, CoGTA,DIRCO
2030
Develop and implement a mandatory, modular hands-onqualification for municipal water managers (technicalmanager) to be run over 18 months and accredited byEWSETA to include aspects such as asset management, tariffsand revenue management, drought management,stakeholder engagement and customer relations (2.3.4)
DWS, EWSETA,Institutions ofHigher Learning
Ongoing
Partner with institutions to fund training of water sectorpractitioners in the curation, management and use of data aswell as the associated technologies (2.3.5)
DWS, EWSETA Ongoing
Develop and implement institutional arrangement thatrecognise the diversity of circumstances across South Africa,the legacy of Apartheid and allow for regional crosssubsidisation (2.4.1)
NT, DWS 2021
Implement accurate billing and effective revenuemanagement systems in all entities in the water value chainwith a strict “No payment = no water” approach toagriculture/industrial/commercial users and restricted supplyto domestic users (2.4.2)
WSAs, WBs,DWS, AGSA
2024
All conditional grants to be dependent on meeting of currentpayments to the next entity in the value chain, improvementsto Blue Drop, Green Drop and No Drop Scores to meetingtargets and audit outcome. Allow conditional grants to beused for operational costs (2.4.3)
NT, AGSA, DWS 2023
Develop regulations in terms of Section 139 (8) of theConstitution, which allows for a national entity to take overthe water service functions, including revenue and billing, in amunicipality if service deliver criteria are not met (2.4.4)
DWS, CoGTA 2022
Ensure that sufficient revenue is received through tariffs andgrants to operate, maintain and improve the water supply andsanitation system. The tariff structure must allow for crosssubsidisation for the indigent and building of a reserve forperiods of drought (2.4.5)
WSAs, WBs,DWS, NT, AGSA
2024
In all entities put in place mechanisms to deal withaccumulated debts (2.4.6)
WSAs, WBs,DWS, NT, AGSA
2020
Review the Municipal Financial Management Act (MFMA) andthe Municipal Systems Act (specifically chapter 8) to ensure
NT, DWS,CoGTA, SALGA
2020

National Water and Sanitation Master Plan Water is Life – Sanitation is Dignity
31 October 2018 NW&SMP: Volume 2: Plan to ActionFinal Draft (version 4.2)
5-24
Action Responsibility Completion date
that they provide an enabling environment for the provisionof reliable water and sanitation services (2.5.4)
Develop new policies and strategies on matters not previouslyaddressed, in consultation with all stakeholders, to facilitatethe sustainability of various water sector programmes (2.5.5)
DWS 2025
Implement and regularly review/revise Research,Development and Innovation Policies, Plans and Roadmapsacross the sector (2.6.1)
DWS, DST,WRC, CSIR
2021
Unlock investment, procurement and other localisationbarriers to reposition the sector to implement new/nichesolutions and approaches and roadmap the NMIU (2.6.2)
DWS, NT,CoGTA, DST,NMIU
Ongoing
Fund research into new models to better understandimplementation approaches for water allocation reform, andequity issues (2.6.6)
DWS, WRC,CSIR, DST
Ongoing
Develop technologies, guidelines and implementationsupport tools that enable SA to use alternative andappropriate sources as part of water supply (2.6.7)
DWS, WRC,CSIR, DST,SALGA, CoGTA,WSAs
2023
Scan and sort the innovation sector for solutions that areready for application and invest in their implementation(2.6.10)
WRC, CSIR, DST,DWS
2021
Alternative Sanitation: Develop and demonstrate and validateappropriate alternative, water-less and off grid sanitationsolutions (Current – 2025) (2.6.11)
DWS, WRC,CSIR, DST,BMGF, the dti,Municipalities
Ongoing
Domestic and industrial Waste Water: Develop andDemonstrate appropriate waste water technologies for costeffectiveness, energy efficiency and beneficiation (2.6.12)
DWS, TCTA,WRC, CSIR, thedti, DST, TIA,MINTEK
Ongoing
Scan and sort the innovation sector for solutions that areready for application and invest in their implementation(2.6.13)
WRC, CSIR, DST,DWS
2021
5.4 ENSURING IMPLEMENTATION THROUGH REGULATION
All water institutions (and private owners where relevant) must take responsibility to operate and
maintain water related infrastructure according to the set norms and standards.
The Department of Water and Sanitation must take responsibility to develop policy and
regulations and to promulgate after consultation in the sector.
The Department will enforce regulations (including set norms and standards) according to the
Regulatory Framework (as per the Strategic Framework of 2003) and revitalise/expand innovative
approaches such as the incentive-based regulation programmes (Blue Drop, Green Drop and No
Drop programmes). Clear timeframes will be required to inform the sector on when new
regulations will be promulgated and by when regulatory programmes will be implemented.
Regulation will be discussed in detail in the next chapter.

National Water and Sanitation Master Plan Water is Life – Sanitation is Dignity
31 October 2018 NW&SMP: Volume 2: Plan to ActionFinal Draft (version 4.2)
6-1
6. REGULATING THE WATER AND SANITATION SECTOR
6.1 PRESENT STATE
Regulation of the water and sanitation sector is extremely
complex, with a large number of bodies responsible for different
aspects of regulation, as shown in Figure 6-1 below. The
primary regulation of the sector, however, is the responsibility of
the Department of Water and Sanitation. In addition to the formal
regulatory system, informal regulation, or influencing of
behaviour, is done through the media, community pressure groups, and voluntary regulation.
Figure 6-1: Regulatory responsibilities for the water and sanitation sector
Water resources regulation is aimed at achieving the sustainable and equitable use of a common
pool resource – water. Water services regulation is aimed at ensuring the provision of financially
sustainable, reliable and universal water supply and sanitation provision, with a particular focus
on ensuring affordable access to the poor.
Three different types of regulation are included in this framework: technical regulation,
governance regulation and economic regulation.
Technical regulation, such as water quality or abstraction control, is related to, but distinct from
the governance or economic regulation of water management and water services institutions.
Technical water resources regulation refers to the control of activities that impact on a water
resource. Economic regulation, on the other hand, refers to interventions in what are considered
1.4RegulatingWater andSanitation

National Water and Sanitation Master Plan Water is Life – Sanitation is Dignity
31 October 2018 NW&SMP: Volume 2: Plan to ActionFinal Draft (version 4.2)
6-2
to be market decisions, such as pricing, competition, the entry to or exit from the market, and
promoting economic efficiency. ‘Governance regulation’ refers to regulation of the governance of
subsidiary water institutions, such as catchment management agencies and water user
associations. This includes regulation of such matters as whether Governing Boards are
operating according to statutory and best practice requirements, whether adequate financial
management systems and controls are in place, and whether statutory requirements relating to
business plans, audited financial statements, and annual reports are met. Since an institution with
authority cannot delegate accountability to a contracted entity, it has to ensure that acceptable
standards are maintained according to service level standards agreed to in the Service Level
Agreement (SLA)/ Memorandum of Understanding (MOU) / Contract.
Broadly there are four categories of regulatory instruments used in the water sector: command
and control, economic and market instruments, information as regulation, and voluntary
instruments such as negotiated agreements and community-based policing.
Whatever regulatory instruments are used, some form of enforcement of those instruments is
required, either by ensuring compliance with command and control requirements, ensuring
payment for water use, or ensuring the accuracy of information provided.
Regulatory responsibilities
DWS is responsible for the regulation of water use (water use authorisation for the eleven uses
defined in the NWA, dam safety, ensuring equitable access to water and protection of aquatic
ecosystems). Dam safety is regulated through the Dam Safety Office in DWS. DWS also sets the
charges for raw water (infrastructure charges and water resources management charges and the
planned waste discharge charges) which, if correctly designed can play a regulatory role in water
use.
DWS is also responsible for the governance regulation of CMAs, water boards, water user
associations, the Trans Caledon Tunnel Authority (TCTA), WRC and the Komati Basin Water
Authority (KOBWA).
In relation to water services, DWS is responsible for ensuring that water services tariffs are in
accordance with regulations published under sections 9 and 10 of the WSA, and for setting
technical standards for water services and sanitation provision. Drinking water quality is regulated
under standards set by the South African Bureau of Standards (SABS). SABS also plays a critical
role in setting standards for water technology including taps and pipes.
Water services authorities are responsible for regulating water and sanitation provision and use
through by-laws and contracts with water services providers.
The use of public funds is regulated either through the PFMA or, at local government level,
through the MFMA.
Other government departments also have regulatory roles, as set out in Figure 6-1.
6.2 DRIVERS
There are several challenges that need to be addressed going forward to ensure an improved
and streamlined regulatory framework, as well as improved regulation of the sector.

National Water and Sanitation Master Plan Water is Life – Sanitation is Dignity
31 October 2018 NW&SMP: Volume 2: Plan to ActionFinal Draft (version 4.2)
6-3
Regulatory Complexity
The existing regulatory framework (legislation, regulations, policies, strategies, by-laws etc) for
the water cycle/value chain is highly complex in that multiple stakeholders/ role-players are
involved and different regulatory authorities; regulatory domains and mechanisms apply at
different levels. (e.g. environment, social, economic, health etc). The mandates of the various
players are not always clear, for example, in relation to the roles of DWS and COGTA in relation
to local government. The relative roles of DWS and CMAs are also not clear.
In addition, there are several regulatory bodies not in the water sector, that have functions and
powers that directly affect water resources, in particular DAFF, DEA, the Departments of Mineral
Resources, Energy, Human Settlements and Health. Changes to the regulations issued by, and
the regulatory practices of these bodies can significantly impact on water and sanitation
regulation.
A further complexity is the regulation of one sphere of government (local government) by another
(DWS) particularly since national government also has an obligation to support local government
to perform its functions effectively. A protocol has been developed on taking action against local
government which must be implemented effectively by DWS.
An integrated approach to water and sanitation regulation, and streamlined institutional
arrangements are thus required at the national level and across the spheres of government.
A significant challenge in the regulation of the water resources sector, and in achieving
transformation is access to water, is the ongoing use of water under the existing lawful use (ELU)
clause of the National Water Act. This clause was originally intended as a transitional one, but it
still governs most water use in the country. Water used under the ELU clause is more difficult to
regulate than licenced water use, as there are no specific and enforceable conditions attached to
the use as there are with licenced use.
Regulatory Capacity
The regulatory authorities need to have the necessary authority and capacity to effectively enforce
regulatory requirements and decisions. The current regulatory capacity in the water sector,
however, is insufficient, both in terms of the number of skilled staff, and in the appropriate tools
for regulation in the context of limited staff and financial resources.
In this regard, serious consideration will be given to the introduction of a system of administrative
penalties, rather than relying on the court system as the only means of imposing penalties on
those breaking the law. This approach will allow DWS and/or CMAs to impose significant fines on
those stealing water, discharging wastewater unlawfully, or otherwise breaking the law. The fines
must be concomitant with the seriousness of water crime in a water scarce country and relative
to the potential impact on human and ecological health.
Regulatory Autonomy and Independence
Some network industries lend themselves to competition, but elements such as electricity grids,
water pipelines and railway lines tend to be natural monopolies. They tend to have high fixed
costs and the average cost of service provisions decreases with the number of users of the
network. It is thus difficult to create meaningful competition or to encourage multiple market
entrants in these sectors. This requires effective economic regulation to protect both customers
and service providers. Some international practice has shown that such regulation works best
where there is the political will for economic regulation, and where regulators are independent,

National Water and Sanitation Master Plan Water is Life – Sanitation is Dignity
31 October 2018 NW&SMP: Volume 2: Plan to ActionFinal Draft (version 4.2)
6-4
publicly accountable and transparent, and where they have sufficient institutional and human
capacity. The potential for independent economic regulation in South Africa is under investigation
by DWS.
Information and regulation
Effective regulation of the water cycle/value chain is underpinned by the need to have access to
accurate and reliable information on an ongoing basis. The capacity of relevant institutions to
collect and collate such information and report on an ongoing basis and the capacity of the
regulatory authorities to interpret and respond to appropriately and timeously to the information is
clearly a major challenge for effective regulation of the sector.
The publication of information has also been shown, internationally, to be a powerful tool in
regulating the behaviour of water users. In South Africa, the Blue Drop, No Drop and Green Drop
reports have been extremely useful in changing the performance of municipalities. However, they
have not been produced since 2014. The re-invigoration of these three reports is seen as a critical
step in regulating the water services sector, and one that can be introduced immediately in 2018.
Internationally, water efficiency labelling and standards systems have been shown to be very
effective in driving down water demand. SABS has an important role to play in supporting DWS
in developing such a system for South Africa.
6.3 PRIORITIES FOR THE FUTURE
Achievement of the actions in the NW&SMP will result in a situation where there is sufficient
capacity in the regulatory institutions of the water sector in terms of staff, tools and legislative
backing to effectively regulate the use of water, the protection of water resources, and the
provision of water services and sanitation in the country. This will include sufficient engineering
capacity in DWS to carry out the dam safety regulatory function effectively.
A targeted approach will be adopted in which those whose non-compliance with legislation and
regulatory requirements has the biggest impact are the primary focus of compliance monitoring
and enforcement programmes. Only once the non-compliant high impact users have been
brought under control are smaller impact users addressed. In this way, the greatest impact will
be achieved with limited resources.
The intention is that, in introducing this targeted approach, successful prosecutions of high impact
users will be widely publicised, in order to drive behaviour change amongst other users based on
the realisation that DWS is taking action against defaulters. The imposition of significant
administrative fines on defaulters will make this easier.
WSAs use by-laws will be used effectively to protect urban river systems and groundwater, and
to meet water conservation and demand management targets in their areas of jurisdiction.
The following table as copied from Volume 1 (Call to Action) provides a summary of the PriorityActions:

National Water and Sanitation Master Plan Water is Life – Sanitation is Dignity
31 October 2018 NW&SMP: Volume 2: Plan to ActionFinal Draft (version 4.2)
6-5
Table 6-1: Priority Actions
Action Responsibility Completion date
Set cap on water use with reducing targets over time(Volume 3, Action 1.1.2)
DWS, CMAs, WSAs,CoGTA
2030
Revitalise the Green, Blue and No Drop programmesand publish results. Revise and establish norms andstandards (1.4.1)
DWS, WSAs Annually
Include water use efficiency and conservation targetsin the KPIs of municipal managers and municipalwater supply and sanitation managers, and inmunicipal implementation plans (1.4.2)
CoGTA, Municipalities 2019
Establish Water Efficiency Labelling and Standards(WELS) Scheme (1.4.3)
SABS, DWS 2025
Identify and prosecute major non-compliantabstractors (water thieves) across the country, with anational communication campaign to accompany theaction inclusive of reviving the Blue Scorpions (1.4.4)
CMAs, NPA, SAPS, DEA,Regulator, DMR, DWS,Blue Scorpions
2020
Replace all Existing Lawful Use (ELU) with licenceswith enforceable water use conditions (1.4.5)
DWS, CMAs 2030
Development and implementation of the MoUbetween the DWS and strategic users (1.4.6)
DWS, Chamber ofMines, Eskom,Industries
2020
Develop and implement municipal by-laws to protectwater quality (1.4.7)
DWS, WSAs 2020
Identify and prosecute big polluters across thecountry (including municipalities), with a nationalcommunication campaign to accompany the actioninclusive of reviving the Blue Scorpions (1.4.8)
CMAs, NPA, SAPS, DEA,DMR, DWS, BlueScorpions
2020
Establish a mechanism for applying administrativepenalties (1.4.9)
DWS, Dept of Justice 2023
Develop improved regulatory approaches to managepollution from land-based and in-stream activities(SA1, SA7, SA20 & SA29) (1.4.10)
DWS 2022
Develop and implement an action plan to strengthenwater use authorisation processes (SA24, SA25, SA26,SA27 & SA28) (1.4.11)
DWS, CMAs, WRC, CSIR 2022
Implement the Waste Discharge Charge System(WDCS) in priority catchments (SA5, SA41, SA42, SA43& SA44) (1.5.8)
NT, DWS, CMAs 2030
Ensure fiscal support for IWQM (SA38 & SA39)(1.5.11)
DWS, WSAs 2021
Develop and implement a diffuse pollution sourcestrategy that includes the regulation of land use(1.5.14)
DWS, CMAs 2023
Declare strategic water source areas and criticalgroundwater recharge areas and aquatic ecosystemsrecognised as threatened or sensitive as protectedareas (1.6.1)
DWS, CMAs, DEA 2021
Establish a business case for streamlined institutionalarrangements in the water and sanitation sector(2.1.1)
DWS 2020

National Water and Sanitation Master Plan Water is Life – Sanitation is Dignity
31 October 2018 NW&SMP: Volume 2: Plan to ActionFinal Draft (version 4.2)
6-6
Action Responsibility Completion date
Establish financially sustainable CMAs across thecountry, and transfer staff and budget and delegatedfunctions, including licensing of water use andmonitoring and evaluation of water resources (2.1.3)
DWS 2020
Determine the optimal configuration of water boardsto manage regional bulk water supply; assistmunicipalities to perform their primary water andsanitation services mandate where necessary,manage regional water resources infrastructure,manage regional bulk WTWs and WWTWs (2.1.5)
DWS, WBs 2020
Review and develop comprehensive and appropriateManagement, Monitoring and Reporting Structuresof the DWS data portal (2.2.1)
DWS Annually
Establish regulations on required qualifications andexperience for senior and technical positions in DWS,CMAs, water boards and municipal servicesinstitutions (2.3.1)
DWS, CoGTA, SETA 2023
Develop and implement programme for recruitingexperienced technical and managerial staff in firstSouth Africa and then internationally (2.3.2)
DWS, CoGTA, DIRCO 2030
Define (and reinstate in some cases) career pathswith defined training and on the job experience tobuild a knowledgeable sector of professionals (2.3.3)
DWS, WSAs, WBs,CMAs
2023
Develop and implement a mandatory, modularhands-on qualification for municipal water managers(technical manager) to be run over 18 months andaccredited by EWSETA to include aspects such asasset management, tariffs and revenue management,drought management, stakeholder engagement andcustomer relations (2.3.4)
DWS, EWSETA,Institutions of HigherLearning
Ongoing
All conditional grants to be dependent on meeting ofcurrent payments to the next entity in the valuechain, improvements to Blue Drop, Green Drop andNo Drop Scores to meeting targets and auditoutcome. Allow conditional grants to be used foroperational costs (2.4.3)
NT, AGSA, DWS 2023
Ensure that sufficient revenue is received throughtariffs and grants to operate, maintain and improvethe water supply and sanitation system. The tariffstructure must allow for cross subsidisation for theindigent and building of a reserve for periods ofdrought (2.4.5)
WSAs, WBs, DWS, NT,AGSA
2024
Review the Municipal Financial Management Act(MFMA) and the Municipal Systems Act (specificallychapter 8) to ensure that they provide an enablingenvironment for the provision of reliable water andsanitation services (2.5.4)
NT, DWS, CoGTA,SALGA
2020
Develop new policies and strategies on matters notpreviously addressed, in consultation with all
DWS 2025

National Water and Sanitation Master Plan Water is Life – Sanitation is Dignity
31 October 2018 NW&SMP: Volume 2: Plan to ActionFinal Draft (version 4.2)
6-7
Action Responsibility Completion date
stakeholders, to facilitate the sustainability of variouswater sector programmes (2.5.5)
Continue to invest in understanding emergingcontaminants (detection and treatment) in order toimprove our transition to reuse, reclamation andrecycling of water (2.6.15)
DWS, WRC, CSIR,Municipalities
Ongoing
Improving raw water quality:Invest in Communities of practise that bring togetherbuilt and ecological infrastructure experts andsolutions (2.6.16)
DWS, DEA, SANBI,WRC, CSIR, DST
Ongoing
Link the Global Environment Fund 6 project on WaterPricing and Ecosystems to Water Master Planimplementation and position DWS to be closelyinvolved in this process (2.6.17)
DWS, DEA, SANBI,WRC, CSIR
2024

National Water and Sanitation Master Plan Water is Life – Sanitation is Dignity
31 October 2018 NW&SMP: Volume 2: Plan to ActionFinal Draft (version 4.2)
7-1
7. IMPROVING RAW WATER QUALITY
7.1 PRESENT STATE
Water quality refers to the chemical, physical and biological
characteristics of water and is a measure of the condition of
water relative to a water quality compliance standard, or
relative to the water quality requirements of one or more
biotic species or receiving water users.
Although scientific measurements are used to define the quality of water, it's not a simple matter
to say that "this water is good" or "that water is bad". The quality of water that is required for
industrial purposes, for instance, is not necessarily the same quality of water that is required for
drinking purposes. Therefore, water quality, should be compliant to a set standard, or suitable
for its intended use, be it for agricultural, domestic, industrial, recreational or spiritual purposes,
or its suitability to maintain a healthy aquatic ecosystem.
South Africa faces a wide range of water quality challenges impacting on both surface water and
groundwater, originating from both point source discharges such as industrial processes and
municipal waste water treatment works, and from non-point sources due to run-off from land.
Approximately 83% of the country’s national monitoring sites reflect some form of water quality
challenge.
Deteriorating water quality has the potential to significantly limit the economic growth potential of
the country. The deterioration of water quality in rivers, streams, dams, wetlands, estuaries and
aquifers impacts on the economy, on human health, and on the healthy functioning of aquatic
ecosystems. Deteriorating water quality reduces the amount of water available for use as more
water must be retained to maintain the dilution capacity in our river systems. It increases the
costs of doing business as many enterprises are forced to treat water before using it in their
industrial processes.
The deterioration in water quality also impacts on human well-being, with productivity falling as
more work days are lost due to water-related illnesses and, finally, it threatens several economic
sectors by impacting on crop yields and making crops vulnerable to import restrictions in key
trading partner countries. Some of the impacts of water quality deterioration are immediately
visible, such as in the case of major fish kills, while others are more insidious and long-term.
Combined, however, they have a significant negative impact on socio-economic development in
South Africa.
Water quality and water quantity issues are inextricably linked, and the management of
water quality cannot be done in isolation from the management of abstraction, storage and use.
One of the elements of water quality management is recognising that water resources have a
limited capacity to assimilate waste, point above which the water resources becomes unfit for use
and lose ecological viability.
1. Water andSanitation
Management
1.5Improving RawWater Quality

National Water and Sanitation Master Plan Water is Life – Sanitation is Dignity
31 October 2018 NW&SMP: Volume 2: Plan to ActionFinal Draft (version 4.2)
7-2
Water quality problems are manifested at various scales (see figure below). Salinization,
sedimentation, nutrient enrichment and microbial pollution (associated with urban effluent) occur
at a national scale while acid mine drainage, agrochemical pollution and nutrient enrichment
(associated with industrial effluent and irrigation return-flows) occur at regional or site-specific
scales.
Figure 7-1: Different types of Water Quality problems across South Africa (Ashton, 2012)
Most of the country’s water resources are negatively impacted by a combination of wastewater
discharges and run-off from land-based activities. Major impacting sources include agricultural
drainage and wash-off (irrigation return-flows, fertilisers, pesticides and runoff from feedlots);
urban wash-off and effluent return-flows (bacteriological contamination, salts and nutrients);
industries (chemical substances); mining (acids, salts, metals and radioactivity); and areas with
insufficient sanitation services (microbial contamination). The quality of groundwater is impacted
on by mining activities, leachate from landfills, human settlements and intrusion of sea water.
As the economy and technologies develop, the pressures to stay abreast of new forms of pollution
increase, and monitoring and /or further investigation to improve our understanding of these
pollutants and their impacts will be critical.
There are five priority water quality issues that will be addressed through a strategic, adaptive
and action-oriented water quality management programme. These five priority issues are:
eutrophication; salinisation; acid mine drainage and acidification; sedimentation; and urban runoff
pollution.
These priority water quality challenges all have multi-sectoral characteristics and will need
strategic regulatory collaboration and partnerships between DWS and various other state
institutions across all three spheres of government (including CMAs, Water Boards, WSAs, DAFF,
DMR and the Department of Trade and Industry (DTI), the private sector and organised civil
society.

National Water and Sanitation Master Plan Water is Life – Sanitation is Dignity
31 October 2018 NW&SMP: Volume 2: Plan to ActionFinal Draft (version 4.2)
7-3
Historically, water quality management has been the sole mandate of DWS. However, there are
other government departments whose mandates have a profound impact on water quality, most
critically, the Departments of Environmental Affairs (DEA), Mineral Resources (DMR), Agriculture,
Forestry and Fisheries (DAFF), Health (DH), Human Settlements (DHS), Education (DoE), Co-
operative Government and Traditional Affairs (COGTA), National Treasury (NT), Trade and
Industry (DTI), together with provincial counterparts where relevant, and municipalities/WSAs.
Water quality management is, therefore, a government-wide task, to be implemented under
strong leadership of the DWS, with both the private sector and civil society playing a role.
“Mega trends” potentially affecting water quality
Several “mega-trends” have been identified, which can be expected to unfold in South Africa
during the next few decades and which could lead to new or accelerated water quality challenges
in many locations across the country. These include: climate change; hydraulic fracturing;
rural-urban migration and growth of inadequately serviced densely populated settlements; the
adoption of new manufacturing and industrial processes, and water re-use. These trends will
require new and adaptive management approaches, increased levels of cooperative governance
between sectors, and ongoing monitoring and evaluation.
7.2 PRIORITIES FOR THE FUTURE
7.2.1 High-level Water Quality Management Master Plan Targets
The national Integrated Water Quality Management Plan43 contains three high-level outcome-
based targets to be progressively realised by 2030. These targets also support those components
of SDG 6 that have direct water quality relevance. Each of these targets is only realisable through
the implementation of multiple preceding strategic actions. These three high-level targets pertain
to resource water quality management; source control; and integrated water quality management,
as follows:
43 Department of Water and Sanitation (DWS). 2017. Integrated Water Quality Management Plan

National Water and Sanitation Master Plan Water is Life – Sanitation is Dignity
31 October 2018 NW&SMP: Volume 2: Plan to ActionFinal Draft (version 4.2)
7-4
Figure 7-2: High-level Water Quality Management Master Plan Targets
TARGET 1: By 2030,water in, or from water resources shall be fit for use44
For water resources to be able to continuously sustain economic growth and social development,
the quality (or “resource quality”) of such water resources needs to be maintained within pre-
determined parameters.
These resource parameters, or Resource Directed Measures (RDMs), are represented by the
Resource Management Class, Resource Quality Objectives (RQOs) and the Reserve.
Collectively the RDMs, and more specifically the resource water quality objective (RWQO)
components of RQOs, provide performance indicators to benchmark the fitness-for-use of water
resources; and to measure the effectiveness of water quality management measures being
applied. It is, thus, essential that RWQOs must be determined for all significant water resources
and that they are given effect through appropriate source controls, such as through water use
licensing (as per Section below). Suitable water quality monitoring must also be carried out to
gauge performance as a potential precursor to possible corrective action.
The purpose of Target 1 is to progressively ensure that all water resources are fit for use. It is
further unpacked in the table below.
44 National Planning Commission.2012. National Development Plan.

National Water and Sanitation Master Plan Water is Life – Sanitation is Dignity
31 October 2018 NW&SMP: Volume 2: Plan to ActionFinal Draft (version 4.2)
7-5
Table 7-1: High-level Water Quality Management Master Plan Target 1
Target text Normative interpretation
“By 2030… Implies the progressive realisation of the set target over time by thespecified year.
…water in, or from water resources… Implies custodianship over all surface water, groundwater andestuaries.
…shall be fit for use.” Implies compliance to the fitness-for-use criteria, as determined forreceiving water resources. Such fitness-for-use criteria arerepresented by Resource Quality Objectives (RQOs), determined interms of Section 13(1)(b) of the National Water Act, 1998 (Act No. 36of 1998), or in the absence thereof, by in-stream water qualityobjectives that are set, based on the South African Water QualityGuidelines. Fitness-for-use may relate to the water qualityrequirements of the aquatic ecosystem, or the domestic-, agricultural-, industrial- and/ or recreational water user sectors.
Note: Source control measures to ensure fitness-for-use ofreceiving water resources may relate to the management ofpoint- and diffuse source impacts. Target 2 focuses on thecontrol of point-sources of potential pollution.
TARGET 2: By 2030, all waste/ water containing waste generated by households and byeconomic activities shall be disposed of/ discharged lawfully and safely45
The control and management of sources of water pollution is guided by the
National Environmental Management Act, 1998 (Act No. 107 of 1998) as well as the Resource
Directed Measures (RDMs) determined for affected water resources.
The precautionary approach is always applicable and will be balanced against socio-economic
needs. Preventing pollution in the first place will always be encouraged while pursuing the best
practicable environmental option. Should some water quality degradation be inevitable, waste
minimisation will be encouraged.
All water uses that may affect the water quality of a water resource, i.e. the disposal of waste or
the discharges of water containing waste to a water resource, are regulated under the National
Water Act, 1998 (Act No. 36 of 1998) and must be compliant with the conditions of the relevant
water use authorisation. Discharges of water containing waste to municipal waste water
treatment works must be compliant with the relevant bylaws of such municipalities. Compliance
monitoring is essential, and strong action will be taken against unlawful and/or non-compliant
water uses.
The effective regulation of water use and the effective control of potential sources of water
pollution are prerequisites to maintaining and improving the water quality of the country’s water
resources. Target 2 is focused on improving the water quality regulatory environment. The table
below provides an interpretation of this target.
45 National Planning Commission.2012. National Development Plan.

National Water and Sanitation Master Plan Water is Life – Sanitation is Dignity
31 October 2018 NW&SMP: Volume 2: Plan to ActionFinal Draft (version 4.2)
7-6
Table 7-2: High-level Water Quality Management Master Plan Target 2
Target text Normative interpretation
“By 2030… Implies the progressive realisation of the set target overtime by the specified year.
…all waste/… Implies disposed waste that may potentiallydetrimentally affect (a) water resource(s).
…water containing waste… Implies discarded effluent that is no longer required bythe owner or user. Such effluent includes effluentdischarged to a municipal waste water treatment worksor to a water resource or reused by another user withoutfurther treatment.
…generated by households… Implies sewage and faecal sludge emanating from thedomestic sector.
…and by economic activities… Implies industrial effluent and waste emanating fromactivities identified in the Standard IndustrialClassification of all Economic Activities (1993), asamended and supplemented.
…shall be disposed of/ discharged lawfully… Implies (1) the implementation of the Water QualityManagement Hierarchy of pollution prevention, wasteminimisation, and the differentiated utilisation of thecapacity of receiving water resources to assimilatewaste, as per Section 2(4)(ii) and (iv) of the NationalEnvironmental Management Act, 1998 (Act No. 107 of1998); (2) where relevant, that such water use ispermissible in terms of the National Water Act, 1998(Act No. 36 of 1998); (3) where relevant, such water useis compliant with the conditions contained in theapplicable authorisation; and (4) where relevant, thatsuch water use is compliant with the stipulations of theapplicable bylaws.
…and safely.” Implies that the conditions that are attached to suchlawful water use should link to the resource qualityrequirements of receiving water resources. See Target1 (Table 7-1.
TARGET 3: By 2030, integrated Water Quality Management shall be implemented at alllevels, including the transboundary, national, water management area (WMA) and sub-catchment levels
Integrated water quality management (IWQM) aims to achieve specific objectives in a particular
management unit, taking into consideration the defining principles and background conditions
relevant to that specific management unit, whether the management unit in question is at the level
of an internationally shared river basin, at the level of an individual water user, or somewhere in
between. See the figure below.

National Water and Sanitation Master Plan Water is Life – Sanitation is Dignity
31 October 2018 NW&SMP: Volume 2: Plan to ActionFinal Draft (version 4.2)
7-7
Figure 7-3: International, national and catchment Water Quality Planning (adapted from DWS, 2015)
Operationally, IWQM involves applying knowledge from various disciplines, as well as the insights
from diverse stakeholders, to devise and implement efficient, equitable and sustainable solutions
to water quality and development challenges. Coherent and integrated water quality management
is only achievable when water quality challenges are addressed holistically within catchments
through a process of water quality planning to attain desired water quality outcomes.
The establishment and implementation of water quality management strategies at WMA and/ or
sub-catchment level is central to the integration of management efforts. These strategies will also
provide input to the development and implementation of catchment management strategies and
future revisions of the National Water and Sanitation Resources and Services Strategy.
Target 3 aims to establish structure towards the integrated management of Water Quality and
stands in support of the aims of Targets 1 and 2. The table below provides an interpretation
Target 3.
Table 7-3: High-level Water Quality Management Master Plan Target 3
Target text Normative interpretation
“By 2030… Implies the progressive realisation of the set target over time bythe specified year.
…integrated Water Quality Management… Is that distinct component of Integrated Water ResourceManagement that promotes the coordinated and holisticmanagement of Water Quality to achieve specific objectiveswithin a particular management unit, taking into consideration thedefining principles and background conditions relevant to thatspecific management unit, in order to maximize the resultanteconomic and social benefit in an equitable manner withoutcompromising ecologically sustainable development.
…shall be implemented… Refers to the Johannesburg Plan of Implementation (2002)objective, i.e. to develop Integrated Water Resource Managementand Water Efficiency plans. The aforementioned include WaterQuality Management and considering Targets 1 (Table 7-1) and2 (Table 7-2).

National Water and Sanitation Master Plan Water is Life – Sanitation is Dignity
31 October 2018 NW&SMP: Volume 2: Plan to ActionFinal Draft (version 4.2)
7-8
…at all levels,… Refers primarily to vertical levels of governance, fromtransboundary cooperation between basin states to nationalGovernment to CMAs to local government, including water usersand stakeholder participation.
…including the trans-boundary(international),...
Implies the development and implementation of cooperationagreements to address water quality matters of mutual interest inrespect of surface water and/ or groundwater basins (aquifers)that cross international borders or are shared among two or moreco-basin states.
…national,… Implies the development and implementation of water qualitymanagement approaches that apply uniformly across SouthAfrica, including national policy and strategy.
…Water Management Area (WMA) andsub-catchment levels.
Implies the development and implementation of water qualitymanagement approaches that address catchment specificchallenges and concerns, including the development andimplementation of catchment water quality managementstrategies and thematic plans.
7.2.2 Prioritised focus for maintaining or improving water quality
There are several areas that are priority for implementation under the NW&SMP. Firstly, there is
a need to develop a diffuse source pollution strategy that will include improved regulation of land
use in order to reduce diffuse source pollution.
The implementation of the waste discharge charges strategy is of critical importance in order to
increase the funding available for the management and rehabilitation of polluted catchments, but
also in order to incentivise the reduction of pollution. In line with this, the waste discharge charge
will be implemented in three priority catchments initially, the upper Crocodile, the upper Vaal and
the upper Olifants catchments. This will be followed by programmes to rehabilitate and manage
the water quality in these catchments.
At the municipal level, there is a need to restructure the grant funding mechanisms for water
supply and sanitation to ensure that existing infrastructure is effectively maintained, including
waste water treatment works. This also requires standardised O&M budgeting and expenditure.
A national programme is also needed to turn around dysfunctional WWTW and to ensure that
they are effectively maintained once they have been rehabilitated.
Pollution in the Vaal River system will be improved by the construction of a desalination plant to
treat AMD from the Wits mining basins.
Strong enforcement of licence conditions is necessary to prevent pollution and to improve water
quality across the country. While the introduction of a system of administrative penalties will assist
in this regard, in the interim, the more conventional route of prosecution through the courts will be
required.
To support this, it will be important to build the necessary skills and expertise in government
through clear definition of career paths, and on the job training and experience.
7.2.3 List of priority actions
The following table as summarised in Volume 1 of the NW&SMP provides a list of priority actions
to be implemented:

National Water and Sanitation Master Plan Water is Life – Sanitation is Dignity
31 October 2018 NW&SMP: Volume 2: Plan to ActionFinal Draft (version 4.2)
7-9
Table 7-4: Priority Actions
Action Responsibility Completion date
Development of strategic water resources infrastructure(Volume 3, Action 1.1.10)
DWS, LHDA, WSAs,WBs, TCTA
2025
A National water and wastewater treatment performanceturnaround plan to be developed and implemented. Turnaround the functionality of five, currently dysfunctional,large water and wastewater treatment works with anaccompanying publicity campaign, followed by aprogramme addressing the rest (1.3.12)
DWS, WSAs, NT,WBs, CoGTA
2030
Develop and implement municipal bylaws to protectwater quality (1.4.7)
DWS, WSAs 2020
Identify and prosecute big polluters across the country(including municipalities), with a national communicationcampaign to accompany the action (1.4.8)
CMAs, NPA, SAPS,DEA, DMR, DWS,Blue Scorpions
2020
Establish a mechanism for applying administrativepenalties (1.4.9)
DWS, Dept ofJustice
2023
Implement measures to ensure that water users use anddischarge water responsibly and adhere to regulatoryrequirements (1.5.1)
DWS, CMAs, WSAs 2022
Determine in-stream Resource Water Quality Objectives(RWQOs), based on the SA Water Quality Guidelines(SA36), in support of RQO's (1.5.1)
DWS, CMAs 2020
Routinely monitor resource water quality (SA46, SA47SA48) (1.5.2)
DWS, CMAs 2030
Establish and maintain appropriate and accessibleinformation management system(s) for resource waterquality (SA49, SA51 & SA60) (1.5.3)
DWS, CMAs 2030
Assess resource water quality information (SA52 & SA59)(1.5.4)
DWS, CMAs 2030
Implement adaptive source control-based water qualitymanagement interventions, in accordance with relevantcatchment plans and strategies (SA34 & SA35) (1.5.5)
Chamber of Mines,DWS, CMAs, DMR
2030
Develop and implement a strategic action plan for therehabilitation and upgrade of prioritized WWTWs (SA17)(1.5.6)
DWS, WSAs, NT,SALGA, CoGTA
2023
Adopt an integrated planning approach at trans-boundary(international), national, Water Management Area andsub-catchment levels (SA16, SA17, SA18, SA21, SA22, SA23& SA33) (1.5.7)
DWS 2030
Implement the Waste Discharge Charge System (WDCS) inpriority catchments (SA5, SA41, SA42, SA43 & SA44)(1.5.8)
NT, DWS, CMAs 2030
Ensure IWQM is supported by effective departmentalarrangements (SA8 & SA9) (1.5.9)
DWS 2020
Formalise governance frameworks to supportengagements on water quality management (SA10, SA11,SA12, SA13, SA14, SA15, SA54 & SA61) (1.5.10)
DWS, CMAs, WSAs 2030

National Water and Sanitation Master Plan Water is Life – Sanitation is Dignity
31 October 2018 NW&SMP: Volume 2: Plan to ActionFinal Draft (version 4.2)
7-10
Action Responsibility Completion date
Ensure fiscal support for IWQM (SA38 & SA39) (1.5.11) DWS, WSAs 2021
Build water quality management capacity throughrecruitment, education and training (SA53, SA54, SA55 &SA56) (1.5.12)
DWS, CMAs, NT,WRC, CSIR, SETA
2030
Create an informed, supportive and responsible public(SA62) (1.5.13)
DWS, CMAs, WSAs 2030
(1.5.14) Develop and implement a diffuse pollution sourcestrategy that includes the regulation of land use
DWS, CMAs 2023
Implement programmes to rehabilitate catchmentsthrough development of Catchment business plans(1.5.15)
DWS, NT, CMAs 2025
Secure funds for restoration and ongoing maintenance ofecological infrastructure through operationalising thewater pricing strategy (1.6.4)
DWS, CMAs, DEA,SANBI
Annually
Establish a business case for streamlined institutionalarrangements in the water and sanitation sector (2.1.1)
DWS 2020
Establish financially sustainable CMAs across the country,and transfer staff and budget and delegated functions,including licensing of water use and monitoring andevaluation of water resources (2.1.3)
DWS 2020
Establish the National Water Resources and ServicesAuthority (2.1.4)
DWS, NT 2020
Review and develop comprehensive and appropriateManagement, Monitoring and Reporting Structures of theDWS data portal (2.2.1))
DWS Annually
Review and develop a comprehensive DWS informationmanagement strategyto include among other:• Amended authorisation conditions to provide for self-reporting• Harmonization of monitoring actions by all responsibleinstitutions• Perform information V&V audit (2.2.2) s
DWS Annually
Alignment of monitoring institutions to support Nationaland International reporting programmes, e.g. SDGs,Agenda 63 and AMCO (2.2.3)
DWS 2021
Establish regulations on required qualifications andexperience for senior and technical positions in DWS,CMAs, water boards and municipal services institutions(2.3.1)
DWS, CoGTA, SETA 2023
Develop and implement programme for recruitingexperienced technical and managerial staff first in SouthAfrica and then internationally (2.3.2)
DWS, CoGTA,DIRCO
2030
Define (and reinstate in some cases) career paths withdefined training and on the job experience to build aknowledgeable sector of professionals (2.3.3)
DWS, WSAs, WBs,CMAs
2023
Develop and implement institutional arrangement thatrecognise the diversity of circumstances across SouthAfrica, the legacy of Apartheid and allow for regional crosssubsidisation (2.4.1)
NT, DWS 2021

National Water and Sanitation Master Plan Water is Life – Sanitation is Dignity
31 October 2018 NW&SMP: Volume 2: Plan to ActionFinal Draft (version 4.2)
7-11
Action Responsibility Completion date
Develop new policies and strategies on matters notpreviously addressed, in consultation with allstakeholders, to facilitate the sustainability of variouswater sector programmes (2.5.5)
DWS 2025
Improving raw water quality:Invest in Communities of practise that bring together builtand ecological infrastructure experts and solutions(2.6.16)
DWS, DEA, SANBI,WRC, CSIR, DST
Ongoing
Continue to do research on land use impact on waterlinked ecosystems (2.6.18)
WRC, CSIR, DEA,DWS, DAFF, ARC
Ongoing
Ongoing research, modelling and planning around climatechange and its impacts on water security and waterinfrastructure needs to be conducted (2.6.19)
DWS, DEA, DSTWRC, CSIR
Ongoing
7.2.4 Provincial priorities
When implementing the priority actions cognizance to be given to specific water quality priorities
per province46. These are summarised in Table 7-5.
Table 7-5: Provincial Priorities
Province Meeting backlogAddressing wastewater
treatment worksO&M priorities
Eastern Cape
Additional resources* forrural programme andurban informalsettlements, as well asother backlogs.
Upgrade failing WWTW,extend capacity of under-capacity works
Moderate Green Drop riskprofile: Strengthen O&Mcapacity and resources inall areas
Free State
Additional resources* forrural & urban programmesas well as other backlogs.
Replace all bucket toiletsin formal areas
Upgrade failing WWTWs,improve maintenance ofWWTWs, extend capacityof under-capacity works
Moderate Green Drop riskprofile: Strengthen O&Mcapacity and resources inall areas
Gauteng
Additional resources* forurban informalsettlements as well asother backlogs.
Extend good performanceto all areas
Moderate Green Drop riskprofile: Strengthen O&Mcapacity and resources inall areas
Kwa-Zulu Natal
Additional resources* forrural programme andurban informalsettlements as well asother backlogs.
Extend good performanceto all areas
Moderate Green Drop riskprofile: Strengthen O&Mcapacity and resources inall areas
LimpopoAdditional resources* forrural programme as wellas other backlogs.
Upgrade failing WWTWs,improve maintenance ofWWTWs, extend capacityof under-capacity works
High Green Drop riskprofile: Strengthen O&Mcapacity and resources inall areas
46 Department of Water and Sanitation.2017. Integrated Water Quality Management Policy.

National Water and Sanitation Master Plan Water is Life – Sanitation is Dignity
31 October 2018 NW&SMP: Volume 2: Plan to ActionFinal Draft (version 4.2)
7-12
Province Meeting backlogAddressing wastewater
treatment worksO&M priorities
Mpumalanga
Additional resources* forrural and small townprogrammes as well asother backlogs.
Upgrade failing WWTWs,improve maintenance ofWWTWs, extend capacityof under-capacity works
High Green Drop riskprofile: Strengthen O&Mcapacity and resources inall areas
North West
Additional resources* forrural and small townprogrammes as well asother backlogs.
Upgrade failing WWTWs,improve maintenance ofWWTWs, extend capacityof under-capacity works
High Green Drop riskprofile: Strengthen O&Mcapacity and resources inall areas
Northern Cape
Additional resources* forsmall town programmesas well as other backlogs.
Replace all bucketsanitation in formal areas.
Upgrade failing WWTWs,improve maintenance ofWWTWs, extend capacityof under-capacity works
High Green Drop riskprofile: Strengthen O&Mcapacity and resources inall areas
Western Cape
Additional resources* forurban informalsettlements as well asother backlogs.
Extend good performanceto all areas
Moderate Green Drop riskprofile: Strengthen O&Mcapacity and resources inall areas
* Resource needs include financial, skilled human resources and dedicated institutional units

National Water and Sanitation Master Plan Water is Life – Sanitation is Dignity
31 October 2018 NW&SMP: Volume 2: Plan to ActionFinal Draft (version 4.2)
8-1
8. PROTECTING AND RESTORING ECOLOGICAL INFRASTRUCTURE
South Africa is known for its rich biodiversity boasting one of the world’s six floral kingdoms and
a wide variety of aquatic ecosystems, including seven of the world’s freshwater eco-regions.
These eco-regions are characterised by a wide range of river ecosystems, wetlands and estuarine
types.
The protection of the ecological infrastructure of our natural aquatic ecosystems is crucial for
economic development, water and food security and the assurance of healthy and functional
water resources that will support future sustainable development.
The Millennium Ecosystem Assessment categorised four types of ecosystem services:
provisioning, regulating, cultural and supportive as described below:
Provisioning: Products that are obtained from ecosystems such as food, wood, and
water;
Regulating: Benefits that are accrued from the regulation of ecosystem services such as
water purification, and water regulation (wetlands) disease regulation and climate
regulation;
Cultural: Non-material benefits that are obtained from ecosystems and includes spiritual
and religious, aesthetic, sense of place and recreational; and
Supportive: Services that are necessary to support all other services and includes soil
formation and retention (i.e. riparian vegetation, wetlands) water cycling, nutrient cycling
and primary production (migratory routes and connectivity of water resources from source
to sea).
The continuous over utilisation and inadequate protection of ecological systems and infrastructure
has led to changed characteristics of rivers from perennial to more seasonal, from ephemeral to
perennial and in many cases, has pushed the rivers and/or other water resources beyond the
point where they can be restored to their original ecological condition. In these worst-case
scenarios, the ecological services and functions of the water resource have been lost to such an
extent that rehabilitation of these systems is not possible without significant investment.
About 50% of South Africa’s water resourcesoriginate from 8% of our land. These strategic watersources (‘water factories’) must be protected andmaintained through appropriate regulation.
The capacity of catchment-based institutions toharness the value of ecological infrastructure in thewater value chain needs urgent attention.

National Water and Sanitation Master Plan Water is Life – Sanitation is Dignity
31 October 2018 NW&SMP: Volume 2: Plan to ActionFinal Draft (version 4.2)
8-2
Figure 8-1: Deterioration of ecological condition of South African rivers, 1999 – 2011 (Source: Nel, J.L. & Driver, A. 2015. National River Ecosystem Accounts for SouthAfrica)

National Water and Sanitation Master Plan Water is Life – Sanitation is Dignity
31 October 2018 NW&SMP: Volume 2: Plan to ActionFinal Draft (version 4.2)
8-3
Figure 8-2: Ecological condition of South African wetlands, 2011 (Source: Nel J.L. and Driver A. 2012. South African National Biodiversity Assessment 2011: TechnicalReport. Volume 2: Freshwater)

National Water and Sanitation Master Plan Water is Life – Sanitation is Dignity
31 October 2018 NW&SMP: Volume 2: Plan to ActionFinal Draft (version 4.2)
8-4
8.1 PRESENT STATE
Water ecosystems comprise river ecosystems, wetland ecosystems, estuarine ecosystems, as
well as the contribution from aquifers.
8.1.1 River Ecosystems
River ecosystems are vital for supplying fresh water: they store and transport water and,
combined with constructed storage and transfer schemes, bring water to urban and rural areas,
irrigate croplands, take away waste and provide cultural and aesthetic services. Healthy
tributaries help to maintain natural flow pulses and flush pollutants from hard- working larger
rivers, contributing to the quantity and quality of water supplies.
Contrary to popular perception, fresh water flowing from rivers out to sea is not wasted but is
essential for maintaining healthy ecological systems in estuaries as well as coastal and marine
ecosystems, and the social and economic benefits received from them.
Fifty-seven percent of river ecosystem types are threatened (25% critically endangered, 19%
endangered and 13% vulnerable). Tributaries tend to be in better ecological condition than main
rivers, so the proportion of threatened river ecosystem types is higher if only main rivers are
assessed, with 65% of main rivers threatened (including 46% critically endangered)47.
Mountain streams are the best protected while lowland rivers have the highest proportion of
ecosystem types with no protection.
High water yield areas are defined as sub-quaternary catchments in which mean annual runoff is
at least three times the average for the related primary catchment. These areas constitute only
4% of South Africa’s surface area and are the ‘water factories’ of the country. Currently only 18%
of them have any form of formal protection. Given their strategic importance for water security,
options for formal protection of high water yield areas should be explored, for example declaring
them as Protected Environments in terms of the Protected Areas Act.
Rivers are linear ecosystems and are impacted on by land uses and activities throughout their
catchments. Protected areas alone will seldom do the full job of protecting river ecosystems,
particularly in the lower reaches. This highlights the importance of using the integrated water
resource management tools provided by the National Water Act and other pieces of legislation,
including the ecological reserve, the classification of water resources and the determination and
implementation of resource quality objectives. For all rivers, good land-use practices such as
keeping natural vegetation intact along river banks can make a vital difference to their ecological
integrity.
8.1.2 Wetland Ecosystems
Wetland ecosystems are vital for purifying water and regulating water flows, acting as sponges
that store water and release it slowly, filtering pollutants and easing the impact of droughts and
47 Department of Environmental Affairs. 2011. National Biodiversity Assessment 2011: An Assessment of South
Africa’s biodiversity and ecosystems.

National Water and Sanitation Master Plan Water is Life – Sanitation is Dignity
31 October 2018 NW&SMP: Volume 2: Plan to ActionFinal Draft (version 4.2)
8-5
floods in the process. They also support a rich diversity of species, which have both intrinsic and
economic value.
According to the National Biodiversity Assessment (2011), 65% of wetland ecosystem types are
threatened (48% critically endangered, 12% endangered and 5% vulnerable), making wetlands
the most threatened of all ecosystems. Only 11% of wetland ecosystem types are well protected,
with 71% not being protected at all, reflecting the fact that wetland ecosystems have not been
systematically considered in establishing and expanding land-based protected areas. There is
clearly scope for the protected area network to play a bigger role in protecting South Africa’s
wetlands.
Wetlands are exceptionally high-value ecosystems that make up only a small fraction of the
surface area of the country. Given their strategic importance as ecological infrastructure for
ensuring water quality and regulating water supplies, investments in conserving, managing and
restoring wetlands are likely to generate disproportionately large returns.
8.1.3 Estuarine Ecosystems
Estuaries are formed where fresh water from rivers meets the sea, although the mouths of some
estuaries periodically close off from the sea. They are often focal points for coastal development
and recreation, including water sports, fishing and holiday-making.
Estuaries provide nursery areas for many commercially important fish species and pass through
sediments that form and maintain beaches and provide nutrients for marine food webs.
Estuaries face multiple pressures from human activities, often resulting from development too
close to the estuary as well as the cumulative impacts of land uses throughout the catchment.
Reductions in the quantity and quality of fresh water that reaches an estuary, because, for
example, of dams higher up in the catchment, or activities such as sand mining, can impact
severely on its ecological condition and ability to provide ecosystem services.
Of estuary ecosystem types, 43% are threatened (39% critically endangered, 2% endangered
and 2% vulnerable). The proportion of threatened types is highest in the cool temperate region
(the west coast, which has relatively few estuaries) and lowest in the warm temperate region
(south and southeast coast, including the many small estuaries along the Wild Coast, most of
which are in good ecological condition). Only 33% of estuary ecosystem types are well protected
and 59% have no protection at all48.
8.1.4 Groundwater
An aquifer is both a reservoir and a transport channel. Groundwater flow in an aquifer is governed
by the aquifer’s intrinsic characteristics (shape, size, permeability etc.) but also by its recharge,
largely produced by infiltration of precipitation.
48 Department of Environmental Affairs. 2011. National Biodiversity Assessment 2011: An Assessment of South
Africa’s biodiversity and ecosystems.

National Water and Sanitation Master Plan Water is Life – Sanitation is Dignity
31 October 2018 NW&SMP: Volume 2: Plan to ActionFinal Draft (version 4.2)
8-6
Most of the groundwater flow eventually ends up in springs and streams. Groundwater recharge
and discharge are thus the links between groundwater and other components of the water cycle.
Wherever groundwater flows or discharges to the surface, aquifer-dependent ecosystems (ADEs)
can occur. Their identification is often difficult, but a type-setting and identification study has been
undertaken to guide groundwater management and allocation.
8.2 DRIVERS
8.2.1 River Ecosystems
Rivers are the lowest points in any given topography, and often the receivers of cumulative
impacts from across the landscape.
Abstraction of water and changes to the timing and quantity of flows, because of dams or transfer
schemes between catchments, exert pressure on aquatic ecosystems in rivers. Pollution is a
serious and growing problem, as is the destruction of natural vegetation along river banks which
results in irreversible damage to rivers and their ability to provide ecosystem services. Sand
mining and other structural alterations in rivers also impacts negatively on riverine ecosystems.
Invasive alien species in rivers and along the banks are also impacting negatively on ecosystem
functioning.
Land management throughout catchments influences the health of river ecosystems. Water
resources cannot be managed in isolation from the land-based activities that surround them.
8.2.2 Wetland Ecosystems
Several pressures contribute to the loss and degradation of wetlands, some of them occurring at
the wetland site and others related to land management in the wider catchment. The most
prevalent on-site causes of wetland loss and degradation are: mining, cultivation, urban
development, dam construction and poor grazing management causing erosion.
The most prevalent off-site causes of wetland degradation are:
Disruption of the flow regime (changes to the amount and timing of flows of freshwater to the
wetland, for example as a result of water abstraction, effluent discharge, and dams in the
catchment)
Deterioration of water quality in associated rivers as a result of polluting activities in the
surrounding catchment and
Poor grazing management or poor crop production practices in the catchment that result in
an increased sediment load being deposited in the wetland.
The health of rivers and wetlands is linked. A river in poor condition is likely to affect the condition
of associated wetlands. Similarly, destruction of wetlands has an impact on river condition
because the wetlands are no longer able to filter pollutants from surrounding land uses to prevent
them ending up in the river. Buffers of natural vegetation around wetlands can play a major role
in keeping wetlands healthy and well-functioning, even if land uses in the surrounding catchment
are not wetland-friendly.
8.2.3 Estuarine Ecosystems
The threats to estuarine health and biodiversity can ultimately be grouped as follows:
Flow modification

National Water and Sanitation Master Plan Water is Life – Sanitation is Dignity
31 October 2018 NW&SMP: Volume 2: Plan to ActionFinal Draft (version 4.2)
8-7
Pollution (e.g. from agriculture, waste water treatment works (WWTW), industry, mining, and
sediment)
Over-exploitation of living resources (fish and invertebrates)
Habitat destruction (within the estuarine functional zone)
Invasive alien species and
Climate change.
A general trend is that estuaries fed by larger catchments tend to be in poorer health than
estuaries in neighbouring smaller catchments. This is partly because larger catchments have
larger rivers which are generally more heavily utilised and attract more coastal development and
other economic activity.
Smaller estuaries (and their related smaller catchments) generally tend to be subjected to fewer
pressures. If there are no direct development pressures such as urban development on these
smaller estuaries, they tend to be healthy.
8.2.4 Groundwater
Land-use exerts major contaminating impacts on groundwater from a wide range of activities and
through impacting groundwater recharge processes. The negative impacts are enhanced by
ignorance and by the unseen nature of groundwater - it takes a long time to notice that it has
become polluted and it is difficult to clean a contaminated aquifer.
Knowledge of groundwater pollution is limited because monitoring information is only available at
a national or regional level, while pollution impacts are generally localized. Groundwater
compliance monitoring is not yet sufficiently operational. A major concern, picked up through
national monitoring49, is increasing nitrate levels in boreholes in parts of the Limpopo, North West
and Free State provinces.
8.3 PRIORITIES FOR THE FUTURE
The desired state of a water resource is the state that ensures that it functions sustainably i.e. a
state that supports ecological functioning as well as socio-economic requirements (which include
basic human needs) without compromising the ability of the resource to provide appropriate goods
and services.
Ecosystems that are in a state consistent with its Recommended Ecological Category (REC) are
referred to as being in a desired state. However, practically this cannot be achieved for some
water resources due to irreversible actions such as dam building. Therefore, in these instances
the desired state may be not be the REC but maintaining the Present Ecological State (PES) and
not allowing any further degradation. The RECs and PESs have been determined for a most of
the water resources in South Africa through RDM studies (i.e. Reserve, Classes and Resource
Quality Objectives).
49 Water Research Commission. 2017. National Groundwater Strategy.

National Water and Sanitation Master Plan Water is Life – Sanitation is Dignity
31 October 2018 NW&SMP: Volume 2: Plan to ActionFinal Draft (version 4.2)
8-8
8.3.1 Rivers and Wetlands
A free-flowing river is a long stretch of river that has not been dammed. There are very few large
rivers that are dam-free, or ‘free-flowing’ in South Africa. The flagship free-flowing rivers identified
in the National Freshwater Ecosystem Priority Areas (NFEPA) initiative should receive top priority
for maintaining their dam-free status, while carefully weighed against the plans to increase supply
through a number of planned dams as discussed in section 3.7.1.
Managing these areas in a good condition is not just about conserving freshwater plants and
animals – but should also be regarded as a comprehensive approach to sustainable and equitable
development of water resources. The PES and/or REC for all river Freshwater Ecosystem Priority
Areas (FEPAs) needs to be maintained or improved.
Healthy tributaries can improve water quality by ‘flushing’ pollutants when they join their main
stem rivers, and they also replenish water supply in the main stem. Wetlands filter pollutants and
sediments from the surrounding landscape thus preventing them from entering the river. They
also regulate the flow of water from the surrounding landscape which helps to reduce the effects
of flood (by slowing down run-off) and droughts (by reducing evaporation).
8.3.2 Estuaries
Freshwater running out to sea should not be considered wasted. Fresh water flowing to estuaries
and the sea provide important inputs such as nutrients, sediments and carbon, which in turn
maintain important ecological processes that keep marine resources healthy. Healthy marine and
coastal ecosystems sustain commercial and recreational fish stocks and provide a source of food
to poor coastal communities that depend directly on marine resources for food.
A certain amount of water is also required to scour the mouth of most estuaries – without this
scouring effect, sediments build up at the mouth and the risk of back-flooding during storms
increases. Artificial breaching of an estuary mouth to minimise this risk is expensive and damages
estuarine ecosystems.
Important estuaries must be classified, have RQOs and reserves determined and be monitored
for compliance with the class, RQOs and reserve requirements.
8.3.3 High water yield areas play a critical role in securing South Africa’s water supplies
High water yield areas and high groundwater areas generally occur in mountain catchment areas.
These are the ‘water factories’ of the catchment and generate a large proportion of the water for
human and ecological use. Maintaining these areas in a healthy state will allow for the use of
clean water downstream that can also maintain ecosystem functioning and biodiversity.
The CSIR, in association with DWS and the WRC, identified and delineated key water source
areas in the country that need protection, as per the map below.

National Water and Sanitation Master Plan Water is Life – Sanitation is Dignity
31 October 2018 NW&SMP: Volume 2: Plan to ActionFinal Draft (version 4.2)
8-9
Figure 8-3: Key water source areas
(Source: Enhancement of the method to identify and delineate South Africa’s Water Source Areas (K5/2431). Deliverable 7. Draft Integrated Report. June 20 Le Maitre, D..C., Seyler,
H., Holland, M., Smith-Adao, L.B., Maherry, A., Nel, J.L. and Witthüser, K. 2017).

National Water and Sanitation Master Plan Water is Life – Sanitation is Dignity
31 October 2018 NW&SMP: Volume 2: Plan to ActionFinal Draft (version 4.2)
8-10
8.3.4 Groundwater
Groundwater resources and aquifer-dependent ecosystems are protected to secure a sustainable
supply of water for human survival and socio-economic development, while maintaining essential
groundwater environmental services
Key groundwater resources and aquifer-dependent ecosystems must be classified, have RQOs
and reserves determined and be monitored for compliance with the class, RQOs and reserve
requirements
Groundwater abstracted from river beds, close to streams, and from shallow alluvial aquifers has
a very direct influence on river flow and plays an important role in sustaining wetlands and river
flows (‘base flows’) and supporting refuge pools in the dry season. Apart from the human benefits
of maintaining river flows in the dry season, refuge pools in seasonal rivers support water
dependent animals that would otherwise not survive when the rivers dry up. It is only when
groundwater has very weak links to surface water (such as in deep, confined aquifers) that it may
be possible to abstract it without significantly impacting on river flow. However, the long-term
impacts are not well understood.
8.3.5 List of Priority Actions
The following table as summarised in Volume 1 of the NW&SMP provides a list of priority actions
to be implemented:
Table 8-1: Priority Actions
Action Responsibility Completion date
Declare strategic water source areas and criticalgroundwater recharge areas and aquatic ecosystemsrecognised as threatened or sensitive as protected areas(Volume 3, Action 1.6.1)
DWS, CMAs,DEA
2021
Review and promulgate aggressive restrictions within thelegislation to restore and protect ecological infrastructure(1.6.2)
DEA, DWS,CMAs, SANBI,CSIR
2020
Implementation of the Reserve:(The classification, RQO’s and the Reserve (collectivelyknown as Resource Directed Measures (RDM)) for mainstem rivers starting with the Berg, Breede and Gouritz,Middle and upper Vaal WMA’s) (1.6.3)
DWS, CMAs 2022
Secure funds for restoration and ongoing maintenance ofecological infrastructure through operationalising thewater pricing strategy (1.6.4)
DWS, CMAs,DEA, SANBI
Annually
Develop and implement a diffuse pollution source strategythat includes the regulation of land use (1.5.14)
DWS, CMAs 2023
Implement programmes to rehabilitate catchmentsthrough development of Catchment business plans(1.5.15)
DWS, NT, CMAs 2025
Develop new policies and strategies on matters notpreviously addressed, in consultation with all stakeholders,to facilitate the sustainability of various water sectorprogrammes (2.5.5)
DWS 2025

National Water and Sanitation Master Plan Water is Life – Sanitation is Dignity
31 October 2018 NW&SMP: Volume 2: Plan to ActionFinal Draft (version 4.2)
8-11
Action Responsibility Completion date
Link the Global Environment Fund 6 project on WaterPricing and Ecosystems to Water Master Planimplementation and position DWS to be closely involved inthis process (2.6.17)
DWS, DEA,SANBI, WRC,CSIR
2024
Ongoing research, modelling and planning around climatechange and its impacts on water security and waterinfrastructure needs to be conducted (2.6.19)
DWS, DEA, DST,WRC, CSIR
Ongoing

National Water and Sanitation Master Plan Water is Life – Sanitation is Dignity
31 October 2018 NW&SMP: Volume 2: Plan to ActionFinal Draft (version 4.2)
9-1
SECTION 2: ENABLING ENVIRONMENT
9. CREATING EFFECTIVE WATER
SECTOR INSTITUTIONS
9.1 PRESENT STATE
The Minister of Water and Sanitation is the
Executive Authority for public institutions in the
water sector and is accountable to Parliament
for the performance of these institutions. These
institutions are currently thirteen water boards,
two catchment management agencies, the
Water Research Commission (WRC), the
Trans-Caledon Tunnel Authority (TCTA), and a
large number of water user associations.
The mandates for the water sector institutions
are set out in three pieces of legislation, the
National Water Act (Act 36 of 1998), the Water
Services Act (Act 108 of 1997) and the Water Research Act, 1971 (Act No 34 of 1971), and
Government Notice 277 in Government Gazette No 21017 dated 24 March 2000 for the TCTA.
Two special purpose entities were established for the development, financing and operations of
water projects across the borders of SA namely the Komati Basin Water Authority (established in
terms of the Treaty on the Development and Utilization of the Water Resources of the Komati
River Basin (1992) and the Lesotho Highlands Development Authority (LHDA). The latter is
responsible for the implementation of phases 1 and 2 of the Lesotho Highlands Water Project
The CMAs and the WRC are Schedule 3A public entities in terms of the PFMA, while water boards
are listed under Schedule 3B. The TCTA is a Schedule 2 entity. The Minister is also responsible
for overseeing water user associations and irrigation boards, however, these institutions are not
listed under the Public Finance Management Act (PFMA).
The international river basins are managed via river basin commissions. These basins have
international river basin commissions operating in them, namely the Orange-Senqu River
Commission (ORASECOM) for the Orange-Senqu River basin, the LIMCOM for the Limpopo
River basin, and the TPTC (SA, Mozambique and Swaziland). The Inkomati and Maputo basins
does not yet have such a commission established. These commissions play an advisory role in
relation to the management of shared water courses, under the framework provided by the
Southern African Development Community (SADC) Protocol on Shared Watercourses.
Local government has the constitutional responsibility for providing potable water supply and
domestic sanitation services, as designated water services authorities (WSAs) and using a water
services provider to deliver the services, as per the Water Services Act.
Water Boards are established under the Water Services Act.
Water sector institutions have a critical contribution to make towards achieving government’s
transformation and development objectives outlined in the National Development Plan. They
have an essential role in the achievement of sustainable water and sanitation provision to give
2.1CreatingEffective
Institutions

National Water and Sanitation Master Plan Water is Life – Sanitation is Dignity
31 October 2018 NW&SMP: Volume 2: Plan to ActionFinal Draft (version 4.2)
9-2
effect to the fundamental right of every individual to have access to water and to human dignity,
as well as socio-economic objectives.
9.2 DRIVERS
Government recognises that institutional inadequacies within the water sector carry heavy socio-
economic costs for the country. Management of a scarce resource such as water requires
constant review of institutional mechanisms to ensure effectiveness and efficiency.
In addition, increasing concerns regarding water availability and water quality create a basis for
review of how institutional performance and misalignment of institutions contributes to high public
discontent.
The 2011 Diagnosis Report compiled by the National Planning Commission50 highlighted several
challenges in the institutional framework for the water and sanitation sector, which remain
relevant. These include a lack of shared vision; differing interpretation of obligations; capacity
and coverage of water institutions; regulation of institutions by national government (DWS); poor
performance of some institutions; transformation, restructuring and realignment of water
institutions; and the number of institutions reporting to the Minister.
Other institutional challenges included slow institutional establishment, varying institutional
capacity, viability and sustainability challenges, duplication of effort and resources, even within
the same region, lack of regulation and compliance, as well as a low skills base.
9.2.1 Specific Challenges
9.2.1.1 National Water Resource Infrastructure
It is acknowledged that the performance of DWS with respect to the management of
national and regional water resource infrastructure has been poor. Functions between
DWS and TCTA are duplicated; and financing arrangements across the sector are sub-
optimal with the result that assets are funded out of the government budget where these
could be financed through water use charges. Poor collection of water use charges means
that maintenance of water resources infrastructure is considerably under-funded.
In addition, the requirement of off-take agreements prior to the construction of large
infrastructure projects has led to delays in implementation that have increased water
vulnerability, particularly in Cape Town, Durban and Gauteng.
9.2.1.2 Managing Water Resources at Catchment Management Level
The National Water Act provides for the establishment of catchment management agencies to
manage one or more water management area (WMAs). The number of WMAs was reduced from
nineteen (19) to nine (9) in 2013. The establishment of CMAs has been slow. By end of 2016,
only two of the nine CMAs were established and functional. A number of process and institutional
challenges have delayed the process, leading to a review of the initial plan to establish nine
CMAs.
50 National Planning Commission. 2011. Diagnostic Report

National Water and Sanitation Master Plan Water is Life – Sanitation is Dignity
31 October 2018 NW&SMP: Volume 2: Plan to ActionFinal Draft (version 4.2)
9-3
9.2.1.3 The management of regional water infrastructure and the future role of WaterBoards
While most water boards have been established for pragmatic reasons and several have had a
history of good performance by both local and international standards, there are three primary
drivers for change:
The weak performance in the management of water supply and sanitation services by many
municipalities compromises the extension of services to those without, and results in (or
threatens to result in) unreliable and unsafe services;
There are some important gaps in the existing institutional and financial framework –
responsibilities for water resources development at the local and regional level, and for
regional bulk services outside of the existing water board service areas are not clear; and
There have been, and currently still are, governance and performance-related problems for
some of the water boards.
9.2.1.4 Managing local water resource infrastructure
Water User Associations (WUAs) are local-level institutions with voluntary membership intended
to support the management of local water resources in the common interest. Most, but not all
WUAs, serve the irrigation community. They are intended to include all users of a resource, both
consumptive and non-consumptive. This is an institutional space that is too localised for DWS to
manage and the department relies on these institutions to manage local resources and
infrastructure (both state owned and private) themselves. Legislation provides that WUAs can be
delegated additional functions to perform on behalf of the DWS or CMAs if it is more effective for
them to do so.
The development and transformation of WUAs, either through the transformation of irrigation
boards through broader representivity, or through the establishment of new WUAs comprising
resource poor farmers, has been very slow. This has been due to a combination of difficulties in
meeting representivity targets, unresolved concerns regarding the transfer of private assets and
liabilities to a wider grouping, and bureaucratic delays by the DWS.
The creation of WUAs to manage government water schemes has been stalled by staff not
wishing to be transferred from government to what are essentially private bodies.
There is a lack of financial and technical resources to support new ‘developmental’ WUAs. DWS
does not have the capacity (human and financial) to provide support on a large scale.
9.2.2 Drivers
Water sector institutions should be consolidated to achieve, among others, the following
outcomes:
Economies of scale in terms of capacity and service delivery
Sufficient institutional capacity to attain sustainability and capability to execute service delivery
mandates of affected institution
Integrated planning for water sector development
Sufficient delegation and decentralisation of water services delivery mandates
Economic and financial viability of institutions

National Water and Sanitation Master Plan Water is Life – Sanitation is Dignity
31 October 2018 NW&SMP: Volume 2: Plan to ActionFinal Draft (version 4.2)
9-4
Elimination of inefficiencies and duplication and
Enhancement of regulatory compliance.
Table 9-1: Key Drivers
Issue Rationale
Transformation and rationalisation of the number ofinstitutions
More effective use of limited state resources
Governance, accountability and transparency Improved governance and accountability in water sectorinstitutions
Financial sustainability Responding to cost containment measures
Adopting a sustainable funding model
Performance Respond to poor performance of institutions
Ownership of water and sanitation infrastructure Transfer of infrastructure to appropriate organ of state
9.3 PRIORITIES FOR THE FUTURE
The vision is to create sustainable water sector institutions that will facilitate effective service
delivery while supporting government’s transformational objectives. This will be achieved by the
separation of policy making, shareholding and regulation to ensure that there will be effective
governance in the sector. Institutional integration is also required to ensure that functions are
allocated to institutions that are best placed to undertake them, to optimize sector capacity and,
to facilitate economies of scope and scale.
Figure 9-1: Possible future institutional arrangements
Dept of Water and
Sanitation
National Water
Resources and
Services Authority
Water Research
Commission
National Water
Resources and
Services Regulator
Catchment
Management
Agencies
Local Water Resource
Management Institutions
International
Water Bodies(
ORASECOM, etc)
Water Boards
Dept of CoGTA
Water Services
Authorities
Water Services
Providers
SALGA

National Water and Sanitation Master Plan Water is Life – Sanitation is Dignity
31 October 2018 NW&SMP: Volume 2: Plan to ActionFinal Draft (version 4.2)
9-5
The desired institutional state (set out in the figure above) is envisioned as follows:
The overall trusteeship and regulation of the water value chain lies with the Minister of
Water and Sanitation who is responsible for ensuring that efficient and effective water
institutions give effect to his/her public trusteeship of the water and sanitation business
value chain.
A considerably smaller DWS will set policy and the regulatory framework for water
resources, water supply and sanitation management and will monitor the overall
performance of the sector.
A National Water Resources and Services Authority (NWRSA) will be established to
finance, develop, manage and operate national water resource infrastructure and
sanitation. New capability around bulk sanitation provision will be developed.
A National Water Resources and Services Regulator (NWRSR) will be established which
will be responsible for ensuring the development, implementation, monitoring and review
of regulations across the water and sanitation value chain in accordance with the
provisions of the National Water Act (1998), the Water Services Act (1997) and related
water and sanitation policies. The possibility of an independent economic regulator to
regulate tariffs, standards and performance in the water services sector has been
proposed.
The establishment of CMAs has progressed slowly with only two of nine planned CMAs
established and functional. While the establishment of a single Catchment Management
Agency for the country was raised during the initial development of the NW&SMP, this
proposal has not carried and the implementation of a total of nine CMAs is envisaged.
The water boards are of different sizes and capabilities, with only a few technically and
financially strong, each serving one or more major cities, while the smaller boards are
technically and financially stretched and are serving economically weaker and less dense
areas. Rand Water and Umgeni Water together make up 75% of national water board
capacity. A process is underway to amalgamate some of the boards to reduce the overall
number to nine with an expanded mandate, including for regional bulk infrastructure.
The development, financing, management, operation and maintenance of regional bulk
water and wastewater services will be the responsibility of water boards.
All irrigation boards should have been transformed into WUAs by 1999. A policy position
that all WUAs and IBs will cease to exist in future was approved by Cabinet in 2013. A
roadmap has been developed to transform all IBs and WUAs into local water resource
management institutions.
The transboundary water management bodies will be responsible for co-ordinated and
overseeing development and management of transboundary water resources.
The challenges faced by WSAs are addressed under the section on water services and
sanitation.
9.3.1 Priority Actions
DWS, as the leader of the water and sanitation sector, will lead a process, with other sector
partners, to simplify and streamline the currently complex institutional arrangements in the sector.
In addition, it will drive increased functionality and efficiency in institutional arrangements.
Institutional Rationalisation and Organisational Alignment is urgently required and is supported

National Water and Sanitation Master Plan Water is Life – Sanitation is Dignity
31 October 2018 NW&SMP: Volume 2: Plan to ActionFinal Draft (version 4.2)
9-6
by the Presidential review on State Owned Enterprises (SOEs). However, implementation of
changes must not impact negatively on the implementation of other aspects of this plan.
The following table as summarised in Volume 1 of the NW&SMP provides a list of priority actions
to be implemented:
Table 9-2: Priority Actions
Action Responsibility Completion date
Develop and implement a long-term plan for theturn-around of water supply and sanitation servicesin the country based on a sector-wide approach,that recognises DWS as regulator of W&S provisionthat includes the development of centralisedprogrammes to obtain economies of scale and toensure impact (e.g. driving municipal non-revenue-water improvements, and assessing the cost-effectiveness and appropriate systems fordesalination) (Volume 3, Action 1.3.1)
DWS, CoGTA, NT,SALGA
Annually
Develop and implement Provincial Water ServicesDelivery Master Plans to provide reliable andsustainable water supply and sanitation to allhouseholds within South Africa:• Provincial Bulk Services Master Plans• Reliable Services Delivery Action Plans thatincludes a backlog analysis and infrastructure assetmanagement plans (1.3.6)
DWS, WSAs,CoGTA, SALGA, NT,WBs
2030
Establish a business case for streamlinedinstitutional arrangements in the water andsanitation sector (2.1.1)
DWS 2020
Establish a Municipal Intervention Unit for Waterand Sanitation in DWS, staffed with highlycompetent experts to drive a national programmeof intervention at the municipal level (2.1.2)
DWS 2022
Transform all WUAs into Local water resourcesmanagement institutions as per the developedroadmap (2.1.7)
DWS, WBs, WRMI,CMAs
2021
Establish financially sustainable CMAs across thecountry, and transfer staff and budget anddelegated functions, including licensing of water useand monitoring and evaluation of water resources(2.1.3)
DWS 2020
Establish the National Water Resources and ServicesAuthority (2.1.4)
DWS, NT 2020
Determine the optimal configuration of waterboards to manage regional bulk water supply; assistmunicipalities to perform their primary water andsanitation services mandate where necessary,manage regional water resources infrastructure,manage regional bulk WTWs and WWTWs (2.1.5)
DWS, WBs 2020
Establish the National Water Resources and ServicesRegulator (NWRSR) (2.1.6)
DWS, NT 2020

National Water and Sanitation Master Plan Water is Life – Sanitation is Dignity
31 October 2018 NW&SMP: Volume 2: Plan to ActionFinal Draft (version 4.2)
9-7
Action Responsibility Completion date
Implement accurate billing and effective revenuemanagement systems in all entities in the watervalue chain with a strict “No payment = no water”approach to agriculture/industrial/commercialusers and restricted supply to domestic users (2.4.2)
WSAs, WBs, DWS,AGSA
2024
Ensure that sufficient revenue is received throughtariffs and grants to operate, maintain and improvethe water supply and sanitation system. The tariffstructure must allow for cross subsidisation for theindigent and building of a reserve for periods ofdrought (2.4.5)
WSAs, WBs, DWS,NT, AGSA
2024

National Water and Sanitation Master Plan Water is Life – Sanitation is Dignity
31 October 2018 NW&SMP: Volume 2: Plan to ActionFinal Draft (version 4.2)
10-1
10. MANAGING DATA AND INFORMATION
10.1 PRESENT STATE
Reliable data, information and knowledge on the status of the country’s water
resources, water supply and sanitation is required to understand and
enable spatial and non-spatial analysis and presentation of water use
and water demand including the manner in which various economic,
social and environmental activities in catchments affect (consume,
pollute, increase) or constrain (limit, degrade) water quality, quantity and
ecosystems. DWS has developed a systematic knowledge base and associated knowledge
products of their water services and resources business with the aim to share the knowledge in
the public domain. Information is available in a Geographic Information System (GIS) format as
well as various separate and supporting formats that are of non-spatial nature.
Water resources data includes regular measurements of rainfall, streamflow, dam levels, and of
chemical and biological determinants based on a well-established network of monitoring points.
It further includes information on the ecological properties of water resources, both surface and
groundwater. The coverage of rainfall and runoff gauging in the country has, however, been
allowed to deteriorate and many rainfall measurement stations and gauging weirs are no longer
functional. The South African Weather Service and HydroNET joined forces to provide reliable
weather information. HydroNET is a web-based decision support system which transfers weather
and water data into sophisticated applications and dashboards to make well-informed and
transparent decisions.
DWS runs a number of monitoring programmes on a national level to provide:
Information required for performing its regulation and custodian role e.g. information to
CMAs, the public, NGOs, WUAs, tertiary & research institutions including on the status of,
and trends in water resources quantity and quality
Information to national, provincial and local government e.g. other national departments,
provincial and local government, and
Information in terms of international/regional/trans-boundary agreements and national
level water resources strategic and development planning e.g. UNEP GEMS/Water,
ORASECOM, LIMCOM, KOBWA.
The monitoring programmes run by DWS include:
The National Chemical Monitoring Programme, which assesses the status and trends of
water resources’ chemistry
The National Microbial Monitoring Programme, which assesses trends of faecal pollution
and associated health risks and
The National Eutrophication Monitoring Programme which assesses trophic status, risks
and trends of single impoundments, river reaches or canals.
The National Toxicity Monitoring Programme is currently being designed and is intended to
assess the status and trends of toxicity and toxicants in water resources. A National Radioactivity
Programme is currently in the testing phase.
2. EnablingEnvironment
2.2Managing Data
andInformation

National Water and Sanitation Master Plan Water is Life – Sanitation is Dignity
31 October 2018 NW&SMP: Volume 2: Plan to ActionFinal Draft (version 4.2)
10-2
DWS also runs a National Ecosystem Health Monitoring Programme (NAEHMP), which has three
components:
River Ecosystem Monitoring Programme (REMP) /formerly River Health Programme
(RHP)
National Wetlands Monitoring Programme (NWMP) and
National Estuaries Monitoring Programme (NESMP).
DWS also monitors the state of dams and river flow in the country, through the Hydrological
Information System. Flood monitoring is also conducted in the Orange-Vaal system through a
near real-time monitoring system.
DWS is also responsible for the assessment of groundwater resources, data acquisition and data
management, and the development and maintenance of information systems in this regard. This
is done to ensure the sustainable development and use of groundwater countrywide through the
establishment of monitoring network infrastructure and management.
Water use data (according to the water use as defined by the National Water Act, Section 21) is
captured by DWS through the Water Authorisations and Registration Management System
(WARMS). It is however a challenge to ensure the system is kept up-to-date to allow for new
developments or uses of water by registered and new users.
Rainfall is monitored by the South African Weather Service (SAWS) which is also responsible for
weather forecasting and seasonal rainfall predictions.
DEA monitors the status of wetlands and estuaries across the country.

National Water and Sanitation Master Plan Water is Life – Sanitation is Dignity
31 October 2018 NW&SMP: Volume 2: Plan to ActionFinal Draft (version 4.2)
10-3
Figure 10-1: Monitoring Network Design: Surface Water Quantity and Quality

National Water and Sanitation Master Plan Water is Life – Sanitation is Dignity
31 October 2018 NW&SMP: Volume 2: Plan to ActionFinal Draft (version 4.2)
10-4
Water services institutions, water supply and sanitation information and monitoring
DWS maintains a geodatabase of water services provision by all WSAs51 which includes spatial
footprints and supporting attribute data of water supply and sanitation infrastructure and
settlements. This is further extended by the Water Services / Regulation Systems Menu. StatsSA
collects data on water services and sanitation provision through the national census, and the
regular household and community surveys.
Important tools for monitoring the status of water supply and sanitation delivery were the Blue
Drop, Green Drop and No Drop assessments and progress reports. The Municipal Services Self-
Assessment (MuSSA) programme, together with its supporting databases is also an important
tool to assess the capacities and constraints of water services institutions. Water Services
Authorities (WSAs) report on water supply and sanitation through their Water Services
Development Plans, as required by the WSAct, section 12.
Section 155(7) of the Constitution, as well as Section 62(1) of the WSAct, mandate national
government to monitor the performance of the water sector and specifically grant DWS the
mandate to monitor the performance of all water services institutions. Reliable data is required on
the performance of water services institutions, on the delivery of sustainable and reliable water
and sanitation services, and on the state of water and sanitation assets in order to monitor
progress towards the goals of universal and reliable coverage of services. WSAs are responsible
for water supply and sanitation provision, including monitoring of potable water quality and the
quality of effluent discharged from WWTWs, and for monitoring the performance of WSPs.
Currently the most reliable information on municipal financial performance is maintained in the
National Treasury databases, but unfortunately water and sanitation financial information is still
not clearly ring-fenced.
The Municipal Systems Act makes provision for the Member of the Executive Committee for Local
Government in a province to: establish mechanisms, processes and procedures to monitor the
performance of municipalities of their powers functions; monitor the development of local
government capacity in the province; and assess the support needed by municipalities to
strengthen their capacity to deliver.
It is also a hinderance that there are insufficient, accessible and up-to-date information available
within the DWS on supporting datasets such as agricultural activities, energy generation, water
requirements for all sectors – various scales, socio-economic data or scenario planning, to assist
in water management and governance activities.
10.2 DRIVERS
Effective information management, monitoring and evaluation is crucial for the successful
management and regulation of water resources or water services as it creates the platform to
initiate interventions / actions, understand trends, adapt management plans appropriately or plan
51 Department of Water & Sanitation Water Services Geodatabase
National Water and Sanitation Master Plan Water is Life – Sanitation is Dignity
31 October 2018 NW&SMP: Volume 2: Plan to ActionFinal Draft (version 4.2)
10-5
effectively for the future. This is particularly critical in an environment facing significant change.
The lack of data and information resulting from weak monitoring systems, information systems
that are outdated or not maintained, pose a high risk to the achievement of the goals set out in
the NWRS2 and the NW&SMP.
Monitoring and reporting has also been compromised by the high staff turnover in DWS, resulting
in the lack of technically qualified staff. There are also budget constraints with increasing costs
for running the programmes. There is ongoing pressure to expand and maintain the networks due
to an increase in demand for more reliable information, but there are insufficient funds to achieve
this.
While DWS has worked alongside sector partners in the development of other ambitious
regulatory and/or benchmarking databases, such as the National Benchmarking Initiative
undertaken by SALGA, the WRC, and the South African Association of Water Utilities (SAAWU),
these exercises have unfortunately never achieved full coverage and most have been allowed to
lapse. It requires a tremendous amount of human resources, technical skills and coordination to
ensure information exchange between the DWS and water services institutions to ensure
continued update and maintenance of information on water services infrastructure and provision.
The highly successful Blue, Green and No Drop programme have also been allowed to lapse in
2014.
Ensuring that data and information are shared, accessible in suitable formats and gender
disaggregated in order to support the aims of government and in empowering women, remain a
challenge.
10.3 PRIORITIES FOR THE FUTURE
Improved and modernised information systems must be developed in support of the
implementation of the NW&SMP and continue to build and expand on the suite of knowledge
products and communication channels that are and should be utilised to share knowledge in
a customized manner. Spatial and non-spatial datasets should be packaged as time-series
knowledge products such as atlases, interactive dataset exploration and visualization toolkits
(appropriate charts, maps and schematic). Online mapping and interfacing with modelling tools
inclusive of systematic metadata and factsheets on the knowledge base should also be
included. In addition, there will be a need to include other non-spatial data and information such
as existing information, maps reports, data on policies, programs, and projects, institutional
information to name a few.
A comprehensive knowledge and information management strategy should be developed and
implemented that outlines the development of a variety of interactive knowledge products
These products could include among other:
An interactive atlas of key water resources, water and sanitation management related
topics that are visualised as maps, supporting text, graphs, schematics, photographs,
and other graphics;
A repository of relevant existing reports key reports, documents, journal articles, web links,
etc. relevant to the water sector; and
Metadata of the associated database/GIS data developed. This should include information
on the sources, coverage, date, and spatial processing related to each of the datasets and
enable systematic documentation of the data.

National Water and Sanitation Master Plan Water is Life – Sanitation is Dignity
31 October 2018 NW&SMP: Volume 2: Plan to ActionFinal Draft (version 4.2)
10-6
The knowledge products must be derived from reputable national water monitoring networks and
information systems that are extensive and aligned with the country’s strategic, governance and
management requirements to meet current and future requirements. In order to give sufficient
weight to this, the following existing projects and programmes should be developed / revitalised
to enforce the credibility and relevance of current and future interventions:
the formalisation of a national hydrological and geohydrological monitoring centre should
be considered amongst other actions. This could be achieved by ensuring hydrological
monitoring is ‘back up to standard’ through the recruitment and training of suitable
personnel and the allocation of adequate funds for the installation, refurbishment and
maintenance of rainfall and river flow gauging stations;
WARMS52 is a critical tool in the management of water resources in the country and in
being able to track transformation of equitable access to water. As such, it is important
that it functions effectively and information is updated and maintained;
The Blue, Green and No Drop programme have played a critical role in the collection,
provision and dissemination of information, and as such should be revitalised and results
published annually as a matter of urgency; and
The DWS Water Services / Regulation Systems Menu consists of a suite of programs and
tools to report on water supply, sanitation, water services institutions and programmes.
The information should continue to be updated through information exchange between
DWS, water services and water resource institutions, and other departments or
organisations such as StatsSA.
The following table as summarised in Volume 1 of the NW&SMP provides a list of priority actions
to be implemented:
Table 10-1: Priority Actions
Action Responsibility Completion date
Revitalise the Green, Blue and No Drop programmes andpublish results. Revise and establish norms andstandards to be applied in the Green, Blue and No Dropprogrammes (Volume 3, Action 1.4.1)
DWS, WSAs Annually
Review and develop and implement comprehensive andappropriate Management, Monitoring and ReportingStructures of the DWS data portal (2.2.1)
DWS Annually
Review, develop and implement a comprehensive DWSinformation and knowledge management strategyto include among other:• Amended authorisation conditions to provide for self-reporting• Harmonization of monitoring actions by all responsibleinstitutions• Perform information V&V audits (2.2.2)
DWS Annually
52 http://www.dwa.gov.za/Projects/WARMS

National Water and Sanitation Master Plan Water is Life – Sanitation is Dignity
31 October 2018 NW&SMP: Volume 2: Plan to ActionFinal Draft (version 4.2)
10-7
Alignment of monitoring institutions to support Nationaland International reporting requirements andprogrammes, e.g. SDGs, Agenda 63 and AMCO (2.2.3)
DWS 2021
Monitor, review, evaluate, report on and updateNW&SMP (2.7.4)
DPME, DWS Annual report to Parliament

National Water and Sanitation Master Plan Water is Life – Sanitation is Dignity
31 October 2018 NW&SMP: Volume 2: Plan to ActionFinal Draft (version 4.2)
11-1
11. BUILDING CAPACITY FOR ACTION
The water sector is inter-sectoral and multi-disciplinary in nature.
At an inter-sectoral level, it links with agriculture, health,
education, local government, mining, forestry, industry and
environment.
Its multi-disciplinary nature covers a range of responsibilities,
including policy and regulation, planning and management, capital works design, construction,
operation and maintenance, ecological, water quality and social analysis, financial management,
all across both urban and rural environments.
These responsibilities are allocated to a number of water sector institutions, mostly within the
public sector such as water services authorities, water services providers, water boards,
catchment management agencies and water user associations, but the private sector and civil
society also play a role.
An effective water sector requires human resources capacity for different functions at different
institutions – both in terms of numbers to meet demand for specific skills; and competencies in
terms of skills, qualifications and experience.
11.1.1 Approach to Skills Development and Capacity Building
Skills and capacity building should be defined beyond individual capacity, as the institutional
capacity and the enabling environmental have aspects of capacity that should be taken into
consideration. This chapter has adopted the Department of Cooperative and Traditional Affairs’
(COGTA) definition of capacity building as espoused in the National Capacity Building Framework
(NCBF).
Figure 11-1: Multi-dimensional Approach to Capacity Building
2. EnablingEnvironment
2.3Building Capacity
for Action

National Water and Sanitation Master Plan Water is Life – Sanitation is Dignity
31 October 2018 NW&SMP: Volume 2: Plan to ActionFinal Draft (version 4.2)
11-2
It is recognized that skills are produced over many years through an education and training
system (the Pipeline Approach). The system begins at pre-primary level, through the general
education and training (GET), further education and training (FET) as well as higher education
and training (HET) bands and covers the occupational learning sphere.
The approach proposes a strategic intervention in each of the blocks that constitute the education
and training pipeline with the understanding that the effective functioning of the system will
produce sufficient numbers of work-ready graduates required by the sector. The figure below
illustrates the pipeline approach to education and training.
A leading example of the utilisation of the pipeline approach is the 2020 Vision for Water and
Sanitation Education Programme53 (VfWSEP) which seeks to address water conservation,
demand management and skills shortages in the sector.
Figure 11-2: Pipeline Approach
11.1.2 Institutional Capacity
Institutional capacity refers to the capacity of sector institutions and entities to plan and manage
the execution of sector mandates efficiently and effectively, and includes:
Powers and functions of various institutions;
Institutional service delivery models;
Institutionalised arrangements for planning and delivery of services;
Regulations and bylaws;
Financial resources;
Leadership and governance; and
Awareness and constituency engagement.
Capacity building includes all physical and non-physical resources necessary for institutions to
undertake their functions and a seamless relationship amongst institutions with a clear division of
functions, liabilities, obligations and powers.
11.1.3 Environmental Capacity
Environmental capacity refers to external enablers for effective and efficient functioning of water
sector institutions. These include sector policies, legislation, strategies, plans, funding and
institutional arrangements for effective regulation and seamless accountability. Other issues
include the political and socio-economic environments and how water sector institutions are
enabled to operate optimally and navigate through challenges such as skills deficit, limited
53 Possible link to DWS website?

National Water and Sanitation Master Plan Water is Life – Sanitation is Dignity
31 October 2018 NW&SMP: Volume 2: Plan to ActionFinal Draft (version 4.2)
11-3
government fiscus, high levels of poverty, demographic trends such as high rural to urban
migration, high rate of informal settlements, low levels of cost recovery, and public unrests.
11.2 PRESENT STATE
The NW&SMP sets out the challenges that must be addressed to ensure a secure water future.
These will not be achieved without addressing the issue of capacity – human resources with the
necessary qualifications, knowledge, attitudes, competencies and capabilities to improve the
water sector planning and management processes; and an enabling environment with appropriate
policy and legal frameworks; institutional tools, systems and processes including public
participation, partnerships and intergovernmental relations. Environmental and institutional
capacity constraints are addressed elsewhere in the Master Plan and the focus is on human
resources capacity both in terms of numbers and skills.
Three key challenges impact on the human resources capacity – number of vacancies in critical
areas especially engineering; development of new skills for a changing environment; and
development of functional skills for incumbents in water sector institutions.
A skills gap analysis conducted by the WRC in 2015, looking at numbers of staff and their skills
relative to required skills, showed significant skills gaps in all water sector institutions, including
DWS, CMAs, water boards and Water Services Authorities54. Recent reports (2017) by National
Treasury identified over 800 vacancies within DWS55. StatsSA’s Non-Financial Census of
Municipalities 201656 reported a 13,7% vacancy rate in the water and sanitation departments
across all municipalities.
11.2.1 The Skills Development Mandate in the Water Sector
The responsibility for the coordination of education, training and skills development across various
sectors is vested in the Department of Higher Education through the various Sector Education
and Training Authorities (SETAs). The Skills Development Act (No. 97 of 1998, as amended)
conferred the primary legislative responsibilities of facilitation of learning programmes (linked to
occupations), disbursement of workplace training funds (mandatory and discretionary grants) and
skills planning functions to Sector Education and Training Authorities (SETAs).
For the water sector, the Energy and Water Sector Education and Training Authority (EWSETA)
is charged with the responsibility of coordinating and facilitating skills development and capacity
building in accordance with the Skills Development Strategy, Human Resource Development
Strategy II (2010-2030) and the New Growth Path, National Skills Accord (NSA) between
government, business and labour. Through its Sector Skills Plan, the EWSETA focuses on
determining skills development priorities after thorough analysis.
54 Integrated Water Sector Skills Intervention Map based on a sector skills gap analysis report to the Water Research
Commission by A Vienings (Water Concepts) & M Lima (Onyxx Human Capital) (co-project leaders) WRC 201555Parliamentary Monitoring Group www.pmg.org.za.56Statistics South Africa; 2016 Non-Financial Census of Municipalities

National Water and Sanitation Master Plan Water is Life – Sanitation is Dignity
31 October 2018 NW&SMP: Volume 2: Plan to ActionFinal Draft (version 4.2)
11-4
11.2.2 Skills Development
The water and sanitation sector is dependent on high levels of professionals and technicians;
however, there is a serious shortage of specific critical skills within various water sector institutions
across the water and sanitation business value chain. Achieving sustainable water resources
management requires a multi-dimensional approach to how skills and capacity is addressed
across the value chain from regulation through to provision, usage, treatment and re-use of water,
in both rural and urban areas and across the gender divide.
The EWSETA 2017-2022 Sector Skills Plan highlights challenges such as:
limited number of people studying in engineering
graduates not having the required practical skills
the quality of Technical Vocational Education and Training (TVET) colleges not being
adequate
many current personnel nearing retirement and the shortage of experienced people in the
pipeline that can fill these positions and
inadequacy of the sets of qualifications for emerging occupations.
As a result of this serious shortage of technical skills, even the Department of Water and
Sanitation continues to over-rely on consultants in key strategic areas including planning and
programme management.
The skills and capacity required by the Water Services Authorities (WSAs) to deliver and maintain
water and sanitation services sustainably also remain inadequate. This is compounded by the
difficulties in attracting qualified professionals to rural municipalities in particular.
The publication entitled Numbers and Needs in Local Government (Lawless 2005) highlighted
that municipalities were short of civil engineers, technologists and technicians, with some 28% of
municipalities having no in-house civil engineering capacity at all at that time. The updated
Numbers and Needs (Lawless, 2007) further highlights the fact that civil engineering levels in
municipalities is too low to adequately plan, deliver, operate and maintain local government
infrastructure in a sustainable manner.
To determine progress made, The South African Institute of Civil Engineers’ (SAICE) Professional
Development and Project has undertaken a comparison between the 2005 results and the status
quo in 2015. As indicated in the table below, the number of municipalities with no civil engineers
on their staff has increased from 126 to 202. Twenty-eight have no civil engineering staff at all,
while 81 have only technicians.
Table 11-1: Civil Engineering Metrics – 2005 compared with 2015
Totals 2005 2015 Number of municipalities with 2005 2015
Civil engineering staff 1 875 2 387 No civil engineering staff 82 28
Civil in metros 1 059* 1 201 No civil engineers 126 202
Civil in districts 240 260 One civil engineering staff member 60 41
Civil in locals 576 926 Only civil engineering technicians 95 81
Population 47.640m 54.432m Female civil engineering staff 56 153
Households 11.754m 16.122m Registered civil engineering staff 85 56

National Water and Sanitation Master Plan Water is Life – Sanitation is Dignity
31 October 2018 NW&SMP: Volume 2: Plan to ActionFinal Draft (version 4.2)
11-5
The Municipal Demarcation Board’s State of Municipal Capacity Report (2012) also highlighted
the uneven distribution of registered Engineers, which is an essential capacity to manage water
and sanitation services. As indicated in the figure below, particularly small and rural municipalities
are struggling to attract and retain engineers.
Figure 11-3: Number of Registered Engineers per Municipal Category
11.2.3 Current Supply Trends
Records from the Council for Higher Education show that the number of Civil Engineering
graduates doubled between 2010 and 2015 from approximately 1 000 to 2 000 graduates per
year. It is not clear how many of these graduates seek work in the water sector. Other graduate
numbers with qualifications that apply to the water sector also increased dramatically in this
period, leading to no shortage of science graduates applying to work in the sector. However, the
challenge of appointing qualified and experienced staff remains, especially in municipalities and
the Department of Water and Sanitation. Key constraints include the availability of competitive
salaries and suitable working environments to attract and retain the required skills, as well as the
lack of experienced engineers and scientists to provide mentorship and training to graduates to
enable them to register as professionals.
11.3 PROBLEMS, CHALLENGES & DRIVERS FOR CHANGE
The South African water sector has experienced major sectoral, regulatory and institutional reform
since 1994. These have had significant impact on the governance, operations and management
of water sector institutions and engagement with water users, and on the capabilities and
expertise required. The capacity gaps are present at various levels – environmental, institutional
and human skills. Environmental and institutional capacity gaps are a result of a multiple factors
beyond the control of the water sector.
11.3.1 Human Skills
The following human skills capacity gaps are noted:
Experienced professionals are leaving public institutions to work in the private sector and in
foreign countries due partly to the inability of public sector institutions to attract and retain
such staff.

National Water and Sanitation Master Plan Water is Life – Sanitation is Dignity
31 October 2018 NW&SMP: Volume 2: Plan to ActionFinal Draft (version 4.2)
11-6
Mentoring of new entrants into the water sector has become a major challenge due to
shortage of experienced personnel in the public sector.
Impact assessments are hardly ever conducted, allowing little evidence of the actual impact
of capacity building and skills development interventions in the sector.
Primary planning data, which under ideal circumstance should be generated through the
workplace skills planning process, is poor.
Limited water and sanitation sector occupations are listed in the Organising Framework for
Occupation (OFO), as these workplace skills plans from employers are not standardised and
reflective of the actual needs/gaps. This contributes to inaccurate prioritisation and allocation
of funding for interventions.
The ongoing retirement of a large cohort of older, experienced workers is leaving significant
gaps in skills and experience in the sector.
There are new capability requirements to meet the emerging demands of climate change,
environmental management, new technologies, and the multi-disciplinary nature of
sustainable water management.
Resource constraints and the low capacity to engage with the water sector, hampers the
updating of materials, and the generation of new courses relevant to emerging needs and to
deliver industry-relevant education and training.
There are low levels of entrants and completions in education and training programmes
relevant to the water sector, including sciences and engineering.
Other trends which influence skills availability and retention within the water sector include the
following:
Extensive corporatisation and the contracting out of many functions of water utilities in the 80s
and 90s, and a resulting reduction in the level of inhouse training provided by the state
The overall shortages of technical skills in the South African economy, the strong competition
for human resources within the infrastructure/ mining sectors in particular and an extended
period of low investment in curriculum development
Demand from the mining and construction industries for a limited pool of scientists and
engineers
Changing/evolving job roles, definitions and qualifications make it difficult to choose a specific
career path in the water industry
Changing expectations from younger members of workforce who expect greater flexibility in
working hours, the opportunity to achieve a work/life balance and better optimised career
paths than is offered by industry and
Variable connectivity of universities with industry resulting in less employment-relevant
curriculum.
11.4 PRIORITIES FOR THE FUTURE
The future is envisaged as follows:
A well-skilled and adaptable water sector work force
An attractive sector that competes with other sectors for skills and can retain skilled staff in
the water sector

National Water and Sanitation Master Plan Water is Life – Sanitation is Dignity
31 October 2018 NW&SMP: Volume 2: Plan to ActionFinal Draft (version 4.2)
11-7
Accountable and strong governance structures focused primarily on monitoring and
evaluation of new and existing training/skills development programmes and
Funding available for scarce skills throughout the skills development pipeline.
While the present needs are urgent, and solutions are required in a corresponding short-term
framework, the solution will take time. Both the water sector and the education sector operate in
long timeframes, with gestation periods of years and decades. Addressing skills needs across
these sectors requires a long-term perspective, balanced with the need for urgent action. There
are significant current commitments to education and training places, and recent further
commitments announced. Some of the actions identified by EWSETA Sector Skills Plan 2017-
2022 are as follows:
Develop new skills and leadership for Hydrologists, Hydrogeologists and Ecologists, to drive
groundwater use at local level and improve artificial recharge of aquifers
Build human and institutional capacity to better manage water databases, create
communication and awareness and project the cost implications of utilizing alternative
sources of water and the development of green processes and technologies
Expand high-level knowledge and quality research in areas such as groundwater use,
desalination, water treatment, and the role of women in water in rural areas and informal
settlements
Facilitate the War on Leaks training programme
Align skills development interventions to support green jobs and initiatives
Mainstream issues of sustainability and environmental ethics into education and training
programmes
Develop high level of technical and research skills that underpin technological advancement
and innovation
Up-skill and retain the existing labour force that participate in varying capacities within the
sector to address changing skills needs linked to technological advancement
Develop industry-research / skills development partnerships with research institutions,
science councils and universities of technology in areas identified for innovation and
Train women involved in accessing and distributing water in rural areas and informal
settlements in the safe and efficient usage of water and sanitation.
Skills development (planning to implementation) happens within the National Qualification
Framework (NQF), and its sub-framework of quality councils and structured pipeline bands. This
form of capacity is exclusive to individual capability and knowledge to fill a particular occupation.
It is important to develop and implement a mandatory, modular hands-on qualification for
municipal water managers to be run over 18 months and accredited by EWSETA to include
aspects such as asset management, tariffs and revenue management, drought management,
stakeholder engagement and customer relations
In addition, regulations should be developed regarding the required qualifications and experience
for senior and technical positions in DWS, CMAs, water boards and municipal water services,
accompanied by a programme for recruiting and retaining experienced technical and managerial
staff with technical qualifications in South Africa and internationally. The definition of career paths
with defined training and on-the-job experience will help to build a cadre of sector professionals.
National Water and Sanitation Master Plan Water is Life – Sanitation is Dignity
31 October 2018 NW&SMP: Volume 2: Plan to ActionFinal Draft (version 4.2)
11-8
A detailed assessment of sector skills and capacity building needs will be concluded after
approval of this plan. The following ten-point plan incorporates this thinking:
Undertake water and sanitation sector skills capacity needs analysis. The study will
investigate current state of skills and map stakeholders throughout the water value chain
in terms of mandate, current capacity and required capacity for optimal performance. It
will indicate the skills gaps in terms of numbers per occupation, and skills levels within
each of the water sector institutions.
Develop a skills and institutional capacity development strategy for the sector aligned to
the 2030 National Water and Sanitation Master Plan by indicating what skills
(competencies and numbers) are needed by the different water sector institutions to
achieve the sector goals and priorities identified in the National Water and Sanitation
Master Plan, the NDP, the SDGs and the NWRS2. The focus of skills will be at all levels
– artisans, administrative, supervisory, management, technical, legal, scientific and
financial.
Assess and develop appropriate institutional arrangements required to achieve sector
goals and priorities. This will take into consideration work done through the institutional
reform and realignment project. Focus will be on effective division of powers and functions
for potable water supply and sanitation.
Undertake a study to identify constraints and capacity gaps in water sector institutions that
prevent water sector institutions from achieving sector goals and priorities identified in the
National Water and Sanitation Master Plan and the SDGs. Identify interventions to
address the constraints and institutional capacity per sector. The sectors referred to are:
domestic use (local government), mining, industry and agriculture. The intervention
required will be comprehensive to include amongst others, human capital, technical,
social, institutional, environmental, financial management and legislative issues.
Evaluate various alternative interventions and institutional arrangements to meet current
and future water and sanitation capacity demands considering the benefits and challenges
of every alternative mechanism or solution. Develop support models and institutional
mechanisms to address the identified constraints and capacity per sector.
Resource, expand and continue to implement the 2020 Vision of Water and Sanitation
Schools Education Programme. Review the programme and focus on the 2030 Vision.
Resource, expand and continue to implement the Community Water Education
Programme incorporating climate change.
Resource and implement the Water Councillor Leadership Programme.
Establish partnerships with private sector and international development partners for skills
development and institutional capacity building. Assess opportunities for private public
partnerships throughout the water and sanitation business value chain.
Establish partnership with Non-Governmental Organisations for institutional capacity
development.
The following table as summarised in Volume 1 of the NW&SMP provides a list of priority actions
to be implemented:

National Water and Sanitation Master Plan Water is Life – Sanitation is Dignity
31 October 2018 NW&SMP: Volume 2: Plan to ActionFinal Draft (version 4.2)
11-9
Table 11-2: Priority Actions
Action Responsibility Completion date
Establish regulations on required qualifications andexperience for senior and technical positions in DWS,CMAs, water boards and municipal services institutions(Volume 3, Action 2.3.1)
DWS, CoGTA,SETA
2023
Develop and implement programme for recruitingexperienced technical and managerial staff in first SouthAfrica and then internationally (2.3.2)
DWS, CoGTA,DIRCO
2030
Define (and reinstate in some cases) career paths withdefined training and on the job experience to build aknowledgeable sector of professionals (2.3.3)
DWS, WSAs, WBs,CMAs
2023
Develop and implement a mandatory, modular hands-onqualification for municipal water managers (technicalmanager) to be run over 18 months and accredited byEWSETA to include aspects such as asset management,tariffs and revenue management, drought management,stakeholder engagement and customer relations (2.3.4)
DWS, EWSETA,Institutions ofHigher Learning
Ongoing
Partner with institutions to fund training of water sectorpractitioners in the curation, management and use ofdata as well as the associated technologies (2.3.5)
DWS, EWSETA Ongoing
Initiate a focused research capability initiative in watersector economics to address this existing skills gap (2.3.6)
DWS, WRC, CSIR,DST
Ongoing
Continue to develop high end skills (post graduate) toensure a future science, technology and innovationcapability in South Africa (2.3.7)
DWS, DST, NRF,WRC, CSIR, the dti(THRIP)
Ongoing
Continue to support programmes that enabledevelopment of critical skills and exposure to emerginginnovations (e.g. Young Engineers Programme) (2.3.8)
SALGA, DST, WRC,CSIR, DWS,CoGTA, MISA
Ongoing

National Water and Sanitation Master Plan Water is Life – Sanitation is Dignity
31 October 2018 NW&SMP: Volume 2: Plan to ActionFinal Draft (version 4.2)
12-1
12. ENSURING FINANCIAL SUSTAINABILITY
Sustainable financial water management involves the full spectrum of
financial management and governance activities required to develop
and sustain effective water and sanitation services to the
people, environment and the economy of the country. The
focus of the country must be on sustainable management
and not only on infrastructure investment.
To stay in business, income (funding) and expenditure must remain positive or in balance. The
following sections present the current financial situation, future investment needs, funding
sources, financing mechanisms and financial governance to achieve and maintain financial
sustainability in the water sector.
12.1 FINANCIAL HEALTH OF THE SECTOR
The water and sanitation sector is currently not financially sustainable. Funding needs are on the
increase and available funding is limited due to the economic recession, reduced revenues and
accumulating debt. In general, this Master Plan indicates the need for an immediate “turn-around”
and mind-shift change with regards to the sector, which is also the case from a financial
sustainability perspective.
The following diagram illustrates the current situation and depicts three financial health scenarios
for the future:
Figure 12-1: Three Scenarios for the Future
2. EnablingEnvironment
2.4EnsuringFinancial
Sustainability

National Water and Sanitation Master Plan Water is Life – Sanitation is Dignity
31 October 2018 NW&SMP: Volume 2: Plan to ActionFinal Draft (version 4.2)
12-2
As illustrated in the above diagram, the following scenarios apply:
Scenario 1: “Business as usual” with continued decline of financial health and large-
scale failures
Scenario 2: “Ad-hoc” approach with short-lived illusory recovery resulting in borrowings
that cannot be serviced resulting in continued dysfunctionalities in sector and
Scenario 3: “Turn-around” based on sustainable financing of economic and social
projects.
Scenario 1: Business as usual is not an option. The risk of not spending what is required will
result in further infrastructure degradation over time (a “reverse gear” situation); water investment
not providing an enabling environment for economic growth; socio-economic targets and
objectives not being attained and a sector that is not able to provide a level of service acceptable
to users.
Scenario 2: “Ad-hoc” approach can result in large expenditure and raising of long-term loans
to provide quick relief but does not support financial sustainability in the long term. In terms of
this scenario, a non-integrated or selective approach to finding solutions for the sector can result
in scarce financial resources being utilised on the wrong solutions. Loans can tie future revenue
streams to committed funding structures for the next two to three decades, hampering recovery
of the sector as a whole and putting undue pressure on the fiscus and user tariffs in the future.
This approach would typically respond through “cherry-picking” where the best revenue streams
are isolated for purposes of a transaction, but where this does not form part of the holistic solution
required. It can be a case of “low-hanging fruit” where short-term impacts are the focus through
emergency schemes providing only symptomatic relief.
Scenario 3: The “Turn-around” approach is the only viable option to ensure financial
sustainability of the South African water sector in the long-term. A well-planned and executed
turn-around is required and decisions have to be based on solid information to evaluate the
challenges at hand and assess the most appropriate solutions. A turn-around will inevitably
require change where strong (and sometimes unfavourable) decisions would have to be taken.
There is no time to be wasted and immediate action
is required on an integrated and balanced approach.
Although financial sustainability is outlined in this
chapter as a separate focus area and an enabler to
the success of the sector, it is equally inter-
dependant on the successful implementation of the
other enabling pillars such as enforcement,
regulation and having value attached to water
security. This integrated approach can, together with
fundamental financial management, mobilise
sustainable financing for the sector.
A turn-around towards financial sustainability is not optional and requires dedicated,purposeful intervention and a serious mind-shift by all stakeholders.

National Water and Sanitation Master Plan Water is Life – Sanitation is Dignity
31 October 2018 NW&SMP: Volume 2: Plan to ActionFinal Draft (version 4.2)
12-3
12.2 KEY CHALLENGES TO FINANCIAL HEALTH IN WATER AND SANITATION
The sector is currently not financially sustainable and challenged with inter alia the following
factors that impacts on the financial health of the sector:
Lack of understanding of the strategic value of water (particularly the importance of water
security);
Degradation of existing asset value (backlogs in operations, maintenance and refurbishment);
Funding gap (expectations exceeding current capacity);
Water use not optimised (lack of demand management, water allocations insufficient);
High non-revenue water (non-paying users, insufficient revenue management system,
growing debt);
Backlogs on Free Basic Water supply and sanitation provision (still catching up);
Inefficient sector institutions (complex structure and governed under different legislation);
Fiscal constraints (limited capacity by fiscus to provide funding or guarantees);
Tariffs not cost-reflective (under-recovery, agricultural subsidies);
Capacity constraints (lack of skills and integrated, practical support programmes);
Non-alignment on priorities and strategic value of water;
Institutions not creditworthy (financially constrained municipalities - especially in rural areas);
Private sector participation not optimized;
Reducing water quality (increasing costs and environmental risks); and
Value for money procurement not optimal.
The South African water sector is in decline with highly vulnerable municipalities characterised by
declining levels of service, a continued increase in customer dissatisfaction, rising levels of unpaid
bills and aging infrastructure. In terms of the Vulnerability Assessment report57, 78% of
municipalities rate are between ‘high’ and ‘extreme’ in terms of vulnerability. The dire situation is
confirmed by No-Drop and Green Drop Reports which shows high levels of non-revenue water
and large numbers of wastewater treatment works not meeting the discharge standards.
57Department of Water and Sanitation (DWS). 2015. Municipal Strategic Self-Assessment (MuSSA)

National Water and Sanitation Master Plan Water is Life – Sanitation is Dignity
31 October 2018 NW&SMP: Volume 2: Plan to ActionFinal Draft (version 4.2)
12-4
Figure 12-2: MuSSA Vulnerability Assessment (MuSSA 2013/14)

National Water and Sanitation Master Plan Water is Life – Sanitation is Dignity
31 October 2018 NW&SMP: Volume 2: Plan to ActionFinal Draft (version 4.2)
12-5
Although these challenges are substantial and should by no means be underestimated, an
immediate and focused implementation of the Master Plan could save the sector if the identified
corrective measures are implemented and maintained to protect this strategic, yet vulnerable
sector, to the benefit of all. The turn-around will require a mind-shift change and commitment
from each and every citizen to be mobilized successfully.
12.3 PRESENT STATE
12.3.1 Strategic Overview of Financial Position
Funding of the water sector
comprises capital for infrastructure
development, operation and
maintenance (O&M) along the water
supply chain, as well as funding for
governance (plan, organize, lead
and control) and effective
management of water and sanitation
services provisioning.
The adjacent graph shows the
extent of required funding in all three
funding streams58. The capital
requirement of the sector totals
approximately R90 billion per
annum, comprising about R70 billion
for water supply infrastructure from
source to end-user and about R20
billion for sanitation and wastewater
collection and treatment.
58 Department of Water and Sanitation (DWS). 2017. National Water Investment Framework
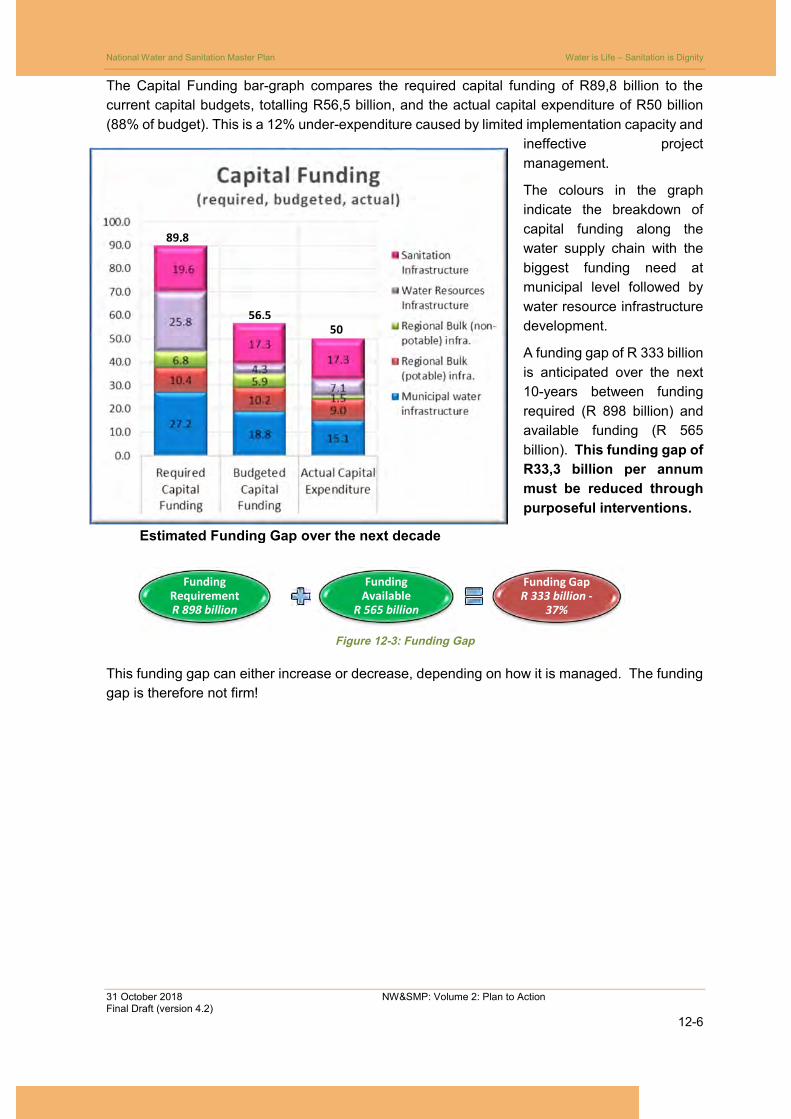
National Water and Sanitation Master Plan Water is Life – Sanitation is Dignity
31 October 2018 NW&SMP: Volume 2: Plan to ActionFinal Draft (version 4.2)
12-6
The Capital Funding bar-graph compares the required capital funding of R89,8 billion to the
current capital budgets, totalling R56,5 billion, and the actual capital expenditure of R50 billion
(88% of budget). This is a 12% under-expenditure caused by limited implementation capacity and
ineffective project
management.
The colours in the graph
indicate the breakdown of
capital funding along the
water supply chain with the
biggest funding need at
municipal level followed by
water resource infrastructure
development.
A funding gap of R 333 billion
is anticipated over the next
10-years between funding
required (R 898 billion) and
available funding (R 565
billion). This funding gap of
R33,3 billion per annum
must be reduced through
purposeful interventions.
Figure 12-3: Funding Gap
This funding gap can either increase or decrease, depending on how it is managed. The funding
gap is therefore not firm!
Estimated Funding Gap over the next decade
FundingRequirementR 898 billion
FundingAvailable
R 565 billion
Funding GapR 333 billion -
37%
89,8
56,550

National Water and Sanitation Master Plan Water is Life – Sanitation is Dignity
31 October 2018 NW&SMP: Volume 2: Plan to ActionFinal Draft (version 4.2)
12-7
Potential increase in the funding
gap: As illustrated in the adjacent
graph, the funding gap can
increase as a result of increased
costs (see A) due to poor project
planning, unsolicited bidding,
construction delays, vandalism,
delays in implementation of Master
Plan actions, poor contract and
financial management, unrealistic
expectation of users and
unexpected risk events such as
natural disasters, vandalism and
theft of infrastructure.
It can also increase as a result of
declining funding availability (see
B) from reduced revenue
(affordability and willingness-to-
pay), budget reallocations, fiscal
shortfalls, misappropriation of
available funds, etc.
Potential decrease in the funding
gap: The funding gap can equally be reduced through various interventions, policy reviews,
enhanced regulation, implementation of cost efficiency measures and proper management of
user expectation and demands.
Interventions to reduce costs and increase revenue in the sector have to feature as a strategic
priority for the country.
The following sections provide more detail on above capital requirement and summarize the
status of key financial indicators.

National Water and Sanitation Master Plan Water is Life – Sanitation is Dignity
31 October 2018 NW&SMP: Volume 2: Plan to ActionFinal Draft (version 4.2)
12-8
12.3.2 Asset value of existing infrastructure
The value of existing infrastructure is an asset,
representing the sum of past capital investments.
The capital replacement value of the existing water and
sanitation infrastructure is a key indicator of the size
(financial extent) of the sector. South Africa has a
substantial existing water and sanitation network valued at
an estimated R 1 362 billion in 2017 at capital replacement
value. The existing assets are however also depreciating,
resulting in a current book value of the infrastructure of
about R 584 billion, or 43% of capital replacement cost59.
“Asset value” is measured by its assured revenue streams.
While this fixed asset value is significant, it can seldom be
used as collateral for loan funding since it is mostly a permanent installation and common good
which cannot be sold. Instead loans are primarily secured through the assured income streams
that can be generated by the infrastructure.
The focus of the past twenty years in South Africa was on new water and sanitation services to
address historic backlogs and rapid urbanisation. The operational reality is that existing
infrastructure was “stretched” because of significant underinvestment in infrastructure
maintenance and delays in renewal of aged infrastructure.
59 Department of Water and Sanitation (DWS). 2018. National Water Investment Framework
* Infrastructure is ageing (57%depreciated) and needs urgentrefurbishment and renewal.
* Refurbishment backlog ofR59 billion needs about R12billion per annum over 5 yearsto recover.
* Renewal backlog total R332billion with R125 billion apriority need

National Water and Sanitation Master Plan Water is Life – Sanitation is Dignity
31 October 2018 NW&SMP: Volume 2: Plan to ActionFinal Draft (version 4.2)
12-9
A lack of maintenance has resulted in an accumulated refurbishment backlog of about R 59 billion.
The majority (R 25 billion) of this is with municipal infrastructure, while refurbishment of irrigation
canals totals about R 18 billion. The municipal budget reform process increased municipal
maintenance budgets from R 9 billion to R 24 billion, targeting 8% of asset replacement value or
11% of operational expenses. Municipal expenditure on repairs and maintenance is however
lagging due to shortages in skills and capacity.
Ageing infrastructure has led to a significant backlog in
infrastructure renewals, estimated at R 332 billion of which
about R 125 billion is critical. Proper life-cycle asset
management is required to address the backlog and to
reinstate sustainable financing of renewals from depreciation
charges deposited into Capital Renewal Reserves.
However, most institutions have depleted these reserves
and currently only about R12 billion per annum is allocated
to renewal of infrastructure, which is about 1% of the capital
invested.
A large renewal backlog exists of which the largest
component is municipal infrastructure such as treatment
works, pump stations and reticulation networks. If
sustainable financing of renewal is not implemented, existing
infrastructure will deteriorate further resulting in regular
service interruptions and a downward spiral of customer
dissatisfaction, non-payments, protest and vandalism.
Large scale irrigation infrastructure refurbishment is
required. The DWS conducted a detailed condition assessment of its irrigation infrastructure in
2016/2017 to establish a detailed list of required refurbishments amounting to an estimated R 21
billion60. With the addition of government owned irrigation infrastructure of the Department of
Agriculture Forestry and Fisheries, a total refurbishment need of R 28 billion is estimated.
12.3.3 Capital investment need and funding
Investment in infrastructure includes refurbishment, renewal and upgrades to existing
infrastructure, as well as new green-field infrastructure and extensions.
60 Department of Water and Sanitation (DWS). 2016.Condition Assessment Audit of Irrigation Scheme Infrastructure.

National Water and Sanitation Master Plan Water is Life – Sanitation is Dignity
31 October 2018 NW&SMP: Volume 2: Plan to ActionFinal Draft (version 4.2)
12-10
Available capital investment in water infrastructure is in
the order of R 40 to R 42 billion per annum, while
investment in sanitation is approximately R 13 to R 15
billion per annum, totalling R 55 billion for the sector61.
This can vary by more than 10% from year to year,
subject to infrastructure investment needs, priorities in
the national budget allocations, the socio-economic
factors affecting the revenue streams and the ability to
raise additional financing.
However, capital investment over the next 10 years of
at least R90 billion per annum is required, is based on
the following priority needs:
remaining backlog in basic water and sanitation
services (at current street tap service levels);
critical refurbishment backlogs (caused by poor
maintenance);
critical renewals of aged infrastructure;
provision for water resource developments
identified in DWS planning studies; and
provision of new bulk, connector and reticulation
infrastructure to meet the demands of
population growth and agreed water use
extensions aimed at promoting economic
growth.
The capital funding gap is the difference between the
“expectation” or development target, and the available
funding. Based on above estimates, the current funding
gap over the next 10 years is estimated at R333 billion.
The cost of abnormal climate and water related disasters is not included in the current shortfall.
If Government cannot provide disaster relief funding, a dedicated fund will be needed which could
extend the funding gap.
The reality of the sector is that funding options are limited. There are essentially only two means
to pay for capital and operation of infrastructure, being either taxes (national) and/or tariffs (users).
However, loan funding is not “new funding”, but is used to address immediate funding needs to
be repaid over a longer-term with interest from future tariffs.
In addition, fiscal funding and government guarantees are constrained. The water and sanitation
sector is currently heavily reliant on fiscal allocations to survive. Citizens are paying taxes and
61 Department of Water and Sanitation (DWS). 2017. National Water Investment Framework.
National Treasury. 2017. Division of Revenue Act
* Additional capital investment ofR33 billion is needed per annum
* Water resource developmentsuccessfully mobilised R 50 billioncapital loans and municipalitiesabout R 11 billion
* The ability to take up more loansis limited by the poor revenuestreams and a decline increditworthiness
* About R3 billion per annum israised from the market throughbonds.
* Bond market requires skilledissuers and public confidence incapacity
* Private sector participationoptions are not optimised
* Skilled technical, financial andlegal capacity is required tomanage contracts effectively andensure that infrastructure meets orexceeds its expected useful life
* Projects normally depend onrevenue from the bigger systemand may not be bankable on theirown

National Water and Sanitation Master Plan Water is Life – Sanitation is Dignity
31 October 2018 NW&SMP: Volume 2: Plan to ActionFinal Draft (version 4.2)
12-11
fiscal allocations are made to the sector to fund agreed social services and the conservation of
the natural environment via budget allocations, grants, equitable share etc. The economic
component of infrastructure is normally funded through tariffs from the economic users. In some
cases, certain subsidies or incentives to achieve development targets or to bridge unforeseen
disasters is made available from the fiscus. Off-budget funding often requires government support
in the form of explicit or implicit guarantees which increases reliance on the fiscus. Availability of
further guarantees or government support is limited, and the sector has to compete with other
sectors for such support.
Capital loans are used effectively in the sector totalling about R 61 billion62. The majority (78%)
of the loans are for water resource development projects undertaken by the DWS and the TCTA.
The TCTA as a special purpose vehicle to the DWS, borrows from financial markets in its own
capacity and manages project implementation of bulk raw water infrastructure. Once the
infrastructure is built, the DWS operates and maintains the infrastructure on an integrated systems
basis, while the TCTA services the debt with payments from the DWS emanating from water tariffs
charged to users.
Municipal budgets indicate total annual borrowings of about R 11 billion by creditworthy
metropolitan and large municipalities, while maximum municipal borrowing capacity is estimated
at about R 18 billion to R 20 billion per annum for all municipal services of which only a small
portion (about R 3 billion to R 5 billion) would typically be available for water and sanitation
services63. Municipal borrowings have declined over the past 3 years from about 24% to 15% of
capital expenditure, primarily due to a deterioration in their financial health and creditworthiness.
The DBSA is the primary lender with a gradual involvement from other large commercial banks.
The ability to raise capital funding from the open market is constrained due to limited capacity in
the water and sanitation sector to access funding. The capacity constraint is underpinned by lack
of resources, low credit ratings, non-ringfencing of revenues at municipal level and current
structures which generally does not create an enabling environment to mobilise private sector
funding.
Grant/donor funding is available but limited in quantity and South Africa often does not qualify for
substantial concessional funding. “Tied” export credit funding has successfully been applied but
conditions are not necessarily supportive of South Africa’s socio-economic goals to create local
job opportunities and procure goods and services from South African suppliers where feasible.
Not all projects have clear and sizable foreign content to justify export credit funding. However,
treatment plants and Acid Mine Drainage technology could pose more future opportunities if
revenue streams are bankable.
Capital market bonds are used effectively at national level and currently totalling about R 23 billion
within water institutions. The TCTA has raised about R19 billion through its bond programme to
date from local and international markets, Rand Water about R 2,8 billion and Umgeni Water
around R 1,5 billion64. Increased utilisation of the capital market bond funding is envisaged by
62 DWS and National Treasury. 2017. National Water Investment Framework & Municipal Budget Data Base63 National Treasury.2017. Municipal Borrowing Bulletin & Municipal Budget Data Base64 TCTA. 2017. TCTA Annual Report

National Water and Sanitation Master Plan Water is Life – Sanitation is Dignity
31 October 2018 NW&SMP: Volume 2: Plan to ActionFinal Draft (version 4.2)
12-12
these institutions depending on funding requirements and borrowing limits granted through PFMA
and the financial sector’s risk view of state owned entities in general.
Municipalities are also issuing bonds as part of their funding portfolio although it is not specific to
water and sanitation projects and therefore not easy to determine how much relates to the sector’s
specific needs. It is mostly the large water boards and metros with reputable management
capacity and creditworthiness that are able to make use of this instrument.
Bond funding requires public confidence in the institution’s capacity to manage the investor’s
money over the life of the bond and to honour the scheduled payments. In some cases, it requires
an explicit government guarantee to be a viable instrument. Bond funding is often cheaper than
long-term loan funding but not necessarily the most suitable, or cost-effective funding instrument
for smaller entities.
The bond market is generally hesitant to cover construction risk and ring-fenced project bonds
are still in a developing phase, although it should not be overlooked as a potential funding
mechanism. In the water and sanitation sector, the implementation of projects can be ring-fenced,
but the cash-flow to repay the debt is normally from a system and not the project in isolation as
required by pure ring-fenced instruments.
Other funding structures are successfully applied in the sector. The concept of private sector
participation (PSP) is largely applied in the sector e.g. where private funding is mobilised to fund
public infrastructure, private contractors are appointed to implement public infrastructure or
operate and maintain infrastructure on behalf of Government etc. However, limited cases of formal
Public Private-Partnerships (PPP’S) have been implemented in the sector where the private
sector assumes more risk and payment is performance based. PPP’s have proven to provide
successful funding and implementation structures, but expensive and overly cumbersome to set-
up and in certain cases, the public sector lacks the expertise to structure PPP’s.
To date, two large water concessions have been implemented successfully, one at Nelspruit (the
Mbombela Concession) and one at Ballito (the Dolphin Coast Concession). Private sector
indicates clear appetite for large scale investment in the sector, but bankable projects are not
clearly identifiable for increased participation. Lack of ring-fencing at municipal level reduces
bankability and the sector’s institutional structure review needs to consider funders’ needs to
identify bankable projects.
Blended funding structures are also successfully applied in the sector but underutilised to date. It
consists of a mix of funding solutions to fund a defined project and has various permutations such
as a mix of fiscal funding, off-budget funding, equity, concessionary loans, credit enhancements,
grants, subordinated loans, guaranteed components etc.
With most projects having to provide for economic and social use collectively, this funding
structure has capacity to be developed and further expanded under skilled capacitated entities
such as TCTA, MISA and DBSA where capacity exists in project implementation, funding and
contract management resulting in more effective procurement, cost efficiencies, clearly defined
risk allocation and management.
The challenges experienced with blended funding structures are the extensive time required to
obtain approval for each of the funding components. These approvals are generally progressive
and approval processes are not necessarily aligned.

National Water and Sanitation Master Plan Water is Life – Sanitation is Dignity
31 October 2018 NW&SMP: Volume 2: Plan to ActionFinal Draft (version 4.2)
12-13
A systems approach to infrastructure development is applied. Projects are often added to an
existing system and the revenue from the collective user base is used to create bankable revenue
streams. Blended funding lends itself well to this scenario where water projects are intended to
increase assurance of supply (i.e. provide storage capacity) and therefore would not necessarily
have predictable and continuous use, but the benefit and cost is being shared over multiple users.
12.3.4 Operating cost and funding
Operating costs include the direct costs for bulk purchases of water and electricity, the employee
costs for operators and maintenance staff, operator expenditure (e.g. travel, spare parts and
disbursements), the financing costs of infrastructure, and provisions for asset depreciation and
impairment.
Annual operating expenditure in the water and sanitation
sector is estimated at R 100 to R 120 billion per annum65. This
is a first-order estimate as water services are currently not ring-
fenced in municipal accounting.
A typical cost split between the different municipal services, has
been applied to establish a representative estimate.
Figure 12-4: Cost Split between Municipal Services & Water Supply Chain
65 DWS and National Treasury. 2017. National Water Investment Framework & Municipal Budget Data Base
Operating costs areestimated at R10 billionper month.

National Water and Sanitation Master Plan Water is Life – Sanitation is Dignity
31 October 2018 NW&SMP: Volume 2: Plan to ActionFinal Draft (version 4.2)
12-14
The costs increase along the water supply chain from about R 9 billion per annum (7%) at water
resource level to about R 87 billion (70% of total OPEX) at municipal level66.
Municipal operating costs typically comprise 30% for employee costs and 30% for bulk purchases
(water purchases from water boards and DWS, and electricity for pumping and treatment of water)
with the balance for depreciation and financing charges (see right-hand graph).
Operating costs differ between rural and urban schemes, primarily due to type of water source,
logistics and available skills. Rural schemes do not benefit from economies of scale, increasing
the operating cost per unit of water.
Available funding for operations of water and sanitation services is difficult to determine as
municipal accounting is not ring-fenced per service. The current revenue from water and
sanitation services amounts to R 72 billion per annum along the full water and wastewater supply
chain. Operating grants are primarily from the Equitable Share and total an additional R 29 billion
per annum, based on the DoRA allocation guidelines. The Equitable Share is however
unconditional, and municipalities can use it at own discretion. The total funding for water &
sanitation operations is estimated at R 98 billion, if the full revenue is allocated to operation and
maintenance. Revenue is however, also needed to finance capital, which decreases the available
funding for operations proportionally.
A funding gap for good operations, albeit difficult to determine, is
estimated at R 5 billion per annum if all water services revenue is
allocated to operations or up to R 10 billion per annum, if revenue
is committed to new capital financing. These shortfalls must either
be cross-subsidized from other revenue streams, such as property
taxes, or will result in sub-standard operations, a lack of infrastructure maintenance and/or an
accumulation of bulk purchases debts.
12.3.5 Governance and Financial Management Cost and Funding
The elements of Water Governance and Water Management are described in detail under
chapters 3 to 11. Actions identified in these chapters include management and governance
actions that must be funded from administrative budgets.
Institutional arrangements for sector management and financial governance
66 DWS and National Treasury,2017. National Water Investment Framework & Municipal Budget Data Base
O&M funding gapis R5 to R10 billion
per annum
Governance of the water sector involves various institutions at national, provincial and localspheres of government. It is constitutionally a shared responsibility which must becoordinated and managed to achieve the required outcome for social and economic
development.
Sanitation is mostly a local government function.

National Water and Sanitation Master Plan Water is Life – Sanitation is Dignity
31 October 2018 NW&SMP: Volume 2: Plan to ActionFinal Draft (version 4.2)
12-15
Figure 12-5: Governance of Water
An additional challenge is that the governance of the water sector is fragmented between different
Acts (legislation) and different institutions, which makes it very difficult to resolve the financial
challenges confronting the sector, particularly at municipal level. With an integrated revenue
stream but partly governed by the PFMA and partly by the MFMA, Municipal Structures Act and
the Municipal System Act, the true integration of the sector and the revenue management, is
challenged. The above diagram provides a high-level overview of governance of financial
management of entities that currently exist in the water supply chain.
The DWS is the sector leader responsible for sector-specific policies and legislation, strategic
planning, water resource management, water quality management, programme coordination and
regulation. It also owns and operates strategic water resource infrastructure through its internal
branch, the DWS Water Trading Entity, and institutions such as water boards and water user
associations. Financially, it funds and implements new bulk water resource infrastructure from
the fiscus or through the TCTA and collects revenue from its raw water provisioning. Water
boards fund their operations and capital programmes from bulk water provision (potable and raw)
to municipalities and industries.
National Treasury (NT) leads financial governance comprising financial policy development and
legislation, financial management (budgeting and expenditure) of national, provincial and local
government institutions. The NT plays a critical role in overseeing and enabling good budgeting
and financial accounting of water and sanitation services development and delivery as part of the
total financial management of each institution. This includes dedicated grant funding programmes
(RBIG, MIG, WSIG, ACIP and others) to finance the social component of infrastructure

National Water and Sanitation Master Plan Water is Life – Sanitation is Dignity
31 October 2018 NW&SMP: Volume 2: Plan to ActionFinal Draft (version 4.2)
12-16
development. It also manages the allocation of the equitable share to enable effective
management, operation and maintenance of water and sanitation services delivery to the indigent
population.
COGTA oversees provincial and local government and plays a key role in building the necessary
skills and capacities for effective municipal services delivery. They manage the integrated basic
services programme (MIG) and perform institutional governance functions to create capable
water services authorities.
Additional funding is required to enhance governance. While there are dedicated budgets for
administration and management of government departments, it still needs to be assessed to what
extent it would be adequate to address the implementation of the “turn-around” plan. Existing
budgets provide for planning, sector coordination, regulation and oversight. They also provide for
information systems and specialist support to enable good governance. Where additional
programme management is needed to implement the Master Plan, this will be motivated from the
programme budgets as is the case for RBIG, WSIG and MIG. National Treasury has already
recognised this need and set aside initial funding.
Determination of a required governance budget is
difficult, considering the broad range of functions
involved. Provisional estimates, show that about R10
billion per annum is needed for good water governance
while about R 4 billion per annum is needed for good
sanitation management, including all aspects of
institutional capital and operational costs.
The current budget of the DWS provides
R 3,3 billion for the core governance
functions.
Leadership includes administration of
the Department, the political office and
strategic sector coordination such as
international affairs. There are substantial
shortfalls if Catchment Management
Agencies and the National Water
Resources and Services Regulator are to
be fully implemented and operationalized.
Planning also has specific shortfalls with
many projects not having proper feasibility and bankability studies. This is a high priority in the
financial “turn-around” plan and should form part of the managed life-cycle of all projects.
Coordination of integrated water management is insufficient and ineffective. Additional funding
would be needed to establish catchment management agencies and improve regional bulk water
management.
Financial management and governance is inadequate to achieve and sustainfinancial health of the water sector
Funding requirement for goodwater governance across all
sector institutions is in the orderof R 14 billion per annum.
(detailed budgeting is required)

National Water and Sanitation Master Plan Water is Life – Sanitation is Dignity
31 October 2018 NW&SMP: Volume 2: Plan to ActionFinal Draft (version 4.2)
12-17
Regulation is under-capacitated to do effective monitoring and regulatory interventions on
unlawful water use and non-compliant wastewater discharges. The extent of uncontrolled water
uses and the level of water pollution are evidence of this deficiency.
While there is a need for more funding, it needs to achieve
targeted outcome. Considering the high salary component
of expenses, there are significant inefficiencies within the
various water institutions that need to be addressed in line
with the above strategic governance enhancements.
12.4 DRIVERS
A multi-faceted approach is required to make the “turn-around” in financial health
An inclusive approach between all spheres of the public sector and private sector is pivotal to
address the funding gap. It requires disciplined and intentional action from the entire water supply
chain, individual end-users and role-players such as funders, contractors and service providers.
The funding gap does not indicate the shortfall in funding but quantifies the extent to which
expectations exceed current financial capacity. The following areas need to be addressed
collectively to address the funding gap and financial sustainability of the sector and are the key
drivers to bring about change in the current financial health of the sector:
Figure 12-6: Addressing the Funding Gap
The table below provides an overview of focus areas for the key drivers or “game changers” to
support the turn-around:
Table 12-1: Focus Areas for the Key Drivers
Enhance financial governance and financial management to
increase cost efficiencies – PFMA, MFMA compliance
Delay replacement of existing assets through proper operations,
maintenance, refurbishment (sweat the assets – extend
economic life)
Reduce physical water losses as a wasted expense and reduce
availability of water
Reduce demand to delay future augmentation by getting more
from every drop of water – re-use of water, fit for purpose design,
water efficient technologies etc.
Enforce water quality measures to reduce cost of purification
Need to address inefficienciesin the water governance
across water institutions.

National Water and Sanitation Master Plan Water is Life – Sanitation is Dignity
31 October 2018 NW&SMP: Volume 2: Plan to ActionFinal Draft (version 4.2)
12-18
Review institutional structure for viable water and sanitation
functions – consolidate where required
Improve contract management in DWS and other water
institutions
Improve financial management and control in DWS
Reduce user expectations – “cut your coat according to your
cloth: to operate within funding constrained environment
Address lack of understanding of the usage and value of water
to reduce water use and address non-payment culture
Poor consumers entitled to a basic volume of water but
understand that excessive use must be paid for
Enhance revenue management – address non-revenue water
through enhanced collection based on accurate metering and
billing – quick and fair resolution of disputes with customers
Review water pricing – radical revision to ensure cost reflective
charges based on life-cycle costing
Address agricultural sector benefiting from a large subsidy on
the price of water, as a result of a capping of increases and the
exemption from the Return on Assets charge
Ring-fence water revenue to limit subsidisation of other
functions
Reallocate water allocations – turn “sterilised water” into
“economic water” where appropriate– “use it or lose it”
Integrated political support and alignment (non-politicised
approach to addressing the sectors challenges)
Enhance regulatory enforcement e.g. revive Blue Scorpions –
currently no real consequences for non-payment
Increase reliability – users more willing to pay for good services
Further fiscal transfers would be unlocked if cost efficiencies and
revenue challenges are addressed
Increase capacity through enhanced institutional capability
Demonstrate ability to spend wisely and provide clear budget
submissions
Appropriate spending – solid planning, combat misappropriation
of funds
Prioritisation - articulate priorities in line with major targets –
solicit political agreement on project prioritisation

National Water and Sanitation Master Plan Water is Life – Sanitation is Dignity
31 October 2018 NW&SMP: Volume 2: Plan to ActionFinal Draft (version 4.2)
12-19
Manage expectation of fiscal contribution - use fiscal
allocations for basic supply and kick-start of economic
development where bankability requires fiscal support
Incentivise responsible water management through
benchmarking as a regulation measurement – in line with Blue
drop, Green Drop and No Drop compliance
Further loan funding would be unlocked if cost efficiencies and revenue
challenges are addressed - Creditworthy entities within the sector will
increase
Create enabling environment and investment friendly sector for
private sector participation
ensure regulatory compliance especially PFMA and MFMA –
provides a safe platform for funders to enter into agreements
central access point to identify projects
secured procurement processes
ring-fence water revenue and grants intended for loan repayment
provide capacity - facilitated programme to achieve bankability,
strong project management capacity to implement and operate
projects, assessment of appropriate funding model per project,
strong contract management skills etc.
Build on existing funding models known to funders – quick
mobilisation
Assess most appropriate funding model on case-by-case basis
combine implementation, service provision, management
contract, O&M etc. with funding to enhance bankability
Simplify PPP structure to create simplified and sector specific
guidelines and rules
Below are some pointers to support the key drivers:
Establish integrated long-term cash flow plan:
It is critical to establish an integrated long-term cash flow plan to map the full capital and operating
costs along the full infrastructure life-cycle. It will provide tools to re-prioritize and re-align projects
to fit available revenue streams and loan repayments and facilitate the “cash flow” management
of actual projects, supply systems and revenue streams into the future.
The graph below illustrates a phased management approach to address the estimated average
funding gap over a 5-year period. The first two years are below the average investment
requirement, implying that non-critical investments must be delayed until such time that adequate
revenue is available to cover the cost or secured funding is raised, if needed.
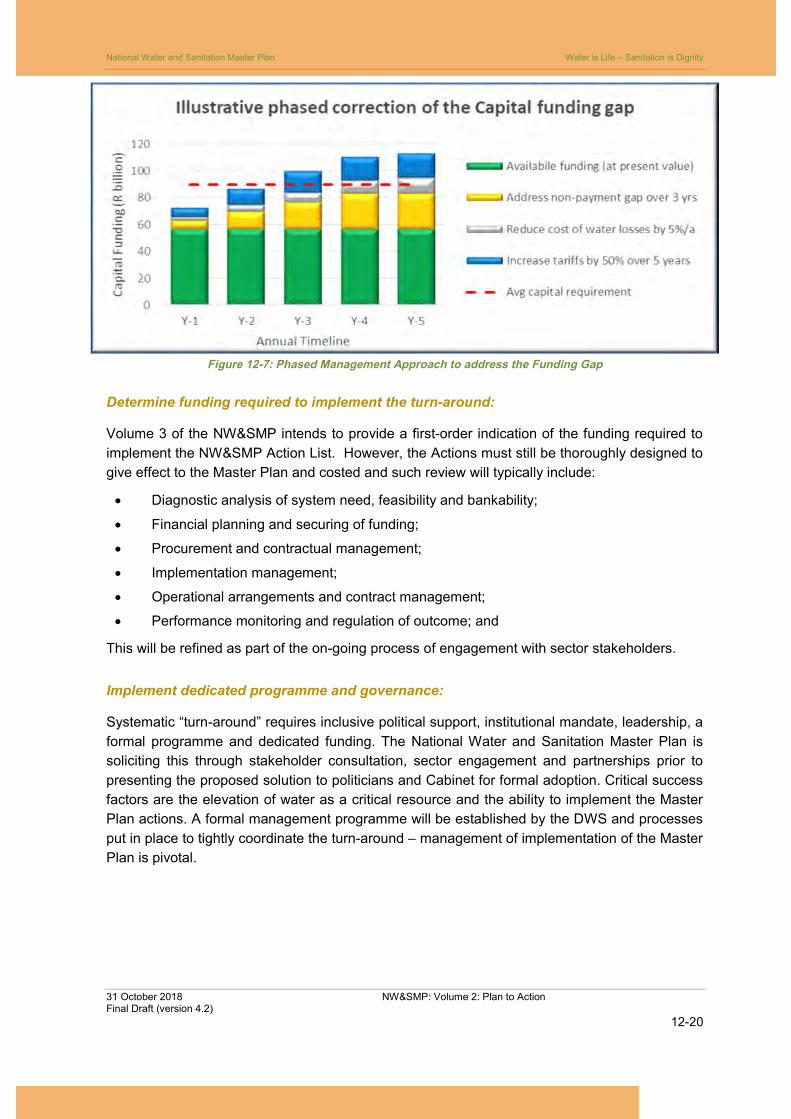
National Water and Sanitation Master Plan Water is Life – Sanitation is Dignity
31 October 2018 NW&SMP: Volume 2: Plan to ActionFinal Draft (version 4.2)
12-20
Figure 12-7: Phased Management Approach to address the Funding Gap
Determine funding required to implement the turn-around:
Volume 3 of the NW&SMP intends to provide a first-order indication of the funding required to
implement the NW&SMP Action List. However, the Actions must still be thoroughly designed to
give effect to the Master Plan and costed and such review will typically include:
Diagnostic analysis of system need, feasibility and bankability;
Financial planning and securing of funding;
Procurement and contractual management;
Implementation management;
Operational arrangements and contract management;
Performance monitoring and regulation of outcome; and
This will be refined as part of the on-going process of engagement with sector stakeholders.
Implement dedicated programme and governance:
Systematic “turn-around” requires inclusive political support, institutional mandate, leadership, a
formal programme and dedicated funding. The National Water and Sanitation Master Plan is
soliciting this through stakeholder consultation, sector engagement and partnerships prior to
presenting the proposed solution to politicians and Cabinet for formal adoption. Critical success
factors are the elevation of water as a critical resource and the ability to implement the Master
Plan actions. A formal management programme will be established by the DWS and processes
put in place to tightly coordinate the turn-around – management of implementation of the Master
Plan is pivotal.

National Water and Sanitation Master Plan Water is Life – Sanitation is Dignity
31 October 2018 NW&SMP: Volume 2: Plan to ActionFinal Draft (version 4.2)
12-21
Assess appropriate funding options:
Funding options are limited to basically three categories as follows:
Transfers – Public Sector Focus: There is a substantial role for the public sector to contribute
to the sustainability of the sector. The water and sanitation sector will always have a social impact
and without water, no economic development can take place.
Revenue – User Focus: The water and sanitation sector is already reliant on user tariffs and
regular income from providing services such as the sale of potable water and charging for waste
treatment, provides a revenue stream to the provider of services. In addition, there may be an
indirect income from, for example, property taxes. Revenue that can be generated by the sector
has to be optimised and fully explored in addition to transfers from the fiscus. This will require
enhanced enforcement and regulation to mobilise and provide support structures to municipalities
to enforce the “user-pays” principle for sanitation services and use of water in excess of FBW.
Punitive charges are intended to influence behaviour and should not be considered a funding
source. However, such tariffs can assist in alleviating the pressure on the system. A holistic
review of water pricing is required to ensure cost recovery and optimization of revenue as a
funding source.
Loans – Private Sector Focus: The reference to “Loans” is used to describe any form of a
borrowing with an obligation to be repaid or be compensated for. It can be in the form of loans,
bonds, structured finance, export credit facilities, concessions or any other structure combining
implementation, O&M, management contracts, etc. with funding.
Fiscal allocations (funded
from taxes on national level
and/or government
borrowings)
Grants
Untied donations
Etc.
Tariffs
Levies
Statutory charges
Punitive charges
Etc.
Capital market bonds
Project Finance loans
Private sector participation
structures
Public Private Partnerships
Structured finance
Development funding
Tied funding
Etc.
Transfers refer to any cashcontributions without a
requirement to be repaidor compensated for
Revenue is generated fromtariffs/charges to the watersector users as allowed for
in the NWA and otherlegislation
Loan funding optionsinclude any form of
borrowing with arequirement to be repaid
or compensated for

National Water and Sanitation Master Plan Water is Life – Sanitation is Dignity
31 October 2018 NW&SMP: Volume 2: Plan to ActionFinal Draft (version 4.2)
12-22
Combined approach / Blended funding refers to any combination of the above three categories
of funding options which could be applied. Crowding-in of financiers can be well mobilised with
blended funding models whereby funders with different risk appetites, different portfolio structures
and so on, could collectively address the funding needs of a project or management intervention.
12.4.1 Reduce Costs
The first key driver of turnaround is a reduction in costs. Various measures and actions are
outlined throughout the NW&SMP to increase cost efficiency in the sector and will not be repeated
in this Chapter. However, for purposes of financial health, some additional focus is given below
on financial governance and financial management.
Financial governance is critical to achieve financial health. This involves strategic financial
planning and the application of financial policy and regulations (PFMA and MFMA) to achieve
financial sustainability and viability to all stakeholders in the sector. Strategic financial planning
is a multi-stakeholder policy dialogue to establish a national consensus on a phased action plan
to achieve and maintain affordable levels and quality of water supply and sanitation services for
all people in the country. Financially, this boils down to doing the right thing within the financial
means of the sector (reduce expectations to close the gap; “cut your coat to fit the cloth”).
Financial management: This involves appropriate budgeting for the capital and operational
expenditure within the available funding and implementation capacity of the organisations.
Subsequently, it requires cost-effective procurement of services, material and equipment,
contract management and progress monitoring to implement the budget in accordance with the
agreed milestones and outcome. Finally, all financial transactions must be accounted for within
the policy and regulations of the PFMA and MFMA to prove that the expenditure was “fruitful” and
in accordance with the budget.
Improved financial management must start at the sector leader, DWS. Reports of meetings in
Parliament of the Standing Committee on Public Accounts (SCOPA) have reflected badly on the
current state of affairs and it is essential that his is addressed.
National Treasury has repeatedly highlighted the financial management challenges in provinces
and municipalities, noting that there is poor financial planning, alarming under spending on capital
budgets, cost overruns and very poor revenue collection. Seven of the nine provinces under spent
their capital budgets by 20% to 23% in 2017, totalling a sum of over R50 billion. A large portion
of this under-spending is in municipalities with large service delivery backlogs and ailing service
provision quality. Spending on the water and sanitation grant programmes (RBIG, WSIG, MIG)
has been slightly better than the rest, but continues to rely heavily on municipal capacity to
implement projects in accordance with industry standards.
A quick conclusion is normally that a funding gap exist which needs to be funded from loans.
However, often availability of funding is not the constraint, but the capacity to spend. Alternatively,
sufficient revenue can be available from water and sanitation services, but the revenue is applied
to cross-subsidise other services and not spent on much-needed investment in the sector.
Therefore, if financial governance and financial management are addressed through the
regulatory environment, the sector could already look much different (although not perfect),
without even having to increase water and sanitation tariffs or obtaining additional loans. Users
will most probably not allow increases in tariffs if simultaneous better control over spending is not
clearly demonstrated.

National Water and Sanitation Master Plan Water is Life – Sanitation is Dignity
31 October 2018 NW&SMP: Volume 2: Plan to ActionFinal Draft (version 4.2)
12-23
12.4.2 Increase Revenue
The second key driver is to increase revenue. Increase in revenue collectively considers the cost
of water (pricing) as well as revenue management (metering, billing and collection).
Valuing water: A mindset-shift is required by users and
water utilities with regards to the value of water. Users have
to acknowledge that water security is worth more than the
price of a unit of water and financial pricing is not the only
criteria to be considered. There are other strategic values
with indirect social and/or economic impact that should also
inform the cost of water, distribution of water and allocated
water uses.
Scarcity of water should increase the value of water and enforce water demand and conservation
measures for sustainable water use between competing uses. This will differ spatially with some
areas having high competition between multiple users while other remote areas have less
competition and hence a lesser impact on water pricing.
Water pricing: With water being under-priced, increases in
excess of inflation over the next few years to achieve
economically sustainable cost-reflective water pricing, are
inevitable.
The water and sanitation sector is
large and annual revenue totals about
R 98 billion per annum67. The adjacent
graph shows the revenue throughout
the water supply chain.
Revenue is primarily collected at the
end-user/municipal level, from where it
feeds up the supply chain via water
boards or water user associations to
the raw water supply by the DWS. It is
the same revenue stream that
supports the entire water supply chain
and the cost of water to the end-user
has to be sufficient to sustain the
various layers within the water supply
chain, including cross-subsidisation of
Free Basic Water (FBW) supply.
A review of water pricing is required to
ensure the financial sustainability of
the sector; however, revenue should
67 DWS and National Treasury. 2017.National Water Investment Framework & Municipal Budget Data Base
The Value of Water is notonly its financial value (i.e.
tariff) it also has a socialvalue, environmental value,
strategic value, scarcityvalue and political value.
Water is under-priced – andwill become more expensive

National Water and Sanitation Master Plan Water is Life – Sanitation is Dignity
31 October 2018 NW&SMP: Volume 2: Plan to ActionFinal Draft (version 4.2)
12-24
not be considered in isolation as reduction in cost and increase in revenues should be balanced
and optimised.
To provide some context to the relativity of water cost compared to other services, the adjacent
graph68 indicates that electricity and equitable share are the main contributors to municipal
revenue and water is the third largest. Water only represents about 13% of total budgeted
revenue.
Figure 12-8: Municipal Revenue per Service Type & Source
Increases have been above the Consumer Price Index (CPI), varying between 8% and 11% per
annum over the past 5-years.
Enhance revenue collection: The price of water and sanitation does not have an impact if it is
not charged or paid for. It would therefore be equally important to consider the price of water and
ensure that users pay. Poor revenue collection is currently a major contributor to the funding gap.
Financial management involves cost efficient service delivery but also enhanced revenue
collection to meet ongoing financial commitments. Without serious improvement of revenue
collection at the end-user level (municipality, WUA and CMAs) systems will not become bankable
and this will inhibit the entire water and sanitation supply chain from recovering.
The following sub-sections describe the tariffs and status of revenue collection for raw water and
potable water:
68 National Treasury.2017. Municipal Budget Data Base (MSCoA),
National Treasury, 2017. Division of Revenue Act, 2017

National Water and Sanitation Master Plan Water is Life – Sanitation is Dignity
31 October 2018 NW&SMP: Volume 2: Plan to ActionFinal Draft (version 4.2)
12-25
Raw water tariffs and revenue collection:
Raw water is provided by the DWS which manages the water resources nationally and operates
the national water infrastructure to ensure regional distribution. DWS also sets the raw water
tariffs and collects the revenue.
Raw water tariffs are determined by the “National Pricing Strategy for Water Use Charges”, which
is currently under revision. These tariffs are currently not regulated with the result that DWS is
both “player” and “referee”. The current strategy provides for the following types of raw water
charges:
water resources management charges (to fund the protection, allocation, conservation and
control of water resources in South Africa)
water resources infrastructure charges (which provide for operation and maintenance, and
asset depreciation charges, capital use charges, assurance of supply charges and non-
consumptive use charges such as hydropower)
waste discharge mitigation charges (to ensure that the polluter pays) and
water research charge (to fund the Water Research Commission).
Raw Water tariffs are mostly system specific with little to no provision for cross-subsidisation
between systems. Some systems benefit from existing infrastructure (mostly historically funded
by the fiscus) and have a large established user base, lowering the unit cost of water to those
users through economies of scale.
Rural areas lack the economies of scale and seldom share in the lower cost of larger urban
schemes. In addition, most rural schemes have recently been developed, at current development
costs, while urban areas benefit from lower unit costs of
older schemes.
Raw water tariffs are formula driven with the intention of
cost recovery, but in certain cases it is calculated on the
delivery capacity of the system (yield) but charged on
actual use, resulting in under recovery when the full yield
of the system is not utilised.
Irrigation tariffs are very low, benefitting from historical under-pricing and a cap on annual
increases. This places an increased responsibility on other sectors and the fiscus to cover the
cost of water provision to irrigators. When determining the price of irrigation water cognisance
must be taken of the fact that irrigation water often originates from return flows and discharges
from WWTWs and is often of a poor quality.
Raw water tariffs are an input cost to the entire sector and users tend to challenge annual
increases in excess of inflation, even if new projects have to transport water over longer distances
resulted in a financially unsustainable sector where operations, maintenance, betterments,
refurbishments and renewals have been sub-optimal done.
Raw water billing is substantial, but revenue collection is failing. Water pricing is based on the
“user-pays” principle and tariffs from users provide a significant cash inflow to the sector with
Water tariffs are system specificand not equalized nationally or
across regions, as is the casewith electricity with a national
electricity grid.

National Water and Sanitation Master Plan Water is Life – Sanitation is Dignity
31 October 2018 NW&SMP: Volume 2: Plan to ActionFinal Draft (version 4.2)
12-26
billing of raw water of about R 16 billion per annum to more than 85,000 users69. Billing and
collection is a major administrative and operating challenge with such a large user base.
Consideration must be given to whether a branch in a government department, such as the
Trading Entity is the most efficient body to collect revenue. A dedicated infrastructure agency is
necessary therefore the DWS will establish a National Water Resources and Services Authority
to finance, develop, manage and operate national water resource infrastructure and sanitation.
The billing is typically split between users as illustrated in the left-hand pie diagram below.
However, only about R14 billion is collected annually leaving a shortfall of R1,5 billion to R2 billion
per annum. This has accumulated to a total debt of R10,5 billion in 2017, presented in the right-
hand pie diagram.
Figure 12-9: Raw Water Billing & Raw Water Debts
Revenue management within the DWS is not optimal and not properly structured/geared to
address the billing and collection challenges that exist.
Bulk raw water supply to domestic and industrial users (including
mines and power stations) is often metered by the bulk user and
DWS is not always directly involved, making meter reading
problematic and erratic, impacting on billing and revenue
collection. Accumulated debt of the DWS has almost doubled
from R5,9 billion in 2013 to R10.5 billion in 2017, which represents
an average increase of R1,15 billion per annum70.
69 Department of Water and Sanitation (DWS). 2017.Debt Collection Performance Report, 201770 Department of Water and Sanitation (DWS). 2017.Debt Collection Performance Report, 2017
Accumulated debt ofraw water supply by
the DWS is R10,5 billionwith municipalitiesaccounting for 50%
directly and a further20% via water boards

National Water and Sanitation Master Plan Water is Life – Sanitation is Dignity
31 October 2018 NW&SMP: Volume 2: Plan to ActionFinal Draft (version 4.2)
12-27
Municipal accounts represent about 50% of the accumulated raw
water debt at DWS, while water boards add another R1,7 billion,
which is mostly also due to non-payment by local municipalities.
Municipalities are thus responsible for more than 80% of the
accumulated debt. No resolution is imminent despite
intergovernmental intervention, with municipalities not honouring
the signed payment agreements. Looking at the debtors of
municipalities (currently more than R143 billion71 for all services),
the origin of the revenue problem is primarily with the end-user
not paying, municipalities not collecting and financial
management not being efficient. There is little consequence (if
any) at the moment for users not paying for water and the user-pay principle is under threat.
Irrigation water revenue is at 46%72 of billable amount. Irrigation water is poorly metered, and
billing is at best described as “ad-hoc”. The large irrigation schemes have established water user
associations (WUAs) and irrigation boards (IRBs), who assist the DWS with operation and
maintenance of water distribution to irrigable farm areas and selected towns and industries located
along the canals. Currently, 47 of the 240 WUAs are also assisting the DWS with revenue
collection through signed “billing agent agreements”. The balance represents many small
irrigation schemes, which are not efficiently metered and billed, partly due to the small-scale
farming and low economic base that they represent. Currently, irrigation revenue is about R1,2
billion per annum representing about 46% of the billable amount of R2,6 billion at current
subsidized irrigation tariffs. The WUAs collect the tariffs based on the list of irrigated areas
(hectares) and the volume of water allocated per hectare during the growing season. The Water
Accounting Software (WAS) was developed by the WRC to improve water distribution efficiency
through the canal networks in accordance with scheduled water requests from farmers. It
improves the monitoring of irrigation water use and can support the DWS accounting, billing and
revenue collection of the irrigated water use.
The waste discharge charge system (WDCS) was developed by the DWS to promote waste
reduction and support water conservation. While it is legislated in the National Water Act (NWA)
and Raw Water Pricing Strategy, its implementation depends on the setting of resource quality
objectives (RQOs), which have not been determined for most receiving water bodies. If users
are discharging effluent that is not in accordance with the licence they can already be held
responsible for costs. However, most water users are discharging waste water without being
monitored, charged or penalized, resulting in extensive contamination of water resources.
Reduced water quality increases the cost of purification to down-stream users which unfairly
subsidises the polluters who should have purified the waste to acceptable levels before
discharging. Revenue is not collected and even if the WDCS would be implemented, there is no
indication how such revenue will be applied. Users indicated that such revenue should be diverted
to those entities that are incurring the additional cost of purification.
71 National Treasury. 2016. The state of local government finances and financial management.72 Department of Water and Sanitation (DWS). 2017. Debt Collection Performance Report, 2017
Revenue feeds up frommunicipal level viabulk water service
providers to the DWS.
Without municipalrevenue collection the
entire water supplychain is AT RISK

National Water and Sanitation Master Plan Water is Life – Sanitation is Dignity
31 October 2018 NW&SMP: Volume 2: Plan to ActionFinal Draft (version 4.2)
12-28
Key challenges on raw water revenue management for DWS include:
extensive customer base of over 85,000 accounts
only 836 marked as metered customers (albeit the large users)
most meters are not owned by the DWS
poorly maintained bulk meters
large volumes of irrigation water are estimated based on water license allocations
estimated water use has a high risk on revenue loss as the water users might consume more
than their allocation, decreasing the assurance of supply to other users and
installation of additional bulk meters at strategic bulk users has been slow.
Potable water tariffs and revenue collection:
Municipal tariffs are not effectively regulated. Potable water is normally provided by
municipalities to domestic and industrial users. The setting of municipal tariffs for water and
sanitation is governed by the MFMA, while the Water Services Act also provides tariff regulations.
Regulation is thus a split responsibility which leads to poor implementation. While both
legislations state the importance of setting cost-reflective tariffs, it is not implemented accordingly.
Regulatory procedures should be improved to assess the cost-reflectiveness of tariffs on a regular
basis and engage with water services authorities on how to address this.
Integration of the water sector is not visible w.r.t. water pricing. The water sector is
integrated with the same water flowing from water resources, via the water supply chain to end-
users and back into the system, but the pricing of water is de-linked between raw and potable
water. Equally waterborne sanitation is almost completely dependent and inter-linked with water,
but sanitation tariffs are set in isolation of water implications. Sanitation decisions in general are
not considered within the context of water availability and the cost of water provision and
alternative technologies have not been fully explored and implemented. Such alternative
technologies for sanitation can have a substantial saving on water provision and water can be
redistributed for other uses and potentially create a better return on water investments.
Municipal water and sanitation tariffs are not cost reflective. These tariffs vary significantly
with many municipalities not pursuing the setting of cost-reflective tariffs as required by Water
Services Act regulations. Annual review of municipal tariffs by the DWS, shows that many
municipalities do not have cost-reflective tariffs and proposes urgent consultative intervention to
raise tariffs to affordable and sustainable levels. It would be beneficial if the basic water supply
and sanitation allocations from the equitable share would also be cost-reflective, but this is
currently seen to be too complex to implement.
Cross-subsidisation in tariffs exists at municipal and raw water level. Municipalities
effectively use block-tariffs to charge high end users more per unit of water to enable them to
subsidise the indigent users. Raw water is often also cross-subsidized within schemes (e.g. Vaal
River System and Mooi-Mgeni System) or within bulk water supplier institutions (e.g. Rand Water
cross-subsidizes within their distribution system).

National Water and Sanitation Master Plan Water is Life – Sanitation is Dignity
31 October 2018 NW&SMP: Volume 2: Plan to ActionFinal Draft (version 4.2)
12-29
User-pay principle not enforced. Although the “user-pay” principle is generally applied to water
and sanitation services, there are a large number of users who do not pay. The payment profile
per province is outlined in the graphs below and based on the “Living Conditions Survey” of
StatsSA undertaken in 2014/201573. This is aligned with similar data from the StatsSA GHS of
2016 and should be monitored closely to track changes over time. The "green" portions indicate
those who are paying, and “blue” portions represent the population stating that they receive Free
Basic Water (FBW) or have permission from the municipality not to pay, which implies that their
payment should come from the equitable share allocation or other cross-subsidization. The
balance (in red) represents people that should pay, but do not pay, which is the priority area for
revenue enhancement. They represent 30% of the national population or 43% of the population
that should pay. If this can be addressed, revenues could increase by up to R26 billion per annum
at current tariffs. With the funding gap at R 33 billion per annum, a significant portion of it can be
funded from increased revenue management if such revenues are applied to the water and
sanitation sector.
Figure 12-10: Population Paying for Domestic Water Supply
73 Statistics South Africa. 2015. Living Conditions Survey 2014/2015.P

National Water and Sanitation Master Plan Water is Life – Sanitation is Dignity
31 October 2018 NW&SMP: Volume 2: Plan to ActionFinal Draft (version 4.2)
12-30
The reason for non-payment is further analysed in the graphs below. It excludes valid reasons for
non-payment, such as the indigent population qualifying for Free Basic Water (FBW) and the
population using own water sources.
Figure 12-11: Reason for Non-Payment
Debt is growing. This coincides with poor revenue
collection, often due to political interference and capacity
challenges, leaving municipalities cash-strapped and
unable to pay for bulk water and electricity supply,
infrastructure spare parts and other essential services.
While metros have the highest debt collection ratio of
about 95%, their mere size holds them accountable for
close to 50% of the debt value. Secondary cities collect about 84% of their bills, with the worst 44
revenue collecting municipalities collecting less than 50% of their bills. About 65% of the debt is
with households.
Municipalities in turn owe their creditors R43,8 billion of
which electricity is about R11,5 billion and water about
R10,7 billion. Both DWS and Eskom initiated legal action
at the end of 2017 threatening to cut-off water supply and
electricity or invoking Section 216(2) of the Constitution to
ask National Treasury to withhold equitable share from
such municipalities.
Key principles for domestic water and sanitation tariffs are:
water services tariffs should remain affordable and supportive of socio-economic
development
a rising tariff block structure should be applied that caters for both the free basic services and
higher service level consumers in a municipal area
Aggregated municipal consumerdebt amounted to R143,6 billionin 2017 with the water portion
continuing to escalate
Revenue streams originate at endconsumers and if this is not
collected, ripples through theentire water supply chain.

National Water and Sanitation Master Plan Water is Life – Sanitation is Dignity
31 October 2018 NW&SMP: Volume 2: Plan to ActionFinal Draft (version 4.2)
12-31
tariffs should also be used to address sustainability risks created by wasteful water uses,
droughts and water scarcity and
tariffs can be a means to increase revenue collection from those who can afford to those who
can’t, thereby achieve and maintain financially sustainable water services provisioning. The
ability to cross-subsidize is dependent on the income profile of the user base.
12.4.3 Increase Fiscal Transfers
The third key driver to financial sustainability is to increase fiscal transfers and Government
support for funding structures.
Government’s risk approach: It would largely assist the sector if Government could strengthen
or extend its role to create an enabling environment for socio-economic development through
water and sanitation provision and critically review the risk it is willing/capable to assume in this
regard. In certain large infrastructure developments, Government requires fully committed off-
take agreements to mobilise borrowing limits to water utilities via the PFMA. This model works
well where the infrastructure is purpose-built for a small number of off-takers but does not share
the risk on a project to be developed between public and private sector that involves a number of
users or sectors where bankability of the entire project cannot be proven in the early years. If 80%
is bankable, no funding can be raised until the last 20% is also proven bankable.
Government could play this catalytic role to support the final 20% and ensure that the project is
funded and implemented. Government recently approved such a structure for Phase 2 of the
Mokolo and Crocodile River (West) Water Augmentation Projects between the Department of
Energy, National Treasury, Department Water and Sanitation and the TCTA and this model could
be extended, depending on the ability of the state to carry such residual off-take risk.
Increased financial support: The biggest risk to Government would be a dysfunctional sector
and where possible and appropriate, increased financial support from the fiscus has to be
provided (whether it be through increased allocations/grants, support or leniency to support
alternative funding solutions where additional transfers are not possible).
Articulation of priorities: Allocations should be prioritized and considered in light of its impact
on the sector. The PFMA and MFMA provide clear guidelines on promotion of projects for fiscal
funding and the water and sanitation sector has to provide well-structured business cases for its
projects as well as clear priorities to the NT which could result in increased fiscal allocations to
the sector.
Incentivise grants: Government has the option to incentivize grants to municipalities complying
with Blue Drop, Green Drop and No Drop benchmarks to support sustainability of the sector in a
broader sense. This could include incentives for good financial management.
Longer-term financing strategies: For longer-term investments, Government would to need to
look beyond the 5-year political administration window to plan and support projects that has longer
planning and implementation horizons (refer to the Long-Term Financing Strategy of National
Treasury).
Improved revenue collection from non-paying customers can raise an additional R26 billion perannum from domestic users.

National Water and Sanitation Master Plan Water is Life – Sanitation is Dignity
31 October 2018 NW&SMP: Volume 2: Plan to ActionFinal Draft (version 4.2)
12-32
Additional grants: Some grants/transfers from other spheres of government or from actors
outside of government can include the following:
Inter-Governmental Transfers that are normally "tied" to specific projects or aims (e.g. new
or refurbished infrastructure) and subject to conditions published in the budget in the
annual Division of Revenue Act (DoRA).
The Equitable Share of national revenue is theoretically an unconditional transfer but
established practice has resulted in a portion of it being unofficially "earmarked" to support
municipal water and sanitation services, by means of a guideline in the DoRA.
A range of other sources that may be mobilized such as international donor grants (always
very specific and relatively small amounts), private sector corporate social responsibility
grants (with same limitations as donor grants) and partnerships with big water users (e.g.
water stewardship partners). Private sector equity normally forms part of an integrated
funding structure and is considered as part of a loan/funding structure rather than a
transfer.
12.4.4 Increase Loan Funding
The fourth key driver to financial sustainability is to increase loan funding through the private
sector.
Private sector participation: Loans form an integral part of the funding solution to address cash
flow mismatches between timing of infrastructure development needs or management
interventions required versus revenue which is received over a longer-term. The need for loan
funding creates an opportunity to mobilise sizable private sector participation. There are many
degrees of private sector participation in the water sector from something as simple as out-
sourcing meter readings through to letting a long-term concession involving capital investment
and direct contact with customers. Some of these are true partnerships where risk is shared,
typically called PPP (Public-Private Partnership) and some erroneously called privatization – as
occurred in England, Wales and Chile.
Borrowing powers: Water boards, the TCTA and municipalities are mandated to borrow funds
within defined limits set under the PFMA and 3-year MTEF window for municipalities or
specifically authorized longer commitments under the MFMA. Water boards and municipalities
depend on the reliability of revenue and the strength of current assets in their balance sheets.
Borrowing by TCTA is largely on the strength of explicit and implicit government guarantees, the
availability of which will be more difficult to rely on in future. DWS may not borrow directly from
the private sector, but National Treasury can raise funds through borrowing and provide the
capital funding to the DWS. The cheapest source of funding would be via the National Treasury
but where possible, the sector also needs to find funding solutions that will relieve the Government
from additional fiscal borrowings.
Long-term implications: Loans should not be entered into “at any cost” as they create future
obligations and the legacy left to future generations should be affordable and fair. Interest cost
should not be overlooked as a cost to be borne by the users and it could impact substantially on
the future cost of water. Loans tie future revenue streams to debt repayment and affordability
has to be established to prove bankability. However, loans also create an opportunity to develop
quicker and fast track implementation of the turn-around and if managed well, it could be
successfully applied to achieve the objectives of the sector to the benefit its users. Implemented
incorrectly or sub-optimally, the consequences will burden the sector for very long.

National Water and Sanitation Master Plan Water is Life – Sanitation is Dignity
31 October 2018 NW&SMP: Volume 2: Plan to ActionFinal Draft (version 4.2)
12-33
Application of loans: While water utilities might need to take short-term loans to provide
temporary working capital they must never consider long term borrowing for operating expenses
but limit its application to capital expenditure on infrastructure (an exception might be made for
spending on institutional reform and other credit enhancements that could be seen as once-off
capital investments).
Risk sharing: Funders require bankable projects and repayment of loans have to be proven.
Funders tend to request some form of Government support or “back-stop” to ensure that ultimate
risk allocation is borne by Government which is not sustainable for Government and will not
achieve sufficient risk sharing between public and private sector. Funders would need to look at
alternative measures of performance and risk mitigation in the loan conditions, rather than a
safety-net by Government for variability in input assumptions, unless justifiably a Government
risk.
Protection of water cost: The sector is monopolistic in nature and “profit making” from water
and sanitation should be controlled. Private sector participation has to include a level of profit by
its very design, but the users need to be protected through value-for-money procurement
decisions and capacity to manage the contracts to ensure users get what they pay for.
Investor friendly environment: Funders indicated the need for an enabling environment to
mobilise larger private sector involvement. The funding sector is well structured to enter into
discussions and platforms for interaction are either existing, or quick to mobilise and to participate
in the funding work streams.
There is not a “one-size-fits-all” funding approach for the South African water sector. Each project
and water institution will have its own specific funding need and financing options, based on its
socio-economic profile and the available revenue from economic tariffs, social grants and cross-
subsidization.
Ring-fencing of projects in the water sector is different to standard ring-fenced project financing.
Water projects are generally linked to the revenue stream from the system and not the individual
project. Bankability is therefore assessed against the revenue stream of the larger scheme or its
management institution (e.g. municipality, water board or WUA).
A programmatic support programme to help municipalities
prepare bankable project proposals is a key requirement of the
“turn-around” plan. Such a programme will assist water
institutions to manage the project development cycle from
inception, through financing and construction into operations, until
hand-over can be made to the official operator (this can be in
different contractual arrangements, including a Build-Operate-
Train-and-Transfer (BOTT), a Build-Own-Operate-and-Transfer
(BOOT) or similar contractual arrangement).
The collective capacity of entities like the TCTA/NWSIA, MISA and DBSA could be suitable
agents for Government to coordinate such a programme, considering their financial management
mandates, contract management ability, involvement in water utilities (municipalities, water
boards and water user associations), knowledge of funding options and oversight by DWS and
National Treasury.
Implement a dedicated andcentralized approach to
ensure cost and timeefficient financing andimplementation of the“turn-around” process.

National Water and Sanitation Master Plan Water is Life – Sanitation is Dignity
31 October 2018 NW&SMP: Volume 2: Plan to ActionFinal Draft (version 4.2)
12-34
Seed funding from development funding institutions (DFI) could be made available to prepare
bankable project proposals and assist in fast-tracking projects through standardized processes
and support mechanisms.
The poor profitability of water is at the heart of its financing problem. Due to delayed positive
cash flow and resistance to tariff increases, financial rates of return in the water sector are among
the lowest of all other sectors. Sanitation and wastewater services are even more difficult to make
profitable, and in most cases the sanitation tariff is linked to water billing or other property taxes.
The state of municipal finances is currently one of the biggest risks for water sector investments
as its revenue streams are already heavily burdened by accumulated debt and records of poor
financial management.
Mobilise Funding Work Stream: Various work streams will be set-up to ensure the
implementation of the NW&SMP and the urgency of the Financing Work Stream has to be
considered as a high priority as mobilization of international and multilateral DFI’s generally take
longer than local DFI’s, commercial banks and long-term investment managers.
Following are some of the funding structure options that could be considered in additionto typical loans:
Public-Private Partnerships (PPP) have been viewed with suspicion in the past, largely on
ideological grounds, but the growing crisis in the sector is beginning to encourage decision-
makers to see private sector participation as a pragmatic and beneficial response. However,
PSP/PPP contracts need to be carefully designed, competitively procured and diligently
supervised, with suitable sanctions if agreed service levels are not maintained.
The longer the contract period, and the larger the private sector investment, the longer they take
to prepare, the greater the need for good advice and skills (technical, financial and legal), and the
thicker the contract document becomes to be managed. PPP’s are overly cumbersome and
expensive to enter into and National Treasury needs to consider a simplified PPP approach on
smaller scale which is specific the sector’s guidelines and rules. The sector needs funding
solutions for large mega projects but also a renewed focus on smaller projects which could even
be structured as a community involvement project.
Special Purpose Vehicles (SPVs) can be created as standalone legal entities to manage the
risk, performance and financing in a contractual manner. This effectively ringfences the business
for preparation of bankability and accountability that funders will require which is well-known to
the South African market. SPV’s are quick to setup compared to PPP’s.
Private sector equity (shares in a private utility) is technically also a funding option but it is not
considered significant. Only investment-linked contracts include equity which is typically less than
20% of the total investment amount. With water being a strategic resource of the country,
ownership of infrastructure normally vests in Government which reduces the suitability of equity
structures. Where private sector equity is used in a blended financing option and the risks,
obligations and performance measures are clearly articulated and managed, equity structures
would not have to be excluded.
Blended financing: Most schemes comprise social and economic users. In most cases, the
social component would be partly or fully funded from grants while the economic component
would require one or more of the financing solutions discussed in the previous paragraph. The
National Water and Sanitation Master Plan Water is Life – Sanitation is Dignity
31 October 2018 NW&SMP: Volume 2: Plan to ActionFinal Draft (version 4.2)
12-35
best “blend” of funds needs to be determined using financial and economic modelling. This could
comprise of a combination of grants, short-term and long-term loans, private equity and gearing
from commercial banks. Certain risks could be mitigated through insurance or specialist funds
(e.g. Climate Finance Fund, Green Funds or Carbon-credits).
Pooled funding: Some funds require a minimum investment amount to be feasible. Projects of
similar type and similar risk profile could then be “pooled” / combined to achieve the necessary
economy-of-scale required by the funder. Pooling could also create the economy of scale for the
launch of specialist bonds and be a mechanism to securitize risks. While the individual projects
are not bankable due to limited size, the pool of projects can be. Pooled funding (in its most basic
sense) is used by municipalities where non-ringfenced funding is sourced and revenue from a
number of services is used to repay a loan. In exceptional cases, pooled funding could be applied
to a group of projects with different risk profiles to enable cross-subsidisation between the
projects. In these cases, the stronger revenue stream must be adequate to also repay the weaker
project’s commitments.
Funding for re-financing purposes: Financing is seldom rigid and could be changed over the
life-time of the investment when the risk profile changes. This could typically apply to projects
post completion of the construction phase where the risk profile has changed (greenfield to
brownfield projects) or where projects became more bankable due to enhanced revenue
management. The cost of interest on large projects funded over the long-term, often outweighs
construction cost and interest should be managed in line with the risk profile of the project to
ensure a cheaper funding cost to the users. Breakage cost conditions and voluntary prepayment
arrangements in the loans should therefore also be considered to allow an entity to become more
creditworthy and able to re-finance.
12.5 PRIORITIES FOR THE FUTURE
To attract investors, Government needs to provide investors with transparent long-term
investment paths and manage a pipeline of projects to achieve the development goals set by
Cabinet (e.g. the MTSF for 2019) and international agreements such as the sustainable
development goals (SDG) by 2030. The proposed pipeline of projects must be affordable and
bankable considering grant funding for the social component. The following sub-section describes
a high-level action list to manage finances and investment for the sector.
The following framework is proposed for the “turn-around” intervention and prioritisation of
actions.
The goal of the intervention action plan is to achieve:
“Financial Sustainability”.

National Water and Sanitation Master Plan Water is Life – Sanitation is Dignity
31 October 2018 NW&SMP: Volume 2: Plan to ActionFinal Draft (version 4.2)
12-36
Table 12-2: Proposed Framework
Immediate actions
Political commitment, costsavings and revenue
enhancement
Medium-term actions
Regain investor confidence,improve credit rating & increase
funding
Longer-term actions
Political leadership to
promote investor
confidence in sector
institutions
Sector institutions to
prioritize cost savings
and revenue
enhancement
Prioritization of grants
and serviceable loans
for critical renewal and
new developments
Affordable cost-
reflective tariffs and
revenue optimization to
improve credit rating &
borrowing capacity
Establish adequate
capacity and skills for
effective operation and
maintenance
Increase borrowing in-
line with improvement in
economy and
creditworthiness
Good financial
management
(budgeting, cashflow
management &
accountability)
Introduction of
affordable and enabling
economic use charges
Polluter-pays principle
and rehabilitation of
water quality impacts
(incl. acid mine
drainage)
Good infrastructure
asset management to
optimize asset life and
return on investment
The following enablers are needed to achieve the “turn-around” in financial health:
Political leadership to manage the strategy across the entire water sector
Dedicated “turn-around” management with firm performance targets and rewards
Dedicated institutional support, training and mentoring to redress weaknesses
Dedicated funding from Government and the sector to enable the turn-around actions
Differentiated approaches for economic and socio-economic scheme developments and
Effective monitoring, evaluation, reporting and adjustment to keep the turn-around on track
The goal is “financial sustainability” and can only be achieved if the ‘turn-around” in financial
health is realised. It requires commitment and diligent implementation by key sector stakeholders
under the leadership of the Ministers of Finance, the Minister of Water and Sanitation and the
Minister of Cooperative Governance and Traditional Affairs.
National Water and Sanitation Master Plan Water is Life – Sanitation is Dignity
31 October 2018 NW&SMP: Volume 2: Plan to ActionFinal Draft (version 4.2)
12-37
Volume 1 of the NW&SMP identifies the following list of actions necessary to initiate the financial
turnaround.
Table 12-3: Priority Actions
Action Responsibility Completion date
Set cap on water use with reducing targets over time(Volume 3, Action 1.1.2)
DWS, CMAs, WSAs,CoGTA
2030
Develop and implement a long-term plan for the turn-around of water supply and sanitation services in thecountry based on a sector-wide approach, that recognisesDWS as regulator of W&S provision that includes thedevelopment of centralised programmes to obtaineconomies of scale and to ensure impact (e.g. drivingmunicipal non-revenue-water improvements, andassessing the cost-effectiveness and appropriate systemsfor desalination) (1.3.1)
DWS, CoGTA, NT,SALGA
Annually
Implement the Waste Discharge Charge System (WDCS) inpriority catchments (SA5, SA41, SA42, SA43 & SA44) (1.5.8)
NT, DWS, CMAs 2030
Ensure fiscal support for IWQM (SA38 & SA39) (1.5.11) DWS, WSAs 2021
Establish a business case for streamlined institutionalarrangements in the water and sanitation sector (2.1.1)
DWS 2020
Develop and implement institutional arrangements thatrecognise the diversity of circumstances across SouthAfrica, the legacy of Apartheid and allow for regional crosssubsidisation (2.4.1)
NT, DWS 2021
Implement accurate billing and effective revenuemanagement systems in all entities in the water valuechain with a strict “No payment = no water” approach toagriculture/industrial/commercial users and restrictedsupply to domestic users (2.4.2)
WSAs, WBs, DWS,AGSA
2024
All conditional grants to be dependent on meeting ofcurrent payments to the next entity in the value chain,improvements to Blue Drop, Green Drop and No DropScores to meeting targets and audit outcome. Allowconditional grants to be used for operational costs (2.4.3)
NT, AGSA, DWS 2023
Develop regulations in terms of Section 139 (8) of theConstitution, which allows for a national entity to take overthe water service functions, including revenue and billing,in a municipality if service deliver criteria are not met(2.4.4)
DWS, CoGTA 2022
Ensure that sufficient revenue is received through tariffsand grants to operate, maintain and improve the watersupply and sanitation system. The tariff structure mustallow for cross subsidisation for the indigent and buildingof a reserve for periods of drought (2.4.5)
WSAs, WBs, DWS,NT, AGSA
2024
In all entities put in place mechanisms to deal withaccumulated debts (2.4.6)
WSAs, WBs, DWS,NT, AGSA
2020

National Water and Sanitation Master Plan Water is Life – Sanitation is Dignity
31 October 2018 NW&SMP: Volume 2: Plan to ActionFinal Draft (version 4.2)
12-38
Action Responsibility Completion date
Roll out of ring-fenced institutional models to increaseprivate sector investment (2.4.7)
DWS, NT, CoGTA 2021
National Treasury – linkage to Medium Term SectorExpenditure Framework (MTSEF) (2.4.8)
NT, DWS Ongoing
The current financial crisis presents risks, but also opportunities to reinforcecommitments to the water sector, and to invest in water infrastructure as part of
fiscal stimulus packages.

National Water and Sanitation Master Plan Water is Life – Sanitation is Dignity
31 October 2018 NW&SMP: Volume 2: Plan to ActionFinal Draft (version 4.2)
13-1
13. AMENDING THE LEGISLATION
13.1 PRESENT STATE
The water sector is guided by the following national policies as approved by
Cabinet:
White Paper on Water Supply and Sanitation (1994)
White Paper on a National Water Resources Paper for South
Africa (1997)
White Paper on Basic Household Sanitation (2001)
Strategic Framework for Water Services (2003)
National Water Policy Review (2013) and
National Sanitation Policy (2016).
These policy documents are given legislative force through the Water Services Act, Act 108 of
1997 (WSAct) and the National Water Act, 36 of 1998 (NWA) although amendments are needed
to incorporate the more recent policy developments. The NWA addresses the water resource
component while the Water Services Act addresses the water services component. In addition,
many small-scale water users obtain water through customary law and practices in communal
areas.
While consideration has been given to incorporating both the Acts into a single piece of legislation
over the past few years, the current approach of government is to limit the tabling of new
legislation, and therefore work towards necessary amendment of the current Acts is anticipated.
A number of important strategies and operational policies have been compiled since the
enactment of the national policy and water acts in order to flesh out and implement the legislation
and policy. These include:
The Second Edition of the National Water Resources Strategy (NWRS2, 2013)
Policy Position on Water Use in Bio-Fuel Production in South Africa (2015)
Mine Water Management Policy (2017)
Integrated Water Quality Management Policy (2017)
Water and Sanitation Sector Policy on Climate Change (2017)
Infrastructure Ownership and Management Draft Policy (2017)
Wetland Policy (2017)
Sustainable Hydropower Development Policy (2017) and
Mechanisms for Partnerships in the Water and Sanitation Sector – Water Stewardship Policy
(2017).
Further policies have been initiated recently and are in various stages of completion:
Water for Development: Sustainable Livelihoods
International Water Obligations
Water Scarcity and Security in the Water Sector
Water for Mining and Industry
2. EnablingEnvironment
2.5AmendingLegislation

National Water and Sanitation Master Plan Water is Life – Sanitation is Dignity
31 October 2018 NW&SMP: Volume 2: Plan to ActionFinal Draft (version 4.2)
13-2
Groundwater Management and Use
Water Mix
Uncertainties and Risks of Water Related Hazards, such as Floods: Droughts and Pollution
National Water and Sanitation Resources and Services Strategy and
The adoption of the Sustainable Development Goals (SDGs).
As discussed elsewhere, there is acknowledgement that the current legislative environment is
overly complex, insufficiently streamlined and hampering effective service delivery, the attainment
of transformation objectives and the leveraging of economic growth. The Department of Water
and Sanitation will therefore lead a process that ensures that water sector legislation is amended
and aligned, and ready for the future and ahead of the curve.
13.2 DRIVERS
DWS’s policy mandate covers the full value chain of water resources, water services and
sanitation services. While the legislation and policies are well aligned with the Constitution and
older legislative frameworks, the policies are still relatively silent on the National Development
Plan and the Sustainable Development Goals (SDGs). A further challenge lies in balancing the
use of scarce water resources for economic development, urban use, and rural development,
poverty eradication and ecological protection.
DWS is responsible for implementation of the legislation in relation to water resources, while its
mandate in relation to water services is one of setting and monitoring adherence to national norms
and standards, monitoring delivery of services, establishing and regulating water boards, and
providing oversight and support to municipalities.
However, there are still grey areas in responsibility and accountability and the policy and
legislative framework is not conducive to promoting appropriate and effective regulation of the
whole water and sanitation business value chain.
The current legislative split between water resources and water services does not provide a single
cohesive legislative framework which addresses the entire value chain in the water sector and
there are gaps in relation to regional bulk infrastructure in particular, as well as the role of the
department in regulating water services delivery.
Institutional arrangements are currently fragmented among a large number of water boards,
catchment management agencies and municipalities and although consolidation is envisaged, it
has not been effectively actioned through the revision of policy and legislation.
In addition, poor alignment of policies and strategies between various government departments
and spheres of government have an impact on the ability of DWS to deliver on its mandate.
The lack of policy and legislative integration between DWS, DAFF, and the Department of
Minerals (DMR) and inadequate maintenance and control of effluent from waste water treatment
by municipalities has contributed to a deterioration in potable water quality and the quality of water
in wetlands.
The failure of alignment between agricultural, land and water reform processes has seen land
transferred to beneficiaries without water rights, and the collapse of once productive farms
through land reform.

National Water and Sanitation Master Plan Water is Life – Sanitation is Dignity
31 October 2018 NW&SMP: Volume 2: Plan to ActionFinal Draft (version 4.2)
13-3
The policies are also not sufficiently clear on the risk and the remedies associated with climate
change.
13.3 PRIORITIES FOR THE FUTURE
It is necessary to amend both the National Water Act and the Water Services Act to better respond
to the needs of the entire value chain.
An updated and consolidated National Water and Sanitation Strategy is required that is aligned
to updated legislation will be necessary, and is in keeping with the five-pillar approach of the
Minister: Water and Sanitation, announced in May 2018:
a national water resources and services water authority for South Africa;
a national water resources and services regulator;
a water resources and services value chain for water;
a water resources and services master plan; and
institutional rationalising and alignment.
The following table as summarised in Volume 1 of the NW&SMP provides a list of priority actions
to be implemented in this work stream:
Table 13-1: Priority Actions
Action Responsibility Completion Date
Gazette the National Water Amendment Bill, WaterServices Amendment Bill and Water ResearchAmendment Bill (Volume 3, Action 2.5.1)
DWS, PortfolioCommittee, StandingCommittee
2021
Hold public consultation on National Water AmendmentBill, Water Services Amendment Bill and Water ResearchAmendment Bill (2.5.2)
DWS, PortfolioCommittee, StandingCommittee
2022
Revise and promulgate the National Water AmendmentBill, Water Services Amendment Bill, and the WaterResearch Amendment Act (2.5.3)
DWS, PortfolioCommittee, StandingCommittee
2023
Review the Municipal Financial Management Act (MFMA)and the Municipal Systems Act (specifically chapter 8) toensure that they provide an enabling environment for theprovision of reliable water and sanitation services (2.5.4)
NT, DWS, CoGTA,SALGA
2020
Develop new policies and strategies on matters notpreviously addressed, in consultation with allstakeholders, to facilitate the sustainability of variouswater sector programmes (2.5.5)
DWS 2025
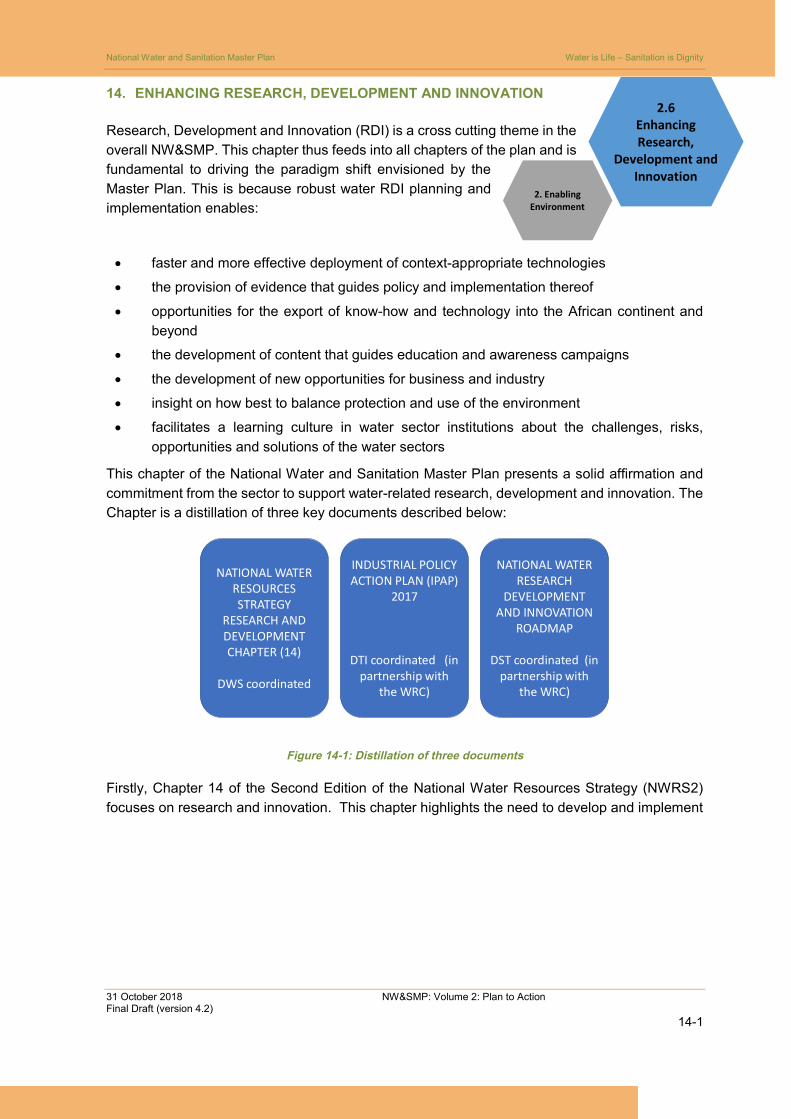
National Water and Sanitation Master Plan Water is Life – Sanitation is Dignity
31 October 2018 NW&SMP: Volume 2: Plan to ActionFinal Draft (version 4.2)
14-1
14. ENHANCING RESEARCH, DEVELOPMENT AND INNOVATION
Research, Development and Innovation (RDI) is a cross cutting theme in the
overall NW&SMP. This chapter thus feeds into all chapters of the plan and is
fundamental to driving the paradigm shift envisioned by the
Master Plan. This is because robust water RDI planning and
implementation enables:
faster and more effective deployment of context-appropriate technologies
the provision of evidence that guides policy and implementation thereof
opportunities for the export of know-how and technology into the African continent and
beyond
the development of content that guides education and awareness campaigns
the development of new opportunities for business and industry
insight on how best to balance protection and use of the environment
facilitates a learning culture in water sector institutions about the challenges, risks,
opportunities and solutions of the water sectors
This chapter of the National Water and Sanitation Master Plan presents a solid affirmation and
commitment from the sector to support water-related research, development and innovation. The
Chapter is a distillation of three key documents described below:
Figure 14-1: Distillation of three documents
Firstly, Chapter 14 of the Second Edition of the National Water Resources Strategy (NWRS2)
focuses on research and innovation. This chapter highlights the need to develop and implement
NATIONAL WATERRESOURCESSTRATEGY
RESEARCH ANDDEVELOPMENTCHAPTER (14)
DWS coordinated
INDUSTRIAL POLICYACTION PLAN (IPAP)
2017
DTI coordinated (inpartnership with
the WRC)
NATIONAL WATERRESEARCH
DEVELOPMENTAND INNOVATION
ROADMAP
DST coordinated (inpartnership with
the WRC)
2. EnablingEnvironment
2.6EnhancingResearch,
Development andInnovation
National Water and Sanitation Master Plan Water is Life – Sanitation is Dignity
31 October 2018 NW&SMP: Volume 2: Plan to ActionFinal Draft (version 4.2)
14-2
national plan for research and innovation, improve the utilization of outputs of research and clarify
roles and mandates between various institutions involved in research and development74.
Secondly, in response to Chapter 14 of the NWRS2, the Department of Science and Technology
(DST), DWS and the Water Research Commission (WRC) collaborated to develop the National
Water RDI Roadmap. This was finalised in 2015 and was adopted as the implementation plan
for Chapter 14 of the NWRS2. The Water RDI Roadmap75 is the National innovation plan for RDI
in the water sector and thus is the basis for the content and recommendations of the Water RDI
Master Plan. The Water RDI Roadmap was developed through an exhaustive, structured process
of eliciting responses from the professional community, reviewing the inputs, and assessing their
implications. The Roadmap mapping process included participation from key stakeholders in
industry, government and organisations within the National System of Innovation. The plan
provides strategic direction, a set of action plans and an implementation framework to guide, plan,
coordinate and manage South Africa’s RDI investment.
Thirdly, a water chapter has been included in the 2017/18-2019/20 Industrial Policy Action Plan76
(IPAP) of the Department of Trade and Industry in South Africa. This builds on the focal areas of
the National Water RDI Roadmap and has a particular focus on desalination and water
manufacturing, the next generation of sanitation solutions, and waste water technologies.
14.1 PRESENT STATE
South Africa has a long history of research and innovation within the water and sanitation sector,
with research institutions, universities and the private sector having made internationally
recognised breakthroughs in various fields. The South African contribution to the global share of
water-related papers in journals indexed by the Thomson Reuters Web of Science is more than
3 times the average for all disciplines in the country, and South Africa ranks 19th in the world in
the domain of ‘Water Resources’77. This provides a firm basis to build from in implementing the
RDI aspects of the Water Master Plan.
There are various institutions engaged in different aspects of water research, development and
innovation to start building from. The WRC is the leading funder of water research in South Africa.
It is funded from water user charges and leverages additional resources from various partnerships
and programmes. Various government departments are involved with funding and supporting
research and innovation activities in different ways. There is also a range of science councils,
tertiary academic institutions, non-profit organisations and private sector role players that are
involved in developing and supporting water research and innovation.
Whilst there is a rich institutional and skills environment to draw from; water research,
development and innovation continues to face a range of challenges including: poor coordination
and synergising of activities between institutions; a weak understanding of the role of all water
sector organisations in driving innovation and shifting solutions to practise, challenges in scaling
74 Department of Water and Sanitation. 2013. National Water Resources Strategy. Pretoria.75 Department of Science and Technology. 2015. National Water RDI Roadmap. WRC: Pretoria.76 Department of Trade and Industry. 2017. Industrial Policy Action Plan 2017/18 – 2019/20. Pretoria.77 Jacobs, IM., Pouris, A., Naidoo, D. 2014. A scientometric examination of the performance of water research in South
Africa, Water SA, Vol 40(4).

National Water and Sanitation Master Plan Water is Life – Sanitation is Dignity
31 October 2018 NW&SMP: Volume 2: Plan to ActionFinal Draft (version 4.2)
14-3
up of solutions to be ready for the market, and highly limited funding for innovation (particularly in
its scale up/ deployment stages). This results in many solutions that emerge from the research
and development space not being implemented in practise. For South Africa to be ready for the
future we must be able to address the innovation chasm where emerging solutions fail to be tested
at scale or be developed into viable business that are able to engage with different public and
private sector role players.
14.1.1 Pillars of the RDI Master Plan
Like the National Water RDI Roadmap, this chapter rests on three pillars. Firstly, there is a focus
on research activities, secondly a focus on skills and thirdly a focus on deployment of innovation.
The intention of the Research Pillar is to address ongoing research gaps, deepen insight and
output in areas where South Africa has a unique global contribution to make, and continue to
grow capability in areas key to South African water security.
The pillar on skills focuses on high-end skills with a particular emphasis on post graduate, post-
doctoral and research skills (in line with international RDI trends). In addition to ensuring that
there are suitably qualified people to drive the system of innovation for water, there is also a need
to understand how universities are preparing their graduates for future jobs in the water sector.
There is also a need to interrogate how to better orient graduates towards workplace readiness
through applied learning in the research and innovation space. Here there are a suite of national
skills programmes and learning sites that could potentially be used in a more synergised and
coordinated manner. In addition, it is important for these skills to be understood within a wider
landscape of artisanal, undergraduate, workplace-based learning/ reskilling needs and
opportunities.
The third pillar focuses on deploying innovation into practice. This happens in a range of different
ways. It involves packaging the outputs of research in a way that supports decision-making or
policy-making. It involves the demonstration and validation of a range of technology, and decision
support tools. A range of other knowledge brokering platforms are also valuable in the innovation
deployment space.
14.1.2 Supporting implementation of the RDI aspects of the Master Plan
Currently there are three core partners driving the water research, development and innovation
strategy nationally: the DWS, DST and the WRC. Linked to these core partners there are a range
of traditional research role players that are key including the National Research Foundation
(NRF), Technology Innovation Agency (TIA), Research Councils, Units and Universities. There
are also a range of other organisations that are pivotal in scaling up, testing and deploying new
innovations to practise. These include utilities, municipalities, the private sector, non-profit
organisations and others.
There is a Portfolio Management Unit for National Water RDI Coordination and Implementation
housed at the WRC, funded by the DST. The function of the unit includes:
Prioritisation and Project Management: Managing and reporting on a suite of priority
interventions within available budgets, and tracking emerging priorities and opportunities;
Partnerships and Investment: Developing and managing partnerships with water RDI role
players that enable more synergised monitoring and reporting of RDI investments and

National Water and Sanitation Master Plan Water is Life – Sanitation is Dignity
31 October 2018 NW&SMP: Volume 2: Plan to ActionFinal Draft (version 4.2)
14-4
activities in the water sector; new Water RDI funding contributions; and improved research,
development and innovation capacity in the system;
Visibility: Profiling the successes of the water RDI sector in achieving impact;
Monitoring and Evaluation: Managing and reporting on the Monitoring, Evaluation and
Learning (MEL) outcomes related to the Water RDI Roadmap;
Governance and Positioning: Influencing strategies, policies, processes and plans to drive the
vision of the RDI Roadmap and ensure effective governance of Roadmap implementation.
14.2 DRIVERS
Although there are many drivers to consider, two in particular are key to unlocking the RDI
priorities of the Master Plan: 1) re-imagining of RDI investment and Partnerships; 2) effective RDI
implementation mechanisms.
14.2.1 Re-imagining Water RDI Investment and Partnership
The overall investment ambition required to achieve all aspects of the RDI ambition laid out in the
Water RDI Roadmap is R 8.4 billion over a 10-year period. Detailed breakdown of this costing is
laid out in the Water RDI Roadmap Document78. In 2015 it is estimated that there was an average
of R 415 million was spent on water research, development and innovation79.This illustrates that
there is a large deficit (approximately R 400 million a year) on an annual basis hindering the
achievement of the RDI ambition and opportunity in South Africa.
Addressing this gap requires a re-imaging of how to drive investment into Water RDI in South
Africa. It is essential to recognise that achieving the ambition of the Research, Development and
Innovation component of the NW&SMP demands coordination and investment from multiple
institutions. The traditional RDI funding institutions such as the National Research Foundation
and Water Research Commission remain key players in driving the research and high-end skills
opportunities and needs of the water sector. However, these institutions and their associated
budgets cannot manage the full investment aspiration for RDI alone.
Achieving this investment aspiration demands a range of multi-partner collaborative initiatives to
drive opportunities in a range of gaps. There is a particular need to look at the cost sharing
associated with the later stages of the innovation pipeline (technology demonstrations,
professional service centres, etc) as this is typically the higher cost and more complex funding
space. Getting this right requires inputs from utilities, municipalities, the private sector, donor
community and strong investment, leadership and support from the Department of Water and
Sanitation in collaboration with partners.
In order to unlock the needed investment, partnerships are going to have to:
Address how best to link the testing and de-risking of an emerging pipeline of technologies
to bulk infrastructure planning and implementation processes;
78 Department of Science and Technology. 2015. National Water RDI Roadmap. WRC: Pretoria.79 Pouris, A. 2018. Water RDI Roadmap 2015 Baseline. WRC. Pretoria.
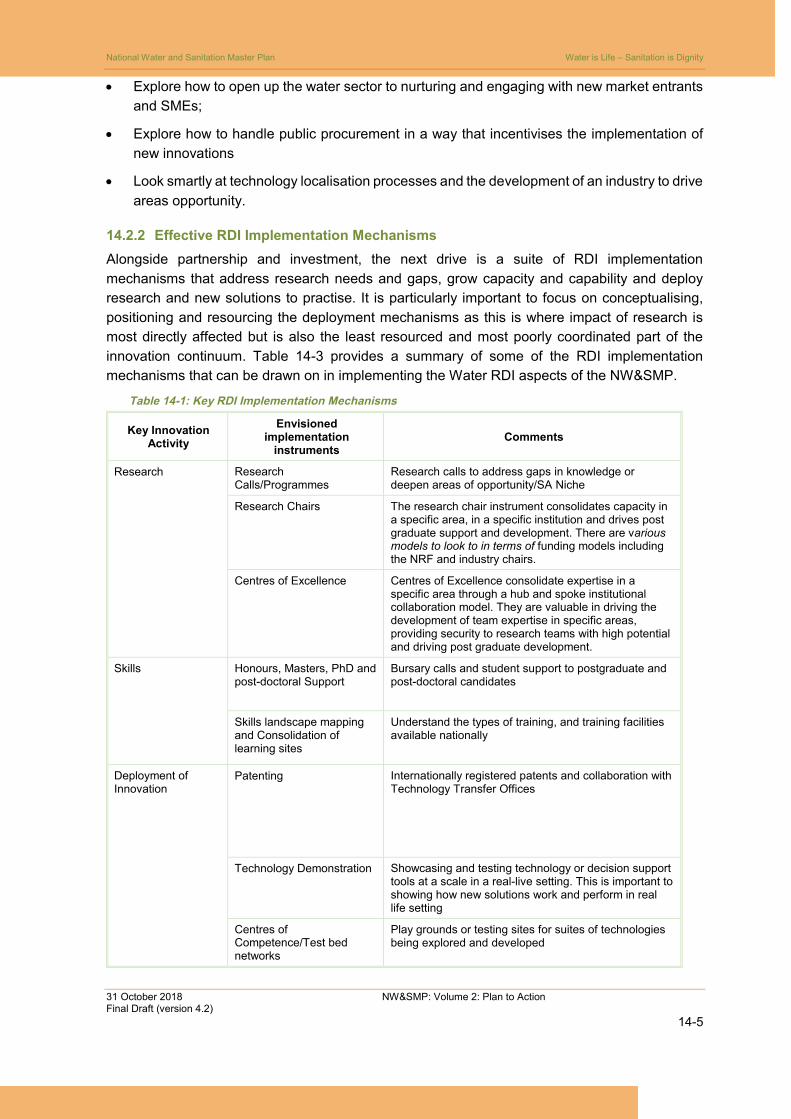
National Water and Sanitation Master Plan Water is Life – Sanitation is Dignity
31 October 2018 NW&SMP: Volume 2: Plan to ActionFinal Draft (version 4.2)
14-5
Explore how to open up the water sector to nurturing and engaging with new market entrants
and SMEs;
Explore how to handle public procurement in a way that incentivises the implementation of
new innovations
Look smartly at technology localisation processes and the development of an industry to drive
areas opportunity.
14.2.2 Effective RDI Implementation Mechanisms
Alongside partnership and investment, the next drive is a suite of RDI implementation
mechanisms that address research needs and gaps, grow capacity and capability and deploy
research and new solutions to practise. It is particularly important to focus on conceptualising,
positioning and resourcing the deployment mechanisms as this is where impact of research is
most directly affected but is also the least resourced and most poorly coordinated part of the
innovation continuum. Table 14-3 provides a summary of some of the RDI implementation
mechanisms that can be drawn on in implementing the Water RDI aspects of the NW&SMP.
Table 14-1: Key RDI Implementation Mechanisms
Key InnovationActivity
Envisionedimplementation
instrumentsComments
Research ResearchCalls/Programmes
Research calls to address gaps in knowledge ordeepen areas of opportunity/SA Niche
Research Chairs The research chair instrument consolidates capacity ina specific area, in a specific institution and drives postgraduate support and development. There are variousmodels to look to in terms of funding models includingthe NRF and industry chairs.
Centres of Excellence Centres of Excellence consolidate expertise in aspecific area through a hub and spoke institutionalcollaboration model. They are valuable in driving thedevelopment of team expertise in specific areas,providing security to research teams with high potentialand driving post graduate development.
Skills Honours, Masters, PhD andpost-doctoral Support
Bursary calls and student support to postgraduate andpost-doctoral candidates
Skills landscape mappingand Consolidation oflearning sites
Understand the types of training, and training facilitiesavailable nationally
Deployment ofInnovation
Patenting Internationally registered patents and collaboration withTechnology Transfer Offices
Technology Demonstration Showcasing and testing technology or decision supporttools at a scale in a real-live setting. This is important toshowing how new solutions work and perform in reallife setting
Centres ofCompetence/Test bednetworks
Play grounds or testing sites for suites of technologiesbeing explored and developed

National Water and Sanitation Master Plan Water is Life – Sanitation is Dignity
31 October 2018 NW&SMP: Volume 2: Plan to ActionFinal Draft (version 4.2)
14-6
Key InnovationActivity
Envisionedimplementation
instrumentsComments
Communities of practise Structured platforms for the epistemic community tocollaborate, share and network.
Professional ServiceCentres
Knowledge Brokering units and workplace-basedtraining facilities
14.3 PRIORITIES FOR THE FUTURE
The Water RDI Roadmap highlights 6 priority thematic clusters that research, skills development
and innovation deployment activities should be focused on. These clusters, summarised in Table
14-2, are aligned to the various focal areas and technical chapters of the NW&SMP.
Table 14-2 summarises the high-level objective, outcome and description of each cluster. It also
highlights some of the important first steps/priorities in addressing the RDI need of each cluster.
Note that these priorities should be treated in a reflexive way. New priorities may need to be
added, and additional projects may to the fore as a wide array of institutions work on different
aspects of these clusters.

National Water and Sanitation Master Plan Water is Life – Sanitation is Dignity
31 October 2018 NW&SMP: Volume 2: Plan to ActionFinal Draft (version 4.2)
14-7
Table 14-2: Investment Themes for the NW&SMP
Cluster Objective RDI Outcome High level descriptionEmergent Priorities/ collaborative
interventions
Cluster 1:UnlockAlternativeSources ofWater
Increase ability tomake use of moresources of water,includingalternatives.
Technology assessment anddevelopment for utilisation ofdiverse water sources at differentlocations, with source localisationand exploitation driven by fitnessfor use
The focus is on unlocking large volumes ofwater that can assist in achieving the targets ofNWRS II)
Sources can be derived from all aspects of thewater cycle (river, ground, atmosphere, rain,sea and green water)
Grey & brackish water (including storm andindustrial water reuse) are a key part of thismix
Initiate a consolidation researchprogramme for alternative sources
Implement a suite of alternate sourcesolutions and technologies todemonstrate a mix in a specific location(drawn from feasibility research)
Cluster 2:Govern, planand managesupply anddemand
Improvegovernance,planning andmanagement ofsupply and delivery,and management ofdemand and use.
Focus on improved quality andresilience of planning for thefuture – ability to respond tochanges, including climatechange.
There is equitable and transparentaccess to water supplies that aremanaged at catchment level byDWS co-operatively with DoH,DAFF, DHS, and DEA.
Transparency over rights, quotas,allocations, and transfers hasbeen achieved and co-operativegovernance with respect toplanning and management hasbeen improved.
For supply there is a focus on:
Governance of water sources
Water resources managementinstitutions
Climate change adaptation anddisaster response
Accountability
For demand there is a focus on:
Regulation and self-regulation
Insertion of new solutions intocommunities
Equity is a key issue
Initiate a focused ResearchProgramme: Water governance andsociety
Run a transboundary data analyticsresearch programme
Create Communities of Practice:Transboundary Water Data and generalGovernance issues
Cluster 3: Builtand EcologicalInfrastructure
Improve adequacyand performance ofsupplyinfrastructure.
Increased volume and adaptabilityof storage capacity for raw waterand treated effluent is available.
Focus on increased levels ofprotection and reliability ofecological infrastructure andhaving sufficient ecologicalreserve.
New ways of approaching watersupply and distribution infrastructure
Managing ecological infrastructure
Combining built and ecologicalapproaches
Waste Water Treatment and drinkingwater treatment bulk technologies
Initiate a focused research programmeon water smart cities/towns and climateresilient planning and nurture a WaterSensitive Design Community ofPractise
Run an Ecological InfrastructureResearch Programme.
Engage and support the GEF 6 (Waterand Ecosystems) initiative managed bySANBI (embed ecosystems into watermanagement planning and financing)

National Water and Sanitation Master Plan Water is Life – Sanitation is Dignity
31 October 2018 NW&SMP: Volume 2: Plan to ActionFinal Draft (version 4.2)
14-8
Cluster Objective RDI Outcome High level descriptionEmergent Priorities/ collaborative
interventions
Support an alternative sanitationportfolio of technologies andlocalisation
Initiate a Tech solutions portfolio:Infrastructure
Cluster 4: Runthe Water Sectoras a sustainablebusiness
Improve operationalperformance andrun Water as asustainable“business”.
The financial sustainability of thewater services system is secured.
Pricing is equitable, and theattribution of water use isaccurate. Non-revenue water isbelow 15% and revenues arecollected punctually. Operationalefficiency has been gained and>90% of water and wastewatertreatment works have Blue Drop /Green Drop status.
Economic impacts of poor waterquality and drought
Creating the investment case forinvesting in water innovation
Pricing and Billing
Public-private partnerships
Procurement, Service delivery andAsset management
Initiate a Research Chair/ResearchProgramme in Water Sector Economics
Initiate a Municipal Water servicessupport and advisory function (RDIoutput focused)
Cluster 5:Efficiency
Reduce unintendedlosses and increaseefficiency ofproductive use.
Non-productive uses of waterhave been eliminated orminimised.
Evidenced by reduction in: watertransport losses, leakages,volume of water use, output tounrecoverable sources, volumeand toxicity of pollution, anddischarge of poor quality water.
Respond to non-revenue waterchallenges
Industrial/large scale focus
Consumer/household focus
Industry, Agriculture, Business bestpractise
Initiate a technology solutions portfolio:Efficiency (Household, industrial, public& agri efficiency),
Support Mine Water Demonstrationvalidation and process learning
Cluster 6:Monitoring andMetering
Improveperformance ofPricing, Monitoring,Billing, Meteringand Collection.
Improved accuracy has beenattained in water use monitoring,and metering management
Intelligence gathering
Big data and smart systems
Responsiveness
Evidence informed investment ininfrastructure and solutions
Citizen science
Support the catalysing of a HydrologicalMonitoring Centre for South Africa
Initiative a Technology SolutionsPortfolio: (water quality testing,monitoring tech, ICT innovations)

National Water and Sanitation Master Plan Water is Life – Sanitation is Dignity
31 October 2018 NW&SMP: Volume 2: Plan to ActionFinal Draft (version 4.2)
14-9
Table 14-3 highlights the key systemic actions that need to be taken to start orienting the Water
RDI system towards effectively addressing research gaps/knowledge needs, growing the
innovation skills base and shifting RDI derived solutions and know-how into practise.
Table 14-3: Action
Action Responsibility Completion Date
Implement and regularly review/revise Research,Development and Innovation Policies, Plans andRoadmaps across the sector (Volume 3, Action2.6.1)
DWS, DST, WRC, CSIR 2021
Unlock investment, procurement and otherlocalisation barriers to reposition the sector toimplement new/niche solutions and approachesand roadmap the NMIU (2.6.2)
DWS, NT, CoGTA, DST,NMIU
Ongoing
Coordinate, and where needed establish newplatforms, to enable a synergised set ofinstitutions that enable the shifting of innovationsinto the market (including business developmentand SME support) (2.6.3)
DWS, the dti, Dept SmallBusiness, EDD
2019
Strengthen partnerships with key water sectorinstitutions to accelerate research and solutionsinto practice (2.6.4)
DWS, WRC, CSIR, DST,CoGTA, SALGA, the dti,DAFF
2020
Structure test bed partners with key water sectorinstitutions in order to accelerate innovations tothe market/public sector (2.6.5)
WRC, CSIR, DWS, DST,SALGA, Municipalities
Ongoing
Fund research into new models to betterunderstand implementation approaches for waterallocation reform, and equity issues (2.6.6)
DWS, WRC, CSIR, DST Ongoing
Develop technologies, guidelines andimplementation support tools that enable SA touse alternative and appropriate sources as part ofwater supply (2.6.7)
DWS, WRC, CSIR, DST,SALGA, CoGTA, WSAs
2023
Apply the concepts of water sensitive urban designto a robust city-wide case study to demonstrateand learn how a city can transition to a sustainablecity (2.6.8)
DWS, SALGA, Metros,District Municipalities
2027
Tools for agriculture early warning systems needto be developed and tested at scale (2.6.9)
WRC, CSIR, DWS, DAFF,ARC
Ongoing
Scan and sort the innovation sector for solutionsthat are ready for application and invest in theirimplementation (2.6.10)
WRC, CSIR, DST, DWS 2021
Alternative Sanitation: Develop and demonstrateand validate appropriate alternative, water-lessand off grid sanitation solutions (Current – 2025)(2.6.11)
DWS, WRC, CSIR, DST,BMGF, the dti,Municipalities
Ongoing
Domestic and industrial Waste Water: Developand Demonstrate appropriate waste watertechnologies for cost effectiveness, energyefficiency and beneficiation (2.6.12)
DWS, TCTA, WRC, CSIR, thedti, DST, TIA, MINTEK
Ongoing

National Water and Sanitation Master Plan Water is Life – Sanitation is Dignity
31 October 2018 NW&SMP: Volume 2: Plan to ActionFinal Draft (version 4.2)
14-10
Action Responsibility Completion Date
Scan and sort the innovation sector for solutionsthat are ready for application and invest in theirimplementation (2.6.13)
WRC, CSIR, DST, DWS 2021
Drinking Water Treatment: Develop andDemonstrate solutions that allow for the use ofalternative sources of water for safe humanconsumption and water security (2.6.14)
DWS, WRC, CSIR,Municipalities
Ongoing
Continue to invest in understanding emergingcontaminants (detection and treatment) in orderto improve our transition to reuse, reclamationand recycling of water (2.6.15)
DWS, WRC, CSIR,Municipalities
Ongoing
Improving raw water quality:Invest in Communities of practise that bringtogether built and ecological infrastructureexperts and solutions (2.6.16)
DWS, DEA, SANBI, WRC,CSIR, DST
Ongoing
Link the Global Environment Fund 6 project onWater Pricing and Ecosystems to Water MasterPlan implementation and position DWS to beclosely involved in this process (2.6.17)
DWS, DEA, SANBI, WRC,CSIR
2024
Continue to do research on land use impact onwater linked ecosystems (2.6.18)
WRC, CSIR, DEA, DWS,DAFF, ARC
Ongoing
Ongoing research, modelling and planning aroundclimate change and its impacts on water securityand water infrastructure needs to be conducted(2.6.19)
DWS, DEA, DST WRC, CSIR Ongoing
Initiate a hydrological monitoring centre for SouthAfrica in order to re-establish a robust data,monitoring and information capability for moreeffective water resources planning and climatechange forecasting in future (2.6.20)
DWS, DEA, ARC, DAFF,WRC, CSIR, DST, SAWS,CSIR, StatsSA
2021
Test a suit of ICT and citizen science tools for datasourcing (2.6.21)
WRC, CSIR, DWS, DST,CoGTA, SALGA, the dti,DAFF
Ongoing
Partner with institutions to fund training of watersector practitioners in the curation, managementand use of data as well as the associatedtechnologies (2.6.22)
DWS, EWSETA Ongoing
Review all relevant guidelines and R&D productsto understand where training modules need to bedeveloped around new knowledge (2.6.23)
DWS, WRC, CSIR, SETAs,WISA, DHET
National Water and Sanitation Master Plan Water is Life – Sanitation is Dignity
31 October 2018 NW&SMP: Volume 2: Plan to ActionFinal Draft (version 4.2)
15-11
SECTION 3: SUPPORTING IMPLEMENTATION
15. PERFORMANCE MANAGEMENT, MONITORING AND EVALUATION
15.1 INTRODUCTION
Performance information is used to assess how well an institution is delivering on its mandate. It
is a crucial management tool to coordinate planning, budgeting, monitoring and evaluation. It
facilitates accountability and enables legislators as well as interested and affected parties to
monitor progress whilst also identifying areas of improvement. The availability of performance
information enhances institutional decision-making and supports results-based management
approaches (for example, performance contracting and risk management).
South Africa has had various reforms in the management of performance information. In 2004,
government programmes and policies were set out in a Medium Term Strategic Framework
(MTSF). Subsequently, in an effort to achieve more with the limited available resources, in 2009
the government outcomes approach was introduced. In 2011, the National Development Plan
(NDP) provided long-term targets for government.
Sound indicators that will be the basis for clear and comprehensive monitoring are essential to
effectively monitor and evaluate any plan. As the NW&SMP guides delivery in the water and
sanitation sector, it is paramount to understand the relationships between the various government
planning tools and the planning, budgeting, monitoring and evaluation cycle. The understanding
of these processes will provide the basis for aligning the ongoing monitoring and evaluation of
progress in implementing the NW&SMP with that of other related government plans.
It is critical to monitor progress at regular intervals and provide the necessary performance
information that enable adjustments to approach and, where needed, in intent. Therefore, whilst
it is important to understand the broader monitoring and evaluation environment, it is equally
important to enable the modalities for a more “live” approach.
15.2 PRESENT STATE OF PLANNING
Government performance planning focuses on a longer period (i.e. five to twenty years) while
budgeting has a short-term perspective (i.e. one to three years). This creates an “inherent
tension” between planning and budgeting resulting in difficult integration of the two. Given South
Africa’s position as a developmental state with limited resources, long term plans need to inform
the allocation of resources so that “historical inequities can be progressively addressed”.
Therefore, operational or implementation plans that are informed by the long term strategic plans
will be developed within the context of limited resources. In view of this, the NW&SMP is
anticipated to be a strategic plan that will inform the water and sanitation sectors’ operational
plans.
In an effort to align planning and budgeting, departments will develop budget programme
structures that link their objectives with their detailed operational budgets. The underlying
principle for this is to “ensure a stable framework linking successive plans and strategic priorities
to budget allocations and performance indicators that track delivery over medium to long term”.
There is a significant focus on strengthening the integration of performance planning and
budgeting with sophisticated methods proposed in ensuring outcomes-based costing. Each
department will define “performance enhancing processes, costs those processes and establish

National Water and Sanitation Master Plan Water is Life – Sanitation is Dignity
31 October 2018 NW&SMP: Volume 2: Plan to ActionFinal Draft (version 4.2)
15-12
the unit cost of delivery”. This information will “inform budget calculations and the choice of
performance targets”.

National Water and Sanitation Master Plan Water is Life – Sanitation is Dignity
31 October 2018 NW&SMP: Volume 2: Plan to ActionFinal Draft (version 4.2)
15-13
Figure 15.1: Long-term Relationship and Timing of Government Accountability Documents
(Source: Adapted from Framework for Strategic Plans and Annual Performance Plans)
2009 2010 2011 2012 2013 2014 2015 2016 2017 2018 2019
5 year electoral mandate 5 year electoral mandate
Ele
ctio
n
Ele
ctio
n
Ele
ctio
n
National Development Plan vision 2030
MTSF (Outcomes)
5 year strategic plan
MTSF (Outcomes)
5 year strategic plan
3 YRAPP
3 YRAPP
1 YRENE
3 YRAPP
1 YRENE
3 YRAPP
1 YRENE
3 YRAPP
1 YRENE
3 YRAPP
1 YRENE
1 YRENE
3 YRAPP
1 YRENE
3 YRAPP
1 YRENE
3 YRAPP
1 YRENE
12 IYM 12 IYM12 IYM
4QR
12 IYM
4QR 4QR 4QR
12 IYM
4QR
12 IYM
4QR
12 IYM
4QR
12 IYM
4QR
12 IYM
4QR
12 IYM
4QR
AR AR AR AR AR AR AR AR AR AR
1 YRENE
3 YRAPP
Ele
cto
ral
cyc
leP
lan
nin
ga
nd
bu
dg
eti
ng
cyc
leM
on
ito
rin
g&
eva
lua
tio
nc
yc
le
EPR EPR
Fis
cal
ye
ar

National Water and Sanitation Master Plan Water is Life – Sanitation is Dignity
31 October 2018 NW&SMP: Volume 2: Plan to ActionFinal Draft (version 4.2)
15-14
15.2.1 Present Planning Requirements
The figure on the previous page illustrates the relationships between the government planning
tools and the timing of associated monitoring and evaluation requirements. It can be
summarised as follows:
15.2.1.1 The National Development Plan
This is government’s long-term plan that determines what the country should look like by 2030.
It highlights two strategic goals of eliminating poverty and sharply reducing inequality with
associated objectives to ensure their achievement. As it identifies the various priority areas
over the long-term period, it is the underlying document for all government plans.
15.2.1.2 The Medium Term Strategic Framework
This is a government five-year strategic plan (i.e. within a given electoral term) that reflects
commitments made in the governing party’s election manifesto and commitments to
implement the NDP. It is a building block towards achieving the country’s long-term plan and
contains priority actions from various government plans within a given electoral term. It is thus
a link between priorities in the governing party’s election manifesto and the individual plans of
government departments. As the performance agreements signed between the President and
each Minister are based on relevant actions in the MTSF, it is crucial for each department to
ensure that their respective strategic and annual performance plans are aligned with the MTSF
targets. The MTSF is the result of an intensive iterative planning process involving all three
spheres of government. For the MTSF to be systematically implemented, its actions must be
incorporated into other government plans. Efficient and effective monitoring of the
implementation of the NDP requires that there is a high level of alignment of the measurable
indicators and targets across all these plans.
15.2.1.3 The Strategic Plan
This is a departmental level five-year plan that identifies policy priorities, programmes and
projects within the scope of the available resources that are consistent with the MTEF. It
should focus on the department’s strategic outcome oriented goals and objectives for each
service delivery areas that are aligned to its budget programmes and sub-programmes. It lays
the basis for the development of an annual performance plan and must be reviewed every five
years, ideally from the first planning cycle following an election (i.e. towards the end of the
period it covers). Its revision may occur during the five-year period it covers but changes
should be limited to revisions relating to significant policy shifts or service delivery changes. If
reviewed during this period, it should also be re-tabled with the updated Annual Performance
Plan. It should consider the NDP, the MTSF, Provincial Growth and Development Strategies,
municipal Integrated Development Plans, relevant executive authority performance
agreements signed with the President and relevant intergovernmental service delivery
agreements and international commitments.
15.2.1.4 The Annual Performance Plan:
This is a three-year departmental plan that sets out among other things the performance
indicators and targets per budget programme and sub-programme within the scope of
available resources. It must align with the strategic plan, NDP, the MTSF, PGDS, municipal
IDPs, relevant executive authority performance agreements signed with the President and

National Water and Sanitation Master Plan Water is Life – Sanitation is Dignity
31 October 2018 NW&SMP: Volume 2: Plan to ActionFinal Draft (version 4.2)
15-15
relevant intergovernmental service delivery agreements and international commitments. It
lays the basis for the development of the department’s medium-term expenditure framework,
programme business plans and officials’ performance agreements. It is reviewed annually to
factor in changes in the indicative budget allocations as well as recommendations from various
interested and affected parties. It must include quarterly performance targets and budget for
the following financial year per budget programmes and sub-programmes. Although in-year
changes are not encouraged, in instances where they occur the approval of the Executive
Authority needs to be obtained before Parliament passes the midterm Appropriation Bill. In
addition, these changes should be indicated in the annual report.
15.2.1.5 The Estimates of National Expenditure:
This sets out what funds have been allocated to each department to deliver services as per
the APP. It provides comprehensive information on how budget resources are generated and
how they will be spent by respective departments. It covers financial resources for the current
financial year and indicative figures for the two following years (Medium Term Expenditure
Framework). It is developed within the framework of a department’s strategic plan and must
be informed by and inform the annual performance plan.
15.3 PRESENT STATE OF MONITORING AND EVALUATION
15.3.1 Current Monitoring Requirements
Monitoring and evaluation are essential components of effective management. The various
reforms in the management of performance information stipulated above resulted in a change
of emphasis in the monitoring, reporting and evaluation requirements within the public sector.
The introduction of the government wide monitoring and evaluation framework (GWME)
brought the integration of monitoring requirements with other government spheres.
The current accountability documents that fall within government’s monitoring the reporting
framework are as follows:

National Water and Sanitation Master Plan Water is Life – Sanitation is Dignity
31 October 2018 NW&SMP: Volume 2: Plan to ActionFinal Draft (version 4.2)
15-16
Figure 15.2: Accountability Documents within the Reporting Framework
15.3.1.1 In-year monitoring reports
These are monthly financial reports that all government departments should provide by the
prescribed timeframes. These include 30 day payment certificates, bank reconciliations, in-
year monitoring and cash flow projections, suspense accounts reconciliation and age analysis,
deviation from normal procurement process, awarded contracts, commitments, irregular,
fruitless and wasteful expenditure, movable assets verified, value in Rands for finance leased
assets.
15.3.1.2 Quarterly performance information reports
These are required quarterly reports that provide progress updates on the implementation of
the APP’s predetermined targets. These progress reports provide the Accounting Officer with
an opportunity to indicate measures that will be taken to ensure that the APP’s implementation
is on track. There are also other intergovernmental reports monitoring the implementation of
the MTSF (e.g. outcomes and mid-year reports) that are developed from quarterly reports of
respective departments and submitted to coordinating departments within the required
timeframes. The coordinating department will collate and analyse all contributions and submit
to Cabinet for approval.
15.3.1.3 Annual report
This provides information on the organisation’s performance in the preceding financial year
for the purposes of oversight. It looks at the department’s performance relative to the targets
set in the APP and provides audited annual financial statements revealing how the budget
was implemented and the state of the institution’s financial management systems.
15.3.1.4 Evaluation of performance reports:
An institution should produce an end-term review towards the end of the period covered by its
Strategic Plan. The review should broadly follow the format of the plan. The institution should
In-year monitoringreports
Quarterlyperformance
information report
Annual Report
Evaluation ofperformance
reports

National Water and Sanitation Master Plan Water is Life – Sanitation is Dignity
31 October 2018 NW&SMP: Volume 2: Plan to ActionFinal Draft (version 4.2)
15-17
report on the extent to which it has succeeded in achieving each of the strategic outcome
oriented goals and objectives set at the beginning of the five-year period, as well as on any
other evaluations conducted during the period.
15.3.2 Current Evaluation Requirements
An evaluation is the systematic collection and objective analysis of evidence on public policies,
programmes, projects, functions and organisations to assess issues such as relevance,
performance (effectiveness and efficiency), value for money, impact and sustainability and
recommend ways forward.
The National Evaluation Policy Framework indicates that evaluation should be undertaken for
four primary purposes of improving performance; improving accountability; generating
knowledge (i.e. what works and what does not work) and improving decision-making.
Each department is required to develop a multi-year evaluation plan summarising the
evaluations that will be conducted over one to three years. In addition, the department is
required to conduct at least one evaluation report with recommendations for specific policies
or programmes.
The importance of the NW&SMP in guiding sector-wide processes in support of the NDP,
indicates that regular evaluation to improve performance will be essential. Alignment of these
evaluations with other evaluation processes across the broader sector will be critical. The
timing of these must align with the broader governmental frameworks.
15.3.3 Current Evaluation Processes
Corporate Planning and Organisational Performance is the central coordinator for evaluation
in the organisation with the following processes followed:
Call for evaluations:
The CPOP unit circulates a call for evaluations to all programme managers to identify
programmes that should be evaluated and if concept notes exist and budgets have been
allocated.
Departmental evaluation plan:
The CPOP unit is the repository of evaluations that will be and have been undertaken in the
department. In addition, the unit liaises with programme managers to suggest evaluations to
be included in the annual and three-year national evaluation plan managed by the DPME.
15.4 DESIRED STATE OF MONITORING AND EVALUATION FOR THE NW&SMP
The departmental strategic plan is replaced by the National Water and Sanitation
Strategy with a minimum of a 5-year horizon;
The NW&SMP sets out strategic actions that will be included in the department’s APP
and entities’ corporate plans with a 3-year horizon that will be reviewed annually;
NW&SMP timelines are aligned with governmental timelines to streamline them with
budgeting timelines

National Water and Sanitation Master Plan Water is Life – Sanitation is Dignity
31 October 2018 NW&SMP: Volume 2: Plan to ActionFinal Draft (version 4.2)
15-18
Figure 15.3: Theory of change for the National Water and Sanitation Master Pan
15.4.1 Proposed Monitoring and Evaluation Processes
DWS will develop, based on current systems, a monitoring and evaluation system to measure
implementation of the NW&SMP. Successful monitoring and evaluation will require DWS to
collate relevant information from other departments, WSAs and public entities, and to evaluate
performance, measure trends, and adjust implementation targets and approaches based on
these results. The annual reporting to FOSAD on implementation of the NW&SMP will be
based on this monitoring, reporting and evaluation system.
It is critical that the monitoring and evaluation is used to adjust the implementation plan, and
this must be done with the relevant government partners.
Logical model Performance levels National Water & Sanitation Master Plan
Impacts achieved NW&SMP goals
Outcomes realisedNW&SMP measurable
actions
Outputs deliveredNW&SMP measurable
annual milestones
Activities implementedNW&SMP operational/implementation plan
Inputs utilisedPerformanceagreements
Mandate, vision, mission,goals
Strategic actions (unique tolead implementer)
Lead implementer(s)performance indicators
Programme plans
Individuals performanceagreements
Impacts indicators
Outcomesindicators /
2030 targets
Outputs indicators/annual targets
Activities indicators/quarterly targets
Inputs indicators/targets
Natio
nal
sca
le
WM
A,
pro
vin
cia
l&
mu
nic
ipa
litysca
les

National Water and Sanitation Master Plan Water is Life – Sanitation is Dignity
31 October 2018 NW&SMP: Volume 2: Plan to ActionFinal Draft (version 4.2)
16-1
16. INFORMATION MANAGEMENT AND DATA PORTAL
This chapter focuses on information management and development of a data portal for the
National Water & Sanitation Master Plan (NW&SMP).
Most decision-making is driven by the availability and content of information at hand. The
Master Plan is based on existing policies, strategies, studies and spatial information that assist
in setting the scene in terms of the current status, desired status and activities to achieve
planned outcomes.
16.1 PRESENT STATE
The DWS has a well-established website and document management system that provide
users access to information on the DWS’s structure, programmes, activities and services. The
website is updated daily and serves as the first point of contact with the DWS and the sector
stakeholders including; consumers, water institutions and those interested in the water and
sanitation sector.
The website also communicates new initiatives, inviting comments on draft policies such as
the Mine Water Management Policy (currently being workshopped, October 2017) and
provides linkages to water entities (water boards, the Water Research Commission and the
Trans-Caledon Tunnel Authority).
The document management system consists of a library that provides access, via a search
function, to legislated documents, study reports and strategic plans. Users can perform
searches based on a geographic area or by entering keywords.
16.2 DRIVERS FOR NW&SMP WEB PORTAL
The purpose of the NW&SMP web portal is to disseminate information on the content and
actions from the Master Plan and to report on progress in implementation. The portal is
therefore a communication tool not only on the development process of the MP or the content
and actions from the completed NW&SMP, but also the lifecycle of implementation, review
and updates of the NW&SMP.
The portal will also provide access to information on stakeholder engagement activities
planned and held to ensure active participation during the development process and
thereafter.
16.3 CONTENT AND FUNCTIONALITY
The content of the NW&SMP web portal will reflect the key theme areas of the NW&SMP, but
will also include elements related to the implementation of the plan, communication and
documentation in support of the NW&SMP and its activities.
The portal will provide concise, informative content for each NW&SMP theme related to the
drivers, vision and enabling activities to achieve the desired future state. Where appropriate,
linkages to existing portals and programmes of the DWS will be included.
Supporting documentation would form part of the DWS document management portal or
library, with specific reference to the MP.

National Water and Sanitation Master Plan Water is Life – Sanitation is Dignity
31 October 2018 NW&SMP: Volume 2: Plan to ActionFinal Draft (version 4.2)
16-2
A preliminary design of the MP portal is illustrated in the figure below. It has a similar design
to the existing DWS web portals to ensure easy navigation and familiarity in the user
experience.
The web portal will include a GIS component, illustrating aspects related to projects and
activities. The hosting of the GIS component is still to be determined: either as part of the
NW&SMP portal or as part of the existing Spatial and Land Information Management (SLIMS)
portal or the National Integrated Water Information System (NIWIS).
Functionality of the portal will encourage users to be interactive when viewing the contents of
the portal or engaging on the themes of the NW&SMP. Appropriate social media applications
will therefore be incorporated.
16.4 ACTION PLAN
The existing DWS website provides the platform from which the NW&SMP web portal will
function. It is therefore an extension of the existing website functionality and should enjoy a
high level of visibility and ease of access. Technical maintenance of the portal forms part of
the DWS website maintenance. Content maintenance of the portal will be assigned to the
relevant DWS officials involved in the development and implementation of the NW&SMP.

National Water and Sanitation Master Plan Water is Life – Sanitation is Dignity
31 October 2018 NW&SMP: Volume 2: Plan to ActionFinal Draft (version 4.2)
17-1
17. ENGAGING SECTOR PARTNERS
The Department of Water and Sanitation embarked on a consultative process of engagement
towards the development of the NW&SMP with valuable input received from a wide range of
stakeholders and organs of state. The Master Plan has been greatly improved and informed
by these engagements and inputs and remains a “living” document to be reviewed annually,
regularly updated and continuously improved in order to ensure that it does indeed, best serve
the needs of the country as it strives to ensure a water secure, sustainable water sector.
Key stakeholder engagement was undertaken as follows:
Date Stakeholders engaged/Engagement event
19 May 2017 Various/National Dialogue
REGIONAL WORKSHOPS: Round 1
21 Jun 2017 Eastern Cape
26 Jun 2017 Mpumalanga
4 Jul 2017 Northern Cape
6 Jul 2017 Limpopo
13 Jul 2017 Free State
18 Jul 2017 Gauteng
21 Jul 2017 Western Cape: Brede-Gouritz WMA
25 Jul 2017 KwaZulu Natal
27 Jul 2017 Western Cape: Berg-Olifants WMA
31 Jul 2017 North West
South Africans share common interests and challenges in the pursuit of water security.
Achieving water security requires sound evidence to inform policy and dialogue, goodgovernance, advances in research and technology, the mobilisation of finance andinvestment, management of climate risks, and cooperation in managing transboundarywater resources.
Water security also requires balancing demand (reducing individual use) and supply(increasing supply for a growing population and economy), redistributing water equitably,managing water and sanitation services effectively, regulating water with a focus on highimpact use, improving raw water quality and protecting and restoring ecosystems.
These themes orient the NW&SMP and provide a rallying point for government, civilsociety, the private sector, researchers and innovators, the international community andordinary South Africans.

National Water and Sanitation Master Plan Water is Life – Sanitation is Dignity
31 October 2018 NW&SMP: Volume 2: Plan to ActionFinal Draft (version 4.2)
17-2
Date Stakeholders engaged/Engagement event
Jan 2018 REGIONAL WORKSHOPS: Round 2
19 Jan 2018 Gauteng
22 Jan 2018 Limpopo
24 Jan 2018 KwaZulu Natal, Eastern Cape & Free State
25 Jan 2018 Gauteng & Northern Cape
26 Jan 2018 North West
26 Jan 2018 Western Cape
29 Jan 2018 Mpumalanga
OTHER ENGAGEMENTS
15 Sept 2017 National Treasury
12 Oct 2017 3rd Annual Water Stewardship Event: Municipal Water InfrastructureFinancing
1 Nov 2017 Parliament Portfolio Committee on Water and Sanitation
15 Nov 2017 SANCOLD keynote and presentation
20 Nov 2017 Director Generals Meeting with CE’s of Entities
21 Nov 2017 Minister Meeting with Chairpersons of Entities
23 Nov 2017 NSBA Breakfast Seminar: “Water in South Africa – Opportunity inCrisis”
27 Nov 2017 TCTA Board Strategy Session
30 Nov 2017 Water Infrastructure Summit
6 Dec 2017 Professional Bodies (1st session)
7 Dec 2017 National Departments (including National Treasury
14 Dec 2017 Eskom and Sasol
19 Dec 2017 WRC: Steering committee on Road Map for Water RDI
10 Jan 2018 SALGA (1st session)
1 Feb 2018 National Departments (including National Treasury) and relatedassociations: 2nd session

National Water and Sanitation Master Plan Water is Life – Sanitation is Dignity
31 October 2018 NW&SMP: Volume 2: Plan to ActionFinal Draft (version 4.2)
17-3
Date Stakeholders engaged/Engagement event
2 Feb 2018 Civil Groups, Business Association, Academic Institutions andProfessional Bodies: 2nd session
2 Feb 2018 Wetlands Seminar
2 Feb 2018 Outcome 10: Working Group Meeting
5 Feb 2018 National Treasury
13 Feb 2018 SAICE
15 Feb 2018 SALGA (2nd session)
CSIR
22 Feb 2018 SALGA: Dialogue and Showcasing Water Innovation and TechnologyOptions
9 Mar 2018 Department of Trade and Industry IPAP
14 Mar 2018 FOSAD: Social Protection, Community and Human Development(SPCHD) Cluster
16 Mar 2018 WRC/ISS on Preventing a National Water Crisis
20 Mar 2018 National Committee on Climate Change: stakeholder dialogue
23 Mar 2018 DPME: discussion on mini-Phakisa
27 Mar 2018 Symposium on Water Scarcity Impact on Business: Mail & Guardian
12 Apr 2018 FOSAD: ESEID Cluster presentation
27 June 2018 Presentation to RSA Cabinet Committee
17.1 NARROWING FOCUS TO MAXIMISE BREAK THROUGH
The Constitution of South African contains several provisions that give direction to the water
and sanitation sector.
Firstly, the values of the Constitution include those of human dignity, the achievement of
equality and the advancement of human rights and freedoms.
Secondly, the Constitution states that everyone has the right to an environment that is not
harmful to their health or well-being; and to have the environment protected, for the benefit of
present and future generations, through reasonable legislative and other measures that
(i) prevent pollution and ecological degradation
(ii) promote conservation and

National Water and Sanitation Master Plan Water is Life – Sanitation is Dignity
31 October 2018 NW&SMP: Volume 2: Plan to ActionFinal Draft (version 4.2)
17-4
(iii) secure ecologically sustainable development and use of natural resources while
promoting justifiable economic and social development.
Thirdly, the Constitution states that everyone has the right to have access to sufficient food
and water.
Fourthly, the Constitution states that the property clause may not impede the state from taking
measures to achieve land, water and related reform, in order to redress the results of past
discrimination.
These constitutional imperatives, combined with the national water and sanitation policy
papers, the National Water Act and the Water Services Act, give the mandate to the water
sector to:
Provide universal and equitable access to reliable water supply and sanitation services
Protect, manage and develop the nation’s water resources in a manner that supports
justifiable and ecologically sustainable economic and social development and
Transform access to water to redress the racial imbalances created by apartheid.
As demonstrated in this volume of the National Water and Sanitation Master Plan, and as
articulated in the Call to Action (Volume 1), there are significant challenges in achieving the
Constitutional and policy mandate of the water sector. Understanding the critical need for
maximum progress, the Master Plan has exercised great restraint and deliberately focussed
on a basket of critical national interest challenges. The declining reliability of water services
and sanitation services, as evidenced inter alia by the poor condition of numerous waste water
treatment works (WWTWs) and water treatment works (WTWs) is putting the health of the
nation at risk. Other operational realities include, some municipalities consistently failing to
deliver adequate services, increasing water scarcity, and decreasing raw water quality.
Over 3 million people still do not have access to a basic water supply and 14.1 million people
do not have access to a safe sanitation facility. At the same time, although access to water
and sanitation services have improved significantly, the reliability of services that have been
provided since the advent of democracy is declining, with only 64 % of households now having
access to a reliable and safe water supply.
Climate change adds significant additional stress to an already stressed environment and is
changing rainfall patterns in ways that we have yet to understand fully.
The NW&SMP (Volumes 1 – 3 read together) has identified a number of critical priority actions
that must be implemented to address the current crisis in the water sector and to achieve the
constitutional and legal mandate given to the sector. It prioritises the actions that will deliver
the greatest impact with limited resources, with a focus on reducing water individual demand,
increasing supply, ensuring universal, reliable and safe water supply and sanitation, protecting
infrastructure through effective asset management, restoring ecological infrastructure and
improving raw water quality, and ensuring equity in access to water for productive uses.
Of critical importance is the issue of financial sustainability. Currently the sector is not
financially sustainable and increases in excess of inflationary targets will be required to
address the historic undervaluation of water and sanitation services. High levels of debt at
municipal level reverberate up the value chain, impacting on the financial sustainability of all
institutions in the water sector, exacerbated by poor revenue collection by the Department of

National Water and Sanitation Master Plan Water is Life – Sanitation is Dignity
31 October 2018 NW&SMP: Volume 2: Plan to ActionFinal Draft (version 4.2)
17-5
Water and Sanitation itself. There are five legs to the financial sustainability issue that must
be addressed as a matter of urgent national priority:
A strong message must be given that - apart from free basic water - all water users must
pay for water and that water will become progressively more expensive
The significant subsidy provided to the agricultural sector through water use charges must
be removed
Municipal tariffs must be revised to protect the rights of the poor to affordable water, ensure
cost recovery (of true costs) and establish punitive tariffs for those wasting water
The grant system must be restructured to incentivise the life cycle infrastructure asset
management approach and
The waste discharge charges system must be implemented immediately to provide
funding for the reduction of pollution and the rehabilitation of polluted river systems.
Sound financial management will have to start at DWS where the latest reports by both the
Office of the Auditor General (AG) and Parliament’s Standing Committee on Public Accounts
(SCOPA) painted a grim picture. Improved financial sustainability will enable the sector to turn
around the currently poor levels of maintenance and refurbishment that are contributing to the
decline in reliability of services and the high levels of wastage of water through leaks.
Improvement in the condition of WWTWs will also contribute to improved water resource
quality and the reduction of public health risks.
Addressing unacceptably high levels of water loss is a critical element of reducing individual
water demand. Non-revenue water levels in municipalities are estimated at an average of
41%, which is unacceptably high. As a result, municipalities are losing some R 9.9 billion of
potential revenue per year. The reduction of water losses and the introduction of water
conservation and demand management measures in municipalities must be enforced to
achieve the targets in the NDP. A national programme is proposed that will drive the reduction
of non-revenue water levels to meet national and catchment targets. In addition, water
conservation and demand management targets will be set for all municipalities and reflected
in the KPIs of Municipal Managers and other senior staff.
At the municipal level, the current crisis will need the combined engagement of DWS, COGTA,
National Treasury, SALGA, water boards and WSAs. The reintroduction of a sector-wide
approach (SWAP) programme is proposed, led by DWS, to tackle the current challenges. In
this programme, a differentiated (triage) approach will be adopted in which WSAs will be
categorised according to the challenges that they are facing, and targeted responses will be
developed and implemented for the various categories. A specialised municipal intervention
unit for water and sanitation (MIUWS) will be established by DWS, staffed with a small team
of highly competent experts, to run the diagnostic analysis necessary to categorise the WSAs,
and to drive the national programme of interventions where required.
A national programme, driven by the MIUWS, is also proposed to support the adoption of
alternative water sources such as desalination and water re-use. It is proposed that DWS lead
a programme that will examine the costs and benefits of these technologies at a regional level
to support WSAs in making decisions on the most appropriate water sources to use to increase
supply. In addition, a national, targeted programme of refurbishing and turning around failing
WWTWs to protect our natural resources and citizen health is non-negotiable. DWS will also,

National Water and Sanitation Master Plan Water is Life – Sanitation is Dignity
31 October 2018 NW&SMP: Volume 2: Plan to ActionFinal Draft (version 4.2)
17-6
with effect from 2019/20, re-introduce the highly-respected Blue, Green and No Drop
programmes.
At present, the constitutional water supply and sanitation services responsibility lies with 144
municipalities that are WSAs. At least a third of these WSAs are regarded as dysfunctional
and more than half have no, or very limited, technical staff. Twenty-seven priority district
municipalities have been identified as being particularly dysfunctional and requiring specific
intervention (though not all are WSAs). High levels of corruption have impacted on service
delivery in a number of municipalities.
Where WSAs show consistent inability to deliver effective water and sanitation services, a
national intervention lead by the MIUWS will determine the appropriate water services provider
to be used as well as the appropriate service delivery model such as management contracts
and concessions. This will require a revision of Chapter 8 of the Municipal Systems Act which
DWS will engage COGTA and NT on. In addition, a legislative review will be done to ensure
that internal procedures and decision-making systems in local government support effective
water and sanitation provision.
A national curriculum will be put in place for municipal water managers, which will become a
mandatory qualification for all such water managers.
On the water resources side, the strategic water sources of the country, the 8% of the land
which produces 50% of the nation’s water resources, are under threat from development
including mining. In order to ensure the water security of the country, these areas will be
declared as protected areas as soon as possible. DWS will engage DEA on this. Metering of
water use in the agricultural sector and the removal of the subsidy on agricultural water
charges will drive water conservation in this sector.
DWS, working in partnership with DEA, will get tough on enforcement. A high-profile campaign
of enforcement of water use licence conditions for both abstraction and waste discharge,
accompanied by a public communication programme will see the prosecution of high-impact
non-compliant water users with significant publicity around the campaign and the results. This
is aimed at reducing non-compliant water use and creating an awareness of the work being
done by DWS in this regard. This will be an important signal that this is ‘business unusual’ and
that those who are non-compliant can no longer risk continued illegal water use activities.
The water sector research, development and innovation programme, driven by the DST and
the WRC will support the implementation of the NW&SMP.
Finally, the water sector has, over the past 20 years, failed to deliver on its mandate for water
allocation reform, or the reallocation of water to black water users. This, along with land reform,
remains a major challenge facing the country, and one that must be addressed. It is proposed
that a joint land, water and agrarian reform programme, to be led by the Department of Rural
Development and Land Reform be established to ensure that the reallocation of both land and
water are aligned and take place within a framework of agrarian reform and effective rural
development.

National Water and Sanitation Master Plan Water is Life – Sanitation is Dignity
31 October 2018 NW&SMP: Volume 2: Plan to ActionFinal Draft (version 4.2)
17-7
17.2 INITIATING IMPLEMENTATION
Recognising the need to ensure that the water sector converges around the key water and
sanitation challenges confronting South Africa and commits to working collaboratively to
define and implement game-changing solutions, the Department of Water and Sanitation has
ensured that Cabinet has noted the NW&SMP. The intention is that upon approval by Cabinet,
the Department will host a Phakisa process (rapid results planning initiative) in the latter part
of 2018. `Phakisa80’ is South Africa’s coining of a planning methodology implemented initially
by the Malaysian Government. This big, fast results approach was launched in South Africa
by the Presidency in 2014, with the Department of Performance Monitoring and Evaluation
(DPME) as its custodian. The methodology, which
seeks to implement the objectives of the NDP, is
transformatory in nature and aims to unlock economic
benefits. The Phakisa methodology has been used to
great effect by several sectors, including Agriculture,
Education and Health.
As the development of the NW&SMP has already been
through an extensive consultative process, the mini-
Phakisa for the water sector will invite stakeholders to
spend two weeks deepening, refining and focusing the
Plan, including the completion of the agreed Schedule
of Actions (Volume 3 of the NW& SMP) for the first
planning cycle. The utilisation of the Government-led
Phakisa tool recognises that due to limited resources,
implementation priorities may need to be narrowed
down to fewer but essential critical actions and will
bring decision-makers together to facilitate this
advancement.
On approval of the Phakisa process by Cabinet, The
Department of Water and Sanitation and DPME, will set
up an organising committee for the Phakisa, and will
ensure broad sector participation in this game-
changing initiative led by Government. Budget to
support this process needs to be secured for the
2018/19 FY. With the Master Plan acknowledged as
one of the five pillars of the programme of the newly appointed Minster, it is anticipated that
all relevant programmes of the Department of Water and Sanitation will be mobilised and
harnessed to support the implementation of the Master Plan. As Phakisa processes are
subjected to rigorous monitoring and reporting co-ordinated on behalf of Government by
DPME, NW&SMP implementation progress will be tracked, and information available to
80 Department of Planning, Monitoring & Evaluation, 2014:
https://www.operationphakisa.gov.za/pages/home.aspx#
Sector departments participatingin the water sector Phakisa:
Department of Planning,Monitoring and Evaluation(DPME)
Department of Health (DOH) National Treasury (NT) Department of Environmental
Affairs (DOE) Department of Public
Enterprises (DPE) Department of Minerals
(DOM) Department of Energy (DOE) Department of Cooperative
Governance and TraditionalAffairs (COGTA)
Department of Agriculture,Forestry and Fisheries(DAFF)
Department of RuralDevelopment and LandReform (DRDLR)
Department of HumanSettlement (DHS)
Offices of the Premier (OTP)

National Water and Sanitation Master Plan Water is Life – Sanitation is Dignity
31 October 2018 NW&SMP: Volume 2: Plan to ActionFinal Draft (version 4.2)
17-8
stakeholders, through the NW&SMP Portal currently under development by DWS.
Communication support to both the mobilisation of the Phakisa and its subsequent
implementation will be provided by the DWS Branch: Communications. Similarly, Phakisa
outcomes are expected to impact the programmes of all affected sector departments and
sector stakeholders, as the country works together to be “Ready for the Future, and Ahead of
the Curve”.
Due to the nature of a Phakisa process, it will replace previously envisaged stakeholder
consultation, intergovernmental cooperation and monitoring and evaluation processes, which
will then be driven by the DPME.

National Water and Sanitation Master Plan Water is Life – Sanitation is Dignity
31 October 2018 NW&SMP: Volume 2: Plan to ActionFinal Draft (version 4.2)
18-1
18. CONCLUSION
The Constitution of South African contains several provisions that give direction to the water
and sanitation sector.
Firstly, the values of the Constitution include those of human dignity, the achievement of
equality and the advancement of human rights and freedoms.
Secondly, the Constitution states that everyone has the right to an environment that is not
harmful to their health or well-being; and to have the environment protected, for the benefit of
present and future generations, through reasonable legislative and other measures that (i)
prevent pollution and ecological degradation; (ii) promote conservation; and (iii) secure
ecologically sustainable development and use of natural resources while promoting justifiable
economic and social development.
Thirdly, the Constitution states that everyone has the right to have access to sufficient food
and water.
Fourthly, the Constitution states that the property clause may not impede the state from taking
measures to achieve land, water and related reform, in order to redress the results of past
racial discrimination.
These constitutional imperatives, combined with the national water and sanitation policy
papers, the National Water Act and the Water Services Act, give the mandate to the water
sector to:
Provide universal and equitable access to reliable water supply and sanitation services
Protect, manage and develop the nation’s water resources in a manner that supports
justifiable and ecologically sustainable economic and social development and
Transform access to water to redress the racial imbalances created by apartheid.
Clearly, however, there are significant challenges in achieving this mandate, with declining
reliability of water services and sanitation services, numerous WWTWs and WTWs in poor
condition putting the health of the nation at risk, some municipalities consistently failing to
deliver adequate services, increasing water scarcity, and decreasing raw water quality. Over
3 million people still do not have access to a basic water supply and 14.1 million people do
not have access to a safe sanitation facility. At the same time, although access to water and
sanitation services have improved significantly, the reliability of services that have been
provided since the advent of democracy is declining, with only 64 % of households now having
access to a reliable and safe water supply. Climate change adds significant additional stress
to an already stressed environment and is changing rainfall patterns in ways that we have yet
to understand fully.
The NW&SMP has identified a number of critical priority actions that must be implemented to
address the current crisis in the water sector and to achieve the constitutional and legal
mandate given to the sector. It prioritises the actions that will deliver the greatest impact with
limited resources, with a focus on reducing water demand, increasing supply, ensuring
universal, reliable and safe water supply and sanitation, protecting infrastructure through
effective asset management, improving raw water quality, and ensuring equity in access to
water.

National Water and Sanitation Master Plan Water is Life – Sanitation is Dignity
31 October 2018 NW&SMP: Volume 2: Plan to ActionFinal Draft (version 4.2)
18-2
Of critical importance is the issue of financial sustainability. Currently the sector is not
financially sustainable and increases in excess of inflationary targets will be required to
address the historic undervaluation of water and sanitation services. High levels of debt at
municipal level reverberate up the value chain, impacting on the financial sustainability of all
institutions in the water sector, exacerbated by poor revenue collection by DWS itself. There
are five legs to the financial sustainability issue that must be addressed:
A strong message must be given that - apart from free basic water - all water users must
pay for water
The significant subsidy provided to the agricultural sector through water use charges must
be removed
Municipal tariffs must be revised to protect the rights of the poor to affordable water, ensure
cost recovery (of true costs) and establish punitive tariffs for those wasting water
The grant system must be restructured to incentivise the life cycle infrastructure asset
management approach and
The waste discharge charges system must be implemented immediately to provide
funding for the reduction of pollution and the rehabilitation of polluted river systems.
Sound financial management will have to start at DWS where the latest AG and SCOPA
reports painted a grim picture. Improved financial sustainability will enable the sector to turn
around the currently poor levels of maintenance and refurbishment that are contributing to the
decline in reliability of services and the high levels of wastage of water through leaks.
Improvement in the condition of WWTWs will also contribute to improved water resource
quality and the reduction of public health risks.
Addressing unacceptably high levels of water loss is a critical element of reducing water
demand. Non-revenue water levels in municipalities are estimated at an average of 41%,
which is unacceptably high. As a result, municipalities are losing some R 9.9 billion of potential
revenue per year. The reduction of water losses and the introduction of water conservation
and demand management measures in municipalities must be enforced to achieve the targets
in the NDP. A national programme is proposed that will drive the reduction of non-revenue
water levels to meet national and catchment targets. In addition, water conservation and
demand management targets will be set for all municipalities and reflected in the KPIs of
Municipal Managers and other senior staff.
At the municipal level, the current crisis will need the combined engagement of DWS, COGTA,
National Treasury, SALGA, water boards and WSAs. The reintroduction of a sector-wide
approach (SWAP) programme is proposed, led by DWS, to tackle the current challenges. In
this programme, a differentiated (triage) approach will be adopted in which WSAs will be
categorised according to the challenges that they are facing, and targeted responses will be
developed and implemented for the various categories. A specialised municipal intervention
unit for water and sanitation (MIUWS) will be established by DWS, staffed with a small team
of highly competent experts, to run the diagnostic analysis necessary to categorise the WSAs,
and to drive the national programme of interventions where required.
A national programme, driven by the MIUWS, is also proposed to support the adoption of
alternative water sources such as desalination and water re-use. It is proposed that DWS lead
a programme that will examine the costs and benefits of these technologies at a regional level

National Water and Sanitation Master Plan Water is Life – Sanitation is Dignity
31 October 2018 NW&SMP: Volume 2: Plan to ActionFinal Draft (version 4.2)
18-3
to support WSAs in making decisions on the most appropriate water sources to use to increase
supply. In addition, a national, targeted programme of refurbishing and turning around failing
WWTWs to protect our natural resources and citizen health is non-negotiable. DWS will also,
with effect from 2018/19, re-introduce the highly-respected Blue, Green and No Drop
programmes.
At present, the constitutional water supply and sanitation responsibility lies with 144
municipalities that are WSAs. At least a third of these WSAs are regarded as dysfunctional
and more than half have no, or very limited, technical staff. Twenty-seven priority district
municipalities have been identified as being particularly dysfunctional and requiring specific
intervention (though not all are WSAs). High levels of corruption have impacted on service
delivery in a number of municipalities.
Where WSAs show consistent inability to deliver effective water and sanitation services, a
national intervention lead by the MIUWS will determine the appropriate water services provider
to be used as well as the appropriate service delivery model such as management contracts
and concessions. This will require a revision of Chapter 8 of the Municipal Systems Act which
DWS will engage COGTA and NT on. In addition, a legislative review will be done to ensure
that internal procedures and decision-making systems in local government support effective
water and sanitation provision.
A national curriculum will be put in place for municipal water managers, which will become a
mandatory qualification for all such water managers.
On the water resources side, the strategic water sources of the country, the 8% of the land
which produces 50% of the nation’s water resources, are under threat from development
including mining. In order to ensure the water security of the country, these areas will be
declared as protected areas as soon as possible. DWS will engage DEA on this. Metering of
water use in the agricultural sector and the removal of the subsidy on agricultural water
charges will drive water conservation in this sector.
DWS, working in partnership with DEA, will get tough on enforcement. A high-profile campaign
of enforcement of water use licence conditions for both abstraction and waste discharge,
accompanied by a public communication programme will see the prosecution of high-impact
non-compliant water users with significant publicity around the campaign and the results. This
is aimed at reducing non-compliant water use and creating an awareness of the work being
done by DWS in this regard. This will be an important signal that this is ‘business unusual’ and
that those who are non-compliant can no longer risk continued illegal activities.
The water sector research, development and innovation programme, driven by the DST and
the WRC will support the implementation of the NW&SMP.
Finally, the water sector has, over the past 20 years, failed to deliver on its mandate for water
allocation reform, or the reallocation of water to black water users. This, along with land reform,
remains a major challenge facing the country, and one that must be addressed. It is proposed
that a joint land, water and agrarian reform programme, to be led by the Department of Rural
Development and Land Reform be established to ensure that the reallocation of both land and
water are aligned and take place within a framework of agrarian reform and effective rural
development.

National Water and Sanitation Master Plan Water is Life – Sanitation is Dignity
31 October 2018 NW&SMP: Volume 2: Plan to ActionFinal Draft (version 4.2)
18-4
This NW&SMP has been widely consulted on and has been developed with input from a range
of stakeholders and organs of state and has been greatly improved and informed by these
engagements and inputs. It remains a living document to be annually reviewed, updated and
improved. To this end, a mini-Phakisa will be held in the latter part of 2018, where stakeholders
will be invited to spend two weeks deepening, refining and focusing the NW&SMP. Due to
limited resources for implementation priorities may need to be narrowed down to fewer but
essential critical actions.
South Africans share common interests and challenges in the pursuit of water security.
Achieving water security requires sound evidence to inform policy and dialogue, good
governance, advances in research and technology, the mobilisation of finance and
investment, management of climate risks, and cooperation in managing transboundary water
resources. It requires balancing supply and demand, redistributing water, managing water and
sanitation services effectively, regulating water with a focus on high impact use, improving raw
water quality and protecting and restoring ecosystems. These themes orient the NW&SMP
and provide a rallying point for government, civil society, the private sector, researchers and
innovators, the international community and ordinary South Africans.

National Water and Sanitation Master Plan Water is Life – Sanitation is Dignity
31 October 2018 NW&SMP: Volume 2: Plan to ActionFinal Draft (version 4.2)
1
ANNEXURE 1: DEFINITIONS
Acid rain Rainfall of abnormally high acidity which results from atmospheric pollutionby emissions of sulphur dioxide, nitrogen oxide, and chloride.
Anti-pollution measures The reduction or elimination of pollution by restricting or prohibiting activitieswhich cause pollution.
Aquifer Aquifer' means a geological formation which has structures or textures thathold water or permit appreciable water movement through them
Biodiversity The number and variety of organisms and life forms, including all species,representing the totality of all their genes, found in an ecosystem or in aregion.
Biosphere The global sum of all ecosystems in the zone of life on Earth; integrating allliving beings and their relationships. All life forms in the atmosphere, alloceans, freshwater, soils, land surfaces and the underlying geologicalhorizons.
Capable and developmental state A state that has sufficient human, financial, economic and natural resourcesto achieve the national objectives for the benefit of all citizens, througheffective institutions and infrastructure that enable the economy and societyto operate to its full potential.
Catchment An area from which any rainfall will drain into the watercourse orwatercourses or part of a watercourse, through surface flow to a commonpoint or common points.
Climate change Changes in climatic conditions due to natural causes or to anthropogenic(man-made) effects such as emissions of greenhouse gases, e.g. carbondioxide, nitrous oxide, and methane, from industry, transport, farming anddeforestation, that are expected to have significant consequences for rainfalland water availability on earth.
Constituents Individual components, elements, or biological entities, such as suspendedsolids or dissolved salts.
Consumption Use of water abstracted from any source, such as a river, groundwater orwater supply system, for domestic, commercial, industrial, power generation,irrigation or any other purpose.
Contaminants Constituents which are added to a water supply through the use thereof.
Deforestation Removing natural forests from the landscape for the purpose of harvestingthe timber or for making the land available for other purposes.
Democracy Rule by the people.
Desalination The removal of unwanted salts (constituents) from water to make it fit foruse.
Development The systematic use of scientific and technical knowledge, together withtraditional knowledge systems and cultural values, to realise the potential ofnatural resources to support social and economic transformation.
Ecosystem A community of all the organisms, such as plants, animals, fish andmicrobes, living in complex but balanced relationships with the physicalfeatures of their environment such as light, heat, moisture, wind, water,nutrients and minerals.
Efficiency-equity trade off Seeking the socially, economically and politically most acceptable outcomeof decision-making concerning the competing merits of efficiency and ofequity and fairness.
Effluent The liquid discharged from a processing step, usually from an industry, froma water purification works or from a waste water treatment plant.
Effluent discharge Standards Minimum standards set for the quality of effluent streams as a means ofcontrolling externalities, i.e. the economic and other effects on others.
Efficient water allocation A situation in which the available water resources are allocated in a way thatachieves maximum benefit.

National Water and Sanitation Master Plan Water is Life – Sanitation is Dignity
31 October 2018 NW&SMP: Volume 2: Plan to ActionFinal Draft (version 4.2)
2
Emissions Solid, liquid or gaseous substances, or energy in the form of heat, usuallydischarged into the environment, by people and other living organisms or bychemical or physical processes; usually refers to products of combustionemitted into the atmosphere.
Environmental engineering The application of science and technology to minimise the negative and tomaximise the positive impacts on the environment of physical developmentand of the utilization of natural resources for the benefit of society.
Environmental protection Avoiding negative impacts on the environment caused by physical activities,by the discharge of harmful solid, liquid or gaseous wastes or by the releaseof radiation.
Equity Fairness, justice and impartiality which supplements or overrides commonand statute law.
Externalities Consequences of an action, usually negative but could be positive, whichaffect other parties but are not reflected in the costs.
Hydraulic fracturing Also known as fracking. It is the process of injecting pressurised fluids intovarious rock layers in order to create cracks to allow natural gas to movefreely.
Fog harvesting The interception and precipitation of moisture in fog to form water.
Governance Action or manner of governing by implementing sound rules and procedures.
Global warming The increase in the average surface temperatures across the globe, usuallymeasured over long periods of time; reported to have increased by 1⁰C overthe past hundred years.
Government This refers to the total of all levels of government, including national,provincial, and local government as in South Africa. It is always necessary tocheck what level of government is being referred to in any particular context.
Greenhouse gas Gases such as water vapour, carbon dioxide and methane in the atmospherethat do not affect incoming sunlight, but trap heat emitted from the Earth,thus contributing to global warming; hence the greenhouse effect.
Green water footprint The volume of water evaporated from rainfall stored in the soil as soilmoisture.
Grey water footprint The volume of freshwater required to assimilate a pollution load to at leastcomply with acceptable water quality standards.
Groundwater Rainfall that infiltrates into the soil surface and percolates downwards,seepage from water in streams, lakes and artificial impoundments, andirrigation water that percolates down into the ground and accumulates inaquifers comprising permeable underground layers of sand, gravel and rock.
Growth An increase in an economic factor or variable, normally persisting oversuccessive periods. Rapid or persistent growth is likely to involve changes inthe nature of economic activity, with new products or processes, and newtypes of labour skills, capital goods, and economic conditions.
Impurities Constituents which are added to the water supply through use.
Management The people who make decisions in an organization; the effect, impact andoutcome of these decisions.
Mandate Authority to carry out a policy, course of action or legal command from asuperior.
Pollutants Constituents which are added to water through use.
Pollution control Methods for controlling pollution, usually by monitoring against minimumstandards and acting against contraventions.
Potable Water safe 23
to be used for drinking purposes.
Private sector Those parts of the economy not run by the government, includinghouseholds, voluntary associations, community organizations, sole traders,partnerships, and privately owned company.
Property rights The rights of an owner over property.

National Water and Sanitation Master Plan Water is Life – Sanitation is Dignity
31 October 2018 NW&SMP: Volume 2: Plan to ActionFinal Draft (version 4.2)
3
Public sector Those parts of the economy which are not controlled by individuals, voluntaryorganizations, or privately-owned companies.
Rain water harvesting Interception, collection and storage of water during rain seasons for use inother times
Reclamation Treatment of wastewater for reuse, including indirectly or directly as potablewater.
Recycling The reuse of wastewater, with or without various degrees of treatment.
Regulation A rule or directive made and implemented by an authority, which individualsor organizations are obliged to respect and comply with.
Regulatory agency A body created to decide on and enforce regulations or rules.
Research and development The use of resources to create new knowledge, and to develop new andimproved products or processes, to enhance economic activities and thequality of life.
Repurification Treatment of wastewater to a quality standard suitable for various uses,including for indirect or direct reuse as potable water.
Reuse Beneficial use of reclaimed or re-purified wastewater.
Rights based approach Priority given to the allocation of water to people who do not have access towater, even to satisfy their basic human needs which is a constitutionallyentrenched right; individuals and communities are given access to fullinformation, justice, and to participation in decision-making processesconcerning water-related issues. Such water allocations enjoy priority overother uses such as for irrigated agriculture and for industrial use.
Right to access to water Every person in South Africa is entitled to sufficient, acceptable, safe,physically accessible and affordable water for personal and domestic uses.
River pollution The effects on rivers of the discharge or dumping into the environment ofindustrial, agricultural and any other waste products.
Runoff The portion of rainfall on land or on any other surface that drains away toaccumulate in a stream or a river, and which does not infiltrate into thesurface, get intercepted by vegetation and other covers where it is stored, orevaporate back into the atmosphere. Runoff is also fed by groundwaterwhich moves naturally into streams and rivers.
Sanitation Services The collection, removal, disposal or treatment of human excreta anddomestic wastewater, and the collection, treatment and disposal of industrialwastewater. This includes all the organisational arrangements necessary toensure the provision of sanitation services including, amongst others,appropriate health, hygiene and sanitation-related awareness, themeasurement of the quantity and quality of discharges where appropriate,and the associated billing, collection of revenue and consumer care. Waterservices authorities have a right but not an obligation to accept industrialwastewater from industries within their area of jurisdiction.
Sand mining The removal of sand (mainly from river beds and banks) for commercialpurposes; including the screening and washing of fine material out of theproduct.
Sewage Liquid waste, with some suspended material, mainly human excrement.
Sewage disposal The discharge of liquid waste from human occupation to the environment,usually after some of full treatment.
Sewerage Infrastructure for the collection, treatment, and disposal of liquid waste(sewage).
Sludge Solids removed from wastewater during treatment.
Storm water Runoff from an area after heavy rain
Surface water Runoff that occurs in streams and rivers, also in natural lakes and reservoirs;a major resource for water supplies.

National Water and Sanitation Master Plan Water is Life – Sanitation is Dignity
31 October 2018 NW&SMP: Volume 2: Plan to ActionFinal Draft (version 4.2)
4
Virtual water The volume of water required to produce products which a country importsand exports; the volume of water embedded in products that are tradedbetween countries or regions. Most relevant to arid or semi-arid countrieswith scarce water resources.
Value Engineering A systematic method to improve the value of infrastructure or services byeither improving the function or reducing the cost. It is a primary tenet ofvalue engineering that basic functions must be preserved and may not bereduced because of pursuing value improvements. (Value is defined as theratio of function to cost.)
Wastewater treatment This includes any process which may be used to favourably modify thecharacteristics of the wastewater.
Water authorisation Permission to use water for a specific purpose.
Water balance The regulation or rationalisation of human activity to match the sustainablelocal water supply, rather than base, or a process of balancing water supplyand demand to ensure that water use does not exceed supply.
Water efficiency Getting any given results such as equity, gravity, and development with thesmallest possible inputs, or getting the maximum possible output from givenresources.
Water footprint An indicator of water use that considers both direct and indirect water use.The water footprint of a product (good or services) is the volume of freshwater used to produce the product, summed over the various steps of theproduction chain. Water footprint includes 3 components:
Volume of water as consumptive use or evaporation of rainwater/stored insoil moisture (green water)
Volume of water as consumptive use or evaporation of water withdrawn fromgroundwater or surface water (blue water) and
Volume of polluted water, calculated as water that is required to dilutepollutants to such an extent that the quality of the water remains aboveagreed water quality standards (grey water).
Water licence A general authorisation issued by a responsible authority for water use isauthorised by a licence under the National Water Act, 1998.
Water neutral The reducing of the impact of the water consuming activity in making theimpact ‘water neutral’ by simultaneous investment in water conservationmeasures of other alternatives. Water neutral thereby means that onereduces the water footprint of an activity as much as reasonably possible,and offsets the negative externalities of the remaining water.
Water offsetting The residual water footprint is offset by making a ‘reasonable investment’ inestablishing or supporting projects that aim at the sustainable and equitableuse of water.
Water resource strategy A plan for dealing with uncertain future circumstances with respect to theavailability of clean and sufficient water for domestic and commercial use.This is the set of rules by which the action to be taken depends on thecircumstances, including natural events such as climate change and theactions of other people.
Water resource Water that can be used to contribute to economic activity, including a watercourse, surface water, estuary and ground water in an aquifer.
Water resources protection Protection in relation to a water resource, means:
maintenance of the quality of the water resource to the extent that the waterresource may be used in an ecologically sustainable way;
prevention of the degradation of the water resource; and
rehabilitation of the water resource.
Water risk Essentially the pressure of decreasing water availability and the reliability ofsupplies. The fact that the results of any use of water resources are notcertain but may take more than one value.
Water scarcity Water is scarce relative to human demands, not in and of itself.
Water services Water supply services and/or sanitation services, or any part thereof.

National Water and Sanitation Master Plan Water is Life – Sanitation is Dignity
31 October 2018 NW&SMP: Volume 2: Plan to ActionFinal Draft (version 4.2)
5
Water Supply Services The abstraction from a water resource, conveyance, treatment, storage anddistribution of potable water, water intended to be converted to potable waterand water for industrial or other use, to consumers or other water servicesproviders. This includes all the organisational arrangements necessary toensure the provision of water supply services including, amongst others,appropriate health, hygiene and water-related awareness, the measurementof consumption and the associated billing, collection of revenue andconsumer care. Water services authorities have a right but not an obligationto provide industrial water to industries within their area of jurisdiction.
Water trading The process of buying and selling of water access or use entitlements, alsocalled water rights. The terms of the trade can be either permanent ortemporary, depending on the legal status of the water rights.
Wetland Land which is transitional between terrestrial and aquatic systems where thewater table is usually at or near the surface or the land is periodicallycovered with shallow water, and which land in normal circumstancessupports or would support vegetation typically adapted to life in saturatedsoil.

National Water and Sanitation Master Plan Water is Life – Sanitation is Dignity
31 October 2018 NW&SMP: Volume 2: Plan to ActionFinal Draft (version 4.2)
6
ANNEXURE 2: INFORMATION ON THIRTEEN MAJOR RECONCILIATION STRATEGIES
The Vaal River System (Developed in 200981 now in the second phase ofimplementation82)
The supply area of the Vaal River System stretches far beyond the catchment boundaries of the
Vaal River and includes most of Gauteng, Eskom’s power-stations and Sasol’s petro-chemical
plants on the Mpumalanga Highveld, the North-West and Free State goldfields, iron and
manganese mines in the Northern Cape, Kimberley, several small towns along the main course
of the river, as well as the Vaalharts Irrigation Scheme. It will soon be extended to also supply
water to the developments on the Waterberg coal-fields near the town of Lephalale in the Mokolo
catchment.
The size of the Vaal River System, the various inter-basin transfers coupled with the extensive
bulk water distribution infrastructure and the geographical location of the water users in relation
to the position of the water resource components provides for a complex mix of variables that
influences both the demand and availability.
Vaal River System proposed reconciliation interventions23
81 DWS, 2009, Vaal River System: Large Bulk Water Supply Reconciliation Strategy, P RSA C000/00/4406/09,
Prepared by DMM, Golder, SRK, WRP & Zitholele82 DWS, 2015, Strategy Steering Committee of the Vaal River System (VRS): Status Report June 2015, Prepared by
WRP

National Water and Sanitation Master Plan Water is Life – Sanitation is Dignity
31 October 2018 NW&SMP: Volume 2: Plan to ActionFinal Draft (version 4.2)
7
Ensuring that sufficient water is available to supply the future water requirements in the supply
area of the Vaal River System requires the following main interventions:
Eradicate unlawful water use;
Continuation with the implementation of WC/WDM;
Mine water effluent (acid mine drainage) must be treated and ready for use by 2020/21;
Implement Phase 2 of LHWP, the Polihali Dam and transfer infrastructure, to deliver water
by the year 2024; and
Implement re-use of water as proposed in Tshwane’s Water Resource Master Plan.
The Orange River System83 (Developed in 2014)
The Orange River System extents into four International Basin States with the Senqu River
originating in the highlands of Lesotho, Botswana in the north eastern part of the Basin, the Fish
River in Namibia and the largest area situated in South Africa.
From the Reconciliation Strategy it is noted that water required to supply the current and future
social and economic activities, as well as supporting the transfer to the Vaal River System, will
have to come from within the Orange/Senqu basin. The existing EWR needs to be maintained,
and the implementation of the EWR additional releases, can only be implemented after a new
dam is commissioned.
Orange River System proposed reconciliation interventions, including implementation of EWR, excludingraising of Gariep/implementation of Verbeeldingskraal Dam24
83 DWS, 2013, Development of Reconciliation Strategies for Large Bulk Water Supply Systems: Orange River: Final
Reconciliation Strategy, P RSA D000/00/18312/10, Prepared by WRP, Aurecon, Golder & Zitholele

National Water and Sanitation Master Plan Water is Life – Sanitation is Dignity
31 October 2018 NW&SMP: Volume 2: Plan to ActionFinal Draft (version 4.2)
8
Interventions and Measures envisaged for the Orange River system (South African portion) to
maintain a water balance between the water needs and availability up to the year 2050 have been
identified, as follows.
Plan and implement WC/WDM in the domestic and irrigation water use sectors.
Implement the real time monitoring of the Vaal River and Orange River flows downstream
of Bloemhof and Vanderkloof dams as soon as possible, as this option is regarded as a
quick win.
Feasibility study on the proposed Noordoewer/Vioolsdrift Dam on the Lower Orange River.
Investigate the utilisation of the Vanderkloof Dam lower level storage. Then proceed with
the design and implementation of the pumping station and pipelines for pumping water
from the reduced minimum operating level of Vanderkloof Dam into the existing Oranje
Riet canal.
Commission a pre-feasibility study for choosing between the raising of Gariep Dam and
the Verbeeldingskraal Dam, to provide additional storage in the middle Orange River,
followed by the relevant feasibility study.
The Kwa-Zulu Natal Coastal Metropolitan Bulk Water Supply System (Developed in 2010,second phase of continuation completed)
The Kwa-Zulu Natal Coastal Metropolitan Bulk Water Supply System extends from the Thukela
River Mouth on the KZN North Coast to the uMtwalume River on the South Coast, as well as from
Howick in the KwaZulu-Natal (KZN) Midlands to Durban on the east coast. It includes the
eThekwini Metropolitan Municipality (MM), Msunduzi Local Municipality (LM), as well as portions
of uMgungundlovu, iLembe, and Ugu District Municipalities (DMs). The area consists of three
main water supply systems (WSSs), that are interlinked, namely North Coast WSS, Integrated
Mgeni WSS and the South Coast WSS.
The KwaZulu-Natal Coastal Metropolitan area is the third largest contributor to the national
economy and is the economic hub of KZN. This area is experiencing rapid growth in water
requirements because of the influx of people from the rural areas, economic growth and
development initiatives. Although a high level of emphasis is placed on a drive to increase the
efficiency of water use through on-going water conservation and water demand management
(WC/WDM) initiatives in order to delay other interventions, the Strategy shows that the
development of water resource infrastructure is the solution to satisfy long-term water needs.
The following priority interventions are required:
North Coast WSS:
Complete the raising of Hazelmere Dam by August 2018/2019 (DWS);
Commissioning of the Lower Thukela Bulk Water Supply Scheme Phase 2(LTBWSS-2) by the end of 2019 (Umgeni Water);
Desalination of sea water at Lovu (Umgeni Water): 150 Ml/d; and
direct reuse of treated wastewater (eThekwini MM): (2018) 41 million m³/a.
Integrated Mgeni WSS:
Implement the uMkhomazi Water Project Phase 1 (uMWP-1), with theproposed Smithfield Dam and associated transfer and bulk infrastructurescheme, as soon as possible (DWS and Umgeni Water);

National Water and Sanitation Master Plan Water is Life – Sanitation is Dignity
31 October 2018 NW&SMP: Volume 2: Plan to ActionFinal Draft (version 4.2)
9
Complete the Western and Northern aqueducts to deliver water from uMWP-1to the planned areas in eThekwini (Umgeni Water); and
Implementation of the eThekwini Re-mix Project pilot plant (eThekwini MM).
South Coast WSS:
The Lower uMkhomazi Bulk Water Supply System (Ngwadini Dam) by 2022(Umgeni Water): 100 Ml/d; and
Desalination of seawater at Tongaat (Umgeni Water): 150 Ml/d.
The Richards Bay Water Supply System84 (Developed in 2014)
The Richards Bay Water System covers the City of uMhlathuze Local Municipality, comprising
Empangeni, Ngwelezana, Esikhaweni and a number of rural villages as well as large well-
developed industries, commercial areas and business centres, such as Mondi Richards Bay,
Tronox, Foskor, Richards Bay Minerals, Hillside and Bayside Aluminium and the Richards Bay
Coal Terminal. Richards Bay is the economic centre of the uMhlathuze Local Municipality and is
one of the strategic economic hubs of the country. Though the water resources available to the
uMhlathuze Municipality are currently sufficient to cater for the existing requirements, should
anticipated growth and industrial development materialise the current water sources are likely to
come under stress within years.
Richards Bay Water Supply System proposed reconciliation interventions8
The following interventions have been identified:
Raising of Goedertrouw Dam by 2.8 m.
84 DWS, 2015, Water Reconciliation Strategy for Richards Bay and Surrounding Towns: Extended Executive Summary¸
109343, Prepared by Aurecon

National Water and Sanitation Master Plan Water is Life – Sanitation is Dignity
31 October 2018 NW&SMP: Volume 2: Plan to ActionFinal Draft (version 4.2)
10
A pre-feasibility comparison of one or more of the following augmentation schemes,
followed by a feasibility study:
Increased capacity of the Thukela-Mhlathuze Transfer Scheme at Middledriftand potential phasing thereof,
Coastal transfer pipeline from the lower Thukela River at Mandini,
The preferred Mfolozi River transfer scheme to the Richards Bay WSS.
Evaluation and potential implementation of the following development options: a) a dam
on the Nseleni River, b) Use of treated effluent from the Arboretum macerator site, and c)
Seawater desalination.
The Mbombela Bulk Water Supply System85 (Developed in 2014)
The Mbombela Bulk Water Supply System covers Mbombela Municipal Area. However, this area
straddles the Crocodile and Sabie River catchment and hence it necessitated a broader approach
than only considering the water use and water resources within the municipal boundaries. The
water resources of the Sabie and Crocodile catchments were included in the study area for the
purposed of sourcing possible future water resources for Mbombela. For the purposes of this
study, eight distinct supply centres were identified, namely: Nelspruit (including Mataffin, the
Agricultural College and Matumi Golf Course), White River Town (including White River Country
Estate and Rocky Drift), Hazyview, Nsikazi North, Nsikazi South, Karino Plaston Corridor,
Matsulu, and Smaller centres, i.e. Kaapsche Hoop, Ngodwana and Elandshoek.
Several interventions are proposed for the supply centres, ranging from WC/WDM, removal of
IAP, re-allocation of irrigation water, groundwater development, optimising of system operating
rules, rain and fog harvesting, as well as a proposed regional scheme within the Crocodile River
catchment, with the following three schemes to be further investigated, namely the Boschejeskop
Dam; the Mountain View Dam; and the Strathmore off-channel storage dam.
The Western Cape Water Supply System (Developed in 2007, now in second phase ofcontinuation86)
The Western Cape Water Supply System covers the City of Cape Town and certain Overberg,
Boland, West Coast and Swartland towns, as well as irrigators along the Berg, Eerste and
Riviersonderend rivers. Although, the system was in surplus after the completion of the Berg
River Dam (2006/07), estimated high growth in water requirements, including the successful
implementation of the WC/WDM measures, indicated that the surplus would only be adequate to
2017.
85 DWS, 2014, Water Requirements and Availability Reconciliation Strategy for the Mbombela Municipal Area,
PWMA 05/X22/00/2012/6, Prepared by IWR Water Resources, Aurecon, SRK, Kyamandi and WRP86 DWS, 2014, Western Cape Water Supply System Reconciliation Strategy: Status Report, Prepared by Umvoto

National Water and Sanitation Master Plan Water is Life – Sanitation is Dignity
31 October 2018 NW&SMP: Volume 2: Plan to ActionFinal Draft (version 4.2)
11
Western Cape Water Supply System proposed reconciliation interventions (without climate change)87
87 DWS, 2010, Assessment of the ultimate potential and future marginal cost of water resources in South Africa,
P RSA 000/00/12610, prepared by BKS Pty Ltd

National Water and Sanitation Master Plan Water is Life – Sanitation is Dignity
31 October 2018 NW&SMP: Volume 2: Plan to ActionFinal Draft (version 4.2)
12
Western Cape Water Supply System proposed reconciliation interventions (includes the negative effects ofclimate change)
The following interventions were identified from the assessment of the current water requirements
and updated scenario planning:
Berg River-Voëlvlei (Phase 1) augmentation ;
Langebaan Road Aquifer Artificial Recharge Scheme;
Table Mountain Group Aquifer (TMG) development;
Cape Flats and Newlands Aquifer development;
Lourens River Diversion ;
Water Re-use;
Desalination of seawater;
Michell’s Pass Diversion Scheme;
Raising of Steenbras Lower Dam;
The Amatole Bulk Water Supply System88 (Developed in 2008)
The System covers urban, rural and agricultural users in the catchments of the Buffalo and
Nahoon rivers, including the Buffalo City Municipality, King William’s Town, Bisho and
Stutterheim.
88 DWS, 2012, Amatole Water Supply System Reconciliation Strategy: Status Report 2012, Prepared by UWP

National Water and Sanitation Master Plan Water is Life – Sanitation is Dignity
31 October 2018 NW&SMP: Volume 2: Plan to ActionFinal Draft (version 4.2)
13
Amatole Bulk Water Supply System proposed reconciliation interventions, with the phasing in of EWR89
The following interventions have been identified:
Implement the amended operating rules to maximized the system yield.
Study potential water re-use schemes, which should seek to deliver an additional yield of
2.9 million m³/a per year over 5 years.
Commence planning for the next surface water augmentation schemes by 2016, the
Nahoon River Dam (Stone Island) and transfer from Keiskamma River (Sandile Dam),
depending on the implementation of the EWR.
The extent of IAP and the potential for increased forestry be reviewed, as well as their
potential impacts on System Yield.
The Algoa Water Supply System90 (Developed in 2010)
The System covers, inter alia, the Nelson Mandela Bay Municipality, the Gamtoos Irrigation Board
and the Sundays River Water User Association. Drought conditions in the region have forced the
fast-tracking of several recommended interventions.
89 DWS, 2010, “Assessment of the ultimate potential and future marginal cost of water resources in South Africa”,
P RSA 000/00/12610, prepared by BKS Pty Ltd90 DWS, 2012, Water Reconciliation Strategy for the Algoa Water Supply Area: Status Report 2: 2012, Prepared by
Aurecon

National Water and Sanitation Master Plan Water is Life – Sanitation is Dignity
31 October 2018 NW&SMP: Volume 2: Plan to ActionFinal Draft (version 4.2)
14
Algoa Water Supply System proposed reconciliation interventions90
The supply interventions to meet future needs which have been identified as probably feasible to
increase the available supply to the supply area of the Algoa WSS are:
Nooitgedacht Low-Level Scheme (which is currently being implemented), and later
Phase 2.
Groundwater development – Coega Kop aquifer and Churchill Dam area.
Re-use of water treated to industrial standards for the Coega IDZ – Fish Water Flats
WWTW.
NMBM apply for a water use licence for the additional water use from Loerie Dam.
Feasibility study on seawater desalination
Investigate the possibility of raising the Kouga Dam.
Limpopo Water Management Area North91 (Developed in 2016)
The Limpopo Water Management Area North Reconciliation Strategy includes the all the
catchments of the Limpopo WMA (Matlabas, Mokolo, Lephalala, Mogalakwena, Sand and
Nzhelele catchments), excluding the Marico, Crocodile (West) and Luvuvhu catchments that are
included in separate Reconciliation Strategies. Several transfer schemes from respectively the
Letaba, Olifants and Crocodile West catchments, provide about 34 million m³/a of water into the
Limpopo WMA North.
91 DWS, 2016, Limpopo Water Management Area North Reconciliation Strategy, P WMA 01/000/00/02914/11A,
Prepared by AECOM

National Water and Sanitation Master Plan Water is Life – Sanitation is Dignity
31 October 2018 NW&SMP: Volume 2: Plan to ActionFinal Draft (version 4.2)
15
The main urban areas within the WMA include Mokopane, Polokwane, Mookgophong, Modimolle,
Lephalale, Musina and Louis Trichardt. The Limpopo WMA North forms part of the internationally
shared Limpopo River Basin which also includes sections of Botswana, Zimbabwe and
Mozambique.
Limpopo Water Management Area North 2010 water balances12
The supply interventions to meet future needs in the Limpopo Water Management Area North
have been identified in the Reconciliation Strategy, as listed below:
Monitor observed flows and storage levels at strategic points as well as water quality and
monitor water use to confirm water requirement projections before implementing options.
Plan and implement WC/WDM in all water use sectors.
Continue with the implementation of planned bulk water distribution systems, such as the
MCWAP-1, ORWRDP phases (including transfer from the Olifants to Polokwane) and
water supply systems from Nandoni Dam.
Refurbish the canal downstream of the Nzhelele Dam.
Construct canal downstream of the Glen Alpine Dam.
Commission feasibility studies on groundwater development in relevant areas.
Commission studies to investigate potential supply from Zimbabwe.

National Water and Sanitation Master Plan Water is Life – Sanitation is Dignity
31 October 2018 NW&SMP: Volume 2: Plan to ActionFinal Draft (version 4.2)
16
The Olifants River Water Supply System92 (Developed in 2011)
The System covers, towns and rural areas within the Olifants Catchment as well as augmentation
to the towns Polokwane and Mokopane and their surrounding rural areas northbound and outside
of the catchment area serving more than 3 million people. The water requirements in the Olifants
catchment and its adjacent supply areas have increased substantially over the last number of
years due to increases in a range of activities including power generation, significantly increase
in mining, the steel industry, urban development and agriculture. Due to this significant growth in
water requirements, the recently commissioned De Hoop Dam’s firm yield will soon be exceeded.
For the successful implementation of the Olifants River Reconciliation Strategy, the need for large
scale interventions by 2026 are pressing. It is therefore recommended that:
Plan and implement WC/WDM in all water use sectors.
Completion of the current Olifants River Water Resources Development Project.
Groundwater augmentation investigations underway, the implementation of groundwater
schemes to be initiated as soon as possible.
Elimination of unlawful use.
Investigation and implement the use of treated mine water, as well as municipal effluent
re-use.
Compulsory licensing, or similar reallocation initiatives, may have to be initiated for the
Olifants River catchment to ensure a positive water balance over the long-term future.
An Integrated Olifants River Operating Rule Study needs to be initiated as soon as
possible to optimise the system, thereby avoiding uncontrolled water supply shortages.
The Crocodile West River System93 (Developed in 2009, second phase of continuationcompleted94)
The catchment area of the Crocodile West River is one of the most developed in the country. It is
characterized by the sprawling urban and industrial areas of northern Johannesburg and Pretoria,
extensive irrigation downstream of Hartbeespoort Dam and large mining developments north of
the Magaliesberg. As a result, the Crocodile River is one of the rivers in the country that has been
most influenced by human activities, and where more specific management strategies are of
paramount importance.
92 DWS, 2015, Olifants River Water Supply System Reconciliation Strategy 2015, P WMA 04/B50/00/8715, prepared
by WRP93 DWS, 2012, Crocodile West River Reconciliation Strategy 2012, P WMA 03/A31?00/6110/4, prepared by BKS and
WRP94 DWS, 2015, Crocodile West River Reconciliation Strategy, P WMA 03/A31/00/6115/2, prepared by AECOM and
WRP

National Water and Sanitation Master Plan Water is Life – Sanitation is Dignity
31 October 2018 NW&SMP: Volume 2: Plan to ActionFinal Draft (version 4.2)
17
Crocodile West River System water balance93
The water resources that naturally occur in the catchment have already been fully developed and
most of the tributaries as well as the main stem of the Crocodile River are highly regulated. Much
of the water supplied to the metropolitan areas and some mining developments is transferred
from the Vaal River system via Rand Water. This in turn results in large quantities of effluent from
the urban and industrial users, most of which is discharged to the river system after treatment, for
re-use downstream. In many of the streams and impoundments, water quality is severely
compromised by the proportionate large return flows. The effluent return flows constitute a large
portion of the water availability in the catchment and are an important resource, that is earmarked
for the augmentation of the Mokolo System, as shown in figure below for a base and high growth
scenario.

National Water and Sanitation Master Plan Water is Life – Sanitation is Dignity
31 October 2018 NW&SMP: Volume 2: Plan to ActionFinal Draft (version 4.2)
18
Surplus water available from Crocodile West River System for augmentation to the Mokolo94
The growing water requirements in the Lephalale area in the Mokolo River catchment to the north
and north-east of the Crocodile River catchment exceed the available water from the Mokolo River
system. The transfer of surplus water in the Crocodile River system to the Lephalale area
(Mokolo-Crocodile Water Augmentation Project) will be implemented 2019/2020.
The following interventions have been identified in the Strategy:
The Rand Water service area in the Crocodile West River catchment will in future continue
to be supplied from the Vaal River System and additional re-use will be considered only
when surplus becomes available.
The areas north of the Magaliesberg outside the Rand Water supply area will receive
increased treated effluent from the metropolitan areas as a future source of water.
In the Waterberg area (north of Crocodile West catchment) the optimal utilisation of local
resources will continue and surplus water in the Crocodile West River System will be
transferred to the Lephalale area.
Intervention to supply short-duration shortfall will be evaluated by investigating demand
side management and/or potential augmentation by transferring treated wastewater from
the Vaal River System to the Crocodile West River System.
Available groundwater resources should be utilised in all areas and opportunities for
conjunctive surface / groundwater utilisation should be explored.
Continue with the Crocodile (West) Annual Operating Analyses.

National Water and Sanitation Master Plan Water is Life – Sanitation is Dignity
31 October 2018 NW&SMP: Volume 2: Plan to ActionFinal Draft (version 4.2)
19
The Greater Bloemfontein Bulk Water Supply System95 (Developed in 2011)
The System covers the larger centres of Bloemfontein, Thaba Nchu and Botshabelo, as well as
to the smaller towns of Wepener, Dewetsdorp, Reddersburg, Edenburg and Excelsior, which are
also dependent to varying degrees on local water sources. Currently approximately 66% of the
treated water is supplied by Bloem Water, primarily through Welbedacht and Rustfontein Water
Treatment Plant (WTP) and the balance via MMM’s Maselspoort WTP.
Greater Bloemfontein Bulk Water Supply System proposed reconciliation interventions, including theMetolong Dam and implementation of the Caledon River EWR95
The following interventions should be undertaken: Plan and implement WC/WDM in all
water use sectors.
Install two additional (1 m³/s) Pump Sets at Tienfontein Pump Station to increase the
design capacity to 4 m³/s.
The Welbedacht Dam should be scoured to increase the capacity of the dam and to ensure
that the siltation at Tienfontein Pump Station does not further hamper operations and
maintenance.
Initiate a feasibility study to investigate the most appropriate means to augment Knellpoort
Dam.
Initiate a study to investigate feasibility of obtaining additional water from the Orange River.
95 DWS, 2012, Water Reconciliation Strategy Study for the Large Bulk Water Supply Systems: Greater Bloemfontein
Area: Final Strategy Report, P WMA 14/C520/00/0910/05, prepared by Aurecon, GHT Consulting Scientist, Illiso
Consulting

National Water and Sanitation Master Plan Water is Life – Sanitation is Dignity
31 October 2018 NW&SMP: Volume 2: Plan to ActionFinal Draft (version 4.2)
20
A Feasibility Study on Water Re-use should be undertaken.
Investigate and implement groundwater developments. The Luvuvhu and Letaba WaterSupply System (Developed in 2015)96
The System covers the entire Luvuvhu and Letaba Water Management Area (WMA) and small
parts of the adjacent WMAs. Most of the development in this water management area is
agriculture based, with strong contributions by irrigated agriculture and afforestation.
Thohoyandou, Tzaneen and Giyani are the largest urban centres in WMA, with some agro-based
industries, mainly in the Tzaneen area. The Kruger National Park (KNP) lies along the eastern
boundary and occupies approximately 35% of the WMA.
The following measures are envisaged for the Luvuvhu and Letaba systems to maintain a water
balance between the water needs and availability up to the year 2040.
Implementation of the Groot Letaba Water Development Project (GLeWaP), comprising
of the raising of the Tzaneen dam, and construction of a the new Nwamitwa dam on the
Janetsi Farm 463LT, in process.
Implement WC/WDM for both municipal and agriculture sectors.
Investigate, plan to development of a pipeline to replace the canal between Middel Letaba
and Nsami dams.
Investigate the possible increase of the Nandoni sub-system yield by improved utilising of
downstream incremental flows.
Commission Feasibility studies on groundwater development in the relevant areas.
Commission Feasibility studies on groundwater development in relevant areas, and the
construction of storage dam in the Mutale River.
All Town studies
Over eight hundred (800) All-Town stand-alone strategies / studies are now in continuation phase.
The All-Town Studies are in this phase to ensure that the strategies developed remain relevant
and are live documents. These All-Town Strategies showed that, in most cases, water supply
deficits are not the result of water resource shortages but rather of poor water supply
management. Improved management will solve most of the immediate problems – these are
typically:
A lack of metering information, resulting in WSAs having limited information on how much
water is used or wasted.
A large wastage of water.
High per capita use.
96 DWS, 2015, Development of Water of a Reconciliation Strategy for the Luvuvhu and Letaba Water Supply System,
P WMA 02/B810/00/1412/16, Prepared by WRP Consulting Engineers

National Water and Sanitation Master Plan Water is Life – Sanitation is Dignity
31 October 2018 NW&SMP: Volume 2: Plan to ActionFinal Draft (version 4.2)
21
Free water being provided far above the indigent level obligations.
Poor cost recovery.
Lack of proper maintenance and skilled operators.
Low technical competency.
The All-Town Strategies also showed that groundwater is a very important resource for towns and
an option in some instances.

National Water and Sanitation Master Plan Water is Life – Sanitation is Dignity
31 October 2018 NW&SMP: Volume 2: Plan to ActionFinal Draft (version 4.2)
22
ANNEXURE 3: REFERENCES
African Union (AU). 2015. AGENDA 2063.
Ashton, P. 2012. WATER QUALITY CHALLENGES IN SOUTH AFRICA. Council for Scientific
and Industrial Research (CSIR). Pretoria, South Africa.
Central Statistics Service, 1993. Standard Industrial Classification (SIC) of All Economic
Activities. Edition 5. Pretoria, South Africa. pp 1 - 247.
Colvin, C et al. 2013. DEFINING SOUTH AFRICA’S WATER SOURCE AREAS. WWF-World
Wide Fund for Nature. Cape Town, South Africa.
Butler, D et al. 2016. RELIABLE, RESILIENT AND SUSTAINABLE WATER MANAGEMENT:
THE SAFE & SURE APPROACH. Global Challenges. Vol. 1 pp- 63-77.
Department of Agriculture Forestry and Fisheries (DAFF). 2015. IRRIGATION STRATEGY FOR
SOUTH AFRICA. Pretoria, South Africa.
Department of Environmental Affairs (DEA). 2011. NATIONAL BIODIVERSITY ASSESSMENT
2011: An Assessment of South Africa’s biodiversity and ecosystems. pp 1-180.
Department of Environmental Affairs (DEA) 2010. MINIMUM EMISSION STANDARDS. Pretoria,
South Africa.
Department of Environmental Affairs (DEA). 2013. THE ECONOMICS OF ADAPTATION TO
FUTURE CLIMATES IN SOUTH AFRICA: AN INTEGRATED BIOPHYSICAL AND ECONOMIC
ANALYSIS. Pretoria, South Africa.
Department of Economic Development. 2010. NEW GROWTH PATH FRAMEWORK. Pretoria,
South Africa.
Department of Trade and Industry (DTI). 2017. INDUSTRIAL POLICY ACTION PLAN (IPAP)
2017/18-2019/20. Pretoria, South Africa.
Department of Water Affairs (DWA). BLUE DROP REPORTS. Pretoria, South Africa
Department of Water Affairs (DWA). GREEN DROP REPORTS. Pretoria, South Africa
Department of Water Affairs (DWA). 2011. PLANNING-LEVEL REVIEW OF WATER QUALITY
IN SOUTH AFRICA. Pretoria, South Africa. pp. 1-167.
Department of Water Affairs. 2013. STRATEGIC OVERVIEW OF THE WATER SECTOR IN
RSA. Directorate: Water Services Planning & Information. Pretoria, South Africa.
Department of Water Affairs (DWA). 2015. PLANNING-LEVEL REVIEW OF WATER QUALITY
IN SOUTH AFRICA. Pretoria, South Africa. (draft).
Department of Water Affairs (DWA). REGULATORY PERFORMANCE MEASUREMENT
SYSTEM (RPMS) REPORTS. Pretoria, South Africa.
Department of Water Affairs and Forestry (DWAF). 1991. WATER QUALITY MANAGEMENT
POLICIES AND STRATEGIES IN THE REPUBLIC OF SOUTH AFRICA. Pretoria, South Africa.
pp. 1-39.

National Water and Sanitation Master Plan Water is Life – Sanitation is Dignity
31 October 2018 NW&SMP: Volume 2: Plan to ActionFinal Draft (version 4.2)
23
Department of Water Affairs and Forestry (DWAF). 2003. NORMS AND STANDARDS FOR
WATER SERVICES.
Department of Water Affairs and Forestry (DWAF). 2004. NATIONAL WATER RESOURCE
STRATEGY. Edition 1. Pretoria, South Africa.
Department of Water Affairs and Forestry (DWAF). 2006. RESOURCE DIRECTED OF WATER
QUALITY: GUIDELINE FOR DETERMINING RESOURCE WATER QUALITY OBJECTIVES
(RWQOs), ALLOCATABLE WATER QUALITY AND THE STRESS OF THE WATER
RESOURCE. Edition 2. Pretoria, South Africa.
Department of Water Affairs and Forestry (DWAF). 2014. NATIONAL WATER SERVICES
INFRASTRUCTURE ASSET MANAGEMENT STRATEGY. Pretoria, South Africa.
Department of Water and Sanitation (DWS). ASSET VERIFICATION REPORTS ON NATIONAL
WATER RESOURCE INFRASTRUCTURE. Pretoria, South Africa.
Department of Water and Sanitation(DWS) . ALL TOWNS RECONCILIATION STRATEGIES
FOR THE NORTHERN PLANNING REGION
http://www.dwa.gov.za/Projects/AllTownsRecStrat_NP/default.aspx
Department of Water and Sanitation(DWS). DAM SAFETY RECORDS. South Africa.
Department of Water and Sanitation(DWS). RECONCILIATION STRATEGIES FOR WESTERN
CAPE WATER SUPPLY SYSTEM. South Africa. http://www.dwa.gov.za/projects.aspx .
Department of Water and Sanitation(DWS). 2013a. NATIONAL GROUNDWATER STRATEGY.
Pretoria, South Africa
Department of Water and Sanitation(DWS). 2013b. NATIONAL WATER POLICY POSITIONS.
Pretoria, South Africa. Pp.16.
Department of Water and Sanitation (DWS). 2013c. NATIONAL WATER RESOURCE
STRATEGY. Edition 2. Pretoria, South Africa. pp. 1-115.
Department of Water and Sanitation (DWS). 2015a. MUNICIPAL STRATEGIC SELF-
ASSESSMENT (MuSSA). Pretoria, South Africa.
Department of Water and Sanitation (DWS). 2015b. 2014 NO DROP REPORT- FIRST ORDER
ASSESSMENT OF WATER LOSS, WATER USE EFFICIENCY AND NON-REVENUE WATER
IN MUNICIPALITIES
Department of Water and Sanitation (DWS). 2015c. 2015 NO DROP REPORT-THE STATUS OF
WATER LOSS, WATER USE EFFICIENCY AND NON-REVENUE WATER IN METROPOLITAN
MUNICIPALITIES.
Department of Water and Sanitation (DWS). 2015d. STRATEGY FOR INCENTIVE-BASED
REGULATION OF WATER USE EFFICIENCY IN MUNICIPALITIES
Department of Water and Sanitation (DWS). REGULATIONS REGARDING THE SAFETY OF
DAMS i.t.o. SECTION 123 OF THE NWA, 1998. Pretoria, South Africa.

National Water and Sanitation Master Plan Water is Life – Sanitation is Dignity
31 October 2018 NW&SMP: Volume 2: Plan to ActionFinal Draft (version 4.2)
24
(Department of Water and Sanitation (DWS). 2016a. BENCHMARKS FOR WATER
CONSERVATION AND WATER DEMAND MANAGEMENT (WC/WDM) IN THE MINING
SECTOR. Pretoria, South Africa.
Department of Water and Sanitation (DWS). 2016b.CONDITION ASSESSMENT AUDIT OF
IRRIGATION SCHEME INFRASTRUCTURE. Pretoria, South Africa.
Department of Water and Sanitation (DWS). 2016 DRAFT POLICY ON SUSTAINABLE
HYDROPOWER GENERATION. General Notice No. 400 of 2016. Pretoria, South Africa.
Department of Water and Sanitation (DWS). 2016c. GUIDELINE FOR THE DEVELOPMENT
AND IMPLEMENTATION OF WATER CONSERVATION AND WATER DEMAND
MANAGEMENT PLANS FOR THE MINING SECTOR. Pretoria, South Africa
Department of Water and Sanitation(DWS). 2016. KZN METRO RECONCILIATION STRATEGY.
Department of Water and Sanitation (DWS). 2017a. MuSSA FOR WATER SERVICES FORSOUTH AFRICA, 2016/2017. Pretoria, South Africa.
Department of Water and Sanitation (DWS). 2017b. BENCHMARKING OF WATER LOSSES,
WATER USE AND NON-REVENUE WATER IN SOUTH AFRICAN MUNICIPALITIES (2004/05
TO 2015/16).
Department of Water and Sanitation (DWS). 2017c. DEBT COLLECTION PERFORMANCE
REPORT, 2017. Pretoria, South Africa.
Department of Water and Sanitation (DWS). 2017d. NATIONAL GROUNDWATER STRATEGY.
Pretoria, South Africa. pp.2-111.
Department of Water and Sanitation (DWS). 2017e. DWS. 2017. NATIONAL WATER
INVESTMENT FRAMEWORK.
Department of Water and Sanitation (DWS). 2017f. REVIEW, EVALUATION AND
OPTIMISATION OF THE SOUTH AFRICAN WATER RESOURCES MONITORING NETWORK:
IMPLEMENTATION STRATEGY. Pretoria, South Africa.
Department of Water and Sanitation (DWS). 2017g. STATUS REPORT ON WATER LOSSES
WITHIN THE 8 LARGE WATER SUPPLY SYSTEMS. Pretoria, South Africa.
Department of Water and Sanitation (DWS). 2017h. WATER QUALITY MANAGEMENT
POLICIES AND STRATEGIES FOR SOUTH AFRICA: INTEGRATED WATER QUALITY
MANAGEMENT IMPLEMENTATION PLAN. Edition 2. Pretoria, South Africa.
Department of Water and Sanitation (DWS). 2017i. WATER QUALITY MANAGEMENT
POLICIES AND STRATEGIES FOR SOUTH AFRICA: INTEGRATED WATER QUALITY
MANAGEMENT POLICY. Edition 2. Pretoria, South Africa. pp. 1-75.
Department of Water and Sanitation (DWS). 2017j. WATER QUALITY MANAGEMENT
POLICIES AND STRATEGIES FOR SOUTH AFRICA: INTEGRATED WATER QUALITY
MANAGEMENT STRATEGY. Edition 2. Pretoria, South Africa. pp. 1-85.

National Water and Sanitation Master Plan Water is Life – Sanitation is Dignity
31 October 2018 NW&SMP: Volume 2: Plan to ActionFinal Draft (version 4.2)
25
Department of Water and Sanitation (DWS). 2017k. WATER QUALITY MANAGEMENT
POLICIES AND STRATEGIES FOR SOUTH AFRICA: MONITORING AND EVALUATION
FRAMEWORK. Edition 2. Pretoria, South Africa. pp. 1-51.
Department of Water and Sanitation (DWS). 2017l. WATER QUALITY MANAGEMENT
POLICIES AND STRATEGIES FOR SOUTH AFRICA: WATER QUALITY AND WATER
QUALITY MANAGEMENT CHALLENGES IN SOUTH AFRICA. Edition 1. Pretoria, South
Africa. pp. 1-123.
Department of Water and Sanitation (DWS) and National Treasury. 2017m. NATIONAL WATER
INVESTMENT FRAMEWORK & MUNICIPAL BUDGET DATABASE. Pretoria, South Africa
Department of Water and Sanitation (DWS). 2018. NATIONAL WATER INVESTMENT
FRAMEWORK. Pretoria, South Africa.
Escobor, I et al. 2009. SUSTAINABLE WATER FOR THE FUTURE – WATER RECYCLING
VERSUS DESALINATION. Elsevier Publishers
Eskom. 2013. COMPILATION OF AN APPLICATION FOR EXEMPTION FROM MINIMUM
EMISSION STANDARDS AND EXTENSION OF THE MINIMUM EMISSION STANDARD
TIMEFRAMES FOR ESKOM'S POWER STATIONS: WATER RESOURCES ASSESSMENT.
Eskom Annual Report. 2016. ANNUAL PERFORMANCE REPORT – WATER USE
INTENSITIES FOR THE PAST THREE YEARS.
FAO. 1993. THE STATE OF FOOD AND AGRICULTURE 1993. FAO Agriculture Series no 26.
Global Water Partnership. 2010. WHAT IS WATER SECURITY? - THE WATER CHALLENGE.
Grey, D & Sadoff, CW. 2007. SINK OR SWIM: WATER SECURITY FOR GROWTH AND
DEVELOPMENT. World Bank, Washington DC.
Grobler, G. 2002. PERSONAL COMMUNICATION
Isabel Escobor et al. 2010. SUSTAINABLE WATER FOR THE FUTURE – WATER RECYCLING
VERSUS DESALINATION. Elsevier Publishers.
Institute for Poverty, Land and Agrarian Studies. FACT CHECK NO. 1 LAND REFORM, THE
DISTRIBUTION OF LAND IN SOUTH AFRICA: AN OVERVIEW.
http://www.plaas.org.za/sites/default/files/publications-pdf/No1%20Fact%20check%20web.pdf
Li, Y. and Migliaccio, K. 2010. WATER QUALITY CONCEPTS, SAMPLING, AND ANALYSES.
CRC Press.
National Planning Committee (NPC). 2011. DIAGNOSTICS REPORT, Pretoria, South Africa.
National Planning Commission (NPC).2011. NATIONAL DEVELOPMENT PLAN 2030 OUR
FUTURE-MAKE IT WORK. Pretoria, South Africa.
National Treasury. 2016. THE STATE OF LOCAL GOVERNMENT FINANCES AND FINANCIAL
MANAGEMENT. Pretoria, South Africa.
National Treasury. 2017a. DIVISION OF REVENUE ACT. Pretoria, South Africa.

National Water and Sanitation Master Plan Water is Life – Sanitation is Dignity
31 October 2018 NW&SMP: Volume 2: Plan to ActionFinal Draft (version 4.2)
26
National Treasury.2017b. MUNICIPAL BORROWING BULLETIN & MUNICIPAL BUDGET
DATA BASE. Pretoria, South Africa.
National Treasury.2017c. MUNICIPAL BUDGET DATA BASE (MSCoA). Pretoria, South Africa.
Pitman, W, V. 2011. OVERVIEW OF WATER RESOURCE ASSESSMENT IN SOUTH AFRICA:
CURRENT STATE AND FUTURE CHALLENGES. Water SA vol 37 no 5 Pretoria January 2011
http://www.scielo.org.za
Raziyeh Farmani David Butler et al. RELIABLE, RESILIENT AND SUSTAINABLE WATER
MANAGEMENT: THE SAFE & SURE APPROACH.
Randall, A. 1981. PROPERTY ENTITLEMENTS AND PRICING POLICIES FOR A MATURING
WATER ECONOMY. Australian Journal of Agricultural Economics, Vol. 25, No 3: 165-220.
Statistics South Africa. 2011. CENSUS 2011 STATISTICAL RELEASE P0301.4. Pretoria, South
Africa.
Statistics South Africa. 2015. LIVING CONDITIONS SURVEY 2014/2015.P. Pretoria, South
Africa.
Statistics South Africa. 2016. COMMUNITY SURVEY 2016 STATISTICAL RELEASE
P0301.Pretoria, South Africa
Statistics South Africa. 2016. STATS SA GENERAL HOUSEHOLD SURVEY 2016. Pretoria,
South Africa.
Strategic Water Partnership Network. 2016. WATER ADMINISTRATION SYSTEM – FINAL
REPORT PHASE 1 WATER RELEASE MODULE.
Trans Caledon Tunnel Authority (TCTA). 2017. TCTA ANNUAL REPORT, 2017.
United Nations (UN Water). 2013. WHAT IS WATER SECURITY?
http://www.unwater.org/publications/water-security-infographic/
United Nations (UN Water). 2016. SUSTAINABLE DEVELOPMENT GOALS – 17 GOALS TO
TRANSFORM OUR WORLD: INTEGRATED MONITORING GUIDE FOR SDG 6: TARGETS
AND GLOBAL INDICATORS. Work in progress. Pp 1-26.
Water Research Commission. 2005. A COMPILATION OF ALL THE FRESHWATER
AGREEMENTS ENTERED INTO BY SOUTH AFRICA WITH OTHER STATES. Report No.
WRC K5-1515. Pretoria, South Africa
Water Research Commission. 2012. THE STATE OF NON-REVENUE WATER IN SOUTH
AFRICA. Report TT 522/12. Pretoria, South Africa.
Water Research Commission. 2015. SOUTH AFRICA'S WATER RESEARCH,
DEVELOPMENT, AND INNOVATION (RDI) ROADMAP: 2015-2025
Water Research Commission (WRC). 2017. NATIONAL GROUNDWATER STRATEGY (Report
No.TT714/17). Pretoria, South Africa.

National Water and Sanitation Master Plan Water is Life – Sanitation is Dignity
31 October 2018 NW&SMP: Volume 2: Plan to ActionFinal Draft (version 4.2)
27
World Wide Fund – South Africa (WWF-SA). 2013. AN INTRODUCTION TO SOUTH AFRICA’S
WATER SOURCE AREAS: THE 8% LAND AREA THAT PROVIDES 50% OF OUR SURFACE
WATER. Cape Town, South Africa. pp. 1-29