Editors: Ali Ghaffarianhoseini Amirhosein Ghaffarianhoseini Nicola ...
Upload
khangminh22Category
view
0download
0
201-2079 Falcon Rd | Kamloops BC | V2C 4J2 | www.true.bc.ca | tel 250.828.0881 | fax 250.828.0717
Pritchard Wastewater Master Plan
Thompson Nicola Regional District
April 2018
Project No. 379-491
April 2018

PRITCHARD WASTEWATER MASTER PLAN THOMPSON NICOLA REGIONAL DISTRICT – APRIL 2018
Distribution List
# of Hard Copies PDF Required Association / Company Name 1 1 TNRD
Revision Log
Revision # Revised by Date Issue / Revision Description 1 R Wall Jan 19, 2018 First Draft 2 R Wall Apr 20, 2018 Final
Report Submission
Report Prepared By:
Report Reviewed By:
Rob Wall, P. Eng. Project Engineer
Dave Underwood, P. Eng. Project Engineer
R:\Clients\300-399\379\379-491\05 Reports\379-491-TNRD-Pritchard Wastewater Master Plan-April 2018.docx

PRITCHARD WASTEWATER MASTER PLAN i
THOMPSON NICOLA REGIONAL DISTRICT – APRIL 2018
Table of Contents
Executive Summary.................................................................................................................iv
1.0 Background ....................................................................................................................1
1.1 Influent Flows............................................................................................................... 3
1.2 Sludge Production........................................................................................................ 4
1.3 Effluent Quality Analysis .............................................................................................. 5
1.4 Regulatory Agency Certificates and Approvals ............................................................ 8
1.4.1 BC Ministry of Environment....................................................................................8
1.4.2 Environment Canada .............................................................................................9
2.0 Capacity and Condition of Sewer System ..................................................................10
2.1 Sewer Network ...........................................................................................................10
2.2 Lift Station...................................................................................................................12
3.0 Treatment / Disinfection...............................................................................................14
3.1 General.......................................................................................................................14
3.2 Headworks..................................................................................................................17
3.3 Settling Tanks .............................................................................................................19
3.4 Trickling Filter .............................................................................................................20
3.5 Disinfection System ....................................................................................................23
3.6 Odour Control .............................................................................................................24
4.0 Controls and Electrical ................................................................................................25
5.0 Effluent Disposal ..........................................................................................................26
6.0 Rights of Way ...............................................................................................................29
7.0 Improvement Plan ........................................................................................................30
7.1 General.......................................................................................................................30
7.2 Treatment ...................................................................................................................32
8.0 Cost Summary..............................................................................................................33
PRITCHARD WASTEWATER MASTER PLAN ii
THOMPSON NICOLA REGIONAL DISTRICT – APRIL 2018
APPENDICES
Appendix A – Effluent Monitoring Results
Appendix B – Permit To Operate
List of Tables
Table 1-1: Pritchard WWTP – Annual Flow Summary................................................................ 3 Table 1-2: Sludge Disposal by Month (m3) ................................................................................. 4
Table 1-3: Effluent Analysis – Effluent Sample Port – Relative to Permit.................................... 5 Table 1-4: Effluent Analysis - Upper Flow Through Port............................................................. 6 Table 1-5: Water Analysis – South Thompson River .................................................................. 7 Table 1-6: Reliability Requirements Category II Plant ................................................................ 9 Table 7-1: Estimated Trickling Filter Re-Cladding Cost .............................................................32 Table 7-2: Estimated UV Disinfection Replacement Cost..........................................................32 Table 8-1: Recommended Upgrades and Estimated Costs.......................................................33
List of Figures
Figure 1-1: Location Plan ........................................................................................................... 2 Figure 1-2: Flow Trend - Pritchard Community Sewer System ................................................... 3 Figure 2-1 Pritchard Sewer Mains ............................................................................................11 Figure 2-2: Pritchard Lift Station – River Road ..........................................................................12 Figure 3-1: Wastewater Treatment Process Diagram................................................................15 Figure 3-2: Sewage Treatment Plant Site Plan..........................................................................16 Figure 3-3: Internally-fed rotary drum screen ............................................................................18 Figure 3-4: Trickling Filter Cladding...........................................................................................21 Figure 3-5: Trickling Filter Spray System...................................................................................21 Figure 3-6: UV Disinfection Systems.........................................................................................23 Figure 5-1: Cross Section Through Effluent Disposal Area........................................................27 Figure 6-1: Effluent Disposal Area Right of Way .......................................................................29 Figure 7-1: Pritchard Sewage Treatment Plant - Proposed Improvements ................................31

PRITCHARD WASTEWATER MASTER PLAN iii
THOMPSON NICOLA REGIONAL DISTRICT – APRIL 2018
List of Acronyms
GSC Geodetic Survey of CanadaIHA Interior Health AuthorityTNRD Thompson Nicola Regional DistrictTRUE TRUE Consulting
Units of Measure
ft feetIgpm Imperial gallons per minutekm kilometreL/d Litres per dayL/m Litres per minuteL/s Litres per secondlpcd Litres per capita per daym metremg/L milligrams per Litremm millimetreNTU Nephelometric Turbidity Unitspsi pounds per square inchUSgpm US gallons per minute
Referenced Reports
1 Pritchard Developments Ltd - Water System Assessment Study. TRUE Consulting Group. November 1999.
2 Draft Report - Pritchard Water System - Water Treatment Feasibility Study. CH2M Hill May 2007
3 Golder Associates. Reconnaissance of Pritchard Sewage Basins. 2004.

PRITCHARD WASTEWATER MASTER PLAN iv
THOMPSON NICOLA REGIONAL DISTRICT – APRIL 2018
Executive Summary
The Thompson Nicola Regional District has commissioned a master plan assessment of its water
and sewer infrastructure. The master plans will enable better planning for the future of the
communities and sets out priorities for improvements to the systems to ensure safe, clean, reliable
and affordable water and wastewater services.
The master plans list recommended upgrades with estimated costs to enable the TNRD to
prepare a financial plan with the general objective of making improvements for compliance with
regulatory requirements, and capacity for future growth.
The analysis of the Pritchard Community Sewer System has identified a need for the following
key improvements;
Replace Trickling Filter Cladding
Replace UV Disinfection System
Rapid Infiltration Basin seepage bed repairs (assessed under a separate study).

PRITCHARD WASTEWATER MASTER PLAN 1
THOMPSON NICOLA REGIONAL DISTRICT – APRIL 2018
1.0 Background
Constructed 1998Customers 169 (approximately)Location 30 km east of KamloopsDischarge Location South Thompson RiverTreatment Process Secondary treatment and infiltration
Pritchard is located approximately 30 km east of Kamloops on the north side of the South
Thompson River (See Figure 1-1). The original Pritchard Developments Ltd. Subdivision
development was constructed in the period 1971 to 1973 and comprises 169 single family lots
averaging 1000 m2 in area. The subdivision is serviced by a community water system originally
constructed by the developer. Sewer service was originally by septic fields, but local ground
conditions and the small lot sizes lead to numerous failures.
As a result, a community sewer and treatment system were installed by 1998. The original design
capacity of the treatment facility was 273 m3/day.

10,0001:
WGS_1984_Web_Mercator_Auxiliary_Sphere
0.5
Kilometers
0 0.50.25
Projection: June 30, 2017
THIS IS NOT A LEGAL SURVEY PLAN. This map is a user generated static output from theThompson-Nicola Regional District Internet Mapping site and is provided on an “as is” and “as
available” basis, without warranties of any kind, either expressed or implied. The information wasgenerated from Geographic Information System (GIS) data maintained by different source agencies.Information contained in the map may be approximate, and is not necessarily complete, accurate or
current. While all reasonable efforts have been made to ensure the accuracy of the data, reliance onthis information without verification from original records is done at the user's own risk. Figure 1-1: Location Plan
Legend
Pritchard Community SewerSystem
TNRD Sewer System
Emergency Services
Police Station
Ambulance Station
Fire Station
Hospital
Local Authority Office
Facility
Other
Cemetery
Community Hall
Education
Emergency Response
Government Building
Health
Landmark
Recreation
Transportation
Utility
Parcel
TNRD Boundary (Outline)
Administrative Boundary (Outline)
First Nations Reserve (Outline)
Provincial Parks & Protected Areas

PRITCHARD WASTEWATER MASTER PLAN 3
THOMPSON NICOLA REGIONAL DISTRICT – APRIL 2018
1.1 Influent Flows
Daily flows appear to be stable throughout the year and there has been no apparent trend from
one year to the next in the period from 2012 to 2017. The TNRD report issues with infiltration in
the spring, which have been gradually addressed by raising manhole covers. In addition,
residents of trailers must run taps to prevents pipes freezing, which increases winter flows.
TABLE 1-1: PRITCHARD WWTP – ANNUAL FLOW SUMMARY
Year WWTP Effluent Flowm3/annum m3/day l/cap/day1
2012 31,201 85.5 200
2013 31,220 85.5 200
2014 33,184 90.9 212
2015 29,414 80.6 188
2016 30,150 82.6 193
2017 32,725 89.7 210
FIGURE 1-2: FLOW TREND - PRITCHARD COMMUNITY SEWER SYSTEM
The Pritchard Developments Ltd. sewer system currently services a total of 169 single family lots
averaging approximately 1000m2 in size. The planned Osprey development to the North East of
the community comprises 65 lots ranging from 333m2 to 650m2 in size. The new lots will host
1 The TNRD estimate the population of Pritchard to be 428 people.

PRITCHARD WASTEWATER MASTER PLAN 4
THOMPSON NICOLA REGIONAL DISTRICT – APRIL 2018
manufactured homes. At an assumed average daily flow of 0.5 m3/lot/day (based on current
community flows), the average daily flow from the lots will be 33m3/d. It should be noted that this
flow per lot is relatively low by municipal standards.
In addition, the waste flow from a future water treatment plant is expected to be between 3 and
5% of raw water flow. Pritchard average water consumption is currently 150 m3/d. Allowing for
the additional flow from the Osprey this would result in a waste flow of the order of 10m3/d.
Therefore, the total future flow based on expected medium term demands would be in the range
130 - 170 m3/d.
1.2 Sludge Production
The plant currently averages one to two 12m3 loads of sludge per month. The rate of sludge
disposal varies reasonably evenly through the year and represents approximately 0.5% of the
total annual flow as a result of efforts taken to consolidate sludge by settling. Sludge quantities
have reduced recently as a result of the construction of a new headworks building.
TABLE 1-2: SLUDGE DISPOSAL BY MONTH (M3)
2012 2013 2014 2015 2016 2017
January 12 12 12 12
February 24 12 24 12 24
March 12 12 12 12
April 21 12 12 36 24
May 24 12 12
June 22 12 24 12
July 12 12 24 12 12
August 24 24 12 24 12 12
September 12 12 12 12 12
October 12 24 36 12 12 24
November 12 12 12 12 12
December 12 12 24 12 12
Total 166 165 156 156 132 132

PRITCHARD WASTEWATER MASTER PLAN 5
THOMPSON NICOLA REGIONAL DISTRICT – APRIL 2018
1.3 Effluent Quality Analysis
Pritchard WWTP effluent quality testing shows that, under the present loading, the plant
consistently meets permit requirements (Refer to Table 1-3).
TABLE 1-3: EFFLUENT ANALYSIS – EFFLUENT SAMPLE PORT – RELATIVE TO PERMIT
Date BOD, 5-day Total Suspended Solids
Phosphorus, Total (as P)
Total Nitrogen
Fecal Coliforms
Permit Limit 10 10 1 NA 200
20-Jan-16 <9 2 0.076 22.9 <1
25-Feb-16 <10 <2 0.141 22.1 130
15-Mar-16 <10 4 0.135 22.6 2
05-Apr-16 <7 3 0.093 21.3 13
26-May-16 <8 <2 0.064 30.7 <1
23-Jun-16 <6 <2 0.015 28.8 <1
27-Jul-16 <7 4 0.163 23.8 <1
01-Sep-16 <7 5 0.281 21.5 1
29-Sep-16 <6 2 0.16 10.2 <1
27-Oct-16 11 <2 0.089 22.7 <1
23-Nov-16 <6 6 0.167 23.2 <1
15-Dec-16 8 7 0.231 19.9 <1
26-Jul-17 <7.4 5.8 0.242 22.7 <1
23-Aug-17 <2.0 0.0549 24.9 <1

PRITCHARD WASTEWATER MASTER PLAN 6
THOMPSON NICOLA REGIONAL DISTRICT – APRIL 2018
The sample analysis from the monitoring well downstream of the infiltration basins indicates a
further improvement in effluent quality, primarily in terms of the total nitrogen concentration (Refer
to Table 1-4). The average total nitrogen values fall from 23mg/L to 4 mg/L. The average values
for other parameters remain similar.
TABLE 1-4: EFFLUENT ANALYSIS - UPPER FLOW THROUGH PORT
Date BOD, 5-day Total Suspended
Solids
Phosphorus, Total (as P)
Total Nitrogen
Fecal Coliforms
20-Jan-16 <9 <2 0.054 12.1 52
25-Feb-16 <10 <2 0.05 4.37 2
15-Mar-16 <10 <2 0.05 4.93 <1
05-Apr-16 8 4 0.033 3.87 <1
26-May-16 <8 <2 0.069 3.04 <1
23-Jun-16 <6 <2 0.097 1.21 1
27-Jul-16 <7 <2 0.154 2.05 <1
01-Sep-16 <7 <2 0.217 2.4 35
29-Sep-16 <6 <2 0.211 2.08 2
27-Oct-16 <8 <2 0.144 2.07 <1
23-Nov-16 <6 <2 0.468 4.74 <1
15-Dec-16 <6 <2 0.187 7.55 <1
26-Jul-17 <7.4 <2.0 0.105 2.44 <1
23-Aug-17 <2.0 0.138 1.87 <1

PRITCHARD WASTEWATER MASTER PLAN 7
THOMPSON NICOLA REGIONAL DISTRICT – APRIL 2018
Sampling undertaken in the South Thompson River shows little or no measurable impact on the
receiving environment from the discharge.
TABLE 1-5: WATER ANALYSIS – SOUTH THOMPSON RIVER
Date Sample Location
Total Dissolved
Phosphorus
Total Nitrogen
Fecal Coliforms
E. coli
25-Feb-16 TRDA 0.017 0.023 <1 <1
25-Feb-16 TRUS 0.008 0.269 <1 <1
25-Feb-16 TRDS 0.009 0.32 <1 <1
26-May-16 TRDA <0.002 0.154 260 170
26-May-16 TRUS 0.008 0.204 4 2
26-May-16 TRDS 0.007 0.19 2 2
01-Sep-16 TRDA <0.002 1.24 70 88
01-Sep-16 TRUS <0.002 1.16 69 69
01-Sep-16 TRDS 0.003 0.281 100 74
23-Nov-16 TRDA 0.004 0.138 3 3
23-Nov-16 TRUS 0.003 0.17 5 5
23-Nov-16 TRDS <0.002 0.214 6 5
23-Aug-17 TRDA <0.0020 0.174 38 38
23-Aug-17 TRUS <0.0020 0.159 46 4623-Aug-17 TRDS <0.0020 0.297 330 330
TRDA = South Thompson River Discharge Area, TRUS = South Thompson River Upstream,
TRDS = South Thompson River Downstream
PRITCHARD WASTEWATER MASTER PLAN 8
THOMPSON NICOLA REGIONAL DISTRICT – APRIL 2018
1.4 Regulatory Agency Certificates and Approvals
The principal regulatory agency certificates, licenses and approvals which combine to provide
approval for the construction and operation of the water system are summarized following.
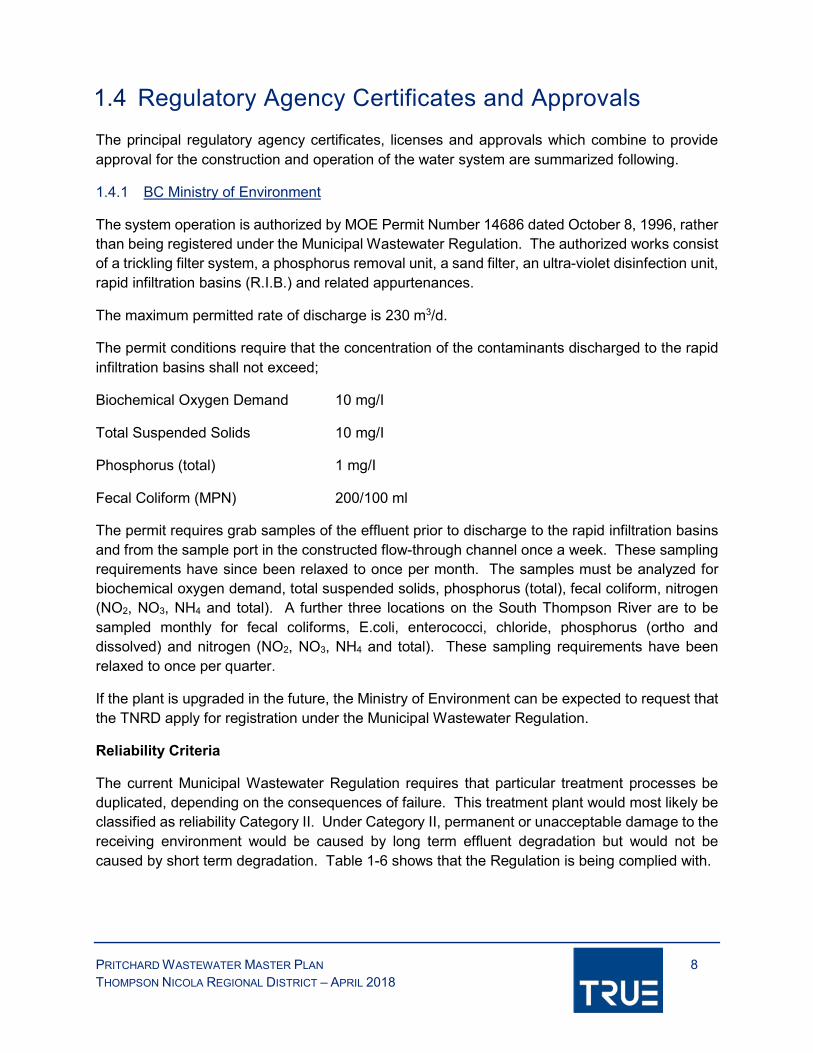
1.4.1 BC Ministry of Environment
The system operation is authorized by MOE Permit Number 14686 dated October 8, 1996, rather
than being registered under the Municipal Wastewater Regulation. The authorized works consist
of a trickling filter system, a phosphorus removal unit, a sand filter, an ultra-violet disinfection unit,
rapid infiltration basins (R.I.B.) and related appurtenances.
The maximum permitted rate of discharge is 230 m3/d.
The permit conditions require that the concentration of the contaminants discharged to the rapid
infiltration basins shall not exceed;
Biochemical Oxygen Demand 10 mg/I
Total Suspended Solids 10 mg/I
Phosphorus (total) 1 mg/I
Fecal Coliform (MPN) 200/100 ml
The permit requires grab samples of the effluent prior to discharge to the rapid infiltration basins
and from the sample port in the constructed flow-through channel once a week. These sampling
requirements have since been relaxed to once per month. The samples must be analyzed for
biochemical oxygen demand, total suspended solids, phosphorus (total), fecal coliform, nitrogen
(NO2, NO3, NH4 and total). A further three locations on the South Thompson River are to be
sampled monthly for fecal coliforms, E.coli, enterococci, chloride, phosphorus (ortho and
dissolved) and nitrogen (NO2, NO3, NH4 and total). These sampling requirements have been
relaxed to once per quarter.
If the plant is upgraded in the future, the Ministry of Environment can be expected to request that
the TNRD apply for registration under the Municipal Wastewater Regulation.
Reliability Criteria
The current Municipal Wastewater Regulation requires that particular treatment processes be
duplicated, depending on the consequences of failure. This treatment plant would most likely be
classified as reliability Category II. Under Category II, permanent or unacceptable damage to the
receiving environment would be caused by long term effluent degradation but would not be
caused by short term degradation. Table 1-6 shows that the Regulation is being complied with.

PRITCHARD WASTEWATER MASTER PLAN 9
THOMPSON NICOLA REGIONAL DISTRICT – APRIL 2018
TABLE 1-6: RELIABILITY REQUIREMENTS CATEGORY II PLANT
Components Minimum Redundancy RequirementBackup Power Source
Compliant
PrimarySedimentation
2 minimum. Plant capable of 50% of design max flow with largest unit out of
service.Required Yes
Trickling Filters1
Multiple Units. Plant capable of 75% of design max flow with largest unit out of
service.Optional Yes
Flocculation No backup required Optional Yes
Final SedimentationMultiple Units. Plant capable of 50% of design max flow with largest unit out of
service.Optional Yes
Effluent Filters2 minimum. Plant capable of 75% of
design max flow with largest unit out of service.
Required Yes
1.4.2 Environment Canada
The federal Wastewater Systems Effluent Regulation (WSER) applies to wastewater systems
where the annual average flow is greater than 100 m3/d, or the system is designed for more than
100m3/d. The average system flow is currently less than 100 m3/d and an Identification Report
has not been submitted to Environment Canada. The Osprey Development and wastes from a
future water treatment plant are expected to increase the flow above 100 m3/d. However, the
realization of these flows may be a number of years into the future.
In the future, when the system is registered under the WSER, quarterly reporting will be required
where the system flow is between 17,500 and 50,000 m3/annum. The plant flow is currently
around 30,000 m3/annum. As a result, the TNRD would be required to submit quarterly reports
to Environment Canada which would include the following information for each month:
Number of days effluent was deposited
Volume of effluent deposited
Average CBOD
Average SS concentration
Acute lethality (once for the quarter)
CBOD and TSS testing will be a weekly composite sample. Acute lethality sampling is a quarterly
grab sample.
The existing plant performance does not raise any concerns with meeting WSER effluent quality
criteria.
PRITCHARD WASTEWATER MASTER PLAN 10
THOMPSON NICOLA REGIONAL DISTRICT – APRIL 2018
2.0 Capacity and Condition of Sewer System
2.1 Sewer Network
Description
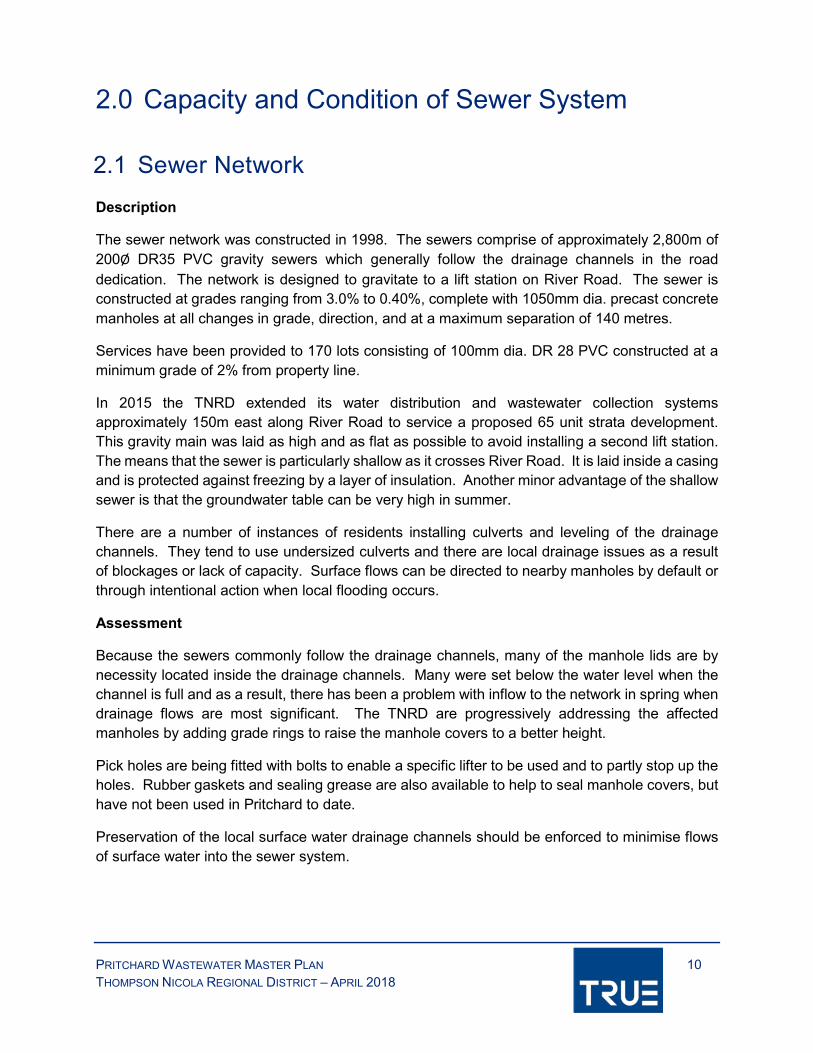
The sewer network was constructed in 1998. The sewers comprise of approximately 2,800m of
200Ø DR35 PVC gravity sewers which generally follow the drainage channels in the road
dedication. The network is designed to gravitate to a lift station on River Road. The sewer is
constructed at grades ranging from 3.0% to 0.40%, complete with 1050mm dia. precast concrete
manholes at all changes in grade, direction, and at a maximum separation of 140 metres.
Services have been provided to 170 lots consisting of 100mm dia. DR 28 PVC constructed at a
minimum grade of 2% from property line.
In 2015 the TNRD extended its water distribution and wastewater collection systems
approximately 150m east along River Road to service a proposed 65 unit strata development.
This gravity main was laid as high and as flat as possible to avoid installing a second lift station.
The means that the sewer is particularly shallow as it crosses River Road. It is laid inside a casing
and is protected against freezing by a layer of insulation. Another minor advantage of the shallow
sewer is that the groundwater table can be very high in summer.
There are a number of instances of residents installing culverts and leveling of the drainage
channels. They tend to use undersized culverts and there are local drainage issues as a result
of blockages or lack of capacity. Surface flows can be directed to nearby manholes by default or
through intentional action when local flooding occurs.
Assessment
Because the sewers commonly follow the drainage channels, many of the manhole lids are by
necessity located inside the drainage channels. Many were set below the water level when the
channel is full and as a result, there has been a problem with inflow to the network in spring when
drainage flows are most significant. The TNRD are progressively addressing the affected
manholes by adding grade rings to raise the manhole covers to a better height.
Pick holes are being fitted with bolts to enable a specific lifter to be used and to partly stop up the
holes. Rubber gaskets and sealing grease are also available to help to seal manhole covers, but
have not been used in Pritchard to date.
Preservation of the local surface water drainage channels should be enforced to minimise flows
of surface water into the sewer system.
")
")
")
")
")
")
")
")
")
")
")
")
")
")
")
")
")
")
")
")
")
")
")
")
")
")
")
")
")
")
")
")
")
")
")
")
")
100
100
200
100200 100
200
200
200
200
200
200
100
200
200
200
200
200
200
200
200
200
200
200
100
200
200
200
200
200
200
200
20
0
200
200
200
200
200
200
200
200
200
200
20
0
200
200
200
200
¯1:5,000
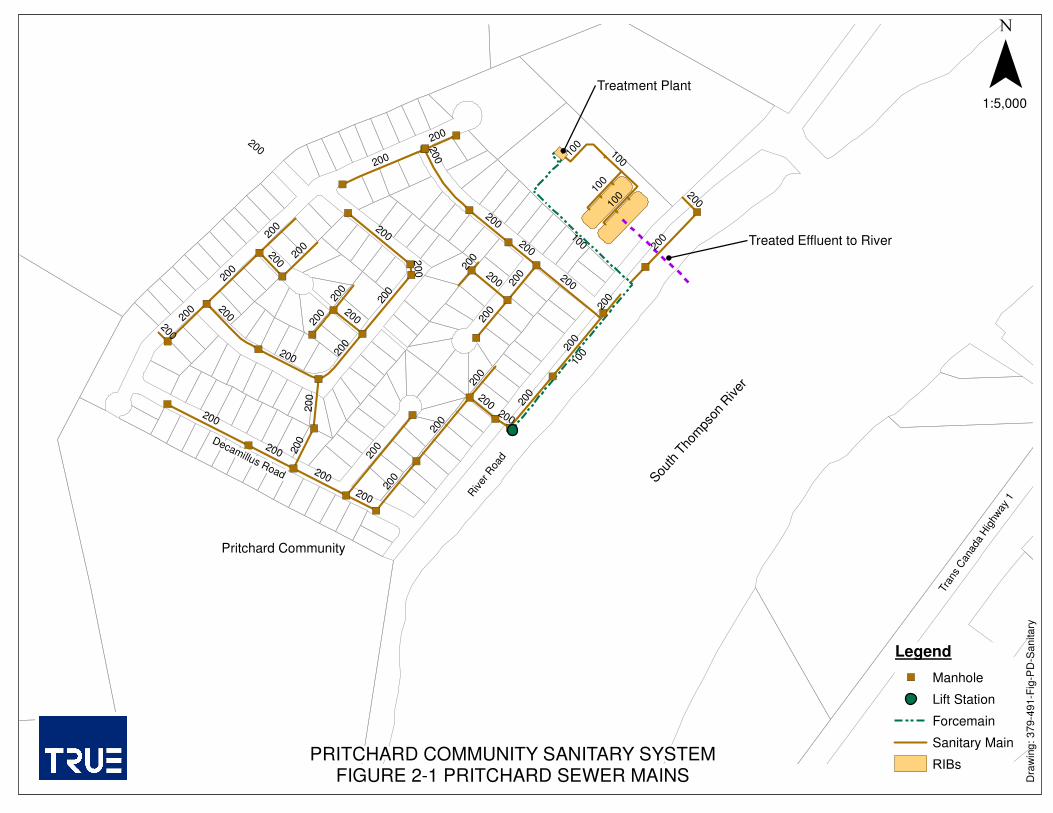
PRITCHARD COMMUNITY SANITARY SYSTEMFIGURE 2-1 PRITCHARD SEWER MAINS
Legend
") Manhole
Lift Station Forcemain Sanitary Main RIBs
Pritchard Community
Tran
s C
anad
a H
ighw
ay 1
Decamillus Road
Dra
win
g:
37
9-4
91-F
ig-P
D-S
an
ita
ry
Riv
er R
oad
Sou
th T
hom
pson
River
Treatment Plant
200
Treated Effluent to River

PRITCHARD WASTEWATER MASTER PLAN 12
THOMPSON NICOLA REGIONAL DISTRICT – APRIL 2018
2.2 Lift Station
Description
The sewage lift station is a 1830mm diameter packaged Flygt FRP station supplied with duty
standby 5hp 3 phase Flygt CP 3102MT submersible pumps with impeller 432. The station is
equipped with a Flygt flushing valve to minimise sedimentation in the pump well. Level control is
by a Milltronics Multiranger Ultrasonic unit. Pumped flow is calculated to be 13 L/s.
The lift station is constructed on a raised bench at elevation 347.0m as protection against river
flooding. The top of the chamber is also approximately 0.6 metres above ground as further
protection.
The lift station chamber is equipped with an odour control system. This system includes a
chamber-mounted Dayton air blower (Model 4C 108) and a Trican charcoal filter (CY-1000). The
blower is equipped with a speed control which can be adjusted as required.
There is an on-site 20 kW / 600V natural gas fueled standby generator which was installed as
part of the original system in 1998.
A 100Ø C900 CL100 PVC sanitary forcemain connects the lift station to the wastewater treatment
plant.
FIGURE 2-2: PRITCHARD LIFT STATION – RIVER ROAD

PRITCHARD WASTEWATER MASTER PLAN 13
THOMPSON NICOLA REGIONAL DISTRICT – APRIL 2018
Assessment
FRP lift stations are non-corrodible and long lasting, apart from the metal fittings which tend to
require occasional replacement depending on the nature of the atmosphere in the chamber. This
chamber was in good condition. Some corrosion of the aluminum ladder was noted. An FRP
ladder would be preferable.
The paint on the standby generator is deteriorating but it is understood that the unit is in otherwise
acceptable condition.

PRITCHARD WASTEWATER MASTER PLAN 14
THOMPSON NICOLA REGIONAL DISTRICT – APRIL 2018
3.0 Treatment / Disinfection
3.1 General
The Pritchard Sewage Treatment Plant includes a series of treatment process designed to
progressively clean the wastewater. The operating manual states that the design capacity of the
treatment facility is 273 m3/day.


PRITCHARD WASTEWATER MASTER PLAN 17
THOMPSON NICOLA REGIONAL DISTRICT – APRIL 2018
3.2 Headworks
Description
The wastewater treatment plant headworks structure was constructed in 2016 and consists of:
6.1 m x 4.0m x 3.1 m cast-in-place concrete sludge holding tank / building foundation
4.3m x 4.0m x 2.8m precast concrete screening building
One internally-fed rotary drum screen complete with conveyor and compactor
The station is designed to screen the wastewater as it is pumped to the plant by the lift station.
Screenings are compressed to remove excess water and minimise the quantity for disposal.
Screenings are disposed of to a small garbage bin. The screened wastewater flows by gravity to
the primary settling tanks. The purpose of the screening facility is to remove inorganic solids prior
to the primary storage tanks, which was prone to accumulating mats of non-biodegradable solids.
It also protects the pumps and trickling filter nozzles from these solids.
The rotary drum screen is an IPEC Model IFM 1839P unit with an IPEC Model PLB 630 conveyor
/ compactor.
A Rosemount 8750WA electromagnetic flow meter records wastewater flow into the WWTP.
A Rosemount pH analyser records the wastewater pH with the objective of detecting sewage
discharges that may cause a treatment process upset.
All electrical equipment in the room is explosion rated due to the possibility of an explosive
atmosphere in the headworks building. This is a requirement of NFPA820 Standard for Fire
Protection in Wastewater Treatment and Collection Facilities.
The alum is injected prior to the secondary clarifier to promote coagulation and flocculation. Prior
to the headworks screen upgrade, sludge from the clarifier and filters was recycled back to the
primary tanks. It was believed that the alum contained within the recycled sludge was reacting
with the primary influent and causing the sludge to become excessively thick and difficult to
handle.
To keep the secondary clarifier and filter sludge separate from the primary sludge, the headworks
building foundation has been constructed as a tank for sludge settling and storage. Clarifier and
filter sludge are pumped directly to the new tank. The storage tank has sloping walls to
concentrate and bring sludge to a sludge withdrawal pipe, which a vacuum truck connects to.
Supernatant overflows back to Primary Settling Tank #1.

PRITCHARD WASTEWATER MASTER PLAN 18
THOMPSON NICOLA REGIONAL DISTRICT – APRIL 2018
FIGURE 3-3: INTERNALLY-FED ROTARY DRUM SCREEN
Assessment
The system is operating without any serious issues and is in new condition.
A standby generator was installed at the WWTP in late 2017 as a second phase of the headworks
upgrade. The lift station was equipped with standby power and the WWTP was not. The system
relied on a quick response by the operator to bypass the screen building and, if necessary, turn
off the lift station in the event of a power failure. This was a temporary arrangement until the
WWTP generator was installed in December 2017. The generator is now fully functional and
operates automatically.

PRITCHARD WASTEWATER MASTER PLAN 19
THOMPSON NICOLA REGIONAL DISTRICT – APRIL 2018
3.3 Settling Tanks
Description
There are three simple settling tanks arranged in series. Primary Tank #1 and Primary Tank #2
are intended as both equalization tanks and primary settling basins. Screened flow is discharged
to a grit chamber at the southwest corner of Primary Tank #1. The tank designated as the
‘secondary’ settling tank is positioned after the other two tanks.
Primary tank #1 Volume 73m3
Primary tank #2 Volume 73m3
Secondary Tank Volume 59m3
The three tanks have a combined storage of almost two days at typical flows. This storage is
sufficient for treatment typical of a basic septic tank system.
Facilities have been provided to bypass the tanks for maintenance. Normally all of the tanks
operate to achieve optimum performance.
The operator can bypass Primary Tank #1 with valves located 3 metres away from the tankage,
and direct the flow into Primary Tank #2.
Sludge removal from the new sludge tank under the screen building is undertaken by tanker truck
with a 12m3 load taken each time, which includes the clarifier sludge. This happens approximately
monthly.
Assessment
The settling tanks were not inspected internally, but are reported by the operator to be in
acceptable condition.
The Primary Tanks have manholes on the top of the slab to access the tank. The manholes are
located in the center of the tanks, so it is difficult to access the corners and sides of the tanks
where the majority of the heavy solids accumulate.
Achieving effective sludge removal was very difficult prior to the installation of the headworks
screen due to large amounts of floating material and the consolidated alum sludge. This situation
has now improved.

PRITCHARD WASTEWATER MASTER PLAN 20
THOMPSON NICOLA REGIONAL DISTRICT – APRIL 2018
3.4 Trickling Filter
Description
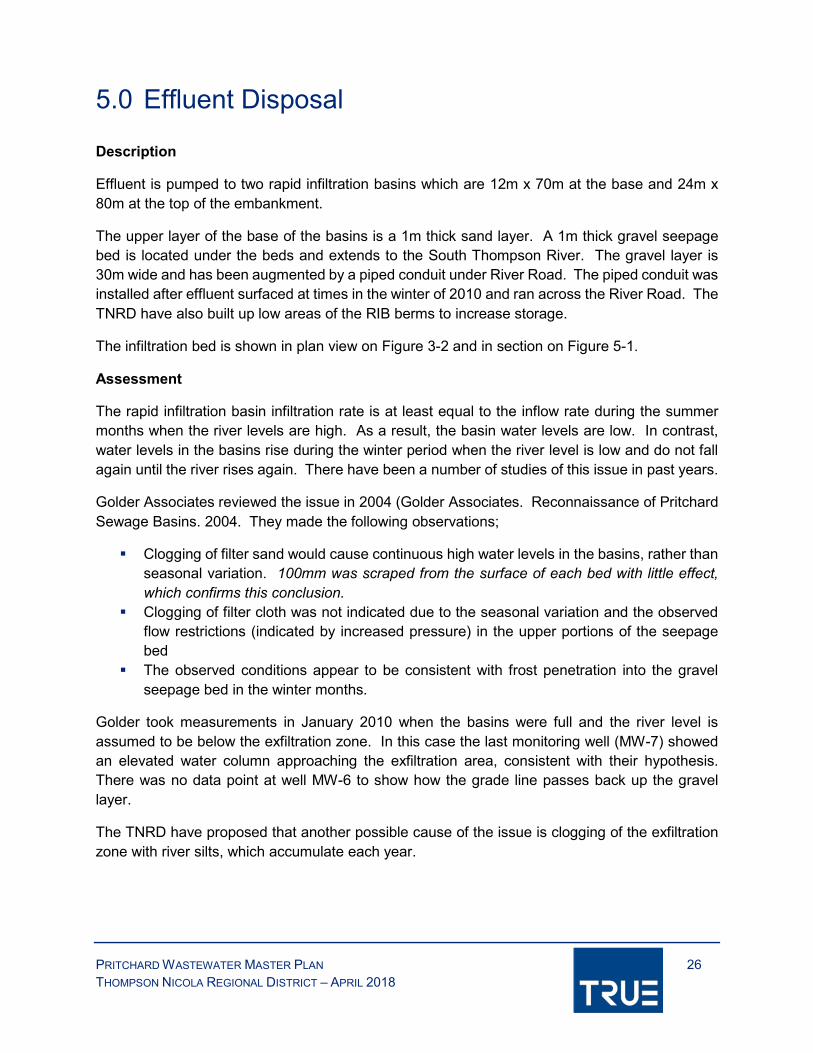
The trickling filter consists of a bed of plastic media which supports biomass growth. Wastewater
is applied at a controlled rate using an evenly spaced array of fixed nozzles. As the wastewater
trickles down through the media, organic matter is bio-degraded by microorganisms living on the
media. The treated wastewater is then collected by a recirculation tank.
The Pritchard trickling filter is a 9.2m x 2.5m x 3m (LxWxH) unit consisting of 69m3 (6,695m2) of
Marley Marpac MXF3000 media with a steel cladding designed to retain fluid within the perimeter
of the system.
There is an 80m3 recirculation tank beneath the tricking filters, which the fluid drains into. This
tank has three recirculation pumps which are 5hp (3.7kW) 3 phase Flygt CP 3102LT submersible
pumps (3102.180.1233-441). Two of the submersible pumps (Recirculation Pump #1 and #2) are
designed to recirculate the wastewater through the Trickling Filter tower spray nozzles, and one
submersible pump (Air Injector Supply Pump #3) is designed to pump flow through Mazzei air
injectors located at the bottom of the Recirculation Tank. The Air Injector Supply Pump #3 can
be used to recirculate wastewater through the Trickling Filter if the valve to the air injectors is
closed and the valve to the recirculation spray nozzles is open.
The biodegraded wastewater flows from the recirculation tank to a flash mix chamber where
coagulant (alum) is dosed to precipitate phosphorus and generally improve solids removal in the
clarifier. The original design included polymer dosing to the effluent flow following the alum.
There is currently no polymer dosing. Flocculation occurs in a mechanically stirred tank prior to
entry into the clarifier.
The clarifier is an upflow clarifier constructed using the same Marley MXF 3000 plastic media
acting as a tube settler. Effluent passes upward through this media to reach the effluent trough.
The clarifier is constructed with a double hopper bottom. The upflow clarifier is equipped with two
0.5hp desludge pumps (Barnes Model 2SE-51).
Clarifier supernatant is polished in two parallel Sanitherm sand filters which provide a final barrier
to suspended solids prior to discharge to the rapid infiltration basins. The sand filters are each
1.2m x 1.2m horizontally with 0.9 m depth of silica sand. Each filter has a flow-through capacity
of 3.15 L/s, providing 100% standby capacity for redundancy.
Back wash water is supplied from the effluent pump well by a single 5hp (3.7kW) 3 phase Flygt
CP 3102LT submersible pump (impeller 441).
The treated effluent lift station is a concrete tank with duty standby 2.2hp (1.6kW) 3 phase Flygt
CP3085MT submersible pumps. Level control is by an ultrasonic level transmitter. The effluent
pumps transfer effluent to the UV disinfection units and out to the rapid infiltration basins.
PRITCHARD WASTEWATER MASTER PLAN 21
THOMPSON NICOLA REGIONAL DISTRICT – APRIL 2018
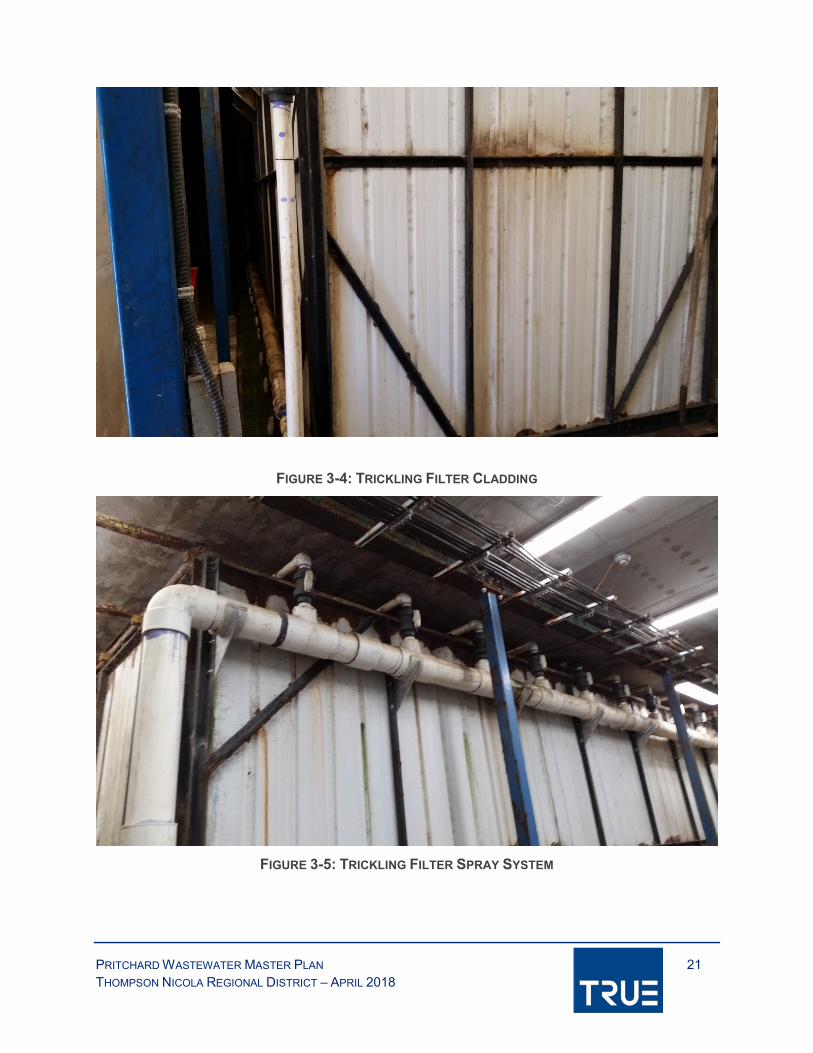
FIGURE 3-4: TRICKLING FILTER CLADDING
FIGURE 3-5: TRICKLING FILTER SPRAY SYSTEM

PRITCHARD WASTEWATER MASTER PLAN 22
THOMPSON NICOLA REGIONAL DISTRICT – APRIL 2018
Assessment
The trickling filters and recirculation tank were not inspected internally, but are understood to be
in acceptable condition. However, the trickling filter exterior cladding has deteriorated to the point
where it now requires replacement. The function of the cladding is to prevent splashing of the
effluent outside the structure. It is not a structural element required to support the media.
There are non-corrodible alternatives for the replacement cladding such as FRP and plastic
sheets. It would be feasible to wet apply FRP to the exterior of the filter cladding while leaving
the existing cladding in place, or, preferably to remove the cladding and replace it with new
cladding. It is not practical to replace the cladding on the rear wall without dismantling the filters,
as there is no practical access.

PRITCHARD WASTEWATER MASTER PLAN 23
THOMPSON NICOLA REGIONAL DISTRICT – APRIL 2018
3.5 Disinfection System
Description
The sand filters discharge effluent to the Effluent Holding Tank, where the effluent pump directs
effluent through flow meter and a pressurised ultraviolet (UV) disinfection unit. The operating UV
disinfection unit is the original Waterguard reactor (model WG-12-L-G) dating from 1998. The
TNRD installed a replacement UV unit (Spectral Innovations) more recently2, but electrical and
mechanical failures have prevented the use of this unit.
FIGURE 3-6: UV DISINFECTION SYSTEMS
Assessment
The Waterguard unit is achieving disinfection targets and is in acceptable condition.
Unfortunately, it has reached an age where it is increasingly difficult to source replacement lamps.
Because the newer Spectral Innovations unit is not reliable, a new UV unit should be purchased
to replace both systems.
2 Thought to have occurred in 2007 - 2008

PRITCHARD WASTEWATER MASTER PLAN 24
THOMPSON NICOLA REGIONAL DISTRICT – APRIL 2018
3.6 Odour Control
Description
There is an activated carbon odour control system fitted to the lift station.
The WWTP has a biofilter which is no longer in use as the bed has become compacted and no
longer passes the required air flows. It has not been reinstated as the plant is relatively odourless
and there have been no complaints from local residents.
Assessment
Activated carbon media is a replacement item. The current media appeared to be effective as
there was no apparent odour at the lift station. Because the wastewater is relatively fresh and
aerobic, odour is not as serious an issue as at many other lift stations.
The biological filter is expected to remain out of commission at this stage. Being an active
biological process, biofilter media will eventually break down and will require replacement. The
time for this to occur varies significantly. It appears that the media has become compacted
resulting in a high head loss. Improvements such as moisture sensors and an improved media
design would be recommended if the biofilter is reinstated. Moisture control is essential for
effective biological activity and is especially difficult to manage in the dry Pritchard climate.

PRITCHARD WASTEWATER MASTER PLAN 25
THOMPSON NICOLA REGIONAL DISTRICT – APRIL 2018
4.0 Controls and Electrical
Description
The control system comprises:
Pump control panel at the lift station with an ultrasonic level sensor and backup floats for
pump starting and high and low level alarms.
Buried telemetry cable linking the lift station with WWTP.
WWTP PLC control panel with pump and motor controls for the various components.
Dialer and modem for transmission by telephone of alarm conditions to the water system
operator. Alarm conditions that can be forwarded to the operator by telephone include low
well level, low/high reservoir level and low temperature in the pumphouse, phase loss, etc.
SCADA system with remote access.
The WWTP has a 600V three phase electrical service. There is a standby generator at the lift
station site and at the WWTP (WWTP unit installed in December 2017).
Explosion proof electrical equipment has been used in the headworks building in accordance with
NFPA820.
The system control philosophy is described in the WWTP Operating Manual.
Assessment
No changes are proposed for the electrical and control system.
PRITCHARD WASTEWATER MASTER PLAN 26
THOMPSON NICOLA REGIONAL DISTRICT – APRIL 2018
5.0 Effluent Disposal
Description
Effluent is pumped to two rapid infiltration basins which are 12m x 70m at the base and 24m x
80m at the top of the embankment.
The upper layer of the base of the basins is a 1m thick sand layer. A 1m thick gravel seepage
bed is located under the beds and extends to the South Thompson River. The gravel layer is
30m wide and has been augmented by a piped conduit under River Road. The piped conduit was
installed after effluent surfaced at times in the winter of 2010 and ran across the River Road. The
TNRD have also built up low areas of the RIB berms to increase storage.
The infiltration bed is shown in plan view on Figure 3-2 and in section on Figure 5-1.
Assessment
The rapid infiltration basin infiltration rate is at least equal to the inflow rate during the summer
months when the river levels are high. As a result, the basin water levels are low. In contrast,
water levels in the basins rise during the winter period when the river level is low and do not fall
again until the river rises again. There have been a number of studies of this issue in past years.
Golder Associates reviewed the issue in 2004 (Golder Associates. Reconnaissance of Pritchard
Sewage Basins. 2004. They made the following observations;
Clogging of filter sand would cause continuous high water levels in the basins, rather than
seasonal variation. 100mm was scraped from the surface of each bed with little effect,
which confirms this conclusion.
Clogging of filter cloth was not indicated due to the seasonal variation and the observed
flow restrictions (indicated by increased pressure) in the upper portions of the seepage
bed
The observed conditions appear to be consistent with frost penetration into the gravel
seepage bed in the winter months.
Golder took measurements in January 2010 when the basins were full and the river level is
assumed to be below the exfiltration zone. In this case the last monitoring well (MW-7) showed
an elevated water column approaching the exfiltration area, consistent with their hypothesis.
There was no data point at well MW-6 to show how the grade line passes back up the gravel
layer.
The TNRD have proposed that another possible cause of the issue is clogging of the exfiltration
zone with river silts, which accumulate each year.


PRITCHARD WASTEWATER MASTER PLAN 28
THOMPSON NICOLA REGIONAL DISTRICT – APRIL 2018
The river exfiltration area was scarified in the fall of 2012 and a hydraulic survey was undertaken
using piezometers between May 2nd and July 26th 2013. The study period started with the river
level high enough to cover the exfiltration area and finished with the river level near the annual
peak. Over this period the water column of the hydraulic profile remained high through the gravel
layer until Monitoring Well #3, then dropped to near the bottom of the gravel layer by River Road.
By September of 2013 both Rapid Infiltration Basins had drained completely as a result of the
scarification in the previous fall. The observations from May to July 2013 indicated that the most
significant head losses were the area between MW-3 and MW-4. TRUE investigated the area
between MW-3 and MW-4 further by installing another test hole prior to the July 3rd reading. This
indicated that the slope of the grade line is constant between MW-3 and MW-4. TRUE did not
measure the water column in freezing conditions, as the mean daily temperature was in the low
teens by May 2013. This means that the impact of frost penetration in the exfiltration area was
not measured in this study.
The TNRD propose to dig test pits in the gravel layer to check for blockage by migrating silts and
undertake further piezometer monitoring. The TNRD also propose to install a clay cap over the
seepage bed on the upgradient side of River Road to safeguard against future surfacing of the
effluent, which affects the use of the road.
A new engineering study is currently underway, investigating the winter infiltration issue. This
master plan may be updated with the findings of that study at a later date. The study is expected
to recommend measures to improve winter exfiltration. These may include infrastructure to
protect the exfiltration zone from siltation and/or from freezing.

PRITCHARD WASTEWATER MASTER PLAN 29
THOMPSON NICOLA REGIONAL DISTRICT – APRIL 2018
6.0 Rights of Way
In accordance with the terms of reference for this assessment study, the status of rights of way
covering components of the water system not located in public road rights of way has been
reviewed. Components of the water system not located in public road rights of way are listed
following:
Sewer System and Pump Station
The sewers are generally located inside the MOTI road dedication and have dedicated right of
ways where needed. The lift station and force main are in a dedicated right of way (KAP 62169).
Wastewater Treatment Plant
The wastewater treatment plant is located on TNRD property.
Discharge to the South Thompson River
The discharge area is located inside a 34m wide by 100m long right of way as it crosses the MOTI
road dedication and enters the river channel.
FIGURE 6-1: EFFLUENT DISPOSAL AREA RIGHT OF WAY

PRITCHARD WASTEWATER MASTER PLAN 30
THOMPSON NICOLA REGIONAL DISTRICT – APRIL 2018
7.0 Improvement Plan
7.1 General
In Section 7 of this report, improvements to the water system are described based on an
assessment of regulatory standards and operating condition. Aside from infrastructure
improvements the TNRD are working on the development of a variety of other tasks that will
enhance the management of the wastewater systems. These include;
GIS data collection (completed)
Asset management plan (completed)
Long term life cycle financial planning (in progress)


PRITCHARD WASTEWATER MASTER PLAN 32
THOMPSON NICOLA REGIONAL DISTRICT – APRIL 2018
7.2 Treatment
Costs for the replacement of the trickling filter cladding are primarily for labour. The costs are
highly dependant on methodology and the effect of risk pricing. As a result, there is considerable
uncertainty regarding costs and a collaborative approach to procurement should be considered.
The work should be undertaken in stages so as to avoid a deterioration of effluent quality, which
would require regulatory authorisation.
TABLE 7-1: ESTIMATED TRICKLING FILTER RE-CLADDING COST
Description Unit Price Number Subtotal
Dismantle ex filter in sections and replace cladding
$80 180h $14,400
Materials - Polypropylene sheet and metal frame
$75 72 $10,000
Engineering and Contingencies $ 50% $12,200
TOTAL $37,000
A single new closed vessel UV disinfection unit similar to the existing system has been assumed.
The purchase cost of an open channel system would be less than a closed vessel unit but the
installed cost would be higher, particularly given the space constraints in the existing building.
TABLE 7-2: ESTIMATED UV DISINFECTION REPLACEMENT COST
Description Unit Price Number Subtotal
UV Disinfection Unit $38,000 $38,000
Pipe components $5,000 $5,000
Installation $80 100h 8,000
Commissioning and Start-up Services $5,500 $5,500
Engineering and Contingencies $ 50% $28,250
TOTAL $85,000

PRITCHARD WASTEWATER MASTER PLAN 33
THOMPSON NICOLA REGIONAL DISTRICT – APRIL 2018
8.0 Cost Summary
Table 8-1 shows the major system upgrades described in this master plan along with expected
costs for the work. The costs include design and construction costs in 2018 dollars.
TABLE 8-1: RECOMMENDED UPGRADES AND ESTIMATED COSTS
Schedule Description Estimated Cost2018 UV disinfection replacement $85,0002019 Trickling Filter Cladding $37,000
Cost estimates are developed to the Class ‘C’ level, per Engineers and Geoscientists British
Columbia (EGBC) Budget Guidelines for Consulting Engineering Services, Class ‘C’ estimates
are defined as follows:
Class C estimate (±25-40%): An estimate prepared with limited site information and based on
probable conditions affecting the project. It represents the summation of all identifiable project
elemental costs and is used for program planning, to establish a more specific definition of client
needs and to obtain preliminary project approval.

APPENDIX A
Effluent Monitoring Results

379-491 Water Analysis 2018 01 31.xlsx Pritchard WW (2) 18/04/2018
Pritchard WWTPQuarterly Effluent TestingDate Lab ID Sample
LocationBOD, 5-day Total
Suspended Solids
Phosphorus, Total
Phosphorus, Total Dissolved
Phosphorus, Ortho
Chloride Ammonia, Total
Nitrogen, Total Kjeldahl
Nitrite Nitrate Nitrogen, Total
Coliforms, Fecal
Coliforms, Total
Background Colonies
E. coli
Unit mg/L mg/L mg/L as P mg/L as P mg/L mg/L mg/L as N mg/L as N mg/L as N mg/L as N mg/L as N CFU/ 100mL
CFU/ 100mL
CFU/ 100mL
CFU/ 100mL
Permit Limit (to RI Basins) ESP 10 10 1 20020‐Jan‐16 6011017-01 ESP <9 2 0.076 3.74 12.1 0.66 16.8 22.9 <120‐Jan‐16 6011017-02 UFP <9 <2 0.054 6.25 7.33 <0.010 4.78 12.1 52
25‐Feb‐16 6021645-01 ESP <10 <2 0.141 1.69 3.79 0.269 18 22 13025‐Feb‐16 6021645-02 UFP <10 <2 0.05 2.31 2.46 0.427 1.49 4.37 225‐Feb‐16 6021645-03 TRDA 0.017 <0.01 13.6 0.047 0.37 <0.010 0.023 0.023 <1 12 20 <125‐Feb‐16 6021645-04 TRUS 0.008 <0.01 1.32 0.044 0.17 <0.010 0.101 0.269 <1 <410 120000 <125‐Feb‐16 6021645-05 TRDS 0.009 <0.01 14.8 0.024 0.32 <0.010 0.014 0.32 <1 <10 <10 <1
15‐Mar‐16 6031110-01 ESP <10 4 0.135 1.62 2.58 0.053 20 22.6 215‐Mar‐16 6031110-02 UFP <10 <2 0.05 1.19 1.64 1.75 1.54 4.93 <1
05‐Apr‐16 6040362-01 ESP <7 3 0.093 3.21 3.32 0.041 17.9 21.3 1305‐Apr‐16 6040362-02 UFP 8 4 0.033 0.028 0.7 0.012 2.95 3.87 <1
26‐May‐16 6052139‐01 ESP <8 <2 0.064 10.5 12.7 0.403 17.6 30.7 <126‐May‐16 6052139‐02 UFP <8 <2 0.069 0.358 0.93 0.061 2.05 3.04 <126‐May‐16 6052139‐03 TRDA <0.002 <0.01 0.66 <0.020 0.12 <0.010 0.039 0.154 260 >700 5200 17026‐May‐16 6052139‐04 TRUS 0.008 <0.01 0.63 <0.020 0.14 <0.010 0.06 0.204 4 48 1900 226‐May‐16 6052139‐05 TRDS 0.007 <0.002 0.6 <0.020 0.19 <0.010 0.053 0.19 2 >18 680 2
23‐Jun‐16 6082050‐01 ESP <6 <2 0.015 8.82 9.28 0.01 17.4 28.8 <123‐Jun‐16 6082050‐02 UFP <6 <2 0.097 0.444 0.7 <0.010 0.512 1.21 1
27‐Jul‐16 6072089‐01 ESP <7 4 0.163 4.11 8.11 <0.010 17.7 23.8 <127‐Jul‐16 6072089‐02 UFP <7 <2 0.154 1.01 1.77 0.018 0.255 2.05 <1
01‐Sep‐16 6090143‐01 ESP <7 5 0.281 5.12 7.06 0.132 14.2 21.5 101‐Sep‐16 6090143‐02 UFP <7 <2 0.217 1.93 2.08 0.027 0.314 2.4 3501‐Sep‐16 6090143‐03 TRDA <0.002 <0.01 0.94 <0.020 1.24 <0.010 <0.010 1.24 70 270 14000 8801‐Sep‐16 6090143‐04 TRUS <0.002 <0.01 1.42 0.025 1.15 <0.010 0.011 1.16 69 >220 21000 6901‐Sep‐16 6090143‐05 TRDS 0.003 <0.01 1.07 <0.020 0.28 <0.010 <0.010 0.281 100 >150 27000 74
29‐Sep‐16 6092238‐01 ESP <6 2 0.16 6.92 8.92 <0.010 1.29 10.2 <129‐Sep‐16 6092238‐02 UFP <6 <2 0.211 1.91 2.05 <0.010 0.026 2.08 2
27‐Oct‐16 6101989‐01 ESP 11 <2 0.089 3.44 5.35 <0.10 17.4 22.7 <127‐Oct‐16 6101989‐02 UFP <8 <2 0.144 1.87 1.87 <0.010 0.2 2.07 <1
23‐Nov‐16 6111748‐01 ESP <6 6 0.167 3.77 6.19 0.14 16.8 23.2 <123‐Nov‐16 6111748‐02 UFP <6 <2 0.468 3.83 4.74 <0.010 <0.010 4.74 <123‐Nov‐16 6111748‐03 TRDA 0.004 <0.01 0.43 0.02 0.11 <0.010 0.0211 0.138 3 13 1100 323‐Nov‐16 6111748‐04 TRUS 0.003 <0.01 0.45 <0.020 0.14 <0.010 0.028 0.17 5 54 1300 523‐Nov‐16 6111748‐05 TRDS <0.002 <0.01 0.44 0.023 0.19 <0.010 0.026 0.214 6 84 2200 5
15‐Dec‐16 6121129‐01 ESP 8 7 0.231 2.62 4.23 0.216 15.5 19.9 <115‐Dec‐16 6121129‐02 UFP <6 <2 0.187 2.66 3.31 <0.010 4.24 7.55 <1
26‐Jul‐17 7072330-01 ESP <7.4 5.8 0.242 8 9.79 0.342 12.6 22.7 <126‐Jul‐17 7072330-02 UFP <7.4 <2.0 0.105 0.991 1.74 <0.010 0.697 2.44 <1
23‐Aug‐17 7082198-01 ESP <2.0 0.0549 30.2 11.1 11.6 0.316 13.1 24.9 <123‐Aug‐17 7082198-02 UFP <2.0 0.138 0.876 1.2 <0.050 0.67 1.87 <123‐Aug‐17 7082198-03 TRDA <0.0020 <0.0050 0.67 0.055 0.174 <0.010 <0.010 0.174 38 100 > 200 3823‐Aug‐17 7082198-04 TRUS <0.0020 <0.0050 0.59 0.024 0.159 <0.010 <0.010 0.159 46 100 > 200 4623‐Aug‐17 7082198-05 TRDS <0.0020 <0.0050 1.35 0.057 0.297 <0.010 <0.010 0.297 330 400 11000 330
ESP Effluent Sample Port UFP Upper Flow Through PortTRDA Thompson River Discharge AreaTRUS Thompson River UpstreamTRDS Thompson River Downstream
APPENDIX B
Permit to Operate

·~· .. ~·-~--•• ""'~-. -~~· -3v~ •• -~·~· ~~~3'0 -~·~· ... I"" ,;:, <J l(i§l''-,_"~'• ) )~ ' ,~'G_, )~-, G ' ,l_,i'i, _@w .. • - ~·..i-;,
~I ·~ ffl! ~-! ~i. PROVINCE OF -~- Environmental Protection Gf(tJ ! BRITISH COLUMBIA r 1259 Dalhousie Drive ))!el tt,~~ ~~i~!~
0
b~lumbia V2C 525 ~;I Telephone: (604) 371-6200 l.
l~J.:i 'ft--s· MINISTRY OF ENVIRONMENT, '""'~
. l LANDS AND PARKS I~;; ~l l~ ffl I~
PERMIT ~f-ffl PE 14686
\~
m 1.~·.· i~J:i • Under the Provisions of the Waste Management Act 1 f;'cJ'-
ffl ! \~ Thompson Nicola Regional District I~
!~ !~ is authorized to discharge effluent to the ground from a sewage treatment plant located in
Pritchard, British Columbia, subject to the conditions listed below. Contravention of any of these conditions is a violation of the Waste Management Act and may result in prosecution.
This Permit does not authorize entry upon, crossing over, or use for any purpose of private or Crown lands or works, unless and except as authorized by the owner of such lands or works. The responsibility for obtaining such authority shall rest with the Permittee.
\~
l~ 1m
Im Im I~
onald K. May, P.En . Asst. Regional Waste Manager m Datelssued: October 8, 1996
Amendment Date:
Page: 1 of 7 PERMIT NO. : PE 14686 :
'fl)iv
m ffll ~e)!l~e)!I~~ e)!I~ ;;J!J~e)!I~ er.~ ;;J!J~~~~~ DK-1337

PROVINCE OF BRITISH COLUMBIA
Environmental Protection
1. AUTHORIZED DISCHARGE
2.
1.1 This subsection identifies the discharge of effluent from a residential subdivision as approximately shown on the site plan on page 6.
1.1.1 The maximum authorized rate of discharge is: 230 m3/d. The authorized discharge period is 24 hours/day, 7 days/week.
1.1.2 The concentration of the contaminants discharged to the R.I. basins shall not exceed:
Biochemical Oxygen Demand Total Suspended Solids Phosphorus (total) Fecal Coliform (MPN)
- 10 mg/I - 10 mg/I - 1 mg/I - 200/100 ml
1.1.3 The authorized works shall consist of: A trickling filter system, a phosphorus removal unit, a sand filter, an ultra-violet disinfection unit, rapid infiltration (R.I.) basins and related appurtenances.
1.1.4 The location of the point of discharge shall be: Lot I, Plan 50563, Kamloops Division Yale District, West of the Sixth Meridian.
GENERAL REQUIREMENTS
2.1 Maintenance of Works, Bypasses and Emergency Procedures
The Permittee shall inspect the pollution control works regularly and maintain them in good working order. In the event of an emergency or condition which prevents continuing operation of the approved method of pollution control, the Permittee shall immediately notify the Regional Waste Manager and take appropriate remedial action.
The bypass of the designated pollution control works without the written approval of the Regional Waste Manager is prohibited.
2.2 Process Modifications
The Permittee shall notify the Regional Waste Manager prior to implementing changes to any process that may affect the qualit1/1or quantity of the discharge.
, I / / /
Datelssued: October 8, 1996 Amendment Date:
Page: 2 of 7 PERMIT NO. : PE 14686
.•, ' PROVINCE OF
BRITISH COLUMBIA
Environmental Protection
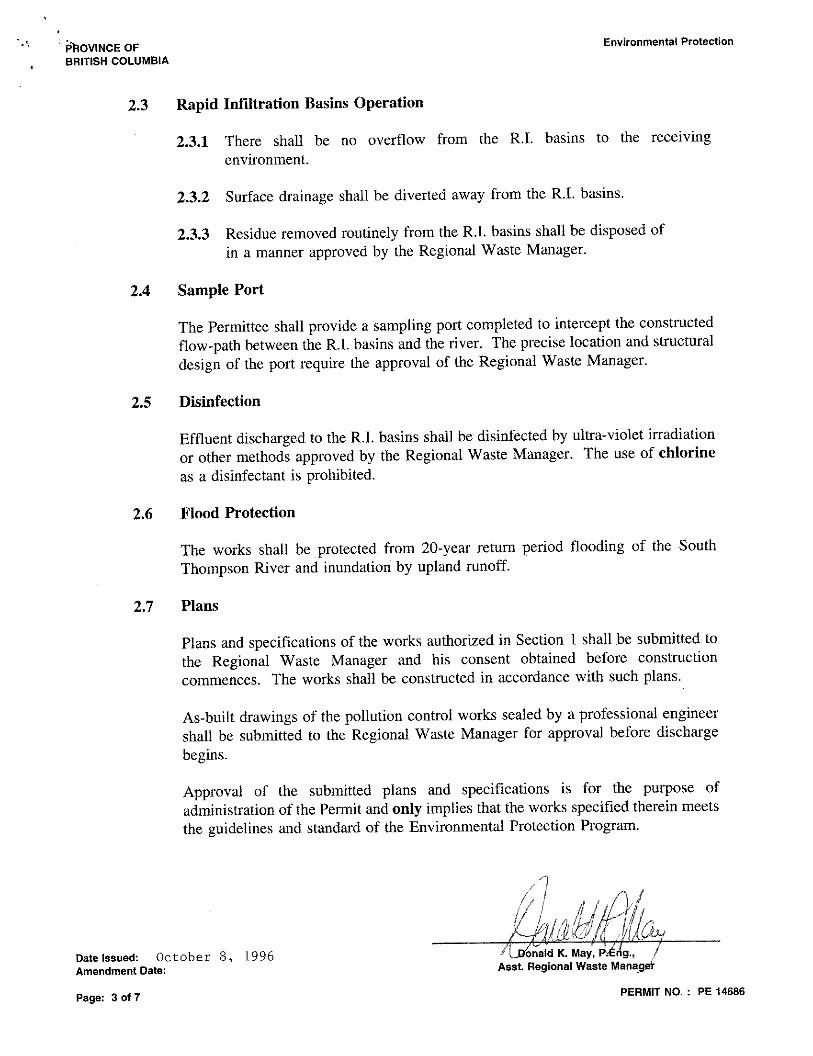
2.3 Rapid Infiltration Basins Operation
2.3.1 There shall be no overflow from the R.I. basins to the receiving
environment.
2.3.2 Surface drainage shall be diverted away from the R.I. basins.
2.3.3 Residue removed routinely from the R.I. basins shall be disposed of
in a manner approved by the Regional Waste Manager.
2.4 Sample Port
The Permittee shall provide a sampling port completed to intercept the constructed
flow-path between the R.I. basins and the river. The precise location and structural
design of the port require the approval of the Regional Waste Manager.
2.5 Disinfection
Effluent discharged to the R.I. basins shall be disinfected by ultra-violet irradiation
or other methods approved by the Regional Waste Manager. The use of chlorine
as a disinfectant is prohibited.
2.6 Flood Protection
The works shall be protected from 20-year return period flooding of the South
Thompson River and inundation by upland runoff.
2.7 Plans
Plans and specifications of the works authorized in Section 1 shall be submitted to
the Regional Waste Manager and his consent obtained before construction
commences. The works shall be constructed in accordance with such plans.
As-built drawings of the pollution control works sealed by a professional engineer
shall be submitted to the Regional Waste Manager for approval before discharge
begins.
Approval of the submitted plans and specifications is for the purpose of
administration of the Permit and only implies that the works specified therein meets
the guidelines and standard of the Environmental Protection Program.
/7
/I/ . ;/. Jj ' I I 1/f)j~ f I //_ - /_ '
Date Issued: October 8, 1996 Amendment Date:
){;;Pl &1/;{ vif(ry · • onald K. May, ~{g., f
Asst. Regional Waste Mana_~
Page: 3 of 7 PERMIT NO. : PE 14686

''' ' PROVINCE OF BRITISH COLUMBIA
Environmental Protection
3.
2.8 Plant Classification and Operator Certification
The Permittee shall have the works authorized by this Permit classified ( and the classification shall be maintained) by the Environmental Operators Certification Program Society (Society). The works shall be operated and maintained by person/s certified within and according to the program provided by the Society.
Certification must be completed to the satisfaction of the Regional Waste Manager. In addition, the Regional Waste Manager shall be notified of the classification level of the facility, the certification levels of the operators, and changes of operators and/or operator certification levels within 30 days of any change.
2.9 River Bank Remediation
In the event that the river bank has been damaged by the construction of the granular flow-through channel the Permittee shall carry out appropriate remediation work to the satisfaction of the Regional Waste Manager, when so directed in writing.
2.10 Operations and Maintenance Manual
An Operations and Maintenance Manual for the works authorized in section 1.1.3 shall be written by the design engineers and submitted to the Regional Waste Manager for approval before discharge begins.
MONITORING AND REPORTING REQUIREMENTS
The Permittee shall undertake the following monitoring program which represents the maximum required of the Permittee. The Regional Waste Manager may reduce the annual program based upon the results submitted as well as any other information obtained from the Environmental Protection staff in connection with this discharge.
The Regional Waste Manager will advise the Permittee in writing, of any changes to the monitoring program at least one month prior to the implementation of the modified program.
Date Issued: October 8, 1996 Amendment Date:
· onald K. May, P.Eng., . {/ sst. Regional Waste Mana,fler
Page: 4 of 7 PERMIT NO. : PE 14686
. ... ' P'ROVINCE OF BRITISH COLUMBIA
Environmental Protection
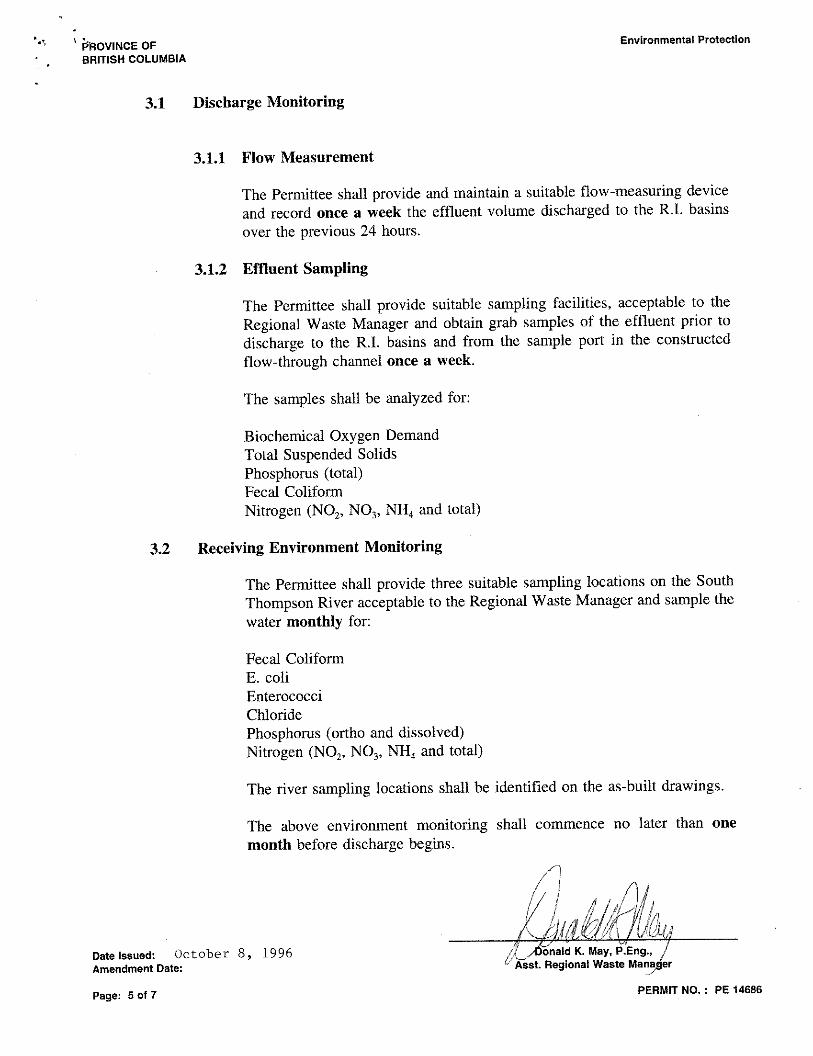
3.1 Discharge Monitoring
3.1.1 Flow Measurement
The Permittee shall provide and maintain a suitable flow-measuring device
and record once a week the effluent volume discharged to the R.L basins
over the previous 24 hours.
3.1.2 Effluent Sampling
The Permittee shall provide suitable sampling facilities, acceptable to the
Regional Waste Manager and obtain grab samples of the effluent prior to
discharge to the R.I. basins and from the sample port in the constructed
flow-through channel once a week.
The samples shall be analyzed for:
Biochemical Oxygen Demand Total Suspended Solids Phosphorus (total) Fecal Coliform Nitrogen (NO2, NO3, NH4 and total)
3.2 Receiving Environment Monitoring
The Permittee shall provide three suitable sampling locations on the South
Thompson River acceptable to the Regional Waste Manager and sample the
water monthly for:
Fecal Coliform E.coli Enterococci Chloride Phosphorus ( ortho and dissolved) Nitrogen (NO2, NO3, NH4 and total)
The river sampling locations shall be identified on the as-built drawings.
The above environment monitoring shall commence no later than one
month before discharge begins.
Datelssued: October 8, 1996 Amendment Date:
/ onald K. May, P.Eng., ; 0 Asst. Regional Waste Ma~er
Page: 5 ol 7 PERMIT NO. : PE 14686

• :• ... -. ' ..
PROVINCE OF Environmental Protection BRITISH COLUMBIA
3.3 Monitoring Procedures
3.3.1 Sampling and Flow Measurement Procedures
Sampling and flow measurement of the effluent shall be carried out in accordance with the procedures described in " Field Criteria for Sampling Effluents and Receiving Waters," April 1989, 17 pp., or by suitable alternative procedures as authorized by the Regional Waste Manager.
Copies of the above manual may be purchased from the Environmental Protection Division, Ministry of Environment, Lands and Parks, 777 Broughton Street, Victoria, British Columbia VSV 1X5, and are also available for inspection at all Environmental Protection Program Offices.
3.3.2 Chemical Analyses
Analyses are to be carried out in accordance with procedures described in the latest version of " British Columbia Environmental Laboratory Manual for the Analysis of Water, Wastewater, Sediment and Biological Materials, March 1994 Permittee Edition," or by suitable alternative procedures as authorized by the Regional Waste Manager.
Copies of the above manual may be purchased from the Queen's Printer Publications Centre, 2nd Floor, 563 Superior Street, Victoria, British Columbia VSV 4R6 (l-800-663-6105), and are also available for inspection at all Environmental Protection Program Offices.
3.4 Reporting
The Permitee shall maintain data of analyses and flow measurements for inspection by Environmental Protection staff and submit the data, suitably tabulated, to the Regional Waste Manager six months after discharge begins and annually thereafter.
Datelssued: October 8, 1996 Amendment Date:
£ onald K. May, P.Eng., Asst. Regional Waste Managef
Page: 6 of 7 PERMIT NO. : PE 14686

"',, ..... ,, -PROVINCE OF BRITISH COLUMBIA
Kam loops
Sorento ___ ,_I
ar~
Environmental Protection
Scale: , , o co
/ Permit No.: PE 14686
Date: October 8, 1996
I
ffawtJ, /ksf-, Regional Waste Manager
Copyright © 2022 FDOKUMEN